Implementing Lean and Agile Manufacturing System in the Electric Motor Industry for Sustainable...
20
Implementing Lean and Agile Manufacturing System in the Electric Motor Industry for Sustainable Environment Abstract Many leading companies have implemented Lean and Agile Manufacturing Programs which yield increased efficiency, reduced costs, improved customer response and more. The system is capable to survive and prosper in a competitive environment of continuous and unpredictable change by reacting quickly and effectively to changing markets, driven by customer-designed products and services. Since Lean and Agile Programs each require management commitment and employee involvement, identification and reduction of organizational wastes, and continuously improving organizations and responding to the sustainable environment. This studies suggest implementing one program may actually make implementing the second program less arduous. In this paper an attempt has been made to apply lean and agile techniques in industrial motors manufacturing company. The results shows reduction in waste and the system responsiveness according to the changing customers needs through lean and agile techniques. It would result in sustainable development. Key Words : Lean production, Agile Manufacturing, Waste minimization, value stream mapping, Responsiveness 1.0 Introduction: Lean manufacturing is a systematic approach for identifying and eliminating waste in operations through continuous improvement for doing everything more efficiently, reducing the cost of operating system and fulfilling the customers desire for maximum value at the lowest price. Many organizations have realized the capability of producing high quality products more economically even in lower volume by using just a fraction of the normal work in processes
-
Upload
independent -
Category
Documents
-
view
4 -
download
0
Transcript of Implementing Lean and Agile Manufacturing System in the Electric Motor Industry for Sustainable...

Implementing Lean and Agile Manufacturing System in theElectric Motor Industry for Sustainable Environment
Abstract
Many leading companies have implemented Lean and AgileManufacturing Programs which yield increased efficiency,reduced costs, improved customer response and more. Thesystem is capable to survive and prosper in a competitiveenvironment of continuous and unpredictable change byreacting quickly and effectively to changing markets, drivenby customer-designed products and services.
Since Lean and Agile Programs each require managementcommitment and employee involvement, identification andreduction of organizational wastes, and continuouslyimproving organizations and responding to the sustainableenvironment. This studies suggest implementing one programmay actually make implementing the second program lessarduous.
In this paper an attempt has been made to apply lean andagile techniques in industrial motors manufacturing company.The results shows reduction in waste and the systemresponsiveness according to the changing customers needsthrough lean and agile techniques. It would result insustainable development.
Key Words : Lean production, Agile Manufacturing, Waste minimization, valuestream mapping, Responsiveness
1.0 Introduction:
Lean manufacturing is a systematic approach for identifyingand eliminating waste in operations through continuousimprovement for doing everything more efficiently, reducingthe cost of operating system and fulfilling the customersdesire for maximum value at the lowest price. Manyorganizations have realized the capability of producing highquality products more economically even in lower volume byusing just a fraction of the normal work in processes

inventory. For the enterprises keen to win and retaincustomer confidence, to realize efficiency and effectivenessin all business processes and to improve the chance of makingprofit consistently , lean manufacturing has proved to be avery reliable “good management practice”. Whereas, increased global competition forces manufacturingcompanies to take action, both in terms of operationalperformance as well as strategic positioning. Companies needcontinuously to improve their operations to stay competitive.The choice of a lean or agile improvement program would alsodepend on the performance effects that can be expected. Ifthere are differences, the choice would be related to theareas of operational performance that need to bestrengthened. On the other hand, if the

effects on individual performance measures are similar, itwould lead to the conclusion that lean and agile have moresimilarities than differences, and that the differences donot significantly affect performance.
1.1 Lean Manufacturing:
Lean manufacturing is widely recognized as a mechanism forensuring improvement in the manufacturing processes.
The goal of lean manufacturing is to reduce the wastes interms of human effort, inventory, time to market andmanufacturing space and become highly responsive tocustomer demand while producing world class qualityproducts in most efficient and economic manner (Liker,1998).
(Todd 2000) and Shigeo Shingo (1992) strongly advocatedthe elimination of waste and put forth the idea, ‘don’taccept waste as unavoidable’. The basis of leanmanufacturing is the elimination of waste.
Main Kinds of Waste in Lean Manufacturing :(i) Over-production (ii) Defects (iii) Inventory (iv)
Transportation (v) Waiting (vi) Motion(vii)Correction (viii) Over-processing (ix) KnowledgeDisconnection
ProcessEvaluation andAssessment
Identificationof
Redesigningthe Process
ChangeManagement
ProcessStandardizatio
Kaizen
JIT CellularMfg. Poka Yoke
Daily ProcessManagement

Fig1.1 Lean Manufacturing Processes.
OverallEquipment
Evaluation &Assessment
Optimization

1.2 Agile Manufacturing:
Agile manufacturing does not aim for pure costreduction with a focus on solely achieving efficiency,but is rather a concept that incorporates theimportance of price, quality, flexibility and highcustomer satisfaction.
Due to this, the Agile manufacturing concept isdifferent to the principles of Lean manufacturing,which focuses solely on the avoidance of waste in orderto improve productivity, shorten lead times and costreduction. Furthermore, the Lean manufacturing conceptis applicable in an environment characterized byrepetitive patterns and mass production aiming foreconomies of scale through standardized products. Thesecharacteristics of the Lean manufacturing concept havetheir limitations with regard to a fast-changingenvironment. To overcome the difficulties of leanmanufacturing, agile manufacturing came into existencewith fast changing environment and changing marketscenario.
Agile system as a productive system capable of dealingwith a specific (or predictable) scope of productvariation. The system is also capable of dealing withan unplanned manufacturing request with frequent designchanges.
Fig1.2 Agile Manufacturing Processe
Range of markets, Customers product
Knowledge workers,
Multifunctional , Multilingual
IT skill
Cost
Agile Manufacturing
Flexibility
QualityFlexible people
Alliances, Core competencies, Long term business plan
Market focus
Strategic Planning & Objective
FMS, CIM, CAD/CAE, CAPP, EDI, Internet, Robotics
Flexible technology
Responsiveness
Fig1.2 Agile Manufacturing Paradigm
2.0 Case Study of Electric Motor Manufacturing Plant:
The case study was conducted in an industry in eastern partof India which was a job shop industry. There were manyproblems related with the wastes. In this study it wasconfined with two major parameters time of manufacturing andits inventory levels. The study was conducted keeping in viewthe lean and agile concept. The company produces electricmotors from 1/2 HP to 800 HP, with literally thousands ofmotor configurations to choose from single phase, threephase, multi-speed, inverter duty, hazardous duty, severeduty, wash down, marine duty motors, spin master AC microdrive, Premium efficiency ratings motors etc.
2.1 Current State Map: The company produces several productssuch as motors, generators, motor guidelines for beltedapplication ,belting and chain drive etc. The focus of thisvalue stream mapping is one product family ,i.e. motorassembly.
The customizations that occur inside a standard productfamily do not leads to significant differences in processingtime and set-up times. Cycle time of different process stepsfor different Motor family are shown below:

Table 2.1: Cycle time of different process steps for different Motorfamily
CYCLE TIME(min.)
Motor family
Processing Stage
Motor family Motorfamily
Motorfamily
Motorfamily
A B C D
Motor assembly 61 60 60 58
Stator assembly
50 50 52 48
Rotor assembly 20 18 20 19
Housing machine 15 14 15 15
Shaft machine 14 14 14 14
Saw 1 1 1 1
End-bell machine 15 14 15 14

X
Forecast
Critical customer
list
ICT=15 min I
I
II
Raw material
II I
I
lead time
time 127 min.
Figure 2: Current state map
I
Production
8days 2.8hrs
N/A
1min
1 day
15 min.
3 days
50 min
4 days
61 min
15 min
Value added
End Bell
Machine♀ 7, CT=15 min, CO=30min
shippingMotor assembly♀ 7
CT=61 min, CO=2min
2 shifts
Shaft
Machine♀ 7
CT=14min
CO=35min
2 shifts
Saw
♀ 1
Rotor
Assembly♀ 3
CT=20 min
CO=7min
2 shifts
Housing
Machine♀ 3
CO=26min
2 shifts
Stator
Assembly♀ 11
CT=50 min
CO=66min
2 shifts
Day/Week/Month
Day/Week/ Month
Utilization weekly schedule for each cell
Monthly
Order
Customer2010 pieces / month
2 shiftsContainer of 1
Suppliers1 Month
Forecast
Sales order
Production
ControlMRP


Strategy for Improvement Set for the AB Product Line:
Production of 80 motors/day, based on perceived marketneeds (current production throughput is 67 motors/day)that means, to increase the production of AB product linewithout incurring additional capital expense.
Manufacturing lead-time of less than 24 hours (current lead-time is 8 days).
Reduce the in – process inventories and non value added time. On-time delivery of 99% (current on-time delivery is below
70%).The Value Stream Mapping was drawn with the help ofconventional icons used for mapping. Figure:2 shows thecurrent state map.
3.0. Future State Map
Based on the outcome of the current state map, defects,waiting, and inventory, are identified as the three majorwastes affecting the performance of the industry under study.In this section, the wastes concerning with inventory,overproduction and waiting are taken into account. Analyticaltreatment is also included by taking into account takt time,pitch, heijunka box etc. Improvements in the existing processhave been identified and accordingly future state map has beendeveloped. The future state map is developed by answering eight questionsin a straight forward manner, using approach prescribed byRother and Shook (1999).
Eight questions must be answered for developing future statemap. All these questions have different strategies and itsapplication.The first five questions are related to basic issues related toconstruction of future state map. The next two questions deal with technical implementationdetails such as the detail of control system (e.g. “heijunka”).They help in defining non-mapping details such as productionmix, order release time, etc.

Finally, the last question is related to the definition ofeffort or actions needed (“Kaizen”) to migrate from the currentstate to the future state. Question 1: What is Takt time?
Takt Time = Available working time per day/Customer demand perdayTakt Time= (15 hrs. x 60 min//h) / 80 motors= 11.25min/motor
Question 2: Will production produce directly to the shipping or to a finishedgoods supermarket?A supermarket is nothing more than a buffer area for storage ofthe products that are ready to be shipped and is located at theend of the production line.
Question 3: Where will the company needs to use a pull systemsupermarket inside the value stream?Eight additional pull system supermarkets are needed to createa continuous flow at complete motor assembly depending on up-time, changeover time and percentage defects at differentprocessing stages.Average cycle time (taking into consideration number ofresources available) of different processing stages fordifferent motor family and by knowing the average cycle time wecan calculate the average monthly and daily demand.i.e.30,20 ,20,10 for motor part family A,B,C and Drespectively.The next step is for calculation of lot size, trigger point andnumber of kanban for different supermarkets.
3.1 Steps for setting up triangle kanban after analyzingcurrent state map:
Calculation of available time for changeover (work) at eachwork station : 450 minutes per shift or,900 minutes per day,

also we have to determine required run time per day and alsotime available for set-up and change-over. i.e. 311.35 min.
Number of changeovers per day after calculation : 8.28 = 8changeovers per day.
Calculation of batch factor : Batch factor= Number of productfamily / Number of change over per day = 0.4831
Setting up a lot size for production : By multiplying batchfactor* demand / day(Lot size = Numbers of kanban) =39 pieces (14+10+10+5)
Establish a trigger point for reorder: Trigger point= Totallead time to replenish / Part takt timeBy exercising all the four steps, we can determine what arethe time available for changeover/cycle time per day, averagelot size for production and trigger point for reorder in 8 pullsystem supermarkets in a whole value stream. Calculation oftrigger point for reorder is only necessary for SM-B,D,E &Gbecause changeover time is more & company need a trianglekanban. In other four SM changeover time is less, socalculation of trigger point for reorder is not necessary andsimple withdrawal kanbans are used.
Inventory levels at various supermarkets : By proceeding thesame way in all the supermarkets we can calculate required runtime / day, time required / day, to meet average demand, nettime available for set-ups and change-over, average down time,desired number of change-over / day ,batch factors, lot sizeand number of kanban or ,inventory levels at varioussupermarkets.Tables 3.0 provides details of lot size, number of kanbans,total lead time, takt time, and trigger point for reorder to thesupermarkets ahead of every processing stage and is calculatedon the basis of aforementioned equations. Similarly we cancalculate lot size, number of kanbans, total lead time, takttime, and trigger point for reorder from one super market tothe other super markets.

Table 3.0 : Lot size, trigger point and number of kanban for supermarket B (SM-B) that is between motor assembly and stator assembly.
PART Average demand per
Average Cycle time
Average changeover
Average scrap
Down time
Required run time A 30 7.14 30 2.5% 7% 219.64
B 20 7.14 30 2.5% 7% 146.43C 20 7.43 30 2.5% 7% 152.29D 10 6.86 30 2.5% 7% 70.29
588.64
Net time available for setup and change over (min.) 311.3571429Average down time (not including setup and
changeover) min.63
Time available for change over (min.) 248.3571429Desired number of changeover per day 8.28
Batch Factor = number of parts/ desired no of changeovers per day
0.483175151
Products Lot size No. of Kanban Total LeadTime(min)A 14 14 156
B 10 10 119C 10 10 122D 5 5 79
First container time
= 10 minutes
PART Lot size Longest LeadTime (min)
TAKT TIME Trigger Point
Trigger point (No. of containers)
A 14 122 30 4 4B 10 156 45 3 3C 10 156 45 3 3D 5 156 90 2 2

Question 4: Where can continuous flow processing be utilized ?Whenever the supermarkets are at their full capacity then therespective processing stage could be switched to make otherproduct types.
Question 5: What single point in the production chain (thepacemaker process) should be scheduled ?To stop overproduction at any workstation in the value stream ,only one processing stage in the supplier to customer valuestream needs to be scheduled. The processing stage is calledthe pacemaker process , because this point sets the pace ofproduction for all the upstream process together.
Question 6: How should company level the production at the pacemakerprocess?The basis for addressing this question is to distribute theproduction of the four motor part families uniformly over theproduction line at the pace maker process. To determine theproduction sequence , level the product mix in a given pitchinterval and produce the four different products at constantrate. The relationship used is: qir =(r-0.5) (Q/Ddi)
Table 3.1 : Generating production sequence for smooth production
Product(i) Unit qir qir(Sorted) Product(i)A 1 1.33 1.33 AA 2 6.00 2.00 BA 3 10.00 2.00 CA 4 9.33 4.00 AA 5 36.00 4.00 DA 6 22.00 6.00 BA 7 26.00 6.00 CA 8 20.00 6.67 A
Question 7: What increment of work (the “pitch”) will beconsistently released to the pacemaker process?
Depending upon the sequence determined by the last question, howoften should one release and withdraw (the “pitch”) the increment
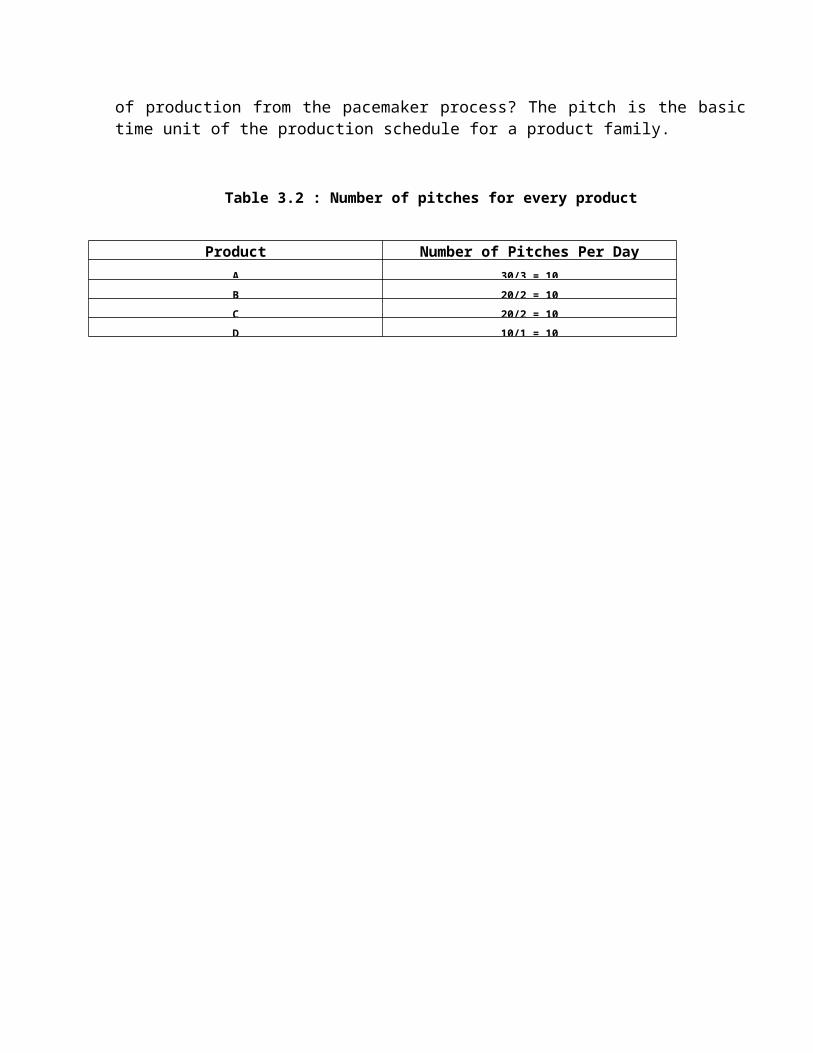
of production from the pacemaker process? The pitch is the basictime unit of the production schedule for a product family.
Table 3.2 : Number of pitches for every product
Product Number of Pitches Per DayA 30/3 = 10B 20/2 = 10C 20/2 = 10D 10/1 = 10

X
Forecast
Reduce set-up time
Reduce c/o time
SM-D SM-B
Raw
materi SM-ASM-F SM-E SM-C
time 127 min
Production lead time
1min 15 min. 50 min 61 min
Value added
End Bell
Machine
OXOX
ShippingMotorassembly
Rotor
Assembly
Saw Shaft
Machine
Stator
Assembly
Day/Week/ MonthHousing
Machine
Day/Week/
Daily schedule Shipping Schedule
Monthly
Order
Customer2400 pieces / monthContainer of 1
SuppliersProduction
Control
1 Month
Forecast
SM - H

Figure 3 : Future state map

Question 8: What process improvements will be necessary?
To realize future state map, it is essential for the company toincorporate improvements in the material and information flow asenvisioned after intensive analysis of various processes.Whatever is the value of takt time, pitch, kanban control andproduction leveling etc. discussed in previous question, it maynot lead to the improvements in production unless specific effortsare directed to improve the processes by involving specific set oflean tools.
4.0 Results and Discussion of Lean (Value Stream Mapping) and Agile System:
Three wastes identified as vital wastes afterdiscussion with company people i.e. inventory,overproduction and waiting have been addressed throughvalue stream mapping (developed in the future statemap).
Eight pull system super markets have been suggestedamong the different stages. The lot size and the numberof kanban requirements at each super market have beencalculated. Triangular kanbans are utilized forreplenishment of four super markets which are locatedafter the processing stage ( housing, shaft, stator andend bell) having higher set up time and requiring higherinventory level.
By the application of pull system, a drastic reductionin the in-process inventory, and elimination of wasterelated to over production is anticipated.The inventory lead time falls to 12.0135 hrs. from 8days 2.8 hrs. Therefore, a reduction of in-processinventory by 90% is estimated by implementation of thefuture state map.
The capacity of the motor manufacturing company to adapt tochange (semi automated varnishing unit to automated unit)to have a flexible production system.

Conclusion:
The main goal of this paper is to develop strategies tominimize the wastes that exist in the manufacturingindustries in the form of operational inefficiency and leadsto increase in the production cost and the manufacturing leadtime. It is found that the wastes occur in the industries inlayers. If one layer is removed then another will appear.Therefore, continuous improvement of the manufacturingprocesses is required for elimination / minimization ofwastes presents in form of layers in the industries.
Agility is broader in scope, applicable to the enterpriselevel and even beyond to the formation of virtualenterprises. The emphasis is on thriving in an environmentmarked by continuous and unpredictable change in the electricmotor industry.
The analysis for the motor manufacturing unit can beconverted to agile manufacturing program by incorporatingsystem responsiveness. The purpose of this paper is to enablethe organization to survive and prosper in a competitiveenvironment of continuous and unpredictable change byresponding quickly and effectively in the volatile marketscenario. For a company to be agile, it must also be lean.
References:
1. ABBETT, D., & PAYNE, V. (1999) Gulfstream V valuestream tour, 1999 Lean Summit (Atlanta, GA, Lean EnterpriseInstitute).
2.BLACK, J., 1991, The Design of factory with a future (McGraw-Hill,New York).
3. Bergmiller, G.G., and McCright, P.R., 2009, “ParallelModels for Lean and Green Operations,” Proceedings of the2009 Industrial Engineering Research Conference, Miami, FL,May 2009.

4. Gary G. Bergmiller & Paul R. McCright ,AZero Waste Management Strategy to Reduce the Cost of Alternative Energy :Proceeding of 2009 Industrial Engineering & Research Conference.
5.Gunasekaran, A. (1998), “Agile manufacturing: enablers andan implementation framework”, International Journal ofProduction Research, Vol. 36 No. 5, pp. 1223-47.
6.Goldman, S.L., Nagel, R.N. and Preiss, K. (1995), AgileCompetitors and Virtual Organisations – Measuring Agility andInfrastructure for Agility, Van Nostrand Reinhold,New York, NY.
7.Liker, J., 2004, The Toyota Way: 14 Management Principlesfrom the World’s Greatest Manufacturer, McGraw-Hill, NewYork, NY.
8.Yusuf, Y.Y. and Adeleye, E.O. (2002), “A comparative studyof lean and agile manufacturing with a related survey ofcurrent practices in the UK”, International Journal ofProduction Research, Vol. 40 No. 17, pp. 4545-62.