
The application of Lean Principles and Six Sigma in the Mexican
186
© María de los Angeles López Tlahuiz March 2011 This thesis is copyright material and no quotations from it may be published without proper acknowledgment.
-
Upload
khangminh22 -
Category
Documents
-
view
1 -
download
0
Transcript of The application of Lean Principles and Six Sigma in the Mexican

i
© María de los Angeles López Tlahuiz March 2011 This thesis is copyright material and no quotations from it may be published without proper acknowledgment.
ii
The application of Lean Principles and Six Sigma in the Mexican
Health care system
A thesis submitted for the degree of MPhil at the University of
Leicester
by
María de los Angeles López Tlahuiz
Department of Engineering
University of Leicester
2011

iii
Para mi Mamá
iv
Statement of originality
The accompanying thesis submitted for the degree of M.Phil. entitled “The
application of Lean Principles and Six Sigma in the Mexican health care
system” is based on work conducted by the author in the Department of
Engineering of the University of Leicester mainly during the period between
January 2005 and September 2009.
All the work recorded in this thesis is original unless otherwise acknowledged in
the text or by references.
None of the work has been submitted for another degree in this or any other
University.
Signed:____________________ Date:__March 2011.___
iii

v
i
Acknowledgments
I would like to thank God, for giving me the opportunity and strength to go through this
research.
I would like to thank Dr. Jorge S. Manzanilla Cadenas, for his vital help in making this
research at the ISSSTE, Puebla; Q.F.B. Alicia Sanchez Clinical Lab Manager, and
Prof. Graham Cherryman, for the opportunity to participate in the “Green Belt Project”
at the Imaging Directorate of the UHL.
I also would like to thank my family for the support and confidence in this journey; to my
friends Tony, Edgardo (†), Don Antonio (†) and Doña Angeles, Elias, Ing. Joel (†),
Esteban, Tio Enrique and Tia, Jorge, Clau, Isa, Alma, and especially to Gareth for his
patience, hard work and help.
I wish to thank my Mexican friends in Leicester: Monse, Magda, for their help, support
and time during my stay in Leicester, thanks also to Monica and Mark for their
hospitality, kindness and help.
Additionally, I would like to thank to the “Bobby tour” friends David and Pepe, and
especially to Mr. J. Roberto Pulido for cheering me up. Many thanks for being there
and making this time enjoyable.
Finally, I would like to express my gratitude to my sponsor CONACYT and to my
country Mexico, for giving me the opportunity to pursue my degree in higher education.

v
The application of Lean Principles and Six Sigma in the Mexican health
care system
María de los Angeles López Tlahuiz, Research student, [email protected]
University of Leicester, Leicester, LE1 7RH, UK
Abstract
This research addresses the application of Lean principles and Six Sigma in health
care.
Lean manufacturing methods were developed in Toyota after World War II and focused
on continuous improvement, involvement of personnel, and the elimination of waste.
Six Sigma was introduced by Motorola in the late 1980‟s as a variation reduction
approach. Of the two, Six Sigma is fundamentally statistical. By contrast, Lean‟s power
comes from its simplicity although underlying this is a process basis that is arguably
statistical.
Both approaches started being used in health care, mostly in US Hospitals, having
results such as the reduction of mortality rates, improving discharging processes,
reduction of surgical site infections, to mention a few. In Europe, the Red Cross
Hospital (the Netherlands) applied Six Sigma in at least three different areas; in the UK,
places using these approaches include the Royal Gwent Hospital in Cardiff (reducing
waiting lists for ultrasound), Bolton Hospital (death rates for patients having operations
were reduced by a third); and just recently in Mexico.
The goal of this research is to examine the applicability of Lean principles and/ Six
Sigma in health care (with a focus on the Mexican health care system), as well as to
identify the most useful tools/techniques, and what key factors are needed to succeed
in the implementation of the approach in health care.
Research was conducted at two different provider organisations in different countries:
the University Hospitals of Leicester (UK) and at the ISSSTE Puebla Regional Hospital
(Mexico). The research was undertaken using two pilot and two case studies.
Interviews with consultants, hospital managers, staff and some patients were also
carried out. Thus, qualitative and quantitative information was gathered.
vi
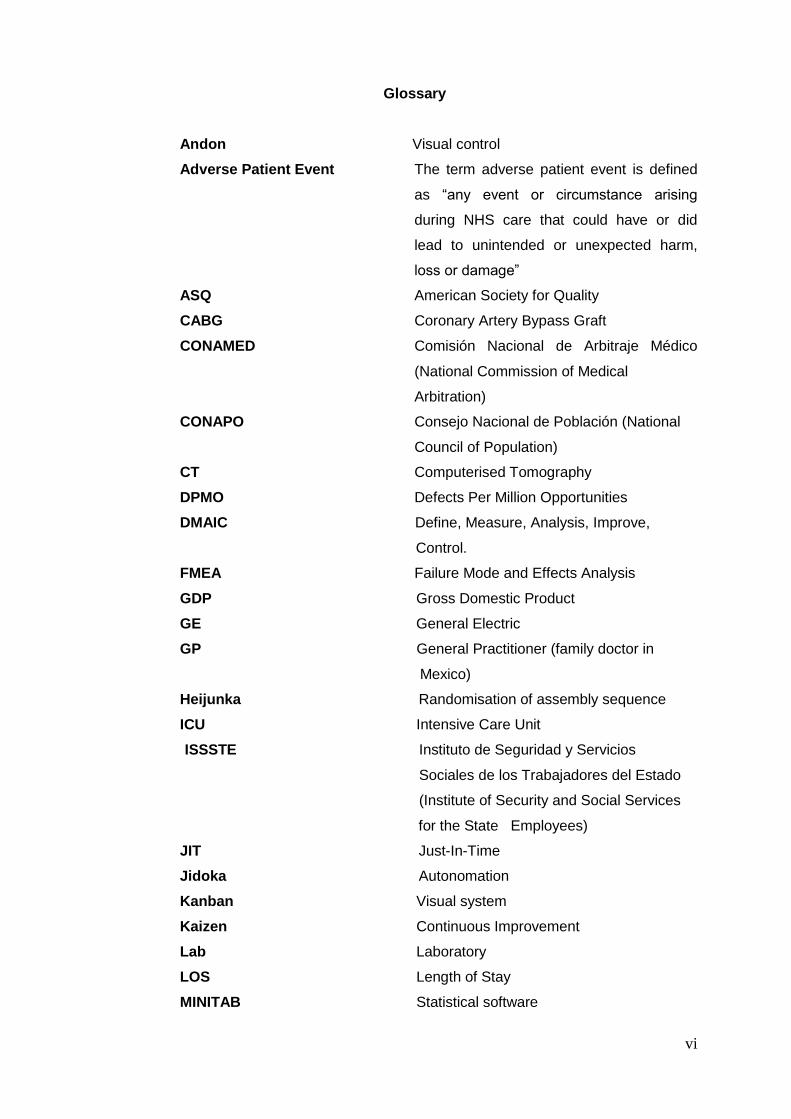
Glossary
Andon Visual control
Adverse Patient Event The term adverse patient event is defined
as “any event or circumstance arising
during NHS care that could have or did
lead to unintended or unexpected harm,
loss or damage”
ASQ American Society for Quality
CABG Coronary Artery Bypass Graft
CONAMED Comisión Nacional de Arbitraje Médico
(National Commission of Medical
Arbitration)
CONAPO Consejo Nacional de Población (National
Council of Population)
CT Computerised Tomography
DPMO Defects Per Million Opportunities
DMAIC Define, Measure, Analysis, Improve,
Control.
FMEA Failure Mode and Effects Analysis
GDP Gross Domestic Product
GE General Electric
GP General Practitioner (family doctor in
Mexico)
Heijunka Randomisation of assembly sequence
ICU Intensive Care Unit
ISSSTE Instituto de Seguridad y Servicios
Sociales de los Trabajadores del Estado
(Institute of Security and Social Services
for the State Employees)
JIT Just-In-Time
Jidoka Autonomation
Kanban Visual system
Kaizen Continuous Improvement
Lab Laboratory
LOS Length of Stay
MINITAB Statistical software
vii
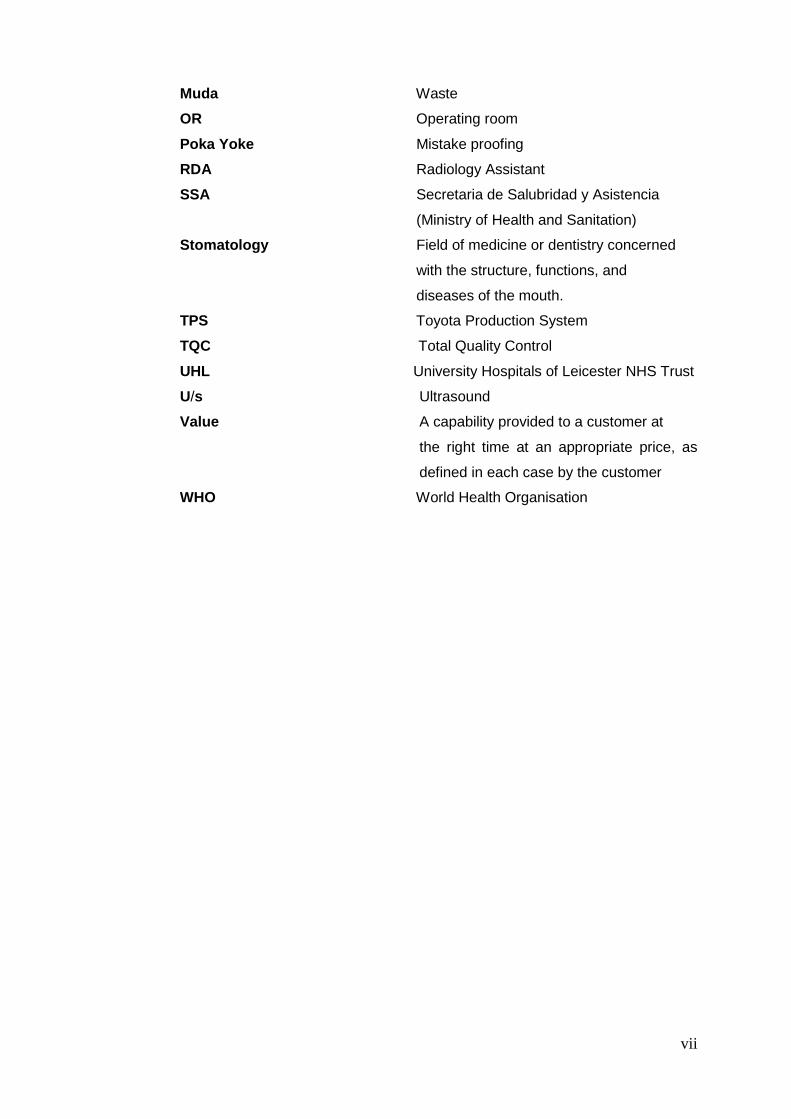
Muda Waste
OR Operating room
Poka Yoke Mistake proofing
RDA Radiology Assistant
SSA Secretaria de Salubridad y Asistencia
(Ministry of Health and Sanitation)
Stomatology Field of medicine or dentistry concerned
with the structure, functions, and
diseases of the mouth.
TPS Toyota Production System
TQC Total Quality Control
UHL University Hospitals of Leicester NHS Trust
U/s Ultrasound
Value A capability provided to a customer at
the right time at an appropriate price, as
defined in each case by the customer
WHO World Health Organisation
viii
Contents
Title
Dedication i
Statement of originality ii
Acknowledgments iii
Abstract iv
Glossary v
Contents vii
List of Figures x
List of Tables xiii
Chapter 1
Introduction 1
Chapter 2
Literature review 7
2.1 Lean principles development 7
2.1.1 Lean tools 11
2.1.2 Lean applications in industry/services 16
2.2 Six Sigma 16
2.2.1 Six Sigma tools 19
2.3 Lean and Six Sigma in health care 22
2.3.1 Lean cases in health care 24
2.3.1.1 Benefits of using Lean 32
2.3.2 Six Sigma in health care 33
2.4 Applicability of Lean and Six Sigma in health care 39
2.5 Enquiry 41
2.6 Key factors 43
2.7 The Mexican context 44
2.7.1 What is health? 44
2.7.2 Economic implications of health care 45
2.7.3 An opportunity for the Mexican health care system 47
2.8 Research questions and Aims 47
Summary 48
ix
Chapter 3
Methodology 49
3.1 Introduction 49
3.2 Development of methodology 50
3.3 Pilot studies 52
3.4 Research programme 53
Summary 56
Chapter 4
Pilot studies in the NHS 57
4.1 University Hospitals of Leicester 57
4.2 Methodology 58
4.3 The Ultrasound pilot study 59
4.3.1 Observation and collection of data 63
4.3.2 Ultrasound map correction 70
4.4 The Plastic Surgery pilot study 73
Summary 77
Chapter 5
The Mexican health care system 78
5.1 The Mexican health care system and its structure 78
5.2 Health Institutions 79
5.3 The National Crusade for the improvement of the health services 80
5.4 ISSSTE 81
5.4.1 ISSSTE current situation 83
Summary 87
Chapter 6
The ISSSTE Puebla Regional Hospital 88
6.1 The ISSSTE case study Clinical Laboratory 90
6.1.1 Major customers of the Clinical Laboratory, type and quantity 92
of lab tests ordered
6.1.2 Lab test results delivery 93
6.1.3 Queuing problem 96
6.1.4 Reduction of waiting time at the reception desk 100
6.2 ISSSTE Referral and Counter-referral case study 104
6.2.1 Approaches utilised for the case study 104
x
6.3 ISSSTE Referral and Counter-referral data analysis 106
6.4 Role of unions in Mexico 113
Summary 114
Chapter 7
Discussion 116
7.1 Introduction 116
7.2 Principal findings 118
7.3 Comparison between UK and Mexico 120
7.4 Comparison with other UK studies 121
7.5 Comparison of methods, tools and techniques 123
7.6 Key factors 125
Chapter 8
Conclusions 127
Bibliography 130
Appendices 147
Appendix 1 A typical FMEA form 148
Appendix 2 Sample of questions from interviews 149
Appendix 3 Ultrasound map elaborated by the U/s Staff 150
University Hospitals of Leicester June 2005 General Ultrasound
Appendix 4 Data collected at the UHL U/s 156
Appendix 5 Parts of the U/s map not in accordance with the real 158
Ultrasound path
Appendix 6 Plastic Surgery team goal statement, identification of the 162
problem, and tasks to perform
Appendix 7 ISSSTE Structure 164
Appendix 8 Referral process 165
xi
List of Figures
Figure 1. A Kanban card example. Source: Ohno, 1988. 12
Figure 2. Example of a Poka-Yoke device. 13
Figure 3. Example of a cell manufacturing layout. 14
Figure 4. Icons used for value stream mapping. Source: Rother and Shook, 15
1999.
Figure 5. Example of a map. Source: DeBusk et al., 2004. 16
Figure 6. Sigma levels. 18 Figure 7. Similarities between Manufacturing and Health. Graph made by the 41
researcher.
Figure 8. The virtuous cycle. Source : Frenk J., et al., 1994. 45
Figure 9. Expenditure in Health. Source : OECD Health Division, 2007. 46
Figure 10. Template for usage of U/s rooms. Source: Co-ordinator of the Green 63
Belt Project. 2005.
Figure 11. Means to carry out a U/s at each location. Graphic made by the author. 65
Figure 12a. Letter from the UHL Imaging Directorate. 75
Figure 12b. Supporting data patient waiting times and size of waiting list. Data 76
provided by the project Co-ordinator.
Figure 13. Population covered by IMSS and ISSSTE. Source: Fox, 2005. 80
Figure 14. Population pyramid in 2000. Source: ISSSTE, 2004. 85
Figure 15. Population pyramid in 2010. Source ISSSTE, 2004. 85
Figure 16. Population pyramid for the ISSSTE. Source: ISSSTE, 2004. 86
Figure 17. Population pyramid for the ISSSTE. Source: ISSSTE, 2004. 86
xii
Figure 18. Location of Puebla State. 88
Figure 19. Puebla State Head Municipalities. Source: Papeleriacontable. 2007. 89
Figure 20. Spaghetti diagram for a patient to pick up lab test results at the ISSSTE 94
Clinic Lab. Made by the author.
Figure 21. Number of patients served by the ISSSTE Clinical Lab during August 96
2005. Source: ISSSTE database. Graphic made by the author.
Figure 22. Number of patients served by the ISSSTE Clinical Lab during September 97
2005. Source: ISSSTE database. Graphic made by the author.
Figure 23. Number of patients served by the ISSSTE Clinical Lab during October 98
2005. Source: ISSSTE database. Graphic made by the author.
Figure 24. Number of patients served by the ISSSTE Clinical Lab during November 98
2005. Source: ISSSTE database. Graphic made by the author.
Figure 25. Number of patients served by the ISSSTE Clinical Lab during December 99
2006. Source: ISSSTE database. Graphic made by the author.
Figure 26. Number of patients served by the ISSSTE Clinical Lab during January 99
2006. Source: ISSSTE database. Graphic made by the author.
Figure 27. Layout of the reception desk. Graph made by the author. 101
Figure 28. New layout for Lab reception. Graph made by the author. 101
Figure 29. Distribution of time for getting physical samples at the ISSSTE Clinical 103
Lab sampling rooms. Data collected and graph made by the author. August
and September, 2005.
Figure 30. Structure for the Referral Counter-referral project. Graph made by the 104
author.
Figure 31. Information obtained in a brainstorming session. 105
Figure 32. ISSSTE Cause- effect diagram to identify causes of high costs. 107
Graph made by the author.
Figure 33. Costs generated by medical units. Source: ISSSTE Finance 108
Department database. Graphic made by the author

xiii
Figure 34. Pareto Chart for Transport Expenses per medical unit. 108
Source: ISSSTE Finance Department database. Graph made by the author.
Figure 35. Expenses incurred for patients referrals. Source: ISSSTE 112
Finance Department database. Graph made by the author.
xiv
List of Tables
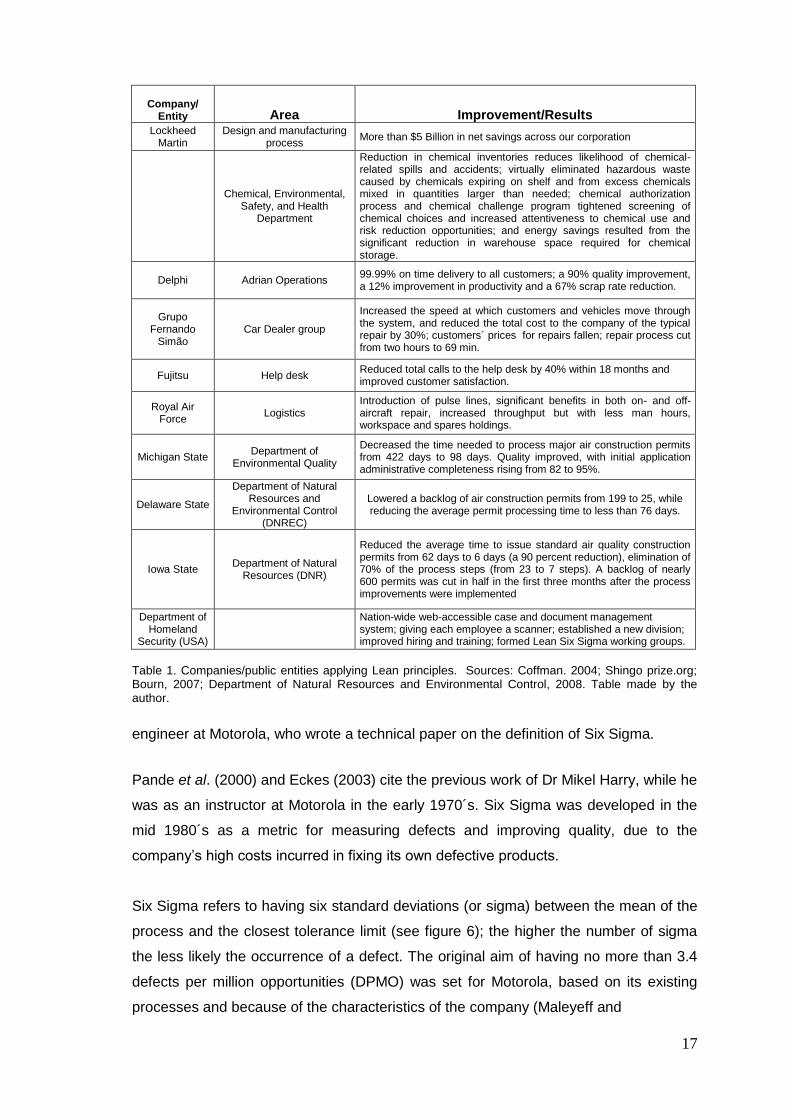
Table 1. Companies/public entities applying Lean principles. Sources: Coffman, 17
2004; Shingo prize.org, 2005; Bourn, 2007; Department of Natural Resources and
Environmental Control, 2008. Table made by the author.
Table 2. List of some tools utilised in Six Sigma. 19
Table 3. Benefits for companies applying Six Sigma. Sources: General Electric, 20
2005; Bowman, 2000; Rucker, 2005. Table made by the author.
Table 4. Comparison between Lean Thinking and Six Sigma approaches. Source: 21
Pyzdek, 2005
Table 5. The 7 wastes of Health care. Source: www.gemba.com 22
Table 6. Examples of Hospitals using Lean. Table made by the author. 25
Table 7. Examples of Hospitals using Six Sigma. Table made by the author. 34
Table 8. Similarities and differences between Lean and Six Sigma in health care. 40
Table made by the researcher.
Table 9. Answers to the questions sent by the author to experts. 42
Table 10. Barriers to healthcare change and potential solutions. Source: 44
Pexton, 2005.
Table 11. Data from the observation at the three hospitals. Made by the author. 64
Table 12. Parameters to perform U/s at each site. Made by the author 66
Table 13. Percentage of session time used at each site. Table made by the author 67
Table 14. Elapsed time (minutes) since a patient left the room and the next one 67
entered into that room. Table made by the author.
Table 15. Outcomes during observation/collection of data at UHL sites. Table 69
made by the author.
xv
Table 16. Classification of the waste found in U/s. Table made by the author 71
Table 17. Main indicators of Social Security. Source: Ochoa León, 2006. 83
Table 18. Rooms and clinics available at the ISSSTE Hospital in Puebla. 89
Source: Clinical Direction, 2006.
Table 19. Type of tests ordered and quantity. Source: ISSSTE database. 92
Table made by the author.
Table 20. Major Lab customers. Source: ISSSTE database. Table made by the 92
author.
Table 21.Number of results per month not picked up by patient/medical unit. 93
Table 22. Parameters of patients served by the Clinical Lab. Table made by the 100
author.
Table 23. Performance statistics for chemists to get physical samples. C10 is 103
room 1, C11 is room 2 and C12 is room 3 for getting blood samples. Data collected
and table made by the author.
Table 24. List of some ISSSTE peripheral medical units in Puebla State. Source: 107
ISSSTE Clinical Direction.
Table 25. Type and origin of referrals. Source: ISSSTE Clinical Direction records. 109
Table made by the author.
Table 26. Summary of pilot and case studies. Table made by the author. 118
Table 27. Findings from pilot and case studies. Table made by the author. 119
1
Chapter 1
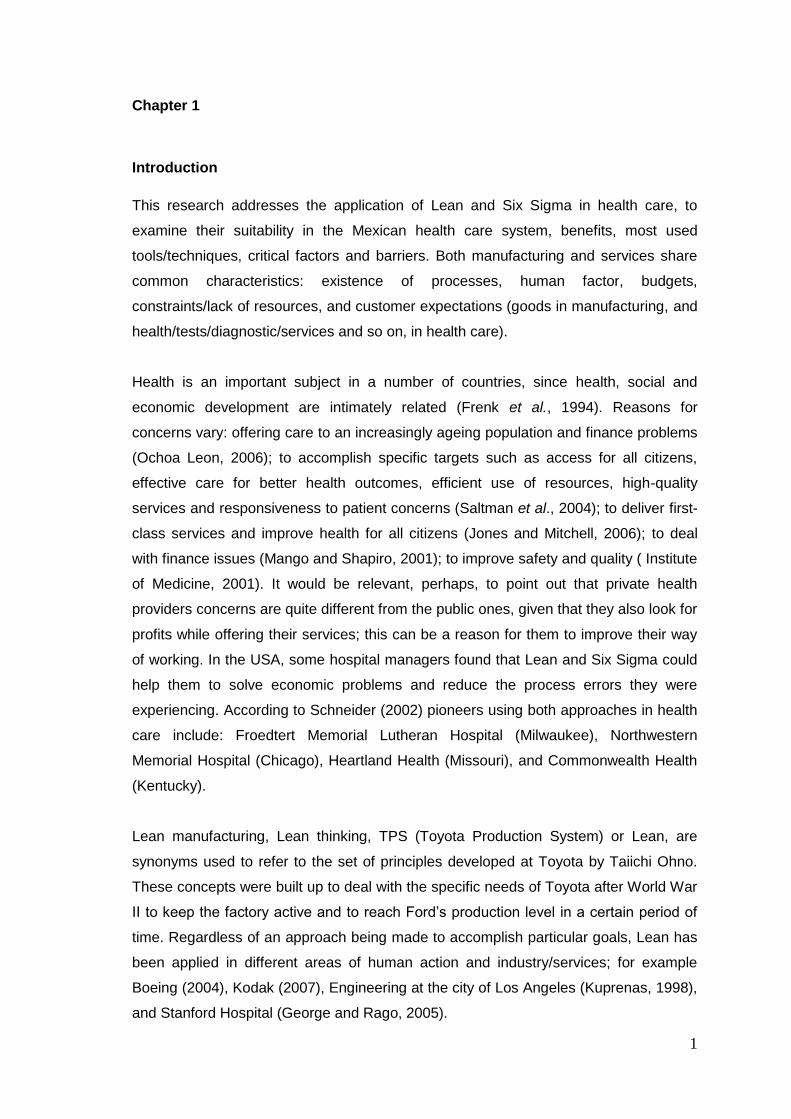
Introduction
This research addresses the application of Lean and Six Sigma in health care, to
examine their suitability in the Mexican health care system, benefits, most used
tools/techniques, critical factors and barriers. Both manufacturing and services share
common characteristics: existence of processes, human factor, budgets,
constraints/lack of resources, and customer expectations (goods in manufacturing, and
health/tests/diagnostic/services and so on, in health care).
Health is an important subject in a number of countries, since health, social and
economic development are intimately related (Frenk et al., 1994). Reasons for
concerns vary: offering care to an increasingly ageing population and finance problems
(Ochoa Leon, 2006); to accomplish specific targets such as access for all citizens,
effective care for better health outcomes, efficient use of resources, high-quality
services and responsiveness to patient concerns (Saltman et al., 2004); to deliver first-
class services and improve health for all citizens (Jones and Mitchell, 2006); to deal
with finance issues (Mango and Shapiro, 2001); to improve safety and quality ( Institute
of Medicine, 2001). It would be relevant, perhaps, to point out that private health
providers concerns are quite different from the public ones, given that they also look for
profits while offering their services; this can be a reason for them to improve their way
of working. In the USA, some hospital managers found that Lean and Six Sigma could
help them to solve economic problems and reduce the process errors they were
experiencing. According to Schneider (2002) pioneers using both approaches in health
care include: Froedtert Memorial Lutheran Hospital (Milwaukee), Northwestern
Memorial Hospital (Chicago), Heartland Health (Missouri), and Commonwealth Health
(Kentucky).
Lean manufacturing, Lean thinking, TPS (Toyota Production System) or Lean, are
synonyms used to refer to the set of principles developed at Toyota by Taiichi Ohno.
These concepts were built up to deal with the specific needs of Toyota after World War
II to keep the factory active and to reach Ford‟s production level in a certain period of
time. Regardless of an approach being made to accomplish particular goals, Lean has
been applied in different areas of human action and industry/services; for example
Boeing (2004), Kodak (2007), Engineering at the city of Los Angeles (Kuprenas, 1998),
and Stanford Hospital (George and Rago, 2005).
2
There are several definitions of Lean, depending on the field of application, e.g. for
Toyota, it is a production control system, a way of "making things" (Toyota web site,
2008). Others have described it as: a total organisational change (Koenigsaecker,
2000); a management system (Ballé, 2008); a philosophy that incorporates a collection
of tools and techniques into the business processes to optimize time, human
resources, assets, and productivity, while improving the quality level of products and
services to their customers (Becker, 2008), Lean can be defined as a philosophy that
brings into play techniques in the pursuit of the elimination of all activities that do not
add value (from the customer‟s eye) to a product/service while it is processed,
delivering it to time, in the right amount and place, satisfying customer expectations,
and without extra expenses (Womack and Jones, 1996; Joyce and Schechter, 2005;
Maleyeff, 2007).
Six Sigma was developed in industry (Motorola) in order to lower costs and improve the
quality of the items produced, and defining it as a metric, a methodology and a
management system (Motorola web site, 2008); General Electric defines the approach
as a “highly disciplined process that helps us focus on developing and delivering near-
perfect products and services“ (General Electric web site, 2005), and it is also
considered as a powerful breakthrough management tool (Harry and Schroeder, 2000).
Six Sigma is based in a methodology named DMAIC (Define, Measure, Analyse,
Improve, Control), which defines the problem, measures those variables which are
considered as a source of variation; next these data are analysed and sources of
variability are detected, then are eliminated/reduced, improving the process and setting
controls to avoid a return to the previous practices that were the origin of defects. The
aim of Six Sigma is the elimination/reduction of variability by following a structured style
and by employing statistical techniques. Because of the benefits reported by Motorola,
other companies like GE, Citibank (Rucker, 2005), Honeywell, Dow Chemical Co. and
Du Pont to cite some, are also utilising this approach.
Lean and Six Sigma are approaches that were created to deal with specific needs of
companies, to make them not only competitive but profitable, both using different
concepts and methods, but sharing the same objective: a continuous improvement
process. Their inclusion (along with their outcomes) in other fields like public services,
banking, military and so on, signify an excellent opportunity to bring in a new field:
health care. From this, several hospitals across the US have launched their own
projects using Lean principles and/ or Six Sigma. Not only have American hospitals
applied these techniques, but European countries have also done so, such as the
Netherlands, France, Ireland, Sweden and the UK. Van den Heuvel et al. (2004)
3
reported that the average length of stay (LOS) for patients in the recovery room at the
department of Gynaecology at the Red Cross Hospital in Beverwijk (Netherlands) was
reduced. In another case, the Royal Gwent Hospital (Wales) reduced the waiting list for
an Ultrasound from 18 - 20 weeks to just two weeks, by using Lean principles (Angel,
2005). Westwood et al. (2007) cite Bolton Hospitals (UK) as a place where a 50%
reduction in hospital mortality for older patients with a fractured neck of femur was
achieved. In addition, there was a 37% reduction in overall mortality for adult trauma
patients, and a 32% shorter LOS, among other improvements. At the Mater
Misericordiae University Hospital and the Children's Hospital Temple Street (Ireland),
the National Pathology Service (2008) reported batch size reduction. The flow of small
batches to analyses highlighted 50% over capacity in analysers, handoffs (the act of
passing something or the control of it from one person to another) reduced from seven
to six, areas of over staffing, surplus inventory, excess equipment capacity and poor
skills mix. The Lidköping Hospital in Sweden (Lifvergren and Bergman, 2008)
conducted a project to reduce morbidity and mortality of patients on Warfarin (an
anticoagulant) treatment using Lean/Six Sigma. Henderson (2005) revealed that the
Adelaide & Meath Hospital in the Republic of Ireland started a Six Sigma project in
order to improve the hospital performance.
Health is fundamental in raising both workers‟ and companies‟ productivity, as well as a
nation‟s development. Government expenditures in health care can consume high
percentages of GDP as Jones (2002) mentions, and these resources can be invested
in other areas such as education, agriculture, energy, housing, science to mention
some. In both fields (manufacturing and health) customers are the reason for the
existence of businesses/services.
The significant changes taking place in Mexico to cover most of its population with
medical services, the structure of its health care institutions, budget constraints and a
growing ageing population, along with the advent of Lean and Six Sigma offer a
significant research challenge. The paucity of research on such approaches in Mexican
health care organisations demonstrates the need for investigation in this area.
In the UK, the National Health System (NHS) was created on July 5 1948 by the health
secretary Aneurin Bevan, to provide healthcare free at the point of delivery, on the
basis of citizenship, rather than payment of fees or insurance premiums. In addition a
national system of benefits was also introduced to provide social security (Palmer,
2008). The NHS central principles are: health service available to all and financed
4
entirely from taxation. In 2007/8 it received a budget of more than £90 billion (NHS
website, 2008).
Before the NHS was established, low-paid working men were provided with the
services of a „panel‟ doctor in return for a compulsory fee per week in National
Insurance contributions. The employer had to pay in three pence and the state two
pence. However, hospital care was not provided. Higher-paid workers and all women
and children had to pay to see the GP (Palmer, 2008). Hospitals charged for services
although there were some local authorities and voluntary hospitals that did provide free
or subsidized care for those who could not afford to pay. They survived only through
fundraising, wealthy benefactors, and the goodwill of consultants who gave their
services for free or for a minimal charge while making their living from private patients‟
fees.
At the beginning, the NHS was separated into three parts: hospitals, general practice
and local health authorities. It was launched as a single organisation based on 14
regional hospital boards. It took over control of 2,751 hospitals containing 533,000
beds. For the first time, consultants and senior physicians were paid like other staff and
no longer honorary and entirely dependent on private patients for a living. There was a
vast surge in demand for medical care from people who had previously been denied
access to free treatment. There has been huge development in the NHS since 1948.
According to the NHS website (2008), the 1967 Cogwheel Report considered the
organisation of doctors in hospitals and the proposal of speciality groupings. It also
highlighted the efforts made to reduce the disadvantages of the three-part NHS
structure – hospitals, general practice and local health authorities – acknowledging the
complexity of the NHS and the importance of change to meet future needs.
In 2001, the Chief Medical Officer recognised health inequalities (Donaldson, 2002).
Since then, issues about poor medical performance and poor access to primary care,
long waiting times, poor maternity care and the deaths of women giving birth, old
buildings, financial deficits, hospital-acquired infections, capacity constraints,
accusations of endemic inefficiency, and adverse events, have been brought into public
light (Donaldson, 2006; Boseley, 2008). With an annual budget of more than £90 billion
the NHS still faces inadequate levels of care, poor quality, staff shortages and constant
resource pressures (King‟s Fund, 2005; Tomson and Berwick, 2006), as well as a
constant shifting of goalposts, imitation of projects from other places with a lack of
consciousness (since the circumstances were different among sites; thus, no real
5
knowledge of reasons for using/applying approaches or procedures for that). Several
quality initiatives have been put in place (Stahr, 2001) causing staff confusion and
dissatisfaction because no one knows what programme has priority, as Maddock
(2002) pointed out.
The NHS is struggling to deliver better health and health care while dealing with public
and political concern about these issues, implementing several plans to manage the
situation. The NHS currently is under a 10 year programme of transformational change,
that was set to provide health and healthcare service that meets the life-long needs of
the citizens of England (Bevan et al., 2006).
The Mexican health care system is organised into a National Health System, which
involves agencies and entities of the Public administration, local and Federal, and
people from the social and private sector who provide health services. It is important to
note that, in Mexico, as long as a person has a job, but is not self- employed, medical
attention can be accessed by law; however, if a person is unemployed or self-
employed, health care will need to be personally financed.
In Mexico there are three main institutions which provide public health services:
1. IMSS (Mexican Institute of Social Services).
2. ISSSTE (Social Security Services Institute for Federal Employees).
3. SSA (Ministry of Health and Assistance).
Mexican health institutions are coping with offering health services to an increasing
number of people, an ageing population, and financial difficulties. The research in
Mexico is based at the ISSSTE, which is immersed in serious financial problems and is
looking for a way to improve its services and cut its costs (without putting at risk
patients‟ lives). There is an opportunity for a country like Mexico to improve one of its
main health care institutions by using industrial approaches (Lean and Six Sigma).
A survey of the applications of Lean and Six Sigma in health care was instigated. From
this information the author concluded that it was not possible to pursue the research
aim outlined only by studying and evaluating existing applications. It was necessary to
carry out applications on real situations as part of the research. A pilot-study approach
in an NHS Trust provided a major opportunity to get in-depth experience. This was
followed by case studies at the ISSSTE.
6
At the ISSSTE in Mexico case studies were set up in the Clinical Laboratory
(Pathology) and in the Referral Counter-referral process. Lean was used in the Clinical
Laboratory first, because the Hospital Director wanted to see quick results, which were
achieved through the reduction of service time at the reception desk; at the same time
Six Sigma was used in order to reduce variability in the number of patients served per
day. Due to the outcomes obtained in the first case study, the ISSSTE Clinical Director
and the author set a second case study to be made on the Referral and Counter-
referral process in order to reduce costs.
This thesis is structured as follows: chapter two includes a revision of the roots and
development, tools/techniques of both Lean and Six Sigma approaches, as well as the
Mexican context and the aims of the research. Chapter three contains the methodology
utilised in the research. Chapter four is concerned with the pilot studies in the UHL at
the UK. Chapter five is about the Mexican Health care system and the ISSSTE
situation. Chapter six is about the case studies carried out at the ISSSTE. Chapter
seven contains the discussion regarding the research. And finally, Chapter eight
comprises the conclusions of this research.
7
CHAPTER 2
Literature review
A literature survey was conducted firstly to comprehend Lean principles, and Six Sigma
methodology. Later, a second and focused review of its application in health care was
conducted to identify examples of applications, barriers, tools/techniques, and contact
(where possible) people and places, using one or both approaches in health care.
The Mexican context is briefly introduced to discuss the significance of health issues in
a developing country and define the research aims in more detail. The Mexican health
care system is discussed in more detail in chapter five.
2.1 Lean principles development
In 1934 Kiichiro Toyoda, Toyota‟s owner, sent some staff personnel to the USA to learn
from their production systems for six months. An engineer named Taiichi Ohno was
part of this group. Later on, Toyoda selected the most useful aspects of the American
mass-production system, since the whole concept was not applicable to his company
(Fujimoto, 1999). Toyoda also faced difficulties in establishing the ideas of the mass-
production system due to the traditional Japanese craft-type system in place. A
reluctance to change was based on the people‟s perception and distrust of a new way
of working.
As a consequence of War World II, Toyota was having tremendous problems in the late
1940´s, because of the poor quality of its products and, crucially, the lack of human
resources, raw materials, and money available (Japón, 1962). Because of the lack of
economic resources any improvement in productivity needed to be without much
hardware investment. Taiichi Ohno was a key in the improvement programme (Ohno,
1982). His findings have led to the belief that on a production line, the right parts
required should not only be received at the time they are needed, but also by the
amount as well. This idea stands by the notion of eliminating all unnecessary resources
that do not add value to the process/product.
In 1947 Ohno changed the machine layout according to the production sequence, first
into an “L” shape, later changing into a “horseshoe” shape. This is the origin of cell
manufacturing. At the same time, he developed the Kanban system (visual system). It
was a continuous process of trial and error.
8
Another important issue is the concept of working in teams. Ohno mentioned that
manufacturing is done through teamwork, just like in some team sports, where
individuals have a common target. (Ohno, 1988); he discovered that the action of a
single individual affected the work of others. He also pointed out that assigning
responsibilities is not enough to make things “...run smoothly...” at work.
The Korean War in the 1950´s was an important factor in Toyota‟s recovery because
the APA (American Army Procurement Agency) ordered motor vehicles from Toyota; it
then had to produce more with less by eliminating as much wasted effort as possible.
Under these conditions Ohno developed the JIT (Just-In-Time) concept. It happened
while he was observing the activities in a North American supermarket that he
conceived the idea of a flow. By visualizing how supermarket shelf replenishment was
undertaken only when necessary and by an amount determined by demand. In other
words, JIT provides goods when the customer needs them and in the amount required.
This results in a minimum inventory of items (raw material, final product, and so on)
and only produces the amount of goods that can be sold. Ohno comprehended the
importance of customer needs and listened to their requirements. He defined JIT as
“an extremely rational approach to eliminating waste” (Ohno with Mito, 1988).
Through his visit to some American automobile plants in 1956, Ohno identified and
classified seven types of waste arising from:
1. Overproducing (producing more than the customer needs).
2. Waiting (idle time created when material, information, people, or equipment is
not ready).
3. Transportation (unnecessary movement of product, material, paperwork).
4. Processing itself (unnecessary steps in the production of goods/services).
5. Unnecessary stock on hand (more materials, parts, or products on hand than the
customer needs).
6. Unnecessary motion (unnecessary movement of people).
7. Producing defective goods (work that contains errors, rework, and mistakes or
lack of something necessary).
Ohno also recognised the control that certain people had over the process. While
workers knew what was wrong in a process and how to solve it, they did not have the
“power” to stop the process and correct it. They had to wait for an order from a
9
supervisor. He noticed that manpower was beyond measurement and those
capabilities had no limit once everyone began to think.
By 1955 automated systems were introduced in Toyota leading to the arrival of
Autonomation (automation with a human touch). Ohno observed that it was not
necessary to have a worker attached to a machine watching how it worked and
equipment should be able to stop when an irregularity happened, preventing the
production of defective goods (Ohno, 1988). At the same time, Shigeo Shingo was
hired to help find a solution in setup and changeover problems. In 1962, he developed
Poka-Yoke (prevent inadvertent mistake) or “mistake-proof techniques”.
In the 1950´s Toyota introduced:
a) Susha system or strong project leader and product champion, continuing in learning
American scientific management techniques, education of first line supervisors for
quality control,
b) Kaizen (continuous improvement).
c) Andon system (visual control), which through lights and visual signs indicated the
mode of operation in a process. It encouraged workers to stop the production line if an
abnormality was detected. Another part of the Andon system was the standard
worksheets, which contained three elements of the standard work procedure: cycle
time, work sequence and standard inventory.
This was the beginning of worker empowerment, nevertheless, workers found difficult
the change of approach, since they were not used to making decisions on their own.
Ohno says that if someone wants a change, first thing is to persuade people, bringing
them around to the way of thinking.
In the 1970´s Toyota experienced an era of growth; a key factor was the oil crisis.
However, this sudden growth also required then to diversify their range of car
production. To cope with this increase, Toyota established the levelisation of
production by both volume and product mix (Fujimoto, 1999). Levelisation refers to
reducing lot sizes, reducing set-up times and minimising mass production.
10
Ohno´s concepts of Lean are simple, like the 5W; he suggested that the best way to
deal with a problem is by always asking “why?” at least five times, which allows to
uncover the root problem and correct it. Below, an example is given: in a finishing area
of a clothes manufacturer, inspectors have found needle holes in different parts of a
shirt:
1. Why are these holes appearing?
- It is a new type of fabric and workers were not aware of this fact and did not change
needles.
2. Why were the workers not aware?
- the supervisor was absent and did not write/give any instructions
3. Why did the supervisor not leave any indications?
- he does not trust anyone else
4. Why is he the only one who handles this information?
- The instructions are written in English
5. Why are the instructions not translated?
- No one in the company is in charge of that.
Solution: Provide a translation of the customer‟s indications, placing them on a board,
addressed to the workers involved in the process. This example is taken from the
researcher‟s personal experience in industry.
Customer demand is the driving force behind these systems (Ohno, 1988). The general
idea is to create a flow by linking work centres, generating an even and balanced
stream of materials through the entire production process. Toyota did not look for zero
inventories, which in practice is not possible, but to level the flows of production and
goods (Ohno with Mito, 1988).
In 1977 Anderson Ashburn editor of American Machinist referred to Ohno´s concepts
as the “Ohno system”. Later on Ohno called them Toyota Production System or TPS.
The term “Lean Manufacturing” was conceived by John Krafcik while he was working
as a researcher at the International Motor Vehicles Program in the 1990´s, and it
indicates a system that utilises less (in terms of all inputs) to create the same final
items/services as those produced by a typical mass-production system. It is also known
as “Lean thinking”, “Lean principles”, or “Lean”.
Ohno´s original ideas on Lean have been summarized into five principles by Womack
and Jones (2003) as:
11
1. Value
2. The value stream map
3. Flow
4. Pull
5. Perfection
Tracing the history of Lean is not an easy task. Causes of this are that concepts were
developed according to the specific situation that Toyota was facing at that time as
Ohno (1988), Majima (1992), and Bodek (2006) cite; the system was different from the
ones existing; Majima (1992) mentions that the Toyota Production System was a well-
kept secret and the way the system works was not clear for other companies. Another
reason is that Lean is based on methods that are considered difficult to evaluate and
were perceived as “inelegant, work-floor based” as Majima wrote. Aside from that, the
first book written about TPS was not released until 1978 by Ohno, and even then only
in Japanese.
2.1.1 Lean tools
The following lines will explain with more detail the most usual tools referenced in
literature. It is beyond the scope of this research to describe all the individual tools and
techniques that comprise Lean (and Six Sigma).
1. Kanban. (Sign board): this is a card inserted in a vinyl pouch which is used for
production control. It notifies workers who are making parts whether those parts
are needed or not, thus components in a production line are only produced/
delivered at the required moment and in the required quantity. This card is
attached to a box/container. An example of this is shown in figure 1.
Information regarding production quantity, time, method, sequence or transfer
quantity, transfer time, destination, storage point, etc. can be seen with a quick look.
There are other types of Kanban like transport, supplier, withdrawal, to name a few.

12
Figure 1. A Kanban card example. Source: Ohno, 1988.
2. Andon (Line stop alarm lights): is a board placed above machines, and uses
different coloured lights according to the situation. For instance, when
operations were normal, a green light was “on”; when an adjustment was
needed and the worker needed help, a yellow light came on; if a line stopped to
rectify a problem, a red light was on. With this concept, workers were
encouraged to stop a line and not to be afraid of doing so. It was always better
to correct defects at an early stage, rather than producing defective items.
Standard worksheets are a part of Andon, since they are visual signs. The sheet lists
three elements of the standard work procedure:
a) Cycle time. This is the time allocated to make one piece or unit, which is
determined by production quantity, e.g. the quantity required and the
operating time.
Quantity required per day days operating ofnumber sMonth'
monthper required Quantity
Cycle time dayper requiredQuantity
hours Operating
b) Work sequence. This refers to the order of operations in which a worker
processes items: transporting, mounting, removing and so on.
c) Standard inventory. The minimum amount of items needed for
operations to proceed.
13
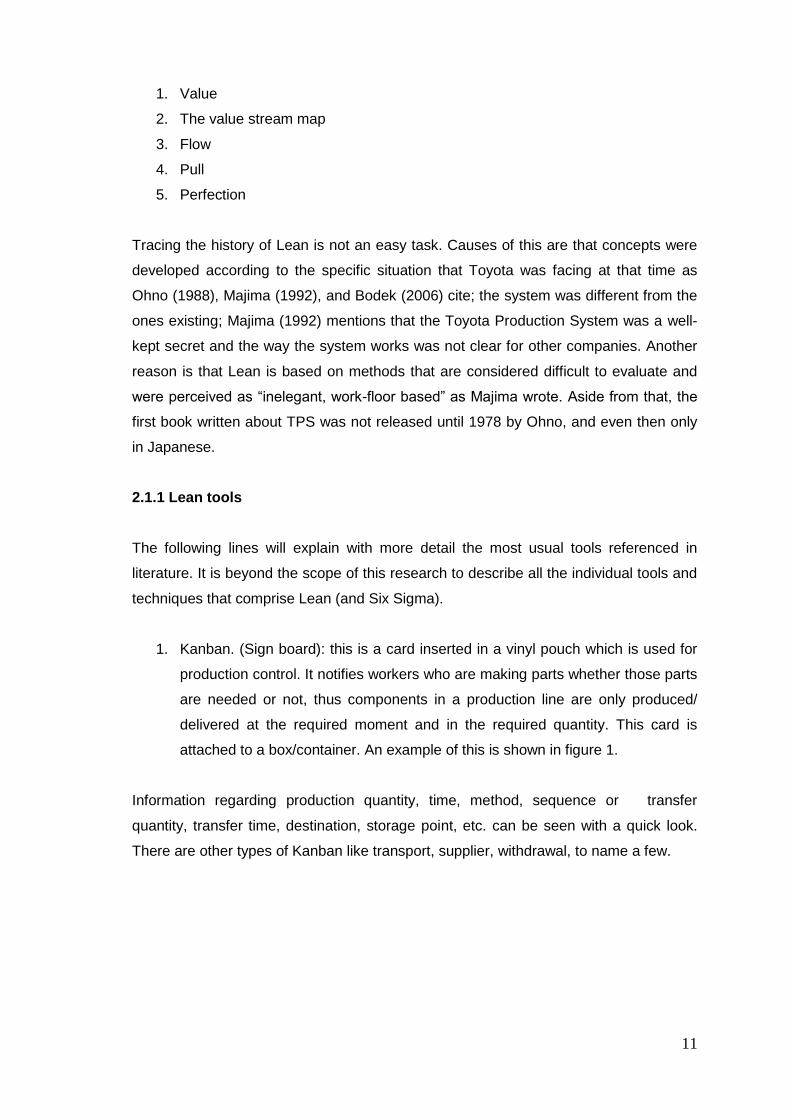
3. Poka-yoke (Defect prevention): this concept is concerned with designing
processes/devices in a form that reduces the likelihood of mistakes to zero or
as close as possible.
There are two major categories for devices: prevention and detection. A prevention
device affects the process by stopping it, not switching on, etc. So that it is impossible
to make a mistake; an example of this type of device is shown in figure 2, where the
position and shape of the holes avoid an incorrect plug-in.
Figure 2. Example of a Poka-Yoke device.
A detection device indicates by a sound, light, etc. to the operator when a mistake has
been made, allowing the operator to correct the problem.
4. 5W (5 Whys´): asking five times “why?” whenever a problem is found. This is
concerned with the nature of the problem as its solution becomes clear. The
solution is designed as 1H (How to).
5. Kaizen (Continuous improvement): this concept stands on teamwork and
process standardisation. Its goal is to increase productivity by controlling the
manufacturing process through a reduction of cycle times, standardisation of
quality criteria and work methods. It uses statistical quality control. The kaizen
is made in four steps: establishing a plan to change what needs to be improved,
carrying out changes on a small scale, observing the results, evaluating both
results and the processes, and determining the lesson learnt.
6. Go Esu (5S): this concept is related to five points of organisation and
maintenance of the workplace.
a) Seiri (Classify/organise), means to separate all the useful and necessary
things in the workplace from the useless and unnecessary, keeping just
the items needed.
14
b) Seiton (Systematize) makes available/provides a convenient, safe and
neat place for all the essential elements, in order to have them on hand
when needed.
c) Seiso (Sanitize) keeps the workplace –including machinery- clean and
tidy.
d) Seiketsu (Standardise) refers to acquiring the state of tidiness and
organization through the application of the first 3S, which leads to a
standardisation process.
e) Shitsuke (Self-discipline) sustains the procedures already established
through the first 4S‟. It involves a periodic control, worker self-control,
respect for oneself and others. It is a continuous improvement process.
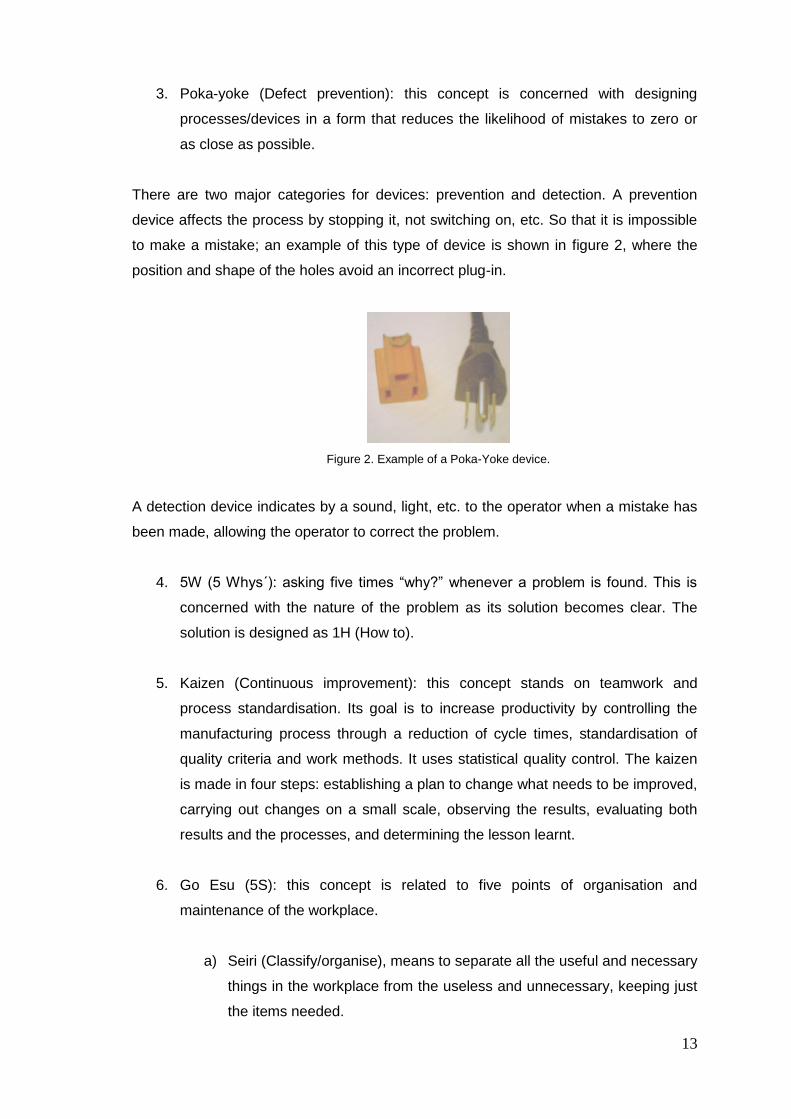
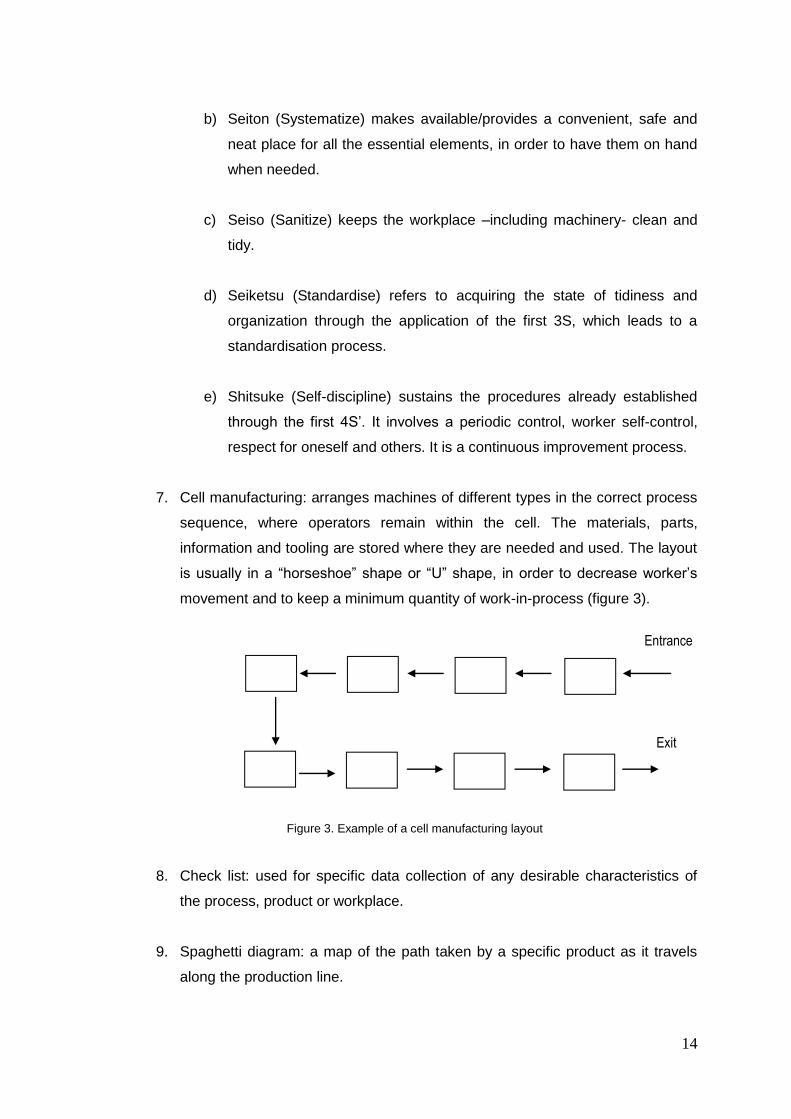
7. Cell manufacturing: arranges machines of different types in the correct process
sequence, where operators remain within the cell. The materials, parts,
information and tooling are stored where they are needed and used. The layout
is usually in a “horseshoe” shape or “U” shape, in order to decrease worker‟s
movement and to keep a minimum quantity of work-in-process (figure 3).
Figure 3. Example of a cell manufacturing layout
8. Check list: used for specific data collection of any desirable characteristics of
the process, product or workplace.
9. Spaghetti diagram: a map of the path taken by a specific product as it travels
along the production line.
Entrance
Exit

15
Another tool used in Lean was developed by Womack and Jones (1996, 2003) called
“value stream map”. This is a graphic representation of all actions, value added as well
as non-value added, which are required to bring a product or a group of
products/services that use the same resources through the main flows, from raw
material to the customer. The goal is to identify all the waste and then eliminate it as
much as possible. In taking into account the overall picture rather than an isolated part
(individual processes) improvement in the whole flow can be achieved.
The benefits of using the value stream map according to Rother and Shook (1999) are:
- it helps to visualize more than just the single process level
- mapping not only helps to see waste but also its source
- it provides a common language for the stakeholders
- it forms the basis for an implementation plan
A useful tool for showing the complete problem is by using a predefined set of icons
according to Rother and Shook (1999) to draw a value stream map. Figure 4 illustrates
some of them.
Figure 4. Icons used for value stream mapping. Source: Rother and Shook, 1999.
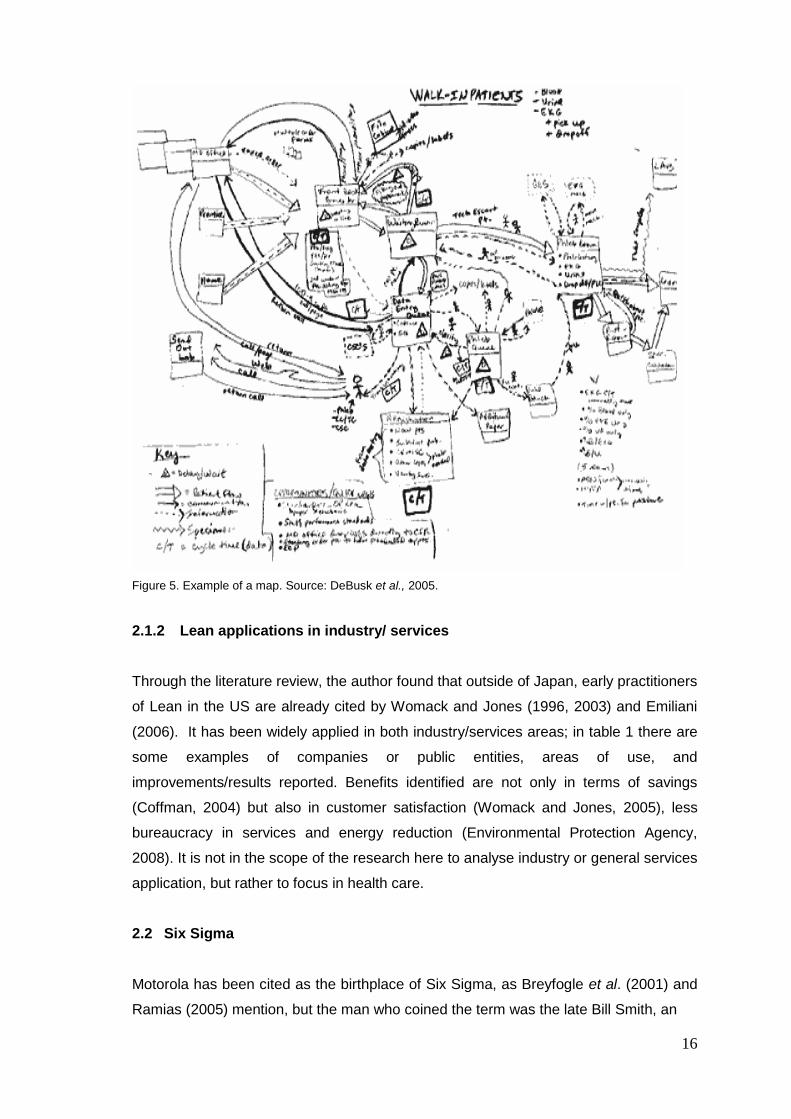
However, the icons are not essential, as long as people can understand the idea of the
flow to identify the waste (see figure 5).
Manufacturing
process
Outside source Supermarket Data Box
Push arrow Kaizen Physical pull
Withdrawal Kanban Production
Kanban
External
Shipment
16
Figure 5. Example of a map. Source: DeBusk et al., 2005.
2.1.2 Lean applications in industry/ services
Through the literature review, the author found that outside of Japan, early practitioners
of Lean in the US are already cited by Womack and Jones (1996, 2003) and Emiliani
(2006). It has been widely applied in both industry/services areas; in table 1 there are
some examples of companies or public entities, areas of use, and
improvements/results reported. Benefits identified are not only in terms of savings
(Coffman, 2004) but also in customer satisfaction (Womack and Jones, 2005), less
bureaucracy in services and energy reduction (Environmental Protection Agency,
2008). It is not in the scope of the research here to analyse industry or general services
application, but rather to focus in health care.
2.2 Six Sigma
Motorola has been cited as the birthplace of Six Sigma, as Breyfogle et al. (2001) and
Ramias (2005) mention, but the man who coined the term was the late Bill Smith, an
17
Company/
Entity Area Improvement/Results Lockheed
Martin Design and manufacturing
process More than $5 Billion in net savings across our corporation
Chemical, Environmental,
Safety, and Health Department
Reduction in chemical inventories reduces likelihood of chemical-related spills and accidents; virtually eliminated hazardous waste caused by chemicals expiring on shelf and from excess chemicals mixed in quantities larger than needed; chemical authorization process and chemical challenge program tightened screening of chemical choices and increased attentiveness to chemical use and risk reduction opportunities; and energy savings resulted from the significant reduction in warehouse space required for chemical storage.
Delphi Adrian Operations 99.99% on time delivery to all customers; a 90% quality improvement, a 12% improvement in productivity and a 67% scrap rate reduction.
Grupo Fernando
Simão Car Dealer group
Increased the speed at which customers and vehicles move through the system, and reduced the total cost to the company of the typical repair by 30%; customers´ prices for repairs fallen; repair process cut from two hours to 69 min.
Fujitsu Help desk Reduced total calls to the help desk by 40% within 18 months and improved customer satisfaction.
Royal Air Force
Logistics Introduction of pulse lines, significant benefits in both on- and off-aircraft repair, increased throughput but with less man hours, workspace and spares holdings.
Michigan State Department of
Environmental Quality
Decreased the time needed to process major air construction permits from 422 days to 98 days. Quality improved, with initial application administrative completeness rising from 82 to 95%.
Delaware State
Department of Natural Resources and
Environmental Control (DNREC)
Lowered a backlog of air construction permits from 199 to 25, while reducing the average permit processing time to less than 76 days.
Iowa State Department of Natural
Resources (DNR)
Reduced the average time to issue standard air quality construction permits from 62 days to 6 days (a 90 percent reduction), elimination of 70% of the process steps (from 23 to 7 steps). A backlog of nearly 600 permits was cut in half in the first three months after the process improvements were implemented
Department of Homeland
Security (USA)
Nation-wide web-accessible case and document management system; giving each employee a scanner; established a new division; improved hiring and training; formed Lean Six Sigma working groups.
Table 1. Companies/public entities applying Lean principles. Sources: Coffman. 2004; Shingo prize.org; Bourn, 2007; Department of Natural Resources and Environmental Control, 2008. Table made by the author.
engineer at Motorola, who wrote a technical paper on the definition of Six Sigma.
Pande et al. (2000) and Eckes (2003) cite the previous work of Dr Mikel Harry, while he
was as an instructor at Motorola in the early 1970´s. Six Sigma was developed in the
mid 1980´s as a metric for measuring defects and improving quality, due to the
company‟s high costs incurred in fixing its own defective products.
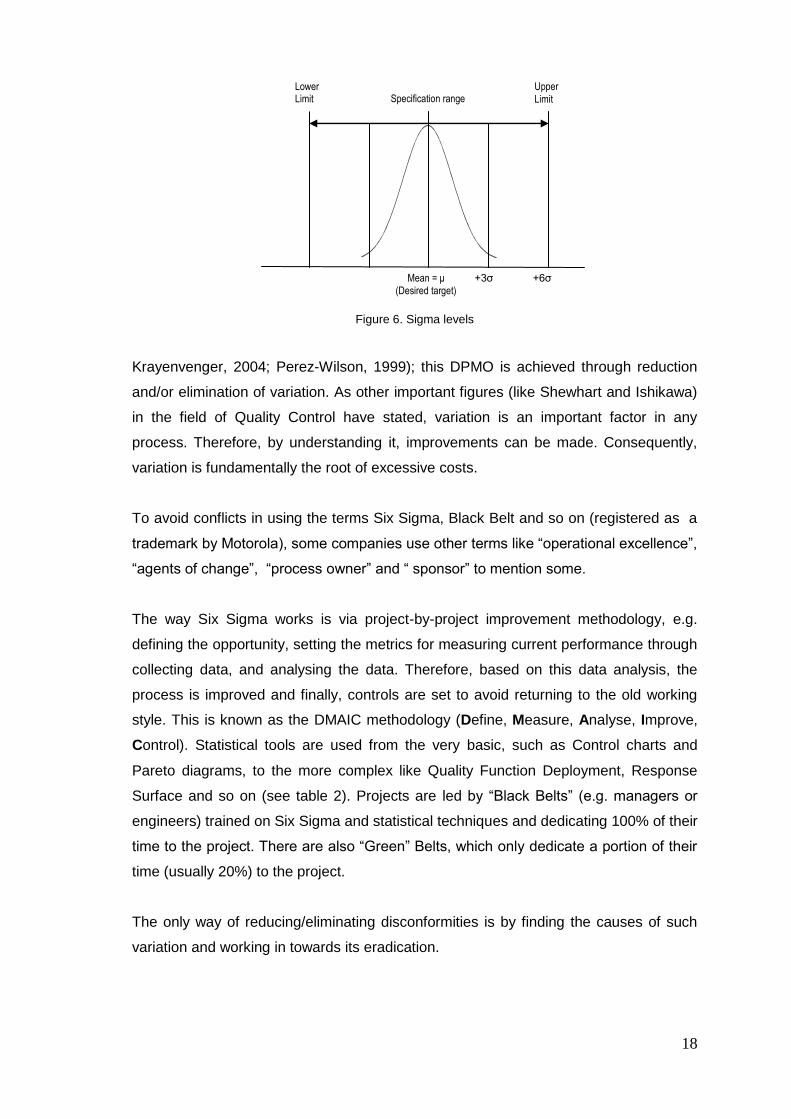
Six Sigma refers to having six standard deviations (or sigma) between the mean of the
process and the closest tolerance limit (see figure 6); the higher the number of sigma
the less likely the occurrence of a defect. The original aim of having no more than 3.4
defects per million opportunities (DPMO) was set for Motorola, based on its existing
processes and because of the characteristics of the company (Maleyeff and
18
Specification range Upper
Limit
Lower Limit
Mean = μ
(Desired target)
+3σ +6σ
Figure 6. Sigma levels
Krayenvenger, 2004; Perez-Wilson, 1999); this DPMO is achieved through reduction
and/or elimination of variation. As other important figures (like Shewhart and Ishikawa)
in the field of Quality Control have stated, variation is an important factor in any
process. Therefore, by understanding it, improvements can be made. Consequently,
variation is fundamentally the root of excessive costs.
To avoid conflicts in using the terms Six Sigma, Black Belt and so on (registered as a
trademark by Motorola), some companies use other terms like “operational excellence”,
“agents of change”, “process owner” and “ sponsor” to mention some.
The way Six Sigma works is via project-by-project improvement methodology, e.g.
defining the opportunity, setting the metrics for measuring current performance through
collecting data, and analysing the data. Therefore, based on this data analysis, the
process is improved and finally, controls are set to avoid returning to the old working
style. This is known as the DMAIC methodology (Define, Measure, Analyse, Improve,
Control). Statistical tools are used from the very basic, such as Control charts and
Pareto diagrams, to the more complex like Quality Function Deployment, Response
Surface and so on (see table 2). Projects are led by “Black Belts” (e.g. managers or
engineers) trained on Six Sigma and statistical techniques and dedicating 100% of their
time to the project. There are also “Green” Belts, which only dedicate a portion of their
time (usually 20%) to the project.
The only way of reducing/eliminating disconformities is by finding the causes of such
variation and working in towards its eradication.

19
Table 2. List of some tools utilised in Six Sigma.
2.2.1 Six Sigma tools
1. Statistical Process Control. This is a set of charts on which a phenomenon
behaviour/trend, characteristics can be illustrated. Following this, predictions,
changes, or problem solving can be made. The choice of charts in use depends
on what the person is interested in analysing, such as Mean-Range ( Rx ),
Mean-Standard deviation ( Sx ), cumulative sum (CUSUM), dispersion and
bars, to mention a few.
2. Flow chart. This is a diagram where the activities in a process can be
visualised and comprehended. It is often used in the measurement stage.
3. Design of Experiments (DOE). This was created by Sir Ronald A. Fisher as a
tool to improve yields in agriculture in the UK in the 1920´s. It is based on the
examination of factors that can affect a process. These factors are chosen and
then modified observing the results. For example, in a metal hardness process,
the researcher considers that two factors (temperature, concentration of salts)
are affecting the hardness. Then he/she changes these factors to a
higher/lower level and observes the result of those changes, determining which
one is the real cause of influence in the product. Therefore, the best conditions
can be established and the process improved.
4. FMEA (Failure Mode Effect and Analysis). This is a tool in which a potential
failure mode can be identified and prevented, before problems can occur. An
example can be found in Appendix 1.
Statistical Process Control
Flow chart
Process capability index (Cp)
Design of experiments
Failure Mode Effect and Analysis (FMEA)
Regression analysis
Analysis of means and variance (ANOVA)
Hypothesis test
20
5. ANOVA (Analysis of Variance). A statistical tool used to compare differences
between two or more means ( x ) of samples and to determine if they are a
result of randomness or if there are real dissimilarities.
6. Regression. A statistical tool which examines the relationship between two
continuous variables: one response (y) and one predictor (x). When the two
variables are related, it is possible to predict a response value from a predictor
value with better than chance accuracy.
7. Hypothesis test. A statistical tool to decide if a population parameter is or is not
equal to a previous determined value. For instance, making sure that an item is
between the specification limits.
8. Talking wall. This is a tool used after a brainstorming session, where the ideas
are written on post-its, and then placed on a wall in a random manner, in order
to elaborate an affinity diagram.
9. Affinity diagram. It is a tool that gathers large amounts of language data (ideas,
opinions, issues) and organises them into groups based on their natural
relationships.
10. Pareto chart. It is a series of bars whose heights reflect the frequency or impact
of problems. The bars are arranged in descending order of height from left to
right. This means the categories represented by the tall bars on the left are
relatively more significant than those on the right. This bar chart is used to
separate the “vital few” from the “trivial many”.
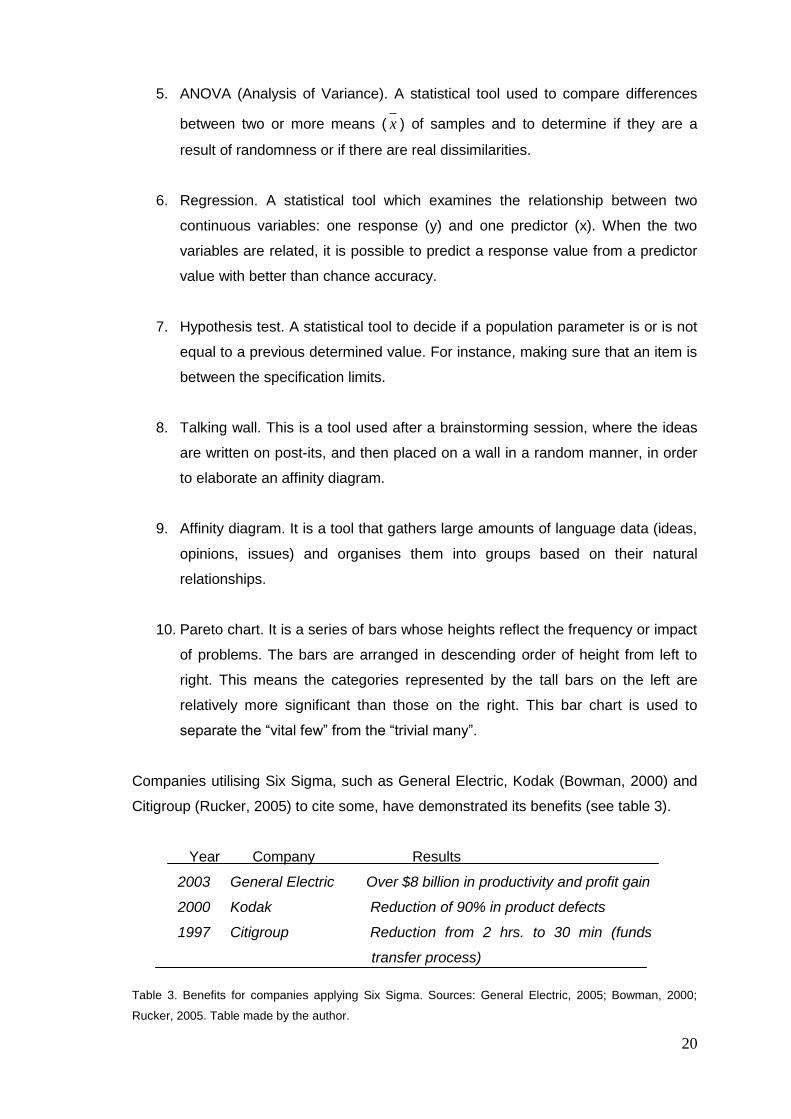
Companies utilising Six Sigma, such as General Electric, Kodak (Bowman, 2000) and
Citigroup (Rucker, 2005) to cite some, have demonstrated its benefits (see table 3).
Year Company Results
2003 General Electric Over $8 billion in productivity and profit gain
2000 Kodak Reduction of 90% in product defects
1997 Citigroup Reduction from 2 hrs. to 30 min (funds
transfer process)
Table 3. Benefits for companies applying Six Sigma. Sources: General Electric, 2005; Bowman, 2000;
Rucker, 2005. Table made by the author.
21
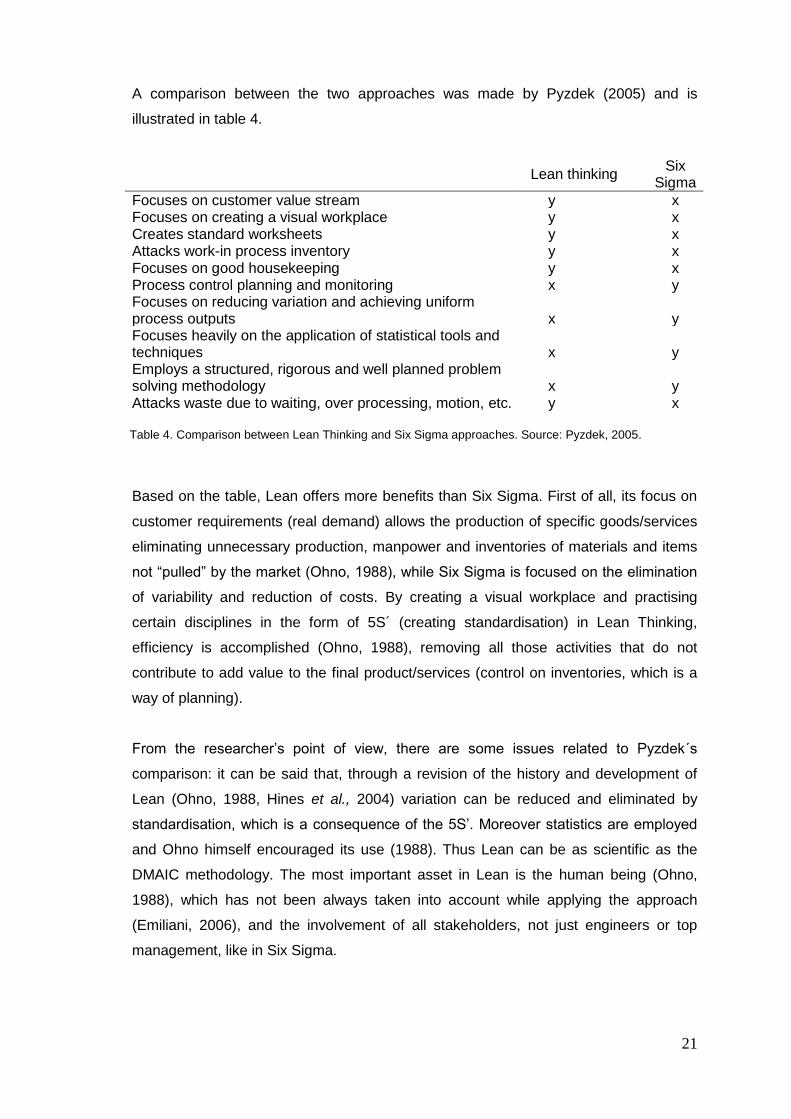
A comparison between the two approaches was made by Pyzdek (2005) and is
illustrated in table 4.
.
Based on the table, Lean offers more benefits than Six Sigma. First of all, its focus on
customer requirements (real demand) allows the production of specific goods/services
eliminating unnecessary production, manpower and inventories of materials and items
not “pulled” by the market (Ohno, 1988), while Six Sigma is focused on the elimination
of variability and reduction of costs. By creating a visual workplace and practising
certain disciplines in the form of 5S´ (creating standardisation) in Lean Thinking,
efficiency is accomplished (Ohno, 1988), removing all those activities that do not
contribute to add value to the final product/services (control on inventories, which is a
way of planning).
From the researcher‟s point of view, there are some issues related to Pyzdek´s
comparison: it can be said that, through a revision of the history and development of
Lean (Ohno, 1988, Hines et al., 2004) variation can be reduced and eliminated by
standardisation, which is a consequence of the 5S‟. Moreover statistics are employed
and Ohno himself encouraged its use (1988). Thus Lean can be as scientific as the
DMAIC methodology. The most important asset in Lean is the human being (Ohno,
1988), which has not been always taken into account while applying the approach
(Emiliani, 2006), and the involvement of all stakeholders, not just engineers or top
management, like in Six Sigma.
Lean thinking
Six Sigma
Focuses on customer value stream y x Focuses on creating a visual workplace y x Creates standard worksheets y x Attacks work-in process inventory y x Focuses on good housekeeping y x Process control planning and monitoring x y Focuses on reducing variation and achieving uniform process outputs x y Focuses heavily on the application of statistical tools and techniques x y Employs a structured, rigorous and well planned problem solving methodology x y Attacks waste due to waiting, over processing, motion, etc. y x
Table 4. Comparison between Lean Thinking and Six Sigma approaches. Source: Pyzdek, 2005.
22
2.3 Lean and Six Sigma in health care
According to Lean principles, customers are unique. Therefore, a production line must
produce unique items, one by one, because their preferences are diverse, more
personalised and more rigid as Ohno mentioned to Mito (Ohno, 1988). If we transpose
the automobile industry into health care terms, we should be talking about patients as
customers, as they are similarly unique, with differing health needs (George and Rago,
2005). Thus, the health care provided must fulfil those needs. The idea of Lean in
health care is to eliminate the “waste” (all unnecessary activities) and in doing so give
the patient what they need when they need it for the lowest cost. The product (e.g.
laboratory test results) or service (patient care) can make the difference between life
and death.
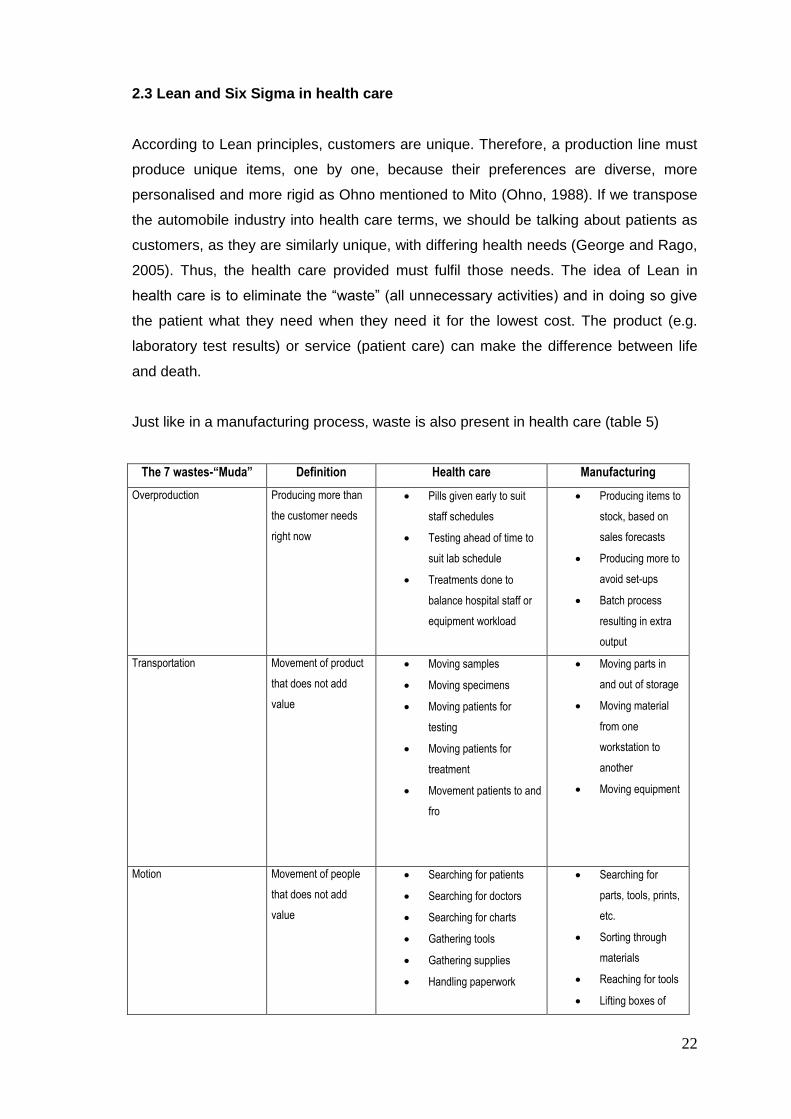
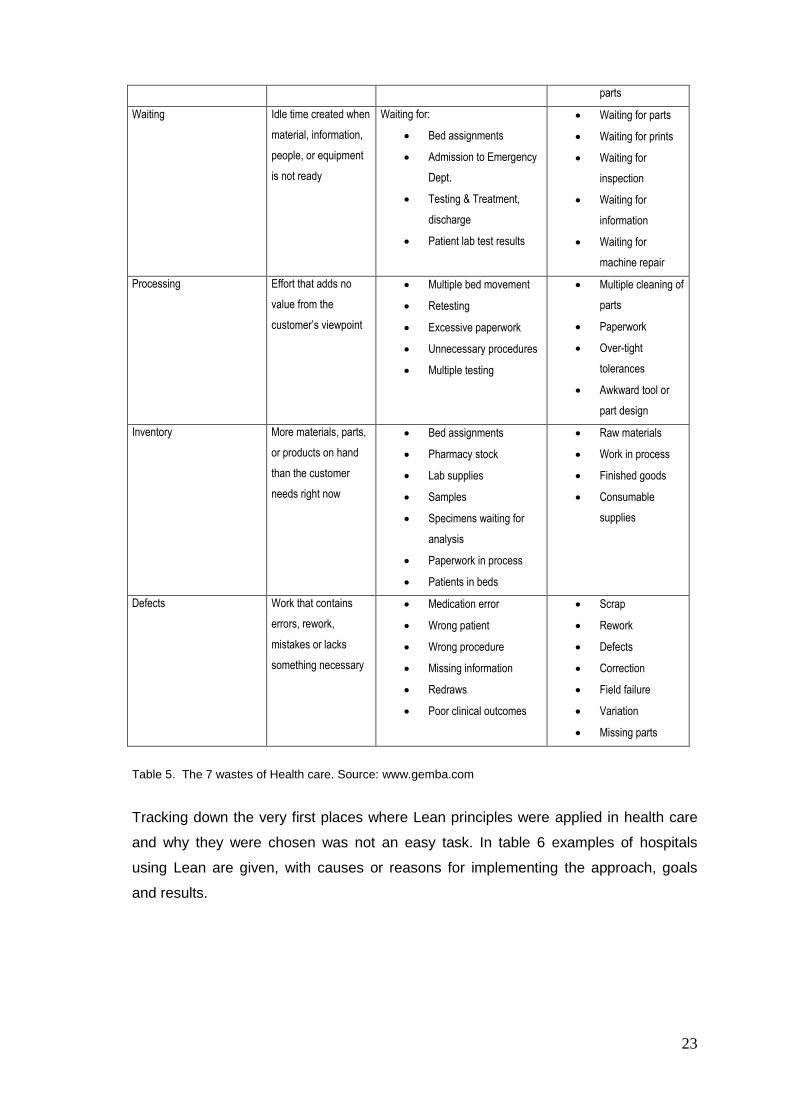
Just like in a manufacturing process, waste is also present in health care (table 5)
The 7 wastes-“Muda” Definition Health care Manufacturing
Overproduction Producing more than
the customer needs
right now
Pills given early to suit
staff schedules
Testing ahead of time to
suit lab schedule
Treatments done to
balance hospital staff or
equipment workload
Producing items to
stock, based on
sales forecasts
Producing more to
avoid set-ups
Batch process
resulting in extra
output
Transportation Movement of product
that does not add
value
Moving samples
Moving specimens
Moving patients for
testing
Moving patients for
treatment
Movement patients to and
fro
Moving parts in
and out of storage
Moving material
from one
workstation to
another
Moving equipment
Motion Movement of people
that does not add
value
Searching for patients
Searching for doctors
Searching for charts
Gathering tools
Gathering supplies
Handling paperwork
Searching for
parts, tools, prints,
etc.
Sorting through
materials
Reaching for tools
Lifting boxes of
23
parts
Waiting Idle time created when
material, information,
people, or equipment
is not ready
Waiting for:
Bed assignments
Admission to Emergency
Dept.
Testing & Treatment,
discharge
Patient lab test results
Waiting for parts
Waiting for prints
Waiting for
inspection
Waiting for
information
Waiting for
machine repair
Processing Effort that adds no
value from the
customer‟s viewpoint
Multiple bed movement
Retesting
Excessive paperwork
Unnecessary procedures
Multiple testing
Multiple cleaning of
parts
Paperwork
Over-tight
tolerances
Awkward tool or
part design
Inventory More materials, parts,
or products on hand
than the customer
needs right now
Bed assignments
Pharmacy stock
Lab supplies
Samples
Specimens waiting for
analysis
Paperwork in process
Patients in beds
Raw materials
Work in process
Finished goods
Consumable
supplies
Defects Work that contains
errors, rework,
mistakes or lacks
something necessary
Medication error
Wrong patient
Wrong procedure
Missing information
Redraws
Poor clinical outcomes
Scrap
Rework
Defects
Correction
Field failure
Variation
Missing parts
Table 5. The 7 wastes of Health care. Source: www.gemba.com
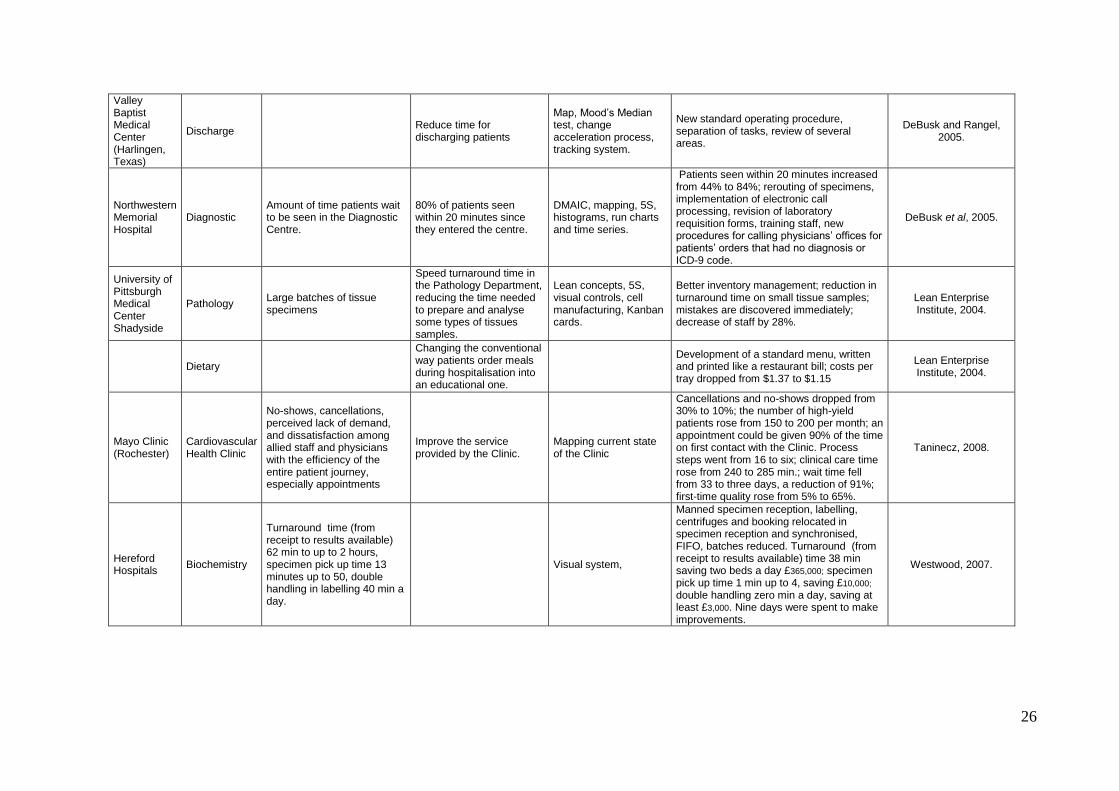
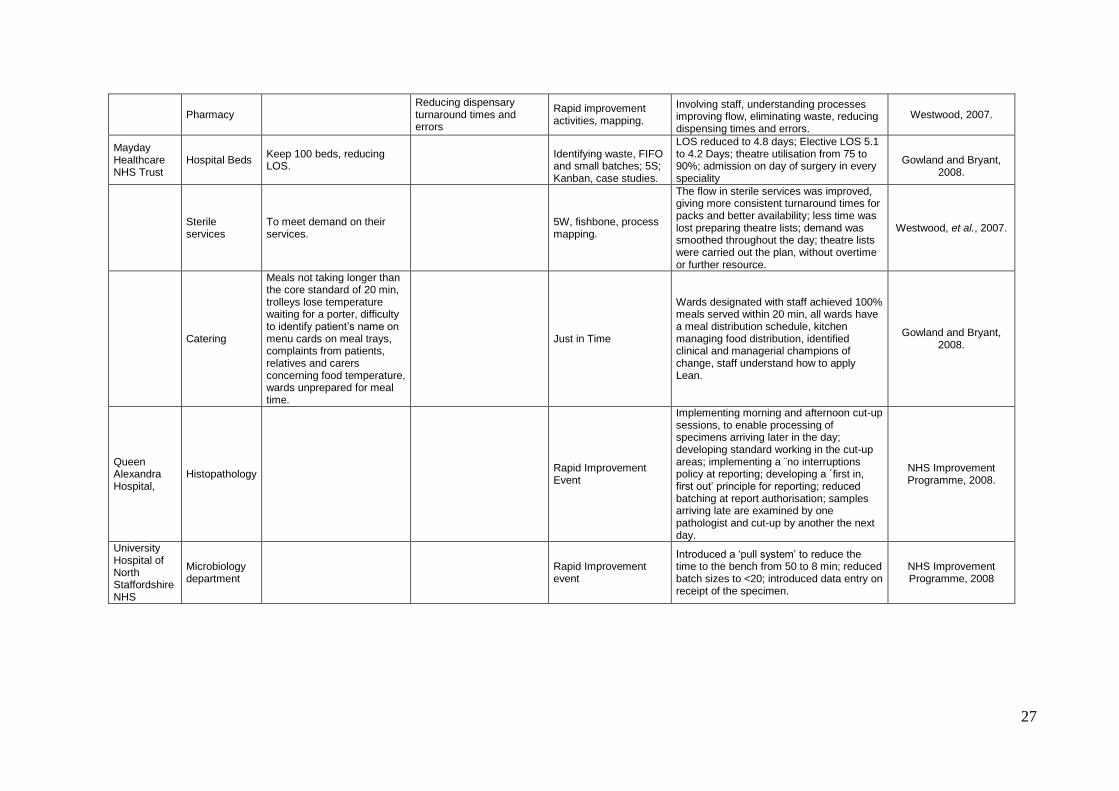
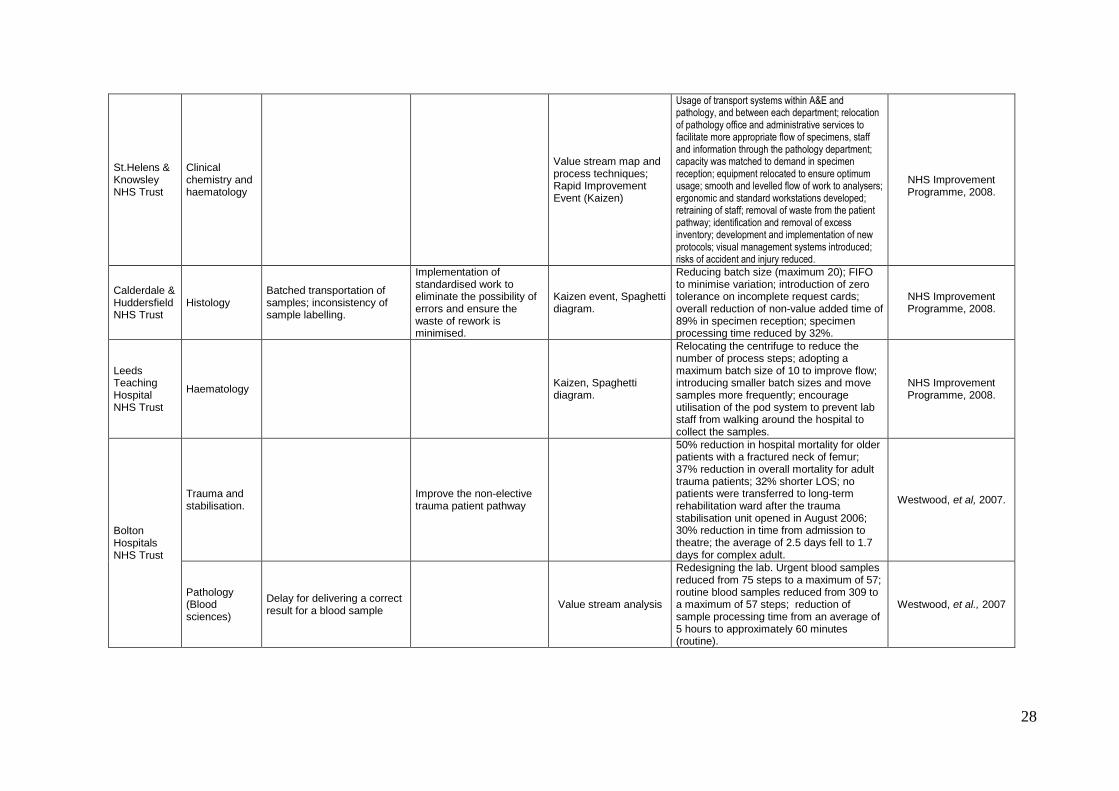
Tracking down the very first places where Lean principles were applied in health care
and why they were chosen was not an easy task. In table 6 examples of hospitals
using Lean are given, with causes or reasons for implementing the approach, goals
and results.
24
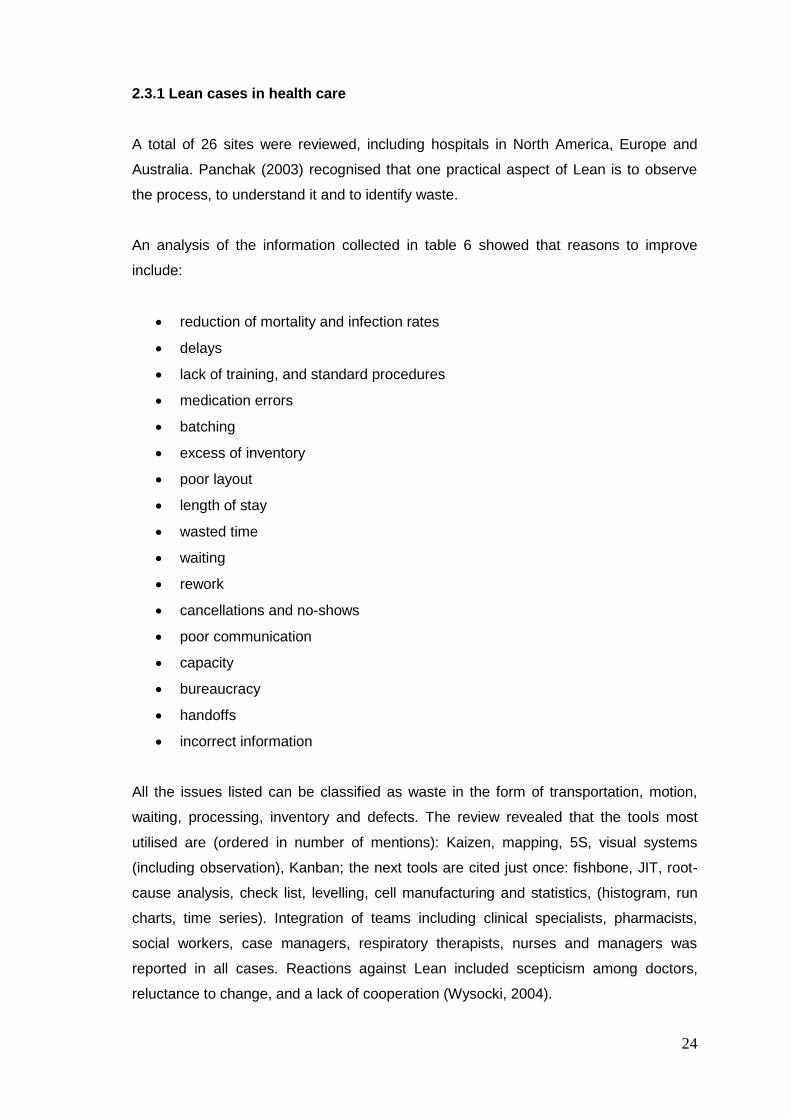
2.3.1 Lean cases in health care
A total of 26 sites were reviewed, including hospitals in North America, Europe and
Australia. Panchak (2003) recognised that one practical aspect of Lean is to observe
the process, to understand it and to identify waste.
An analysis of the information collected in table 6 showed that reasons to improve
include:
reduction of mortality and infection rates
delays
lack of training, and standard procedures
medication errors
batching
excess of inventory
poor layout
length of stay
wasted time
waiting
rework
cancellations and no-shows
poor communication
capacity
bureaucracy
handoffs
incorrect information
All the issues listed can be classified as waste in the form of transportation, motion,
waiting, processing, inventory and defects. The review revealed that the tools most
utilised are (ordered in number of mentions): Kaizen, mapping, 5S, visual systems
(including observation), Kanban; the next tools are cited just once: fishbone, JIT, root-
cause analysis, check list, levelling, cell manufacturing and statistics, (histogram, run
charts, time series). Integration of teams including clinical specialists, pharmacists,
social workers, case managers, respiratory therapists, nurses and managers was
reported in all cases. Reactions against Lean included scepticism among doctors,
reluctance to change, and a lack of cooperation (Wysocki, 2004).
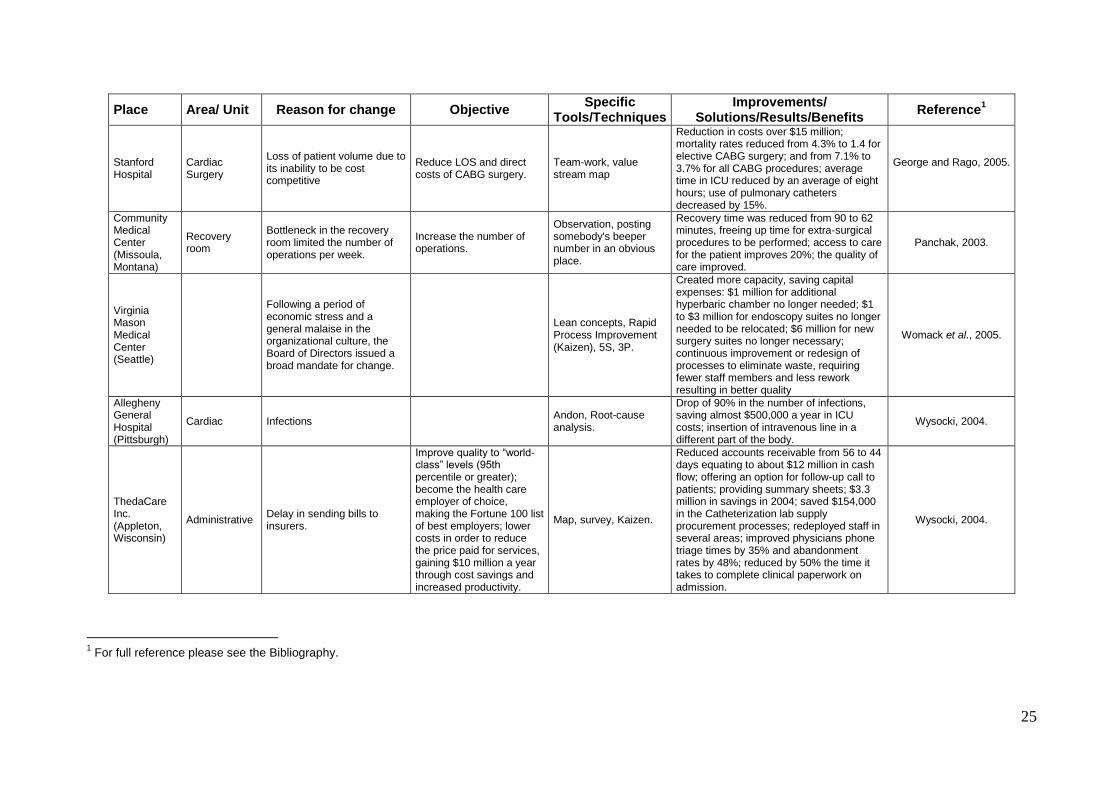
25
Place Area/ Unit Reason for change Objective Specific
Tools/Techniques Improvements/
Solutions/Results/Benefits Reference
1
Stanford Hospital
Cardiac Surgery
Loss of patient volume due to its inability to be cost competitive
Reduce LOS and direct costs of CABG surgery.
Team-work, value stream map
Reduction in costs over $15 million; mortality rates reduced from 4.3% to 1.4 for elective CABG surgery; and from 7.1% to 3.7% for all CABG procedures; average time in ICU reduced by an average of eight hours; use of pulmonary catheters decreased by 15%.
George and Rago, 2005.
Community Medical Center (Missoula, Montana)
Recovery room
Bottleneck in the recovery room limited the number of operations per week.
Increase the number of operations.
Observation, posting somebody's beeper number in an obvious place.
Recovery time was reduced from 90 to 62 minutes, freeing up time for extra-surgical procedures to be performed; access to care for the patient improves 20%; the quality of care improved.
Panchak, 2003.
Virginia Mason Medical Center (Seattle)
Following a period of economic stress and a general malaise in the organizational culture, the Board of Directors issued a broad mandate for change.
Lean concepts, Rapid Process Improvement (Kaizen), 5S, 3P.
Created more capacity, saving capital expenses: $1 million for additional hyperbaric chamber no longer needed; $1 to $3 million for endoscopy suites no longer needed to be relocated; $6 million for new surgery suites no longer necessary; continuous improvement or redesign of processes to eliminate waste, requiring fewer staff members and less rework resulting in better quality
Womack et al., 2005.
Allegheny General Hospital (Pittsburgh)
Cardiac Infections Andon, Root-cause analysis.
Drop of 90% in the number of infections, saving almost $500,000 a year in ICU costs; insertion of intravenous line in a different part of the body.
Wysocki, 2004.
ThedaCare Inc. (Appleton, Wisconsin)
Administrative Delay in sending bills to insurers.
Improve quality to “world-class” levels (95th percentile or greater); become the health care employer of choice, making the Fortune 100 list of best employers; lower costs in order to reduce the price paid for services, gaining $10 million a year through cost savings and increased productivity.
Map, survey, Kaizen.
Reduced accounts receivable from 56 to 44 days equating to about $12 million in cash flow; offering an option for follow-up call to patients; providing summary sheets; $3.3 million in savings in 2004; saved $154,000 in the Catheterization lab supply procurement processes; redeployed staff in several areas; improved physicians phone triage times by 35% and abandonment rates by 48%; reduced by 50% the time it takes to complete clinical paperwork on admission.
Wysocki, 2004.
1 For full reference please see the Bibliography.
26
Valley Baptist Medical Center (Harlingen, Texas)
Discharge Reduce time for discharging patients
Map, Mood‟s Median test, change acceleration process, tracking system.
New standard operating procedure, separation of tasks, review of several areas.
DeBusk and Rangel, 2005.
Northwestern Memorial Hospital
Diagnostic Amount of time patients wait to be seen in the Diagnostic Centre.
80% of patients seen within 20 minutes since they entered the centre.
DMAIC, mapping, 5S, histograms, run charts and time series.
Patients seen within 20 minutes increased from 44% to 84%; rerouting of specimens, implementation of electronic call processing, revision of laboratory requisition forms, training staff, new procedures for calling physicians‟ offices for patients‟ orders that had no diagnosis or ICD-9 code.
DeBusk et al, 2005.
University of Pittsburgh Medical Center Shadyside
Pathology Large batches of tissue specimens
Speed turnaround time in the Pathology Department, reducing the time needed to prepare and analyse some types of tissues samples.
Lean concepts, 5S, visual controls, cell manufacturing, Kanban cards.
Better inventory management; reduction in turnaround time on small tissue samples; mistakes are discovered immediately; decrease of staff by 28%.
Lean Enterprise Institute, 2004.
Dietary
Changing the conventional way patients order meals during hospitalisation into an educational one.
Development of a standard menu, written and printed like a restaurant bill; costs per tray dropped from $1.37 to $1.15
Lean Enterprise Institute, 2004.
Mayo Clinic (Rochester)
Cardiovascular Health Clinic
No-shows, cancellations, perceived lack of demand, and dissatisfaction among allied staff and physicians with the efficiency of the entire patient journey, especially appointments
Improve the service provided by the Clinic.
Mapping current state of the Clinic
Cancellations and no-shows dropped from 30% to 10%; the number of high-yield patients rose from 150 to 200 per month; an appointment could be given 90% of the time on first contact with the Clinic. Process steps went from 16 to six; clinical care time rose from 240 to 285 min.; wait time fell from 33 to three days, a reduction of 91%; first-time quality rose from 5% to 65%.
Taninecz, 2008.
Hereford Hospitals
Biochemistry
Turnaround time (from receipt to results available) 62 min to up to 2 hours, specimen pick up time 13 minutes up to 50, double handling in labelling 40 min a day.
Visual system,
Manned specimen reception, labelling, centrifuges and booking relocated in specimen reception and synchronised, FIFO, batches reduced. Turnaround (from receipt to results available) time 38 min saving two beds a day £365,000; specimen pick up time 1 min up to 4, saving £10,000; double handling zero min a day, saving at least £3,000. Nine days were spent to make improvements.
Westwood, 2007.
27
Pharmacy
Reducing dispensary turnaround times and errors
Rapid improvement activities, mapping.
Involving staff, understanding processes improving flow, eliminating waste, reducing dispensing times and errors.
Westwood, 2007.
Mayday Healthcare NHS Trust
Hospital Beds Keep 100 beds, reducing LOS.
Identifying waste, FIFO and small batches; 5S; Kanban, case studies.
LOS reduced to 4.8 days; Elective LOS 5.1 to 4.2 Days; theatre utilisation from 75 to 90%; admission on day of surgery in every speciality
Gowland and Bryant,
2008.
Sterile services
To meet demand on their services.
5W, fishbone, process mapping.
The flow in sterile services was improved, giving more consistent turnaround times for packs and better availability; less time was lost preparing theatre lists; demand was smoothed throughout the day; theatre lists were carried out the plan, without overtime or further resource.
Westwood, et al., 2007.
Catering
Meals not taking longer than the core standard of 20 min, trolleys lose temperature waiting for a porter, difficulty to identify patient‟s name on menu cards on meal trays, complaints from patients, relatives and carers concerning food temperature, wards unprepared for meal time.
Just in Time
Wards designated with staff achieved 100% meals served within 20 min, all wards have a meal distribution schedule, kitchen managing food distribution, identified clinical and managerial champions of change, staff understand how to apply Lean.
Gowland and Bryant, 2008.
Queen Alexandra Hospital,
Histopathology
Rapid Improvement Event
Implementing morning and afternoon cut-up sessions, to enable processing of specimens arriving later in the day; developing standard working in the cut-up areas; implementing a ¨no interruptions policy at reporting; developing a ´first in, first out‟ principle for reporting; reduced batching at report authorisation; samples arriving late are examined by one pathologist and cut-up by another the next day.
NHS Improvement Programme, 2008.
University Hospital of North Staffordshire NHS
Microbiology department
Rapid Improvement event
Introduced a „pull system‟ to reduce the time to the bench from 50 to 8 min; reduced batch sizes to <20; introduced data entry on receipt of the specimen.
NHS Improvement Programme, 2008
28
St.Helens & Knowsley NHS Trust
Clinical chemistry and haematology
Value stream map and process techniques; Rapid Improvement Event (Kaizen)
Usage of transport systems within A&E and pathology, and between each department; relocation of pathology office and administrative services to facilitate more appropriate flow of specimens, staff and information through the pathology department; capacity was matched to demand in specimen reception; equipment relocated to ensure optimum usage; smooth and levelled flow of work to analysers; ergonomic and standard workstations developed; retraining of staff; removal of waste from the patient pathway; identification and removal of excess inventory; development and implementation of new protocols; visual management systems introduced; risks of accident and injury reduced.
NHS Improvement Programme, 2008.
Calderdale & Huddersfield NHS Trust
Histology Batched transportation of samples; inconsistency of sample labelling.
Implementation of standardised work to eliminate the possibility of errors and ensure the waste of rework is minimised.
Kaizen event, Spaghetti diagram.
Reducing batch size (maximum 20); FIFO to minimise variation; introduction of zero tolerance on incomplete request cards; overall reduction of non-value added time of 89% in specimen reception; specimen processing time reduced by 32%.
NHS Improvement Programme, 2008.
Leeds Teaching Hospital NHS Trust
Haematology
Kaizen, Spaghetti diagram.
Relocating the centrifuge to reduce the number of process steps; adopting a maximum batch size of 10 to improve flow; introducing smaller batch sizes and move samples more frequently; encourage utilisation of the pod system to prevent lab staff from walking around the hospital to collect the samples.
NHS Improvement Programme, 2008.
Bolton Hospitals NHS Trust
Trauma and stabilisation.
Improve the non-elective trauma patient pathway
50% reduction in hospital mortality for older patients with a fractured neck of femur; 37% reduction in overall mortality for adult trauma patients; 32% shorter LOS; no patients were transferred to long-term rehabilitation ward after the trauma stabilisation unit opened in August 2006; 30% reduction in time from admission to theatre; the average of 2.5 days fell to 1.7 days for complex adult.
Westwood, et al, 2007.
Pathology (Blood sciences)
Delay for delivering a correct result for a blood sample
Value stream analysis
Redesigning the lab. Urgent blood samples reduced from 75 steps to a maximum of 57; routine blood samples reduced from 309 to a maximum of 57 steps; reduction of sample processing time from an average of 5 hours to approximately 60 minutes (routine).
Westwood, et al., 2007
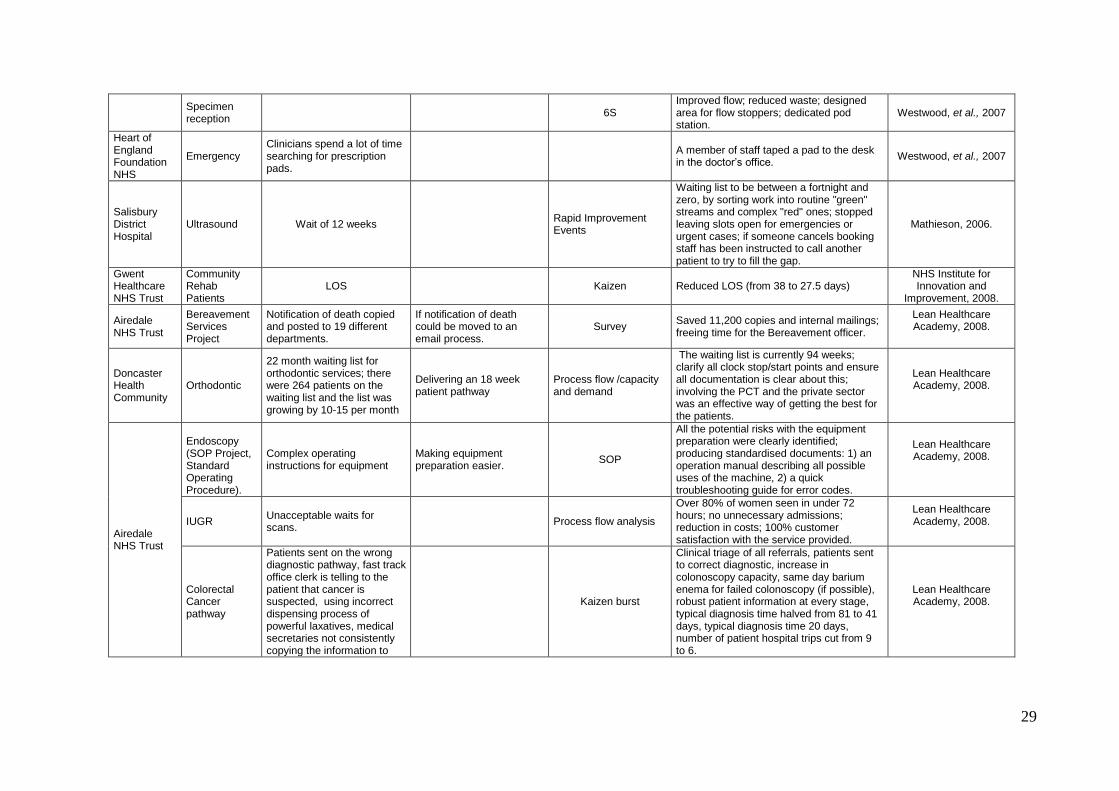
29
Specimen reception
6S
Improved flow; reduced waste; designed area for flow stoppers; dedicated pod station.
Westwood, et al., 2007
Heart of England Foundation NHS
Emergency Clinicians spend a lot of time searching for prescription pads.
A member of staff taped a pad to the desk in the doctor‟s office.
Westwood, et al., 2007
Salisbury District Hospital
Ultrasound Wait of 12 weeks
Rapid Improvement Events
Waiting list to be between a fortnight and zero, by sorting work into routine "green" streams and complex "red" ones; stopped leaving slots open for emergencies or urgent cases; if someone cancels booking staff has been instructed to call another patient to try to fill the gap.
Mathieson, 2006.
Gwent Healthcare NHS Trust
Community Rehab Patients
LOS
Kaizen Reduced LOS (from 38 to 27.5 days) NHS Institute for Innovation and
Improvement, 2008.
Airedale NHS Trust
Bereavement Services Project
Notification of death copied and posted to 19 different departments.
If notification of death could be moved to an email process.
Survey Saved 11,200 copies and internal mailings; freeing time for the Bereavement officer.
Lean Healthcare Academy, 2008.
Doncaster Health Community
Orthodontic
22 month waiting list for orthodontic services; there were 264 patients on the waiting list and the list was growing by 10-15 per month
Delivering an 18 week patient pathway
Process flow /capacity and demand
The waiting list is currently 94 weeks; clarify all clock stop/start points and ensure all documentation is clear about this; involving the PCT and the private sector was an effective way of getting the best for the patients.
Lean Healthcare Academy, 2008.
Airedale NHS Trust
Endoscopy (SOP Project, Standard Operating Procedure).
Complex operating instructions for equipment
Making equipment preparation easier.
SOP
All the potential risks with the equipment preparation were clearly identified; producing standardised documents: 1) an operation manual describing all possible uses of the machine, 2) a quick troubleshooting guide for error codes.
Lean Healthcare Academy, 2008.
IUGR Unacceptable waits for scans.
Process flow analysis
Over 80% of women seen in under 72 hours; no unnecessary admissions; reduction in costs; 100% customer satisfaction with the service provided.
Lean Healthcare Academy, 2008.
Colorectal Cancer pathway
Patients sent on the wrong diagnostic pathway, fast track office clerk is telling to the patient that cancer is suspected, using incorrect dispensing process of powerful laxatives, medical secretaries not consistently copying the information to
Kaizen burst
Clinical triage of all referrals, patients sent to correct diagnostic, increase in colonoscopy capacity, same day barium enema for failed colonoscopy (if possible), robust patient information at every stage, typical diagnosis time halved from 81 to 41 days, typical diagnosis time 20 days, number of patient hospital trips cut from 9 to 6.
Lean Healthcare Academy, 2008.
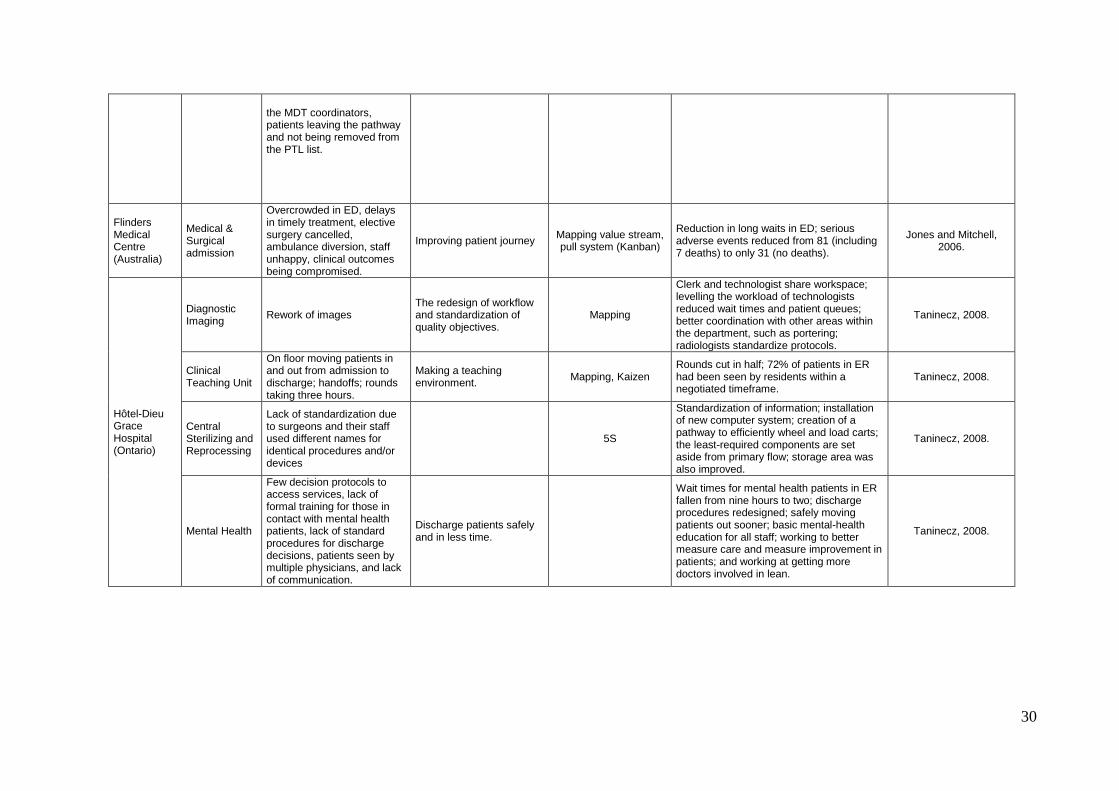
30
the MDT coordinators, patients leaving the pathway and not being removed from the PTL list.
Flinders Medical Centre (Australia)
Medical & Surgical admission
Overcrowded in ED, delays in timely treatment, elective surgery cancelled, ambulance diversion, staff unhappy, clinical outcomes being compromised.
Improving patient journey Mapping value stream, pull system (Kanban)
Reduction in long waits in ED; serious adverse events reduced from 81 (including 7 deaths) to only 31 (no deaths).
Jones and Mitchell, 2006.
Hôtel-Dieu Grace Hospital (Ontario)
Diagnostic Imaging
Rework of images The redesign of workflow and standardization of quality objectives.
Mapping
Clerk and technologist share workspace; levelling the workload of technologists reduced wait times and patient queues; better coordination with other areas within the department, such as portering; radiologists standardize protocols.
Taninecz, 2008.
Clinical Teaching Unit
On floor moving patients in and out from admission to discharge; handoffs; rounds taking three hours.
Making a teaching environment.
Mapping, Kaizen Rounds cut in half; 72% of patients in ER had been seen by residents within a negotiated timeframe.
Taninecz, 2008.
Central Sterilizing and Reprocessing
Lack of standardization due to surgeons and their staff used different names for identical procedures and/or devices
5S
Standardization of information; installation of new computer system; creation of a pathway to efficiently wheel and load carts; the least-required components are set aside from primary flow; storage area was also improved.
Taninecz, 2008.
Mental Health
Few decision protocols to access services, lack of formal training for those in contact with mental health patients, lack of standard procedures for discharge decisions, patients seen by multiple physicians, and lack of communication.
Discharge patients safely and in less time.
Wait times for mental health patients in ER fallen from nine hours to two; discharge procedures redesigned; safely moving patients out sooner; basic mental-health education for all staff; working to better measure care and measure improvement in patients; and working at getting more doctors involved in lean.
Taninecz, 2008.
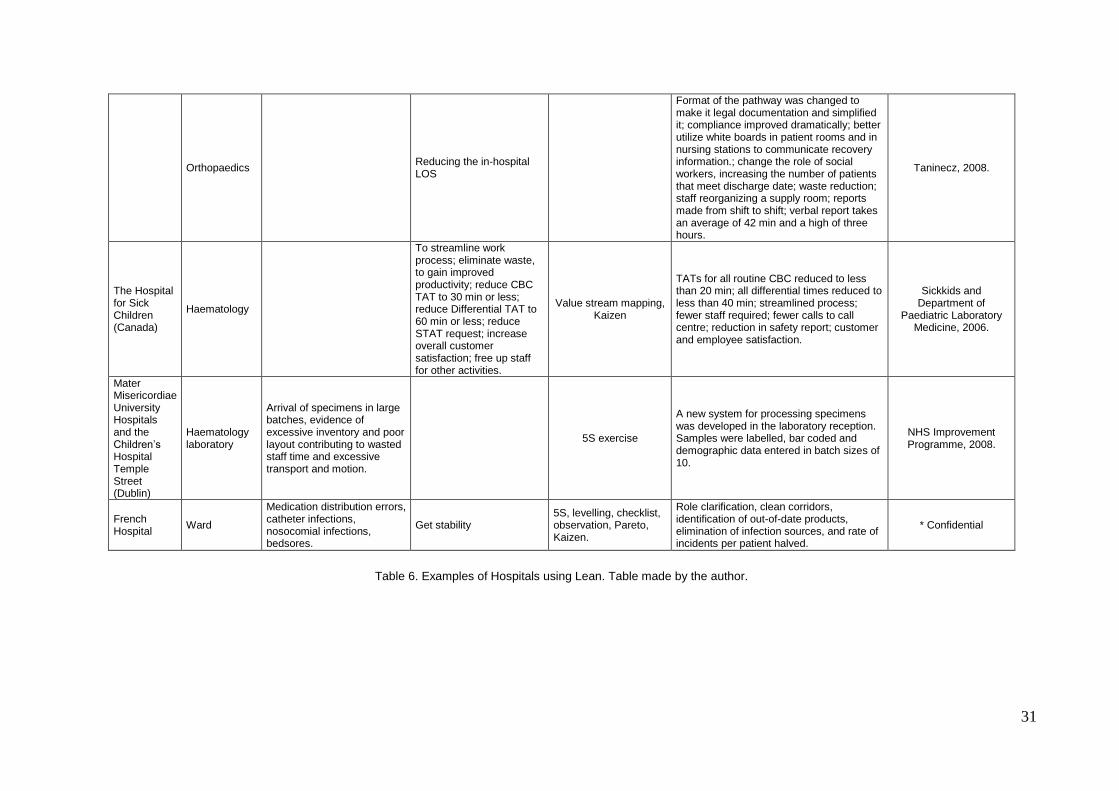
31
Orthopaedics
Reducing the in-hospital LOS
Format of the pathway was changed to make it legal documentation and simplified it; compliance improved dramatically; better utilize white boards in patient rooms and in nursing stations to communicate recovery information.; change the role of social workers, increasing the number of patients that meet discharge date; waste reduction; staff reorganizing a supply room; reports made from shift to shift; verbal report takes an average of 42 min and a high of three hours.
Taninecz, 2008.
The Hospital for Sick Children (Canada)
Haematology
To streamline work process; eliminate waste, to gain improved productivity; reduce CBC TAT to 30 min or less; reduce Differential TAT to 60 min or less; reduce STAT request; increase overall customer satisfaction; free up staff for other activities.
Value stream mapping, Kaizen
TATs for all routine CBC reduced to less than 20 min; all differential times reduced to less than 40 min; streamlined process; fewer staff required; fewer calls to call centre; reduction in safety report; customer and employee satisfaction.
Sickkids and Department of
Paediatric Laboratory Medicine, 2006.
Mater Misericordiae University Hospitals and the Children‟s Hospital Temple Street (Dublin)
Haematology laboratory
Arrival of specimens in large batches, evidence of excessive inventory and poor layout contributing to wasted staff time and excessive transport and motion.
5S exercise
A new system for processing specimens was developed in the laboratory reception. Samples were labelled, bar coded and demographic data entered in batch sizes of 10.
NHS Improvement Programme, 2008.
French Hospital
Ward
Medication distribution errors, catheter infections, nosocomial infections, bedsores.
Get stability 5S, levelling, checklist, observation, Pareto, Kaizen.
Role clarification, clean corridors, identification of out-of-date products, elimination of infection sources, and rate of incidents per patient halved.
* Confidential
Table 6. Examples of Hospitals using Lean. Table made by the author.
32
In three cases customer dissatisfaction was reported including patients, staff and
physicians; in two cases finance was mentioned as a driver of improvement (George
and Rago, 2005; Womack et al., 2005). For public organisations (NHS and the
ISSSTE) the need to improve is not caused by making profit, but to accomplish their
purpose of delivering health to the population, and at the same time using public funds
efficiently.
Some lessons learnt (George and Rago, 2005; Lean Healthcare Academy, 2008) are:
a) CEO engagement is critical.
b) Needs support and time from senior managers.
c) Improvement teams must have credibility with physicians.
d) Data is required.
e) The process should be adapted to the population.
f) When possible, improvements must be made quickly.
g) Understanding the human dynamic is critical.
h) Standard operating procedures can be written.
i) Visual approach makes documents clearer and easier to understand.
j) Small changes can have a big impact.
k) If there is a repeated task try to find an easier way to do it.
2.3.1.1 Benefits of using Lean
Among the benefits Lean principles offered are:
- a low cost approach
- prompt response to customer requests
- listening to the customer‟s voice
- ability to directly intervene in the process by shop-floor people
- a culture of continuous improvement
- reliability
One of the key ideas in Lean is to decrease response time, since it is not possible to
increase the amount of time available in a 24-hour day as Miller (2004) remarks. By
reducing the waste and increasing efficiency, a hospital can provide a health service of
quality to a greater number of patients. Small changes can have a big impact (Lean
Healthcare Academy, 2008).
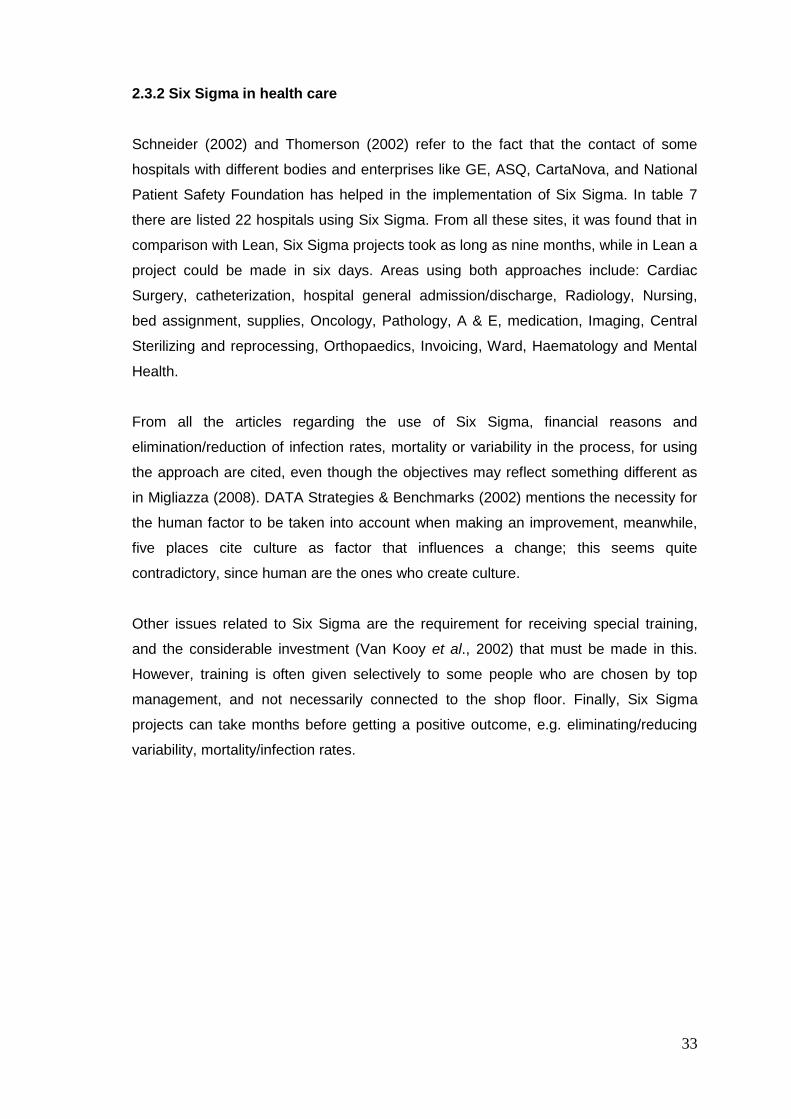
33
2.3.2 Six Sigma in health care
Schneider (2002) and Thomerson (2002) refer to the fact that the contact of some
hospitals with different bodies and enterprises like GE, ASQ, CartaNova, and National
Patient Safety Foundation has helped in the implementation of Six Sigma. In table 7
there are listed 22 hospitals using Six Sigma. From all these sites, it was found that in
comparison with Lean, Six Sigma projects took as long as nine months, while in Lean a
project could be made in six days. Areas using both approaches include: Cardiac
Surgery, catheterization, hospital general admission/discharge, Radiology, Nursing,
bed assignment, supplies, Oncology, Pathology, A & E, medication, Imaging, Central
Sterilizing and reprocessing, Orthopaedics, Invoicing, Ward, Haematology and Mental
Health.
From all the articles regarding the use of Six Sigma, financial reasons and
elimination/reduction of infection rates, mortality or variability in the process, for using
the approach are cited, even though the objectives may reflect something different as
in Migliazza (2008). DATA Strategies & Benchmarks (2002) mentions the necessity for
the human factor to be taken into account when making an improvement, meanwhile,
five places cite culture as factor that influences a change; this seems quite
contradictory, since human are the ones who create culture.
Other issues related to Six Sigma are the requirement for receiving special training,
and the considerable investment (Van Kooy et al., 2002) that must be made in this.
However, training is often given selectively to some people who are chosen by top
management, and not necessarily connected to the shop floor. Finally, Six Sigma
projects can take months before getting a positive outcome, e.g. eliminating/reducing
variability, mortality/infection rates.
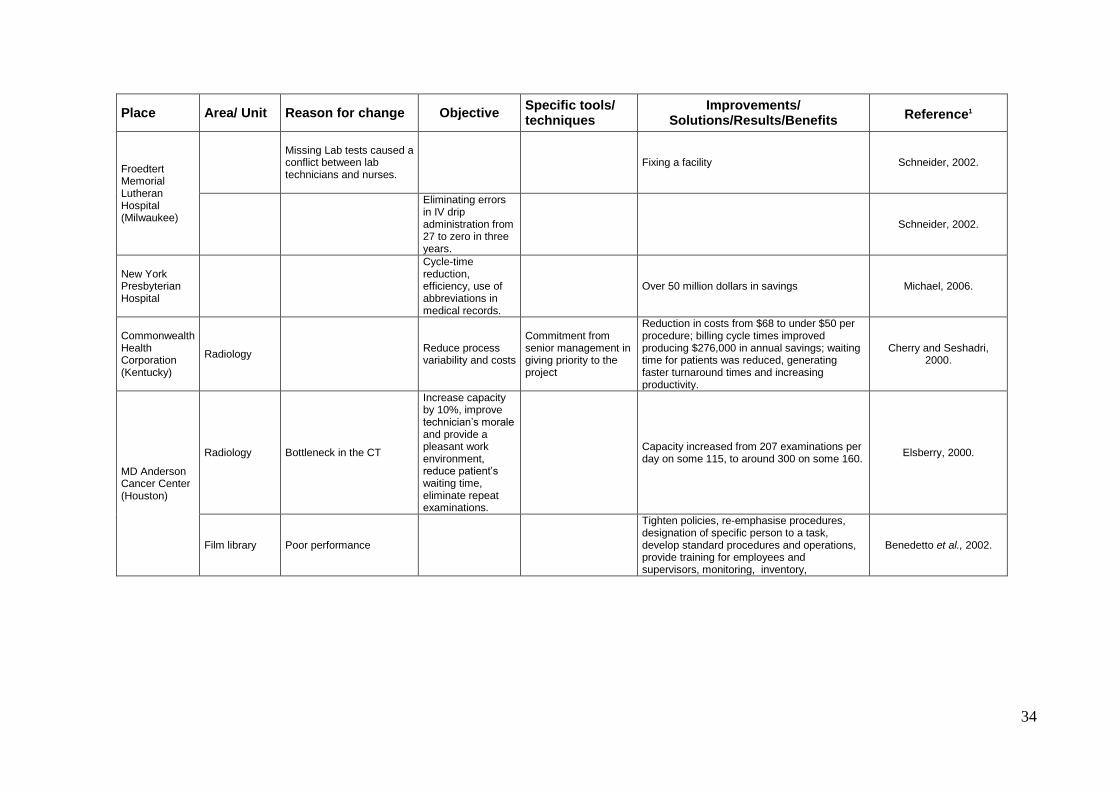
34
Place Area/ Unit Reason for change Objective Specific tools/ techniques
Improvements/ Solutions/Results/Benefits
Reference1
Froedtert Memorial Lutheran Hospital (Milwaukee)
Missing Lab tests caused a conflict between lab technicians and nurses.
Fixing a facility Schneider, 2002.
Eliminating errors in IV drip administration from 27 to zero in three years.
Schneider, 2002.
New York Presbyterian Hospital
Cycle-time reduction, efficiency, use of abbreviations in medical records.
Over 50 million dollars in savings Michael, 2006.
Commonwealth Health Corporation (Kentucky)
Radiology Reduce process variability and costs
Commitment from senior management in giving priority to the project
Reduction in costs from $68 to under $50 per procedure; billing cycle times improved producing $276,000 in annual savings; waiting time for patients was reduced, generating faster turnaround times and increasing productivity.
Cherry and Seshadri, 2000.
MD Anderson Cancer Center (Houston)
Radiology Bottleneck in the CT
Increase capacity by 10%, improve technician‟s morale and provide a pleasant work environment, reduce patient‟s waiting time, eliminate repeat examinations.
Capacity increased from 207 examinations per day on some 115, to around 300 on some 160.
Elsberry, 2000.
Film library Poor performance
Tighten policies, re-emphasise procedures, designation of specific person to a task, develop standard procedures and operations, provide training for employees and supervisors, monitoring, inventory,
Benedetto et al., 2002.
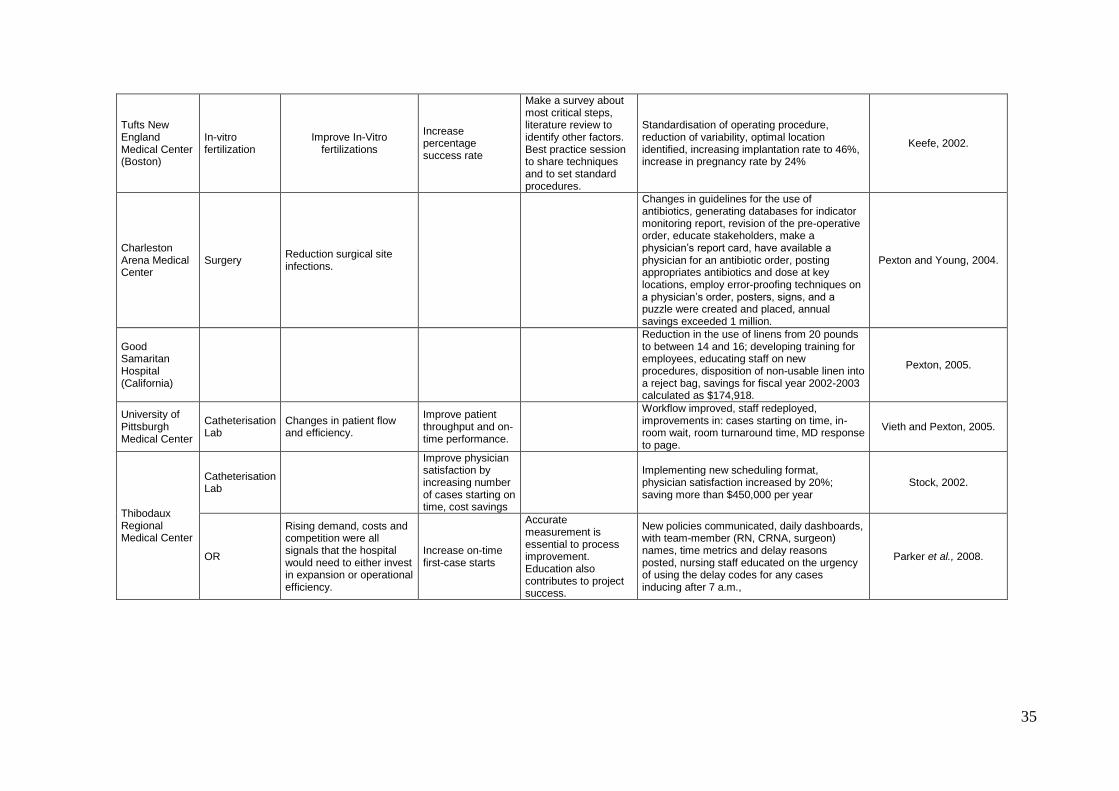
35
Tufts New England Medical Center (Boston)
In-vitro fertilization
Improve In-Vitro fertilizations
Increase percentage success rate
Make a survey about most critical steps, literature review to identify other factors. Best practice session to share techniques and to set standard procedures.
Standardisation of operating procedure, reduction of variability, optimal location identified, increasing implantation rate to 46%, increase in pregnancy rate by 24%
Keefe, 2002.
Charleston Arena Medical Center
Surgery Reduction surgical site infections.
Changes in guidelines for the use of antibiotics, generating databases for indicator monitoring report, revision of the pre-operative order, educate stakeholders, make a physician‟s report card, have available a physician for an antibiotic order, posting appropriates antibiotics and dose at key locations, employ error-proofing techniques on a physician‟s order, posters, signs, and a puzzle were created and placed, annual savings exceeded 1 million.
Pexton and Young, 2004.
Good Samaritan Hospital (California)
Reduction in the use of linens from 20 pounds to between 14 and 16; developing training for employees, educating staff on new procedures, disposition of non-usable linen into a reject bag, savings for fiscal year 2002-2003 calculated as $174,918.
Pexton, 2005.
University of Pittsburgh Medical Center
Catheterisation Lab
Changes in patient flow and efficiency.
Improve patient throughput and on-time performance.
Workflow improved, staff redeployed, improvements in: cases starting on time, in-room wait, room turnaround time, MD response to page.
Vieth and Pexton, 2005.
Thibodaux Regional Medical Center
Catheterisation Lab
Improve physician satisfaction by increasing number of cases starting on time, cost savings
Implementing new scheduling format, physician satisfaction increased by 20%; saving more than $450,000 per year
Stock, 2002.
OR
Rising demand, costs and competition were all signals that the hospital would need to either invest in expansion or operational efficiency.
Increase on-time first-case starts
Accurate measurement is essential to process improvement. Education also contributes to project success.
New policies communicated, daily dashboards, with team-member (RN, CRNA, surgeon) names, time metrics and delay reasons posted, nursing staff educated on the urgency of using the delay codes for any cases inducing after 7 a.m.,
Parker et al., 2008.
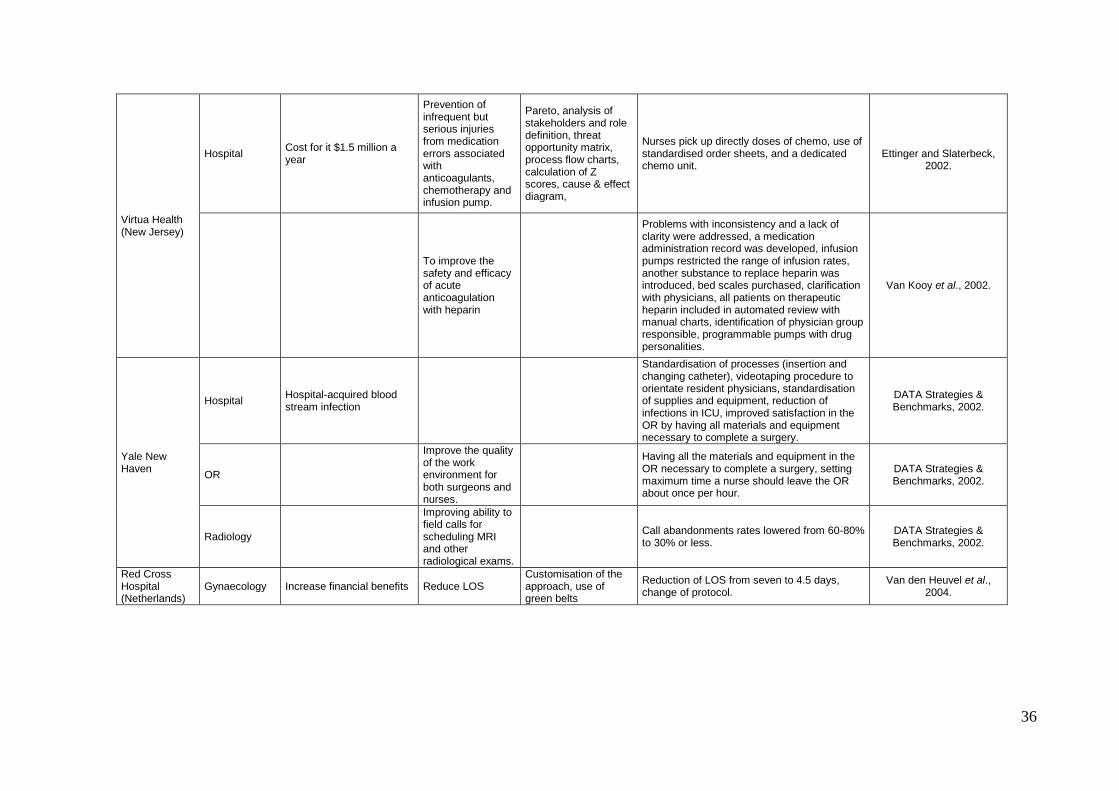
36
Virtua Health (New Jersey)
Hospital Cost for it $1.5 million a year
Prevention of infrequent but serious injuries from medication errors associated with anticoagulants, chemotherapy and infusion pump.
Pareto, analysis of stakeholders and role definition, threat opportunity matrix, process flow charts, calculation of Z scores, cause & effect diagram,
Nurses pick up directly doses of chemo, use of standardised order sheets, and a dedicated chemo unit.
Ettinger and Slaterbeck,
2002.
To improve the safety and efficacy of acute anticoagulation with heparin
Problems with inconsistency and a lack of clarity were addressed, a medication administration record was developed, infusion pumps restricted the range of infusion rates, another substance to replace heparin was introduced, bed scales purchased, clarification with physicians, all patients on therapeutic heparin included in automated review with manual charts, identification of physician group responsible, programmable pumps with drug personalities.
Van Kooy et al., 2002.
Yale New Haven
Hospital Hospital-acquired blood stream infection
Standardisation of processes (insertion and changing catheter), videotaping procedure to orientate resident physicians, standardisation of supplies and equipment, reduction of infections in ICU, improved satisfaction in the OR by having all materials and equipment necessary to complete a surgery.
DATA Strategies & Benchmarks, 2002.
OR
Improve the quality of the work environment for both surgeons and nurses.
Having all the materials and equipment in the OR necessary to complete a surgery, setting maximum time a nurse should leave the OR about once per hour.
DATA Strategies & Benchmarks, 2002.
Radiology
Improving ability to field calls for scheduling MRI and other radiological exams.
Call abandonments rates lowered from 60-80% to 30% or less.
DATA Strategies & Benchmarks, 2002.
Red Cross Hospital (Netherlands)
Gynaecology Increase financial benefits Reduce LOS Customisation of the approach, use of green belts
Reduction of LOS from seven to 4.5 days, change of protocol.
Van den Heuvel et al., 2004.
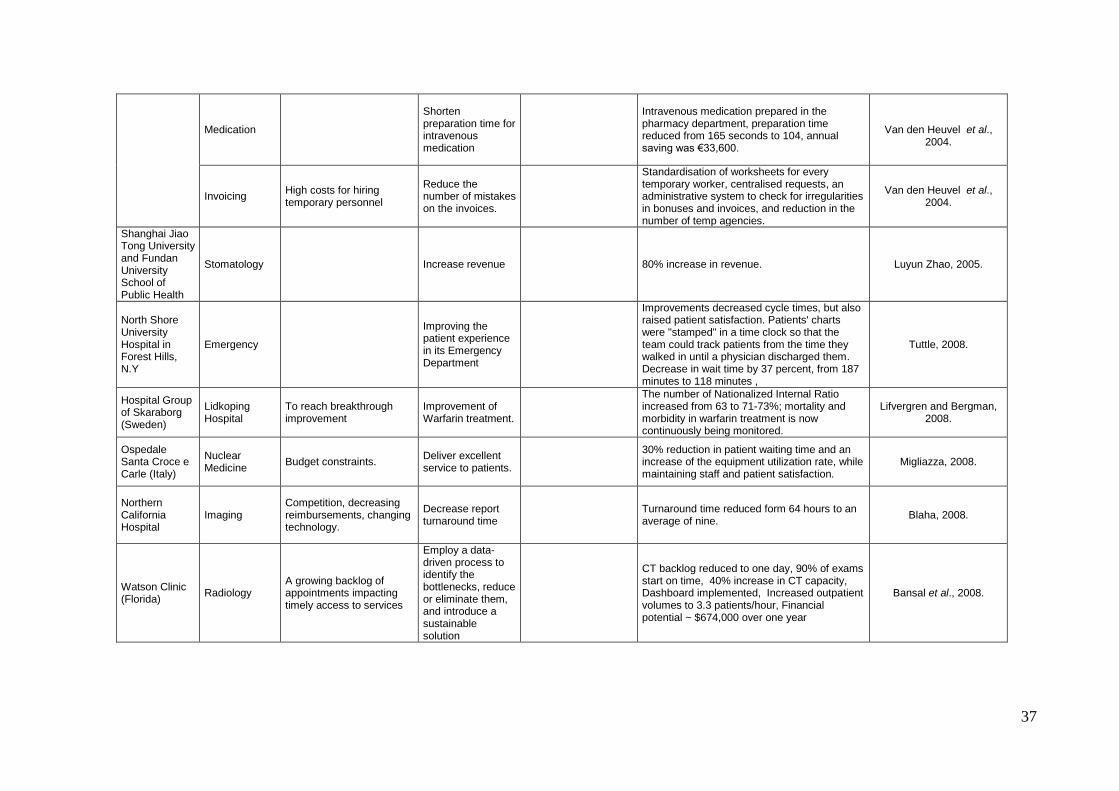
37
Medication
Shorten preparation time for intravenous medication
Intravenous medication prepared in the pharmacy department, preparation time reduced from 165 seconds to 104, annual saving was €33,600.
Van den Heuvel et al.,
2004.
Invoicing High costs for hiring temporary personnel
Reduce the number of mistakes on the invoices.
Standardisation of worksheets for every temporary worker, centralised requests, an administrative system to check for irregularities in bonuses and invoices, and reduction in the number of temp agencies.
Van den Heuvel et al., 2004.
Shanghai Jiao Tong University and Fundan University School of Public Health
Stomatology Increase revenue 80% increase in revenue. Luyun Zhao, 2005.
North Shore University Hospital in Forest Hills, N.Y
Emergency
Improving the patient experience in its Emergency Department
Improvements decreased cycle times, but also raised patient satisfaction. Patients' charts were "stamped" in a time clock so that the team could track patients from the time they walked in until a physician discharged them. Decrease in wait time by 37 percent, from 187 minutes to 118 minutes ,
Tuttle, 2008.
Hospital Group of Skaraborg (Sweden)
Lidkoping Hospital
To reach breakthrough improvement
Improvement of Warfarin treatment.
The number of Nationalized Internal Ratio increased from 63 to 71-73%; mortality and morbidity in warfarin treatment is now continuously being monitored.
Lifvergren and Bergman, 2008.
Ospedale Santa Croce e Carle (Italy)
Nuclear Medicine
Budget constraints. Deliver excellent service to patients.
30% reduction in patient waiting time and an increase of the equipment utilization rate, while maintaining staff and patient satisfaction.
Migliazza, 2008.
Northern California Hospital
Imaging Competition, decreasing reimbursements, changing technology.
Decrease report turnaround time
Turnaround time reduced form 64 hours to an average of nine.
Blaha, 2008.
Watson Clinic (Florida)
Radiology A growing backlog of appointments impacting timely access to services
Employ a data-driven process to identify the bottlenecks, reduce or eliminate them, and introduce a sustainable solution
CT backlog reduced to one day, 90% of exams start on time, 40% increase in CT capacity, Dashboard implemented, Increased outpatient volumes to 3.3 patients/hour, Financial potential ~ $674,000 over one year
Bansal et al., 2008.
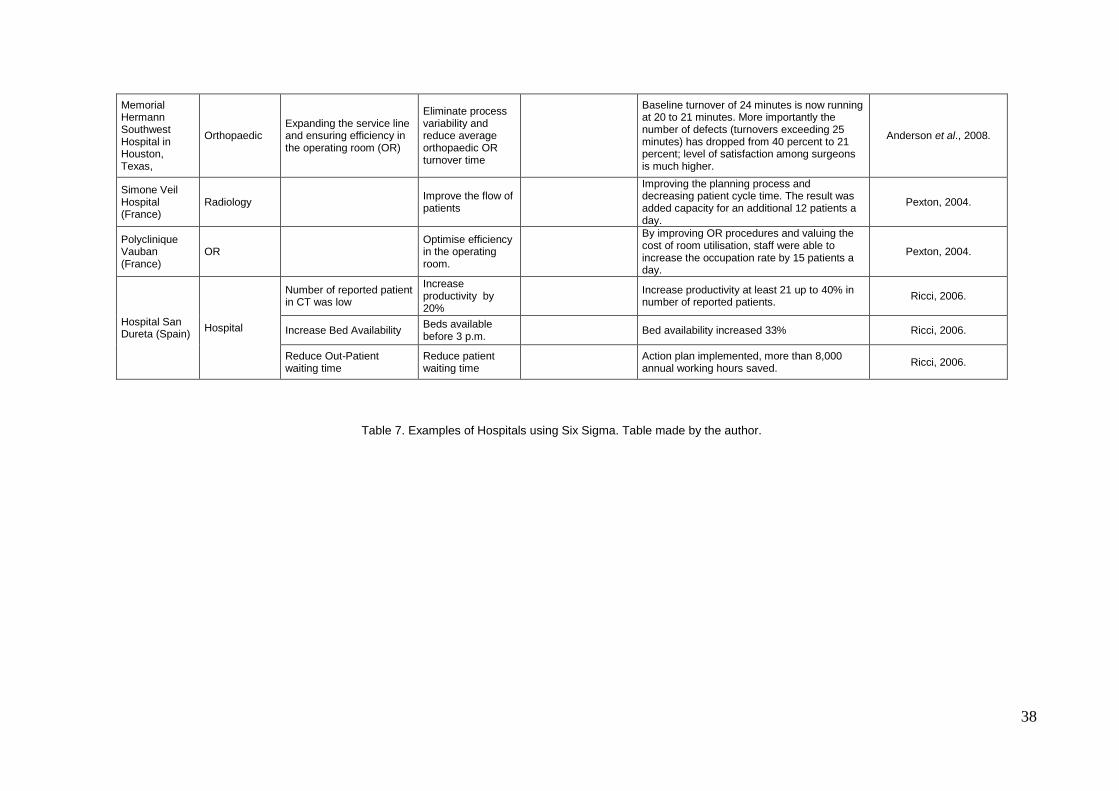
38
Memorial Hermann Southwest Hospital in Houston, Texas,
Orthopaedic Expanding the service line and ensuring efficiency in the operating room (OR)
Eliminate process variability and reduce average orthopaedic OR turnover time
Baseline turnover of 24 minutes is now running at 20 to 21 minutes. More importantly the number of defects (turnovers exceeding 25 minutes) has dropped from 40 percent to 21 percent; level of satisfaction among surgeons is much higher.
Anderson et al., 2008.
Simone Veil Hospital (France)
Radiology Improve the flow of patients
Improving the planning process and decreasing patient cycle time. The result was added capacity for an additional 12 patients a day.
Pexton, 2004.
Polyclinique Vauban (France)
OR Optimise efficiency in the operating room.
By improving OR procedures and valuing the cost of room utilisation, staff were able to increase the occupation rate by 15 patients a day.
Pexton, 2004.
Hospital San Dureta (Spain)
Hospital
Number of reported patient in CT was low
Increase productivity by 20%
Increase productivity at least 21 up to 40% in number of reported patients.
Ricci, 2006.
Increase Bed Availability Beds available before 3 p.m.
Bed availability increased 33% Ricci, 2006.
Reduce Out-Patient waiting time
Reduce patient waiting time
Action plan implemented, more than 8,000 annual working hours saved.
Ricci, 2006.
Table 7. Examples of Hospitals using Six Sigma. Table made by the author.
39
2.4 Applicability of Lean and Six Sigma in health care
After the author reviewed the application of Lean and Six Sigma in health care, the
reasons for improving are not always identified in some cases, but they can be inferred
from the description of the case and/or the objectives for such change; hence, almost
all of them were driven by economic reasons or public pressure to perform better,
except by the Mayo Clinic where its improvement process was led by an objective to
perform better (Taninecz, 2008). In all Lean cases stakeholders were involved in the
improvement process.
The UK seems to register the largest number of Kaizen events, accounting for a total of
eight cases, due to the need of getting “quick results” (Lean Healthcare Academy,
2008), this was after trying several approaches as the Office for Health Management
(2003) and Fillingham (2007) mention. However, in all cases, Lean has been reduced
to a set of tools, whereas Lean is more than that, as Ballé stated (2008).
Womack et al., (2005) mentions culture as an issue to consider in implementing lean
and that it cannot be changed by edict: people must be convinced to behave in a
certain way. At Thedacare (Womack et al., 2005) when setting principles for changes,
respect for people is first mentioned, followed by teaching through experience, while at
Virginia Mason Medical Center (Womack et al., 2005) the value of employees work
was pointed out; George and Rago (2005) refer to the need to understand the human
dynamic. Therefore, the human being is the first issue to deal with while applying this
approach.
All examples reviewed (a total of 48) showed that both Lean principles and Six Sigma
can be suitable for health care, not only in clinical cases (those that can cause an
adverse event), but also in non-clinical ones ( more related to administrative, paper
work, and that do not harm patients), in terms of results (benefits) achieved. Some
authors support their applicability in health care (Jones and Filochoswki, 2006; Young
et al., 2004; Breyfogle and Salvaker, 2004; Jones and Mitchell, 2006; Westwood and
Silvester, 2007). Based on the cases reviewed a summary of the similarities and
differences between Lean and Six Sigma, is shown in table 8.
Moreover, there are similarities between manufacturing and health (Rich and Essain,
2008) see figure 7; Jones and Filochowski (2006) pointed out that health care I full of
processes disrupted by queues; perhaps can be found under the form of
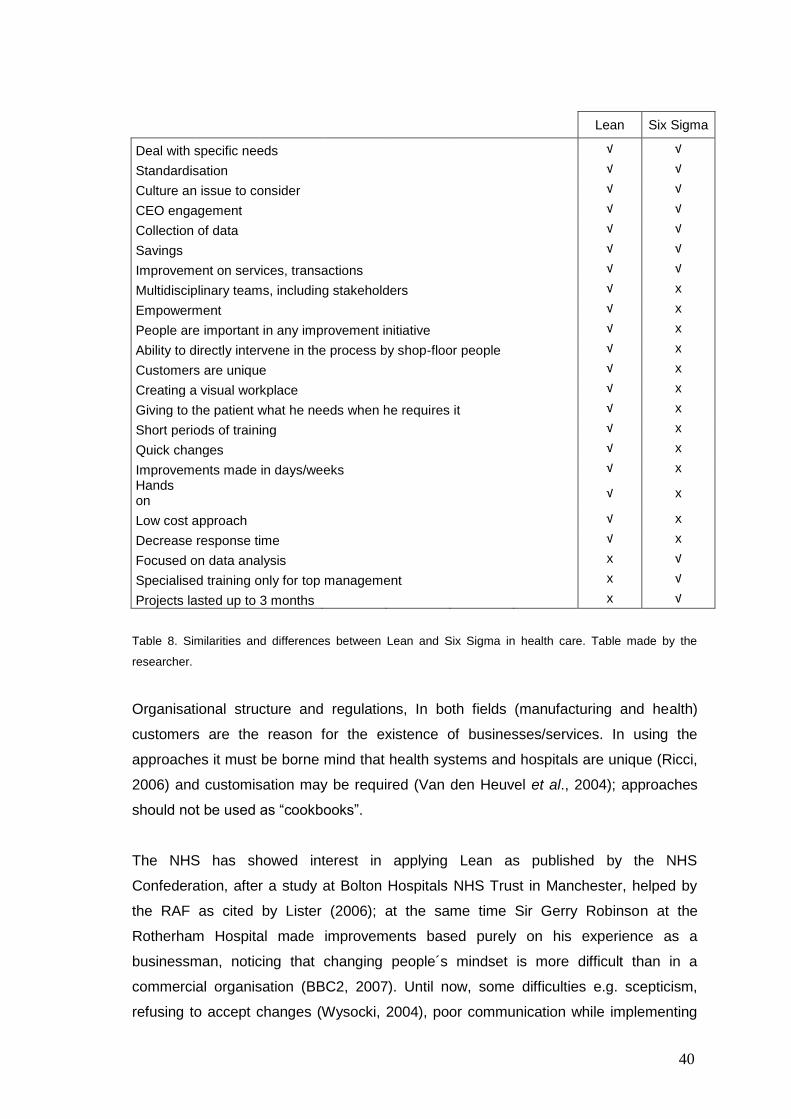
40
Lean Six Sigma
Deal with specific needs √ √
Standardisation
√ √
Culture an issue to consider
√ √
CEO engagement
√ √
Collection of data
√ √
Savings
√ √
Improvement on services, transactions
√ √
Multidisciplinary teams, including stakeholders
√ x
Empowerment
√ x
People are important in any improvement initiative
√ x
Ability to directly intervene in the process by shop-floor people
√ x
Customers are unique
√ x
Creating a visual workplace
√ x
Giving to the patient what he needs when he requires it
√ x
Short periods of training
√ x
Quick changes
√ x
Improvements made in days/weeks
√ x
Hands on
√ x
Low cost approach
√ x
Decrease response time
√ x
Focused on data analysis
x √
Specialised training only for top management
x √
Projects lasted up to 3 months x √
Table 8. Similarities and differences between Lean and Six Sigma in health care. Table made by the
researcher.
Organisational structure and regulations, In both fields (manufacturing and health)
customers are the reason for the existence of businesses/services. In using the
approaches it must be borne mind that health systems and hospitals are unique (Ricci,
2006) and customisation may be required (Van den Heuvel et al., 2004); approaches
should not be used as “cookbooks”.
The NHS has showed interest in applying Lean as published by the NHS
Confederation, after a study at Bolton Hospitals NHS Trust in Manchester, helped by
the RAF as cited by Lister (2006); at the same time Sir Gerry Robinson at the
Rotherham Hospital made improvements based purely on his experience as a
businessman, noticing that changing people´s mindset is more difficult than in a
commercial organisation (BBC2, 2007). Until now, some difficulties e.g. scepticism,
refusing to accept changes (Wysocki, 2004), poor communication while implementing
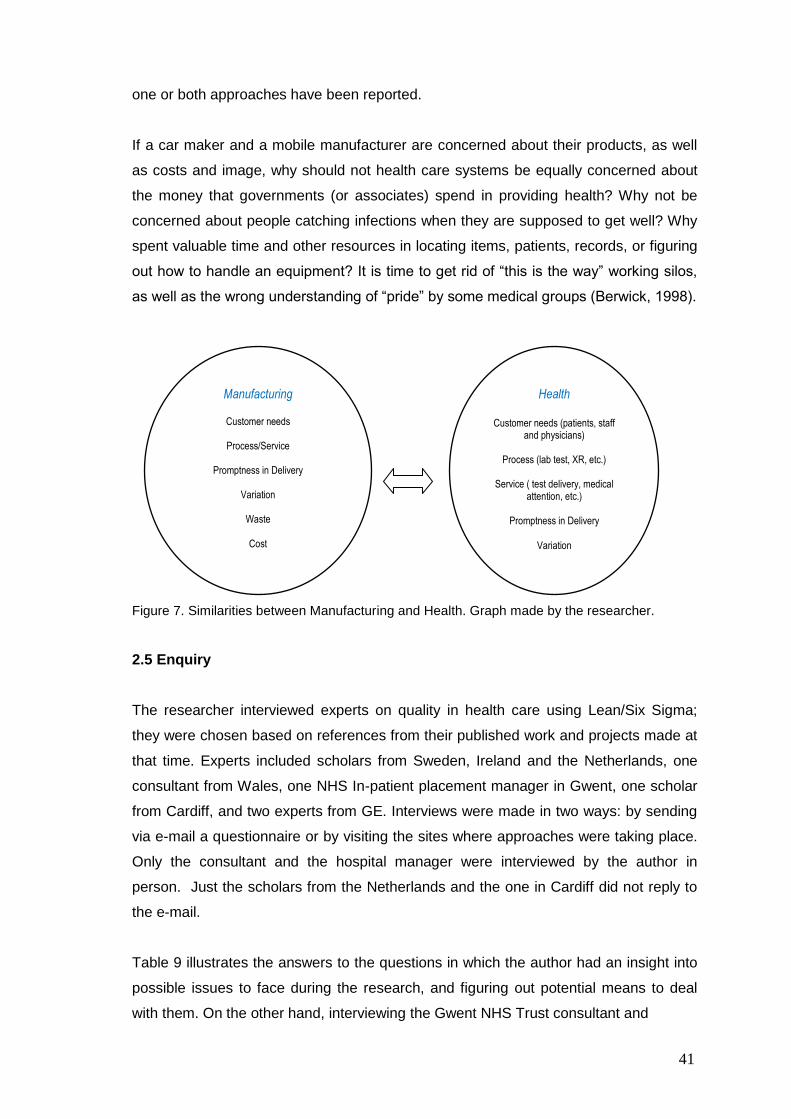
41
one or both approaches have been reported.
If a car maker and a mobile manufacturer are concerned about their products, as well
as costs and image, why should not health care systems be equally concerned about
the money that governments (or associates) spend in providing health? Why not be
concerned about people catching infections when they are supposed to get well? Why
spent valuable time and other resources in locating items, patients, records, or figuring
out how to handle an equipment? It is time to get rid of “this is the way” working silos,
as well as the wrong understanding of “pride” by some medical groups (Berwick, 1998).
Figure 7. Similarities between Manufacturing and Health. Graph made by the researcher.
2.5 Enquiry
The researcher interviewed experts on quality in health care using Lean/Six Sigma;
they were chosen based on references from their published work and projects made at
that time. Experts included scholars from Sweden, Ireland and the Netherlands, one
consultant from Wales, one NHS In-patient placement manager in Gwent, one scholar
from Cardiff, and two experts from GE. Interviews were made in two ways: by sending
via e-mail a questionnaire or by visiting the sites where approaches were taking place.
Only the consultant and the hospital manager were interviewed by the author in
person. Just the scholars from the Netherlands and the one in Cardiff did not reply to
the e-mail.
Table 9 illustrates the answers to the questions in which the author had an insight into
possible issues to face during the research, and figuring out potential means to deal
with them. On the other hand, interviewing the Gwent NHS Trust consultant and
Health
Customer needs (patients, staff and physicians)
Process (lab test, XR, etc.)
Service ( test delivery, medical
attention, etc.)
Promptness in Delivery
Variation
Manufacturing
Customer needs
Process/Service
Promptness in Delivery
Variation
Waste
Cost
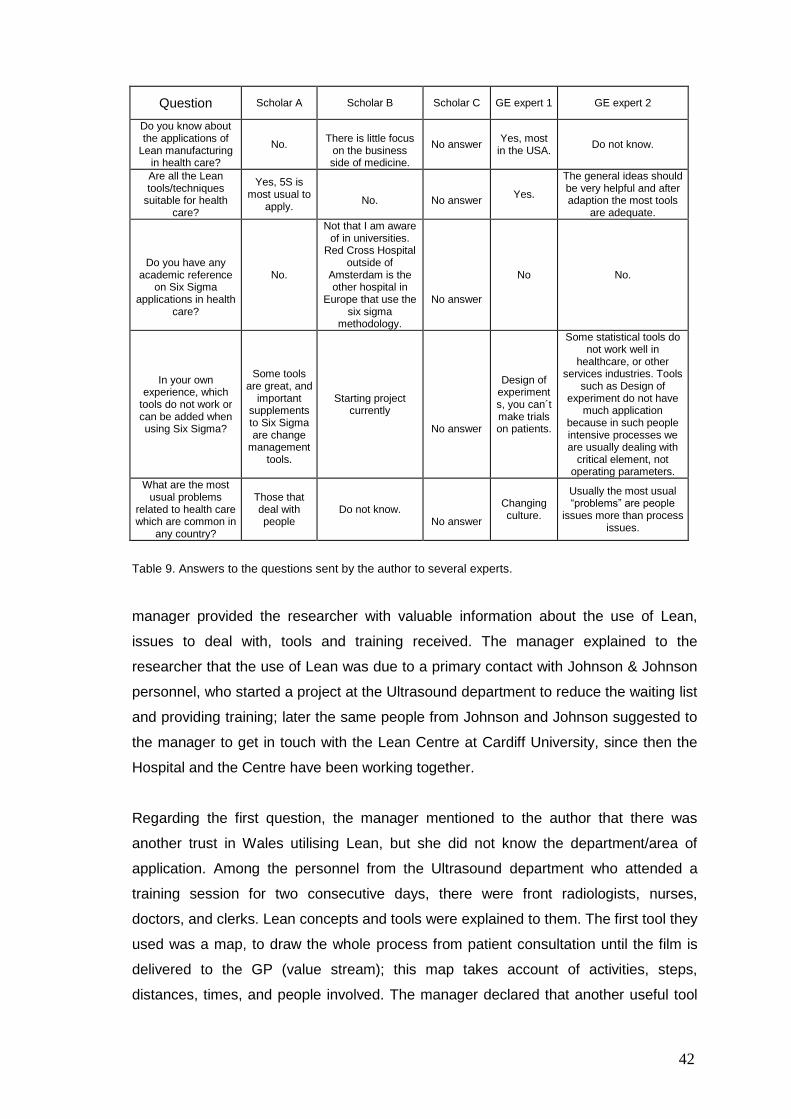
42
Question Scholar A Scholar B Scholar C GE expert 1 GE expert 2
Do you know about the applications of
Lean manufacturing in health care?
No.
There is little focus
on the business side of medicine.
No answer Yes, most
in the USA. Do not know.
Are all the Lean tools/techniques
suitable for health care?
Yes, 5S is most usual to
apply.
No.
No answer
Yes.
The general ideas should be very helpful and after adaption the most tools
are adequate.
Do you have any academic reference
on Six Sigma applications in health
care?
No.
Not that I am aware of in universities.
Red Cross Hospital outside of
Amsterdam is the other hospital in
Europe that use the six sigma
methodology.
No answer
No No.
In your own experience, which
tools do not work or can be added when using Six Sigma?
Some tools are great, and
important supplements to Six Sigma are change
management tools.
Starting project currently
No answer
Design of experiments, you can´t make trials on patients.
Some statistical tools do not work well in
healthcare, or other services industries. Tools
such as Design of experiment do not have
much application because in such people intensive processes we are usually dealing with
critical element, not operating parameters.
What are the most usual problems
related to health care which are common in
any country?
Those that deal with people
Do not know.
No answer
Changing culture.
Usually the most usual “problems” are people
issues more than process issues.
Table 9. Answers to the questions sent by the author to several experts.
manager provided the researcher with valuable information about the use of Lean,
issues to deal with, tools and training received. The manager explained to the
researcher that the use of Lean was due to a primary contact with Johnson & Johnson
personnel, who started a project at the Ultrasound department to reduce the waiting list
and providing training; later the same people from Johnson and Johnson suggested to
the manager to get in touch with the Lean Centre at Cardiff University, since then the
Hospital and the Centre have been working together.
Regarding the first question, the manager mentioned to the author that there was
another trust in Wales utilising Lean, but she did not know the department/area of
application. Among the personnel from the Ultrasound department who attended a
training session for two consecutive days, there were front radiologists, nurses,
doctors, and clerks. Lean concepts and tools were explained to them. The first tool they
used was a map, to draw the whole process from patient consultation until the film is
delivered to the GP (value stream); this map takes account of activities, steps,
distances, times, and people involved. The manager declared that another useful tool

43
was the 5W while examining the data collected from the map. Issues that the manager
had to deal with included some degree of doubt among all the people involved, and
freeing up time to make sessions for the project. The manager acknowledged that an
important feature for the project was the support of the Hospital manager, and the Lean
centre involvement. The manager attended a Six Sigma course as part of the Trust
initiative for improvements, and she only knew about cases in the US (at the time of
this interview), and Singapore, but not in the UK. She finally pointed out that the most
usual problem in health care is related to people‟s behaviour, because they have been
working in a way that was considered the best, and found some difficulties in accepting
the new and better way of working.
On the other hand, the consultant was hired by the Trust to support the ultrasound
project, due to his experience in improvements. He was aware of Lean applications in
the North West Wales NHS Trust, and in Scotland via GE, while the Adelaide and
Meath Hospital (Ireland) was using Six Sigma. In order to deal with the issue of
´problematic´ people in the project, he and the manager organised them into one team.
The consultant stated that this team changed their attitudes once they started to work
with the map, becoming the biggest supporters of Lean. The consultant declared that
Lean tools were easy to use and to understand. He showed the author the value
stream map that was made by the staff with the icons suggested by Rother and Shook
(1999). He said that this was done as a way to standardise the mapping process:
“...in this way, we prevent any misunderstanding of the meaning of something in the
map...Anyone can see it, and can get the idea”.
As a result of applying Lean, the ultrasound department reduced the waiting list from
18-20 weeks to only two weeks.
2.6 Key factors
By understanding the factors (key issues) that affect the implementation of changes in
an improvement project, this comprehension permits the elimination of or diminishes
the effect of them, leading to an effective execution of the improvement, which avoids
wasting time and resources.
According to Pexton (2005), Benedetto et al. (2002), Antony and Banuelas (2002), in
order to succeed in improvement projects, the following factors are necessary: a
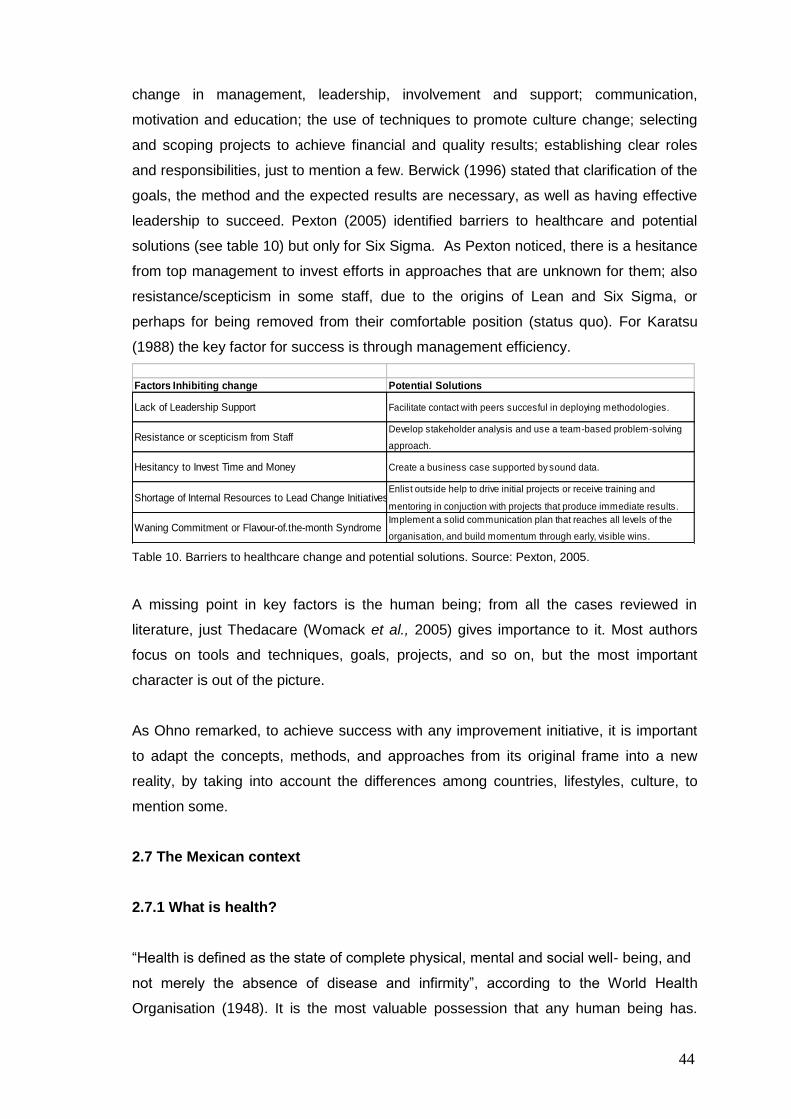
44
change in management, leadership, involvement and support; communication,
motivation and education; the use of techniques to promote culture change; selecting
and scoping projects to achieve financial and quality results; establishing clear roles
and responsibilities, just to mention a few. Berwick (1996) stated that clarification of the
goals, the method and the expected results are necessary, as well as having effective
leadership to succeed. Pexton (2005) identified barriers to healthcare and potential
solutions (see table 10) but only for Six Sigma. As Pexton noticed, there is a hesitance
from top management to invest efforts in approaches that are unknown for them; also
resistance/scepticism in some staff, due to the origins of Lean and Six Sigma, or
perhaps for being removed from their comfortable position (status quo). For Karatsu
(1988) the key factor for success is through management efficiency.
Factors Inhibiting change Potential Solutions
Lack of Leadership Support Facilitate contact with peers succesful in deploying methodologies.
Resistance or scepticism from StaffDevelop stakeholder analysis and use a team-based problem-solving
approach.
Hesitancy to Invest Time and Money Create a business case supported by sound data.
Shortage of Internal Resources to Lead Change InitiativesEnlist outside help to drive initial projects or receive training and
mentoring in conjuction with projects that produce immediate results.
Waning Commitment or Flavour-of.the-month SyndromeImplement a solid communication plan that reaches all levels of the
organisation, and build momentum through early, visible wins.
Table 10. Barriers to healthcare change and potential solutions. Source: Pexton, 2005.
A missing point in key factors is the human being; from all the cases reviewed in
literature, just Thedacare (Womack et al., 2005) gives importance to it. Most authors
focus on tools and techniques, goals, projects, and so on, but the most important
character is out of the picture.
As Ohno remarked, to achieve success with any improvement initiative, it is important
to adapt the concepts, methods, and approaches from its original frame into a new
reality, by taking into account the differences among countries, lifestyles, culture, to
mention some.
2.7 The Mexican context
2.7.1 What is health?
“Health is defined as the state of complete physical, mental and social well- being, and
not merely the absence of disease and infirmity”, according to the World Health
Organisation (1948). It is the most valuable possession that any human being has.
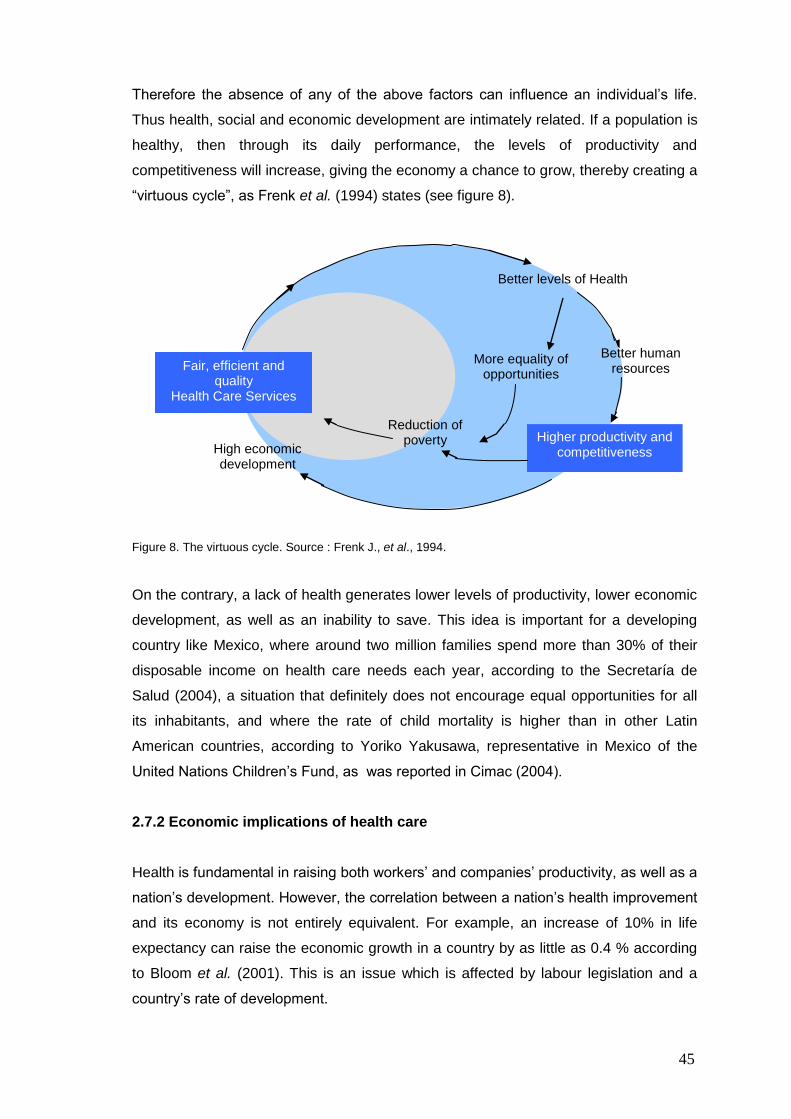
45
Therefore the absence of any of the above factors can influence an individual‟s life.
Thus health, social and economic development are intimately related. If a population is
healthy, then through its daily performance, the levels of productivity and
competitiveness will increase, giving the economy a chance to grow, thereby creating a
“virtuous cycle”, as Frenk et al. (1994) states (see figure 8).
Figure 8. The virtuous cycle. Source : Frenk J., et al., 1994.
On the contrary, a lack of health generates lower levels of productivity, lower economic
development, as well as an inability to save. This idea is important for a developing
country like Mexico, where around two million families spend more than 30% of their
disposable income on health care needs each year, according to the Secretaría de
Salud (2004), a situation that definitely does not encourage equal opportunities for all
its inhabitants, and where the rate of child mortality is higher than in other Latin
American countries, according to Yoriko Yakusawa, representative in Mexico of the
United Nations Children‟s Fund, as was reported in Cimac (2004).
2.7.2 Economic implications of health care
Health is fundamental in raising both workers‟ and companies‟ productivity, as well as a
nation‟s development. However, the correlation between a nation‟s health improvement
and its economy is not entirely equivalent. For example, an increase of 10% in life
expectancy can raise the economic growth in a country by as little as 0.4 % according
to Bloom et al. (2001). This is an issue which is affected by labour legislation and a
country‟s rate of development.
Fair, efficient and quality
Health Care Services
High economic development
Reduction of poverty
More equality of opportunities
Higher productivity and competitiveness
Better human resources
Better levels of Health
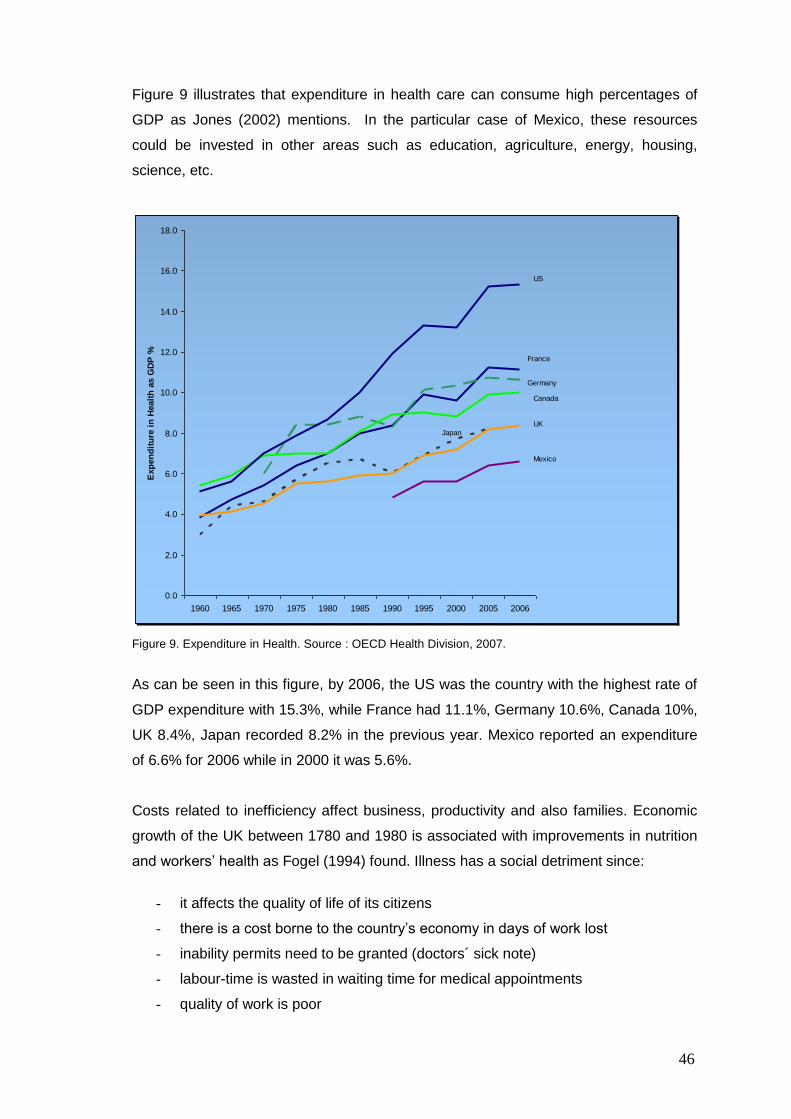
46
Figure 9 illustrates that expenditure in health care can consume high percentages of
GDP as Jones (2002) mentions. In the particular case of Mexico, these resources
could be invested in other areas such as education, agriculture, energy, housing,
science, etc.
0.0
2.0
4.0
6.0
8.0
10.0
12.0
14.0
16.0
18.0
1960 1965 1970 1975 1980 1985 1990 1995 2000 2005 2006
Exp
en
dit
ure
in
Healt
h a
s G
DP
%
US
France
Germany
Canada
UK
Mexico
Japan
Figure 9. Expenditure in Health. Source : OECD Health Division, 2007.
As can be seen in this figure, by 2006, the US was the country with the highest rate of
GDP expenditure with 15.3%, while France had 11.1%, Germany 10.6%, Canada 10%,
UK 8.4%, Japan recorded 8.2% in the previous year. Mexico reported an expenditure
of 6.6% for 2006 while in 2000 it was 5.6%.
Costs related to inefficiency affect business, productivity and also families. Economic
growth of the UK between 1780 and 1980 is associated with improvements in nutrition
and workers‟ health as Fogel (1994) found. Illness has a social detriment since:
- it affects the quality of life of its citizens
- there is a cost borne to the country‟s economy in days of work lost
- inability permits need to be granted (doctors´ sick note)
- labour-time is wasted in waiting time for medical appointments
- quality of work is poor
47
- there is a failure to realise human potential
As Coleman et al. say (1997), it is almost always more expensive to get people well
than to prevent them from getting sick.
2.7.3 An opportunity for the Mexican health care system
If North American hospitals and counterparts in Europe have found a way to improve
their health care systems, using Lean principles and/or more sophisticated ones (Six
Sigma), why not apply them in other places? How could we translate this idea into a
specific improvement project for the Mexican health care system? Mexico is facing a
double challenge: how to better invest funds to eliminate the inefficient use of scarce
resources and, at the same time, how to invest more in its population‟s health.
2.8 Research questions and Aims
As mentioned before, most literature on Lean principles and Six Sigma in health care is
from the USA, and some from European countries like France, Ireland, Sweden, the
Netherlands and the UK. Therefore, some questions come up:
1. If they achieved improvements in their services via Lean and Six Sigma, why not
implement them in the Mexican health care system?
2. Which one is better?
3. Where can they be applied?
4. What are the key factors to take into account?
5. How important is manager support?
6. Is it necessary to train people? If so, to what extent?
7. What will the benefits be?
The aims of the research were to:
- carry out and record implementations of the above approaches in health care,
48
with particular emphasis on the Mexican context
- identify which one of these two approaches is most suitable for health care, and
what the most useful tools/techniques are
- identify critical factors before, during, and after applying the approaches
- identify any specific issues that are important in Mexico. For example, the
influence/role of Mexican unions in the improvement process will be shown to
be a significant issue.
Summary
Lean and Six Sigma were developed in manufacturing at different points of time, and
facing dissimilar scenarios, developing their own tools, techniques and methods. Both
have proven benefits in their original environment, and later in other fields like services
and most recently in health care. The US is the pioneer in using the approaches in
health care, GE being one of the sources of advice to health systems/hospitals,
spreading to other countries the benefits achieved through the use of Lean and Six
Sigma. Canada, Italy, Spain, France, the Netherlands, Australia, Ireland and the UK
also have implemented the approaches. The question of whether both methods are
suitable for health has begun to be answered by the cases reported in the countries
cited previously. There are however key factors that must be taken into account for
implementing these approaches, such as leadership, involvement and support;
communication, motivation and education.
49
CHAPTER 3
Methodology
3.1 Introduction
This chapter discusses some possible approaches to meeting the research aims given
in section 2.7 and describes how the research methods were selected and developed.
Hence, a survey of the applications of Lean and Six Sigma in health care was
instigated. Two observations can be drawn from this survey, which are particularly
important in determining how research can be carried out in this area:
1. Lean and Six Sigma are concerned with intervening in a work situation and
changing how people work and think. This clearly has implications for staff time,
the organisation‟s costs and, in the health care situation, potentially for the life
and well-being of patients.
2. At the time the research started, there had been few applications of Lean and
Six Sigma in the health care sector in the UK and none in Mexico.
It follows from these points that it was not possible to pursue the research aims
outlined in section 2.7 only by studying and evaluating existing applications. It was
necessary to carry out applications on real situations as part of the research. This
meant that the consent and co-operation of hospitals was essential, and hence that the
research would be constrained by what they would accept. The work therefore comes
under the heading of “real world research” as discussed by Robson (1993). The
features he identifies as characterising this, as opposed to laboratory research, such as
solving problems, predicting effects, developing and testing programmes, are clearly
present in this work.
Robson identifies a number of research methodologies that are suitable for “real world
research”. Those that are potentially most applicable to this research are evaluation
research, action research and case study. The term action research is commonly,
although not exclusively, used when the research is carried out by those who work in
the area under investigation and do it as part of their work rather than the work being
done by external researchers who come in only for the purposes of doing the research
(Robson, 1993). It therefore tends to be used for interventions in a single location or
50
activity. The aim in this research was to carry out a number of interventions and the
researcher was external and only involved in a particular area for as long as required to
make and evaluate the intervention. Therefore, the concepts of evaluation and case
study are both applicable. According to Eisenhardt (1989), case studies can be applied
in order to accomplish various aims, such as providing description, testing or
generating a theory.
The practicalities of having only a single researcher and needing to negotiate each
application and carry out the work meant that only a limited number of discrete cases
could be undertaken in the time available. The overall aim of the research is to
evaluate the potential applicability of Lean and Six Sigma in the health care context,
particularly in Mexico.
Two other factors also drive the research in the direction of studying a number of
cases. One is that Lean and Six Sigma contain a large number of tools and techniques,
and it is only practicable to use a limited number of these in any one situation. The
second is that the Mexican health care system contains a number of different
organisations as well as the inevitable division into different hospitals and departments
within those hospitals so again a small sample of the possible range has to be
selected.
3.2 Development of methodology
Many of the points Robson makes about evaluations are applicable in this research.
For instance, they can use “either qualitative or quantitative methods, or some
combination of both types”; “the characteristics of real world enquiry discussed …
above are present in evaluations in a very clear cut way”; “gatekeepers such as middle
management … may be obstructive”.
In order to meet the aims, the criteria against which the evaluation is made should be
those in Lean and Six Sigma themselves. Their literature typically lays down a series of
steps to follow. The expectation is then that, provided any stated conditions such as
management commitment are met, there should be measurable reductions in waste
(Lean) or variation (Six Sigma).
Ideally in an evaluation a comparison is made between two groups, one of which has
been subject to the innovation, while the other is a control group that has not. Robson
51
comments, however, that there are often severe problems in finding an appropriate
control group, and this was not possible in the situations studied here. Instead, the
comparison is made between different groups of patients before and after the
intervention. This raises the possibility that the apparent effect of the intervention will
be due to other changes taking place at the same time or to differences between the
two groups of patients. This sort of problem is difficult to avoid in this type of research,
as discussed above, and means that each evaluation can only provide provisional and
tentative conclusions. Steps were taken to minimise these effects by keeping the
overall timescale short so that there were unlikely to be other significant changes
confounding the results. Also, the researcher was able to observe activities before and
after the changes and record comments made by the workers involved in the changes.
These can potentially provide some qualitative evidence about whether those most
involved attributed any observed improvement in performance to the changes or to
other factors.
A case study is “an appropriate research method” (Yin, 1993) when a particular object
of an investigation and its context need to be covered. Eisenhardt and Graebner (2007)
mention the importance of not isolating the phenomena from their context, and case
studies “emphasize the rich, real-world context in which the phenomena occur”. Since
the UK and Mexico have a completely different background (including health
structures, idiosyncrasy, budget, technology, and management support), the case
study method seemed to be appropriate for this research.
The case study is fundamentally a research strategy “to be likened to an experiment, a
history, or a simulation, which may be considered alternative research strategies” (Yin,
1993). Moreover, in case studies, data from multiple sources of information are
employed, thus, information can be qualitative or quantitative. In this particular
research, both are brought into play. There is a kind of distrust, from those using only
quantitative data, about the application of case studies and qualitative information in a
research, since the latter is associated with inadequate evidence (Yin, 1993). Perhaps
it is caused by a lack of information on integrating quantitative and qualitative
information (Bryman, 2007). Possibly one disadvantage of case study is that, the
results might not generalise to other situations.
In each case study, the managers who approve the study will provide more detailed
aims that they hope the work will achieve and which provide them with the justification
for approving the work. These will be spelt out in the chapters describing the particular

52
studies. In this way, the case studies replicate the way the process would be carried
out if the hospital had been doing it entirely themselves.
Clearly the conclusions that can be drawn from a finite number of case studies are
limited. One successful application of Lean (or Six Sigma) would be sufficient to
disprove a hypothesis that the method was completely inappropriate in the context of
the application. Equally, an unsuccessful attempt to apply the method would appear to
be sufficient to invalidate a hypothesis that success was inevitable, although one might
be able to argue about details in such a case.
Eisenhardt (1989) discusses the use of case studies to build theory. The examples she
discusses were mainly done by teams rather than by an individual researcher, and
were also largely conducted by observations and interviews to study an existing
situation, rather than requiring an intervention and innovation in that situation.
However, in a „real world‟ setting such as a hospital, and where the research requires
an innovation in other people‟s work, the intervention will only be allowed by the
responsible manager if it appears to have a reasonable chance of succeeding and
producing an improvement. It is unlikely to be given the go-ahead if the responsible
manager does not already believe that there is room for improvement.
Active case studies such as those carried out in this research will therefore gradually
contribute to the accumulation of evidence about the usefulness of techniques such as
Lean and Six Sigma and to the development of theory to discriminate between
circumstances in which they will be useful in the future and those where they will not
be, and about which techniques will be advantageous in which circumstances.
3.3 Pilot studies
The research design is based on two pilot studies at the UHL (from April 2005 to July
2005), and two longitudinal case studies at the ISSSTE (from August 2005 to February
2007).
The pilot studies were aimed at gaining experience in applying the concepts of Lean
and Six Sigma in real situations, and to enable the researcher to face possible
scenarios that she could experience in subsequent case studies. The pilot studies also
bring the possible advantage of enabling the researcher herself to compare from
personal experience applications in the UK and Mexico, and to compare the UK
53
experience with that in the literature. This provides an intermediate step between the
Mexican work, which is the main intended focus of the research, and the bulk of the
available literature.
3.4 Research programme
This research uses the Lean methodology as suggested by Angel (2005), Robertson
(2005), Byrne and Fiume (2005), Jones and Mitchell (2006), to cite some and the
DMAIC steps. The same steps were used that these and other authors had applied
while carrying out their projects:
1. Specifying the customer requirements
2. Identifying the process
3. Recognising waste in the process
4. Improving the outcomes
5. Setting a continuous improvement process.
At the time the researcher started to study Lean and Six Sigma in health care (January
2005), most of the literature about applications in health care was in the form of
website articles, and most of the studies had been performed in the USA. However,
there were two hospitals in Wales doing some projects, and the author contacted them
in order to gain knowledge about their experiences. Because of constraints on time,
budget, and access, the researcher had to instigate two pilot cases implementing the
aforementioned approaches in the UK and two case studies in Mexico.
Both primary and secondary methods were used.
1) Primary research methods.
The author interviewed some people using Lean and/or Six Sigma in health
care/industry (see section 2.3 page 39). Front line staff in the UK and Mexico
was also interviewed in an informal way during the course of the research. Data
was collected by observing processes, and recording information; in Mexico
computer databases and intern reports (containing confidential information from
the ISSSTE) were accessed. The data obtained would be either quantitative or
qualitative. Quantitative analysis is descriptive in nature, summarising data in
the form of charts, tables, percentages and averages.
54
2) Secondary research methods.
A number of journals, newspapers, government sources, conference papers,
presentations, research papers and websites were consulted, in order to
provide the academic theories, models, and statistics to underpin the author‟s
findings, and are listed in the bibliography section. The documents are analysed
according to their contribution to the research field, and comprehensiveness of
the utilised approaches.
The steps followed in this research were:
1. A literature review about Lean and Six Sigma origins, development, tools,
techniques and applications in industry and services was made by consulting
articles, journals, newspapers, websites, and books. The objective of this
primary review was to comprehend both approaches, evaluate them in terms of
goals and outcomes, exploring benefits and pitfalls, and obstacles. An analysis
of the mentioned approaches suggests that both of them seek to improve
processes/services. Lean makes special emphasis about respect for people,
empowerment of front-line workers and involvement of stakeholders. On the
other hand, Six Sigma is usually addressed to a top management level, where
managers and/or engineers are trained as experts in the methodology. The
issues with Six Sigma are: it requires an accreditation by a certified body or a
consultant; spending quite a large amount of money (in the UK it costs at least
£ 4,000 per person attending a four week course) to train people in the
approach, and it requires allowing over-time or release duties to those who
attend the course (an issue if there are labour/human resources/ restrictions).
2. A focused search of literature for applications in the health care sector was
conducted from January 2005 to August 2008. Analysis of reported cases was
made, exploring possible trends in areas of application, goals, outcomes,
tools/techniques used, and obstacles. It was found that some authors
encountered a certain degree of resistance (stakeholders) to the application of
any of the approaches, or to make changes, as well as adaptation of the
approaches to particular situations. At the beginning of this research in 2005
many examples were found in North American hospitals, in different areas
(clinical and non-clinical) and a few in other countries. It has been remarkable
the growth that Lean had experienced in a few years. For instance, in 2005 in
the UK only three places were reporting using Lean, while at the beginning of
55
2008 there are 17 sites at least. Analysis of these cases was conducted, and is
presented in Chapter two.
3. Collecting first hand data from some experts and researchers applying
improvement approaches such as Prof Bo Bergman from Chalmers University
(Sweden), Prof Peter Hines from Cardiff University, Jaap Van den Heuvel from
the Beverwikj Red Cross Hospital (Netherlands), Caroline Pexton and John
Kalb from General Electric (USA), Mary Hickey Process Improvement Manager,
Adelaide and Meath Hospital, Dublin, Lesley Angel and Ken Robertson from the
Royal Gwent Hospital in Wales, were contacted and some of them interviewed
via e-mail and/or personally, about the whole implementation process, tools,
barriers, and key factors they faced during the course of action. A set of five
open questions (see Appendix 2) to obtain understanding towards the
implementation of Lean and Six Sigma, were sent via e-mail to the GE experts,
Prof. Bergman, Prof Hines, GP Van den Heuvel, Mrs Hickey, and two personal
interviews; a visit to the Royal Gwent Hospital and to the Trust were made.
From all, the expert in the Netherlands and the scholar from Cardiff did not reply
to the e mail.
4. Attending a formal Six Sigma course to get the necessary knowledge and gain
experience in the methodology.
5. Performing pilot studies in the UK and case studies in Mexico. The selection of
areas of opportunity was based on projects reported in literature, and under the
assumption that health areas are similar, despite the country, e.g. an X- Ray
department in the US performs similar tests to those in the UK or in Mexico.
Through a series of interviews and requests across the University Hospitals of
Leicester (UHL) to conduct pilot studies using Lean and Six Sigma were done.
As a consequence, originally three Directors agreed to participate: Cardiac
Surgery, Imaging and Plastic Surgery. The latter has a double goal: as a part of
the pilots for this research and to get the Black Belt certification in Six Sigma.
From the original three sites, the Cardiac Surgery study was put aside by the
Director after a couple of weeks of the first interview, despite the attempts made
later by the researcher to carry on. In Mexico, due to facilities and interest of a
Clinical Director of a Federal Government institution two cases were put in
place: one in the Clinical Laboratory (Pathology) and one in the Referral-
Counter referral process of patients (from GP to special medical attention). Data
56
was collected a) during the observation course at both sites, b) accessing intern
databases. In addition, informal conversations with staff took place. Data
collected in the UK was obtained by direct observation at three hospitals for two
consecutive days at each place. In Mexico observation was conducted in the
Clinical Lab between August and October 2005, and January 2006. Databases
and classified information were accessed. MINITAB (statistical software) to
analyse data collected was used, and Excel to generate some graphs, and in
other cases the information was analysed and grouped according to its nature,
e.g. tables, figures.
The pilots started as exercises in Six Sigma, but the Definition stage suggested that
waste was the real problem and Lean tools appeared to be most useful. The later
stages confirmed this. The DMAIC methodology was utilised in the second pilot but
only to some extent due to supporter‟s retirement.
The case studies represent the first time that industrial approaches have been used in
the Mexican health care system. The cases were chosen because both are relevant
and exemplary, since they reflect real-life situations.
Summary
A literature survey was conducted on Lean and Six Sigma approaches, its origins and
applications in industry/services and health care. Key factors for their application were
found; however, the literature survey was not enough to reach the objectives set for
this research. Hence, a “real world” investigation must be made; therefore the research
is made via pilot and case studies. Primary and secondary research methods are
utilised.
57
Chapter 4
Pilot studies in the NHS
The NHS origins and situation has been already explained in chapter one;
consequently, this chapter only deals with pilot studies carried out in the UK.
4.1 University Hospitals of Leicester
The University Hospitals of Leicester NHS Trust (UHL) includes Glenfield Hospital,
Leicester General Hospital and Leicester Royal Infirmary, employing over 12,000
people and providing services for nearly two million people across Leicester,
Leicestershire and Rutland (UHL web site, 2007). The UHL are organised
into corporate and clinical directorates under the leadership of the chief executive.
Each corporate directorate is headed by an executive or associate director.
Responsibility for the management of each clinical directorate is shared by a clinical
director and a general manager. The corporate directors, supported by the clinical
directors and general managers, are responsible for the day-to-day management and
running of the hospital's services and report to a trust board.
Glenfield Hospital (GH) is about three miles North West of Leicester city centre. The
hospital has around 520 beds and provides a range services for patients, including
nationally recognised medical care for heart disease, lung cancer and breast care. The
hospital has its own helipad to allow rapid access for helicopters carrying emergency
patients to the hospital.
Leicester General Hospital (LGH) was opened on 28th September 1905. It was
designed to accommodate 512 patients. It is on the outskirts of Leicester in Evington
and hosts the headquarters of University Hospitals of Leicester NHS Trust (UHL). It is
about three miles east of Leicester city centre and now has around 680 beds. The
hospital provides a range of medical services including care at the national centre for
renal and urology patients.
Leicester Royal Infirmary (LRI) opened in September 1771. As a voluntary hospital the
LRI relied on subscriptions from the city‟s rich and good to keep it going. It had no
running water but did boast its own brewery. Alcohol was used as a treatment for a
whole range of conditions. In the 18th century, nurses and matrons were generally
58
women who made beds and looked after patients.
4.2 Methodology
This research is based on two pilots studies conducted at the UHL. The areas of
application were based on similar topics to the ones found in the cases reported in
literature regarding Six Sigma methodology. In a first stage, the DMAIC steps were
followed.
1. Definition. The areas of application were set by the managers of the sites
(Imaging and Surgical Services, respectively), based on their own needs.
Consequently, for the Imaging Directorate and Plastic Surgery the aim was to
reducing the waiting lists for a) an ultrasound (u/s), and b) to have surgery.
By the beginning of April 2005 the number of patients waiting for an ultrasound was
4,796 patients, of which 3,269 had to wait between five and 26 weeks for a routine
scan (information disclosed by the Project Co-ordinator).
By March 2005, at Plastic Surgery there were 119 patients waiting for surgery.
2. Measurement. For u/s the outcome is mostly quantitative, which is translated as
descriptive statistics; a qualitative fragment is also included. The identification of
the data source, data collection, validation and analysis of data, and
measurement of the current system performance against the one depicted by
the u/s and Plastic Surgery staff is made.
The pilot study at Plastic Surgery was halted at this stage because of the retirement of
the head of the Surgery department.
3. Analysis. The outcome of this stage is the identification of those factors that
drive the process results. The author revised a map made by the u/s staff where
they identified all the steps required to make a u/s, once it has been ordered by
a referrer and until the result is sent to the origin. A subsequent physical tour
was made by the author to verify the steps illustrated by the staff.
4. Improvement. The result of this stage is the implementation and measurement
of changes to the process. The u/s pilot study ended at this stage.
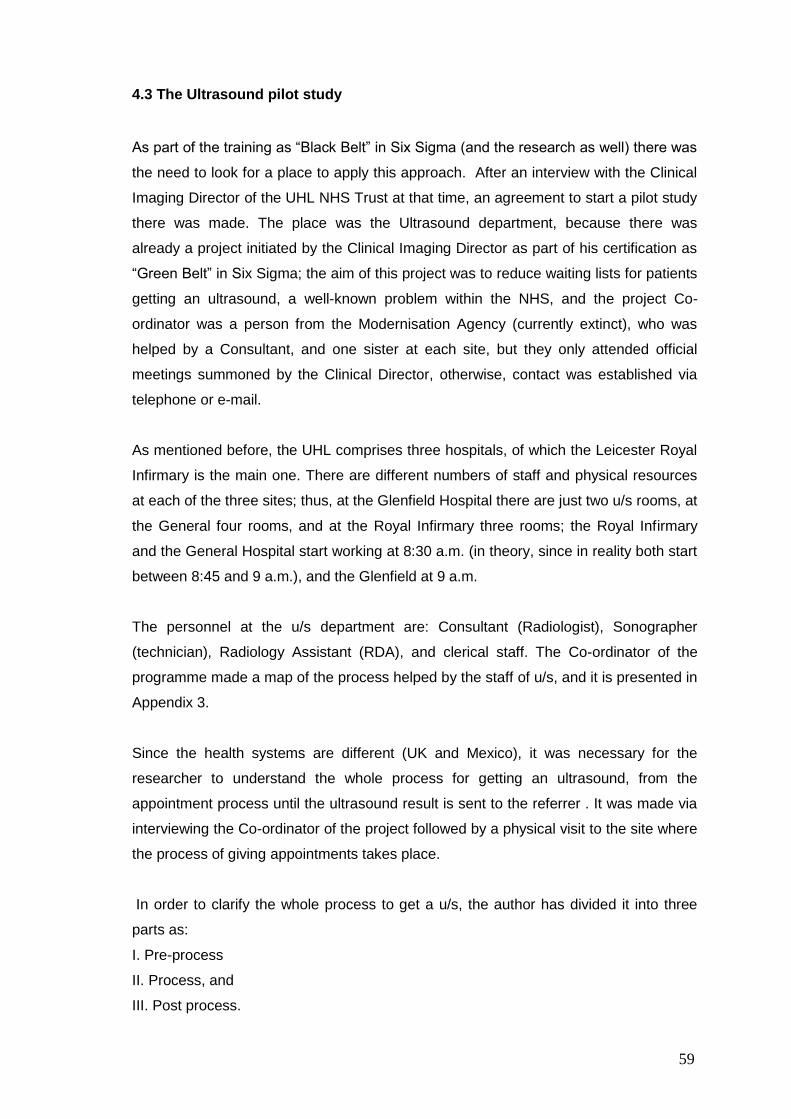
59
4.3 The Ultrasound pilot study
As part of the training as “Black Belt” in Six Sigma (and the research as well) there was
the need to look for a place to apply this approach. After an interview with the Clinical
Imaging Director of the UHL NHS Trust at that time, an agreement to start a pilot study
there was made. The place was the Ultrasound department, because there was
already a project initiated by the Clinical Imaging Director as part of his certification as
“Green Belt” in Six Sigma; the aim of this project was to reduce waiting lists for patients
getting an ultrasound, a well-known problem within the NHS, and the project Co-
ordinator was a person from the Modernisation Agency (currently extinct), who was
helped by a Consultant, and one sister at each site, but they only attended official
meetings summoned by the Clinical Director, otherwise, contact was established via
telephone or e-mail.
As mentioned before, the UHL comprises three hospitals, of which the Leicester Royal
Infirmary is the main one. There are different numbers of staff and physical resources
at each of the three sites; thus, at the Glenfield Hospital there are just two u/s rooms, at
the General four rooms, and at the Royal Infirmary three rooms; the Royal Infirmary
and the General Hospital start working at 8:30 a.m. (in theory, since in reality both start
between 8:45 and 9 a.m.), and the Glenfield at 9 a.m.
The personnel at the u/s department are: Consultant (Radiologist), Sonographer
(technician), Radiology Assistant (RDA), and clerical staff. The Co-ordinator of the
programme made a map of the process helped by the staff of u/s, and it is presented in
Appendix 3.
Since the health systems are different (UK and Mexico), it was necessary for the
researcher to understand the whole process for getting an ultrasound, from the
appointment process until the ultrasound result is sent to the referrer . It was made via
interviewing the Co-ordinator of the project followed by a physical visit to the site where
the process of giving appointments takes place.
In order to clarify the whole process to get a u/s, the author has divided it into three
parts as:
I. Pre-process
II. Process, and
III. Post process.
60
I. Pre-process
The referrals can come from: GPs, Clinics, A & E, Hospital Wards, and from the LGH
and GH. Depending on the source, referrals are sent via external, or internal post,
and/or fax. In the case where posted referrals are not marked for u/s they are sent to
the main X-Ray office, causing a delay. Otherwise, referrals go directly to the booking
clerk. Inpatient referrals are collected three times a day by one RDA (just for LGH and
LRI); at Glenfield, they are sorted out by RDAs.
After the referrals are received by the booking clerk, they are typed into a waiting list,
and are sent for protocolling. This process can take between zero and three days, or in
the worst case two weeks. Referrals are protocolled by one senior radiologist every two
weeks. The referrals are classified then as “urgent” or “elective”, and assigned to a
radiologist/sonographer. After this, the senior radiologist returns all the referrals already
classified to the booking staff who sort the referrals out based on the “urgent” or
“elective” code. The “urgent” referrals are booked immediately, while the “elective” can
wait for an appointment for three weeks. Then an appointment letter is printed and sent
to the patient by post service; first class post is used only for urgent referrals.
This pre-process ends when the patient receives the appointment letter.
II. Process
The process for inpatients and for outpatients is quite different in the very first steps.
For inpatients, the wards are advised about the u/s time one hour in advance, and a
call is logged on the porters´ system. After this, a porter picks an inpatient up, collecting
the patient‟s file and takes them to the u/s reception; then the porter gives to the clerk
the file and the referral, leaving the patient there.
Once outpatients have received the appointment letter, they have the option to change
the appointment day in case they cannot attend it on the date pointed out in the letter; it
is made through a phone call to the booking clerk. On the contrary, if they agreed the
day, outpatients just attend the appointment on the set day.
Outpatients must bring with them the appointment letter to the u/s reception. The next
steps are shared by both inpatients and outpatients.
61
The patient arrives at the reception where he/she hands in the appointment letter, and
the receptionist scans a barcode (printed on the letter) in order to print labels for u/s.
Then, she or a RDA takes the letter and the labels to the assigned
radiologist/sonographer room. The patient then waits until he/she is called by a
radiologist/sonographer. Once the patient is called and enters into the room, the RDA
helps him to lay down on the couch, and covers the patient with a paper towel;
meantime, the radiologist/sonographer enters patient‟s details on the u/s machine,
checking at the same time the patient‟s ID, previous images and reports. After this, the
patient is scanned. Once the scan has finished, the RDA removes from the patient the
gel used for scanning, and gets the patient off the couch. Outpatients leave the u/s and
go home. Inpatients have to wait for the u/s report and are then fetched by a porter.
III. Post-process
The results of the u/s are typed in a report. This report can be made immediately
(inpatients usually) or can take some time (12-24 hours) depending on
radiologist/sonographer preferences. This procedure can be made in different ways:
a) The radiologist can dictate the report into a voice recorder.
b) Writing a provisional report in notes.
c) Writing the report immediately by the radiologist/RDA.
In the first case, the radiologist or RDA types the report once he/she has some free
time, or they can hand the tape in to a RDA to transcribe it, and it is verified by one of
them before being printed. In the second case, the radiologist made a revision of the
u/s and his/her notes and then the report is typed into the u/s database. If the
radiologist did batches he or the RDA checks for unverified reports on the system.
Finally, in the third case, the radiologist/sonographer immediately types the report onto
the system. At the LRI the RDA puts labels on report and films. If the report belongs to
an inpatient, both (report and films) are attached to his file. For outpatients, the verified
reports are printed off. If they are “urgent” then a red sticker is put on them. Clerical
staff sort, envelope and address “elective” reports, placing them in: internal or external
post, pigeon holes. Reports marked as “urgent” are faxed. Finally, the referrer can read
the report.
All these three parts above are the description of the u/s staff for getting an ultrasound,
and is the base for further questions made by the author on the process.

62
Direct observation and collection of data from the process for doing a u/s was made,
and informal interviews with people involved in the procedure at the three sites took
place. Data collected is referred to the time taken for performing a u/s. A review of the
process showed that the activities in the map differed from the real process at some
points, and this was notified to the Co-ordinator. The author had to modify the diagram
in these inconsistent parts; these modifications will be explained later on this chapter.
The author was in charge of collecting information in order to find the capacity and the
real usage of the u/s rooms. Visits to the three hospitals were arranged, informing staff
and consultants about the presence of the author and the purpose of the visit. A set of
templates was provided to verify the usage of each room (see figure 10) at the Royal
Infirmary. On the other two sites the templates were not applied, because there was no
one in charge there, as stated by the Co-ordinator of the project. The purpose of the
template was to identify usage of rooms and assignment of radiologist/sonographer to
wards (for inpatients), as an attempt to facilitate the standardisation of all sessions;
however in the template those slots assigned to wards are not marked. The length of
the slots was established by the Co-ordinator without previous knowledge, just based
on her own experience, as she explained to the author:
“Before I worked for the Agency, I worked as a nurse…so, I know how long an
ultrasound takes, and that is why I assigned slots of 15 minutes”.
After the researcher observed the activity at the LRI u/s department and the template, a
question came out: what was the criterion to determine the number of slots assigned to
wards? The Co-ordinator was asked about this, and her response was:
“Well, sisters have their own way of working, but I am not sure of the reason for that”
A meeting with the u/s project team took place and the Co-ordinator asked the above
question to the site manager directly, and her answer was:
“It has always been like that”
After questioning this issue, the lead sonographer could not explain the reason for
having such number of slots booked for inpatients. She and the Co-ordinator agreed to
look carefully at the number of slots assigned for inpatients.
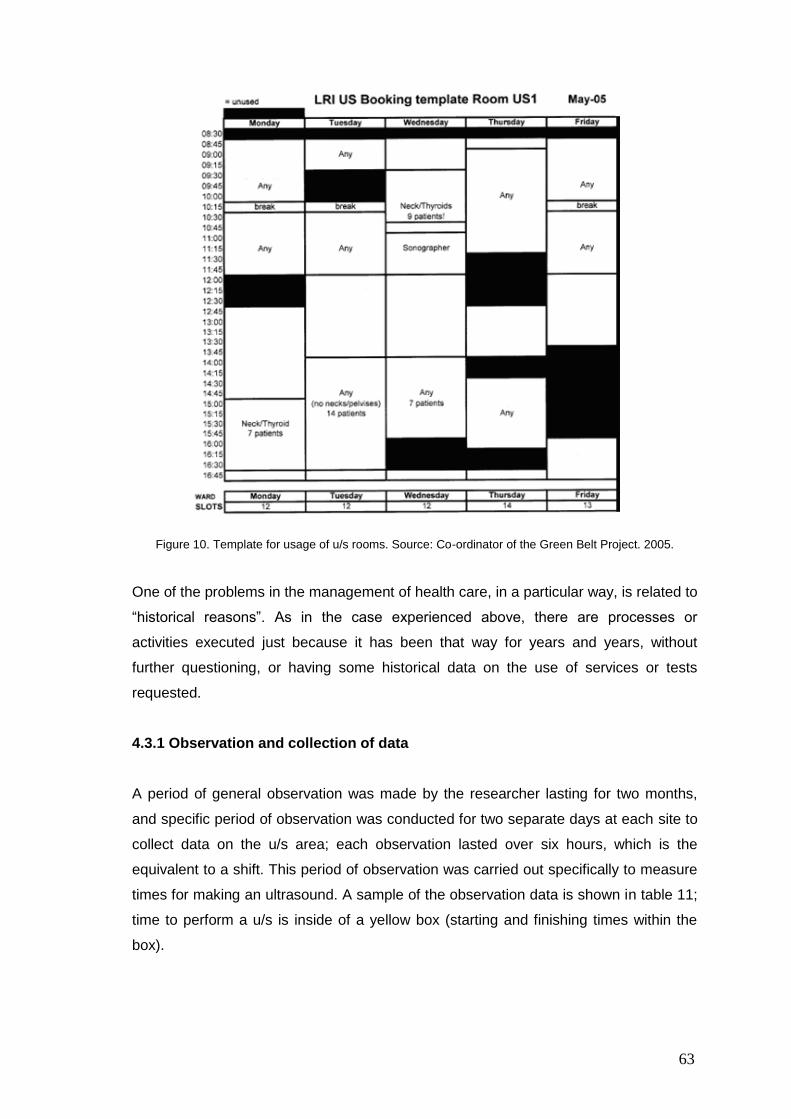
63
Figure 10. Template for usage of u/s rooms. Source: Co-ordinator of the Green Belt Project. 2005.
One of the problems in the management of health care, in a particular way, is related to
“historical reasons”. As in the case experienced above, there are processes or
activities executed just because it has been that way for years and years, without
further questioning, or having some historical data on the use of services or tests
requested.
4.3.1 Observation and collection of data
A period of general observation was made by the researcher lasting for two months,
and specific period of observation was conducted for two separate days at each site to
collect data on the u/s area; each observation lasted over six hours, which is the
equivalent to a shift. This period of observation was carried out specifically to measure
times for making an ultrasound. A sample of the observation data is shown in table 11;
time to perform a u/s is inside of a yellow box (starting and finishing times within the
box).
Wards
Wards
Wards
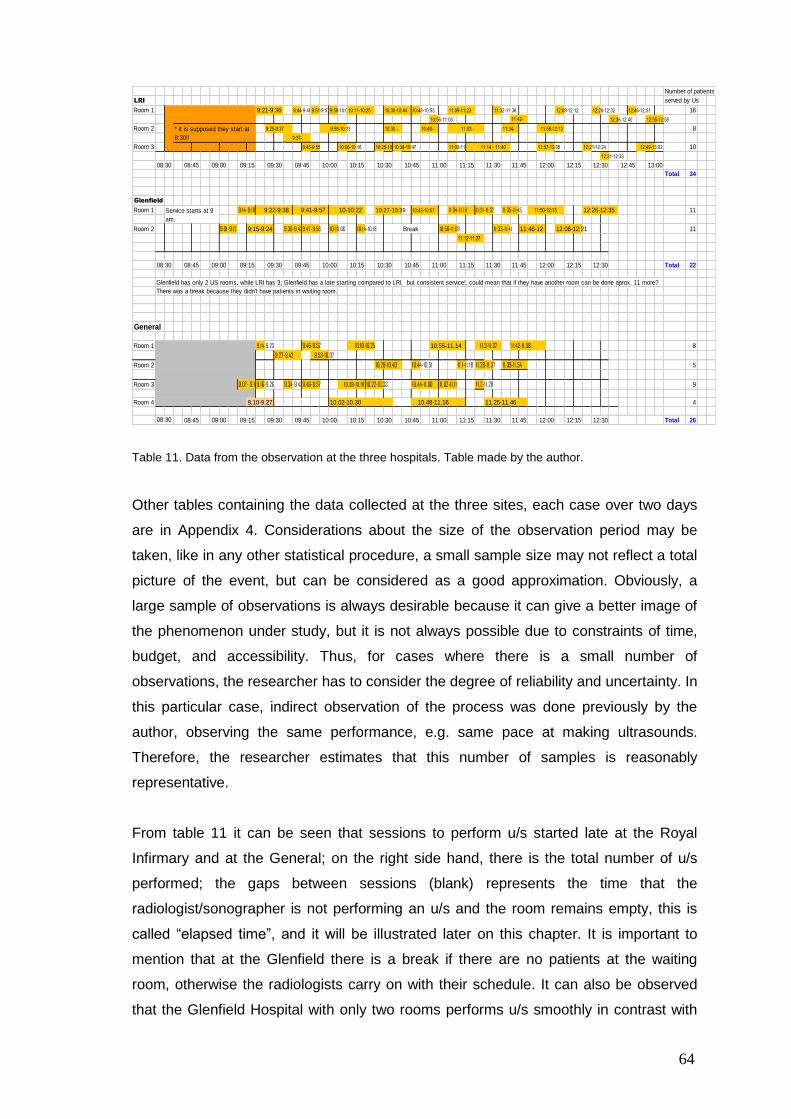
64
Number of patients
LRI served by Us
Room 1 9:21-9:36 9:44-9:489:51-9:579:59-10:07 10:48-10:53 11:32-11:36 12:08-12:12 12:26-12:32 12:46-12:51 16
10:56-11:03 12:36-12:40 12:55-13:55
Room 2 9:58-10:13 8
Room 3 9:45-9:55 10:06-10:16 10:25-10:3110:38-10:47 11:05-11:07 11:57-12:05 12:21-12:24 12:49-13:02 10
12:31-12:33
Total 34
Glenfield
Room 1 9: 14-9: 18 9:22-9:38 9:41-9:57 10-10:22 10:27-10:39 10:43-10:57 11:04-11: 19 11:21-11:32 11:35-11:45 11:50-12:13 12:26-12:35 11
Room 2 9:01-9: 12 9:15-9:24 9:36-9:439:47-9:56 10-10:06 10: 14-10: 18 10:58-11:09 11:33-11:41 11:46-12 12:08-12:21 11
11:12-11:27
Total 22
Glenfield has only 2 US rooms, while LRI has 3; Glenfield has a late starting compared to LRI, but consistent service!, could mean that if they have another room can be done aprox. 11 more?
There was a break because they didn't have patients in waiting room.
General
Room 1 9. 14-9.23 9.46-9.52 10.10-10.25 10.55-11.14 11.2-11.37 11.42-11.58 8
9.27-9.42 9.53-10.07
Room 2 10.28-10.40 10.44-10.51 11. 1-11. 18 11.28-11.37 11.39-11.54 5
Room 3 9.07- 9.149.16-9.26 9.34-9.439.46-9.57 10.08-10. 19 10.22-10.33 10.44-11.00 11.02-11. 11 11.2-11.28 9
Room 4 9.10-9.27 10.02-10.30 10.48-11.16 11.25-11.46 4
Total 26
12:30 12:45 13:00
* It is supposed they start at
8:30!!
11:30 11:45 12:00 12:1510:30 10:45 11:00 11:1509:30 09:45 10:00 10:1508:30 08:45 09:00 09:15
11:34- 11:56-12:12
9:37-
11:14 - 11:40
10:30 - 10:49- 11:03 -
10:11-10:25 10:30-10:44 11:09-11:23
11:42-
Service starts at 9
am.
9:25-9:37
11:45 12:00
Break
08:30 08:45 09:00 09:15 09:30 10:15 10:30 12:15 12:3010:45 11:00 11:15 11:30
08:30
09:45 10:00
09:45 10:00 10:45 12:00 12:15 12:3011:00 11:15 11:30 11:4510:15 10:3008:45 09:00 09:15 09:30
Table 11. Data from the observation at the three hospitals. Table made by the author.
Other tables containing the data collected at the three sites, each case over two days
are in Appendix 4. Considerations about the size of the observation period may be
taken, like in any other statistical procedure, a small sample size may not reflect a total
picture of the event, but can be considered as a good approximation. Obviously, a
large sample of observations is always desirable because it can give a better image of
the phenomenon under study, but it is not always possible due to constraints of time,
budget, and accessibility. Thus, for cases where there is a small number of
observations, the researcher has to consider the degree of reliability and uncertainty. In
this particular case, indirect observation of the process was done previously by the
author, observing the same performance, e.g. same pace at making ultrasounds.
Therefore, the researcher estimates that this number of samples is reasonably
representative.
From table 11 it can be seen that sessions to perform u/s started late at the Royal
Infirmary and at the General; on the right side hand, there is the total number of u/s
performed; the gaps between sessions (blank) represents the time that the
radiologist/sonographer is not performing an u/s and the room remains empty, this is
called “elapsed time”, and it will be illustrated later on this chapter. It is important to
mention that at the Glenfield there is a break if there are no patients at the waiting
room, otherwise the radiologists carry on with their schedule. It can also be observed
that the Glenfield Hospital with only two rooms performs u/s smoothly in contrast with
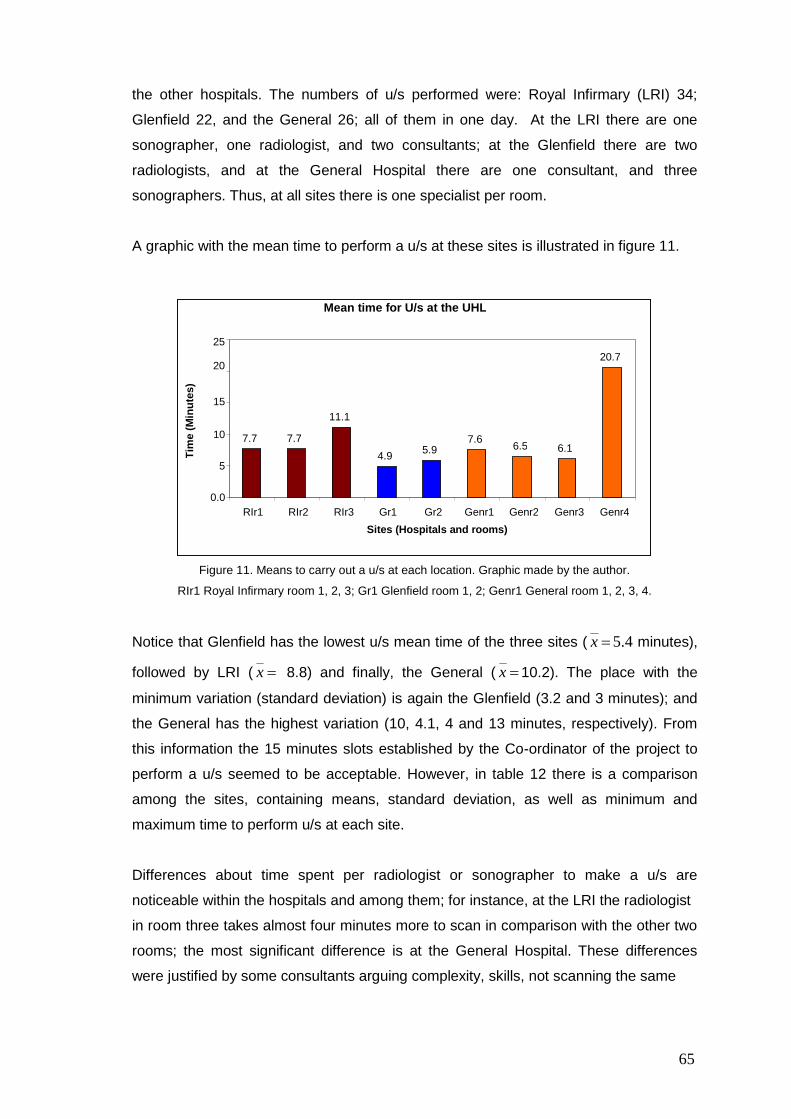
65
the other hospitals. The numbers of u/s performed were: Royal Infirmary (LRI) 34;
Glenfield 22, and the General 26; all of them in one day. At the LRI there are one
sonographer, one radiologist, and two consultants; at the Glenfield there are two
radiologists, and at the General Hospital there are one consultant, and three
sonographers. Thus, at all sites there is one specialist per room.
A graphic with the mean time to perform a u/s at these sites is illustrated in figure 11.
Figure 11. Means to carry out a u/s at each location. Graphic made by the author.
RIr1 Royal Infirmary room 1, 2, 3; Gr1 Glenfield room 1, 2; Genr1 General room 1, 2, 3, 4.
Notice that Glenfield has the lowest u/s mean time of the three sites ( x 5.4 minutes),
followed by LRI ( x 8.8) and finally, the General ( x 10.2). The place with the
minimum variation (standard deviation) is again the Glenfield (3.2 and 3 minutes); and
the General has the highest variation (10, 4.1, 4 and 13 minutes, respectively). From
this information the 15 minutes slots established by the Co-ordinator of the project to
perform a u/s seemed to be acceptable. However, in table 12 there is a comparison
among the sites, containing means, standard deviation, as well as minimum and
maximum time to perform u/s at each site.
Differences about time spent per radiologist or sonographer to make a u/s are
noticeable within the hospitals and among them; for instance, at the LRI the radiologist
in room three takes almost four minutes more to scan in comparison with the other two
rooms; the most significant difference is at the General Hospital. These differences
were justified by some consultants arguing complexity, skills, not scanning the same
Mean time for U/s at the UHL
7.7 7.7
11.1
4.9 5.9 7.6
6.5 6.1
20.7
0.0
5
10
15
20
25
RIr1 RIr2 RIr3 Gr1 Gr2 Genr1 Genr2 Genr3 Genr4 Sites (Hospitals and rooms)
Tim
e (
Min
ute
s)
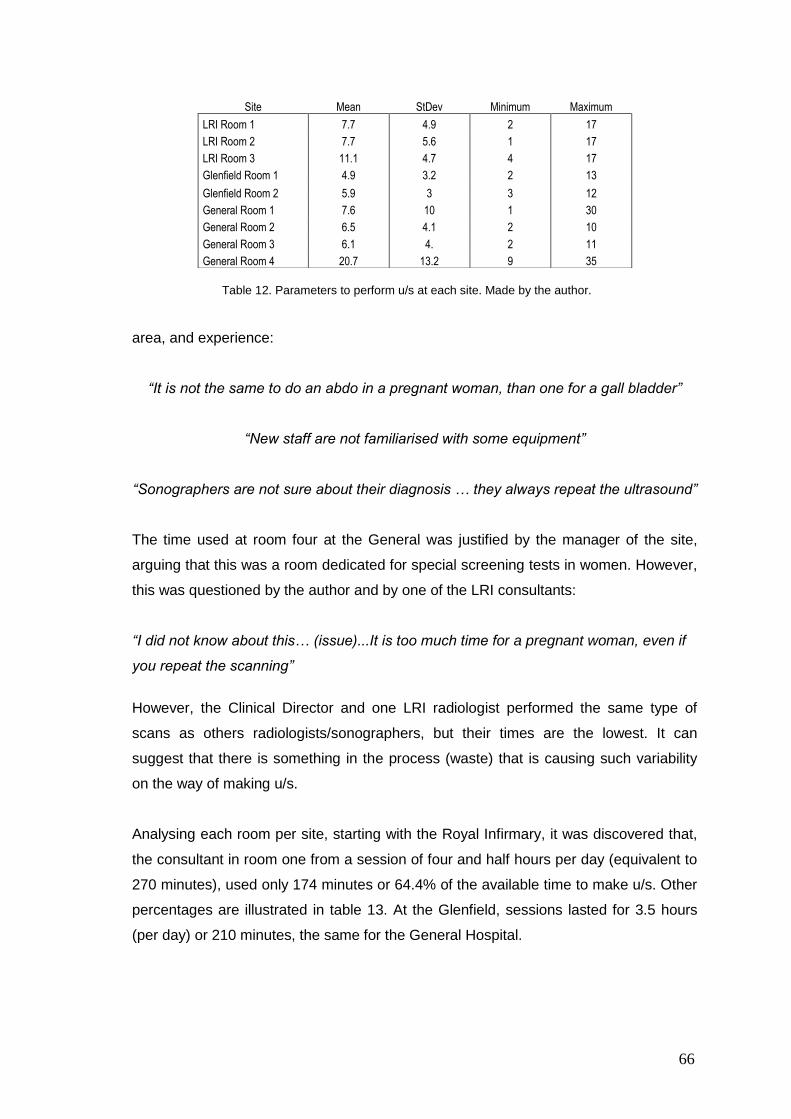
66
Table 12. Parameters to perform u/s at each site. Made by the author.
area, and experience:
“It is not the same to do an abdo in a pregnant woman, than one for a gall bladder”
“New staff are not familiarised with some equipment”
“Sonographers are not sure about their diagnosis … they always repeat the ultrasound”
The time used at room four at the General was justified by the manager of the site,
arguing that this was a room dedicated for special screening tests in women. However,
this was questioned by the author and by one of the LRI consultants:
“I did not know about this… (issue)...It is too much time for a pregnant woman, even if
you repeat the scanning”
However, the Clinical Director and one LRI radiologist performed the same type of
scans as others radiologists/sonographers, but their times are the lowest. It can
suggest that there is something in the process (waste) that is causing such variability
on the way of making u/s.
Analysing each room per site, starting with the Royal Infirmary, it was discovered that,
the consultant in room one from a session of four and half hours per day (equivalent to
270 minutes), used only 174 minutes or 64.4% of the available time to make u/s. Other
percentages are illustrated in table 13. At the Glenfield, sessions lasted for 3.5 hours
(per day) or 210 minutes, the same for the General Hospital.
Site Mean StDev Minimum Maximum
LRI Room 1 7.7 4.9 2 17
LRI Room 2 7.7 5.6 1 17
LRI Room 3 11.1 4.7 4 17
Glenfield Room 1 4.9 3.2 2 13
Glenfield Room 2 5.9 3 3 12
General Room 1 7.6 10 1 30
General Room 2 6.5 4.1 2 10
General Room 3 6.1 4. 2 11
General Room 4 20.7 13.2 9 35
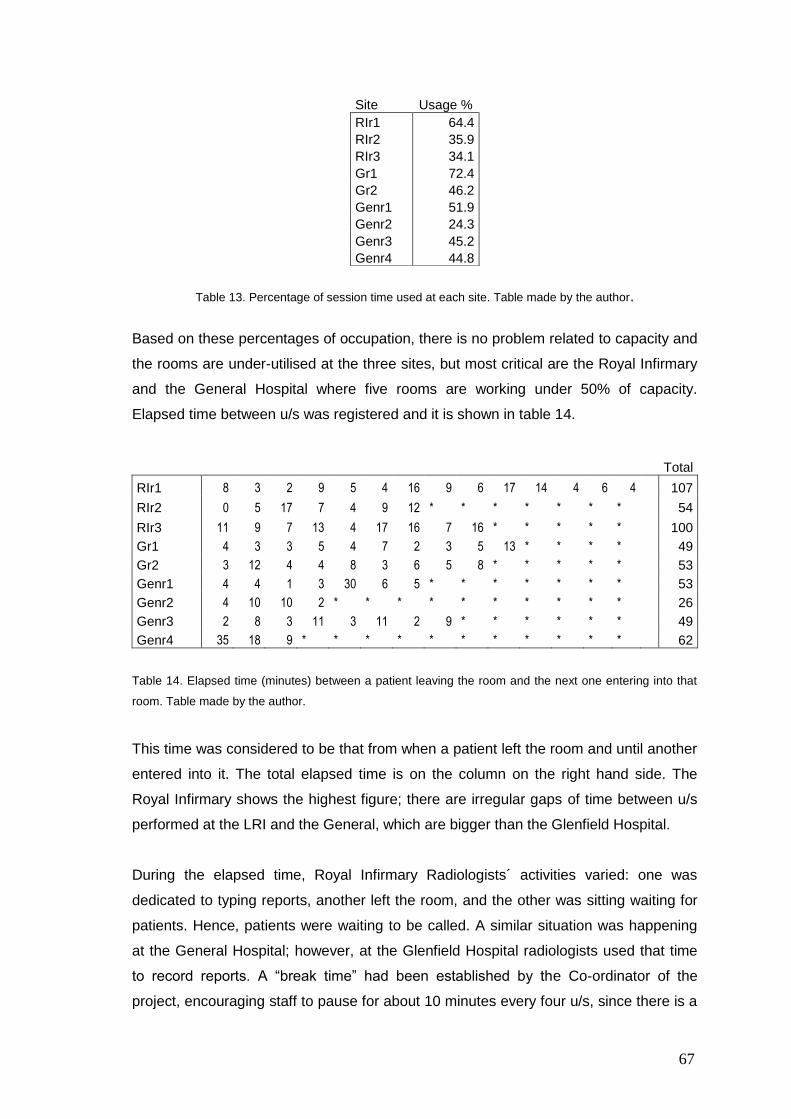
67
Table 13. Percentage of session time used at each site. Table made by the author.
Based on these percentages of occupation, there is no problem related to capacity and
the rooms are under-utilised at the three sites, but most critical are the Royal Infirmary
and the General Hospital where five rooms are working under 50% of capacity.
Elapsed time between u/s was registered and it is shown in table 14.
Total
RIr1 8 3 2 9 5 4 16 9 6 17 14 4 6 4 107
RIr2 0 5 17 7 4 9 12 * * * * * * * 54
RIr3 11 9 7 13 4 17 16 7 16 * * * * * 100
Gr1 4 3 3 5 4 7 2 3 5 13 * * * * 49
Gr2 3 12 4 4 8 3 6 5 8 * * * * * 53
Genr1 4 4 1 3 30 6 5 * * * * * * * 53
Genr2 4 10 10 2 * * * * * * * * * * 26
Genr3 2 8 3 11 3 11 2 9 * * * * * * 49
Genr4 35 18 9 * * * * * * * * * * * 62
Table 14. Elapsed time (minutes) between a patient leaving the room and the next one entering into that
room. Table made by the author.
This time was considered to be that from when a patient left the room and until another
entered into it. The total elapsed time is on the column on the right hand side. The
Royal Infirmary shows the highest figure; there are irregular gaps of time between u/s
performed at the LRI and the General, which are bigger than the Glenfield Hospital.
During the elapsed time, Royal Infirmary Radiologists´ activities varied: one was
dedicated to typing reports, another left the room, and the other was sitting waiting for
patients. Hence, patients were waiting to be called. A similar situation was happening
at the General Hospital; however, at the Glenfield Hospital radiologists used that time
to record reports. A “break time” had been established by the Co-ordinator of the
project, encouraging staff to pause for about 10 minutes every four u/s, since there is a
Site Usage %
RIr1 64.4
RIr2 35.9
RIr3 34.1
Gr1 72.4
Gr2 46.2
Genr1 51.9
Genr2 24.3
Genr3 45.2
Genr4 44.8
68
human factor involved, and people are not machines. When the data on usage of u/s
rooms was presented by the author to the Radiology Improvement team, this
information demonstrated that the “break time” was not necessary due to the poor
utilisation of the rooms.
Waste was present in the whole process: unclear work role (specifications), paper-work
and specialisation, waiting for Radiographer, waiting for in-patients, moving couch in
and out of the room. Another issue was reactions to being observed by an external
individual, which were different at the three sites. In the first site (LRI), being observed
was not a problem for clerical staff, radiology assistants or sonographers. However,
consultants (radiologists) rejected the idea of being observed, even when they were
informed in advance about this part of the pilot study.
“Why are you observing us? We are professionals and we work in the best way, it has
been like that for a long time. Having good results, I do not see the point of change”
The consultants´ reasoning was that they are specialists, know how to do their job and
consequently do not need improvement (a reluctance to embrace change), as well as
“historical reasons”. A possible explanation for their reluctance to be observed was
because there was the perception that everything they did would be reported to the
Clinical Director. The sense of being “policed” arose because some consultants were
not doing the number of cases they had reported (as the project Co-ordinator noticed
when the author showed to her the usage of rooms), starting and/or finishing their
sessions late, and a lack of organisation in doing their jobs, consequently affecting
RDAs who work beyond schedule due to radiologists‟ performance, finishing their shift
late.
At the General Hospital, RDAs were not particularly welcoming towards being
observed, for the same reasons as consultants at the LRI. In contrast, at the third place
(Glenfield) there were no incidents. Furthermore, all the people working there offered
their help without restriction, being totally co-operative and asked for feedback to
improve; there was a sense of teamwork, and a realisation that the patient comes first.
At this stage, issues raised and were noticed by the author and compiled in table 15.

69
Lack of signs at the General Hospital to indicate where the U/s area is located; patients spent about 10 minutes on average to find the U/s
desk.
Sessions that ran well and efficiently: Dr Campbell (ER), Dr Tyagi (General U/s only), Sonographers sessions. Clear instructions were
given to RDAs for scheduling patients. RDAs prefer a quick well-organised session to a slow, confusing one. Can the RDAs and
Radiologists be asked to define what makes a session run well/to time i.e. what for both of them is a good way to work?
Dr Hammed -some early training/equipment issues as expected. One problem with CRIS system in typing a report took longer than
expected to resolve. RDA could not help; Dr Dux spent 20 minutes of his time trying to help. Was this a good use of everyone´s time
when IT staff were available? Does everyone know how to contact Ramanesh from CRIS team?
U/s image printer broke down on one ocassion. Technician took over one hour to fix. Had to use other room for printer only.
Report printer not working -15 minutes spent trying to figure out- technician called and pressed one button to fix. Is unfamiliarity with
equipment an issue? Is there some reluctance to call technicians when a problem occurs -whereas Dr Dux can be asked?
RDAs -two Ultrasound- trained RDAs were present and another two were sent to help/train. The two training were not clearly instructed
by the others so were not much use.
Unused equipment had been shifted to Room 8 to clear the patient scanning area in Room 1. However, when this was collected and
used by other staff they left it for RDAs to return to Room 8 instead of taking it back themselves.
Speed of GP reports reaching GPs -approx seven days or more. RDAs batch printed reports daily in a blue box in U/s area. Next day
they were taken to post basket in secretary´s office. Postal staff collect (three times daily) and take to Sandrigham Level 0 (LRI) from
where GP post is sorted and sent out. Could this process be more efficient? Fewer steps? Less batching? Less waiting?
General point -RDAs do not seem to have a clear picture of what is required of them. Duplication of effort. Unable to deflect inapropriate
requests from other staff groups. Clarification of RDAs role in U/s needed? Time out?
Radiologists session - it was not uncommon for one Radiologist to disappear during the session (to do other things?) which interrupted
the flow of the session and extended it beyond the scheduled time.
Target for this Radiologist & Sonographer was: 25 patients between 8:45 and 12:45 ; 18 patients between 8:45 and 1:30, respectively
Radiologist kept the RDA over lunch as the work was not finished -but this was his responsibility.
Portering of ward patients was still an issue: arriving late;dumping patients in waiting area without notifying staff on their arrival (if no
visible presence at the reception desk).
Table 15. Outcomes during observation/collection of data at UHL sites. Table Made by the author.
At Glenfield, concepts of Lean have already been established, e.g. by using colours to
make clear which patients belong to the X-Ray department and those from ultrasound;
use of small boxes outside the rooms to place the orders that arrive (making a pull
system), attaching the printed images of an u/s with a clip to the boxes and sending
them immediately to the post room.
Differences at the three sites were detected by the author during the observation, and
in separate interviews with the two RDAs at LRI, two at Glenfield, and two at the
General. They did not have a clear idea of their own role/activities:
“I am a chaperone during the u/s”
70
“I have to help patient to get on and off the couch, cleaning the gel off the scanned
area”
“I have to look for the patient, explain the procedure to him/her, act as a chaperone,
and help the radiographer in placing the patient on the couch”
4.3.2 Ultrasound map correction
A map of the patient flow was made by the LRI staff (Appendix 3), but it was not at all
accurate in some parts; therefore, the author had to trace (physically) the stream in
order to include those activities not added in before. The omission of details can lead to
a misconception of the problem, wrong conclusions and decisions; those parts that
were not in accordance with the actual processes are shown in Appendix 5 in red
letters. It was in this step that the researcher noticed that using Lean concepts fitted
best to deal with the issues at u/s.
As a result of re-mapping the whole process, a summary of problems in the form of
waste was elaborated by the author (table 16) and listed on column four. The first three
columns are based on “The 7 wastes of Health care” (www.gemba.com) in section 2.3.
There was a lack of consistency in standards between the three sites. For instance,
Glenfield and LRI have different exam codes for CRIS (which are established by a
consultant while sorting out referrals), consultants dictate outpatient reports to tape or
digital system, or into CRIS, as they prefer; the General Hospital enters inpatients and
outpatients onto the CRIS waiting list, meanwhile LRI and Glenfield only put
outpatients.
Among the three sites, it was observed that Glenfield portering is really efficient: finding
correct patient, having the right information and being able to get the patient off the
ward.
The author visited the LRI on a daily basis (Monday to Friday, from 8 am to 2 pm)
during a two month period for meetings and discussions and to carry out the
observations referred to previously. From these experiences, the author considers that:
there is an excessive amount of movement by staff; there is a lack of standardisation,
aimed at adopting best practice, among and within the sites; a lack of communication
between hospital staff and managers. One site is already applying Lean principles and
working as a team, since they are conscious about the effects and impact of their

71
The 7 wastes-
“Muda” Definition Health care
Overproduction Producing more than the
customer needs right now
Pills given early to
suit staff schedules
Testing ahead of
time to suit lab
schedule
Treatments done to
balance hospital
staff or equipment
workload
- Slots can be reserved or „carved out‟
especially for urgency.
Transportation Movement of product that
does not add value
Moving samples
Moving specimens
Moving patients for
testing
Moving patients for
treatment
Movement patients
to and fro
- Porters need to know patient ID, time
required, transport requirements (One or
two porters, bed, trolley, chair).
- Moving couch out to get bed in at LRI.
- It is quite frequent to see two porters
for a patient in a wheelchair, or one for a
trolley.
Motion Movement of people that
does not add value
Searching for
patients
Searching for
doctors
Searching for charts
Gathering tools
Gathering supplies
Handling paperwork
- General Hospital Consultants &
Sonographers have different policies
about patients wearing or not a dressing
gown.
- At LRI RDAs and Radiology nurses
fetched inpatients
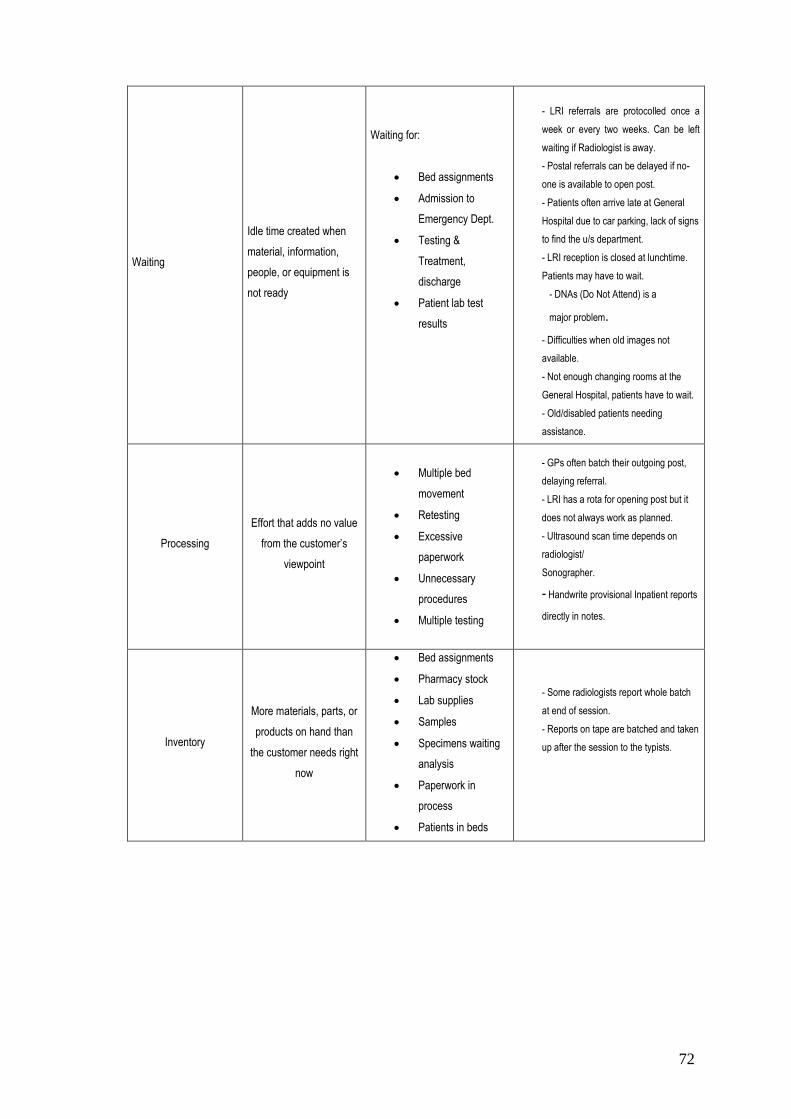
72
Waiting
Idle time created when
material, information,
people, or equipment is
not ready
Waiting for:
Bed assignments
Admission to
Emergency Dept.
Testing &
Treatment,
discharge
Patient lab test
results
- LRI referrals are protocolled once a
week or every two weeks. Can be left
waiting if Radiologist is away.
- Postal referrals can be delayed if no-
one is available to open post.
- Patients often arrive late at General
Hospital due to car parking, lack of signs
to find the u/s department.
- LRI reception is closed at lunchtime.
Patients may have to wait.
- DNAs (Do Not Attend) is a
major problem.
- Difficulties when old images not
available.
- Not enough changing rooms at the
General Hospital, patients have to wait.
- Old/disabled patients needing
assistance.
Processing
Effort that adds no value
from the customer‟s
viewpoint
Multiple bed
movement
Retesting
Excessive
paperwork
Unnecessary
procedures
Multiple testing
- GPs often batch their outgoing post,
delaying referral.
- LRI has a rota for opening post but it
does not always work as planned.
- Ultrasound scan time depends on
radiologist/
Sonographer.
- Handwrite provisional Inpatient reports
directly in notes.
Inventory
More materials, parts, or
products on hand than
the customer needs right
now
Bed assignments
Pharmacy stock
Lab supplies
Samples
Specimens waiting
analysis
Paperwork in
process
Patients in beds
- Some radiologists report whole batch
at end of session.
- Reports on tape are batched and taken
up after the session to the typists.
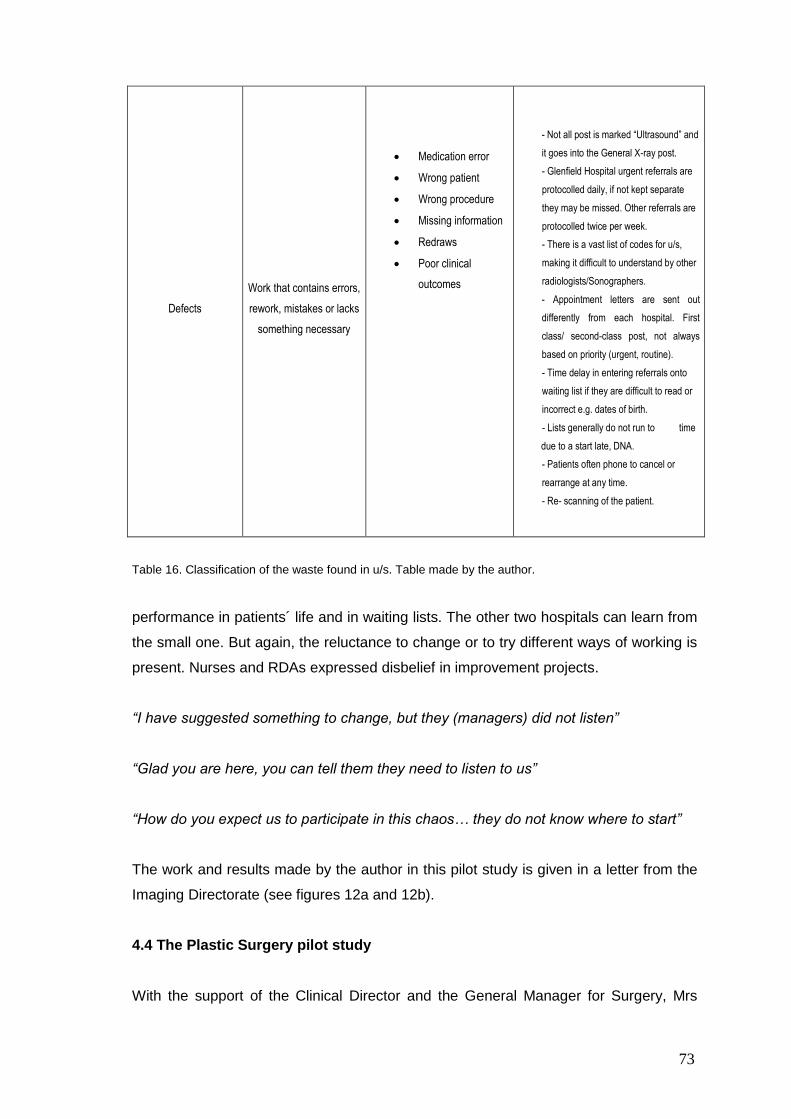
73
Defects
Work that contains errors,
rework, mistakes or lacks
something necessary
Medication error
Wrong patient
Wrong procedure
Missing information
Redraws
Poor clinical
outcomes
- Not all post is marked “Ultrasound” and
it goes into the General X-ray post.
- Glenfield Hospital urgent referrals are
protocolled daily, if not kept separate
they may be missed. Other referrals are
protocolled twice per week.
- There is a vast list of codes for u/s,
making it difficult to understand by other
radiologists/Sonographers.
- Appointment letters are sent out
differently from each hospital. First
class/ second-class post, not always
based on priority (urgent, routine).
- Time delay in entering referrals onto
waiting list if they are difficult to read or
incorrect e.g. dates of birth.
- Lists generally do not run to time
due to a start late, DNA.
- Patients often phone to cancel or
rearrange at any time.
- Re- scanning of the patient.
Table 16. Classification of the waste found in u/s. Table made by the author.
performance in patients´ life and in waiting lists. The other two hospitals can learn from
the small one. But again, the reluctance to change or to try different ways of working is
present. Nurses and RDAs expressed disbelief in improvement projects.
“I have suggested something to change, but they (managers) did not listen”
“Glad you are here, you can tell them they need to listen to us”
“How do you expect us to participate in this chaos… they do not know where to start”
The work and results made by the author in this pilot study is given in a letter from the
Imaging Directorate (see figures 12a and 12b).
4.4 The Plastic Surgery pilot study
With the support of the Clinical Director and the General Manager for Surgery, Mrs
74
Julia Spencer the Service Manager for Day Care Services was appointed to take part
in a pilot study at the LRI Plastic Surgery Department, using Six Sigma to reduce
waiting lists in Plastic Surgery.
The Plastic Surgery mission is to improve the quality of patient‟s lives that have
suffered disfigurement and functional impairment. There are five main areas of work:
1. Trauma and burns.
2. Cancer (skin, head and neck, breast and sarcoma).
3. Congenital deformities.
4. Tissue degenerative conditions requiring reconstruction.
5. Normalisation and improvement of appearance.
Therefore, it is vital to reduce the waiting lists for this area.
The day case manager organised a meeting with people involved in that area, where
the author explained the Six Sigma approach. In this pilot study, the author had the
opportunity to work starting to integrate a team which included: Service Manager Day
Care Services ward sisters, waiting list Co-ordinator, and two assistants of the Service
Manager. A week later, a second meeting was organised to define the problem using
some tools like brainstorming, enlightened thinking, and talking wall; at the end of the
session the team came up with a statement of the purpose of the pilot, they also were
able to identify the problem, and in doing so, clarify the sort of data needed. Roles of
those involved in the pilot were identified, and tasks were assigned (see Appendix 6)
as preparation for the second step of the DMAIC.
Data which needed to be collected in a first stage included theatre utilisation, number
of surgeons, timing and type of surgeries. Through this initial collection of data the
team noticed the following: surgeons usually scheduled more time than required for the
surgery; late starting; consultants made more cases on Saturday than those during the
week; and programming teaching sessions for auditing every week (with no real
reason).
Due to other tasks to be completed by the Service Manager in the other two hospitals,
it was not easy to arrange sessions in a regular basis; therefore, by the fourth session
just three members of the team could attend it. Unfortunately, the Clinical Director left
the hospital just one month after the author‟s interview, and the pilot was not a priority
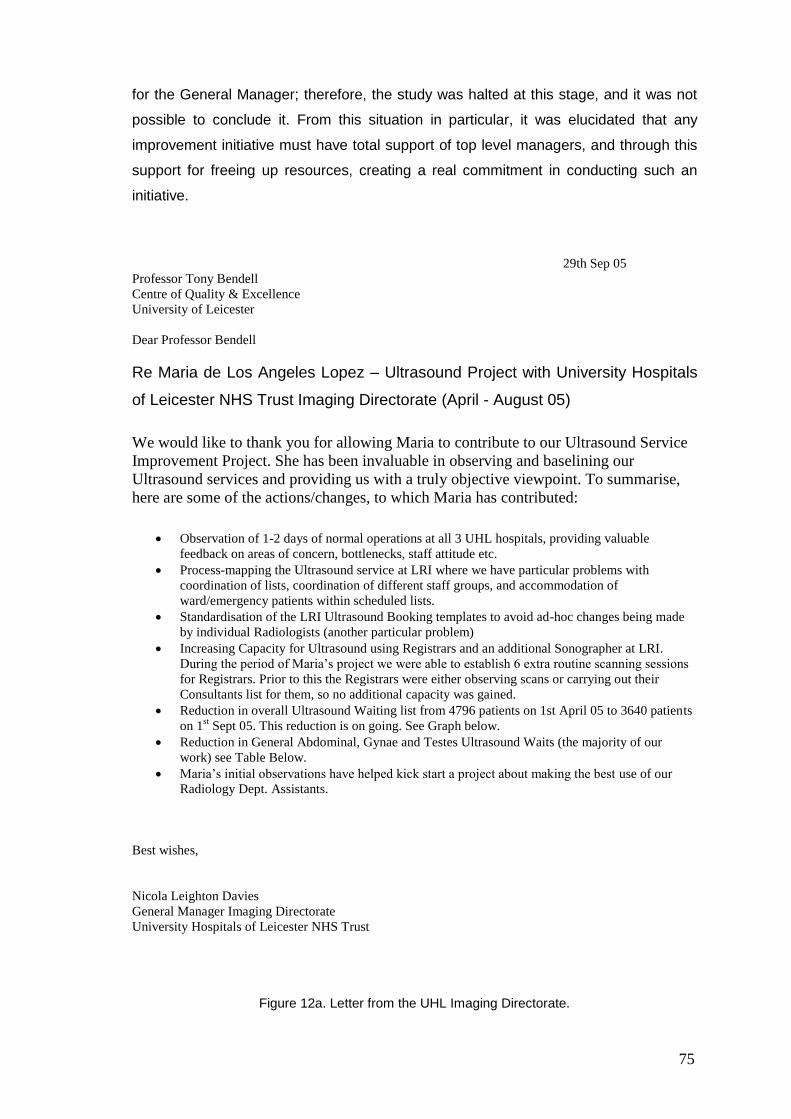
75
for the General Manager; therefore, the study was halted at this stage, and it was not
possible to conclude it. From this situation in particular, it was elucidated that any
improvement initiative must have total support of top level managers, and through this
support for freeing up resources, creating a real commitment in conducting such an
initiative.
29th Sep 05
Professor Tony Bendell
Centre of Quality & Excellence
University of Leicester
Dear Professor Bendell
Re Maria de Los Angeles Lopez – Ultrasound Project with University Hospitals
of Leicester NHS Trust Imaging Directorate (April - August 05)
We would like to thank you for allowing Maria to contribute to our Ultrasound Service
Improvement Project. She has been invaluable in observing and baselining our
Ultrasound services and providing us with a truly objective viewpoint. To summarise,
here are some of the actions/changes, to which Maria has contributed:
Observation of 1-2 days of normal operations at all 3 UHL hospitals, providing valuable
feedback on areas of concern, bottlenecks, staff attitude etc.
Process-mapping the Ultrasound service at LRI where we have particular problems with
coordination of lists, coordination of different staff groups, and accommodation of
ward/emergency patients within scheduled lists.
Standardisation of the LRI Ultrasound Booking templates to avoid ad-hoc changes being made
by individual Radiologists (another particular problem)
Increasing Capacity for Ultrasound using Registrars and an additional Sonographer at LRI.
During the period of Maria’s project we were able to establish 6 extra routine scanning sessions
for Registrars. Prior to this the Registrars were either observing scans or carrying out their
Consultants list for them, so no additional capacity was gained.
Reduction in overall Ultrasound Waiting list from 4796 patients on 1st April 05 to 3640 patients
on 1st Sept 05. This reduction is on going. See Graph below.
Reduction in General Abdominal, Gynae and Testes Ultrasound Waits (the majority of our
work) see Table Below.
Maria’s initial observations have helped kick start a project about making the best use of our
Radiology Dept. Assistants.
Best wishes,
Nicola Leighton Davies
General Manager Imaging Directorate
University Hospitals of Leicester NHS Trust
Figure 12a. Letter from the UHL Imaging Directorate.
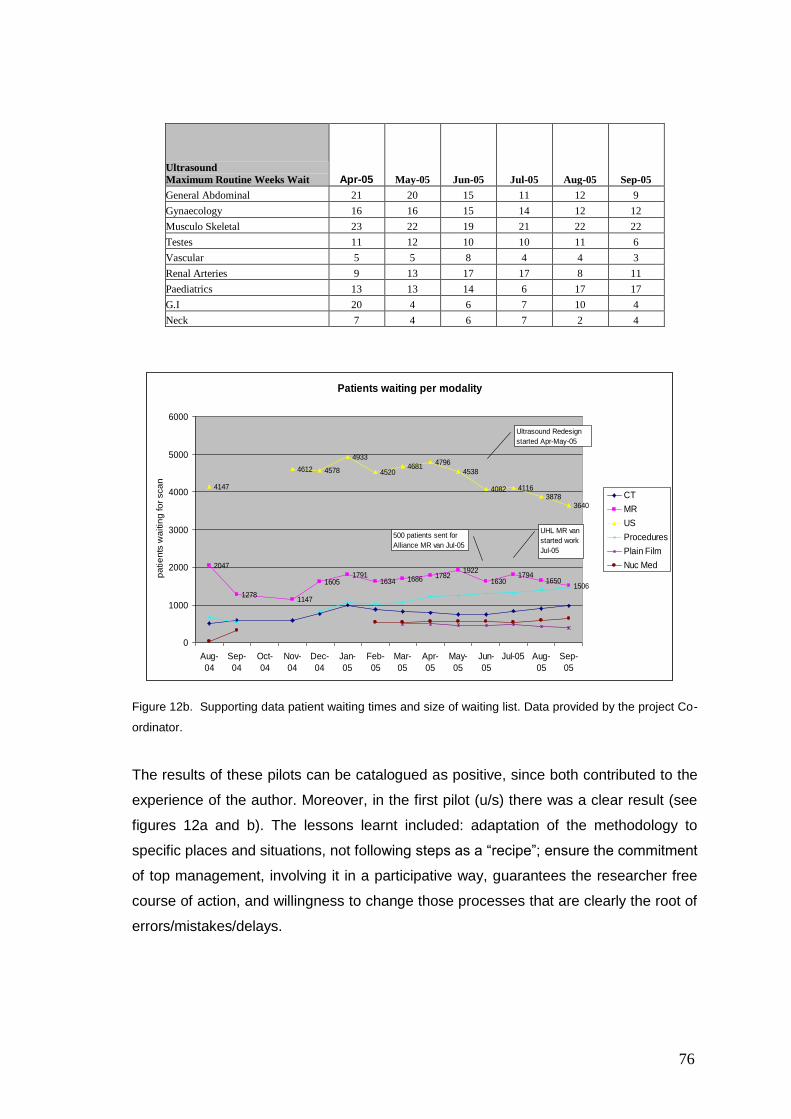
76
Figure 12b. Supporting data patient waiting times and size of waiting list. Data provided by the project Co-
ordinator.
The results of these pilots can be catalogued as positive, since both contributed to the
experience of the author. Moreover, in the first pilot (u/s) there was a clear result (see
figures 12a and b). The lessons learnt included: adaptation of the methodology to
specific places and situations, not following steps as a “recipe”; ensure the commitment
of top management, involving it in a participative way, guarantees the researcher free
course of action, and willingness to change those processes that are clearly the root of
errors/mistakes/delays.
Ultrasound
Maximum Routine Weeks Wait Apr-05 May-05 Jun-05 Jul-05 Aug-05 Sep-05
General Abdominal 21 20 15 11 12 9
Gynaecology 16 16 15 14 12 12
Musculo Skeletal 23 22 19 21 22 22
Testes 11 12 10 10 11 6
Vascular 5 5 8 4 4 3
Renal Arteries 9 13 17 17 8 11
Paediatrics 13 13 14 6 17 17
G.I 20 4 6 7 10 4
Neck 7 4 6 7 2 4
Patients waiting per modality
2047
12781147
16051791
1634 1686 17821922
16301794
16501506
4147
4612 4578
4933
45204681
4796
4538
4082 41163878
3640
0
1000
2000
3000
4000
5000
6000
Aug-
04
Sep-
04
Oct-
04
Nov-
04
Dec-
04
Jan-
05
Feb-
05
Mar-
05
Apr-
05
May-
05
Jun-
05
Jul-05 Aug-
05
Sep-
05
pa
tie
nts
wa
itin
g fo
r sca
n
CT
MR
US
Procedures
Plain Film
Nuc Med
500 patients sent for
Alliance MR van Jul-05
Ultrasound Redesign
started Apr-May-05
UHL MR van
started work
Jul-05
77
Summary
The University Hospitals of Leicester NHS Trust (UHL) includes Glenfield Hospital,
Leicester General Hospital and Leicester Royal Infirmary, employing over 12,000
people and providing services for nearly two million people across Leicester,
Leicestershire and Rutland (http://www.uhl-tr.nhs.uk/).
At the UHL a pilot study was conducted to reduce the waiting lists for ultrasounds.
Observing the whole process was important, for reasons like underuse of facilities, lack
of standardisation in processes and policies, unclear roles, lack of communication, and
resistance to change became clear. A second pilot in Plastic Surgery was not finished
because reasons beyond the researcher‟s control, but still gave valuable insight. The
DMAIC methodology was used at an early stage of the pilots, and due to the course of
action in both cases, this suggested that waste was the real problem and Lean tools
seemed the most useful.
78
CHAPTER 5
The Mexican health care system
5.1 The Mexican health care system and its structure
The Mexican health care system is organised into a National Health System, which
involves agencies and entities of the Public administration, local and Federal, and
people from the social and private sector who provide health services.
The health system is under the authority of the Secretaría de Salud (Ministry of Health
and Assistance), as established in the Mexican Constitution and ruled by the Ley
Federal de Salud (1984) as published in the Federation Official Paper, whose main
objectives are:
1. To provide health services to the population and improve its quality
2. To contribute to a harmonious demographic development
3. To create social wealth for the population through social assistance services
mainly for abandoned children, old people and handicapped people
4. To impel family and community development
5. To improve sanitary conditions that lead towards a satisfactory development of
life
6. To implement a rational management system and development of human
resources in order to improve health
7. To help in the modification of cultural patterns related to health
8. To promote a system of sanitary practices
Health services are classified into three types as was published in the Ley Federal de
Salud (1984):
1. Medical attention
2. Public health
3. Social assistance
Medical attention is divided into three levels according to the type of service required
as follows:
79
1. First level. Medical units that provide external consultation, or first contact
of the patient with medical services; can give emergency attention but
depending on the seriousness have to send the patient to a higher level of
attention. This level includes rural medical units. They have resources for
consultation, dentistry rooms and cold room (for vaccine storage).
2. Second level. This refers to hospital units, which have registered beds to
undertake surgical procedures or to hospitalise patients. These units have
out-patients and emergency services, but at least 4 specialities must exist:
gynaecology and obstetrics, paediatrics, internal medicine and surgery.
3. Third level. These are high specialisation units, also called institutes, such
as cancer institute, nutrition institute, cardiology institute, etc. They receive
patients referred from the first and second levels.
5.2 Health Institutions
It is important to note that, in Mexico, as long as a person has a job, but is not self-
employed, medical attention can be accessed by law; however, if a person is
unemployed or self-employed, health care will need to be personally financed.
Therefore, health services are classified as:
1. Public services for all population
2. Services for members of public institutions of social security
3. Social and private services
There are three main institutions which provide health services:
3. IMSS (Mexican Institute of Social Services)
4. ISSSTE (Social Security Services Institute for Federal Employees)
5. SSA (Ministry of Health and Assistance)
According to the CONAPO (2006) the IMSS and ISSSTE cover nearly 51.54 % of the
population in the country. Figure 13 illustrates how these institutions have been
increasing their coverage through the years.
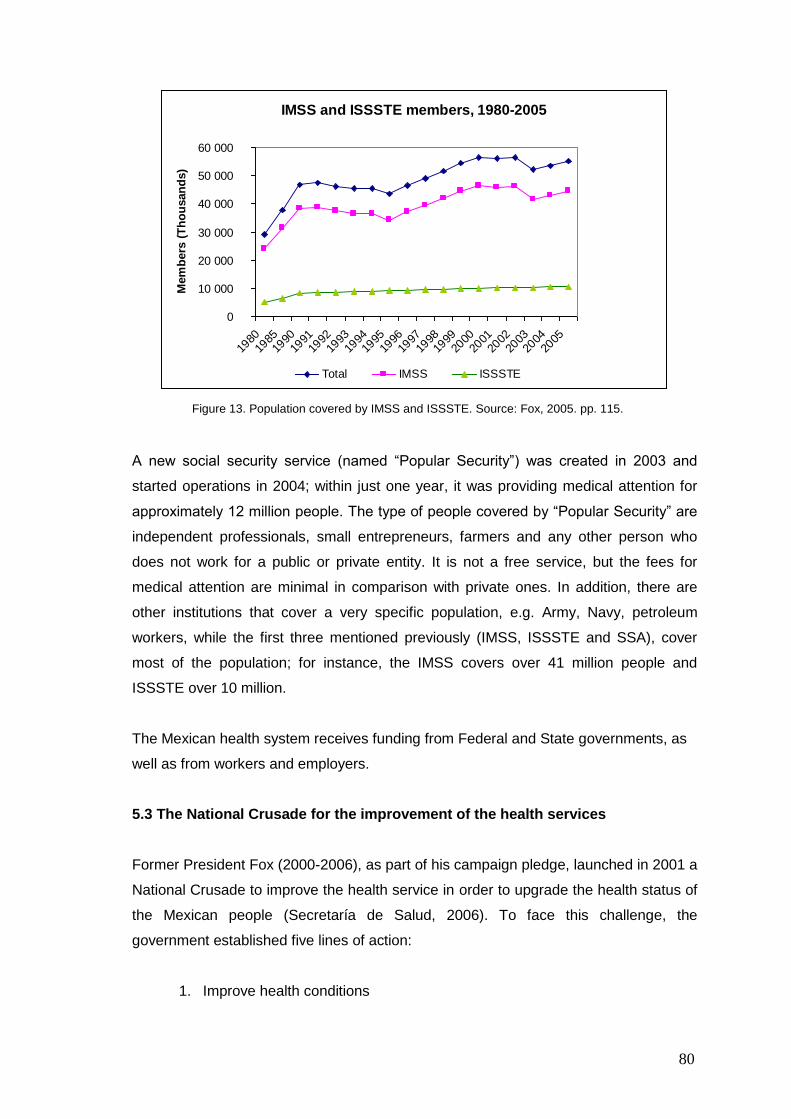
80
IMSS and ISSSTE members, 1980-2005
0
10 000
20 000
30 000
40 000
50 000
60 000
1980
1985
1990
1991
1992
1993
1994
1995
1996
1997
1998
1999
2000
2001
2002
2003
2004
2005
Mem
bers
(T
ho
usan
ds)
Total IMSS ISSSTE
Figure 13. Population covered by IMSS and ISSSTE. Source: Fox, 2005. pp. 115.
A new social security service (named “Popular Security”) was created in 2003 and
started operations in 2004; within just one year, it was providing medical attention for
approximately 12 million people. The type of people covered by “Popular Security” are
independent professionals, small entrepreneurs, farmers and any other person who
does not work for a public or private entity. It is not a free service, but the fees for
medical attention are minimal in comparison with private ones. In addition, there are
other institutions that cover a very specific population, e.g. Army, Navy, petroleum
workers, while the first three mentioned previously (IMSS, ISSSTE and SSA), cover
most of the population; for instance, the IMSS covers over 41 million people and
ISSSTE over 10 million.
The Mexican health system receives funding from Federal and State governments, as
well as from workers and employers.
5.3 The National Crusade for the improvement of the health services
Former President Fox (2000-2006), as part of his campaign pledge, launched in 2001 a
National Crusade to improve the health service in order to upgrade the health status of
the Mexican people (Secretaría de Salud, 2006). To face this challenge, the
government established five lines of action:
1. Improve health conditions
81
2. Address health inequalities
3. Guarantee the responsiveness of public and private services
4. Ensure financing
5. Strengthen the health system, with a particular emphasis on public
institutions
As a result, the crusade was expected to allow medical attention to be effective (fulfil
expected results by patients), efficient (encourage the optimum use of available
resources), ethical (attached to universal values), and secure (offer a service with the
minimum risk possible).
5.4 ISSSTE
There is little information available about organised and formal attempts to protect
workers before the Mexican Revolution in 1910. However, in Mexico City in 1904 and
Nuevo Leon in 1906, laws were passed concerning labour accidents, indicating
employers as responsible for compensation. It was not until 1911 that former President
Francisco I. Madero included in his programme an initiative to issue laws officially
concerning pensions and compensations for labour accidents (ISSSTE, 2007). In
addition, only in 1917, with the proclamation of the Constitution, were workers´ rights
acknowledged and protected. The Constitution granted social security in article 123,
obligating the employer to provide pensions, comfortable and hygienic rooms, schools,
infirmaries and other services to the workers.
Because of the rapid economic and social growth during the 1920´s, it was necessary
to proclaim laws as well as create institutions to sustain the diversity of society. Also,
by law there were some employees that already had security like the Mexican Foreign
Service and the Postal services. In 1924, the District Law of Common Tribunal
Organisation and Federal Territories pronounced that magistrates, judges and officials
that were not wealthy were allowed to receive a pension. However, there was a large
group of public employees that were outside of this law (ISSSTE, 2007). As a result, in
1925, the General Law of Civil Pensions and Retirement was proclaimed, creating a
General Direction.
In 1938, the Workers Trade Federation for the State (FSTSE in Spanish) was born,
giving a legal personality to the workers and to guarantee employment and freedom of
association.
82
In 1959, former President Adolfo López Mateos proposed a law to create the ISSSTE,
which was approved and published on 30th December 1959. By 1960, the ISSSTE
protected 129,512 workers; 11,912 pensioners and 346,318 workers relatives. The
structure of the ISSSTE is shown in appendix 7.
The management is presided over by a Board, which is the main body and is
composed of five Federal Government representatives, five members of the Workers
Trade Federation and a General Director. The President of the Republic names the
President of the Board and the General Director. The ISSSTE is funded by the Federal
Government and workers‟ fees. In each state there is one Delegation, and four in the
city of Mexico; at each one there is a Delegate and a Clinical Medical Director (who is
under the authority of the Delegate) who represent the ISSSTE and are responsible for
granting and promoting insurance, rights, and services to the Institute members, in
order to solve the correspondent requests, procedures and actions within its jurisdiction
in good time.
The ISSSTE´s main function is to provide social security; therefore, it protects and
defends its members, by granting 20 forms of insurance (ISSSTE, 2007) and services
which are the following:
preventive medicine
insurance for illness and motherhood
services for physical and mental rehabilitation
insurance for labour risks
insurance for retirement based on time served in employment
insurance for age retirement and service time
insurance for invalidity
insurance for cause of death
insurance for advanced age retirement
global compensation
services and development of children
services to the retired and pensioners
housing and renting
medium term loans
short term loans
shops and pharmacies
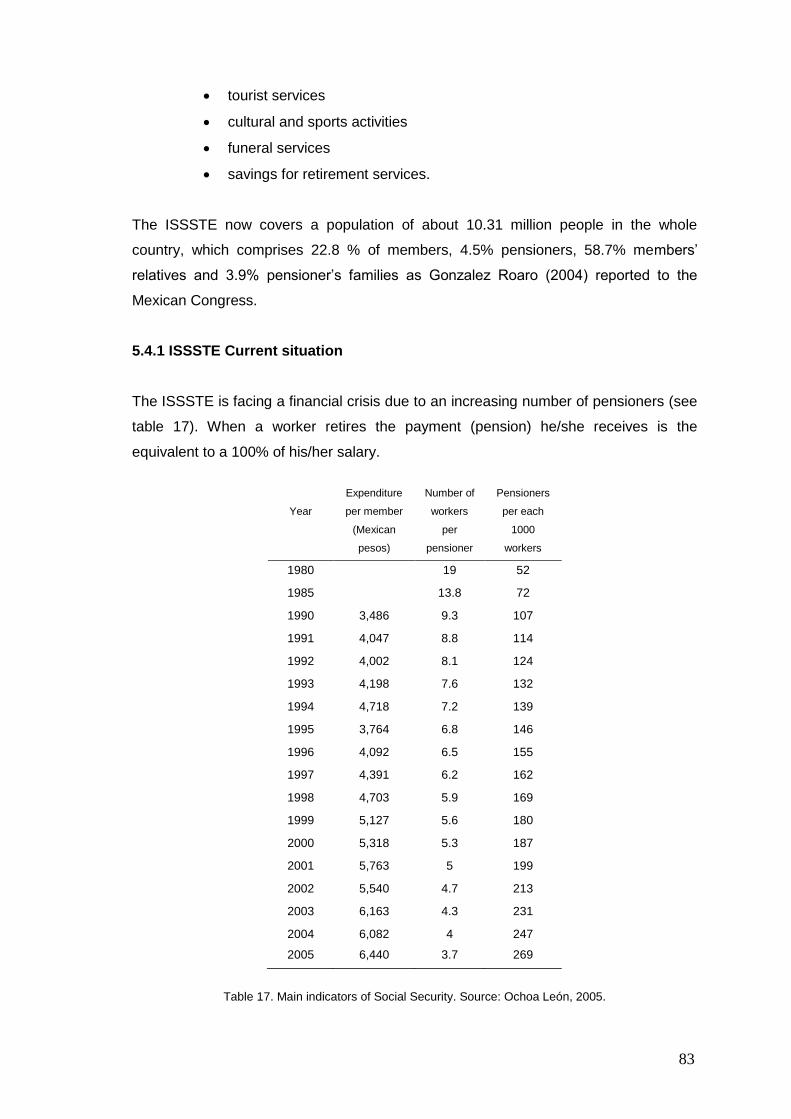
83
tourist services
cultural and sports activities
funeral services
savings for retirement services.
The ISSSTE now covers a population of about 10.31 million people in the whole
country, which comprises 22.8 % of members, 4.5% pensioners, 58.7% members‟
relatives and 3.9% pensioner‟s families as Gonzalez Roaro (2004) reported to the
Mexican Congress.
5.4.1 ISSSTE Current situation
The ISSSTE is facing a financial crisis due to an increasing number of pensioners (see
table 17). When a worker retires the payment (pension) he/she receives is the
equivalent to a 100% of his/her salary.
Year
Expenditure
per member
(Mexican
pesos)
Number of
workers
per
pensioner
Pensioners
per each
1000
workers
1980 19 52
1985 13.8 72
1990 3,486 9.3 107
1991 4,047 8.8 114
1992 4,002 8.1 124
1993 4,198 7.6 132
1994 4,718 7.2 139
1995 3,764 6.8 146
1996 4,092 6.5 155
1997 4,391 6.2 162
1998 4,703 5.9 169
1999 5,127 5.6 180
2000 5,318 5.3 187
2001 5,763 5 199
2002 5,540 4.7 213
2003 6,163 4.3 231
2004 6,082 4 247
2005 6,440 3.7 269
Table 17. Main indicators of Social Security. Source: Ochoa León, 2005.
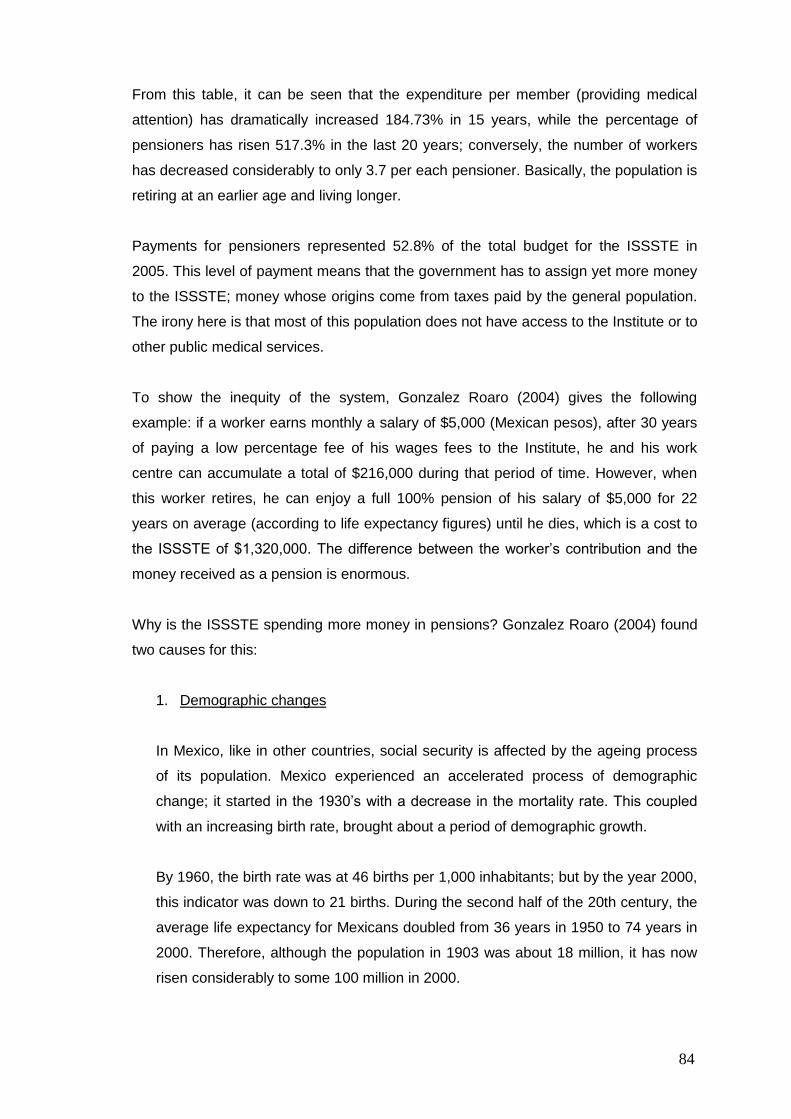
84
From this table, it can be seen that the expenditure per member (providing medical
attention) has dramatically increased 184.73% in 15 years, while the percentage of
pensioners has risen 517.3% in the last 20 years; conversely, the number of workers
has decreased considerably to only 3.7 per each pensioner. Basically, the population is
retiring at an earlier age and living longer.
Payments for pensioners represented 52.8% of the total budget for the ISSSTE in
2005. This level of payment means that the government has to assign yet more money
to the ISSSTE; money whose origins come from taxes paid by the general population.
The irony here is that most of this population does not have access to the Institute or to
other public medical services.
To show the inequity of the system, Gonzalez Roaro (2004) gives the following
example: if a worker earns monthly a salary of $5,000 (Mexican pesos), after 30 years
of paying a low percentage fee of his wages fees to the Institute, he and his work
centre can accumulate a total of $216,000 during that period of time. However, when
this worker retires, he can enjoy a full 100% pension of his salary of $5,000 for 22
years on average (according to life expectancy figures) until he dies, which is a cost to
the ISSSTE of $1,320,000. The difference between the worker‟s contribution and the
money received as a pension is enormous.
Why is the ISSSTE spending more money in pensions? Gonzalez Roaro (2004) found
two causes for this:
1. Demographic changes
In Mexico, like in other countries, social security is affected by the ageing process
of its population. Mexico experienced an accelerated process of demographic
change; it started in the 1930‟s with a decrease in the mortality rate. This coupled
with an increasing birth rate, brought about a period of demographic growth.
By 1960, the birth rate was at 46 births per 1,000 inhabitants; but by the year 2000,
this indicator was down to 21 births. During the second half of the 20th century, the
average life expectancy for Mexicans doubled from 36 years in 1950 to 74 years in
2000. Therefore, although the population in 1903 was about 18 million, it has now
risen considerably to some 100 million in 2000.
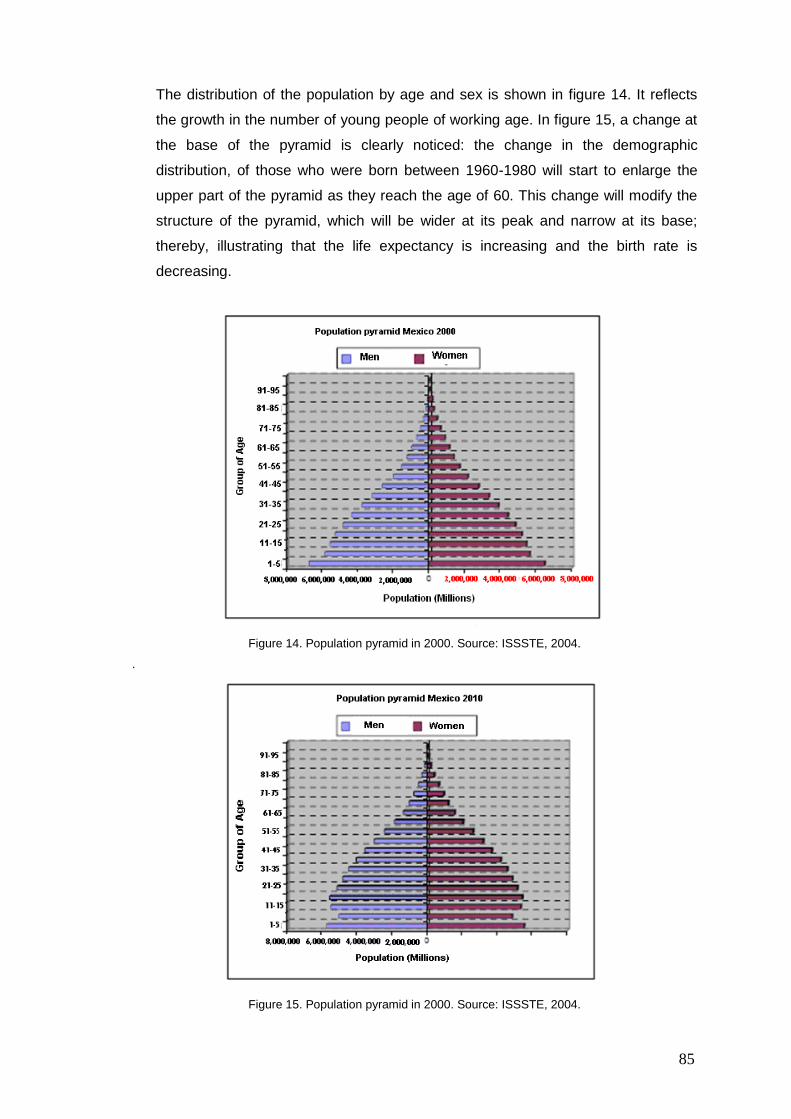
85
The distribution of the population by age and sex is shown in figure 14. It reflects
the growth in the number of young people of working age. In figure 15, a change at
the base of the pyramid is clearly noticed: the change in the demographic
distribution, of those who were born between 1960-1980 will start to enlarge the
upper part of the pyramid as they reach the age of 60. This change will modify the
structure of the pyramid, which will be wider at its peak and narrow at its base;
thereby, illustrating that the life expectancy is increasing and the birth rate is
decreasing.
Figure 14. Population pyramid in 2000. Source: ISSSTE, 2004.
.
Figure 15. Population pyramid in 2000. Source: ISSSTE, 2004.
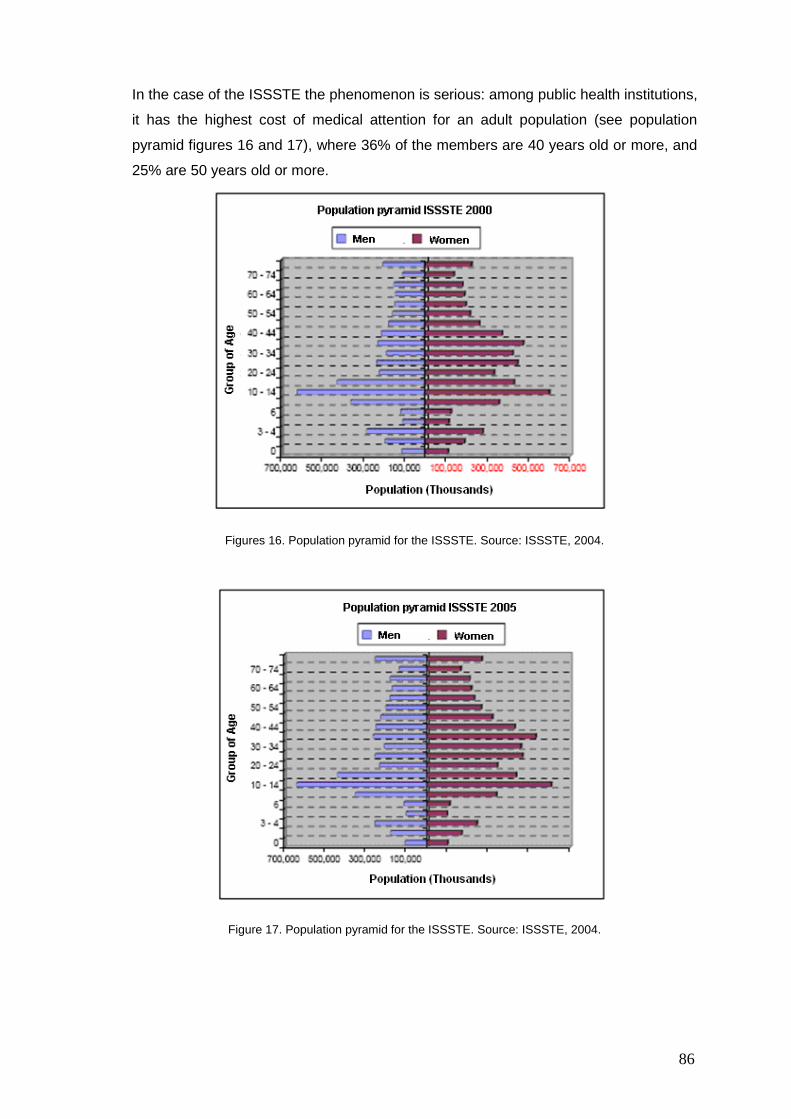
86
In the case of the ISSSTE the phenomenon is serious: among public health institutions,
it has the highest cost of medical attention for an adult population (see population
pyramid figures 16 and 17), where 36% of the members are 40 years old or more, and
25% are 50 years old or more.
Figures 16. Population pyramid for the ISSSTE. Source: ISSSTE, 2004.
Figure 17. Population pyramid for the ISSSTE. Source: ISSSTE, 2004.
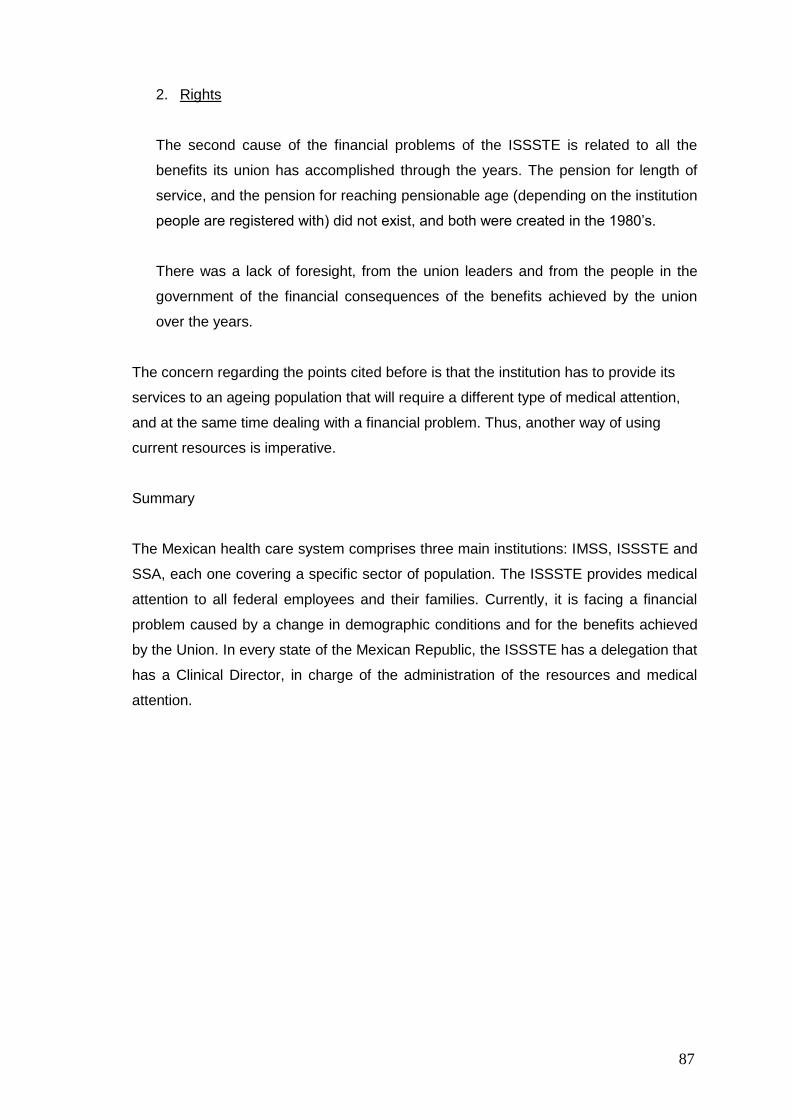
87
2. Rights
The second cause of the financial problems of the ISSSTE is related to all the
benefits its union has accomplished through the years. The pension for length of
service, and the pension for reaching pensionable age (depending on the institution
people are registered with) did not exist, and both were created in the 1980‟s.
There was a lack of foresight, from the union leaders and from the people in the
government of the financial consequences of the benefits achieved by the union
over the years.
The concern regarding the points cited before is that the institution has to provide its
services to an ageing population that will require a different type of medical attention,
and at the same time dealing with a financial problem. Thus, another way of using
current resources is imperative.
Summary
The Mexican health care system comprises three main institutions: IMSS, ISSSTE and
SSA, each one covering a specific sector of population. The ISSSTE provides medical
attention to all federal employees and their families. Currently, it is facing a financial
problem caused by a change in demographic conditions and for the benefits achieved
by the Union. In every state of the Mexican Republic, the ISSSTE has a delegation that
has a Clinical Director, in charge of the administration of the resources and medical
attention.
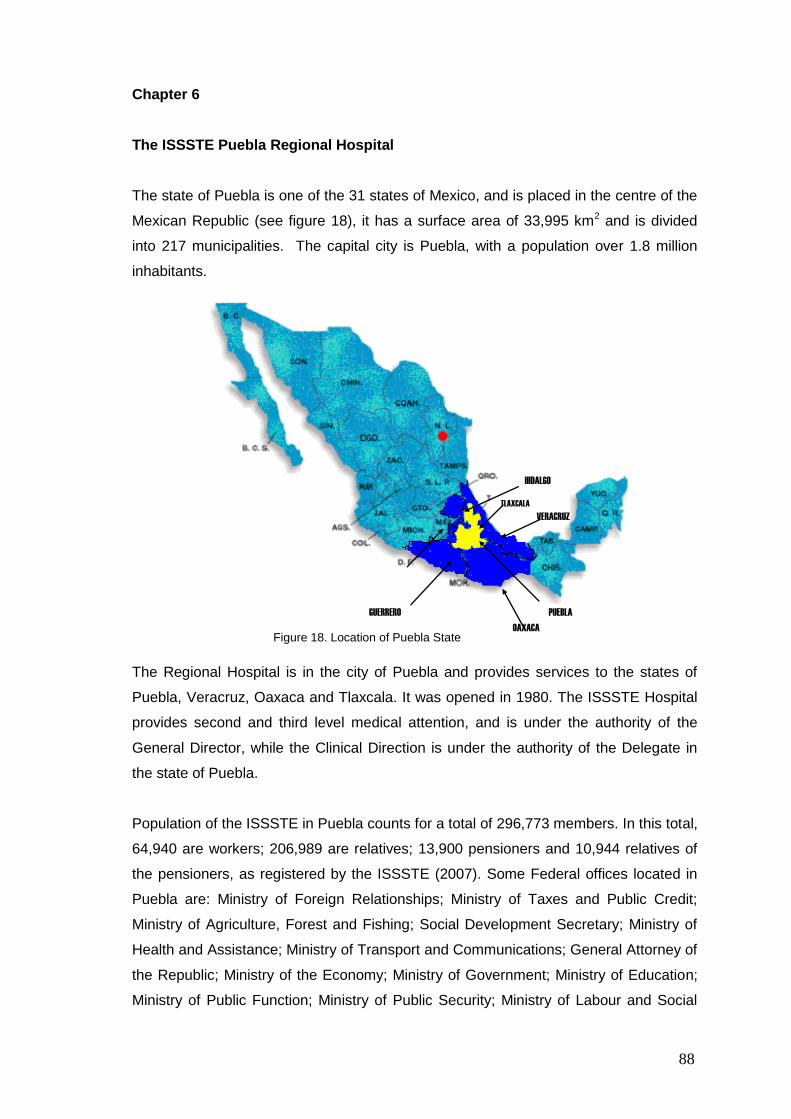
88
Chapter 6
The ISSSTE Puebla Regional Hospital
The state of Puebla is one of the 31 states of Mexico, and is placed in the centre of the
Mexican Republic (see figure 18), it has a surface area of 33,995 km2 and is divided
into 217 municipalities. The capital city is Puebla, with a population over 1.8 million
inhabitants.
The Regional Hospital is in the city of Puebla and provides services to the states of
Puebla, Veracruz, Oaxaca and Tlaxcala. It was opened in 1980. The ISSSTE Hospital
provides second and third level medical attention, and is under the authority of the
General Director, while the Clinical Direction is under the authority of the Delegate in
the state of Puebla.
Population of the ISSSTE in Puebla counts for a total of 296,773 members. In this total,
64,940 are workers; 206,989 are relatives; 13,900 pensioners and 10,944 relatives of
the pensioners, as registered by the ISSSTE (2007). Some Federal offices located in
Puebla are: Ministry of Foreign Relationships; Ministry of Taxes and Public Credit;
Ministry of Agriculture, Forest and Fishing; Social Development Secretary; Ministry of
Health and Assistance; Ministry of Transport and Communications; General Attorney of
the Republic; Ministry of the Economy; Ministry of Government; Ministry of Education;
Ministry of Public Function; Ministry of Public Security; Ministry of Labour and Social
TLAXCALA
Figure 18. Location of Puebla State
HIDALGO
VERACRUZ
GUERRERO PUEBLA
OAXACA
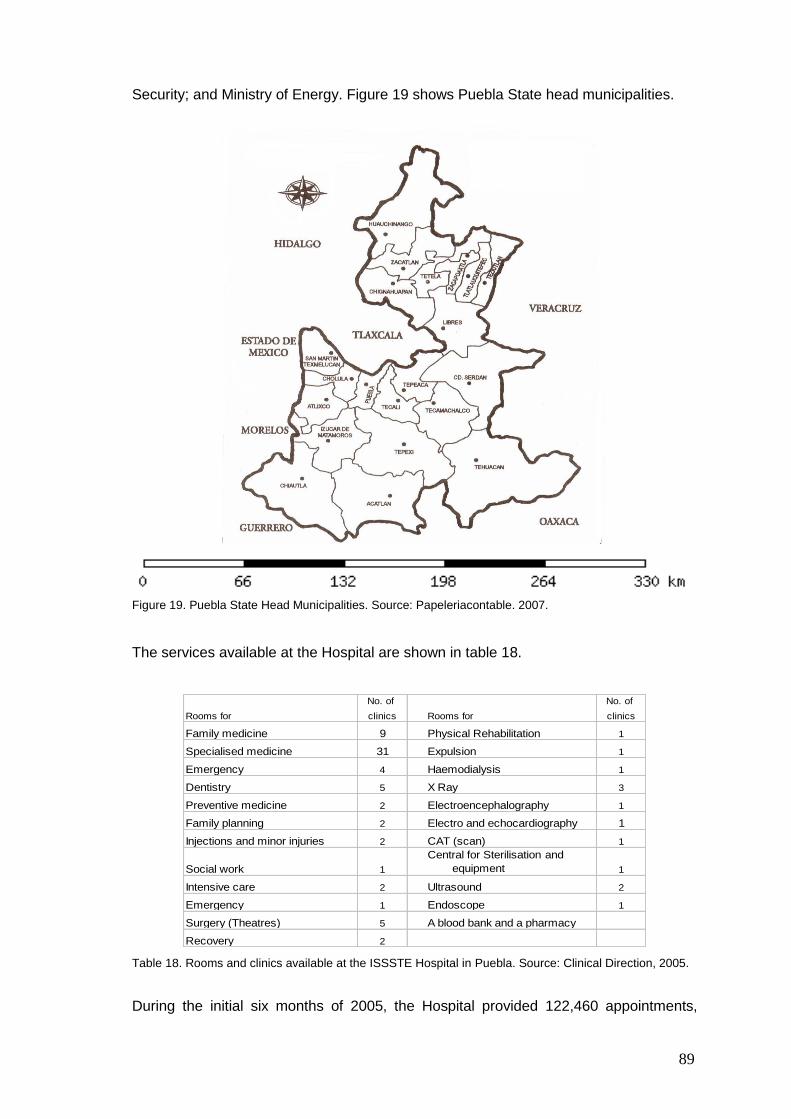
89
Security; and Ministry of Energy. Figure 19 shows Puebla State head municipalities.
Figure 19. Puebla State Head Municipalities. Source: Papeleriacontable. 2007.
The services available at the Hospital are shown in table 18.
Rooms for
No. of
clinics Rooms for
No. of
clinics
Family medicine 9 Physical Rehabilitation 1
Specialised medicine 31 Expulsion 1
Emergency 4 Haemodialysis 1
Dentistry 5 X Ray 3
Preventive medicine 2 Electroencephalography 1
Family planning 2 Electro and echocardiography 1
Injections and minor injuries 2 CAT (scan) 1
Social work 1
Central for Sterilisation and
equipment 1
Intensive care 2 Ultrasound 2
Emergency 1 Endoscope 1
Surgery (Theatres) 5 A blood bank and a pharmacy
Recovery 2
Table 18. Rooms and clinics available at the ISSSTE Hospital in Puebla. Source: Clinical Direction, 2005.
During the initial six months of 2005, the Hospital provided 122,460 appointments,
90
while the clinical laboratory processed 231,372 tests from January to September the
same year.
The Mexican Institute of Social Security and Services for Federal Employees (ISSSTE)
Clinical Laboratory is responsible for tests of: serology, microbiology, special tests (e.g.
testosterone), haematology, biochemistry, functional tests, others like organic liquids,
sodium, potassium; calcium; arterial gases, general urine test, immunology, just to
mention some. Patients visit the Lab for the following reasons: to get an appointment
for tests; to collect results of the tests in order to attend a consultation, and to deliver
samples.
In the following couple of cases there the author and the ISSSTE Clinical Director were
both involved. The Lab Manager was also involved to a minor degree but just for the
case study at the clinical lab. Both cases are longitudinal; the first one lasted for six
months from August 2005 to January 2006, and the second one from November 2005
to February 2007.
6.1 The ISSSTE case study Clinical Laboratory
In an interview with the Clinical Director of the Puebla ISSSTE Delegation, areas of
opportunity to apply Lean and Six Sigma were discussed; the Clinical Laboratory was
suggested by him based on his internal reports of the performance of the Lab, such as
number of tests ordered by some specialists, number of patients´ served, and costs for
conducting those tests. A meeting with the Clinical Director, Hospital Director, Manager
of the Lab, and the Manager of Services was arranged to explain the purpose of
making a case study there. The Hospital Director indicated two problems:
a) a large queue in a main corridor of the hospital, causing bottlenecks at one
access to the hospital, and to the X-Ray archive,
b) patients´ dissatisfaction because of a lengthy process of being served at the
Lab.
The author carried out a case study (helped by the Lab Manager to be acquainted with
some terms and official procedures) to solve the aforementioned problems and with
some issues cited by the Clinical Director; therefore the objectives of this case study
were to:
91
- find out the quantity and type of lab tests ordered
- find out which area was ordering the most lab tests
- improve the results delivery service
- reduce the number of outpatients waiting in queue
- reduce waiting time at the reception desk
The author used Lean principles based on the previous experience at the UK. The
DMAIC steps were used as a way to structure the application of Lean.
The case study was carried out by the author between August and October 2005 (from
Monday to Friday, starting at 6.30 am, finishing at 2 pm), with monthly assessments the
same year and until January 2006. In the assessments the author presented to the
Clinical Director the Lab performance through graphs and statistics (mean and
standard deviation), suggesting changes, evaluating effectiveness and sustainability of
the agreed modifications as a result of applying the approach. The assessments from
August to October 2005 and the second week of January 2006 were made in person,
while November and December were through e-mail.
Historical data existed in different databases and was confuse regarding number of
patients served per day, types and quantity of tests performed; therefore, the author
had to select and organise them. On the other hand, data required for the research like
time a patient spent waiting, time being served at the desk, time to get blood samples,
to mention some did not exist. Consequently, it was collected and analysed by the
researcher.
The author conducted a walk through the Hospital and the Clinical Lab to discern the
areas and to observe front line staff performing their jobs. After this, the researcher
started the specific period of observation for Clinical Lab performance, personnel and
patients arriving there. The researcher spent a total of nine weeks at sampling rooms
studying each one of the chemists while they were taking samples, and at the same
time interviewing them informally. During these informal conversations, topics like ways
of working, improvement initiatives, management support, union, assignment of
activities, quality concepts, and internal policies to mention some were discussed.
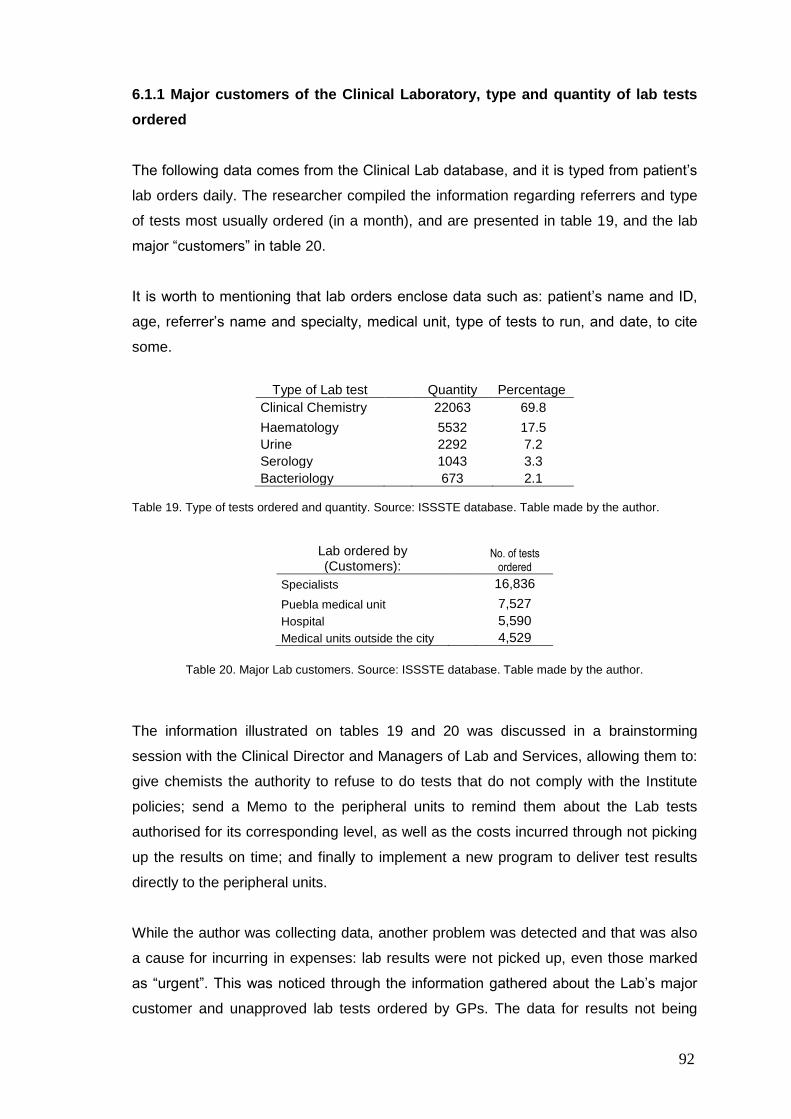
92
6.1.1 Major customers of the Clinical Laboratory, type and quantity of lab tests
ordered
The following data comes from the Clinical Lab database, and it is typed from patient‟s
lab orders daily. The researcher compiled the information regarding referrers and type
of tests most usually ordered (in a month), and are presented in table 19, and the lab
major “customers” in table 20.
It is worth to mentioning that lab orders enclose data such as: patient‟s name and ID,
age, referrer‟s name and specialty, medical unit, type of tests to run, and date, to cite
some.
Type of Lab test Quantity Percentage
Clinical Chemistry 22063 69.8
Haematology 5532 17.5
Urine 2292 7.2
Serology 1043 3.3
Bacteriology 673 2.1 Table 19. Type of tests ordered and quantity. Source: ISSSTE database. Table made by the author.
Lab ordered by (Customers):
No. of tests ordered
Specialists 16,836
Puebla medical unit 7,527
Hospital 5,590
Medical units outside the city 4,529
Table 20. Major Lab customers. Source: ISSSTE database. Table made by the author.
The information illustrated on tables 19 and 20 was discussed in a brainstorming
session with the Clinical Director and Managers of Lab and Services, allowing them to:
give chemists the authority to refuse to do tests that do not comply with the Institute
policies; send a Memo to the peripheral units to remind them about the Lab tests
authorised for its corresponding level, as well as the costs incurred through not picking
up the results on time; and finally to implement a new program to deliver test results
directly to the peripheral units.
While the author was collecting data, another problem was detected and that was also
a cause for incurring in expenses: lab results were not picked up, even those marked
as “urgent”. This was noticed through the information gathered about the Lab‟s major
customer and unapproved lab tests ordered by GPs. The data for results not being
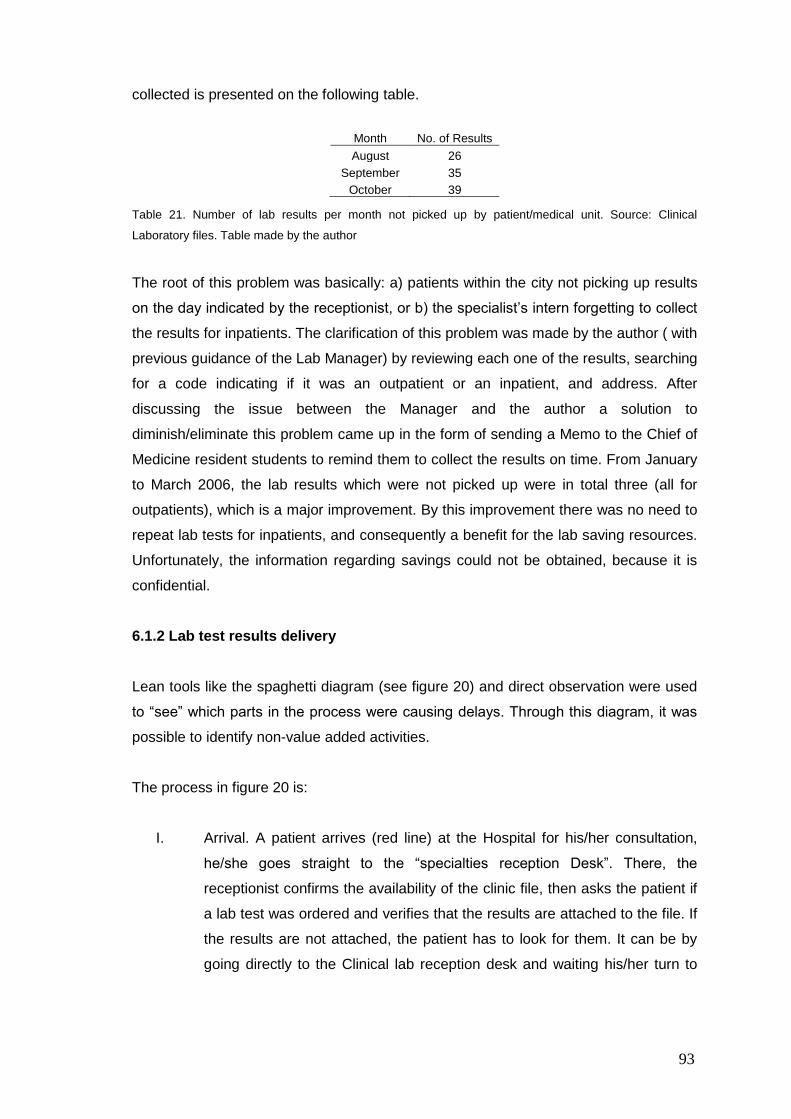
93
collected is presented on the following table.
Table 21. Number of lab results per month not picked up by patient/medical unit. Source: Clinical
Laboratory files. Table made by the author
The root of this problem was basically: a) patients within the city not picking up results
on the day indicated by the receptionist, or b) the specialist‟s intern forgetting to collect
the results for inpatients. The clarification of this problem was made by the author ( with
previous guidance of the Lab Manager) by reviewing each one of the results, searching
for a code indicating if it was an outpatient or an inpatient, and address. After
discussing the issue between the Manager and the author a solution to
diminish/eliminate this problem came up in the form of sending a Memo to the Chief of
Medicine resident students to remind them to collect the results on time. From January
to March 2006, the lab results which were not picked up were in total three (all for
outpatients), which is a major improvement. By this improvement there was no need to
repeat lab tests for inpatients, and consequently a benefit for the lab saving resources.
Unfortunately, the information regarding savings could not be obtained, because it is
confidential.
6.1.2 Lab test results delivery
Lean tools like the spaghetti diagram (see figure 20) and direct observation were used
to “see” which parts in the process were causing delays. Through this diagram, it was
possible to identify non-value added activities.
The process in figure 20 is:
I. Arrival. A patient arrives (red line) at the Hospital for his/her consultation,
he/she goes straight to the “specialties reception Desk”. There, the
receptionist confirms the availability of the clinic file, then asks the patient if
a lab test was ordered and verifies that the results are attached to the file. If
the results are not attached, the patient has to look for them. It can be by
going directly to the Clinical lab reception desk and waiting his/her turn to
Month No. of Results
August 26
September 35
October 39
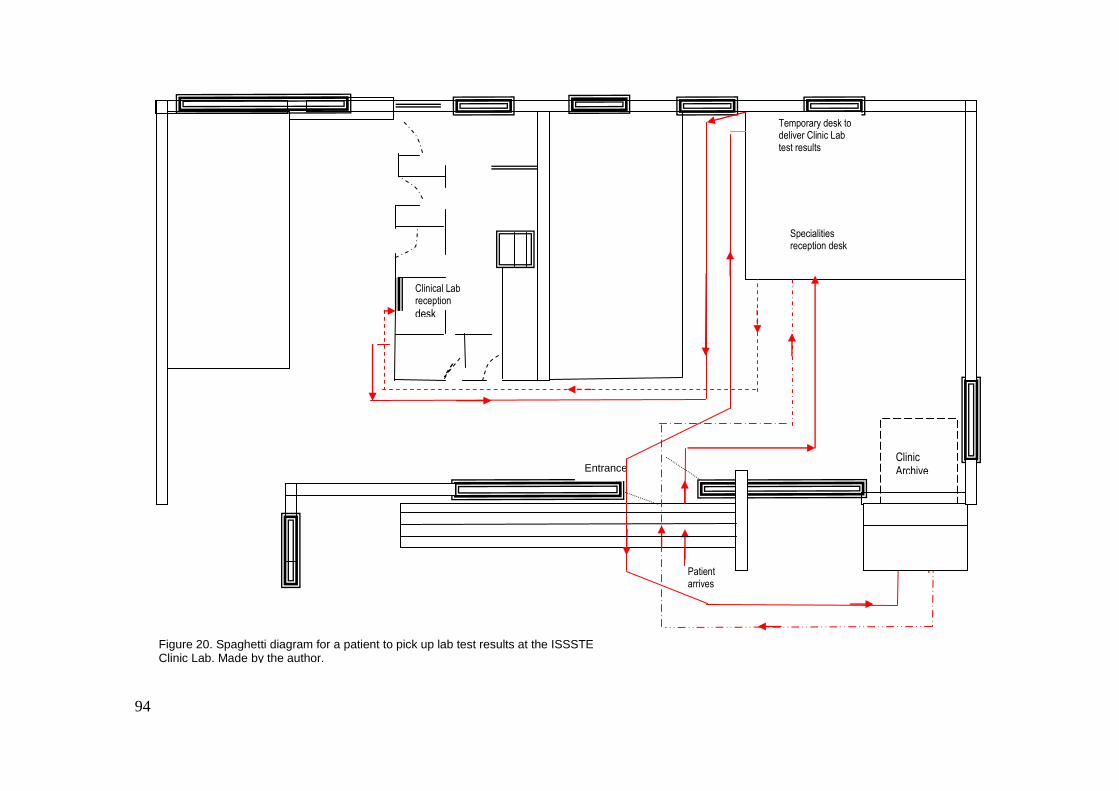
Clinic Archive
Clinical Lab reception desk
Patient arrives
Specialities reception desk
Temporary desk to deliver Clinic Lab test results
Entrance
Figure 20. Spaghetti diagram for a patient to pick up lab test results at the ISSSTE Clinic Lab. Made by the author.
94
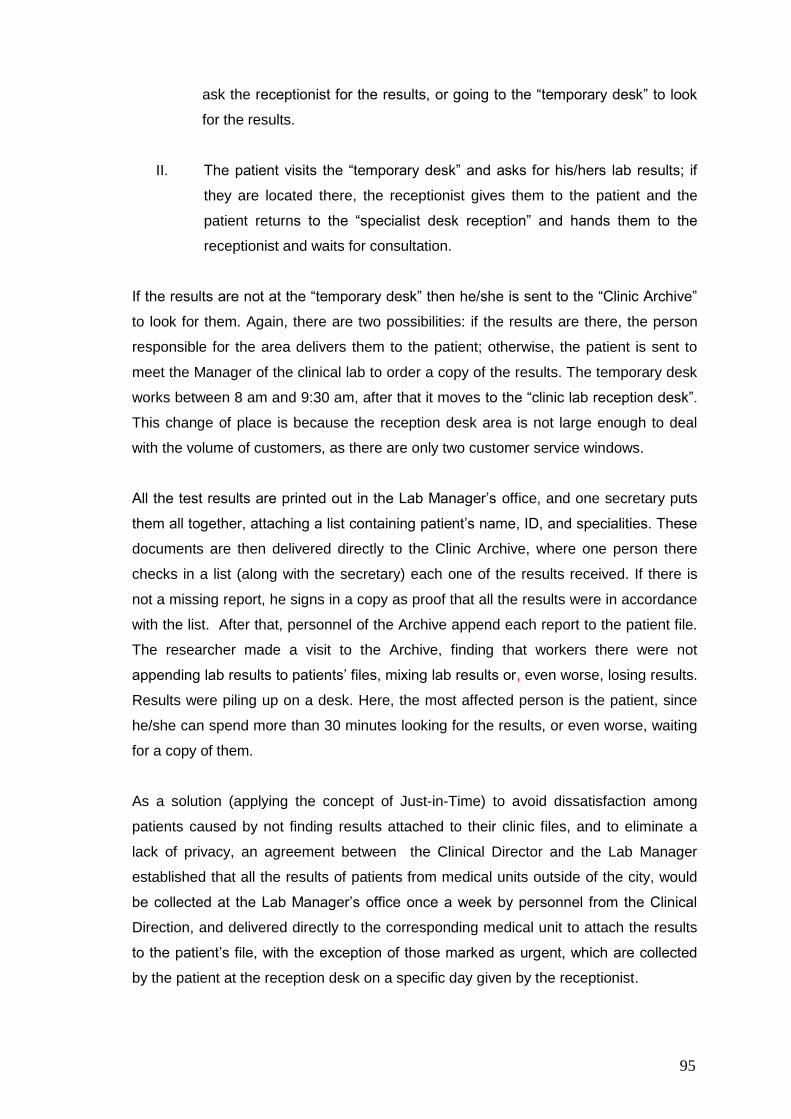
95
ask the receptionist for the results, or going to the “temporary desk” to look
for the results.
II. The patient visits the “temporary desk” and asks for his/hers lab results; if
they are located there, the receptionist gives them to the patient and the
patient returns to the “specialist desk reception” and hands them to the
receptionist and waits for consultation.
If the results are not at the “temporary desk” then he/she is sent to the “Clinic Archive”
to look for them. Again, there are two possibilities: if the results are there, the person
responsible for the area delivers them to the patient; otherwise, the patient is sent to
meet the Manager of the clinical lab to order a copy of the results. The temporary desk
works between 8 am and 9:30 am, after that it moves to the “clinic lab reception desk”.
This change of place is because the reception desk area is not large enough to deal
with the volume of customers, as there are only two customer service windows.
All the test results are printed out in the Lab Manager‟s office, and one secretary puts
them all together, attaching a list containing patient‟s name, ID, and specialities. These
documents are then delivered directly to the Clinic Archive, where one person there
checks in a list (along with the secretary) each one of the results received. If there is
not a missing report, he signs in a copy as proof that all the results were in accordance
with the list. After that, personnel of the Archive append each report to the patient file.
The researcher made a visit to the Archive, finding that workers there were not
appending lab results to patients‟ files, mixing lab results or, even worse, losing results.
Results were piling up on a desk. Here, the most affected person is the patient, since
he/she can spend more than 30 minutes looking for the results, or even worse, waiting
for a copy of them.
As a solution (applying the concept of Just-in-Time) to avoid dissatisfaction among
patients caused by not finding results attached to their clinic files, and to eliminate a
lack of privacy, an agreement between the Clinical Director and the Lab Manager
established that all the results of patients from medical units outside of the city, would
be collected at the Lab Manager‟s office once a week by personnel from the Clinical
Direction, and delivered directly to the corresponding medical unit to attach the results
to the patient‟s file, with the exception of those marked as urgent, which are collected
by the patient at the reception desk on a specific day given by the receptionist.
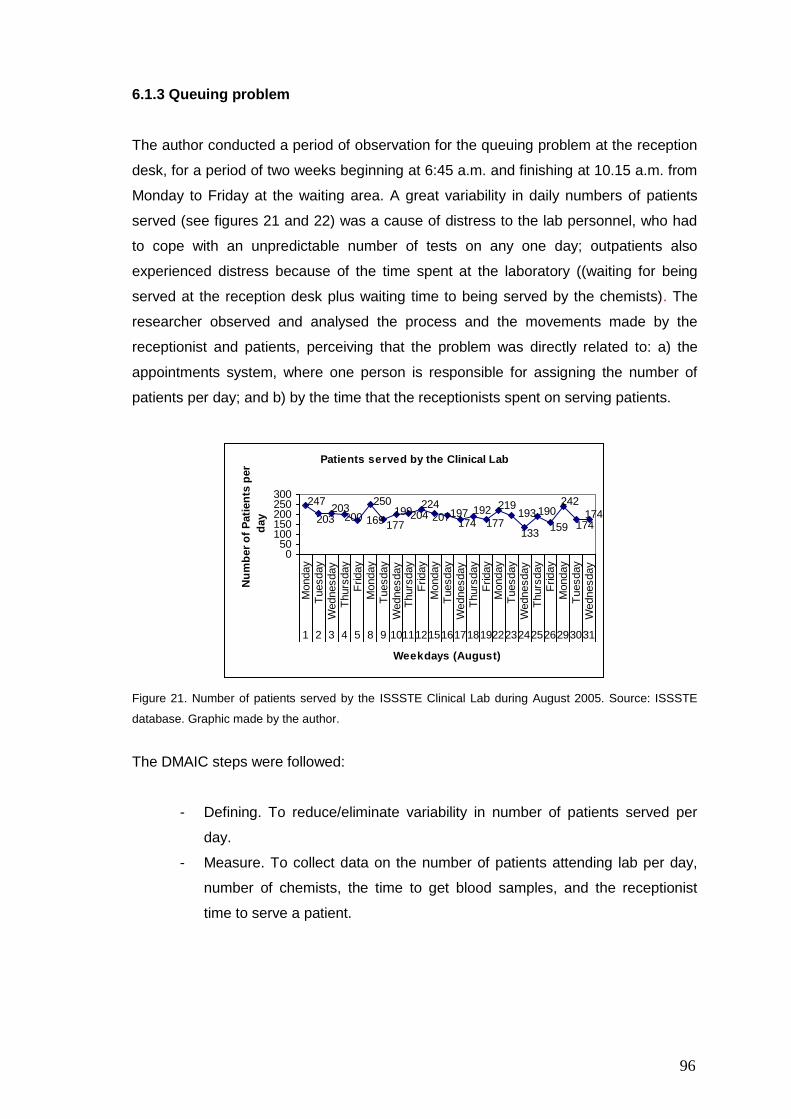
96
6.1.3 Queuing problem
The author conducted a period of observation for the queuing problem at the reception
desk, for a period of two weeks beginning at 6:45 a.m. and finishing at 10.15 a.m. from
Monday to Friday at the waiting area. A great variability in daily numbers of patients
served (see figures 21 and 22) was a cause of distress to the lab personnel, who had
to cope with an unpredictable number of tests on any one day; outpatients also
experienced distress because of the time spent at the laboratory ((waiting for being
served at the reception desk plus waiting time to being served by the chemists). The
researcher observed and analysed the process and the movements made by the
receptionist and patients, perceiving that the problem was directly related to: a) the
appointments system, where one person is responsible for assigning the number of
patients per day; and b) by the time that the receptionists spent on serving patients.
Patients served by the Clinical Lab
169
247
203203
200
250
177
199204224
207197174
192
177
219193
133
190
159
242
174174
050
100150200250300
Monday
Tuesday
Wednesday
Thurs
day
Friday
Monday
Tuesday
Wednesday
Thurs
day
Friday
Monday
Tuesday
Wednesday
Thurs
day
Friday
Monday
Tuesday
Wednesday
Thurs
day
Friday
Monday
Tuesday
Wednesday
1 2 3 4 5 8 9 10111215161718192223242526293031
Weekdays (August)
Nu
mb
er
of
Pati
en
ts p
er
day
Figure 21. Number of patients served by the ISSSTE Clinical Lab during August 2005. Source: ISSSTE
database. Graphic made by the author.
The DMAIC steps were followed:
- Defining. To reduce/eliminate variability in number of patients served per
day.
- Measure. To collect data on the number of patients attending lab per day,
number of chemists, the time to get blood samples, and the receptionist
time to serve a patient.
97
Patients served by the Clinical Lab
127
160173
135 142
226
127
159
167164
102
185
65
205
181
92
143
142
209
104
182
0
50
100
150
200
250
Thurs
day
Friday
Monday
Tuesday
Wednesday
Thurs
day
Friday
Monday
Tuesday
Wednesday
Thurs
day
Monday
Tuesday
Wednesday
Thurs
day
Friday
Monday
Tuesday
Wednesday
Thurs
day
Friday
1 2 5 6 7 8 9 12 13 14 15 19 20 21 22 23 26 27 28 29 30
Weekdays (September 2005)
Nu
mb
er
of
pati
en
ts p
er
day
Figure 22. Number of patients served by the ISSSTE Clinical Lab during September 2005. Source: SSSTE
Database. Graphic made by the author
Thus, in this step data was collected, starting with the number of patients served by the
laboratory. The standard deviation is a measure of variability and was calculated for
each month. Therefore, in August there were on average 194 patients served per day,
with a standard deviation of 29, while in September the figures were 152 and 41,
respectively. As can be seen, variability is greater in September than in August, even
though there were fewer patients served at the clinical lab.
Through a data analysis and observing the appointment process a severe problem was
highlighted: the person giving the appointments did not care about the limit established
by the computer program when it displayed that the day chosen was fully booked,
adding more patients; the Lab manager explained to the author that the software
utilised had a pre-established number of appointments per day:
“The software utilised to register appointments automatically limits to 180 appointments
per day, but the receptionist can add more people if necessary... just in case of
emergency, or if the Hospital Director asks for. The secretary should follow indications
regarding when adding more patients”
A meeting with the Clinical Director, the Hospital Director, Services Manager and the
Lab Manager was held in the third week of September. The first results of the case
study were shown by the author and after discussion a limit was set on the number of
patients seen per day to 195, with a possible increase of 10, in case of emergencies.
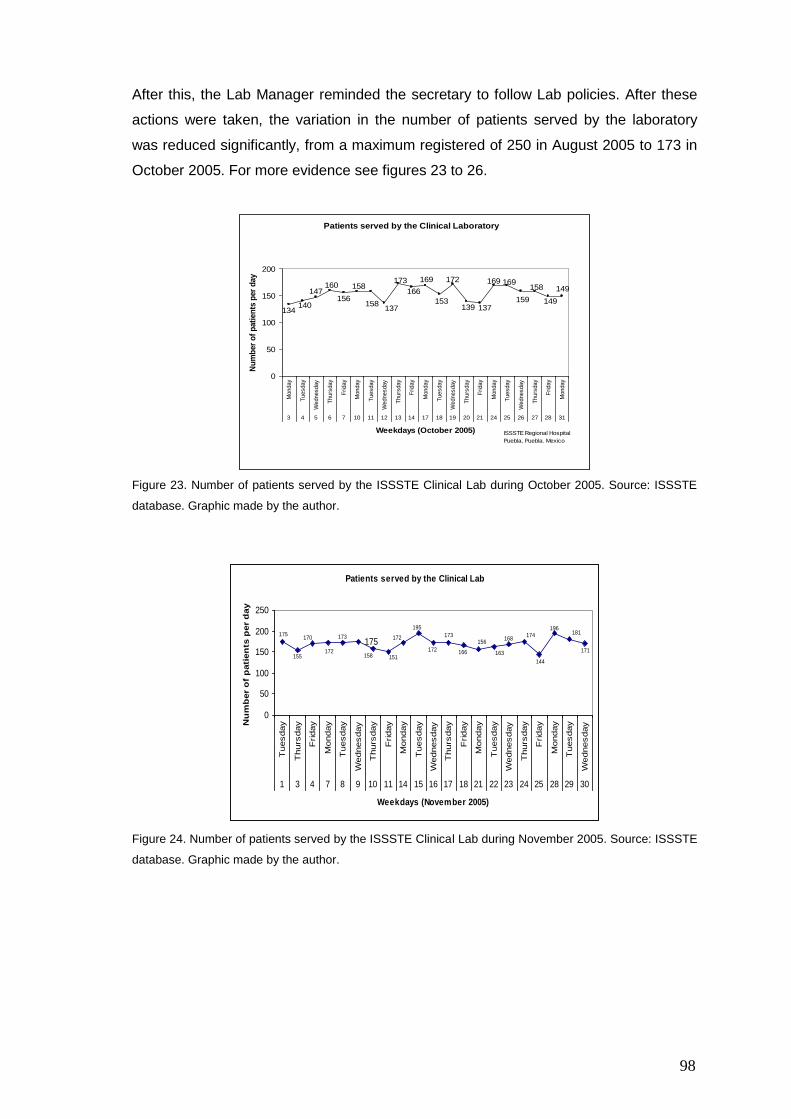
98
After this, the Lab Manager reminded the secretary to follow Lab policies. After these
actions were taken, the variation in the number of patients served by the laboratory
was reduced significantly, from a maximum registered of 250 in August 2005 to 173 in
October 2005. For more evidence see figures 23 to 26.
Patients served by the Clinical Laboratory
149
149
158
159
169169
137139
172
153
169
166
173
137158
158
156
160147
140134
0
50
100
150
200
Monday
Tuesday
Wednesday
Thurs
day
Friday
Monday
Tuesday
Wednesday
Thurs
day
Friday
Monday
Tuesday
Wednesday
Thurs
day
Friday
Monday
Tuesday
Wednesday
Thurs
day
Friday
Monday
3 4 5 6 7 10 11 12 13 14 17 18 19 20 21 24 25 26 27 28 31
Weekdays (October 2005)
Nu
mb
er
of
pati
en
ts p
er
day
ISSSTE Regional Hospital
Puebla, Puebla. Mexico
Figure 23. Number of patients served by the ISSSTE Clinical Lab during October 2005. Source: ISSSTE
database. Graphic made by the author.
Patients served by the Clinical Lab
175171
181196
144
174168
163
156
166
173
172
195
172
151158
173
172
170
155
175
0
50
100
150
200
250
Tuesday
Thurs
day
Friday
Monday
Tuesday
Wednesday
Thurs
day
Friday
Monday
Tuesday
Wednesday
Thurs
day
Friday
Monday
Tuesday
Wednesday
Thurs
day
Friday
Monday
Tuesday
Wednesday
1 3 4 7 8 9 10 11 14 15 16 17 18 21 22 23 24 25 28 29 30
Weekdays (November 2005)
Nu
mb
er
of
pati
en
ts p
er
day
Figure 24. Number of patients served by the ISSSTE Clinical Lab during November 2005. Source: ISSSTE
database. Graphic made by the author.
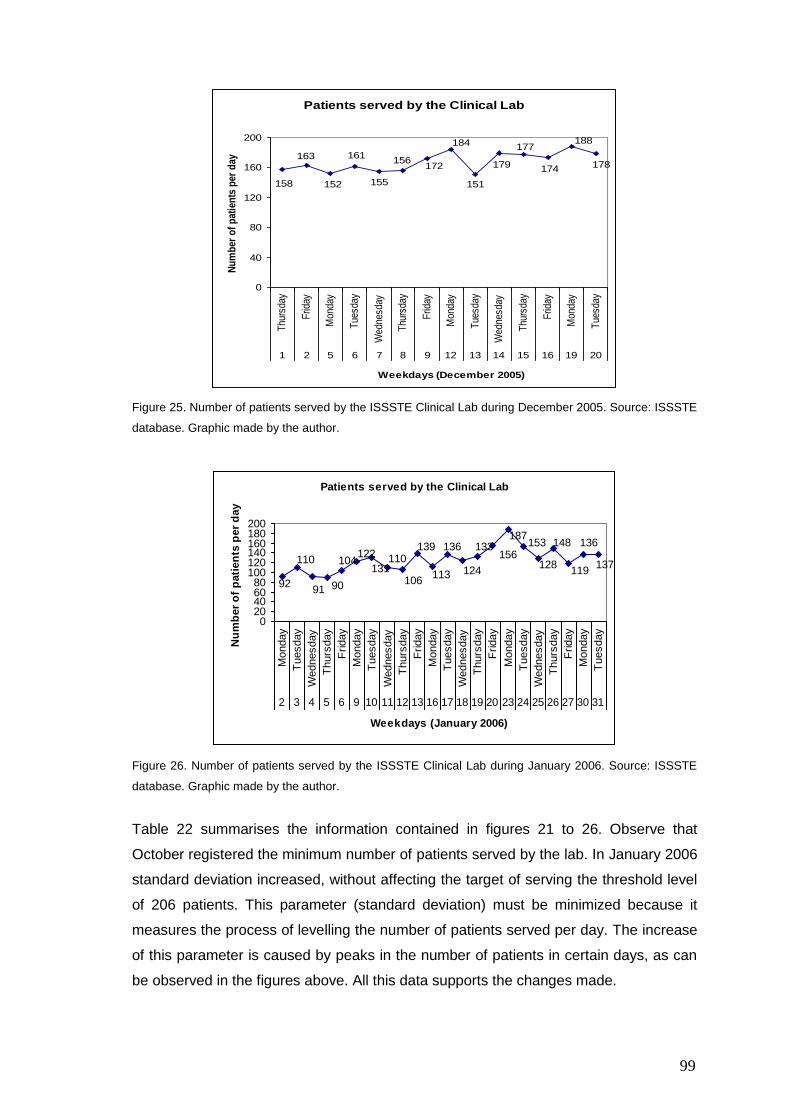
99
Patients served by the Clinical Lab
188
178174
177
179
151
184
172156
155
161
152
163
158
0
40
80
120
160
200
Thu
rsda
y
Frid
ay
Mon
day
Tue
sday
Wed
nesd
ay
Thu
rsda
y
Frid
ay
Mon
day
Tue
sday
Wed
nesd
ay
Thu
rsda
y
Frid
ay
Mon
day
Tue
sday
1 2 5 6 7 8 9 12 13 14 15 16 19 20
Weekdays (December 2005)
Nu
mb
er o
f p
atie
nts
per
day
Figure 25. Number of patients served by the ISSSTE Clinical Lab during December 2005. Source: ISSSTE
database. Graphic made by the author.
Patients served by the Clinical Lab
92
110
91 90
104122
131110
106
139
113
136
124
133156
187153
128
148
119
136
137
020406080
100120140160180200
Monday
Tuesday
Wednesday
Thurs
day
Friday
Monday
Tuesday
Wednesday
Thurs
day
Friday
Monday
Tuesday
Wednesday
Thurs
day
Friday
Monday
Tuesday
Wednesday
Thurs
day
Friday
Monday
Tuesday
2 3 4 5 6 9 10 11 12 13 16 17 18 19 20 23 24 25 26 27 30 31
Weekdays (January 2006)
Nu
mb
er
of
pati
en
ts p
er
day
Figure 26. Number of patients served by the ISSSTE Clinical Lab during January 2006. Source: ISSSTE
database. Graphic made by the author.
Table 22 summarises the information contained in figures 21 to 26. Observe that
October registered the minimum number of patients served by the lab. In January 2006
standard deviation increased, without affecting the target of serving the threshold level
of 206 patients. This parameter (standard deviation) must be minimized because it
measures the process of levelling the number of patients served per day. The increase
of this parameter is caused by peaks in the number of patients in certain days, as can
be observed in the figures above. All this data supports the changes made.
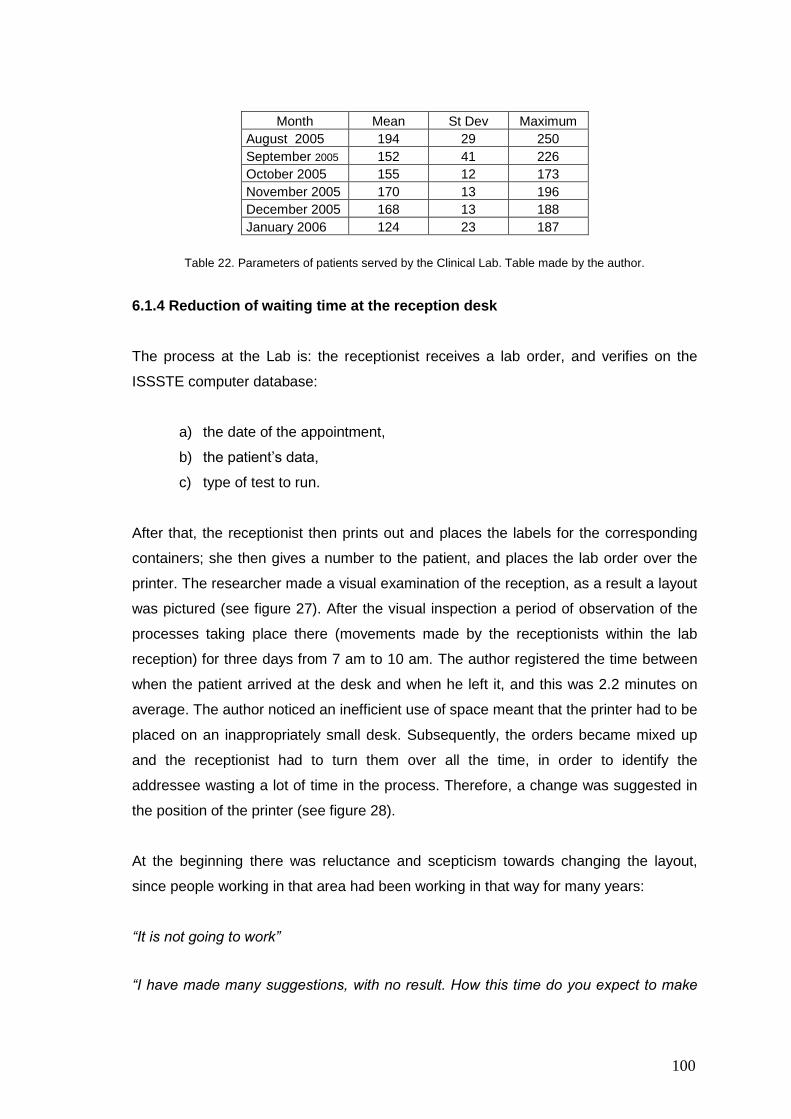
100
Month Mean St Dev Maximum
August 2005 194 29 250
September 2005 152 41 226
October 2005 155 12 173
November 2005 170 13 196
December 2005 168 13 188
January 2006 124 23 187
Table 22. Parameters of patients served by the Clinical Lab. Table made by the author.
6.1.4 Reduction of waiting time at the reception desk
The process at the Lab is: the receptionist receives a lab order, and verifies on the
ISSSTE computer database:
a) the date of the appointment,
b) the patient‟s data,
c) type of test to run.
After that, the receptionist then prints out and places the labels for the corresponding
containers; she then gives a number to the patient, and places the lab order over the
printer. The researcher made a visual examination of the reception, as a result a layout
was pictured (see figure 27). After the visual inspection a period of observation of the
processes taking place there (movements made by the receptionists within the lab
reception) for three days from 7 am to 10 am. The author registered the time between
when the patient arrived at the desk and when he left it, and this was 2.2 minutes on
average. The author noticed an inefficient use of space meant that the printer had to be
placed on an inappropriately small desk. Subsequently, the orders became mixed up
and the receptionist had to turn them over all the time, in order to identify the
addressee wasting a lot of time in the process. Therefore, a change was suggested in
the position of the printer (see figure 28).
At the beginning there was reluctance and scepticism towards changing the layout,
since people working in that area had been working in that way for many years:
“It is not going to work”
“I have made many suggestions, with no result. How this time do you expect to make
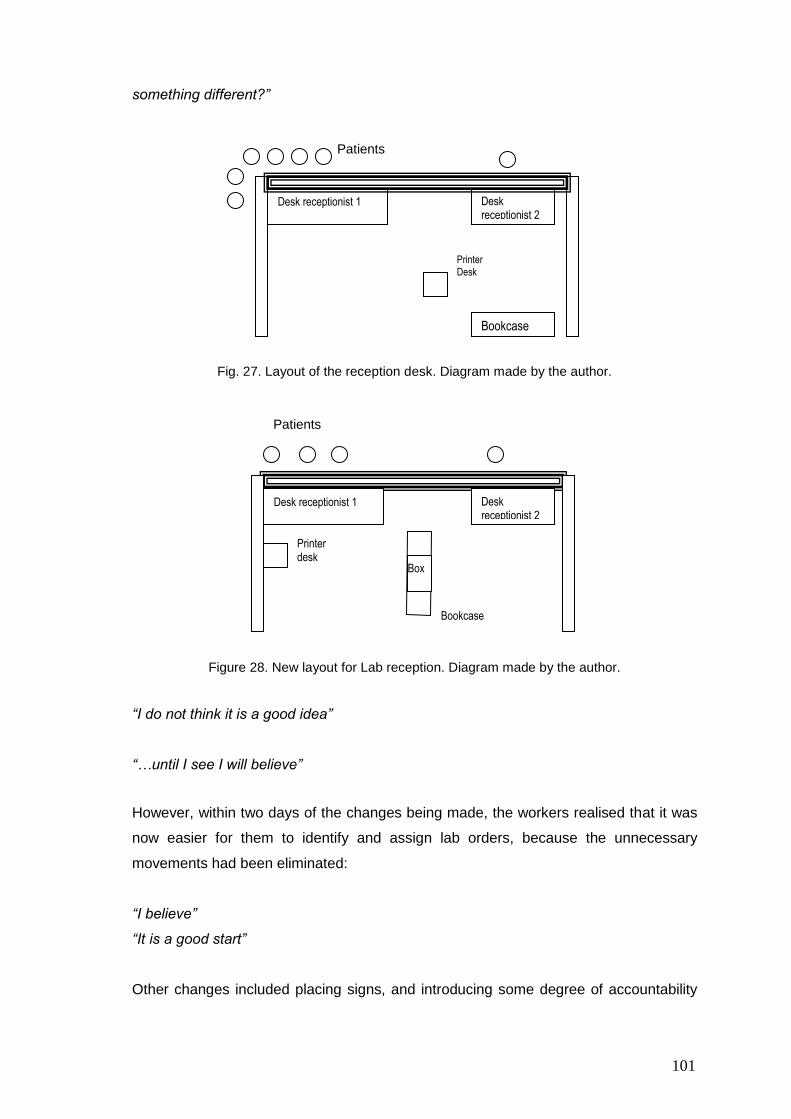
101
something different?”
Fig. 27. Layout of the reception desk. Diagram made by the author.
Figure 28. New layout for Lab reception. Diagram made by the author.
“I do not think it is a good idea”
“…until I see I will believe”
However, within two days of the changes being made, the workers realised that it was
now easier for them to identify and assign lab orders, because the unnecessary
movements had been eliminated:
“I believe”
“It is a good start”
Other changes included placing signs, and introducing some degree of accountability
Desk receptionist 1 Desk receptionist 2
Bookcase
Printer Desk
Patients
Desk receptionist 1 Desk receptionist 2
Printer desk
Box
Bookcase
Patients
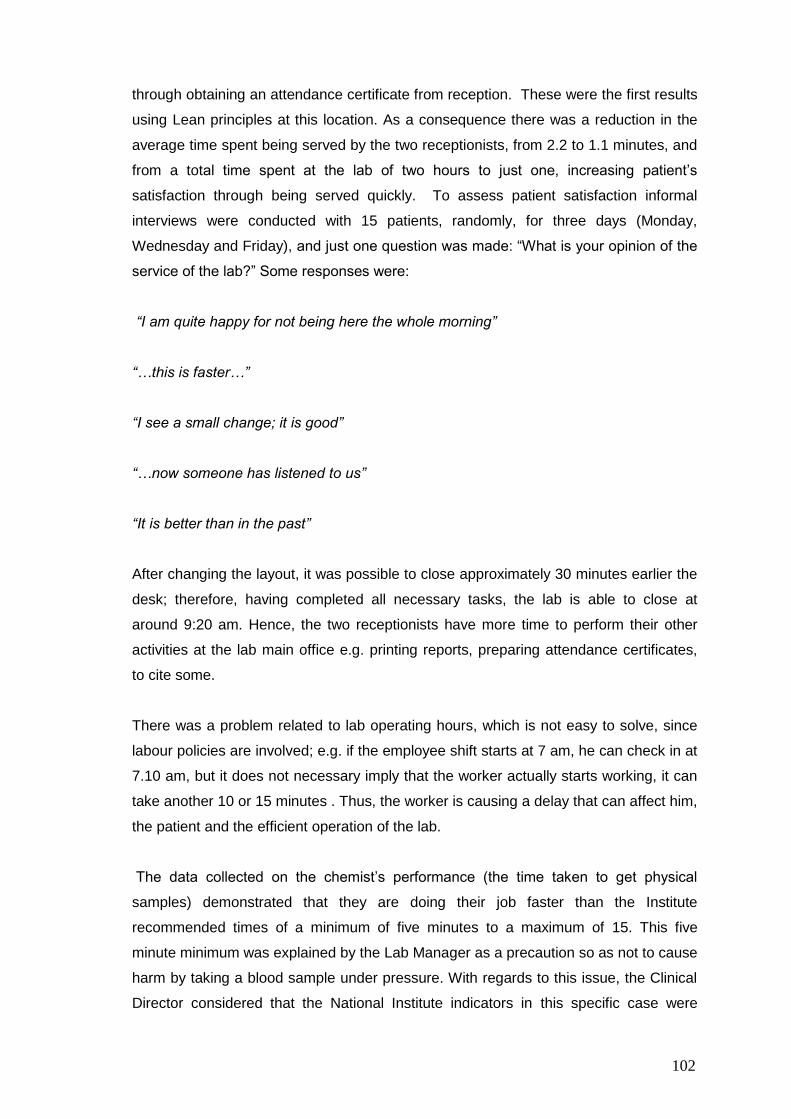
102
through obtaining an attendance certificate from reception. These were the first results
using Lean principles at this location. As a consequence there was a reduction in the
average time spent being served by the two receptionists, from 2.2 to 1.1 minutes, and
from a total time spent at the lab of two hours to just one, increasing patient‟s
satisfaction through being served quickly. To assess patient satisfaction informal
interviews were conducted with 15 patients, randomly, for three days (Monday,
Wednesday and Friday), and just one question was made: “What is your opinion of the
service of the lab?” Some responses were:
“I am quite happy for not being here the whole morning”
“…this is faster…”
“I see a small change; it is good”
“…now someone has listened to us”
“It is better than in the past”
After changing the layout, it was possible to close approximately 30 minutes earlier the
desk; therefore, having completed all necessary tasks, the lab is able to close at
around 9:20 am. Hence, the two receptionists have more time to perform their other
activities at the lab main office e.g. printing reports, preparing attendance certificates,
to cite some.
There was a problem related to lab operating hours, which is not easy to solve, since
labour policies are involved; e.g. if the employee shift starts at 7 am, he can check in at
7.10 am, but it does not necessary imply that the worker actually starts working, it can
take another 10 or 15 minutes . Thus, the worker is causing a delay that can affect him,
the patient and the efficient operation of the lab.
The data collected on the chemist‟s performance (the time taken to get physical
samples) demonstrated that they are doing their job faster than the Institute
recommended times of a minimum of five minutes to a maximum of 15. This five
minute minimum was explained by the Lab Manager as a precaution so as not to cause
harm by taking a blood sample under pressure. With regards to this issue, the Clinical
Director considered that the National Institute indicators in this specific case were
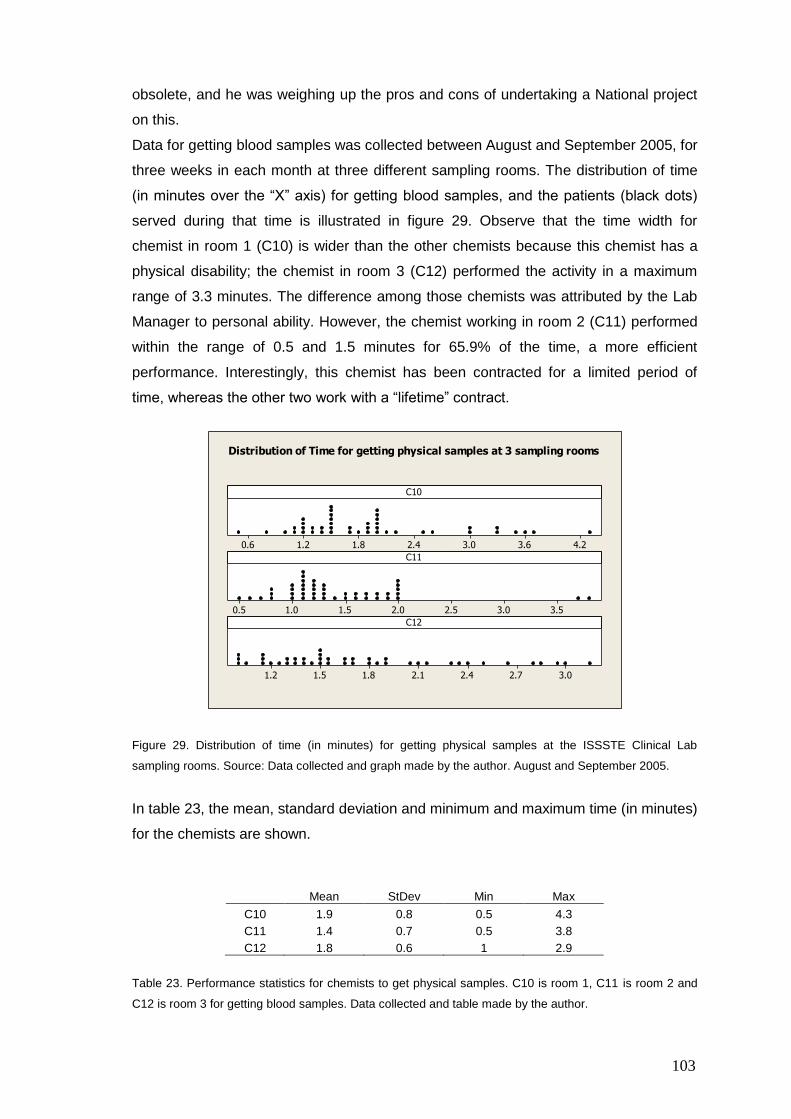
103
obsolete, and he was weighing up the pros and cons of undertaking a National project
on this.
Data for getting blood samples was collected between August and September 2005, for
three weeks in each month at three different sampling rooms. The distribution of time
(in minutes over the “X” axis) for getting blood samples, and the patients (black dots)
served during that time is illustrated in figure 29. Observe that the time width for
chemist in room 1 (C10) is wider than the other chemists because this chemist has a
physical disability; the chemist in room 3 (C12) performed the activity in a maximum
range of 3.3 minutes. The difference among those chemists was attributed by the Lab
Manager to personal ability. However, the chemist working in room 2 (C11) performed
within the range of 0.5 and 1.5 minutes for 65.9% of the time, a more efficient
performance. Interestingly, this chemist has been contracted for a limited period of
time, whereas the other two work with a “lifetime” contract.
4.23.63.02.41.81.20.6
3.53.02.52.01.51.00.5
3.02.72.42.11.81.51.2
C10
C11
C12
Distribution of Time for getting physical samples at 3 sampling rooms
Figure 29. Distribution of time (in minutes) for getting physical samples at the ISSSTE Clinical Lab
sampling rooms. Source: Data collected and graph made by the author. August and September 2005.
In table 23, the mean, standard deviation and minimum and maximum time (in minutes)
for the chemists are shown.
Mean StDev Min Max
C10 1.9 0.8 0.5 4.3
C11 1.4 0.7 0.5 3.8
C12 1.8 0.6 1 2.9
Table 23. Performance statistics for chemists to get physical samples. C10 is room 1, C11 is room 2 and
C12 is room 3 for getting blood samples. Data collected and table made by the author.
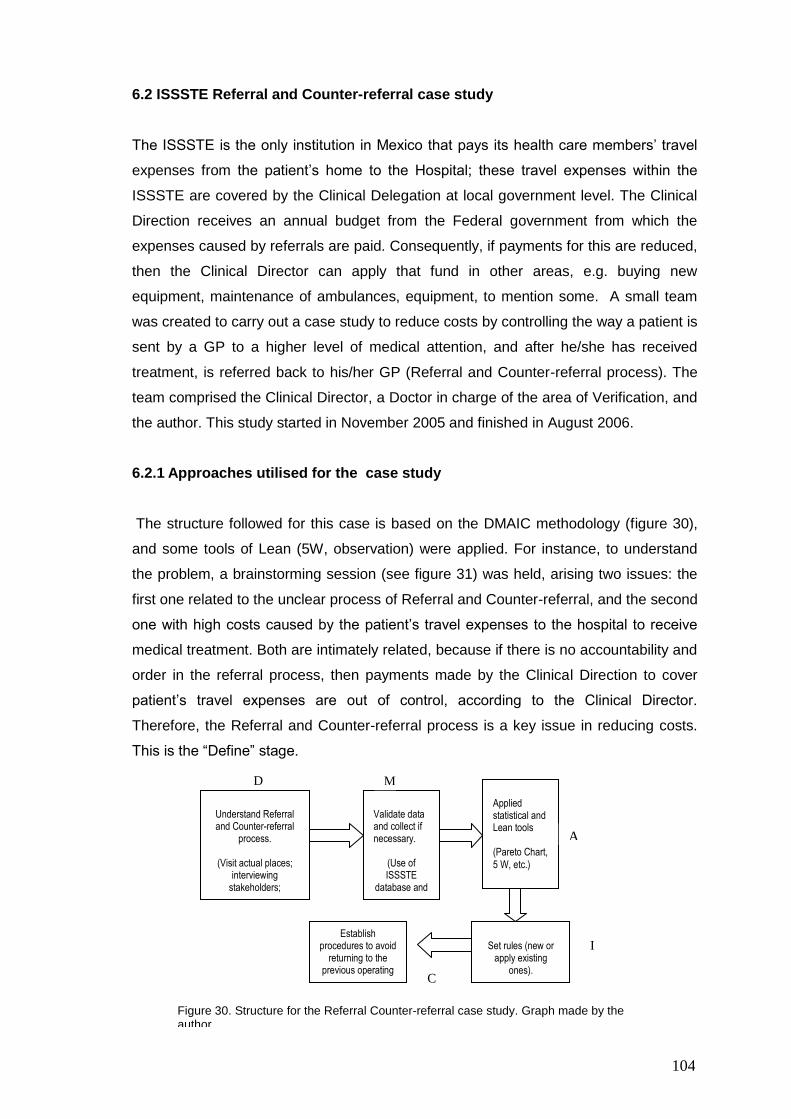
104
6.2 ISSSTE Referral and Counter-referral case study
The ISSSTE is the only institution in Mexico that pays its health care members‟ travel
expenses from the patient‟s home to the Hospital; these travel expenses within the
ISSSTE are covered by the Clinical Delegation at local government level. The Clinical
Direction receives an annual budget from the Federal government from which the
expenses caused by referrals are paid. Consequently, if payments for this are reduced,
then the Clinical Director can apply that fund in other areas, e.g. buying new
equipment, maintenance of ambulances, equipment, to mention some. A small team
was created to carry out a case study to reduce costs by controlling the way a patient is
sent by a GP to a higher level of medical attention, and after he/she has received
treatment, is referred back to his/her GP (Referral and Counter-referral process). The
team comprised the Clinical Director, a Doctor in charge of the area of Verification, and
the author. This study started in November 2005 and finished in August 2006.
6.2.1 Approaches utilised for the case study
The structure followed for this case is based on the DMAIC methodology (figure 30),
and some tools of Lean (5W, observation) were applied. For instance, to understand
the problem, a brainstorming session (see figure 31) was held, arising two issues: the
first one related to the unclear process of Referral and Counter-referral, and the second
one with high costs caused by the patient‟s travel expenses to the hospital to receive
medical treatment. Both are intimately related, because if there is no accountability and
order in the referral process, then payments made by the Clinical Direction to cover
patient‟s travel expenses are out of control, according to the Clinical Director.
Therefore, the Referral and Counter-referral process is a key issue in reducing costs.
This is the “Define” stage.
Understand Referral and Counter-referral
process.
(Visit actual places; interviewing
stakeholders; reading manuals).
Validate data and collect if necessary.
(Use of ISSSTE
database and Finance
Department)
Applied statistical and Lean tools (Pareto Chart,
5 W, etc.)
Set rules (new or
apply existing ones).
Establish procedures to avoid
returning to the previous operating
mode.
Figure 30. Structure for the Referral Counter-referral case study. Graph made by the author.
D M
A
I
C
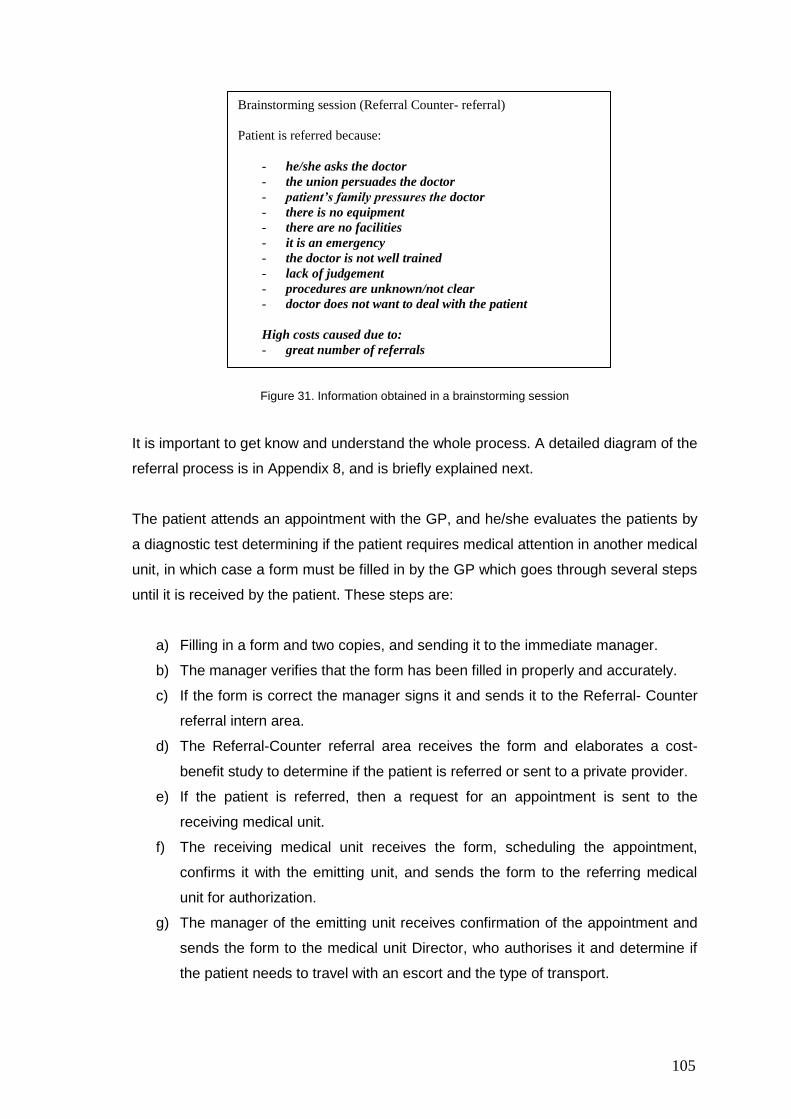
105
Figure 31. Information obtained in a brainstorming session
It is important to get know and understand the whole process. A detailed diagram of the
referral process is in Appendix 8, and is briefly explained next.
The patient attends an appointment with the GP, and he/she evaluates the patients by
a diagnostic test determining if the patient requires medical attention in another medical
unit, in which case a form must be filled in by the GP which goes through several steps
until it is received by the patient. These steps are:
a) Filling in a form and two copies, and sending it to the immediate manager.
b) The manager verifies that the form has been filled in properly and accurately.
c) If the form is correct the manager signs it and sends it to the Referral- Counter
referral intern area.
d) The Referral-Counter referral area receives the form and elaborates a cost-
benefit study to determine if the patient is referred or sent to a private provider.
e) If the patient is referred, then a request for an appointment is sent to the
receiving medical unit.
f) The receiving medical unit receives the form, scheduling the appointment,
confirms it with the emitting unit, and sends the form to the referring medical
unit for authorization.
g) The manager of the emitting unit receives confirmation of the appointment and
sends the form to the medical unit Director, who authorises it and determine if
the patient needs to travel with an escort and the type of transport.
Brainstorming session (Referral Counter- referral)
Patient is referred because:
- he/she asks the doctor
- the union persuades the doctor
- patient’s family pressures the doctor
- there is no equipment
- there are no facilities
- it is an emergency
- the doctor is not well trained
- lack of judgement
- procedures are unknown/not clear
- doctor does not want to deal with the patient
High costs caused due to:
- great number of referrals
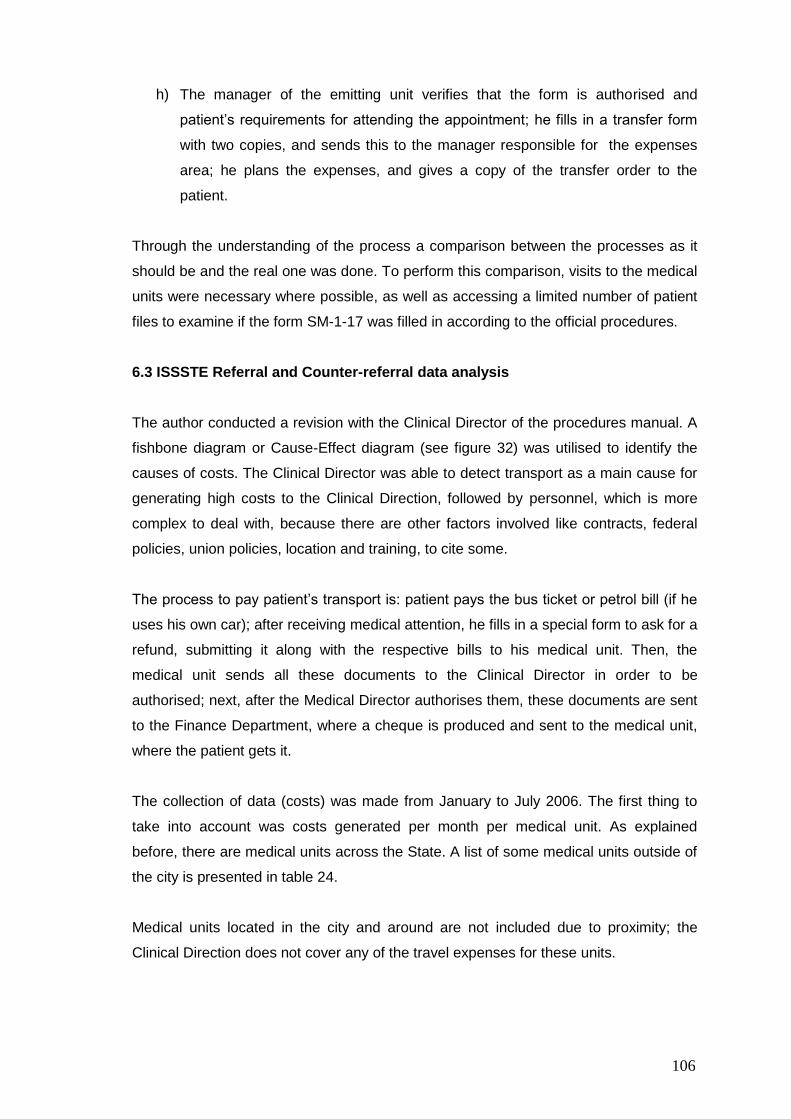
106
h) The manager of the emitting unit verifies that the form is authorised and
patient‟s requirements for attending the appointment; he fills in a transfer form
with two copies, and sends this to the manager responsible for the expenses
area; he plans the expenses, and gives a copy of the transfer order to the
patient.
Through the understanding of the process a comparison between the processes as it
should be and the real one was done. To perform this comparison, visits to the medical
units were necessary where possible, as well as accessing a limited number of patient
files to examine if the form SM-1-17 was filled in according to the official procedures.
6.3 ISSSTE Referral and Counter-referral data analysis
The author conducted a revision with the Clinical Director of the procedures manual. A
fishbone diagram or Cause-Effect diagram (see figure 32) was utilised to identify the
causes of costs. The Clinical Director was able to detect transport as a main cause for
generating high costs to the Clinical Direction, followed by personnel, which is more
complex to deal with, because there are other factors involved like contracts, federal
policies, union policies, location and training, to cite some.
The process to pay patient‟s transport is: patient pays the bus ticket or petrol bill (if he
uses his own car); after receiving medical attention, he fills in a special form to ask for a
refund, submitting it along with the respective bills to his medical unit. Then, the
medical unit sends all these documents to the Clinical Director in order to be
authorised; next, after the Medical Director authorises them, these documents are sent
to the Finance Department, where a cheque is produced and sent to the medical unit,
where the patient gets it.
The collection of data (costs) was made from January to July 2006. The first thing to
take into account was costs generated per month per medical unit. As explained
before, there are medical units across the State. A list of some medical units outside of
the city is presented in table 24.
Medical units located in the city and around are not included due to proximity; the
Clinical Direction does not cover any of the travel expenses for these units.
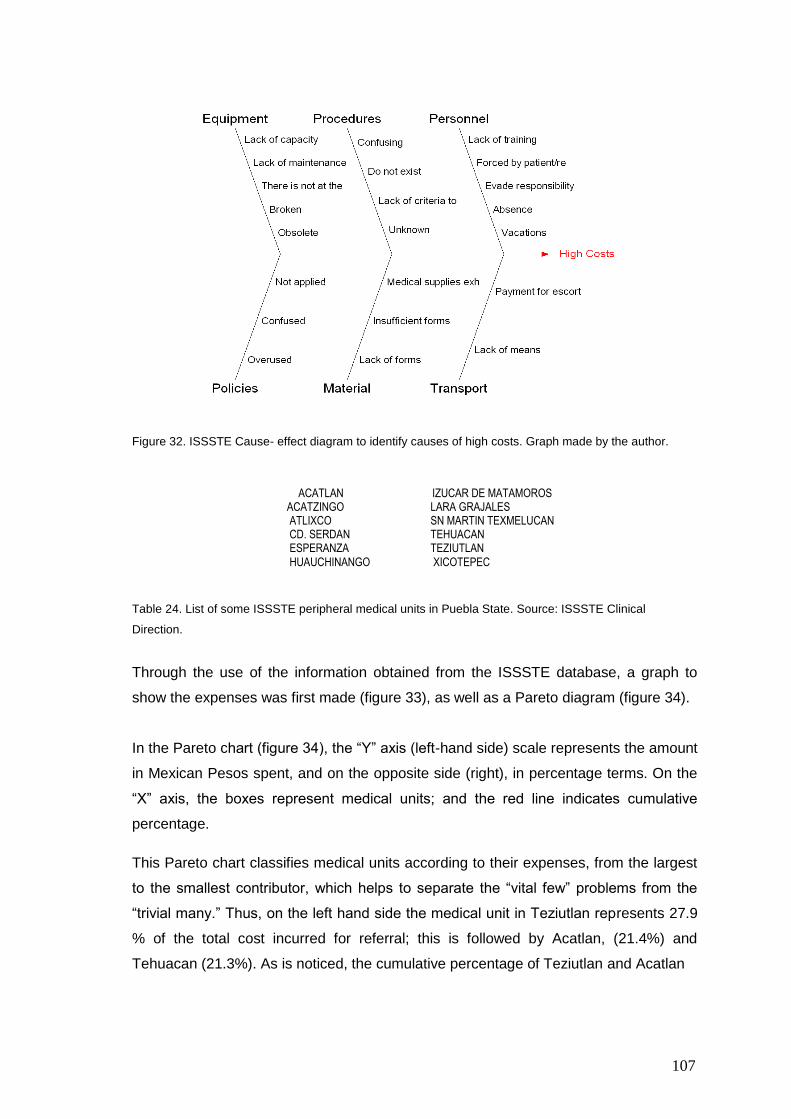
107
Figure 32. ISSSTE Cause- effect diagram to identify causes of high costs. Graph made by the author.
Table 24. List of some ISSSTE peripheral medical units in Puebla State. Source: ISSSTE Clinical
Direction.
Through the use of the information obtained from the ISSSTE database, a graph to
show the expenses was first made (figure 33), as well as a Pareto diagram (figure 34).
In the Pareto chart (figure 34), the “Y” axis (left-hand side) scale represents the amount
in Mexican Pesos spent, and on the opposite side (right), in percentage terms. On the
“X” axis, the boxes represent medical units; and the red line indicates cumulative
percentage.
This Pareto chart classifies medical units according to their expenses, from the largest
to the smallest contributor, which helps to separate the “vital few” problems from the
“trivial many.” Thus, on the left hand side the medical unit in Teziutlan represents 27.9
% of the total cost incurred for referral; this is followed by Acatlan, (21.4%) and
Tehuacan (21.3%). As is noticed, the cumulative percentage of Teziutlan and Acatlan
ACATLAN IZUCAR DE MATAMOROS ACATZINGO LARA GRAJALES ATLIXCO SN MARTIN TEXMELUCAN CD. SERDAN TEHUACAN ESPERANZA TEZIUTLAN
HUAUCHINANGO XICOTEPEC
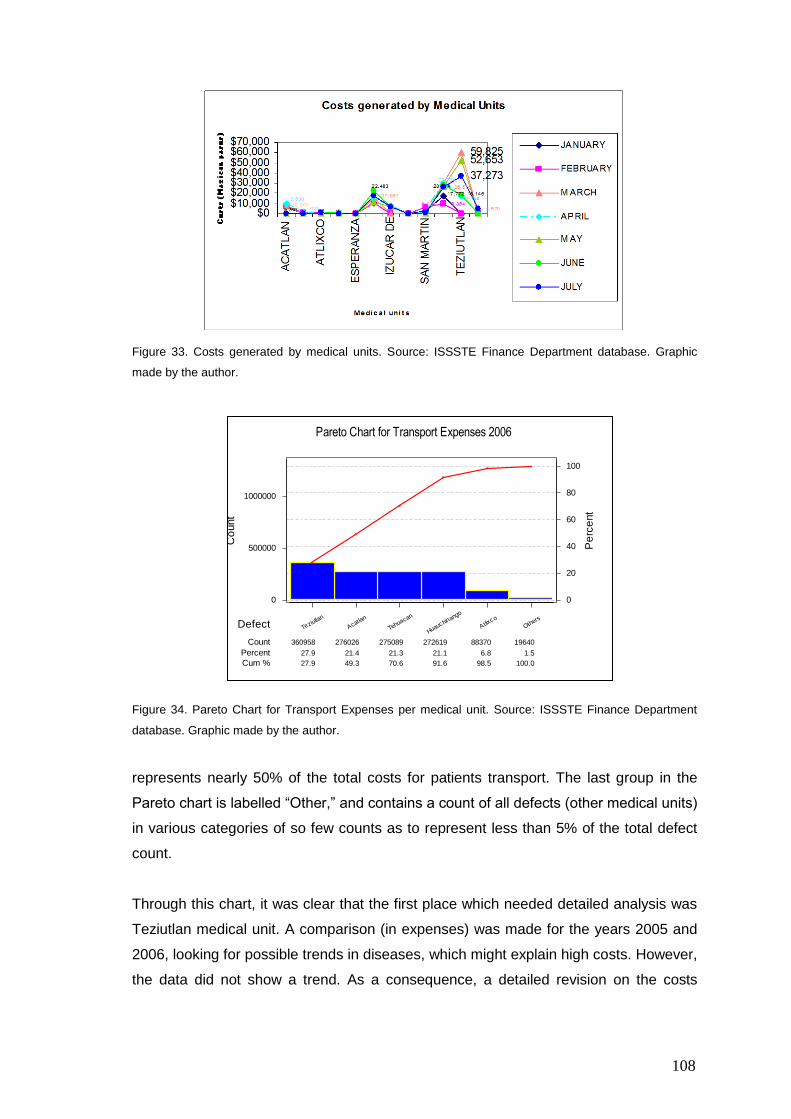
108
Figure 33. Costs generated by medical units. Source: ISSSTE Finance Department database. Graphic
made by the author.
Figure 34. Pareto Chart for Transport Expenses per medical unit. Source: ISSSTE Finance Department
database. Graphic made by the author.
represents nearly 50% of the total costs for patients transport. The last group in the
Pareto chart is labelled “Other,” and contains a count of all defects (other medical units)
in various categories of so few counts as to represent less than 5% of the total defect
count.
Through this chart, it was clear that the first place which needed detailed analysis was
Teziutlan medical unit. A comparison (in expenses) was made for the years 2005 and
2006, looking for possible trends in diseases, which might explain high costs. However,
the data did not show a trend. As a consequence, a detailed revision on the costs
Others
Atlixco
Huauchinango
Tehuacan
Acatlan
Teziutlan
19640 88370272619275089276026360958
1.5 6.821.121.321.427.9
100.0 98.5 91.6 70.6 49.3 27.9
1000000
500000
0
100
80
60
40
20
0
Defect
Count
Percent
Cum %
Pe
rce
nt
Co
unt
Pareto Chart for Transport Expenses 2006
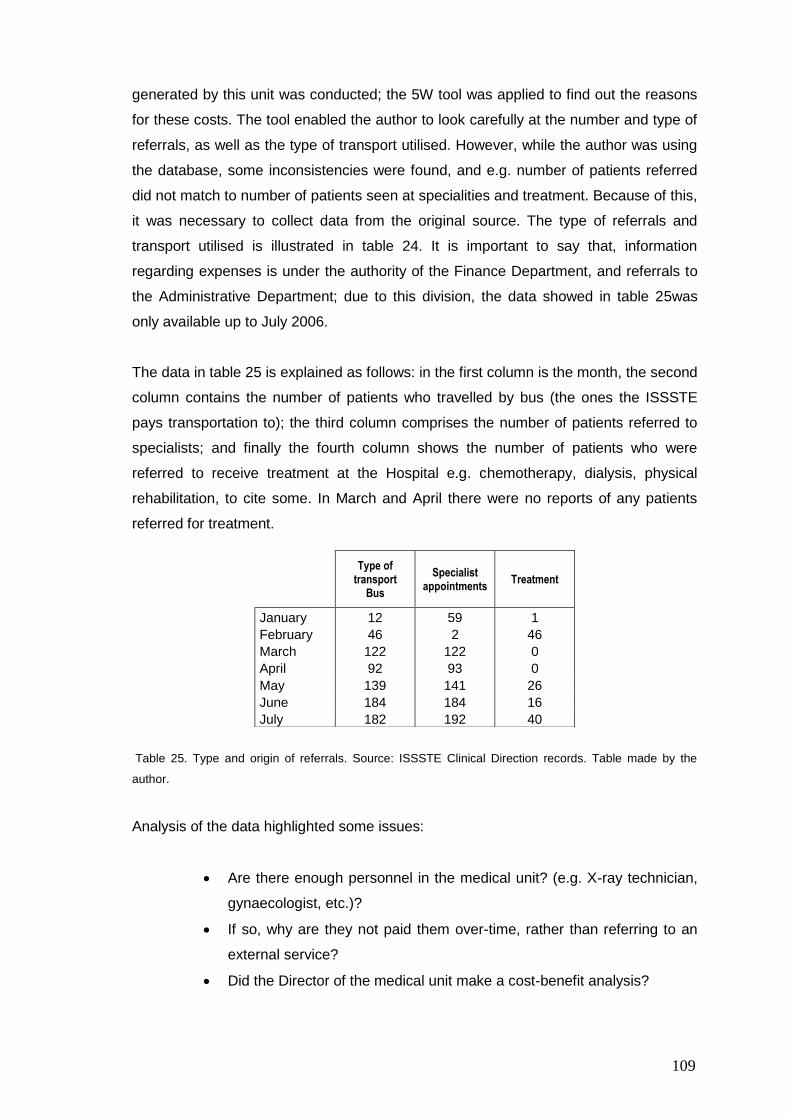
109
generated by this unit was conducted; the 5W tool was applied to find out the reasons
for these costs. The tool enabled the author to look carefully at the number and type of
referrals, as well as the type of transport utilised. However, while the author was using
the database, some inconsistencies were found, and e.g. number of patients referred
did not match to number of patients seen at specialities and treatment. Because of this,
it was necessary to collect data from the original source. The type of referrals and
transport utilised is illustrated in table 24. It is important to say that, information
regarding expenses is under the authority of the Finance Department, and referrals to
the Administrative Department; due to this division, the data showed in table 25was
only available up to July 2006.
The data in table 25 is explained as follows: in the first column is the month, the second
column contains the number of patients who travelled by bus (the ones the ISSSTE
pays transportation to); the third column comprises the number of patients referred to
specialists; and finally the fourth column shows the number of patients who were
referred to receive treatment at the Hospital e.g. chemotherapy, dialysis, physical
rehabilitation, to cite some. In March and April there were no reports of any patients
referred for treatment.
Table 25. Type and origin of referrals. Source: ISSSTE Clinical Direction records. Table made by the
author.
Analysis of the data highlighted some issues:
Are there enough personnel in the medical unit? (e.g. X-ray technician,
gynaecologist, etc.)?
If so, why are they not paid them over-time, rather than referring to an
external service?
Did the Director of the medical unit make a cost-benefit analysis?
Type of transport
Bus
Specialist appointments
Treatment
January 12 59 1
February 46 2 46
March 122 122 0
April 92 93 0
May 139 141 26
June 184 184 16
July 182 192 40
110
Was it necessary to refer those patients for special medical attention?
Does the patient actually need to travel accompanied?
These issues were asked in an interview with the Clinical Director, who answered:
“Directors of medical units have to do several tasks, aside from the management of the
unit; they have to fill in reports, dealing with requests…and do not have enough time to
check GPs procedures. It is not an excuse, may be they need to organise themselves
better.”
He and the researcher searched into the files, and noticed that most of the time:
- Policies were not followed by the doctors, director and other people involved in
the process.
- Peripheral medical units have not got an area of Referral and Counter-referral,
because of the population size (too small). Consequently, the doctor or the
nurse should do the paperwork, apart from working as pharmacists.
- Not all the forms SM1-17 were correctly filled in, there were blots, amendments,
incomplete data, illegible handwriting, just to mention a few.
- Lack of rules to impartially decide if a patient‟s travel expenses had to be paid
by the Institute; currently, the decision is made by the doctor‟s personal opinion.
- There is no accountability to register the number of referrals, number of times
that a patient is sent for the same illness and case. According to the policies
there is a limit of five consultations. Any subsequent consultation should be
notified to the medical unit Director. However, this situation is not
communicated to the Director, who was unaware about the actual time that a
patient stays in the system. The patient can be under medical treatment for
different illnesses from the original one. For example, a patient can be referred
to a neurology consultant and after the consultation he/she is referred to
another speciality like orthopaedics, cardiology, etc., losing control on money,
which has to be covered by the Institute. This is a waste of resources not only
economic, but also in time and personnel.
111
- The cost-benefit study was not made: thus, in some cases the Institute pays
more for a substitute provider service (because the most expensive was
chosen) rather than paying overtime to a radiologist, doctor, technician, nurse
or chemist.
- Finally, inconsistencies in the procedures policies were found as discussed with
the Clinical Director. This could be because the Referral and Counter referral
manual was written at different points of time and for different people.
Because the manual is used in the whole country, corrections have to be made through
consensus of the Clinical Directors in the country. A unique document must then be
produced and sent to the respective authorities for its consideration. However, the
Clinical Director was able to order (at the end of March 2006) that some basic
procedures should be followed like:
a) registering the number and type of referrals made by each GP
b) GPs with unusual number of referrals require the medical unit Manager‟s
authorisation, prior to giving the patient a referral
c) selecting referrals randomly (at least two per month) , to assess diagnosis and
proper form filling
d) analysing the payment of overtime before referring the patient to a substitute
provider; if it was not possible to get specialists available by paying overtime,
then to choose a substitute provider (not an expensive one) without
compromising patient‟s life
As mentioned before, due to inconsistencies in data, a second comparison in expenses
for 2005, 2006 and the first two months of 2007 was made (see figure 35). This
information was obtained through the Clinical Direction. Reduction in expenses can be
noticed in May, June, July, August, and November in 2006 (with a small increment in
September, which was caused by a rise in the bus fare tickets as the author examined
and compared each ticket to previous months); for October and November, less
patients were reported sent to the hospital; yet, there was a high amount that was paid
in December caused by extemporaneous bills presented by patients´ to their medical
unit, which is authorised by the Finance Department; in order to eliminate this
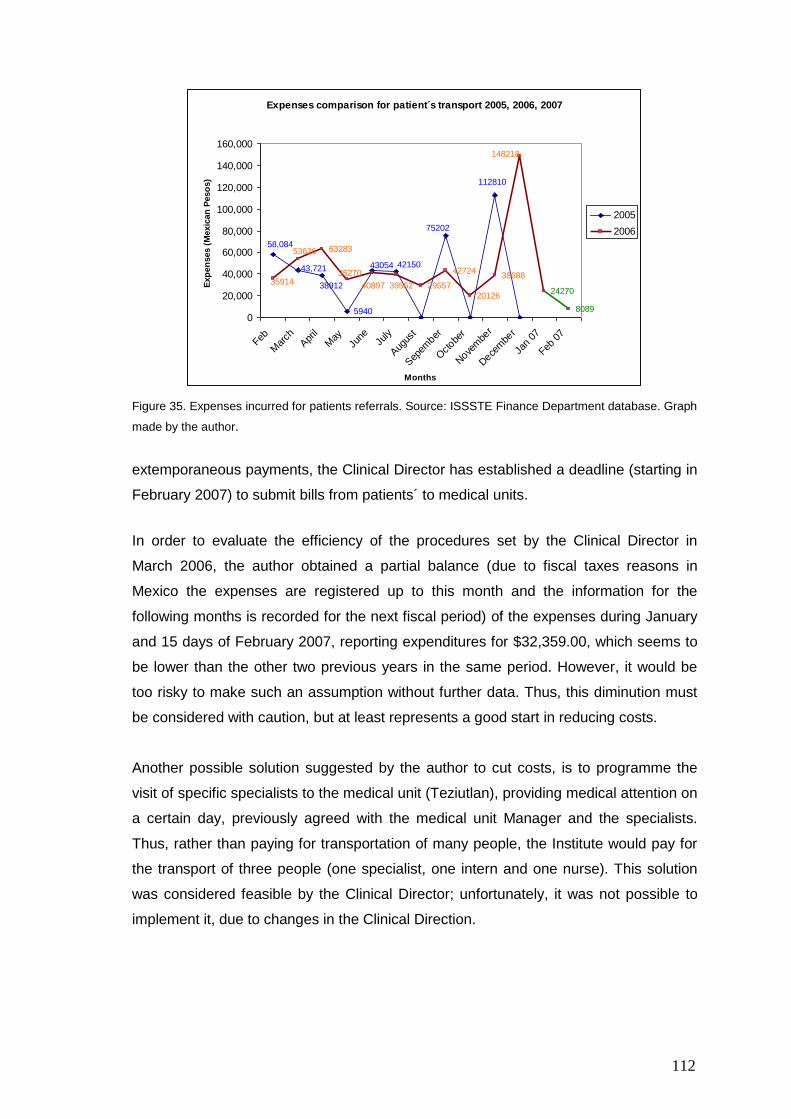
112
Expenses comparison for patient´s transport 2005, 2006, 2007
58,084
43,721
38912
5940
43054 42150
75202
112810
40897 3956235914
53626 63283
35270
29557
42724
20126
38688
148218
24270
80890
20,000
40,000
60,000
80,000
100,000
120,000
140,000
160,000
Feb
Mar
chApr
il
May
June
July
Aug
ust
Sep
ember
Octobe
r
Nove
mbe
r
Dece
mbe
r
Jan
07
Feb
07
Months
Exp
en
ses (
Mexic
an
Peso
s)
2005
2006
Figure 35. Expenses incurred for patients referrals. Source: ISSSTE Finance Department database. Graph
made by the author.
extemporaneous payments, the Clinical Director has established a deadline (starting in
February 2007) to submit bills from patients´ to medical units.
In order to evaluate the efficiency of the procedures set by the Clinical Director in
March 2006, the author obtained a partial balance (due to fiscal taxes reasons in
Mexico the expenses are registered up to this month and the information for the
following months is recorded for the next fiscal period) of the expenses during January
and 15 days of February 2007, reporting expenditures for $32,359.00, which seems to
be lower than the other two previous years in the same period. However, it would be
too risky to make such an assumption without further data. Thus, this diminution must
be considered with caution, but at least represents a good start in reducing costs.
Another possible solution suggested by the author to cut costs, is to programme the
visit of specific specialists to the medical unit (Teziutlan), providing medical attention on
a certain day, previously agreed with the medical unit Manager and the specialists.
Thus, rather than paying for transportation of many people, the Institute would pay for
the transport of three people (one specialist, one intern and one nurse). This solution
was considered feasible by the Clinical Director; unfortunately, it was not possible to
implement it, due to changes in the Clinical Direction.
113
6.4 Role of unions in Mexico
Maleyeff (2007) recognised unions as a barrier in the public sector, and Mexican public
institutions are not an exception; they are so powerful that they can change
Presidential or Congress initiatives, through strike action or public demonstrations, as
was seen recently in the southern state of Oaxaca, when teachers protested about
their salaries. Over the last 70 years and due to agreements with a political party (PRI
or Revolutionary Institutional Party), they have achieved exaggerated power and
“benefits” as Gomez Mena (2005) indicates. It is not a secret that in public Mexican
health institutions, a large number of staff workers do not have the skills required for
those positions (e.g. secretaries, receptionists). It is always a kind of reward for political
favours, current employees “agreed” with the Union to get a place for a relative, or
even worse, workers give their job positions to a son or a daughter, which makes it
almost impossible to offer a place for people not related to the system even when they
are properly qualified for the job (Santana, 2007; Ruíz and Ruíz, 2008). The “lifetime
contract” catalogued by Mexican unions as a “labour right” gives workers a job security,
creating a sense of “it does not matter how hard or well one person works”, the
employee still will earn the same salary. The opposite attitude can be seen in the
Japanese culture, where lifetime contract encourages loyalty to the company, workers
do not look for overtime payment (Karatsu, 1988).
It was due to the industrial revolution in England that production systems changed, and
in doing so, work organisation was modified too, creating the trade-unions. In Mexico
these changes took place in the late XIX century. In their origins, they were organised
to protect workers from unfair labour policies at the beginning of the XX century. A wide
variety of trade unions were created to represent workers of the different sectors, e.g.
mining, steel, milkmen, etc. Unfortunately, after the Revolution (1910), there was a kind
of alliance between the political party of the time (PRI), and the worker‟s leaders that
supported the Revolution. This association reinforced the position of this political party
in power until 2000, receiving in reciprocity “carte blanche” to act as they wanted. As a
result, their leaders became rich, and remained in their positions for years (more than
40 in one case), or as a property of a family, like the mining Union. Therefore, the
original principles of protecting workers disappeared through time due to the voracity of
the “leaders” of the numerous unions grouped in an entity called Work Congress (CT in
Spanish). The way the Union leaders compel workers to support them, is made via the
same company or by using coercive methods, especially in the public sector, where
they can promote or relegate people. Because of this, unions are quite powerful, even
114
when a new party is ruling the country.
Any changes in public health institutions usually have to be approved by the Union,
once no risk is found for the workers, and are then put in place. Usually, things like
changing a workers´ schedule, reducing/eliminating permits, allowing late starting, etc.
are subject to the Union approval. As Sarmiento says (2003), only in Mexico can a
Union declare a strike without its members´ consensus or force new “rights” or benefits.
In the mid 1990´s there was a leaders´ movement inside some public and private
institutions to break the domination of the official one, and to eliminate all the pressure
imposed on the workers by the official leaders, creating a new group of unions in 1997
called Workers National Unity (UNT in Spanish). At the beginning this new group tried
to eliminate the vicious practices of the CT, but after some time they became a copy of
the old unions (Gomez Mena, 2007; Contreras and Busca, 2008), the only difference
being that they did not support the government.
With the change of political party in the Presidency since 2000, union leaders were
aware of proposed changes (Rocha, et al., 2007). These changes represent a
challenge for the current President Felipe Calderon Hinojosa, as transformations for
the benefit of the country are not always welcomed by unions just because they will be
affected directly, not necessarily the workers (Martínez González, 2008). This situation
is similar to the new ISSSTE scheme, whose economic situation has already been
shown in section 5.4.1.
The Union role in Mexico is an important contributor to the success of making changes
that lead to improvements. As a consequence, studies can take up more time than
expected if workers feel that their jobs are threatened, or if they are not doing duties
that they are supposed to do, and are protected by the Union. This situation was
experienced by the author during the case studies at the ISSSTE, and also reported by
the Clinical Director:
“I know what things must be change, but it is not easy when you try to eliminate vicious
practices…the Union is always there to protest if its members are involved.”
Summary
At the city of Puebla is located a regional hospital that offers medical attention not only
115
to the state but to other states in close proximity to it. It was at this place where two
case studies took place: Clinical Laboratory and Referral-Counter referral process.
Both Lean and Six Sigma DMAIC were used. Some Lean tools used were direct
observation, spaghetti diagram, brainstorming, cause-effect diagram, 5W, Kaizen and
basic statistics, Pareto chart and diagrams. Benefits at the clinical lab were:
establishing a number of patients to be served by the clinical lab, reduction of the
waiting time to be served by lab desk from 2.2 minutes to 1.1, reduction of the total
time that an outpatient spent at the lab, from two hours to one. For the Referral-
Counter referral process, the research permitted to detect medical units and periods
where they incurred high costs and it was noticed that the Referral process was not
being followed, allowing to the Clinical Director to set some policies regarding this
issue. The Union plays an important role in improvement processes at public
institutions if workers´ rights are involved in major changes to be done.
116
Chapter 7
Discussion
7.1 Introduction
The main goals of this research were to: a) carry out and record implementations of
Lean and/or Six Sigma approaches in healthcare, with a focus on the Mexican health
system, b) gain experience with pilots in Ultrasound and Plastic Surgery at UHL, c)
investigate which one of these approaches fits best into health care, and what the most
useful tools/techniques are, d) identify critical factors before, during, and after applying
the approaches to achieve a successful implementation, and e) identify any specific
issues that are important in Mexico.
The first task was to investigate places applying these approaches in Health care and
in which areas, which of them were used more frequently and what sort of
tools/techniques were used. Through a literature review, it was shown that both
methods have been widely applied in American hospitals and in countries like the
Netherlands, the Republic of Ireland, Sweden, France, Australia , and some trusts in
the UK (Hereford. Salisbury, Bolton, Airedale, Gwent to mention some). A rapid growth
of Lean in British health care has been experienced recently; Radnor et al. (2006)
suggested that it was originated by the dispersion of Lean facilitators who worked in the
extinct Modernisation Agency. Areas of application include clinical and administrative
areas. The use of these tools/techniques seemed to be based on each particular
situation, e.g. the NHS used Kaizen events, perhaps as a way to demonstrate
immediate results, and to exclude possible negative responses from stakeholders due
to past initiatives.
In the course of the pilots at the UHL and the case studies at the ISSSTE, the author
could appreciate both applicability and factors to use, while implementing both
approaches. The first pilot was about the reduction of waiting lists at the Imaging
department in the UHL, specifically at the Ultrasound area. From this experience, the
author noticed the importance of the necessary factors for success in improvement
projects, such as: management support, organisation, teamwork, communication,
seeing problems as a whole, not just parts, and involving “front-line” people, since they
know the processes and possible solutions. However, throughout this pilot at the U/s,
the researcher observed that even when management supported an initiative for
117
making changes/ improvements, every person in charge of different areas (e.g.
consultants, sisters, clerical staff.) worked separately, not as part of the same team;
perhaps this is a reason for failures in other initiatives (Moran and Brightman, 1998).
Also, historical reasons are still an important issue in the NHS: resistance to change
and to the adaptation of ways of working to the current needs of health care is a
characteristic of the UHL. However, among the three sites, at least in one of them, the
situation was completely different. Their attitude toward changes/improvements is
positive, they even asked for feedback about their performance. It was strange for the
author to experience this attitude after minor incidents with some radiologists and
RDAs at the other sites. The question was unavoidable: why can this hospital work in a
better way than the others? The only possible answer for the author is: they work as a
team, and are aware of their job and that the patient comes first; there is no such
division between radiologists, sonographers, RDAs; all of them are part of a whole.
The second pilot at the UHL was finished in an early stage due to the retirement of the
supporter of this initiative. The DMAIC methodology was applied and helped the site
manager and her team to identify the actual problem of large waiting lists, setting a
goal and the metrics for the pilot, as well as assigning tasks for the Measurement step;
all of this was made in sessions and using tools such as brainstorming, 5W, and the
“talking wall”. When they were working as a team issues related to the way of booking
theatres, surgeons‟ morning meetings, and differences in number of operations
performed during weekdays and those on Saturdays were revealed. Working as a team
allows seeing the whole and not just a part of the picture. After the supporter left his
position, the site manager showed interest in the project, but due to her job and tasks
to perform at the three hospitals it was not possible to carry on.
The two case studies at the ISSSTE also prove the applicability of Lean and DMAIC
steps; one of those ventures by March 2006 was still applying the techniques learnt.
Lean tools (spaghetti diagram, 5 W), basic statistics to obtain parameters of the
process (mean and standard deviation), and charts to illustrate the trend of data, were
utilised. Factors that influence implementation of improvements are quite similar to the
ones in the UHL; but in the Mexican case, the Union plays an important part if changes
involved or affected the workers‟ comfort, e.g. changing their shift or working hours,
assignment of new tasks to perform, to cite some. Conversely, in the UK the author did
not notice an issue like that, but a series of labour regulations and/or rights that ruled
working conditions. For instance, despite the late start at the u/s RDAs remained
working there until the sessions programmed finished, after finishing their shifts. In
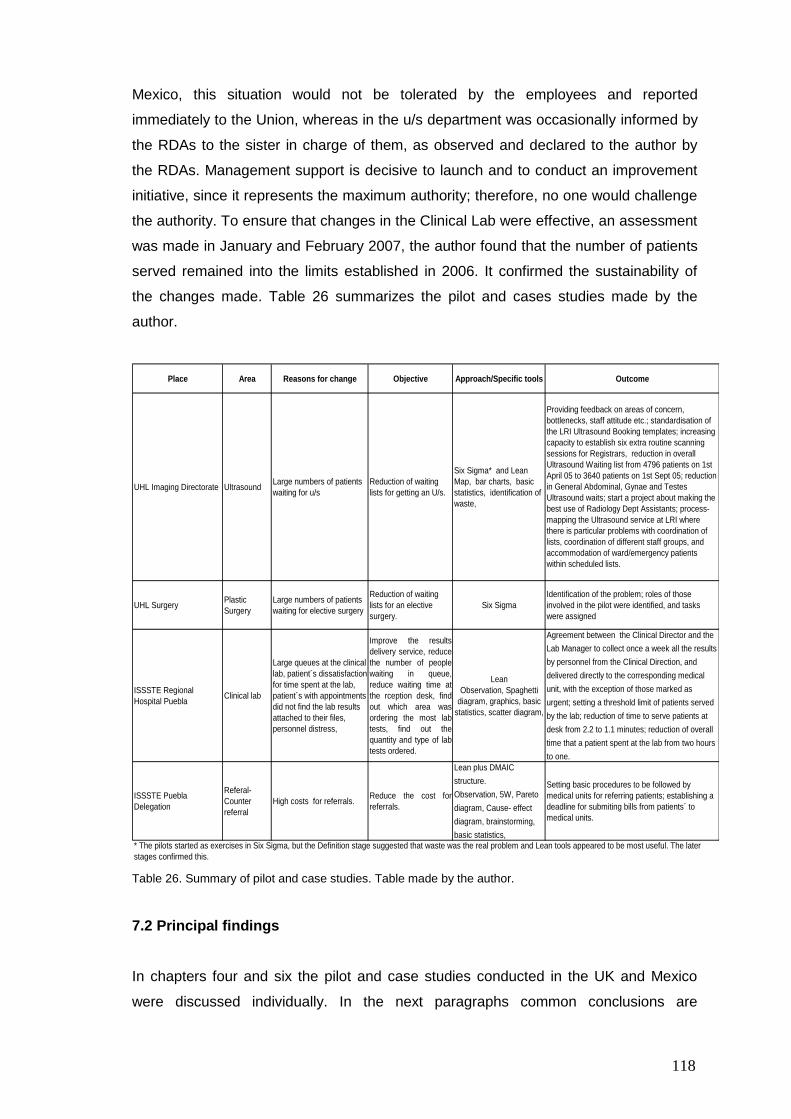
118
Mexico, this situation would not be tolerated by the employees and reported
immediately to the Union, whereas in the u/s department was occasionally informed by
the RDAs to the sister in charge of them, as observed and declared to the author by
the RDAs. Management support is decisive to launch and to conduct an improvement
initiative, since it represents the maximum authority; therefore, no one would challenge
the authority. To ensure that changes in the Clinical Lab were effective, an assessment
was made in January and February 2007, the author found that the number of patients
served remained into the limits established in 2006. It confirmed the sustainability of
the changes made. Table 26 summarizes the pilot and cases studies made by the
author.
Place Area Reasons for change Objective Approach/Specific tools Outcome
UHL Imaging Directorate UltrasoundLarge numbers of patients
waiting for u/s
Reduction of waiting
lists for getting an U/s.
Six Sigma* and Lean
Map, bar charts, basic
statistics, identification of
waste,
Providing feedback on areas of concern,
bottlenecks, staff attitude etc.; standardisation of
the LRI Ultrasound Booking templates; increasing
capacity to establish six extra routine scanning
sessions for Registrars, reduction in overall
Ultrasound Waiting list from 4796 patients on 1st
April 05 to 3640 patients on 1st Sept 05; reduction
in General Abdominal, Gynae and Testes
Ultrasound waits; start a project about making the
best use of Radiology Dept Assistants; process-
mapping the Ultrasound service at LRI where
there is particular problems with coordination of
lists, coordination of different staff groups, and
accommodation of ward/emergency patients
within scheduled lists.
UHL SurgeryPlastic
Surgery
Large numbers of patients
waiting for elective surgery
Reduction of waiting
lists for an elective
surgery.
Six Sigma
Identification of the problem; roles of those
involved in the pilot were identified, and tasks
were assigned
ISSSTE Regional
Hospital PueblaClinical lab
Large queues at the clinical
lab, patient´s dissatisfaction
for time spent at the lab,
patient´s with appointments
did not find the lab results
attached to their files,
personnel distress,
Improve the results
delivery service, reduce
the number of people
waiting in queue,
reduce waiting time at
the rception desk, find
out which area was
ordering the most lab
tests, find out the
quantity and type of lab
tests ordered.
Lean
Observation, Spaghetti
diagram, graphics, basic
statistics, scatter diagram,
Agreement between the Clinical Director and the
Lab Manager to collect once a week all the results
by personnel from the Clinical Direction, and
delivered directly to the corresponding medical
unit, with the exception of those marked as
urgent; setting a threshold limit of patients served
by the lab; reduction of time to serve patients at
desk from 2.2 to 1.1 minutes; reduction of overall
time that a patient spent at the lab from two hours
to one.
ISSSTE Puebla
Delegation
Referal-
Counter
referral
High costs for referrals.Reduce the cost for
referrals.
Lean plus DMAIC
structure.
Observation, 5W, Pareto
diagram, Cause- effect
diagram, brainstorming,
basic statistics,
Setting basic procedures to be followed by
medical units for referring patients; establishing a
deadline for submiting bills from patients´ to
medical units.
* The pilots started as exercises in Six Sigma, but the Definition stage suggested that waste was the real problem and Lean tools appeared to be most useful. The later
stages confirmed this.
Table 26. Summary of pilot and case studies. Table made by the author.
7.2 Principal findings
In chapters four and six the pilot and case studies conducted in the UK and Mexico
were discussed individually. In the next paragraphs common conclusions are
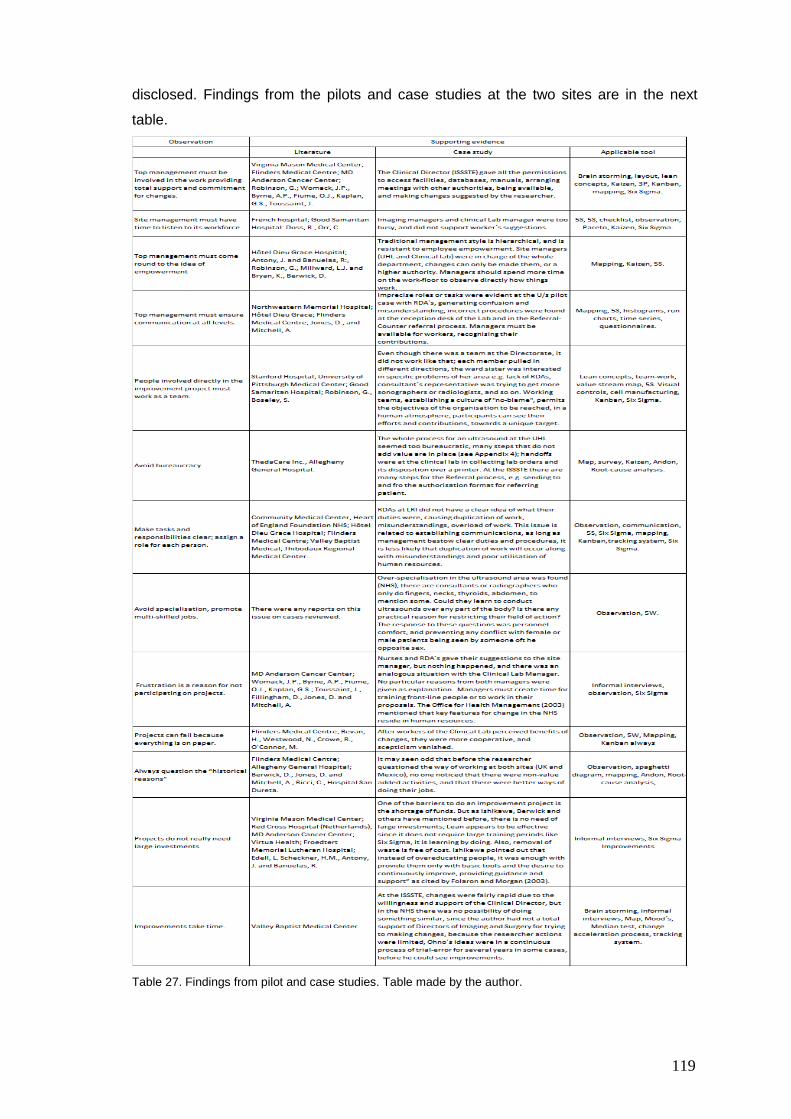
119
disclosed. Findings from the pilots and case studies at the two sites are in the next
table.
Table 27. Findings from pilot and case studies. Table made by the author.
120
7.3 Comparison between UK and Mexico
Carrying out pilot studies in the UHL allowed the author to compare: a) studies in the
UK against the cases in Mexico; b) evaluate the studies in the UHL against those
conducted in other sites within the UK.
There is a difference of resources and facilities between the NHS and the institutions in
Mexico; expenditure per capita is $794 in Mexico against $2,760 in the UK (in US
dollars); there are 1.9 practising physicians in Mexico against 2.5 in the UK, and 1.7
hospital beds in Mexico versus 3.6 in the UK (per 1,000 population the last two figures),
according to the OECD (2007).
In Mexico, there is a population of over 100 million of which more than 60 million are
covered by the IMSS, the ISSSTE and the SSA. The NHS with greater resources and a
smaller population has large waiting lists and poor utilisation of facilities and resources
(Moore, 2007). At any public medical unit in Mexico a patient can ask for a GP
appointment the same day; a GP can serve up to 27 patients in a shift of four hours
(including physical examination); U/s departments can see as many patients as
possible (including A&E, in-patients and out-patients) sometimes with only one
radiologist per shift; while at the U/s in one of the UHL there is one “finger” specialist
who sees only four patients per week.2
The fear for change is present and perhaps is the most problematic issue. Hence, the
human factor or cultural issues are very important in any improvement program
(Millward and Bryan, 2005; Westwood 2008; Westwood and Silvester, 2007; Antony
and Banuelas, 2002) as was experienced at the UHL and at the ISSSTE Clinical Lab. A
variety of causes include: uncertainty, inconvenience, work environment, lack of
information, inadequate resources, fear of an increased workload, economical threat,
self-interest, group pressure, inertia, to cite some.
Even though management support is a key for making changes, the unions in Mexico
play a key role in public and private institutions/entities when workers perceive a
possible effect on their rights. Thus, the person who is the driver of the improvement
must inform union representatives of the goals, people and areas involved, and if
necessary set agreements between them. If the union and stakeholders understand the
purpose and benefits of improvements, and that jobs and positions are not threatened,
2 For someone from a country in development, this experience was a real shock.
121
then a positive outcome can be obtained. Workers need to feel that their work is
valuable, and that they can contribute to the Institute (Womack et al., 2005). However,
in the case studies conducted at the ISSSTE the author was fully aware that these
cases would be possible affected or restricted by the Union. Because of this, during the
whole process for making changes or suggesting them, the author was able to deal
with this by means of establishing clear communication with the lab employees about
the researcher‟s presence and objective. The author considers that, it would have been
possibly to carry out other cases having large improvements in other fields, where
unfortunately the labour contract is involved.
Other factors that should be borne in mind in order to make changes include labour
policies, regional and national health programs from federal and state government.
Another important issue is related to have top management support, which In Mexico
was granted by an ISSSTE high level authority (Clinical Director), while in the UHL was
consent with different directives of the departments. In Mexico the „top management‟
has to be higher up in the organisation, because it has to be high enough to have the
institutional and political power to: a) overcome the authority of the union, and b)
implement changes. Improvements made can work better if those changes are driven
by a high level of authority, as was proved through the cases carried out.
Some similarities between the NHS and the ISSSTE reside in: over regulation, unions,
labour policies and rights, and frustration among front line employees.
7.4 Comparisons with other UK studies
At the UHL, nurses at one site experienced a sense of frustration, inhibiting to a certain
degree their participation in improvement projects. Previous suggestions had been
made for changes but were not taken into account by the authorities of the Directorate.
Similar situations happened at the Clinical Lab, where one of the chemists did not
participate in institutional efforts of improvement, because in the past the Manager
accepted her proposals, but then these were stored away. In the literature, physicians
have been reported to show unsympathetic reactions to improvement (Blumental and
Edwards, 1995; Wysocki, 2004), but also the author experienced something similar
with some Consultants at the UHL. Wysocki (2004) found that doctors were the most
sceptical among stakeholders, arguing “historical reasons”. “Why change if things are
working well?” Traditional management must change (Doss and Orr, 2007).
122
In agreement with the experiences of Sir Gerry Robinson, the NHS is, definitely,
suffering due to poor management; it has the financial, human and technical resources
to provide a better health service; Robinson remarks that “quite small sums of money
properly and sensibly spent could have produced very large results in terms of reduced
waiting lists, and actually very large sums of money had been thrown at the NHS and
produced very little…” as cited by Mount (2007). Tomson and Berwick (2006) said that
investing more on health does not mean that a better or safer service is provided. It is
about using in an efficient way all the resources. The researcher observed in the NHS:
there is a protective attitude towards employees and staff (overregulated); several
bodies such as NICE, Institute for Improvement and Innovation, National Patient Safety
Agency, working towards a better health service, but until the end of 2007 there were
some progress in improvements by using one or both approaches, just after several
attempts of the extinct Modernisation Agency. Possible failure of the latter was caused
by asking hospitals to examine the procedures that work in other sites (Maddock, 2002)
but not considering each particular situation (Lim and Tang, 2000); a focus on demand
and capacity; hence, they could not observe the entire operation of the site. There is no
communication among NHS hospitals across the country, with a notorious regionalism,
as confirmed by Angel (2005), losing opportunities to learn from each site.
Changing ways of working is quite difficult, particularly when talking about specialists or
managers, those who had some degree of “power” (sometimes arrogance or pride), as
the author discovered while carrying out this research. Berwick (1998), Moran and
Brightman (1998) reinforce this thought: people feel comfortable living in a status quo,
having a certain degree of control, and which has been reached because of a number
of opposing forces e.g. people, habits, emotions, and attitudes, to mention some. Sir
Gerry Robinson found that changing people‟s attitude was difficult, in comparison to
any commercial organisation where “… you need to make things happen and you need
to make it happen now, otherwise in business you run the risk of dying on the vine. The
Health Service, you‟re protected, so you can take your time, you don‟t have to
change…” (BBC2, 2007); Ennis and Harrington (1999) found in a survey of hospitals´
that 47% of them indicated organisational resistance to change as a barrier. But also
the health care structure is itself a barrier, because it is “fragmented” (Merry and
Brown, 2002). Stock (2002) indicates that to get a hospital or health system performing
at a high level a cultural transformation is necessary.
123
7.5 Comparison of methods, tools and techniques
From the two approaches, Lean can be easier to apply due to its simplicity and active
involvement of stakeholders in changes/improvements, and the fact that it is based on
listening to those people who know best the processes/services; on the other hand,
failures associated to Six sigma have been reported: development of cynicism and
disinterest, focusing on demonstrating savings rather than how to transfer process
knowledge and sustain gains over time (Sanders and Hild, 2000). Its goal of 3.4 DPMO
might be too demanding, since final outcomes (patients/services) cannot be directly
compared to those in industry. Another difference is, Lean is “learning by doing” in a
team integrated by people from different areas and layers of the organisation,
conferring front-line workers with authority to make changes; empowerment originally
was intended to integrate workers, in a “humane atmosphere”, according to Ohno. It
means providing employees with knowledge and skills, with a consciousness about the
importance of making decisions towards implementing changes. While in Six Sigma
just a selected group of the organisation is trained; apparently this level of
management is required due to the nature of the methodology, decisions and
techniques that need to be learned. On the contrary, Lean does not require special
training or financial investment, or sophisticated tools. From all the examples reviewed
of applications in health care, just in the case of ThedaCare, is the respect for people
emphasised (Womack et al., 2005). The human being is the most valuable asset,
without it no activity or service could be done and/or provided, and its performance
affects the whole organisation. This is one reason that may explain why many other
attempts have failed, people must be the primary factor to take into account when an
improvement initiative is about to start.
Most usual tools for both approaches were: Pareto charts, R -X charts, scatter
diagrams, value stream maps, Kaizen, Andon, 5W, 5S, spaghetti diagram, cause-effect
diagrams, Kanban, and cell manufacturing. The concept of empowerment should not
be misunderstood as an allowance to workers to act thoughtlessly, without having in
mind the consequences of their actions. A flaw in Six Sigma is that it does not consider
human factors (Bevan et al., 2006). Note that Lean concepts work because respect for
people is present, valuing each worker, and encouraging communication.
These approaches must be adapted to each particular situation (Tanner and Gadd,
2007; Radnor et al. 2006) to prevent any pitfalls and attribute them for not being
124
“culturally transferable” (Folaron and Morgan, 2003). The approaches must be
considered as a whole and not only as individual tools/ techniques. Van den Heuvel et
al. (2004) customised Six Sigma, because hospitals do not have the same quantity of
resources (human, financial). Also the reality for the American health care system is
different from the British one or the Mexican.
Some authors pointed to negative consequences on people working with Lean,
suffering of stress and psychological pressure. The author does not consider this issue
as something that is exclusive to Lean: pressure and stress are present in every day,
working in an office or in a factory, or in a hospital. Barriers reported while using Lean
and Six Sigma have been reported as: lack of/or inconsistency in leadership, poor
management, lack of communication, existence of unions, policies and regulations,
lack of training and education, to cite some (Maleyeff, 2007). In all of them the human
factor is involved in some degree; Radnor et al. (2006) gave some reasons for
resistance to change. For Lean and Six Sigma the human factor is decisive in making
improvements; the first approach involves people from all levels despite their position in
the company. That is, all workers have the chance to participate in the improvement
practice. They are seen as able to learn, to create, in a word people capable of thought
(Ohno, 1988), relying on their own decisions (empowerment); it does not encourage
“subcultures” (e.g. operators, engineers and executives). Robinson mentioned that
chief executives should get down on the shop floor more often. Øvretveit (2001) says
that manager‟s role must change from the “controller” to one of empowerment.
Changing culture is not made by an edict (Womack et al., 2005), having present that
perhaps that culture has been existing for a long time (Koenigsaecker, 2000);
managers or leaders must propitiate conditions to make a shift, and must be gradual
(Maleyeff, 2007), each person has its own pace and its own behaviours, values and
beliefs.
While conducting the pilots, the author found that management were prone to
organising committees, set agendas, and so on. On a certain degree it is
comprehensible that management looks carefully for using something completely new
and unfamiliar as the approaches mentioned in this work. Thus, a proper introduction
and explanation about what the approaches are is required, involving not just
managers but also front line staff. In these sort of organisations if they are not able to
see figures through collection of data, no opportunity of making any suggestions for
improvements exists. Unfortunately, the people who are cooperative and eager to put
in place the lessons learnt do not have the sufficient power over the process to make
125
changes. Therefore, Six Sigma would be the best way to make improvements when
situations like the ones described above happens. On the contrary, in the case studies
the engagement of top management to make improvements allowed the use of Lean,
and after a first period of observation of two weeks and collection of data – only as a
support, preliminary results demonstrated that small and inexpensive changes resulted
in services improvement, as well as employees and patient satisfaction. Involvement of
front line staff was important, even though when they did not receive any type of
training. This first result was a driver for setting another project in a more critical area.
Lean principles are agile and scalable, leading to rapid improvements.
From the experiences of the pilot and case studies, the author suggests that Six Sigma
can be too demanding for health care as well as expensive and lengthy, but the
collection and analysis of data as supporting evidence for cases where human life is
directly involved (such as application of medication) is necessary and must not be
ignored. On the other hand, before empowering frontline staff, it is necessary that
everyone fully understands their responsibility in the processes, otherwise making
decisions by themselves without having in mind this issue will cause more problems
than the existing ones. The appreciation of cultural issues is important and must be
taken into account. Hence, Lean needs of Six Sigma, but to just use it as a reference
and framework, not as cooking recipe; both concepts as well as tools and techniques
must be adapted for each particular situation.
Reduction/elimination of waste does not need to cost money; this is a very important
issue, especially for hose health care systems that are under government‟s
responsibility, and Lean fits very well, since it is inexpensive, as demonstrated on the
literature review.
7.6 Key factors
According to Pexton (2005), Benedetto et al. (2002), Antony and Banuelas (2002), in
order to succeed in improvement projects, the following factors are necessary: a
change in management, leadership, involvement and support; communication,
motivation and education; the use of techniques to promote culture change; selecting
and scoping projects to achieve financial and quality results; establishing clear roles
and responsibilities, just to mention a few. For Karatsu (1988) the key factor for
success is through management efficiency. Berwick (1996) stated that clarification of
the goals, the method and the expected results are necessary, as well as having
126
effective leadership to succeed. Pexton (2005) identified barriers to healthcare and
potential solutions but only for Six Sigma. Results are important if people have invested
time and effort, and must be communicated immediately to the stakeholders. This
avoids a low morale for those who have worked hard. Another key issue that has an
important influence is the support of top management, as already cited. This is
confirmed by the fact that the studies at the UHL were stopped in an early stage,
because the sponsors of both pilots left the UHL, with no one else at top management
level committed to the studies.
As Ohno remarked, to achieve success with any improvement initiative, it is important
to adapt the concepts, methods, and approaches from its original frame into a new
reality, by taking into account the differences among countries, lifestyles, culture, to cite
some. Radnor et. al. (2006) found that concepts and notions of Lean were adapted in
the public sector. By understanding the factors (key issues) that affect the
implementation of changes in an improvement project, this understanding permits the
elimination of or diminishes the effect of them, leading to an effective execution of the
improvement, which avoids wasting time and resources.
By focusing in the elimination of waste improvements were made and results obtained.
In response to the question about if Lean and Six Sigma are suitable for healthcare:
both of them can be applied in any health care system; this is also supported by the
existent literature. Besides, where there are processes, it is possible to use industrial
methods, as was the case of the pilot studies.
“In health care, improvement is not just about building more beds or hiring more staff it
is about efficiently utilising all the resources” (Horton, 2005), keeping the processes or
services as simple as possible; in addition, miraculous, instant results cannot be
expected.
127
Chapter 8
Conclusions
In this research the use of Lean and Six Sigma in health care are addressed, with a
special focus on the Mexican health care system, by means of pilot and case studies
conducted in the UHL (UK) and the ISSSTE (Mexico).
In order to achieve the aims of showing the feasibility of Lean and Six Sigma in health
care with a focus in the Mexican health system, including which one of the approaches
fits best, tools/and techniques most useful, and the key factors for the implementation
of such approaches, that the research should be made on the field. This was achieved
by means of pilot and case studies in two health care organisations: the University
Hospitals of Leicester in the UK, and the ISSSTE Regional Hospital in Puebla (Mexico).
From the two pilots made at the UHL the author considers that even though when the
pilot at Plastic Surgery was stopped in an early stage, this situation gave some insight
into key factors to take into account for implementing an improvement initiative.
Benefits obtained at the Ultrasound department include: a feedback about the way of
working, standardisation of booking templates, increasing capacity to performing U/s,
start a project about making the best use of RDAs.
Another benefit of the pilots is that, they allowed the researcher to identify which one of
the approaches is most suitable, which in this case is Lean due to the simplicity of the
concepts and tools. This is confirmed through the case studies. Lean empowers the
workforce, and acknowledges employees´ experience, making each participant an
owner of the process. At the same time, it recognises that team work is essential in any
organisation. Its focus on removing waste is more relevant to the needs of the sector.
Furthermore, it does not require large periods of training and investment; benefits can
be seen in a relatively short period of time, especially if Kaizen events are promoted.
In case studies performed at the ISSSTE Regional Hospital in Puebla, in the Clinical
and Referral-Counter referral process, the outcomes include an improvement in the
service provided to the patients, and avoiding the distress among the chemists by
determining a limit on the number of patients served by them every day. As a result of
the second case study, the Clinical Director was able to set up basic procedures that
medical units must follow in order to reduce the costs of referring patients from medical
units to specialties.
128
The studies concur with the key factors found in other studies, such as management
support, communication, teamwork and empowerment, sense of commitment, clear
assignment of tasks, responsibility, effective communication at all levels, fear of
change, specialisation, bureaucracy, historical reasons, frustration and attitudes. In the
Mexican case, another factor was discerned: unions. From the pilot studies, the
researcher confirmed that top management support is vital for an improvement
initiative, and moreover, in the Mexican case, the support must come from a high level
of management. The author found that a way to avoid any sort of conflict with the
Union was through the communication with the employees as well as having the
support from a prominent authority in order to have a balance with the union. The
research in Mexico was sponsored by the Clinical Director (top management); his
commitment to the case studies, getting involved in the research and granting access
to all sort of information related to the cases, allowed the author to complete them.
Unfortunately, it was not the case in the two pilots, since the persons that agreed to
start the pilots left their respective positions at the UHL. Consequently, in the first pilot
there was not a total support to carry on with the original project; a similar situation
happened with the second pilot which was stopped at an early stage.
Through the observation performed during the pilot and case studies, the author
realised that the processes in the UHL are guided by “historical reasons”, and there are
a few people that question the way of doing things. The pride in following the methods
established through the time is present; there is reluctance to questioning the current
way of working.
This research represents the very first time –at the time the author started it- that an
attempt to apply Lean and the DMAIC methodology are applied to health care in a
developing country, with outcomes that were of great value for the ISSSTE.
It is worth mentioning that limitations in research exist since a few cases cannot prove
that Lean or Six Sigma will always work, as each case is a distinct experiment3.
Particularly since applications will usually only be approved if it seems likely that they
will be beneficial. Hence, this research is only a contribution to growing evidence. The
case studies contribute to the growing body of evidence that Lean and Six Sigma
(DMAIC methodology) can be applied in the health care field.
3 Eisenhardt and Graebner, 2007.
129
The differences between the UK and Mexico are patent. Mexico is a developing
country, with notorious inequalities among its population, and health care is not an
exception. Other differences between both countries in health care include expenditure
per capita, number of practising physicians per inhabitants, number of beds available,
and number of scanners (3.5 in Mexico compared with 7.5 in the UK per million
population by 2005). Despite this, the similarity is that health care systems in each
country are dealing with patients, and in doing so, processes exist. In this way, a
comparison of both systems can be made.
Finally, further research on the applications of Lean in other areas like surgical ones
can be of great benefit to health care, given that it not only has such an important
impact on costs, but at a most important asset: human life.
130
Bibliography
Anderson, H; Brazda M; Struble S., Pexton, C. Six Sigma trims turnover time for
orthopedic surgeries. Available on line from: http://healthcare.isixsigma.com/library
/content/c070228b.asp. [Accessed March 1st, 2008]
Angel, L. Gwent Health Care NHS Trust. Personal Conversation at the Royal Gwent
Hospital, Wales. May 2005.
Antony, J. and Banuelas, R., 2002. Key ingredients for the effective implementation of
six sigma program. Measuring Business Excellence. Vol. 6, No. 2, p. 20-27.
Ballé, M. Lean as a learning system in a hospital ward. Working paper n°8, Project
Lean Enterprise. Available on line from: http://www.superfactory.com/articles/
smalley_Basic_Stability.htm. [Accessed March 1st, 2008].
Bansal, M; Darwazeh, F.; Pexton, C. Removing the bottlenecks, improving flow in
Radiology. Available on line from: http://healthcare.isixsigma.com/library/content/
co70912a.asp. [Accessed March 1st, 2008]
Bassahm, J. Redesigning care improving the patient journey. Available on line from:
http://www.leanuk.org/articles/LHF2/LHF2_jane_bassham.pdf. [Accessed March 1st,
2008].
BBC2. Can Gerry Robinson fix the NHS? Available on line from:
http://www.open2.net/nhs/gerry_robinson_prog1.html [Accessed January 16th, 2007].
Becker, R.M., Lean manufacturing and the Toyota production system. SAE
International. Available on line from: http://www.sae.org/manufacturing/lean/column
/leanjun01.htm. [Accessed on January 10th, 2008].
Benedetto, A.R., Dunnington J.S., Oxford-Zelenske D., 2002. Using Six Sigma to
improve the film library. Radiology Management. Vol. 24, No. 5.
Berwick, D., 1996. A primer on leading the improvement of systems. British Medical
Journal, Vol. 312, p. 619-622.
131
Berwick, D., 1998. Crossing the boundary: changing mental models in the service of
improvement. International Journal for Quality in Health Care; Vol. 10, No. 5, p.435-
441.
Berwick, D., Leape, L. L., 1999. Reducing errors in medicine. It‟s time to take this more
seriously. British Medical Journal, Vol. 319, p. 136-137.
Bevan, H., Westwood, N., Crowe, R. O‟Connor, M., 2006. Lean Six Sigma: some basic
concepts. NHS Institute for Innovation and Improvement.
Bevan, H. On an ambidextrous NHS. Available on line from: http://www.goodmanag
ement-hsj.co.uk/bevan/index.shtml [Accessed November 1st 2006].
Blaha, J. Outpatient imaging reports TAT cut from 64 to 9 hours. Available on line
from: http://healthcare.isixsigma.com/library/content/c060927a.asp. [Accessed March
1st, 2008].
Bloom, D.E., Canning D., Sevilla J., 2001. Health, human capital and economic growth.
In: Commission on macroeconomics and health. Geneva. WHO, CMH.
Blumental, D. and Edwards, J.N., 1995. Involving physicians in total quality
management: results of a study. In: Improving Clinical Practice: Total Quality
Management and the Physician, ed by D. Blumental and A.C.
Bodek, N., 1988. Preface Just-In-time for today and tomorrow. USA: Productivity Press
Inc.
Bodek, N. Dr. Shigeo Shingo –the greatest manufacturing consultant. Superfactory.
Available on line from: www.superfactory.com/articles/BodekShingo.htm [Accessed
September 1st, 2006].
Boeing Frontiers on line. Lean on me. 2004. Vol. 3, No. 7. November. Available on line
from: http://www.boeing.com/news/frontiers/archive/2004/november/cover.html.
[Accessed June 13th, 2005].
Boseley, S. Serious flaws found in NHS maternity care. The Guardian, July 10th 2008.
132
Bourn, J., 2007. Report by the Comptroller and Auditor General. Session 2006-2007.
July. London: National Audit Office.
Bowman, R. Quality is not just a buzzword or fad, it’s required for success, 2000.
September Available on line from: http://www.supplychainbrain.com/archives
/9.00.Quality.htm?adcode75 [Accessed January 20th, 2006].
Breyfogle, F., Capello J., Meadows B., 2001, Managing Six Sigma a practical guide to
understanding, assessing, and implementing the strategy that yields bottom- line
success. USA: John Wiley & Sons Inc.
Breyfogle, F. and Salveker, A., 2004. Lean Six Sigma in sickness and in health,
Smarter Solutions, Austin, TX.
Bryman, A., 2007. Barriers to integrating quantitative and qualitative research. Journal
of Mixed Methods Research. Vol. 1, No. 1, p. 8-22.
Byrne, A.P. and Fiume, O.P. Going Lean in health care. 2005. Institute for Healthcare
Improvement. February 4th. Audio Conference.
Canadian Driver. Automotive companies and suppliers win lion's share of awards for
lean manufacturing. Available on line from: ttp://www.canadiandriver.com/news/02022
7-2.htm. [Accessed March 1st, 2005].
Cherry, J. and Seshadri, S., 2000. Six Sigma: using statistics to reduce process
variability and costs in radiology. Radiology Management, November/ December. p 42-
45.
Cimac. February 26, 2004. Available on line from: http//www.cimac.noticias.com/
Noticias/04feb/04022611.htm [Accessed March 1st, 2005].
Coffman, V. D., 2004. Second Annual Missile Defence Conference, Washington; U.S.
Available on line from: http://www.epa.gov/lean/studies/lockheed.htm. [Accessed
March 5th, 2008].
Coleman, W.P., Gaynicotche, A., Mejía Mendoza, S., Healthcare systems process
133
reengineering for developing countries: A Report to IMIA working Group 9. WPCMath.
1997. Available on line from: www.wpcmath.com [Accessed July 1st, 2005].
CONAPO. Available on line from: www.conapo.gob.mx/00cifras/Proy/RM.xls [Accessed
June 12th 2006].
Contreras, J., Busca, F. H. Reelección ´perpetua´. Available on line from:
http://www.exonline.com.mx/diario/noticia/primera/pulsonacional/busca_francisco__her
nandez_reeleccion_perpetua/281468. [Accessed July 10th, 2008].
Darzi, A., 2007. Our NHS our future NHS Next stage review Interim report: Summary.
London: Department of Health.
DATA Strategies & Benchmarks., 2002. Six Sigma effort paying dividends for CT
hospital. National Health Information. Vol. 6, No. 1.
DeBusk, C. and Rangel, A. Jr, Creating a Lean Six Sigma hospital discharge process.
An iSixSigma case study. Available on line from: http://ealthcare.isixsigma.com
[Accessed on January 17th 2005].
DeBusk C., Pexton C., Cogswell N. Streamlining diagnostic testing at Northwestern
Memorial. Available on line from: iSixsigma. 2005. http:// healthcare.isixsigma.com
[Accessed on January 17th 2005].
Department of Natural Resources and Environmental Control. Available on line from:
http://www.epa.gov/lean/toolkit/LeanGovtPrimer.pdf [Accessed June 1st, 2008]
Department of Environmental Quality. ttp://www.epa.gov/lean/toolkit/LeanGovtPrimer.
pdf [Accessed June 1st, 2008].
Donaldson, L., 2002. Annual report of the Chief Medical Officer. Available on line from:
http://www.dh.gov.uk/en/Publicationsandstatistics/Publications/AnnualReports
/Browsable/DH_4094860. [Accessed on January 17th 2008].
Donaldson, L., 2006. On the state of public health: Annual Report of the Chief Medical
Officer. Available on line from http://www.library.nhs.uk/healthmanagement/View
134
Resource.aspx?resID=258754. [Accessed on March 17th 2008].
Doss, R., Orr, C., 2007. Lean leadership in healthcare. White Paper. RWD. Available
on line from: www.rwd.com [Accessed on April 17th 2007].
Eckes, G. 2003. Six Sigma for everyone. USA: John Wiley & Sons Inc.
Eisenhardt, K. M., 1989. Building theories from case study research. Academy of
Management Review. Vol. 14, No. 4, p 532-550. October.
Eisenhardt, K.M., Graebner, M.E., 2007. Theory building from cases: opportunities and
challenges. Academy of Management Journal, Vol. 50, No. 1, p. 25–32.
Elsberry, R., Six Sigma: Applying a corporate model to radiology. Imaging Economics.
November/December 2000. Available on line from: http://www.imaginge
conomics.com/issues/articles/2000-11_08.asp [Accessed January 17th 2005].
Emiliani, M.L., 2006. Origins of Lean management in America. The role of Connecticut
businesses. Journal of Management History. Vol. 12, No. 2, p. 167-184.
Ennis, K., Harrington, D., 1999. Factors to consider in the implementation of quality
within Irish healthcare. Managing Service Quality. Vol. 9, No. 5, p. 320-326.
Environmental Protection Agency web site. Available on line from: http://www.epa.gov
[Accessed on April 13th, 2008].
Environmental Protection Agency. http://www.epa.gov [Accessed June 1st, 2008].
Ettinger, W. and Slaterbeck, J., 2002. Case study 2: Cancer and chemotherapy.
Modern Physician. p. 17.
Fillingham, D., 2007. Viewpoint can lean save lives? Leadership in Health Services.
Vol. 20, No. 4, p. 231-241.
Fogel, R. W., 1994. Economic growth, population theory, and physiology: The bearing
of long –term processes on the making, The American Economic Review, Vol. 84, No.
3, p. 369-395.

135
Folaron, J., Morgan, J.P. Chase and Co., The evolution of Six Sigma. August 2003.
Available on line from: www.asq.org [Accessed on December 12th 2007].
Fox, V. Q., 2005. Quinto Informe Presidencial. México: Presidencia de la República.
Frenk, J., Lozano, R., González-Block, M.A., 1994. Economía y salud: propuesta para
el avance del sistema de salud en México. México: Fundación Mexicana para la Salud.
Fujimoto, T., 1999. The evolution of manufacturing system at Toyota. USA: Oxford
University Press.
General Electric web site. Available on line from: http://www.ge.com. [Accessed on
April15th, 2005].
George, M. L., Rago K., Case study: An application of Lean Six Sigma principles in
healthcare. Available on line from: www.georgegroup.com [Accessed on January 12th
2005].
Gómez Mena, C., Sindicatos: un auténtico negocio en México. La Jornada. August
2005.
Gómez Mena, C., Casi sin credibilidad, la UNT cumple 10 años. La Jornada.
November, 2007.
González, I. Y. Avanza la tasa de desempleo en el país. El Universal. February 21st
2008.
Gonzalez Roaro, B., Appearance of the ISSSTE Director before the Senate. 2004.
Gowland, B., Bryant, C. Implementing Lean at Mayday. Available on line from:
http://www.leanuk.org/downloads/LHF3/LHF3_ben_gowland.pdf [Accessed on January
6th, 2008].
Harry, M., Schroeder, R., 2000. Six Sigma The breakthrough management strategy
revolutionizing the world’s top corporations. USA: Doubleday.
Henderson, R., National Stroke Audit Coordinator. Personal Conversation at the Cardiff
City Hall. July 2005.
136
Hines, P., Holweg, M., and Rich, N., 2004. Learning to evolve: A review of
contemporary Lean thinking. International Journal of Operations and production
Management. Vol. 24, No. 10, p. 994-1011.
Horton, S., Improving flow without adding resources: A success story. Institute for
Healthcare Improvement. Available on line from: www.ihi.org/ I/topics/flow/patientflow
/ImprovementStories/ImprovingFlowwitoutAddingResourcesaSuccessStory. [Accessed
on March 3rd, 2005].
INEGI Available on line from: http://dgcnesyp.inegi.org.mx/cgi-win/bdieintsi.exe/NIVI1
0008500450050#ARBOL. [Accessed on January 12th 2008].
Institute of Medicine. 2001. Committee on Quality of Healthcare in America Crossing
the Quality Chasm: A new Health System for the 21st Century. Washington, D.C.
National Academies Press.
Ishikawa, K., 1976. Guide to Quality Control. Asian Productivity Organization. Tokyo.
ISSSTE. Medio Ambiente, Finanzas y Perspectivas. 2004. Available on line from:
http://www.issste.gob.mx/informes/ISSSTE_Ent_Sit_Fin_Pers.pdf [Accessed on July
20th 2006].
ISSSTE Clinical Direction, Manual de procedimientos. 2005.
ISSSTE Anuario Estadístico 2007. Available on line from: ttp://1148.245.224.30/pobla
cion/index.htm [Accessed on April 10th 2007].
Japón. Ministerio de Asuntos Extranjeros del Japón. Factores del desarrollo económico
del Japón. 1962.
Jones, C.I., 2002. Why have health expenditures as share of GDP risen so much.
January. National Bureau of Economic Research, wp9325, November.
Jones, D.T., and Filochoswki, J., 2006. Think yourself thin. Health Service Journal
Supplement. April 6th.
Jones, D. and Mitchell, A., 2006. Lean thinking for the NHS. 2006. London: NHS
137
Confederation.
Joyce, M., Schechter, B., The Lean enterprise–A management philosophy at Lockheed
Martin. Defense Acquisition Review Journal. Available on line from
http://www.dau.mil/pubs/arq/Joyce.pdf [Accessed on January 7th, 2005].
Karatsu, H., 1988. TQC wisdom of Japan managing for total quality control. USA:
Productivity Press.
Keefe, D., 2002. Case study 1: In-vitro fertilization. Modern Physician. p. 16.
King‟s Fund. 2005. The business of caring: King‟s Fund inquiry into care services for
older people in London. London: King’s Fund.
Kodak. 2007. Managing a Lean graphic arts business with Kodak business workflow
solutions. A White Paper from Kodak. Available online from: http://graphics1.kodak.co
m/documents/KODAK_BWF_Lean_White_Paper.pdf?countryid=global. [Accessed on
February 17th, 2008].
Koenigsaecker, G., The psychology of change. 2000. April. The Lean Manufacturing
Advisor. Productivity Inc. Available on line from:http://www.simpler.com/pdf/PP_Apr00
_PsychologyChange.pdf [Accessed on December 4th 2005]
Kohn, L., Corrigan, J., Donaldson, M.S., 2000. To err is human: building a safer health
system. Institute of Medicine. Washington: National Academy Press.
Kuprenas, J. A. 1998. Implementation of Lean concepts for public sector engineering
design and construction: A case study. Proceedings IGLC ´98, Sixth Annual
Conference of the International Group for Lean Construction (IGLC-6) Guaruja, Brazil.
Lean Enterprise Institute. 2004. The anatomy of innovation. Available on line from:
http://www.ihi.org/NR/rdonlyres/B6EA145C-BA93-429B-9BDF46CE63F1B1C/0/Shadys
ideSuccessStory.pdf. [Accessed on April 4th, 2005].
Lean Healthcare Academy. Available on line from: ttp://www.leanhealthcareacademy.
co.uk/Lean_Successes [Accessed on July 31st , 2008].
138
Ley Federal de Salud. Diario Oficial de la Federación., 1984. Mexico
Lifvergren, S., Bergman B. Patient Safety: Improvement of warfarin treatment; a black
belt project. Institute of Technology Sweden. Available on line from:
http://www.isbis2007.uac.pt/pdf/inviteSpeakers/Quality%20in%20Healthcare.pdf.
[Accessed on February 4th 2008]
Lim, P.C. and Tang, N. K.H., 2000. The development of a model for total quality
healthcare. Managing Service Quality. Vol. 10, No. 2, p. 103-111.
Lister, S., 2006. Bloated NHS to get the Tesco treatment. The Times. June 15.
Luyun Zhao E. Six Sigma has successful start in a Shangai hospital. Available on line
from: iSixsigma. 2005. http:// healthcare.isixsigma.com [Accessed on March 4th 2005]
Maddock, S., 2002. Making modernisation work. New narratives, change strategies
and people management in the public sector. The International Journal of Public
Sector Management. Vol. 15, No. 1, p. 13-43.
Majima, I., 1992. The shift to JIT. How people make the difference. USA: Productivity
Press.
Maleyeff, J. and Krayenverger, D.E., 2004. Goal setting with Six Sigma mean shift
deviation. Aircraft Engineering & Aerospace Technology, Vol. 76, No. 6, p. 577-583.
Maleyeff, J., 2007. Improving service delivery in government with Lean Six Sigma. IBM
center for the business of government.
Mango, P.D., Shapiro, L.A., 2001. Hospitals get serious about operations. The
McKinsey Quarterly. 2001. No. 2, p. 74-85.
Martínez González, J., 2008. Acusan a Telmex de hostigar a los opositores de
Hernández Juárez. La Crónica de hoy. June 27th.
Martínez González, M. L,. Mala imagen pública de los sindicatos. Available on line
from: http://www.frecuencialaboral.com/lideres.html. [Accessed June 1st, 2008].
139
Mathieson, S.A., 2006. NHS should embrace lean times. Society Guardian. June 8th.
Merry, M.D. and Brown, J.P., 2002. From a culture of safety to a culture of excellence:
quality science, human factors, and the future of healthcare quality. Journal of
Innovative Management. Vol.7, No. 2, p. 29-46.
Merry, M.D. and Brown, J.P. 2002. From a culture of safety to a culture of excellence:
quality science, human factor and the future of healthcare quality. Journal of Innovation
Management. Vol. 7, No. 2. p. 29-46.
Michael, M., Six Sigma at New York-Presbyterian Hospital. Available on line from:
http://www.sixsigmacompanies.com/archive/six_sigma_at_newyork_presbyterian_hosp
ital.html. [Accessed on June 1st, 2006].
Migliazza, M., Six Sigma improves workflow in n-medicine department. Available on
line from: http://healthcare.isixsigma.com/library/content/c061025a.asp. [Accessed
March 1st, 2008].
Miller J., Applying flow to healthcare. February 2004. Available on line from: www.gem
bapantarei.com [Accessed January 17th, 2005].
Millward, L.J. and Bryan, K. 2005. Clinical leadership in health care: a position
statement. Leadership in Health Services. Vol. 8, No. 2, p. 13-25.
Moran, J.W. and Brightman B.K., 1998. Effective management of healthcare change.
The TQM Magazine. Vol. 10, No. 1, p. 27-29.
Moore, M. Deploying Lean in the National Health Service special report. Available on
line from: http://www.onesixsigma.com/radio_4_lean_nhs. [Accessed on March 17th
2007].
Mount, P., 2007. Public Opinion. Times on line. January 16th.
Motorola web site. Available on line from: www.motorola.com. [Accessed on January
5th, 2008].
140
National Health Service web site. http://modern.nhs.uk [Accessed on February17th
2008].
NHS Institute for Innovation and Improvement. Available on line from: http://www.institu
te.nhs.uk/quality_and_value/lean_thinking/rapid_improvement_events_%E2%80%93_
benefits.html [Accessed on August13th, 2008].
NHS Improvement Programme. Available on line from: http://www.improvement.nhs.
uk [Accessed on February 17th, 2008].
National Pathology Service web site. Available on line from: http://www.pathologyim
provement.nhs.uk/casestudies/Case%20Study%204%20Mater.pdf [Accessed on June
21st , 2008].
Ochoa León, S.M., 2006. Indicadores del seguro social del Centro de Seguridad Social
de Estudios sociales y de opinión. México: Cámara de Diputados.
OECD Health Division, Health expenditure, 2007. Available on line from:
http://www.oecd.org/document/30/0,3343,en_2649_34631_12968734_1_1_1_37407,0
0.html [Accessed on December 17th 2007].
Office for Health Management. 2003. Learning from the NHS in change a study on the
management of major structural change in the NHS. Prepared by OPM.
Ohno, T., 1982. The origin of Toyota production system and Kanban system.
Proceedings of the International Conference on Productivity and Quality Deployment.
Tokyo.
Ohno, T., 1988. Toyota production system beyond large scale production. USA:
Productivity Press.
Ohno T. with Mito S., 1988. Just-In-time for today and tomorrow. USA: Productivity
Press Inc.
Øvretvei, J., 2001. The Norwegian approach to integrated quality development.
Journal of Management in Medicine, Vol. 15, No. 2, p. 125-140.
141
Palmer, J., 2008. Sixty Years of the National Health Service a proud past and a healthy
future. Produced by COI for the Department of Health. London. Available on line from:
www.dh.gov.uk/publications [Accessed on July 17th 2008].
Palmer, J. Sixty Years of the National Health Service a proud past and a healthy future.
2008. Produced by COI for the Department of Health. Available on line from:
www.dh.gov.uk/publications [Accessed on July 17th 2008].
Panchak, P., 2003. Lean health care? It Works! Industry Week. November 1st.
Pande, P., Neuman R.P., Cavanaugh R. R., 2000. The Six Sigma way: How GE,
Motorola, and other Top Companies are Honing their Performance. USA: Mc Graw Hill.
Parker, M; Hattle, R; Prejeant, D., Stock, G., Starting the first surgical case on time to
cut delays. Available on line from: ttp://healthcare.isixsigma.com/library/content/c0804
23a.asp. [Accessed on August 1st, 2008].
Perez-Wilson, M., 1999.Six Sigma: Understanding the concept, implications and
challenges. USA: Advanced Systems Consultants.
Pexton, C. and Young D., 2004. Reducing surgical site infections through Six Sigma &
change management. Patient Safety and Quality Healthcare. July/September.
Pexton, C. Measuring Six Sigma results in the healthcare Industry. Available on line
from: iSixsigma. 2005. http:// healthcare.isixsigma.library/content/c040623a.asp
[Accessed on January 17th 2005].
Pexton, C. Going from good to great at L.A.’s Good Samaritan. Available on line from:
iSixsigma. 2005.http:// healthcare.isixsigma. com [Accessed on January 17th 2005].
Pexton, C. Framing the need to improve health care using Six Sigma methodologies.
Available on line from: iSixsigma. 2005. http://healthcare.isix sigma.com [Accessed on
May 20th 2005].
Pexton, C. Overcoming the barriers to change in healthcare system. Available on line
from: iSixsigma. 2005. http://healthcare.isix sigma. com [Accessed on September 28th
142
2005].
Pexton, C. Utilising six sigma to address global healthcare challenges. Feb 2004
Quality Issues. http://www.gehealthcare.com/usen/service/docs/hd_pexton.pdf.
[Accessed on March 24th, 2006].
Pettigrew, A. E., 1988. The management of strategic change. Oxford, UK: Basil
Blackwell Ltd.
Pyzdek, T., Available on line from: www.qualitydigest.com/jan00/htlm [Accessed on
February 17th 2005].
Radnor, Z., Walley, P., Stephens, A. and Bucci G., 2006. Evaluation of the Lean
approach to business management and its use in the public sector. Scottish Executive
Social Research. Scottish Executive Social Research.
Ramias, A., The Mists of Six Sigma. BPTrends, October 2005. Available on line from:
www.bptrends.com [Accessed on September 1st, 2006].
Ramírez, E. 2007. Sindicatos contra reforma calderonista. Contralínea.
Ricci, C., Six Sigma tools to improve hospital management: The Son Dureta
experience. European Congress of Radiology. 2006. Available on line from:
http://has.onsite.tv/gesamt/data/popup_index.htm?presentationPath=session1/present
ation2/. [Accessed on December 1st, 2007].
Rich, N. and Esain, A., Streaming in Acute Healthcare. Available on line from:
http://www.cf.ac.uk/carbs/research/sections/lom/workingpapers.html. [Accessed March
17th 2008].
Robertson, K., Personal Conversation at the Royal Gwent Health Care Trust, March
2005.
Robson, C., 1993. Real world research a resource for social scientists and practitioner-
researcher. Oxford UK: Blackwell Publishers Inc.
Rocha Larrainzar, F., Hernández Juárez, F.; Rodríguez Fuentes, A., 2007. Propuesta
143
de la Unión Nacional de Trabajadores para el nuevo gobierno. Available on line from:
http://www.unt.org.mx/docs/reflabor.htm. [Accessed on September 29th, 2007].
Rother, M. and Shook, J.,1999. Learning to see. The Lean Enterprise Institute, USA:
Brookline.
Rucker, R., Six Sigma at Citibank. Available on line from: http://www.qualitydigest.
com/dec99/html/citibank.html. [Accessed on September 29th 2005].
Ruíz, F. and Ruíz Ramón, F., Convierte PRI a Pemex en agencia de colocaciones.
Tabasco Hoy. August 3rd, 2008. http://www.tabascohoy.com.mx/nota_interior_
impressa.php?id_nota=160095. [Accessed on August 9th 2008].
Saltman, R. B.; Busse, R., Figueras, J., 2004. Social health insurance systems in
Western Europe. World Health Organization on behalf of the European Observatory on
Health Systems and Policies. Available on line from: http://www.euro.who.int/docum
ent/E84968.pdf. [Accessed on July 9th, 2006]
Sanders, D. and Hild, C., 2000. A Discussion of Strategies for Six Sigma
Implementation. Quality Engineering, Vol. 12, No. 3, p. 303-309.
Santana, R. Maestros de Campeche acusan a su líder de corrupción, tráfico de plazas
y nepotismo. Available on line from: http://www.proceso.com.mxnoticia.html?nid
=46358&cat=2. [Accessed on December 19th 2007].
Sarmiento, S. 2003. Ley Laboral/Jaque mate. El Siglo de Torreón. May 13th.
Schneider, T.P., 2002. Cover Story. Modern Physician. June, p. 13-15.
Secretaría de Salud. 2004. México, SSA.
Secretaria de Salud. Cruzada Nacional por la Calidad de los Servicios de Salud.
Available on line from: http://www.salud.gob.mx/unidades/dgcs/sala_noticias/campa
nas/2001-01-25/cruzada-nacional.htm. [Accessed on May 19th 2006].
Shewhart, W.A., 1931. Economic Control of Quality of Manufactured Products. New
York: Van Nostrand.
144
Sickkids and Department of Paediatric Laboratory Medicine. "Lean in the Haematology
Laboratory at the Hospital for Sick Children”. November 2006. Available on line
from:http://www.leanadvisors.com/index.php/impact/results_full/hospital_haematology
_laboratory/. [Accessed on January 5th, 2008]
Snyder, K., Peters, N., 2004. Lean Six Sigma in the public sector: Applying proven
methodologies to improve quality, remove waste, and uncover hidden opportunities in
state and local government. Xerox Global Services White paper. September.
Spear, S., 2005. Fixing Healthcare from the Inside, today. Harvard Business Review.
Stahr, H., 2001. Developing a culture of quality within the United Kingdom healthcare
system. International Journal of Health Care Quality Assurance. Vol.14, No. 14, p. 174-
180.
Stock, G., 2002., Taking Performance To a Higher Level. How Six Sigma helped a rural
hospital achieve a cultural transformation. Six Sigma Forum Magazine. May. American
Society for Quality.
Taninecz, G., Best in Healthcare Getting Better with Lean Mayo Clinic Division of
Cardiovascular Diseases improving patient-flow processes. Lean Enterprise Institute.
Available on line from: www.lean.org. [Accessed on May 21st, 2008].
Taninecz, G., "Pulling" Lean through a Hospital. Lean Enterprise Institute. Available on
line from: www.lean.org. [Accessed on May 21st 2008].
Tanner, S.J., Gadd, K.W., 2007. Lean in Government Part 2. Driver - a pragmatic
improvement approach. Oakland Consulting. European Centre for Business
Excellence. September.
The Lean Healthcare Academy Web site Available on line from:
www.leanhealthcareacademy.co.uk. [Accessed on May 21st 2008].
The Times Online. 2006. NHS Waiting lists on the increase. March 4th.
Thomerson, L., 2002. The healthcare pioneer of Six Sigma. ΣΧTRAOrdinarySense.
March.
145
Tomson, C.R.V., Berwick, D.M., 2006. What can the UK learn from the USA about
improving the quality and safety of healthcare? Clinical Medicine, Vol. 6, No. 6, p. 551-
558.
Toyota web site. Available on line from: http://www.toyota.co.jp/en/vision/production
system/index.html. [Accessed on January 20thst, 2008].
Tuttle, K.G., Improving ED Wait Times at North Shore University Hospital. Available on
line from: http://healthcare.isixsigma.com/library/content/c040428a.asp. [Accessed
June 1st, 2008]
UHL web site. Available on line from: http://www.uhl-tr.nhs.uk/ [Accessed on December
1st, 2007].
Van den Heuvel J., Does, R., Vermaat, M.B., 2004. Six Sigma in a Dutch hospital:
Does it work in the nursing department? Quality and Reliability Engineering
International, Vol. 20, p. 419-426.
Van Kooy M., Edell L., Scheckner H.M., 2002, Use of Six Sigma to improve the safety
and efficacy of acute anticoagulation with Heparin. JCOM Vol. 9, No. 8, p. 445-453.
Vieth, C. and Pexton C., Increasing cath lab capacity through Six Sigma. Available on
line from: http:// healthcare.isixsigma.com [Accessed on January 17th 2005].
Walder, J., Karlin, J., Kerk, C., 2007. Integrated Lean Thinking & Ergonomics: Utilizing
material handling assists device solutions for a productive workplace. MHIA White
Paper. November 1st.
Westwood, N., 2007. Reducing turnaround times in Pathology using Lean Thinking.
NHS Improvement. Available on line from: ttp://www.improvement.nhs.uk/diagnostics/
/LinkClick.aspx?fileticket=e6Q3Y8kXPDs%3d&tabid=74. [Accessed on February 10th,
2008].
Westwood, N., Silvester, K., 2007. Eliminate NHS losses by adding Lean and some Six
Sigma. Operations Management, No. 5. Available on line from:
http://www.iomnet.org.uk/uploaded/documents/WESTWOOD%20ARTICLE.pdf.

146
[Accessed on January 17th 2008].
Westwood, N., James-Moore, M., Cooke. M., 2007. Going lean in the NHS. The NHS
Institute for Innovation and Improvement. Heart of England Foundation and University
of Warwick.
Westwood, N., 2008. Learning by doing. Institute for Innovation and Improvement.
Womack, J., Creating Lean Healthcare. Available on line from: www.leanuk.org.
[Accessed on May 21st 2007].
Womack, J.P., Jones, D.T., Lean Thinking (1996, 2003). Second Edition. Free Press
Business.
Womack, J.P., and Jones, D.T., 2005. Available on line from: http://custom.hbsp.com
/b01/en/implicit/custom.jhtml?pr=LEANER0503C2005030462. [Accessed on August
17th 2005].
Womack, J.P., Byrne, A.P., Flume, O.J., Kaplan, G.S., Toussaint, J., 2005. Going Lean
in health care. Institute for Healthcare Improvement. USA
World Health Organisation. Preamble to the Constitution of the World Health
Organization as adopted by the international Health Conference, New York, 19-22
June 1946; signed on 22 July 1946 by the representatives of 61 states (Official Reports
of the World Health Organization, No. 2, p. 100) and entered into force on 7 April 1948.
Wysocki, B., 2004. To fix health care, hospitals take tips from factory floor. The Wall
Street Journal on line, April 9th.
Yin, R.K., 1993. Applications of Case Study Research. USA: Sage Publications Inc.
Young, T., Braislford, S., Connell, C., Davies, R., Harper, P. and Klein, J.H., 2004.
Using industrial processes to improve patient care. British Medical Journal, Vol. 29, No.
4, p. 162-164.

147
APPENDICES
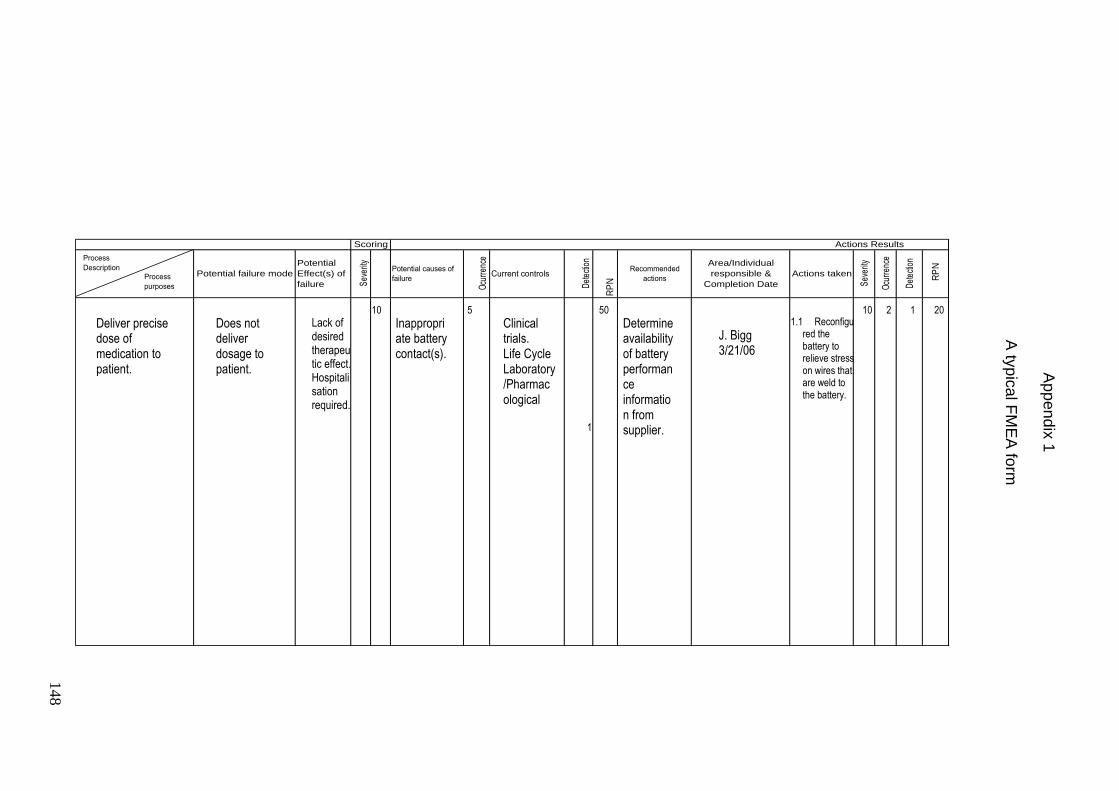
165
1
Sev
erity
Ocu
rren
ce
Det
ectio
n
Actions Results
R
PNPotential
Effect(s) of
failure
Potential failure mode
Scoring
Recommended
actions
Area/Individual
responsible &
Completion Date
Actions taken
RP
NDet
ectio
n
Sev
erity
Potential causes of
failure
Ocu
rren
ce
Current controls
Process
Description
Process
purposes
Deliver precise dose of medication to patient.
Does not deliver dosage to patient.
Lack of desired therapeutic effect. Hospitalisation required.
10
Inappropriate battery contact(s).
5
Clinical trials. Life Cycle Laboratory/Pharmacological
50
Determine availability of battery performance information from supplier.
1.1 Reconfigured the battery to relieve stress on wires that are weld to the battery.
J. Bigg 3/21/06
10 2 1 20
Ap
pen
dix
1
A ty
pic
al F
ME
A fo
rm
148
149
Appendix 2
Sample of questions from interviews
1. Do you know about the applications of Lean manufacturing in health care?
2. Are all the Lean tools/techniques suitable for health care?
3. Do you have any academic reference on Six Sigma application in health care?
4. In your own experience, which tools do not work or can be added when using
Six Sigma?
5. What are the most usual problems related to health care which are common in
any country?
Answers
Person A:
1. I do not.
2. The general ideas should be very helpful and after adaption the most tools are
adequate.
3. No.
4. Some statistical tools do not work well in healthcare, or other services
industries. Tools such as Design of experiment do not have much application
because in such people intensive processes we are usually dealing with critical
element, not operating parameters.
5. Usually the most usual “problems” are people issues more than process issues.
Person B:
1. No
2. Yes, 5S is most usual to apply.
3. No.
4. Some tools are great, and important supplements to Six Sigma are change
management tools.
5. Those that deal with people.
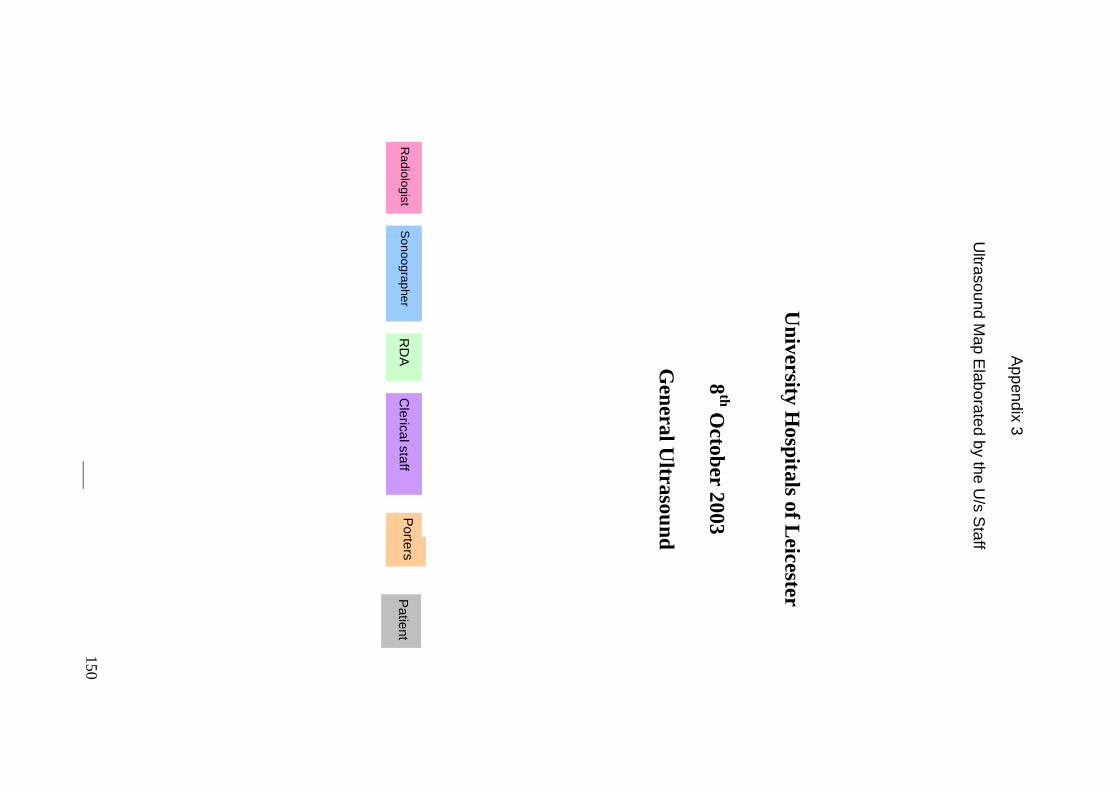
150
June 2005 University Hospitals of Leicester NHS Trust
Ultrasound Map 8th
June 2005
General Ultrasound
S
on
oo
gra
phe
r R
ad
iolo
gis
t R
DA
C
leric
al s
taff
Porte
rs
Patie
nt
Un
iversity
Ho
spita
ls of L
eicester
8th O
ctob
er 2
00
3
Gen
eral U
ltraso
un
d
A
pp
en
dix
3
Ultra
so
un
d M
ap
Ela
bo
rate
d b
y th
e U
/s S
taff
150
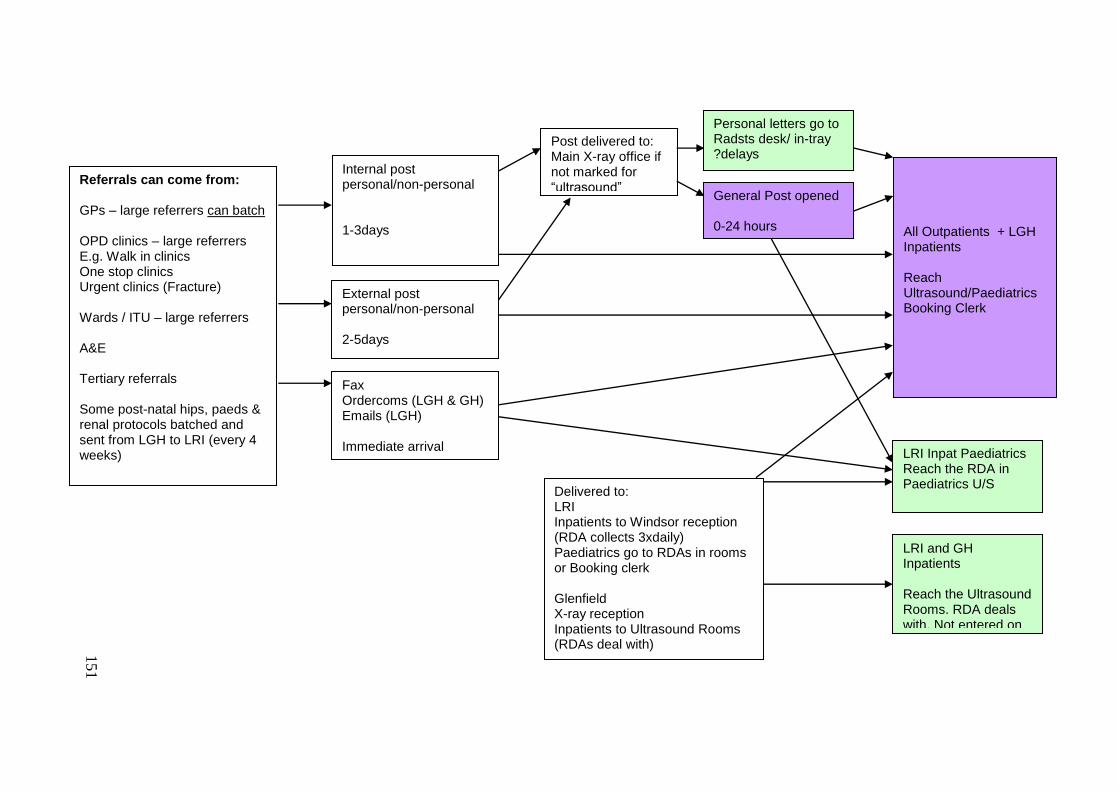
151
Sonographer Code :
Referrals can come from: GPs – large referrers can batch OPD clinics – large referrers E.g. Walk in clinics One stop clinics Urgent clinics (Fracture) Wards / ITU – large referrers A&E Tertiary referrals Some post-natal hips, paeds & renal protocols batched and sent from LGH to LRI (every 4 weeks)
Post delivered to: Main X-ray office if not marked for “ultrasound”
External post personal/non-personal 2-5days
Internal post personal/non-personal 1-3days
Fax Ordercoms (LGH & GH) Emails (LGH) Immediate arrival
Delivered to: LRI Inpatients to Windsor reception (RDA collects 3xdaily) Paediatrics go to RDAs in rooms or Booking clerk Glenfield X-ray reception Inpatients to Ultrasound Rooms (RDAs deal with)
Personal letters go to Radsts desk/ in-tray ?delays
General Post opened 0-24 hours
All Outpatients + LGH Inpatients Reach Ultrasound/Paediatrics Booking Clerk
LRI and GH Inpatients Reach the Ultrasound Rooms. RDA deals with. Not entered on waiting list.
LRI Inpat Paediatrics Reach the RDA in Paediatrics U/S
151
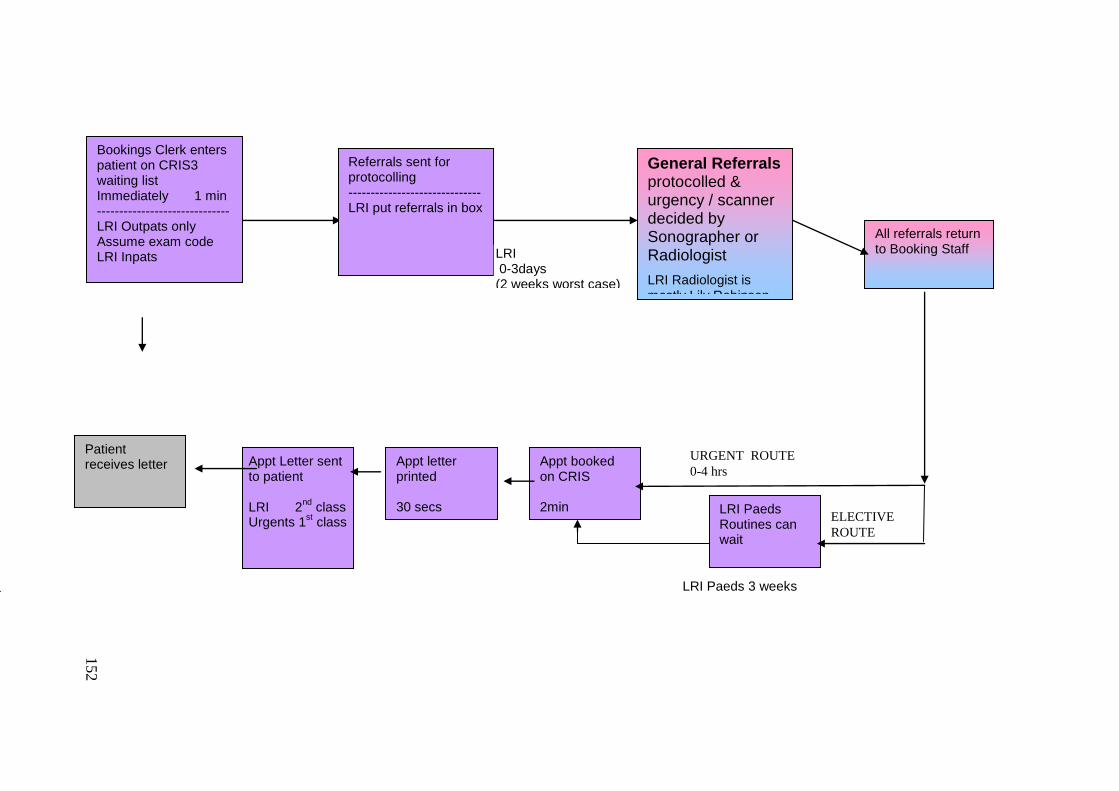
152
URGENT ROUTE
0-4 hrs
ELECTIVE
ROUTE
Appt booked on CRIS 2min
Bookings Clerk enters patient on CRIS3 waiting list Immediately 1 min ------------------------------ LRI Outpats only Assume exam code LRI Inpats
Referrals sent for protocolling ------------------------------ LRI put referrals in box
General Referrals protocolled & urgency / scanner decided by Sonographer or Radiologist
LRI Radiologist is mostly Lily Robinson
Dr Robinson classifies them, 4 hrs
LRI 0-3days (2 weeks worst case) Urgents 0-1 day
All referrals return to Booking Staff
LRI Paeds Routines can wait
Appt Letter sent to patient LRI 2
nd class
Urgents 1st class
Patient receives letter Appt letter
printed 30 secs
LRI Paeds 3 weeks
152
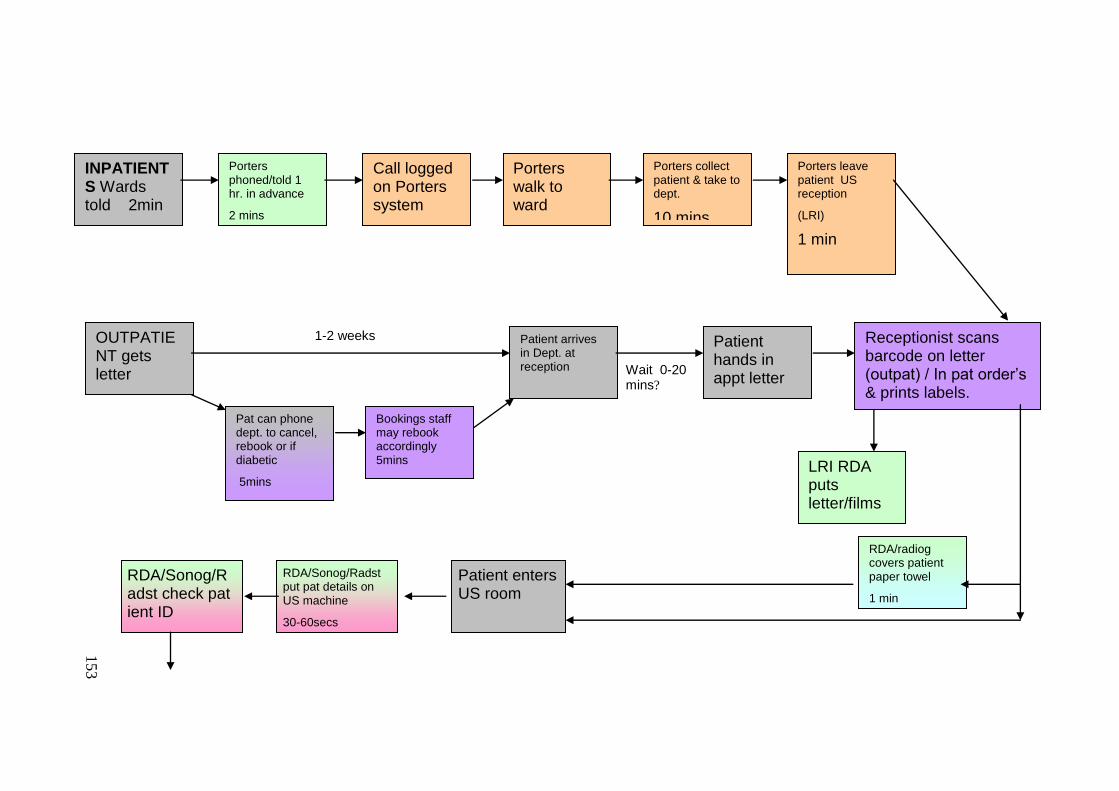
153
1-2 weeks
Wait 0-20 mins?
OUTPATIENT gets letter
1min
INPATIENTS Wards told 2min
Porters phoned/told 1 hr. in advance
2 mins
1min
Call logged on Porters system
2 mins
1min
Porters walk to ward
2 -10 mins
1min
Porters collect patient & take to dept.
10 mins
10 mins
1min
Porters leave patient US reception
(LRI)
1 min
10 minutes
1min
Pat can phone dept. to cancel, rebook or if diabetic
5mins
Bookings staff may rebook accordingly 5mins
Patient arrives in Dept. at reception
1min
Patient hands in appt letter
10 secs
Receptionist scans barcode on letter (outpat) / In pat order‟s & prints labels.
10 secs-3mins
LRI RDA puts letter/films
/labels in US room 1 min
10 secs
RDA/radiog covers patient paper towel
1 min
10 secs
Patient enters US room
RDA/Sonog/Radst put pat details on US machine
30-60secs
RDA/Sonog/Radst check pat ient ID
30secs
153
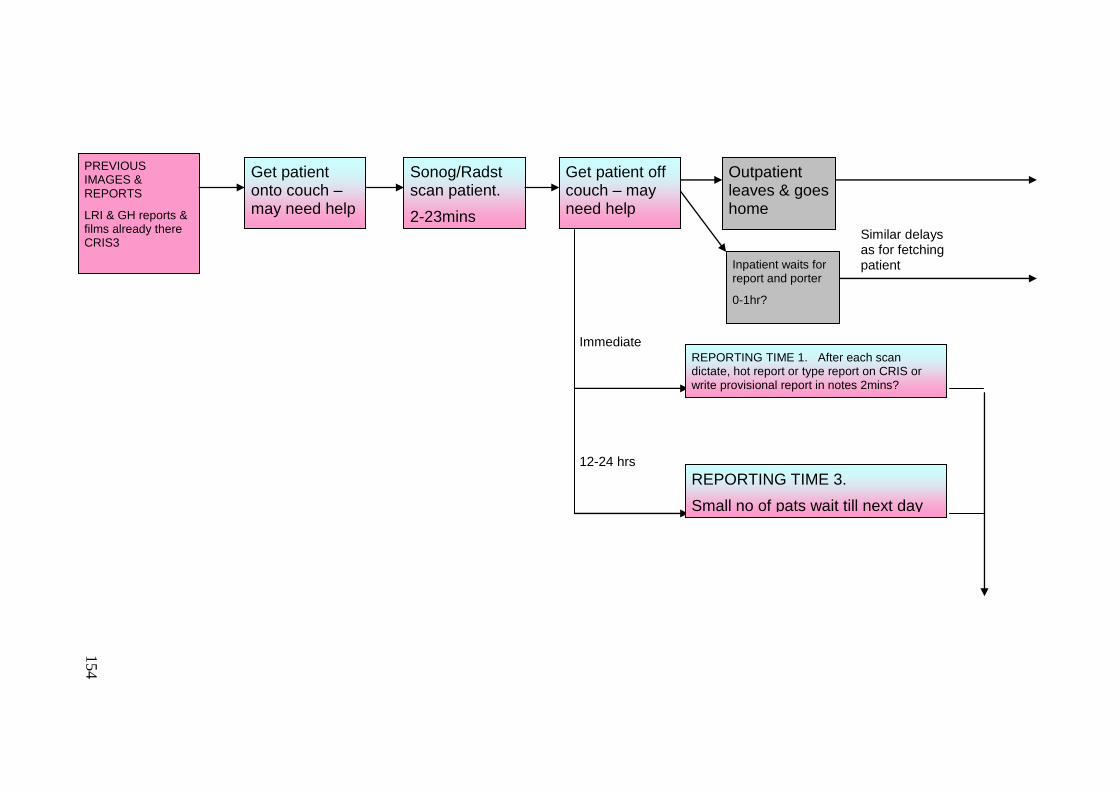
154
PREVIOUS IMAGES & REPORTS
LRI & GH reports & films already there CRIS3
Get patient onto couch – may need help
0-10mins
Sonog/Radst scan patient.
2-23mins
Get patient off couch – may need help
0-3mins
REPORTING TIME 1. After each scan dictate, hot report or type report on CRIS or write provisional report in notes 2mins?
10-15mins
Outpatient leaves & goes home
Inpatient waits for report and porter
0-1hr?
Similar delays as for fetching patient
REPORTING TIME 3.
Small no of pats wait till next day
Immediate
12-24 hrs
154
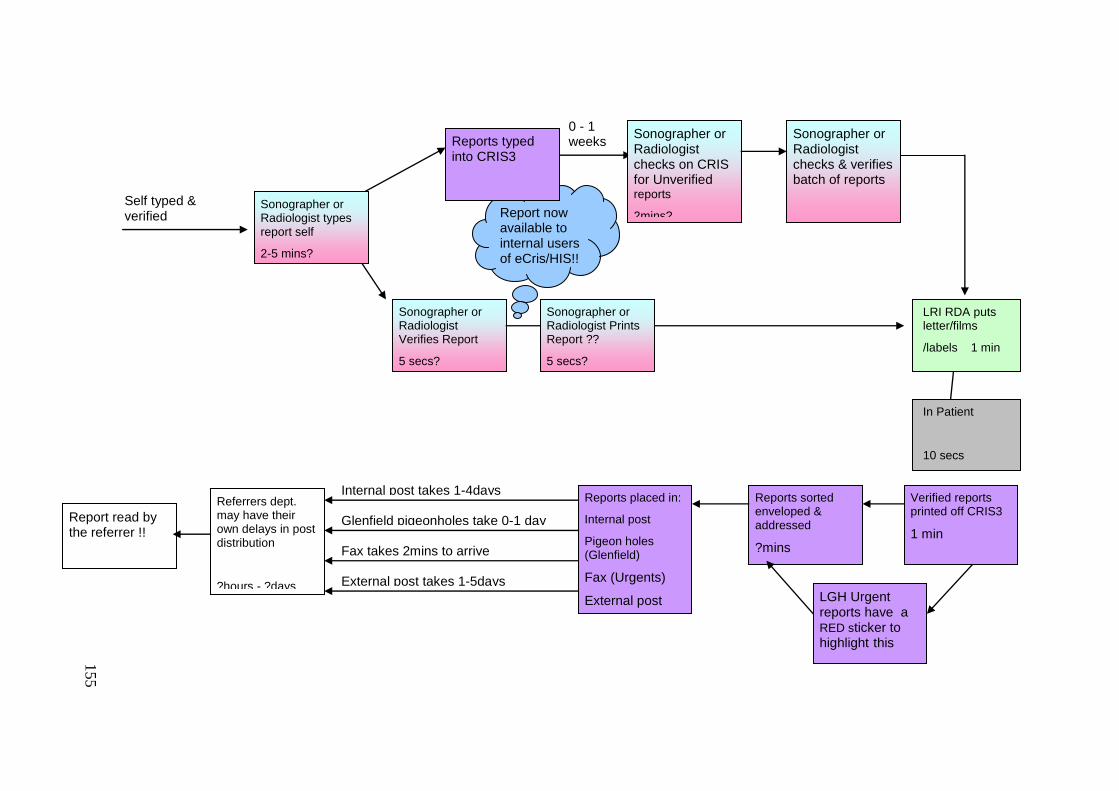
155
Fax takes 2mins to arrive
Report now available to internal users of eCris/HIS!! !!
0 - 1 weeks
Self typed & verified
Reports typed into CRIS3
1-5mins Sonographer or Radiologist types report self
2-5 mins?
Sonographer or Radiologist Verifies Report
5 secs?
Sonographer or Radiologist checks on CRIS for Unverified reports
2mins?
Sonographer or Radiologist checks & verifies batch of reports
2-10mins?
Sonographer or Radiologist Prints Report ??
5 secs?
Verified reports printed off CRIS3
1 min
Reports sorted enveloped & addressed
?mins
Reports placed in:
Internal post
Pigeon holes (Glenfield)
Fax (Urgents)
External post LGH Urgent reports have a RED sticker to highlight this
Referrers dept. may have their own delays in post distribution
?hours - ?days
Internal post takes 1-4days
Glenfield pigeonholes take 0-1 day
External post takes 1-5days
Report read by the referrer !!
LRI RDA puts letter/films
/labels 1 min
10 secs In Patient
10 secs
155
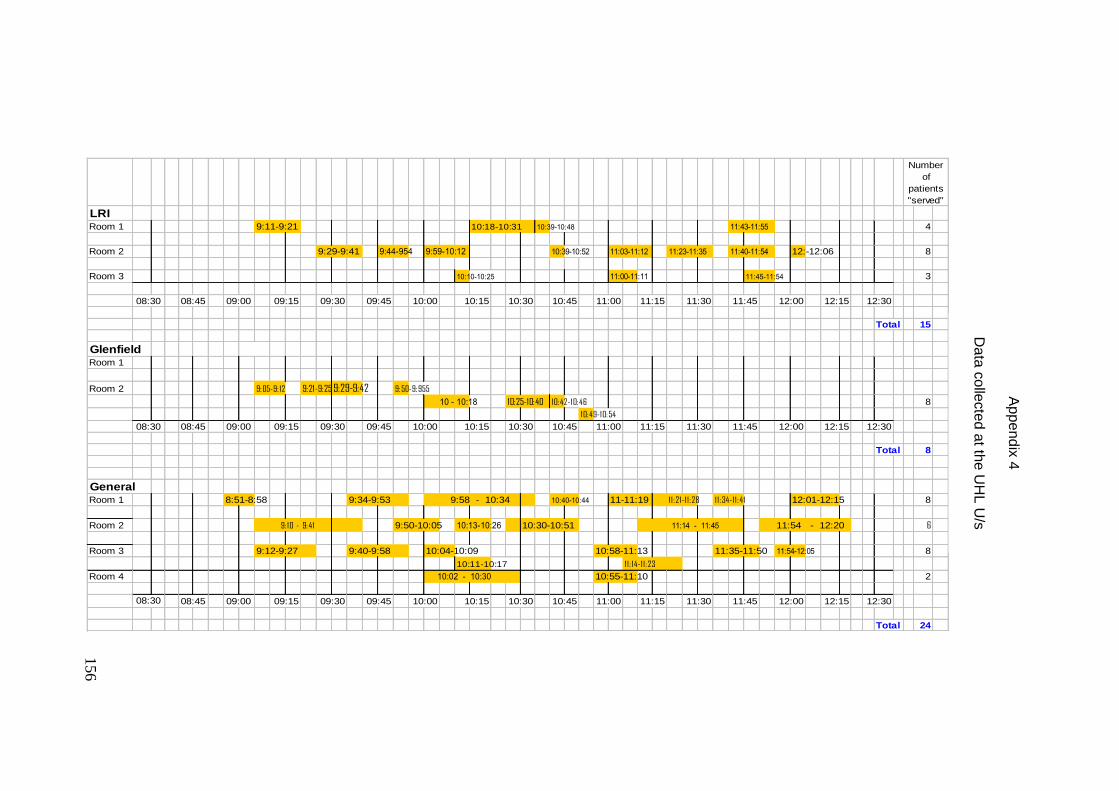
156
LRIRoom 1 10:39-10:48 4
Room 2 9:44-954 9:59-10:12 10:39-10:52 11:03-11:12 12:-12:06 8
Room 3 10:10-10:25 11:00-11:11 11:45-11:54 3
Total 15
GlenfieldRoom 1
Room 2 9:05-9: 12 9:21-9:25 9:29-9:42 9:50-9:955
10 - 10:18 10:25-10:40 10:42-10:46 8
10:49-10:54
Total 8
GeneralRoom 1 8:51-8:58 9:34-9:53 9:58 - 10:34 10:40-10:44 11-11:19 11:21-11:28 11:34-11:41 12:01-12:15 8
Room 2 9: 10 - 9:41 9:50-10:05 10:13-10:26 10:30-10:51 11:14 - 11:45 11:54 - 12:20 6
Room 3 9:12-9:27 9:40-9:58 10:04-10:09 10:58-11:13 11:35-11:50 11:54-12:05 8
10:11-10:17 11: 14-11:23
Room 4 10:02 - 10:30 10:55-11:10 2
Total 24
Number
of
patients
"served"
08:30 08:45 09:00 09:15
9:11-9:21 10:18-10:31 11:43-11:55
9:29-9:41 11:23-11:35
11:30 11:45 12:0010:30 10:45 11:00 11:1509:30 09:45
10:00
12:3012:1510:00 10:15
11:30 11:45 12:0008:30 08:45 09:00 09:15
09:30 09:45 10:00
11:1510:15 10:30 10:45 11:0009:30 09:45
08:30 08:45 09:00 09:15 10:15 10:30 10:45 11:00
11:40-11:54
12:15 12:3011:15 11:30 11:45 12:00
12:15 12:30
Ap
pe
nd
ix 4
D
ata
co
llecte
d a
t the U
HL
U/s
156
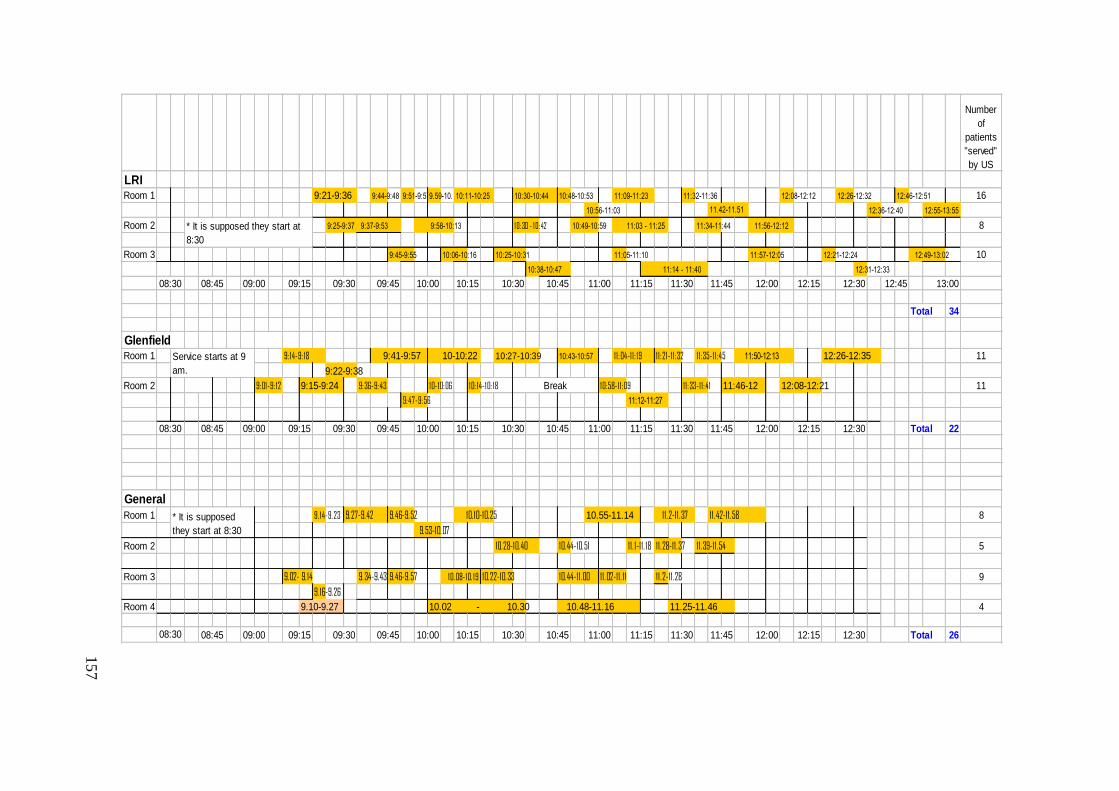
157
Number
of
patients
"served"
by US
LRIRoom 1 9:21-9:36 9:44-9:48 9:51-9:579.59-10.02 10:48-10:53 11:32-11:36 12:08-12:12 12:26-12:32 12:46-12:51 16
10:56-11:03 12:36-12:40 12:55-13:55
Room 2 9:25-9:37 9:58-10:13 10: 30 - 10: 42 10:49-10:59 11:03 - 11:25 11:34-11:44 8
Room 3 9:45-9:55 10:06-10:16 10:25-10:31 11:05-11:10 11:57-12:05 12:21-12:24 12:49-13:02 10
10:38-10:47 12:31-12:33
Total 34
GlenfieldRoom 1 9: 14-9: 18 9:41-9:57 10-10:22 10:27-10:39 10:43-10:57 11:04-11: 19 11:21-11:32 11:35-11:45 11:50-12:13 12:26-12:35 11
9:22-9:38
Room 2 9:01-9: 12 9:15-9:24 9:36-9:43 10-10:06 10: 14-10: 18 10:58-11:09 11:33-11:41 11:46-12 12:08-12:21 11
9:47-9:56 11:12-11:27
Total 22
General
Room 1 9. 14-9.23 9.27-9.42 9.46-9.52 10.10-10.25 10.55-11.14 11.2-11.37 11.42-11.58 8
9.53-10.07
Room 2 10.28-10.40 10.44-10.51 11. 1-11. 18 11.28-11.37 11.39-11.54 5
Room 3 9.02- 9.14 9.34-9.43 9.46-9.57 10.08-10. 19 10.22-10.33 10.44-11.00 11.02-11. 11 11.2-11.28 9
9.16-9.26
Room 4 9.10-9.27 10.02 - 10.30 10.48-11.16 11.25-11.46 4
Total 26
* It is supposed
they start at 8:30
* It is supposed they start at
8:30
11.42-11.51
12:3009:30 09:45 10:00
11:56-12:12 9:37-9:53
11:14 - 11:40
10:30 13:0011:30 11:45 12:00 12:15 12:45
11:09-11:23
Service starts at 9
am.
09:00 09:15 10:45 11:00 11:1510:1508:30 08:45
10:15 10:30
10:11-10:25 10:30-10:44
08:30 08:45 09:00 09:15 12:15 12:3010:45 11:00 11:15 11:30 11:45 12:00
08:30
09:45 10:00
10:4509:45 10:00 10:15 10:3008:45 09:00 12:00 12:15 12:3011:30 11:4509:15 09:30 11:00 11:15
Break
09:30
1
57
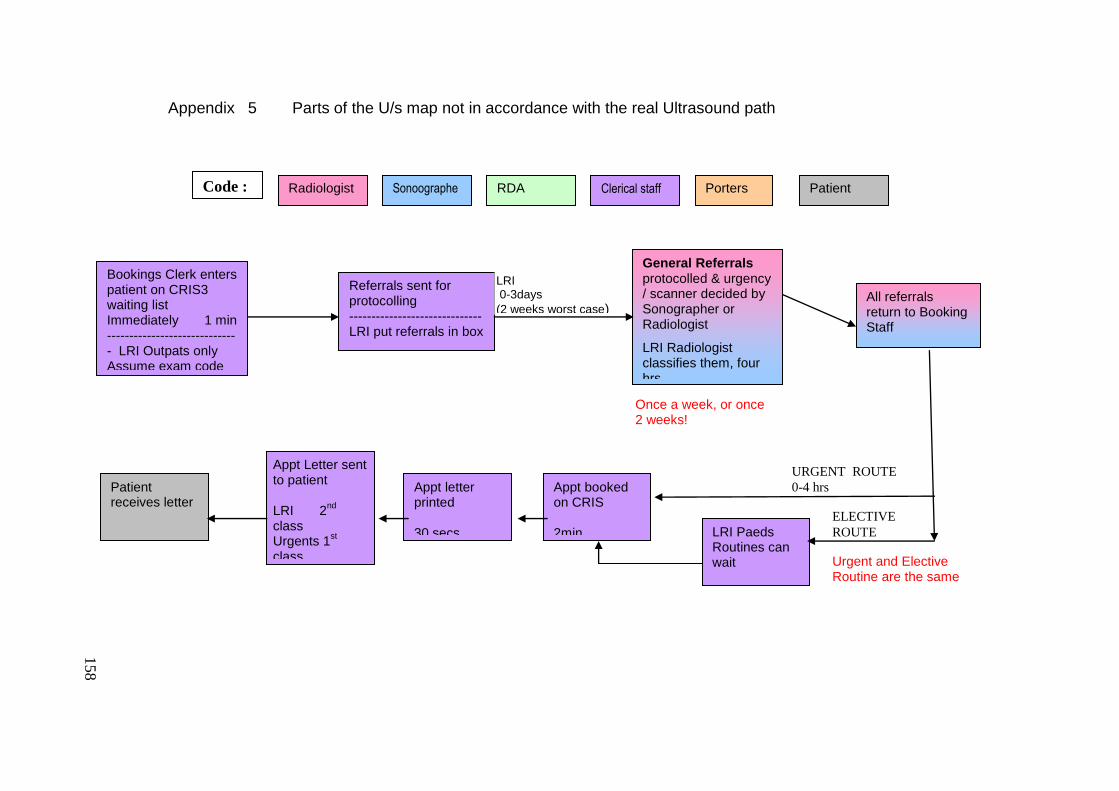
158
Urgent and Elective Routine are the same
URGENT ROUTE
0-4 hrs
ELECTIVE
ROUTE
Appt booked on CRIS 2min
Bookings Clerk enters patient on CRIS3 waiting list Immediately 1 min ------------------------------ LRI Outpats only Assume exam code
Referrals sent for protocolling ------------------------------ LRI put referrals in box
General Referrals protocolled & urgency / scanner decided by Sonographer or Radiologist
LRI Radiologist classifies them, four hrs
LRI 0-3days
(2 weeks worst case) Urgents 0-1 day
All referrals return to Booking Staff
LRI Paeds Routines can wait
Appt Letter sent to patient LRI 2
nd
class Urgents 1
st
class
Patient receives letter
Appt letter printed 30 secs
Once a week, or once 2 weeks!
Radiologist Sonoographer
RDA Clerical staff Porters Patient Code :
Appendix 5 Parts of the U/s map not in accordance with the real Ultrasound path
158
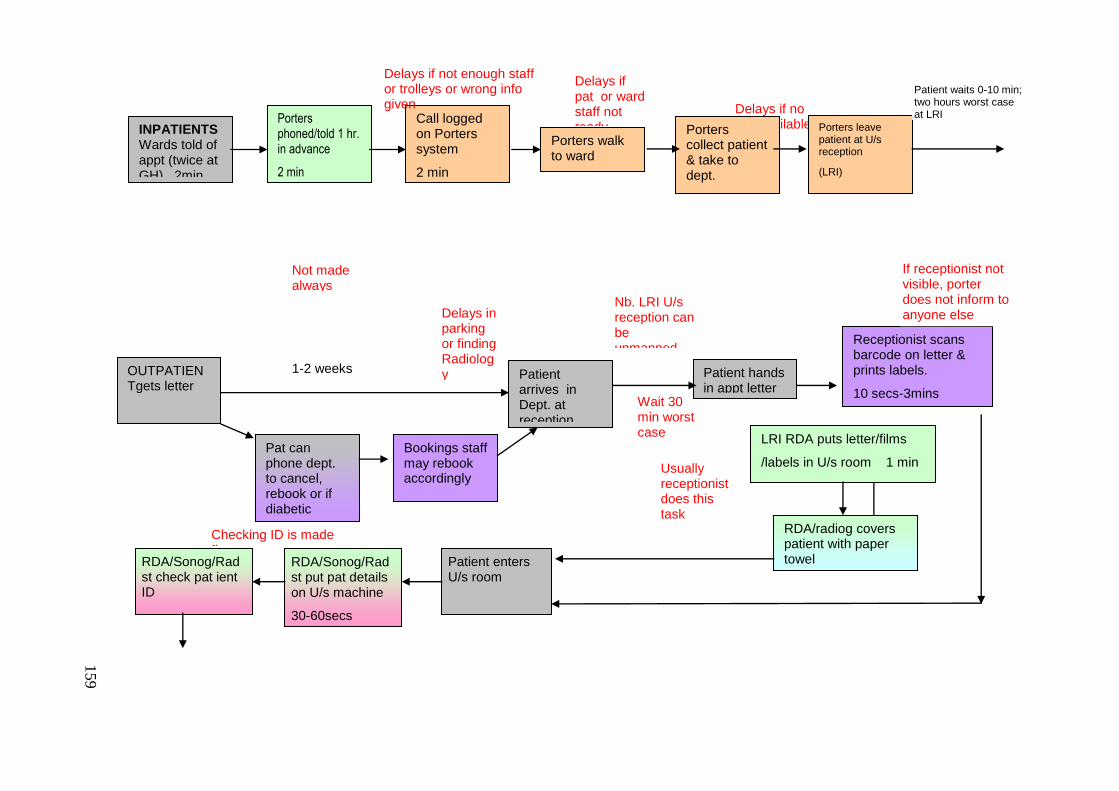
159
Delays if no lifts available
Delays if pat or ward staff not ready
Wait 30 min worst case
Nb. LRI U/s reception can be unmanned over lunch
OUTPATIENTgets letter
1min
INPATIENTS Wards told of appt (twice at GH) 2min
Porters phoned/told 1 hr. in advance
2 min
1min
Call logged on Porters system
2 min
1min
Porters walk to ward
2 -10 mins
1min
Porters collect patient & take to dept.
10 min
10 mins
1min
Porters leave patient at U/s reception
(LRI)
1 min
10 mins
1min
Delays if not enough staff or trolleys or wrong info given
Pat can phone dept. to cancel, rebook or if diabetic
5mins
Bookings staff may rebook accordingly
Patient arrives in Dept. at reception
1min
1-2 weeks
Delays in parking or finding Radiology Patient hands
in appt letter
10 secs
Receptionist scans barcode on letter & prints labels.
10 secs-3mins
LRI RDA puts letter/films
/labels in U/s room 1 min
10 secs
RDA/radiog covers patient with paper towel
10 secs
Patient enters U/s room
RDA/Sonog/Radst put pat details on U/s machine
30-60secs
RDA/Sonog/Radst check pat ient ID
30secs
Not made always
If receptionist not visible, porter does not inform to anyone else
Patient waits 0-10 min; two hours worst case at LRI
Usually receptionist does this task
Checking ID is made first
159
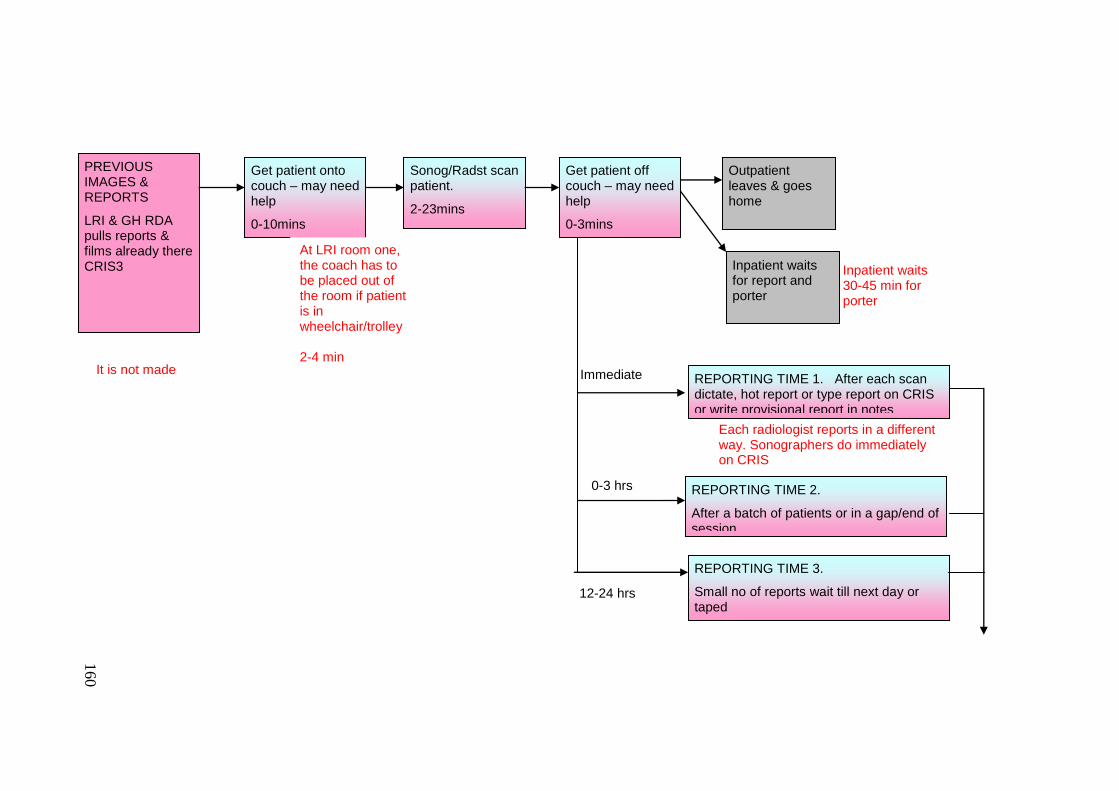
160
REPORTING TIME 1. After each scan dictate, hot report or type report on CRIS or write provisional report in notes
10-15mins
PREVIOUS IMAGES & REPORTS
LRI & GH RDA pulls reports & films already there CRIS3
Get patient onto couch – may need help
0-10mins
Sonog/Radst scan patient.
2-23mins
Get patient off couch – may need help
0-3mins
Outpatient leaves & goes home
Inpatient waits for report and porter
0-1hr?
Inpatient waits 30-45 min for porter
REPORTING TIME 3.
Small no of reports wait till next day or taped
Immediate
12-24 hrs
It is not made
At LRI room one, the coach has to be placed out of the room if patient is in wheelchair/trolley 2-4 min
Each radiologist reports in a different way. Sonographers do immediately on CRIS
REPORTING TIME 2.
After a batch of patients or in a gap/end of session
0-3 hrs
160
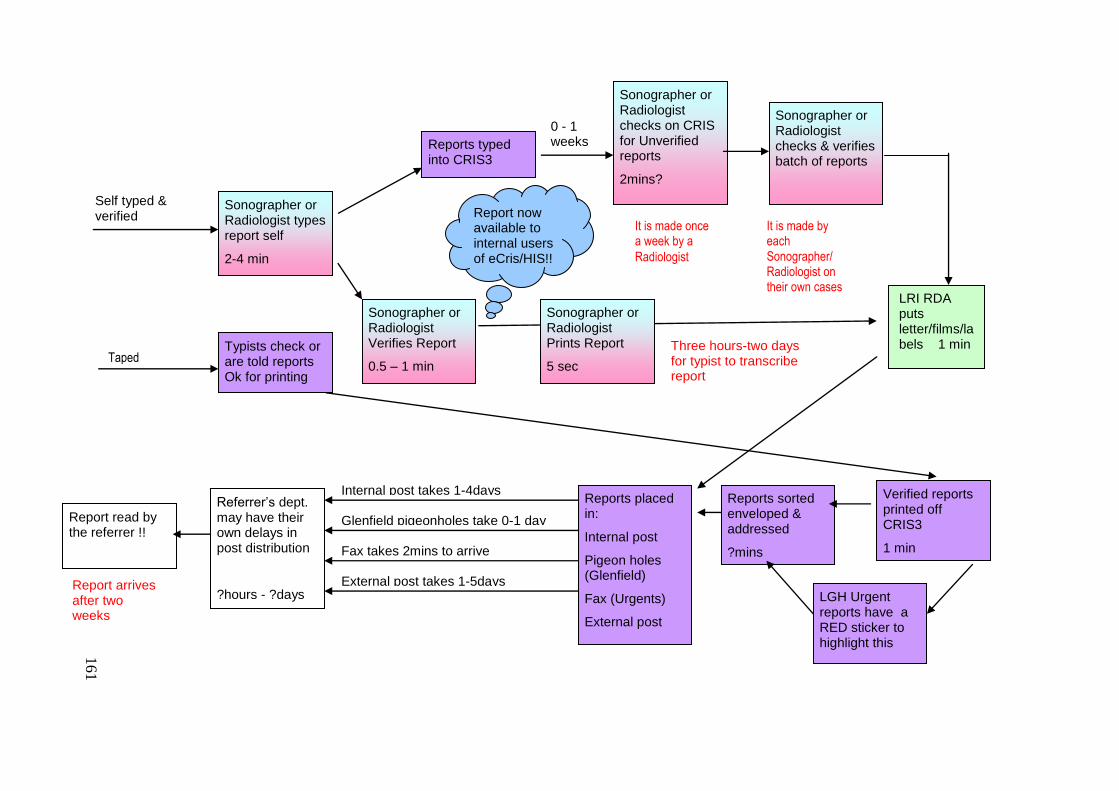
161
0 - 1 weeks
Self typed & verified
Reports typed into CRIS3
1-5mins Sonographer or Radiologist types report self
2-4 min
Sonographer or Radiologist Verifies Report
0.5 – 1 min
Sonographer or Radiologist checks on CRIS for Unverified reports
2mins?
Sonographer or Radiologist checks & verifies batch of reports
2-10mins?
Sonographer or Radiologist Prints Report
5 sec
Verified reports printed off CRIS3
1 min
Reports sorted enveloped & addressed
?mins
Reports placed in:
Internal post
Pigeon holes (Glenfield)
Fax (Urgents)
External post
LGH Urgent reports have a RED sticker to highlight this
Referrer‟s dept. may have their own delays in post distribution
?hours - ?days
Internal post takes 1-4days
Glenfield pigeonholes take 0-1 day
Fax takes 2mins to arrive
External post takes 1-5days
Report read by the referrer !!
Report now available to internal users of eCris/HIS!! !!
LRI RDA puts letter/films/labels 1 min
10 secs
It is made once a week by a
Radiologist
It is made by each Sonographer/ Radiologist on their own cases
Three hours-two days for typist to transcribe report
Typists check or are told reports Ok for printing
Taped
Report arrives after two weeks
161
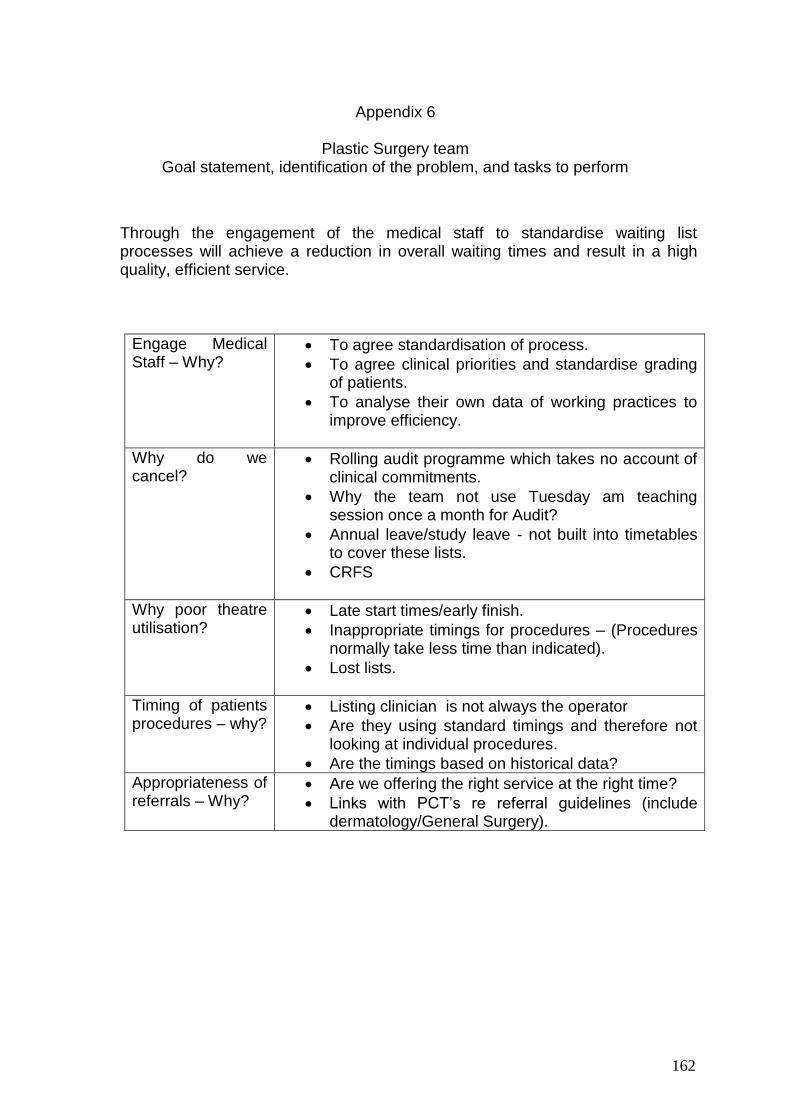
162
Through the engagement of the medical staff to standardise waiting list processes will achieve a reduction in overall waiting times and result in a high quality, efficient service.
Engage Medical Staff – Why?
To agree standardisation of process.
To agree clinical priorities and standardise grading of patients.
To analyse their own data of working practices to improve efficiency.
Why do we cancel?
Rolling audit programme which takes no account of clinical commitments.
Why the team not use Tuesday am teaching session once a month for Audit?
Annual leave/study leave - not built into timetables to cover these lists.
CRFS
Why poor theatre utilisation?
Late start times/early finish.
Inappropriate timings for procedures – (Procedures normally take less time than indicated).
Lost lists.
Timing of patients procedures – why?
Listing clinician is not always the operator
Are they using standard timings and therefore not looking at individual procedures.
Are the timings based on historical data?
Appropriateness of referrals – Why?
Are we offering the right service at the right time?
Links with PCT‟s re referral guidelines (include dermatology/General Surgery).
Appendix 6
Plastic Surgery team Goal statement, identification of the problem, and tasks to perform

163
ACTIONS TIMESCALE BY WHOM
Measurements to present.
Average time to undertake set procedures. (To include all day case procedures by grade of staff.)
Timings on waiting list slip
Back up information broken down to individual levels.
June & July Julia
Weekly timings vs. Saturday operating
June & July Julia
Number of lists lost due to annual leave and study leave and Audit – will reflect the impact of Mr Rauf.
Last rolling 12 months.
Julia
Start and finishing times – overall, and broken down to individuals.
June & July Julia
Grading patients by procedure.
June & July Julia.
Cancer wait times information – down to patient level.
June & July Angharad.
Activity through the day ward – Plastic Surgery.
Last rolling 12 months.
Angharad.

164
General Director
Secretary of the Board Organ of Internal Control
General Sub-Direction of Medicine
General Sub-Direction of Services
Juridical Sub-Direction
General Sub-Direction of Finance
General
Coordinati
on
managem
ent Sub-Direction of finance planning and institute evaluation
General Coordination of Delegation
development
General Coordination of Social
Communication
Sub-Direction of assets and
planning
Sub-Direction of pensions
Sub-Direction of the
consultation
General treasury
Sub-Direction of warehouses
Sub-Direction of innovation
and quality
Sub-Direction of programming
and budgeting
Sub-Direction of physical resources and
services
General Sub-Direction of Transformation and Institution
Development
Sub-Direction of information
technology
Sub-Direction of human resources
Sub-Direction of Health regulation and
attention
Sub-Direction of health services management
Sub-Direction of Infrastructure
Sub-Direction of medical
supplies
Sub-Direction of maintenance and conservation
Sub-Direction of granting
credits
Sub-Direction of affiliation and
validity
Sub-Direction of social and cultural services
Sub-Direction of credit
recovering
Sub-Direction of training and educational services
Sub-Direction of the
contentious
Sub-
Direction of notary and
estates
Unit of projects coordination
Sub-Direction of customer
service
Sub-Direction of
accountability
Sub-Direction of health
assurance
Sub-
Direction of building
and
contractors
National Medical Centre 20 de
Noviembre
Regional
Hospitals
School of Diet and Nutrition
Fund of housing
(FOVISSSTE) Delegations Integral system
of shops, pharmacies and regional administrations
System of tourist agencies (TURISSSTE)
Appendix 7 ISSSTE Structure
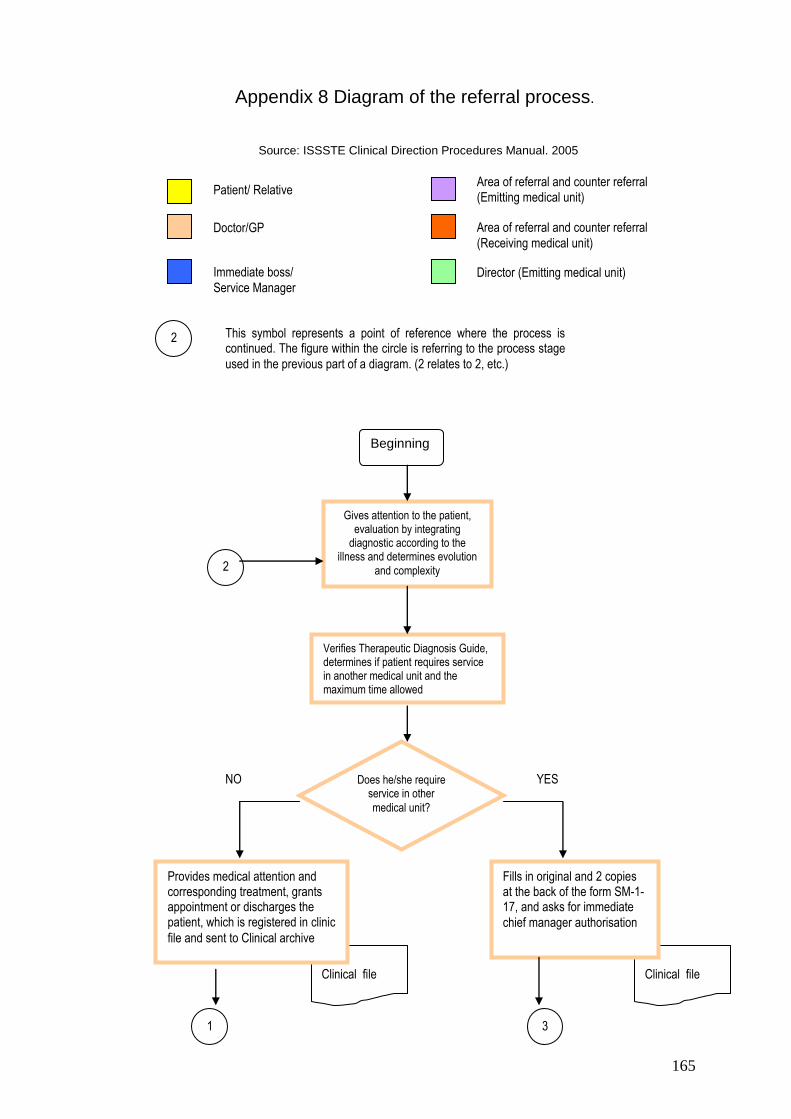
165
Appendix 8 Diagram of the referral process.
Source: ISSSTE Clinical Direction Procedures Manual. 2005
Clinical file
Clinical file
Beginning
Gives attention to the patient, evaluation by integrating
diagnostic according to the illness and determines evolution
and complexity
Verifies Therapeutic Diagnosis Guide, determines if patient requires service in another medical unit and the maximum time allowed
Does he/she require service in other
medical unit?
Fills in original and 2 copies at the back of the form SM-1-17, and asks for immediate
chief manager authorisation
Provides medical attention and corresponding treatment, grants appointment or discharges the patient, which is registered in clinic
file and sent to Clinical archive
1
2
YES NO
3
Doctor/GP
Immediate boss/
Service Manager
Area of referral and counter referral
(Receiving medical unit)
Director (Emitting medical unit)
2 This symbol represents a point of reference where the process is continued. The figure within the circle is referring to the process stage
used in the previous part of a diagram. (2 relates to 2, etc.)
Patient/ Relative Area of referral and counter referral (Emitting medical unit)
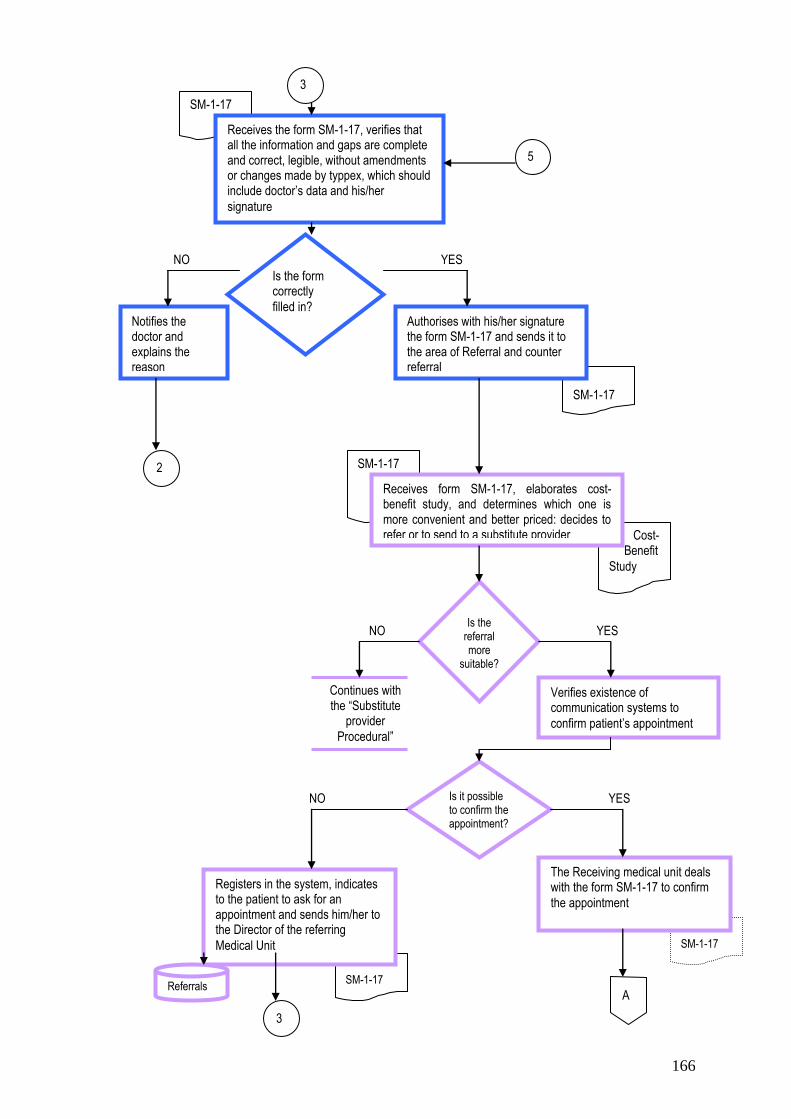
166
SM-1-17
Cost- Benefit
Study
SM-1-17
SM-1-17
SM-1-17
SM-1-17
Receives form SM-1-17, elaborates cost-benefit study, and determines which one is more convenient and better priced: decides to refer or to send to a substitute provider
Continues with the “Substitute
provider
Procedural”
The Receiving medical unit deals with the form SM-1-17 to confirm
the appointment
Verifies existence of communication systems to
confirm patient‟s appointment
Is it possible to confirm the appointment?
Is the referral more
suitable?
Registers in the system, indicates to the patient to ask for an appointment and sends him/her to the Director of the referring
Medical Unit
Referrals
3
Receives the form SM-1-17, verifies that all the information and gaps are complete and correct, legible, without amendments or changes made by typpex, which should include doctor‟s data and his/her
signature
Is the form correctly
filled in? Notifies the doctor and explains the reason
Authorises with his/her signature the form SM-1-17 and sends it to the area of Referral and counter referral
2
3
YES
YES
YES
NO
NO
NO
5
A

167
SM-1-17
SM-1-17
4
Receives the form SM-1-17 f, via telephone/fax, e-mail or Telemedicine, determines capacity and maximum allowed time for
transference
Does it have
capacity?
Notifies to the referring Medical Unit
Confirms to the referring medical unit the appointment and registers it in the service record book
Receives negative confirmation. Look up for the next option in the “Catalogue of Services” via telephone and/or fax, e-mail or Telemedicine, the SM-1-17 form to confirm the appointment
Manages the SM-1-17 form to confirm the appointment with the receiving medical unit
Continues with the “Substitute provider
procedure”
Are there any other
options?
Catalogue of Services
4
Appointment
confirmed Referrals
NO
NO
YES
YES
Receives confirmation and sends the SM-1-17 form to the Director of the referring Medical Unit for his
authorization
A
B
Record of Services
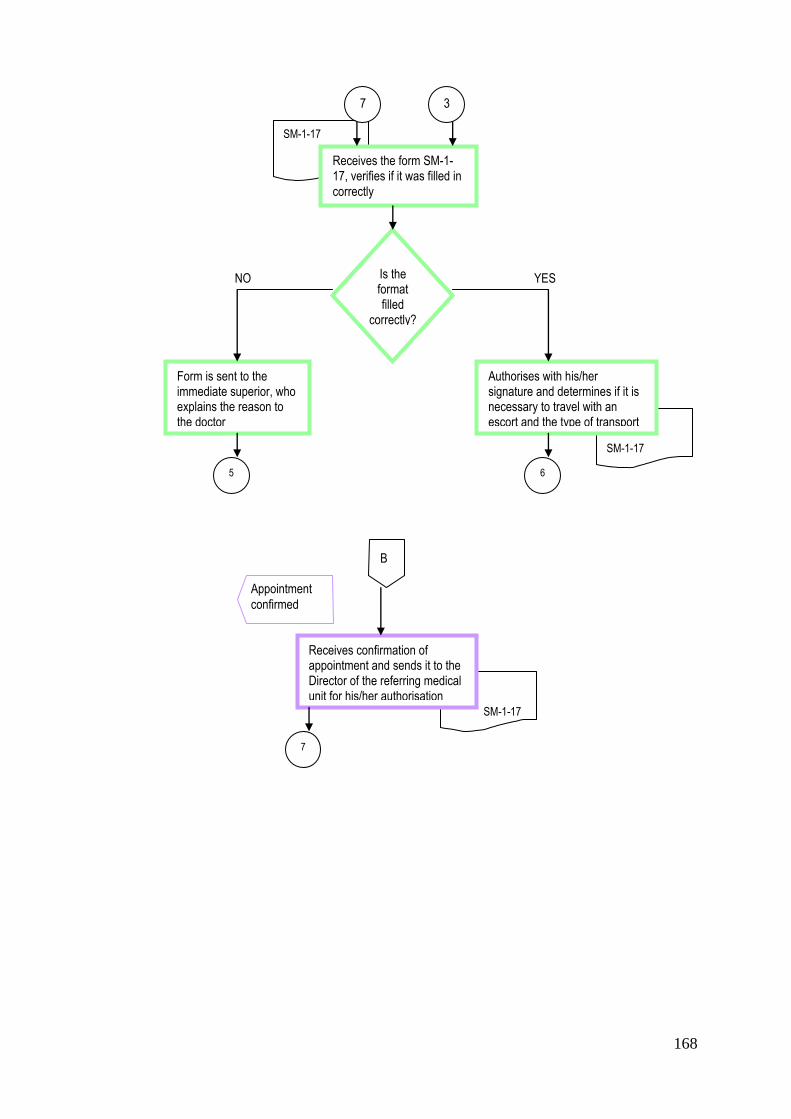
168
SM-1-17
SM-1-17
SM-1-17
Receives the form SM-1-17, verifies if it was filled in correctly
Is the format filled
correctly?
Authorises with his/her signature and determines if it is necessary to travel with an escort and the type of transport
Form is sent to the immediate superior, who explains the reason to the doctor
7 3
6 5
YES NO
B
Appointment
confirmed
Receives confirmation of appointment and sends it to the Director of the referring medical unit for his/her authorisation
7
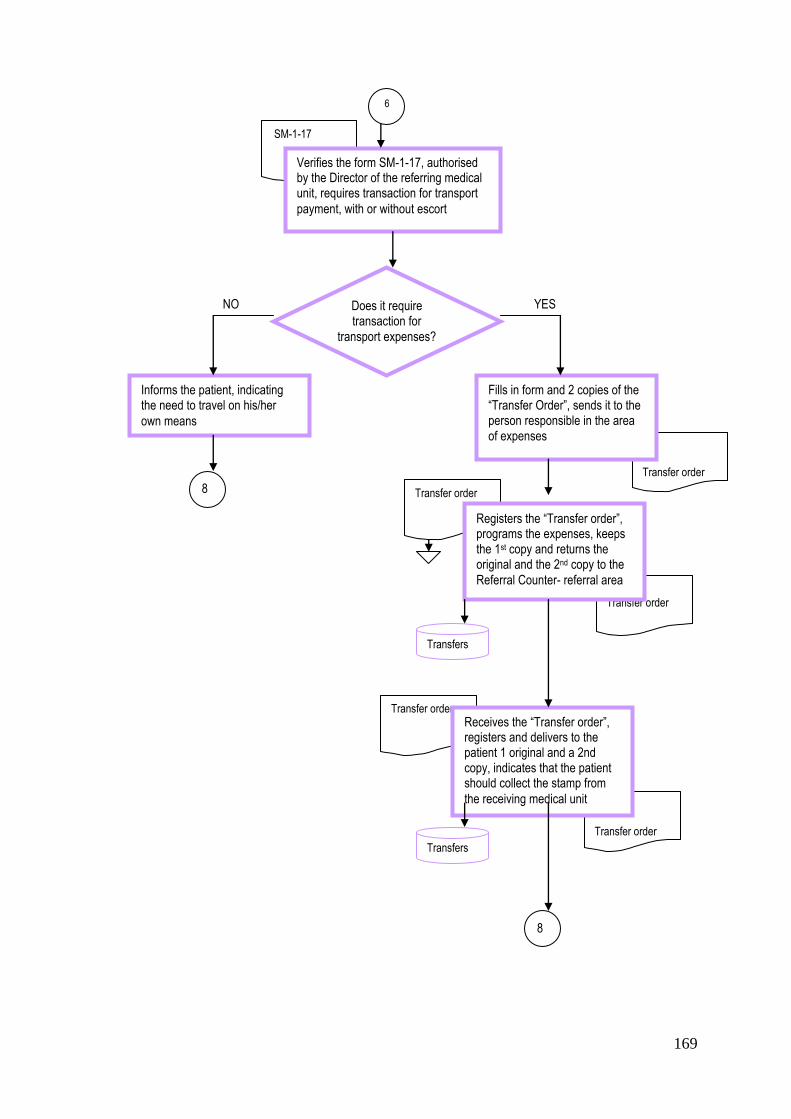
169
SM-1-17
Transfer order
Transfer order
Transfer order
Transfer order
Transfer order
6
Verifies the form SM-1-17, authorised by the Director of the referring medical unit, requires transaction for transport
payment, with or without escort
Does it require transaction for
transport expenses?
Informs the patient, indicating the need to travel on his/her
own means
Fills in form and 2 copies of the “Transfer Order”, sends it to the person responsible in the area of expenses
8
Transfers
Registers the “Transfer order”, programs the expenses, keeps the 1st copy and returns the original and the 2nd copy to the
Referral Counter- referral area
Receives the “Transfer order”, registers and delivers to the patient 1 original and a 2nd copy, indicates that the patient should collect the stamp from
the receiving medical unit
Transfers
YES NO
8
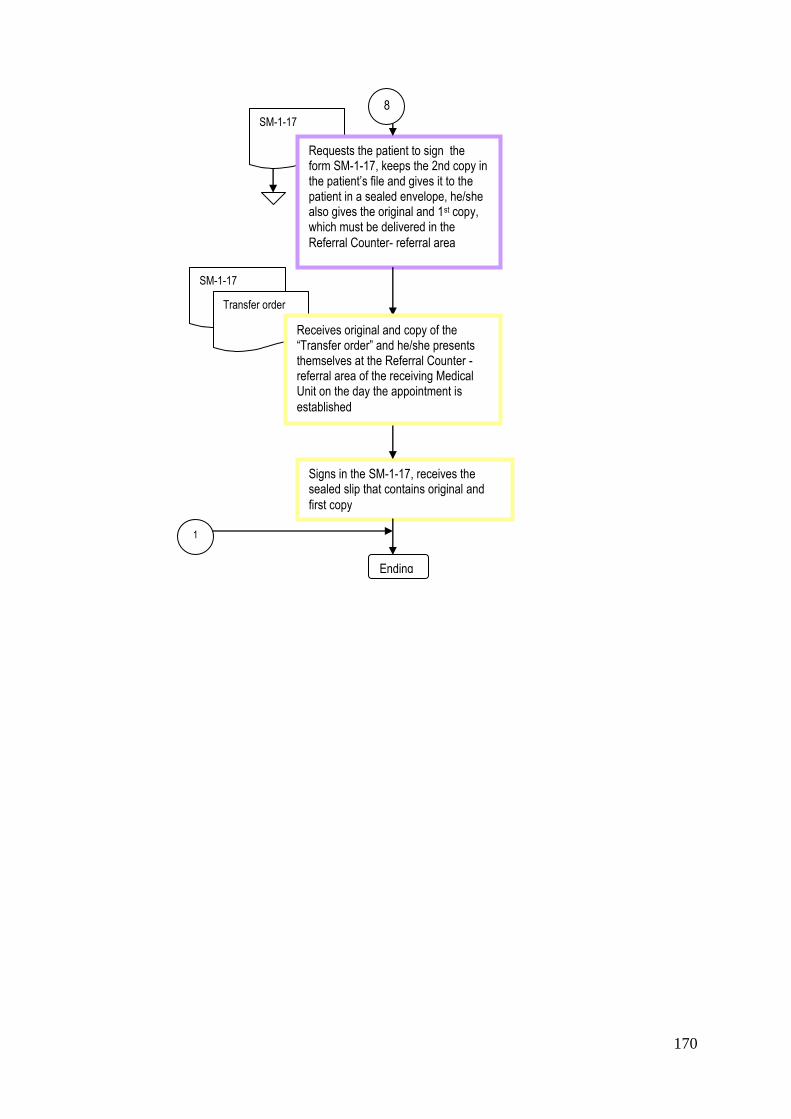
170
SM-1-17
SM-1-17
Requests the patient to sign the form SM-1-17, keeps the 2nd copy in the patient‟s file and gives it to the patient in a sealed envelope, he/she also gives the original and 1st copy, which must be delivered in the
Referral Counter- referral area
Signs in the SM-1-17, receives the sealed slip that contains original and
first copy
Ending
1
Transfer order
Receives original and copy of the “Transfer order” and he/she presents themselves at the Referral Counter -referral area of the receiving Medical Unit on the day the appointment is
established
8