Spatial Centering of a Quadcopter in an Underground Coal Mine
Upload
khangminh22Category
view
1download
0
GCS (Pty) Ltd. Reg No: 2004/000765/07 Est. 1987
Offices: Johannesburg (Head Office) | Durban | Gaborone | Lusaka | Maseru | Windhoek | Ostrava
Directors: AC Johnstone (CEO) | A Gunn (COO) | A Wilke | M Van Rooyen | W Sherriff (Financial) N Marday (HR)
Non-Executive Director: B Wilson-Jones
www.gcs-sa.biz
63 Wessel Road, Rivonia, 2128 PO Box 2597, Rivonia, 2128 South Africa
Tel: +27 (0) 11 803 5726 Fax: +27 (0) 11 803 5745 Web: www.gcs-sa.biz
Exxaro Leeuwpan Coal Mine Section 21(a)
Water Use Licence Application (WULA)
Report
Version – Public Review
04 March 2021
Exxaro Resources Ltd
GCS Project Number: 19-0902
Client Reference: PO: 4512334972
Exxaro Resources Ltd Section 21(a) WULA
19-0902 04 March 2021 Page ii
Exxaro Leeuwpan Coal Mine Section 21(a)
Water Use Licence Application (WULA)
Report Version – Public Review
04 March 2021
Exxaro Resources Ltd
19-0902
DOCUMENT ISSUE STATUS
Report Issue Public Review
GCS Reference Number 19-0902
Client Reference PO: 4512334972
Title Exxaro Leeuwpan Coal Mine Section 21(a) Water Use Licence Application (WULA)
Name Signature Date
Author Shayna-Ann Cuthbertson
04 March 2021
Document Reviewer Kate Cain
04 March 2021
Unit Director Adam Gunn 04 March 2021
LEGAL NOTICE
This report or any proportion thereof and any associated documentation remain the property of GCS until the mandator effects payment of all fees and disbursements due to GCS in terms of the GCS Conditions of Contract and Project Acceptance Form. Notwithstanding the aforesaid, any reproduction, duplication, copying, adaptation, editing, change, disclosure, publication, distribution, incorporation, modification, lending, transfer, sending, delivering, serving or broadcasting must be authorised in writing by GCS.
Exxaro Resources Ltd Section 21(a) WULA
19-0902 04 March 2021 Page iii
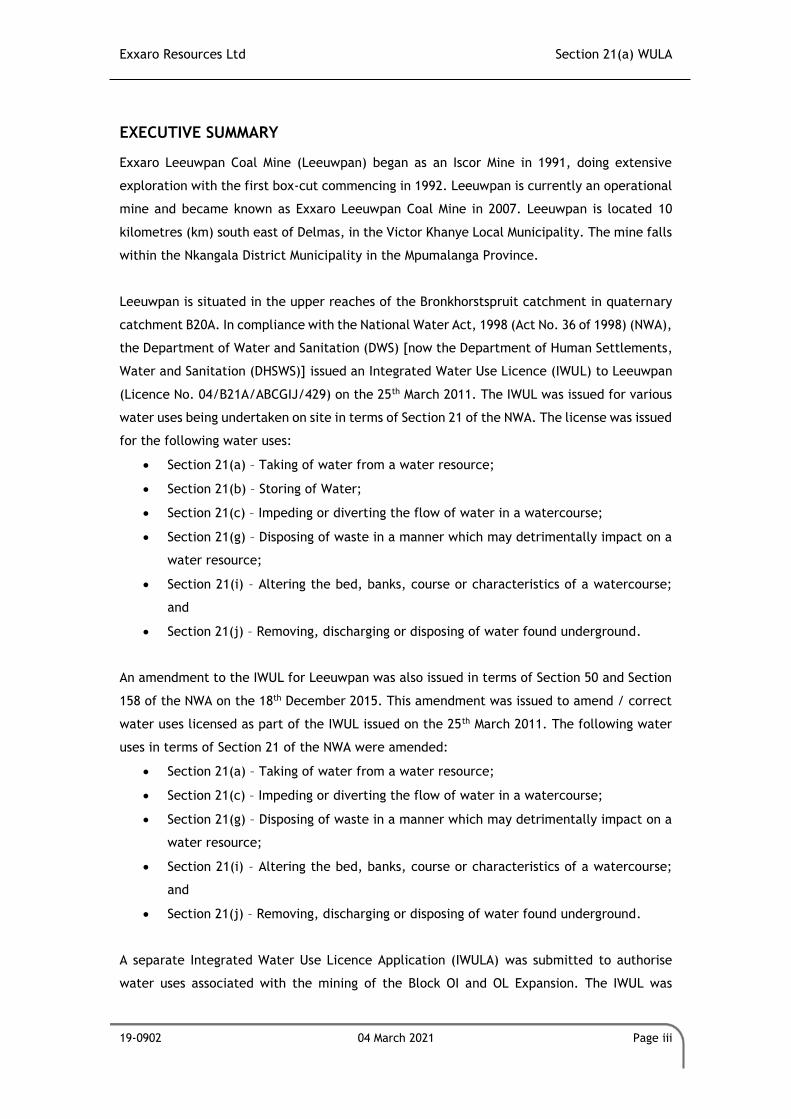
EXECUTIVE SUMMARY
Exxaro Leeuwpan Coal Mine (Leeuwpan) began as an Iscor Mine in 1991, doing extensive
exploration with the first box-cut commencing in 1992. Leeuwpan is currently an operational
mine and became known as Exxaro Leeuwpan Coal Mine in 2007. Leeuwpan is located 10
kilometres (km) south east of Delmas, in the Victor Khanye Local Municipality. The mine falls
within the Nkangala District Municipality in the Mpumalanga Province.
Leeuwpan is situated in the upper reaches of the Bronkhorstspruit catchment in quaternary
catchment B20A. In compliance with the National Water Act, 1998 (Act No. 36 of 1998) (NWA),
the Department of Water and Sanitation (DWS) [now the Department of Human Settlements,
Water and Sanitation (DHSWS)] issued an Integrated Water Use Licence (IWUL) to Leeuwpan
(Licence No. 04/B21A/ABCGIJ/429) on the 25th March 2011. The IWUL was issued for various
water uses being undertaken on site in terms of Section 21 of the NWA. The license was issued
for the following water uses:
• Section 21(a) – Taking of water from a water resource;
• Section 21(b) – Storing of Water;
• Section 21(c) – Impeding or diverting the flow of water in a watercourse;
• Section 21(g) – Disposing of waste in a manner which may detrimentally impact on a
water resource;
• Section 21(i) – Altering the bed, banks, course or characteristics of a watercourse;
and
• Section 21(j) – Removing, discharging or disposing of water found underground.
An amendment to the IWUL for Leeuwpan was also issued in terms of Section 50 and Section
158 of the NWA on the 18th December 2015. This amendment was issued to amend / correct
water uses licensed as part of the IWUL issued on the 25th March 2011. The following water
uses in terms of Section 21 of the NWA were amended:
• Section 21(a) – Taking of water from a water resource;
• Section 21(c) – Impeding or diverting the flow of water in a watercourse;
• Section 21(g) – Disposing of waste in a manner which may detrimentally impact on a
water resource;
• Section 21(i) – Altering the bed, banks, course or characteristics of a watercourse;
and
• Section 21(j) – Removing, discharging or disposing of water found underground.
A separate Integrated Water Use Licence Application (IWULA) was submitted to authorise
water uses associated with the mining of the Block OI and OL Expansion. The IWUL was
Exxaro Resources Ltd Section 21(a) WULA
19-0902 04 March 2021 Page iv
awarded to Leeuwpan (Licence No. 04/B20A/CIJ/4032) on the 18th December 2015. The IWUL
was issued for various water uses required for the expansion project in terms of Section 21
of the NWA. The license was issued for the following water uses:
• Section 21(a) – Taking of water from a water resource;
• Section 21(c) – Impeding or diverting the flow of water in a watercourse;
• Section 21(g) – Disposing of waste in a manner which may detrimentally impact on a
water resource;
• Section 21(i) – Altering the bed, banks, course or characteristics of a watercourse;
and
• Section 21(j) – Removing, discharging or disposing of water found underground.
An additional application was submitted to expand mining Block OI to include the area where
planned infrastructure would have originally been located. This expansion area is referred to
as OI West. Water uses for this expansion are triggered in terms of Section 21(c) and (i) of
the NWA. The IWUL was awarded to Leeuwpan (Licence No. 06/B20A/CI/9521) on the 4th
March 2020. The license was issued for the following water uses:
• Section 21(c) – Impeding or diverting the flow of water in a watercourse; and
• Section 21(i) – Altering the bed, banks, course or characteristics of a watercourse.
Following a meeting with the DHSWS, the DHSWS indicated that Leeuwpan requires
authorisation in the form of a Water Use License (WUL) for the abstraction of water from the
Witklip borehole (Witklip Borehole 1) for operations at the Leeuwpan Coal Mine. This
borehole was not licensed as part of the authorisations previously issued and was previously
been listed as an Existing Lawful Water Use (ELWU) in previous reports. DHSWS have however,
requested that an application be made to license this abstraction. In addition, a second
borehole (Witklip Borehole 2) is being applied for as a backup supply borehole to supplement
Witklip borehole 1 water if water cannot be abstracted from it. Abstraction of water from
the two boreholes triggers a water use in terms of Section 21(a) ‘taking water from a water
resource’ of the NWA. The authorisation process requires that an application in the form of
a Water Use License Application (WULA) be undertaken.
GCS Water and Environment (Pty) Ltd (GCS) were appointed to undertake the WULA process
in order to authorise the required abstractions. This report serves as the technical application
report pertaining to the Section 21(a) WULA.
Current Mining:
Exxaro Resources Ltd Section 21(a) WULA
19-0902 04 March 2021 Page v
Mining at Leeuwpan is carried out by opencast methods, involving blasting and truck and
shovel operations. Leeuwpan is an existing coal mining operation with existing infrastructure
associated with the following mining areas:
• Block OMW;
• Weltevreden;
• Block OL; and
• Block OI and OI West
Water Use to be Licenced:
The water abstracted from the Witklip Borehole 1 will be used for coal processing and
domestic water supply. The water, once abstracted from the borehole, is pumped to the
Silver Tank where it is distributed to the plant as well as the mining area, mining offices and
the engineering workshops for domestic use. The borehole water will not be used for drinking
purposes. The proposed daily abstraction for Witklip Borehole 1 of 602.74m3/day amounts to
an average annual abstraction of 220 000m3/year.
The Witklip Borehole 2 has also been included as part of this application process as it will be
used as a backup supply borehole should there be any reason that water cannot be abstracted
from Witklip Borehole 1 (e.g. pump maintenance). The proposed daily abstraction for Witklip
Borehole 2 of 100m3/day amounts to an average annual abstraction of 36 500 m3/year. It
must be noted that water will not be abstracted from both boreholes at the same time.
The total abstraction triggers the following water use in terms of the NWA:
• Section 21(a) – taking water from a water resource.
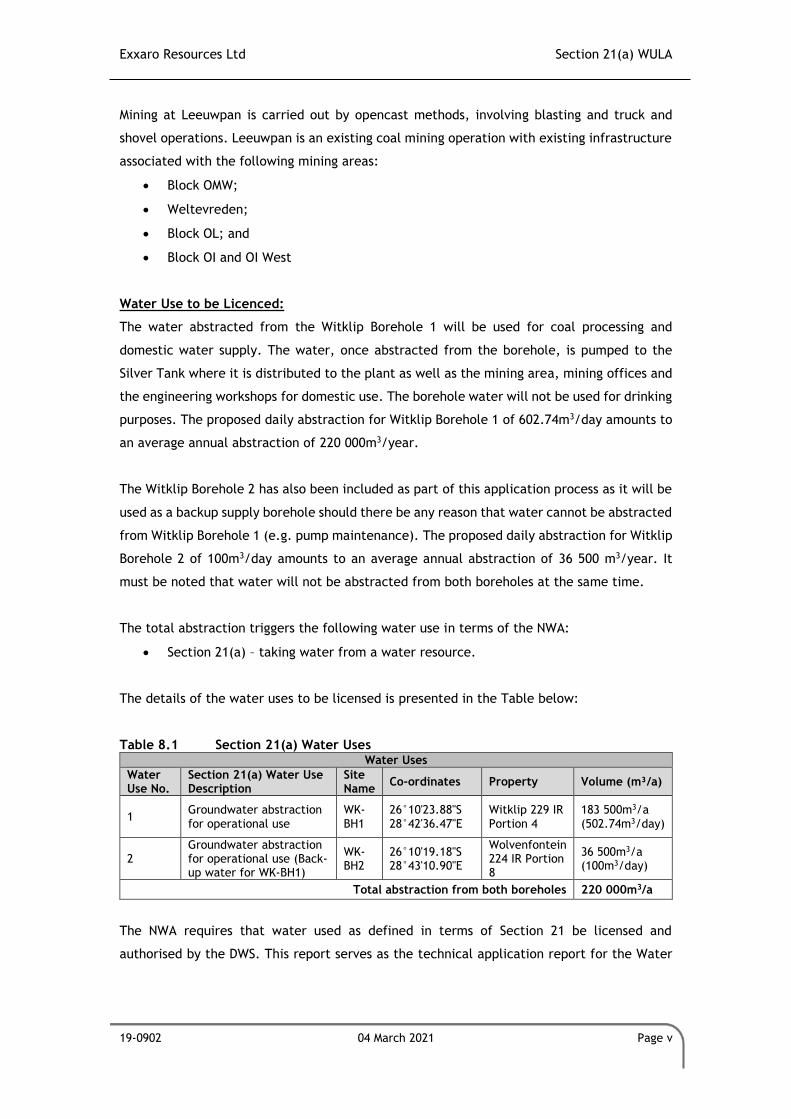
The details of the water uses to be licensed is presented in the Table below:
Table 8.1 Section 21(a) Water Uses Water Uses
Water Use No.
Section 21(a) Water Use Description
Site Name
Co-ordinates Property Volume (m³/a)
1 Groundwater abstraction for operational use
WK-BH1
26°10'23.88"S 28°42'36.47"E
Witklip 229 IR Portion 4
183 500m3/a (502.74m3/day)
2 Groundwater abstraction for operational use (Back-up water for WK-BH1)
WK-BH2
26°10'19.18"S 28°43'10.90"E
Wolvenfontein 224 IR Portion 8
36 500m3/a (100m3/day)
Total abstraction from both boreholes 220 000m3/a
The NWA requires that water used as defined in terms of Section 21 be licensed and
authorised by the DWS. This report serves as the technical application report for the Water
Exxaro Resources Ltd Section 21(a) WULA
19-0902 04 March 2021 Page vi
Use License Application (WULA) for the abstraction of water from the Witklip borehole 1 (WK-
BH1) and Witklip Borehole 2 (WK-BH2).
Potential Environmental Impacts:
The following potential impact will have to be monitored and evaluated:
• Impact of abstraction on surrounding groundwater levels.
The impact identified and mitigation measures provided are detailed in Section 5 of this
report.
Exxaro Resources Ltd Section 21(a) WULA
19-0902 04 March 2021 Page vii
CONTENTS PAGE
1 INTRODUCTION .......................................................................................................................... 1
1.1 ACTIVITY BACKGROUND .................................................................................................................. 1 1.2 CONTACT DETAILS ......................................................................................................................... 2 1.3 REGIONAL SETTING AND LOCATION OF ACTIVITY .................................................................................. 2
1.3.1 Magisterial District and Local Municipality ...................................................................... 2 1.4 PROPERTY DESCRIPTION .................................................................................................................. 5
2 CONCEPTUALISATION OF THE ACTIVITY ..................................................................................... 7
2.1 DESCRIPTION OF THE ACTIVITY ......................................................................................................... 7 2.1.1 Existing Operations ........................................................................................................... 7
2.2 EXTENT OF THE ACTIVITY ................................................................................................................. 9 2.3 KEY ACTIVITY RELATED PROCESSES AND PRODUCT ............................................................................... 9
2.3.1 Mining Method ................................................................................................................. 9 2.3.2 Mineral Processing............................................................................................................ 9 2.3.3 Product............................................................................................................................ 10
2.4 ACTIVITY LIFE DESCRIPTION ........................................................................................................... 10 2.5 ACTIVITY INFRASTRUCTURE DESCRIPTION ......................................................................................... 11
2.5.1 Kenbar and Witklip ......................................................................................................... 11 2.5.2 Block OE .......................................................................................................................... 11 2.5.3 Block OD, OFPAD, OH and OM ........................................................................................ 12 2.5.4 Block OJ and OL............................................................................................................... 12 2.5.5 Block OD, OI and OWM ................................................................................................... 12
2.6 KEY WATER USES AND WASTE STREAMS .......................................................................................... 15 2.6.1 Key Water Uses ............................................................................................................... 15 2.6.2 Key Waste Streams ......................................................................................................... 16
2.7 ORGANISATIONAL STRUCTURE OF THE ACTIVITY ................................................................................. 16 2.8 BUSINESS AND CORPORATE POLICIES ............................................................................................... 18
2.8.1 Safety, Health and Environmental Policy ........................................................................ 18 2.8.2 Objectives and Strategies ............................................................................................... 19
3 REGULATORY WATER AND WASTE MANAGEMENT FRAMEWORK ............................................ 20
3.1 SUMMARY OF ALL WATER USES ..................................................................................................... 20 3.2 EXISTING LAWFUL WATER USES ..................................................................................................... 28 3.3 RELEVANT EXEMPTIONS ................................................................................................................ 29 3.4 GENERALLY AUTHORISED WATER USES ............................................................................................ 30 3.5 NEW WATER USES TO BE LICENSED ................................................................................................. 30 3.6 WASTE MANAGEMENT ACTIVITIES AND WASTE RELATED AUTHORISATIONS............................................ 32
3.6.1 Domestic Waste .............................................................................................................. 32 3.6.2 Mine Waste ..................................................................................................................... 32 3.6.3 Hazardous Waste ............................................................................................................ 32
3.7 OTHER AUTHORISATIONS AND REGULATIONS .................................................................................... 33 3.8 LEGAL ASSESSMENT ..................................................................................................................... 33
3.8.1 The Constitution of South Africa, 1996 (Act No.108 of 1996) ......................................... 34 3.8.2 The National Environmental Management Act, 1998 (Act No.107 of 1998) .................. 35 3.8.3 The Mineral and Petroleum Resources Development Act, 2002 (Act No.48 of 2002) ..... 36 3.8.4 The National Water Act, 1998 (Act No.36 of 1998) ........................................................ 37
4 PRESENT ENVIRONMENTAL SITUATION .................................................................................... 39
4.1 CLIMATE .................................................................................................................................... 39 4.1.1 Regional Climate ............................................................................................................. 39 4.1.2 Rainfall ............................................................................................................................ 39 4.1.3 Evaporation..................................................................................................................... 40
4.2 SURFACE WATER ......................................................................................................................... 40
Exxaro Resources Ltd Section 21(a) WULA
19-0902 04 March 2021 Page viii
4.2.1 Water Management Area ............................................................................................... 40 4.2.2 Surface Water Hydrology ................................................................................................ 42 4.2.3 Surface Water Quality .................................................................................................... 42 4.2.4 Mean Annual Runoff ....................................................................................................... 45 4.2.5 Resource Class and River Health ..................................................................................... 46 4.2.6 Surface Water User Survey ............................................................................................. 47 4.2.7 Sensitive Areas (Wetlands) ............................................................................................. 48
4.3 GROUNDWATER .......................................................................................................................... 55 4.3.1 Aquifer Characterisation ................................................................................................. 55 4.3.2 Groundwater Quality ...................................................................................................... 60 4.3.3 Hydrocensus .................................................................................................................... 66 4.3.4 Potential Pollution Source Identification ........................................................................ 76 4.3.5 Analytical Groundwater Model ....................................................................................... 76 4.3.6 Acid Mine Drainage Plan ................................................................................................ 84
4.4 SOCIO-ECONOMIC ENVIRONMENT .................................................................................................. 85 4.4.1 Regional Context ............................................................................................................. 85 4.4.2 Local Context .................................................................................................................. 86
5 ANALYSES AND CHARACTERISATION OF ACTIVITY .................................................................... 92
5.1 SITE DELINEATION FOR CHARACTERISATION ...................................................................................... 92 5.2 WATER AND WASTE MANAGEMENT ............................................................................................... 92
5.2.1 Process Water ................................................................................................................. 98 5.2.2 Storm Water ................................................................................................................... 98 5.2.3 Groundwater ................................................................................................................... 99 5.2.4 Waste .............................................................................................................................. 99
5.3 OPERATIONAL MANAGEMENT ...................................................................................................... 100 5.3.1 Organisational Structure............................................................................................... 100 5.3.2 Resources and Competence .......................................................................................... 100 5.3.3 Education and Training ................................................................................................. 101 5.3.4 Internal and External Communication .......................................................................... 101 5.3.5 Awareness Raising ........................................................................................................ 103
5.4 MONITORING AND CONTROL ....................................................................................................... 103 5.4.1 Surface Water Monitoring ............................................................................................ 104 5.4.2 Groundwater Monitoring .............................................................................................. 111 5.4.3 Biomonitoring ............................................................................................................... 114 5.4.4 Waste Monitoring ......................................................................................................... 117
5.5 RISK ASSESSMENT/BEST PRACTICE ASSESSMENT .............................................................................. 118 5.6 ISSUES AND RESPONSES FROM PUBLIC CONSULTATION PROCESS ......................................................... 122 5.7 MATTERS REQUIRING ATTENTION/PROBLEM STATEMENT ................................................................. 122 5.8 ASSESSMENT OF LEVEL AND CONFIDENCE OF INFORMATION ............................................................... 122
6 WATER AND WASTE MANAGEMENT ...................................................................................... 123
6.1 WATER AND WASTE MANAGEMENT PHILOSOPHY ............................................................................ 123 6.1.1 Process Water ............................................................................................................... 123 6.1.2 Storm Water ................................................................................................................. 124 6.1.3 Groundwater ................................................................................................................. 124 6.1.4 Waste ............................................................................................................................ 124
6.2 STRATEGIES .............................................................................................................................. 124 6.2.1 Process Water ............................................................................................................... 124 6.2.2 Storm Water ................................................................................................................. 124 6.2.3 Groundwater ................................................................................................................. 125 6.2.4 Waste ............................................................................................................................ 125
6.3 PERFORMANCE OBJECTIVES/GOALS .............................................................................................. 125 6.4 MEASURES TO ACHIEVE AND SUSTAIN PERFORMANCE OBJECTIVES ...................................................... 126 6.5 OPTION ANALYSIS AND MOTIVATION FOR IMPLEMENTATION OF PREFERRED OPTIONS ............................ 126
Exxaro Resources Ltd Section 21(a) WULA
19-0902 04 March 2021 Page ix
6.6 LEEUWPAN’S IWWMP ACTION PLAN ........................................................................................... 126 6.7 CONTROL AND MONITORING ....................................................................................................... 128
6.7.1 Monitoring of Change in Baseline information ............................................................. 128 6.7.2 Audit and Report on Performance Measures................................................................ 129
7 CONCLUSION .......................................................................................................................... 129
7.1 REGULATORY STATUS OF ACTIVITY ................................................................................................ 129 7.2 STATEMENT OF WATER USE REQUIRING AUTHORISATION ................................................................. 130 7.3 SECTION 27 MOTIVATION ........................................................................................................... 130 7.4 PROPOSED LICENSE CONDITIONS .................................................................................................. 130
8 REFERENCES ........................................................................................................................... 131
LIST OF FIGURES
Figure 1.1 Locality Map .............................................................................. 3 Figure 1.2 Locality within the Municipal Boundaries ............................................ 4 Figure 1.3 Leeuwpan MRA Property Boundaries .................................................. 6 Figure 2.1 Block OI box-cut ......................................................................... 7 Figure 2.2 Mining Right Area and Mining Sections ................................................ 8 Figure 2.3 Existing Infrastructure at Leeuwpan Mine .......................................... 14 Figure 2.4: Organisational Structure of Leeuwpan ................................................ 17 Figure 3.1 Water Use Map ......................................................................... 31 Figure 4.1 S-Pan Evaporation at Leeuwpan ..................................................... 40 Figure 4.2 Water Management Area of Leeuwpan ............................................. 41 Figure 4.3 Identified Wetland Areas ............................................................. 50 Figure 4.4 Map showing wetland units ........................................................... 51 Figure 4.5 Drawdown and recovery curve for borehole WK-BH1 ............................. 58 Figure 4.6 Drawdown and recovery curve for borehole WK-BH2 ............................. 59 Figure 4.7 Piper Diagram for Sample WK-BH1 .................................................. 63 Figure 4.8 Expanded Durov diagram of groundwater chemistry regarding March 2020 (Envass, 2020) .......................................................................................... 65 Figure 4.9 Stiff diagrams of groundwater chemistry regarding September 2020 (Envass, 2020) 66 Figure 4.10 Monitoring Boreholes ............................................................... 67 Figure 4.11 Delineated Sub-catchment with WARMS Boreholes shown on map ........... 75 Figure 4.12 The output per sector (IDP, 2020) ................................................ 92 Figure 5.1 Water balance process flow diagram – Average monthly conditions ........... 94 Figure 5.2 Water balance process flow diagram – Average annual conditions ............. 95 Figure 5.3 Water balance process flow diagram – Summer conditions ...................... 96 Figure 5.4 Water balance process flow diagram – Winter conditions ........................ 97 Figure 5.5 Internal Communication ............................................................. 102 Figure 5.6 Receiving Environment Water Sampling Locality Map ........................... 106 Figure 5.7 Process Water Sampling Locality Map .............................................. 107 Figure 5.8 Effluent Water Sampling Locality Map ............................................. 108 Figure 5.9 Potable Water Sampling Locality Map ............................................. 109 Figure 5.10 Groundwater Monitoring Boreholes .............................................. 113 Figure 5.11 Biomonitoring sites (dry season) ................................................. 115
LIST OF TABLES
Table 0.1 Section 21(a) Water Uses ............................................................... 5
Exxaro Resources Ltd Section 21(a) WULA
19-0902 04 March 2021 Page x
Table 1.1 Contact Details ........................................................................... 2 Table 1.2 Farm portions related to existing infrastructure .................................... 5 Table 2.1 Mine Schedule .......................................................................... 10 Table 2.2 Kenbar/Witklip approved infrastructure from Original EMP ..................... 11 Table 2.3 Block OE Activity/Infrastructure approved under MPRDA ........................ 11 Table 2.4 OM, OH, OFPAD and OD approved Infrastructure / Activities under the MPRDA 12 Table 2.5 OJ, OL Extension Infrastructure / Activity approved under the MPRDA ....... 12 Table 2.6 OD Infrastructure/Activities .......................................................... 13 Table 2.7 OWM Infrastructure/Activities ....................................................... 13 Table 2.8 Environmental Management at Leeuwpan - Key Responsibilities ............... 18 Table 3.1 Licensed Water Uses (Licence No. 04/B21A/ABCGIJ/429) ....................... 20 Table 3.2 Licensed Water Uses (Block OI and OL) (Licence No. 04/B20A/CIJ/4032) ..... 27 Table 3.3: Existing Approved Water Uses (Block OI West) ....................................... 28 Table 3.4 Existing Lawful Water Uses under Section 21 ...................................... 28 Table 3.5 Section 21(a) Water Use .............................................................. 30 Table 3.6 Leeuwpan's Existing Authorisations ................................................. 33 Table 4.1 Average minimum and maximum temperatures at Delmas ...................... 39 Table 4.2 B20A - Mean Monthly & Annual Precipitation, Evaporation and Runoff ........ 45 Table 4.3 Resource Classes at set out by the DWS ............................................ 46 Table 4.4 Resource Classes for the Bronkhorstspruit ......................................... 47 Table 4.5 Wilge River RWQOs .................................................................... 47 Table 4.6 Extent of wetland types identified on site ......................................... 48 Table 4.7 Aquifer Test Borehole Details ........................................................ 57 Table 4.8 Aquifer Test Results ................................................................... 59 Table 4.9 Recommended Pumping Schedule ................................................... 60 Table 4.10 Groundwater Laboratory Results .................................................... 61 Table 4.11 Quaternary Catchment Details for Catchment B20A .............................. 68 Table 4.12 WARMS Borehole Details for Quaternary Catchment B20A and B20B ........... 69 Table 4.13 Groundwater Balance Calculation for quaternary catchment B20A containing the DDC 72 Table 4.14 Groundwater Balance Calculation for quaternary catchment B20B containing the DDC 73 Table 4.15 Guide for determining the level of stress of a groundwater resource unit .... 74 Table 4.16 Parameters assigned to various lithologies in the analytical equations ........ 78 Table 4.17 Radius of Influence Calculations ..................................................... 79 Table 4.18 Thiem Formula drawdown calculations for WK-BH1 and WK-BH2 ............... 80 Table 4.19 Equation 4 and 5 Calculations ........................................................ 81 Table 4.20 Equation 6 Calculations ............................................................... 82 Table 4.21 Equation 7 and 8 Calculations ........................................................ 82 Table 4.22 Hantush-Jacob Formula drawdown calculations for WK-BH1 .................... 83 Table 4.23 Hantush-Jacob Formula drawdown calculations for WK-BH2 .................... 83 Table 4.24 Head of household by sex (adult: above 18 years old) (Stats SA, 2016) ....... 87 Table 5.1 Summary of Components monitoring for Leeuwpan ............................. 103 Table 5.2 Leeuwpan Surface Water Sampling Points ........................................ 105 Table 5.3 Water quality parameters for Leeuwpan Coal Mine.............................. 110 Table 5.4 Water Level Monitoring Plan for WK-BH1 .......................................... 111 Table 5.5 Groundwater Monitoring (Envass, 2020) ........................................... 112 Table 5.6 Severity ................................................................................ 119 Table 5.7 Spatial Scale - How big is the area that the aspect is impacting on? .......... 119 Table 5.8 Duration ................................................................................ 119 Table 5.9 Frequency of the activity - How often do you do the specific activity?....... 119 Table 5.10 Frequency of the incident/impact - How often does the activity impact the environment? .......................................................................................... 119 Table 5.11 Legal issues - How is the activity governed by legislation? ..................... 119 Table 5.12 Detection - How quickly/easily can the impacts/risks of the activity be detected on the environment, people and property? ....................................................... 120
Exxaro Resources Ltd Section 21(a) WULA
19-0902 04 March 2021 Page xi
Table 5.13 Impact Ratings ........................................................................ 120 Table 5.14 Impacts and Management Measures ................................................ 121 Table 6.1 Leeuwpan’s IWWMP Action Plan .................................................... 126
LIST OF ANNEXURES
Annexure A Section 27 Motivation Annexure B Hydrogeological Assessment Annexure C Monthly Water Quality Report Annexure D Biannual Aquatic Biomonitoring Assessment Annexure E Water Balance Annexure F Current Licenses Issued Annexure G Wetland Delineation Assessment Annexure H Quarterly Water Quality Report
Exxaro Resources Ltd Section 21(a) WULA
19-0902 04 March 2021 Page 1
1 INTRODUCTION
1.1 Activity Background
Exxaro Leeuwpan Coal Mine (Leeuwpan) began as an Iscor Mine in 1991, doing extensive
exploration with the first box-cut commencing in 1992. Leeuwpan is currently an operational
mine and became known as Exxaro Leeuwpan Coal Mine in 2007. Leeuwpan is located 10
kilometres (km) south east of Delmas, in the Victor Khanye Local Municipality. The mine falls
within the Nkangala District Municipality in the Mpumalanga Province.
Leeuwpan is an operational coal mine that has been operating in line with several approved
Environmental Management Plans (EMP’s). These EMP’s were submitted to and approved by
the Department of Mineral resources (DMR). As a result of the authorisations issued,
Leeuwpan is a lawful mining operation in terms of the Mineral and Petroleum Resources
Development Act, 2002 (Act No. 28 of 2002) (MPRDA).
Leeuwpan is situated in the upper reaches of the Bronkhorstspruit catchment in quaternary
catchment B20A. In compliance with the National Water Act, 1998 (Act No. 36 of 1998) (NWA),
the Department of Water and Sanitation (DWS) [now the Department of Human Settlements,
Water and Sanitation (DHSWS)] issued an Integrated Water Use Licence (IWUL) to Leeuwpan
(Licence No. 04/B21A/ABCGIJ/429) on the 25th March 2011.
Following a meeting with the DHSWS, the DHSWS indicated that Leeuwpan requires
authorisation in the form of a Water Use License (WUL) for the abstraction of water from the
Witklip borehole (Witklip Borehole 1) for operations at the Leeuwpan Coal Mine. This
borehole was not licensed as part of the authorisations previously issued and was previously
been listed as an Existing Lawful Water Use (ELWU) in previous reports. DHSWS have however,
requested that an application be made to license this abstraction. In addition, a second
borehole (Witklip Borehole 2) is being applied for as a backup supply borehole to supplement
Witklip borehole 1 water if water cannot be abstracted from it. Abstraction of water from
the two boreholes triggers a water use in terms of Section 21(a) ‘taking water from a water
resource’ of the NWA. The authorisation process requires that an application in the form of
a Water Use License Application (WULA) be undertaken.
GCS Water and Environment (Pty) Ltd (GCS) were appointed to undertake the WULA process
in order to authorise the required abstractions. This report serves as the technical application
report pertaining to the Section 21(a) WULA.
Exxaro Resources Ltd Section 21(a) WULA
19-0902 04 March 2021 Page 2
1.2 Contact Details
The contact details of the mine and the consultant compiling this WULA update can be seen
in Table 1.1.
Table 1.1 Contact Details
Contact Details of the Applicant
Name of the Company Exxaro Resources Limited
Name of the Mine Leeuwpan Coal Mine
Physical Address R50 Delmas
Postal Address PO Box 9229 Pretoria 0001
Telephone (011) 441-6800
Fax Number (011) 268 6734
Contact Person Lucy Mogakane (Leeuwpan Mine Environmental Specialist) [email protected]
Contact Details of the Environmental Consultant
Name of the Company GCS Water and Environment (Pty) Ltd
Physical Address 63 Wessel Road, Rivonia, 2128
Postal Address P.O. Box 2597, Rivonia, 2128
Telephone (011) 803 5726
Fax Number (011) 803 5745
Contact Person
Shayna-Ann Cuthbertson (Water Use Authorisation Consultant) [email protected] Kate Cain (Water Use Authorisation Unit Manager) [email protected]
1.3 Regional Setting and Location of Activity
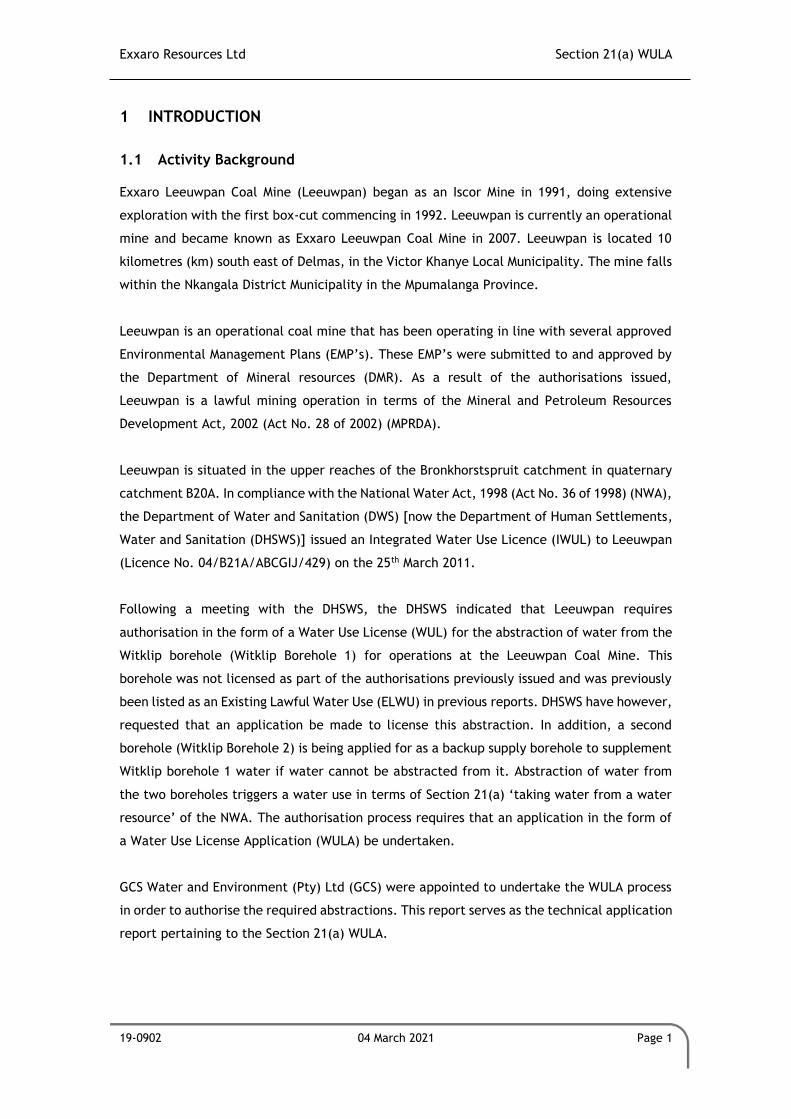
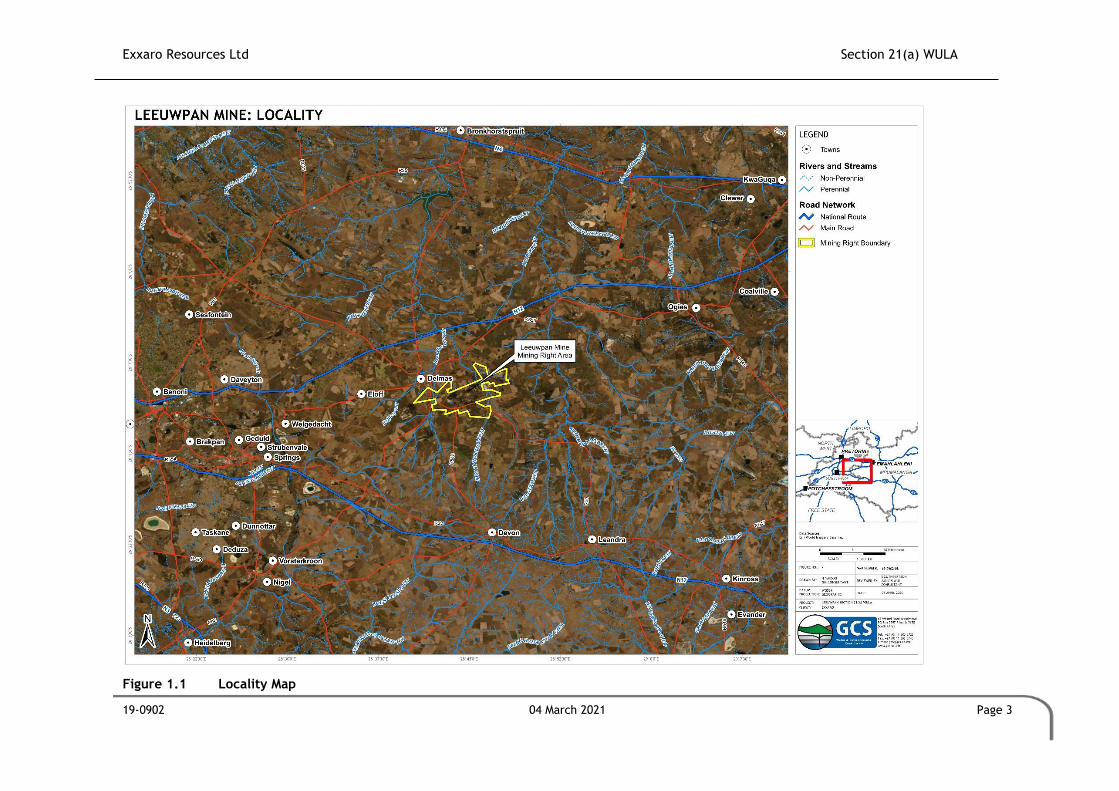
The Leeuwpan Mining Right Area (MRA) is located approximately 10km south east of Delmas.
The MRA is adjacent to Ferroglobe (formerly Thaba Chueu) Silica Mine and Stuart Coal. Refer
to Figure 1.1 for the map indicating the location of the project area.
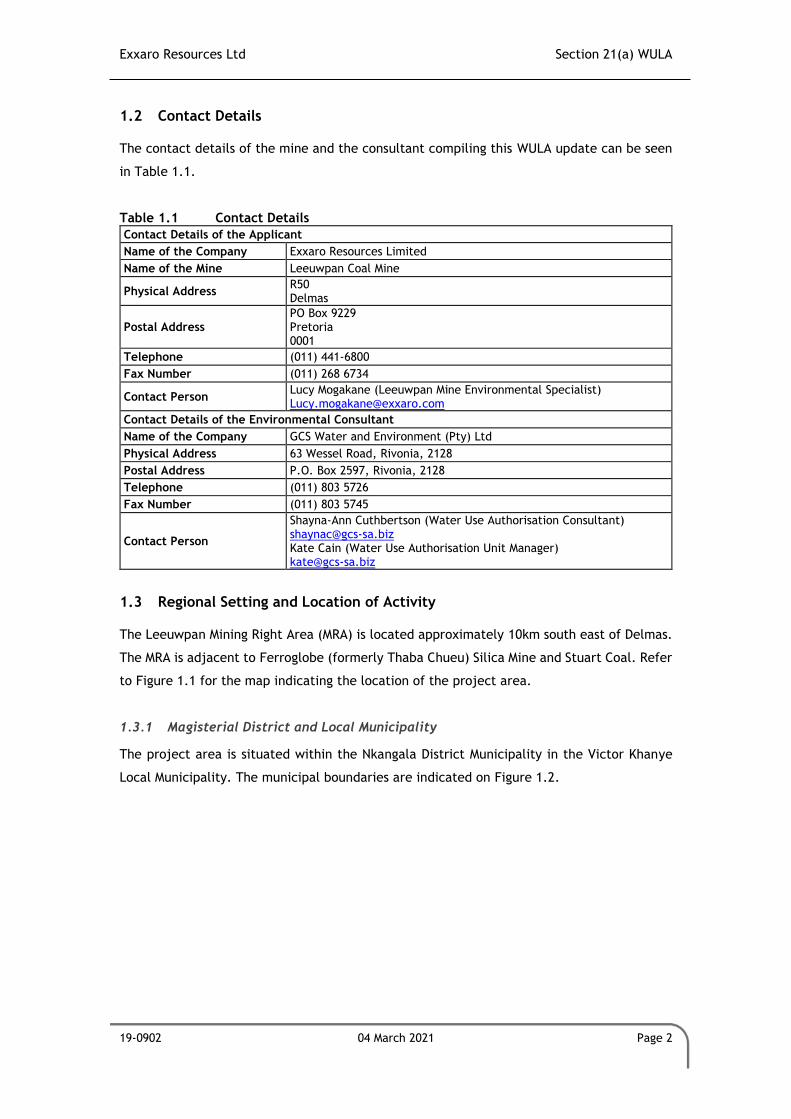
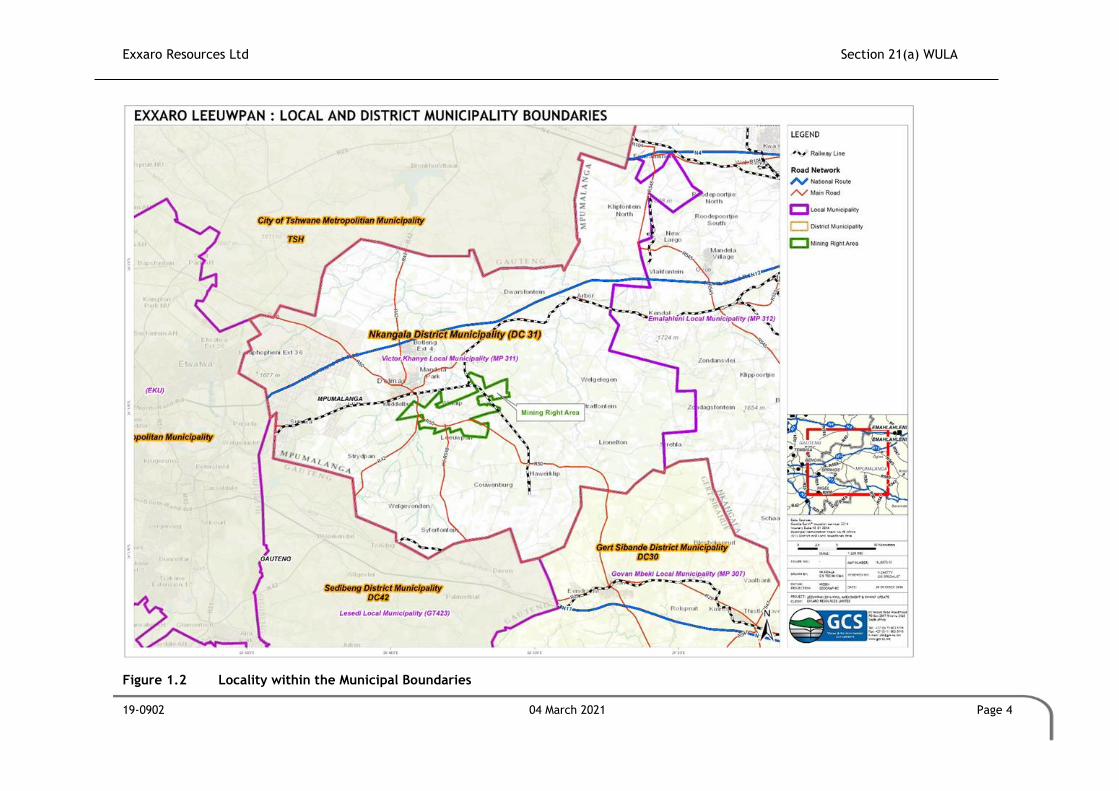
1.3.1 Magisterial District and Local Municipality
The project area is situated within the Nkangala District Municipality in the Victor Khanye
Local Municipality. The municipal boundaries are indicated on Figure 1.2.
Exxaro Resources Ltd Section 21(a) WULA
19-0902 04 March 2021 Page 3
Figure 1.1 Locality Map
Exxaro Resources Ltd Section 21(a) WULA
19-0902 04 March 2021 Page 4
Figure 1.2 Locality within the Municipal Boundaries
Exxaro Resources Ltd Section 21(a) WULA
19-0902 04 March 2021 Page 5
1.4 Property Description
The Mining Right Area (MRA) comprises eight (8) farms, namely Kenbar 257 IR, Leeuwpan 246
IR, Moabsvelden 248 IR, Weltevreden 227 IR, Witklip 229 IR, Witklip 232 IR, Wolvenfontein
244 IR and Rietkuil 249. Nine mineral resource blocks have been mined or are in the process
of being mined.
Three Mineral resource blocks, located on Rietkuil 249 IR, Moabsvelden 248 IR and
Wolvenfontein 244 IR are currently being mined. The property details for the MRA were
obtained from the government deeds website (www.deeds.gov.za). The majority of the
surface rights are privately owned.
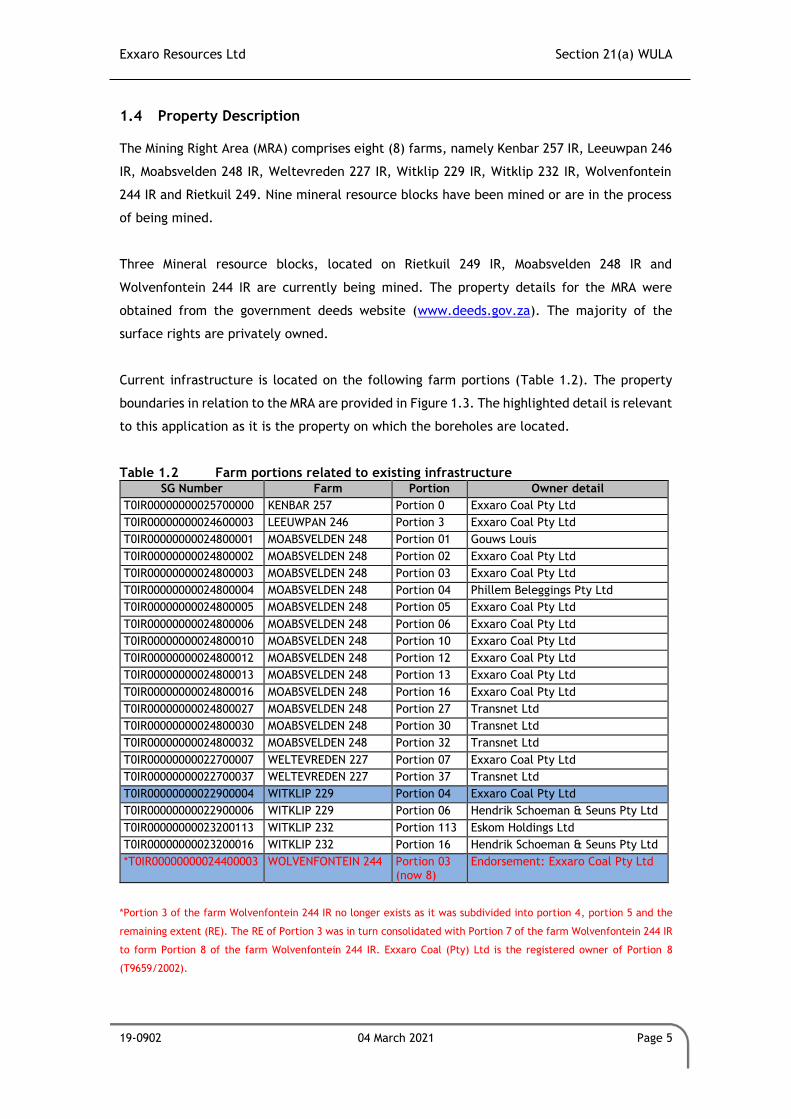
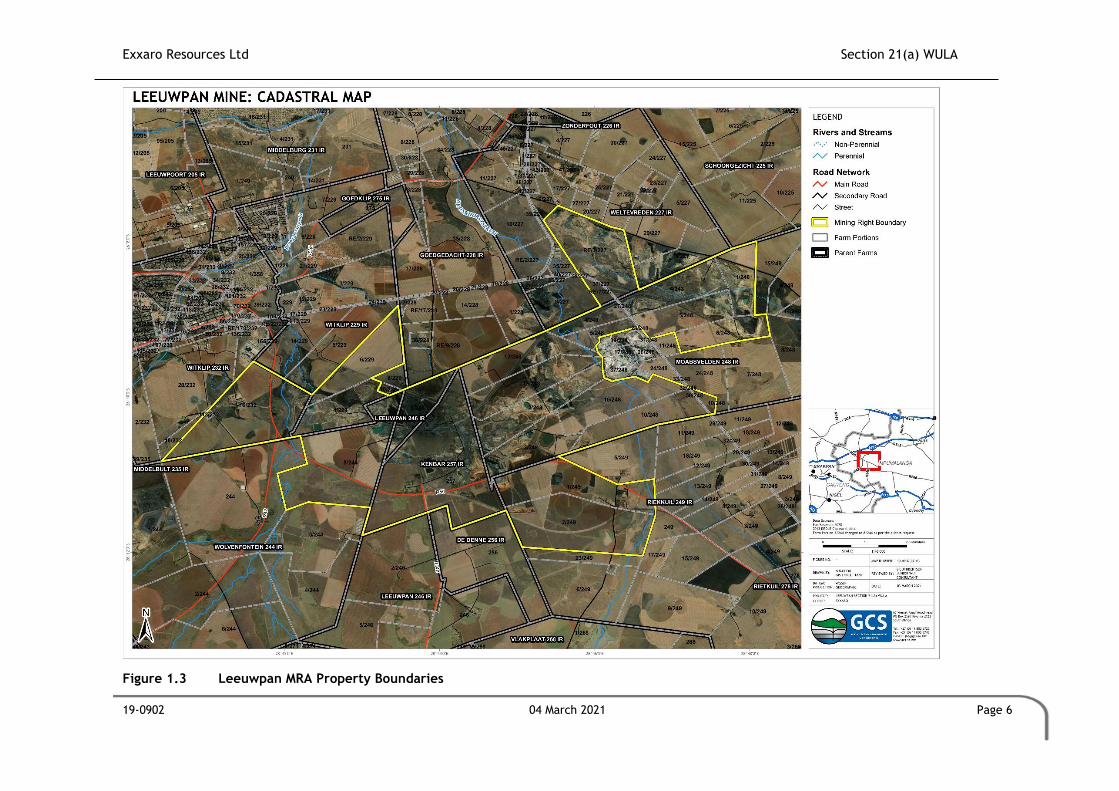
Current infrastructure is located on the following farm portions (Table 1.2). The property
boundaries in relation to the MRA are provided in Figure 1.3. The highlighted detail is relevant
to this application as it is the property on which the boreholes are located.
Table 1.2 Farm portions related to existing infrastructure SG Number Farm Portion Owner detail
T0IR00000000025700000 KENBAR 257 Portion 0 Exxaro Coal Pty Ltd
T0IR00000000024600003 LEEUWPAN 246 Portion 3 Exxaro Coal Pty Ltd
T0IR00000000024800001 MOABSVELDEN 248 Portion 01 Gouws Louis
T0IR00000000024800002 MOABSVELDEN 248 Portion 02 Exxaro Coal Pty Ltd
T0IR00000000024800003 MOABSVELDEN 248 Portion 03 Exxaro Coal Pty Ltd
T0IR00000000024800004 MOABSVELDEN 248 Portion 04 Phillem Beleggings Pty Ltd
T0IR00000000024800005 MOABSVELDEN 248 Portion 05 Exxaro Coal Pty Ltd
T0IR00000000024800006 MOABSVELDEN 248 Portion 06 Exxaro Coal Pty Ltd
T0IR00000000024800010 MOABSVELDEN 248 Portion 10 Exxaro Coal Pty Ltd
T0IR00000000024800012 MOABSVELDEN 248 Portion 12 Exxaro Coal Pty Ltd
T0IR00000000024800013 MOABSVELDEN 248 Portion 13 Exxaro Coal Pty Ltd
T0IR00000000024800016 MOABSVELDEN 248 Portion 16 Exxaro Coal Pty Ltd
T0IR00000000024800027 MOABSVELDEN 248 Portion 27 Transnet Ltd
T0IR00000000024800030 MOABSVELDEN 248 Portion 30 Transnet Ltd
T0IR00000000024800032 MOABSVELDEN 248 Portion 32 Transnet Ltd
T0IR00000000022700007 WELTEVREDEN 227 Portion 07 Exxaro Coal Pty Ltd
T0IR00000000022700037 WELTEVREDEN 227 Portion 37 Transnet Ltd
T0IR00000000022900004 WITKLIP 229 Portion 04 Exxaro Coal Pty Ltd
T0IR00000000022900006 WITKLIP 229 Portion 06 Hendrik Schoeman & Seuns Pty Ltd
T0IR00000000023200113 WITKLIP 232 Portion 113 Eskom Holdings Ltd
T0IR00000000023200016 WITKLIP 232 Portion 16 Hendrik Schoeman & Seuns Pty Ltd
*T0IR00000000024400003 WOLVENFONTEIN 244 Portion 03 (now 8)
Endorsement: Exxaro Coal Pty Ltd
*Portion 3 of the farm Wolvenfontein 244 IR no longer exists as it was subdivided into portion 4, portion 5 and the
remaining extent (RE). The RE of Portion 3 was in turn consolidated with Portion 7 of the farm Wolvenfontein 244 IR
to form Portion 8 of the farm Wolvenfontein 244 IR. Exxaro Coal (Pty) Ltd is the registered owner of Portion 8
(T9659/2002).
Exxaro Resources Ltd Section 21(a) WULA
19-0902 04 March 2021 Page 6
Figure 1.3 Leeuwpan MRA Property Boundaries
Exxaro Resources Ltd Section 21(a) WULA
19-0902 04 March 2021 Page 7
2 CONCEPTUALISATION OF THE ACTIVITY
2.1 Description of the Activity
2.1.1 Existing Operations
Leeuwpan is an existing coal mining operation with existing infrastructure associated with
the following mining areas:
• Block OMW;
• Weltevreden;
• Block OL; and
• Block OI and OI West
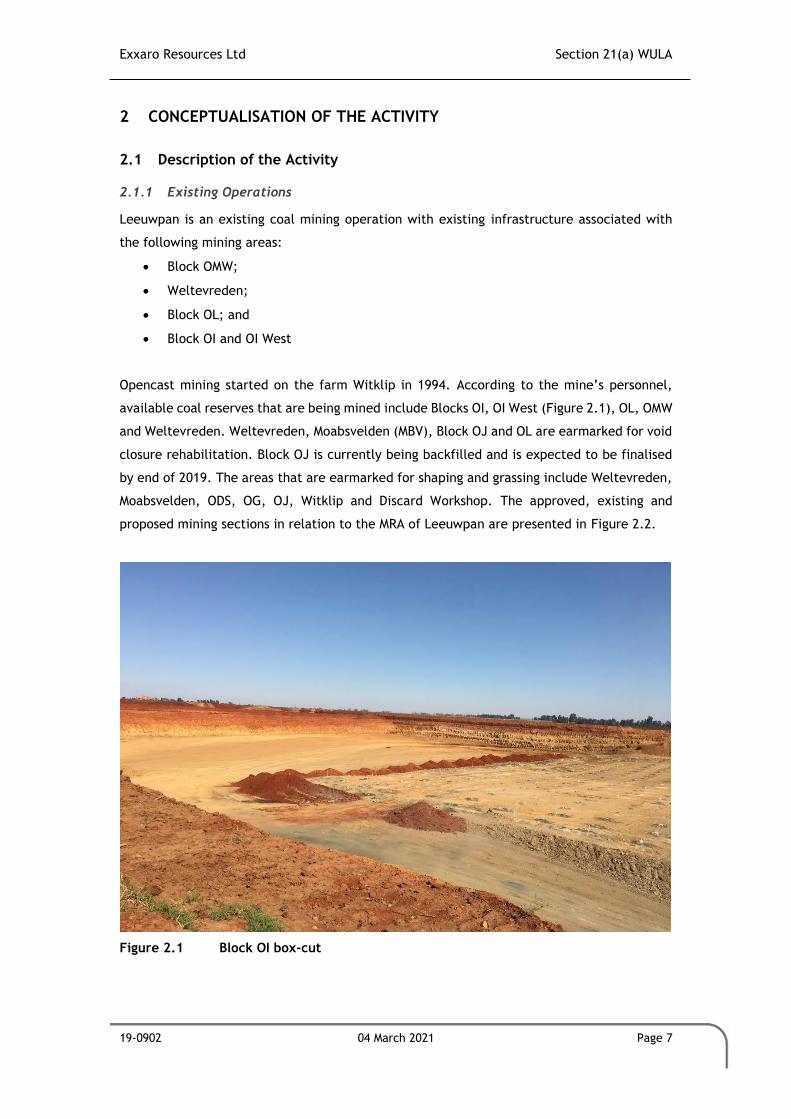
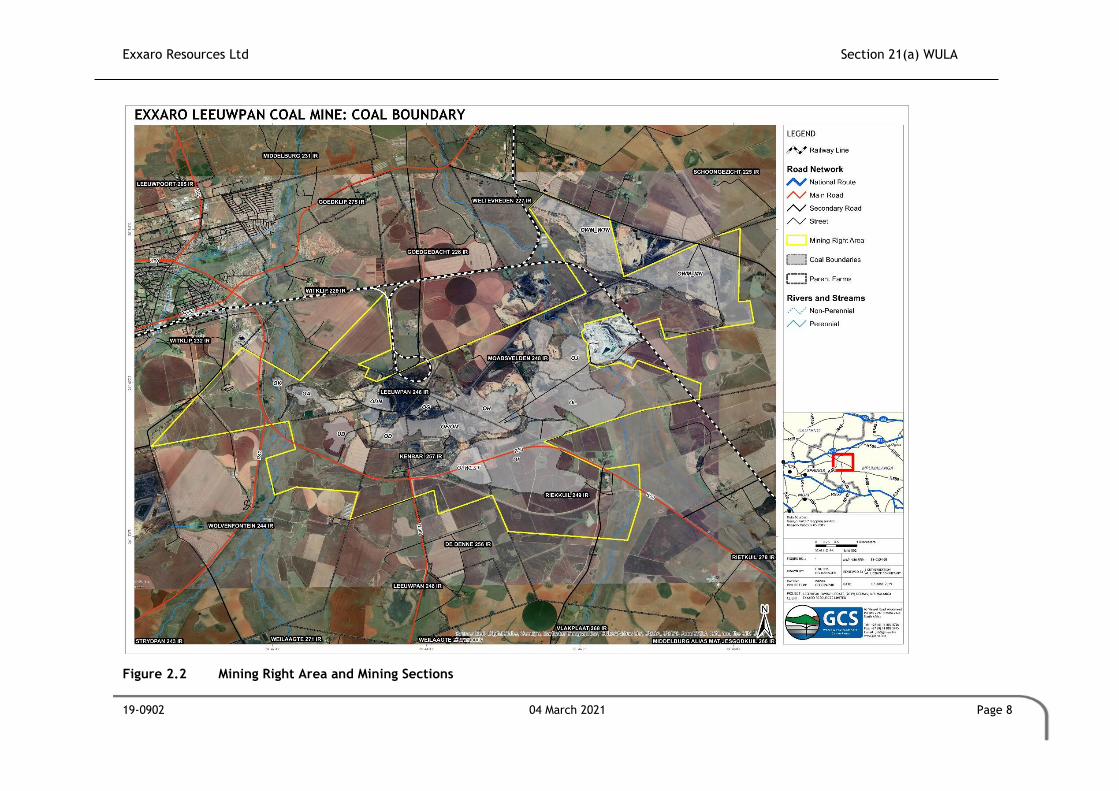
Opencast mining started on the farm Witklip in 1994. According to the mine’s personnel,
available coal reserves that are being mined include Blocks OI, OI West (Figure 2.1), OL, OMW
and Weltevreden. Weltevreden, Moabsvelden (MBV), Block OJ and OL are earmarked for void
closure rehabilitation. Block OJ is currently being backfilled and is expected to be finalised
by end of 2019. The areas that are earmarked for shaping and grassing include Weltevreden,
Moabsvelden, ODS, OG, OJ, Witklip and Discard Workshop. The approved, existing and
proposed mining sections in relation to the MRA of Leeuwpan are presented in Figure 2.2.
Figure 2.1 Block OI box-cut
Exxaro Resources Ltd Section 21(a) WULA
19-0902 04 March 2021 Page 8
Figure 2.2 Mining Right Area and Mining Sections

Exxaro Resources Ltd Section 21(a) WULA
19-0902 04 March 2021 Page 9
2.2 Extent of the Activity
All activities relating to the mining activities take place within the approved MRA of
Leeuwpan. The operations at Leeuwpan Coal spread over 4 256ha, of which the majority is
comprised of mining areas (operational, rehabilitated and proposed mining areas), such as
box-cuts, dams and stockpiled material. The remaining areas comprise of the Beneficiation
Plant, as well as workshops and administration blocks which belong to both Exxaro Resources
Limited as well as the appointed contractors.
2.3 Key Activity Related Processes and Product
2.3.1 Mining Method
Opencast coal mining techniques are used at Leeuwpan Mine to produce steam and
metallurgical grade coal. Coal is selectively mined using a modified terrace method with a
fleet of 100 ton class hydraulic excavators and 40 ton articulated dump trucks. The reserves
are mined using the drilling, blasting, loading and hauling with truck and shovel, excavator
and fleet methods. Once the coal has been mined it is transported to the plant area for
processing.
2.3.2 Mineral Processing
Currently the coal distribution consists of a crusher plant and a washer to refine the coal by
means of a wet process. A Final Phase Coal Processing Plant is used for washing and sorting.
The Interim Phase processing plant has been dismantled and removed from the site. The final
phase processing plant consists of two Dense Medium Separation (DMS) plants (operated by
Frazer Alexander and one by Exxaro) and crush and stack plant (operated by B&E).
The Processing Plant area consists of various areas, such as the:
• Beneficiation plant;
• Run of Mine (ROM) Stockpiles;
• Crush and screening plant;
• Product stockpiles;
• Filter press;
• Pollution Control Dams (PCD);
• Laboratories; and
• Plant offices and control room.
Exxaro Resources Ltd Section 21(a) WULA
19-0902 04 March 2021 Page 10
2.3.2.1 Existing beneficiation plant:
The Beneficiation Plant consists of a Crushing and Washing Plant. Process water, consisting
of groundwater ingress into the pits and make-up water from boreholes, is used at the
Beneficiation Plant.
Process water is used on a continuous basis and is proportional to the amount of coal that is
being washed per day. No significant daily fluctuations exist in the use of water on the mine.
The Beneficiation Plant operates 24 hours a day for 313 days per year.
2.3.3 Product
The niche market for the mine is the production of low volatile coal. From the plant the
processed coal is transported via conveyors to the load out area siding. The final coal product
is transported by means of railroad to the different work centres or via road transport to
other markets such as Eskom. Road transport is handled by means of a weighbridge.
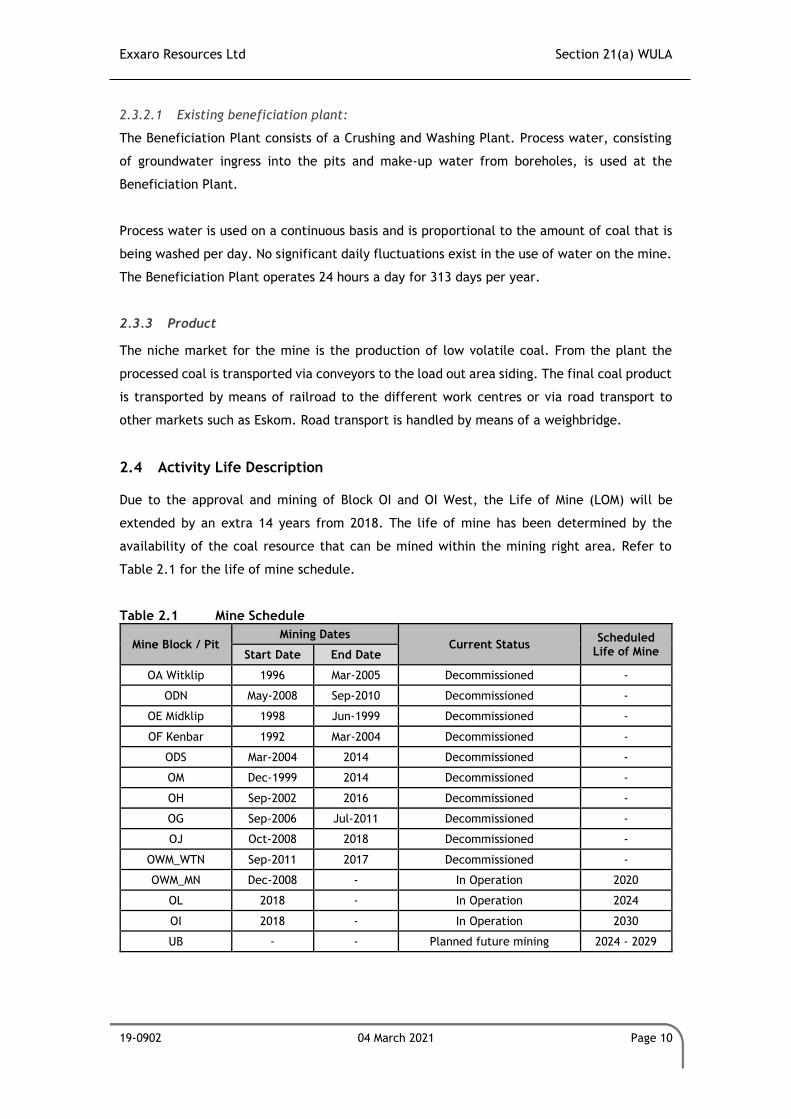
2.4 Activity Life Description
Due to the approval and mining of Block OI and OI West, the Life of Mine (LOM) will be
extended by an extra 14 years from 2018. The life of mine has been determined by the
availability of the coal resource that can be mined within the mining right area. Refer to
Table 2.1 for the life of mine schedule.
Table 2.1 Mine Schedule
Mine Block / Pit Mining Dates
Current Status Scheduled
Life of Mine Start Date End Date
OA Witklip 1996 Mar-2005 Decommissioned -
ODN May-2008 Sep-2010 Decommissioned -
OE Midklip 1998 Jun-1999 Decommissioned -
OF Kenbar 1992 Mar-2004 Decommissioned -
ODS Mar-2004 2014 Decommissioned -
OM Dec-1999 2014 Decommissioned -
OH Sep-2002 2016 Decommissioned -
OG Sep-2006 Jul-2011 Decommissioned -
OJ Oct-2008 2018 Decommissioned -
OWM_WTN Sep-2011 2017 Decommissioned -
OWM_MN Dec-2008 - In Operation 2020
OL 2018 - In Operation 2024
OI 2018 - In Operation 2030
UB - - Planned future mining 2024 - 2029
Exxaro Resources Ltd Section 21(a) WULA
19-0902 04 March 2021 Page 11
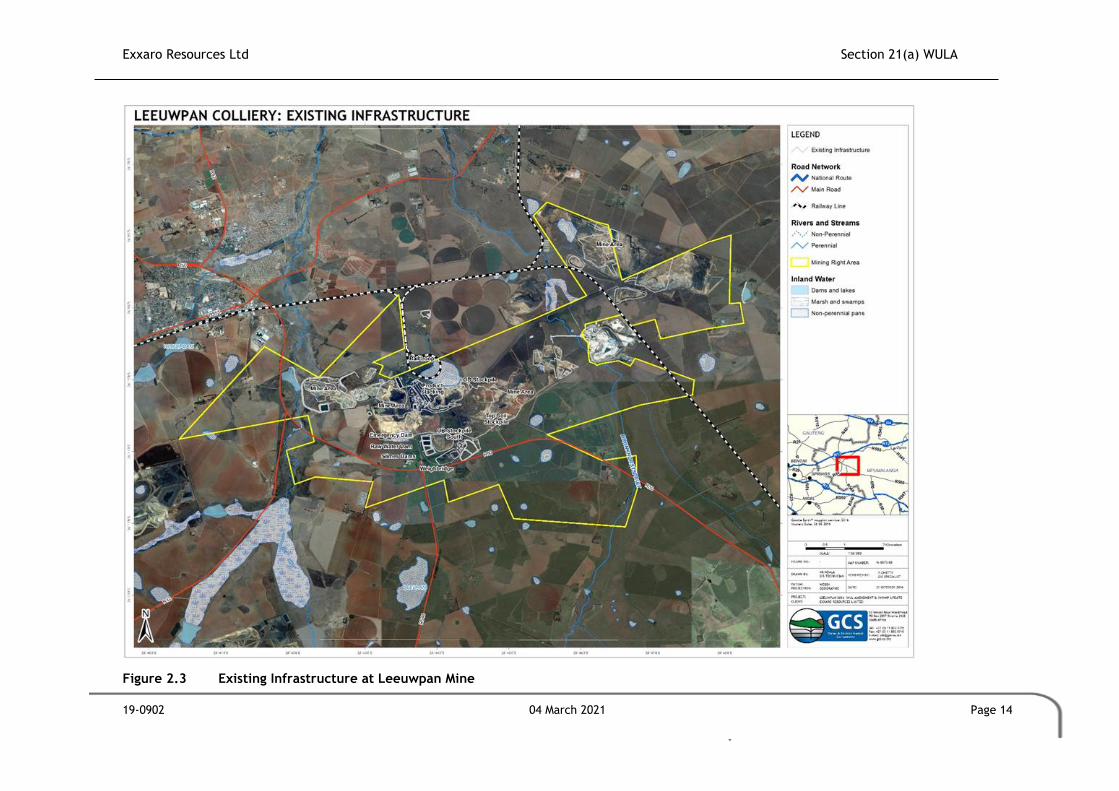
2.5 Activity Infrastructure Description
As previously stated, Leeuwpan mine is an operational mine that has been operating in line
with several approved Environmental Management Plans (EMPs). Infrastructure approved
under the Mineral and Petroleum Resources Development Act, 2002 (Act No. 28 of 2002)
(MPRDA) at Leeuwpan is detailed in the sections that follow for each of the mining areas.
Each table indicates what infrastructure still exists and what has been removed. Figure 2.3
shows the existing infrastructure of Leeuwpan Coal Mine.
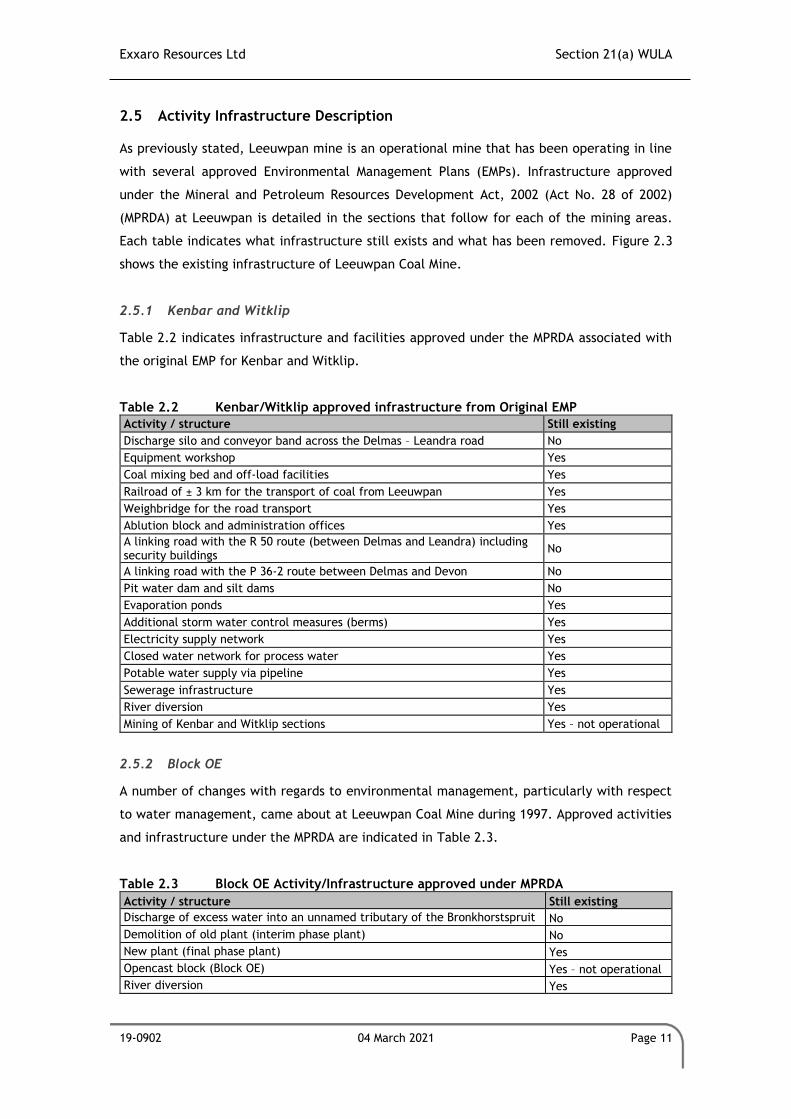
2.5.1 Kenbar and Witklip
Table 2.2 indicates infrastructure and facilities approved under the MPRDA associated with
the original EMP for Kenbar and Witklip.
Table 2.2 Kenbar/Witklip approved infrastructure from Original EMP
Activity / structure Still existing
Discharge silo and conveyor band across the Delmas – Leandra road No
Equipment workshop Yes
Coal mixing bed and off-load facilities Yes
Railroad of ± 3 km for the transport of coal from Leeuwpan Yes
Weighbridge for the road transport Yes
Ablution block and administration offices Yes
A linking road with the R 50 route (between Delmas and Leandra) including security buildings
No
A linking road with the P 36-2 route between Delmas and Devon No
Pit water dam and silt dams No
Evaporation ponds Yes
Additional storm water control measures (berms) Yes
Electricity supply network Yes
Closed water network for process water Yes
Potable water supply via pipeline Yes
Sewerage infrastructure Yes
River diversion Yes
Mining of Kenbar and Witklip sections Yes – not operational
2.5.2 Block OE
A number of changes with regards to environmental management, particularly with respect
to water management, came about at Leeuwpan Coal Mine during 1997. Approved activities
and infrastructure under the MPRDA are indicated in Table 2.3.
Table 2.3 Block OE Activity/Infrastructure approved under MPRDA
Activity / structure Still existing
Discharge of excess water into an unnamed tributary of the Bronkhorstspruit No
Demolition of old plant (interim phase plant) No
New plant (final phase plant) Yes
Opencast block (Block OE) Yes – not operational
River diversion Yes
Exxaro Resources Ltd Section 21(a) WULA
19-0902 04 March 2021 Page 12
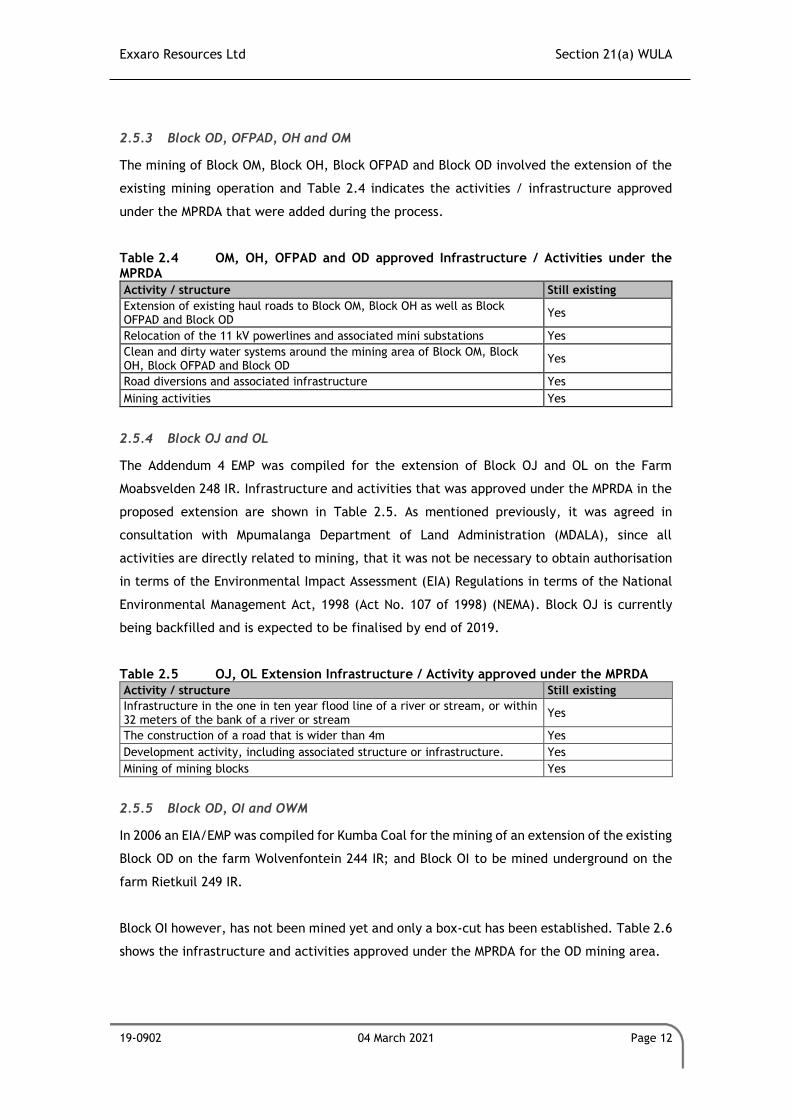
2.5.3 Block OD, OFPAD, OH and OM
The mining of Block OM, Block OH, Block OFPAD and Block OD involved the extension of the
existing mining operation and Table 2.4 indicates the activities / infrastructure approved
under the MPRDA that were added during the process.
Table 2.4 OM, OH, OFPAD and OD approved Infrastructure / Activities under the MPRDA
Activity / structure Still existing
Extension of existing haul roads to Block OM, Block OH as well as Block OFPAD and Block OD
Yes
Relocation of the 11 kV powerlines and associated mini substations Yes
Clean and dirty water systems around the mining area of Block OM, Block OH, Block OFPAD and Block OD
Yes
Road diversions and associated infrastructure Yes
Mining activities Yes
2.5.4 Block OJ and OL
The Addendum 4 EMP was compiled for the extension of Block OJ and OL on the Farm
Moabsvelden 248 IR. Infrastructure and activities that was approved under the MPRDA in the
proposed extension are shown in Table 2.5. As mentioned previously, it was agreed in
consultation with Mpumalanga Department of Land Administration (MDALA), since all
activities are directly related to mining, that it was not be necessary to obtain authorisation
in terms of the Environmental Impact Assessment (EIA) Regulations in terms of the National
Environmental Management Act, 1998 (Act No. 107 of 1998) (NEMA). Block OJ is currently
being backfilled and is expected to be finalised by end of 2019.
Table 2.5 OJ, OL Extension Infrastructure / Activity approved under the MPRDA
Activity / structure Still existing
Infrastructure in the one in ten year flood line of a river or stream, or within 32 meters of the bank of a river or stream
Yes
The construction of a road that is wider than 4m Yes
Development activity, including associated structure or infrastructure. Yes
Mining of mining blocks Yes
2.5.5 Block OD, OI and OWM
In 2006 an EIA/EMP was compiled for Kumba Coal for the mining of an extension of the existing
Block OD on the farm Wolvenfontein 244 IR; and Block OI to be mined underground on the
farm Rietkuil 249 IR.
Block OI however, has not been mined yet and only a box-cut has been established. Table 2.6
shows the infrastructure and activities approved under the MPRDA for the OD mining area.
Exxaro Resources Ltd Section 21(a) WULA
19-0902 04 March 2021 Page 13
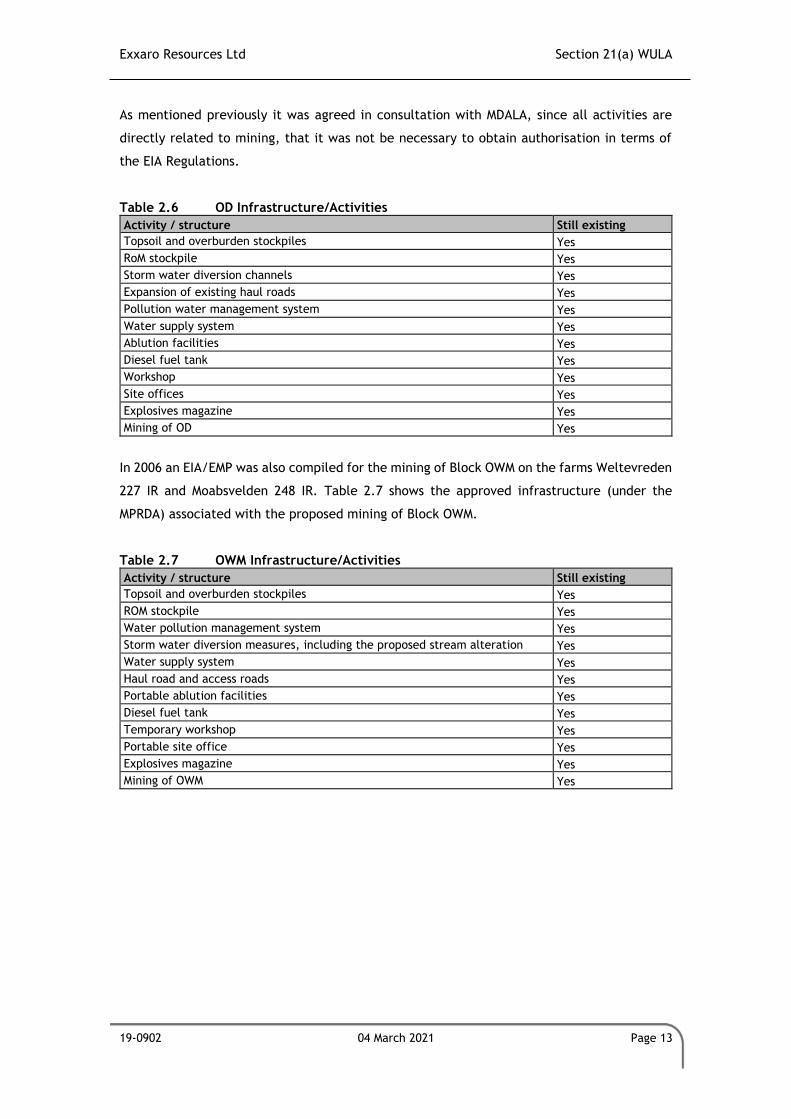
As mentioned previously it was agreed in consultation with MDALA, since all activities are
directly related to mining, that it was not be necessary to obtain authorisation in terms of
the EIA Regulations.
Table 2.6 OD Infrastructure/Activities
Activity / structure Still existing
Topsoil and overburden stockpiles Yes
RoM stockpile Yes
Storm water diversion channels Yes
Expansion of existing haul roads Yes
Pollution water management system Yes
Water supply system Yes
Ablution facilities Yes
Diesel fuel tank Yes
Workshop Yes
Site offices Yes
Explosives magazine Yes
Mining of OD Yes
In 2006 an EIA/EMP was also compiled for the mining of Block OWM on the farms Weltevreden
227 IR and Moabsvelden 248 IR. Table 2.7 shows the approved infrastructure (under the
MPRDA) associated with the proposed mining of Block OWM.
Table 2.7 OWM Infrastructure/Activities
Activity / structure Still existing
Topsoil and overburden stockpiles Yes
ROM stockpile Yes
Water pollution management system Yes
Storm water diversion measures, including the proposed stream alteration Yes
Water supply system Yes
Haul road and access roads Yes
Portable ablution facilities Yes
Diesel fuel tank Yes
Temporary workshop Yes
Portable site office Yes
Explosives magazine Yes
Mining of OWM Yes
Exxaro Resources Ltd Section 21(a) WULA
19-0902 04 March 2021 Page 14
Figure 2.3 Existing Infrastructure at Leeuwpan Mine
Exxaro Resources Ltd Section 21(a) WULA
19-0902 04 March 2021 Page 15
2.6 Key Water Uses and Waste Streams
2.6.1 Key Water Uses
Leeuwpan was issued with an IWUL on the 25th March 2011 (Licence No.
04/B21A/ABCGIJ/429). The IWUL was issued for various water uses being undertaken on site
in terms of Section 21 of the NWA. The license was issued for the following water uses:
• Section 21(a) – Taking of water from a water resource;
• Section 21(b) – Storing of Water;
• Section 21(c) – Impeding or diverting the flow of water in a watercourse;
• Section 21(g) – Disposing of waste in a manner which may detrimentally impact on a
water resource;
• Section 21(i) – Altering the bed, banks, course or characteristics of a watercourse;
and
• Section 21(j) – Removing, discharging or disposing of water found underground
An amendment to the IWUL for Leeuwpan was also issued in terms of Section 50 and Section
158 of the NWA on the 18th December 2015. This amendment was issued to amend / correct
water uses licensed as part of the IWUL issued on the 25th March 2011. The following water
uses in terms of Section 21 of the NWA were amended:
• Section 21(a) – Taking of water from a water resource;
• Section 21(c) – Impeding or diverting the flow of water in a watercourse;
• Section 21(g) – Disposing of waste in a manner which may detrimentally impact on a
water resource;
• Section 21(i) – Altering the bed, banks, course or characteristics of a watercourse;
and
• Section 21(j) – Removing, discharging or disposing of water found underground
A separate Integrated Water Use Licence Application (IWULA) was submitted to authorise
water uses associated with the mining of the Block OI and OL Expansion. The IWUL was
awarded to Leeuwpan (Licence No. 04/B20A/CIJ/4032) on the 18th December 2015. The IWUL
was issued for various water uses required for the expansion project in terms of Section 21
of the NWA. The license was issued for the following water uses:
• Section 21(a) – Taking of water from a water resource;
• Section 21(c) – Impeding or diverting the flow of water in a watercourse;
• Section 21(g) – Disposing of waste in a manner which may detrimentally impact on a
water resource;
• Section 21(i) – Altering the bed, banks, course or characteristics of a watercourse;
and
Exxaro Resources Ltd Section 21(a) WULA
19-0902 04 March 2021 Page 16
• Section 21(j) – Removing, discharging or disposing of water found underground.
An additional application was submitted to expand mining Block OI to include the area where
planned infrastructure would have originally been located. This expansion area is referred to
as OI West. Water uses for this expansion are triggered in terms of Section 21(c) and (i) of
the NWA. The IWUL was awarded to Leeuwpan (Licence No. 06/B20A/CI/9521) on the 4th
March 2020. The license was issued for the following water uses:
• Section 21(c) – Impeding or diverting the flow of water in a watercourse; and
• Section 21(i) – Altering the bed, banks, course or characteristics of a watercourse.
Refer to Section 3 for detailed information regarding the water uses for Leeuwpan Mine. The
two boreholes being applied for as part of this application is considered a key water use for
the operation of Leeuwpan in terms of water supply.
2.6.2 Key Waste Streams
The waste streams associated with the Leeuwpan mining operation include coal discard,
polluted mine water, sewage, hydrocarbon wastes, and general waste. These include:
• Mine Residue Deposit (MRD), which includes:
o Carbon-carrying shales;
o Plant residue; and
o Fine coal recovered from the slimes dams.
• Polluted mine water, which includes the various pollution control dams (PCDs);
• Hydrocarbon waste such as oil, diesel & grease; and
• General waste which is limited to domestic and commercial waste.
Refer to Section 5.2.4 of this report for more details pertaining to the waste generated on
site and the management thereof.
2.7 Organisational Structure of the Activity
Please refer to Figure 2.4 for the Organisational Structure relating to Leeuwpan Mine.

Exxaro Resources Ltd Section 21(a) WULA
19-0902 04 March 2021 Page 17
Figure 2.4: Organisational Structure of Leeuwpan
Exxaro Resources Ltd Section 21(a) WULA
19-0902 04 March 2021 Page 18
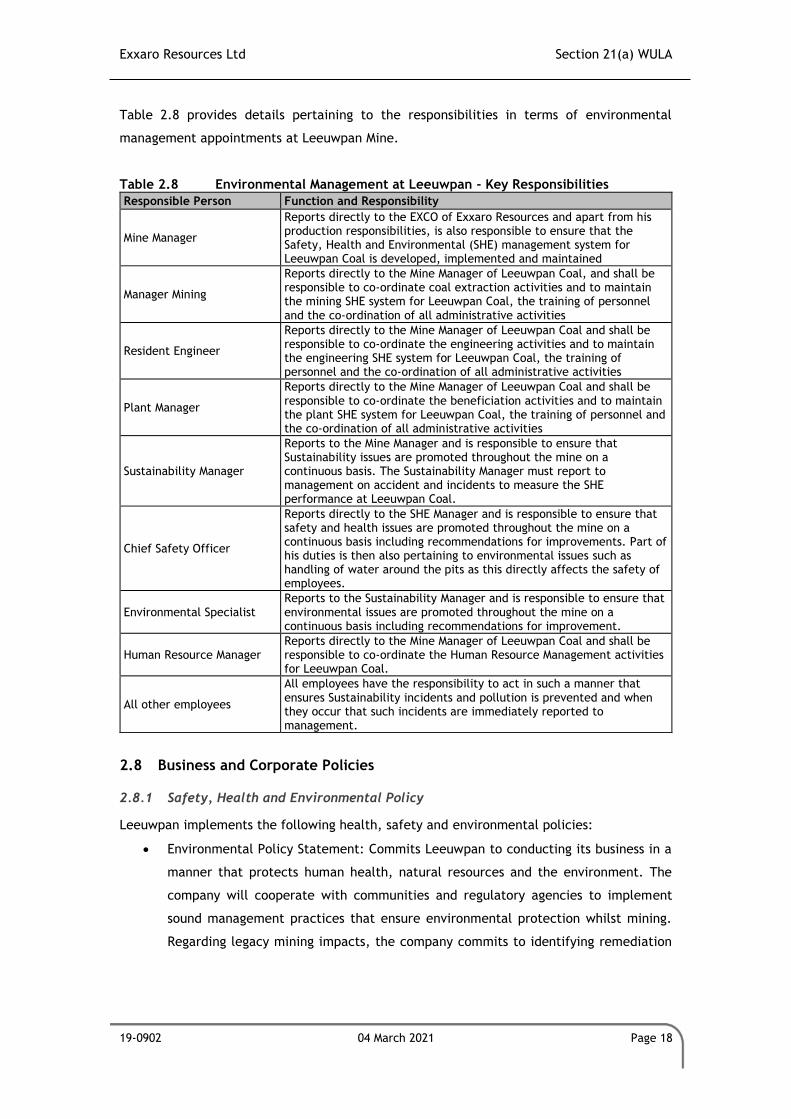
Table 2.8 provides details pertaining to the responsibilities in terms of environmental
management appointments at Leeuwpan Mine.
Table 2.8 Environmental Management at Leeuwpan - Key Responsibilities
Responsible Person Function and Responsibility
Mine Manager
Reports directly to the EXCO of Exxaro Resources and apart from his production responsibilities, is also responsible to ensure that the Safety, Health and Environmental (SHE) management system for Leeuwpan Coal is developed, implemented and maintained
Manager Mining
Reports directly to the Mine Manager of Leeuwpan Coal, and shall be responsible to co-ordinate coal extraction activities and to maintain the mining SHE system for Leeuwpan Coal, the training of personnel and the co-ordination of all administrative activities
Resident Engineer
Reports directly to the Mine Manager of Leeuwpan Coal and shall be responsible to co-ordinate the engineering activities and to maintain the engineering SHE system for Leeuwpan Coal, the training of personnel and the co-ordination of all administrative activities
Plant Manager
Reports directly to the Mine Manager of Leeuwpan Coal and shall be responsible to co-ordinate the beneficiation activities and to maintain the plant SHE system for Leeuwpan Coal, the training of personnel and the co-ordination of all administrative activities
Sustainability Manager
Reports to the Mine Manager and is responsible to ensure that Sustainability issues are promoted throughout the mine on a continuous basis. The Sustainability Manager must report to management on accident and incidents to measure the SHE performance at Leeuwpan Coal.
Chief Safety Officer
Reports directly to the SHE Manager and is responsible to ensure that safety and health issues are promoted throughout the mine on a continuous basis including recommendations for improvements. Part of his duties is then also pertaining to environmental issues such as handling of water around the pits as this directly affects the safety of employees.
Environmental Specialist Reports to the Sustainability Manager and is responsible to ensure that environmental issues are promoted throughout the mine on a continuous basis including recommendations for improvement.
Human Resource Manager Reports directly to the Mine Manager of Leeuwpan Coal and shall be responsible to co-ordinate the Human Resource Management activities for Leeuwpan Coal.
All other employees
All employees have the responsibility to act in such a manner that ensures Sustainability incidents and pollution is prevented and when they occur that such incidents are immediately reported to management.
2.8 Business and Corporate Policies
2.8.1 Safety, Health and Environmental Policy
Leeuwpan implements the following health, safety and environmental policies:
• Environmental Policy Statement: Commits Leeuwpan to conducting its business in a
manner that protects human health, natural resources and the environment. The
company will cooperate with communities and regulatory agencies to implement
sound management practices that ensure environmental protection whilst mining.
Regarding legacy mining impacts, the company commits to identifying remediation
Exxaro Resources Ltd Section 21(a) WULA
19-0902 04 March 2021 Page 19
activities and implementing such plans in a manner that is credible and transparent;
and
• Occupational Health and Safety Policy: Provides for the protection of all Leeuwpan
employees and those who are not employees but who are directly affected by
Leeuwpan’s activities.
2.8.2 Objectives and Strategies
The objectives of the Safety and Health management system are to:
▪ Have an injury free working environment combined with zero tolerance for non-
compliance or unsafe behaviour;
▪ Minimise major occupational risk in the work environment in order to eliminate
occupational illness and disability; and
▪ Maintain high standards in respect to all of Leeuwpan’s operations.
The Environmental objectives are to ensure sustainable exploitation of natural resources
through dedicated programmes focusing on water resource management, air quality
management and biodiversity management steered by the Environmental Management
division.
The following strategically important water resource management objectives could be
identified:
• Water Resource Protection;
• Water Use Management;
• Water Conservation (WC) and Water Demand Management (WDM); and
• Monitoring and Information Management.
It is necessary to consider that water impacts might increase over time. This entails that the
cost for operational and closure water management will increase, as well as an increased risk
to the environment (social, ecologic and economic) in the future.
The framework in which Leeuwpan proposes water management makes provision for the
following requirements:
• Treatment technologies are expensive and will have associated long-term operating
and maintenance costs;
• Industry needs to be profitable with a return on investment to shareholders;
Exxaro Resources Ltd Section 21(a) WULA
19-0902 04 March 2021 Page 20
• The operation has the responsibility to manage risks associated with water impacts.
The applicant will be in a position to manage long-term liabilities and risks associated
with post closure;
• Leeuwpan would have the liability for post closure environmental impacts (including
water impacts); and
• It should be recognised that the cost to manage water is time dependent and
intervention during the operational water management phase would reduce long-
term liability.
3 REGULATORY WATER AND WASTE MANAGEMENT FRAMEWORK
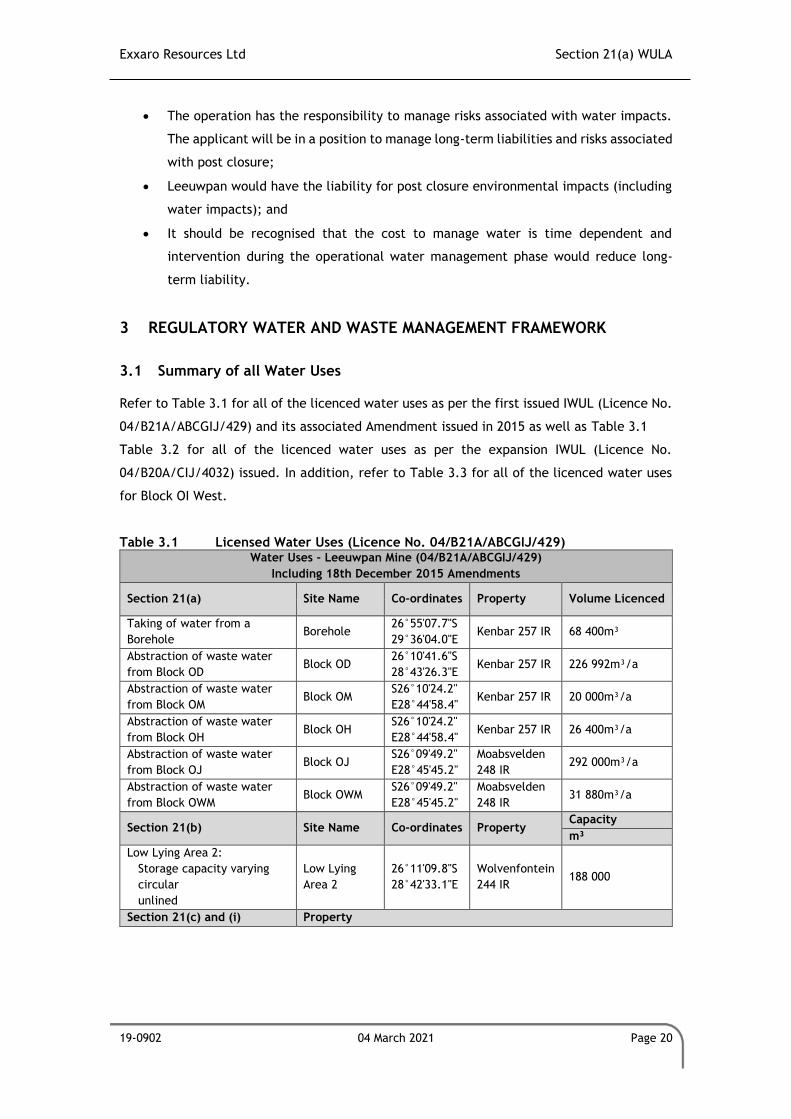
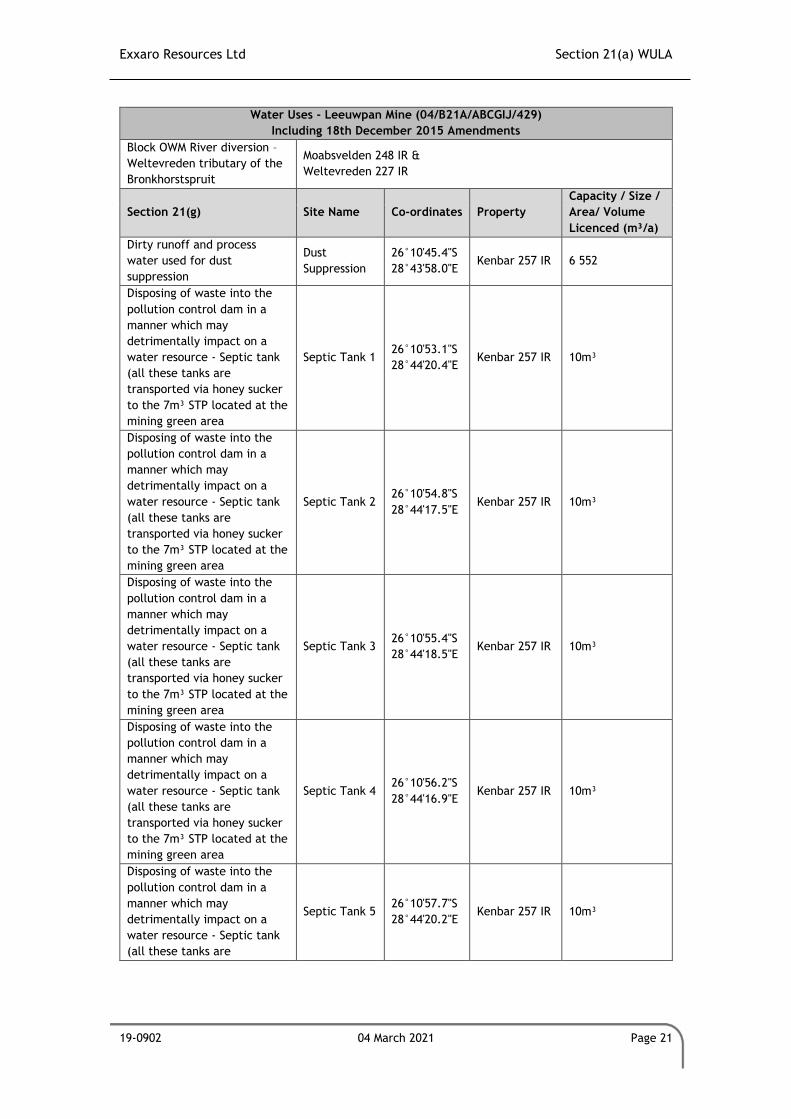
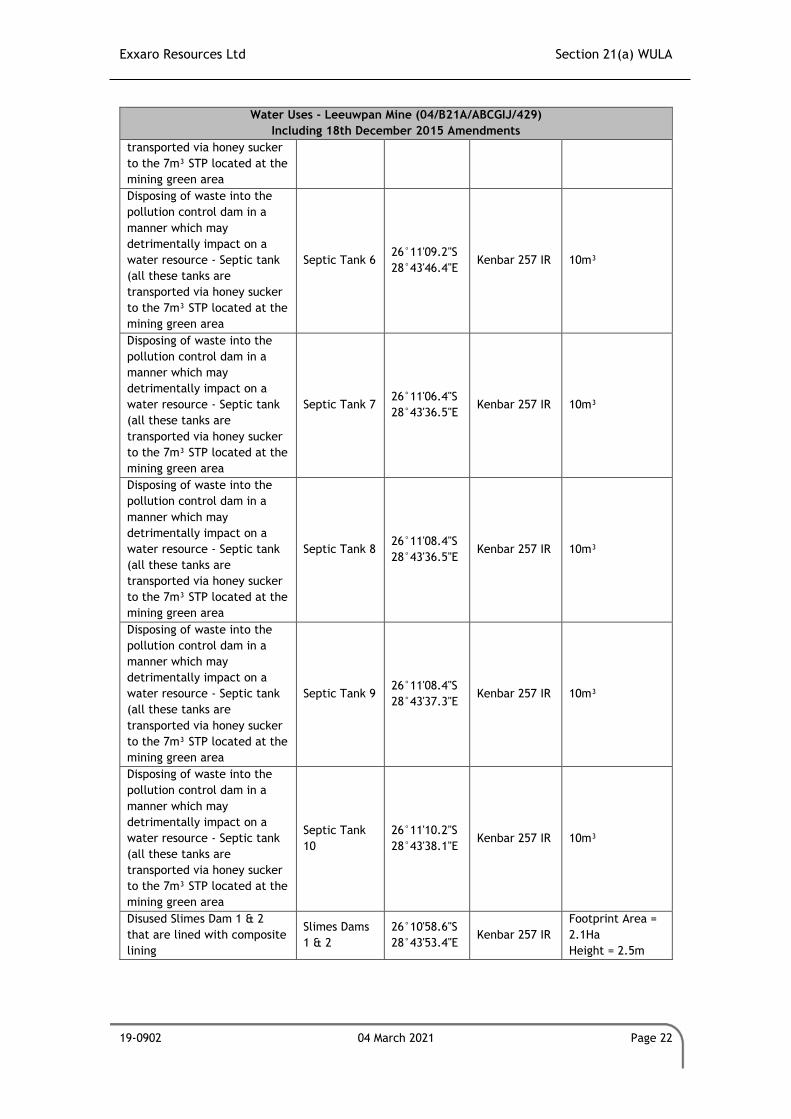
3.1 Summary of all Water Uses
Refer to Table 3.1 for all of the licenced water uses as per the first issued IWUL (Licence No.
04/B21A/ABCGIJ/429) and its associated Amendment issued in 2015 as well as Table 3.1
Table 3.2 for all of the licenced water uses as per the expansion IWUL (Licence No.
04/B20A/CIJ/4032) issued. In addition, refer to Table 3.3 for all of the licenced water uses
for Block OI West.
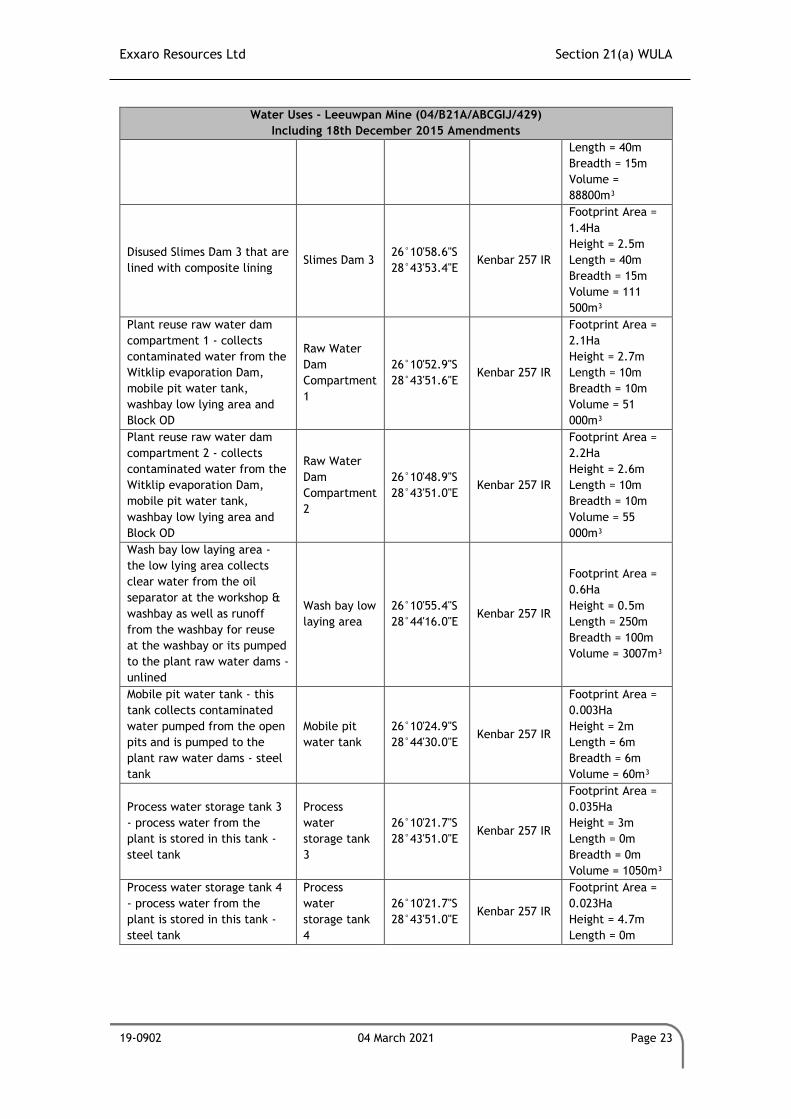
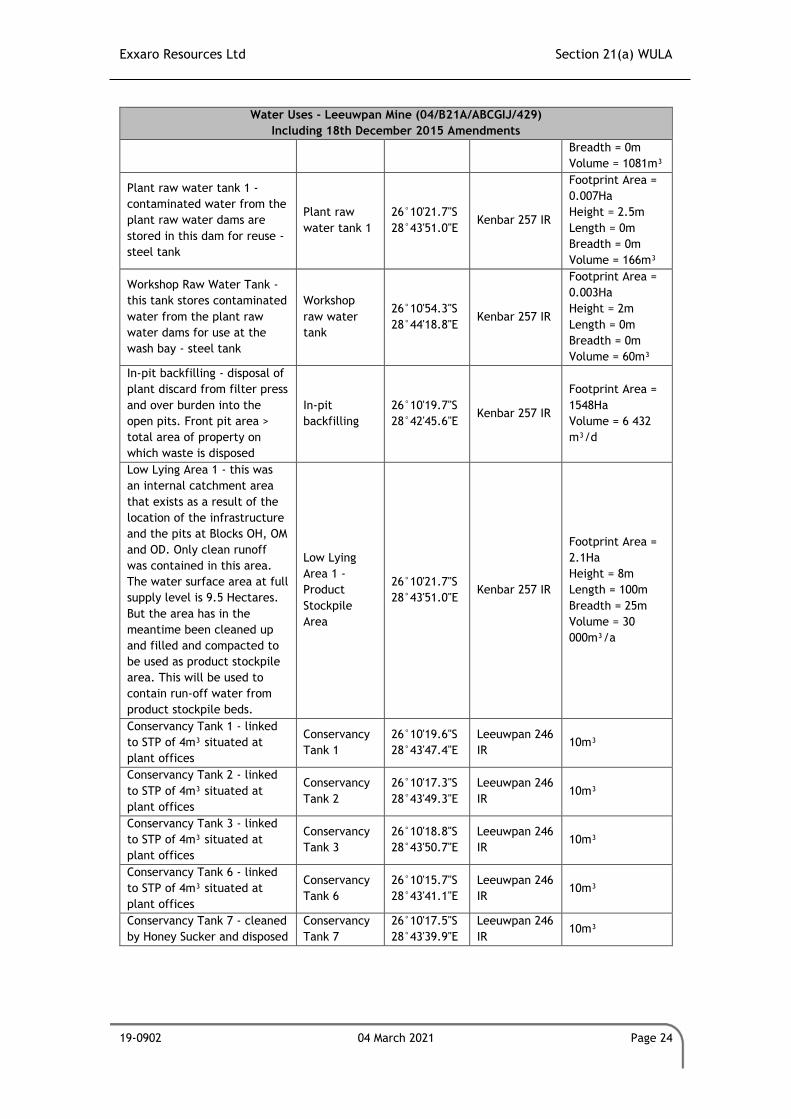
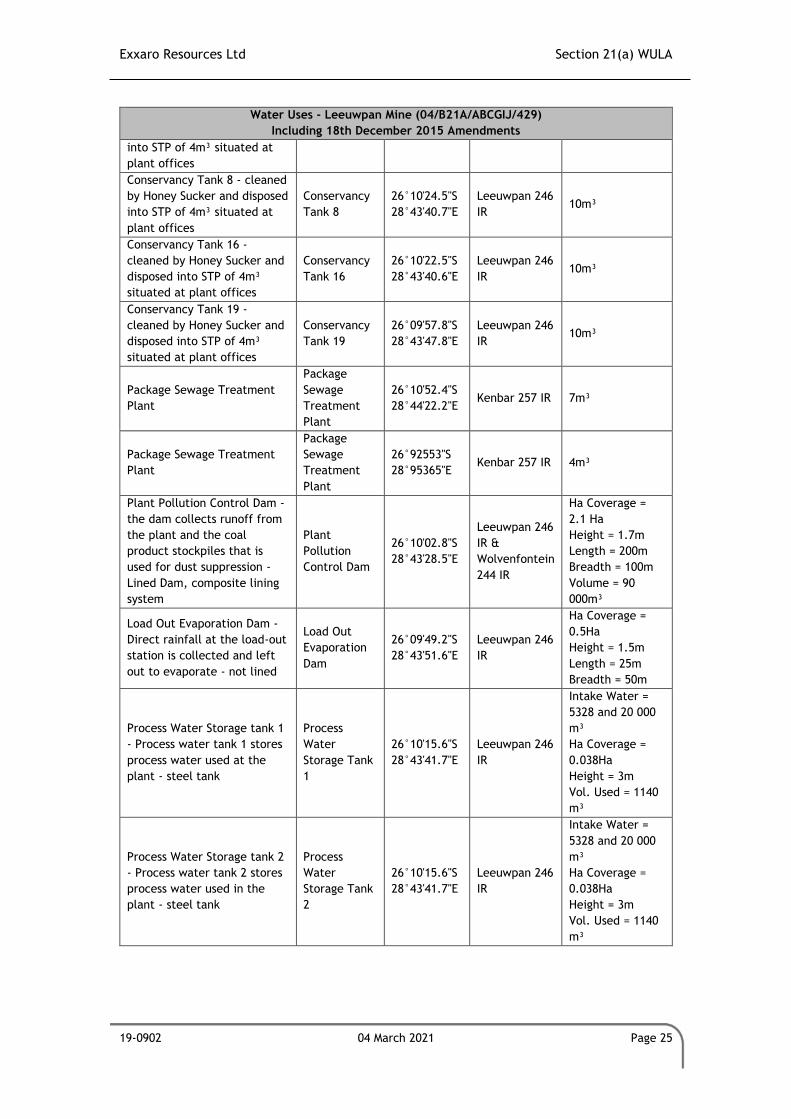
Table 3.1 Licensed Water Uses (Licence No. 04/B21A/ABCGIJ/429) Water Uses - Leeuwpan Mine (04/B21A/ABCGIJ/429)
Including 18th December 2015 Amendments
Section 21(a) Site Name Co-ordinates Property Volume Licenced
Taking of water from a
Borehole Borehole
26°55'07.7"S
29°36'04.0"E Kenbar 257 IR 68 400m³
Abstraction of waste water
from Block OD Block OD
26°10'41.6"S
28°43'26.3"E Kenbar 257 IR 226 992m³/a
Abstraction of waste water
from Block OM Block OM
S26°10'24.2"
E28°44'58.4" Kenbar 257 IR 20 000m³/a
Abstraction of waste water
from Block OH Block OH
S26°10'24.2"
E28°44'58.4" Kenbar 257 IR 26 400m³/a
Abstraction of waste water
from Block OJ Block OJ
S26°09'49.2"
E28°45'45.2"
Moabsvelden
248 IR 292 000m³/a
Abstraction of waste water
from Block OWM Block OWM
S26°09'49.2"
E28°45'45.2"
Moabsvelden
248 IR 31 880m³/a
Section 21(b) Site Name Co-ordinates Property Capacity
m³
Low Lying Area 2:
Storage capacity varying
circular
unlined
Low Lying
Area 2
26°11'09.8"S
28°42'33.1"E
Wolvenfontein
244 IR 188 000
Section 21(c) and (i) Property
Exxaro Resources Ltd Section 21(a) WULA
19-0902 04 March 2021 Page 21
Water Uses - Leeuwpan Mine (04/B21A/ABCGIJ/429)
Including 18th December 2015 Amendments
Block OWM River diversion –
Weltevreden tributary of the
Bronkhorstspruit
Moabsvelden 248 IR &
Weltevreden 227 IR
Section 21(g) Site Name Co-ordinates Property
Capacity / Size /
Area/ Volume
Licenced (m³/a)
Dirty runoff and process
water used for dust
suppression
Dust
Suppression
26°10'45.4"S
28°43'58.0"E Kenbar 257 IR 6 552
Disposing of waste into the
pollution control dam in a
manner which may
detrimentally impact on a
water resource - Septic tank
(all these tanks are
transported via honey sucker
to the 7m³ STP located at the
mining green area
Septic Tank 1 26°10'53.1"S
28°44'20.4"E Kenbar 257 IR 10m³
Disposing of waste into the
pollution control dam in a
manner which may
detrimentally impact on a
water resource - Septic tank
(all these tanks are
transported via honey sucker
to the 7m³ STP located at the
mining green area
Septic Tank 2 26°10'54.8"S
28°44'17.5"E Kenbar 257 IR 10m³
Disposing of waste into the
pollution control dam in a
manner which may
detrimentally impact on a
water resource - Septic tank
(all these tanks are
transported via honey sucker
to the 7m³ STP located at the
mining green area
Septic Tank 3 26°10'55.4"S
28°44'18.5"E Kenbar 257 IR 10m³
Disposing of waste into the
pollution control dam in a
manner which may
detrimentally impact on a
water resource - Septic tank
(all these tanks are
transported via honey sucker
to the 7m³ STP located at the
mining green area
Septic Tank 4 26°10'56.2"S
28°44'16.9"E Kenbar 257 IR 10m³
Disposing of waste into the
pollution control dam in a
manner which may
detrimentally impact on a
water resource - Septic tank
(all these tanks are
Septic Tank 5 26°10'57.7"S
28°44'20.2"E Kenbar 257 IR 10m³
Exxaro Resources Ltd Section 21(a) WULA
19-0902 04 March 2021 Page 22
Water Uses - Leeuwpan Mine (04/B21A/ABCGIJ/429)
Including 18th December 2015 Amendments
transported via honey sucker
to the 7m³ STP located at the
mining green area
Disposing of waste into the
pollution control dam in a
manner which may
detrimentally impact on a
water resource - Septic tank
(all these tanks are
transported via honey sucker
to the 7m³ STP located at the
mining green area
Septic Tank 6 26°11'09.2"S
28°43'46.4"E Kenbar 257 IR 10m³
Disposing of waste into the
pollution control dam in a
manner which may
detrimentally impact on a
water resource - Septic tank
(all these tanks are
transported via honey sucker
to the 7m³ STP located at the
mining green area
Septic Tank 7 26°11'06.4"S
28°43'36.5"E Kenbar 257 IR 10m³
Disposing of waste into the
pollution control dam in a
manner which may
detrimentally impact on a
water resource - Septic tank
(all these tanks are
transported via honey sucker
to the 7m³ STP located at the
mining green area
Septic Tank 8 26°11'08.4"S
28°43'36.5"E Kenbar 257 IR 10m³
Disposing of waste into the
pollution control dam in a
manner which may
detrimentally impact on a
water resource - Septic tank
(all these tanks are
transported via honey sucker
to the 7m³ STP located at the
mining green area
Septic Tank 9 26°11'08.4"S
28°43'37.3"E Kenbar 257 IR 10m³
Disposing of waste into the
pollution control dam in a
manner which may
detrimentally impact on a
water resource - Septic tank
(all these tanks are
transported via honey sucker
to the 7m³ STP located at the
mining green area
Septic Tank
10
26°11'10.2"S
28°43'38.1"E Kenbar 257 IR 10m³
Disused Slimes Dam 1 & 2
that are lined with composite
lining
Slimes Dams
1 & 2
26°10'58.6"S
28°43'53.4"E Kenbar 257 IR
Footprint Area =
2.1Ha
Height = 2.5m
Exxaro Resources Ltd Section 21(a) WULA
19-0902 04 March 2021 Page 23
Water Uses - Leeuwpan Mine (04/B21A/ABCGIJ/429)
Including 18th December 2015 Amendments
Length = 40m
Breadth = 15m
Volume =
88800m³
Disused Slimes Dam 3 that are
lined with composite lining Slimes Dam 3
26°10'58.6"S
28°43'53.4"E Kenbar 257 IR
Footprint Area =
1.4Ha
Height = 2.5m
Length = 40m
Breadth = 15m
Volume = 111
500m³
Plant reuse raw water dam
compartment 1 - collects
contaminated water from the
Witklip evaporation Dam,
mobile pit water tank,
washbay low lying area and
Block OD
Raw Water
Dam
Compartment
1
26°10'52.9"S
28°43'51.6"E Kenbar 257 IR
Footprint Area =
2.1Ha
Height = 2.7m
Length = 10m
Breadth = 10m
Volume = 51
000m³
Plant reuse raw water dam
compartment 2 - collects
contaminated water from the
Witklip evaporation Dam,
mobile pit water tank,
washbay low lying area and
Block OD
Raw Water
Dam
Compartment
2
26°10'48.9"S
28°43'51.0"E Kenbar 257 IR
Footprint Area =
2.2Ha
Height = 2.6m
Length = 10m
Breadth = 10m
Volume = 55
000m³
Wash bay low laying area -
the low lying area collects
clear water from the oil
separator at the workshop &
washbay as well as runoff
from the washbay for reuse
at the washbay or its pumped
to the plant raw water dams -
unlined
Wash bay low
laying area
26°10'55.4"S
28°44'16.0"E Kenbar 257 IR
Footprint Area =
0.6Ha
Height = 0.5m
Length = 250m
Breadth = 100m
Volume = 3007m³
Mobile pit water tank - this
tank collects contaminated
water pumped from the open
pits and is pumped to the
plant raw water dams - steel
tank
Mobile pit
water tank
26°10'24.9"S
28°44'30.0"E Kenbar 257 IR
Footprint Area =
0.003Ha
Height = 2m
Length = 6m
Breadth = 6m
Volume = 60m³
Process water storage tank 3
- process water from the
plant is stored in this tank -
steel tank
Process
water
storage tank
3
26°10'21.7"S
28°43'51.0"E Kenbar 257 IR
Footprint Area =
0.035Ha
Height = 3m
Length = 0m
Breadth = 0m
Volume = 1050m³
Process water storage tank 4
- process water from the
plant is stored in this tank -
steel tank
Process
water
storage tank
4
26°10'21.7"S
28°43'51.0"E Kenbar 257 IR
Footprint Area =
0.023Ha
Height = 4.7m
Length = 0m
Exxaro Resources Ltd Section 21(a) WULA
19-0902 04 March 2021 Page 24
Water Uses - Leeuwpan Mine (04/B21A/ABCGIJ/429)
Including 18th December 2015 Amendments
Breadth = 0m
Volume = 1081m³
Plant raw water tank 1 -
contaminated water from the
plant raw water dams are
stored in this dam for reuse -
steel tank
Plant raw
water tank 1
26°10'21.7"S
28°43'51.0"E Kenbar 257 IR
Footprint Area =
0.007Ha
Height = 2.5m
Length = 0m
Breadth = 0m
Volume = 166m³
Workshop Raw Water Tank -
this tank stores contaminated
water from the plant raw
water dams for use at the
wash bay - steel tank
Workshop
raw water
tank
26°10'54.3"S
28°44'18.8"E Kenbar 257 IR
Footprint Area =
0.003Ha
Height = 2m
Length = 0m
Breadth = 0m
Volume = 60m³
In-pit backfilling - disposal of
plant discard from filter press
and over burden into the
open pits. Front pit area >
total area of property on
which waste is disposed
In-pit
backfilling
26°10'19.7"S
28°42'45.6"E Kenbar 257 IR
Footprint Area =
1548Ha
Volume = 6 432
m³/d
Low Lying Area 1 - this was
an internal catchment area
that exists as a result of the
location of the infrastructure
and the pits at Blocks OH, OM
and OD. Only clean runoff
was contained in this area.
The water surface area at full
supply level is 9.5 Hectares.
But the area has in the
meantime been cleaned up
and filled and compacted to
be used as product stockpile
area. This will be used to
contain run-off water from
product stockpile beds.
Low Lying
Area 1 -
Product
Stockpile
Area
26°10'21.7"S
28°43'51.0"E Kenbar 257 IR
Footprint Area =
2.1Ha
Height = 8m
Length = 100m
Breadth = 25m
Volume = 30
000m³/a
Conservancy Tank 1 - linked
to STP of 4m³ situated at
plant offices
Conservancy
Tank 1
26°10'19.6"S
28°43'47.4"E
Leeuwpan 246
IR 10m³
Conservancy Tank 2 - linked
to STP of 4m³ situated at
plant offices
Conservancy
Tank 2
26°10'17.3"S
28°43'49.3"E
Leeuwpan 246
IR 10m³
Conservancy Tank 3 - linked
to STP of 4m³ situated at
plant offices
Conservancy
Tank 3
26°10'18.8"S
28°43'50.7"E
Leeuwpan 246
IR 10m³
Conservancy Tank 6 - linked
to STP of 4m³ situated at
plant offices
Conservancy
Tank 6
26°10'15.7"S
28°43'41.1"E
Leeuwpan 246
IR 10m³
Conservancy Tank 7 - cleaned
by Honey Sucker and disposed
Conservancy
Tank 7
26°10'17.5"S
28°43'39.9"E
Leeuwpan 246
IR 10m³
Exxaro Resources Ltd Section 21(a) WULA
19-0902 04 March 2021 Page 25
Water Uses - Leeuwpan Mine (04/B21A/ABCGIJ/429)
Including 18th December 2015 Amendments
into STP of 4m³ situated at
plant offices
Conservancy Tank 8 - cleaned
by Honey Sucker and disposed
into STP of 4m³ situated at
plant offices
Conservancy
Tank 8
26°10'24.5"S
28°43'40.7"E
Leeuwpan 246
IR 10m³
Conservancy Tank 16 -
cleaned by Honey Sucker and
disposed into STP of 4m³
situated at plant offices
Conservancy
Tank 16
26°10'22.5"S
28°43'40.6"E
Leeuwpan 246
IR 10m³
Conservancy Tank 19 -
cleaned by Honey Sucker and
disposed into STP of 4m³
situated at plant offices
Conservancy
Tank 19
26°09'57.8"S
28°43'47.8"E
Leeuwpan 246
IR 10m³
Package Sewage Treatment
Plant
Package
Sewage
Treatment
Plant
26°10'52.4"S
28°44'22.2"E Kenbar 257 IR 7m³
Package Sewage Treatment
Plant
Package
Sewage
Treatment
Plant
26°92553"S
28°95365"E Kenbar 257 IR 4m³
Plant Pollution Control Dam -
the dam collects runoff from
the plant and the coal
product stockpiles that is
used for dust suppression -
Lined Dam, composite lining
system
Plant
Pollution
Control Dam
26°10'02.8"S
28°43'28.5"E
Leeuwpan 246
IR &
Wolvenfontein
244 IR
Ha Coverage =
2.1 Ha
Height = 1.7m
Length = 200m
Breadth = 100m
Volume = 90
000m³
Load Out Evaporation Dam -
Direct rainfall at the load-out
station is collected and left
out to evaporate - not lined
Load Out
Evaporation
Dam
26°09'49.2"S
28°43'51.6"E
Leeuwpan 246
IR
Ha Coverage =
0.5Ha
Height = 1.5m
Length = 25m
Breadth = 50m
Process Water Storage tank 1
- Process water tank 1 stores
process water used at the
plant - steel tank
Process
Water
Storage Tank
1
26°10'15.6"S
28°43'41.7"E
Leeuwpan 246
IR
Intake Water =
5328 and 20 000
m³
Ha Coverage =
0.038Ha
Height = 3m
Vol. Used = 1140
m³
Process Water Storage tank 2
- Process water tank 2 stores
process water used in the
plant - steel tank
Process
Water
Storage Tank
2
26°10'15.6"S
28°43'41.7"E
Leeuwpan 246
IR
Intake Water =
5328 and 20 000
m³
Ha Coverage =
0.038Ha
Height = 3m
Vol. Used = 1140
m³
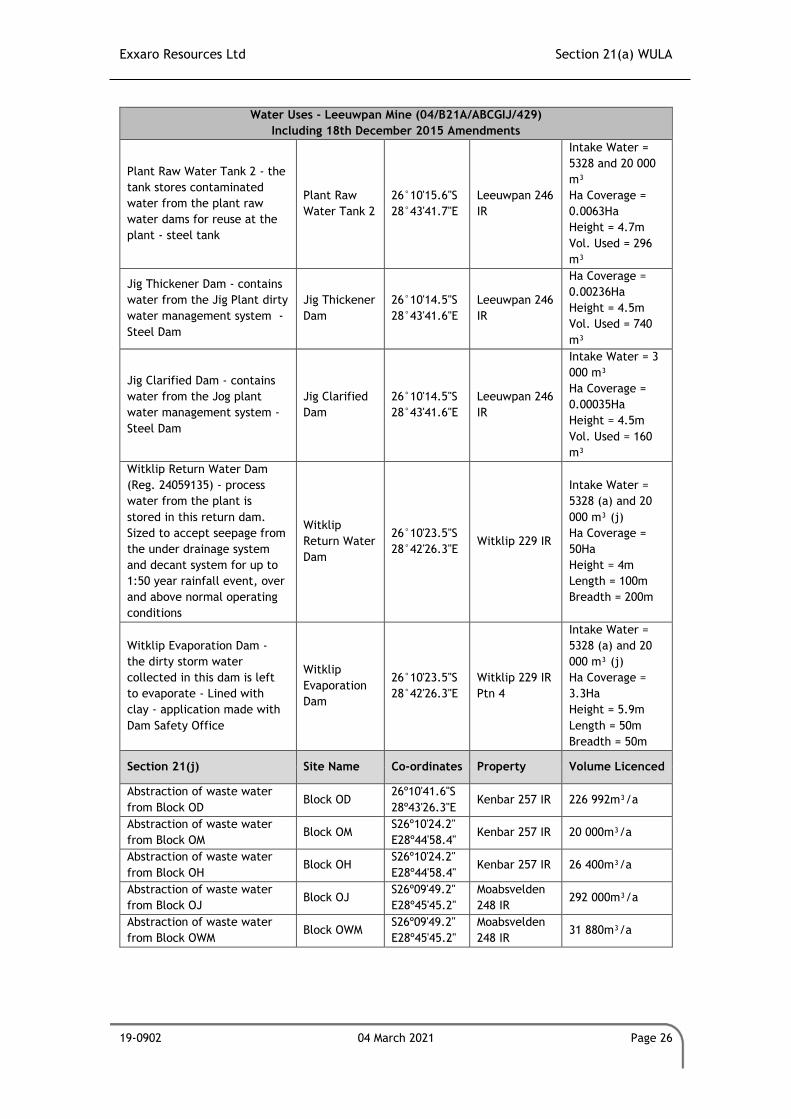
Exxaro Resources Ltd Section 21(a) WULA
19-0902 04 March 2021 Page 26
Water Uses - Leeuwpan Mine (04/B21A/ABCGIJ/429)
Including 18th December 2015 Amendments
Plant Raw Water Tank 2 - the
tank stores contaminated
water from the plant raw
water dams for reuse at the
plant - steel tank
Plant Raw
Water Tank 2
26°10'15.6"S
28°43'41.7"E
Leeuwpan 246
IR
Intake Water =
5328 and 20 000
m³
Ha Coverage =
0.0063Ha
Height = 4.7m
Vol. Used = 296
m³
Jig Thickener Dam - contains
water from the Jig Plant dirty
water management system -
Steel Dam
Jig Thickener
Dam
26°10'14.5"S
28°43'41.6"E
Leeuwpan 246
IR
Ha Coverage =
0.00236Ha
Height = 4.5m
Vol. Used = 740
m³
Jig Clarified Dam - contains
water from the Jog plant
water management system -
Steel Dam
Jig Clarified
Dam
26°10'14.5"S
28°43'41.6"E
Leeuwpan 246
IR
Intake Water = 3
000 m³
Ha Coverage =
0.00035Ha
Height = 4.5m
Vol. Used = 160
m³
Witklip Return Water Dam
(Reg. 24059135) - process
water from the plant is
stored in this return dam.
Sized to accept seepage from
the under drainage system
and decant system for up to
1:50 year rainfall event, over
and above normal operating
conditions
Witklip
Return Water
Dam
26°10'23.5"S
28°42'26.3"E Witklip 229 IR
Intake Water =
5328 (a) and 20
000 m³ (j)
Ha Coverage =
50Ha
Height = 4m
Length = 100m
Breadth = 200m
Witklip Evaporation Dam -
the dirty storm water
collected in this dam is left
to evaporate - Lined with
clay - application made with
Dam Safety Office
Witklip
Evaporation
Dam
26°10'23.5"S
28°42'26.3"E
Witklip 229 IR
Ptn 4
Intake Water =
5328 (a) and 20
000 m³ (j)
Ha Coverage =
3.3Ha
Height = 5.9m
Length = 50m
Breadth = 50m
Section 21(j) Site Name Co-ordinates Property Volume Licenced
Abstraction of waste water
from Block OD Block OD
26º10'41.6"S
28º43'26.3"E Kenbar 257 IR 226 992m³/a
Abstraction of waste water
from Block OM Block OM
S26º10'24.2"
E28º44'58.4" Kenbar 257 IR 20 000m³/a
Abstraction of waste water
from Block OH Block OH
S26º10'24.2"
E28º44'58.4" Kenbar 257 IR 26 400m³/a
Abstraction of waste water
from Block OJ Block OJ
S26º09'49.2"
E28º45'45.2"
Moabsvelden
248 IR 292 000m³/a
Abstraction of waste water
from Block OWM Block OWM
S26º09'49.2"
E28º45'45.2"
Moabsvelden
248 IR 31 880m³/a
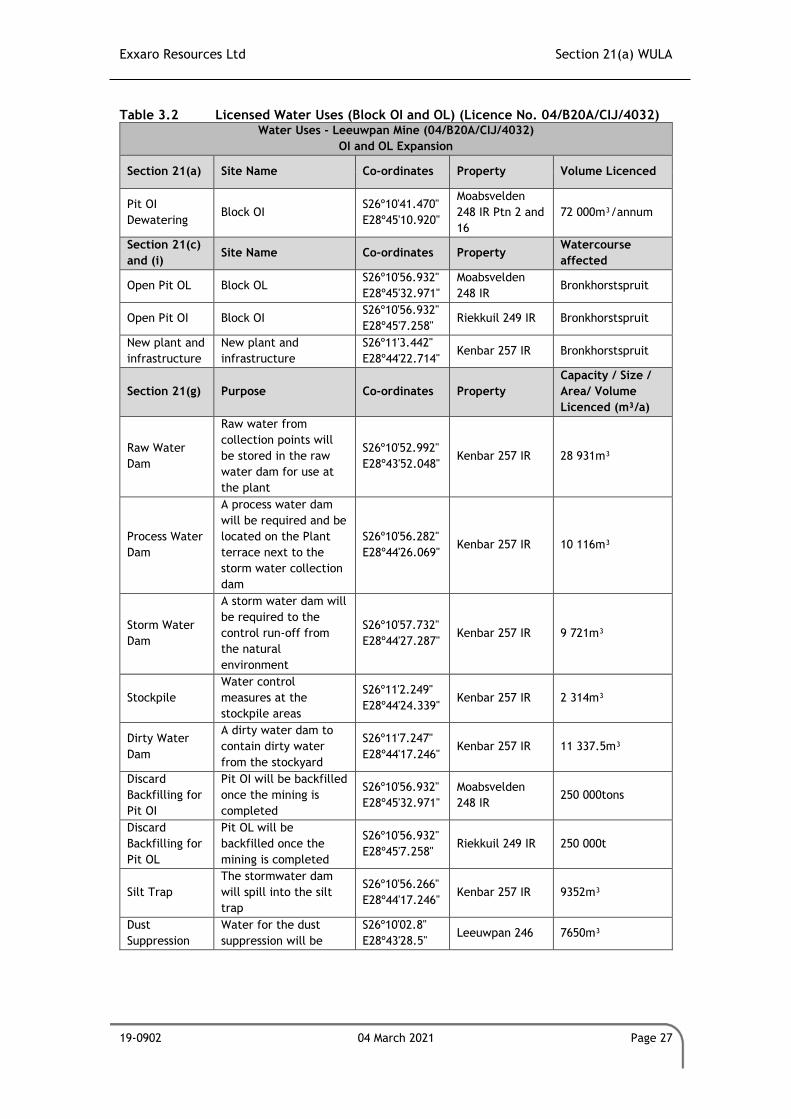
Exxaro Resources Ltd Section 21(a) WULA
19-0902 04 March 2021 Page 27
Table 3.2 Licensed Water Uses (Block OI and OL) (Licence No. 04/B20A/CIJ/4032) Water Uses - Leeuwpan Mine (04/B20A/CIJ/4032)
OI and OL Expansion
Section 21(a) Site Name Co-ordinates Property Volume Licenced
Pit OI
Dewatering Block OI
S26º10'41.470"
E28º45'10.920"
Moabsvelden
248 IR Ptn 2 and
16
72 000m³/annum
Section 21(c)
and (i) Site Name Co-ordinates Property
Watercourse
affected
Open Pit OL Block OL S26º10'56.932"
E28º45'32.971"
Moabsvelden
248 IR Bronkhorstspruit
Open Pit OI Block OI S26º10'56.932"
E28º45'7.258" Riekkuil 249 IR Bronkhorstspruit
New plant and
infrastructure
New plant and
infrastructure
S26º11'3.442"
E28º44'22.714" Kenbar 257 IR Bronkhorstspruit
Section 21(g) Purpose Co-ordinates Property
Capacity / Size /
Area/ Volume
Licenced (m³/a)
Raw Water
Dam
Raw water from
collection points will
be stored in the raw
water dam for use at
the plant
S26º10'52.992"
E28º43'52.048" Kenbar 257 IR 28 931m³
Process Water
Dam
A process water dam
will be required and be
located on the Plant
terrace next to the
storm water collection
dam
S26º10'56.282"
E28º44'26.069" Kenbar 257 IR 10 116m³
Storm Water
Dam
A storm water dam will
be required to the
control run-off from
the natural
environment
S26º10'57.732"
E28º44'27.287" Kenbar 257 IR 9 721m³
Stockpile
Water control
measures at the
stockpile areas
S26º11'2.249"
E28º44'24.339" Kenbar 257 IR 2 314m³
Dirty Water
Dam
A dirty water dam to
contain dirty water
from the stockyard
S26º11'7.247"
E28º44'17.246" Kenbar 257 IR 11 337.5m³
Discard
Backfilling for
Pit OI
Pit OI will be backfilled
once the mining is
completed
S26º10'56.932"
E28º45'32.971"
Moabsvelden
248 IR 250 000tons
Discard
Backfilling for
Pit OL
Pit OL will be
backfilled once the
mining is completed
S26º10'56.932"
E28º45'7.258" Riekkuil 249 IR 250 000t
Silt Trap
The stormwater dam
will spill into the silt
trap
S26º10'56.266"
E28º44'17.246" Kenbar 257 IR 9352m³
Dust
Suppression
Water for the dust
suppression will be
S26º10'02.8"
E28º43'28.5" Leeuwpan 246 7650m³
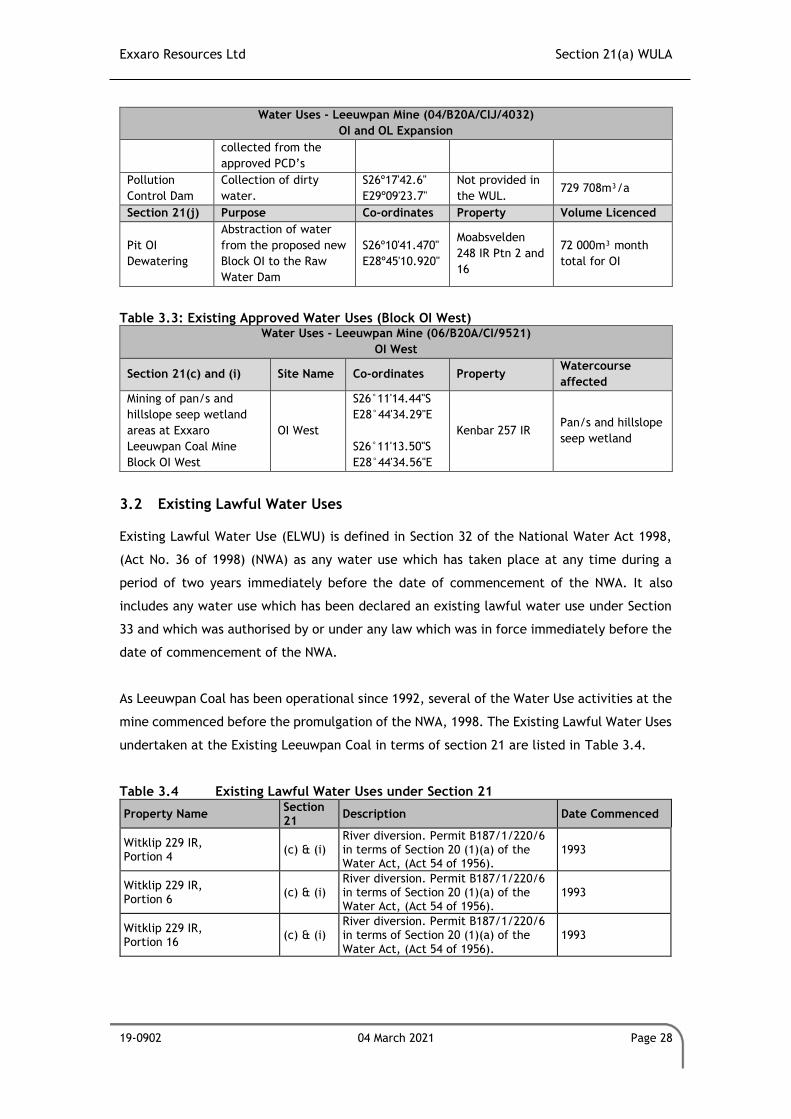
Exxaro Resources Ltd Section 21(a) WULA
19-0902 04 March 2021 Page 28
Water Uses - Leeuwpan Mine (04/B20A/CIJ/4032)
OI and OL Expansion
collected from the
approved PCD’s
Pollution
Control Dam
Collection of dirty
water.
S26º17'42.6"
E29º09'23.7"
Not provided in
the WUL. 729 708m³/a
Section 21(j) Purpose Co-ordinates Property Volume Licenced
Pit OI
Dewatering
Abstraction of water
from the proposed new
Block OI to the Raw
Water Dam
S26º10'41.470"
E28º45'10.920"
Moabsvelden
248 IR Ptn 2 and
16
72 000m³ month
total for OI
Table 3.3: Existing Approved Water Uses (Block OI West) Water Uses - Leeuwpan Mine (06/B20A/CI/9521)
OI West
Section 21(c) and (i) Site Name Co-ordinates Property Watercourse
affected
Mining of pan/s and
hillslope seep wetland
areas at Exxaro
Leeuwpan Coal Mine
Block OI West
OI West
S26°11'14.44"S
E28°44'34.29"E
S26°11'13.50"S
E28°44'34.56"E
Kenbar 257 IR Pan/s and hillslope
seep wetland
3.2 Existing Lawful Water Uses
Existing Lawful Water Use (ELWU) is defined in Section 32 of the National Water Act 1998,
(Act No. 36 of 1998) (NWA) as any water use which has taken place at any time during a
period of two years immediately before the date of commencement of the NWA. It also
includes any water use which has been declared an existing lawful water use under Section
33 and which was authorised by or under any law which was in force immediately before the
date of commencement of the NWA.
As Leeuwpan Coal has been operational since 1992, several of the Water Use activities at the
mine commenced before the promulgation of the NWA, 1998. The Existing Lawful Water Uses
undertaken at the Existing Leeuwpan Coal in terms of section 21 are listed in Table 3.4.
Table 3.4 Existing Lawful Water Uses under Section 21
Property Name Section 21
Description Date Commenced
Witklip 229 IR, Portion 4
(c) & (i) River diversion. Permit B187/1/220/6 in terms of Section 20 (1)(a) of the Water Act, (Act 54 of 1956).
1993
Witklip 229 IR, Portion 6
(c) & (i) River diversion. Permit B187/1/220/6 in terms of Section 20 (1)(a) of the Water Act, (Act 54 of 1956).
1993
Witklip 229 IR, Portion 16
(c) & (i) River diversion. Permit B187/1/220/6 in terms of Section 20 (1)(a) of the Water Act, (Act 54 of 1956).
1993
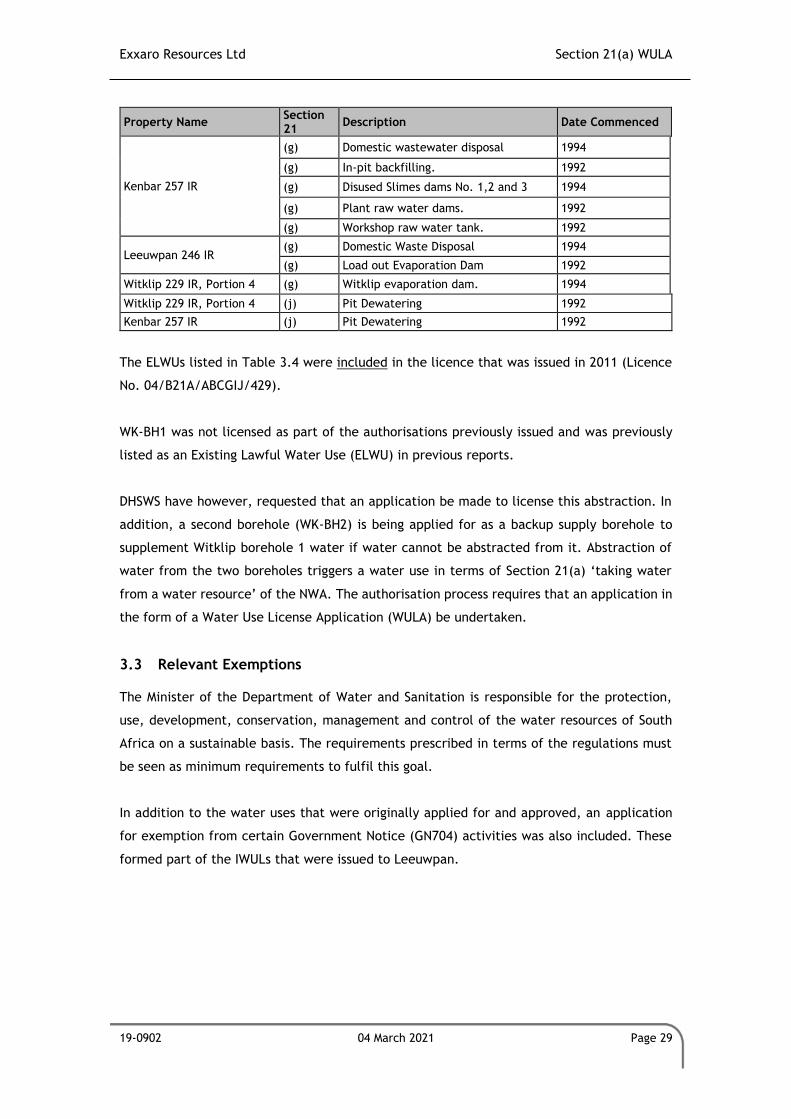
Exxaro Resources Ltd Section 21(a) WULA
19-0902 04 March 2021 Page 29
Property Name Section 21
Description Date Commenced
Kenbar 257 IR
(g) Domestic wastewater disposal 1994
(g) In-pit backfilling. 1992
(g) Disused Slimes dams No. 1,2 and 3 1994
(g) Plant raw water dams. 1992
(g) Workshop raw water tank. 1992
Leeuwpan 246 IR (g) Domestic Waste Disposal 1994
(g) Load out Evaporation Dam 1992
Witklip 229 IR, Portion 4 (g) Witklip evaporation dam. 1994
Witklip 229 IR, Portion 4 (j) Pit Dewatering 1992
Kenbar 257 IR (j) Pit Dewatering 1992
The ELWUs listed in Table 3.4 were included in the licence that was issued in 2011 (Licence
No. 04/B21A/ABCGIJ/429).
WK-BH1 was not licensed as part of the authorisations previously issued and was previously
listed as an Existing Lawful Water Use (ELWU) in previous reports.
DHSWS have however, requested that an application be made to license this abstraction. In
addition, a second borehole (WK-BH2) is being applied for as a backup supply borehole to
supplement Witklip borehole 1 water if water cannot be abstracted from it. Abstraction of
water from the two boreholes triggers a water use in terms of Section 21(a) ‘taking water
from a water resource’ of the NWA. The authorisation process requires that an application in
the form of a Water Use License Application (WULA) be undertaken.
3.3 Relevant Exemptions
The Minister of the Department of Water and Sanitation is responsible for the protection,
use, development, conservation, management and control of the water resources of South
Africa on a sustainable basis. The requirements prescribed in terms of the regulations must
be seen as minimum requirements to fulfil this goal.
In addition to the water uses that were originally applied for and approved, an application
for exemption from certain Government Notice (GN704) activities was also included. These
formed part of the IWULs that were issued to Leeuwpan.
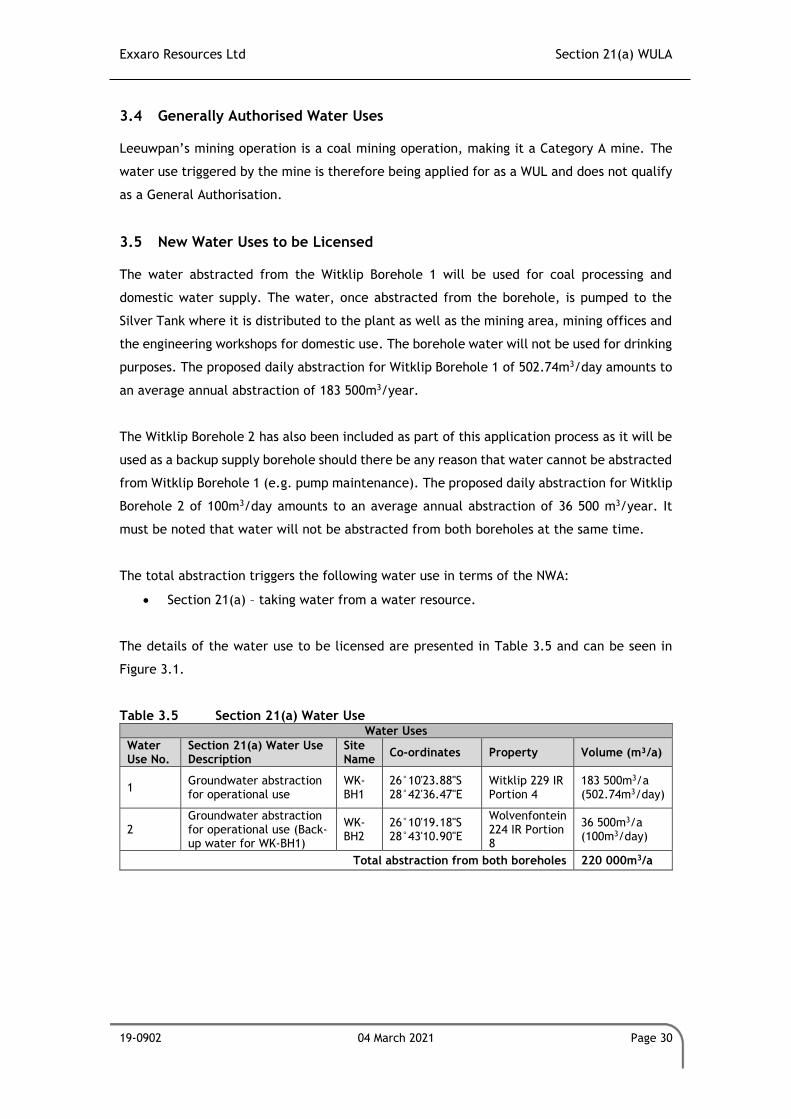
Exxaro Resources Ltd Section 21(a) WULA
19-0902 04 March 2021 Page 30
3.4 Generally Authorised Water Uses
Leeuwpan’s mining operation is a coal mining operation, making it a Category A mine. The
water use triggered by the mine is therefore being applied for as a WUL and does not qualify
as a General Authorisation.
3.5 New Water Uses to be Licensed
The water abstracted from the Witklip Borehole 1 will be used for coal processing and
domestic water supply. The water, once abstracted from the borehole, is pumped to the
Silver Tank where it is distributed to the plant as well as the mining area, mining offices and
the engineering workshops for domestic use. The borehole water will not be used for drinking
purposes. The proposed daily abstraction for Witklip Borehole 1 of 502.74m3/day amounts to
an average annual abstraction of 183 500m3/year.
The Witklip Borehole 2 has also been included as part of this application process as it will be
used as a backup supply borehole should there be any reason that water cannot be abstracted
from Witklip Borehole 1 (e.g. pump maintenance). The proposed daily abstraction for Witklip
Borehole 2 of 100m3/day amounts to an average annual abstraction of 36 500 m3/year. It
must be noted that water will not be abstracted from both boreholes at the same time.
The total abstraction triggers the following water use in terms of the NWA:
• Section 21(a) – taking water from a water resource.
The details of the water use to be licensed are presented in Table 3.5 and can be seen in
Figure 3.1.
Table 3.5 Section 21(a) Water Use Water Uses
Water Use No.
Section 21(a) Water Use Description
Site Name
Co-ordinates Property Volume (m³/a)
1 Groundwater abstraction for operational use
WK-BH1
26°10'23.88"S 28°42'36.47"E
Witklip 229 IR Portion 4
183 500m3/a (502.74m3/day)
2 Groundwater abstraction for operational use (Back-up water for WK-BH1)
WK-BH2
26°10'19.18"S 28°43'10.90"E
Wolvenfontein 224 IR Portion 8
36 500m3/a (100m3/day)
Total abstraction from both boreholes 220 000m3/a
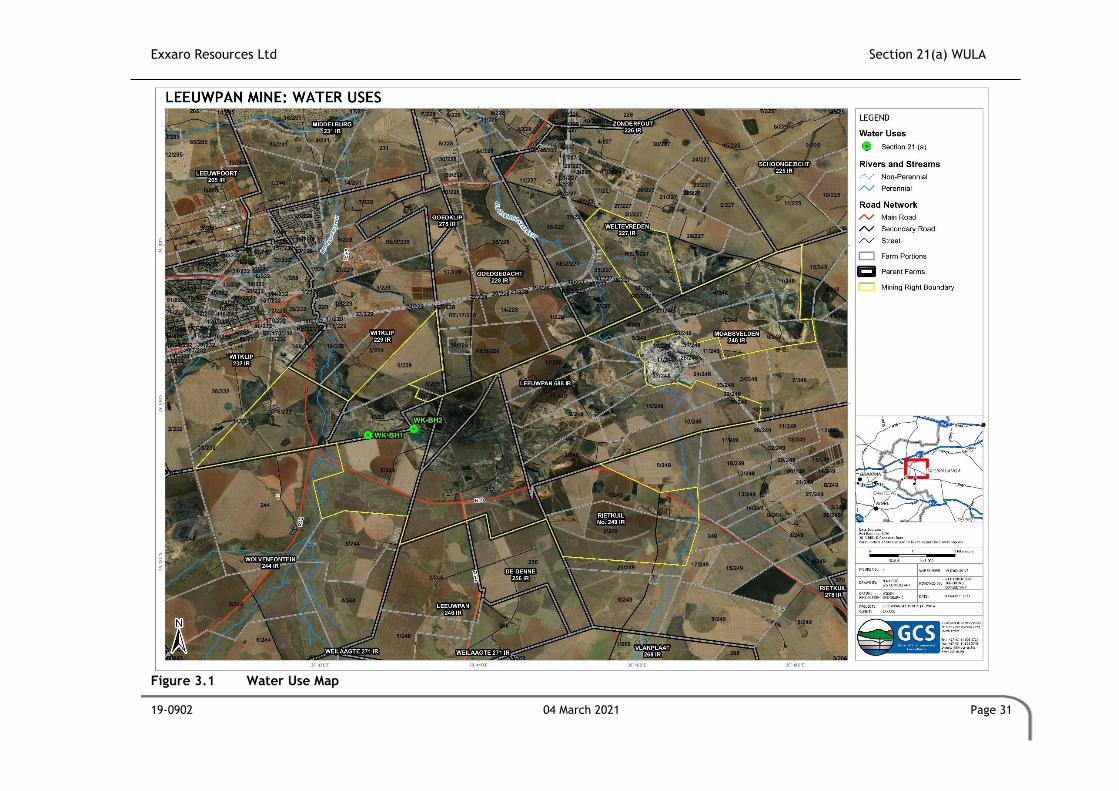
Exxaro Resources Ltd Section 21(a) WULA
19-0902 04 March 2021 Page 31
Figure 3.1 Water Use Map
Exxaro Resources Ltd Section 21(a) WULA
19-0902 04 March 2021 Page 32
3.6 Waste Management Activities and Waste Related Authorisations
3.6.1 Domestic Waste
The domestic waste that is generated on-site is disposed of into green allocated and marked
waste bins/containers. Domestic waste is then collected and disposed of in steel skips located
on site (i.e. at the workshop) within the Leeuwpan boundary area. The steel skips are
collected by Interwaste and taken to Klinkerstene for disposal. No domestic waste is dumped
in any unauthorised landfill site/waste site or dumped in a pit.
Recyclable materials are collected and disposed of into dark blue allocated and marked waste
bins / containers.
3.6.2 Mine Waste
Originally, the mine residue consisting of carbon-carrying shales, plant residue and fine coal
recovered from the slimes dams, was compacted and disposed of into the mined-out pits
below the groundwater table. It was then covered with a clay layer and topsoil so that it
would be suitable for agricultural purposes at a later stage.
No mine residue disposal sites were constructed for Block OM, Block OH, Block OFPAD or
Block OD. Discard material from these Blocks was placed back into the open pits.
For Blocks OJ and OL (Phase 1) the topsoil was stripped and used in rehabilitation operations.
The initial box cut material was also used for the development of the stormwater
management berms. Backfilling at Phase 1 Pit took place 45m from the working face. Due to
the risk of pollution to the Bronkhorstspruit River, no discard was backfilled into the Phase 1
Pit.
For Block OWM and OD, carbonaceous residue material from the existing Process Plant(s),
stockpiled top coal and slurry cakes from the existing filter press, as well as overburden are
disposed of back into the pits as part of the mining rehabilitation process.
3.6.3 Hazardous Waste
All hazardous waste (excluding mine waste) is stored in accordance with the minimum
requirements for the handling, classification and disposal of hazardous waste – including
appropriate roofing, fencing, locking (preventing unauthorised access), labelling, waterproof
hard standing, protection from storm water ingress (bunding, etc.), drainage and collection
system for spills and general protection from potential environmental pollution.
Exxaro Resources Ltd Section 21(a) WULA
19-0902 04 March 2021 Page 33
Any hazardous waste is disposed of in clearly marked black containers, which are then sent
to the mine workshop hazardous waste storage area (which is a bunded and roofed area). An
additional bunded area for waste storage has been constructed and is in use. This storage
area is located within the existing mine boundary area, and waste is removed by a waste
contractor (Interwaste) to a licensed waste disposal site.
The hazardous waste storage facility permit that already exists at Leeuwpan has been
renewed for the extension (for Blocks OI and OL) of the life of mine.
3.7 Other Authorisations and Regulations
Refer to Table 3.6 for a summary of the existing authorisations obtained for the Leeuwpan
mining operation.
Table 3.6 Leeuwpan's Existing Authorisations Description Record of Decision (ROD) / Description
Existing Water Use Licences and Amendments
• River diversion. Permit B187/1/220/6 in terms of Section 20 (1)(a) of the Water Act, (Act 54 of 1956).
• IWUL for Leeuwpan Mining activities (Licence No. 04/B21A/ABCGIJ/429);
• IWUL Amendment (Licence No. 04/B21A/ABCGIJ/429) issued 18th December 2015;
• IWUL for R50 road realignment (License No. 06/B20A/CI/5332);
• IWUL for TCM Access road (License No. 06/B20A/CI/5333);
• IWUL issued for Block OI and OL Expansion (Licence No. 04/B20A/CIJ/4032); and
• IWUL issued for Block OI West (06/B20A/CI/9521).
EMPs
• Various EMPs authorised and approved by DMR (5 addendums as referred to above in Section 2.1);
• Consolidated EMP, including the proposed expansion activities, approved 25 April 2017 [Reference number: MP 30/5/1/2/3/2/1 (171) EM].
Environmental Authorisation
• Previous NEMA authorisation not required;
• Environmental Authorisation received for expansion activities from MDARDLEA (MDEDET reference number: 17/2/3N-180)
Waste Permit • Leeuwpan has an approved hazardous waste storage facility permit
3.8 Legal Assessment
One of the main and ever-continuing concerns in South Africa is the sustainability of water
provision, and the costs associated with the prevention and remediation of pollution in a
country with an average rainfall below international standards. The NWA is one of the
Government’s answers to some of these challenges and is based on the constitutional right
to access to sufficient water (Section 27 of the Constitution), and furthermore functions as
sectoral legislation within the framework of the National Environmental Management Act,
1998 (Act No. 107 of 1998) (NEMA).
Exxaro Resources Ltd Section 21(a) WULA
19-0902 04 March 2021 Page 34
Water management at mines is primarily controlled by the following legislation:
• The NWA;
• The MPRDA and
• The NEMA.
3.8.1 The Constitution of South Africa, 1996 (Act No.108 of 1996)
The Constitution reigns supreme and the advancement of human rights is one of the
foundations of South Africa’s democracy. Furthermore, the Bill of Rights plays a central role
in the democratic regime because it embodies a set of fundamental values which should be
promoted at all times. One of the fundamental values is contained in Section 24 and is,
arguably, the cornerstone for environmental governance in South Africa which includes the
mining industry. Section 24 of the constitution provides:
Everyone has the right:
a) to an environment that is not harmful to their health or well-being;
b) to have the environment protected, for the benefit of present and future
generations, through reasonable legislative and other measures that
i. prevent pollution and ecological degradation;
ii. promote conservation; and
iii. secure ecologically sustainable development and use of natural resources
while promoting justifiable economic and social development.
Mining companies are thus duty-bound to constitutional, legislative, and other measures to
prevent pollution and ecological degradation, promote conservation and to develop in a
sustainable manner.
The constitutional environmental right elevates the importance of environmental protection
and conservation and emphasises the significance that South Africans attach to a sound and
healthy environment. In addition, the environmental right applies horizontally and this
implies that the mining industry has to exercise a duty of care if liability, on the basis of the
constitutional environmental right, is to be avoided. The constitutional environmental right
is given effect to by means of detailed statutory provisions ranging from framework to
sectoral legislation which relate to mining.
Exxaro Resources Ltd Section 21(a) WULA
19-0902 04 March 2021 Page 35
3.8.2 The National Environmental Management Act, 1998 (Act No.107 of 1998)
NEMA is South Africa’s overarching framework for environmental legislation. The NEMA sets
out the principles of Integrated Environmental Management (IEM). NEMA aims to promote
sustainable development, with wide-ranging implications for national, provincial, and local
government. Included amongst the key principles is that all development must be
environmentally, economically and socially sustainable and that environmental management
must place people and their needs at the forefront, and equitably serve their physical,
developmental, psychological, cultural and social interest.
NEMA is the environmental framework legislation promulgated to replace the Environmental
Conservation Act, 1989 (Act No. 73 of 1989), and ensure that the environmental rights
contemplated in Section 24 of the Constitution are realised. NEMA sets out:
• the fundamental principles that need to be incorporated in the environmental
decision making process;
• the principles that are necessary to achieve sustainable development;
• provides for duty of care to prevent, control and rehabilitate the effect of significant
pollution and environmental degradation; and
• it allows for the prosecution of environmental crimes.
The Duty of Care Principle is discussed in Section 28 of NEMA and it states that:
I. Every person who causes, has caused or may cause significant pollution or
degradation of the environment must take reasonable measures to prevent such
pollution or degradation from occurring, continuing or recurring, or, in so far as
such to harm the environment is authorized by law or cannot reasonably be
avoided or stopped, to minimize and rectify such pollution or degradation of the
environment;
II. Without limiting the generality of the duty in subsection (1), the persons on
whom subsection (1) imposes an obligation to take reasonable measures, include
an owner of land or premise, a person in control of land or premises or a person
who has a right to use the land or premises on which:
(a) any activity or process is or was performed or undertaken; or
(b) any other situation exists.
Which causes, has caused or is likely to cause significant pollution or degradation of the
environment.
Exxaro Resources Ltd Section 21(a) WULA
19-0902 04 March 2021 Page 36
The NEMA provides for the identification of activities which will impact the environment. The
impacts of the listed activities must be investigated, assessed and reported to the competent
authority before authorisation to commence with such listed activities can be granted.
Listed activities under the NEMA didn’t come into effect before 2006 and therefore
Leeuwpan’s existing infrastructure didn’t need approval under the NEMA. For the EMPP
Addendums 4 and 5 conducted in 2006 – 2007, mining applications were excluded until further
notice from the EIA process legislated under the NEMA. Several activities associated with the
mining operations that were proposed in Addendums 4 and 5 have however been listed under
the NEMA EIA Regulations (No. GNR 385, 386 and 387 of 2006). As was agreed then in
consultation with Mpumalanga Department of Land Administration (MDALA), since all
activities are directly related to mining, it was not be necessary to obtain authorisation in
terms of the EIA Regulations for those addendums.
3.8.3 The Mineral and Petroleum Resources Development Act, 2002 (Act No.48 of 2002)
This Act makes provision for the equitable access to and sustainable development of South
Africa’s mineral and petroleum resources. Regulations under the Act ensure that activities
relating to the mining of minerals are undertaken in a manner that is sustainable and that is
equitable to all.
In terms of Section 38 of the MPRDA, mining companies are required to familiarize themselves
of potential environmental impacts; manage any environmental impacts; and rehabilitate the
environment in so far as is reasonably possible. Furthermore, Section 38(1)(e) states that
such holders, whose mining causes or results in ecological degradation, pollution, or
environmental damage that may be harmful to the health or well-being of anyone:
“…is responsible for any environmental damage, pollution or ecological degradation as
a result of his or her operations and which may occur inside and outside the boundaries
of the area to which such right, permit or permission relates.”
These holders will “…remain responsible for any environmental liability, pollution or
ecological degradation and the management thereof until a closure certificate has been
issued”.
Section 39 provides that a mine must indicate how it will contain or remedy the cause of
pollution or degradation and migration of pollutants and comply with any prescribed waste
standards or management practice.
Exxaro Resources Ltd Section 21(a) WULA
19-0902 04 March 2021 Page 37
Granting of permission to mine or prospect, among others, is conditional on an environmental
management programme and plan being submitted and accepted by the relevant government
authority. Section 43 is one of the most important provisions as it deals with the responsibility
for any environmental liability, pollution or ecological degradation until the issue of the
closure certificate. It is important to note that environmental liability will not necessarily
cease or fall away by the issuing of a closure certificate. In addition to the broader liability
provisions above, Section 45 provides that the relevant authority may direct a mine to
undertake remedial measures where:
“...any prospecting, mining, reconnaissance or production operations cause or results
in ecological degradation, pollution or environmental damage which may be harmful to
the health or well-being of anyone and requires urgent remedial measures.”
Where the mine fails to take these measures, the relevant authority will act on its behalf and
then recover costs incurred from the mine. If the mine fails to compensate the authority, the
latter is empowered to seize and sell the mine’s property to recover the costs. The mine will
thus remain financially liable for the rehabilitation, even if it chooses to ignore the
government directive.
3.8.4 The National Water Act, 1998 (Act No.36 of 1998)
Section 19 of the NWA mirrors the provision of Section 28 of NEMA and addresses the
prevention and remediation of the effects of pollution. The NWA provides a wide duty of care
in that:
“(1) an owner of land, a person in control of land or a person who occupies or uses the
land on which-
(a) any activity or process is or was performed or undertaken; or
(b) any other situation exists, which causes, has caused or is likely to cause pollution of
a water resource must take all reasonable measures to prevent any such pollution from
occurring, continuing or recurring.”
The words “likely to cause pollution” broadens the scope of the duty, which enables an
activity, or situation that is land-based, to trigger the application of the duty. The
“reasonable measures” are not prescribed, but may include measures intended to:
“cease, modify or control any act or process causing the pollution; comply with any
prescribed waste standard or management practice; contain or prevent the movement
Exxaro Resources Ltd Section 21(a) WULA
19-0902 04 March 2021 Page 38
of pollutants; eliminate any source of pollution; remedy the effects of pollution; and
remedy the effects of any disturbance to the bed and banks of a watercourse.”
The NWA, furthermore, provides for water use authorisations which a mine will have to apply
for, before commencing with its primary activity of mining. Various conditions may be
attached to these licenses and a breach thereof will result in criminal and civil liability. The
conditions attached to water use authorisations will function alongside the additional
protective measures, duty of care and statutory liability provisions provided by the NWA and
other legislation to regulate a whole array of water issues.
The detrimental impact of mining on water resources is further regulated by the NWA in a
comprehensive set of regulations titled: “Regulations on the Use of Water for Mining and
Related Activities Aimed at the Protection of Water Resources” (GN R704 of 4 June 1999)
(hereinafter referred to as the “NWA: Mining Water Regulations”). In terms of these
regulations:
“No person in control of a mine or [mining] activity may place or dispose of any residue
or substance which causes or is likely to cause pollution of a water resource, in the
workings of any underground or opencast mine excavation, prospecting diggings, pit or
any other excavation.”
Regulation 7 provides for a whole array of provisions which specifically aim to protect water
resources from mining. These provisions state that every person in control of a mine or mining
activity must take all reasonable measures to, inter alia: prevent water containing waste or
any substance which causes or is likely to cause pollution from entering any water resource;
design, modify, locate, construct and maintain all water systems including residue deposits,
to prevent the pollution of any water resource through the operation or use thereof; cause
effective measures to be taken to minimise the flow of any surface water or floodwater into
mine workings, opencast workings, other workings or subterranean caverns; prevent the
erosion or leaching of materials from any residue deposit or stockpile from any area; and
ensure that water used in any process at a mine or activity is recycled as far as practicable.
These provisions specifically relate to the protection of water resources and they clearly set
out further additional liabilities for mines as far as their water resource protection activities
are concerned.
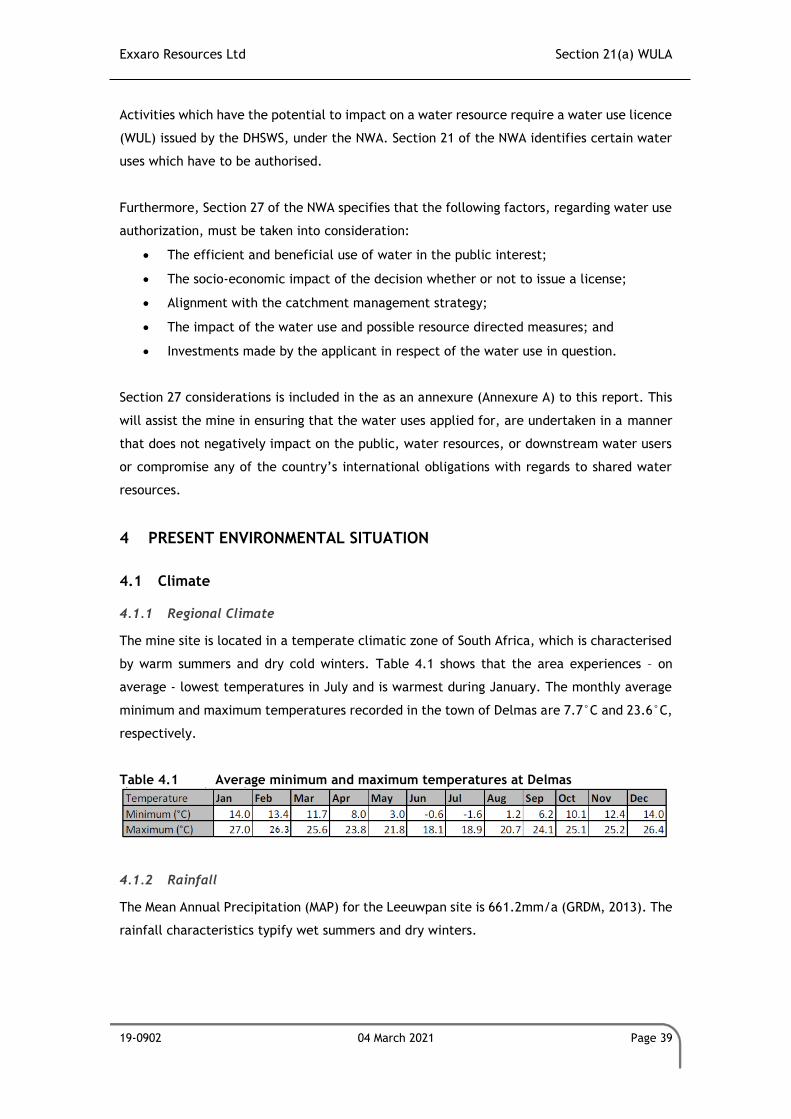
Exxaro Resources Ltd Section 21(a) WULA
19-0902 04 March 2021 Page 39
Activities which have the potential to impact on a water resource require a water use licence
(WUL) issued by the DHSWS, under the NWA. Section 21 of the NWA identifies certain water
uses which have to be authorised.
Furthermore, Section 27 of the NWA specifies that the following factors, regarding water use
authorization, must be taken into consideration:
• The efficient and beneficial use of water in the public interest;
• The socio-economic impact of the decision whether or not to issue a license;
• Alignment with the catchment management strategy;
• The impact of the water use and possible resource directed measures; and
• Investments made by the applicant in respect of the water use in question.
Section 27 considerations is included in the as an annexure (Annexure A) to this report. This
will assist the mine in ensuring that the water uses applied for, are undertaken in a manner
that does not negatively impact on the public, water resources, or downstream water users
or compromise any of the country’s international obligations with regards to shared water
resources.
4 PRESENT ENVIRONMENTAL SITUATION
4.1 Climate
4.1.1 Regional Climate
The mine site is located in a temperate climatic zone of South Africa, which is characterised
by warm summers and dry cold winters. Table 4.1 shows that the area experiences – on
average - lowest temperatures in July and is warmest during January. The monthly average
minimum and maximum temperatures recorded in the town of Delmas are 7.7°C and 23.6°C,
respectively.
Table 4.1 Average minimum and maximum temperatures at Delmas
4.1.2 Rainfall
The Mean Annual Precipitation (MAP) for the Leeuwpan site is 661.2mm/a (GRDM, 2013). The
rainfall characteristics typify wet summers and dry winters.
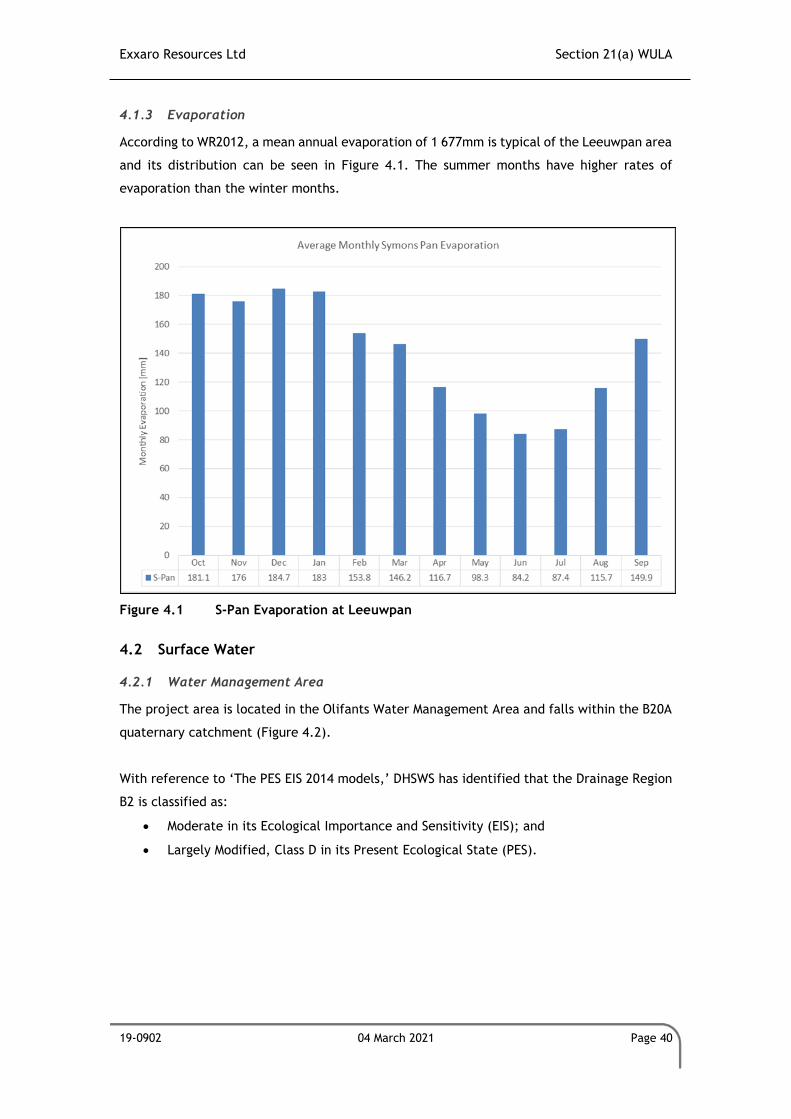
Exxaro Resources Ltd Section 21(a) WULA
19-0902 04 March 2021 Page 40
4.1.3 Evaporation
According to WR2012, a mean annual evaporation of 1 677mm is typical of the Leeuwpan area
and its distribution can be seen in Figure 4.1. The summer months have higher rates of
evaporation than the winter months.
Figure 4.1 S-Pan Evaporation at Leeuwpan
4.2 Surface Water
4.2.1 Water Management Area
The project area is located in the Olifants Water Management Area and falls within the B20A
quaternary catchment (Figure 4.2).
With reference to ‘The PES EIS 2014 models,’ DHSWS has identified that the Drainage Region
B2 is classified as:
• Moderate in its Ecological Importance and Sensitivity (EIS); and
• Largely Modified, Class D in its Present Ecological State (PES).
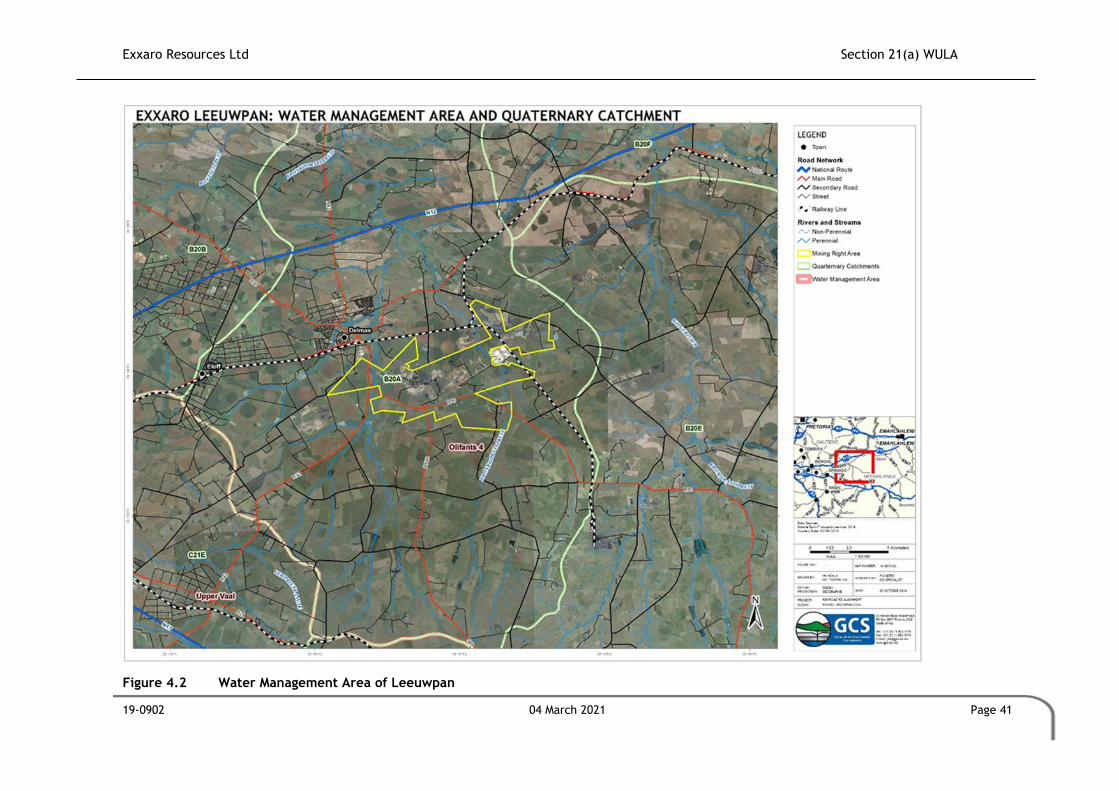
Exxaro Resources Ltd Section 21(a) WULA
19-0902 04 March 2021 Page 41
Figure 4.2 Water Management Area of Leeuwpan
Exxaro Resources Ltd Section 21(a) WULA
19-0902 04 March 2021 Page 42
4.2.2 Surface Water Hydrology
The Bronkhorstspruit River flows in a south-north direction through the site to eventually end
in the Bronkhorstspruit Dam downstream of the site area. Natural water features on site
include tributaries of the Bronkhorstspruit River and pans. Artificial water features on site
include farm dams, old void areas, Pollution Control Dams (PCD’s), rain water in open cast
pits and river diversion channels.
4.2.3 Surface Water Quality
The surface water quality results were obtained from the Monthly Water Quality Report
conducted by Environmental Assurance (Envass) in October 2020 (Annexure C). Refer to
Section 5.4.1 for the details pertaining to the surface water monitoring points.
4.2.3.1 Receiving Environmental Water Quality
Surface water monitoring was performed at ten (10) monitoring localities during the
monitoring period. The following samples were recorded as dry during the site assessment:
LSW06, LSW07, LSW08, LSW12, WP01 and RD1.
The majority of the sampled receiving environment monitoring localities water quality
analysis indicated exceedances in terms of the DWAF Domestic Guideline Limits for Turbidity,
Calcium and Dissolved Organic Carbon (DOCmg/l). Additional exceedances included the
Calcium (Ca), Magnesium (Mg), Sulphate (SO4), Manganese (Mn) and E.coli.
From the October 2020 results it is evident that the majority of the receiving environment
monitoring localities presented overall fair condition. Turbidity within the surface water
samples are expected, as turbidity refers to the measurement of the cloudiness or muddiness
of water, which is influenced by both natural (flow velocity, rainfall, run-off etc.) and
anthropogenic activities (disturbance/mining activities). Overall, the Total Inorganic
Nitrogen (TIN), Nitrate (NO3-N) and the Ammonia (NH3-N) levels remained low, with the
majority (excluding LSW13) of the concentrations recording below the detection limit.
Duplicate samples were obtained from monitoring localities LSW03, LSW05 and WP02 in order
to determine the accuracy and precision of inter-laboratory results. Comparison of the
calculated TDS and computation of relative percent difference for the duplicate pairs were
calculated between a range of 0.0 to 3.65% for the October 2020 monitoring run, recording
within the acceptable range (30%).
Exxaro Resources Ltd Section 21(a) WULA
19-0902 04 March 2021 Page 43
4.2.3.2 Process Water Quality
Process water monitoring was performed at sixteen (16) monitoring localities during the
monitoring period. The following samples could not be obtained during the monitoring run:
KR03, KR04, OG PIT, OH PIT, OJ PIT, OM PIT, WLV PIT and OWM-PIT. Refer to the sampling
register as presented in Appendix A of Annexure C for details.
All of the monitored process localities revealed compliance to the stipulated WUL limits. The
October 2020 exceedances can be summarised as follows:
• KR01A , LSW09 and WP04:
o General Authorisation Limit: Electrical Conductivity (EC) and Manganese
(Mn).
• ODN PIT:
o General Authorisation Limit: Electrical Conductivity (EC) and Manganese (Mn)
WUL Limit: E.coli.
Discharge of the process water into the receiving environment is prohibited according to the
General Authorisation (Section 21f and h, 2013) as it could have limiting effects on the
receiving water environment. Note that regular maintenance on process water facilities
linings and transfer pipes are vital for water resource protection.
4.2.3.3 Effluent Water Quality
Final effluent samples are collected at two (2) monitoring localities inclusive of the Septic
tanks at plant and the Final effluent from the sewage plant.
The final effluent from LWP-SP-P historically recorded non-compliant to the set Ammonia
Wastewater WUL limits, while exceedances related to the General Authorisation limits
included Suspended Solids, Ammonia and Chemical Oxygen Demand.
During the monitoring period it was noted that the LWP-SP-P was not active and no access
was obtained to the LWP-SP-W monitoring point.
4.2.3.4 Potable Water Quality
Four (4) potable water localities form part of the monitoring programme at Exxaro Leeuwpan
Mine. It should be noted that the water is not used as a potable source, however
monitored as such in case of accidental consumption as a precautionary measurement.
During the monitoring period a sample could not be obtained from PIET-SCHUTTE as water
was not pumping.
Exxaro Resources Ltd Section 21(a) WULA
19-0902 04 March 2021 Page 44
The potable water quality at Leeuwpan can generally (historical results) be described as
neutral, non-saline and hard while elevated salinity and Total Hardness was present from
Load-Out Bay Offices (LLBDW) and Drinking Water at Laboratory (LWDL) during October 2020.
The Load-Out Bay Offices (LLBDW) revealed exceedances of Electrical Conductivity (EC),
Total Dissolved Solids (TDS), Sulphate (SO4), Turbidity, Heterotrophic Plate Counts and E.coli
which renders the water as not suitable for potable purposes. The Drinking Water Supply Tank
(LDWST) presented an exceedance of Heterotrophic Plate Counts, while the remainder of the
parameters presented ideal water quality. The Drinking Water at Laboratory (LWDL)
presented an exceedance of Electrical Conductivity (EC), Total Dissolved Solids (TDS),
Sulphate (SO4) and Heterotrophic Plate Counts.
Based on the historical analysed parameters and data, the potable water poses a risk for
infection due to the elevated Heterotrophic Plate Counts and thus it is strongly advised that
the water be treated and filters regularly disinfected and cleaned as the high counts may be
attributed to biofilms.
4.2.3.5 Conclusion and Aspects to Consider
The scope of work performed at the Leeuwpan Coal Mine is as per WUL requirements as listed
in this report. This report aims to highlight the conditions requirements of the WUL as well
as aspects that are to be considered in order to improve compliance of the IWUL.
During the monitoring period samples LSW06, LSW07, LSW08, LSW12, WP01, RD1, KR03, KR04,
OG PIT, OH PIT, OJ PIT, OM PIT, WLV PIT, LWP-SP-W, OWM-PIT and PIET-SCHUTTE could not
be obtained during the monitoring period due to access issues.
Based on the historical analysed parameters and data, the potable water poses a risk for
infection due to the elevated Heterotrophic Plate Counts as well as health risks. It is strongly
advised that the water not be used for potable or domestic purposes and “no-drinking signs”
be present as current implemented.
Exceedances of Ca, Mg, Turbidity, Dissolved Organic Carbon (DOC) and indicated presence of
Oil and Grease were presented at the receiving environment. From the results it is evident
that the majority of the receiving environment monitoring localities presented overall fair
condition with general low salinity content.
The process water samples revealed compliance to the stipulated WUL limits, except for the
ODN-PIT monitoring point which exceeded the limit for E.coli. Discharge of the process water
into the receiving environment is prohibited according to the General Authorisation (Section
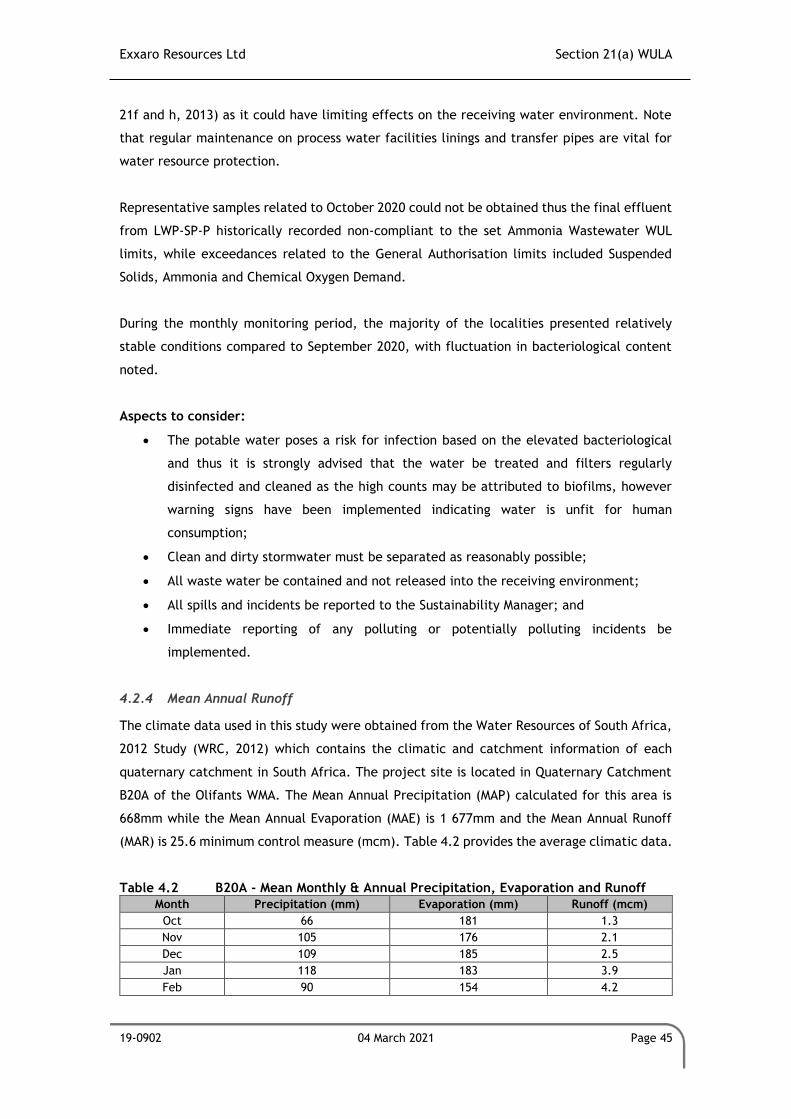
Exxaro Resources Ltd Section 21(a) WULA
19-0902 04 March 2021 Page 45
21f and h, 2013) as it could have limiting effects on the receiving water environment. Note
that regular maintenance on process water facilities linings and transfer pipes are vital for
water resource protection.
Representative samples related to October 2020 could not be obtained thus the final effluent
from LWP-SP-P historically recorded non-compliant to the set Ammonia Wastewater WUL
limits, while exceedances related to the General Authorisation limits included Suspended
Solids, Ammonia and Chemical Oxygen Demand.
During the monthly monitoring period, the majority of the localities presented relatively
stable conditions compared to September 2020, with fluctuation in bacteriological content
noted.
Aspects to consider:
• The potable water poses a risk for infection based on the elevated bacteriological
and thus it is strongly advised that the water be treated and filters regularly
disinfected and cleaned as the high counts may be attributed to biofilms, however
warning signs have been implemented indicating water is unfit for human
consumption;
• Clean and dirty stormwater must be separated as reasonably possible;
• All waste water be contained and not released into the receiving environment;
• All spills and incidents be reported to the Sustainability Manager; and
• Immediate reporting of any polluting or potentially polluting incidents be
implemented.
4.2.4 Mean Annual Runoff
The climate data used in this study were obtained from the Water Resources of South Africa,
2012 Study (WRC, 2012) which contains the climatic and catchment information of each
quaternary catchment in South Africa. The project site is located in Quaternary Catchment
B20A of the Olifants WMA. The Mean Annual Precipitation (MAP) calculated for this area is
668mm while the Mean Annual Evaporation (MAE) is 1 677mm and the Mean Annual Runoff
(MAR) is 25.6 minimum control measure (mcm). Table 4.2 provides the average climatic data.
Table 4.2 B20A - Mean Monthly & Annual Precipitation, Evaporation and Runoff
Month Precipitation (mm) Evaporation (mm) Runoff (mcm)
Oct 66 181 1.3
Nov 105 176 2.1
Dec 109 185 2.5
Jan 118 183 3.9
Feb 90 154 4.2
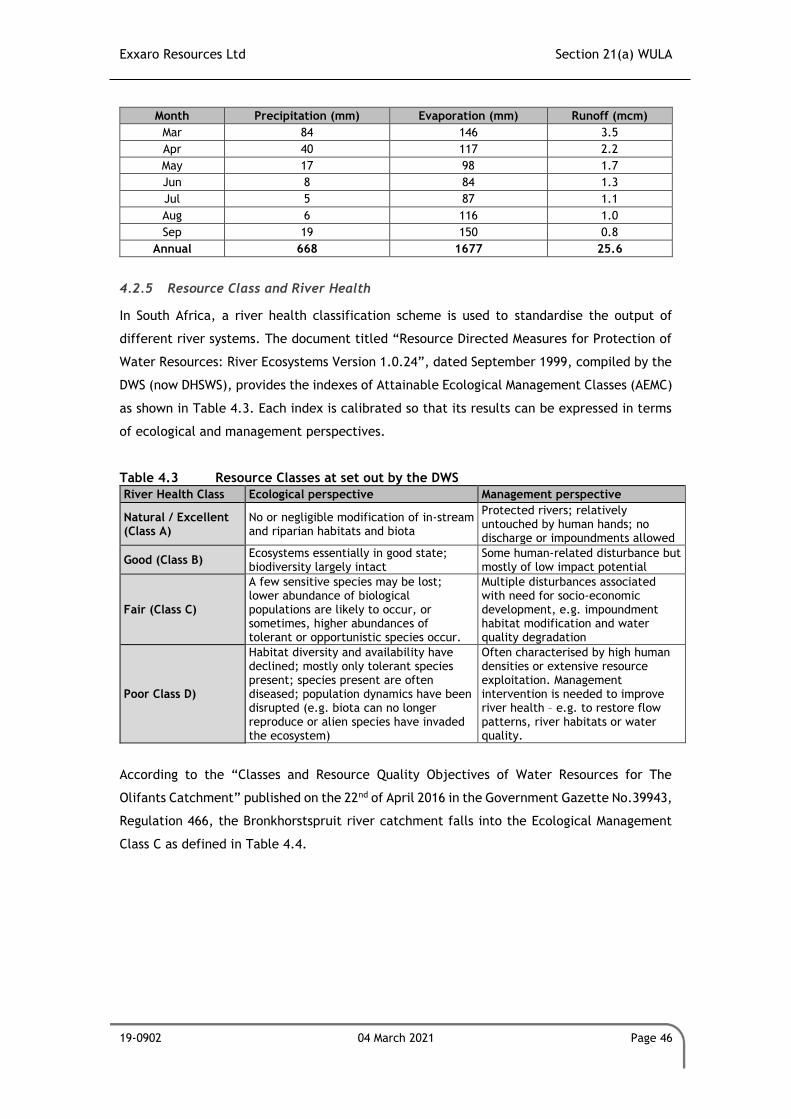
Exxaro Resources Ltd Section 21(a) WULA
19-0902 04 March 2021 Page 46
Month Precipitation (mm) Evaporation (mm) Runoff (mcm)
Mar 84 146 3.5
Apr 40 117 2.2
May 17 98 1.7
Jun 8 84 1.3
Jul 5 87 1.1
Aug 6 116 1.0
Sep 19 150 0.8
Annual 668 1677 25.6
4.2.5 Resource Class and River Health
In South Africa, a river health classification scheme is used to standardise the output of
different river systems. The document titled “Resource Directed Measures for Protection of
Water Resources: River Ecosystems Version 1.0.24”, dated September 1999, compiled by the
DWS (now DHSWS), provides the indexes of Attainable Ecological Management Classes (AEMC)
as shown in Table 4.3. Each index is calibrated so that its results can be expressed in terms
of ecological and management perspectives.
Table 4.3 Resource Classes at set out by the DWS
River Health Class Ecological perspective Management perspective
Natural / Excellent (Class A)
No or negligible modification of in-stream and riparian habitats and biota
Protected rivers; relatively untouched by human hands; no discharge or impoundments allowed
Good (Class B) Ecosystems essentially in good state; biodiversity largely intact
Some human-related disturbance but mostly of low impact potential
Fair (Class C)
A few sensitive species may be lost; lower abundance of biological populations are likely to occur, or sometimes, higher abundances of tolerant or opportunistic species occur.
Multiple disturbances associated with need for socio-economic development, e.g. impoundment habitat modification and water quality degradation
Poor Class D)
Habitat diversity and availability have declined; mostly only tolerant species present; species present are often diseased; population dynamics have been disrupted (e.g. biota can no longer reproduce or alien species have invaded the ecosystem)
Often characterised by high human densities or extensive resource exploitation. Management intervention is needed to improve river health – e.g. to restore flow patterns, river habitats or water quality.
According to the “Classes and Resource Quality Objectives of Water Resources for The
Olifants Catchment” published on the 22nd of April 2016 in the Government Gazette No.39943,
Regulation 466, the Bronkhorstspruit river catchment falls into the Ecological Management
Class C as defined in Table 4.4.
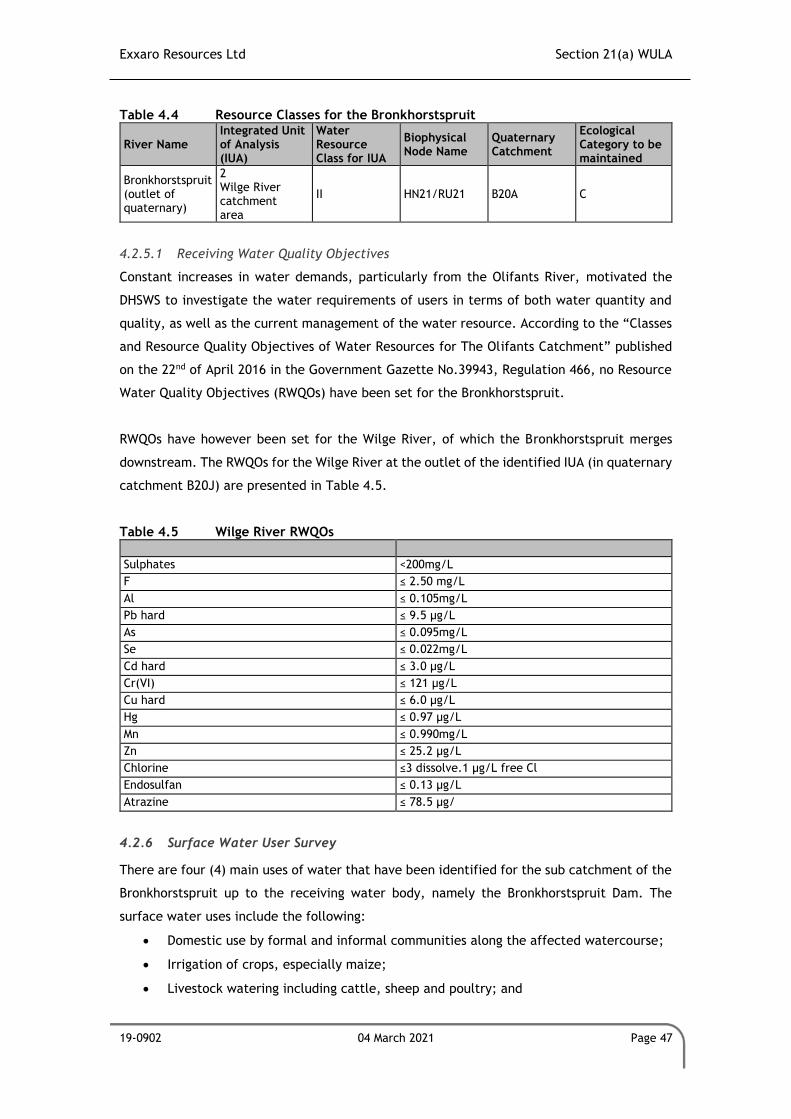
Exxaro Resources Ltd Section 21(a) WULA
19-0902 04 March 2021 Page 47
Table 4.4 Resource Classes for the Bronkhorstspruit
River Name Integrated Unit of Analysis (IUA)
Water Resource Class for IUA
Biophysical Node Name
Quaternary Catchment
Ecological Category to be maintained
Bronkhorstspruit (outlet of quaternary)
2 Wilge River catchment area
II HN21/RU21 B20A C
4.2.5.1 Receiving Water Quality Objectives
Constant increases in water demands, particularly from the Olifants River, motivated the
DHSWS to investigate the water requirements of users in terms of both water quantity and
quality, as well as the current management of the water resource. According to the “Classes
and Resource Quality Objectives of Water Resources for The Olifants Catchment” published
on the 22nd of April 2016 in the Government Gazette No.39943, Regulation 466, no Resource
Water Quality Objectives (RWQOs) have been set for the Bronkhorstspruit.
RWQOs have however been set for the Wilge River, of which the Bronkhorstspruit merges
downstream. The RWQOs for the Wilge River at the outlet of the identified IUA (in quaternary
catchment B20J) are presented in Table 4.5.
Table 4.5 Wilge River RWQOs
Sulphates <200mg/L
F ≤ 2.50 mg/L
Al ≤ 0.105mg/L
Pb hard ≤ 9.5 μg/L
As ≤ 0.095mg/L
Se ≤ 0.022mg/L
Cd hard ≤ 3.0 μg/L
Cr(VI) ≤ 121 μg/L
Cu hard ≤ 6.0 μg/L
Hg ≤ 0.97 μg/L
Mn ≤ 0.990mg/L
Zn ≤ 25.2 μg/L
Chlorine ≤3 dissolve.1 μg/L free Cl
Endosulfan ≤ 0.13 μg/L
Atrazine ≤ 78.5 μg/
4.2.6 Surface Water User Survey
There are four (4) main uses of water that have been identified for the sub catchment of the
Bronkhorstspruit up to the receiving water body, namely the Bronkhorstspruit Dam. The
surface water uses include the following:
• Domestic use by formal and informal communities along the affected watercourse;
• Irrigation of crops, especially maize;
• Livestock watering including cattle, sheep and poultry; and
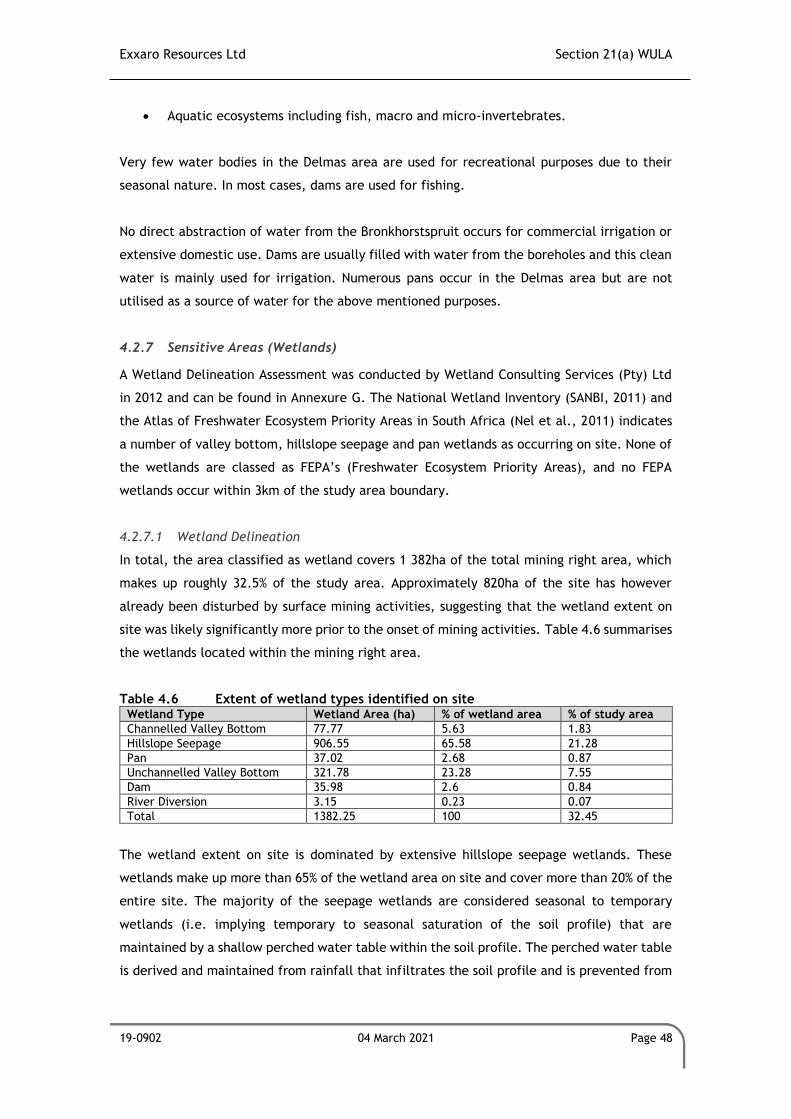
Exxaro Resources Ltd Section 21(a) WULA
19-0902 04 March 2021 Page 48
• Aquatic ecosystems including fish, macro and micro-invertebrates.
Very few water bodies in the Delmas area are used for recreational purposes due to their
seasonal nature. In most cases, dams are used for fishing.
No direct abstraction of water from the Bronkhorstspruit occurs for commercial irrigation or
extensive domestic use. Dams are usually filled with water from the boreholes and this clean
water is mainly used for irrigation. Numerous pans occur in the Delmas area but are not
utilised as a source of water for the above mentioned purposes.
4.2.7 Sensitive Areas (Wetlands)
A Wetland Delineation Assessment was conducted by Wetland Consulting Services (Pty) Ltd
in 2012 and can be found in Annexure G. The National Wetland Inventory (SANBI, 2011) and
the Atlas of Freshwater Ecosystem Priority Areas in South Africa (Nel et al., 2011) indicates
a number of valley bottom, hillslope seepage and pan wetlands as occurring on site. None of
the wetlands are classed as FEPA’s (Freshwater Ecosystem Priority Areas), and no FEPA
wetlands occur within 3km of the study area boundary.
4.2.7.1 Wetland Delineation
In total, the area classified as wetland covers 1 382ha of the total mining right area, which
makes up roughly 32.5% of the study area. Approximately 820ha of the site has however
already been disturbed by surface mining activities, suggesting that the wetland extent on
site was likely significantly more prior to the onset of mining activities. Table 4.6 summarises
the wetlands located within the mining right area.
Table 4.6 Extent of wetland types identified on site Wetland Type Wetland Area (ha) % of wetland area % of study area
Channelled Valley Bottom 77.77 5.63 1.83
Hillslope Seepage 906.55 65.58 21.28
Pan 37.02 2.68 0.87
Unchannelled Valley Bottom 321.78 23.28 7.55
Dam 35.98 2.6 0.84
River Diversion 3.15 0.23 0.07
Total 1382.25 100 32.45
The wetland extent on site is dominated by extensive hillslope seepage wetlands. These
wetlands make up more than 65% of the wetland area on site and cover more than 20% of the
entire site. The majority of the seepage wetlands are considered seasonal to temporary
wetlands (i.e. implying temporary to seasonal saturation of the soil profile) that are
maintained by a shallow perched water table within the soil profile. The perched water table
is derived and maintained from rainfall that infiltrates the soil profile and is prevented from
Exxaro Resources Ltd Section 21(a) WULA
19-0902 04 March 2021 Page 49
deeper infiltration by an aquitard within the soil profile, usually a hard of soft plinthic layer.
It is suspected that little interaction between deeper groundwater and this perched water
table occurs, though no testing or modelling to support this statement was undertaken on
site.
In many areas, the temporary edges of the hillslope seepage wetlands have been cultivated
and are either still currently under maize cultivation or have been converted to planted
pastures. Especially on the Farm Rietkuil, the intrusion of cultivation into the hillslope
seepage wetlands has been extensive. Nonetheless, the remaining areas of hillslope seepage
wetland characterised by natural vegetation represent, together with the two large valley
bottom wetlands, the largest expanse of natural grassland within the study area.
Three (3) valley bottom wetlands were delineated within the study area (refer to Figure 4.3),
consisting of the Bronkhorstspruit and two of its tributaries. Some confusion exists with
regards to the naming of the Bronkhorstspruit, as the 1:50 000 topographical maps name the
large valley bottom wetland in the east of the site as the Bronkhorstspruit, while road signs
along the R50 tar road name the western valley bottom as the Bronkhorstspruit. For the
purpose of this study, the naming as per the 1:50 000 topographical maps will be followed.
The Bronkhorstspruit valley bottom wetland consists of a broad, mostly unchannelled system
characterised by vertic clay soils. The upper catchment as well as the upper reach of the
wetland on site is utilised agriculturally, with livestock grazing the main activity within the
wetland. On site, mining takes place on either side of the wetland and includes the Silica
Mine that extends significantly into the wetland. A dam as well as several berms have been
constructed within this reach of the wetland to control flows through the mining area.
Downstream of the study area the character of the wetland changes significantly as flows
become confined and a clearly incised channel forms where the alluvial deposits associated
with the upper wetland end and the river flows over dolomite.
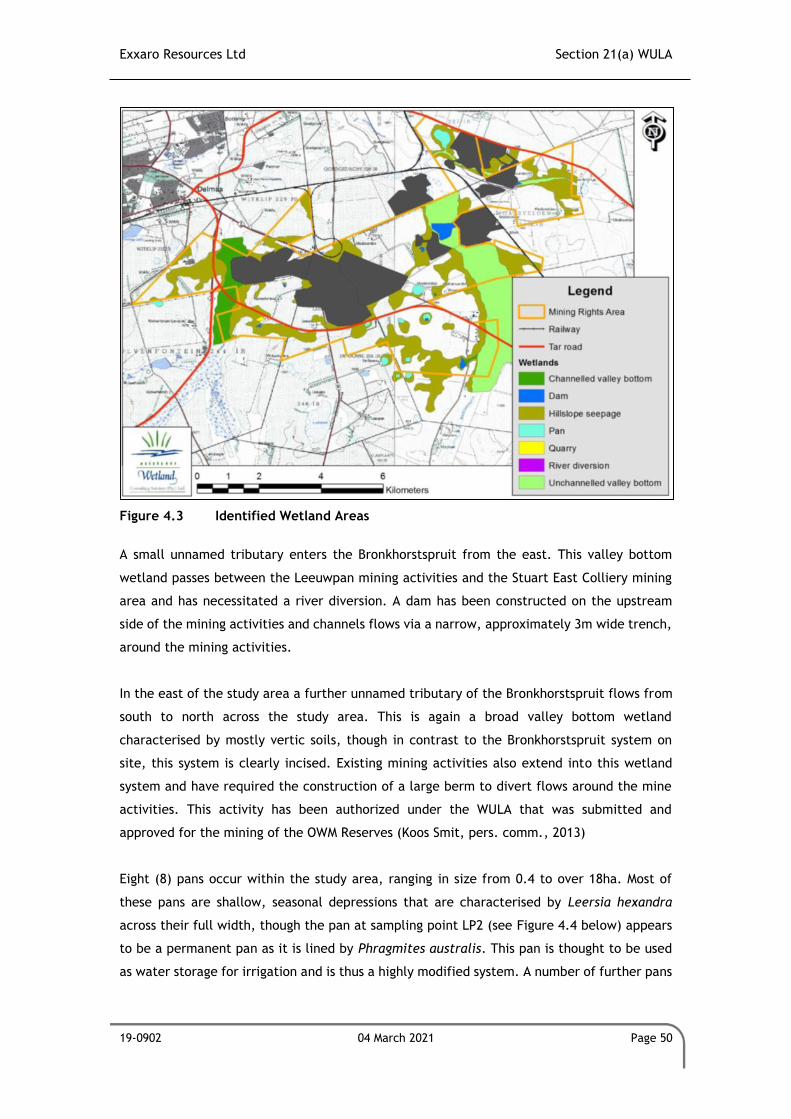
Exxaro Resources Ltd Section 21(a) WULA
19-0902 04 March 2021 Page 50
Figure 4.3 Identified Wetland Areas
A small unnamed tributary enters the Bronkhorstspruit from the east. This valley bottom
wetland passes between the Leeuwpan mining activities and the Stuart East Colliery mining
area and has necessitated a river diversion. A dam has been constructed on the upstream
side of the mining activities and channels flows via a narrow, approximately 3m wide trench,
around the mining activities.
In the east of the study area a further unnamed tributary of the Bronkhorstspruit flows from
south to north across the study area. This is again a broad valley bottom wetland
characterised by mostly vertic soils, though in contrast to the Bronkhorstspruit system on
site, this system is clearly incised. Existing mining activities also extend into this wetland
system and have required the construction of a large berm to divert flows around the mine
activities. This activity has been authorized under the WULA that was submitted and
approved for the mining of the OWM Reserves (Koos Smit, pers. comm., 2013)
Eight (8) pans occur within the study area, ranging in size from 0.4 to over 18ha. Most of
these pans are shallow, seasonal depressions that are characterised by Leersia hexandra
across their full width, though the pan at sampling point LP2 (see Figure 4.4 below) appears
to be a permanent pan as it is lined by Phragmites australis. This pan is thought to be used
as water storage for irrigation and is thus a highly modified system. A number of further pans
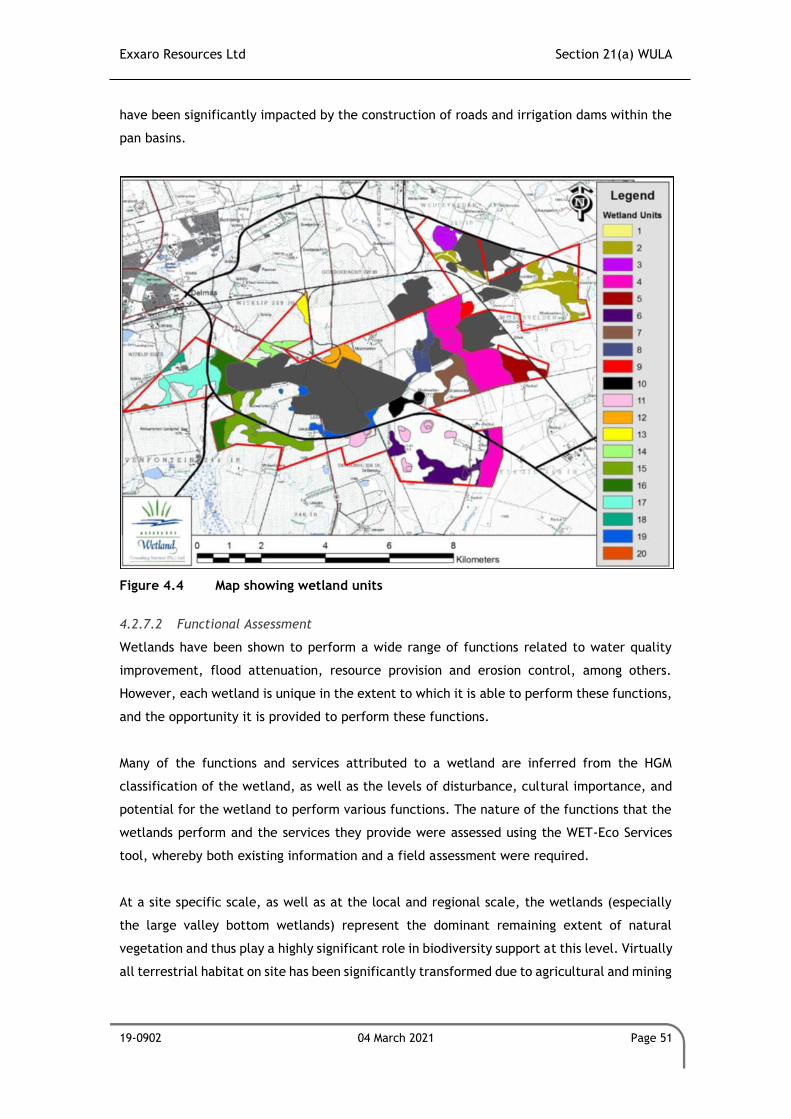
Exxaro Resources Ltd Section 21(a) WULA
19-0902 04 March 2021 Page 51
have been significantly impacted by the construction of roads and irrigation dams within the
pan basins.
Figure 4.4 Map showing wetland units
4.2.7.2 Functional Assessment
Wetlands have been shown to perform a wide range of functions related to water quality
improvement, flood attenuation, resource provision and erosion control, among others.
However, each wetland is unique in the extent to which it is able to perform these functions,
and the opportunity it is provided to perform these functions.
Many of the functions and services attributed to a wetland are inferred from the HGM
classification of the wetland, as well as the levels of disturbance, cultural importance, and
potential for the wetland to perform various functions. The nature of the functions that the
wetlands perform and the services they provide were assessed using the WET-Eco Services
tool, whereby both existing information and a field assessment were required.
At a site specific scale, as well as at the local and regional scale, the wetlands (especially
the large valley bottom wetlands) represent the dominant remaining extent of natural
vegetation and thus play a highly significant role in biodiversity support at this level. Virtually
all terrestrial habitat on site has been significantly transformed due to agricultural and mining
Exxaro Resources Ltd Section 21(a) WULA
19-0902 04 March 2021 Page 52
activities and most terrestrial areas are under cultivation, forcing species that under natural
conditions might not be directly dependent on wetland habitats to frequent wetland habitats
on site.
Loss of the wetland habitat on site would thus result not only in the loss of wetland dependent
fauna, but also impact significantly on terrestrial faunal species that remain on site. At the
National and International level, the importance of many of the smaller hillslope seepage
wetlands and pans in biodiversity support is limited due to the disturbances that have already
taken place within these systems, the generally low species richness of wetlands compared
to other ecosystems (e.g. terrestrial grassland), and the limited number of Red Data species
likely to occur on site.
Hillslope Seepage Wetlands:
As alluded to earlier, hillslope seepage wetlands are maintained by shallow sub-surface
interflow, derived from rainwater.
Rainfall infiltrates the soil profile, percolates through the soil until it reaches an impermeable
layer (e.g. a plinthic horizon or the underlying sandstone), and then percolates laterally
through the soil profile along the aquitard (resulting in the formation of a perched water
table). Such a perched water table occurs across large areas of the Mpumalanga Highveld,
not only within hillslope seepage wetlands, but also within terrestrial areas, only at greater
depth.
The hillslope seepage wetlands are merely the surface expression of this perched water table
in those areas where a shallow soil profile results in the perched water table leading to
saturation of the profile within 50cm of the soil surface. The importance of individual seepage
wetlands in temporarily storing and then discharging flows to downslope wetlands (flow
regulation) varies and depends on a number of factors. Generally, seepage wetlands
associated with springs and located adjacent to terrestrial areas characterised by deep, well-
drained soils are more likely to play an important role in flow regulation than seepage
wetlands where the wetland and catchment are characterised by shallower soils. Such
seepage wetlands are likely often maintained mostly by direct rainfall and lose most of their
water to evapotranspiration, and surface run-off during large storm events.
Hillslope seeps can support conditions that facilitate both sulphate and nitrate reduction as
interflow emerges through the organically rich wetland soil profile and are thus thought to
contribute to water quality improvement and/or the provision of high quality water. The
greatest importance of the hillslope seepage wetlands on site is thus taken to be the
Exxaro Resources Ltd Section 21(a) WULA
19-0902 04 March 2021 Page 53
movement of clean water through the hillslope seepage wetlands and into the adjacent valley
bottom wetlands, though the flow contribution from hillslope seepage wetlands to downslope
wetlands was not quantified.
As hillslope seepage wetlands, for the most part, are dependent on the presence of an
aquiclude, either a hard or soft plinthic horizon, they are not generally regarded as significant
sites for groundwater recharge (Parsons, 2004). However, by retaining water in the landscape
and then slowly releasing this water into adjacent valley bottom or floodplain wetlands, some
hillslope seepage wetlands can contribute to stream flow augmentation, especially during
the rainy season and early dry season.
From an overall water yield perspective there is evidence that seepage wetlands contribute
to water loss. The longer the water is retained on or near the surface the more likely it is to
be lost through evapo-transpiration (McCartney, 2000).
Hillslope seepage wetlands are not generally considered to play an important role in flood
attenuation, though early in the season, when still dry, the seeps have some capacity to
retain water and thus reduce surface run-off. Later in the rainy season when the wetland
soils are typically saturated, infiltration will decrease and surface run-off increase. Further
flood attenuation can be provided by the surface roughness of the wetland vegetation; the
greater the surface roughness of a wetland, the greater is the frictional resistance offered to
the flow of water and the more effective the wetland will be in attenuating floods (Reppert
et al., 1979).
In terms of the hillslope seepage wetlands on site, the surface roughness is taken to be
moderately low, given that most of the seepage wetlands are either cultivated of
characterised by typical grassland vegetation, thus offering only slight resistance to flow.
Valley Bottom Wetlands:
The linear nature of valley bottom wetlands within the landscape and their connectivity to
the larger drainage system provides the opportunity for these wetlands to play an important
role as an ecological corridor allowing the movement and migration of fauna and flora
between remaining natural areas within the landscape.
Although modified in certain respects due to changes in land use having brought about
hydrological changes to these wetlands as well as vegetation transformation, the wetlands
still provide a natural refuge for biodiversity, and within the study area and surroundings,
the large valley bottom wetlands with associated footslope seepage wetlands represent the
Exxaro Resources Ltd Section 21(a) WULA
19-0902 04 March 2021 Page 54
most significant extent of remaining natural vegetation, further enhancing their importance
from a biodiversity support function.
Channelled valley bottom wetlands, through the erosion of a channel through the wetland,
indicate that sediment trapping is not always an important function of these wetlands, except
where regular overtopping of the channel occurs and flows spread across the full width of
the wetland. Under low and medium flows, transport of sediment through, and out, of the
system are more likely to be the dominant processes. Erosion may be both vertical and/or
lateral and reflect the attempts of the stream to reach equilibrium with the imposed
hydrology. From a functional perspective channelled valley bottom wetlands can play a role
in flood attenuation when flows over top the channel bank and spread out over a greater
width, with the surface roughness provided by the vegetation further slowing down the flood
flows. These wetlands are considered to play only a minor role in the improvement of water
quality given the short contact period between the water and the soil and vegetation within
the wetland.
Un-channelled valley bottom wetlands reflect conditions where surface flow velocities are
such that they do not, under existing flow conditions, have sufficient energy to transport
sediment to the extent that a channel is formed. In addition to the biodiversity associated
with these systems it is expected that they play an important role in retaining water in the
landscape as well as in contributing to influencing water quality through for example
mineralisation of rain water. These wetlands could be seen to play an important role in
nutrient removal, including ammonia, through adsorption onto clay particles. The large size
of the unchannelled valley bottom wetland associated with the Bronkhorstspruit suggests that
this wetland plays an important role in flood attenuation – the temporary storage of flood
waters within the wetland.
Pans/Depressions:
Given the position of many pans within the landscape, which is usually isolated from any
stream channels, the opportunity for pans to attenuate floods is fairly limited, though some
run-off is stored in pans. In the cases where pans are linked to the drainage network via seep
zones, the function of flood attenuation is somewhat elevated. Pans are also not considered
important for sediment trapping, as many pans are formed through the removal of sediment
by wind when the pan basins are dry. Some precipitation of minerals and de-nitrification is
expected to take place within pans, which contributes to improving water quality. Some of
the accumulated salts and nutrients can however be exported out of the system and
deposited on the surrounding slopes by wind during dry periods.
Exxaro Resources Ltd Section 21(a) WULA
19-0902 04 March 2021 Page 55
An important function usually performed by pans is the support of faunal and floral
biodiversity, which is enhanced by the diversity in habitat types offered by different pans.
Within the study area however, the small size of most of the pans, together with their
seasonal nature and the disturbed vegetation, the biodiversity support of these pans
individually is expected to be limited. All of the pans are seasonal or even ephemeral systems,
though the differences in pan basin size and depth, as well as catchment size and catchment
soil characteristics results in pans that fill up and drain at different rates and times. As a
consequence, a great diversity of habitat is provided by the pans on site and in the
surrounding area, and though they are all seasonal systems, the differing hydro periods result
in the fact that at least some of the pans are likely to have water at any one time. The pans
when seen as a complex of pan wetlands are thus of high importance in terms of biodiversity
support, whereas if each pan is assessed in isolation, its importance in terms of biodiversity
is limited.
4.3 Groundwater
4.3.1 Aquifer Characterisation
Four distinct aquifer types or hydrogeological units are present with the study area. These
units vary by aquifer characteristics; however, the aquifers are generally interconnected by
fractures and dolerite dykes (GCS, 2014).
• Shallow weathered Karoo aquifer: a shallow aquifer formed within the residual and
weathered zone of the Karoo Supergroup, locally perched on fresh bedrock.
• Deeper fractured Karoo aquifer: a deeper aquifer formed by fracturing of the Karoo
Supergroup and dolerite intrusions.
• Fractured dolomitic aquifer: a fractured aquifer hosted within the dolomite- and
chert-rich Malmani Subgroup.
• Karst aquifer: an aquifer hosted within karstic dolomite, i.e. dolomite within which
water has dissolved the soft rock along fractures, significantly increasing the size of
fractures to form cavities.
Diamictite of the Dwyka Group is clay-rich and poorly sorted. Consequently, the rock has a
lower permeability than overlying sandstone, and underlying fractured or karst dolomite
aquifers, and is termed an aquitard. According to Sen (2015), an aquitard is a semipervious
geological formation that transmits water at slower rates than an aquifer, with significantly
lower yields than adjacent aquifers. The aquitard would influence the interconnectivity
between overlying and underlying aquitards. Within the study area, interconnectivity
between the Karoo and Malmani aquifers is likely limited, influenced by the occurrence and
thickness of the Dwyka aquitard. The extent and connectivity of fracture networks within
Exxaro Resources Ltd Section 21(a) WULA
19-0902 04 March 2021 Page 56
rock of the Ecca Group, Dwyka Group and Malmani Subgroup, as well as the presence of
dolerite dykes that have intruded across the geological formations, will also influence the
interconnectivity of the aquifers and could result in localised zones of interconnection.
4.3.1.1 Shallow Weathered Karoo Rock Aquifer
Unconsolidated colluvium and weathered sediments overlie the consolidated formations.
Underlying mudstone and siltstone bedrock often result in perched aquifer conditions. The
depth of weathering generally ranges between 5 to 12 mbgl in the study area and receives
relatively high recharge from rainfall (3% of MAP) (GCS, 2014). The water level of this perched
aquifer is shallow and may daylight as springs occasionally when intersected by barriers such
as topography, dykes and basement highs in valleys and topographic lows/depressions (GCS,
2014). The aquifer is relatively low yielding (0.01 – 0.14 l/s). As a result, groundwater is
rarely abstracted from the aquifer. This aquifer is important as it often acts as a pathway for
contaminants migrating from surface activities to surface water bodies such as rivers.
4.3.1.2 Fractured Karoo Rock Aquifer
The Vryheid Formation of the Ecca Group, Karoo Supergroup is characterised by thick
sandstone and gritstone, alternated by sandy shale and coal beds. Most of the groundwater
flow associated with mining will occur along the fractures, cracks and joints that are present
within Karoo Sediments, and along contacts with dolerite intrusions. These conductive zones
effectively interconnect the strata of the Karoo sediments, both vertically and horizontally
into a highly heterogeneous and anisotropic unit.
The dolerite sill and dyke intrusions prevalent in the Karoo Supergroup and the study area
generally act as aquitards and compartmentalize the groundwater regime. However fractured
contact zones between the host rock and the intrusions often represent highly conductive
groundwater flow paths. The horizontally and vertically extensive nature of the dolerite
intrusions means that these conductive zones are interconnected and govern groundwater
flows. The aquifer characteristics of these contact zones are heterogeneous. The boreholes
where dolerite was intersected at shallow depths during drilling in 2014 did not encounter
any water strikes (GCS, 2014).
The fractured Karoo aquifer can be classified as a minor (low yielding) aquifer system
(Parsons, 1995) which displays variable yields and water quality. The Ecca Group is not known
for the development of major aquifers, but occasional moderate - yielding boreholes may be
present. This aquifer is reported to be approximately 40 m thick and exhibits characteristics
of the intergranular and fractured regime (Barnard, 1999), which indicates that groundwater
Exxaro Resources Ltd Section 21(a) WULA
19-0902 04 March 2021 Page 57
storage and flow occurs mainly within the fractures of the rock. Dominant yield classes vary
between 0.1 - 5.0 l/s.
4.3.1.3 Malmani Dolomitic Aquifer
The formation consists mainly of alternating layers of chert-free dolomite and chert-rich
dolomite (Visser, 1989). The Dwyka Group of the Karoo Supergroup separates the dolomitic
aquifer (targeted for water supply) from the overlying Vryheid Formation (mined for coal).
The Dwyka tillite consists of gravelly diamictite with minor shale and mudstone that is less
permeable than both the Vryheid Formation and the Malmani dolomite. The Dwyka is
normally considered an aquitard (Woodford and Chevallier, 2002). Although the Dwyka
aquitard can effectively limit the interconnection between the Karoo and Malmani
(dolomitic) aquifers, localised zones of interconnection may exist at the contact with dolerite
dykes, extensive fractures, sinkholes and boreholes that may have connected the aquifers.
An effective depth of 300m has been accepted as the maximum depth to which significant
dissolution of the dolomite has taken place. A hydraulic conductivity that varies between 5
and 100m/day is considered representative of a karst aquifer. A karst aquifer has undergone
dissolution of the soft rock along fractures, leading to significantly larger cavities for
groundwater flow. Lower hydraulic conductivity and transmissivity values could be indicative
of a fractured dolomitic aquifer that has not yet undergone significant kartsification.
The karst systems of the Malmani Subgroup are considered major aquifer systems which are
normally high yielding and producers of good quality water (Barnard, 1999). High yields
denote cavities associated with fracturing and jointing, and the groundwater yield is normally
more than 5 l/s. The Malmani karst aquifer is a higher yielding resource for water supply than
the overlying Karoo aquifers.
4.3.1.4 Aquifer Testing
Aquifer test results
A Hydrogeological Investigation was conducted by GCS is 2019/2020 and the full report can
be found in Annexure B. Constant Rate (CR) and Recovery Tests (RT) were conducted on the
production borehole WK-BH1 and reserve borehole WK-BH2. The pump inlet depth of borehole
WK-BH1 could not be determined at the time of the site visit. WK-BH2 was tested by sub-
contractors and available data was provided by the client and GCS for inclusion into the
study. The borehole details are presented in Table 4.7.
Table 4.7 Aquifer Test Borehole Details
BH ID Coordinates
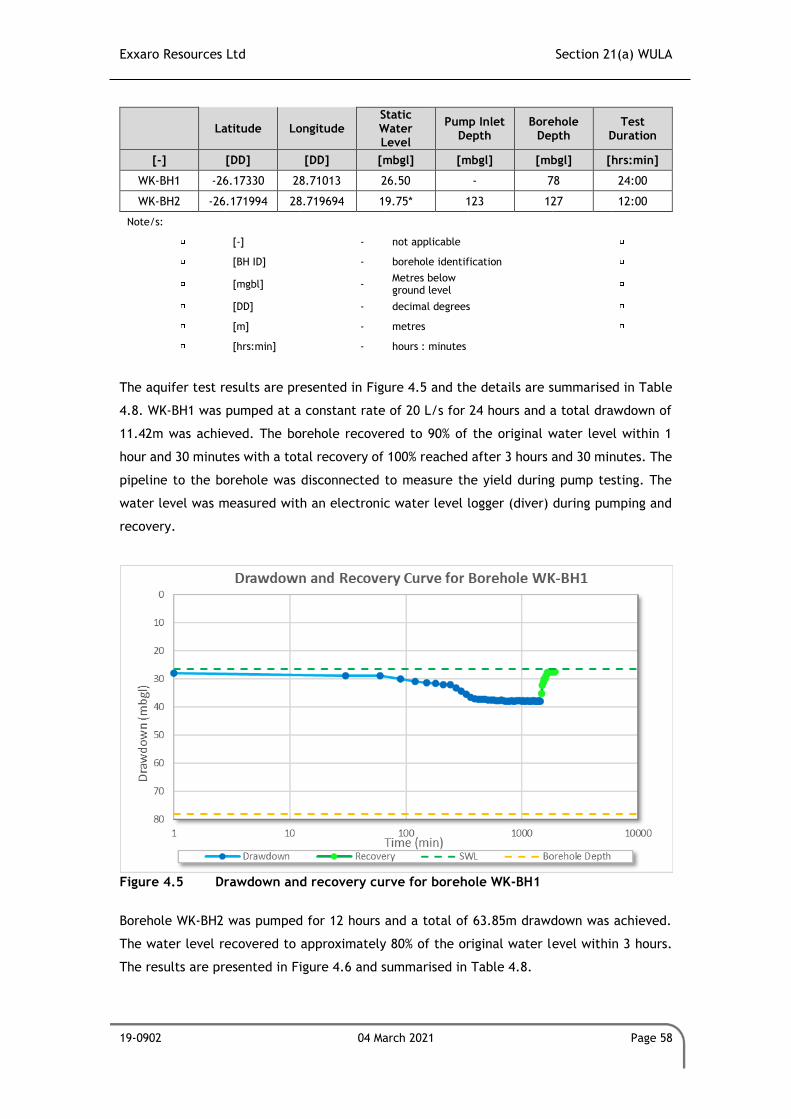
Exxaro Resources Ltd Section 21(a) WULA
19-0902 04 March 2021 Page 58
Latitude Longitude Static Water Level
Pump Inlet Depth
Borehole Depth
Test Duration
[-] [DD] [DD] [mbgl] [mbgl] [mbgl] [hrs:min]
WK-BH1 -26.17330 28.71013 26.50 - 78 24:00
WK-BH2 -26.171994 28.719694 19.75* 123 127 12:00
Note/s:
[-] - not applicable
[BH ID] - borehole identification
[mgbl] - Metres below ground level
[DD] - decimal degrees
[m] - metres
[hrs:min] - hours : minutes
The aquifer test results are presented in Figure 4.5 and the details are summarised in Table
4.8. WK-BH1 was pumped at a constant rate of 20 L/s for 24 hours and a total drawdown of
11.42m was achieved. The borehole recovered to 90% of the original water level within 1
hour and 30 minutes with a total recovery of 100% reached after 3 hours and 30 minutes. The
pipeline to the borehole was disconnected to measure the yield during pump testing. The
water level was measured with an electronic water level logger (diver) during pumping and
recovery.
Figure 4.5 Drawdown and recovery curve for borehole WK-BH1
Borehole WK-BH2 was pumped for 12 hours and a total of 63.85m drawdown was achieved.
The water level recovered to approximately 80% of the original water level within 3 hours.
The results are presented in Figure 4.6 and summarised in Table 4.8.
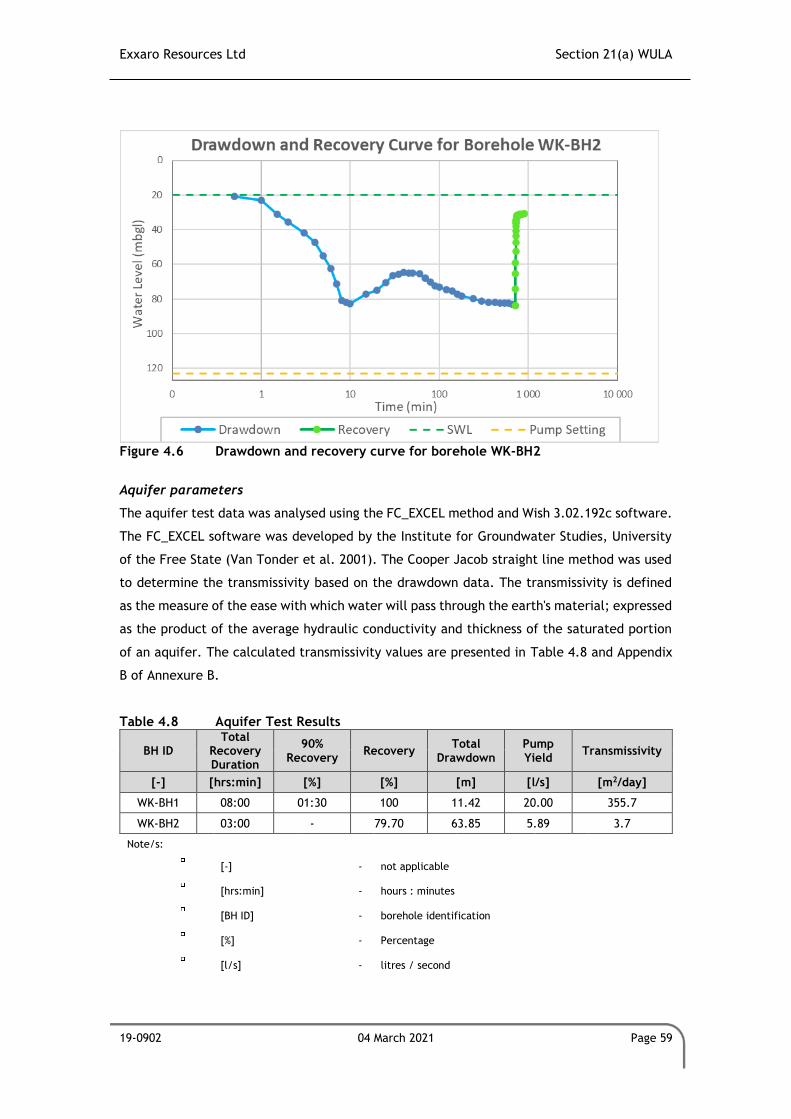
Exxaro Resources Ltd Section 21(a) WULA
19-0902 04 March 2021 Page 59
Figure 4.6 Drawdown and recovery curve for borehole WK-BH2
Aquifer parameters
The aquifer test data was analysed using the FC_EXCEL method and Wish 3.02.192c software.
The FC_EXCEL software was developed by the Institute for Groundwater Studies, University
of the Free State (Van Tonder et al. 2001). The Cooper Jacob straight line method was used
to determine the transmissivity based on the drawdown data. The transmissivity is defined
as the measure of the ease with which water will pass through the earth's material; expressed
as the product of the average hydraulic conductivity and thickness of the saturated portion
of an aquifer. The calculated transmissivity values are presented in Table 4.8 and Appendix
B of Annexure B.
Table 4.8 Aquifer Test Results
BH ID Total
Recovery Duration
90% Recovery
Recovery Total
Drawdown Pump Yield
Transmissivity
[-] [hrs:min] [%] [%] [m] [l/s] [m2/day]
WK-BH1 08:00 01:30 100 11.42 20.00 355.7
WK-BH2 03:00 - 79.70 63.85 5.89 3.7
Note/s:
[-] - not applicable
[hrs:min] - hours : minutes
[BH ID] - borehole identification
[%] - Percentage
[l/s] - litres / second
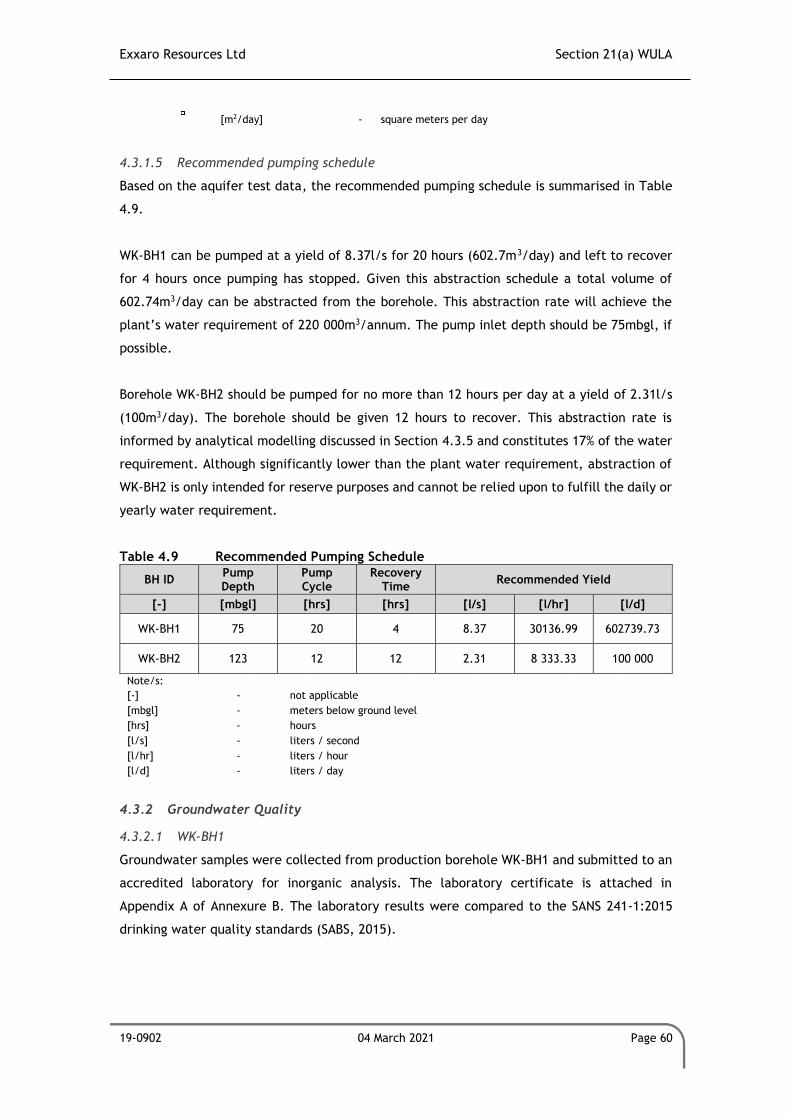
Exxaro Resources Ltd Section 21(a) WULA
19-0902 04 March 2021 Page 60
[m2/day] - square meters per day
4.3.1.5 Recommended pumping schedule
Based on the aquifer test data, the recommended pumping schedule is summarised in Table
4.9.
WK-BH1 can be pumped at a yield of 8.37l/s for 20 hours (602.7m3/day) and left to recover
for 4 hours once pumping has stopped. Given this abstraction schedule a total volume of
602.74m3/day can be abstracted from the borehole. This abstraction rate will achieve the
plant’s water requirement of 220 000m3/annum. The pump inlet depth should be 75mbgl, if
possible.
Borehole WK-BH2 should be pumped for no more than 12 hours per day at a yield of 2.31l/s
(100m3/day). The borehole should be given 12 hours to recover. This abstraction rate is
informed by analytical modelling discussed in Section 4.3.5 and constitutes 17% of the water
requirement. Although significantly lower than the plant water requirement, abstraction of
WK-BH2 is only intended for reserve purposes and cannot be relied upon to fulfill the daily or
yearly water requirement.
Table 4.9 Recommended Pumping Schedule
BH ID Pump Depth
Pump Cycle
Recovery Time
Recommended Yield
[-] [mbgl] [hrs] [hrs] [l/s] [l/hr] [l/d]
WK-BH1 75 20 4 8.37 30136.99 602739.73
WK-BH2 123 12 12 2.31 8 333.33 100 000
Note/s: [-] - not applicable
[mbgl] - meters below ground level
[hrs] - hours
[l/s] - liters / second
[l/hr] - liters / hour
[l/d] - liters / day
4.3.2 Groundwater Quality
4.3.2.1 WK-BH1
Groundwater samples were collected from production borehole WK-BH1 and submitted to an
accredited laboratory for inorganic analysis. The laboratory certificate is attached in
Appendix A of Annexure B. The laboratory results were compared to the SANS 241-1:2015
drinking water quality standards (SABS, 2015).
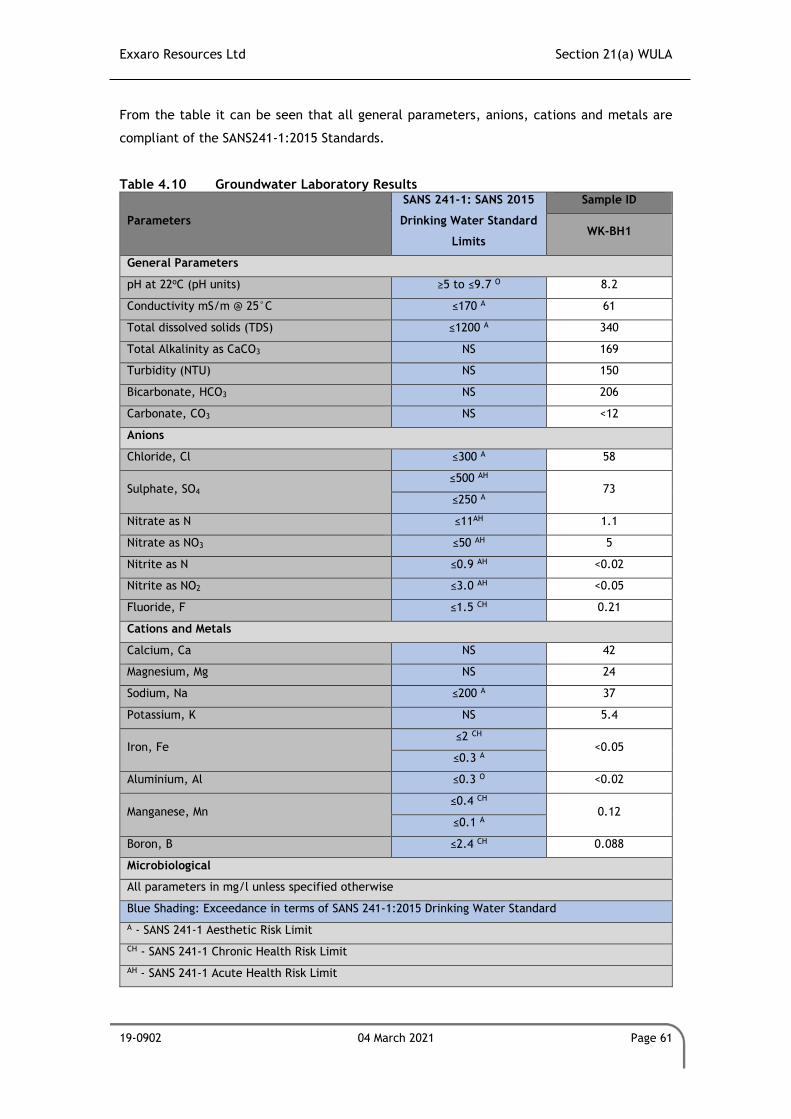
Exxaro Resources Ltd Section 21(a) WULA
19-0902 04 March 2021 Page 61
From the table it can be seen that all general parameters, anions, cations and metals are
compliant of the SANS241-1:2015 Standards.
Table 4.10 Groundwater Laboratory Results
Parameters
SANS 241-1: SANS 2015
Drinking Water Standard
Limits
Sample ID
WK-BH1
General Parameters
pH at 22oC (pH units) ≥5 to ≤9.7 O 8.2
Conductivity mS/m @ 25°C ≤170 A 61
Total dissolved solids (TDS) ≤1200 A 340
Total Alkalinity as CaCO3 NS 169
Turbidity (NTU) NS 150
Bicarbonate, HCO3 NS 206
Carbonate, CO3 NS <12
Anions
Chloride, Cl ≤300 A 58
Sulphate, SO4 ≤500 AH
73 ≤250 A
Nitrate as N ≤11AH 1.1
Nitrate as NO3 ≤50 AH 5
Nitrite as N ≤0.9 AH <0.02
Nitrite as NO2 ≤3.0 AH <0.05
Fluoride, F ≤1.5 CH 0.21
Cations and Metals
Calcium, Ca NS 42
Magnesium, Mg NS 24
Sodium, Na ≤200 A 37
Potassium, K NS 5.4
Iron, Fe ≤2 CH
<0.05 ≤0.3 A
Aluminium, Al ≤0.3 O <0.02
Manganese, Mn ≤0.4 CH
0.12 ≤0.1 A
Boron, B ≤2.4 CH 0.088
Microbiological
All parameters in mg/l unless specified otherwise
Blue Shading: Exceedance in terms of SANS 241-1:2015 Drinking Water Standard
A - SANS 241-1 Aesthetic Risk Limit
CH - SANS 241-1 Chronic Health Risk Limit
AH - SANS 241-1 Acute Health Risk Limit
Exxaro Resources Ltd Section 21(a) WULA
19-0902 04 March 2021 Page 62
Parameters
SANS 241-1: SANS 2015
Drinking Water Standard
Limits
Sample ID
WK-BH1
O - SANS 241-1 Operational Risk Limit
NS- No Standard
NS- No Standard
*Exceeds SANS 2015: Drinking Water Quality Standard
A piper diagram represents the chemistry of a water sample graphically from the WK-BH1. It
is a tri-linear diagram that implements major cations calcium, magnesium, sodium and
potassium) and anions (chloride, sulphate and bicarbonate) to reveal the chemistry of water
samples. This is then used to characterise different types of water. The sample WK-BH1
analysed was a magnesium bicarbonate type with water plotting in the unpolluted
groundwater region on the graph (refer to Figure 4.7). The piper diagram can also be used to
verify if the groundwater is being contaminated by examining pollution trends (piper
diagrams of groundwater samples over time).
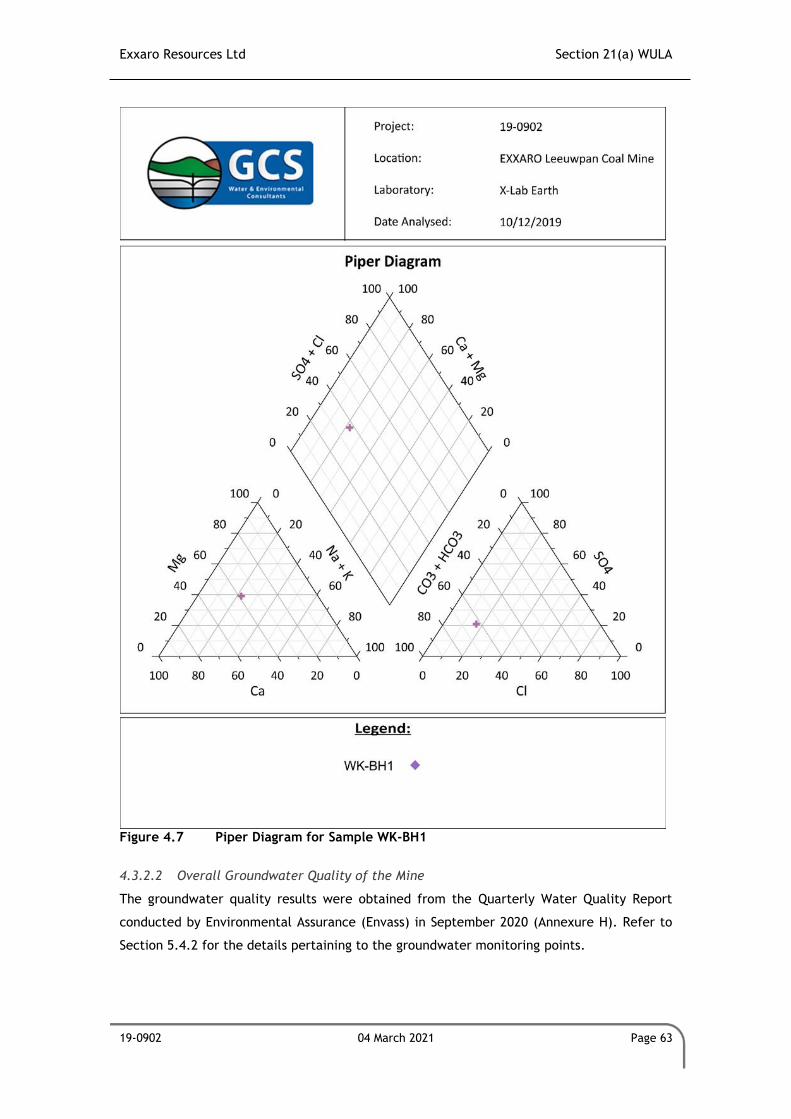
Exxaro Resources Ltd Section 21(a) WULA
19-0902 04 March 2021 Page 63
Figure 4.7 Piper Diagram for Sample WK-BH1
4.3.2.2 Overall Groundwater Quality of the Mine
The groundwater quality results were obtained from the Quarterly Water Quality Report
conducted by Environmental Assurance (Envass) in September 2020 (Annexure H). Refer to
Section 5.4.2 for the details pertaining to the groundwater monitoring points.
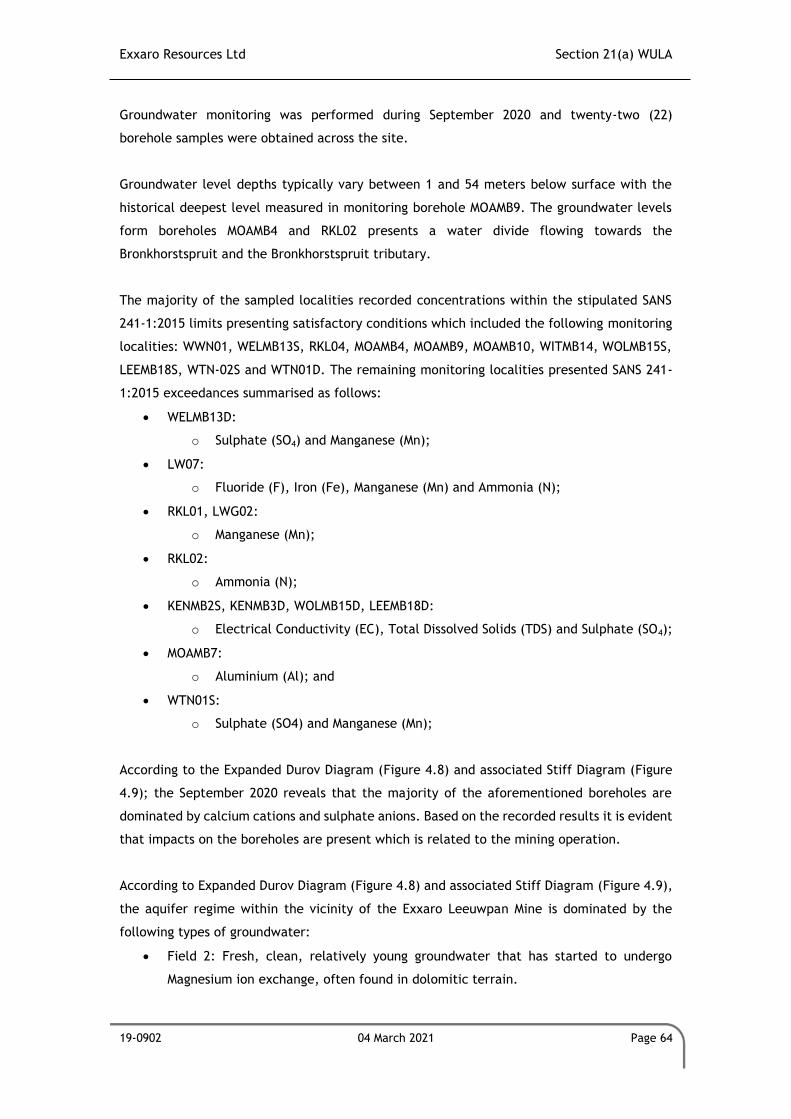
Exxaro Resources Ltd Section 21(a) WULA
19-0902 04 March 2021 Page 64
Groundwater monitoring was performed during September 2020 and twenty-two (22)
borehole samples were obtained across the site.
Groundwater level depths typically vary between 1 and 54 meters below surface with the
historical deepest level measured in monitoring borehole MOAMB9. The groundwater levels
form boreholes MOAMB4 and RKL02 presents a water divide flowing towards the
Bronkhorstspruit and the Bronkhorstspruit tributary.
The majority of the sampled localities recorded concentrations within the stipulated SANS
241-1:2015 limits presenting satisfactory conditions which included the following monitoring
localities: WWN01, WELMB13S, RKL04, MOAMB4, MOAMB9, MOAMB10, WITMB14, WOLMB15S,
LEEMB18S, WTN-02S and WTN01D. The remaining monitoring localities presented SANS 241-
1:2015 exceedances summarised as follows:
• WELMB13D:
o Sulphate (SO4) and Manganese (Mn);
• LW07:
o Fluoride (F), Iron (Fe), Manganese (Mn) and Ammonia (N);
• RKL01, LWG02:
o Manganese (Mn);
• RKL02:
o Ammonia (N);
• KENMB2S, KENMB3D, WOLMB15D, LEEMB18D:
o Electrical Conductivity (EC), Total Dissolved Solids (TDS) and Sulphate (SO4);
• MOAMB7:
o Aluminium (Al); and
• WTN01S:
o Sulphate (SO4) and Manganese (Mn);
According to the Expanded Durov Diagram (Figure 4.8) and associated Stiff Diagram (Figure
4.9); the September 2020 reveals that the majority of the aforementioned boreholes are
dominated by calcium cations and sulphate anions. Based on the recorded results it is evident
that impacts on the boreholes are present which is related to the mining operation.
According to Expanded Durov Diagram (Figure 4.8) and associated Stiff Diagram (Figure 4.9),
the aquifer regime within the vicinity of the Exxaro Leeuwpan Mine is dominated by the
following types of groundwater:
• Field 2: Fresh, clean, relatively young groundwater that has started to undergo
Magnesium ion exchange, often found in dolomitic terrain.
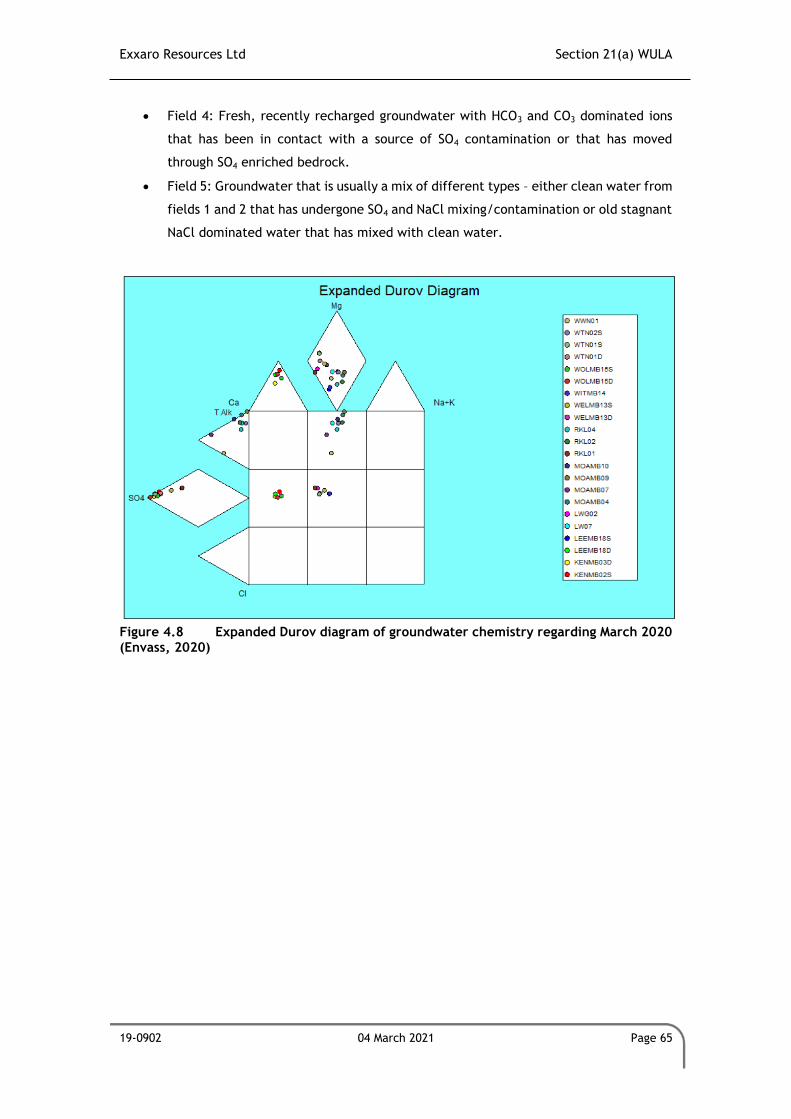
Exxaro Resources Ltd Section 21(a) WULA
19-0902 04 March 2021 Page 65
• Field 4: Fresh, recently recharged groundwater with HCO3 and CO3 dominated ions
that has been in contact with a source of SO4 contamination or that has moved
through SO4 enriched bedrock.
• Field 5: Groundwater that is usually a mix of different types – either clean water from
fields 1 and 2 that has undergone SO4 and NaCl mixing/contamination or old stagnant
NaCl dominated water that has mixed with clean water.
Figure 4.8 Expanded Durov diagram of groundwater chemistry regarding March 2020 (Envass, 2020)
Exxaro Resources Ltd Section 21(a) WULA
19-0902 04 March 2021 Page 66
Figure 4.9 Stiff diagrams of groundwater chemistry regarding September 2020 (Envass, 2020)
4.3.3 Hydrocensus
A Hydrogeological Investigation was undertaken in 2019/2020 by GCS as part of this WULA
and is attached as Annexure B to this report.
A hydrocensus was conducted by GCS within a 1km of the production borehole WK-BH1 and
WK-BH2, on the 28th of November 2019. No production boreholes could be found abstracting
groundwater from the aquifer system/s within the hydrocensus area, or within the sub-
catchment containing the site. A number of monitoring wells are located within the vicinity
of the mine and are presented in Figure 4.10.
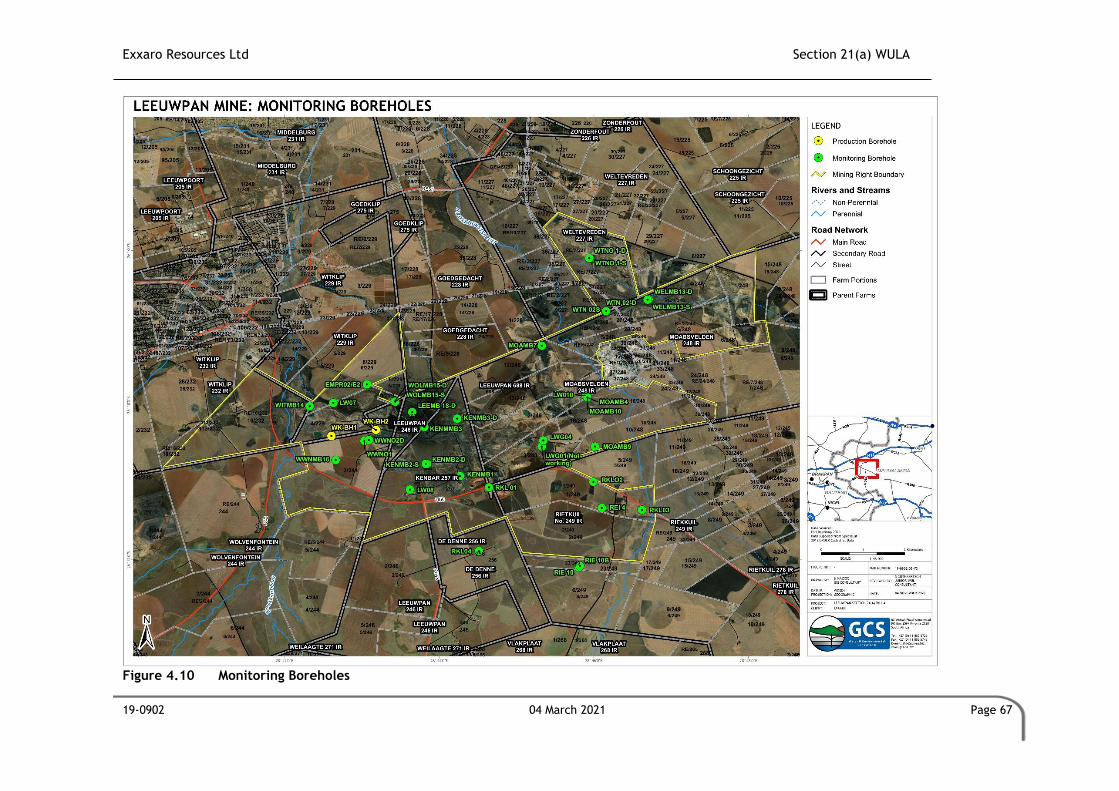
Exxaro Resources Ltd Section 21(a) WULA
19-0902 04 March 2021 Page 67
Figure 4.10 Monitoring Boreholes
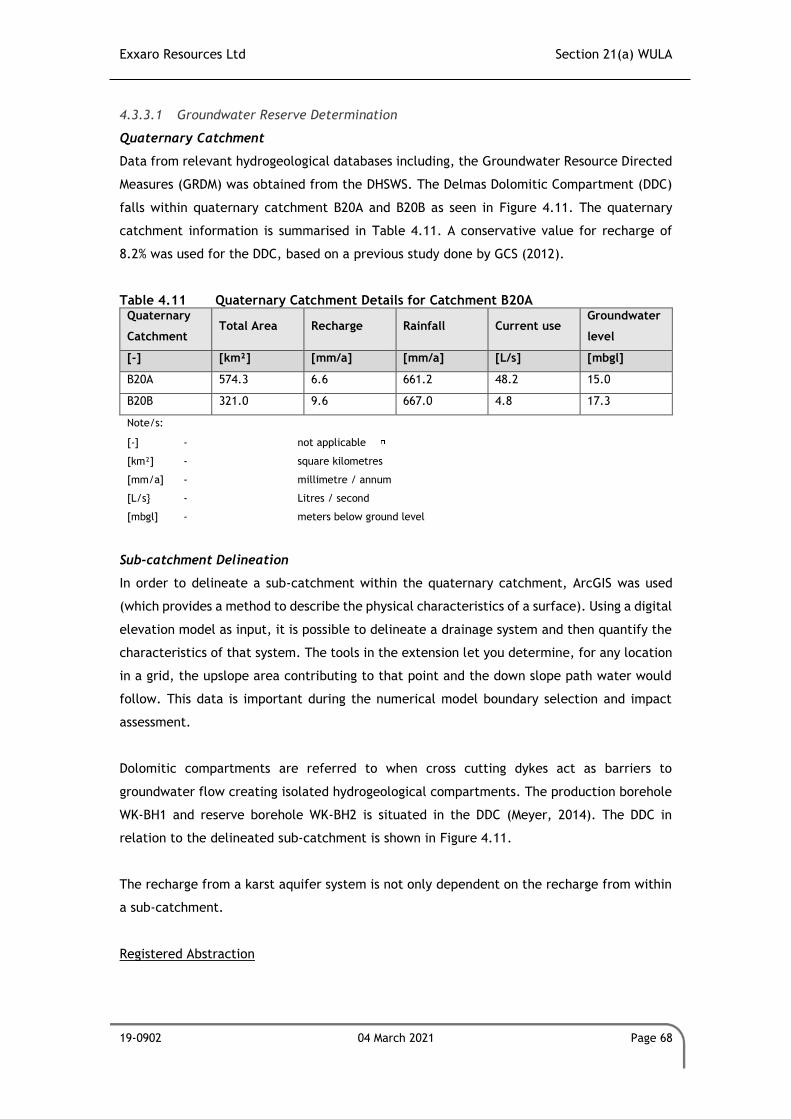
Exxaro Resources Ltd Section 21(a) WULA
19-0902 04 March 2021 Page 68
4.3.3.1 Groundwater Reserve Determination
Quaternary Catchment
Data from relevant hydrogeological databases including, the Groundwater Resource Directed
Measures (GRDM) was obtained from the DHSWS. The Delmas Dolomitic Compartment (DDC)
falls within quaternary catchment B20A and B20B as seen in Figure 4.11. The quaternary
catchment information is summarised in Table 4.11. A conservative value for recharge of
8.2% was used for the DDC, based on a previous study done by GCS (2012).
Table 4.11 Quaternary Catchment Details for Catchment B20A Quaternary
Catchment Total Area Recharge Rainfall Current use
Groundwater
level
[-] [km²] [mm/a] [mm/a] [L/s] [mbgl]
B20A 574.3 6.6 661.2 48.2 15.0
B20B 321.0 9.6 667.0 4.8 17.3
Note/s:
[-] - not applicable
[km²] - square kilometres
[mm/a] - millimetre / annum
[L/s} - Litres / second
[mbgl] - meters below ground level
Sub-catchment Delineation
In order to delineate a sub-catchment within the quaternary catchment, ArcGIS was used
(which provides a method to describe the physical characteristics of a surface). Using a digital
elevation model as input, it is possible to delineate a drainage system and then quantify the
characteristics of that system. The tools in the extension let you determine, for any location
in a grid, the upslope area contributing to that point and the down slope path water would
follow. This data is important during the numerical model boundary selection and impact
assessment.
Dolomitic compartments are referred to when cross cutting dykes act as barriers to
groundwater flow creating isolated hydrogeological compartments. The production borehole
WK-BH1 and reserve borehole WK-BH2 is situated in the DDC (Meyer, 2014). The DDC in
relation to the delineated sub-catchment is shown in Figure 4.11.
The recharge from a karst aquifer system is not only dependent on the recharge from within
a sub-catchment.
Registered Abstraction
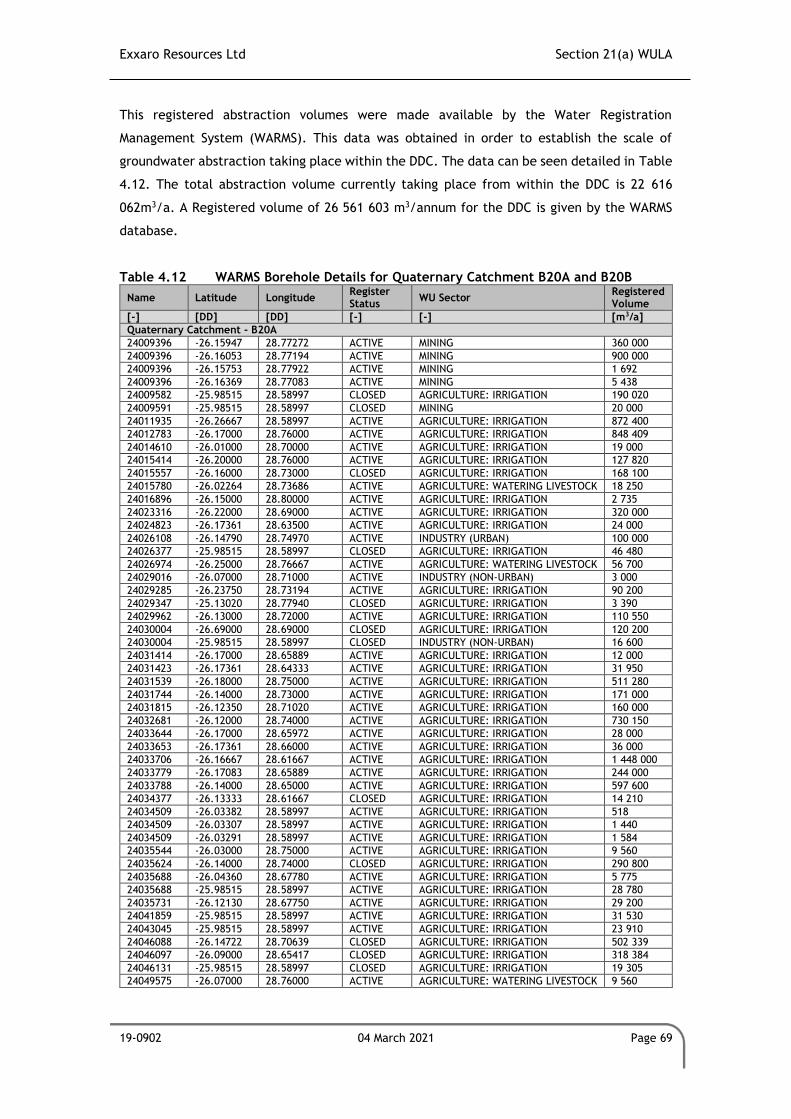
Exxaro Resources Ltd Section 21(a) WULA
19-0902 04 March 2021 Page 69
This registered abstraction volumes were made available by the Water Registration
Management System (WARMS). This data was obtained in order to establish the scale of
groundwater abstraction taking place within the DDC. The data can be seen detailed in Table
4.12. The total abstraction volume currently taking place from within the DDC is 22 616
062m3/a. A Registered volume of 26 561 603 m3/annum for the DDC is given by the WARMS
database.
Table 4.12 WARMS Borehole Details for Quaternary Catchment B20A and B20B
Name Latitude Longitude Register Status
WU Sector Registered Volume
[-] [DD] [DD] [-] [-] [m3/a]
Quaternary Catchment - B20A
24009396 -26.15947 28.77272 ACTIVE MINING 360 000
24009396 -26.16053 28.77194 ACTIVE MINING 900 000
24009396 -26.15753 28.77922 ACTIVE MINING 1 692
24009396 -26.16369 28.77083 ACTIVE MINING 5 438
24009582 -25.98515 28.58997 CLOSED AGRICULTURE: IRRIGATION 190 020
24009591 -25.98515 28.58997 CLOSED MINING 20 000
24011935 -26.26667 28.58997 ACTIVE AGRICULTURE: IRRIGATION 872 400
24012783 -26.17000 28.76000 ACTIVE AGRICULTURE: IRRIGATION 848 409
24014610 -26.01000 28.70000 ACTIVE AGRICULTURE: IRRIGATION 19 000
24015414 -26.20000 28.76000 ACTIVE AGRICULTURE: IRRIGATION 127 820
24015557 -26.16000 28.73000 CLOSED AGRICULTURE: IRRIGATION 168 100
24015780 -26.02264 28.73686 ACTIVE AGRICULTURE: WATERING LIVESTOCK 18 250
24016896 -26.15000 28.80000 ACTIVE AGRICULTURE: IRRIGATION 2 735
24023316 -26.22000 28.69000 ACTIVE AGRICULTURE: IRRIGATION 320 000
24024823 -26.17361 28.63500 ACTIVE AGRICULTURE: IRRIGATION 24 000
24026108 -26.14790 28.74970 ACTIVE INDUSTRY (URBAN) 100 000
24026377 -25.98515 28.58997 CLOSED AGRICULTURE: IRRIGATION 46 480
24026974 -26.25000 28.76667 ACTIVE AGRICULTURE: WATERING LIVESTOCK 56 700
24029016 -26.07000 28.71000 ACTIVE INDUSTRY (NON-URBAN) 3 000
24029285 -26.23750 28.73194 ACTIVE AGRICULTURE: IRRIGATION 90 200
24029347 -25.13020 28.77940 CLOSED AGRICULTURE: IRRIGATION 3 390
24029962 -26.13000 28.72000 ACTIVE AGRICULTURE: IRRIGATION 110 550
24030004 -26.69000 28.69000 CLOSED AGRICULTURE: IRRIGATION 120 200
24030004 -25.98515 28.58997 CLOSED INDUSTRY (NON-URBAN) 16 600
24031414 -26.17000 28.65889 ACTIVE AGRICULTURE: IRRIGATION 12 000
24031423 -26.17361 28.64333 ACTIVE AGRICULTURE: IRRIGATION 31 950
24031539 -26.18000 28.75000 ACTIVE AGRICULTURE: IRRIGATION 511 280
24031744 -26.14000 28.73000 ACTIVE AGRICULTURE: IRRIGATION 171 000
24031815 -26.12350 28.71020 ACTIVE AGRICULTURE: IRRIGATION 160 000
24032681 -26.12000 28.74000 ACTIVE AGRICULTURE: IRRIGATION 730 150
24033644 -26.17000 28.65972 ACTIVE AGRICULTURE: IRRIGATION 28 000
24033653 -26.17361 28.66000 ACTIVE AGRICULTURE: IRRIGATION 36 000
24033706 -26.16667 28.61667 ACTIVE AGRICULTURE: IRRIGATION 1 448 000
24033779 -26.17083 28.65889 ACTIVE AGRICULTURE: IRRIGATION 244 000
24033788 -26.14000 28.65000 ACTIVE AGRICULTURE: IRRIGATION 597 600
24034377 -26.13333 28.61667 CLOSED AGRICULTURE: IRRIGATION 14 210
24034509 -26.03382 28.58997 ACTIVE AGRICULTURE: IRRIGATION 518
24034509 -26.03307 28.58997 ACTIVE AGRICULTURE: IRRIGATION 1 440
24034509 -26.03291 28.58997 ACTIVE AGRICULTURE: IRRIGATION 1 584
24035544 -26.03000 28.75000 ACTIVE AGRICULTURE: IRRIGATION 9 560
24035624 -26.14000 28.74000 CLOSED AGRICULTURE: IRRIGATION 290 800
24035688 -26.04360 28.67780 ACTIVE AGRICULTURE: IRRIGATION 5 775
24035688 -25.98515 28.58997 ACTIVE AGRICULTURE: IRRIGATION 28 780
24035731 -26.12130 28.67750 ACTIVE AGRICULTURE: IRRIGATION 29 200
24041859 -25.98515 28.58997 ACTIVE AGRICULTURE: IRRIGATION 31 530
24043045 -25.98515 28.58997 ACTIVE AGRICULTURE: IRRIGATION 23 910
24046088 -26.14722 28.70639 CLOSED AGRICULTURE: IRRIGATION 502 339
24046097 -26.09000 28.65417 CLOSED AGRICULTURE: IRRIGATION 318 384
24046131 -25.98515 28.58997 CLOSED AGRICULTURE: IRRIGATION 19 305
24049575 -26.07000 28.76000 ACTIVE AGRICULTURE: WATERING LIVESTOCK 9 560
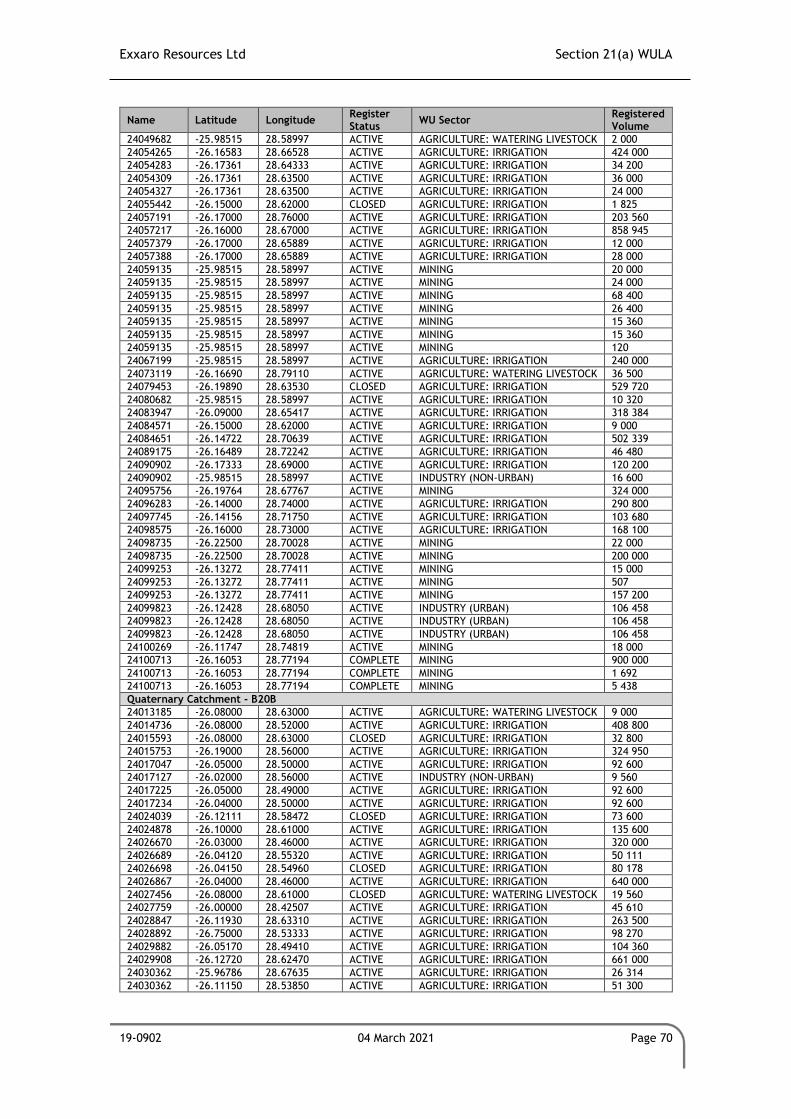
Exxaro Resources Ltd Section 21(a) WULA
19-0902 04 March 2021 Page 70
Name Latitude Longitude Register Status
WU Sector Registered Volume
24049682 -25.98515 28.58997 ACTIVE AGRICULTURE: WATERING LIVESTOCK 2 000
24054265 -26.16583 28.66528 ACTIVE AGRICULTURE: IRRIGATION 424 000
24054283 -26.17361 28.64333 ACTIVE AGRICULTURE: IRRIGATION 34 200
24054309 -26.17361 28.63500 ACTIVE AGRICULTURE: IRRIGATION 36 000
24054327 -26.17361 28.63500 ACTIVE AGRICULTURE: IRRIGATION 24 000
24055442 -26.15000 28.62000 CLOSED AGRICULTURE: IRRIGATION 1 825
24057191 -26.17000 28.76000 ACTIVE AGRICULTURE: IRRIGATION 203 560
24057217 -26.16000 28.67000 ACTIVE AGRICULTURE: IRRIGATION 858 945
24057379 -26.17000 28.65889 ACTIVE AGRICULTURE: IRRIGATION 12 000
24057388 -26.17000 28.65889 ACTIVE AGRICULTURE: IRRIGATION 28 000
24059135 -25.98515 28.58997 ACTIVE MINING 20 000
24059135 -25.98515 28.58997 ACTIVE MINING 24 000
24059135 -25.98515 28.58997 ACTIVE MINING 68 400
24059135 -25.98515 28.58997 ACTIVE MINING 26 400
24059135 -25.98515 28.58997 ACTIVE MINING 15 360
24059135 -25.98515 28.58997 ACTIVE MINING 15 360
24059135 -25.98515 28.58997 ACTIVE MINING 120
24067199 -25.98515 28.58997 ACTIVE AGRICULTURE: IRRIGATION 240 000
24073119 -26.16690 28.79110 ACTIVE AGRICULTURE: WATERING LIVESTOCK 36 500
24079453 -26.19890 28.63530 CLOSED AGRICULTURE: IRRIGATION 529 720
24080682 -25.98515 28.58997 ACTIVE AGRICULTURE: IRRIGATION 10 320
24083947 -26.09000 28.65417 ACTIVE AGRICULTURE: IRRIGATION 318 384
24084571 -26.15000 28.62000 ACTIVE AGRICULTURE: IRRIGATION 9 000
24084651 -26.14722 28.70639 ACTIVE AGRICULTURE: IRRIGATION 502 339
24089175 -26.16489 28.72242 ACTIVE AGRICULTURE: IRRIGATION 46 480
24090902 -26.17333 28.69000 ACTIVE AGRICULTURE: IRRIGATION 120 200
24090902 -25.98515 28.58997 ACTIVE INDUSTRY (NON-URBAN) 16 600
24095756 -26.19764 28.67767 ACTIVE MINING 324 000
24096283 -26.14000 28.74000 ACTIVE AGRICULTURE: IRRIGATION 290 800
24097745 -26.14156 28.71750 ACTIVE AGRICULTURE: IRRIGATION 103 680
24098575 -26.16000 28.73000 ACTIVE AGRICULTURE: IRRIGATION 168 100
24098735 -26.22500 28.70028 ACTIVE MINING 22 000
24098735 -26.22500 28.70028 ACTIVE MINING 200 000
24099253 -26.13272 28.77411 ACTIVE MINING 15 000
24099253 -26.13272 28.77411 ACTIVE MINING 507
24099253 -26.13272 28.77411 ACTIVE MINING 157 200
24099823 -26.12428 28.68050 ACTIVE INDUSTRY (URBAN) 106 458
24099823 -26.12428 28.68050 ACTIVE INDUSTRY (URBAN) 106 458
24099823 -26.12428 28.68050 ACTIVE INDUSTRY (URBAN) 106 458
24100269 -26.11747 28.74819 ACTIVE MINING 18 000
24100713 -26.16053 28.77194 COMPLETE MINING 900 000
24100713 -26.16053 28.77194 COMPLETE MINING 1 692
24100713 -26.16053 28.77194 COMPLETE MINING 5 438
Quaternary Catchment - B20B
24013185 -26.08000 28.63000 ACTIVE AGRICULTURE: WATERING LIVESTOCK 9 000
24014736 -26.08000 28.52000 ACTIVE AGRICULTURE: IRRIGATION 408 800
24015593 -26.08000 28.63000 CLOSED AGRICULTURE: IRRIGATION 32 800
24015753 -26.19000 28.56000 ACTIVE AGRICULTURE: IRRIGATION 324 950
24017047 -26.05000 28.50000 ACTIVE AGRICULTURE: IRRIGATION 92 600
24017127 -26.02000 28.56000 ACTIVE INDUSTRY (NON-URBAN) 9 560
24017225 -26.05000 28.49000 ACTIVE AGRICULTURE: IRRIGATION 92 600
24017234 -26.04000 28.50000 ACTIVE AGRICULTURE: IRRIGATION 92 600
24024039 -26.12111 28.58472 CLOSED AGRICULTURE: IRRIGATION 73 600
24024878 -26.10000 28.61000 ACTIVE AGRICULTURE: IRRIGATION 135 600
24026670 -26.03000 28.46000 ACTIVE AGRICULTURE: IRRIGATION 320 000
24026689 -26.04120 28.55320 ACTIVE AGRICULTURE: IRRIGATION 50 111
24026698 -26.04150 28.54960 CLOSED AGRICULTURE: IRRIGATION 80 178
24026867 -26.04000 28.46000 ACTIVE AGRICULTURE: IRRIGATION 640 000
24027456 -26.08000 28.61000 CLOSED AGRICULTURE: WATERING LIVESTOCK 19 560
24027759 -26.00000 28.42507 ACTIVE AGRICULTURE: IRRIGATION 45 610
24028847 -26.11930 28.63310 ACTIVE AGRICULTURE: IRRIGATION 263 500
24028892 -26.75000 28.53333 ACTIVE AGRICULTURE: IRRIGATION 98 270
24029882 -26.05170 28.49410 ACTIVE AGRICULTURE: IRRIGATION 104 360
24029908 -26.12720 28.62470 ACTIVE AGRICULTURE: IRRIGATION 661 000
24030362 -25.96786 28.67635 ACTIVE AGRICULTURE: IRRIGATION 26 314
24030362 -26.11150 28.53850 ACTIVE AGRICULTURE: IRRIGATION 51 300
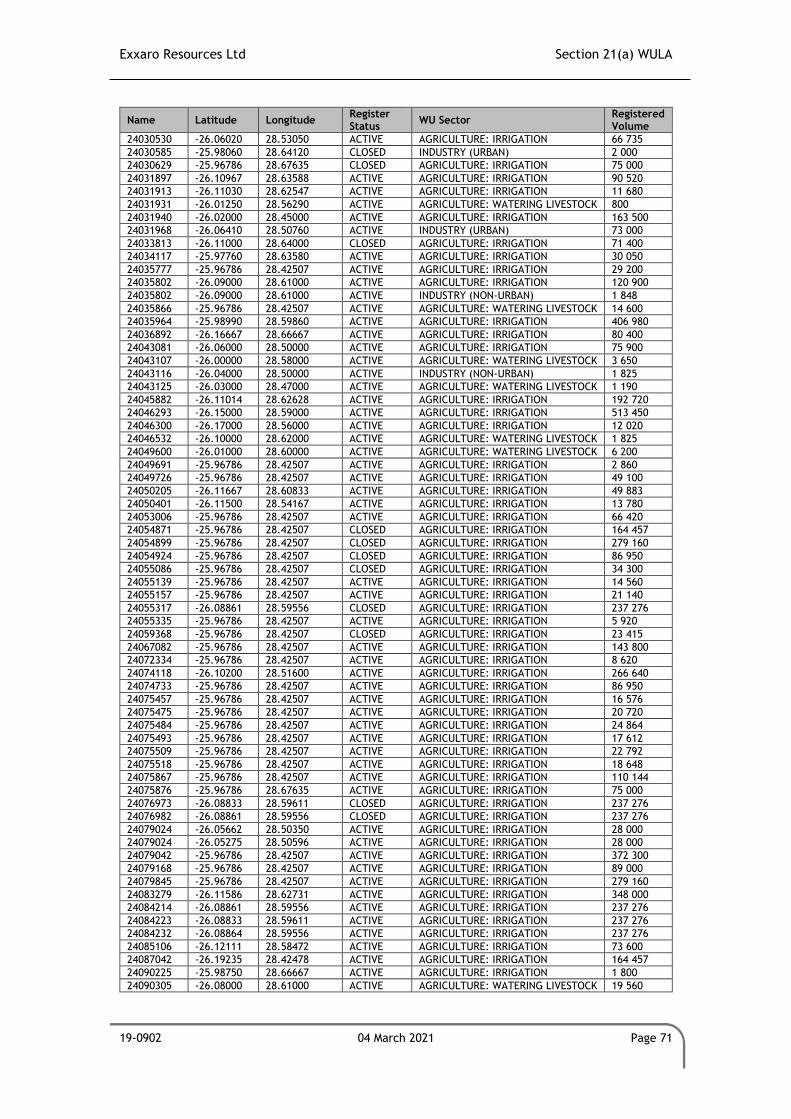
Exxaro Resources Ltd Section 21(a) WULA
19-0902 04 March 2021 Page 71
Name Latitude Longitude Register Status
WU Sector Registered Volume
24030530 -26.06020 28.53050 ACTIVE AGRICULTURE: IRRIGATION 66 735
24030585 -25.98060 28.64120 CLOSED INDUSTRY (URBAN) 2 000
24030629 -25.96786 28.67635 CLOSED AGRICULTURE: IRRIGATION 75 000
24031897 -26.10967 28.63588 ACTIVE AGRICULTURE: IRRIGATION 90 520
24031913 -26.11030 28.62547 ACTIVE AGRICULTURE: IRRIGATION 11 680
24031931 -26.01250 28.56290 ACTIVE AGRICULTURE: WATERING LIVESTOCK 800
24031940 -26.02000 28.45000 ACTIVE AGRICULTURE: IRRIGATION 163 500
24031968 -26.06410 28.50760 ACTIVE INDUSTRY (URBAN) 73 000
24033813 -26.11000 28.64000 CLOSED AGRICULTURE: IRRIGATION 71 400
24034117 -25.97760 28.63580 ACTIVE AGRICULTURE: IRRIGATION 30 050
24035777 -25.96786 28.42507 ACTIVE AGRICULTURE: IRRIGATION 29 200
24035802 -26.09000 28.61000 ACTIVE AGRICULTURE: IRRIGATION 120 900
24035802 -26.09000 28.61000 ACTIVE INDUSTRY (NON-URBAN) 1 848
24035866 -25.96786 28.42507 ACTIVE AGRICULTURE: WATERING LIVESTOCK 14 600
24035964 -25.98990 28.59860 ACTIVE AGRICULTURE: IRRIGATION 406 980
24036892 -26.16667 28.66667 ACTIVE AGRICULTURE: IRRIGATION 80 400
24043081 -26.06000 28.50000 ACTIVE AGRICULTURE: IRRIGATION 75 900
24043107 -26.00000 28.58000 ACTIVE AGRICULTURE: WATERING LIVESTOCK 3 650
24043116 -26.04000 28.50000 ACTIVE INDUSTRY (NON-URBAN) 1 825
24043125 -26.03000 28.47000 ACTIVE AGRICULTURE: WATERING LIVESTOCK 1 190
24045882 -26.11014 28.62628 ACTIVE AGRICULTURE: IRRIGATION 192 720
24046293 -26.15000 28.59000 ACTIVE AGRICULTURE: IRRIGATION 513 450
24046300 -26.17000 28.56000 ACTIVE AGRICULTURE: IRRIGATION 12 020
24046532 -26.10000 28.62000 ACTIVE AGRICULTURE: WATERING LIVESTOCK 1 825
24049600 -26.01000 28.60000 ACTIVE AGRICULTURE: WATERING LIVESTOCK 6 200
24049691 -25.96786 28.42507 ACTIVE AGRICULTURE: IRRIGATION 2 860
24049726 -25.96786 28.42507 ACTIVE AGRICULTURE: IRRIGATION 49 100
24050205 -26.11667 28.60833 ACTIVE AGRICULTURE: IRRIGATION 49 883
24050401 -26.11500 28.54167 ACTIVE AGRICULTURE: IRRIGATION 13 780
24053006 -25.96786 28.42507 ACTIVE AGRICULTURE: IRRIGATION 66 420
24054871 -25.96786 28.42507 CLOSED AGRICULTURE: IRRIGATION 164 457
24054899 -25.96786 28.42507 CLOSED AGRICULTURE: IRRIGATION 279 160
24054924 -25.96786 28.42507 CLOSED AGRICULTURE: IRRIGATION 86 950
24055086 -25.96786 28.42507 CLOSED AGRICULTURE: IRRIGATION 34 300
24055139 -25.96786 28.42507 ACTIVE AGRICULTURE: IRRIGATION 14 560
24055157 -25.96786 28.42507 ACTIVE AGRICULTURE: IRRIGATION 21 140
24055317 -26.08861 28.59556 CLOSED AGRICULTURE: IRRIGATION 237 276
24055335 -25.96786 28.42507 ACTIVE AGRICULTURE: IRRIGATION 5 920
24059368 -25.96786 28.42507 CLOSED AGRICULTURE: IRRIGATION 23 415
24067082 -25.96786 28.42507 ACTIVE AGRICULTURE: IRRIGATION 143 800
24072334 -25.96786 28.42507 ACTIVE AGRICULTURE: IRRIGATION 8 620
24074118 -26.10200 28.51600 ACTIVE AGRICULTURE: IRRIGATION 266 640
24074733 -25.96786 28.42507 ACTIVE AGRICULTURE: IRRIGATION 86 950
24075457 -25.96786 28.42507 ACTIVE AGRICULTURE: IRRIGATION 16 576
24075475 -25.96786 28.42507 ACTIVE AGRICULTURE: IRRIGATION 20 720
24075484 -25.96786 28.42507 ACTIVE AGRICULTURE: IRRIGATION 24 864
24075493 -25.96786 28.42507 ACTIVE AGRICULTURE: IRRIGATION 17 612
24075509 -25.96786 28.42507 ACTIVE AGRICULTURE: IRRIGATION 22 792
24075518 -25.96786 28.42507 ACTIVE AGRICULTURE: IRRIGATION 18 648
24075867 -25.96786 28.42507 ACTIVE AGRICULTURE: IRRIGATION 110 144
24075876 -25.96786 28.67635 ACTIVE AGRICULTURE: IRRIGATION 75 000
24076973 -26.08833 28.59611 CLOSED AGRICULTURE: IRRIGATION 237 276
24076982 -26.08861 28.59556 CLOSED AGRICULTURE: IRRIGATION 237 276
24079024 -26.05662 28.50350 ACTIVE AGRICULTURE: IRRIGATION 28 000
24079024 -26.05275 28.50596 ACTIVE AGRICULTURE: IRRIGATION 28 000
24079042 -25.96786 28.42507 ACTIVE AGRICULTURE: IRRIGATION 372 300
24079168 -25.96786 28.42507 ACTIVE AGRICULTURE: IRRIGATION 89 000
24079845 -25.96786 28.42507 ACTIVE AGRICULTURE: IRRIGATION 279 160
24083279 -26.11586 28.62731 ACTIVE AGRICULTURE: IRRIGATION 348 000
24084214 -26.08861 28.59556 ACTIVE AGRICULTURE: IRRIGATION 237 276
24084223 -26.08833 28.59611 ACTIVE AGRICULTURE: IRRIGATION 237 276
24084232 -26.08864 28.59556 ACTIVE AGRICULTURE: IRRIGATION 237 276
24085106 -26.12111 28.58472 ACTIVE AGRICULTURE: IRRIGATION 73 600
24087042 -26.19235 28.42478 ACTIVE AGRICULTURE: IRRIGATION 164 457
24090225 -25.98750 28.66667 ACTIVE AGRICULTURE: IRRIGATION 1 800
24090305 -26.08000 28.61000 ACTIVE AGRICULTURE: WATERING LIVESTOCK 19 560
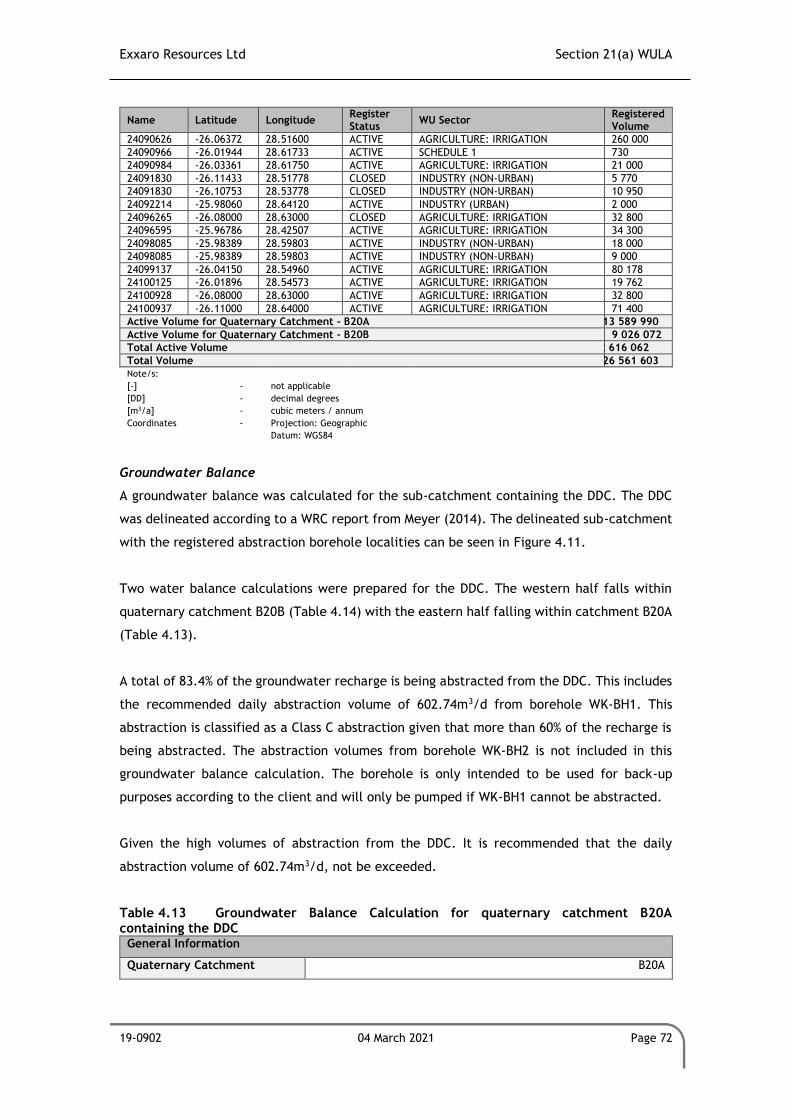
Exxaro Resources Ltd Section 21(a) WULA
19-0902 04 March 2021 Page 72
Name Latitude Longitude Register Status
WU Sector Registered Volume
24090626 -26.06372 28.51600 ACTIVE AGRICULTURE: IRRIGATION 260 000
24090966 -26.01944 28.61733 ACTIVE SCHEDULE 1 730
24090984 -26.03361 28.61750 ACTIVE AGRICULTURE: IRRIGATION 21 000
24091830 -26.11433 28.51778 CLOSED INDUSTRY (NON-URBAN) 5 770
24091830 -26.10753 28.53778 CLOSED INDUSTRY (NON-URBAN) 10 950
24092214 -25.98060 28.64120 ACTIVE INDUSTRY (URBAN) 2 000
24096265 -26.08000 28.63000 CLOSED AGRICULTURE: IRRIGATION 32 800
24096595 -25.96786 28.42507 ACTIVE AGRICULTURE: IRRIGATION 34 300
24098085 -25.98389 28.59803 ACTIVE INDUSTRY (NON-URBAN) 18 000
24098085 -25.98389 28.59803 ACTIVE INDUSTRY (NON-URBAN) 9 000
24099137 -26.04150 28.54960 ACTIVE AGRICULTURE: IRRIGATION 80 178
24100125 -26.01896 28.54573 ACTIVE AGRICULTURE: IRRIGATION 19 762
24100928 -26.08000 28.63000 ACTIVE AGRICULTURE: IRRIGATION 32 800
24100937 -26.11000 28.64000 ACTIVE AGRICULTURE: IRRIGATION 71 400
Active Volume for Quaternary Catchment - B20A 13 589 990
Active Volume for Quaternary Catchment - B20B 9 026 072
Total Active Volume 22 616 062
Total Volume 26 561 603
Note/s: [-] - not applicable [DD] - decimal degrees [m3/a] - cubic meters / annum Coordinates - Projection: Geographic Datum: WGS84
Groundwater Balance
A groundwater balance was calculated for the sub-catchment containing the DDC. The DDC
was delineated according to a WRC report from Meyer (2014). The delineated sub-catchment
with the registered abstraction borehole localities can be seen in Figure 4.11.
Two water balance calculations were prepared for the DDC. The western half falls within
quaternary catchment B20B (Table 4.14) with the eastern half falling within catchment B20A
(Table 4.13).
A total of 83.4% of the groundwater recharge is being abstracted from the DDC. This includes
the recommended daily abstraction volume of 602.74m3/d from borehole WK-BH1. This
abstraction is classified as a Class C abstraction given that more than 60% of the recharge is
being abstracted. The abstraction volumes from borehole WK-BH2 is not included in this
groundwater balance calculation. The borehole is only intended to be used for back-up
purposes according to the client and will only be pumped if WK-BH1 cannot be abstracted.
Given the high volumes of abstraction from the DDC. It is recommended that the daily
abstraction volume of 602.74m3/d, not be exceeded.
Table 4.13 Groundwater Balance Calculation for quaternary catchment B20A containing the DDC
General Information
Quaternary Catchment B20A
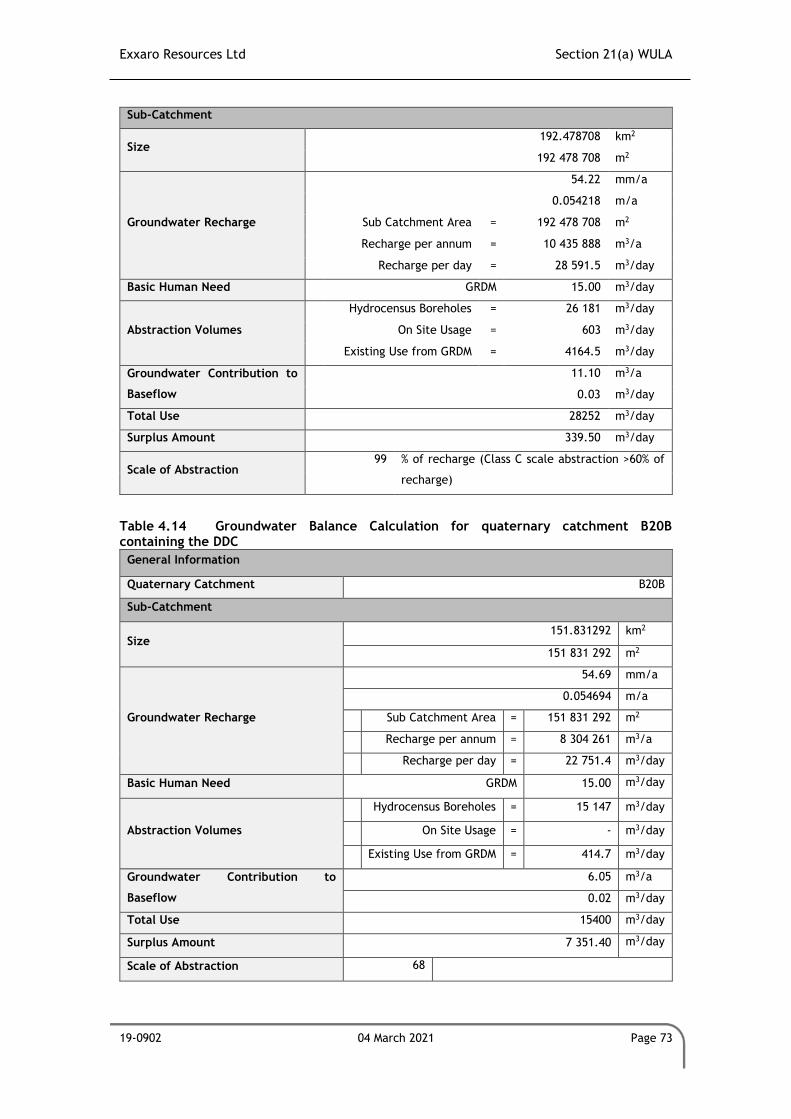
Exxaro Resources Ltd Section 21(a) WULA
19-0902 04 March 2021 Page 73
Sub-Catchment
Size 192.478708 km2
192 478 708 m2
Groundwater Recharge
54.22 mm/a
0.054218 m/a
Sub Catchment Area = 192 478 708 m2
Recharge per annum = 10 435 888 m3/a
Recharge per day = 28 591.5 m3/day
Basic Human Need GRDM 15.00 m3/day
Abstraction Volumes
Hydrocensus Boreholes = 26 181 m3/day
On Site Usage = 603 m3/day
Existing Use from GRDM = 4164.5 m3/day
Groundwater Contribution to
Baseflow
11.10 m3/a
0.03 m3/day
Total Use 28252 m3/day
Surplus Amount 339.50 m3/day
Scale of Abstraction 99 % of recharge (Class C scale abstraction >60% of
recharge)
Table 4.14 Groundwater Balance Calculation for quaternary catchment B20B containing the DDC
General Information
Quaternary Catchment B20B
Sub-Catchment
Size 151.831292 km2
151 831 292 m2
Groundwater Recharge
54.69 mm/a
0.054694 m/a
Sub Catchment Area = 151 831 292 m2
Recharge per annum = 8 304 261 m3/a
Recharge per day = 22 751.4 m3/day
Basic Human Need GRDM 15.00 m3/day
Abstraction Volumes
Hydrocensus Boreholes = 15 147 m3/day
On Site Usage = - m3/day
Existing Use from GRDM = 414.7 m3/day
Groundwater Contribution to
Baseflow
6.05 m3/a
0.02 m3/day
Total Use 15400 m3/day
Surplus Amount 7 351.40 m3/day
Scale of Abstraction 68
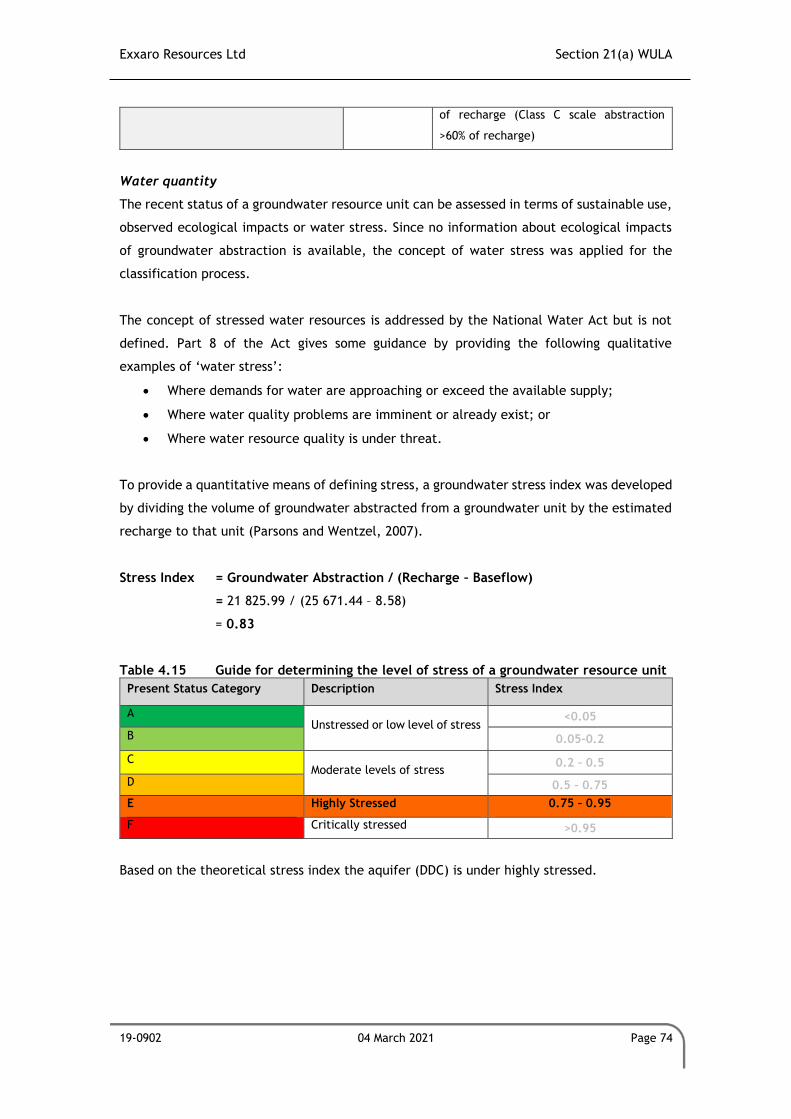
Exxaro Resources Ltd Section 21(a) WULA
19-0902 04 March 2021 Page 74
of recharge (Class C scale abstraction
>60% of recharge)
Water quantity
The recent status of a groundwater resource unit can be assessed in terms of sustainable use,
observed ecological impacts or water stress. Since no information about ecological impacts
of groundwater abstraction is available, the concept of water stress was applied for the
classification process.
The concept of stressed water resources is addressed by the National Water Act but is not
defined. Part 8 of the Act gives some guidance by providing the following qualitative
examples of ‘water stress’:
• Where demands for water are approaching or exceed the available supply;
• Where water quality problems are imminent or already exist; or
• Where water resource quality is under threat.
To provide a quantitative means of defining stress, a groundwater stress index was developed
by dividing the volume of groundwater abstracted from a groundwater unit by the estimated
recharge to that unit (Parsons and Wentzel, 2007).
Stress Index = Groundwater Abstraction / (Recharge – Baseflow)
= 21 825.99 / (25 671.44 – 8.58)
= 0.83
Table 4.15 Guide for determining the level of stress of a groundwater resource unit
Present Status Category Description Stress Index
A Unstressed or low level of stress
<0.05
B 0.05-0.2
C Moderate levels of stress
0.2 – 0.5
D 0.5 – 0.75
E Highly Stressed 0.75 – 0.95
F Critically stressed >0.95
Based on the theoretical stress index the aquifer (DDC) is under highly stressed.
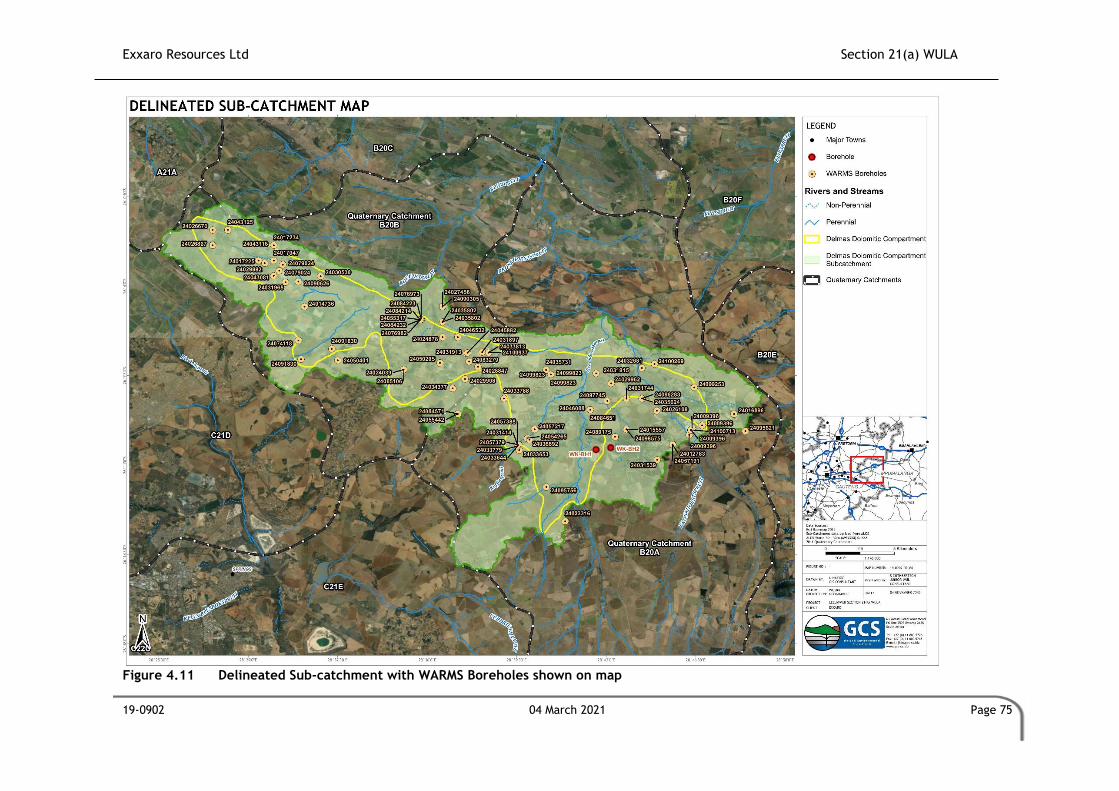
Exxaro Resources Ltd Section 21(a) WULA
19-0902 04 March 2021 Page 75
Figure 4.11 Delineated Sub-catchment with WARMS Boreholes shown on map
Exxaro Resources Ltd Section 21(a) WULA
19-0902 04 March 2021 Page 76
4.3.4 Potential Pollution Source Identification
Potential sources of groundwater pollution are present at Leeuwpan, as at any coal mining
operation, due to the nature of the activity but is being managed. The pollution of
groundwater is very likely in the event should water storage facilities not be adequately lined
to prevent any ingress of dirty water into the groundwater regime. However, negative
impacts on the groundwater regime can be minimised if the commitments stipulated in the
various authorisations and licenses are adhered to.
Potential sources of groundwater pollution at Leeuwpan Coal include:
• All open pits;
• All stockpiles;
• All slimes dams, whether in use or not;
• Wash bays;
• All process water storage facilities;
• All domestic wastewater systems/installations;
• Water holding facilities associated with the Plant; and
• Evaporation dams.
4.3.5 Analytical Groundwater Model
The flow of water in an aquifer can be mathematically described by various partial difference
equations. The equations can be solved by means of a mathematical model consisting of the
applicable governing flow equation, equations describing the hydraulic head at aquifer
boundaries, and initial head conditions in the aquifer. If the aquifer is homogenous and
isotropic, and its boundaries can be described by algebraic equations, the mathematical
model can be solved by use of analytical solutions based on integral calculus (Fetter, 2014).
During abstraction from a borehole, drawdown of the head (groundwater level) within the
aquifer occurs and a cone of depression forms in the aquifer. Drawdown at a specific distance
from the well can be calculated with the use of analytical solutions. Steady groundwater flow
within a confined aquifer occurs toward the well if there is a linear gradient to the
potentiometric surface of the aquifer. The following assumptions apply (Fetter, 2014):
• The aquifer is bounded on the bottom by a confining aquifer.
• All geological formations are horizontal and have infinite horizontal extent.
• The potentiometric surface of the aquifer is horizontal prior to the start of pumping.
• The potentiometric surface of the aquifer is not changing with time prior to the start
of pumping.
• All changes in the position of the potentiometric surface are due to the effect of the
pumping well alone.
Exxaro Resources Ltd Section 21(a) WULA
19-0902 04 March 2021 Page 77
• The aquifer is homogenous and isotropic.
• All flow is radial toward the well.
• Groundwater flow is horizontal.
• Darcy’s Law is valid.
• Groundwater has a constant density and viscosity.
• The pumping wells are fully penetrating, i.e. they are screened over the entire
thickness of the aquifer.
• The pumping well has an infinitesimal radius and is 100% efficient.
Analytical modelling was conducted to assess abstraction from the production borehole WK-
BH1 and the reserve (standby) borehole WK-BH2, which intersect dolomite of the Malmani
Subgroup. It should be noted that abstraction of the boreholes was assessed independently,
i.e. the impacts of concurrent abstraction were not assessed in this study.
4.3.5.1 Aquifer Parameters
Section 4.3.1.4 describes the transmissivity values derived from the pump tests of WK-BH1
and WK-BH2. Borehole logs and data pertaining to the screened intervals of the boreholes
are not available. Therefore, the computed transmissivity could essentially be an indication
of the cumulative transmissivity of the lithologies the boreholes have likely intersected, i.e.
the Ecca Group and Dwyka Group of the Karoo Supergroup, and the Malmani Sub-group of the
Transvaal Supergroup.
To incorporate the potential influence from the Karoo aquifer and the Dwyka aquitard, the
following assumptions have been specified where applicable:
• An indicative depth of the overlying Karoo stratigraphy has been derived by assessing
the coal floor contours or mine floor contours of mine blocks in proximity to the
boreholes. These data files were provided by the client during the compilation of the
numerical hydrogeological model in previous studies;
• Available borehole logs for monitoring boreholes that intersect the Karoo aquifer
were also evaluated;
• The results of pump tests conducted for monitoring boreholes were assessed to derive
a range of hydraulic conductivity values for the Karoo aquifer;
• Indicative thickness and hydraulic conductivity values of the Dwyka aquiclude were
derived from the numerical hydrogeological model constructed and updated in recent
years for Leeuwpan Coal Mine;
• The thickness of the Malmani Subgroup intersected by the two boreholes was
estimated by subtracting the estimated thickness of the Karoo and Dwyka
stratigraphy;
Exxaro Resources Ltd Section 21(a) WULA
19-0902 04 March 2021 Page 78
• Storativity values were derived from the numerical hydrogeological model and
literature; and
• Indicative thickness, hydraulic conductivity, transmissivity and storativity values of
the Karoo, Dwyka and dolomite are provided in Table 4.16.
Table 4.16 Parameters assigned to various lithologies in the analytical equations Borehole WK-BH1
Lithology Thickness Hydraulic Conductivity (K) Storativity (S) Transmissivity (T)
[-] [m] [m/day] [-] [m2/day]
Karoo 23.40 0.30 2.00E-04 7.02
Dwyka 10.00 0.002 1.00E-05 0.02
Dolomite 44.60 7.82 2.23E-03 348.66
Cumulative Transmissivity [m2/day] 355.70
Borehole WK-BH2
Lithology Thickness Hydraulic Conductivity (K) Storativity (S) Transmissivity (T)
[-] [m] [m/day] [-] [m2/day]
Karoo 23.40 0.02 2.00E-04 0.47
Dwyka 10.00 0.002 1.00E-05 0.02
Dolomite 93.60 0.04 9.36E-04 3.41
Cumulative Transmissivity [m2/day] 3.90
4.3.5.2 Analytical Solutions
Predicted radius of influence
The maximum distance at which drawdown of groundwater levels can be detected with the
usual measuring devices in the field is defined as the Radius of Influence (Dragoni, 1998).
The radius of influence can be calculated with the following equation:
𝑅𝑜 = √(2.25𝑥𝑇𝑥𝑡
𝑆)
Where, (Equation 1)
Ro is the radius of influence (m)
T is the aquifer transmissivity (m2/day)
t is time (day)
S is the storativity
The Radius of Influence (Ro) calculated for the two boreholes are presented in Table 4.17.
The Radius of Influence is significantly larger for WK-BH1 than WK-BH2 due to a much higher
(two-orders) transmissivity at WK-BH1. However, the Ro of WK-BH1 is largely constrained to
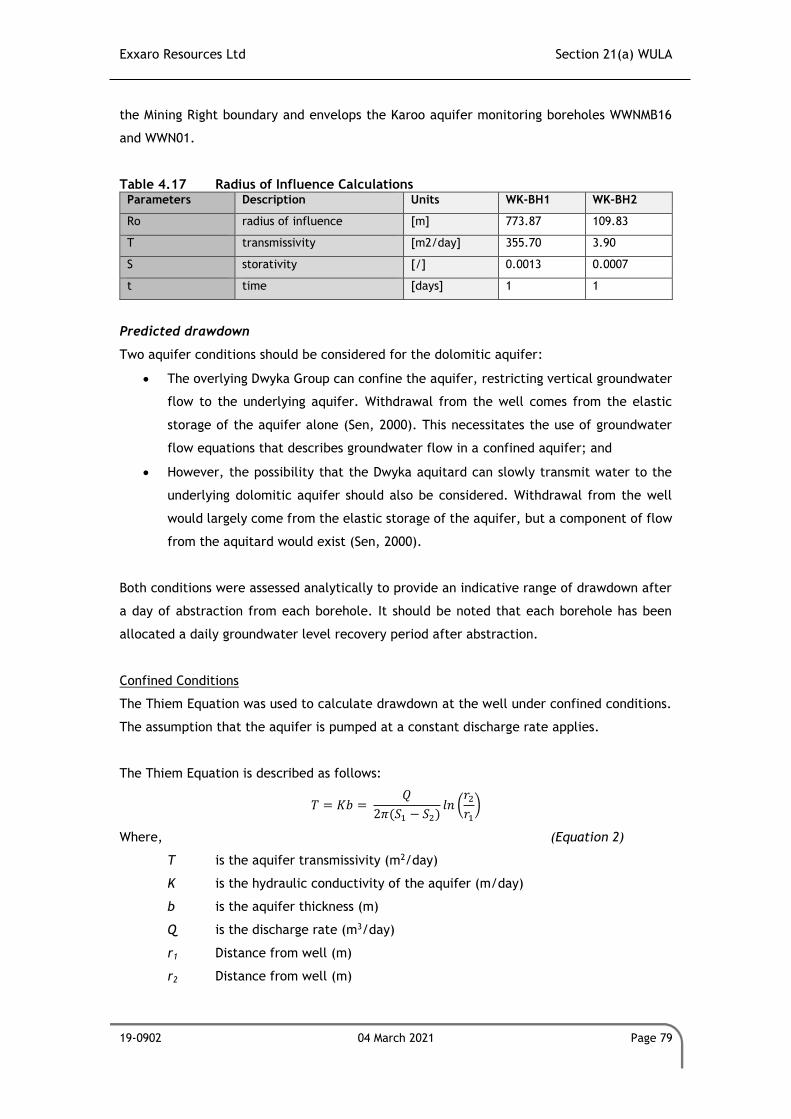
Exxaro Resources Ltd Section 21(a) WULA
19-0902 04 March 2021 Page 79
the Mining Right boundary and envelops the Karoo aquifer monitoring boreholes WWNMB16
and WWN01.
Table 4.17 Radius of Influence Calculations Parameters Description Units WK-BH1 WK-BH2
Ro radius of influence [m] 773.87 109.83
T transmissivity [m2/day] 355.70 3.90
S storativity [/] 0.0013 0.0007
t time [days] 1 1
Predicted drawdown
Two aquifer conditions should be considered for the dolomitic aquifer:
• The overlying Dwyka Group can confine the aquifer, restricting vertical groundwater
flow to the underlying aquifer. Withdrawal from the well comes from the elastic
storage of the aquifer alone (Sen, 2000). This necessitates the use of groundwater
flow equations that describes groundwater flow in a confined aquifer; and
• However, the possibility that the Dwyka aquitard can slowly transmit water to the
underlying dolomitic aquifer should also be considered. Withdrawal from the well
would largely come from the elastic storage of the aquifer, but a component of flow
from the aquitard would exist (Sen, 2000).
Both conditions were assessed analytically to provide an indicative range of drawdown after
a day of abstraction from each borehole. It should be noted that each borehole has been
allocated a daily groundwater level recovery period after abstraction.
Confined Conditions
The Thiem Equation was used to calculate drawdown at the well under confined conditions.
The assumption that the aquifer is pumped at a constant discharge rate applies.
The Thiem Equation is described as follows:
𝑇 = 𝐾𝑏 = 𝑄
2𝜋(𝑆1 − 𝑆2)𝑙𝑛 (
𝑟2
𝑟1
)
Where, (Equation 2)
T is the aquifer transmissivity (m2/day)
K is the hydraulic conductivity of the aquifer (m/day)
b is the aquifer thickness (m)
Q is the discharge rate (m3/day)
r1 Distance from well (m)
r2 Distance from well (m)
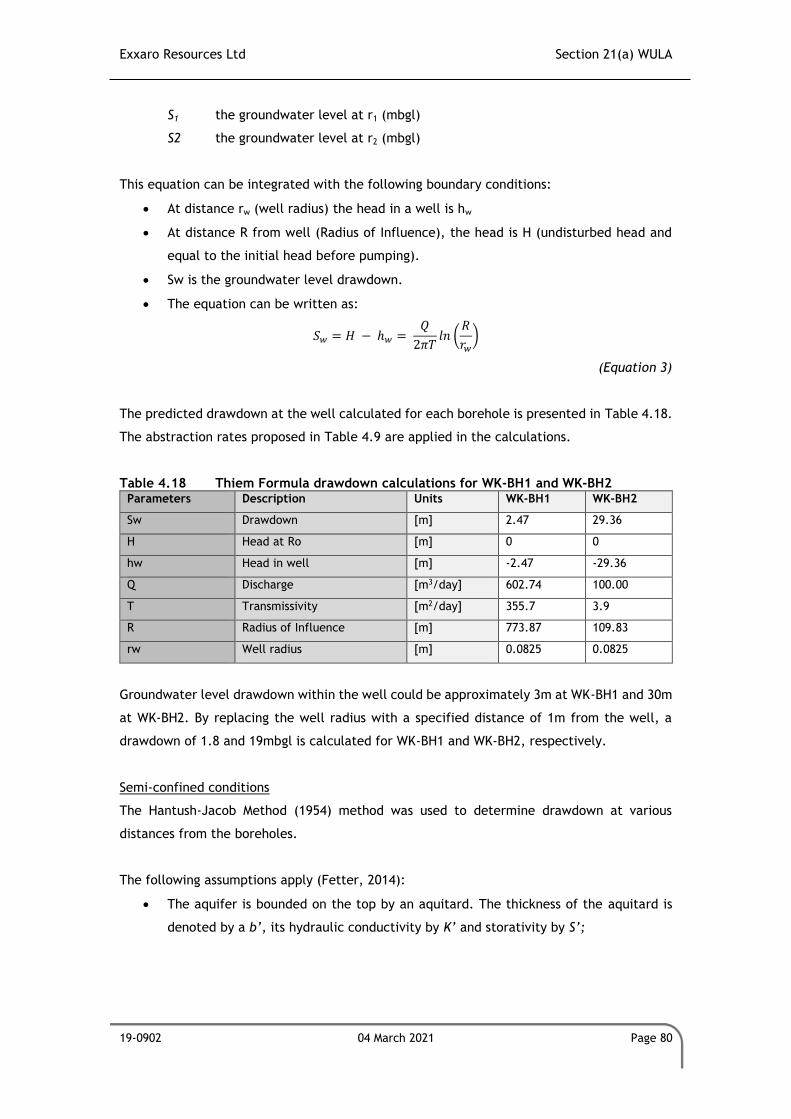
Exxaro Resources Ltd Section 21(a) WULA
19-0902 04 March 2021 Page 80
S1 the groundwater level at r1 (mbgl)
S2 the groundwater level at r2 (mbgl)
This equation can be integrated with the following boundary conditions:
• At distance rw (well radius) the head in a well is hw
• At distance R from well (Radius of Influence), the head is H (undisturbed head and
equal to the initial head before pumping).
• Sw is the groundwater level drawdown.
• The equation can be written as:
𝑆𝑤 = 𝐻 − ℎ𝑤 = 𝑄
2𝜋𝑇𝑙𝑛 (
𝑅
𝑟𝑤
)
(Equation 3)
The predicted drawdown at the well calculated for each borehole is presented in Table 4.18.
The abstraction rates proposed in Table 4.9 are applied in the calculations.
Table 4.18 Thiem Formula drawdown calculations for WK-BH1 and WK-BH2 Parameters Description Units WK-BH1 WK-BH2
Sw Drawdown [m] 2.47 29.36
H Head at Ro [m] 0 0
hw Head in well [m] -2.47 -29.36
Q Discharge [m3/day] 602.74 100.00
T Transmissivity [m2/day] 355.7 3.9
R Radius of Influence [m] 773.87 109.83
rw Well radius [m] 0.0825 0.0825
Groundwater level drawdown within the well could be approximately 3m at WK-BH1 and 30m
at WK-BH2. By replacing the well radius with a specified distance of 1m from the well, a
drawdown of 1.8 and 19mbgl is calculated for WK-BH1 and WK-BH2, respectively.
Semi-confined conditions
The Hantush-Jacob Method (1954) method was used to determine drawdown at various
distances from the boreholes.
The following assumptions apply (Fetter, 2014):
• The aquifer is bounded on the top by an aquitard. The thickness of the aquitard is
denoted by a b’, its hydraulic conductivity by K’ and storativity by S’;
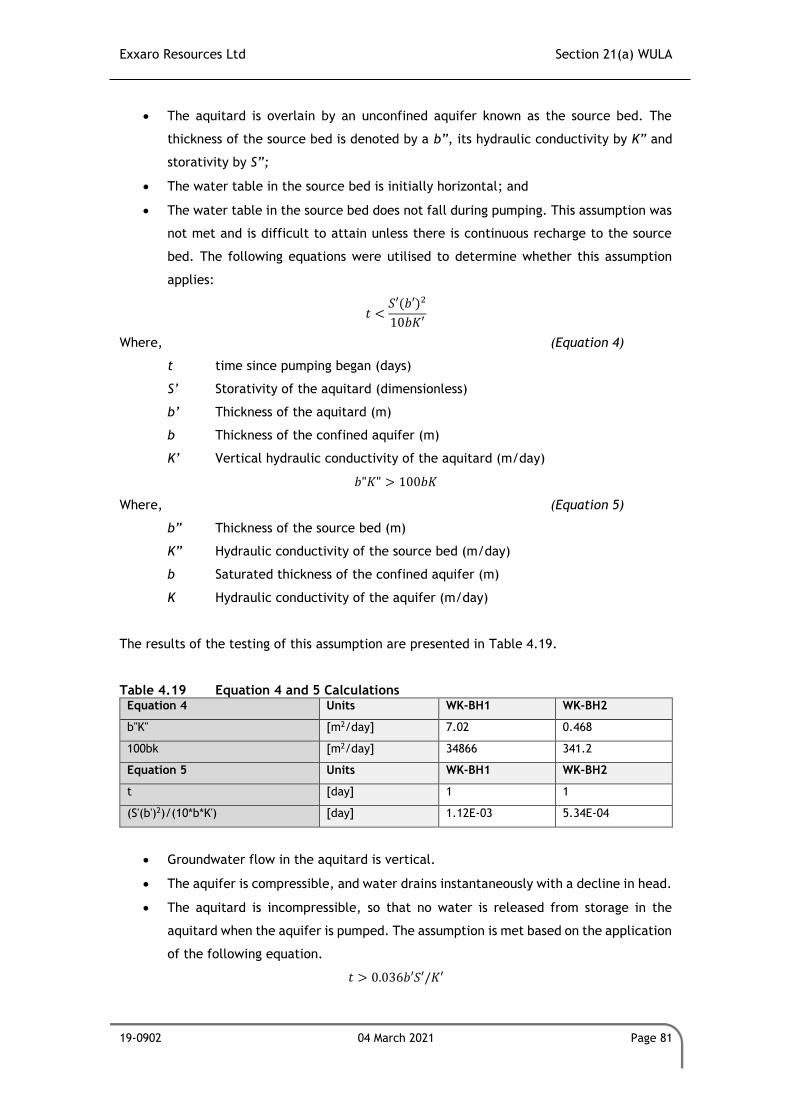
Exxaro Resources Ltd Section 21(a) WULA
19-0902 04 March 2021 Page 81
• The aquitard is overlain by an unconfined aquifer known as the source bed. The
thickness of the source bed is denoted by a b”, its hydraulic conductivity by K” and
storativity by S”;
• The water table in the source bed is initially horizontal; and
• The water table in the source bed does not fall during pumping. This assumption was
not met and is difficult to attain unless there is continuous recharge to the source
bed. The following equations were utilised to determine whether this assumption
applies:
𝑡 <𝑆′(𝑏′)2
10𝑏𝐾′
Where, (Equation 4)
t time since pumping began (days)
S’ Storativity of the aquitard (dimensionless)
b’ Thickness of the aquitard (m)
b Thickness of the confined aquifer (m)
K’ Vertical hydraulic conductivity of the aquitard (m/day)
𝑏"𝐾" > 100𝑏𝐾
Where, (Equation 5)
b” Thickness of the source bed (m)
K” Hydraulic conductivity of the source bed (m/day)
b Saturated thickness of the confined aquifer (m)
K Hydraulic conductivity of the aquifer (m/day)
The results of the testing of this assumption are presented in Table 4.19.
Table 4.19 Equation 4 and 5 Calculations Equation 4 Units WK-BH1 WK-BH2
b"K" [m2/day] 7.02 0.468
100bk [m2/day] 34866 341.2
Equation 5 Units WK-BH1 WK-BH2
t [day] 1 1
(S'(b')2)/(10*b*K') [day] 1.12E-03 5.34E-04
• Groundwater flow in the aquitard is vertical.
• The aquifer is compressible, and water drains instantaneously with a decline in head.
• The aquitard is incompressible, so that no water is released from storage in the
aquitard when the aquifer is pumped. The assumption is met based on the application
of the following equation.
𝑡 > 0.036𝑏′𝑆′/𝐾′
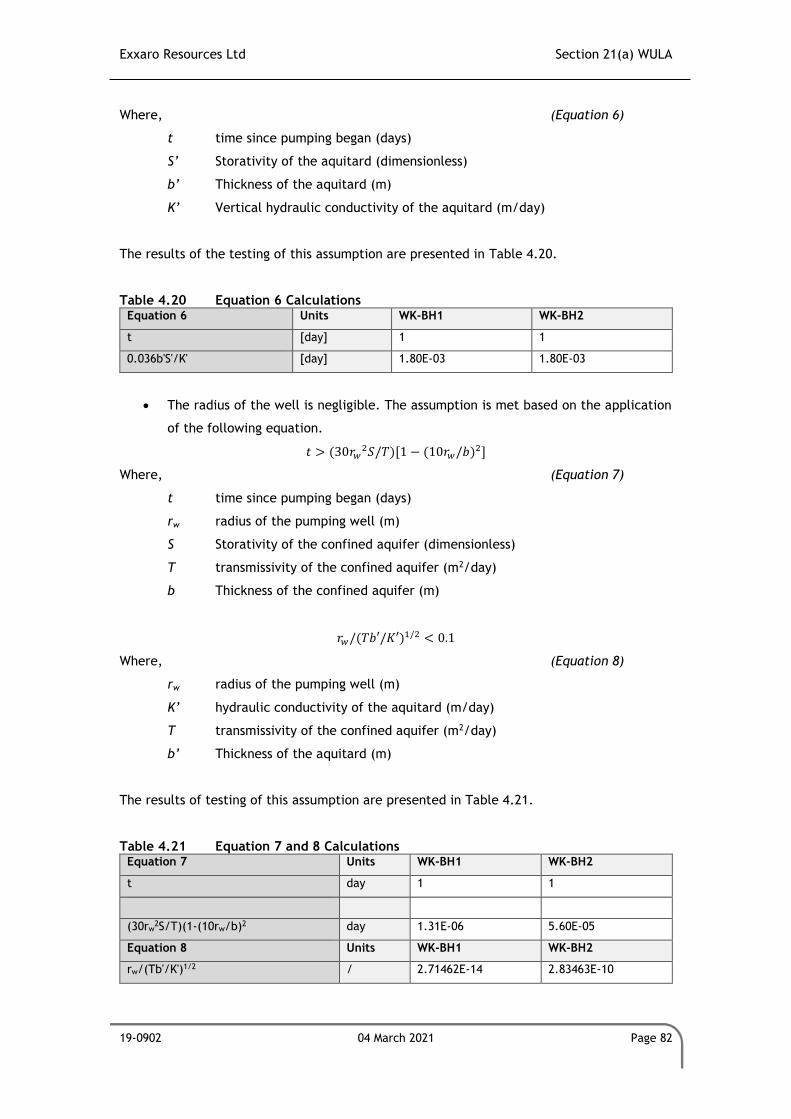
Exxaro Resources Ltd Section 21(a) WULA
19-0902 04 March 2021 Page 82
Where, (Equation 6)
t time since pumping began (days)
S’ Storativity of the aquitard (dimensionless)
b’ Thickness of the aquitard (m)
K’ Vertical hydraulic conductivity of the aquitard (m/day)
The results of the testing of this assumption are presented in Table 4.20.
Table 4.20 Equation 6 Calculations Equation 6 Units WK-BH1 WK-BH2
t [day] 1 1
0.036b'S'/K' [day] 1.80E-03 1.80E-03
• The radius of the well is negligible. The assumption is met based on the application
of the following equation.
𝑡 > (30𝑟𝑤2𝑆/𝑇)[1 − (10𝑟𝑤/𝑏)2]
Where, (Equation 7)
t time since pumping began (days)
rw radius of the pumping well (m)
S Storativity of the confined aquifer (dimensionless)
T transmissivity of the confined aquifer (m2/day)
b Thickness of the confined aquifer (m)
𝑟𝑤/(𝑇𝑏′/𝐾′)1/2 < 0.1
Where, (Equation 8)
rw radius of the pumping well (m)
K’ hydraulic conductivity of the aquitard (m/day)
T transmissivity of the confined aquifer (m2/day)
b’ Thickness of the aquitard (m)
The results of testing of this assumption are presented in Table 4.21.
Table 4.21 Equation 7 and 8 Calculations Equation 7 Units WK-BH1 WK-BH2
t day 1 1
(30rw2S/T)(1-(10rw/b)2 day 1.31E-06 5.60E-05
Equation 8 Units WK-BH1 WK-BH2
rw/(Tb'/K')1/2 / 2.71462E-14 2.83463E-10
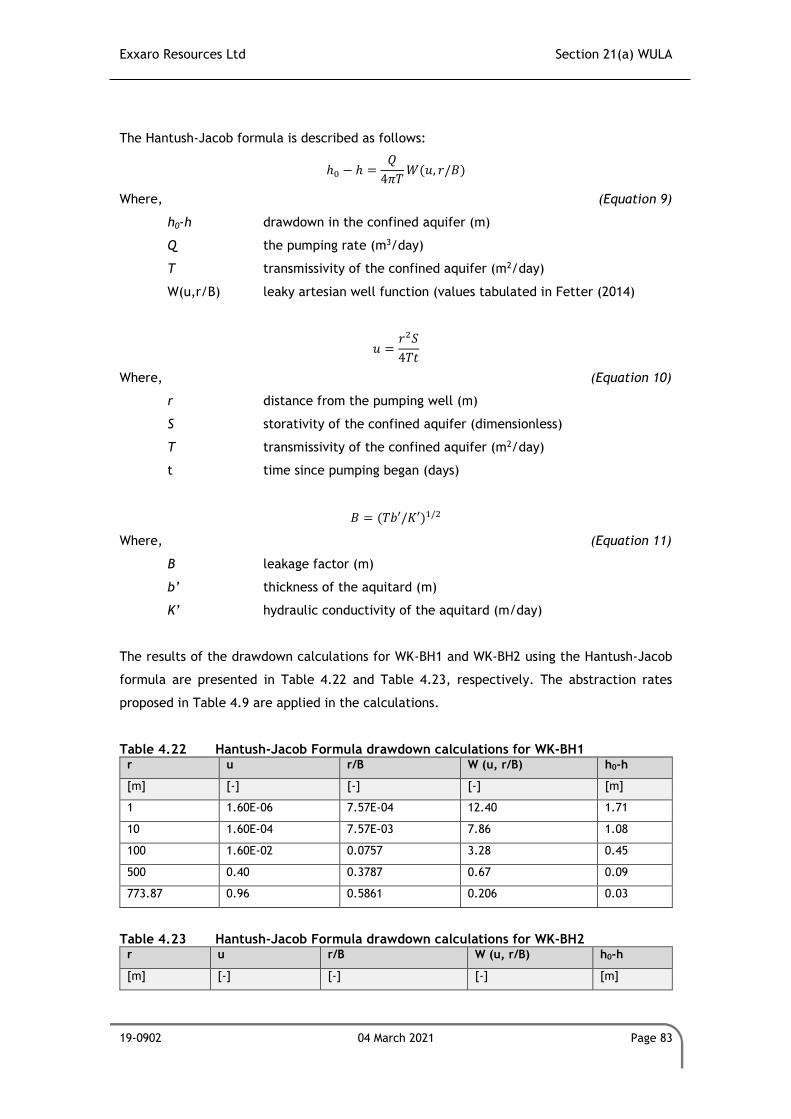
Exxaro Resources Ltd Section 21(a) WULA
19-0902 04 March 2021 Page 83
The Hantush-Jacob formula is described as follows:
ℎ0 − ℎ =𝑄
4𝜋𝑇𝑊(𝑢, 𝑟/𝐵)
Where, (Equation 9)
h0-h drawdown in the confined aquifer (m)
Q the pumping rate (m3/day)
T transmissivity of the confined aquifer (m2/day)
W(u,r/B) leaky artesian well function (values tabulated in Fetter (2014)
𝑢 =𝑟2𝑆
4𝑇𝑡
Where, (Equation 10)
r distance from the pumping well (m)
S storativity of the confined aquifer (dimensionless)
T transmissivity of the confined aquifer (m2/day)
t time since pumping began (days)
𝐵 = (𝑇𝑏′/𝐾′)1/2
Where, (Equation 11)
B leakage factor (m)
b’ thickness of the aquitard (m)
K’ hydraulic conductivity of the aquitard (m/day)
The results of the drawdown calculations for WK-BH1 and WK-BH2 using the Hantush-Jacob
formula are presented in Table 4.22 and Table 4.23, respectively. The abstraction rates
proposed in Table 4.9 are applied in the calculations.
Table 4.22 Hantush-Jacob Formula drawdown calculations for WK-BH1 r u r/B W (u, r/B) h0-h
[m] [-] [-] [-] [m]
1 1.60E-06 7.57E-04 12.40 1.71
10 1.60E-04 7.57E-03 7.86 1.08
100 1.60E-02 0.0757 3.28 0.45
500 0.40 0.3787 0.67 0.09
773.87 0.96 0.5861 0.206 0.03
Table 4.23 Hantush-Jacob Formula drawdown calculations for WK-BH2 r u r/B W (u, r/B) h0-h
[m] [-] [-] [-] [m]
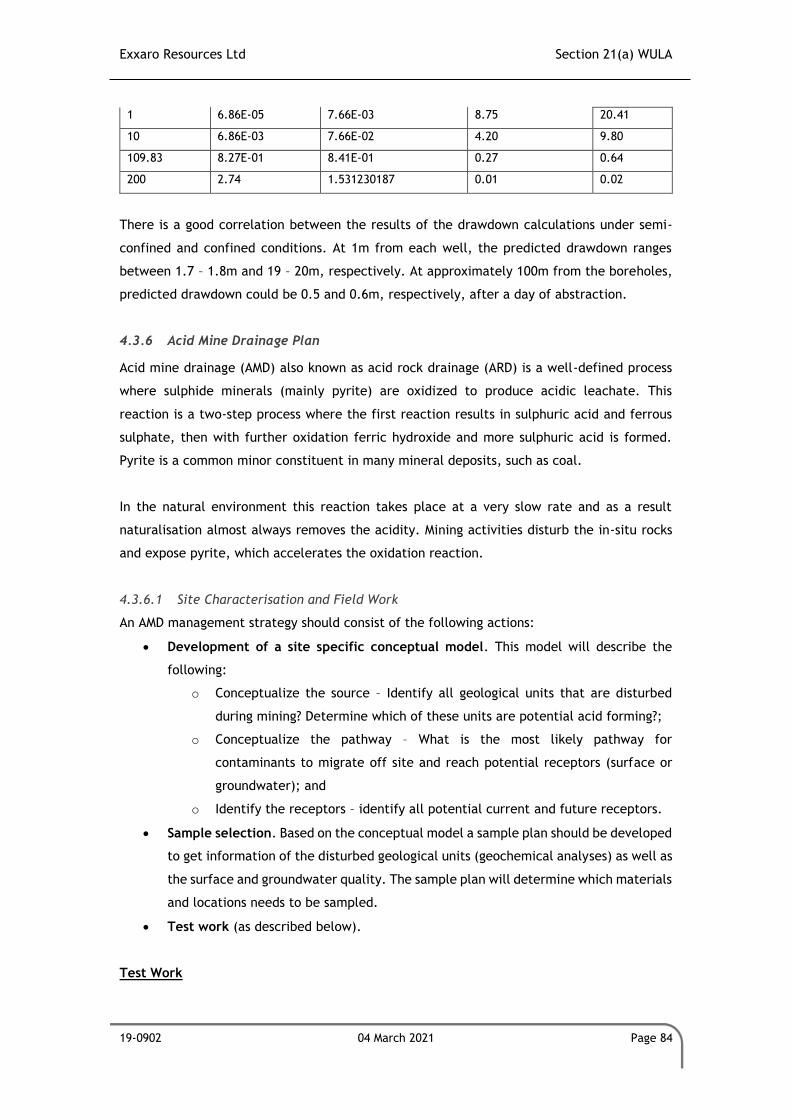
Exxaro Resources Ltd Section 21(a) WULA
19-0902 04 March 2021 Page 84
1 6.86E-05 7.66E-03 8.75 20.41
10 6.86E-03 7.66E-02 4.20 9.80
109.83 8.27E-01 8.41E-01 0.27 0.64
200 2.74 1.531230187 0.01 0.02
There is a good correlation between the results of the drawdown calculations under semi-
confined and confined conditions. At 1m from each well, the predicted drawdown ranges
between 1.7 – 1.8m and 19 – 20m, respectively. At approximately 100m from the boreholes,
predicted drawdown could be 0.5 and 0.6m, respectively, after a day of abstraction.
4.3.6 Acid Mine Drainage Plan
Acid mine drainage (AMD) also known as acid rock drainage (ARD) is a well-defined process
where sulphide minerals (mainly pyrite) are oxidized to produce acidic leachate. This
reaction is a two-step process where the first reaction results in sulphuric acid and ferrous
sulphate, then with further oxidation ferric hydroxide and more sulphuric acid is formed.
Pyrite is a common minor constituent in many mineral deposits, such as coal.
In the natural environment this reaction takes place at a very slow rate and as a result
naturalisation almost always removes the acidity. Mining activities disturb the in-situ rocks
and expose pyrite, which accelerates the oxidation reaction.
4.3.6.1 Site Characterisation and Field Work
An AMD management strategy should consist of the following actions:
• Development of a site specific conceptual model. This model will describe the
following:
o Conceptualize the source – Identify all geological units that are disturbed
during mining? Determine which of these units are potential acid forming?;
o Conceptualize the pathway – What is the most likely pathway for
contaminants to migrate off site and reach potential receptors (surface or
groundwater); and
o Identify the receptors – identify all potential current and future receptors.
• Sample selection. Based on the conceptual model a sample plan should be developed
to get information of the disturbed geological units (geochemical analyses) as well as
the surface and groundwater quality. The sample plan will determine which materials
and locations needs to be sampled.
• Test work (as described below).
Test Work
Exxaro Resources Ltd Section 21(a) WULA
19-0902 04 March 2021 Page 85
Geochemical test work to predict AMD consists of the following:
• Static testing, such as Acid Base Accounting (ABA). Static test gives an indication of
the overall potential that a rock sample will generate acidic leachate. It determines
the balance of acid generating and acid neutralizing capacity of a sample. This is a
relatively low-cost procedure which can be done in a matter of hours to a few days.
• Kinetic testing, such as humidity cell tests attempt to predict the quality of the
leachate over time. Rocks / samples with a net acid generating potential will be
subjected to kinetic test. Kinetic test is defined as a group of test work procedure
wherein acid generation and metal mobilization from a sample is measured over
time. These procedures could take up to 26 weeks to complete.
Field trails are set up as large-scale column leach tests on the sites – under actual field
conditions. Laboratory tests need to be converted to field conditions and the best way of
“calibrating” the lab results are with field trails.
4.3.6.2 Acid Mine Drainage Management Plan for Leeuwpan Mine
The following Acid Mine Drainage management plan has been developed for Leeuwpan Mine:
• A review of geological units that are disturbed during mining has been done. The
geological database was used to develop conceptual geochemical units of all the
disturbed lithologies.
• Geochemical units have been sampled and submitted for static test work.
• Samples from geological units that are potentially acid forming have been submitted
for kinetic test work.
• Field trails have been set up on the mine with potentially acid forming samples.
• Review all surface and groundwater chemical data with reference to acidic leachate
is done on a continuous basis.
• Once the results of the field trials are available, a geochemical report will be
produced which will make proposals for the handling and disposal of potentially acidic
materials. This report will also inform closure scenario selections for the various
mining voids.
4.4 Socio-Economic Environment
The social baseline of the Socio-Economic environment has been assessed and determined
for this application. The information in this section was taken from the ‘Victor Khanye Local
Municipality Final Integrated Development Plan 2019/20 Review’.
4.4.1 Regional Context
Mpumalanga literally means "the place where the sun rises". Mpumalanga lies in eastern South
Africa, north of KwaZulu-Natal and borders Swaziland and Mozambique. In the north it
Exxaro Resources Ltd Section 21(a) WULA
19-0902 04 March 2021 Page 86
borders on the Limpopo Province, while to the west it borders on the Gauteng Province, to
the southwest it borders on the Free State Province and to the south the KwaZulu-Natal
Province. The capital is of the Province is Mbombela (previously known as Nelspruit).
Mpumalanga Province is divided into three District Municipalities (DM), which are further
subdivided into 17 Local Municipalities (LM). The DMs for the Mpumalanga Province are
provided below:
• Gert Sibande DM;
• Nkangala DM; and
• Ehlanzeni DM.
The Nkangala DM is divided into the following LM:
• Emalahleni LM;
• Thembisile Hani LM;
• Dr JS Moroka LM;
• Steve Tshwete LM;
• Victor Khanye LM; and
• Emakhazeni LM
4.4.2 Local Context
Victor Khanye LM (formerly Delmas Local Municipality) is located in the Western Highveld of
the Nkangala DM. The Victor Khanye LM’s boasts a growing economy, with the trade sector,
agriculture and mining sector forming the cornerstones of the economy. Mining activities
within the LM are currently concentrated on coal and silica. Agriculture is, however, the main
source of employment in the area and is growing constantly.
The Victor Khanye LM consist the following main places:
• Delmas;
• Botleng;
• Delpark;
• Eloff; and
• Sundra
4.4.2.1 Demographic profile
According to Stats SA (2016 community survey), Victor Khanye municipality’s population has
grown from 75 452 to 84 151 in 5 years. This recorded a growth rate of 2.5% per annum
between 2011 and 2016. By 2030, population growth is estimated at 118 903 given the historic
population growth per annum, indicative of the migration of labour attracted to the area as
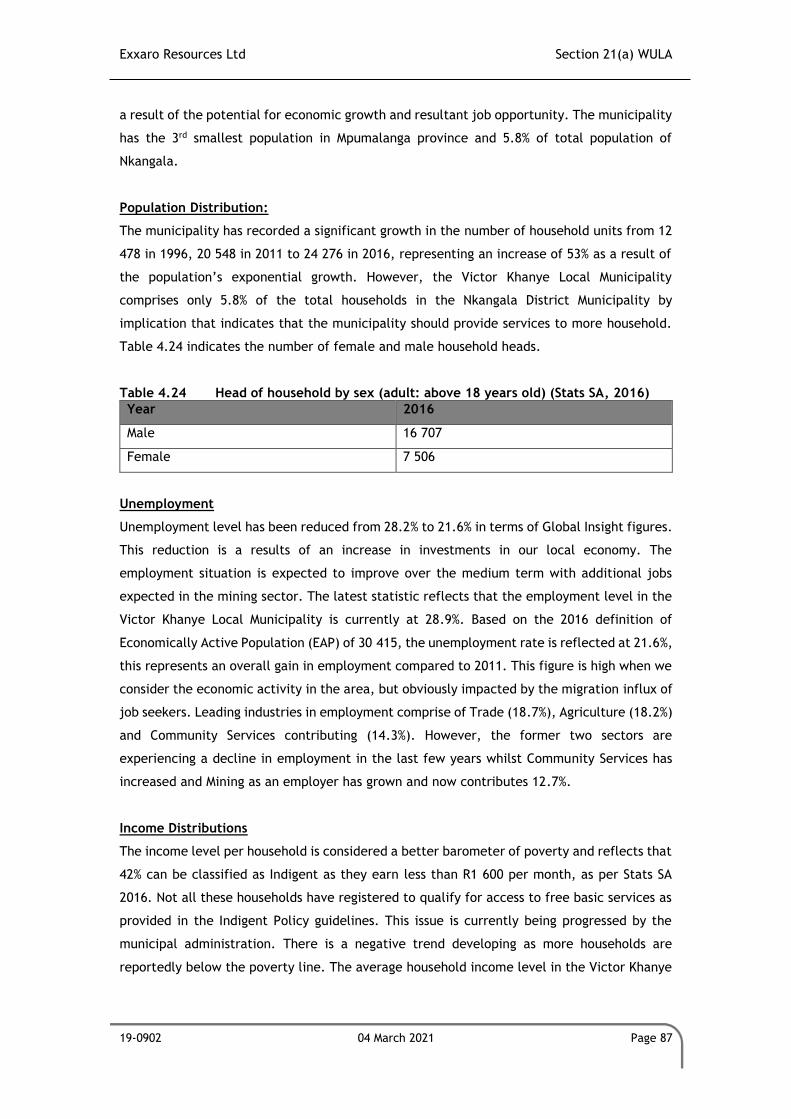
Exxaro Resources Ltd Section 21(a) WULA
19-0902 04 March 2021 Page 87
a result of the potential for economic growth and resultant job opportunity. The municipality
has the 3rd smallest population in Mpumalanga province and 5.8% of total population of
Nkangala.
Population Distribution:
The municipality has recorded a significant growth in the number of household units from 12
478 in 1996, 20 548 in 2011 to 24 276 in 2016, representing an increase of 53% as a result of
the population’s exponential growth. However, the Victor Khanye Local Municipality
comprises only 5.8% of the total households in the Nkangala District Municipality by
implication that indicates that the municipality should provide services to more household.
Table 4.24 indicates the number of female and male household heads.
Table 4.24 Head of household by sex (adult: above 18 years old) (Stats SA, 2016)
Year 2016
Male 16 707
Female 7 506
Unemployment
Unemployment level has been reduced from 28.2% to 21.6% in terms of Global Insight figures.
This reduction is a results of an increase in investments in our local economy. The
employment situation is expected to improve over the medium term with additional jobs
expected in the mining sector. The latest statistic reflects that the employment level in the
Victor Khanye Local Municipality is currently at 28.9%. Based on the 2016 definition of
Economically Active Population (EAP) of 30 415, the unemployment rate is reflected at 21.6%,
this represents an overall gain in employment compared to 2011. This figure is high when we
consider the economic activity in the area, but obviously impacted by the migration influx of
job seekers. Leading industries in employment comprise of Trade (18.7%), Agriculture (18.2%)
and Community Services contributing (14.3%). However, the former two sectors are
experiencing a decline in employment in the last few years whilst Community Services has
increased and Mining as an employer has grown and now contributes 12.7%.
Income Distributions
The income level per household is considered a better barometer of poverty and reflects that
42% can be classified as Indigent as they earn less than R1 600 per month, as per Stats SA
2016. Not all these households have registered to qualify for access to free basic services as
provided in the Indigent Policy guidelines. This issue is currently being progressed by the
municipal administration. There is a negative trend developing as more households are
reportedly below the poverty line. The average household income level in the Victor Khanye
Exxaro Resources Ltd Section 21(a) WULA
19-0902 04 March 2021 Page 88
Local Municipality areas is reflected as R80 239 per annum, ranking it 9th with respect to the
overall province statistics standing.
Education
Outcome 1 of the Delivery Agreement requires the improvement of the quality of basic
education in general and in Maths and Science in particular. The Victor Khanye Local
Municipality has an inherited problem namely that the low-income levels per household in
the community correlate to the low education levels in the area. The 2016 Survey shows that
25% of the population above 15 years of age has had no schooling or did not complete primary
school. Of this number, 5 528 are basically illiterate and therefore, future meaningful
employment prospects are virtually impossible. A further 41% of the population did not
complete the schooling curriculum and therefore, did not reach the level of matric.
Matriculates wrote the year-end exam, which reflects an upward trend and attributed to
Victor Khanye Local Municipality being ranked in 5th place in the province. However, this
improved pass rate was not reflected in the university admission rate with only 26.2% of
scholars seeking to further their education status. When these statistics are compared with
the unemployment statistics, the assumption can be made that a high percentage of job
seekers do not have the minimum education entry level. Unfortunately, these job seekers
will be restricted to unskilled manual work where the main employer in this sector of
employment, namely agriculture, is receding as a leading employer. This poses a huge
problem within the communities as the dependency syndrome increases and criminal
activities increase.
The status of teacher and pupil ratio in the township schools are slowly creating a problem
for public education in Delmas. The Primary schools in Botleng Proper are experiencing a
decline in learner registration. These phenomena might be influenced by the development
of Botleng Extension 3, 4 and 5 versus the ageing of the population in Botleng Proper. Contrary
to this declining trend, the Primary schools in Botleng Extension 3 are experiencing
overcrowding. Secondary schools are not much affected by this situation because these pupils
are more mobile and able to commute between the different areas. With the Development
of Botleng extension 6 the problem will be exacerbated even further. There might be a future
need for transportation for learners to fill the empty schools. The following table illustrates
the attendance levels at the various Educational Institutions by Ward.
4.4.2.2 Infrastructure and Service Delivery
Water and Sanitation
Exxaro Resources Ltd Section 21(a) WULA
19-0902 04 March 2021 Page 89
The bulk provision of water in the urban area of the Victor Khanye Local Municipality is
accessed from two sources: subterranean water via a number of boreholes as well as Rand
Water. The various boreholes provide water for the Botleng, Delmas and Delpark areas whilst
Rand Water is provided in the Sundra and Eloff areas. Approximately 40 000 consumers in the
urban areas of the municipality are supplied from subterranean water sources by means of
boreholes (from 4 borehole fields and 15 operational boreholes). What has become evident,
was that of the (then) 24 276 households in the Victor Khanye Local Municipality, 20 897 (86%)
households (86 %) have piped potable water on their stands.
All stands in the Victor Khanye Local Municipality, excluding those in the Eloff and Sundra
areas (which piped potable water), are connected to a water-borne sanitation system. The
water and sanitation services are therefore, very closely linked to one another. The Water
Services Development Plan referred to under the water service above also addresses the
sanitation service and is therefore, also applicable in this regard. Those stands that are not
connected to the water-borne sanitation system use septic tanks.
Despite the fact that sanitation includes wastewater treatment, the two terms are often use
side by side as "sanitation and wastewater management". The term sanitation has been
connected to several descriptors so that the terms sustainable sanitation, improved
sanitation, unimproved sanitation, environmental sanitation, on-site sanitation, ecological
sanitation, dry sanitation is all in use today. Sanitation should be regarded with a systems
approach in mind which includes collection/containment, conveyance/transport, treatment,
disposal or reuse.
Electricity and Street Lighting
Of the 24 276 households in the Victor Khanye Municipality, 22 324 (92%) households use
electricity for lighting purposes. These figures translate to an electricity backlog of at least
1 946 households.
The Victor Khanye Local Municipality services Delmas and parts of Botleng and its Extensions.
The other areas of Eloff, Sundra, Rietkol, Botleng Ext. 3 and the rural areas receive electricity
directly from Eskom and therefore, do not fall under the municipalities billing system, but
require to be upgraded to ensure that communities receive uninterrupted services. The
electricity network within Victor Khanye Local Municipality is ageing and has become
inefficient. The main electricity substation is under severe pressure and needs to be upgraded
since the electricity demand is increasing due to developments both in the residential,
commercial and industrial sectors. The infrastructure within the area supplied by Eskom
(Eloff, Sundra, Botleng and Extension 3) needs to be upgraded to ensure that communities
receive uninterrupted services. The advent of Pre-paid electricity metering has significantly
Exxaro Resources Ltd Section 21(a) WULA
19-0902 04 March 2021 Page 90
improved revenue collection and this coupled with the 50/50 system of credit and arrears
payment through card purchases is enabling the municipality to reduce the outstanding
debtor base.
Roads and Stormwater
Various national, provincial and municipal roads run through the Victor Khanye Local
Municipality, with many regional routes converging at Delmas which lends it strategic
significance. Consequently, the Municipality features a well-developed regional road and rail
infrastructure. The N12 national toll road that links Johannesburg with Nelspruit runs from
east to west through the northern part of the municipality. This road also links the
Municipality with the Maputo Development Corridor.
The major provincial roads in the municipal area are:
• R50 that links Tshwane with Standerton;
• R43 that links with Bronkhorstspruit;
• R555 that links Springs with Witbank; and
• R548 that links with Balfour; and R42 that links with Nigel.
Local Activity Corridors identified include:
• Sarel Cilliers Street/ Witbank Road in Delmas (R555);
• The Avenue – Eloff Town;
• Main Road – Rietkol Agricultural Holdings; and
• Samuel Road and Van der Walt Street – Delmas; and Dr Nelson Mandela Drive –
Botleng.
Waste Removal
Refuse is removed in most of the Botleng areas twice a week and in Delmas, Sundra and Eloff
once a week. In Sundra, Delmas and Eloff, refuse is removed through the black bag system
and the rest via containers. No service is delivered in the rural areas due to the shortage of
equipment, funds and personnel. A challenge with waste removal is that some of the roads,
especially in Botleng Ext 6 and 7 are almost inaccessible during the rainy season. Due to the
fast expansion of the communities, additional refuse trucks will be needed in the not too
distant future.
Housing
Housing encapsulates the physical structure, which is the house, as well as the services that
go with it, water and sanitation infrastructure, electricity, roads and storm water. Thus,
accelerated provision and facilitation of access to housing can potentially provide a holistic
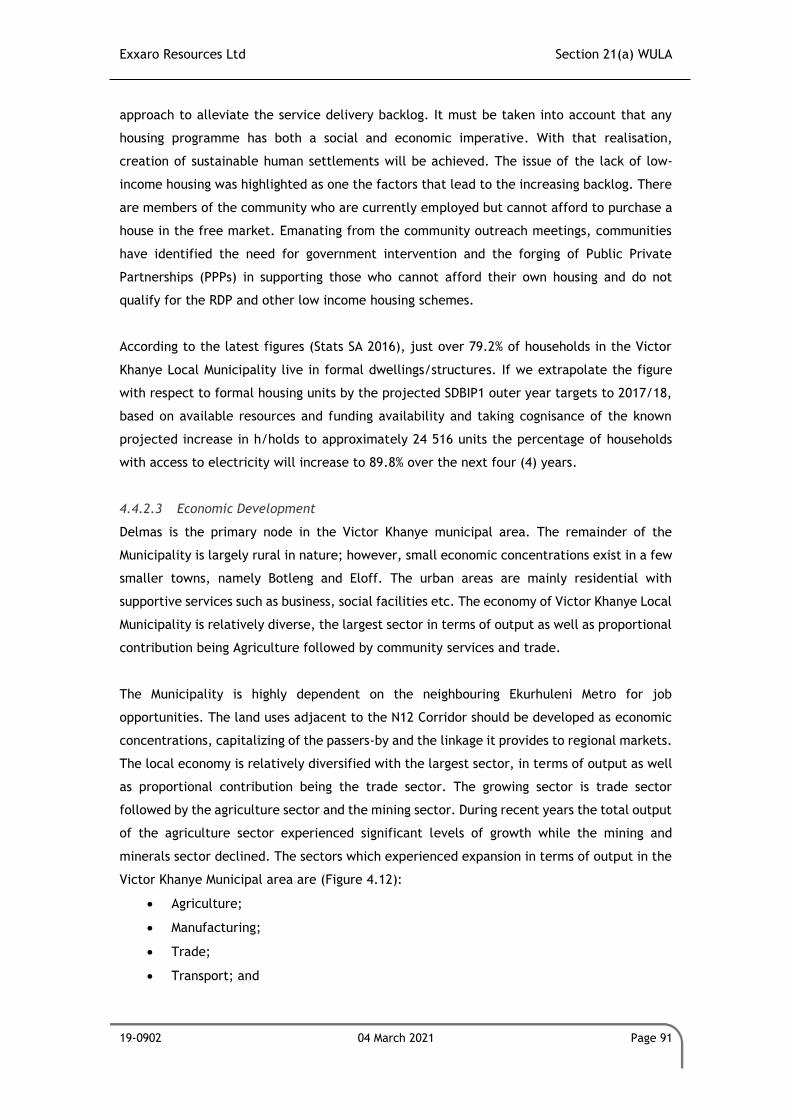
Exxaro Resources Ltd Section 21(a) WULA
19-0902 04 March 2021 Page 91
approach to alleviate the service delivery backlog. It must be taken into account that any
housing programme has both a social and economic imperative. With that realisation,
creation of sustainable human settlements will be achieved. The issue of the lack of low-
income housing was highlighted as one the factors that lead to the increasing backlog. There
are members of the community who are currently employed but cannot afford to purchase a
house in the free market. Emanating from the community outreach meetings, communities
have identified the need for government intervention and the forging of Public Private
Partnerships (PPPs) in supporting those who cannot afford their own housing and do not
qualify for the RDP and other low income housing schemes.
According to the latest figures (Stats SA 2016), just over 79.2% of households in the Victor
Khanye Local Municipality live in formal dwellings/structures. If we extrapolate the figure
with respect to formal housing units by the projected SDBIP1 outer year targets to 2017/18,
based on available resources and funding availability and taking cognisance of the known
projected increase in h/holds to approximately 24 516 units the percentage of households
with access to electricity will increase to 89.8% over the next four (4) years.
4.4.2.3 Economic Development
Delmas is the primary node in the Victor Khanye municipal area. The remainder of the
Municipality is largely rural in nature; however, small economic concentrations exist in a few
smaller towns, namely Botleng and Eloff. The urban areas are mainly residential with
supportive services such as business, social facilities etc. The economy of Victor Khanye Local
Municipality is relatively diverse, the largest sector in terms of output as well as proportional
contribution being Agriculture followed by community services and trade.
The Municipality is highly dependent on the neighbouring Ekurhuleni Metro for job
opportunities. The land uses adjacent to the N12 Corridor should be developed as economic
concentrations, capitalizing of the passers-by and the linkage it provides to regional markets.
The local economy is relatively diversified with the largest sector, in terms of output as well
as proportional contribution being the trade sector. The growing sector is trade sector
followed by the agriculture sector and the mining sector. During recent years the total output
of the agriculture sector experienced significant levels of growth while the mining and
minerals sector declined. The sectors which experienced expansion in terms of output in the
Victor Khanye Municipal area are (Figure 4.12):
• Agriculture;
• Manufacturing;
• Trade;
• Transport; and
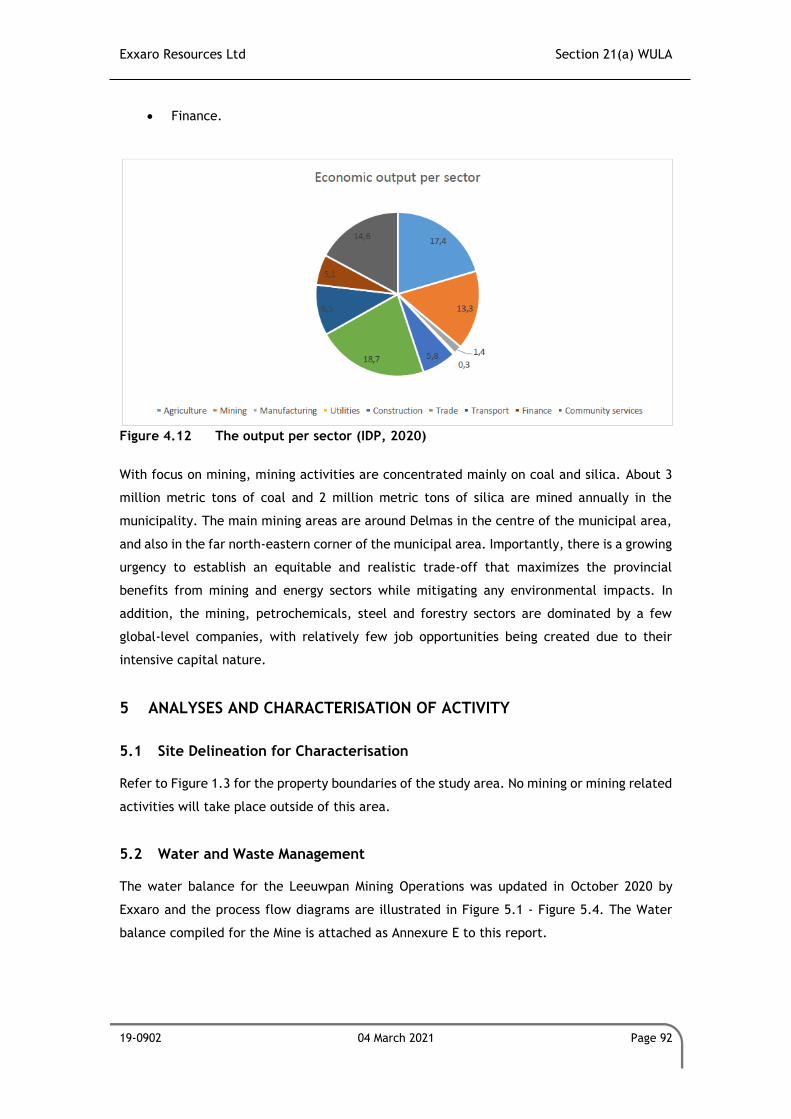
Exxaro Resources Ltd Section 21(a) WULA
19-0902 04 March 2021 Page 92
• Finance.
Figure 4.12 The output per sector (IDP, 2020)
With focus on mining, mining activities are concentrated mainly on coal and silica. About 3
million metric tons of coal and 2 million metric tons of silica are mined annually in the
municipality. The main mining areas are around Delmas in the centre of the municipal area,
and also in the far north-eastern corner of the municipal area. Importantly, there is a growing
urgency to establish an equitable and realistic trade-off that maximizes the provincial
benefits from mining and energy sectors while mitigating any environmental impacts. In
addition, the mining, petrochemicals, steel and forestry sectors are dominated by a few
global-level companies, with relatively few job opportunities being created due to their
intensive capital nature.
5 ANALYSES AND CHARACTERISATION OF ACTIVITY
5.1 Site Delineation for Characterisation
Refer to Figure 1.3 for the property boundaries of the study area. No mining or mining related
activities will take place outside of this area.
5.2 Water and Waste Management
The water balance for the Leeuwpan Mining Operations was updated in October 2020 by
Exxaro and the process flow diagrams are illustrated in Figure 5.1 - Figure 5.4. The Water
balance compiled for the Mine is attached as Annexure E to this report.
Exxaro Resources Ltd Section 21(a) WULA
19-0902 04 March 2021 Page 93
Four water balances were calculated for the Leeuwpan Coal mine and are used to provide a
general insight into the overall total water demands and uses. These include an annual
average monthly water balance, an average annual balance, summer condition water balance
and a winter condition water balance.
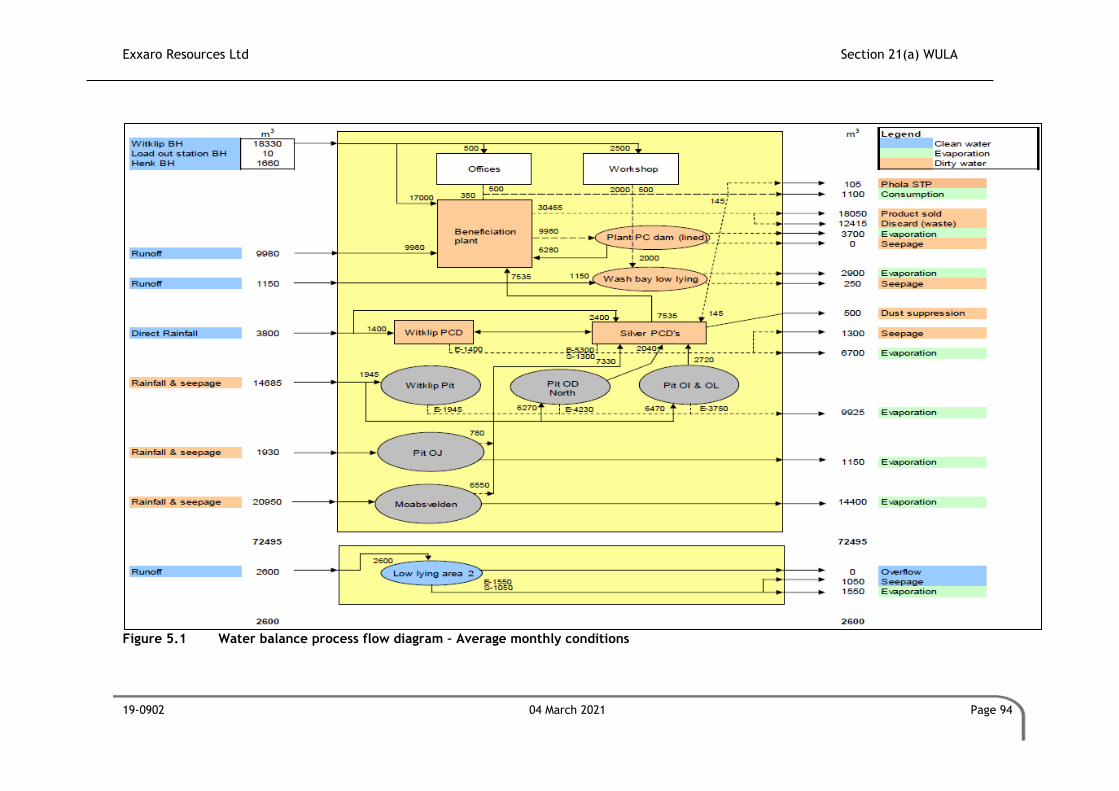
Exxaro Resources Ltd Section 21(a) WULA
19-0902 04 March 2021 Page 94
Figure 5.1 Water balance process flow diagram – Average monthly conditions
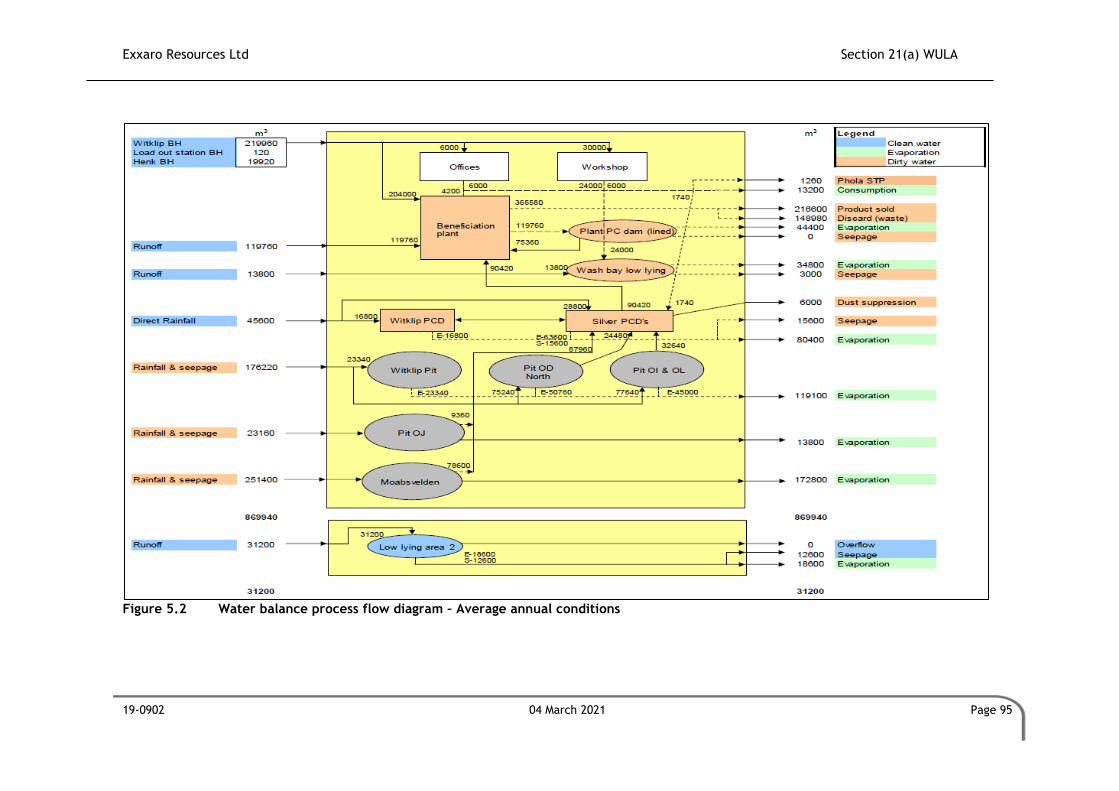
Exxaro Resources Ltd Section 21(a) WULA
19-0902 04 March 2021 Page 95
Figure 5.2 Water balance process flow diagram – Average annual conditions
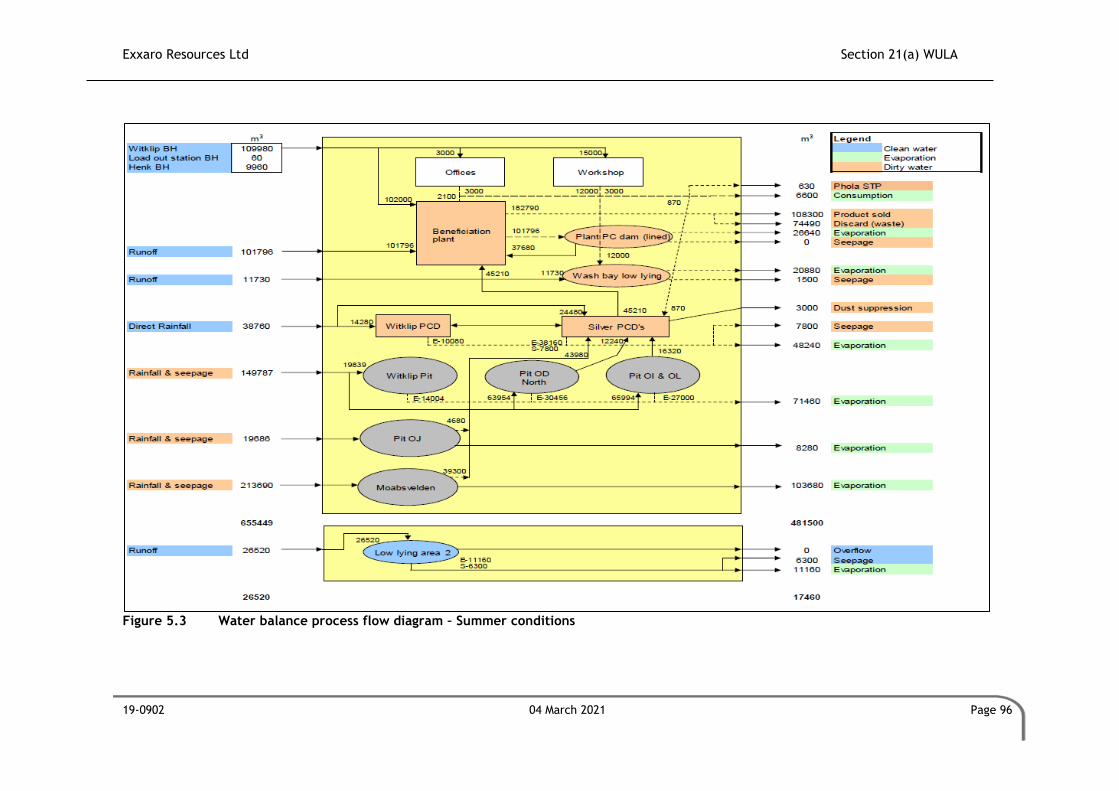
Exxaro Resources Ltd Section 21(a) WULA
19-0902 04 March 2021 Page 96
Figure 5.3 Water balance process flow diagram – Summer conditions
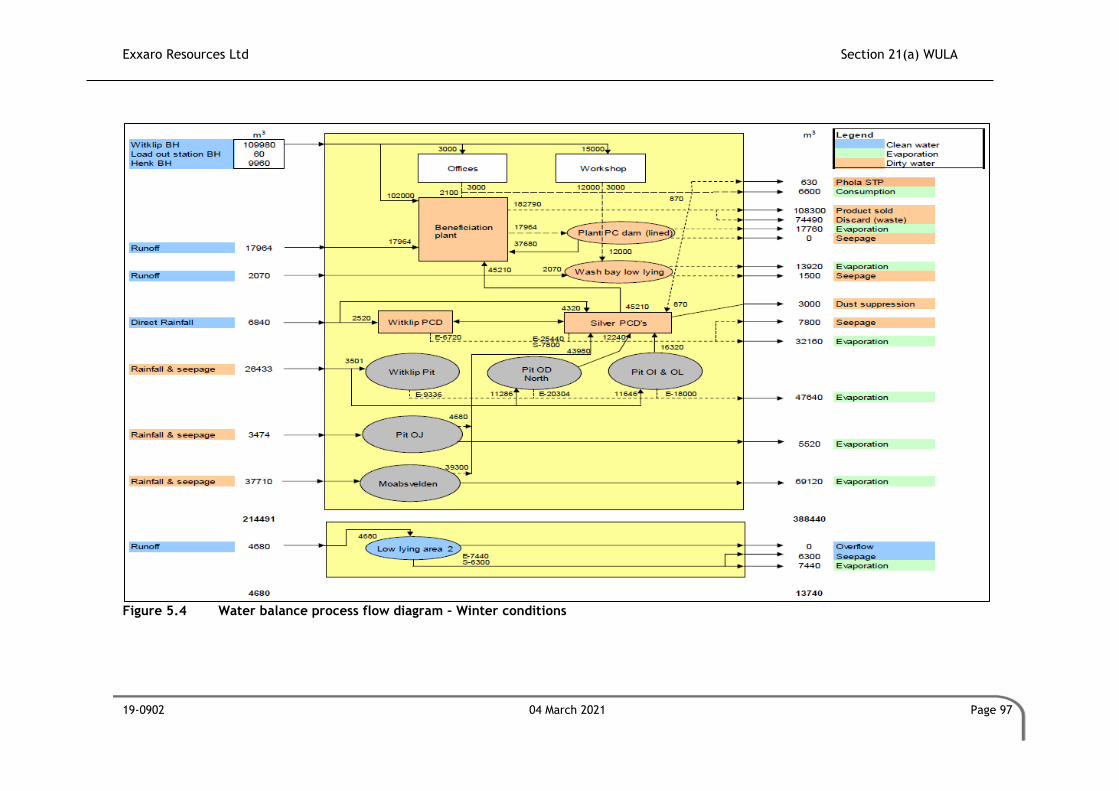
Exxaro Resources Ltd Section 21(a) WULA
19-0902 04 March 2021 Page 97
Figure 5.4 Water balance process flow diagram – Winter conditions
Exxaro Resources Ltd Section 21(a) WULA
19-0902 04 March 2021 Page 98
5.2.1 Process Water
The only process where water is used for industrial purposes is at the existing coal
beneficiation plant. Process water is supplied from a closed system, which includes the plant,
PCDs, mobile tanks and process dams. Water replenishment comes from the pits, but if this
is insufficient, make-up water from six boreholes is also used. The WK-BH1 and WK-BH2 would
contribute to this process water.
Water is used on a constant basis and is proportional to the amount of coal that is being
washed per day. No significant daily fluctuations exist in the use of water on the mine. The
beneficiation plant operates 24 hours a day for 313 days per year.
5.2.2 Storm Water
Government Notice No. 704, published in terms of the National Water Act (Act No. 36 of
1998) requires the following, which will be adhered to:
▪ All clean water systems must be designed and operated in such a manner that they
are at all times capable of handling the 1:50 year flood event on top of their mean
operation level without spilling;
▪ Any water arising from an area, which causes, has caused or is likely to cause
pollution of a water resource, including polluted storm water, must be contained
within a dirty water system. In order to reduce the volume of polluted water,
contaminated areas should be minimised. While clean water should be diverted to
natural water courses, polluted water should be re-used wherever possible, thereby
reducing the use of clean water; and
▪ Design, construct, maintain and operate any dam or tailings facility that forms part
of a dirty water system to have a minimum freeboard of 0.8m above full supply level.
5.2.2.1 Current Storm Water Management Infrastructure
Some of the existing storm water measures and infrastructure at the mine include:
• Storm water canals were built around the evaporation dams in order to prevent clean
storm water from entering the dirty water area;
• For Blocks OJ and OL, the initial box cut material was used for the development of
the stormwater management berms;
• Storm water cut-off trenches have been constructed around all areas where affected
mine water occurs or where water might become affected. This was done to prevent
clean water from mixing with affected water;
• All storm water that falls within this area has been channelled to the evaporation
dams from where it will be either evaporated or re-used;
Exxaro Resources Ltd Section 21(a) WULA
19-0902 04 March 2021 Page 99
• Pollution control dams are designed to have an 800mm freeboard. The pollution
control dams can therefore accommodate run-off events bigger than the 1:50 year
flows;
• Storm water management facilities includes, all clean and dirty water separation
structures such as berms, cut-off trenches, and silt traps;
• All water falling within a dirty water area is collected within dirty water dams for re-
use;
• A series of berms and storm water diversion channels collect all the storm waters
towards the Pits and respective Pollution Control Dams; and
• The pollution control dams, with the exceptions of the Raw Water Settling Dam and
Emergency Overflow Dam which are unlined, are HDPE lined to prevent leakages and
ingress into ground water and possibly contaminating the surface and ground water.
5.2.3 Groundwater
The water from the WK-BH1 is pumped to the Silver Tank where it is distributed to the plant
as well as the mining area, mining offices and the engineering workshops which use the water
as potable water. The WK-BH2 is only intended to be used for back-up purposes and will only
be pumped if WK-BH1 cannot be abstracted.
In addition to this application, groundwater is also abstracted from the existing pits and is
authorised as part of the existing IWULs issued. The water is abstracted for the safe
continuation of mining activities and used as process water in the processing of the ore
mined.
The IWUL issued to Leeuwpan also licensed the abstraction of groundwater from other
boreholes (excluding WK-BH1 and WK-BH2) located at the mine. The borehole water is used
for process water at the mine when there is insufficient water from the pits.
5.2.4 Waste
There are several waste sources that have been identified as part of the mining activities at
Leeuwpan. These waste sources include:
• Mine Residue Deposit (MRD), which includes:
o carbon-carrying shales;
o plant residue; and
o fine coal recovered from the slimes dams.
• Polluted mine water, which includes the various pollution control dams;
• Hazardous and Hydrocarbon waste such as oil, diesel & grease; and
• General waste which is limited to domestic and commercial waste.
Exxaro Resources Ltd Section 21(a) WULA
19-0902 04 March 2021 Page 100
Refer to Section 3.6 for details pertaining to the management and disposal of the various
waste streams generated at Leeuwpan.
5.3 Operational Management
5.3.1 Organisational Structure
Refer to Figure 2.4 above in Section 2.7 for the organisation structure of Leeuwpan Mine.
5.3.2 Resources and Competence
Leeuwpan Coal comprises of mining-, process-, technical-, administration- and the surface
infrastructure related operations that are undertaken during all phases of the operation. The
mine’s Environmental Management System (EMS) is ISO 14001:2004 and OHSAS 18001:2007
based and describes the principles of implementing policies and environmental programmes.
The management, operational and monitoring procedures and codes of practices have been
compiled to manage the significant aspects and impacts of the activities and products of
Leeuwpan Coal. The system also involves local Authorities, contractors working on-site,
government agencies and Interested and Affected Parties (I&APs). In addition, Figure 2.4
indicates the competence at Leeuwpan.
Leeuwpan Coal is committed to the implementation of the Exxaro Resources Safety, Health
and Environmental (SHE) Management Policy. Exxaro Resources actively care for the health
and safety of people, the environment and resources by ensuring sustainable Safety, Health
and Environmental (SHE) conditions at all of Exxaro’s activities.
Exxaro Resources is committed to:
• Consulting with employees and representatives and other stakeholders in appropriate
forums to develop, communicate and review responsible and innovative policies,
programmes and guidelines that proved safeguards for the community, employees,
contractors and the environment, while providing flexibility to meet the needs of the
Exxaro businesses;
• Achieving high standards of environmental care and providing a safe and healthy
workplace for employees, contractors and other relevant persons;
• Ensuring a proper organisational structure and resources to manage safety, health
and environmental matters including sustainable development and legal compliance;
• Implementing internationally accepted standards for safety, occupational health and
Environmental Management Systems (EMS);
Exxaro Resources Ltd Section 21(a) WULA
19-0902 04 March 2021 Page 101
• Complying with all applicable SHE legislation and relevant international obligations
as a minimum requirement and implementing company standards, programmes and
processes to achieve greater protection against risks;
• Maintaining continuous hazard and aspect identification and risk assessment
regarding safety, health and environmental impact;
• Establishing competence and awareness regarding relevant safety, health and
environmental matters of employees and contractors through effective training,
mentoring and communication;
• Conserving natural resources and reducing the environmental burden of waste
generation, disposal and emissions to the air, water and land through strategies
focusing on reducing, re-using, recycling and safe deposit / disposal of waste;
• Establish objectives / targets and continuously improve operations regarding safety,
health and environmental performance and management systems;
• Ensuring that all employees report potential safety, health and environmental
hazards and impacts, and be included in the planning and implementing of solutions;
• Ensuring that all incidents leading to an environmental impact, injury, occupational
disease, damage to property or process losses are reported and analysed thoroughly
in order to determine all contributing factors to promptly implement corrective and
preventive action;
• Establishing and maintaining appropriate controls, including periodic audits and
reviews, to ensure that this policy is being implemented and updated; and
• Maintaining a high level of emergency preparedness and response to manage any
potential emergency.
5.3.3 Education and Training
The awareness and training information is contained in the Training Awareness and
Competence Procedure (No. SP LP-SHE 006, dated September 2015). This procedure provides
a framework to ensure all staff, contractors and consultants at Leeuwpan Coal, whose work
may create a significant risk on the Integrated Management Systems (IMS), receives
appropriate training. It provides guidelines for increasing over-all employee awareness on
SHE issues in general, the significant environmental aspects, SHE hazards at Leeuwpan Coal
and the SHE policy.
5.3.4 Internal and External Communication
Leeuwpan Coal has implemented the Communication and Consultation Procedure, dated
December 2004, to outline the procedure followed by the mine to ensure effective internal
and external communication. Internal or external complaints are handled according to SPI
LP-SHE.001. The information from this procedure is summarised below.
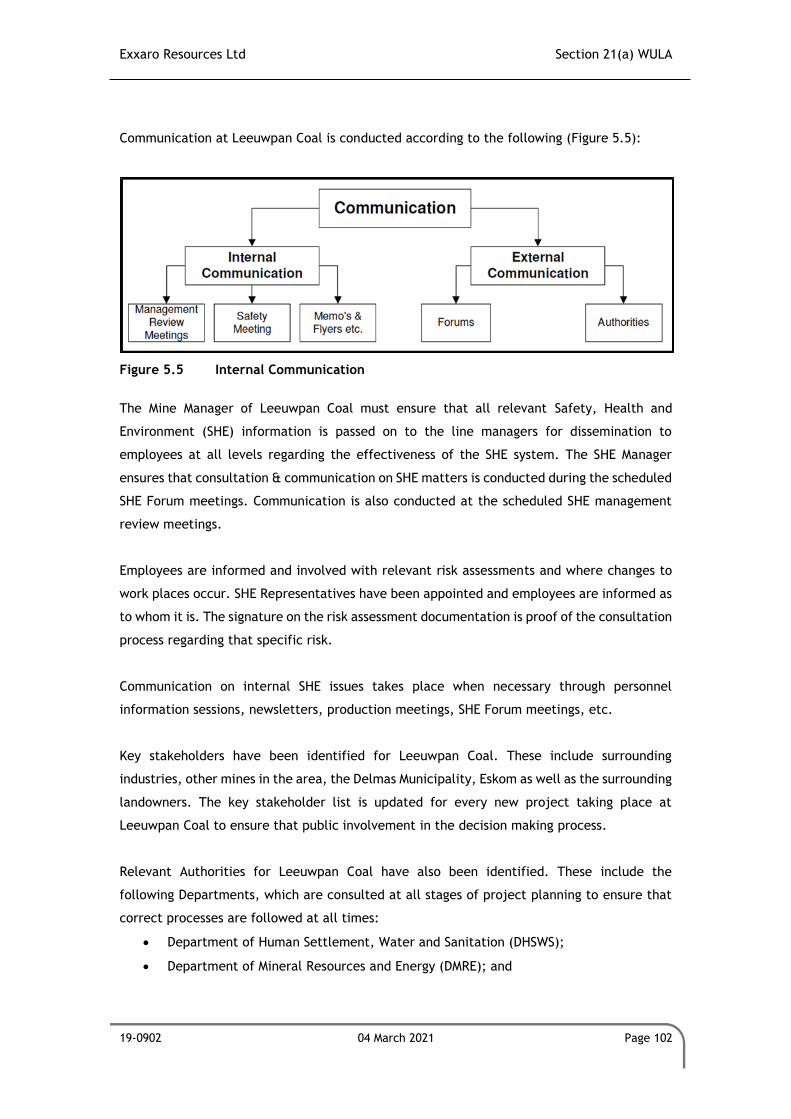
Exxaro Resources Ltd Section 21(a) WULA
19-0902 04 March 2021 Page 102
Communication at Leeuwpan Coal is conducted according to the following (Figure 5.5):
Figure 5.5 Internal Communication
The Mine Manager of Leeuwpan Coal must ensure that all relevant Safety, Health and
Environment (SHE) information is passed on to the line managers for dissemination to
employees at all levels regarding the effectiveness of the SHE system. The SHE Manager
ensures that consultation & communication on SHE matters is conducted during the scheduled
SHE Forum meetings. Communication is also conducted at the scheduled SHE management
review meetings.
Employees are informed and involved with relevant risk assessments and where changes to
work places occur. SHE Representatives have been appointed and employees are informed as
to whom it is. The signature on the risk assessment documentation is proof of the consultation
process regarding that specific risk.
Communication on internal SHE issues takes place when necessary through personnel
information sessions, newsletters, production meetings, SHE Forum meetings, etc.
Key stakeholders have been identified for Leeuwpan Coal. These include surrounding
industries, other mines in the area, the Delmas Municipality, Eskom as well as the surrounding
landowners. The key stakeholder list is updated for every new project taking place at
Leeuwpan Coal to ensure that public involvement in the decision making process.
Relevant Authorities for Leeuwpan Coal have also been identified. These include the
following Departments, which are consulted at all stages of project planning to ensure that
correct processes are followed at all times:
• Department of Human Settlement, Water and Sanitation (DHSWS);
• Department of Mineral Resources and Energy (DMRE); and
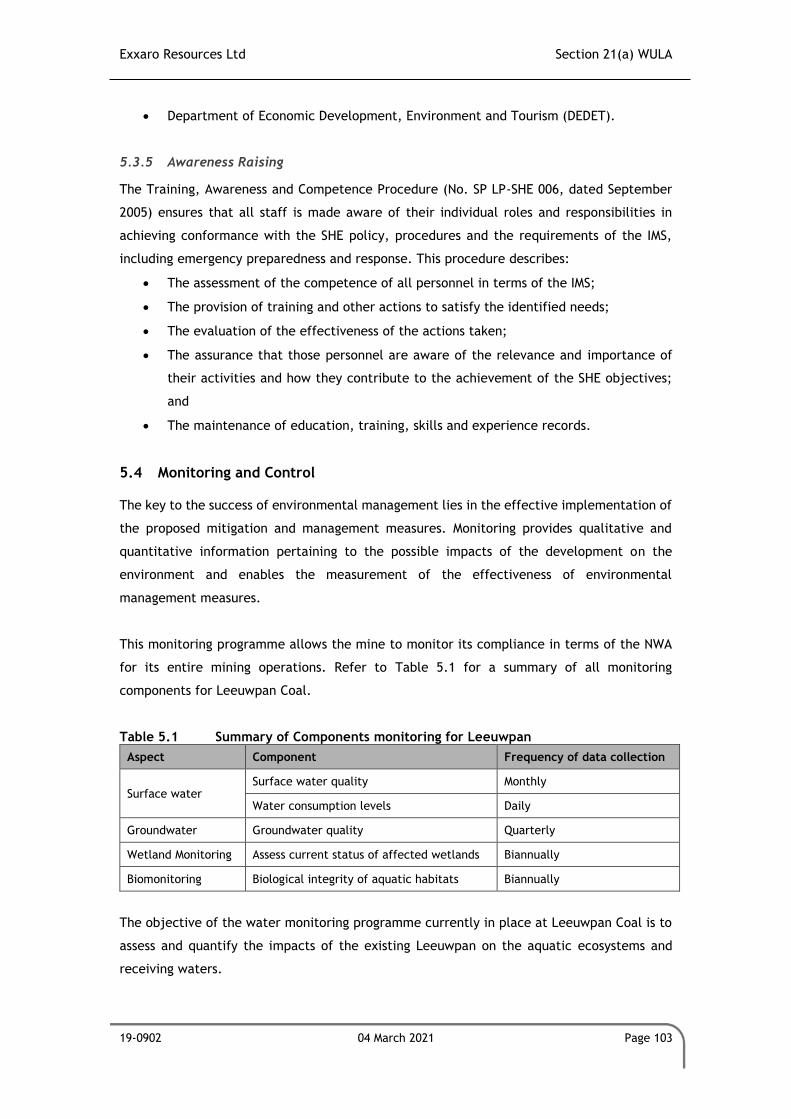
Exxaro Resources Ltd Section 21(a) WULA
19-0902 04 March 2021 Page 103
• Department of Economic Development, Environment and Tourism (DEDET).
5.3.5 Awareness Raising
The Training, Awareness and Competence Procedure (No. SP LP-SHE 006, dated September
2005) ensures that all staff is made aware of their individual roles and responsibilities in
achieving conformance with the SHE policy, procedures and the requirements of the IMS,
including emergency preparedness and response. This procedure describes:
• The assessment of the competence of all personnel in terms of the IMS;
• The provision of training and other actions to satisfy the identified needs;
• The evaluation of the effectiveness of the actions taken;
• The assurance that those personnel are aware of the relevance and importance of
their activities and how they contribute to the achievement of the SHE objectives;
and
• The maintenance of education, training, skills and experience records.
5.4 Monitoring and Control
The key to the success of environmental management lies in the effective implementation of
the proposed mitigation and management measures. Monitoring provides qualitative and
quantitative information pertaining to the possible impacts of the development on the
environment and enables the measurement of the effectiveness of environmental
management measures.
This monitoring programme allows the mine to monitor its compliance in terms of the NWA
for its entire mining operations. Refer to Table 5.1 for a summary of all monitoring
components for Leeuwpan Coal.
Table 5.1 Summary of Components monitoring for Leeuwpan
Aspect Component Frequency of data collection
Surface water Surface water quality Monthly
Water consumption levels Daily
Groundwater Groundwater quality Quarterly
Wetland Monitoring Assess current status of affected wetlands Biannually
Biomonitoring Biological integrity of aquatic habitats Biannually
The objective of the water monitoring programme currently in place at Leeuwpan Coal is to
assess and quantify the impacts of the existing Leeuwpan on the aquatic ecosystems and
receiving waters.
Exxaro Resources Ltd Section 21(a) WULA
19-0902 04 March 2021 Page 104
Sampling is performed according to recognised legal procedures (minimum requirements for
water monitoring at waste management facilities, Department of Water Affairs and Forestry
(DWAF), 1998) and follows approved laboratory analysis techniques.
The NWA sets out a framework for the management of water resources in South Africa. This
framework provides for the establishment of water management institutions, made up of
role-players in each catchment. It is therefore of utmost importance that the requirements
of down-stream users be determined pro-actively.
5.4.1 Surface Water Monitoring
Monthly monitoring of the various surface water monitoring points is conducted, as well as
from the Bronkhorstspruit localities, which are up and downstream from potential impact
points that may originate from Leeuwpan. Results generated at these localities are used to
characterise and identify potential pollution sources on the mine, and for early detection of
acid mine water formation. Samples are also taken on a monthly basis from each of the
monitoring localities for drinking water. A sample is taken in a sterile container and this
water is analysed for bacterial species richness and diversity. Surface water monitoring at
the Leeuwpan Mine is currently conducted by Environmental Assurance (Envass). The latest
water quality report (October 2020) for the Mine is attached as Annexure C to this report.
The main objectives of the surface water monitoring:
• To assess, on a monthly basis, the quality of the surface water resources in and
around the Leeuwpan study area in accordance with the mine’s approved IWUL
(number 04/B21A/ABCGIJ/429) and its amendments;
• To make use of the data for both human and environmental health and impact
assessments;
• To compare results to previous survey results with the aim of detecting
environmental trends in the surface water quality; and
• To identify potential impacts of the mining operations on the receiving water
resources and provide suitable mitigation measures for adaptive management.
The surface water monitoring points and their respective geographical information is
provided in Table 5.2. The geographical positions are illustrated in Figure 5.6 - Figure 5.9.
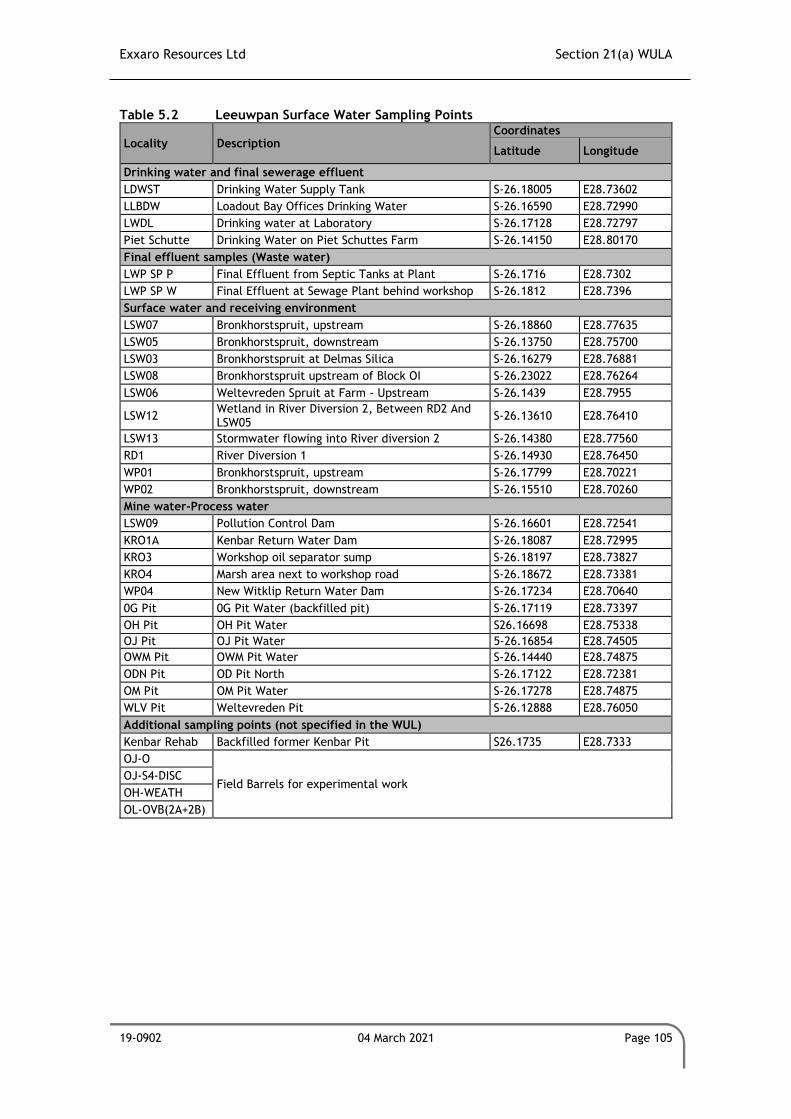
Exxaro Resources Ltd Section 21(a) WULA
19-0902 04 March 2021 Page 105
Table 5.2 Leeuwpan Surface Water Sampling Points
Locality Description Coordinates
Latitude Longitude
Drinking water and final sewerage effluent
LDWST Drinking Water Supply Tank S-26.18005 E28.73602
LLBDW Loadout Bay Offices Drinking Water S-26.16590 E28.72990
LWDL Drinking water at Laboratory S-26.17128 E28.72797
Piet Schutte Drinking Water on Piet Schuttes Farm S-26.14150 E28.80170
Final effluent samples (Waste water)
LWP SP P Final Effluent from Septic Tanks at Plant S-26.1716 E28.7302
LWP SP W Final Effluent at Sewage Plant behind workshop S-26.1812 E28.7396
Surface water and receiving environment
LSW07 Bronkhorstspruit, upstream S-26.18860 E28.77635
LSW05 Bronkhorstspruit, downstream S-26.13750 E28.75700
LSW03 Bronkhorstspruit at Delmas Silica S-26.16279 E28.76881
LSW08 Bronkhorstspruit upstream of Block OI S-26.23022 E28.76264
LSW06 Weltevreden Spruit at Farm - Upstream S-26.1439 E28.7955
LSW12 Wetland in River Diversion 2, Between RD2 And LSW05
S-26.13610 E28.76410
LSW13 Stormwater flowing into River diversion 2 S-26.14380 E28.77560
RD1 River Diversion 1 S-26.14930 E28.76450
WP01 Bronkhorstspruit, upstream S-26.17799 E28.70221
WP02 Bronkhorstspruit, downstream S-26.15510 E28.70260
Mine water-Process water
LSW09 Pollution Control Dam S-26.16601 E28.72541
KRO1A Kenbar Return Water Dam S-26.18087 E28.72995
KRO3 Workshop oil separator sump S-26.18197 E28.73827
KRO4 Marsh area next to workshop road S-26.18672 E28.73381
WP04 New Witklip Return Water Dam S-26.17234 E28.70640
0G Pit 0G Pit Water (backfilled pit) S-26.17119 E28.73397
OH Pit OH Pit Water S26.16698 E28.75338
OJ Pit OJ Pit Water 5-26.16854 E28.74505
OWM Pit OWM Pit Water S-26.14440 E28.74875
ODN Pit OD Pit North S-26.17122 E28.72381
OM Pit OM Pit Water S-26.17278 E28.74875
WLV Pit Weltevreden Pit S-26.12888 E28.76050
Additional sampling points (not specified in the WUL)
Kenbar Rehab Backfilled former Kenbar Pit S26.1735 E28.7333
OJ-O
Field Barrels for experimental work OJ-S4-DISC
OH-WEATH
OL-OVB(2A+2B)
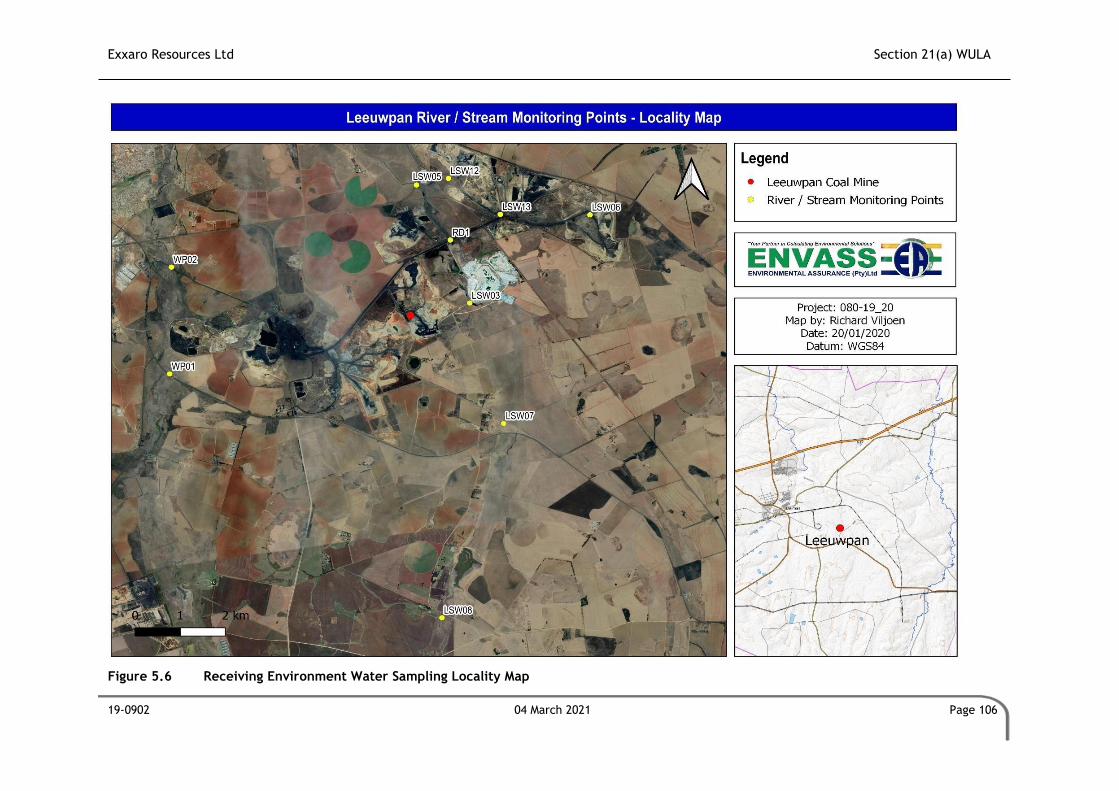
Exxaro Resources Ltd Section 21(a) WULA
19-0902 04 March 2021 Page 106
Figure 5.6 Receiving Environment Water Sampling Locality Map
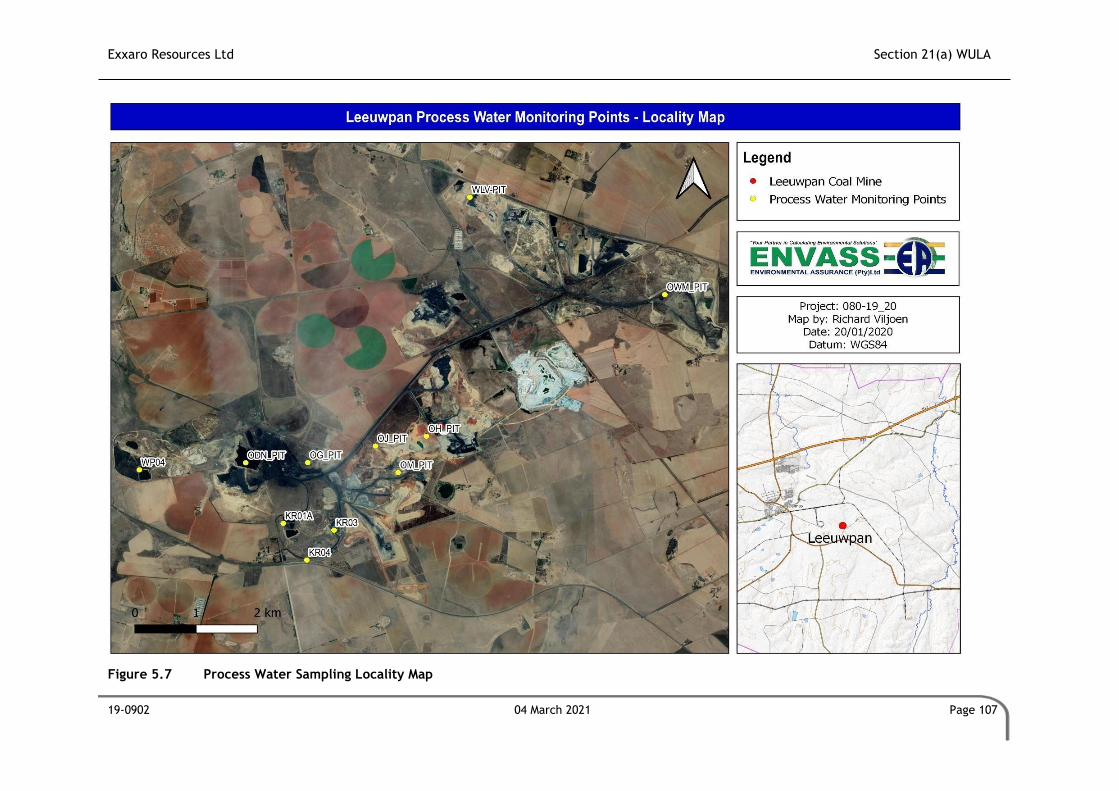
Exxaro Resources Ltd Section 21(a) WULA
19-0902 04 March 2021 Page 107
Figure 5.7 Process Water Sampling Locality Map
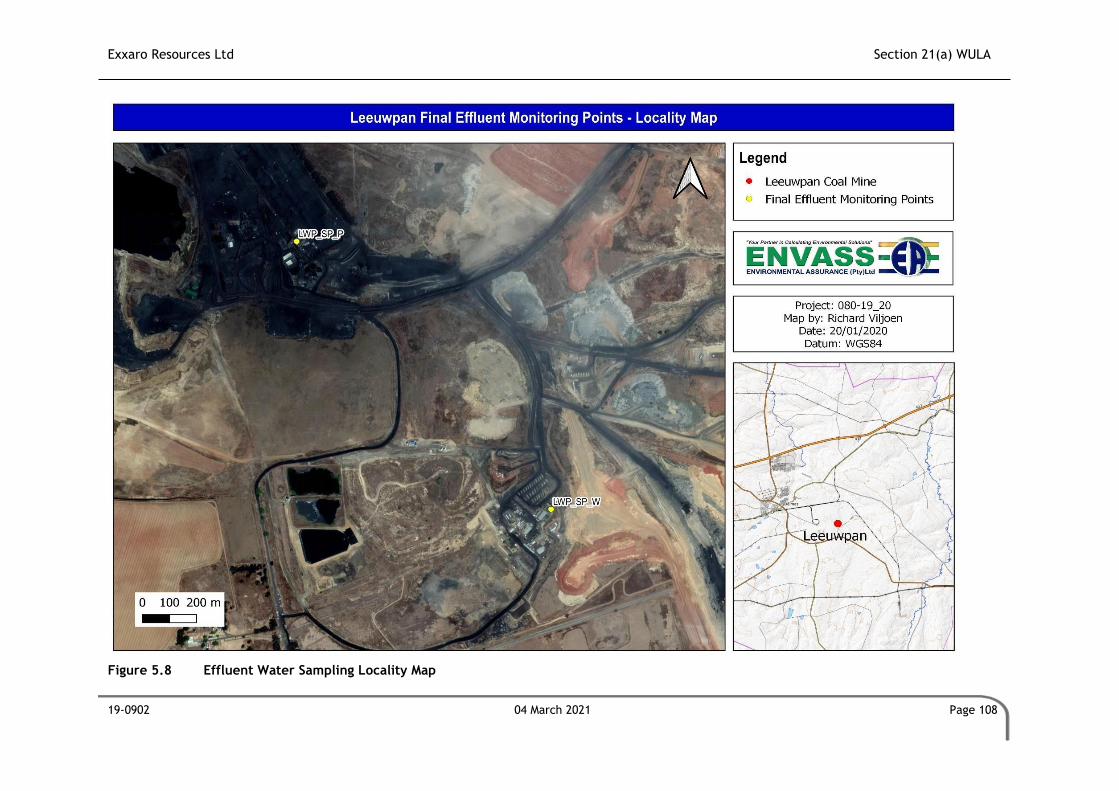
Exxaro Resources Ltd Section 21(a) WULA
19-0902 04 March 2021 Page 108
Figure 5.8 Effluent Water Sampling Locality Map
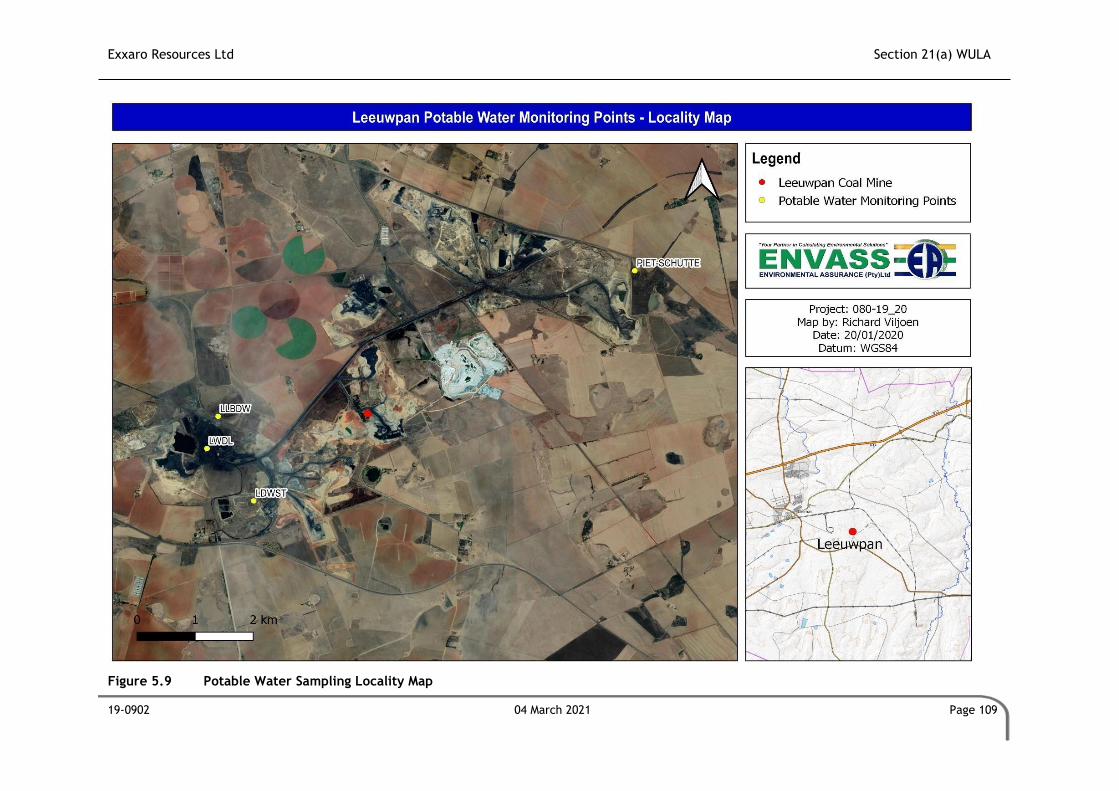
Exxaro Resources Ltd Section 21(a) WULA
19-0902 04 March 2021 Page 109
Figure 5.9 Potable Water Sampling Locality Map
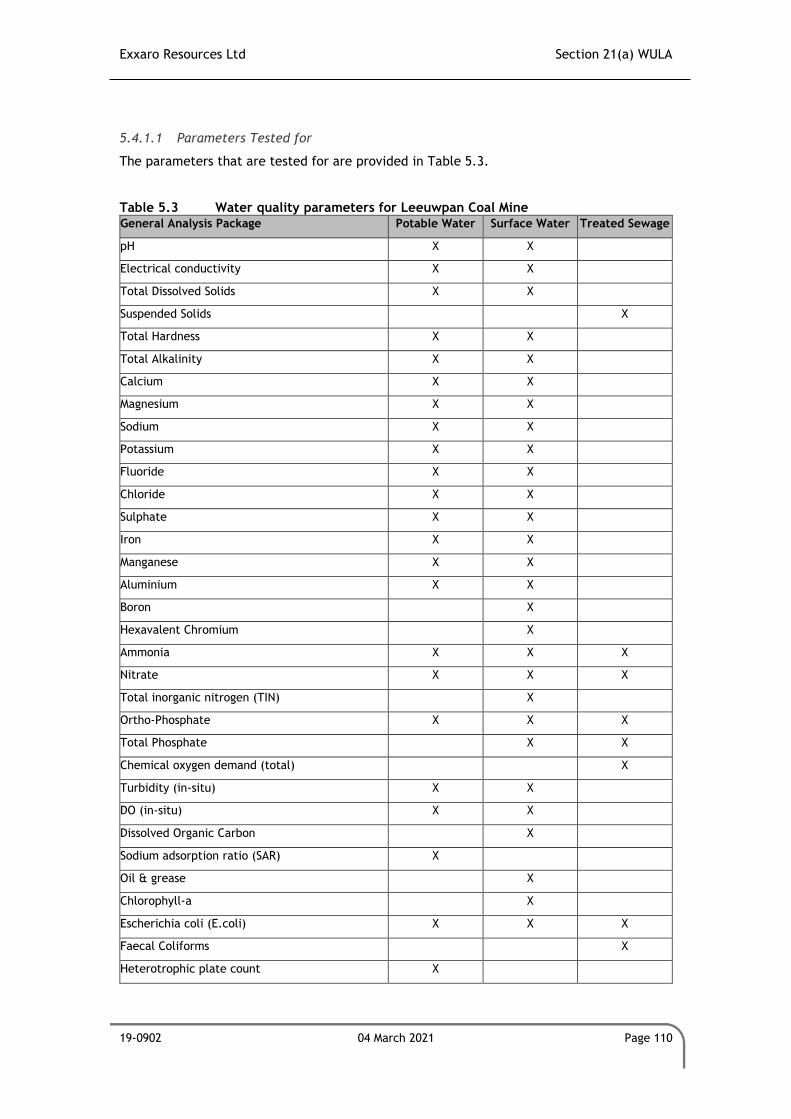
Exxaro Resources Ltd Section 21(a) WULA
19-0902 04 March 2021 Page 110
5.4.1.1 Parameters Tested for
The parameters that are tested for are provided in Table 5.3.
Table 5.3 Water quality parameters for Leeuwpan Coal Mine General Analysis Package Potable Water Surface Water Treated Sewage
pH X X
Electrical conductivity X X
Total Dissolved Solids X X
Suspended Solids X
Total Hardness X X
Total Alkalinity X X
Calcium X X
Magnesium X X
Sodium X X
Potassium X X
Fluoride X X
Chloride X X
Sulphate X X
Iron X X
Manganese X X
Aluminium X X
Boron X
Hexavalent Chromium X
Ammonia X X X
Nitrate X X X
Total inorganic nitrogen (TIN) X
Ortho-Phosphate X X X
Total Phosphate X X
Chemical oxygen demand (total) X
Turbidity (in-situ) X X
DO (in-situ) X X
Dissolved Organic Carbon X
Sodium adsorption ratio (SAR) X
Oil & grease X
Chlorophyll-a X
Escherichia coli (E.coli) X X X
Faecal Coliforms X
Heterotrophic plate count X
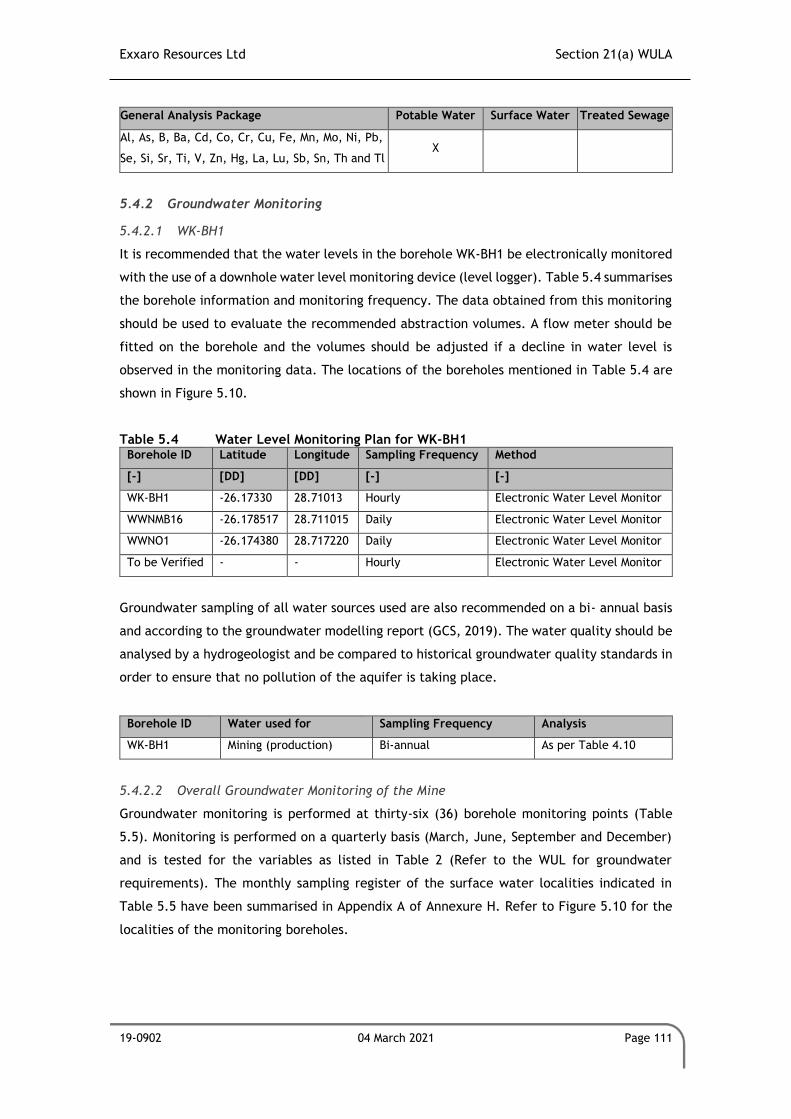
Exxaro Resources Ltd Section 21(a) WULA
19-0902 04 March 2021 Page 111
General Analysis Package Potable Water Surface Water Treated Sewage
Al, As, B, Ba, Cd, Co, Cr, Cu, Fe, Mn, Mo, Ni, Pb,
Se, Si, Sr, Ti, V, Zn, Hg, La, Lu, Sb, Sn, Th and Tl X
5.4.2 Groundwater Monitoring
5.4.2.1 WK-BH1
It is recommended that the water levels in the borehole WK-BH1 be electronically monitored
with the use of a downhole water level monitoring device (level logger). Table 5.4 summarises
the borehole information and monitoring frequency. The data obtained from this monitoring
should be used to evaluate the recommended abstraction volumes. A flow meter should be
fitted on the borehole and the volumes should be adjusted if a decline in water level is
observed in the monitoring data. The locations of the boreholes mentioned in Table 5.4 are
shown in Figure 5.10.
Table 5.4 Water Level Monitoring Plan for WK-BH1 Borehole ID Latitude Longitude Sampling Frequency Method
[-] [DD] [DD] [-] [-]
WK-BH1 -26.17330 28.71013 Hourly Electronic Water Level Monitor
WWNMB16 -26.178517 28.711015 Daily Electronic Water Level Monitor
WWNO1 -26.174380 28.717220 Daily Electronic Water Level Monitor
To be Verified - - Hourly Electronic Water Level Monitor
Groundwater sampling of all water sources used are also recommended on a bi- annual basis
and according to the groundwater modelling report (GCS, 2019). The water quality should be
analysed by a hydrogeologist and be compared to historical groundwater quality standards in
order to ensure that no pollution of the aquifer is taking place.
Borehole ID Water used for Sampling Frequency Analysis
WK-BH1 Mining (production) Bi-annual As per Table 4.10
5.4.2.2 Overall Groundwater Monitoring of the Mine
Groundwater monitoring is performed at thirty-six (36) borehole monitoring points (Table
5.5). Monitoring is performed on a quarterly basis (March, June, September and December)
and is tested for the variables as listed in Table 2 (Refer to the WUL for groundwater
requirements). The monthly sampling register of the surface water localities indicated in
Table 5.5 have been summarised in Appendix A of Annexure H. Refer to Figure 5.10 for the
localities of the monitoring boreholes.
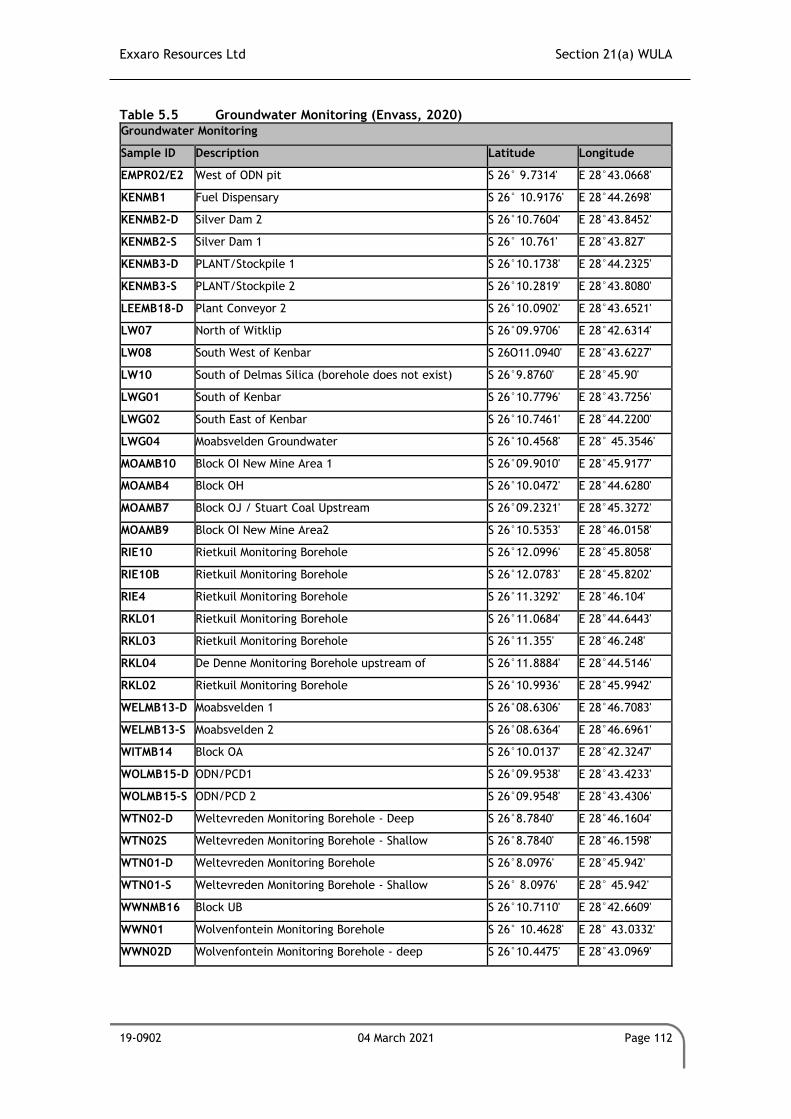
Exxaro Resources Ltd Section 21(a) WULA
19-0902 04 March 2021 Page 112
Table 5.5 Groundwater Monitoring (Envass, 2020) Groundwater Monitoring
Sample ID Description Latitude Longitude
EMPR02/E2 West of ODN pit S 26° 9.7314' E 28°43.0668'
KENMB1 Fuel Dispensary S 26° 10.9176' E 28°44.2698'
KENMB2-D Silver Dam 2 S 26°10.7604' E 28°43.8452'
KENMB2-S Silver Dam 1 S 26° 10.761' E 28°43.827'
KENMB3-D PLANT/Stockpile 1 S 26°10.1738' E 28°44.2325'
KENMB3-S PLANT/Stockpile 2 S 26°10.2819' E 28°43.8080'
LEEMB18-D Plant Conveyor 2 S 26°10.0902' E 28°43.6521'
LW07 North of Witklip S 26°09.9706' E 28°42.6314'
LW08 South West of Kenbar S 26O11.0940' E 28°43.6227'
LW10 South of Delmas Silica (borehole does not exist) S 26°9.8760' E 28°45.90'
LWG01 South of Kenbar S 26°10.7796' E 28°43.7256'
LWG02 South East of Kenbar S 26°10.7461' E 28°44.2200'
LWG04 Moabsvelden Groundwater S 26°10.4568' E 28° 45.3546'
MOAMB10 Block OI New Mine Area 1 S 26°09.9010' E 28°45.9177'
MOAMB4 Block OH S 26°10.0472' E 28°44.6280'
MOAMB7 Block OJ / Stuart Coal Upstream S 26°09.2321' E 28°45.3272'
MOAMB9 Block OI New Mine Area2 S 26°10.5353' E 28°46.0158'
RIE10 Rietkuil Monitoring Borehole S 26°12.0996' E 28°45.8058'
RIE10B Rietkuil Monitoring Borehole S 26°12.0783' E 28°45.8202'
RIE4 Rietkuil Monitoring Borehole S 26°11.3292' E 28°46.104'
RKL01 Rietkuil Monitoring Borehole S 26°11.0684' E 28°44.6443'
RKL03 Rietkuil Monitoring Borehole S 26°11.355' E 28°46.248'
RKL04 De Denne Monitoring Borehole upstream of S 26°11.8884' E 28°44.5146'
RKL02 Rietkuil Monitoring Borehole S 26°10.9936' E 28°45.9942'
WELMB13-D Moabsvelden 1 S 26°08.6306' E 28°46.7083'
WELMB13-S Moabsvelden 2 S 26°08.6364' E 28°46.6961'
WITMB14 Block OA S 26°10.0137' E 28°42.3247'
WOLMB15-D ODN/PCD1 S 26°09.9538' E 28°43.4233'
WOLMB15-S ODN/PCD 2 S 26°09.9548' E 28°43.4306'
WTN02-D Weltevreden Monitoring Borehole - Deep S 26°8.7840' E 28°46.1604'
WTN02S Weltevreden Monitoring Borehole - Shallow S 26°8.7840' E 28°46.1598'
WTN01-D Weltevreden Monitoring Borehole S 26°8.0976' E 28°45.942'
WTN01-S Weltevreden Monitoring Borehole - Shallow S 26° 8.0976' E 28° 45.942'
WWNMB16 Block UB S 26°10.7110' E 28°42.6609'
WWN01 Wolvenfontein Monitoring Borehole S 26° 10.4628' E 28° 43.0332'
WWN02D Wolvenfontein Monitoring Borehole - deep S 26°10.4475' E 28°43.0969'
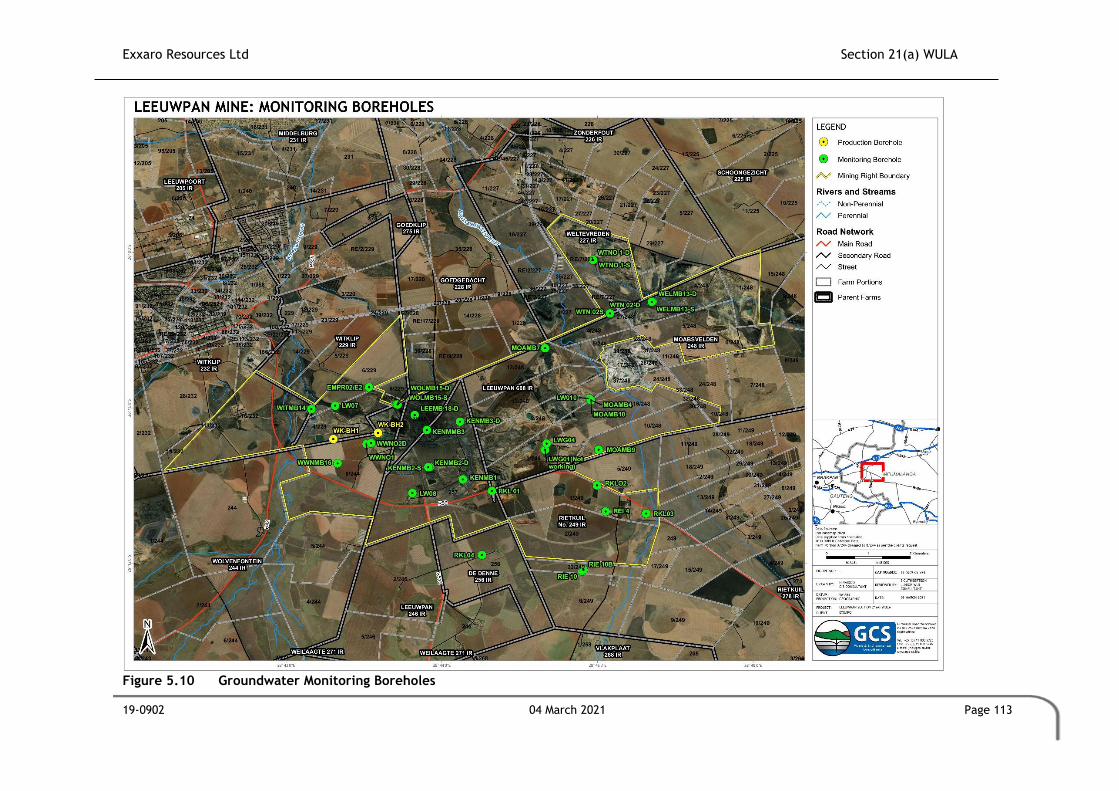
Exxaro Resources Ltd Section 21(a) WULA
19-0902 04 March 2021 Page 113
Figure 5.10 Groundwater Monitoring Boreholes
Exxaro Resources Ltd Section 21(a) WULA
19-0902 04 March 2021 Page 114
5.4.3 Biomonitoring
Biomonitoring at the Leeuwpan Mine is currently conducted by Environmental Assurance
(Envass). The latest biomonitoring report (September 2020) for the Mine is attached as
Annexure D to this report.
Four (4) biomonitoring predetermined sites were selected on representative aquatic systems
up and downstream of the study site (Figure 5.11). These sample points were presumably
chosen as a result of:
• Their vicinity to the study area; and
• Their ability to represent the various biotopes/habitats that are required for the
SASS5 and IHAS methodologies.
Bronkhorstspruit SQR no. B20A- 1298:
• LP-WEL-DS: Downstream of the Leeuwpan Colliery on a Weltevreden Tributary.
SASS5, IHAS, Diatom analysis and toxicity testing were conducted at this site; and
• LP-RK-US: Upstream of the Leeuwpan Colliery on a Rietkuil Tributary. This site
indicated stagnant conditions during the 2020 dry season field survey, the Diatom
analysis and toxicity testing were conducted at this site at a small pool.
SQR no. B20A- 1308:
• LP-BS-DS: Downstream of the Leeuwpan Colliery on the Bronkhorstspruit River.
SASS5, IHAS, Diatom analysis and toxicity testing were conducted at this site; and
• LP-BS-US: Upstream of the Leeuwpan Colliery on the Bronkhorstspruit River. SASS5,
IHAS, Diatom analysis and toxicity testing were conducted at this site.
Quarterly DEEEP Toxicity Testing Sites:
• KR01A: Kenbar Return Water Dam (RWD), which replaces the mined-out D-DS site;
• D-DS (LSW13): Divergent channel 3 on-site, which flows into a Weltevreden Tributary
and then into the downstream Bronkhorstspruit River; and
• LSW09: Pollution Control Dam (PCD) on-site.
The localities of the biomonitoring sites are illustrated in Figure 5.11.
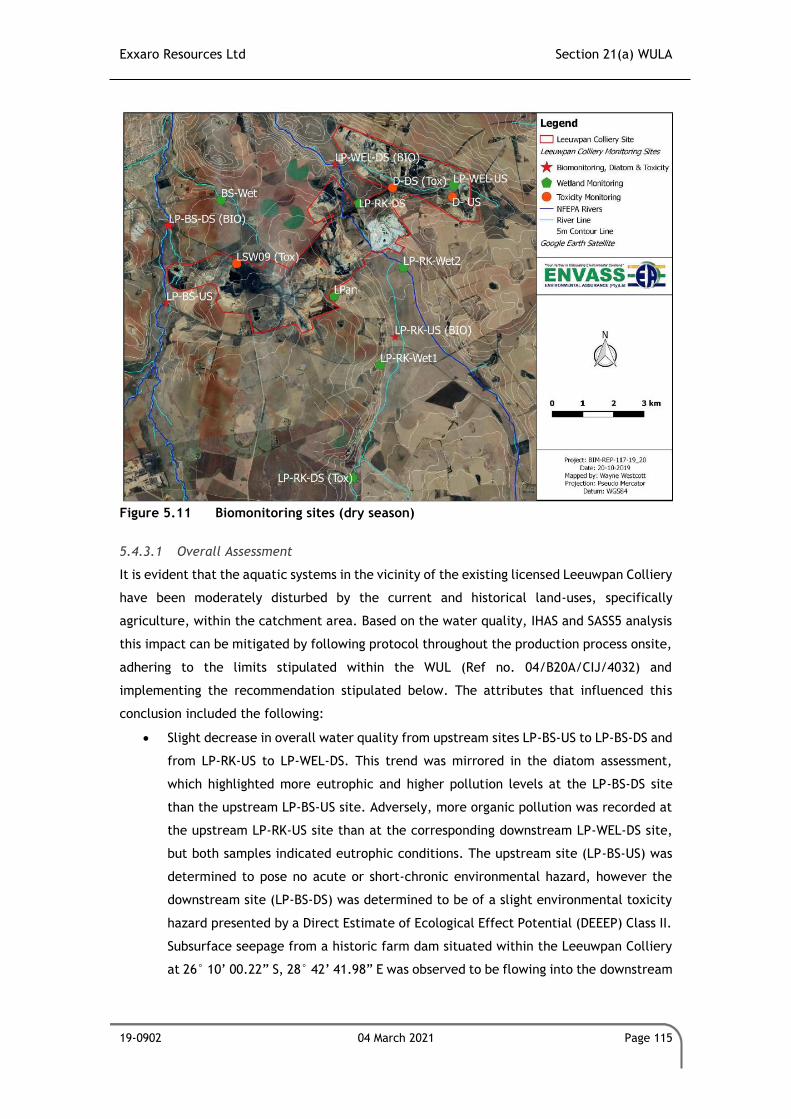
Exxaro Resources Ltd Section 21(a) WULA
19-0902 04 March 2021 Page 115
Figure 5.11 Biomonitoring sites (dry season)
5.4.3.1 Overall Assessment
It is evident that the aquatic systems in the vicinity of the existing licensed Leeuwpan Colliery
have been moderately disturbed by the current and historical land-uses, specifically
agriculture, within the catchment area. Based on the water quality, IHAS and SASS5 analysis
this impact can be mitigated by following protocol throughout the production process onsite,
adhering to the limits stipulated within the WUL (Ref no. 04/B20A/CIJ/4032) and
implementing the recommendation stipulated below. The attributes that influenced this
conclusion included the following:
• Slight decrease in overall water quality from upstream sites LP-BS-US to LP-BS-DS and
from LP-RK-US to LP-WEL-DS. This trend was mirrored in the diatom assessment,
which highlighted more eutrophic and higher pollution levels at the LP-BS-DS site
than the upstream LP-BS-US site. Adversely, more organic pollution was recorded at
the upstream LP-RK-US site than at the corresponding downstream LP-WEL-DS site,
but both samples indicated eutrophic conditions. The upstream site (LP-BS-US) was
determined to pose no acute or short-chronic environmental hazard, however the
downstream site (LP-BS-DS) was determined to be of a slight environmental toxicity
hazard presented by a Direct Estimate of Ecological Effect Potential (DEEEP) Class II.
Subsurface seepage from a historic farm dam situated within the Leeuwpan Colliery
at 26° 10’ 00.22” S, 28° 42’ 41.98” E was observed to be flowing into the downstream
Exxaro Resources Ltd Section 21(a) WULA
19-0902 04 March 2021 Page 116
tributary of the Bronkhorstspruit River above site LP-BS-DS. There may therefore be
an influence from this farm dam on the change in toxicity levels evident at LP-BS-DS.
Surrounding land-uses were also considered, however as a higher flow volume was
entering the system from farm dam than the agricultural croplands and stormwater
runoff from the adjacent tar road, it was determined to have a higher influence on
this conclusion.
• The previously elevated pH has decreased unto overall acceptable levels, likely the
result of dilution due to increased rainfall in the area prior to the assessment. This
was mirrored by both sites having improved and only LP-WEL-DS being determined to
fall within Class II (Slight environmental toxicity hazard) toxicity, LP-WEL-DS
recording Some Degree of Acute/Short- chronic Toxic Hazard (S.D.O.T.H) at one (1)
trophic level.
• The diatom analysis recorded eutrophic conditions at LP-WEL-DS and the conclusion
was that the habitat decreased and impacted water quality was evident. The diatom
analysis on the downstream point LP-BS-DS also indicated slightly impacted water
quality, however this impact was largely present in the upstream environment at LP-
BS-US as well. However, since the on-site sampled revealed no acute toxicity it
cannot be conclusively stated that the pollution is attributed to the site. These
results revealed that surrounding activities in the upstream environment had a
definitive impact and only a slight decrease was observed at the downstream point.
• The overall increase in aquatic macroinvertebrate health at the downstream
biomonitoring sites was presumably due to the dilution of water attributed to the
elevated availability of water at the monitoring points and the overall increased
water quality measured and therewith the slightly improved habitat.
5.4.3.2 Recommendations
• The banks of the artificial earthen channels that have been excavated to divert flow
around the mining areas should be landscaped to slopes exhibiting a ratio of 1:3 (v:h)
and revegetation with plugs from the surrounding wetland area. This will provide
further filtration of the stormwater runoff and episodic flow through the channels
and into the downstream Bronkhorstspruit River. Ideally, the existing wetlands on-
site should be maintained at their base-line Present Ecological State score (PRES) by
implementing rehabilitation and mitigation measures. This will increase the filtration
of potentially harmful contaminants that may be present in the surface- and
subsurface-flow that may be originating from the Leeuwpan Colliery.
• Toxicity testing of the water within the historic farm dam at 26° 10’ 00.22” S, 28°
42’ 41.98” E should be considered. This may further narrow the search for any
Exxaro Resources Ltd Section 21(a) WULA
19-0902 04 March 2021 Page 117
potential contamination sources on-site and create further measures of monitoring
the potential impact on water quality within the downstream aquatic ecosystems.
• Clearing of Invasive Alien Plant Species (IAPS) from the aquatic ecosystems in areas
under the control of the mine and associated with the reaches on which the affected
biomonitoring points are situated to improve the water balance and natural
biodiversity within and around the system. The controlling and maintenance of all
IAPS on a land owner portion is a legal requirement in terms of the National
Environmental Management: Biodiversity Act (Act no. 10 of 2004) Alien and Invasive
Species List, 2016 (DEA, 2016).
• Ongoing monitoring of the aquatic community integrity, that is implemented at the
Leeuwpan Colliery, should be maintained.
• The results presented within this biannual 2020 dry season aquatic assessment of the
biomonitoring points associated with the Leeuwpan Colliery must be spatially and
temporally compared to the results obtained during previous and future dry season
biomonitoring studies. If the comparison highlights any significant alteration in the
health/integrity of the at-risk or downstream aquatic ecosystems, the cause, extent
and significance of the impact must be identified and appropriate mitigation and/or
rehabilitation measures implemented to improve the health of the impacted systems.
5.4.4 Waste Monitoring
In terms of the waste monitoring that is performed on site, a risk management approach is
adopted. Continuous assessments are also performed i.e. audits, in order to assess the
performance of the waste management on site. After the evaluation and the necessary
controls have been set up to eliminate wastages, the environmental management have to
ensure continuity and follow up:
• Issue based assessments regarding Waste Management, when required;
• Continuous assessments regarding Waste Management;
• Training and education with regards to the Waste Management;
• PPE (application, availability, types, usage, and costs);
• Purchasing standards with regards to waste producing equipment and machinery;
• Periodic review of the Base Line Risk Assessment regarding Waste; and
• Periodic review of this procedure.
All necessary tests are carried out by the contracted waste removal company.
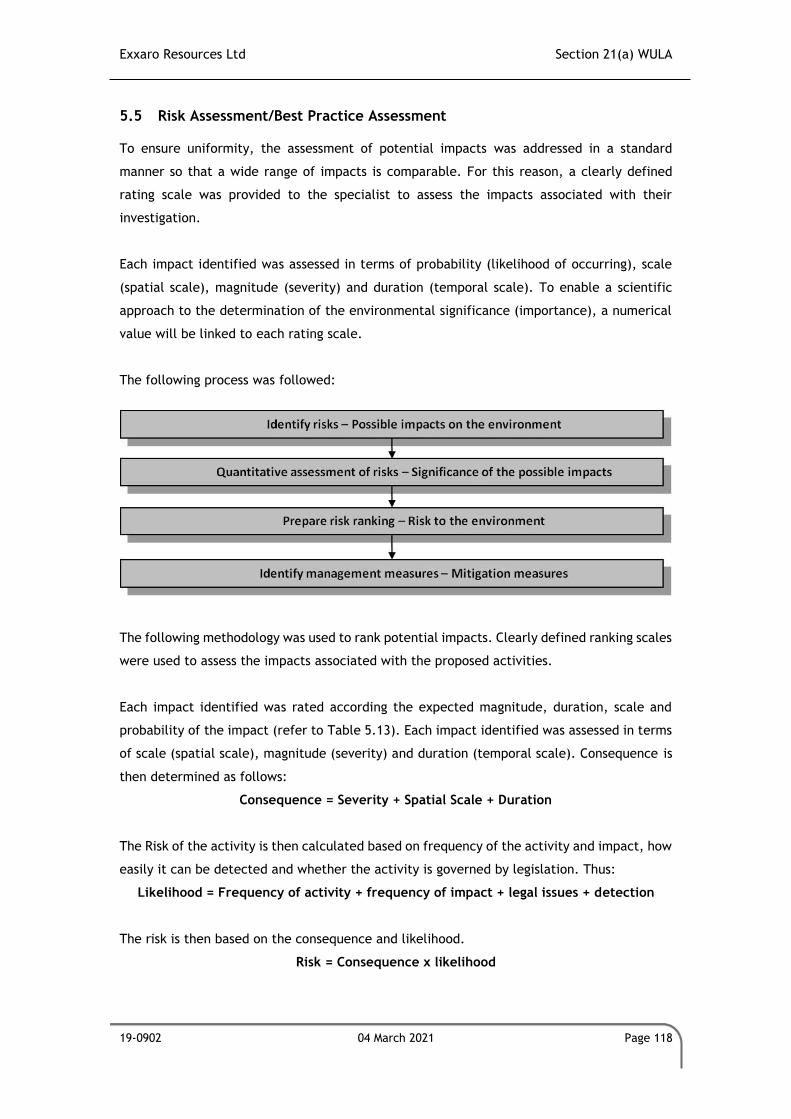
Exxaro Resources Ltd Section 21(a) WULA
19-0902 04 March 2021 Page 118
5.5 Risk Assessment/Best Practice Assessment
To ensure uniformity, the assessment of potential impacts was addressed in a standard
manner so that a wide range of impacts is comparable. For this reason, a clearly defined
rating scale was provided to the specialist to assess the impacts associated with their
investigation.
Each impact identified was assessed in terms of probability (likelihood of occurring), scale
(spatial scale), magnitude (severity) and duration (temporal scale). To enable a scientific
approach to the determination of the environmental significance (importance), a numerical
value will be linked to each rating scale.
The following process was followed:
The following methodology was used to rank potential impacts. Clearly defined ranking scales
were used to assess the impacts associated with the proposed activities.
Each impact identified was rated according the expected magnitude, duration, scale and
probability of the impact (refer to Table 5.13). Each impact identified was assessed in terms
of scale (spatial scale), magnitude (severity) and duration (temporal scale). Consequence is
then determined as follows:
Consequence = Severity + Spatial Scale + Duration
The Risk of the activity is then calculated based on frequency of the activity and impact, how
easily it can be detected and whether the activity is governed by legislation. Thus:
Likelihood = Frequency of activity + frequency of impact + legal issues + detection
The risk is then based on the consequence and likelihood.
Risk = Consequence x likelihood
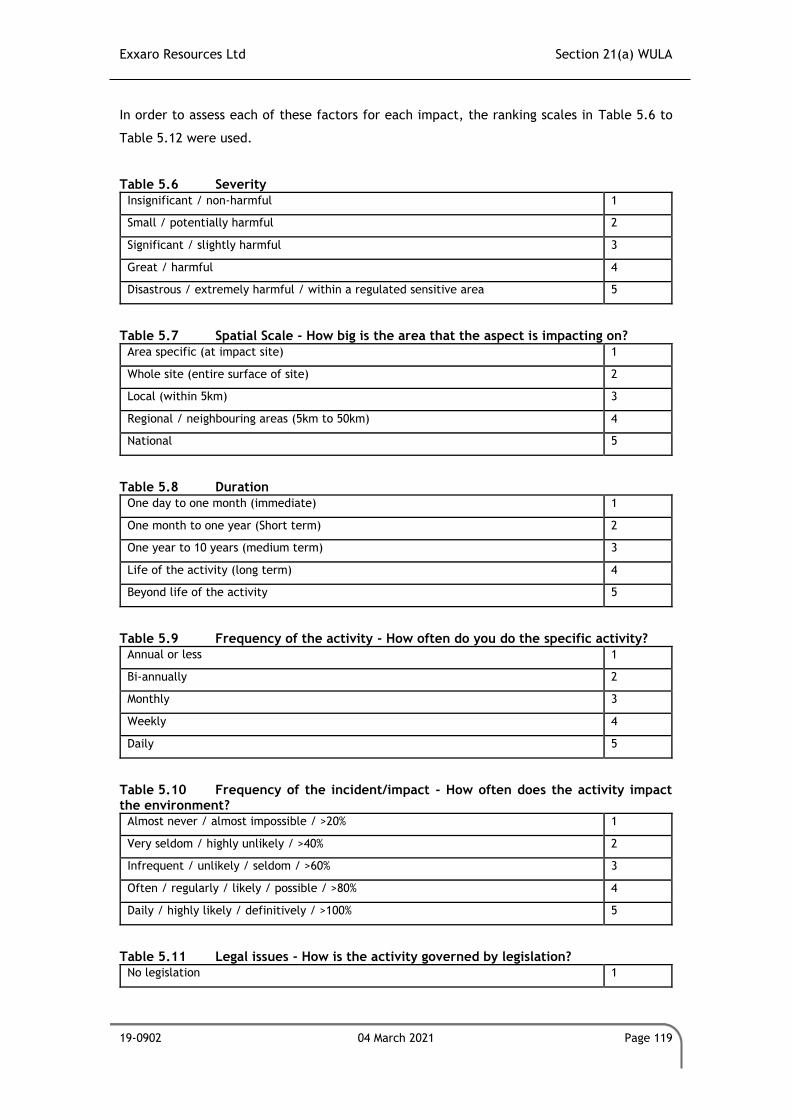
Exxaro Resources Ltd Section 21(a) WULA
19-0902 04 March 2021 Page 119
In order to assess each of these factors for each impact, the ranking scales in Table 5.6 to
Table 5.12 were used.
Table 5.6 Severity
Insignificant / non-harmful 1
Small / potentially harmful 2
Significant / slightly harmful 3
Great / harmful 4
Disastrous / extremely harmful / within a regulated sensitive area 5
Table 5.7 Spatial Scale - How big is the area that the aspect is impacting on?
Area specific (at impact site) 1
Whole site (entire surface of site) 2
Local (within 5km) 3
Regional / neighbouring areas (5km to 50km) 4
National 5
Table 5.8 Duration
One day to one month (immediate) 1
One month to one year (Short term) 2
One year to 10 years (medium term) 3
Life of the activity (long term) 4
Beyond life of the activity 5
Table 5.9 Frequency of the activity - How often do you do the specific activity? Annual or less 1
Bi-annually 2
Monthly 3
Weekly 4
Daily 5
Table 5.10 Frequency of the incident/impact - How often does the activity impact the environment?
Almost never / almost impossible / >20% 1
Very seldom / highly unlikely / >40% 2
Infrequent / unlikely / seldom / >60% 3
Often / regularly / likely / possible / >80% 4
Daily / highly likely / definitively / >100% 5
Table 5.11 Legal issues - How is the activity governed by legislation? No legislation 1
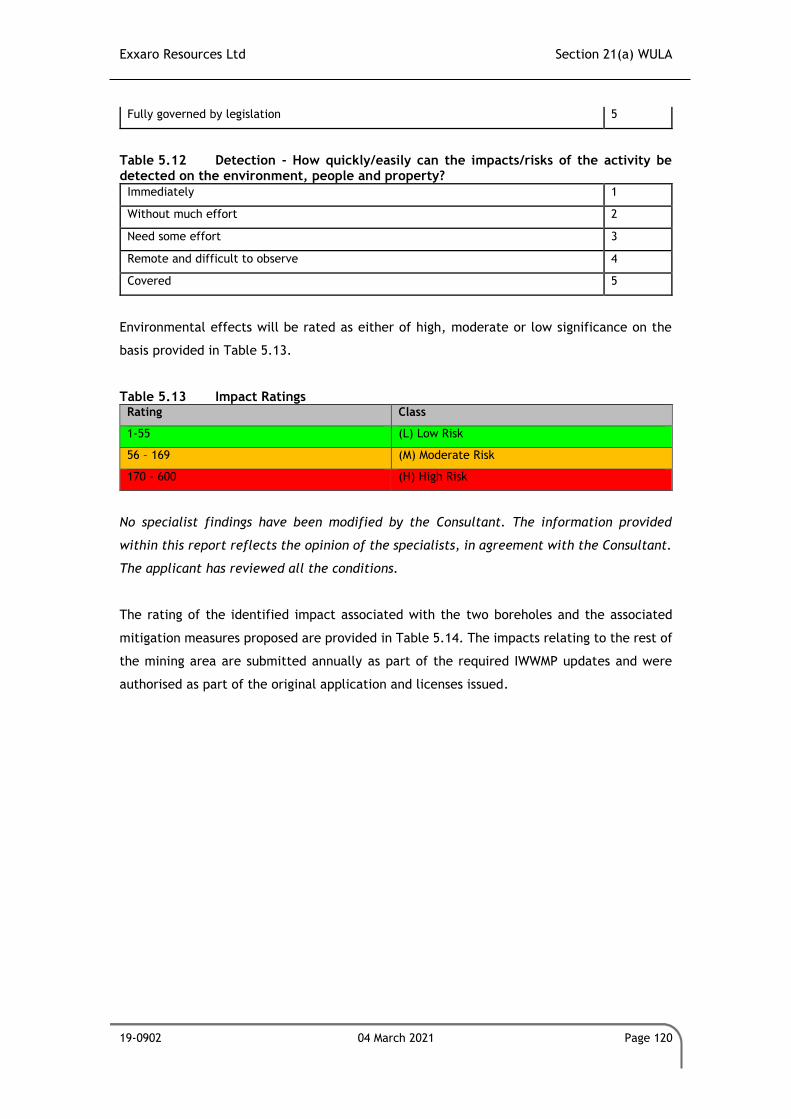
Exxaro Resources Ltd Section 21(a) WULA
19-0902 04 March 2021 Page 120
Fully governed by legislation 5
Table 5.12 Detection - How quickly/easily can the impacts/risks of the activity be detected on the environment, people and property?
Immediately 1
Without much effort 2
Need some effort 3
Remote and difficult to observe 4
Covered 5
Environmental effects will be rated as either of high, moderate or low significance on the
basis provided in Table 5.13.
Table 5.13 Impact Ratings Rating Class
1-55 (L) Low Risk
56 – 169 (M) Moderate Risk
170 - 600 (H) High Risk
No specialist findings have been modified by the Consultant. The information provided
within this report reflects the opinion of the specialists, in agreement with the Consultant.
The applicant has reviewed all the conditions.
The rating of the identified impact associated with the two boreholes and the associated
mitigation measures proposed are provided in Table 5.14. The impacts relating to the rest of
the mining area are submitted annually as part of the required IWWMP updates and were
authorised as part of the original application and licenses issued.
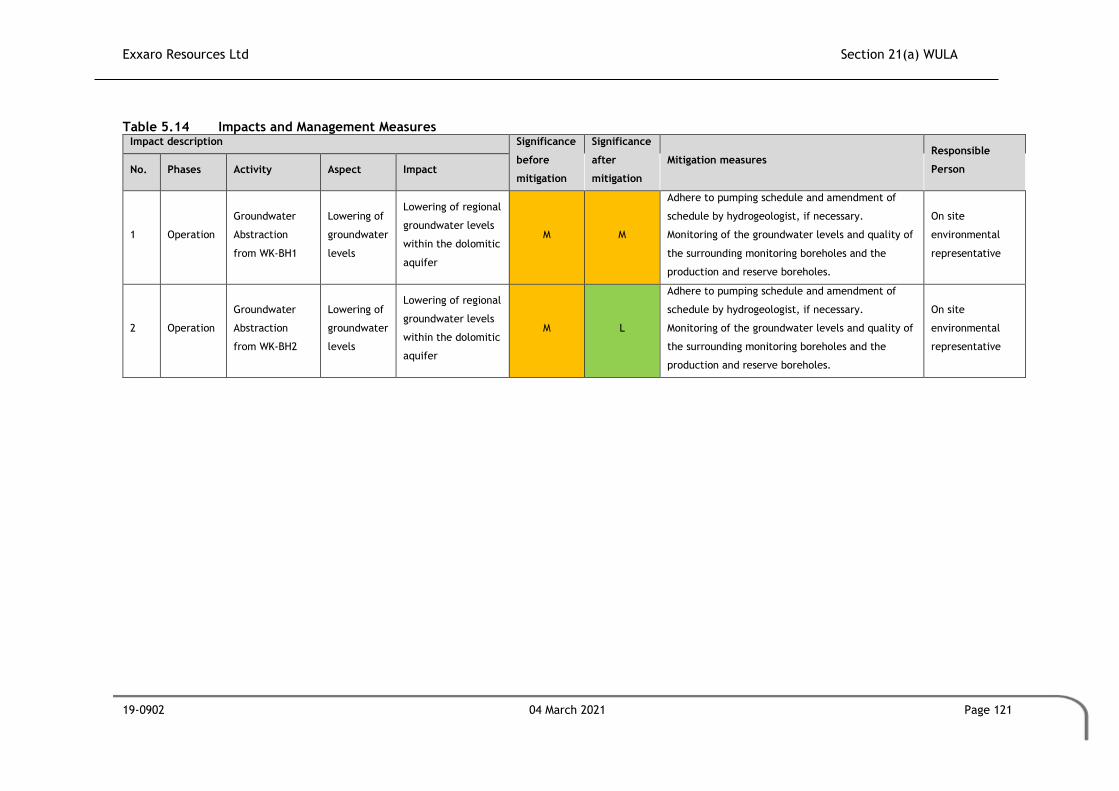
Exxaro Resources Ltd Section 21(a) WULA
19-0902 04 March 2021 Page 121
Table 5.14 Impacts and Management Measures Impact description Significance
before
mitigation
Significance
after
mitigation
Mitigation measures Responsible
Person No. Phases Activity Aspect Impact
1 Operation
Groundwater
Abstraction
from WK-BH1
Lowering of
groundwater
levels
Lowering of regional
groundwater levels
within the dolomitic
aquifer
M M
Adhere to pumping schedule and amendment of
schedule by hydrogeologist, if necessary.
Monitoring of the groundwater levels and quality of
the surrounding monitoring boreholes and the
production and reserve boreholes.
On site
environmental
representative
2 Operation
Groundwater
Abstraction
from WK-BH2
Lowering of
groundwater
levels
Lowering of regional
groundwater levels
within the dolomitic
aquifer
M L
Adhere to pumping schedule and amendment of
schedule by hydrogeologist, if necessary.
Monitoring of the groundwater levels and quality of
the surrounding monitoring boreholes and the
production and reserve boreholes.
On site
environmental
representative
Exxaro Resources Ltd Section 21(a) WULA
19-0902 04 March 2021 Page 122
5.6 Issues and Responses from Public Consultation Process
Public participation is an essential and legislative requirement for any environmental
authorisation process. The principles that demand communication with society at large are
best embodied in the principles of the National Environmental Management Act 1998 (Act No.
107 of 1998) (NEMA), South Africa’s overarching environmental law.
Section 41 (4) of the NWA provides that the competent authority, the DWS, may, at any stage
of the application process, require the applicant to place a suitable notice in newspapers and
other media, and to take other reasonable steps as directed by the competent authority to
bring the application to the attention of relevant organs of state, interested persons and the
general public. The required Public Participation Process (PPP) is outlined in the Government
Notice Regulation 267, Regulations Regarding the Procedural Requirements for Water Use
Licence Applications and Appeals published in Government Gazette 40713 on 24 March 2017.
As such, the following PPP will be undertaken for this WULA in accordance with GNR.267:
• Erecting of Site Notices (English and isiZulu) on the 5th March 2021;
• Distribution of Background Information Documents (BIDs) to adjacent landowners,
the respective local governments and any other Interested and Affected Party (I&AP)
on the 5th March 2021 (via email); and
• Placement of an advertisement in two local newspapers (Highveld Chronicle and
Streek Nuus) on the 5th March 2021.
The PPP will commence on the 5th March 2021 and will run for 60 days ending on the 6th May
2021. A full PP report will be compiled to include all responses from the public after the 60
day period.
5.7 Matters Requiring Attention/Problem Statement
Not applicable to this application.
5.8 Assessment of Level and Confidence of Information
All information contained in this WULA was sourced from the following:
• Specialist studies conducted for the project area which include:
o Envass – Aquatic Assessment;
o GCS – Hydrogeological Investigation;
o Envass – Monthly Water Quality Report; and
o Exxaro – Integrated Water Balance Report for Leeuwpan Mine.
• The 2019 IWWMP Update conducted by GCS;
Exxaro Resources Ltd Section 21(a) WULA
19-0902 04 March 2021 Page 123
• The EIA / EMP consolidation compiled and submitted to the DMR and the MDEDET for
the expansion project; and
• Previous environmental reports conducted for the Leeuwpan Mine.
The specialists appointed to undertake the various investigations are considered to be
competent in their particular fields. In light of the above, the level of confidence with regards
to the information and reports used to compile this document is high.
6 WATER AND WASTE MANAGEMENT
6.1 Water and Waste Management Philosophy
The project policy of Leeuwpan Coal is to provide a benchmark for its employees, customers
and contractors to meet the highest standards and make every effort to conform to all legal
requirements including all set key performance objectives.
Leeuwpan Coals project management philosophy is to continually improve the project
execution performances of their project activities and to set objectives so as to reduce risks
associated with those actions.
The Directors and the project team are wholly committed to a safe, accident free working
environment and must endeavour to show continual improvement in employee safety and
health.
The company should make effort to ensure that safety, health and environmental legislation
and regulations are complied with, in execution of project activities.
The project team should continually improve the quality of actions to ensure that key
performance objectives are met.
6.1.1 Process Water
The philosophy with respect to process water management is to:
• Minimise the amount of process water produced (continually investigate emerging
technologies for processing);
• Contain all process water to ensure zero discharge to the environment; and
• Re-use process water for dust suppression and in the process.
Exxaro Resources Ltd Section 21(a) WULA
19-0902 04 March 2021 Page 124
6.1.2 Storm Water
The philosophy for stormwater management on site is in keeping with the GN704 principles:
• To keep clean and dirty water separated;
• To contain any dirty water within a system;
• To prevent contamination of clean water; and
• To return clean water to the catchment.
6.1.3 Groundwater
The philosophy for waste management of groundwater is:
• Ensure that all potential groundwater impacts are identified; and
• Ensure that groundwater monitoring is conducted quarterly and that records are kept
and a database compiled to identify trends over time.
6.1.4 Waste
The philosophy for the management of the various waste streams on site is:
• Minimisation of waste through reducing, re-using and recycling of waste;
• Monitoring of waste management practises;
• Best practise storage and disposal of waste; and
• Consideration of alternative cost effective technologies with regards to waste
Management.
6.2 Strategies
The following strategies have been outlined and implemented for Leeuwpan.
6.2.1 Process Water
Process water management will consist of:
• Investigating new alternatives for process water treatment and re-use; and
• Continued, regular monitoring of dirty water dams which contain process water to
ensure that the water quality is appropriate for re-use.
6.2.2 Storm Water
A storm water management plan should be developed and updated for Leeuwpan operations.
Storm water management will comprise of:
• Regular monitoring of surface water quality; and
• Regular monitoring and maintenance of stormwater control structures.
Exxaro Resources Ltd Section 21(a) WULA
19-0902 04 March 2021 Page 125
6.2.3 Groundwater
Groundwater management strategies will comprise of:
• Continued, regular monitoring of groundwater levels and quality; and
• Annual compliance audits.
6.2.4 Waste
Waste management strategies will consist of:
• Implementation of good housekeeping and best practises;
• Investigating new, cleaner and more cost effective technologies to reduce and
manage waste;
• Monitor compliance with best practises; and
• Creating environmental awareness and sensitivity through improvements to the
induction programme for employees.
6.3 Performance Objectives/Goals
The following objectives and strategies are followed in order to achieve the Safety, Health,
Environment and Community Policy:
• Compliance:
o Identify all applicable legislation and other applicable requirements to the
identified environmental aspects and ensure that the operations remain in
compliance with such legislation and requirements.
• Pollution Prevention:
o Identify the impacts that all operations, processes and products have on the
environment and will ensure that pollution on the environment is prevented
or minimised.
• Improvement:
o Set objectives and targets to improve environmental performance and the
Environmental Management System and will continually strive to find even
better sustainable solutions to problems.
• Competence:
o Ensure that all people who perform work for or on behalf of Leeuwpan Coal
are competent and understand the impact of their activities on the
environment, and their role in the prevention of pollution and the
maintenance of the Environmental Management System.
• Communication:
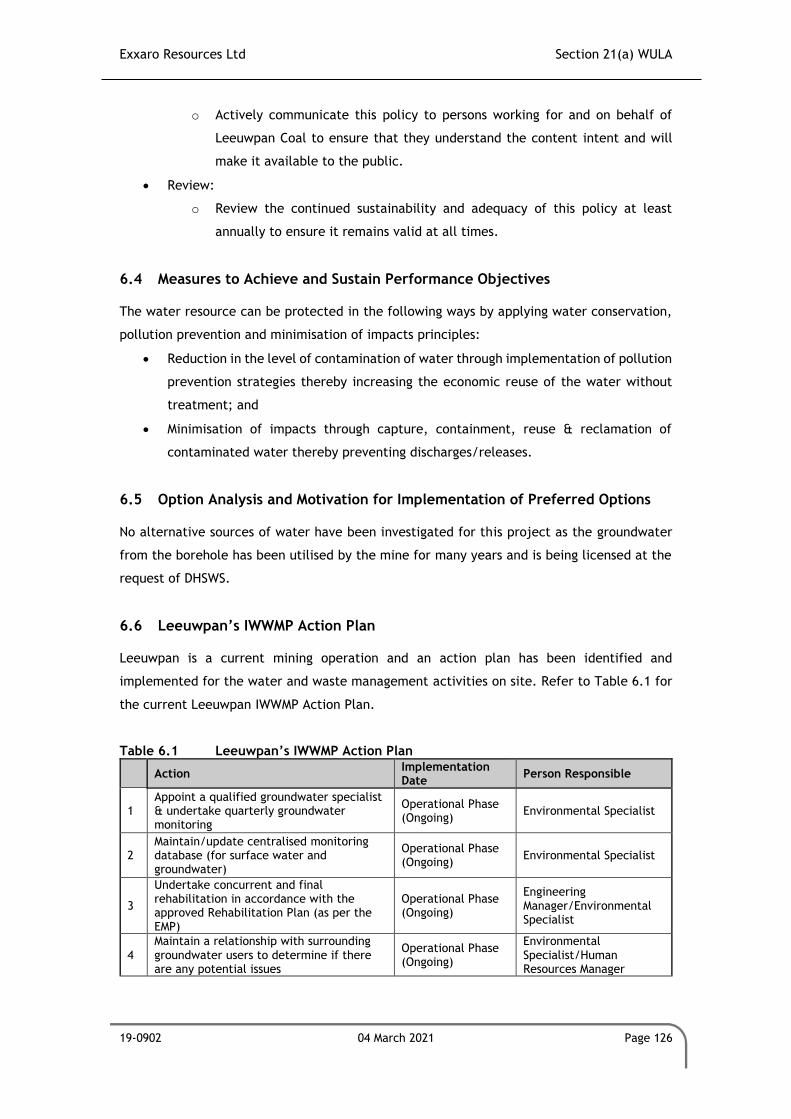
Exxaro Resources Ltd Section 21(a) WULA
19-0902 04 March 2021 Page 126
o Actively communicate this policy to persons working for and on behalf of
Leeuwpan Coal to ensure that they understand the content intent and will
make it available to the public.
• Review:
o Review the continued sustainability and adequacy of this policy at least
annually to ensure it remains valid at all times.
6.4 Measures to Achieve and Sustain Performance Objectives
The water resource can be protected in the following ways by applying water conservation,
pollution prevention and minimisation of impacts principles:
• Reduction in the level of contamination of water through implementation of pollution
prevention strategies thereby increasing the economic reuse of the water without
treatment; and
• Minimisation of impacts through capture, containment, reuse & reclamation of
contaminated water thereby preventing discharges/releases.
6.5 Option Analysis and Motivation for Implementation of Preferred Options
No alternative sources of water have been investigated for this project as the groundwater
from the borehole has been utilised by the mine for many years and is being licensed at the
request of DHSWS.
6.6 Leeuwpan’s IWWMP Action Plan
Leeuwpan is a current mining operation and an action plan has been identified and
implemented for the water and waste management activities on site. Refer to Table 6.1 for
the current Leeuwpan IWWMP Action Plan.
Table 6.1 Leeuwpan’s IWWMP Action Plan
Action Implementation Date
Person Responsible
1 Appoint a qualified groundwater specialist & undertake quarterly groundwater monitoring
Operational Phase (Ongoing)
Environmental Specialist
2 Maintain/update centralised monitoring database (for surface water and groundwater)
Operational Phase (Ongoing)
Environmental Specialist
3
Undertake concurrent and final rehabilitation in accordance with the approved Rehabilitation Plan (as per the EMP)
Operational Phase (Ongoing)
Engineering Manager/Environmental Specialist
4 Maintain a relationship with surrounding groundwater users to determine if there are any potential issues
Operational Phase (Ongoing)
Environmental Specialist/Human Resources Manager
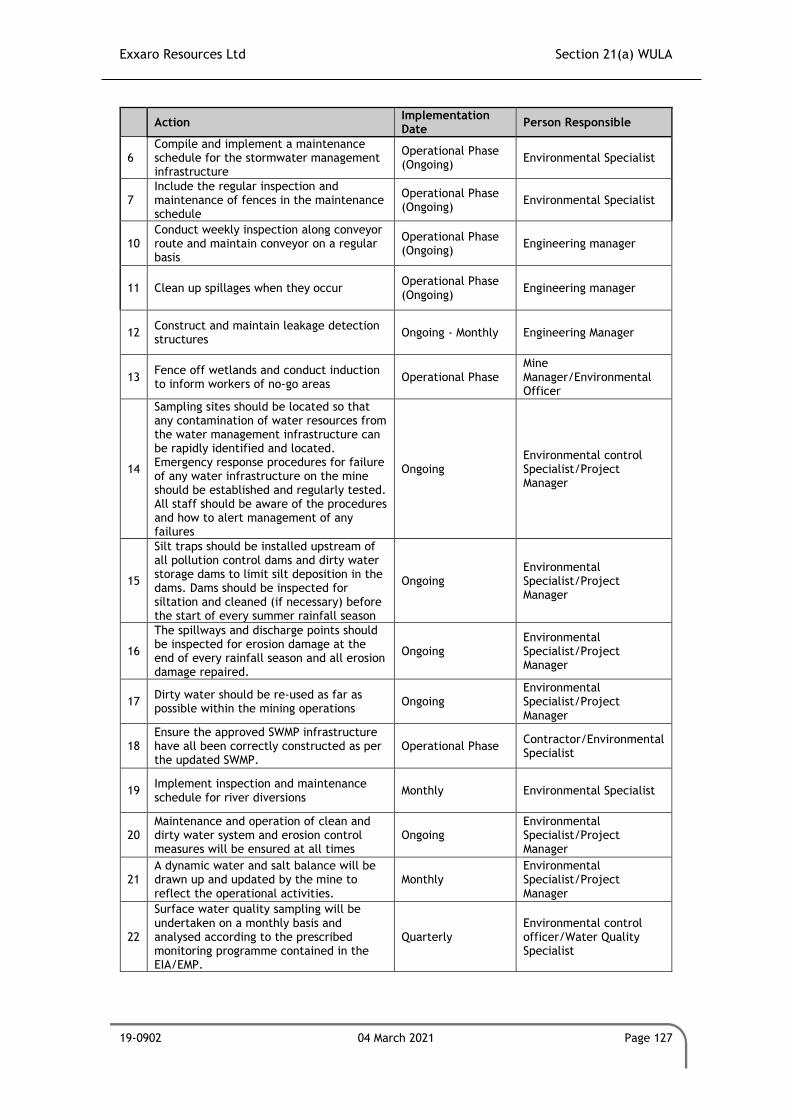
Exxaro Resources Ltd Section 21(a) WULA
19-0902 04 March 2021 Page 127
Action Implementation Date
Person Responsible
6 Compile and implement a maintenance schedule for the stormwater management infrastructure
Operational Phase (Ongoing)
Environmental Specialist
7 Include the regular inspection and maintenance of fences in the maintenance schedule
Operational Phase (Ongoing)
Environmental Specialist
10 Conduct weekly inspection along conveyor route and maintain conveyor on a regular basis
Operational Phase (Ongoing)
Engineering manager
11 Clean up spillages when they occur Operational Phase (Ongoing)
Engineering manager
12 Construct and maintain leakage detection structures
Ongoing - Monthly Engineering Manager
13 Fence off wetlands and conduct induction to inform workers of no-go areas
Operational Phase Mine Manager/Environmental Officer
14
Sampling sites should be located so that any contamination of water resources from the water management infrastructure can be rapidly identified and located. Emergency response procedures for failure of any water infrastructure on the mine should be established and regularly tested. All staff should be aware of the procedures and how to alert management of any failures
Ongoing Environmental control Specialist/Project Manager
15
Silt traps should be installed upstream of all pollution control dams and dirty water storage dams to limit silt deposition in the dams. Dams should be inspected for siltation and cleaned (if necessary) before the start of every summer rainfall season
Ongoing Environmental Specialist/Project Manager
16
The spillways and discharge points should be inspected for erosion damage at the end of every rainfall season and all erosion damage repaired.
Ongoing Environmental Specialist/Project Manager
17 Dirty water should be re-used as far as possible within the mining operations
Ongoing Environmental Specialist/Project Manager
18 Ensure the approved SWMP infrastructure have all been correctly constructed as per the updated SWMP.
Operational Phase Contractor/Environmental Specialist
19 Implement inspection and maintenance schedule for river diversions
Monthly Environmental Specialist
20 Maintenance and operation of clean and dirty water system and erosion control measures will be ensured at all times
Ongoing Environmental Specialist/Project Manager
21 A dynamic water and salt balance will be drawn up and updated by the mine to reflect the operational activities.
Monthly Environmental Specialist/Project Manager
22
Surface water quality sampling will be undertaken on a monthly basis and analysed according to the prescribed monitoring programme contained in the EIA/EMP.
Quarterly Environmental control officer/Water Quality Specialist
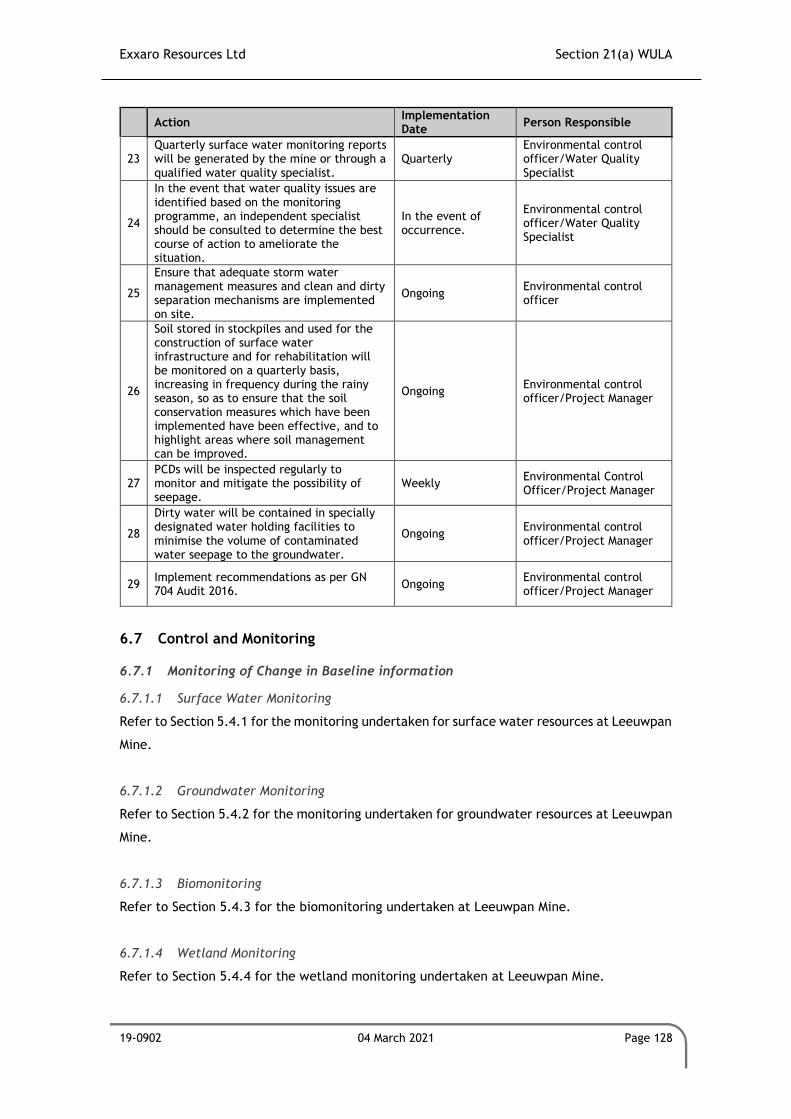
Exxaro Resources Ltd Section 21(a) WULA
19-0902 04 March 2021 Page 128
Action Implementation Date
Person Responsible
23 Quarterly surface water monitoring reports will be generated by the mine or through a qualified water quality specialist.
Quarterly Environmental control officer/Water Quality Specialist
24
In the event that water quality issues are identified based on the monitoring programme, an independent specialist should be consulted to determine the best course of action to ameliorate the situation.
In the event of occurrence.
Environmental control officer/Water Quality Specialist
25
Ensure that adequate storm water management measures and clean and dirty separation mechanisms are implemented on site.
Ongoing Environmental control officer
26
Soil stored in stockpiles and used for the construction of surface water infrastructure and for rehabilitation will be monitored on a quarterly basis, increasing in frequency during the rainy season, so as to ensure that the soil conservation measures which have been implemented have been effective, and to highlight areas where soil management can be improved.
Ongoing Environmental control officer/Project Manager
27 PCDs will be inspected regularly to monitor and mitigate the possibility of seepage.
Weekly Environmental Control Officer/Project Manager
28
Dirty water will be contained in specially designated water holding facilities to minimise the volume of contaminated water seepage to the groundwater.
Ongoing Environmental control officer/Project Manager
29 Implement recommendations as per GN 704 Audit 2016.
Ongoing Environmental control officer/Project Manager
6.7 Control and Monitoring
6.7.1 Monitoring of Change in Baseline information
6.7.1.1 Surface Water Monitoring
Refer to Section 5.4.1 for the monitoring undertaken for surface water resources at Leeuwpan
Mine.
6.7.1.2 Groundwater Monitoring
Refer to Section 5.4.2 for the monitoring undertaken for groundwater resources at Leeuwpan
Mine.
6.7.1.3 Biomonitoring
Refer to Section 5.4.3 for the biomonitoring undertaken at Leeuwpan Mine.
6.7.1.4 Wetland Monitoring
Refer to Section 5.4.4 for the wetland monitoring undertaken at Leeuwpan Mine.
Exxaro Resources Ltd Section 21(a) WULA
19-0902 04 March 2021 Page 129
6.7.2 Audit and Report on Performance Measures
Each component within the WUL has an associated audit and performance review component.
Regular review and auditing is important to ensure systems are up-to-date and still relevant
for current situations. Evaluation is required to verify its appropriateness and suitability by
comparing performance to objectives set. Changes or adjustments to systems are required
where review/auditing highlights shortcomings or gaps. Performance should be measured
against:
• Internal audit (conducted annually);
• External audit (conducted annually); and
• DHSWS reporting (conducted bi-annually).
7 CONCLUSION
7.1 Regulatory Status of Activity
There are currently three Water Use Licences for the Leeuwpan mining operation. The IWULs
that pertains to this report were issued in 2011 (Licence No. 04/B21A/ABCGIJ/429) and its
associated amendment, as well as the IWUL for the OI and OL expansion (Licence No.
04/B20A/CIJ/4032) that was issued in 2015 for the current, existing and future mining
operations. An additional IWUL (Licence No. 06/B20A/CI/9521) was issued for the expansion
of mining Block OI to include the area where planned infrastructure would have originally
been located. This expansion area is referred to as OI West.
Furthermore, following a meeting with the DHSWS, the DHSWS indicated that Leeuwpan
requires authorisation in the form of a Water Use License (WUL) for the abstraction of water
from the Witklip borehole (WK-BH1) for operations at the Leeuwpan Coal Mine. This borehole
was not licensed as part of the authorisations previously issued and was previously been listed
as an Existing Lawful Water Use (ELWU) in previous reports. DHSWS have however, requested
that an application be made to license this abstraction. In addition, a second borehole (WK-
BH2) is being applied for as a backup supply borehole to supplement Witklip borehole 1 water
if water cannot be abstracted from it. Abstraction of water from the two boreholes triggers
a water use in terms of Section 21(a) ‘taking water from a water resource’ of the NWA.
The WK-BH1 and WK-BH2 are not licensed as part of the IWULs issued and as a result is being
applied for in this application.
Exxaro Resources Ltd Section 21(a) WULA
19-0902 04 March 2021 Page 130
7.2 Statement of Water Use Requiring Authorisation
As a result of the need for abstraction of water from the WK-BH1 and the back-up WK-BH2
this water use is being applied for as a Section 21(a) water use in terms of the requirements
of the NWA. For this abstraction, a monitoring programme will be implemented and has been
discussed in this document. This is to ensure that all conditions of the water licence are met
and that the receiving environment is not adversely affected by the two boreholes.
7.3 Section 27 Motivation
Refer to Annexure A for the Section 27 Motivation compiled for the two boreholes.
7.4 Proposed License Conditions
It is hereby recommended that the water use be authorised under a water use licence issued
by the DHSWS for a period of 15 years with a review period of 5 years.
Exxaro Resources Ltd Section 21(a) WULA
19-0902 04 March 2021 Page 131
8 REFERENCES
Department of Water and Sanitation, DWS. (2013). Groundwater Resource Directed Measures
(GRDM). Version 2.3.2.
Environmental Authorisation and Environmental Management Plan reports compiled for the
Block OI Expansion project.
Specialist Studies conducted for the Leeuwpan monitoring programme.
Specialist Studies conducted for the Block OI Expansion project.
Victor Khanye Local Municipality. (2020). Victor Khanye Local Municipality Integrated
Development Plan Final 2019/20 Review.
Annexure A Section 27 Motivation
63 Wessel Road, Rivonia, 2128 PO Box 2597, Rivonia, 2128 South Africa
Tel: +27 (0) 11 803 5726 Fax: +27 (0) 11 803 5745 Web: www.gcs-sa.biz
www.gcs-sa.biz
GCS (Pty) Ltd. Reg No: 2004/000765/07 Est. 1987
Offices: Durban Gaborone Johannesburg Lusaka Maseru Ostrava Pretoria Windhoek
Directors: AC Johnstone (Managing) PF Labuschagne AWC Marais S Napier W Sherriff (Financial)
Non-Executive Director: B Wilson-Jones
Section 27 Motivation
National Water Act, 1998 (Act No. 36 of 1998)
Report
Version – Public Review
04 March 2021
Exxaro Leeuwpan
GCS Project Number: 20-1014
Client Reference: PO: 4512334972
Exxaro Resources Ltd Leeuwpan 2020 IWWMP Update
19-0902 04 March 2021 Page ii
Section 27 Motivation
Report Version – Public Review
04 March 2021
Exxaro Leeuwpan
20-1014
DOCUMENT ISSUE STATUS
Report Issue Public Review
GCS Reference Number 19-0902
Client Reference 4512334972
Title Section 27 Motivation
Name Signature Date
Author Shayna-Ann Cuthbertson
04 March 2021
Document Reviewer Kate Cain
04 March 2021
LEGAL NOTICE This report or any proportion thereof and any associated documentation remain the property of GCS until the mandator effects payment of all fees and disbursements due to GCS in terms of the GCS Conditions of Contract and Project Acceptance Form. Notwithstanding the aforesaid, any reproduction, duplication, copying, adaptation, editing, change, disclosure, publication, distribution, incorporation, modification, lending, transfer, sending, delivering, serving or broadcasting must be authorised in writing by GCS.
Exxaro Resources Ltd Section 21(a) WULA
19-0902 04 March 2021 Page iii
CONTENTS PAGE
1 EXISTING LAWFUL WATER USE ................................................................................................... 1
2 THE NEED TO REDRESS THE RESULTS OF PAST RACIAL AND GENDER DISCRIMINATION ............. 7
2.1 PROCUREMENT ............................................................................................................................. 7 2.2 EMPLOYMENT EQUITY .................................................................................................................... 8 2.3 WOMEN IN MINING ....................................................................................................................... 9 2.4 SKILLS DEVELOPMENT PLAN ............................................................................................................. 9 2.5 MENTORSHIP PLAN ...................................................................................................................... 11 2.6 INTERNSHIP AND BURSARY PLAN .................................................................................................... 12
3 EFFICIENT AND BENEFICIAL USE OF WATER IN THE PUBLIC INTEREST ....................................... 12
4 THE SOCIO ECONOMIC IMPACT ................................................................................................ 15
4.1 OF THE WATER USE OR USES IF AUTHORISED ...................................................................................... 15 4.1.1 The Social Impact: ........................................................................................................... 15 4.1.2 Economic Impact............................................................................................................. 15
4.2 OF THE FAILURE TO AUTHORISE THE WATER USE OR USES: .................................................................... 16
5 ANY CATCHMENT MANAGEMENT STRATEGY APPLICABLE TO THE RELEVANT WATER RESOURCE 16
6 THE LIKELY EFFECT OF THE WATER USE TO BE AUTHORISED ON THE WATER RESOURCE AND ON OTHER WATER USERS ...................................................................................................................... 17
6.1 SURFACE WATER ......................................................................................................................... 17 6.2 GROUNDWATER .......................................................................................................................... 17
7 THE CLASS AND THE RESOURCE QUALITY OBJECTIVES OF THE WATER RESOURCE ................... 18
7.1 RECEIVING WATER QUALITY OBJECTIVES AND THE RESERVE ................................................................... 19
8 INVESTMENTS ALREADY MADE AND TO BE MADE BY THE WATER USER IN RESPECT TO THE WATER USE IN QUESTION ................................................................................................................ 19
9 THE STRATEGIC IMPORTANCE OF THE WATER USES TO BE AUTHORISED ................................. 20
10 THE QUALITY OF WATER IN THE WATER RESOURCE WHICH MAY BE REQUIRED FOR THE RESERVE AND FOR MEETING INTERNATIONAL AGREEMENTS .......................................................... 21
10.1 INTERNATIONAL AGREEMENTS ....................................................................................................... 21 10.2 SURFACE WATER QUALITY ............................................................................................................ 21
10.2.1 Receiving Environmental Water Quality ......................................................................... 21 10.2.2 Process Water Quality .................................................................................................... 22 10.2.3 Effluent Water Quality .................................................................................................... 23 10.2.4 Potable Water Quality .................................................................................................... 23 10.2.5 Conclusion and Aspects to Consider ............................................................................... 23
10.3 GROUNDWATER QUALITY .............................................................................................................. 25
11 THE PROBABLE DURATION OF ANY UNDERTAKING OR WHICH A WATER USE IS TO BE AUTHORISED .................................................................................................................................... 27
12 REFERENCES ............................................................................................................................. 28
LIST OF TABLES
Table 1.1 Existing Lawful Water Uses under Section 21 ........................................ 1 Table 1.2 Existing Approved Water Uses ......................................................... 2 Table 2.1 Women in mining – Five year project projection .................................... 9 Table 7.1 Resource classes as set out by the DWS ............................................ 18 Table 7.2 Resource classes for the Bronkhorstspruit ......................................... 19 Table 7.3 System variables (DWA 2001) ........................................................ 19
Exxaro Resources Ltd Section 21(a) WULA
19-0902 04 March 2021 Page iv
LIST OF FIGURES
Figure 10.1 Expanded Durov diagram of groundwater chemistry regarding March 2020 (Envass, 2020) .......................................................................... 26
Figure 10.2 Stiff diagrams of groundwater chemistry regarding September 2020 (Envass, 2020) ..................................................................................... 27
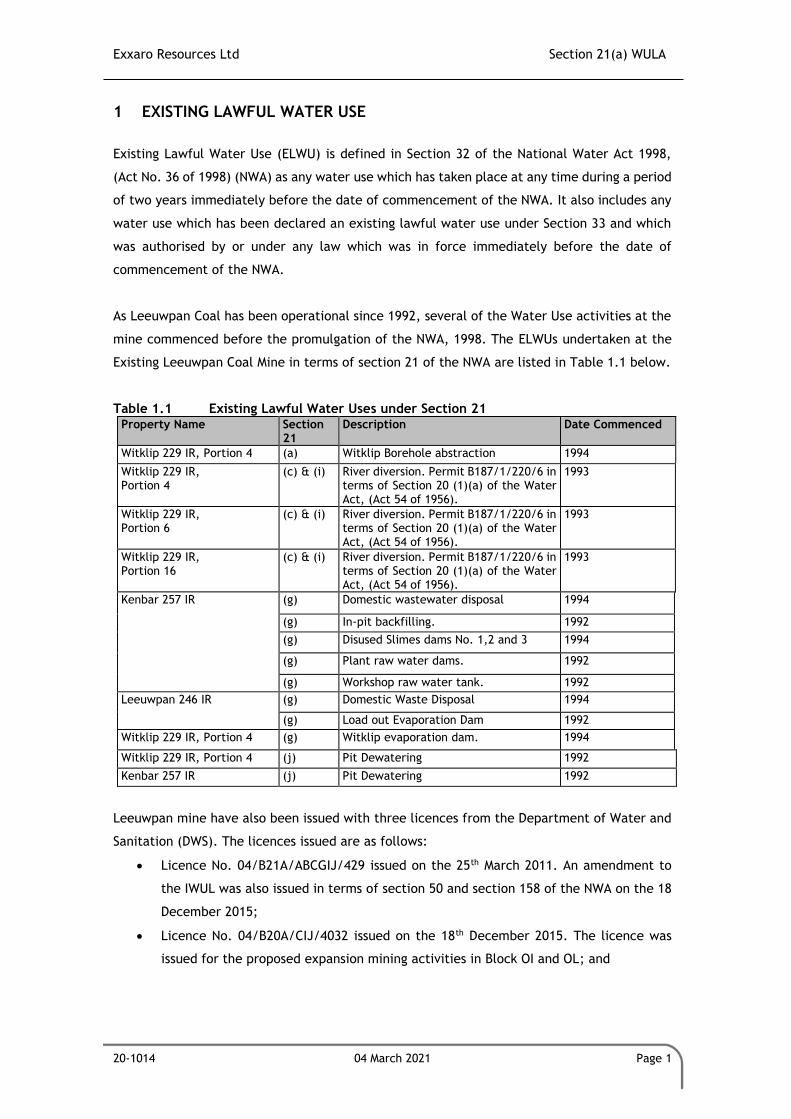
Exxaro Resources Ltd Section 21(a) WULA
20-1014 04 March 2021 Page 1
1 EXISTING LAWFUL WATER USE
Existing Lawful Water Use (ELWU) is defined in Section 32 of the National Water Act 1998,
(Act No. 36 of 1998) (NWA) as any water use which has taken place at any time during a period
of two years immediately before the date of commencement of the NWA. It also includes any
water use which has been declared an existing lawful water use under Section 33 and which
was authorised by or under any law which was in force immediately before the date of
commencement of the NWA.
As Leeuwpan Coal has been operational since 1992, several of the Water Use activities at the
mine commenced before the promulgation of the NWA, 1998. The ELWUs undertaken at the
Existing Leeuwpan Coal Mine in terms of section 21 of the NWA are listed in Table 1.1 below.
Table 1.1 Existing Lawful Water Uses under Section 21 Property Name Section
21 Description Date Commenced
Witklip 229 IR, Portion 4 (a) Witklip Borehole abstraction 1994
Witklip 229 IR, Portion 4
(c) & (i) River diversion. Permit B187/1/220/6 in terms of Section 20 (1)(a) of the Water Act, (Act 54 of 1956).
1993
Witklip 229 IR, Portion 6
(c) & (i) River diversion. Permit B187/1/220/6 in terms of Section 20 (1)(a) of the Water Act, (Act 54 of 1956).
1993
Witklip 229 IR, Portion 16
(c) & (i) River diversion. Permit B187/1/220/6 in terms of Section 20 (1)(a) of the Water Act, (Act 54 of 1956).
1993
Kenbar 257 IR (g) Domestic wastewater disposal 1994
(g) In-pit backfilling. 1992
(g) Disused Slimes dams No. 1,2 and 3 1994
(g) Plant raw water dams. 1992
(g) Workshop raw water tank. 1992
Leeuwpan 246 IR (g) Domestic Waste Disposal 1994
(g) Load out Evaporation Dam 1992
Witklip 229 IR, Portion 4 (g) Witklip evaporation dam. 1994
Witklip 229 IR, Portion 4 (j) Pit Dewatering 1992
Kenbar 257 IR (j) Pit Dewatering 1992
Leeuwpan mine have also been issued with three licences from the Department of Water and
Sanitation (DWS). The licences issued are as follows:
• Licence No. 04/B21A/ABCGIJ/429 issued on the 25th March 2011. An amendment to
the IWUL was also issued in terms of section 50 and section 158 of the NWA on the 18
December 2015;
• Licence No. 04/B20A/CIJ/4032 issued on the 18th December 2015. The licence was
issued for the proposed expansion mining activities in Block OI and OL; and
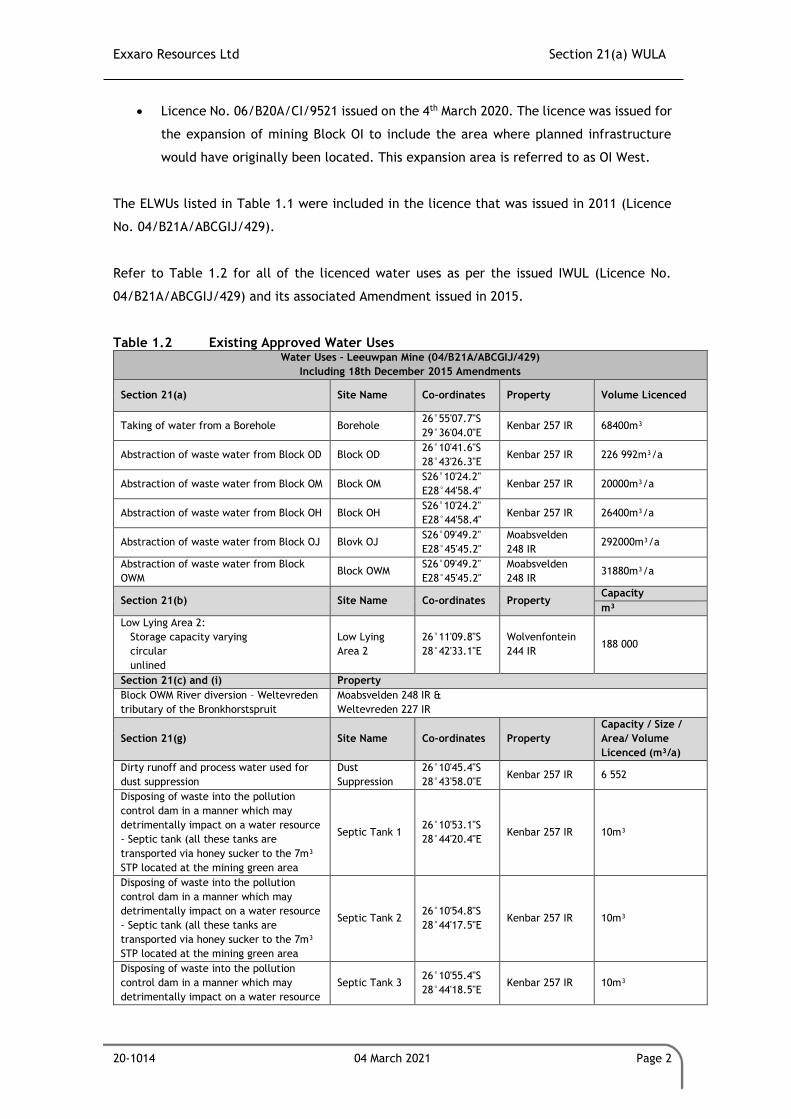
Exxaro Resources Ltd Section 21(a) WULA
20-1014 04 March 2021 Page 2
• Licence No. 06/B20A/CI/9521 issued on the 4th March 2020. The licence was issued for
the expansion of mining Block OI to include the area where planned infrastructure
would have originally been located. This expansion area is referred to as OI West.
The ELWUs listed in Table 1.1 were included in the licence that was issued in 2011 (Licence
No. 04/B21A/ABCGIJ/429).
Refer to Table 1.2 for all of the licenced water uses as per the issued IWUL (Licence No.
04/B21A/ABCGIJ/429) and its associated Amendment issued in 2015.
Table 1.2 Existing Approved Water Uses Water Uses - Leeuwpan Mine (04/B21A/ABCGIJ/429)
Including 18th December 2015 Amendments
Section 21(a) Site Name Co-ordinates Property Volume Licenced
Taking of water from a Borehole Borehole 26°55'07.7"S
29°36'04.0"E Kenbar 257 IR 68400m³
Abstraction of waste water from Block OD Block OD 26°10'41.6"S
28°43'26.3"E Kenbar 257 IR 226 992m³/a
Abstraction of waste water from Block OM Block OM S26°10'24.2"
E28°44'58.4" Kenbar 257 IR 20000m³/a
Abstraction of waste water from Block OH Block OH S26°10'24.2"
E28°44'58.4" Kenbar 257 IR 26400m³/a
Abstraction of waste water from Block OJ Blovk OJ S26°09'49.2"
E28°45'45.2"
Moabsvelden
248 IR 292000m³/a
Abstraction of waste water from Block
OWM Block OWM
S26°09'49.2"
E28°45'45.2"
Moabsvelden
248 IR 31880m³/a
Section 21(b) Site Name Co-ordinates Property Capacity
m³
Low Lying Area 2:
Storage capacity varying
circular
unlined
Low Lying
Area 2
26°11'09.8"S
28°42'33.1"E
Wolvenfontein
244 IR 188 000
Section 21(c) and (i) Property
Block OWM River diversion – Weltevreden
tributary of the Bronkhorstspruit
Moabsvelden 248 IR &
Weltevreden 227 IR
Section 21(g) Site Name Co-ordinates Property
Capacity / Size /
Area/ Volume
Licenced (m³/a)
Dirty runoff and process water used for
dust suppression
Dust
Suppression
26°10'45.4"S
28°43'58.0"E Kenbar 257 IR 6 552
Disposing of waste into the pollution
control dam in a manner which may
detrimentally impact on a water resource
- Septic tank (all these tanks are
transported via honey sucker to the 7m³
STP located at the mining green area
Septic Tank 1 26°10'53.1"S
28°44'20.4"E Kenbar 257 IR 10m³
Disposing of waste into the pollution
control dam in a manner which may
detrimentally impact on a water resource
- Septic tank (all these tanks are
transported via honey sucker to the 7m³
STP located at the mining green area
Septic Tank 2 26°10'54.8"S
28°44'17.5"E Kenbar 257 IR 10m³
Disposing of waste into the pollution
control dam in a manner which may
detrimentally impact on a water resource
Septic Tank 3 26°10'55.4"S
28°44'18.5"E Kenbar 257 IR 10m³
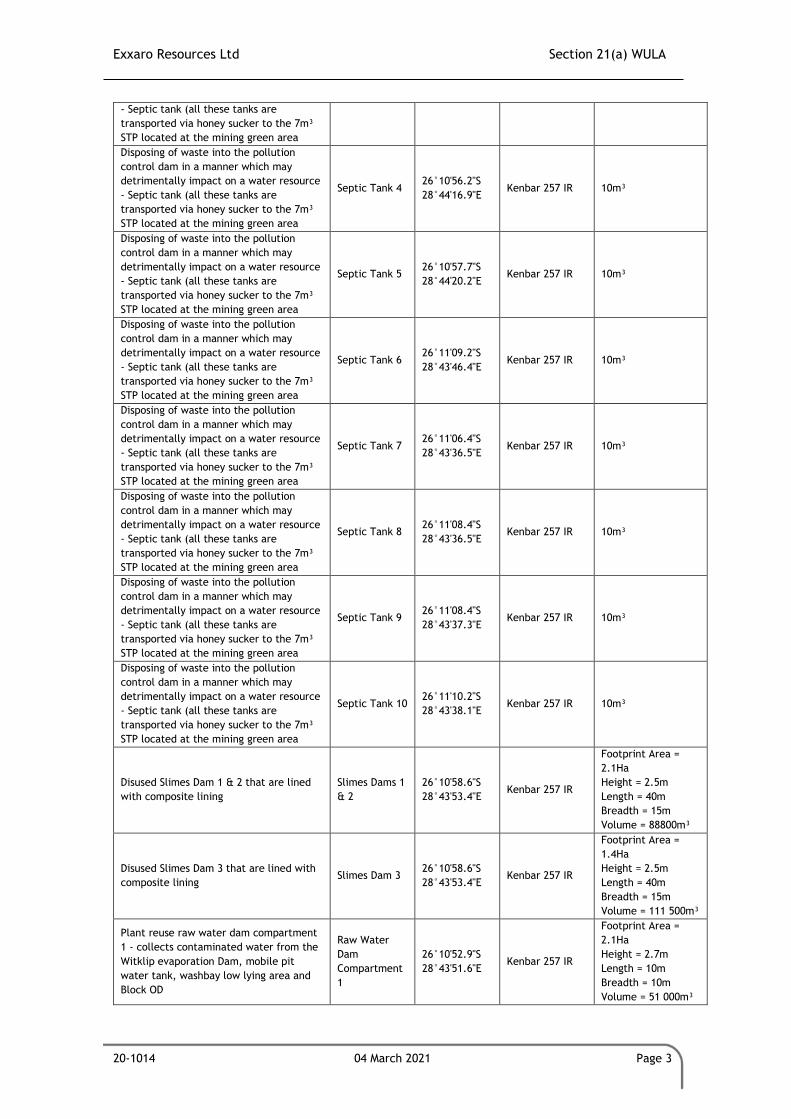
Exxaro Resources Ltd Section 21(a) WULA
20-1014 04 March 2021 Page 3
- Septic tank (all these tanks are
transported via honey sucker to the 7m³
STP located at the mining green area
Disposing of waste into the pollution
control dam in a manner which may
detrimentally impact on a water resource
- Septic tank (all these tanks are
transported via honey sucker to the 7m³
STP located at the mining green area
Septic Tank 4 26°10'56.2"S
28°44'16.9"E Kenbar 257 IR 10m³
Disposing of waste into the pollution
control dam in a manner which may
detrimentally impact on a water resource
- Septic tank (all these tanks are
transported via honey sucker to the 7m³
STP located at the mining green area
Septic Tank 5 26°10'57.7"S
28°44'20.2"E Kenbar 257 IR 10m³
Disposing of waste into the pollution
control dam in a manner which may
detrimentally impact on a water resource
- Septic tank (all these tanks are
transported via honey sucker to the 7m³
STP located at the mining green area
Septic Tank 6 26°11'09.2"S
28°43'46.4"E Kenbar 257 IR 10m³
Disposing of waste into the pollution
control dam in a manner which may
detrimentally impact on a water resource
- Septic tank (all these tanks are
transported via honey sucker to the 7m³
STP located at the mining green area
Septic Tank 7 26°11'06.4"S
28°43'36.5"E Kenbar 257 IR 10m³
Disposing of waste into the pollution
control dam in a manner which may
detrimentally impact on a water resource
- Septic tank (all these tanks are
transported via honey sucker to the 7m³
STP located at the mining green area
Septic Tank 8 26°11'08.4"S
28°43'36.5"E Kenbar 257 IR 10m³
Disposing of waste into the pollution
control dam in a manner which may
detrimentally impact on a water resource
- Septic tank (all these tanks are
transported via honey sucker to the 7m³
STP located at the mining green area
Septic Tank 9 26°11'08.4"S
28°43'37.3"E Kenbar 257 IR 10m³
Disposing of waste into the pollution
control dam in a manner which may
detrimentally impact on a water resource
- Septic tank (all these tanks are
transported via honey sucker to the 7m³
STP located at the mining green area
Septic Tank 10 26°11'10.2"S
28°43'38.1"E Kenbar 257 IR 10m³
Disused Slimes Dam 1 & 2 that are lined
with composite lining
Slimes Dams 1
& 2
26°10'58.6"S
28°43'53.4"E Kenbar 257 IR
Footprint Area =
2.1Ha
Height = 2.5m
Length = 40m
Breadth = 15m
Volume = 88800m³
Disused Slimes Dam 3 that are lined with
composite lining Slimes Dam 3
26°10'58.6"S
28°43'53.4"E Kenbar 257 IR
Footprint Area =
1.4Ha
Height = 2.5m
Length = 40m
Breadth = 15m
Volume = 111 500m³
Plant reuse raw water dam compartment
1 - collects contaminated water from the
Witklip evaporation Dam, mobile pit
water tank, washbay low lying area and
Block OD
Raw Water
Dam
Compartment
1
26°10'52.9"S
28°43'51.6"E Kenbar 257 IR
Footprint Area =
2.1Ha
Height = 2.7m
Length = 10m
Breadth = 10m
Volume = 51 000m³
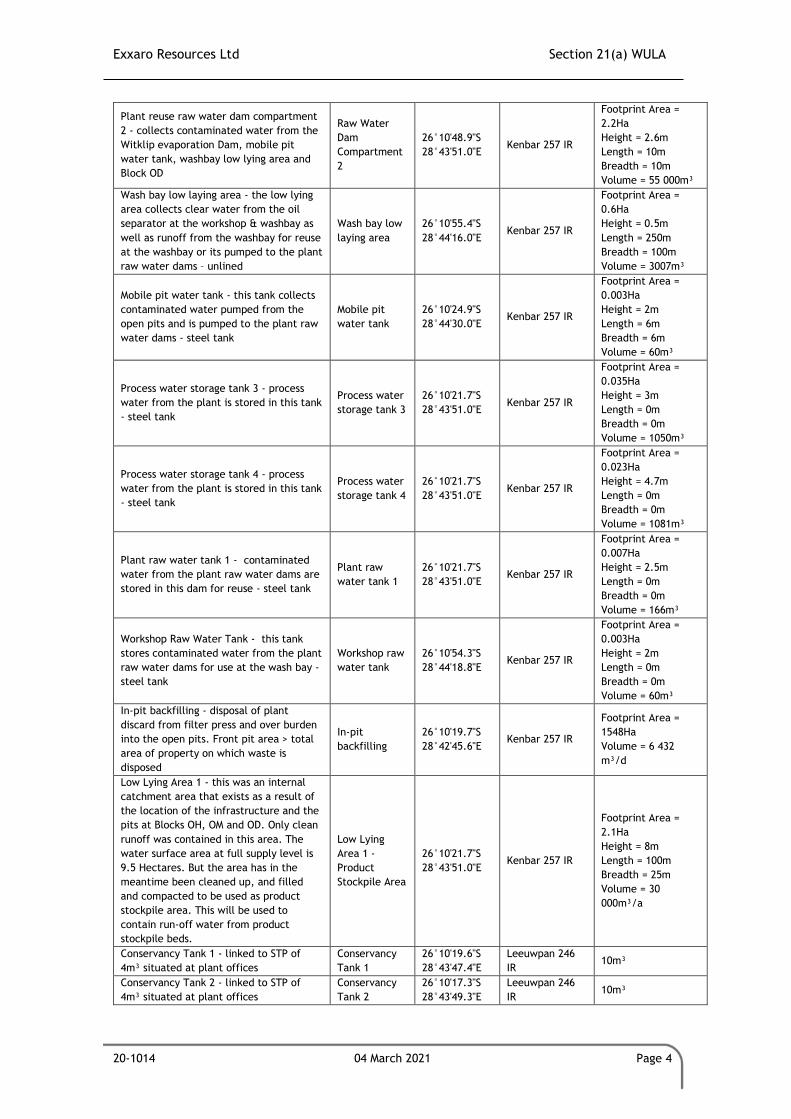
Exxaro Resources Ltd Section 21(a) WULA
20-1014 04 March 2021 Page 4
Plant reuse raw water dam compartment
2 - collects contaminated water from the
Witklip evaporation Dam, mobile pit
water tank, washbay low lying area and
Block OD
Raw Water
Dam
Compartment
2
26°10'48.9"S
28°43'51.0"E Kenbar 257 IR
Footprint Area =
2.2Ha
Height = 2.6m
Length = 10m
Breadth = 10m
Volume = 55 000m³
Wash bay low laying area - the low lying
area collects clear water from the oil
separator at the workshop & washbay as
well as runoff from the washbay for reuse
at the washbay or its pumped to the plant
raw water dams – unlined
Wash bay low
laying area
26°10'55.4"S
28°44'16.0"E Kenbar 257 IR
Footprint Area =
0.6Ha
Height = 0.5m
Length = 250m
Breadth = 100m
Volume = 3007m³
Mobile pit water tank - this tank collects
contaminated water pumped from the
open pits and is pumped to the plant raw
water dams - steel tank
Mobile pit
water tank
26°10'24.9"S
28°44'30.0"E Kenbar 257 IR
Footprint Area =
0.003Ha
Height = 2m
Length = 6m
Breadth = 6m
Volume = 60m³
Process water storage tank 3 - process
water from the plant is stored in this tank
- steel tank
Process water
storage tank 3
26°10'21.7"S
28°43'51.0"E Kenbar 257 IR
Footprint Area =
0.035Ha
Height = 3m
Length = 0m
Breadth = 0m
Volume = 1050m³
Process water storage tank 4 - process
water from the plant is stored in this tank
- steel tank
Process water
storage tank 4
26°10'21.7"S
28°43'51.0"E Kenbar 257 IR
Footprint Area =
0.023Ha
Height = 4.7m
Length = 0m
Breadth = 0m
Volume = 1081m³
Plant raw water tank 1 - contaminated
water from the plant raw water dams are
stored in this dam for reuse - steel tank
Plant raw
water tank 1
26°10'21.7"S
28°43'51.0"E Kenbar 257 IR
Footprint Area =
0.007Ha
Height = 2.5m
Length = 0m
Breadth = 0m
Volume = 166m³
Workshop Raw Water Tank - this tank
stores contaminated water from the plant
raw water dams for use at the wash bay -
steel tank
Workshop raw
water tank
26°10'54.3"S
28°44'18.8"E Kenbar 257 IR
Footprint Area =
0.003Ha
Height = 2m
Length = 0m
Breadth = 0m
Volume = 60m³
In-pit backfilling - disposal of plant
discard from filter press and over burden
into the open pits. Front pit area > total
area of property on which waste is
disposed
In-pit
backfilling
26°10'19.7"S
28°42'45.6"E Kenbar 257 IR
Footprint Area =
1548Ha
Volume = 6 432
m³/d
Low Lying Area 1 - this was an internal
catchment area that exists as a result of
the location of the infrastructure and the
pits at Blocks OH, OM and OD. Only clean
runoff was contained in this area. The
water surface area at full supply level is
9.5 Hectares. But the area has in the
meantime been cleaned up, and filled
and compacted to be used as product
stockpile area. This will be used to
contain run-off water from product
stockpile beds.
Low Lying
Area 1 -
Product
Stockpile Area
26°10'21.7"S
28°43'51.0"E Kenbar 257 IR
Footprint Area =
2.1Ha
Height = 8m
Length = 100m
Breadth = 25m
Volume = 30
000m³/a
Conservancy Tank 1 - linked to STP of
4m³ situated at plant offices
Conservancy
Tank 1
26°10'19.6"S
28°43'47.4"E
Leeuwpan 246
IR 10m³
Conservancy Tank 2 - linked to STP of
4m³ situated at plant offices
Conservancy
Tank 2
26°10'17.3"S
28°43'49.3"E
Leeuwpan 246
IR 10m³
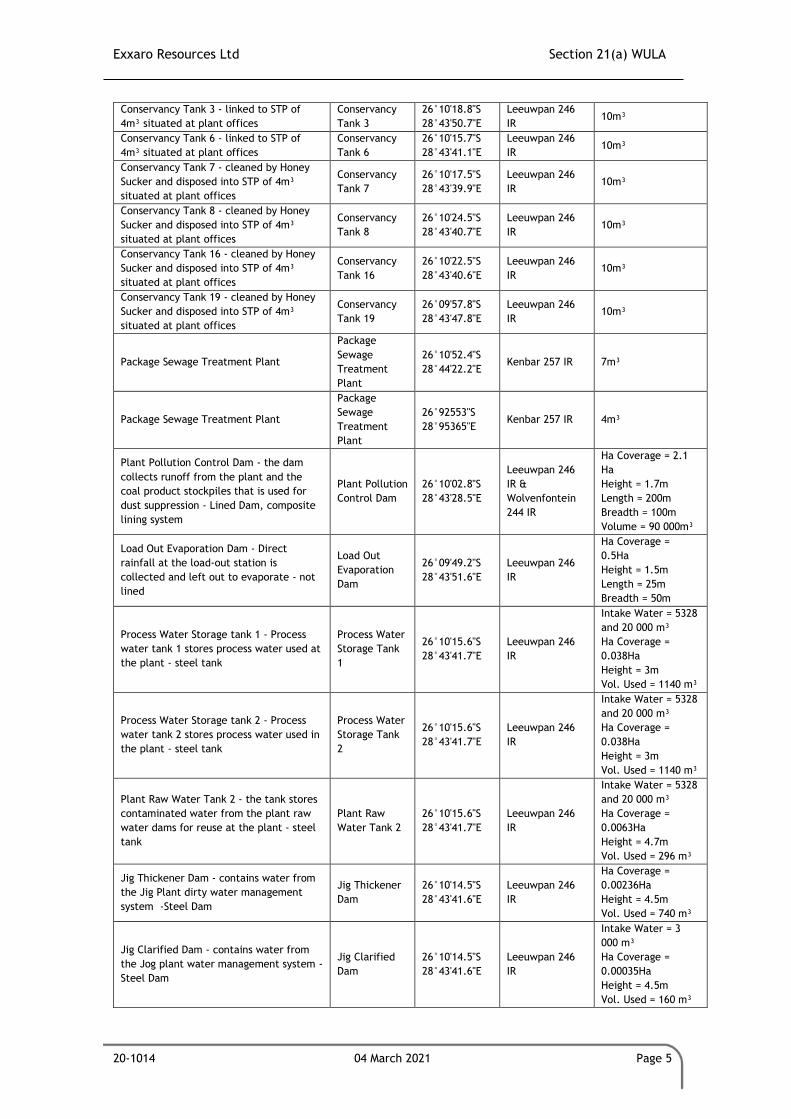
Exxaro Resources Ltd Section 21(a) WULA
20-1014 04 March 2021 Page 5
Conservancy Tank 3 - linked to STP of
4m³ situated at plant offices
Conservancy
Tank 3
26°10'18.8"S
28°43'50.7"E
Leeuwpan 246
IR 10m³
Conservancy Tank 6 - linked to STP of
4m³ situated at plant offices
Conservancy
Tank 6
26°10'15.7"S
28°43'41.1"E
Leeuwpan 246
IR 10m³
Conservancy Tank 7 - cleaned by Honey
Sucker and disposed into STP of 4m³
situated at plant offices
Conservancy
Tank 7
26°10'17.5"S
28°43'39.9"E
Leeuwpan 246
IR 10m³
Conservancy Tank 8 - cleaned by Honey
Sucker and disposed into STP of 4m³
situated at plant offices
Conservancy
Tank 8
26°10'24.5"S
28°43'40.7"E
Leeuwpan 246
IR 10m³
Conservancy Tank 16 - cleaned by Honey
Sucker and disposed into STP of 4m³
situated at plant offices
Conservancy
Tank 16
26°10'22.5"S
28°43'40.6"E
Leeuwpan 246
IR 10m³
Conservancy Tank 19 - cleaned by Honey
Sucker and disposed into STP of 4m³
situated at plant offices
Conservancy
Tank 19
26°09'57.8"S
28°43'47.8"E
Leeuwpan 246
IR 10m³
Package Sewage Treatment Plant
Package
Sewage
Treatment
Plant
26°10'52.4"S
28°44'22.2"E Kenbar 257 IR 7m³
Package Sewage Treatment Plant
Package
Sewage
Treatment
Plant
26°92553"S
28°95365"E Kenbar 257 IR 4m³
Plant Pollution Control Dam - the dam
collects runoff from the plant and the
coal product stockpiles that is used for
dust suppression - Lined Dam, composite
lining system
Plant Pollution
Control Dam
26°10'02.8"S
28°43'28.5"E
Leeuwpan 246
IR &
Wolvenfontein
244 IR
Ha Coverage = 2.1
Ha
Height = 1.7m
Length = 200m
Breadth = 100m
Volume = 90 000m³
Load Out Evaporation Dam - Direct
rainfall at the load-out station is
collected and left out to evaporate - not
lined
Load Out
Evaporation
Dam
26°09'49.2"S
28°43'51.6"E
Leeuwpan 246
IR
Ha Coverage =
0.5Ha
Height = 1.5m
Length = 25m
Breadth = 50m
Process Water Storage tank 1 - Process
water tank 1 stores process water used at
the plant - steel tank
Process Water
Storage Tank
1
26°10'15.6"S
28°43'41.7"E
Leeuwpan 246
IR
Intake Water = 5328
and 20 000 m³
Ha Coverage =
0.038Ha
Height = 3m
Vol. Used = 1140 m³
Process Water Storage tank 2 - Process
water tank 2 stores process water used in
the plant - steel tank
Process Water
Storage Tank
2
26°10'15.6"S
28°43'41.7"E
Leeuwpan 246
IR
Intake Water = 5328
and 20 000 m³
Ha Coverage =
0.038Ha
Height = 3m
Vol. Used = 1140 m³
Plant Raw Water Tank 2 - the tank stores
contaminated water from the plant raw
water dams for reuse at the plant - steel
tank
Plant Raw
Water Tank 2
26°10'15.6"S
28°43'41.7"E
Leeuwpan 246
IR
Intake Water = 5328
and 20 000 m³
Ha Coverage =
0.0063Ha
Height = 4.7m
Vol. Used = 296 m³
Jig Thickener Dam - contains water from
the Jig Plant dirty water management
system -Steel Dam
Jig Thickener
Dam
26°10'14.5"S
28°43'41.6"E
Leeuwpan 246
IR
Ha Coverage =
0.00236Ha
Height = 4.5m
Vol. Used = 740 m³
Jig Clarified Dam - contains water from
the Jog plant water management system -
Steel Dam
Jig Clarified
Dam
26°10'14.5"S
28°43'41.6"E
Leeuwpan 246
IR
Intake Water = 3
000 m³
Ha Coverage =
0.00035Ha
Height = 4.5m
Vol. Used = 160 m³
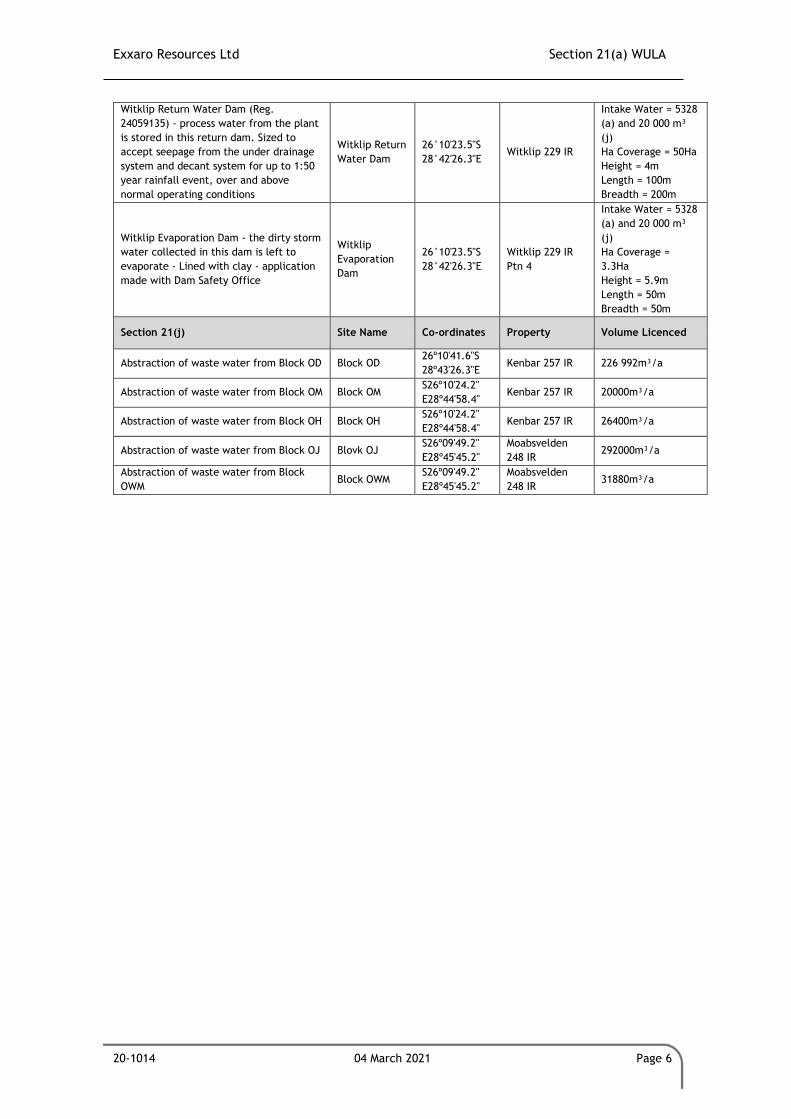
Exxaro Resources Ltd Section 21(a) WULA
20-1014 04 March 2021 Page 6
Witklip Return Water Dam (Reg.
24059135) - process water from the plant
is stored in this return dam. Sized to
accept seepage from the under drainage
system and decant system for up to 1:50
year rainfall event, over and above
normal operating conditions
Witklip Return
Water Dam
26°10'23.5"S
28°42'26.3"E Witklip 229 IR
Intake Water = 5328
(a) and 20 000 m³
(j)
Ha Coverage = 50Ha
Height = 4m
Length = 100m
Breadth = 200m
Witklip Evaporation Dam - the dirty storm
water collected in this dam is left to
evaporate - Lined with clay - application
made with Dam Safety Office
Witklip
Evaporation
Dam
26°10'23.5"S
28°42'26.3"E
Witklip 229 IR
Ptn 4
Intake Water = 5328
(a) and 20 000 m³
(j)
Ha Coverage =
3.3Ha
Height = 5.9m
Length = 50m
Breadth = 50m
Section 21(j) Site Name Co-ordinates Property Volume Licenced
Abstraction of waste water from Block OD Block OD 26º10'41.6"S
28º43'26.3"E Kenbar 257 IR 226 992m³/a
Abstraction of waste water from Block OM Block OM S26º10'24.2"
E28º44'58.4" Kenbar 257 IR 20000m³/a
Abstraction of waste water from Block OH Block OH S26º10'24.2"
E28º44'58.4" Kenbar 257 IR 26400m³/a
Abstraction of waste water from Block OJ Blovk OJ S26º09'49.2"
E28º45'45.2"
Moabsvelden
248 IR 292000m³/a
Abstraction of waste water from Block
OWM Block OWM
S26º09'49.2"
E28º45'45.2"
Moabsvelden
248 IR 31880m³/a
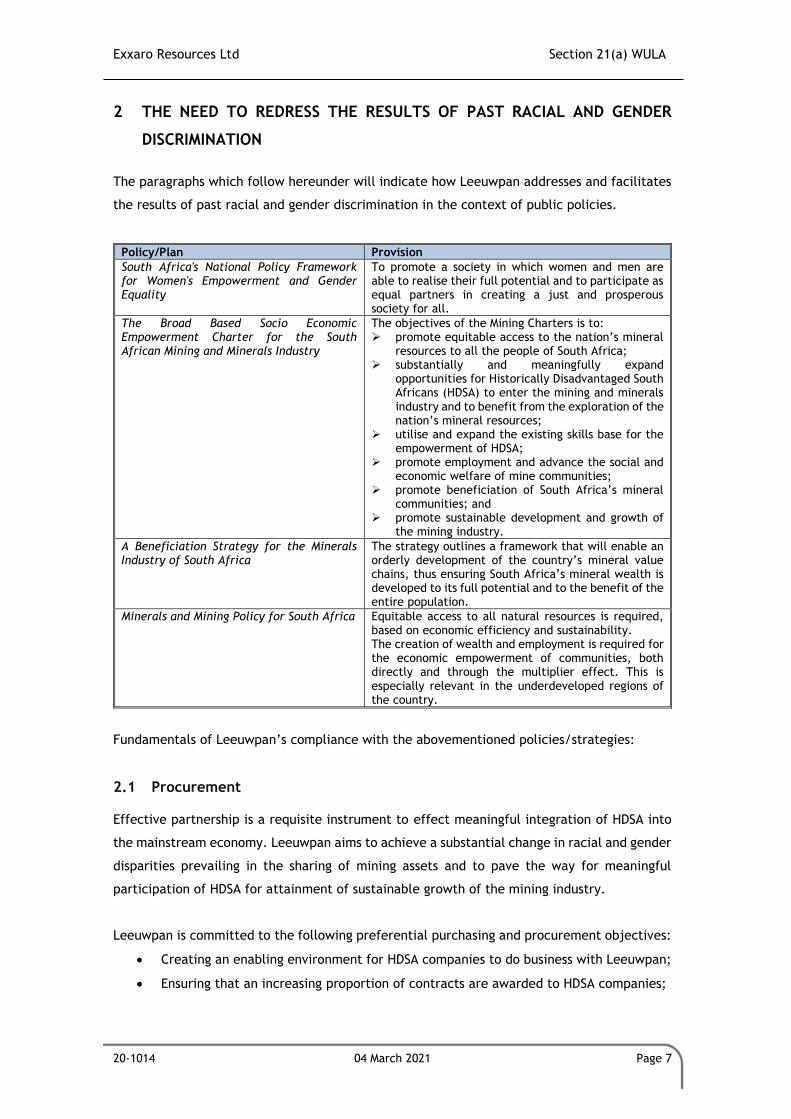
Exxaro Resources Ltd Section 21(a) WULA
20-1014 04 March 2021 Page 7
2 THE NEED TO REDRESS THE RESULTS OF PAST RACIAL AND GENDER
DISCRIMINATION
The paragraphs which follow hereunder will indicate how Leeuwpan addresses and facilitates
the results of past racial and gender discrimination in the context of public policies.
Policy/Plan Provision
South Africa's National Policy Framework for Women's Empowerment and Gender Equality
To promote a society in which women and men are able to realise their full potential and to participate as equal partners in creating a just and prosperous society for all.
The Broad Based Socio Economic Empowerment Charter for the South African Mining and Minerals Industry
The objectives of the Mining Charters is to: ➢ promote equitable access to the nation’s mineral
resources to all the people of South Africa; ➢ substantially and meaningfully expand
opportunities for Historically Disadvantaged South Africans (HDSA) to enter the mining and minerals industry and to benefit from the exploration of the nation’s mineral resources;
➢ utilise and expand the existing skills base for the empowerment of HDSA;
➢ promote employment and advance the social and economic welfare of mine communities;
➢ promote beneficiation of South Africa’s mineral communities; and
➢ promote sustainable development and growth of the mining industry.
A Beneficiation Strategy for the Minerals Industry of South Africa
The strategy outlines a framework that will enable an orderly development of the country’s mineral value chains, thus ensuring South Africa’s mineral wealth is developed to its full potential and to the benefit of the entire population.
Minerals and Mining Policy for South Africa Equitable access to all natural resources is required, based on economic efficiency and sustainability. The creation of wealth and employment is required for the economic empowerment of communities, both directly and through the multiplier effect. This is especially relevant in the underdeveloped regions of the country.
Fundamentals of Leeuwpan’s compliance with the abovementioned policies/strategies:
2.1 Procurement
Effective partnership is a requisite instrument to effect meaningful integration of HDSA into
the mainstream economy. Leeuwpan aims to achieve a substantial change in racial and gender
disparities prevailing in the sharing of mining assets and to pave the way for meaningful
participation of HDSA for attainment of sustainable growth of the mining industry.
Leeuwpan is committed to the following preferential purchasing and procurement objectives:
• Creating an enabling environment for HDSA companies to do business with Leeuwpan;
• Ensuring that an increasing proportion of contracts are awarded to HDSA companies;
Exxaro Resources Ltd Section 21(a) WULA
20-1014 04 March 2021 Page 8
• Providing opportunities to businesses that implement their own proven economic
empowerment programmes; and
• Creating awareness, understanding and support of economic empowerment objectives
among key stakeholders.
Leeuwpan is dedicated to developing entrepreneurs in the informal business sector, which is
the largest employer of people. To achieve the aforementioned, Exxaro has adopted the
Business Incubator model to develop entrepreneurs and to overcome barriers to employment.
The Business Incubator aims to develop the youth, the unemployed and to start up enterprises.
The Incubator will provide support to entrepreneurs by means of operational business support
and funding. The ultimate objective is to establish sustainable, financially and operationally
independent businesses as a means to create jobs and grow the economy of the area.
To ensure the objective of increasing the number of HDSA SMME suppliers is met, capacity
building initiatives as well as training and development are undertaken which enables small
operators in the local area to become more efficient.
2.2 Employment Equity
Workplace diversity and equitable representation at all levels are catalysts for social cohesion,
transformation and competitiveness of the mining industry.
In line with Exxaro’s Employment Equity policy, Leeuwpan’s broad objectives are to accelerate
the training and promotion of designated groups and to create an environment of sustainable
diversity through the implementation of Employment Equity programmes. In addition to the
aforementioned, Leeuwpan strives to achieve the following:
• Preventing the existence of unfair discriminatory practices;
• Preventing sexual and racial harassment;
• Preventing the existence of barriers in the workplace which unfairly restrict
employment and promotion opportunities of any person;
• Achieving an enhanced representation of underrepresented categories of people with
the emphasis on individuals from designated groups, at all levels in the organisation,
focused on the long-term objective of reflecting the demographics of the South African
population; and
• Creating an organisational culture in which diversity is encouraged and valued while
focusing on shared values in order to develop team spirit, promote mutual
understanding, optimise potential and achieve organisational goals in serving the
community.
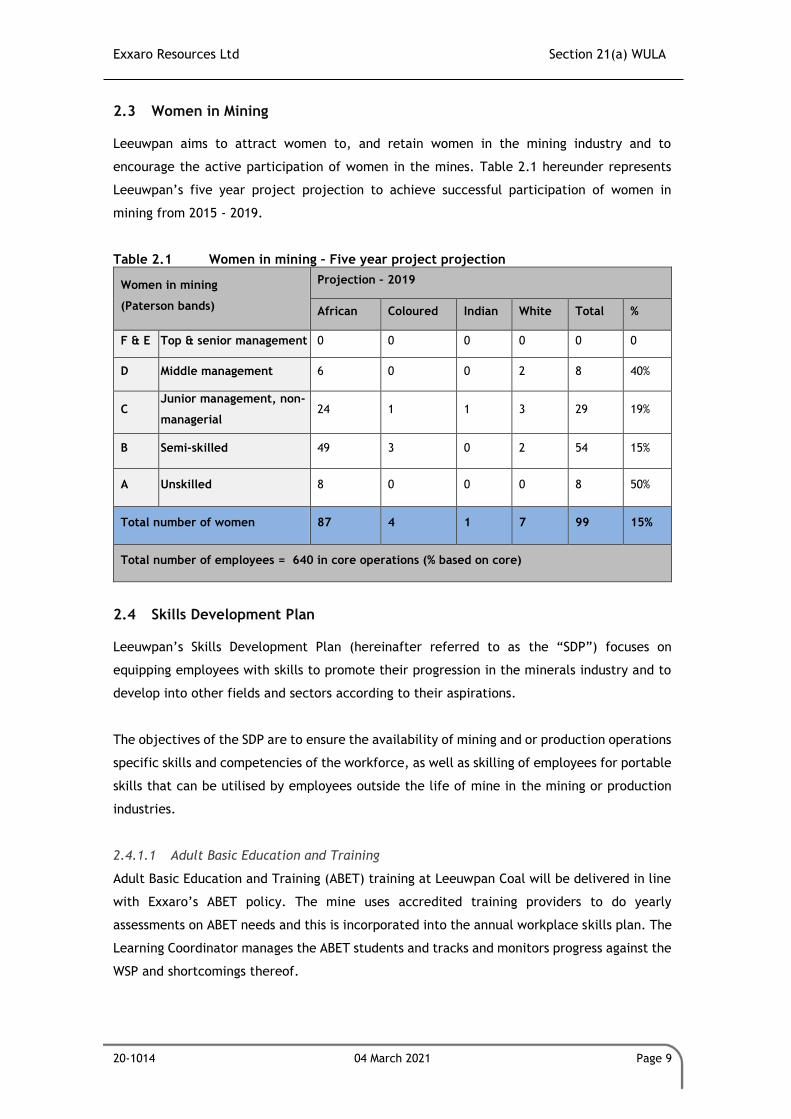
Exxaro Resources Ltd Section 21(a) WULA
20-1014 04 March 2021 Page 9
2.3 Women in Mining
Leeuwpan aims to attract women to, and retain women in the mining industry and to
encourage the active participation of women in the mines. Table 2.1 hereunder represents
Leeuwpan’s five year project projection to achieve successful participation of women in
mining from 2015 - 2019.
Table 2.1 Women in mining – Five year project projection
Women in mining
(Paterson bands)
Projection – 2019
African Coloured Indian White Total %
F & E Top & senior management 0 0 0 0 0 0
D Middle management 6 0 0 2 8 40%
C Junior management, non-
managerial 24 1 1 3 29 19%
B Semi-skilled 49 3 0 2 54 15%
A Unskilled 8 0 0 0 8 50%
Total number of women 87 4 1 7 99 15%
Total number of employees = 640 in core operations (% based on core)
2.4 Skills Development Plan
Leeuwpan’s Skills Development Plan (hereinafter referred to as the “SDP”) focuses on
equipping employees with skills to promote their progression in the minerals industry and to
develop into other fields and sectors according to their aspirations.
The objectives of the SDP are to ensure the availability of mining and or production operations
specific skills and competencies of the workforce, as well as skilling of employees for portable
skills that can be utilised by employees outside the life of mine in the mining or production
industries.
2.4.1.1 Adult Basic Education and Training
Adult Basic Education and Training (ABET) training at Leeuwpan Coal will be delivered in line
with Exxaro’s ABET policy. The mine uses accredited training providers to do yearly
assessments on ABET needs and this is incorporated into the annual workplace skills plan. The
Learning Coordinator manages the ABET students and tracks and monitors progress against the
WSP and shortcomings thereof.
Exxaro Resources Ltd Section 21(a) WULA
20-1014 04 March 2021 Page 10
The ABET Plan includes:
• Block release (sixteen weeks full-time) for ABET 1;
• Delivery by an accredited provider;
• Monthly meetings with all ABET students to determine needs and progress;
• Six monthly meetings with potential and lapsed ABET students, and with the unions,
to motivate enrolment;
• Annual screening for new applicants;
• Identification of relevant foremen and production heads as mentors for the different
ABET levels;
• Career progression planning for learners entering ABET 4;
• Monitoring of implementation by mine management; and
• Union support to continuously motivate and engage employees needing ABET training.
2.4.1.2 Learnerships
Leeuwpan supports the development of employees and the youth towards full or part
qualifications. Learnerships are a full qualification. Employees can be developed as part of
their career development through a learnership. Learnerships in the core and critical
disciplines of mining necessitates the maintenance of a talent pipeline in identified and
approved learnerships. For the talent pipeline, the unemployed youth are recruited and
selected for development via learnerships.
For both employees and the youth, the Mining Qualifications Authority (MQA) seven step
process is used to develop people through learnerships. When the unemployed youth have
been developed they are not automatically guaranteed a position, but the benefit is that with
completion of the programme they are in possession of a nationally accepted qualification
that will make them marketable when applying for a job.
The budget for learners (unemployed youth) is guided by the minimum remuneration and
conditions of the sectoral determination for learnerships which forms part of the Basic
Conditions of Employment Act. Added to this is the cost for recruitment and selection, the
institutional phase at a training provider (e.g. Colliery Training College (CTC), accommodation
and travel where relevant and other personal requirements like a toolbox and Personal
Protective Equipment (PPE) requirements. The average period in training for these learners
is 24-30 months.
Employees selected and approved towards learnerships (18.1) receive the normal
remuneration of the position for which they have been appointed while they are being trained.
They are assessed through the MQA seven step process. Other costs involved are selection
costs, assessment costs, and costs to the training provider for required institutional training.

Exxaro Resources Ltd Section 21(a) WULA
20-1014 04 March 2021 Page 11
Leeuwpan develops employees and the youth towards the core and critical disciplines of
engineering, mining and plant learnerships. Opportunities are also offered to contractors
based them meeting the entry requirements of the programme. Only accredited MQA providers
are used.
2.5 Mentorship Plan
Leeuwpan has developed and is currently implementing a mentorship plan aimed at facilitating
the developmental needs of its employees. Particular focus is placed on transfer of skills,
knowledge and competencies to HDSA.
Mentorship will be used as one of the interventions to address a suitable socialisation
programme for the induction of protégés into the new/anticipated managerial/leadership
environment. Psychological preparation, acquisition of career management skills, and
addressing the values, fears and aspirations of protégés are essential for the success of the
programme.
Leeuwpan will facilitate the allocation of a mentor to all candidates in training as well as
development schemes in order to guide employees through the career development processes.
Students and employees on formal training programs and in the talent pool will benefit from
the mentoring process. The mentoring will be based on group mentoring, peer mentoring,
external mentoring and also senior manager mentoring.
The benefits of the Mentorship Plan are that a trainee becomes:
• An appropriately trained and developed competent professional who can take
responsibility for a wide range of engineering activities;
• A well-integrated professional who can contribute meaningfully to the profession;
• A professional who can ensure economic benefit;
• A professional who can contribute to the continuing mentorship of others; and
• A professional who renders a service to the community with integrity and who adheres
to the professions code of conduct.
Mentorship will be managed formally through a deliberate, structured, and focused process at
Leeuwpan. Mentorship will be used as one of the interventions to address a suitable
socialization programme for the induction of trainees into the new/anticipated
managerial/leadership environment. Psychological preparation, acquisition of career
management skills, and addressing the values, fears and aspirations of trainees are essential
for the success of the programme.
Exxaro Resources Ltd Section 21(a) WULA
20-1014 04 March 2021 Page 12
2.6 Internship and Bursary Plan
Internships are organized programmes whereby students gain practical work experience
relevant to their field of study. Leeuwpan Coal will provide learning opportunities to youth in
the community who are in possession of a diploma and who require the experiential learning
for the completion of the diploma.
Bursary plans consist of providing financial assistance to students to pay for study related cost
and offering them the opportunity to gain work experience in their field of study during
vacation periods. Bursaries are allocated in the following engineering fields namely, mining,
metallurgy, geology, engineering (electrical and mechanical), and industrial and in the
following support services, namely human resources and environmental studies. Candidates
are chosen according to set selection criteria to ensure that they are given the best
opportunity to fulfil the university requirements.
Leeuwpan has developed an Internship and Bursary Plan which conforms to the Skills
Development Plan, and which focuses on building capacity in various skills and careers for
HDSAs. Through offering the opportunity of internships to unemployed graduates, Leeuwpan
will increase participants’ chances of finding employment in the future.
Workplace diversity and equitable representation at all levels are catalysts for social cohesion,
transformation and competitiveness of the mining industry.
3 EFFICIENT AND BENEFICIAL USE OF WATER IN THE PUBLIC INTEREST
In 2012, Ms Susan Shabangu, the then Minister of Mineral Resources of South Africa, in an
address at the 2012 South African Coal Export Conference, exclaimed the vital and strategic
role played by coal in South Africa’s economy. The role played by this industry is supported
by the vast resources illustrated in the country’s world rankings. According to the Chamber of
Mines of South Africa (CMSA), the country is home to 3.5% of the world’s coal resources.
The approved IWULs enables the Leeuwpan mining operations to produce coal from the
activities which contributes to the abovementioned strategic role that the coal industry plays
in South Africa’s economy. The licensing of the Witklip Borehole 1 (WK-BH1) and Witklip
Borehole 2 (WK-BH2) will allow for mining at Leeuwpan to continue. Furthermore, the public
indirectly benefits from coal through fuel and electricity usage. Coal provides 81% of the power
generated by state-owned power utility Eskom. In addition, the coal industry benefits the
public through being a large employer of workers. According to the CMSA, excluding Sasol, the
coal sector employs in the region of 92 230 people, the third largest group in the mining sector
after gold and platinum group metals. Their annual earnings are in the region of R139.3 billion.
Exxaro Resources Ltd Section 21(a) WULA
20-1014 04 March 2021 Page 13
This highlights the economic contribution, and therefore summarises the economic context
within which the industry operates.
The concept of “public interest” is a very complex one. Under the Water Act of 1956, permits
were issued to users provided that they use the water beneficially. The use was considered
beneficial if the applicant was going to make a profit. Public interest however, goes much
wider.
The fact that the applicant has to undertake a public participation process for proposed mining
activities, and the public’s opinion is to be elicited, means that, at least, the public opinion
can be gauged by the response and the comments and concerns received.
As public trustee of the water resources, the Department of Water and Sanitation (DWS) must
ensure that the water is protected, used, developed, conserved, managed and controlled in a
sustainable and equitable manner for the benefit of all users. The Minister, through the
department has to ensure that the water is allocated equitably and used beneficially in the
public interest, while promoting environmental values.
A detailed public participation process for the project was undertaken and all the identified
impacts were able to be mitigated taking the other water users into consideration.
Leeuwpan recognises that water is a scarce resource which belongs to all people and will strive
(through adherence to the conditions and provisions of the IWULs and the IWWMP) to meet
the following principles (as stipulated in Section 2 of the NWA) which form the foundation of
the NWA:
• Redressing the results of past racial and gender discrimination;
• Promoting the efficient, sustainable and beneficial use of water in the public interest;
• Facilitating social and economic development;
• Protecting aquatic and associated ecosystems and their biological diversity; and
• Reducing and preventing pollution and degradation of water resources.
In addition to the abovementioned, Leeuwpan will adhere to Section 19 of the NWA which
stipulates that a water user must take all reasonable measures to prevent any pollution of a
water resource from occurring, continuing or recurring. By adhering to the provision,
Leeuwpan will ensure that the surrounding water resources are protected and utilised in a
beneficial manner.
Exxaro Resources Ltd Section 21(a) WULA
20-1014 04 March 2021 Page 14
Water use activities may not commence without an approved water use authorisation. Thus,
approval of the water use will indirectly contribute to the beneficial use of water by
illustrating that Leeuwpan is committed to adhere to the regulatory regime governing water
use in South Africa. Furthermore, Leeuwpan is committed to responsible management of its
approved water uses and strives to adhere to the principles of water conservation and demand
management which will benefit the community in terms of employment. Monitoring of water
resources has been implemented to detect any impacts during the early stages and to mitigate
these as soon as practically possible.
As a world-class minerals producer, Exxaro has a moral and legal obligation to ensure
responsible and sound environmental management performances. Leeuwpan has an
environmental management programme as required under the MPRDA, as well as ISO 14001
accreditation, reflecting global industry standards to minimise environmental impacts.
Exxaro has a Water Management Programme which guides the implementation of best practice
water management through-out the organisation. The Water Management Programme focusses
on the availability and security of water supply, the efficient and responsible use of scarce
resources as well as regulatory compliance. The programme is aligned to best-practice
guidelines from the DWS covering integrated water and waste management planning, storm
water management planning, water and salt balances and water monitoring systems amongst
other issues.
The current water uses are undertaken, managed and controlled in such a way as to ensure
that pollution of the water resources is minimised and avoided.
Social and economic development will be facilitated through the employment of local
residence and the technical training which these employees receive. Goods and services will
be sourced from local businesses as far as possible, to enhance the economic benefits of the
project.
During the Water Conservation and Demand Management (WCDM) process at the mining
operation, they will deal with Pollution Prevention and also reiterate the key issues relating
to impact minimisation, i.e. Water Re-use and Reclamation. It is worthwhile emphasising that
consideration and application of water conservation strategies will also often have a direct
and significant effect on pollution prevention.
Accordingly, Leeuwpan contributes to the efficient and beneficial use of water by adhering to
the regulatory provisions as contained in the IWUL, the provisions of the NWA, best practice
standards as well as new best practice technologies.
Exxaro Resources Ltd Section 21(a) WULA
20-1014 04 March 2021 Page 15
4 THE SOCIO ECONOMIC IMPACT
4.1 Of the water use or uses if authorised
4.1.1 The Social Impact:
The authorisation of the WK-BH1 and WK-BH2 enables Leeuwpan to continue their initiatives
which include, but are not limited to:
• Skills transfer;
• Training initiatives;
• Scholarship opportunities; and
• Other financial contributions made by Leeuwpan.
In addition to the abovementioned, Leeuwpan employs 710 permanent employees and 1145
contractors with employees coming primarily from the local municipality, Delmas area in
Mpumalanga and others from other parts of South Africa.
4.1.2 Economic Impact
Leeuwpan’s mining operations have a positive impact on the economy, which has lead to
increased business sales and increased standards of living in the greater community. Increased
employment is associated with increased income and consequently with increased buying
power in the area, thus leading to new business sales. The economic benefits mostly include
an increase in trade such as local shops, accommodation and transport services.
With the increased employment and a subsequent increase in monthly income, increased
business opportunities are experienced within the local environment. The economic benefits
that could be generated include an increase in trade, and the development of new trade such
as local spaza shops, stalls, etc.
To enhance the positive economic impact of Leeuwpan’s operations on the surrounding
community, Leeuwpan has an objective of increasing the number of HDSA SMME suppliers
through capacity building initiatives which will allow small operators in the local area to
become more efficient. At Leeuwpan there are locally owned HDSA companies from which the
mine currently procure and if required they will be targeted for a mentorship programme to
ensure the sustainability of their business. In addition, Leeuwpan plans to procure additional
goods/services that are core to the operations of the mine from other locally owned HDSA
companies.
Exxaro Resources Ltd Section 21(a) WULA
20-1014 04 March 2021 Page 16
4.2 Of the failure to authorise the water use or uses:
If the mine does not authorise its water uses, the mine will be operating illegally in terms of
the NWA. This will have a tremendous impact on the surrounding communities and the mine
will be prevented from investing large sums of money that reach an existing community in the
forms of income and taxes. The presence of the mine, the employment of local persons and
the utilisation of local services will result in an increased income for local communities and
businesses and an increased tax base for traditional authorities and municipalities.
The magnitude of the positive economic effect of the Leeuwpan in terms of its contribution
to the economy of Nkangala in the form of GDP and employment growth; the strategic
importance of this activity in securing much needed foreign exchange for South Africa; for
contributing to a sustainable supply of coal to secure generation of electricity and a
commitment to ensure no net-loss in agricultural productivity post-mining; creates a
compelling case for the continuation of the Leeuwpan Coal Mine. These opportunities will be
lost should the project not continue, and will have negative consequences on the local,
regional, national and international scale.
5 ANY CATCHMENT MANAGEMENT STRATEGY APPLICABLE TO THE
RELEVANT WATER RESOURCE
The DWS, in the spirit of the NWA, recognises the past imbalances relating to water allocation
and seeks to regulate water use by enforcing better sharing of water and water related
benefits between the whites who have historically been the “high volume water users” and
the historically disadvantaged and mostly poor black population.
Catchment Management Agencies (CMAs) are recognised in the NWA as operational institutions
to actively support the implementation of integrated catchment (watershed) management
policies and strategies at a local level. The agencies are tasked with ensuring that the nation's
water resources are protected, used, developed, conserved, managed and controlled in an
equitable manner. The CMA is responsible inter alia for: (a) developing and implementing a
catchment management strategy that reflects the needs and concerns of all role-players, and
(b) coordinating the activities of water users and water. The Olifants River Basin is one of 19
catchment-based water management areas in the country to be managed by a Catchment
Management Agency (CMA).
The Olifants River Basin Catchment Management Agency (CMA) is in the process of being
established. It will take over direct water resource management responsibilities in the basin
currently being performed by DWS. The CMA co-ordinates water-related activities in the basin
and provides an effective mechanism for stakeholder participation in water management.
Exxaro Resources Ltd Section 21(a) WULA
20-1014 04 March 2021 Page 17
6 THE LIKELY EFFECT OF THE WATER USE TO BE AUTHORISED ON THE
WATER RESOURCE AND ON OTHER WATER USERS
6.1 Surface Water
There are four (4) main uses of water that have been identified for the sub catchment of the
Bronkhorstspruit up to the receiving water body, namely the Bronkhorstspruit Dam. The
surface water uses include the following;
• Domestic use by formal and informal communities along the affected watercourse,
• Irrigation of crops, especially maize,
• Livestock watering including cattle, sheep and poultry and
• Aquatic ecosystems including fish, macro and micro-invertebrates.
Very few water bodies in the Delmas area are used for recreational purposes due to their
seasonal nature. In most cases, dams are used for fishing.
No direct abstraction of water from the Bronkhorstspruit occurs for commercial irrigation or
extensive domestic use. Dams are usually filled with water from the boreholes and this clean
water is mainly used for irrigation. Numerous pans occur in the Delmas area but are not
utilized as a source of water for the above mentioned purposes.
6.2 Groundwater
Groundwater is mainly used for domestic supply, small scale irrigation (gardens), livestock
watering as well as large scale pivot irrigation of crops. The boreholes used for large scale
irrigation exploit the dolomitic aquifer as the yields from the Karoo Supergroup are too low to
sustain the high abstraction rates. The groundwater quality in the area is generally good.
Drainage from the opencast backfill will become acidic over the long-term as the ABA results
show that the material has the potential to generate acid-mine drainage. The sandstone and
soft overburden have limited potential for acidic generation. The shale samples show a great
variance in net acidic generation, but may have a potential for acidic generation. Elevation of
TDS and SO4 will occur as a result of pyrite oxidation. In the opencast the SO4 will increase
roughly to about 2 500 mg/l over the long term.
It is not foreseen that significant elevation in metals will occur at near-neutral conditions.
After acidification non-compliance for Al, Fe and Mn may occur. Cr, Ni and to a lesser degree
As and V are some of the other trace elements that may be slightly elevated and may reach
occasional marginal to non-compliance.
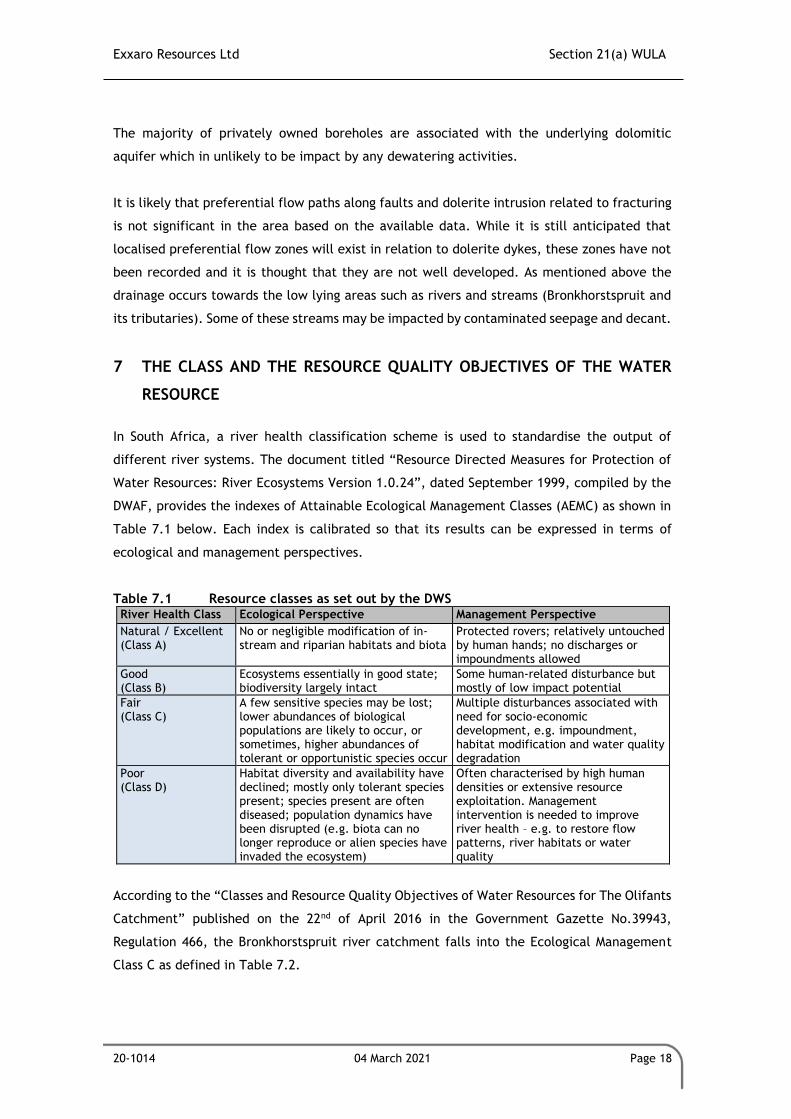
Exxaro Resources Ltd Section 21(a) WULA
20-1014 04 March 2021 Page 18
The majority of privately owned boreholes are associated with the underlying dolomitic
aquifer which in unlikely to be impact by any dewatering activities.
It is likely that preferential flow paths along faults and dolerite intrusion related to fracturing
is not significant in the area based on the available data. While it is still anticipated that
localised preferential flow zones will exist in relation to dolerite dykes, these zones have not
been recorded and it is thought that they are not well developed. As mentioned above the
drainage occurs towards the low lying areas such as rivers and streams (Bronkhorstspruit and
its tributaries). Some of these streams may be impacted by contaminated seepage and decant.
7 THE CLASS AND THE RESOURCE QUALITY OBJECTIVES OF THE WATER
RESOURCE
In South Africa, a river health classification scheme is used to standardise the output of
different river systems. The document titled “Resource Directed Measures for Protection of
Water Resources: River Ecosystems Version 1.0.24”, dated September 1999, compiled by the
DWAF, provides the indexes of Attainable Ecological Management Classes (AEMC) as shown in
Table 7.1 below. Each index is calibrated so that its results can be expressed in terms of
ecological and management perspectives.
Table 7.1 Resource classes as set out by the DWS River Health Class Ecological Perspective Management Perspective
Natural / Excellent (Class A)
No or negligible modification of in-stream and riparian habitats and biota
Protected rovers; relatively untouched by human hands; no discharges or impoundments allowed
Good (Class B)
Ecosystems essentially in good state; biodiversity largely intact
Some human-related disturbance but mostly of low impact potential
Fair (Class C)
A few sensitive species may be lost; lower abundances of biological populations are likely to occur, or sometimes, higher abundances of tolerant or opportunistic species occur
Multiple disturbances associated with need for socio-economic development, e.g. impoundment, habitat modification and water quality degradation
Poor (Class D)
Habitat diversity and availability have declined; mostly only tolerant species present; species present are often diseased; population dynamics have been disrupted (e.g. biota can no longer reproduce or alien species have invaded the ecosystem)
Often characterised by high human densities or extensive resource exploitation. Management intervention is needed to improve river health – e.g. to restore flow patterns, river habitats or water quality
According to the “Classes and Resource Quality Objectives of Water Resources for The Olifants
Catchment” published on the 22nd of April 2016 in the Government Gazette No.39943,
Regulation 466, the Bronkhorstspruit river catchment falls into the Ecological Management
Class C as defined in Table 7.2.
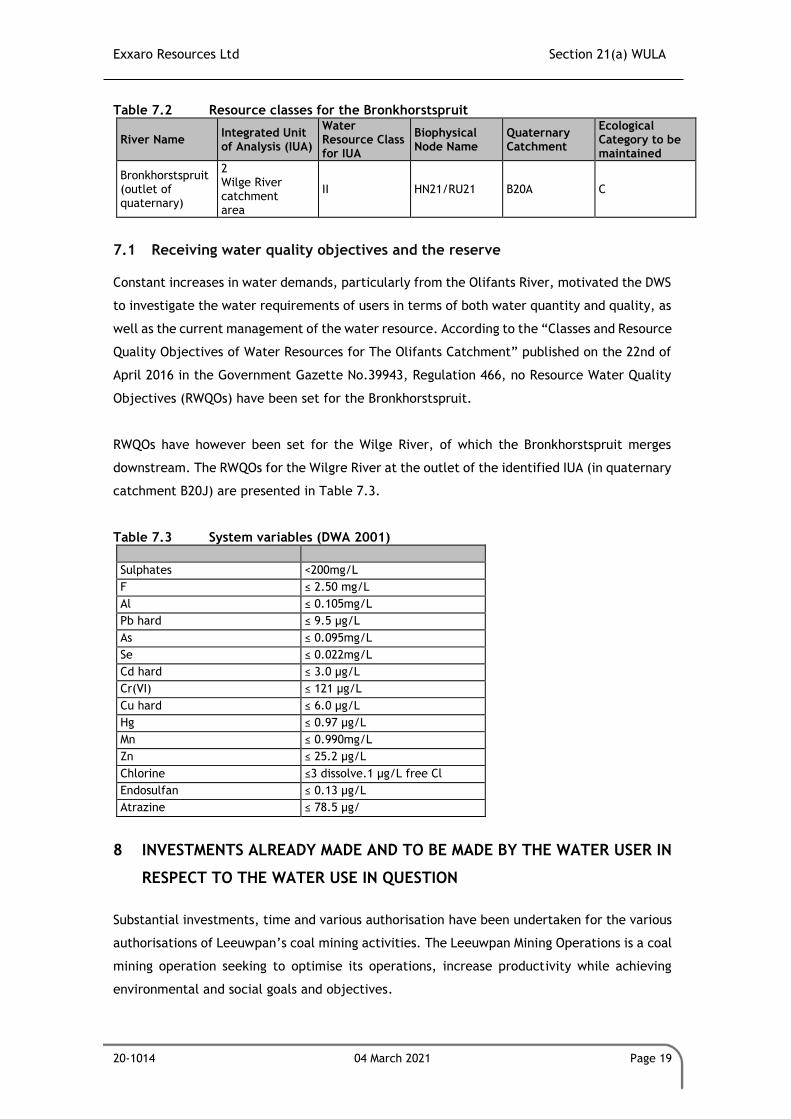
Exxaro Resources Ltd Section 21(a) WULA
20-1014 04 March 2021 Page 19
Table 7.2 Resource classes for the Bronkhorstspruit
River Name Integrated Unit of Analysis (IUA)
Water Resource Class for IUA
Biophysical Node Name
Quaternary Catchment
Ecological Category to be maintained
Bronkhorstspruit (outlet of quaternary)
2 Wilge River catchment area
II HN21/RU21 B20A C
7.1 Receiving water quality objectives and the reserve
Constant increases in water demands, particularly from the Olifants River, motivated the DWS
to investigate the water requirements of users in terms of both water quantity and quality, as
well as the current management of the water resource. According to the “Classes and Resource
Quality Objectives of Water Resources for The Olifants Catchment” published on the 22nd of
April 2016 in the Government Gazette No.39943, Regulation 466, no Resource Water Quality
Objectives (RWQOs) have been set for the Bronkhorstspruit.
RWQOs have however been set for the Wilge River, of which the Bronkhorstspruit merges
downstream. The RWQOs for the Wilgre River at the outlet of the identified IUA (in quaternary
catchment B20J) are presented in Table 7.3.
Table 7.3 System variables (DWA 2001)
Sulphates <200mg/L
F ≤ 2.50 mg/L
Al ≤ 0.105mg/L
Pb hard ≤ 9.5 μg/L
As ≤ 0.095mg/L
Se ≤ 0.022mg/L
Cd hard ≤ 3.0 μg/L
Cr(VI) ≤ 121 μg/L
Cu hard ≤ 6.0 μg/L
Hg ≤ 0.97 μg/L
Mn ≤ 0.990mg/L
Zn ≤ 25.2 μg/L
Chlorine ≤3 dissolve.1 μg/L free Cl
Endosulfan ≤ 0.13 μg/L
Atrazine ≤ 78.5 μg/
8 INVESTMENTS ALREADY MADE AND TO BE MADE BY THE WATER USER IN
RESPECT TO THE WATER USE IN QUESTION
Substantial investments, time and various authorisation have been undertaken for the various
authorisations of Leeuwpan’s coal mining activities. The Leeuwpan Mining Operations is a coal
mining operation seeking to optimise its operations, increase productivity while achieving
environmental and social goals and objectives.
Exxaro Resources Ltd Section 21(a) WULA
20-1014 04 March 2021 Page 20
Leeuwpan’s current investments and future investments relates to the continuous
maintenance and upkeep of the current closed water systems which includes the operation of
all water pipelines on the mine, and the maintenance of all trenches and channels, and Dams
that is part of the clean and dirty water systems. Leeuwpan will not intentionally discharge
water into the environment as the mine works on a closed water system.
9 THE STRATEGIC IMPORTANCE OF THE WATER USES TO BE AUTHORISED
In strict economic terms, the overall mining industry is paramount to South Africa’s current
and future prosperity. The primary value chain alone accounts for approximately 500 000 jobs
directly and indirectly creates further employment opportunities and jobs that contribute to
the economy. As per the CMSA’s Integrated Annual Review for 2019, the mining sector
contributed R360.9 billion to GDP (8.1%), R24.3 billion to taxes and employed 454 861 people.
Numerous Mining Companies are further listed on the Johannesburg Stock Exchange (JSE),
which therefore helps create wealth for millions of South African pension fund holders and
investors, while at the same time attracting significant foreign capital flows that help unlock
our mineral potential. And, perhaps most critically, more than half of our export earnings are
derived from mining and mineral products.
With specific reference to coal mining, total sales for coal in 2019 reached R139.3 billion with
an overall production of 258.9Mt. The coal industry employed 92 230 people directly who
collectively earned R27.9 billion.
The mining industry is of strategic importance to South Africa and thus awarding the water
use licence will enable Leeuwpan to continue mining and to actively participate as an essential
element of South Africa’s economy. As previously stated, Leeuwpan directly contributes to
the South African economy by means of the following:
• Promoting BEE;
• Creating jobs;
• Developing its people, and in so doing contributing to the transformation of the
industry’s leadership and skills base; and
• By having a positive impact on the local communities through economic development
and sustainable social initiatives.
Exxaro Resources Ltd Section 21(a) WULA
20-1014 04 March 2021 Page 21
10 THE QUALITY OF WATER IN THE WATER RESOURCE WHICH MAY BE
REQUIRED FOR THE RESERVE AND FOR MEETING INTERNATIONAL
AGREEMENTS
10.1 International Agreements
International negotiations and institutional arrangements are handled at National Level. From
a WMA management perspective, it will be required to communicate all issues relating to the
international agreements through the appropriate channels at National Level.
The Olifants WMA falls within the Limpopo River Basin, which is shared by South Africa,
Botswana, Zimbabwe and Mozambique. As the Olifants River flows directly from South Africa
into Mozambique, where it joins the Limpopo River, developments in South Africa directly
impact upon Mozambique.
Discussions have been held between Mozambique and South Africa as far back as 1971 with
the development of the Massingir Agreement of 1971. This agreement dealt specifically with
the building of the Massingir Dam. The principles of the Helsinki Rules were used prior to 2000
to guide the relations between South Africa and neighbouring states. In 1995, the SADC
countries established the 1995 Protocol dealing with Shared Watercourse Systems. The 1995
Protocol was repealed in September 2003 and replaced with the 2000 Protocol which is now
used to guide management and development on Shared Watercourse Systems.
Joint utilization of the water resources of the Olifants River is facilitated through the bilateral
Joint Water Commission between South Africa and Mozambique. International co-operation
with respect to the use and management of the watercourses in the Limpopo River Basin, was
overseen by the Limpopo Basin Permanent Technical Committee (LBPTC) with membership by
South Africa, Botswana, Zimbabwe and Mozambique. The LBPTC was replaced by the Limpopo
Water Course Commission, established in November 2003 (Olifant ISP).
10.2 Surface Water Quality
The surface water quality results were obtained from the Monthly Water Quality Report
conducted by Environmental Assurance (Envass) in October 2020 (Annexure B of the IWWMP
Report).
10.2.1 Receiving Environmental Water Quality
Surface water monitoring was performed at ten (10) monitoring localities during the
monitoring period. The following samples were recorded as dry during the site assessment:
LSW06, LSW07, LSW08, LSW12, WP01 and RD1.
Exxaro Resources Ltd Section 21(a) WULA
20-1014 04 March 2021 Page 22
The majority of the sampled receiving environment monitoring localities water quality analysis
indicated exceedances in terms of the DWAF Domestic Guideline Limits for Turbidity, Calcium
and Dissolved Organic Carbon (DOCmg/l). Additional exceedances included the Calcium (Ca),
Magnesium (Mg), Sulphate (SO4), Manganese (Mn) and E.coli.
From the October 2020 results it is evident that the majority of the receiving environment
monitoring localities presented overall fair condition. Turbidity within the surface water
samples are expected, as turbidity refers to the measurement of the cloudiness or muddiness
of water, which is influenced by both natural (flow velocity, rainfall, run-off etc.) and
anthropogenic activities (disturbance/mining activities). Overall, the Total Inorganic Nitrogen
(TIN), Nitrate (NO3-N) and the Ammonia (NH3-N) levels remained low, with the majority
(excluding LSW13) of the concentrations recording below the detection limit.
Duplicate samples were obtained from monitoring localities LSW03, LSW05 and WP02 in order
to determine the accuracy and precision of inter-laboratory results. Comparison of the
calculated TDS and computation of relative percent difference for the duplicate pairs were
calculated between a range of 0.0 to 3.65% for the October 2020 monitoring run, recording
within the acceptable range (30%).
10.2.2 Process Water Quality
Process water monitoring was performed at sixteen (16) monitoring localities during the
monitoring period. The following samples could not be obtained during the monitoring run:
KR03, KR04, OG PIT, OH PIT, OJ PIT, OM PIT, WLV PIT and OWM-PIT. Refer to the sampling
register as presented in Appendix A of Annexure B for details.
All of the monitored process localities revealed compliance to the stipulated WUL limits. The
October 2020 exceedances can be summarised as follows:
• KR01A , LSW09 and WP04:
o General Authorisation Limit: Electrical Conductivity (EC) and Manganese (Mn).
• ODN PIT:
o General Authorisation Limit: Electrical Conductivity (EC) and Manganese (Mn)
WUL Limit: E.coli.
Discharge of the process water into the receiving environment is prohibited according to the
General Authorisation (Section 21f and h, 2013) as it could have limiting effects on the
receiving water environment. Note that regular maintenance on process water facilities linings
and transfer pipes are vital for water resource protection.
Exxaro Resources Ltd Section 21(a) WULA
20-1014 04 March 2021 Page 23
10.2.3 Effluent Water Quality
Final effluent samples are collected at two (2) monitoring localities inclusive of the Septic
tanks at plant and the Final effluent from the sewage plant.
The final effluent from LWP-SP-P historically recorded non-compliant to the set Ammonia
Wastewater WUL limits, while exceedances related to the General Authorisation limits
included Suspended Solids, Ammonia and Chemical Oxygen Demand.
During the monitoring period it was noted that the LWP-SP-P was not active and no access was
obtained to the LWP-SP-W monitoring point.
10.2.4 Potable Water Quality
Four (4) potable water localities form part of the monitoring programme at Exxaro Leeuwpan
Mine. It should be noted that the water is not used as a potable source, however monitored
as such in case of accidental consumption as a precautionary measurement. During the
monitoring period a sample could not be obtained from PIET-SCHUTTE as water was not
pumping.
The potable water quality at Leeuwpan can generally (historical results) be described as
neutral, non-saline and hard while elevated salinity and Total Hardness was present from
Load-Out Bay Offices (LLBDW) and Drinking Water at Laboratory (LWDL) during October 2020.
The Load-Out Bay Offices (LLBDW) revealed exceedances of Electrical Conductivity (EC), Total
Dissolved Solids (TDS), Sulphate (SO4), Turbidity, Heterotrophic Plate Counts and E.coli which
renders the water as not suitable for potable purposes. The Drinking Water Supply Tank
(LDWST) presented an exceedance of Heterotrophic Plate Counts, while the remainder of the
parameters presented ideal water quality. The Drinking Water at Laboratory (LWDL) presented
an exceedance of Electrical Conductivity (EC), Total Dissolved Solids (TDS), Sulphate (SO4)
and Heterotrophic Plate Counts.
Based on the historical analysed parameters and data, the potable water poses a risk for
infection due to the elevated Heterotrophic Plate Counts and thus it is strongly advised that
the water be treated and filters regularly disinfected and cleaned as the high counts may be
attributed to biofilms.
10.2.5 Conclusion and Aspects to Consider
The scope of work performed at the Leeuwpan Coal Mine is as per WUL requirements as listed
in this report. This report aims to highlight the conditions requirements of the WUL as well as
aspects that are to be considered in order to improve compliance of the IWUL.
Exxaro Resources Ltd Section 21(a) WULA
20-1014 04 March 2021 Page 24
During the monitoring period samples LSW06, LSW07, LSW08, LSW12, WP01, RD1, KR03, KR04,
OG PIT, OH PIT, OJ PIT, OM PIT, WLV PIT, LWP-SP-W, OWM-PIT and PIET-SCHUTTE could not
be obtained during the monitoring period.
Based on the historical analysed parameters and data, the potable water poses a risk for
infection due to the elevated Heterotrophic Plate Counts as well as health risks. It is strongly
advised that the water not be used for potable or domestic purposes and “no-drinking signs”
be present as current implemented.
Exceedances of Ca, Mg, Turbidity, Dissolved Organic Carbon (DOC) and indicated presence of
Oil and Grease were presented at the receiving environment. From the results it is evident
that the majority of the receiving environment monitoring localities presented overall fair
condition with general low salinity content.
The process water samples revealed compliance to the stipulated WUL limits, except for the
ODN-PIT monitoring point which exceeded the limit for E.coli. Discharge of the process water
into the receiving environment is prohibited according to the General Authorisation (Section
21f and h, 2013) as it could have limiting effects on the receiving water environment. Note
that regular maintenance on process water facilities linings and transfer pipes are vital for
water resource protection.
Representative samples related to October 2020 could not be obtained thus the final effluent
from LWP-SP-P historically recorded non-compliant to the set Ammonia Wastewater WUL
limits, while exceedances related to the General Authorisation limits included Suspended
Solids, Ammonia and Chemical Oxygen Demand.
During the monthly monitoring period, the majority of the localities presented relatively
stable conditions compared to September 2020, with fluctuation in bacteriological content
noted.
Aspects to consider:
• The potable water poses a risk for infection based on the elevated bacteriological and
thus it is strongly advised that the water be treated and filters regularly disinfected
and cleaned as the high counts may be attributed to biofilms, however warning signs
have been implemented indicating water is unfit for human consumption;
• Clean and dirty stormwater must be separated as reasonably possible;
• All waste water be contained and not released into the receiving environment;
• All spills and incidents be reported to the SHEQ manager; and
Exxaro Resources Ltd Section 21(a) WULA
20-1014 04 March 2021 Page 25
• Immediate reporting of any polluting or potentially polluting incidents be
implemented.
10.3 Groundwater Quality
The groundwater quality results were obtained from the Quarterly Water Quality Report
conducted by Environmental Assurance (Envass) in September 2020 (Annexure C of the IWWMP
Report).
Groundwater monitoring was performed during September 2020 and twenty-two (22) borehole
samples were obtained across the site.
Groundwater level depths typically vary between 1 and 54 meters below surface with the
historical deepest level measured in monitoring borehole MOAMB9. The groundwater levels
form boreholes MOAMB4 and RKL02 presents a water divide flowing towards the
Bronkhorstspruit and the Bronkhorstspruit tributary.
The majority of the sampled localities recorded concentrations within the stipulated SANS
241-1:2015 limits presenting satisfactory conditions which included the following monitoring
localities: WWN01, WELMB13S, RKL04, MOAMB4, MOAMB9, MOAMB10, WITMB14, WOLMB15S,
LEEMB18S, WTN-02S and WTN01D. The remaining monitoring localities presented SANS 241-
1:2015 exceedances summarised as follows:
• WELMB13D:
o Sulphate (SO4) and Manganese (Mn);
• LW07:
o Fluoride (F), Iron (Fe), Manganese (Mn) and Ammonia (N);
• RKL01, LWG02:
o Manganese (Mn);
• RKL02:
o Ammonia (N);
• KENMB2S, KENMB3D, WOLMB15D, LEEMB18D:
o Electrical Conductivity (EC), Total Dissolved Solids (TDS) and Sulphate (SO4);
• MOAMB7:
o Aluminium (Al); and
• WTN01S:
o Sulphate (SO4) and Manganese (Mn);
According to the Expanded Durov Diagram (Figure 10.1) and associated Stiff Diagram (Figure
10.2); the September 2020 reveals that the majority of the aforementioned boreholes are
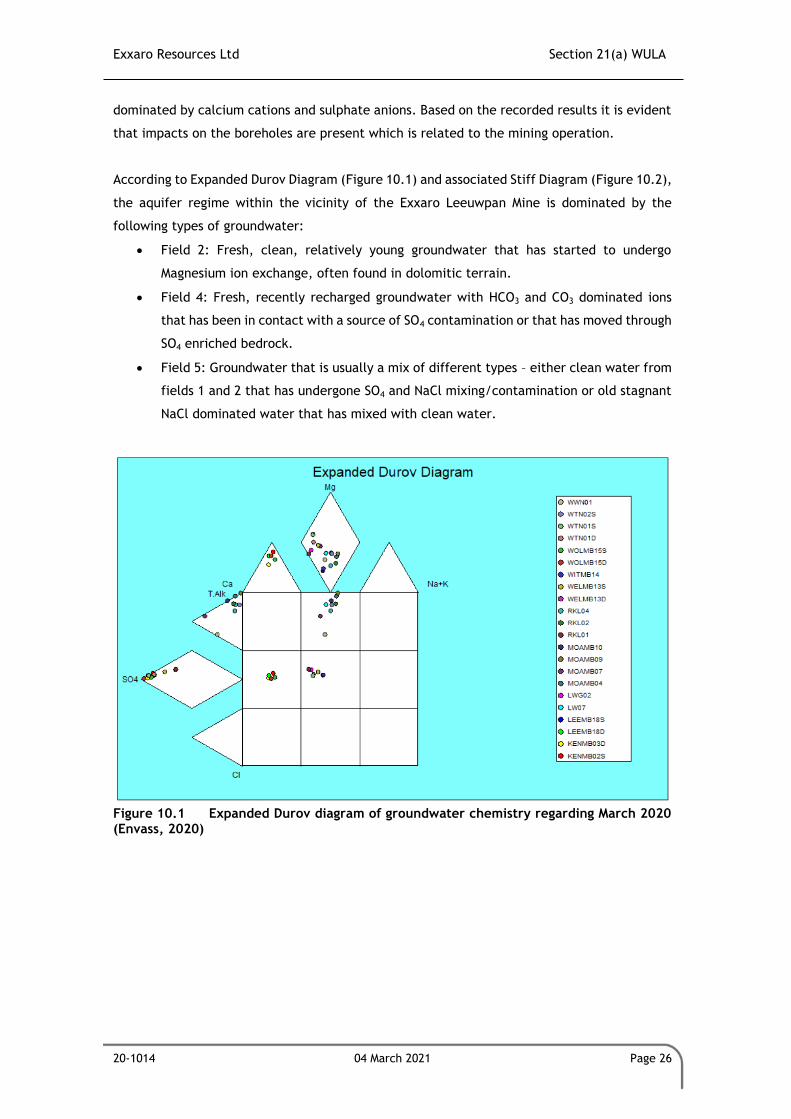
Exxaro Resources Ltd Section 21(a) WULA
20-1014 04 March 2021 Page 26
dominated by calcium cations and sulphate anions. Based on the recorded results it is evident
that impacts on the boreholes are present which is related to the mining operation.
According to Expanded Durov Diagram (Figure 10.1) and associated Stiff Diagram (Figure 10.2),
the aquifer regime within the vicinity of the Exxaro Leeuwpan Mine is dominated by the
following types of groundwater:
• Field 2: Fresh, clean, relatively young groundwater that has started to undergo
Magnesium ion exchange, often found in dolomitic terrain.
• Field 4: Fresh, recently recharged groundwater with HCO3 and CO3 dominated ions
that has been in contact with a source of SO4 contamination or that has moved through
SO4 enriched bedrock.
• Field 5: Groundwater that is usually a mix of different types – either clean water from
fields 1 and 2 that has undergone SO4 and NaCl mixing/contamination or old stagnant
NaCl dominated water that has mixed with clean water.
Figure 10.1 Expanded Durov diagram of groundwater chemistry regarding March 2020 (Envass, 2020)
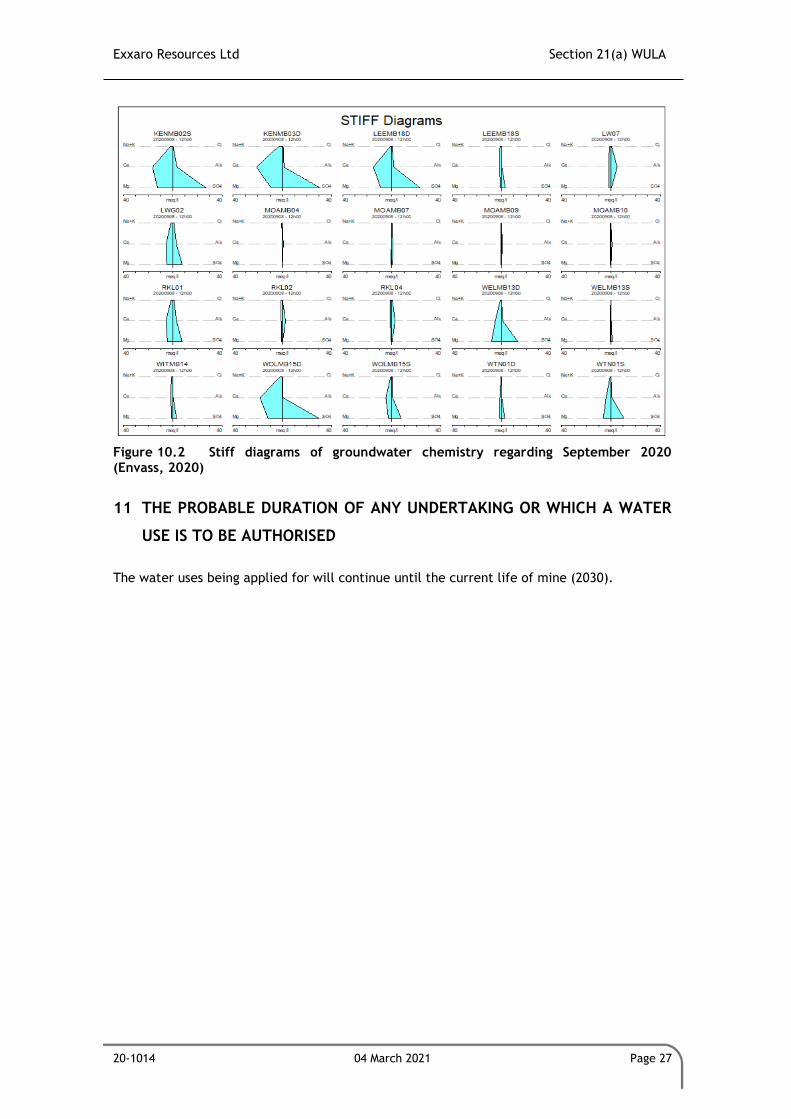
Exxaro Resources Ltd Section 21(a) WULA
20-1014 04 March 2021 Page 27
Figure 10.2 Stiff diagrams of groundwater chemistry regarding September 2020 (Envass, 2020)
11 THE PROBABLE DURATION OF ANY UNDERTAKING OR WHICH A WATER
USE IS TO BE AUTHORISED
The water uses being applied for will continue until the current life of mine (2030).
Exxaro Resources Ltd Section 21(a) WULA
20-1014 04 March 2021 Page 28
12 REFERENCES
Chamber of Mines of South Africa. 2019; Coal. https://www.mineralscouncil.org.za/industry-
news/publications/annual-reports. Accessed 18 November 2020.
Department of Water Affairs and Forestry (DWAF), South Africa.2001; Olifants River Ecological
Water Requirements Assessment. Prepared by A Singh and M van Veelen on behalf of the
Directorate: National Water Resource Planning. DWAF Report No. PB-000-00-5299.
Department of Water Affairs and Forestry, South Africa. 2004. Olifants Water Management
Area: Internal Strategic Perspective. Prepared by GMKS, Tlou and Matji and WMB on behalf of
the Directorate: National Water Resource Planning. DWAF Report No P WMA 04/000/00/0304.
Exxaro Leeuwpan Coal. 2015; Social and Labour Plan 25 March 2015 until 24 March 2020. Doc
No. MCX-000321-PMG-PLN.
Annexure B Hydrogeological Assessment
GCS (Pty) Ltd. Reg No: 2004/000765/07 Est. 1987
Offices: Durban Gaborone Johannesburg Lusaka Maseru Ostrava Pretoria Windhoek
Directors: AC Johnstone (Managing) PF Labuschagne AWC Marais S Napier W Sherriff (Financial)
Non-Executive Director: B Wilson-Jones www.gcs-sa.biz
63 Wessel Road, Rivonia, 2128 PO Box 2597, Rivonia, 2128 South Africa
Tel: +27 (0) 11 803 5726 Fax: +27 (0) 11 803 5745 Web: www.gcs-sa.biz
Exxaro Leeuwpan Coal Mine Section 21 (a)
Water Use License Application (WULA)
DRAFT-Report
Version –Draft
02 April 2020
GCS Project Number: 19-0292
Client Reference: EXXARO (GCS 19-0292)
EXXARO - Leeuwpan Coal Mine Section 21(a) WULA
19-0902 2 April 2020 Page ii of 41
Exxaro Leeuwpan Coal Mine Section 21(a)
Water Use License Application (WULA)
Version – 1
02 April 2020
19-0902
DOCUMENT ISSUE STATUS
Report Issue 1
GCS Reference Number GCS Ref – 19-0902
Client Reference Section 21(a) WULA
Title Exxaro Leeuwpan Coal Mine
Section 21(a) Water Use License Application (WULA)
Name Signature Date
Author Rudolf Van Heerden
02 April 2020
Unit Manager Kobus Troskie
02 April 2020
Director Alkie Marais
02 April 2020
LEGAL NOTICE This report or any proportion thereof and any associated documentation remain the property of GCS until the mandator effects payment of all fees and disbursements due to GCS in terms of the GCS Conditions of Contract and Project Acceptance Form. Notwithstanding the aforesaid, any reproduction, duplication, copying, adaptation, editing, change, disclosure, publication, distribution, incorporation, modification, lending, transfer, sending, delivering, serving or broadcasting must be authorised in writing by GCS.
EXXARO - Leeuwpan Coal Mine Section 21(a) WULA
19-0902 2 April 2020 Page iii of 41
CONTENTS PAGE
1 INTRODUCTION .......................................................................................................................... 5
2 SCOPE OF WORK ........................................................................................................................ 5
3 METHODOLOGY ......................................................................................................................... 5
3.1 DESKTOP STUDY ............................................................................................................................ 5 3.2 HYDROCENSUS .............................................................................................................................. 6 3.3 AQUIFER TESTING .......................................................................................................................... 6 3.4 GROUNDWATER SAMPLING ............................................................................................................. 6 3.5 GROUNDWATER RESERVE DETERMINATION ........................................................................................ 7
4 SITE INFORMATION .................................................................................................................... 8
4.1 LOCALITY ..................................................................................................................................... 8 4.2 TOPOGRAPHY AND HYDROLOGY ....................................................................................................... 8 4.3 GEOLOGICAL AND HYDROGEOLOGICAL SETTING ................................................................................... 8
5 FIELD INVESTIGATION............................................................................................................... 11
5.1 HYDROCENSUS ............................................................................................................................ 11 5.2 AQUIFER TESTING ........................................................................................................................ 11
5.2.1 Recommended pumping schedule .................................................................................. 12
6 LABOROTORY ANALYSIS ........................................................................................................... 15
6.1.1 General Parameters ........................................................................................................ 16 6.1.2 Anions ............................................................................................................................. 16 6.1.3 Cations and Metals ......................................................................................................... 16
6.2 PIPER DIAGRAM .......................................................................................................................... 16
7 GROUNDWATER RESERVE DETERMINATION ............................................................................ 18
7.1 QUATERNARY CATCHMENT ............................................................................................................ 18 7.2 SUB-CATCHMENT DELINEATION ...................................................................................................... 18
7.2.1 Registered Abstraction.................................................................................................... 19 7.2.2 Theoretical Groundwater Balance .................................................................................. 21 7.2.3 Theoretical Water Quantity ............................................................................................ 22
8 IMPACT ASSESSMENT ............................................................................................................... 25
8.1 IMPACT ASSESSMENT ................................................................................................................... 27 8.1.1 Operational Phase .......................................................................................................... 27 8.1.2 Mitigation Plan ............................................................................................................... 29 8.1.3 Groundwater monitoring plan ........................................................................................ 29
9 CONCLUSION ............................................................................................................................ 30
10 REFERENCES ............................................................................................................................. 31
LIST OF FIGURES
Figure 4-1: Locality Map ................................................................................ 9 Figure 4-2: Geology Map .............................................................................. 10 Figure 5-1: Site Layout Map .......................................................................... 13 Figure 5-2: Aquifer Test Results for Borehole WK-BH1 ........................................... 14 Figure 6-1: Piper Diagram for Sample WK-BH1 .................................................... 17 Figure 7-1: Delineated Sub-catchment with WARMS Boreholes shown on map ............... 24
EXXARO - Leeuwpan Coal Mine Section 21(a) WULA
19-0902 2 April 2020 Page iv of 41
LIST OF TABLES
Table 5-1: Aquifer Test Borehole Details for Borehole WK-BH1 ................................. 11 Table 5-2: Aquifer Test Results for Borehole WK-BH1 ............................................ 12 Table 5-3: Recommended Pumping Schedule for WK-BH1 ....................................... 12 Table 6-1: Groundwater Laboratory Results ....................................................... 15 Table 7-1: Quaternary Catchment Details for Catchment B20A ................................. 18 Table 7-2: WARMS Borehole Details for Quaternary Catchment B20A .......................... 19 Table 7-3: Theoretical Groundwater Balance Calculation for Delineated Sub-catchment Containing the Site .................................................................................... 22 Table 7-4: Guide for determining the level of stress of a groundwater resource unit ....... 23 Table 8-1: Severity .................................................................................... 25 Table 8-2: Spatial Scale - How big is the area that the aspect is impacting on? .............. 25 Table 8-3: Duration .................................................................................... 26 Table 8-4: Frequency of the activity - How often do you do the specific activity? .......... 26 Table 8-5: Frequency of the incident/impact - How often does the activity impact the environment? ........................................................................................... 26 Table 8-6: Legal issues - How is the activity governed by legislation? ......................... 26 Table 8-7: Detection - How quickly/easily can the impacts/risks of the activity be detected on the environment, people and property? ........................................................ 26 Table 8-8: Impact Ratings ............................................................................ 26 Table 8-9: Impact Assessment Results .............................................................. 28 Table 8-10: Water Level Monitoring Plan for WK-BH1 ............................................ 29 Table 8-11: Hydro chemical Sampling Plan for WK-BH1 .......................................... 30
LIST OF APPENDICES
APPENDIX A: LABORATORY CERTIFICATE ......................................................................................... 33
APPENDIX B: AQUIFER TEST RESULTS ............................................................................................... 38
APPENDIX C: GROUNDWATER MODEL REPORT (GCS, 2019) ............................................................. 41
EXXARO - Leeuwpan Coal Mine Section 21(a) WULA
19-0902 2 April 2020 Page 5
1 INTRODUCTION
GCS Water and Environmental (Pty) Ltd was contracted by Exxaro Leeuwpan Coal Mine to
conduct a hydrogeological investigation as per proposal by GCS dated 24 October 2019. The
document will be submitted as supporting documents for a Water Use Licence Application
(WULA).
2 SCOPE OF WORK
Following work was accepted as the scope of work:
• Detailed desktop study;
• Hydrocensus/neighbouring land survey within a 1km radius of the sub-catchment
containing the abstraction borehole;
• Identify any sensitive areas (e.g. wetlands, streams etc.) within a 500m radius of the
site;
• Aquifer testing;
• Groundwater sampling;
• Groundwater reserve determination;
• Compilation of a detailed hydrogeological report with the findings of the
investigation as well as detailed recommendations for resource development,
management and monitoring and relevant information for inclusion within the WULA.
3 METHODOLOGY
3.1 Desktop study
GCS assessed all available geological and hydrogeological data prior to the commencement
of any fieldwork. All existing groundwater data was reviewed and assessed during the desktop
study.
The following data sources were used during the study:
• Topographic 1:50 000 maps;
• Geological 1:250 000 map;
• Hydrogeological 1:500 000 map;
• Groundwater Resource Directed Measures (GRDM, 2013) obtained from the
Department of Water and Sanitation (DWS);
EXXARO - Leeuwpan Coal Mine Section 21(a) WULA
19-0902 2 April 2020 Page 6
• Existing hydrogeological reports for the site or in the area.
3.2 Hydrocensus
A hydrocensus was conducted within the sub-catchment containing the site, within all
accessible areas. The following information was recorded during the hydrocensus:
• GPS co-ordinates and elevation of existing boreholes or springs;
• Water levels of the boreholes, where accessible;
• Estimated abstraction volumes, where provided;
• Any other information regarding the water reliability or quality;
• Identifying surface water bodies and usage;
• Determine groundwater usage and identify groundwater users.
3.3 Aquifer testing
The borehole was pumped for 24 hours at a constant rate. The water level within the borehole
was monitored during the pumping. This data was used to determine the aquifer
characteristics, such as transmissivity and storage.
After pumping the water level within the borehole was monitored to determine the recovery
of the water level with time. This allows for the evaluation of dewatering and pumping
schedules. The aquifer test data was analysed to determine the following:
• Sustainable yield;
• Abstraction schedule;
• Pump inlet depth; and
• Management.
3.4 Groundwater Sampling
A groundwater sample was collected from the existing production borehole to determine the
preliminary groundwater condition. The methodology in the collection and preservation of
groundwater samples are important for the reliability of the analysis.
The samples were submitted to an accredited laboratory services for analysis and included
the following analyses:
• Metals: Ca, Mg, Na, K, Fe, Al, Mn and B.
• pH, Electrical conductivity, Alkalinity,
• Nitrate and nitrite, Chloride, Sulphate and Fluoride.
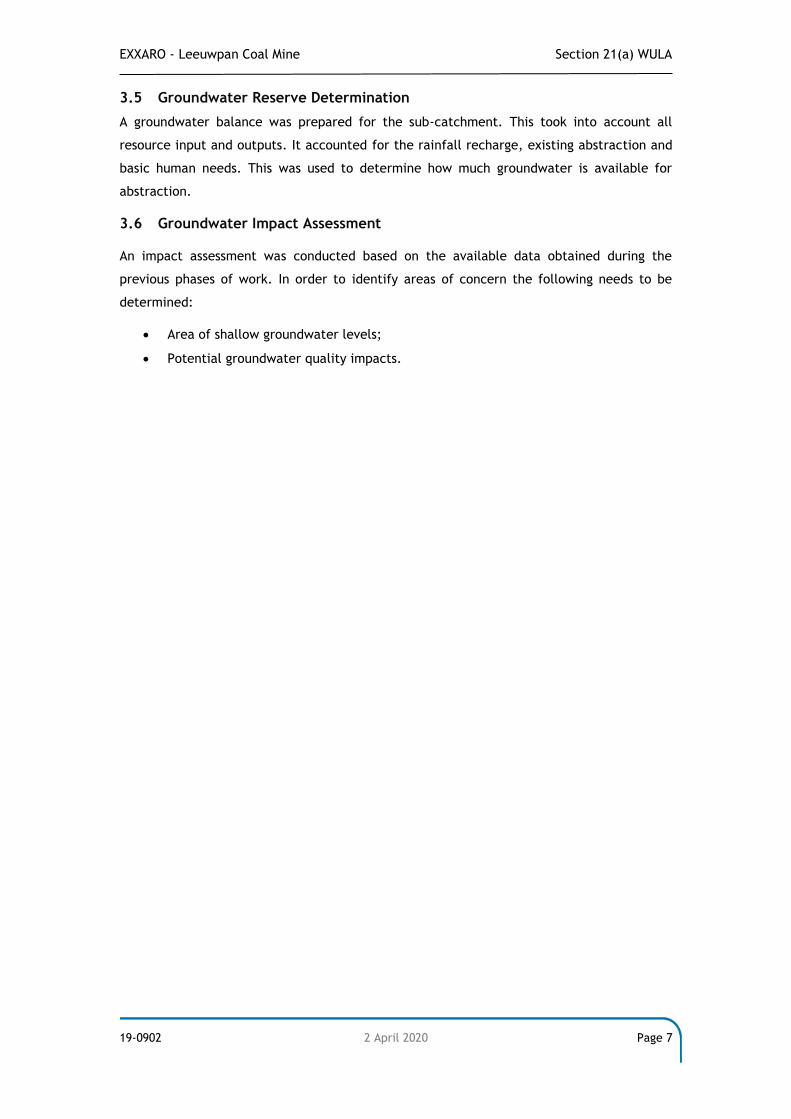
EXXARO - Leeuwpan Coal Mine Section 21(a) WULA
19-0902 2 April 2020 Page 7
3.5 Groundwater Reserve Determination
A groundwater balance was prepared for the sub-catchment. This took into account all
resource input and outputs. It accounted for the rainfall recharge, existing abstraction and
basic human needs. This was used to determine how much groundwater is available for
abstraction.
3.6 Groundwater Impact Assessment
An impact assessment was conducted based on the available data obtained during the
previous phases of work. In order to identify areas of concern the following needs to be
determined:
• Area of shallow groundwater levels;
• Potential groundwater quality impacts.
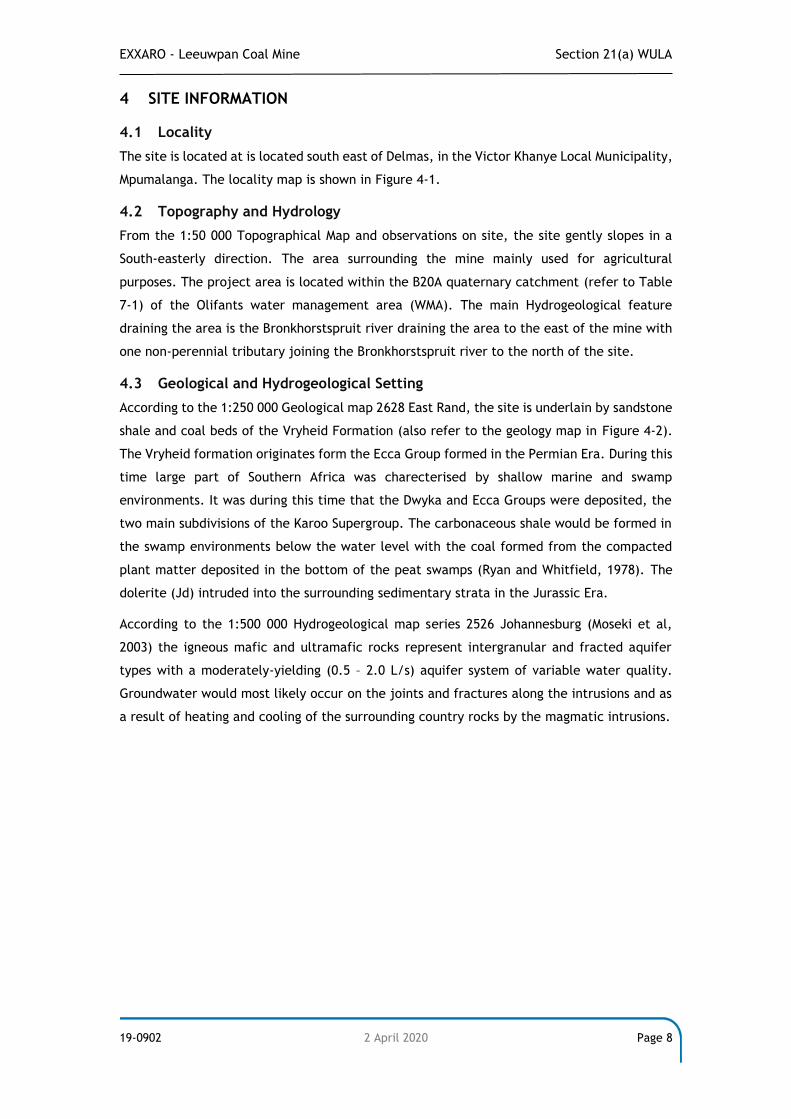
EXXARO - Leeuwpan Coal Mine Section 21(a) WULA
19-0902 2 April 2020 Page 8
4 SITE INFORMATION
4.1 Locality
The site is located at is located south east of Delmas, in the Victor Khanye Local Municipality,
Mpumalanga. The locality map is shown in Figure 4-1.
4.2 Topography and Hydrology
From the 1:50 000 Topographical Map and observations on site, the site gently slopes in a
South-easterly direction. The area surrounding the mine mainly used for agricultural
purposes. The project area is located within the B20A quaternary catchment (refer to Table
7-1) of the Olifants water management area (WMA). The main Hydrogeological feature
draining the area is the Bronkhorstspruit river draining the area to the east of the mine with
one non-perennial tributary joining the Bronkhorstspruit river to the north of the site.
4.3 Geological and Hydrogeological Setting
According to the 1:250 000 Geological map 2628 East Rand, the site is underlain by sandstone
shale and coal beds of the Vryheid Formation (also refer to the geology map in Figure 4-2).
The Vryheid formation originates form the Ecca Group formed in the Permian Era. During this
time large part of Southern Africa was charecterised by shallow marine and swamp
environments. It was during this time that the Dwyka and Ecca Groups were deposited, the
two main subdivisions of the Karoo Supergroup. The carbonaceous shale would be formed in
the swamp environments below the water level with the coal formed from the compacted
plant matter deposited in the bottom of the peat swamps (Ryan and Whitfield, 1978). The
dolerite (Jd) intruded into the surrounding sedimentary strata in the Jurassic Era.
According to the 1:500 000 Hydrogeological map series 2526 Johannesburg (Moseki et al,
2003) the igneous mafic and ultramafic rocks represent intergranular and fracted aquifer
types with a moderately-yielding (0.5 – 2.0 L/s) aquifer system of variable water quality.
Groundwater would most likely occur on the joints and fractures along the intrusions and as
a result of heating and cooling of the surrounding country rocks by the magmatic intrusions.
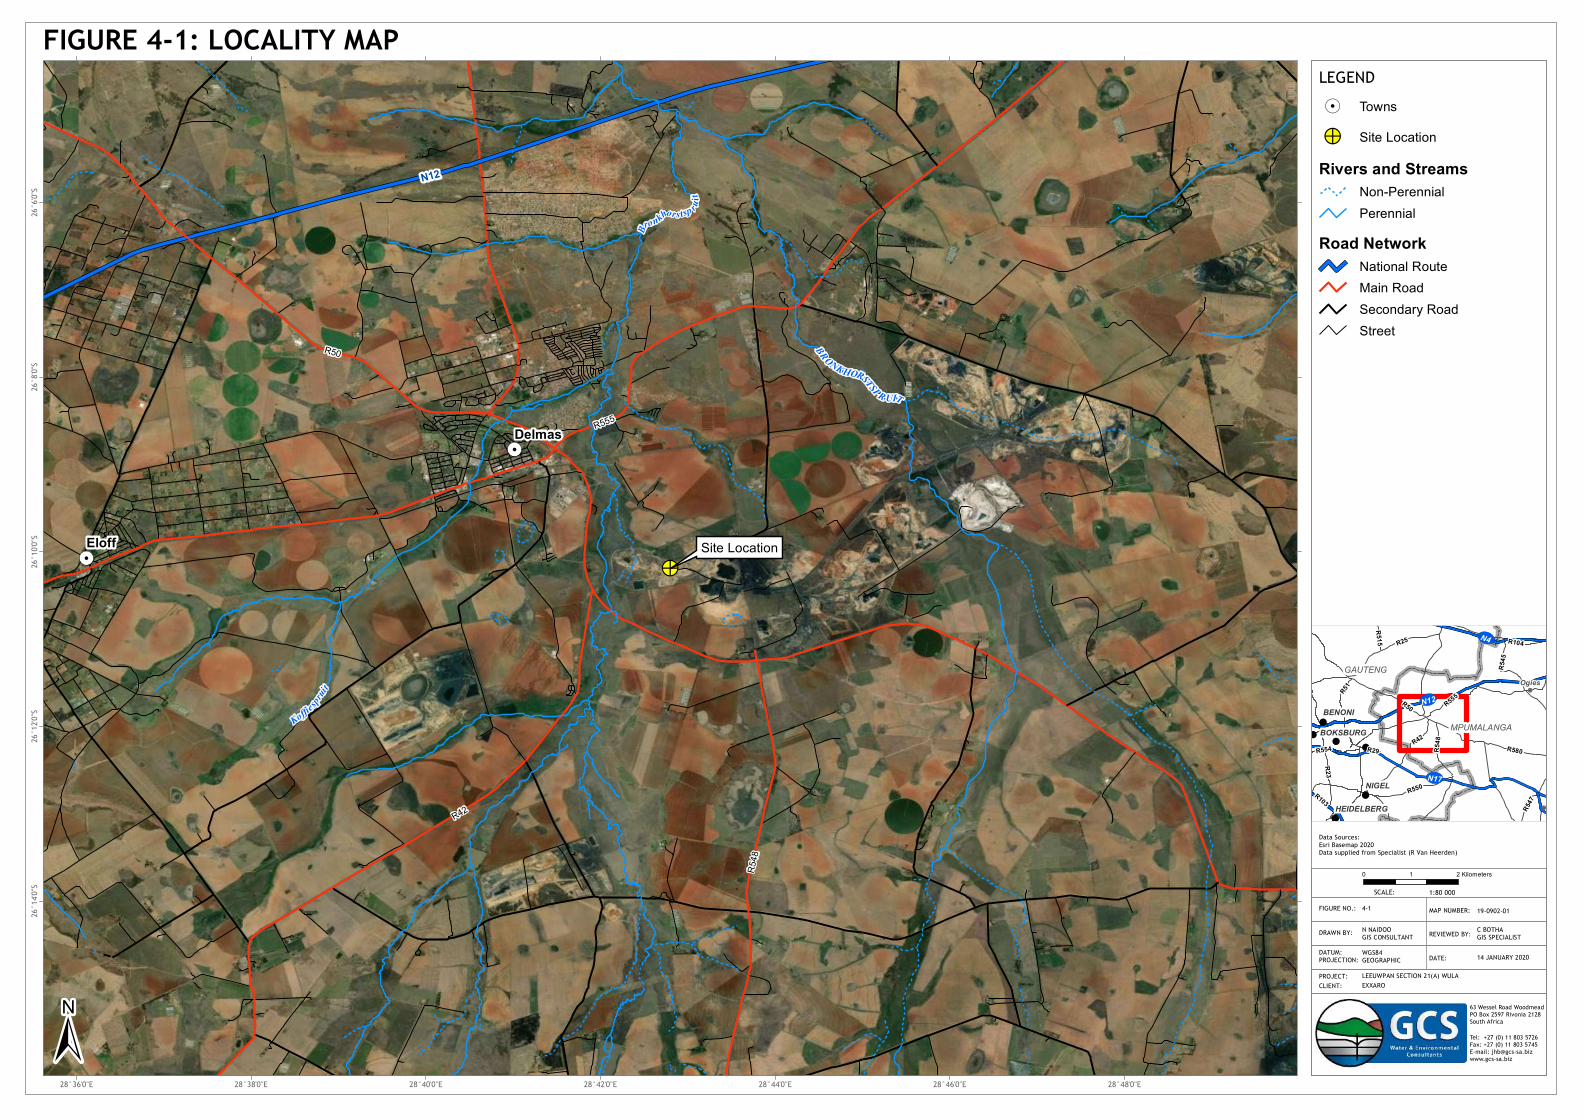
!
!!
!
!
!
!
!
Ogies
BENONI
BOKSBURG
NIGEL
HEIDELBERG
GAUTENG
MPUMALANGA
UVN17
UVN4
UVN12
R25 R104
R103
R29
R515
R555
R554 R548
R51
R50
R23
R550
R545
R580
R547
R42
<Double-click here to enter title>
!.
!.
!>
R548
R42
R50
R555
N12
Site Location
BRONK HORSTSPR UIT
Koffie
spruit
Bronkhors tsp ru
it
Eloff
Delmas
28°48'0"E28°46'0"E28°44'0"E28°42'0"E28°40'0"E28°38'0"E28°36'0"E
26°6
'0"S
26°8
'0"S
26°1
0'0"S
26°1
2'0"S
26°1
4'0"S
LEGEND
Data Sources:Esri Basemap 2020Data supplied from Specialist (R Van Heerden)
63 Wessel Road WoodmeadPO Box 2597 Rivonia 2128South Africa
Tel: +27 (0) 11 803 5726Fax: +27 (0) 11 803 5745E-mail: [email protected]
FIGURE 4-1: LOCALITY MAP
1:80 000
!. Towns
!> Site Location
Rivers and StreamsNon-PerennialPerennial
Road NetworkNational RouteMain RoadSecondary RoadStreet
4-1FIGURE NO.: 19-0902-01MAP NUMBER:
DRAWN BY: N NAIDOOGIS CONSULTANT REVIEWED BY: C BOTHA
GIS SPECIALISTDATUM:PROJECTION:
WGS84GEOGRAPHIC DATE: 14 JANUARY 2020
CLIENT:PROJECT:
SCALE:
0 21 Kilometers
±LEEUWPAN SECTION 21(A) WULAEXXARO
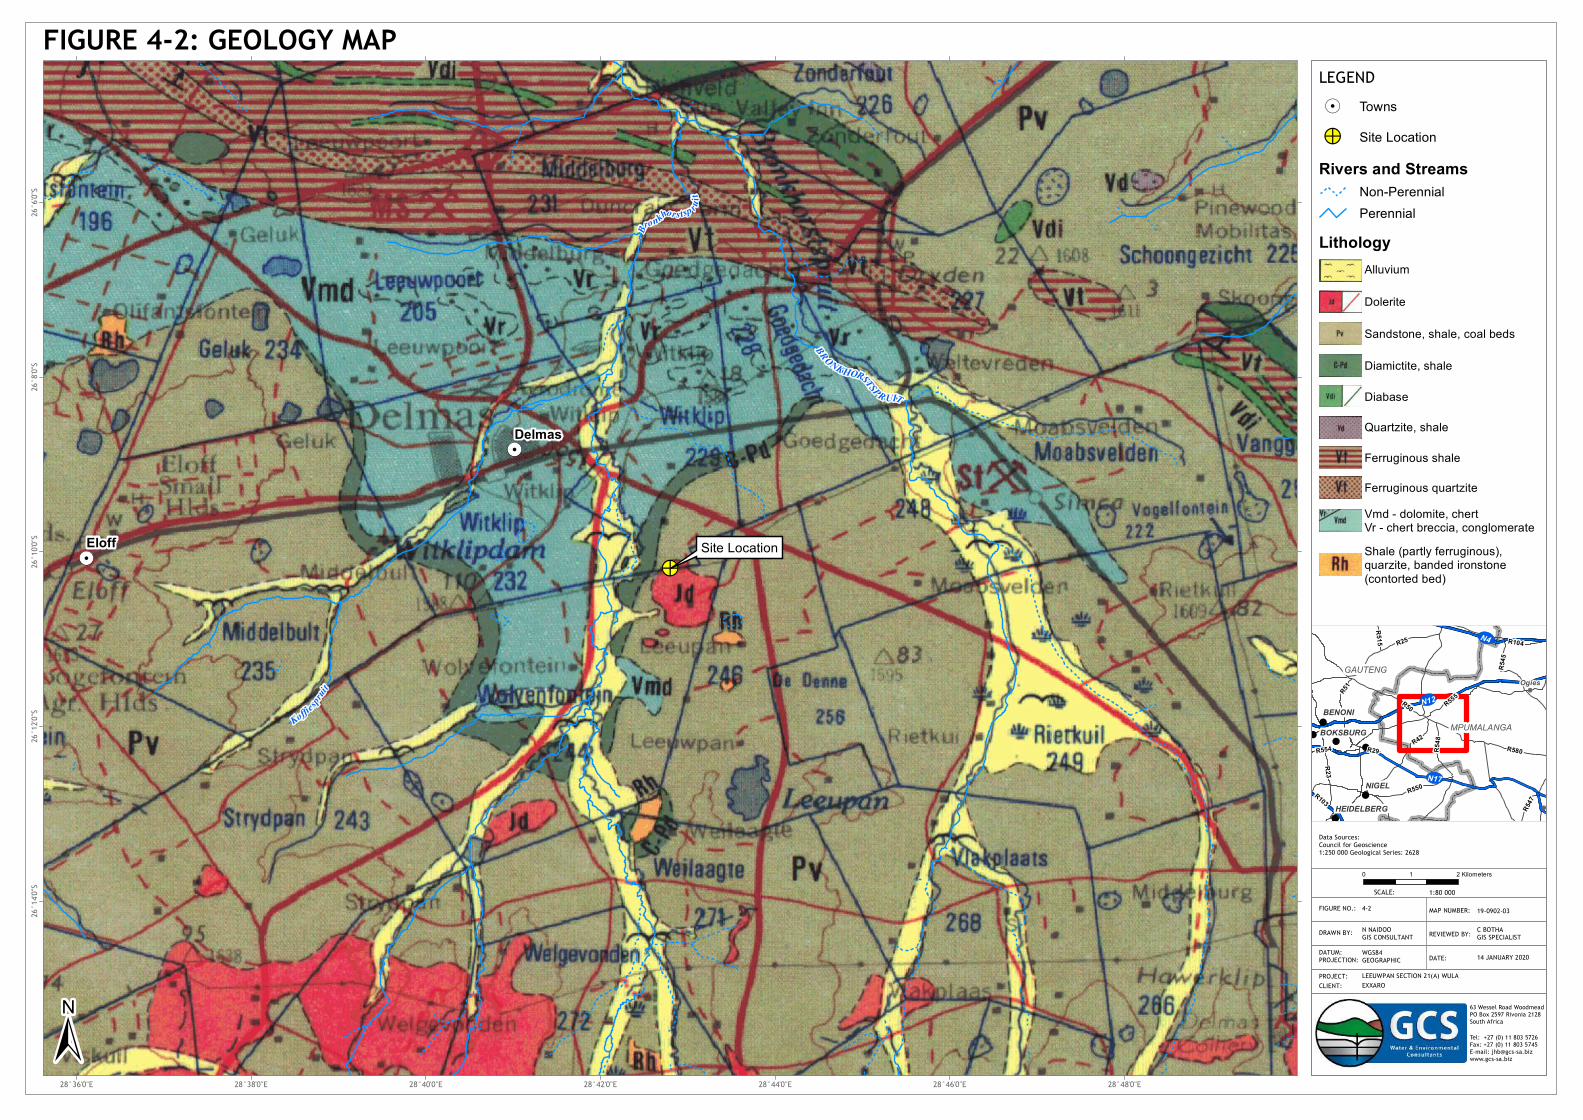
!
!!
!
!
!
!
!
Ogies
BENONI
BOKSBURG
NIGEL
HEIDELBERG
GAUTENG
MPUMALANGA
UVN17
UVN4
UVN12
R25 R104
R103
R29
R515
R555
R554 R548
R51
R50
R23
R550
R545
R580
R547
R42
<Double-click here to enter title>
!.
!.
!>Site Location
BRONK HORSTSPR UIT
Koffie
spruit
Bronkhors tsp ru
it
Eloff
Delmas
28°48'0"E28°46'0"E28°44'0"E28°42'0"E28°40'0"E28°38'0"E28°36'0"E
26°6
'0"S
26°8
'0"S
26°1
0'0"S
26°1
2'0"S
26°1
4'0"S
LEGEND
Data Sources:Council for Geoscience1:250 000 Geological Series: 2628
63 Wessel Road WoodmeadPO Box 2597 Rivonia 2128South Africa
Tel: +27 (0) 11 803 5726Fax: +27 (0) 11 803 5745E-mail: [email protected]
FIGURE 4-2: GEOLOGY MAP
1:80 000
!. Towns
!> Site Location
Rivers and StreamsNon-PerennialPerennial
4-2FIGURE NO.: 19-0902-03MAP NUMBER:
DRAWN BY: N NAIDOOGIS CONSULTANT REVIEWED BY: C BOTHA
GIS SPECIALISTDATUM:PROJECTION:
WGS84GEOGRAPHIC DATE: 14 JANUARY 2020
CLIENT:PROJECT:
SCALE:
0 21 Kilometers
±LEEUWPAN SECTION 21(A) WULAEXXARO
Lithology
Dolerite
Alluvium
Sandstone, shale, coal beds
Diamictite, shale
Diabase
Quartzite, shale
Ferruginous shale
Ferruginous quartziteVmd - dolomite, chertVr - chert breccia, conglomerateShale (partly ferruginous), quarzite, banded ironstone (contorted bed)
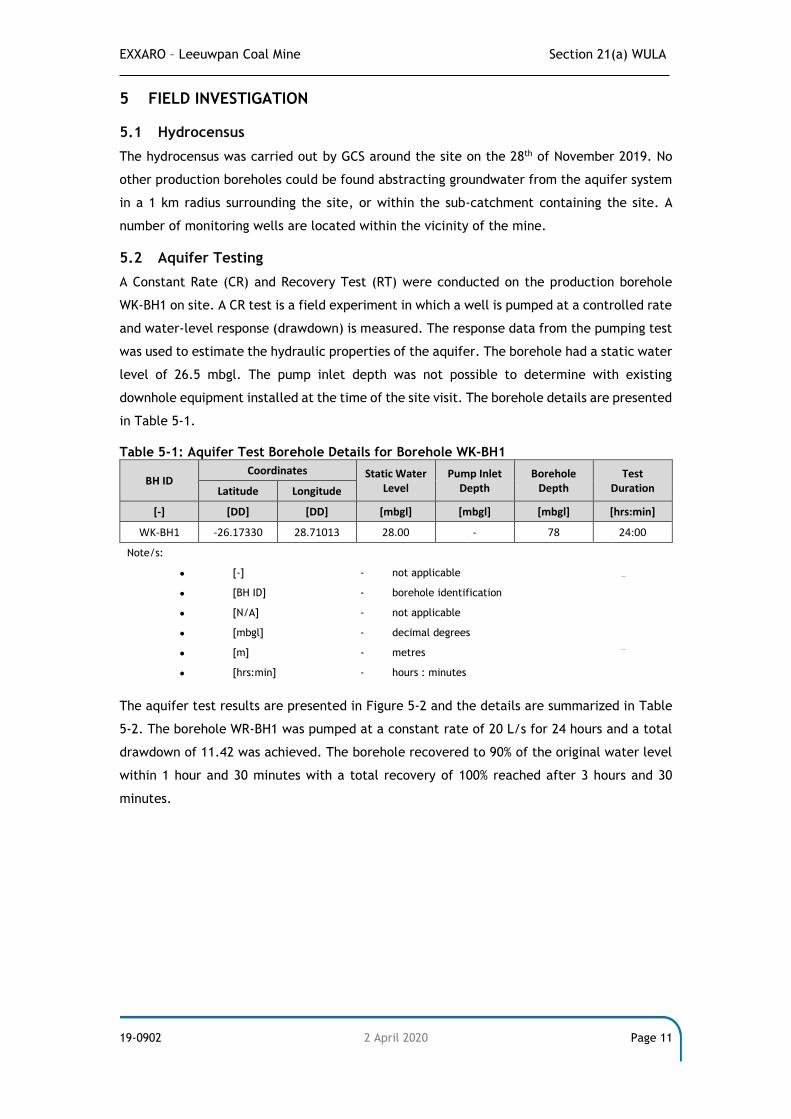
EXXARO – Leeuwpan Coal Mine Section 21(a) WULA
19-0902 2 April 2020 Page 11
5 FIELD INVESTIGATION
5.1 Hydrocensus
The hydrocensus was carried out by GCS around the site on the 28th of November 2019. No
other production boreholes could be found abstracting groundwater from the aquifer system
in a 1 km radius surrounding the site, or within the sub-catchment containing the site. A
number of monitoring wells are located within the vicinity of the mine.
5.2 Aquifer Testing
A Constant Rate (CR) and Recovery Test (RT) were conducted on the production borehole
WK-BH1 on site. A CR test is a field experiment in which a well is pumped at a controlled rate
and water-level response (drawdown) is measured. The response data from the pumping test
was used to estimate the hydraulic properties of the aquifer. The borehole had a static water
level of 26.5 mbgl. The pump inlet depth was not possible to determine with existing
downhole equipment installed at the time of the site visit. The borehole details are presented
in Table 5-1.
Table 5-1: Aquifer Test Borehole Details for Borehole WK-BH1
BH ID Coordinates Static Water
Level Pump Inlet
Depth Borehole
Depth Test
Duration Latitude Longitude
[-] [DD] [DD] [mbgl] [mbgl] [mbgl] [hrs:min]
WK-BH1 -26.17330 28.71013 28.00 - 78 24:00
Note/s:
• [-] - not applicable
• [BH ID] - borehole identification
• [N/A] - not applicable
• [mbgl] - decimal degrees
• [m] - metres
• [hrs:min] - hours : minutes The aquifer test results are presented in Figure 5-2 and the details are summarized in Table
5-2. The borehole WR-BH1 was pumped at a constant rate of 20 L/s for 24 hours and a total
drawdown of 11.42 was achieved. The borehole recovered to 90% of the original water level
within 1 hour and 30 minutes with a total recovery of 100% reached after 3 hours and 30
minutes.
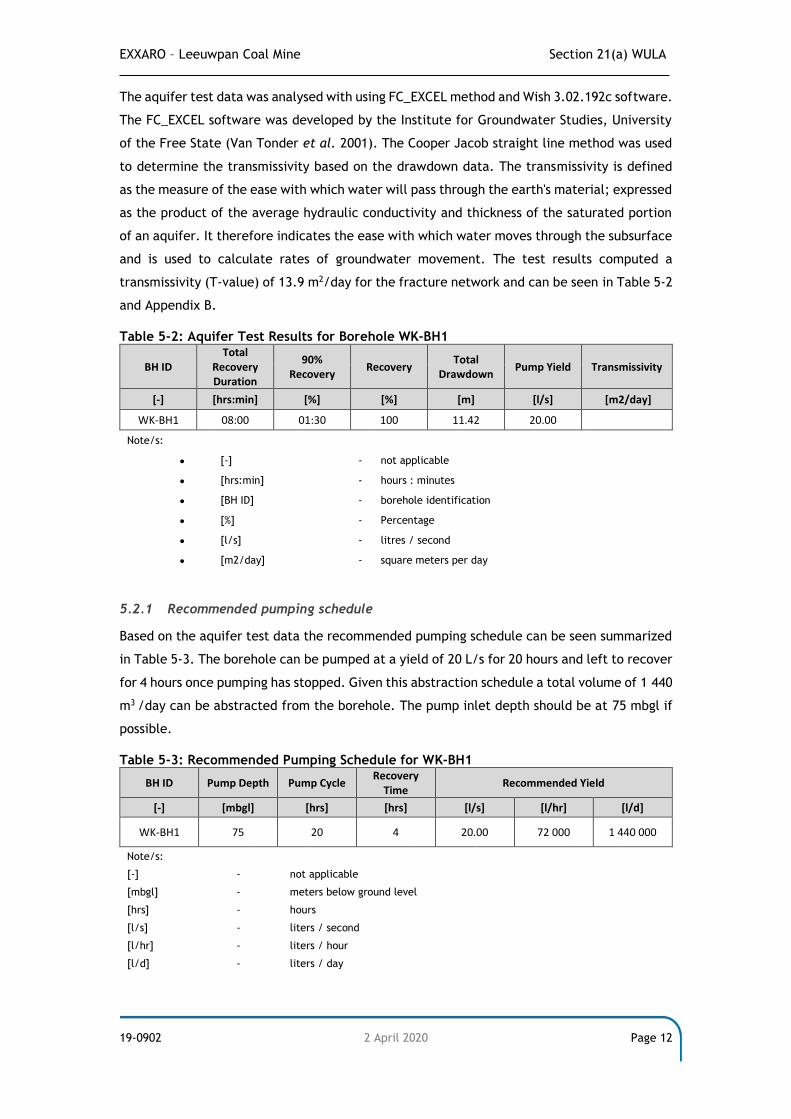
EXXARO – Leeuwpan Coal Mine Section 21(a) WULA
19-0902 2 April 2020 Page 12
The aquifer test data was analysed with using FC_EXCEL method and Wish 3.02.192c software.
The FC_EXCEL software was developed by the Institute for Groundwater Studies, University
of the Free State (Van Tonder et al. 2001). The Cooper Jacob straight line method was used
to determine the transmissivity based on the drawdown data. The transmissivity is defined
as the measure of the ease with which water will pass through the earth's material; expressed
as the product of the average hydraulic conductivity and thickness of the saturated portion
of an aquifer. It therefore indicates the ease with which water moves through the subsurface
and is used to calculate rates of groundwater movement. The test results computed a
transmissivity (T-value) of 13.9 m2/day for the fracture network and can be seen in Table 5-2
and Appendix B.
Table 5-2: Aquifer Test Results for Borehole WK-BH1
BH ID Total
Recovery Duration
90% Recovery
Recovery Total
Drawdown Pump Yield Transmissivity
[-] [hrs:min] [%] [%] [m] [l/s] [m2/day]
WK-BH1 08:00 01:30 100 11.42 20.00
Note/s: • [-] - not applicable • [hrs:min] - hours : minutes • [BH ID] - borehole identification • [%] - Percentage • [l/s] - litres / second • [m2/day] - square meters per day
5.2.1 Recommended pumping schedule
Based on the aquifer test data the recommended pumping schedule can be seen summarized
in Table 5-3. The borehole can be pumped at a yield of 20 L/s for 20 hours and left to recover
for 4 hours once pumping has stopped. Given this abstraction schedule a total volume of 1 440
m3 /day can be abstracted from the borehole. The pump inlet depth should be at 75 mbgl if
possible.
Table 5-3: Recommended Pumping Schedule for WK-BH1
BH ID Pump Depth Pump Cycle Recovery
Time Recommended Yield
[-] [mbgl] [hrs] [hrs] [l/s] [l/hr] [l/d]
WK-BH1 75 20 4 20.00 72 000 1 440 000
Note/s: [-] - not applicable [mbgl] - meters below ground level [hrs] - hours [l/s] - liters / second [l/hr] - liters / hour [l/d] - liters / day
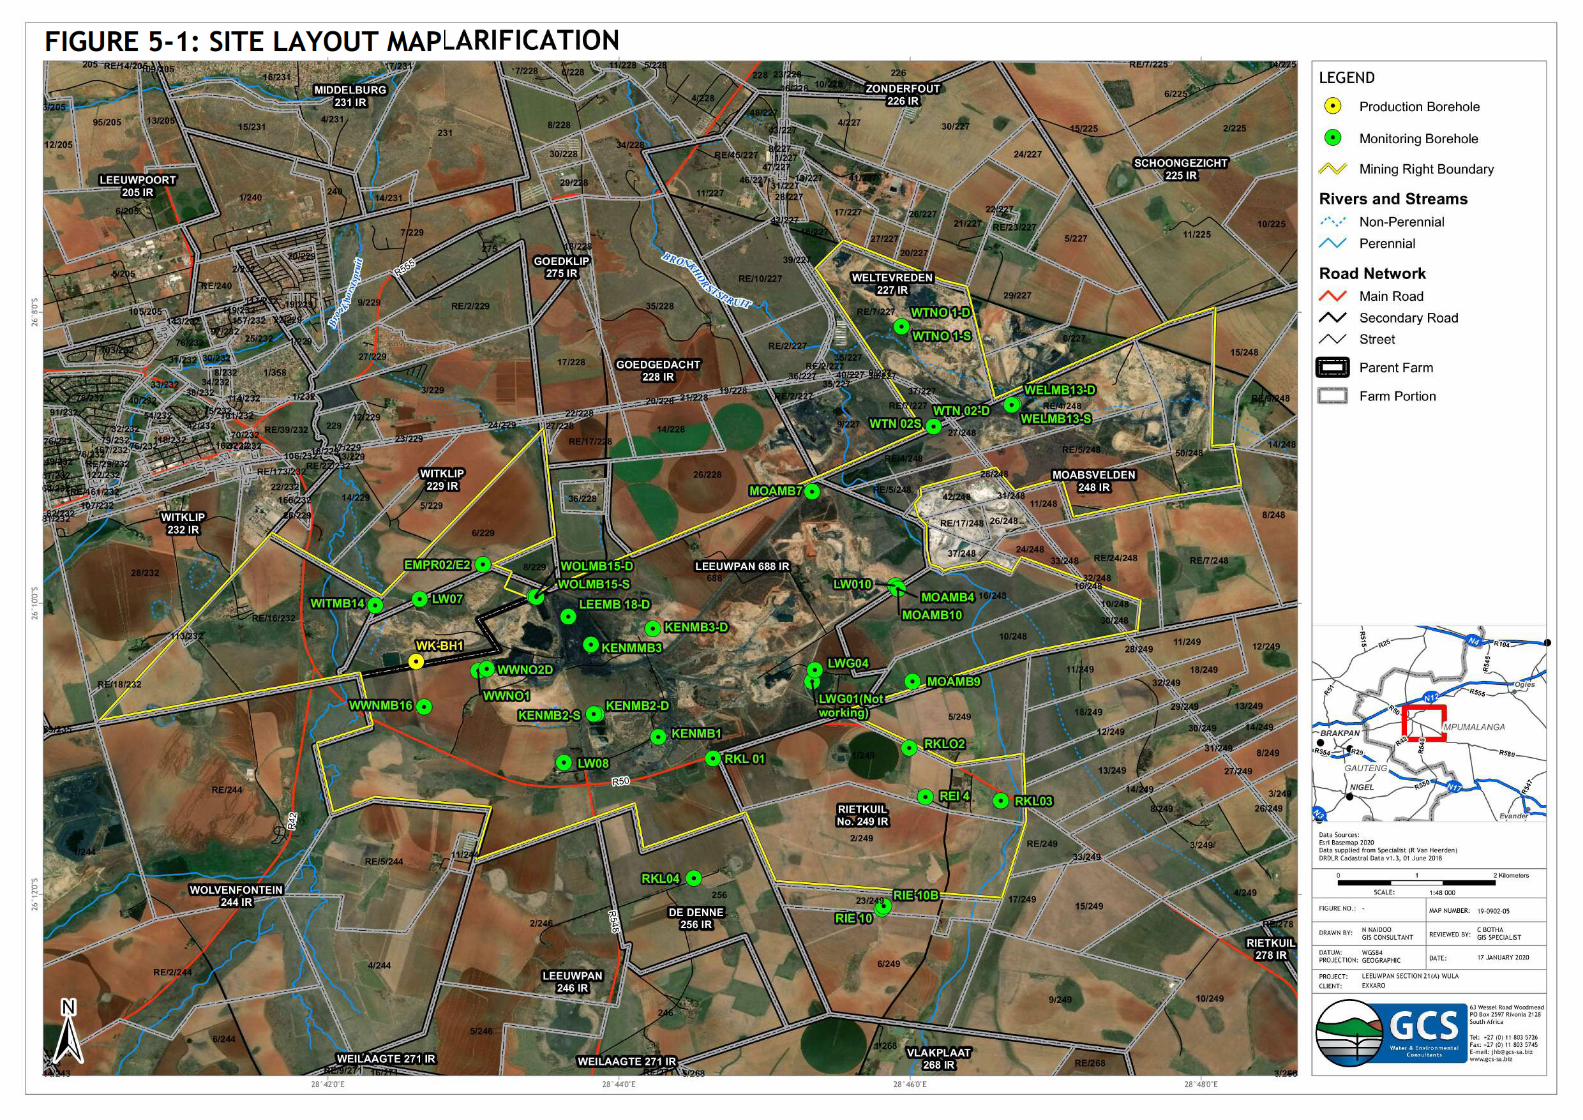
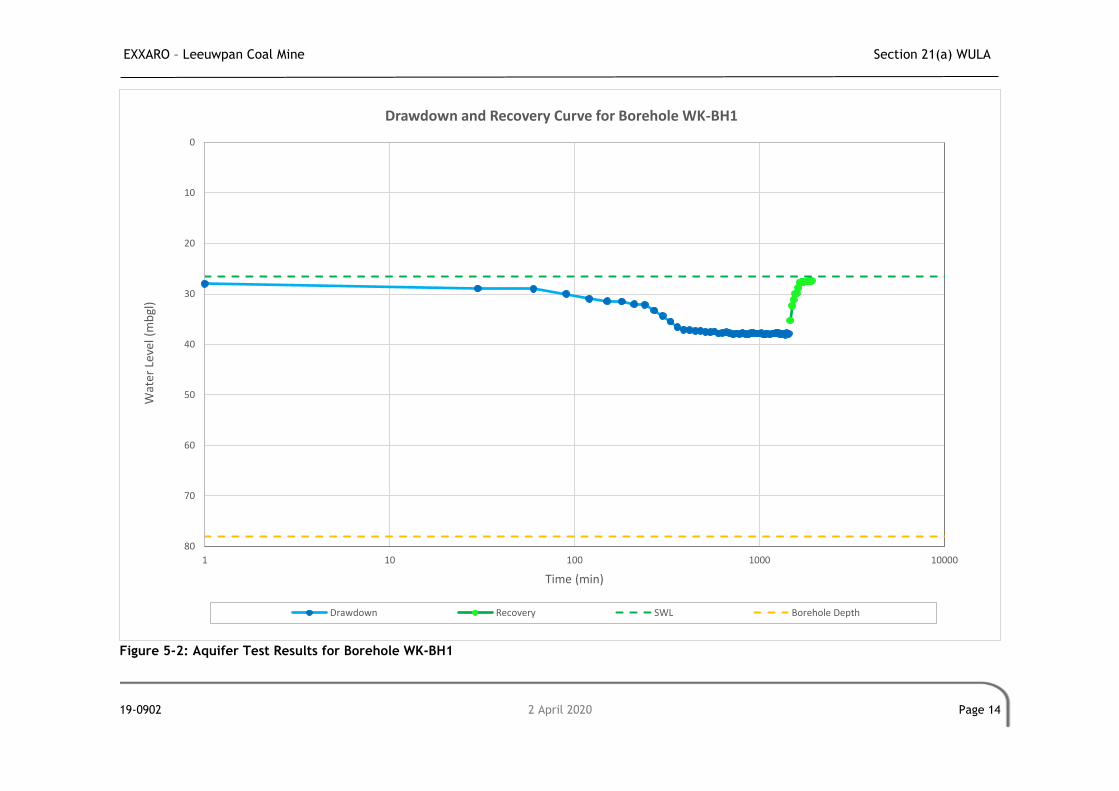
EXXARO – Leeuwpan Coal Mine Section 21(a) WULA
19-0902 2 April 2020 Page 14
Figure 5-2: Aquifer Test Results for Borehole WK-BH1
0
10
20
30
40
50
60
70
80
1 10 100 1000 10000
Wat
er L
evel
(m
bgl
)
Time (min)
Drawdown and Recovery Curve for Borehole WK-BH1
Drawdown Recovery SWL Borehole Depth
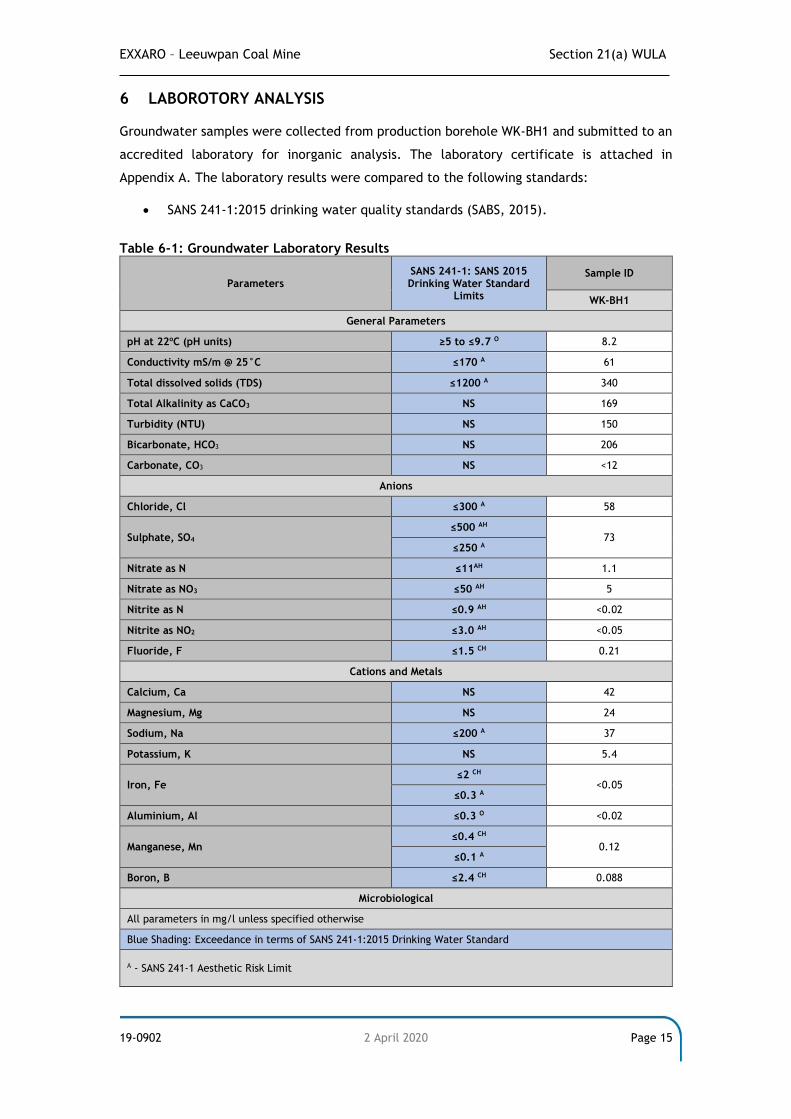
EXXARO – Leeuwpan Coal Mine Section 21(a) WULA
19-0902 2 April 2020 Page 15
6 LABOROTORY ANALYSIS
Groundwater samples were collected from production borehole WK-BH1 and submitted to an
accredited laboratory for inorganic analysis. The laboratory certificate is attached in
Appendix A. The laboratory results were compared to the following standards:
• SANS 241-1:2015 drinking water quality standards (SABS, 2015).
Table 6-1: Groundwater Laboratory Results
Parameters SANS 241-1: SANS 2015 Drinking Water Standard
Limits
Sample ID
WK-BH1
General Parameters
pH at 22oC (pH units) ≥5 to ≤9.7 O 8.2
Conductivity mS/m @ 25°C ≤170 A 61
Total dissolved solids (TDS) ≤1200 A 340
Total Alkalinity as CaCO3 NS 169
Turbidity (NTU) NS 150
Bicarbonate, HCO3 NS 206
Carbonate, CO3 NS <12
Anions
Chloride, Cl ≤300 A 58
Sulphate, SO4 ≤500 AH
73 ≤250 A
Nitrate as N ≤11AH 1.1
Nitrate as NO3 ≤50 AH 5
Nitrite as N ≤0.9 AH <0.02
Nitrite as NO2 ≤3.0 AH <0.05
Fluoride, F ≤1.5 CH 0.21
Cations and Metals
Calcium, Ca NS 42
Magnesium, Mg NS 24
Sodium, Na ≤200 A 37
Potassium, K NS 5.4
Iron, Fe ≤2 CH
<0.05 ≤0.3 A
Aluminium, Al ≤0.3 O <0.02
Manganese, Mn ≤0.4 CH
0.12 ≤0.1 A
Boron, B ≤2.4 CH 0.088
Microbiological
All parameters in mg/l unless specified otherwise
Blue Shading: Exceedance in terms of SANS 241-1:2015 Drinking Water Standard
A - SANS 241-1 Aesthetic Risk Limit
EXXARO – Leeuwpan Coal Mine Section 21(a) WULA
19-0902 2 April 2020 Page 16
CH - SANS 241-1 Chronic Health Risk Limit
AH - SANS 241-1 Acute Health Risk Limit
O - SANS 241-1 Operational Risk Limit
NS- No Standard
NS- No Standard
*Exceeds SANS 2015: Drinking Water Quality Standard
6.1.1 General Parameters
All general parameters are compliant of the SANS241-1:2015 Standards.
6.1.2 Anions
All general parameters are compliant of the SANS241-1:2015 Standards.
6.1.3 Cations and Metals
All general parameters are compliant of the SANS241-1:2015 Standards.
6.2 Piper Diagram
A piper diagram represents the chemistry of a water sample graphically. It is a tri-linear
diagram that implements major cations calcium, magnesium, sodium and potassium) and
anions (chloride, sulphate and bicarbonate) to reveal the chemistry of water samples. This is
then used to characterize different types of water. The sample WK-BH1 analyzed was a
magnesium bicarbonate type with water plotting in the unpolluted groundwater region on
the graph (refer to Figure 6-1). The piper diagram can also be used to verify if the
groundwater is being contaminated by examining pollution trends (piper diagrams of
groundwater samples over time).
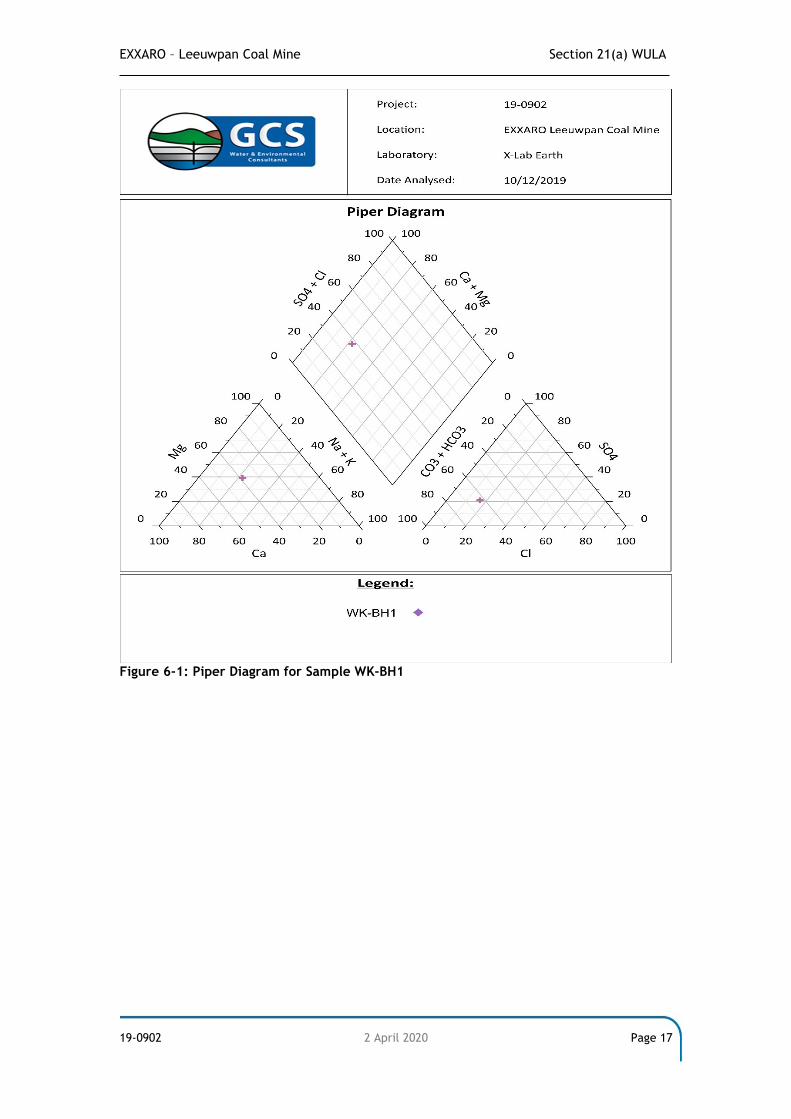
EXXARO – Leeuwpan Coal Mine Section 21(a) WULA
19-0902 2 April 2020 Page 17
Figure 6-1: Piper Diagram for Sample WK-BH1
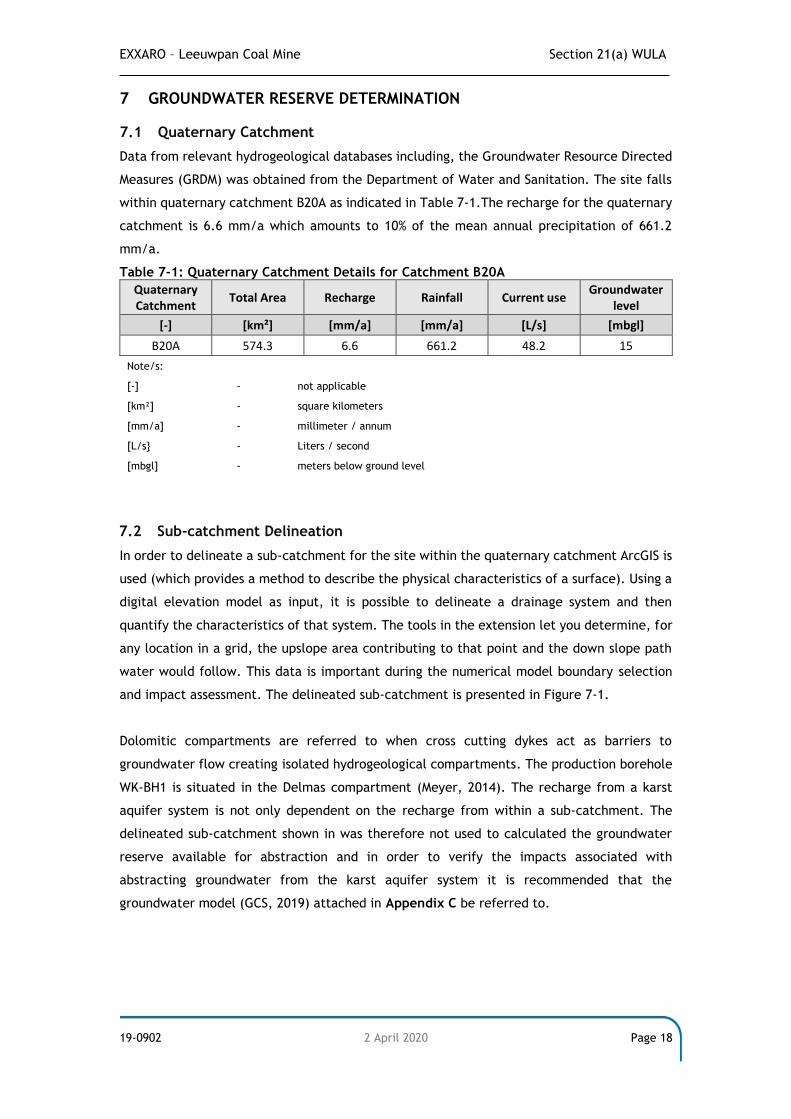
EXXARO – Leeuwpan Coal Mine Section 21(a) WULA
19-0902 2 April 2020 Page 18
7 GROUNDWATER RESERVE DETERMINATION
7.1 Quaternary Catchment
Data from relevant hydrogeological databases including, the Groundwater Resource Directed
Measures (GRDM) was obtained from the Department of Water and Sanitation. The site falls
within quaternary catchment B20A as indicated in Table 7-1.The recharge for the quaternary
catchment is 6.6 mm/a which amounts to 10% of the mean annual precipitation of 661.2
mm/a.
Table 7-1: Quaternary Catchment Details for Catchment B20A
Quaternary Catchment
Total Area Recharge Rainfall Current use Groundwater
level
[-] [km²] [mm/a] [mm/a] [L/s] [mbgl]
B20A 574.3 6.6 661.2 48.2 15
Note/s: [-] - not applicable [km²] - square kilometers [mm/a] - millimeter / annum [L/s} - Liters / second [mbgl] - meters below ground level
7.2 Sub-catchment Delineation
In order to delineate a sub-catchment for the site within the quaternary catchment ArcGIS is
used (which provides a method to describe the physical characteristics of a surface). Using a
digital elevation model as input, it is possible to delineate a drainage system and then
quantify the characteristics of that system. The tools in the extension let you determine, for
any location in a grid, the upslope area contributing to that point and the down slope path
water would follow. This data is important during the numerical model boundary selection
and impact assessment. The delineated sub-catchment is presented in Figure 7-1.
Dolomitic compartments are referred to when cross cutting dykes act as barriers to
groundwater flow creating isolated hydrogeological compartments. The production borehole
WK-BH1 is situated in the Delmas compartment (Meyer, 2014). The recharge from a karst
aquifer system is not only dependent on the recharge from within a sub-catchment. The
delineated sub-catchment shown in was therefore not used to calculated the groundwater
reserve available for abstraction and in order to verify the impacts associated with
abstracting groundwater from the karst aquifer system it is recommended that the
groundwater model (GCS, 2019) attached in Appendix C be referred to.
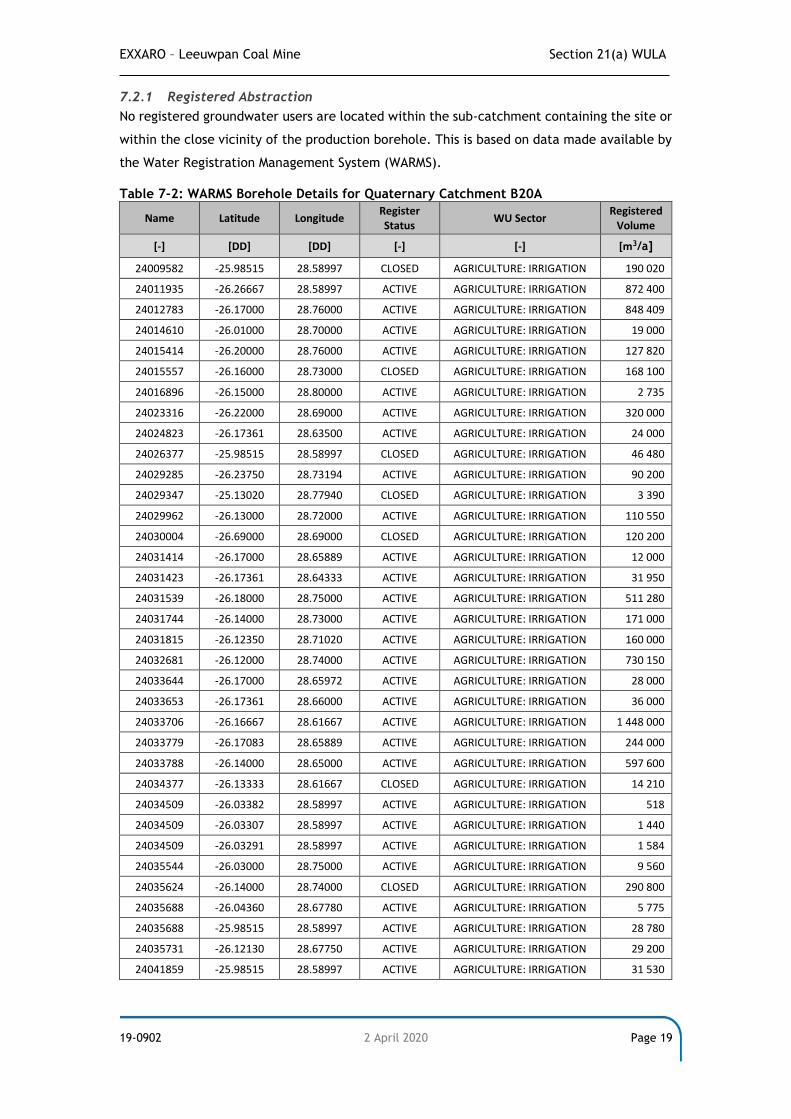
EXXARO – Leeuwpan Coal Mine Section 21(a) WULA
19-0902 2 April 2020 Page 19
7.2.1 Registered Abstraction
No registered groundwater users are located within the sub-catchment containing the site or
within the close vicinity of the production borehole. This is based on data made available by
the Water Registration Management System (WARMS).
Table 7-2: WARMS Borehole Details for Quaternary Catchment B20A
Name Latitude Longitude Register Status
WU Sector Registered
Volume
[-] [DD] [DD] [-] [-] [m3/a]
24009582 -25.98515 28.58997 CLOSED AGRICULTURE: IRRIGATION 190 020
24011935 -26.26667 28.58997 ACTIVE AGRICULTURE: IRRIGATION 872 400
24012783 -26.17000 28.76000 ACTIVE AGRICULTURE: IRRIGATION 848 409
24014610 -26.01000 28.70000 ACTIVE AGRICULTURE: IRRIGATION 19 000
24015414 -26.20000 28.76000 ACTIVE AGRICULTURE: IRRIGATION 127 820
24015557 -26.16000 28.73000 CLOSED AGRICULTURE: IRRIGATION 168 100
24016896 -26.15000 28.80000 ACTIVE AGRICULTURE: IRRIGATION 2 735
24023316 -26.22000 28.69000 ACTIVE AGRICULTURE: IRRIGATION 320 000
24024823 -26.17361 28.63500 ACTIVE AGRICULTURE: IRRIGATION 24 000
24026377 -25.98515 28.58997 CLOSED AGRICULTURE: IRRIGATION 46 480
24029285 -26.23750 28.73194 ACTIVE AGRICULTURE: IRRIGATION 90 200
24029347 -25.13020 28.77940 CLOSED AGRICULTURE: IRRIGATION 3 390
24029962 -26.13000 28.72000 ACTIVE AGRICULTURE: IRRIGATION 110 550
24030004 -26.69000 28.69000 CLOSED AGRICULTURE: IRRIGATION 120 200
24031414 -26.17000 28.65889 ACTIVE AGRICULTURE: IRRIGATION 12 000
24031423 -26.17361 28.64333 ACTIVE AGRICULTURE: IRRIGATION 31 950
24031539 -26.18000 28.75000 ACTIVE AGRICULTURE: IRRIGATION 511 280
24031744 -26.14000 28.73000 ACTIVE AGRICULTURE: IRRIGATION 171 000
24031815 -26.12350 28.71020 ACTIVE AGRICULTURE: IRRIGATION 160 000
24032681 -26.12000 28.74000 ACTIVE AGRICULTURE: IRRIGATION 730 150
24033644 -26.17000 28.65972 ACTIVE AGRICULTURE: IRRIGATION 28 000
24033653 -26.17361 28.66000 ACTIVE AGRICULTURE: IRRIGATION 36 000
24033706 -26.16667 28.61667 ACTIVE AGRICULTURE: IRRIGATION 1 448 000
24033779 -26.17083 28.65889 ACTIVE AGRICULTURE: IRRIGATION 244 000
24033788 -26.14000 28.65000 ACTIVE AGRICULTURE: IRRIGATION 597 600
24034377 -26.13333 28.61667 CLOSED AGRICULTURE: IRRIGATION 14 210
24034509 -26.03382 28.58997 ACTIVE AGRICULTURE: IRRIGATION 518
24034509 -26.03307 28.58997 ACTIVE AGRICULTURE: IRRIGATION 1 440
24034509 -26.03291 28.58997 ACTIVE AGRICULTURE: IRRIGATION 1 584
24035544 -26.03000 28.75000 ACTIVE AGRICULTURE: IRRIGATION 9 560
24035624 -26.14000 28.74000 CLOSED AGRICULTURE: IRRIGATION 290 800
24035688 -26.04360 28.67780 ACTIVE AGRICULTURE: IRRIGATION 5 775
24035688 -25.98515 28.58997 ACTIVE AGRICULTURE: IRRIGATION 28 780
24035731 -26.12130 28.67750 ACTIVE AGRICULTURE: IRRIGATION 29 200
24041859 -25.98515 28.58997 ACTIVE AGRICULTURE: IRRIGATION 31 530
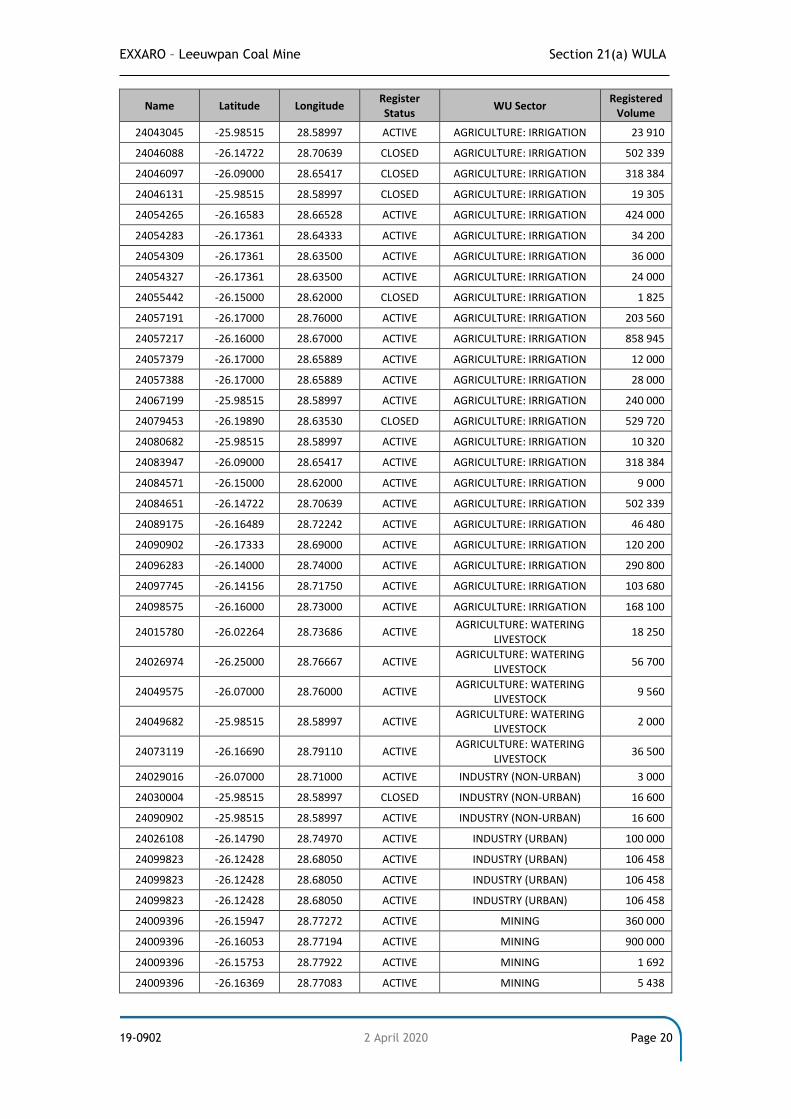
EXXARO – Leeuwpan Coal Mine Section 21(a) WULA
19-0902 2 April 2020 Page 20
Name Latitude Longitude Register Status
WU Sector Registered
Volume
24043045 -25.98515 28.58997 ACTIVE AGRICULTURE: IRRIGATION 23 910
24046088 -26.14722 28.70639 CLOSED AGRICULTURE: IRRIGATION 502 339
24046097 -26.09000 28.65417 CLOSED AGRICULTURE: IRRIGATION 318 384
24046131 -25.98515 28.58997 CLOSED AGRICULTURE: IRRIGATION 19 305
24054265 -26.16583 28.66528 ACTIVE AGRICULTURE: IRRIGATION 424 000
24054283 -26.17361 28.64333 ACTIVE AGRICULTURE: IRRIGATION 34 200
24054309 -26.17361 28.63500 ACTIVE AGRICULTURE: IRRIGATION 36 000
24054327 -26.17361 28.63500 ACTIVE AGRICULTURE: IRRIGATION 24 000
24055442 -26.15000 28.62000 CLOSED AGRICULTURE: IRRIGATION 1 825
24057191 -26.17000 28.76000 ACTIVE AGRICULTURE: IRRIGATION 203 560
24057217 -26.16000 28.67000 ACTIVE AGRICULTURE: IRRIGATION 858 945
24057379 -26.17000 28.65889 ACTIVE AGRICULTURE: IRRIGATION 12 000
24057388 -26.17000 28.65889 ACTIVE AGRICULTURE: IRRIGATION 28 000
24067199 -25.98515 28.58997 ACTIVE AGRICULTURE: IRRIGATION 240 000
24079453 -26.19890 28.63530 CLOSED AGRICULTURE: IRRIGATION 529 720
24080682 -25.98515 28.58997 ACTIVE AGRICULTURE: IRRIGATION 10 320
24083947 -26.09000 28.65417 ACTIVE AGRICULTURE: IRRIGATION 318 384
24084571 -26.15000 28.62000 ACTIVE AGRICULTURE: IRRIGATION 9 000
24084651 -26.14722 28.70639 ACTIVE AGRICULTURE: IRRIGATION 502 339
24089175 -26.16489 28.72242 ACTIVE AGRICULTURE: IRRIGATION 46 480
24090902 -26.17333 28.69000 ACTIVE AGRICULTURE: IRRIGATION 120 200
24096283 -26.14000 28.74000 ACTIVE AGRICULTURE: IRRIGATION 290 800
24097745 -26.14156 28.71750 ACTIVE AGRICULTURE: IRRIGATION 103 680
24098575 -26.16000 28.73000 ACTIVE AGRICULTURE: IRRIGATION 168 100
24015780 -26.02264 28.73686 ACTIVE AGRICULTURE: WATERING
LIVESTOCK 18 250
24026974 -26.25000 28.76667 ACTIVE AGRICULTURE: WATERING
LIVESTOCK 56 700
24049575 -26.07000 28.76000 ACTIVE AGRICULTURE: WATERING
LIVESTOCK 9 560
24049682 -25.98515 28.58997 ACTIVE AGRICULTURE: WATERING
LIVESTOCK 2 000
24073119 -26.16690 28.79110 ACTIVE AGRICULTURE: WATERING
LIVESTOCK 36 500
24029016 -26.07000 28.71000 ACTIVE INDUSTRY (NON-URBAN) 3 000
24030004 -25.98515 28.58997 CLOSED INDUSTRY (NON-URBAN) 16 600
24090902 -25.98515 28.58997 ACTIVE INDUSTRY (NON-URBAN) 16 600
24026108 -26.14790 28.74970 ACTIVE INDUSTRY (URBAN) 100 000
24099823 -26.12428 28.68050 ACTIVE INDUSTRY (URBAN) 106 458
24099823 -26.12428 28.68050 ACTIVE INDUSTRY (URBAN) 106 458
24099823 -26.12428 28.68050 ACTIVE INDUSTRY (URBAN) 106 458
24009396 -26.15947 28.77272 ACTIVE MINING 360 000
24009396 -26.16053 28.77194 ACTIVE MINING 900 000
24009396 -26.15753 28.77922 ACTIVE MINING 1 692
24009396 -26.16369 28.77083 ACTIVE MINING 5 438
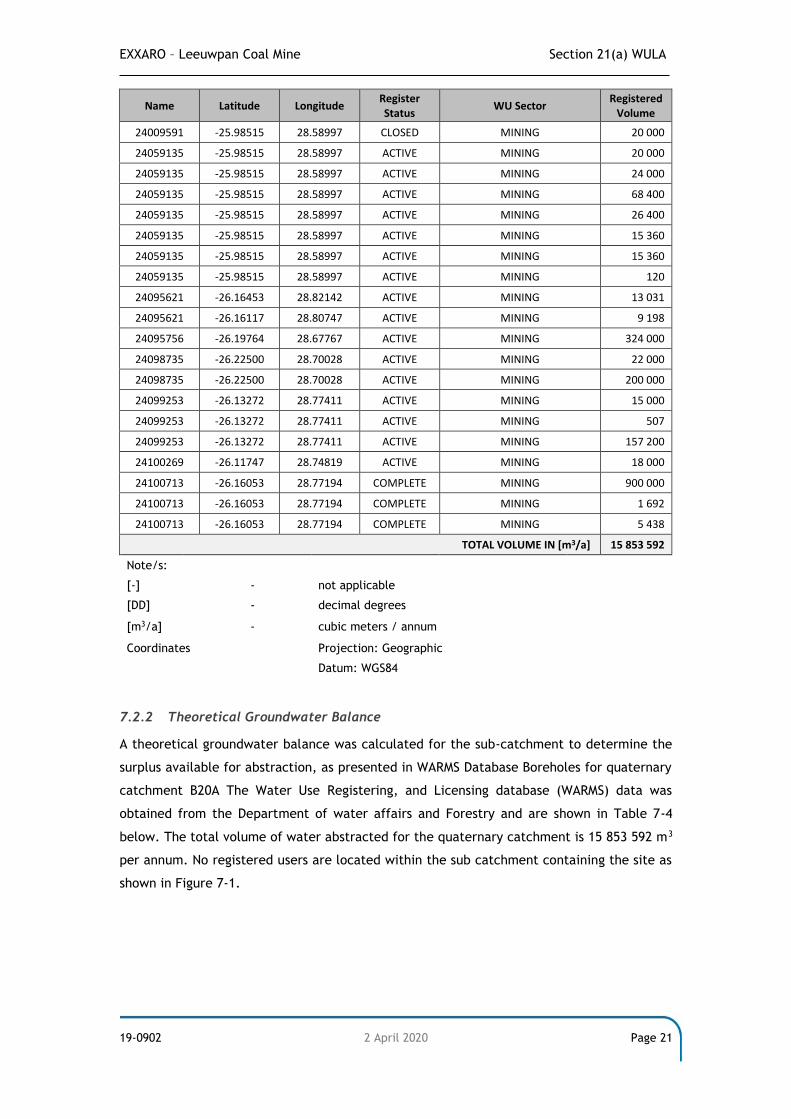
EXXARO – Leeuwpan Coal Mine Section 21(a) WULA
19-0902 2 April 2020 Page 21
Name Latitude Longitude Register Status
WU Sector Registered
Volume
24009591 -25.98515 28.58997 CLOSED MINING 20 000
24059135 -25.98515 28.58997 ACTIVE MINING 20 000
24059135 -25.98515 28.58997 ACTIVE MINING 24 000
24059135 -25.98515 28.58997 ACTIVE MINING 68 400
24059135 -25.98515 28.58997 ACTIVE MINING 26 400
24059135 -25.98515 28.58997 ACTIVE MINING 15 360
24059135 -25.98515 28.58997 ACTIVE MINING 15 360
24059135 -25.98515 28.58997 ACTIVE MINING 120
24095621 -26.16453 28.82142 ACTIVE MINING 13 031
24095621 -26.16117 28.80747 ACTIVE MINING 9 198
24095756 -26.19764 28.67767 ACTIVE MINING 324 000
24098735 -26.22500 28.70028 ACTIVE MINING 22 000
24098735 -26.22500 28.70028 ACTIVE MINING 200 000
24099253 -26.13272 28.77411 ACTIVE MINING 15 000
24099253 -26.13272 28.77411 ACTIVE MINING 507
24099253 -26.13272 28.77411 ACTIVE MINING 157 200
24100269 -26.11747 28.74819 ACTIVE MINING 18 000
24100713 -26.16053 28.77194 COMPLETE MINING 900 000
24100713 -26.16053 28.77194 COMPLETE MINING 1 692
24100713 -26.16053 28.77194 COMPLETE MINING 5 438
TOTAL VOLUME IN [m3/a] 15 853 592
Note/s:
[-] - not applicable
[DD] - decimal degrees
[m3/a] - cubic meters / annum
Coordinates Projection: Geographic
Datum: WGS84
7.2.2 Theoretical Groundwater Balance
A theoretical groundwater balance was calculated for the sub-catchment to determine the
surplus available for abstraction, as presented in WARMS Database Boreholes for quaternary
catchment B20A The Water Use Registering, and Licensing database (WARMS) data was
obtained from the Department of water affairs and Forestry and are shown in Table 7-4
below. The total volume of water abstracted for the quaternary catchment is 15 853 592 m3
per annum. No registered users are located within the sub catchment containing the site as
shown in Figure 7-1.
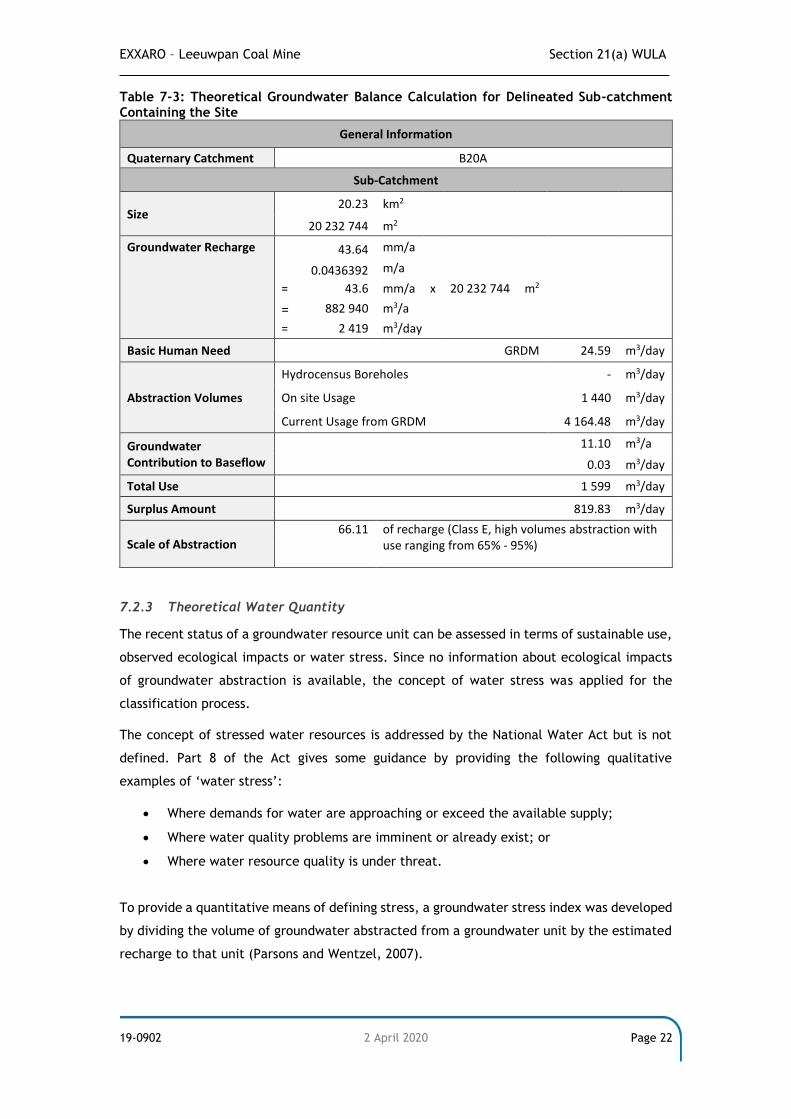
EXXARO – Leeuwpan Coal Mine Section 21(a) WULA
19-0902 2 April 2020 Page 22
Table 7-3: Theoretical Groundwater Balance Calculation for Delineated Sub-catchment Containing the Site
General Information
Quaternary Catchment B20A
Sub-Catchment
Size 20.23 km2
20 232 744 m2
Groundwater Recharge 43.64 mm/a
0.0436392 m/a
= 43.6 mm/a x 20 232 744 m2
= 882 940 m3/a
= 2 419 m3/day
Basic Human Need GRDM 24.59 m3/day
Abstraction Volumes
Hydrocensus Boreholes - m3/day
On site Usage 1 440 m3/day
Current Usage from GRDM 4 164.48 m3/day
Groundwater Contribution to Baseflow
11.10 m3/a
0.03 m3/day
Total Use 1 599 m3/day
Surplus Amount 819.83 m3/day
Scale of Abstraction 66.11 of recharge (Class E, high volumes abstraction with
use ranging from 65% - 95%)
7.2.3 Theoretical Water Quantity
The recent status of a groundwater resource unit can be assessed in terms of sustainable use,
observed ecological impacts or water stress. Since no information about ecological impacts
of groundwater abstraction is available, the concept of water stress was applied for the
classification process.
The concept of stressed water resources is addressed by the National Water Act but is not
defined. Part 8 of the Act gives some guidance by providing the following qualitative
examples of ‘water stress’:
• Where demands for water are approaching or exceed the available supply;
• Where water quality problems are imminent or already exist; or
• Where water resource quality is under threat.
To provide a quantitative means of defining stress, a groundwater stress index was developed
by dividing the volume of groundwater abstracted from a groundwater unit by the estimated
recharge to that unit (Parsons and Wentzel, 2007).
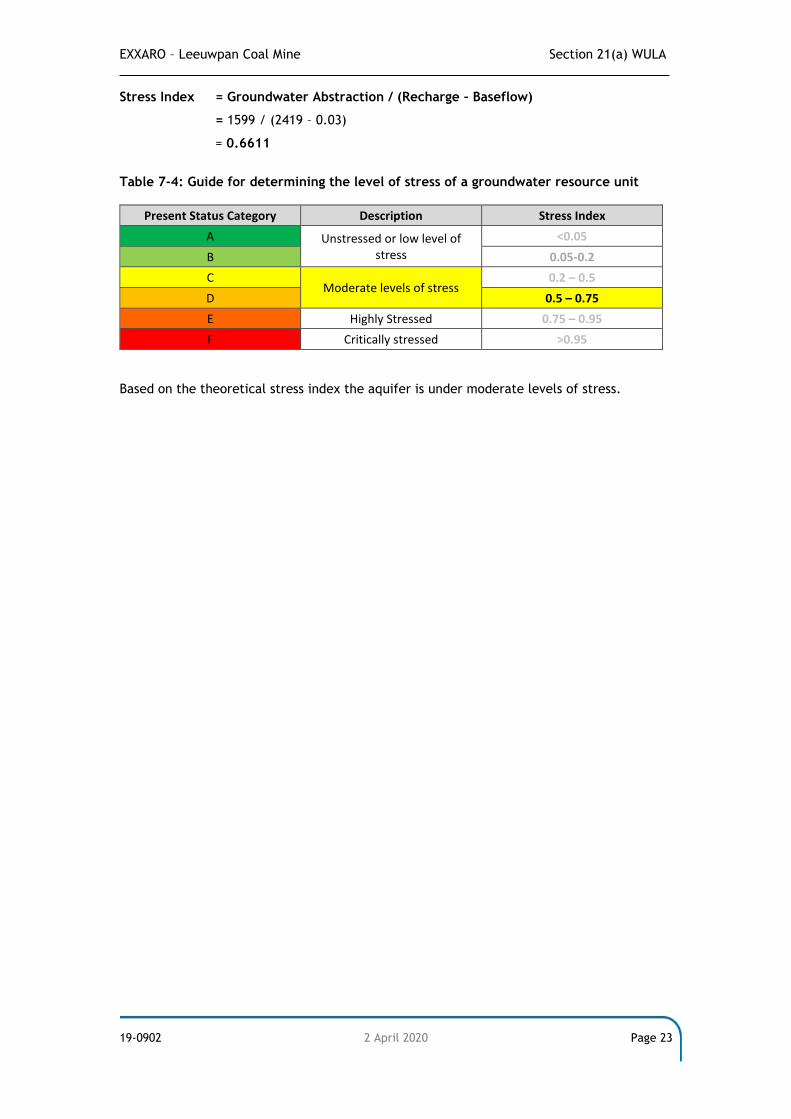
EXXARO – Leeuwpan Coal Mine Section 21(a) WULA
19-0902 2 April 2020 Page 23
Stress Index = Groundwater Abstraction / (Recharge – Baseflow)
= 1599 / (2419 – 0.03)
= 0.6611
Table 7-4: Guide for determining the level of stress of a groundwater resource unit
Present Status Category Description Stress Index
A Unstressed or low level of stress
<0.05
B 0.05-0.2
C Moderate levels of stress
0.2 – 0.5
D 0.5 – 0.75
E Highly Stressed 0.75 – 0.95
F Critically stressed >0.95
Based on the theoretical stress index the aquifer is under moderate levels of stress.
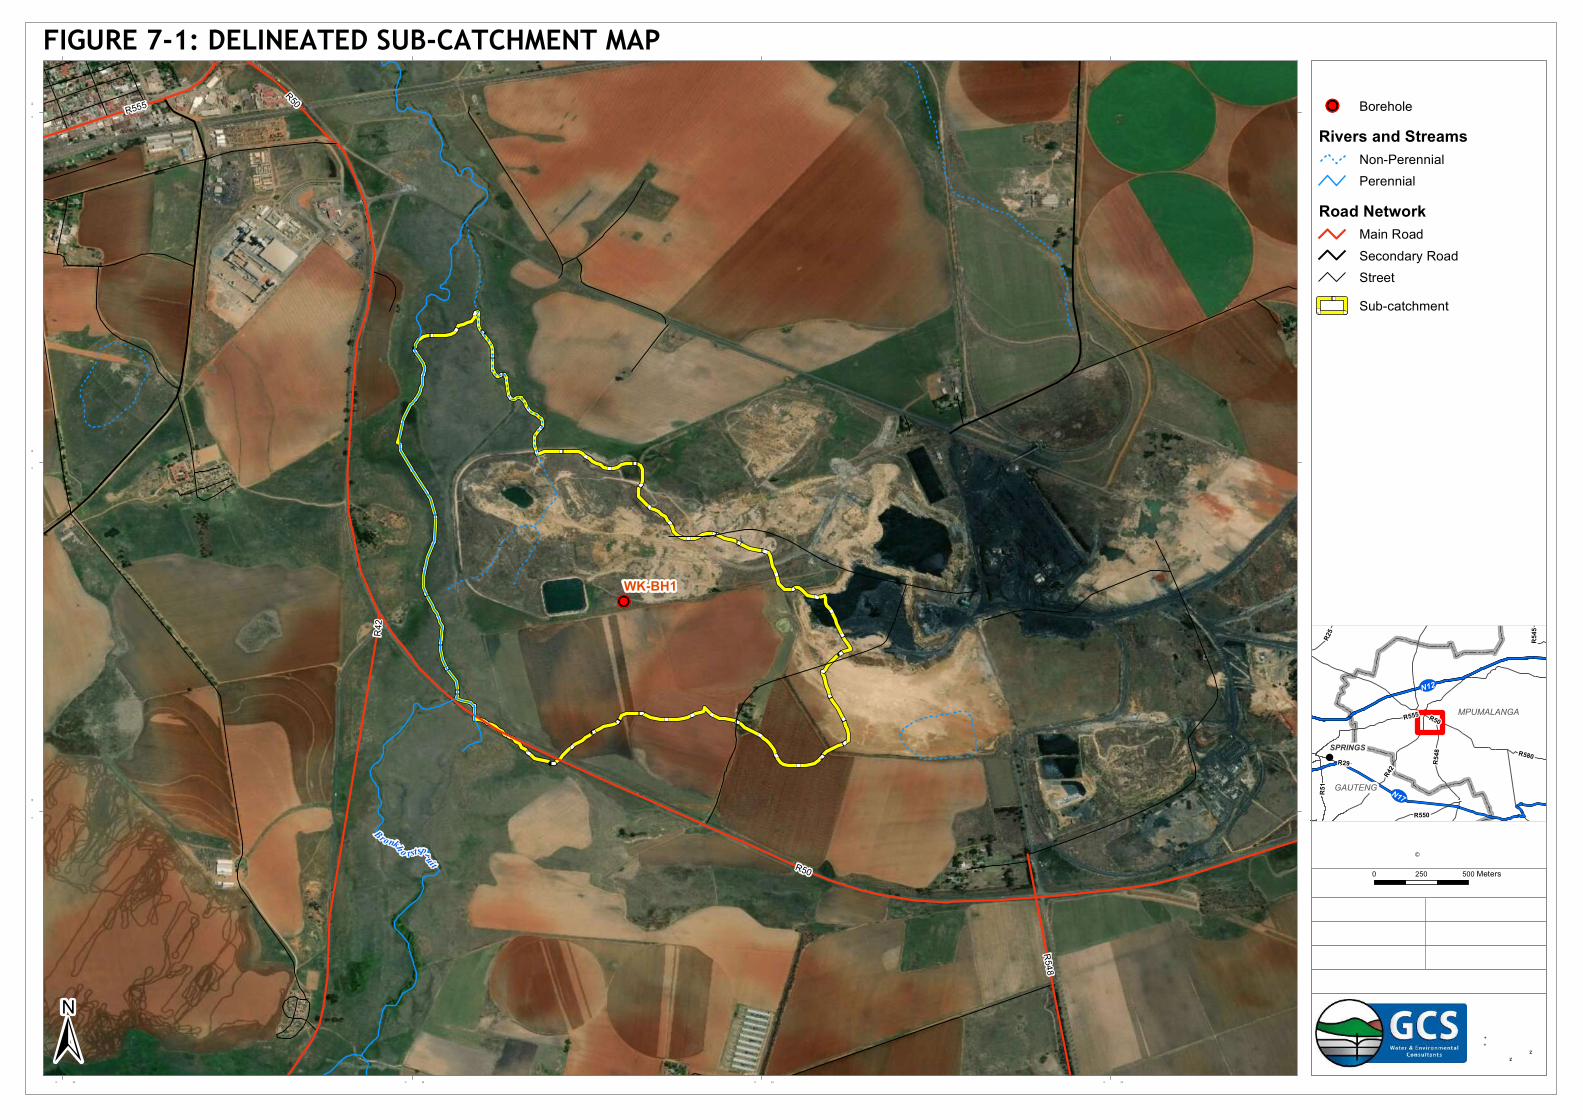
!
!
SPRINGS
GAUTENG
MPUMALANGA
UVN17
UVN12
R29
R555
R548 R580
R25
R50
R51
R550
R42
R545
<Double-click here to enter title>
!P
R50
R555
R548
R42
R50
Bronkh o rstspruit
WK-BH1
28°44'0"E28°43'0"E28°42'0"E28°41'0"E
26°9'0"S
26°10'0"S
26°11'0"S
LEGEND
Data Sources:Esri Basem ap 2019Sub-Catchm ent data derived from ALO SALO S W orld 3D – 30m (AW 3D30) ©JAXAData sup p lied from Sp ec ialist (R Van Heerden)
63 W essel Road W oodm eadPO Box 2597 Rivonia 2128South Africa
Tel: +27 (0) 11 803 5726Fax: +27 (0) 11 803 5745E-m ail: [email protected] izwww.gcs-sa.b iz
FIGURE 7-1: DELINEATED SUB-CATCHMENT MAP
1:20 000
!P BoreholeRivers and Streams
Non-PerennialPerennial
Road NetworkMain RoadSecondary RoadStreetSub-catchment
-FIGU RE NO .: 19-0902-02M AP NU M BER:
DRAW N BY: A LO VEGIS CO NSU LTANT REVIEW ED BY: C BO THAGIS SPECIALIST
DATU M :PRO JECTIO N:
W GS84GEO GRAPHIC DATE: 14 JANU ARY 2020
CLIENT:PRO JECT:
SCALE:
0 500250 Meters
±LEEU W PAN SECTIO N 21(A) W U LAEXXARO
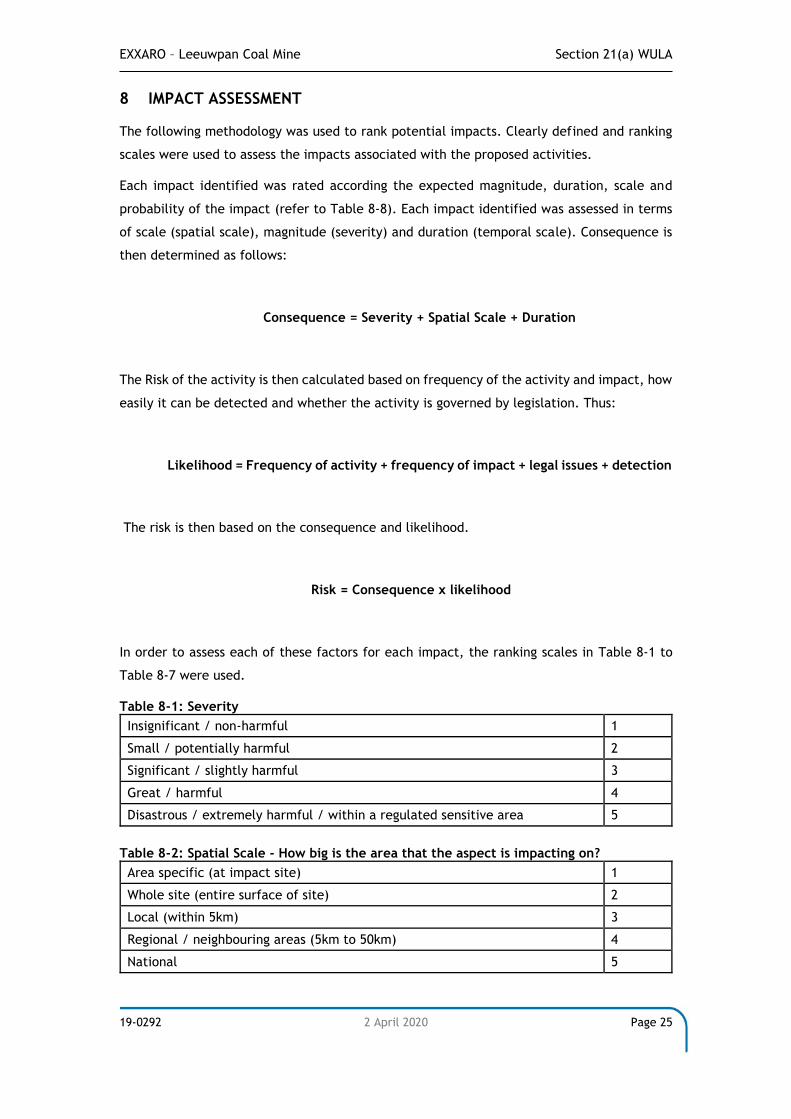
EXXARO – Leeuwpan Coal Mine Section 21(a) WULA
19-0292 2 April 2020 Page 25
8 IMPACT ASSESSMENT
The following methodology was used to rank potential impacts. Clearly defined and ranking
scales were used to assess the impacts associated with the proposed activities.
Each impact identified was rated according the expected magnitude, duration, scale and
probability of the impact (refer to Table 8-8). Each impact identified was assessed in terms
of scale (spatial scale), magnitude (severity) and duration (temporal scale). Consequence is
then determined as follows:
Consequence = Severity + Spatial Scale + Duration
The Risk of the activity is then calculated based on frequency of the activity and impact, how
easily it can be detected and whether the activity is governed by legislation. Thus:
Likelihood = Frequency of activity + frequency of impact + legal issues + detection
The risk is then based on the consequence and likelihood.
Risk = Consequence x likelihood
In order to assess each of these factors for each impact, the ranking scales in Table 8-1 to
Table 8-7 were used.
Table 8-1: Severity
Insignificant / non-harmful 1
Small / potentially harmful 2
Significant / slightly harmful 3
Great / harmful 4
Disastrous / extremely harmful / within a regulated sensitive area 5
Table 8-2: Spatial Scale - How big is the area that the aspect is impacting on?
Area specific (at impact site) 1
Whole site (entire surface of site) 2
Local (within 5km) 3
Regional / neighbouring areas (5km to 50km) 4
National 5
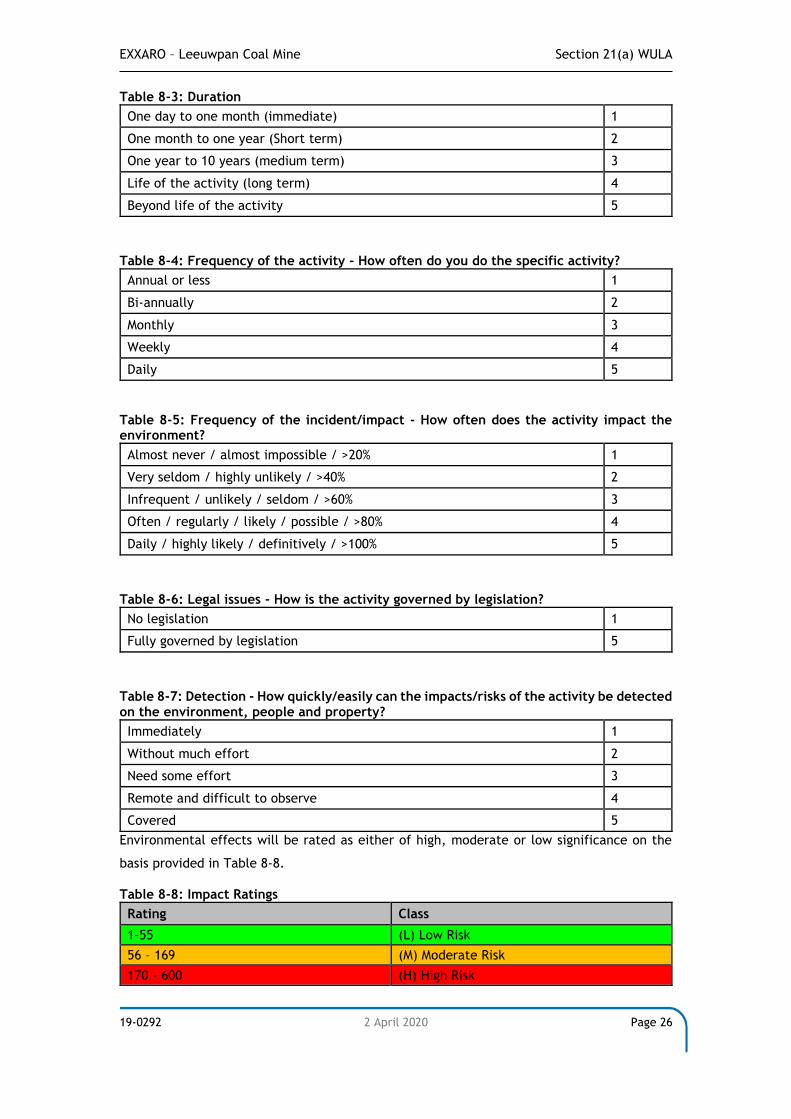
EXXARO – Leeuwpan Coal Mine Section 21(a) WULA
19-0292 2 April 2020 Page 26
Table 8-3: Duration
One day to one month (immediate) 1
One month to one year (Short term) 2
One year to 10 years (medium term) 3
Life of the activity (long term) 4
Beyond life of the activity 5
Table 8-4: Frequency of the activity - How often do you do the specific activity?
Annual or less 1
Bi-annually 2
Monthly 3
Weekly 4
Daily 5
Table 8-5: Frequency of the incident/impact - How often does the activity impact the environment?
Almost never / almost impossible / >20% 1
Very seldom / highly unlikely / >40% 2
Infrequent / unlikely / seldom / >60% 3
Often / regularly / likely / possible / >80% 4
Daily / highly likely / definitively / >100% 5
Table 8-6: Legal issues - How is the activity governed by legislation?
No legislation 1
Fully governed by legislation 5
Table 8-7: Detection - How quickly/easily can the impacts/risks of the activity be detected on the environment, people and property?
Immediately 1
Without much effort 2
Need some effort 3
Remote and difficult to observe 4
Covered 5
Environmental effects will be rated as either of high, moderate or low significance on the
basis provided in Table 8-8.
Table 8-8: Impact Ratings
Rating Class
1-55 (L) Low Risk
56 – 169 (M) Moderate Risk
170 - 600 (H) High Risk
EXXARO – Leeuwpan Coal Mine Section 21(a) WULA
19-0292 2 April 2020 Page 27
8.1 Impact Assessment
The impact assessment results can be seen summarized in Table 8-9.
8.1.1 Operational Phase
Nature of impact: Abstraction of groundwater via the production borehole and lowering of
the regional groundwater levels.
Mitigation Measures: The mitigation measures would include monitoring of the water levels
and quality of the surrounding boreholes and the production borehole.
Significance: The impact will have medium negative significance.
Based on the impact assessment determined from a hydrogeological perspective it can be
concluded that the abstraction of the groundwater will have a medium significant impact in
the operational phase. It is recommended that the full impacts associated with the
abstraction of groundwater from a karst or dolomitic aquifer be evaluated with a groundwater
model.
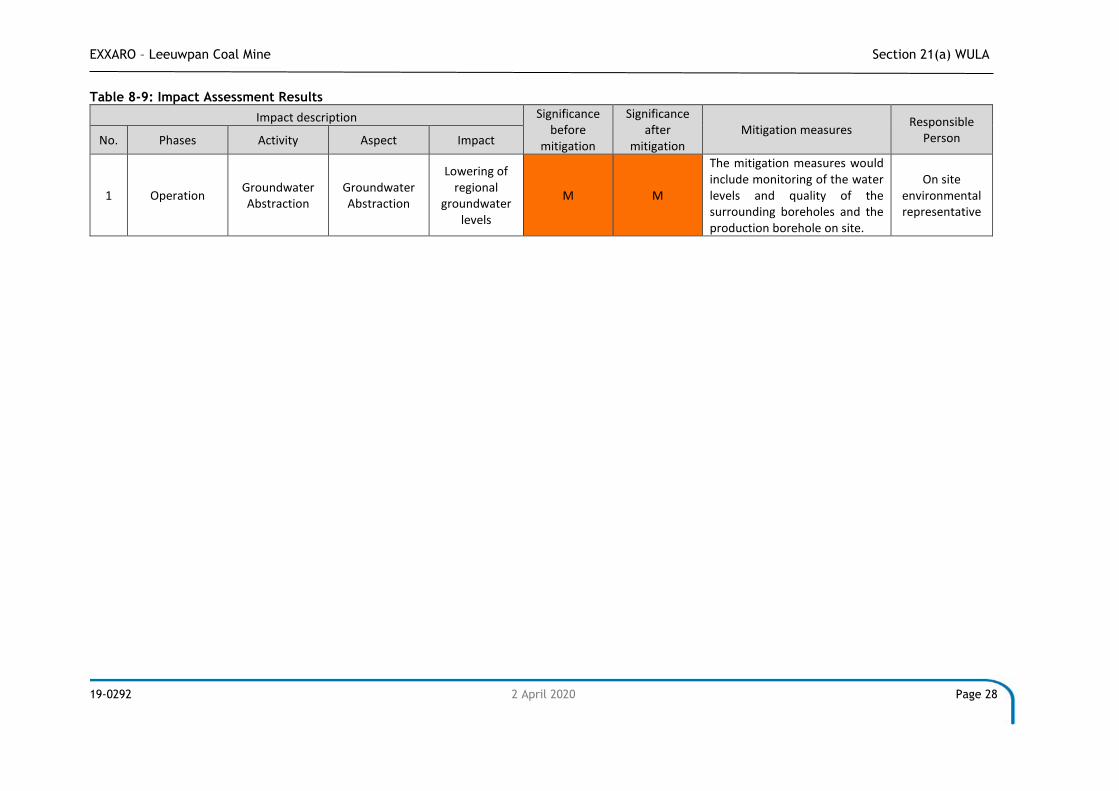
EXXARO – Leeuwpan Coal Mine Section 21(a) WULA
19-0292 2 April 2020 Page 28
Table 8-9: Impact Assessment Results
Impact description Significance before
mitigation
Significance after
mitigation Mitigation measures
Responsible Person No. Phases Activity Aspect Impact
1 Operation Groundwater Abstraction
Groundwater Abstraction
Lowering of regional
groundwater levels
M M
The mitigation measures would include monitoring of the water levels and quality of the surrounding boreholes and the production borehole on site.
On site environmental representative
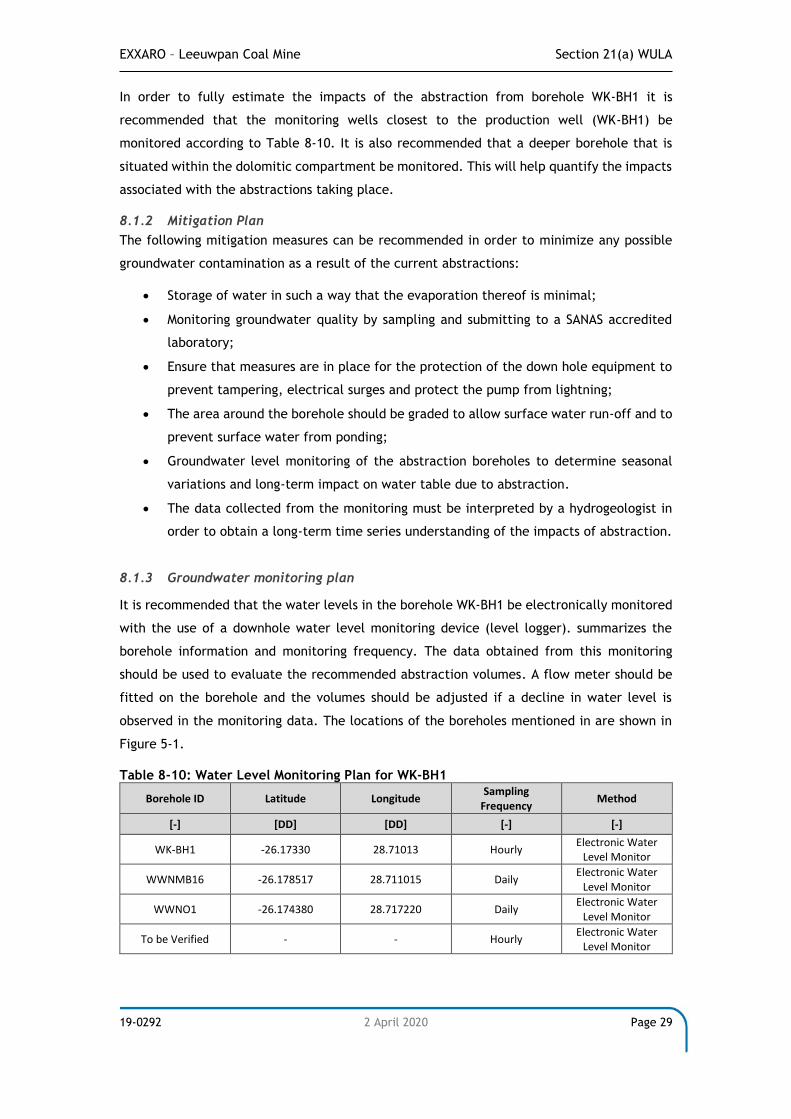
EXXARO – Leeuwpan Coal Mine Section 21(a) WULA
19-0292 2 April 2020 Page 29
In order to fully estimate the impacts of the abstraction from borehole WK-BH1 it is
recommended that the monitoring wells closest to the production well (WK-BH1) be
monitored according to Table 8-10. It is also recommended that a deeper borehole that is
situated within the dolomitic compartment be monitored. This will help quantify the impacts
associated with the abstractions taking place.
8.1.2 Mitigation Plan
The following mitigation measures can be recommended in order to minimize any possible
groundwater contamination as a result of the current abstractions:
• Storage of water in such a way that the evaporation thereof is minimal;
• Monitoring groundwater quality by sampling and submitting to a SANAS accredited
laboratory;
• Ensure that measures are in place for the protection of the down hole equipment to
prevent tampering, electrical surges and protect the pump from lightning;
• The area around the borehole should be graded to allow surface water run-off and to
prevent surface water from ponding;
• Groundwater level monitoring of the abstraction boreholes to determine seasonal
variations and long-term impact on water table due to abstraction.
• The data collected from the monitoring must be interpreted by a hydrogeologist in
order to obtain a long-term time series understanding of the impacts of abstraction.
8.1.3 Groundwater monitoring plan
It is recommended that the water levels in the borehole WK-BH1 be electronically monitored
with the use of a downhole water level monitoring device (level logger). summarizes the
borehole information and monitoring frequency. The data obtained from this monitoring
should be used to evaluate the recommended abstraction volumes. A flow meter should be
fitted on the borehole and the volumes should be adjusted if a decline in water level is
observed in the monitoring data. The locations of the boreholes mentioned in are shown in
Figure 5-1.
Table 8-10: Water Level Monitoring Plan for WK-BH1
Borehole ID Latitude Longitude Sampling
Frequency Method
[-] [DD] [DD] [-] [-]
WK-BH1 -26.17330 28.71013 Hourly Electronic Water
Level Monitor
WWNMB16 -26.178517 28.711015 Daily Electronic Water
Level Monitor
WWNO1 -26.174380 28.717220 Daily Electronic Water
Level Monitor
To be Verified - - Hourly Electronic Water
Level Monitor
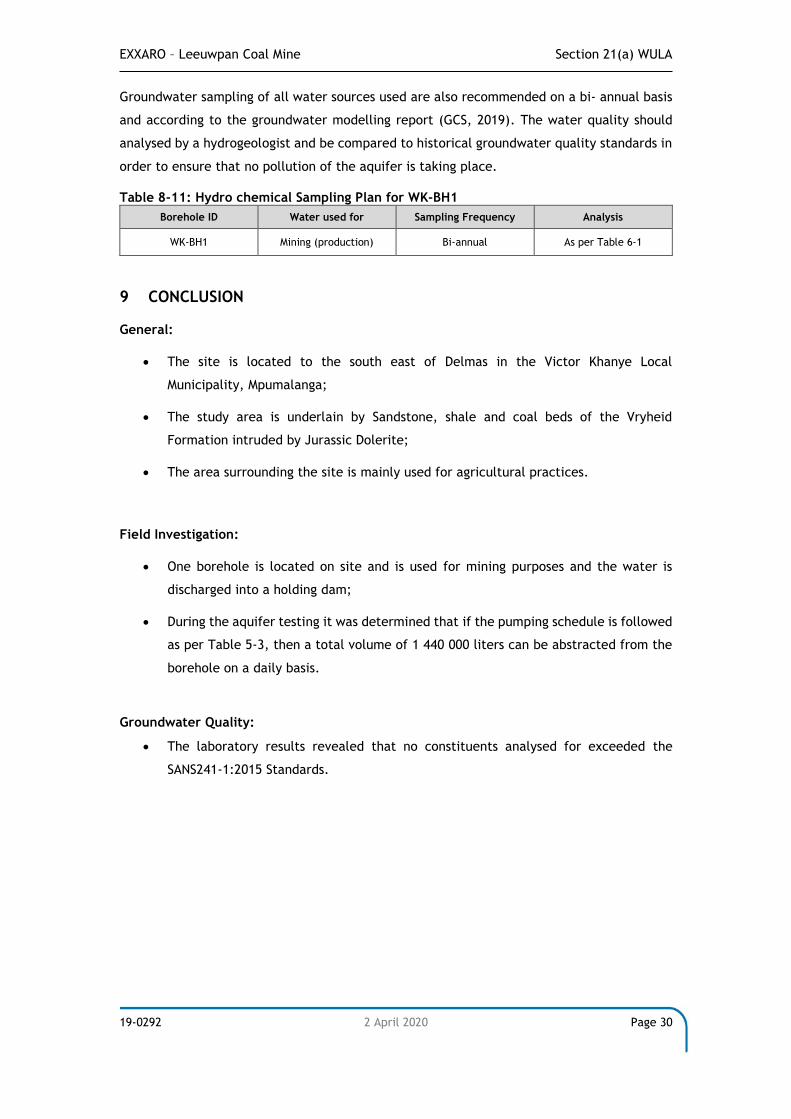
EXXARO – Leeuwpan Coal Mine Section 21(a) WULA
19-0292 2 April 2020 Page 30
Groundwater sampling of all water sources used are also recommended on a bi- annual basis
and according to the groundwater modelling report (GCS, 2019). The water quality should
analysed by a hydrogeologist and be compared to historical groundwater quality standards in
order to ensure that no pollution of the aquifer is taking place.
Table 8-11: Hydro chemical Sampling Plan for WK-BH1
Borehole ID Water used for Sampling Frequency Analysis
WK-BH1 Mining (production) Bi-annual As per Table 6-1
9 CONCLUSION
General:
• The site is located to the south east of Delmas in the Victor Khanye Local
Municipality, Mpumalanga;
• The study area is underlain by Sandstone, shale and coal beds of the Vryheid
Formation intruded by Jurassic Dolerite;
• The area surrounding the site is mainly used for agricultural practices.
Field Investigation:
• One borehole is located on site and is used for mining purposes and the water is
discharged into a holding dam;
• During the aquifer testing it was determined that if the pumping schedule is followed
as per Table 5-3, then a total volume of 1 440 000 liters can be abstracted from the
borehole on a daily basis.
Groundwater Quality:
• The laboratory results revealed that no constituents analysed for exceeded the
SANS241-1:2015 Standards.
EXXARO – Leeuwpan Coal Mine Section 21(a) WULA
19-0292 2 April 2020 Page 31
Groundwater Reserve Determination:
• The production borehole is situated within the Delmas dolomitic compartment and it
is therefore recommended that the GCS (2019) report be referred to.
• The theoretical reserve however indicated that sufficient water is available for
abstraction.
Groundwater Impact:
• The Groundwater impact was identified to be low should all monitoring and
mitigation be adhered to.
Recommendations:
• It is recommended that the groundwater levels and the hydrochemistry of the
borehole be monitored as per the mitigation plan in section 8.1.3 in this report;
• Water should be used sparingly, and all leaks and faulty reticulation should be
attended to as soon as detected;
• The data collected from the monitoring must be interpreted by a hydrogeologist in
order to obtain a long-term impacts of abstraction;
• It is recommended that the abstraction volumes from borehole WK-BH1 be included
in the GCS groundwater model (2019) report (PN: 19-0297) attached as an addendum
to this report (attached in Appendix C); and
• The theoretical groundwater balance was prepared for the sub-catchment with the
current abstraction volumes as set out in the scope of work, however the full impact
of the abstraction taking place will only be appreciated once the groundwater model
has been updated.
10 REFERENCES
Council for Geoscience (1988). 2628 West Rand Geological map, 1:250 000.
Department of Water Affairs and Forestry. DWAF. (1996). South African Water Quality
Guidelines (second edition). Volume 4: Agricultural Use: Irrigation.
Department of Water and Sanitation. DWS. (2012). Aquifer Classification Map of South
Africa.
Department of Water and Sanitation. DWS. (2013). Aquifer Vulnerability Map of South
Africa.
Department of Water and Sanitation, DWS. (2013). Groundwater Resource Directed
Measures (GRDM). Version 2.3.2.
EXXARO – Leeuwpan Coal Mine Section 21(a) WULA
19-0292 2 April 2020 Page 32
GCS (2019). EXXARO Leeuwpan Coal Mine Hydrogeological Investigation Update. GCS Ref
Number: 19-0297.
Meyer, M. (2014). Hydrogeology of Groundwater Region 10: The Karst Belt (WRC Project
No.K5/1916).
Moseki M.C., Meyer P.S., Chetty T. and Jonck F. (2003). 1:500 000 Hydrogeological Map
Series of the Republic of South Africa: 2722 Kimberley.
Parsons, R. and Conrad, J. (1998). Explanatory notes of the aquifer classification map of
South Africa. Water Research Commission: Department of Water Affairs and Forestry.
WRC Report No. KV 116/98. ISBN 1 8845 4568.
Parsons, R. and Wentzel, J. (2007). Groundwater Resource Directed Measures Manual.
Department of Water Affairs and Forestry, Pretoria, 109pp.
Ryan, P.J. and Whitfield, G.G. (1978). Basin analysis of the Ecca and Lowermost Beaufort
beds and associated coal, uranium and heavy mineral beach sand occurrences. (South
Africa).
South African Bureau of Standards. SABS. (2015). South African National Standard:
Drinking Water Part 1: Microbiological, physical, aesthetic and chemical determinants:
SANS 241-1:2015 2nd Ed. ISBN 978-0-626-29841-8.
Van Tonder, G.J., Bardenhagen, I., Rieman, K., van Bosch, J., Dzanga, P., and Xu, Y.
(2001). Manual of pumping test analysis in fractured rock aquifers. Institute for
Groundwater Studies, UFS, Bloemfontein.
EXXARO – Leeuwpan Coal Mine Section 21(a) WULA
19-0292 2 April 2020 Page 33
APPENDIX A: LABORATORY CERTIFICATE
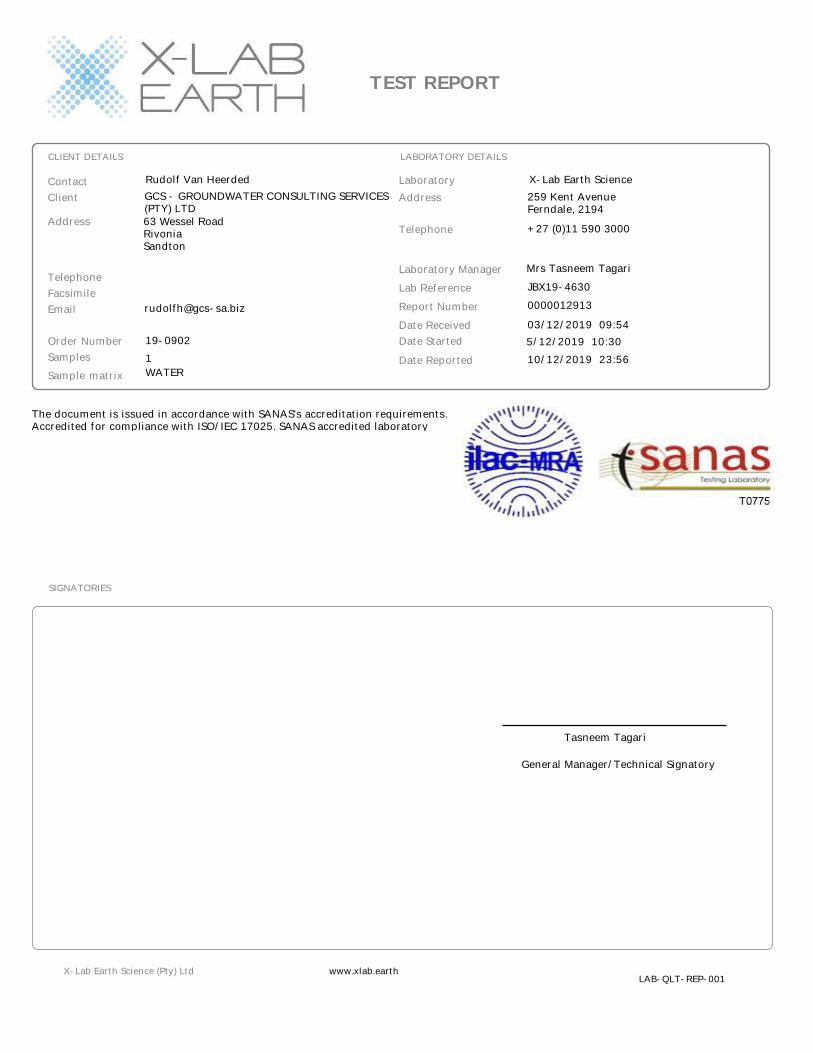
The document is issued in accordance with SANAS's accreditation requirements. Accredited for compliance with ISO/IEC 17025. SANAS accredited laboratory
www.xlab.earthX-Lab Earth Science (Pty) Ltd
SIGNATORIES
LAB-QLT-REP-001
Sample matrix
1
03/12/2019 09:54
10/12/2019 23:56
5/12/2019 10:30
Date Received
Report Number
Contact
Lab Reference
Telephone
Address
Laboratory Manager
Laboratory
Samples
Order Number
Facsimile
Telephone
Address
Client
CLIENT DETAILS LABORATORY DETAILS
259 Kent AvenueFerndale, 2194
+27 (0)11 590 3000
Date Reported
Rudolf Van Heerded
WATER
GCS - GROUNDWATER CONSULTING SERVICES (PTY) LTD
TEST REPORT
Mrs Tasneem Tagari
0000012913
X-Lab Earth Science
JBX19-4630
19-0902 Date Started
63 Wessel Road Rivonia Sandton
Tasneem Tagari
General Manager/Technical Signatory
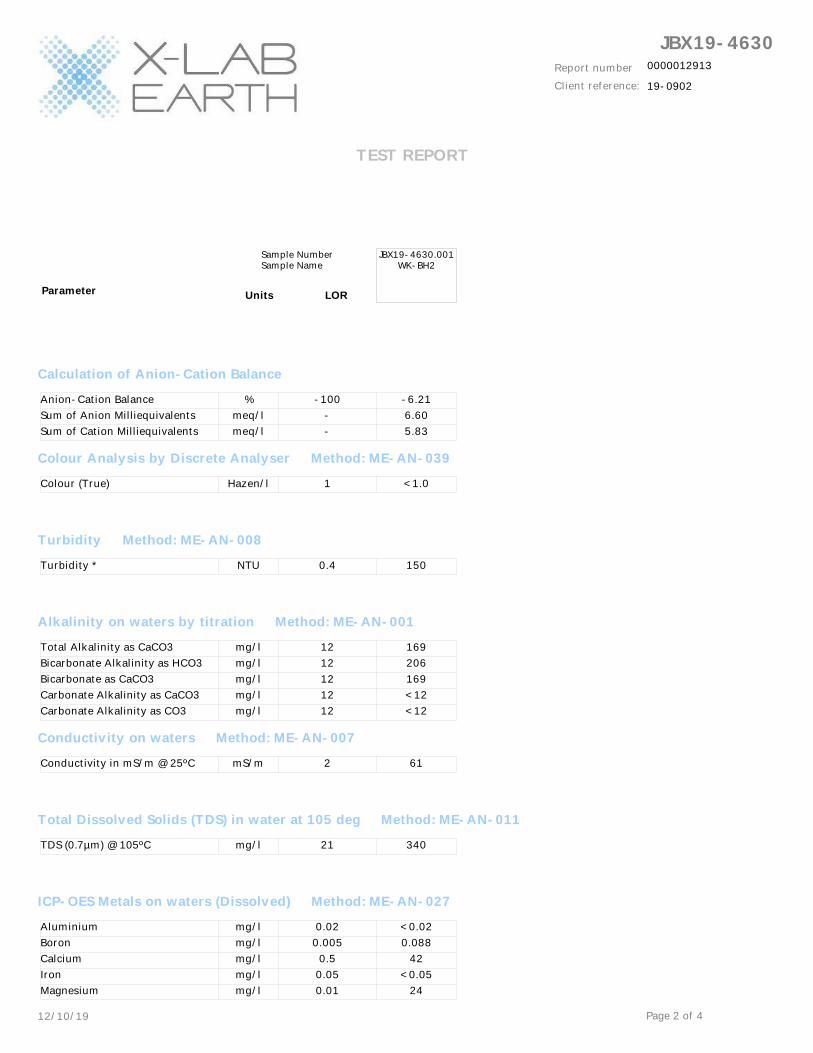
12/10/19
JBX19-4630
Client reference:
Report number 0000012913
19-0902
Page 2 of 4
TEST REPORT
Parameter Units
Sample Number Sample Name
Calculation of Anion-Cation Balance
Colour Analysis by Discrete Analyser Method: ME-AN-039
Turbidity Method: ME-AN-008
Alkalinity on waters by titration Method: ME-AN-001
Conductivity on waters Method: ME-AN-007
Total Dissolved Solids (TDS) in water at 105 deg Method: ME-AN-011
ICP-OES Metals on waters (Dissolved) Method: ME-AN-027
-
-
-100 -6.21
6.60
5.83
1 <1.0
0.4 150
12
12
12
12
12 169
206
169
<12
<12
2 61
21 340
0.01
0.05
0.5
0.005
0.02 <0.02
0.088
42
<0.05
24
JBX19-4630.001 WK-BH2
LOR
meq/l
meq/l
%
Hazen/l
NTU
mg/l
mg/l
mg/l
mg/l
mg/l
mS/m
mg/l
mg/l
mg/l
mg/l
mg/l
mg/l
Sum of Cation Milliequivalents
Sum of Anion Milliequivalents
Anion-Cation Balance
Colour (True)
Turbidity *
Carbonate Alkalinity as CO3
Carbonate Alkalinity as CaCO3
Bicarbonate as CaCO3
Bicarbonate Alkalinity as HCO3
Total Alkalinity as CaCO3
Conductivity in mS/m @ 25ºC
TDS (0.7µm) @ 105ºC
Magnesium
Iron
Calcium
Boron
Aluminium
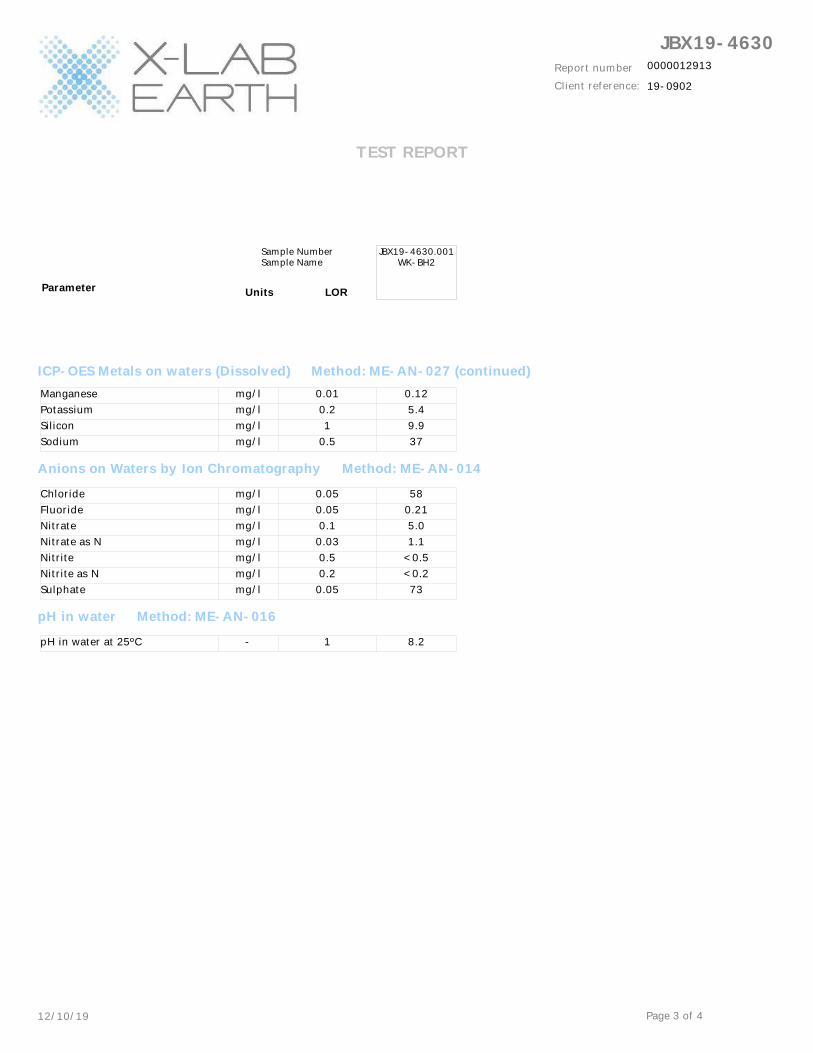
12/10/19
JBX19-4630
Client reference:
Report number 0000012913
19-0902
Page 3 of 4
TEST REPORT
Parameter Units
Sample Number Sample Name
ICP-OES Metals on waters (Dissolved) Method: ME-AN-027 (continued)
Anions on Waters by Ion Chromatography Method: ME-AN-014
pH in water Method: ME-AN-016
0.5
1
0.2
0.01 0.12
5.4
9.9
37
0.05
0.2
0.5
0.03
0.1
0.05
0.05 58
0.21
5.0
1.1
<0.5
<0.2
73
1 8.2
JBX19-4630.001 WK-BH2
LOR
mg/l
mg/l
mg/l
mg/l
mg/l
mg/l
mg/l
mg/l
mg/l
mg/l
mg/l
-
Sodium
Silicon
Potassium
Manganese
Sulphate
Nitrite as N
Nitrite
Nitrate as N
Nitrate
Fluoride
Chloride
pH in water at 25ºC
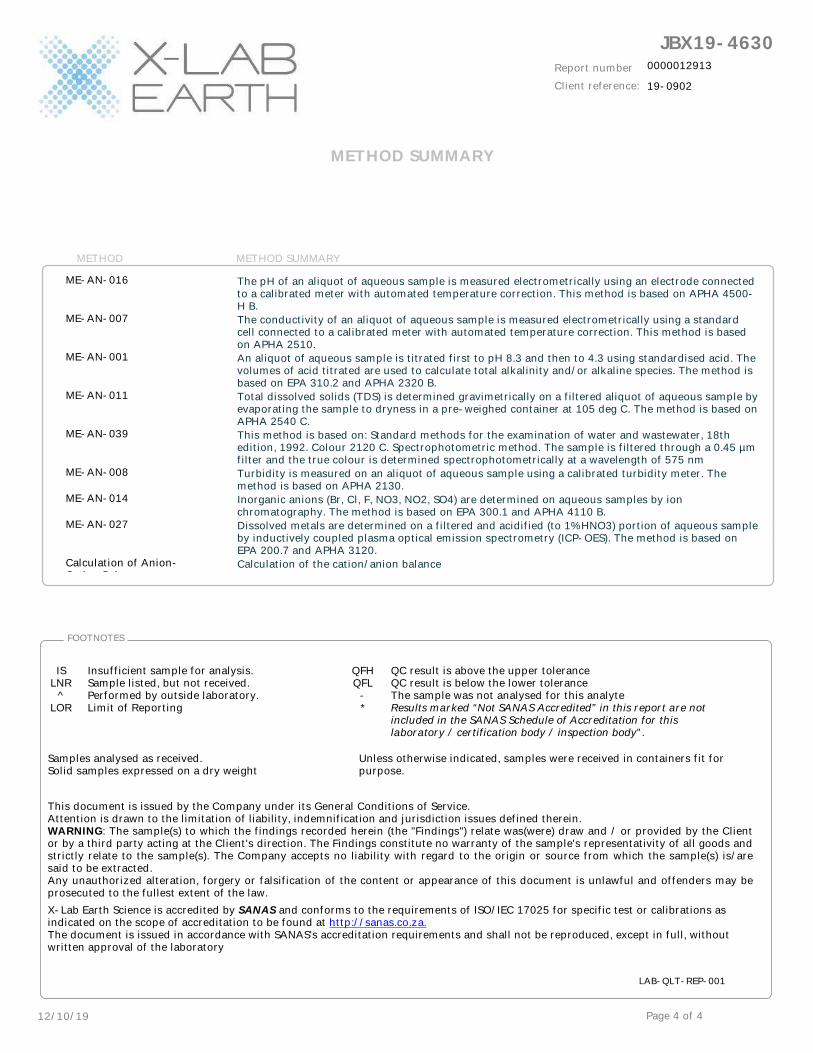
12/10/19
JBX19-4630
Client reference:
Report number 0000012913
19-0902
Page 4 of 4
Samples analysed as received.Solid samples expressed on a dry weight basis.
Unless otherwise indicated, samples were received in containers fit for purpose.
This document is issued by the Company under its General Conditions of Service. Attention is drawn to the limitation of liability, indemnification and jurisdiction issues defined therein.WARNING: The sample(s) to which the findings recorded herein (the "Findings") relate was(were) draw and / or provided by the Client or by a third party acting at the Client's direction. The Findings constitute no warranty of the sample's representativity of all goods and strictly relate to the sample(s). The Company accepts no liability with regard to the origin or source from which the sample(s) is/are said to be extracted.Any unauthorized alteration, forgery or falsification of the content or appearance of this document is unlawful and offenders may be prosecuted to the fullest extent of the law.
X-Lab Earth Science is accredited by SANAS and conforms to the requirements of ISO/IEC 17025 for specific test or calibrations as indicated on the scope of accreditation to be found at http://sanas.co.za.The document is issued in accordance with SANAS's accreditation requirements and shall not be reproduced, except in full, without written approval of the laboratory
ISLNR
^LOR
Insufficient sample for analysis.Sample listed, but not received.Performed by outside laboratory.Limit of Reporting
QFHQFL
-*
QC result is above the upper toleranceQC result is below the lower toleranceThe sample was not analysed for this analyteResults marked “Not SANAS Accredited” in this report are not included in the SANAS Schedule of Accreditation for this laboratory / certification body / inspection body”.
FOOTNOTES
LAB-QLT-REP-001
METHOD SUMMARY
Calculation of Anion-Cation Balance
METHOD METHOD SUMMARY
ME-AN-016 The pH of an aliquot of aqueous sample is measured electrometrically using an electrode connected to a calibrated meter with automated temperature correction. This method is based on APHA 4500-H B.
ME-AN-007 The conductivity of an aliquot of aqueous sample is measured electrometrically using a standard cell connected to a calibrated meter with automated temperature correction. This method is based on APHA 2510.
ME-AN-001 An aliquot of aqueous sample is titrated first to pH 8.3 and then to 4.3 using standardised acid. The volumes of acid titrated are used to calculate total alkalinity and/or alkaline species. The method is based on EPA 310.2 and APHA 2320 B.
ME-AN-011 Total dissolved solids (TDS) is determined gravimetrically on a filtered aliquot of aqueous sample by evaporating the sample to dryness in a pre-weighed container at 105 deg C. The method is based on APHA 2540 C.
ME-AN-039 This method is based on: Standard methods for the examination of water and wastewater, 18th edition, 1992. Colour 2120 C. Spectrophotometric method. The sample is filtered through a 0.45 µm filter and the true colour is determined spectrophotometrically at a wavelength of 575 nm
ME-AN-008 Turbidity is measured on an aliquot of aqueous sample using a calibrated turbidity meter. The method is based on APHA 2130.
ME-AN-014 Inorganic anions (Br, Cl, F, NO3, NO2, SO4) are determined on aqueous samples by ion chromatography. The method is based on EPA 300.1 and APHA 4110 B.
ME-AN-027 Dissolved metals are determined on a filtered and acidified (to 1% HNO3) portion of aqueous sample by inductively coupled plasma optical emission spectrometry (ICP-OES). The method is based on EPA 200.7 and APHA 3120.Calculation of the cation/anion balance
EXXARO – Leeuwpan Coal Mine Section 21(a) WULA
19-0292 2 April 2020 Page 38
APPENDIX B: AQUIFER TEST RESULTS
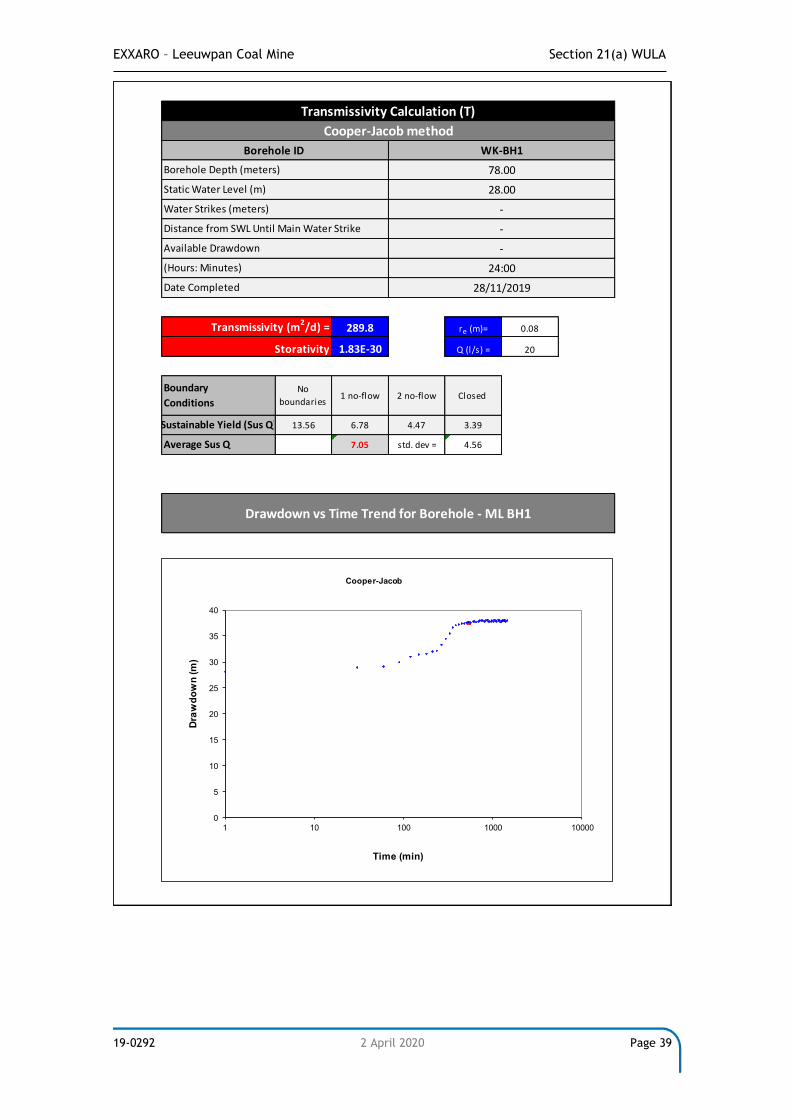
EXXARO – Leeuwpan Coal Mine Section 21(a) WULA
19-0292 2 April 2020 Page 39
289.8 re (m)= 0.08 0.08
1.83E-30 Q (l/s) = 20
13.56 6.78 4.47 3.39
7.05 std. dev = 4.56
-
Transmissivity Calculation (T)
Cooper-Jacob method
Borehole ID WK-BH1
Borehole Depth (meters)
including influence of bh's
(Hours: Minutes) 24:00
2 no-flow Closed
Static Water Level (m)
Distance from SWL Until Main Water Strike
78.00
28.00
-
Water Strikes (meters) -
Available Drawdown
Boundary
Conditions
Sustainable Yield (Sus Q)
Average Sus Q
Date Completed 28/11/2019
Drawdown vs Time Trend for Borehole - ML BH1
Transmissivity (m2/d) =
Storativity
No
boundaries1 no-flow
0
5
10
15
20
25
30
35
40
1 10 100 1000 10000
Dra
wd
ow
n (m
)
Time (min)
Cooper-Jacob
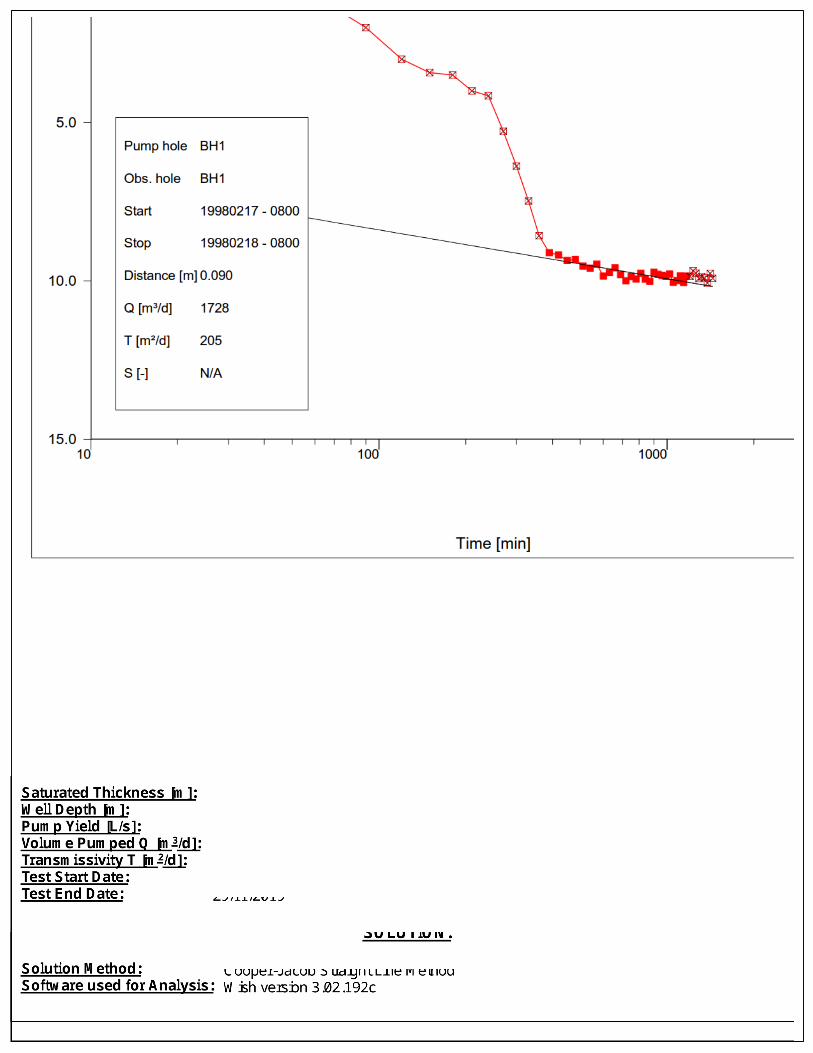
EXXARO – Leeuwpan Coal Mine Section 21(a) WULA
19-0292 2 April 2020 Page 41
APPENDIX C: GROUNDWATER MODEL REPORT (GCS, 2019)
Annexure C Monthly Water Quality Report

PREPARED FOR: EXXARO COAL MPUMALANGA
(PTY) LTD. LEEUWPAN COAL MINE
PREPARED BY: ENVASS
MONTH: OCTOBER 2020
REPORT NUMBER: MON-WQR-080-19_20 (20-10)
VERSION: 0.0
EXXARO Coal Mpumalanga (Pty) Ltd., Leeuwpan Coal Mine, located near
Delmas, Mpumalanga Province.
MONTHLY WATER QUALITY
REPORT
Document No: Revision: Date:
MON-WQR-080-19_20 (20-10) 0.0 October 2020
Leeuwpan Coal Mine
Client Restricted Author: W. Esterhuizen
i
DOCUMENT CONTROL
Document Title Exxaro Leeuwpan Monthly Water Quality Report
Report Number MON-WQR-080-19_20 (20-10)
Version 0.0
Date October 2020
Submitted to
Lucy Mogakane
Environmental Practitioner
Distribution EXXARO Coal Mpumalanga (Pty) Ltd.
Environmental Assurance (Pty) Ltd.
QUALITY CONTROL
Originated By Technical Review
Name Wian Esterhuizen Anton Botha
Designation Environmental Consultant Environmental Consultant
Signature
Date 28-10-2020 04-11-2020
DISCLAIMER
Copyright ENVASS. All Rights Reserved - This documentation is considered the intellectual property of ENVASS.
Unauthorised reproduction or distribution of this documentation or any portion of it may result in severe civil and criminal
penalties, and violators will be prosecuted to the maximum extent possible under law. Any observations,
recommendations and actions taken from this report remain the responsibility of the client. Environmental Assurance
(Pty) Ltd and authors of this report are protected from any legal action, possible loss, damage or liability resulting from
the content of this report. This document is considered confidential and remains so unless requested by a court of law.
Document No: Revision: Date:
MON-WQR-080-19_20 (20-10) 0.0 October 2020
Leeuwpan Coal Mine
Client Restricted Author: W. Esterhuizen
ii
EXECUTIVE SUMMARY
Environmental Assurance (Pty) Ltd. (ENVASS) is appointed by EXXARO Coal Mpumalanga (Pty) Ltd. to implement and
maintain an environmental compliance monitoring programme at the Leeuwpan Coal Mine, located near Delmas,
Mpumalanga Province. The water quality monitoring program was initiated at Leeuwpan Coal Mine as per the Water Use
License requirements, including; surface water sampling as well as reporting requirements. The surface water localities are
monitored on a monthly basis.
This report communicates the monthly water monitoring and results conducted within October 2020. All monitoring was
conducted according to recognised standards and sent to a SANAS accredited laboratory for analysis as further described
in this report.
The following findings pertain to the October 2020 surface water monitoring:
• Four (4) water localities form part of the potable monitoring programme at Exxaro Leeuwpan Mine. It should be
noted that the water is not used as a potable source, however monitored as such in case of accidental consumption
as a precautionary measurement. The Load-Out Bay Offices (LLBDW) revealed exceedances of Electrical
Conductivity, Total Dissolved Solids, Sulphate, Turbidity, Heterotrophic Plate Counts and E.coli which renders the
water as not suitable for potable purposes. The Drinking Water Supply Tank (LDWST) presented an exceedance
of Heterotrophic Plate Counts, while the majority of the parameters presented ideal water quality. The Drinking
Water at Laboratory (LWDL) presented an exceedance of Electrical Conductivity, Total Dissolved Solids, Sulphate
and Heterotrophic Plate Counts;
• The receiving environment monitoring localities presented exceedances of Ca, Mg, Turbidity, DOC and indicated
presence of Oil and Grease;
• The process water samples revealed compliance to the stipulated WUL limits, except for the ODN-PIT monitoring
point which exceeded the limit for E.coli;
• Representative samples related to October 2020 could not be obtained thus the final effluent from LWP-SP-P
historically recorded non-compliant to the set Ammonia Wastewater WUL limits, while exceedances related to the
General Authorisation limits included Suspended Solids, Ammonia and Chemical Oxygen Demand. During the
monitoring period it was noted that the LWP-SP-P was not active and no access was obtained to the LWP-SP-W
monitoring point;
• Samples LSW06, LSW07, LSW08, LSW12, WP01, RD1, KR03, KR04, OG PIT, OH PIT, OJ PIT, OM PIT, WLV
PIT, LWP-SP-W, OWM-PIT and PIET-SCHUTTE could not be obtained during the monitoring period; and
• During the monthly monitoring period, the majority of the localities presented relatively stable conditions compared
to September 2020, with fluctuation in bacteriological content noted.
Document No: Revision: Date:
MON-WQR-080-19_20 (20-10) 0.0 October 2020
Leeuwpan Coal Mine
Client Restricted Author: W. Esterhuizen
iii
TABLE OF CONTENTS
1. INTRODUCTION .......................................................................................................................................................... 1
2. SYSTEMS AUDIT......................................................................................................................................................... 1
3. PURPOSE .................................................................................................................................................................... 1
4. METHODOLOGY ......................................................................................................................................................... 3
5. SCOPE OF WORK ....................................................................................................................................................... 4
5.1 LABORATORY ANALYSIS .................................................................................................................................. 4
5.2 SURFACE WATER MONITORING ..................................................................................................................... 5
6. RESULTS ................................................................................................................................................................... 11
6.1 SURFACE WATER RESULTS .......................................................................................................................... 11
7. DISCUSSION ............................................................................................................................................................. 33
7.1 RECEIVING ENVIRONMENT WATER QUALITY ............................................................................................. 33
7.2 PROCESS WATER QUALITY ........................................................................................................................... 34
7.3 EFFLUENT WATER QUALITY .......................................................................................................................... 34
7.4 POTABLE WATER QUALITY ............................................................................................................................ 34
7.5 EXCEEDING VARIABLE DISCUSSION ............................................................................................................ 35
7.6 CONCLUSION AND ASPECTS TO CONSIDER ............................................................................................... 38
APPENDIX A – SAMPLING REGISTER ............................................................................................................................. 39
APPENDIX B – PROBE FIELD MEASUREMENTS ............................................................................................................ 50
APPENDIX C – SURFACE WATER GRAPHS ................................................................................................................... 51
RECEIVING ENVIRONMENT GRAPHS .................................................................................................................... 51
PROCESS WATER GRAPHS .................................................................................................................................... 53
EFFLUENT WATER GRAPHS ................................................................................................................................... 56
POTABLE WATER GRAPHS ......................................................................................................................................... 59
LIST OF FIGURES
Figure 1: Leeuwpan Coal Mine Location Map ....................................................................................................................... 2
Figure 2: Receiving Environment Water Sampling Locality Map ........................................................................................... 7
Figure 3: Process Water Sampling Locality Map .................................................................................................................. 8
Figure 4: Effluent Water Sampling Locality Map ................................................................................................................... 9
Figure 5: Potable Water Sampling Locality Map ................................................................................................................. 10
Figure 6: pH value ............................................................................................................................................................... 51
Figure 7: Electrical Conductivity .......................................................................................................................................... 51
Figure 8: Total Dissolved Solids .......................................................................................................................................... 52
Figure 9: Sulphate ............................................................................................................................................................... 52
Document No: Revision: Date:
MON-WQR-080-19_20 (20-10) 0.0 October 2020
Leeuwpan Coal Mine
Client Restricted Author: W. Esterhuizen
iv
Figure 10: Escherichia coli .................................................................................................................................................. 53
Figure 11: pH value ............................................................................................................................................................. 53
Figure 12: Electrical Conductivity ........................................................................................................................................ 54
Figure 13: Total Dissolved Solids ........................................................................................................................................ 54
Figure 14: Sulphate ............................................................................................................................................................. 55
Figure 15: Oil and Grease ................................................................................................................................................... 55
Figure 16: Nitrate ................................................................................................................................................................ 56
Figure 17: Suspended Solids .............................................................................................................................................. 56
Figure 18: Ammonia ............................................................................................................................................................ 57
Figure 19: Nitrate ................................................................................................................................................................ 57
Figure 20: Ortho-Phosphate ................................................................................................................................................ 58
Figure 21: Total Phosphate ................................................................................................................................................. 58
Figure 22: Chemical Oxygen Demand (COD) ..................................................................................................................... 59
Figure 23: pH value ............................................................................................................................................................. 59
Figure 24: Turbidity ............................................................................................................................................................. 60
Figure 25: Electrical Conductivity ........................................................................................................................................ 60
Figure 26: Heterotrophic Plate Count .................................................................................................................................. 61
Figure 27: Total Dissolved Solids ........................................................................................................................................ 61
LIST OF TABLES
Table 1: Water Use License details ....................................................................................................................................... 1
Table 2: Water quality parameters for Leeuwpan Coal Mine ................................................................................................ 4
Table 3: Surface Water Monitoring ........................................................................................................................................ 5
Document No: Revision: Date:
MON-WQR-080-19_20 (20-10) 0.0 October 2020
Leeuwpan Coal Mine
Client Restricted Author: W. Esterhuizen
v
GLOSSARY
A list of commonly used acronyms, measurement units and definitions are included below for the purpose of ensuring
uniformity in the interpretation of this report:
Acronyms
DWS Department of Water and Sanitation
(Formerly Department of Water Affairs and Forestry – DWAF and Department of Water Affairs - DWA)
EC Electrical Conductivity
EMP Environmental Management Programme
MDEDET Mpumalanga Department of Economic Development, Environment and Tourism (Formerly Mpumalanga
Department of Agriculture Land Administration – MDALA)
NEMA National Environmental Management Act 107 of 1998
NWA National Water Act 36 of 1998
PCD Pollution control dam
SAR Sodium Absorption Ratio
SHE Safety, Health and Environment
WUL Water Use License
Measurement Units
Ha Hectare
M Meters
Mamsl meters above mean sea level
mg/l milligrams per litre
Definitions
Pit Any open excavation
Pollution
control
dam
A dam that forms part of a mine’s water management system with the purpose to minimise the impact of
polluted water on water resources, by separating clean and dirty water streams and capturing and retaining
dirty water to prevent its discharge due to water quality constraints (DWAF, Best practice guideline A4:
Pollution control dams, 2007).
Document No: Revision: Date:
MON-WQR-080-19_20 (20-10) 0.0 October 2020
Leeuwpan Coal Mine
Client Restricted Author: W. Esterhuizen
1
1. INTRODUCTION
Environmental Assurance (Pty) Ltd. (ENVASS) was appointed by EXXARO Coal Mpumalanga (Pty) Ltd. to undertake the
environmental compliance monitoring programme at Leeuwpan Coal Mine to fulfil the Water Use Licence Conditions
(Licence no. 04/B20A/CIJ/4032), approved on 18 December 2015.
The mining operation is located to the east of Delmas within the Victor Khanye Local Municipality. The mine is located within
the Upper Olifants River Catchment. East of the mine, the Bronkhorstspruit flows as fed by a tributary running to the west
of the mine. The underlying geology found in the area is comprised primarily of sedimentary rocks from the Karoo
Supergroup with Dolerite intrusions featuring within the project area.
The monthly water quality monitoring at Leeuwpan Coal Mine consists of the monthly surface water quality monitoring as
required in the WUL. The scope of work performed at the Leeuwpan Coal Mine is aligned to the WUL requirements, which
are listed within the report.
2. SYSTEMS AUDIT
All monitoring points are presented within locality maps and are discussed under the relevant sections of this report. In all
instances spatial scale was adjusted in order to present the position of all of the monitoring points relative to the mine and
associated infrastructure.
The descriptions below (Table 1) provide extracts from the approved Water Use Licence (IWUL) number 04/B20A/CIJ/4032
to describe the environmental monitoring for this site.
Table 1: Water Use License details
Water Use Licence details
Authorisation: 04/B21A/ABCGIJ/429
Date: 18 December 2015
Licensee: Leeuwpan Coal Mine
Competent Authority: Department of Water and Sanitation
Water Use authorised: Section 21 (a, c, i, g & j)
3. PURPOSE
The purpose of this report is to test and report on the operational compliance as it relates to water quality conditions set out
in the WUL and management requirements from the approved Department of Mineral Resources (DMR) Environmental
Management Programme (EMPr).
- Various water samples are taken and analysed from the provided surface water localities.
- Surface water resources are monitored on a monthly basis.
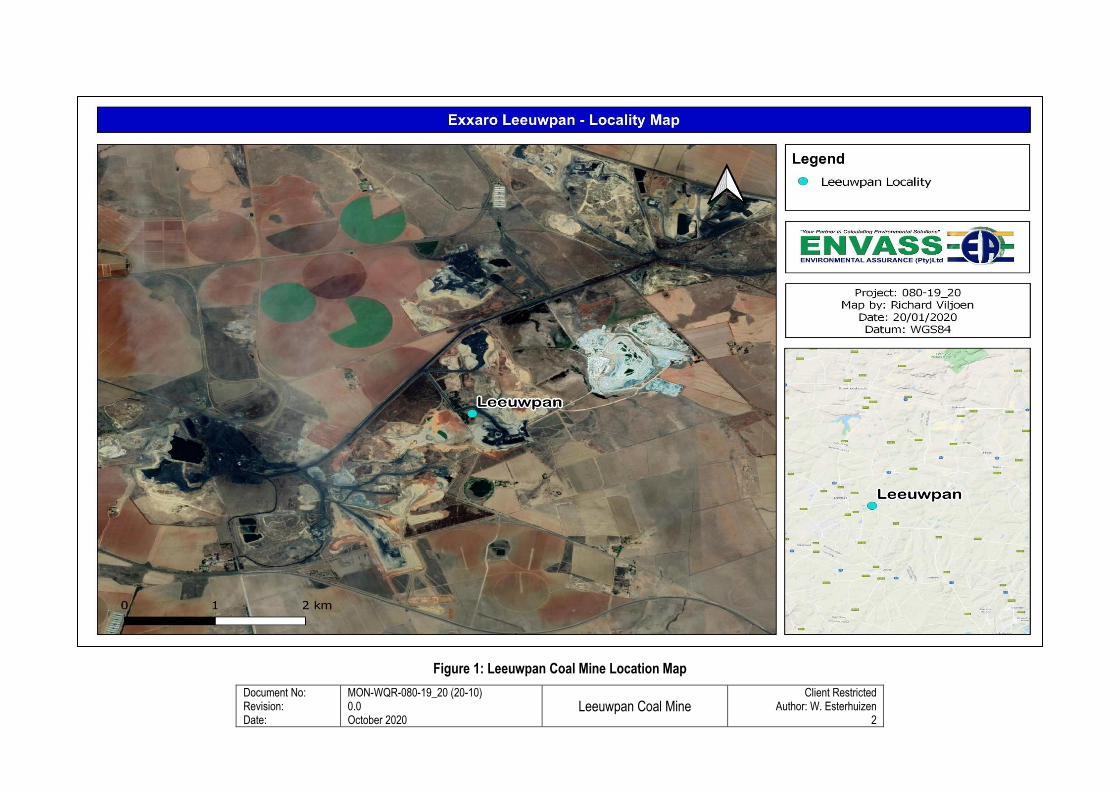
Document No: Revision: Date:
MON-WQR-080-19_20 (20-10) 0.0 October 2020
Leeuwpan Coal Mine
Client Restricted Author: W. Esterhuizen
2
Figure 1: Leeuwpan Coal Mine Location Map
Document No: Revision: Date:
MON-WQR-080-19_20 (20-10) 0.0 October 2020
Leeuwpan Coal Mine
Client Restricted Author: W. Esterhuizen
3
4. METHODOLOGY
All fieldwork is carried out by trained ENVASS environmental consultants and field technicians, fully trained in all of the
methods of sampling as required. This includes as a minimum sampling for surface and groundwater.
Sampling at the selected Leeuwpan Coal sites will be in accordance with the following guidelines:
• Guidance on the design of sampling programs and sampling techniques
ISO 5667-1:2006/SANS 5667-1:2008
• Guidance on the preservation and handling of water samples
SANS 5667-3:2006/ISO 5667-3:2003
(SABS ISO 5667-3)
• Guidance on sampling of drinking water from treatment works and piped distribution systems
SANS 5667-5:2006/ISO 5667-5:2006
(SABS ISO 5667-5)
• Guidance on sampling of rivers and streams
SANS 5667-6:2006/ISO 5667-6:2005
(SABS ISO 5667-6)
• Guidance on sampling of waste waters
SANS 5667-10:2007/ISO 5667-10:1992
• Guidance on quality assurance of environmental water sampling and handling
SANS 5667-14:2016/ISO 5667-14:2014
• DWAF Best Practice Guidelines Series G3: General Guidelines for Water Monitoring Systems.
Water sampling locations are set out in the WUL and/or received from the mine and previous sampling reports; and
ultimately these samples are used to identify areas of concern and areas from which water could effectively leave the site
into some form of receiving environment.
This report is prepared by ENVASS, drawing from the following sources of information:
• Water Use License (04/B21A/ABCGIJ/429) (Waste Water Limits);
• General Authorisation Limits (Process and Effluent Water)
• SANS 241: 2015 standards (Potable Water);
• DWAF Domestic Target Water Quality (Surface Water as comparison);
• A site visit to the Leeuwpan and surrounding areas; and
• Result of water samples analysed.
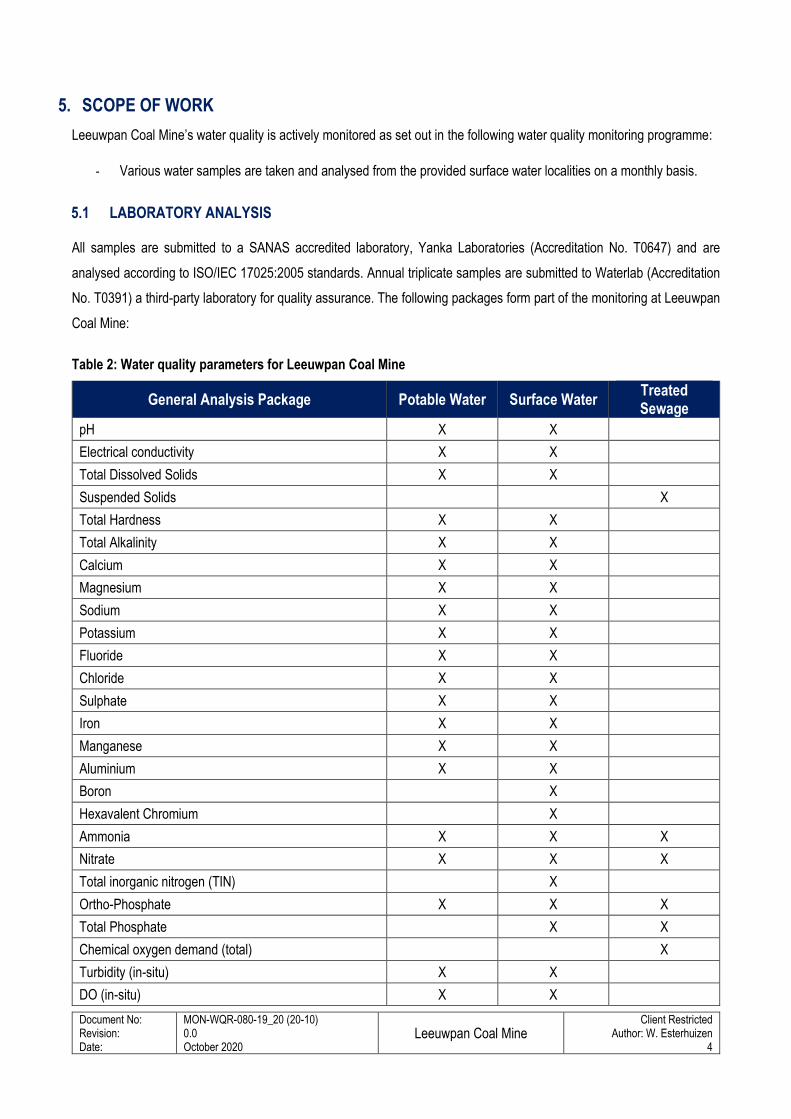
Document No: Revision: Date:
MON-WQR-080-19_20 (20-10) 0.0 October 2020
Leeuwpan Coal Mine
Client Restricted Author: W. Esterhuizen
4
5. SCOPE OF WORK
Leeuwpan Coal Mine’s water quality is actively monitored as set out in the following water quality monitoring programme:
- Various water samples are taken and analysed from the provided surface water localities on a monthly basis.
5.1 LABORATORY ANALYSIS
All samples are submitted to a SANAS accredited laboratory, Yanka Laboratories (Accreditation No. T0647) and are
analysed according to ISO/IEC 17025:2005 standards. Annual triplicate samples are submitted to Waterlab (Accreditation
No. T0391) a third-party laboratory for quality assurance. The following packages form part of the monitoring at Leeuwpan
Coal Mine:
Table 2: Water quality parameters for Leeuwpan Coal Mine
General Analysis Package Potable Water Surface Water Treated Sewage
pH X X
Electrical conductivity X X
Total Dissolved Solids X X
Suspended Solids X
Total Hardness X X
Total Alkalinity X X
Calcium X X
Magnesium X X
Sodium X X
Potassium X X
Fluoride X X
Chloride X X
Sulphate X X
Iron X X
Manganese X X
Aluminium X X
Boron X
Hexavalent Chromium X
Ammonia X X X
Nitrate X X X
Total inorganic nitrogen (TIN) X
Ortho-Phosphate X X X
Total Phosphate X X
Chemical oxygen demand (total) X
Turbidity (in-situ) X X
DO (in-situ) X X
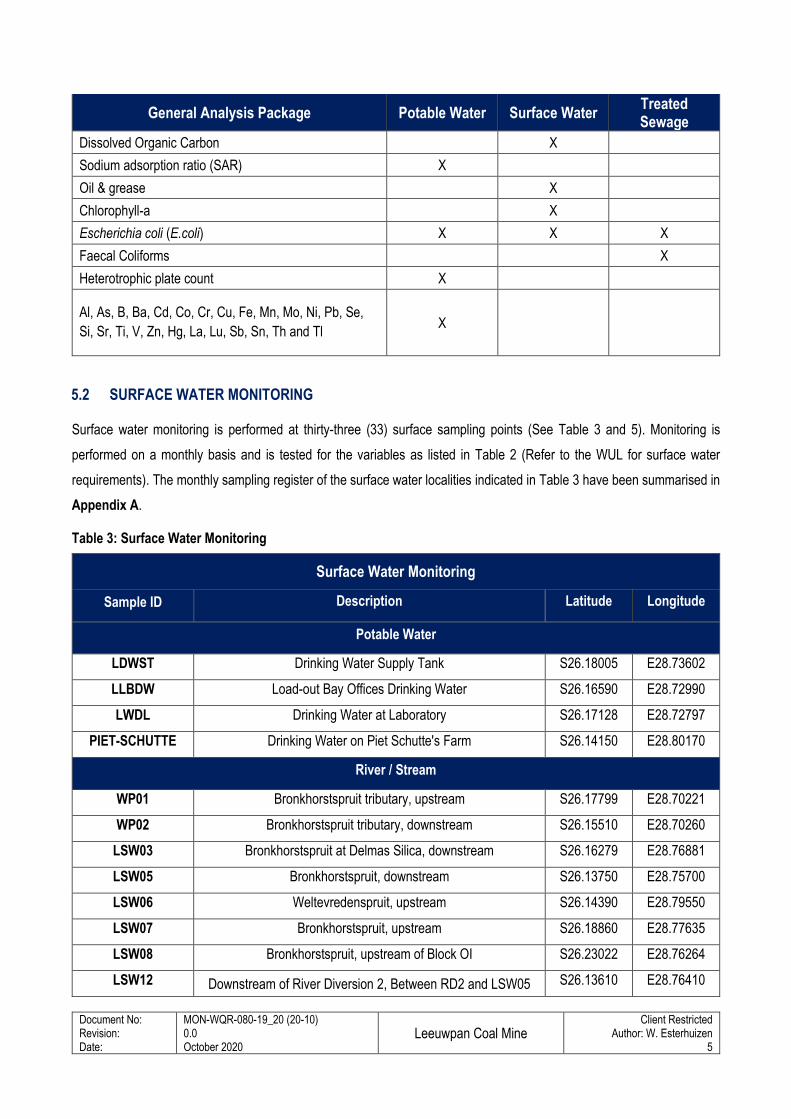
Document No: Revision: Date:
MON-WQR-080-19_20 (20-10) 0.0 October 2020
Leeuwpan Coal Mine
Client Restricted Author: W. Esterhuizen
5
General Analysis Package Potable Water Surface Water Treated Sewage
Dissolved Organic Carbon X
Sodium adsorption ratio (SAR) X
Oil & grease X
Chlorophyll-a X
Escherichia coli (E.coli) X X X
Faecal Coliforms X
Heterotrophic plate count X
Al, As, B, Ba, Cd, Co, Cr, Cu, Fe, Mn, Mo, Ni, Pb, Se,
Si, Sr, Ti, V, Zn, Hg, La, Lu, Sb, Sn, Th and Tl X
5.2 SURFACE WATER MONITORING
Surface water monitoring is performed at thirty-three (33) surface sampling points (See Table 3 and 5). Monitoring is
performed on a monthly basis and is tested for the variables as listed in Table 2 (Refer to the WUL for surface water
requirements). The monthly sampling register of the surface water localities indicated in Table 3 have been summarised in
Appendix A.
Table 3: Surface Water Monitoring
Surface Water Monitoring
Sample ID Description Latitude Longitude
Potable Water
LDWST Drinking Water Supply Tank S26.18005 E28.73602
LLBDW Load-out Bay Offices Drinking Water S26.16590 E28.72990
LWDL Drinking Water at Laboratory S26.17128 E28.72797
PIET-SCHUTTE Drinking Water on Piet Schutte's Farm S26.14150 E28.80170
River / Stream
WP01 Bronkhorstspruit tributary, upstream S26.17799 E28.70221
WP02 Bronkhorstspruit tributary, downstream S26.15510 E28.70260
LSW03 Bronkhorstspruit at Delmas Silica, downstream S26.16279 E28.76881
LSW05 Bronkhorstspruit, downstream S26.13750 E28.75700
LSW06 Weltevredenspruit, upstream S26.14390 E28.79550
LSW07 Bronkhorstspruit, upstream S26.18860 E28.77635
LSW08 Bronkhorstspruit, upstream of Block OI S26.23022 E28.76264
LSW12 Downstream of River Diversion 2, Between RD2 and LSW05 S26.13610 E28.76410
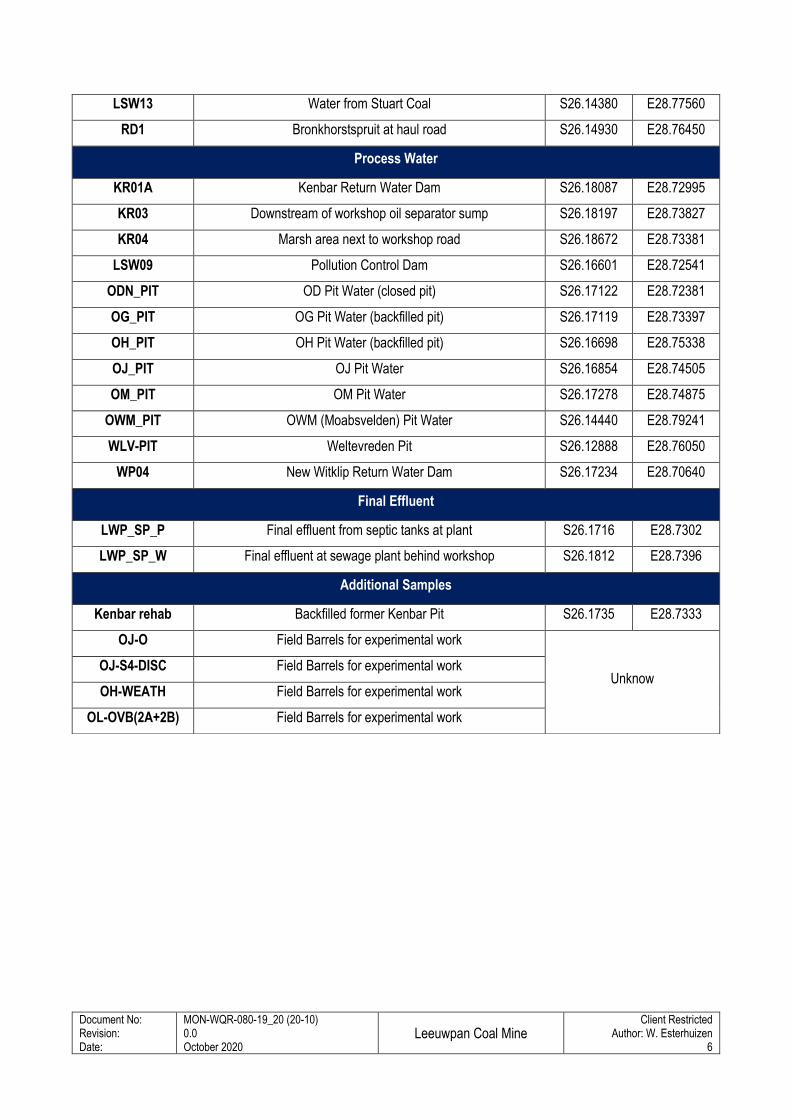
Document No: Revision: Date:
MON-WQR-080-19_20 (20-10) 0.0 October 2020
Leeuwpan Coal Mine
Client Restricted Author: W. Esterhuizen
6
LSW13 Water from Stuart Coal S26.14380 E28.77560
RD1 Bronkhorstspruit at haul road S26.14930 E28.76450
Process Water
KR01A Kenbar Return Water Dam S26.18087 E28.72995
KR03 Downstream of workshop oil separator sump S26.18197 E28.73827
KR04 Marsh area next to workshop road S26.18672 E28.73381
LSW09 Pollution Control Dam S26.16601 E28.72541
ODN_PIT OD Pit Water (closed pit) S26.17122 E28.72381
OG_PIT OG Pit Water (backfilled pit) S26.17119 E28.73397
OH_PIT OH Pit Water (backfilled pit) S26.16698 E28.75338
OJ_PIT OJ Pit Water S26.16854 E28.74505
OM_PIT OM Pit Water S26.17278 E28.74875
OWM_PIT OWM (Moabsvelden) Pit Water S26.14440 E28.79241
WLV-PIT Weltevreden Pit S26.12888 E28.76050
WP04 New Witklip Return Water Dam S26.17234 E28.70640
Final Effluent
LWP_SP_P Final effluent from septic tanks at plant S26.1716 E28.7302
LWP_SP_W Final effluent at sewage plant behind workshop S26.1812 E28.7396
Additional Samples
Kenbar rehab Backfilled former Kenbar Pit S26.1735 E28.7333
OJ-O Field Barrels for experimental work
Unknow OJ-S4-DISC Field Barrels for experimental work
OH-WEATH Field Barrels for experimental work
OL-OVB(2A+2B) Field Barrels for experimental work
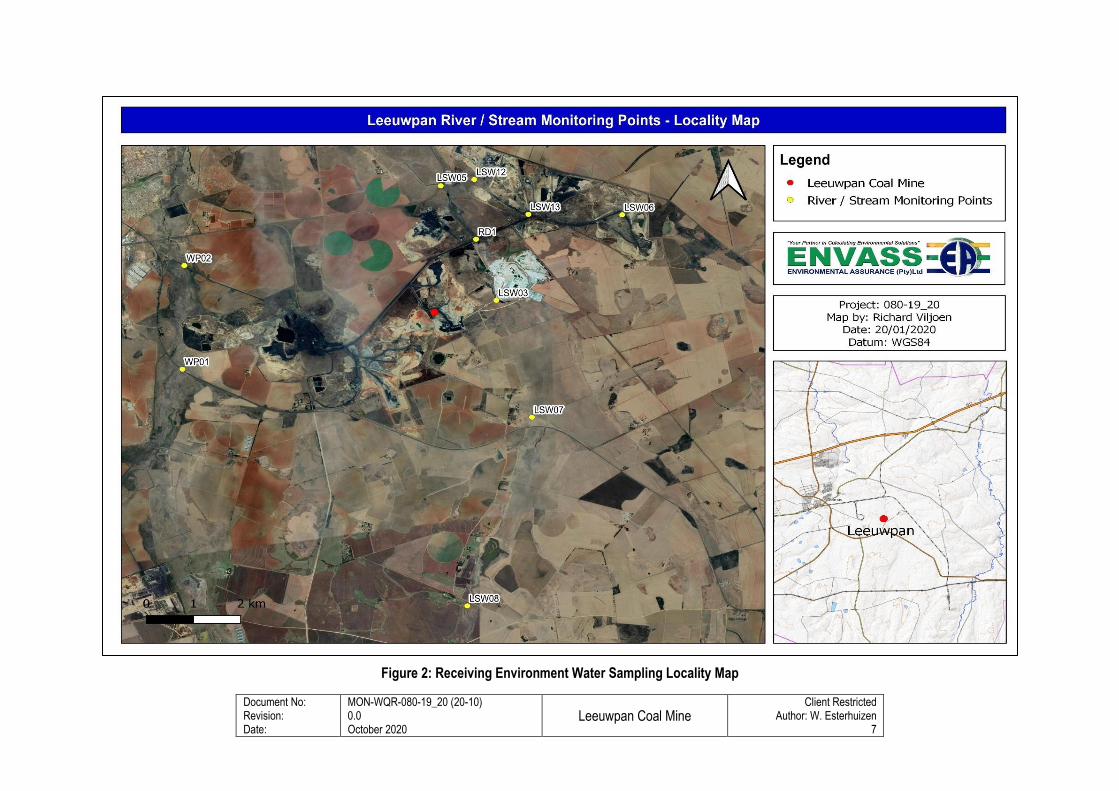
Document No: Revision: Date:
MON-WQR-080-19_20 (20-10) 0.0 October 2020
Leeuwpan Coal Mine
Client Restricted Author: W. Esterhuizen
7
Figure 2: Receiving Environment Water Sampling Locality Map
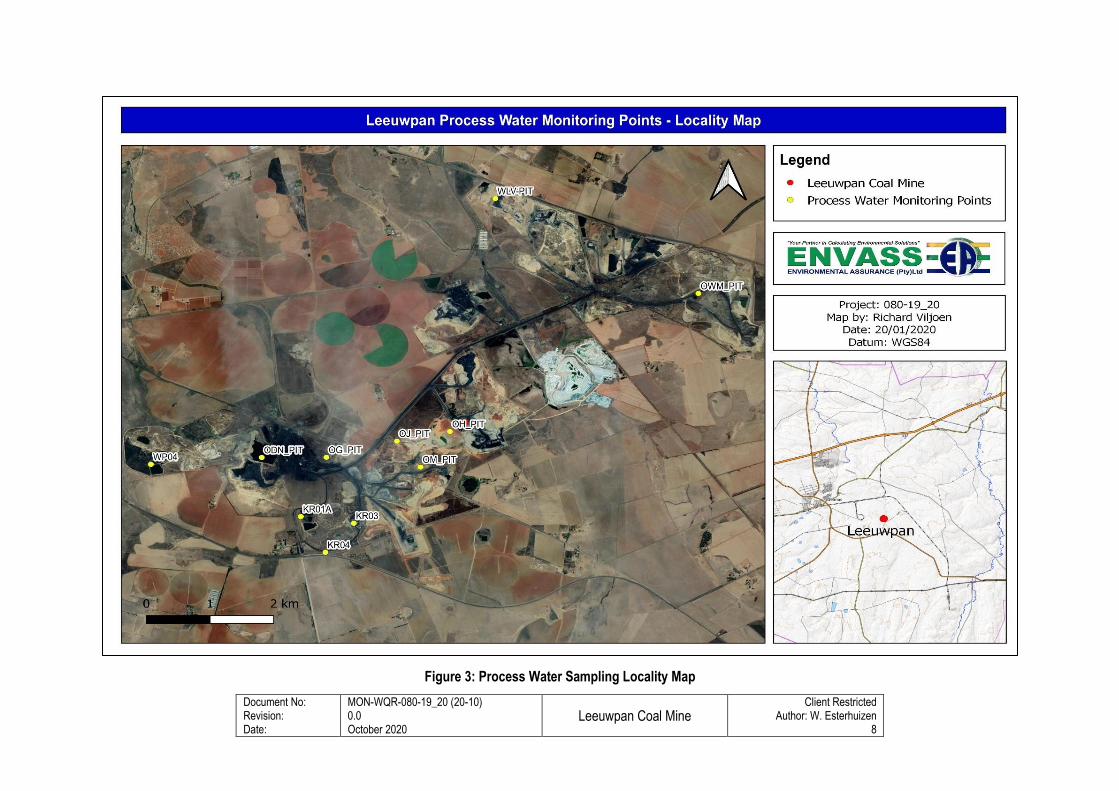
Document No: Revision: Date:
MON-WQR-080-19_20 (20-10) 0.0 October 2020
Leeuwpan Coal Mine
Client Restricted Author: W. Esterhuizen
8
Figure 3: Process Water Sampling Locality Map
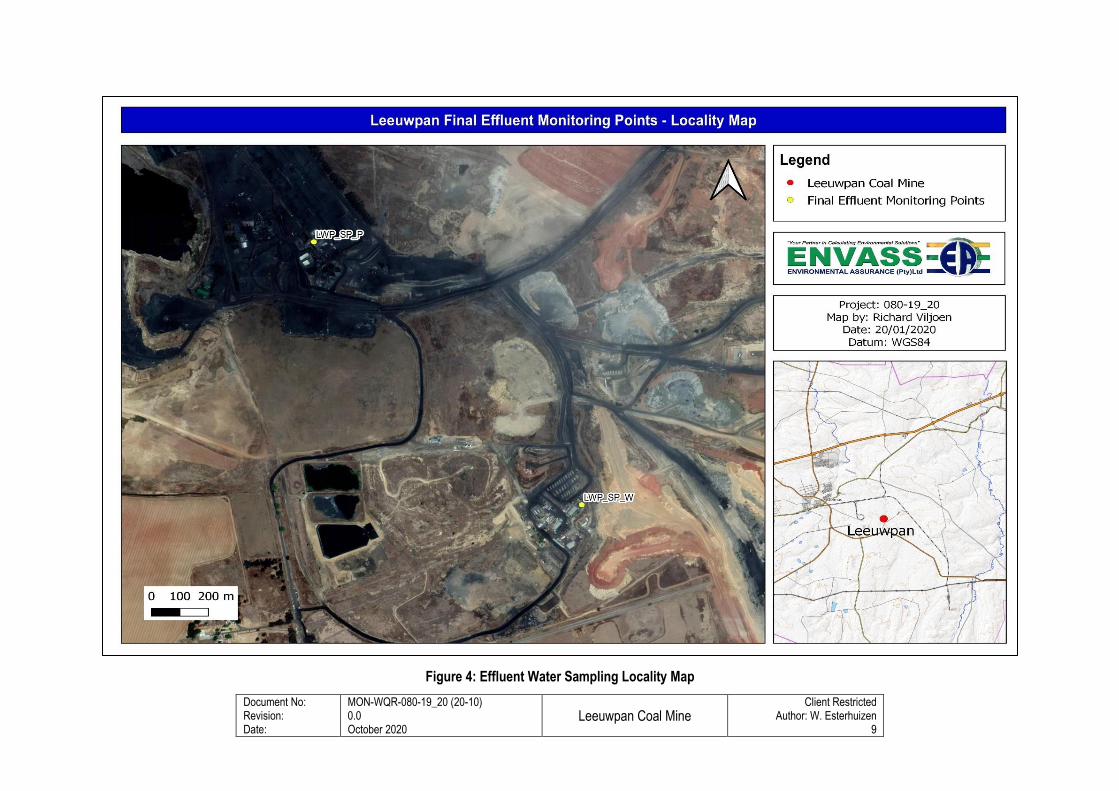
Document No: Revision: Date:
MON-WQR-080-19_20 (20-10) 0.0 October 2020
Leeuwpan Coal Mine
Client Restricted Author: W. Esterhuizen
9
Figure 4: Effluent Water Sampling Locality Map
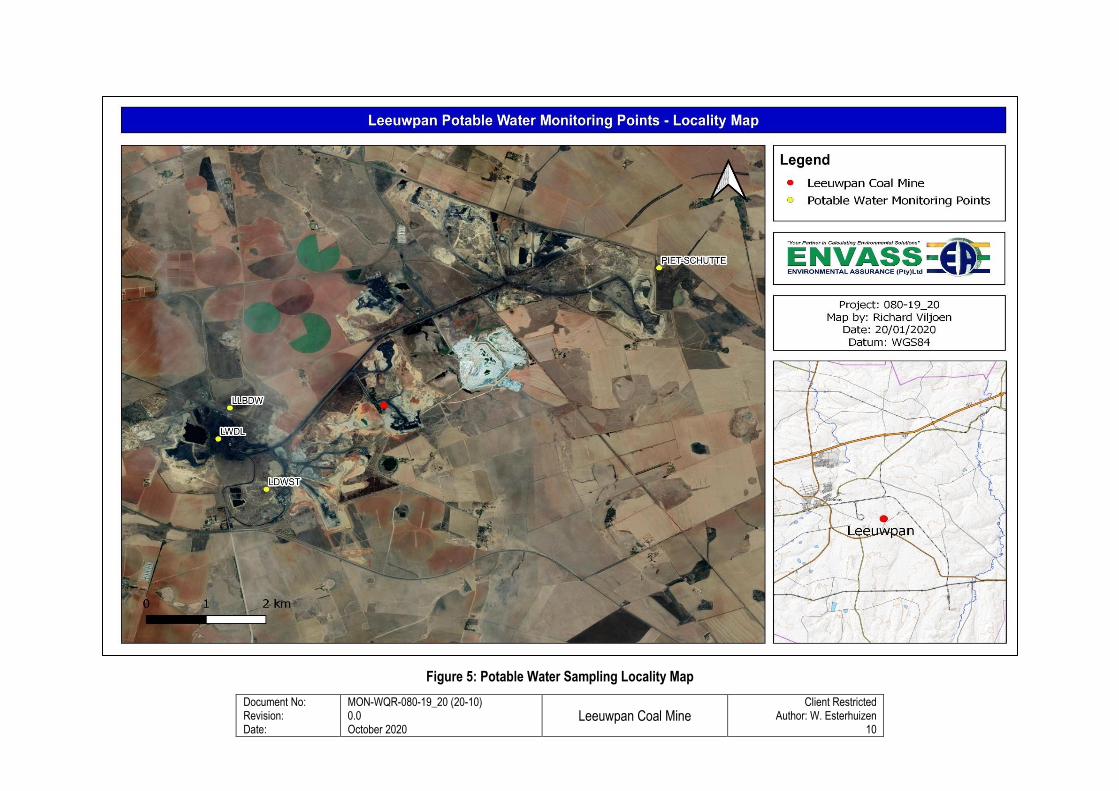
Document No: Revision: Date:
MON-WQR-080-19_20 (20-10) 0.0 October 2020
Leeuwpan Coal Mine
Client Restricted Author: W. Esterhuizen
10
Figure 5: Potable Water Sampling Locality Map
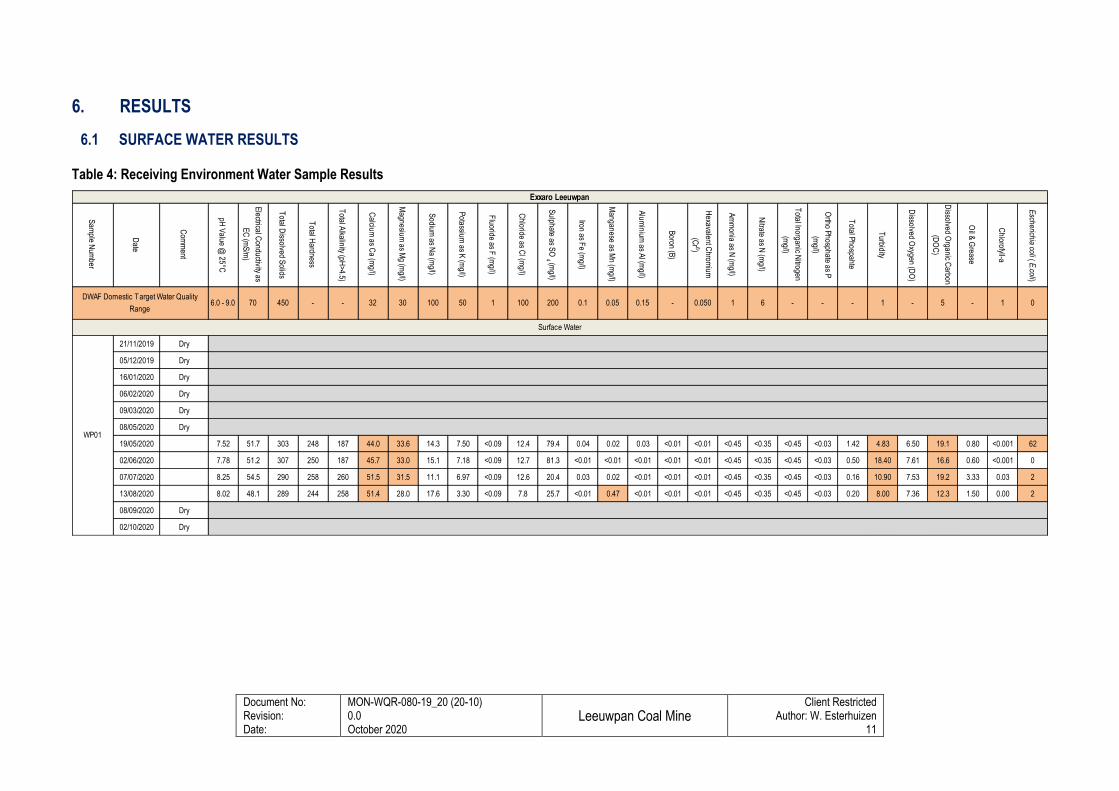
Document No: Revision: Date:
MON-WQR-080-19_20 (20-10) 0.0 October 2020
Leeuwpan Coal Mine
Client Restricted Author: W. Esterhuizen
11
6. RESULTS
6.1 SURFACE WATER RESULTS
Table 4: Receiving Environment Water Sample Results
Sam
ple Num
ber
Date
Com
ment
pH V
alue @ 25°C
Electrical C
onductivity as
EC
(mS
/m)
Total D
issolved Solids
Total H
ardness
Total A
lkalinity (pH>4.5)
Calcium
as Ca (m
g/l)
Magnesium
as Mg (m
g/l)
Sodium
as Na (m
g/l)
Potassium
as K (m
g/l)
Fluoride as F
(mg/l)
Chloride as C
l (mg/l)
Sulphate as S
O 4
(mg/l)
Iron as Fe (m
g/l)
Manganese as M
n (mg/l)
Alum
inium as A
l (mg/l)
Boron (B
)
Hexavalent C
hromium
(Cr 6)
Am
monia as N
(mg/l)
Nitrate as N
(mg/l)
Total Inorganic N
itrogen
(mg/l)
Ortho P
hosphate as P
(mg/l)
Total P
hospahte
Turbidity
Dissolved O
xygen (DO
)
Dissolved O
rganic Carbon
(DO
C)
Oil &
Grease
Chlorofyll-a
Escherichia coli ( E
.coli)
21/11/2019 Dry
05/12/2019 Dry
16/01/2020 Dry
06/02/2020 Dry
09/03/2020 Dry
08/05/2020 Dry
19/05/2020 7.52 51.7 303 248 187 44.0 33.6 14.3 7.50 <0.09 12.4 79.4 0.04 0.02 0.03 <0.01 <0.01 <0.45 <0.35 <0.45 <0.03 1.42 4.83 6.50 19.1 0.80 <0.001 62
02/06/2020 7.78 51.2 307 250 187 45.7 33.0 15.1 7.18 <0.09 12.7 81.3 <0.01 <0.01 <0.01 <0.01 <0.01 <0.45 <0.35 <0.45 <0.03 0.50 18.40 7.61 16.6 0.60 <0.001 0
07/07/2020 8.25 54.5 290 258 260 51.5 31.5 11.1 6.97 <0.09 12.6 20.4 0.03 0.02 <0.01 <0.01 <0.01 <0.45 <0.35 <0.45 <0.03 0.16 10.90 7.53 19.2 3.33 0.03 2
13/08/2020 8.02 48.1 289 244 258 51.4 28.0 17.6 3.30 <0.09 7.8 25.7 <0.01 0.47 <0.01 <0.01 <0.01 <0.45 <0.35 <0.45 <0.03 0.20 8.00 7.36 12.3 1.50 0.00 2
08/09/2020 Dry
02/10/2020 Dry
DWAF Domestic Target Water Quality
Range0.050-0.15
WP01
-45070 32- 0.050.12001001 -
Exxaro Leeuwpan
6.0 - 9.0 01-5-1--615010030
Surface Water
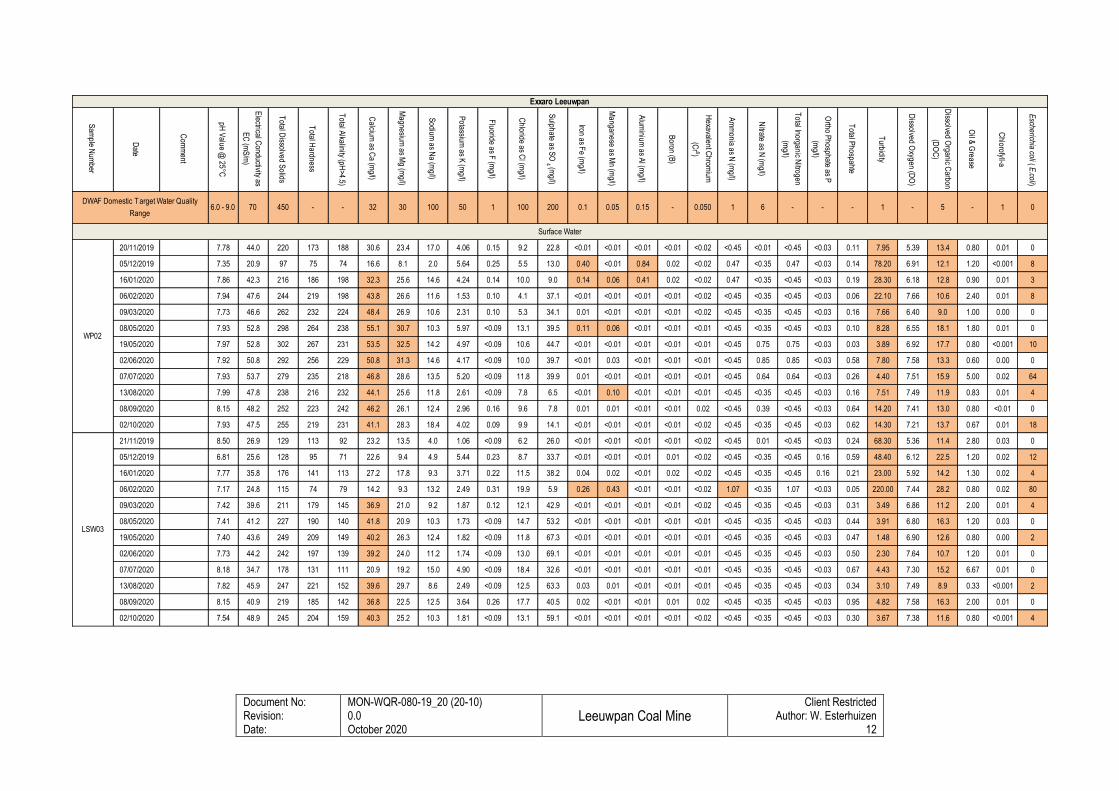
Document No: Revision: Date:
MON-WQR-080-19_20 (20-10) 0.0 October 2020
Leeuwpan Coal Mine
Client Restricted Author: W. Esterhuizen
12
Sam
ple Num
ber
Date
Com
ment
pH V
alue @ 25°C
Electrical C
onductivity as
EC
(mS
/m)
Total D
issolved Solids
Total H
ardness
Total A
lkalinity (pH>4.5)
Calcium
as Ca (m
g/l)
Magnesium
as Mg (m
g/l)
Sodium
as Na (m
g/l)
Potassium
as K (m
g/l)
Fluoride as F
(mg/l)
Chloride as C
l (mg/l)
Sulphate as S
O 4
(mg/l)
Iron as Fe (m
g/l)
Manganese as M
n (mg/l)
Alum
inium as A
l (mg/l)
Boron (B
)
Hexavalent C
hromium
(Cr 6)
Am
monia as N
(mg/l)
Nitrate as N
(mg/l)
Total Inorganic N
itrogen
(mg/l)
Ortho P
hosphate as P
(mg/l)
Total P
hospahte
Turbidity
Dissolved O
xygen (DO
)
Dissolved O
rganic Carbon
(DO
C)
Oil &
Grease
Chlorofyll-a
Escherichia coli ( E
.coli)
20/11/2019 7.78 44.0 220 173 188 30.6 23.4 17.0 4.06 0.15 9.2 22.8 <0.01 <0.01 <0.01 <0.01 <0.02 <0.45 <0.01 <0.45 <0.03 0.11 7.95 5.39 13.4 0.80 0.01 0
05/12/2019 7.35 20.9 97 75 74 16.6 8.1 2.0 5.64 0.25 5.5 13.0 0.40 <0.01 0.84 0.02 <0.02 0.47 <0.35 0.47 <0.03 0.14 78.20 6.91 12.1 1.20 <0.001 8
16/01/2020 7.86 42.3 216 186 198 32.3 25.6 14.6 4.24 0.14 10.0 9.0 0.14 0.06 0.41 0.02 <0.02 0.47 <0.35 <0.45 <0.03 0.19 28.30 6.18 12.8 0.90 0.01 3
06/02/2020 7.94 47.6 244 219 198 43.8 26.6 11.6 1.53 0.10 4.1 37.1 <0.01 <0.01 <0.01 <0.01 <0.02 <0.45 <0.35 <0.45 <0.03 0.06 22.10 7.66 10.6 2.40 0.01 8
09/03/2020 7.73 46.6 262 232 224 48.4 26.9 10.6 2.31 0.10 5.3 34.1 0.01 <0.01 <0.01 <0.01 <0.02 <0.45 <0.35 <0.45 <0.03 0.16 7.66 6.40 9.0 1.00 0.00 0
08/05/2020 7.93 52.8 298 264 238 55.1 30.7 10.3 5.97 <0.09 13.1 39.5 0.11 0.06 <0.01 <0.01 <0.01 <0.45 <0.35 <0.45 <0.03 0.10 8.28 6.55 18.1 1.80 0.01 0
19/05/2020 7.97 52.8 302 267 231 53.5 32.5 14.2 4.97 <0.09 10.6 44.7 <0.01 <0.01 <0.01 <0.01 <0.01 <0.45 0.75 0.75 <0.03 0.03 3.89 6.92 17.7 0.80 <0.001 10
02/06/2020 7.92 50.8 292 256 229 50.8 31.3 14.6 4.17 <0.09 10.0 39.7 <0.01 0.03 <0.01 <0.01 <0.01 <0.45 0.85 0.85 <0.03 0.58 7.80 7.58 13.3 0.60 0.00 0
07/07/2020 7.93 53.7 279 235 218 46.8 28.6 13.5 5.20 <0.09 11.8 39.9 0.01 <0.01 <0.01 <0.01 <0.01 <0.45 0.64 0.64 <0.03 0.26 4.40 7.51 15.9 5.00 0.02 64
13/08/2020 7.99 47.8 238 216 232 44.1 25.6 11.8 2.61 <0.09 7.8 6.5 <0.01 0.10 <0.01 <0.01 <0.01 <0.45 <0.35 <0.45 <0.03 0.16 7.51 7.49 11.9 0.83 0.01 4
08/09/2020 8.15 48.2 252 223 242 46.2 26.1 12.4 2.96 0.16 9.6 7.8 0.01 0.01 <0.01 <0.01 0.02 <0.45 0.39 <0.45 <0.03 0.64 14.20 7.41 13.0 0.80 <0.01 0
02/10/2020 7.93 47.5 255 219 231 41.1 28.3 18.4 4.02 0.09 9.9 14.1 <0.01 <0.01 <0.01 <0.01 <0.02 <0.45 <0.35 <0.45 <0.03 0.62 14.30 7.21 13.7 0.67 0.01 18
21/11/2019 8.50 26.9 129 113 92 23.2 13.5 4.0 1.06 <0.09 6.2 26.0 <0.01 <0.01 <0.01 <0.01 <0.02 <0.45 0.01 <0.45 <0.03 0.24 68.30 5.36 11.4 2.80 0.03 0
05/12/2019 6.81 25.6 128 95 71 22.6 9.4 4.9 5.44 0.23 8.7 33.7 <0.01 <0.01 <0.01 0.01 <0.02 <0.45 <0.35 <0.45 0.16 0.59 48.40 6.12 22.5 1.20 0.02 12
16/01/2020 7.77 35.8 176 141 113 27.2 17.8 9.3 3.71 0.22 11.5 38.2 0.04 0.02 <0.01 0.02 <0.02 <0.45 <0.35 <0.45 0.16 0.21 23.00 5.92 14.2 1.30 0.02 4
06/02/2020 7.17 24.8 115 74 79 14.2 9.3 13.2 2.49 0.31 19.9 5.9 0.26 0.43 <0.01 <0.01 <0.02 1.07 <0.35 1.07 <0.03 0.05 220.00 7.44 28.2 0.80 0.02 80
09/03/2020 7.42 39.6 211 179 145 36.9 21.0 9.2 1.87 0.12 12.1 42.9 <0.01 <0.01 <0.01 <0.01 <0.02 <0.45 <0.35 <0.45 <0.03 0.31 3.49 6.86 11.2 2.00 0.01 4
08/05/2020 7.41 41.2 227 190 140 41.8 20.9 10.3 1.73 <0.09 14.7 53.2 <0.01 <0.01 <0.01 <0.01 <0.01 <0.45 <0.35 <0.45 <0.03 0.44 3.91 6.80 16.3 1.20 0.03 0
19/05/2020 7.40 43.6 249 209 149 40.2 26.3 12.4 1.82 <0.09 11.8 67.3 <0.01 <0.01 <0.01 <0.01 <0.01 <0.45 <0.35 <0.45 <0.03 0.47 1.48 6.90 12.6 0.80 0.00 2
02/06/2020 7.73 44.2 242 197 139 39.2 24.0 11.2 1.74 <0.09 13.0 69.1 <0.01 <0.01 <0.01 <0.01 <0.01 <0.45 <0.35 <0.45 <0.03 0.50 2.30 7.64 10.7 1.20 0.01 0
07/07/2020 8.18 34.7 178 131 111 20.9 19.2 15.0 4.90 <0.09 18.4 32.6 <0.01 <0.01 <0.01 <0.01 <0.01 <0.45 <0.35 <0.45 <0.03 0.67 4.43 7.30 15.2 6.67 0.01 0
13/08/2020 7.82 45.9 247 221 152 39.6 29.7 8.6 2.49 <0.09 12.5 63.3 0.03 0.01 <0.01 <0.01 <0.01 <0.45 <0.35 <0.45 <0.03 0.34 3.10 7.49 8.9 0.33 <0.001 2
08/09/2020 8.15 40.9 219 185 142 36.8 22.5 12.5 3.64 0.26 17.7 40.5 0.02 <0.01 <0.01 0.01 0.02 <0.45 <0.35 <0.45 <0.03 0.95 4.82 7.58 16.3 2.00 0.01 0
02/10/2020 7.54 48.9 245 204 159 40.3 25.2 10.3 1.81 <0.09 13.1 59.1 <0.01 <0.01 <0.01 <0.01 <0.02 <0.45 <0.35 <0.45 <0.03 0.30 3.67 7.38 11.6 0.80 <0.001 4
DWAF Domestic Target Water Quality
Range0.050-0.15-45070 32- 0.050.12001001 -
Exxaro Leeuwpan
6.0 - 9.0 01-5-1--615010030
Surface Water
WP02
LSW03
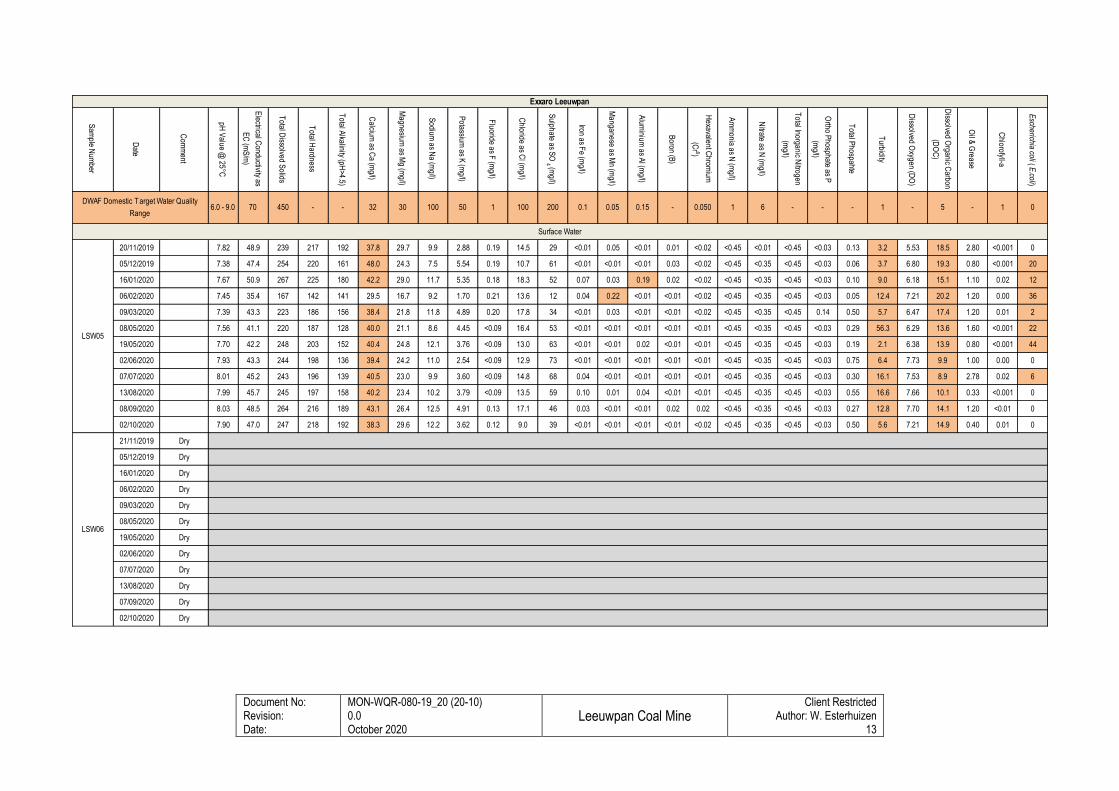
Document No: Revision: Date:
MON-WQR-080-19_20 (20-10) 0.0 October 2020
Leeuwpan Coal Mine
Client Restricted Author: W. Esterhuizen
13
Sam
ple Num
ber
Date
Com
ment
pH V
alue @ 25°C
Electrical C
onductivity as
EC
(mS
/m)
Total D
issolved Solids
Total H
ardness
Total A
lkalinity (pH>4.5)
Calcium
as Ca (m
g/l)
Magnesium
as Mg (m
g/l)
Sodium
as Na (m
g/l)
Potassium
as K (m
g/l)
Fluoride as F
(mg/l)
Chloride as C
l (mg/l)
Sulphate as S
O 4
(mg/l)
Iron as Fe (m
g/l)
Manganese as M
n (mg/l)
Alum
inium as A
l (mg/l)
Boron (B
)
Hexavalent C
hromium
(Cr 6)
Am
monia as N
(mg/l)
Nitrate as N
(mg/l)
Total Inorganic N
itrogen
(mg/l)
Ortho P
hosphate as P
(mg/l)
Total P
hospahte
Turbidity
Dissolved O
xygen (DO
)
Dissolved O
rganic Carbon
(DO
C)
Oil &
Grease
Chlorofyll-a
Escherichia coli ( E
.coli)
20/11/2019 7.82 48.9 239 217 192 37.8 29.7 9.9 2.88 0.19 14.5 29 <0.01 0.05 <0.01 0.01 <0.02 <0.45 <0.01 <0.45 <0.03 0.13 3.2 5.53 18.5 2.80 <0.001 0
05/12/2019 7.38 47.4 254 220 161 48.0 24.3 7.5 5.54 0.19 10.7 61 <0.01 <0.01 <0.01 0.03 <0.02 <0.45 <0.35 <0.45 <0.03 0.06 3.7 6.80 19.3 0.80 <0.001 20
16/01/2020 7.67 50.9 267 225 180 42.2 29.0 11.7 5.35 0.18 18.3 52 0.07 0.03 0.19 0.02 <0.02 <0.45 <0.35 <0.45 <0.03 0.10 9.0 6.18 15.1 1.10 0.02 12
06/02/2020 7.45 35.4 167 142 141 29.5 16.7 9.2 1.70 0.21 13.6 12 0.04 0.22 <0.01 <0.01 <0.02 <0.45 <0.35 <0.45 <0.03 0.05 12.4 7.21 20.2 1.20 0.00 36
09/03/2020 7.39 43.3 223 186 156 38.4 21.8 11.8 4.89 0.20 17.8 34 <0.01 0.03 <0.01 <0.01 <0.02 <0.45 <0.35 <0.45 0.14 0.50 5.7 6.47 17.4 1.20 0.01 2
08/05/2020 7.56 41.1 220 187 128 40.0 21.1 8.6 4.45 <0.09 16.4 53 <0.01 <0.01 <0.01 <0.01 <0.01 <0.45 <0.35 <0.45 <0.03 0.29 56.3 6.29 13.6 1.60 <0.001 22
19/05/2020 7.70 42.2 248 203 152 40.4 24.8 12.1 3.76 <0.09 13.0 63 <0.01 <0.01 0.02 <0.01 <0.01 <0.45 <0.35 <0.45 <0.03 0.19 2.1 6.38 13.9 0.80 <0.001 44
02/06/2020 7.93 43.3 244 198 136 39.4 24.2 11.0 2.54 <0.09 12.9 73 <0.01 <0.01 <0.01 <0.01 <0.01 <0.45 <0.35 <0.45 <0.03 0.75 6.4 7.73 9.9 1.00 0.00 0
07/07/2020 8.01 45.2 243 196 139 40.5 23.0 9.9 3.60 <0.09 14.8 68 0.04 <0.01 <0.01 <0.01 <0.01 <0.45 <0.35 <0.45 <0.03 0.30 16.1 7.53 8.9 2.78 0.02 6
13/08/2020 7.99 45.7 245 197 158 40.2 23.4 10.2 3.79 <0.09 13.5 59 0.10 0.01 0.04 <0.01 <0.01 <0.45 <0.35 <0.45 <0.03 0.55 16.6 7.66 10.1 0.33 <0.001 0
08/09/2020 8.03 48.5 264 216 189 43.1 26.4 12.5 4.91 0.13 17.1 46 0.03 <0.01 <0.01 0.02 0.02 <0.45 <0.35 <0.45 <0.03 0.27 12.8 7.70 14.1 1.20 <0.01 0
02/10/2020 7.90 47.0 247 218 192 38.3 29.6 12.2 3.62 0.12 9.0 39 <0.01 <0.01 <0.01 <0.01 <0.02 <0.45 <0.35 <0.45 <0.03 0.50 5.6 7.21 14.9 0.40 0.01 0
21/11/2019 Dry
05/12/2019 Dry
16/01/2020 Dry
06/02/2020 Dry
09/03/2020 Dry
08/05/2020 Dry
19/05/2020 Dry
02/06/2020 Dry
07/07/2020 Dry
13/08/2020 Dry
07/09/2020 Dry
02/10/2020 Dry
DWAF Domestic Target Water Quality
Range0.050-0.15-45070 32- 0.050.12001001 -
Exxaro Leeuwpan
6.0 - 9.0 01-5-1--615010030
Surface Water
LSW05
LSW06
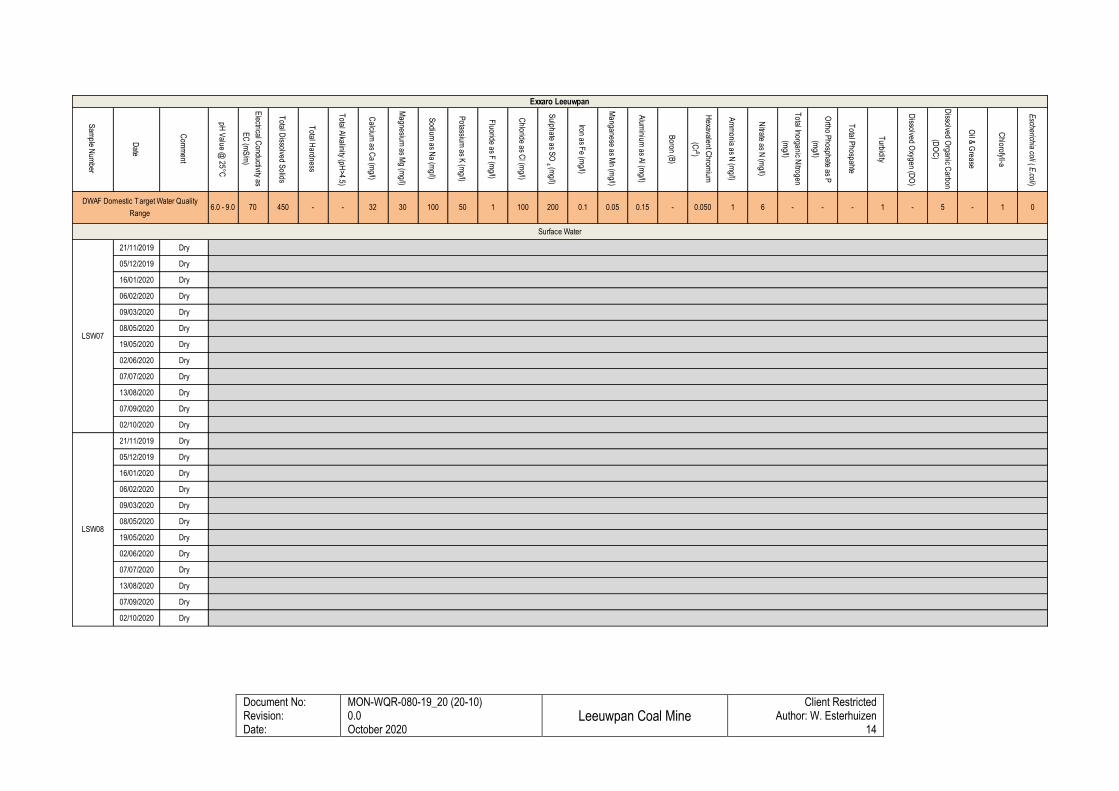
Document No: Revision: Date:
MON-WQR-080-19_20 (20-10) 0.0 October 2020
Leeuwpan Coal Mine
Client Restricted Author: W. Esterhuizen
14
Sam
ple Num
ber
Date
Com
ment
pH V
alue @ 25°C
Electrical C
onductivity as
EC
(mS
/m)
Total D
issolved Solids
Total H
ardness
Total A
lkalinity (pH>4.5)
Calcium
as Ca (m
g/l)
Magnesium
as Mg (m
g/l)
Sodium
as Na (m
g/l)
Potassium
as K (m
g/l)
Fluoride as F
(mg/l)
Chloride as C
l (mg/l)
Sulphate as S
O 4
(mg/l)
Iron as Fe (m
g/l)
Manganese as M
n (mg/l)
Alum
inium as A
l (mg/l)
Boron (B
)
Hexavalent C
hromium
(Cr 6)
Am
monia as N
(mg/l)
Nitrate as N
(mg/l)
Total Inorganic N
itrogen
(mg/l)
Ortho P
hosphate as P
(mg/l)
Total P
hospahte
Turbidity
Dissolved O
xygen (DO
)
Dissolved O
rganic Carbon
(DO
C)
Oil &
Grease
Chlorofyll-a
Escherichia coli ( E
.coli)
21/11/2019 Dry
05/12/2019 Dry
16/01/2020 Dry
06/02/2020 Dry
09/03/2020 Dry
08/05/2020 Dry
19/05/2020 Dry
02/06/2020 Dry
07/07/2020 Dry
13/08/2020 Dry
07/09/2020 Dry
02/10/2020 Dry
21/11/2019 Dry
05/12/2019 Dry
16/01/2020 Dry
06/02/2020 Dry
09/03/2020 Dry
08/05/2020 Dry
19/05/2020 Dry
02/06/2020 Dry
07/07/2020 Dry
13/08/2020 Dry
07/09/2020 Dry
02/10/2020 Dry
DWAF Domestic Target Water Quality
Range0.050-0.15-45070 32- 0.050.12001001 -
Exxaro Leeuwpan
6.0 - 9.0 01-5-1--615010030
Surface Water
LSW07
LSW08
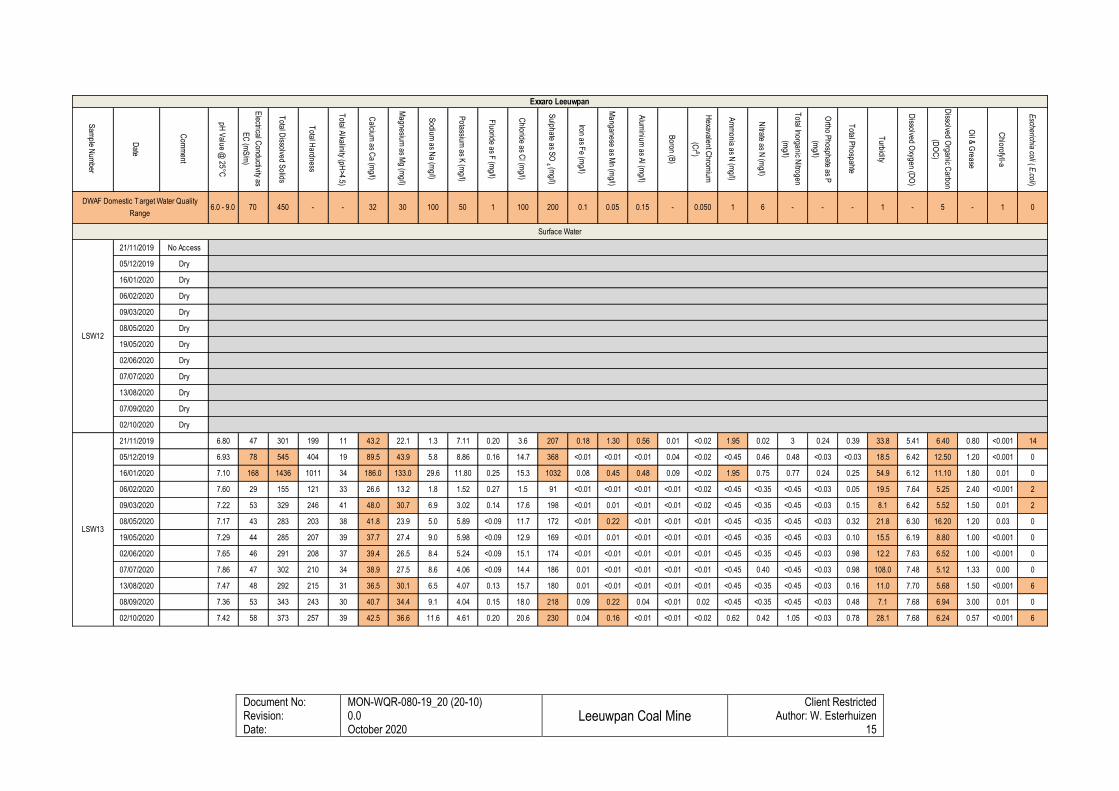
Document No: Revision: Date:
MON-WQR-080-19_20 (20-10) 0.0 October 2020
Leeuwpan Coal Mine
Client Restricted Author: W. Esterhuizen
15
Sam
ple Num
ber
Date
Com
ment
pH V
alue @ 25°C
Electrical C
onductivity as
EC
(mS
/m)
Total D
issolved Solids
Total H
ardness
Total A
lkalinity (pH>4.5)
Calcium
as Ca (m
g/l)
Magnesium
as Mg (m
g/l)
Sodium
as Na (m
g/l)
Potassium
as K (m
g/l)
Fluoride as F
(mg/l)
Chloride as C
l (mg/l)
Sulphate as S
O 4
(mg/l)
Iron as Fe (m
g/l)
Manganese as M
n (mg/l)
Alum
inium as A
l (mg/l)
Boron (B
)
Hexavalent C
hromium
(Cr 6)
Am
monia as N
(mg/l)
Nitrate as N
(mg/l)
Total Inorganic N
itrogen
(mg/l)
Ortho P
hosphate as P
(mg/l)
Total P
hospahte
Turbidity
Dissolved O
xygen (DO
)
Dissolved O
rganic Carbon
(DO
C)
Oil &
Grease
Chlorofyll-a
Escherichia coli ( E
.coli)
21/11/2019 No Access
05/12/2019 Dry
16/01/2020 Dry
06/02/2020 Dry
09/03/2020 Dry
08/05/2020 Dry
19/05/2020 Dry
02/06/2020 Dry
07/07/2020 Dry
13/08/2020 Dry
07/09/2020 Dry
02/10/2020 Dry
21/11/2019 6.80 47 301 199 11 43.2 22.1 1.3 7.11 0.20 3.6 207 0.18 1.30 0.56 0.01 <0.02 1.95 0.02 3 0.24 0.39 33.8 5.41 6.40 0.80 <0.001 14
05/12/2019 6.93 78 545 404 19 89.5 43.9 5.8 8.86 0.16 14.7 368 <0.01 <0.01 <0.01 0.04 <0.02 <0.45 0.46 0.48 <0.03 <0.03 18.5 6.42 12.50 1.20 <0.001 0
16/01/2020 7.10 168 1436 1011 34 186.0 133.0 29.6 11.80 0.25 15.3 1032 0.08 0.45 0.48 0.09 <0.02 1.95 0.75 0.77 0.24 0.25 54.9 6.12 11.10 1.80 0.01 0
06/02/2020 7.60 29 155 121 33 26.6 13.2 1.8 1.52 0.27 1.5 91 <0.01 <0.01 <0.01 <0.01 <0.02 <0.45 <0.35 <0.45 <0.03 0.05 19.5 7.64 5.25 2.40 <0.001 2
09/03/2020 7.22 53 329 246 41 48.0 30.7 6.9 3.02 0.14 17.6 198 <0.01 0.01 <0.01 <0.01 <0.02 <0.45 <0.35 <0.45 <0.03 0.15 8.1 6.42 5.52 1.50 0.01 2
08/05/2020 7.17 43 283 203 38 41.8 23.9 5.0 5.89 <0.09 11.7 172 <0.01 0.22 <0.01 <0.01 <0.01 <0.45 <0.35 <0.45 <0.03 0.32 21.8 6.30 16.20 1.20 0.03 0
19/05/2020 7.29 44 285 207 39 37.7 27.4 9.0 5.98 <0.09 12.9 169 <0.01 0.01 <0.01 <0.01 <0.01 <0.45 <0.35 <0.45 <0.03 0.10 15.5 6.19 8.80 1.00 <0.001 0
02/06/2020 7.65 46 291 208 37 39.4 26.5 8.4 5.24 <0.09 15.1 174 <0.01 <0.01 <0.01 <0.01 <0.01 <0.45 <0.35 <0.45 <0.03 0.98 12.2 7.63 6.52 1.00 <0.001 0
07/07/2020 7.86 47 302 210 34 38.9 27.5 8.6 4.06 <0.09 14.4 186 0.01 <0.01 <0.01 <0.01 <0.01 <0.45 0.40 <0.45 <0.03 0.98 108.0 7.48 5.12 1.33 0.00 0
13/08/2020 7.47 48 292 215 31 36.5 30.1 6.5 4.07 0.13 15.7 180 0.01 <0.01 <0.01 <0.01 <0.01 <0.45 <0.35 <0.45 <0.03 0.16 11.0 7.70 5.68 1.50 <0.001 6
08/09/2020 7.36 53 343 243 30 40.7 34.4 9.1 4.04 0.15 18.0 218 0.09 0.22 0.04 <0.01 0.02 <0.45 <0.35 <0.45 <0.03 0.48 7.1 7.68 6.94 3.00 0.01 0
02/10/2020 7.42 58 373 257 39 42.5 36.6 11.6 4.61 0.20 20.6 230 0.04 0.16 <0.01 <0.01 <0.02 0.62 0.42 1.05 <0.03 0.78 28.1 7.68 6.24 0.57 <0.001 6
DWAF Domestic Target Water Quality
Range0.050-0.15-45070 32- 0.050.12001001 -
Exxaro Leeuwpan
6.0 - 9.0 01-5-1--615010030
Surface Water
LSW12
LSW13
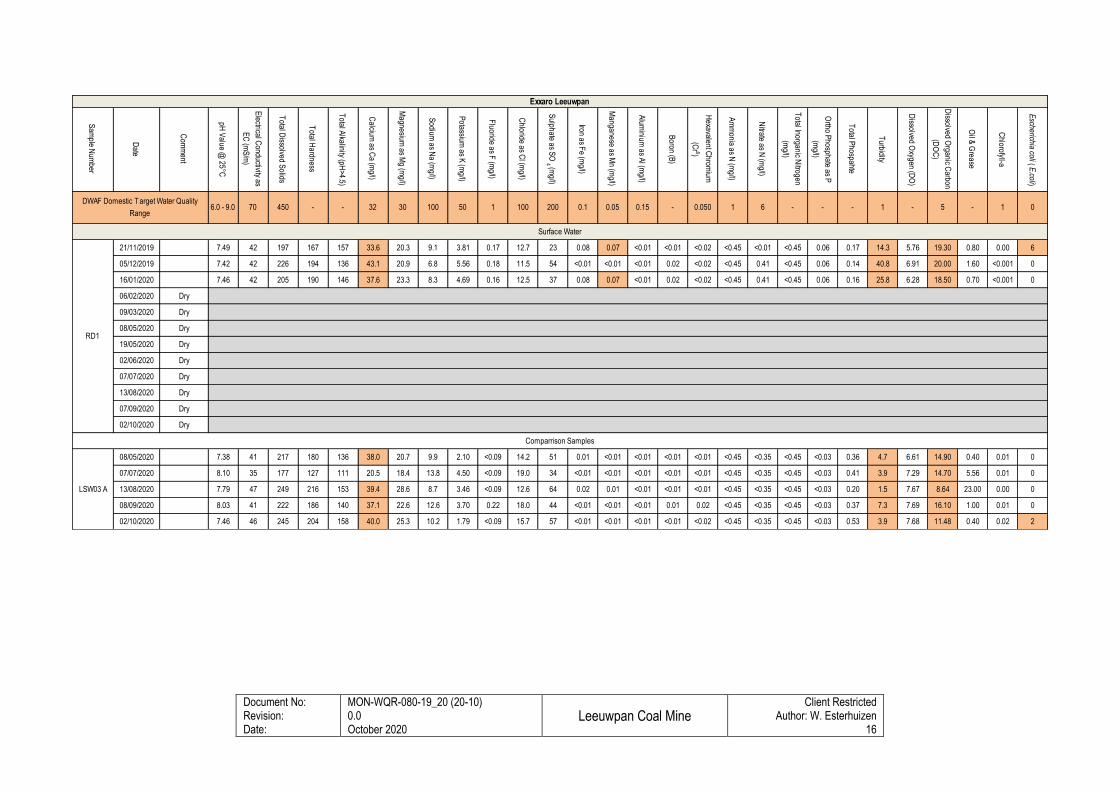
Document No: Revision: Date:
MON-WQR-080-19_20 (20-10) 0.0 October 2020
Leeuwpan Coal Mine
Client Restricted Author: W. Esterhuizen
16
Sam
ple Num
ber
Date
Com
ment
pH V
alue @ 25°C
Electrical C
onductivity as
EC
(mS
/m)
Total D
issolved Solids
Total H
ardness
Total A
lkalinity (pH>4.5)
Calcium
as Ca (m
g/l)
Magnesium
as Mg (m
g/l)
Sodium
as Na (m
g/l)
Potassium
as K (m
g/l)
Fluoride as F
(mg/l)
Chloride as C
l (mg/l)
Sulphate as S
O 4
(mg/l)
Iron as Fe (m
g/l)
Manganese as M
n (mg/l)
Alum
inium as A
l (mg/l)
Boron (B
)
Hexavalent C
hromium
(Cr 6)
Am
monia as N
(mg/l)
Nitrate as N
(mg/l)
Total Inorganic N
itrogen
(mg/l)
Ortho P
hosphate as P
(mg/l)
Total P
hospahte
Turbidity
Dissolved O
xygen (DO
)
Dissolved O
rganic Carbon
(DO
C)
Oil &
Grease
Chlorofyll-a
Escherichia coli ( E
.coli)
21/11/2019 7.49 42 197 167 157 33.6 20.3 9.1 3.81 0.17 12.7 23 0.08 0.07 <0.01 <0.01 <0.02 <0.45 <0.01 <0.45 0.06 0.17 14.3 5.76 19.30 0.80 0.00 6
05/12/2019 7.42 42 226 194 136 43.1 20.9 6.8 5.56 0.18 11.5 54 <0.01 <0.01 <0.01 0.02 <0.02 <0.45 0.41 <0.45 0.06 0.14 40.8 6.91 20.00 1.60 <0.001 0
16/01/2020 7.46 42 205 190 146 37.6 23.3 8.3 4.69 0.16 12.5 37 0.08 0.07 <0.01 0.02 <0.02 <0.45 0.41 <0.45 0.06 0.16 25.8 6.28 18.50 0.70 <0.001 0
06/02/2020 Dry
09/03/2020 Dry
08/05/2020 Dry
19/05/2020 Dry
02/06/2020 Dry
07/07/2020 Dry
13/08/2020 Dry
07/09/2020 Dry
02/10/2020 Dry
08/05/2020 7.38 41 217 180 136 38.0 20.7 9.9 2.10 <0.09 14.2 51 0.01 <0.01 <0.01 <0.01 <0.01 <0.45 <0.35 <0.45 <0.03 0.36 4.7 6.61 14.90 0.40 0.01 0
07/07/2020 8.10 35 177 127 111 20.5 18.4 13.8 4.50 <0.09 19.0 34 <0.01 <0.01 <0.01 <0.01 <0.01 <0.45 <0.35 <0.45 <0.03 0.41 3.9 7.29 14.70 5.56 0.01 0
13/08/2020 7.79 47 249 216 153 39.4 28.6 8.7 3.46 <0.09 12.6 64 0.02 0.01 <0.01 <0.01 <0.01 <0.45 <0.35 <0.45 <0.03 0.20 1.5 7.67 8.64 23.00 0.00 0
08/09/2020 8.03 41 222 186 140 37.1 22.6 12.6 3.70 0.22 18.0 44 <0.01 <0.01 <0.01 0.01 0.02 <0.45 <0.35 <0.45 <0.03 0.37 7.3 7.69 16.10 1.00 0.01 0
02/10/2020 7.46 46 245 204 158 40.0 25.3 10.2 1.79 <0.09 15.7 57 <0.01 <0.01 <0.01 <0.01 <0.02 <0.45 <0.35 <0.45 <0.03 0.53 3.9 7.68 11.48 0.40 0.02 2
DWAF Domestic Target Water Quality
Range0.050-0.15-45070 32- 0.050.12001001 -
Exxaro Leeuwpan
6.0 - 9.0 01-5-1--615010030
Comparrison Samples
Surface Water
RD1
LSW03 A
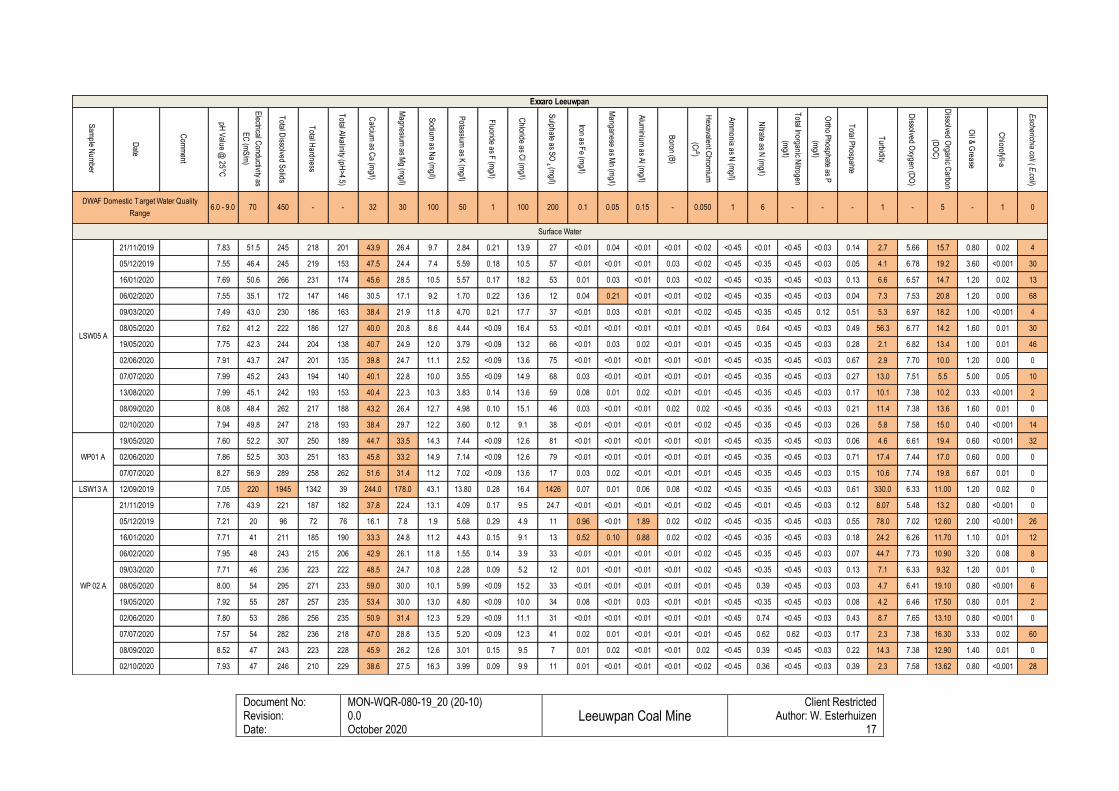
Document No: Revision: Date:
MON-WQR-080-19_20 (20-10) 0.0 October 2020
Leeuwpan Coal Mine
Client Restricted Author: W. Esterhuizen
17
Sam
ple Num
ber
Date
Com
ment
pH V
alue @ 25°C
Electrical C
onductivity as
EC
(mS
/m)
Total D
issolved Solids
Total H
ardness
Total A
lkalinity (pH>4.5)
Calcium
as Ca (m
g/l)
Magnesium
as Mg (m
g/l)
Sodium
as Na (m
g/l)
Potassium
as K (m
g/l)
Fluoride as F
(mg/l)
Chloride as C
l (mg/l)
Sulphate as S
O 4
(mg/l)
Iron as Fe (m
g/l)
Manganese as M
n (mg/l)
Alum
inium as A
l (mg/l)
Boron (B
)
Hexavalent C
hromium
(Cr 6)
Am
monia as N
(mg/l)
Nitrate as N
(mg/l)
Total Inorganic N
itrogen
(mg/l)
Ortho P
hosphate as P
(mg/l)
Total P
hospahte
Turbidity
Dissolved O
xygen (DO
)
Dissolved O
rganic Carbon
(DO
C)
Oil &
Grease
Chlorofyll-a
Escherichia coli (
E.coli)
21/11/2019 7.83 51.5 245 218 201 43.9 26.4 9.7 2.84 0.21 13.9 27 <0.01 0.04 <0.01 <0.01 <0.02 <0.45 <0.01 <0.45 <0.03 0.14 2.7 5.66 15.7 0.80 0.02 4
05/12/2019 7.55 46.4 245 219 153 47.5 24.4 7.4 5.59 0.18 10.5 57 <0.01 <0.01 <0.01 0.03 <0.02 <0.45 <0.35 <0.45 <0.03 0.05 4.1 6.78 19.2 3.60 <0.001 30
16/01/2020 7.69 50.6 266 231 174 45.6 28.5 10.5 5.57 0.17 18.2 53 0.01 0.03 <0.01 0.03 <0.02 <0.45 <0.35 <0.45 <0.03 0.13 6.6 6.57 14.7 1.20 0.02 13
06/02/2020 7.55 35.1 172 147 146 30.5 17.1 9.2 1.70 0.22 13.6 12 0.04 0.21 <0.01 <0.01 <0.02 <0.45 <0.35 <0.45 <0.03 0.04 7.3 7.53 20.8 1.20 0.00 68
09/03/2020 7.49 43.0 230 186 163 38.4 21.9 11.8 4.70 0.21 17.7 37 <0.01 0.03 <0.01 <0.01 <0.02 <0.45 <0.35 <0.45 0.12 0.51 5.3 6.97 18.2 1.00 <0.001 4
08/05/2020 7.62 41.2 222 186 127 40.0 20.8 8.6 4.44 <0.09 16.4 53 <0.01 <0.01 <0.01 <0.01 <0.01 <0.45 0.64 <0.45 <0.03 0.49 56.3 6.77 14.2 1.60 0.01 30
19/05/2020 7.75 42.3 244 204 138 40.7 24.9 12.0 3.79 <0.09 13.2 66 <0.01 0.03 0.02 <0.01 <0.01 <0.45 <0.35 <0.45 <0.03 0.28 2.1 6.82 13.4 1.00 0.01 46
02/06/2020 7.91 43.7 247 201 135 39.8 24.7 11.1 2.52 <0.09 13.6 75 <0.01 <0.01 <0.01 <0.01 <0.01 <0.45 <0.35 <0.45 <0.03 0.67 2.9 7.70 10.0 1.20 0.00 0
07/07/2020 7.99 45.2 243 194 140 40.1 22.8 10.0 3.55 <0.09 14.9 68 0.03 <0.01 <0.01 <0.01 <0.01 <0.45 <0.35 <0.45 <0.03 0.27 13.0 7.51 5.5 5.00 0.05 10
13/08/2020 7.99 45.1 242 193 153 40.4 22.3 10.3 3.83 0.14 13.6 59 0.08 0.01 0.02 <0.01 <0.01 <0.45 <0.35 <0.45 <0.03 0.17 10.1 7.38 10.2 0.33 <0.001 2
08/09/2020 8.08 48.4 262 217 188 43.2 26.4 12.7 4.98 0.10 15.1 46 0.03 <0.01 <0.01 0.02 0.02 <0.45 <0.35 <0.45 <0.03 0.21 11.4 7.38 13.6 1.60 0.01 0
02/10/2020 7.94 49.8 247 218 193 38.4 29.7 12.2 3.60 0.12 9.1 38 <0.01 <0.01 <0.01 <0.01 <0.02 <0.45 <0.35 <0.45 <0.03 0.26 5.8 7.58 15.0 0.40 <0.001 14
19/05/2020 7.60 52.2 307 250 189 44.7 33.5 14.3 7.44 <0.09 12.6 81 <0.01 <0.01 <0.01 <0.01 <0.01 <0.45 <0.35 <0.45 <0.03 0.06 4.6 6.61 19.4 0.60 <0.001 32
02/06/2020 7.86 52.5 303 251 183 45.8 33.2 14.9 7.14 <0.09 12.6 79 <0.01 <0.01 <0.01 <0.01 <0.01 <0.45 <0.35 <0.45 <0.03 0.71 17.4 7.44 17.0 0.60 0.00 0
07/07/2020 8.27 56.9 289 258 262 51.6 31.4 11.2 7.02 <0.09 13.6 17 0.03 0.02 <0.01 <0.01 <0.01 <0.45 <0.35 <0.45 <0.03 0.15 10.6 7.74 19.8 6.67 0.01 0
12/09/2019 7.05 220 1945 1342 39 244.0 178.0 43.1 13.80 0.28 16.4 1426 0.07 0.01 0.06 0.08 <0.02 <0.45 <0.35 <0.45 <0.03 0.61 330.0 6.33 11.00 1.20 0.02 0
21/11/2019 7.76 43.9 221 187 182 37.8 22.4 13.1 4.09 0.17 9.5 24.7 <0.01 <0.01 <0.01 <0.01 <0.02 <0.45 <0.01 <0.45 <0.03 0.12 8.07 5.48 13.2 0.80 <0.001 0
05/12/2019 7.21 20 96 72 76 16.1 7.8 1.9 5.68 0.29 4.9 11 0.96 <0.01 1.89 0.02 <0.02 <0.45 <0.35 <0.45 <0.03 0.55 78.0 7.02 12.60 2.00 <0.001 26
16/01/2020 7.71 41 211 185 190 33.3 24.8 11.2 4.43 0.15 9.1 13 0.52 0.10 0.88 0.02 <0.02 <0.45 <0.35 <0.45 <0.03 0.18 24.2 6.26 11.70 1.10 0.01 12
06/02/2020 7.95 48 243 215 206 42.9 26.1 11.8 1.55 0.14 3.9 33 <0.01 <0.01 <0.01 <0.01 <0.02 <0.45 <0.35 <0.45 <0.03 0.07 44.7 7.73 10.90 3.20 0.08 8
09/03/2020 7.71 46 236 223 222 48.5 24.7 10.8 2.28 0.09 5.2 12 0.01 <0.01 <0.01 <0.01 <0.02 <0.45 <0.35 <0.45 <0.03 0.13 7.1 6.33 9.32 1.20 0.01 0
08/05/2020 8.00 54 295 271 233 59.0 30.0 10.1 5.99 <0.09 15.2 33 <0.01 <0.01 <0.01 <0.01 <0.01 <0.45 0.39 <0.45 <0.03 0.03 4.7 6.41 19.10 0.80 <0.001 6
19/05/2020 7.92 55 287 257 235 53.4 30.0 13.0 4.80 <0.09 10.0 34 0.08 <0.01 0.03 <0.01 <0.01 <0.45 <0.35 <0.45 <0.03 0.08 4.2 6.46 17.50 0.80 0.01 2
02/06/2020 7.80 53 286 256 235 50.9 31.4 12.3 5.29 <0.09 11.1 31 <0.01 <0.01 <0.01 <0.01 <0.01 <0.45 0.74 <0.45 <0.03 0.43 8.7 7.65 13.10 0.80 <0.001 0
07/07/2020 7.57 54 282 236 218 47.0 28.8 13.5 5.20 <0.09 12.3 41 0.02 0.01 <0.01 <0.01 <0.01 <0.45 0.62 0.62 <0.03 0.17 2.3 7.38 16.30 3.33 0.02 60
08/09/2020 8.52 47 243 223 228 45.9 26.2 12.6 3.01 0.15 9.5 7 0.01 0.02 <0.01 <0.01 0.02 <0.45 0.39 <0.45 <0.03 0.22 14.3 7.38 12.90 1.40 0.01 0
02/10/2020 7.93 47 246 210 229 38.6 27.5 16.3 3.99 0.09 9.9 11 0.01 <0.01 <0.01 <0.01 <0.02 <0.45 0.36 <0.45 <0.03 0.39 2.3 7.58 13.62 0.80 <0.001 28
DWAF Domestic Target Water Quality
Range0.050-0.15-45070 32- 0.050.12001001 -
Exxaro Leeuwpan
6.0 - 9.0 01-5-1--615010030
LSW05 A
LSW13 A
WP 02 A
Surface Water
WP01 A
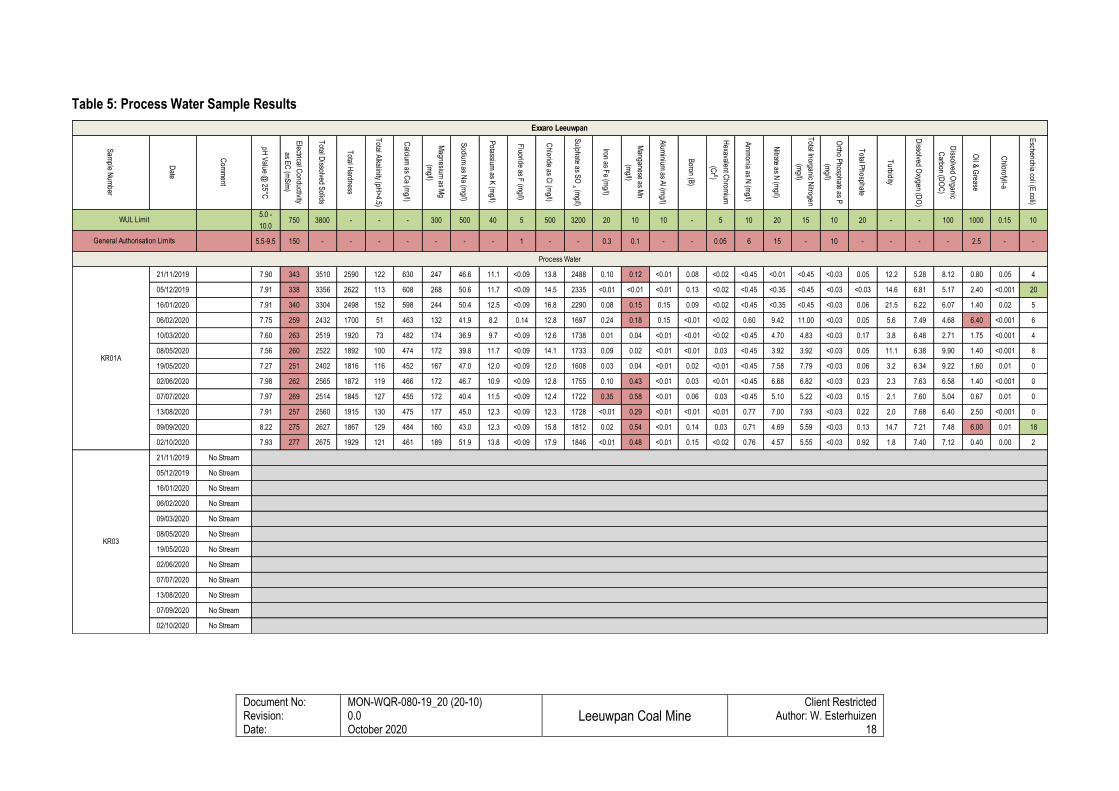
Document No: Revision: Date:
MON-WQR-080-19_20 (20-10) 0.0 October 2020
Leeuwpan Coal Mine
Client Restricted Author: W. Esterhuizen
18
Table 5: Process Water Sample Results
Sam
ple Num
ber
Date
Com
ment
pH V
alue @ 25°C
Electrical C
onductivity
as EC
(mS
/m)
Total D
issolved Solids
Total H
ardness
Total A
lkalinity (pH>4.5)
Calcium
as Ca (m
g/l)
Magnesium
as Mg
(mg/l)
Sodium
as Na (m
g/l)
Potassium
as K (m
g/l)
Fluoride as F
(mg/l)
Chloride as C
l (mg/l)
Sulphate as S
O 4 (m
g/l)
Iron as Fe (m
g/l)
Manganese as M
n
(mg/l)
Alum
inium as A
l (mg/l)
Boron (B
)
Hexavalent C
hromium
(Cr 6)
Am
monia as N
(mg/l)
Nitrate as N
(mg/l)
Total Inorganic N
itrogen
(mg/l)
Ortho P
hosphate as P
(mg/l)
Total P
hosphate
Turbidity
Dissolved O
xygen (DO
)
Dissolved O
rganic
Carbon (D
OC
)
Oil &
Grease
Chlorofyll-a
Escherichia coli (E
.coli)
5.0 -
10.0 750 3800 - - - 300 500 40 5 500 3200 20 10 10 - 5 10 20 15 10 20 - - 100 1000 0.15 10
5.5-9.5 150 - - - - - - - 1 - - 0.3 0.1 - - 0.05 6 15 - 10 - - - - 2.5 - -
21/11/2019 7.90 343 3510 2590 122 630 247 46.6 11.1 <0.09 13.8 2488 0.10 0.12 <0.01 0.08 <0.02 <0.45 <0.01 <0.45 <0.03 0.05 12.2 5.28 8.12 0.80 0.05 4
05/12/2019 7.91 338 3356 2622 113 608 268 50.6 11.7 <0.09 14.5 2335 <0.01 <0.01 <0.01 0.13 <0.02 <0.45 <0.35 <0.45 <0.03 <0.03 14.6 6.81 5.17 2.40 <0.001 20
16/01/2020 7.91 340 3304 2498 152 598 244 50.4 12.5 <0.09 16.8 2290 0.08 0.15 0.15 0.09 <0.02 <0.45 <0.35 <0.45 <0.03 0.06 21.5 6.22 6.07 1.40 0.02 5
06/02/2020 7.75 259 2432 1700 51 463 132 41.9 8.2 0.14 12.8 1697 0.24 0.18 0.15 <0.01 <0.02 0.60 9.42 11.00 <0.03 0.05 5.6 7.49 4.68 6.40 <0.001 6
10/03/2020 7.60 263 2519 1920 73 482 174 36.9 9.7 <0.09 12.6 1738 0.01 0.04 <0.01 <0.01 <0.02 <0.45 4.70 4.83 <0.03 0.17 3.8 6.48 2.71 1.75 <0.001 4
08/05/2020 7.56 260 2522 1892 100 474 172 39.8 11.7 <0.09 14.1 1733 0.09 0.02 <0.01 <0.01 0.03 <0.45 3.92 3.92 <0.03 0.05 11.1 6.38 9.90 1.40 <0.001 8
19/05/2020 7.27 251 2402 1816 116 452 167 47.0 12.0 <0.09 12.0 1608 0.03 0.04 <0.01 0.02 <0.01 <0.45 7.58 7.79 <0.03 0.06 3.2 6.34 9.22 1.60 0.01 0
02/06/2020 7.98 262 2565 1872 119 466 172 46.7 10.9 <0.09 12.8 1755 0.10 0.43 <0.01 0.03 <0.01 <0.45 6.68 6.82 <0.03 0.23 2.3 7.63 6.58 1.40 <0.001 0
07/07/2020 7.97 269 2514 1845 127 455 172 40.4 11.5 <0.09 12.4 1722 0.35 0.58 <0.01 0.06 0.03 <0.45 5.10 5.22 <0.03 0.15 2.1 7.60 5.04 0.67 0.01 0
13/08/2020 7.91 257 2560 1915 130 475 177 45.0 12.3 <0.09 12.3 1728 <0.01 0.29 <0.01 <0.01 <0.01 0.77 7.00 7.93 <0.03 0.22 2.0 7.68 6.40 2.50 <0.001 0
09/09/2020 8.22 275 2627 1867 129 484 160 43.0 12.3 <0.09 15.8 1812 0.02 0.54 <0.01 0.14 0.03 0.71 4.69 5.59 <0.03 0.13 14.7 7.21 7.48 6.00 0.01 18
02/10/2020 7.93 277 2675 1929 121 461 189 51.9 13.8 <0.09 17.9 1846 <0.01 0.48 <0.01 0.15 <0.02 0.76 4.57 5.55 <0.03 0.92 1.8 7.40 7.12 0.40 0.00 2
21/11/2019 No Stream
05/12/2019 No Stream
16/01/2020 No Stream
06/02/2020 No Stream
09/03/2020 No Stream
08/05/2020 No Stream
19/05/2020 No Stream
02/06/2020 No Stream
07/07/2020 No Stream
13/08/2020 No Stream
07/09/2020 No Stream
02/10/2020 No Stream
Exxaro Leeuwpan
WUL Limit
Process Water
General Authorisation Limits
KR01A
KR03
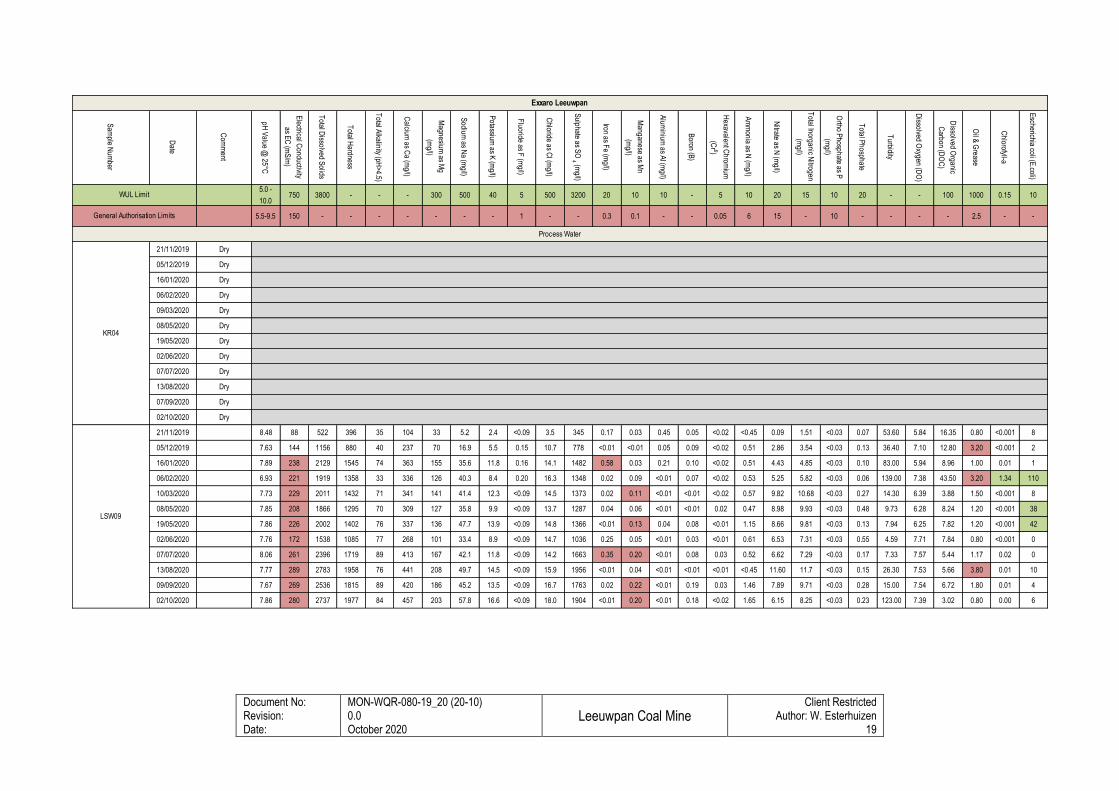
Document No: Revision: Date:
MON-WQR-080-19_20 (20-10) 0.0 October 2020
Leeuwpan Coal Mine
Client Restricted Author: W. Esterhuizen
19
Sam
ple Num
ber
Date
Com
ment
pH V
alue @ 25°C
Electrical C
onductivity
as EC
(mS
/m)
Total D
issolved Solids
Total H
ardness
Total A
lkalinity (pH>4.5)
Calcium
as Ca (m
g/l)
Magnesium
as Mg
(mg/l)
Sodium
as Na (m
g/l)
Potassium
as K (m
g/l)
Fluoride as F
(mg/l)
Chloride as C
l (mg/l)
Sulphate as S
O 4 (m
g/l)
Iron as Fe (m
g/l)
Manganese as M
n
(mg/l)
Alum
inium as A
l (mg/l)
Boron (B
)
Hexavalent C
hromium
(Cr 6)
Am
monia as N
(mg/l)
Nitrate as N
(mg/l)
Total Inorganic N
itrogen
(mg/l)
Ortho P
hosphate as P
(mg/l)
Total P
hosphate
Turbidity
Dissolved O
xygen (DO
)
Dissolved O
rganic
Carbon (D
OC
)
Oil &
Grease
Chlorofyll-a
Escherichia coli (E
.coli)
5.0 -
10.0 750 3800 - - - 300 500 40 5 500 3200 20 10 10 - 5 10 20 15 10 20 - - 100 1000 0.15 10
5.5-9.5 150 - - - - - - - 1 - - 0.3 0.1 - - 0.05 6 15 - 10 - - - - 2.5 - -
21/11/2019 Dry
05/12/2019 Dry
16/01/2020 Dry
06/02/2020 Dry
09/03/2020 Dry
08/05/2020 Dry
19/05/2020 Dry
02/06/2020 Dry
07/07/2020 Dry
13/08/2020 Dry
07/09/2020 Dry
02/10/2020 Dry
21/11/2019 8.48 88 522 396 35 104 33 5.2 2.4 <0.09 3.5 345 0.17 0.03 0.45 0.05 <0.02 <0.45 0.09 1.51 <0.03 0.07 53.60 5.84 16.35 0.80 <0.001 8
05/12/2019 7.63 144 1156 880 40 237 70 16.9 5.5 0.15 10.7 778 <0.01 <0.01 0.05 0.09 <0.02 0.51 2.86 3.54 <0.03 0.13 36.40 7.10 12.80 3.20 <0.001 2
16/01/2020 7.89 238 2129 1545 74 363 155 35.6 11.8 0.16 14.1 1482 0.58 0.03 0.21 0.10 <0.02 0.51 4.43 4.85 <0.03 0.10 83.00 5.94 8.96 1.00 0.01 1
06/02/2020 6.93 221 1919 1358 33 336 126 40.3 8.4 0.20 16.3 1348 0.02 0.09 <0.01 0.07 <0.02 0.53 5.25 5.82 <0.03 0.06 139.00 7.38 43.50 3.20 1.34 110
10/03/2020 7.73 229 2011 1432 71 341 141 41.4 12.3 <0.09 14.5 1373 0.02 0.11 <0.01 <0.01 <0.02 0.57 9.82 10.68 <0.03 0.27 14.30 6.39 3.88 1.50 <0.001 8
08/05/2020 7.85 208 1866 1295 70 309 127 35.8 9.9 <0.09 13.7 1287 0.04 0.06 <0.01 <0.01 0.02 0.47 8.98 9.93 <0.03 0.48 9.73 6.28 8.24 1.20 <0.001 38
19/05/2020 7.86 226 2002 1402 76 337 136 47.7 13.9 <0.09 14.8 1366 <0.01 0.13 0.04 0.08 <0.01 1.15 8.66 9.81 <0.03 0.13 7.94 6.25 7.82 1.20 <0.001 42
02/06/2020 7.76 172 1538 1085 77 268 101 33.4 8.9 <0.09 14.7 1036 0.25 0.05 <0.01 0.03 <0.01 0.61 6.53 7.31 <0.03 0.55 4.59 7.71 7.84 0.80 <0.001 0
07/07/2020 8.06 261 2396 1719 89 413 167 42.1 11.8 <0.09 14.2 1663 0.35 0.20 <0.01 0.08 0.03 0.52 6.62 7.29 <0.03 0.17 7.33 7.57 5.44 1.17 0.02 0
13/08/2020 7.77 289 2783 1958 76 441 208 49.7 14.5 <0.09 15.9 1956 <0.01 0.04 <0.01 <0.01 <0.01 <0.45 11.60 11.7 <0.03 0.15 26.30 7.53 5.66 3.80 0.01 10
09/09/2020 7.67 269 2536 1815 89 420 186 45.2 13.5 <0.09 16.7 1763 0.02 0.22 <0.01 0.19 0.03 1.46 7.89 9.71 <0.03 0.28 15.00 7.54 6.72 1.80 0.01 4
02/10/2020 7.86 280 2737 1977 84 457 203 57.8 16.6 <0.09 18.0 1904 <0.01 0.20 <0.01 0.18 <0.02 1.65 6.15 8.25 <0.03 0.23 123.00 7.39 3.02 0.80 0.00 6
Exxaro Leeuwpan
WUL Limit
Process Water
General Authorisation Limits
KR04
LSW09
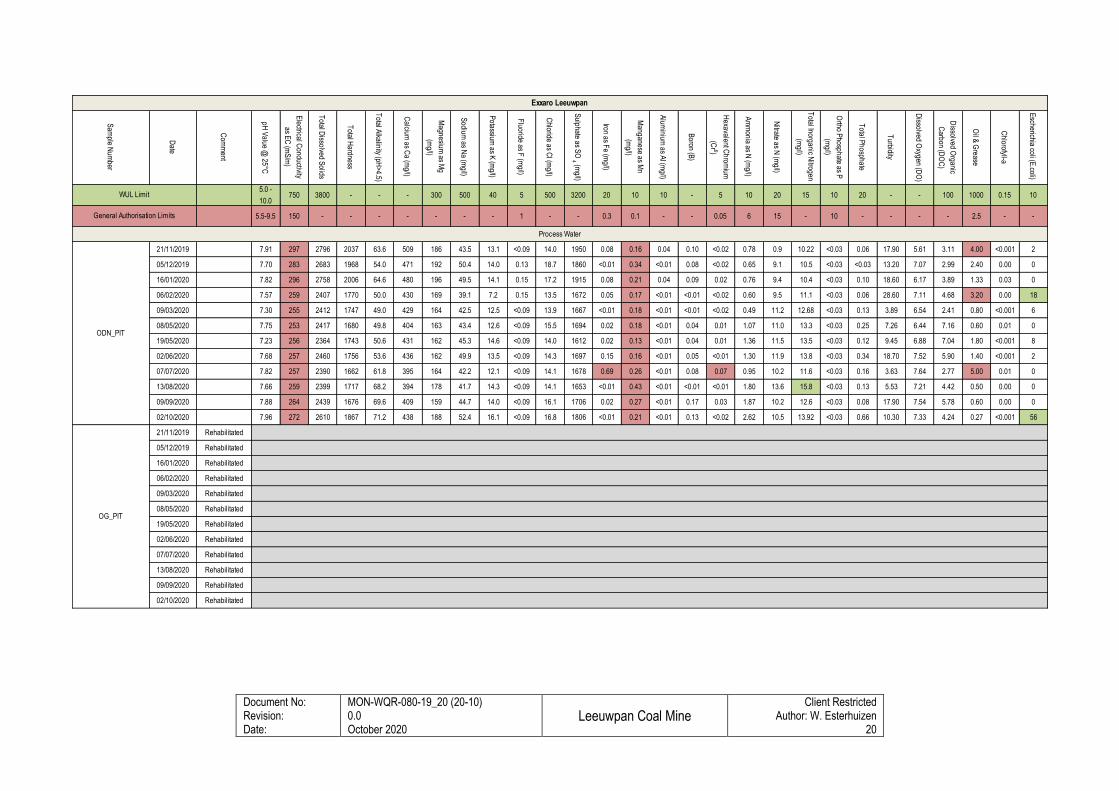
Document No: Revision: Date:
MON-WQR-080-19_20 (20-10) 0.0 October 2020
Leeuwpan Coal Mine
Client Restricted Author: W. Esterhuizen
20
Sam
ple Num
ber
Date
Com
ment
pH V
alue @ 25°C
Electrical C
onductivity
as EC
(mS
/m)
Total D
issolved Solids
Total H
ardness
Total A
lkalinity (pH>4.5)
Calcium
as Ca (m
g/l)
Magnesium
as Mg
(mg/l)
Sodium
as Na (m
g/l)
Potassium
as K (m
g/l)
Fluoride as F
(mg/l)
Chloride as C
l (mg/l)
Sulphate as S
O 4 (m
g/l)
Iron as Fe (m
g/l)
Manganese as M
n
(mg/l)
Alum
inium as A
l (mg/l)
Boron (B
)
Hexavalent C
hromium
(Cr 6)
Am
monia as N
(mg/l)
Nitrate as N
(mg/l)
Total Inorganic N
itrogen
(mg/l)
Ortho P
hosphate as P
(mg/l)
Total P
hosphate
Turbidity
Dissolved O
xygen (DO
)
Dissolved O
rganic
Carbon (D
OC
)
Oil &
Grease
Chlorofyll-a
Escherichia coli (E
.coli)
5.0 -
10.0 750 3800 - - - 300 500 40 5 500 3200 20 10 10 - 5 10 20 15 10 20 - - 100 1000 0.15 10
5.5-9.5 150 - - - - - - - 1 - - 0.3 0.1 - - 0.05 6 15 - 10 - - - - 2.5 - -
21/11/2019 7.91 297 2796 2037 63.6 509 186 43.5 13.1 <0.09 14.0 1950 0.08 0.16 0.04 0.10 <0.02 0.78 0.9 10.22 <0.03 0.06 17.90 5.61 3.11 4.00 <0.001 2
05/12/2019 7.70 283 2683 1968 54.0 471 192 50.4 14.0 0.13 18.7 1860 <0.01 0.34 <0.01 0.08 <0.02 0.65 9.1 10.5 <0.03 <0.03 13.20 7.07 2.99 2.40 0.00 0
16/01/2020 7.82 296 2758 2006 64.6 480 196 49.5 14.1 0.15 17.2 1915 0.08 0.21 0.04 0.09 0.02 0.76 9.4 10.4 <0.03 0.10 18.60 6.17 3.89 1.33 0.03 0
06/02/2020 7.57 259 2407 1770 50.0 430 169 39.1 7.2 0.15 13.5 1672 0.05 0.17 <0.01 <0.01 <0.02 0.60 9.5 11.1 <0.03 0.06 28.60 7.11 4.68 3.20 0.00 18
09/03/2020 7.30 255 2412 1747 49.0 429 164 42.5 12.5 <0.09 13.9 1667 <0.01 0.18 <0.01 <0.01 <0.02 0.49 11.2 12.68 <0.03 0.13 3.89 6.54 2.41 0.80 <0.001 6
08/05/2020 7.75 253 2417 1680 49.8 404 163 43.4 12.6 <0.09 15.5 1694 0.02 0.18 <0.01 0.04 0.01 1.07 11.0 13.3 <0.03 0.25 7.26 6.44 7.16 0.60 0.01 0
19/05/2020 7.23 256 2364 1743 50.6 431 162 45.3 14.6 <0.09 14.0 1612 0.02 0.13 <0.01 0.04 0.01 1.36 11.5 13.5 <0.03 0.12 9.45 6.88 7.04 1.80 <0.001 8
02/06/2020 7.68 257 2460 1756 53.6 436 162 49.9 13.5 <0.09 14.3 1697 0.15 0.16 <0.01 0.05 <0.01 1.30 11.9 13.8 <0.03 0.34 18.70 7.52 5.90 1.40 <0.001 2
07/07/2020 7.82 257 2390 1662 61.8 395 164 42.2 12.1 <0.09 14.1 1678 0.69 0.26 <0.01 0.08 0.07 0.95 10.2 11.6 <0.03 0.16 3.63 7.64 2.77 5.00 0.01 0
13/08/2020 7.66 259 2399 1717 68.2 394 178 41.7 14.3 <0.09 14.1 1653 <0.01 0.43 <0.01 <0.01 <0.01 1.80 13.6 15.8 <0.03 0.13 5.53 7.21 4.42 0.50 0.00 0
09/09/2020 7.88 264 2439 1676 69.6 409 159 44.7 14.0 <0.09 16.1 1706 0.02 0.27 <0.01 0.17 0.03 1.87 10.2 12.6 <0.03 0.08 17.90 7.54 5.78 0.60 0.00 0
02/10/2020 7.96 272 2610 1867 71.2 438 188 52.4 16.1 <0.09 16.8 1806 <0.01 0.21 <0.01 0.13 <0.02 2.62 10.5 13.92 <0.03 0.66 10.30 7.33 4.24 0.27 <0.001 56
21/11/2019 Rehabilitated
05/12/2019 Rehabilitated
16/01/2020 Rehabilitated
06/02/2020 Rehabilitated
09/03/2020 Rehabilitated
08/05/2020 Rehabilitated
19/05/2020 Rehabilitated
02/06/2020 Rehabilitated
07/07/2020 Rehabilitated
13/08/2020 Rehabilitated
09/09/2020 Rehabilitated
02/10/2020 Rehabilitated
Exxaro Leeuwpan
WUL Limit
Process Water
General Authorisation Limits
ODN_PIT
OG_PIT
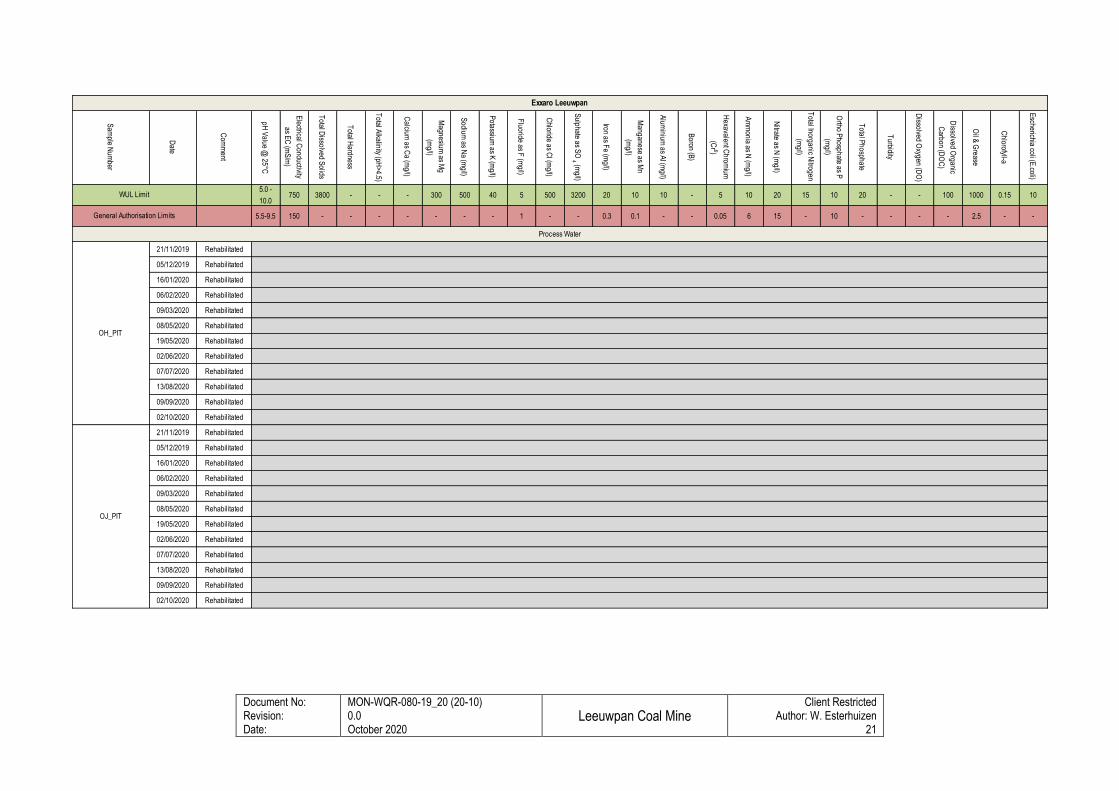
Document No: Revision: Date:
MON-WQR-080-19_20 (20-10) 0.0 October 2020
Leeuwpan Coal Mine
Client Restricted Author: W. Esterhuizen
21
Sam
ple Num
ber
Date
Com
ment
pH V
alue @ 25°C
Electrical C
onductivity
as EC
(mS
/m)
Total D
issolved Solids
Total H
ardness
Total A
lkalinity (pH>4.5)
Calcium
as Ca (m
g/l)
Magnesium
as Mg
(mg/l)
Sodium
as Na (m
g/l)
Potassium
as K (m
g/l)
Fluoride as F
(mg/l)
Chloride as C
l (mg/l)
Sulphate as S
O 4 (m
g/l)
Iron as Fe (m
g/l)
Manganese as M
n
(mg/l)
Alum
inium as A
l (mg/l)
Boron (B
)
Hexavalent C
hromium
(Cr 6)
Am
monia as N
(mg/l)
Nitrate as N
(mg/l)
Total Inorganic N
itrogen
(mg/l)
Ortho P
hosphate as P
(mg/l)
Total P
hosphate
Turbidity
Dissolved O
xygen (DO
)
Dissolved O
rganic
Carbon (D
OC
)
Oil &
Grease
Chlorofyll-a
Escherichia coli (E
.coli)
5.0 -
10.0 750 3800 - - - 300 500 40 5 500 3200 20 10 10 - 5 10 20 15 10 20 - - 100 1000 0.15 10
5.5-9.5 150 - - - - - - - 1 - - 0.3 0.1 - - 0.05 6 15 - 10 - - - - 2.5 - -
21/11/2019 Rehabilitated
05/12/2019 Rehabilitated
16/01/2020 Rehabilitated
06/02/2020 Rehabilitated
09/03/2020 Rehabilitated
08/05/2020 Rehabilitated
19/05/2020 Rehabilitated
02/06/2020 Rehabilitated
07/07/2020 Rehabilitated
13/08/2020 Rehabilitated
09/09/2020 Rehabilitated
02/10/2020 Rehabilitated
21/11/2019 Rehabilitated
05/12/2019 Rehabilitated
16/01/2020 Rehabilitated
06/02/2020 Rehabilitated
09/03/2020 Rehabilitated
08/05/2020 Rehabilitated
19/05/2020 Rehabilitated
02/06/2020 Rehabilitated
07/07/2020 Rehabilitated
13/08/2020 Rehabilitated
09/09/2020 Rehabilitated
02/10/2020 Rehabilitated
OJ_PIT
Exxaro Leeuwpan
WUL Limit
Process Water
General Authorisation Limits
OH_PIT
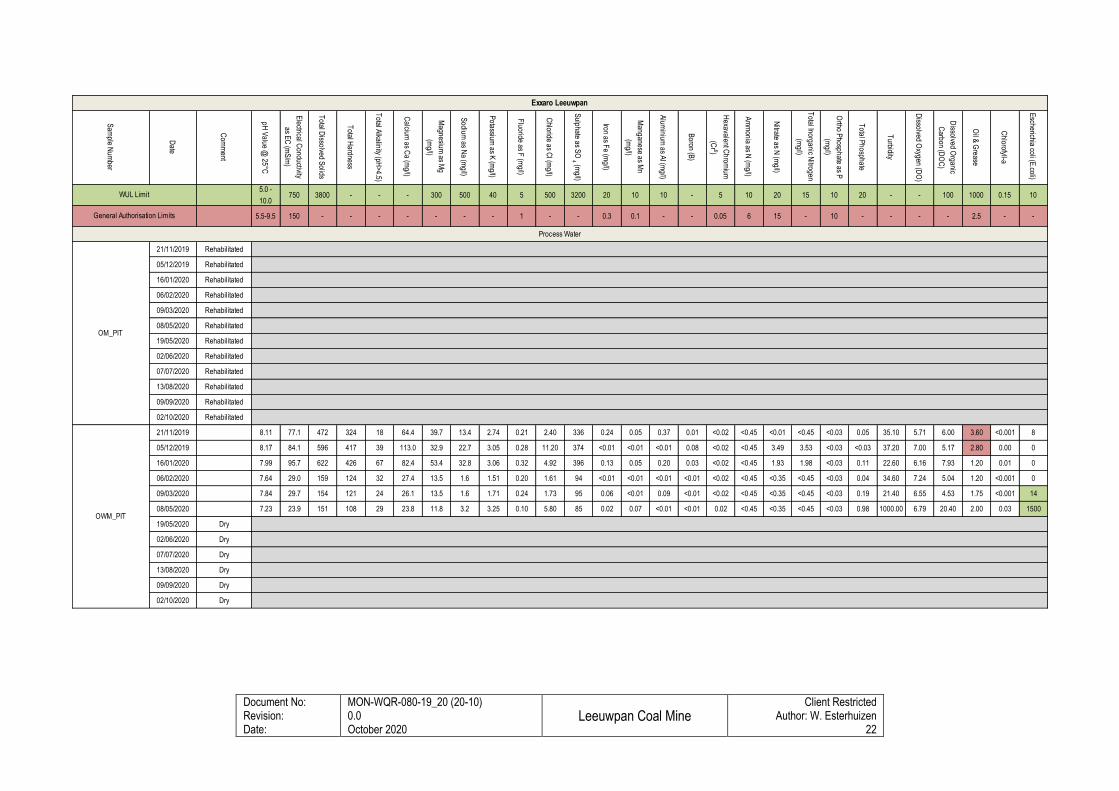
Document No: Revision: Date:
MON-WQR-080-19_20 (20-10) 0.0 October 2020
Leeuwpan Coal Mine
Client Restricted Author: W. Esterhuizen
22
Sam
ple Num
ber
Date
Com
ment
pH V
alue @ 25°C
Electrical C
onductivity
as EC
(mS
/m)
Total D
issolved Solids
Total H
ardness
Total A
lkalinity (pH>4.5)
Calcium
as Ca (m
g/l)
Magnesium
as Mg
(mg/l)
Sodium
as Na (m
g/l)
Potassium
as K (m
g/l)
Fluoride as F
(mg/l)
Chloride as C
l (mg/l)
Sulphate as S
O 4 (m
g/l)
Iron as Fe (m
g/l)
Manganese as M
n
(mg/l)
Alum
inium as A
l (mg/l)
Boron (B
)
Hexavalent C
hromium
(Cr 6)
Am
monia as N
(mg/l)
Nitrate as N
(mg/l)
Total Inorganic N
itrogen
(mg/l)
Ortho P
hosphate as P
(mg/l)
Total P
hosphate
Turbidity
Dissolved O
xygen (DO
)
Dissolved O
rganic
Carbon (D
OC
)
Oil &
Grease
Chlorofyll-a
Escherichia coli (E
.coli)
5.0 -
10.0 750 3800 - - - 300 500 40 5 500 3200 20 10 10 - 5 10 20 15 10 20 - - 100 1000 0.15 10
5.5-9.5 150 - - - - - - - 1 - - 0.3 0.1 - - 0.05 6 15 - 10 - - - - 2.5 - -
21/11/2019 Rehabilitated
05/12/2019 Rehabilitated
16/01/2020 Rehabilitated
06/02/2020 Rehabilitated
09/03/2020 Rehabilitated
08/05/2020 Rehabilitated
19/05/2020 Rehabilitated
02/06/2020 Rehabilitated
07/07/2020 Rehabilitated
13/08/2020 Rehabilitated
09/09/2020 Rehabilitated
02/10/2020 Rehabilitated
21/11/2019 8.11 77.1 472 324 18 64.4 39.7 13.4 2.74 0.21 2.40 336 0.24 0.05 0.37 0.01 <0.02 <0.45 <0.01 <0.45 <0.03 0.05 35.10 5.71 6.00 3.60 <0.001 8
05/12/2019 8.17 84.1 596 417 39 113.0 32.9 22.7 3.05 0.28 11.20 374 <0.01 <0.01 <0.01 0.08 <0.02 <0.45 3.49 3.53 <0.03 <0.03 37.20 7.00 5.17 2.80 0.00 0
16/01/2020 7.99 95.7 622 426 67 82.4 53.4 32.8 3.06 0.32 4.92 396 0.13 0.05 0.20 0.03 <0.02 <0.45 1.93 1.98 <0.03 0.11 22.60 6.16 7.93 1.20 0.01 0
06/02/2020 7.64 29.0 159 124 32 27.4 13.5 1.6 1.51 0.20 1.61 94 <0.01 <0.01 <0.01 <0.01 <0.02 <0.45 <0.35 <0.45 <0.03 0.04 34.60 7.24 5.04 1.20 <0.001 0
09/03/2020 7.84 29.7 154 121 24 26.1 13.5 1.6 1.71 0.24 1.73 95 0.06 <0.01 0.09 <0.01 <0.02 <0.45 <0.35 <0.45 <0.03 0.19 21.40 6.55 4.53 1.75 <0.001 14
08/05/2020 7.23 23.9 151 108 29 23.8 11.8 3.2 3.25 0.10 5.80 85 0.02 0.07 <0.01 <0.01 0.02 <0.45 <0.35 <0.45 <0.03 0.98 1000.00 6.79 20.40 2.00 0.03 1500
19/05/2020 Dry
02/06/2020 Dry
07/07/2020 Dry
13/08/2020 Dry
09/09/2020 Dry
02/10/2020 Dry
OM_PIT
OWM_PIT
Exxaro Leeuwpan
WUL Limit
Process Water
General Authorisation Limits
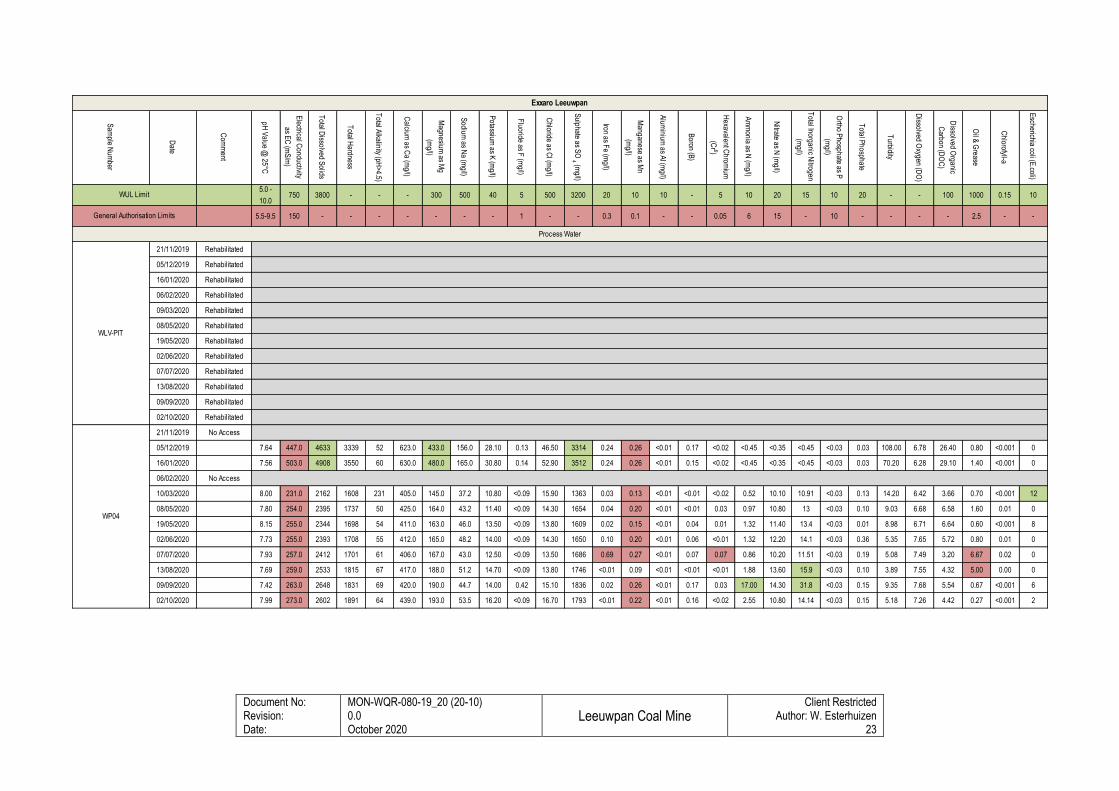
Document No: Revision: Date:
MON-WQR-080-19_20 (20-10) 0.0 October 2020
Leeuwpan Coal Mine
Client Restricted Author: W. Esterhuizen
23
Sam
ple Num
ber
Date
Com
ment
pH V
alue @ 25°C
Electrical C
onductivity
as EC
(mS
/m)
Total D
issolved Solids
Total H
ardness
Total A
lkalinity (pH>4.5)
Calcium
as Ca (m
g/l)
Magnesium
as Mg
(mg/l)
Sodium
as Na (m
g/l)
Potassium
as K (m
g/l)
Fluoride as F
(mg/l)
Chloride as C
l (mg/l)
Sulphate as S
O 4 (m
g/l)
Iron as Fe (m
g/l)
Manganese as M
n
(mg/l)
Alum
inium as A
l (mg/l)
Boron (B
)
Hexavalent C
hromium
(Cr 6)
Am
monia as N
(mg/l)
Nitrate as N
(mg/l)
Total Inorganic N
itrogen
(mg/l)
Ortho P
hosphate as P
(mg/l)
Total P
hosphate
Turbidity
Dissolved O
xygen (DO
)
Dissolved O
rganic
Carbon (D
OC
)
Oil &
Grease
Chlorofyll-a
Escherichia coli (E
.coli)
5.0 -
10.0 750 3800 - - - 300 500 40 5 500 3200 20 10 10 - 5 10 20 15 10 20 - - 100 1000 0.15 10
5.5-9.5 150 - - - - - - - 1 - - 0.3 0.1 - - 0.05 6 15 - 10 - - - - 2.5 - -
21/11/2019 Rehabilitated
05/12/2019 Rehabilitated
16/01/2020 Rehabilitated
06/02/2020 Rehabilitated
09/03/2020 Rehabilitated
08/05/2020 Rehabilitated
19/05/2020 Rehabilitated
02/06/2020 Rehabilitated
07/07/2020 Rehabilitated
13/08/2020 Rehabilitated
09/09/2020 Rehabilitated
02/10/2020 Rehabilitated
21/11/2019 No Access
05/12/2019 7.64 447.0 4633 3339 52 623.0 433.0 156.0 28.10 0.13 46.50 3314 0.24 0.26 <0.01 0.17 <0.02 <0.45 <0.35 <0.45 <0.03 0.03 108.00 6.78 26.40 0.80 <0.001 0
16/01/2020 7.56 503.0 4908 3550 60 630.0 480.0 165.0 30.80 0.14 52.90 3512 0.24 0.26 <0.01 0.15 <0.02 <0.45 <0.35 <0.45 <0.03 0.03 70.20 6.28 29.10 1.40 <0.001 0
06/02/2020 No Access
10/03/2020 8.00 231.0 2162 1608 231 405.0 145.0 37.2 10.80 <0.09 15.90 1363 0.03 0.13 <0.01 <0.01 <0.02 0.52 10.10 10.91 <0.03 0.13 14.20 6.42 3.66 0.70 <0.001 12
08/05/2020 7.80 254.0 2395 1737 50 425.0 164.0 43.2 11.40 <0.09 14.30 1654 0.04 0.20 <0.01 <0.01 0.03 0.97 10.80 13 <0.03 0.10 9.03 6.68 6.58 1.60 0.01 0
19/05/2020 8.15 255.0 2344 1698 54 411.0 163.0 46.0 13.50 <0.09 13.80 1609 0.02 0.15 <0.01 0.04 0.01 1.32 11.40 13.4 <0.03 0.01 8.98 6.71 6.64 0.60 <0.001 8
02/06/2020 7.73 255.0 2393 1708 55 412.0 165.0 48.2 14.00 <0.09 14.30 1650 0.10 0.20 <0.01 0.06 <0.01 1.32 12.20 14.1 <0.03 0.36 5.35 7.65 5.72 0.80 0.01 0
07/07/2020 7.93 257.0 2412 1701 61 406.0 167.0 43.0 12.50 <0.09 13.50 1686 0.69 0.27 <0.01 0.07 0.07 0.86 10.20 11.51 <0.03 0.19 5.08 7.49 3.20 6.67 0.02 0
13/08/2020 7.69 259.0 2533 1815 67 417.0 188.0 51.2 14.70 <0.09 13.80 1746 <0.01 0.09 <0.01 <0.01 <0.01 1.88 13.60 15.9 <0.03 0.10 3.89 7.55 4.32 5.00 0.00 0
09/09/2020 7.42 263.0 2648 1831 69 420.0 190.0 44.7 14.00 0.42 15.10 1836 0.02 0.26 <0.01 0.17 0.03 17.00 14.30 31.8 <0.03 0.15 9.35 7.68 5.54 0.67 <0.001 6
02/10/2020 7.99 273.0 2602 1891 64 439.0 193.0 53.5 16.20 <0.09 16.70 1793 <0.01 0.22 <0.01 0.16 <0.02 2.55 10.80 14.14 <0.03 0.15 5.18 7.26 4.42 0.27 <0.001 2
Exxaro Leeuwpan
WUL Limit
Process Water
General Authorisation Limits
WLV-PIT
WP04
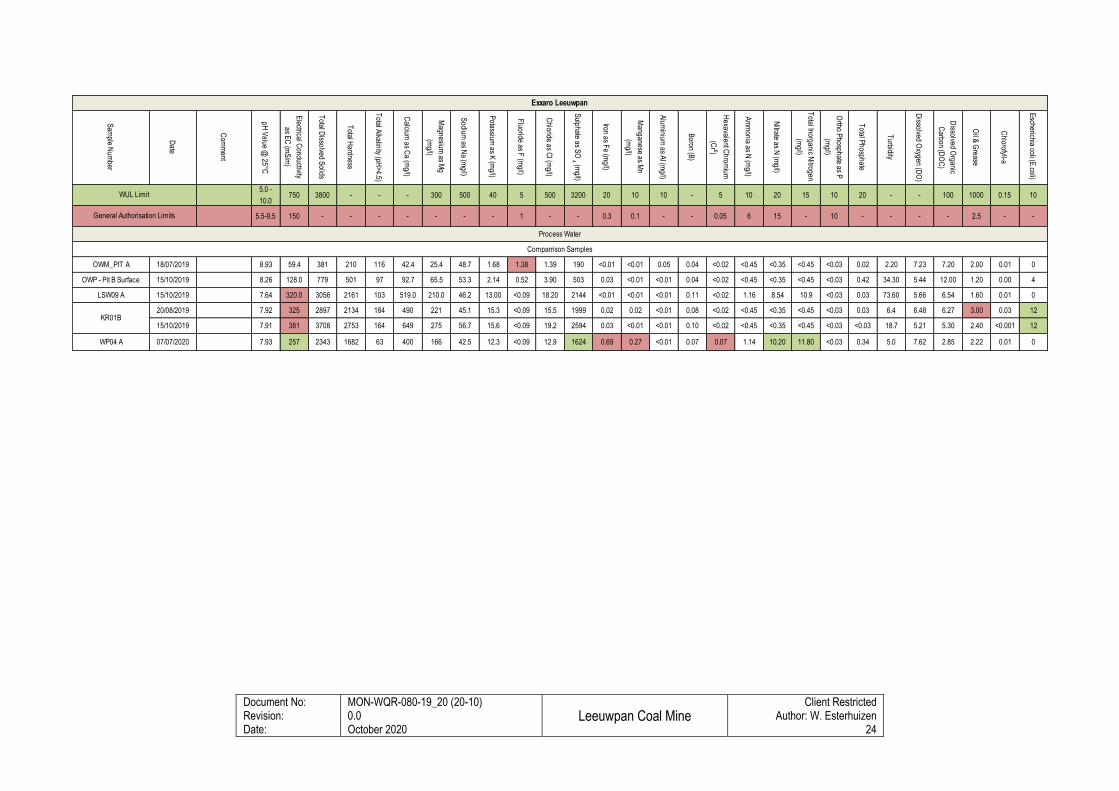
Document No: Revision: Date:
MON-WQR-080-19_20 (20-10) 0.0 October 2020
Leeuwpan Coal Mine
Client Restricted Author: W. Esterhuizen
24
Sam
ple Num
ber
Date
Com
ment
pH V
alue @ 25°C
Electrical C
onductivity
as EC
(mS
/m)
Total D
issolved Solids
Total H
ardness
Total A
lkalinity (pH>4.5)
Calcium
as Ca (m
g/l)
Magnesium
as Mg
(mg/l)
Sodium
as Na (m
g/l)
Potassium
as K (m
g/l)
Fluoride as F
(mg/l)
Chloride as C
l (mg/l)
Sulphate as S
O 4 (m
g/l)
Iron as Fe (m
g/l)
Manganese as M
n
(mg/l)
Alum
inium as A
l (mg/l)
Boron (B
)
Hexavalent C
hromium
(Cr 6)
Am
monia as N
(mg/l)
Nitrate as N
(mg/l)
Total Inorganic N
itrogen
(mg/l)
Ortho P
hosphate as P
(mg/l)
Total P
hosphate
Turbidity
Dissolved O
xygen (DO
)
Dissolved O
rganic
Carbon (D
OC
)
Oil &
Grease
Chlorofyll-a
Escherichia coli (E
.coli)
5.0 -
10.0 750 3800 - - - 300 500 40 5 500 3200 20 10 10 - 5 10 20 15 10 20 - - 100 1000 0.15 10
5.5-9.5 150 - - - - - - - 1 - - 0.3 0.1 - - 0.05 6 15 - 10 - - - - 2.5 - -
OWM_PIT A 18/07/2019 8.93 59.4 381 210 116 42.4 25.4 48.7 1.68 1.38 1.39 190 <0.01 <0.01 0.05 0.04 <0.02 <0.45 <0.35 <0.45 <0.03 0.02 2.20 7.23 7.20 2.00 0.01 0
OWP - Pit B Surface 15/10/2019 8.26 128.0 779 501 97 92.7 65.5 53.3 2.14 0.52 3.90 503 0.03 <0.01 <0.01 0.04 <0.02 <0.45 <0.35 <0.45 <0.03 0.42 34.30 5.44 12.00 1.20 0.00 4
LSW09 A 15/10/2019 7.64 320.0 3056 2161 103 519.0 210.0 46.2 13.00 <0.09 18.20 2144 <0.01 <0.01 <0.01 0.11 <0.02 1.16 8.54 10.9 <0.03 0.03 73.60 5.66 6.54 1.60 0.01 0
20/08/2019 7.92 325 2897 2134 184 490 221 45.1 15.3 <0.09 15.5 1999 0.02 0.02 <0.01 0.08 <0.02 <0.45 <0.35 <0.45 <0.03 0.03 6.4 6.48 6.27 3.00 0.03 12
15/10/2019 7.91 381 3708 2753 164 649 275 56.7 15.6 <0.09 19.2 2594 0.03 <0.01 <0.01 0.10 <0.02 <0.45 <0.35 <0.45 <0.03 <0.03 18.7 5.21 5.30 2.40 <0.001 12
WP04 A 07/07/2020 7.93 257 2343 1682 63 400 166 42.5 12.3 <0.09 12.9 1624 0.69 0.27 <0.01 0.07 0.07 1.14 10.20 11.80 <0.03 0.34 5.0 7.62 2.85 2.22 0.01 0
KR01B
Exxaro Leeuwpan
WUL Limit
Process Water
General Authorisation Limits
Comparrison Samples
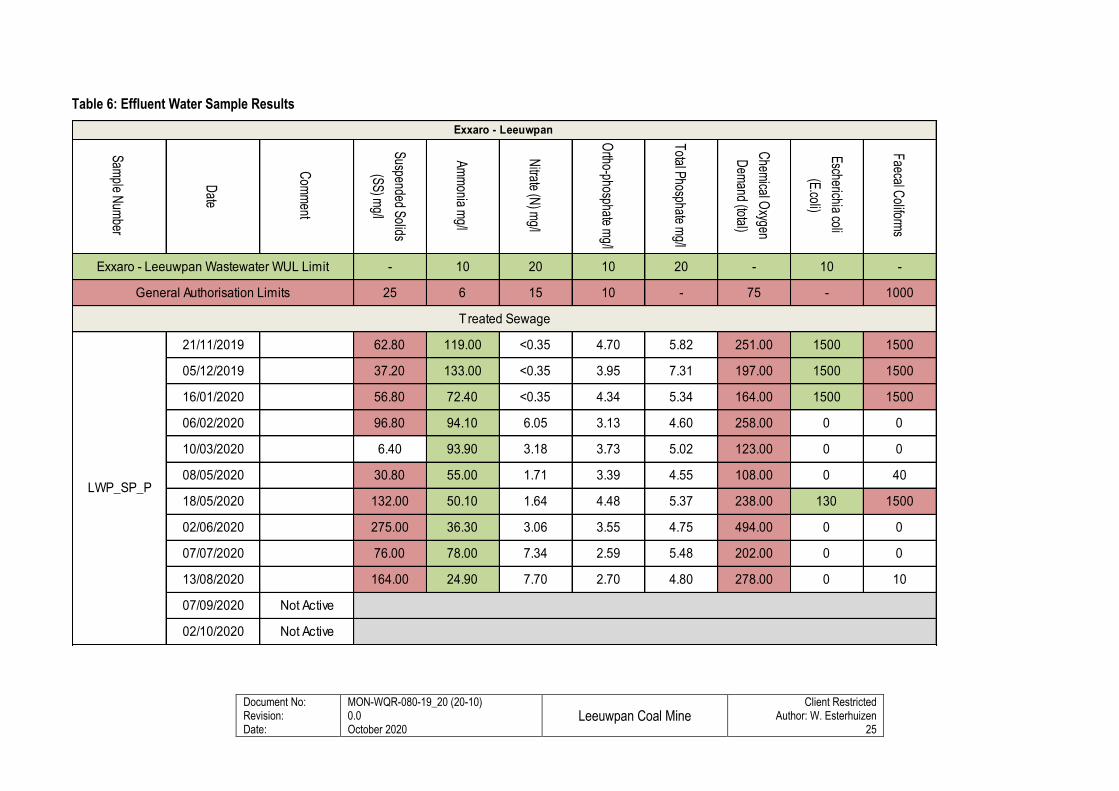
Document No: Revision: Date:
MON-WQR-080-19_20 (20-10) 0.0 October 2020
Leeuwpan Coal Mine
Client Restricted Author: W. Esterhuizen
25
Table 6: Effluent Water Sample Results
Sam
ple Num
ber
Date
Com
ment
Suspended S
olids
(SS
) mg/l
Am
monia m
g/l
Nitrate (N
) mg/l
Ortho-phosphate m
g/l
Total P
hosphate mg/l
Chem
ical Oxygen
Dem
and (total)
Escherichia coli
(E.coli)
Faecal C
oliforms
- 10 20 10 20 - 10 -
25 6 15 10 - 75 - 1000
21/11/2019 62.80 119.00 <0.35 4.70 5.82 251.00 1500 1500
05/12/2019 37.20 133.00 <0.35 3.95 7.31 197.00 1500 1500
16/01/2020 56.80 72.40 <0.35 4.34 5.34 164.00 1500 1500
06/02/2020 96.80 94.10 6.05 3.13 4.60 258.00 0 0
10/03/2020 6.40 93.90 3.18 3.73 5.02 123.00 0 0
08/05/2020 30.80 55.00 1.71 3.39 4.55 108.00 0 40
18/05/2020 132.00 50.10 1.64 4.48 5.37 238.00 130 1500
02/06/2020 275.00 36.30 3.06 3.55 4.75 494.00 0 0
07/07/2020 76.00 78.00 7.34 2.59 5.48 202.00 0 0
13/08/2020 164.00 24.90 7.70 2.70 4.80 278.00 0 10
07/09/2020 Not Active
02/10/2020 Not Active
Exxaro - Leeuwpan
Exxaro - Leeuwpan Wastewater WUL Limit
Treated Sewage
General Authorisation Limits
LWP_SP_P

Document No: Revision: Date:
MON-WQR-080-19_20 (20-10) 0.0 October 2020
Leeuwpan Coal Mine
Client Restricted Author: W. Esterhuizen
26
Sam
ple Num
ber
Date
Com
ment
Suspended S
olids
(SS
) mg/l
Am
monia m
g/l
Nitrate (N
) mg/l
Ortho-phosphate m
g/l
Total P
hosphate mg/l
Chem
ical Oxygen
Dem
and (total)
Escherichia coli
(E.coli)
Faecal C
oliforms
- 10 20 10 20 - 10 -
25 6 15 10 - 75 - 1000
21/11/2019 Maintenance
05/12/2019 Maintenance
16/01/2020 Maintenance
09/03/2020 Maintenance
08/05/2020 Maintenance
18/05/2020 Maintenance
02/06/2020 Maintenance
07/07/2020 Maintenance
13/08/2020 Maintenance
08/09/2020 No Access
02/10/2020 No Access
Exxaro - Leeuwpan
Exxaro - Leeuwpan Wastewater WUL Limit
Treated Sewage
General Authorisation Limits
LWP_SP_W
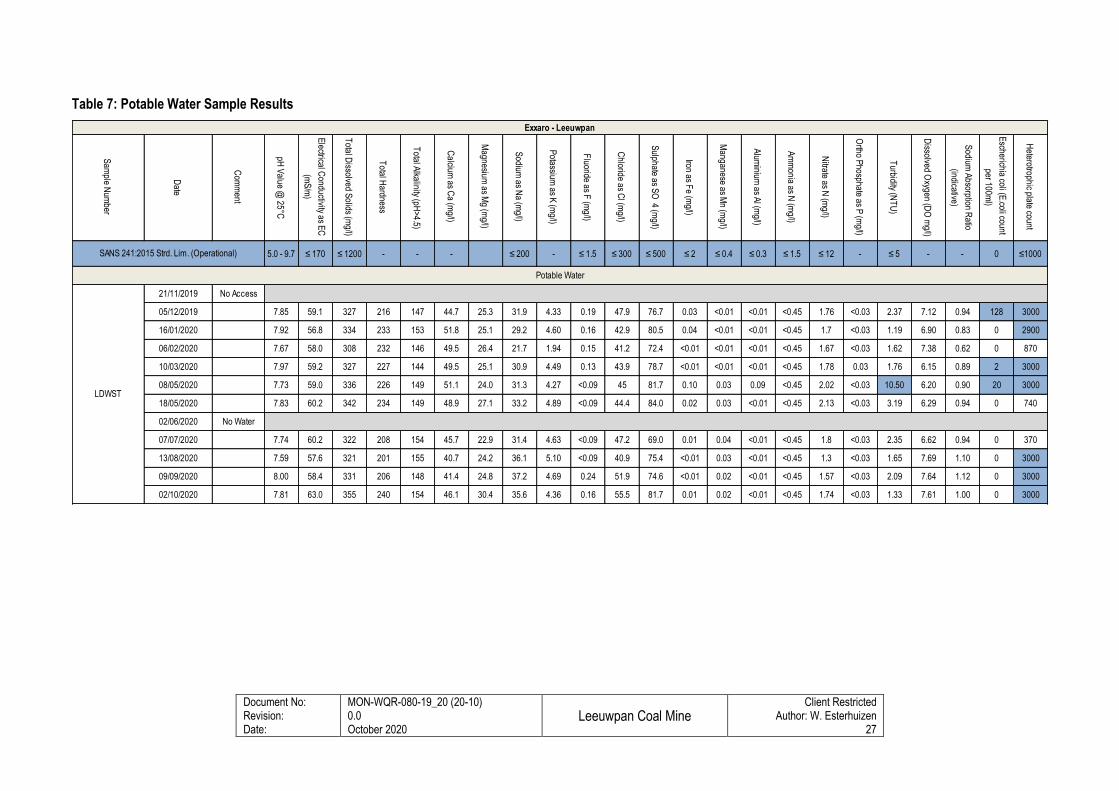
Document No: Revision: Date:
MON-WQR-080-19_20 (20-10) 0.0 October 2020
Leeuwpan Coal Mine
Client Restricted Author: W. Esterhuizen
27
Table 7: Potable Water Sample Results
Sam
ple Num
ber
Date
Com
ment
pH V
alue @ 25°C
Electrical C
onductivity as EC
(mS
/m)
Total D
issolved Solids (m
g/l)
Total H
ardness
Total A
lkalinity (pH>4.5)
Calcium
as Ca (m
g/l)
Magnesium
as Mg (m
g/l)
Sodium
as Na (m
g/l)
Potassium
as K (m
g/l)
Fluoride as F
(mg/l)
Chloride as C
l (mg/l)
Sulphate as S
O 4 (m
g/l)
Iron as Fe (m
g/l)
Manganese as M
n (mg/l)
Alum
inium as A
l (mg/l)
Am
monia as N
(mg/l)
Nitrate as N
(mg/l)
Ortho P
hosphate as P (m
g/l)
Turbidity (N
TU
)
Dissolved O
xygen (DO
mg/l)
Sodium
Absorption R
atio
(indicative)
Escherichia coli (E
.coli count
per 100ml)
Heterotrophic plate count
5.0 - 9.7 ≤ 170 ≤ 1200 - - - ≤ 200 - ≤ 1.5 ≤ 300 ≤ 500 ≤ 2 ≤ 0.4 ≤ 0.3 ≤ 1.5 ≤ 12 - ≤ 5 - - 0 ≤1000
21/11/2019 No Access
05/12/2019 7.85 59.1 327 216 147 44.7 25.3 31.9 4.33 0.19 47.9 76.7 0.03 <0.01 <0.01 <0.45 1.76 <0.03 2.37 7.12 0.94 128 3000
16/01/2020 7.92 56.8 334 233 153 51.8 25.1 29.2 4.60 0.16 42.9 80.5 0.04 <0.01 <0.01 <0.45 1.7 <0.03 1.19 6.90 0.83 0 2900
06/02/2020 7.67 58.0 308 232 146 49.5 26.4 21.7 1.94 0.15 41.2 72.4 <0.01 <0.01 <0.01 <0.45 1.67 <0.03 1.62 7.38 0.62 0 870
10/03/2020 7.97 59.2 327 227 144 49.5 25.1 30.9 4.49 0.13 43.9 78.7 <0.01 <0.01 <0.01 <0.45 1.78 0.03 1.76 6.15 0.89 2 3000
08/05/2020 7.73 59.0 336 226 149 51.1 24.0 31.3 4.27 <0.09 45 81.7 0.10 0.03 0.09 <0.45 2.02 <0.03 10.50 6.20 0.90 20 3000
18/05/2020 7.83 60.2 342 234 149 48.9 27.1 33.2 4.89 <0.09 44.4 84.0 0.02 0.03 <0.01 <0.45 2.13 <0.03 3.19 6.29 0.94 0 740
02/06/2020 No Water
07/07/2020 7.74 60.2 322 208 154 45.7 22.9 31.4 4.63 <0.09 47.2 69.0 0.01 0.04 <0.01 <0.45 1.8 <0.03 2.35 6.62 0.94 0 370
13/08/2020 7.59 57.6 321 201 155 40.7 24.2 36.1 5.10 <0.09 40.9 75.4 <0.01 0.03 <0.01 <0.45 1.3 <0.03 1.65 7.69 1.10 0 3000
09/09/2020 8.00 58.4 331 206 148 41.4 24.8 37.2 4.69 0.24 51.9 74.6 <0.01 0.02 <0.01 <0.45 1.57 <0.03 2.09 7.64 1.12 0 3000
02/10/2020 7.81 63.0 355 240 154 46.1 30.4 35.6 4.36 0.16 55.5 81.7 0.01 0.02 <0.01 <0.45 1.74 <0.03 1.33 7.61 1.00 0 3000
LDWST
Potable Water
SANS 241:2015 Strd. Lim. (Operational)
Exxaro - Leeuwpan
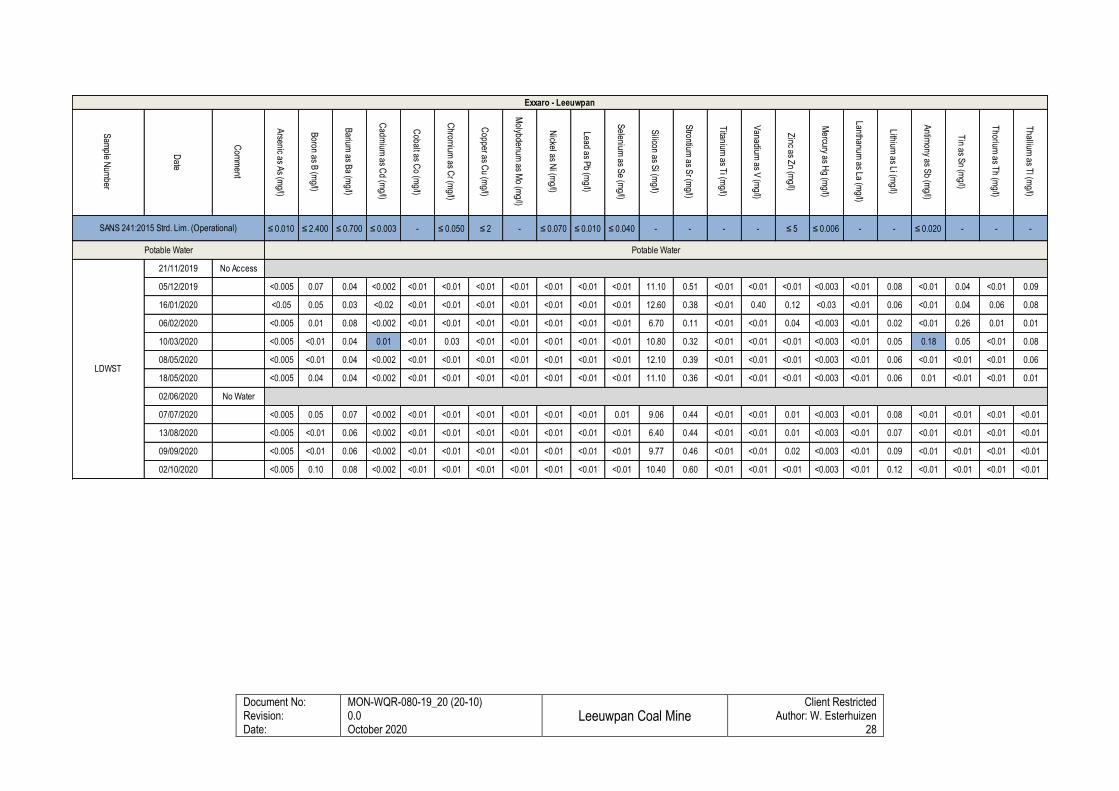
Document No: Revision: Date:
MON-WQR-080-19_20 (20-10) 0.0 October 2020
Leeuwpan Coal Mine
Client Restricted Author: W. Esterhuizen
28
Sam
ple Num
ber
Date
Com
ment
Arsenic as A
s (mg/l)
Boron as B
(mg/l)
Barium
as Ba (m
g/l)
Cadm
ium as C
d (mg/l)
Cobalt as C
o (mg/l)
Chrom
ium as C
r (mg/l)
Copper as C
u (mg/l)
Molybdenum
as Mo (m
g/l)
Nickel as N
i (mg/l)
Lead as Pb (m
g/l)
Selenium
as Se (m
g/l)
Silicon as S
i (mg/l)
Strontium
as Sr (m
g/l)
Titanium
as Ti (m
g/l)
Vanadium
as V (m
g/l)
Zinc as Z
n (mg/l)
Mercury as H
g (mg/l)
Lanthanum as La (m
g/l)
Lithium as Li (m
g/l)
Antim
ony as Sb (m
g/l)
Tin as S
n (mg/l)
Thorium
as Th (m
g/l)
Thallium
as Tl (m
g/l)
≤ 0.010 ≤ 2.400 ≤ 0.700 ≤ 0.003 - ≤ 0.050 ≤ 2 - ≤ 0.070 ≤ 0.010 ≤ 0.040 - - - - ≤ 5 ≤ 0.006 - - ≤ 0.020 - - -
21/11/2019 No Access
05/12/2019 <0.005 0.07 0.04 <0.002 <0.01 <0.01 <0.01 <0.01 <0.01 <0.01 <0.01 11.10 0.51 <0.01 <0.01 <0.01 <0.003 <0.01 0.08 <0.01 0.04 <0.01 0.09
16/01/2020 <0.05 0.05 0.03 <0.02 <0.01 <0.01 <0.01 <0.01 <0.01 <0.01 <0.01 12.60 0.38 <0.01 0.40 0.12 <0.03 <0.01 0.06 <0.01 0.04 0.06 0.08
06/02/2020 <0.005 0.01 0.08 <0.002 <0.01 <0.01 <0.01 <0.01 <0.01 <0.01 <0.01 6.70 0.11 <0.01 <0.01 0.04 <0.003 <0.01 0.02 <0.01 0.26 0.01 0.01
10/03/2020 <0.005 <0.01 0.04 0.01 <0.01 0.03 <0.01 <0.01 <0.01 <0.01 <0.01 10.80 0.32 <0.01 <0.01 <0.01 <0.003 <0.01 0.05 0.18 0.05 <0.01 0.08
08/05/2020 <0.005 <0.01 0.04 <0.002 <0.01 <0.01 <0.01 <0.01 <0.01 <0.01 <0.01 12.10 0.39 <0.01 <0.01 <0.01 <0.003 <0.01 0.06 <0.01 <0.01 <0.01 0.06
18/05/2020 <0.005 0.04 0.04 <0.002 <0.01 <0.01 <0.01 <0.01 <0.01 <0.01 <0.01 11.10 0.36 <0.01 <0.01 <0.01 <0.003 <0.01 0.06 0.01 <0.01 <0.01 0.01
02/06/2020 No Water
07/07/2020 <0.005 0.05 0.07 <0.002 <0.01 <0.01 <0.01 <0.01 <0.01 <0.01 0.01 9.06 0.44 <0.01 <0.01 0.01 <0.003 <0.01 0.08 <0.01 <0.01 <0.01 <0.01
13/08/2020 <0.005 <0.01 0.06 <0.002 <0.01 <0.01 <0.01 <0.01 <0.01 <0.01 <0.01 6.40 0.44 <0.01 <0.01 0.01 <0.003 <0.01 0.07 <0.01 <0.01 <0.01 <0.01
09/09/2020 <0.005 <0.01 0.06 <0.002 <0.01 <0.01 <0.01 <0.01 <0.01 <0.01 <0.01 9.77 0.46 <0.01 <0.01 0.02 <0.003 <0.01 0.09 <0.01 <0.01 <0.01 <0.01
02/10/2020 <0.005 0.10 0.08 <0.002 <0.01 <0.01 <0.01 <0.01 <0.01 <0.01 <0.01 10.40 0.60 <0.01 <0.01 <0.01 <0.003 <0.01 0.12 <0.01 <0.01 <0.01 <0.01
LDWST
Potable Water Potable Water
SANS 241:2015 Strd. Lim. (Operational)
Exxaro - Leeuwpan
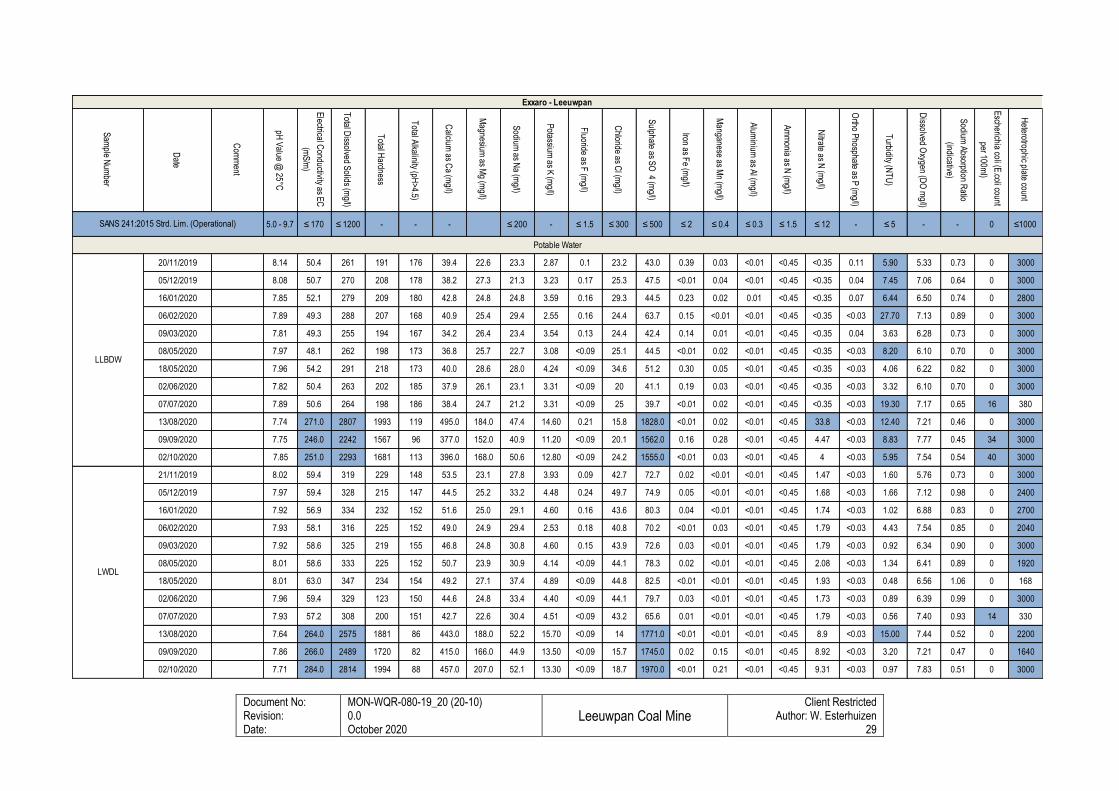
Document No: Revision: Date:
MON-WQR-080-19_20 (20-10) 0.0 October 2020
Leeuwpan Coal Mine
Client Restricted Author: W. Esterhuizen
29
Sam
ple Num
ber
Date
Com
ment
pH V
alue @ 25°C
Electrical C
onductivity as EC
(mS
/m)
Total D
issolved Solids (m
g/l)
Total H
ardness
Total A
lkalinity (pH>4.5)
Calcium
as Ca (m
g/l)
Magnesium
as Mg (m
g/l)
Sodium
as Na (m
g/l)
Potassium
as K (m
g/l)
Fluoride as F
(mg/l)
Chloride as C
l (mg/l)
Sulphate as S
O 4 (m
g/l)
Iron as Fe (m
g/l)
Manganese as M
n (mg/l)
Alum
inium as A
l (mg/l)
Am
monia as N
(mg/l)
Nitrate as N
(mg/l)
Ortho P
hosphate as P (m
g/l)
Turbidity (N
TU
)
Dissolved O
xygen (DO
mg/l)
Sodium
Absorption R
atio
(indicative)
Escherichia coli (E
.coli count
per 100ml)
Heterotrophic plate count
5.0 - 9.7 ≤ 170 ≤ 1200 - - - ≤ 200 - ≤ 1.5 ≤ 300 ≤ 500 ≤ 2 ≤ 0.4 ≤ 0.3 ≤ 1.5 ≤ 12 - ≤ 5 - - 0 ≤1000
20/11/2019 8.14 50.4 261 191 176 39.4 22.6 23.3 2.87 0.1 23.2 43.0 0.39 0.03 <0.01 <0.45 <0.35 0.11 5.90 5.33 0.73 0 3000
05/12/2019 8.08 50.7 270 208 178 38.2 27.3 21.3 3.23 0.17 25.3 47.5 <0.01 0.04 <0.01 <0.45 <0.35 0.04 7.45 7.06 0.64 0 3000
16/01/2020 7.85 52.1 279 209 180 42.8 24.8 24.8 3.59 0.16 29.3 44.5 0.23 0.02 0.01 <0.45 <0.35 0.07 6.44 6.50 0.74 0 2800
06/02/2020 7.89 49.3 288 207 168 40.9 25.4 29.4 2.55 0.16 24.4 63.7 0.15 <0.01 <0.01 <0.45 <0.35 <0.03 27.70 7.13 0.89 0 3000
09/03/2020 7.81 49.3 255 194 167 34.2 26.4 23.4 3.54 0.13 24.4 42.4 0.14 0.01 <0.01 <0.45 <0.35 0.04 3.63 6.28 0.73 0 3000
08/05/2020 7.97 48.1 262 198 173 36.8 25.7 22.7 3.08 <0.09 25.1 44.5 <0.01 0.02 <0.01 <0.45 <0.35 <0.03 8.20 6.10 0.70 0 3000
18/05/2020 7.96 54.2 291 218 173 40.0 28.6 28.0 4.24 <0.09 34.6 51.2 0.30 0.05 <0.01 <0.45 <0.35 <0.03 4.06 6.22 0.82 0 3000
02/06/2020 7.82 50.4 263 202 185 37.9 26.1 23.1 3.31 <0.09 20 41.1 0.19 0.03 <0.01 <0.45 <0.35 <0.03 3.32 6.10 0.70 0 3000
07/07/2020 7.89 50.6 264 198 186 38.4 24.7 21.2 3.31 <0.09 25 39.7 <0.01 0.02 <0.01 <0.45 <0.35 <0.03 19.30 7.17 0.65 16 380
13/08/2020 7.74 271.0 2807 1993 119 495.0 184.0 47.4 14.60 0.21 15.8 1828.0 <0.01 0.02 <0.01 <0.45 33.8 <0.03 12.40 7.21 0.46 0 3000
09/09/2020 7.75 246.0 2242 1567 96 377.0 152.0 40.9 11.20 <0.09 20.1 1562.0 0.16 0.28 <0.01 <0.45 4.47 <0.03 8.83 7.77 0.45 34 3000
02/10/2020 7.85 251.0 2293 1681 113 396.0 168.0 50.6 12.80 <0.09 24.2 1555.0 <0.01 0.03 <0.01 <0.45 4 <0.03 5.95 7.54 0.54 40 3000
21/11/2019 8.02 59.4 319 229 148 53.5 23.1 27.8 3.93 0.09 42.7 72.7 0.02 <0.01 <0.01 <0.45 1.47 <0.03 1.60 5.76 0.73 0 3000
05/12/2019 7.97 59.4 328 215 147 44.5 25.2 33.2 4.48 0.24 49.7 74.9 0.05 <0.01 <0.01 <0.45 1.68 <0.03 1.66 7.12 0.98 0 2400
16/01/2020 7.92 56.9 334 232 152 51.6 25.0 29.1 4.60 0.16 43.6 80.3 0.04 <0.01 <0.01 <0.45 1.74 <0.03 1.02 6.88 0.83 0 2700
06/02/2020 7.93 58.1 316 225 152 49.0 24.9 29.4 2.53 0.18 40.8 70.2 <0.01 0.03 <0.01 <0.45 1.79 <0.03 4.43 7.54 0.85 0 2040
09/03/2020 7.92 58.6 325 219 155 46.8 24.8 30.8 4.60 0.15 43.9 72.6 0.03 <0.01 <0.01 <0.45 1.79 <0.03 0.92 6.34 0.90 0 3000
08/05/2020 8.01 58.6 333 225 152 50.7 23.9 30.9 4.14 <0.09 44.1 78.3 0.02 <0.01 <0.01 <0.45 2.08 <0.03 1.34 6.41 0.89 0 1920
18/05/2020 8.01 63.0 347 234 154 49.2 27.1 37.4 4.89 <0.09 44.8 82.5 <0.01 <0.01 <0.01 <0.45 1.93 <0.03 0.48 6.56 1.06 0 168
02/06/2020 7.96 59.4 329 123 150 44.6 24.8 33.4 4.40 <0.09 44.1 79.7 0.03 <0.01 <0.01 <0.45 1.73 <0.03 0.89 6.39 0.99 0 3000
07/07/2020 7.93 57.2 308 200 151 42.7 22.6 30.4 4.51 <0.09 43.2 65.6 0.01 <0.01 <0.01 <0.45 1.79 <0.03 0.56 7.40 0.93 14 330
13/08/2020 7.64 264.0 2575 1881 86 443.0 188.0 52.2 15.70 <0.09 14 1771.0 <0.01 <0.01 <0.01 <0.45 8.9 <0.03 15.00 7.44 0.52 0 2200
09/09/2020 7.86 266.0 2489 1720 82 415.0 166.0 44.9 13.50 <0.09 15.7 1745.0 0.02 0.15 <0.01 <0.45 8.92 <0.03 3.20 7.21 0.47 0 1640
02/10/2020 7.71 284.0 2814 1994 88 457.0 207.0 52.1 13.30 <0.09 18.7 1970.0 <0.01 0.21 <0.01 <0.45 9.31 <0.03 0.97 7.83 0.51 0 3000
LLBDW
LWDL
Potable Water
SANS 241:2015 Strd. Lim. (Operational)
Exxaro - Leeuwpan
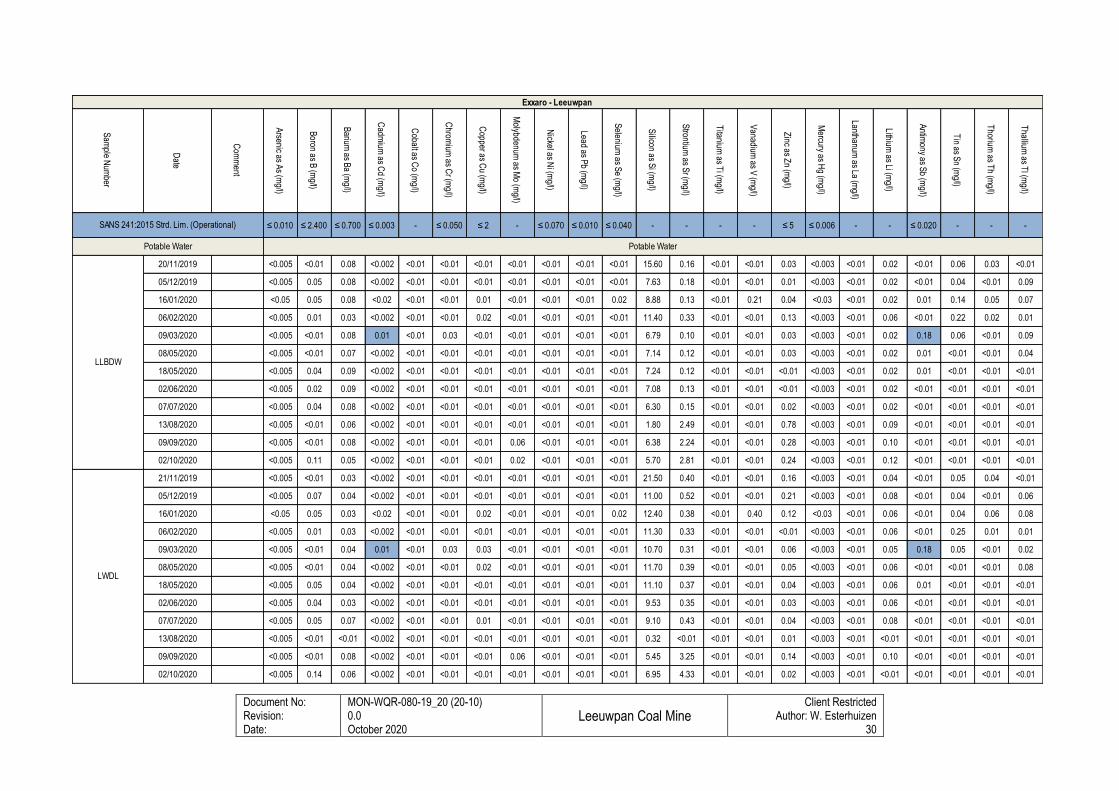
Document No: Revision: Date:
MON-WQR-080-19_20 (20-10) 0.0 October 2020
Leeuwpan Coal Mine
Client Restricted Author: W. Esterhuizen
30
Sam
ple Num
ber
Date
Com
ment
Arsenic as A
s (mg/l)
Boron as B
(mg/l)
Barium
as Ba (m
g/l)
Cadm
ium as C
d (mg/l)
Cobalt as C
o (mg/l)
Chrom
ium as C
r (mg/l)
Copper as C
u (mg/l)
Molybdenum
as Mo (m
g/l)
Nickel as N
i (mg/l)
Lead as Pb (m
g/l)
Selenium
as Se (m
g/l)
Silicon as S
i (mg/l)
Strontium
as Sr (m
g/l)
Titanium
as Ti (m
g/l)
Vanadium
as V (m
g/l)
Zinc as Z
n (mg/l)
Mercury as H
g (mg/l)
Lanthanum as La (m
g/l)
Lithium as Li (m
g/l)
Antim
ony as Sb (m
g/l)
Tin as S
n (mg/l)
Thorium
as Th (m
g/l)
Thallium
as Tl (m
g/l)
≤ 0.010 ≤ 2.400 ≤ 0.700 ≤ 0.003 - ≤ 0.050 ≤ 2 - ≤ 0.070 ≤ 0.010 ≤ 0.040 - - - - ≤ 5 ≤ 0.006 - - ≤ 0.020 - - -
20/11/2019 <0.005 <0.01 0.08 <0.002 <0.01 <0.01 <0.01 <0.01 <0.01 <0.01 <0.01 15.60 0.16 <0.01 <0.01 0.03 <0.003 <0.01 0.02 <0.01 0.06 0.03 <0.01
05/12/2019 <0.005 0.05 0.08 <0.002 <0.01 <0.01 <0.01 <0.01 <0.01 <0.01 <0.01 7.63 0.18 <0.01 <0.01 0.01 <0.003 <0.01 0.02 <0.01 0.04 <0.01 0.09
16/01/2020 <0.05 0.05 0.08 <0.02 <0.01 <0.01 0.01 <0.01 <0.01 <0.01 0.02 8.88 0.13 <0.01 0.21 0.04 <0.03 <0.01 0.02 0.01 0.14 0.05 0.07
06/02/2020 <0.005 0.01 0.03 <0.002 <0.01 <0.01 0.02 <0.01 <0.01 <0.01 <0.01 11.40 0.33 <0.01 <0.01 0.13 <0.003 <0.01 0.06 <0.01 0.22 0.02 0.01
09/03/2020 <0.005 <0.01 0.08 0.01 <0.01 0.03 <0.01 <0.01 <0.01 <0.01 <0.01 6.79 0.10 <0.01 <0.01 0.03 <0.003 <0.01 0.02 0.18 0.06 <0.01 0.09
08/05/2020 <0.005 <0.01 0.07 <0.002 <0.01 <0.01 <0.01 <0.01 <0.01 <0.01 <0.01 7.14 0.12 <0.01 <0.01 0.03 <0.003 <0.01 0.02 0.01 <0.01 <0.01 0.04
18/05/2020 <0.005 0.04 0.09 <0.002 <0.01 <0.01 <0.01 <0.01 <0.01 <0.01 <0.01 7.24 0.12 <0.01 <0.01 <0.01 <0.003 <0.01 0.02 0.01 <0.01 <0.01 <0.01
02/06/2020 <0.005 0.02 0.09 <0.002 <0.01 <0.01 <0.01 <0.01 <0.01 <0.01 <0.01 7.08 0.13 <0.01 <0.01 <0.01 <0.003 <0.01 0.02 <0.01 <0.01 <0.01 <0.01
07/07/2020 <0.005 0.04 0.08 <0.002 <0.01 <0.01 <0.01 <0.01 <0.01 <0.01 <0.01 6.30 0.15 <0.01 <0.01 0.02 <0.003 <0.01 0.02 <0.01 <0.01 <0.01 <0.01
13/08/2020 <0.005 <0.01 0.06 <0.002 <0.01 <0.01 <0.01 <0.01 <0.01 <0.01 <0.01 1.80 2.49 <0.01 <0.01 0.78 <0.003 <0.01 0.09 <0.01 <0.01 <0.01 <0.01
09/09/2020 <0.005 <0.01 0.08 <0.002 <0.01 <0.01 <0.01 0.06 <0.01 <0.01 <0.01 6.38 2.24 <0.01 <0.01 0.28 <0.003 <0.01 0.10 <0.01 <0.01 <0.01 <0.01
02/10/2020 <0.005 0.11 0.05 <0.002 <0.01 <0.01 <0.01 0.02 <0.01 <0.01 <0.01 5.70 2.81 <0.01 <0.01 0.24 <0.003 <0.01 0.12 <0.01 <0.01 <0.01 <0.01
21/11/2019 <0.005 <0.01 0.03 <0.002 <0.01 <0.01 <0.01 <0.01 <0.01 <0.01 <0.01 21.50 0.40 <0.01 <0.01 0.16 <0.003 <0.01 0.04 <0.01 0.05 0.04 <0.01
05/12/2019 <0.005 0.07 0.04 <0.002 <0.01 <0.01 <0.01 <0.01 <0.01 <0.01 <0.01 11.00 0.52 <0.01 <0.01 0.21 <0.003 <0.01 0.08 <0.01 0.04 <0.01 0.06
16/01/2020 <0.05 0.05 0.03 <0.02 <0.01 <0.01 0.02 <0.01 <0.01 <0.01 0.02 12.40 0.38 <0.01 0.40 0.12 <0.03 <0.01 0.06 <0.01 0.04 0.06 0.08
06/02/2020 <0.005 0.01 0.03 <0.002 <0.01 <0.01 <0.01 <0.01 <0.01 <0.01 <0.01 11.30 0.33 <0.01 <0.01 <0.01 <0.003 <0.01 0.06 <0.01 0.25 0.01 0.01
09/03/2020 <0.005 <0.01 0.04 0.01 <0.01 0.03 0.03 <0.01 <0.01 <0.01 <0.01 10.70 0.31 <0.01 <0.01 0.06 <0.003 <0.01 0.05 0.18 0.05 <0.01 0.02
08/05/2020 <0.005 <0.01 0.04 <0.002 <0.01 <0.01 0.02 <0.01 <0.01 <0.01 <0.01 11.70 0.39 <0.01 <0.01 0.05 <0.003 <0.01 0.06 <0.01 <0.01 <0.01 0.08
18/05/2020 <0.005 0.05 0.04 <0.002 <0.01 <0.01 <0.01 <0.01 <0.01 <0.01 <0.01 11.10 0.37 <0.01 <0.01 0.04 <0.003 <0.01 0.06 0.01 <0.01 <0.01 <0.01
02/06/2020 <0.005 0.04 0.03 <0.002 <0.01 <0.01 <0.01 <0.01 <0.01 <0.01 <0.01 9.53 0.35 <0.01 <0.01 0.03 <0.003 <0.01 0.06 <0.01 <0.01 <0.01 <0.01
07/07/2020 <0.005 0.05 0.07 <0.002 <0.01 <0.01 0.01 <0.01 <0.01 <0.01 <0.01 9.10 0.43 <0.01 <0.01 0.04 <0.003 <0.01 0.08 <0.01 <0.01 <0.01 <0.01
13/08/2020 <0.005 <0.01 <0.01 <0.002 <0.01 <0.01 <0.01 <0.01 <0.01 <0.01 <0.01 0.32 <0.01 <0.01 <0.01 0.01 <0.003 <0.01 <0.01 <0.01 <0.01 <0.01 <0.01
09/09/2020 <0.005 <0.01 0.08 <0.002 <0.01 <0.01 <0.01 0.06 <0.01 <0.01 <0.01 5.45 3.25 <0.01 <0.01 0.14 <0.003 <0.01 0.10 <0.01 <0.01 <0.01 <0.01
02/10/2020 <0.005 0.14 0.06 <0.002 <0.01 <0.01 <0.01 <0.01 <0.01 <0.01 <0.01 6.95 4.33 <0.01 <0.01 0.02 <0.003 <0.01 <0.01 <0.01 <0.01 <0.01 <0.01
LLBDW
LWDL
Potable Water Potable Water
SANS 241:2015 Strd. Lim. (Operational)
Exxaro - Leeuwpan
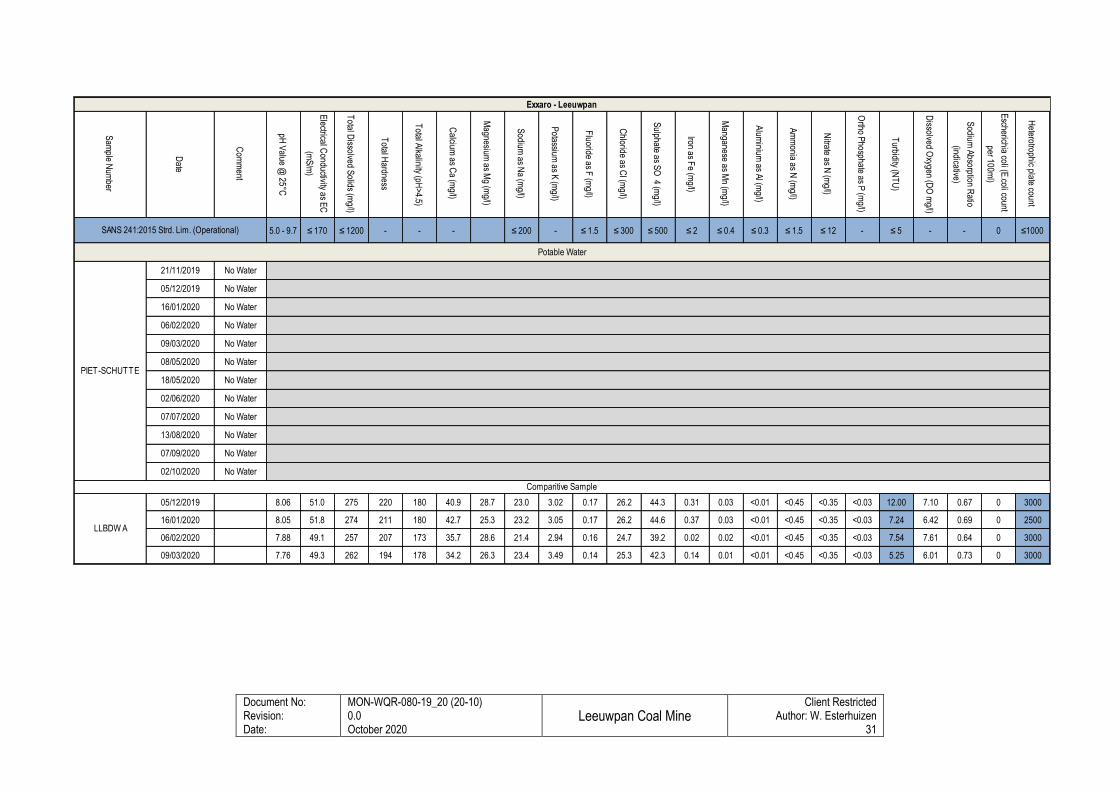
Document No: Revision: Date:
MON-WQR-080-19_20 (20-10) 0.0 October 2020
Leeuwpan Coal Mine
Client Restricted Author: W. Esterhuizen
31
Sam
ple Num
ber
Date
Com
ment
pH V
alue @ 25°C
Electrical C
onductivity as EC
(mS
/m)
Total D
issolved Solids (m
g/l)
Total H
ardness
Total A
lkalinity (pH>4.5)
Calcium
as Ca (m
g/l)
Magnesium
as Mg (m
g/l)
Sodium
as Na (m
g/l)
Potassium
as K (m
g/l)
Fluoride as F
(mg/l)
Chloride as C
l (mg/l)
Sulphate as S
O 4 (m
g/l)
Iron as Fe (m
g/l)
Manganese as M
n (mg/l)
Alum
inium as A
l (mg/l)
Am
monia as N
(mg/l)
Nitrate as N
(mg/l)
Ortho P
hosphate as P (m
g/l)
Turbidity (N
TU
)
Dissolved O
xygen (DO
mg/l)
Sodium
Absorption R
atio
(indicative)
Escherichia coli (E
.coli count
per 100ml)
Heterotrophic plate count
5.0 - 9.7 ≤ 170 ≤ 1200 - - - ≤ 200 - ≤ 1.5 ≤ 300 ≤ 500 ≤ 2 ≤ 0.4 ≤ 0.3 ≤ 1.5 ≤ 12 - ≤ 5 - - 0 ≤1000
21/11/2019 No Water
05/12/2019 No Water
16/01/2020 No Water
06/02/2020 No Water
09/03/2020 No Water
08/05/2020 No Water
18/05/2020 No Water
02/06/2020 No Water
07/07/2020 No Water
13/08/2020 No Water
07/09/2020 No Water
02/10/2020 No Water
05/12/2019 8.06 51.0 275 220 180 40.9 28.7 23.0 3.02 0.17 26.2 44.3 0.31 0.03 <0.01 <0.45 <0.35 <0.03 12.00 7.10 0.67 0 3000
16/01/2020 8.05 51.8 274 211 180 42.7 25.3 23.2 3.05 0.17 26.2 44.6 0.37 0.03 <0.01 <0.45 <0.35 <0.03 7.24 6.42 0.69 0 2500
06/02/2020 7.88 49.1 257 207 173 35.7 28.6 21.4 2.94 0.16 24.7 39.2 0.02 0.02 <0.01 <0.45 <0.35 <0.03 7.54 7.61 0.64 0 3000
09/03/2020 7.76 49.3 262 194 178 34.2 26.3 23.4 3.49 0.14 25.3 42.3 0.14 0.01 <0.01 <0.45 <0.35 <0.03 5.25 6.01 0.73 0 3000
LLBDW A
Comparitive Sample
PIET-SCHUTTE
Potable Water
SANS 241:2015 Strd. Lim. (Operational)
Exxaro - Leeuwpan
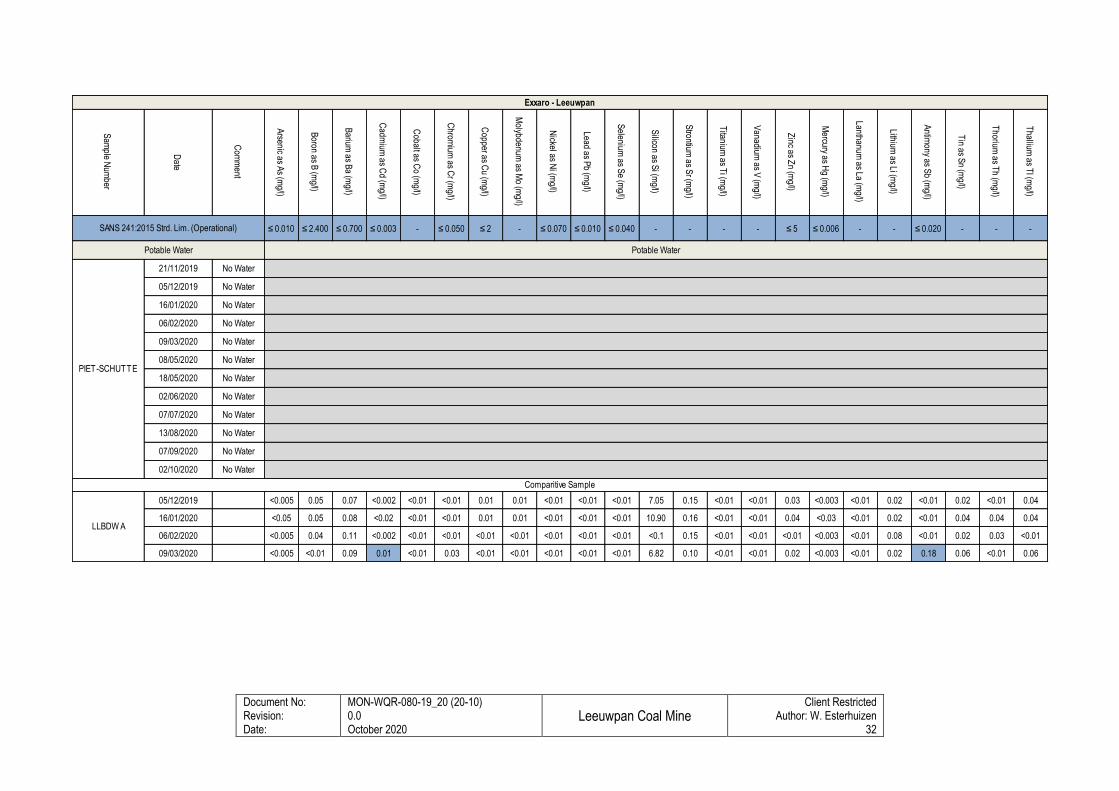
Document No: Revision: Date:
MON-WQR-080-19_20 (20-10) 0.0 October 2020
Leeuwpan Coal Mine
Client Restricted Author: W. Esterhuizen
32
Sam
ple Num
ber
Date
Com
ment
Arsenic as A
s (mg/l)
Boron as B
(mg/l)
Barium
as Ba (m
g/l)
Cadm
ium as C
d (mg/l)
Cobalt as C
o (mg/l)
Chrom
ium as C
r (mg/l)
Copper as C
u (mg/l)
Molybdenum
as Mo (m
g/l)
Nickel as N
i (mg/l)
Lead as Pb (m
g/l)
Selenium
as Se (m
g/l)
Silicon as S
i (mg/l)
Strontium
as Sr (m
g/l)
Titanium
as Ti (m
g/l)
Vanadium
as V (m
g/l)
Zinc as Z
n (mg/l)
Mercury as H
g (mg/l)
Lanthanum as La (m
g/l)
Lithium as Li (m
g/l)
Antim
ony as Sb (m
g/l)
Tin as S
n (mg/l)
Thorium
as Th (m
g/l)
Thallium
as Tl (m
g/l)
≤ 0.010 ≤ 2.400 ≤ 0.700 ≤ 0.003 - ≤ 0.050 ≤ 2 - ≤ 0.070 ≤ 0.010 ≤ 0.040 - - - - ≤ 5 ≤ 0.006 - - ≤ 0.020 - - -
21/11/2019 No Water
05/12/2019 No Water
16/01/2020 No Water
06/02/2020 No Water
09/03/2020 No Water
08/05/2020 No Water
18/05/2020 No Water
02/06/2020 No Water
07/07/2020 No Water
13/08/2020 No Water
07/09/2020 No Water
02/10/2020 No Water
05/12/2019 <0.005 0.05 0.07 <0.002 <0.01 <0.01 0.01 0.01 <0.01 <0.01 <0.01 7.05 0.15 <0.01 <0.01 0.03 <0.003 <0.01 0.02 <0.01 0.02 <0.01 0.04
16/01/2020 <0.05 0.05 0.08 <0.02 <0.01 <0.01 0.01 0.01 <0.01 <0.01 <0.01 10.90 0.16 <0.01 <0.01 0.04 <0.03 <0.01 0.02 <0.01 0.04 0.04 0.04
06/02/2020 <0.005 0.04 0.11 <0.002 <0.01 <0.01 <0.01 <0.01 <0.01 <0.01 <0.01 <0.1 0.15 <0.01 <0.01 <0.01 <0.003 <0.01 0.08 <0.01 0.02 0.03 <0.01
09/03/2020 <0.005 <0.01 0.09 0.01 <0.01 0.03 <0.01 <0.01 <0.01 <0.01 <0.01 6.82 0.10 <0.01 <0.01 0.02 <0.003 <0.01 0.02 0.18 0.06 <0.01 0.06
LLBDW A
Comparitive Sample
PIET-SCHUTTE
Potable Water Potable Water
SANS 241:2015 Strd. Lim. (Operational)
Exxaro - Leeuwpan
Document No: Revision: Date:
MON-WQR-080-19_20 (20-10) 0.0 October 2020
Leeuwpan Coal Mine
Client Restricted Author: W. Esterhuizen
33
7. DISCUSSION
7.1 RECEIVING ENVIRONMENT WATER QUALITY
Surface water monitoring was performed at ten (10) monitoring localities during the monitoring period. The following samples
were recorded as dry during the site assessment:
• LSW06, LSW07, LSW08, LSW12, WP01 and RD1.
The majority of the sampled receiving environment monitoring localities water quality analysis indicated exceedances in
terms of the DWAF Domestic Guideline Limits for Turbidity, Calcium and Dissolved Organic Carbon (DOC mg/l). Additional
exceedances included the Calcium (Ca), Magnesium (Mg), Sulphate (SO4), Manganese (Mn) and E.coli.
From the October 2020 results it is evident that the majority of the receiving environment monitoring localities presented
overall fair condition. Turbidity within the surface water samples are expected, as turbidity refers to the measurement of the
cloudiness or muddiness of water, which is influenced by both natural (flow velocity, rainfall, run-off etc.) and anthropogenic
activities (disturbance / mining activities). Overall, the Total Inorganic Nitrogen (TIN), Nitrate (NO3-N) and the Ammonia
(NH3-N) levels remained low, with the majority (excluding LSW13) of the concentrations recording below the detection limit.
Duplicate samples were obtained from monitoring localities LSW03, LSW05 and WP02 in order to determine the accuracy
and precision of inter-laboratory results. Comparison of the calculated TDS and computation of relative percent difference
for the duplicate pairs were calculated between a range of 0.0 to 3.65 % for the October 2020 monitoring run, recording
within the acceptable range (30%).
Document No: Revision: Date:
MON-WQR-080-19_20 (20-10) 0.0 October 2020
Leeuwpan Coal Mine
Client Restricted Author: W. Esterhuizen
34
7.2 PROCESS WATER QUALITY
Process water monitoring was performed at sixteen (16) monitoring localities during the monitoring period. The following
samples could not be obtained during the monitoring run:
• KR03, KR04, OG PIT, OH PIT, OJ PIT, OM PIT, WLV PIT and OWM-PIT. Please refer to the sampling register as
presented in Appendix A for details.
All of the monitored process localities revealed compliance to the stipulated WUL limits. The October 2020 exceedances
can be summarised as follows:
• KR01A , LSW09 and WP04
o General Authorisation Limit: Electrical Conductivity (EC) and Manganese (Mn)
• ODN PIT
o General Authorisation Limit: Electrical Conductivity (EC) and Manganese (Mn)
o WUL Limit: E.coli
Discharge of the process water into the receiving environment is prohibited according to the General Authorisation (Section
21f and h, 2013) as it could have limiting effects on the receiving water environment. Note that regular maintenance on
process water facilities linings and transfer pipes are vital for water resource protection.
7.3 EFFLUENT WATER QUALITY
Final effluent samples are collected at two (2) monitoring localities inclusive of the Septic tanks at plant and the Final effluent
from the sewage plant.
The final effluent from LWP-SP-P historically recorded non-compliant to the set Ammonia Wastewater WUL limits, while
exceedances related to the General Authorisation limits included Suspended Solids, Ammonia and Chemical Oxygen
Demand.
During the monitoring period it was noted that the LWP-SP-P was not active and no acces was obtained to the LWP-SP-W
monitoring point.
7.4 POTABLE WATER QUALITY
Four (4) potable water localities form part of the monitoring programme at Exxaro Leeuwpan Mine. It should be noted that
the water is not used as a potable source, however monitored as such in case of accidental consumption as a
precautionary measurement. During the monitoring period a sample could not be obtained from PIET-SCHUTTE as water
was not pumping.
The potable water quality at Leeuwpan can generally (historical results) be described as neutral, non-saline and hard while
elevated salinity and Total Hardness was present from Load-Out Bay Offices (LLBDW) and Drinking Water at Laboratory
(LWDL) during October 2020. The Load-Out Bay Offices (LLBDW) revealed exceedances of Electrical Conductivity (EC),
Total Dissolved Solids (TDS), Sulphate (SO4), Turbidity, Heterotrophic Plate Counts and E.coli which renders the water as
Document No: Revision: Date:
MON-WQR-080-19_20 (20-10) 0.0 October 2020
Leeuwpan Coal Mine
Client Restricted Author: W. Esterhuizen
35
not suitable for potable purposes. The Drinking Water Supply Tank (LDWST) presented an exceedance of Heterotrophic
Plate Counts, while the remainder of the parameters presented ideal water quality. The Drinking Water at Laboratory (LWDL)
presented an exceedance of Electrical Conductivity (EC), Total Dissolved Solids (TDS), Sulphate (SO4) and Heterotrophic
Plate Counts;
Based on the historical analysed parameters and data, the potable water poses a risk for infection due to the elevated
Heterotrophic Plate Counts and thus it is strongly advised that the water be treated and filters regularly disinfected and
cleaned as the high counts may be attributed to biofilms.
7.5 EXCEEDING VARIABLE DISCUSSION
Salinity (EC and TDS)
A high salinity level in water is associated with a salty taste and does not necessarily slake thirst. Health effects occur only
at levels above 370 mS/m and may include disturbance of salt and water balance within infants. Individuals with renal or
heart diseases, as well as high blood pressure are particularly vulnerable to adverse effects. Under irrigation, saline soils
are formed primarily when high salinity water is used for irrigation; this in return results in a higher leaching fraction,
influencing the crop yield. Wetting of the foliage of salt-sensitive crops should be avoided using water with EC concentrations
between 40 and 90 mS/m. Increasing problems with encrustation of irrigation pipes and clogging of drip irrigation may be
experienced.
Chemical Oxygen Demand
The Chemical Oxygen Demand, or COD for short, is a measure of the oxygen equivalent of the organic matter content in a
sample that is susceptible to oxidation by a strong oxidising agent and is therefore an estimate of the organic matter levels
present in water. Human activities such as agricultural the production of industrial and domestic wastes are significant
sources of organic matter. The organic matter can be present either in dissolved form or as particulate organic matter. The
former may be associated with undesirable tastes and odours, while the particulate organic matter contributes to the
suspended solids load of a water body (South African Water Quality Guidelines 1996). The COD gives a rough indication
of organic matter content in the water that will be available for decomposition (an oxygen depleting process) and ultimately
nutrients for plant and algae growth. In terms of wastewater used for irrigation, the organic matter is a substrate for bacterial
growth which, at high levels, may therefore lead to bacterial after-growth and fouling or clogging of the irrigation system.
Manganese
Manganese is an essential element in the diet of humans and animals, therefore adverse health effects are expected due
to both a shortage and overdose thereof. Manganese may affect the taste of drinking water at concentrations exceeding 0.1
mg/l, while a black precipitate will form in water pipes at concentrations exceeding 0.2 mg/l. The solubility of manganese in
groundwater varies from good to poor depending on the nature of the chemical compound.
Adverse aesthetic effects limit the acceptability of manganese-containing water for domestic use at concentrations
exceeding 0.15 mg/l. Manganese is nutritionally essential in small amount for cartilage integrity, but supports growth of
Document No: Revision: Date:
MON-WQR-080-19_20 (20-10) 0.0 October 2020
Leeuwpan Coal Mine
Client Restricted Author: W. Esterhuizen
36
certain nuisance organisms in water distribution systems, giving rise to taste, odour and turbidity problems. Thus, an
unpleasant taste and staining of plumbing fixtures and laundry occurs. Health problems associated with manganese
concentration in water are rare, neurotoxic effects may occur at high concentrations, but overall manganese is considered
to be one of the least potentially harmful of the elements.
Nitrate (NO3)
High nitrate levels are regularly associated with mining operations as nitrate is a major component of most explosives used
in the mining sector and remnants of the nitrate finds its way into process water sources and hence natural resources such
as groundwater. Other major sources of nitrate include agricultural practices such as feedlotting and kraaling (nitrate in
animal manure) and crop production (nitrate in fertilizer) as well as human sanitation (pit latrines, septic tank systems,
sewage treatment plants; in association with phosphate and pathogens) and also certain natural sources such as nitrogen
fixation through leguminous plants. When consumed in high concentrations, nitrate causes methaemoglobinaemia due to
reduction of nitrate (NO3) to nitrite (NO2) in the gastrointestinal tract. Nitrite readily binds to haemoglobin, the red oxygen-
carrying blood pigment, rendering it inactive which leads to oxygen deficiency in the body tissues.
Nitrate is a plant nutrient, being the end product of the oxidation of ammonia (NH3) and nitrite (NO2). As nitrates are produced
by decay of plant, animal and human wastes, pollution of water with nitrate is typically found wherever intensive land use
activities take place and nitrate-nitrogen concentrations exceeding 20mg/l are a common occurrence in groundwater.
Methods to remove nitrate from water include ion-exchange, reverse osmosis, and biological reduction (denitrification) using
a carbon source.
Ammonia/Ammonium
Nitrates (NO3) and Nitrites (NO2) occur together in the environment and interconvert readily, depending on the redox state
of the water (reducing or oxidising conditions). Ammonia (NH3) and Ammonium (NH4+) also interconvert readily and their
relative proportions of inter-conversion are controlled by water temperature and pH-levels. Inorganic nitrogen is primarily of
concern in the aquatic habitat due to its stimulatory effect on aquatic plants and algae and due to the toxicity of ammonia to
aquatic life. Ammonia affects the respiratory systems of many aquatic animals, either by inhibiting cellular metabolism or by
decreasing oxygen permeability of cell membranes. The methods employed to remove ammonia from water, called air
stripping, utilises the characteristic that the toxic forms of ammonia are volatile and predominate at a pH of around 11; so
by artificially raising the pH to these levels, the ammonia escapes in the gaseous phase.
Sodium (Na)
The predominant effect of sodium at the concentration usually found in fresh water is aesthetic and usually together with
chloride, sodium imparts a salty taste to water. Excessive intake of sodium salts in babies can strain kidneys and the heart,
while leading to serious disturbances of salt imbalance regarding water retention. Crops irrigated by water containing high
sodium or SAR levels are exposed not only to the root zone sodium, but also to the absorption directly through leaves.
Effects of sodium and SAR include leaf burn, scorch and dead tissue along the outside edges of leaves. The crop quality is
Document No: Revision: Date:
MON-WQR-080-19_20 (20-10) 0.0 October 2020
Leeuwpan Coal Mine
Client Restricted Author: W. Esterhuizen
37
also affected by sodium-induced leaf injury, especially where leaves are the marketed product and where restrictions on the
sodium content of the final product exists.
Sulphate
The presence of sulphate in drinking water can cause noticeable taste defects, and very high levels might cause a laxative
effect in unaccustomed consumers. Taste impairment varies with the nature of the associated cation; taste thresholds have
been found to range from 250 mg/l for sodium sulphate to 1 000 mg/l for calcium sulphate. It is generally considered that
taste impairment is minimal at levels below 250 mg/l.
Turbidity
Turbidity is defined as the light-scattering ability of water, and is the measurement of the cloudiness or muddiness of water.
Turbidity does note health effects per se, but is an indicator of microbiological water quality and of inefficient water treatment.
As elevated turbidities are often associated with the possibility of microbiological contamination, sensitive groups affected
will most possible infants under the age of 2. Thus, depending on the nature of the origin of suspended matter causing
turbidity, there may be associated health effects. Serious health effect typically occurs under a turbidity greater that fifty
NTU (>50 NTU).
Bacteria
Coliforms are used as indicators of the presence of faecal pollution, and thus the possible presence of disease-causing
organisms, such as bacteria, viruses or parasites which may give rise to gastro-intestinal diseases typically characterized
by diarrhoea, and sometimes fever and other secondary complications. Faecal coliforms, more specifically Escherichia coli,
are the most common bacterial indicators of faecal pollution by warm blooded animals. If water is consumed, high coliform
counts pose health risks in all users and specifically sensitive users. When crops, especially crops of which the leaves (e.g.
lettuce, cabbage, spinach) or underground parts (e.g. potatoes, beetroot, carrots) are consumed, are irrigated with water
containing high coliform counts, the risk remains that the consumer of the crop can contract gastro-intestinal diseases.
Document No: Revision: Date:
MON-WQR-080-19_20 (20-10) 0.0 October 2020
Leeuwpan Coal Mine
Client Restricted Author: W. Esterhuizen
38
7.6 CONCLUSION AND ASPECTS TO CONSIDER
The scope of work performed at the Leeuwpan Coal Mine is as per WUL requirements as listed in this report. This report
aims to highlight the conditions requirements of the WUL as well as aspects that are to be considered in order to improve
compliance of the IWUL.
During the monitoring period samples LSW06, LSW07, LSW08, LSW12, WP01, RD1, KR03, KR04, OG PIT, OH PIT, OJ
PIT, OM PIT, WLV PIT, LWP-SP-W, OWM-PIT and PIET-SCHUTTE could not be obtained during the monitoring period.
Based on the historical analysed parameters and data, the potable water poses a risk for infection due to the elevated
Heterotrophic Plate Counts as well as health risks. It is strongly advised that the water not be used for potable or domestic
purposes and “no-drinking signs” be present as current implemented.
Exceedances of Ca, Mg, Turbidity, DOC and indicated presence of Oil and Grease were presented at the receiving
environment. From the results it is evident that the majority of the receiving environment monitoring localities presented
overall fair condition with general low salinity content.
The process water samples revealed compliance to the stipulated WUL limits, except for the ODN-PIT monitoring point
which exceeded the limit for E.coli. Discharge of the process water into the receiving environment is prohibited according
to the General Authorisation (Section 21f and h, 2013) as it could have limiting effects on the receiving water environment.
Note that regular maintenance on process water facilities linings and transfer pipes are vital for water resource protection.
Representative samples related to October 2020 could not be obtained thus the final effluent from LWP-SP-P historically
recorded non-compliant to the set Ammonia Wastewater WUL limits, while exceedances related to the General
Authorisation limits included Suspended Solids, Ammonia and Chemical Oxygen Demand.
During the monthly monitoring period, the majority of the localities presented relatively stable conditions compared to
September 2020, with fluctuation in bacteriological content noted.
Aspects to consider:
• The potable water poses a risk for infection based on the elevated bacteriological and thus it is strongly advised that
the water be treated and filters regularly disinfected and cleaned as the high counts may be attributed to biofilms,
however warning signs have been implemented indicating water is unfit for human consumption;
• Clean and dirty stormwater must be separated as reasonably possible;
• All waste water be contained and not released into the receiving environment;
• All spills and incidents be reported to the SHEQ manager; and
• Immediate reporting of any polluting or potentially polluting incidents be implemented.
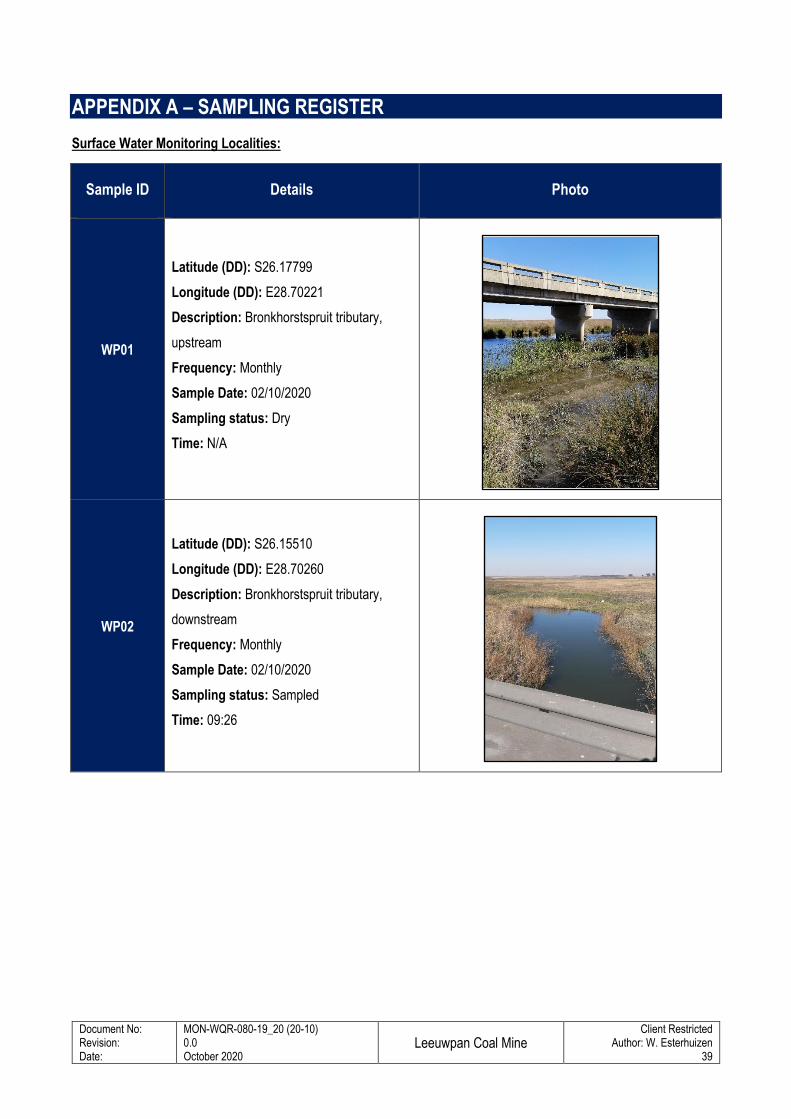
Document No: Revision: Date:
MON-WQR-080-19_20 (20-10) 0.0 October 2020
Leeuwpan Coal Mine
Client Restricted Author: W. Esterhuizen
39
APPENDIX A – SAMPLING REGISTER
Surface Water Monitoring Localities:
Sample ID Details Photo
WP01
Latitude (DD): S26.17799
Longitude (DD): E28.70221
Description: Bronkhorstspruit tributary,
upstream
Frequency: Monthly
Sample Date: 02/10/2020
Sampling status: Dry
Time: N/A
WP02
Latitude (DD): S26.15510
Longitude (DD): E28.70260
Description: Bronkhorstspruit tributary,
downstream
Frequency: Monthly
Sample Date: 02/10/2020
Sampling status: Sampled
Time: 09:26
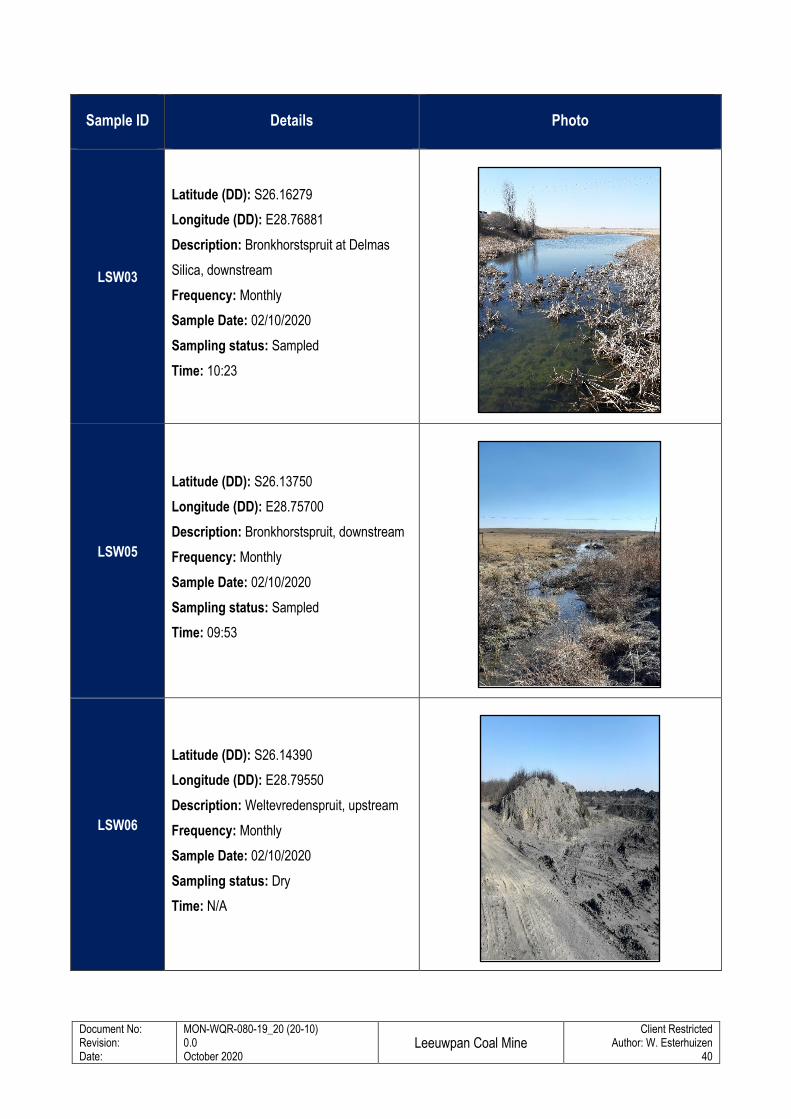
Document No: Revision: Date:
MON-WQR-080-19_20 (20-10) 0.0 October 2020
Leeuwpan Coal Mine
Client Restricted Author: W. Esterhuizen
40
Sample ID Details Photo
LSW03
Latitude (DD): S26.16279
Longitude (DD): E28.76881
Description: Bronkhorstspruit at Delmas
Silica, downstream
Frequency: Monthly
Sample Date: 02/10/2020
Sampling status: Sampled
Time: 10:23
LSW05
Latitude (DD): S26.13750
Longitude (DD): E28.75700
Description: Bronkhorstspruit, downstream
Frequency: Monthly
Sample Date: 02/10/2020
Sampling status: Sampled
Time: 09:53
LSW06
Latitude (DD): S26.14390
Longitude (DD): E28.79550
Description: Weltevredenspruit, upstream
Frequency: Monthly
Sample Date: 02/10/2020
Sampling status: Dry
Time: N/A

Document No: Revision: Date:
MON-WQR-080-19_20 (20-10) 0.0 October 2020
Leeuwpan Coal Mine
Client Restricted Author: W. Esterhuizen
41
Sample ID Details Photo
LSW07
Latitude (DD): S26.18860
Longitude (DD): E28.77635
Description: Bronkhorstspruit, upstream
Frequency: Monthly
Sample Date: 02/10/2020
Sampling status: Dry
Time: N/A
LSW08
Latitude (DD): S26.23022
Longitude (DD): E28.76264
Description: Bronkhorstspruit, upstream of
block OI
Frequency: Monthly
Sample Date: 02/10/2020
Sampling status: Dry
Time: N/A
LSW12
Latitude (DD): S26.13610
Longitude (DD): E28.76410
Description: Downstream of River Diversion
2, between RD2 and LSW05
Frequency: Monthly
Sample Date: 02/10/2020
Sampling status: Dry
Time: N/A
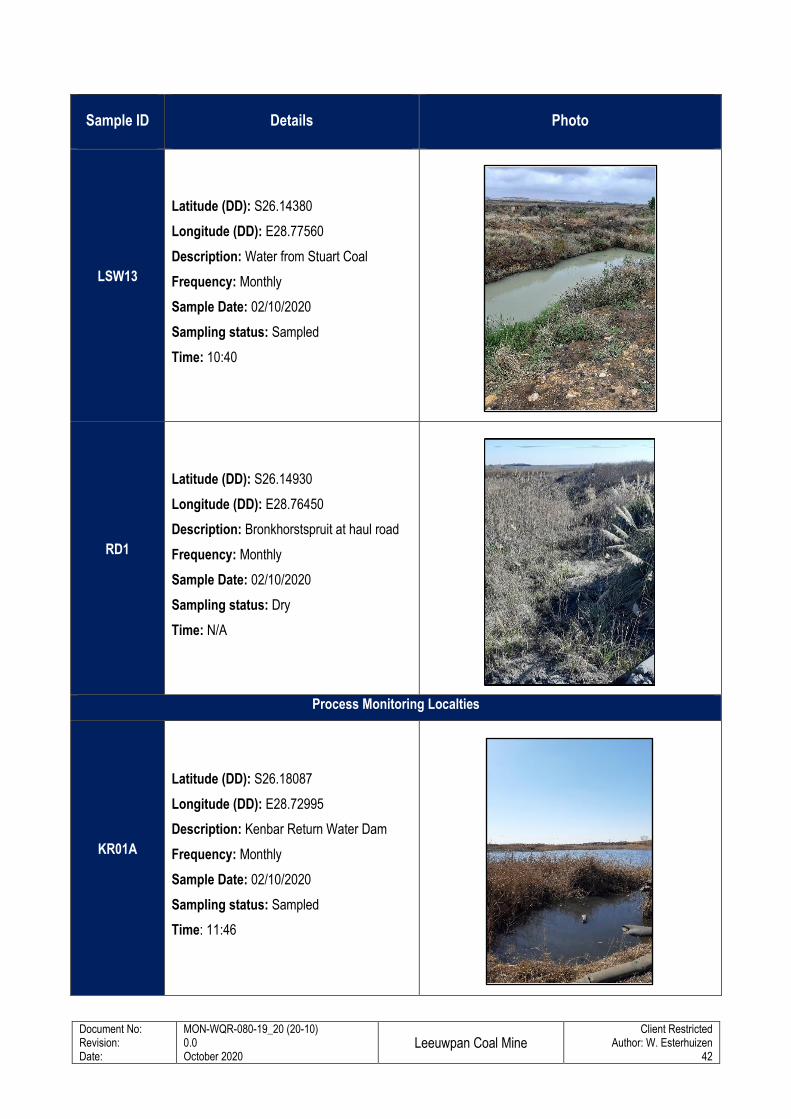
Document No: Revision: Date:
MON-WQR-080-19_20 (20-10) 0.0 October 2020
Leeuwpan Coal Mine
Client Restricted Author: W. Esterhuizen
42
Sample ID Details Photo
LSW13
Latitude (DD): S26.14380
Longitude (DD): E28.77560
Description: Water from Stuart Coal
Frequency: Monthly
Sample Date: 02/10/2020
Sampling status: Sampled
Time: 10:40
RD1
Latitude (DD): S26.14930
Longitude (DD): E28.76450
Description: Bronkhorstspruit at haul road
Frequency: Monthly
Sample Date: 02/10/2020
Sampling status: Dry
Time: N/A
Process Monitoring Localties
KR01A
Latitude (DD): S26.18087
Longitude (DD): E28.72995
Description: Kenbar Return Water Dam
Frequency: Monthly
Sample Date: 02/10/2020
Sampling status: Sampled
Time: 11:46
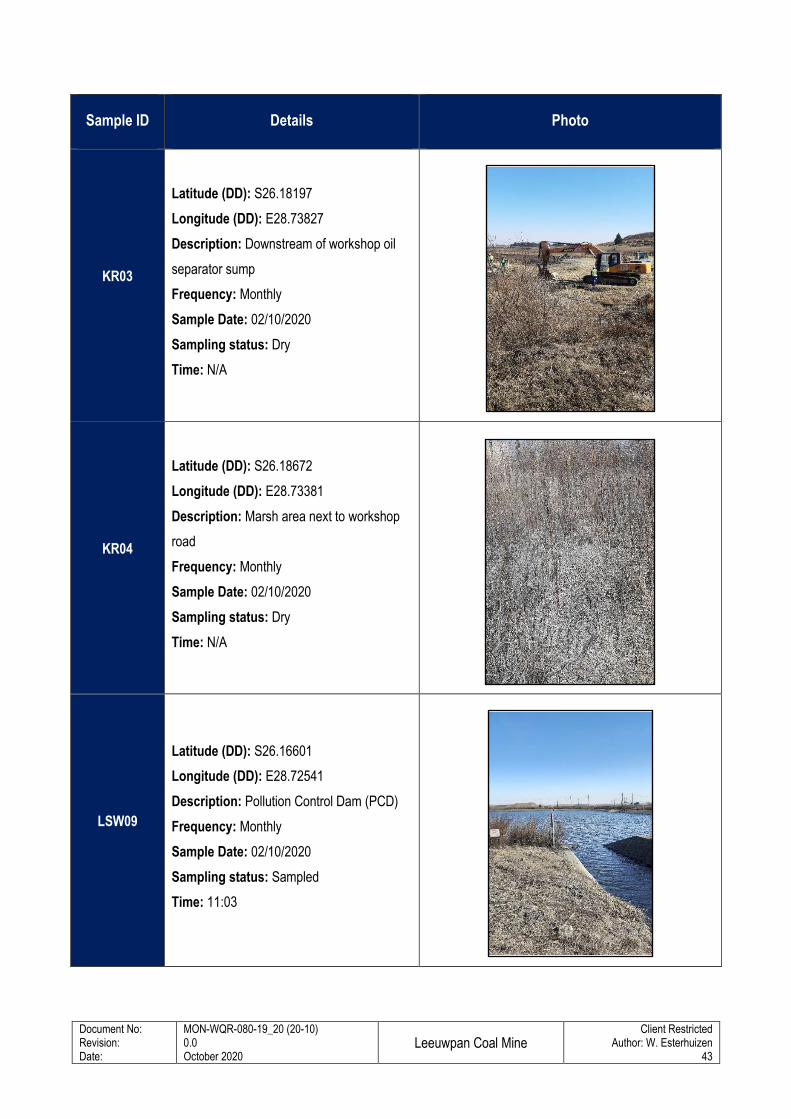
Document No: Revision: Date:
MON-WQR-080-19_20 (20-10) 0.0 October 2020
Leeuwpan Coal Mine
Client Restricted Author: W. Esterhuizen
43
Sample ID Details Photo
KR03
Latitude (DD): S26.18197
Longitude (DD): E28.73827
Description: Downstream of workshop oil
separator sump
Frequency: Monthly
Sample Date: 02/10/2020
Sampling status: Dry
Time: N/A
KR04
Latitude (DD): S26.18672
Longitude (DD): E28.73381
Description: Marsh area next to workshop
road
Frequency: Monthly
Sample Date: 02/10/2020
Sampling status: Dry
Time: N/A
LSW09
Latitude (DD): S26.16601
Longitude (DD): E28.72541
Description: Pollution Control Dam (PCD)
Frequency: Monthly
Sample Date: 02/10/2020
Sampling status: Sampled
Time: 11:03

Document No: Revision: Date:
MON-WQR-080-19_20 (20-10) 0.0 October 2020
Leeuwpan Coal Mine
Client Restricted Author: W. Esterhuizen
44
Sample ID Details Photo
ODN_PIT
Latitude (DD): S26.17122
Longitude (DD): E28.72381
Description: OD Pit Water
Frequency: Monthly
Sample Date: 02/10/2020
Sampling status: Sampled
Time: 11:16
OG_PIT
Latitude (DD): S26.17119
Longitude (DD): E28.73397
Description: OG Pit Water (Backfilled pit)
Frequency: Monthly
Sample Date: 02/10/2020
Sampling status: Rehabilitated
Time: N/A
OH_PIT
Latitude (DD): S26.16698
Longitude (DD): E28.75338
Description: OH Pit Water (Backfilled pit)
Frequency: Monthly
Sample Date: 02/10/2020
Sampling status: Rehabilitated
Time: N/A
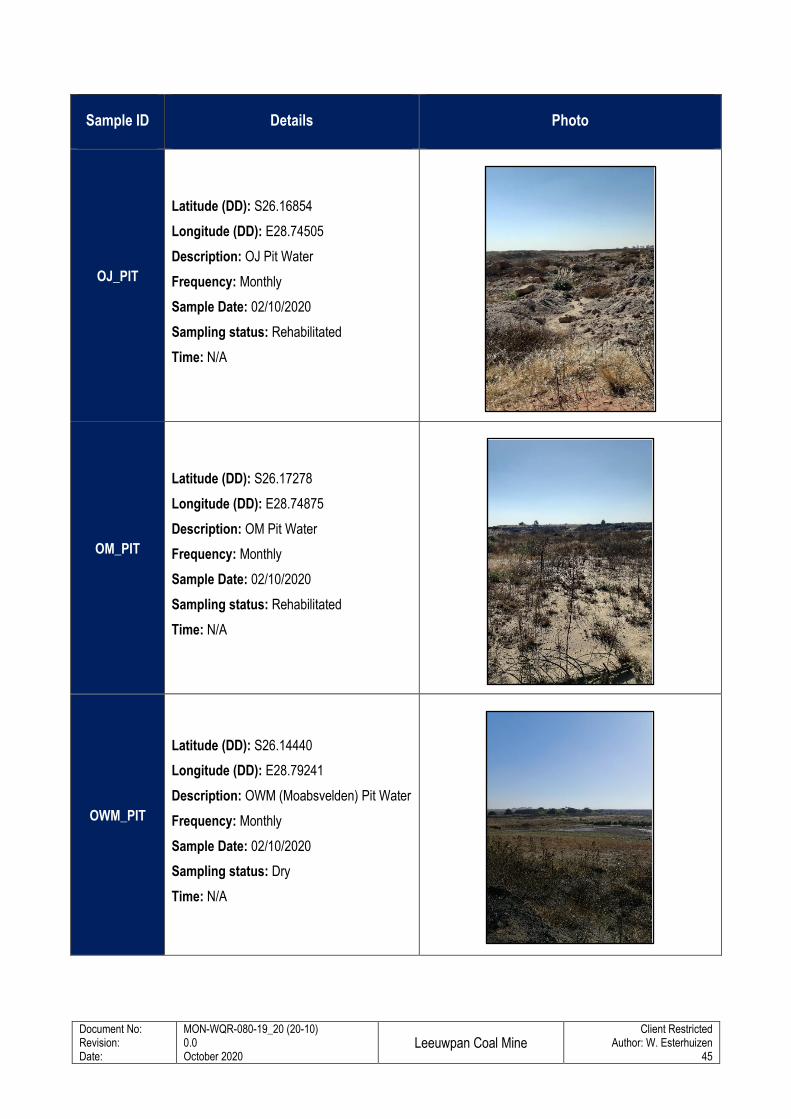
Document No: Revision: Date:
MON-WQR-080-19_20 (20-10) 0.0 October 2020
Leeuwpan Coal Mine
Client Restricted Author: W. Esterhuizen
45
Sample ID Details Photo
OJ_PIT
Latitude (DD): S26.16854
Longitude (DD): E28.74505
Description: OJ Pit Water
Frequency: Monthly
Sample Date: 02/10/2020
Sampling status: Rehabilitated
Time: N/A
OM_PIT
Latitude (DD): S26.17278
Longitude (DD): E28.74875
Description: OM Pit Water
Frequency: Monthly
Sample Date: 02/10/2020
Sampling status: Rehabilitated
Time: N/A
OWM_PIT
Latitude (DD): S26.14440
Longitude (DD): E28.79241
Description: OWM (Moabsvelden) Pit Water
Frequency: Monthly
Sample Date: 02/10/2020
Sampling status: Dry
Time: N/A
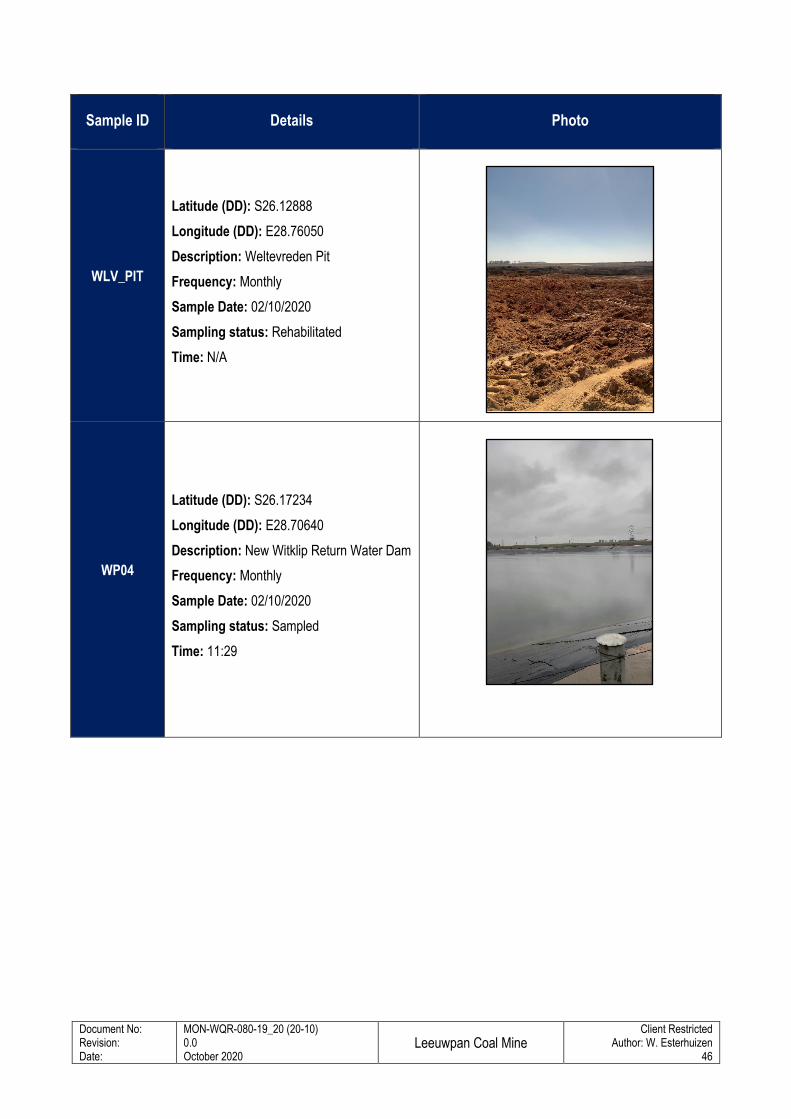
Document No: Revision: Date:
MON-WQR-080-19_20 (20-10) 0.0 October 2020
Leeuwpan Coal Mine
Client Restricted Author: W. Esterhuizen
46
Sample ID Details Photo
WLV_PIT
Latitude (DD): S26.12888
Longitude (DD): E28.76050
Description: Weltevreden Pit
Frequency: Monthly
Sample Date: 02/10/2020
Sampling status: Rehabilitated
Time: N/A
WP04
Latitude (DD): S26.17234
Longitude (DD): E28.70640
Description: New Witklip Return Water Dam
Frequency: Monthly
Sample Date: 02/10/2020
Sampling status: Sampled
Time: 11:29
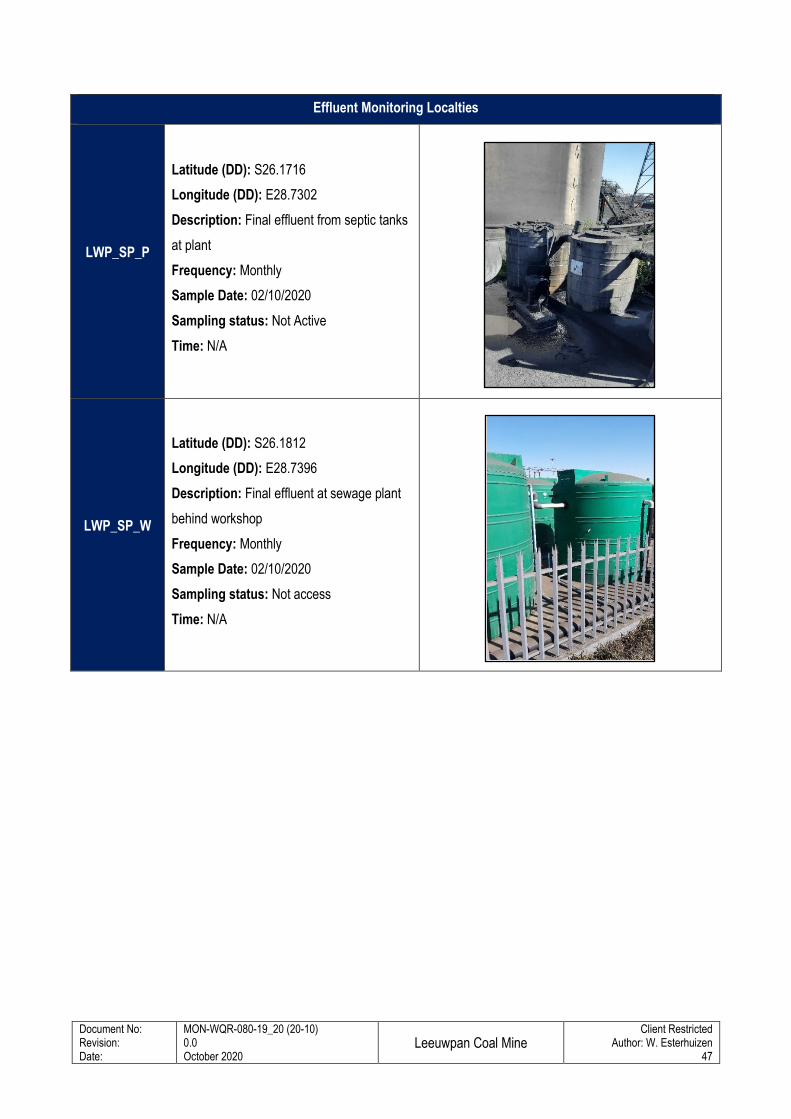
Document No: Revision: Date:
MON-WQR-080-19_20 (20-10) 0.0 October 2020
Leeuwpan Coal Mine
Client Restricted Author: W. Esterhuizen
47
Effluent Monitoring Localties
LWP_SP_P
Latitude (DD): S26.1716
Longitude (DD): E28.7302
Description: Final effluent from septic tanks
at plant
Frequency: Monthly
Sample Date: 02/10/2020
Sampling status: Not Active
Time: N/A
LWP_SP_W
Latitude (DD): S26.1812
Longitude (DD): E28.7396
Description: Final effluent at sewage plant
behind workshop
Frequency: Monthly
Sample Date: 02/10/2020
Sampling status: Not access
Time: N/A
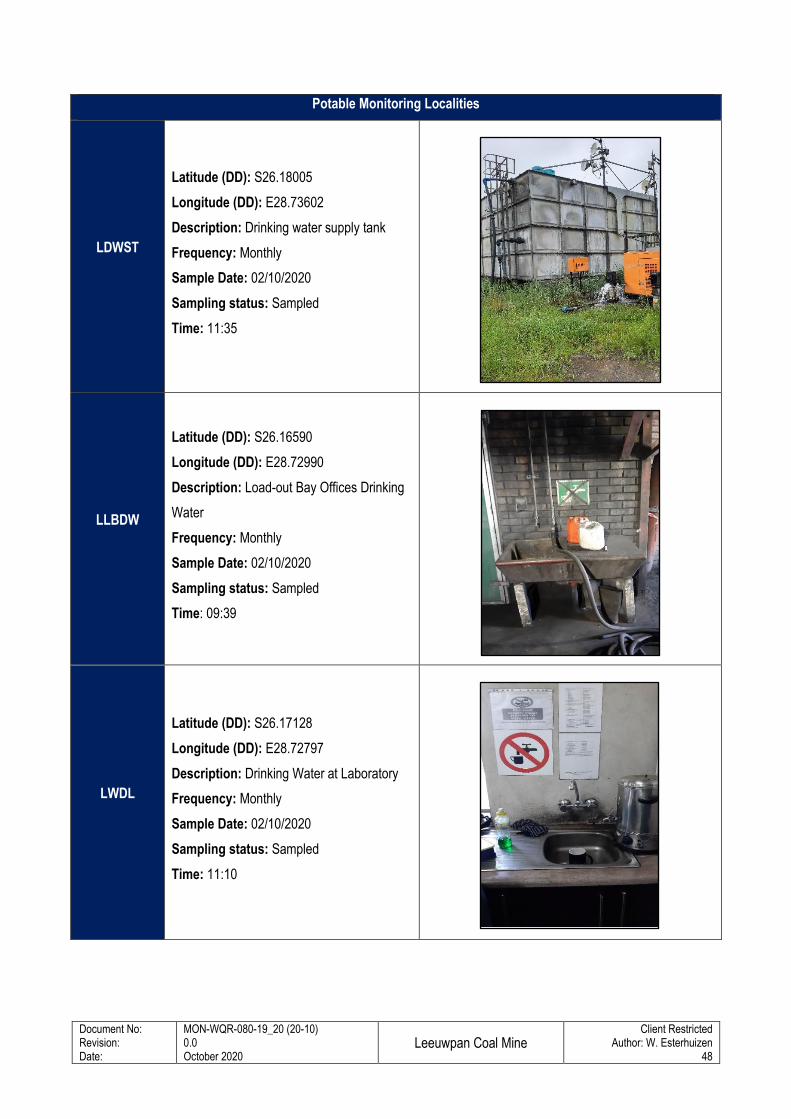
Document No: Revision: Date:
MON-WQR-080-19_20 (20-10) 0.0 October 2020
Leeuwpan Coal Mine
Client Restricted Author: W. Esterhuizen
48
Potable Monitoring Localities
LDWST
Latitude (DD): S26.18005
Longitude (DD): E28.73602
Description: Drinking water supply tank
Frequency: Monthly
Sample Date: 02/10/2020
Sampling status: Sampled
Time: 11:35
LLBDW
Latitude (DD): S26.16590
Longitude (DD): E28.72990
Description: Load-out Bay Offices Drinking
Water
Frequency: Monthly
Sample Date: 02/10/2020
Sampling status: Sampled
Time: 09:39
LWDL
Latitude (DD): S26.17128
Longitude (DD): E28.72797
Description: Drinking Water at Laboratory
Frequency: Monthly
Sample Date: 02/10/2020
Sampling status: Sampled
Time: 11:10
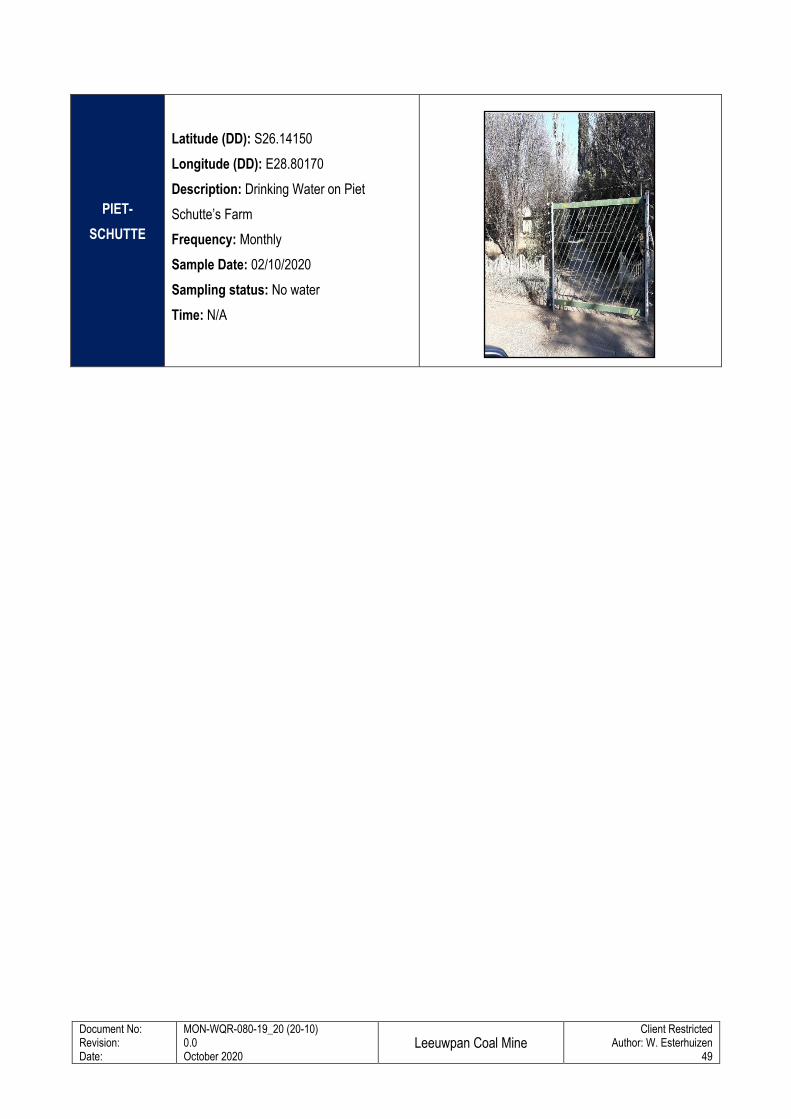
Document No: Revision: Date:
MON-WQR-080-19_20 (20-10) 0.0 October 2020
Leeuwpan Coal Mine
Client Restricted Author: W. Esterhuizen
49
PIET-
SCHUTTE
Latitude (DD): S26.14150
Longitude (DD): E28.80170
Description: Drinking Water on Piet
Schutte’s Farm
Frequency: Monthly
Sample Date: 02/10/2020
Sampling status: No water
Time: N/A
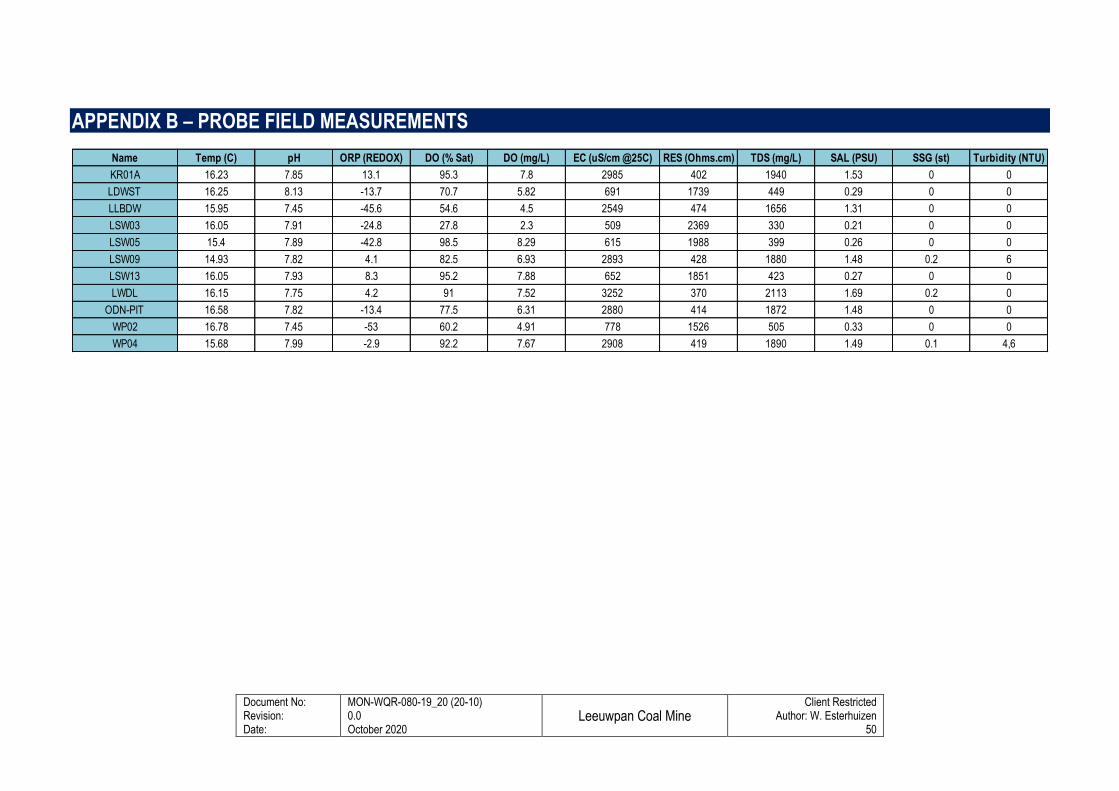
Document No: Revision: Date:
MON-WQR-080-19_20 (20-10) 0.0 October 2020
Leeuwpan Coal Mine
Client Restricted Author: W. Esterhuizen
50
APPENDIX B – PROBE FIELD MEASUREMENTS
Name Temp (C) pH ORP (REDOX) DO (% Sat) DO (mg/L) EC (uS/cm @25C) RES (Ohms.cm) TDS (mg/L) SAL (PSU) SSG (st) Turbidity (NTU)
KR01A 16.23 7.85 13.1 95.3 7.8 2985 402 1940 1.53 0 0
LDWST 16.25 8.13 -13.7 70.7 5.82 691 1739 449 0.29 0 0
LLBDW 15.95 7.45 -45.6 54.6 4.5 2549 474 1656 1.31 0 0
LSW03 16.05 7.91 -24.8 27.8 2.3 509 2369 330 0.21 0 0
LSW05 15.4 7.89 -42.8 98.5 8.29 615 1988 399 0.26 0 0
LSW09 14.93 7.82 4.1 82.5 6.93 2893 428 1880 1.48 0.2 6
LSW13 16.05 7.93 8.3 95.2 7.88 652 1851 423 0.27 0 0
LWDL 16.15 7.75 4.2 91 7.52 3252 370 2113 1.69 0.2 0
ODN-PIT 16.58 7.82 -13.4 77.5 6.31 2880 414 1872 1.48 0 0
WP02 16.78 7.45 -53 60.2 4.91 778 1526 505 0.33 0 0
WP04 15.68 7.99 -2.9 92.2 7.67 2908 419 1890 1.49 0.1 4,6
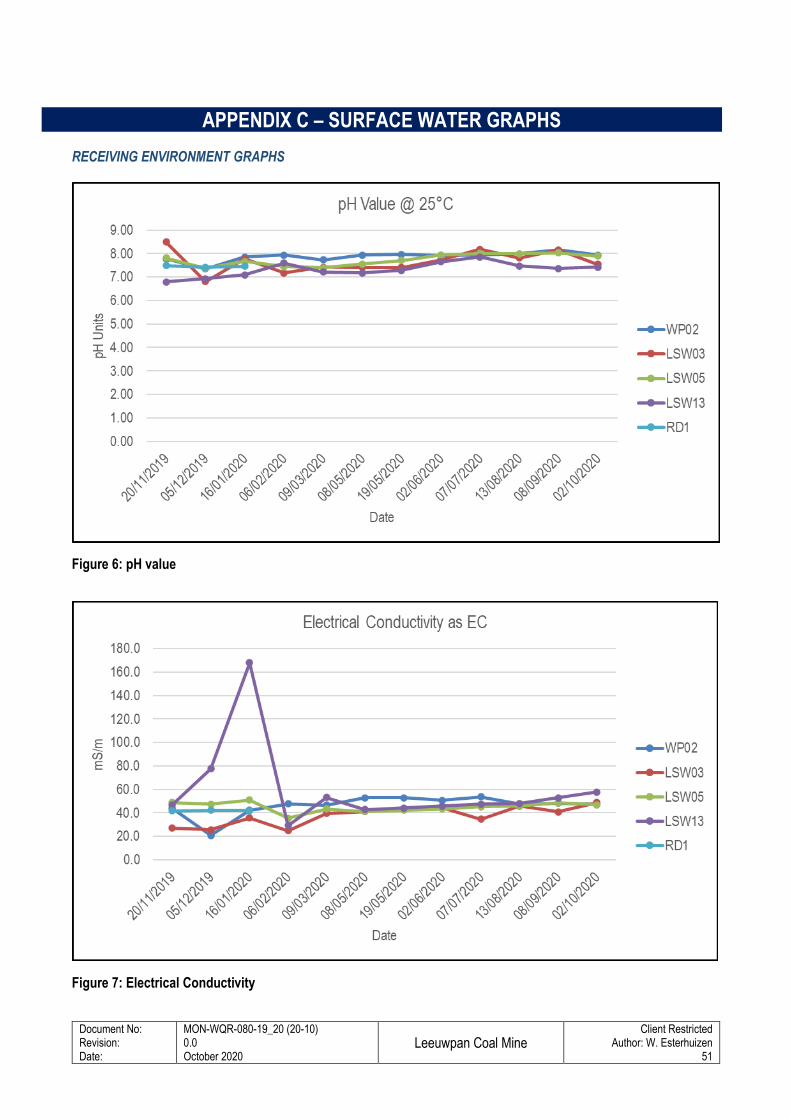
Document No: Revision: Date:
MON-WQR-080-19_20 (20-10) 0.0 October 2020
Leeuwpan Coal Mine
Client Restricted Author: W. Esterhuizen
51
APPENDIX C – SURFACE WATER GRAPHS
RECEIVING ENVIRONMENT GRAPHS
Figure 6: pH value
Figure 7: Electrical Conductivity
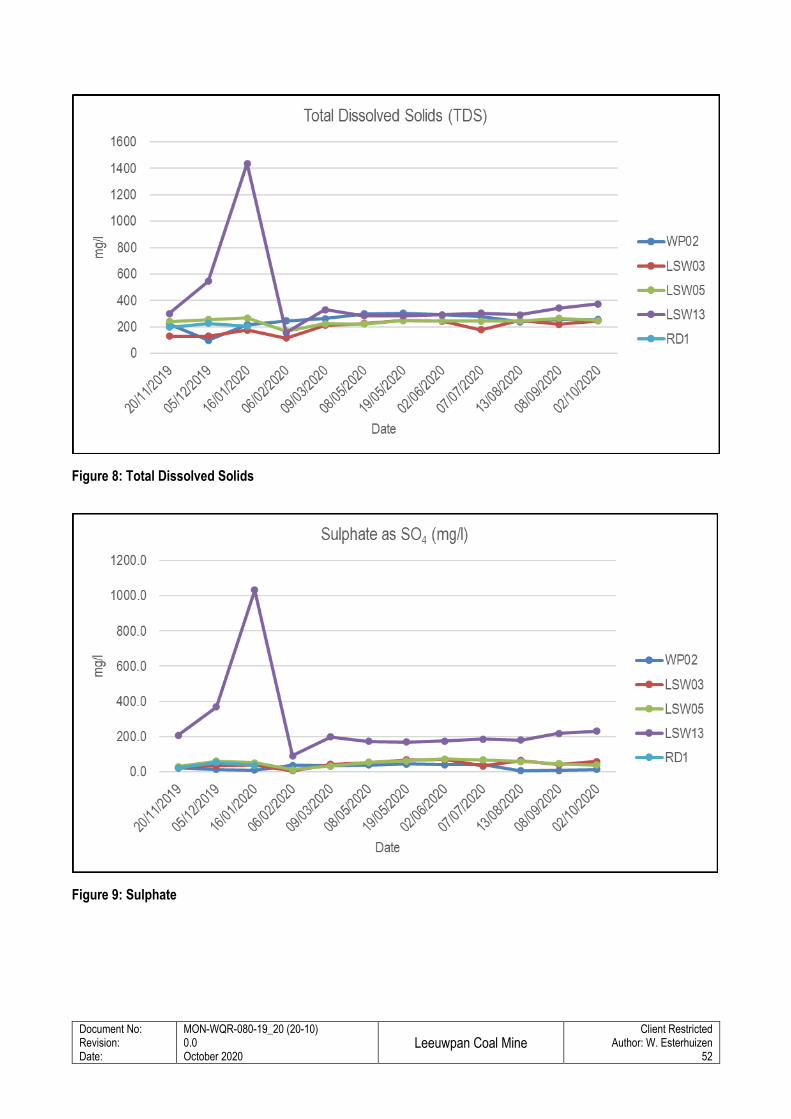
Document No: Revision: Date:
MON-WQR-080-19_20 (20-10) 0.0 October 2020
Leeuwpan Coal Mine
Client Restricted Author: W. Esterhuizen
52
Figure 8: Total Dissolved Solids
Figure 9: Sulphate
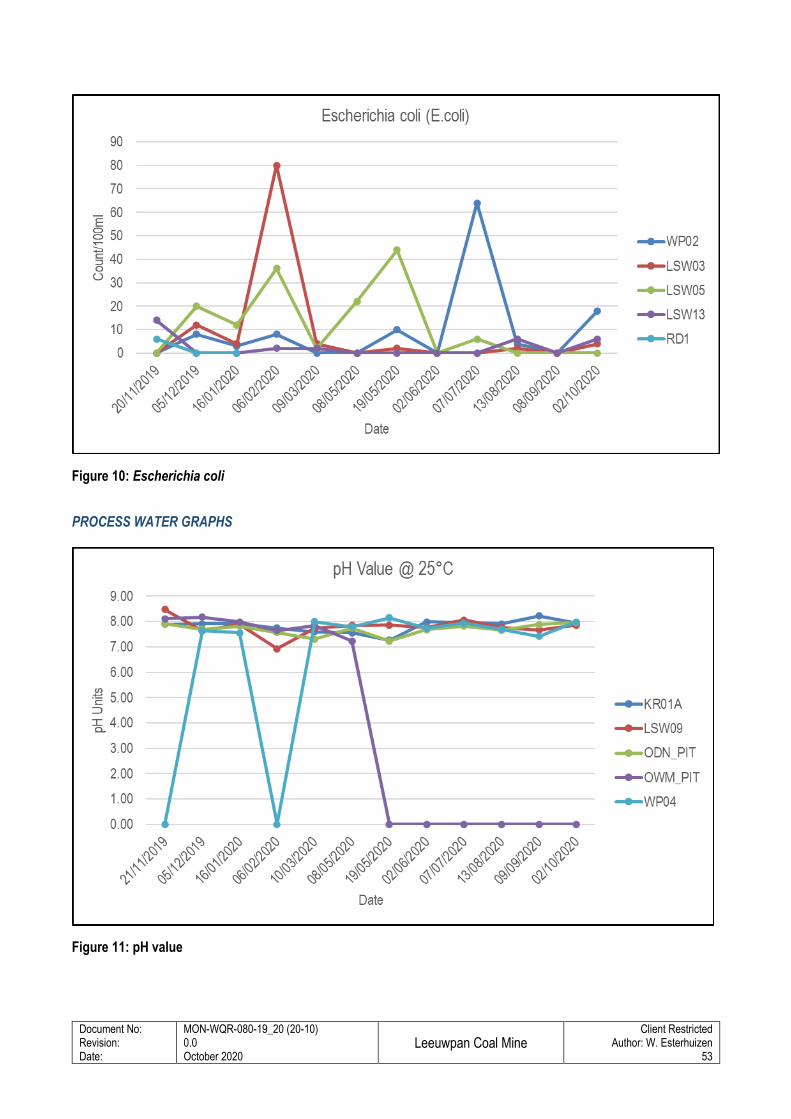
Document No: Revision: Date:
MON-WQR-080-19_20 (20-10) 0.0 October 2020
Leeuwpan Coal Mine
Client Restricted Author: W. Esterhuizen
53
Figure 10: Escherichia coli
PROCESS WATER GRAPHS
Figure 11: pH value
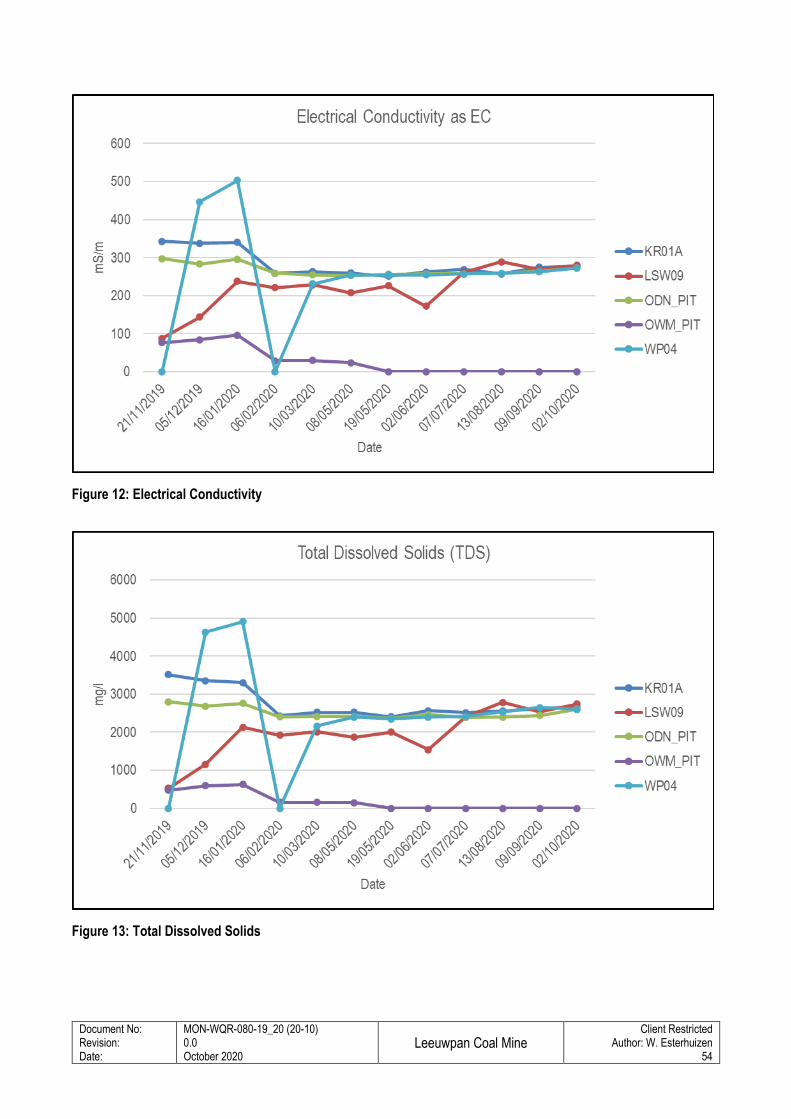
Document No: Revision: Date:
MON-WQR-080-19_20 (20-10) 0.0 October 2020
Leeuwpan Coal Mine
Client Restricted Author: W. Esterhuizen
54
Figure 12: Electrical Conductivity
Figure 13: Total Dissolved Solids
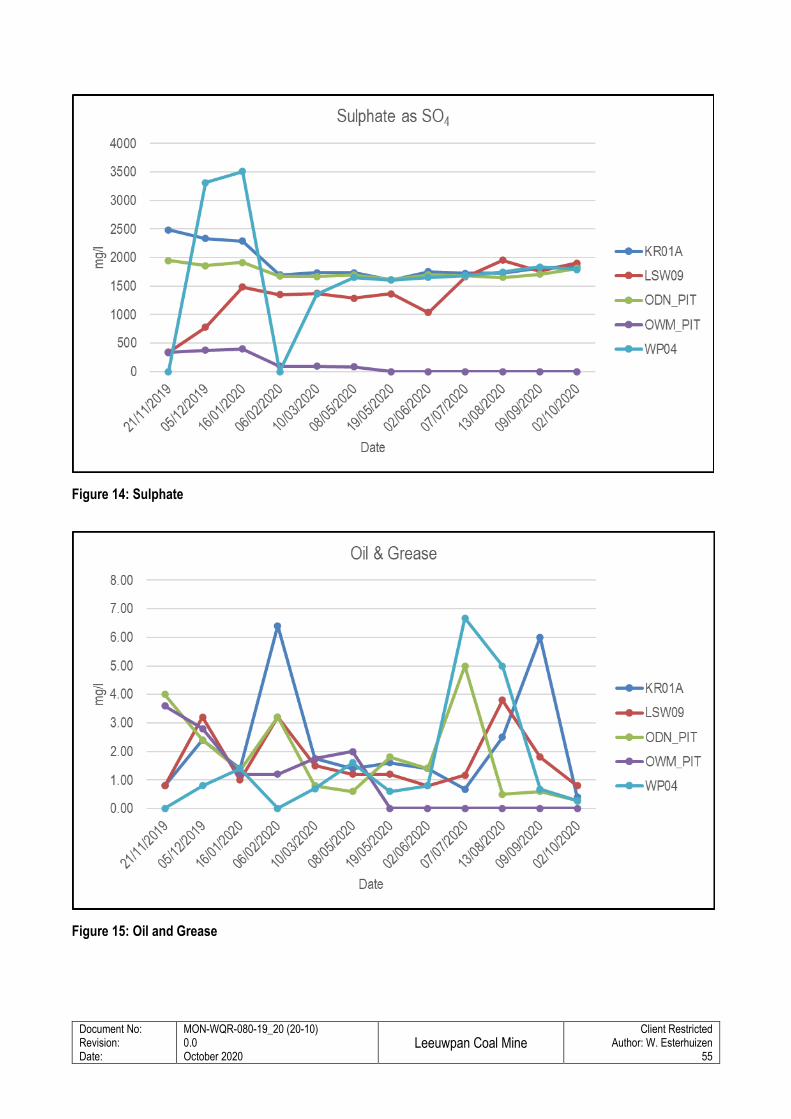
Document No: Revision: Date:
MON-WQR-080-19_20 (20-10) 0.0 October 2020
Leeuwpan Coal Mine
Client Restricted Author: W. Esterhuizen
55
Figure 14: Sulphate
Figure 15: Oil and Grease
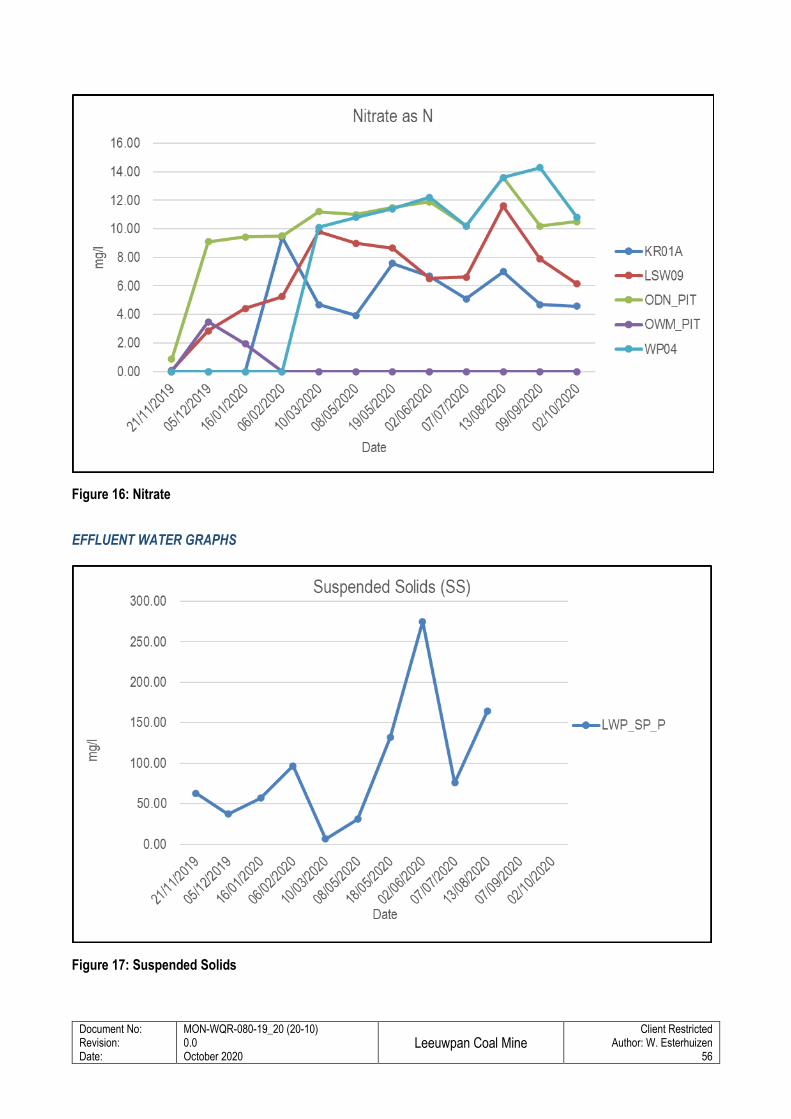
Document No: Revision: Date:
MON-WQR-080-19_20 (20-10) 0.0 October 2020
Leeuwpan Coal Mine
Client Restricted Author: W. Esterhuizen
56
Figure 16: Nitrate
EFFLUENT WATER GRAPHS
Figure 17: Suspended Solids
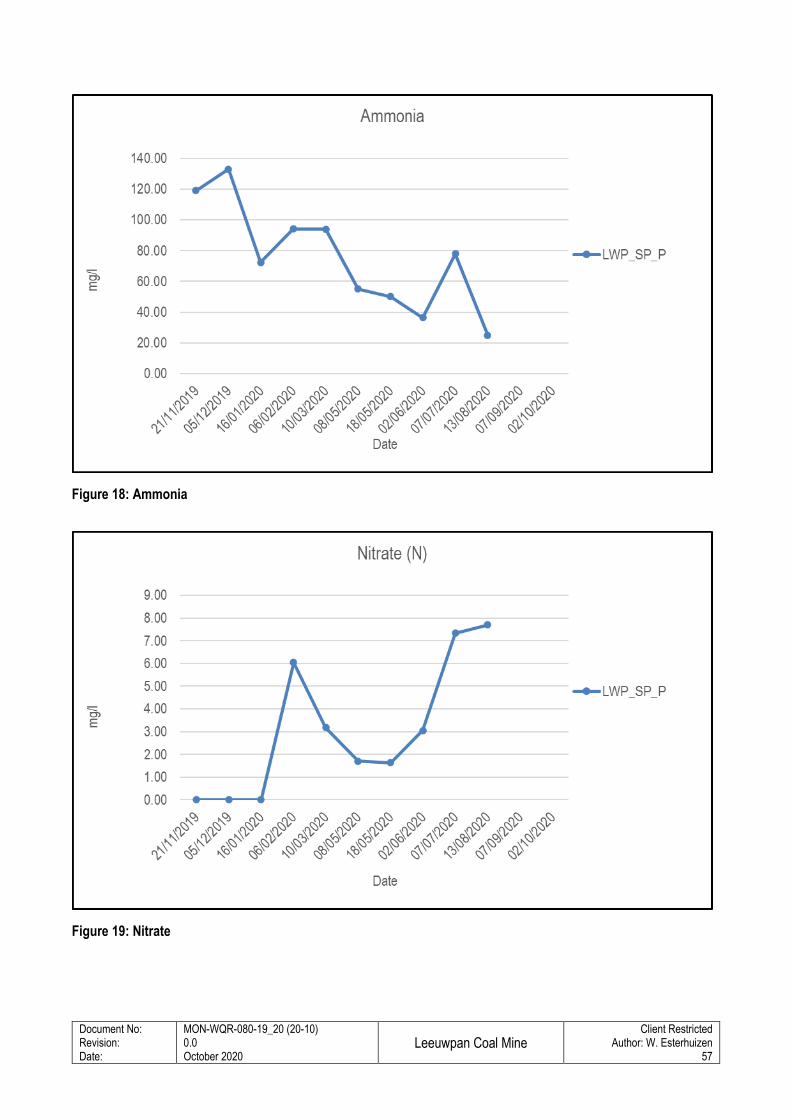
Document No: Revision: Date:
MON-WQR-080-19_20 (20-10) 0.0 October 2020
Leeuwpan Coal Mine
Client Restricted Author: W. Esterhuizen
57
Figure 18: Ammonia
Figure 19: Nitrate
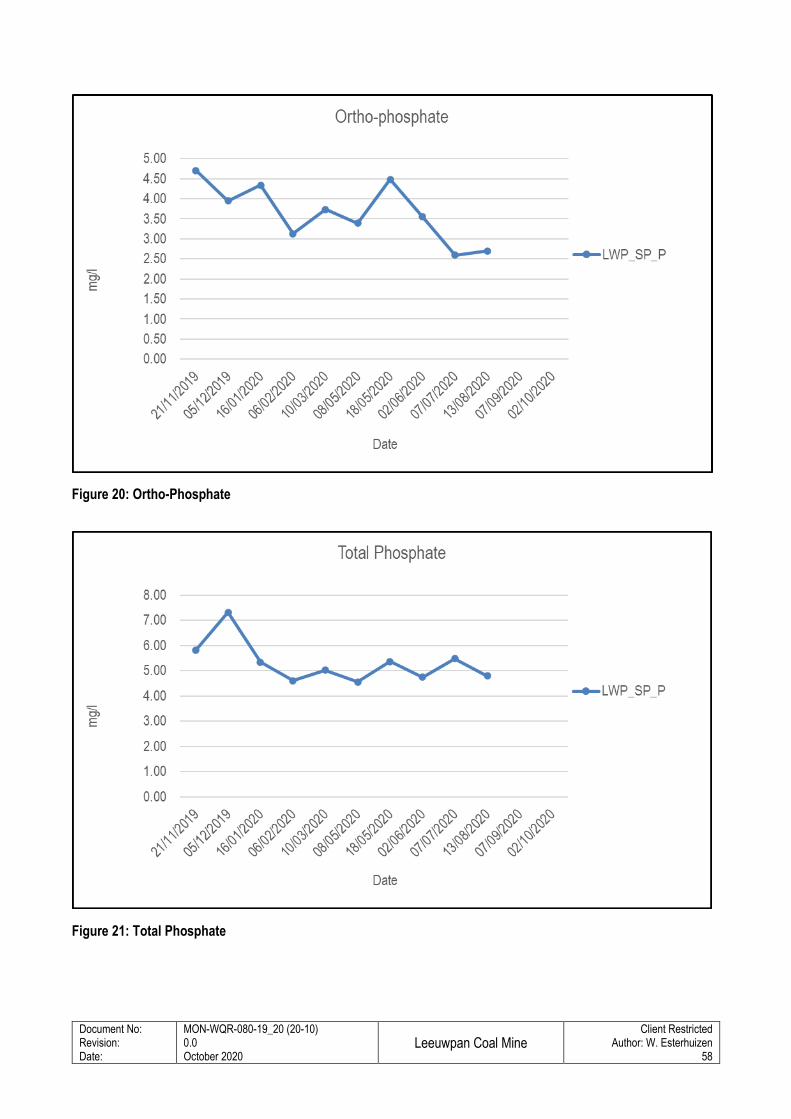
Document No: Revision: Date:
MON-WQR-080-19_20 (20-10) 0.0 October 2020
Leeuwpan Coal Mine
Client Restricted Author: W. Esterhuizen
58
Figure 20: Ortho-Phosphate
Figure 21: Total Phosphate
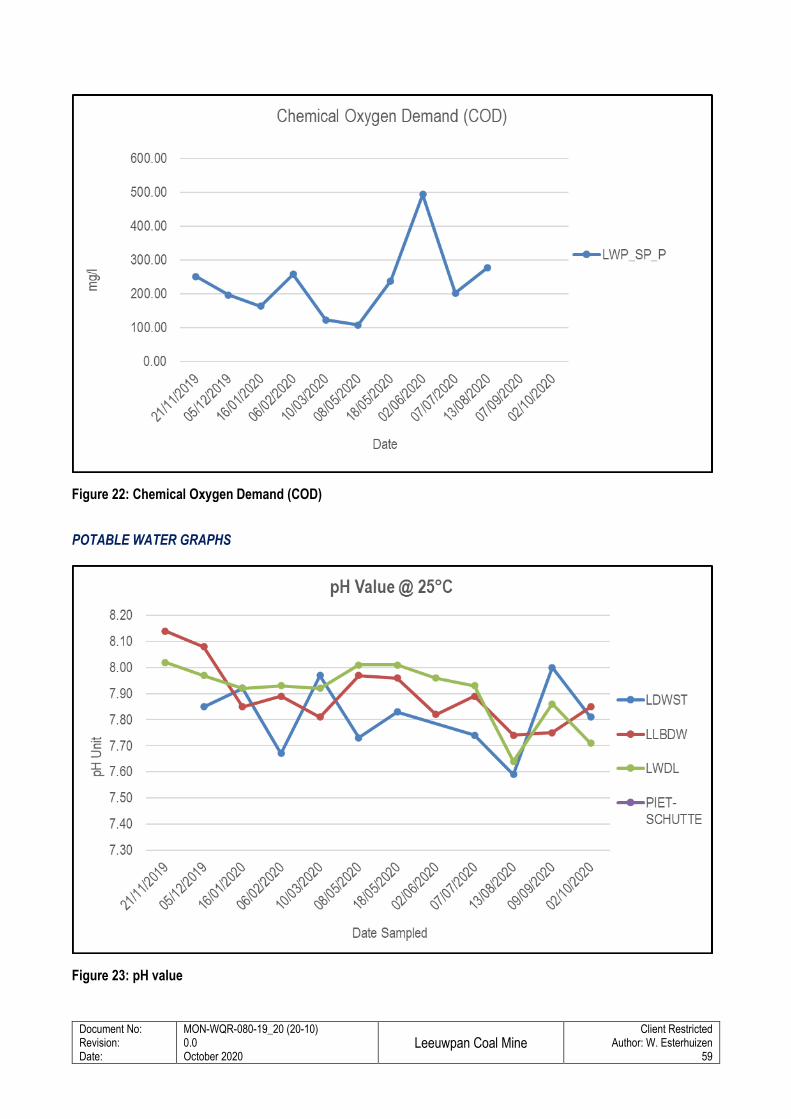
Document No: Revision: Date:
MON-WQR-080-19_20 (20-10) 0.0 October 2020
Leeuwpan Coal Mine
Client Restricted Author: W. Esterhuizen
59
Figure 22: Chemical Oxygen Demand (COD)
POTABLE WATER GRAPHS
Figure 23: pH value
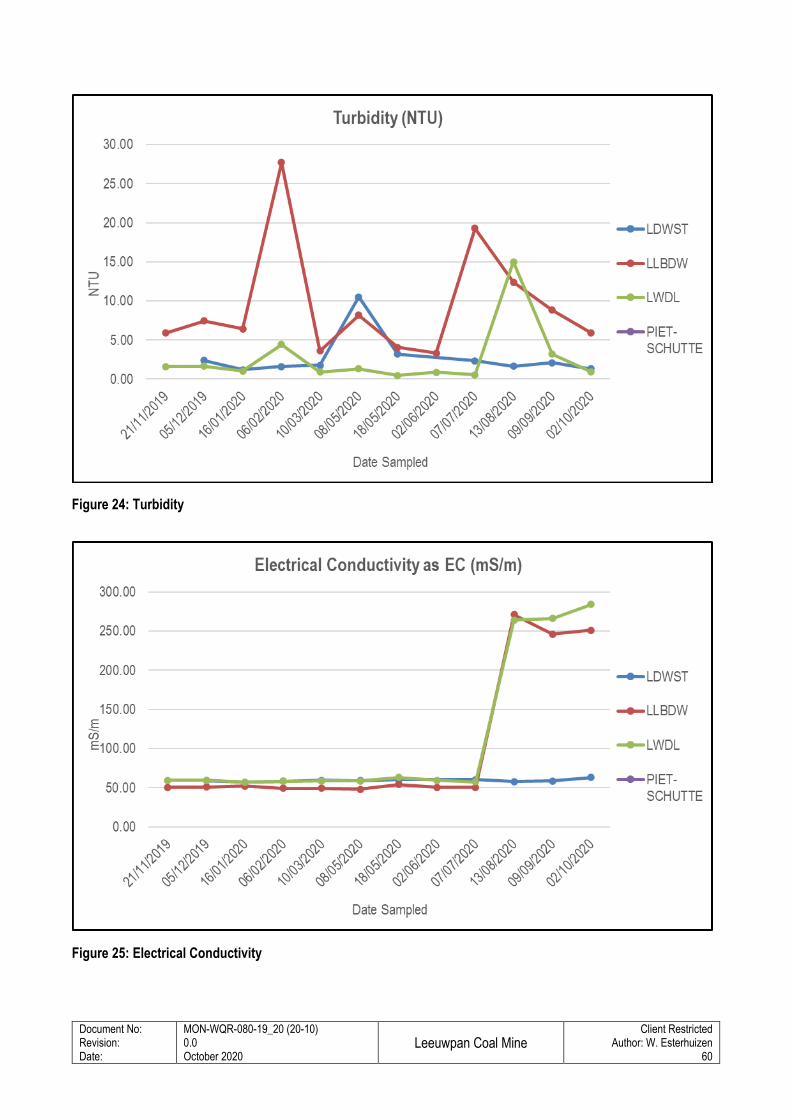
Document No: Revision: Date:
MON-WQR-080-19_20 (20-10) 0.0 October 2020
Leeuwpan Coal Mine
Client Restricted Author: W. Esterhuizen
60
Figure 24: Turbidity
Figure 25: Electrical Conductivity
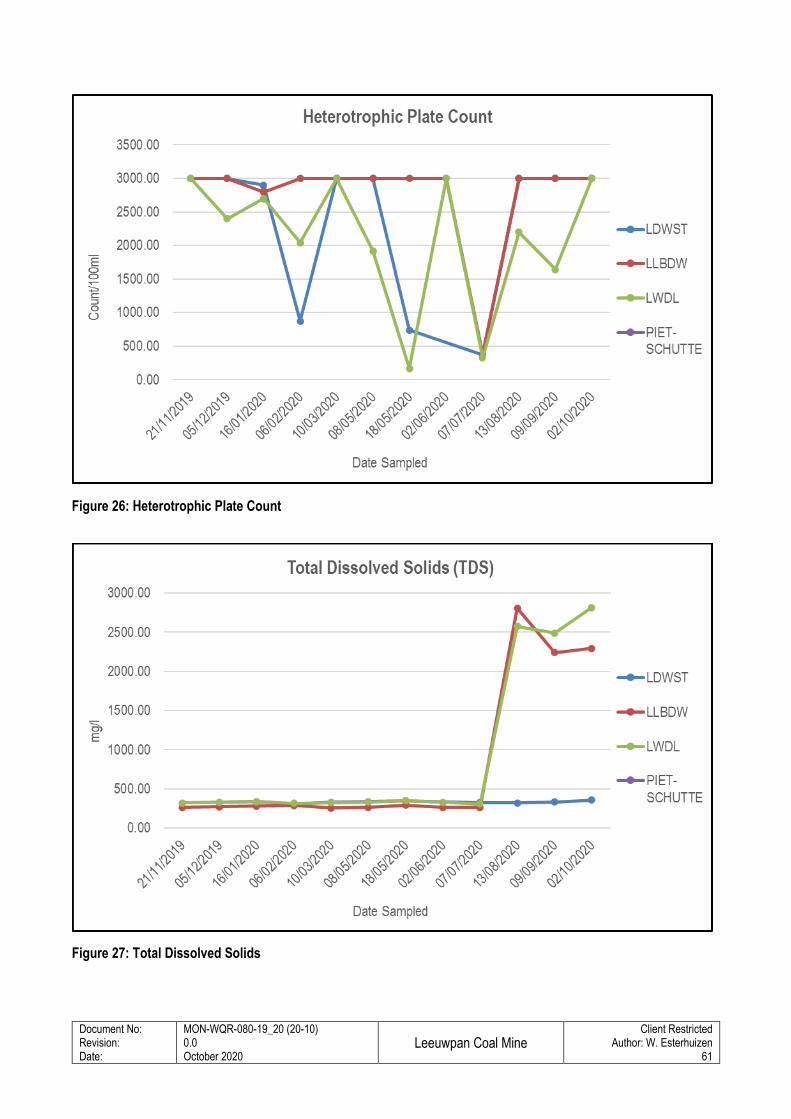
Document No: Revision: Date:
MON-WQR-080-19_20 (20-10) 0.0 October 2020
Leeuwpan Coal Mine
Client Restricted Author: W. Esterhuizen
61
Figure 26: Heterotrophic Plate Count
Figure 27: Total Dissolved Solids
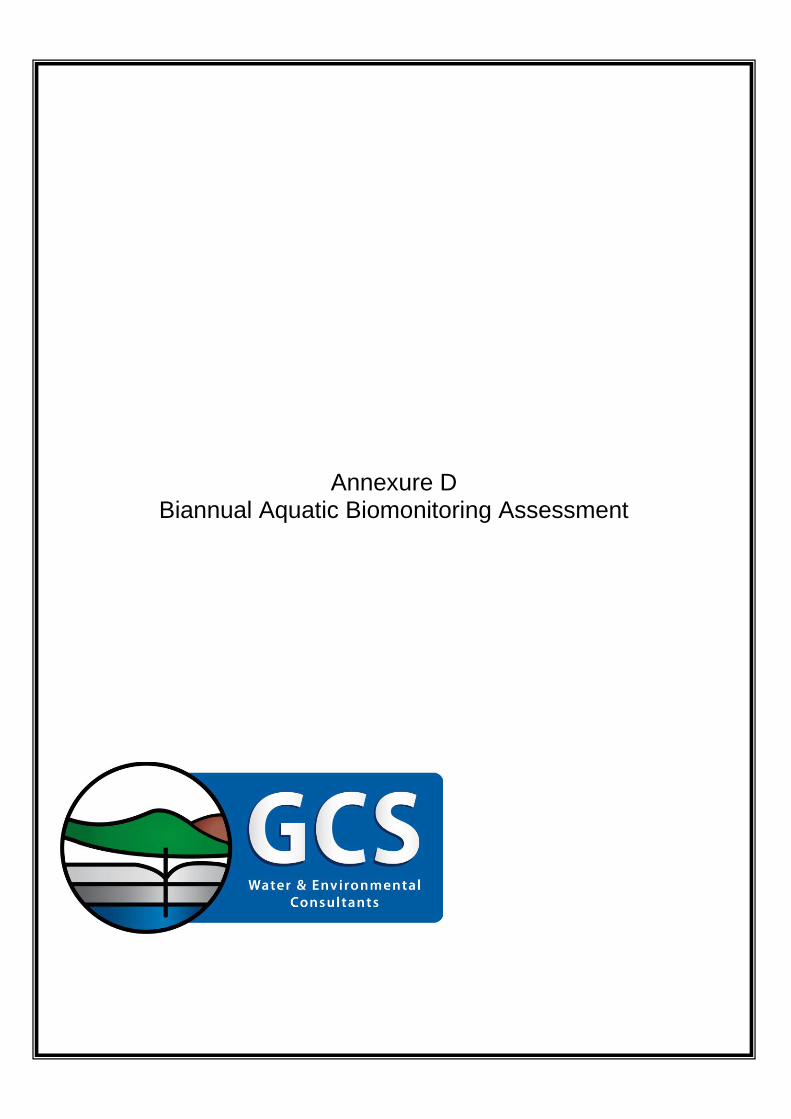
Annexure D Biannual Aquatic Biomonitoring Assessment
Exxaro: 2020 Dry Season Aquatic Assessment Project: BIM-REP-117-19_20
Environmental Assurance (Pty) Ltd
Aquatic Division
www.envass.co.za
Client Restricted
ENVASS
i
AQUATIC ASSESSMENT
BIANNUAL AQUATIC BIOMONITORING ASSESSMENT OF THE EXISTING EXXARO
LEEUWPAN COLLIERY NEAR DELMAS MPUMALANGA, SOUTH AFRICA
DRY SEASON 2020
PREPARED FOR: Exxaro Coal (Pty) Ltd.
PREPARED BY: Environmental Assurance (Pty) Ltd.
SUBMITTED TO: Lucy Mogakane
EMAIL: [email protected]
DATE: September 2020
PROPOSAL NUMBER: BIM-REP-117-19_20
VERSION: 0.1
Exxaro: 2020 Dry Season Aquatic Assessment Project: BIM-REP-117-19_20
Environmental Assurance (Pty) Ltd
Aquatic Division
www.envass.co.za
Client Restricted
ENVASS
ii
DOCUMENT CONTROL
Document Title Biannual Aquatic Biomonitoring Assessment of the Existing Exxaro Leeuwpan Colliery near
Delmas Mpumalanga, South Africa: Dry Season 2020
Report Number BIM-REP-117-19_20 (EXXARO- 2020 Dry)
Version 0.1
Date of Field
Assessment 18 May 2020
Date of Report July 2020
Date of Amendment September 2020
Submitted to
Client: Exxaro Coal (Pty) Ltd.
Contact Person: Lucy Mogakane
Position: Environmental Officer
Email: [email protected]
Distribution x1 Exxaro Coal (Pty) Ltd.
x1 Environmental Assurance (Pty) Ltd.
EXPERTISE OF AUTHOR
Accreditations Registered with South African Council for Natural Scientific Professionals (SACNASP) (no.
119357), DWS accredited SASS5 aquatic biomonitoring practitioner.
QUALITY CONTROL
Author Internal Review Technical Review
Name Wietsche Roets Wayne Westcott Carl Schoeman
Designation Environmental Scientist
Cand.Sci.Nat.: 119357
Wetland and Aquatic
Ecologist
Pr.Sci.Nat.: 117334
Environmental Scientist
Pr.Sci.Nat.: 114848
Signature
Date 29-06-2020 14-07-2020 16-07-2020
DISCLAIMER
Copyright ENVASS. All Rights Reserved - This documentation is considered the intellectual property of ENVASS. Unauthorised
reproduction or distribution of this documentation or any portion of it may result in severe civil and criminal penalties, and violators
will be prosecuted to the maximum extent possible under law.
Exxaro: 2020 Dry Season Aquatic Assessment Project: BIM-REP-117-19_20
Environmental Assurance (Pty) Ltd
Aquatic Division
www.envass.co.za
Client Restricted
ENVASS
iii
SPECIALIST DECLARATION:
I Wietsche Roets, declare that:
• I acted as an independent specialist;
• The assessment results were interpreted in an objective manner, even if the conclusions were not favourable to
the client;
• I have the relevant expertise required to conduct a specialist report of this nature in terms of the National
Environmental Management Act (NEMA) (Act no. 107 of 1998) and the National Environmental Management;
Biodiversity Act (Act no. 10 of 2004);
• The contents of this report comply with the relevant legislative requirements, specifically Appendix 6 of the NEMA:
EIA Regulations (2014, as amended in 2017);
• I understand that any false information published in this document is an offence in terms of Regulation 71 and is
punishable in terms of Section 24(f) of the Act; and
• I am a registered scientist with the South African Council for Natural Scientific Professions (SACNASP).
Wietsche Roets
Cand.Sci.Nat. (no. 119357)
Suggested Report Citation:
Environmental Assurance, 2020. Biannual Aquatic Biomonitoring Assessment of the Existing Exxaro Leeuwpan Colliery
near Delmas Mpumalanga, South Africa: Dry Season 2020. Prepared for Exxaro Coal (Pty) Ltd. July 2020.
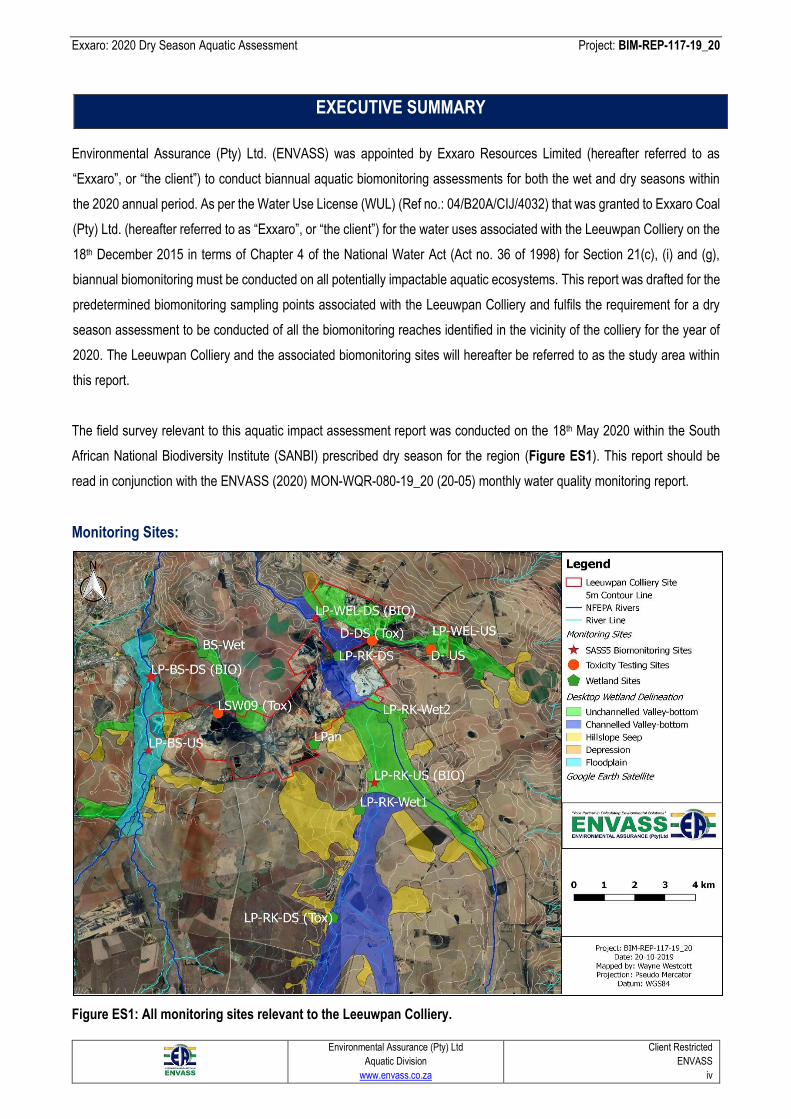
Exxaro: 2020 Dry Season Aquatic Assessment Project: BIM-REP-117-19_20
Environmental Assurance (Pty) Ltd
Aquatic Division
www.envass.co.za
Client Restricted
ENVASS
iv
EXECUTIVE SUMMARY
Environmental Assurance (Pty) Ltd. (ENVASS) was appointed by Exxaro Resources Limited (hereafter referred to as
“Exxaro”, or “the client”) to conduct biannual aquatic biomonitoring assessments for both the wet and dry seasons within
the 2020 annual period. As per the Water Use License (WUL) (Ref no.: 04/B20A/CIJ/4032) that was granted to Exxaro Coal
(Pty) Ltd. (hereafter referred to as “Exxaro”, or “the client”) for the water uses associated with the Leeuwpan Colliery on the
18th December 2015 in terms of Chapter 4 of the National Water Act (Act no. 36 of 1998) for Section 21(c), (i) and (g),
biannual biomonitoring must be conducted on all potentially impactable aquatic ecosystems. This report was drafted for the
predetermined biomonitoring sampling points associated with the Leeuwpan Colliery and fulfils the requirement for a dry
season assessment to be conducted of all the biomonitoring reaches identified in the vicinity of the colliery for the year of
2020. The Leeuwpan Colliery and the associated biomonitoring sites will hereafter be referred to as the study area within
this report.
The field survey relevant to this aquatic impact assessment report was conducted on the 18th May 2020 within the South
African National Biodiversity Institute (SANBI) prescribed dry season for the region (Figure ES1). This report should be
read in conjunction with the ENVASS (2020) MON-WQR-080-19_20 (20-05) monthly water quality monitoring report.
Monitoring Sites:
Figure ES1: All monitoring sites relevant to the Leeuwpan Colliery.
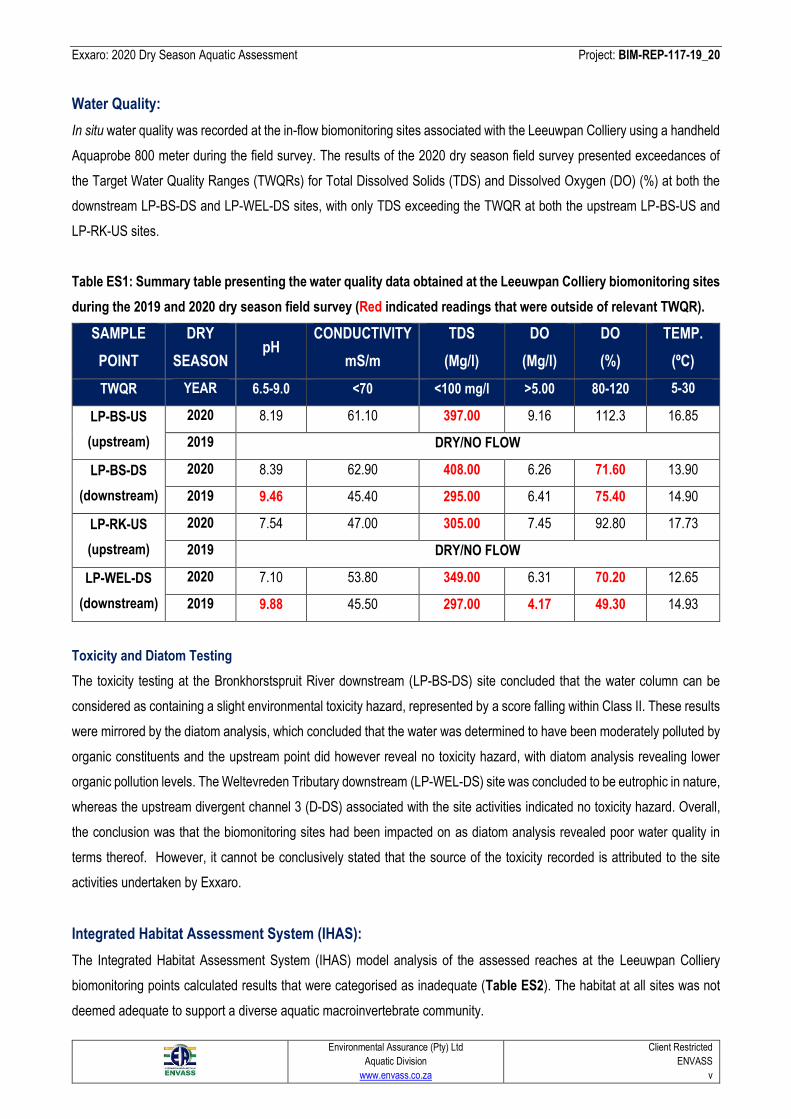
Exxaro: 2020 Dry Season Aquatic Assessment Project: BIM-REP-117-19_20
Environmental Assurance (Pty) Ltd
Aquatic Division
www.envass.co.za
Client Restricted
ENVASS
v
Water Quality:
In situ water quality was recorded at the in-flow biomonitoring sites associated with the Leeuwpan Colliery using a handheld
Aquaprobe 800 meter during the field survey. The results of the 2020 dry season field survey presented exceedances of
the Target Water Quality Ranges (TWQRs) for Total Dissolved Solids (TDS) and Dissolved Oxygen (DO) (%) at both the
downstream LP-BS-DS and LP-WEL-DS sites, with only TDS exceeding the TWQR at both the upstream LP-BS-US and
LP-RK-US sites.
Table ES1: Summary table presenting the water quality data obtained at the Leeuwpan Colliery biomonitoring sites
during the 2019 and 2020 dry season field survey (Red indicated readings that were outside of relevant TWQR).
SAMPLE
POINT
DRY
SEASON pH
CONDUCTIVITY
mS/m
TDS
(Mg/l)
DO
(Mg/l)
DO
(%)
TEMP.
(ºC)
TWQR YEAR 6.5-9.0 <70 <100 mg/l >5.00 80-120 5-30
LP-BS-US
(upstream)
2020 8.19 61.10 397.00 9.16 112.3 16.85
2019 DRY/NO FLOW
LP-BS-DS
(downstream)
2020 8.39 62.90 408.00 6.26 71.60 13.90
2019 9.46 45.40 295.00 6.41 75.40 14.90
LP-RK-US
(upstream)
2020 7.54 47.00 305.00 7.45 92.80 17.73
2019 DRY/NO FLOW
LP-WEL-DS
(downstream)
2020 7.10 53.80 349.00 6.31 70.20 12.65
2019 9.88 45.50 297.00 4.17 49.30 14.93
Toxicity and Diatom Testing
The toxicity testing at the Bronkhorstspruit River downstream (LP-BS-DS) site concluded that the water column can be
considered as containing a slight environmental toxicity hazard, represented by a score falling within Class II. These results
were mirrored by the diatom analysis, which concluded that the water was determined to have been moderately polluted by
organic constituents and the upstream point did however reveal no toxicity hazard, with diatom analysis revealing lower
organic pollution levels. The Weltevreden Tributary downstream (LP-WEL-DS) site was concluded to be eutrophic in nature,
whereas the upstream divergent channel 3 (D-DS) associated with the site activities indicated no toxicity hazard. Overall,
the conclusion was that the biomonitoring sites had been impacted on as diatom analysis revealed poor water quality in
terms thereof. However, it cannot be conclusively stated that the source of the toxicity recorded is attributed to the site
activities undertaken by Exxaro.
Integrated Habitat Assessment System (IHAS):
The Integrated Habitat Assessment System (IHAS) model analysis of the assessed reaches at the Leeuwpan Colliery
biomonitoring points calculated results that were categorised as inadequate (Table ES2). The habitat at all sites was not
deemed adequate to support a diverse aquatic macroinvertebrate community.
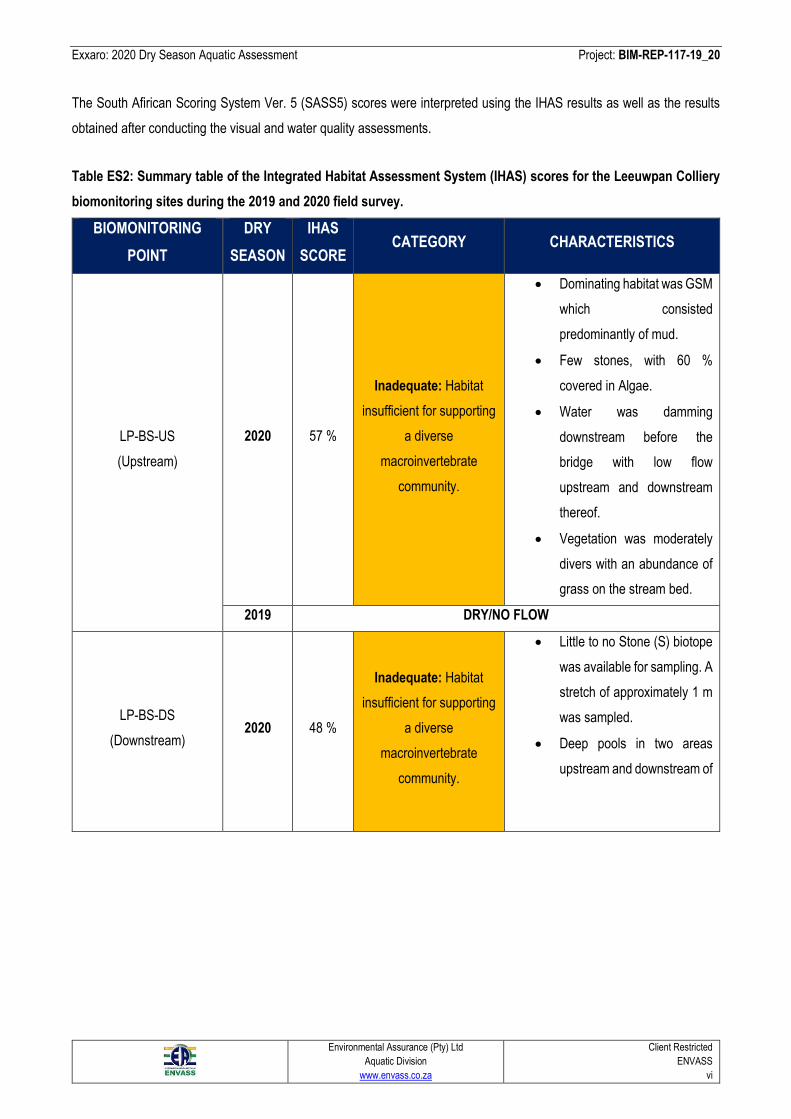
Exxaro: 2020 Dry Season Aquatic Assessment Project: BIM-REP-117-19_20
Environmental Assurance (Pty) Ltd
Aquatic Division
www.envass.co.za
Client Restricted
ENVASS
vi
The South Afirican Scoring System Ver. 5 (SASS5) scores were interpreted using the IHAS results as well as the results
obtained after conducting the visual and water quality assessments.
Table ES2: Summary table of the Integrated Habitat Assessment System (IHAS) scores for the Leeuwpan Colliery
biomonitoring sites during the 2019 and 2020 field survey.
BIOMONITORING
POINT
DRY
SEASON
IHAS
SCORE CATEGORY CHARACTERISTICS
LP-BS-US
(Upstream)
2020 57 %
Inadequate: Habitat
insufficient for supporting
a diverse
macroinvertebrate
community.
• Dominating habitat was GSM
which consisted
predominantly of mud.
• Few stones, with 60 %
covered in Algae.
• Water was damming
downstream before the
bridge with low flow
upstream and downstream
thereof.
• Vegetation was moderately
divers with an abundance of
grass on the stream bed.
2019 DRY/NO FLOW
LP-BS-DS
(Downstream) 2020 48 %
Inadequate: Habitat
insufficient for supporting
a diverse
macroinvertebrate
community.
• Little to no Stone (S) biotope
was available for sampling. A
stretch of approximately 1 m
was sampled.
• Deep pools in two areas
upstream and downstream of
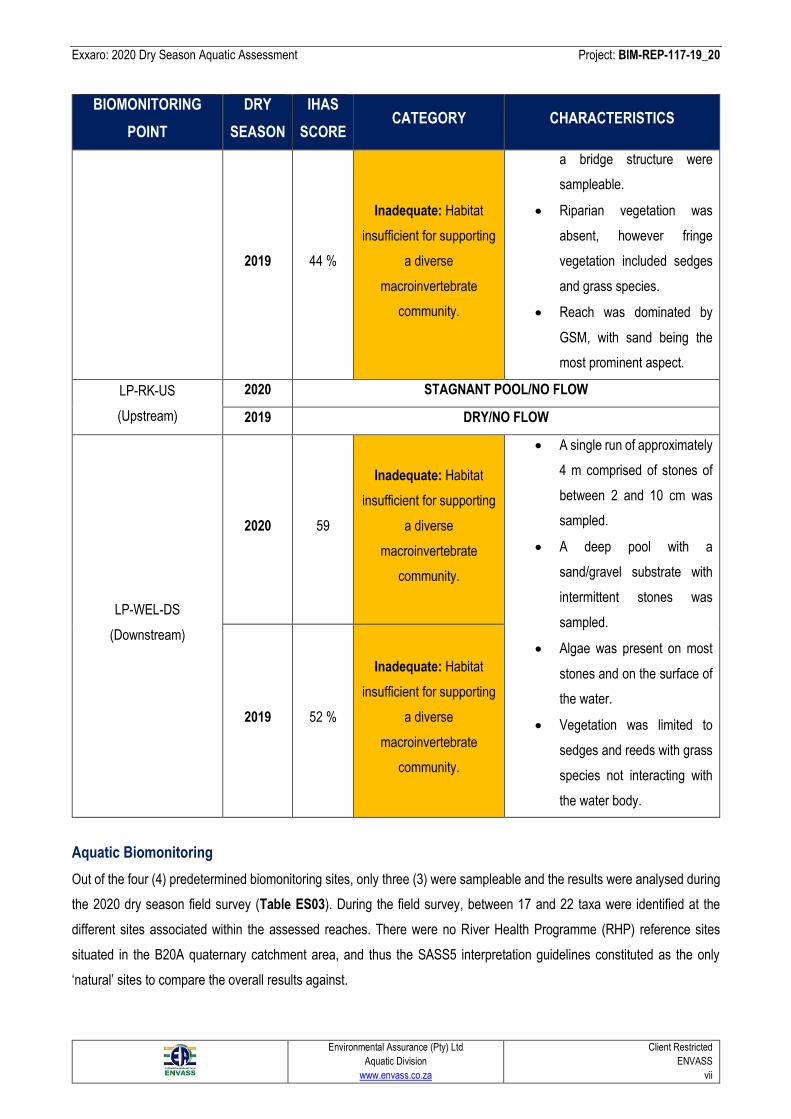
Exxaro: 2020 Dry Season Aquatic Assessment Project: BIM-REP-117-19_20
Environmental Assurance (Pty) Ltd
Aquatic Division
www.envass.co.za
Client Restricted
ENVASS
vii
BIOMONITORING
POINT
DRY
SEASON
IHAS
SCORE CATEGORY CHARACTERISTICS
2019 44 %
Inadequate: Habitat
insufficient for supporting
a diverse
macroinvertebrate
community.
a bridge structure were
sampleable.
• Riparian vegetation was
absent, however fringe
vegetation included sedges
and grass species.
• Reach was dominated by
GSM, with sand being the
most prominent aspect.
LP-RK-US
(Upstream)
2020 STAGNANT POOL/NO FLOW
2019 DRY/NO FLOW
LP-WEL-DS
(Downstream)
2020 59
Inadequate: Habitat
insufficient for supporting
a diverse
macroinvertebrate
community.
• A single run of approximately
4 m comprised of stones of
between 2 and 10 cm was
sampled.
• A deep pool with a
sand/gravel substrate with
intermittent stones was
sampled.
• Algae was present on most
stones and on the surface of
the water.
• Vegetation was limited to
sedges and reeds with grass
species not interacting with
the water body.
2019 52 %
Inadequate: Habitat
insufficient for supporting
a diverse
macroinvertebrate
community.
Aquatic Biomonitoring
Out of the four (4) predetermined biomonitoring sites, only three (3) were sampleable and the results were analysed during
the 2020 dry season field survey (Table ES03). During the field survey, between 17 and 22 taxa were identified at the
different sites associated within the assessed reaches. There were no River Health Programme (RHP) reference sites
situated in the B20A quaternary catchment area, and thus the SASS5 interpretation guidelines constituted as the only
‘natural’ sites to compare the overall results against.
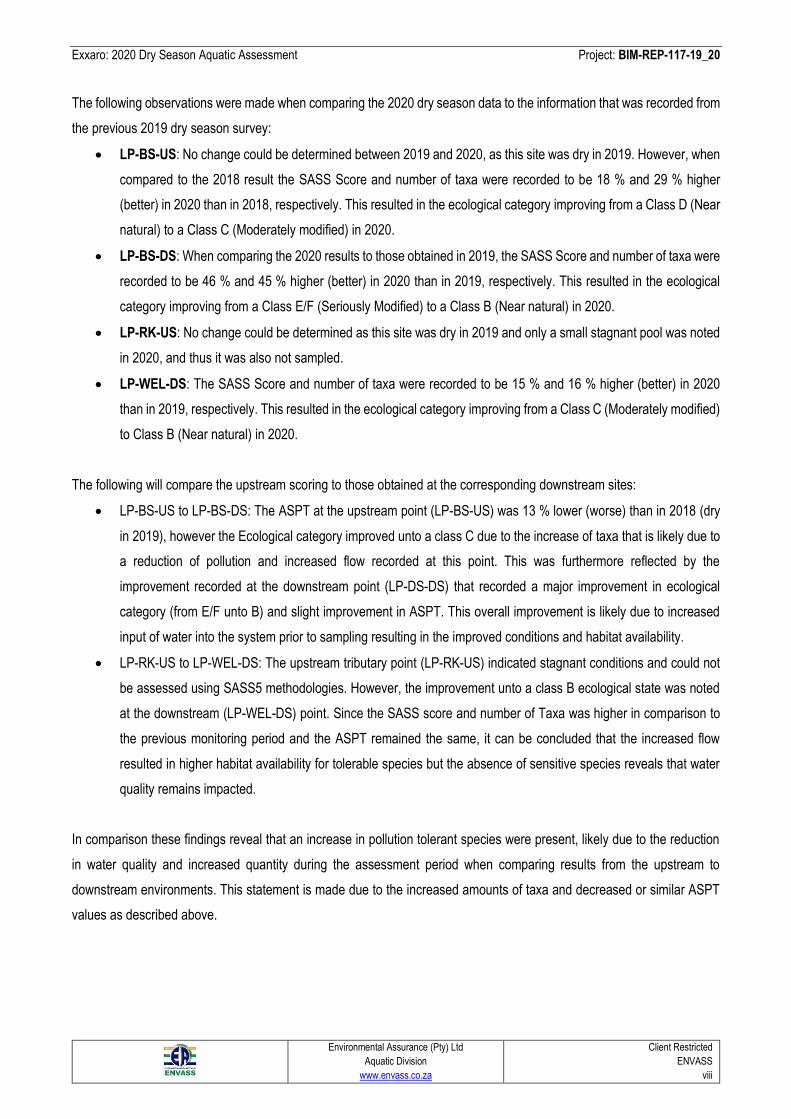
Exxaro: 2020 Dry Season Aquatic Assessment Project: BIM-REP-117-19_20
Environmental Assurance (Pty) Ltd
Aquatic Division
www.envass.co.za
Client Restricted
ENVASS
viii
The following observations were made when comparing the 2020 dry season data to the information that was recorded from
the previous 2019 dry season survey:
• LP-BS-US: No change could be determined between 2019 and 2020, as this site was dry in 2019. However, when
compared to the 2018 result the SASS Score and number of taxa were recorded to be 18 % and 29 % higher
(better) in 2020 than in 2018, respectively. This resulted in the ecological category improving from a Class D (Near
natural) to a Class C (Moderately modified) in 2020.
• LP-BS-DS: When comparing the 2020 results to those obtained in 2019, the SASS Score and number of taxa were
recorded to be 46 % and 45 % higher (better) in 2020 than in 2019, respectively. This resulted in the ecological
category improving from a Class E/F (Seriously Modified) to a Class B (Near natural) in 2020.
• LP-RK-US: No change could be determined as this site was dry in 2019 and only a small stagnant pool was noted
in 2020, and thus it was also not sampled.
• LP-WEL-DS: The SASS Score and number of taxa were recorded to be 15 % and 16 % higher (better) in 2020
than in 2019, respectively. This resulted in the ecological category improving from a Class C (Moderately modified)
to Class B (Near natural) in 2020.
The following will compare the upstream scoring to those obtained at the corresponding downstream sites:
• LP-BS-US to LP-BS-DS: The ASPT at the upstream point (LP-BS-US) was 13 % lower (worse) than in 2018 (dry
in 2019), however the Ecological category improved unto a class C due to the increase of taxa that is likely due to
a reduction of pollution and increased flow recorded at this point. This was furthermore reflected by the
improvement recorded at the downstream point (LP-DS-DS) that recorded a major improvement in ecological
category (from E/F unto B) and slight improvement in ASPT. This overall improvement is likely due to increased
input of water into the system prior to sampling resulting in the improved conditions and habitat availability.
• LP-RK-US to LP-WEL-DS: The upstream tributary point (LP-RK-US) indicated stagnant conditions and could not
be assessed using SASS5 methodologies. However, the improvement unto a class B ecological state was noted
at the downstream (LP-WEL-DS) point. Since the SASS score and number of Taxa was higher in comparison to
the previous monitoring period and the ASPT remained the same, it can be concluded that the increased flow
resulted in higher habitat availability for tolerable species but the absence of sensitive species reveals that water
quality remains impacted.
In comparison these findings reveal that an increase in pollution tolerant species were present, likely due to the reduction
in water quality and increased quantity during the assessment period when comparing results from the upstream to
downstream environments. This statement is made due to the increased amounts of taxa and decreased or similar ASPT
values as described above.
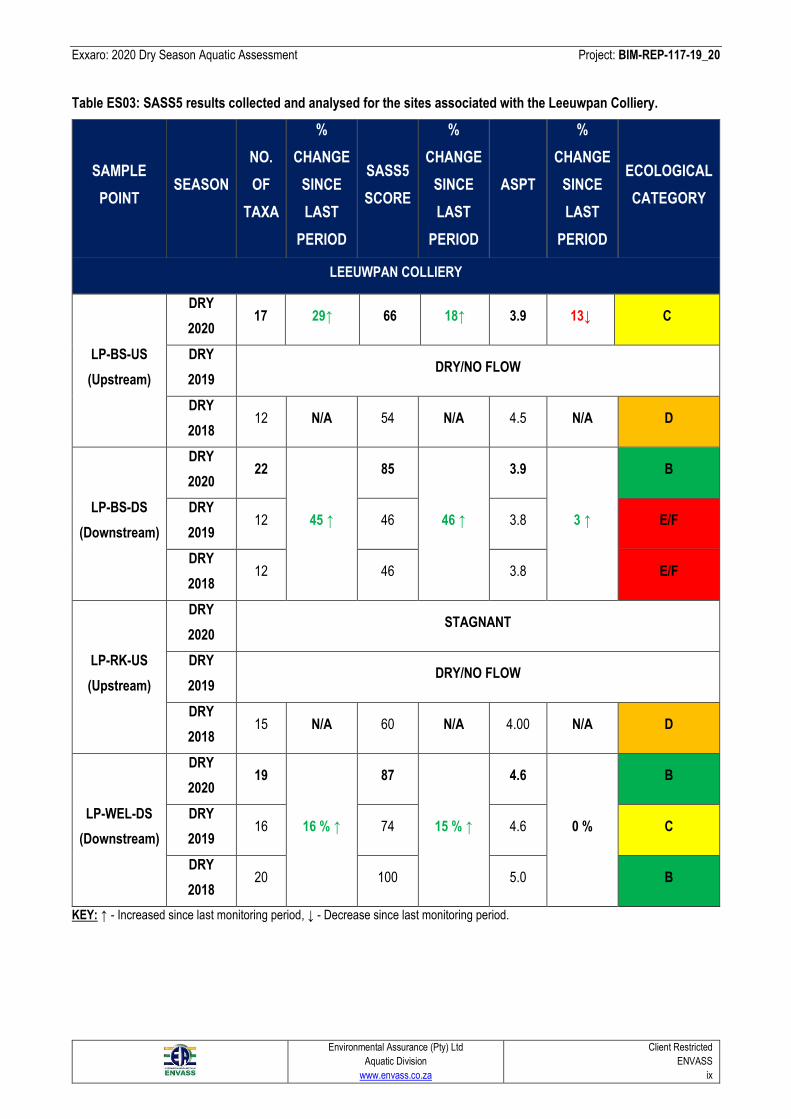
Exxaro: 2020 Dry Season Aquatic Assessment Project: BIM-REP-117-19_20
Environmental Assurance (Pty) Ltd
Aquatic Division
www.envass.co.za
Client Restricted
ENVASS
ix
Table ES03: SASS5 results collected and analysed for the sites associated with the Leeuwpan Colliery.
SAMPLE
POINT SEASON
NO.
OF
TAXA
%
CHANGE
SINCE
LAST
PERIOD
SASS5
SCORE
%
CHANGE
SINCE
LAST
PERIOD
ASPT
%
CHANGE
SINCE
LAST
PERIOD
ECOLOGICAL
CATEGORY
LEEUWPAN COLLIERY
LP-BS-US
(Upstream)
DRY
2020 17 29↑ 66 18↑ 3.9 13↓ C
DRY
2019 DRY/NO FLOW
DRY
2018 12 N/A 54 N/A 4.5 N/A D
LP-BS-DS
(Downstream)
DRY
2020 22
45 ↑
85
46 ↑
3.9
3 ↑
B
DRY
2019 12 46 3.8 E/F
DRY
2018 12 46 3.8 E/F
LP-RK-US
(Upstream)
DRY
2020 STAGNANT
DRY
2019 DRY/NO FLOW
DRY
2018 15 N/A 60 N/A 4.00 N/A D
LP-WEL-DS
(Downstream)
DRY
2020 19
16 % ↑
87
15 % ↑
4.6
0 %
B
DRY
2019 16 74 4.6 C
DRY
2018 20 100 5.0 B
KEY: ↑ - Increased since last monitoring period, ↓ - Decrease since last monitoring period.
Exxaro: 2020 Dry Season Aquatic Assessment Project: BIM-REP-117-19_20
Environmental Assurance (Pty) Ltd
Aquatic Division
www.envass.co.za
Client Restricted
ENVASS
x
Conclusion
It is evident that the aquatic systems in the vicinity of the existing licensed Leeuwpan Colliery have been moderately
disturbed and thus degraded by the current and historical land-uses, specifically agriculture, within the catchment area.
Based on the toxicity testing and diatom assessment that were conducted for the 2020 dry season survey, it is the specialists
substantive opinion that the Leeuwpan Colliery was having having a slight negative impact on the downstream aquatic
ecosystems at LP-BS-DS and LP-WEL-DS. However, based on the water quality, IHAS and SASS5 analysis this impact
can be mitigated by following protocol throughout the production process onsite, adhering to the limits stipulated within the
WUL (Ref no. 04/B20A/CIJ/4032) and implementing the recommendation stipulated below. The attributes that influenced
this conclusion included the following:
• Slight decrease in overall water quality from upstream sites LP-BS-US to LP-BS-DS and from LP-RK-US to LP-
WEL-DS. This trend was mirrored in the diatom assessment, which highlighted more eutrophic and higher pollution
levels at the LP-BS-DS site than the upstream LP-BS-US site. Adversely, more organic pollution was recorded at
the upstream LP-RK-US site than at the corresponding downstream LP-WEL-DS site, but both samples indicated
eutrophic conditions.
• The upstream site (LP-BS-US) was determined to pose no acute or short-chronic environmental hazard, however
the downstream site (LP-BS-DS) was determined to be of a slight environmental toxicity hazard presented by a
Direct Estimate of Ecological Effect Potential (DEEEP) Class II. Subsurface seepage from a historic farm dam
situated within the Leeuwpan Colliery at 26° 10’ 00.22” S, 28° 42’ 41.98” E was observed to be flowing into the
downstream tributary of the Bronkhorstspuit River above site LP-BS-DS. There may therefore be an influence from
this farm dam on the change in toxicity levels evident at LP-BS-DS. Surrounding land-uses were also considered,
however as a higher flow volume was entering the system from farm dam than the agricultural croplands and
stormwater runoff from the adjacent tar road, it was determined to have a higher influence on this conclusion.
• The previously elevated pH has decreased unto overall acceptable levels, likely the result of dilution due to
increased rainfall in the area prior to the assessment. This was mirrored by both sites having improved and only
LP-WEL-DS being determined to fall within Class II (Slight environmental toxicity hazard) toxicity, LP-WEL-DS
recording Some Degree of Acute/Short- chronic Toxic Hazard (S.D.O.T.H) at one (1) trophic level.
• The diatom analysis recorded eutrophic conditions at LP-WEL-DS and the conclusion was that the habitat
decreased and impacted water quality was evident. The diatom analysis on the downstream point LP-BS-DS also
indicated slightly impacted water quality, however this impact was largely present in the upstream environment at
LP-BS-US as well. However, since the on-site sampled revealed no acute toxicity it cannot be conclusively stated
that the pollution is attributed to the site. These results revealed that surrounding activities in the upstream
environment had a definitive impact and only a slight decrease was observed at the downstream point.
• The overall increase in aquatic macroinvertebrate health at the downstream biomonitoring sites was presumably
due to the dilution of water attributed to the elevated availability of water at the monitoring points and the overall
increased water quality measured and therewith the slightly improved habitat.
Exxaro: 2020 Dry Season Aquatic Assessment Project: BIM-REP-117-19_20
Environmental Assurance (Pty) Ltd
Aquatic Division
www.envass.co.za
Client Restricted
ENVASS
xi
Specialist’s Recommendation
• The slopes of the artificial earthen channels that have been excavated to divert flow around the mining areas
should be landscaped to slopes exhibiting a ratio of 1:3 (v:h) and revegetation with plugs from the surrounding
wetland area. This will provide further filtration of the stormwater runoff and episodic flow through the channels and
into the downstream Weltevredenspruit tributary. Ideally, the existing wetlands on-site should be maintained at
their base-line Present Ecological State score (PRES) by implementing rehabilitation and mitigation measures.
This will increase the filtration of potentially harmful contaminants that may be present in the surface- and
subsurface-flow that may be originating from the Leeuwpan Colliery.
• Toxicity testing of the water within the historic farm dam at 26° 10’ 00.22” S, 28° 42’ 41.98” E should be considered.
This may further narrow the search for any potential contamination sources on-site and create further measures
of monitoring the potential impact on water quality within the downstream aquatic ecosystems.
• Clearing of Invasive Alien Plant Species (IAPS) from the aquatic ecosystems in areas under the control of the mine
and associated with the reaches on which the affected biomonitoring points are situated to improve the water
balance and natural biodiversity within and around the system. The controlling and maintenance of all IAPS on a
landowner portion is a legal requirement in terms of the National Environmental Management: Biodiversity Act (Act
no. 10 of 2004) Alien and Invasive Species List, 2016 (DEA, 2016).
• Ongoing monitoring of the aquatic community integrity, that is implemented at the Leeuwpan Colliery, should be
maintained.
• The results presented within this biannual 2020 dry season aquatic assessment of the biomonitoring points
associated with the Leeuwpan Colliery must be spatially and temporally compared to the results obtained during
previous and future dry season biomonitoring studies. If the comparison highlights any significant alteration in the
health/integrity of the at-risk or downstream aquatic ecosystems, the cause, extent and significance of the impact
must be identified and appropriate mitigation and/or rehabilitation measures implemented to improve the health of
the impacted systems.
Exxaro: 2020 Dry Season Aquatic Assessment Project: BIM-REP-117-19_20
Environmental Assurance (Pty) Ltd
Aquatic Division
www.envass.co.za
Client Restricted
ENVASS
xii
TABLE OF CONTENTS
1 INTRODUCTION ....................................................................................................................................................... 1
1.1 Background.......................................................................................................................................................... 1
1.2 Locality ................................................................................................................................................................ 1
1.3 Applicable Legislation .......................................................................................................................................... 3
2 ASSUMPTIONS AND LIMITATIONS ........................................................................................................................ 5
3 OBJECTIVES ............................................................................................................................................................ 5
4 SCOPE OF WORK .................................................................................................................................................... 6
5 METHODOLOGY ...................................................................................................................................................... 6
5.1 Aquatic Assessment ............................................................................................................................................ 6
5.2 Desktop Assessment ........................................................................................................................................... 7
5.3 Visual Inspection .................................................................................................................................................. 8
5.4 Physicochemical Water Quality Analyses ............................................................................................................ 9
5.5 Index of Habitat Integrity Assessment (IHIA) ....................................................................................................... 9
5.6 Integrated Habitat Assessment System (IHAS) ................................................................................................. 11
5.7 South African Scoring System Ver. 5 (SASS5) .................................................................................................. 11
6 DESKTOP ASSESSMENT ...................................................................................................................................... 13
6.1 Hydrological Setting ........................................................................................................................................... 13
6.2 Ecoregion........................................................................................................................................................... 15
6.3 Sub-Quaternary Reaches (SQRs) ..................................................................................................................... 17
6.4 Land Use ........................................................................................................................................................... 20
6.5 Vegetation.......................................................................................................................................................... 20
6.6 Conservation Plan: Mpumalanga Province ........................................................................................................ 24
6.7 National Freshwater Ecosystem Priority Areas (NFEPAs) ................................................................................ 24
6.8 Geology and Soils .............................................................................................................................................. 27
7 BIOMONITORING SAMPLE SITES ........................................................................................................................ 30
7.1 Description of the Biomonitoring Points ............................................................................................................. 32
8 RESULTS .........................................................................................................................................................XXXVII
8.1 Physicochemical Water Quality .................................................................................................................... xxxvii
8.2 Toxicity Testing .............................................................................................................................................. xxxix
8.3 Diatom Analysis ................................................................................................................................................ xliii
8.3.1 Ecological Classification........................................................................................................................... xliii
8.3.2 Diatom Spatial Analysis ........................................................................................................................... xliv
8.4 Integrated Habitat Assessment System (IHAS) ................................................................................................ xlvi
8.5 South African Scoring System 5 (SASS5) Data Interpretation ....................................................................... xlviii
9 CONCLUSION AND SPECIALIST’S RECOMMENDATION .................................................................................... LI
Exxaro: 2020 Dry Season Aquatic Assessment Project: BIM-REP-117-19_20
Environmental Assurance (Pty) Ltd
Aquatic Division
www.envass.co.za
Client Restricted
ENVASS
xiii
10 REFERENCES ........................................................................................................................................................ 54
11 APPENDIX A: SPECIALIST’S QUALIFICATIONS ................................................................................................. 57
LIST OF TABLES
Table 1: Description of the legislation that was considered when drafting this aquatic biomonitoring assessment. ............. 3
Table 2: Presentation of the datasets and available information that was utilised during the desktop study associated with
this assessment. ........................................................................................................................................................... 7
Table 3: Category of score for the Present Ecological State (PES). ................................................................................... 10
Table 4: Classification of the Present Ecological State (PES) Classes in terms of Habitat Integrity (Based on Kemper, 1999).
.................................................................................................................................................................................... 10
Table 5: Presentation of the classes used to interpret the IHAS results. ............................................................................ 11
Table 6: Classification protocol for determining the Present State Class as modelled for the Highveld- Lower ecoregion
(Dallas, 2007). ............................................................................................................................................................. 13
Table 7: Main attributes associated with the Highveld Ecoregion. ...................................................................................... 15
Table 8: Characteristics of the Sub-Quaternary Reaches (SQRs) associated with the biomonitoring points...................... 17
Table 9: Fish species that could occur within the two SQRs associated with the study area (DWS, 2014; IUCN, 2020;
Skelton, 2001). ............................................................................................................................................................ 18
Table 10: Site characteristics recorded within the assessed reach at the LP-WEL-DS site. ............................................... 32
Table 11: Site characteristics recorded within the assessed reach of upstream LP-RK-US. .............................................. 33
Table 12: Site characteristics recorded within the assessed reach at site LP-BS-US. ........................................................ 34
Table 13: Site characteristics recorded within the assessed reach at LP-BS-DS. .............................................................. 35
Table 14: In situ water quality of the samples collected during the 2019 and 2020 dry season field survey (Red indicates
those readings outside of the relevant TWQR). ..................................................................................................... xxxvii
Table 15: Presentation of the overall hazard classed based on the DEEEP protocol. .................................................... xxxix
Table 16: Acute Toxicity Analysis of the water samples that were collected at the relevant biomonitoring sites. ................. xl
Table 17: Acute Toxicity Analysis of the additional water samples that were collected at the relevant sites. ..................... xlii
Table 18: Ecological descriptions of the four (4) sites at the Leeuwpan Colliery based on the diatom community (van Dam
et al., 1994; Taylor et al., 2007).................................................................................................................................. xliii
Table 19: Diatom index scores for the study sites that had sufficient diatom counts to determine the ecological condition of
the water column. ....................................................................................................................................................... xlvi
Table 20: The Integrated Habitat Assessment System (IHAS) scores for the Leeuwpan Colliery biomonitoring sites during
the 2019 and 2020 field survey. ................................................................................................................................ xlvii
Table 21: SASS5 results collected and analysed for the sites associated with the Leeuwpan Colliery. ............................ xlix
Exxaro: 2020 Dry Season Aquatic Assessment Project: BIM-REP-117-19_20
Environmental Assurance (Pty) Ltd
Aquatic Division
www.envass.co.za
Client Restricted
ENVASS
xiv
LIST OF FIGURES
Figure 1: Locality map of the study area in relation to surrounding towns and municipal boundaries within the Gauteng
Province, South Africa. .................................................................................................................................................. 2
Figure 2: Illustration of the quaternary catchment area and Water management Areas (WMAs) that were associated with
the study area (DWS, 2012). ....................................................................................................................................... 14
Figure 3: Ecoregion associated with the study area (DWS, 2012). ..................................................................................... 16
Figure 4: Illustration of the SQRs that are relevant to the biomonitoring sites within the study area. .................................. 19
Figure 5: Land cover associated with the proposed development study area (SANBI, 2013/14). ....................................... 21
Figure 6: Terrestrial vegetation types associated with the proposed development study area (SANBI, 2006-2018). ......... 22
Figure 7: Illustration of the wetland vegetation types and their conservation status relevant to the study area. ................. 23
Figure 8: Terrestrial Conservation Units that were determined to be relevant to the study area (MBCP, 2006). ................ 25
Figure 9: Illustration of the NFEPA wetland and river systems that were recorded within and around the study area (Driver
et al., 2011). ................................................................................................................................................................ 26
Figure 10: Illustration of the lithostratigraphic units that were recorded within the study area (Council of Geoscience, 2008).
.................................................................................................................................................................................... 28
Figure 11: Illustration of the hydrological runoff potential of the soil forms within the study area. ....................................... 29
Figure 12: All monitoring sites relevant to the Leeuwpan Colliery. Only the biomonitoring sites were relevant to this dry
season study. .............................................................................................................................................................. 31
Figure 13: Illustration of the SASS interpretation guideline relevant to the Highveld- Lower ecoregion (Dallas, 2007). ........ li
Exxaro: 2020 Dry Season Aquatic Assessment Project: BIM-REP-117-19_20
Environmental Assurance (Pty) Ltd
Aquatic Division
www.envass.co.za
Client Restricted
ENVASS
xv
LIST OF ABBREVIATIONS AND ACRONYMS
TERM EXPANSION
ASPT Average Species Per Taxa
BA Biodiversity Area
CBA Critical Biodiversity Area
CR Critically Endangered
DAFF Department of Agriculture, Forestry and Fisheries
DWA Department of Water Affairs
DWAF Department of Water Affairs and Forestry
DWS Department of Water and Sanitation
ECO Environmental Control Officer
EIA Environmental Impact Assessment
EMPr Environmental Management Programme
EN Endangered
ESS Ecosystem Services
FEPA Freshwater Ecosystem Priority Area
FHIA Freshwater Habitat Impact Assessment
GG Government Gazette
GIS Geographic Information System
GN General Notice
GPS Geographic Positioning System
HGM Hydrogeomorphic
IAPS Invasive Alien Plant Species
IHI Index of Habitat Integrity
LT Least Threatened
MAMSL Meters Above Mean Sea Level
MAP Mean Annual Precipitation
MASR Mean Annual Surface Runoff
MAT Mean Annual Temperature
NEMA National Environmental Management Act (Act no. 107 of 1998)
NFEPA National Freshwater Ecosystem Priority Area
Exxaro: 2020 Dry Season Aquatic Assessment Project: BIM-REP-117-19_20
Environmental Assurance (Pty) Ltd
Aquatic Division
www.envass.co.za
Client Restricted
ENVASS
xvi
TERM EXPANSION
NWA National Water Act (Act no. 36 of 1998)
PES Present Ecological State
PU Planning Unit
REC Recommended Ecological Category
RMO Recommended Management Objective
RWQO Resource Water Quality Objectives
SANBI South African National Biodiversity Institute
SASS5 South African Scoring System Version 5
SCC Species of Conservation Concern
TWQR Target Water Quality Range
VU Vulnerable
WMA Water Management Area
WULA Water Use Licence Application
WUL Water Use Licence
Exxaro: 2020 Dry Season Aquatic Assessment Project: BIM-REP-117-19_20
Environmental Assurance (Pty) Ltd
Aquatic Division
www.envass.co.za
Client Restricted
ENVASS
1
1 INTRODUCTION
1.1 Background
Environmental Assurance (Pty) Ltd. (ENVASS) was appointed by Exxaro Resources Limited (hereafter referred to as
“Exxaro”, or “the client”) to conduct biannual aquatic biomonitoring assessments for both the wet and dry seasons within
the annual period. As per the Water Use License (WUL) (Ref no.: 04/B20A/CIJ/4032) that was granted to Exxaro Coal (Pty)
Ltd. (hereafter referred to as “Exxaro”, or “the client”) for the water uses associated with the Leeuwpan Colliery on the 18th
December 2015 in terms of Chapter 4 of the National Water Act (Act no. 36 of 1998) for Section 21(c), (i) and (g), biannual
biomonitoring must be conducted on all potentially impactable aquatic ecosystems. This report was drafted for the
predetermined biomonitoring sampling points associated with the Leeuwpan Colliery and fulfils the requirement for a dry
season assessment to be conducted of all the biomonitoring reaches identified in the vicinity of the colliery for the year of
2020. The Leeuwpan Colliery and the associated biomonitoring sites will hereafter be referred to as the study area within
this report.
The field survey relevant to this aquatic impact assessment report was conducted on the 18th May 2020 within the South
African National Biodiversity Institute (SANBI) prescribed dry season for the region. This report should be read in conjunction
with the ENVASS (2020) MON-WQR-080-19_20 (20-05) monthly water quality monitoring report.
1.2 Locality
The Leeuwpan Colliery is located approximately 5 Kilometres (km) north of the town of Delmas, which is situated in the
Victor Khanye Local and Nkangala District Municipalities within the Mpumalanga Province of South Africa. Figure 1 overleaf
presents the Leeuwpan Colliery in relation to the surrounding towns within the relevant municipal boundaries.
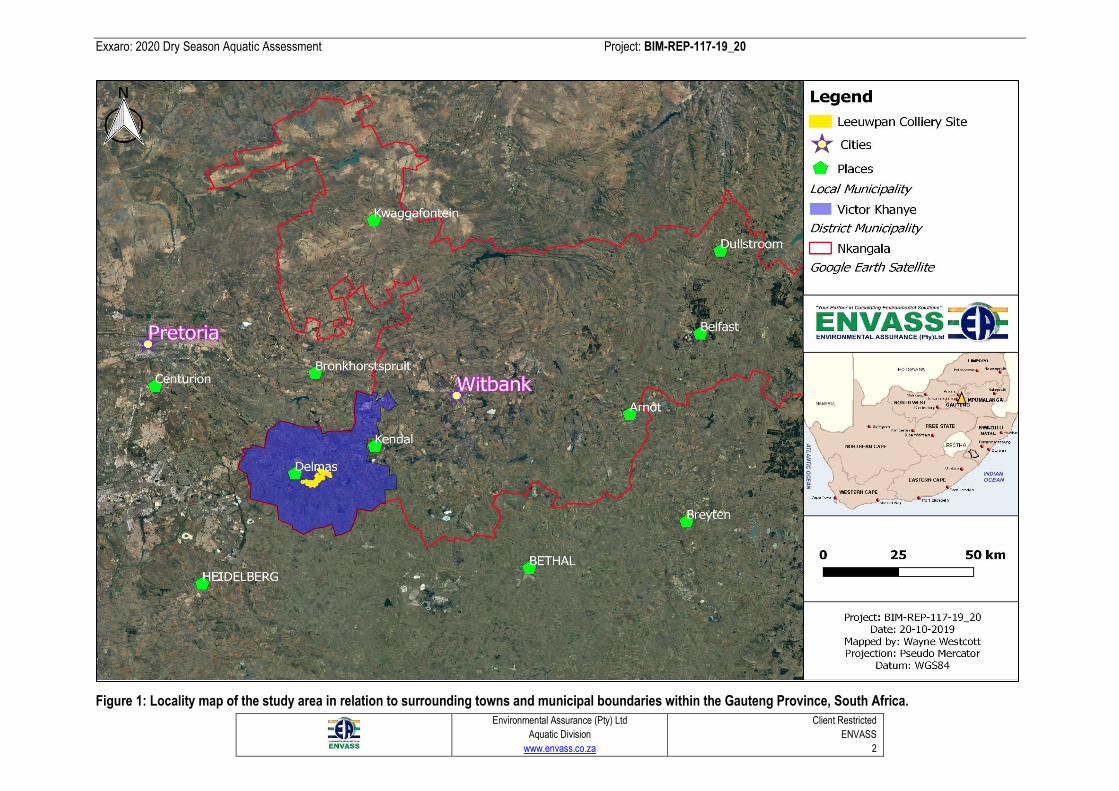
Exxaro: 2020 Dry Season Aquatic Assessment Project: BIM-REP-117-19_20
Environmental Assurance (Pty) Ltd
Aquatic Division
www.envass.co.za
Client Restricted
ENVASS
2
Figure 1: Locality map of the study area in relation to surrounding towns and municipal boundaries within the Gauteng Province, South Africa.
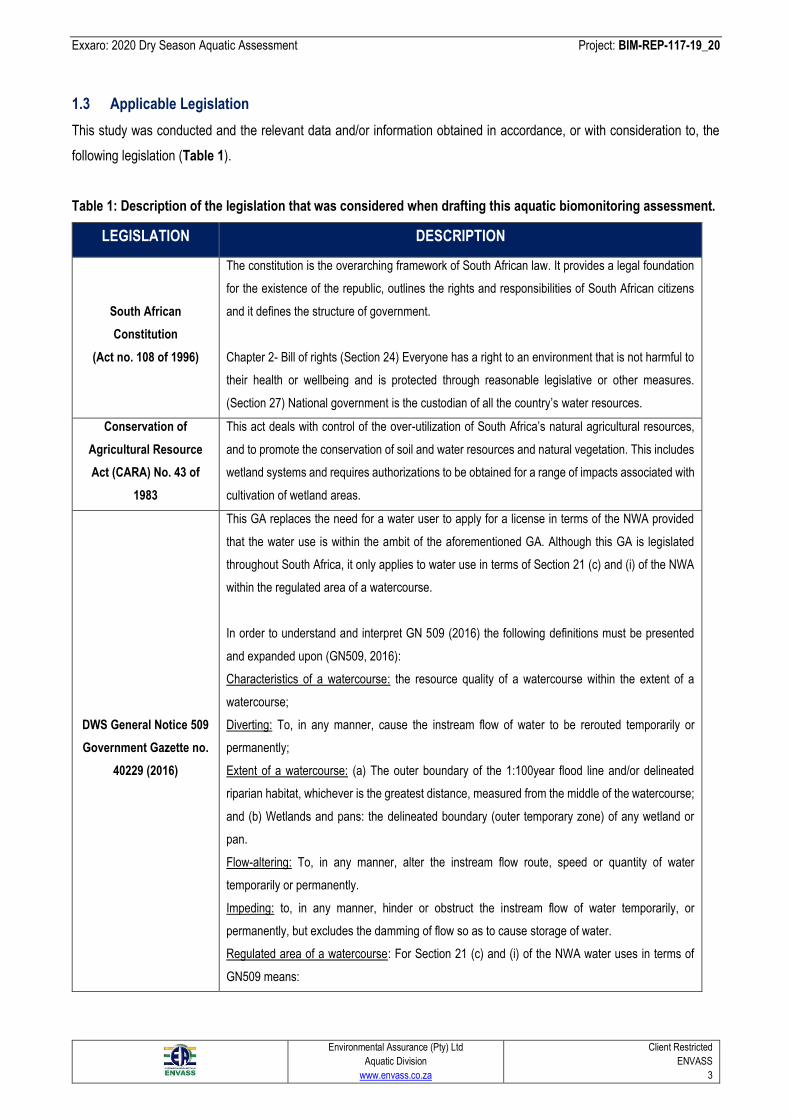
Exxaro: 2020 Dry Season Aquatic Assessment Project: BIM-REP-117-19_20
Environmental Assurance (Pty) Ltd
Aquatic Division
www.envass.co.za
Client Restricted
ENVASS
3
1.3 Applicable Legislation
This study was conducted and the relevant data and/or information obtained in accordance, or with consideration to, the
following legislation (Table 1).
Table 1: Description of the legislation that was considered when drafting this aquatic biomonitoring assessment.
LEGISLATION DESCRIPTION
South African
Constitution
(Act no. 108 of 1996)
The constitution is the overarching framework of South African law. It provides a legal foundation
for the existence of the republic, outlines the rights and responsibilities of South African citizens
and it defines the structure of government.
Chapter 2- Bill of rights (Section 24) Everyone has a right to an environment that is not harmful to
their health or wellbeing and is protected through reasonable legislative or other measures.
(Section 27) National government is the custodian of all the country’s water resources.
Conservation of
Agricultural Resource
Act (CARA) No. 43 of
1983
This act deals with control of the over-utilization of South Africa’s natural agricultural resources,
and to promote the conservation of soil and water resources and natural vegetation. This includes
wetland systems and requires authorizations to be obtained for a range of impacts associated with
cultivation of wetland areas.
DWS General Notice 509
Government Gazette no.
40229 (2016)
This GA replaces the need for a water user to apply for a license in terms of the NWA provided
that the water use is within the ambit of the aforementioned GA. Although this GA is legislated
throughout South Africa, it only applies to water use in terms of Section 21 (c) and (i) of the NWA
within the regulated area of a watercourse.
In order to understand and interpret GN 509 (2016) the following definitions must be presented
and expanded upon (GN509, 2016):
Characteristics of a watercourse: the resource quality of a watercourse within the extent of a
watercourse;
Diverting: To, in any manner, cause the instream flow of water to be rerouted temporarily or
permanently;
Extent of a watercourse: (a) The outer boundary of the 1:100year flood line and/or delineated
riparian habitat, whichever is the greatest distance, measured from the middle of the watercourse;
and (b) Wetlands and pans: the delineated boundary (outer temporary zone) of any wetland or
pan.
Flow-altering: To, in any manner, alter the instream flow route, speed or quantity of water
temporarily or permanently.
Impeding: to, in any manner, hinder or obstruct the instream flow of water temporarily, or
permanently, but excludes the damming of flow so as to cause storage of water.
Regulated area of a watercourse: For Section 21 (c) and (i) of the NWA water uses in terms of
GN509 means:
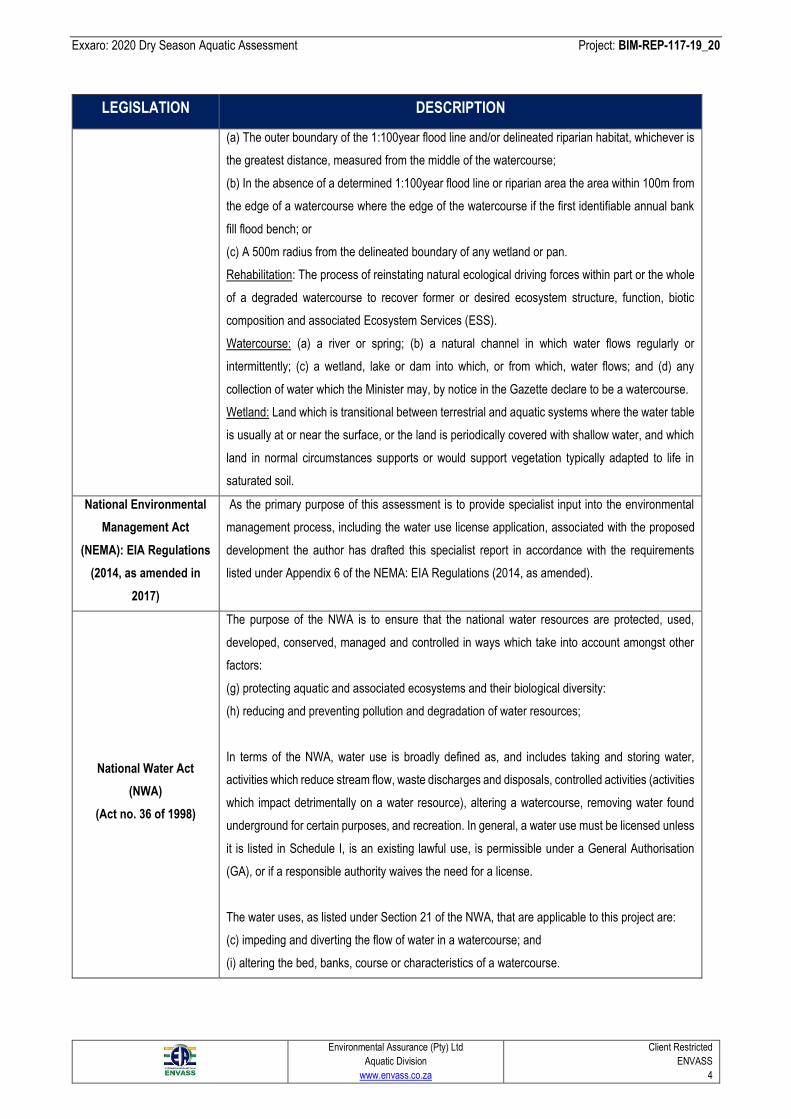
Exxaro: 2020 Dry Season Aquatic Assessment Project: BIM-REP-117-19_20
Environmental Assurance (Pty) Ltd
Aquatic Division
www.envass.co.za
Client Restricted
ENVASS
4
LEGISLATION DESCRIPTION
(a) The outer boundary of the 1:100year flood line and/or delineated riparian habitat, whichever is
the greatest distance, measured from the middle of the watercourse;
(b) In the absence of a determined 1:100year flood line or riparian area the area within 100m from
the edge of a watercourse where the edge of the watercourse if the first identifiable annual bank
fill flood bench; or
(c) A 500m radius from the delineated boundary of any wetland or pan.
Rehabilitation: The process of reinstating natural ecological driving forces within part or the whole
of a degraded watercourse to recover former or desired ecosystem structure, function, biotic
composition and associated Ecosystem Services (ESS).
Watercourse: (a) a river or spring; (b) a natural channel in which water flows regularly or
intermittently; (c) a wetland, lake or dam into which, or from which, water flows; and (d) any
collection of water which the Minister may, by notice in the Gazette declare to be a watercourse.
Wetland: Land which is transitional between terrestrial and aquatic systems where the water table
is usually at or near the surface, or the land is periodically covered with shallow water, and which
land in normal circumstances supports or would support vegetation typically adapted to life in
saturated soil.
National Environmental
Management Act
(NEMA): EIA Regulations
(2014, as amended in
2017)
As the primary purpose of this assessment is to provide specialist input into the environmental
management process, including the water use license application, associated with the proposed
development the author has drafted this specialist report in accordance with the requirements
listed under Appendix 6 of the NEMA: EIA Regulations (2014, as amended).
National Water Act
(NWA)
(Act no. 36 of 1998)
The purpose of the NWA is to ensure that the national water resources are protected, used,
developed, conserved, managed and controlled in ways which take into account amongst other
factors:
(g) protecting aquatic and associated ecosystems and their biological diversity:
(h) reducing and preventing pollution and degradation of water resources;
In terms of the NWA, water use is broadly defined as, and includes taking and storing water,
activities which reduce stream flow, waste discharges and disposals, controlled activities (activities
which impact detrimentally on a water resource), altering a watercourse, removing water found
underground for certain purposes, and recreation. In general, a water use must be licensed unless
it is listed in Schedule I, is an existing lawful use, is permissible under a General Authorisation
(GA), or if a responsible authority waives the need for a license.
The water uses, as listed under Section 21 of the NWA, that are applicable to this project are:
(c) impeding and diverting the flow of water in a watercourse; and
(i) altering the bed, banks, course or characteristics of a watercourse.
Exxaro: 2020 Dry Season Aquatic Assessment Project: BIM-REP-117-19_20
Environmental Assurance (Pty) Ltd
Aquatic Division
www.envass.co.za
Client Restricted
ENVASS
5
LEGISLATION DESCRIPTION
National Environmental
Management Act:
Biodiversity Act
(NEM:BA) (Act No. 10 of
2004)
The objectives of the NEM:BA are (within the framework of NEMA) to provide for:
(i) the management and conservation of biological diversity within the Republic and of the
components of such biological diversity;
(ii) the use of indigenous biological resources in a sustainable manner; and
(iii) the fair and equitable sharing among stakeholders of benefits arising from bioprospecting
involving indigenous biological resources.
Victor Khanye Local
Municipality bylaws
These legislated documents must be reviewed by the design team to ensure that all requirements
regarding conservation targets and land-use zonation/planning is met and the proposed
development is in-line with the overall purpose of the area. All construction activities must also
adhere to the requirements stipulated within these bylaws.
2 ASSUMPTIONS AND LIMITATIONS
The following assumptions and limitations are relevant to this aquatic study:
- A dry season aquatic study was to be conducted within the SANBI prescribed dry season for the annual period. Only
biomonitoring sites that were recorded to be sampleable (i.e. had sufficient flow) in accordance with the ISO certified
South African Scoring System ver. 5 (SASS5) methodology must be assessed.
- The primary objective of this study was to assess the impact of the existing Licensed Exxaro Leeuwpan Colliery on the
receiving aquatic environment from an aquatic macroinvertebrate perspective.
- This study did not include water quality analyses through a SANAS accredited laboratory, and thus a handheld Aqua
probe AP-800, which was calibrated prior to use, was utilised to measure the in situ water quality at each biomonitoring
site.
- The assessment of impacts and recommendation of mitigation measures was informed by the site-specific ecological
issues identified during the field survey and based on the assessor’s working knowledge and experience with similar
mining activity projects.
- This report will be submitted to the Department of Water and Sanitation (DWS) case officer for review and record
purposes.
3 OBJECTIVES
The primary objective of this aquatic biomonitoring assessment was to gather results from the potentially at-risk aquatic
systems in the vicinity of the Leeuwpan Colliery to ascertain whether the production and associated activities have had an
impact on the Present Ecological State (PES) of the systems. The quantitative data that was gathered by implementing
best-practice and legislated methodologies and techniques was compared to the baseline condition of the various
biomonitoring points to determine the long-term PES (integrity) trends of the aquatic ecosystems.
Exxaro: 2020 Dry Season Aquatic Assessment Project: BIM-REP-117-19_20
Environmental Assurance (Pty) Ltd
Aquatic Division
www.envass.co.za
Client Restricted
ENVASS
6
Based on the identified trends and the potential impacts recorded (if any), mitigation and/or rehabilitation measures were
recommended and must be implemented to maintain the Recommended Management Objectives (RMOs) that have been
set for each system by the Department of Water and Sanitation (DWS) River Eco-status Monitoring Programme (REMP)
(previously the River Health Programme (RHP)).
4 SCOPE OF WORK
ENVASS was appointed to conduct biomonitoring, toxicity testing, fish surveys, diatom analysis and wetland assessment
at sites in and around the existing Leeuwpan Colliery during the wet and dry season assessment periods. Due to the non-
perennial nature of the watercourses on and around the site, the Scope of Work (SoW) different between seasons. The
following will present the SoW relevant to the dry season period:
1. Detailed desktop study, mapping and literature review of all data and studies relevant to the study area;
2. Aquatic biomonitoring of four (4) sites using the South African Scoring System ver. 5 (SASS5) methodology;
3. Aquatic habitat assessment of the aforementioned biomonitoring sites using the Integrated Habitat Assessment
System (IHAS) methodology;
4. In situ water quality testing of the pH, Electrical Conductivity (EC), Total Dissolved Solids (TDS) & Dissolved
Oxygen (DO) at the biomonitoring sites;
5. Toxicity testing of three (3) sites in and around the study area using the Direct Estimation of Ecological Effect
Potential (DEEP) protocol;
6. Diatom analysis on samples collected from the four (4) biomonitoring sites in around the study area; and
7. Compile a single report for the 2020 dry season period.
5 METHODOLOGY
The following section will outline the various methodologies and tools that were utilised during this study, which was
associated with the Leeuwpan Colliery.
5.1 Aquatic Assessment
Assessment of the freshwater ecosystem entail the characterisation of the aquatic environment, aquatic habitat and
associated biota. In order to enable an adequate description of the aquatic environment and determination of the PES, the
following stressor, habitat and response indicators will be evaluated:
• Current and potential threats to water quality and watercourse condition;
• Information regarding upstream and downstream conditions, point and non-point pollution sources, water usage etc.
and translate it into information that may be used to measure the compliance against WUL conditions and the integrity
of the watercourses;
• Baseline data with regard to PES, resources water quality objectives and the desired future system condition;
Exxaro: 2020 Dry Season Aquatic Assessment Project: BIM-REP-117-19_20
Environmental Assurance (Pty) Ltd
Aquatic Division
www.envass.co.za
Client Restricted
ENVASS
7
• Isolate point source impacts and assess the nature and significance of these impacts;
• Implement the most up-to-date best practice methodologies and techniques (e.g. South African Scoring System
Version 5 (SASS5) (Dickens & Graham, 2002)) to accurately assess the current and change in condition within each
reach;
• Expand on the baseline condition at each watercourse against which future studies and monitoring works may be
measured;
• Provide specialist recommendations that may be implemented to mitigation and/or rehabilitated the identified and
quantified impacts; and
• Develop a comprehensive report containing result analyses and specialist recommendations that will assist with
decisions and the development of management objectives.
5.2 Desktop Assessment
A desktop assessment was undertaken, in which all the available data (e.g. government records and previous studies)
pertaining to the study area was sourced and subsequently utilised to determine the theoretical importance and sensitivity
of the freshwater ecosystems involved. Additionally, the study area was digitally illustrated and mapped utilising
Geographical Information Systems (GIS) (e.g. QGIS and/or ArcGIS) to better understand the layout and structure of the
surrounding environment and plant site. During this process, all the relevant GIS shapefiles were overlain onto Google Earth
Satellite imagery to provide the reader with a holistic view of the study area. Table 2 below presents the datasets that were
utilised, their references and date of publication.
Table 2: Presentation of the datasets and available information that was utilised during the desktop study
associated with this assessment.
DATASET/TOOL SOURCE RELEVANCE
Catchment data DWS (2012)
Determine the regional hydrological
characteristics of the site (e.g. Mean
Annual Precipitation (MAP), Mean
Annual Simulated Runoff (MASR),
Mean Annual Temperature (MAT) and
the general flow direction into, through
and out of the study area.
Google Earth Pro™ Imagery Google Earth Pro™ (2019)
Survey the current and historical
imagery of the study area to determine
the change in land-use practices, and
thus identify potential impacts.
Exxaro: 2020 Dry Season Aquatic Assessment Project: BIM-REP-117-19_20
Environmental Assurance (Pty) Ltd
Aquatic Division
www.envass.co.za
Client Restricted
ENVASS
8
DATASET/TOOL SOURCE RELEVANCE
DWS Ecoregions (Geographic
Information System (GIS) data) DWS (2005)
Determine the characteristics of the
freshwater resources within the study
area.
National Freshwater Ecosystem
Priority Areas (NFEPA) river and
wetland inventories (GIS coverage)
Council for Scientific and Industrial
Research (CSIR) (2011)
Ascertain which freshwater resources
have been categorised as important
and/or sensitive habitats at a national
scale, and thus those that will require
conservation.
Aquatic Critical Biodiversity Areas for
MP GDARD (2011)
Ascertain which planning units have
been categorised as critically
important to maintaining, or achieving
the conservation targets at a national
scale, and thus those that will require
conservation.
South African Geological Map (GIS
coverage) Geological Survey (1988)
Determine the underlying
lithostratigraphic units to extrapolate
the sub-surface flow movements and
the parent material of the hydric soils.
South African national land-cover (GIS
coverage) GeoTerralmage (2015)
To conduct a comparison of what is
presented in the dataset against what
is currently observed on-site, and thus
identify potential disturbance/impacts.
Wetland Vegetation dataset of South
Africa SANBI (2011)
Determine the presumed natural
hydrophilic vegetation communities
within the study area to ascertain the
degree to which the natural cover has
been altered by change in land-use
practices.
5.3 Visual Inspection
During the fieldwork, a visual investigation of the proposed study area was conducted to identify any on site and upstream
impacts, from both the surrounding land-use activities and environmental processes which may have influenced the overall
health and functionality of the impacted watercourses. The impacts observed and condition of the study area were
photographed, documented and related to professional experience. This essentially provided a baseline for further studies
and justify the PES of the impacted watercourses.
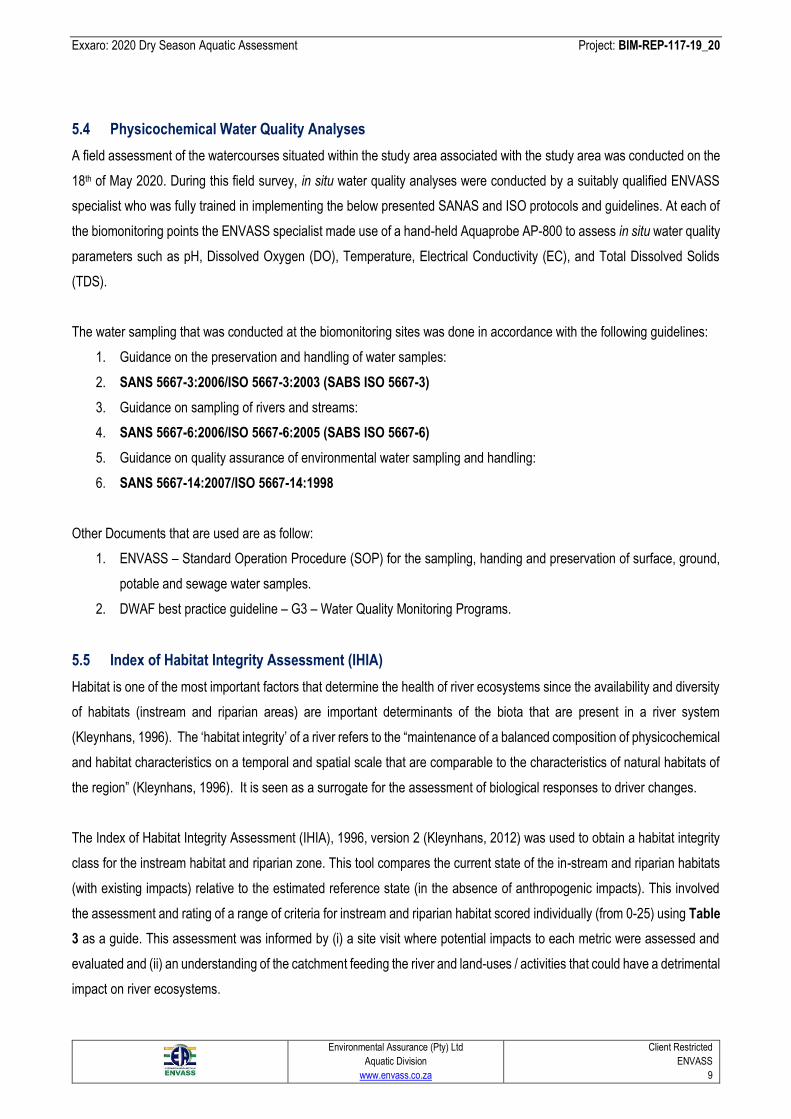
Exxaro: 2020 Dry Season Aquatic Assessment Project: BIM-REP-117-19_20
Environmental Assurance (Pty) Ltd
Aquatic Division
www.envass.co.za
Client Restricted
ENVASS
9
5.4 Physicochemical Water Quality Analyses
A field assessment of the watercourses situated within the study area associated with the study area was conducted on the
18th of May 2020. During this field survey, in situ water quality analyses were conducted by a suitably qualified ENVASS
specialist who was fully trained in implementing the below presented SANAS and ISO protocols and guidelines. At each of
the biomonitoring points the ENVASS specialist made use of a hand-held Aquaprobe AP-800 to assess in situ water quality
parameters such as pH, Dissolved Oxygen (DO), Temperature, Electrical Conductivity (EC), and Total Dissolved Solids
(TDS).
The water sampling that was conducted at the biomonitoring sites was done in accordance with the following guidelines:
1. Guidance on the preservation and handling of water samples:
2. SANS 5667-3:2006/ISO 5667-3:2003 (SABS ISO 5667-3)
3. Guidance on sampling of rivers and streams:
4. SANS 5667-6:2006/ISO 5667-6:2005 (SABS ISO 5667-6)
5. Guidance on quality assurance of environmental water sampling and handling:
6. SANS 5667-14:2007/ISO 5667-14:1998
Other Documents that are used are as follow:
1. ENVASS – Standard Operation Procedure (SOP) for the sampling, handing and preservation of surface, ground,
potable and sewage water samples.
2. DWAF best practice guideline – G3 – Water Quality Monitoring Programs.
5.5 Index of Habitat Integrity Assessment (IHIA)
Habitat is one of the most important factors that determine the health of river ecosystems since the availability and diversity
of habitats (instream and riparian areas) are important determinants of the biota that are present in a river system
(Kleynhans, 1996). The ‘habitat integrity’ of a river refers to the “maintenance of a balanced composition of physicochemical
and habitat characteristics on a temporal and spatial scale that are comparable to the characteristics of natural habitats of
the region” (Kleynhans, 1996). It is seen as a surrogate for the assessment of biological responses to driver changes.
The Index of Habitat Integrity Assessment (IHIA), 1996, version 2 (Kleynhans, 2012) was used to obtain a habitat integrity
class for the instream habitat and riparian zone. This tool compares the current state of the in-stream and riparian habitats
(with existing impacts) relative to the estimated reference state (in the absence of anthropogenic impacts). This involved
the assessment and rating of a range of criteria for instream and riparian habitat scored individually (from 0-25) using Table
3 as a guide. This assessment was informed by (i) a site visit where potential impacts to each metric were assessed and
evaluated and (ii) an understanding of the catchment feeding the river and land-uses / activities that could have a detrimental
impact on river ecosystems.
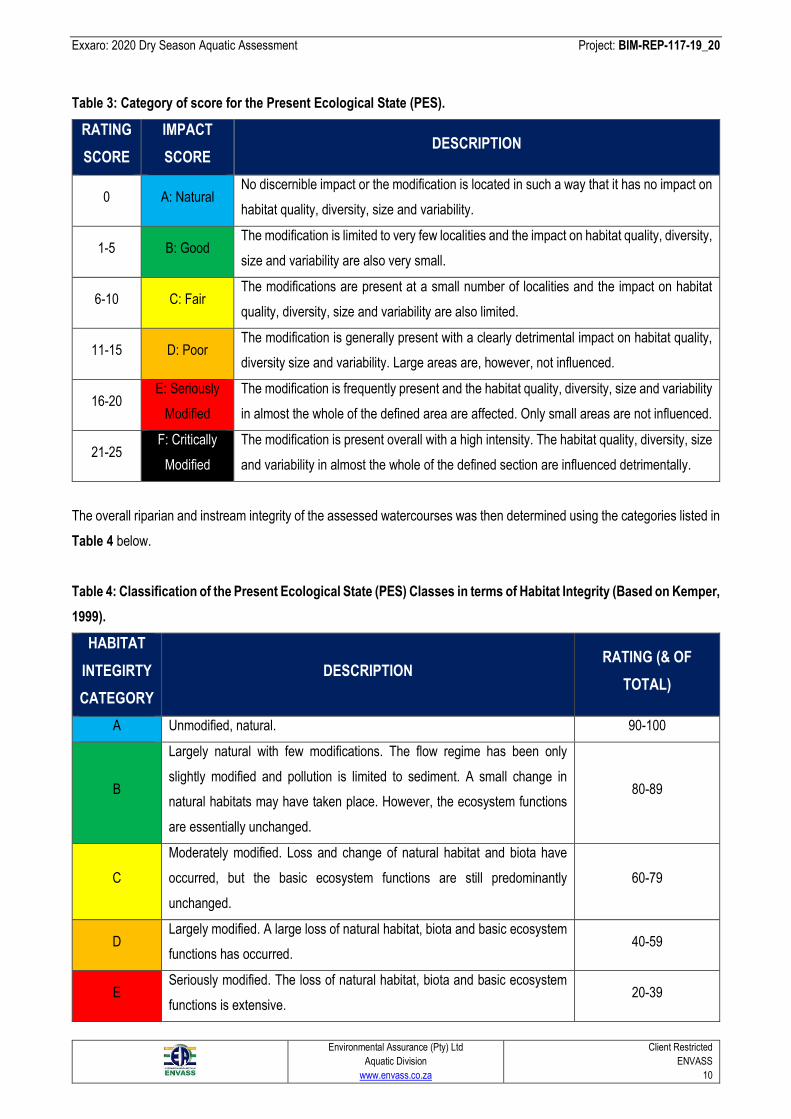
Exxaro: 2020 Dry Season Aquatic Assessment Project: BIM-REP-117-19_20
Environmental Assurance (Pty) Ltd
Aquatic Division
www.envass.co.za
Client Restricted
ENVASS
10
Table 3: Category of score for the Present Ecological State (PES).
RATING
SCORE
IMPACT
SCORE DESCRIPTION
0 A: Natural No discernible impact or the modification is located in such a way that it has no impact on
habitat quality, diversity, size and variability.
1-5 B: Good The modification is limited to very few localities and the impact on habitat quality, diversity,
size and variability are also very small.
6-10 C: Fair The modifications are present at a small number of localities and the impact on habitat
quality, diversity, size and variability are also limited.
11-15 D: Poor The modification is generally present with a clearly detrimental impact on habitat quality,
diversity size and variability. Large areas are, however, not influenced.
16-20 E: Seriously
Modified
The modification is frequently present and the habitat quality, diversity, size and variability
in almost the whole of the defined area are affected. Only small areas are not influenced.
21-25 F: Critically
Modified
The modification is present overall with a high intensity. The habitat quality, diversity, size
and variability in almost the whole of the defined section are influenced detrimentally.
The overall riparian and instream integrity of the assessed watercourses was then determined using the categories listed in
Table 4 below.
Table 4: Classification of the Present Ecological State (PES) Classes in terms of Habitat Integrity (Based on Kemper,
1999).
HABITAT
INTEGIRTY
CATEGORY
DESCRIPTION RATING (& OF
TOTAL)
A Unmodified, natural. 90-100
B
Largely natural with few modifications. The flow regime has been only
slightly modified and pollution is limited to sediment. A small change in
natural habitats may have taken place. However, the ecosystem functions
are essentially unchanged.
80-89
C
Moderately modified. Loss and change of natural habitat and biota have
occurred, but the basic ecosystem functions are still predominantly
unchanged.
60-79
D Largely modified. A large loss of natural habitat, biota and basic ecosystem
functions has occurred. 40-59
E Seriously modified. The loss of natural habitat, biota and basic ecosystem
functions is extensive. 20-39
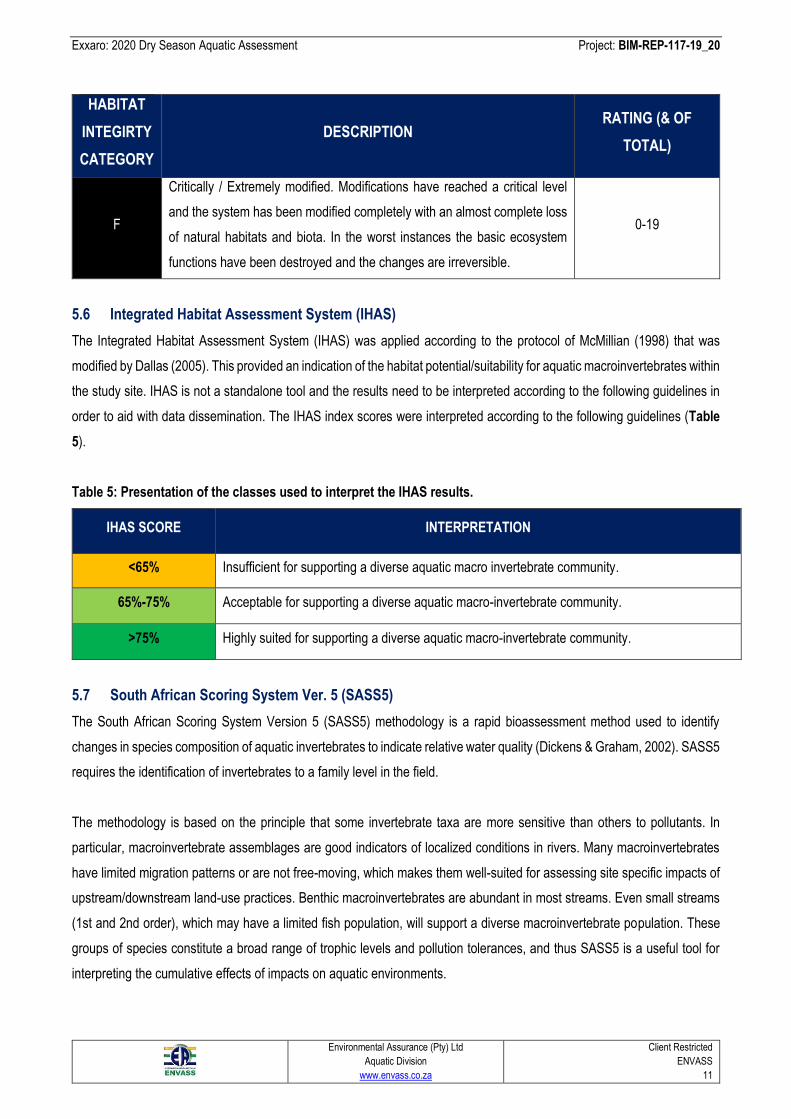
Exxaro: 2020 Dry Season Aquatic Assessment Project: BIM-REP-117-19_20
Environmental Assurance (Pty) Ltd
Aquatic Division
www.envass.co.za
Client Restricted
ENVASS
11
HABITAT
INTEGIRTY
CATEGORY
DESCRIPTION RATING (& OF
TOTAL)
F
Critically / Extremely modified. Modifications have reached a critical level
and the system has been modified completely with an almost complete loss
of natural habitats and biota. In the worst instances the basic ecosystem
functions have been destroyed and the changes are irreversible.
0-19
5.6 Integrated Habitat Assessment System (IHAS)
The Integrated Habitat Assessment System (IHAS) was applied according to the protocol of McMillian (1998) that was
modified by Dallas (2005). This provided an indication of the habitat potential/suitability for aquatic macroinvertebrates within
the study site. IHAS is not a standalone tool and the results need to be interpreted according to the following guidelines in
order to aid with data dissemination. The IHAS index scores were interpreted according to the following guidelines (Table
5).
Table 5: Presentation of the classes used to interpret the IHAS results.
IHAS SCORE INTERPRETATION
<65% Insufficient for supporting a diverse aquatic macro invertebrate community.
65%-75% Acceptable for supporting a diverse aquatic macro-invertebrate community.
>75% Highly suited for supporting a diverse aquatic macro-invertebrate community.
5.7 South African Scoring System Ver. 5 (SASS5)
The South African Scoring System Version 5 (SASS5) methodology is a rapid bioassessment method used to identify
changes in species composition of aquatic invertebrates to indicate relative water quality (Dickens & Graham, 2002). SASS5
requires the identification of invertebrates to a family level in the field.
The methodology is based on the principle that some invertebrate taxa are more sensitive than others to pollutants. In
particular, macroinvertebrate assemblages are good indicators of localized conditions in rivers. Many macroinvertebrates
have limited migration patterns or are not free-moving, which makes them well-suited for assessing site specific impacts of
upstream/downstream land-use practices. Benthic macroinvertebrates are abundant in most streams. Even small streams
(1st and 2nd order), which may have a limited fish population, will support a diverse macroinvertebrate population. These
groups of species constitute a broad range of trophic levels and pollution tolerances, and thus SASS5 is a useful tool for
interpreting the cumulative effects of impacts on aquatic environments.
Exxaro: 2020 Dry Season Aquatic Assessment Project: BIM-REP-117-19_20
Environmental Assurance (Pty) Ltd
Aquatic Division
www.envass.co.za
Client Restricted
ENVASS
12
Using a 'kick net', the SASS5 method prescribes specific time-periods and spatial areas for the kicking of in- and out-of-
current stones and bedrock (Stones biotope); sweeping of in- and out-of-current marginal and aquatic vegetation, as well
as the kicking of the Gravel, Sand and Mud (GSM) biotope followed by visual observations via hand-picking. The results of
each biotope are kept separate, until all observations are noted. The entire sample is then returned to the river, retained
alive, or preserved for further identification.
In a SASS5 analysis, species abundance is recorded on an SASS5 score sheet which weighs the different taxa common to
South African rivers from 1 (pollutant tolerant) to 15 (pollution sensitive). The SASS5 score will be high at a particular site if
the taxa are pollution sensitive and low if they are mostly pollution tolerant.
The endpoint of any biological or ecosystem assessment is a value expressed either in the form of measurements (data
collected) or in a more meaningful format by summarising these measurements into one or several index values (Cyrus et
al., 2000). On the SASS5 score sheet, organisms in the trays are identified up to family level, they are then ticked off under
the appropriate biotope on the score sheet, and the abundance for each taxon is indicated and the results calculated
thereafter. The main indices derived and calculated from the score sheet (to be utilised for data interpretation) are:
• Number of taxa: The total number of different taxa identified within the assessed reach;
• SASS5 score: Obtained from adding the quality or sensitivity scores from each identified taxon on the score
sheet; and
• Average Score Per Taxon (ASPT): Obtained from dividing the SASS5 score by the number of taxa identified
at the site.
To determine the overall Ecological Category (EC) of each site, the indices calculated for each site were plotted on the
standard SASS interpretation guideline graphs relevant to the ecoregion in which each biomonitoring site was recorded to
fall. These interpretations were modelled for each ecoregion using available SASS data, which was extracted from the River
Health Programme (RHP) database and other external sources. Ecoregions were broken down further into simplified
longitudinal zones based on differentiation into upland and lowland sites (Dallas, 2007). These interpretation guidelines
were utilised as a reference condition during the analyses of the data gathered during the field survey. The modelled
reference conditions relevant to the study ecoregion (i.e. Highveld- Lower) are presented in Table 6 for ease of reference
(Dallas, 2007).
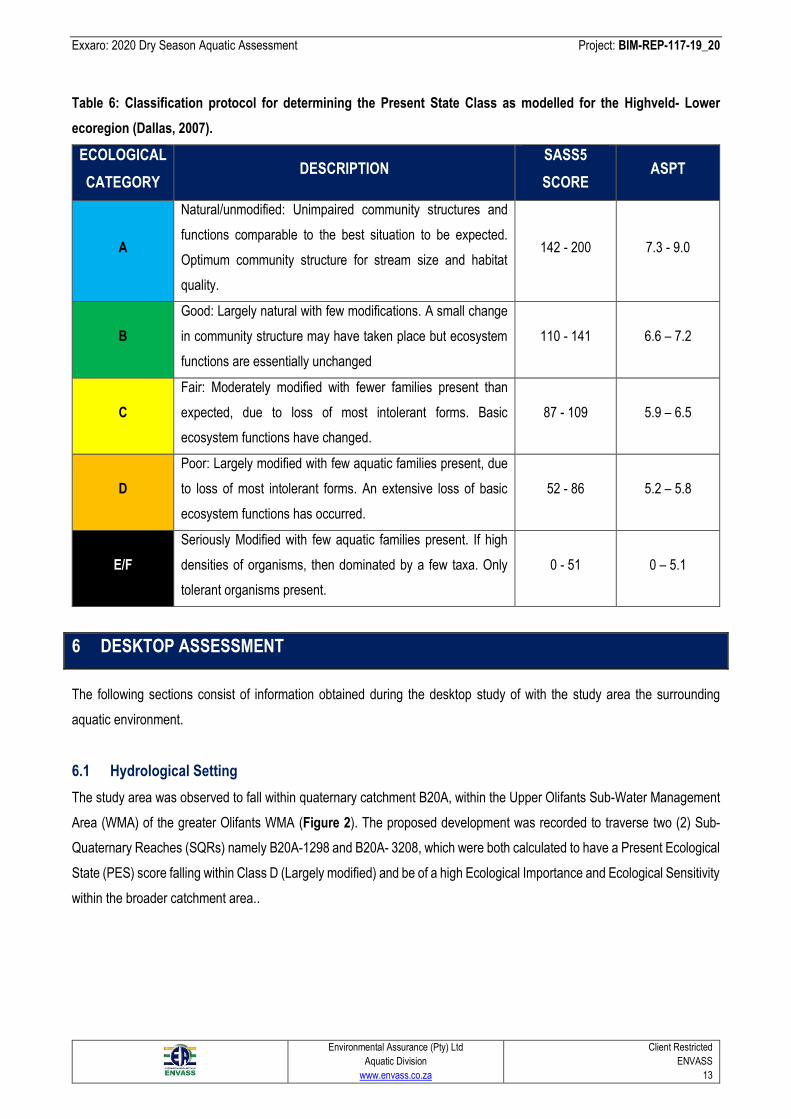
Exxaro: 2020 Dry Season Aquatic Assessment Project: BIM-REP-117-19_20
Environmental Assurance (Pty) Ltd
Aquatic Division
www.envass.co.za
Client Restricted
ENVASS
13
Table 6: Classification protocol for determining the Present State Class as modelled for the Highveld- Lower
ecoregion (Dallas, 2007).
ECOLOGICAL
CATEGORY DESCRIPTION
SASS5
SCORE ASPT
A
Natural/unmodified: Unimpaired community structures and
functions comparable to the best situation to be expected.
Optimum community structure for stream size and habitat
quality.
142 - 200 7.3 - 9.0
B
Good: Largely natural with few modifications. A small change
in community structure may have taken place but ecosystem
functions are essentially unchanged
110 - 141 6.6 – 7.2
C
Fair: Moderately modified with fewer families present than
expected, due to loss of most intolerant forms. Basic
ecosystem functions have changed.
87 - 109 5.9 – 6.5
D
Poor: Largely modified with few aquatic families present, due
to loss of most intolerant forms. An extensive loss of basic
ecosystem functions has occurred.
52 - 86 5.2 – 5.8
E/F
Seriously Modified with few aquatic families present. If high
densities of organisms, then dominated by a few taxa. Only
tolerant organisms present.
0 - 51 0 – 5.1
6 DESKTOP ASSESSMENT
The following sections consist of information obtained during the desktop study of with the study area the surrounding
aquatic environment.
6.1 Hydrological Setting
The study area was observed to fall within quaternary catchment B20A, within the Upper Olifants Sub-Water Management
Area (WMA) of the greater Olifants WMA (Figure 2). The proposed development was recorded to traverse two (2) Sub-
Quaternary Reaches (SQRs) namely B20A-1298 and B20A- 3208, which were both calculated to have a Present Ecological
State (PES) score falling within Class D (Largely modified) and be of a high Ecological Importance and Ecological Sensitivity
within the broader catchment area..
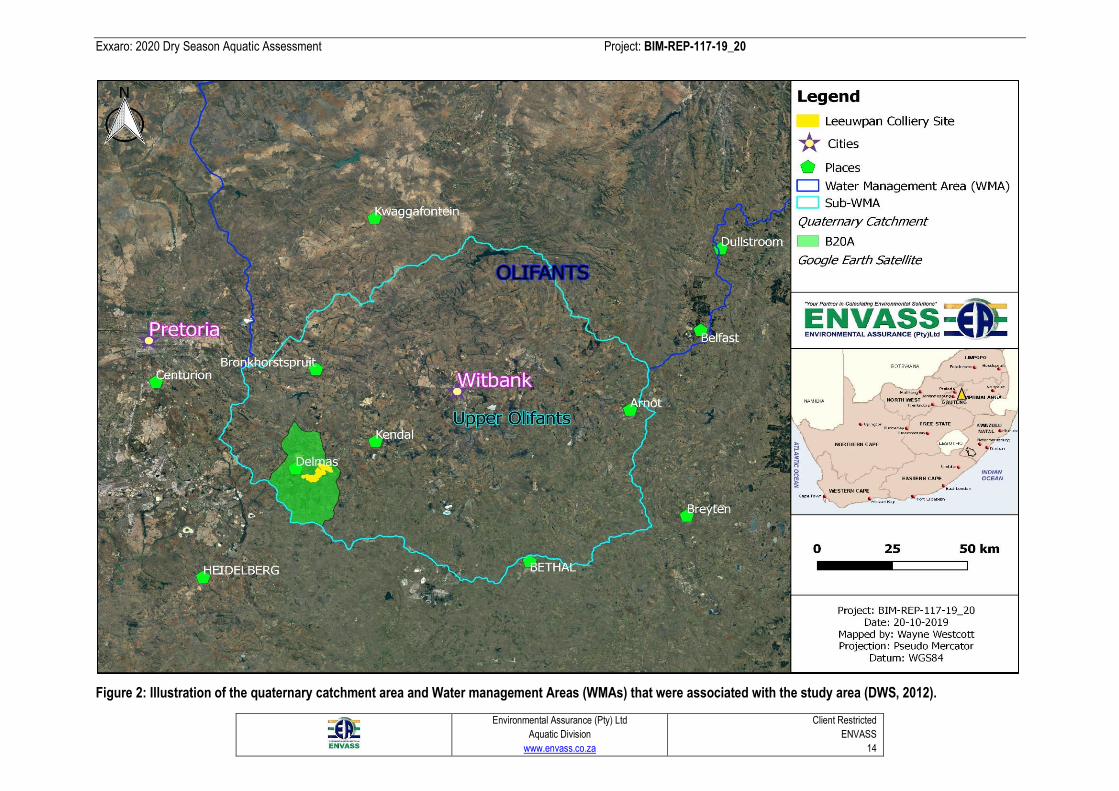
Exxaro: 2020 Dry Season Aquatic Assessment Project: BIM-REP-117-19_20
Environmental Assurance (Pty) Ltd
Aquatic Division
www.envass.co.za
Client Restricted
ENVASS
14
Figure 2: Illustration of the quaternary catchment area and Water management Areas (WMAs) that were associated with the study area (DWS, 2012).
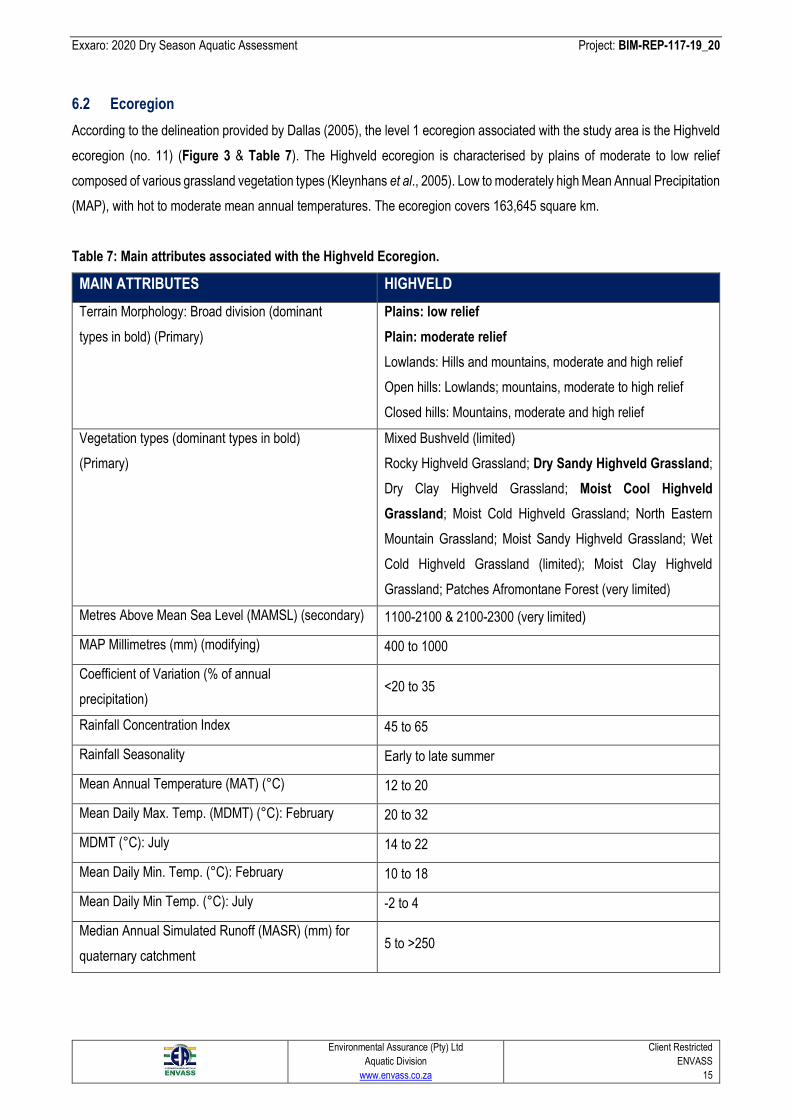
Exxaro: 2020 Dry Season Aquatic Assessment Project: BIM-REP-117-19_20
Environmental Assurance (Pty) Ltd
Aquatic Division
www.envass.co.za
Client Restricted
ENVASS
15
6.2 Ecoregion
According to the delineation provided by Dallas (2005), the level 1 ecoregion associated with the study area is the Highveld
ecoregion (no. 11) (Figure 3 & Table 7). The Highveld ecoregion is characterised by plains of moderate to low relief
composed of various grassland vegetation types (Kleynhans et al., 2005). Low to moderately high Mean Annual Precipitation
(MAP), with hot to moderate mean annual temperatures. The ecoregion covers 163,645 square km.
Table 7: Main attributes associated with the Highveld Ecoregion.
MAIN ATTRIBUTES HIGHVELD
Terrain Morphology: Broad division (dominant
types in bold) (Primary)
Plains: low relief
Plain: moderate relief
Lowlands: Hills and mountains, moderate and high relief
Open hills: Lowlands; mountains, moderate to high relief
Closed hills: Mountains, moderate and high relief
Vegetation types (dominant types in bold)
(Primary)
Mixed Bushveld (limited)
Rocky Highveld Grassland; Dry Sandy Highveld Grassland;
Dry Clay Highveld Grassland; Moist Cool Highveld
Grassland; Moist Cold Highveld Grassland; North Eastern
Mountain Grassland; Moist Sandy Highveld Grassland; Wet
Cold Highveld Grassland (limited); Moist Clay Highveld
Grassland; Patches Afromontane Forest (very limited)
Metres Above Mean Sea Level (MAMSL) (secondary) 1100-2100 & 2100-2300 (very limited)
MAP Millimetres (mm) (modifying) 400 to 1000
Coefficient of Variation (% of annual
precipitation) <20 to 35
Rainfall Concentration Index 45 to 65
Rainfall Seasonality Early to late summer
Mean Annual Temperature (MAT) (°C) 12 to 20
Mean Daily Max. Temp. (MDMT) (°C): February 20 to 32
MDMT (°C): July 14 to 22
Mean Daily Min. Temp. (°C): February 10 to 18
Mean Daily Min Temp. (°C): July -2 to 4
Median Annual Simulated Runoff (MASR) (mm) for
quaternary catchment 5 to >250
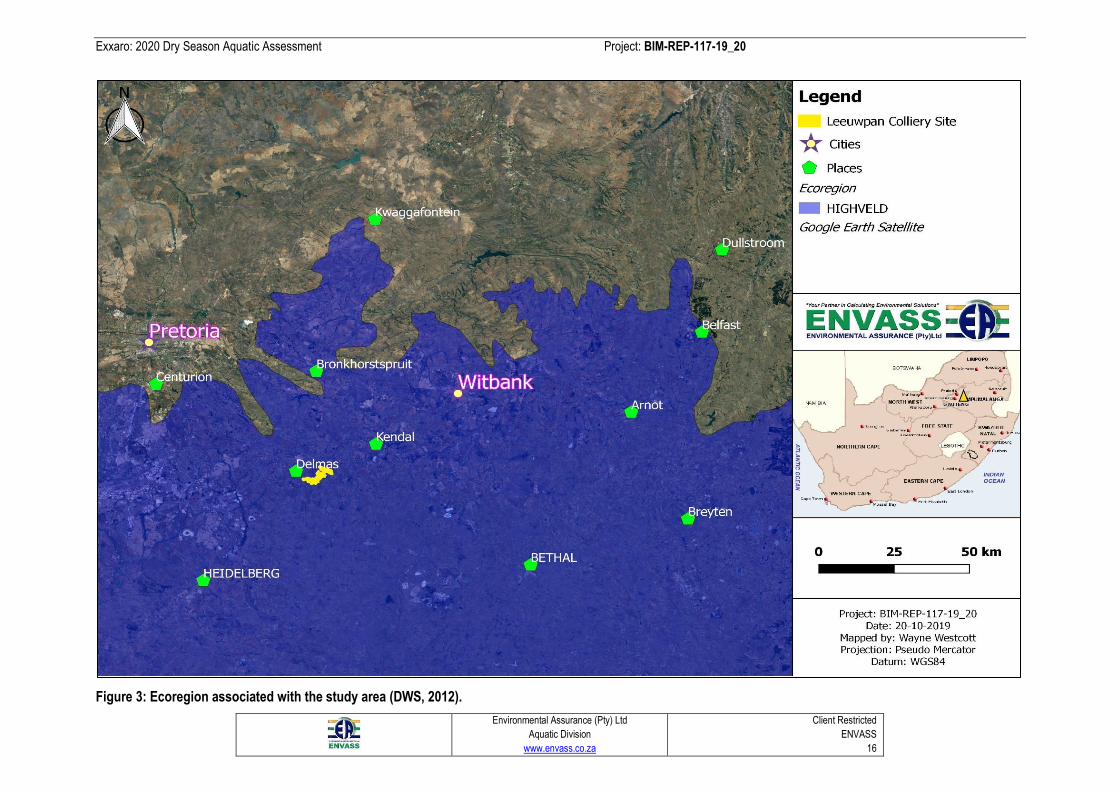
Exxaro: 2020 Dry Season Aquatic Assessment Project: BIM-REP-117-19_20
Environmental Assurance (Pty) Ltd
Aquatic Division
www.envass.co.za
Client Restricted
ENVASS
16
Figure 3: Ecoregion associated with the study area (DWS, 2012).
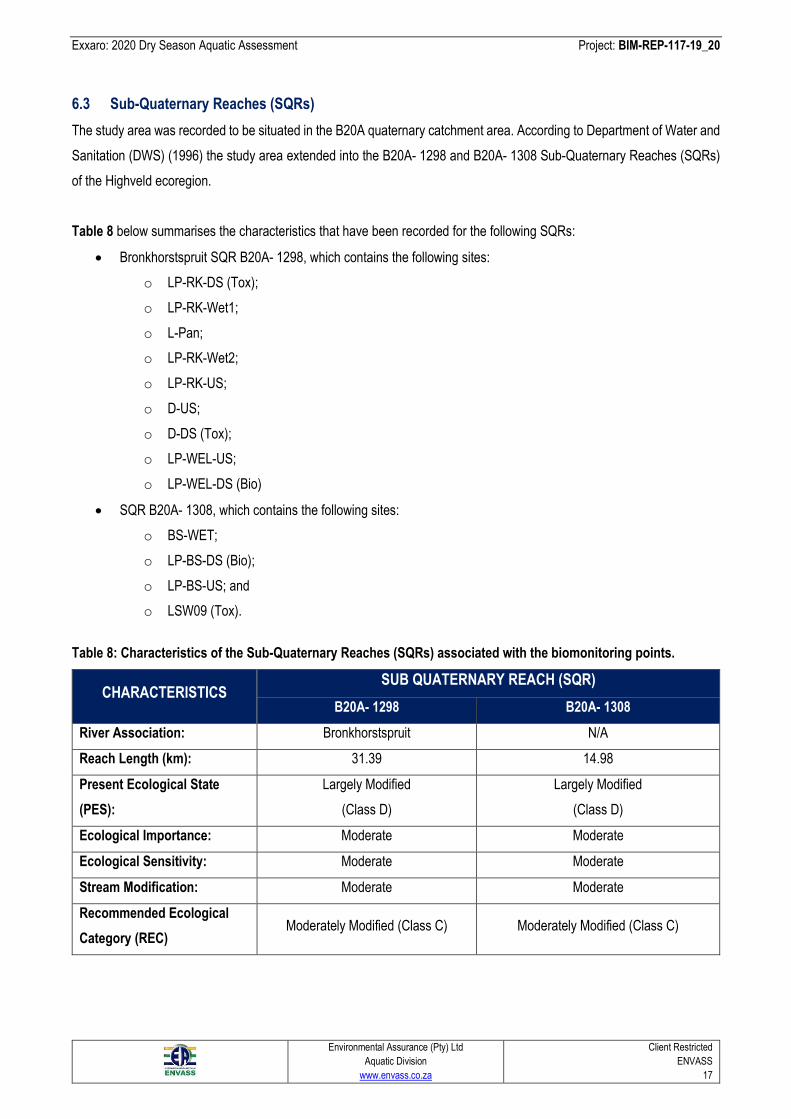
Exxaro: 2020 Dry Season Aquatic Assessment Project: BIM-REP-117-19_20
Environmental Assurance (Pty) Ltd
Aquatic Division
www.envass.co.za
Client Restricted
ENVASS
17
6.3 Sub-Quaternary Reaches (SQRs)
The study area was recorded to be situated in the B20A quaternary catchment area. According to Department of Water and
Sanitation (DWS) (1996) the study area extended into the B20A- 1298 and B20A- 1308 Sub-Quaternary Reaches (SQRs)
of the Highveld ecoregion.
Table 8 below summarises the characteristics that have been recorded for the following SQRs:
• Bronkhorstspruit SQR B20A- 1298, which contains the following sites:
o LP-RK-DS (Tox);
o LP-RK-Wet1;
o L-Pan;
o LP-RK-Wet2;
o LP-RK-US;
o D-US;
o D-DS (Tox);
o LP-WEL-US;
o LP-WEL-DS (Bio)
• SQR B20A- 1308, which contains the following sites:
o BS-WET;
o LP-BS-DS (Bio);
o LP-BS-US; and
o LSW09 (Tox).
Table 8: Characteristics of the Sub-Quaternary Reaches (SQRs) associated with the biomonitoring points.
CHARACTERISTICS SUB QUATERNARY REACH (SQR)
B20A- 1298 B20A- 1308
River Association: Bronkhorstspruit N/A
Reach Length (km): 31.39 14.98
Present Ecological State
(PES):
Largely Modified
(Class D)
Largely Modified
(Class D)
Ecological Importance: Moderate Moderate
Ecological Sensitivity: Moderate Moderate
Stream Modification: Moderate Moderate
Recommended Ecological
Category (REC) Moderately Modified (Class C) Moderately Modified (Class C)
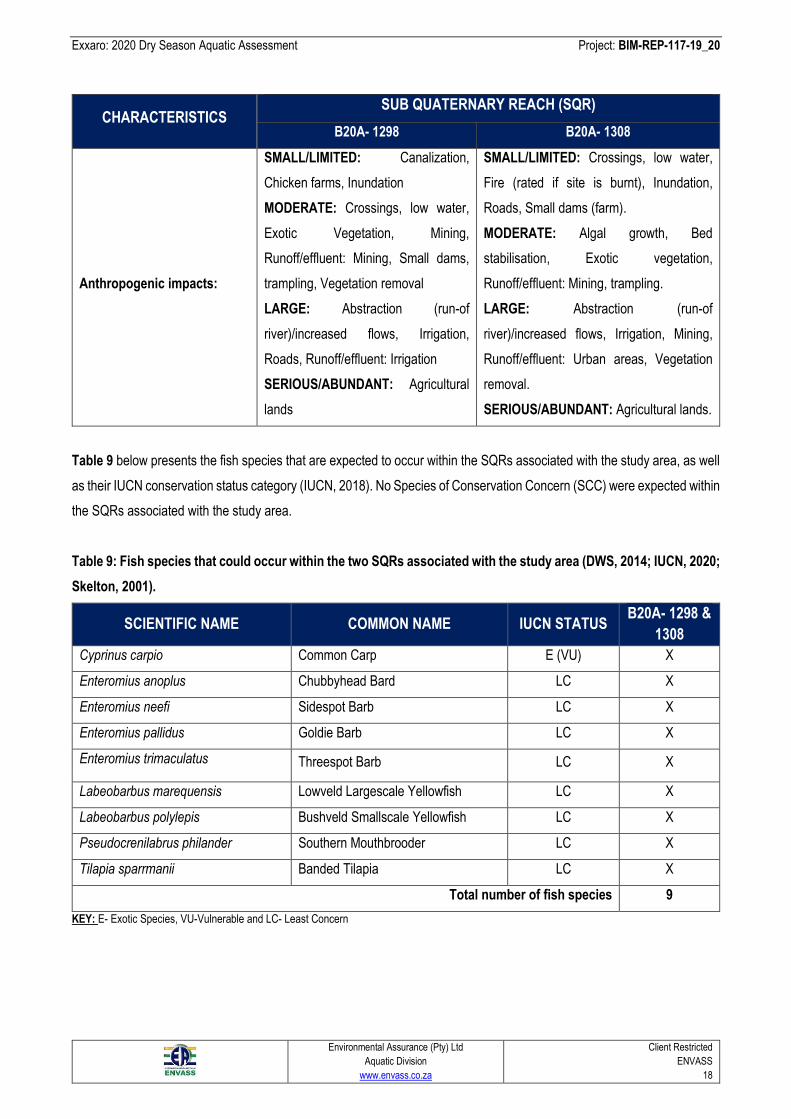
Exxaro: 2020 Dry Season Aquatic Assessment Project: BIM-REP-117-19_20
Environmental Assurance (Pty) Ltd
Aquatic Division
www.envass.co.za
Client Restricted
ENVASS
18
CHARACTERISTICS SUB QUATERNARY REACH (SQR)
B20A- 1298 B20A- 1308
Anthropogenic impacts:
SMALL/LIMITED: Canalization,
Chicken farms, Inundation
MODERATE: Crossings, low water,
Exotic Vegetation, Mining,
Runoff/effluent: Mining, Small dams,
trampling, Vegetation removal
LARGE: Abstraction (run-of
river)/increased flows, Irrigation,
Roads, Runoff/effluent: Irrigation
SERIOUS/ABUNDANT: Agricultural
lands
SMALL/LIMITED: Crossings, low water,
Fire (rated if site is burnt), Inundation,
Roads, Small dams (farm).
MODERATE: Algal growth, Bed
stabilisation, Exotic vegetation,
Runoff/effluent: Mining, trampling.
LARGE: Abstraction (run-of
river)/increased flows, Irrigation, Mining,
Runoff/effluent: Urban areas, Vegetation
removal.
SERIOUS/ABUNDANT: Agricultural lands.
Table 9 below presents the fish species that are expected to occur within the SQRs associated with the study area, as well
as their IUCN conservation status category (IUCN, 2018). No Species of Conservation Concern (SCC) were expected within
the SQRs associated with the study area.
Table 9: Fish species that could occur within the two SQRs associated with the study area (DWS, 2014; IUCN, 2020;
Skelton, 2001).
SCIENTIFIC NAME COMMON NAME IUCN STATUS B20A- 1298 &
1308
Cyprinus carpio Common Carp E (VU) X
Enteromius anoplus Chubbyhead Bard LC X
Enteromius neefi Sidespot Barb LC X
Enteromius pallidus Goldie Barb LC X
Enteromius trimaculatus Threespot Barb LC X
Labeobarbus marequensis Lowveld Largescale Yellowfish LC X
Labeobarbus polylepis Bushveld Smallscale Yellowfish LC X
Pseudocrenilabrus philander Southern Mouthbrooder LC X
Tilapia sparrmanii Banded Tilapia LC X
Total number of fish species 9
KEY: E- Exotic Species, VU-Vulnerable and LC- Least Concern
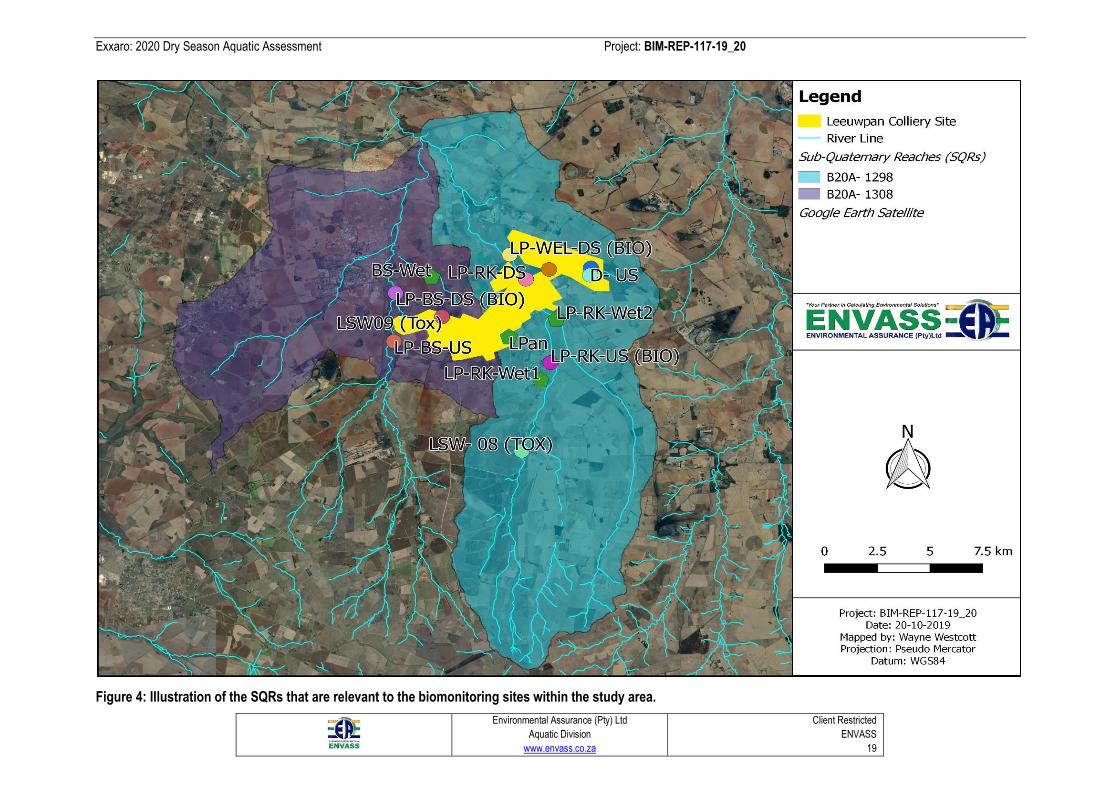
Exxaro: 2020 Dry Season Aquatic Assessment Project: BIM-REP-117-19_20
Environmental Assurance (Pty) Ltd
Aquatic Division
www.envass.co.za
Client Restricted
ENVASS
19
Figure 4: Illustration of the SQRs that are relevant to the biomonitoring sites within the study area.
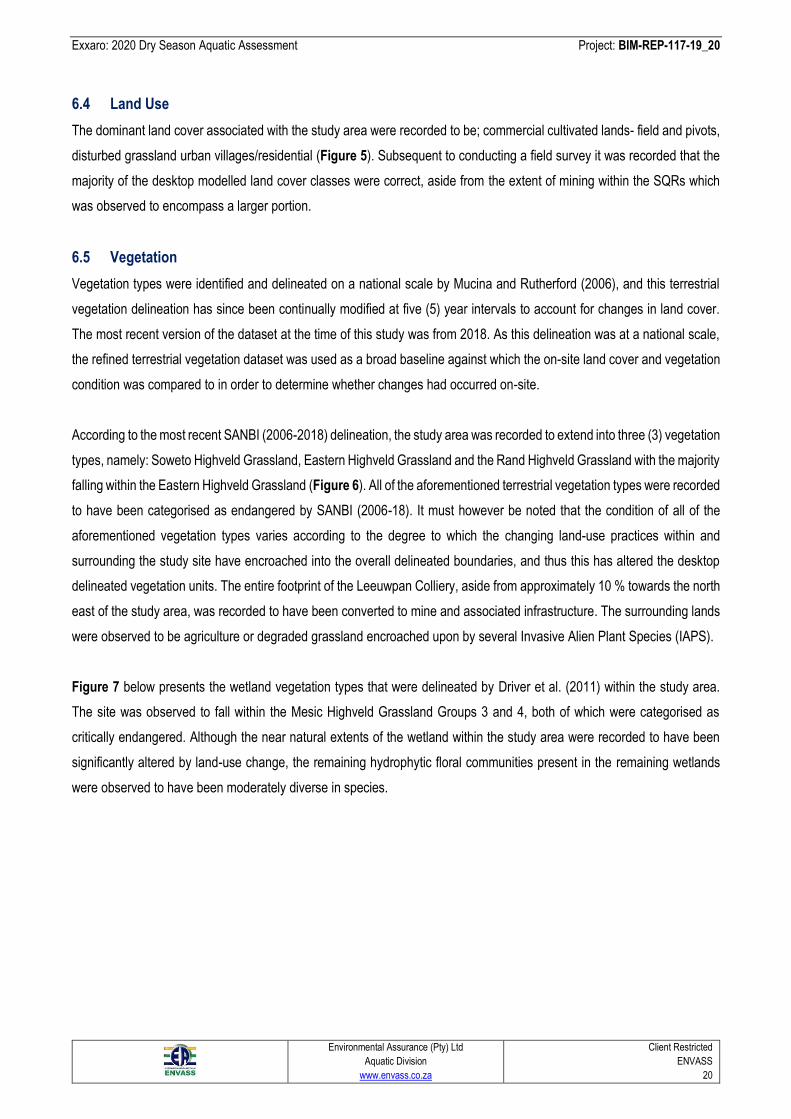
Exxaro: 2020 Dry Season Aquatic Assessment Project: BIM-REP-117-19_20
Environmental Assurance (Pty) Ltd
Aquatic Division
www.envass.co.za
Client Restricted
ENVASS
20
6.4 Land Use
The dominant land cover associated with the study area were recorded to be; commercial cultivated lands- field and pivots,
disturbed grassland urban villages/residential (Figure 5). Subsequent to conducting a field survey it was recorded that the
majority of the desktop modelled land cover classes were correct, aside from the extent of mining within the SQRs which
was observed to encompass a larger portion.
6.5 Vegetation
Vegetation types were identified and delineated on a national scale by Mucina and Rutherford (2006), and this terrestrial
vegetation delineation has since been continually modified at five (5) year intervals to account for changes in land cover.
The most recent version of the dataset at the time of this study was from 2018. As this delineation was at a national scale,
the refined terrestrial vegetation dataset was used as a broad baseline against which the on-site land cover and vegetation
condition was compared to in order to determine whether changes had occurred on-site.
According to the most recent SANBI (2006-2018) delineation, the study area was recorded to extend into three (3) vegetation
types, namely: Soweto Highveld Grassland, Eastern Highveld Grassland and the Rand Highveld Grassland with the majority
falling within the Eastern Highveld Grassland (Figure 6). All of the aforementioned terrestrial vegetation types were recorded
to have been categorised as endangered by SANBI (2006-18). It must however be noted that the condition of all of the
aforementioned vegetation types varies according to the degree to which the changing land-use practices within and
surrounding the study site have encroached into the overall delineated boundaries, and thus this has altered the desktop
delineated vegetation units. The entire footprint of the Leeuwpan Colliery, aside from approximately 10 % towards the north
east of the study area, was recorded to have been converted to mine and associated infrastructure. The surrounding lands
were observed to be agriculture or degraded grassland encroached upon by several Invasive Alien Plant Species (IAPS).
Figure 7 below presents the wetland vegetation types that were delineated by Driver et al. (2011) within the study area.
The site was observed to fall within the Mesic Highveld Grassland Groups 3 and 4, both of which were categorised as
critically endangered. Although the near natural extents of the wetland within the study area were recorded to have been
significantly altered by land-use change, the remaining hydrophytic floral communities present in the remaining wetlands
were observed to have been moderately diverse in species.
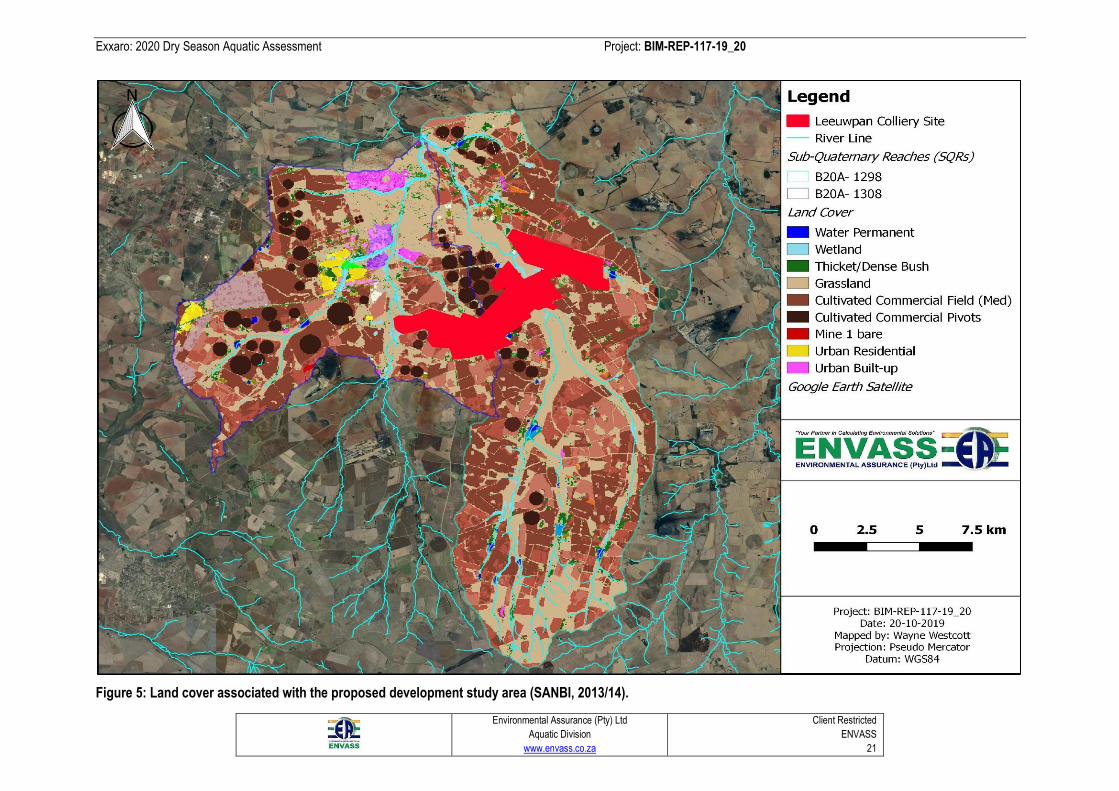
Exxaro: 2020 Dry Season Aquatic Assessment Project: BIM-REP-117-19_20
Environmental Assurance (Pty) Ltd
Aquatic Division
www.envass.co.za
Client Restricted
ENVASS
21
Figure 5: Land cover associated with the proposed development study area (SANBI, 2013/14).
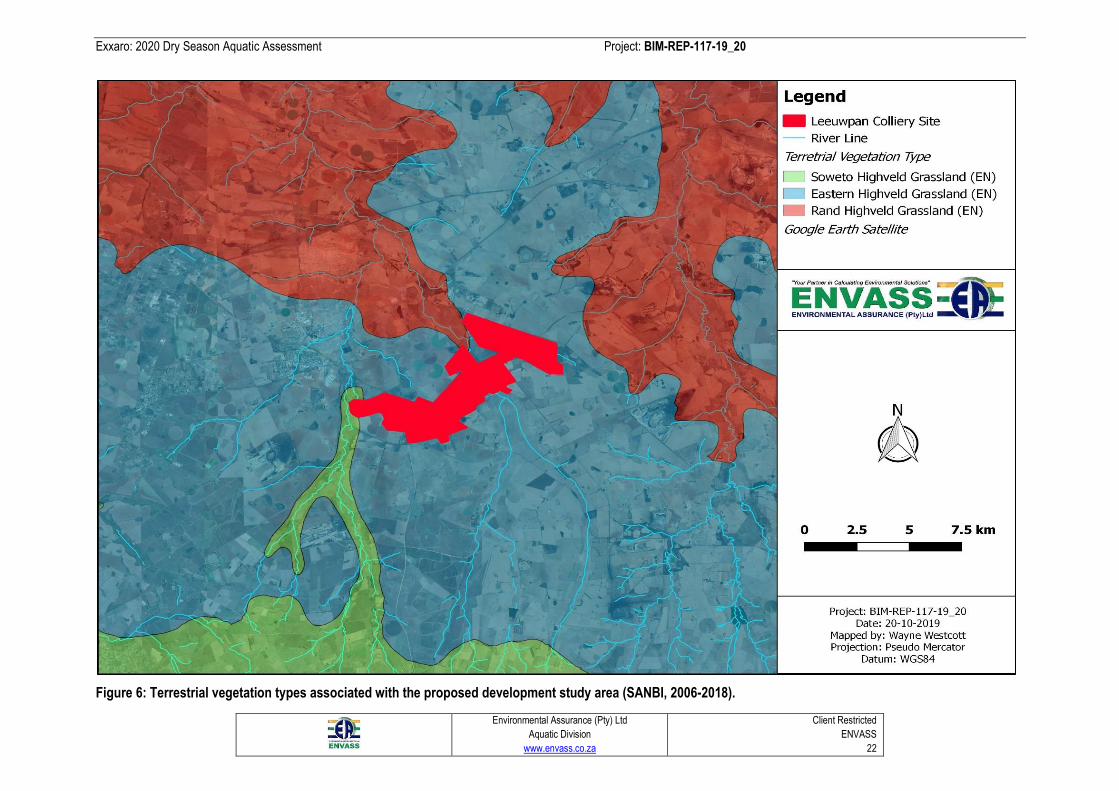
Exxaro: 2020 Dry Season Aquatic Assessment Project: BIM-REP-117-19_20
Environmental Assurance (Pty) Ltd
Aquatic Division
www.envass.co.za
Client Restricted
ENVASS
22
Figure 6: Terrestrial vegetation types associated with the proposed development study area (SANBI, 2006-2018).
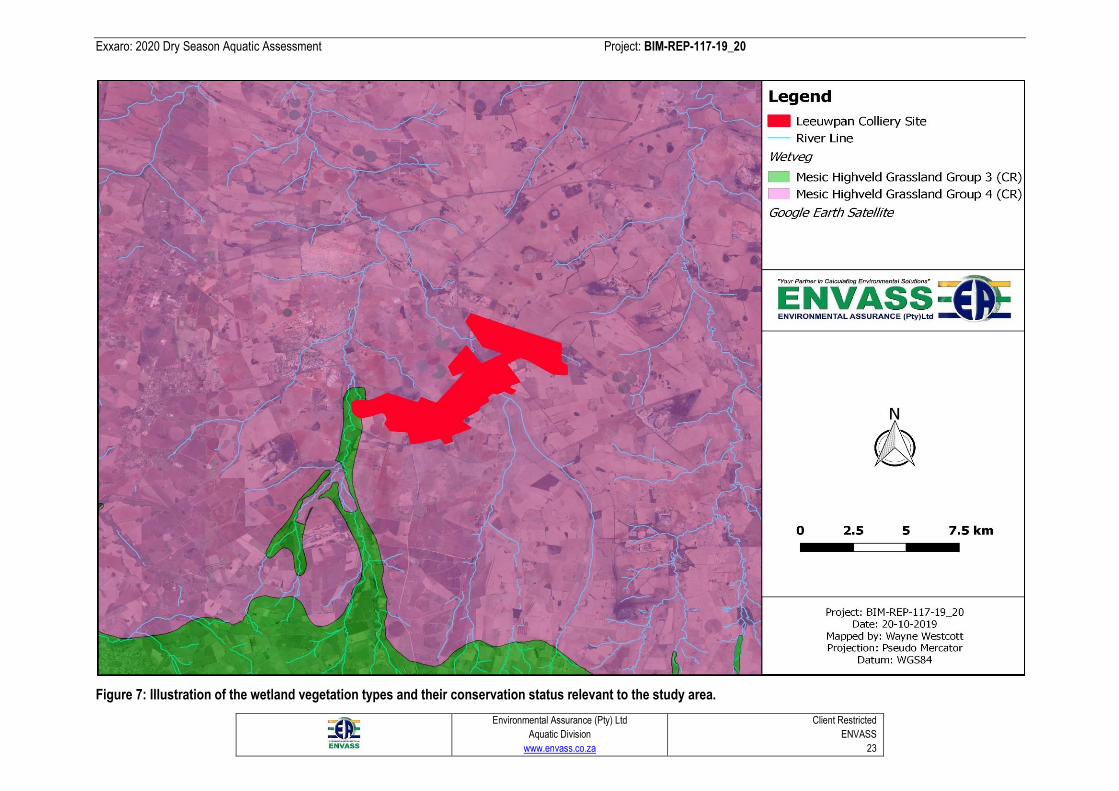
Exxaro: 2020 Dry Season Aquatic Assessment Project: BIM-REP-117-19_20
Environmental Assurance (Pty) Ltd
Aquatic Division
www.envass.co.za
Client Restricted
ENVASS
23
Figure 7: Illustration of the wetland vegetation types and their conservation status relevant to the study area.
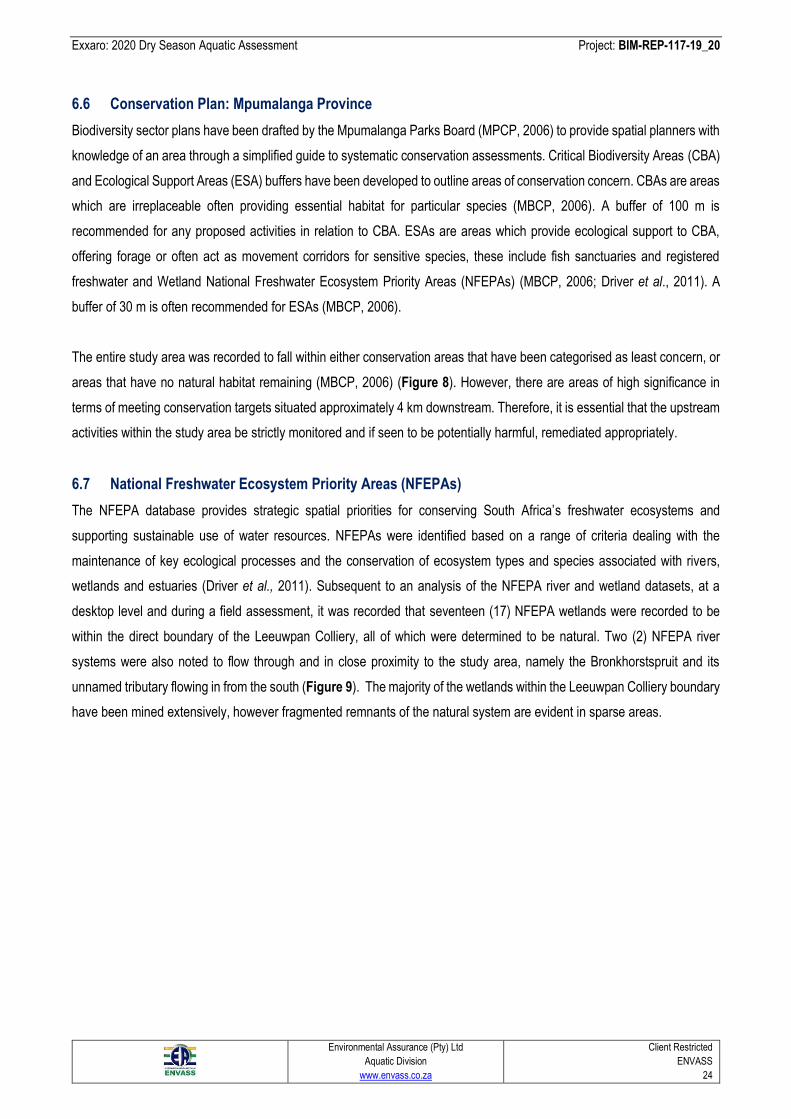
Exxaro: 2020 Dry Season Aquatic Assessment Project: BIM-REP-117-19_20
Environmental Assurance (Pty) Ltd
Aquatic Division
www.envass.co.za
Client Restricted
ENVASS
24
6.6 Conservation Plan: Mpumalanga Province
Biodiversity sector plans have been drafted by the Mpumalanga Parks Board (MPCP, 2006) to provide spatial planners with
knowledge of an area through a simplified guide to systematic conservation assessments. Critical Biodiversity Areas (CBA)
and Ecological Support Areas (ESA) buffers have been developed to outline areas of conservation concern. CBAs are areas
which are irreplaceable often providing essential habitat for particular species (MBCP, 2006). A buffer of 100 m is
recommended for any proposed activities in relation to CBA. ESAs are areas which provide ecological support to CBA,
offering forage or often act as movement corridors for sensitive species, these include fish sanctuaries and registered
freshwater and Wetland National Freshwater Ecosystem Priority Areas (NFEPAs) (MBCP, 2006; Driver et al., 2011). A
buffer of 30 m is often recommended for ESAs (MBCP, 2006).
The entire study area was recorded to fall within either conservation areas that have been categorised as least concern, or
areas that have no natural habitat remaining (MBCP, 2006) (Figure 8). However, there are areas of high significance in
terms of meeting conservation targets situated approximately 4 km downstream. Therefore, it is essential that the upstream
activities within the study area be strictly monitored and if seen to be potentially harmful, remediated appropriately.
6.7 National Freshwater Ecosystem Priority Areas (NFEPAs)
The NFEPA database provides strategic spatial priorities for conserving South Africa’s freshwater ecosystems and
supporting sustainable use of water resources. NFEPAs were identified based on a range of criteria dealing with the
maintenance of key ecological processes and the conservation of ecosystem types and species associated with rivers,
wetlands and estuaries (Driver et al., 2011). Subsequent to an analysis of the NFEPA river and wetland datasets, at a
desktop level and during a field assessment, it was recorded that seventeen (17) NFEPA wetlands were recorded to be
within the direct boundary of the Leeuwpan Colliery, all of which were determined to be natural. Two (2) NFEPA river
systems were also noted to flow through and in close proximity to the study area, namely the Bronkhorstspruit and its
unnamed tributary flowing in from the south (Figure 9). The majority of the wetlands within the Leeuwpan Colliery boundary
have been mined extensively, however fragmented remnants of the natural system are evident in sparse areas.
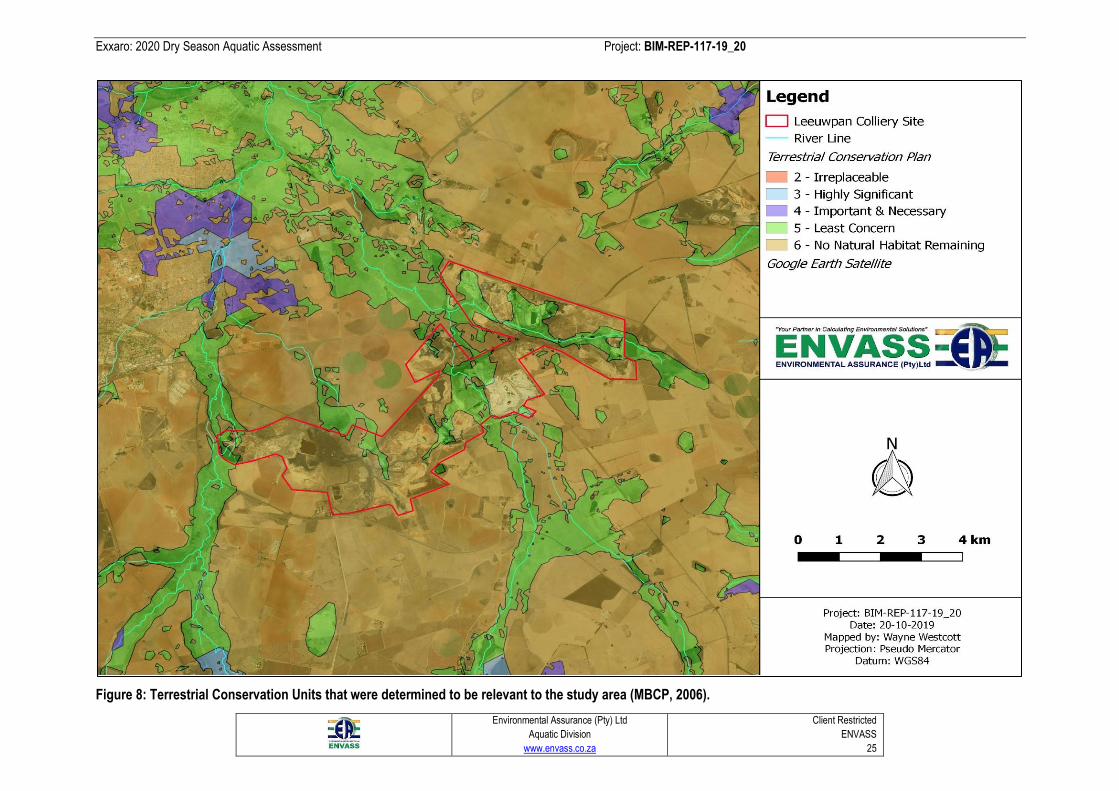
Exxaro: 2020 Dry Season Aquatic Assessment Project: BIM-REP-117-19_20
Environmental Assurance (Pty) Ltd
Aquatic Division
www.envass.co.za
Client Restricted
ENVASS
25
Figure 8: Terrestrial Conservation Units that were determined to be relevant to the study area (MBCP, 2006).
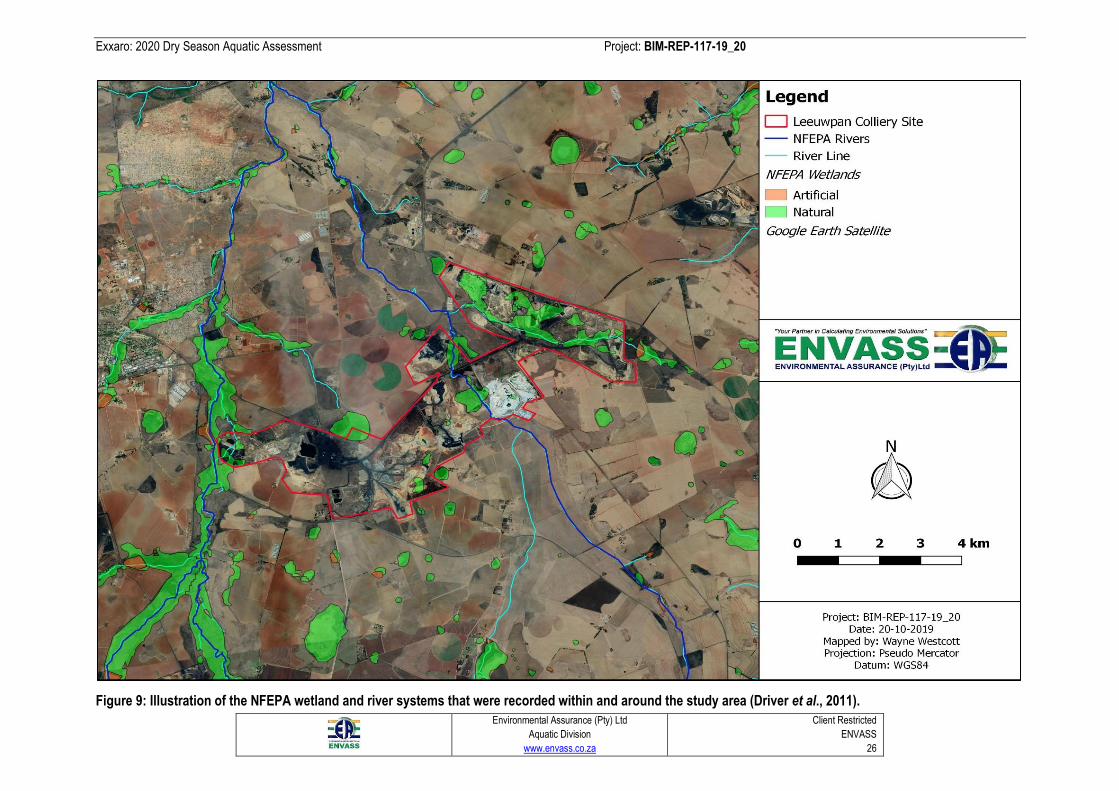
Exxaro: 2020 Dry Season Aquatic Assessment Project: BIM-REP-117-19_20
Environmental Assurance (Pty) Ltd
Aquatic Division
www.envass.co.za
Client Restricted
ENVASS
26
Figure 9: Illustration of the NFEPA wetland and river systems that were recorded within and around the study area (Driver et al., 2011).
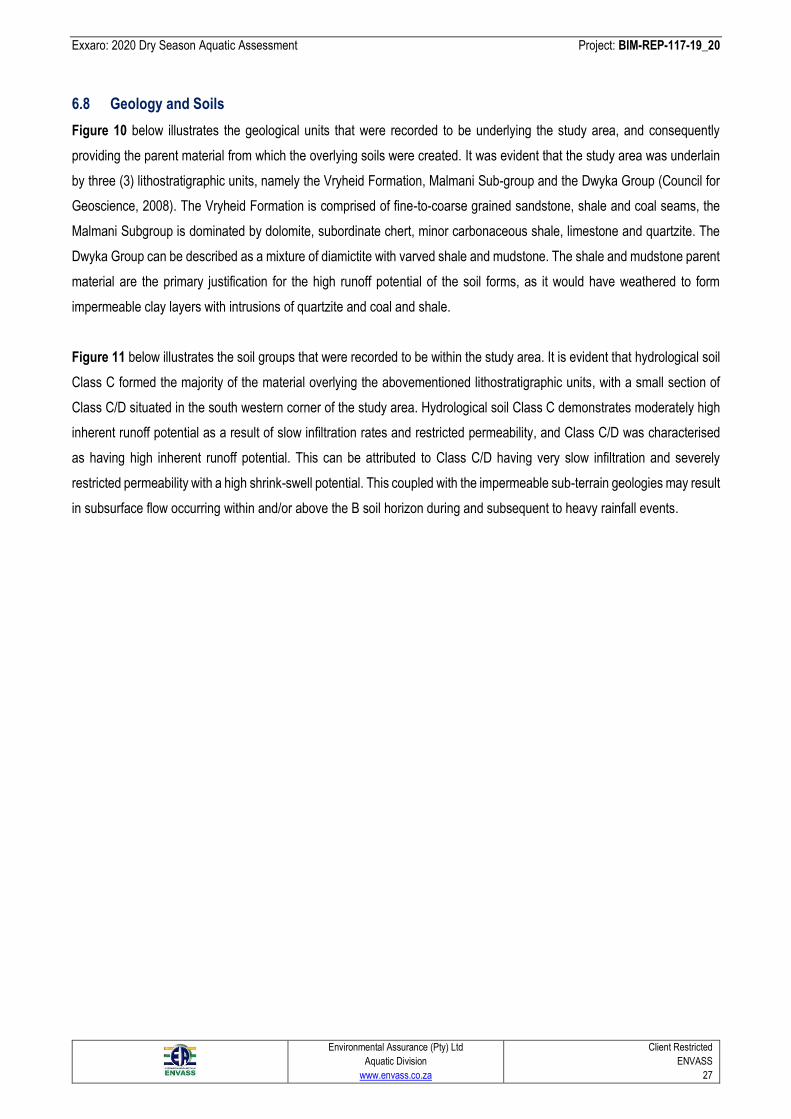
Exxaro: 2020 Dry Season Aquatic Assessment Project: BIM-REP-117-19_20
Environmental Assurance (Pty) Ltd
Aquatic Division
www.envass.co.za
Client Restricted
ENVASS
27
6.8 Geology and Soils
Figure 10 below illustrates the geological units that were recorded to be underlying the study area, and consequently
providing the parent material from which the overlying soils were created. It was evident that the study area was underlain
by three (3) lithostratigraphic units, namely the Vryheid Formation, Malmani Sub-group and the Dwyka Group (Council for
Geoscience, 2008). The Vryheid Formation is comprised of fine-to-coarse grained sandstone, shale and coal seams, the
Malmani Subgroup is dominated by dolomite, subordinate chert, minor carbonaceous shale, limestone and quartzite. The
Dwyka Group can be described as a mixture of diamictite with varved shale and mudstone. The shale and mudstone parent
material are the primary justification for the high runoff potential of the soil forms, as it would have weathered to form
impermeable clay layers with intrusions of quartzite and coal and shale.
Figure 11 below illustrates the soil groups that were recorded to be within the study area. It is evident that hydrological soil
Class C formed the majority of the material overlying the abovementioned lithostratigraphic units, with a small section of
Class C/D situated in the south western corner of the study area. Hydrological soil Class C demonstrates moderately high
inherent runoff potential as a result of slow infiltration rates and restricted permeability, and Class C/D was characterised
as having high inherent runoff potential. This can be attributed to Class C/D having very slow infiltration and severely
restricted permeability with a high shrink-swell potential. This coupled with the impermeable sub-terrain geologies may result
in subsurface flow occurring within and/or above the B soil horizon during and subsequent to heavy rainfall events.
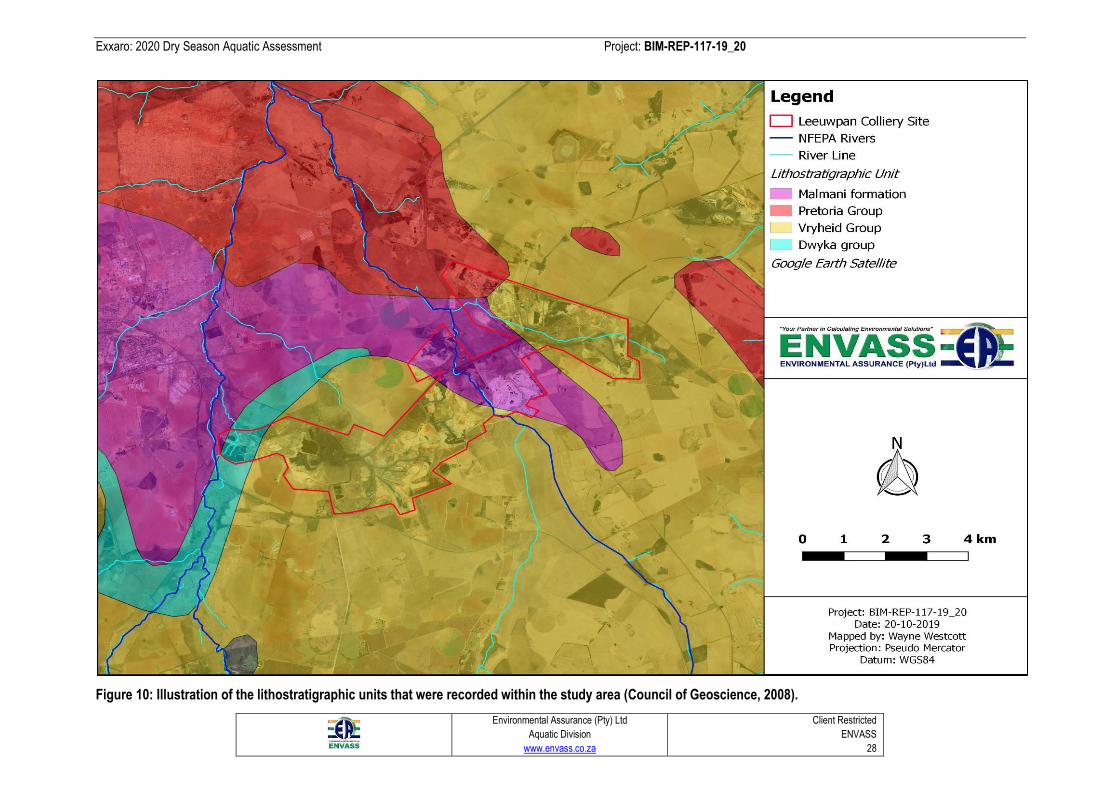
Exxaro: 2020 Dry Season Aquatic Assessment Project: BIM-REP-117-19_20
Environmental Assurance (Pty) Ltd
Aquatic Division
www.envass.co.za
Client Restricted
ENVASS
28
Figure 10: Illustration of the lithostratigraphic units that were recorded within the study area (Council of Geoscience, 2008).
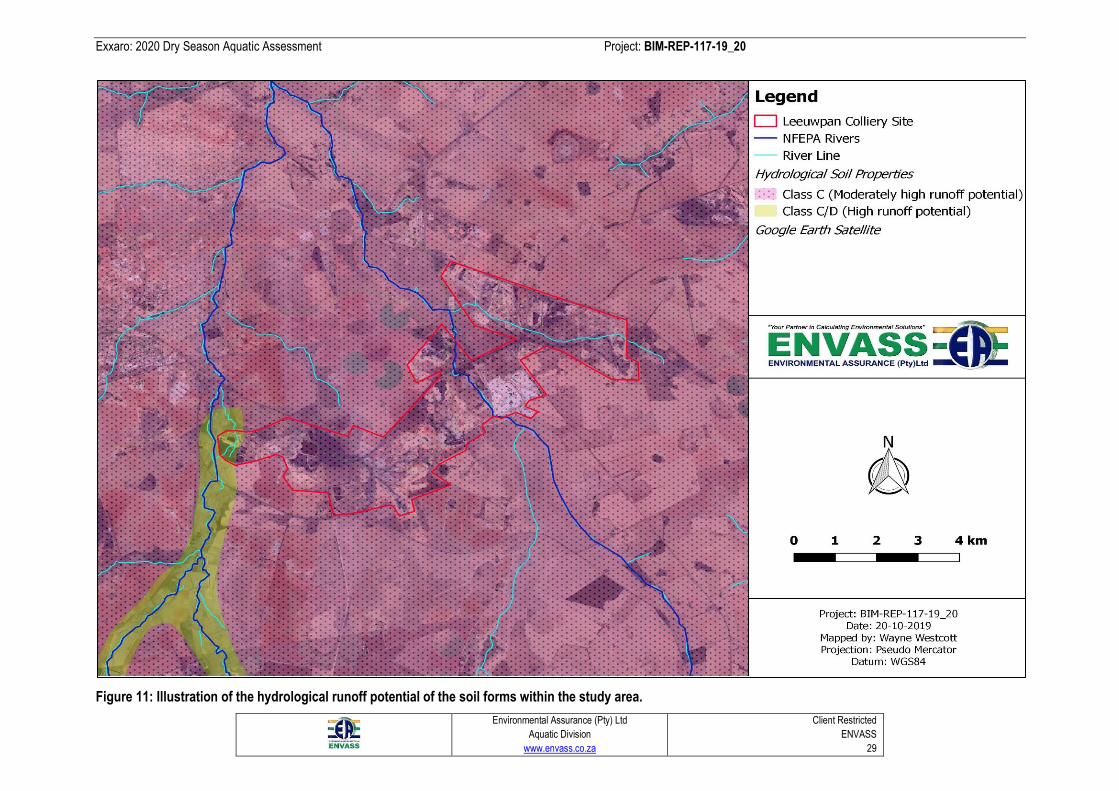
Exxaro: 2020 Dry Season Aquatic Assessment Project: BIM-REP-117-19_20
Environmental Assurance (Pty) Ltd
Aquatic Division
www.envass.co.za
Client Restricted
ENVASS
29
Figure 11: Illustration of the hydrological runoff potential of the soil forms within the study area.
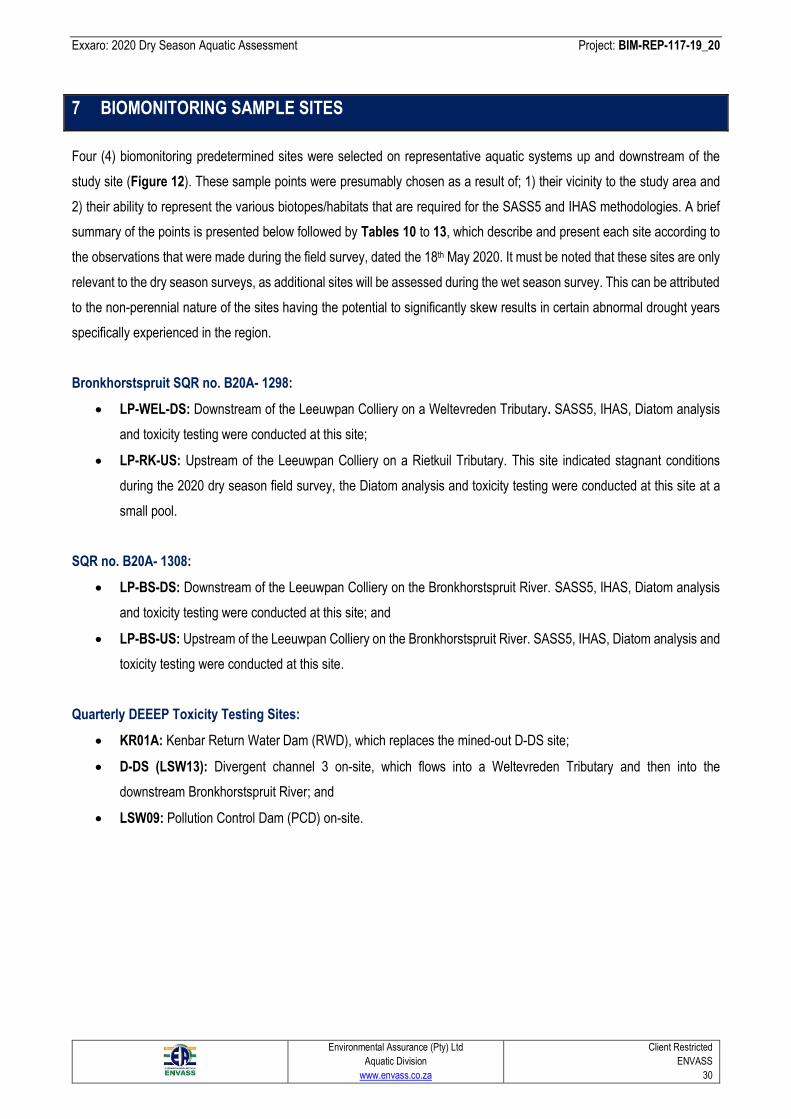
Exxaro: 2020 Dry Season Aquatic Assessment Project: BIM-REP-117-19_20
Environmental Assurance (Pty) Ltd
Aquatic Division
www.envass.co.za
Client Restricted
ENVASS
30
7 BIOMONITORING SAMPLE SITES
Four (4) biomonitoring predetermined sites were selected on representative aquatic systems up and downstream of the
study site (Figure 12). These sample points were presumably chosen as a result of; 1) their vicinity to the study area and
2) their ability to represent the various biotopes/habitats that are required for the SASS5 and IHAS methodologies. A brief
summary of the points is presented below followed by Tables 10 to 13, which describe and present each site according to
the observations that were made during the field survey, dated the 18th May 2020. It must be noted that these sites are only
relevant to the dry season surveys, as additional sites will be assessed during the wet season survey. This can be attributed
to the non-perennial nature of the sites having the potential to significantly skew results in certain abnormal drought years
specifically experienced in the region.
Bronkhorstspruit SQR no. B20A- 1298:
• LP-WEL-DS: Downstream of the Leeuwpan Colliery on a Weltevreden Tributary. SASS5, IHAS, Diatom analysis
and toxicity testing were conducted at this site;
• LP-RK-US: Upstream of the Leeuwpan Colliery on a Rietkuil Tributary. This site indicated stagnant conditions
during the 2020 dry season field survey, the Diatom analysis and toxicity testing were conducted at this site at a
small pool.
SQR no. B20A- 1308:
• LP-BS-DS: Downstream of the Leeuwpan Colliery on the Bronkhorstspruit River. SASS5, IHAS, Diatom analysis
and toxicity testing were conducted at this site; and
• LP-BS-US: Upstream of the Leeuwpan Colliery on the Bronkhorstspruit River. SASS5, IHAS, Diatom analysis and
toxicity testing were conducted at this site.
Quarterly DEEEP Toxicity Testing Sites:
• KR01A: Kenbar Return Water Dam (RWD), which replaces the mined-out D-DS site;
• D-DS (LSW13): Divergent channel 3 on-site, which flows into a Weltevreden Tributary and then into the
downstream Bronkhorstspruit River; and
• LSW09: Pollution Control Dam (PCD) on-site.
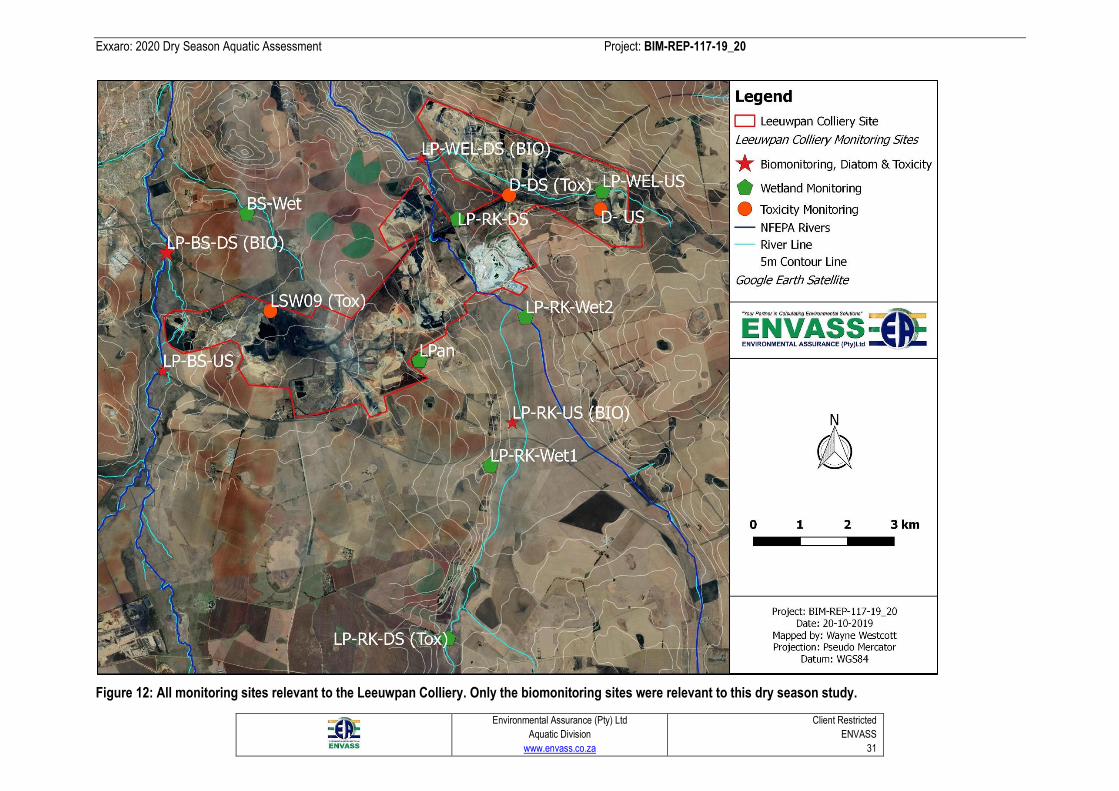
Exxaro: 2020 Dry Season Aquatic Assessment Project: BIM-REP-117-19_20
Environmental Assurance (Pty) Ltd
Aquatic Division
www.envass.co.za
Client Restricted
ENVASS
31
Figure 12: All monitoring sites relevant to the Leeuwpan Colliery. Only the biomonitoring sites were relevant to this dry season study.
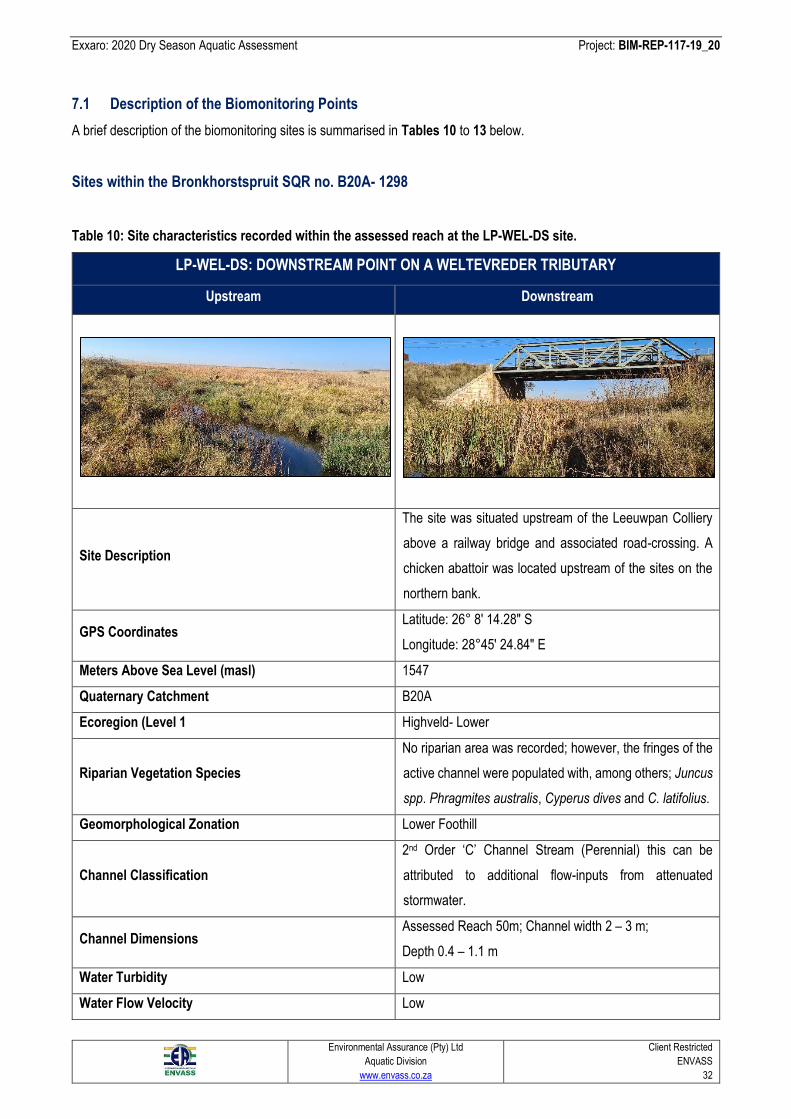
Exxaro: 2020 Dry Season Aquatic Assessment Project: BIM-REP-117-19_20
Environmental Assurance (Pty) Ltd
Aquatic Division
www.envass.co.za
Client Restricted
ENVASS
32
7.1 Description of the Biomonitoring Points
A brief description of the biomonitoring sites is summarised in Tables 10 to 13 below.
Sites within the Bronkhorstspruit SQR no. B20A- 1298
Table 10: Site characteristics recorded within the assessed reach at the LP-WEL-DS site.
LP-WEL-DS: DOWNSTREAM POINT ON A WELTEVREDER TRIBUTARY
Upstream Downstream
Site Description
The site was situated upstream of the Leeuwpan Colliery
above a railway bridge and associated road-crossing. A
chicken abattoir was located upstream of the sites on the
northern bank.
GPS Coordinates Latitude: 26° 8' 14.28" S
Longitude: 28°45' 24.84" E
Meters Above Sea Level (masl) 1547
Quaternary Catchment B20A
Ecoregion (Level 1 Highveld- Lower
Riparian Vegetation Species
No riparian area was recorded; however, the fringes of the
active channel were populated with, among others; Juncus
spp. Phragmites australis, Cyperus dives and C. latifolius.
Geomorphological Zonation Lower Foothill
Channel Classification
2nd Order ‘C’ Channel Stream (Perennial) this can be
attributed to additional flow-inputs from attenuated
stormwater.
Channel Dimensions Assessed Reach 50m; Channel width 2 – 3 m;
Depth 0.4 – 1.1 m
Water Turbidity Low
Water Flow Velocity Low
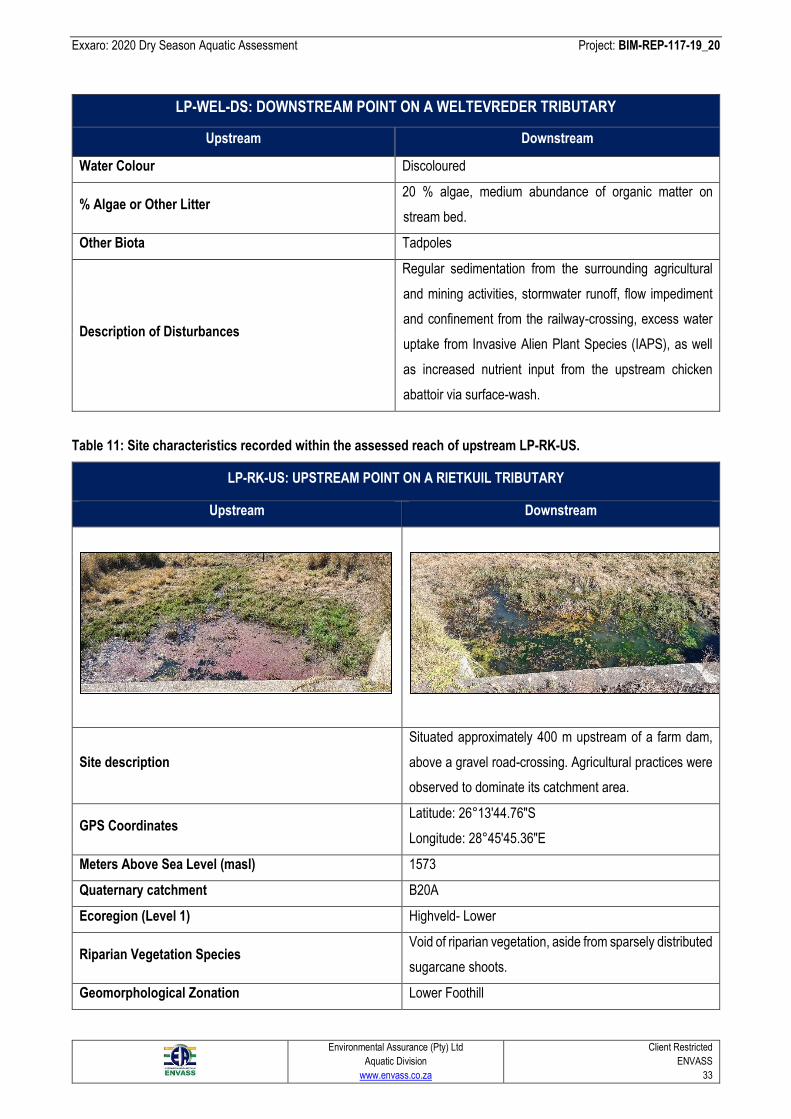
Exxaro: 2020 Dry Season Aquatic Assessment Project: BIM-REP-117-19_20
Environmental Assurance (Pty) Ltd
Aquatic Division
www.envass.co.za
Client Restricted
ENVASS
33
LP-WEL-DS: DOWNSTREAM POINT ON A WELTEVREDER TRIBUTARY
Upstream Downstream
Water Colour Discoloured
% Algae or Other Litter 20 % algae, medium abundance of organic matter on
stream bed.
Other Biota Tadpoles
Description of Disturbances
Regular sedimentation from the surrounding agricultural
and mining activities, stormwater runoff, flow impediment
and confinement from the railway-crossing, excess water
uptake from Invasive Alien Plant Species (IAPS), as well
as increased nutrient input from the upstream chicken
abattoir via surface-wash.
Table 11: Site characteristics recorded within the assessed reach of upstream LP-RK-US.
LP-RK-US: UPSTREAM POINT ON A RIETKUIL TRIBUTARY
Upstream Downstream
Site description
Situated approximately 400 m upstream of a farm dam,
above a gravel road-crossing. Agricultural practices were
observed to dominate its catchment area.
GPS Coordinates Latitude: 26°13'44.76"S
Longitude: 28°45'45.36"E
Meters Above Sea Level (masl) 1573
Quaternary catchment B20A
Ecoregion (Level 1) Highveld- Lower
Riparian Vegetation Species Void of riparian vegetation, aside from sparsely distributed
sugarcane shoots.
Geomorphological Zonation Lower Foothill
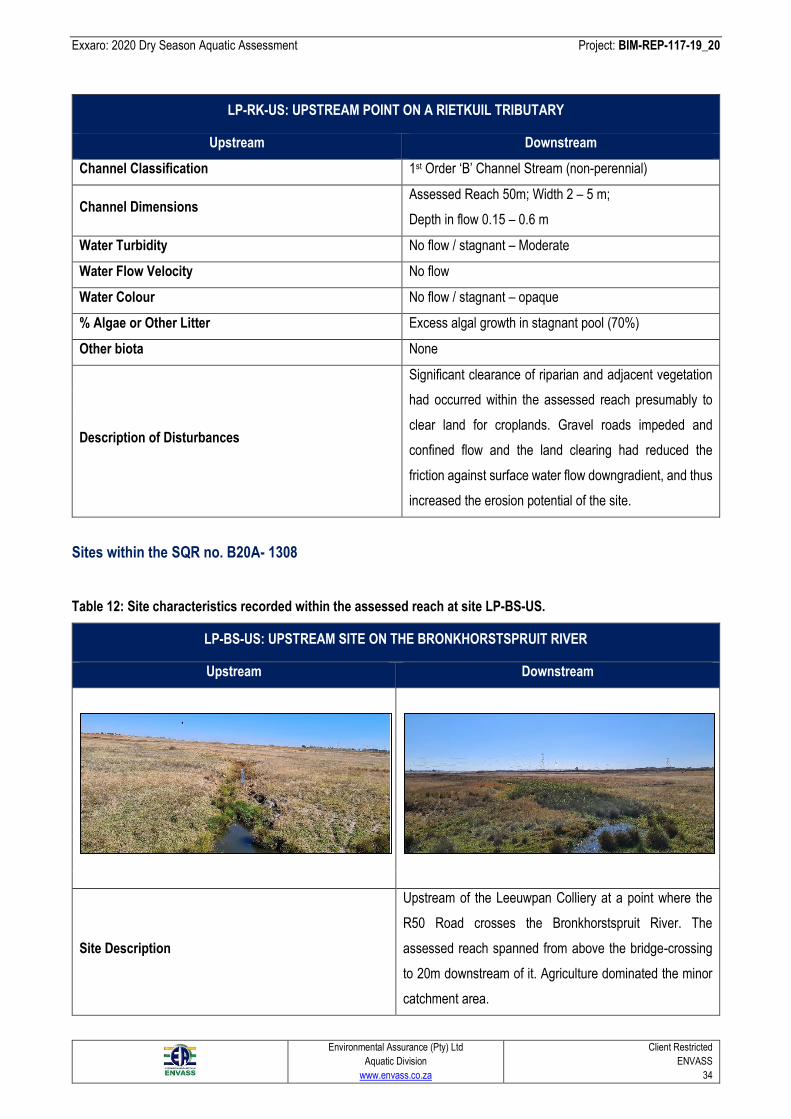
Exxaro: 2020 Dry Season Aquatic Assessment Project: BIM-REP-117-19_20
Environmental Assurance (Pty) Ltd
Aquatic Division
www.envass.co.za
Client Restricted
ENVASS
34
LP-RK-US: UPSTREAM POINT ON A RIETKUIL TRIBUTARY
Upstream Downstream
Channel Classification 1st Order ‘B’ Channel Stream (non-perennial)
Channel Dimensions Assessed Reach 50m; Width 2 – 5 m;
Depth in flow 0.15 – 0.6 m
Water Turbidity No flow / stagnant – Moderate
Water Flow Velocity No flow
Water Colour No flow / stagnant – opaque
% Algae or Other Litter Excess algal growth in stagnant pool (70%)
Other biota None
Description of Disturbances
Significant clearance of riparian and adjacent vegetation
had occurred within the assessed reach presumably to
clear land for croplands. Gravel roads impeded and
confined flow and the land clearing had reduced the
friction against surface water flow downgradient, and thus
increased the erosion potential of the site.
Sites within the SQR no. B20A- 1308
Table 12: Site characteristics recorded within the assessed reach at site LP-BS-US.
LP-BS-US: UPSTREAM SITE ON THE BRONKHORSTSPRUIT RIVER
Upstream Downstream
Site Description
Upstream of the Leeuwpan Colliery at a point where the
R50 Road crosses the Bronkhorstspruit River. The
assessed reach spanned from above the bridge-crossing
to 20m downstream of it. Agriculture dominated the minor
catchment area.
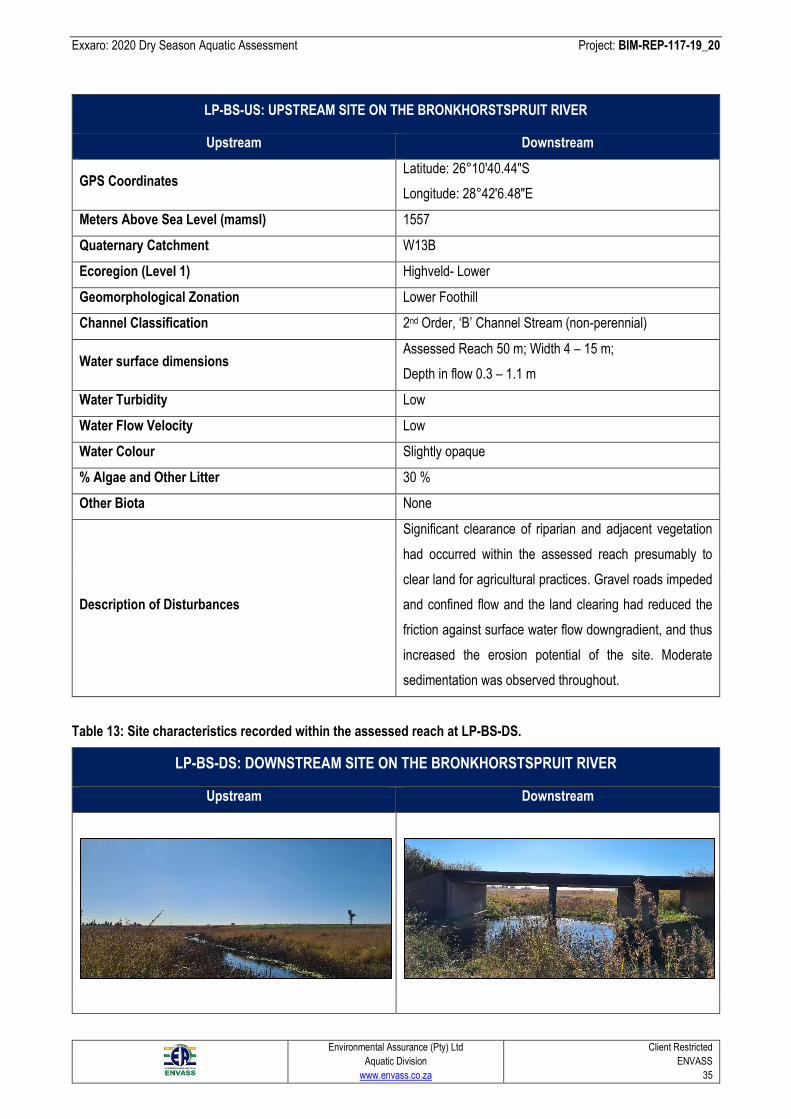
Exxaro: 2020 Dry Season Aquatic Assessment Project: BIM-REP-117-19_20
Environmental Assurance (Pty) Ltd
Aquatic Division
www.envass.co.za
Client Restricted
ENVASS
35
LP-BS-US: UPSTREAM SITE ON THE BRONKHORSTSPRUIT RIVER
Upstream Downstream
GPS Coordinates Latitude: 26°10'40.44"S
Longitude: 28°42'6.48"E
Meters Above Sea Level (mamsl) 1557
Quaternary Catchment W13B
Ecoregion (Level 1) Highveld- Lower
Geomorphological Zonation Lower Foothill
Channel Classification 2nd Order, ‘B’ Channel Stream (non-perennial)
Water surface dimensions Assessed Reach 50 m; Width 4 – 15 m;
Depth in flow 0.3 – 1.1 m
Water Turbidity Low
Water Flow Velocity Low
Water Colour Slightly opaque
% Algae and Other Litter 30 %
Other Biota None
Description of Disturbances
Significant clearance of riparian and adjacent vegetation
had occurred within the assessed reach presumably to
clear land for agricultural practices. Gravel roads impeded
and confined flow and the land clearing had reduced the
friction against surface water flow downgradient, and thus
increased the erosion potential of the site. Moderate
sedimentation was observed throughout.
Table 13: Site characteristics recorded within the assessed reach at LP-BS-DS.
LP-BS-DS: DOWNSTREAM SITE ON THE BRONKHORSTSPRUIT RIVER
Upstream Downstream
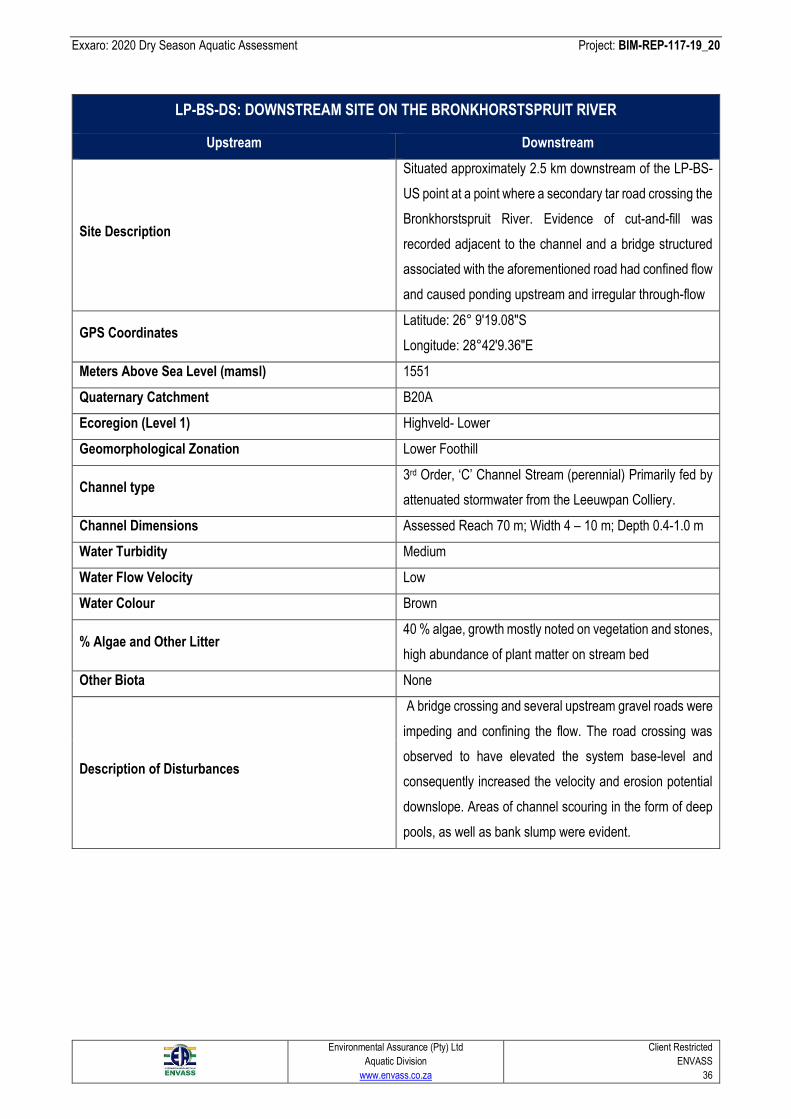
Exxaro: 2020 Dry Season Aquatic Assessment Project: BIM-REP-117-19_20
Environmental Assurance (Pty) Ltd
Aquatic Division
www.envass.co.za
Client Restricted
ENVASS
36
LP-BS-DS: DOWNSTREAM SITE ON THE BRONKHORSTSPRUIT RIVER
Upstream Downstream
Site Description
Situated approximately 2.5 km downstream of the LP-BS-
US point at a point where a secondary tar road crossing the
Bronkhorstspruit River. Evidence of cut-and-fill was
recorded adjacent to the channel and a bridge structured
associated with the aforementioned road had confined flow
and caused ponding upstream and irregular through-flow
GPS Coordinates Latitude: 26° 9'19.08"S
Longitude: 28°42'9.36"E
Meters Above Sea Level (mamsl) 1551
Quaternary Catchment B20A
Ecoregion (Level 1) Highveld- Lower
Geomorphological Zonation Lower Foothill
Channel type 3rd Order, ‘C’ Channel Stream (perennial) Primarily fed by
attenuated stormwater from the Leeuwpan Colliery.
Channel Dimensions Assessed Reach 70 m; Width 4 – 10 m; Depth 0.4-1.0 m
Water Turbidity Medium
Water Flow Velocity Low
Water Colour Brown
% Algae and Other Litter 40 % algae, growth mostly noted on vegetation and stones,
high abundance of plant matter on stream bed
Other Biota None
Description of Disturbances
A bridge crossing and several upstream gravel roads were
impeding and confining the flow. The road crossing was
observed to have elevated the system base-level and
consequently increased the velocity and erosion potential
downslope. Areas of channel scouring in the form of deep
pools, as well as bank slump were evident.
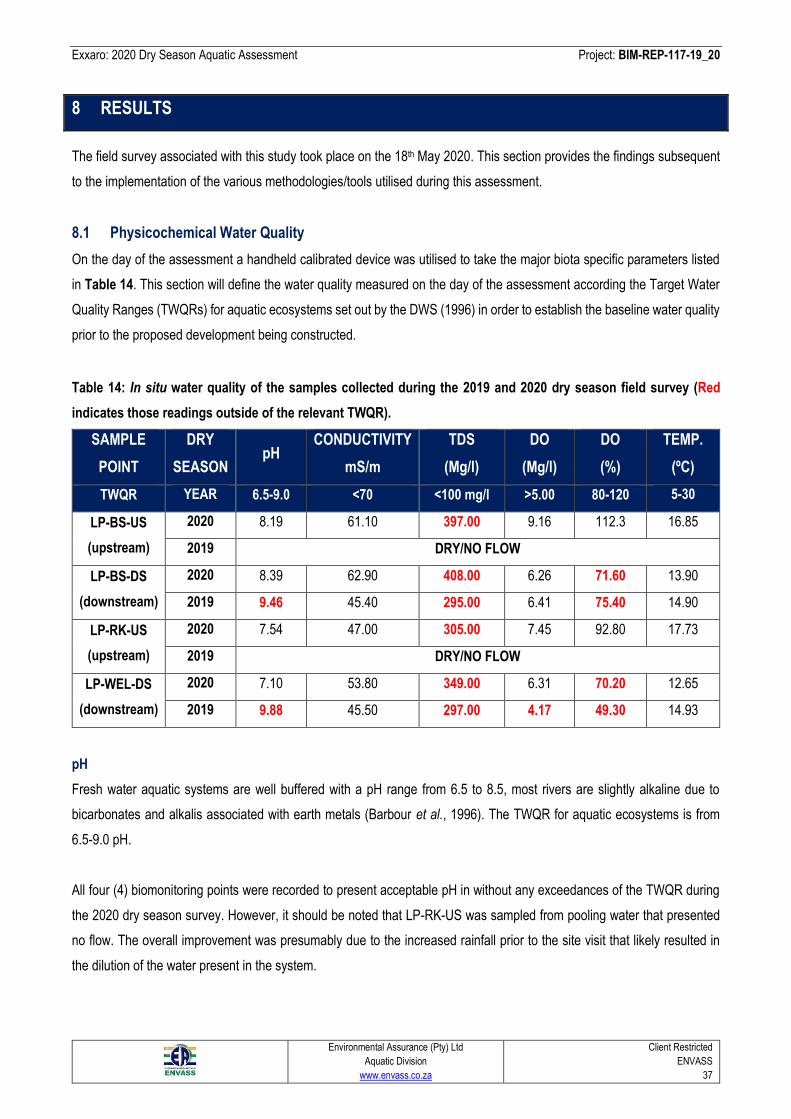
Exxaro: 2020 Dry Season Aquatic Assessment Project: BIM-REP-117-19_20
Environmental Assurance (Pty) Ltd
Aquatic Division
www.envass.co.za
Client Restricted
ENVASS
37
8 RESULTS
The field survey associated with this study took place on the 18th May 2020. This section provides the findings subsequent
to the implementation of the various methodologies/tools utilised during this assessment.
8.1 Physicochemical Water Quality
On the day of the assessment a handheld calibrated device was utilised to take the major biota specific parameters listed
in Table 14. This section will define the water quality measured on the day of the assessment according the Target Water
Quality Ranges (TWQRs) for aquatic ecosystems set out by the DWS (1996) in order to establish the baseline water quality
prior to the proposed development being constructed.
Table 14: In situ water quality of the samples collected during the 2019 and 2020 dry season field survey (Red
indicates those readings outside of the relevant TWQR).
SAMPLE
POINT
DRY
SEASON pH
CONDUCTIVITY
mS/m
TDS
(Mg/l)
DO
(Mg/l)
DO
(%)
TEMP.
(ºC)
TWQR YEAR 6.5-9.0 <70 <100 mg/l >5.00 80-120 5-30
LP-BS-US
(upstream)
2020 8.19 61.10 397.00 9.16 112.3 16.85
2019 DRY/NO FLOW
LP-BS-DS
(downstream)
2020 8.39 62.90 408.00 6.26 71.60 13.90
2019 9.46 45.40 295.00 6.41 75.40 14.90
LP-RK-US
(upstream)
2020 7.54 47.00 305.00 7.45 92.80 17.73
2019 DRY/NO FLOW
LP-WEL-DS
(downstream)
2020 7.10 53.80 349.00 6.31 70.20 12.65
2019 9.88 45.50 297.00 4.17 49.30 14.93
pH
Fresh water aquatic systems are well buffered with a pH range from 6.5 to 8.5, most rivers are slightly alkaline due to
bicarbonates and alkalis associated with earth metals (Barbour et al., 1996). The TWQR for aquatic ecosystems is from
6.5-9.0 pH.
All four (4) biomonitoring points were recorded to present acceptable pH in without any exceedances of the TWQR during
the 2020 dry season survey. However, it should be noted that LP-RK-US was sampled from pooling water that presented
no flow. The overall improvement was presumably due to the increased rainfall prior to the site visit that likely resulted in
the dilution of the water present in the system.
Exxaro: 2020 Dry Season Aquatic Assessment Project: BIM-REP-117-19_20
Environmental Assurance (Pty) Ltd
Aquatic Division
www.envass.co.za
Client Restricted
ENVASS
38
The results for the LP-BS-US and LP-BS-DS monitoring points indicate a basic pH environment associated with the
Bronkhorstspruit River, which typically stems from an increased concentration of calcareous minerals resulting in carbonate
buffering.
Electrical Conductivity (EC)
The Electrical Conductivity (EC) of a river is the ability of water to conduct an electrical current, this ability stems from the
presence of carbonate, bicarbonate, chloride, sulphate, nitrate, sodium, potassium, calcium and magnesium ions present
in the water (DWS, 1996). The TWQR for conductivity in freshwater systems is anything less than 70 mS/m. The EC
readings were measured in μS/cm, where 1 microsiemens/centimetre [μS/cm] = 0.1 millisiemens/meter [mS/m].
The EC at all four (4) sites were recorded to have been within the TWQR for EC during the 2020 dry season field survey.
Slightly higher EC readings were recorded at the downstream sites in comparison to their upstream counterparts. The
Bronkhorstspruit River on which LKP-BS-US and LP-BS-DS was recorded to have overall higher EC readings than the other
systems.
Total Dissolved Solids (TDS)
The amount of suspended material in the water column including anything from colloids (0.1 Femtometre (Fm)) to large
organic and inorganic materials is known as Total Dissolved Solids (TDS) of a river. The increase of suspended solids
occurs with discharge of sediment during rainfall, as the flow returns to normal and the solids remain suspended in the water
column. This parameter must be monitored closely in correlation with the EC reading captured at each point, as there is a
strong correlation between the conductivity and the cations and anions that are typically contained in the TDS within a
system. The TWQR for aquatic systems is anything less than 100 mg/l (DWS, 1996). Prolonged exposure may have an
effect on the nutrient cycling of sensitive taxa within the reach (DWS, 1996).
Water samples from all four (4) biomonitoring sites were recorded to contain TDS concentrations that exceeded the TWQR
for TDS. The LP-BS-US, LP-BS-DS, LP-RK-US and LP-WEL-DS sites contained 75 %, 75 %, 67 % and 71 % more TDS
than the max TWQR for TDS. The increased TDS is likely associated with the recent input of sediment due to rainfall prior
to the assessment.
Dissolved Oxygen (DO)
The Dissolved Oxygen (DO) present in the water column originates from the atmosphere via rainfall, turbid water in fast
flowing streams and is a product of photosynthesis by hydrophilic floral species, specifically microalgae. As a result of all
aerobic organisms needing oxygen to survive, DO is considered an accurate measure of the health of an aquatic ecosystem.
In moderate-to-large sized dams the levels of DO may rise during the day as a result of photosynthesis, but may reduce
during the night to plant respiration.
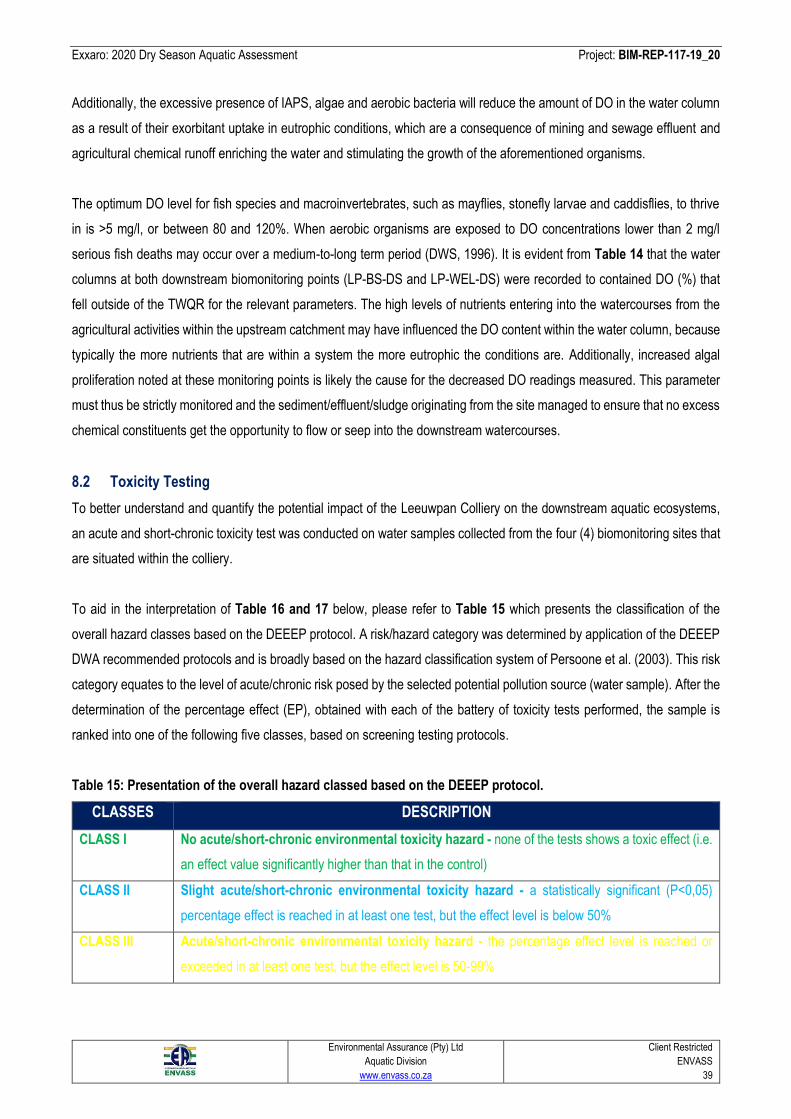
Exxaro: 2020 Dry Season Aquatic Assessment Project: BIM-REP-117-19_20
Environmental Assurance (Pty) Ltd
Aquatic Division
www.envass.co.za
Client Restricted
ENVASS
39
Additionally, the excessive presence of IAPS, algae and aerobic bacteria will reduce the amount of DO in the water column
as a result of their exorbitant uptake in eutrophic conditions, which are a consequence of mining and sewage effluent and
agricultural chemical runoff enriching the water and stimulating the growth of the aforementioned organisms.
The optimum DO level for fish species and macroinvertebrates, such as mayflies, stonefly larvae and caddisflies, to thrive
in is >5 mg/l, or between 80 and 120%. When aerobic organisms are exposed to DO concentrations lower than 2 mg/l
serious fish deaths may occur over a medium-to-long term period (DWS, 1996). It is evident from Table 14 that the water
columns at both downstream biomonitoring points (LP-BS-DS and LP-WEL-DS) were recorded to contained DO (%) that
fell outside of the TWQR for the relevant parameters. The high levels of nutrients entering into the watercourses from the
agricultural activities within the upstream catchment may have influenced the DO content within the water column, because
typically the more nutrients that are within a system the more eutrophic the conditions are. Additionally, increased algal
proliferation noted at these monitoring points is likely the cause for the decreased DO readings measured. This parameter
must thus be strictly monitored and the sediment/effluent/sludge originating from the site managed to ensure that no excess
chemical constituents get the opportunity to flow or seep into the downstream watercourses.
8.2 Toxicity Testing
To better understand and quantify the potential impact of the Leeuwpan Colliery on the downstream aquatic ecosystems,
an acute and short-chronic toxicity test was conducted on water samples collected from the four (4) biomonitoring sites that
are situated within the colliery.
To aid in the interpretation of Table 16 and 17 below, please refer to Table 15 which presents the classification of the
overall hazard classes based on the DEEEP protocol. A risk/hazard category was determined by application of the DEEEP
DWA recommended protocols and is broadly based on the hazard classification system of Persoone et al. (2003). This risk
category equates to the level of acute/chronic risk posed by the selected potential pollution source (water sample). After the
determination of the percentage effect (EP), obtained with each of the battery of toxicity tests performed, the sample is
ranked into one of the following five classes, based on screening testing protocols.
Table 15: Presentation of the overall hazard classed based on the DEEEP protocol.
CLASSES DESCRIPTION
CLASS I No acute/short-chronic environmental toxicity hazard - none of the tests shows a toxic effect (i.e.
an effect value significantly higher than that in the control)
CLASS II Slight acute/short-chronic environmental toxicity hazard - a statistically significant (P<0,05)
percentage effect is reached in at least one test, but the effect level is below 50%
CLASS III Acute/short-chronic environmental toxicity hazard - the percentage effect level is reached or
exceeded in at least one test, but the effect level is 50-99%
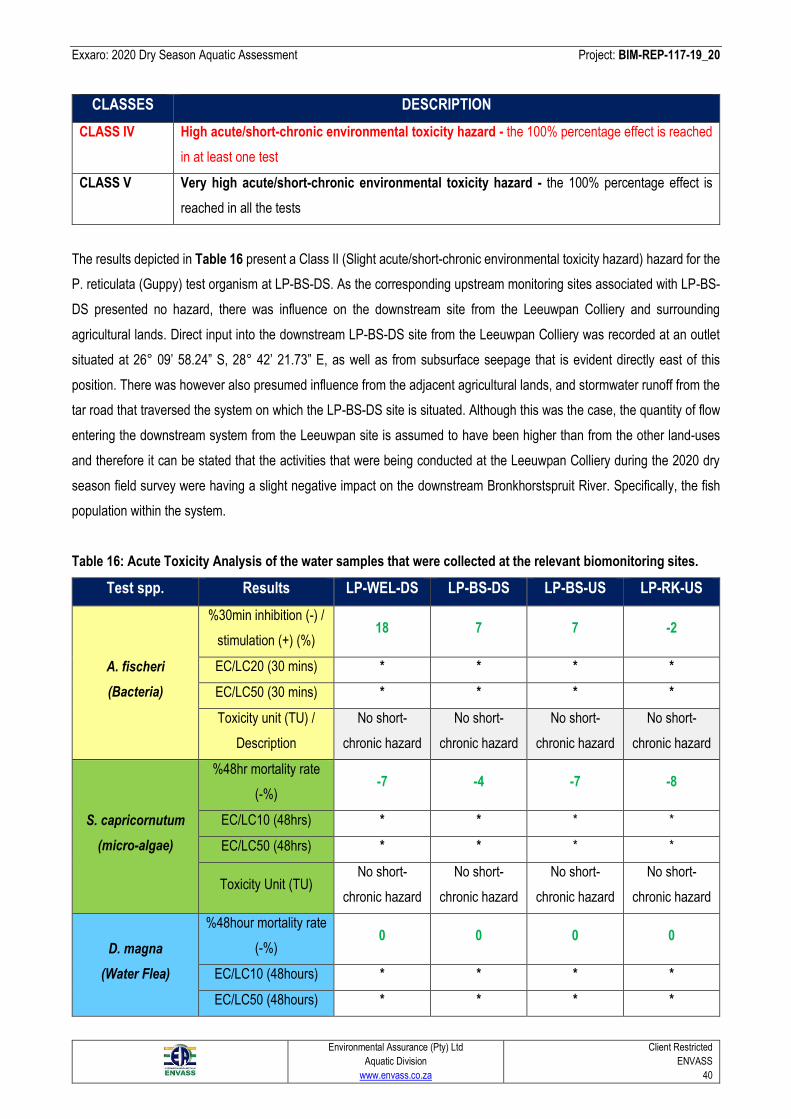
Exxaro: 2020 Dry Season Aquatic Assessment Project: BIM-REP-117-19_20
Environmental Assurance (Pty) Ltd
Aquatic Division
www.envass.co.za
Client Restricted
ENVASS
40
CLASSES DESCRIPTION
CLASS IV High acute/short-chronic environmental toxicity hazard - the 100% percentage effect is reached
in at least one test
CLASS V Very high acute/short-chronic environmental toxicity hazard - the 100% percentage effect is
reached in all the tests
The results depicted in Table 16 present a Class II (Slight acute/short-chronic environmental toxicity hazard) hazard for the
P. reticulata (Guppy) test organism at LP-BS-DS. As the corresponding upstream monitoring sites associated with LP-BS-
DS presented no hazard, there was influence on the downstream site from the Leeuwpan Colliery and surrounding
agricultural lands. Direct input into the downstream LP-BS-DS site from the Leeuwpan Colliery was recorded at an outlet
situated at 26° 09’ 58.24” S, 28° 42’ 21.73” E, as well as from subsurface seepage that is evident directly east of this
position. There was however also presumed influence from the adjacent agricultural lands, and stormwater runoff from the
tar road that traversed the system on which the LP-BS-DS site is situated. Although this was the case, the quantity of flow
entering the downstream system from the Leeuwpan site is assumed to have been higher than from the other land-uses
and therefore it can be stated that the activities that were being conducted at the Leeuwpan Colliery during the 2020 dry
season field survey were having a slight negative impact on the downstream Bronkhorstspruit River. Specifically, the fish
population within the system.
Table 16: Acute Toxicity Analysis of the water samples that were collected at the relevant biomonitoring sites.
Test spp. Results LP-WEL-DS LP-BS-DS LP-BS-US LP-RK-US
A. fischeri
(Bacteria)
%30min inhibition (-) /
stimulation (+) (%) 18 7 7 -2
EC/LC20 (30 mins) * * * *
EC/LC50 (30 mins) * * * *
Toxicity unit (TU) /
Description
No short-
chronic hazard
No short-
chronic hazard
No short-
chronic hazard
No short-
chronic hazard
S. capricornutum
(micro-algae)
%48hr mortality rate
(-%) -7 -4 -7 -8
EC/LC10 (48hrs) * * * *
EC/LC50 (48hrs) * * * *
Toxicity Unit (TU) No short-
chronic hazard
No short-
chronic hazard
No short-
chronic hazard
No short-
chronic hazard
D. magna
(Water Flea)
%48hour mortality rate
(-%) 0 0 0 0
EC/LC10 (48hours) * * * *
EC/LC50 (48hours) * * * *
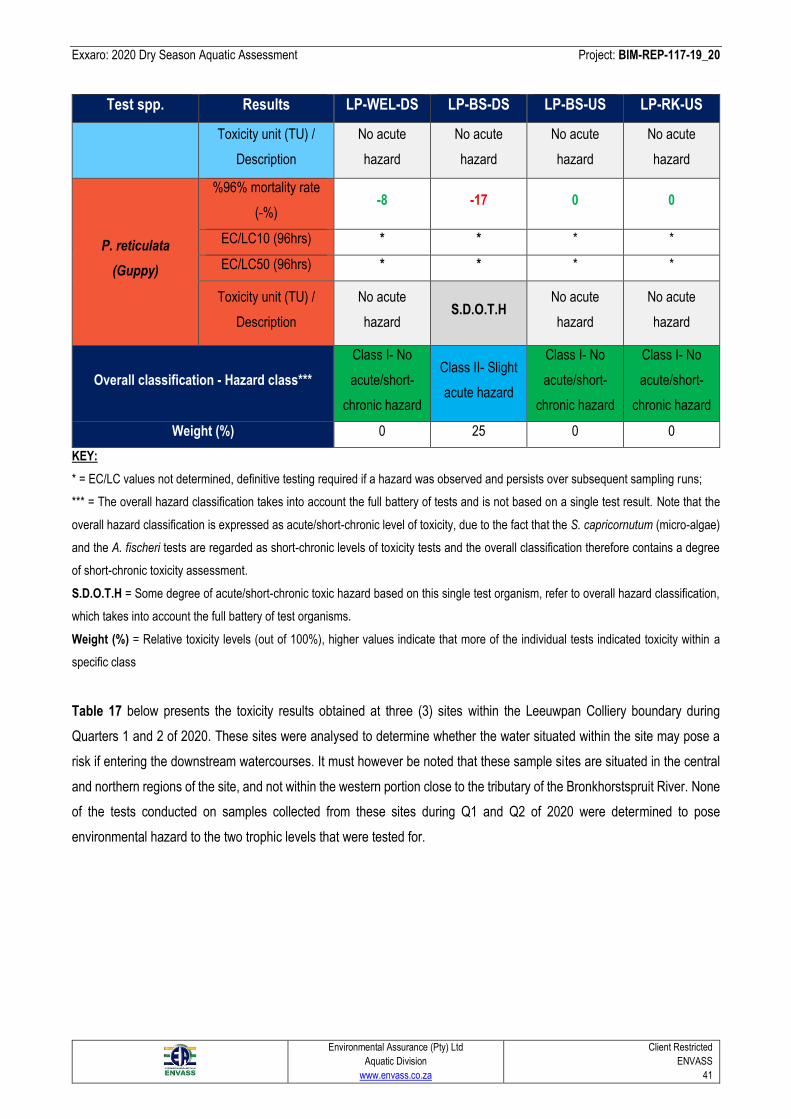
Exxaro: 2020 Dry Season Aquatic Assessment Project: BIM-REP-117-19_20
Environmental Assurance (Pty) Ltd
Aquatic Division
www.envass.co.za
Client Restricted
ENVASS
41
Test spp. Results LP-WEL-DS LP-BS-DS LP-BS-US LP-RK-US
Toxicity unit (TU) /
Description
No acute
hazard
No acute
hazard
No acute
hazard
No acute
hazard
P. reticulata
(Guppy)
%96% mortality rate
(-%) -8 -17 0 0
EC/LC10 (96hrs) * * * *
EC/LC50 (96hrs) * * * *
Toxicity unit (TU) /
Description
No acute
hazard S.D.O.T.H
No acute
hazard
No acute
hazard
Overall classification - Hazard class***
Class I- No
acute/short-
chronic hazard
Class II- Slight
acute hazard
Class I- No
acute/short-
chronic hazard
Class I- No
acute/short-
chronic hazard
Weight (%) 0 25 0 0
KEY:
* = EC/LC values not determined, definitive testing required if a hazard was observed and persists over subsequent sampling runs;
*** = The overall hazard classification takes into account the full battery of tests and is not based on a single test result. Note that the
overall hazard classification is expressed as acute/short-chronic level of toxicity, due to the fact that the S. capricornutum (micro-algae)
and the A. fischeri tests are regarded as short-chronic levels of toxicity tests and the overall classification therefore contains a degree
of short-chronic toxicity assessment.
S.D.O.T.H = Some degree of acute/short-chronic toxic hazard based on this single test organism, refer to overall hazard classification,
which takes into account the full battery of test organisms.
Weight (%) = Relative toxicity levels (out of 100%), higher values indicate that more of the individual tests indicated toxicity within a
specific class
Table 17 below presents the toxicity results obtained at three (3) sites within the Leeuwpan Colliery boundary during
Quarters 1 and 2 of 2020. These sites were analysed to determine whether the water situated within the site may pose a
risk if entering the downstream watercourses. It must however be noted that these sample sites are situated in the central
and northern regions of the site, and not within the western portion close to the tributary of the Bronkhorstspruit River. None
of the tests conducted on samples collected from these sites during Q1 and Q2 of 2020 were determined to pose
environmental hazard to the two trophic levels that were tested for.
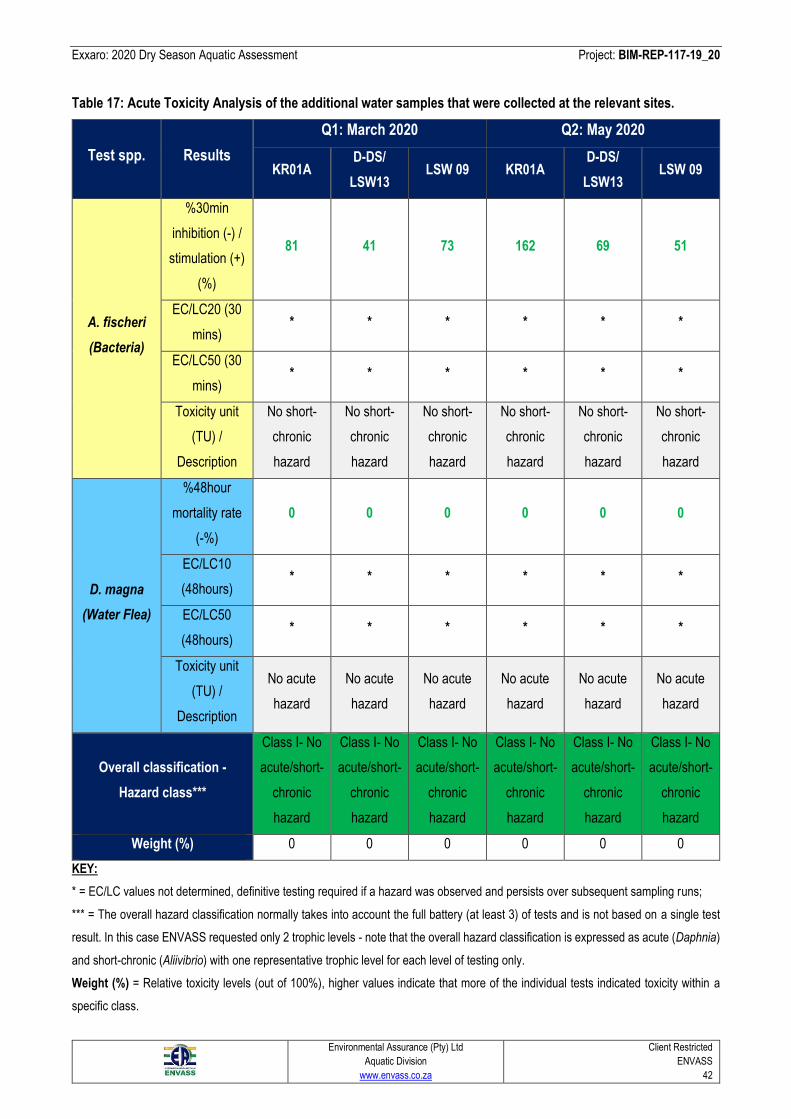
Exxaro: 2020 Dry Season Aquatic Assessment Project: BIM-REP-117-19_20
Environmental Assurance (Pty) Ltd
Aquatic Division
www.envass.co.za
Client Restricted
ENVASS
42
Table 17: Acute Toxicity Analysis of the additional water samples that were collected at the relevant sites.
Test spp. Results
Q1: March 2020 Q2: May 2020
KR01A D-DS/
LSW13 LSW 09 KR01A
D-DS/
LSW13 LSW 09
A. fischeri
(Bacteria)
%30min
inhibition (-) /
stimulation (+)
(%)
81 41 73 162 69 51
EC/LC20 (30
mins) * * * * * *
EC/LC50 (30
mins) * * * * * *
Toxicity unit
(TU) /
Description
No short-
chronic
hazard
No short-
chronic
hazard
No short-
chronic
hazard
No short-
chronic
hazard
No short-
chronic
hazard
No short-
chronic
hazard
D. magna
(Water Flea)
%48hour
mortality rate
(-%)
0 0 0 0 0 0
EC/LC10
(48hours) * * * * * *
EC/LC50
(48hours) * * * * * *
Toxicity unit
(TU) /
Description
No acute
hazard
No acute
hazard
No acute
hazard
No acute
hazard
No acute
hazard
No acute
hazard
Overall classification -
Hazard class***
Class I- No
acute/short-
chronic
hazard
Class I- No
acute/short-
chronic
hazard
Class I- No
acute/short-
chronic
hazard
Class I- No
acute/short-
chronic
hazard
Class I- No
acute/short-
chronic
hazard
Class I- No
acute/short-
chronic
hazard
Weight (%) 0 0 0 0 0 0
KEY:
* = EC/LC values not determined, definitive testing required if a hazard was observed and persists over subsequent sampling runs;
*** = The overall hazard classification normally takes into account the full battery (at least 3) of tests and is not based on a single test
result. In this case ENVASS requested only 2 trophic levels - note that the overall hazard classification is expressed as acute (Daphnia)
and short-chronic (Aliivibrio) with one representative trophic level for each level of testing only.
Weight (%) = Relative toxicity levels (out of 100%), higher values indicate that more of the individual tests indicated toxicity within a
specific class.
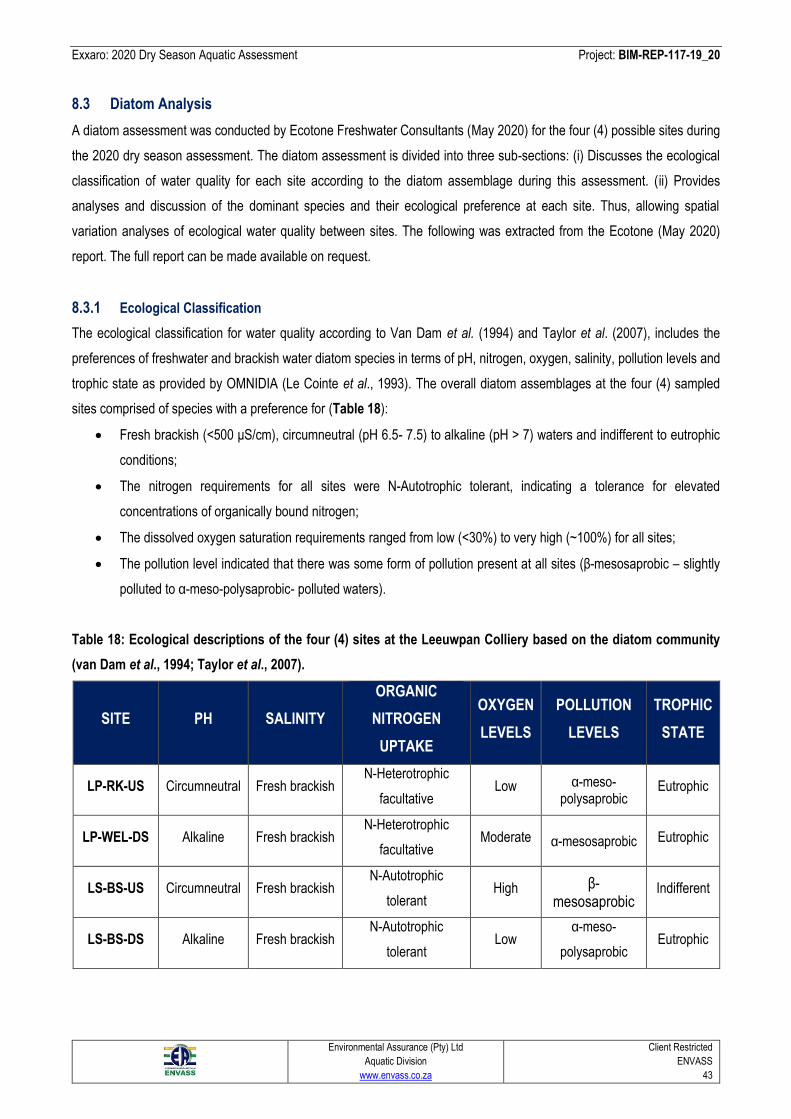
Exxaro: 2020 Dry Season Aquatic Assessment Project: BIM-REP-117-19_20
Environmental Assurance (Pty) Ltd
Aquatic Division
www.envass.co.za
Client Restricted
ENVASS
43
8.3 Diatom Analysis
A diatom assessment was conducted by Ecotone Freshwater Consultants (May 2020) for the four (4) possible sites during
the 2020 dry season assessment. The diatom assessment is divided into three sub-sections: (i) Discusses the ecological
classification of water quality for each site according to the diatom assemblage during this assessment. (ii) Provides
analyses and discussion of the dominant species and their ecological preference at each site. Thus, allowing spatial
variation analyses of ecological water quality between sites. The following was extracted from the Ecotone (May 2020)
report. The full report can be made available on request.
8.3.1 Ecological Classification
The ecological classification for water quality according to Van Dam et al. (1994) and Taylor et al. (2007), includes the
preferences of freshwater and brackish water diatom species in terms of pH, nitrogen, oxygen, salinity, pollution levels and
trophic state as provided by OMNIDIA (Le Cointe et al., 1993). The overall diatom assemblages at the four (4) sampled
sites comprised of species with a preference for (Table 18):
• Fresh brackish (<500 μS/cm), circumneutral (pH 6.5- 7.5) to alkaline (pH > 7) waters and indifferent to eutrophic
conditions;
• The nitrogen requirements for all sites were N-Autotrophic tolerant, indicating a tolerance for elevated
concentrations of organically bound nitrogen;
• The dissolved oxygen saturation requirements ranged from low (<30%) to very high (~100%) for all sites;
• The pollution level indicated that there was some form of pollution present at all sites (β-mesosaprobic – slightly
polluted to α-meso-polysaprobic- polluted waters).
Table 18: Ecological descriptions of the four (4) sites at the Leeuwpan Colliery based on the diatom community
(van Dam et al., 1994; Taylor et al., 2007).
SITE PH SALINITY
ORGANIC
NITROGEN
UPTAKE
OXYGEN
LEVELS
POLLUTION
LEVELS
TROPHIC
STATE
LP-RK-US Circumneutral Fresh brackish N-Heterotrophic
facultative Low α-meso-
polysaprobic Eutrophic
LP-WEL-DS Alkaline Fresh brackish N-Heterotrophic
facultative Moderate α-mesosaprobic Eutrophic
LS-BS-US Circumneutral Fresh brackish N-Autotrophic
tolerant High β-
mesosaprobic Indifferent
LS-BS-DS Alkaline Fresh brackish N-Autotrophic
tolerant Low
α-meso-
polysaprobic Eutrophic
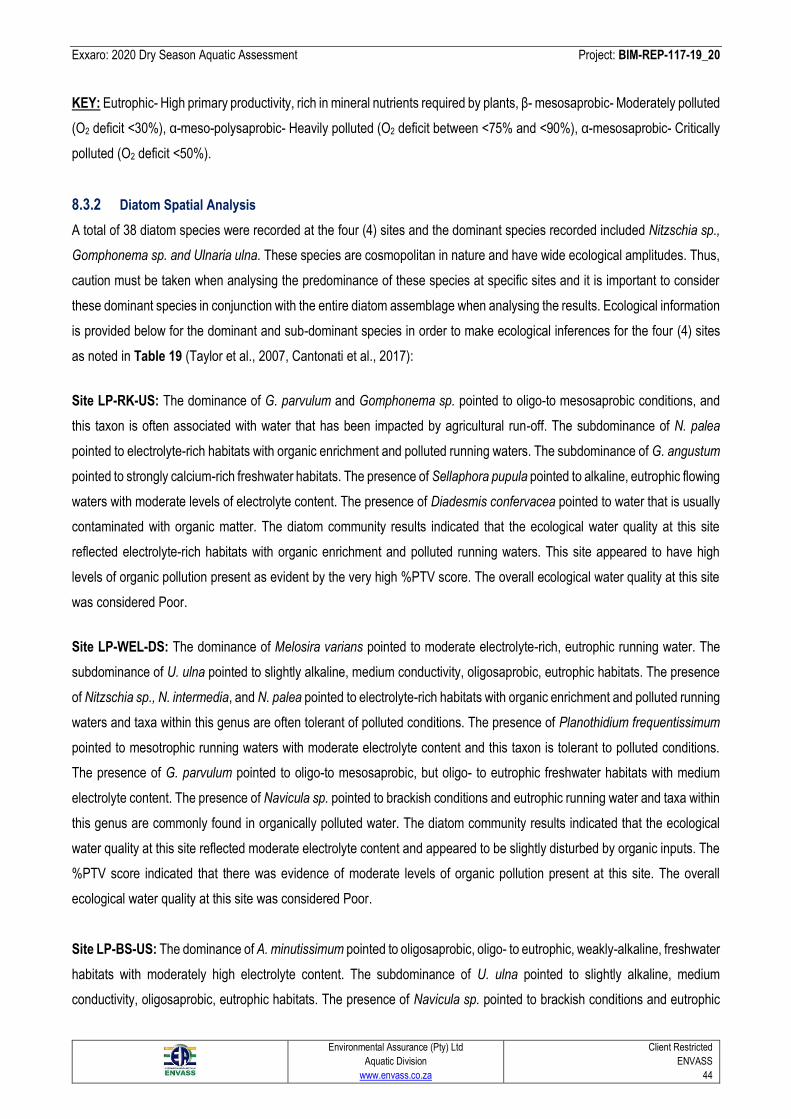
Exxaro: 2020 Dry Season Aquatic Assessment Project: BIM-REP-117-19_20
Environmental Assurance (Pty) Ltd
Aquatic Division
www.envass.co.za
Client Restricted
ENVASS
44
KEY: Eutrophic- High primary productivity, rich in mineral nutrients required by plants, β- mesosaprobic- Moderately polluted
(O2 deficit <30%), α-meso-polysaprobic- Heavily polluted (O2 deficit between <75% and <90%), α-mesosaprobic- Critically
polluted (O2 deficit <50%).
8.3.2 Diatom Spatial Analysis
A total of 38 diatom species were recorded at the four (4) sites and the dominant species recorded included Nitzschia sp.,
Gomphonema sp. and Ulnaria ulna. These species are cosmopolitan in nature and have wide ecological amplitudes. Thus,
caution must be taken when analysing the predominance of these species at specific sites and it is important to consider
these dominant species in conjunction with the entire diatom assemblage when analysing the results. Ecological information
is provided below for the dominant and sub-dominant species in order to make ecological inferences for the four (4) sites
as noted in Table 19 (Taylor et al., 2007, Cantonati et al., 2017):
Site LP-RK-US: The dominance of G. parvulum and Gomphonema sp. pointed to oligo-to mesosaprobic conditions, and
this taxon is often associated with water that has been impacted by agricultural run-off. The subdominance of N. palea
pointed to electrolyte-rich habitats with organic enrichment and polluted running waters. The subdominance of G. angustum
pointed to strongly calcium-rich freshwater habitats. The presence of Sellaphora pupula pointed to alkaline, eutrophic flowing
waters with moderate levels of electrolyte content. The presence of Diadesmis confervacea pointed to water that is usually
contaminated with organic matter. The diatom community results indicated that the ecological water quality at this site
reflected electrolyte-rich habitats with organic enrichment and polluted running waters. This site appeared to have high
levels of organic pollution present as evident by the very high %PTV score. The overall ecological water quality at this site
was considered Poor.
Site LP-WEL-DS: The dominance of Melosira varians pointed to moderate electrolyte-rich, eutrophic running water. The
subdominance of U. ulna pointed to slightly alkaline, medium conductivity, oligosaprobic, eutrophic habitats. The presence
of Nitzschia sp., N. intermedia, and N. palea pointed to electrolyte-rich habitats with organic enrichment and polluted running
waters and taxa within this genus are often tolerant of polluted conditions. The presence of Planothidium frequentissimum
pointed to mesotrophic running waters with moderate electrolyte content and this taxon is tolerant to polluted conditions.
The presence of G. parvulum pointed to oligo-to mesosaprobic, but oligo- to eutrophic freshwater habitats with medium
electrolyte content. The presence of Navicula sp. pointed to brackish conditions and eutrophic running water and taxa within
this genus are commonly found in organically polluted water. The diatom community results indicated that the ecological
water quality at this site reflected moderate electrolyte content and appeared to be slightly disturbed by organic inputs. The
%PTV score indicated that there was evidence of moderate levels of organic pollution present at this site. The overall
ecological water quality at this site was considered Poor.
Site LP-BS-US: The dominance of A. minutissimum pointed to oligosaprobic, oligo- to eutrophic, weakly-alkaline, freshwater
habitats with moderately high electrolyte content. The subdominance of U. ulna pointed to slightly alkaline, medium
conductivity, oligosaprobic, eutrophic habitats. The presence of Navicula sp. pointed to brackish conditions and eutrophic
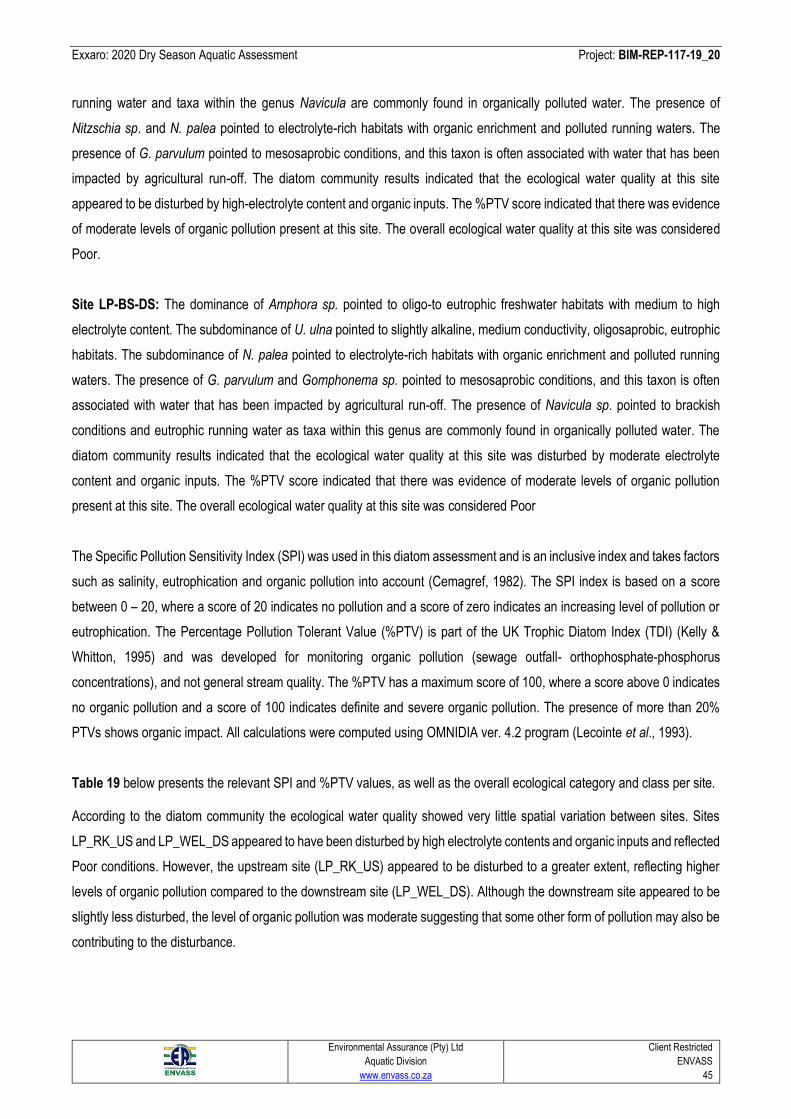
Exxaro: 2020 Dry Season Aquatic Assessment Project: BIM-REP-117-19_20
Environmental Assurance (Pty) Ltd
Aquatic Division
www.envass.co.za
Client Restricted
ENVASS
45
running water and taxa within the genus Navicula are commonly found in organically polluted water. The presence of
Nitzschia sp. and N. palea pointed to electrolyte-rich habitats with organic enrichment and polluted running waters. The
presence of G. parvulum pointed to mesosaprobic conditions, and this taxon is often associated with water that has been
impacted by agricultural run-off. The diatom community results indicated that the ecological water quality at this site
appeared to be disturbed by high-electrolyte content and organic inputs. The %PTV score indicated that there was evidence
of moderate levels of organic pollution present at this site. The overall ecological water quality at this site was considered
Poor.
Site LP-BS-DS: The dominance of Amphora sp. pointed to oligo-to eutrophic freshwater habitats with medium to high
electrolyte content. The subdominance of U. ulna pointed to slightly alkaline, medium conductivity, oligosaprobic, eutrophic
habitats. The subdominance of N. palea pointed to electrolyte-rich habitats with organic enrichment and polluted running
waters. The presence of G. parvulum and Gomphonema sp. pointed to mesosaprobic conditions, and this taxon is often
associated with water that has been impacted by agricultural run-off. The presence of Navicula sp. pointed to brackish
conditions and eutrophic running water as taxa within this genus are commonly found in organically polluted water. The
diatom community results indicated that the ecological water quality at this site was disturbed by moderate electrolyte
content and organic inputs. The %PTV score indicated that there was evidence of moderate levels of organic pollution
present at this site. The overall ecological water quality at this site was considered Poor
The Specific Pollution Sensitivity Index (SPI) was used in this diatom assessment and is an inclusive index and takes factors
such as salinity, eutrophication and organic pollution into account (Cemagref, 1982). The SPI index is based on a score
between 0 – 20, where a score of 20 indicates no pollution and a score of zero indicates an increasing level of pollution or
eutrophication. The Percentage Pollution Tolerant Value (%PTV) is part of the UK Trophic Diatom Index (TDI) (Kelly &
Whitton, 1995) and was developed for monitoring organic pollution (sewage outfall- orthophosphate-phosphorus
concentrations), and not general stream quality. The %PTV has a maximum score of 100, where a score above 0 indicates
no organic pollution and a score of 100 indicates definite and severe organic pollution. The presence of more than 20%
PTVs shows organic impact. All calculations were computed using OMNIDIA ver. 4.2 program (Lecointe et al., 1993).
Table 19 below presents the relevant SPI and %PTV values, as well as the overall ecological category and class per site.
According to the diatom community the ecological water quality showed very little spatial variation between sites. Sites
LP_RK_US and LP_WEL_DS appeared to have been disturbed by high electrolyte contents and organic inputs and reflected
Poor conditions. However, the upstream site (LP_RK_US) appeared to be disturbed to a greater extent, reflecting higher
levels of organic pollution compared to the downstream site (LP_WEL_DS). Although the downstream site appeared to be
slightly less disturbed, the level of organic pollution was moderate suggesting that some other form of pollution may also be
contributing to the disturbance.
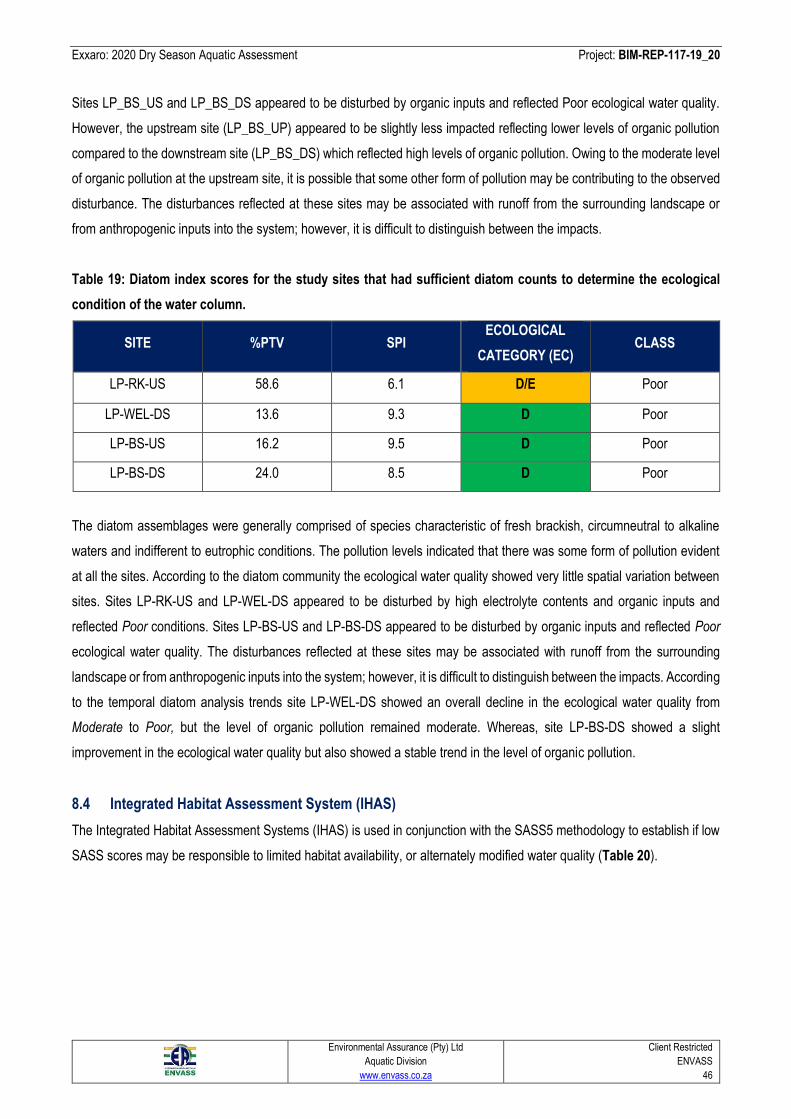
Exxaro: 2020 Dry Season Aquatic Assessment Project: BIM-REP-117-19_20
Environmental Assurance (Pty) Ltd
Aquatic Division
www.envass.co.za
Client Restricted
ENVASS
46
Sites LP_BS_US and LP_BS_DS appeared to be disturbed by organic inputs and reflected Poor ecological water quality.
However, the upstream site (LP_BS_UP) appeared to be slightly less impacted reflecting lower levels of organic pollution
compared to the downstream site (LP_BS_DS) which reflected high levels of organic pollution. Owing to the moderate level
of organic pollution at the upstream site, it is possible that some other form of pollution may be contributing to the observed
disturbance. The disturbances reflected at these sites may be associated with runoff from the surrounding landscape or
from anthropogenic inputs into the system; however, it is difficult to distinguish between the impacts.
Table 19: Diatom index scores for the study sites that had sufficient diatom counts to determine the ecological
condition of the water column.
SITE %PTV SPI ECOLOGICAL
CATEGORY (EC) CLASS
LP-RK-US 58.6 6.1 D/E Poor
LP-WEL-DS 13.6 9.3 D Poor
LP-BS-US 16.2 9.5 D Poor
LP-BS-DS 24.0 8.5 D Poor
The diatom assemblages were generally comprised of species characteristic of fresh brackish, circumneutral to alkaline
waters and indifferent to eutrophic conditions. The pollution levels indicated that there was some form of pollution evident
at all the sites. According to the diatom community the ecological water quality showed very little spatial variation between
sites. Sites LP-RK-US and LP-WEL-DS appeared to be disturbed by high electrolyte contents and organic inputs and
reflected Poor conditions. Sites LP-BS-US and LP-BS-DS appeared to be disturbed by organic inputs and reflected Poor
ecological water quality. The disturbances reflected at these sites may be associated with runoff from the surrounding
landscape or from anthropogenic inputs into the system; however, it is difficult to distinguish between the impacts. According
to the temporal diatom analysis trends site LP-WEL-DS showed an overall decline in the ecological water quality from
Moderate to Poor, but the level of organic pollution remained moderate. Whereas, site LP-BS-DS showed a slight
improvement in the ecological water quality but also showed a stable trend in the level of organic pollution.
8.4 Integrated Habitat Assessment System (IHAS)
The Integrated Habitat Assessment Systems (IHAS) is used in conjunction with the SASS5 methodology to establish if low
SASS scores may be responsible to limited habitat availability, or alternately modified water quality (Table 20).
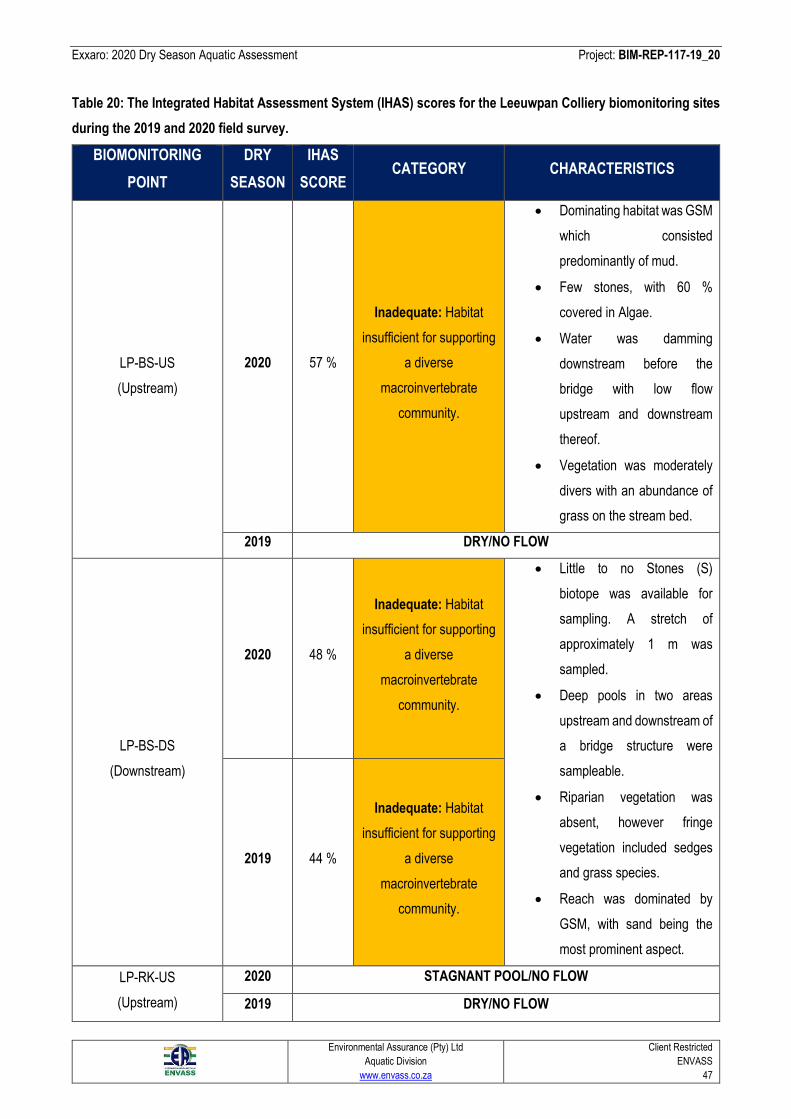
Exxaro: 2020 Dry Season Aquatic Assessment Project: BIM-REP-117-19_20
Environmental Assurance (Pty) Ltd
Aquatic Division
www.envass.co.za
Client Restricted
ENVASS
47
Table 20: The Integrated Habitat Assessment System (IHAS) scores for the Leeuwpan Colliery biomonitoring sites
during the 2019 and 2020 field survey.
BIOMONITORING
POINT
DRY
SEASON
IHAS
SCORE CATEGORY CHARACTERISTICS
LP-BS-US
(Upstream)
2020 57 %
Inadequate: Habitat
insufficient for supporting
a diverse
macroinvertebrate
community.
• Dominating habitat was GSM
which consisted
predominantly of mud.
• Few stones, with 60 %
covered in Algae.
• Water was damming
downstream before the
bridge with low flow
upstream and downstream
thereof.
• Vegetation was moderately
divers with an abundance of
grass on the stream bed.
2019 DRY/NO FLOW
LP-BS-DS
(Downstream)
2020 48 %
Inadequate: Habitat
insufficient for supporting
a diverse
macroinvertebrate
community.
• Little to no Stones (S)
biotope was available for
sampling. A stretch of
approximately 1 m was
sampled.
• Deep pools in two areas
upstream and downstream of
a bridge structure were
sampleable.
• Riparian vegetation was
absent, however fringe
vegetation included sedges
and grass species.
• Reach was dominated by
GSM, with sand being the
most prominent aspect.
2019 44 %
Inadequate: Habitat
insufficient for supporting
a diverse
macroinvertebrate
community.
LP-RK-US
(Upstream)
2020 STAGNANT POOL/NO FLOW
2019 DRY/NO FLOW
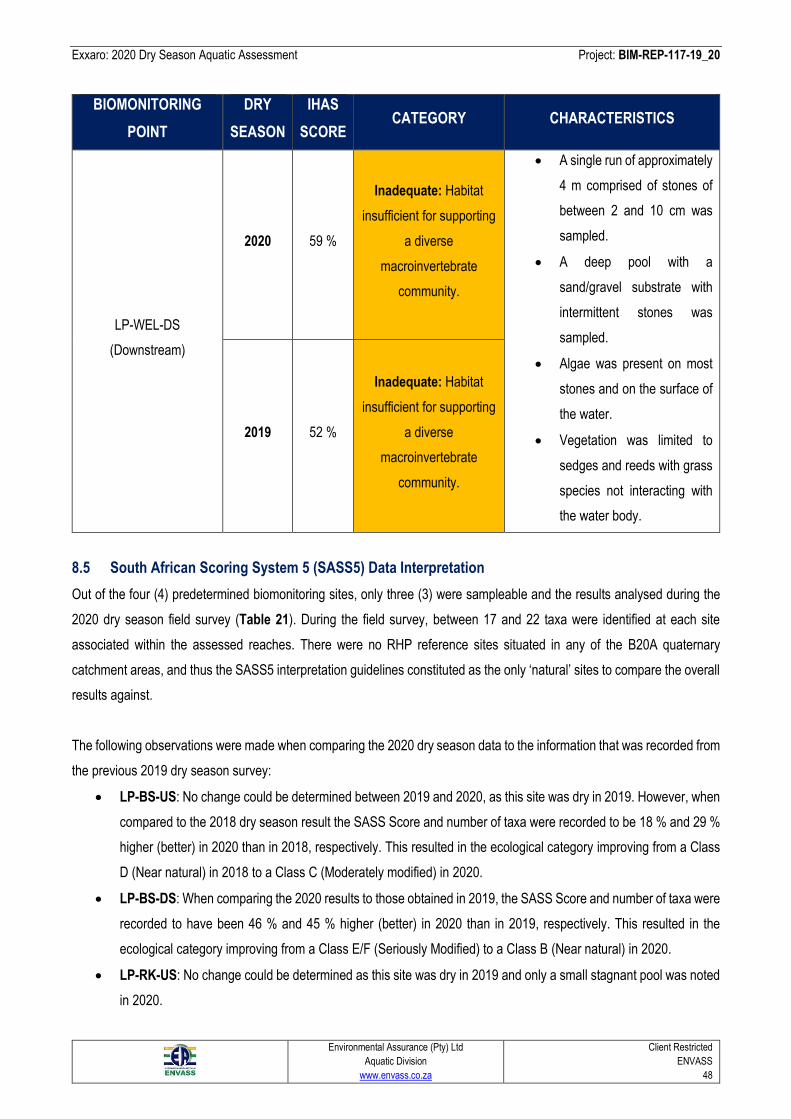
Exxaro: 2020 Dry Season Aquatic Assessment Project: BIM-REP-117-19_20
Environmental Assurance (Pty) Ltd
Aquatic Division
www.envass.co.za
Client Restricted
ENVASS
48
BIOMONITORING
POINT
DRY
SEASON
IHAS
SCORE CATEGORY CHARACTERISTICS
LP-WEL-DS
(Downstream)
2020 59 %
Inadequate: Habitat
insufficient for supporting
a diverse
macroinvertebrate
community.
• A single run of approximately
4 m comprised of stones of
between 2 and 10 cm was
sampled.
• A deep pool with a
sand/gravel substrate with
intermittent stones was
sampled.
• Algae was present on most
stones and on the surface of
the water.
• Vegetation was limited to
sedges and reeds with grass
species not interacting with
the water body.
2019 52 %
Inadequate: Habitat
insufficient for supporting
a diverse
macroinvertebrate
community.
8.5 South African Scoring System 5 (SASS5) Data Interpretation
Out of the four (4) predetermined biomonitoring sites, only three (3) were sampleable and the results analysed during the
2020 dry season field survey (Table 21). During the field survey, between 17 and 22 taxa were identified at each site
associated within the assessed reaches. There were no RHP reference sites situated in any of the B20A quaternary
catchment areas, and thus the SASS5 interpretation guidelines constituted as the only ‘natural’ sites to compare the overall
results against.
The following observations were made when comparing the 2020 dry season data to the information that was recorded from
the previous 2019 dry season survey:
• LP-BS-US: No change could be determined between 2019 and 2020, as this site was dry in 2019. However, when
compared to the 2018 dry season result the SASS Score and number of taxa were recorded to be 18 % and 29 %
higher (better) in 2020 than in 2018, respectively. This resulted in the ecological category improving from a Class
D (Near natural) in 2018 to a Class C (Moderately modified) in 2020.
• LP-BS-DS: When comparing the 2020 results to those obtained in 2019, the SASS Score and number of taxa were
recorded to have been 46 % and 45 % higher (better) in 2020 than in 2019, respectively. This resulted in the
ecological category improving from a Class E/F (Seriously Modified) to a Class B (Near natural) in 2020.
• LP-RK-US: No change could be determined as this site was dry in 2019 and only a small stagnant pool was noted
in 2020.
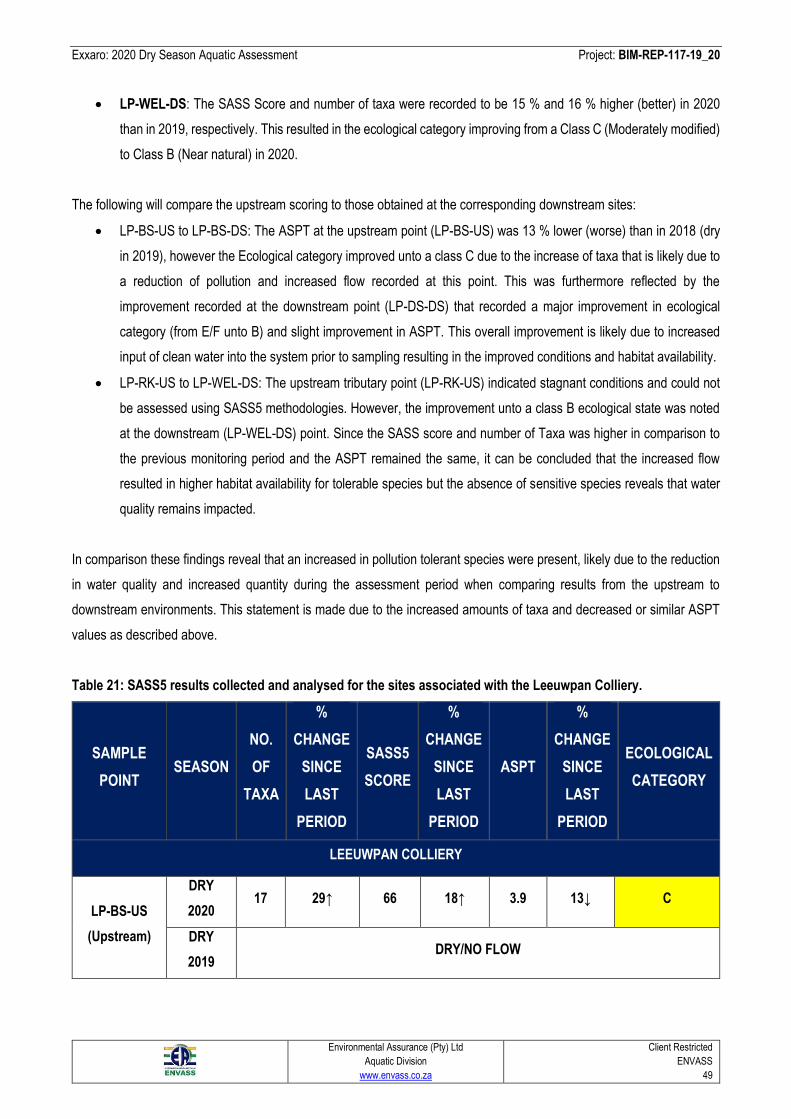
Exxaro: 2020 Dry Season Aquatic Assessment Project: BIM-REP-117-19_20
Environmental Assurance (Pty) Ltd
Aquatic Division
www.envass.co.za
Client Restricted
ENVASS
49
• LP-WEL-DS: The SASS Score and number of taxa were recorded to be 15 % and 16 % higher (better) in 2020
than in 2019, respectively. This resulted in the ecological category improving from a Class C (Moderately modified)
to Class B (Near natural) in 2020.
The following will compare the upstream scoring to those obtained at the corresponding downstream sites:
• LP-BS-US to LP-BS-DS: The ASPT at the upstream point (LP-BS-US) was 13 % lower (worse) than in 2018 (dry
in 2019), however the Ecological category improved unto a class C due to the increase of taxa that is likely due to
a reduction of pollution and increased flow recorded at this point. This was furthermore reflected by the
improvement recorded at the downstream point (LP-DS-DS) that recorded a major improvement in ecological
category (from E/F unto B) and slight improvement in ASPT. This overall improvement is likely due to increased
input of clean water into the system prior to sampling resulting in the improved conditions and habitat availability.
• LP-RK-US to LP-WEL-DS: The upstream tributary point (LP-RK-US) indicated stagnant conditions and could not
be assessed using SASS5 methodologies. However, the improvement unto a class B ecological state was noted
at the downstream (LP-WEL-DS) point. Since the SASS score and number of Taxa was higher in comparison to
the previous monitoring period and the ASPT remained the same, it can be concluded that the increased flow
resulted in higher habitat availability for tolerable species but the absence of sensitive species reveals that water
quality remains impacted.
In comparison these findings reveal that an increased in pollution tolerant species were present, likely due to the reduction
in water quality and increased quantity during the assessment period when comparing results from the upstream to
downstream environments. This statement is made due to the increased amounts of taxa and decreased or similar ASPT
values as described above.
Table 21: SASS5 results collected and analysed for the sites associated with the Leeuwpan Colliery.
SAMPLE
POINT SEASON
NO.
OF
TAXA
%
CHANGE
SINCE
LAST
PERIOD
SASS5
SCORE
%
CHANGE
SINCE
LAST
PERIOD
ASPT
%
CHANGE
SINCE
LAST
PERIOD
ECOLOGICAL
CATEGORY
LEEUWPAN COLLIERY
LP-BS-US
(Upstream)
DRY
2020 17 29↑ 66 18↑ 3.9 13↓ C
DRY
2019 DRY/NO FLOW
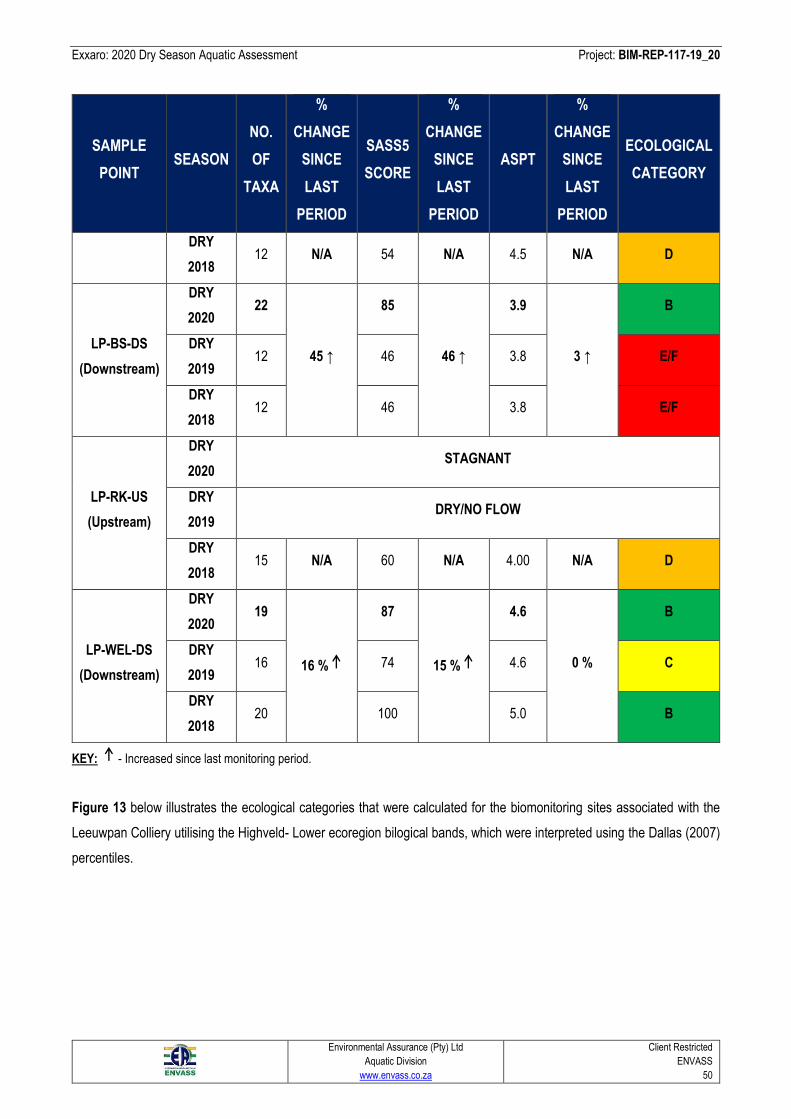
Exxaro: 2020 Dry Season Aquatic Assessment Project: BIM-REP-117-19_20
Environmental Assurance (Pty) Ltd
Aquatic Division
www.envass.co.za
Client Restricted
ENVASS
50
SAMPLE
POINT SEASON
NO.
OF
TAXA
%
CHANGE
SINCE
LAST
PERIOD
SASS5
SCORE
%
CHANGE
SINCE
LAST
PERIOD
ASPT
%
CHANGE
SINCE
LAST
PERIOD
ECOLOGICAL
CATEGORY
DRY
2018 12 N/A 54 N/A 4.5 N/A D
LP-BS-DS
(Downstream)
DRY
2020 22
45 ↑
85
46 ↑
3.9
3 ↑
B
DRY
2019 12 46 3.8 E/F
DRY
2018 12 46 3.8 E/F
LP-RK-US
(Upstream)
DRY
2020 STAGNANT
DRY
2019 DRY/NO FLOW
DRY
2018 15 N/A 60 N/A 4.00 N/A D
LP-WEL-DS
(Downstream)
DRY
2020 19
16 %
87
15 %
4.6
0 %
B
DRY
2019 16 74 4.6 C
DRY
2018 20 100 5.0 B
KEY: - Increased since last monitoring period.
Figure 13 below illustrates the ecological categories that were calculated for the biomonitoring sites associated with the
Leeuwpan Colliery utilising the Highveld- Lower ecoregion bilogical bands, which were interpreted using the Dallas (2007)
percentiles.
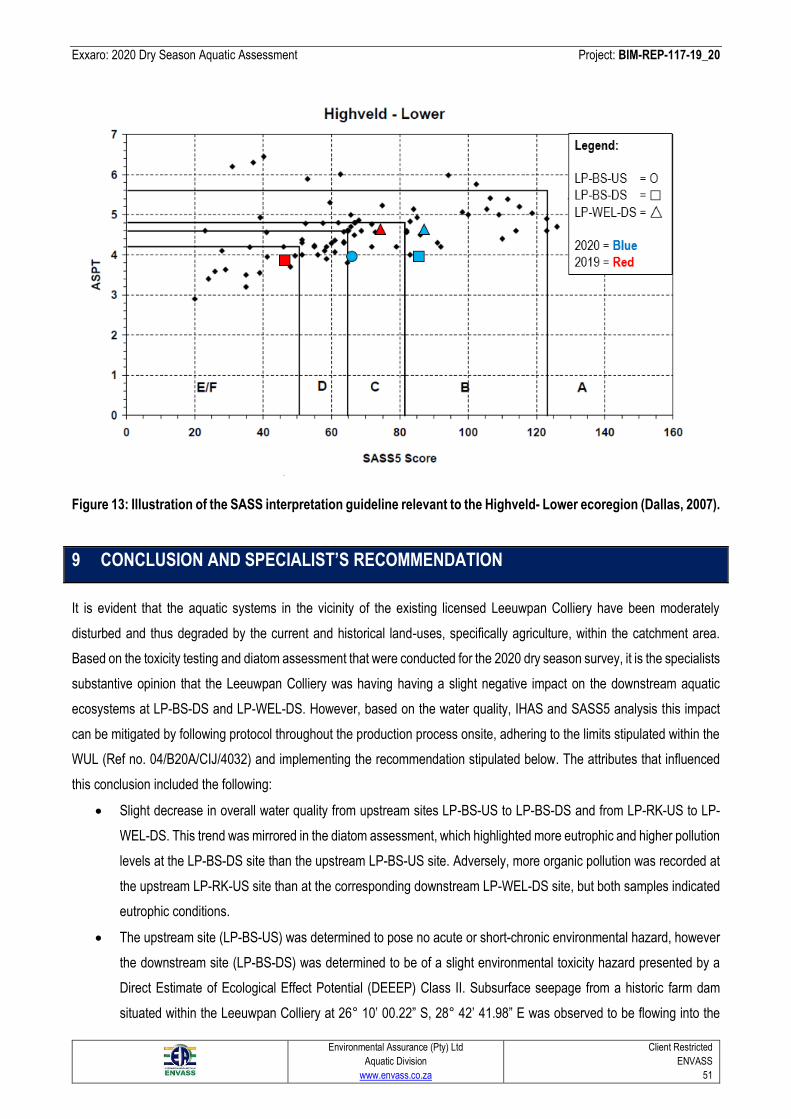
Exxaro: 2020 Dry Season Aquatic Assessment Project: BIM-REP-117-19_20
Environmental Assurance (Pty) Ltd
Aquatic Division
www.envass.co.za
Client Restricted
ENVASS
51
Figure 13: Illustration of the SASS interpretation guideline relevant to the Highveld- Lower ecoregion (Dallas, 2007).
9 CONCLUSION AND SPECIALIST’S RECOMMENDATION
It is evident that the aquatic systems in the vicinity of the existing licensed Leeuwpan Colliery have been moderately
disturbed and thus degraded by the current and historical land-uses, specifically agriculture, within the catchment area.
Based on the toxicity testing and diatom assessment that were conducted for the 2020 dry season survey, it is the specialists
substantive opinion that the Leeuwpan Colliery was having having a slight negative impact on the downstream aquatic
ecosystems at LP-BS-DS and LP-WEL-DS. However, based on the water quality, IHAS and SASS5 analysis this impact
can be mitigated by following protocol throughout the production process onsite, adhering to the limits stipulated within the
WUL (Ref no. 04/B20A/CIJ/4032) and implementing the recommendation stipulated below. The attributes that influenced
this conclusion included the following:
• Slight decrease in overall water quality from upstream sites LP-BS-US to LP-BS-DS and from LP-RK-US to LP-
WEL-DS. This trend was mirrored in the diatom assessment, which highlighted more eutrophic and higher pollution
levels at the LP-BS-DS site than the upstream LP-BS-US site. Adversely, more organic pollution was recorded at
the upstream LP-RK-US site than at the corresponding downstream LP-WEL-DS site, but both samples indicated
eutrophic conditions.
• The upstream site (LP-BS-US) was determined to pose no acute or short-chronic environmental hazard, however
the downstream site (LP-BS-DS) was determined to be of a slight environmental toxicity hazard presented by a
Direct Estimate of Ecological Effect Potential (DEEEP) Class II. Subsurface seepage from a historic farm dam
situated within the Leeuwpan Colliery at 26° 10’ 00.22” S, 28° 42’ 41.98” E was observed to be flowing into the
Exxaro: 2020 Dry Season Aquatic Assessment Project: BIM-REP-117-19_20
Environmental Assurance (Pty) Ltd
Aquatic Division
www.envass.co.za
Client Restricted
ENVASS
52
downstream tributary of the Bronkhorstspuit River above site LP-BS-DS. There may therefore be an influence from
this farm dam on the change in toxicity levels evident at LP-BS-DS. Surrounding land-uses were also considered,
however as a higher flow volume was entering the system from farm dam than the agricultural croplands and
stormwater runoff from the adjacent tar road, it was determined to have a higher influence on this conclusion.
• The previously elevated pH has decreased unto overall acceptable levels, likely the result of dilution due to
increased rainfall in the area prior to the assessment. This was mirrored by both sites having improved and only
LP-WEL-DS being determined to fall within Class II (Slight environmental toxicity hazard) toxicity, LP-WEL-DS
recording Some Degree of Acute/Short- chronic Toxic Hazard (S.D.O.T.H) at one (1) trophic level.
• The diatom analysis recorded eutrophic conditions at LP-WEL-DS and the conclusion was that the habitat
decreased and impacted water quality was evident. The diatom analysis on the downstream point LP-BS-DS also
indicated slightly impacted water quality, however this impact was largely present in the upstream environment at
LP-BS-US as well. However, since the on-site sampled revealed no acute toxicity it cannot be conclusively stated
that the pollution is attributed to the site. These results revealed that surrounding activities in the upstream
environment had a definitive impact and only a slight decrease was observed at the downstream point.
• The overall increase in aquatic macroinvertebrate health at the downstream biomonitoring sites was presumably
due to the dilution of water attributed to the elevated availability of water at the monitoring points and the overall
increased water quality measured and therewith the slightly improved habitat.
Exxaro: 2020 Dry Season Aquatic Assessment Project: BIM-REP-117-19_20
Environmental Assurance (Pty) Ltd
Aquatic Division
www.envass.co.za
Client Restricted
ENVASS
53
Specialist’s Recommendation
• The banks of the artificial earthen channels that have been excavated to divert flow around the mining areas should
be landscaped to slopes exhibiting a ratio of 1:3 (v:h) and revegetation with plugs from the surrounding wetland
area. This will provide further filtration of the stormwater runoff and episodic flow through the channels and into the
downstream Bronkhorstspruit River. Ideally, the existing wetlands on-site should be maintained at their base-line
Present Ecological State score (PRES) by implementing rehabilitation and mitigation measures. This will increase
the filtration of potentially harmful contaminants that may be present in the surface- and subsurface-flow that may
be originating from the Leeuwpan Colliery.
• Toxicity testing of the water within the historic farm dam at 26° 10’ 00.22” S, 28° 42’ 41.98” E should be considered.
This may further narrow the search for any potential contamination sources on-site and create further measures
of monitoring the potential impact on water quality within the downstream aquatic ecosystems.
• Clearing of Invasive Alien Plant Species (IAPS) from the aquatic ecosystems in areas under the control of the mine
and associated with the reaches on which the affected biomonitoring points are situated to improve the water
balance and natural biodiversity within and around the system. The controlling and maintenance of all IAPS on a
land owner portion is a legal requirement in terms of the National Environmental Management: Biodiversity Act
(Act no. 10 of 2004) Alien and Invasive Species List, 2016 (DEA, 2016).
• Ongoing monitoring of the aquatic community integrity, that is implemented at the Leeuwpan Colliery, should be
maintained.
• The results presented within this biannual 2020 dry season aquatic assessment of the biomonitoring points
associated with the Leeuwpan Colliery must be spatially and temporally compared to the results obtained during
previous and future dry season biomonitoring studies. If the comparison highlights any significant alteration in the
health/integrity of the at-risk or downstream aquatic ecosystems, the cause, extent and significance of the impact
must be identified and appropriate mitigation and/or rehabilitation measures implemented to improve the health of
the impacted systems.
Exxaro: 2020 Dry Season Aquatic Assessment Project: BIM-REP-117-19_20
Environmental Assurance (Pty) Ltd
Aquatic Division
www.envass.co.za
Client Restricted
ENVASS
54
10 REFERENCES
Bromilow, C. 2001. Problem Plants of South Africa: A Guide to the Identification and Control of more than 300 invasive
plants and other weeds. Briza Publications, Pretoria.
CEMAGREF. (1982). Etude des méthodes biologiques quantitatives d'appréciation de la qualité des eaux. Rapport Division
Qualité des Eaux Lyon - Agence Financiére de Bassin Rhône- Méditerranée- Corse. Pierre-Benite.
Cantonati, M., Kelly, M.G. and Lange-Bertalot, H. (2017). Freshwater benthic diatoms of central Europe: Over 800 common
species used in ecological assessment. Koeltz Botanical Books.
CSIR (Council for Scientific and Industrial Research). 2010. National Freshwater Ecosystem Priority Areas (NFEPA).
Council for Scientific and Industrial Research, Pretoria, South Africa.
Dallas, H.F. 2007. River Health Programme: South African Scoring System (SASS) data interpretation guidelines. Report
prepared for Institute of Natural Resources and Department of Water Affairs and Forestry.
Department of Environmental Affairs, Department of Mineral Resources, Chamber of Mines, South African Mining and
Biodiversity Forum, and South African National Biodiversity Institute. 2013. Mining and Biodiversity Guideline:
Mainstreaming biodiversity into the mining sector. Pretoria. 100 pages.
Department of Water Affairs, 2012. Classification of significant water resources in the Usutu to Mhlathuze Water
Management Area. Ecologically sustainable base configuration scenario report.
Department of Water Affairs. 2015. Licence in terms of chapter 4 of the National Water Act. License. no. 04/B20A/CIJ/4032.
File no. 16/2/7/B100/C27.
Department of Water Affairs and Forestry, 1999a. Resource Directed Measures for Protection of Water Resources. Volume
4. Wetland Ecosystems Version 1.0, Pretoria.
Department of Water Affairs and Forestry, 2005. A Practical Field Procedure for Identification and Delineation of Wetland
and Riparian areas. Edition 1, September 2005. DWAF, Pretoria.
Department of Water Affairs and Forestry. 2008. Updated Manual for the Identification and Delineation of Wetlands and
Riparian Areas, prepared by M. Rountree, A. L. Batchelor, J. MacKenzie and D. Hoare. Report no. 02. Stream Flow
Reduction Activities, Department of Water Affairs and Forestry, Pretoria, South Africa
Exxaro: 2020 Dry Season Aquatic Assessment Project: BIM-REP-117-19_20
Environmental Assurance (Pty) Ltd
Aquatic Division
www.envass.co.za
Client Restricted
ENVASS
55
Edokpayi N.J., Odiyo J.O. and Durowoju O.S. 2017. Impact of Wastewater on Surface Water Quality in Developing
Countries: A Case Study of South Africa. Department of Hydrology and Water Resources, School of Environmental
Sciences, University of Venda, Thohoyandou, South Africa.
IUCN 2020. The IUCN Red List of Threatened Species. https://www.iucnredlist.org/ [Accessed 29/06/2020]
Kelly, M.G. & Whitton, B.A. (1995). The trophic diatom index: a new index for monitoring eutrophication in rivers. Journal of
Applied Phycology, 7: 433-444.
Kleynhans C.J. 1996. A qualitative procedure for the assessment of the habitat integrity status of the Luvuvhu River. Journal
of Aquatic Ecosystem health. 5: 41-54.
Kleynhans, C.J. and Kemper, N., 2000. Overview of the river and assessment of habitat integrity. Manual for the building
block Methodology. WRC report No: TT 131/100
Kleynhans, C.J., Thirion, C. and Moolman, J 2005. A Level I River Ecoregion Classification System for South Africa, Lesotho
and Swaziland. Report No. N/0000/00/REQ0104.
Kleynhans, C. J., and Louw, M. D. 2007. Module A: EcoClassification and EcoStatus determination in River
EcoClassification: Manual for EcoStatus Determination (version 2). Joint Water Research Commission and Department of
Water Affairs and Forestry report. WRC Report No.TT 329/08.
Le Cointe, C., Coste, M. & Prygiel, J. (1993). “Omnidia”: Software for taxonomy, calculation of diatom indices and inventories
management. Hydrobiologia 269/270: 509-513.
Mema V. 2010. Impact of poorly maintained wastewater and sewage treatment plants: lessons from South Africa. Pretoria:
Council for Scientific and Industrial Research. Internet source:
http://www.ewisa.co.za/literature/files/335_269%20Mema.pdf. [Accessed 15/09/2019].
Morrison, G., Fatoki, O.S., Persson, L. and Ekberg, A. 2001. Assessment of the impact of point source pollution from the
Keiskammahoek Sewage Treatment Plant on the Keiskamma River - pH, lelctrical conductivity, oxygen-demanding
substrate (COD) and nutrients. South Africa: Water SA, 2001, Water SA, pp. 475-480.
Mucina, L. and Rutherford, M.C. (eds.) 2006. The Vegetation of South Africa, Lesotho and Swaziland. Strelitzia 19. Pretoria:
South African National Biodiversity Institute.
Exxaro: 2020 Dry Season Aquatic Assessment Project: BIM-REP-117-19_20
Environmental Assurance (Pty) Ltd
Aquatic Division
www.envass.co.za
Client Restricted
ENVASS
56
Nel, J.L., A. Driver, W.F. Strydom, A. Maherry, C. Petersen, L. Hill, D.J. Roux, S. Nienaber, H. Van Deventer, E.R. Swartz,
L.B. Smith-Adao. 2011. Atlas of freshwater ecosystem priority areas in South Africa: Maps to support sustainable
development of water resources. Water Research Commission, WRC Report NO. TT 500/11, South Africa.
National Environmental Management Act 107 of 1998, (Gazette No. 19519, Notice No. 1540. Commencement date: 29
January 1999 [Proc. No. 8, Gazette No.19703]).
Persoone, G., Blahoslav, M., Blinova, I., Törökne, A., Zarina, T., Manusadzianas, L., Nalecz-Jawecki, G., Tofan, L.,
Stepanova, L., Tothova, L., and Kolar, B. (2003). A practical and user-friendly toxicity classification system with
Microbiotests for natural waters and wastewaters (personal communication).
Rountree, M. W., Malan, H. L., Weston, B. C., (EDS). 2013, Manual for the Rapid Ecological Reserve Determination of
Inland Wetlands (Version 2.0). Report to Report to the Water Research Commission and Department of Water Affairs: Chief
Directorate: Resource Directed Measures. WRC Report No. 1788/1/12
Taylor, J.C., Harding, W.R. & Archibald, C.G.M. (2007). An illustrated guide to some common diatom species from South
Africa. WRC Report No. TT 282/07. Water Research Commission, Pretoria, South Africa.
Van Dam, H., Mertens, A. & Sinkeldam, J. (1994). A coded checklist and ecological indicator values of freshwater diatoms
from the Netherlands. Netherlands Journal of Aquatic Ecology, 28: 133-17.
Exxaro: 2020 Dry Season Aquatic Assessment Project: BIM-REP-117-19_20
Environmental Assurance (Pty) Ltd
Aquatic Division
www.envass.co.za
Client Restricted
ENVASS
57
11 APPENDIX A: SPECIALIST’S QUALIFICATIONS
EMPLOYEE NAME WIETSCHE ROETS
POSITION ENVIRONMENTAL DATA ANALYST AND CONSULTANT
DETAILS Office: 394 Tram Street, New Muckleneuk, Pretoria, 0181
T: 012 460 9768; M: 072 316 6512; F: 012 460 9768
E mail: [email protected]
EDUCATION AND
QUALIFICATIONS
Completed Qualification
2015 BSc Honours in Environmental Sciences
North-West University (NWU), Potchefstroom.
2014 BSc in Environmental and Biological Sciences
North-West University (NWU), Potchefstroom.
2011 Matriculation
High School Outeniqua, George
PROFESSIONAL
AFFILIATIONS
Registered as a Candidate Scientist with the South African Council of Natural Scientific
Professionals (SACNASP) (no. 119357).
EXPERIENCE
Environmental Assurance (Pty) Ltd. (ENVASS) - Day to day work and monthly field
assessments of water and air quality, data capturing, data interpretation and
recommendations. Site assessments and inspections. GIS mapping and updates. Report
writing with recommendations and client interaction. DWS SASS5 Accredited Practitioner.
Specialist studies in relation to Noise, Invasive Alien Plant Species Control Plans and
Biomonitoring.
Employer
Period
Environmental Assurance (Pty) Ltd. (ENVASS)
April 2017 – Current
Position Environmental Data Analyst and Consultant
Responsibilities Data capturing, processing and interpretation. Proposal composition, marketing, fieldwork
and report planning, client liaison, Noise Assessments, Invasive Alien Plant Assessments,
Aquatic Biomonitoring.
INTERNAL &
EXTERNAL
COURSES
2020 Back-2-Basics Wetland Workshop
GDARD, Rietvlei Nature Reserve.
2019 SASS5 Accreditation
Department of Water and Sanitation (DWS)
2019 Environmental Legal Update Training
TABACKS C&A Law Advisors
Exxaro: 2020 Dry Season Aquatic Assessment Project: BIM-REP-117-19_20
Environmental Assurance (Pty) Ltd
Aquatic Division
www.envass.co.za
Client Restricted
ENVASS
58
2018 SASS5 Aquatic Biomonitoring Training
GroundTruth
2018 Basic Life Support and First Aid Procedures (Level 1)
NOSA Training Centre, Centurion.
2017 Environmental Legal Update Training
MacRobert Attorneys
2017 Higher Certificate in Christian Life (HCCL)
South African Theological Seminary (SATS)
REFERENCES CONTACT NAME COMPANY RELATIONSHIP CONTACT NR
Prof. Victor Wepener NWU
Potchefstroom
Professor 018 299 2385
Mr. Carl Schoeman ENVASS Co-worker 071 371 1178
Dr. Wietsche Roets DWS Father 082 604 7730
1
Exxaro: 2020 Dry Season Aquatic Assessment Project: BIM-REP-117-19_20
Environmental Assurance (Pty) Ltd
Aquatic Division
www.envass.co.za
Client Restricted
ENVASS
59
2
Exxaro: 2020 Dry Season Aquatic Assessment Project: BIM-REP-117-19_20
Environmental Assurance (Pty) Ltd
Aquatic Division
www.envass.co.za
Client Restricted
ENVASS
60
Exxaro: 2020 Dry Season Aquatic Assessment Project: BIM-REP-117-19_20
Environmental Assurance (Pty) Ltd
Aquatic Division
www.envass.co.za
Client Restricted
ENVASS
61
CERTIFICATION
I, WIETSCHE ROETS
Declare that, to the best of my knowledge, all the information contained herein is true.
Signature:
On the 2nd day of July 2020
Annexure E Water Balance
Integrated Water Balance Report for
LEEUWPAN MINE
Exxaro Resources Ltd
October 2020
Prepared by: Charles Linström Hydrologist Pr.Sci.Nat. Sustainability Tel + 27 12 307 4100 Mobile + 27 83 609 0173 Email [email protected]
www.exxaro.com
1. INTRODUCTION
Leeuwpan mine is situated 80km south-east from Pretoria and close to the town of Delmas in the
Mpumalanga Province. The mine employs about 490 people. Leeuwpan is an open-pit mine
producing 6.7 Mtpa ROM of metallurgical and power station coal. This conventional open-pit mine
uses modified terraced configurations and truck and shovel methods. The coal is processed using
jigging technology and dense medium separation.
Sustainable water resource management forms part of the mine’s integrated water management
principles and involves the development of an integrated approach of water accounting that more
accurately reflects the reality of water use on the mine.
Water accounting uses a water balance approach to quantify the amount of water entering a system
(through precipitation and groundwater flows) and the amount leaving a system (through
evaporation, surface water flows, sewage, product water loss and groundwater flows).
To ensure adequate storage during summer conditions the water balance were also determined for
the six months summer and six months winter conditions. The summer period was taken from
October to March with winter period from April to September.
Data considered for the update has been averaged for the period July 2019 to June 2020.
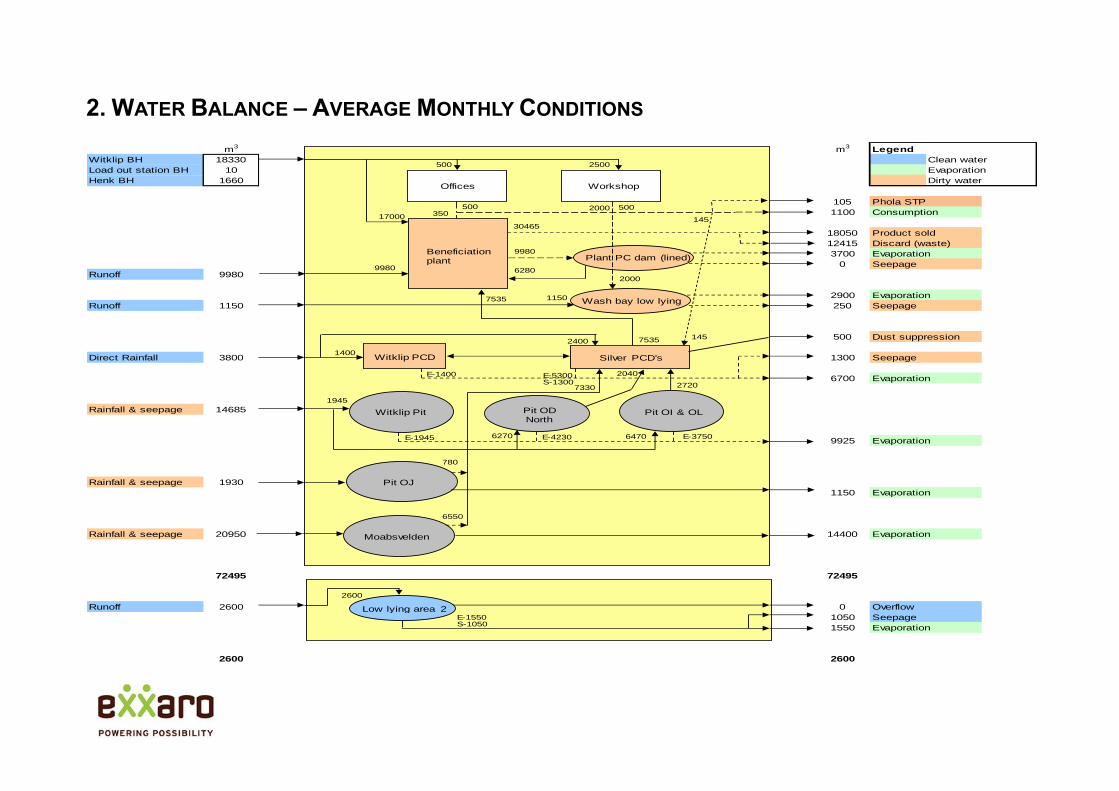
2. WATER BALANCE – AVERAGE MONTHLY CONDITIONS
m3 m3 Legend
Witklip BH 18330 Clean water
Load out station BH 10 Evaporation
Henk BH 1660 Dirty water
105 Phola STP
1100 Consumption
18050 Product sold
12415 Discard (waste)
3700 Evaporation
0 Seepage
Runoff 9980
2900 Evaporation
Runoff 1150 250 Seepage
500 Dust suppression
Direct Rainfall 3800 1300 Seepage
6700 Evaporation
Rainfall & seepage 14685
9925 Evaporation
Rainfall & seepage 1930
1150 Evaporation
Rainfall & seepage 20950 14400 Evaporation
72495 72495
Runoff 2600 0 Overflow
1050 Seepage
1550 Evaporation
2600 2600
Offices Workshop
Pit OI & OLPit OD North
Witklip Pit
Witklip PCD Silver PCD's
Beneficiation plant
17000
500
1945
6270 6470E-4230 E-3750
E-1400
2720
2040
Low lying area 2
Wash bay low lying
9980
1400
2400
2600
E-5300S-1300
E-1550S-1050
Pit OJ
780
Moabsvelden
6550
7330
E-1945
9980
500
2000
30465
350
2500
11507535
6280
7535
Plant PC dam (lined)
500
145
145
2000
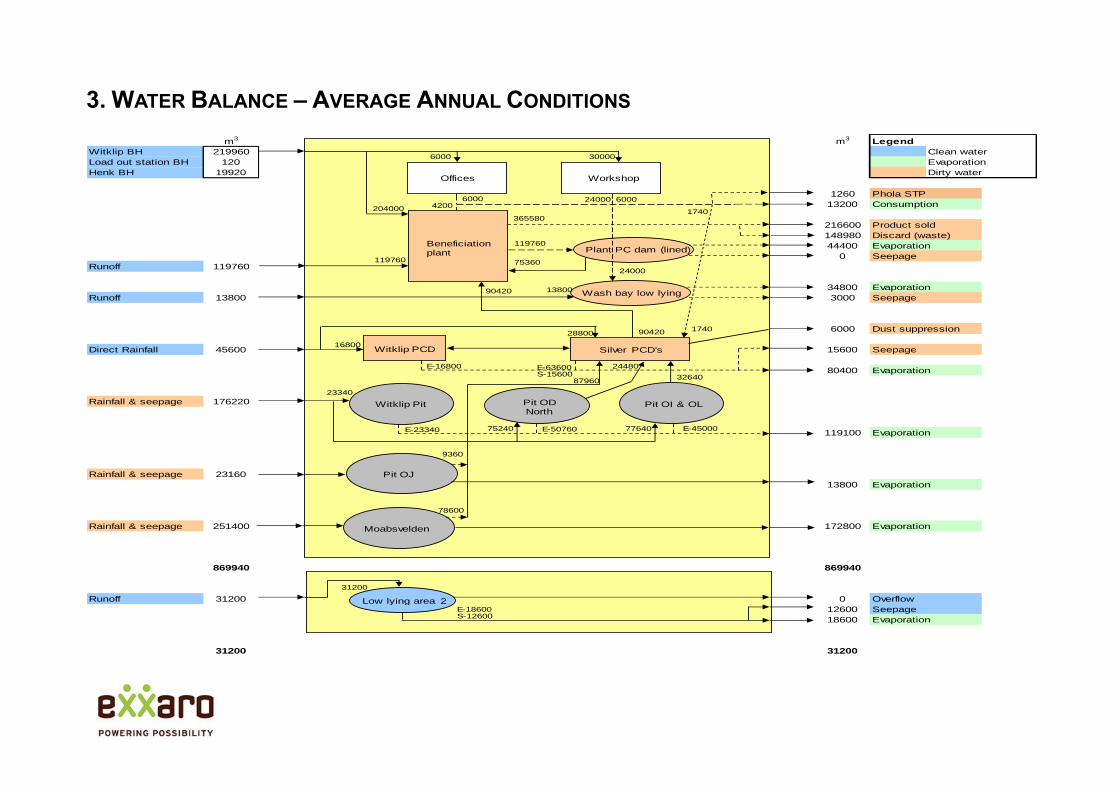
3. WATER BALANCE – AVERAGE ANNUAL CONDITIONS
m3 m3 Legend
Witklip BH 219960 Clean water
Load out station BH 120 Evaporation
Henk BH 19920 Dirty water
1260 Phola STP
13200 Consumption
216600 Product sold
148980 Discard (waste)
44400 Evaporation
0 Seepage
Runoff 119760
34800 Evaporation
Runoff 13800 3000 Seepage
6000 Dust suppression
Direct Rainfall 45600 15600 Seepage
80400 Evaporation
Rainfall & seepage 176220
119100 Evaporation
Rainfall & seepage 23160
13800 Evaporation
Rainfall & seepage 251400 172800 Evaporation
869940 869940
Runoff 31200 0 Overflow
12600 Seepage
18600 Evaporation
31200 31200
Offices Workshop
Pit OI & OLPit OD North
Witklip Pit
Witklip PCD Silver PCD's
Beneficiation plant
204000
6000
23340
75240 77640E-50760 E-45000
E-16800
32640
24480
Low lying area 2
Wash bay low lying
119760
16800
28800
31200
E-63600S-15600
E-18600S-12600
Pit OJ
9360
Moabsvelden
78600
87960
E-23340
119760
6000
24000
365580
4200
30000
1380090420
75360
90420
Plant PC dam (lined)
6000
1740
1740
24000
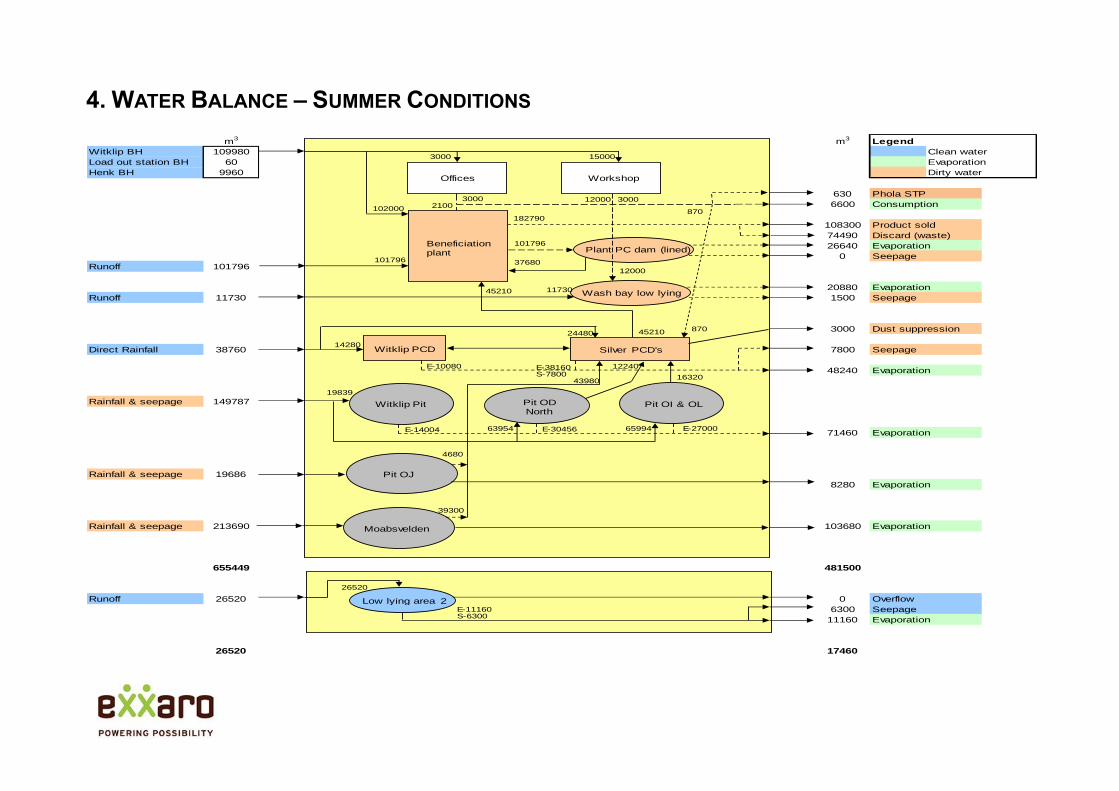
4. WATER BALANCE – SUMMER CONDITIONS
m3 m3 Legend
Witklip BH 109980 Clean water
Load out station BH 60 Evaporation
Henk BH 9960 Dirty water
630 Phola STP
6600 Consumption
108300 Product sold
74490 Discard (waste)
26640 Evaporation
0 Seepage
Runoff 101796
20880 Evaporation
Runoff 11730 1500 Seepage
3000 Dust suppression
Direct Rainfall 38760 7800 Seepage
48240 Evaporation
Rainfall & seepage 149787
71460 Evaporation
Rainfall & seepage 19686
8280 Evaporation
Rainfall & seepage 213690 103680 Evaporation
655449 481500
Runoff 26520 0 Overflow
6300 Seepage
11160 Evaporation
26520 17460
Offices Workshop
Pit OI & OLPit OD North
Witklip Pit
Witklip PCD Silver PCD's
Beneficiation plant
102000
3000
19839
63954 65994E-30456 E-27000
E-10080
16320
12240
Low lying area 2
Wash bay low lying
101796
14280
24480
26520
E-38160S-7800
E-11160S-6300
Pit OJ
4680
Moabsvelden
39300
43980
E-14004
101796
3000
12000
182790
2100
15000
1173045210
37680
45210
Plant PC dam (lined)
3000
870
870
12000
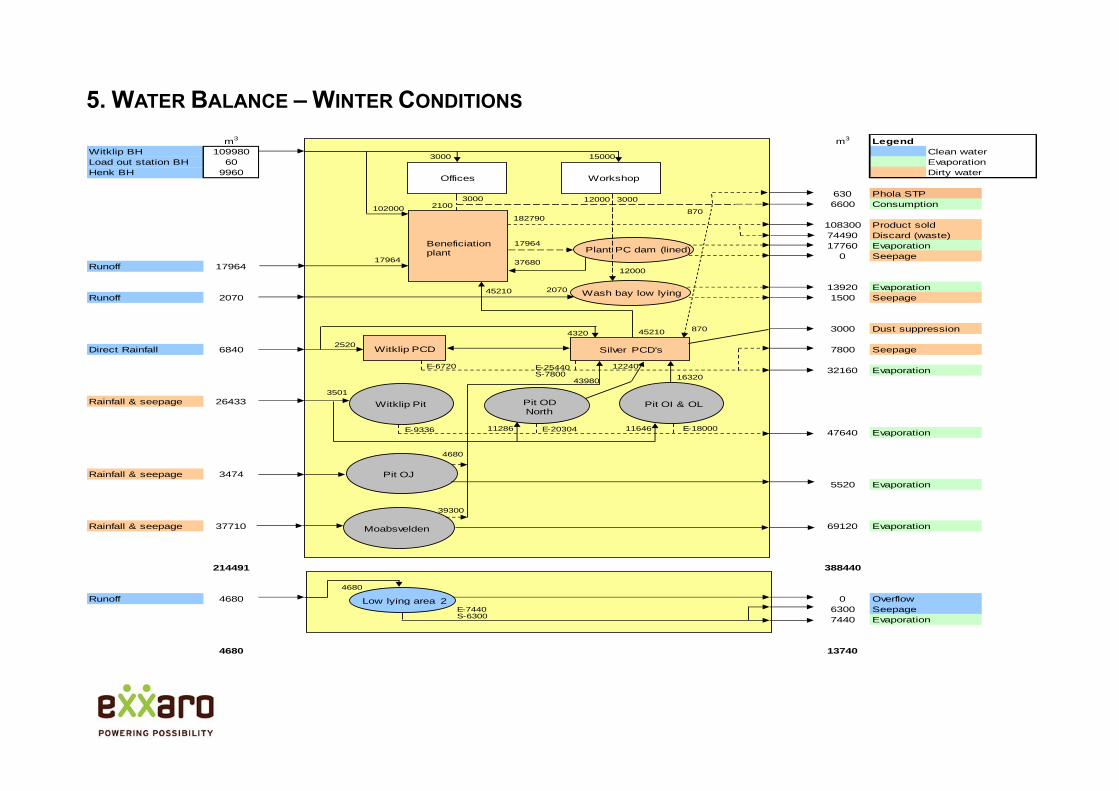
5. WATER BALANCE – WINTER CONDITIONS
m3 m3 Legend
Witklip BH 109980 Clean water
Load out station BH 60 Evaporation
Henk BH 9960 Dirty water
630 Phola STP
6600 Consumption
108300 Product sold
74490 Discard (waste)
17760 Evaporation
0 Seepage
Runoff 17964
13920 Evaporation
Runoff 2070 1500 Seepage
3000 Dust suppression
Direct Rainfall 6840 7800 Seepage
32160 Evaporation
Rainfall & seepage 26433
47640 Evaporation
Rainfall & seepage 3474
5520 Evaporation
Rainfall & seepage 37710 69120 Evaporation
214491 388440
Runoff 4680 0 Overflow
6300 Seepage
7440 Evaporation
4680 13740
Offices Workshop
Pit OI & OLPit OD North
Witklip Pit
Witklip PCD Silver PCD's
Beneficiation plant
102000
3000
3501
11286 11646E-20304 E-18000
E-6720
16320
12240
Low lying area 2
Wash bay low lying
17964
2520
4320
4680
E-25440S-7800
E-7440S-6300
Pit OJ
4680
Moabsvelden
39300
43980
E-9336
17964
3000
12000
182790
2100
15000
207045210
37680
45210
Plant PC dam (lined)
3000
870
870
12000
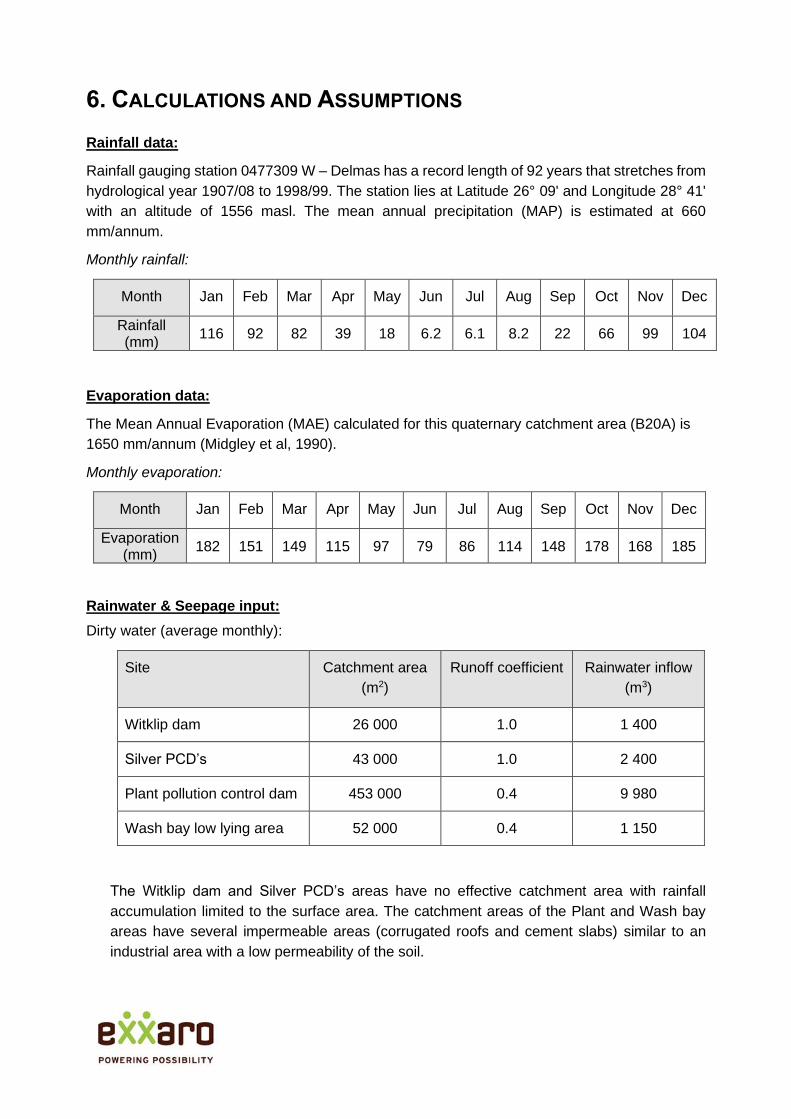
6. CALCULATIONS AND ASSUMPTIONS
Rainfall data:
Rainfall gauging station 0477309 W – Delmas has a record length of 92 years that stretches from
hydrological year 1907/08 to 1998/99. The station lies at Latitude 26° 09' and Longitude 28° 41'
with an altitude of 1556 masl. The mean annual precipitation (MAP) is estimated at 660
mm/annum.
Monthly rainfall:
Month Jan Feb Mar Apr May Jun Jul Aug Sep Oct Nov Dec
Rainfall (mm)
116 92 82 39 18 6.2 6.1 8.2 22 66 99 104
Evaporation data:
The Mean Annual Evaporation (MAE) calculated for this quaternary catchment area (B20A) is
1650 mm/annum (Midgley et al, 1990).
Monthly evaporation:
Month Jan Feb Mar Apr May Jun Jul Aug Sep Oct Nov Dec
Evaporation (mm)
182 151 149 115 97 79 86 114 148 178 168 185
Rainwater & Seepage input:
Dirty water (average monthly):
Site Catchment area
(m2)
Runoff coefficient Rainwater inflow
(m3)
Witklip dam 26 000 1.0 1 400
Silver PCD’s 43 000 1.0 2 400
Plant pollution control dam 453 000 0.4 9 980
Wash bay low lying area 52 000 0.4 1 150
The Witklip dam and Silver PCD’s areas have no effective catchment area with rainfall
accumulation limited to the surface area. The catchment areas of the Plant and Wash bay
areas have several impermeable areas (corrugated roofs and cement slabs) similar to an
industrial area with a low permeability of the soil.
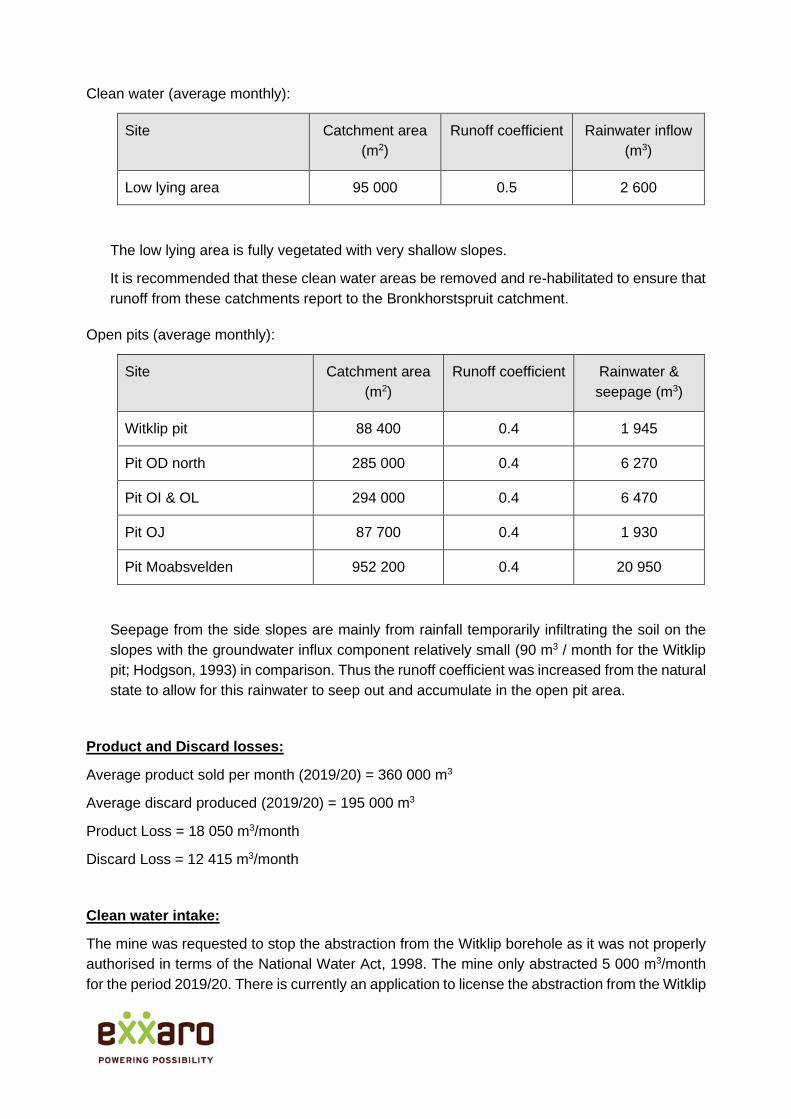
Clean water (average monthly):
Site Catchment area
(m2)
Runoff coefficient Rainwater inflow
(m3)
Low lying area 95 000 0.5 2 600
The low lying area is fully vegetated with very shallow slopes.
It is recommended that these clean water areas be removed and re-habilitated to ensure that
runoff from these catchments report to the Bronkhorstspruit catchment.
Open pits (average monthly):
Site Catchment area
(m2)
Runoff coefficient Rainwater &
seepage (m3)
Witklip pit 88 400 0.4 1 945
Pit OD north 285 000 0.4 6 270
Pit OI & OL 294 000 0.4 6 470
Pit OJ 87 700 0.4 1 930
Pit Moabsvelden 952 200 0.4 20 950
Seepage from the side slopes are mainly from rainfall temporarily infiltrating the soil on the
slopes with the groundwater influx component relatively small (90 m3 / month for the Witklip
pit; Hodgson, 1993) in comparison. Thus the runoff coefficient was increased from the natural
state to allow for this rainwater to seep out and accumulate in the open pit area.
Product and Discard losses:
Average product sold per month (2019/20) = 360 000 m3
Average discard produced (2019/20) = 195 000 m3
Product Loss = 18 050 m3/month
Discard Loss = 12 415 m3/month
Clean water intake:
The mine was requested to stop the abstraction from the Witklip borehole as it was not properly
authorised in terms of the National Water Act, 1998. The mine only abstracted 5 000 m3/month
for the period 2019/20. There is currently an application to license the abstraction from the Witklip
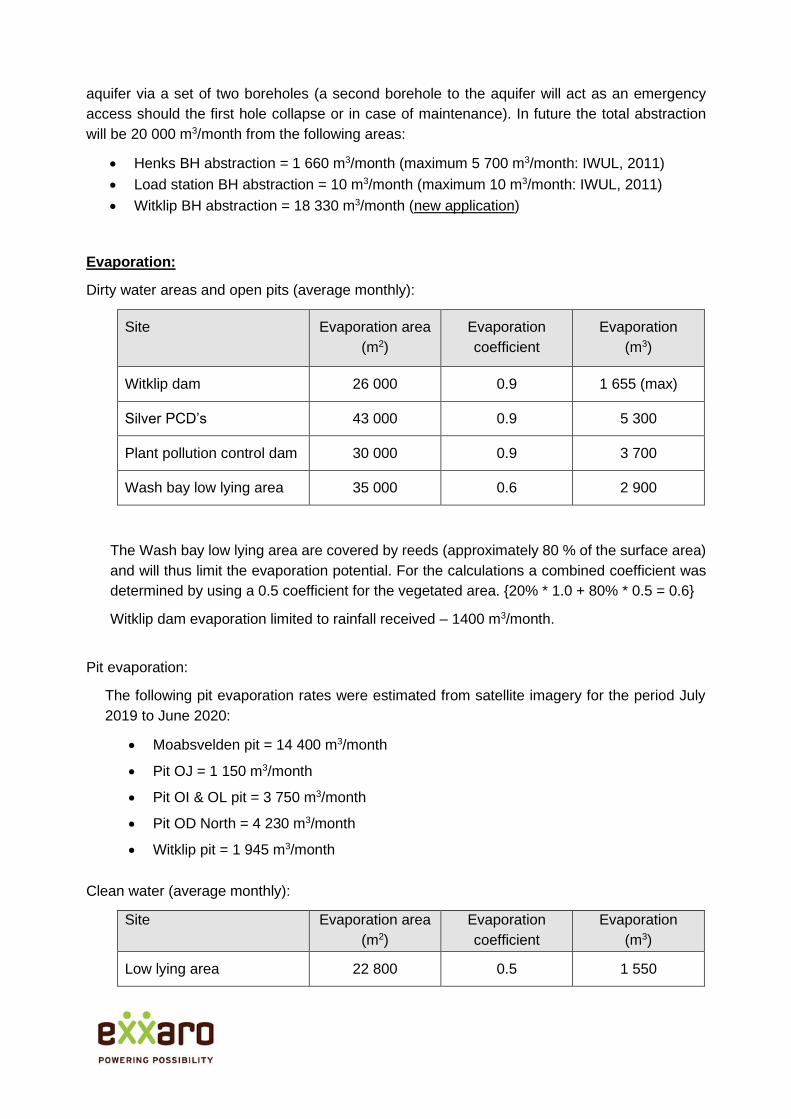
aquifer via a set of two boreholes (a second borehole to the aquifer will act as an emergency
access should the first hole collapse or in case of maintenance). In future the total abstraction
will be 20 000 m3/month from the following areas:
• Henks BH abstraction = 1 660 m3/month (maximum 5 700 m3/month: IWUL, 2011)
• Load station BH abstraction = 10 m3/month (maximum 10 m3/month: IWUL, 2011)
• Witklip BH abstraction = 18 330 m3/month (new application)
Evaporation:
Dirty water areas and open pits (average monthly):
Site Evaporation area
(m2)
Evaporation
coefficient
Evaporation
(m3)
Witklip dam 26 000 0.9 1 655 (max)
Silver PCD’s 43 000 0.9 5 300
Plant pollution control dam 30 000 0.9 3 700
Wash bay low lying area 35 000 0.6 2 900
The Wash bay low lying area are covered by reeds (approximately 80 % of the surface area)
and will thus limit the evaporation potential. For the calculations a combined coefficient was
determined by using a 0.5 coefficient for the vegetated area. {20% * 1.0 + 80% * 0.5 = 0.6}
Witklip dam evaporation limited to rainfall received – 1400 m3/month.
Pit evaporation:
The following pit evaporation rates were estimated from satellite imagery for the period July
2019 to June 2020:
• Moabsvelden pit = 14 400 m3/month
• Pit OJ = 1 150 m3/month
• Pit OI & OL pit = 3 750 m3/month
• Pit OD North = 4 230 m3/month
• Witklip pit = 1 945 m3/month
Clean water (average monthly):
Site Evaporation area
(m2)
Evaporation
coefficient
Evaporation
(m3)
Low lying area 22 800 0.5 1 550
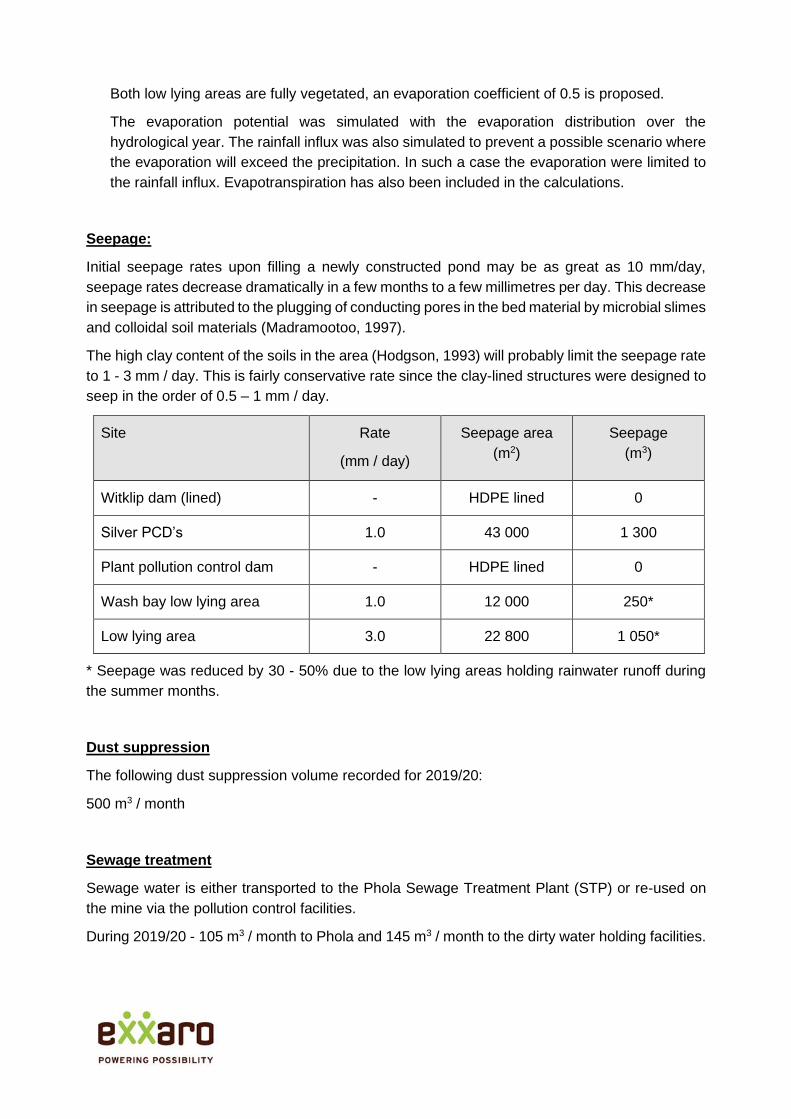
Both low lying areas are fully vegetated, an evaporation coefficient of 0.5 is proposed.
The evaporation potential was simulated with the evaporation distribution over the
hydrological year. The rainfall influx was also simulated to prevent a possible scenario where
the evaporation will exceed the precipitation. In such a case the evaporation were limited to
the rainfall influx. Evapotranspiration has also been included in the calculations.
Seepage:
Initial seepage rates upon filling a newly constructed pond may be as great as 10 mm/day,
seepage rates decrease dramatically in a few months to a few millimetres per day. This decrease
in seepage is attributed to the plugging of conducting pores in the bed material by microbial slimes
and colloidal soil materials (Madramootoo, 1997).
The high clay content of the soils in the area (Hodgson, 1993) will probably limit the seepage rate
to 1 - 3 mm / day. This is fairly conservative rate since the clay-lined structures were designed to
seep in the order of 0.5 – 1 mm / day.
Site Rate
(mm / day)
Seepage area
(m2)
Seepage
(m3)
Witklip dam (lined) - HDPE lined 0
Silver PCD’s 1.0 43 000 1 300
Plant pollution control dam - HDPE lined 0
Wash bay low lying area 1.0 12 000 250*
Low lying area 3.0 22 800 1 050*
* Seepage was reduced by 30 - 50% due to the low lying areas holding rainwater runoff during
the summer months.
Dust suppression
The following dust suppression volume recorded for 2019/20:
500 m3 / month
Sewage treatment
Sewage water is either transported to the Phola Sewage Treatment Plant (STP) or re-used on
the mine via the pollution control facilities.
During 2019/20 - 105 m3 / month to Phola and 145 m3 / month to the dirty water holding facilities.
REFERENCES
Chandra A. Madramootoo William R. Johnston and Lyman S. Willardson, 1997. Management of
agricultural drainage water quality. Water Reports 13. INTERNATIONAL COMMISSION ON
IRRIGATION AND DRAINAGE. FOOD AND AGRICULTURE ORGANIZATION OF THE UNITED
NATIONS Rome
Midgley DC, Pitman WV & Middleton BT, 1990. Surface water resources of South Africa –
Volumes I to VI. WRC report 298/I to VI/94, Water Research Commission, South Africa
Hodgson F, 1993. Geo-hydrological investigation at the Leeuwpan and Witklip collieries with
the purpose of submitting an application to the mine.
Geo-pollution Technologies, 2002. Geo-hydrological investigation at the Leeuwpan mine.
Report number LPN/01/222, Pretoria, South Africa.
GCS, 2014. Leeuwpan Colliery Geo-hydrological Investigation, Report Number 11-447GW,
Johannesburg, South Africa.
Annexure F Current Licenses Issued
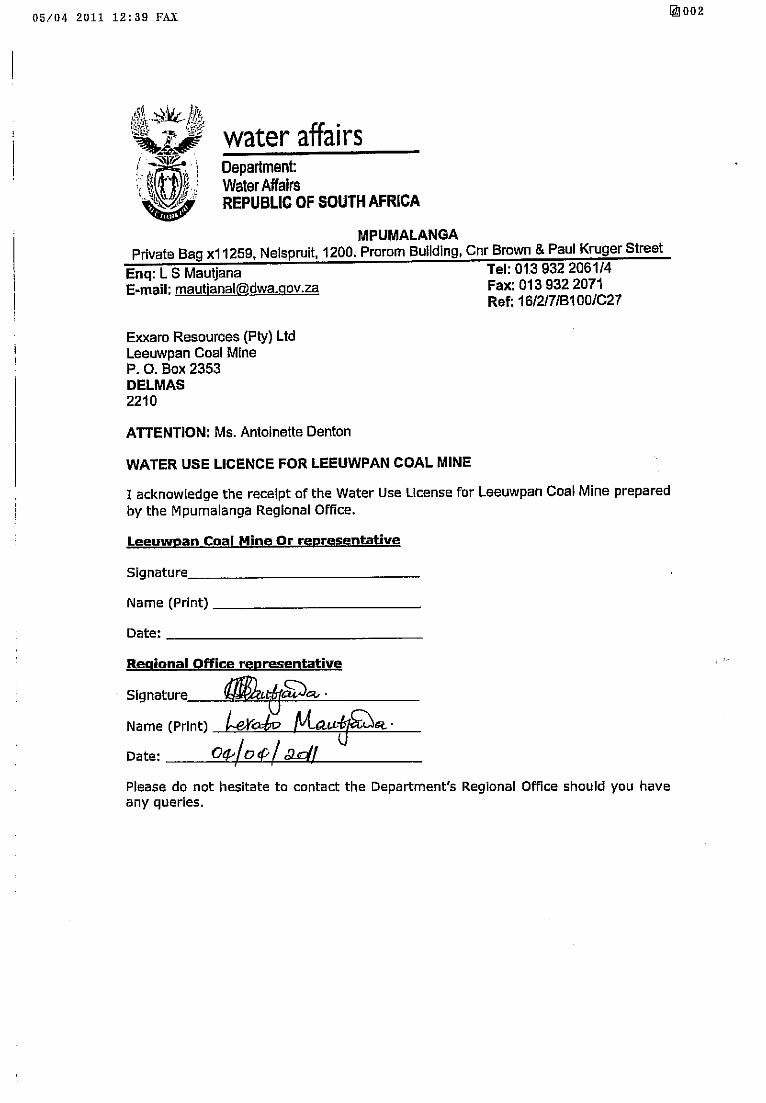
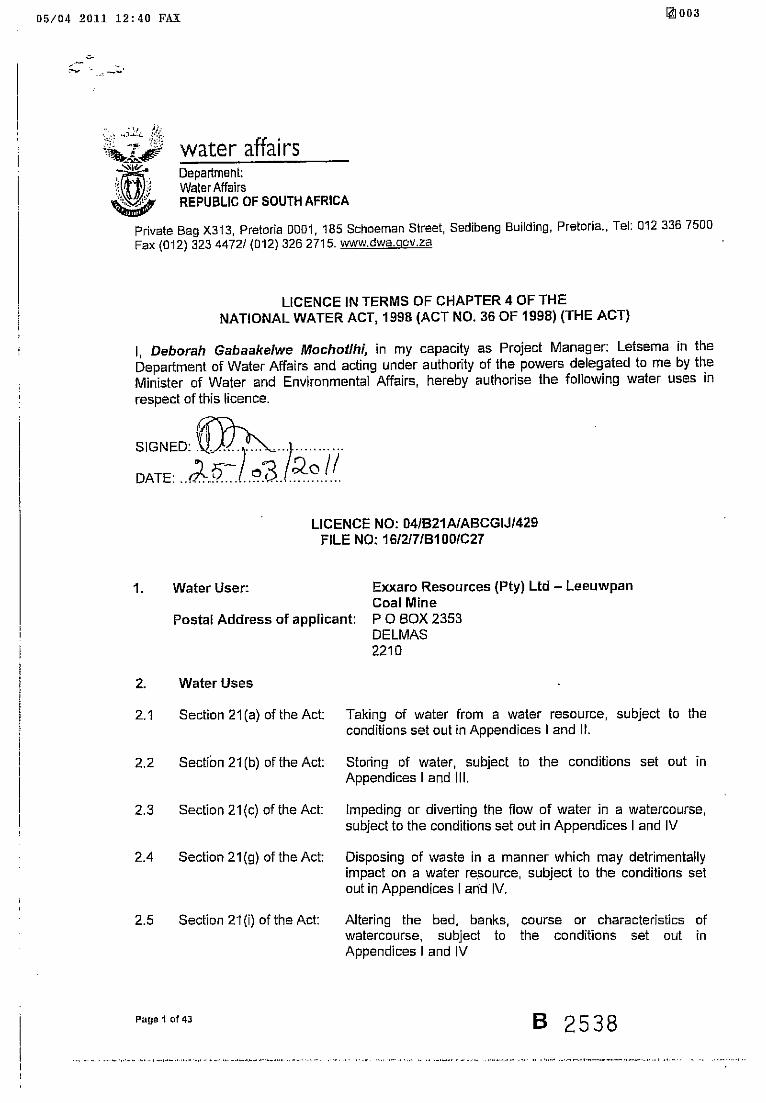
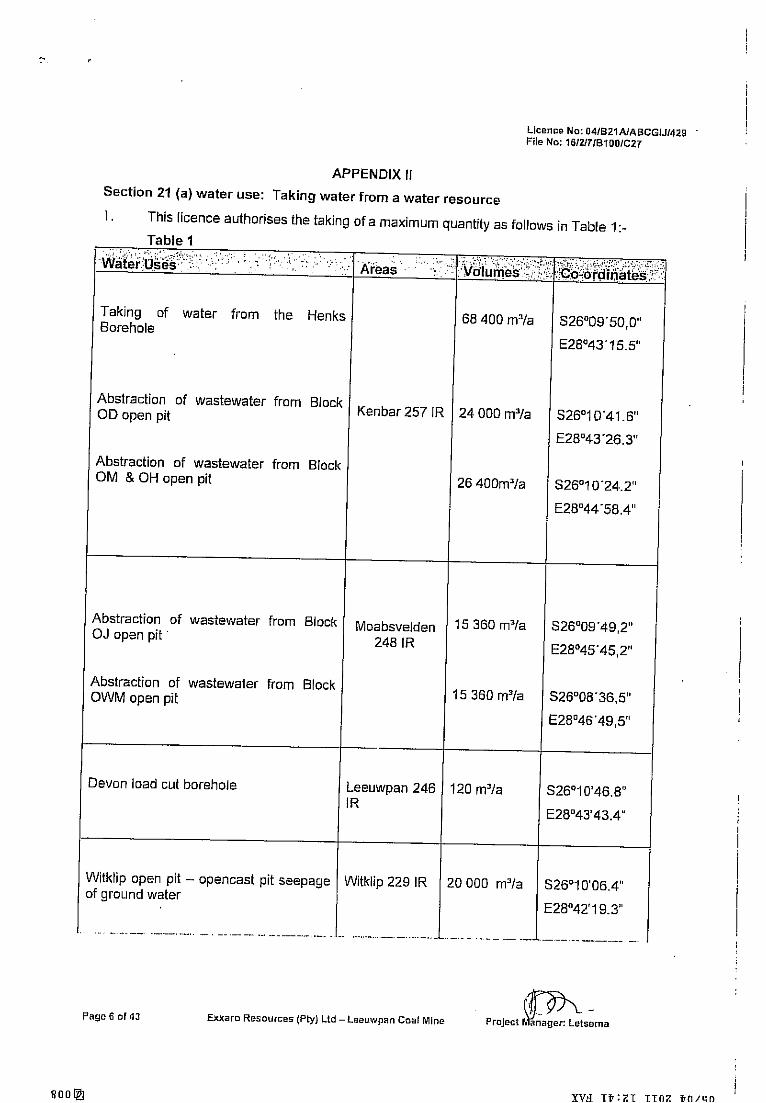
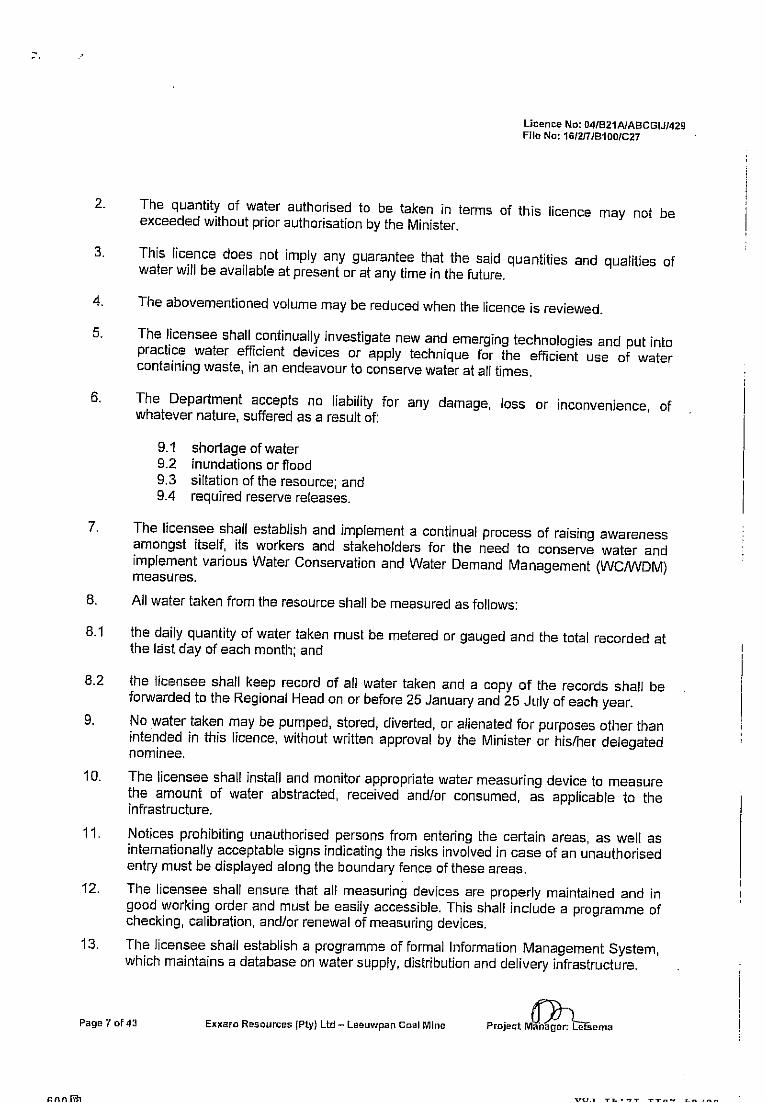
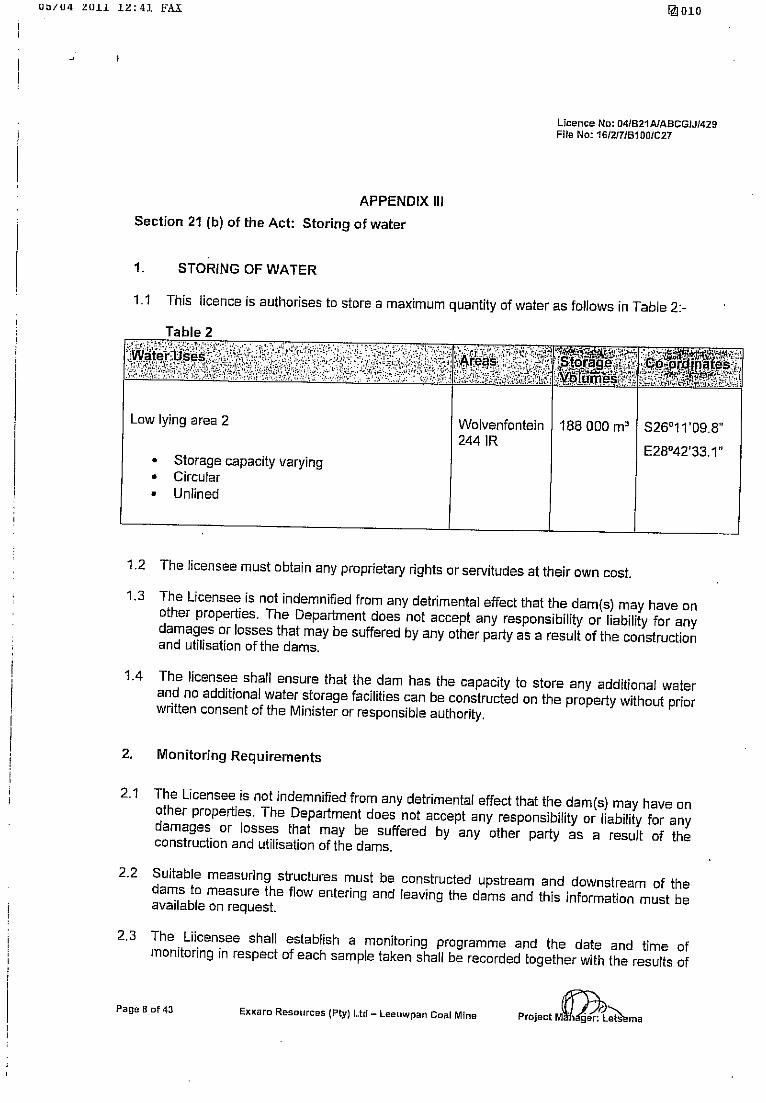
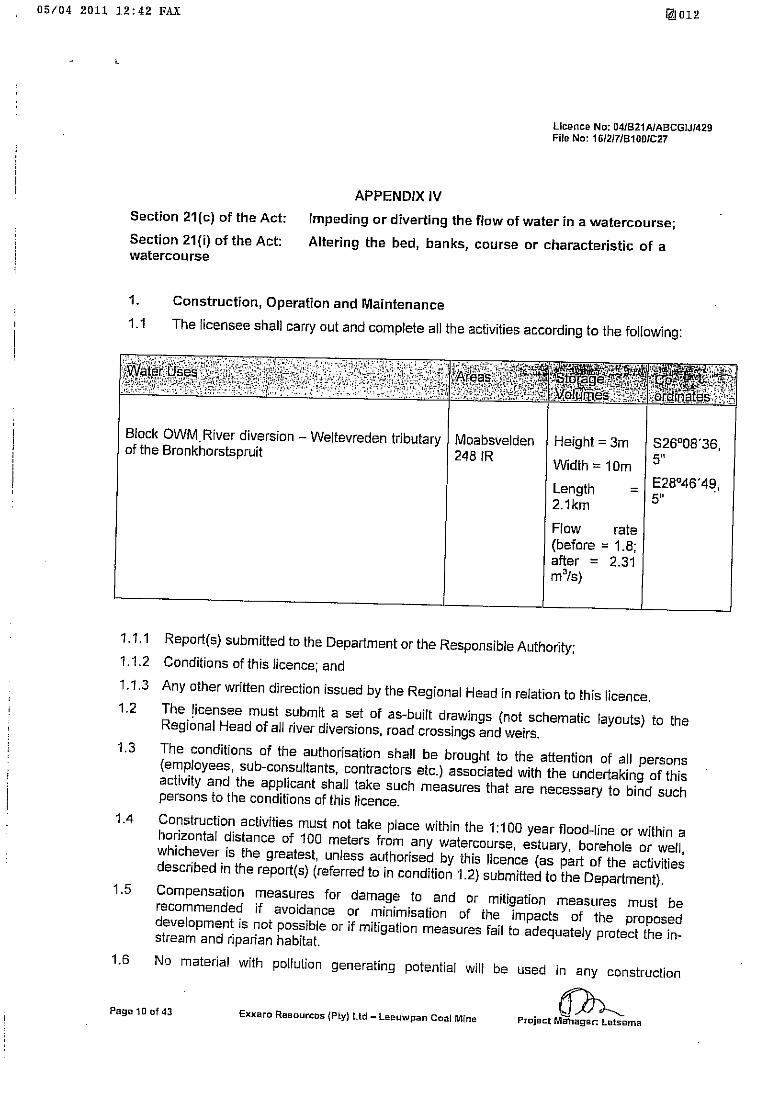
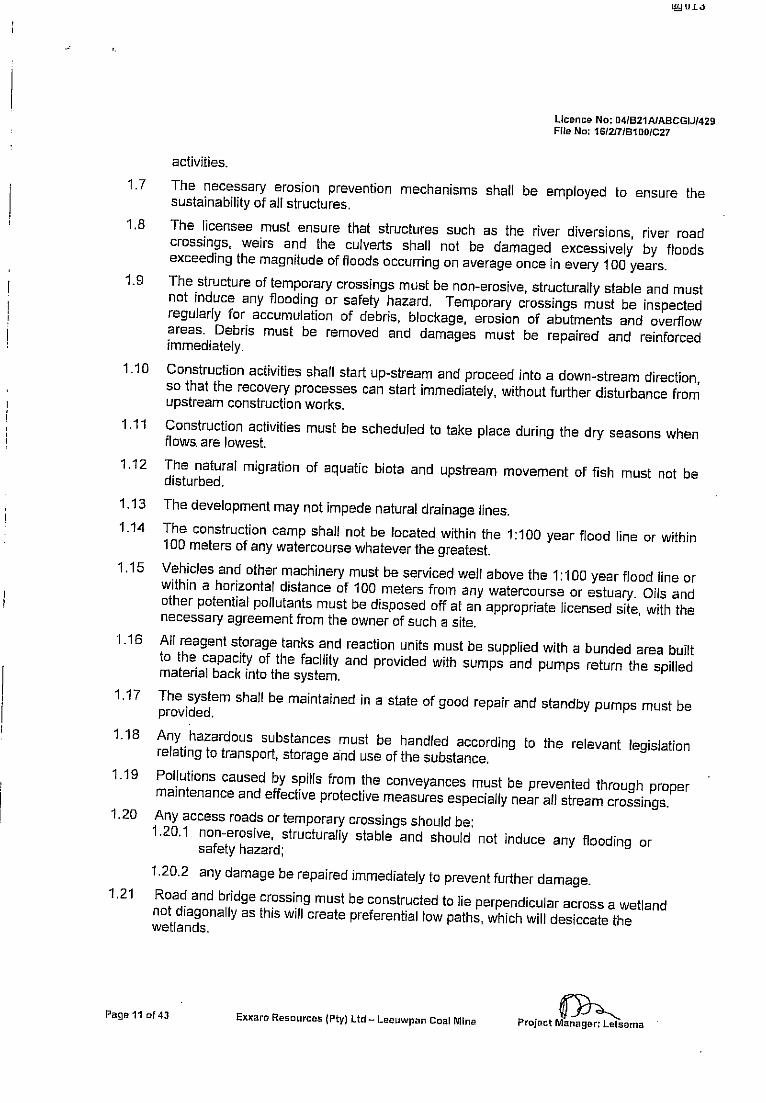
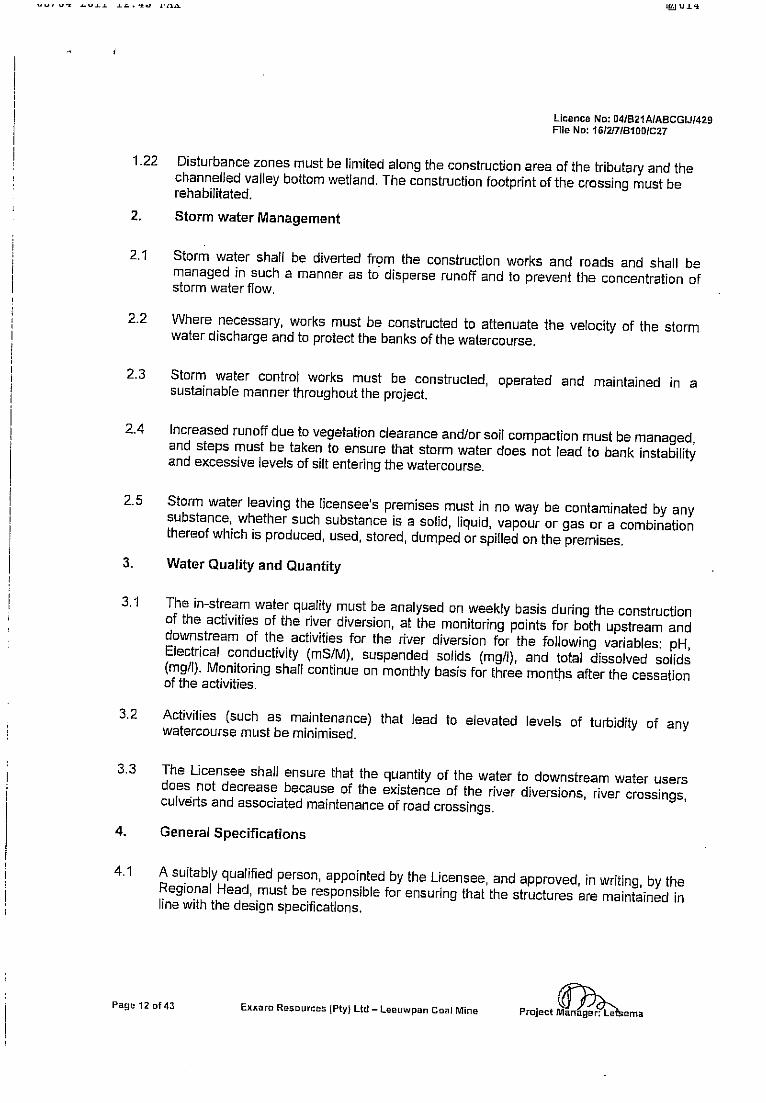
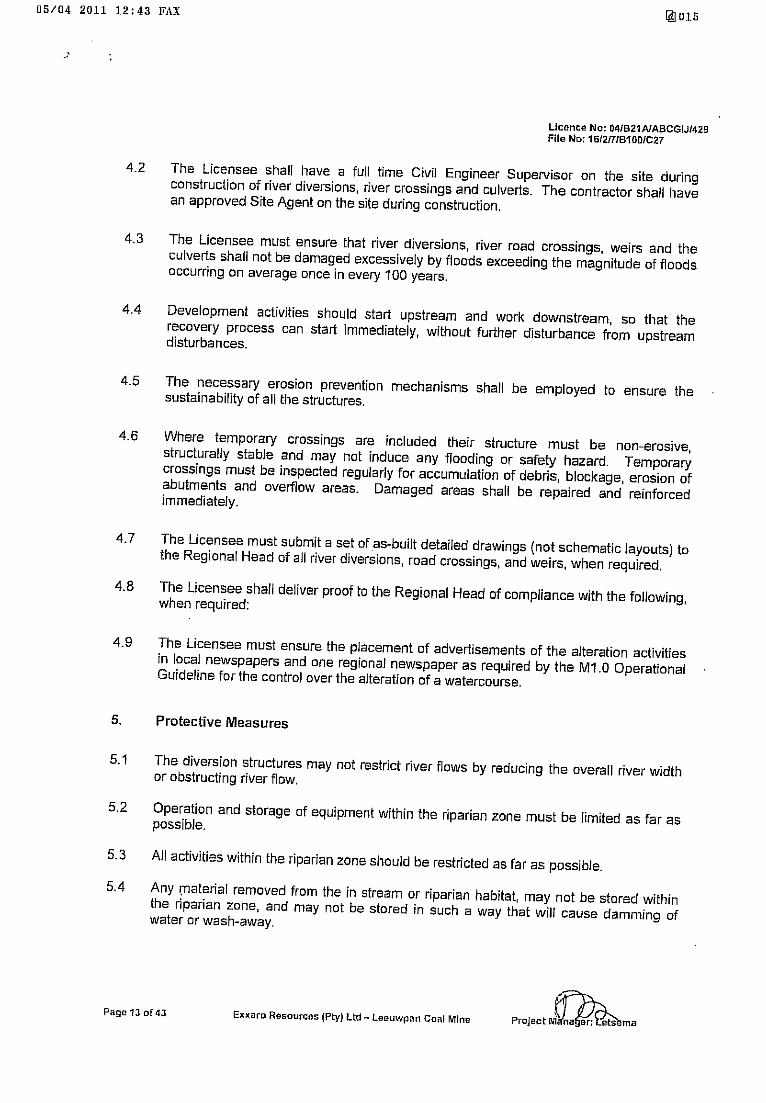
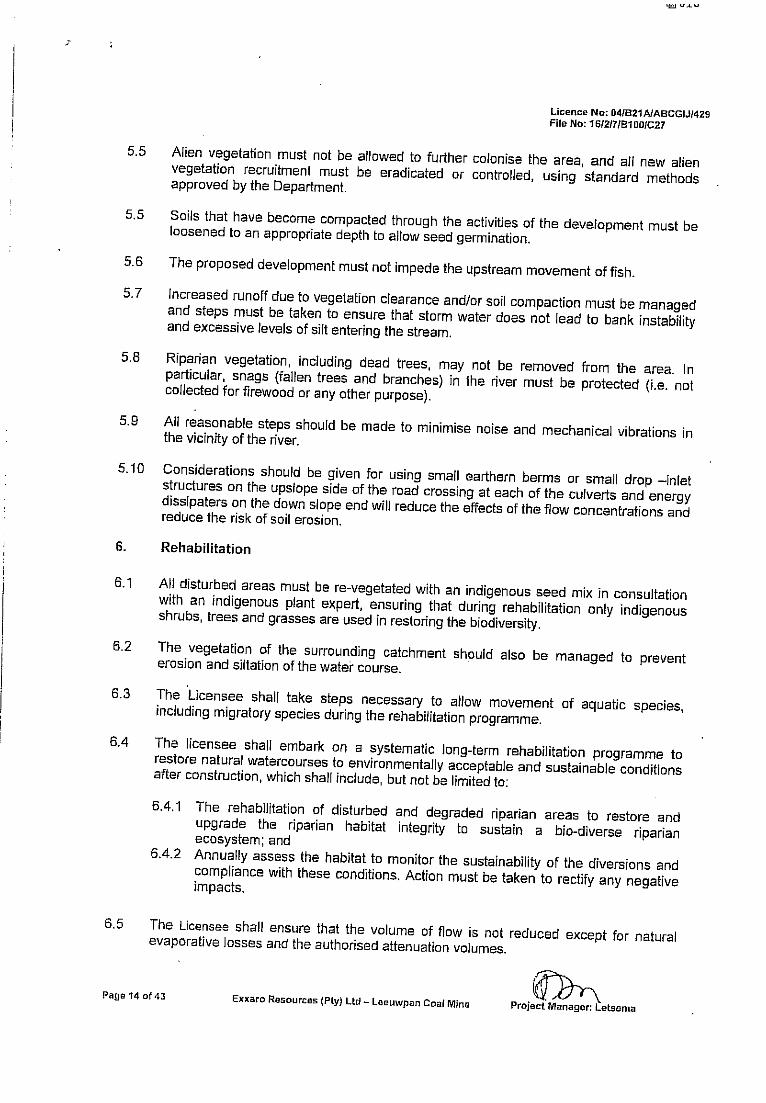
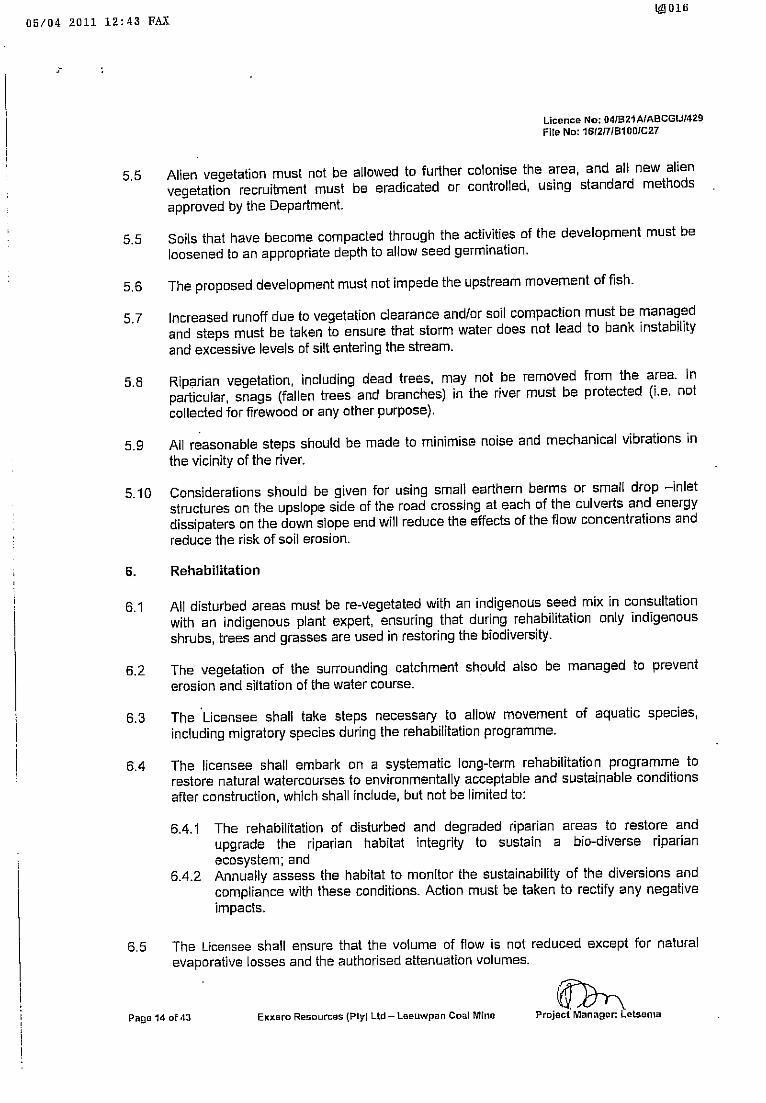
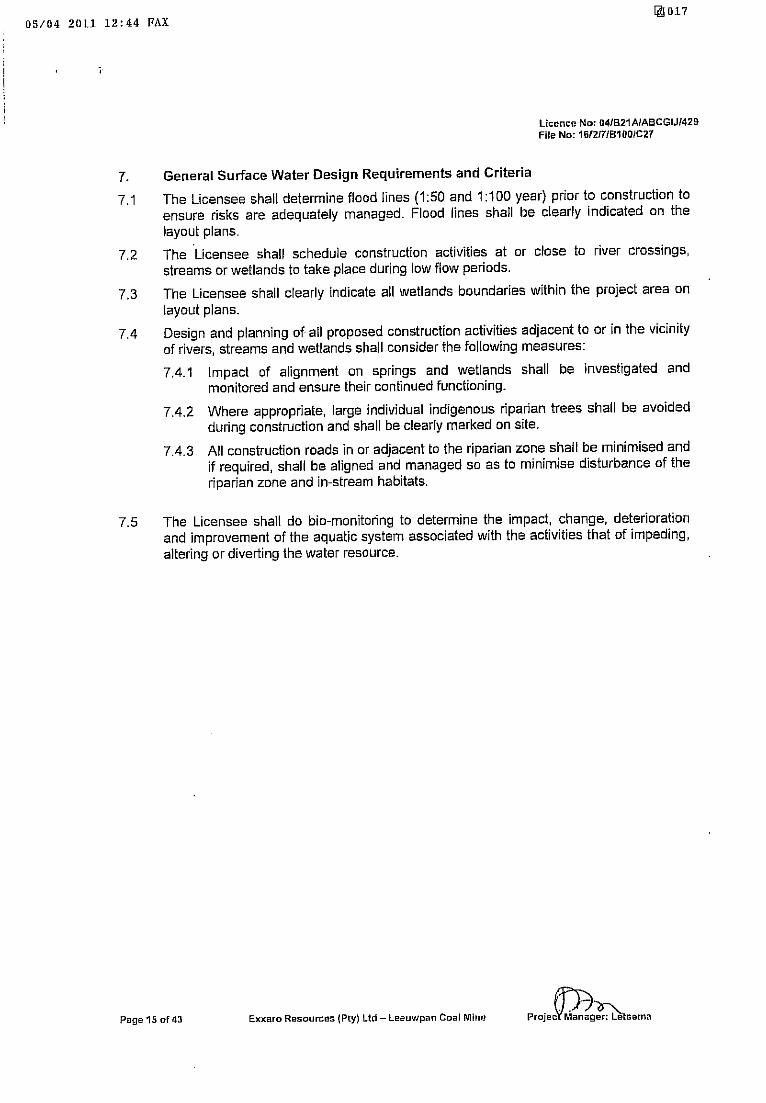
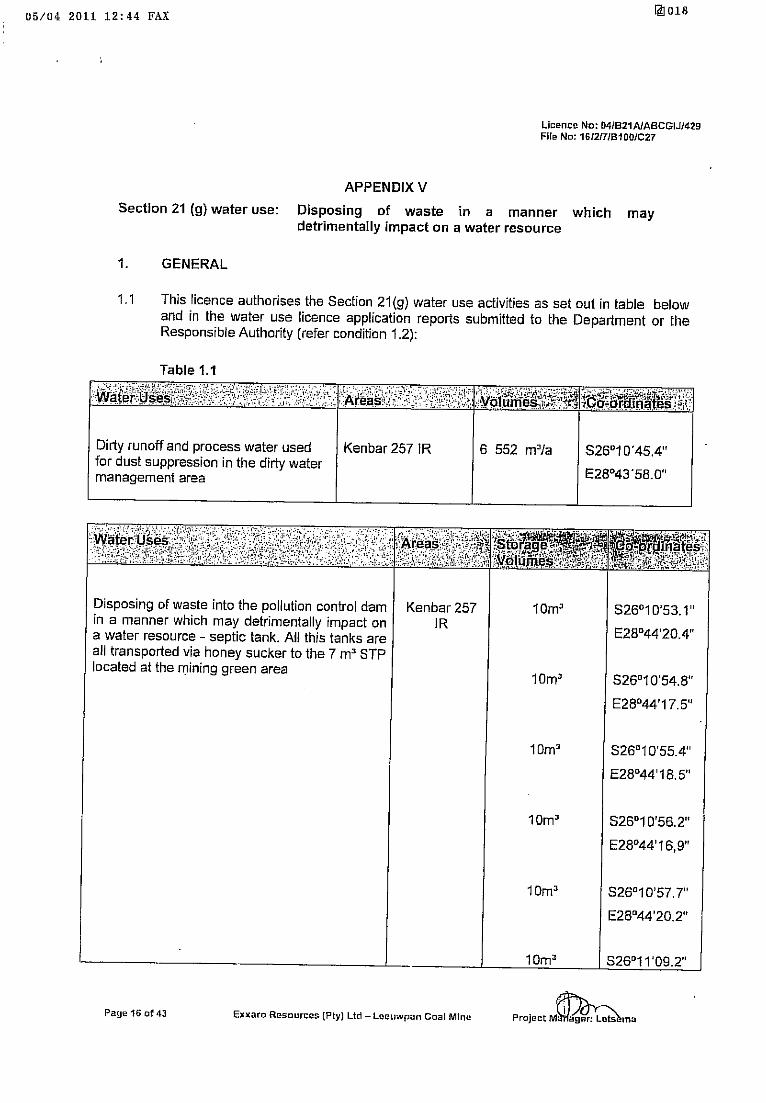
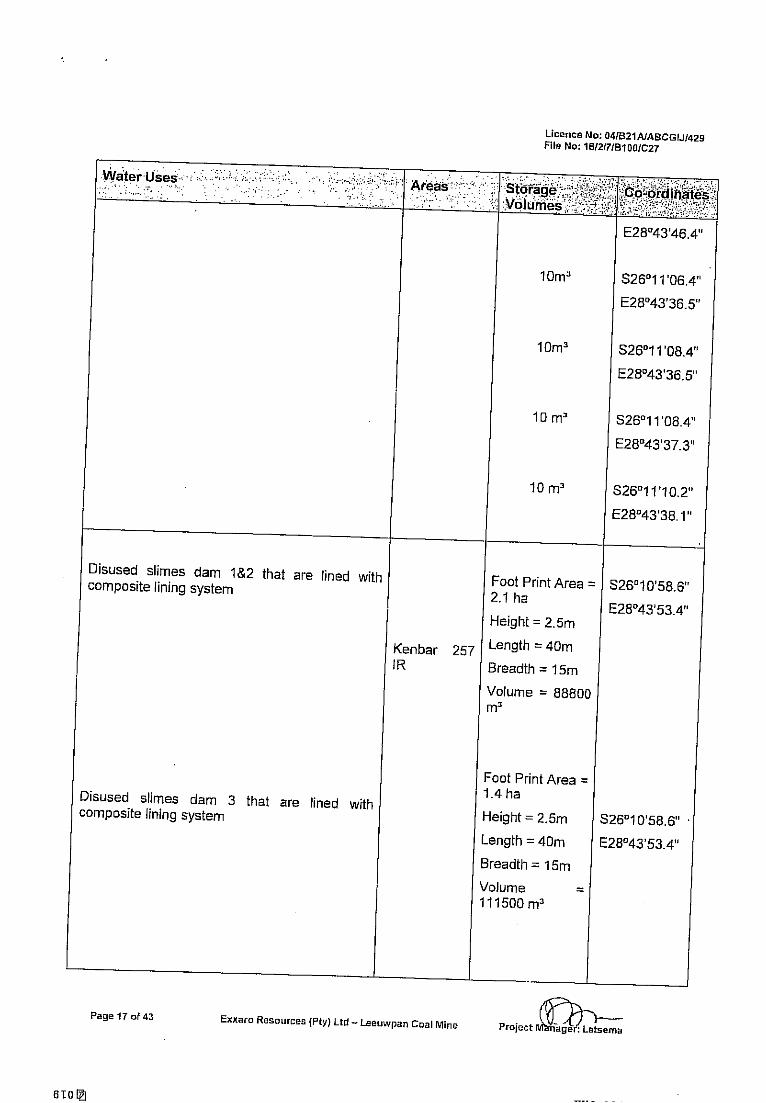
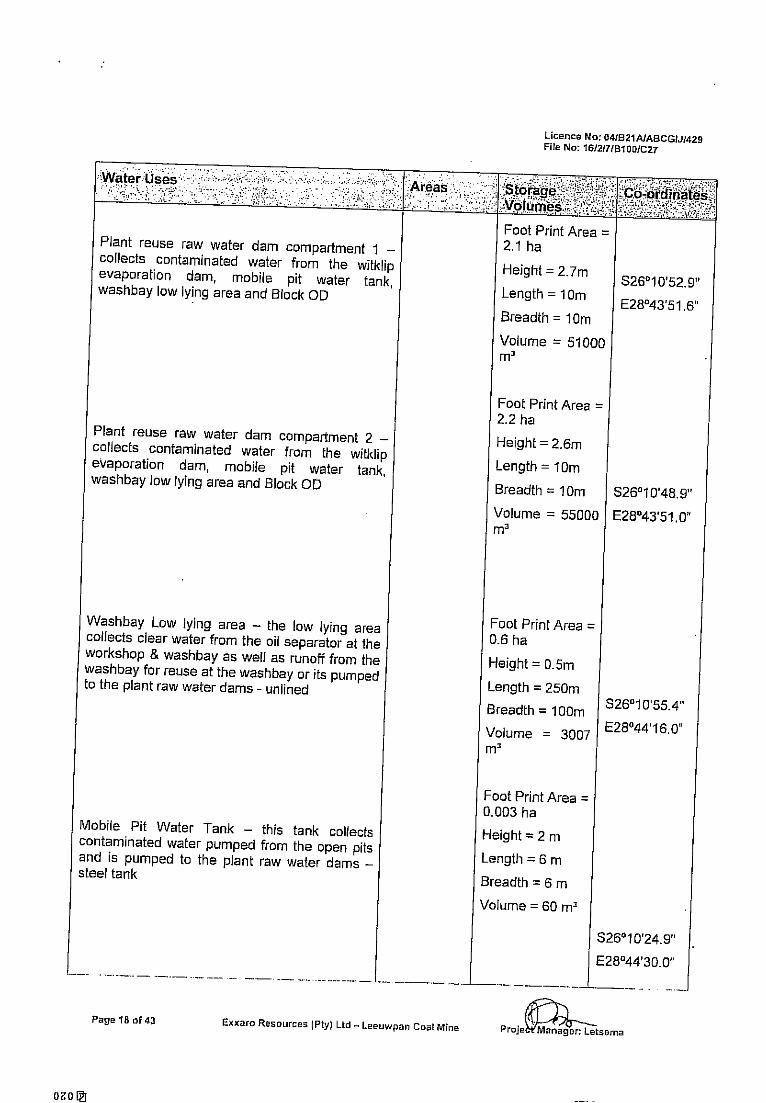
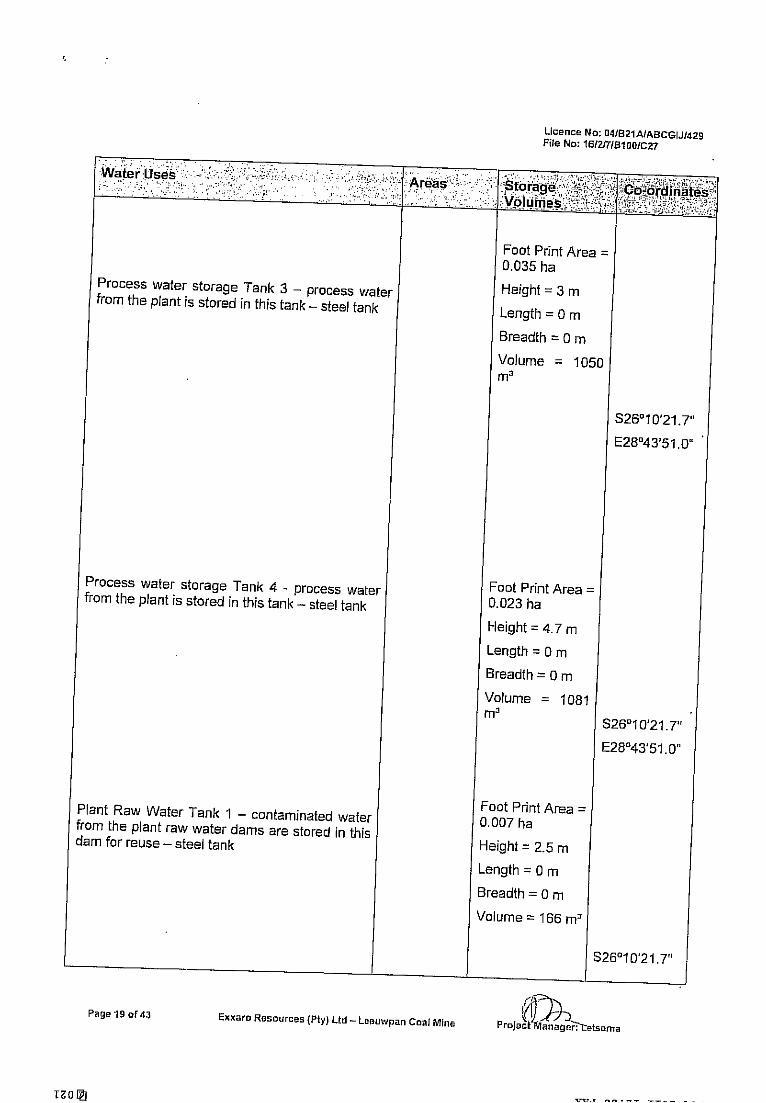
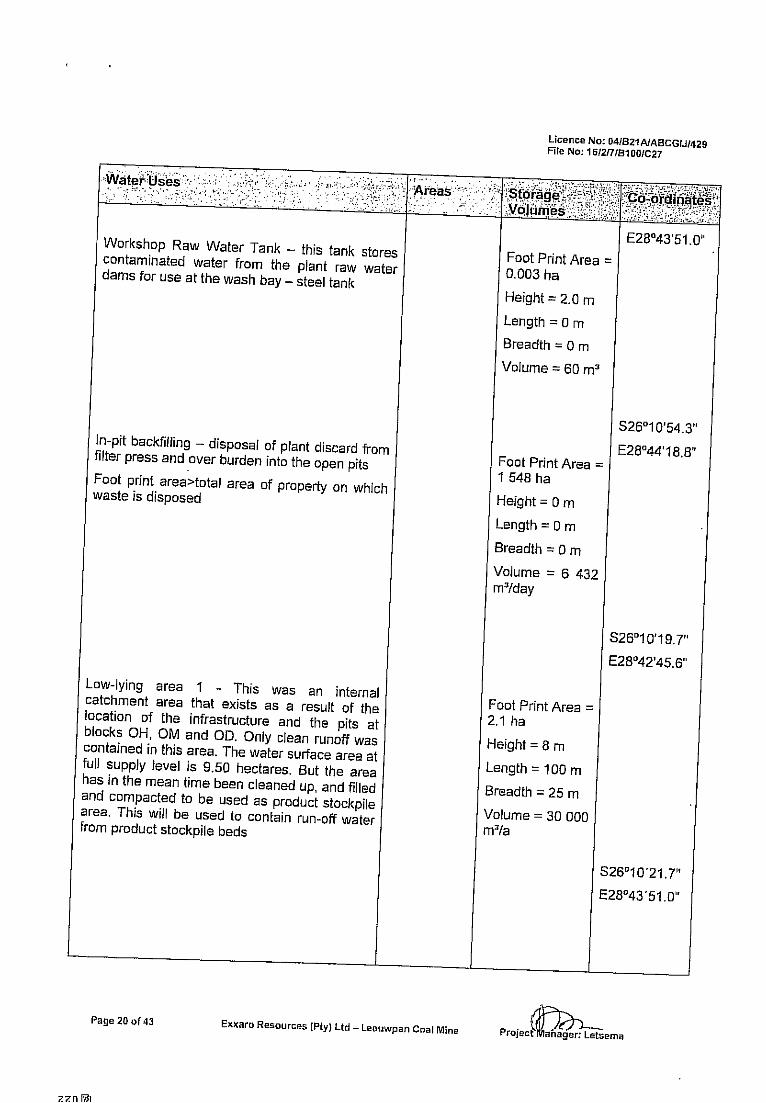
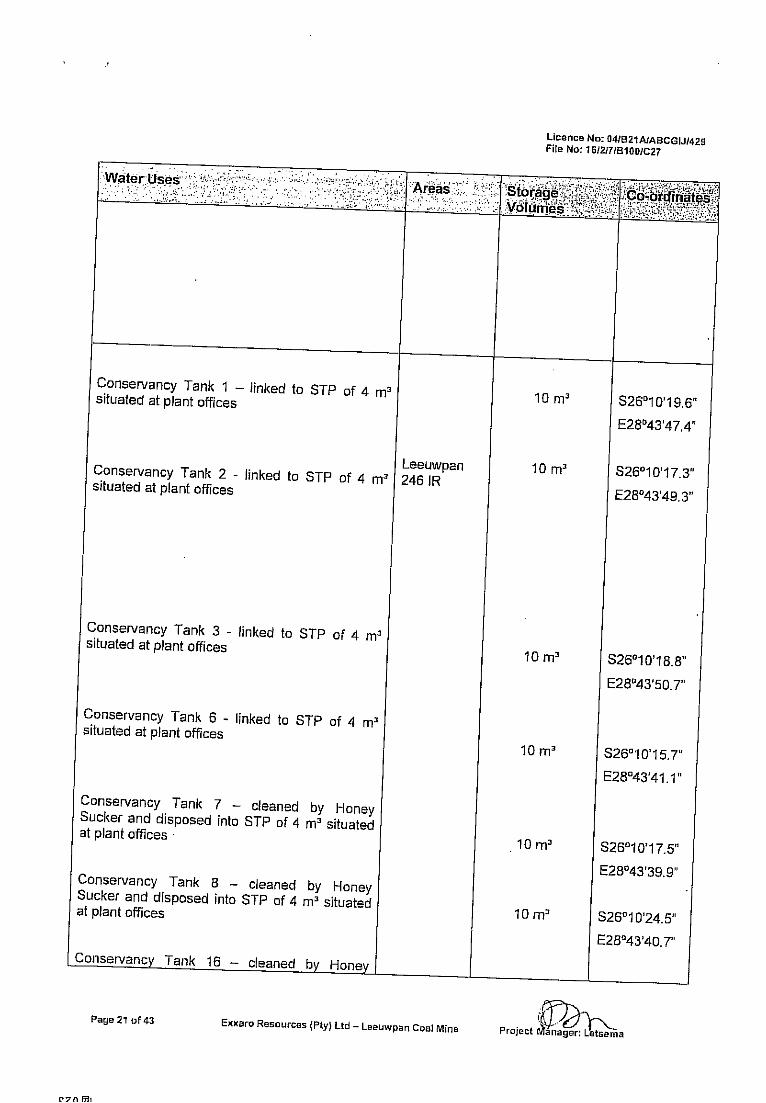
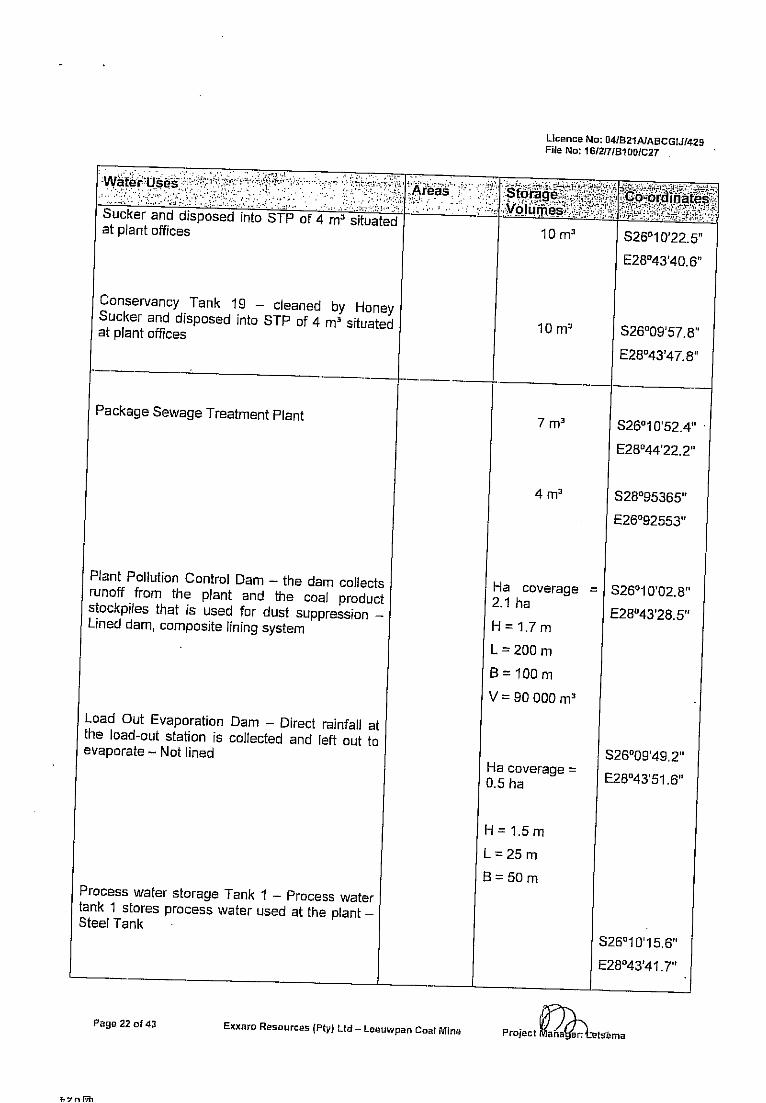
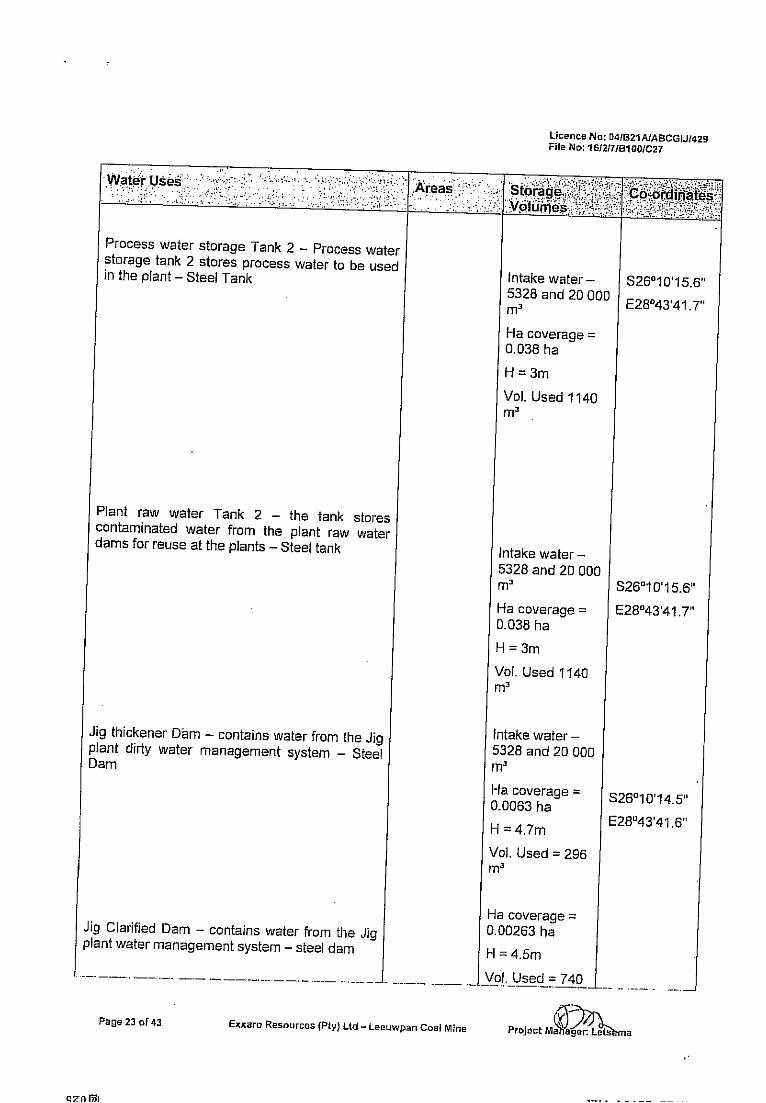
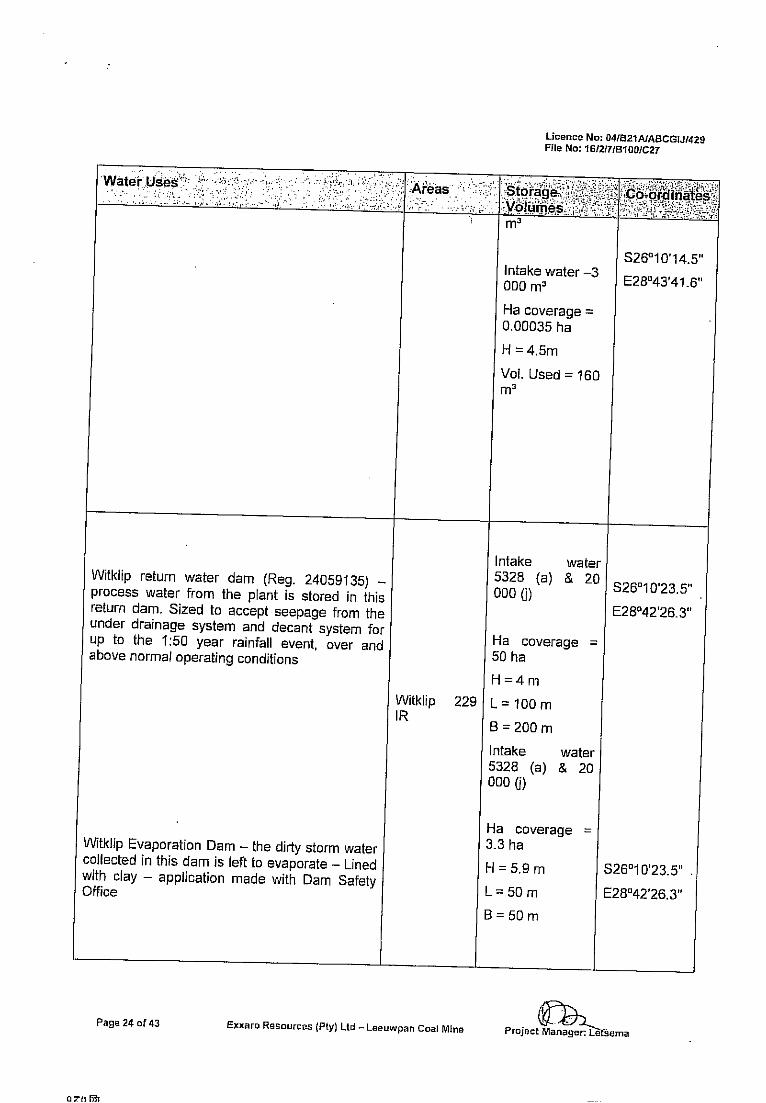
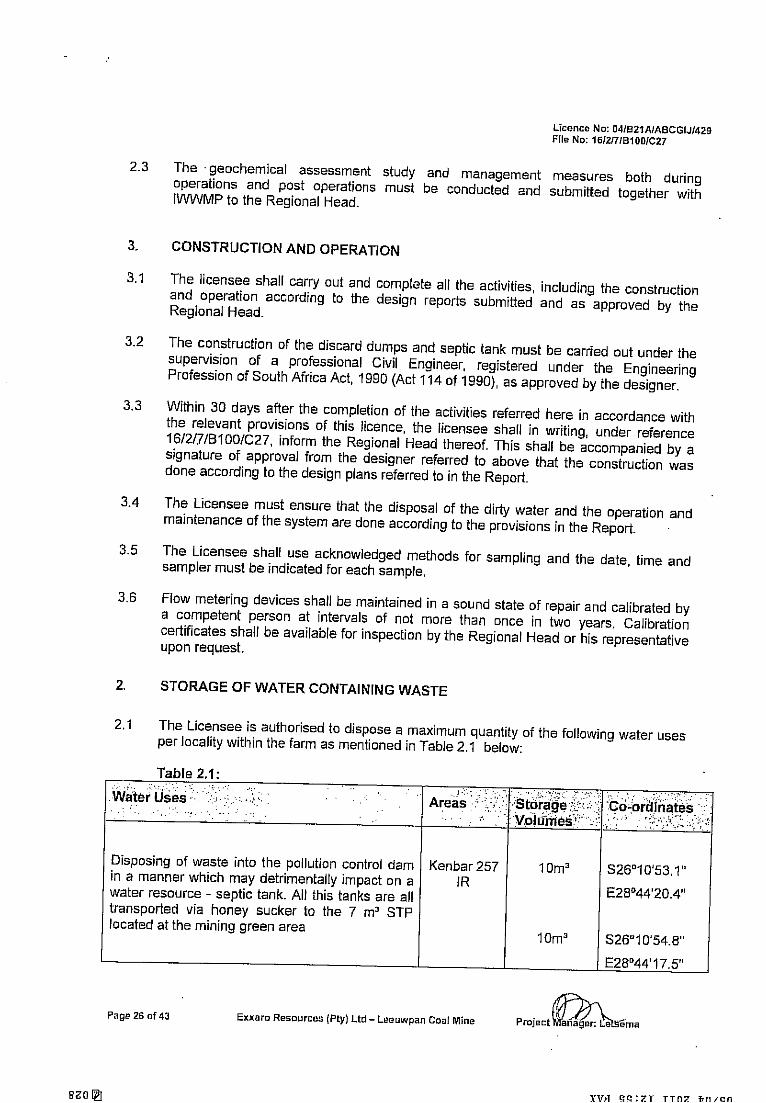
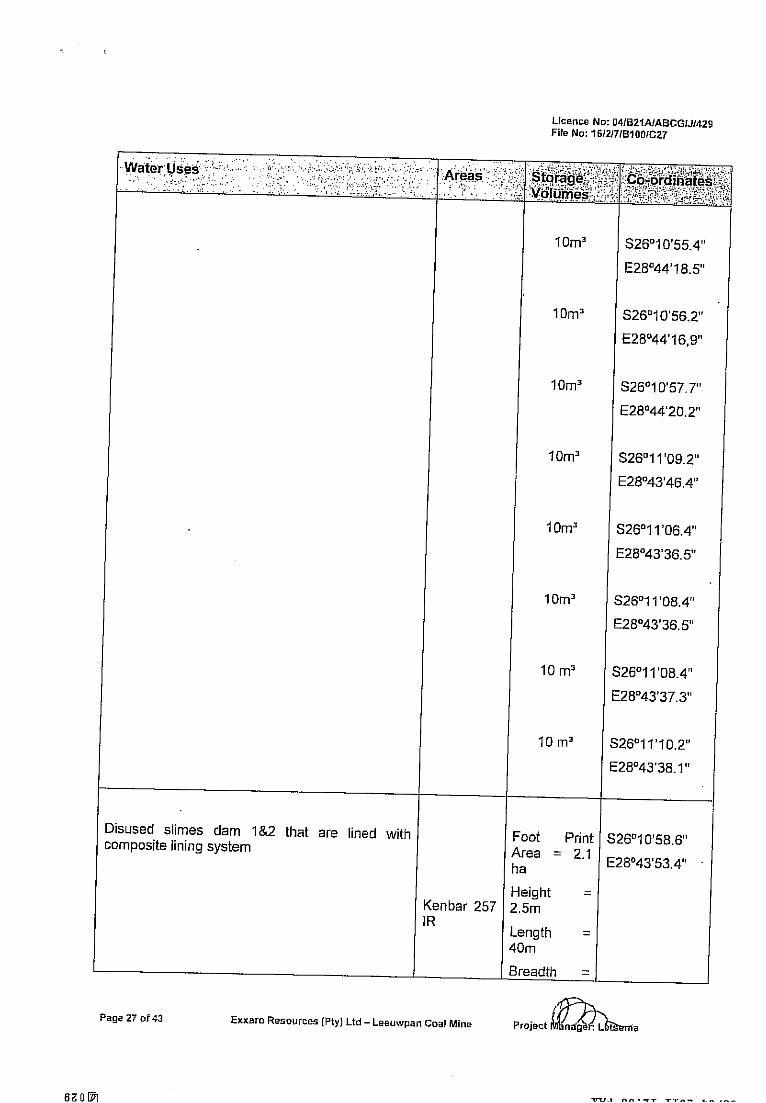
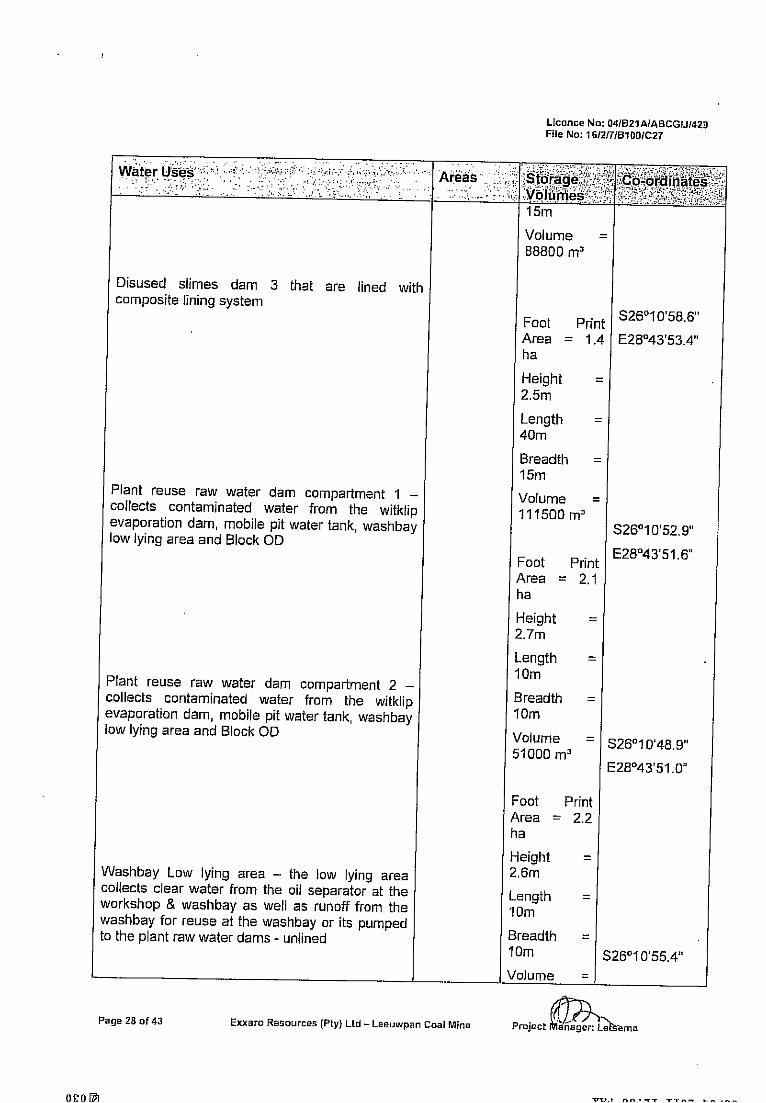
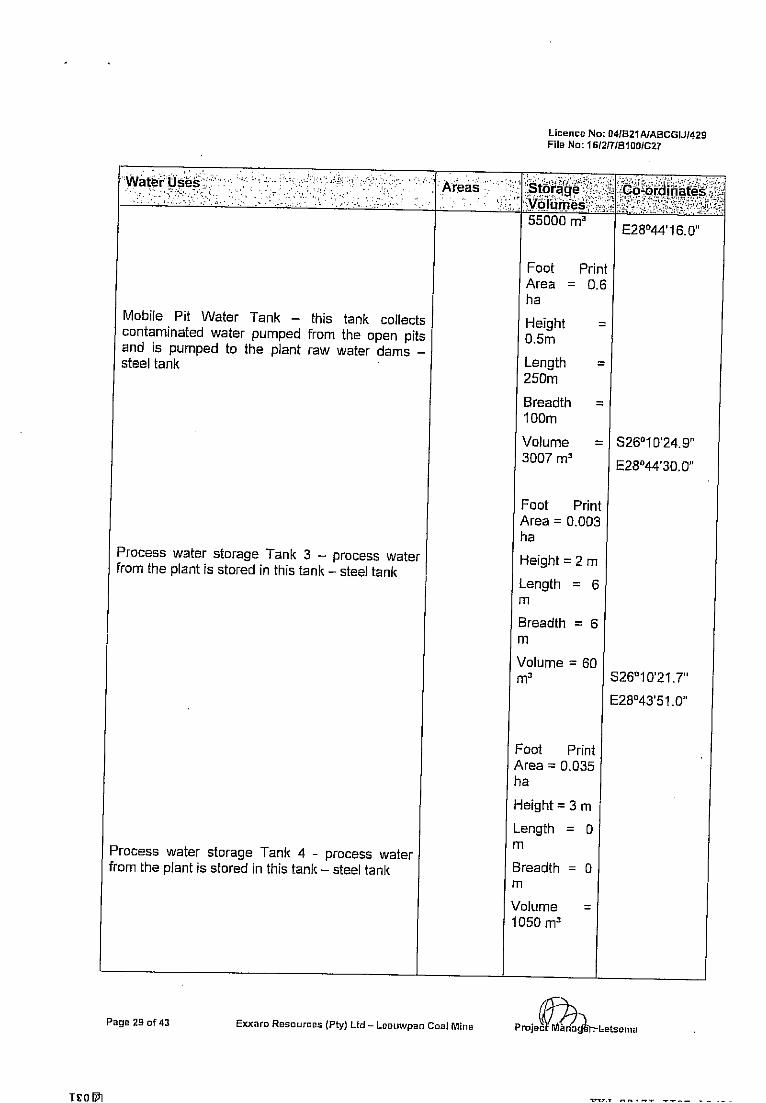
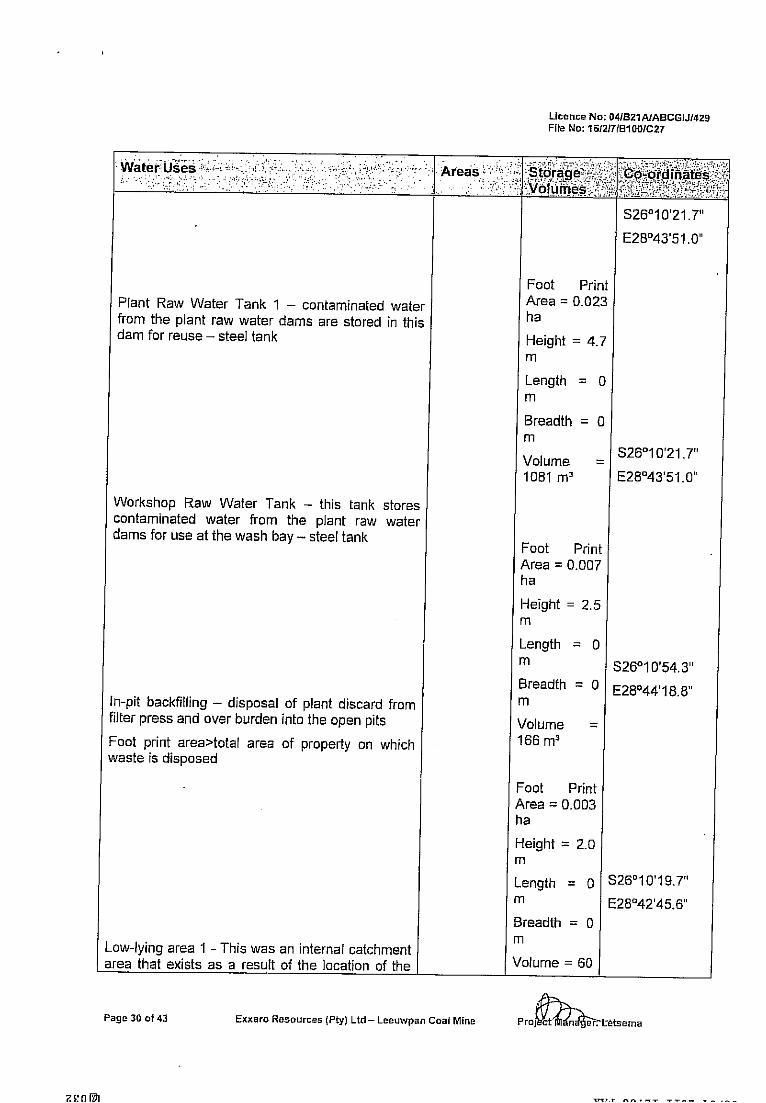
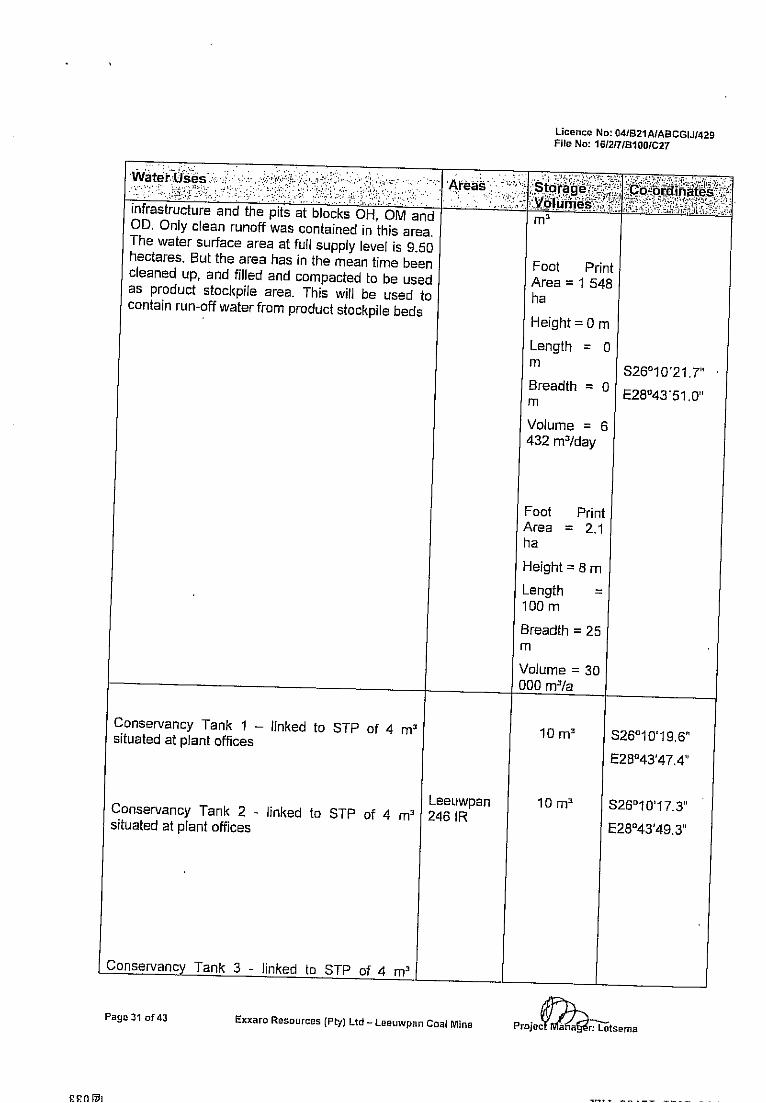
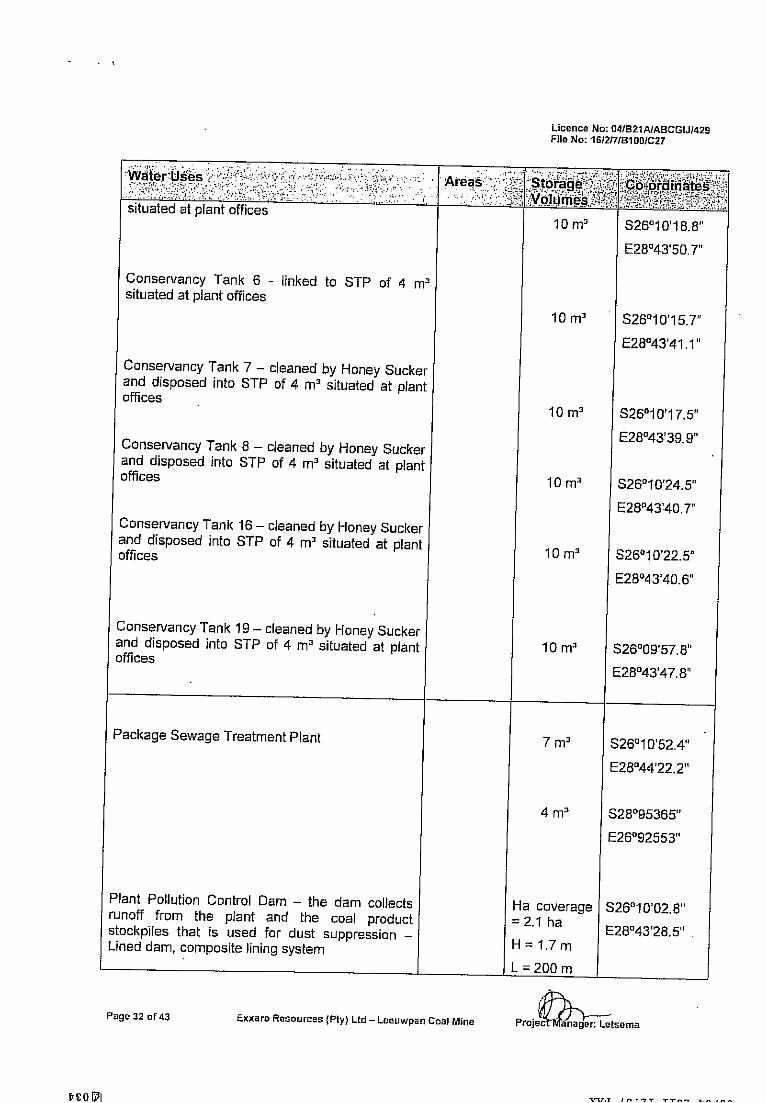
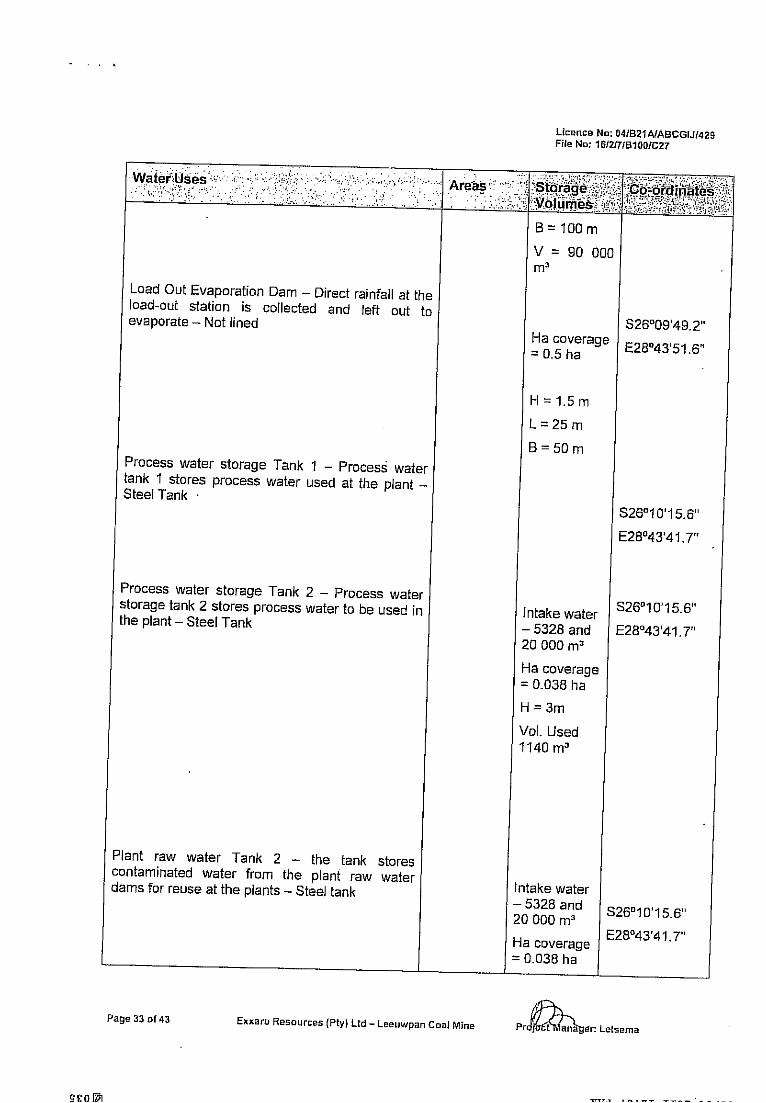
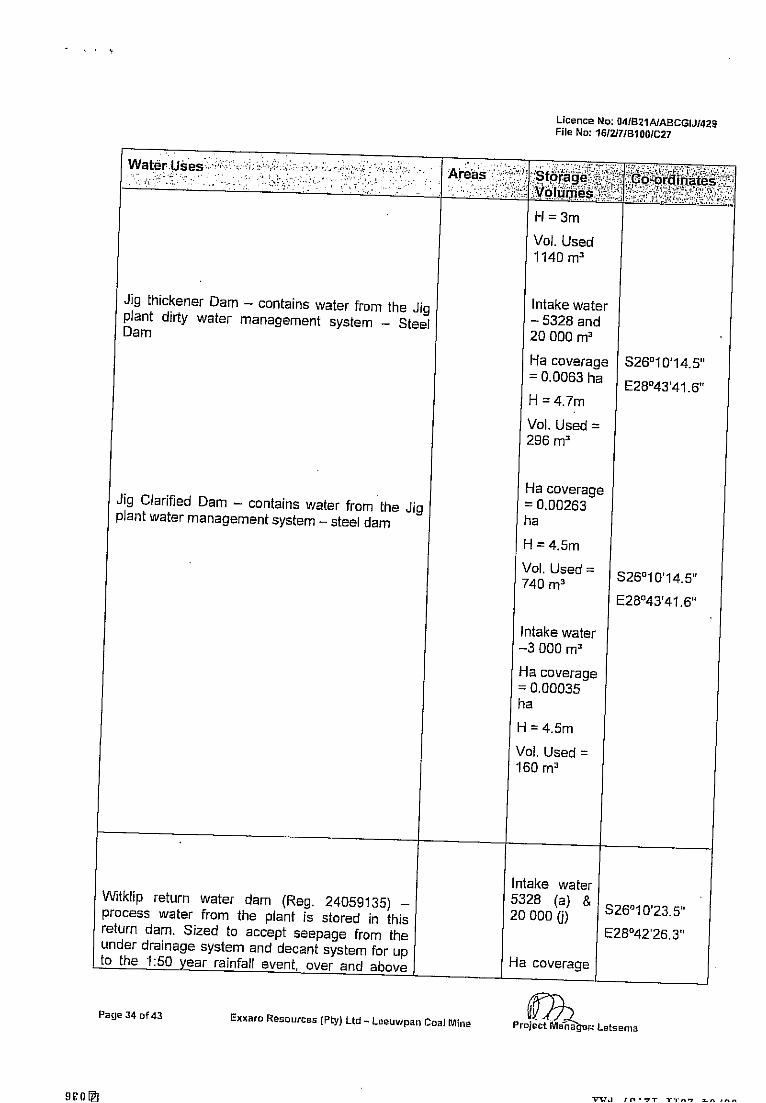
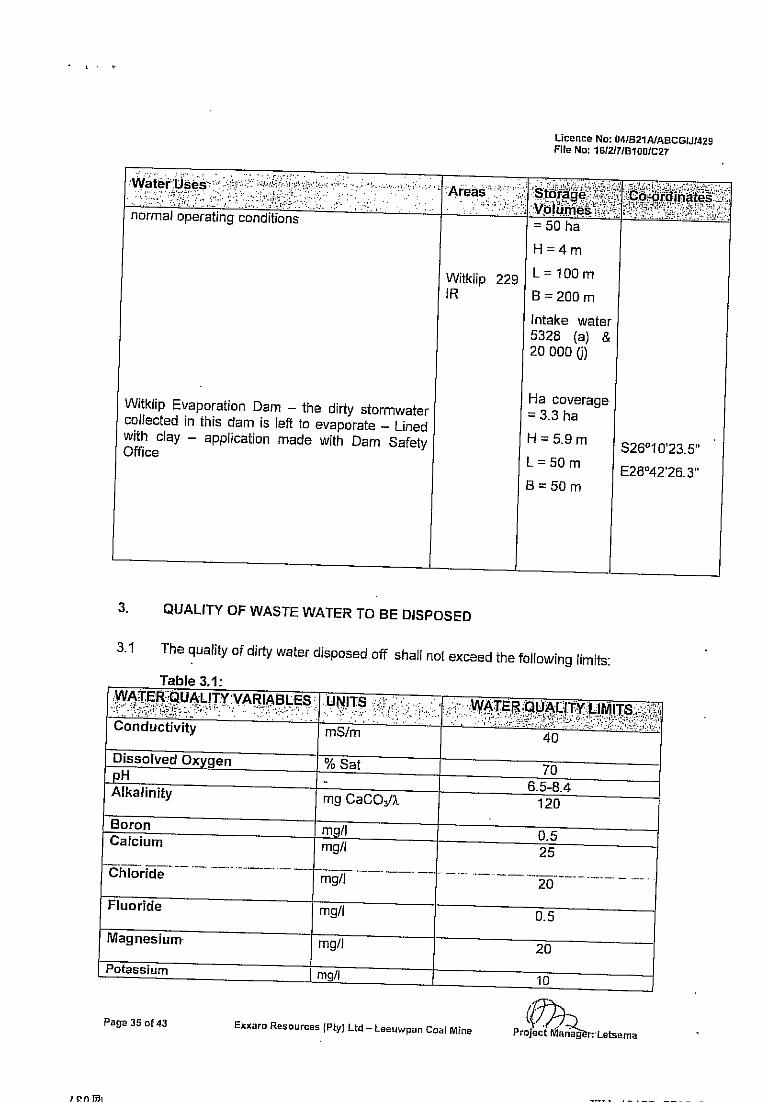
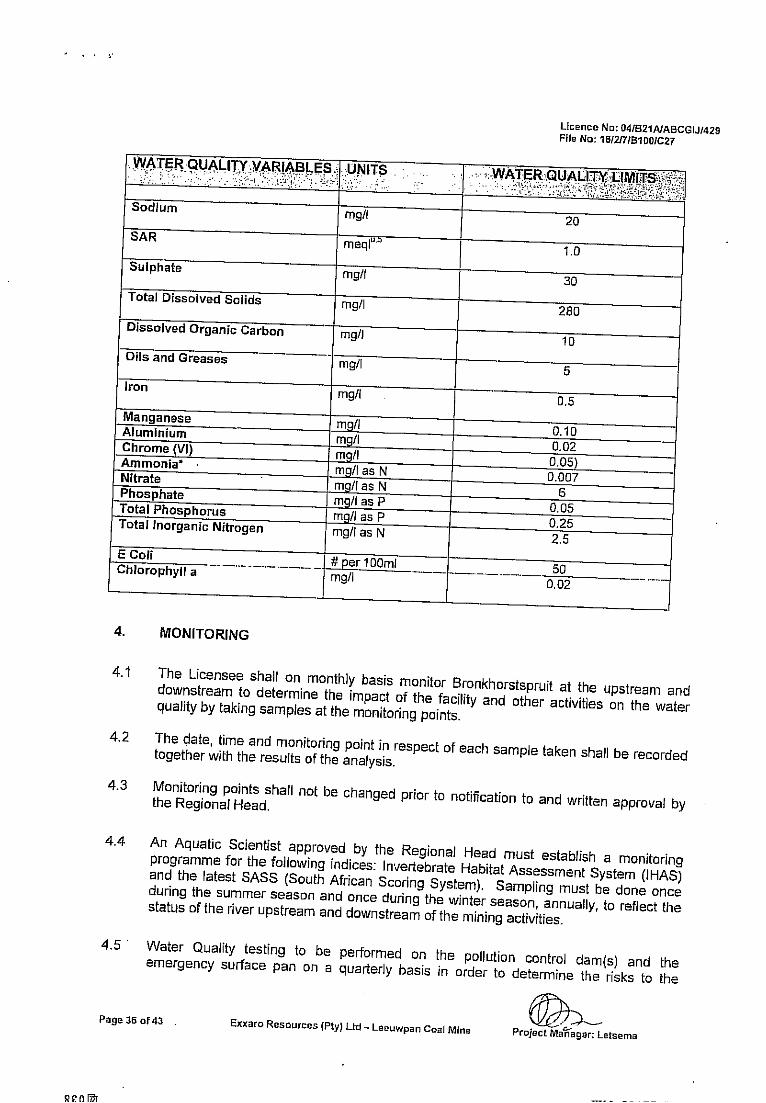
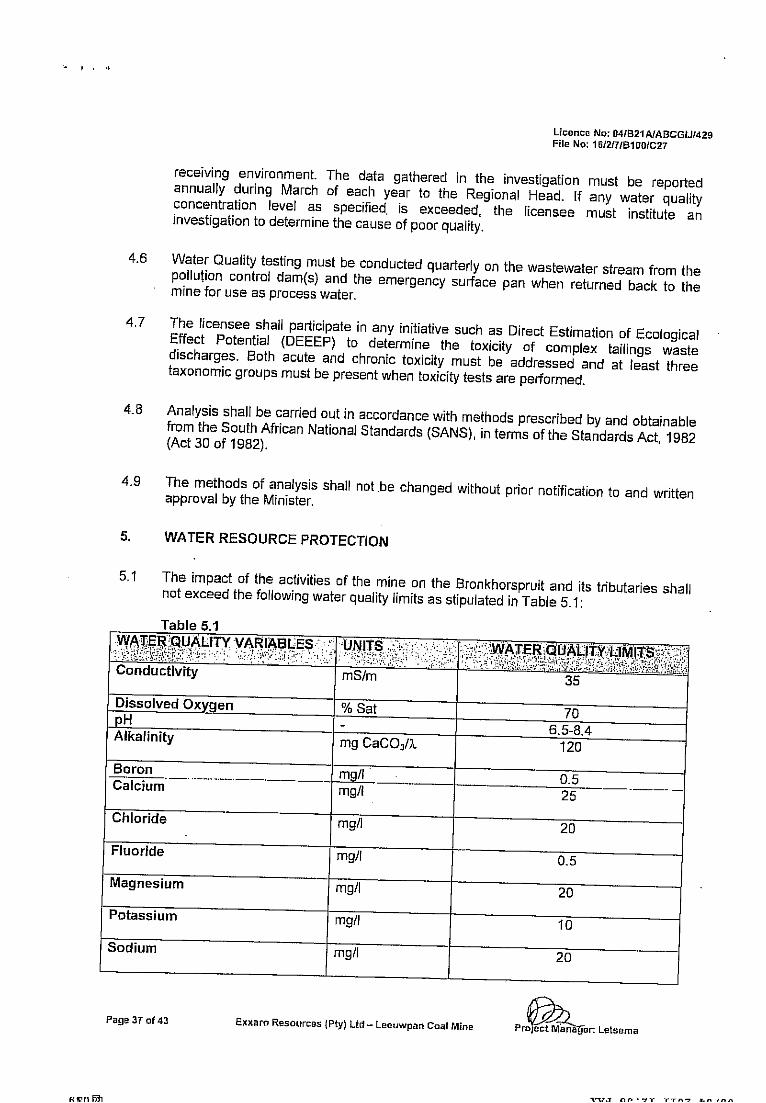
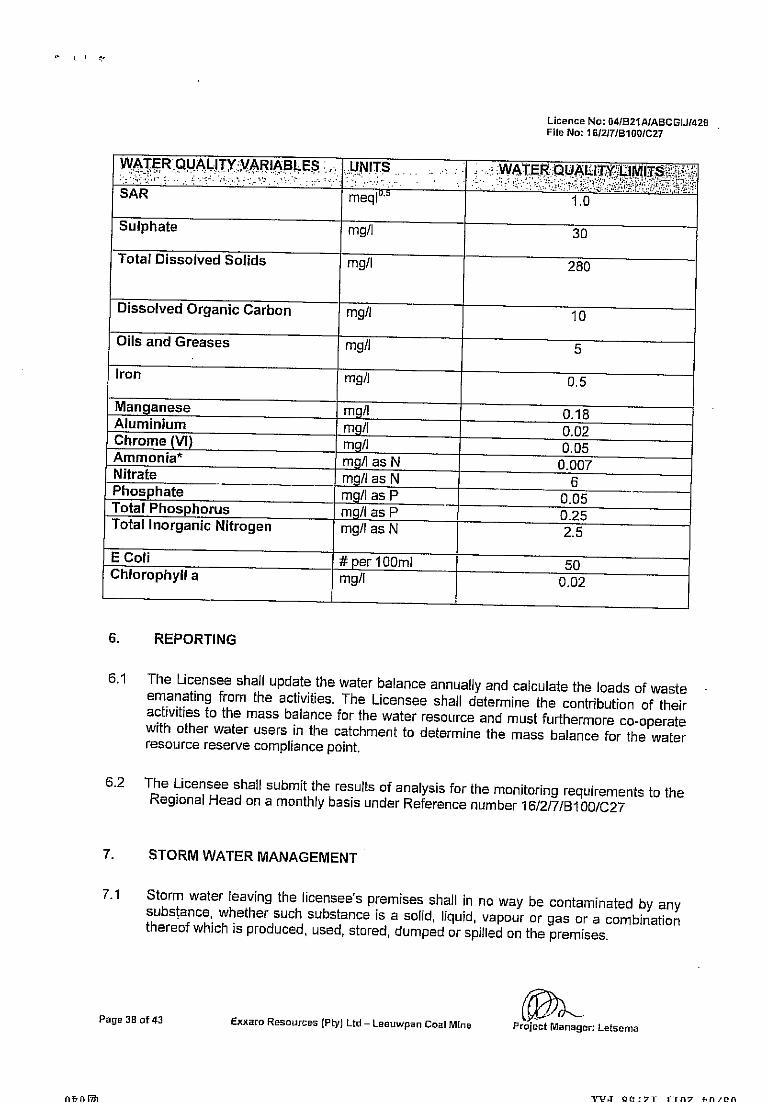
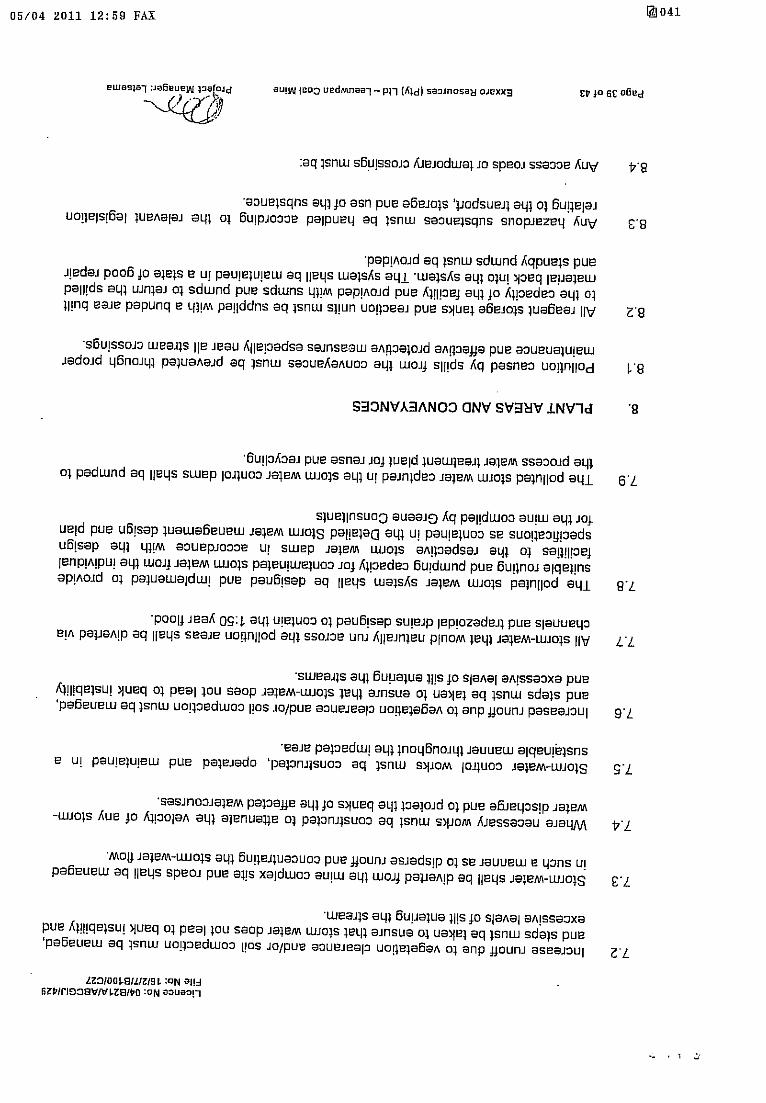
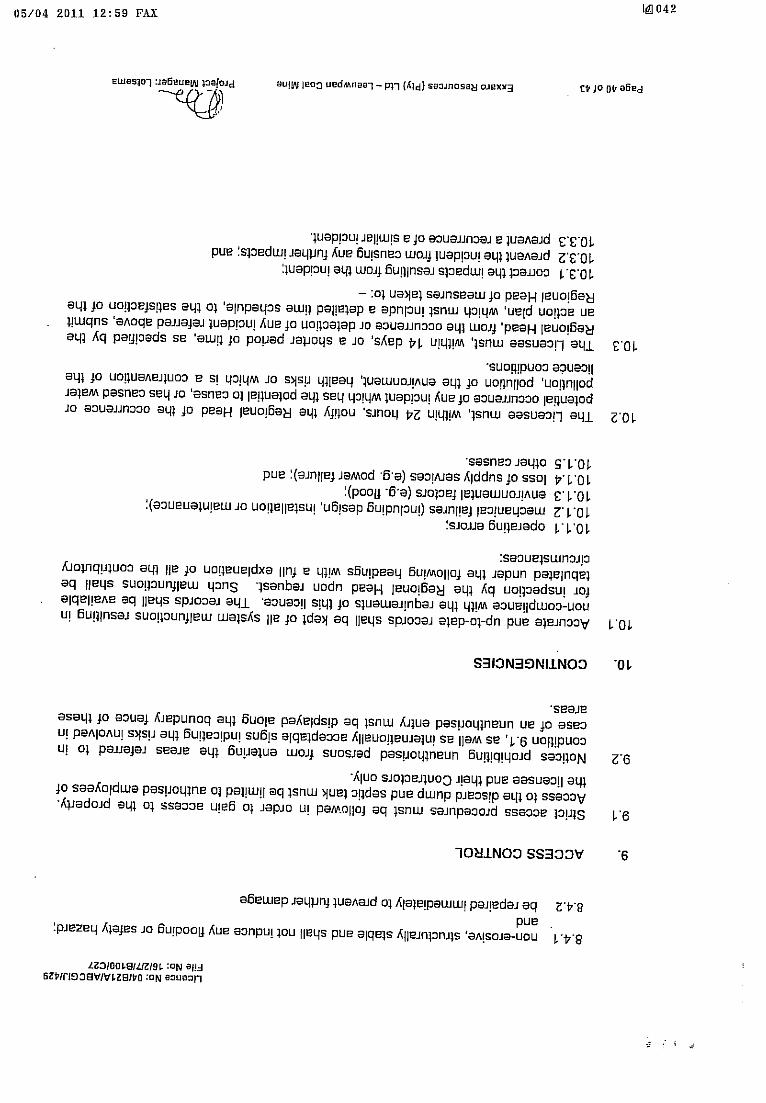
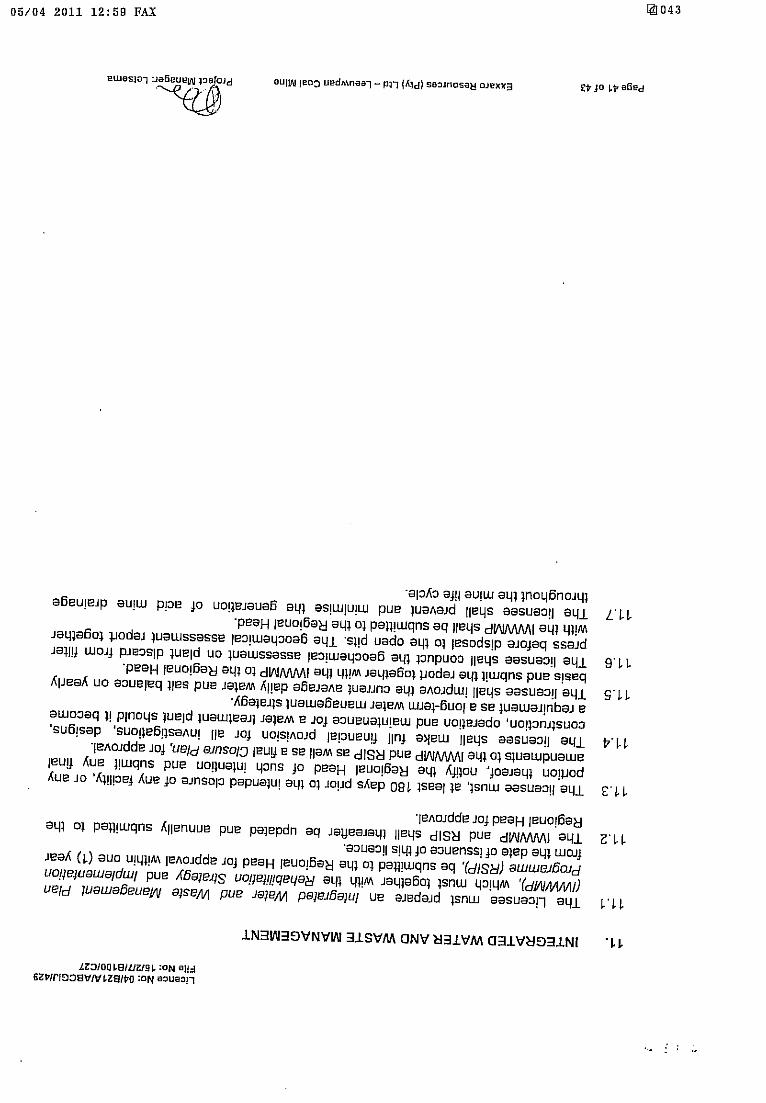
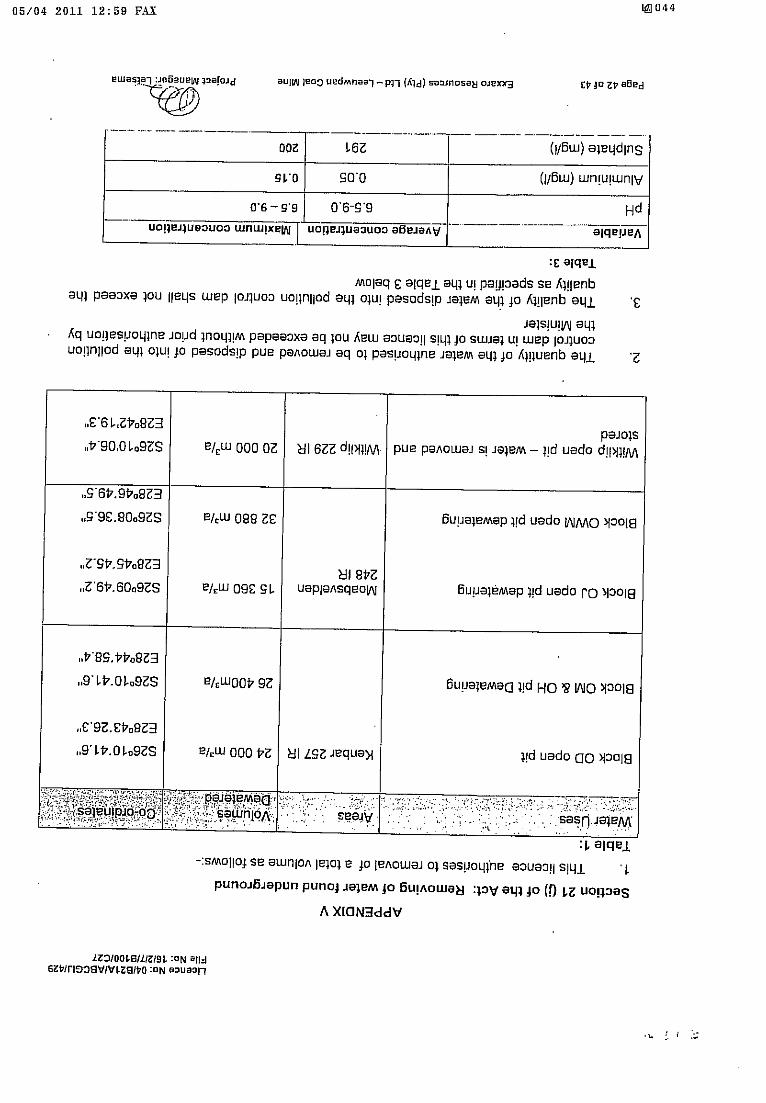
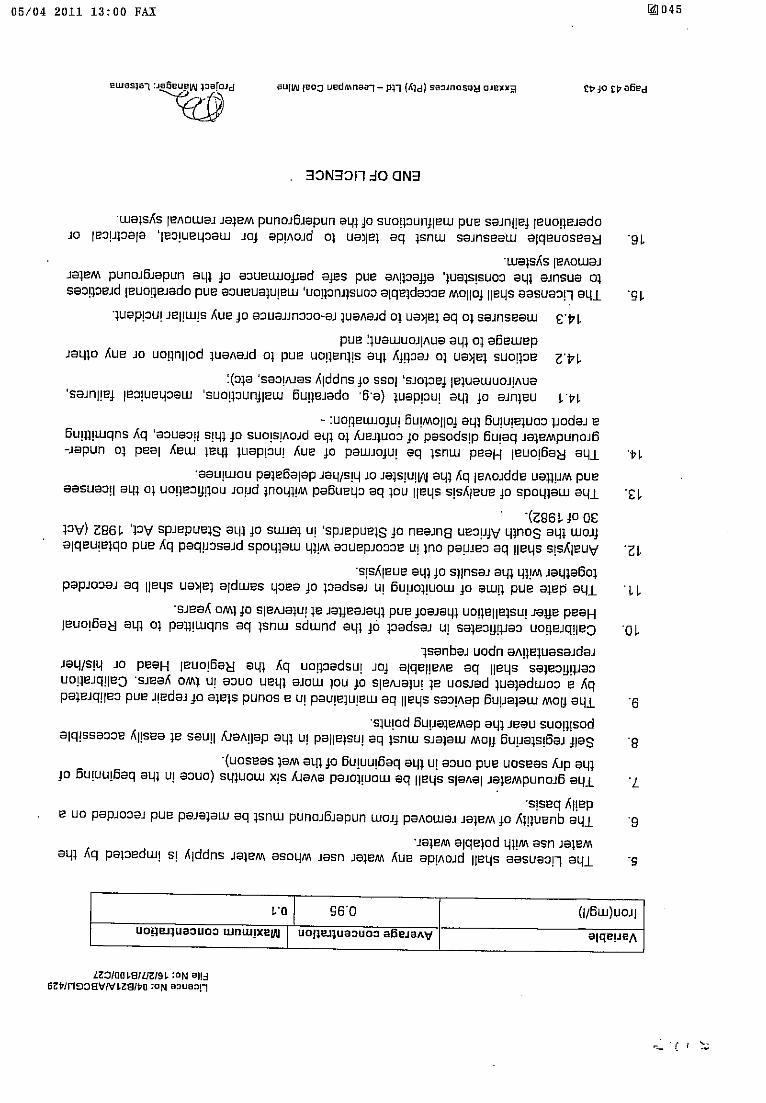
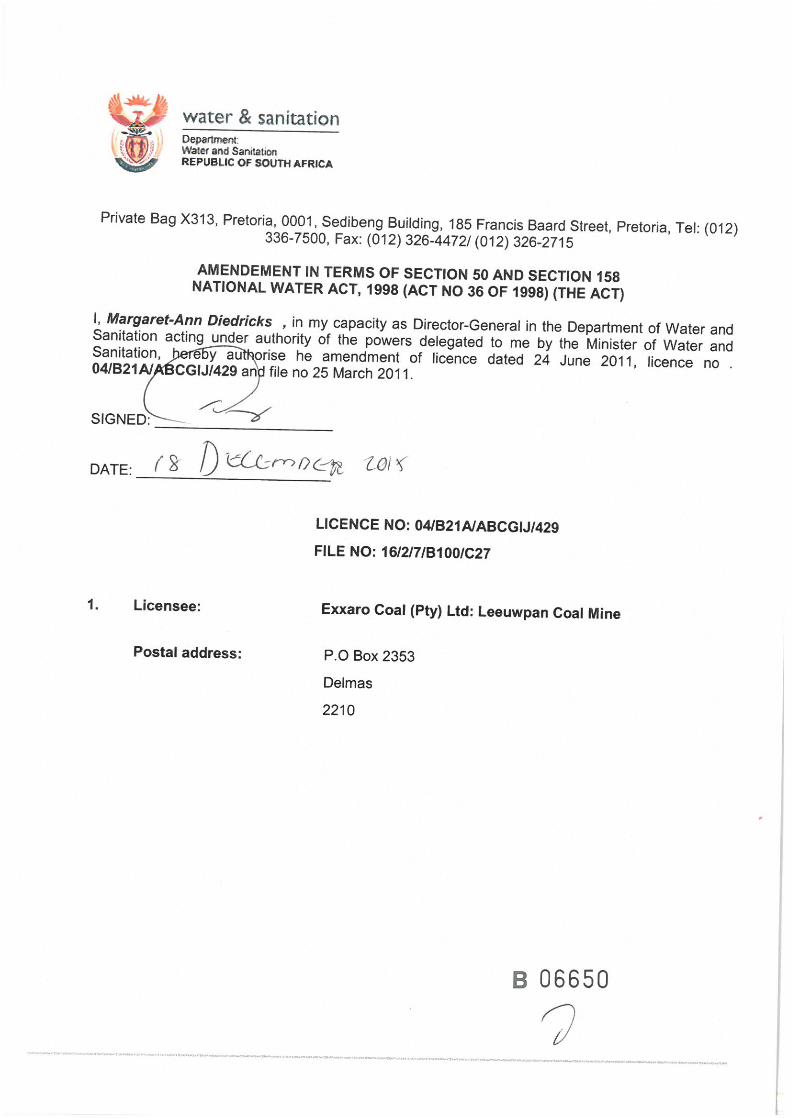
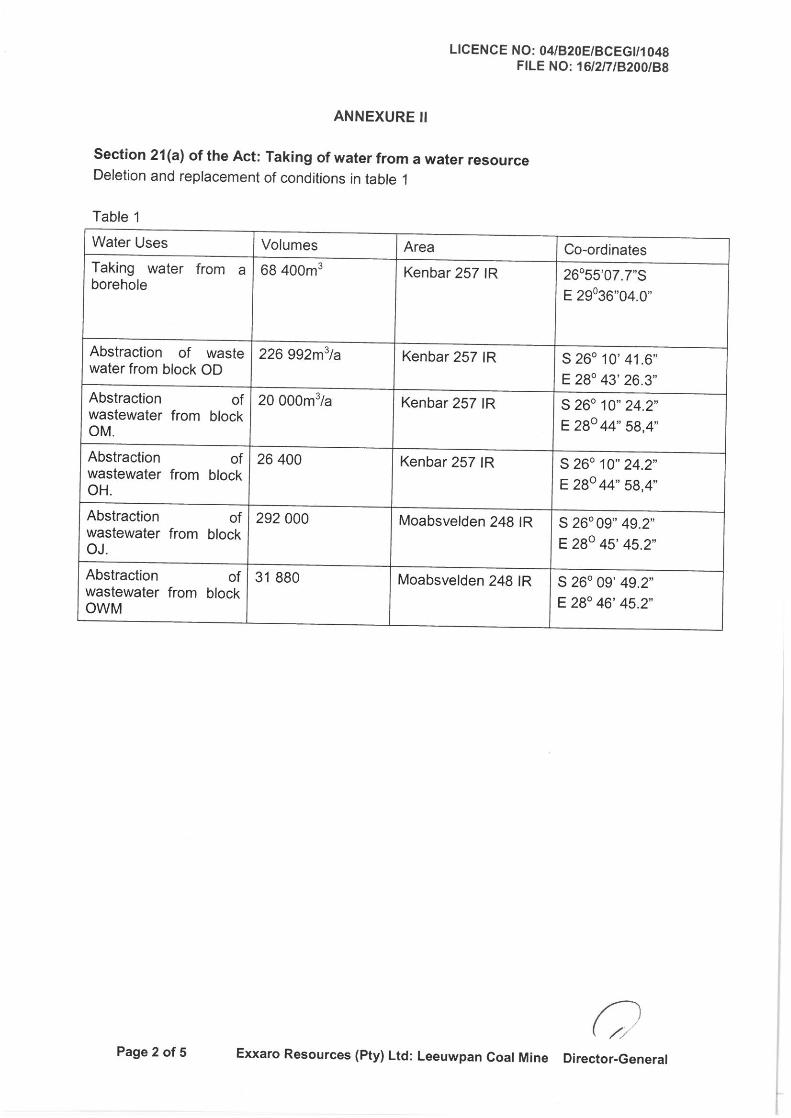
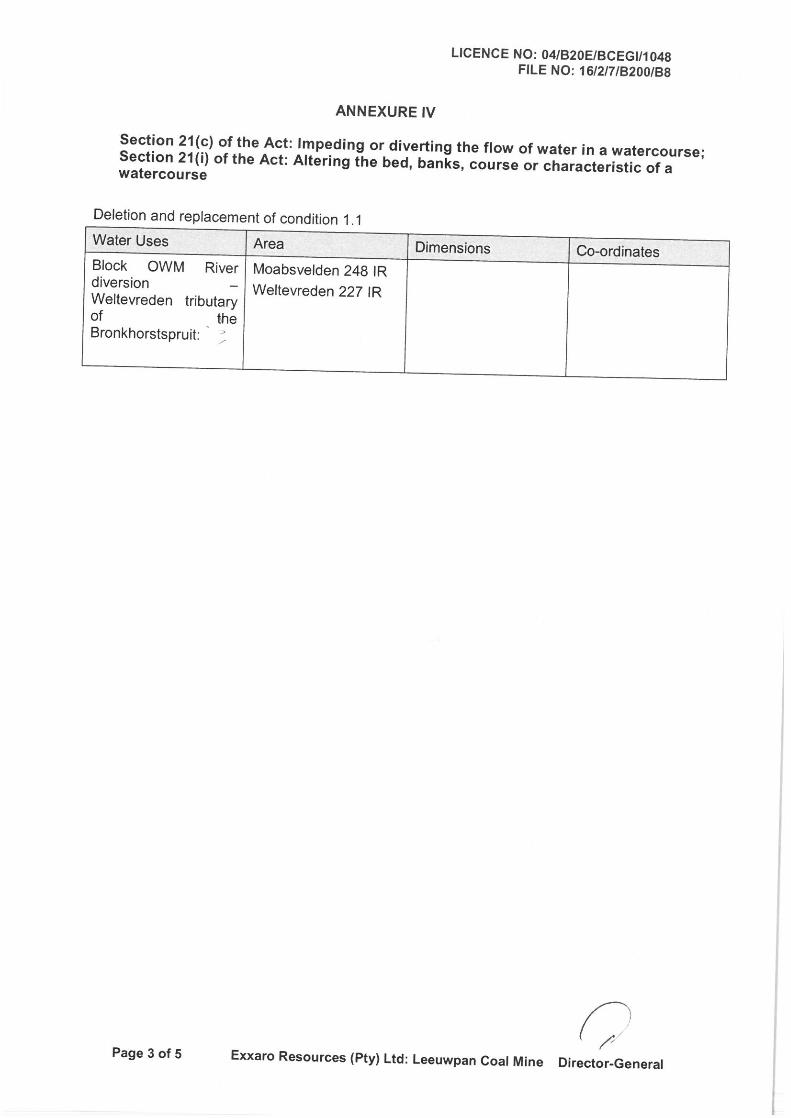
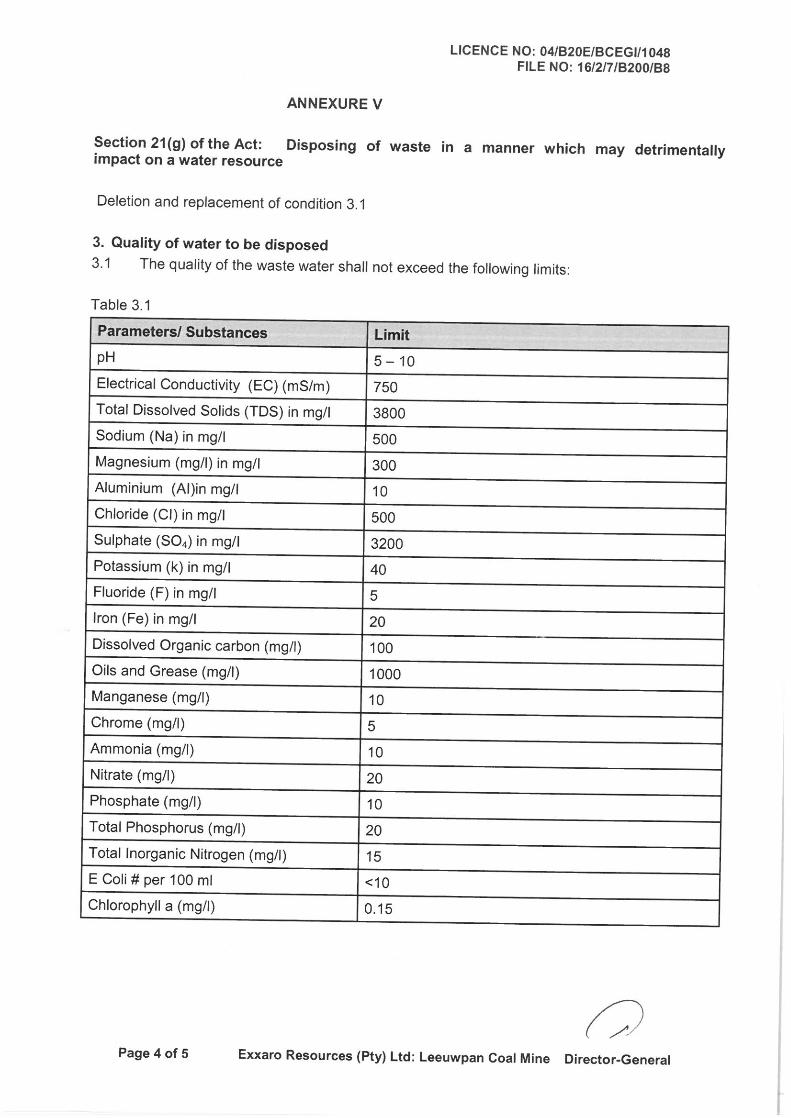
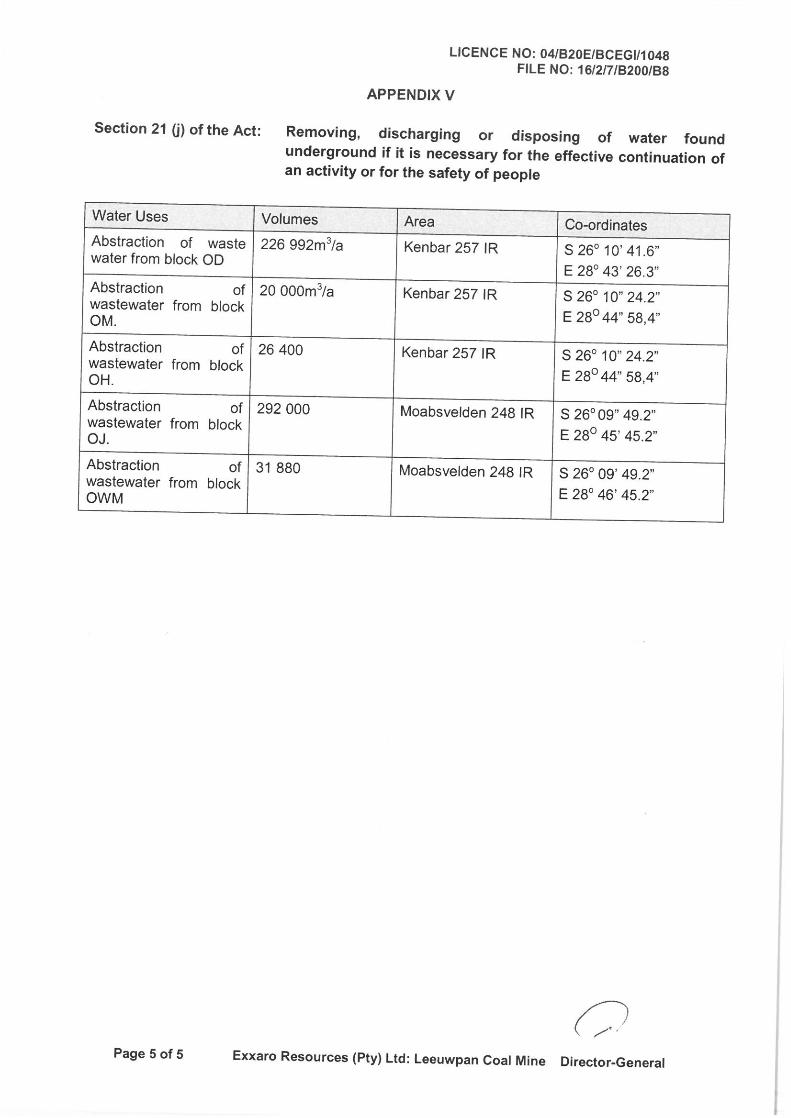
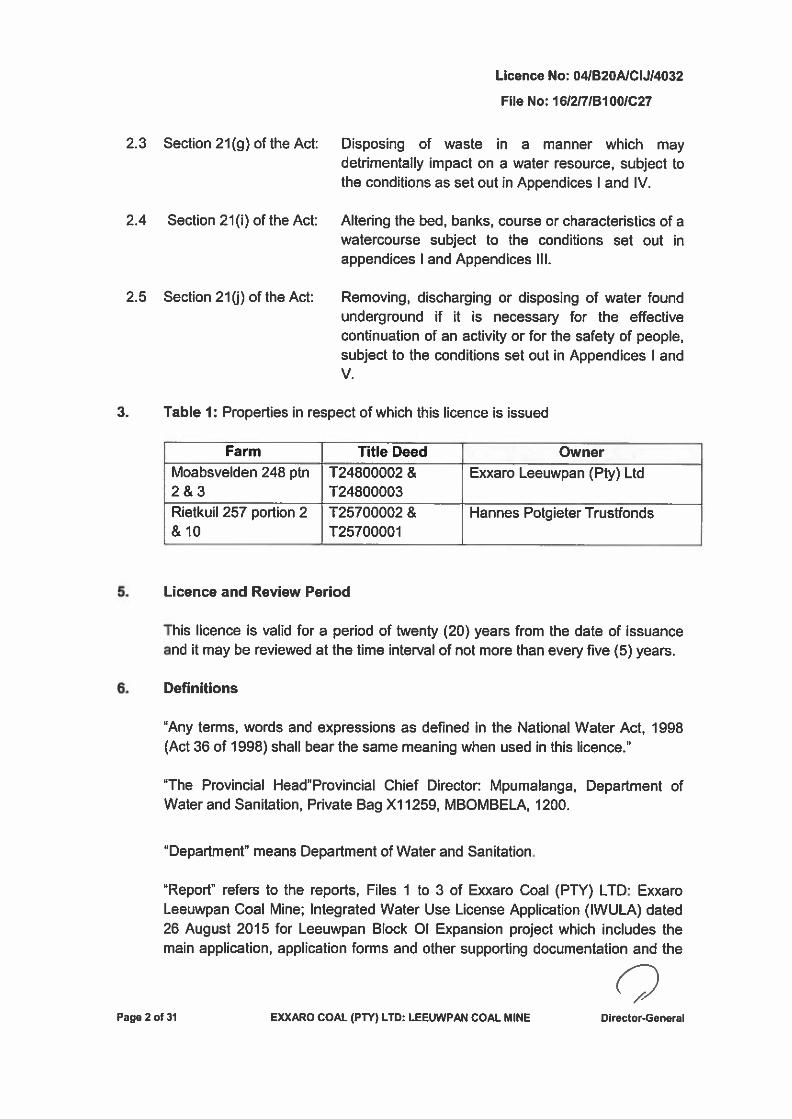
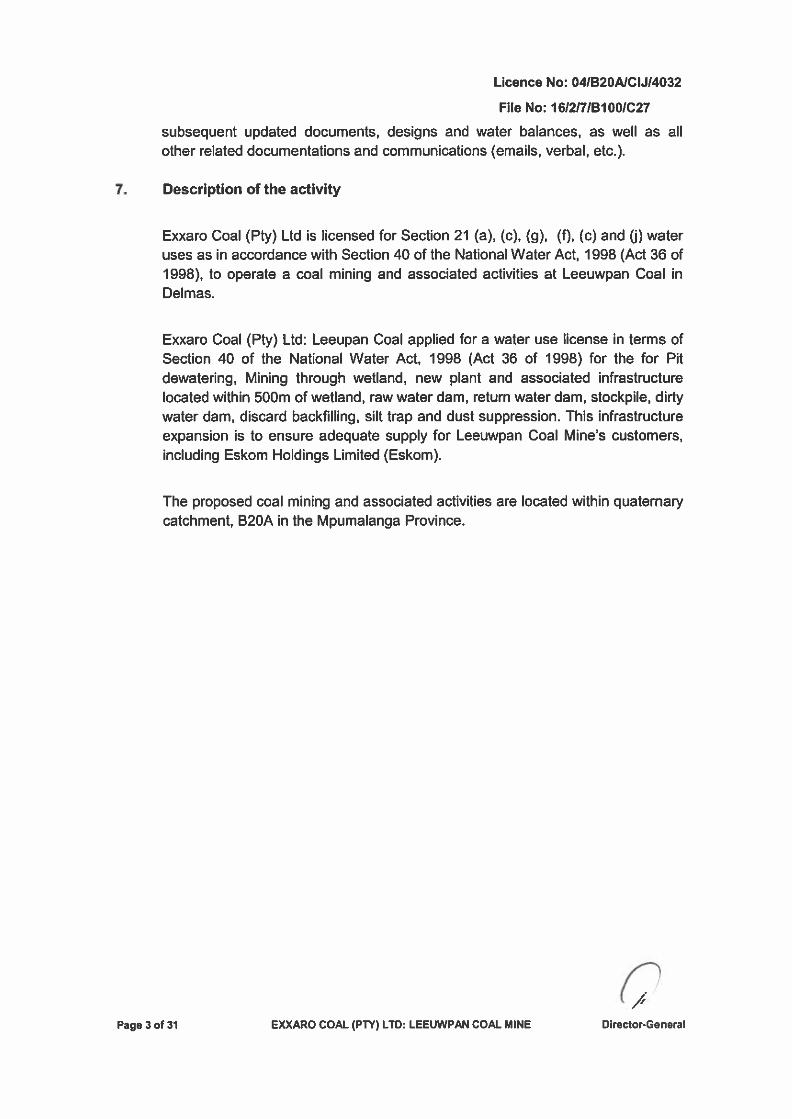
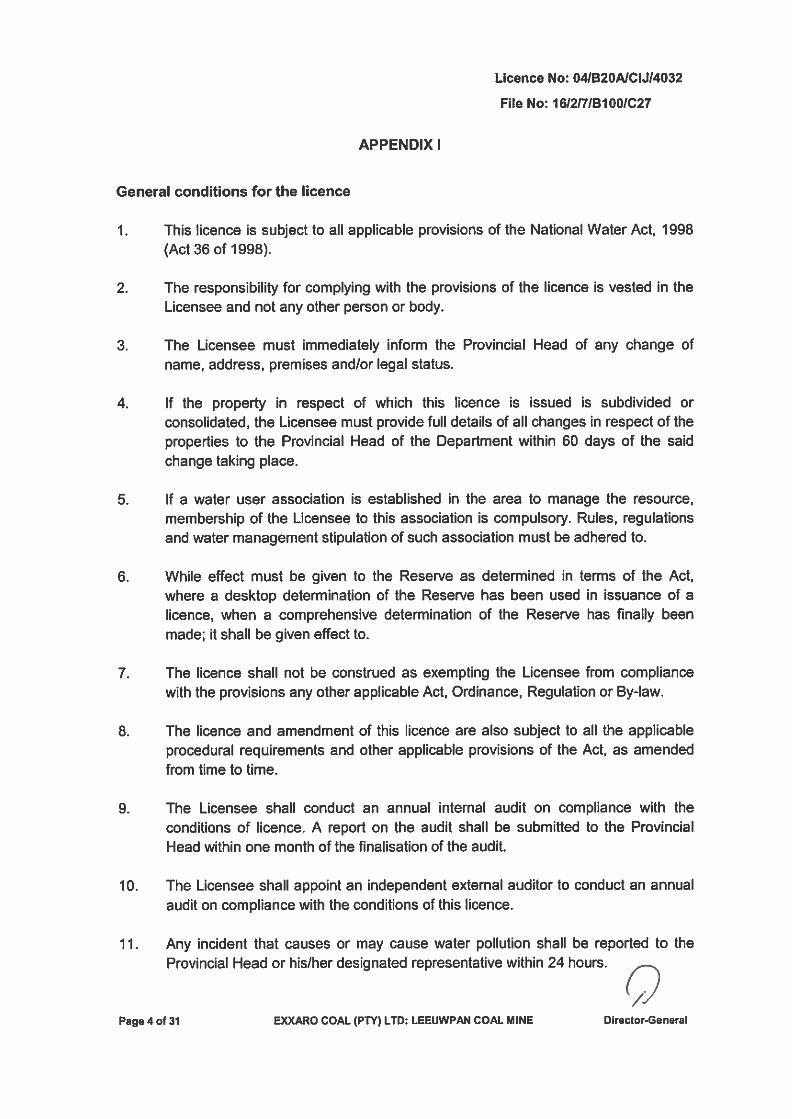
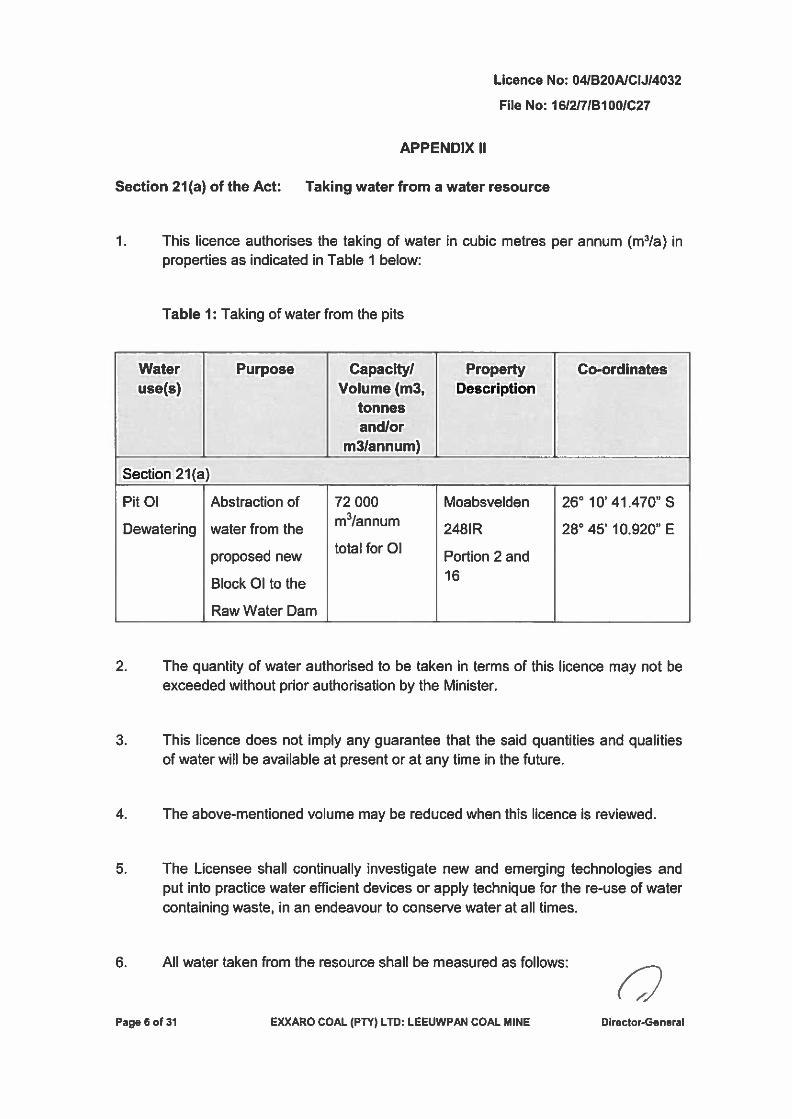
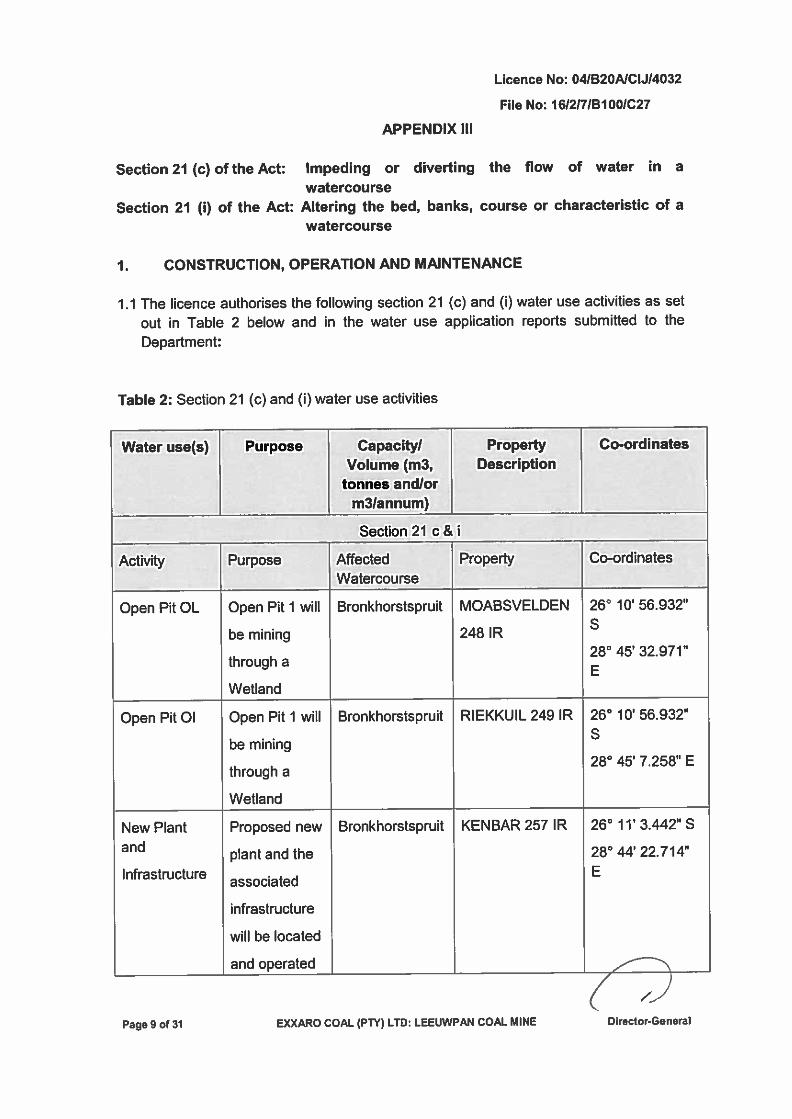
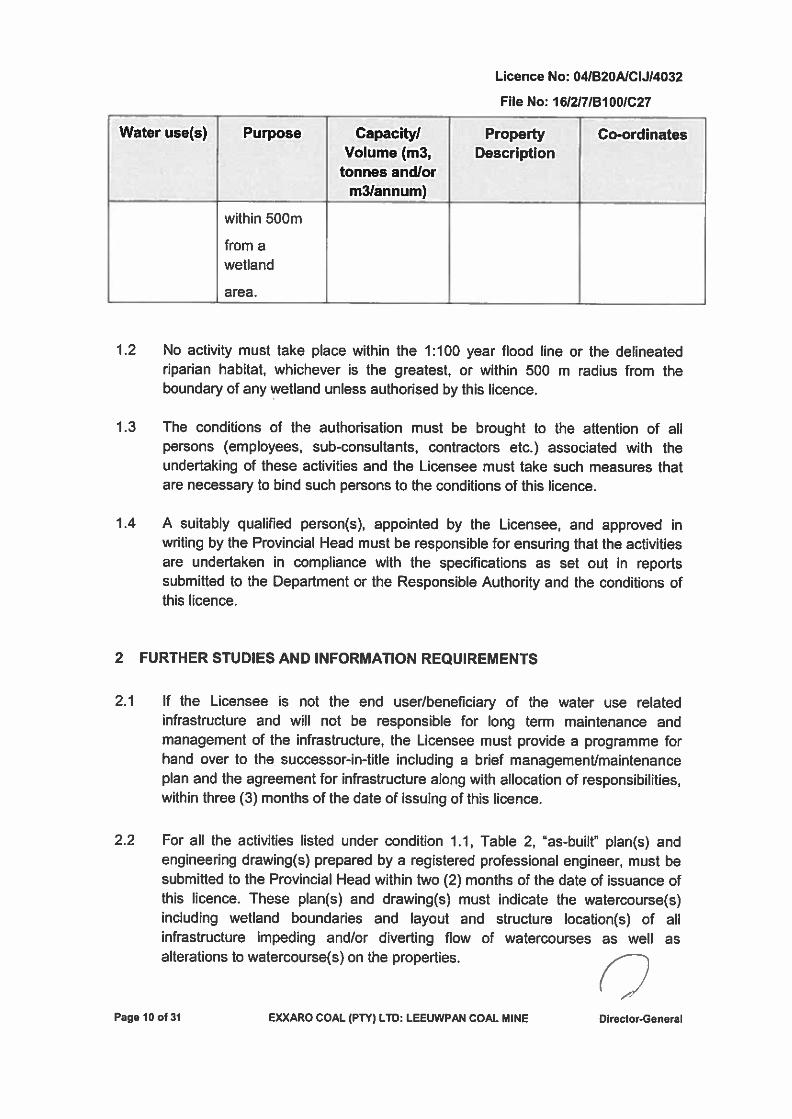
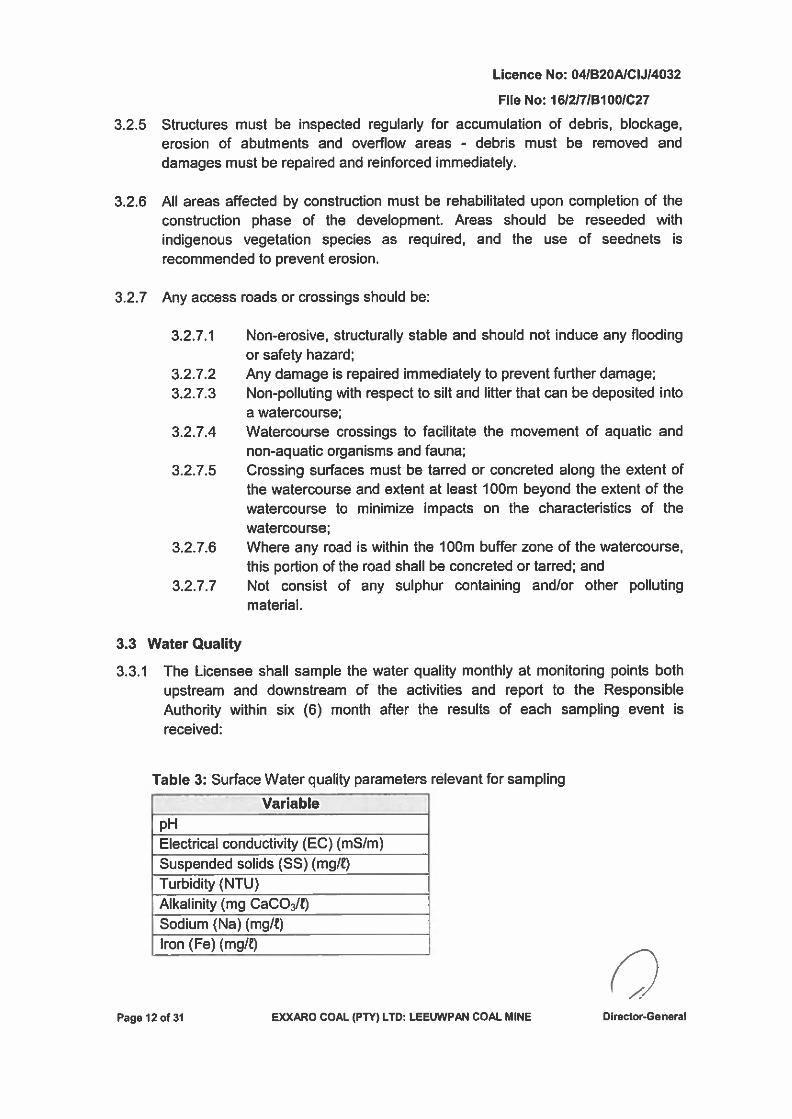
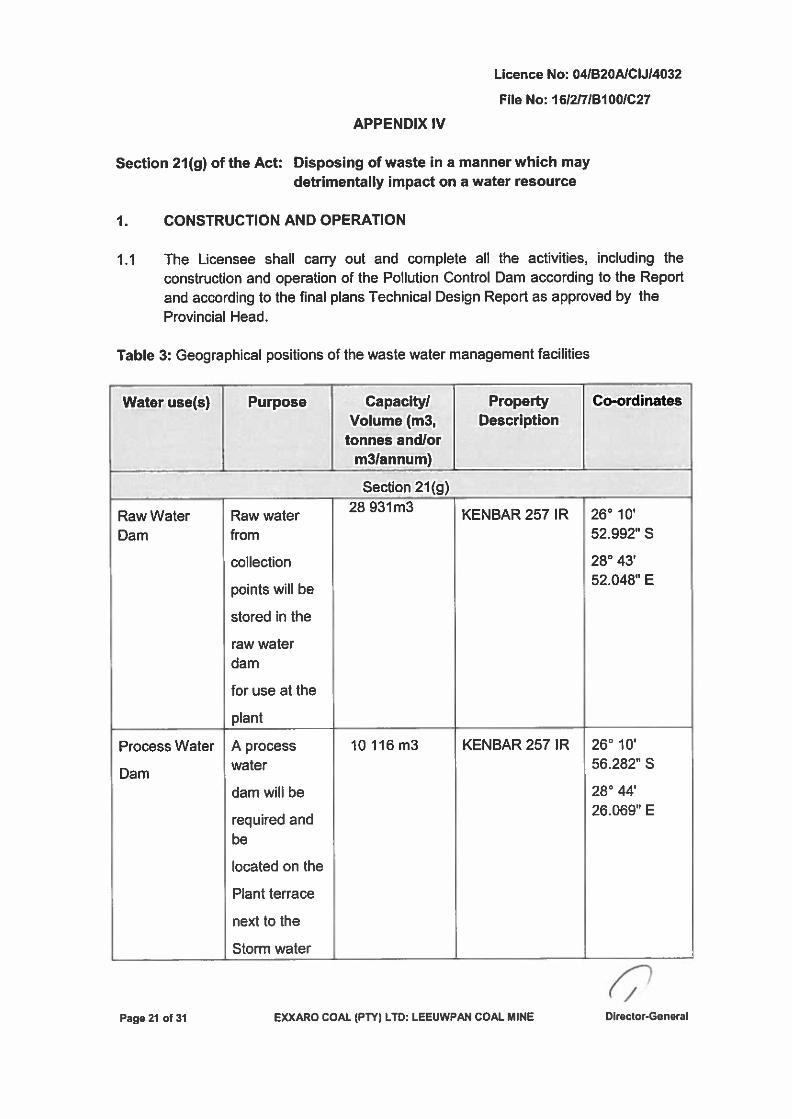
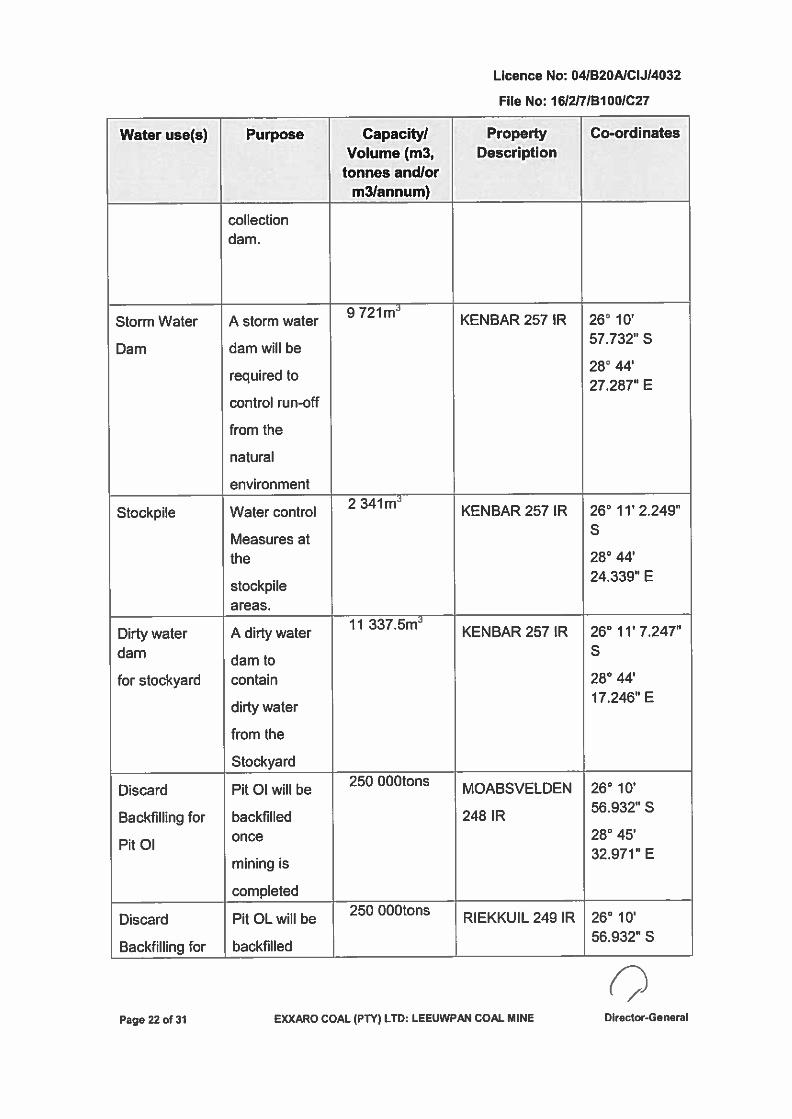
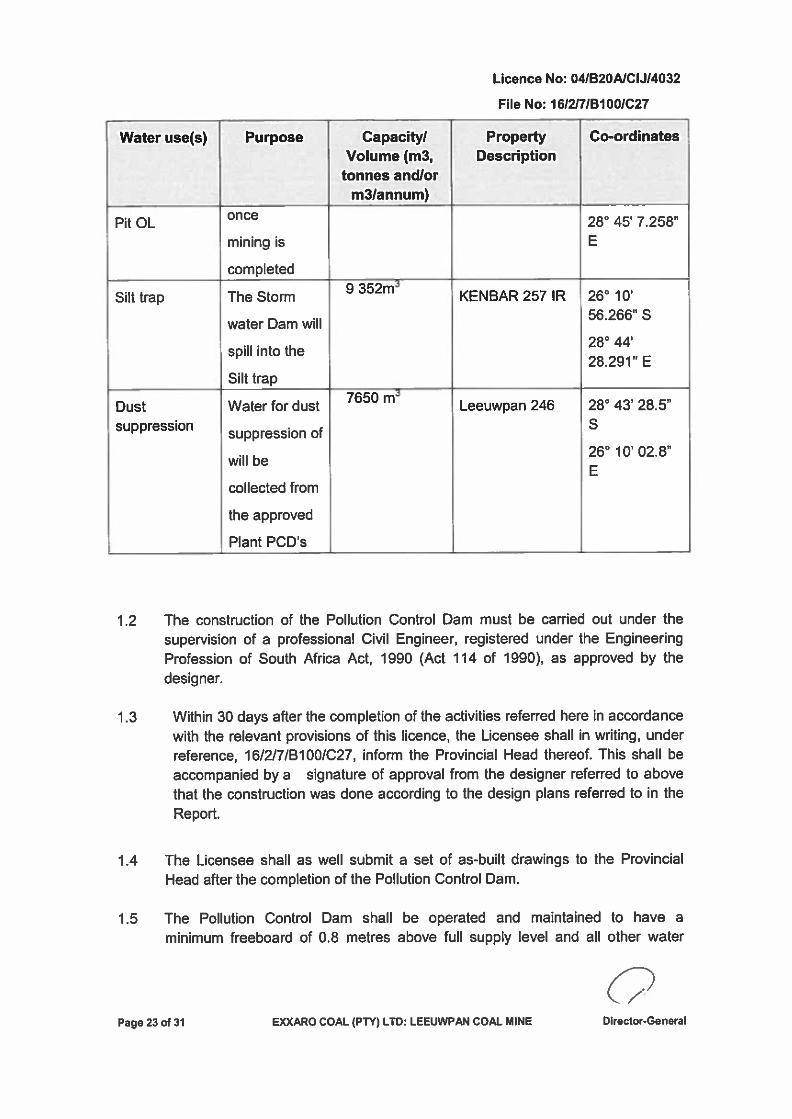
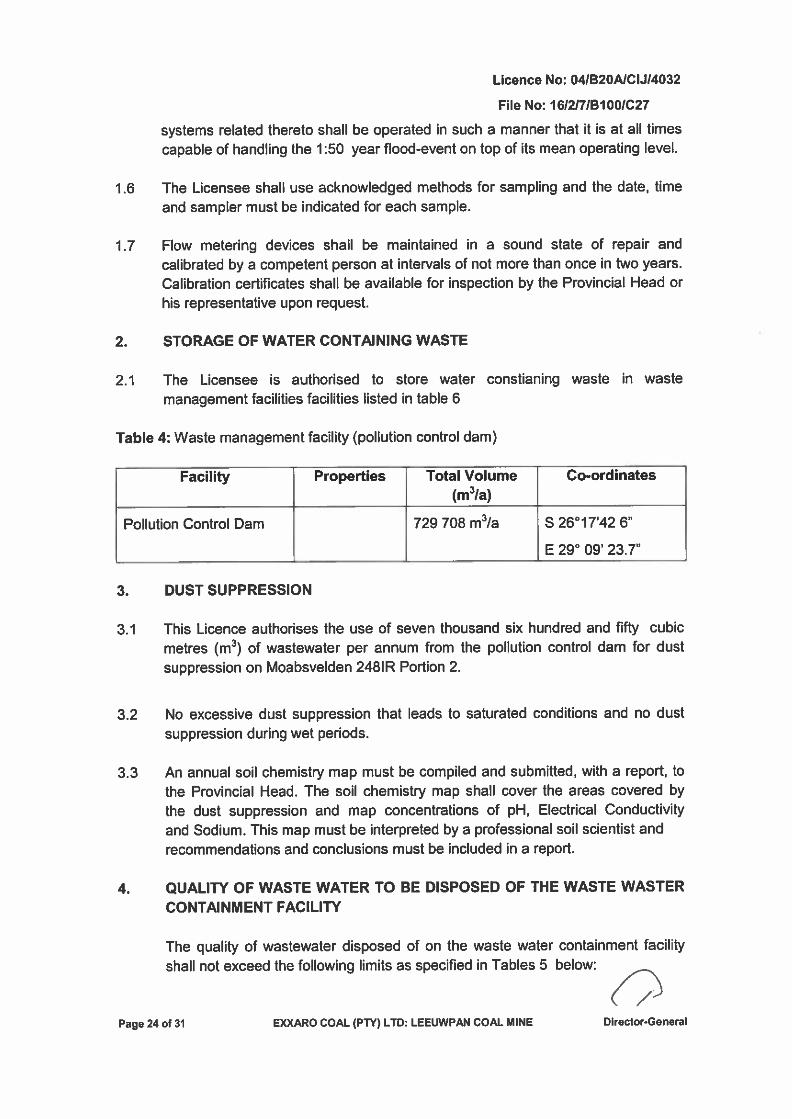
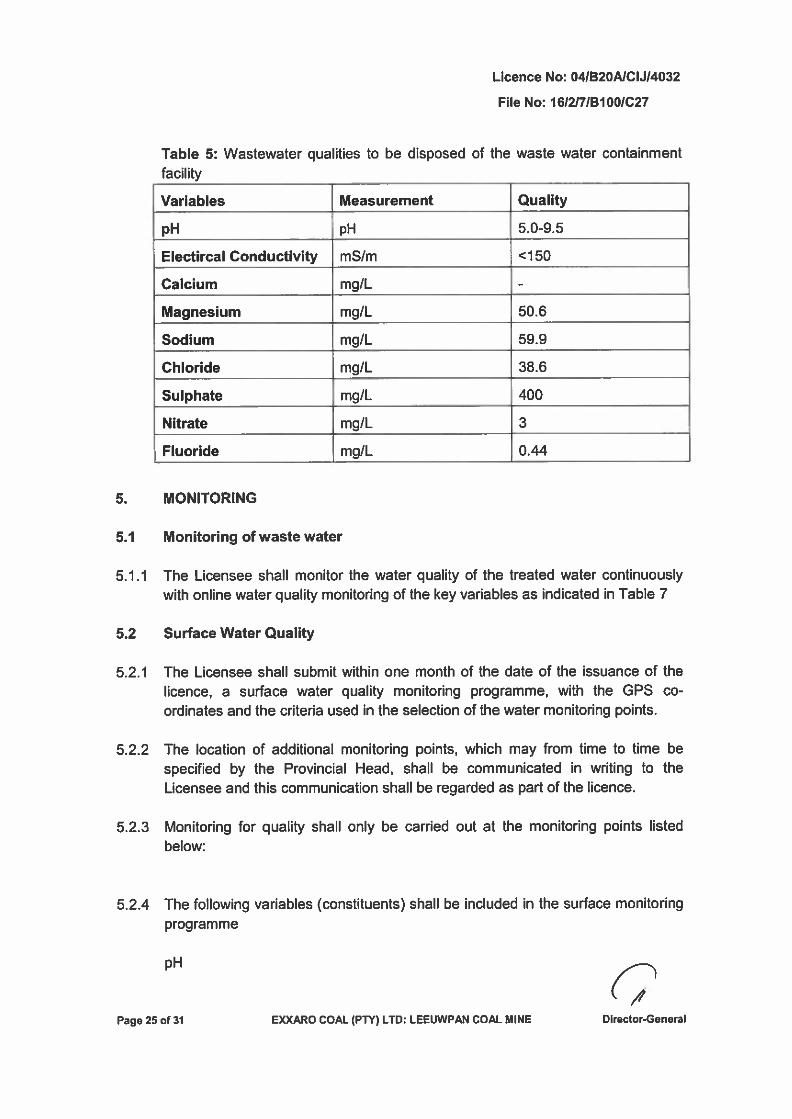
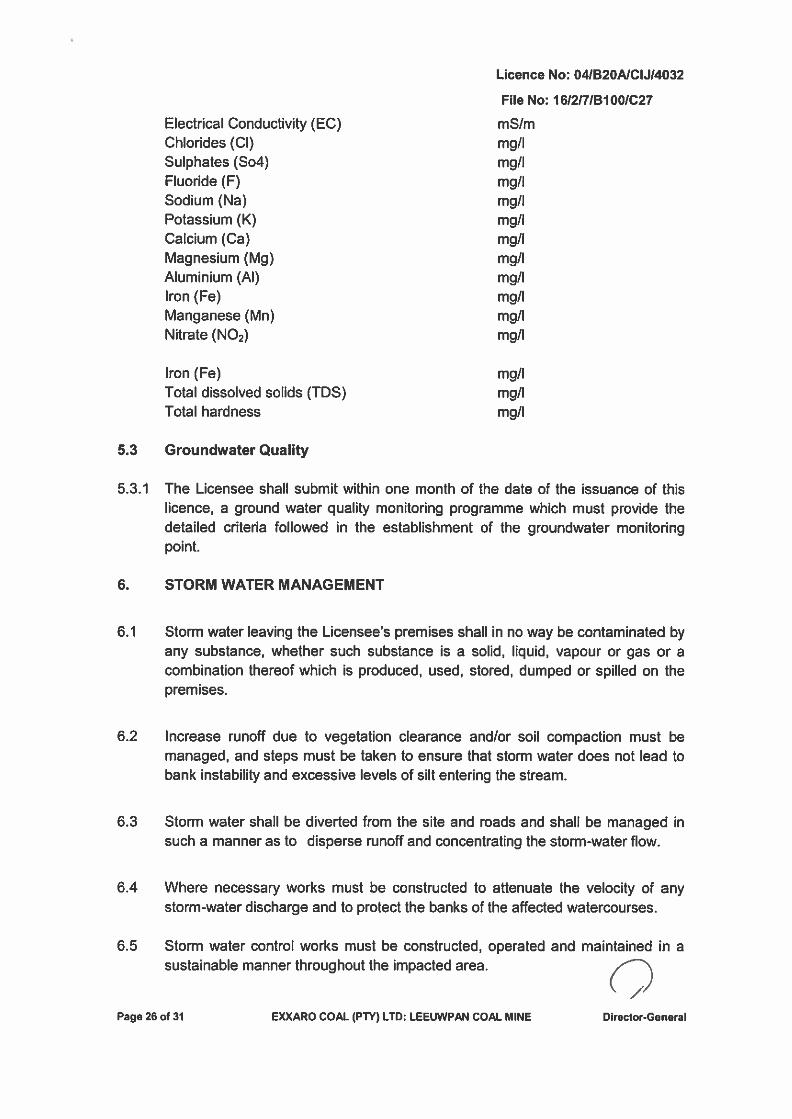
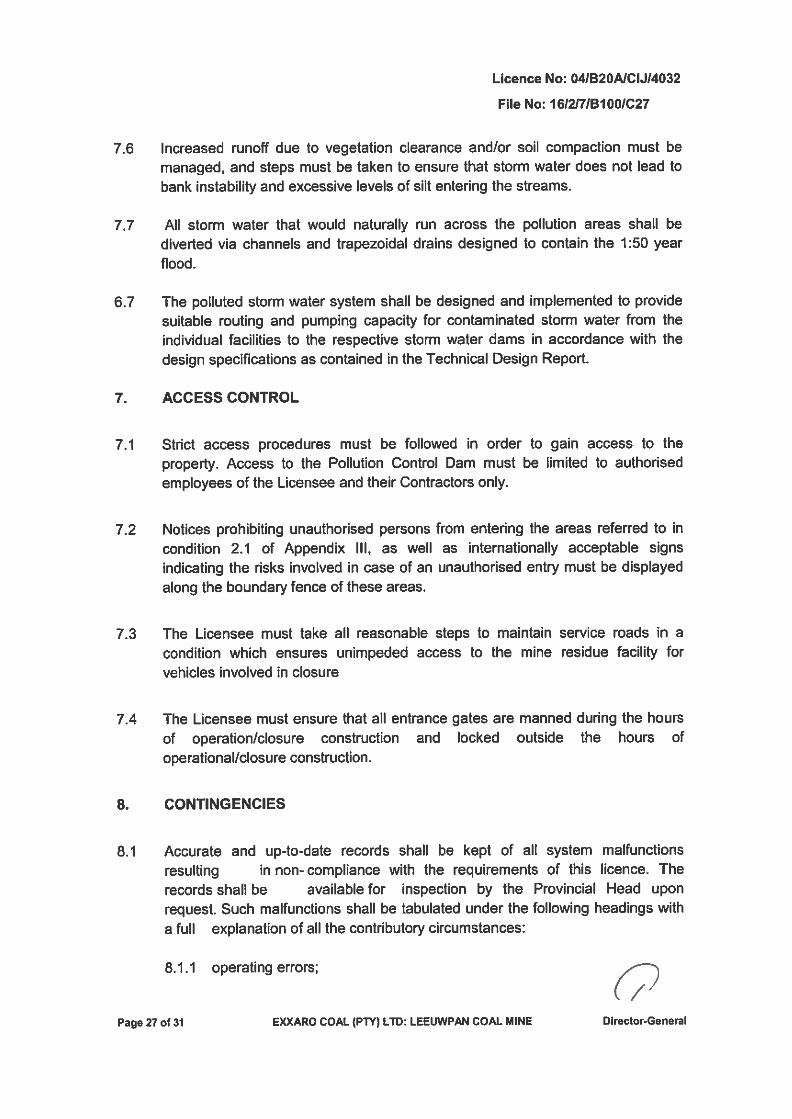
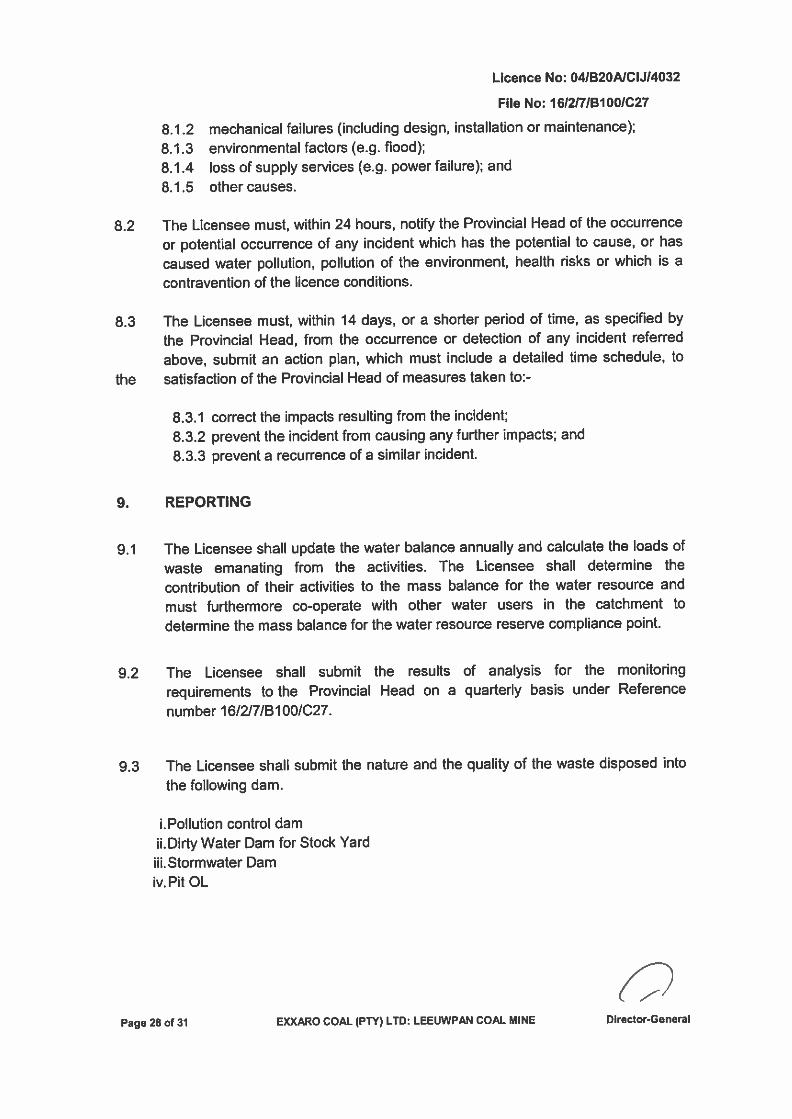
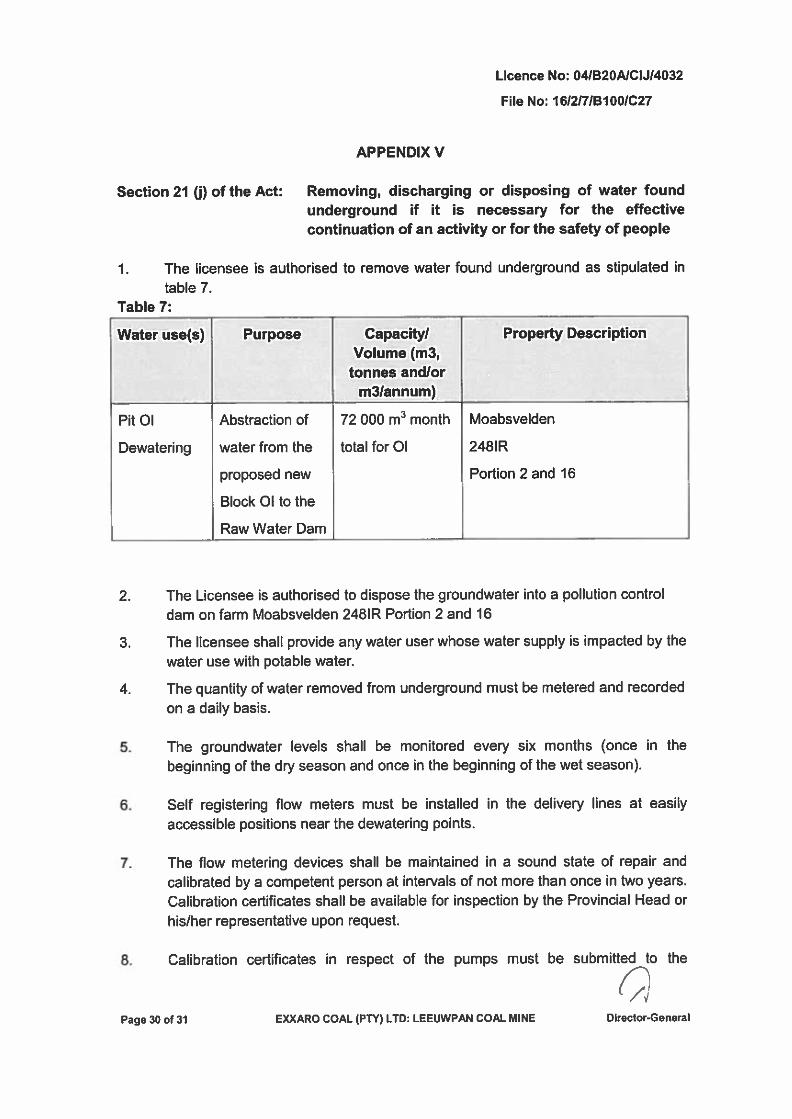
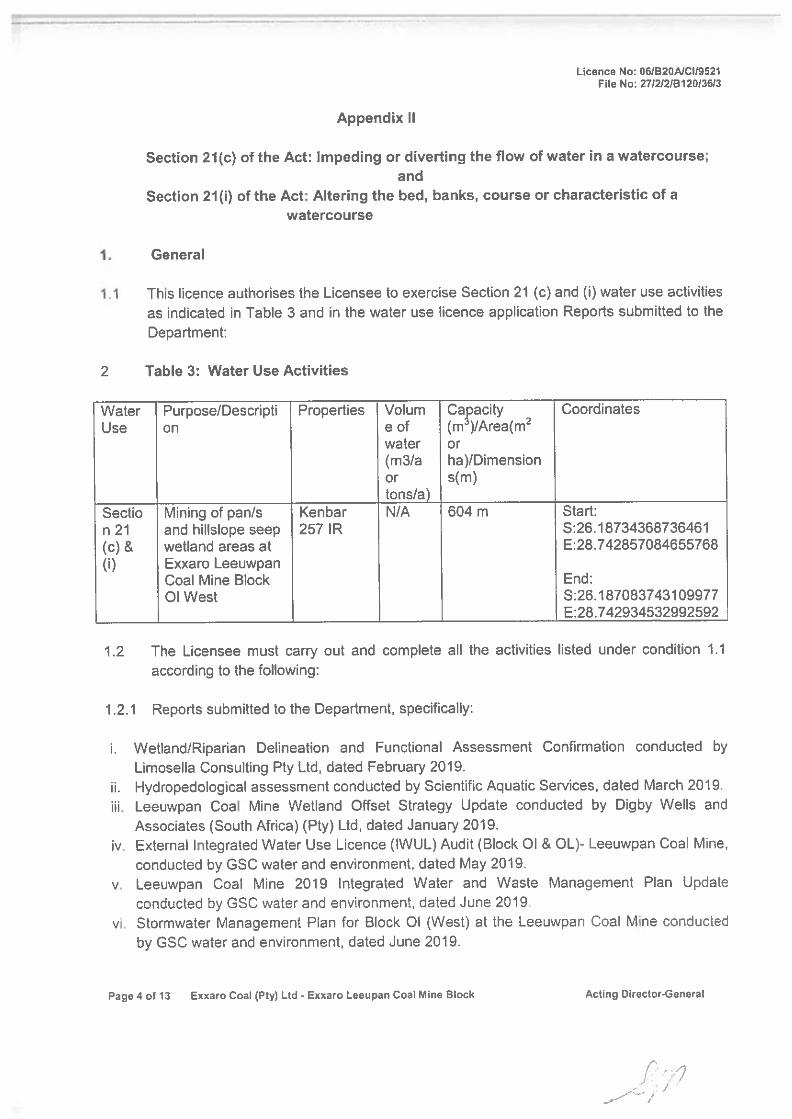
Annexure G Wetland Delineation Assessment
Wetland Delineation and Assessment for the Exxaro
Leeuwpan Coal Mine near Delmas, Mpumalanga
For:
Riana Panaino
P.O. Box 2597
Rivonia
2128
Tel: (011) 803 5726
By:
Wetland Consulting Services (Pty) Ltd
Wetland Consulting Services (Pty.) Ltd.
PO Box 72295
Lynnwood Ridge
Pretoria
0040
Tel: 012 349 2699
Fax: 012 349 2993
Email: [email protected]
Reference: 842/2012
Wetland Delineation and Assessment for the Exxaro Leeuwpan Colliery near Delmas, Mpumalanga
October 2012
DOCUMENT SUMMARY DATA
PROJECT: Wetland Delineation and Assessment for the Exxaro
Leeuwpan Coal Mine near Delmas, Mpumalanga
CLIENT: GCS (Pty.) Ltd.
CONTACT DETAILS: GCS (Pty.) Ltd.
Jaco Viviers
P.O. Box 2597
Rivonia
2128
Tel: (011) 803 5726
Email: [email protected]
CONSULTANT: Wetland Consulting Services, (Pty) Ltd.
CONTACT DETAILS: PO Box 72295
Lynnwood Ridge
0040
Telephone number: (012) 349 2699
Fax number: (012) 349 2993
E-mail: [email protected]
Wetland Delineation and Assessment for the Exxaro Leeuwpan Colliery near Delmas, Mpumalanga
October 2012
i
TABLE OF CONTENTS
1. BACKGROUND INFORMATION 6
2. SCOPE OF WORK 6
3. LIMITATIONS & ASSUMPTIONS 7
4. STUDY AREA 7
4.1 Catchments 8 4.2 Geology and Soils 9 4.3 Vegetation 10 4.4 National Freshwater Ecosystem Priority Areas 13
5. APPROACH 14
5.1 Wetland Delineation and Classification 14 5.2 Brief history of wetland delineation in South Africa 15 5.3 Water Quality and Diatoms 16 5.4 Functional Assessment 16 5.5 Present Ecological State and Ecological Importance & Sensitivity 17
6. FINDINGS 17
6.1 Wetland Delineation and Classification 17 6.2 Water Quality and Diatoms 20
6.2.1 Water Quality 20 6.2.2 Diatoms 22
6.3 Wetland Assessment 24 6.3.1 Functional Assessment 25 6.3.2 Hillslope seepage wetlands 25 6.3.3 Valley bottom wetlands 27 6.3.4 Pans/Depressions 28
6.4 Present Ecological Status (PES) Assessment 28 6.5 Ecological Importance and Sensitivity (EIS) 32
7. IMPACT ASSESSMENT 36
7.1 Project Description 36 7.2 Impact Assessment Methodology 37 7.3 Opencast Coal Mining 38
7.3.1 Loss and disturbance of wetland habitat 40 7.3.2 Increased surface runoff from bare soil areas 41 7.3.3 Increased sediment transport into wetlands 42 7.3.4 Decreased water make to downslope wetlands 42 7.3.5 Loss and disturbance of wetland habitat 43 7.3.6 Increased surface runoff from bare soil areas 43 7.3.7 Increased sediment transport into wetlands 44 7.3.8 Water quality deterioration 44 7.3.9 Altered hydrology 45
Wetland Delineation and Assessment for the Exxaro Leeuwpan Colliery near Delmas, Mpumalanga
October 2012
ii
7.3.10 Deteriorating water quality 45 7.3.11 Increased sediment transport into wetlands 46 7.3.12 Increase in alien vegetation 46
7.4 Conveyors and roads 47 7.4.1 Loss and disturbance of wetland habitat 48 7.4.2 Increased erosion and sedimentation 48 7.4.3 Deteriorating Water Quality due to Coal Spillages 49 7.4.4 Stormwater discharge into the wetlands 49 7.4.5 Altered flows in the wetland 50 7.4.6 Mobilisation of pollutants 50 7.4.7 Disturbance of wetland habitat and fauna 51 7.4.8 Increased sediment movement into wetlands 51
7.5 Other linear infrastructure 52 7.5.1 Loss and disturbance of wetland habitat 52 7.5.2 Increased erosion and sedimentation 53 7.5.3 Piping and preferential flow paths 53 7.5.4 Altered water movement through the landscape 53 7.5.5 Water quality deterioration 54 7.5.6 Water quality deterioration due to leaks or pipe failure 54 7.5.7 Disturbance to wetland habitat due to maintenance activities 54 7.5.8 Mobilisation of pollutants 55 7.5.9 Disturbance of wetland habitat and fauna 55 7.5.10 Increased sediment movement into wetlands 55
7.6 Surface infrastructure 56 7.6.1 Loss of wetland habitat 56 7.6.2 Increased sediment movement into wetlands 58 7.6.3 Increase in alien and pioneer vegetation 58 7.6.4 Water quality deterioration 59 7.6.5 Increased surface runoff and erosion 59 7.6.6 Deterioration in water quality 60 7.6.7 Mobilisation of pollutants 60 7.6.8 Disturbance of wetland habitat and fauna 61 7.6.9 Increased sediment movement into wetlands 61
7.7 Water management infrastructure 62 7.7.1 Loss of wetland habitat 62 7.7.2 Increased sediment movement into wetlands 64 7.7.3 Increase in alien and pioneer vegetation 64 7.7.4 Water quality deterioration 65 7.7.5 Water quality deterioration - Seepage out of the dams 65 7.7.6 Water quality deterioration – Overflow of dams 66 7.7.7 Erosion due to overflow of dams 66 7.7.8 Disturbance to wetland habitat and biota 67 7.7.9 Increased occurrence of alien and weedy species 67 7.7.10 Water quality deterioration 68 7.7.11 Increased sediment movement into wetlands 68
8. REHABILITATION 69
8.1 Fencing or demarcation of affected area 69 8.2 Re-vegetation/ rehabilitation 69 8.3 The eradication of invasive plant species 70 8.4 Guide to installing erosion and siltation preventing devices: 71
9. MONITORING & EVALUATION 73
9.1 Vegetation re-establishment 73
Wetland Delineation and Assessment for the Exxaro Leeuwpan Colliery near Delmas, Mpumalanga
October 2012
iii
9.2 Erosion 73 9.3 Surface water quality monitoring program 73
10. CONCLUSION 75
11. REFERENCES 78
APPENDIX 1: 81
APPENDIX 2: 84
APPENDIX 3: 87
TABLE OF FIGURES Figure 1: Map showing the location of the study area within the mining right area of Leeuwpan Coal Mine ...................................................................................................................................................................... 8
Figure 2: Map showing the Leeuwpan Coal Mine study area in relation to the quaternary catchment ...................................................................................................................................................................... 9
Figure 3: Geology map of the Leeuwpan Coal Mine mining right area derived from the 1:250 000 geological map of the area, 2628 East Rand ................................................................................................... 10
Figure 4: Map showing the vegetation mapping units of the area according to Mucina and Rutherford (2006) ..................................................................................................................................................... 11
Figure 5: Extract of the Atlas of Freshwater Ecosystem Priority Ares in South Africa (Nel et al., 2011) ............................................................................................................................................................................. 14
Figure 6: Diagram illustrating the position of the various wetland types within the landscape ........ 15
Figure 7: Map of the delineated wetlands on within the Leeuwpan Coal Mine mining right areas and adjacent areas ................................................................................................................................................... 19
Figure 8: Map showing the location of water quality and diatom sampling sites .................................. 20
Figure 9: Map of the wetland units within the Leuwpan Coal Mine mining right area showing the numbering system .................................................................................................................................................... 24
Figure 10: Radial plots showing the results of the WET-EcoServices assessment ............................ 26
Figure 11: Radial plots showing the results of the WET-EcoServices assessment ............................ 28
Figure 12: Radial plots showing the results of the WET-EcoServices assessment ............................ 28
Figure 13: Results of the PES assessments for wetlands on site ............................................................. 30
Figure 14: Map showing the numbering system used for the pans .......................................................... 31
Figure 15: Map showing the results of the EIS assessment ....................................................................... 35
Figure 16: Delineated wetlands within the proposed opencast pits. Wetlands to be mined through have been highlighted in orange .......................................................................................................................... 39
Figure 17. Map showing the proposed surface infrastructure and mining areas. ................................ 47
Figure 18: Proposed new surface infrastructure in relation to delineated wetlands ............................ 57
Figure 19: Proposed new water management infrastructure in relation to delineated wetlands ..... 63
Wetland Delineation and Assessment for the Exxaro Leeuwpan Colliery near Delmas, Mpumalanga
October 2012
iv
Figure 20: A siltation screen below a construction site to prevent the movement of sediment downstream (image from www.wikipedia.com) ............................................................................................... 71
Figure 21: Photograph of fibre rolls from EPA erosion control website ................................................... 72
Figure 22: Additional points (shown as yellow circles) to include within the surface water quality monitoring programme for the mine .................................................................................................................... 74
Figure 23: Map showing the delineated wetlands on site with a 500m buffer. Any activity proposed within the buffer area will require authorisation under a Water Use License. .................... 77
TABLE OF TABLES Table 1: Table showing the mean annual precipitation, run-off and potential evaporation per quaternary catchment (Middleton, B.J., Midgley, D.C and Pitman, W.V., 1990) .................................... 8
Table 2: Table showing the extent of the various geological formations on site .................................. 10
Table 3: Summarised findings of the wetland ecosystem threat status assessment as undertaken by the National Biodiversity Assessment 2011: Freshwater Component (Nel et al., 2011b) for wetland ecosystems recorded on site ................................................................................................................ 12
Table 4: Extent of the various wetland types recorded on site................................................................... 17
Table 5: Results of the water quality analyses undertaken ......................................................................... 21
Table 6: Results of the ICP-OES scan for metals undertaken for the water samples ........................ 22
Table 7. Results of the PES assessment. ........................................................................................................ 29
Table 8: Results of the Level 1 WET-Health assessment ........................................................................... 31
Table 9: Results of the PES assessment for the pans on site ................................................................... 32
Table 10: Table showing the rating scale used for the PES assessment ............................................... 32
Table 11: Results of the EIS assessment ......................................................................................................... 34
Table 12: Scoring system used for the EIS assessment ............................................................................. 35
Wetland Delineation and Assessment for the Exxaro Leeuwpan Colliery near Delmas, Mpumalanga
October 2012
v
INDEMNITY AND CONDITIONS RELATING TO THIS
REPORT
The findings, results, observations, conclusions and recommendations given in this report are based
on the author’s best scientific and professional knowledge as well as available information. The report
is based on survey and assessment techniques which are limited by time and budgetary constraints
relevant to the type and level of investigation undertaken and Wetland Consulting Services (Pty.) Ltd.
and its staff reserve the right to modify aspects of the report including the recommendations if and
when new information may become available from ongoing research or further work in this field, or
pertaining to this investigation.
Although Wetland Consulting Services (Pty.) Ltd. exercises due care and diligence in rendering
services and preparing documents, Wetland Consulting Services (Pty.) Ltd. accepts no liability, and
the client, by receiving this document, indemnifies Wetland Consulting Services (Pty.) Ltd. and its
directors, managers, agents and employees against all actions, claims, demands, losses, liabilities,
costs, damages and expenses arising from or in connection with services rendered, directly or
indirectly by Wetland Consulting Services (Pty.) Ltd. and by the use of the information contained in this
document.
This report must not be altered or added to without the prior written consent of the author. This also
refers to electronic copies of this report which are supplied for the purposes of inclusion as part of
other reports, including main reports. Similarly, any recommendations, statements or conclusions
drawn from or based on this report must make reference to this report. If these form part of a main
report relating to this investigation or report, this report must be included in its entirety as an appendix
or separate section to the main report.
Wetland Delineation and Assessment for the Exxaro Leeuwpan Colliery near Delmas, Mpumalanga
October 2012
Copyright © 2012 Wetland Consulting Services (Pty.) Ltd. 6
1. BACKGROUND INFORMATION
Wetland Consulting Services (Pty.) Ltd. was appointed by GCS (Pty.) Ltd. to undertake the wetland
delineation and impact assessment for the proposed EIA/EMP consolidation for the Exxaro
Leeuwpan Coal Mine near Delmas in the Mpumalanga Province.
The requirement to establish the existence and/or extent of wetlands on the property is based on
the legal requirements contained in the National Environmental Management Act (NEMA) (Act No
107 of 1998) and the National Water Act (Act No 36 of 1998), as well as the Mineral and Petroleum
Resources Development Act (MPRDA) (Act No 28 of 2002). Given the stringent legislation
regarding developments within or near wetland areas, it is important that these areas are identified
and developments planned sensitively around them to minimize any potential impacts.
The purpose of this document is to describe the wetlands within the study area, to identify existing
impacts of current mining activities on wetlands, to identify and assess expected impacts on the
wetlands due to the proposed developments and to provide recommendations regarding
appropriate mitigation and/or management measures to be implemented should the proposed
activities be authorised.
2. SCOPE OF WORK
The following task formed part of the agreed upon scope of work.
Baseline Assessment:
Review of existing available data;
Delineation and classification of all the wetlands within the study area;
Determination of the Present Ecological State and Ecological Importance and Sensitivity
of all the wetlands identified within the study area;
Functional Assessment of all the wetlands identified;
Collection and analysis of water and diatom samples;
Present Ecological State (PES) and Ecological Importance and Sensitivity (EIS) of aquatic
ecosystems on site using the DWAF scoring system (DWAF, 1999);
Identify and map sensitive areas; and
Compilation of all the findings in a specialist report.
Impact Assessment:
Identify all the impacts on aquatic ecosystems resulting from the proposed
developments;
Evaluate all identified impacts based on a significance rating scale embracing notions
such as extent, magnitude, duration and significance of impacts;
Recommend suitable mitigation and management measures, where applicable, to
minimise any potential impacts; and
Provide a comprehensive impact assessment report detailing all the information.
Wetland Delineation and Assessment for the Exxaro Leeuwpan Colliery near Delmas, Mpumalanga
October 2012
Copyright © 2012 Wetland Consulting Services (Pty.) Ltd. 7
3. LIMITATIONS & ASSUMPTIONS
Due to the scale of the remote imagery used (1:10 000 orthophotos and Google Earth Imagery), as
well as the accuracy of the handheld GPS unit used to delineate wetlands in the field, the
delineated wetland boundaries cannot be guaranteed beyond an accuracy of about 20m on the
ground. Should greater mapping accuracy be required, the wetlands would need to be pegged in
the field and surveyed using conventional survey techniques.
The temporary edges of especially hillslope seepage wetlands are extensively cultivated and
transformed on site, precluding the use of vegetation indicators in determining wetland boundaries
in these areas and thus reducing the confidence of the delineation accuracy in those areas where
cultivation extends into the wetlands.
The impact assessment was based on the mine plan as provided by GCS (Pty.) Ltd. Activities not
indicated on the provided mine plan were not assessed.
4. STUDY AREA
The Leeuwpan Coal Mine Mining Rights Area (MRA), which forms the study boundaries for the
current study, is located to the south east of the town of Delmas in the Mpumalanga Province. The
R50 road from Delmas to Leandra traverses the western and southern reaches of the site.
The study area, which covers 4 260 hectares, includes portions of the following Farms:
Witklip 232-IR;
Witklip 229-IR;
Wolvenfontein 244-IR;
Goedgedacht 228-IR;
Leeuwpan 246-IR;
De Denne 256-IR;
Rietkuil 249-IR;
Moabsvelden 248-IR; and
Weltevreden 227-IR.
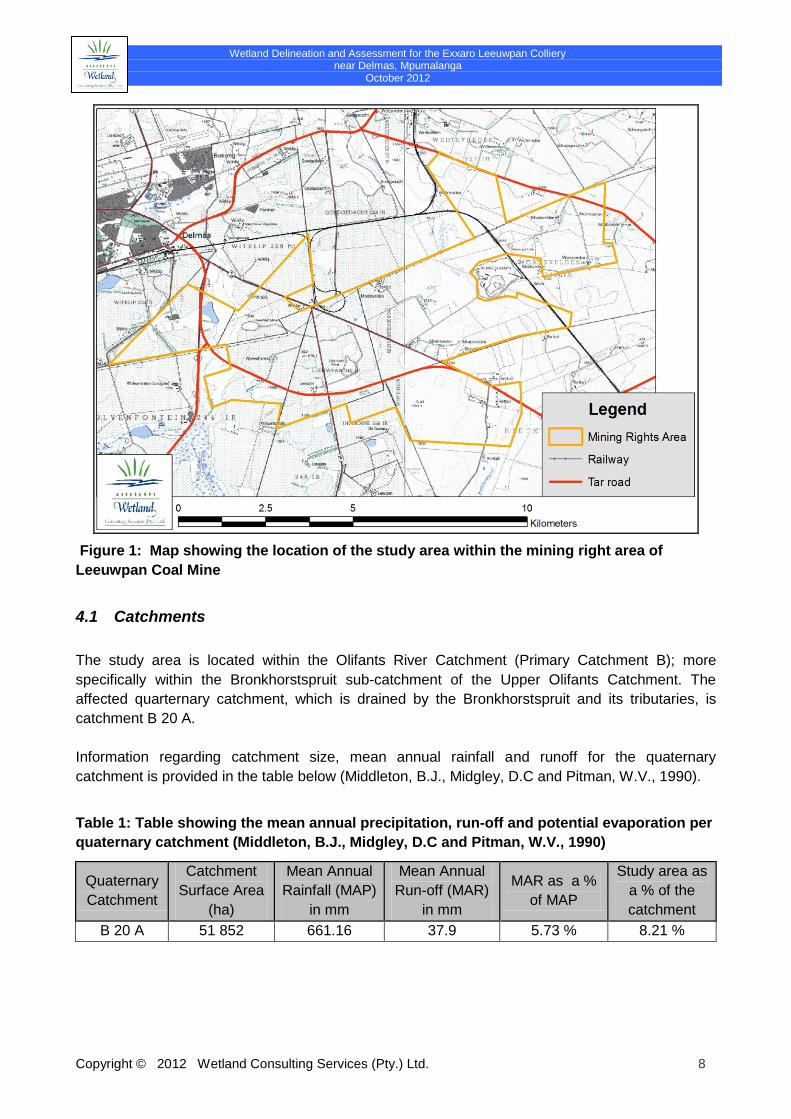
Wetland Delineation and Assessment for the Exxaro Leeuwpan Colliery near Delmas, Mpumalanga
October 2012
Copyright © 2012 Wetland Consulting Services (Pty.) Ltd. 8
Figure 1: Map showing the location of the study area within the mining right area of
Leeuwpan Coal Mine
4.1 Catchments
The study area is located within the Olifants River Catchment (Primary Catchment B); more
specifically within the Bronkhorstspruit sub-catchment of the Upper Olifants Catchment. The
affected quarternary catchment, which is drained by the Bronkhorstspruit and its tributaries, is
catchment B 20 A.
Information regarding catchment size, mean annual rainfall and runoff for the quaternary
catchment is provided in the table below (Middleton, B.J., Midgley, D.C and Pitman, W.V., 1990).
Table 1: Table showing the mean annual precipitation, run-off and potential evaporation per
quaternary catchment (Middleton, B.J., Midgley, D.C and Pitman, W.V., 1990)
Quaternary
Catchment
Catchment
Surface Area
(ha)
Mean Annual
Rainfall (MAP)
in mm
Mean Annual
Run-off (MAR)
in mm
MAR as a %
of MAP
Study area as
a % of the
catchment
B 20 A 51 852 661.16 37.9 5.73 % 8.21 %
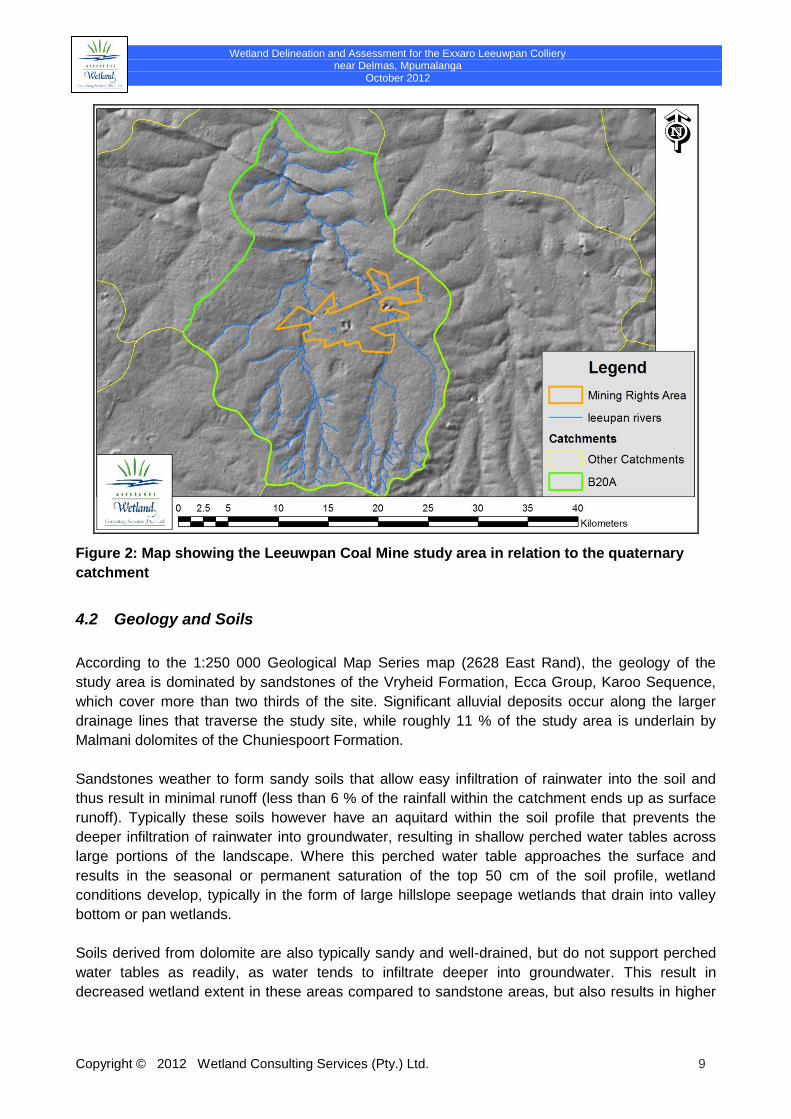
Wetland Delineation and Assessment for the Exxaro Leeuwpan Colliery near Delmas, Mpumalanga
October 2012
Copyright © 2012 Wetland Consulting Services (Pty.) Ltd. 9
Figure 2: Map showing the Leeuwpan Coal Mine study area in relation to the quaternary
catchment
4.2 Geology and Soils
According to the 1:250 000 Geological Map Series map (2628 East Rand), the geology of the
study area is dominated by sandstones of the Vryheid Formation, Ecca Group, Karoo Sequence,
which cover more than two thirds of the site. Significant alluvial deposits occur along the larger
drainage lines that traverse the study site, while roughly 11 % of the study area is underlain by
Malmani dolomites of the Chuniespoort Formation.
Sandstones weather to form sandy soils that allow easy infiltration of rainwater into the soil and
thus result in minimal runoff (less than 6 % of the rainfall within the catchment ends up as surface
runoff). Typically these soils however have an aquitard within the soil profile that prevents the
deeper infiltration of rainwater into groundwater, resulting in shallow perched water tables across
large portions of the landscape. Where this perched water table approaches the surface and
results in the seasonal or permanent saturation of the top 50 cm of the soil profile, wetland
conditions develop, typically in the form of large hillslope seepage wetlands that drain into valley
bottom or pan wetlands.
Soils derived from dolomite are also typically sandy and well-drained, but do not support perched
water tables as readily, as water tends to infiltrate deeper into groundwater. This result in
decreased wetland extent in these areas compared to sandstone areas, but also results in higher
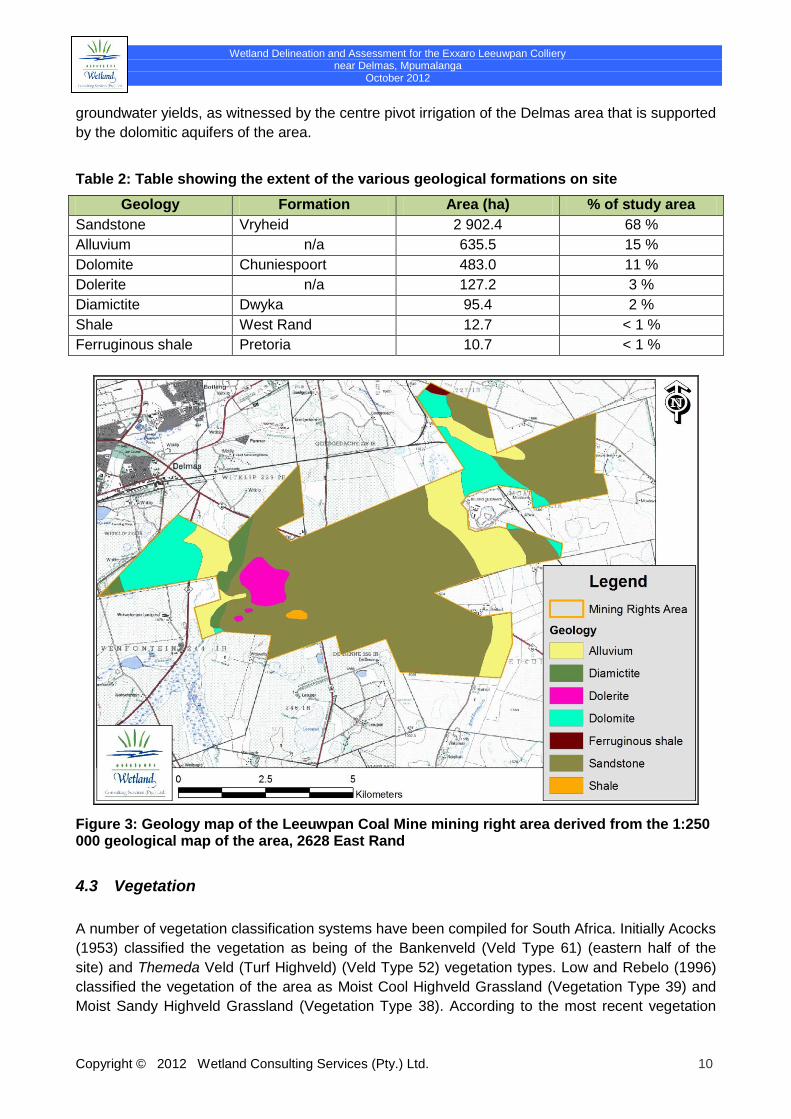
Wetland Delineation and Assessment for the Exxaro Leeuwpan Colliery near Delmas, Mpumalanga
October 2012
Copyright © 2012 Wetland Consulting Services (Pty.) Ltd. 10
groundwater yields, as witnessed by the centre pivot irrigation of the Delmas area that is supported
by the dolomitic aquifers of the area.
Table 2: Table showing the extent of the various geological formations on site
Geology Formation Area (ha) % of study area
Sandstone Vryheid 2 902.4 68 %
Alluvium n/a 635.5 15 %
Dolomite Chuniespoort 483.0 11 %
Dolerite n/a 127.2 3 %
Diamictite Dwyka 95.4 2 %
Shale West Rand 12.7 < 1 %
Ferruginous shale Pretoria 10.7 < 1 %
Figure 3: Geology map of the Leeuwpan Coal Mine mining right area derived from the 1:250 000 geological map of the area, 2628 East Rand
4.3 Vegetation
A number of vegetation classification systems have been compiled for South Africa. Initially Acocks
(1953) classified the vegetation as being of the Bankenveld (Veld Type 61) (eastern half of the
site) and Themeda Veld (Turf Highveld) (Veld Type 52) vegetation types. Low and Rebelo (1996)
classified the vegetation of the area as Moist Cool Highveld Grassland (Vegetation Type 39) and
Moist Sandy Highveld Grassland (Vegetation Type 38). According to the most recent vegetation
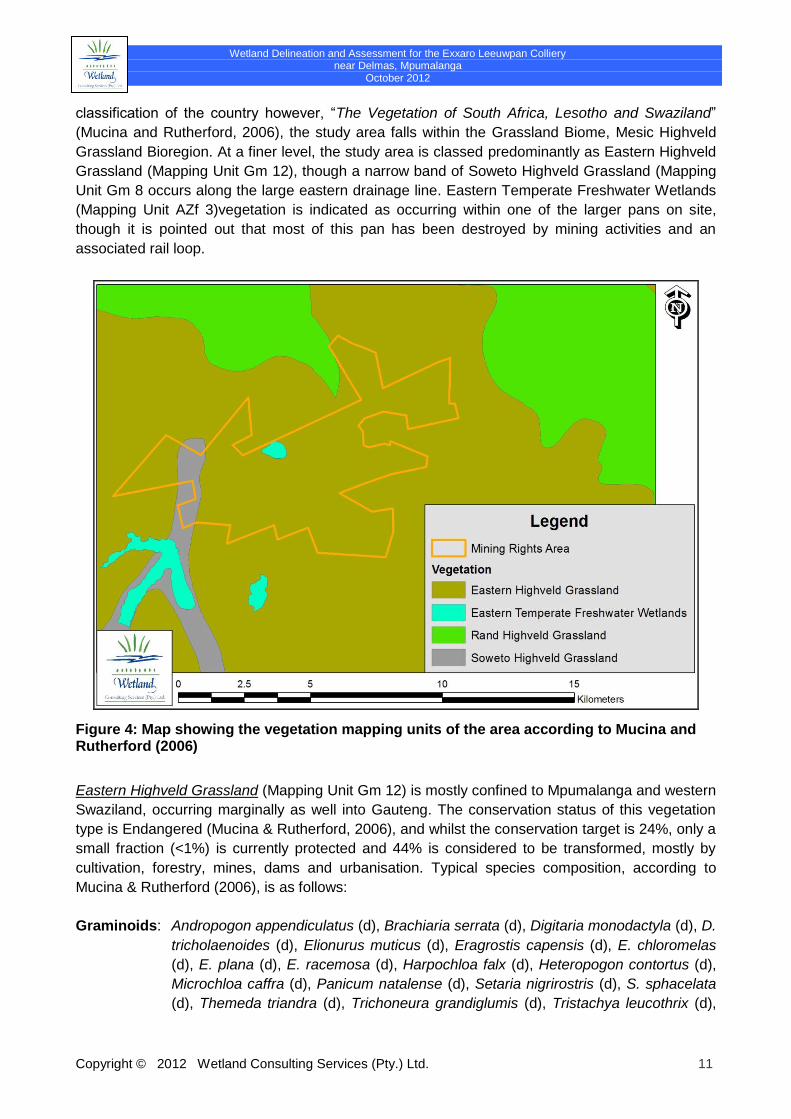
Wetland Delineation and Assessment for the Exxaro Leeuwpan Colliery near Delmas, Mpumalanga
October 2012
Copyright © 2012 Wetland Consulting Services (Pty.) Ltd. 11
classification of the country however, “The Vegetation of South Africa, Lesotho and Swaziland”
(Mucina and Rutherford, 2006), the study area falls within the Grassland Biome, Mesic Highveld
Grassland Bioregion. At a finer level, the study area is classed predominantly as Eastern Highveld
Grassland (Mapping Unit Gm 12), though a narrow band of Soweto Highveld Grassland (Mapping
Unit Gm 8 occurs along the large eastern drainage line. Eastern Temperate Freshwater Wetlands
(Mapping Unit AZf 3)vegetation is indicated as occurring within one of the larger pans on site,
though it is pointed out that most of this pan has been destroyed by mining activities and an
associated rail loop.
Figure 4: Map showing the vegetation mapping units of the area according to Mucina and Rutherford (2006)
Eastern Highveld Grassland (Mapping Unit Gm 12) is mostly confined to Mpumalanga and western
Swaziland, occurring marginally as well into Gauteng. The conservation status of this vegetation
type is Endangered (Mucina & Rutherford, 2006), and whilst the conservation target is 24%, only a
small fraction (<1%) is currently protected and 44% is considered to be transformed, mostly by
cultivation, forestry, mines, dams and urbanisation. Typical species composition, according to
Mucina & Rutherford (2006), is as follows:
Graminoids: Andropogon appendiculatus (d), Brachiaria serrata (d), Digitaria monodactyla (d), D.
tricholaenoides (d), Elionurus muticus (d), Eragrostis capensis (d), E. chloromelas
(d), E. plana (d), E. racemosa (d), Harpochloa falx (d), Heteropogon contortus (d),
Microchloa caffra (d), Panicum natalense (d), Setaria nigrirostris (d), S. sphacelata
(d), Themeda triandra (d), Trichoneura grandiglumis (d), Tristachya leucothrix (d),
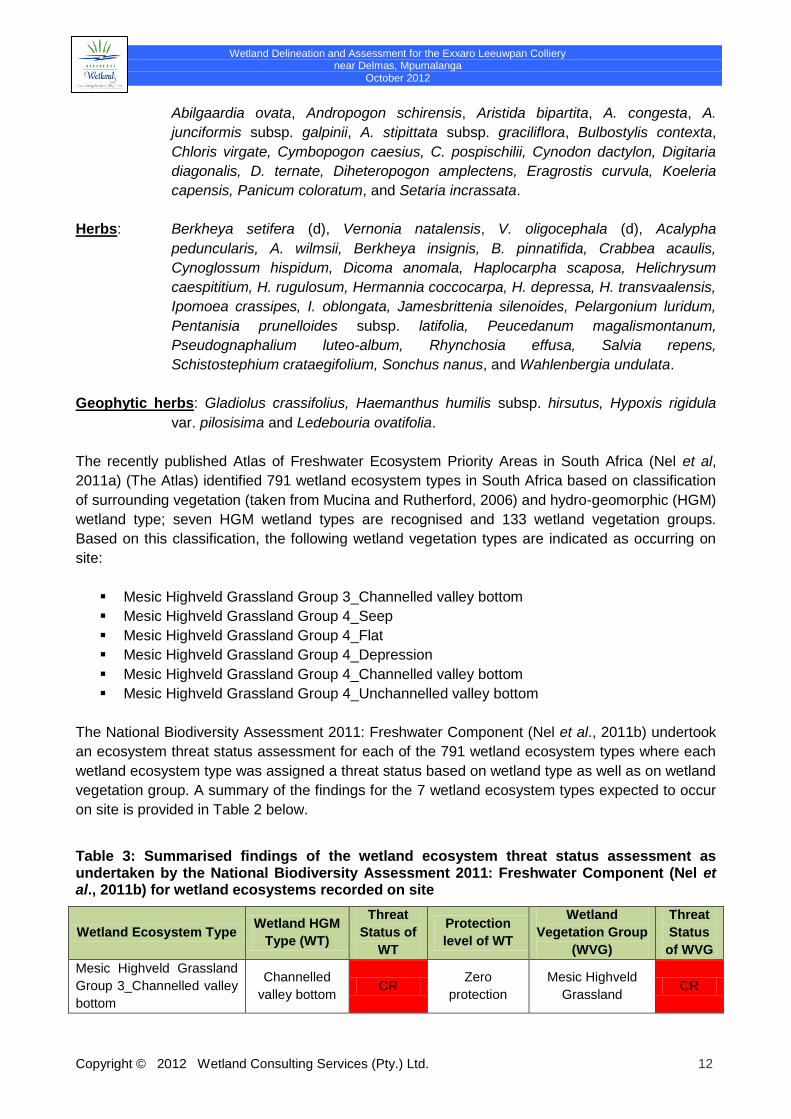
Wetland Delineation and Assessment for the Exxaro Leeuwpan Colliery near Delmas, Mpumalanga
October 2012
Copyright © 2012 Wetland Consulting Services (Pty.) Ltd. 12
Abilgaardia ovata, Andropogon schirensis, Aristida bipartita, A. congesta, A.
junciformis subsp. galpinii, A. stipittata subsp. graciliflora, Bulbostylis contexta,
Chloris virgate, Cymbopogon caesius, C. pospischilii, Cynodon dactylon, Digitaria
diagonalis, D. ternate, Diheteropogon amplectens, Eragrostis curvula, Koeleria
capensis, Panicum coloratum, and Setaria incrassata.
Herbs: Berkheya setifera (d), Vernonia natalensis, V. oligocephala (d), Acalypha
peduncularis, A. wilmsii, Berkheya insignis, B. pinnatifida, Crabbea acaulis,
Cynoglossum hispidum, Dicoma anomala, Haplocarpha scaposa, Helichrysum
caespititium, H. rugulosum, Hermannia coccocarpa, H. depressa, H. transvaalensis,
Ipomoea crassipes, I. oblongata, Jamesbrittenia silenoides, Pelargonium luridum,
Pentanisia prunelloides subsp. latifolia, Peucedanum magalismontanum,
Pseudognaphalium luteo-album, Rhynchosia effusa, Salvia repens,
Schistostephium crataegifolium, Sonchus nanus, and Wahlenbergia undulata.
Geophytic herbs: Gladiolus crassifolius, Haemanthus humilis subsp. hirsutus, Hypoxis rigidula
var. pilosisima and Ledebouria ovatifolia.
The recently published Atlas of Freshwater Ecosystem Priority Areas in South Africa (Nel et al,
2011a) (The Atlas) identified 791 wetland ecosystem types in South Africa based on classification
of surrounding vegetation (taken from Mucina and Rutherford, 2006) and hydro-geomorphic (HGM)
wetland type; seven HGM wetland types are recognised and 133 wetland vegetation groups.
Based on this classification, the following wetland vegetation types are indicated as occurring on
site:
Mesic Highveld Grassland Group 3_Channelled valley bottom
Mesic Highveld Grassland Group 4_Seep
Mesic Highveld Grassland Group 4_Flat
Mesic Highveld Grassland Group 4_Depression
Mesic Highveld Grassland Group 4_Channelled valley bottom
Mesic Highveld Grassland Group 4_Unchannelled valley bottom
The National Biodiversity Assessment 2011: Freshwater Component (Nel et al., 2011b) undertook
an ecosystem threat status assessment for each of the 791 wetland ecosystem types where each
wetland ecosystem type was assigned a threat status based on wetland type as well as on wetland
vegetation group. A summary of the findings for the 7 wetland ecosystem types expected to occur
on site is provided in Table 2 below.
Table 3: Summarised findings of the wetland ecosystem threat status assessment as undertaken by the National Biodiversity Assessment 2011: Freshwater Component (Nel et al., 2011b) for wetland ecosystems recorded on site
Wetland Ecosystem Type Wetland HGM
Type (WT)
Threat
Status of
WT
Protection
level of WT
Wetland
Vegetation Group
(WVG)
Threat
Status
of WVG
Mesic Highveld Grassland
Group 3_Channelled valley
bottom
Channelled
valley bottom CR
Zero
protection
Mesic Highveld
Grassland CR
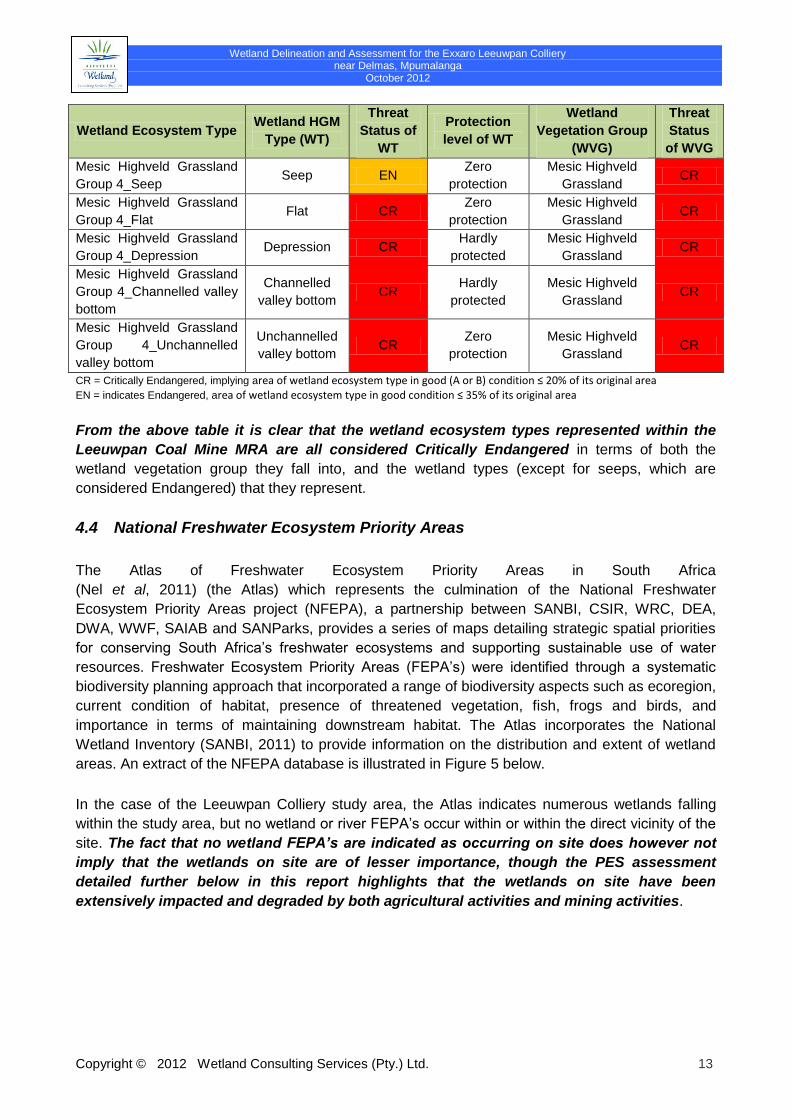
Wetland Delineation and Assessment for the Exxaro Leeuwpan Colliery near Delmas, Mpumalanga
October 2012
Copyright © 2012 Wetland Consulting Services (Pty.) Ltd. 13
Wetland Ecosystem Type Wetland HGM
Type (WT)
Threat
Status of
WT
Protection
level of WT
Wetland
Vegetation Group
(WVG)
Threat
Status
of WVG
Mesic Highveld Grassland
Group 4_Seep Seep EN
Zero
protection
Mesic Highveld
Grassland CR
Mesic Highveld Grassland
Group 4_Flat Flat CR
Zero
protection
Mesic Highveld
Grassland CR
Mesic Highveld Grassland
Group 4_Depression Depression CR
Hardly
protected
Mesic Highveld
Grassland CR
Mesic Highveld Grassland
Group 4_Channelled valley
bottom
Channelled
valley bottom CR
Hardly
protected
Mesic Highveld
Grassland CR
Mesic Highveld Grassland
Group 4_Unchannelled
valley bottom
Unchannelled
valley bottom CR
Zero
protection
Mesic Highveld
Grassland CR
CR = Critically Endangered, implying area of wetland ecosystem type in good (A or B) condition ≤ 20% of its original area EN = indicates Endangered, area of wetland ecosystem type in good condition ≤ 35% of its original area
From the above table it is clear that the wetland ecosystem types represented within the
Leeuwpan Coal Mine MRA are all considered Critically Endangered in terms of both the
wetland vegetation group they fall into, and the wetland types (except for seeps, which are
considered Endangered) that they represent.
4.4 National Freshwater Ecosystem Priority Areas
The Atlas of Freshwater Ecosystem Priority Areas in South Africa
(Nel et al, 2011) (the Atlas) which represents the culmination of the National Freshwater
Ecosystem Priority Areas project (NFEPA), a partnership between SANBI, CSIR, WRC, DEA,
DWA, WWF, SAIAB and SANParks, provides a series of maps detailing strategic spatial priorities
for conserving South Africa’s freshwater ecosystems and supporting sustainable use of water
resources. Freshwater Ecosystem Priority Areas (FEPA’s) were identified through a systematic
biodiversity planning approach that incorporated a range of biodiversity aspects such as ecoregion,
current condition of habitat, presence of threatened vegetation, fish, frogs and birds, and
importance in terms of maintaining downstream habitat. The Atlas incorporates the National
Wetland Inventory (SANBI, 2011) to provide information on the distribution and extent of wetland
areas. An extract of the NFEPA database is illustrated in Figure 5 below.
In the case of the Leeuwpan Colliery study area, the Atlas indicates numerous wetlands falling
within the study area, but no wetland or river FEPA’s occur within or within the direct vicinity of the
site. The fact that no wetland FEPA’s are indicated as occurring on site does however not
imply that the wetlands on site are of lesser importance, though the PES assessment
detailed further below in this report highlights that the wetlands on site have been
extensively impacted and degraded by both agricultural activities and mining activities.
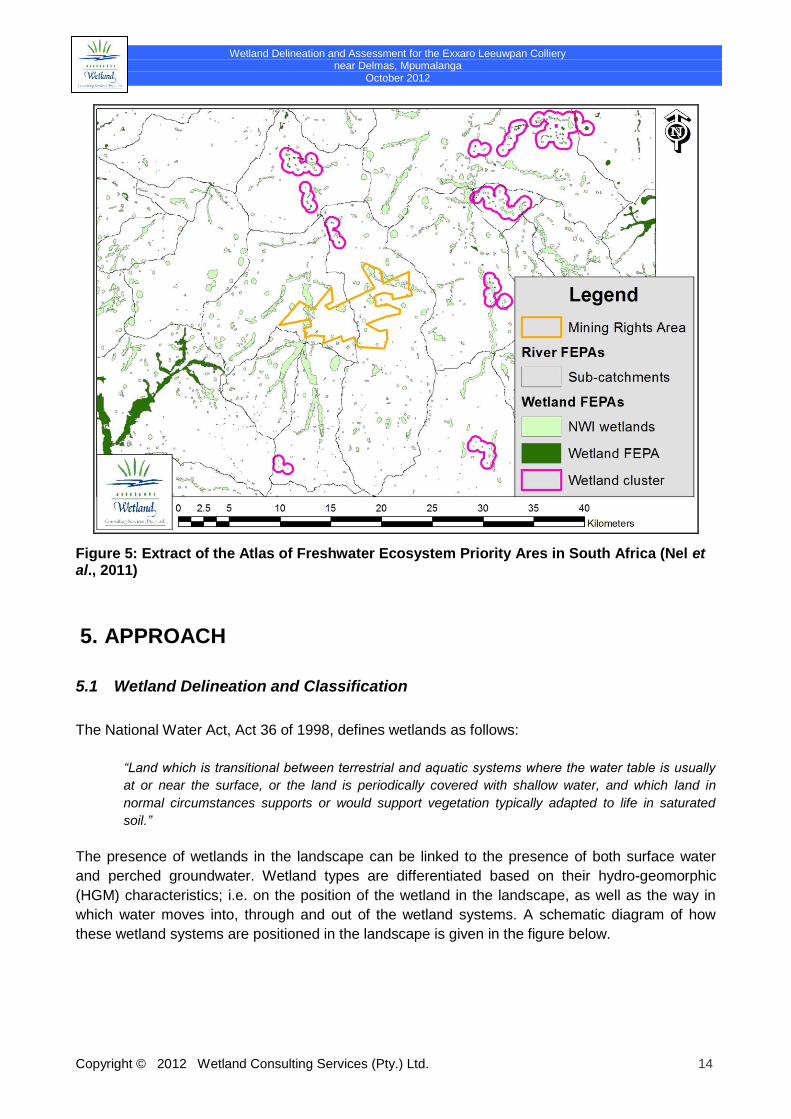
Wetland Delineation and Assessment for the Exxaro Leeuwpan Colliery near Delmas, Mpumalanga
October 2012
Copyright © 2012 Wetland Consulting Services (Pty.) Ltd. 14
Figure 5: Extract of the Atlas of Freshwater Ecosystem Priority Ares in South Africa (Nel et al., 2011)
5. APPROACH
5.1 Wetland Delineation and Classification
The National Water Act, Act 36 of 1998, defines wetlands as follows:
“Land which is transitional between terrestrial and aquatic systems where the water table is usually
at or near the surface, or the land is periodically covered with shallow water, and which land in
normal circumstances supports or would support vegetation typically adapted to life in saturated
soil.”
The presence of wetlands in the landscape can be linked to the presence of both surface water
and perched groundwater. Wetland types are differentiated based on their hydro-geomorphic
(HGM) characteristics; i.e. on the position of the wetland in the landscape, as well as the way in
which water moves into, through and out of the wetland systems. A schematic diagram of how
these wetland systems are positioned in the landscape is given in the figure below.
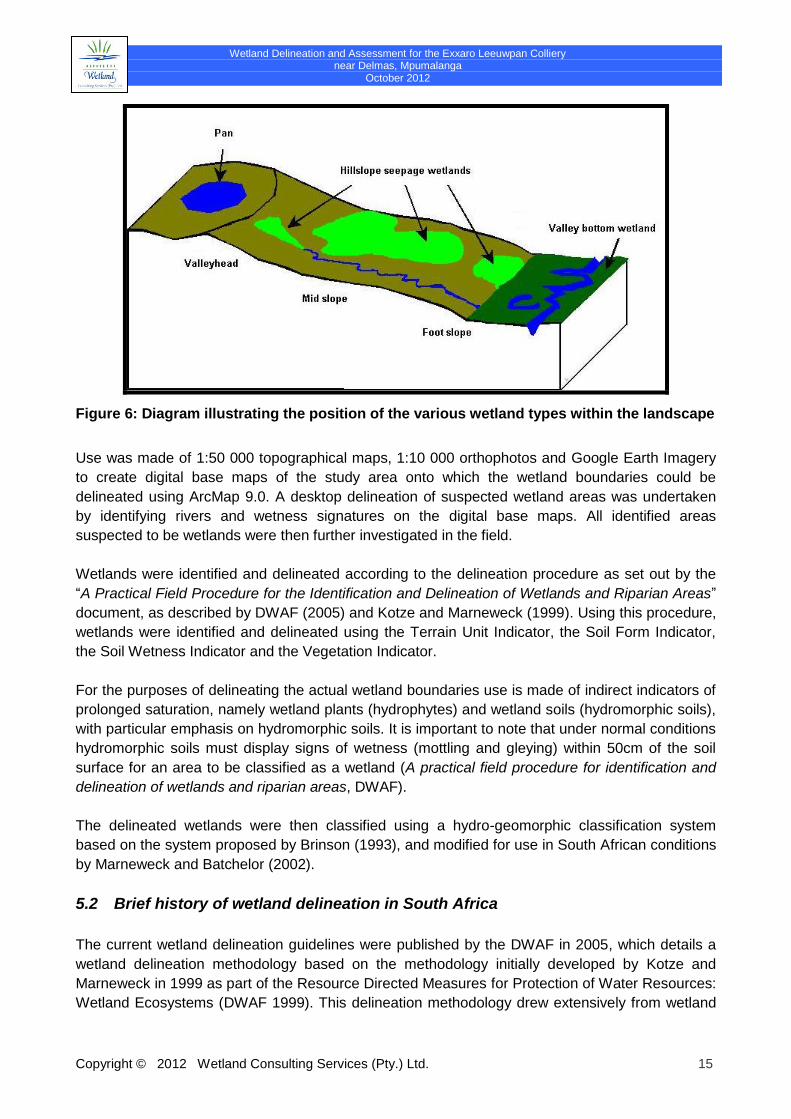
Wetland Delineation and Assessment for the Exxaro Leeuwpan Colliery near Delmas, Mpumalanga
October 2012
Copyright © 2012 Wetland Consulting Services (Pty.) Ltd. 15
Figure 6: Diagram illustrating the position of the various wetland types within the landscape
Use was made of 1:50 000 topographical maps, 1:10 000 orthophotos and Google Earth Imagery
to create digital base maps of the study area onto which the wetland boundaries could be
delineated using ArcMap 9.0. A desktop delineation of suspected wetland areas was undertaken
by identifying rivers and wetness signatures on the digital base maps. All identified areas
suspected to be wetlands were then further investigated in the field.
Wetlands were identified and delineated according to the delineation procedure as set out by the
“A Practical Field Procedure for the Identification and Delineation of Wetlands and Riparian Areas”
document, as described by DWAF (2005) and Kotze and Marneweck (1999). Using this procedure,
wetlands were identified and delineated using the Terrain Unit Indicator, the Soil Form Indicator,
the Soil Wetness Indicator and the Vegetation Indicator.
For the purposes of delineating the actual wetland boundaries use is made of indirect indicators of
prolonged saturation, namely wetland plants (hydrophytes) and wetland soils (hydromorphic soils),
with particular emphasis on hydromorphic soils. It is important to note that under normal conditions
hydromorphic soils must display signs of wetness (mottling and gleying) within 50cm of the soil
surface for an area to be classified as a wetland (A practical field procedure for identification and
delineation of wetlands and riparian areas, DWAF).
The delineated wetlands were then classified using a hydro-geomorphic classification system
based on the system proposed by Brinson (1993), and modified for use in South African conditions
by Marneweck and Batchelor (2002).
5.2 Brief history of wetland delineation in South Africa
The current wetland delineation guidelines were published by the DWAF in 2005, which details a
wetland delineation methodology based on the methodology initially developed by Kotze and
Marneweck in 1999 as part of the Resource Directed Measures for Protection of Water Resources:
Wetland Ecosystems (DWAF 1999). This delineation methodology drew extensively from wetland
Wetland Delineation and Assessment for the Exxaro Leeuwpan Colliery near Delmas, Mpumalanga
October 2012
Copyright © 2012 Wetland Consulting Services (Pty.) Ltd. 16
delineation procedures utilised in the United States of America (e.g. U.S. Fish and Wildlife Service
et al., 1989) and was designed for the needs of the reserve process.
Prior to the wetland delineation methodology developed by Kotze and Marneweck (1999), no
national wetland delineation methodology existed in South Africa. A number of initiatives were
however undertaken in the late 90’s to inform wetland identification, delineation and management.
Published literature produced as part of these various initiatives include ‘Improved criteria for
classifying hydric soils in South Africa’ by Kotze et al. (1996) and the Wetland-use Booklet Series
produced as part of the Rennie’s Wetland Project, ‘What is a Wetland?’ and ‘How wet is a
wetland?’ (Kotze, 1997). At the time, the Forest Owners Association Environmental Committee
also compiled ‘A practical procedure for the delineation of riparian/wetland habitats for land use
practices in South Africa’ (1999).
Wetland delineation as currently practiced in South Africa thus roughly dates back to 1999, with
very limited prior work having been undertaken and widely implemented prior to this date.
Prior to the National Water Act (Act 36 of 1998), which was only promulgated in 1998, the
Conservation of Agricultural Resources Act (CARA) was the deciding statute on wetland utilisation
(Phragmites. 2005). CARA limited wetlands and the utilisation thereof to the 1:10 year floodline. In
effect, this thus excluded all hillslope seepage wetlands, and only valley bottom wetlands and pans
were considered to fall within this definition.
5.3 Water Quality and Diatoms
Diatoms are the unicellular algal group most widely used as indicators of wetland health as they
provide a rapid response to specific physico-chemical conditions in the water and are often the first
indication of change. The presence or absence of indicator taxa can be used to detect specific
changes in environmental conditions such as eutrophication, organic enrichment, salinisation and
changes in pH. They are therefore useful for providing an overall picture of trends within an aquatic
system.
Preparation of diatom slides followed methods as outlined in Taylor et al. (2007). The aim of the
data analysis was to identify and count diatom valves (400 counts) to produce semi-quantitative
data from which ecological conclusions can be drawn (Taylor et al. 2007).
Grab water samples were collected from a number of wetland systems on site and submitted to the
SANAS accredited Waterlab laboratory in Pretoria for analysis.
5.4 Functional Assessment
A functional assessment of the wetlands on site was undertaken using the level 2 assessment as
described in “Wet-EcoServices” (Kotze et al., 2007). This method provides a scoring system for
establishing wetland ecosystem services. It enables one to make relative comparisons of systems
based on a logical framework that measures the likelihood that a wetland is able to perform certain
functions.
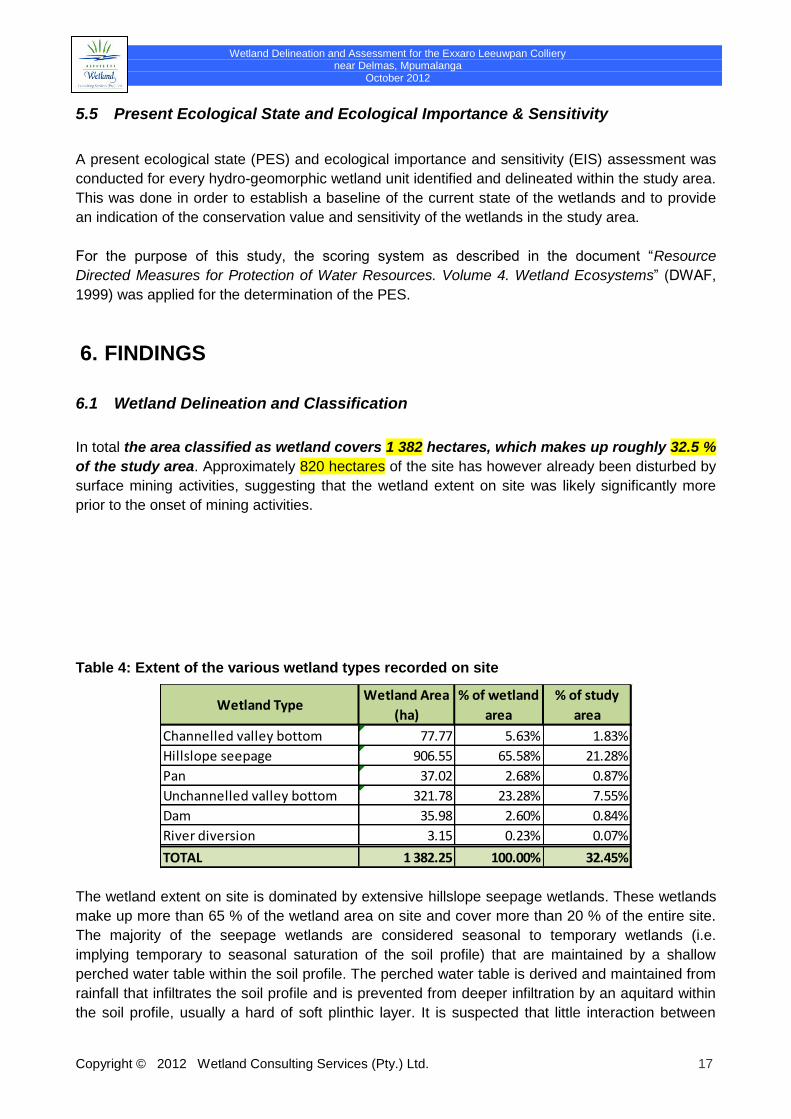
Wetland Delineation and Assessment for the Exxaro Leeuwpan Colliery near Delmas, Mpumalanga
October 2012
Copyright © 2012 Wetland Consulting Services (Pty.) Ltd. 17
5.5 Present Ecological State and Ecological Importance & Sensitivity
A present ecological state (PES) and ecological importance and sensitivity (EIS) assessment was
conducted for every hydro-geomorphic wetland unit identified and delineated within the study area.
This was done in order to establish a baseline of the current state of the wetlands and to provide
an indication of the conservation value and sensitivity of the wetlands in the study area.
For the purpose of this study, the scoring system as described in the document “Resource
Directed Measures for Protection of Water Resources. Volume 4. Wetland Ecosystems” (DWAF,
1999) was applied for the determination of the PES.
6. FINDINGS
6.1 Wetland Delineation and Classification
In total the area classified as wetland covers 1 382 hectares, which makes up roughly 32.5 %
of the study area. Approximately 820 hectares of the site has however already been disturbed by
surface mining activities, suggesting that the wetland extent on site was likely significantly more
prior to the onset of mining activities.
Table 4: Extent of the various wetland types recorded on site
Wetland TypeWetland Area
(ha)
% of wetland
area
% of study
area
Channelled valley bottom 77.77 5.63% 1.83%
Hillslope seepage 906.55 65.58% 21.28%
Pan 37.02 2.68% 0.87%
Unchannelled valley bottom 321.78 23.28% 7.55%
Dam 35.98 2.60% 0.84%
River diversion 3.15 0.23% 0.07%
TOTAL 1 382.25 100.00% 32.45%
The wetland extent on site is dominated by extensive hillslope seepage wetlands. These wetlands
make up more than 65 % of the wetland area on site and cover more than 20 % of the entire site.
The majority of the seepage wetlands are considered seasonal to temporary wetlands (i.e.
implying temporary to seasonal saturation of the soil profile) that are maintained by a shallow
perched water table within the soil profile. The perched water table is derived and maintained from
rainfall that infiltrates the soil profile and is prevented from deeper infiltration by an aquitard within
the soil profile, usually a hard of soft plinthic layer. It is suspected that little interaction between
Wetland Delineation and Assessment for the Exxaro Leeuwpan Colliery near Delmas, Mpumalanga
October 2012
Copyright © 2012 Wetland Consulting Services (Pty.) Ltd. 18
deeper groundwater and this perched water table occurs, though no testing or modeling to support
this statement was undertaken on site.
In many areas the temporary edges of the hillslope seepage wetlands have been cultivated and
are either still currently under maize cultivation or have been converted to planted pastures.
Especially on the Farm Rietkuil the intrusion of cultivation into the hillslope seepage wetlands has
been extensive. Nonetheless, the remaining areas of hillslope seepage wetland characterised by
natural vegetation represent, together with the two large valley bottom wetlands, the largest
expanse of natural grassland within the study area.
Three valley bottom wetlands were delineated within the study area, consisting of the
Bronkhorstspruit and two of its tributaries. Some confusion exists with regards to the naming of the
Bronkhorstspruit, as the 1:50 000 topographical maps name the large valley bottom wetland in the
east of the site as the Bronkhorstspruit, while road signs along the R50 tar road name the western
valley bottom as the Bronkhorstspruit. For the purpose of this study, the naming as per the 1:50
000 topographical maps will be followed.
The Bronkhorstspruit valley bottom wetland consists of a broad, mostly unchannelled system
characterised by vertic clay soils. The upper catchment as well as the upper reach of the wetland
on site is utilised agriculturally, with livestock grazing the main activity within the wetland. On site,
mining takes place on either side of the wetland and includes the Silica Mine that extends
significantly into the wetland. A dam as well as several berms have been constructed within this
reach of the wetland to control flows through the mining area. Downstream of the study area the
character of the wetland changes significantly as flows become confined and a clearly incised
channel forms where the alluvial deposits associated with the upper wetland end and the river
flows over dolomite.
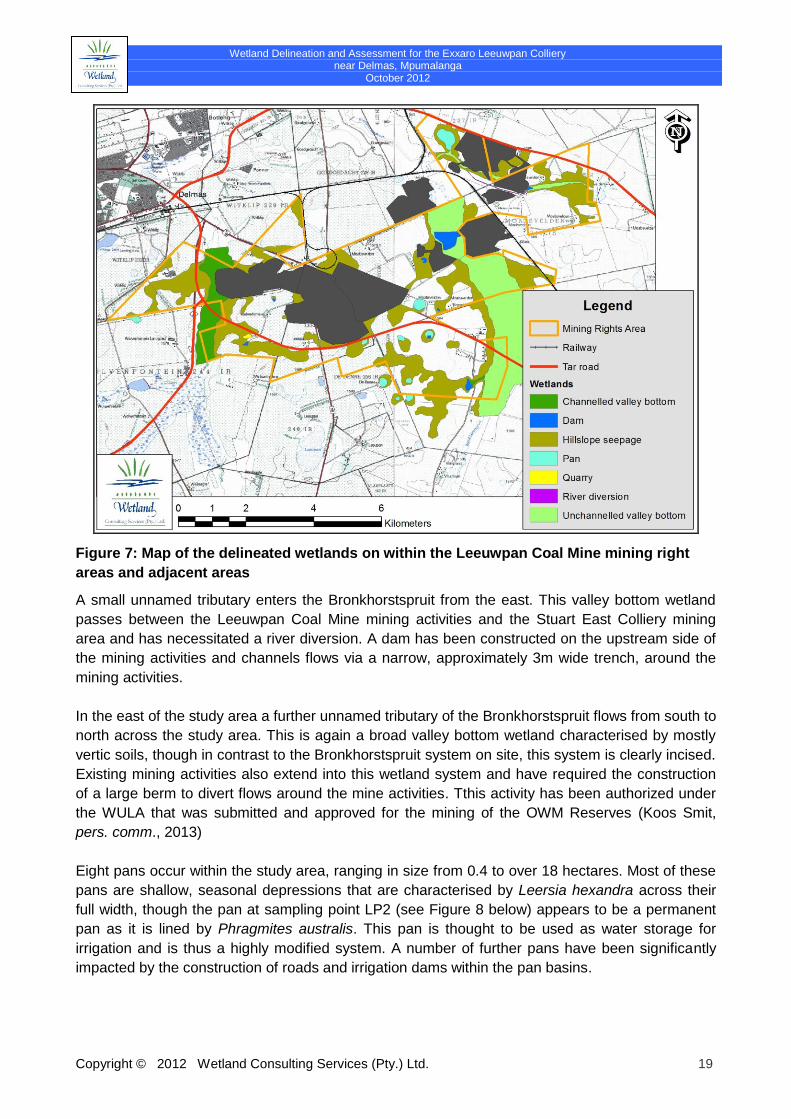
Wetland Delineation and Assessment for the Exxaro Leeuwpan Colliery near Delmas, Mpumalanga
October 2012
Copyright © 2012 Wetland Consulting Services (Pty.) Ltd. 19
Figure 7: Map of the delineated wetlands on within the Leeuwpan Coal Mine mining right
areas and adjacent areas
A small unnamed tributary enters the Bronkhorstspruit from the east. This valley bottom wetland
passes between the Leeuwpan Coal Mine mining activities and the Stuart East Colliery mining
area and has necessitated a river diversion. A dam has been constructed on the upstream side of
the mining activities and channels flows via a narrow, approximately 3m wide trench, around the
mining activities.
In the east of the study area a further unnamed tributary of the Bronkhorstspruit flows from south to
north across the study area. This is again a broad valley bottom wetland characterised by mostly
vertic soils, though in contrast to the Bronkhorstspruit system on site, this system is clearly incised.
Existing mining activities also extend into this wetland system and have required the construction
of a large berm to divert flows around the mine activities. Tthis activity has been authorized under
the WULA that was submitted and approved for the mining of the OWM Reserves (Koos Smit,
pers. comm., 2013)
Eight pans occur within the study area, ranging in size from 0.4 to over 18 hectares. Most of these
pans are shallow, seasonal depressions that are characterised by Leersia hexandra across their
full width, though the pan at sampling point LP2 (see Figure 8 below) appears to be a permanent
pan as it is lined by Phragmites australis. This pan is thought to be used as water storage for
irrigation and is thus a highly modified system. A number of further pans have been significantly
impacted by the construction of roads and irrigation dams within the pan basins.
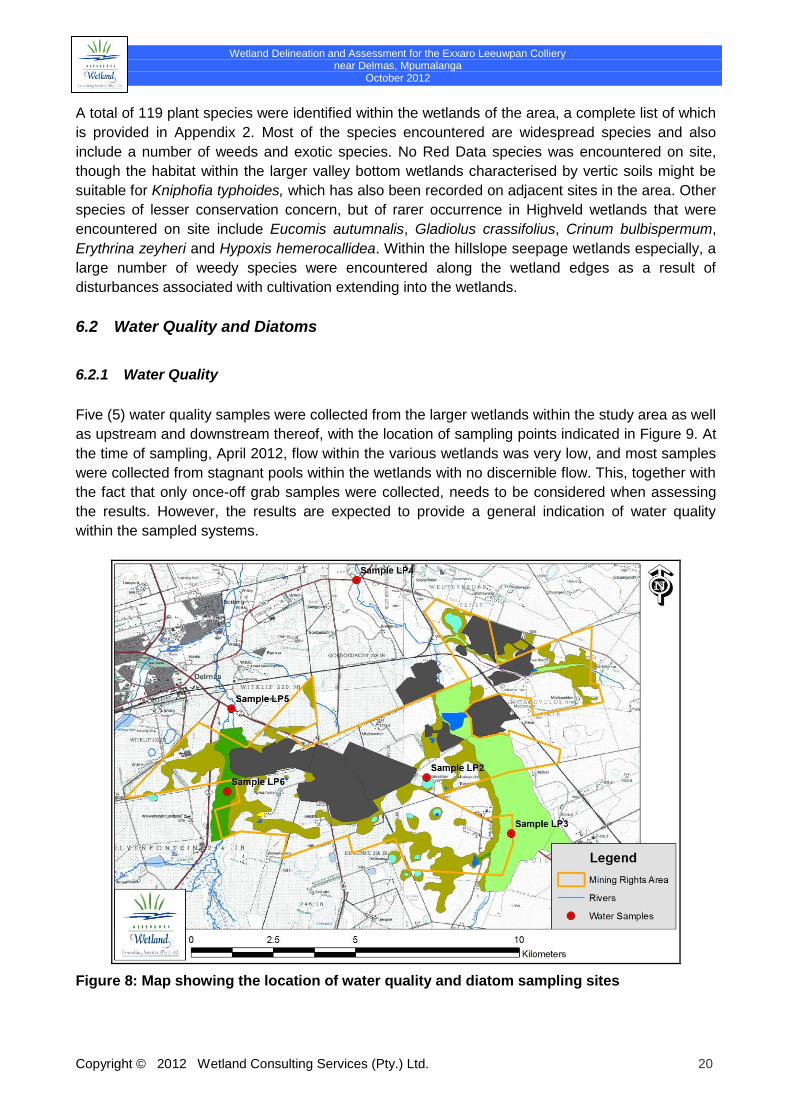
Wetland Delineation and Assessment for the Exxaro Leeuwpan Colliery near Delmas, Mpumalanga
October 2012
Copyright © 2012 Wetland Consulting Services (Pty.) Ltd. 20
A total of 119 plant species were identified within the wetlands of the area, a complete list of which
is provided in Appendix 2. Most of the species encountered are widespread species and also
include a number of weeds and exotic species. No Red Data species was encountered on site,
though the habitat within the larger valley bottom wetlands characterised by vertic soils might be
suitable for Kniphofia typhoides, which has also been recorded on adjacent sites in the area. Other
species of lesser conservation concern, but of rarer occurrence in Highveld wetlands that were
encountered on site include Eucomis autumnalis, Gladiolus crassifolius, Crinum bulbispermum,
Erythrina zeyheri and Hypoxis hemerocallidea. Within the hillslope seepage wetlands especially, a
large number of weedy species were encountered along the wetland edges as a result of
disturbances associated with cultivation extending into the wetlands.
6.2 Water Quality and Diatoms
6.2.1 Water Quality
Five (5) water quality samples were collected from the larger wetlands within the study area as well
as upstream and downstream thereof, with the location of sampling points indicated in Figure 9. At
the time of sampling, April 2012, flow within the various wetlands was very low, and most samples
were collected from stagnant pools within the wetlands with no discernible flow. This, together with
the fact that only once-off grab samples were collected, needs to be considered when assessing
the results. However, the results are expected to provide a general indication of water quality
within the sampled systems.
Figure 8: Map showing the location of water quality and diatom sampling sites
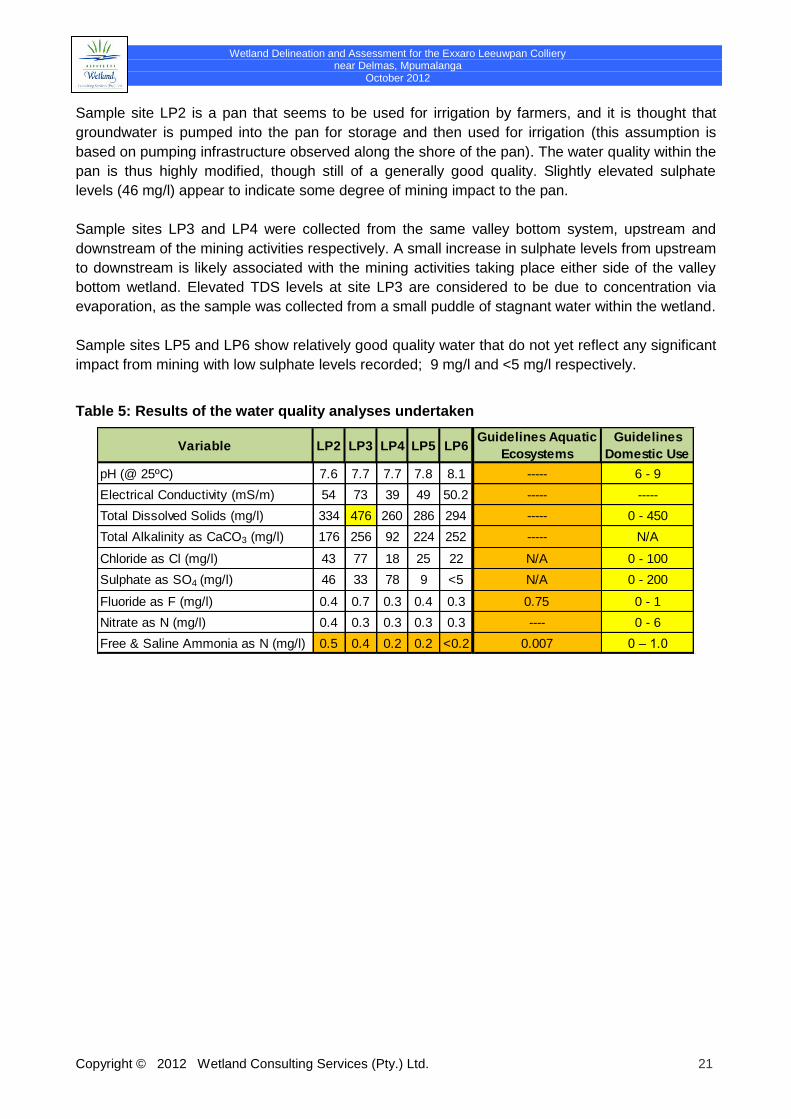
Wetland Delineation and Assessment for the Exxaro Leeuwpan Colliery near Delmas, Mpumalanga
October 2012
Copyright © 2012 Wetland Consulting Services (Pty.) Ltd. 21
Sample site LP2 is a pan that seems to be used for irrigation by farmers, and it is thought that
groundwater is pumped into the pan for storage and then used for irrigation (this assumption is
based on pumping infrastructure observed along the shore of the pan). The water quality within the
pan is thus highly modified, though still of a generally good quality. Slightly elevated sulphate
levels (46 mg/l) appear to indicate some degree of mining impact to the pan.
Sample sites LP3 and LP4 were collected from the same valley bottom system, upstream and
downstream of the mining activities respectively. A small increase in sulphate levels from upstream
to downstream is likely associated with the mining activities taking place either side of the valley
bottom wetland. Elevated TDS levels at site LP3 are considered to be due to concentration via
evaporation, as the sample was collected from a small puddle of stagnant water within the wetland.
Sample sites LP5 and LP6 show relatively good quality water that do not yet reflect any significant
impact from mining with low sulphate levels recorded; 9 mg/l and <5 mg/l respectively.
Table 5: Results of the water quality analyses undertaken
Variable LP2 LP3 LP4 LP5 LP6Guidelines Aquatic
Ecosystems
Guidelines
Domestic Use
pH (@ 25ºC) 7.6 7.7 7.7 7.8 8.1 ----- 6 - 9
Electrical Conductivity (mS/m) 54 73 39 49 50.2 ----- -----
Total Dissolved Solids (mg/l) 334 476 260 286 294 ----- 0 - 450
Total Alkalinity as CaCO3 (mg/l) 176 256 92 224 252 ----- N/A
Chloride as Cl (mg/l) 43 77 18 25 22 N/A 0 - 100
Sulphate as SO4 (mg/l) 46 33 78 9 <5 N/A 0 - 200
Fluoride as F (mg/l) 0.4 0.7 0.3 0.4 0.3 0.75 0 - 1
Nitrate as N (mg/l) 0.4 0.3 0.3 0.3 0.3 ---- 0 - 6
Free & Saline Ammonia as N (mg/l) 0.5 0.4 0.2 0.2 <0.2 0.007 0 – 1.0
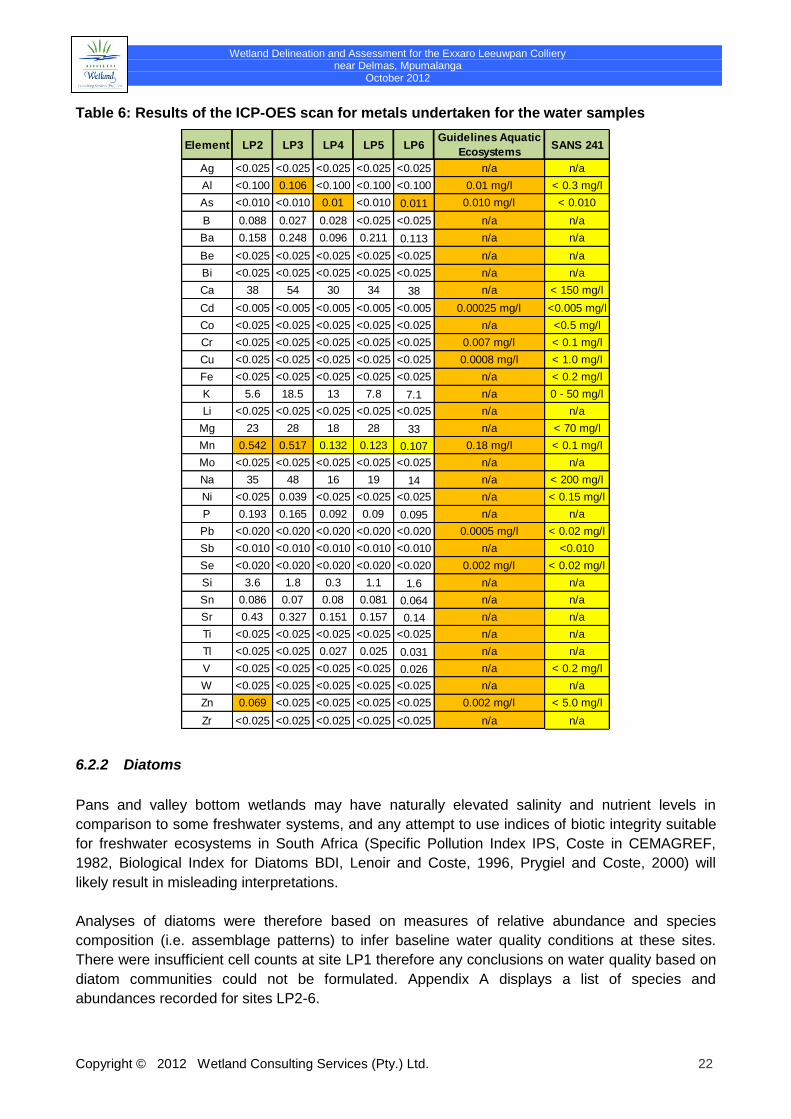
Wetland Delineation and Assessment for the Exxaro Leeuwpan Colliery near Delmas, Mpumalanga
October 2012
Copyright © 2012 Wetland Consulting Services (Pty.) Ltd. 22
Table 6: Results of the ICP-OES scan for metals undertaken for the water samples
Element LP2 LP3 LP4 LP5 LP6Guidelines Aquatic
EcosystemsSANS 241
Ag <0.025 <0.025 <0.025 <0.025 <0.025 n/a n/a
Al <0.100 0.106 <0.100 <0.100 <0.100 0.01 mg/l < 0.3 mg/l
As <0.010 <0.010 0.01 <0.010 0.011 0.010 mg/l < 0.010
B 0.088 0.027 0.028 <0.025 <0.025 n/a n/a
Ba 0.158 0.248 0.096 0.211 0.113 n/a n/a
Be <0.025 <0.025 <0.025 <0.025 <0.025 n/a n/a
Bi <0.025 <0.025 <0.025 <0.025 <0.025 n/a n/a
Ca 38 54 30 34 38 n/a < 150 mg/l
Cd <0.005 <0.005 <0.005 <0.005 <0.005 0.00025 mg/l <0.005 mg/l
Co <0.025 <0.025 <0.025 <0.025 <0.025 n/a <0.5 mg/l
Cr <0.025 <0.025 <0.025 <0.025 <0.025 0.007 mg/l < 0.1 mg/l
Cu <0.025 <0.025 <0.025 <0.025 <0.025 0.0008 mg/l < 1.0 mg/l
Fe <0.025 <0.025 <0.025 <0.025 <0.025 n/a < 0.2 mg/l
K 5.6 18.5 13 7.8 7.1 n/a 0 - 50 mg/l
Li <0.025 <0.025 <0.025 <0.025 <0.025 n/a n/a
Mg 23 28 18 28 33 n/a < 70 mg/l
Mn 0.542 0.517 0.132 0.123 0.107 0.18 mg/l < 0.1 mg/l
Mo <0.025 <0.025 <0.025 <0.025 <0.025 n/a n/a
Na 35 48 16 19 14 n/a < 200 mg/l
Ni <0.025 0.039 <0.025 <0.025 <0.025 n/a < 0.15 mg/l
P 0.193 0.165 0.092 0.09 0.095 n/a n/a
Pb <0.020 <0.020 <0.020 <0.020 <0.020 0.0005 mg/l < 0.02 mg/l
Sb <0.010 <0.010 <0.010 <0.010 <0.010 n/a <0.010
Se <0.020 <0.020 <0.020 <0.020 <0.020 0.002 mg/l < 0.02 mg/l
Si 3.6 1.8 0.3 1.1 1.6 n/a n/a
Sn 0.086 0.07 0.08 0.081 0.064 n/a n/a
Sr 0.43 0.327 0.151 0.157 0.14 n/a n/a
Ti <0.025 <0.025 <0.025 <0.025 <0.025 n/a n/a
Tl <0.025 <0.025 0.027 0.025 0.031 n/a n/a
V <0.025 <0.025 <0.025 <0.025 0.026 n/a < 0.2 mg/l
W <0.025 <0.025 <0.025 <0.025 <0.025 n/a n/a
Zn 0.069 <0.025 <0.025 <0.025 <0.025 0.002 mg/l < 5.0 mg/l
Zr <0.025 <0.025 <0.025 <0.025 <0.025 n/a n/a
6.2.2 Diatoms
Pans and valley bottom wetlands may have naturally elevated salinity and nutrient levels in
comparison to some freshwater systems, and any attempt to use indices of biotic integrity suitable
for freshwater ecosystems in South Africa (Specific Pollution Index IPS, Coste in CEMAGREF,
1982, Biological Index for Diatoms BDI, Lenoir and Coste, 1996, Prygiel and Coste, 2000) will
likely result in misleading interpretations.
Analyses of diatoms were therefore based on measures of relative abundance and species
composition (i.e. assemblage patterns) to infer baseline water quality conditions at these sites.
There were insufficient cell counts at site LP1 therefore any conclusions on water quality based on
diatom communities could not be formulated. Appendix A displays a list of species and
abundances recorded for sites LP2-6.
Wetland Delineation and Assessment for the Exxaro Leeuwpan Colliery near Delmas, Mpumalanga
October 2012
Copyright © 2012 Wetland Consulting Services (Pty.) Ltd. 23
To further determine water quality based on diatom composition at the Leeuwpan sites, diatoms
assemblages collected from 206 sites throughout the Highveld were included in a cluster analysis
to provide a more reliable inference of water quality.
Diatom assemblage patterns at the Leeuwpan sites (Appendix A) suggest the following
(remembering that ‘pollution indicators’ used to determine anthropogenic stress in freshwater
systems may be equally tolerant to the natural stressors that accompany healthy, eutrophic
wetland systems):
Site LP2 is dominated by species found in waters with moderate electrolyte content such as
Amphora pediculus and Cyclostephanos invisitatus. The presence of taxa Nitzschia
fonticola, Gomphonema exilissimum and Placoneis placentula, good indicators of clean
waters and tolerant of slight to moderate levels of pollution may imply that the water quality
at this site is in relatively good condition. The presence of taxa Aulacoseira granulata and
Nitzschia palea points to some nutrient enrichment.
At site LP3, prevalent taxon Gomphonema parvulum is usually a red flag for some type of
pollution. G. parvulum is often linked to a source of organic and nutrient inputs. Sub-
dominant taxa such as Navicula symmetrica and Nitzschia palea are found in waters with
elevated nutrient and electrolyte concentrations. Dominant taxon Fragilaria ulna var. acus
points to elevated levels of inorganic nutrients.
At site LP4, to note is the high abundance of Mayamaea atomus, one of the most pollution
resistant diatoms found in alkaline, heavily polluted waters with high electrolyte content, but
also occurring in moderate quality waters often associated with organic detritus. Dominant
taxon Nitzschia palea points to nutrient and electrolyte enrichment.
The overall diatom assemblage for sites LP5 and LP6 indicates reasonably good water
quality. The sites are comprised of species found in standing and slow flowing waters of
moderate to high electrolyte content such as Gyrosigma attenuatum, Rhopalodia gibba,
Epithemia adnata and Epithemia sorex. Both sites are dominated by the Achnanthidium
genus which may occur across a gradient of nutrient and salinity impacts but never found in
waters with critical levels of organic pollution. The presence of taxon Nitzschia dissipata
var. media is a good indicator of hard water (calcium based salinity) and favours alkaline
conditions.
Species present at sites LP5 and LP6 such as Navicula trivialis, Nitzschia palea,
Mayamaea atomus, Eolimna minima and Sellaphora seminulum indicate some level of
nutrient and organic input at these sites.
Cluster analysis of Leeuwpan sites along with 206 wetland sites across the Highveld (WCS
diatom database, unpublished data) revealed the following:
Site LP2 was related (but not so closely) to a pan with elevated salinity as a result of
high sulphate concentrations.
Site LP3 was closely related to a channelled system impacted by organics and
nutrients from urban developments.
Site LP4 was grouped with a channelled valley bottom site downstream of a mine,
having relatively good water quality with some nutrient and electrolytes inputs.
Sites LP5 and LP6 were closely grouped with channelled valley bottom sites in
relatively good condition with some signs of organic and nutrient inputs.
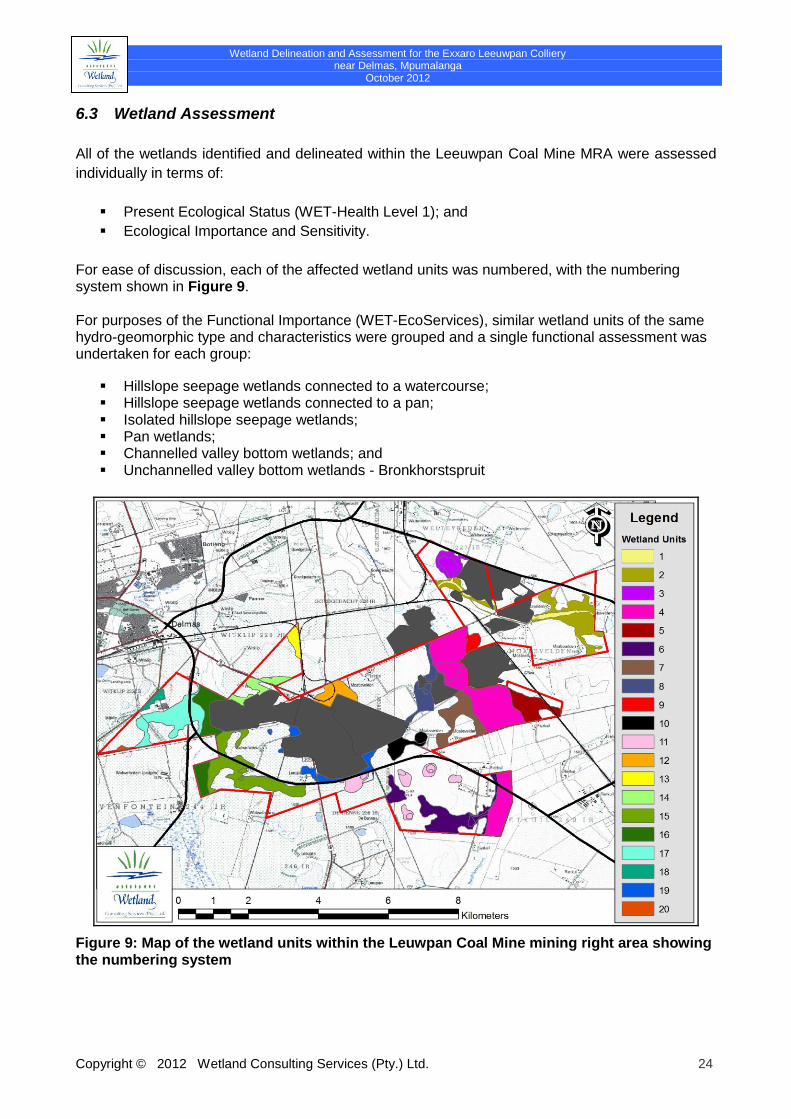
Wetland Delineation and Assessment for the Exxaro Leeuwpan Colliery near Delmas, Mpumalanga
October 2012
Copyright © 2012 Wetland Consulting Services (Pty.) Ltd. 24
6.3 Wetland Assessment
All of the wetlands identified and delineated within the Leeuwpan Coal Mine MRA were assessed
individually in terms of:
Present Ecological Status (WET-Health Level 1); and
Ecological Importance and Sensitivity.
For ease of discussion, each of the affected wetland units was numbered, with the numbering system shown in Figure 9. For purposes of the Functional Importance (WET-EcoServices), similar wetland units of the same hydro-geomorphic type and characteristics were grouped and a single functional assessment was undertaken for each group:
Hillslope seepage wetlands connected to a watercourse; Hillslope seepage wetlands connected to a pan; Isolated hillslope seepage wetlands; Pan wetlands; Channelled valley bottom wetlands; and Unchannelled valley bottom wetlands - Bronkhorstspruit
Figure 9: Map of the wetland units within the Leuwpan Coal Mine mining right area showing the numbering system
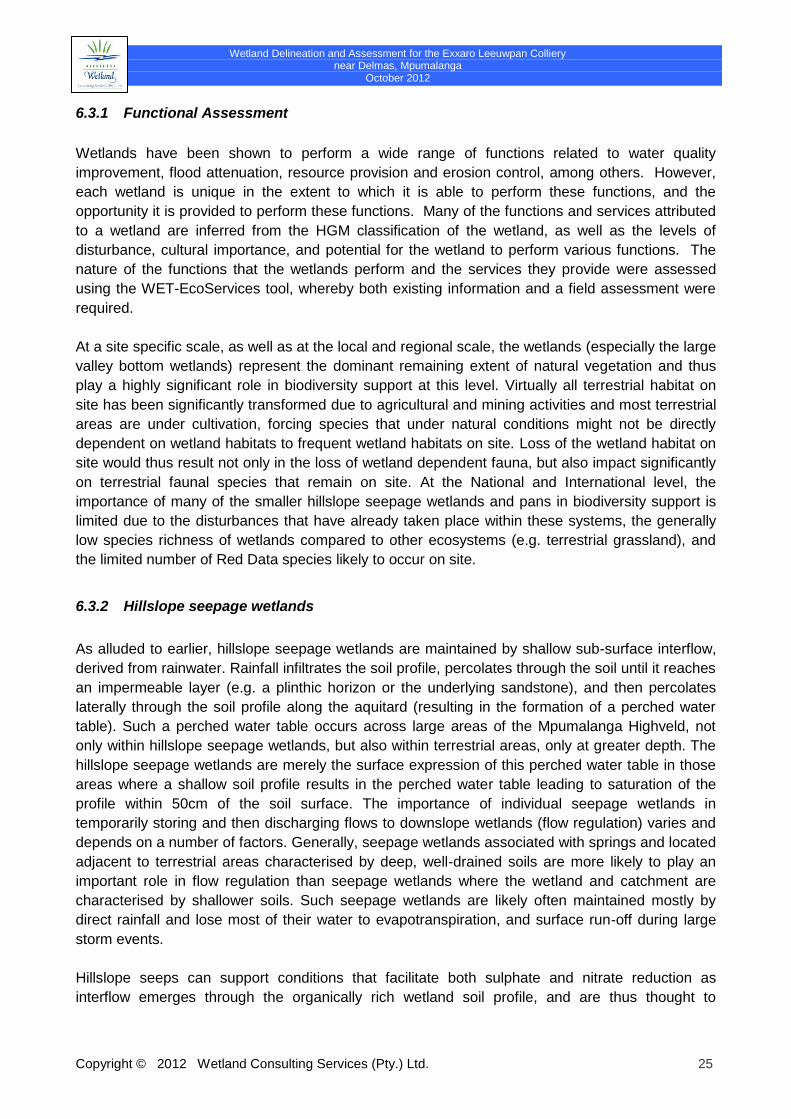
Wetland Delineation and Assessment for the Exxaro Leeuwpan Colliery near Delmas, Mpumalanga
October 2012
Copyright © 2012 Wetland Consulting Services (Pty.) Ltd. 25
6.3.1 Functional Assessment
Wetlands have been shown to perform a wide range of functions related to water quality
improvement, flood attenuation, resource provision and erosion control, among others. However,
each wetland is unique in the extent to which it is able to perform these functions, and the
opportunity it is provided to perform these functions. Many of the functions and services attributed
to a wetland are inferred from the HGM classification of the wetland, as well as the levels of
disturbance, cultural importance, and potential for the wetland to perform various functions. The
nature of the functions that the wetlands perform and the services they provide were assessed
using the WET-EcoServices tool, whereby both existing information and a field assessment were
required.
At a site specific scale, as well as at the local and regional scale, the wetlands (especially the large
valley bottom wetlands) represent the dominant remaining extent of natural vegetation and thus
play a highly significant role in biodiversity support at this level. Virtually all terrestrial habitat on
site has been significantly transformed due to agricultural and mining activities and most terrestrial
areas are under cultivation, forcing species that under natural conditions might not be directly
dependent on wetland habitats to frequent wetland habitats on site. Loss of the wetland habitat on
site would thus result not only in the loss of wetland dependent fauna, but also impact significantly
on terrestrial faunal species that remain on site. At the National and International level, the
importance of many of the smaller hillslope seepage wetlands and pans in biodiversity support is
limited due to the disturbances that have already taken place within these systems, the generally
low species richness of wetlands compared to other ecosystems (e.g. terrestrial grassland), and
the limited number of Red Data species likely to occur on site.
6.3.2 Hillslope seepage wetlands
As alluded to earlier, hillslope seepage wetlands are maintained by shallow sub-surface interflow,
derived from rainwater. Rainfall infiltrates the soil profile, percolates through the soil until it reaches
an impermeable layer (e.g. a plinthic horizon or the underlying sandstone), and then percolates
laterally through the soil profile along the aquitard (resulting in the formation of a perched water
table). Such a perched water table occurs across large areas of the Mpumalanga Highveld, not
only within hillslope seepage wetlands, but also within terrestrial areas, only at greater depth. The
hillslope seepage wetlands are merely the surface expression of this perched water table in those
areas where a shallow soil profile results in the perched water table leading to saturation of the
profile within 50cm of the soil surface. The importance of individual seepage wetlands in
temporarily storing and then discharging flows to downslope wetlands (flow regulation) varies and
depends on a number of factors. Generally, seepage wetlands associated with springs and located
adjacent to terrestrial areas characterised by deep, well-drained soils are more likely to play an
important role in flow regulation than seepage wetlands where the wetland and catchment are
characterised by shallower soils. Such seepage wetlands are likely often maintained mostly by
direct rainfall and lose most of their water to evapotranspiration, and surface run-off during large
storm events.
Hillslope seeps can support conditions that facilitate both sulphate and nitrate reduction as
interflow emerges through the organically rich wetland soil profile, and are thus thought to
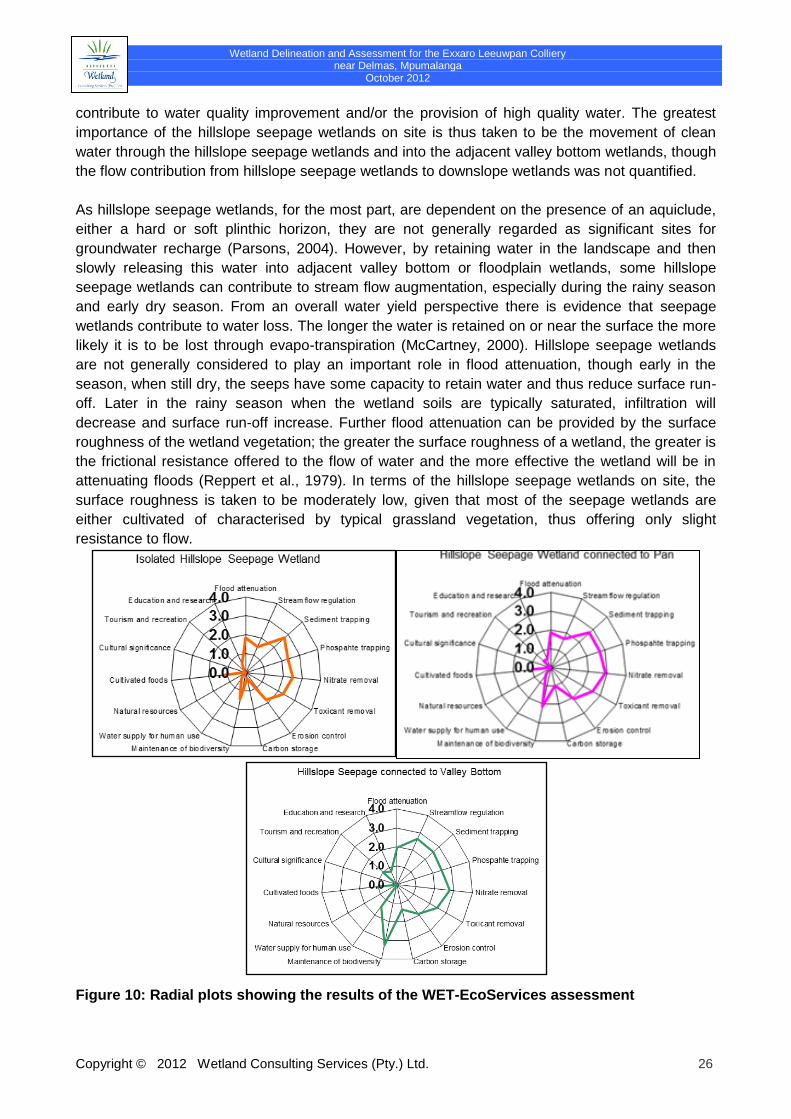
Wetland Delineation and Assessment for the Exxaro Leeuwpan Colliery near Delmas, Mpumalanga
October 2012
Copyright © 2012 Wetland Consulting Services (Pty.) Ltd. 26
contribute to water quality improvement and/or the provision of high quality water. The greatest
importance of the hillslope seepage wetlands on site is thus taken to be the movement of clean
water through the hillslope seepage wetlands and into the adjacent valley bottom wetlands, though
the flow contribution from hillslope seepage wetlands to downslope wetlands was not quantified.
As hillslope seepage wetlands, for the most part, are dependent on the presence of an aquiclude,
either a hard or soft plinthic horizon, they are not generally regarded as significant sites for
groundwater recharge (Parsons, 2004). However, by retaining water in the landscape and then
slowly releasing this water into adjacent valley bottom or floodplain wetlands, some hillslope
seepage wetlands can contribute to stream flow augmentation, especially during the rainy season
and early dry season. From an overall water yield perspective there is evidence that seepage
wetlands contribute to water loss. The longer the water is retained on or near the surface the more
likely it is to be lost through evapo-transpiration (McCartney, 2000). Hillslope seepage wetlands
are not generally considered to play an important role in flood attenuation, though early in the
season, when still dry, the seeps have some capacity to retain water and thus reduce surface run-
off. Later in the rainy season when the wetland soils are typically saturated, infiltration will
decrease and surface run-off increase. Further flood attenuation can be provided by the surface
roughness of the wetland vegetation; the greater the surface roughness of a wetland, the greater is
the frictional resistance offered to the flow of water and the more effective the wetland will be in
attenuating floods (Reppert et al., 1979). In terms of the hillslope seepage wetlands on site, the
surface roughness is taken to be moderately low, given that most of the seepage wetlands are
either cultivated of characterised by typical grassland vegetation, thus offering only slight
resistance to flow.
Figure 10: Radial plots showing the results of the WET-EcoServices assessment
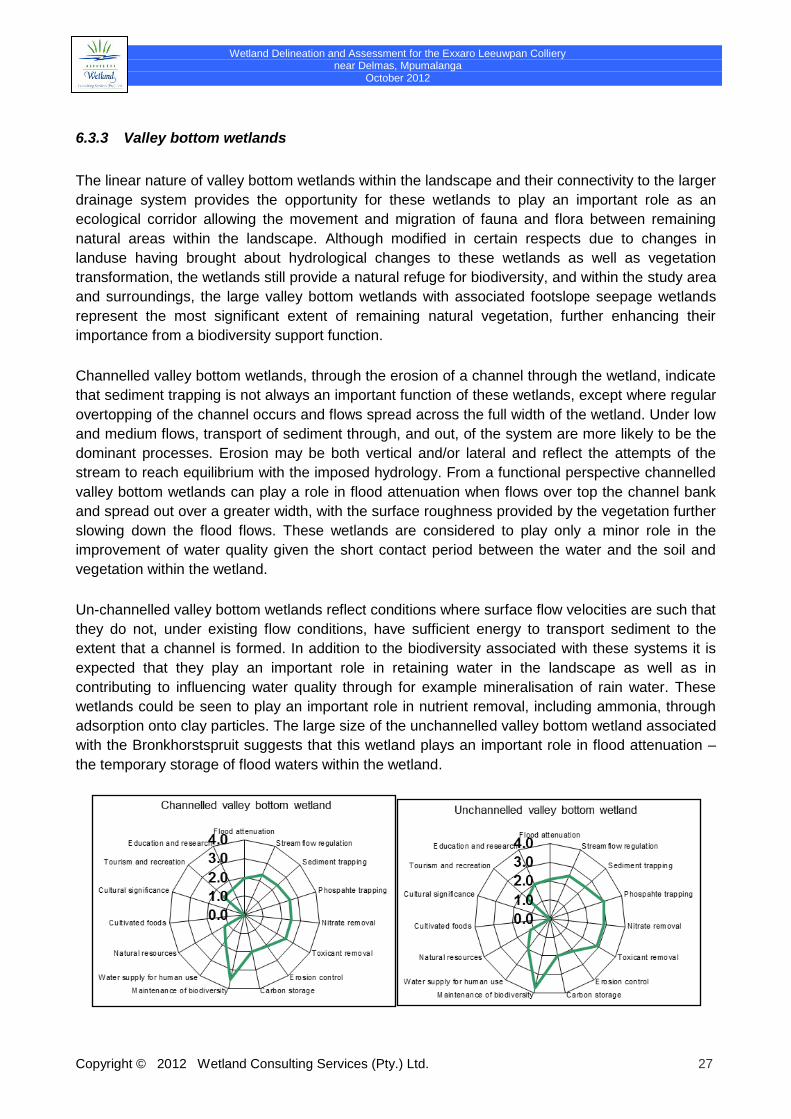
Wetland Delineation and Assessment for the Exxaro Leeuwpan Colliery near Delmas, Mpumalanga
October 2012
Copyright © 2012 Wetland Consulting Services (Pty.) Ltd. 27
6.3.3 Valley bottom wetlands
The linear nature of valley bottom wetlands within the landscape and their connectivity to the larger
drainage system provides the opportunity for these wetlands to play an important role as an
ecological corridor allowing the movement and migration of fauna and flora between remaining
natural areas within the landscape. Although modified in certain respects due to changes in
landuse having brought about hydrological changes to these wetlands as well as vegetation
transformation, the wetlands still provide a natural refuge for biodiversity, and within the study area
and surroundings, the large valley bottom wetlands with associated footslope seepage wetlands
represent the most significant extent of remaining natural vegetation, further enhancing their
importance from a biodiversity support function.
Channelled valley bottom wetlands, through the erosion of a channel through the wetland, indicate
that sediment trapping is not always an important function of these wetlands, except where regular
overtopping of the channel occurs and flows spread across the full width of the wetland. Under low
and medium flows, transport of sediment through, and out, of the system are more likely to be the
dominant processes. Erosion may be both vertical and/or lateral and reflect the attempts of the
stream to reach equilibrium with the imposed hydrology. From a functional perspective channelled
valley bottom wetlands can play a role in flood attenuation when flows over top the channel bank
and spread out over a greater width, with the surface roughness provided by the vegetation further
slowing down the flood flows. These wetlands are considered to play only a minor role in the
improvement of water quality given the short contact period between the water and the soil and
vegetation within the wetland.
Un-channelled valley bottom wetlands reflect conditions where surface flow velocities are such that
they do not, under existing flow conditions, have sufficient energy to transport sediment to the
extent that a channel is formed. In addition to the biodiversity associated with these systems it is
expected that they play an important role in retaining water in the landscape as well as in
contributing to influencing water quality through for example mineralisation of rain water. These
wetlands could be seen to play an important role in nutrient removal, including ammonia, through
adsorption onto clay particles. The large size of the unchannelled valley bottom wetland associated
with the Bronkhorstspruit suggests that this wetland plays an important role in flood attenuation –
the temporary storage of flood waters within the wetland.
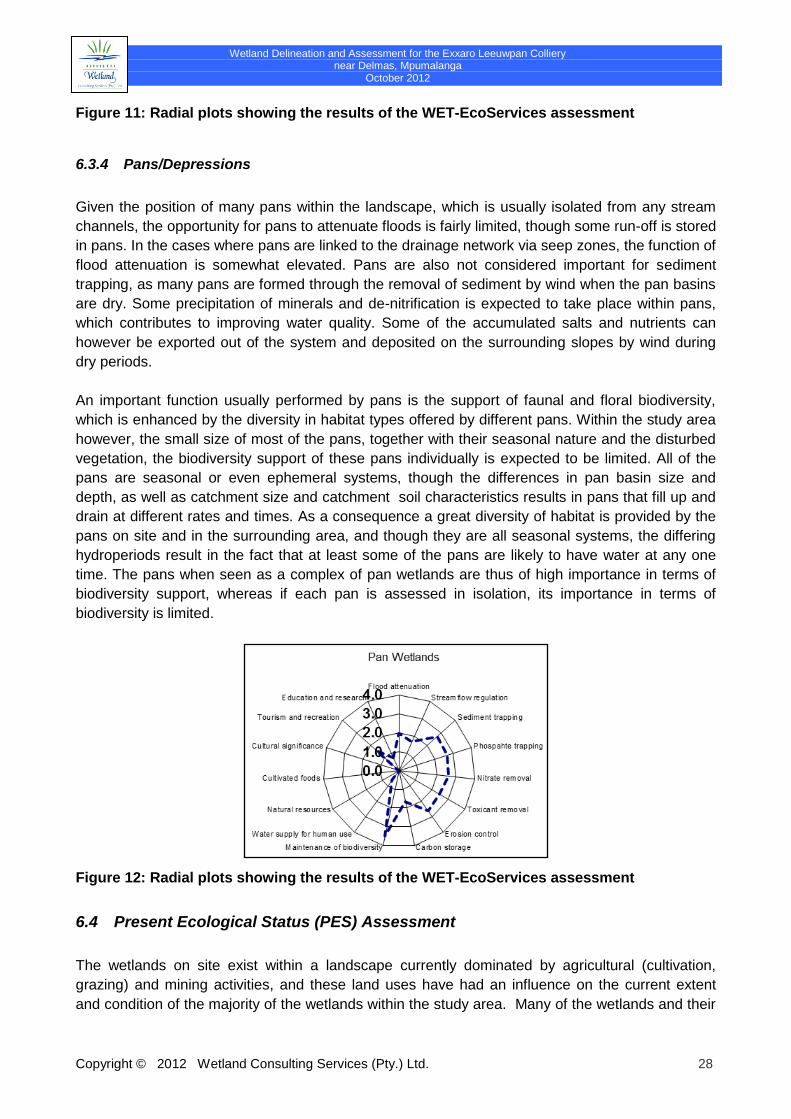
Wetland Delineation and Assessment for the Exxaro Leeuwpan Colliery near Delmas, Mpumalanga
October 2012
Copyright © 2012 Wetland Consulting Services (Pty.) Ltd. 28
Figure 11: Radial plots showing the results of the WET-EcoServices assessment
6.3.4 Pans/Depressions
Given the position of many pans within the landscape, which is usually isolated from any stream
channels, the opportunity for pans to attenuate floods is fairly limited, though some run-off is stored
in pans. In the cases where pans are linked to the drainage network via seep zones, the function of
flood attenuation is somewhat elevated. Pans are also not considered important for sediment
trapping, as many pans are formed through the removal of sediment by wind when the pan basins
are dry. Some precipitation of minerals and de-nitrification is expected to take place within pans,
which contributes to improving water quality. Some of the accumulated salts and nutrients can
however be exported out of the system and deposited on the surrounding slopes by wind during
dry periods.
An important function usually performed by pans is the support of faunal and floral biodiversity,
which is enhanced by the diversity in habitat types offered by different pans. Within the study area
however, the small size of most of the pans, together with their seasonal nature and the disturbed
vegetation, the biodiversity support of these pans individually is expected to be limited. All of the
pans are seasonal or even ephemeral systems, though the differences in pan basin size and
depth, as well as catchment size and catchment soil characteristics results in pans that fill up and
drain at different rates and times. As a consequence a great diversity of habitat is provided by the
pans on site and in the surrounding area, and though they are all seasonal systems, the differing
hydroperiods result in the fact that at least some of the pans are likely to have water at any one
time. The pans when seen as a complex of pan wetlands are thus of high importance in terms of
biodiversity support, whereas if each pan is assessed in isolation, its importance in terms of
biodiversity is limited.
Figure 12: Radial plots showing the results of the WET-EcoServices assessment
6.4 Present Ecological Status (PES) Assessment
The wetlands on site exist within a landscape currently dominated by agricultural (cultivation,
grazing) and mining activities, and these land uses have had an influence on the current extent
and condition of the majority of the wetlands within the study area. Many of the wetlands and their
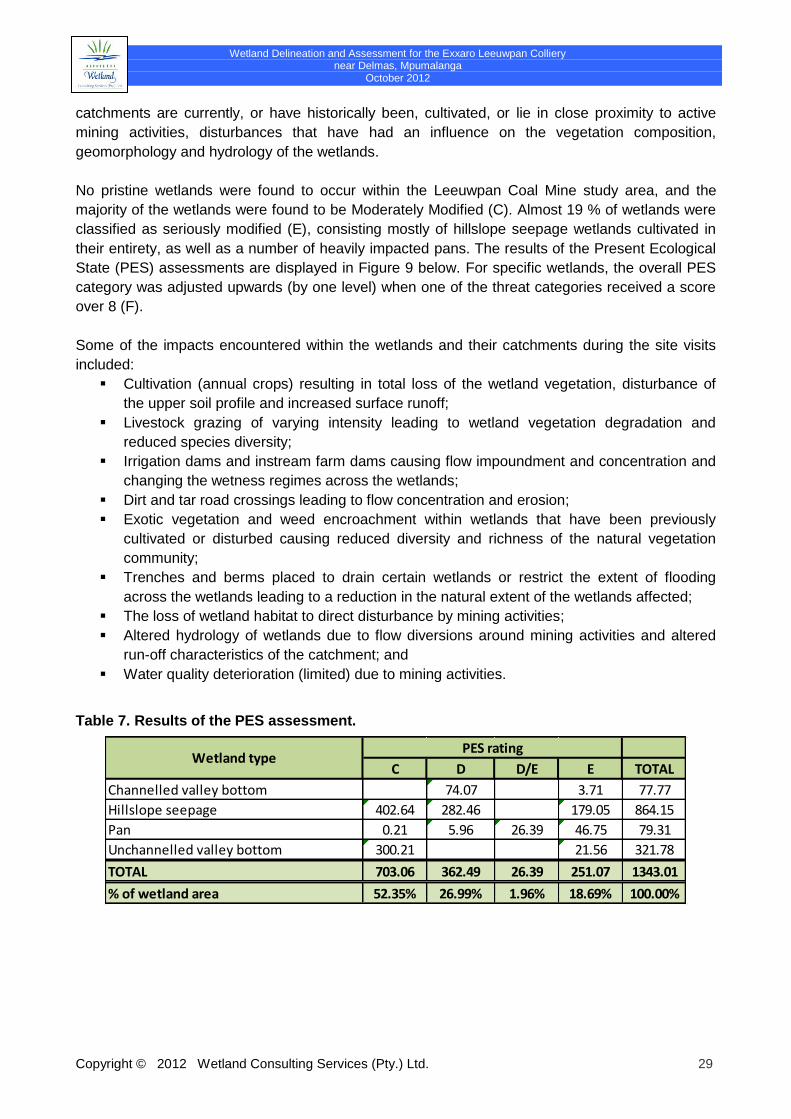
Wetland Delineation and Assessment for the Exxaro Leeuwpan Colliery near Delmas, Mpumalanga
October 2012
Copyright © 2012 Wetland Consulting Services (Pty.) Ltd. 29
catchments are currently, or have historically been, cultivated, or lie in close proximity to active
mining activities, disturbances that have had an influence on the vegetation composition,
geomorphology and hydrology of the wetlands.
No pristine wetlands were found to occur within the Leeuwpan Coal Mine study area, and the
majority of the wetlands were found to be Moderately Modified (C). Almost 19 % of wetlands were
classified as seriously modified (E), consisting mostly of hillslope seepage wetlands cultivated in
their entirety, as well as a number of heavily impacted pans. The results of the Present Ecological
State (PES) assessments are displayed in Figure 9 below. For specific wetlands, the overall PES
category was adjusted upwards (by one level) when one of the threat categories received a score
over 8 (F).
Some of the impacts encountered within the wetlands and their catchments during the site visits
included:
Cultivation (annual crops) resulting in total loss of the wetland vegetation, disturbance of
the upper soil profile and increased surface runoff;
Livestock grazing of varying intensity leading to wetland vegetation degradation and
reduced species diversity;
Irrigation dams and instream farm dams causing flow impoundment and concentration and
changing the wetness regimes across the wetlands;
Dirt and tar road crossings leading to flow concentration and erosion;
Exotic vegetation and weed encroachment within wetlands that have been previously
cultivated or disturbed causing reduced diversity and richness of the natural vegetation
community;
Trenches and berms placed to drain certain wetlands or restrict the extent of flooding
across the wetlands leading to a reduction in the natural extent of the wetlands affected;
The loss of wetland habitat to direct disturbance by mining activities;
Altered hydrology of wetlands due to flow diversions around mining activities and altered
run-off characteristics of the catchment; and
Water quality deterioration (limited) due to mining activities.
Table 7. Results of the PES assessment.
C D D/E E TOTAL
Channelled valley bottom 74.07 3.71 77.77
Hillslope seepage 402.64 282.46 179.05 864.15
Pan 0.21 5.96 26.39 46.75 79.31
Unchannelled valley bottom 300.21 21.56 321.78
TOTAL 703.06 362.49 26.39 251.07 1343.01
% of wetland area 52.35% 26.99% 1.96% 18.69% 100.00%
PES ratingWetland type
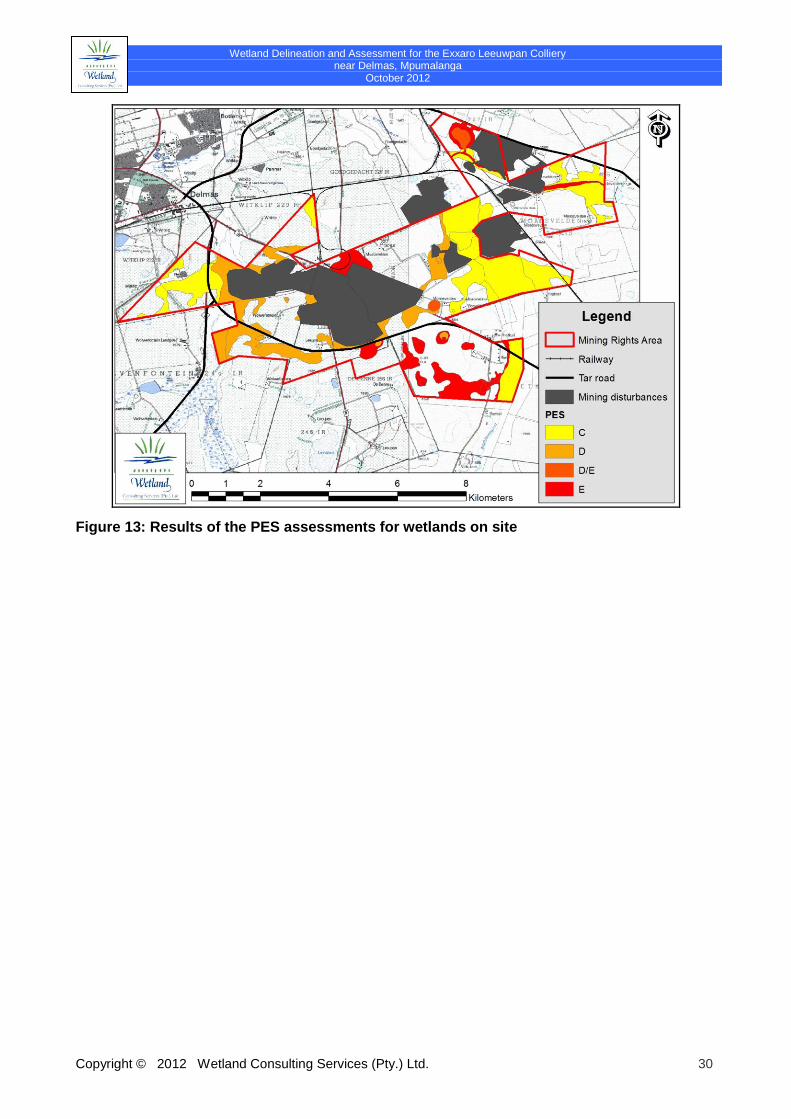
Wetland Delineation and Assessment for the Exxaro Leeuwpan Colliery near Delmas, Mpumalanga
October 2012
Copyright © 2012 Wetland Consulting Services (Pty.) Ltd. 30
Figure 13: Results of the PES assessments for wetlands on site
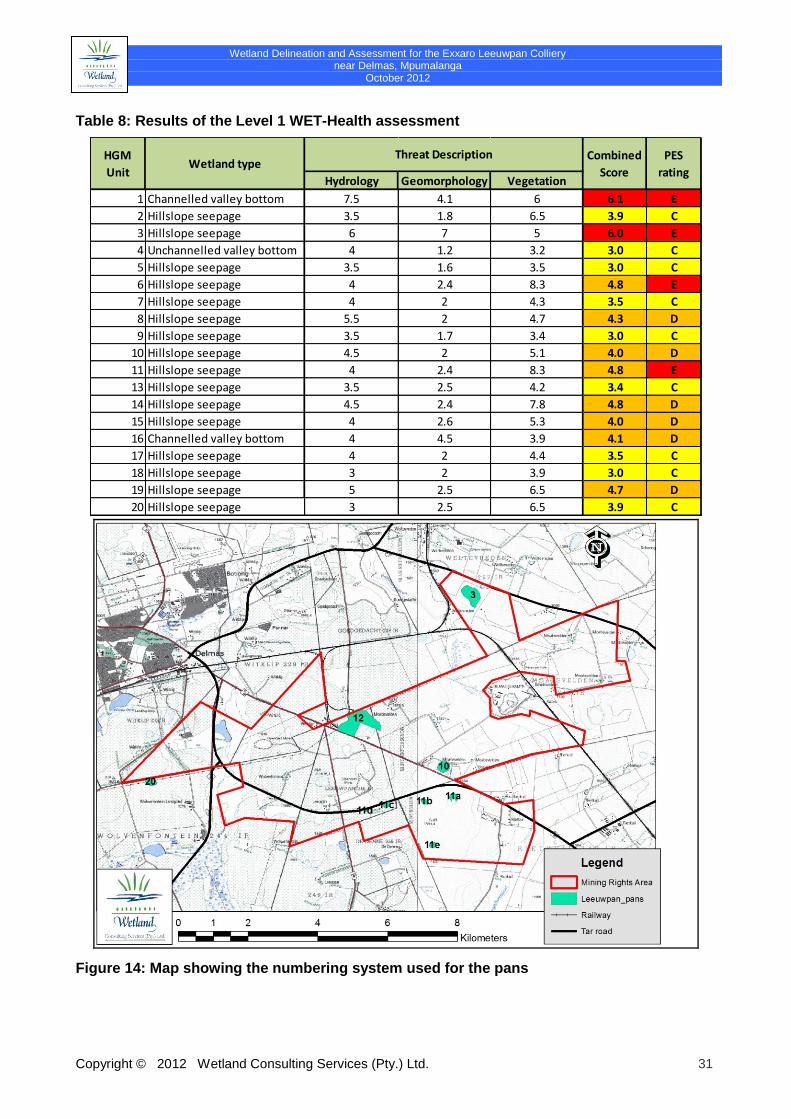
Wetland Delineation and Assessment for the Exxaro Leeuwpan Colliery near Delmas, Mpumalanga
October 2012
Copyright © 2012 Wetland Consulting Services (Pty.) Ltd. 31
Table 8: Results of the Level 1 WET-Health assessment
Hydrology Geomorphology Vegetation
1 Channelled valley bottom 7.5 4.1 6 6.1 E
2 Hillslope seepage 3.5 1.8 6.5 3.9 C
3 Hillslope seepage 6 7 5 6.0 E
4 Unchannelled valley bottom 4 1.2 3.2 3.0 C
5 Hillslope seepage 3.5 1.6 3.5 3.0 C
6 Hillslope seepage 4 2.4 8.3 4.8 E
7 Hillslope seepage 4 2 4.3 3.5 C
8 Hillslope seepage 5.5 2 4.7 4.3 D
9 Hillslope seepage 3.5 1.7 3.4 3.0 C
10 Hillslope seepage 4.5 2 5.1 4.0 D
11 Hillslope seepage 4 2.4 8.3 4.8 E
13 Hillslope seepage 3.5 2.5 4.2 3.4 C
14 Hillslope seepage 4.5 2.4 7.8 4.8 D
15 Hillslope seepage 4 2.6 5.3 4.0 D
16 Channelled valley bottom 4 4.5 3.9 4.1 D
17 Hillslope seepage 4 2 4.4 3.5 C
18 Hillslope seepage 3 2 3.9 3.0 C
19 Hillslope seepage 5 2.5 6.5 4.7 D
20 Hillslope seepage 3 2.5 6.5 3.9 C
Threat Description Combined
Score
PES
rating
HGM
UnitWetland type
Figure 14: Map showing the numbering system used for the pans
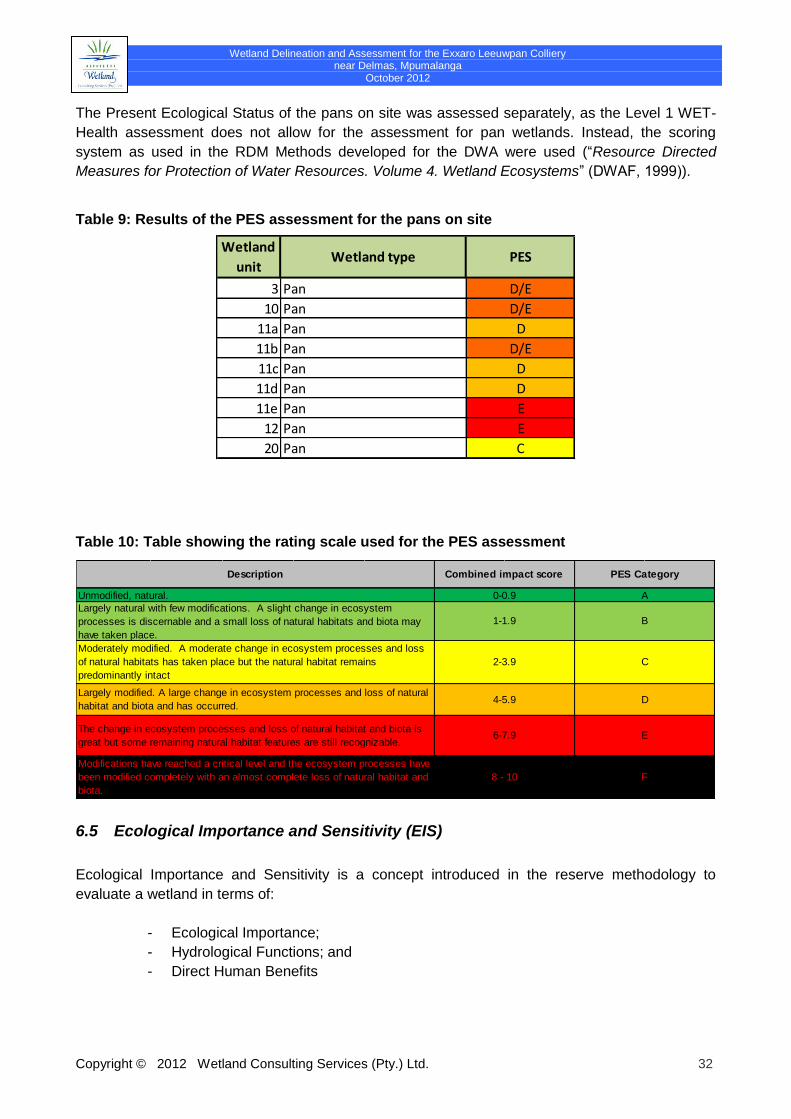
Wetland Delineation and Assessment for the Exxaro Leeuwpan Colliery near Delmas, Mpumalanga
October 2012
Copyright © 2012 Wetland Consulting Services (Pty.) Ltd. 32
The Present Ecological Status of the pans on site was assessed separately, as the Level 1 WET-
Health assessment does not allow for the assessment for pan wetlands. Instead, the scoring
system as used in the RDM Methods developed for the DWA were used (“Resource Directed
Measures for Protection of Water Resources. Volume 4. Wetland Ecosystems” (DWAF, 1999)).
Table 9: Results of the PES assessment for the pans on site
3 Pan D/E
10 Pan D/E
11a Pan D
11b Pan D/E
11c Pan D
11d Pan D
11e Pan E
12 Pan E
20 Pan C
PESWetland
unitWetland type
Table 10: Table showing the rating scale used for the PES assessment
4-5.9
6-7.9
1-1.9
2-3.9
8 - 10
Modifications have reached a critical level and the ecosystem processes have
been modified completely with an almost complete loss of natural habitat and
biota.
The change in ecosystem processes and loss of natural habitat and biota is
great but some remaining natural habitat features are still recognizable.
Largely modified. A large change in ecosystem processes and loss of natural
habitat and biota and has occurred.
PES Category
A
B
C
Combined impact score
0-0.9
D
E
F
Moderately modified. A moderate change in ecosystem processes and loss
of natural habitats has taken place but the natural habitat remains
predominantly intact
Largely natural with few modifications. A slight change in ecosystem
processes is discernable and a small loss of natural habitats and biota may
have taken place.
Unmodified, natural.
Description
6.5 Ecological Importance and Sensitivity (EIS)
Ecological Importance and Sensitivity is a concept introduced in the reserve methodology to
evaluate a wetland in terms of:
- Ecological Importance;
- Hydrological Functions; and
- Direct Human Benefits
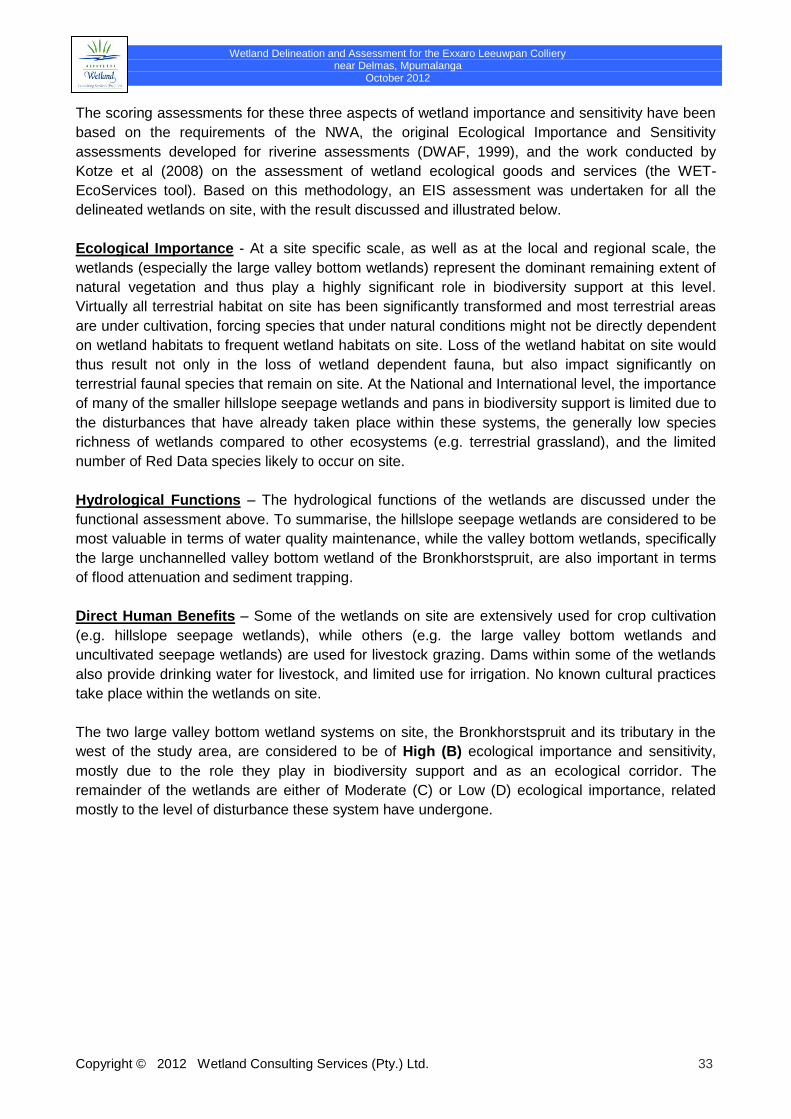
Wetland Delineation and Assessment for the Exxaro Leeuwpan Colliery near Delmas, Mpumalanga
October 2012
Copyright © 2012 Wetland Consulting Services (Pty.) Ltd. 33
The scoring assessments for these three aspects of wetland importance and sensitivity have been
based on the requirements of the NWA, the original Ecological Importance and Sensitivity
assessments developed for riverine assessments (DWAF, 1999), and the work conducted by
Kotze et al (2008) on the assessment of wetland ecological goods and services (the WET-
EcoServices tool). Based on this methodology, an EIS assessment was undertaken for all the
delineated wetlands on site, with the result discussed and illustrated below.
Ecological Importance - At a site specific scale, as well as at the local and regional scale, the
wetlands (especially the large valley bottom wetlands) represent the dominant remaining extent of
natural vegetation and thus play a highly significant role in biodiversity support at this level.
Virtually all terrestrial habitat on site has been significantly transformed and most terrestrial areas
are under cultivation, forcing species that under natural conditions might not be directly dependent
on wetland habitats to frequent wetland habitats on site. Loss of the wetland habitat on site would
thus result not only in the loss of wetland dependent fauna, but also impact significantly on
terrestrial faunal species that remain on site. At the National and International level, the importance
of many of the smaller hillslope seepage wetlands and pans in biodiversity support is limited due to
the disturbances that have already taken place within these systems, the generally low species
richness of wetlands compared to other ecosystems (e.g. terrestrial grassland), and the limited
number of Red Data species likely to occur on site.
Hydrological Functions – The hydrological functions of the wetlands are discussed under the
functional assessment above. To summarise, the hillslope seepage wetlands are considered to be
most valuable in terms of water quality maintenance, while the valley bottom wetlands, specifically
the large unchannelled valley bottom wetland of the Bronkhorstspruit, are also important in terms
of flood attenuation and sediment trapping.
Direct Human Benefits – Some of the wetlands on site are extensively used for crop cultivation
(e.g. hillslope seepage wetlands), while others (e.g. the large valley bottom wetlands and
uncultivated seepage wetlands) are used for livestock grazing. Dams within some of the wetlands
also provide drinking water for livestock, and limited use for irrigation. No known cultural practices
take place within the wetlands on site.
The two large valley bottom wetland systems on site, the Bronkhorstspruit and its tributary in the
west of the study area, are considered to be of High (B) ecological importance and sensitivity,
mostly due to the role they play in biodiversity support and as an ecological corridor. The
remainder of the wetlands are either of Moderate (C) or Low (D) ecological importance, related
mostly to the level of disturbance these system have undergone.
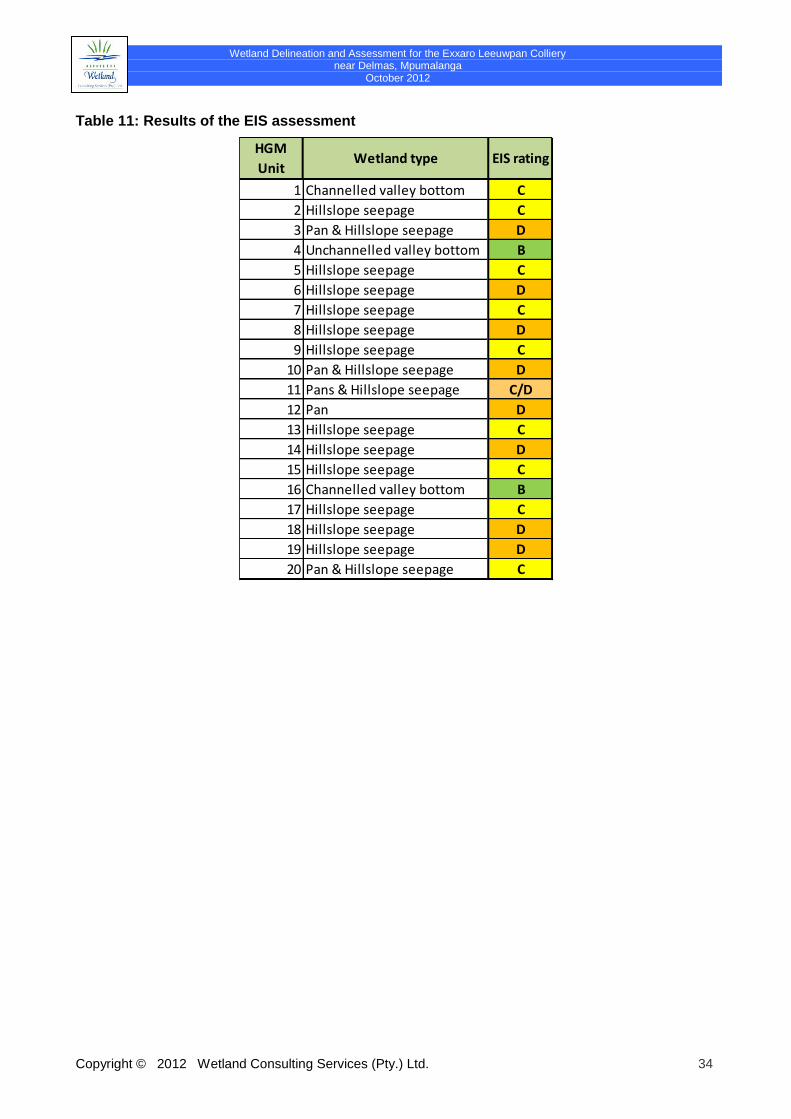
Wetland Delineation and Assessment for the Exxaro Leeuwpan Colliery near Delmas, Mpumalanga
October 2012
Copyright © 2012 Wetland Consulting Services (Pty.) Ltd. 34
Table 11: Results of the EIS assessment
1 Channelled valley bottom C
2 Hillslope seepage C
3 Pan & Hillslope seepage D
4 Unchannelled valley bottom B
5 Hillslope seepage C
6 Hillslope seepage D
7 Hillslope seepage C
8 Hillslope seepage D
9 Hillslope seepage C
10 Pan & Hillslope seepage D
11 Pans & Hillslope seepage C/D
12 Pan D
13 Hillslope seepage C
14 Hillslope seepage D
15 Hillslope seepage C
16 Channelled valley bottom B
17 Hillslope seepage C
18 Hillslope seepage D
19 Hillslope seepage D
20 Pan & Hillslope seepage C
HGM
UnitWetland type EIS rating
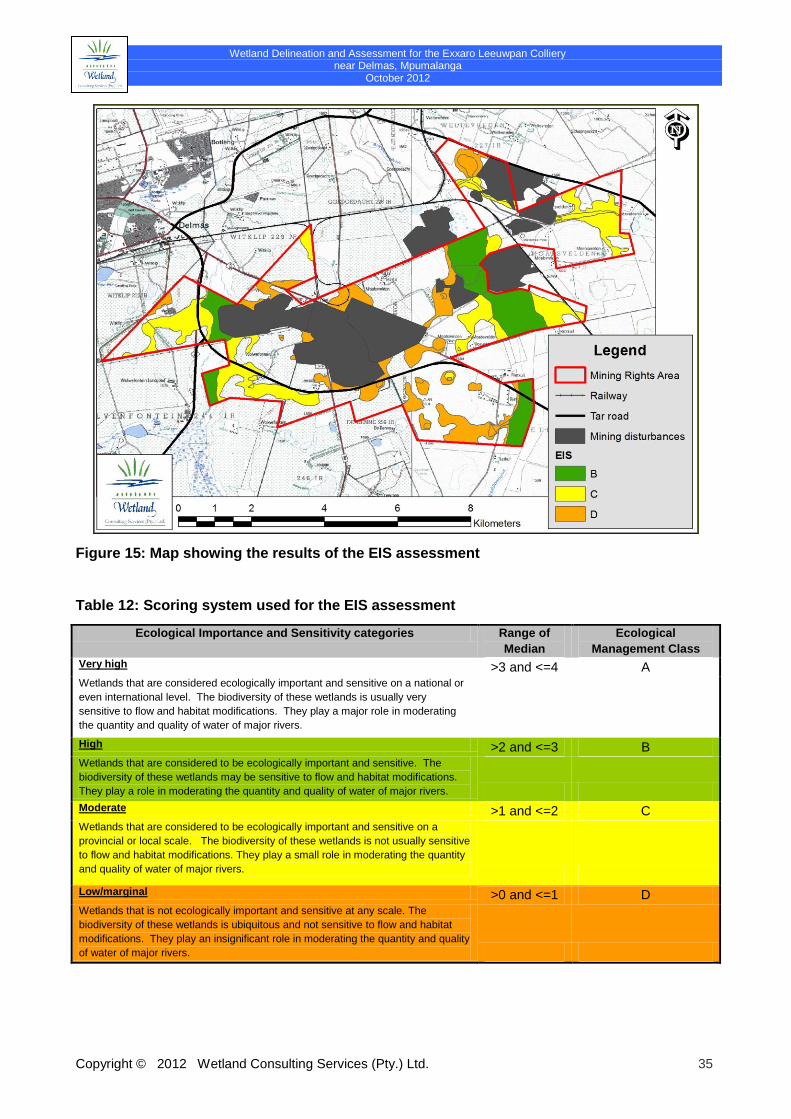
Wetland Delineation and Assessment for the Exxaro Leeuwpan Colliery near Delmas, Mpumalanga
October 2012
Copyright © 2012 Wetland Consulting Services (Pty.) Ltd. 35
Figure 15: Map showing the results of the EIS assessment
Table 12: Scoring system used for the EIS assessment
Ecological Importance and Sensitivity categories Range of
Median
Ecological
Management Class
Very high >3 and <=4 A Wetlands that are considered ecologically important and sensitive on a national or
even international level. The biodiversity of these wetlands is usually very
sensitive to flow and habitat modifications. They play a major role in moderating
the quantity and quality of water of major rivers. High >2 and <=3 B Wetlands that are considered to be ecologically important and sensitive. The
biodiversity of these wetlands may be sensitive to flow and habitat modifications.
They play a role in moderating the quantity and quality of water of major rivers. Moderate >1 and <=2 C Wetlands that are considered to be ecologically important and sensitive on a
provincial or local scale. The biodiversity of these wetlands is not usually sensitive
to flow and habitat modifications. They play a small role in moderating the quantity
and quality of water of major rivers.
Low/marginal >0 and <=1 D Wetlands that is not ecologically important and sensitive at any scale. The
biodiversity of these wetlands is ubiquitous and not sensitive to flow and habitat
modifications. They play an insignificant role in moderating the quantity and quality
of water of major rivers.
Wetland Delineation and Assessment for the Exxaro Leeuwpan Colliery near Delmas, Mpumalanga
October 2012
Copyright © 2012 Wetland Consulting Services (Pty.) Ltd. 36
7. IMPACT ASSESSMENT
7.1 Project Description
This impact assessment is prepared as part of the EIA/EMP consolidation project for Leeuwpan
Coal Mine. As such it deals with both existing activities as well as proposed new activities.
Proposed new activities include the establishment and operation of a new opencast pit, as well as
the required operational infrastructure:
DMS (Dense Media Separation) Plant;
Jig Plant;
Oil and Wash Bay / -extension;
Weighbridges;
Change houses / ablution facilities;
Office buildings / -extensions;
Pipelines;
Clean and Dirty water systems;
Conveyor routes; and
Additional product stockpiles at the rail loop.
The impacts expected due to the proposed activities have been grouped into 5 phases:
Pre-construction Phase;
Construction Phase;
Operational Phase;
Decommissioning & Closure Phase; and
Cumulative Impacts.
The proposed activities largely consist of an expansion of existing activities on site, rather than the
establishment of completely new activities, i.e. opencast coal mining already takes place on site,
as does coal processing, stockpiling and transport. As such, the impacts of the existing activities,
which are all in the operational phase (and in some cases the decommissioning and closure
phases) will be addressed as part of the impacts assessed for the operational phase and
decommissioning and closure phase of the new proposed activities.
In order to allow for more detail and activity specific assessment of impacts, the activities have
been grouped into the following:
Opencast coal mining;
Conveyors & roads;
Other linear infrastructure (powerlines, pipelines etc.);
Surface infrastructure (Plant area, product stockpiles, wash bays, offices, diesel storage
etc.); and
Water management infrastructure.
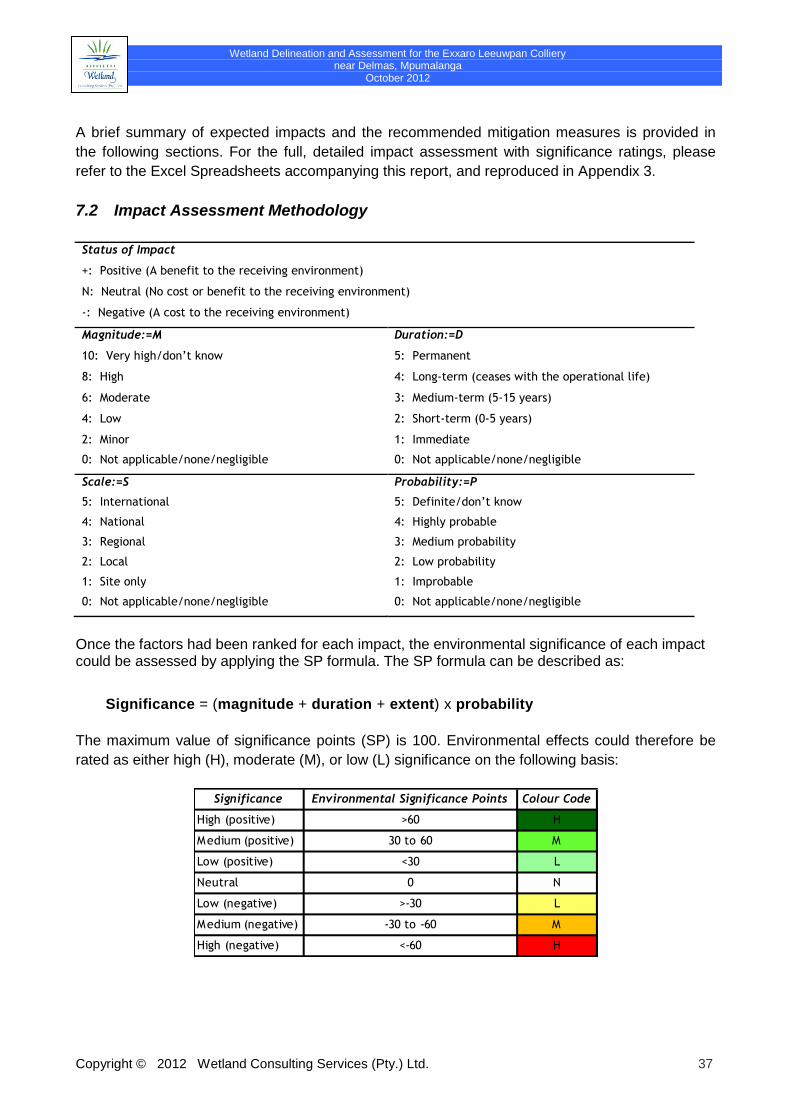
Wetland Delineation and Assessment for the Exxaro Leeuwpan Colliery near Delmas, Mpumalanga
October 2012
Copyright © 2012 Wetland Consulting Services (Pty.) Ltd. 37
A brief summary of expected impacts and the recommended mitigation measures is provided in
the following sections. For the full, detailed impact assessment with significance ratings, please
refer to the Excel Spreadsheets accompanying this report, and reproduced in Appendix 3.
7.2 Impact Assessment Methodology
Status of Impact
+: Positive (A benefit to the receiving environment)
N: Neutral (No cost or benefit to the receiving environment)
-: Negative (A cost to the receiving environment)
Magnitude:=M Duration:=D
10: Very high/don’t know 5: Permanent
8: High 4: Long-term (ceases with the operational life)
6: Moderate 3: Medium-term (5-15 years)
4: Low 2: Short-term (0-5 years)
2: Minor 1: Immediate
0: Not applicable/none/negligible 0: Not applicable/none/negligible
Scale:=S Probability:=P
5: International 5: Definite/don’t know
4: National 4: Highly probable
3: Regional 3: Medium probability
2: Local 2: Low probability
1: Site only 1: Improbable
0: Not applicable/none/negligible 0: Not applicable/none/negligible
Once the factors had been ranked for each impact, the environmental significance of each impact could be assessed by applying the SP formula. The SP formula can be described as:
Significance = (magnitude + duration + extent) x probability
The maximum value of significance points (SP) is 100. Environmental effects could therefore be
rated as either high (H), moderate (M), or low (L) significance on the following basis:
Significance Environmental Significance Points Colour Code
High (positive) >60 H
Medium (positive) 30 to 60 M
Low (positive) <30 L
Neutral 0 N
Low (negative) >-30 L
Medium (negative) -30 to -60 M
High (negative) <-60 H
Wetland Delineation and Assessment for the Exxaro Leeuwpan Colliery near Delmas, Mpumalanga
October 2012
Copyright © 2012 Wetland Consulting Services (Pty.) Ltd. 38
7.3 Opencast Coal Mining
Figure 16 shows the proposed opencast pits in relation to the delineated wetlands. 68.4 ha of wetlands occur within the proposed 272.4 ha opencast mining area, implying that 25 % of the opencast footprint is classified as wetland. Two hydro-geomorphic wetland types were identified, namely hillslope seepage wetlands (54.8 ha) and pan wetlands (12.4 ha). Two dams were also identified, one with a hillslope seepage wetland, and the second an irrigation dam constructed within a pan basin. The hillslope seepage wetlands have been extensively impacted by cultivation within the wetland boundaries, with all hillslope seepage wetlands within the proposed southern opencast pit (south of the R50 tar road) being currently cultivated in their entirety. The northern seepage wetlands have been extensively impacted by cultivation along their perimeters, though the wetlands themselves have not been directly cultivated. The pans have also been significantly impacted by activities associated with irrigation. The northern pan appears to be used as an irrigation dam that is being used for the temporary storage of groundwater prior to use of this water for irrigation (centre-pivot). This has altered the pan from what is assumed to have been a shallow, grassed, seasonal system (supported by observations on historical imagery) to a permanent, open water pan lined by Salix babylonica and Phragmites australis. Regarding the southern two pans, the eastern pan has had a rectangular irrigation dam constructed within the pan basin, as well as a farm road through the pan, while the western pan lies partially within the path of a centre-pivot irrigation system, and the perimeter is entirely cultivated. Should the proposed opencast mining activities proceed as currently proposed, the wetlands within the mining footprint (see Figure 16) will be completely and permanently destroyed. Opencast mining permanently alters the movement of water through the landscape through its impact on geological strata and soil structure, and thus impacts on the opportunity for wetlands to reform in the post mining landscape.
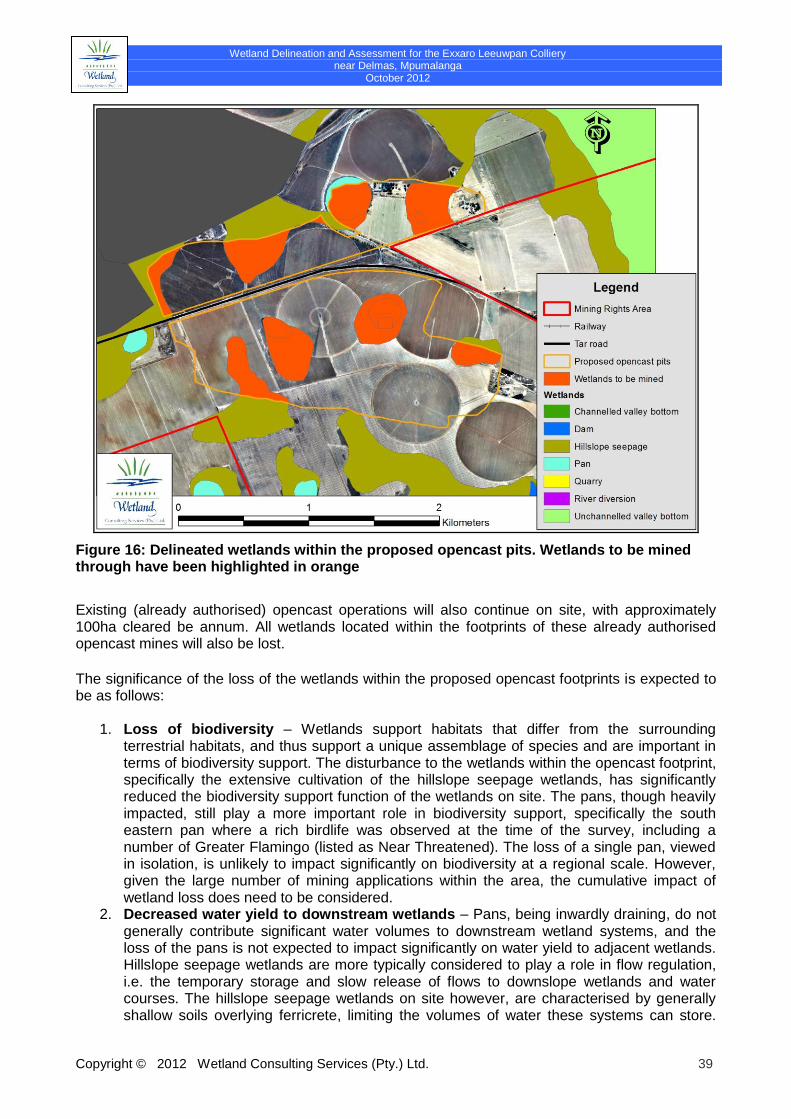
Wetland Delineation and Assessment for the Exxaro Leeuwpan Colliery near Delmas, Mpumalanga
October 2012
Copyright © 2012 Wetland Consulting Services (Pty.) Ltd. 39
Figure 16: Delineated wetlands within the proposed opencast pits. Wetlands to be mined through have been highlighted in orange
Existing (already authorised) opencast operations will also continue on site, with approximately 100ha cleared be annum. All wetlands located within the footprints of these already authorised opencast mines will also be lost.
The significance of the loss of the wetlands within the proposed opencast footprints is expected to be as follows:
1. Loss of biodiversity – Wetlands support habitats that differ from the surrounding terrestrial habitats, and thus support a unique assemblage of species and are important in terms of biodiversity support. The disturbance to the wetlands within the opencast footprint, specifically the extensive cultivation of the hillslope seepage wetlands, has significantly reduced the biodiversity support function of the wetlands on site. The pans, though heavily impacted, still play a more important role in biodiversity support, specifically the south eastern pan where a rich birdlife was observed at the time of the survey, including a number of Greater Flamingo (listed as Near Threatened). The loss of a single pan, viewed in isolation, is unlikely to impact significantly on biodiversity at a regional scale. However, given the large number of mining applications within the area, the cumulative impact of wetland loss does need to be considered.
2. Decreased water yield to downstream wetlands – Pans, being inwardly draining, do not generally contribute significant water volumes to downstream wetland systems, and the loss of the pans is not expected to impact significantly on water yield to adjacent wetlands. Hillslope seepage wetlands are more typically considered to play a role in flow regulation, i.e. the temporary storage and slow release of flows to downslope wetlands and water courses. The hillslope seepage wetlands on site however, are characterised by generally shallow soils overlying ferricrete, limiting the volumes of water these systems can store.
Wetland Delineation and Assessment for the Exxaro Leeuwpan Colliery near Delmas, Mpumalanga
October 2012
Copyright © 2012 Wetland Consulting Services (Pty.) Ltd. 40
Lateral movement of water through the seepage wetlands is also expected to be minimal, further decreasing the importance of these wetlands in contributing flow to downstream wetlands. Most of the water supporting the hillslope seepage wetlands on site is expected to be lost to evapotranspiration. A possible exception is the north eastern hillslope seepage wetland, though the increased saturation of this wetland could be a result of increased seepage of water out of the pan due to the storage of groundwater in the pan. Note however that no modelling was undertaken to verify these assumptions.
3. Loss of wetland ecosystem functions – Wetlands are generally considered to perform a number of ecosystem services, ranging from flood attenuation and water quality enhancement, to biodiversity support and direct human benefits (e.g. provision of natural resources). In the case of the wetlands on site, the most important function performed by the pans is that of biodiversity support (addressed under point 1 above). The hillslope seepage wetlands are considered to be most important in terms of water quality maintenance, though the limited role they are expected to play in discharging flow to downstream wetlands also limits the significance of this function. Under natural conditions, they would also have been important in terms of biodiversity support, but currently only play a role in supporting productivity, i.e. crop cultivation.
4. Deterioration in water quality – Post-mining, the backfilled voids are likely to fill with water and start decanting. Decanting water is likely to be acidic as well as metal (e.g. Aluminium and Iron) and sulphate rich, resulting in significant deterioration of water quality within the Bronkhorstspruit to the east of the opencast pits. Currently, due to the absence of mining activities within the Bronkhorstspruit upstream of the R50 road crossing, the water quality at this point within the Bronkhorstspruit is still good, though agricultural impacts are evident.
The following impacts are expected due to the proposed opencast mining activities: Pre-construction & Construction:
Loss and disturbance of wetland habitat; Increased surface runoff from bare soil areas; Increased sediment transport into wetlands; Decreased water make to downslope wetlands
7.3.1 Loss and disturbance of wetland habitat
As indicated above, 68.4 ha of wetland habitat will be directly destroyed by the proposed opencast mining activities. Construction activities, if not strictly controlled, will also result in additional disturbances to the wetland vegetation and habitat on site, through for example injudicious driving in the wetland area, fire, or temporary stockpiling of material in the wetland area. Such disturbances can lead to increased erosion in the wetlands (e.g. preferential flow paths created by vehicle tracks), displacement of wetland fauna, changes in wetland vegetation and invasion by alien vegetation. Blasting activities are also likely to result in disturbance and possibly displacement to wetland fauna. Mitigation The loss of wetland habitat could only be avoided if the layout and/or location of the proposed opencast pit was adjusted. The location of the pit is however limited by the location of the coal resource, i.e. you can only mine where the coal is located. Adjusting the pit to exclude all wetland
Wetland Delineation and Assessment for the Exxaro Leeuwpan Colliery near Delmas, Mpumalanga
October 2012
Copyright © 2012 Wetland Consulting Services (Pty.) Ltd. 41
areas would also likely render the proposed mining non-feasible. The loss of wetland habitat is thus inevitable if the coal resource is to be mined.
The wetlands falling within the proposed opencast footprint have however already been heavily
impacted by agricultural activities. The main function of these wetlands in their natural condition is
expected to have been biodiversity support, though this has been significantly compromised by the
extensive cultivation of the hillslope seepage wetlands within the proposed opencast footprint.
A consideration should be given to wetland offsets as a means of mitigating the loss of wetland
habitat. Such an offset would need to be informed by the recently published SANBI Guidelines on
wetland offsets.
All wetland areas located adjacent to mining areas should be fenced off prior to commencement of
vegetation clearing activities on site so as to prevent access to construction machinery and
personnel. In addition, all wetland areas should be clearly marked and demarcated as such to alert
construction staff on site. All construction staff should also be educated on the importance and
sensitivity of the wetland systems on site. This should form part of the induction process.
No stockpiling of material may take place within the wetland areas and temporary construction
camps and infrastructure should also be located away from these areas, with a minimum buffer of
50m maintained from delineated wetland boundaries. Regular cleaning up of the wetland areas
should be undertaken to remove litter, while an alien vegetation management plan should be
drawn up by the Environmental Co-ordinator and implemented. Regular removal of invasive alien
species should be undertaken. This should extend right through to the decommissioning and
closure phase of the project
7.3.2 Increased surface runoff from bare soil areas
Stripping of vegetation will increase volumes and velocities of surface runoff generated from the
affected area, increasing erosion risk within downslope wetlands. Soil compaction due to
movement of machinery during construction will further increase runoff, while vehicle ruts and
tracks resulting from construction activity could provide preferential flow paths that lead to flow
concentration, again increasing erosion risk.
Mitigation
The footprint of vegetation clearing should be kept as small as possible. Vegetation clearing should
be phased so as to limit the extent of bare soil areas at any one time. A shallow berm or other
sediment barrier should be constructed downslope of the proposed opencast pits to attenuate/slow
down sheet flow and create a depositional environment to trap sediments. Concentrated runoff
from cleared areas should be avoided. Any preferential flows paths that do develop should be
plugged as soon as possible.
Wetland Delineation and Assessment for the Exxaro Leeuwpan Colliery near Delmas, Mpumalanga
October 2012
Copyright © 2012 Wetland Consulting Services (Pty.) Ltd. 42
7.3.3 Increased sediment transport into wetlands
Bare soil areas resulting from vegetation clearing and soils tripping will provide extensive sediment
sources delivering increased sediment loads to downslope wetlands. Transported sediments are
likely to deposit in the receiving wetlands, leading to changes in vegetation and habitat.
Mitigation
Vegetation clearing and earthworks should be limited to as small an area as possible, preferably
no larger than the direct footprint of the proposed development. Bare soil areas falling outside the
direct footprint should be landscaped to the original landscape profile and re-vegetated as soon as
possible. Hydroseeding with a mix of species (see Section 8.2 below) should be done with regular
monitoring to ensure 70% cover in revegetated areas within 3 months. Where practically possible,
the major earthworks should be undertaken during the dry season (roughly from June to
September) to limit erosion due to rainfall runoff. A shallow berm should be constructed between
the proposed opencast footprint and the downslope wetlands to prevent sediment rich runoff from
the construction site entering the wetlands. These berms should thus be constructed prior to the
commencement of construction on the opencast pit.
7.3.4 Decreased water make to downslope wetlands
Through excluding a portion of the wetlands catchment, and permanently altering the movement of
water through the landscape within the opencast footprints, it is likely that water flow to downslope
wetlands will be cut-off. In the case of the proposed opencast pit, the decrease in water make is
likely to be limited, as the wetlands on site (pans and hillslope seepage wetlands) are not thought
to contribute significantly to flow in downslope wetlands, with the north eastern seepage wetland
(see Figure 16 above) likely to make the most significant contribution, though this could be
influenced by the storage of groundwater in the upslope pan.
No modelling was however done to determine the flow contributions of the catchments to the
wetlands, and the wetlands to the downslope water resources. It is likely that the DWA, based on
experience gained from other recently completed projects, will require modelling to quantify flow
contributions from the catchments to the wetlands. This will need to be done by an eco-hydrologist
and could be undertaken as part of a wetland reserve study, or as a standalone study to supply
additional information to the WULA.
Operation:
The operational phase will involve the progressive development of the opencast pit; the impacts
will be largely the same as for the construction phase of the opencast pits. For completeness, the
impacts and recommended mitigation measures are repeated below.
Loss and disturbance of wetland habitat; Increased surface runoff from bare soil areas; and Increased sediment transport into wetlands. Water quality deterioration.
Wetland Delineation and Assessment for the Exxaro Leeuwpan Colliery near Delmas, Mpumalanga
October 2012
Copyright © 2012 Wetland Consulting Services (Pty.) Ltd. 43
7.3.5 Loss and disturbance of wetland habitat
As indicated above, 68.4 ha of wetland habitat will be directly destroyed by the proposed opencast mining activities. Opencast mining activities, if not strictly controlled, will also result in additional disturbances to the wetland vegetation and habitat on site, through for example injudicious driving in the wetland area, fire, or temporary stockpiling of material in the wetland area. Such disturbances can lead to increased erosion in the wetlands (e.g. preferential flow paths created by vehicle tracks), displacement of wetland fauna, changes in wetland vegetation and invasion by alien vegetation. Blasting activities are also likely to result in disturbance and possibly displacement to wetland fauna. Mitigation The loss of wetland habitat could only be avoided if the layout and/or location of the proposed opencast pit were adjusted. The location of the pit is however limited by the location of the coal resource, i.e. you can only mine where the coal is located. Adjusting the pit to exclude all wetland areas would also likely render the proposed mining non-feasible. The loss of wetland habitat is thus inevitable if the coal resource is to be mined. The wetlands falling within the proposed opencast footprint have however already been heavily impacted by agricultural activities. The main function of these wetlands in their natural condition is expected to have been biodiversity support, though this has been significantly compromised by the extensive cultivation of the hillslope seepage wetlands within the proposed opencast footprint. All wetland areas located adjacent to mining areas should be fenced off prior to commencement of
vegetation clearing activities on site so as to prevent access to construction machinery and
personnel. In addition, all wetland areas should be clearly marked and demarcated as such to alert
construction staff on site. All construction staff should also be educated on the importance and
sensitivity of the wetland systems on site. This should form part of the induction process.
No stockpiling of material may take place within the wetland areas and temporary construction
camps and infrastructure should also be located away from these areas. Regular cleaning up of
the wetland areas should be undertaken to remove litter, while an alien vegetation management
plan should be drawn up by the Environmental Coordinator. Regular removal of invasive alien
species should be undertaken. This should extend right through to the decommissioning and
closure phase of the project
7.3.6 Increased surface runoff from bare soil areas
Stripping of vegetation will increase volumes and velocities of surface runoff generated from the
affected area, increasing erosion risk within downslope wetlands. Soil compaction due to
movement of machinery during construction will further increase runoff, while vehicle ruts and
tracks resulting from vegetation clearing and soil stripping activity could provide preferential flow
paths that lead to flow concentration, again increasing erosion risk.
Mitigation
Wetland Delineation and Assessment for the Exxaro Leeuwpan Colliery near Delmas, Mpumalanga
October 2012
Copyright © 2012 Wetland Consulting Services (Pty.) Ltd. 44
The footprint of vegetation clearing should be kept as small as possible. Vegetation clearing should
be phased so as to limit the extent of bare soil areas at any one time. A shallow berm or other
sediment barrier should be constructed downslope of the proposed opencast pits to attenuate/slow
down sheet flow and create a depositional environment to trap sediments. Concentrated runoff
from cleared areas should be avoided. Any preferential flows paths that do develop should be
plugged as soon as possible.
7.3.7 Increased sediment transport into wetlands
Bare soil areas resulting from vegetation clearing and soils tripping will provide extensive sediment
sources delivering increased sediment loads to downslope wetlands. Transported sediments are
likely to deposit in the receiving wetlands, leading to changes in vegetation and habitat.
Mitigation
Vegetation clearing, topsoil / wetland soil stripping (where required) and earthworks should be
limited to as small an area as possible, preferably no larger than the direct footprint of the
proposed development. Bare soil areas falling outside the direct footprint should be landscaped to
the original landscape profile and re-vegetated as soon as possible. Hydroseeding with a mix of
species (see Section 8.2 below) should be done with regular monitoring to ensure 70% cover in
revegetated areas within 3 months. Where practically possible, the major earthworks should be
undertaken during the dry season (roughly from June to September) to limit erosion due to rainfall
runoff. A shallow berm should be constructed between the proposed opencast footprint and the
downslope wetlands to prevent sediment rich runoff from the construction site entering the
wetlands. These berms should thus be constructed prior to the commencement of construction on
the opencast pit.
7.3.8 Water quality deterioration
As part of supporting activities for the opencast mining activities, numerous hazardous and
potentially polluting substances will be utilised and possibly temporarily stored on site, including for
example diesel and oil. Spillages and leaks of these hydrocarbons could result in the deterioration
of water quality should they enter the adjacent wetland areas via surface runoff.
Mitigation
All hazardous substances should be stored on impervious surfaces, outside any wetland areas,
that allow for the containment of spills and leakages (e.g. bunded areas). Should spills occur,
these should be reported to the ECO. Larger spills will require the appointment of specialist clean-
up teams to rehabilitate the affected area. No hazardous materials may be stockpiled in any
wetland area on site.
Wetland Delineation and Assessment for the Exxaro Leeuwpan Colliery near Delmas, Mpumalanga
October 2012
Copyright © 2012 Wetland Consulting Services (Pty.) Ltd. 45
Decommissioning & Closure:
Altered hydrology;
Water quality deterioration;
Increased sediment transport into wetlands; and
Increase in alien vegetation.
7.3.9 Altered hydrology
Opencast mining permanently alters the movement of water through the landscape through its
impacts on geological strata and soils. Compared to the pre-mining landscape, the rehabilitated
opencast pit will have significantly increased infiltration to groundwater and increased surface
runoff. Typically the rehabilitated opencast areas lack the shallow perched water table that
characterised the pre-mining landscape.
The implications of these changes are that no wetlands are likely to reform on the rehabilitated
opencast areas, and that the remaining wetlands downslope of these areas will be faced with
altered runoff characteristics from their catchment. Typically, surface runoff volumes and velocities
are expected to increase, leading to increases in flood peaks and erosive energy, while subsurface
inputs are expected to decrease, reducing low flows and increasing seasonality.
Mitigation
Opencast mining permanently alters the movement of water through the landscape. Mitigation
options in this regard are thus limited. However, the rehabilitation of the opencast pits should
ensure sufficient compaction of replaced spoils to limit ingress of surface water. A sufficient topsoil
layer, based on the desired end landuse as indicated in the closure plan, should also be replaced.
If excess top soil is available, consideration should be given to increase the top soil depth in valley
bottom areas/low points within the rehabilitated landscape to encourage the formation of wetlands
in these areas.
7.3.10 Deteriorating water quality
Post-mining, the backfilled opencast pits are likely to fill with water as groundwater levels rebound.
Eventually the pits are likely to start decanting. Decanting water is likely to be acidic as well as
metal and sulphate rich. Given the location of the proposed opencast pit, decant is likely to enter
either directly or indirectly into the Bronkhorstspruit wetland system if left unmitigated.
Mitigation
Consideration should be given to the installation of a water treatment plant. Decanting water
should be capture/pumped out of the void to prevent the contaminated water entering the
Bronkhorstspruit. Following treatment, the water could then be discharge back into the
environment, ideally as a combination of direct discharge into the wetlands and irrigation into the
wetland catchments, if areas suitable for irrigation are found within the direct vicinity.
Wetland Delineation and Assessment for the Exxaro Leeuwpan Colliery near Delmas, Mpumalanga
October 2012
Copyright © 2012 Wetland Consulting Services (Pty.) Ltd. 46
7.3.11 Increased sediment transport into wetlands
The rehabilitated mine impacted areas will be susceptible to erosion following rehabilitation,
especially in areas that are sparsely vegetated or not vegetated at all. This will result in increased
sediment loads in the downslope wetlands, leading to deteriorating water quality (increased
turbidity and TSS) and changes in the aquatic fauna. Changes in wetland vegetation can also
occur as sediment loving plants (e.g. Phragmites australis) become dominant.
Mitigation
All disturbed areas should be landscape to approximate the natural landscape profile, but should
avoid steep slopes and concentrated run-off. Compacted soils should be ripped and scarified. The
rehabilitated areas should be re-vegetated as soon as possible following completion of the
earthworks to minimise erosion. Regular long-term follow up of rehabilitated areas will be required
to ensure the successful establishment of vegetation and to survey for any erosion damage on
site. Erosion damage should be repaired immediately. The recommendations contained within the
specialist vegetation and soils reports should be fully implemented to ensure successful
rehabilitation.
7.3.12 Increase in alien vegetation
Following the completion of decommissioning, the recently placed and disturbed soils will be
susceptible to invasion by alien vegetation, e.g. Acacia mearnsii (black wattle). These alien
species could spread to the adjacent wetland areas and result in decreased flows, increased
erosion and decreased biodiversity in these systems.
Mitigation
The alien vegetation management plan compiled by an ecologist during the
construction/operational phase of the mine should be kept in place for several years following mine
closure (minimum of ten years). All species of alien invasive vegetation should be controlled and
removed from site. No spread of alien vegetation into any wetlands or adjacent properties should
be allowed.
Cumulative:
Wetland loss – the proposed project will contribute to the significant wetland loss occurring
within the Upper Olifants River due to opencast mining activities. Several thousand
hectares of land have already been permanently altered by mining activities, including the
permanent loss of the wetlands naturally occurring in those areas.
Water Quality Deterioration – the proposed opencast mines will likely decant acidic mine
water post-closure which will contribute to the serious water quality deterioration that has
already taken place within the Upper Olifants River Catchment. In fact, the Integrated
Water Resource Management Plan for the Upper and Middle Olifants Catchment states
that there is no more assimilative capacity within the Loskop Dam catchment if the resource
water quality objectives are to be met. The report states further that salinity loads within the
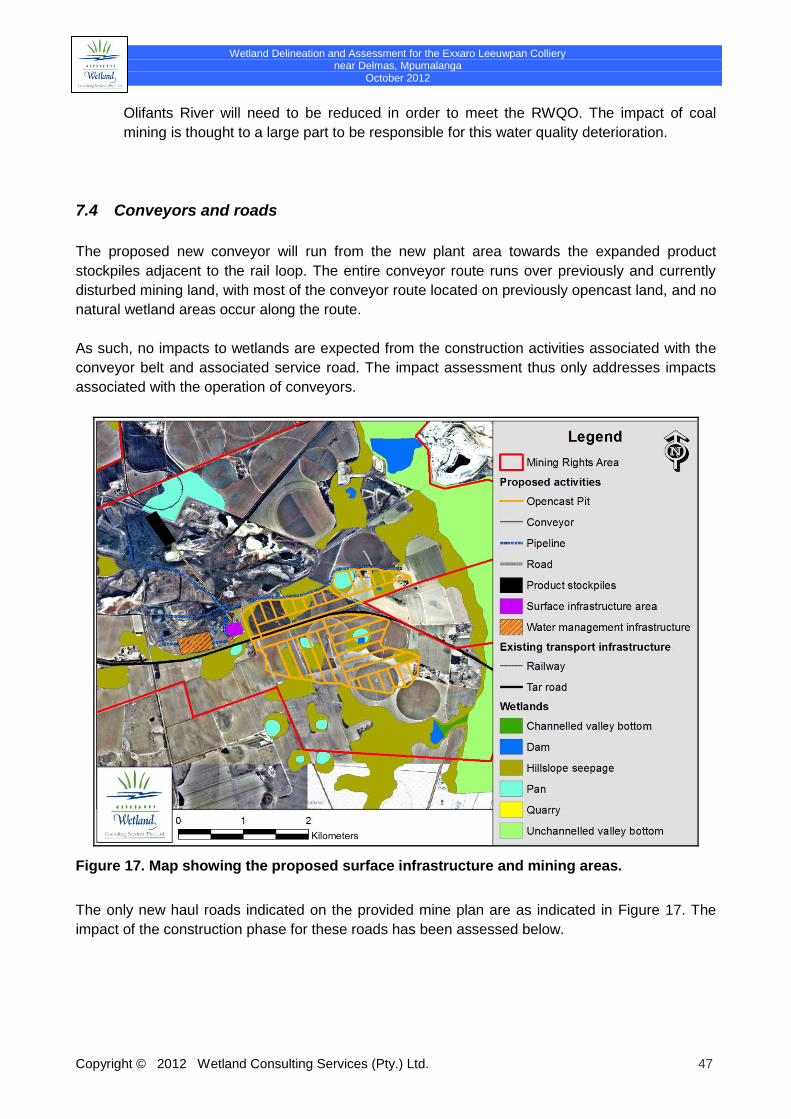
Wetland Delineation and Assessment for the Exxaro Leeuwpan Colliery near Delmas, Mpumalanga
October 2012
Copyright © 2012 Wetland Consulting Services (Pty.) Ltd. 47
Olifants River will need to be reduced in order to meet the RWQO. The impact of coal
mining is thought to a large part to be responsible for this water quality deterioration.
7.4 Conveyors and roads
The proposed new conveyor will run from the new plant area towards the expanded product
stockpiles adjacent to the rail loop. The entire conveyor route runs over previously and currently
disturbed mining land, with most of the conveyor route located on previously opencast land, and no
natural wetland areas occur along the route.
As such, no impacts to wetlands are expected from the construction activities associated with the
conveyor belt and associated service road. The impact assessment thus only addresses impacts
associated with the operation of conveyors.
Figure 17. Map showing the proposed surface infrastructure and mining areas.
The only new haul roads indicated on the provided mine plan are as indicated in Figure 17. The
impact of the construction phase for these roads has been assessed below.
Wetland Delineation and Assessment for the Exxaro Leeuwpan Colliery near Delmas, Mpumalanga
October 2012
Copyright © 2012 Wetland Consulting Services (Pty.) Ltd. 48
Pre-construction & Construction:
7.4.1 Loss and disturbance of wetland habitat
The wetland habitat located directly within the footprint of any proposed crossings will be lost, while
construction activities will result in the disturbance of surrounding wetland habitat. Movement of
machinery through wetlands will trample vegetation, disturb soils and result in the formation of ruts
that could concentrate flows and encourage erosion. Disturbed areas will also be vulnerable to
invasion by alien vegetation.
Mitigation
The construction servitude for roads should be kept as small as possible and should be
clearly demarcated in the field;
No activities should take place outside the construction servitude and no materials may be
stockpiled in the wetland area;
Construction should be undertaken in the dry season; and
Following completion of construction activities, all disturbed areas should be rehabilitated –
where required this will require ripping, scarifying and landscaping of the soil to the natural
landscape profile and to encourage vegetation re-establishment.
7.4.2 Increased erosion and sedimentation
Disturbances to the wetland during construction will increase the risk of erosion. This will be
exacerbated if construction is undertaken with flows in the wetland that will then need to be
diverted around the construction workings and will likely result in flow concentration.
Sediments are also likely to washed into the wetland from construction activities of the road
approaching and departing the wetland crossing. Sediments deposited within the wetland will
change the vegetation of the wetland, with species such as Typha capensis likely to establish in
depositional areas.
Mitigation
The construction servitude for the road should be kept as small as possible and should be
clearly demarcated in the field;
Construction should be undertaken in the dry season;
No activities should take place outside the construction servitude and no materials may be
stockpiled in the wetland area;
Hay bales should be put along the downslope edge of the conveyor servitude to trap any
sediments that may be washed off the construction area;
Stormwater from the approach and departure roads to the crossing should be diverted off
the road and into adjacent grassland at regular intervals, already during the construction
phase to prevent sediment from these areas being washed into the wetland; and
Wetland Delineation and Assessment for the Exxaro Leeuwpan Colliery near Delmas, Mpumalanga
October 2012
Copyright © 2012 Wetland Consulting Services (Pty.) Ltd. 49
Following completion of construction activities, all disturbed areas should be rehabilitated –
where required this will require ripping, scarifying and landscaping of the soil to the natural
landscape profile and to encourage vegetation re-establishment.
Operation:
Deteriorating water quality due to coal spillages; Stormwater discharge into wetlands; and Altered flows in the wetland.
7.4.3 Deteriorating Water Quality due to Coal Spillages
Coal spillages and coal dust from the conveyor and especially belt transfer areas along the
conveyor can lead to pollution of wetlands and other water resources along the conveyor route.
However, coal spillages from coal transported via conveyor are generally considered to be less
than spillages from coal trucks. No wetlands occur along the conveyor route.
Mitigation
Gantries should be used for all wetland crossings to minimise spills and dust. Should larger
spillages occur due to malfunctioning of the conveyor or for any other reason, clean up of the
spillages should be undertaken as soon as possible following the event and should be done under
supervision of a wetland specialist. The movements of vehicles and machinery into wetland areas
during clean-up operations should be limited and strictly controlled; a wetland specialist should
thus be consulted if the spills are of such a nature that vehicles and/or machinery need to enter
wetland areas.
Regular inspections of the entire conveyor route should be undertaken. No belt transfers are to be
located within the wetland areas on site. Where belt transfers are located in close proximity to
wetland areas a small, shallow berm should be constructed between the belt transfer site and the
wetland area to prevent direct run-off of storm water from the belt transfer site into the valley
bottom wetland
7.4.4 Stormwater discharge into the wetlands
Roads will generate stormwater runoff during rain events that will likely be discharged into the
wetland areas. Concentrated, point source discharges will lead to erosion, while stormwater is also
likely to carry hydrocarbon pollutants into the wetland.
Mitigation
Stormwater should not be allowed to accumulate on the road surface. Regular discharge points
into adjacent grassland should be provided. Discharge points should be protected against erosion.
No stormwater should be discharged directly into the wetland.
Wetland Delineation and Assessment for the Exxaro Leeuwpan Colliery near Delmas, Mpumalanga
October 2012
Copyright © 2012 Wetland Consulting Services (Pty.) Ltd. 50
7.4.5 Altered flows in the wetland
Construction of the road across the wetland could lead to the impoundment of flows upslope of the
wetland, extending saturation of the area and encouraging sediment deposition. This will lead to
changes in the wetland vegetation, most likely resulting in the formation of a Typha capensis reed
bed.
The culverts could further lead to concentration of flows, resulting in higher velocity flows with
greater erosive energy that could lead to channel incision above and below the crossing point.
Channel incision will lower the local water table and lead to partial drying out of the wetland verges
and terrrestrialisation of the vegetation.
Mitigation
Any proposed bridge structures should aim to be clear span across the active channels of
wetlands, and aim to maintain wetting of the full wetland front downslope of the crossing through
the incorporation of as many culvert structures as required to achieve this. Use of a single pipe
culvert for crossings over hillslope seepage wetlands should be avoided.
Capacity of crossing structures should be such that no impounding of flows upslope of the crossing
occurs under normal flow events.
Decommissioning & Closure: The decommissioning and removal of infrastructure during closure will result in disturbances similar to the construction phase, and include:
Mobilisation of pollutants; Disturbance of wetland habitat and fauna; and Increased sediment movement into wetlands.
7.4.6 Mobilisation of pollutants
Where activities have resulted in contamination of the underlying soils due to leaks or spills,
decommissioning activities and the associated earthworks could result in mobilisation of the
pollutants of if the contaminated sediments are disturbed. Pollutants could then enter downslope
wetlands via surface runoff.
Mitigation
All solid waste and potentially polluting material should be removed from site during the
decommissioning and closure activities. Any contaminated wetland soils encountered during
decommissioning and closure activities will either need to be rehabilitated in situ under supervision
of a qualified soil/wetland scientist or, if in situ rehabilitation is not possible, be removed from site
and disposed of in a suitable waste disposal facility
Wetland Delineation and Assessment for the Exxaro Leeuwpan Colliery near Delmas, Mpumalanga
October 2012
Copyright © 2012 Wetland Consulting Services (Pty.) Ltd. 51
7.4.7 Disturbance of wetland habitat and fauna
Similar as during the construction phase, disturbance to wetland habitat and fauna is likely to
materialise from decommissioning related activities such as temporary stockpiles, turning circles
for vehicles and machinery, constructor’s camps etc. extending into the wetland area, as well as
increased human traffic in the area. Illegal hunting and fishing activities are also likely to increase
due to an influx of temporary labour to the area during the decommissioning phase.
Mitigation
Decommissioning activities should be restricted to the disturbed footprint, and no activities should
take place within any of the wetlands. Where decommissioning activities need to extend beyond
the disturbed footprint, the required servitude needs to be clearly demarcated in the field.
All wetland areas disturbed during decommissioning activities should be rehabilitated immediately
following completion of decommissioning activities within the affected area. Rehabilitation should
be done as per the guidelines in Section 8 of this report, and should include the ripping, scarifying,
landscaping and revegetation of all disturbed areas.
7.4.8 Increased sediment movement into wetlands
Clearing of infrastructure and earthworks associated with site rehabilitation will likely expose large
expanses of bare soil to erosion by wind and water. Vehicle tracks are likely to create preferential
flow paths along which runoff water concentrates, leading to gully erosion on site and extensive
sediment deposition in the downslope wetlands. Areas of sediment deposition within the wetland
are likely to become colonised by pioneer species as well as alien vegetation. Depending on the
degree of saturation of the deposited sediments, species such as Typha capensis (permanent to
near permanently saturated areas) are likely to dominate. In more temporary areas, deposited
sediments are likely to be colonised by weeds such as Conyza, Tagetes, Verbena etc.
Mitigation
Decommissioning activities should be restricted to the disturbed footprint, and no activities should
take place within any of the wetlands. Where decommissioning activities need to extend beyond
the disturbed footprint, the required servitude needs to be clearly demarcated in the field.
All disturbed areas should be rehabilitated immediately following completion of decommissioning
activities within the affected area. Rehabilitation should be done as per the guidelines in Section 8
of this report, and should include the ripping, scarifying, landscaping and revegetation of all
disturbed areas.
Cumulative: The proposed and existing mining activities will contribute to overall wetland degradation of the
area and increase stress on the wetland systems. Wetlands were classed as the most threatened
ecosystem type within South Africa (National Biodiversity Assessment 2011: Freshwater
Component (Nel et al., 2011b)), and all of the wetland ecosystem types that occur and would have
Wetland Delineation and Assessment for the Exxaro Leeuwpan Colliery near Delmas, Mpumalanga
October 2012
Copyright © 2012 Wetland Consulting Services (Pty.) Ltd. 52
occurred on site under natural conditions are considered Critically Endangered or Endangered.
This makes clear the level of disturbance that the wetlands of the area have undergone, and the
extent of wetland habitat that has already been lost. The proposed mining and associated activities
will contribute towards further wetland degradation an increase stress within wetland ecosystems,
likely resulting in the wetlands entering a trajectory of change towards a lower PES score.
7.5 Other linear infrastructure
The following impacts are expected due to linear infrastructure on site (see Figure 17 above): Pre-construction & Construction:
Loss and disturbance of wetland habitat;
Increased erosion and sedimentation;
Piping and preferential flow paths;
Altered water movement through the landscape; and
Water quality deterioration.
7.5.1 Loss and disturbance of wetland habitat
Where the pipeline crosses wetlands, wetland vegetation will be disturbed during the construction
process. Disturbance is also likely to extend further into the wetland due to movement of
construction workforce and machinery. Disturbed areas will be more prone to erosion and invasion
by alien vegetation.
Where the powerlines cross wetlands, and specifically where poles need to be erected within the
delineated wetlands, construction activities will result in disturbances to the wetland habitat through
trampling of the vegetation, compaction of soils and also disturbance of soils where excavations
are required. Given that the vegetation of the area is short to medium high grassland, no
vegetation clearing will be required, though the vegetation is likely to get trampled. Disturbed areas
will be more susceptible to erosion and will provide opportunity for alien invasive species to
establish.
Mitigation
This impact cannot be avoided; however, it can be limited in extent and magnitude. The
construction servitude needs to be kept to a minimum to limit vegetation destruction, and needs to
be clearly demarcated in the field. No activities should be allowed outside the construction
servitude. Access routes should be limited to the service road that will likely be constructed along
the pipeline, or to a single construction access road. All materials stockpiles and construction
camps should be located outside wetland areas. It should not be necessary to re-plant any areas,
but rather allow natural re-vegetation to occur. The areas where vegetation is destroyed and
disturbed will however need to be monitored against invasion by alien vegetation and, if
encountered, will need to be removed. If natural re-vegetation is unsuccessful, seeding and
planting of the area will need to be implemented in consultation with an appropriate wetland
vegetation specialist.
Wetland Delineation and Assessment for the Exxaro Leeuwpan Colliery near Delmas, Mpumalanga
October 2012
Copyright © 2012 Wetland Consulting Services (Pty.) Ltd. 53
7.5.2 Increased erosion and sedimentation
Clearing of vegetation along the pipeline and powerline servitude and disturbance to the soil
through excavations will increase the risk of erosion and sediment transport into wetlands. Where
sediments deposit in wetlands, changes to the wetland vegetation are expected.
Mitigation
Undertake construction activities in the dry season;
Limit the extent of the construction servitude to as small an area as possible;
Excavated soils should be stockpiled on the upslope side of the excavated trench so that
eroded sediments off the stockpile are washed back into the trench;
Concentration and accumulation of flows along the servitude should be prevented by
regularly providing for surface runoff to flow into the adjacent grassland rather than along
the construction servitude and into the wetlands;and
Closure and rehabilitation of the pipeline servitude should commence as soon as the
pipeline has been laid in the trench.
7.5.3 Piping and preferential flow paths
A coarse bedding material will likely be utilised around the pipe within the trench. This bedding
material is likely to be more permeable than the natural soils of the area and could create a
preferential flow path in the subsurface which, over time, could result in erosion on the surface and
even pipe failure in extreme cases.
Mitigation
It is recommended that trench breakers be installed along the pipeline trench. A material with low
hydrological conductivity (a Bentonite mix is recommended), in the form of trench breakers should
be packed around the pipe and should be installed at regular intervals to prevent the pipeline
behaving as a conduit and to intercept any concentrated flow down the pipeline route. Spacing
between trench breakers should vary depending on the slope of the landscape – the steeper the
slope the smaller the distance between trench breakers. Spacing should be such that flows
backing up behind one trench breaker extend back to the base of the previous trench breaker.
7.5.4 Altered water movement through the landscape
Excavation of the trench could alter water movement through the landscape where the excavation
leads to the destruction of control features within the subsurface, e.g. sub-surface rock banks.
Excavations that extend into such features could in effect “breach subsurface dams” and create
preferential flow paths that could lead to erosion.
Mitigation
Wetland Delineation and Assessment for the Exxaro Leeuwpan Colliery near Delmas, Mpumalanga
October 2012
Copyright © 2012 Wetland Consulting Services (Pty.) Ltd. 54
Where subsurface control features such as rock banks or ledges are damaged by the trench
excavations, these control features should be re-created within the trench to prevent the formation
of preferential flow paths.
7.5.5 Water quality deterioration
Use of polluting substances during construction (e.g. oil, diesel and cement) could lead to
deterioration of water quality if washed into adjacent wetlands.
Mitigation
Institute environmental best practice guidelines as per the DWA Integrated Environmental
Management Series for Construction Activities;
Limit quantities of hazardous substances on site to the volumes used during 1 days work;
Dispose of all soil contaminated due to leaks or spills as hazardous waste; and
Waste should be stored on site in clearly marked containers in a demarca.ted area. All
waste must be disposed of offsite.
Operation:
Increased flows and erosion due to leaks or pipe failure
Disturbance to wetland habitat due to maintenance activities
7.5.6 Water quality deterioration due to leaks or pipe failure
Leaks or failure of the pipe could result in water quality deterioration of affected wetlands as dirty
water is discharged directly into these systems.
Mitigation
Leak detection measures should be installed along the pipeline so that pipe failure, should it occur,
will be noticed immediately and water flow through the pipe can be stopped. Twice monthly checks
along the route should be undertaken to scan for signs of leaks.
7.5.7 Disturbance to wetland habitat due to maintenance activities
Maintenance activities such as vegetation clearing and burning along the powerline or pipeline servitudes could lead to disturbances to wetland vegetation and fauna. Mitigation No burning of vegetation within the wetlands should take place unless it forms part of the burning regime established in a fire management plan for the Leeuwpan Coal Mine compiled by a suitably qualified expert. Maintenance access to the servitudes should be via a single access track, with no vehicular movement through the wetlands along the servitudes other than along the maintenance track.
Wetland Delineation and Assessment for the Exxaro Leeuwpan Colliery near Delmas, Mpumalanga
October 2012
Copyright © 2012 Wetland Consulting Services (Pty.) Ltd. 55
Decommissioning & Closure: The decommissioning and removal of infrastructure during closure will result in disturbances similar to the construction phase, and include:
Mobilisation of pollutants; Disturbance of wetland habitat and fauna; and Increased sediment movement into wetlands.
7.5.8 Mobilisation of pollutants
Where activities have resulted in contamination of the underlying soils due to leaks or spills,
decommissioning activities and the associated earthworks could result in mobilisation of the
pollutants of if the contaminated sediments are disturbed. Pollutants could then enter downslope
wetlands via surface runoff.
Mitigation
All solid waste and potentially polluting material should be removed from site during the
decommissioning and closure activities. Any contaminated wetland soils encountered during
decommissioning and closure activities will either need to be rehabilitated in situ under supervision
of a qualified soil/wetland scientist or, if in situ rehabilitation is not possible, be removed from site
and disposed of in a suitable waste disposal facility
7.5.9 Disturbance of wetland habitat and fauna
Similar as during the construction phase, disturbance to wetland habitat and fauna is likely to
materialise from decommissioning related activities such as temporary stockpiles, turning circles
for vehicles and machinery, constructor’s camps etc. extending into the wetland area, as well as
increased human traffic in the area. Illegal hunting and fishing activities are also likely to increase
due to an influx of temporary labour to the area during the decommissioning phase.
Mitigation
Decommissioning activities should be restricted to the disturbed footprint, and no activities should
take place within any of the wetlands. Where decommissioning activities need to extend beyond
the disturbed footprint, the required servitude needs to be clearly demarcated in the field.
All disturbed areas should be rehabilitated immediately following completion of decommissioning
activities within the affected area. Rehabilitation should be done as per the guidelines in Section 8
of this report, and should include the ripping, scarifying, landscaping and revegetation of all
disturbed areas.
7.5.10 Increased sediment movement into wetlands
Clearing of infrastructure and earthworks associated with site rehabilitation will likely expose large
expanses of bare soil to erosion by wind and water. Vehicle tracks are likely to create preferential
Wetland Delineation and Assessment for the Exxaro Leeuwpan Colliery near Delmas, Mpumalanga
October 2012
Copyright © 2012 Wetland Consulting Services (Pty.) Ltd. 56
flow paths along which runoff water concentrates, leading to gully erosion on site and extensive
sediment deposition in the downslope wetlands. Areas of sediment deposition within the wetland
are likely to become colonised by pioneer species as well as alien vegetation. Depending on the
degree of saturation of the deposited sediments, species such as Typha capensis (permanent to
near permanently saturated areas) are likely to dominate. In more temporary areas, deposited
sediments are likely to be colonised by weeds such as Conyza, Tagetes, Verbena etc.
Mitigation
Decommissioning activities should be restricted to the disturbed footprint, and no activities should
take place within any of the wetlands. Where decommissioning activities need to extend beyond
the disturbed footprint, the required servitude needs to be clearly demarcated in the field.
All disturbed areas should be rehabilitated immediately following completion of decommissioning
activities within the affected area. Rehabilitation should be done as per the guidelines in Section 8
of this report, and should include the ripping, scarifying, landscaping and revegetation of all
disturbed areas, except within wetland areas.
Cumulative: The proposed and existing mining activities will contribute to overall wetland degradation of the
area and increase stress on the wetland systems. Wetlands were classed as the most threatened
ecosystem type within South Africa (National Biodiversity Assessment 2011: Freshwater
Component (Nel et al., 2011b)), and all of the wetland ecosystem types that occur and would have
occurred on site under natural conditions are considered Critically Endangered or Endangered.
This makes clear the level of disturbance that the wetlands of the area have undergone, and the
extent of wetland habitat that has already been lost. The proposed mining and associated activities
will contribute towards further wetland degradation an increase stress within wetland ecosystems,
likely resulting in the wetlands entering a trajectory of change towards a lower PES score.
7.6 Surface infrastructure
The following impacts are expected due to the surface infrastructure on site (see Figure 18 below): Pre-construction & Construction: The following impacts are expected during the construction phase:
Loss and disturbance of wetland habitat;
Increased sediment movement into wetlands;
Increase in alien and pioneer vegetation; and
Water quality deterioration.
7.6.1 Loss of wetland habitat
The location of the new proposed surface infrastructure is illustrated in the figure below. From the
image it is clear that the infrastructure will mostly be located within a footprint already heavily
disturbed by mining, though right on the edge of a remnant piece of hillslope seepage wetland.
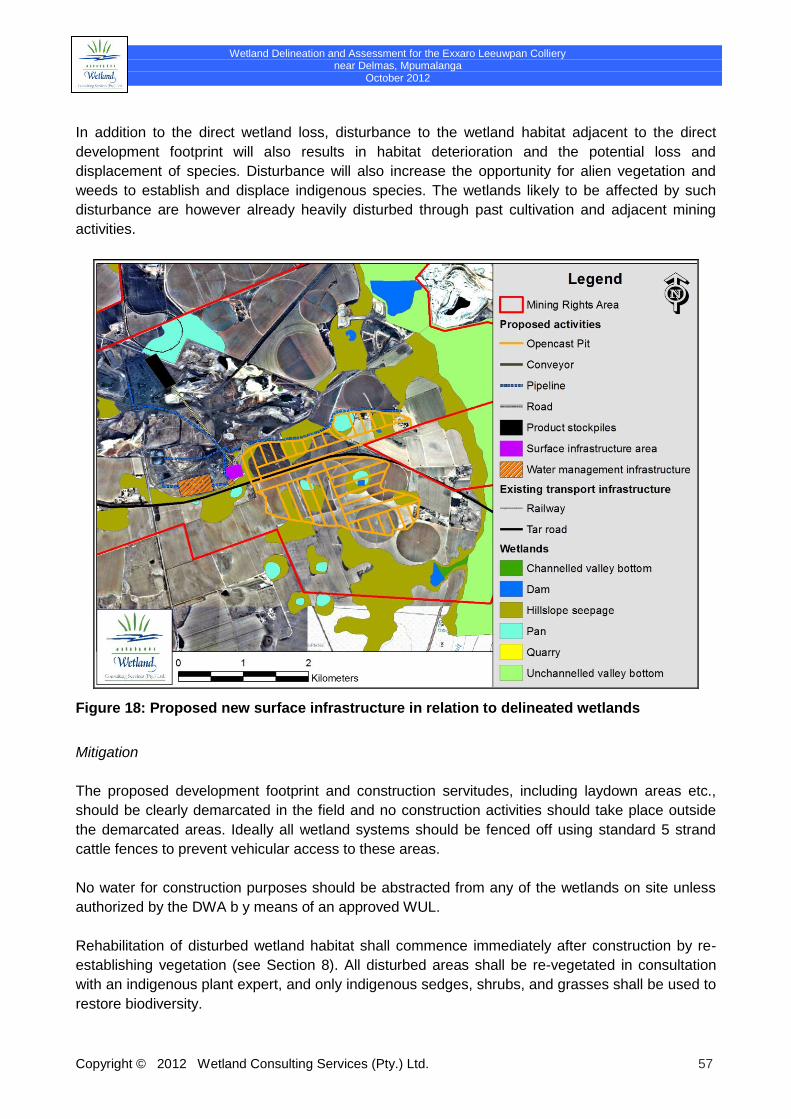
Wetland Delineation and Assessment for the Exxaro Leeuwpan Colliery near Delmas, Mpumalanga
October 2012
Copyright © 2012 Wetland Consulting Services (Pty.) Ltd. 57
In addition to the direct wetland loss, disturbance to the wetland habitat adjacent to the direct
development footprint will also results in habitat deterioration and the potential loss and
displacement of species. Disturbance will also increase the opportunity for alien vegetation and
weeds to establish and displace indigenous species. The wetlands likely to be affected by such
disturbance are however already heavily disturbed through past cultivation and adjacent mining
activities.
Figure 18: Proposed new surface infrastructure in relation to delineated wetlands
Mitigation
The proposed development footprint and construction servitudes, including laydown areas etc.,
should be clearly demarcated in the field and no construction activities should take place outside
the demarcated areas. Ideally all wetland systems should be fenced off using standard 5 strand
cattle fences to prevent vehicular access to these areas.
No water for construction purposes should be abstracted from any of the wetlands on site unless
authorized by the DWA b y means of an approved WUL.
Rehabilitation of disturbed wetland habitat shall commence immediately after construction by re-
establishing vegetation (see Section 8). All disturbed areas shall be re-vegetated in consultation
with an indigenous plant expert, and only indigenous sedges, shrubs, and grasses shall be used to
restore biodiversity.
Wetland Delineation and Assessment for the Exxaro Leeuwpan Colliery near Delmas, Mpumalanga
October 2012
Copyright © 2012 Wetland Consulting Services (Pty.) Ltd. 58
7.6.2 Increased sediment movement into wetlands
Site clearance and preparation activities, including excavations and soil movement, will expose
large areas of bare soil to erosion by wind and water. Clearing vegetation and compacting soils will
increase the generation of surface runoff volumes and velocities. As a consequence, a significant
increase in the movement of sediment off the construction sites and into the adjacent wetlands is
expected.
Increased sediment inputs to the wetlands will increase turbidity, alter the benthic habitats and
likely lead to changes in vegetation structure and composition as deposited sediments are
colonised by species such as Typha capensis or Imperata cylindrica, depending on the duration of
saturation.
Mitigation
The proposed development footprints must be kept as small as possible. Construction activities
should be undertaken during the dry season. Construction activities within the development
footprint should also be phased to minimise the extent of bare soils at any one time, with
vegetation clearing activities delayed to the absolute last moment possible within the construction
schedule. Clearing of vegetation and the subsequent stalling of construction activities so as to
leave areas of bare soil unprotected for extended periods must be avoided.
Stormwater management measures must be implemented during the construction phase to limit
concentration of flows and the generation of high velocity flows that will exacerbate erosion risk.
Regular low level humps should be installed along linear preferential flow paths such as
construction roads/tracks that run perpendicular to the slope to slow down and disperse flows.
Sediment barriers as per the guidelines provided below (Section 8 – Rehabilitation) should be
installed at the start of construction activities.
7.6.3 Increase in alien and pioneer vegetation
Disturbance resulting from construction activities will provide opportunity for alien species and
pioneer vegetation to establish and colonise wetland habitat. Alien vegetation can displace
indigenous species and alter habitat quality, decreasing biodiversity. Alien vegetation and pioneer
species can also increase the susceptibility of the wetland to erosion and significant fire damage.
Mitigation
The area of disturbance should be minimised and the construction servitude clearly demarcated,
with no activities outside the demarcated area.
An alien vegetation management plan should be compiled and implemented for the entire
impacted area and immediate vicinity prior to the onset of construction activities. Identified areas of
alien vegetation should be managed and ideally removed in consultation with an ecologist to
ensure that alien species that might provide habitat/nesting sites for important species are not
removed.
Wetland Delineation and Assessment for the Exxaro Leeuwpan Colliery near Delmas, Mpumalanga
October 2012
Copyright © 2012 Wetland Consulting Services (Pty.) Ltd. 59
All rehabilitated sites should be surveyed for alien species on a yearly basis until a stable
vegetation assemblage and cover has been obtained. Such surveys should be done by a suitably
qualified specialist familiar with succession on rehabilitated areas.
7.6.4 Water quality deterioration
During the construction phase, as activities are taking place within and adjacent to wetlands, there
is a possibility that water quality can be impaired, particularly during the construction phase.
Typically impairment will occur as a consequence of sediment disturbance resulting in an increase
in turbidity. Water quality may also be impaired as a consequence of accidental spillages and the
intentional washing and rinsing of equipment. It is likely that hydrocarbons will be stored and used
on site, as well as cement and other potential pollutants.
Mitigation
Ensure that no equipment is washed in the streams and wetlands of the area, and if washing
facilities are provided, that these are placed no closer than 100m from a wetland or water course.
In order to reduce the potential impacts associated with the introduction of contaminants dissolved
or suspended in the runoff from construction sites, where practically possible, no runoff should be
introduced into wetlands directly. Introduction into dryland areas is preferred as the vegetation and
soils provide an opportunity to limit the movement of contaminants and the environment is
conducive for natural degradation.
Potential contaminants used and stored on site should be stored and prepared on bunded surfaces
to contain spills and leaks. Sufficient spill clean-up material must be kept on site at all times to deal
with minor spills. Larger spills should be reported to the ECO and the relevant authorities (DWA)
immediately, with specialists appointed to oversee the clean-up operations.
Operation: The following impacts are expected:
Increased surface runoff and erosion; Erosion and increased sedimentation; and Deterioration in water quality.
7.6.5 Increased surface runoff and erosion
The increase in hardened surfaces that will result from the construction of the surface
infrastructure will increase surface run-off volumes from the site. Clean stormwater will be
discharged into adjacent wetlands, increasing flow and saturation within the wetlands.
Increased flows in the wetland could result in increased erosion risk and channel incision within the
wetland, though the low slope and isolated nature of the wetlands surrounding the surface
infrastructure area are unlikely to represent a major erosion risk. Increased water inputs to these
Wetland Delineation and Assessment for the Exxaro Leeuwpan Colliery near Delmas, Mpumalanga
October 2012
Copyright © 2012 Wetland Consulting Services (Pty.) Ltd. 60
wetlands are however likely to alter vegetation composition, with species adapted to permanent
saturation such as Typha capensis and Phragmites australis are likely to increase.
Mitigation
Minimise extent of hardened surfaces;
Implement a detailed stormwater management plan which aims to retain the pre-
development run-off characteristics of the site for regular return storm events;
Convey stormwater in grassed swales rather than lined canals/trenches as far as possible
to maximise infiltration and minimise erosion;
Stormwater discharge points should be protected against erosion and incorporate energy
dissipaters. Flows should be encouraged to disperse across a wide an area of the wetland
as possible;
Stormwater should be discharged into adjacent grassland and not directly into the
delineated wetlands as far as possible;
Fixed point photography should be undertaken of the discharge points to monitor for
erosion damage. Photographs should be taken pre-development to provide a baseline, and
then in December and March during the rainy season. If erosion is observed, corrective
measures should be implemented via the appointment of a wetland rehabilitation specialist.
7.6.6 Deterioration in water quality
Discharge of stormwater into adjacent wetlands will likely lead to deteriorating water quality with
deleterious impacts to aquatic biodiversity. The storage of fuel on site, the wash bay and
workshops provide sources of hydrocarbon pollution, while stormwater is also likely to convey
pollutants to the wetlands.
Mitigation
A detailed surface water management plan should be drawn up for the main shaft area that
complies fully with GN704 in terms of the separation of clean and dirty stormwater. Dirty
stormwater should be captured in a pollution control dam on site and no discharge of dirty
stormwater should be allowed into the wetlands on site. The dirty water management system
should have a minimum capacity to cope with a 1:50 year storm event without overflow. Dirty water
should be re-used as far as possible within the mining operations.
Decommissioning & Closure: The decommissioning and removal of infrastructure during closure will result in disturbances similar to the construction phase, and include:
Mobilisation of pollutants; Disturbance of wetland habitat and fauna; and Increased sediment movement into wetlands.
7.6.7 Mobilisation of pollutants
Wetland Delineation and Assessment for the Exxaro Leeuwpan Colliery near Delmas, Mpumalanga
October 2012
Copyright © 2012 Wetland Consulting Services (Pty.) Ltd. 61
Where activities have resulted in contamination of the underlying soils due to leaks or spills,
decommissioning activities and the associated earthworks could result in mobilisation of the
pollutants if the contaminated sediments are disturbed. Pollutants could then enter downslope
wetlands via surface runoff.
Mitigation
All solid waste and potentially polluting material should be removed from site during the
decommissioning and closure activities. Any contaminated wetland soils encountered during
decommissioning and closure activities will either need to be rehabilitated in situ under supervision
of a qualified soil/wetland scientist or, if in situ rehabilitation is not possible, be removed from site
and disposed of in a suitable waste disposal facility
7.6.8 Disturbance of wetland habitat and fauna
Similar as during the construction phase, disturbance to wetland habitat and fauna is likely to
materialise from decommissioning related activities such as temporary stockpiles, turning circles
for vehicles and machinery, constructor’s camps etc. extending into the wetland area, as well as
increased human traffic in the area. Illegal hunting and fishing activities are also likely to increase
due to an influx of temporary labour to the area during the decommissioning phase.
Mitigation
Decommissioning activities should be restricted to the disturbed footprint, and no activities should
take place within any of the wetlands. Where decommissioning activities need to extend beyond
the disturbed footprint, the required servitude needs to be clearly demarcated in the field.
All disturbed areas should be rehabilitated immediately following completion of decommissioning
activities within the affected area. Rehabilitation should be done as per the guidelines in Section 8
of this report, and should include the ripping, scarifying, landscaping and revegetation of all
disturbed areas.
7.6.9 Increased sediment movement into wetlands
Clearing of infrastructure and earthworks associated with site rehabilitation will likely expose large
expanses of bare soil to erosion by wind and water. Vehicle tracks are likely to create preferential
flow paths along which runoff water concentrates, leading to gully erosion on site and extensive
sediment deposition in the downslope wetlands. Areas of sediment deposition within the wetland
are likely to become colonised by pioneer species as well as alien vegetation. Depending on the
degree of saturation of the deposited sediments, species such as Typha capensis (permanent to
near permanently saturated areas) are likely to dominate. In more temporary areas, deposited
sediments are likely to be colonised by weeds such as Conyza, Tagetes, Verbena etc.
Mitigation
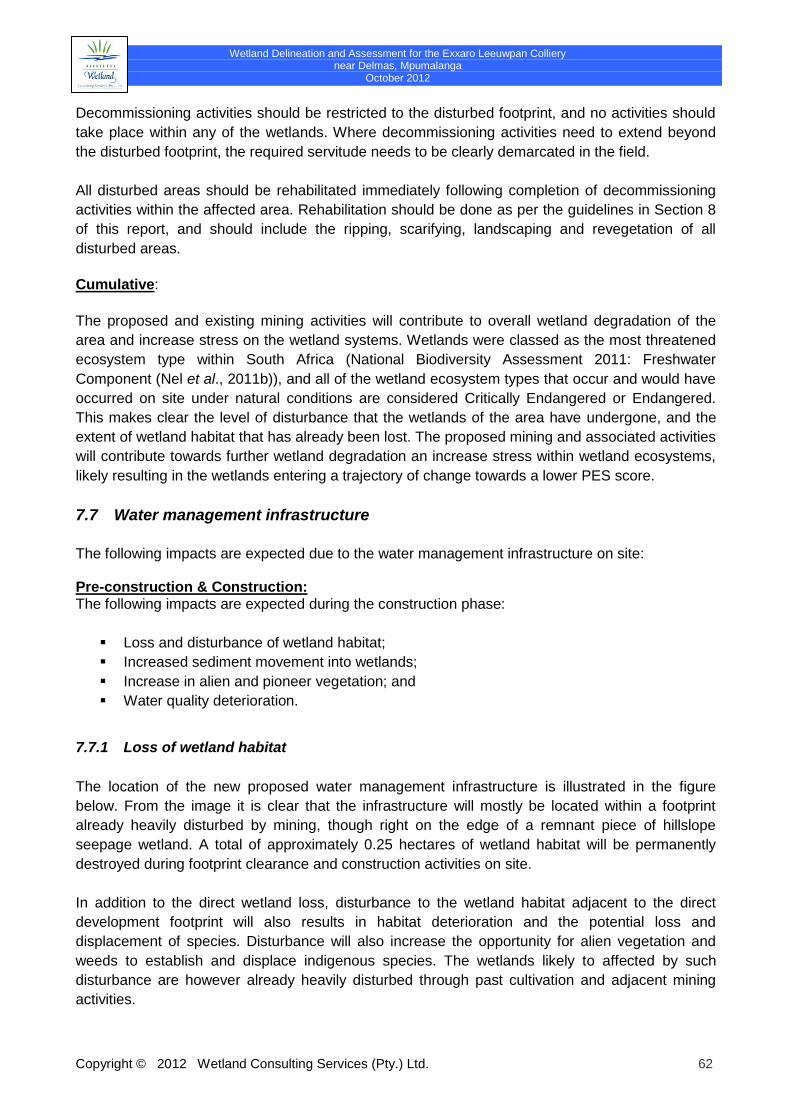
Wetland Delineation and Assessment for the Exxaro Leeuwpan Colliery near Delmas, Mpumalanga
October 2012
Copyright © 2012 Wetland Consulting Services (Pty.) Ltd. 62
Decommissioning activities should be restricted to the disturbed footprint, and no activities should
take place within any of the wetlands. Where decommissioning activities need to extend beyond
the disturbed footprint, the required servitude needs to be clearly demarcated in the field.
All disturbed areas should be rehabilitated immediately following completion of decommissioning
activities within the affected area. Rehabilitation should be done as per the guidelines in Section 8
of this report, and should include the ripping, scarifying, landscaping and revegetation of all
disturbed areas.
Cumulative:
The proposed and existing mining activities will contribute to overall wetland degradation of the
area and increase stress on the wetland systems. Wetlands were classed as the most threatened
ecosystem type within South Africa (National Biodiversity Assessment 2011: Freshwater
Component (Nel et al., 2011b)), and all of the wetland ecosystem types that occur and would have
occurred on site under natural conditions are considered Critically Endangered or Endangered.
This makes clear the level of disturbance that the wetlands of the area have undergone, and the
extent of wetland habitat that has already been lost. The proposed mining and associated activities
will contribute towards further wetland degradation an increase stress within wetland ecosystems,
likely resulting in the wetlands entering a trajectory of change towards a lower PES score.
7.7 Water management infrastructure
The following impacts are expected due to the water management infrastructure on site: Pre-construction & Construction: The following impacts are expected during the construction phase:
Loss and disturbance of wetland habitat;
Increased sediment movement into wetlands;
Increase in alien and pioneer vegetation; and
Water quality deterioration.
7.7.1 Loss of wetland habitat
The location of the new proposed water management infrastructure is illustrated in the figure
below. From the image it is clear that the infrastructure will mostly be located within a footprint
already heavily disturbed by mining, though right on the edge of a remnant piece of hillslope
seepage wetland. A total of approximately 0.25 hectares of wetland habitat will be permanently
destroyed during footprint clearance and construction activities on site.
In addition to the direct wetland loss, disturbance to the wetland habitat adjacent to the direct
development footprint will also results in habitat deterioration and the potential loss and
displacement of species. Disturbance will also increase the opportunity for alien vegetation and
weeds to establish and displace indigenous species. The wetlands likely to affected by such
disturbance are however already heavily disturbed through past cultivation and adjacent mining
activities.
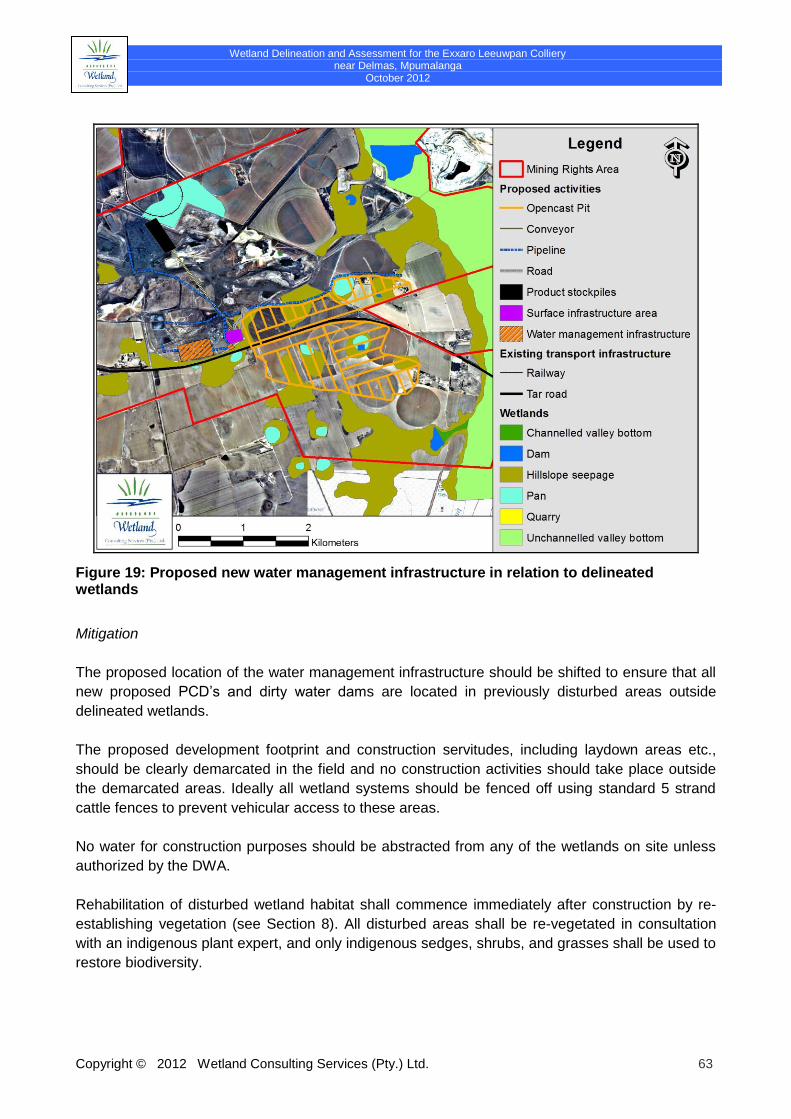
Wetland Delineation and Assessment for the Exxaro Leeuwpan Colliery near Delmas, Mpumalanga
October 2012
Copyright © 2012 Wetland Consulting Services (Pty.) Ltd. 63
Figure 19: Proposed new water management infrastructure in relation to delineated wetlands
Mitigation
The proposed location of the water management infrastructure should be shifted to ensure that all
new proposed PCD’s and dirty water dams are located in previously disturbed areas outside
delineated wetlands.
The proposed development footprint and construction servitudes, including laydown areas etc.,
should be clearly demarcated in the field and no construction activities should take place outside
the demarcated areas. Ideally all wetland systems should be fenced off using standard 5 strand
cattle fences to prevent vehicular access to these areas.
No water for construction purposes should be abstracted from any of the wetlands on site unless
authorized by the DWA.
Rehabilitation of disturbed wetland habitat shall commence immediately after construction by re-
establishing vegetation (see Section 8). All disturbed areas shall be re-vegetated in consultation
with an indigenous plant expert, and only indigenous sedges, shrubs, and grasses shall be used to
restore biodiversity.

Wetland Delineation and Assessment for the Exxaro Leeuwpan Colliery near Delmas, Mpumalanga
October 2012
Copyright © 2012 Wetland Consulting Services (Pty.) Ltd. 64
7.7.2 Increased sediment movement into wetlands
Site clearance and preparation activities, including excavations and soil movement, will expose
large areas of bare soil to erosion by wind and water. Clearing vegetation and compacting soils will
increase the generation of surface runoff volumes and velocities. As a consequence, a significant
increase in the movement of sediment off the construction sites and into the adjacent wetlands is
expected.
Increased sediment inputs to the wetlands will increase turbidity, alter the benthic habitats and
likely lead to changes in vegetation structure and composition as deposited sediments are
colonised by species such as Typha capensis or Imperata cylindrica, depending on the duration of
saturation.
Mitigation
The proposed development footprints must be kept as small as possible. Construction activities
should be undertaken during the dry season. Construction activities within the development
footprint should also be phased to minimise the extent of bare soils at any one time, with
vegetation clearing activities delayed to the absolute last moment possible within the construction
schedule. Clearing of vegetation and the subsequent stalling of construction activities so as to
leave areas of bare soil unprotected for extended periods must be avoided.
Stormwater management measures must be implemented during the construction phase to limit
concentration of flows and the generation of high velocity flows that will exacerbate erosion risk.
Regular low level humps should be installed along linear preferential flow paths such as
construction roads/tracks that run perpendicular to the slope to slow down and disperse flows.
Sediment barriers as per the guidelines provided below (Section 8 – Rehabilitation) should be
installed at the start of construction activities.
7.7.3 Increase in alien and pioneer vegetation
Disturbance resulting from construction activities will provide opportunity for alien species and
pioneer vegetation to establish and colonise wetland habitat. Alien vegetation can displace
indigenous species and alter habitat quality, decreasing biodiversity. Alien vegetation and pioneer
species can also increase the susceptibility of the wetland to erosion and significant fire damage.
Mitigation
The area of disturbance should be minimised and the construction servitude clearly demarcated,
with no activities outside the demarcated area.
An alien vegetation management plan should be compiled and implemented for the entire
impacted area and immediate vicinity prior to the onset of construction activities. Identified areas of
alien vegetation should be managed and ideally removed in consultation with an ecologist to
ensure that alien species that might provide habitat/nesting sites for important species are not
removed.
Wetland Delineation and Assessment for the Exxaro Leeuwpan Colliery near Delmas, Mpumalanga
October 2012
Copyright © 2012 Wetland Consulting Services (Pty.) Ltd. 65
All rehabilitated sites should be surveyed for alien species on an annual basis until a stable
vegetation assemblage and cover has been obtained. Such surveys should be done by a suitably
qualified specialist familiar with succession on rehabilitated areas.
7.7.4 Water quality deterioration
During the construction phase, as activities are taking place within and adjacent to wetlands, there
is a possibility that water quality can be impaired, particularly during the construction phase.
Typically impairment will occur as a consequence of sediment disturbance resulting in an increase
in turbidity. Water quality may also be impaired as a consequence of accidental spillages and the
intentional washing and rinsing of equipment. It is likely that hydrocarbons will be stored and used
on site, as well as cement and other potential pollutants.
Mitigation
Ensure that no equipment is washed in the streams and wetlands of the area, and if washing
facilities are provided, that these are placed no closer than 100m from a wetland or water course.
In order to reduce the potential impacts associated with the introduction of contaminants dissolved
or suspended in the runoff from construction sites, where practically possible, no runoff should be
introduced into wetlands directly. Introduction into dryland areas is preferred as the vegetation and
soils provide an opportunity to limit the movement of contaminants and the environment is
conducive for natural degradation.
Potential contaminants used and stored on site should be stored and prepared on bunded surfaces
to contain spills and leaks. Sufficient spill clean-up material must be kept on site at all times to deal
with minor spills. Larger spills should be reported to the ECO and the relevant authorities (DWA)
immediately, with specialists appointed to oversee the clean-up operations.
Operation: The following impacts to the wetlands are expected during the operational phase:
Water quality deterioration due to seepage of polluted water out of the dam;
Water quality deterioration due to regular overflow of the dams; and
Erosion due to concentrated overflow from the dams.
7.7.5 Water quality deterioration - Seepage out of the dams
Seepage or leakage of polluted water out of dirty water storage dams and pollution control dams
could result in water quality deterioration within adjacent and downslope wetlands.
Mitigation
Wetland Delineation and Assessment for the Exxaro Leeuwpan Colliery near Delmas, Mpumalanga
October 2012
Copyright © 2012 Wetland Consulting Services (Pty.) Ltd. 66
All dirty water dams should be lined. Regular inspections and maintenance of the liner should be
undertaken to ensure no seepage of polluted water out of the dams. If damaged, the liner should
be repaired or replaced as soon as possible.
The existing water quality monitoring plan should be expanded to include all water management
infrastructures on the Leeuwpan Coal Mine (existing and proposed). Sampling sites should be
located so that any contamination of water resources from the water management infrastructure
can be rapidly identified and located.
Emergency response procedures for failure of any water infrastructure on the mine should be
established and regularly tested. All staff should be aware of the procedures and how to alert
management of any failures.
7.7.6 Water quality deterioration – Overflow of dams
Regular overflow of dirty water management infrastructure into adjacent and downslope wetlands
could result in water quality deterioration. The capacity of the water management infrastructure is
not known, but is assumed to comply with GN704. Incorrect management of the dams, e.g.
maintaining water levels too high within the dams, could result in regular overflowing of the dams
into adjacent and downslope wetlands. Silting up of the dams will also over time decrease the
capacity of the dams and increase the likelihood and frequency of overflow.
Mitigation
It should be ensured that the storage capacity of all dams is sufficient and compliant with
legislation and best practice guidelines.
Water levels in the dams should at all times be carefully managed so as to ensure sufficient
storage capacity. Daily inspections of water levels should be undertaken during the summer
months (October to April) and a log book kept.
Every overflow of dirty water dams should be recorded in a detailed log book, including reasons for
overflow (e.g. amount of rainfall preceding overflow event).
Silt traps should be installed upstream of all pollution control dams and dirty water storage dams to
limit silt deposition in the dams. Dams should be inspected for siltation and cleaned (if necessary)
before the start of every summer rainfall season.
7.7.7 Erosion due to overflow of dams
Regular overflow of dirty water management infrastructure into adjacent and downslope wetlands
will result in concentrated, channeled, surface flow entering the hillslope seepage wetlands, posing
a high risk of erosion. Erosion will result in a localized lowering of the water table and result in
desiccation of a portion of the wetland, as well as increased sedimentation within the wetland.
Mitigation
Wetland Delineation and Assessment for the Exxaro Leeuwpan Colliery near Delmas, Mpumalanga
October 2012
Copyright © 2012 Wetland Consulting Services (Pty.) Ltd. 67
See mitigation measures recommended above to minimise overflow events. In addition, any
overflow spillways as well as their discharge points should be protected from erosion by ensuring
establishment of dense vegetation cover within the spillway and at its discharge point.
The spillways and discharge points should be inspected for erosion damage at the end of every
rainfall season and all erosion damage repaired. Should erosion pose a significant problem,
protection of the spillway with harder measures (e.g. gabions, rock aprons etc.) should be
considered, as well as the use of energy dissipaters.
Decommissioning & Closure: Impacts expected during the decommissioning and closure phase include:
Disturbance to wetland habitat and biota;
Increased occurrence of alien and weedy species;
Water quality deterioration; and
Increased sediment movement into wetlands
7.7.8 Disturbance to wetland habitat and biota
Decommissioning and removal of the water management infrastructure, and rehabilitation of
affected sites, could result in disturbance to adjacent wetland habitat through for example
injudicious driving on site and incorrect waste disposal/dumping, as well as through increased
noise levels and human traffic.
Mitigation
Decommissioning and closure activities should ideally be restricted to the disturbed footprint, and
only existing roads and tracks on site should be utilised. Unless rehabilitation activities are required
within wetlands areas, all wetland areas should be avoided during closure activities.
Any wetland area disturbed during closure activities should be rehabilitated. Soil compaction
should be ameliorated through ripping and scarifying, followed by landscaping to the natural
landscape profile. Contaminated soils and materials should be removed from site. Bare soil areas
should be re-vegetated using a mix of indigenous grass species. Vegetation re-establishment
should be regularly monitored to ensure sustainable cover is achieved and maintained.
7.7.9 Increased occurrence of alien and weedy species
Disturbances to wetland vegetation during closure activities could provide opportunity for invasion
by alien species and weeds.
Mitigation
Wetland Delineation and Assessment for the Exxaro Leeuwpan Colliery near Delmas, Mpumalanga
October 2012
Copyright © 2012 Wetland Consulting Services (Pty.) Ltd. 68
Decommissioning and closure activities should ideally be restricted to the disturbed footprint and
only existing roads and tracks on site should be utilised. Unless rehabilitation activities are required
within wetlands areas, all wetland areas should be avoided during closure activities.
The alien vegetation management plan of the mine should be implemented for at least a further 5
years following completion of decommissioning activities, or until alien vegetation has been shown
not to represent a threat. Identified areas of alien vegetation should be managed and ideally
removed in consultation with an ecologist to ensure that alien species do not provide
habitat/nesting sites for important species.
All rehabilitated areas should be surveyed for alien species on a 6 monthly basis until a stable
vegetation assemblage and cover has been obtained. Such surveys should be done by a suitably
qualified specialist familiar with succession on rehabilitated areas.
7.7.10 Water quality deterioration
During decommissioning and closure activities any contaminants found within the soils underlying
the water management infrastructure could be mobilized and enter downslope wetlands, leading to
water quality deterioration.
Mitigation
All contaminated soil and material should be removed from site if onsite amelioration and
rehabilitation is not possible (consult relevant specialists). All removed material should be disposed
of in suitable waste facilities fully compliant with the relevant legislation.
7.7.11 Increased sediment movement into wetlands
Site clearance and rehabilitation activities, including excavations and soil movement, will expose
large areas of bare soil to erosion by wind and water. Clearing vegetation and compacting soils will
increase the generation of surface runoff volumes and velocities. As a consequence, a significant
increase in the movement of sediment off the rehabilitation site and into the adjacent wetlands is
expected.
Increased sediment inputs to the wetlands will increase turbidity, alter the benthic habitats and
likely lead to changes in vegetation structure and composition as deposited sediments are
colonised by species such as Typha capensis.
Mitigation
The area of disturbance should be minimised and the area of activity during closure clearly
demarcated, with no activities outside the demarcated area.
Bare soil areas should be revegetated as soon as possible.
Wetland Delineation and Assessment for the Exxaro Leeuwpan Colliery near Delmas, Mpumalanga
October 2012
Copyright © 2012 Wetland Consulting Services (Pty.) Ltd. 69
Sediment barriers should be installed downslope of large bare soil areas until vegetation cover has re-established. Cumulative: The water management infrastructure proposed for the Leeuwpan Coal Mine is designed as a
mitigation measure to reduce the impact of the mine on water quality within adjacent water
courses. However, such water management infrastructure is unlikely to be 100% effective in
trapping pollutants, and some contamination of surrounding wetlands and water courses is
expected. The water management infrastructure is thus likely to contribute to water quality
deterioration within the Upper Olifants River Catchment, though in the absence of the water quality
infrastructure, the impact of the mine would likely be of much greater significance.
The proposed and existing mining activities will contribute to overall wetland degradation of the
area and increase stress on the wetland systems. Wetlands were classed as the most threatened
ecosystem type within South Africa (National Biodiversity Assessment 2011: Freshwater
Component (Nel et al., 2011b)), and all of the wetland ecosystem types that occur and would have
occurred on site under natural conditions are considered Critically Endangered or Endangered.
This makes clear the level of disturbance that the wetlands of the area have undergone, and the
extent of wetland habitat that has already been lost. The proposed mining and associated activities
will contribute towards further wetland degradation an increase stress within wetland ecosystems,
likely resulting in the wetlands entering a trajectory of change towards a lower PES score.
8. REHABILITATION
Any of the wetlands impacted during the construction process (and again during the
decommissioning and closure phase) on site should be rehabilitated according the a well defined
wetland rehabilitation plan compiled by a registered wetland specialist. The following measures are
proposed to serve as broad guidelines to prevent unnecessary damage to the wetlands adjacent to
the proposed development area. All measures detailed below should be implemented in
consultation with a wetland specialist to ensure site and activity specific recommendations can be
implemented.
8.1 Fencing or demarcation of affected area
Prior to any activities in the wetland areas, limits of construction related activities must be clearly
demarcated so as to avoid unnecessary direct impacts to the vegetation beyond the limits of
construction.
8.2 Re-vegetation/ rehabilitation
Bare soil areas within the wetlands resulting from construction/decommissioning activities should be re-vegetated as soon as possible following the disturbance. Wetland specialist must assist during re-vegetation and must prescribed the suitable species for re-vegetation of disturbed wetland areas. Typical species that should be considered include a mix of pioneer and climax species such as the following:
Digitaria eriantha
Wetland Delineation and Assessment for the Exxaro Leeuwpan Colliery near Delmas, Mpumalanga
October 2012
Copyright © 2012 Wetland Consulting Services (Pty.) Ltd. 70
Chloris gayana Eragrostis curvula Eragrostis tef Cynodon dactylon Setaria spp. Panicum maximum Melinis repens
Suitable seed mixes are available from Sakata Seed (Biomosome Grassveld Reclamation Mixture) and Advanced-Seed (Indigi Mix). Soil compaction should be alleviated through ploughing/ripping and scarifying, followed by
landscaping to the natural/surrounding landscape profile. Where ploughing/ripping takes place on
slopes leading towards wetland areas or water courses, sediment barriers (see below) should be
installed along the lower edge of the ploughed area.
Once soil preparation is complete, seed beds should be prepared as per the guidelines supplied by
the seed supplier, or as follows: Furrows should be made in the soil by hand using hoes. Furrows
must be made horizontally in the soil (parallel to slope) and should be spaced 0.4 meters
(maximum) apart and at least 10 cm deep. Work should commence from the top of the slope and
be conducted downwards and any loose soil and rocks from the process should be removed to
prevent siltation of the wetlands downwards. The beds should follow the contours of the land and
not in any way allow water to collect or flow in high volumes, thus creating erosion gullies. Larger
clumps of soil and stones should be removed to prevent impeded flow of water. On steep slopes
and high erosion risk areas the use of hessian blankets is recommended to increase erosion
protection.
Seeding should commence as soon as the hessian is in place and seed bed preparation has been
completed. Either hand or hydro-seeding can be considered, depending on the area required to be
planted. Both hand and hydro-seeding must be done by professionals only. If any fertilizers are
recommended these should be applied to the side slopes only and not within the wetland. If hydro
seeding is selected for the seeding process the hydro-seeders used must run for 10 minutes at
least before the commencement of the seeding project. This is to ensure adequate mixing of the
seed and water. Water extraction for the hydro-seeding from the wetlands and pans is not allowed
unless authorization is received from the Department of Water Affairs. A good rehabilitation grass
mix can be obtained from Advanced-seed or African grass seeds, but must contain indigenous
grass species which are conspicuous in the Highveld grassland.
Once the initial rehabilitation has been completed the rehabilitated areas should be checked for erosion at the end of the first summer. If erosion is observed, appropriate action should be taken to limit its extent.
8.3 The eradication of invasive plant species
Alien plants are likely to colonise the areas disturbed during the construction/decommissioning
process. Areas disturbed during the construction process should be checked on a 6 monthly basis
and any undesirable plants encountered in the areas immediately upstream and downstream of
the rehabilitated areas should be removed, ideally by hand so as to reduce the risk of herbicides
being transferred further into the wetlands.
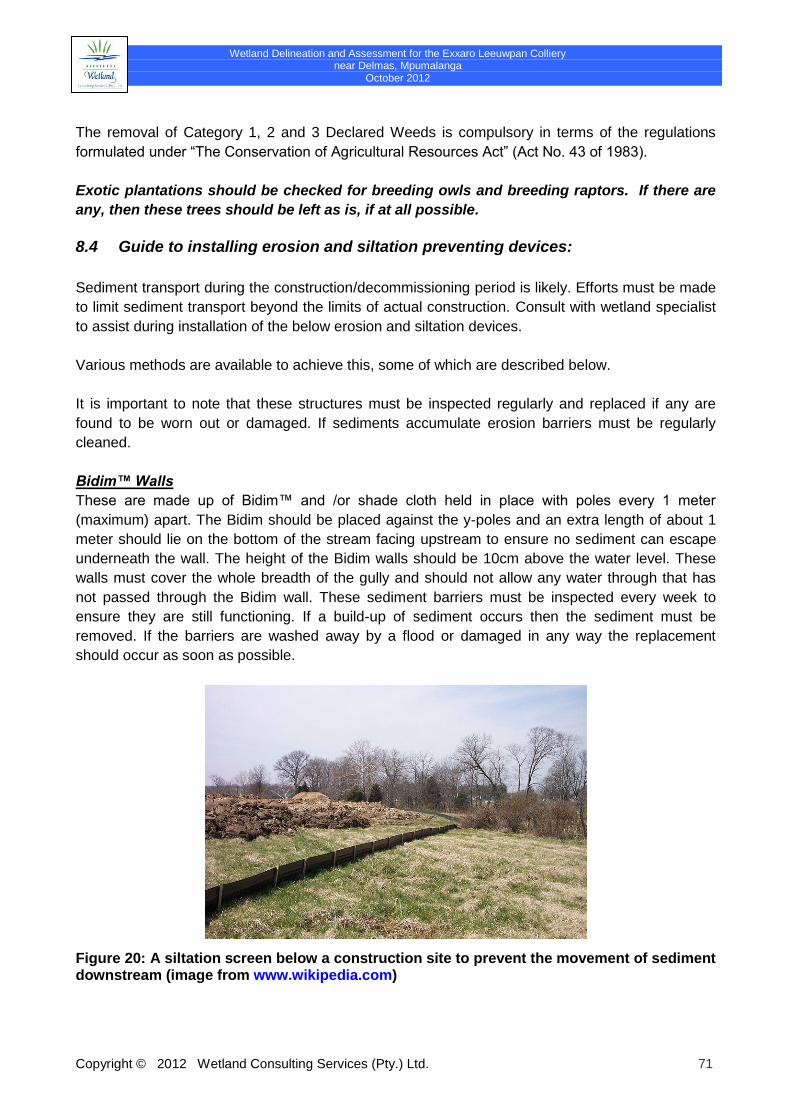
Wetland Delineation and Assessment for the Exxaro Leeuwpan Colliery near Delmas, Mpumalanga
October 2012
Copyright © 2012 Wetland Consulting Services (Pty.) Ltd. 71
The removal of Category 1, 2 and 3 Declared Weeds is compulsory in terms of the regulations
formulated under “The Conservation of Agricultural Resources Act” (Act No. 43 of 1983).
Exotic plantations should be checked for breeding owls and breeding raptors. If there are
any, then these trees should be left as is, if at all possible.
8.4 Guide to installing erosion and siltation preventing devices:
Sediment transport during the construction/decommissioning period is likely. Efforts must be made
to limit sediment transport beyond the limits of actual construction. Consult with wetland specialist
to assist during installation of the below erosion and siltation devices.
Various methods are available to achieve this, some of which are described below.
It is important to note that these structures must be inspected regularly and replaced if any are
found to be worn out or damaged. If sediments accumulate erosion barriers must be regularly
cleaned.
Bidim™ Walls
These are made up of Bidim™ and /or shade cloth held in place with poles every 1 meter
(maximum) apart. The Bidim should be placed against the y-poles and an extra length of about 1
meter should lie on the bottom of the stream facing upstream to ensure no sediment can escape
underneath the wall. The height of the Bidim walls should be 10cm above the water level. These
walls must cover the whole breadth of the gully and should not allow any water through that has
not passed through the Bidim wall. These sediment barriers must be inspected every week to
ensure they are still functioning. If a build-up of sediment occurs then the sediment must be
removed. If the barriers are washed away by a flood or damaged in any way the replacement
should occur as soon as possible.
Figure 20: A siltation screen below a construction site to prevent the movement of sediment downstream (image from www.wikipedia.com)
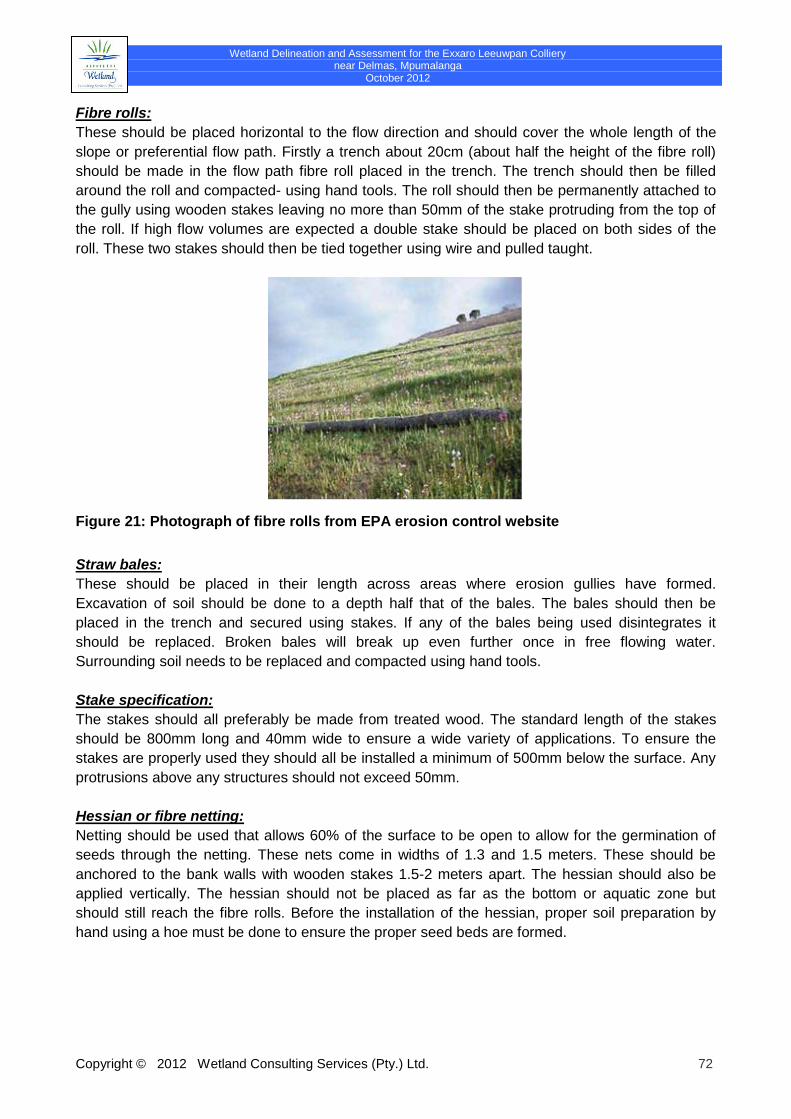
Wetland Delineation and Assessment for the Exxaro Leeuwpan Colliery near Delmas, Mpumalanga
October 2012
Copyright © 2012 Wetland Consulting Services (Pty.) Ltd. 72
Fibre rolls:
These should be placed horizontal to the flow direction and should cover the whole length of the
slope or preferential flow path. Firstly a trench about 20cm (about half the height of the fibre roll)
should be made in the flow path fibre roll placed in the trench. The trench should then be filled
around the roll and compacted- using hand tools. The roll should then be permanently attached to
the gully using wooden stakes leaving no more than 50mm of the stake protruding from the top of
the roll. If high flow volumes are expected a double stake should be placed on both sides of the
roll. These two stakes should then be tied together using wire and pulled taught.
Figure 21: Photograph of fibre rolls from EPA erosion control website
Straw bales:
These should be placed in their length across areas where erosion gullies have formed.
Excavation of soil should be done to a depth half that of the bales. The bales should then be
placed in the trench and secured using stakes. If any of the bales being used disintegrates it
should be replaced. Broken bales will break up even further once in free flowing water.
Surrounding soil needs to be replaced and compacted using hand tools.
Stake specification:
The stakes should all preferably be made from treated wood. The standard length of the stakes
should be 800mm long and 40mm wide to ensure a wide variety of applications. To ensure the
stakes are properly used they should all be installed a minimum of 500mm below the surface. Any
protrusions above any structures should not exceed 50mm.
Hessian or fibre netting:
Netting should be used that allows 60% of the surface to be open to allow for the germination of
seeds through the netting. These nets come in widths of 1.3 and 1.5 meters. These should be
anchored to the bank walls with wooden stakes 1.5-2 meters apart. The hessian should also be
applied vertically. The hessian should not be placed as far as the bottom or aquatic zone but
should still reach the fibre rolls. Before the installation of the hessian, proper soil preparation by
hand using a hoe must be done to ensure the proper seed beds are formed.
Wetland Delineation and Assessment for the Exxaro Leeuwpan Colliery near Delmas, Mpumalanga
October 2012
Copyright © 2012 Wetland Consulting Services (Pty.) Ltd. 73
9. MONITORING & EVALUATION
A number of aspects relating to the wetlands on site should be monitored to ensure effectiveness
of mitigation and management measures, and to inform improvements where required.
9.1 Vegetation re-establishment
Areas re-vegetated following construction activities, decommissioning activities or any activities
leading to vegetation removal and disturbance should be monitored following seeding to ensure
successful establishment of vegetation. The following broad guidelines should apply, though the
site specific details should be determined by a suitably qualified expert:
Vegetation monitoring in re-vegetated sites:
Monthly monitoring for the first 6 months, then annual monitoring during the growing
season;
Monitoring for the first 6 months should focus on cover;
70% cover should be achieved after 3 months; and
Annual monitoring (representative sample of re-vegetated sites only) should be undertaken
until the appointed independent specialist is satisfied that a sustainable vegetation cover
has been established.
9.2 Erosion
All wetland areas requiring revegetation should be monitored for signs of erosion. In addition, all of
the following areas should also be monitored:
All stormwater discharge points;
All clean water diversion discharge points;
All road and conveyor crossings; and
All river diversions.
Monitoring activities should consist of fixed point photography as well as a walk through survey
to observe for signs of erosion in the field. Monitoring should be done annually at the end of the
rainy season. Any erosion damage observed should be repaired immediately.
9.3 Surface water quality monitoring program
The proposed new activities should be included within the Leeuwpan Coal Mine surface water
quality and biomonitoring monitoring plan. As a minimum the points as indicated in Figure 21
below should be included in the plan, though if existing monitoring points occupy a similar
location and are considered suitable, the existing monitoring points should be retained. The
following should be monitored (as far as possible):
Water quality (pH, EC, TDS, SO4 as well as standard anions and cations) – monthly;
Aquatic macro-invertebrates (SASS) – biannually (start and end of wet season); and
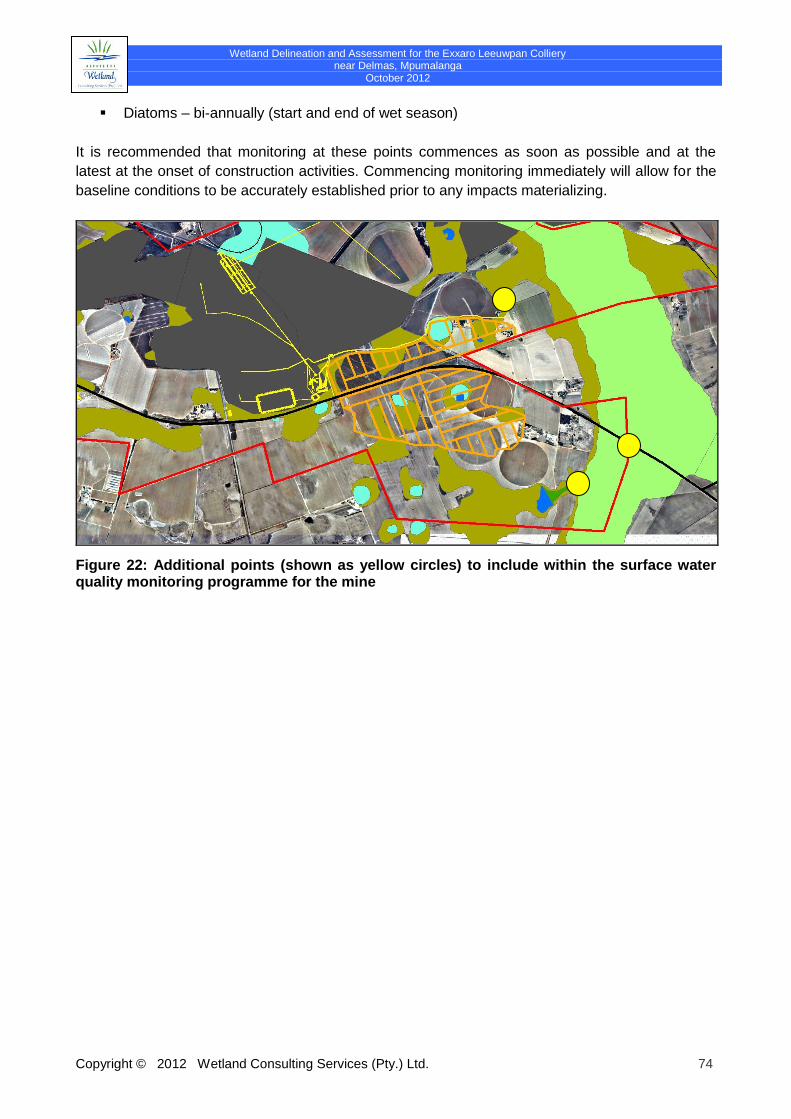
Wetland Delineation and Assessment for the Exxaro Leeuwpan Colliery near Delmas, Mpumalanga
October 2012
Copyright © 2012 Wetland Consulting Services (Pty.) Ltd. 74
Diatoms – bi-annually (start and end of wet season)
It is recommended that monitoring at these points commences as soon as possible and at the
latest at the onset of construction activities. Commencing monitoring immediately will allow for the
baseline conditions to be accurately established prior to any impacts materializing.
Figure 22: Additional points (shown as yellow circles) to include within the surface water quality monitoring programme for the mine
Wetland Delineation and Assessment for the Exxaro Leeuwpan Colliery near Delmas, Mpumalanga
October 2012
Copyright © 2012 Wetland Consulting Services (Pty.) Ltd. 75
10. CONCLUSION
In total the area classified as wetland covers 1 382 hectares, which makes up roughly 32.5 %
of the study area. Approximately 820 hectares of the site has however already been disturbed by
historic and current surface mining activities, suggesting that the wetland extent on site was likely
significantly more prior to the onset of mining activities.
The wetlands on site exist within a landscape currently dominated by agricultural (cultivation,
grazing) and mining activities, and these land uses have had an influence on the current extent
and condition of the majority of the wetlands within the study area. Many of the wetlands and their
catchments are currently, or have historically been, cultivated, or lie in close proximity to active
mining activities, disturbances that have had an influence on the vegetation composition,
geomorphology and hydrology of the wetlands. No pristine wetlands were found to occur within the
study area, and the majority of the wetlands were found to be Moderately Modified (C). Almost 19
% of wetlands were classified as seriously modified (E), consisting mostly of hillslope seepage
wetlands cultivated in their entirety, as well as a number of heavily impacted pans.
The two large valley bottom wetland systems on site, the Bronkhorstspruit and its tributary in the
west of the study area, are considered to be of High (B) ecological importance and sensitivity,
mostly due to the role they play in biodiversity support and as ecological corridors. The remainder
of the wetlands are either of Moderate (C) or Low (D) ecological importance, related mostly to the
level of disturbance these systems have undergone.
The existing mining activities on site, as well as the proposed new opencast pit and associated
surface infrastructure will have a number of impacts on the wetlands on site. Many of the impacts
associated with the supporting infrastructure required for mining can be successfully mitigated to
reduce the impact to wetlands. The impacts of opencast mining, specifically the loss of wetland
habitat and the permanent alteration of the hydrological characteristics of the landscape within the
opencast footprints, are more difficult to address.
The significance of the loss of the wetlands within the proposed opencast footprints is expected to
be as follows:
1. Loss of biodiversity – Wetlands support habitats that differ from the surrounding
terrestrial habitats, and thus support a unique assemblage of species and are important in
terms of biodiversity support. The disturbance to the wetlands within the opencast footprint,
specifically the extensive cultivation of the hillslope seepage wetlands, has significantly
reduced the biodiversity support function of the wetlands on site. The pans, though heavily
impacted, still play a more important role in biodiversity support, specifically the south
eastern pan where a rich birdlife was observed at the time of the survey, including a
number of Greater Flamingo (listed as Near Threatened). The loss of a single pan, viewed
in isolation, is unlikely to impact significantly on biodiversity at a regional scale. However,
given the large number of mining applications within the area, the cumulative impact of
wetland loss does need to be considered.
2. Decreased water yield to downstream wetlands – Pans, being inwardly draining, do not
generally contribute significant water volumes to downstream wetland systems, and the
Wetland Delineation and Assessment for the Exxaro Leeuwpan Colliery near Delmas, Mpumalanga
October 2012
Copyright © 2012 Wetland Consulting Services (Pty.) Ltd. 76
loss of the pans is not expected to impact significantly on water yield to adjacent wetlands.
Hillslope seepage wetlands are more typically considered to play a role in flow regulation,
i.e. the temporary storage and slow release of flows to downslope wetlands and water
courses. The hillslope seepage wetlands on site however, are characterised by generally
shallow soils overlying ferricrete, limiting the volumes of water these systems can store.
Lateral movement of water through the seepage wetlands is also expected to be minimal,
further decreasing the importance of these wetlands in contributing flow to downstream
wetlands. Most of the water supporting the hillslope seepage wetlands on site is expected
to be lost to evapotranspiration. A possible exception is the north eastern hillslope seepage
wetland, though the increased saturation of this wetland could be a result of increased
seepage of water out of the pan due to the storage of groundwater in the pan.
3. Loss of wetland ecosystem functions – Wetlands are generally considered to perform a
number of ecosystem services, ranging from flood attenuation and water quality
enhancement, to biodiversity support and direct human benefits (e.g. provision of natural
resources). In the case of the wetlands on site, the most important function performed by
the pans is that of biodiversity support (addressed under point 1 above). The hillslope
seepage wetlands are considered to be most important in terms of water quality
maintenance, though the limited role they are expected to play in discharging flow to
downstream wetlands also limits the significance of this function. Under natural conditions,
they would also have been important in terms of biodiversity support, but currently only play
a role in supporting productivity, i.e. crop cultivation.
4. Deterioration in water quality – Post-mining, the backfilled voids are likely to fill with
water and start decanting. Decanting water is likely to be acidic as well as metal (e.g.
Aluminium and Iron) and sulphate rich, resulting in significant deterioration of water quality
within the Bronkhorstspruit to the east of the opencast pits. Currently, due to the absence of
mining activities within the Bronkhorstspruit upstream of the R50 road crossing, the water
quality at this point within the Bronkhorstspruit is still good, though agricultural impacts are
evident.
Figure 22 shows the delineated wetlands with a 500m buffer zone. According to GN1199 of 18
December 2009, all activities taking place within a 500m radius of any wetland require a Water
Use License in terms of water uses 21(c) and (i).
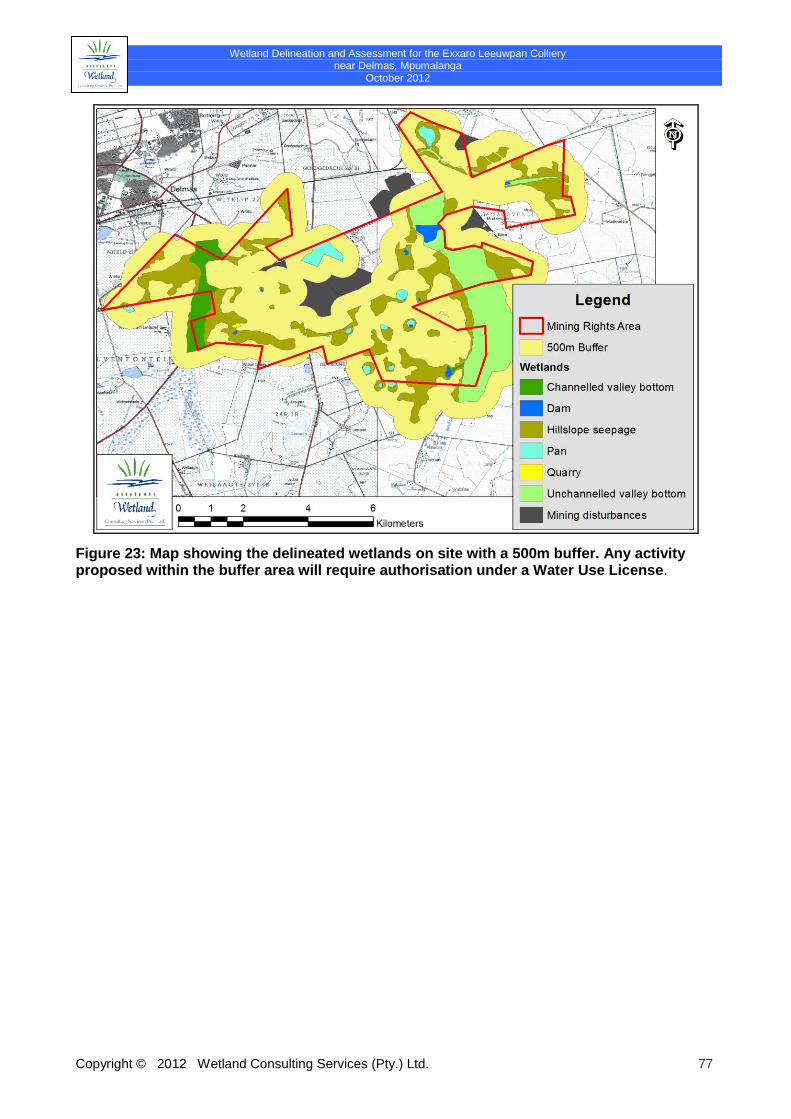
Wetland Delineation and Assessment for the Exxaro Leeuwpan Colliery near Delmas, Mpumalanga
October 2012
Copyright © 2012 Wetland Consulting Services (Pty.) Ltd. 77
Figure 23: Map showing the delineated wetlands on site with a 500m buffer. Any activity proposed within the buffer area will require authorisation under a Water Use License.
Wetland Delineation and Assessment for the Exxaro Leeuwpan Colliery near Delmas, Mpumalanga
October 2012
Copyright © 2012 Wetland Consulting Services (Pty.) Ltd. 78
11. REFERENCES
ANON, 1999. A practical procedure for the delineation of riparian/wetland habitats for land use practices in South Africa.
Forest Owners Association Environmental Committee.
Brinson, M. M. 1993. A hydrogeomorphic classification for wetlands. Wetlands Research Program Technical Report
WRP-DE-4. U. S. Army Corps of Engineers, Waterway Experiment Station. Vicksburg, MS: Bridgham and Richardson.
COWARDIN L M, CARTER V, GOLET F C, and LAROE E T, 1979. Classification of wetlands and deepwater habitats
of the United States. US Department of Interior, Fish and Wildlife Services Report FWS/UBS 79-31.
Department of Water Affairs and Forestry. 1999a. Resource Directed Measures for Protection of Water Resources.
Volume 4. Wetland Ecosystems Version 1.0, Pretoria.
Department of Water Affairs and Forestry. 1999b. Resource Directed Measures for Protection of Water Resources.
Volume 1. River Ecosystems Version 1.0, Pretoria.
Department of Water Affairs and Forestry, 2005. A practical field procedure for identification and delineation of
wetland and riparian areas. DWAF, Pretoria.
Department of Water Affairs and Forestry. 2009. INTEGRATED WATER RESOURCE MANAGEMENT PLAN FOR
THE UPPER AND MIDDLE OLIFANTS CATCHMENT: Integrated Water Resource Management Plan. Report Number:
P WMA 04/000/00/7007.
Department of Water Affairs and Forestry, 2009. INTEGRATED WATER RESOURCE MANAGEMENT PLAN FOR
THE UPPER AND MIDDLE OLIFANTS CATCHMENT: Integrated Water Resource Management Plan. Report Number:
P WMA 04/000/00/7007. DWAF, Pretoria
Ferrar, A.A. and Lötter, M.C. 2006. Mpumalanga Biodiversity Conservation Plan Map. Mpumalanga Tourism and Parks
Agency, Nelspruit.
FISH AND WILDLIFE SERVICE, ENVIRONMENTAL PROTECTION AGENCY, DEPARTMENT OF THE ARMY, and
SOIL CONSERVATION SERVICE. 1989. Federal Manual for identifying and delineating jurisdictional wetlands. An
interagency publication. U. S. Government Printing Office, Washington.
JACKSON S, 1995. Delineating bordering vegetated wetlands under the Massachusetts Wetlands Protection Act: a
handbook. Massachusetts Department of Environmental Protection, Division of Wetlands and Waterways, Boston.
Kleynhans, C.J. 1996. A qualitative procedure for the assessment of the habitat integrity status of the Luvuvhu River.
Journal of Aquatic Ecosystem Health 5: 41 - 54.
Kleynhans, C.J. 1999. A procedure for the determination of the ecological reserve for the purposes of the national water
balance model for South African Rivers. Institute for Water Quality Studies. Department of Water Affairs and Forestry,
Pretoria.
KOTZE D C, 1997. How wet is a wetland? An introduction to understanding wetland hydrology, soils and landforms,
WETLAND-USE Booklet 2. SHARE-NET, Wildlife and Environment Society of South Africa, Howick.
Wetland Delineation and Assessment for the Exxaro Leeuwpan Colliery near Delmas, Mpumalanga
October 2012
Copyright © 2012 Wetland Consulting Services (Pty.) Ltd. 79
KOTZE D C, KLUG J R, HUGHES J C, and BREEN C M 1996. Improved criteria for classifying hydric soils in South
Africa. South African Journal of Plant and Soil 13: 67-73.
KOTZE D C, KLUG J R, and BREEN C M, in press. WETLAND-USE, a wetland managment decision support system
for South African freshwater palustrine wetlands. Part 1: biophysical assessment. South African Wetlands Conservation
Programme, Department of Environmental Affairs and Tourism, Pretoria.
Kotze, D.C, Marneweck, G.C., Batchelor, A.L., Lindley, D. and Collins, N. 2004. Wetland Assess: A rapid
assessment procedure for describing wetland benefits. Mondi Wetland Project, Unpublished report.
Kotze, D.C., Marneweck, G.C., Batchelor, A.L., Lindley, D.S. and Collins, N.B. 2007. WET-EcoServices: A technique
for rapidly assessing ecosystem services supplied by wetlands. Water Research Commission. WRC TT 339/09
Kotze, D.C. and Marneweck, G.C. 1999. Guidelines for delineating the boundaries of a wetland and the zones within a
wetland in terms of the South African Water Act. Pretoria: Department of Water Affairs.
Marneweck, G.C. and Batchelor, A. 2002. Wetland inventory and classification. In: Ecological and economic evaluation
of wetlands in the upper Olifants River catchment. (Palmer, R.W., Turpie, J., Marneweck, G.C and Batchelor (eds.).
Water Research Commission Report No. 1162/1/02.
McCartney, M.P. 2000. The water budget of a headwater catchment containing a dambo. Institute of Hydrology,
Crowmarsh Gifford, Wallingford, Oxon, OX10 8BB, UK
Midgley, D.C., Pitman, W.V. and Middelton, B.J. 1994. Surface Water Resources of South Africa 1990 Book of Maps:
Volume 1. Water Research Commission. WRC 298/1.2/94
Mucina, L. and Rutherford, M.C. 2006. The Vegetation of South Africa, Lesotho and Swaziland. Strelizia 19. SANBI,
Pretoria.
Nel, J.L., Driver, A., Strydom, W.F., Maherry, A., Petersen, C., Hill, L., Roux, D.J., Nienaber, S., van Deventer, H.
Swartz, E. and Smith-Adao, L.B. 2011. Atlas of Freshwater Ecosystem Priority Areas in South Africa: Maps to support
sustainable development of water resources. Water Research Commission, Gezina. WRC Report No. TT 500/11
Parsons, R. 2004. Surface Water: Groundwater Interaction in a South African Context. Water Research Commission.
WRC TT 218/03
Reppert RT, Sigleo W, Srackhiv E, Messman L and Meyers C, 1979. Wetland values: concepts and methods for
wetlands evaluation. IWR Research Report 79-R-1, U.S. Army Corps Engineers, Fort Belvoir, VA.
SANBI. 2009. Further Development of a Proposed National Wetland Classification System for South Africa. Primary
Project Report. Prepared by the Freshwater Consulting Group (FCG) for the South African National Biodiversity Institute
(SANBI).
South Africa. 1998. National Water Act 38 of 1998. Pretoria: Government Printer
Taylor, J.C., W.R. Harding and C.G.M Archibald. 2007. An illustrated guide to some common diatom species from
South Africa. Water Research Commission. WRC TT 282/07.
Walker, L.R. 1999. Ecosystems of Disturbed Ground. In: Ecosystems of the World. Elsevier
Wetland Delineation and Assessment for the Exxaro Leeuwpan Colliery near Delmas, Mpumalanga
October 2012
Copyright © 2012 Wetland Consulting Services (Pty.) Ltd. 80
Prygiel, J. and M. Coste. 2000. Guide méthodologique pour la mise en oeuvre de l'Indice Biologique Diatomées. NF
T90-354. Agence de l'eau Artois Picardie, Douai.
Taylor, JC, Harding, WR and Archibald, CGM 2007. A methods manual for the collection, preparation and analysis of
diatom samples. Water Research Commission Report TT281/07. Water Research Commission. Pretoria.
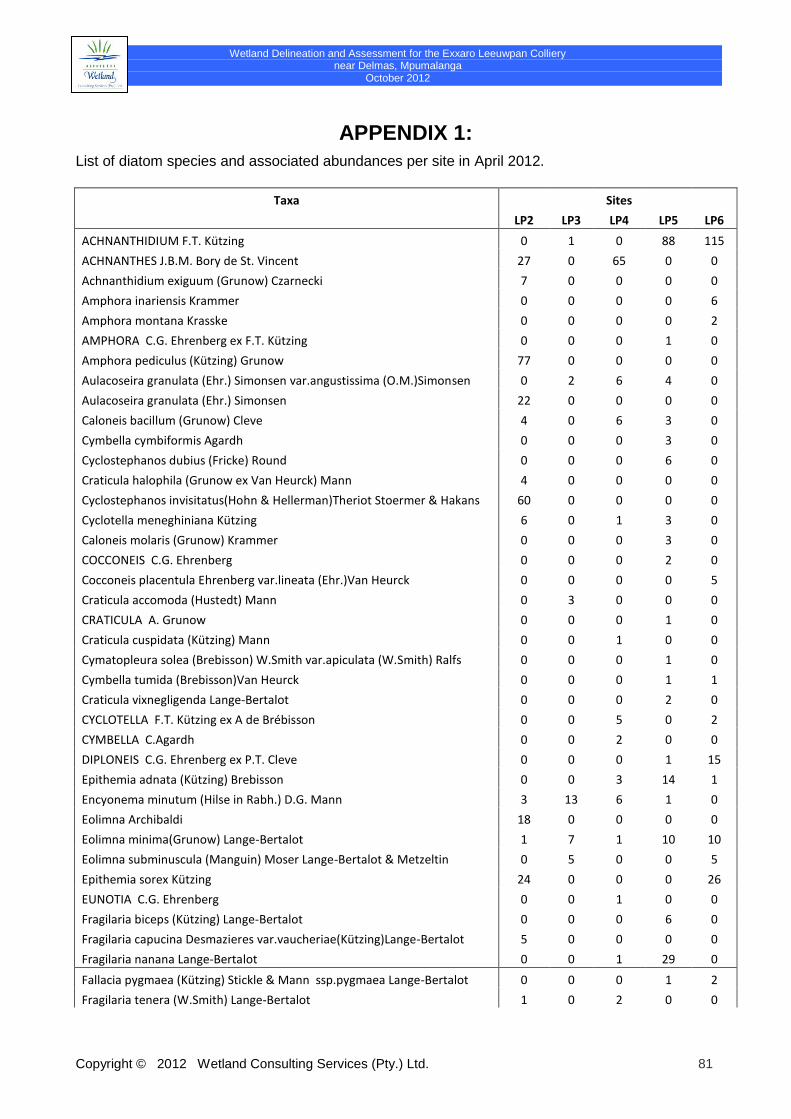
Wetland Delineation and Assessment for the Exxaro Leeuwpan Colliery near Delmas, Mpumalanga
October 2012
Copyright © 2012 Wetland Consulting Services (Pty.) Ltd. 81
APPENDIX 1:
List of diatom species and associated abundances per site in April 2012.
Taxa Sites
LP2 LP3 LP4 LP5 LP6
ACHNANTHIDIUM F.T. Kützing 0 1 0 88 115
ACHNANTHES J.B.M. Bory de St. Vincent 27 0 65 0 0
Achnanthidium exiguum (Grunow) Czarnecki 7 0 0 0 0
Amphora inariensis Krammer 0 0 0 0 6
Amphora montana Krasske 0 0 0 0 2
AMPHORA C.G. Ehrenberg ex F.T. Kützing 0 0 0 1 0
Amphora pediculus (Kützing) Grunow 77 0 0 0 0
Aulacoseira granulata (Ehr.) Simonsen var.angustissima (O.M.)Simonsen 0 2 6 4 0
Aulacoseira granulata (Ehr.) Simonsen 22 0 0 0 0
Caloneis bacillum (Grunow) Cleve 4 0 6 3 0
Cymbella cymbiformis Agardh 0 0 0 3 0
Cyclostephanos dubius (Fricke) Round 0 0 0 6 0
Craticula halophila (Grunow ex Van Heurck) Mann 4 0 0 0 0
Cyclostephanos invisitatus(Hohn & Hellerman)Theriot Stoermer & Hakans 60 0 0 0 0
Cyclotella meneghiniana Kützing 6 0 1 3 0
Caloneis molaris (Grunow) Krammer 0 0 0 3 0
COCCONEIS C.G. Ehrenberg 0 0 0 2 0
Cocconeis placentula Ehrenberg var.lineata (Ehr.)Van Heurck 0 0 0 0 5
Craticula accomoda (Hustedt) Mann 0 3 0 0 0
CRATICULA A. Grunow 0 0 0 1 0
Craticula cuspidata (Kützing) Mann 0 0 1 0 0
Cymatopleura solea (Brebisson) W.Smith var.apiculata (W.Smith) Ralfs 0 0 0 1 0
Cymbella tumida (Brebisson)Van Heurck 0 0 0 1 1
Craticula vixnegligenda Lange-Bertalot 0 0 0 2 0
CYCLOTELLA F.T. Kützing ex A de Brébisson 0 0 5 0 2
CYMBELLA C.Agardh 0 0 2 0 0
DIPLONEIS C.G. Ehrenberg ex P.T. Cleve 0 0 0 1 15
Epithemia adnata (Kützing) Brebisson 0 0 3 14 1
Encyonema minutum (Hilse in Rabh.) D.G. Mann 3 13 6 1 0
Eolimna Archibaldi 18 0 0 0 0
Eolimna minima(Grunow) Lange-Bertalot 1 7 1 10 10
Eolimna subminuscula (Manguin) Moser Lange-Bertalot & Metzeltin 0 5 0 0 5
Epithemia sorex Kützing 24 0 0 0 26
EUNOTIA C.G. Ehrenberg 0 0 1 0 0
Fragilaria biceps (Kützing) Lange-Bertalot 0 0 0 6 0
Fragilaria capucina Desmazieres var.vaucheriae(Kützing)Lange-Bertalot 5 0 0 0 0
Fragilaria nanana Lange-Bertalot 0 0 1 29 0
Fallacia pygmaea (Kützing) Stickle & Mann ssp.pygmaea Lange-Bertalot 0 0 0 1 2
Fragilaria tenera (W.Smith) Lange-Bertalot 1 0 2 0 0
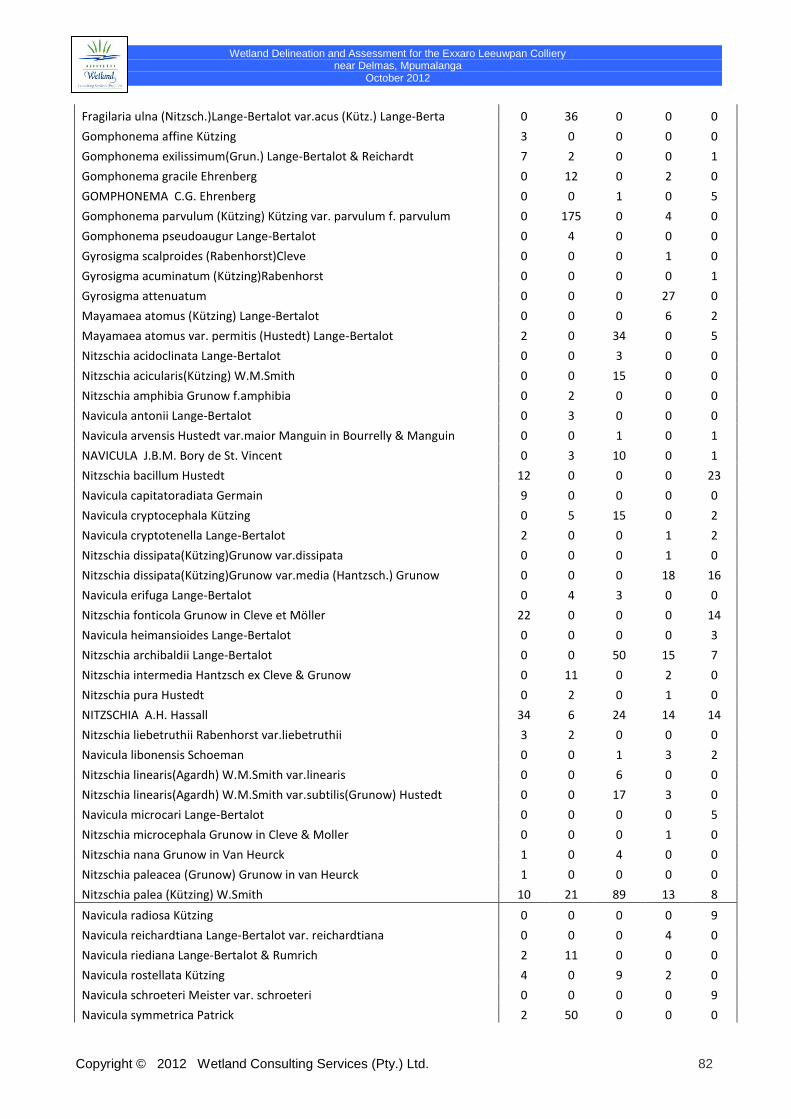
Wetland Delineation and Assessment for the Exxaro Leeuwpan Colliery near Delmas, Mpumalanga
October 2012
Copyright © 2012 Wetland Consulting Services (Pty.) Ltd. 82
Fragilaria ulna (Nitzsch.)Lange-Bertalot var.acus (Kütz.) Lange-Berta 0 36 0 0 0
Gomphonema affine Kützing 3 0 0 0 0
Gomphonema exilissimum(Grun.) Lange-Bertalot & Reichardt 7 2 0 0 1
Gomphonema gracile Ehrenberg 0 12 0 2 0
GOMPHONEMA C.G. Ehrenberg 0 0 1 0 5
Gomphonema parvulum (Kützing) Kützing var. parvulum f. parvulum 0 175 0 4 0
Gomphonema pseudoaugur Lange-Bertalot 0 4 0 0 0
Gyrosigma scalproides (Rabenhorst)Cleve 0 0 0 1 0
Gyrosigma acuminatum (Kützing)Rabenhorst 0 0 0 0 1
Gyrosigma attenuatum 0 0 0 27 0
Mayamaea atomus (Kützing) Lange-Bertalot 0 0 0 6 2
Mayamaea atomus var. permitis (Hustedt) Lange-Bertalot 2 0 34 0 5
Nitzschia acidoclinata Lange-Bertalot 0 0 3 0 0
Nitzschia acicularis(Kützing) W.M.Smith 0 0 15 0 0
Nitzschia amphibia Grunow f.amphibia 0 2 0 0 0
Navicula antonii Lange-Bertalot 0 3 0 0 0
Navicula arvensis Hustedt var.maior Manguin in Bourrelly & Manguin 0 0 1 0 1
NAVICULA J.B.M. Bory de St. Vincent 0 3 10 0 1
Nitzschia bacillum Hustedt 12 0 0 0 23
Navicula capitatoradiata Germain 9 0 0 0 0
Navicula cryptocephala Kützing 0 5 15 0 2
Navicula cryptotenella Lange-Bertalot 2 0 0 1 2
Nitzschia dissipata(Kützing)Grunow var.dissipata 0 0 0 1 0
Nitzschia dissipata(Kützing)Grunow var.media (Hantzsch.) Grunow 0 0 0 18 16
Navicula erifuga Lange-Bertalot 0 4 3 0 0
Nitzschia fonticola Grunow in Cleve et Möller 22 0 0 0 14
Navicula heimansioides Lange-Bertalot 0 0 0 0 3
Nitzschia archibaldii Lange-Bertalot 0 0 50 15 7
Nitzschia intermedia Hantzsch ex Cleve & Grunow 0 11 0 2 0
Nitzschia pura Hustedt 0 2 0 1 0
NITZSCHIA A.H. Hassall 34 6 24 14 14
Nitzschia liebetruthii Rabenhorst var.liebetruthii 3 2 0 0 0
Navicula libonensis Schoeman 0 0 1 3 2
Nitzschia linearis(Agardh) W.M.Smith var.linearis 0 0 6 0 0
Nitzschia linearis(Agardh) W.M.Smith var.subtilis(Grunow) Hustedt 0 0 17 3 0
Navicula microcari Lange-Bertalot 0 0 0 0 5
Nitzschia microcephala Grunow in Cleve & Moller 0 0 0 1 0
Nitzschia nana Grunow in Van Heurck 1 0 4 0 0
Nitzschia paleacea (Grunow) Grunow in van Heurck 1 0 0 0 0
Nitzschia palea (Kützing) W.Smith 10 21 89 13 8
Navicula radiosa Kützing 0 0 0 0 9
Navicula reichardtiana Lange-Bertalot var. reichardtiana 0 0 0 4 0
Navicula riediana Lange-Bertalot & Rumrich 2 11 0 0 0
Navicula rostellata Kützing 4 0 9 2 0
Navicula schroeteri Meister var. schroeteri 0 0 0 0 9
Navicula symmetrica Patrick 2 50 0 0 0
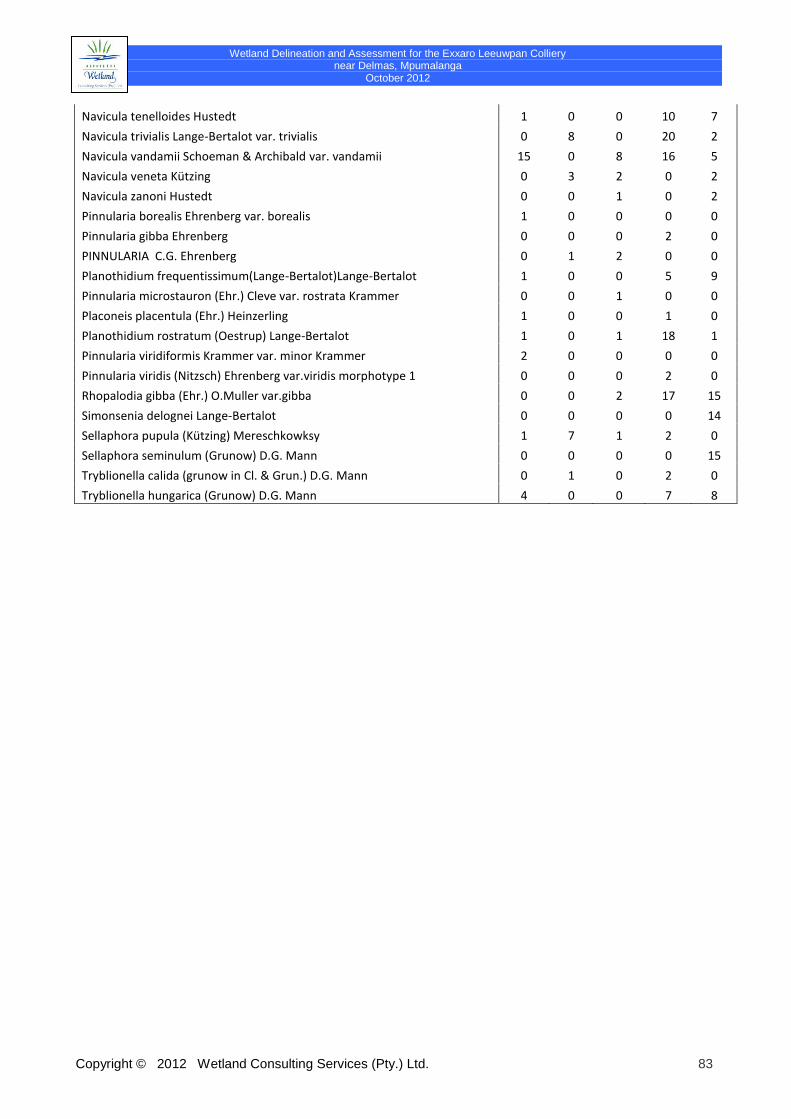
Wetland Delineation and Assessment for the Exxaro Leeuwpan Colliery near Delmas, Mpumalanga
October 2012
Copyright © 2012 Wetland Consulting Services (Pty.) Ltd. 83
Navicula tenelloides Hustedt 1 0 0 10 7
Navicula trivialis Lange-Bertalot var. trivialis 0 8 0 20 2
Navicula vandamii Schoeman & Archibald var. vandamii 15 0 8 16 5
Navicula veneta Kützing 0 3 2 0 2
Navicula zanoni Hustedt 0 0 1 0 2
Pinnularia borealis Ehrenberg var. borealis 1 0 0 0 0
Pinnularia gibba Ehrenberg 0 0 0 2 0
PINNULARIA C.G. Ehrenberg 0 1 2 0 0
Planothidium frequentissimum(Lange-Bertalot)Lange-Bertalot 1 0 0 5 9
Pinnularia microstauron (Ehr.) Cleve var. rostrata Krammer 0 0 1 0 0
Placoneis placentula (Ehr.) Heinzerling 1 0 0 1 0
Planothidium rostratum (Oestrup) Lange-Bertalot 1 0 1 18 1
Pinnularia viridiformis Krammer var. minor Krammer 2 0 0 0 0
Pinnularia viridis (Nitzsch) Ehrenberg var.viridis morphotype 1 0 0 0 2 0
Rhopalodia gibba (Ehr.) O.Muller var.gibba 0 0 2 17 15
Simonsenia delognei Lange-Bertalot 0 0 0 0 14
Sellaphora pupula (Kützing) Mereschkowksy 1 7 1 2 0
Sellaphora seminulum (Grunow) D.G. Mann 0 0 0 0 15
Tryblionella calida (grunow in Cl. & Grun.) D.G. Mann 0 1 0 2 0
Tryblionella hungarica (Grunow) D.G. Mann 4 0 0 7 8
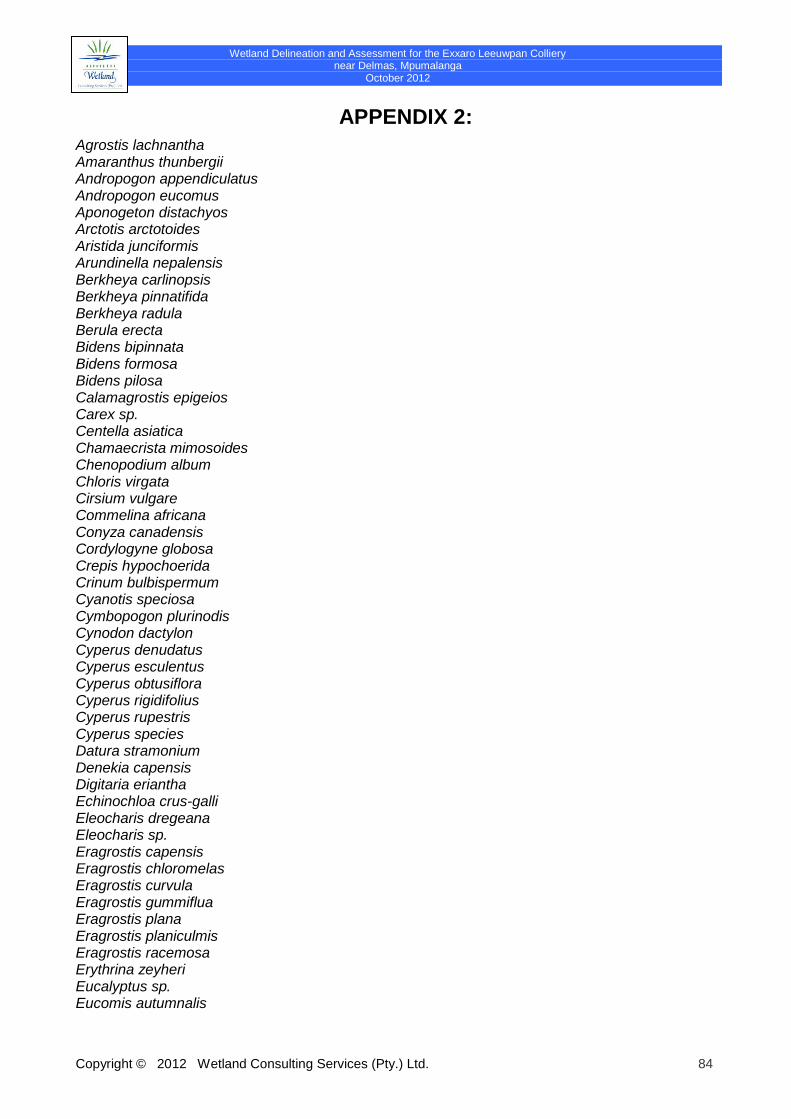
Wetland Delineation and Assessment for the Exxaro Leeuwpan Colliery near Delmas, Mpumalanga
October 2012
Copyright © 2012 Wetland Consulting Services (Pty.) Ltd. 84
APPENDIX 2:
Agrostis lachnantha Amaranthus thunbergii Andropogon appendiculatus Andropogon eucomus Aponogeton distachyos Arctotis arctotoides Aristida junciformis Arundinella nepalensis Berkheya carlinopsis Berkheya pinnatifida Berkheya radula Berula erecta Bidens bipinnata Bidens formosa Bidens pilosa Calamagrostis epigeios Carex sp. Centella asiatica Chamaecrista mimosoides Chenopodium album Chloris virgata Cirsium vulgare Commelina africana Conyza canadensis Cordylogyne globosa Crepis hypochoerida Crinum bulbispermum Cyanotis speciosa Cymbopogon plurinodis Cynodon dactylon Cyperus denudatus Cyperus esculentus Cyperus obtusiflora Cyperus rigidifolius Cyperus rupestris Cyperus species Datura stramonium Denekia capensis Digitaria eriantha Echinochloa crus-galli Eleocharis dregeana Eleocharis sp. Eragrostis capensis Eragrostis chloromelas Eragrostis curvula Eragrostis gummiflua Eragrostis plana Eragrostis planiculmis Eragrostis racemosa Erythrina zeyheri Eucalyptus sp. Eucomis autumnalis
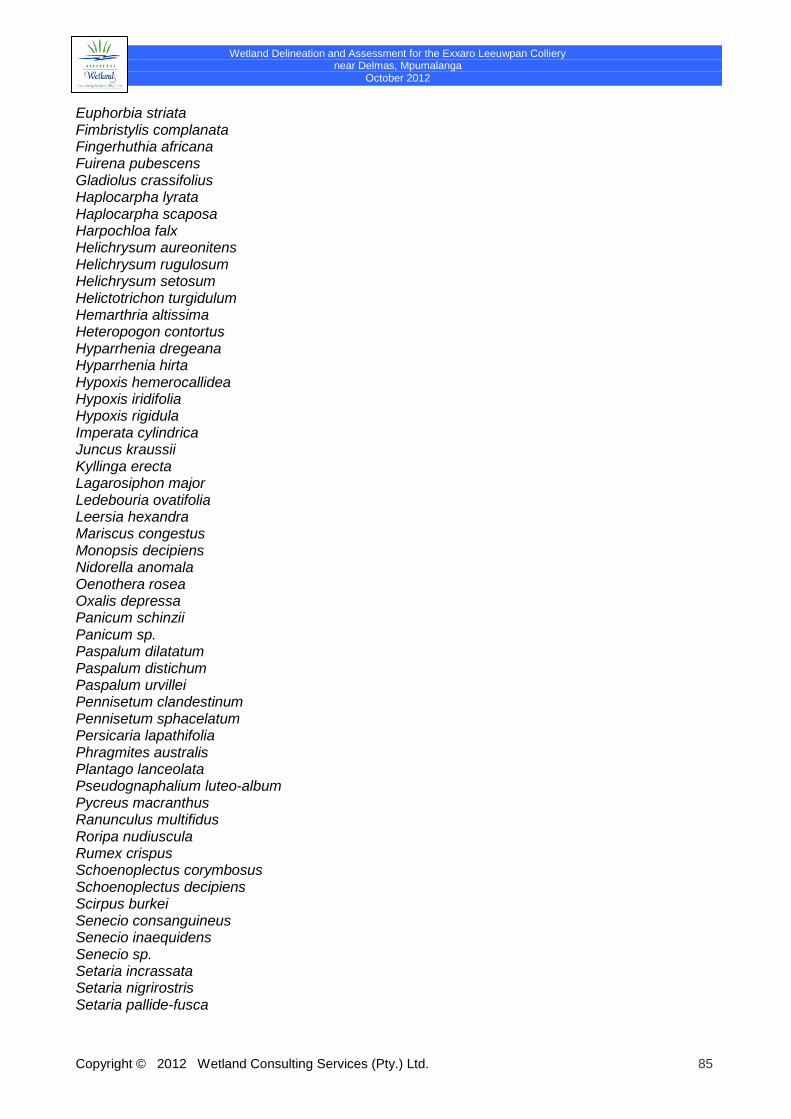
Wetland Delineation and Assessment for the Exxaro Leeuwpan Colliery near Delmas, Mpumalanga
October 2012
Copyright © 2012 Wetland Consulting Services (Pty.) Ltd. 85
Euphorbia striata Fimbristylis complanata Fingerhuthia africana Fuirena pubescens Gladiolus crassifolius Haplocarpha lyrata Haplocarpha scaposa Harpochloa falx Helichrysum aureonitens Helichrysum rugulosum Helichrysum setosum Helictotrichon turgidulum Hemarthria altissima Heteropogon contortus Hyparrhenia dregeana Hyparrhenia hirta Hypoxis hemerocallidea Hypoxis iridifolia Hypoxis rigidula Imperata cylindrica Juncus kraussii Kyllinga erecta Lagarosiphon major Ledebouria ovatifolia Leersia hexandra Mariscus congestus Monopsis decipiens Nidorella anomala Oenothera rosea Oxalis depressa Panicum schinzii Panicum sp. Paspalum dilatatum Paspalum distichum Paspalum urvillei Pennisetum clandestinum Pennisetum sphacelatum Persicaria lapathifolia Phragmites australis Plantago lanceolata Pseudognaphalium luteo-album Pycreus macranthus Ranunculus multifidus Roripa nudiuscula Rumex crispus Schoenoplectus corymbosus Schoenoplectus decipiens Scirpus burkei Senecio consanguineus Senecio inaequidens Senecio sp. Setaria incrassata Setaria nigrirostris Setaria pallide-fusca
Wetland Delineation and Assessment for the Exxaro Leeuwpan Colliery near Delmas, Mpumalanga
October 2012
Copyright © 2012 Wetland Consulting Services (Pty.) Ltd. 86
Setaria sphacelata Sonchus species Sporobolus africanus Stoebe vulgaris Tagetes minuta Themeda triandra Tolpis capensis Tristachya leucothrix Typha capensis Verbena bonariensis Wahlenbergia undulate Walafrida densiflora Zea mays
Wetland Delineation and Assessment for the Exxaro Leeuwpan Colliery near Delmas, Mpumalanga
October 2012
Copyright © 2012 Wetland Consulting Services (Pty.) Ltd. 87
APPENDIX 3:
Annexure H Quarterly Water Quality Report
PREPARED FOR: EXXARO COAL MPUMALANGA
(PTY) LTD. LEEUWPAN COAL MINE
PREPARED BY: ENVASS
MONTH: SEPTEMBER 2020
REPORT NUMBER: MON-WQR-080-19_20 (20-09)
VERSION: 0.0
EXXARO Coal Mpumalanga (Pty) Ltd., Leeuwpan Coal Mine, located near
Delmas, Mpumalanga Province.
QUARTERLY WATER QUALITY
REPORT
Document No: Revision: Date:
MON-WQR-080-19_20 (20-09) 0.0 September 2020
Leeuwpan Coal Mine
Client Restricted Author: W. Esterhuizen
i
DOCUMENT CONTROL
Document Title Exxaro Leeuwpan Quarterly Water Quality Report
Report Number MON-WQR-080-19_20 (20-09)
Version 0.0
Date September 2020
Submitted to
Lucy Mogakane
Environmental Practitioner
Distribution EXXARO Coal Mpumalanga (Pty) Ltd.
Environmental Assurance (Pty) Ltd.
QUALITY CONTROL
Originated By Technical Review
Name Wian Esterhuizen Anton Botha
Designation Environmental Consultant Environmental Consultant
Signature
Date 12-10-2020 16-10-2020
DISCLAIMER
Copyright ENVASS. All Rights Reserved - This documentation is considered the intellectual property of ENVASS.
Unauthorised reproduction or distribution of this documentation or any portion of it may result in severe civil and criminal
penalties, and violators will be prosecuted to the maximum extent possible under law. Any observations,
recommendations and actions taken from this report remain the responsibility of the client. Environmental Assurance
(Pty) Ltd and authors of this report are protected from any legal action, possible loss, damage or liability resulting from
the content of this report. This document is considered confidential and remains so unless requested by a court of law.
Document No: Revision: Date:
MON-WQR-080-19_20 (20-09) 0.0 September 2020
Leeuwpan Coal Mine
Client Restricted Author: W. Esterhuizen
ii
EXECUTIVE SUMMARY
Environmental Assurance (Pty) Ltd. (ENVASS) is appointed by EXXARO Coal Mpumalanga (Pty) Ltd. to implement and
maintain an environmental compliance monitoring programme at the Leeuwpan Coal Mine, located near Delmas,
Mpumalanga Province.
The water quality monitoring program was initiated at Leeuwpan Coal Mine as per the Water Use License requirements,
including; surface- and groundwater sampling as well as reporting requirement. The water quality is conducted on the
following sampling frequency: surface water localities are monitored on a monthly basis, while groundwater localities are
monitored quarterly through purging, including the measurement of groundwater levels.
This report communicates the monthly water monitoring and results conducted within September 2020. All monitoring was
conducted according to recognised standards and sent to a SANAS accredited laboratory for analysis as further described
in this report.
The following findings pertain to the September 2020 surface water monitoring:
• Samples LSW06, LSW07, LSW08, LSW12, WP01, KR03, KR04, RD1, OWM PIT, OG PIT, OH PIT, OJ PIT, OM
PIT, WLV PIT, OJ-O, OJ-S4-DISC, OH-WEATH, OL-OVB (2A+2B), LWP-SP-W and PIET-SCHUTTE could not be
obtained during the monitoring period;
• The Load-out Bay Offices Water (LLBDW), Drinking Water Supply Tank (LDWST) and Drinking Water at
Laboratory (LWDL) revealed elevated Heterotrophic Plate Counts which renders the water as not suitable for
potable purposes. It should be noted that elevated E.coli was also present within the LLBDW locality;
• The majority of the receiving environment monitoring localities presented overall fair condition;
• Minor exceedances occurred at the process localities, while the majority of the monitoring point parameters were
compliant to the stipulated WUL limits. All of the locallities exceeded the WUL limits for EC;
• The final effluent from LWP-SP-P was not active during the monitoring period, however historically recorded non-
compliant to the set Wastewater WUL limits due to the exceedance of Ammonia, with the General Authorisation
limits being exceeded in terms of Ammonia, Suspended Solids and COD. No access was available for LWP-SP-
W; and
• During the monthly monitoring period of September 2020, the majority of the parameters analysed remained
relatively constant with no major changes present compared to August 2020.
Document No: Revision: Date:
MON-WQR-080-19_20 (20-09) 0.0 September 2020
Leeuwpan Coal Mine
Client Restricted Author: W. Esterhuizen
iii
The following findings pertain to the September 2020 groundwater monitoring:
• Samples EMPR02/E2, KENMB1, KENMB2-D, KENMB3-S, LW08, LW10, LWG01, LWG04, MOAMB10, RIE10,
RIE10B, RIE4, RKL03, WTN02-D, WWNMB 16 and WWN02D could not be obtained during the monitoring period;
• The majority of the monitoring boreholes recorded satisfactory concentrations compared to SANS241-1:2015; and
• From the monitoring results some boreholes presented elevated salinity and sulphate concentrations which may
be attributed to the mining operation.
Document No: Revision: Date:
MON-WQR-080-19_20 (20-09) 0.0 September 2020
Leeuwpan Coal Mine
Client Restricted Author: W. Esterhuizen
iv
TABLE OF CONTENTS
1. INTRODUCTION .......................................................................................................................................................... 1
2. SYSTEMS AUDIT......................................................................................................................................................... 1
3. PURPOSE .................................................................................................................................................................... 1
4. METHODOLOGY ......................................................................................................................................................... 3
5. SCOPE OF WORK ....................................................................................................................................................... 4
5.1 LABORATORY ANALYSIS .................................................................................................................................. 4
5.2 SURFACE WATER MONITORING ..................................................................................................................... 5
5.3 GROUNDWATER MONITORING........................................................................................................................ 7
6. RESULTS ................................................................................................................................................................... 14
6.1 SURFACE WATER RESULTS .......................................................................................................................... 14
6.2 GROUNDWATER RESULTS ............................................................................................................................ 35
7. DISCUSSION ............................................................................................................................................................. 40
7.1 RECEIVING ENVIRONMENT WATER QUALITY ............................................................................................. 40
7.2 PROCESS WATER QUALITY ........................................................................................................................... 41
7.3 EFFLUENT WATER QUALITY .......................................................................................................................... 42
7.4 POTABLE WATER QUALITY ............................................................................................................................ 42
7.5 EXCEEDING VARIABLE DISCUSSION ............................................................................................................ 43
7.6 GROUNDWATER QUALITY ............................................................................................................................. 46
8. CONCLUSION AND ASPECTS TO CONSIDER ....................................................................................................... 51
Appendix A – SAMPLING REGISTER ................................................................................................................................ 53
Appendix B – PROBE FIELD MEASUREMENTS ............................................................................................................... 75
APPENDIX C – WATER MONITORING GRAPHS ............................................................................................................. 76
RECEIVING ENVIRONMENT GRAPHS .................................................................................................................... 76
PROCESS WATER GRAPHS .................................................................................................................................... 78
EFFLUENT WATER GRAPHS ................................................................................................................................... 81
POTABLE WATER GRAPHS ......................................................................................................................................... 84
GROUNDWATER GRAPHS ...................................................................................................................................... 87
Document No: Revision: Date:
MON-WQR-080-19_20 (20-09) 0.0 September 2020
Leeuwpan Coal Mine
Client Restricted Author: W. Esterhuizen
v
LIST OF FIGURES
Figure 1: Leeuwpan Coal Mine Location Map ....................................................................................................................... 2
Figure 2: Receiving Environment Water Sampling Locality Map ........................................................................................... 9
Figure 3: Process Water Sampling Locality Map ................................................................................................................ 10
Figure 4: Effluent Water Sampling Locality Map ................................................................................................................. 11
Figure 5: Potable Water Sampling Locality Map ................................................................................................................. 12
Figure 6: Groundwater Sampling Locality Map ................................................................................................................... 13
Figure 7: Expanded Durov diagram of groundwater chemistry regarding March 2020 ....................................................... 48
Figure 8: Stiff diagrams of groundwater chemistry regarding September 2020 .................................................................. 49
Figure 9: Water levels measured at Exxaro Leeuwpan Operations March 2017 – September 2020 .................................. 50
Figure 10: pH value ............................................................................................................................................................. 76
Figure 11: Electrical Conductivity ........................................................................................................................................ 76
Figure 12: Total Dissolved Solids ........................................................................................................................................ 77
Figure 13: Sulphate ............................................................................................................................................................. 77
Figure 14: Escherichia coli (E.coli) ...................................................................................................................................... 78
Figure 15: pH value ............................................................................................................................................................. 78
Figure 16: Electrical Conductivity ........................................................................................................................................ 79
Figure 17: Total Dissolved Solids ........................................................................................................................................ 79
Figure 18: Sulphate ............................................................................................................................................................. 80
Figure 19: Oil and Grease ................................................................................................................................................... 80
Figure 20: Nitrate ................................................................................................................................................................ 81
Figure 21: Suspended Solids .............................................................................................................................................. 81
Figure 22: Ammonia ............................................................................................................................................................ 82
Figure 23: Nitrate ................................................................................................................................................................ 82
Figure 24: Ortho-Phosphate ................................................................................................................................................ 83
Figure 25: Total Phosphate ................................................................................................................................................. 83
Figure 26: Chemical Oxygen Demand (COD) ..................................................................................................................... 84
Figure 27: pH value ............................................................................................................................................................. 84
Figure 28: Turbidity ............................................................................................................................................................. 85
Figure 29: Electrical Conductivity ........................................................................................................................................ 85
Figure 30: Heterotrophic Plate Count .................................................................................................................................. 86
Figure 31: Total Dissolved Solids ........................................................................................................................................ 86
Figure 32: pH Value ............................................................................................................................................................ 87
Figure 33: Electrical Conductivity ........................................................................................................................................ 87
Figure 34: Total Dissolved Solids (TDS) ............................................................................................................................. 88
Figure 35: Sulphates as SO4 ............................................................................................................................................... 88
Document No: Revision: Date:
MON-WQR-080-19_20 (20-09) 0.0 September 2020
Leeuwpan Coal Mine
Client Restricted Author: W. Esterhuizen
vi
LIST OF TABLES
Table 1: Water Use License details ....................................................................................................................................... 1
Table 2: Water quality parameters for Leeuwpan Coal Mine ................................................................................................ 4
Table 3: Surface Water Monitoring ........................................................................................................................................ 6
Table 4: Groundwater Monitoring .......................................................................................................................................... 7
Table 5: Receiving Environment Water Sample Results ..................................................................................................... 14
Table 6: Process Water Sample Results ............................................................................................................................. 21
Table 7: Effluent Water Sample Results ............................................................................................................................. 28
Table 8: Potable Water Sample Results ............................................................................................................................. 30
Table 9: Groundwater Sample Results ............................................................................................................................... 35
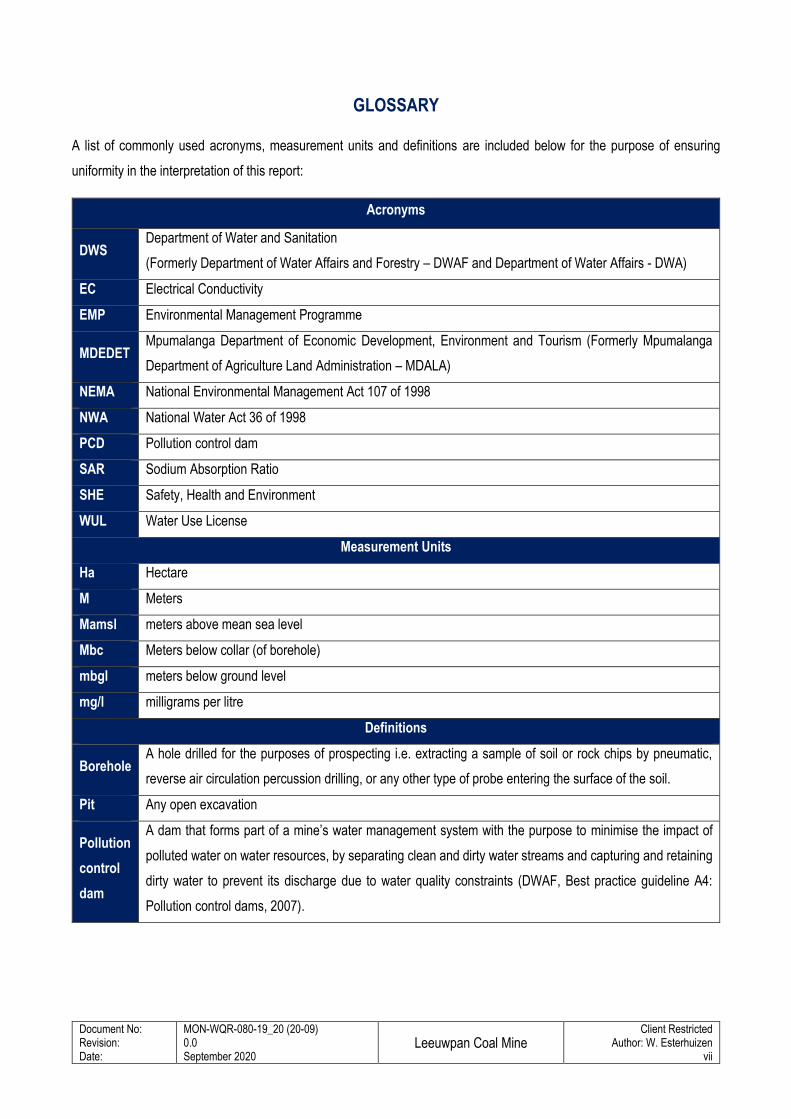
Document No: Revision: Date:
MON-WQR-080-19_20 (20-09) 0.0 September 2020
Leeuwpan Coal Mine
Client Restricted Author: W. Esterhuizen
vii
GLOSSARY
A list of commonly used acronyms, measurement units and definitions are included below for the purpose of ensuring
uniformity in the interpretation of this report:
Acronyms
DWS Department of Water and Sanitation
(Formerly Department of Water Affairs and Forestry – DWAF and Department of Water Affairs - DWA)
EC Electrical Conductivity
EMP Environmental Management Programme
MDEDET Mpumalanga Department of Economic Development, Environment and Tourism (Formerly Mpumalanga
Department of Agriculture Land Administration – MDALA)
NEMA National Environmental Management Act 107 of 1998
NWA National Water Act 36 of 1998
PCD Pollution control dam
SAR Sodium Absorption Ratio
SHE Safety, Health and Environment
WUL Water Use License
Measurement Units
Ha Hectare
M Meters
Mamsl meters above mean sea level
Mbc Meters below collar (of borehole)
mbgl meters below ground level
mg/l milligrams per litre
Definitions
Borehole A hole drilled for the purposes of prospecting i.e. extracting a sample of soil or rock chips by pneumatic,
reverse air circulation percussion drilling, or any other type of probe entering the surface of the soil.
Pit Any open excavation
Pollution
control
dam
A dam that forms part of a mine’s water management system with the purpose to minimise the impact of
polluted water on water resources, by separating clean and dirty water streams and capturing and retaining
dirty water to prevent its discharge due to water quality constraints (DWAF, Best practice guideline A4:
Pollution control dams, 2007).
Document No: Revision: Date:
MON-WQR-080-19_20 (20-09) 0.0 September 2020
Leeuwpan Coal Mine
Client Restricted Author: W. Esterhuizen
1
1. INTRODUCTION
Environmental Assurance (Pty) Ltd. (ENVASS) was appointed by EXXARO Coal Mpumalanga (Pty) Ltd. to undertake the
environmental compliance monitoring programme at Leeuwpan Coal Mine to fulfil the Water Use Licence Conditions
(Licence no. 04/B20A/CIJ/4032), approved on 18 December 2015.
The mining operation is located to the east of Delmas within the Victor Khanye Local Municipality. The mine is located within
the Upper Olifants River Catchment. East of the mine, the Bronkhorstspruit flows as fed by a tributary running to the west
of the mine. The underlying geology found in the area is comprised primarily of sedimentary rocks from the Karoo
Supergroup with Dolerite intrusions featuring within the project area. The monthly and quarterly water quality monitoring at
Leeuwpan Coal Mine consists out of the following, as per the Water Use License requirements; surface- and groundwater
sampling.
The scope of work performed at the Leeuwpan Coal Mine is aligned to the WUL requirements, which are listed within the
report.
2. SYSTEMS AUDIT
All monitoring points are presented within locality maps and are discussed under the relevant sections of this report. In all
instances spatial scale was used in order to present the position of all of the monitoring points relative to the mine and
associated infrastructure.
The descriptions below (Table 1) provide extracts from the amended approved Water Use Licence (IWUL) number
4/B21A/ABCGIJ/429 to describe the environmental monitoring for this site.
Table 1: Water Use License details
Water Use Licence details
Authorisation: 4/B21A/ABCGIJ/429
Date: 18- December 2015
Licensee: Leeuwpan Coal Mine
Competent Authority: Department of Water and Sanitation
Water Use authorised: Section 21 (a, c, i, g & j)
3. PURPOSE
The purpose of this report is to test and report on the operational compliance as it relates to water quality conditions set out
in the WUL and management requirements from the approved Department of Mineral Resources (DMR) Environmental
Management Programme (EMPr).
- Various water samples are taken and analysed from the provided surface- and groundwater localities.
- Surface water resources are monitored on a monthly basis, while groundwater samples are taken quarterly.
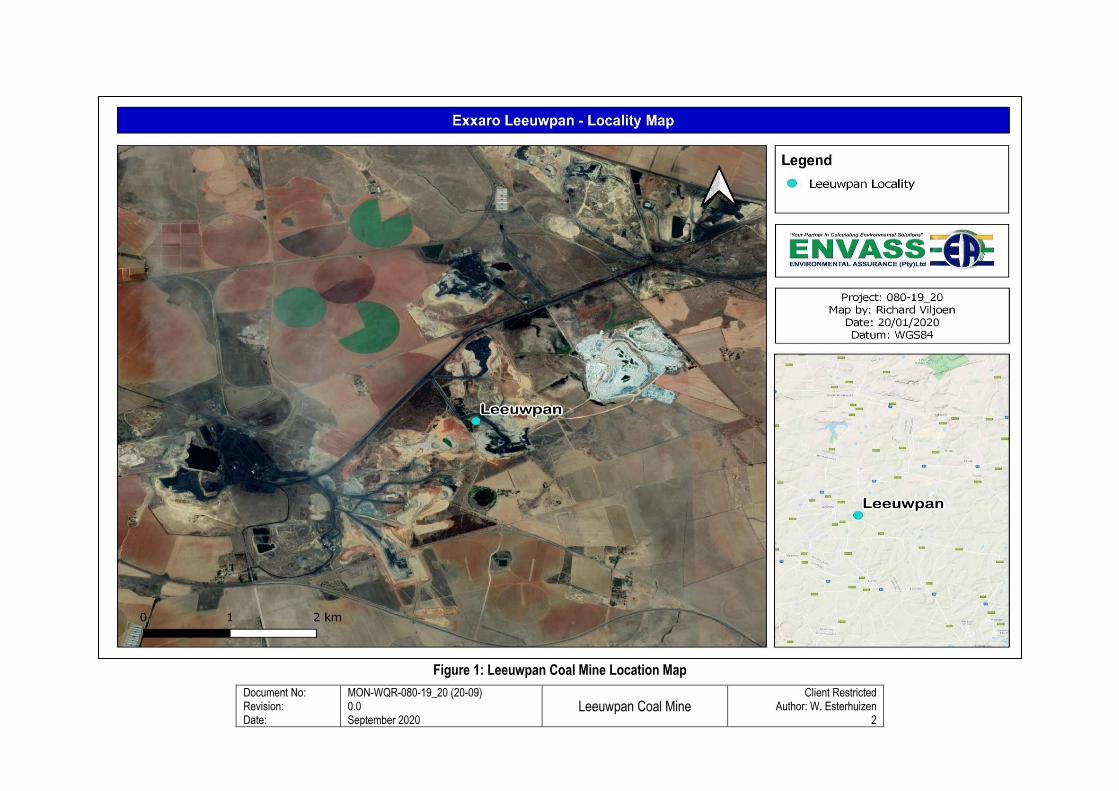
Document No: Revision: Date:
MON-WQR-080-19_20 (20-09) 0.0 September 2020
Leeuwpan Coal Mine
Client Restricted Author: W. Esterhuizen
2
Figure 1: Leeuwpan Coal Mine Location Map
Document No: Revision: Date:
MON-WQR-080-19_20 (20-09) 0.0 September 2020
Leeuwpan Coal Mine
Client Restricted Author: W. Esterhuizen
3
4. METHODOLOGY
All fieldwork is carried out by trained ENVASS environmental consultants and field technicians, fully trained in all of the
methods of sampling as required. This includes as a minimum sampling for surface and groundwater.
Sampling at the selected Leeuwpan Coal sites will be in accordance with the following guidelines:
• Guidance on the design of sampling programs and sampling techniques
ISO 5667-1:2006
• Guidance on the preservation and handling of water samples
SANS 5667-3:2006/ISO 5667-3:2003
(SABS ISO 5667-3)
• Guidance on sampling of drinking water from treatment works and piped distribution systems
SANS 5667-5:2006/ISO 5667-5:2006
(SABS ISO 5667-5)
• Guidance on sampling of rivers and streams
SANS 5667-6:2006/ISO 5667-6:2005
(SABS ISO 5667-6)
• Guidance on sampling of waste waters
SANS 5667-10:2007/ISO 5667-10:1992
• Guidance on sampling of groundwater
SANS 5667-11:1993/ISO 5667-11:1993
(SABS ISO 5667-11)
• Guidance on quality assurance of environmental water sampling and handling
SANS 5667-14:2016/ISO 5667-14:2014
• DWAF Best Practice Guidelines Series G3: General Guidelines for Water Monitoring Systems.
Water sampling locations are set out in the WUL and/or received from the mine and previous sampling reports; and
ultimately these samples are used to identify areas of concern and areas from which water could effectively leave the site
into some form of receiving environment.
This report is prepared by ENVASS, drawing from the following sources of information:
• Water Use License (04/B20A/CIJ/4032) (Process and Effluent Water Limits);
• General Authorisation Limits (Process and Effluent Water)
• SANS 241: 2015 standards (Potable Water);
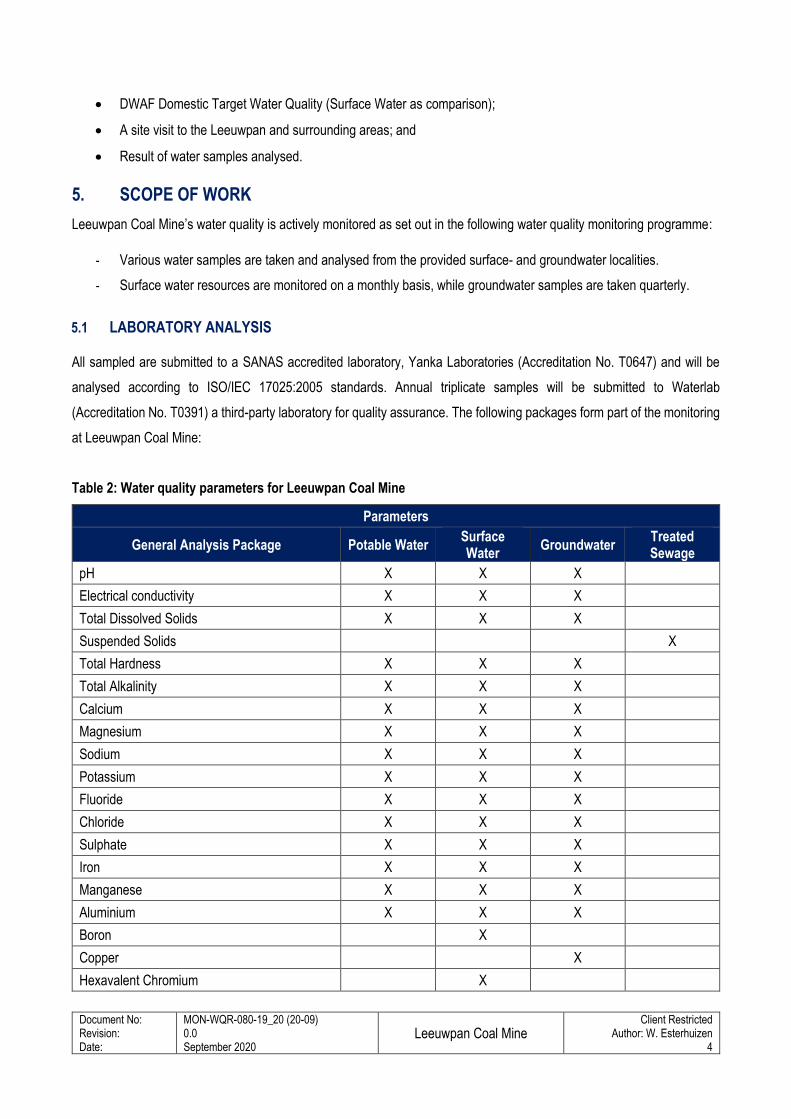
Document No: Revision: Date:
MON-WQR-080-19_20 (20-09) 0.0 September 2020
Leeuwpan Coal Mine
Client Restricted Author: W. Esterhuizen
4
• DWAF Domestic Target Water Quality (Surface Water as comparison);
• A site visit to the Leeuwpan and surrounding areas; and
• Result of water samples analysed.
5. SCOPE OF WORK
Leeuwpan Coal Mine’s water quality is actively monitored as set out in the following water quality monitoring programme:
- Various water samples are taken and analysed from the provided surface- and groundwater localities.
- Surface water resources are monitored on a monthly basis, while groundwater samples are taken quarterly.
5.1 LABORATORY ANALYSIS
All sampled are submitted to a SANAS accredited laboratory, Yanka Laboratories (Accreditation No. T0647) and will be
analysed according to ISO/IEC 17025:2005 standards. Annual triplicate samples will be submitted to Waterlab
(Accreditation No. T0391) a third-party laboratory for quality assurance. The following packages form part of the monitoring
at Leeuwpan Coal Mine:
Table 2: Water quality parameters for Leeuwpan Coal Mine
Parameters
General Analysis Package Potable Water Surface Water
Groundwater Treated Sewage
pH X X X
Electrical conductivity X X X
Total Dissolved Solids X X X
Suspended Solids X
Total Hardness X X X
Total Alkalinity X X X
Calcium X X X
Magnesium X X X
Sodium X X X
Potassium X X X
Fluoride X X X
Chloride X X X
Sulphate X X X
Iron X X X
Manganese X X X
Aluminium X X X
Boron X
Copper X
Hexavalent Chromium X
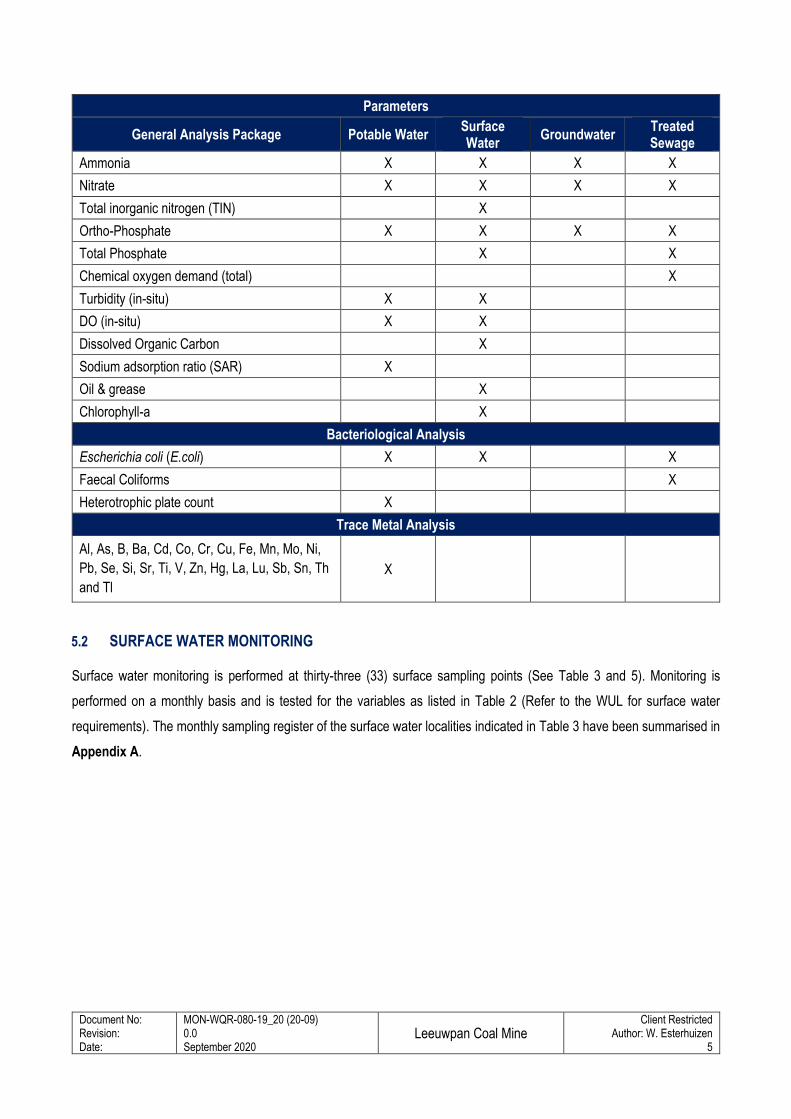
Document No: Revision: Date:
MON-WQR-080-19_20 (20-09) 0.0 September 2020
Leeuwpan Coal Mine
Client Restricted Author: W. Esterhuizen
5
Parameters
General Analysis Package Potable Water Surface Water
Groundwater Treated Sewage
Ammonia X X X X
Nitrate X X X X
Total inorganic nitrogen (TIN) X
Ortho-Phosphate X X X X
Total Phosphate X X
Chemical oxygen demand (total) X
Turbidity (in-situ) X X
DO (in-situ) X X
Dissolved Organic Carbon X
Sodium adsorption ratio (SAR) X
Oil & grease X
Chlorophyll-a X
Bacteriological Analysis
Escherichia coli (E.coli) X X X
Faecal Coliforms X
Heterotrophic plate count X
Trace Metal Analysis
Al, As, B, Ba, Cd, Co, Cr, Cu, Fe, Mn, Mo, Ni,
Pb, Se, Si, Sr, Ti, V, Zn, Hg, La, Lu, Sb, Sn, Th
and Tl
X
5.2 SURFACE WATER MONITORING
Surface water monitoring is performed at thirty-three (33) surface sampling points (See Table 3 and 5). Monitoring is
performed on a monthly basis and is tested for the variables as listed in Table 2 (Refer to the WUL for surface water
requirements). The monthly sampling register of the surface water localities indicated in Table 3 have been summarised in
Appendix A.
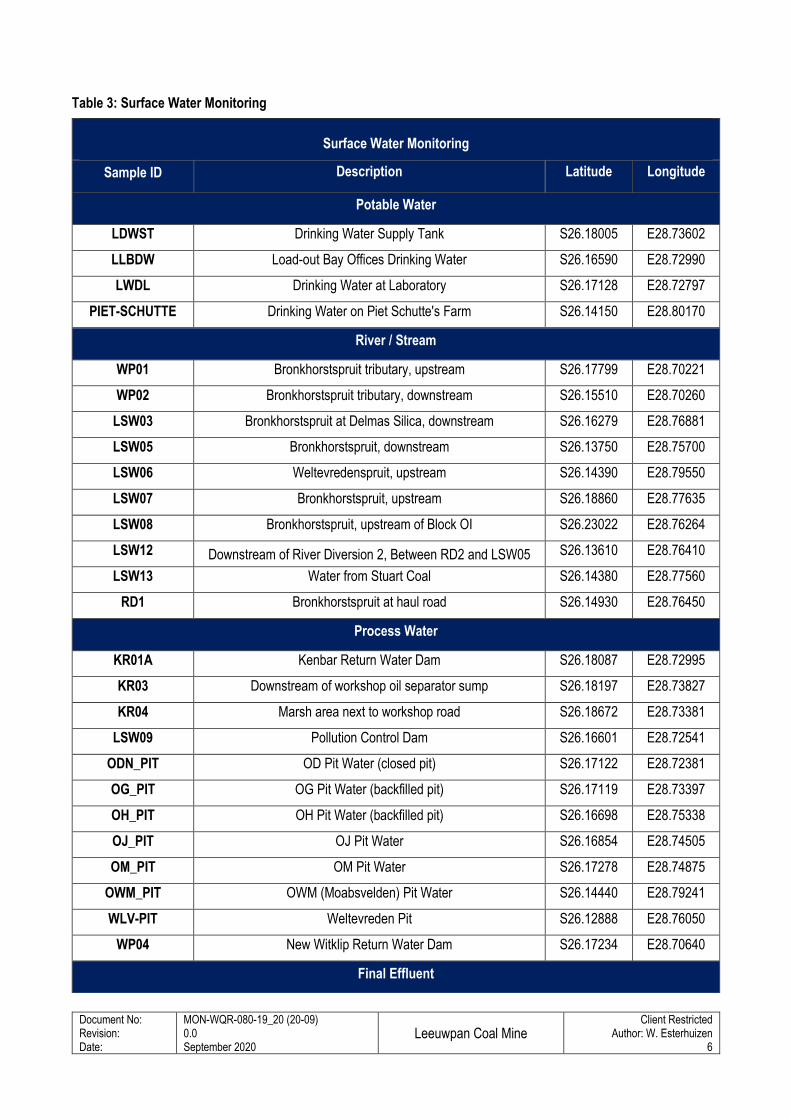
Document No: Revision: Date:
MON-WQR-080-19_20 (20-09) 0.0 September 2020
Leeuwpan Coal Mine
Client Restricted Author: W. Esterhuizen
6
Table 3: Surface Water Monitoring
Surface Water Monitoring
Sample ID Description Latitude Longitude
Potable Water
LDWST Drinking Water Supply Tank S26.18005 E28.73602
LLBDW Load-out Bay Offices Drinking Water S26.16590 E28.72990
LWDL Drinking Water at Laboratory S26.17128 E28.72797
PIET-SCHUTTE Drinking Water on Piet Schutte's Farm S26.14150 E28.80170
River / Stream
WP01 Bronkhorstspruit tributary, upstream S26.17799 E28.70221
WP02 Bronkhorstspruit tributary, downstream S26.15510 E28.70260
LSW03 Bronkhorstspruit at Delmas Silica, downstream S26.16279 E28.76881
LSW05 Bronkhorstspruit, downstream S26.13750 E28.75700
LSW06 Weltevredenspruit, upstream S26.14390 E28.79550
LSW07 Bronkhorstspruit, upstream S26.18860 E28.77635
LSW08 Bronkhorstspruit, upstream of Block OI S26.23022 E28.76264
LSW12 Downstream of River Diversion 2, Between RD2 and LSW05 S26.13610 E28.76410
LSW13 Water from Stuart Coal S26.14380 E28.77560
RD1 Bronkhorstspruit at haul road S26.14930 E28.76450
Process Water
KR01A Kenbar Return Water Dam S26.18087 E28.72995
KR03 Downstream of workshop oil separator sump S26.18197 E28.73827
KR04 Marsh area next to workshop road S26.18672 E28.73381
LSW09 Pollution Control Dam S26.16601 E28.72541
ODN_PIT OD Pit Water (closed pit) S26.17122 E28.72381
OG_PIT OG Pit Water (backfilled pit) S26.17119 E28.73397
OH_PIT OH Pit Water (backfilled pit) S26.16698 E28.75338
OJ_PIT OJ Pit Water S26.16854 E28.74505
OM_PIT OM Pit Water S26.17278 E28.74875
OWM_PIT OWM (Moabsvelden) Pit Water S26.14440 E28.79241
WLV-PIT Weltevreden Pit S26.12888 E28.76050
WP04 New Witklip Return Water Dam S26.17234 E28.70640
Final Effluent
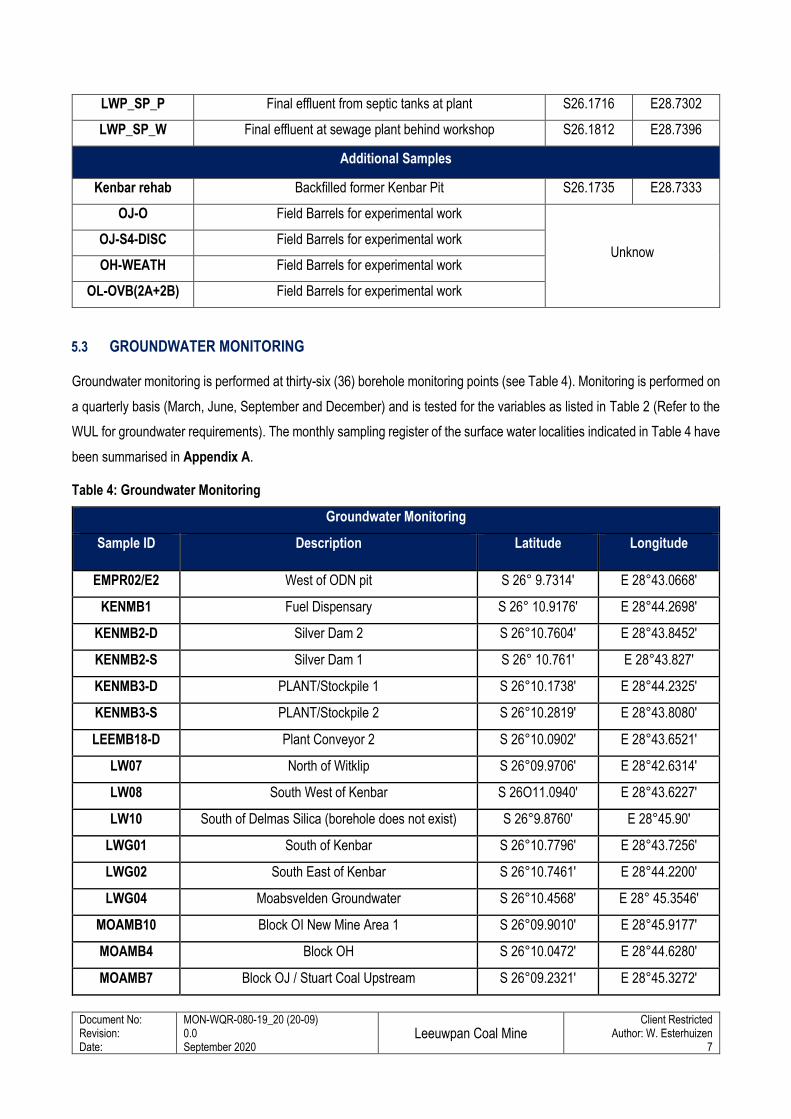
Document No: Revision: Date:
MON-WQR-080-19_20 (20-09) 0.0 September 2020
Leeuwpan Coal Mine
Client Restricted Author: W. Esterhuizen
7
5.3 GROUNDWATER MONITORING
Groundwater monitoring is performed at thirty-six (36) borehole monitoring points (see Table 4). Monitoring is performed on
a quarterly basis (March, June, September and December) and is tested for the variables as listed in Table 2 (Refer to the
WUL for groundwater requirements). The monthly sampling register of the surface water localities indicated in Table 4 have
been summarised in Appendix A.
Table 4: Groundwater Monitoring
Groundwater Monitoring
Sample ID Description Latitude Longitude
EMPR02/E2 West of ODN pit S 26° 9.7314' E 28°43.0668'
KENMB1 Fuel Dispensary S 26° 10.9176' E 28°44.2698'
KENMB2-D Silver Dam 2 S 26°10.7604' E 28°43.8452'
KENMB2-S Silver Dam 1 S 26° 10.761' E 28°43.827'
KENMB3-D PLANT/Stockpile 1 S 26°10.1738' E 28°44.2325'
KENMB3-S PLANT/Stockpile 2 S 26°10.2819' E 28°43.8080'
LEEMB18-D Plant Conveyor 2 S 26°10.0902' E 28°43.6521'
LW07 North of Witklip S 26°09.9706' E 28°42.6314'
LW08 South West of Kenbar S 26O11.0940' E 28°43.6227'
LW10 South of Delmas Silica (borehole does not exist) S 26°9.8760' E 28°45.90'
LWG01 South of Kenbar S 26°10.7796' E 28°43.7256'
LWG02 South East of Kenbar S 26°10.7461' E 28°44.2200'
LWG04 Moabsvelden Groundwater S 26°10.4568' E 28° 45.3546'
MOAMB10 Block OI New Mine Area 1 S 26°09.9010' E 28°45.9177'
MOAMB4 Block OH S 26°10.0472' E 28°44.6280'
MOAMB7 Block OJ / Stuart Coal Upstream S 26°09.2321' E 28°45.3272'
LWP_SP_P Final effluent from septic tanks at plant S26.1716 E28.7302
LWP_SP_W Final effluent at sewage plant behind workshop S26.1812 E28.7396
Additional Samples
Kenbar rehab Backfilled former Kenbar Pit S26.1735 E28.7333
OJ-O Field Barrels for experimental work
Unknow OJ-S4-DISC Field Barrels for experimental work
OH-WEATH Field Barrels for experimental work
OL-OVB(2A+2B) Field Barrels for experimental work
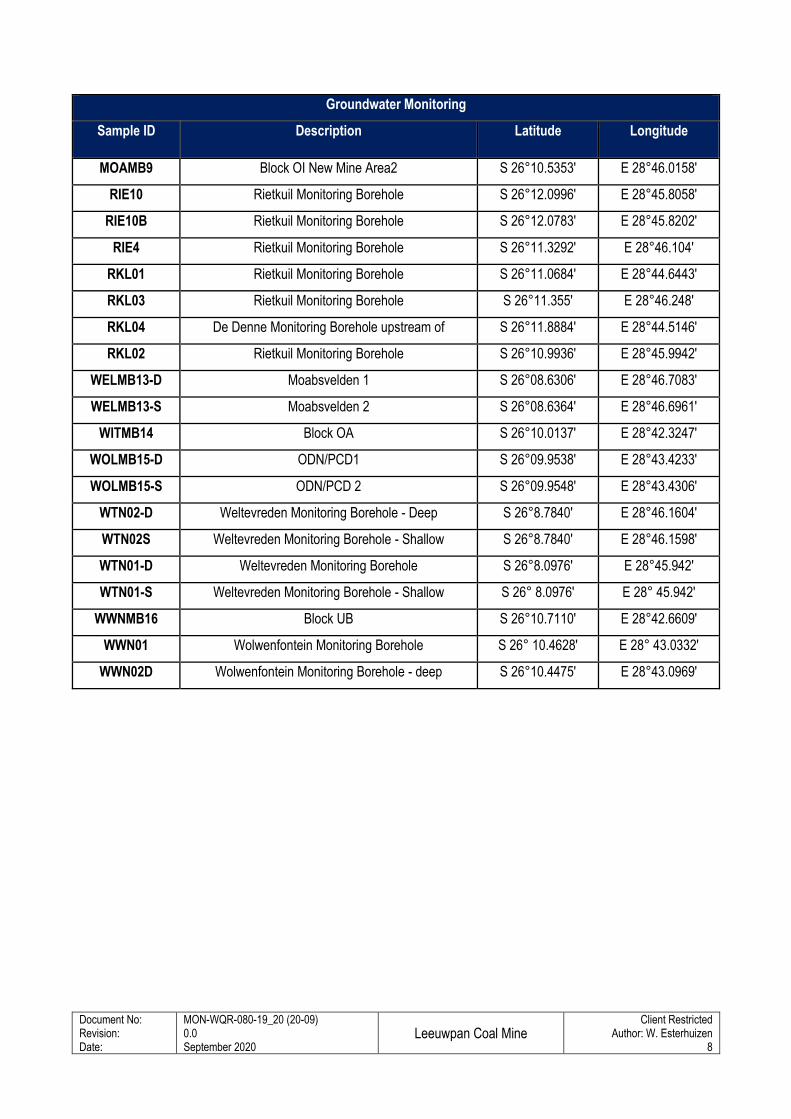
Document No: Revision: Date:
MON-WQR-080-19_20 (20-09) 0.0 September 2020
Leeuwpan Coal Mine
Client Restricted Author: W. Esterhuizen
8
Groundwater Monitoring
Sample ID Description Latitude Longitude
MOAMB9 Block OI New Mine Area2 S 26°10.5353' E 28°46.0158'
RIE10 Rietkuil Monitoring Borehole S 26°12.0996' E 28°45.8058'
RIE10B Rietkuil Monitoring Borehole S 26°12.0783' E 28°45.8202'
RIE4 Rietkuil Monitoring Borehole S 26°11.3292' E 28°46.104'
RKL01 Rietkuil Monitoring Borehole S 26°11.0684' E 28°44.6443'
RKL03 Rietkuil Monitoring Borehole S 26°11.355' E 28°46.248'
RKL04 De Denne Monitoring Borehole upstream of S 26°11.8884' E 28°44.5146'
RKL02 Rietkuil Monitoring Borehole S 26°10.9936' E 28°45.9942'
WELMB13-D Moabsvelden 1 S 26°08.6306' E 28°46.7083'
WELMB13-S Moabsvelden 2 S 26°08.6364' E 28°46.6961'
WITMB14 Block OA S 26°10.0137' E 28°42.3247'
WOLMB15-D ODN/PCD1 S 26°09.9538' E 28°43.4233'
WOLMB15-S ODN/PCD 2 S 26°09.9548' E 28°43.4306'
WTN02-D Weltevreden Monitoring Borehole - Deep S 26°8.7840' E 28°46.1604'
WTN02S Weltevreden Monitoring Borehole - Shallow S 26°8.7840' E 28°46.1598'
WTN01-D Weltevreden Monitoring Borehole S 26°8.0976' E 28°45.942'
WTN01-S Weltevreden Monitoring Borehole - Shallow S 26° 8.0976' E 28° 45.942'
WWNMB16 Block UB S 26°10.7110' E 28°42.6609'
WWN01 Wolwenfontein Monitoring Borehole S 26° 10.4628' E 28° 43.0332'
WWN02D Wolwenfontein Monitoring Borehole - deep S 26°10.4475' E 28°43.0969'
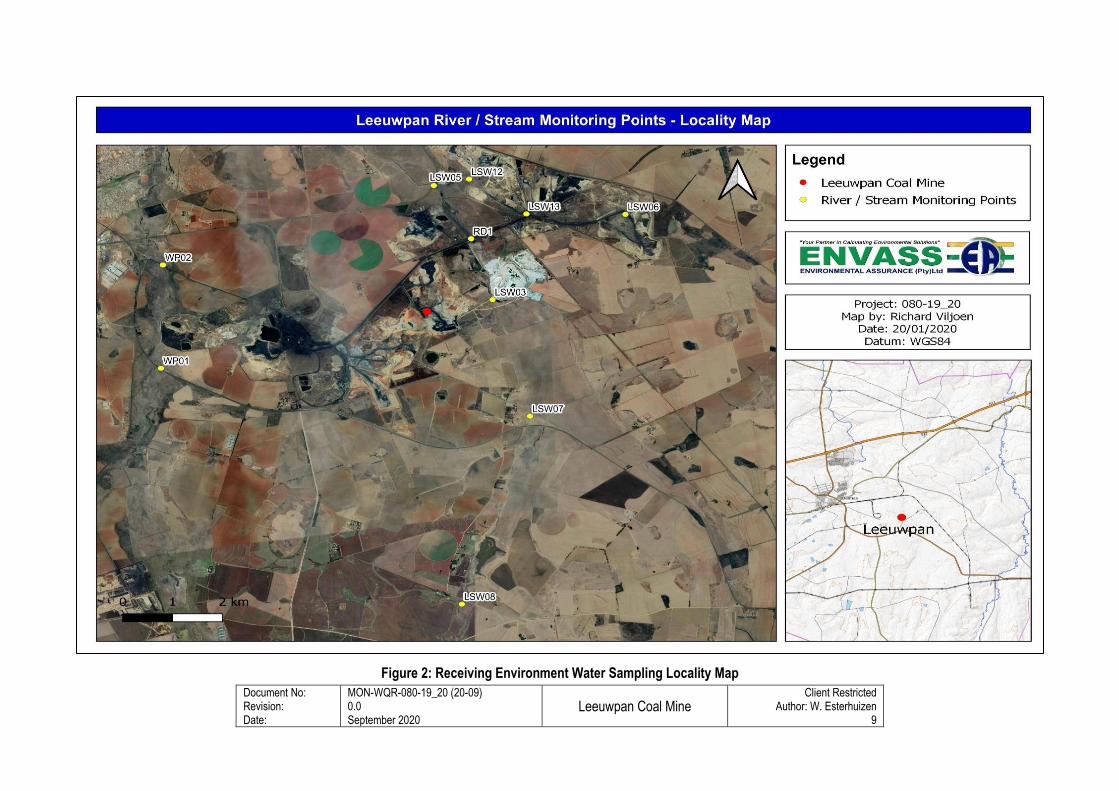
Document No: Revision: Date:
MON-WQR-080-19_20 (20-09) 0.0 September 2020
Leeuwpan Coal Mine
Client Restricted Author: W. Esterhuizen
9
Figure 2: Receiving Environment Water Sampling Locality Map
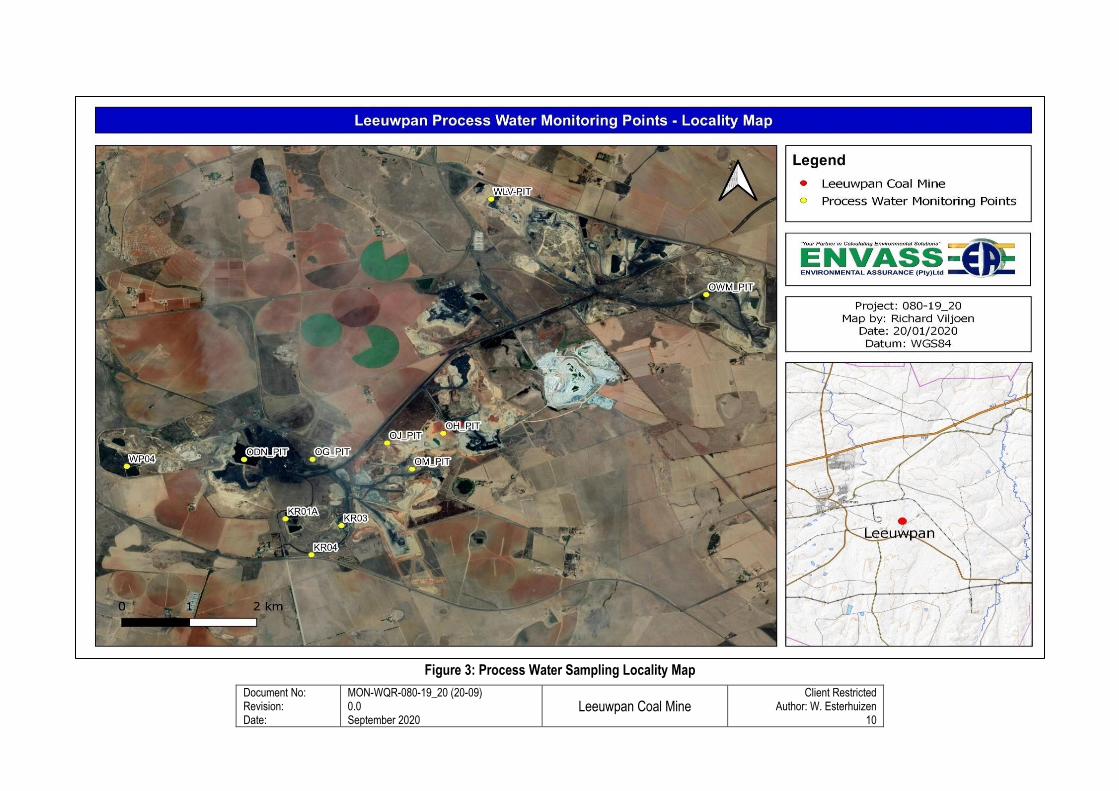
Document No: Revision: Date:
MON-WQR-080-19_20 (20-09) 0.0 September 2020
Leeuwpan Coal Mine
Client Restricted Author: W. Esterhuizen
10
Figure 3: Process Water Sampling Locality Map
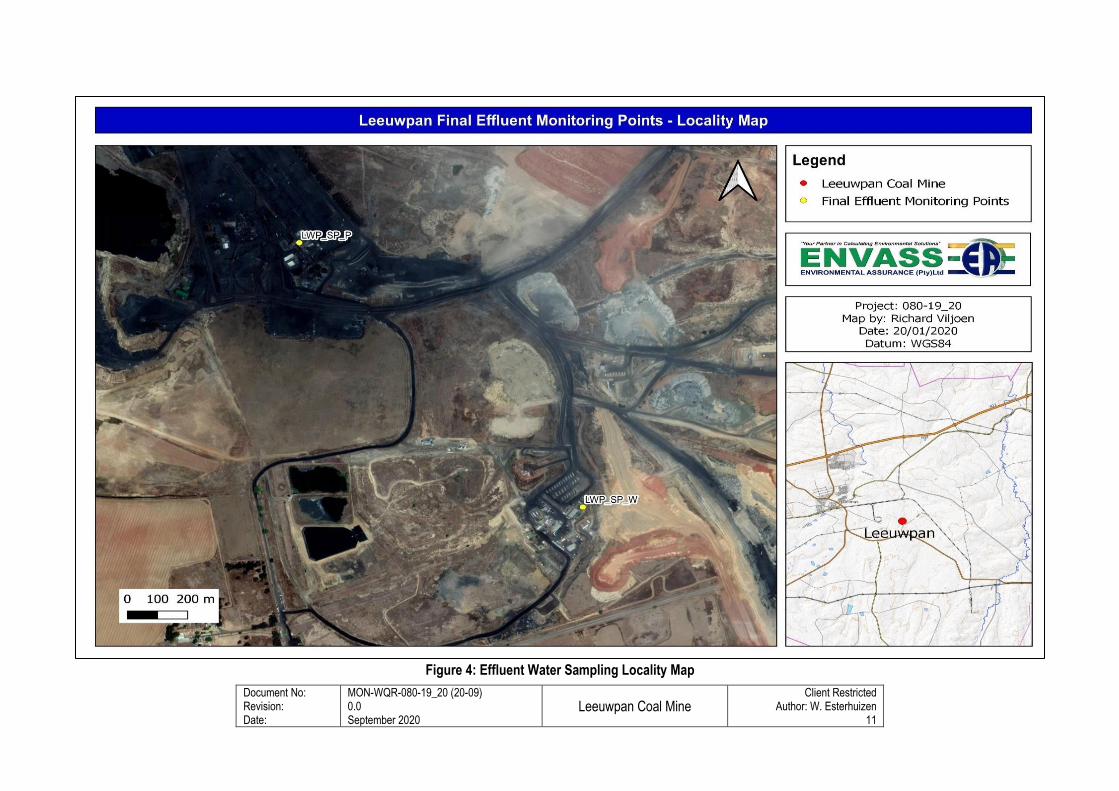
Document No: Revision: Date:
MON-WQR-080-19_20 (20-09) 0.0 September 2020
Leeuwpan Coal Mine
Client Restricted Author: W. Esterhuizen
11
Figure 4: Effluent Water Sampling Locality Map
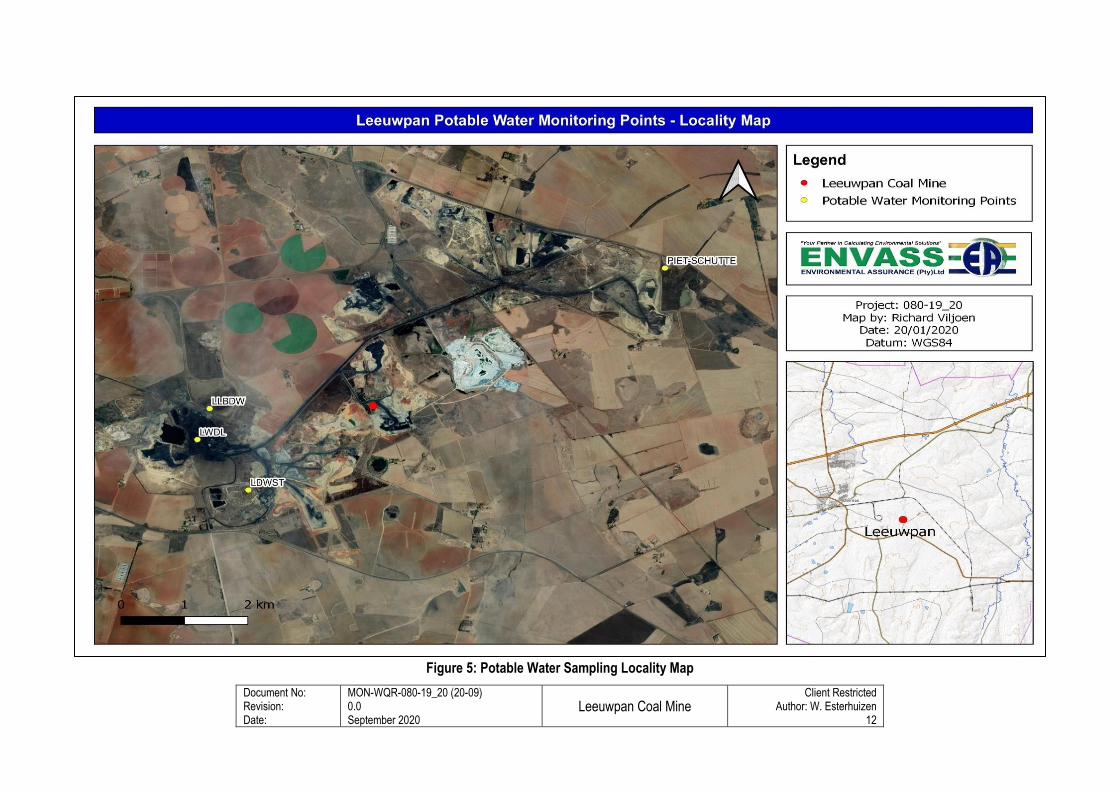
Document No: Revision: Date:
MON-WQR-080-19_20 (20-09) 0.0 September 2020
Leeuwpan Coal Mine
Client Restricted Author: W. Esterhuizen
12
Figure 5: Potable Water Sampling Locality Map
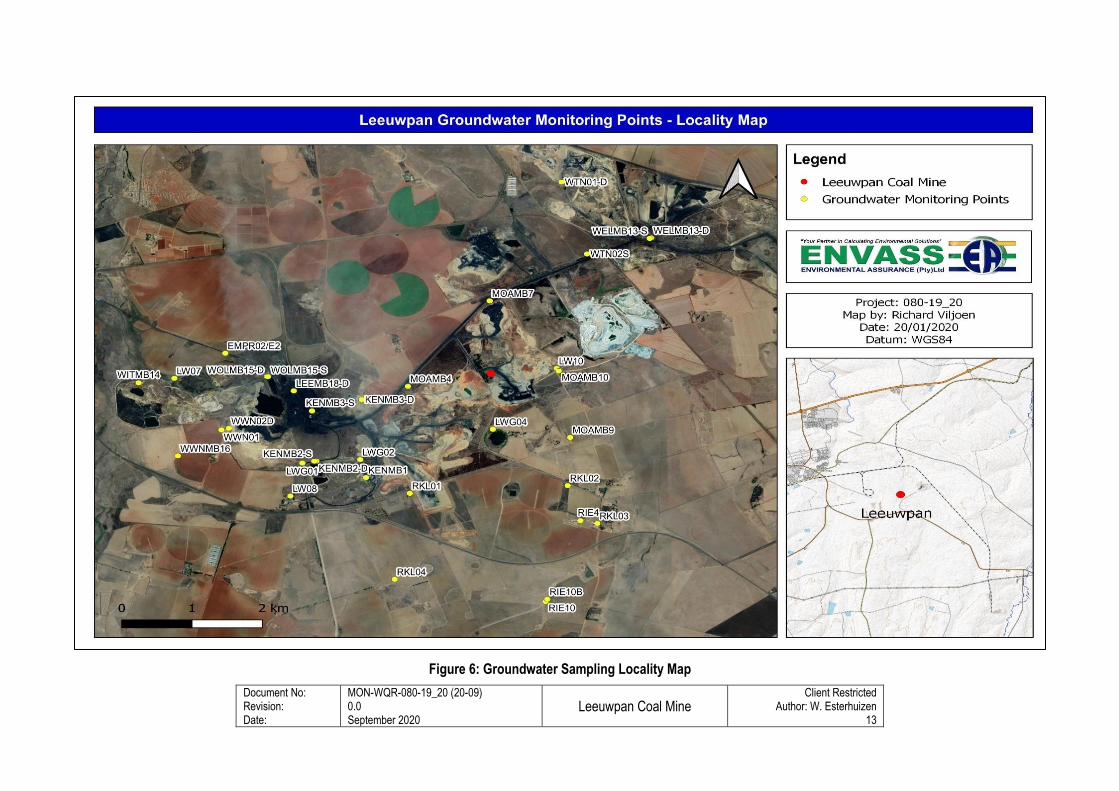
Document No: Revision: Date:
MON-WQR-080-19_20 (20-09) 0.0 September 2020
Leeuwpan Coal Mine
Client Restricted Author: W. Esterhuizen
13
Figure 6: Groundwater Sampling Locality Map
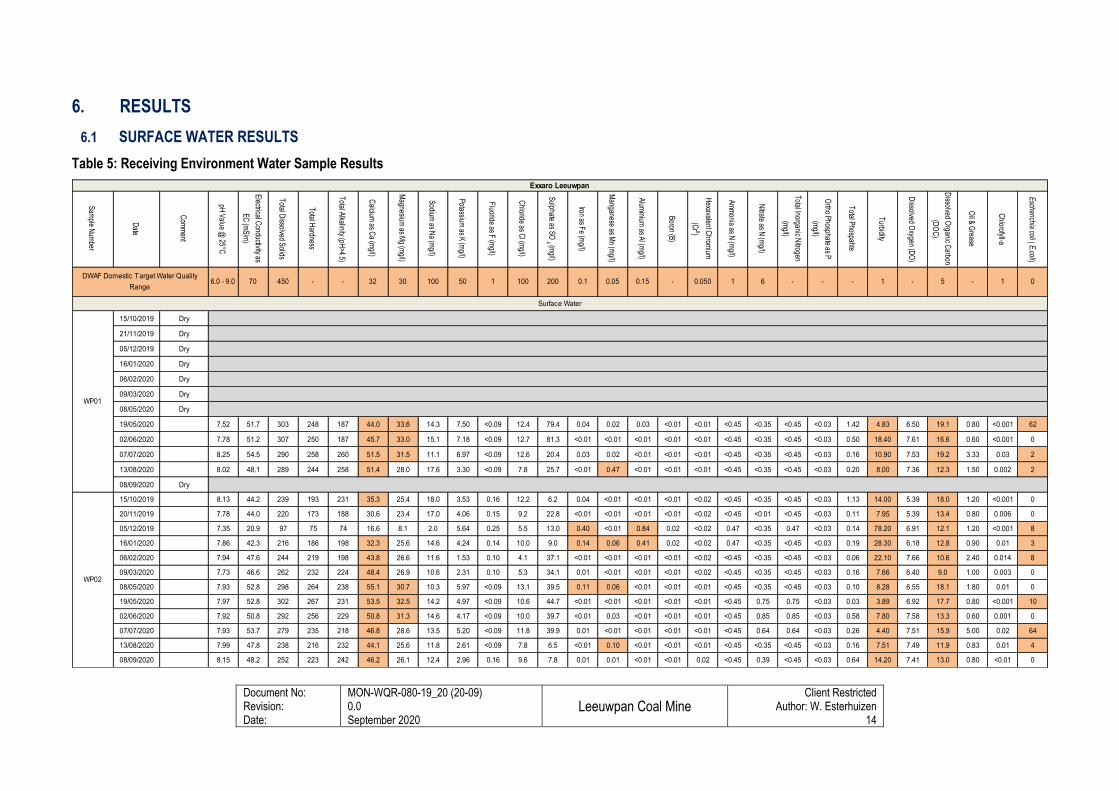
Document No: Revision: Date:
MON-WQR-080-19_20 (20-09) 0.0 September 2020
Leeuwpan Coal Mine
Client Restricted Author: W. Esterhuizen
14
6. RESULTS
6.1 SURFACE WATER RESULTS
Table 5: Receiving Environment Water Sample Results
Sam
ple Num
ber
Date
Com
ment
pH V
alue @ 25°C
Electrical C
onductivity as
EC
(mS
/m)
Total D
issolved Solids
Total H
ardness
Total A
lkalinity (pH>4.5)
Calcium
as Ca (m
g/l)
Magnesium
as Mg (m
g/l)
Sodium
as Na (m
g/l)
Potassium
as K (m
g/l)
Fluoride as F
(mg/l)
Chloride as C
l (mg/l)
Sulphate as S
O 4 (m
g/l)
Iron as Fe (m
g/l)
Manganese as M
n (mg/l)
Alum
inium as A
l (mg/l)
Boron (B
)
Hexavalent C
hromium
(Cr 6)
Am
monia as N
(mg/l)
Nitrate as N
(mg/l)
Total Inorganic N
itrogen
(mg/l)
Ortho P
hosphate as P
(mg/l)
Total P
hospahte
Turbidity
Dissolved O
xygen (DO
)
Dissolved O
rganic Carbon
(DO
C)
Oil &
Grease
Chlorofyll-a
Escherichia coli ( E
.coli)
15/10/2019 Dry
21/11/2019 Dry
05/12/2019 Dry
16/01/2020 Dry
06/02/2020 Dry
09/03/2020 Dry
08/05/2020 Dry
19/05/2020 7.52 51.7 303 248 187 44.0 33.6 14.3 7.50 <0.09 12.4 79.4 0.04 0.02 0.03 <0.01 <0.01 <0.45 <0.35 <0.45 <0.03 1.42 4.83 6.50 19.1 0.80 <0.001 62
02/06/2020 7.78 51.2 307 250 187 45.7 33.0 15.1 7.18 <0.09 12.7 81.3 <0.01 <0.01 <0.01 <0.01 <0.01 <0.45 <0.35 <0.45 <0.03 0.50 18.40 7.61 16.6 0.60 <0.001 0
07/07/2020 8.25 54.5 290 258 260 51.5 31.5 11.1 6.97 <0.09 12.6 20.4 0.03 0.02 <0.01 <0.01 <0.01 <0.45 <0.35 <0.45 <0.03 0.16 10.90 7.53 19.2 3.33 0.03 2
13/08/2020 8.02 48.1 289 244 258 51.4 28.0 17.6 3.30 <0.09 7.8 25.7 <0.01 0.47 <0.01 <0.01 <0.01 <0.45 <0.35 <0.45 <0.03 0.20 8.00 7.36 12.3 1.50 0.002 2
08/09/2020 Dry
15/10/2019 8.13 44.2 239 193 231 35.3 25.4 18.0 3.53 0.16 12.2 6.2 0.04 <0.01 <0.01 <0.01 <0.02 <0.45 <0.35 <0.45 <0.03 1.13 14.00 5.39 18.0 1.20 <0.001 0
20/11/2019 7.78 44.0 220 173 188 30.6 23.4 17.0 4.06 0.15 9.2 22.8 <0.01 <0.01 <0.01 <0.01 <0.02 <0.45 <0.01 <0.45 <0.03 0.11 7.95 5.39 13.4 0.80 0.006 0
05/12/2019 7.35 20.9 97 75 74 16.6 8.1 2.0 5.64 0.25 5.5 13.0 0.40 <0.01 0.84 0.02 <0.02 0.47 <0.35 0.47 <0.03 0.14 78.20 6.91 12.1 1.20 <0.001 8
16/01/2020 7.86 42.3 216 186 198 32.3 25.6 14.6 4.24 0.14 10.0 9.0 0.14 0.06 0.41 0.02 <0.02 0.47 <0.35 <0.45 <0.03 0.19 28.30 6.18 12.8 0.90 0.01 3
06/02/2020 7.94 47.6 244 219 198 43.8 26.6 11.6 1.53 0.10 4.1 37.1 <0.01 <0.01 <0.01 <0.01 <0.02 <0.45 <0.35 <0.45 <0.03 0.06 22.10 7.66 10.6 2.40 0.014 8
09/03/2020 7.73 46.6 262 232 224 48.4 26.9 10.6 2.31 0.10 5.3 34.1 0.01 <0.01 <0.01 <0.01 <0.02 <0.45 <0.35 <0.45 <0.03 0.16 7.66 6.40 9.0 1.00 0.003 0
08/05/2020 7.93 52.8 298 264 238 55.1 30.7 10.3 5.97 <0.09 13.1 39.5 0.11 0.06 <0.01 <0.01 <0.01 <0.45 <0.35 <0.45 <0.03 0.10 8.28 6.55 18.1 1.80 0.01 0
19/05/2020 7.97 52.8 302 267 231 53.5 32.5 14.2 4.97 <0.09 10.6 44.7 <0.01 <0.01 <0.01 <0.01 <0.01 <0.45 0.75 0.75 <0.03 0.03 3.89 6.92 17.7 0.80 <0.001 10
02/06/2020 7.92 50.8 292 256 229 50.8 31.3 14.6 4.17 <0.09 10.0 39.7 <0.01 0.03 <0.01 <0.01 <0.01 <0.45 0.85 0.85 <0.03 0.58 7.80 7.58 13.3 0.60 0.001 0
07/07/2020 7.93 53.7 279 235 218 46.8 28.6 13.5 5.20 <0.09 11.8 39.9 0.01 <0.01 <0.01 <0.01 <0.01 <0.45 0.64 0.64 <0.03 0.26 4.40 7.51 15.9 5.00 0.02 64
13/08/2020 7.99 47.8 238 216 232 44.1 25.6 11.8 2.61 <0.09 7.8 6.5 <0.01 0.10 <0.01 <0.01 <0.01 <0.45 <0.35 <0.45 <0.03 0.16 7.51 7.49 11.9 0.83 0.01 4
08/09/2020 8.15 48.2 252 223 242 46.2 26.1 12.4 2.96 0.16 9.6 7.8 0.01 0.01 <0.01 <0.01 0.02 <0.45 0.39 <0.45 <0.03 0.64 14.20 7.41 13.0 0.80 <0.01 0
Surface Water
WP02
-
Exxaro Leeuwpan
6.0 - 9.0 01-5-1--615010030DWAF Domestic Target Water Quality
Range0.050-0.15
WP01
-45070 32- 0.050.12001001
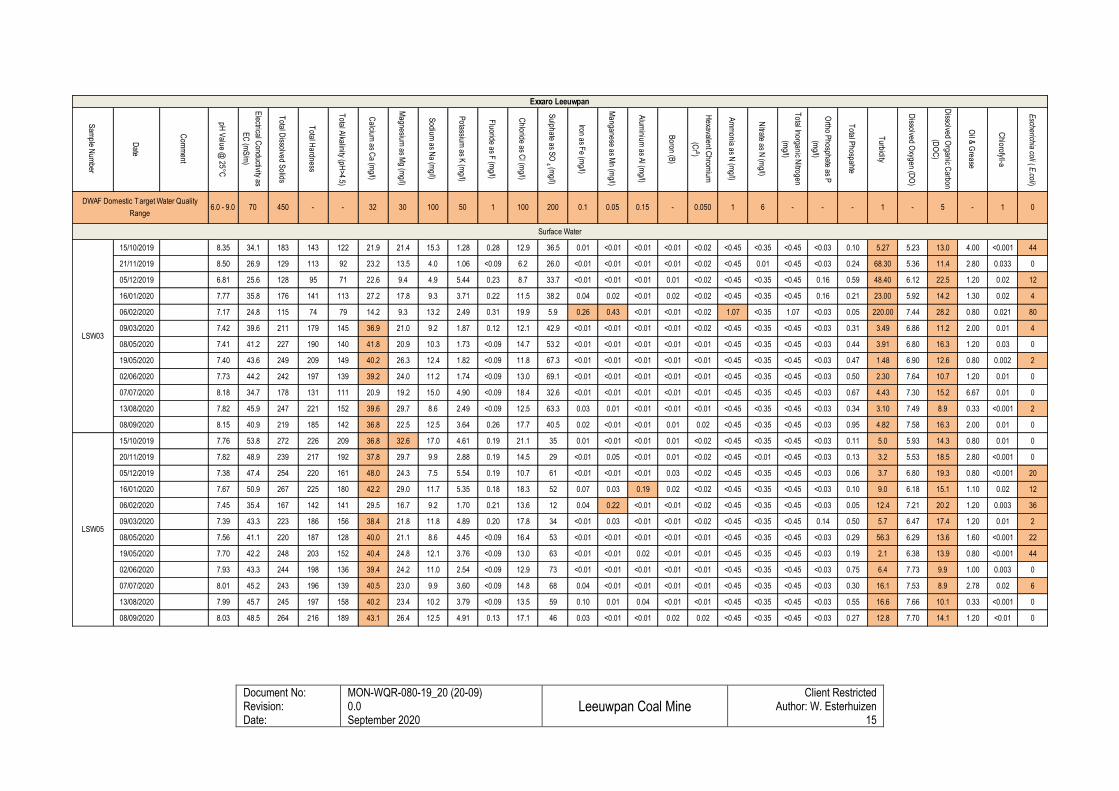
Document No: Revision: Date:
MON-WQR-080-19_20 (20-09) 0.0 September 2020
Leeuwpan Coal Mine
Client Restricted Author: W. Esterhuizen
15
Sam
ple Num
ber
Date
Com
ment
pH V
alue @ 25°C
Electrical C
onductivity as
EC
(mS
/m)
Total D
issolved Solids
Total H
ardness
Total A
lkalinity (pH>4.5)
Calcium
as Ca (m
g/l)
Magnesium
as Mg (m
g/l)
Sodium
as Na (m
g/l)
Potassium
as K (m
g/l)
Fluoride as F
(mg/l)
Chloride as C
l (mg/l)
Sulphate as S
O 4
(mg/l)
Iron as Fe (m
g/l)
Manganese as M
n (mg/l)
Alum
inium as A
l (mg/l)
Boron (B
)
Hexavalent C
hromium
(Cr 6)
Am
monia as N
(mg/l)
Nitrate as N
(mg/l)
Total Inorganic N
itrogen
(mg/l)
Ortho P
hosphate as P
(mg/l)
Total P
hospahte
Turbidity
Dissolved O
xygen (DO
)
Dissolved O
rganic Carbon
(DO
C)
Oil &
Grease
Chlorofyll-a
Escherichia coli ( E
.coli)
15/10/2019 8.35 34.1 183 143 122 21.9 21.4 15.3 1.28 0.28 12.9 36.5 0.01 <0.01 <0.01 <0.01 <0.02 <0.45 <0.35 <0.45 <0.03 0.10 5.27 5.23 13.0 4.00 <0.001 44
21/11/2019 8.50 26.9 129 113 92 23.2 13.5 4.0 1.06 <0.09 6.2 26.0 <0.01 <0.01 <0.01 <0.01 <0.02 <0.45 0.01 <0.45 <0.03 0.24 68.30 5.36 11.4 2.80 0.033 0
05/12/2019 6.81 25.6 128 95 71 22.6 9.4 4.9 5.44 0.23 8.7 33.7 <0.01 <0.01 <0.01 0.01 <0.02 <0.45 <0.35 <0.45 0.16 0.59 48.40 6.12 22.5 1.20 0.02 12
16/01/2020 7.77 35.8 176 141 113 27.2 17.8 9.3 3.71 0.22 11.5 38.2 0.04 0.02 <0.01 0.02 <0.02 <0.45 <0.35 <0.45 0.16 0.21 23.00 5.92 14.2 1.30 0.02 4
06/02/2020 7.17 24.8 115 74 79 14.2 9.3 13.2 2.49 0.31 19.9 5.9 0.26 0.43 <0.01 <0.01 <0.02 1.07 <0.35 1.07 <0.03 0.05 220.00 7.44 28.2 0.80 0.021 80
09/03/2020 7.42 39.6 211 179 145 36.9 21.0 9.2 1.87 0.12 12.1 42.9 <0.01 <0.01 <0.01 <0.01 <0.02 <0.45 <0.35 <0.45 <0.03 0.31 3.49 6.86 11.2 2.00 0.01 4
08/05/2020 7.41 41.2 227 190 140 41.8 20.9 10.3 1.73 <0.09 14.7 53.2 <0.01 <0.01 <0.01 <0.01 <0.01 <0.45 <0.35 <0.45 <0.03 0.44 3.91 6.80 16.3 1.20 0.03 0
19/05/2020 7.40 43.6 249 209 149 40.2 26.3 12.4 1.82 <0.09 11.8 67.3 <0.01 <0.01 <0.01 <0.01 <0.01 <0.45 <0.35 <0.45 <0.03 0.47 1.48 6.90 12.6 0.80 0.002 2
02/06/2020 7.73 44.2 242 197 139 39.2 24.0 11.2 1.74 <0.09 13.0 69.1 <0.01 <0.01 <0.01 <0.01 <0.01 <0.45 <0.35 <0.45 <0.03 0.50 2.30 7.64 10.7 1.20 0.01 0
07/07/2020 8.18 34.7 178 131 111 20.9 19.2 15.0 4.90 <0.09 18.4 32.6 <0.01 <0.01 <0.01 <0.01 <0.01 <0.45 <0.35 <0.45 <0.03 0.67 4.43 7.30 15.2 6.67 0.01 0
13/08/2020 7.82 45.9 247 221 152 39.6 29.7 8.6 2.49 <0.09 12.5 63.3 0.03 0.01 <0.01 <0.01 <0.01 <0.45 <0.35 <0.45 <0.03 0.34 3.10 7.49 8.9 0.33 <0.001 2
08/09/2020 8.15 40.9 219 185 142 36.8 22.5 12.5 3.64 0.26 17.7 40.5 0.02 <0.01 <0.01 0.01 0.02 <0.45 <0.35 <0.45 <0.03 0.95 4.82 7.58 16.3 2.00 0.01 0
15/10/2019 7.76 53.8 272 226 209 36.8 32.6 17.0 4.61 0.19 21.1 35 0.01 <0.01 <0.01 0.01 <0.02 <0.45 <0.35 <0.45 <0.03 0.11 5.0 5.93 14.3 0.80 0.01 0
20/11/2019 7.82 48.9 239 217 192 37.8 29.7 9.9 2.88 0.19 14.5 29 <0.01 0.05 <0.01 0.01 <0.02 <0.45 <0.01 <0.45 <0.03 0.13 3.2 5.53 18.5 2.80 <0.001 0
05/12/2019 7.38 47.4 254 220 161 48.0 24.3 7.5 5.54 0.19 10.7 61 <0.01 <0.01 <0.01 0.03 <0.02 <0.45 <0.35 <0.45 <0.03 0.06 3.7 6.80 19.3 0.80 <0.001 20
16/01/2020 7.67 50.9 267 225 180 42.2 29.0 11.7 5.35 0.18 18.3 52 0.07 0.03 0.19 0.02 <0.02 <0.45 <0.35 <0.45 <0.03 0.10 9.0 6.18 15.1 1.10 0.02 12
06/02/2020 7.45 35.4 167 142 141 29.5 16.7 9.2 1.70 0.21 13.6 12 0.04 0.22 <0.01 <0.01 <0.02 <0.45 <0.35 <0.45 <0.03 0.05 12.4 7.21 20.2 1.20 0.003 36
09/03/2020 7.39 43.3 223 186 156 38.4 21.8 11.8 4.89 0.20 17.8 34 <0.01 0.03 <0.01 <0.01 <0.02 <0.45 <0.35 <0.45 0.14 0.50 5.7 6.47 17.4 1.20 0.01 2
08/05/2020 7.56 41.1 220 187 128 40.0 21.1 8.6 4.45 <0.09 16.4 53 <0.01 <0.01 <0.01 <0.01 <0.01 <0.45 <0.35 <0.45 <0.03 0.29 56.3 6.29 13.6 1.60 <0.001 22
19/05/2020 7.70 42.2 248 203 152 40.4 24.8 12.1 3.76 <0.09 13.0 63 <0.01 <0.01 0.02 <0.01 <0.01 <0.45 <0.35 <0.45 <0.03 0.19 2.1 6.38 13.9 0.80 <0.001 44
02/06/2020 7.93 43.3 244 198 136 39.4 24.2 11.0 2.54 <0.09 12.9 73 <0.01 <0.01 <0.01 <0.01 <0.01 <0.45 <0.35 <0.45 <0.03 0.75 6.4 7.73 9.9 1.00 0.003 0
07/07/2020 8.01 45.2 243 196 139 40.5 23.0 9.9 3.60 <0.09 14.8 68 0.04 <0.01 <0.01 <0.01 <0.01 <0.45 <0.35 <0.45 <0.03 0.30 16.1 7.53 8.9 2.78 0.02 6
13/08/2020 7.99 45.7 245 197 158 40.2 23.4 10.2 3.79 <0.09 13.5 59 0.10 0.01 0.04 <0.01 <0.01 <0.45 <0.35 <0.45 <0.03 0.55 16.6 7.66 10.1 0.33 <0.001 0
08/09/2020 8.03 48.5 264 216 189 43.1 26.4 12.5 4.91 0.13 17.1 46 0.03 <0.01 <0.01 0.02 0.02 <0.45 <0.35 <0.45 <0.03 0.27 12.8 7.70 14.1 1.20 <0.01 0
Surface Water
LSW03
LSW05
-
Exxaro Leeuwpan
6.0 - 9.0 01-5-1--615010030DWAF Domestic Target Water Quality
Range0.050-0.15-45070 32- 0.050.12001001
Document No: Revision: Date:
MON-WQR-080-19_20 (20-09) 0.0 September 2020
Leeuwpan Coal Mine
Client Restricted Author: W. Esterhuizen
16
Sam
ple Num
ber
Date
Com
ment
pH V
alue @ 25°C
Electrical C
onductivity as
EC
(mS
/m)
Total D
issolved Solids
Total H
ardness
Total A
lkalinity (pH>4.5)
Calcium
as Ca (m
g/l)
Magnesium
as Mg (m
g/l)
Sodium
as Na (m
g/l)
Potassium
as K (m
g/l)
Fluoride as F
(mg/l)
Chloride as C
l (mg/l)
Sulphate as S
O 4
(mg/l)
Iron as Fe (m
g/l)
Manganese as M
n (mg/l)
Alum
inium as A
l (mg/l)
Boron (B
)
Hexavalent C
hromium
(Cr 6)
Am
monia as N
(mg/l)
Nitrate as N
(mg/l)
Total Inorganic N
itrogen
(mg/l)
Ortho P
hosphate as P
(mg/l)
Total P
hospahte
Turbidity
Dissolved O
xygen (DO
)
Dissolved O
rganic Carbon
(DO
C)
Oil &
Grease
Chlorofyll-a
Escherichia coli ( E
.coli)
15/10/2019 Dry
21/11/2019 Dry
05/12/2019 Dry
16/01/2020 Dry
06/02/2020 Dry
09/03/2020 Dry
08/05/2020 Dry
19/05/2020 Dry
02/06/2020 Dry
07/07/2020 Dry
13/08/2020 Dry
07/09/2020 Dry
15/10/2019 Dry
21/11/2019 Dry
05/12/2019 Dry
16/01/2020 Dry
06/02/2020 Dry
09/03/2020 Dry
08/05/2020 Dry
19/05/2020 Dry
02/06/2020 Dry
07/07/2020 Dry
13/08/2020 Dry
07/09/2020 Dry
Surface Water
LSW06
LSW07
-
Exxaro Leeuwpan
6.0 - 9.0 01-5-1--615010030DWAF Domestic Target Water Quality
Range0.050-0.15-45070 32- 0.050.12001001
Document No: Revision: Date:
MON-WQR-080-19_20 (20-09) 0.0 September 2020
Leeuwpan Coal Mine
Client Restricted Author: W. Esterhuizen
17
Sam
ple Num
ber
Date
Com
ment
pH V
alue @ 25°C
Electrical C
onductivity as
EC
(mS
/m)
Total D
issolved Solids
Total H
ardness
Total A
lkalinity (pH>4.5)
Calcium
as Ca (m
g/l)
Magnesium
as Mg (m
g/l)
Sodium
as Na (m
g/l)
Potassium
as K (m
g/l)
Fluoride as F
(mg/l)
Chloride as C
l (mg/l)
Sulphate as S
O 4
(mg/l)
Iron as Fe (m
g/l)
Manganese as M
n (mg/l)
Alum
inium as A
l (mg/l)
Boron (B
)
Hexavalent C
hromium
(Cr 6)
Am
monia as N
(mg/l)
Nitrate as N
(mg/l)
Total Inorganic N
itrogen
(mg/l)
Ortho P
hosphate as P
(mg/l)
Total P
hospahte
Turbidity
Dissolved O
xygen (DO
)
Dissolved O
rganic Carbon
(DO
C)
Oil &
Grease
Chlorofyll-a
Escherichia coli ( E
.coli)
15/10/2019 Dry
21/11/2019 Dry
05/12/2019 Dry
16/01/2020 Dry
06/02/2020 Dry
09/03/2020 Dry
08/05/2020 Dry
19/05/2020 Dry
02/06/2020 Dry
07/07/2020 Dry
13/08/2020 Dry
07/09/2020 Dry
15/10/2019 Dry
21/11/2019 No Access
05/12/2019 Dry
16/01/2020 Dry
06/02/2020 Dry
09/03/2020 Dry
08/05/2020 Dry
19/05/2020 Dry
02/06/2020 Dry
07/07/2020 Dry
13/08/2020 Dry
07/09/2020 Dry
Surface Water
LSW08
LSW12
-
Exxaro Leeuwpan
6.0 - 9.0 01-5-1--615010030DWAF Domestic Target Water Quality
Range0.050-0.15-45070 32- 0.050.12001001
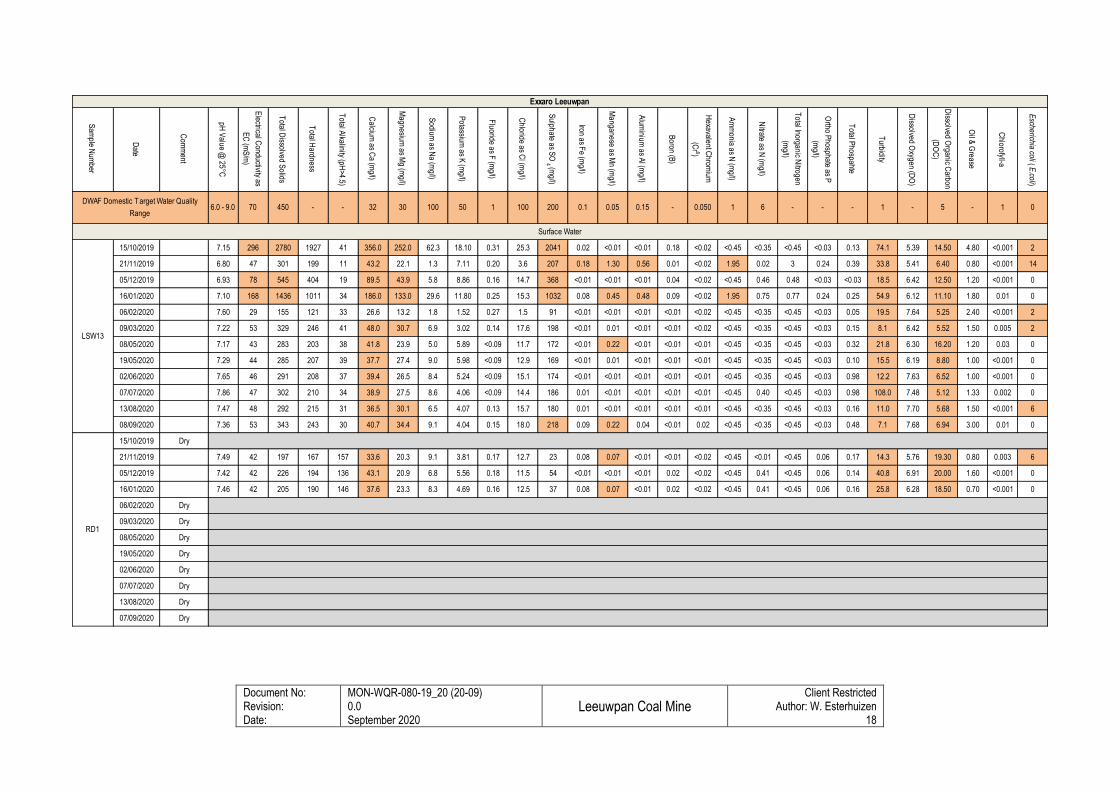
Document No: Revision: Date:
MON-WQR-080-19_20 (20-09) 0.0 September 2020
Leeuwpan Coal Mine
Client Restricted Author: W. Esterhuizen
18
Sam
ple Num
ber
Date
Com
ment
pH V
alue @ 25°C
Electrical C
onductivity as
EC
(mS
/m)
Total D
issolved Solids
Total H
ardness
Total A
lkalinity (pH>4.5)
Calcium
as Ca (m
g/l)
Magnesium
as Mg (m
g/l)
Sodium
as Na (m
g/l)
Potassium
as K (m
g/l)
Fluoride as F
(mg/l)
Chloride as C
l (mg/l)
Sulphate as S
O 4
(mg/l)
Iron as Fe (m
g/l)
Manganese as M
n (mg/l)
Alum
inium as A
l (mg/l)
Boron (B
)
Hexavalent C
hromium
(Cr 6)
Am
monia as N
(mg/l)
Nitrate as N
(mg/l)
Total Inorganic N
itrogen
(mg/l)
Ortho P
hosphate as P
(mg/l)
Total P
hospahte
Turbidity
Dissolved O
xygen (DO
)
Dissolved O
rganic Carbon
(DO
C)
Oil &
Grease
Chlorofyll-a
Escherichia coli ( E
.coli)
15/10/2019 7.15 296 2780 1927 41 356.0 252.0 62.3 18.10 0.31 25.3 2041 0.02 <0.01 <0.01 0.18 <0.02 <0.45 <0.35 <0.45 <0.03 0.13 74.1 5.39 14.50 4.80 <0.001 2
21/11/2019 6.80 47 301 199 11 43.2 22.1 1.3 7.11 0.20 3.6 207 0.18 1.30 0.56 0.01 <0.02 1.95 0.02 3 0.24 0.39 33.8 5.41 6.40 0.80 <0.001 14
05/12/2019 6.93 78 545 404 19 89.5 43.9 5.8 8.86 0.16 14.7 368 <0.01 <0.01 <0.01 0.04 <0.02 <0.45 0.46 0.48 <0.03 <0.03 18.5 6.42 12.50 1.20 <0.001 0
16/01/2020 7.10 168 1436 1011 34 186.0 133.0 29.6 11.80 0.25 15.3 1032 0.08 0.45 0.48 0.09 <0.02 1.95 0.75 0.77 0.24 0.25 54.9 6.12 11.10 1.80 0.01 0
06/02/2020 7.60 29 155 121 33 26.6 13.2 1.8 1.52 0.27 1.5 91 <0.01 <0.01 <0.01 <0.01 <0.02 <0.45 <0.35 <0.45 <0.03 0.05 19.5 7.64 5.25 2.40 <0.001 2
09/03/2020 7.22 53 329 246 41 48.0 30.7 6.9 3.02 0.14 17.6 198 <0.01 0.01 <0.01 <0.01 <0.02 <0.45 <0.35 <0.45 <0.03 0.15 8.1 6.42 5.52 1.50 0.005 2
08/05/2020 7.17 43 283 203 38 41.8 23.9 5.0 5.89 <0.09 11.7 172 <0.01 0.22 <0.01 <0.01 <0.01 <0.45 <0.35 <0.45 <0.03 0.32 21.8 6.30 16.20 1.20 0.03 0
19/05/2020 7.29 44 285 207 39 37.7 27.4 9.0 5.98 <0.09 12.9 169 <0.01 0.01 <0.01 <0.01 <0.01 <0.45 <0.35 <0.45 <0.03 0.10 15.5 6.19 8.80 1.00 <0.001 0
02/06/2020 7.65 46 291 208 37 39.4 26.5 8.4 5.24 <0.09 15.1 174 <0.01 <0.01 <0.01 <0.01 <0.01 <0.45 <0.35 <0.45 <0.03 0.98 12.2 7.63 6.52 1.00 <0.001 0
07/07/2020 7.86 47 302 210 34 38.9 27.5 8.6 4.06 <0.09 14.4 186 0.01 <0.01 <0.01 <0.01 <0.01 <0.45 0.40 <0.45 <0.03 0.98 108.0 7.48 5.12 1.33 0.002 0
13/08/2020 7.47 48 292 215 31 36.5 30.1 6.5 4.07 0.13 15.7 180 0.01 <0.01 <0.01 <0.01 <0.01 <0.45 <0.35 <0.45 <0.03 0.16 11.0 7.70 5.68 1.50 <0.001 6
08/09/2020 7.36 53 343 243 30 40.7 34.4 9.1 4.04 0.15 18.0 218 0.09 0.22 0.04 <0.01 0.02 <0.45 <0.35 <0.45 <0.03 0.48 7.1 7.68 6.94 3.00 0.01 0
15/10/2019 Dry
21/11/2019 7.49 42 197 167 157 33.6 20.3 9.1 3.81 0.17 12.7 23 0.08 0.07 <0.01 <0.01 <0.02 <0.45 <0.01 <0.45 0.06 0.17 14.3 5.76 19.30 0.80 0.003 6
05/12/2019 7.42 42 226 194 136 43.1 20.9 6.8 5.56 0.18 11.5 54 <0.01 <0.01 <0.01 0.02 <0.02 <0.45 0.41 <0.45 0.06 0.14 40.8 6.91 20.00 1.60 <0.001 0
16/01/2020 7.46 42 205 190 146 37.6 23.3 8.3 4.69 0.16 12.5 37 0.08 0.07 <0.01 0.02 <0.02 <0.45 0.41 <0.45 0.06 0.16 25.8 6.28 18.50 0.70 <0.001 0
06/02/2020 Dry
09/03/2020 Dry
08/05/2020 Dry
19/05/2020 Dry
02/06/2020 Dry
07/07/2020 Dry
13/08/2020 Dry
07/09/2020 Dry
Surface Water
LSW13
RD1
-
Exxaro Leeuwpan
6.0 - 9.0 01-5-1--615010030DWAF Domestic Target Water Quality
Range0.050-0.15-45070 32- 0.050.12001001
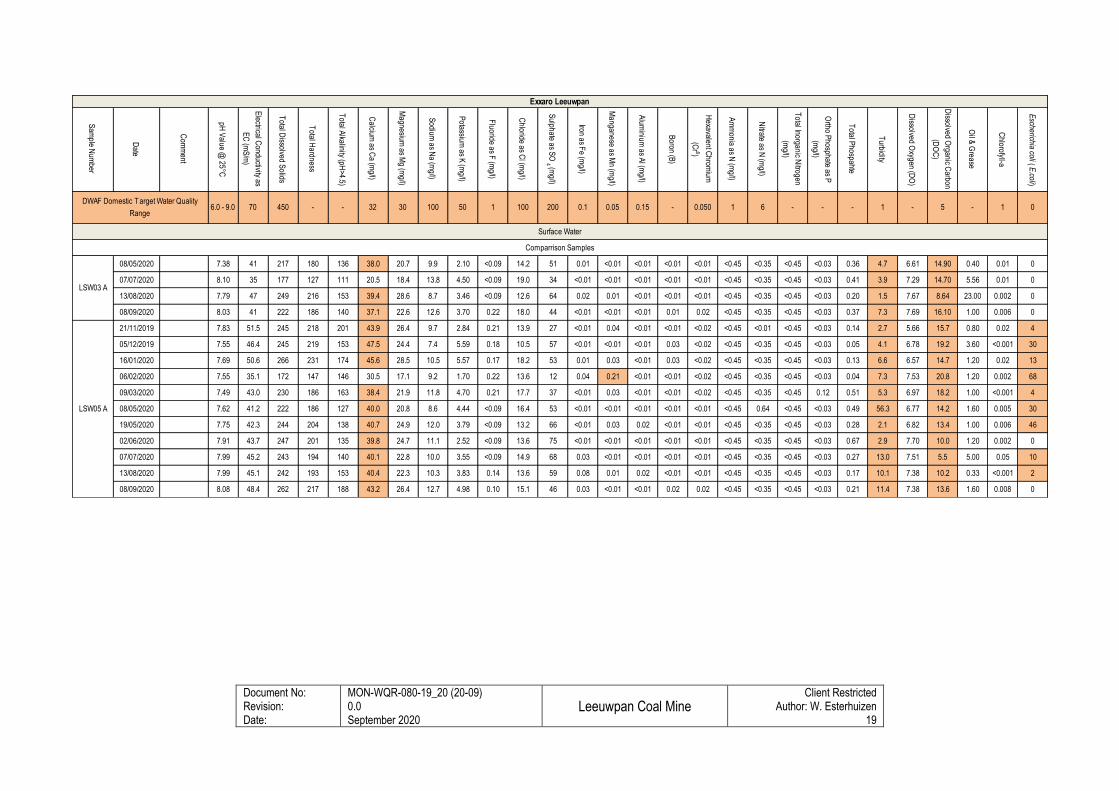
Document No: Revision: Date:
MON-WQR-080-19_20 (20-09) 0.0 September 2020
Leeuwpan Coal Mine
Client Restricted Author: W. Esterhuizen
19
Sam
ple Num
ber
Date
Com
ment
pH V
alue @ 25°C
Electrical C
onductivity as
EC
(mS
/m)
Total D
issolved Solids
Total H
ardness
Total A
lkalinity (pH>4.5)
Calcium
as Ca (m
g/l)
Magnesium
as Mg (m
g/l)
Sodium
as Na (m
g/l)
Potassium
as K (m
g/l)
Fluoride as F
(mg/l)
Chloride as C
l (mg/l)
Sulphate as S
O 4
(mg/l)
Iron as Fe (m
g/l)
Manganese as M
n (mg/l)
Alum
inium as A
l (mg/l)
Boron (B
)
Hexavalent C
hromium
(Cr 6)
Am
monia as N
(mg/l)
Nitrate as N
(mg/l)
Total Inorganic N
itrogen
(mg/l)
Ortho P
hosphate as P
(mg/l)
Total P
hospahte
Turbidity
Dissolved O
xygen (DO
)
Dissolved O
rganic Carbon
(DO
C)
Oil &
Grease
Chlorofyll-a
Escherichia coli ( E
.coli)
08/05/2020 7.38 41 217 180 136 38.0 20.7 9.9 2.10 <0.09 14.2 51 0.01 <0.01 <0.01 <0.01 <0.01 <0.45 <0.35 <0.45 <0.03 0.36 4.7 6.61 14.90 0.40 0.01 0
07/07/2020 8.10 35 177 127 111 20.5 18.4 13.8 4.50 <0.09 19.0 34 <0.01 <0.01 <0.01 <0.01 <0.01 <0.45 <0.35 <0.45 <0.03 0.41 3.9 7.29 14.70 5.56 0.01 0
13/08/2020 7.79 47 249 216 153 39.4 28.6 8.7 3.46 <0.09 12.6 64 0.02 0.01 <0.01 <0.01 <0.01 <0.45 <0.35 <0.45 <0.03 0.20 1.5 7.67 8.64 23.00 0.002 0
08/09/2020 8.03 41 222 186 140 37.1 22.6 12.6 3.70 0.22 18.0 44 <0.01 <0.01 <0.01 0.01 0.02 <0.45 <0.35 <0.45 <0.03 0.37 7.3 7.69 16.10 1.00 0.006 0
21/11/2019 7.83 51.5 245 218 201 43.9 26.4 9.7 2.84 0.21 13.9 27 <0.01 0.04 <0.01 <0.01 <0.02 <0.45 <0.01 <0.45 <0.03 0.14 2.7 5.66 15.7 0.80 0.02 4
05/12/2019 7.55 46.4 245 219 153 47.5 24.4 7.4 5.59 0.18 10.5 57 <0.01 <0.01 <0.01 0.03 <0.02 <0.45 <0.35 <0.45 <0.03 0.05 4.1 6.78 19.2 3.60 <0.001 30
16/01/2020 7.69 50.6 266 231 174 45.6 28.5 10.5 5.57 0.17 18.2 53 0.01 0.03 <0.01 0.03 <0.02 <0.45 <0.35 <0.45 <0.03 0.13 6.6 6.57 14.7 1.20 0.02 13
06/02/2020 7.55 35.1 172 147 146 30.5 17.1 9.2 1.70 0.22 13.6 12 0.04 0.21 <0.01 <0.01 <0.02 <0.45 <0.35 <0.45 <0.03 0.04 7.3 7.53 20.8 1.20 0.002 68
09/03/2020 7.49 43.0 230 186 163 38.4 21.9 11.8 4.70 0.21 17.7 37 <0.01 0.03 <0.01 <0.01 <0.02 <0.45 <0.35 <0.45 0.12 0.51 5.3 6.97 18.2 1.00 <0.001 4
08/05/2020 7.62 41.2 222 186 127 40.0 20.8 8.6 4.44 <0.09 16.4 53 <0.01 <0.01 <0.01 <0.01 <0.01 <0.45 0.64 <0.45 <0.03 0.49 56.3 6.77 14.2 1.60 0.005 30
19/05/2020 7.75 42.3 244 204 138 40.7 24.9 12.0 3.79 <0.09 13.2 66 <0.01 0.03 0.02 <0.01 <0.01 <0.45 <0.35 <0.45 <0.03 0.28 2.1 6.82 13.4 1.00 0.006 46
02/06/2020 7.91 43.7 247 201 135 39.8 24.7 11.1 2.52 <0.09 13.6 75 <0.01 <0.01 <0.01 <0.01 <0.01 <0.45 <0.35 <0.45 <0.03 0.67 2.9 7.70 10.0 1.20 0.002 0
07/07/2020 7.99 45.2 243 194 140 40.1 22.8 10.0 3.55 <0.09 14.9 68 0.03 <0.01 <0.01 <0.01 <0.01 <0.45 <0.35 <0.45 <0.03 0.27 13.0 7.51 5.5 5.00 0.05 10
13/08/2020 7.99 45.1 242 193 153 40.4 22.3 10.3 3.83 0.14 13.6 59 0.08 0.01 0.02 <0.01 <0.01 <0.45 <0.35 <0.45 <0.03 0.17 10.1 7.38 10.2 0.33 <0.001 2
08/09/2020 8.08 48.4 262 217 188 43.2 26.4 12.7 4.98 0.10 15.1 46 0.03 <0.01 <0.01 0.02 0.02 <0.45 <0.35 <0.45 <0.03 0.21 11.4 7.38 13.6 1.60 0.008 0
LSW05 A
Comparrison Samples
Surface Water
LSW03 A
-
Exxaro Leeuwpan
6.0 - 9.0 01-5-1--615010030DWAF Domestic Target Water Quality
Range0.050-0.15-45070 32- 0.050.12001001
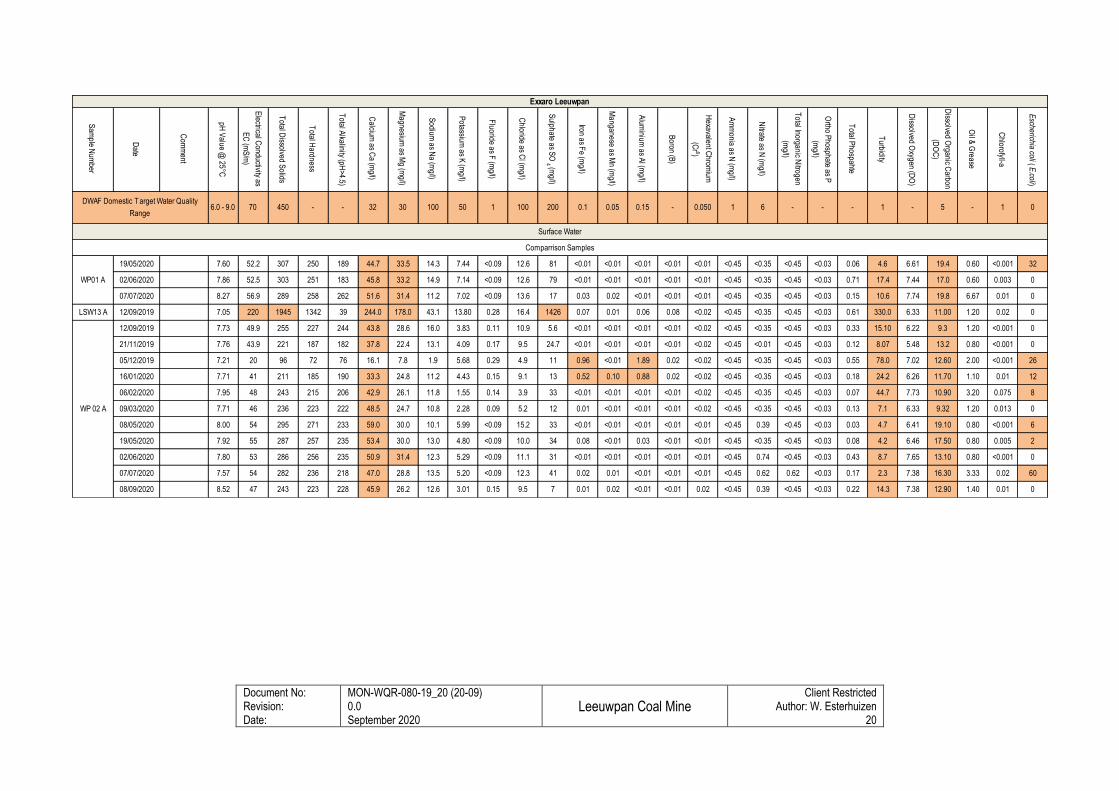
Document No: Revision: Date:
MON-WQR-080-19_20 (20-09) 0.0 September 2020
Leeuwpan Coal Mine
Client Restricted Author: W. Esterhuizen
20
Sam
ple Num
ber
Date
Com
ment
pH V
alue @ 25°C
Electrical C
onductivity as
EC
(mS
/m)
Total D
issolved Solids
Total H
ardness
Total A
lkalinity (pH>4.5)
Calcium
as Ca (m
g/l)
Magnesium
as Mg (m
g/l)
Sodium
as Na (m
g/l)
Potassium
as K (m
g/l)
Fluoride as F
(mg/l)
Chloride as C
l (mg/l)
Sulphate as S
O 4
(mg/l)
Iron as Fe (m
g/l)
Manganese as M
n (mg/l)
Alum
inium as A
l (mg/l)
Boron (B
)
Hexavalent C
hromium
(Cr 6)
Am
monia as N
(mg/l)
Nitrate as N
(mg/l)
Total Inorganic N
itrogen
(mg/l)
Ortho P
hosphate as P
(mg/l)
Total P
hospahte
Turbidity
Dissolved O
xygen (DO
)
Dissolved O
rganic Carbon
(DO
C)
Oil &
Grease
Chlorofyll-a
Escherichia coli ( E
.coli)
19/05/2020 7.60 52.2 307 250 189 44.7 33.5 14.3 7.44 <0.09 12.6 81 <0.01 <0.01 <0.01 <0.01 <0.01 <0.45 <0.35 <0.45 <0.03 0.06 4.6 6.61 19.4 0.60 <0.001 32
02/06/2020 7.86 52.5 303 251 183 45.8 33.2 14.9 7.14 <0.09 12.6 79 <0.01 <0.01 <0.01 <0.01 <0.01 <0.45 <0.35 <0.45 <0.03 0.71 17.4 7.44 17.0 0.60 0.003 0
07/07/2020 8.27 56.9 289 258 262 51.6 31.4 11.2 7.02 <0.09 13.6 17 0.03 0.02 <0.01 <0.01 <0.01 <0.45 <0.35 <0.45 <0.03 0.15 10.6 7.74 19.8 6.67 0.01 0
12/09/2019 7.05 220 1945 1342 39 244.0 178.0 43.1 13.80 0.28 16.4 1426 0.07 0.01 0.06 0.08 <0.02 <0.45 <0.35 <0.45 <0.03 0.61 330.0 6.33 11.00 1.20 0.02 0
12/09/2019 7.73 49.9 255 227 244 43.8 28.6 16.0 3.83 0.11 10.9 5.6 <0.01 <0.01 <0.01 <0.01 <0.02 <0.45 <0.35 <0.45 <0.03 0.33 15.10 6.22 9.3 1.20 <0.001 0
21/11/2019 7.76 43.9 221 187 182 37.8 22.4 13.1 4.09 0.17 9.5 24.7 <0.01 <0.01 <0.01 <0.01 <0.02 <0.45 <0.01 <0.45 <0.03 0.12 8.07 5.48 13.2 0.80 <0.001 0
05/12/2019 7.21 20 96 72 76 16.1 7.8 1.9 5.68 0.29 4.9 11 0.96 <0.01 1.89 0.02 <0.02 <0.45 <0.35 <0.45 <0.03 0.55 78.0 7.02 12.60 2.00 <0.001 26
16/01/2020 7.71 41 211 185 190 33.3 24.8 11.2 4.43 0.15 9.1 13 0.52 0.10 0.88 0.02 <0.02 <0.45 <0.35 <0.45 <0.03 0.18 24.2 6.26 11.70 1.10 0.01 12
06/02/2020 7.95 48 243 215 206 42.9 26.1 11.8 1.55 0.14 3.9 33 <0.01 <0.01 <0.01 <0.01 <0.02 <0.45 <0.35 <0.45 <0.03 0.07 44.7 7.73 10.90 3.20 0.075 8
09/03/2020 7.71 46 236 223 222 48.5 24.7 10.8 2.28 0.09 5.2 12 0.01 <0.01 <0.01 <0.01 <0.02 <0.45 <0.35 <0.45 <0.03 0.13 7.1 6.33 9.32 1.20 0.013 0
08/05/2020 8.00 54 295 271 233 59.0 30.0 10.1 5.99 <0.09 15.2 33 <0.01 <0.01 <0.01 <0.01 <0.01 <0.45 0.39 <0.45 <0.03 0.03 4.7 6.41 19.10 0.80 <0.001 6
19/05/2020 7.92 55 287 257 235 53.4 30.0 13.0 4.80 <0.09 10.0 34 0.08 <0.01 0.03 <0.01 <0.01 <0.45 <0.35 <0.45 <0.03 0.08 4.2 6.46 17.50 0.80 0.005 2
02/06/2020 7.80 53 286 256 235 50.9 31.4 12.3 5.29 <0.09 11.1 31 <0.01 <0.01 <0.01 <0.01 <0.01 <0.45 0.74 <0.45 <0.03 0.43 8.7 7.65 13.10 0.80 <0.001 0
07/07/2020 7.57 54 282 236 218 47.0 28.8 13.5 5.20 <0.09 12.3 41 0.02 0.01 <0.01 <0.01 <0.01 <0.45 0.62 0.62 <0.03 0.17 2.3 7.38 16.30 3.33 0.02 60
08/09/2020 8.52 47 243 223 228 45.9 26.2 12.6 3.01 0.15 9.5 7 0.01 0.02 <0.01 <0.01 0.02 <0.45 0.39 <0.45 <0.03 0.22 14.3 7.38 12.90 1.40 0.01 0
LSW13 A
Comparrison Samples
WP 02 A
Surface Water
WP01 A
-
Exxaro Leeuwpan
6.0 - 9.0 01-5-1--615010030DWAF Domestic Target Water Quality
Range0.050-0.15-45070 32- 0.050.12001001
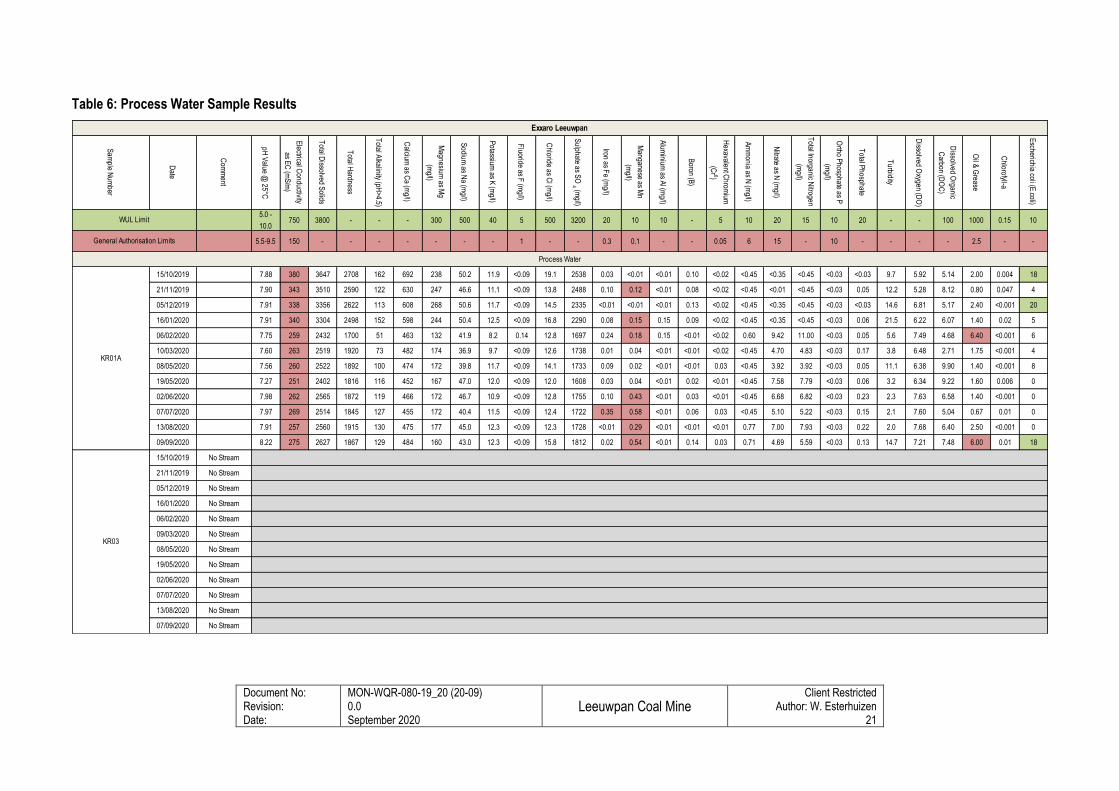
Document No: Revision: Date:
MON-WQR-080-19_20 (20-09) 0.0 September 2020
Leeuwpan Coal Mine
Client Restricted Author: W. Esterhuizen
21
Table 6: Process Water Sample Results
Sam
ple Num
ber
Date
Com
ment
pH V
alue @ 25°C
Electrical C
onductivity
as EC
(mS
/m)
Total D
issolved Solids
Total H
ardness
Total A
lkalinity (pH>4.5)
Calcium
as Ca (m
g/l)
Magnesium
as Mg
(mg/l)
Sodium
as Na (m
g/l)
Potassium
as K (m
g/l)
Fluoride as F
(mg/l)
Chloride as C
l (mg/l)
Sulphate as S
O 4 (m
g/l)
Iron as Fe (m
g/l)
Manganese as M
n
(mg/l)
Alum
inium as A
l (mg/l)
Boron (B
)
Hexavalent C
hromium
(Cr 6)
Am
monia as N
(mg/l)
Nitrate as N
(mg/l)
Total Inorganic N
itrogen
(mg/l)
Ortho P
hosphate as P
(mg/l)
Total P
hosphate
Turbidity
Dissolved O
xygen (DO
)
Dissolved O
rganic
Carbon (D
OC
)
Oil &
Grease
Chlorofyll-a
Escherichia coli (E
.coli)
5.0 -
10.0 750 3800 - - - 300 500 40 5 500 3200 20 10 10 - 5 10 20 15 10 20 - - 100 1000 0.15 10
5.5-9.5 150 - - - - - - - 1 - - 0.3 0.1 - - 0.05 6 15 - 10 - - - - 2.5 - -
15/10/2019 7.88 380 3647 2708 162 692 238 50.2 11.9 <0.09 19.1 2538 0.03 <0.01 <0.01 0.10 <0.02 <0.45 <0.35 <0.45 <0.03 <0.03 9.7 5.92 5.14 2.00 0.004 18
21/11/2019 7.90 343 3510 2590 122 630 247 46.6 11.1 <0.09 13.8 2488 0.10 0.12 <0.01 0.08 <0.02 <0.45 <0.01 <0.45 <0.03 0.05 12.2 5.28 8.12 0.80 0.047 4
05/12/2019 7.91 338 3356 2622 113 608 268 50.6 11.7 <0.09 14.5 2335 <0.01 <0.01 <0.01 0.13 <0.02 <0.45 <0.35 <0.45 <0.03 <0.03 14.6 6.81 5.17 2.40 <0.001 20
16/01/2020 7.91 340 3304 2498 152 598 244 50.4 12.5 <0.09 16.8 2290 0.08 0.15 0.15 0.09 <0.02 <0.45 <0.35 <0.45 <0.03 0.06 21.5 6.22 6.07 1.40 0.02 5
06/02/2020 7.75 259 2432 1700 51 463 132 41.9 8.2 0.14 12.8 1697 0.24 0.18 0.15 <0.01 <0.02 0.60 9.42 11.00 <0.03 0.05 5.6 7.49 4.68 6.40 <0.001 6
10/03/2020 7.60 263 2519 1920 73 482 174 36.9 9.7 <0.09 12.6 1738 0.01 0.04 <0.01 <0.01 <0.02 <0.45 4.70 4.83 <0.03 0.17 3.8 6.48 2.71 1.75 <0.001 4
08/05/2020 7.56 260 2522 1892 100 474 172 39.8 11.7 <0.09 14.1 1733 0.09 0.02 <0.01 <0.01 0.03 <0.45 3.92 3.92 <0.03 0.05 11.1 6.38 9.90 1.40 <0.001 8
19/05/2020 7.27 251 2402 1816 116 452 167 47.0 12.0 <0.09 12.0 1608 0.03 0.04 <0.01 0.02 <0.01 <0.45 7.58 7.79 <0.03 0.06 3.2 6.34 9.22 1.60 0.006 0
02/06/2020 7.98 262 2565 1872 119 466 172 46.7 10.9 <0.09 12.8 1755 0.10 0.43 <0.01 0.03 <0.01 <0.45 6.68 6.82 <0.03 0.23 2.3 7.63 6.58 1.40 <0.001 0
07/07/2020 7.97 269 2514 1845 127 455 172 40.4 11.5 <0.09 12.4 1722 0.35 0.58 <0.01 0.06 0.03 <0.45 5.10 5.22 <0.03 0.15 2.1 7.60 5.04 0.67 0.01 0
13/08/2020 7.91 257 2560 1915 130 475 177 45.0 12.3 <0.09 12.3 1728 <0.01 0.29 <0.01 <0.01 <0.01 0.77 7.00 7.93 <0.03 0.22 2.0 7.68 6.40 2.50 <0.001 0
09/09/2020 8.22 275 2627 1867 129 484 160 43.0 12.3 <0.09 15.8 1812 0.02 0.54 <0.01 0.14 0.03 0.71 4.69 5.59 <0.03 0.13 14.7 7.21 7.48 6.00 0.01 18
15/10/2019 No Stream
21/11/2019 No Stream
05/12/2019 No Stream
16/01/2020 No Stream
06/02/2020 No Stream
09/03/2020 No Stream
08/05/2020 No Stream
19/05/2020 No Stream
02/06/2020 No Stream
07/07/2020 No Stream
13/08/2020 No Stream
07/09/2020 No Stream
Exxaro Leeuwpan
WUL Limit
Process Water
General Authorisation Limits
KR01A
KR03
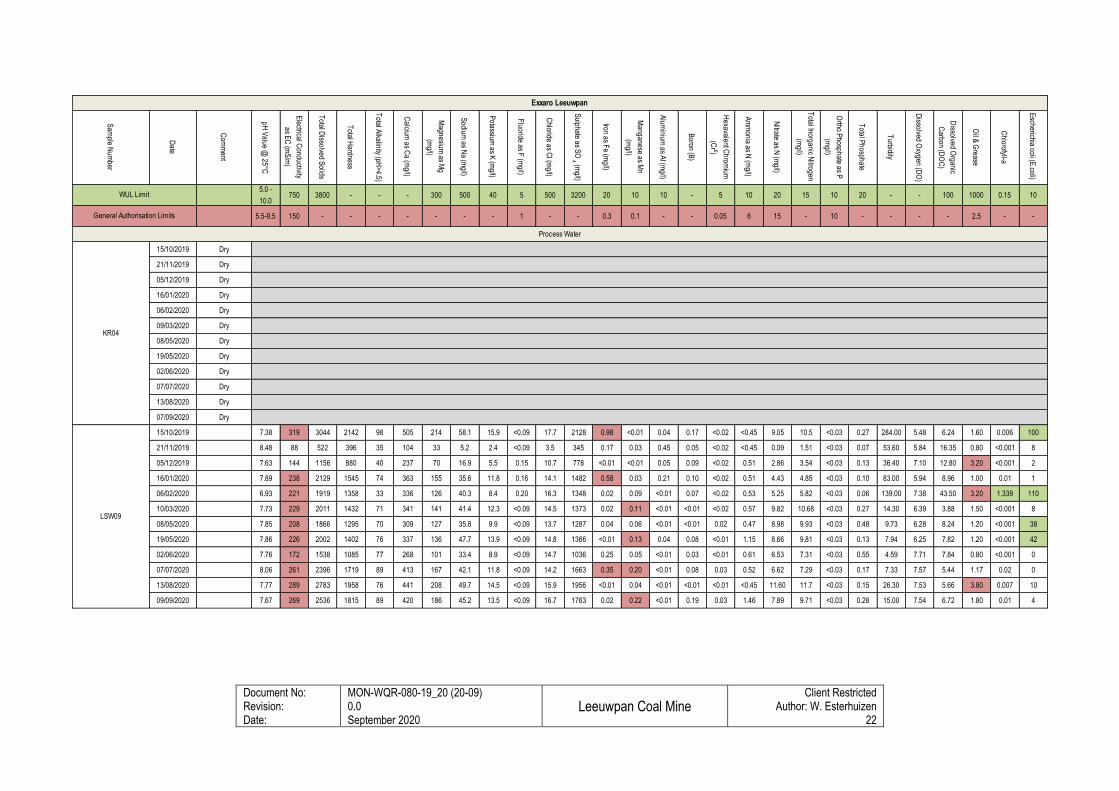
Document No: Revision: Date:
MON-WQR-080-19_20 (20-09) 0.0 September 2020
Leeuwpan Coal Mine
Client Restricted Author: W. Esterhuizen
22
Sam
ple Num
ber
Date
Com
ment
pH V
alue @ 25°C
Electrical C
onductivity
as EC
(mS
/m)
Total D
issolved Solids
Total H
ardness
Total A
lkalinity (pH>4.5)
Calcium
as Ca (m
g/l)
Magnesium
as Mg
(mg/l)
Sodium
as Na (m
g/l)
Potassium
as K (m
g/l)
Fluoride as F
(mg/l)
Chloride as C
l (mg/l)
Sulphate as S
O 4 (m
g/l)
Iron as Fe (m
g/l)
Manganese as M
n
(mg/l)
Alum
inium as A
l (mg/l)
Boron (B
)
Hexavalent C
hromium
(Cr 6)
Am
monia as N
(mg/l)
Nitrate as N
(mg/l)
Total Inorganic N
itrogen
(mg/l)
Ortho P
hosphate as P
(mg/l)
Total P
hosphate
Turbidity
Dissolved O
xygen (DO
)
Dissolved O
rganic
Carbon (D
OC
)
Oil &
Grease
Chlorofyll-a
Escherichia coli (E
.coli)
5.0 -
10.0 750 3800 - - - 300 500 40 5 500 3200 20 10 10 - 5 10 20 15 10 20 - - 100 1000 0.15 10
5.5-9.5 150 - - - - - - - 1 - - 0.3 0.1 - - 0.05 6 15 - 10 - - - - 2.5 - -
15/10/2019 Dry
21/11/2019 Dry
05/12/2019 Dry
16/01/2020 Dry
06/02/2020 Dry
09/03/2020 Dry
08/05/2020 Dry
19/05/2020 Dry
02/06/2020 Dry
07/07/2020 Dry
13/08/2020 Dry
07/09/2020 Dry
15/10/2019 7.38 319 3044 2142 98 505 214 58.1 15.9 <0.09 17.7 2128 0.98 <0.01 0.04 0.17 <0.02 <0.45 9.05 10.5 <0.03 0.27 284.00 5.48 6.24 1.60 0.006 100
21/11/2019 8.48 88 522 396 35 104 33 5.2 2.4 <0.09 3.5 345 0.17 0.03 0.45 0.05 <0.02 <0.45 0.09 1.51 <0.03 0.07 53.60 5.84 16.35 0.80 <0.001 8
05/12/2019 7.63 144 1156 880 40 237 70 16.9 5.5 0.15 10.7 778 <0.01 <0.01 0.05 0.09 <0.02 0.51 2.86 3.54 <0.03 0.13 36.40 7.10 12.80 3.20 <0.001 2
16/01/2020 7.89 238 2129 1545 74 363 155 35.6 11.8 0.16 14.1 1482 0.58 0.03 0.21 0.10 <0.02 0.51 4.43 4.85 <0.03 0.10 83.00 5.94 8.96 1.00 0.01 1
06/02/2020 6.93 221 1919 1358 33 336 126 40.3 8.4 0.20 16.3 1348 0.02 0.09 <0.01 0.07 <0.02 0.53 5.25 5.82 <0.03 0.06 139.00 7.38 43.50 3.20 1.339 110
10/03/2020 7.73 229 2011 1432 71 341 141 41.4 12.3 <0.09 14.5 1373 0.02 0.11 <0.01 <0.01 <0.02 0.57 9.82 10.68 <0.03 0.27 14.30 6.39 3.88 1.50 <0.001 8
08/05/2020 7.85 208 1866 1295 70 309 127 35.8 9.9 <0.09 13.7 1287 0.04 0.06 <0.01 <0.01 0.02 0.47 8.98 9.93 <0.03 0.48 9.73 6.28 8.24 1.20 <0.001 38
19/05/2020 7.86 226 2002 1402 76 337 136 47.7 13.9 <0.09 14.8 1366 <0.01 0.13 0.04 0.08 <0.01 1.15 8.66 9.81 <0.03 0.13 7.94 6.25 7.82 1.20 <0.001 42
02/06/2020 7.76 172 1538 1085 77 268 101 33.4 8.9 <0.09 14.7 1036 0.25 0.05 <0.01 0.03 <0.01 0.61 6.53 7.31 <0.03 0.55 4.59 7.71 7.84 0.80 <0.001 0
07/07/2020 8.06 261 2396 1719 89 413 167 42.1 11.8 <0.09 14.2 1663 0.35 0.20 <0.01 0.08 0.03 0.52 6.62 7.29 <0.03 0.17 7.33 7.57 5.44 1.17 0.02 0
13/08/2020 7.77 289 2783 1958 76 441 208 49.7 14.5 <0.09 15.9 1956 <0.01 0.04 <0.01 <0.01 <0.01 <0.45 11.60 11.7 <0.03 0.15 26.30 7.53 5.66 3.80 0.007 10
09/09/2020 7.67 269 2536 1815 89 420 186 45.2 13.5 <0.09 16.7 1763 0.02 0.22 <0.01 0.19 0.03 1.46 7.89 9.71 <0.03 0.28 15.00 7.54 6.72 1.80 0.01 4
Exxaro Leeuwpan
WUL Limit
Process Water
General Authorisation Limits
KR04
LSW09
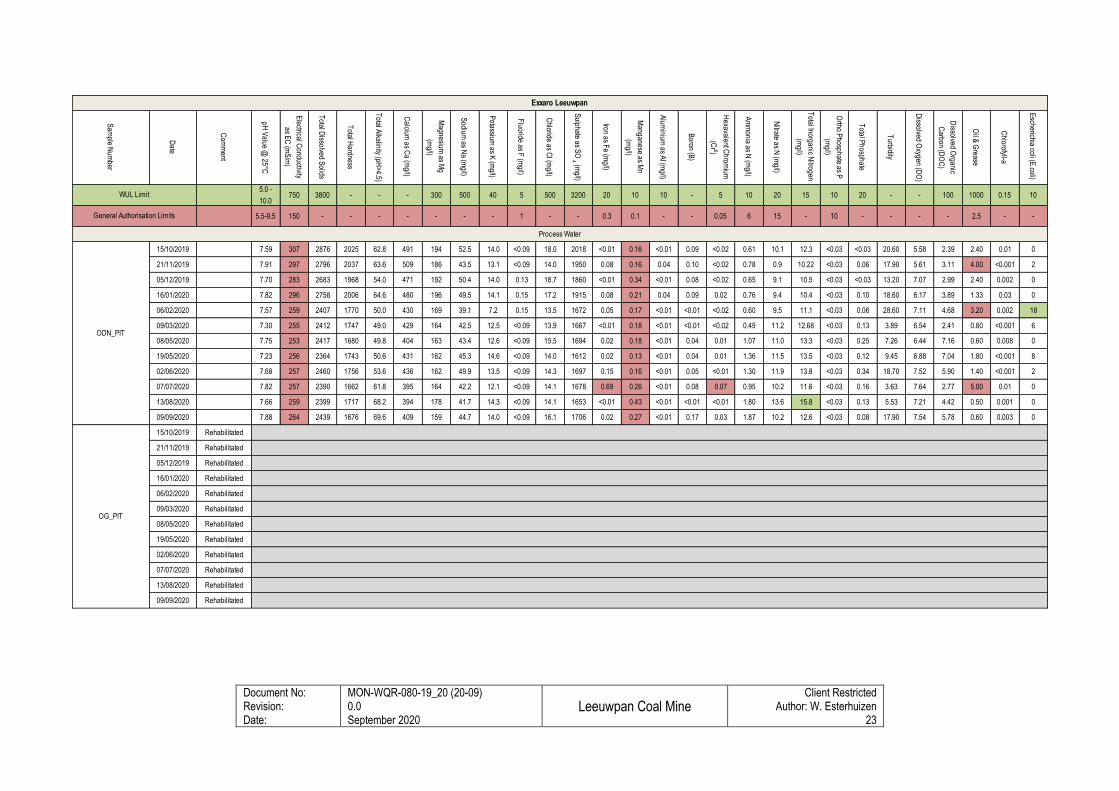
Document No: Revision: Date:
MON-WQR-080-19_20 (20-09) 0.0 September 2020
Leeuwpan Coal Mine
Client Restricted Author: W. Esterhuizen
23
Sam
ple Num
ber
Date
Com
ment
pH V
alue @ 25°C
Electrical C
onductivity
as EC
(mS
/m)
Total D
issolved Solids
Total H
ardness
Total A
lkalinity (pH>4.5)
Calcium
as Ca (m
g/l)
Magnesium
as Mg
(mg/l)
Sodium
as Na (m
g/l)
Potassium
as K (m
g/l)
Fluoride as F
(mg/l)
Chloride as C
l (mg/l)
Sulphate as S
O 4 (m
g/l)
Iron as Fe (m
g/l)
Manganese as M
n
(mg/l)
Alum
inium as A
l (mg/l)
Boron (B
)
Hexavalent C
hromium
(Cr 6)
Am
monia as N
(mg/l)
Nitrate as N
(mg/l)
Total Inorganic N
itrogen
(mg/l)
Ortho P
hosphate as P
(mg/l)
Total P
hosphate
Turbidity
Dissolved O
xygen (DO
)
Dissolved O
rganic
Carbon (D
OC
)
Oil &
Grease
Chlorofyll-a
Escherichia coli (E
.coli)
5.0 -
10.0 750 3800 - - - 300 500 40 5 500 3200 20 10 10 - 5 10 20 15 10 20 - - 100 1000 0.15 10
5.5-9.5 150 - - - - - - - 1 - - 0.3 0.1 - - 0.05 6 15 - 10 - - - - 2.5 - -
15/10/2019 7.59 307 2876 2025 62.8 491 194 52.5 14.0 <0.09 18.0 2018 <0.01 0.16 <0.01 0.09 <0.02 0.61 10.1 12.3 <0.03 <0.03 20.60 5.58 2.39 2.40 0.01 0
21/11/2019 7.91 297 2796 2037 63.6 509 186 43.5 13.1 <0.09 14.0 1950 0.08 0.16 0.04 0.10 <0.02 0.78 0.9 10.22 <0.03 0.06 17.90 5.61 3.11 4.00 <0.001 2
05/12/2019 7.70 283 2683 1968 54.0 471 192 50.4 14.0 0.13 18.7 1860 <0.01 0.34 <0.01 0.08 <0.02 0.65 9.1 10.5 <0.03 <0.03 13.20 7.07 2.99 2.40 0.002 0
16/01/2020 7.82 296 2758 2006 64.6 480 196 49.5 14.1 0.15 17.2 1915 0.08 0.21 0.04 0.09 0.02 0.76 9.4 10.4 <0.03 0.10 18.60 6.17 3.89 1.33 0.03 0
06/02/2020 7.57 259 2407 1770 50.0 430 169 39.1 7.2 0.15 13.5 1672 0.05 0.17 <0.01 <0.01 <0.02 0.60 9.5 11.1 <0.03 0.06 28.60 7.11 4.68 3.20 0.002 18
09/03/2020 7.30 255 2412 1747 49.0 429 164 42.5 12.5 <0.09 13.9 1667 <0.01 0.18 <0.01 <0.01 <0.02 0.49 11.2 12.68 <0.03 0.13 3.89 6.54 2.41 0.80 <0.001 6
08/05/2020 7.75 253 2417 1680 49.8 404 163 43.4 12.6 <0.09 15.5 1694 0.02 0.18 <0.01 0.04 0.01 1.07 11.0 13.3 <0.03 0.25 7.26 6.44 7.16 0.60 0.008 0
19/05/2020 7.23 256 2364 1743 50.6 431 162 45.3 14.6 <0.09 14.0 1612 0.02 0.13 <0.01 0.04 0.01 1.36 11.5 13.5 <0.03 0.12 9.45 6.88 7.04 1.80 <0.001 8
02/06/2020 7.68 257 2460 1756 53.6 436 162 49.9 13.5 <0.09 14.3 1697 0.15 0.16 <0.01 0.05 <0.01 1.30 11.9 13.8 <0.03 0.34 18.70 7.52 5.90 1.40 <0.001 2
07/07/2020 7.82 257 2390 1662 61.8 395 164 42.2 12.1 <0.09 14.1 1678 0.69 0.26 <0.01 0.08 0.07 0.95 10.2 11.6 <0.03 0.16 3.63 7.64 2.77 5.00 0.01 0
13/08/2020 7.66 259 2399 1717 68.2 394 178 41.7 14.3 <0.09 14.1 1653 <0.01 0.43 <0.01 <0.01 <0.01 1.80 13.6 15.8 <0.03 0.13 5.53 7.21 4.42 0.50 0.001 0
09/09/2020 7.88 264 2439 1676 69.6 409 159 44.7 14.0 <0.09 16.1 1706 0.02 0.27 <0.01 0.17 0.03 1.87 10.2 12.6 <0.03 0.08 17.90 7.54 5.78 0.60 0.003 0
15/10/2019 Rehabilitated
21/11/2019 Rehabilitated
05/12/2019 Rehabilitated
16/01/2020 Rehabilitated
06/02/2020 Rehabilitated
09/03/2020 Rehabilitated
08/05/2020 Rehabilitated
19/05/2020 Rehabilitated
02/06/2020 Rehabilitated
07/07/2020 Rehabilitated
13/08/2020 Rehabilitated
09/09/2020 Rehabilitated
Exxaro Leeuwpan
WUL Limit
Process Water
General Authorisation Limits
ODN_PIT
OG_PIT
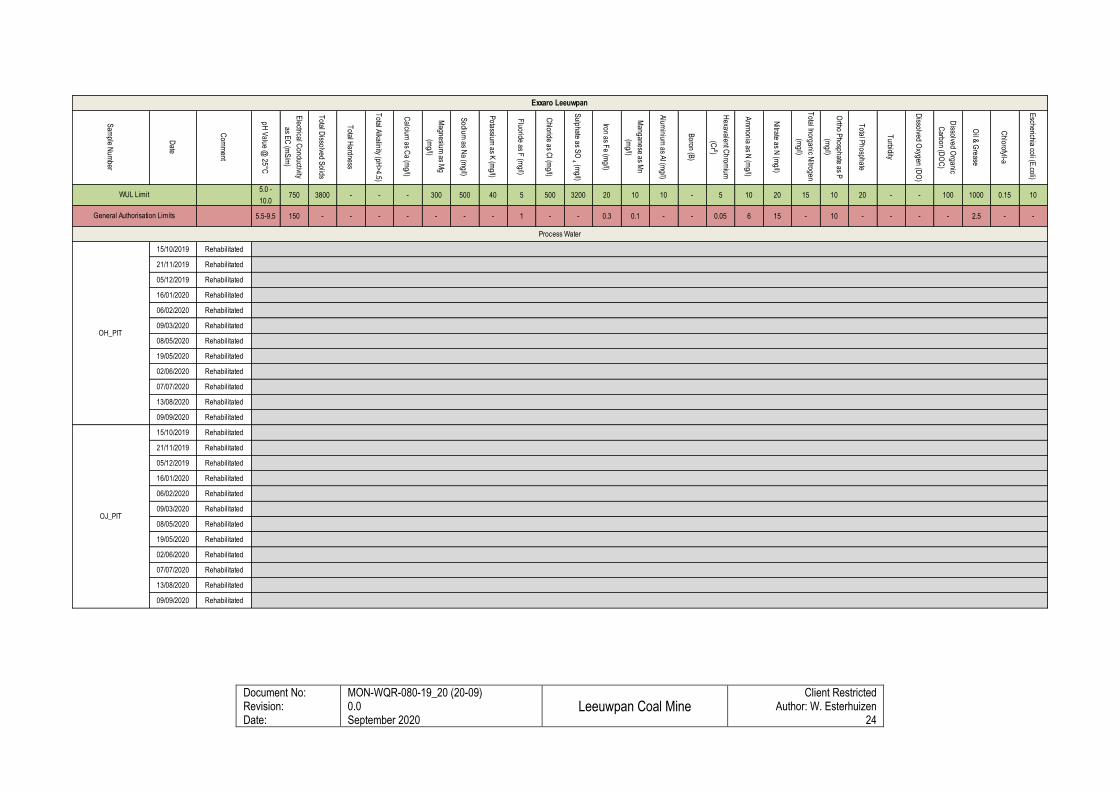
Document No: Revision: Date:
MON-WQR-080-19_20 (20-09) 0.0 September 2020
Leeuwpan Coal Mine
Client Restricted Author: W. Esterhuizen
24
Sam
ple Num
ber
Date
Com
ment
pH V
alue @ 25°C
Electrical C
onductivity
as EC
(mS
/m)
Total D
issolved Solids
Total H
ardness
Total A
lkalinity (pH>4.5)
Calcium
as Ca (m
g/l)
Magnesium
as Mg
(mg/l)
Sodium
as Na (m
g/l)
Potassium
as K (m
g/l)
Fluoride as F
(mg/l)
Chloride as C
l (mg/l)
Sulphate as S
O 4 (m
g/l)
Iron as Fe (m
g/l)
Manganese as M
n
(mg/l)
Alum
inium as A
l (mg/l)
Boron (B
)
Hexavalent C
hromium
(Cr 6)
Am
monia as N
(mg/l)
Nitrate as N
(mg/l)
Total Inorganic N
itrogen
(mg/l)
Ortho P
hosphate as P
(mg/l)
Total P
hosphate
Turbidity
Dissolved O
xygen (DO
)
Dissolved O
rganic
Carbon (D
OC
)
Oil &
Grease
Chlorofyll-a
Escherichia coli (E
.coli)
5.0 -
10.0 750 3800 - - - 300 500 40 5 500 3200 20 10 10 - 5 10 20 15 10 20 - - 100 1000 0.15 10
5.5-9.5 150 - - - - - - - 1 - - 0.3 0.1 - - 0.05 6 15 - 10 - - - - 2.5 - -
15/10/2019 Rehabilitated
21/11/2019 Rehabilitated
05/12/2019 Rehabilitated
16/01/2020 Rehabilitated
06/02/2020 Rehabilitated
09/03/2020 Rehabilitated
08/05/2020 Rehabilitated
19/05/2020 Rehabilitated
02/06/2020 Rehabilitated
07/07/2020 Rehabilitated
13/08/2020 Rehabilitated
09/09/2020 Rehabilitated
15/10/2019 Rehabilitated
21/11/2019 Rehabilitated
05/12/2019 Rehabilitated
16/01/2020 Rehabilitated
06/02/2020 Rehabilitated
09/03/2020 Rehabilitated
08/05/2020 Rehabilitated
19/05/2020 Rehabilitated
02/06/2020 Rehabilitated
07/07/2020 Rehabilitated
13/08/2020 Rehabilitated
09/09/2020 Rehabilitated
Exxaro Leeuwpan
WUL Limit
Process Water
General Authorisation Limits
OH_PIT
OJ_PIT
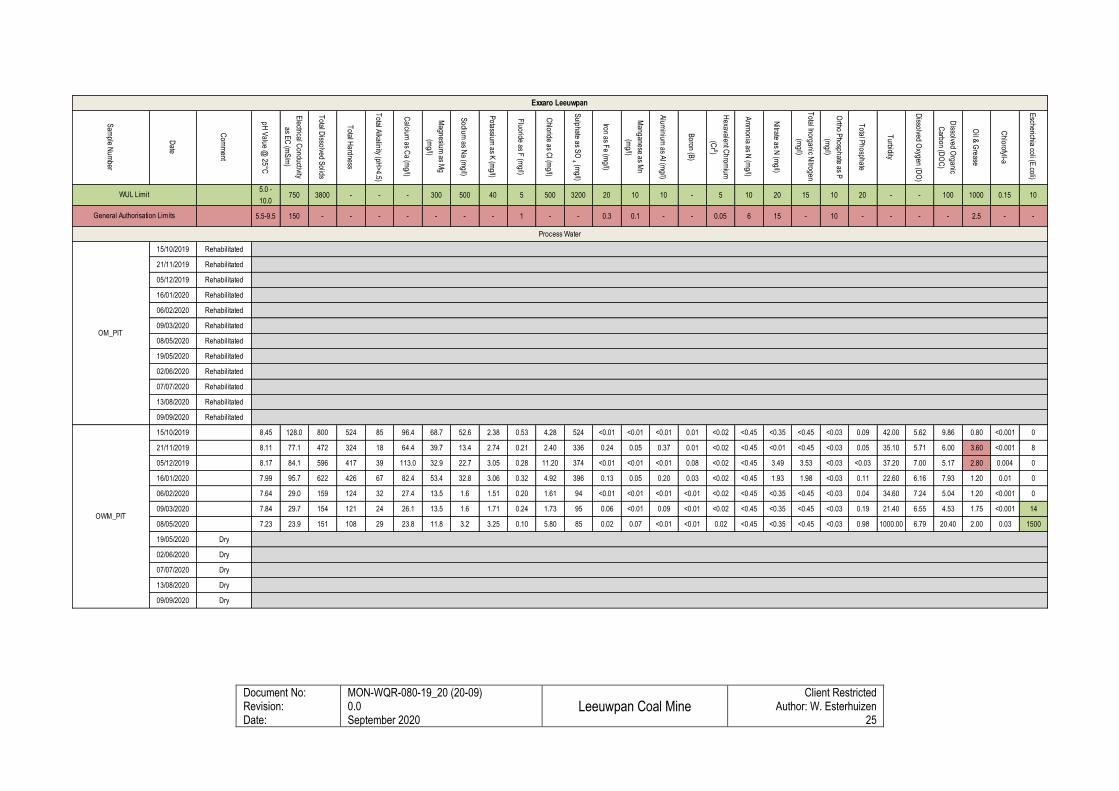
Document No: Revision: Date:
MON-WQR-080-19_20 (20-09) 0.0 September 2020
Leeuwpan Coal Mine
Client Restricted Author: W. Esterhuizen
25
Sam
ple Num
ber
Date
Com
ment
pH V
alue @ 25°C
Electrical C
onductivity
as EC
(mS
/m)
Total D
issolved Solids
Total H
ardness
Total A
lkalinity (pH>4.5)
Calcium
as Ca (m
g/l)
Magnesium
as Mg
(mg/l)
Sodium
as Na (m
g/l)
Potassium
as K (m
g/l)
Fluoride as F
(mg/l)
Chloride as C
l (mg/l)
Sulphate as S
O 4 (m
g/l)
Iron as Fe (m
g/l)
Manganese as M
n
(mg/l)
Alum
inium as A
l (mg/l)
Boron (B
)
Hexavalent C
hromium
(Cr 6)
Am
monia as N
(mg/l)
Nitrate as N
(mg/l)
Total Inorganic N
itrogen
(mg/l)
Ortho P
hosphate as P
(mg/l)
Total P
hosphate
Turbidity
Dissolved O
xygen (DO
)
Dissolved O
rganic
Carbon (D
OC
)
Oil &
Grease
Chlorofyll-a
Escherichia coli (E
.coli)
5.0 -
10.0 750 3800 - - - 300 500 40 5 500 3200 20 10 10 - 5 10 20 15 10 20 - - 100 1000 0.15 10
5.5-9.5 150 - - - - - - - 1 - - 0.3 0.1 - - 0.05 6 15 - 10 - - - - 2.5 - -
15/10/2019 Rehabilitated
21/11/2019 Rehabilitated
05/12/2019 Rehabilitated
16/01/2020 Rehabilitated
06/02/2020 Rehabilitated
09/03/2020 Rehabilitated
08/05/2020 Rehabilitated
19/05/2020 Rehabilitated
02/06/2020 Rehabilitated
07/07/2020 Rehabilitated
13/08/2020 Rehabilitated
09/09/2020 Rehabilitated
15/10/2019 8.45 128.0 800 524 85 96.4 68.7 52.6 2.38 0.53 4.28 524 <0.01 <0.01 <0.01 0.01 <0.02 <0.45 <0.35 <0.45 <0.03 0.09 42.00 5.62 9.86 0.80 <0.001 0
21/11/2019 8.11 77.1 472 324 18 64.4 39.7 13.4 2.74 0.21 2.40 336 0.24 0.05 0.37 0.01 <0.02 <0.45 <0.01 <0.45 <0.03 0.05 35.10 5.71 6.00 3.60 <0.001 8
05/12/2019 8.17 84.1 596 417 39 113.0 32.9 22.7 3.05 0.28 11.20 374 <0.01 <0.01 <0.01 0.08 <0.02 <0.45 3.49 3.53 <0.03 <0.03 37.20 7.00 5.17 2.80 0.004 0
16/01/2020 7.99 95.7 622 426 67 82.4 53.4 32.8 3.06 0.32 4.92 396 0.13 0.05 0.20 0.03 <0.02 <0.45 1.93 1.98 <0.03 0.11 22.60 6.16 7.93 1.20 0.01 0
06/02/2020 7.64 29.0 159 124 32 27.4 13.5 1.6 1.51 0.20 1.61 94 <0.01 <0.01 <0.01 <0.01 <0.02 <0.45 <0.35 <0.45 <0.03 0.04 34.60 7.24 5.04 1.20 <0.001 0
09/03/2020 7.84 29.7 154 121 24 26.1 13.5 1.6 1.71 0.24 1.73 95 0.06 <0.01 0.09 <0.01 <0.02 <0.45 <0.35 <0.45 <0.03 0.19 21.40 6.55 4.53 1.75 <0.001 14
08/05/2020 7.23 23.9 151 108 29 23.8 11.8 3.2 3.25 0.10 5.80 85 0.02 0.07 <0.01 <0.01 0.02 <0.45 <0.35 <0.45 <0.03 0.98 1000.00 6.79 20.40 2.00 0.03 1500
19/05/2020 Dry
02/06/2020 Dry
07/07/2020 Dry
13/08/2020 Dry
09/09/2020 Dry
Exxaro Leeuwpan
WUL Limit
Process Water
General Authorisation Limits
OM_PIT
OWM_PIT
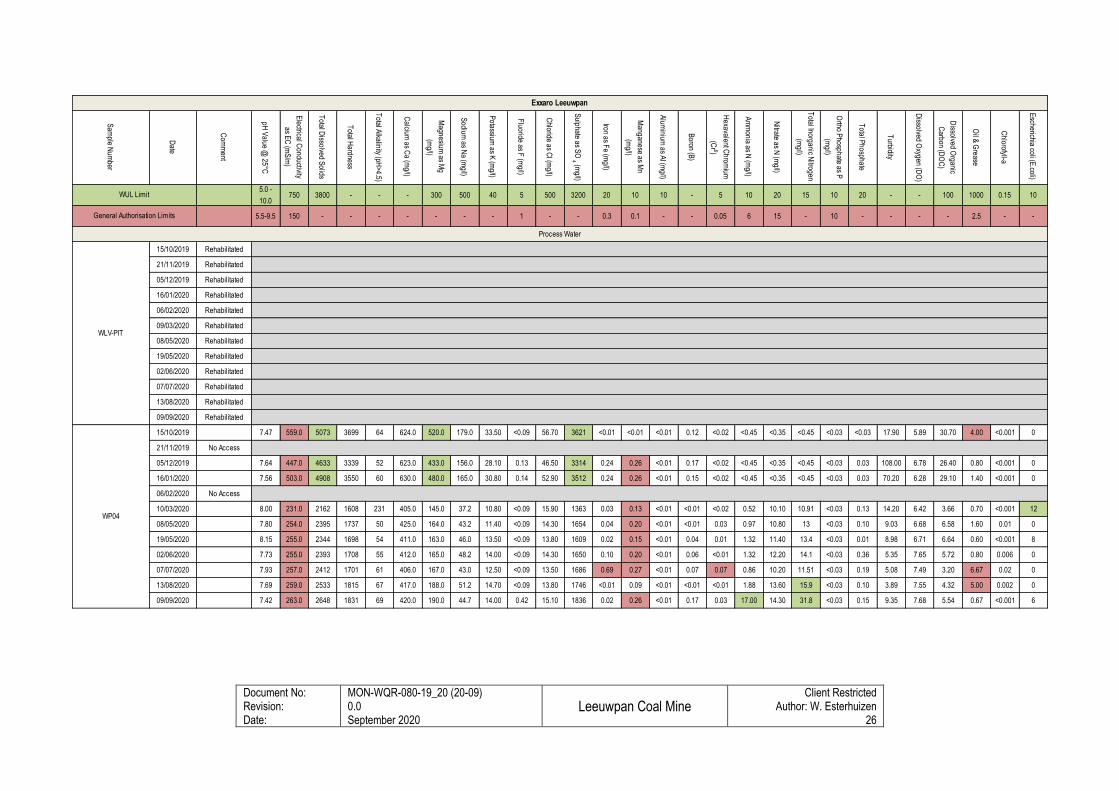
Document No: Revision: Date:
MON-WQR-080-19_20 (20-09) 0.0 September 2020
Leeuwpan Coal Mine
Client Restricted Author: W. Esterhuizen
26
Sam
ple Num
ber
Date
Com
ment
pH V
alue @ 25°C
Electrical C
onductivity
as EC
(mS
/m)
Total D
issolved Solids
Total H
ardness
Total A
lkalinity (pH>4.5)
Calcium
as Ca (m
g/l)
Magnesium
as Mg
(mg/l)
Sodium
as Na (m
g/l)
Potassium
as K (m
g/l)
Fluoride as F
(mg/l)
Chloride as C
l (mg/l)
Sulphate as S
O 4 (m
g/l)
Iron as Fe (m
g/l)
Manganese as M
n
(mg/l)
Alum
inium as A
l (mg/l)
Boron (B
)
Hexavalent C
hromium
(Cr 6)
Am
monia as N
(mg/l)
Nitrate as N
(mg/l)
Total Inorganic N
itrogen
(mg/l)
Ortho P
hosphate as P
(mg/l)
Total P
hosphate
Turbidity
Dissolved O
xygen (DO
)
Dissolved O
rganic
Carbon (D
OC
)
Oil &
Grease
Chlorofyll-a
Escherichia coli (E
.coli)
5.0 -
10.0 750 3800 - - - 300 500 40 5 500 3200 20 10 10 - 5 10 20 15 10 20 - - 100 1000 0.15 10
5.5-9.5 150 - - - - - - - 1 - - 0.3 0.1 - - 0.05 6 15 - 10 - - - - 2.5 - -
15/10/2019 Rehabilitated
21/11/2019 Rehabilitated
05/12/2019 Rehabilitated
16/01/2020 Rehabilitated
06/02/2020 Rehabilitated
09/03/2020 Rehabilitated
08/05/2020 Rehabilitated
19/05/2020 Rehabilitated
02/06/2020 Rehabilitated
07/07/2020 Rehabilitated
13/08/2020 Rehabilitated
09/09/2020 Rehabilitated
15/10/2019 7.47 559.0 5073 3699 64 624.0 520.0 179.0 33.50 <0.09 56.70 3621 <0.01 <0.01 <0.01 0.12 <0.02 <0.45 <0.35 <0.45 <0.03 <0.03 17.90 5.89 30.70 4.00 <0.001 0
21/11/2019 No Access
05/12/2019 7.64 447.0 4633 3339 52 623.0 433.0 156.0 28.10 0.13 46.50 3314 0.24 0.26 <0.01 0.17 <0.02 <0.45 <0.35 <0.45 <0.03 0.03 108.00 6.78 26.40 0.80 <0.001 0
16/01/2020 7.56 503.0 4908 3550 60 630.0 480.0 165.0 30.80 0.14 52.90 3512 0.24 0.26 <0.01 0.15 <0.02 <0.45 <0.35 <0.45 <0.03 0.03 70.20 6.28 29.10 1.40 <0.001 0
06/02/2020 No Access
10/03/2020 8.00 231.0 2162 1608 231 405.0 145.0 37.2 10.80 <0.09 15.90 1363 0.03 0.13 <0.01 <0.01 <0.02 0.52 10.10 10.91 <0.03 0.13 14.20 6.42 3.66 0.70 <0.001 12
08/05/2020 7.80 254.0 2395 1737 50 425.0 164.0 43.2 11.40 <0.09 14.30 1654 0.04 0.20 <0.01 <0.01 0.03 0.97 10.80 13 <0.03 0.10 9.03 6.68 6.58 1.60 0.01 0
19/05/2020 8.15 255.0 2344 1698 54 411.0 163.0 46.0 13.50 <0.09 13.80 1609 0.02 0.15 <0.01 0.04 0.01 1.32 11.40 13.4 <0.03 0.01 8.98 6.71 6.64 0.60 <0.001 8
02/06/2020 7.73 255.0 2393 1708 55 412.0 165.0 48.2 14.00 <0.09 14.30 1650 0.10 0.20 <0.01 0.06 <0.01 1.32 12.20 14.1 <0.03 0.36 5.35 7.65 5.72 0.80 0.006 0
07/07/2020 7.93 257.0 2412 1701 61 406.0 167.0 43.0 12.50 <0.09 13.50 1686 0.69 0.27 <0.01 0.07 0.07 0.86 10.20 11.51 <0.03 0.19 5.08 7.49 3.20 6.67 0.02 0
13/08/2020 7.69 259.0 2533 1815 67 417.0 188.0 51.2 14.70 <0.09 13.80 1746 <0.01 0.09 <0.01 <0.01 <0.01 1.88 13.60 15.9 <0.03 0.10 3.89 7.55 4.32 5.00 0.002 0
09/09/2020 7.42 263.0 2648 1831 69 420.0 190.0 44.7 14.00 0.42 15.10 1836 0.02 0.26 <0.01 0.17 0.03 17.00 14.30 31.8 <0.03 0.15 9.35 7.68 5.54 0.67 <0.001 6
Exxaro Leeuwpan
WUL Limit
Process Water
General Authorisation Limits
WLV-PIT
WP04
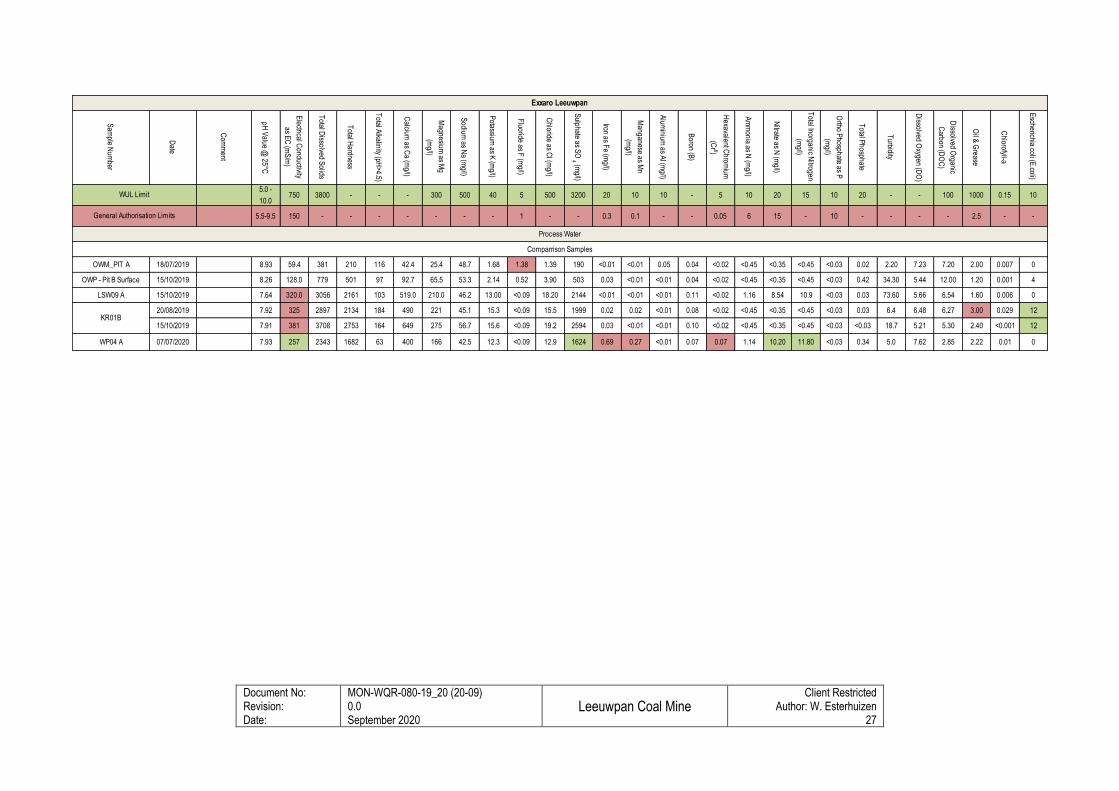
Document No: Revision: Date:
MON-WQR-080-19_20 (20-09) 0.0 September 2020
Leeuwpan Coal Mine
Client Restricted Author: W. Esterhuizen
27
Sam
ple Num
ber
Date
Com
ment
pH V
alue @ 25°C
Electrical C
onductivity
as EC
(mS
/m)
Total D
issolved Solids
Total H
ardness
Total A
lkalinity (pH>4.5)
Calcium
as Ca (m
g/l)
Magnesium
as Mg
(mg/l)
Sodium
as Na (m
g/l)
Potassium
as K (m
g/l)
Fluoride as F
(mg/l)
Chloride as C
l (mg/l)
Sulphate as S
O 4 (m
g/l)
Iron as Fe (m
g/l)
Manganese as M
n
(mg/l)
Alum
inium as A
l (mg/l)
Boron (B
)
Hexavalent C
hromium
(Cr 6)
Am
monia as N
(mg/l)
Nitrate as N
(mg/l)
Total Inorganic N
itrogen
(mg/l)
Ortho P
hosphate as P
(mg/l)
Total P
hosphate
Turbidity
Dissolved O
xygen (DO
)
Dissolved O
rganic
Carbon (D
OC
)
Oil &
Grease
Chlorofyll-a
Escherichia coli (E
.coli)
5.0 -
10.0 750 3800 - - - 300 500 40 5 500 3200 20 10 10 - 5 10 20 15 10 20 - - 100 1000 0.15 10
5.5-9.5 150 - - - - - - - 1 - - 0.3 0.1 - - 0.05 6 15 - 10 - - - - 2.5 - -
OWM_PIT A 18/07/2019 8.93 59.4 381 210 116 42.4 25.4 48.7 1.68 1.38 1.39 190 <0.01 <0.01 0.05 0.04 <0.02 <0.45 <0.35 <0.45 <0.03 0.02 2.20 7.23 7.20 2.00 0.007 0
OWP - Pit B Surface 15/10/2019 8.26 128.0 779 501 97 92.7 65.5 53.3 2.14 0.52 3.90 503 0.03 <0.01 <0.01 0.04 <0.02 <0.45 <0.35 <0.45 <0.03 0.42 34.30 5.44 12.00 1.20 0.001 4
LSW09 A 15/10/2019 7.64 320.0 3056 2161 103 519.0 210.0 46.2 13.00 <0.09 18.20 2144 <0.01 <0.01 <0.01 0.11 <0.02 1.16 8.54 10.9 <0.03 0.03 73.60 5.66 6.54 1.60 0.006 0
20/08/2019 7.92 325 2897 2134 184 490 221 45.1 15.3 <0.09 15.5 1999 0.02 0.02 <0.01 0.08 <0.02 <0.45 <0.35 <0.45 <0.03 0.03 6.4 6.48 6.27 3.00 0.029 12
15/10/2019 7.91 381 3708 2753 164 649 275 56.7 15.6 <0.09 19.2 2594 0.03 <0.01 <0.01 0.10 <0.02 <0.45 <0.35 <0.45 <0.03 <0.03 18.7 5.21 5.30 2.40 <0.001 12
WP04 A 07/07/2020 7.93 257 2343 1682 63 400 166 42.5 12.3 <0.09 12.9 1624 0.69 0.27 <0.01 0.07 0.07 1.14 10.20 11.80 <0.03 0.34 5.0 7.62 2.85 2.22 0.01 0
KR01B
Exxaro Leeuwpan
WUL Limit
Process Water
General Authorisation Limits
Comparrison Samples
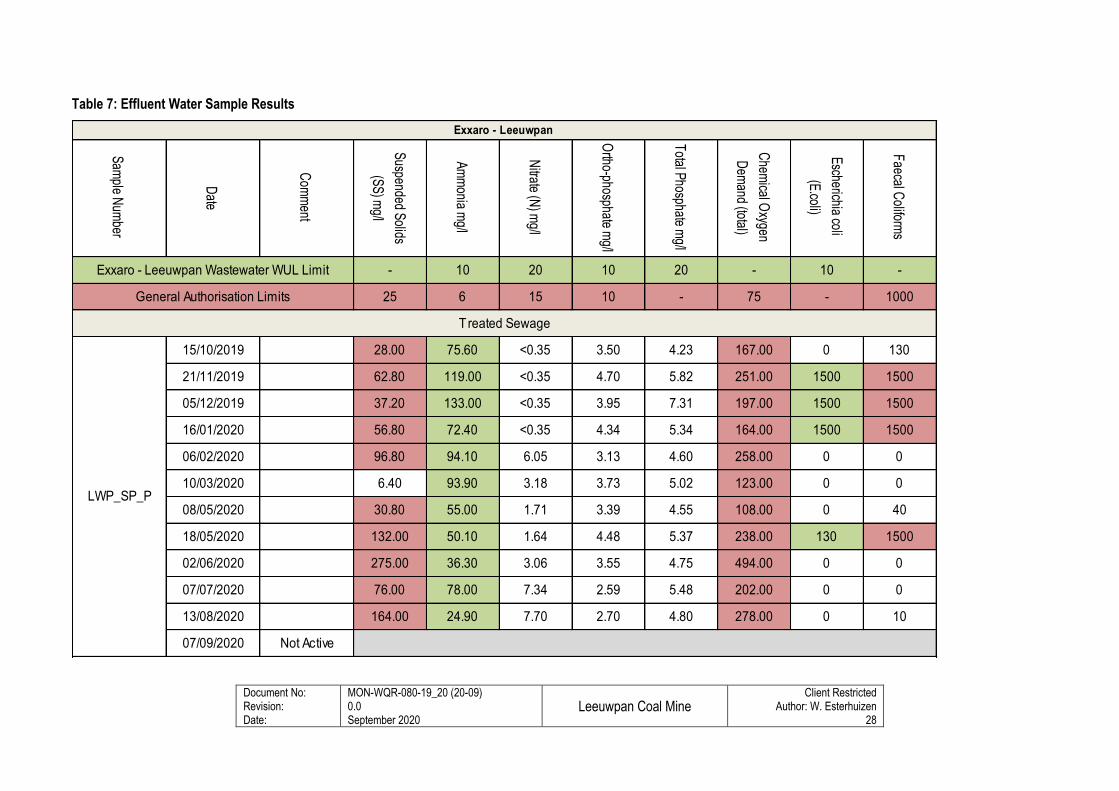
Document No: Revision: Date:
MON-WQR-080-19_20 (20-09) 0.0 September 2020
Leeuwpan Coal Mine
Client Restricted Author: W. Esterhuizen
28
Table 7: Effluent Water Sample Results
Sam
ple Num
ber
Date
Com
ment
Suspended S
olids
(SS
) mg/l
Am
monia m
g/l
Nitrate (N
) mg/l
Ortho-phosphate m
g/l
Total P
hosphate mg/l
Chem
ical Oxygen
Dem
and (total)
Escherichia coli
(E.coli)
Faecal C
oliforms
- 10 20 10 20 - 10 -
25 6 15 10 - 75 - 1000
15/10/2019 28.00 75.60 <0.35 3.50 4.23 167.00 0 130
21/11/2019 62.80 119.00 <0.35 4.70 5.82 251.00 1500 1500
05/12/2019 37.20 133.00 <0.35 3.95 7.31 197.00 1500 1500
16/01/2020 56.80 72.40 <0.35 4.34 5.34 164.00 1500 1500
06/02/2020 96.80 94.10 6.05 3.13 4.60 258.00 0 0
10/03/2020 6.40 93.90 3.18 3.73 5.02 123.00 0 0
08/05/2020 30.80 55.00 1.71 3.39 4.55 108.00 0 40
18/05/2020 132.00 50.10 1.64 4.48 5.37 238.00 130 1500
02/06/2020 275.00 36.30 3.06 3.55 4.75 494.00 0 0
07/07/2020 76.00 78.00 7.34 2.59 5.48 202.00 0 0
13/08/2020 164.00 24.90 7.70 2.70 4.80 278.00 0 10
07/09/2020 Not Active
Treated Sewage
General Authorisation Limits
LWP_SP_P
Exxaro - Leeuwpan
Exxaro - Leeuwpan Wastewater WUL Limit
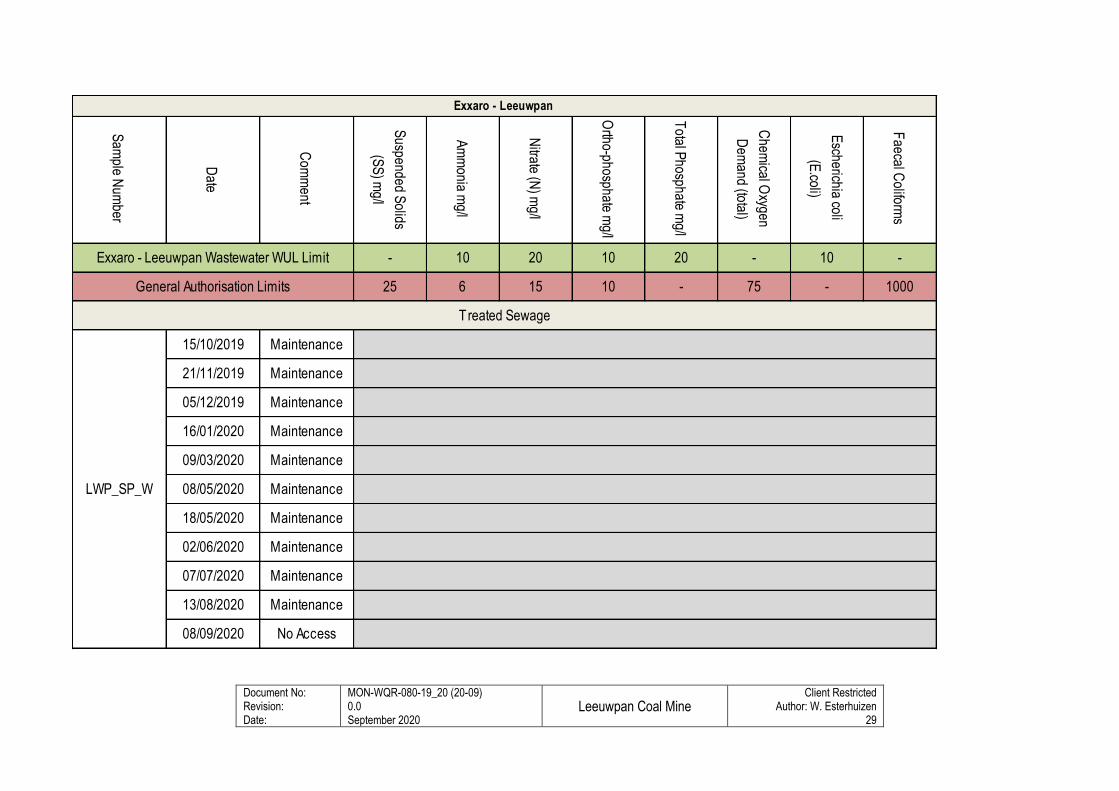
Document No: Revision: Date:
MON-WQR-080-19_20 (20-09) 0.0 September 2020
Leeuwpan Coal Mine
Client Restricted Author: W. Esterhuizen
29
Sam
ple Num
ber
Date
Com
ment
Suspended S
olids
(SS
) mg/l
Am
monia m
g/l
Nitrate (N
) mg/l
Ortho-phosphate m
g/l
Total P
hosphate mg/l
Chem
ical Oxygen
Dem
and (total)
Escherichia coli
(E.coli)
Faecal C
oliforms
- 10 20 10 20 - 10 -
25 6 15 10 - 75 - 1000
15/10/2019 Maintenance
21/11/2019 Maintenance
05/12/2019 Maintenance
16/01/2020 Maintenance
09/03/2020 Maintenance
08/05/2020 Maintenance
18/05/2020 Maintenance
02/06/2020 Maintenance
07/07/2020 Maintenance
13/08/2020 Maintenance
08/09/2020 No Access
Treated Sewage
General Authorisation Limits
LWP_SP_W
Exxaro - Leeuwpan
Exxaro - Leeuwpan Wastewater WUL Limit
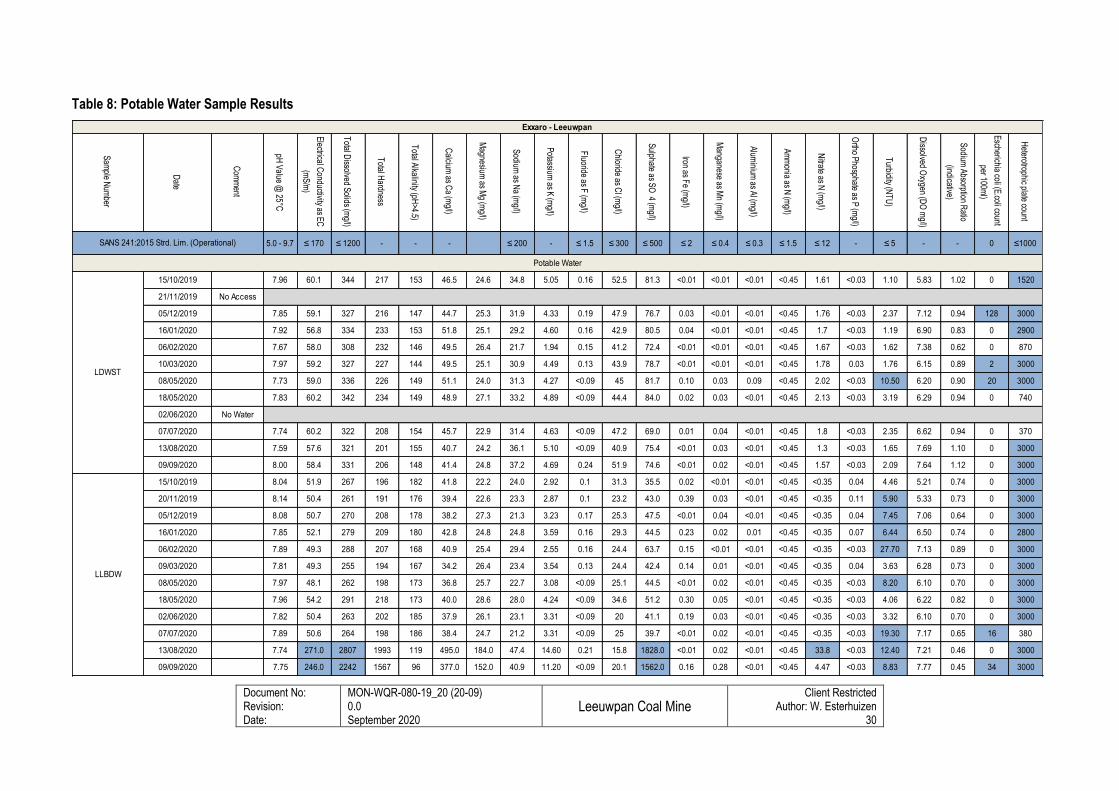
Document No: Revision: Date:
MON-WQR-080-19_20 (20-09) 0.0 September 2020
Leeuwpan Coal Mine
Client Restricted Author: W. Esterhuizen
30
Table 8: Potable Water Sample Results
Sam
ple Num
ber
Date
Com
ment
pH V
alue @ 25°C
Electrical C
onductivity as EC
(mS
/m)
Total D
issolved Solids (m
g/l)
Total H
ardness
Total A
lkalinity (pH>4.5)
Calcium
as Ca (m
g/l)
Magnesium
as Mg (m
g/l)
Sodium
as Na (m
g/l)
Potassium
as K (m
g/l)
Fluoride as F
(mg/l)
Chloride as C
l (mg/l)
Sulphate as S
O 4 (m
g/l)
Iron as Fe (m
g/l)
Manganese as M
n (mg/l)
Alum
inium as A
l (mg/l)
Am
monia as N
(mg/l)
Nitrate as N
(mg/l)
Ortho P
hosphate as P (m
g/l)
Turbidity (N
TU
)
Dissolved O
xygen (DO
mg/l)
Sodium
Absorption R
atio
(indicative)
Escherichia coli (E
.coli count
per 100ml)
Heterotrophic plate count
5.0 - 9.7 ≤ 170 ≤ 1200 - - - ≤ 200 - ≤ 1.5 ≤ 300 ≤ 500 ≤ 2 ≤ 0.4 ≤ 0.3 ≤ 1.5 ≤ 12 - ≤ 5 - - 0 ≤1000
15/10/2019 7.96 60.1 344 217 153 46.5 24.6 34.8 5.05 0.16 52.5 81.3 <0.01 <0.01 <0.01 <0.45 1.61 <0.03 1.10 5.83 1.02 0 1520
21/11/2019 No Access
05/12/2019 7.85 59.1 327 216 147 44.7 25.3 31.9 4.33 0.19 47.9 76.7 0.03 <0.01 <0.01 <0.45 1.76 <0.03 2.37 7.12 0.94 128 3000
16/01/2020 7.92 56.8 334 233 153 51.8 25.1 29.2 4.60 0.16 42.9 80.5 0.04 <0.01 <0.01 <0.45 1.7 <0.03 1.19 6.90 0.83 0 2900
06/02/2020 7.67 58.0 308 232 146 49.5 26.4 21.7 1.94 0.15 41.2 72.4 <0.01 <0.01 <0.01 <0.45 1.67 <0.03 1.62 7.38 0.62 0 870
10/03/2020 7.97 59.2 327 227 144 49.5 25.1 30.9 4.49 0.13 43.9 78.7 <0.01 <0.01 <0.01 <0.45 1.78 0.03 1.76 6.15 0.89 2 3000
08/05/2020 7.73 59.0 336 226 149 51.1 24.0 31.3 4.27 <0.09 45 81.7 0.10 0.03 0.09 <0.45 2.02 <0.03 10.50 6.20 0.90 20 3000
18/05/2020 7.83 60.2 342 234 149 48.9 27.1 33.2 4.89 <0.09 44.4 84.0 0.02 0.03 <0.01 <0.45 2.13 <0.03 3.19 6.29 0.94 0 740
02/06/2020 No Water
07/07/2020 7.74 60.2 322 208 154 45.7 22.9 31.4 4.63 <0.09 47.2 69.0 0.01 0.04 <0.01 <0.45 1.8 <0.03 2.35 6.62 0.94 0 370
13/08/2020 7.59 57.6 321 201 155 40.7 24.2 36.1 5.10 <0.09 40.9 75.4 <0.01 0.03 <0.01 <0.45 1.3 <0.03 1.65 7.69 1.10 0 3000
09/09/2020 8.00 58.4 331 206 148 41.4 24.8 37.2 4.69 0.24 51.9 74.6 <0.01 0.02 <0.01 <0.45 1.57 <0.03 2.09 7.64 1.12 0 3000
15/10/2019 8.04 51.9 267 196 182 41.8 22.2 24.0 2.92 0.1 31.3 35.5 0.02 <0.01 <0.01 <0.45 <0.35 0.04 4.46 5.21 0.74 0 3000
20/11/2019 8.14 50.4 261 191 176 39.4 22.6 23.3 2.87 0.1 23.2 43.0 0.39 0.03 <0.01 <0.45 <0.35 0.11 5.90 5.33 0.73 0 3000
05/12/2019 8.08 50.7 270 208 178 38.2 27.3 21.3 3.23 0.17 25.3 47.5 <0.01 0.04 <0.01 <0.45 <0.35 0.04 7.45 7.06 0.64 0 3000
16/01/2020 7.85 52.1 279 209 180 42.8 24.8 24.8 3.59 0.16 29.3 44.5 0.23 0.02 0.01 <0.45 <0.35 0.07 6.44 6.50 0.74 0 2800
06/02/2020 7.89 49.3 288 207 168 40.9 25.4 29.4 2.55 0.16 24.4 63.7 0.15 <0.01 <0.01 <0.45 <0.35 <0.03 27.70 7.13 0.89 0 3000
09/03/2020 7.81 49.3 255 194 167 34.2 26.4 23.4 3.54 0.13 24.4 42.4 0.14 0.01 <0.01 <0.45 <0.35 0.04 3.63 6.28 0.73 0 3000
08/05/2020 7.97 48.1 262 198 173 36.8 25.7 22.7 3.08 <0.09 25.1 44.5 <0.01 0.02 <0.01 <0.45 <0.35 <0.03 8.20 6.10 0.70 0 3000
18/05/2020 7.96 54.2 291 218 173 40.0 28.6 28.0 4.24 <0.09 34.6 51.2 0.30 0.05 <0.01 <0.45 <0.35 <0.03 4.06 6.22 0.82 0 3000
02/06/2020 7.82 50.4 263 202 185 37.9 26.1 23.1 3.31 <0.09 20 41.1 0.19 0.03 <0.01 <0.45 <0.35 <0.03 3.32 6.10 0.70 0 3000
07/07/2020 7.89 50.6 264 198 186 38.4 24.7 21.2 3.31 <0.09 25 39.7 <0.01 0.02 <0.01 <0.45 <0.35 <0.03 19.30 7.17 0.65 16 380
13/08/2020 7.74 271.0 2807 1993 119 495.0 184.0 47.4 14.60 0.21 15.8 1828.0 <0.01 0.02 <0.01 <0.45 33.8 <0.03 12.40 7.21 0.46 0 3000
09/09/2020 7.75 246.0 2242 1567 96 377.0 152.0 40.9 11.20 <0.09 20.1 1562.0 0.16 0.28 <0.01 <0.45 4.47 <0.03 8.83 7.77 0.45 34 3000
LDWST
Potable Water
SANS 241:2015 Strd. Lim. (Operational)
Exxaro - Leeuwpan
LLBDW
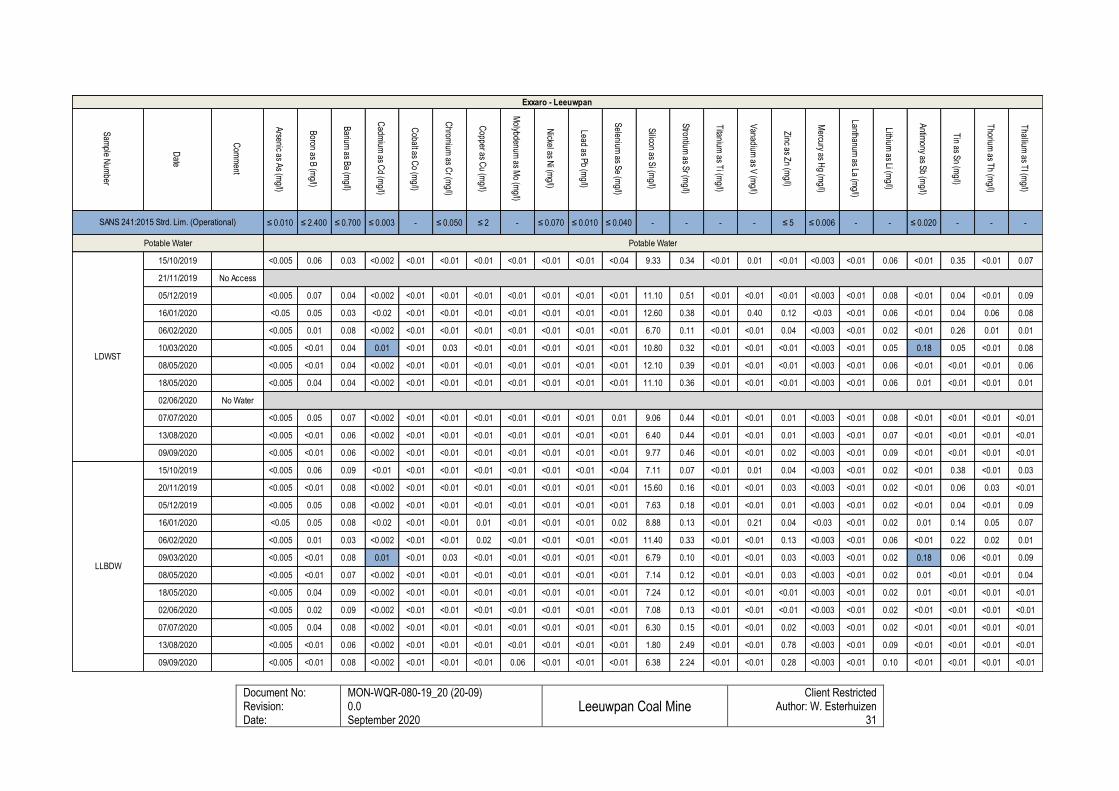
Document No: Revision: Date:
MON-WQR-080-19_20 (20-09) 0.0 September 2020
Leeuwpan Coal Mine
Client Restricted Author: W. Esterhuizen
31
Sam
ple Num
ber
Date
Com
ment
Arsenic as A
s (mg/l)
Boron as B
(mg/l)
Barium
as Ba (m
g/l)
Cadm
ium as C
d (mg/l)
Cobalt as C
o (mg/l)
Chrom
ium as C
r (mg/l)
Copper as C
u (mg/l)
Molybdenum
as Mo (m
g/l)
Nickel as N
i (mg/l)
Lead as Pb (m
g/l)
Selenium
as Se (m
g/l)
Silicon as S
i (mg/l)
Strontium
as Sr (m
g/l)
Titanium
as Ti (m
g/l)
Vanadium
as V (m
g/l)
Zinc as Z
n (mg/l)
Mercury as H
g (mg/l)
Lanthanum as La (m
g/l)
Lithium as Li (m
g/l)
Antim
ony as Sb (m
g/l)
Tin as S
n (mg/l)
Thorium
as Th (m
g/l)
Thallium
as Tl (m
g/l)
≤ 0.010 ≤ 2.400 ≤ 0.700 ≤ 0.003 - ≤ 0.050 ≤ 2 - ≤ 0.070 ≤ 0.010 ≤ 0.040 - - - - ≤ 5 ≤ 0.006 - - ≤ 0.020 - - -
15/10/2019 <0.005 0.06 0.03 <0.002 <0.01 <0.01 <0.01 <0.01 <0.01 <0.01 <0.04 9.33 0.34 <0.01 0.01 <0.01 <0.003 <0.01 0.06 <0.01 0.35 <0.01 0.07
21/11/2019 No Access
05/12/2019 <0.005 0.07 0.04 <0.002 <0.01 <0.01 <0.01 <0.01 <0.01 <0.01 <0.01 11.10 0.51 <0.01 <0.01 <0.01 <0.003 <0.01 0.08 <0.01 0.04 <0.01 0.09
16/01/2020 <0.05 0.05 0.03 <0.02 <0.01 <0.01 <0.01 <0.01 <0.01 <0.01 <0.01 12.60 0.38 <0.01 0.40 0.12 <0.03 <0.01 0.06 <0.01 0.04 0.06 0.08
06/02/2020 <0.005 0.01 0.08 <0.002 <0.01 <0.01 <0.01 <0.01 <0.01 <0.01 <0.01 6.70 0.11 <0.01 <0.01 0.04 <0.003 <0.01 0.02 <0.01 0.26 0.01 0.01
10/03/2020 <0.005 <0.01 0.04 0.01 <0.01 0.03 <0.01 <0.01 <0.01 <0.01 <0.01 10.80 0.32 <0.01 <0.01 <0.01 <0.003 <0.01 0.05 0.18 0.05 <0.01 0.08
08/05/2020 <0.005 <0.01 0.04 <0.002 <0.01 <0.01 <0.01 <0.01 <0.01 <0.01 <0.01 12.10 0.39 <0.01 <0.01 <0.01 <0.003 <0.01 0.06 <0.01 <0.01 <0.01 0.06
18/05/2020 <0.005 0.04 0.04 <0.002 <0.01 <0.01 <0.01 <0.01 <0.01 <0.01 <0.01 11.10 0.36 <0.01 <0.01 <0.01 <0.003 <0.01 0.06 0.01 <0.01 <0.01 0.01
02/06/2020 No Water
07/07/2020 <0.005 0.05 0.07 <0.002 <0.01 <0.01 <0.01 <0.01 <0.01 <0.01 0.01 9.06 0.44 <0.01 <0.01 0.01 <0.003 <0.01 0.08 <0.01 <0.01 <0.01 <0.01
13/08/2020 <0.005 <0.01 0.06 <0.002 <0.01 <0.01 <0.01 <0.01 <0.01 <0.01 <0.01 6.40 0.44 <0.01 <0.01 0.01 <0.003 <0.01 0.07 <0.01 <0.01 <0.01 <0.01
09/09/2020 <0.005 <0.01 0.06 <0.002 <0.01 <0.01 <0.01 <0.01 <0.01 <0.01 <0.01 9.77 0.46 <0.01 <0.01 0.02 <0.003 <0.01 0.09 <0.01 <0.01 <0.01 <0.01
15/10/2019 <0.005 0.06 0.09 <0.01 <0.01 <0.01 <0.01 <0.01 <0.01 <0.01 <0.04 7.11 0.07 <0.01 0.01 0.04 <0.003 <0.01 0.02 <0.01 0.38 <0.01 0.03
20/11/2019 <0.005 <0.01 0.08 <0.002 <0.01 <0.01 <0.01 <0.01 <0.01 <0.01 <0.01 15.60 0.16 <0.01 <0.01 0.03 <0.003 <0.01 0.02 <0.01 0.06 0.03 <0.01
05/12/2019 <0.005 0.05 0.08 <0.002 <0.01 <0.01 <0.01 <0.01 <0.01 <0.01 <0.01 7.63 0.18 <0.01 <0.01 0.01 <0.003 <0.01 0.02 <0.01 0.04 <0.01 0.09
16/01/2020 <0.05 0.05 0.08 <0.02 <0.01 <0.01 0.01 <0.01 <0.01 <0.01 0.02 8.88 0.13 <0.01 0.21 0.04 <0.03 <0.01 0.02 0.01 0.14 0.05 0.07
06/02/2020 <0.005 0.01 0.03 <0.002 <0.01 <0.01 0.02 <0.01 <0.01 <0.01 <0.01 11.40 0.33 <0.01 <0.01 0.13 <0.003 <0.01 0.06 <0.01 0.22 0.02 0.01
09/03/2020 <0.005 <0.01 0.08 0.01 <0.01 0.03 <0.01 <0.01 <0.01 <0.01 <0.01 6.79 0.10 <0.01 <0.01 0.03 <0.003 <0.01 0.02 0.18 0.06 <0.01 0.09
08/05/2020 <0.005 <0.01 0.07 <0.002 <0.01 <0.01 <0.01 <0.01 <0.01 <0.01 <0.01 7.14 0.12 <0.01 <0.01 0.03 <0.003 <0.01 0.02 0.01 <0.01 <0.01 0.04
18/05/2020 <0.005 0.04 0.09 <0.002 <0.01 <0.01 <0.01 <0.01 <0.01 <0.01 <0.01 7.24 0.12 <0.01 <0.01 <0.01 <0.003 <0.01 0.02 0.01 <0.01 <0.01 <0.01
02/06/2020 <0.005 0.02 0.09 <0.002 <0.01 <0.01 <0.01 <0.01 <0.01 <0.01 <0.01 7.08 0.13 <0.01 <0.01 <0.01 <0.003 <0.01 0.02 <0.01 <0.01 <0.01 <0.01
07/07/2020 <0.005 0.04 0.08 <0.002 <0.01 <0.01 <0.01 <0.01 <0.01 <0.01 <0.01 6.30 0.15 <0.01 <0.01 0.02 <0.003 <0.01 0.02 <0.01 <0.01 <0.01 <0.01
13/08/2020 <0.005 <0.01 0.06 <0.002 <0.01 <0.01 <0.01 <0.01 <0.01 <0.01 <0.01 1.80 2.49 <0.01 <0.01 0.78 <0.003 <0.01 0.09 <0.01 <0.01 <0.01 <0.01
09/09/2020 <0.005 <0.01 0.08 <0.002 <0.01 <0.01 <0.01 0.06 <0.01 <0.01 <0.01 6.38 2.24 <0.01 <0.01 0.28 <0.003 <0.01 0.10 <0.01 <0.01 <0.01 <0.01
LDWST
Potable Water Potable Water
SANS 241:2015 Strd. Lim. (Operational)
Exxaro - Leeuwpan
LLBDW
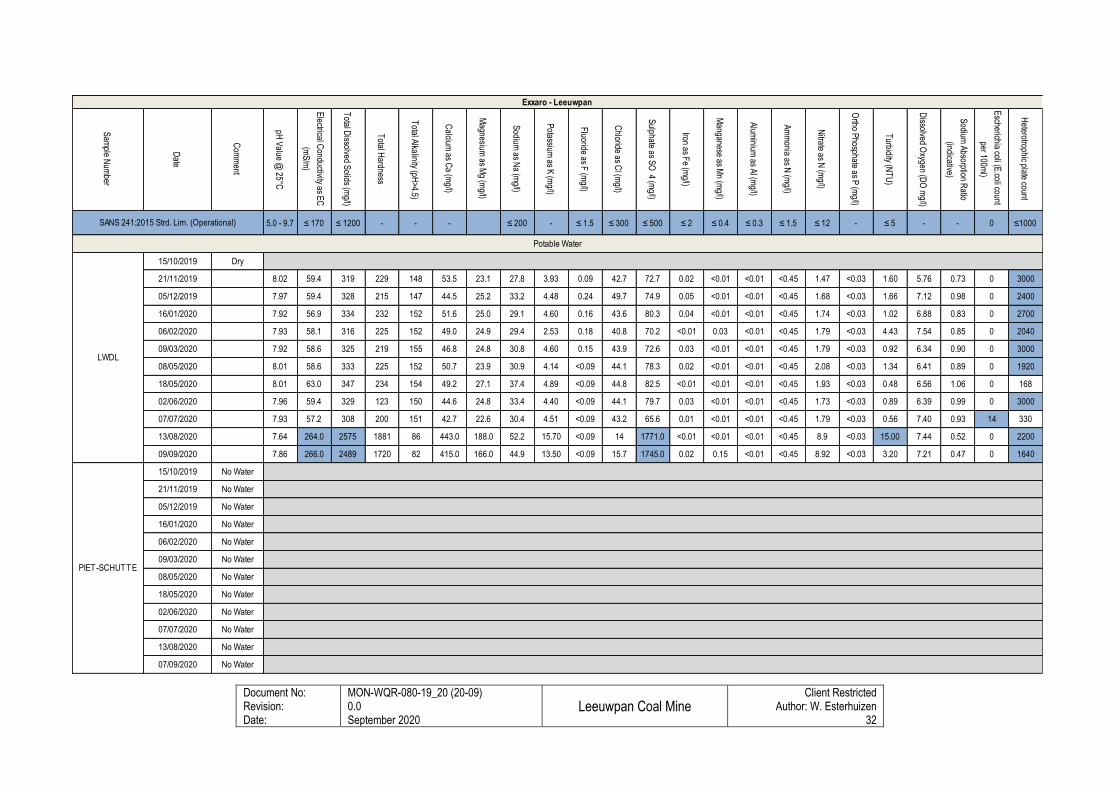
Document No: Revision: Date:
MON-WQR-080-19_20 (20-09) 0.0 September 2020
Leeuwpan Coal Mine
Client Restricted Author: W. Esterhuizen
32
Sam
ple Num
ber
Date
Com
ment
pH V
alue @ 25°C
Electrical C
onductivity as EC
(mS
/m)
Total D
issolved Solids (m
g/l)
Total H
ardness
Total A
lkalinity (pH>4.5)
Calcium
as Ca (m
g/l)
Magnesium
as Mg (m
g/l)
Sodium
as Na (m
g/l)
Potassium
as K (m
g/l)
Fluoride as F
(mg/l)
Chloride as C
l (mg/l)
Sulphate as S
O 4 (m
g/l)
Iron as Fe (m
g/l)
Manganese as M
n (mg/l)
Alum
inium as A
l (mg/l)
Am
monia as N
(mg/l)
Nitrate as N
(mg/l)
Ortho P
hosphate as P (m
g/l)
Turbidity (N
TU
)
Dissolved O
xygen (DO
mg/l)
Sodium
Absorption R
atio
(indicative)
Escherichia coli (E
.coli count
per 100ml)
Heterotrophic plate count
5.0 - 9.7 ≤ 170 ≤ 1200 - - - ≤ 200 - ≤ 1.5 ≤ 300 ≤ 500 ≤ 2 ≤ 0.4 ≤ 0.3 ≤ 1.5 ≤ 12 - ≤ 5 - - 0 ≤1000
15/10/2019 Dry
21/11/2019 8.02 59.4 319 229 148 53.5 23.1 27.8 3.93 0.09 42.7 72.7 0.02 <0.01 <0.01 <0.45 1.47 <0.03 1.60 5.76 0.73 0 3000
05/12/2019 7.97 59.4 328 215 147 44.5 25.2 33.2 4.48 0.24 49.7 74.9 0.05 <0.01 <0.01 <0.45 1.68 <0.03 1.66 7.12 0.98 0 2400
16/01/2020 7.92 56.9 334 232 152 51.6 25.0 29.1 4.60 0.16 43.6 80.3 0.04 <0.01 <0.01 <0.45 1.74 <0.03 1.02 6.88 0.83 0 2700
06/02/2020 7.93 58.1 316 225 152 49.0 24.9 29.4 2.53 0.18 40.8 70.2 <0.01 0.03 <0.01 <0.45 1.79 <0.03 4.43 7.54 0.85 0 2040
09/03/2020 7.92 58.6 325 219 155 46.8 24.8 30.8 4.60 0.15 43.9 72.6 0.03 <0.01 <0.01 <0.45 1.79 <0.03 0.92 6.34 0.90 0 3000
08/05/2020 8.01 58.6 333 225 152 50.7 23.9 30.9 4.14 <0.09 44.1 78.3 0.02 <0.01 <0.01 <0.45 2.08 <0.03 1.34 6.41 0.89 0 1920
18/05/2020 8.01 63.0 347 234 154 49.2 27.1 37.4 4.89 <0.09 44.8 82.5 <0.01 <0.01 <0.01 <0.45 1.93 <0.03 0.48 6.56 1.06 0 168
02/06/2020 7.96 59.4 329 123 150 44.6 24.8 33.4 4.40 <0.09 44.1 79.7 0.03 <0.01 <0.01 <0.45 1.73 <0.03 0.89 6.39 0.99 0 3000
07/07/2020 7.93 57.2 308 200 151 42.7 22.6 30.4 4.51 <0.09 43.2 65.6 0.01 <0.01 <0.01 <0.45 1.79 <0.03 0.56 7.40 0.93 14 330
13/08/2020 7.64 264.0 2575 1881 86 443.0 188.0 52.2 15.70 <0.09 14 1771.0 <0.01 <0.01 <0.01 <0.45 8.9 <0.03 15.00 7.44 0.52 0 2200
09/09/2020 7.86 266.0 2489 1720 82 415.0 166.0 44.9 13.50 <0.09 15.7 1745.0 0.02 0.15 <0.01 <0.45 8.92 <0.03 3.20 7.21 0.47 0 1640
15/10/2019 No Water
21/11/2019 No Water
05/12/2019 No Water
16/01/2020 No Water
06/02/2020 No Water
09/03/2020 No Water
08/05/2020 No Water
18/05/2020 No Water
02/06/2020 No Water
07/07/2020 No Water
13/08/2020 No Water
07/09/2020 No Water
Potable Water
SANS 241:2015 Strd. Lim. (Operational)
Exxaro - Leeuwpan
LWDL
PIET-SCHUTTE
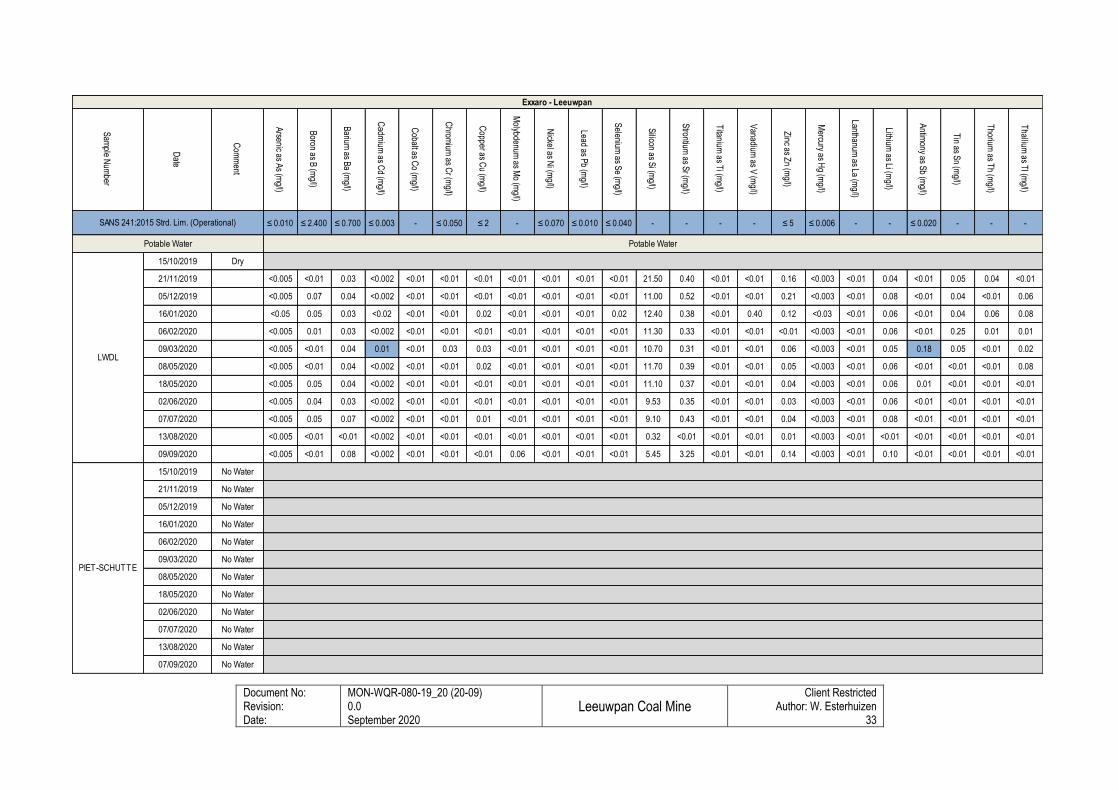
Document No: Revision: Date:
MON-WQR-080-19_20 (20-09) 0.0 September 2020
Leeuwpan Coal Mine
Client Restricted Author: W. Esterhuizen
33
Sam
ple Num
ber
Date
Com
ment
Arsenic as A
s (mg/l)
Boron as B
(mg/l)
Barium
as Ba (m
g/l)
Cadm
ium as C
d (mg/l)
Cobalt as C
o (mg/l)
Chrom
ium as C
r (mg/l)
Copper as C
u (mg/l)
Molybdenum
as Mo (m
g/l)
Nickel as N
i (mg/l)
Lead as Pb (m
g/l)
Selenium
as Se (m
g/l)
Silicon as S
i (mg/l)
Strontium
as Sr (m
g/l)
Titanium
as Ti (m
g/l)
Vanadium
as V (m
g/l)
Zinc as Z
n (mg/l)
Mercury as H
g (mg/l)
Lanthanum as La (m
g/l)
Lithium as Li (m
g/l)
Antim
ony as Sb (m
g/l)
Tin as S
n (mg/l)
Thorium
as Th (m
g/l)
Thallium
as Tl (m
g/l)
≤ 0.010 ≤ 2.400 ≤ 0.700 ≤ 0.003 - ≤ 0.050 ≤ 2 - ≤ 0.070 ≤ 0.010 ≤ 0.040 - - - - ≤ 5 ≤ 0.006 - - ≤ 0.020 - - -
15/10/2019 Dry
21/11/2019 <0.005 <0.01 0.03 <0.002 <0.01 <0.01 <0.01 <0.01 <0.01 <0.01 <0.01 21.50 0.40 <0.01 <0.01 0.16 <0.003 <0.01 0.04 <0.01 0.05 0.04 <0.01
05/12/2019 <0.005 0.07 0.04 <0.002 <0.01 <0.01 <0.01 <0.01 <0.01 <0.01 <0.01 11.00 0.52 <0.01 <0.01 0.21 <0.003 <0.01 0.08 <0.01 0.04 <0.01 0.06
16/01/2020 <0.05 0.05 0.03 <0.02 <0.01 <0.01 0.02 <0.01 <0.01 <0.01 0.02 12.40 0.38 <0.01 0.40 0.12 <0.03 <0.01 0.06 <0.01 0.04 0.06 0.08
06/02/2020 <0.005 0.01 0.03 <0.002 <0.01 <0.01 <0.01 <0.01 <0.01 <0.01 <0.01 11.30 0.33 <0.01 <0.01 <0.01 <0.003 <0.01 0.06 <0.01 0.25 0.01 0.01
09/03/2020 <0.005 <0.01 0.04 0.01 <0.01 0.03 0.03 <0.01 <0.01 <0.01 <0.01 10.70 0.31 <0.01 <0.01 0.06 <0.003 <0.01 0.05 0.18 0.05 <0.01 0.02
08/05/2020 <0.005 <0.01 0.04 <0.002 <0.01 <0.01 0.02 <0.01 <0.01 <0.01 <0.01 11.70 0.39 <0.01 <0.01 0.05 <0.003 <0.01 0.06 <0.01 <0.01 <0.01 0.08
18/05/2020 <0.005 0.05 0.04 <0.002 <0.01 <0.01 <0.01 <0.01 <0.01 <0.01 <0.01 11.10 0.37 <0.01 <0.01 0.04 <0.003 <0.01 0.06 0.01 <0.01 <0.01 <0.01
02/06/2020 <0.005 0.04 0.03 <0.002 <0.01 <0.01 <0.01 <0.01 <0.01 <0.01 <0.01 9.53 0.35 <0.01 <0.01 0.03 <0.003 <0.01 0.06 <0.01 <0.01 <0.01 <0.01
07/07/2020 <0.005 0.05 0.07 <0.002 <0.01 <0.01 0.01 <0.01 <0.01 <0.01 <0.01 9.10 0.43 <0.01 <0.01 0.04 <0.003 <0.01 0.08 <0.01 <0.01 <0.01 <0.01
13/08/2020 <0.005 <0.01 <0.01 <0.002 <0.01 <0.01 <0.01 <0.01 <0.01 <0.01 <0.01 0.32 <0.01 <0.01 <0.01 0.01 <0.003 <0.01 <0.01 <0.01 <0.01 <0.01 <0.01
09/09/2020 <0.005 <0.01 0.08 <0.002 <0.01 <0.01 <0.01 0.06 <0.01 <0.01 <0.01 5.45 3.25 <0.01 <0.01 0.14 <0.003 <0.01 0.10 <0.01 <0.01 <0.01 <0.01
15/10/2019 No Water
21/11/2019 No Water
05/12/2019 No Water
16/01/2020 No Water
06/02/2020 No Water
09/03/2020 No Water
08/05/2020 No Water
18/05/2020 No Water
02/06/2020 No Water
07/07/2020 No Water
13/08/2020 No Water
07/09/2020 No Water
Potable Water Potable Water
SANS 241:2015 Strd. Lim. (Operational)
Exxaro - Leeuwpan
LWDL
PIET-SCHUTTE
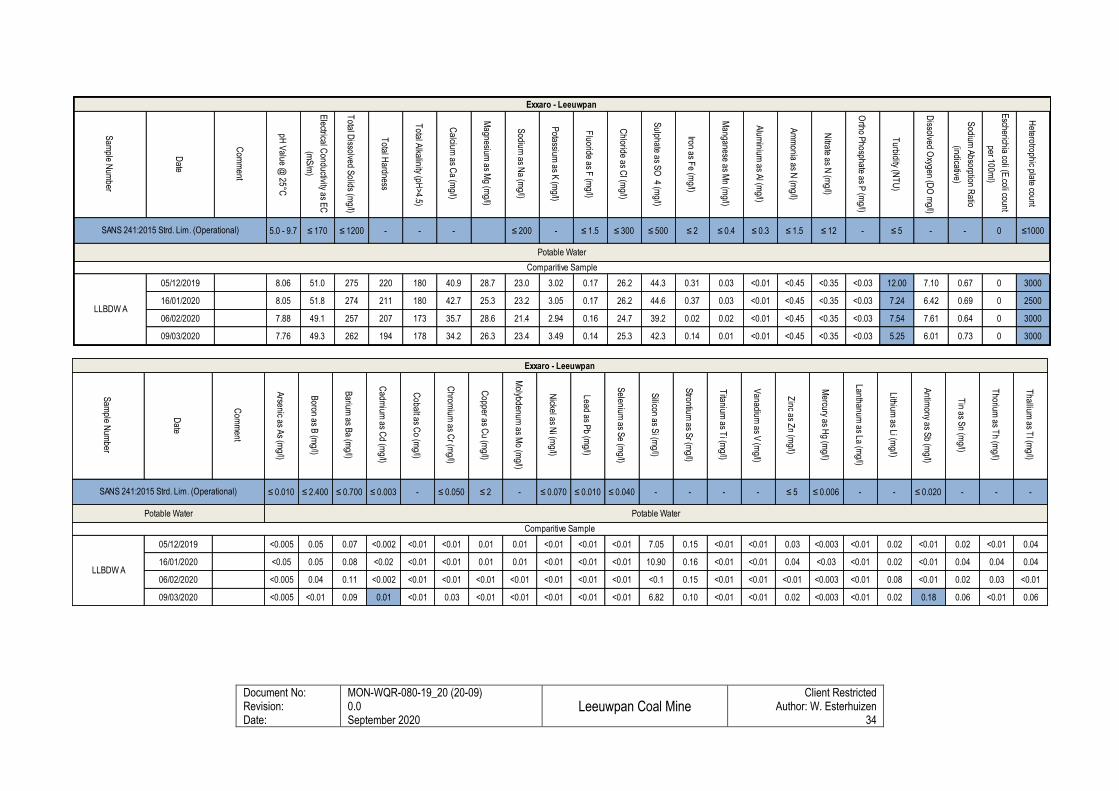
Document No: Revision: Date:
MON-WQR-080-19_20 (20-09) 0.0 September 2020
Leeuwpan Coal Mine
Client Restricted Author: W. Esterhuizen
34
Sam
ple Num
ber
Date
Com
ment
pH V
alue @ 25°C
Electrical C
onductivity as EC
(mS
/m)
Total D
issolved Solids (m
g/l)
Total H
ardness
Total A
lkalinity (pH>4.5)
Calcium
as Ca (m
g/l)
Magnesium
as Mg (m
g/l)
Sodium
as Na (m
g/l)
Potassium
as K (m
g/l)
Fluoride as F
(mg/l)
Chloride as C
l (mg/l)
Sulphate as S
O 4 (m
g/l)
Iron as Fe (m
g/l)
Manganese as M
n (mg/l)
Alum
inium as A
l (mg/l)
Am
monia as N
(mg/l)
Nitrate as N
(mg/l)
Ortho P
hosphate as P (m
g/l)
Turbidity (N
TU
)
Dissolved O
xygen (DO
mg/l)
Sodium
Absorption R
atio
(indicative)
Escherichia coli (E
.coli count
per 100ml)
Heterotrophic plate count
5.0 - 9.7 ≤ 170 ≤ 1200 - - - ≤ 200 - ≤ 1.5 ≤ 300 ≤ 500 ≤ 2 ≤ 0.4 ≤ 0.3 ≤ 1.5 ≤ 12 - ≤ 5 - - 0 ≤1000
05/12/2019 8.06 51.0 275 220 180 40.9 28.7 23.0 3.02 0.17 26.2 44.3 0.31 0.03 <0.01 <0.45 <0.35 <0.03 12.00 7.10 0.67 0 3000
16/01/2020 8.05 51.8 274 211 180 42.7 25.3 23.2 3.05 0.17 26.2 44.6 0.37 0.03 <0.01 <0.45 <0.35 <0.03 7.24 6.42 0.69 0 2500
06/02/2020 7.88 49.1 257 207 173 35.7 28.6 21.4 2.94 0.16 24.7 39.2 0.02 0.02 <0.01 <0.45 <0.35 <0.03 7.54 7.61 0.64 0 3000
09/03/2020 7.76 49.3 262 194 178 34.2 26.3 23.4 3.49 0.14 25.3 42.3 0.14 0.01 <0.01 <0.45 <0.35 <0.03 5.25 6.01 0.73 0 3000
Potable Water
SANS 241:2015 Strd. Lim. (Operational)
Exxaro - Leeuwpan
LLBDW A
Comparitive Sample
Sam
ple Num
ber
Date
Com
ment
Arsenic as A
s (mg/l)
Boron as B
(mg/l)
Barium
as Ba (m
g/l)
Cadm
ium as C
d (mg/l)
Cobalt as C
o (mg/l)
Chrom
ium as C
r (mg/l)
Copper as C
u (mg/l)
Molybdenum
as Mo (m
g/l)
Nickel as N
i (mg/l)
Lead as Pb (m
g/l)
Selenium
as Se (m
g/l)
Silicon as S
i (mg/l)
Strontium
as Sr (m
g/l)
Titanium
as Ti (m
g/l)
Vanadium
as V (m
g/l)
Zinc as Z
n (mg/l)
Mercury as H
g (mg/l)
Lanthanum as La (m
g/l)
Lithium as Li (m
g/l)
Antim
ony as Sb (m
g/l)
Tin as S
n (mg/l)
Thorium
as Th (m
g/l)
Thallium
as Tl (m
g/l)
≤ 0.010 ≤ 2.400 ≤ 0.700 ≤ 0.003 - ≤ 0.050 ≤ 2 - ≤ 0.070 ≤ 0.010 ≤ 0.040 - - - - ≤ 5 ≤ 0.006 - - ≤ 0.020 - - -
05/12/2019 <0.005 0.05 0.07 <0.002 <0.01 <0.01 0.01 0.01 <0.01 <0.01 <0.01 7.05 0.15 <0.01 <0.01 0.03 <0.003 <0.01 0.02 <0.01 0.02 <0.01 0.04
16/01/2020 <0.05 0.05 0.08 <0.02 <0.01 <0.01 0.01 0.01 <0.01 <0.01 <0.01 10.90 0.16 <0.01 <0.01 0.04 <0.03 <0.01 0.02 <0.01 0.04 0.04 0.04
06/02/2020 <0.005 0.04 0.11 <0.002 <0.01 <0.01 <0.01 <0.01 <0.01 <0.01 <0.01 <0.1 0.15 <0.01 <0.01 <0.01 <0.003 <0.01 0.08 <0.01 0.02 0.03 <0.01
09/03/2020 <0.005 <0.01 0.09 0.01 <0.01 0.03 <0.01 <0.01 <0.01 <0.01 <0.01 6.82 0.10 <0.01 <0.01 0.02 <0.003 <0.01 0.02 0.18 0.06 <0.01 0.06
Potable Water Potable Water
SANS 241:2015 Strd. Lim. (Operational)
Exxaro - Leeuwpan
LLBDW A
Comparitive Sample
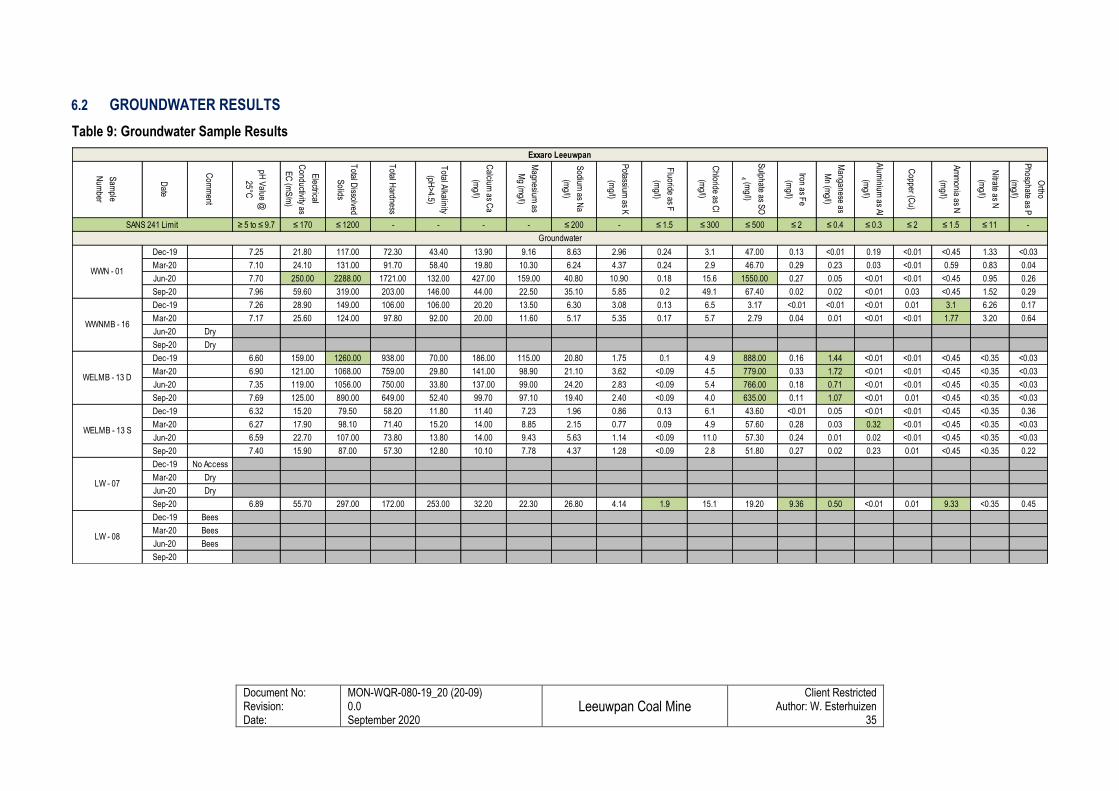
Document No: Revision: Date:
MON-WQR-080-19_20 (20-09) 0.0 September 2020
Leeuwpan Coal Mine
Client Restricted Author: W. Esterhuizen
35
6.2 GROUNDWATER RESULTS
Table 9: Groundwater Sample Results
Sam
ple
Num
ber
Date
Com
ment
pH V
alue @
25°C
Electrical
Conductivity as
EC
(mS
/m)
Total D
issolved
Solids
Total H
ardness
Total A
lkalinity
(pH>4.5)
Calcium
as Ca
(mg/l)
Magnesium
as
Mg (m
g/l)
Sodium
as Na
(mg/l)
Potassium
as K
(mg/l)
Fluoride as F
(mg/l)
Chloride as C
l
(mg/l)
Sulphate as S
O
4 (mg/l)
Iron as Fe
(mg/l)
Manganese as
Mn (m
g/l)
Alum
inium as A
l
(mg/l)
Copper (C
u)
Am
monia as N
(mg/l)
Nitrate as N
(mg/l)
Ortho
Phosphate as P
(mg/l)
≥ 5 to ≤ 9.7 ≤ 170 ≤ 1200 - - - - ≤ 200 - ≤ 1.5 ≤ 300 ≤ 500 ≤ 2 ≤ 0.4 ≤ 0.3 ≤ 2 ≤ 1.5 ≤ 11 -
Dec-19 7.25 21.80 117.00 72.30 43.40 13.90 9.16 8.63 2.96 0.24 3.1 47.00 0.13 <0.01 0.19 <0.01 <0.45 1.33 <0.03
Mar-20 7.10 24.10 131.00 91.70 58.40 19.80 10.30 6.24 4.37 0.24 2.9 46.70 0.29 0.23 0.03 <0.01 0.59 0.83 0.04
Jun-20 7.70 250.00 2288.00 1721.00 132.00 427.00 159.00 40.80 10.90 0.18 15.6 1550.00 0.27 0.05 <0.01 <0.01 <0.45 0.95 0.26
Sep-20 7.96 59.60 319.00 203.00 146.00 44.00 22.50 35.10 5.85 0.2 49.1 67.40 0.02 0.02 <0.01 0.03 <0.45 1.52 0.29
Dec-19 7.26 28.90 149.00 106.00 106.00 20.20 13.50 6.30 3.08 0.13 6.5 3.17 <0.01 <0.01 <0.01 0.01 3.1 6.26 0.17
Mar-20 7.17 25.60 124.00 97.80 92.00 20.00 11.60 5.17 5.35 0.17 5.7 2.79 0.04 0.01 <0.01 <0.01 1.77 3.20 0.64
Jun-20 Dry
Sep-20 Dry
Dec-19 6.60 159.00 1260.00 938.00 70.00 186.00 115.00 20.80 1.75 0.1 4.9 888.00 0.16 1.44 <0.01 <0.01 <0.45 <0.35 <0.03
Mar-20 6.90 121.00 1068.00 759.00 29.80 141.00 98.90 21.10 3.62 <0.09 4.5 779.00 0.33 1.72 <0.01 <0.01 <0.45 <0.35 <0.03
Jun-20 7.35 119.00 1056.00 750.00 33.80 137.00 99.00 24.20 2.83 <0.09 5.4 766.00 0.18 0.71 <0.01 <0.01 <0.45 <0.35 <0.03
Sep-20 7.69 125.00 890.00 649.00 52.40 99.70 97.10 19.40 2.40 <0.09 4.0 635.00 0.11 1.07 <0.01 0.01 <0.45 <0.35 <0.03
Dec-19 6.32 15.20 79.50 58.20 11.80 11.40 7.23 1.96 0.86 0.13 6.1 43.60 <0.01 0.05 <0.01 <0.01 <0.45 <0.35 0.36
Mar-20 6.27 17.90 98.10 71.40 15.20 14.00 8.85 2.15 0.77 0.09 4.9 57.60 0.28 0.03 0.32 <0.01 <0.45 <0.35 <0.03
Jun-20 6.59 22.70 107.00 73.80 13.80 14.00 9.43 5.63 1.14 <0.09 11.0 57.30 0.24 0.01 0.02 <0.01 <0.45 <0.35 <0.03
Sep-20 7.40 15.90 87.00 57.30 12.80 10.10 7.78 4.37 1.28 <0.09 2.8 51.80 0.27 0.02 0.23 0.01 <0.45 <0.35 0.22
Dec-19 No Access
Mar-20 Dry
Jun-20 Dry
Sep-20 6.89 55.70 297.00 172.00 253.00 32.20 22.30 26.80 4.14 1.9 15.1 19.20 9.36 0.50 <0.01 0.01 9.33 <0.35 0.45
Dec-19 Bees
Mar-20 Bees
Jun-20 Bees
Sep-20
SANS 241 Limit
Exxaro Leeuwpan
Groundwater
WELMB - 13 D
WWNMB - 16
WWN - 01
LW - 07
WELMB - 13 S
LW - 08
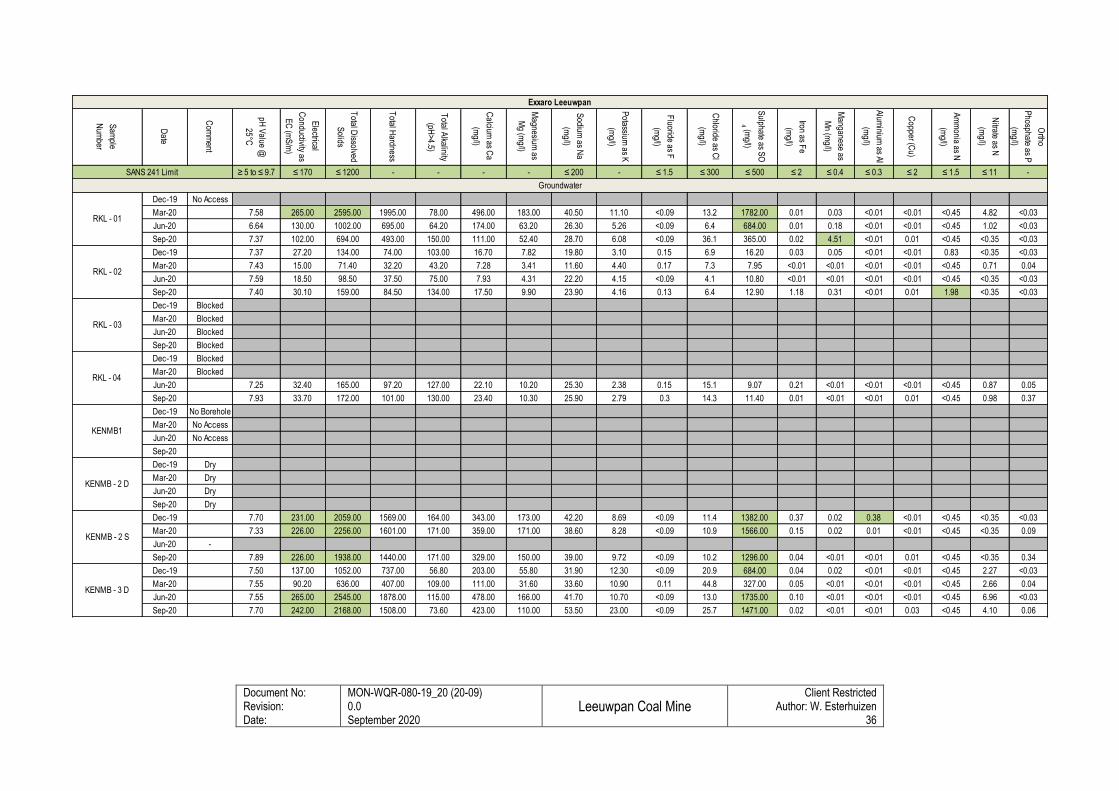
Document No: Revision: Date:
MON-WQR-080-19_20 (20-09) 0.0 September 2020
Leeuwpan Coal Mine
Client Restricted Author: W. Esterhuizen
36
Sam
ple
Num
ber
Date
Com
ment
pH V
alue @
25°C
Electrical
Conductivity as
EC
(mS
/m)
Total D
issolved
Solids
Total H
ardness
Total A
lkalinity
(pH>4.5)
Calcium
as Ca
(mg/l)
Magnesium
as
Mg (m
g/l)
Sodium
as Na
(mg/l)
Potassium
as K
(mg/l)
Fluoride as F
(mg/l)
Chloride as C
l
(mg/l)
Sulphate as S
O
4 (mg/l)
Iron as Fe
(mg/l)
Manganese as
Mn (m
g/l)
Alum
inium as A
l
(mg/l)
Copper (C
u)
Am
monia as N
(mg/l)
Nitrate as N
(mg/l)
Ortho
Phosphate as P
(mg/l)
≥ 5 to ≤ 9.7 ≤ 170 ≤ 1200 - - - - ≤ 200 - ≤ 1.5 ≤ 300 ≤ 500 ≤ 2 ≤ 0.4 ≤ 0.3 ≤ 2 ≤ 1.5 ≤ 11 -
Dec-19 No Access
Mar-20 7.58 265.00 2595.00 1995.00 78.00 496.00 183.00 40.50 11.10 <0.09 13.2 1782.00 0.01 0.03 <0.01 <0.01 <0.45 4.82 <0.03
Jun-20 6.64 130.00 1002.00 695.00 64.20 174.00 63.20 26.30 5.26 <0.09 6.4 684.00 0.01 0.18 <0.01 <0.01 <0.45 1.02 <0.03
Sep-20 7.37 102.00 694.00 493.00 150.00 111.00 52.40 28.70 6.08 <0.09 36.1 365.00 0.02 4.51 <0.01 0.01 <0.45 <0.35 <0.03
Dec-19 7.37 27.20 134.00 74.00 103.00 16.70 7.82 19.80 3.10 0.15 6.9 16.20 0.03 0.05 <0.01 <0.01 0.83 <0.35 <0.03
Mar-20 7.43 15.00 71.40 32.20 43.20 7.28 3.41 11.60 4.40 0.17 7.3 7.95 <0.01 <0.01 <0.01 <0.01 <0.45 0.71 0.04
Jun-20 7.59 18.50 98.50 37.50 75.00 7.93 4.31 22.20 4.15 <0.09 4.1 10.80 <0.01 <0.01 <0.01 <0.01 <0.45 <0.35 <0.03
Sep-20 7.40 30.10 159.00 84.50 134.00 17.50 9.90 23.90 4.16 0.13 6.4 12.90 1.18 0.31 <0.01 0.01 1.98 <0.35 <0.03
Dec-19 Blocked
Mar-20 Blocked
Jun-20 Blocked
Sep-20 Blocked
Dec-19 Blocked
Mar-20 Blocked
Jun-20 7.25 32.40 165.00 97.20 127.00 22.10 10.20 25.30 2.38 0.15 15.1 9.07 0.21 <0.01 <0.01 <0.01 <0.45 0.87 0.05
Sep-20 7.93 33.70 172.00 101.00 130.00 23.40 10.30 25.90 2.79 0.3 14.3 11.40 0.01 <0.01 <0.01 0.01 <0.45 0.98 0.37
Dec-19 No Borehole
Mar-20 No Access
Jun-20 No Access
Sep-20
Dec-19 Dry
Mar-20 Dry
Jun-20 Dry
Sep-20 Dry
Dec-19 7.70 231.00 2059.00 1569.00 164.00 343.00 173.00 42.20 8.69 <0.09 11.4 1382.00 0.37 0.02 0.38 <0.01 <0.45 <0.35 <0.03
Mar-20 7.33 226.00 2256.00 1601.00 171.00 359.00 171.00 38.60 8.28 <0.09 10.9 1566.00 0.15 0.02 0.01 <0.01 <0.45 <0.35 0.09
Jun-20 -
Sep-20 7.89 226.00 1938.00 1440.00 171.00 329.00 150.00 39.00 9.72 <0.09 10.2 1296.00 0.04 <0.01 <0.01 0.01 <0.45 <0.35 0.34
Dec-19 7.50 137.00 1052.00 737.00 56.80 203.00 55.80 31.90 12.30 <0.09 20.9 684.00 0.04 0.02 <0.01 <0.01 <0.45 2.27 <0.03
Mar-20 7.55 90.20 636.00 407.00 109.00 111.00 31.60 33.60 10.90 0.11 44.8 327.00 0.05 <0.01 <0.01 <0.01 <0.45 2.66 0.04
Jun-20 7.55 265.00 2545.00 1878.00 115.00 478.00 166.00 41.70 10.70 <0.09 13.0 1735.00 0.10 <0.01 <0.01 <0.01 <0.45 6.96 <0.03
Sep-20 7.70 242.00 2168.00 1508.00 73.60 423.00 110.00 53.50 23.00 <0.09 25.7 1471.00 0.02 <0.01 <0.01 0.03 <0.45 4.10 0.06
SANS 241 Limit
Exxaro Leeuwpan
Groundwater
KENMB - 3 D
KENMB - 2 S
RKL - 02
RKL - 01
RKL - 03
RKL - 04
KENMB1
KENMB - 2 D
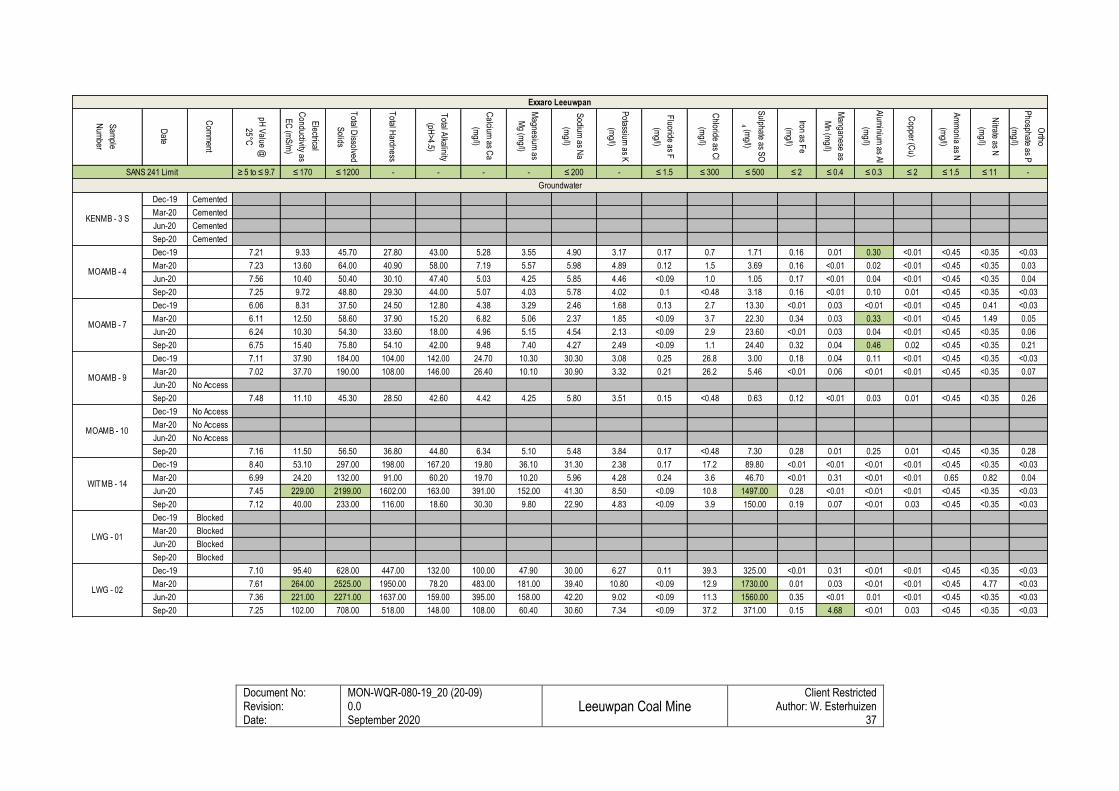
Document No: Revision: Date:
MON-WQR-080-19_20 (20-09) 0.0 September 2020
Leeuwpan Coal Mine
Client Restricted Author: W. Esterhuizen
37
Sam
ple
Num
ber
Date
Com
ment
pH V
alue @
25°C
Electrical
Conductivity as
EC
(mS
/m)
Total D
issolved
Solids
Total H
ardness
Total A
lkalinity
(pH>4.5)
Calcium
as Ca
(mg/l)
Magnesium
as
Mg (m
g/l)
Sodium
as Na
(mg/l)
Potassium
as K
(mg/l)
Fluoride as F
(mg/l)
Chloride as C
l
(mg/l)
Sulphate as S
O
4 (mg/l)
Iron as Fe
(mg/l)
Manganese as
Mn (m
g/l)
Alum
inium as A
l
(mg/l)
Copper (C
u)
Am
monia as N
(mg/l)
Nitrate as N
(mg/l)
Ortho
Phosphate as P
(mg/l)
≥ 5 to ≤ 9.7 ≤ 170 ≤ 1200 - - - - ≤ 200 - ≤ 1.5 ≤ 300 ≤ 500 ≤ 2 ≤ 0.4 ≤ 0.3 ≤ 2 ≤ 1.5 ≤ 11 -
Dec-19 Cemented
Mar-20 Cemented
Jun-20 Cemented
Sep-20 Cemented
Dec-19 7.21 9.33 45.70 27.80 43.00 5.28 3.55 4.90 3.17 0.17 0.7 1.71 0.16 0.01 0.30 <0.01 <0.45 <0.35 <0.03
Mar-20 7.23 13.60 64.00 40.90 58.00 7.19 5.57 5.98 4.89 0.12 1.5 3.69 0.16 <0.01 0.02 <0.01 <0.45 <0.35 0.03
Jun-20 7.56 10.40 50.40 30.10 47.40 5.03 4.25 5.85 4.46 <0.09 1.0 1.05 0.17 <0.01 0.04 <0.01 <0.45 <0.35 0.04
Sep-20 7.25 9.72 48.80 29.30 44.00 5.07 4.03 5.78 4.02 0.1 <0.48 3.18 0.16 <0.01 0.10 0.01 <0.45 <0.35 <0.03
Dec-19 6.06 8.31 37.50 24.50 12.80 4.38 3.29 2.46 1.68 0.13 2.7 13.30 <0.01 0.03 <0.01 <0.01 <0.45 0.41 <0.03
Mar-20 6.11 12.50 58.60 37.90 15.20 6.82 5.06 2.37 1.85 <0.09 3.7 22.30 0.34 0.03 0.33 <0.01 <0.45 1.49 0.05
Jun-20 6.24 10.30 54.30 33.60 18.00 4.96 5.15 4.54 2.13 <0.09 2.9 23.60 <0.01 0.03 0.04 <0.01 <0.45 <0.35 0.06
Sep-20 6.75 15.40 75.80 54.10 42.00 9.48 7.40 4.27 2.49 <0.09 1.1 24.40 0.32 0.04 0.46 0.02 <0.45 <0.35 0.21
Dec-19 7.11 37.90 184.00 104.00 142.00 24.70 10.30 30.30 3.08 0.25 26.8 3.00 0.18 0.04 0.11 <0.01 <0.45 <0.35 <0.03
Mar-20 7.02 37.70 190.00 108.00 146.00 26.40 10.10 30.90 3.32 0.21 26.2 5.46 <0.01 0.06 <0.01 <0.01 <0.45 <0.35 0.07
Jun-20 No Access
Sep-20 7.48 11.10 45.30 28.50 42.60 4.42 4.25 5.80 3.51 0.15 <0.48 0.63 0.12 <0.01 0.03 0.01 <0.45 <0.35 0.26
Dec-19 No Access
Mar-20 No Access
Jun-20 No Access
Sep-20 7.16 11.50 56.50 36.80 44.80 6.34 5.10 5.48 3.84 0.17 <0.48 7.30 0.28 0.01 0.25 0.01 <0.45 <0.35 0.28
Dec-19 8.40 53.10 297.00 198.00 167.20 19.80 36.10 31.30 2.38 0.17 17.2 89.80 <0.01 <0.01 <0.01 <0.01 <0.45 <0.35 <0.03
Mar-20 6.99 24.20 132.00 91.00 60.20 19.70 10.20 5.96 4.28 0.24 3.6 46.70 <0.01 0.31 <0.01 <0.01 0.65 0.82 0.04
Jun-20 7.45 229.00 2199.00 1602.00 163.00 391.00 152.00 41.30 8.50 <0.09 10.8 1497.00 0.28 <0.01 <0.01 <0.01 <0.45 <0.35 <0.03
Sep-20 7.12 40.00 233.00 116.00 18.60 30.30 9.80 22.90 4.83 <0.09 3.9 150.00 0.19 0.07 <0.01 0.03 <0.45 <0.35 <0.03
Dec-19 Blocked
Mar-20 Blocked
Jun-20 Blocked
Sep-20 Blocked
Dec-19 7.10 95.40 628.00 447.00 132.00 100.00 47.90 30.00 6.27 0.11 39.3 325.00 <0.01 0.31 <0.01 <0.01 <0.45 <0.35 <0.03
Mar-20 7.61 264.00 2525.00 1950.00 78.20 483.00 181.00 39.40 10.80 <0.09 12.9 1730.00 0.01 0.03 <0.01 <0.01 <0.45 4.77 <0.03
Jun-20 7.36 221.00 2271.00 1637.00 159.00 395.00 158.00 42.20 9.02 <0.09 11.3 1560.00 0.35 <0.01 0.01 <0.01 <0.45 <0.35 <0.03
Sep-20 7.25 102.00 708.00 518.00 148.00 108.00 60.40 30.60 7.34 <0.09 37.2 371.00 0.15 4.68 <0.01 0.03 <0.45 <0.35 <0.03
SANS 241 Limit
Exxaro Leeuwpan
Groundwater
LWG - 02
WITMB - 14
MOAMB - 9
MOAMB - 7
MOAMB - 4
KENMB - 3 S
LWG - 01
MOAMB - 10
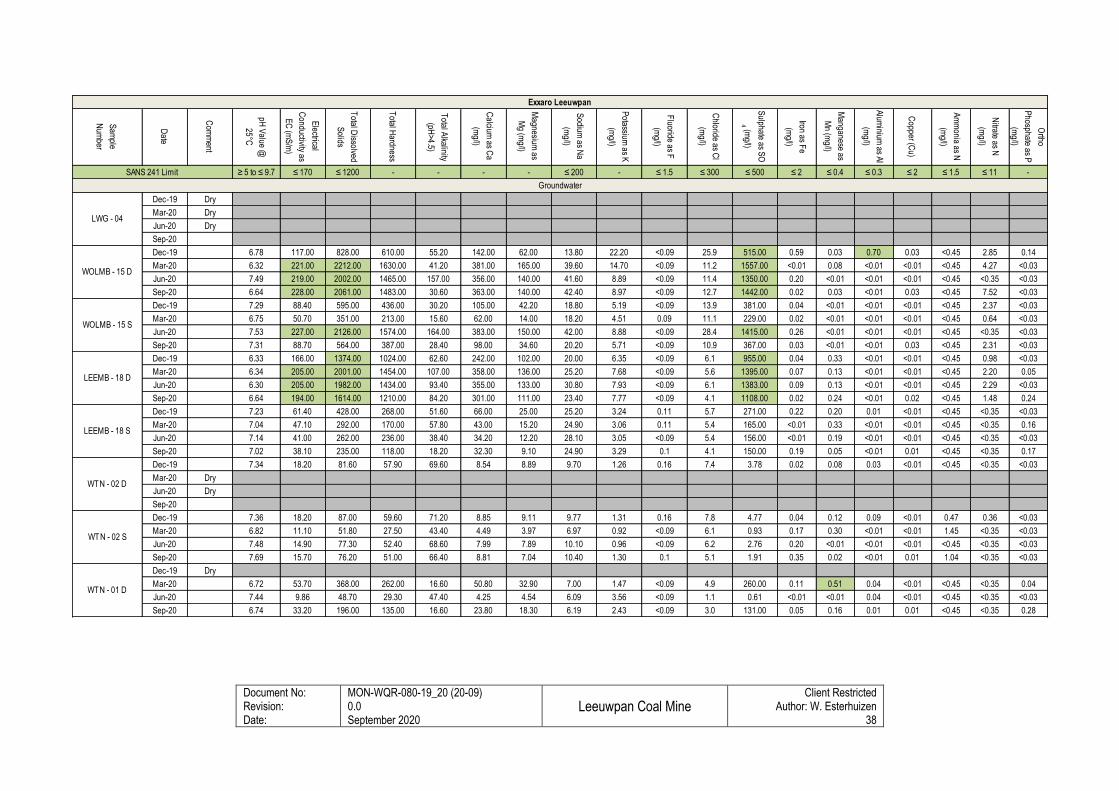
Document No: Revision: Date:
MON-WQR-080-19_20 (20-09) 0.0 September 2020
Leeuwpan Coal Mine
Client Restricted Author: W. Esterhuizen
38
Sam
ple
Num
ber
Date
Com
ment
pH V
alue @
25°C
Electrical
Conductivity as
EC
(mS
/m)
Total D
issolved
Solids
Total H
ardness
Total A
lkalinity
(pH>4.5)
Calcium
as Ca
(mg/l)
Magnesium
as
Mg (m
g/l)
Sodium
as Na
(mg/l)
Potassium
as K
(mg/l)
Fluoride as F
(mg/l)
Chloride as C
l
(mg/l)
Sulphate as S
O
4 (mg/l)
Iron as Fe
(mg/l)
Manganese as
Mn (m
g/l)
Alum
inium as A
l
(mg/l)
Copper (C
u)
Am
monia as N
(mg/l)
Nitrate as N
(mg/l)
Ortho
Phosphate as P
(mg/l)
≥ 5 to ≤ 9.7 ≤ 170 ≤ 1200 - - - - ≤ 200 - ≤ 1.5 ≤ 300 ≤ 500 ≤ 2 ≤ 0.4 ≤ 0.3 ≤ 2 ≤ 1.5 ≤ 11 -
Dec-19 Dry
Mar-20 Dry
Jun-20 Dry
Sep-20
Dec-19 6.78 117.00 828.00 610.00 55.20 142.00 62.00 13.80 22.20 <0.09 25.9 515.00 0.59 0.03 0.70 0.03 <0.45 2.85 0.14
Mar-20 6.32 221.00 2212.00 1630.00 41.20 381.00 165.00 39.60 14.70 <0.09 11.2 1557.00 <0.01 0.08 <0.01 <0.01 <0.45 4.27 <0.03
Jun-20 7.49 219.00 2002.00 1465.00 157.00 356.00 140.00 41.60 8.89 <0.09 11.4 1350.00 0.20 <0.01 <0.01 <0.01 <0.45 <0.35 <0.03
Sep-20 6.64 228.00 2061.00 1483.00 30.60 363.00 140.00 42.40 8.97 <0.09 12.7 1442.00 0.02 0.03 <0.01 0.03 <0.45 7.52 <0.03
Dec-19 7.29 88.40 595.00 436.00 30.20 105.00 42.20 18.80 5.19 <0.09 13.9 381.00 0.04 <0.01 <0.01 <0.01 <0.45 2.37 <0.03
Mar-20 6.75 50.70 351.00 213.00 15.60 62.00 14.00 18.20 4.51 0.09 11.1 229.00 0.02 <0.01 <0.01 <0.01 <0.45 0.64 <0.03
Jun-20 7.53 227.00 2126.00 1574.00 164.00 383.00 150.00 42.00 8.88 <0.09 28.4 1415.00 0.26 <0.01 <0.01 <0.01 <0.45 <0.35 <0.03
Sep-20 7.31 88.70 564.00 387.00 28.40 98.00 34.60 20.20 5.71 <0.09 10.9 367.00 0.03 <0.01 <0.01 0.03 <0.45 2.31 <0.03
Dec-19 6.33 166.00 1374.00 1024.00 62.60 242.00 102.00 20.00 6.35 <0.09 6.1 955.00 0.04 0.33 <0.01 <0.01 <0.45 0.98 <0.03
Mar-20 6.34 205.00 2001.00 1454.00 107.00 358.00 136.00 25.20 7.68 <0.09 5.6 1395.00 0.07 0.13 <0.01 <0.01 <0.45 2.20 0.05
Jun-20 6.30 205.00 1982.00 1434.00 93.40 355.00 133.00 30.80 7.93 <0.09 6.1 1383.00 0.09 0.13 <0.01 <0.01 <0.45 2.29 <0.03
Sep-20 6.64 194.00 1614.00 1210.00 84.20 301.00 111.00 23.40 7.77 <0.09 4.1 1108.00 0.02 0.24 <0.01 0.02 <0.45 1.48 0.24
Dec-19 7.23 61.40 428.00 268.00 51.60 66.00 25.00 25.20 3.24 0.11 5.7 271.00 0.22 0.20 0.01 <0.01 <0.45 <0.35 <0.03
Mar-20 7.04 47.10 292.00 170.00 57.80 43.00 15.20 24.90 3.06 0.11 5.4 165.00 <0.01 0.33 <0.01 <0.01 <0.45 <0.35 0.16
Jun-20 7.14 41.00 262.00 236.00 38.40 34.20 12.20 28.10 3.05 <0.09 5.4 156.00 <0.01 0.19 <0.01 <0.01 <0.45 <0.35 <0.03
Sep-20 7.02 38.10 235.00 118.00 18.20 32.30 9.10 24.90 3.29 0.1 4.1 150.00 0.19 0.05 <0.01 0.01 <0.45 <0.35 0.17
Dec-19 7.34 18.20 81.60 57.90 69.60 8.54 8.89 9.70 1.26 0.16 7.4 3.78 0.02 0.08 0.03 <0.01 <0.45 <0.35 <0.03
Mar-20 Dry
Jun-20 Dry
Sep-20
Dec-19 7.36 18.20 87.00 59.60 71.20 8.85 9.11 9.77 1.31 0.16 7.8 4.77 0.04 0.12 0.09 <0.01 0.47 0.36 <0.03
Mar-20 6.82 11.10 51.80 27.50 43.40 4.49 3.97 6.97 0.92 <0.09 6.1 0.93 0.17 0.30 <0.01 <0.01 1.45 <0.35 <0.03
Jun-20 7.48 14.90 77.30 52.40 68.60 7.99 7.89 10.10 0.96 <0.09 6.2 2.76 0.20 <0.01 <0.01 <0.01 <0.45 <0.35 <0.03
Sep-20 7.69 15.70 76.20 51.00 66.40 8.81 7.04 10.40 1.30 0.1 5.1 1.91 0.35 0.02 <0.01 0.01 1.04 <0.35 <0.03
Dec-19 Dry
Mar-20 6.72 53.70 368.00 262.00 16.60 50.80 32.90 7.00 1.47 <0.09 4.9 260.00 0.11 0.51 0.04 <0.01 <0.45 <0.35 0.04
Jun-20 7.44 9.86 48.70 29.30 47.40 4.25 4.54 6.09 3.56 <0.09 1.1 0.61 <0.01 <0.01 0.04 <0.01 <0.45 <0.35 <0.03
Sep-20 6.74 33.20 196.00 135.00 16.60 23.80 18.30 6.19 2.43 <0.09 3.0 131.00 0.05 0.16 0.01 0.01 <0.45 <0.35 0.28
SANS 241 Limit
Exxaro Leeuwpan
Groundwater
LEEMB - 18 S
LEEMB - 18 D
WOLMB - 15 S
WOLMB - 15 D
WTN - 02 S
WTN - 01 D
LWG - 04
WTN - 02 D
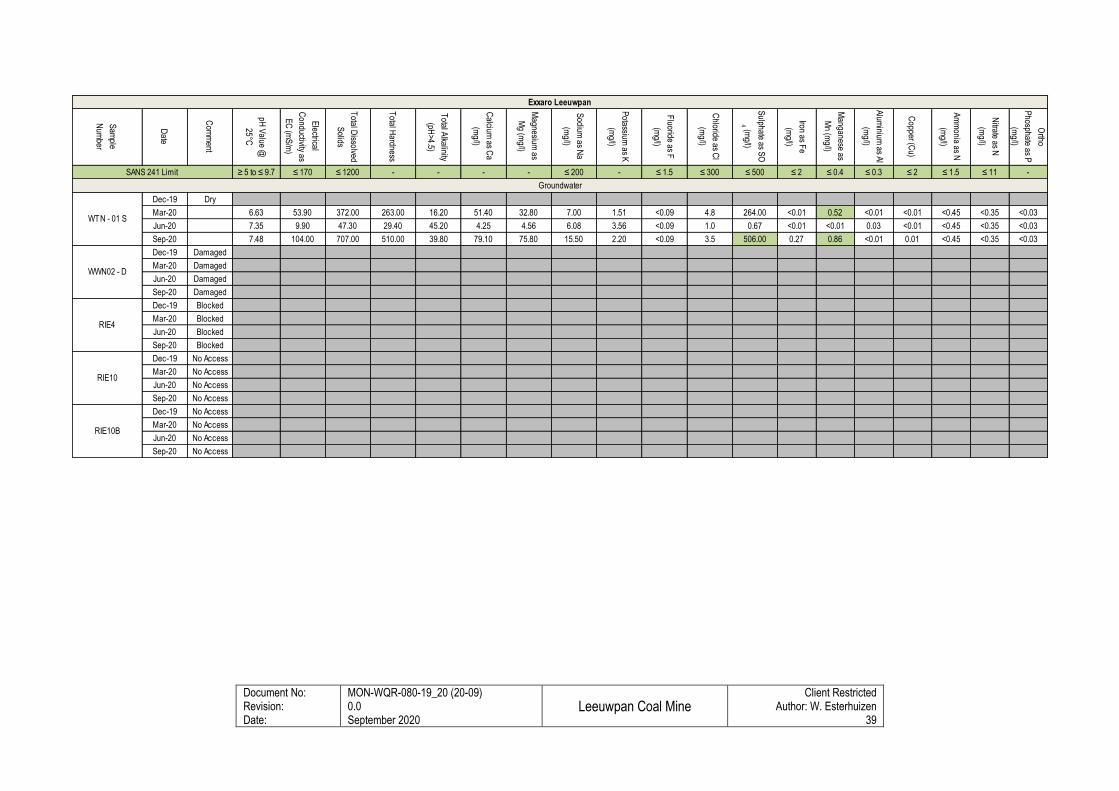
Document No: Revision: Date:
MON-WQR-080-19_20 (20-09) 0.0 September 2020
Leeuwpan Coal Mine
Client Restricted Author: W. Esterhuizen
39
Sam
ple
Num
ber
Date
Com
ment
pH V
alue @
25°C
Electrical
Conductivity as
EC
(mS
/m)
Total D
issolved
Solids
Total H
ardness
Total A
lkalinity
(pH>4.5)
Calcium
as Ca
(mg/l)
Magnesium
as
Mg (m
g/l)
Sodium
as Na
(mg/l)
Potassium
as K
(mg/l)
Fluoride as F
(mg/l)
Chloride as C
l
(mg/l)
Sulphate as S
O
4 (mg/l)
Iron as Fe
(mg/l)
Manganese as
Mn (m
g/l)
Alum
inium as A
l
(mg/l)
Copper (C
u)
Am
monia as N
(mg/l)
Nitrate as N
(mg/l)
Ortho
Phosphate as P
(mg/l)
≥ 5 to ≤ 9.7 ≤ 170 ≤ 1200 - - - - ≤ 200 - ≤ 1.5 ≤ 300 ≤ 500 ≤ 2 ≤ 0.4 ≤ 0.3 ≤ 2 ≤ 1.5 ≤ 11 -
Dec-19 Dry
Mar-20 6.63 53.90 372.00 263.00 16.20 51.40 32.80 7.00 1.51 <0.09 4.8 264.00 <0.01 0.52 <0.01 <0.01 <0.45 <0.35 <0.03
Jun-20 7.35 9.90 47.30 29.40 45.20 4.25 4.56 6.08 3.56 <0.09 1.0 0.67 <0.01 <0.01 0.03 <0.01 <0.45 <0.35 <0.03
Sep-20 7.48 104.00 707.00 510.00 39.80 79.10 75.80 15.50 2.20 <0.09 3.5 506.00 0.27 0.86 <0.01 0.01 <0.45 <0.35 <0.03
Dec-19 Damaged
Mar-20 Damaged
Jun-20 Damaged
Sep-20 Damaged
Dec-19 Blocked
Mar-20 Blocked
Jun-20 Blocked
Sep-20 Blocked
Dec-19 No Access
Mar-20 No Access
Jun-20 No Access
Sep-20 No Access
Dec-19 No Access
Mar-20 No Access
Jun-20 No Access
Sep-20 No Access
SANS 241 Limit
Exxaro Leeuwpan
Groundwater
RIE4
RIE10
RIE10B
WTN - 01 S
WWN02 - D
Document No: Revision: Date:
MON-WQR-080-19_20 (20-09) 0.0 September 2020
Leeuwpan Coal Mine
Client Restricted Author: W. Esterhuizen
40
7. DISCUSSION
7.1 RECEIVING ENVIRONMENT WATER QUALITY
Surface water monitoring was performed at ten (10) monitoring localities during the September 2020 monitoring period. The
following samples were recorded as dry during the site assessment:
• WP01, LSW06, LSW07, LSW08, LSW012 and RD01.
All of the sampled receiving environment monitoring localities water quality analysis indicated exceedances in terms of the
DWAF Domestic Guideline Limits for Calcium (Ca), Turbidity and Dissolved Organic Carbon (DOC mg/l). Additional
exceedances included the Magnesium (LSW13), Sulphate (LSW13) and Manganese (LSW13). It should be noted that all
of the sampled localities recorded the presence of oil and grease.
From the September 2020 results it is evident that the majority of the receiving environment monitoring localities presented
overall fair condition. Historically LSW13, has recorded fluctuating and elevated sulphate (SO4) concentration attributed to
oxidation of pyrite associated with coal reserves, however the concentration presented a significant decrease from February
2020. Turbidity within the surface water samples are expected, as turbidity refers to the measurement of the cloudiness or
muddiness of water, which is influenced by both natural (flow velocity, rainfall, run-off etc.) and anthropogenic activities
(disturbance / mining activities). Overall, the Total Inorganic Nitrogen (TIN), Nitrate (NO3-N) and Ammonia (NH3-N) levels
remained low, with all the concentrations recording below the detection limit.
Trend graphs relating to pH, Electrical Conductivity, Total Dissolved Solids, Sulphate, and E. coli are presented within
Appendix C. The following trends were observed:
• Relative stable pH levels persisted throughout the quarterly monitoring period;
• From the salinity and sulphate graphs it is evident that sulphate dominates the surface water quality profiles as
similar trends for both EC, TDS and SO4 is present;
• Microbial activity was not present during September 2020.
Duplicate samples were obtained from monitoring localities LSW05 and WP02 in order to determine the accuracy and
precision of inter-laboratory results. Comparison of the calculated TDS and computation of relative percent difference for
the duplicate pairs were calculated between a range of 0.76 to 3.57 % for the September 2020 monitoring run, recording
within the acceptable range (30%).
Document No: Revision: Date:
MON-WQR-080-19_20 (20-09) 0.0 September 2020
Leeuwpan Coal Mine
Client Restricted Author: W. Esterhuizen
41
7.2 PROCESS WATER QUALITY
Process water monitoring was performed at sixteen (16) monitoring localities during the September 2020 monitoring period.
The following samples could not be obtained during the monitoring run:
• KR03, KR04, OWM PIT, OG PIT, OH PIT, OJ PIT, OM PIT, WLV PIT, OJ-O, OJ-S4-DISC, OH-WEATH and OL-
OVB (2A+2B). Please refer to the sampling register as presented in Appendix A for details.
The September 2020 exceedances can be summarised as follows:
• KR01A
o General Authorisation Limit: Electrical Conductivity (EC) and Oil & Grease; and
o Wastewater WUL limit: Escherichia coli (E.coli).
• LSW09
o General Authorisation Limit: Electrical Conductivity (EC).
• ODN PIT
o General Authorisation Limit: Electrical Conductivity (EC).
• WP04
o General Authorisation Limit: Electrical Conductivity (EC).
Discharge of the process water into the receiving environment is prohibited according to the General Authorisation (Section
21f and h, 2013) as it could have limiting effects on the receiving water environment. Note that regular maintenance on
process water facilities linings and transfer pipes are vital for water resource protection.
Document No: Revision: Date:
MON-WQR-080-19_20 (20-09) 0.0 September 2020
Leeuwpan Coal Mine
Client Restricted Author: W. Esterhuizen
42
7.3 EFFLUENT WATER QUALITY
Final effluent samples are collected at two (2) monitoring localities inclusive of the Septic tanks at plant and the Final effluent
from the sewage plant.
LWP-SP-P was not active during the monitoring period, however historically recorded non-compliant to the set Wastewater
WUL limits due to the exceedance of Ammonia, with the General Authorisation limits being exceeded in terms of Ammonia,
Suspended Solids and COD. No access was available for LWP-SP-W.
POTABLE WATER QUALITY
Four (4) potable water localities form part of the monitoring programme at Exxaro Leeuwpan Mine. During the September
2020 monitoring period a sample could not be obtained from PIET-SCHUTTE as the pump was inactive.
The potable water quality at Leeuwpan can be described neutral, non-saline and hard, while elevated salinity and Total
Hardness was present from Load-Out Bay Offices (LLBDW) and Drinking Water at Laboratory (LWDL) during September
2020. in terms of the recorded pH, TDS and Total Hardness. It should be noted that the elevated salinity is attributed to the
significant increase in Sulphates, while the water quality is not representative of the historical results. The high salinity is
also confirmed through the in-situ probe results presented within this report. LDWST, LLBDW and LWDL historically
presented exceeding Cadmium (Cd) and Antimony (Sb) metal concentrations which poses health risks.
The Load-out Bay Offices Water (LLBDW), Drinking Water Supply Tank (LDWST) and Drinking Water at Laboratory (LWDL)
revealed elevated Heterotrophic Plate Counts which renders the water as not suitable for potable purposes. It should be
noted that E.coli was also present within the LLBDW locality.
Based on the analysed parameters, the potable water poses a risk for infection due to elevated Heterotrophic Plate Counts
and thus it is strongly advised that the water be treated and filters regularly disinfected and cleaned as biofilms may be
present.
Document No: Revision: Date:
MON-WQR-080-19_20 (20-09) 0.0 September 2020
Leeuwpan Coal Mine
Client Restricted Author: W. Esterhuizen
43
7.4 EXCEEDING VARIABLE DISCUSSION
Salinity (EC and TDS)
A high salinity level in water is associated with a salty taste and does not necessarily slake thirst. Health effects occur only
at levels above 370 mS/m and may include disturbance of salt and water balance within infants. Individuals with renal or
heart diseases, as well as high blood pressure are particularly vulnerable to adverse effects. Under irrigation, saline soils
are formed primarily when high salinity water is used for irrigation; this in return results in a higher leaching fraction,
influencing the crop yield. Wetting of the foliage of salt-sensitive crops should be avoided using water with EC concentrations
between 40 and 90 mS/m. Increasing problems with encrustation of irrigation pipes and clogging of drip irrigation may be
experienced.
Chemical Oxygen Demand
The Chemical Oxygen Demand, or COD for short, is a measure of the oxygen equivalent of the organic matter content in a
sample that is susceptible to oxidation by a strong oxidising agent and is therefore an estimate of the organic matter levels
present in water. Human activities such as agricultural the production of industrial and domestic wastes are significant
sources of organic matter. The organic matter can be present either in dissolved form or as particulate organic matter. The
former may be associated with undesirable tastes and odours, while the particulate organic matter contributes to the
suspended solids load of a water body (South African Water Quality Guidelines 1996). The COD gives a rough indication
of organic matter content in the water that will be available for decomposition (an oxygen depleting process) and ultimately
nutrients for plant and algae growth. In terms of wastewater used for irrigation, the organic matter is a substrate for bacterial
growth which, at high levels, may therefore lead to bacterial after-growth and fouling or clogging of the irrigation system.
Manganese
Manganese is an essential element in the diet of humans and animals, therefore adverse health effects are expected due
to both a shortage and overdose thereof. Manganese may affect the taste of drinking water at concentrations exceeding 0.1
mg/l, while a black precipitate will form in water pipes at concentrations exceeding 0.2 mg/l. The solubility of manganese in
groundwater varies from good to poor depending on the nature of the chemical compound.
Adverse aesthetic effects limit the acceptability of manganese-containing water for domestic use at concentrations
exceeding 0.15 mg/l. Manganese is nutritionally essential in small amount for cartilage integrity, but supports growth of
certain nuisance organisms in water distribution systems, giving rise to taste, odour and turbidity problems. Thus an
unpleasant taste and staining of plumbing fixtures and laundry occurs. Health problems associated with manganese
concentration in water are rare, neurotoxic effects may occur at high concentrations, but overall manganese is considered
to be one of the least potentially harmful of the elements.
Document No: Revision: Date:
MON-WQR-080-19_20 (20-09) 0.0 September 2020
Leeuwpan Coal Mine
Client Restricted Author: W. Esterhuizen
44
Nitrate (NO3)
High nitrate levels are regularly associated with mining operations as nitrate is a major component of most explosives used
in the mining sector and remnants of the nitrate finds its way into process water sources and hence natural resources such
as groundwater. Other major sources of nitrate include agricultural practices such as feedlotting and kraaling (nitrate in
animal manure) and crop production (nitrate in fertilizer) as well as human sanitation (pit latrines, septic tank systems,
sewage treatment plants; in association with phosphate and pathogens) and also certain natural sources such as nitrogen
fixation through leguminous plants. When consumed in high concentrations, nitrate causes methaemoglobinaemia due to
reduction of nitrate (NO3) to nitrite (NO2) in the gastrointestinal tract. Nitrite readily binds to haemoglobin, the red oxygen-
carrying blood pigment, rendering it inactive which leads to oxygen deficiency in the body tissues.
Nitrate is a plant nutrient, being the end product of the oxidation of ammonia (NH3) and nitrite (NO2). As nitrates are produced
by decay of plant, animal and human wastes, pollution of water with nitrate is typically found wherever intensive land use
activities take place and nitrate-nitrogen concentrations exceeding 20mg/l are a common occurrence in groundwater.
Methods to remove nitrate from water include ion-exchange, reverse osmosis, and biological reduction (denitrification) using
a carbon source.
Ammonia/Ammonium
Nitrates (NO3) and Nitrites (NO2) occur together in the environment and interconvert readily, depending on the redox state
of the water (reducing or oxidising conditions). Ammonia (NH3) and Ammonium (NH4+) also interconvert readily and their
relative proportions of inter-conversion are controlled by water temperature and pH-levels. Inorganic nitrogen is primarily of
concern in the aquatic habitat due to its stimulatory effect on aquatic plants and algae and due to the toxicity of ammonia to
aquatic life. Ammonia affects the respiratory systems of many aquatic animals, either by inhibiting cellular metabolism or by
decreasing oxygen permeability of cell membranes. The methods employed to remove ammonia from water, called air
stripping, utilises the characteristic that the toxic forms of ammonia are volatile and predominate at a pH of around 11; so
by artificially raising the pH to these levels, the ammonia escapes in the gaseous phase.
Sodium (Na)
The predominant effect of sodium at the concentration usually found in fresh water is aesthetic and usually together with
chloride, sodium imparts a salty taste to water. Excessive intake of sodium salts in babies can strain kidneys and the heart,
while leading to serious disturbances of salt imbalance regarding water retention. Crops irrigated by water containing high
sodium or SAR levels are exposed not only to the root zone sodium, but also to the absorption directly through leaves.
Effects of sodium and SAR include leaf burn, scorch and dead tissue along the outside edges of leaves. The crop quality is
also affected by sodium-induced leaf injury, especially where leaves are the marketed product and where restrictions on the
sodium content of the final product exists.
Document No: Revision: Date:
MON-WQR-080-19_20 (20-09) 0.0 September 2020
Leeuwpan Coal Mine
Client Restricted Author: W. Esterhuizen
45
Sulphate
The presence of sulphate in drinking water can cause noticeable taste defects, and very high levels might cause a laxative
effect in unaccustomed consumers. Taste impairment varies with the nature of the associated cation; taste thresholds have
been found to range from 250 mg/l for sodium sulphate to 1 000 mg/l for calcium sulphate. It is generally considered that
taste impairment is minimal at levels below 250 mg/l.
Turbidity
Turbidity is defined as the light-scattering ability of water and is the measurement of the cloudiness or muddiness of water.
Turbidity does note health effects per se, but is an indicator of microbiological water quality and of inefficient water treatment.
As elevated turbidities are often associated with the possibility of microbiological contamination, sensitive groups affected
will most possible infants under the age of 2. Thus, depending on the nature of the origin of suspended matter causing
turbidity, there may be associated health effects. Serious health effect typically occurs under a turbidity greater that fifty
NTU (>50 NTU).
Bacteria
Coliforms are used as indicators of the presence of faecal pollution, and thus the possible presence of disease-causing
organisms, such as bacteria, viruses or parasites which may give rise to gastro-intestinal diseases typically characterized
by diarrhoea, and sometimes fever and other secondary complications. Faecal coliforms, more specifically Escherichia coli,
are the most common bacterial indicators of faecal pollution by warm blooded animals. If water is consumed, high coliform
counts pose health risks in all users and specifically sensitive users. When crops, especially crops of which the leaves (e.g.
lettuce, cabbage, spinach) or underground parts (e.g. potatoes, beetroot, carrots) are consumed, are irrigated with water
containing high coliform counts, the risk remains that the consumer of the crop can contract gastro-intestinal diseases.
Document No: Revision: Date:
MON-WQR-080-19_20 (20-09) 0.0 September 2020
Leeuwpan Coal Mine
Client Restricted Author: W. Esterhuizen
46
7.5 GROUNDWATER QUALITY
Groundwater monitoring was performed during September 2020 and twenty-two (22) borehole samples were obtained
across the site.
Groundwater level depths typically vary between 1 and 54 meters below surface with the historical deepest level measured
in monitoring borehole MOAMB9. The groundwater levels form boreholes MOAMB4 and RKL02 presents a water divide
flowing towards the Bronkhorstspruit and the Bronkhorstspruit tributary.
The majority of the sampled localities recorded concentrations within the stipulated SANS 241-1:2015 limits presenting
satisfactory conditions which included the following monitoring localities: WWN01, WELMB13S, RKL04, MOAMB4,
MOAMB9, MOAMB10, WITMB14, WOLMB15S, LEEMB18S, WTN-02S and WTN01D. The remaining monitoring localities
presented SANS 241-1:2015 exceedances summarised as follows:
• WELMB13D
o Sulphate (SO4) and Manganese (Mn);
• LW07
o Fluoride (F), Iron (Fe), Manganese (Mn) and Ammonia (N);
• RKL01, LWG02
o Manganese (Mn);
• RKL02
o Ammonia (N);
• KENMB2S, KENMB3D, WOLMB15D, LEEMB18D
o Electrical Conductivity (EC), Total Dissolved Solids (TDS) and Sulphate (SO4);
• MOAMB7
o Aluminium (Al); and
• WTN01S
o Sulphate (SO4) and Manganese (Mn);
According to the Expanded Durov Diagram (Figure 7) and associated Stiff Diagram (Figure 8); the September 2020 reveals
that the majority of the aforementioned boreholes are dominated by calcium cations and sulphate anions. Based on the
recorded results it is evident that impacts on the boreholes are present which is related to the mining operation.

Document No: Revision: Date:
MON-WQR-080-19_20 (20-09) 0.0 September 2020
Leeuwpan Coal Mine
Client Restricted Author: W. Esterhuizen
47
According to Expanded Durov Diagram (Figure 7) and associated Stiff Diagram (Figure 8), the aquifer regime within the
vicinity of the Exxaro Leeuwpan Mine is dominated by the following types of groundwater:
• Field 2: Fresh, clean, relatively young groundwater that has started to undergo Magnesium ion exchange, often
found in dolomitic terrain.
• Field 4: Fresh, recently recharged groundwater with HCO3 and CO3 dominated ions that has been in contact with
a source of SO4 contamination or that has moved through SO4 enriched bedrock.
• Field 5: Groundwater that is usually a mix of different types – either clean water from fields 1 and 2 that has
undergone SO4 and NaCl mixing/contamination or old stagnant NaCl dominated water that has mixed with clean
water.
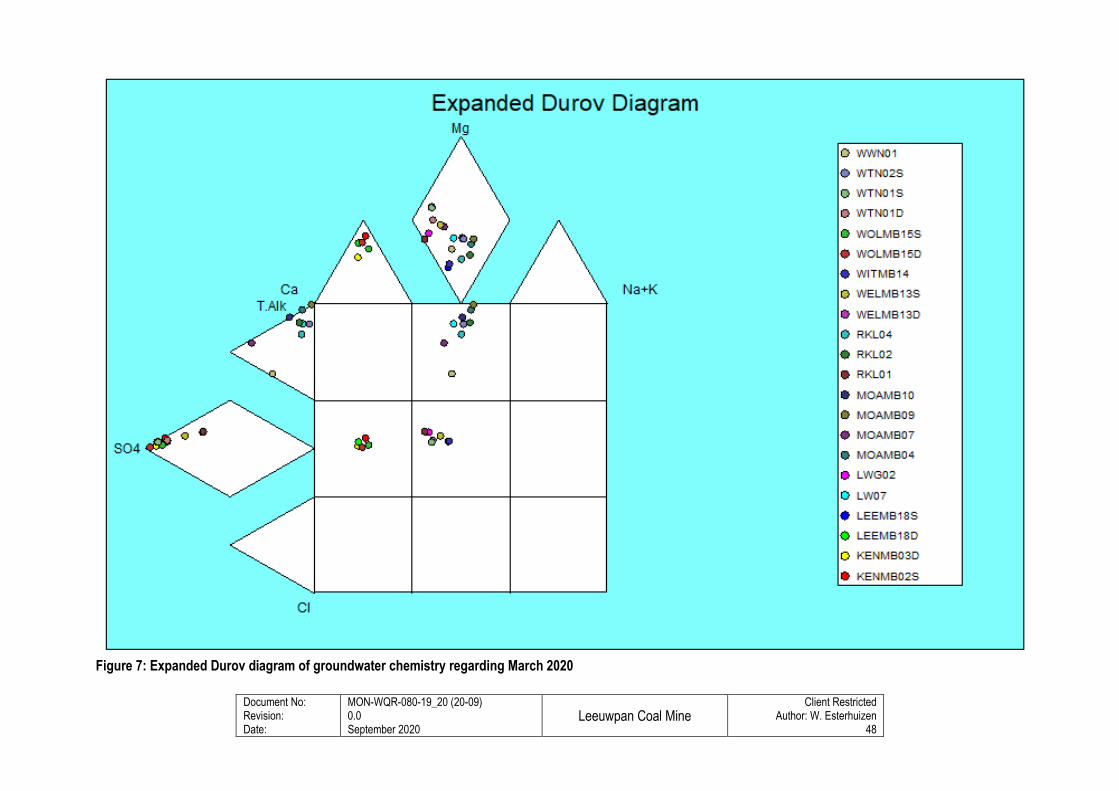
Document No: Revision: Date:
MON-WQR-080-19_20 (20-09) 0.0 September 2020
Leeuwpan Coal Mine
Client Restricted Author: W. Esterhuizen
48
Figure 7: Expanded Durov diagram of groundwater chemistry regarding March 2020
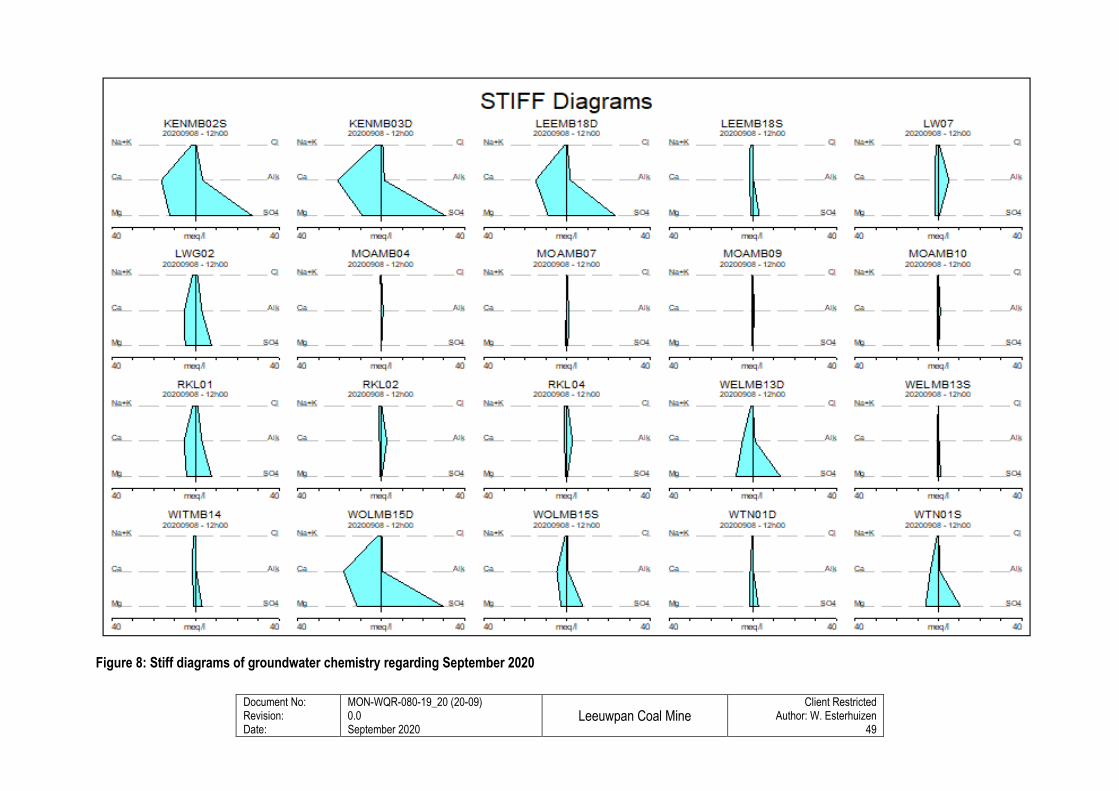
Document No: Revision: Date:
MON-WQR-080-19_20 (20-09) 0.0 September 2020
Leeuwpan Coal Mine
Client Restricted Author: W. Esterhuizen
49
Figure 8: Stiff diagrams of groundwater chemistry regarding September 2020
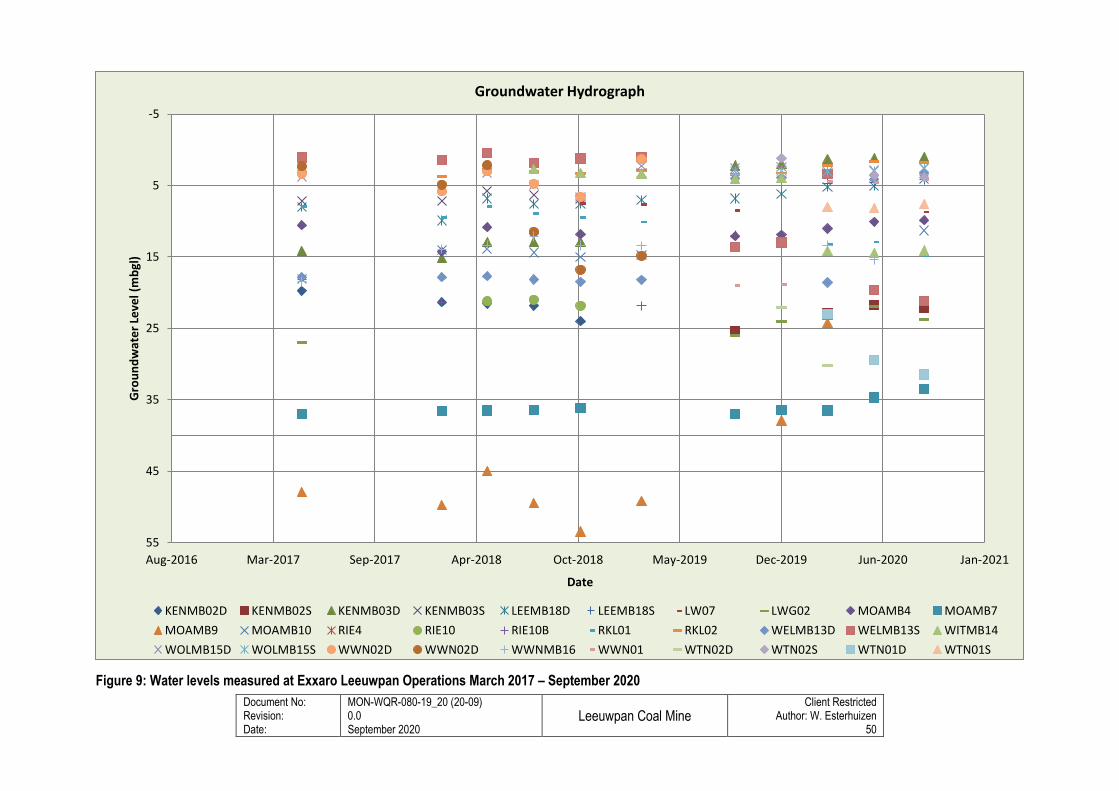
Document No: Revision: Date:
MON-WQR-080-19_20 (20-09) 0.0 September 2020
Leeuwpan Coal Mine
Client Restricted Author: W. Esterhuizen
50
Figure 9: Water levels measured at Exxaro Leeuwpan Operations March 2017 – September 2020
-5
5
15
25
35
45
55
Aug-2016 Mar-2017 Sep-2017 Apr-2018 Oct-2018 May-2019 Dec-2019 Jun-2020 Jan-2021
Gro
un
dw
ate
r Le
vel (
mb
gl)
Date
Groundwater Hydrograph
KENMB02D KENMB02S KENMB03D KENMB03S LEEMB18D LEEMB18S LW07 LWG02 MOAMB4 MOAMB7
MOAMB9 MOAMB10 RIE4 RIE10 RIE10B RKL01 RKL02 WELMB13D WELMB13S WITMB14
WOLMB15D WOLMB15S WWN02D WWN02D WWNMB16 WWN01 WTN02D WTN02S WTN01D WTN01S
Document No: Revision: Date:
MON-WQR-080-19_20 (20-09) 0.0 September 2020
Leeuwpan Coal Mine
Client Restricted Author: W. Esterhuizen
51
8. CONCLUSION AND ASPECTS TO CONSIDER
The scope of work performed at the Leeuwpan Coal Mine is as per WUL requirements as listed in this report. This report
aims to highlight the conditions that have and have not been met with regards to the sampling requirements of the WUL as
well as aspects that are to be considered in order to rectify / achieve compliance of the IWUL.
The following findings pertain to the September 2020 surface water monitoring:
• Samples LSW06, LSW07, LSW08, LSW12, WP01, KR03, KR04, RD1, OWM PIY, OG PIT, OH PIT, OJ PIT, OM
PIT, WLV PIT, OJ-O, OJ-S4-DISC, OH-WEATH, OL-OVB (2A+2B), LWP-SP-W and PIET-SCHUTTE could not be
obtained during the monitoring period;
• The Load-out Bay Offices Water (LLBDW), Drinking Water Supply Tank (LDWST) and Drinking Water at
Laboratory (LWDL) revealed elevated Heterotrophic Plate Counts which renders the water as not suitable for
potable purposes. It should be noted that E.coli was also present within the LLBDW locality;
• The majority of the receiving environment monitoring localities presented overall fair condition;
• Minor exceedances occurred at the process localities, while the majority of the monitoring points were compliant
to the stipulated WUL limits. All of the locallities exceeded the WUL limits for EC;
• The final effluent from LWP-SP-P were not active during the monitoring period, however historically recorded non-
compliant to the set Wastewater WUL limits due to the exceedance of Ammonia and Chemical Oxygen Demand,
with the General Authorisation limits being exceeded in terms of Ammonia. No access was available for LWP-SP-
W; and
• During the monthly monitoring period of September 2020, most of the parameters analysed remained relatively
constant with no major changes presented, when compared to August 2020.
The following findings pertain to the September 2020 groundwater monitoring:
• Samples EMPR02/E2, KENMB1, KENMB2-D, KENMB3-S, LW08, LW10, LWG01, LWG04, MOAMB10, RIE10,
RIE10B, RIE4, RKL03, WTN02-D, WWNMB 16 and WWN02D could not be obtained during the monitoring period;
• The majority of the monitoring boreholes recorded satisfactory concentrations compared to SANS241-1:2015; and
• From the monitoring results some boreholes presented elevated salinity and sulphate concentrations which may
be attributed to the mining operation.
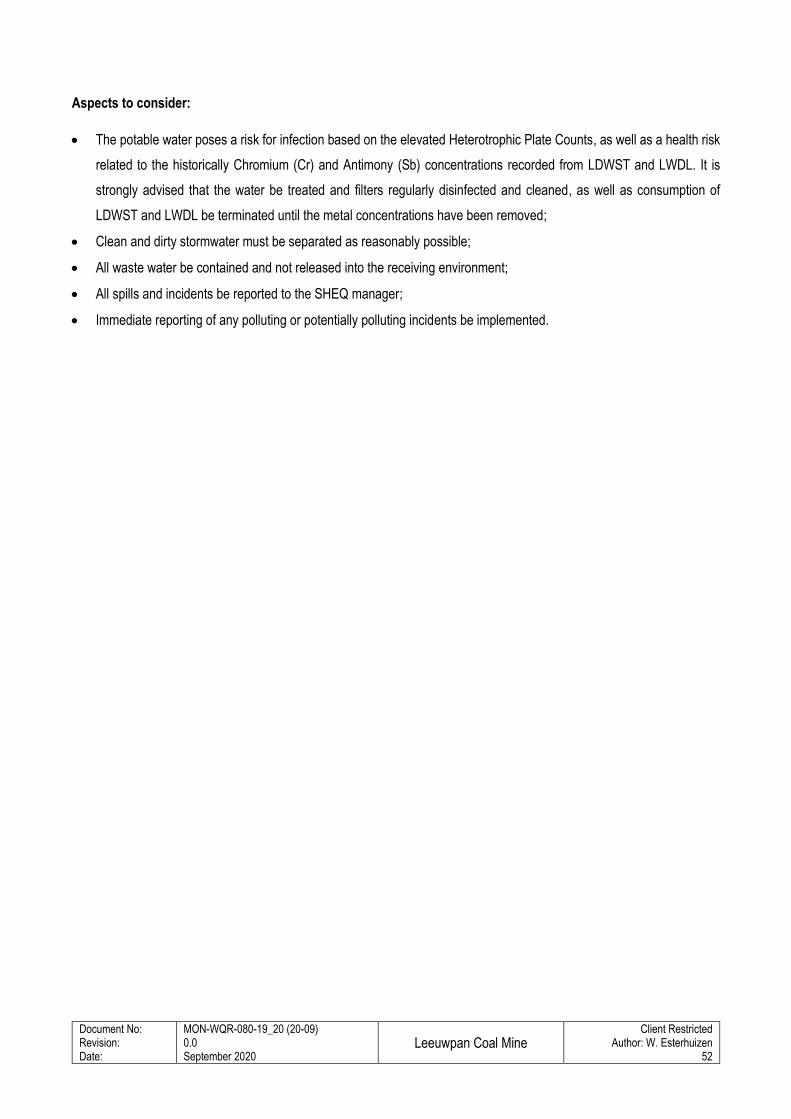
Document No: Revision: Date:
MON-WQR-080-19_20 (20-09) 0.0 September 2020
Leeuwpan Coal Mine
Client Restricted Author: W. Esterhuizen
52
Aspects to consider:
• The potable water poses a risk for infection based on the elevated Heterotrophic Plate Counts, as well as a health risk
related to the historically Chromium (Cr) and Antimony (Sb) concentrations recorded from LDWST and LWDL. It is
strongly advised that the water be treated and filters regularly disinfected and cleaned, as well as consumption of
LDWST and LWDL be terminated until the metal concentrations have been removed;
• Clean and dirty stormwater must be separated as reasonably possible;
• All waste water be contained and not released into the receiving environment;
• All spills and incidents be reported to the SHEQ manager;
• Immediate reporting of any polluting or potentially polluting incidents be implemented.
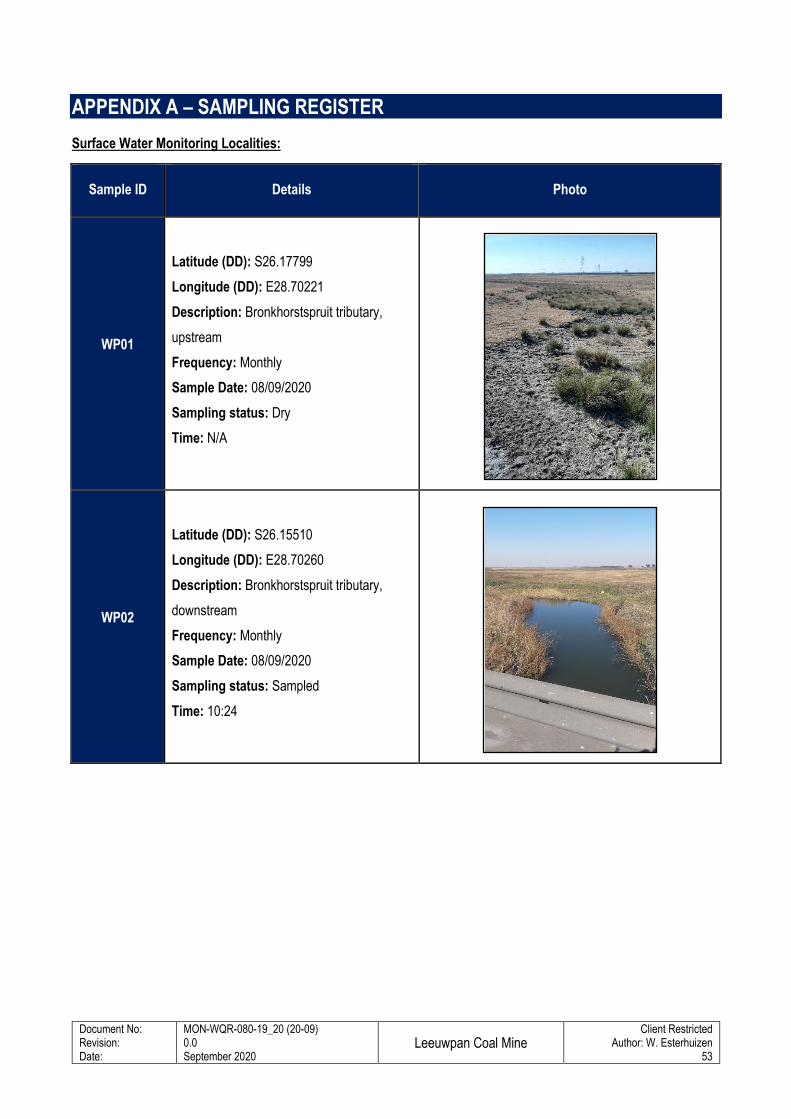
Document No: Revision: Date:
MON-WQR-080-19_20 (20-09) 0.0 September 2020
Leeuwpan Coal Mine
Client Restricted Author: W. Esterhuizen
53
APPENDIX A – SAMPLING REGISTER
Surface Water Monitoring Localities:
Sample ID Details Photo
WP01
Latitude (DD): S26.17799
Longitude (DD): E28.70221
Description: Bronkhorstspruit tributary,
upstream
Frequency: Monthly
Sample Date: 08/09/2020
Sampling status: Dry
Time: N/A
WP02
Latitude (DD): S26.15510
Longitude (DD): E28.70260
Description: Bronkhorstspruit tributary,
downstream
Frequency: Monthly
Sample Date: 08/09/2020
Sampling status: Sampled
Time: 10:24
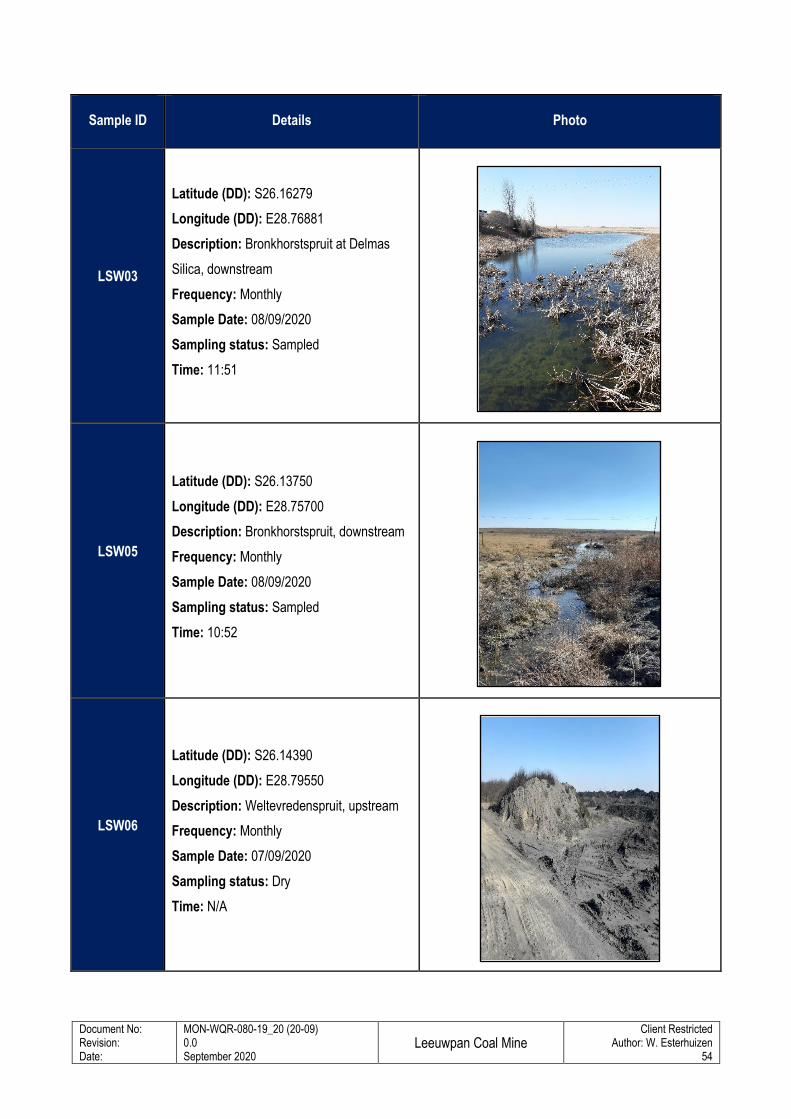
Document No: Revision: Date:
MON-WQR-080-19_20 (20-09) 0.0 September 2020
Leeuwpan Coal Mine
Client Restricted Author: W. Esterhuizen
54
Sample ID Details Photo
LSW03
Latitude (DD): S26.16279
Longitude (DD): E28.76881
Description: Bronkhorstspruit at Delmas
Silica, downstream
Frequency: Monthly
Sample Date: 08/09/2020
Sampling status: Sampled
Time: 11:51
LSW05
Latitude (DD): S26.13750
Longitude (DD): E28.75700
Description: Bronkhorstspruit, downstream
Frequency: Monthly
Sample Date: 08/09/2020
Sampling status: Sampled
Time: 10:52
LSW06
Latitude (DD): S26.14390
Longitude (DD): E28.79550
Description: Weltevredenspruit, upstream
Frequency: Monthly
Sample Date: 07/09/2020
Sampling status: Dry
Time: N/A
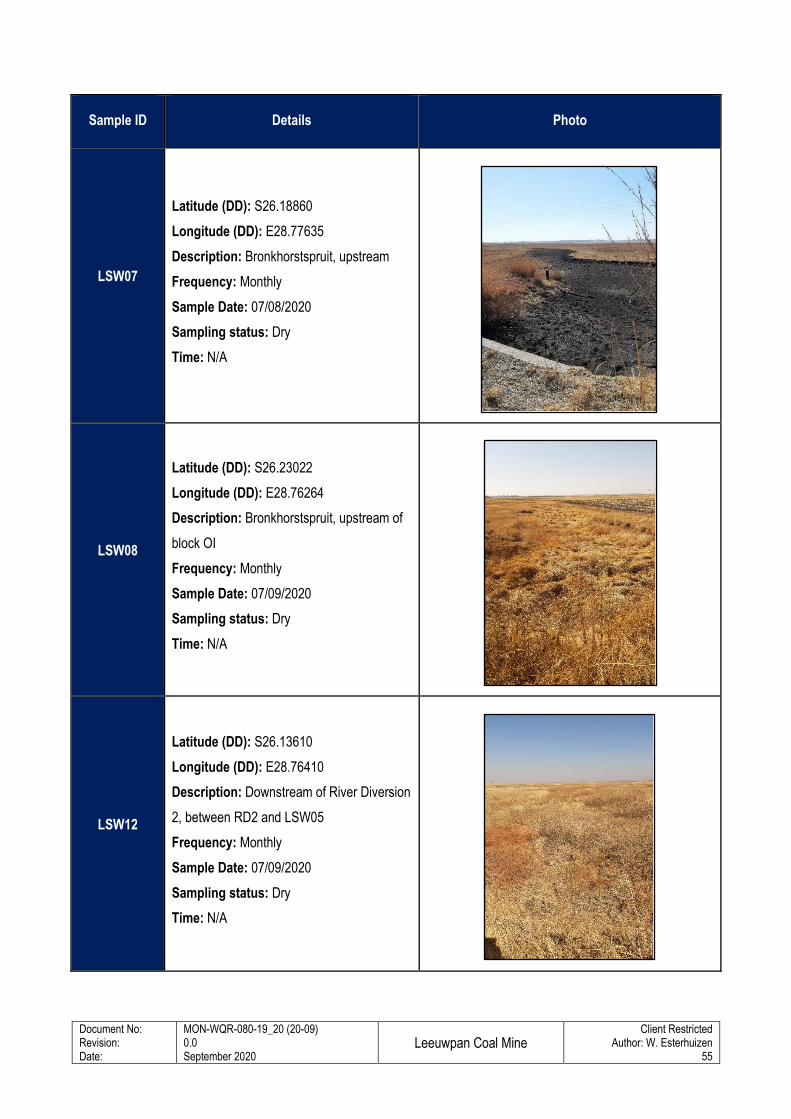
Document No: Revision: Date:
MON-WQR-080-19_20 (20-09) 0.0 September 2020
Leeuwpan Coal Mine
Client Restricted Author: W. Esterhuizen
55
Sample ID Details Photo
LSW07
Latitude (DD): S26.18860
Longitude (DD): E28.77635
Description: Bronkhorstspruit, upstream
Frequency: Monthly
Sample Date: 07/08/2020
Sampling status: Dry
Time: N/A
LSW08
Latitude (DD): S26.23022
Longitude (DD): E28.76264
Description: Bronkhorstspruit, upstream of
block OI
Frequency: Monthly
Sample Date: 07/09/2020
Sampling status: Dry
Time: N/A
LSW12
Latitude (DD): S26.13610
Longitude (DD): E28.76410
Description: Downstream of River Diversion
2, between RD2 and LSW05
Frequency: Monthly
Sample Date: 07/09/2020
Sampling status: Dry
Time: N/A
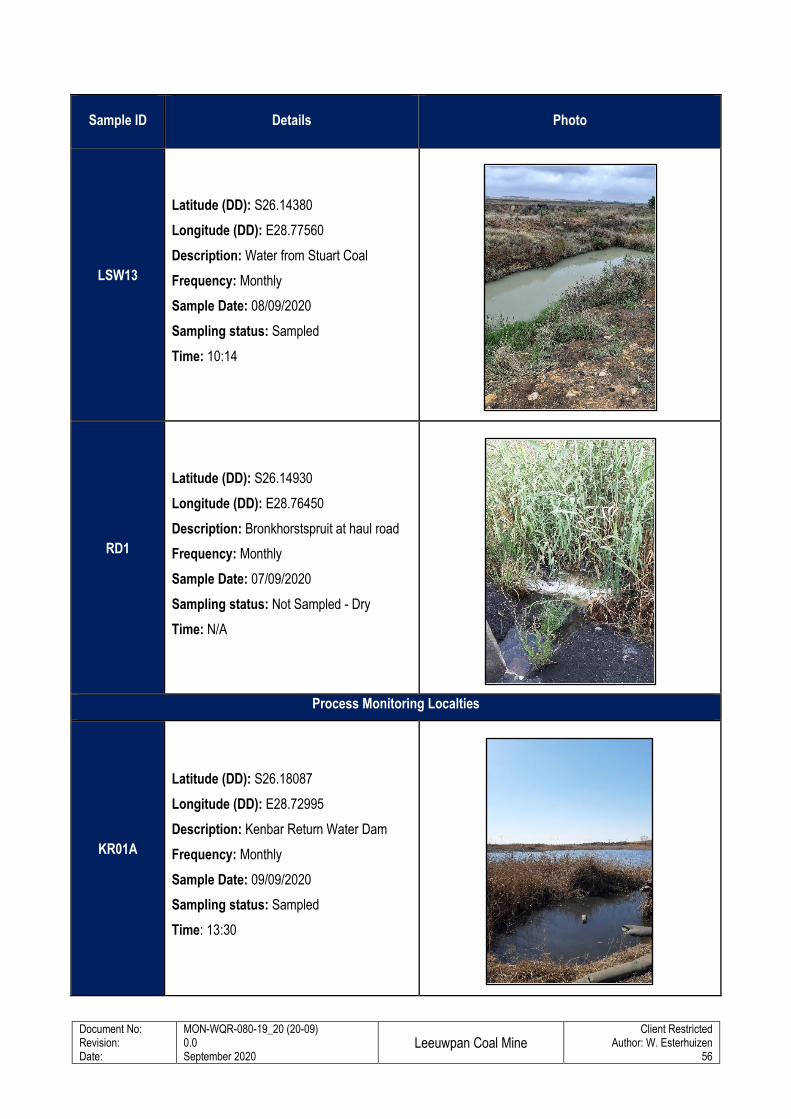
Document No: Revision: Date:
MON-WQR-080-19_20 (20-09) 0.0 September 2020
Leeuwpan Coal Mine
Client Restricted Author: W. Esterhuizen
56
Sample ID Details Photo
LSW13
Latitude (DD): S26.14380
Longitude (DD): E28.77560
Description: Water from Stuart Coal
Frequency: Monthly
Sample Date: 08/09/2020
Sampling status: Sampled
Time: 10:14
RD1
Latitude (DD): S26.14930
Longitude (DD): E28.76450
Description: Bronkhorstspruit at haul road
Frequency: Monthly
Sample Date: 07/09/2020
Sampling status: Not Sampled - Dry
Time: N/A
Process Monitoring Localties
KR01A
Latitude (DD): S26.18087
Longitude (DD): E28.72995
Description: Kenbar Return Water Dam
Frequency: Monthly
Sample Date: 09/09/2020
Sampling status: Sampled
Time: 13:30
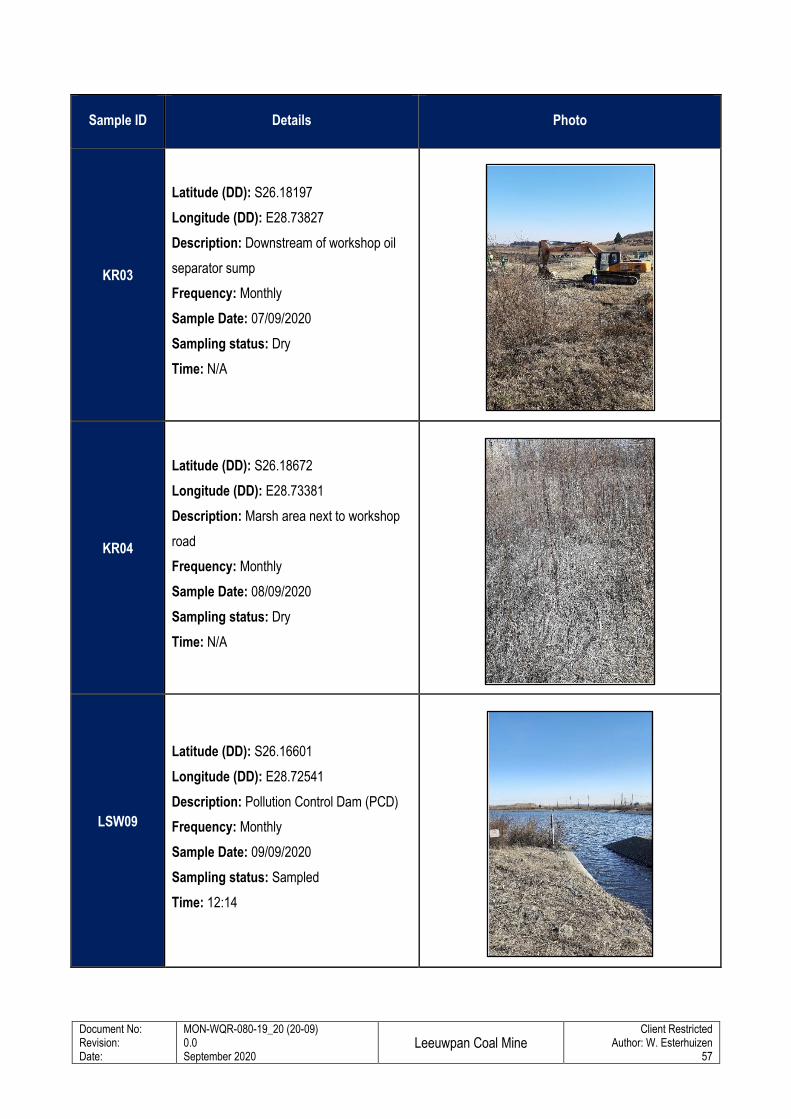
Document No: Revision: Date:
MON-WQR-080-19_20 (20-09) 0.0 September 2020
Leeuwpan Coal Mine
Client Restricted Author: W. Esterhuizen
57
Sample ID Details Photo
KR03
Latitude (DD): S26.18197
Longitude (DD): E28.73827
Description: Downstream of workshop oil
separator sump
Frequency: Monthly
Sample Date: 07/09/2020
Sampling status: Dry
Time: N/A
KR04
Latitude (DD): S26.18672
Longitude (DD): E28.73381
Description: Marsh area next to workshop
road
Frequency: Monthly
Sample Date: 08/09/2020
Sampling status: Dry
Time: N/A
LSW09
Latitude (DD): S26.16601
Longitude (DD): E28.72541
Description: Pollution Control Dam (PCD)
Frequency: Monthly
Sample Date: 09/09/2020
Sampling status: Sampled
Time: 12:14
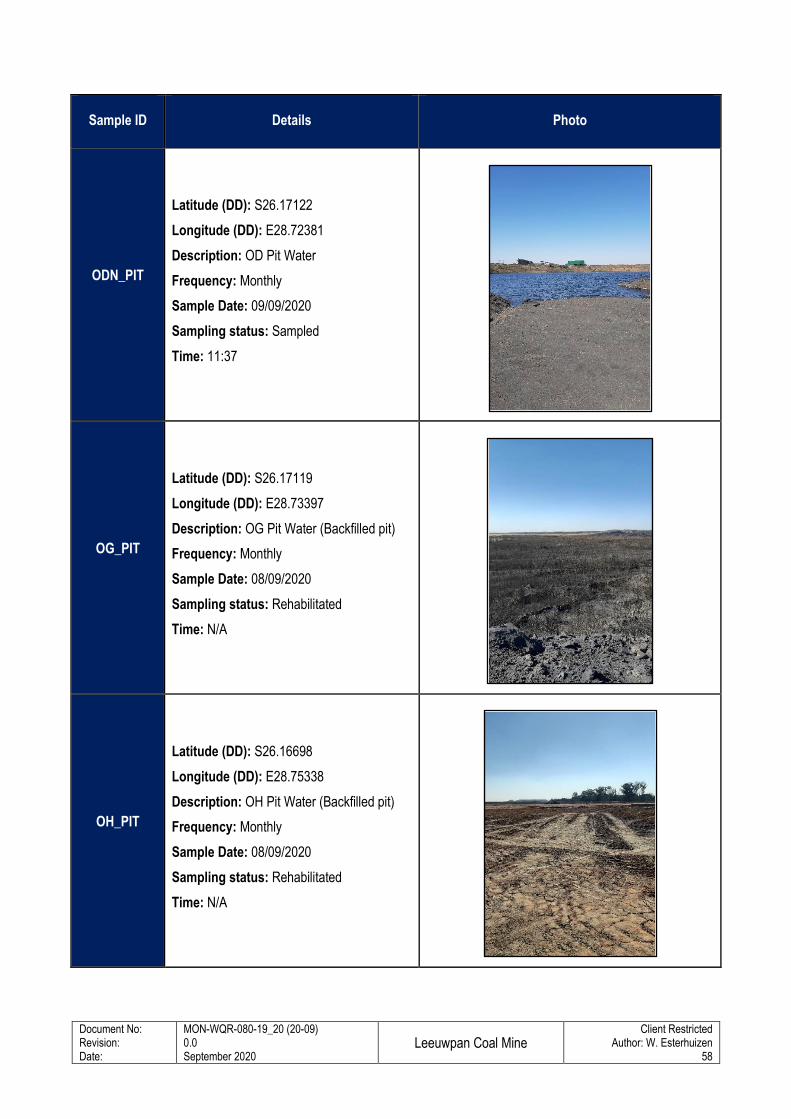
Document No: Revision: Date:
MON-WQR-080-19_20 (20-09) 0.0 September 2020
Leeuwpan Coal Mine
Client Restricted Author: W. Esterhuizen
58
Sample ID Details Photo
ODN_PIT
Latitude (DD): S26.17122
Longitude (DD): E28.72381
Description: OD Pit Water
Frequency: Monthly
Sample Date: 09/09/2020
Sampling status: Sampled
Time: 11:37
OG_PIT
Latitude (DD): S26.17119
Longitude (DD): E28.73397
Description: OG Pit Water (Backfilled pit)
Frequency: Monthly
Sample Date: 08/09/2020
Sampling status: Rehabilitated
Time: N/A
OH_PIT
Latitude (DD): S26.16698
Longitude (DD): E28.75338
Description: OH Pit Water (Backfilled pit)
Frequency: Monthly
Sample Date: 08/09/2020
Sampling status: Rehabilitated
Time: N/A
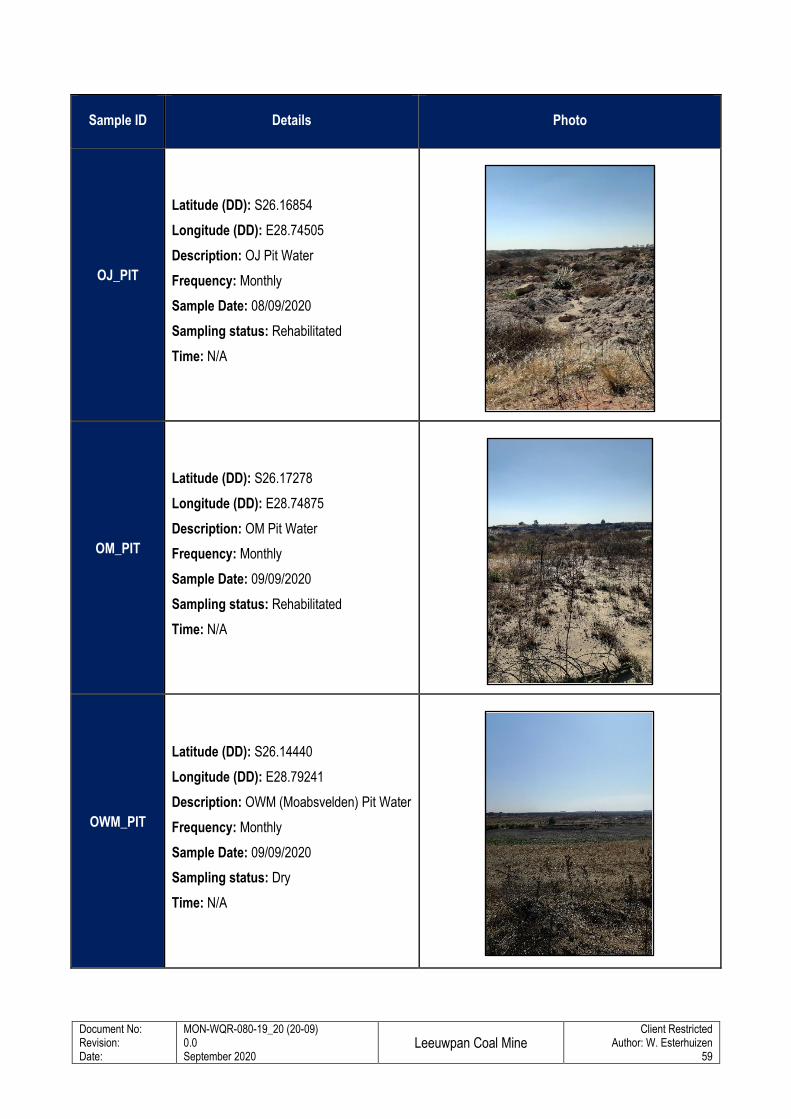
Document No: Revision: Date:
MON-WQR-080-19_20 (20-09) 0.0 September 2020
Leeuwpan Coal Mine
Client Restricted Author: W. Esterhuizen
59
Sample ID Details Photo
OJ_PIT
Latitude (DD): S26.16854
Longitude (DD): E28.74505
Description: OJ Pit Water
Frequency: Monthly
Sample Date: 08/09/2020
Sampling status: Rehabilitated
Time: N/A
OM_PIT
Latitude (DD): S26.17278
Longitude (DD): E28.74875
Description: OM Pit Water
Frequency: Monthly
Sample Date: 09/09/2020
Sampling status: Rehabilitated
Time: N/A
OWM_PIT
Latitude (DD): S26.14440
Longitude (DD): E28.79241
Description: OWM (Moabsvelden) Pit Water
Frequency: Monthly
Sample Date: 09/09/2020
Sampling status: Dry
Time: N/A
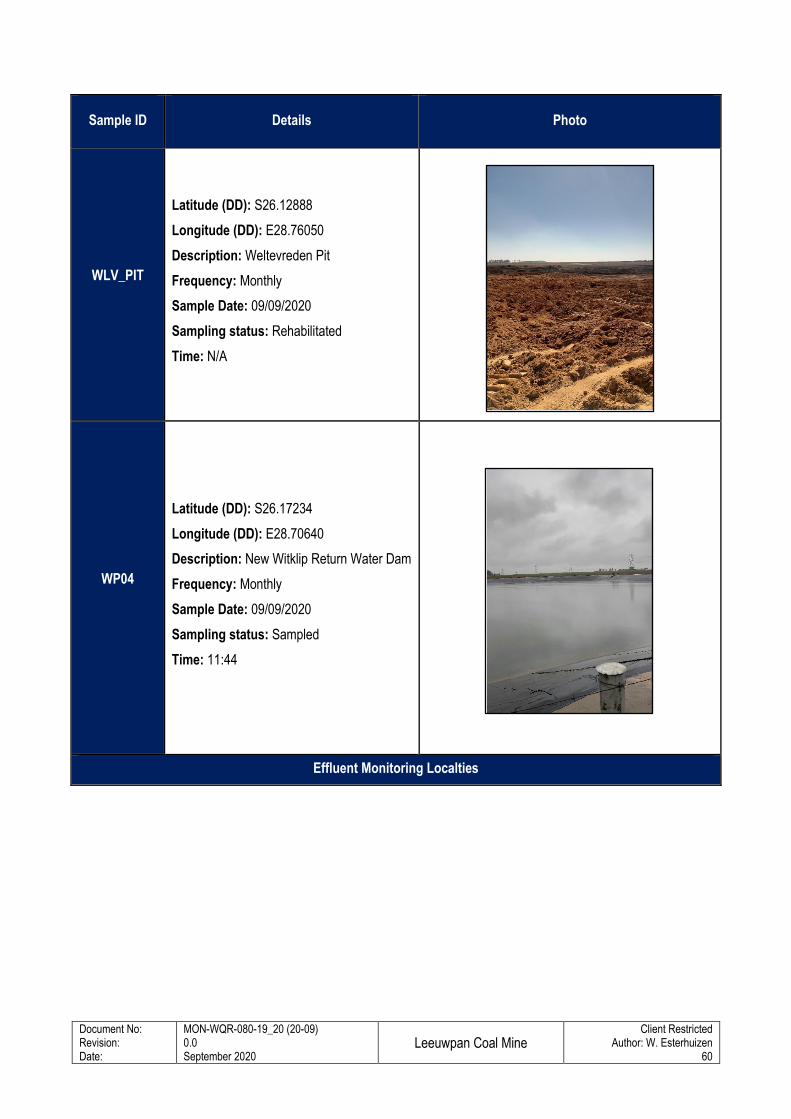
Document No: Revision: Date:
MON-WQR-080-19_20 (20-09) 0.0 September 2020
Leeuwpan Coal Mine
Client Restricted Author: W. Esterhuizen
60
Sample ID Details Photo
WLV_PIT
Latitude (DD): S26.12888
Longitude (DD): E28.76050
Description: Weltevreden Pit
Frequency: Monthly
Sample Date: 09/09/2020
Sampling status: Rehabilitated
Time: N/A
WP04
Latitude (DD): S26.17234
Longitude (DD): E28.70640
Description: New Witklip Return Water Dam
Frequency: Monthly
Sample Date: 09/09/2020
Sampling status: Sampled
Time: 11:44
Effluent Monitoring Localties
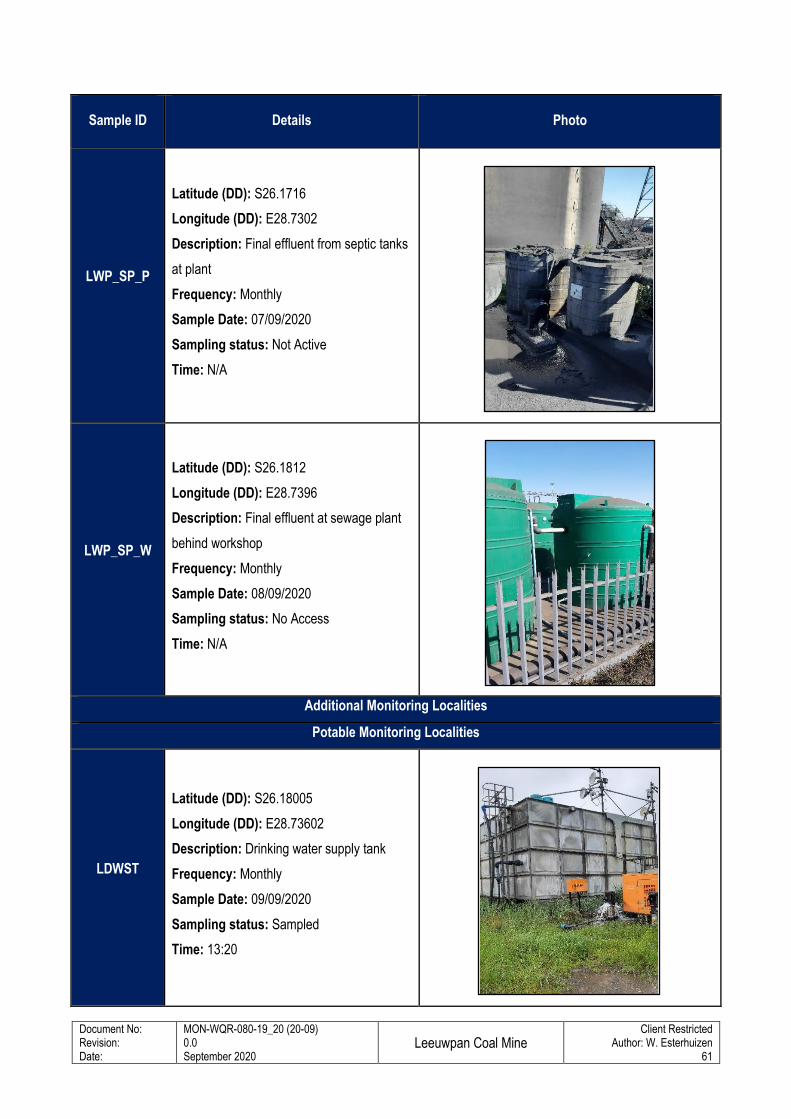
Document No: Revision: Date:
MON-WQR-080-19_20 (20-09) 0.0 September 2020
Leeuwpan Coal Mine
Client Restricted Author: W. Esterhuizen
61
Sample ID Details Photo
LWP_SP_P
Latitude (DD): S26.1716
Longitude (DD): E28.7302
Description: Final effluent from septic tanks
at plant
Frequency: Monthly
Sample Date: 07/09/2020
Sampling status: Not Active
Time: N/A
LWP_SP_W
Latitude (DD): S26.1812
Longitude (DD): E28.7396
Description: Final effluent at sewage plant
behind workshop
Frequency: Monthly
Sample Date: 08/09/2020
Sampling status: No Access
Time: N/A
Additional Monitoring Localities
Potable Monitoring Localities
LDWST
Latitude (DD): S26.18005
Longitude (DD): E28.73602
Description: Drinking water supply tank
Frequency: Monthly
Sample Date: 09/09/2020
Sampling status: Sampled
Time: 13:20
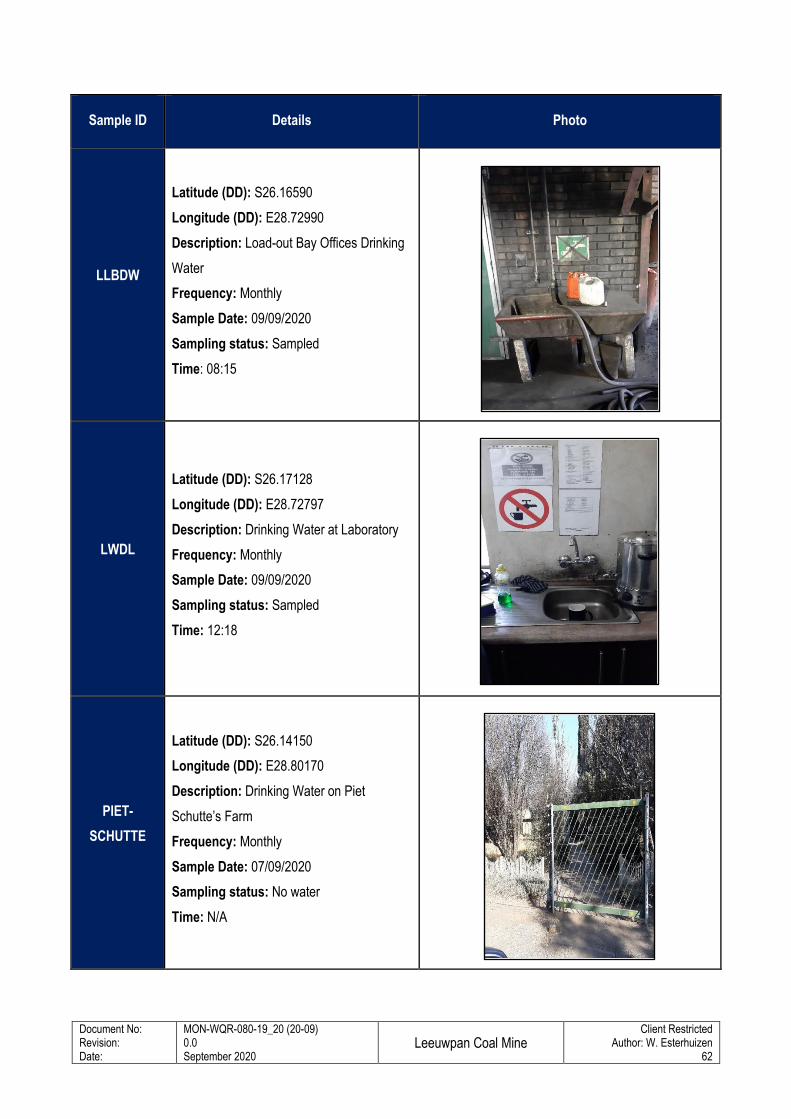
Document No: Revision: Date:
MON-WQR-080-19_20 (20-09) 0.0 September 2020
Leeuwpan Coal Mine
Client Restricted Author: W. Esterhuizen
62
Sample ID Details Photo
LLBDW
Latitude (DD): S26.16590
Longitude (DD): E28.72990
Description: Load-out Bay Offices Drinking
Water
Frequency: Monthly
Sample Date: 09/09/2020
Sampling status: Sampled
Time: 08:15
LWDL
Latitude (DD): S26.17128
Longitude (DD): E28.72797
Description: Drinking Water at Laboratory
Frequency: Monthly
Sample Date: 09/09/2020
Sampling status: Sampled
Time: 12:18
PIET-
SCHUTTE
Latitude (DD): S26.14150
Longitude (DD): E28.80170
Description: Drinking Water on Piet
Schutte’s Farm
Frequency: Monthly
Sample Date: 07/09/2020
Sampling status: No water
Time: N/A
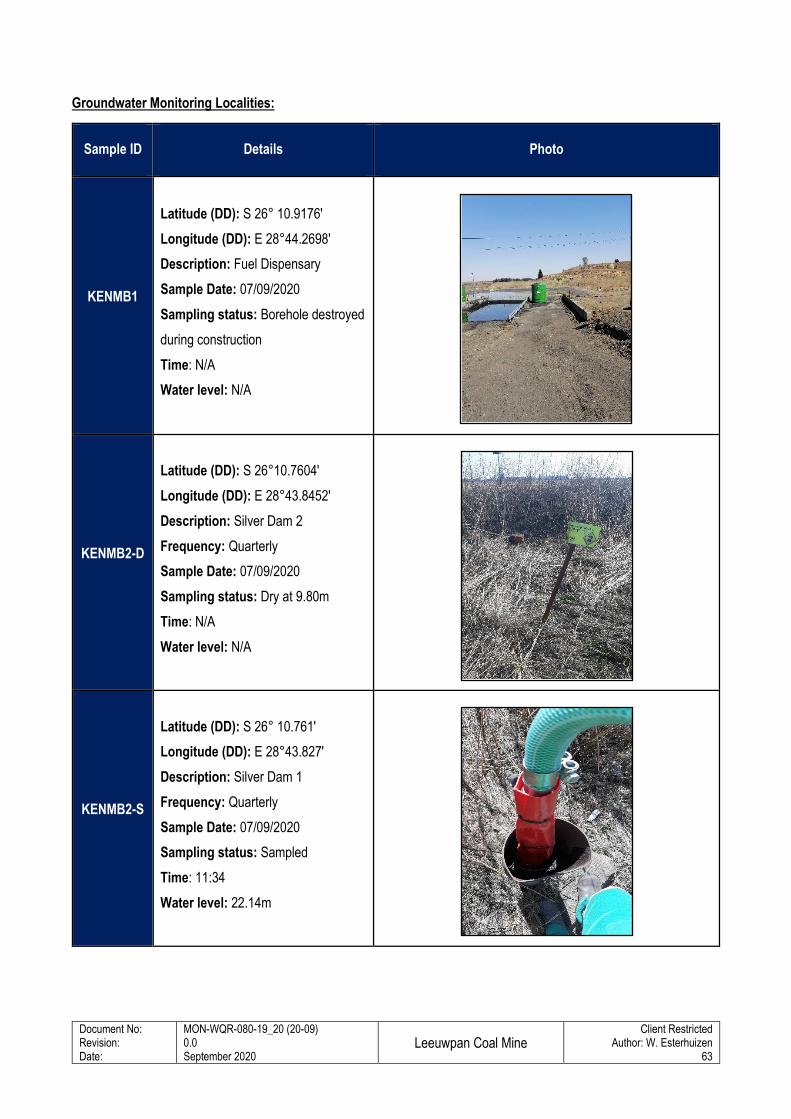
Document No: Revision: Date:
MON-WQR-080-19_20 (20-09) 0.0 September 2020
Leeuwpan Coal Mine
Client Restricted Author: W. Esterhuizen
63
Groundwater Monitoring Localities:
Sample ID Details Photo
KENMB1
Latitude (DD): S 26° 10.9176'
Longitude (DD): E 28°44.2698'
Description: Fuel Dispensary
Sample Date: 07/09/2020
Sampling status: Borehole destroyed
during construction
Time: N/A
Water level: N/A
KENMB2-D
Latitude (DD): S 26°10.7604'
Longitude (DD): E 28°43.8452'
Description: Silver Dam 2
Frequency: Quarterly
Sample Date: 07/09/2020
Sampling status: Dry at 9.80m
Time: N/A
Water level: N/A
KENMB2-S
Latitude (DD): S 26° 10.761'
Longitude (DD): E 28°43.827'
Description: Silver Dam 1
Frequency: Quarterly
Sample Date: 07/09/2020
Sampling status: Sampled
Time: 11:34
Water level: 22.14m
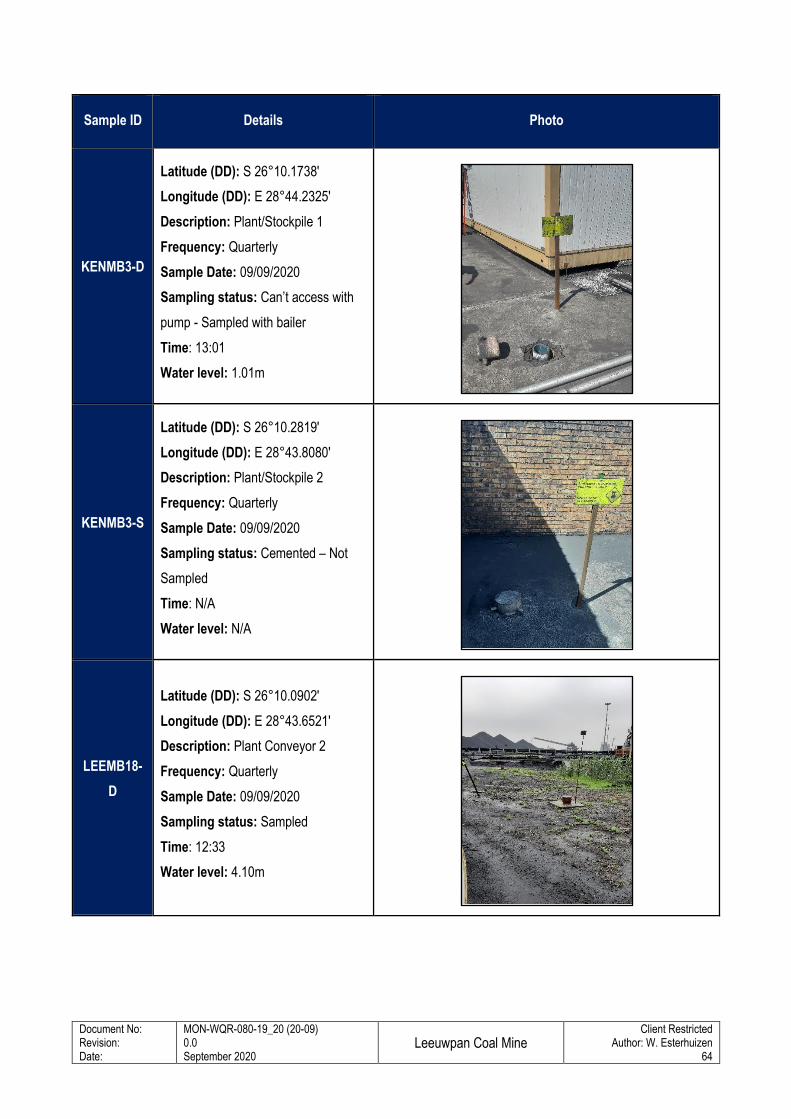
Document No: Revision: Date:
MON-WQR-080-19_20 (20-09) 0.0 September 2020
Leeuwpan Coal Mine
Client Restricted Author: W. Esterhuizen
64
Sample ID Details Photo
KENMB3-D
Latitude (DD): S 26°10.1738'
Longitude (DD): E 28°44.2325'
Description: Plant/Stockpile 1
Frequency: Quarterly
Sample Date: 09/09/2020
Sampling status: Can’t access with
pump - Sampled with bailer
Time: 13:01
Water level: 1.01m
KENMB3-S
Latitude (DD): S 26°10.2819'
Longitude (DD): E 28°43.8080'
Description: Plant/Stockpile 2
Frequency: Quarterly
Sample Date: 09/09/2020
Sampling status: Cemented – Not
Sampled
Time: N/A
Water level: N/A
LEEMB18-
D
Latitude (DD): S 26°10.0902'
Longitude (DD): E 28°43.6521'
Description: Plant Conveyor 2
Frequency: Quarterly
Sample Date: 09/09/2020
Sampling status: Sampled
Time: 12:33
Water level: 4.10m
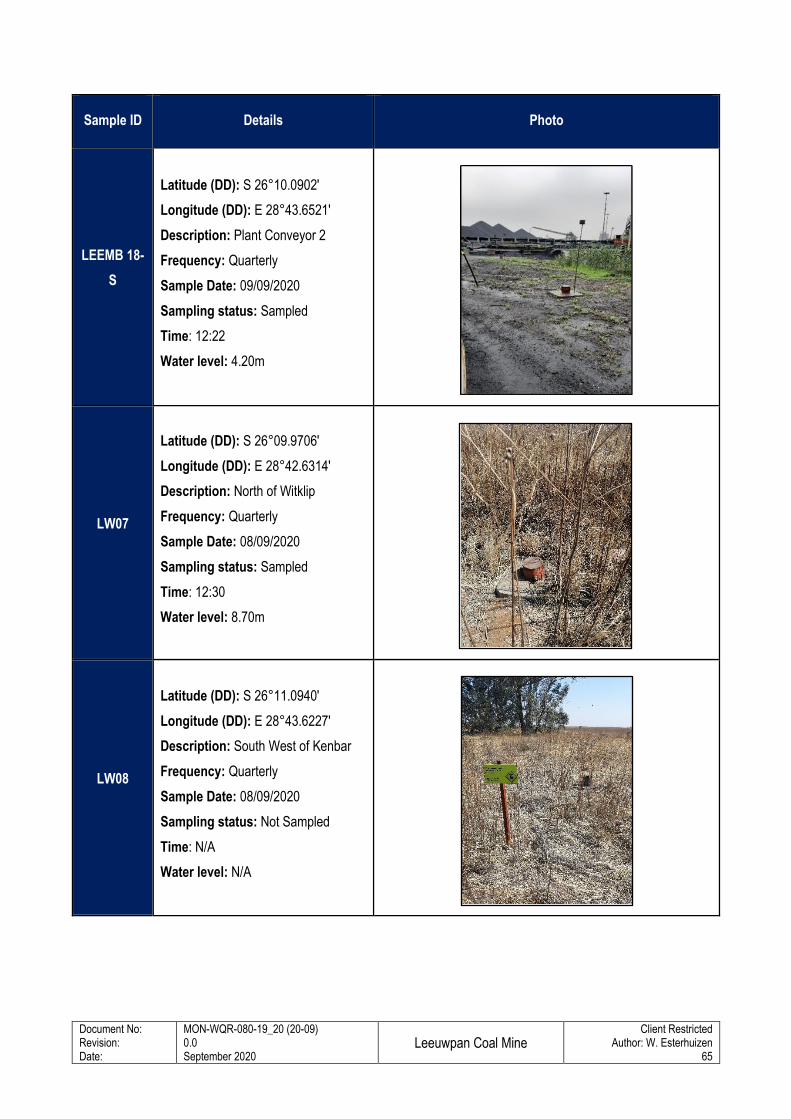
Document No: Revision: Date:
MON-WQR-080-19_20 (20-09) 0.0 September 2020
Leeuwpan Coal Mine
Client Restricted Author: W. Esterhuizen
65
Sample ID Details Photo
LEEMB 18-
S
Latitude (DD): S 26°10.0902'
Longitude (DD): E 28°43.6521'
Description: Plant Conveyor 2
Frequency: Quarterly
Sample Date: 09/09/2020
Sampling status: Sampled
Time: 12:22
Water level: 4.20m
LW07
Latitude (DD): S 26°09.9706'
Longitude (DD): E 28°42.6314'
Description: North of Witklip
Frequency: Quarterly
Sample Date: 08/09/2020
Sampling status: Sampled
Time: 12:30
Water level: 8.70m
LW08
Latitude (DD): S 26°11.0940'
Longitude (DD): E 28°43.6227'
Description: South West of Kenbar
Frequency: Quarterly
Sample Date: 08/09/2020
Sampling status: Not Sampled
Time: N/A
Water level: N/A
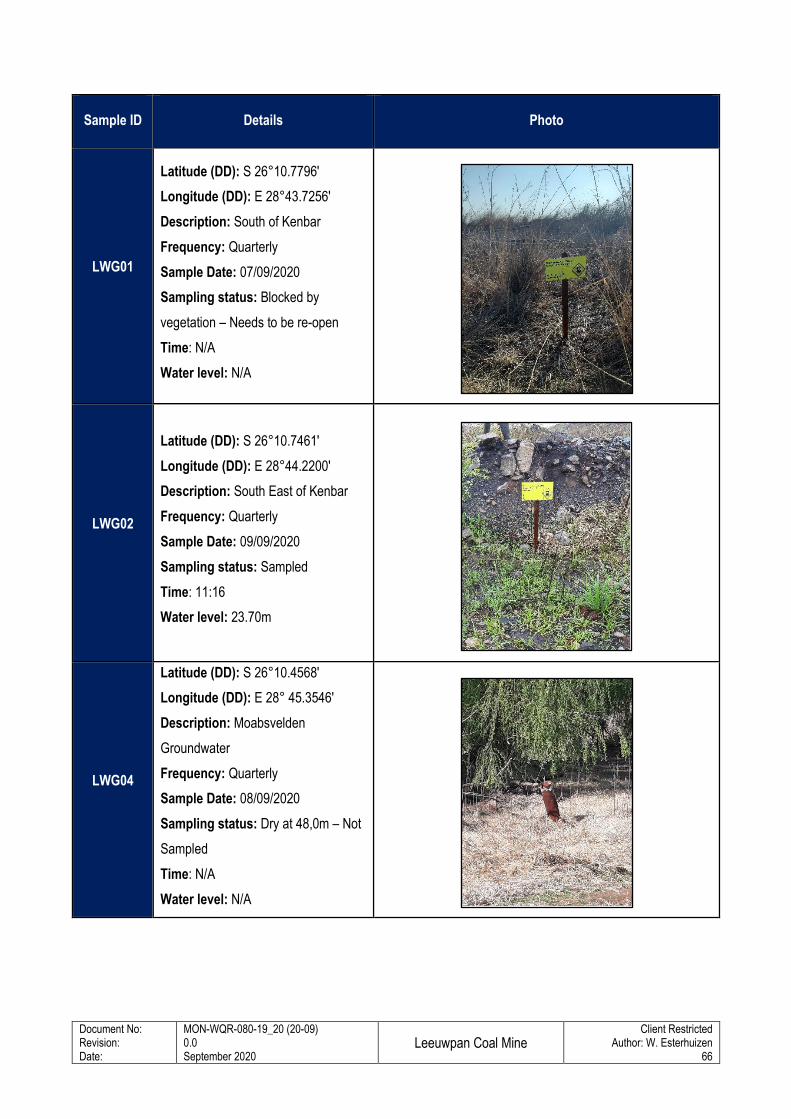
Document No: Revision: Date:
MON-WQR-080-19_20 (20-09) 0.0 September 2020
Leeuwpan Coal Mine
Client Restricted Author: W. Esterhuizen
66
Sample ID Details Photo
LWG01
Latitude (DD): S 26°10.7796'
Longitude (DD): E 28°43.7256'
Description: South of Kenbar
Frequency: Quarterly
Sample Date: 07/09/2020
Sampling status: Blocked by
vegetation – Needs to be re-open
Time: N/A
Water level: N/A
LWG02
Latitude (DD): S 26°10.7461'
Longitude (DD): E 28°44.2200'
Description: South East of Kenbar
Frequency: Quarterly
Sample Date: 09/09/2020
Sampling status: Sampled
Time: 11:16
Water level: 23.70m
LWG04
Latitude (DD): S 26°10.4568'
Longitude (DD): E 28° 45.3546'
Description: Moabsvelden
Groundwater
Frequency: Quarterly
Sample Date: 08/09/2020
Sampling status: Dry at 48,0m – Not
Sampled
Time: N/A
Water level: N/A
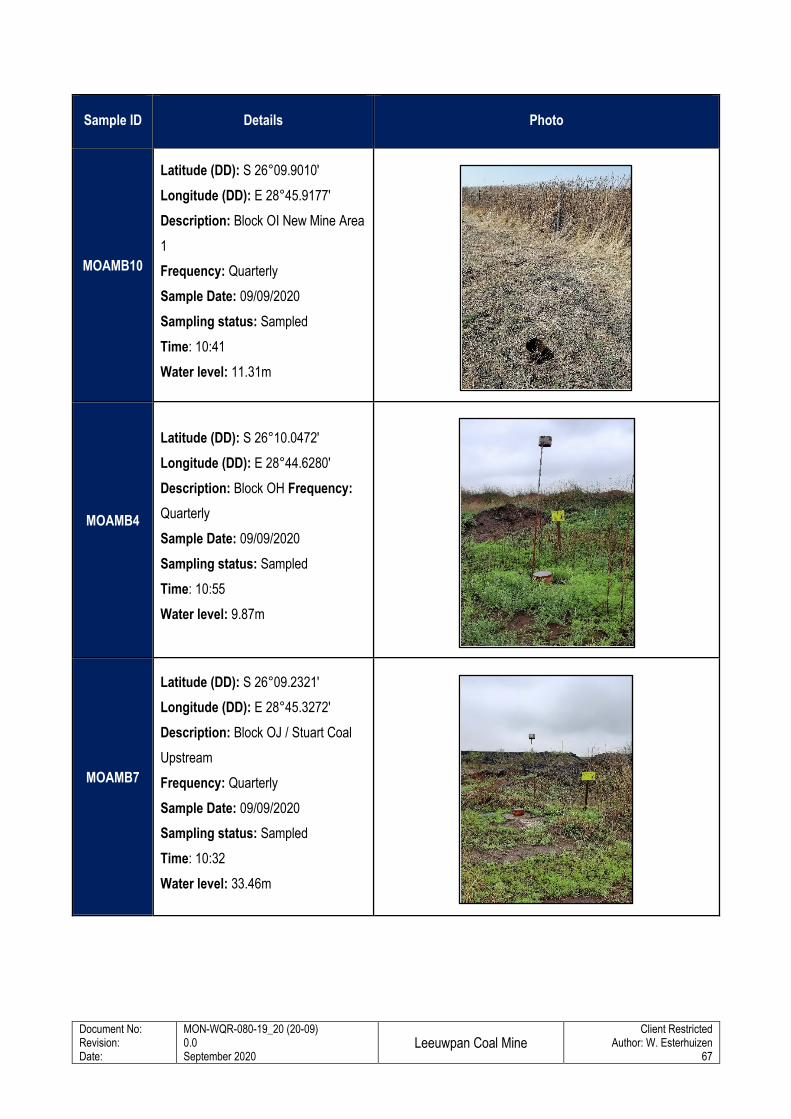
Document No: Revision: Date:
MON-WQR-080-19_20 (20-09) 0.0 September 2020
Leeuwpan Coal Mine
Client Restricted Author: W. Esterhuizen
67
Sample ID Details Photo
MOAMB10
Latitude (DD): S 26°09.9010'
Longitude (DD): E 28°45.9177'
Description: Block OI New Mine Area
1
Frequency: Quarterly
Sample Date: 09/09/2020
Sampling status: Sampled
Time: 10:41
Water level: 11.31m
MOAMB4
Latitude (DD): S 26°10.0472'
Longitude (DD): E 28°44.6280'
Description: Block OH Frequency:
Quarterly
Sample Date: 09/09/2020
Sampling status: Sampled
Time: 10:55
Water level: 9.87m
MOAMB7
Latitude (DD): S 26°09.2321'
Longitude (DD): E 28°45.3272'
Description: Block OJ / Stuart Coal
Upstream
Frequency: Quarterly
Sample Date: 09/09/2020
Sampling status: Sampled
Time: 10:32
Water level: 33.46m
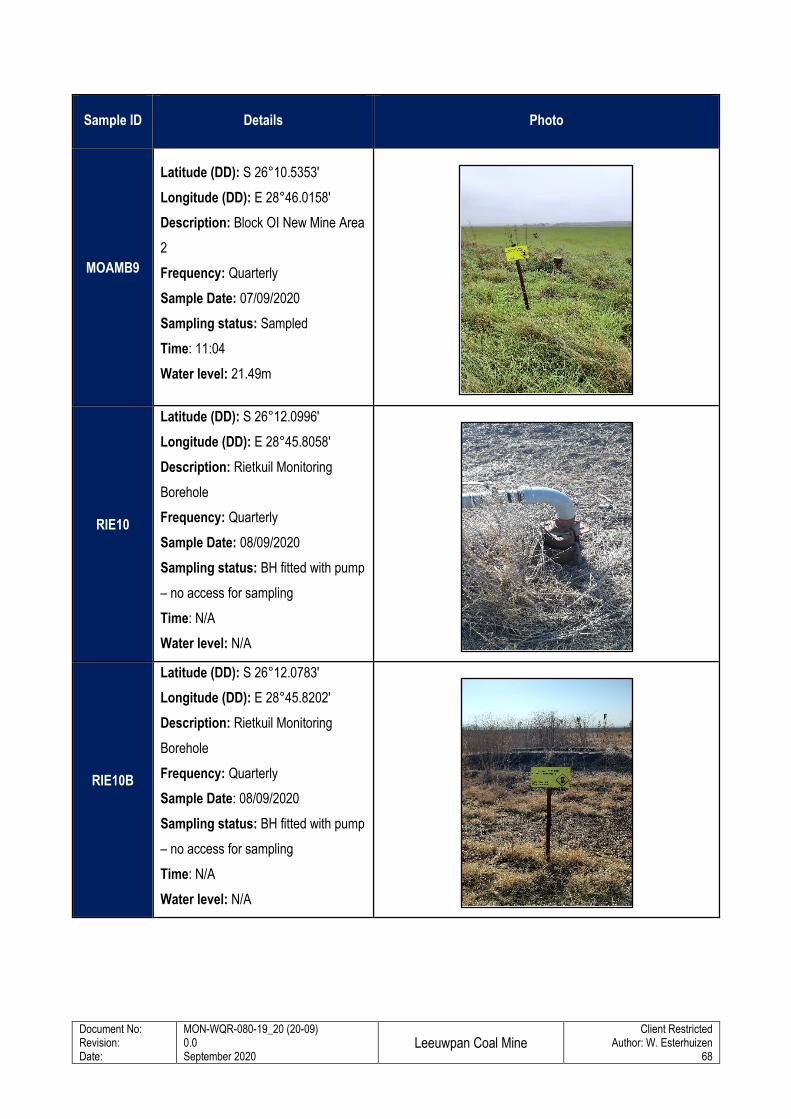
Document No: Revision: Date:
MON-WQR-080-19_20 (20-09) 0.0 September 2020
Leeuwpan Coal Mine
Client Restricted Author: W. Esterhuizen
68
Sample ID Details Photo
MOAMB9
Latitude (DD): S 26°10.5353'
Longitude (DD): E 28°46.0158'
Description: Block OI New Mine Area
2
Frequency: Quarterly
Sample Date: 07/09/2020
Sampling status: Sampled
Time: 11:04
Water level: 21.49m
RIE10
Latitude (DD): S 26°12.0996'
Longitude (DD): E 28°45.8058'
Description: Rietkuil Monitoring
Borehole
Frequency: Quarterly
Sample Date: 08/09/2020
Sampling status: BH fitted with pump
– no access for sampling
Time: N/A
Water level: N/A
RIE10B
Latitude (DD): S 26°12.0783'
Longitude (DD): E 28°45.8202'
Description: Rietkuil Monitoring
Borehole
Frequency: Quarterly
Sample Date: 08/09/2020
Sampling status: BH fitted with pump
– no access for sampling
Time: N/A
Water level: N/A
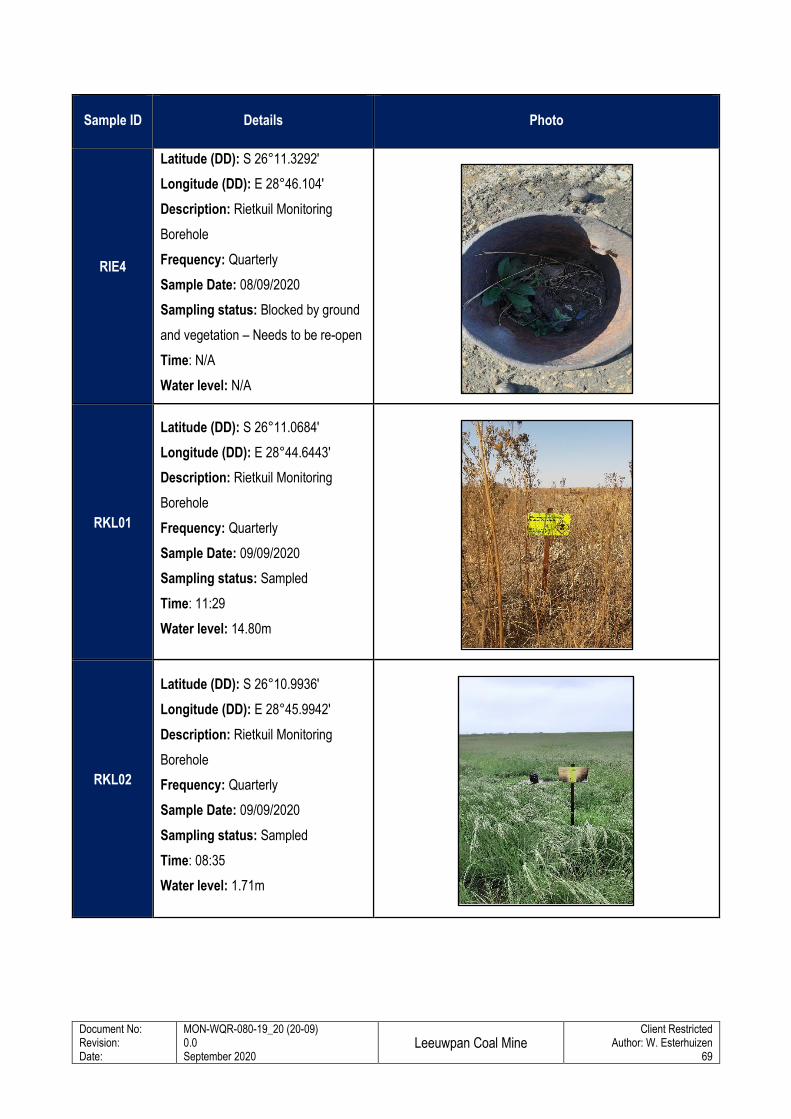
Document No: Revision: Date:
MON-WQR-080-19_20 (20-09) 0.0 September 2020
Leeuwpan Coal Mine
Client Restricted Author: W. Esterhuizen
69
Sample ID Details Photo
RIE4
Latitude (DD): S 26°11.3292'
Longitude (DD): E 28°46.104'
Description: Rietkuil Monitoring
Borehole
Frequency: Quarterly
Sample Date: 08/09/2020
Sampling status: Blocked by ground
and vegetation – Needs to be re-open
Time: N/A
Water level: N/A
RKL01
Latitude (DD): S 26°11.0684'
Longitude (DD): E 28°44.6443'
Description: Rietkuil Monitoring
Borehole
Frequency: Quarterly
Sample Date: 09/09/2020
Sampling status: Sampled
Time: 11:29
Water level: 14.80m
RKL02
Latitude (DD): S 26°10.9936'
Longitude (DD): E 28°45.9942'
Description: Rietkuil Monitoring
Borehole
Frequency: Quarterly
Sample Date: 09/09/2020
Sampling status: Sampled
Time: 08:35
Water level: 1.71m
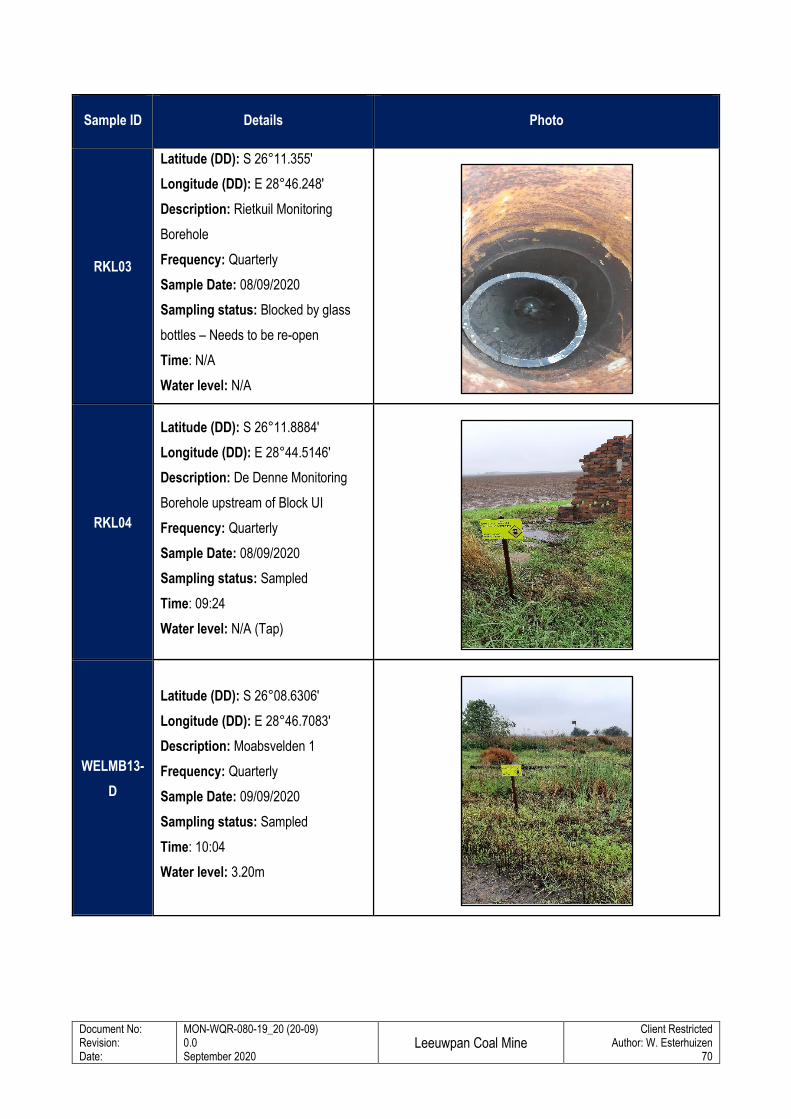
Document No: Revision: Date:
MON-WQR-080-19_20 (20-09) 0.0 September 2020
Leeuwpan Coal Mine
Client Restricted Author: W. Esterhuizen
70
Sample ID Details Photo
RKL03
Latitude (DD): S 26°11.355'
Longitude (DD): E 28°46.248'
Description: Rietkuil Monitoring
Borehole
Frequency: Quarterly
Sample Date: 08/09/2020
Sampling status: Blocked by glass
bottles – Needs to be re-open
Time: N/A
Water level: N/A
RKL04
Latitude (DD): S 26°11.8884'
Longitude (DD): E 28°44.5146'
Description: De Denne Monitoring
Borehole upstream of Block UI
Frequency: Quarterly
Sample Date: 08/09/2020
Sampling status: Sampled
Time: 09:24
Water level: N/A (Tap)
WELMB13-
D
Latitude (DD): S 26°08.6306'
Longitude (DD): E 28°46.7083'
Description: Moabsvelden 1
Frequency: Quarterly
Sample Date: 09/09/2020
Sampling status: Sampled
Time: 10:04
Water level: 3.20m
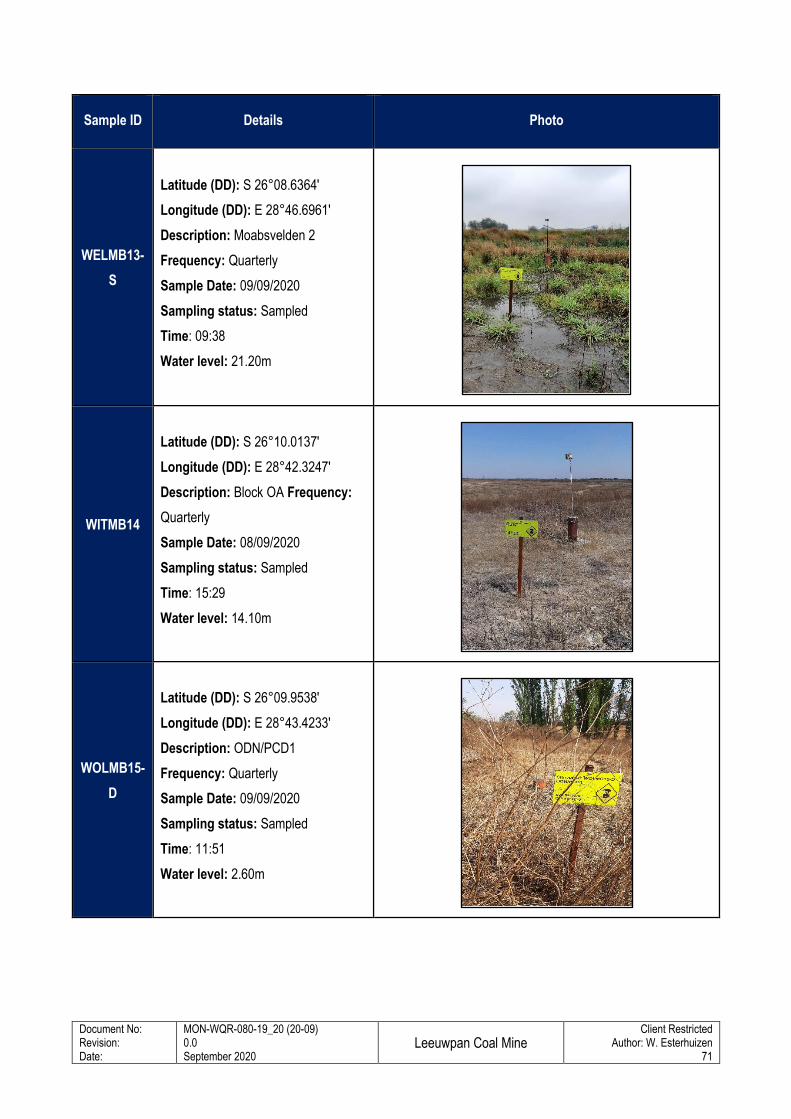
Document No: Revision: Date:
MON-WQR-080-19_20 (20-09) 0.0 September 2020
Leeuwpan Coal Mine
Client Restricted Author: W. Esterhuizen
71
Sample ID Details Photo
WELMB13-
S
Latitude (DD): S 26°08.6364'
Longitude (DD): E 28°46.6961'
Description: Moabsvelden 2
Frequency: Quarterly
Sample Date: 09/09/2020
Sampling status: Sampled
Time: 09:38
Water level: 21.20m
WITMB14
Latitude (DD): S 26°10.0137'
Longitude (DD): E 28°42.3247'
Description: Block OA Frequency:
Quarterly
Sample Date: 08/09/2020
Sampling status: Sampled
Time: 15:29
Water level: 14.10m
WOLMB15-
D
Latitude (DD): S 26°09.9538'
Longitude (DD): E 28°43.4233'
Description: ODN/PCD1
Frequency: Quarterly
Sample Date: 09/09/2020
Sampling status: Sampled
Time: 11:51
Water level: 2.60m
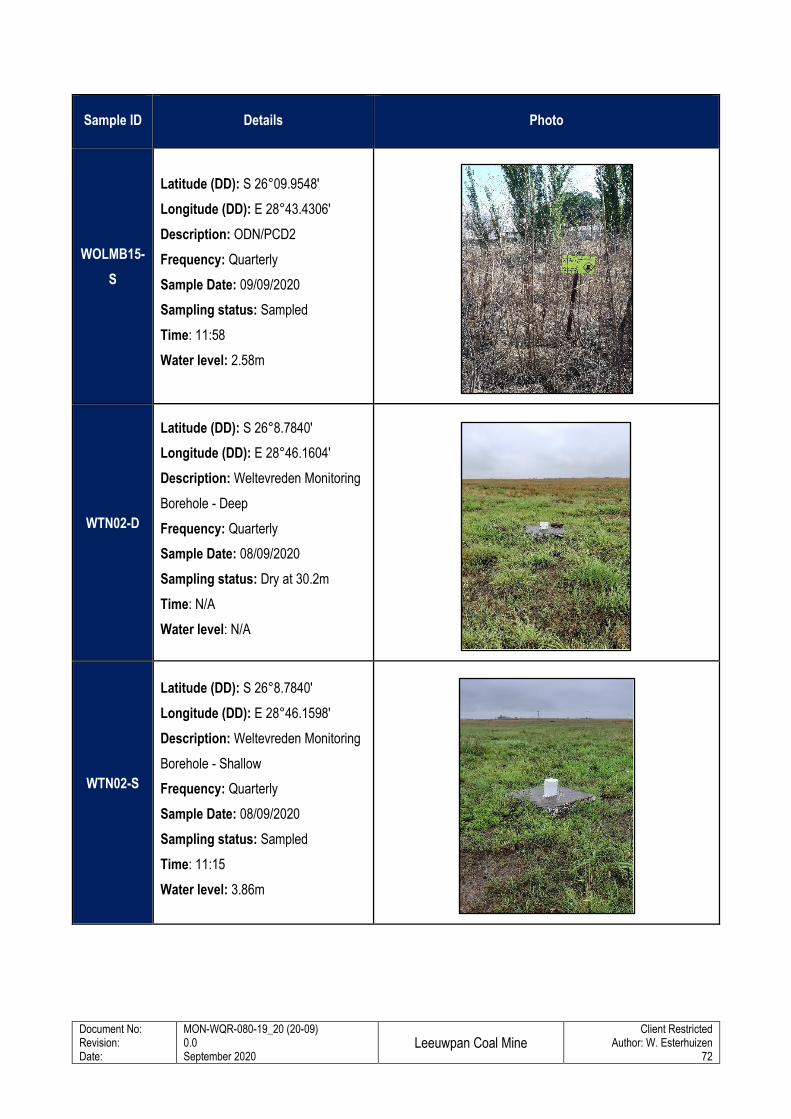
Document No: Revision: Date:
MON-WQR-080-19_20 (20-09) 0.0 September 2020
Leeuwpan Coal Mine
Client Restricted Author: W. Esterhuizen
72
Sample ID Details Photo
WOLMB15-
S
Latitude (DD): S 26°09.9548'
Longitude (DD): E 28°43.4306'
Description: ODN/PCD2
Frequency: Quarterly
Sample Date: 09/09/2020
Sampling status: Sampled
Time: 11:58
Water level: 2.58m
WTN02-D
Latitude (DD): S 26°8.7840'
Longitude (DD): E 28°46.1604'
Description: Weltevreden Monitoring
Borehole - Deep
Frequency: Quarterly
Sample Date: 08/09/2020
Sampling status: Dry at 30.2m
Time: N/A
Water level: N/A
WTN02-S
Latitude (DD): S 26°8.7840'
Longitude (DD): E 28°46.1598'
Description: Weltevreden Monitoring
Borehole - Shallow
Frequency: Quarterly
Sample Date: 08/09/2020
Sampling status: Sampled
Time: 11:15
Water level: 3.86m
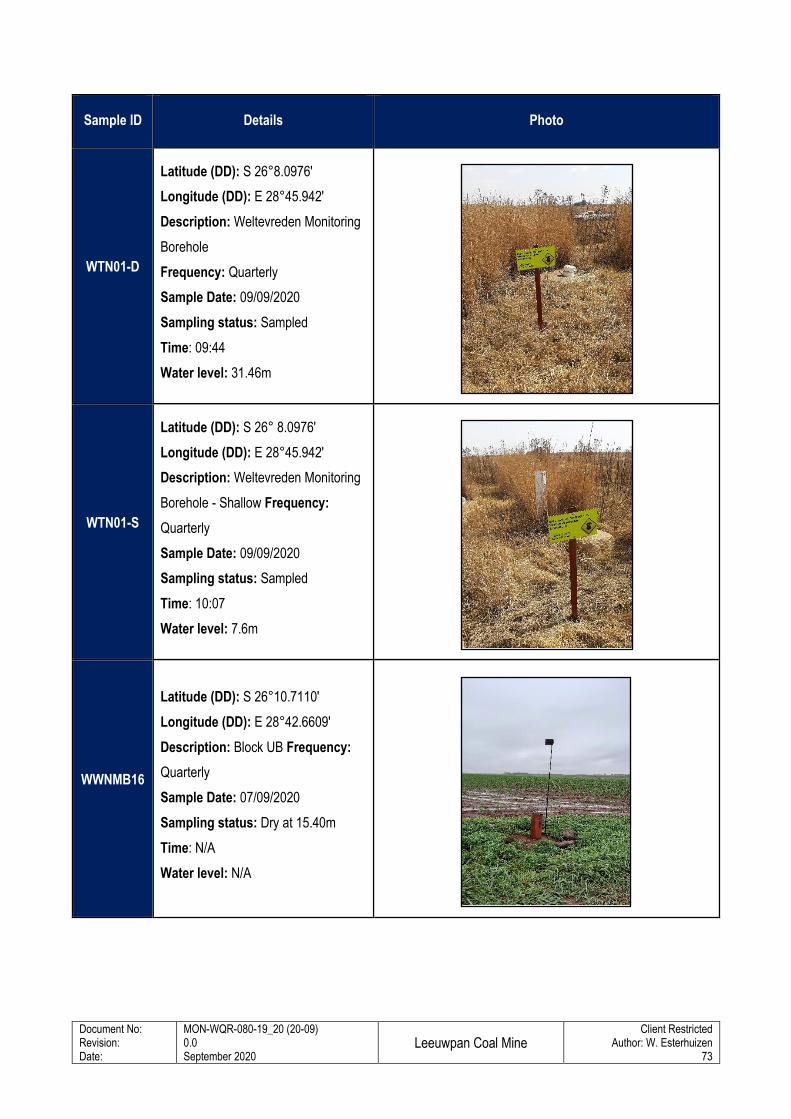
Document No: Revision: Date:
MON-WQR-080-19_20 (20-09) 0.0 September 2020
Leeuwpan Coal Mine
Client Restricted Author: W. Esterhuizen
73
Sample ID Details Photo
WTN01-D
Latitude (DD): S 26°8.0976'
Longitude (DD): E 28°45.942'
Description: Weltevreden Monitoring
Borehole
Frequency: Quarterly
Sample Date: 09/09/2020
Sampling status: Sampled
Time: 09:44
Water level: 31.46m
WTN01-S
Latitude (DD): S 26° 8.0976'
Longitude (DD): E 28°45.942'
Description: Weltevreden Monitoring
Borehole - Shallow Frequency:
Quarterly
Sample Date: 09/09/2020
Sampling status: Sampled
Time: 10:07
Water level: 7.6m
WWNMB16
Latitude (DD): S 26°10.7110'
Longitude (DD): E 28°42.6609'
Description: Block UB Frequency:
Quarterly
Sample Date: 07/09/2020
Sampling status: Dry at 15.40m
Time: N/A
Water level: N/A
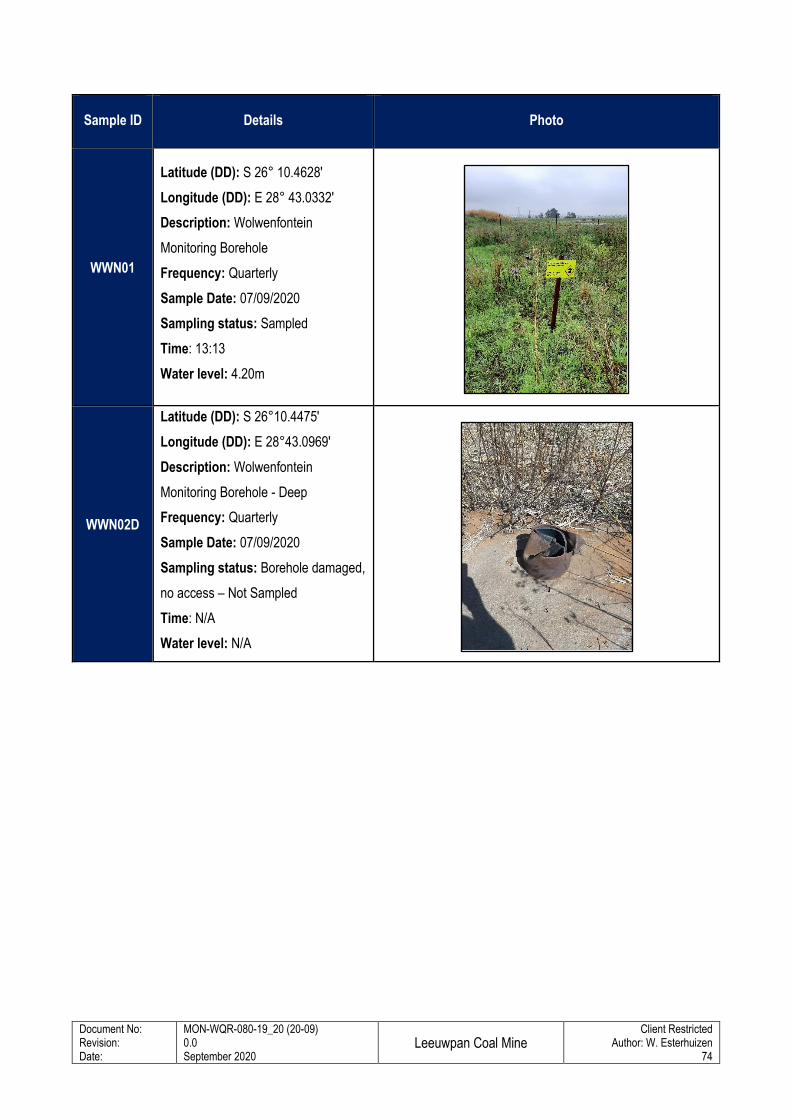
Document No: Revision: Date:
MON-WQR-080-19_20 (20-09) 0.0 September 2020
Leeuwpan Coal Mine
Client Restricted Author: W. Esterhuizen
74
Sample ID Details Photo
WWN01
Latitude (DD): S 26° 10.4628'
Longitude (DD): E 28° 43.0332'
Description: Wolwenfontein
Monitoring Borehole
Frequency: Quarterly
Sample Date: 07/09/2020
Sampling status: Sampled
Time: 13:13
Water level: 4.20m
WWN02D
Latitude (DD): S 26°10.4475'
Longitude (DD): E 28°43.0969'
Description: Wolwenfontein
Monitoring Borehole - Deep
Frequency: Quarterly
Sample Date: 07/09/2020
Sampling status: Borehole damaged,
no access – Not Sampled
Time: N/A
Water level: N/A
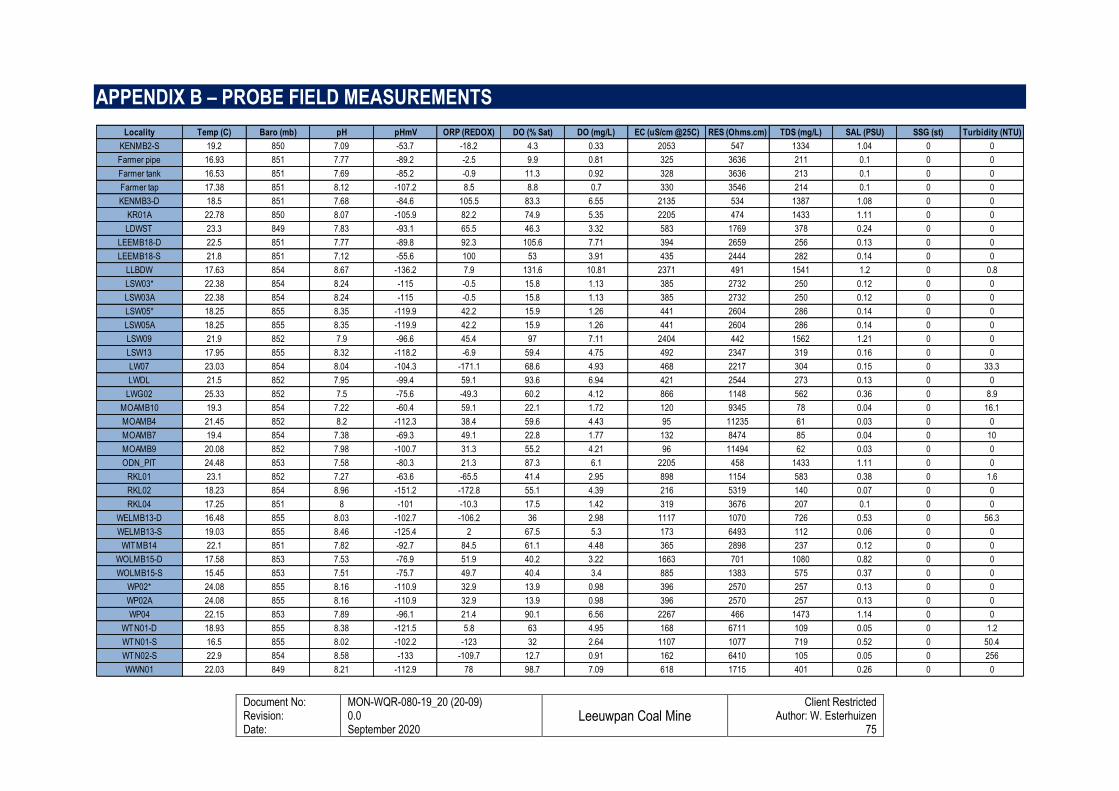
Document No: Revision: Date:
MON-WQR-080-19_20 (20-09) 0.0 September 2020
Leeuwpan Coal Mine
Client Restricted Author: W. Esterhuizen
75
APPENDIX B – PROBE FIELD MEASUREMENTS
Locality Temp (C) Baro (mb) pH pHmV ORP (REDOX) DO (% Sat) DO (mg/L) EC (uS/cm @25C) RES (Ohms.cm) TDS (mg/L) SAL (PSU) SSG (st) Turbidity (NTU)
KENMB2-S 19.2 850 7.09 -53.7 -18.2 4.3 0.33 2053 547 1334 1.04 0 0
Farmer pipe 16.93 851 7.77 -89.2 -2.5 9.9 0.81 325 3636 211 0.1 0 0
Farmer tank 16.53 851 7.69 -85.2 -0.9 11.3 0.92 328 3636 213 0.1 0 0
Farmer tap 17.38 851 8.12 -107.2 8.5 8.8 0.7 330 3546 214 0.1 0 0
KENMB3-D 18.5 851 7.68 -84.6 105.5 83.3 6.55 2135 534 1387 1.08 0 0
KR01A 22.78 850 8.07 -105.9 82.2 74.9 5.35 2205 474 1433 1.11 0 0
LDWST 23.3 849 7.83 -93.1 65.5 46.3 3.32 583 1769 378 0.24 0 0
LEEMB18-D 22.5 851 7.77 -89.8 92.3 105.6 7.71 394 2659 256 0.13 0 0
LEEMB18-S 21.8 851 7.12 -55.6 100 53 3.91 435 2444 282 0.14 0 0
LLBDW 17.63 854 8.67 -136.2 7.9 131.6 10.81 2371 491 1541 1.2 0 0.8
LSW03* 22.38 854 8.24 -115 -0.5 15.8 1.13 385 2732 250 0.12 0 0
LSW03A 22.38 854 8.24 -115 -0.5 15.8 1.13 385 2732 250 0.12 0 0
LSW05* 18.25 855 8.35 -119.9 42.2 15.9 1.26 441 2604 286 0.14 0 0
LSW05A 18.25 855 8.35 -119.9 42.2 15.9 1.26 441 2604 286 0.14 0 0
LSW09 21.9 852 7.9 -96.6 45.4 97 7.11 2404 442 1562 1.21 0 0
LSW13 17.95 855 8.32 -118.2 -6.9 59.4 4.75 492 2347 319 0.16 0 0
LW07 23.03 854 8.04 -104.3 -171.1 68.6 4.93 468 2217 304 0.15 0 33.3
LWDL 21.5 852 7.95 -99.4 59.1 93.6 6.94 421 2544 273 0.13 0 0
LWG02 25.33 852 7.5 -75.6 -49.3 60.2 4.12 866 1148 562 0.36 0 8.9
MOAMB10 19.3 854 7.22 -60.4 59.1 22.1 1.72 120 9345 78 0.04 0 16.1
MOAMB4 21.45 852 8.2 -112.3 38.4 59.6 4.43 95 11235 61 0.03 0 0
MOAMB7 19.4 854 7.38 -69.3 49.1 22.8 1.77 132 8474 85 0.04 0 10
MOAMB9 20.08 852 7.98 -100.7 31.3 55.2 4.21 96 11494 62 0.03 0 0
ODN_PIT 24.48 853 7.58 -80.3 21.3 87.3 6.1 2205 458 1433 1.11 0 0
RKL01 23.1 852 7.27 -63.6 -65.5 41.4 2.95 898 1154 583 0.38 0 1.6
RKL02 18.23 854 8.96 -151.2 -172.8 55.1 4.39 216 5319 140 0.07 0 0
RKL04 17.25 851 8 -101 -10.3 17.5 1.42 319 3676 207 0.1 0 0
WELMB13-D 16.48 855 8.03 -102.7 -106.2 36 2.98 1117 1070 726 0.53 0 56.3
WELMB13-S 19.03 855 8.46 -125.4 2 67.5 5.3 173 6493 112 0.06 0 0
WITMB14 22.1 851 7.82 -92.7 84.5 61.1 4.48 365 2898 237 0.12 0 0
WOLMB15-D 17.58 853 7.53 -76.9 51.9 40.2 3.22 1663 701 1080 0.82 0 0
WOLMB15-S 15.45 853 7.51 -75.7 49.7 40.4 3.4 885 1383 575 0.37 0 0
WP02* 24.08 855 8.16 -110.9 32.9 13.9 0.98 396 2570 257 0.13 0 0
WP02A 24.08 855 8.16 -110.9 32.9 13.9 0.98 396 2570 257 0.13 0 0
WP04 22.15 853 7.89 -96.1 21.4 90.1 6.56 2267 466 1473 1.14 0 0
WTN01-D 18.93 855 8.38 -121.5 5.8 63 4.95 168 6711 109 0.05 0 1.2
WTN01-S 16.5 855 8.02 -102.2 -123 32 2.64 1107 1077 719 0.52 0 50.4
WTN02-S 22.9 854 8.58 -133 -109.7 12.7 0.91 162 6410 105 0.05 0 256
WWN01 22.03 849 8.21 -112.9 78 98.7 7.09 618 1715 401 0.26 0 0
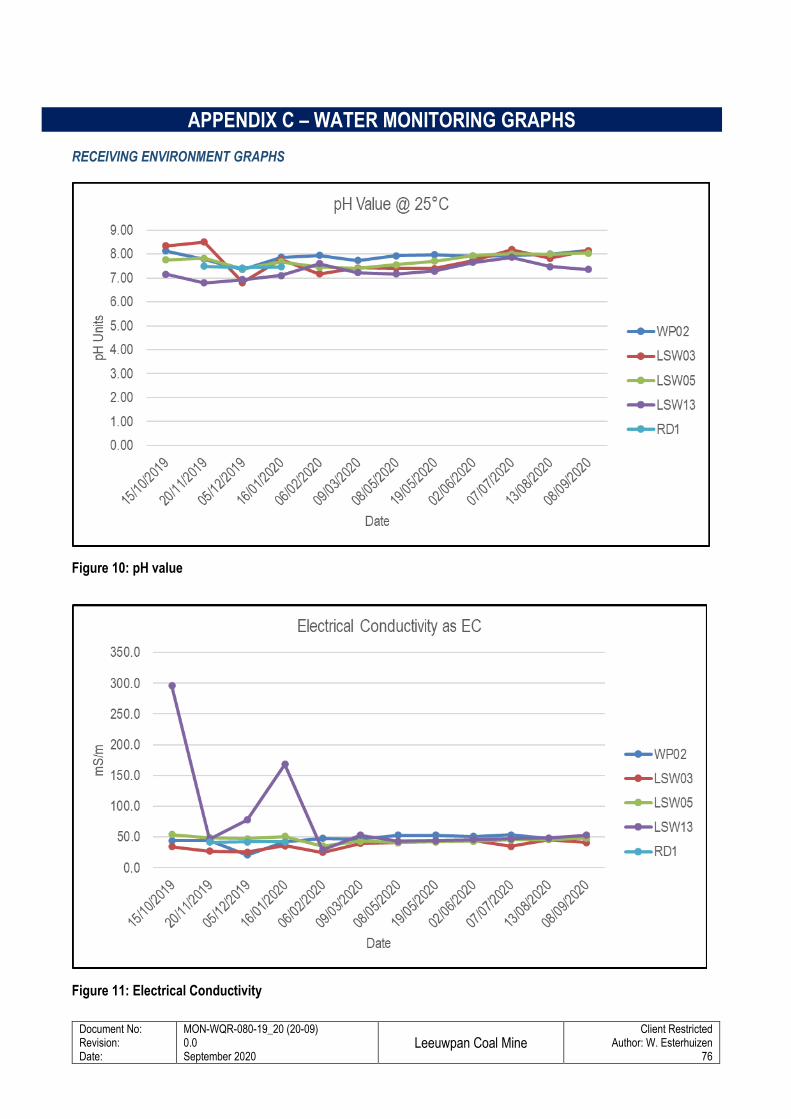
Document No: Revision: Date:
MON-WQR-080-19_20 (20-09) 0.0 September 2020
Leeuwpan Coal Mine
Client Restricted Author: W. Esterhuizen
76
APPENDIX C – WATER MONITORING GRAPHS
RECEIVING ENVIRONMENT GRAPHS
Figure 10: pH value
Figure 11: Electrical Conductivity
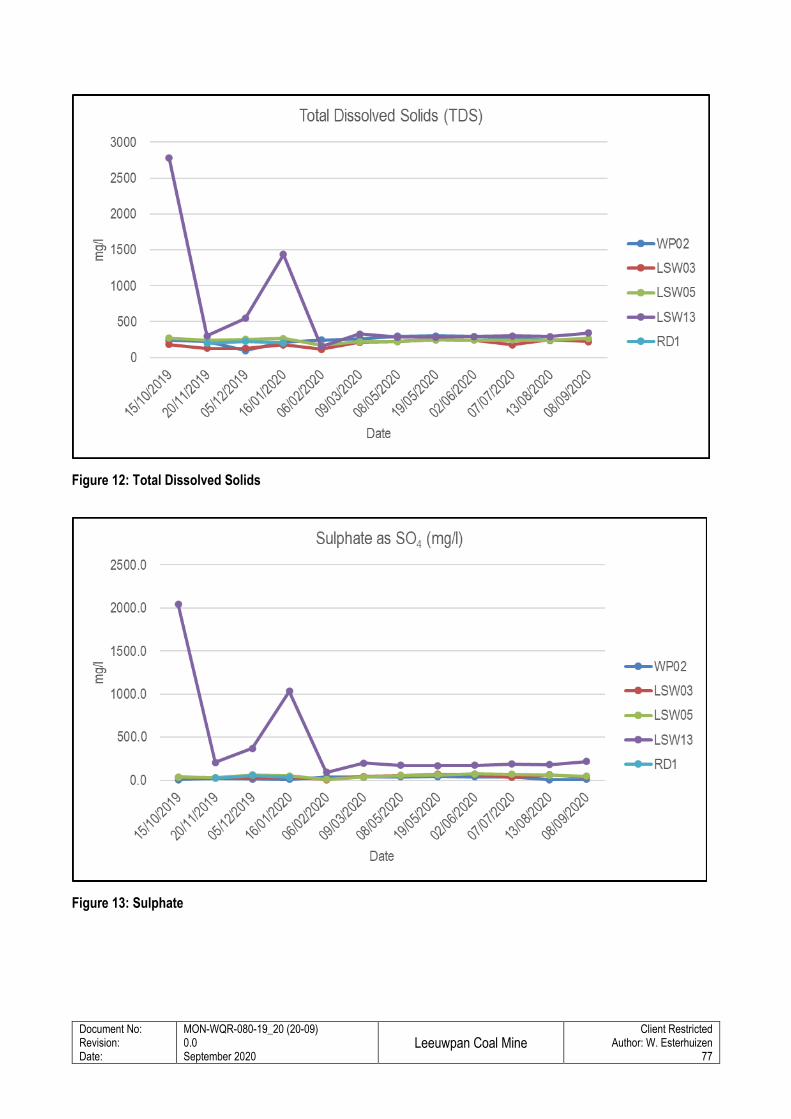
Document No: Revision: Date:
MON-WQR-080-19_20 (20-09) 0.0 September 2020
Leeuwpan Coal Mine
Client Restricted Author: W. Esterhuizen
77
Figure 12: Total Dissolved Solids
Figure 13: Sulphate
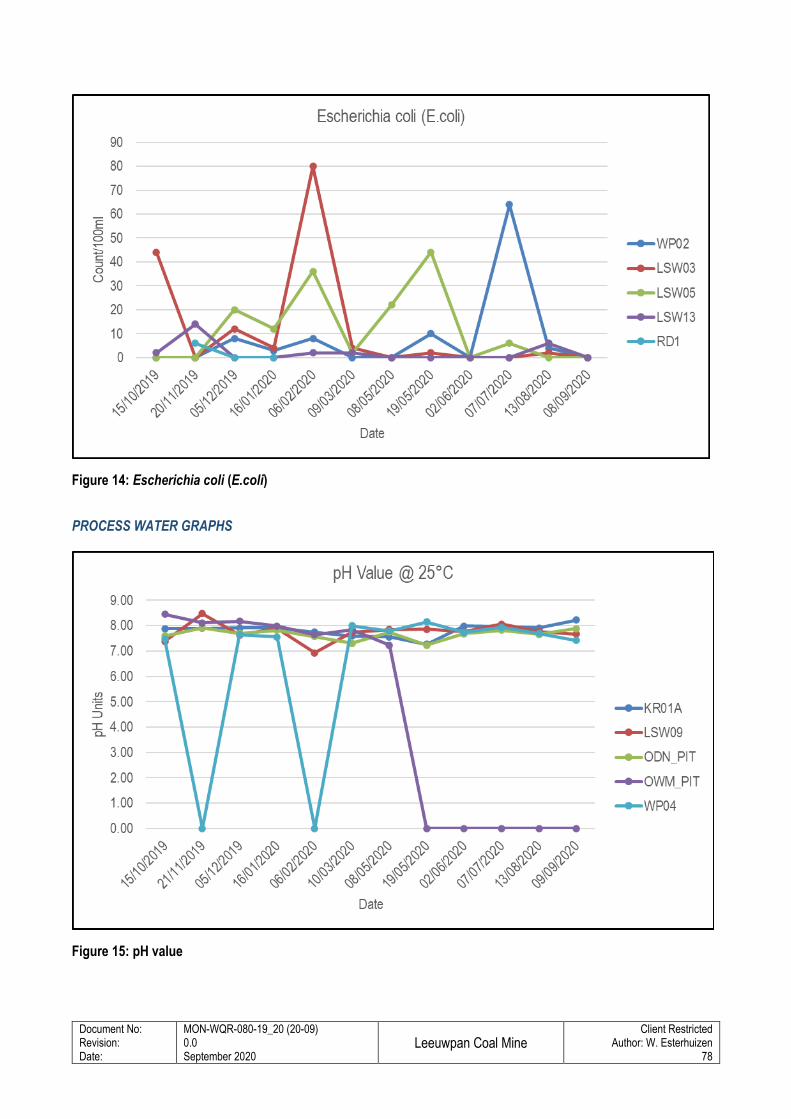
Document No: Revision: Date:
MON-WQR-080-19_20 (20-09) 0.0 September 2020
Leeuwpan Coal Mine
Client Restricted Author: W. Esterhuizen
78
Figure 14: Escherichia coli (E.coli)
PROCESS WATER GRAPHS
Figure 15: pH value
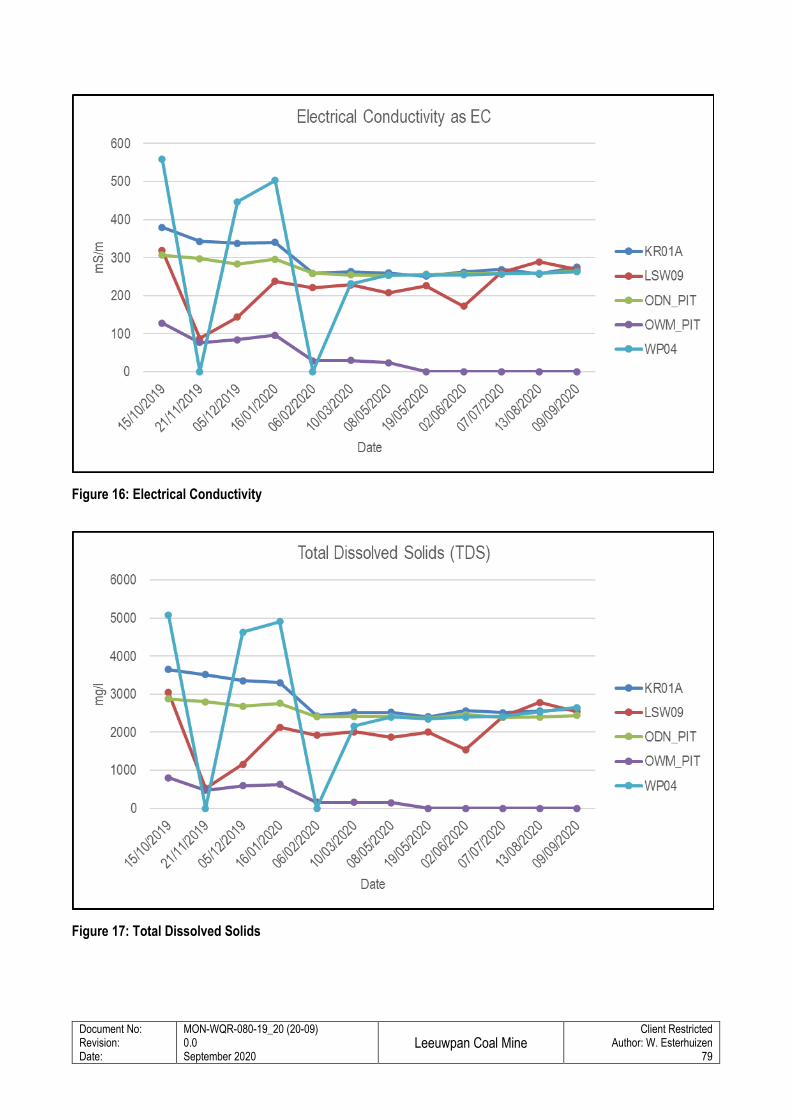
Document No: Revision: Date:
MON-WQR-080-19_20 (20-09) 0.0 September 2020
Leeuwpan Coal Mine
Client Restricted Author: W. Esterhuizen
79
Figure 16: Electrical Conductivity
Figure 17: Total Dissolved Solids
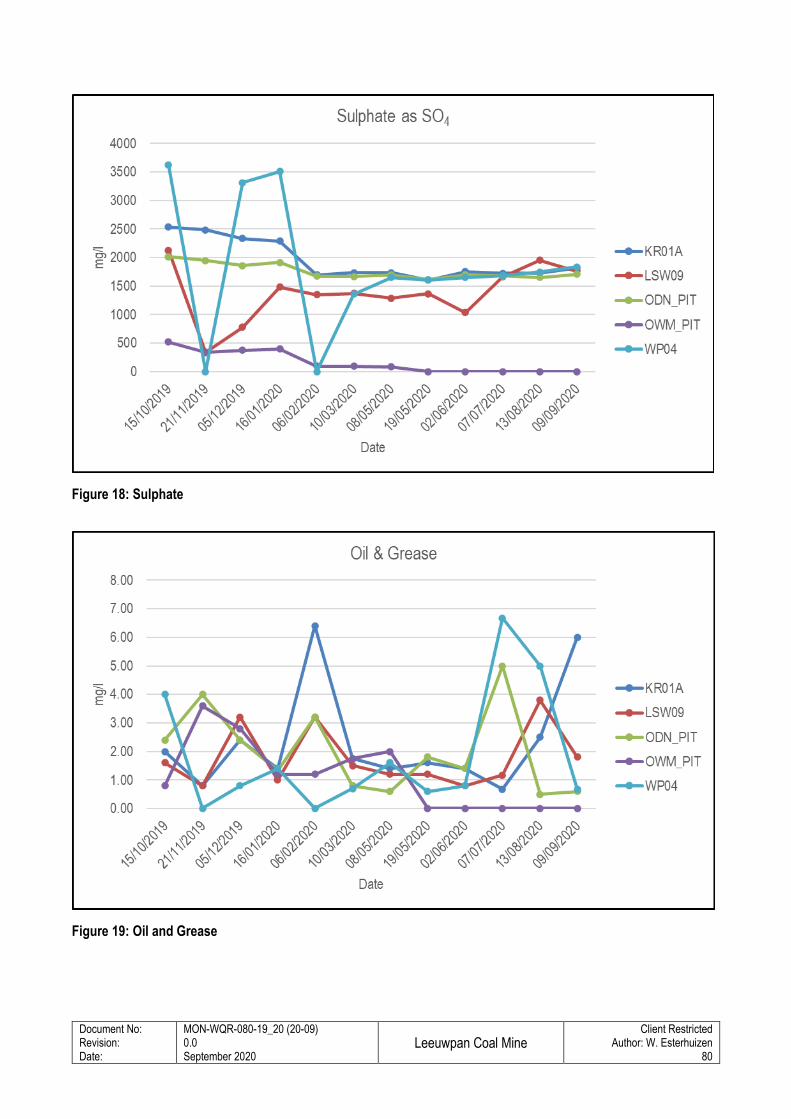
Document No: Revision: Date:
MON-WQR-080-19_20 (20-09) 0.0 September 2020
Leeuwpan Coal Mine
Client Restricted Author: W. Esterhuizen
80
Figure 18: Sulphate
Figure 19: Oil and Grease
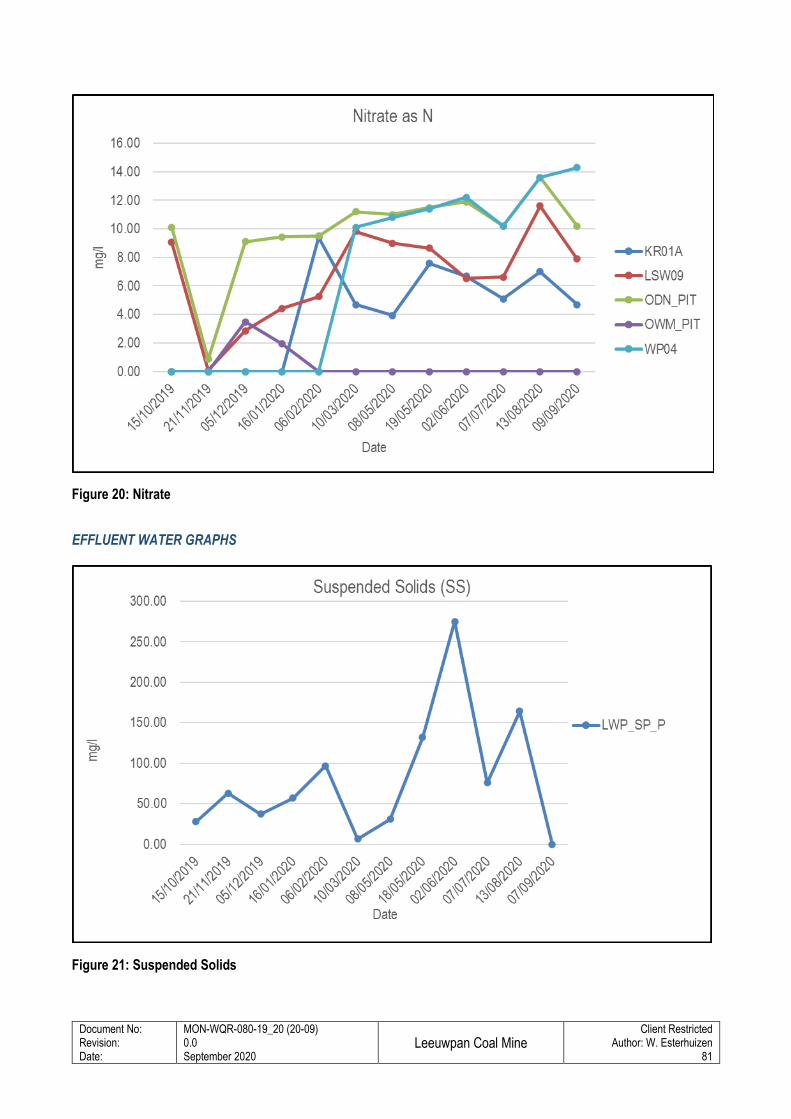
Document No: Revision: Date:
MON-WQR-080-19_20 (20-09) 0.0 September 2020
Leeuwpan Coal Mine
Client Restricted Author: W. Esterhuizen
81
Figure 20: Nitrate
EFFLUENT WATER GRAPHS
Figure 21: Suspended Solids
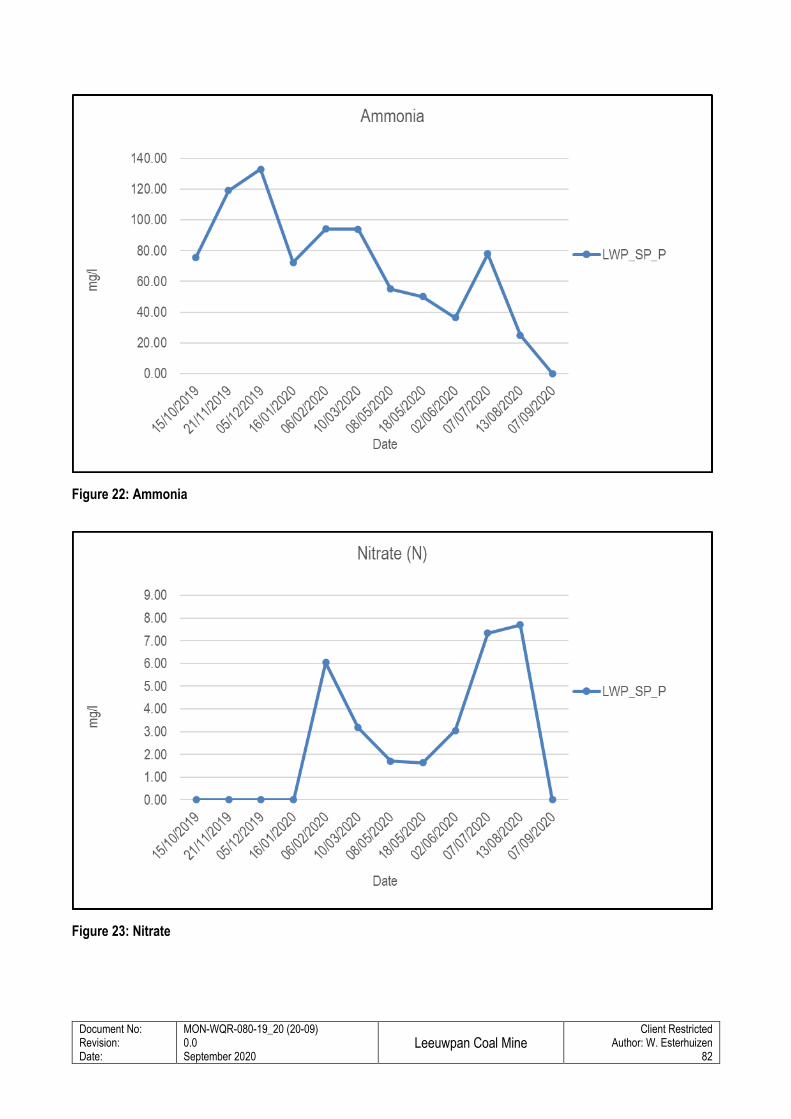
Document No: Revision: Date:
MON-WQR-080-19_20 (20-09) 0.0 September 2020
Leeuwpan Coal Mine
Client Restricted Author: W. Esterhuizen
82
Figure 22: Ammonia
Figure 23: Nitrate
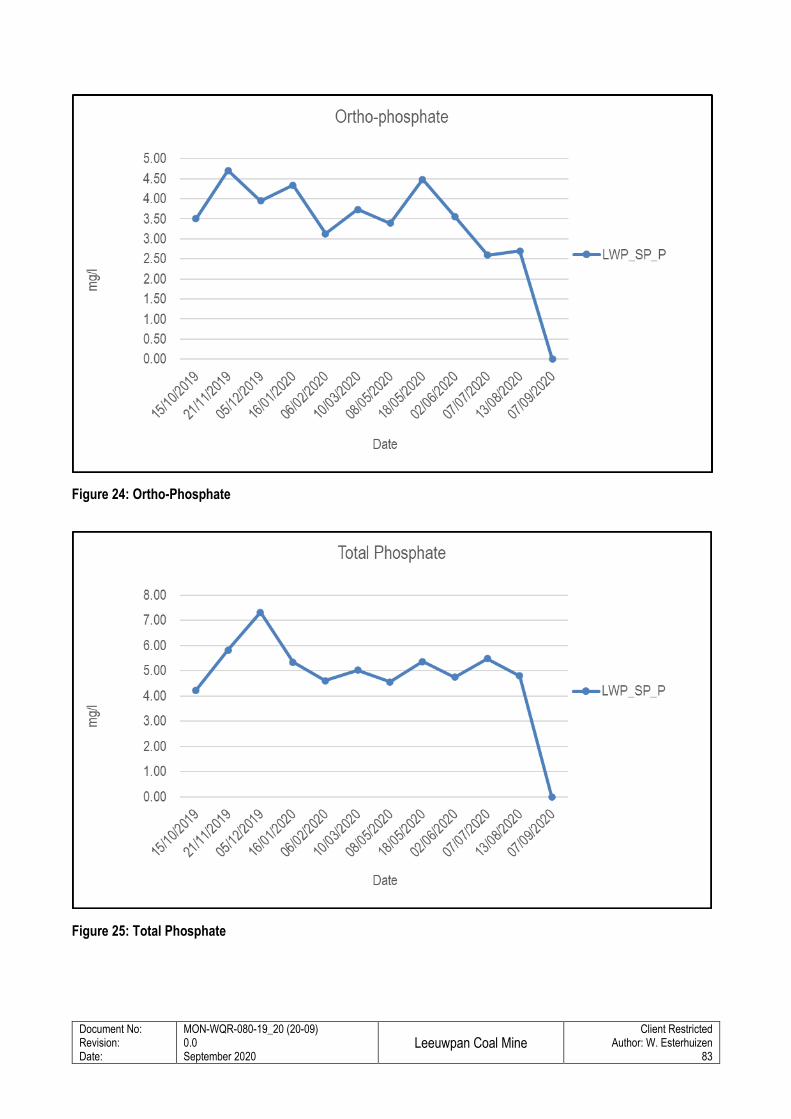
Document No: Revision: Date:
MON-WQR-080-19_20 (20-09) 0.0 September 2020
Leeuwpan Coal Mine
Client Restricted Author: W. Esterhuizen
83
Figure 24: Ortho-Phosphate
Figure 25: Total Phosphate
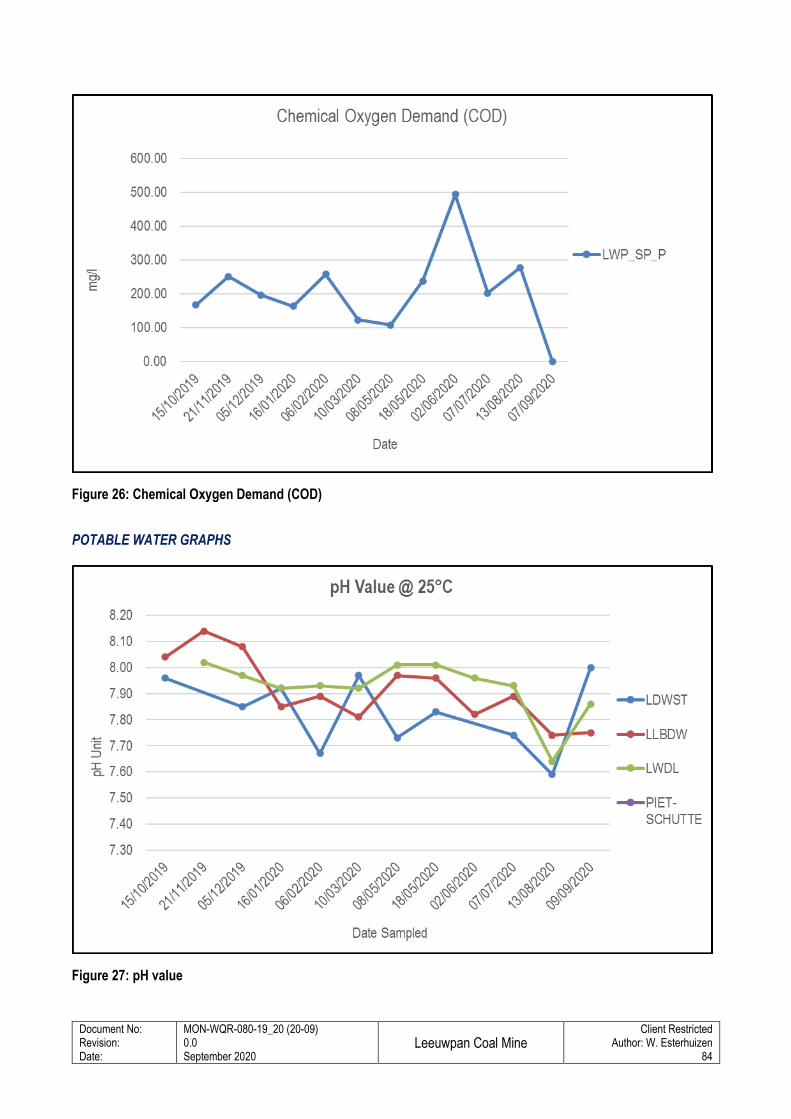
Document No: Revision: Date:
MON-WQR-080-19_20 (20-09) 0.0 September 2020
Leeuwpan Coal Mine
Client Restricted Author: W. Esterhuizen
84
Figure 26: Chemical Oxygen Demand (COD)
POTABLE WATER GRAPHS
Figure 27: pH value
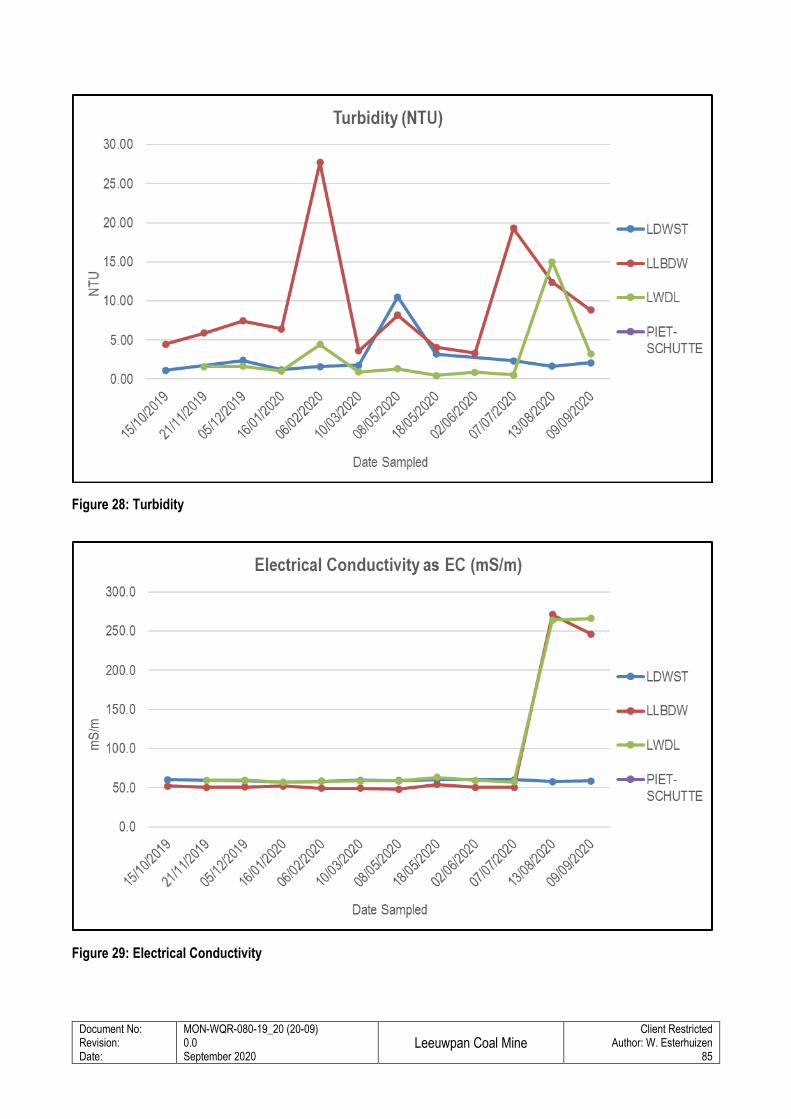
Document No: Revision: Date:
MON-WQR-080-19_20 (20-09) 0.0 September 2020
Leeuwpan Coal Mine
Client Restricted Author: W. Esterhuizen
85
Figure 28: Turbidity
Figure 29: Electrical Conductivity
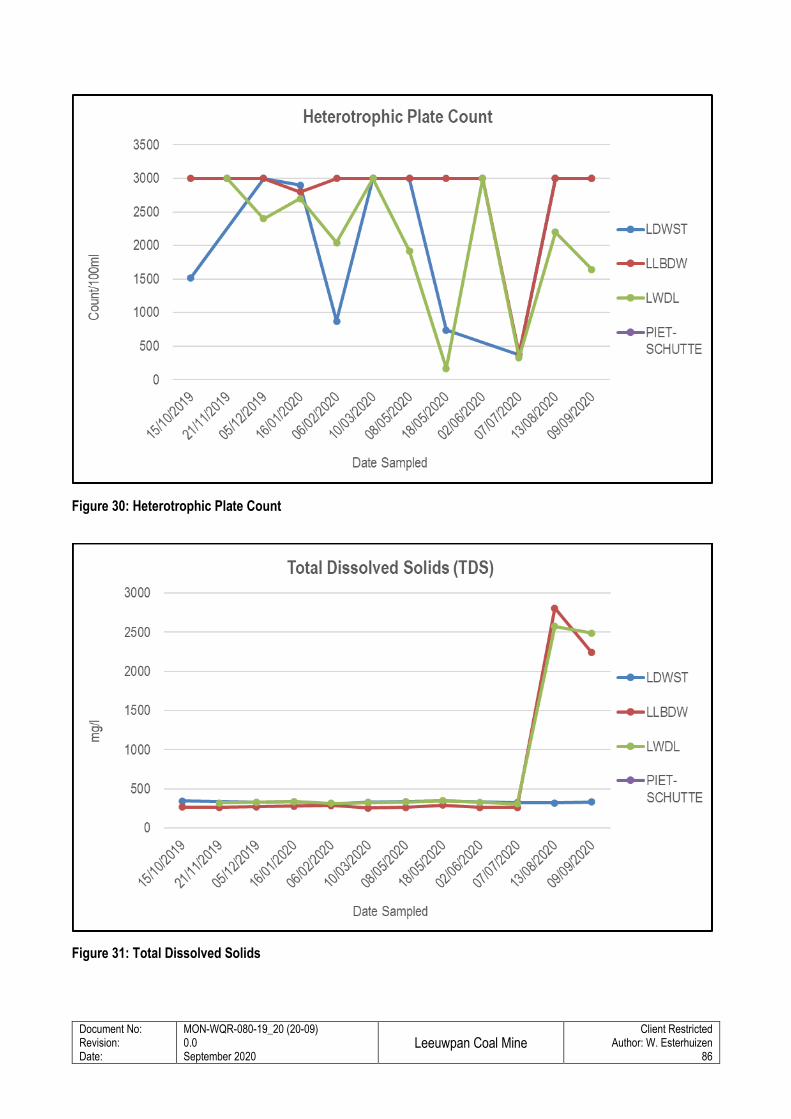
Document No: Revision: Date:
MON-WQR-080-19_20 (20-09) 0.0 September 2020
Leeuwpan Coal Mine
Client Restricted Author: W. Esterhuizen
86
Figure 30: Heterotrophic Plate Count
Figure 31: Total Dissolved Solids
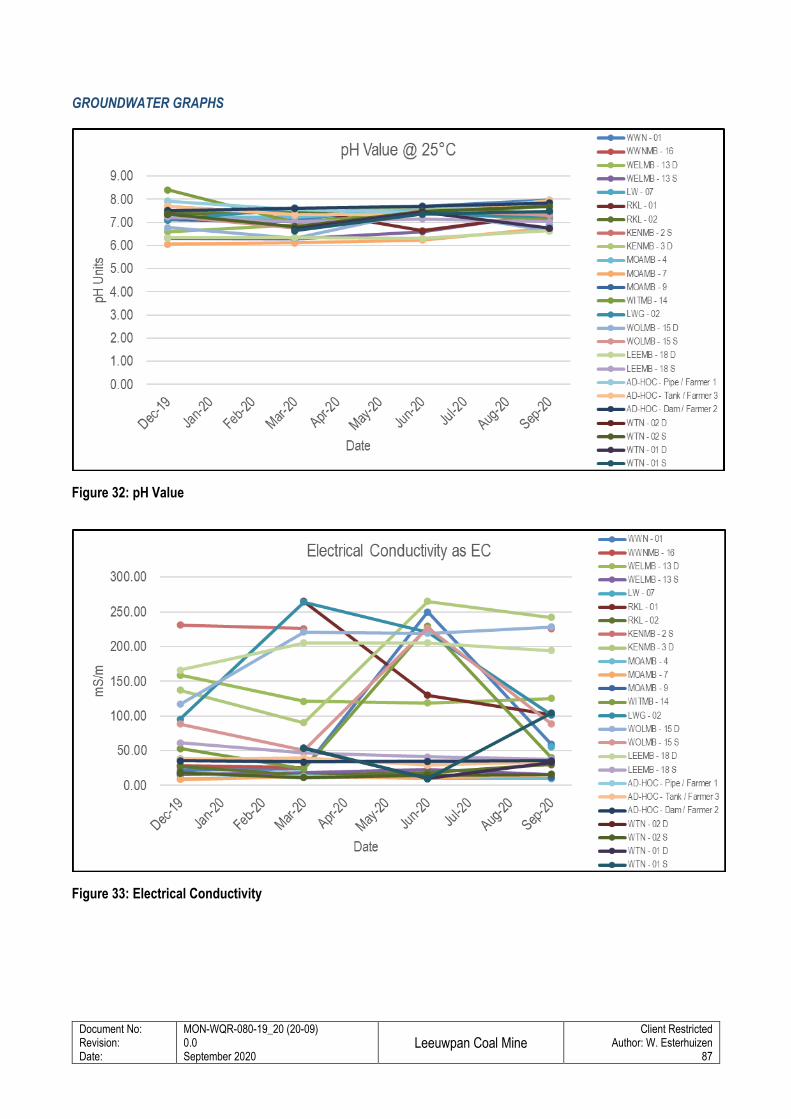
Document No: Revision: Date:
MON-WQR-080-19_20 (20-09) 0.0 September 2020
Leeuwpan Coal Mine
Client Restricted Author: W. Esterhuizen
87
GROUNDWATER GRAPHS
Figure 32: pH Value
Figure 33: Electrical Conductivity
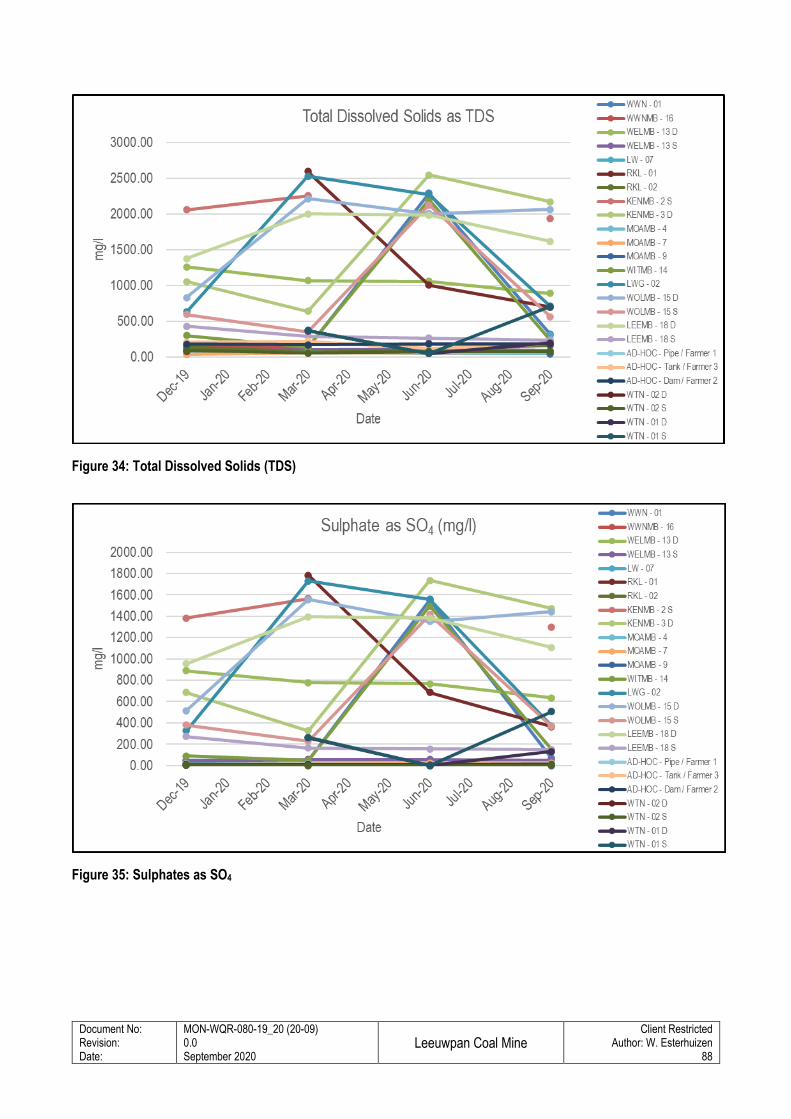
Document No: Revision: Date:
MON-WQR-080-19_20 (20-09) 0.0 September 2020
Leeuwpan Coal Mine
Client Restricted Author: W. Esterhuizen
88
Figure 34: Total Dissolved Solids (TDS)
Figure 35: Sulphates as SO4
Copyright © 2022 FDOKUMEN