Ch. 74 / Techniques in Underground Mining TECHNIQUES IN UNDERGROUND MINING
Upload
khangminh22Category
view
1download
0
Graduate Theses, Dissertations, and Problem Reports
2017
Spatial Centering of a Quadcopter in an Underground Coal Mine Spatial Centering of a Quadcopter in an Underground Coal Mine
Jonathan Itschner
Follow this and additional works at: https://researchrepository.wvu.edu/etd
Recommended Citation Recommended Citation Itschner, Jonathan, "Spatial Centering of a Quadcopter in an Underground Coal Mine" (2017). Graduate Theses, Dissertations, and Problem Reports. 5862. https://researchrepository.wvu.edu/etd/5862
This Thesis is protected by copyright and/or related rights. It has been brought to you by the The Research Repository @ WVU with permission from the rights-holder(s). You are free to use this Thesis in any way that is permitted by the copyright and related rights legislation that applies to your use. For other uses you must obtain permission from the rights-holder(s) directly, unless additional rights are indicated by a Creative Commons license in the record and/ or on the work itself. This Thesis has been accepted for inclusion in WVU Graduate Theses, Dissertations, and Problem Reports collection by an authorized administrator of The Research Repository @ WVU. For more information, please contact [email protected].

Spatial Centering of a Quadcopter in an
Underground Coal Mine
Jonathan Itschner
Thesis submitted to theBenjamin M. Statler College of Engineering and Mineral Resources
at West Virginia Universityin partial fulfillment of the requirements
for the degree of
Master of Sciencein
Electrical Engineering
Roy S. Nutter, Ph.D., ChairPowsiri Klinkhachorn, Ph.D.
Vinod K. Kulathumani, Ph.D.
Lane Department of Computer Science and Electrical Engineering
Morgantown, West Virginia2017
Keywords: LEDDAR, drone, mine, PID, quadcopter
Copyright 2017 Jonathan Itschner

Abstract
Spatial Centering of a Quadcopter in an Underground Coal Mine
Jonathan Itschner
The recent proliferation of smaller and more affordable sensing and computing has con-tributed to an increased availability of unmanned aerial vehicles, UAV’s. Specifically, quadro-tor platforms have become popular due to their low cost, versatility, and relative ease ofoperation. There are a variety of applications for this type of aerial vehicle, ranging fromhobbyist photography to search and rescue operations. This thesis documents the feasibilityof using a quadrotor UAV within the confined space of an underground coal mine duringan emergency. Additionally, this paper notes in the Appendix an experiment to remotelyoperate a quadcopter that is located underground. This work specifies the equipment usedto operate down an eight inch bore hole in terms of radios, fiber optic cables, and videohardware. The operator and quadcopter were located 50 feet apart in the experiment.
One of the most significant challenges of operating a quadcopter in an underground coalmine is collision avoidance. The automation of basic spatial centering in the undergroundcoal mine would lessen the burden on the operator and help prevent collisions. Many spatiallyaware quadcopter systems already exist, but widely rely on GPS signals as a way to determineposition. GPS signals are very weak radio signals that cannot penetrate into the earth. Thebelow-ground nature of an underground coal mine precludes the use of GPS for positioningthe craft. Due to this limitation, it became necessary to explore unique sensing solutions thatwould allow for the spatial centering of the quadcopter while operating in an undergroundenvironment.
The ability for the craft to maintain a distance from its surroundings through the useof a light-based sensor was analyzed. Sensors were placed on the bottom and side of thequadcopter, and the performance of the control system was observed. Altitude was main-tained with a steady state error of 4%, and the response to a step change in ground heightresulted in a 10% lower overshoot than simulation. Simultaneously, distance was maintainedfrom the side with a steady state error of 7.8%. The work presented in this document servesas validation for the basic spatial awareness and crash avoidance capability of a quadcopteroperating without GPS in an underground coal mine while controlled remotely down aneight inch borehole.

iii
Acknowledgments
I would like to thank my advisor, Dr. Nutter, for his invaluable input and guidance.
Without him, I would not have been able to complete my research in a timely manner. His
steadfast direction kept my efforts focused on the scope of the research and helped to convey
my findings in meaningful ways.
I would also like to thank Dr. Klinkhachorn and Dr. Vinod, who indirectly contributed an
incredible amount to my research. Manipulating the hardware and software of the quadcopter
was possible only by calling upon the knowledge that I gained while I was their student.
I would also like to acknowledge the Lane Department for their financial support through-
out my time in graduate school. Without their assistance none of this would have been
possible.
In addition, I would like to acknowledge the financial assistance provided by the Arch
Coal Inc. Endowment for Mine Health and Safety Research in CEMR. My research assis-
tantship in the summer of 2016 was an invaluable experience that directly contributed to
my understanding of the research presented in this thesis.
Finally, I thank my family for their continued support during my research. Their con-
stant encouragement and support was sometimes the only thing that kept me motivated to
continue. I would not be where I am today without them. Thank you.

iv
Contents
Abstract ii
Acknowledgments iii
List of Tables vi
List of Figures vii
1 Introduction 11.1 Motivational Scenario . . . . . . . . . . . . . . . . . . . . . . . . . . . . . . . 11.2 Hardware . . . . . . . . . . . . . . . . . . . . . . . . . . . . . . . . . . . . . 5
1.2.1 LEDDAR Sensor . . . . . . . . . . . . . . . . . . . . . . . . . . . . . 51.2.2 MODBUS Protocol . . . . . . . . . . . . . . . . . . . . . . . . . . . . 10
1.3 Flight Controller . . . . . . . . . . . . . . . . . . . . . . . . . . . . . . . . . 131.4 Cleanflight Process Flow . . . . . . . . . . . . . . . . . . . . . . . . . . . . . 14
2 Literature Review 162.1 Quadcopter Flight Dynamics . . . . . . . . . . . . . . . . . . . . . . . . . . . 16
2.1.1 Motor Orientation . . . . . . . . . . . . . . . . . . . . . . . . . . . . 172.1.2 The PID Controller . . . . . . . . . . . . . . . . . . . . . . . . . . . . 18
The Proportional Block . . . . . . . . . . . . . . . . . . . . . . . . . 20The Integral Block . . . . . . . . . . . . . . . . . . . . . . . . . . . . 20The Derivative Block . . . . . . . . . . . . . . . . . . . . . . . . . . . 21
2.2 Related Quadcopter Sensing and Applications . . . . . . . . . . . . . . . . . 232.2.1 Ultrasonic Sonar Sensor . . . . . . . . . . . . . . . . . . . . . . . . . 23
Autonomous Flying Cameraman . . . . . . . . . . . . . . . . . . . . . 252.2.2 LIDAR . . . . . . . . . . . . . . . . . . . . . . . . . . . . . . . . . . . 26
Aerial Three-Dimensional Mapping . . . . . . . . . . . . . . . . . . . 282.2.3 Inertial Measurement Unit . . . . . . . . . . . . . . . . . . . . . . . . 30
Gyroscope . . . . . . . . . . . . . . . . . . . . . . . . . . . . . . . . . 30Accelerometer . . . . . . . . . . . . . . . . . . . . . . . . . . . . . . . 31Vision-controlled Micro Air Vehicles . . . . . . . . . . . . . . . . . . . 33
2.2.4 Summary . . . . . . . . . . . . . . . . . . . . . . . . . . . . . . . . . 35

CONTENTS v
3 Position Holding 363.1 Sensor Integration . . . . . . . . . . . . . . . . . . . . . . . . . . . . . . . . . 363.2 Linearized Mathematical Model of a Quadcopter . . . . . . . . . . . . . . . . 38
PID Response . . . . . . . . . . . . . . . . . . . . . . . . . . . . . . . 40Simulation Overview . . . . . . . . . . . . . . . . . . . . . . . . . . . 41
3.3 Altitude Hold . . . . . . . . . . . . . . . . . . . . . . . . . . . . . . . . . . . 423.4 Wall Avoidance . . . . . . . . . . . . . . . . . . . . . . . . . . . . . . . . . . 49
4 Conclusion 554.1 Summary . . . . . . . . . . . . . . . . . . . . . . . . . . . . . . . . . . . . . 55
4.1.1 Future Work . . . . . . . . . . . . . . . . . . . . . . . . . . . . . . . . 56
5 Appendix 575.0.1 Down-hole Communications Overview . . . . . . . . . . . . . . . . . 64
References 69
Approval Page i

vi
List of Tables
1.1 LEDDAR Test Data . . . . . . . . . . . . . . . . . . . . . . . . . . . . . . . 6
2.1 Sensor Comparison [1][2][3] . . . . . . . . . . . . . . . . . . . . . . . . . . . . 35
3.1 PID Performance Metrics . . . . . . . . . . . . . . . . . . . . . . . . . . . . 463.2 Controller Performance Metrics . . . . . . . . . . . . . . . . . . . . . . . . . 52

vii
List of Figures
1.1 Quecreek Mine Airshaft [4] . . . . . . . . . . . . . . . . . . . . . . . . . . . . 21.2 An eight inch pipe used for borehole casing . . . . . . . . . . . . . . . . . . . 21.3 Overview of Fiber Optic Communication System . . . . . . . . . . . . . . . . 41.4 LEDDAR One Module [1] . . . . . . . . . . . . . . . . . . . . . . . . . . . . 51.5 LEDDAR Sensor Architecture [1] . . . . . . . . . . . . . . . . . . . . . . . . 71.6 LEDDAR Signal Processing Algorithm [1] . . . . . . . . . . . . . . . . . . . 81.7 MODBUS Transaction [5] . . . . . . . . . . . . . . . . . . . . . . . . . . . . 101.8 Read Input Registers (0x04) [5] . . . . . . . . . . . . . . . . . . . . . . . . . 111.9 LEDDAR MODBUS Registers (Decimal Addressing) [1] . . . . . . . . . . . 111.10 MODBUS Read Register Bytes . . . . . . . . . . . . . . . . . . . . . . . . . 121.11 MODBUS Read Register Response . . . . . . . . . . . . . . . . . . . . . . . 121.12 SPRacingF3 Flight Control Board [6] . . . . . . . . . . . . . . . . . . . . . . 131.13 Cleanflight Process Overview . . . . . . . . . . . . . . . . . . . . . . . . . . 14
2.1 Six degrees of freedom of the quadcopter from (a) top-down (b) frontal view [7] 162.2 Propeller spin configuration for zero net torque [8] . . . . . . . . . . . . . . . 172.3 Feedback Control Loop [9] . . . . . . . . . . . . . . . . . . . . . . . . . . . . 182.4 PID Block Diagram [8] . . . . . . . . . . . . . . . . . . . . . . . . . . . . . . 192.5 PING)))TM Ultrasonic Distance Sensor [2] . . . . . . . . . . . . . . . . . . . 232.6 Ultrasonic Distance Sensor Communication Protocol [2] . . . . . . . . . . . . 242.7 Sensor Limitations [2] . . . . . . . . . . . . . . . . . . . . . . . . . . . . . . . 242.8 Sonar Sensors for Obstacle Avoidance [10] . . . . . . . . . . . . . . . . . . . 252.9 LIDAR time-to-digital conversion (time of flight) [11] . . . . . . . . . . . . . 262.10 Typical LIDAR System Overview [11] . . . . . . . . . . . . . . . . . . . . . . 272.11 Passive rotation of 2-D Laser Scanner [12] . . . . . . . . . . . . . . . . . . . 282.12 Point Cloud Results in Different Underground Environments [12] . . . . . . . 292.13 Operating Principle of MEMS Gyroscope [13] . . . . . . . . . . . . . . . . . 302.14 Operating Principle of MEMS Accelerometer [13] . . . . . . . . . . . . . . . 312.15 Top view of a tri-axial accelerometer [13] . . . . . . . . . . . . . . . . . . . . 312.16 Side view of a tri-axial accelerometer [13] . . . . . . . . . . . . . . . . . . . . 322.17 Vision Based Navigation using the camera-based position estimation. [14] . . 34
3.1 Quadcopter Platform . . . . . . . . . . . . . . . . . . . . . . . . . . . . . . . 373.2 Mathematical Variables in a Quadcopter Model [15] . . . . . . . . . . . . . . 38
LIST OF FIGURES viii
3.3 PID Response Graph [8] . . . . . . . . . . . . . . . . . . . . . . . . . . . . . 403.4 Quadcopter Simulator [16] . . . . . . . . . . . . . . . . . . . . . . . . . . . . 413.5 Simulation Altitude PID [16] . . . . . . . . . . . . . . . . . . . . . . . . . . . 423.6 Ground Truth Data Collection . . . . . . . . . . . . . . . . . . . . . . . . . . 443.7 Altitude Step Response . . . . . . . . . . . . . . . . . . . . . . . . . . . . . . 453.8 Height Above Ground Level Step Response . . . . . . . . . . . . . . . . . . . 473.9 Throttle Step Response . . . . . . . . . . . . . . . . . . . . . . . . . . . . . . 483.10 Simulation Roll Controller [16] . . . . . . . . . . . . . . . . . . . . . . . . . . 493.11 Simulated Roll Step Response . . . . . . . . . . . . . . . . . . . . . . . . . . 503.12 Experimental Roll Controller Performance . . . . . . . . . . . . . . . . . . . 513.13 Roll Command Step Response . . . . . . . . . . . . . . . . . . . . . . . . . . 53
5.1 Altitude PID Step Response . . . . . . . . . . . . . . . . . . . . . . . . . . . 585.2 Height Above Ground Level Step Response . . . . . . . . . . . . . . . . . . . 595.3 Throttle Step Response . . . . . . . . . . . . . . . . . . . . . . . . . . . . . . 605.4 Simulated Roll Step Response . . . . . . . . . . . . . . . . . . . . . . . . . . 615.5 Experimental Roll Controller Performance . . . . . . . . . . . . . . . . . . . 625.6 Roll Command Step Response . . . . . . . . . . . . . . . . . . . . . . . . . . 635.7 Overview of Fiber Optic Communication System . . . . . . . . . . . . . . . . 665.8 Connection Diagram of Control Communication over Fiber . . . . . . . . . . 675.9 Connection Diagram of Video Communication over Fiber . . . . . . . . . . . 68

1
Chapter 1
Introduction
The operation of quadcopter (UAV) within a confined space results in a set of unique
challenges for safe and successful operation. In the case of an underground mine, it is im-
portant to consider the distance between the quadcopter and the surrounding ribs, roof, and
floor during operation to prevent collisions. Due to the nature of the operating environment
in a mine, traditional methods for altitude and position holding such as GPS and barometers
are ineffective. This paper explores the performance of a relatively low cost light-based dis-
tance sensing approach to ensure the positional centering of the quadcopter during operation
in a mine.
1.1 Motivational Scenario
Assessing the condition of an underground coal mine can be of critical importance after
a fire or other emergency that might include a roof collapse or a rib roll. Under the worst
conditions, bore holes are used to drill down from the surface into the mine, and a camera
and/or sensors are used to observe the condition of the mine. One example of this type of
borehole is seen in Figure 1.1, which shows a shaft drilled 240 feet down into the Quecreek
mine to establish communications and provide fresh air to trapped coal miners. This type
of borehole is often used during mine rescue operations. During a coal mine fire, it can be
used to gain insight on the air and fire conditions inside the mine. Of great interest is the
evaluation of the atmospheric conditions in the mine (e.g. carbon monoxide, oxygen, etc.),

Jonathan Itschner Chapter 1. Introduction 2
especially since air quality is one of the most life threatening and dangerous aspects of an
underground coal mine, especially during emergency conditions.
Figure 1.1: Quecreek Mine Airshaft [4]
Figure 1.2: An eight inch pipe used for borehole casing

Jonathan Itschner Chapter 1. Introduction 3
The primary limitation of this approach is the small observable area of the mine that
is limited to the exit of the borehole. Introducing a UAV into the mine via the borehole
could allow for exploration and atmospheric measurements well beyond the bottom of the
borehole. The UAV should be able to move away from the bottom of the borehole and
provide a much broader reading of the mine environment around that location. The UAV
used for mine exploration should ideally be able to carry atmospheric sensing equipment
and a camera capable of both visible and infrared images. To allow for exploration beyond
the bottom of the borehole and further into the mine, a radio repeater network would be
necessary for communication due to the line-of-sight propagation of radio frequency signals
in an underground mine. An automated battery swapping mechanism could also be used
to allow for longer deployments while in the mine, and potentially enable even longer flight
distances from the bottom of the borehole [4].
The UAV used for underground mine exploration will need to fit down an eight inch
bore hole, send live video to the pilot, and be controlled by the pilot who would be located
above-ground. Since radio frequencies used to control quadcopter do not propagate through
the ground, a communication solution must be used to allow for above-ground control of the
quadcopter in the mine and for video and data to be sent from underground to the surface.

Jonathan Itschner Chapter 1. Introduction 4
Figure 1.3: Overview of Fiber Optic Communication System
One solution involves the use of fiber optic cable to effectively transmit the radio signals
from the surface into the mine through the borehole. An example of how such a fiber cable
could be deployed down a borehole is seen in Figure 1.3. The joystick commands sent from
the controller are interpreted and sent through the fiber link to a transmitter in the mine,
which then sends the commands via RF to the UAV underground. The details of this type
of system implemented on a commercial DJI quadcopter can be viewed in the Appendix,
which also documents all parts used in the borehole demonstration.

Jonathan Itschner Chapter 1. Introduction 5
The primary focus of this thesis is the automated spatial centering function of the UAV.
Automated spatial centering would lessen the operational burden on the pilot by automating
much of the collision avoidance. There are several commercially available flight controllers
and quadcopters that have self-stabilizing hardware integrated into the platform. However,
there is no readily available built-in distance sensing functionality which properly adjusts
the quadcopter position to ensure equal distances from all surrounding surfaces in a confined
space.
1.2 Hardware
1.2.1 LEDDAR Sensor
The light-emitting diode detection and ranging (LEDDAR) sensor is a unique technology
developed by LeddarTech. It uses light emission from a set of six LED’s to illuminate an area
of interest, and the reflected light from the object is received by an on-board photodetector.
It is the pulsing of the diffused light emission, the collection of the reflected light, and the s
ignal processing of the full waveform received that allows distance measurements to be
made based on the light’s time of flight[1].
Figure 1.4: LEDDAR One Module [1]
The LeddarOne sensor operates on a 5.0 V power source and consumes a maximum of
1.3 W of power. It consists of an array of 6 LED’s and a single photoreceptor with a 3◦

Jonathan Itschner Chapter 1. Introduction 6
conic beam. The backside of the sensor houses the interface and power pins for UART data
transmission. Figure 1.4 shows the locations of these components on the board[1].
The LEDDAR sensor has a detection range of 0 m to 40 m. The maximum range
is dependent on the reflectivity of the material on which the light is reflecting, where an
object with a higher reflectivity will result in a larger maximum range close to 40 m. The
worst case scenario in which the material has a low reflectivity results in a maximum range
closer to 8 m. It has a stated accuracy of +/- 10 cm and a precision of 5 mm, which is
one standard deviation from the measured distance. The data in table 1.1 below show the
results of measurement tests conducted for 10 seconds each, where a matte white object
was placed at various distance from the sensor. The actual distances at which the object
was placed relative to the sensor are on the left-most column. The results mostly verify the
specifications, though some of the distance errors were greater than the stated +/- 10 cm.
However, the standard deviation results were excellent, and the precision of the sensor is
more important than accuracy for this application.
Table 1.1: LEDDAR Test Data
Measured Distance (cm) Error (%) Standard Deviation
0 cm 7 7 0
100 cm 108.66 8.6 0.005
200 cm 215.45 7.7 0.005
300 cm 285 5.0 0
400 cm 401.78 0.45 0.004

Jonathan Itschner Chapter 1. Introduction 7
Due to the proprietary nature of the LEDDAROne sensor, certain technical details of
the logic design are unavailable. However, the overall sensor architecture is shown in figure
1.5.
Figure 1.5: LEDDAR Sensor Architecture [1]
The major components of the sensor assembly are the emission and reception optics
(LED’s and photodetector), the STM microcontroller, and the ICE40LP1K FPGA. The
LED’s are used to generate the light pulses, which ultimately provide the sensor with distance
data after the pulses are received by the photodetector.
Both the emission and reception optics are fed through AFE (Analog Front End) circuitry
before being sent to the FPGA. This FPGA is used to control the LED pulse rate and the
data acquisition timing of the receiver. It produces a set of waveforms based on the received
light pulses, which is sent to the STM microcontroller. The STM microcontroller recovers
these waveforms from the FPGA, and performs the full waveform analysis, producing the
distance measurements sent over UART [1]. This full waveform analysis is explored in more
detail in Figure 1.6.

Jonathan Itschner Chapter 1. Introduction 8
Figure 1.6: LEDDAR Signal Processing Algorithm [1]
Figure 1.6 shows the overview of the algorithm used by the LEDDAR sensing module to
obtain distance measurements. The process begins with signal acquisition, in which the single
photosensor on the sensor acculumates the received light pulses in such a way which produces
a full-waveform signal. Once this signal is acquired for a given sampling interval, any static
noise generated from external sources (electromagnetic interferences, sensor enclosure, etc.)
is removed. This allows for much more accurate distance sensing.
Once the noise has been cleaned from the full-waveform signal, the pulses detected by the
photoreceptor are analyzed. Due to the nature of the sensing platform, the photoreceptor
can detect light reflections from more than a single object. This stage of the algorithm uses
a modifiable amplitude threshold value to remove any detected pulses below this amplitude.
This helps to minimize any discrepancies in the distance measurements of objects with
differing reflectivity or smaller objects obscuring the primary object of interest. This stage
also controls the intensity of the LED’s based on the pulse analysis. If the pulses suddenly
become saturated, or too weak, the intensity of the light emitted from the LED’s can be
adjusted in real time to maintain optimal measurement accuracy.
The LEDDAR sensor then determines which pulses in the full-waveform signal are satu-
rated, and which are considered normal. A saturated pulse is generated when an object being

Jonathan Itschner Chapter 1. Introduction 9
measured has high reflectivity or is too close to the sensor. The reflected light intensity can
be so great that it will clip the full-waveform signal, which significantly impacts the distance
measurement accuracy, especially at smaller ranges. This stage of the algorithm compen-
sates for these over saturated pulses, providing distance measurement accuracy better than
10 cm.
After this stage, a temperature compensation scheme is applied, which attenuates the
measured distances over a range of temperatures. Specifically, it is designed to stabilize the
distance measurements to within 1 cm of accuracy in less than 10 seconds immediately after
powering the sensor. It will also ensure distance accuracy over the specified operating range
of -45◦C to +85◦C. This is an especially relevant step since the operating environment for
the quadcopter has the potential for a variety of ambient temperatures (e.g. fire, cold air
drafts).
The final stage of the algorithm is smoothing, which reduces measurement jitter. In this
case, jitter can be viewed as the variability of received distance measurements. The smooth-
ing algorithm continuously adapts the cutoff frequency as a function of the measurement
noise. As a result, the standard deviation of the measurements is reduced, which produces
a more stable and precise distance reading [1].

Jonathan Itschner Chapter 1. Introduction 10
1.2.2 MODBUS Protocol
The LEDDAR sensor transmits data over a 3.3V UART link, utilizing the MODBUS
protocol. The MODBUS protocol lies at the application layer, providing a client/server
communication between two different devices. In the case of the quadcopter, the flight control
board (client) interfaces with the LEDDAR sensor (server). It uses big endian encoding,
meaning that the most significant byte is sent first.
The overall premise of the protocol relies on sending specific 1 byte function codes from
the client to the server to perform various tasks (i.e. reading registers, setting registers,
etc.). Valid function codes range from 1 to 255, and are usually followed by a data request
field. This data field is used for information relevant to the function code being used, such as
register addresses, the number of data bytes in the field, and the number of data items to be
handled by the request [5]. The transaction is fairly straightforward, and is initiated by the
client (flight control board) sending this function code and data request over the 3.3V UART
connection to the server (LEDDAR Sensor). The server then returns the same function code
with the data response appended. This process is illustrated in Figure 1.7.
Figure 1.7: MODBUS Transaction [5]
For the purposes of this research, the function code of interest is the Read Input Register
code (0x04). A typical 0x04 read request adheres to the following request/response pair [5]:

Jonathan Itschner Chapter 1. Introduction 11
Figure 1.8: Read Input Registers (0x04) [5]
The input registers on the LEDDAR One sensor module are implemented in a specific
way. There are 10 registers used, ranging from decimal memory addresses 20 to 29, which
contain the measured amplitudes of multiple detections, as well as the timestamp, temper-
ature readings, and more. The figure below illustrates the way in which the registers are
implemented in the LEDDAR sensor [1]:
Figure 1.9: LEDDAR MODBUS Registers (Decimal Addressing) [1]

Jonathan Itschner Chapter 1. Introduction 12
By leveraging the MODBUS protocol and the information in Figure 1.9, it is possible to
construct a MODBUS request message to obtain measurement readings from the LEDDAR
sensor. Based on the MODBUS protocol, a read register request begins with a MODBUS
address (default of 1), followed by the format specified in Figure 1.8.
Figure 1.10: MODBUS Read Register Bytes
This message is sent over the 3.3V UART link from the flight control board to the
LEDDAR module. Note that the addressing uses hexadecimal values (e.g. starting address
0x00 0x14 represents 20). Referring back to the MODBUS request/response protocol for a
register read in Figure 1.8, the response from the LEDDAR sensor will look like the following
sample, utilizing big endian formatting:
Figure 1.11: MODBUS Read Register Response
It should be noted that registers 26-29 are 0 since the LEDDAR sensor is configured
to obtain only a single measurement, verified by the value of input register 23. It should
also be noted that the timestamp value in registers 20 and 21 represent the total time in
milliseconds since the LEDDAR sensor was booted. The temperature value in Celsius is
obtained by converting the big-endian hexadecimal to decimal, and dividing by 256. The
distance value is obtained by converting the value of register 24 to decimal, which provides the
distance measured in millimeters. This demonstrates that the primary value of interest for
the quadcopter centering application is obtainable by using the MODBUS request/response
protocol [1].

Jonathan Itschner Chapter 1. Introduction 13
1.3 Flight Controller
The flight control board functions as the primary computational core of the quadcopter
system. It provides outputs to the electronic speed controllers (ESC) which control the
motor speeds, receives transmitted RF signals from the radio controller, interfaces with the
LEDDAR sensor, and computes a variety of other flight-related calculations like the PID
control system.
An SPRacingF3 flight control board was used due to its tight integration with the clean-
flight software and the availability of multiple UART connectors. The board was designed
and produced by the primary contributor of cleanflight, so it also works well as a develop-
ment platform for new versions of the cleanflight software. An image of the flight controller
used can be seen in Figure 1.12.
Figure 1.12: SPRacingF3 Flight Control Board [6]
The SPRacingF3 relies on the STM32F303 microprocessor running at 72 MHz as its pri-
mary computational core. It also has the ability to process PID calculations faster due to a
dedicated Floating Point Unit (FPU) co-processor. A board integrated MPU6050 accelerom-
eter/gyro sensor is used for flight stability and sensor feedback for the PID Controller. There
is support for up to eight motor connections, though only four are used for the quadcopter.

Jonathan Itschner Chapter 1. Introduction 14
1.4 Cleanflight Process Flow
Cleanflight was chosen as the flight control software due to its open source nature and
available documentation. It has a wide range of supported platforms, including the SPRac-
ingF3 flight control board (FCB) used. Configuration of the software is performed primarily
through the use of a computer application which communicates over USB to the FCB. The
block diagram in Figure 1.13 shows the overall process flow of the cleanflight software as it
operates with the LEDDAR task inserted.
Figure 1.13: Cleanflight Process Overview
The overall process of Cleanflight is fairly straightforward. On system boot, various
system elements are initialized, including the motor operations, sensor port connections or
specific configurations, and the instantiation of the tasks queue. The scheduler function
loops indefinitely, stepping through the tasks that were defined during the initialization

Jonathan Itschner Chapter 1. Introduction 15
stage. Each one of these tasks performs specific operations, including flight stabilization
(PID control), receiver information, and sensor updates.
16
Chapter 2
Literature Review
This chapter presents the related work to quadcopter control schemes, sensing systems,
and collision avoidance.
2.1 Quadcopter Flight Dynamics
As with any flight platform, the possible range of motion is critical to understanding flight
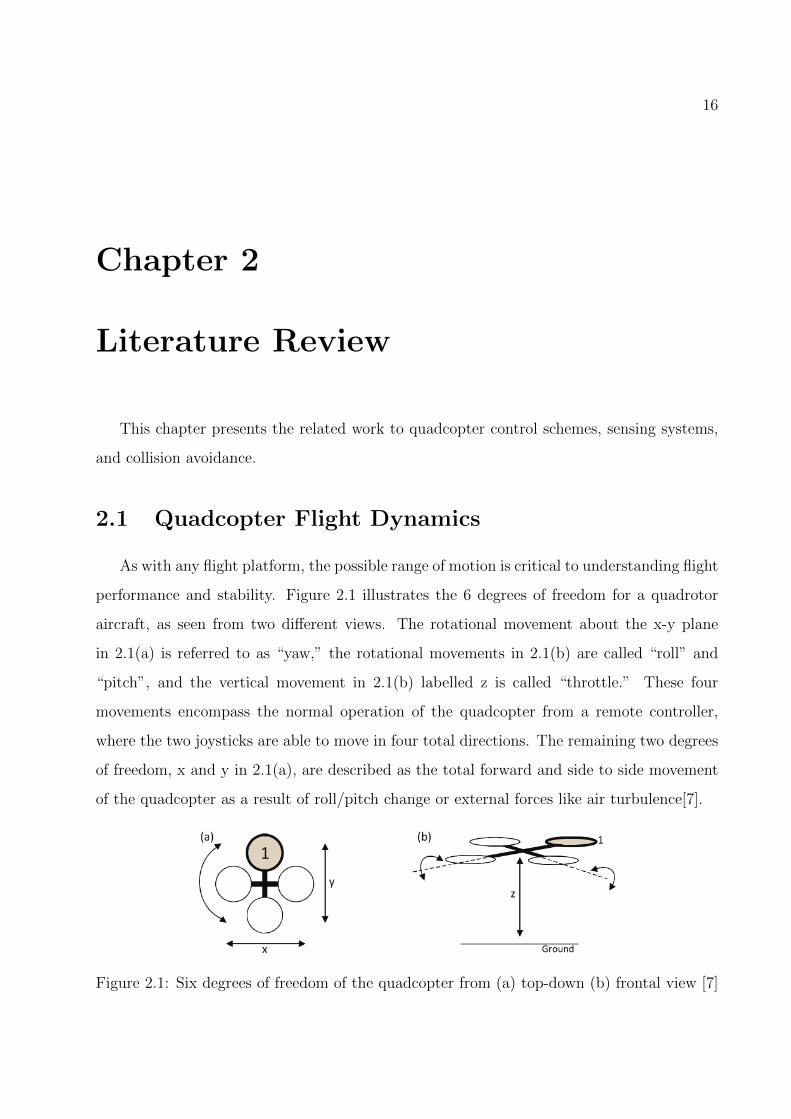
performance and stability. Figure 2.1 illustrates the 6 degrees of freedom for a quadrotor
aircraft, as seen from two different views. The rotational movement about the x-y plane
in 2.1(a) is referred to as “yaw,” the rotational movements in 2.1(b) are called “roll” and
“pitch”, and the vertical movement in 2.1(b) labelled z is called “throttle.” These four
movements encompass the normal operation of the quadcopter from a remote controller,
where the two joysticks are able to move in four total directions. The remaining two degrees
of freedom, x and y in 2.1(a), are described as the total forward and side to side movement
of the quadcopter as a result of roll/pitch change or external forces like air turbulence[7].
Figure 2.1: Six degrees of freedom of the quadcopter from (a) top-down (b) frontal view [7]
Jonathan Itschner Chapter 2. Literature Review 17
2.1.1 Motor Orientation
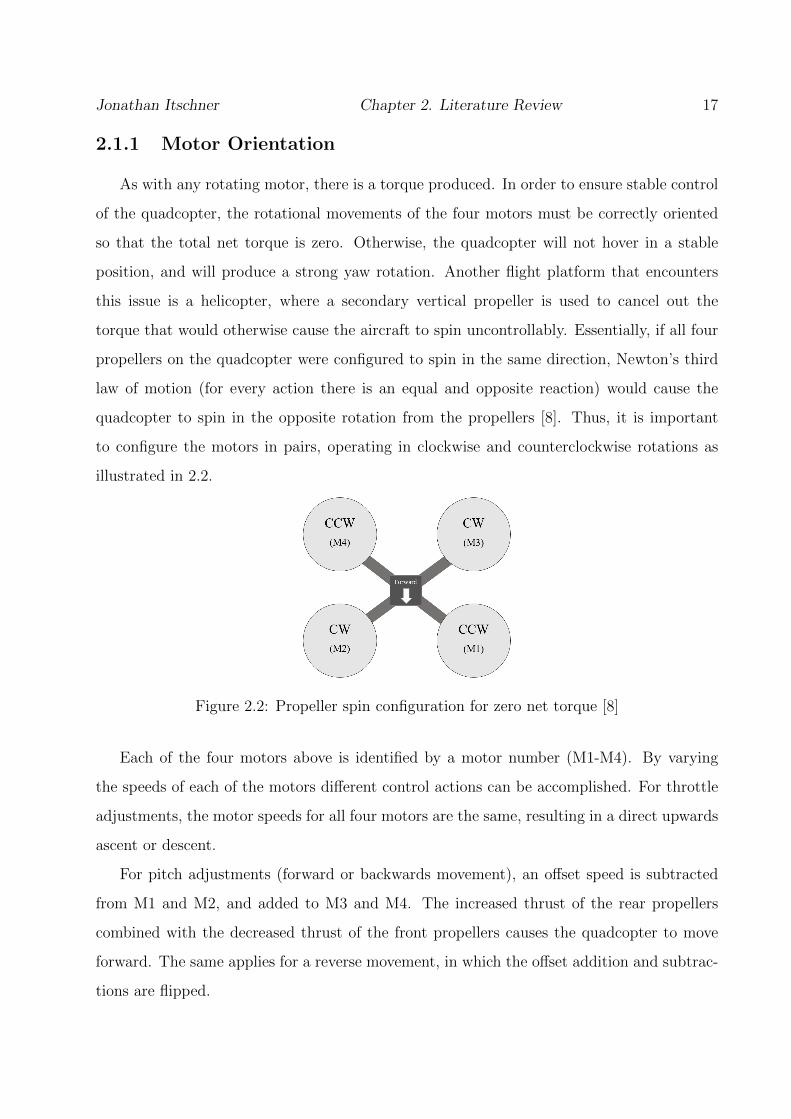
As with any rotating motor, there is a torque produced. In order to ensure stable control
of the quadcopter, the rotational movements of the four motors must be correctly oriented
so that the total net torque is zero. Otherwise, the quadcopter will not hover in a stable
position, and will produce a strong yaw rotation. Another flight platform that encounters
this issue is a helicopter, where a secondary vertical propeller is used to cancel out the
torque that would otherwise cause the aircraft to spin uncontrollably. Essentially, if all four
propellers on the quadcopter were configured to spin in the same direction, Newton’s third
law of motion (for every action there is an equal and opposite reaction) would cause the
quadcopter to spin in the opposite rotation from the propellers [8]. Thus, it is important
to configure the motors in pairs, operating in clockwise and counterclockwise rotations as
illustrated in 2.2.
Figure 2.2: Propeller spin configuration for zero net torque [8]
Each of the four motors above is identified by a motor number (M1-M4). By varying
the speeds of each of the motors different control actions can be accomplished. For throttle
adjustments, the motor speeds for all four motors are the same, resulting in a direct upwards
ascent or descent.
For pitch adjustments (forward or backwards movement), an offset speed is subtracted
from M1 and M2, and added to M3 and M4. The increased thrust of the rear propellers
combined with the decreased thrust of the front propellers causes the quadcopter to move
forward. The same applies for a reverse movement, in which the offset addition and subtrac-
tions are flipped.

Jonathan Itschner Chapter 2. Literature Review 18
For yaw adjustments (horizontal rotation), an offset speed is subtracted from M2 and M3,
and added to M1 and M4. This results in a counterclockwise rotation since there is no longer
a net zero torque due to the increased motor speed of the CCW propeller pair compared to
the CW pair. A similar offset can be applied for a clockwise rotation by increasing M2/M3
and decreasing M1/M4.
For roll adjustments (side-to-side), an offset speed is subtracted from M2 and M4, and
added to M1 and M3. This results in an increased thrust from the right side, which causes
the quadcopter to roll to the left. The same approach is used for rolling to the right, in
which M2/M4 have increased speed offsets relative to M1/M3.
It should also be noted that for the pitch, yaw, and roll adjustments there is no change in
altitude. Since the offset speed is added and subtracted in pairs, there is no net upwards or
downwards thrust. Alterations in the motor speeds are more commonly affected by various
combinations of throttle, yaw, pitch, and roll. The job of the flight control unit is to interpret
the commands sent from the joysticks on the remote controller and adjust the motor speeds
accordingly. In order to add stability and increased control to the quadcopter, a closed loop
feedback system is used [8].
2.1.2 The PID Controller
A Proportional-Integral-Derivative (PID) controller is a three part feedback control sys-
tem that is used to tune a closed loop system. In the case of a quadcopter, a properly set
PID controller can enhance the responsiveness and stability of the platform.
Figure 2.3: Feedback Control Loop [9]
The PID controller relies on the basic structure of a typical high level feedback control
loop as seen in Figure 2.3. A reference signal is sent to the controller, which in the case of

Jonathan Itschner Chapter 2. Literature Review 19
a quadcopter is the flight control board. This then forwards the received joystick command
to the actuators, which are ultimately the motors powering the propellers. The alteration
in motor speed occurs in the process block, and sensor data collected from the gyroscope
is used as feedback to the controller. This results in a closed loop system in which the
current rotational state of the quadcopter is used as a feedback method to control the speed
commands sent to the motors [9].
In the PID controller, a parallel approach is used to incorporate the proportional, integral,
and derivative corrections. An overview of this type of system is shown in Figure 2.4.
Figure 2.4: PID Block Diagram [8]
The setpoint (the input to the system) can be interpreted as the command that is sent
from the joystick to the FCU at a given time t. For instance, if a pitch forward command
is issued by moving the right joystick forward by a certain amount, a specific setpoint is
associated with that joystick movement. The error used in the P, I, and D blocks can be
described as the difference between the output and the setpoint as a function of time (e(t)).
For instance, if the quadcopter is level and a pitch forward command is suddenly issued from
the joystick, e(t) will be very high for the first few values of t since the output is smaller
than the setpoint. As the angle of the quadcopter reaches the desired setpoint based on
the throttles of the motor pair pushing it forward (as described in 2.1.1), e(t) will begin to
decrease. However, if the joystick is suddenly released back to center, resulting in a desired
setpoint of 0, e(t) will once again return to a large value until the quadcopter returns to a
horizontal position and the output matches the setpoint [8].

Jonathan Itschner Chapter 2. Literature Review 20
The summed output from the corrections provided by the parallel adjustments in the P,
I, and D blocks can be described by equation 2.1. It should be noted that the PID controller
is applied to each axes, which include pitch, roll, and yaw motion.
Kpe(t) +Ki
∫ t
0
e(τ)dτ +Kdde(t)
dt(2.1)
The Proportional Block
The proportional (P) block responds to the current control error and is described by
equation 2.2, where Kp is the proportional gain and e(t) is the error signal as a function of
time:
Kpe(t) (2.2)
This is perhaps the most important part of the PID system, since it responds directly to
the current changes in quadcopter orientation provided by the gyroscope. In other words, it
is directly proportional to the current control error at the present time t [8]. The value of
the proportional gain Kp determines the strength of the correction applied. Relying only on
the proportional correction could lead to some potential issues, such as overcompensation.
For instance, if a quadcopter has been traveling forward and the joystick is released back to
center position (no more forward movement is desired), the proportional corrections made to
the throttles may over correct past the stable state. This means that the quadcopter could
get stuck in an oscillating state where it never fully stabilizes since it is constantly trying
to correct its orientation based on the present values. This can be partially solved with the
addition of the integral block [9].
The Integral Block
The integral (I) block relies on the summation of the error over time and is described by
equation 2.3, where Ki is the integral gain and∫ t
0e(τ)dτ is the additive summation of the
error signal over the given time period t:
Jonathan Itschner Chapter 2. Literature Review 21
Ki
∫ t
0
e(τ)dτ (2.3)
Since the integration of the error function results in a cumulative sum of the the values
of the errors over the recent time t, it reacts much more slowly than the proportional ad-
justments. The goal of the integral block is to adjust the steady state value to zero over
the time period t. This is especially relevant in the scenario where the quadcopter does not
fully adjust to the horizontal position and maintains a slight angle, causing it to drift from
center. If there was only a proportional adjustment in play, the feedback would not be strong
enough since the error would be a relatively small value. With the addition of the integral
block, over time the small values of e(t) accumulate to a more significant total value, and the
quadcopter can eventually be returned to the horizontal position. The value of the integral
gain Ki determines how much influence this adjustment has on the overall control, and is
generally kept smaller than the proportional gain [8].
The Derivative Block
The derivative block (D) relies upon the predicted changes in the error function, and
provides a rapid response to the error signal. It can be described by equation 2.4, where Kd
is the derivative gain and de(t)dt
is derivative of the error as a function of time.
Kdde(t)
dt(2.4)
The derivative of the error function in a given time slice ∆t provides information about
the current trend of the value of e(t). This means that future error values can be predicted
based on the current progression of e(t). It is possible to predict an over-correction caused
by the proportional adjustment, thereby compensating for the overshoot and causing the
quadcopter to stop closer to the horizontal position. For instance, if a pitch forward command
is issued by moving the joystick from the center position, e(t) will have a decreasing trend as
the output grows closer to the setpoint value. This results in a negative adjustment from the
derivative block. If the quadcopter has been traveling forward and the joystick is released,
the derivative block will provide a strong positive value since the trend of the error e(t) is

Jonathan Itschner Chapter 2. Literature Review 22
increasing back towards 0. The value of the derivative gain Kd determines the strength of
this adjustment, and is usually kept relatively small. It should also be noted that the value
of ∆t is minimized to prevent erroneous derivative calculations due to sensor noise [8].

Jonathan Itschner Chapter 2. Literature Review 23
2.2 Related Quadcopter Sensing and Applications
There are a large variety of ways in which autonomy is implemented on quadcopters, many
of which rely on features that only work well above ground. Some of the most common sensors
used for self stabilization and altitude control are barometers and GPS positioning systems.
Since GPS signals cannot penetrate the ground, GPS cannot be used in an underground
mine.
2.2.1 Ultrasonic Sonar Sensor
Figure 2.5: PING)))TM Ultrasonic Distance Sensor [2]
Perhaps the most ubiquitous and low cost distance sensor used on a robotics platform
is the ultrasound sonar sensor. One such sensor is developed by Parallax Inc, and uses the
time of travel of sound pulses as a way to determine distance, much like echolocation [7].
The communication protocol illustrated in Figure 2.6 relies on the transmission of a
short ultrasonic burst, and the return time of the burst from the target of interest. A 5
µs pulse, referred to as the “trigger” pulse (tout), is generated by the microcontroller host
and transmitted on the SIG pin. This causes the PING sensor to transmit a 40kHz burst
for 200 µs (tburst). The burst travels through the air, bounces off a target in its path, and
then returns to the sensor. Meanwhile, a 5V pulse is produced by the sensor on the SIG pin
after a set hold off time of 750 µs, and the pulse ends once the reflected burst is heard by
the sensor. The width of this pulse (tin) corresponds to the distance from the sensor to the
target, and can range anywhere from 115 µs to 18.5 ms [2].

Jonathan Itschner Chapter 2. Literature Review 24
Figure 2.6: Ultrasonic Distance Sensor Communication Protocol [2]
The main limitations of this sensor are the detectable distances, angle of detection, and
size of the detected object. The maximum measurable distance is around 3 m, and the angle
between the object being detected and the sensor must be less than 45◦ [2].
Figure 2.7: Sensor Limitations [2]

Jonathan Itschner Chapter 2. Literature Review 25
Autonomous Flying Cameraman
One application that has previously been researched is the use of a quadcopter as a
cameraman, which automatically moves to a person’s position based on the location of
colored markers attached to a microphone. Since the quadcopter must operate within close
proximity to a person, obstacle avoidance is an important consideration. The research team
first attempted to use multiple ultrasound sonar sensors to detect any obstacles located on
the sides of the quadcopter, for a total of four sensors arranged as seen in Figure 2.8 [10].
Figure 2.8: Sonar Sensors for Obstacle Avoidance [10]
The most common problem with using ultrasonic sensors on a quadcopter is noise caused
by air turbulence produced by the propellers interfering with the sensor accuracy. This
effect is commonly referred to as “prop wash.” This effect can be observed in Figure 2.8, in
which the air flow lines produced by each of the four propellers are illustrated. In addition
to the air turbulence produced, the significant sound of the spinning propellers can cause
erroneous distance readings from the sonar sensors [17]. Based on these considerations, it
was determined that the use of a depth sensor that is not sound-based was the best approach.
IR-based distance sensors (SHARP GP2D12) were then used instead, since the IR signal is
not affected by air turbulence or sound. These sensors have an effective range of about 80
cm [10].

Jonathan Itschner Chapter 2. Literature Review 26
2.2.2 LIDAR
LIDAR (LIght Detection and Ranging) sensors are commonly used as a means to obtain
a high-resolution distance measurement. They utilize the time of flight of light between the
laser source and the object being detected, similar in some ways to the ultrasonic sensor
except at a much faster rate and with a different medium [11].
There are many different ways to measure the time it takes for a light pulse to reflect
off an object, but a common approach uses a capacitor as a timing device, as seen in Figure
2.9.
Figure 2.9: LIDAR time-to-digital conversion (time of flight) [11]
In a typical LIDAR system, there is a synchronous and asynchronous component. In
Figure 2.9, a system clock of around 500 MHz is used to measure the synchronous portion,
and the capacitor is used for the asynchronous timing of the laser pulse. The “Bang Pulse”
creates a trigger which starts the discharge of the capacitor voltage, and the system clock is
used to stop the discharge. The capacitor acts as a time-to-amplitude converter (TAC). It
uses a known value of Vset at the beginning of the bang pulse so that it can use the value
of the capacitor voltage Vend at the rising edge of the next clock cycle to represent the time
elapsed. An analog to digital converter (ADC) converts this voltage to a time value T1,

Jonathan Itschner Chapter 2. Literature Review 27
which represents the time at which the bang pulse was transmitted.
The approach used for determining T1 is also applied to the reception of the echo pulse,
which is the reflected light from the object being sensed. A trigger is generated when the
echo pulse is received on the light-receptor, and the discharge of the capacitor is used in
conjunction with the system clock and ADC to generate a time value T2. This represents
the time at which the reflected light pulse was received. The time of flight can then be
determined by comparing the difference T12 with the number of system clock cycles elapsed
[11].
Figure 2.10: Typical LIDAR System Overview [11]
A typical LIDAR system using direct detection can be seen in 2.10. As with most distance
sensors, it consists of a pulsed source and a receptor. In the case of LIDAR sensors, the pulsed
source is light-based (usually laser) and travels through transmission and reception optics.
The reflected light pulse received through the reception optics is then filtered depending on
noise conditions, and a photodiode detector registers the light [11].

Jonathan Itschner Chapter 2. Literature Review 28
Aerial Three-Dimensional Mapping
A common application for LIDAR sensors is the precise 3D mapping of environments.
Due to the aerial nature of the quadcopter platform and the precision of the LIDAR sensor,
it is quite common to use them for surveying purposes in a variety of applications. These
applications includes accurately mapping streets, tunnels, mines, caves, forests, and more.
Since conventional terrain mapping involves the use of a manned craft flying at a high
altitude with a downward facing sensor, the resulting point clouds are relatively sparse and
lack detail. By mounting a lightweight 2-D laser scanner on the bottom of a quadcopter,
it is possible to obtain a much denser point cloud map of the environment. This data is
often used for autonomous navigation, commonly referred to as Simultaneous Localization
and Mapping (SLAM) [12].
Figure 2.11: Passive rotation of 2-D Laser Scanner [12]
One previous research project mounted a 2-D laser scanner underneath the quadcopter,
and the air turbulence produced by the propellers caused the sensor to passively rotate. The
laser scanner used was a Hokuyo UTM-30LX-F, which has a 270◦ field of view and a 100 Hz
scan rate. The quadcopter with the sensor system attached can be seen in Figure 2.11.
Since an accurate point mapping of the craft’s environment is produced, it is possible to
operate the quadcopter with confidence in GPS-deprived environments. A continuous-time
mapping approach was used, in which the trajectory of the sensor payload was estimated
from the range measurements and inertial measurements from a secondary sensor. The
trajectory in this case can be described as the continuous time function that defines the
orientation of the quadcopter within the six degrees of freedom as described in Figure 2.1.

Jonathan Itschner Chapter 2. Literature Review 29
With this information known, a 3D point cloud map can be produced by plotting the data
points produced from the laser scanner onto a coordinate system [12].
(a) Overhead View of a Mine Entry(b) Cave
Figure 2.12: Point Cloud Results in Different Underground Environments [12]
The point clouds produced by the platform produced accurate representations of the sur-
rounding environment in a variety of applications. Two such examples that are particularly
relevant to an underground mine scenario can be seen in Figure 2.12. For the mine entry
scenario shown in 2.12a, the colored lines represent the trajectory information a t a given
point in time, from blue to red. Only a single pass was required to properly map the mine
entry. The point cloud produced in 2.12b was the result of two separate datasets, and are
indicated by the red and purple lines [12].

Jonathan Itschner Chapter 2. Literature Review 30
2.2.3 Inertial Measurement Unit
Perhaps the most critical component of a quadcopter control system is the inertial mea-
surement unit (IMU). This sensor consists of motion detection elements, and uses a gyroscope
to determine the angular rate and an accelerometer to detect the acceleration of the quad-
copter. Inertial Measurement Units found on flight control boards are classified as MEMS
(Micro-Electromechanical Systems) devices, which are small three dimensional structures
produced on a silicon substrate through the use of various chemical processes. [13].
Gyroscope
The operating principles of a typical MEMS gyroscope rely on a “tuning fork” structure
as seen in Figure 2.13.
Figure 2.13: Operating Principle of MEMS Gyroscope [13]
This structure relies on the oscillation of the two masses m in the center of each fork as
the object rotates about ω. The rotation generates a force described in equation 2.5, where
a is the acceleration of the mass, ω is the angular rage, and v is the mass velocity:
F = ma = −2m(w × v) (2.5)
The displacement of the masses during rotation is sensed with a capacitive comb struc-
ture, where the displacement corresponds to an angular rate. This type of MEMS structure
can be used to detect the angular changes for both the pitch and roll directions of the
quadcopter [13].

Jonathan Itschner Chapter 2. Literature Review 31
Accelerometer
Accelerometers implemented as a MEMS device rely on the displacement of a mass m.
The inertial force acting on the mass when the sensor is moved results in a force similar
to a spring reaction with a spring constant K. A small amount of dampening D is applied
to the system, and the displacement x of the mass m results in a proportional relationship
between the acceleration a and displacement x. A diagram illustrating this effect can be
seen in Figure 2.14.
Figure 2.14: Operating Principle of MEMS Accelerometer [13]
A common implementation of a MEMS accelerometer uses multiple suspended masses
with capacitive plate pairs directly above. This configuration can be seen in Figure 2.15.
Figure 2.15: Top view of a tri-axial accelerometer [13]
A single suspended mass is used in conjunction with four capacitors arranged in a grid.
When the sensor is stationary and there is no exposure to acceleration, the distance between
the capacitor plates are all equal. This neutral position is illustrated in the middle section
of Figure 2.16.

Jonathan Itschner Chapter 2. Literature Review 32
∆V =Q
∆C≈ Q∆d
εA(2.6)
The relationship between the voltage and distance between the plates can be seen in
equation 2.6, where Q is the electric charge, ∆C is the change in capacitance, ∆d is the
change in distance between the plates, ε is the dielectric constant, and A is the capacitive
plate area [13].
Figure 2.16: Side view of a tri-axial accelerometer [13]
The movement of the suspended mass causes the distances between the capacitive plates
(∆d) to change. As a result of this motion, the voltage (∆V ) for each of the four capacitors is
representative of the sensor motion. By comparing the different voltages of each capacitor,
the direction and strength of the mass movement can be measured and meaningful data
about the motion of the sensor can be calculated [13].
When the sensor is accelerated vertically, the distance between all four capacitors changes
at the same rate due to the uniform motion of the suspended mass. This scenario is illustrated
in the top section of Figure 2.16. If the sensor is moved horizontally, the mass causes the
distance between the grid of capacitors to change depending on the direction in which the
sensor was moved. For instance, the effect of a rightward movement on the mass and its affect
on the distance between the capacitive plates can be seen in the bottom section of Figure
2.16. This approach can be used to detect horizontal accelerations in any combination of
directions by comparing the different voltages corresponding to each of the spatial capacitors
[13].

Jonathan Itschner Chapter 2. Literature Review 33
Vision-controlled Micro Air Vehicles
A European Union funded project called the “Swarm of Micro Flying Robots (SFLY)”
was tasked with the development of a swarm of vision-controlled micro air vehicles (MAVS)
to operate in GPS-deprived environments. The goal of the project was to enable autonomous
navigation using a single on-board camera and inertial sensor data from the IMU [14].
One of the most common issues related to indoor position holding is drift. Even with the
data from the IMU, the aerial nature of the platform and sensor inaccuracy and noise can
cause the position of the craft to change over time. For the SFLY project, a combination
of the IMU readings and the image processing analysis of the on-board camera was used
to stabilize each of the three crafts and minimize positional drift. This so called “local
navigation” module was run on-board, and used the data from the IMU to estimate the
scale of the images produced by the camera.
Compared to other projects, this approach required a significant amount of processing
power due to the image processing and sensor fusion used. An Extended Filter (EKF)
framework was used to fuse the inertial measurements from the IMU with the camera output.
A 24-element state vector X seen below describes the current state of the quadcopter based
on this fused result [14]:
X = {piTw viT
w qiT
w bTω bTa λ p
si q
si } (2.7)
Where:pi
T
w = position of the IMU
viT
w = velocity of the IMU
qiT
w = attitude quaternion (3D complex equation) of the IMU
bTω = gyroscope bias
bTa = accelerometer bias
λ = scale factor
psi = relative position between the IMU and the camera frames
qsi = relative rotation between the IMU and the camera frames

Jonathan Itschner Chapter 2. Literature Review 34
A visual-odometry algorithm was used in conjunction with this fused state algorithm
X to determine the position and orientation of the quadcopter at a given point in time.
This approach resulted in an overall positional drift of about 1.5 meters in a 350 meter long
trajectory test as shown in Figure 2.17 [14].
Figure 2.17: Vision Based Navigation using the camera-based position estimation. [14]
The blue line labeled “Filter” represents the positional data provided by the fusion of
the IMU and camera, while the red line labeled “Ground Truth” is position data provided
by GPS [14].

Jonathan Itschner Chapter 2. Literature Review 35
2.2.4 Summary
It can be clearly seen that the quadcopter platform provides the opportunity to integrate
a variety of different sensing technologies. All of the sensor applications covered in this
section are implemented so that the quadcopter can gain some sense of perception of its
surroundings. The most commonly used sensor in commercial quadcopter flight control
boards is the IMU, since the rotational and acceleration data is needed as inputs to the PID
controller for flight stability. Cameras are also common in commercial quadcopters, though
they are rarely used for navigation.
Cleanflight has the capability to support the ultrasonic sonar sensor natively, assuming
the required I/O capabilities are present on the flight control board. The IMU is also used
in cleanflight for PID calculations, flight stability, and flight control.
Table 2.1 below provides a summary of the sensors, including the LEDDAR sensor used
on the test quadcopter.
Table 2.1: Sensor Comparison [1][2][3]
Range (m) Pros Cons
PING)))TM Sonar 0.02 - 3Low Cost
Commonly Used
Limited Range
Subject to interference
Hokuyo LIDAR 0.1 - 60
Long Range
High Accuracy
Wide Range (270◦)
High cost
Weight
Power consumption
LEDDAR 0 - 40
Moderate Cost
Long Range
High Precision
Accuracy
MODBUS Overhead

36
Chapter 3
Position Holding
3.1 Sensor Integration
In order to successfully implement and test the LEDDAR sensors, it is vital that accurate
and timely sensor data is read into the Cleanflight software. This is accomplished through
the use of UART ports on the Flight Control Board (FCB), which transmit and receive data
to and from the LEDDAR sensors. Essentially, there must be some type of variable that
exists within the Cleanflight construct that will consistently update based on the LEDDAR
sensor distance readings. This is accomplished through the use of the tasking framework
and the Input/Output (I/O) functionality in Cleanflight.
Due to cost and testing simplicity, two LEDDAR sensors are mounted on the quadcopter
frame, with each using a separate UART port on the FCB. One is oriented to obtain dis-
tance measurements directly below the quadcopter, and the other is oriented to measure the
distance between the center of the craft and obstacles to the right. The hardware used for
implementation and testing can be seen in Figure 3.1.

Jonathan Itschner Chapter 3. Position Holding 37
Figure 3.1: Quadcopter Platform
In order for custom code to be executed within Cleanflight, a task must be established in
the task queue. This task contains many elements common to a scheduler, including priority,
desired frequency of execution, and the task name. In order to receive measurements from
the LEDDAR sensors, a specific sequence of bytes must be sent as described in section 1.2.2.
Also, the data that is sent from the LEDDAR sensors to the FCB must be received and
processed. This means that within the LEDDAR task, two UART ports are opened, data is
transmitted to the sensors, and finally data is read from the UART ports. This effectively
results in consistent distance readings of height above ground level and distance to obstacles
on the right side of the quadcopter. Safeguards are implemented to ensure that data is only
read from the UART ports when there are bytes waiting in the receive buffer. This means
that even if a sensor is disconnected or stops functioning, the flight controller will not enter
an unknown state and cease functioning.
Once data is acquired from both sensors, additional processing must be completed to
control the altitude and attitude of the quadcopter in response to the measured distances.
Both the altitude hold and wall avoidance algorithms employ an additional PID control
system which appropriately adjusts the RC commands to maintain a set distance.

Jonathan Itschner Chapter 3. Position Holding 38
3.2 Linearized Mathematical Model of a Quadcopter
The functioning of a quadcopter in flight can be described by mathematical models which
define its kinematics and dynamics [15]. A visual representation of the variables used in this
model can be seen in Figure 3.2.
Figure 3.2: Mathematical Variables in a Quadcopter Model [15]
A reference frame (X, Y, Z) and a body frame (x, y, z) are used to describe the motion of
the quadcopter. The angular speeds of the propellers are denoted by ω1−4, and the upward
thrust forces produced by each of the propellers are represented by F1−4. The roll, pitch, and
yaw angles are defined as φ,Θ and ψ, respectively. By using Euler Angles, a transformation
matrix R can be obtained between the reference and body frame by rotating the model along
the roll (φ), pitch (Θ), and yaw (ψ) axes. Equation 3.0 effectively describes the rotation of
the rigid body (quadcopter) about the reference frame [15].
[R]
=
c(Θ)c(ψ) s(φ)s(Θ)c(ψ)− c(φ)s(ψ) c(φ)s(Θ)c(ψ) + s(φ)s(ψ)
c(Θ)s(ψ) s(φ)s(Θ)s(ψ)− c(φ)c(ψ) c(φ)s(Θ)s(ψ)− s(φ)c(ψ)
−s(Θ) s(φ)c(Θ) c(φ)c(Θ)
(3.0)
Where “c” represents cos and “s” represents sin.

Jonathan Itschner Chapter 3. Position Holding 39
The linear motion of the quadcopter in flight can be described by Equation 3.1. The
rotation matrix R is used to map thrust vector TB from the body frame to the inertial frame
[18].
m~x =
0
0
−mg
+RTB + FD (3.1)
Where:~x : is the position of the quadcopter
m : is the mass of the quadcopter
g : is the acceleration due to gravity
FD : is the drag force
TB : is the total thrust produced by the four propellers
Both equations 3.0 and 3.1, among others, can be used to describe the behaviour of a
quadcopter in flight. By implementing these equations, the performance of a quadcopter can
be simulated in software under varying conditions.

Jonathan Itschner Chapter 3. Position Holding 40
PID Response
PID control systems are designed to limit the disturbance of external variance. In the
case of a quadcopter, PID controllers are used to obtain a desired positional or thrust state of
the craft. To evaluate the performance of the PID controller, certain parameters are assigned
to the response as seen in Figure 3.3 below [8].
Figure 3.3: PID Response Graph [8]
Rise time is the time it takes for the response to rise from 10% to 90% of the final
(steady state) value. Settling time is the time it takes for the response to settle to within
a certain percentage of the steady state value, usually 5%. Percent overshoot is the
maximum response value obtained, expressed as a percentage compared to the steady state
value. Steady state error is the difference between the actual and ideal output [8].

Jonathan Itschner Chapter 3. Position Holding 41
Simulation Overview
Simulation was conducted using MATLAB Simulink. A software collection called “Quad-
copter Dynamic Modeling and Simulation” was used to generate the required outputs based
on the pure theoretical aspects of the quadcopter operation. A more direct, simplified linear
model was used to simulate the behavior of the quadcopter as a function of time. [[]This
system contains PID implementation, RC control inputs, and quadcopter state outputs [16].
A simplified overview of the system components of interest can be seen in Figure 3.4.
Figure 3.4: Quadcopter Simulator [16]
Each axis contains its own PID controller, and any corrections applied are translated
into motor speeds. Based on a quadcopter model similar to the one used experimentally,
different simulated state outputs were obtained to describe an ideal performance.

Jonathan Itschner Chapter 3. Position Holding 42
3.3 Altitude Hold
To maintain a set altitude above ground level, the control axis of primary concern is
thrust. Essentially, the throttle command must be varied appropriately to maintain a steady
altitude. This is achieved through the use of a PID controller which uses the error between
the desired altitude and current altitude to adjust the throttle accordingly. A block diagram
of the Simulink model used for simulation can be seen in Figure 3.5 below [16].
Figure 3.5: Simulation Altitude PID [16]
As described in section 2.1.2, the proportional, integral, and derivative correction blocks
are present and have gains associated with each. The input to this control system is the error
generated by the difference of the desired altitude (“Z”) and the current altitude. The current
altitude relies solely on the mathematical model which describes the inertial behaviour of the
quadcopter as it flies. One way to interpret this value is to treat it as “ideal” sensor data, in
that it describes the measured above ground level (AGL) based solely on the results of the
simulated quadcopter vertical motion. The output of this system is a corrective adjustment
that is sent to the motors, adjusting the overall thrust based on the feedback produced by
the current altitude measurement [16].
To evaluate the PID controller, a steady hover state at a desired altitude was achieved.
Then, an immediate discontinuity in the AGL measurement was introduced, allowing for the
observation of a step response of the PID controller. For the simulation, this was achieved
by generating a single pulse input for the altitude command, which effectively caused the
simulated quadcopter to suddenly increase altitude, hover, and then suddenly decrease alti-
Jonathan Itschner Chapter 3. Position Holding 43
tude. This allows for the observation of the PID step response for both a rising and falling
edge discontinuity.
To evaluate the PID controller implemented on the actual quadcopter, the PID gains were
set to equivalent proportions. Also, the current altitude state used for the error calculation
relied on the distance measured by the LEDDAR sensor. A step response of the implemented
PID algorithm was observed by introducing a 30 cm high rectangular obstruction underneath
the quadcopter during a stable hover state.
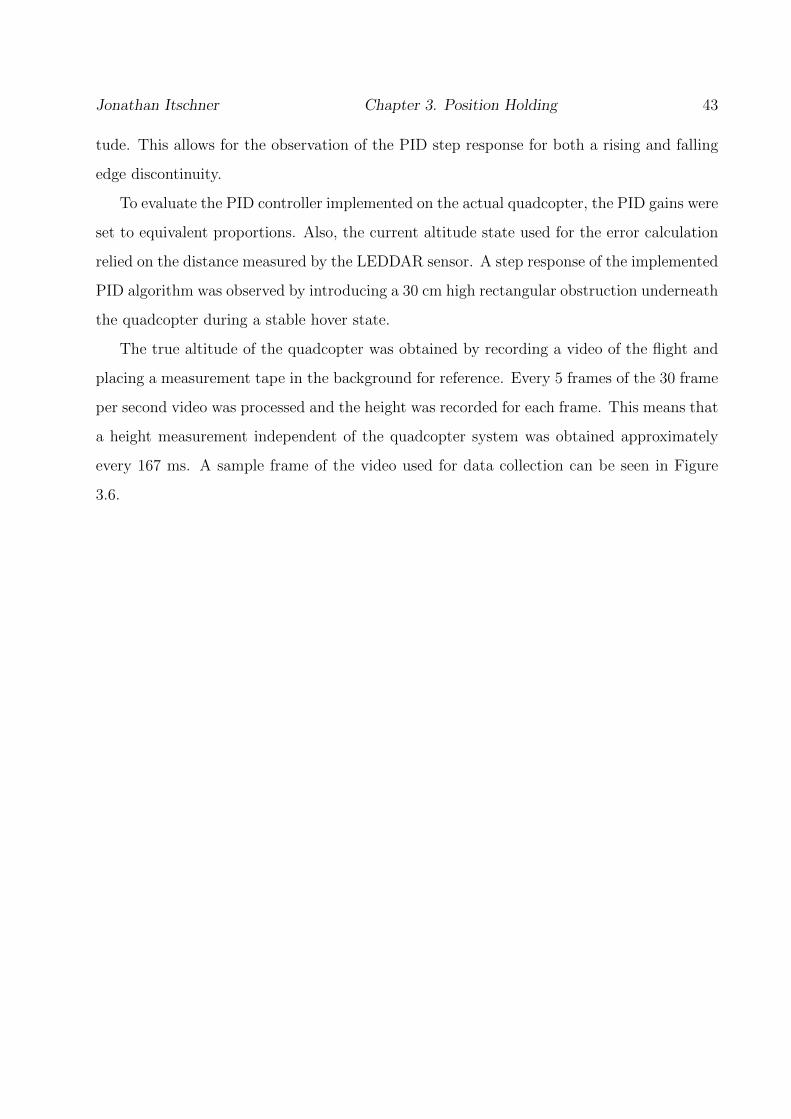
The true altitude of the quadcopter was obtained by recording a video of the flight and
placing a measurement tape in the background for reference. Every 5 frames of the 30 frame
per second video was processed and the height was recorded for each frame. This means that
a height measurement independent of the quadcopter system was obtained approximately
every 167 ms. A sample frame of the video used for data collection can be seen in Figure
3.6.

Jonathan Itschner Chapter 3. Position Holding 44
Figure 3.6: Ground Truth Data Collection
The true altitude of the quadcopter (ground truth data) was obtained and compared to
the simulated altitude as seen in Figure 3.7 (a larger version of the plot is available in the
Appendix).

Jonathan Itschner Chapter 3. Position Holding 45
Figure 3.7: Altitude Step Response
The 30cm high rectangular obstruction suddenly placed underneath the hovering quad-
copter is represented by the dashed line. This can be interpreted as the step input introduced
to the control system, where the rising edge occurs around 17.8 seconds and the falling edge
occurs around 27 seconds. The simulation results are represented by the dot-dash line and
can be considered the ideal altitude response of the quadcopter. This is directly compared to
the solid line, which represents the ground truth data. The ground truth data was acquired
externally, meaning that this altitude data did not rely on the LEDDAR sensor measure-
ments. It can be interpreted as the actual altitude of the quadcopter during flight. One
notable observation is the steady state error of the ground truth altitude compared to the
simulation. However, the scaling of the graph shows that this error only ranges between
about 3 cm to 10 cm, which is insignificant for this application, especially considering the
size of the quadcopter.
The response of the PID controllers are very similar, except for the different in steady
state altitudes. Table 3.1 compares the step response metrics between the simulation and

Jonathan Itschner Chapter 3. Position Holding 46
ground truth data, as described in section 3.2. Much of the error can be accounted for by
the slightly different flight models between the simulated and physical quadcopter, sensor
data variability resulting in a non-ideal step response, and the introduction of air turbulence
in the test area.
Table 3.1: PID Performance Metrics
Simulation Experimental
Rise Time (s) 0.92 0.60
Settling Time (s) 26 26.04
Percent Overshoot (%) 27.3 17.02
Steady State Error (%) 0 4.2

Jonathan Itschner Chapter 3. Position Holding 47
Figure 3.8: Height Above Ground Level Step Response
Another useful plot can be seen in Figure 3.8, which shows the step response of the height
above ground level. Height above ground level is the distance between the quadcopter and
the ground directly beneath it. In this scenario, it can be interpreted as the data acquired
from the LEDDAR sensor. This means that it directly represents the altitude measurement
from the perspective of the quadcopter, and this altitude data is used in the PID control
algorithm. Ideally, this height measurement should stay the same during flight. As the
step input is introduced (“Obstruction Entry”), the height above ground level measurement
suddenly decreases by roughly 30 cm. This can also be observed on the falling edge of the
step input (“Obstruction Exit”), where the height above ground level suddenly increases by
about 30 cm due to the removal of the obstruction.

Jonathan Itschner Chapter 3. Position Holding 48
Figure 3.9: Throttle Step Response
Another way to observe the PID response is to view the throttle commands sent to the
motors. This effectively represents the PID controller’s step response to the sudden change
in height above ground level. In Figure 3.9, the throttle commands generated in simulation
and testing are compared. The dashed line represents the simulated throttle while the solid
line represents experimental throttle. This comparison brings the differences between a
simulation and reality into stark contrast. Though it is clear that the two spikes in throttle
on the rising and falling edge of the pulse are present in both, the throttle commands at
steady state are much more varied in the experimental data. Once again, this can be caused
by numerous factors present in reality that are nonexistent in simulation.

Jonathan Itschner Chapter 3. Position Holding 49
3.4 Wall Avoidance
The roll control axis is used to maintain a set distance from a wall on the right side of
the quadcopter. This means that the side to side movement of the quadcopter along the
Y axis (see Figure 3.2) is used to control its distance relative to the wall. Just as in the
altitude hold configuration, a PID control scheme is used for roll corrections during flight.
The simulation mode can be seen in Figure 3.10 below [16].
Figure 3.10: Simulation Roll Controller [16]
The PD controller in Figure 3.10 is used to generate the φ, or roll commands as if they
were sent from the remote controller. The output of the controller “Phi cmd1” is then
sent to the full PID controller similar to the throttle control system in Figure 3.5. The
simulated error signal, “Velocity Error,” is representative of the velocity of the quadcopter,
in that the position error of the quadcopter is mapped to a desired velocity towards or away
from the wall. This desired velocity is then directly translated to a corresponding angle,
or attitude, command “Phi cmd1.” If there is a sudden change in the target position Y ,
the desired velocity would be updated to reflect the angle of the quadcopter towards or
away from the steady state [16]. It should be noted that there is no integral element in the
simulated controller. The proportional and derivative control account for the velocity error
and acceleration, respectively, and adequately respond to changes in velocity.
To evaluate the PD controller implemented on the quadcopter, the control gains were set
to equivalent proportions. With the quadcopter initialized at a steady state distance Yss away
from the wall, a step input with a rising and falling edge was simulated. A target distance
Ytarget was used to represent the step input by adding the obstruction offset to Yss. The size
of the step used in the simulation represents the depth of a rectangular obstruction suddenly

Jonathan Itschner Chapter 3. Position Holding 50
placed in front of the LEDDAR sensor, which would cause the quadcopter to adjust its true
position relative to the wall. For instance, if the quadcopter was maintaining a distance
of 70 cm from the wall (Yss), a 30 cm obstruction placed between the sensor and the wall
would cause the quadcopter to ideally reach a distance of 100 cm relative to the wall (Ytarget).
This same approach was used to generate the falling edge of the step input by changing the
desired distance from Ytarget to Yss. The results of the simulated response can be seen in
Figure 3.11 (a larger version of the plot is available in the Appendix).
Figure 3.11: Simulated Roll Step Response
The above figure shows the simulated values of the distance to the wall as observed by the
quadcopter. One way to interpret this is to view this plot as the ideal sensor measurements
during the step response. The quadcopter initializes at a distance of 74 cm from the wall,
and the points in time where the 30 cm obstruction is introduced and removed are labeled.
Notice how the relative distance between the quadcopter and the measured distance always
attempts to return to the initial distance of 74 cm.

Jonathan Itschner Chapter 3. Position Holding 51
A step response of the implemented control algorithm was observed by introducing and
removing a 30 cm high rectangular obstruction in front of the wall during steady state
distance holding. The results of the experimental test can be seen below in Figure ?? (a
larger version of the plot is available in the Appendix).
Figure 3.12: Experimental Roll Controller Performance
The above figure shows the distance measurements obtained by the side-mounted LED-
DAR sensor. A system response can be observed at the labeled points where the obstruction
entry and exit occur. A notable observation is the apparent inconsistency in the distance
measurements, especially when compared to the altitude controller. During testing, a no-
ticeable drift was observed, even without the distance holding algorithm active. One of the
main causes of this is the inherent instability of the test quadcopter platform used, caused
by a variety of factors including air turbulence, weight balancing, and IMU noise.
This drift can be seen during the first four seconds, in which the quadcopter moves from
its initial distance of 74 cm to 93 cm. When the obstruction is introduced, the quadcopter
quickly adjusts its distance away from the wall in an attempt to stabilize its relative distance

Jonathan Itschner Chapter 3. Position Holding 52
to the ideal value of 74 cm (Yss). However, the steady state values (6s - 9s) of the quadcopter
are highly variable, ranging from 65 cm to 87 cm, with an average steady state value of 78 cm.
On the falling edge of the step response, labeled as “Obstruction Exit,” a similar behavior
can be observed, in which the quadcopter struggles to return to Yss.
Table 3.2 below summarizes and compares the performance of the simulated and exper-
imental controllers.
Table 3.2: Controller Performance Metrics
Simulation Experimental
Rise Time (s) 0.94 0.30
Settling Time (s) 5.56 8.17
Percent Overshoot (%) 3.43 21.7
Steady State Error (%) 0 7.8

Jonathan Itschner Chapter 3. Position Holding 53
Figure 3.13: Roll Command Step Response
Another way to observe the step response is to view the roll commands sent to the
motors. This effectively represents the controller’s step response to the sudden change in
wall distance due to the introduction and removal of the obstruction. In Figure 3.13, the roll
commands generated in simulation and testing are compared. The dashed line represents
the simulated roll while the solid line represents experimental roll. In the simulation, the
command used to move the quadcopter away from the wall can be seen as a downward, then
upward waveform. Similarly, to move back towards the wall an upward, then downward
waveform is used. For both of these, the complimentary roll command is used to counteract
the inertial motion of the quadcopter as it is moving towards or away from the wall. This
effectively stops the quadcopter so that it will maintain its new position.
The experimental waveform follows this simulation to a minor extent, most notably
around the 6 second mark. Though it is somewhat delayed, the same type of roll command
can be seen to move the quadcopter away from the obstruction. To a lesser extent, this can
also be seen in the roll command at 7 seconds when the obstruction is removed. The extra

Jonathan Itschner Chapter 3. Position Holding 54
roll commands from 0 to 4 seconds are likely a result of extraneous accelerometer data due
to the IMU noise or platform instability, and are potentially one of the contributing factors
to the initial drift in position observed in Figure 3.12.
55
Chapter 4
Conclusion
4.1 Summary
This research shows that it is possible to obtain spatial awareness and centering infor-
mation for a quadcopter without GPS while operating in an underground mine. Compared
to most currently explored solutions, the sensing approach used in this research provides a
compelling compromise between weight, size, cost, power consumption, and system perfor-
mance.
The capability of the quadcopter to alter its position based on the distance measurements
provided by the light-based sensor was evaluated. Both the altitude above the current ground
level and the distance from the current wall were used as inputs to the control systems.
These controllers dynamically adjusted quadcopter commands to ensure the vertical and
side distances were maintained during flight. The behavior of the quadcopter control system
in response to a step input was simulated using a linear model, and then compared to the
experimental results. In both the altitude and wall holding experimental tests, a steady
state error of less than 10% was observed. In addition, the experimental response to the step
input had a smaller overshoot than the simulation.
There were considerably more external disturbances in the test environment when com-
pared to the simulation. Much of this can be accounted for by the nature of the physical
quadcopter system, including flight dynamics, motors, propellers, distance measurement er-
rors, and flight controller sensor data error (e.g., gyroscope, accelerometer). The performance

Jonathan Itschner Chapter 4. Conclusion 56
of the system was adequate when compared to the ideal performance, and it is reasonable
to speculate that with more sensing capability and finer PID tuning full autonomy could be
achieved to maintain the quadcopter position in the center of an entry.
4.1.1 Future Work
In a highly volatile environment like a collapsed mine, it would be beneficial for the
quadcopter to have additional situational awareness beyond the scope of this research. A
relatively minor addition to the configuration used in this research would be the addition of
a second distance sensor on the other side of the quadcopter. This could be used to find the
averaged horizontal distance between the two walls of the mine, and maintain the distance
from both simultaneously. If weight, size, and power constraints could be accounted for, a
laser scanning system similar to the research presented in [12] could be used to obtain a much
higher resolution distance map of the surroundings. It could also be beneficial to investigate
the use of other types of sensors, such as optical flow, IR, and sonar. Image processing
techniques could even be used in conjunction with a camera, similar to the research in [14].
Furthermore, the wall position holding algorithm developed here could be modified to
improve system performance by decreasing error and increasing stability response. It would
also be extremely beneficial to reexamine the physical construction of the test quadcopter to
improve stability and reduce sideways drift. A much more involved approach to navigation
could utilize Simultaneous Localization and Mapping (SLAM) algorithms to obtain more
autonomy. This is a highly popular research topic in the field of robotics, and is directly
applicable to the navigation of a quadcopter in an underground coal mine.

57
Chapter 5
Appendix

Jonathan Itschner Chapter 5: Appendix 58
Fig
ure
5.1:
Alt
itude
PID
Ste
pR
esp
onse

Jonathan Itschner Chapter 5: Appendix 59
Fig
ure
5.2:
Hei
ght
Ab
ove
Gro
und
Lev
elSte
pR
esp
onse

Jonathan Itschner Chapter 5: Appendix 60
Fig
ure
5.3:
Thro
ttle
Ste
pR
esp
onse

Jonathan Itschner Chapter 5: Appendix 61
Fig
ure
5.4:
Sim
ula
ted
Rol
lSte
pR
esp
onse

Jonathan Itschner Chapter 5: Appendix 62
Fig
ure
5.5:
Exp
erim
enta
lR
oll
Con
trol
ler
Per
form
ance

Jonathan Itschner Chapter 5: Appendix 63
Fig
ure
5.6:
Rol
lC
omm
and
Ste
pR
esp
onse

Jonathan Itschner Chapter 5: Appendix 64
5.0.1 Down-hole Communications Overview
The objective of this project is to facilitate the above-ground operation of a quadcopter
operating in a below-ground mine. Since the radio frequencies used to communicate joystick
commands to the quadcopter will not penetrate deep enough into the ground, a different
approach must be used to allow for this communication. In the context of mine rescue
operations, a 6 to 8 inch diameter bore hole can be drilled as a means of access into the
mine. This bore hole could be used as an entry point for a collapsible quadcopter, which
could expand once deployed in the mine and explore the surrounding area. The focus of this
project is to facilitate the communication link between the pilot operating the craft from the
surface and the quadcopter flying in the underground mine. This includes the transmission
of video data back up to the pilot on the surface.

Jonathan Itschner Chapter 5: Appendix 65
The following off the shelf products were used to construct the demonstration system:
• Icron USB 2.0 Ranger 2211
• 9/125, Singlemode Fiber Cable, ST / ST, 1.0m
• Fiber Adapter, ST / SC (Rectangular Mounting), Bronze Alignment Sleeve
• TP-LINK MC210CS
• CAT 6 Ethernet Cable
• Mini HDMI – HDMI cable
• Camplex HDMI to Fiber Optic Extender
• Preterminated fiber optic cable (50 feet)
An overview of the entire system connections used for joystick control commands and
video return can be seen in the following diagrams.

Jonathan Itschner Chapter 5: Appendix 66
Figure 5.7: Overview of Fiber Optic Communication System

Jonathan Itschner Chapter 5: Appendix 67
Figure 5.8: Connection Diagram of Control Communication over Fiber
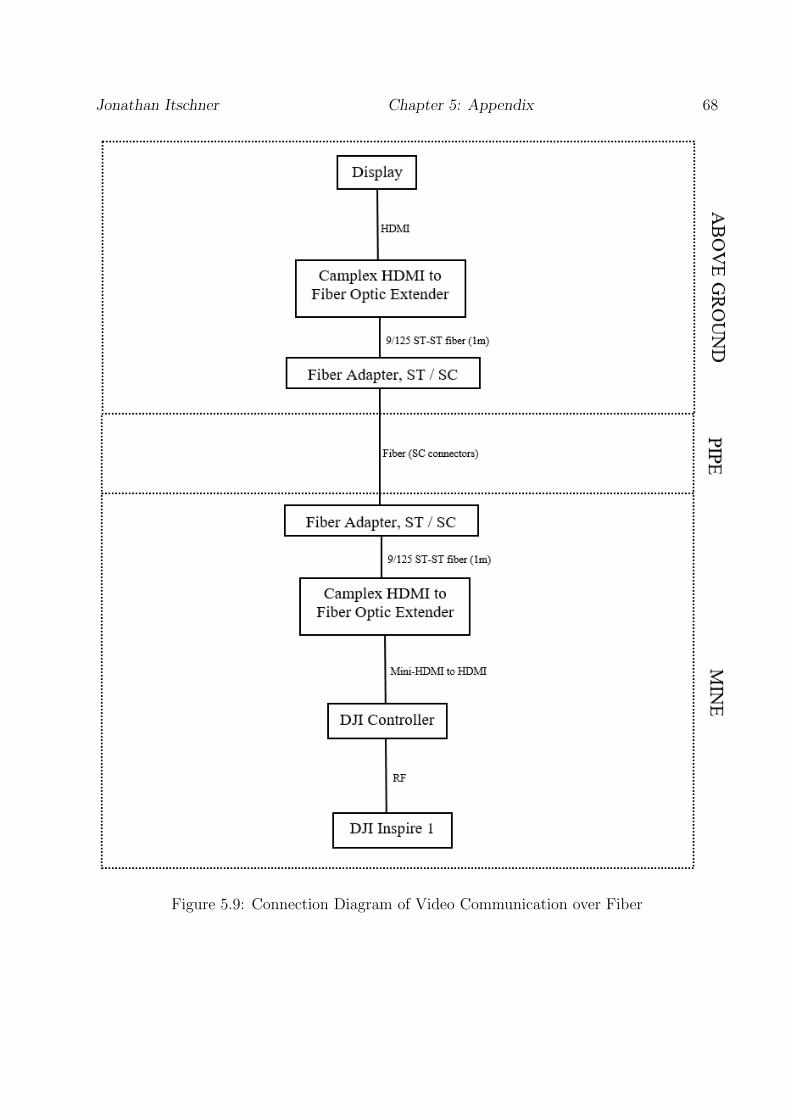
Jonathan Itschner Chapter 5: Appendix 68
Figure 5.9: Connection Diagram of Video Communication over Fiber

69
References
[1] L. Inc., “LeddarTM One User Guide,” Quebec, Canada.
[2] Parallax Inc., “PING)))TM Ultrasonic Distance Sensor (#28015),” pp. 1–12, 2009.[Online]. Available: https://www.parallax.com/sites/default/files/downloads/28015-PING-Documentation-v1.6.pdf
[3] Hokuyo, “Scanning Laser Range Finder Specifications,” pp.1–6, 2012, accessed on 07/16/2017. [Online]. Available:http://projects.asl.ethz.ch/datasets/lib/exe/fetch.php?media=hardware:tiltinglaser:utm-30lx-ln-specification.pdf
[4] Roy S Nutter, Jr., PhD, “2017 Proposal UAV Exporation (Concept Paper final), avail-able by request from wvu through [email protected],” 2017.
[5] Modbus Organization, “MODBUS Application Protocol Specification v1.1b3,”Hopkinton, MA, 2012. [Online]. Available: Modbus-IDA
[6] D. Clifton, “Seriously Pro,” 2015. [Online]. Available:http://seriouslypro.com/spracingf3
[7] B. T. M. Leong, S. M. Low, and M. P. L. Ooi, “Low-cost microcontroller-based hovercontrol design of a quadcopter,” Procedia Engineering, vol. 41, no. Iris, pp. 458–464,2012. [Online]. Available: http://dx.doi.org/10.1016/j.proeng.2012.07.198
[8] Donald Norris, “Quadcopter Flight Dynamics,” in Build Your Own Quadcopter: PowerUp Your Designs with the Parallax Elev-8. McGraw-Hill Education, 2014, ch. 2.
[9] A. Visioli, “Basics of PID Control Closed loop control system,” in Practical PID Control.Springer, 2006, ch. 1, pp. 1–18.
[10] L. N. Hung and L. S. Bon, “A quadcopter-based auto cameraman system,” VCACS 2016- 2016 IEEE Virtual Conference on Application of Commercial Sensors, Proceedings,2017.
[11] G. Brooker, Introduction to Sensors for Ranging and Imaging. Raleigh, NC: SciTechPublishing Inc., 2011, ISBN: 9781891121746.

REFERENCES 70
[12] L. Kaul, R. Zlot, and M. Bosse, “Continuous-Time Three-Dimensional Mapping forMicro Aerial Vehicles with a Passively Actuated Rotating Laser Scanner,” Journal ofField Robotics, vol. 33, no. 1, pp. 103–132, 2016.
[13] W. Gunthner, Enhancing Cognitive Assistance Systems with Inertial MeasurementUnits. Berlin, Germany: Springer, 2008, ISBN: 9783540769965.
[14] D. Scaramuzza, M. C. Achtelik, L. Doitsidis, F. Fraundorfer, E. Kosmatopoulos, A. Mar-tinelli, M. W. Achtelik, M. Chli, S. Chatzichristofis, L. Kneip, D. Gurdan, L. Heng,G. H. Lee, S. Lynen, L. Meier, M. Pollefeys, A. Renzaglia, R. Siegwart, J. C. Stumpf,P. Tanskanen, C. Troiani, and S. Weiss, “Vision-Controlled Micro Flying Robots,” IEEERobotics & Automation magazine, no. September, pp. 26–40, 2014.
[15] F. Ahmed, P. Kumar, and P. P. Patil, “Modeling and simulation of a quadcopter UAV.”vol. 23, no. 4 OP - Nonlinear Studies. 2016, Vol. 23 Issue 4, p553-561. 9p., p. 553, 2016.[Online]. Available: http://search.ebscohost.com/login.aspx?direct=true&site=eds-live&db=a9h&AN=119836746
[16] D. Hartman, K. Landis, M. Mehrer, S. Moreno, and J. Kim, “Quadcopter dynamicmodeling and simulation (quad-sim),” https://github.com/dch33/Quad-Sim, 2014.
[17] B. Gross, “MaxSonar Operation on a Multi-Copter.” [Online]. Available:http://www.maxbotix.com/articles/067.htm
[18] A. Gibiansky, “Quadcopter Dynamics , Simulation , and Control In-troduction Quadcopter Dynamics,” pp. 1–18, 2012. [Online]. Available:http://andrew.gibiansky.com/blog/physics/quadcopter-dynamics/
[19] CleanFlight, “CleanFlight manual,” pp. 1–68, 2016. [Online]. Available:https://github.com/cleanflight/cleanflight/tree/master/docs
[20] R. Zlot, M. Bosse, K. Greenop, Z. Jarzab, E. Juckes, and J. Roberts, “Efficientlycapturing large, complex cultural heritage sites with a handheld mobile 3D lasermapping system,” Journal of Cultural Heritage, vol. 15, no. 6, pp. 670–678, 2014.[Online]. Available: http://dx.doi.org/10.1016/j.culher.2013.11.009
[21] J. Itschner, “Code used for test environment,” https://github.com/Trumar/cleanflight-1, 2017.

Spatial Centering of a Quadcopter in an
Underground Coal Mine
Jonathan Itschner
Thesis submitted to theBenjamin M. Statler College of Engineering and Mineral Resources
at West Virginia Universityin partial fulfillment of the requirements for the degree of
Master of Sciencein
Electrical Engineering
Lane Department of Computer Science and Electrical Engineering
APPROVAL OF THE EXAMINING COMMITTEE
Powsiri Klinkhachorn, Ph.D.
Vinod K. Kulathumani, Ph.D.
Roy S. Nutter, Ph.D., Chair
Date
Copyright © 2022 FDOKUMEN