Exploring the promotion of creative thinking ... - UCL Discovery
373
Exploring the promotion of creative thinking among secondary school students in India A thesis submitted by Mahender Reddy Sarsani in fulfilment of the requirements for the degree of Doctor of Philosophy Institute of Education University of London January 1999
-
Upload
khangminh22 -
Category
Documents
-
view
3 -
download
0
Transcript of Exploring the promotion of creative thinking ... - UCL Discovery

Exploring the promotion of creative thinking among secondary school
students in India
A thesis submitted by
Mahender Reddy Sarsani
in fulfilment of the requirements for the degree of
Doctor of Philosophy
Institute of Education University of London
January 1999

2
Abstract
In India, research on creativity has focused on the construction of tests of
creativity and correlational studies of creativity with self-concept, intelligence,
personality etc.,. There have been no studies considering the effects of schooling on
creativity, teachers' perceptions of creativity or how they could to promote it. This
research focused on teachers' views of creativity and their classroom practices, and on
students' performance on Tests of Creative Thinking by Baqer Mehdi, their attitude
towards curriculum subjects, their occupational choices and their experiences at school.
The sample for the survey included 373 students and 88 teachers drawn from nine
Government schools in Andhra Pradesh, India. All the instruments were developed by
the researcher and data was collected by means of questionnaires for students and
teachers, an scale for assessing teachers encouragement of pupils in the classroom,
interviews with teachers and a check-list for head teachers regarding out-of- school
activities. To analyse the data, various quantitative and qualitative techniques were
applied.
The findings showed that teachers valued creativity, had established criteria for
its definition and for identifying creative children. They believed that the development
of creativity depended on good teacher-pupil relationships, encouraging experimentation
and building self-confidence among the students. Obstacles to the development of
creativity included inadequate resources, lack of instructional materials, lack of funds,
passive unmotivated students with a tendency to rote learning, pressure to complete the
syllabus, preparing students for examinations and teachers' teaching load. They felt that
the curriculum was overloaded, inflexible and not suitable to cater for the needs of the
wide range of learners. They preferred a child centred curriculum based on activities.
The findings from the student data contributed to the development of a model
linking parental factors, the medium of instruction and teacher encouragement. Path
analysis showed that out-of- school activities, mother's education, teacher encouragement
and mother's income had causal relationships with students' creative thinking. On the
basis of the findings practical recommendations have been made for the promotion of
creativity among school students.

3
Acknowledgements
Thanks are due to my supervisors Dr. Elwyn Thomas, Senior Lecturer, Education
and International Development (EID), Institute of Education and Dr. Susan Hallam, Senior
Lecturer, Psychology and Special Needs (P SN) , Institute of Education, University of
London, London.
My gratitude is especially due to Dr. Elwyn Thomas, whose comments based on
close readings and encouraging suggestions have been crucial in helping to me carry
through the various stages of my research work. His humorous and friendly style gave me
immense pleasure in my work.
I am very much indebted to Dr. Susan Hallam for her critical reading, comments,
her corrections of various drafts and her advice on statistical treatments. Her dynamic,
enthusiastic, encouraging and appreciative attitude and artistic abilities gave me the
confidence to complete this research.
Many thanks to Prof.Angela Little, EID and Dr. Sheila Handerson and Dr. Morag
Stuart, PSN, Institute of Education, University of London for their constant willingness to
interrupt busy schedules to talk with me and for their critical suggestions in the initial
stages of the research as research tutors. I also extend my thanks to the Academic Research
groups and Secretaries in both departments i.e., EID & PSN for their timely help.
Many thanks to Dr. Jane Hurry, research tutor, in the doctoral centre of the Institute
of Education, Mrs. Anne Craft, Director, Creativity in Education Research project, School
of Education, The Open University, Milton Keynes, and Dr. B. Datta, retired English
teacher, High School, Waltham Forest Area, London for offering suggestions for the
improvement of the instruments after going through them.
I must also extend thanks to my beloved present and former vice chancellors of
Kakatiya University, Warangal for facilitating completion of this research. Thanks are due
to my colleagues in the Department of Education, Kakatiya University, Warangal for their
co-operation.
The researcher wishes to express his gratitude to Prof. M. MalIa Reddy, former
vice-chancellor, Osmania University (O.U), India, Prof. M. Sreeram Murthy, Dean &
Principal College of Education, O.U; Dr. Sudheer Reddy, Reader in Education O.U and

4
Prof. 1. V. Radha Krishna Murthy, Special Officer for text books, Directorate of School
Education, A..P. for encouraging me to apply for Commonwealth Academic Scholarship
Award and for academic career development.
Thanks to Mr. Veerabadra Reddy, D.E.O and Mr. B. Upender Reddy, Lecturer,
S.C.E.R.T, Hyderabad, for their moral support during the period of my fieldwork. I say a
hearty thank you to all of the head teachers, teachers and students who enthusiastically
participated in this research and inspired me to make further efforts to design research
projects to strengthen the education system in Andhra Pradesh.
It is impossible to mention all those from whom I have benefited over the years, but
I can say "many thanks" to those who helped whether directly or indirectly.
Thanks to my wife Surekha, and daughters, Srinija and Srinila, for affectionate love
at home and for allowing me uninterrupted writing of this work.
Finally, gratitude is expressed to the Commonwealth Scholarship Commission,
U.K, for sponsoring the Commonwealth Academic Scholarship Award for 1995-98 to
enable me to complete the thesis.
Contents
Abstract Acknowledgement Contents Chapter I Introduction
1.1 Creativity in Education 1.2.0 Why creative thinking is essential? 1.3.0 A brief Indian Educational Scenario 1.3.1 Organisation and structure of the education system in India and Andhra Pradesh 1.4.0 Need for the present Investigation 1.5.0 Aims of the present study 1.6.0. A brief resume of the succeeding chapters
Chapter II Creativity-A theoretical approaches 2.1.0 Introduction 2.2.0 DefInition of Creativity 2.2.1 Creative persons 2.2.2 Creativity as Product 2.2.2.1 Criteria for establishing creativity 2.2.3 Creativity as Process 2.2.4 Creative press (or places) 2.2.5 Levels of Creativity 2.3.0 Associationistic approach to creativity 2.4.0 Psychoanalytic Approach to Creativity 2.5.0 Humanistic or Holistic Approach to creativity 2.6.0 Gruber's Piagetian approach 2.7.0 Information processing approach to creativity 2.8.0 Boden's Impossibility theory 2.9.0 Convergent-Divergent thinking and Creative thinking 2.10.0 Lateral thinking and creativity 2.11.0 Creativity and Intelligence 2.12.0 Summary and Conclusions
Chapter III Creative Thinking and Its Development in Students 3.1. 0 Introduction 3.2.0 Is Every Child Creative? 3.3.0 How to Identify a creative child 3.4.0 Measurement of Creative Thinking at High School Level 3.5.0 Creative thinking and its development in students 3.5.1 Creative thinking- Age-wise development 3.5.2 Creative thinking - Grade-wise development 3.5.3 Creative thinking and sex differences 3.5.3.1 Studies on Verbal Creative thinking 3.5.3.2 Studies on Non-verbal Creative thinking 3.5.4. Creative thinking and socio-economic status (SES) 3.5.5 Creative thinking - different types of schools 3.6.0 Summary and conclusions
Chapter IV Creative thinking and the School 4.1.0 Introduction 4.2.0. Creative Thinking - the role of the School 4.3.0. Creativity - School Environment 4.3.1 Barriers to Creative Thinking 4.4.0. Creativity - Curriculum in secondary schools 4.4.1 Creativity-Curricular and Extra-curricular activities 4.4.2 Creativity and status of art education in India 4.5.0 Experimentation and creative work in secondary schools 4.6.0. Is creativity found only in some subjects? 4.7.0 Creativity- Teaching Aids 4.8.0 Creativity - School Examinations
5
Pages
2 3-4 5-11 12-26
15 16 18 19 20 25 26 27-43 27 27 29 31 31 33 34 35 36 37 38 39 40 41 41 42 42 43 44-57 44 44 45 46 50 50 51 51 53 53 53 56 57 58-70 58 58 60 62 63 64 65 66 66 67 68
4.9.0 Creative Thinking - Role of the head teacher 4.10.0 Summary and conclusions
Chapter V Creative Thinking and the Teacher 5.1.0 Introduction 5.2.0. Creative thinking - role of the teachers 5.3.0 What Is the Teacher's Role in Fostering Creativity? 5.4.0 Who is the creative teacher? 5.5.0 Non-Creative teachers 5.6.0 What can teachers do to develop creativity? 5.7.0 Creativity - Teachers classroom questioning behaviour 5.7.1 Importance of open-ended questions 5.7.2 What research says about the usage of open-ended question by the teachers 5.8.0 Instruction for Creativity-Teachers Knowledge and understanding 5.9.0 Creative thinking - Teachers' Views and Defmitions 5.10.0 Creative thinking - Teachers' attitude 5.11.0 Training in creativity 5.12.0 Summary and Conclusion:
Chapter-VI Design and Development of the Research Instruments 6.1.0 Introduction 6.2.0 Methodological issues regarding development of the instruments 6.2.1 The interview as a research tool 6.2.2 The questionnaire as a research instrument 6.2.3 Focus Group discussions 6.2.4 Selection of Open or closed questions 6.3.0. Instruments developed for the study 6.3.1 Interview Scheduled For Teachers (ISFT) 6.3.2 0 Development of Teachers' Questionnaire 6.3.2.1 Designing the Teachers' Questionnaire 6.3.2.3 Drafting the Teachers Questionnaire (TQ) 6.3.3.0 Student Information Sheet (SIS) 6.3.4.0 Verbal and Non-verbal Tests of Creative Thinking by Baqer Mehdi 6.3.4.1 The description of the activities in the Verbal Test of Creative Thinking (VTCT) 6.3.4.2 The scoring procedure for the test 6.3.5.0 Non-Verbal Test of Creative Thinking (NVTCT) 6.3.5.1. The description of the activities in the test 6.3.5.2. The scoring procedure of the test 6.3.6.0 The Development of Teachers' Encouragement Scale (TES) 6.3.7.0 Classroom Observation Schedule (COS) 6.3.8.0 Check-list For Head Teachers (CFHT) 6.4.0 Translation of the research instruments 6.4.1. The procedure of the translation method followed in the study
Chapter-VII Pilot study - Process and Procedure 7.1.0. Introduction 7.2.0 Purpose of the pilot study 7.3.0. Procedure of the conducted Pilot Study 7.4.0 Pilot study 7.5.0.Procedure for the pilot study 7.5.1 Piloting the Student Information Sheet (SIS) 7.5.1.1 Item analysis of the SIS 7.5.2.0 Piloting the creative thinking tests 7.5.2.1 Scoring Procedure and Validity of the items 7.5.3.0 Piloting the Teachers Encouragement Scale (TES) 7.5.3.1 Item analysis of the TES 7.5.4.0 Explorative Interviews 7.5.4.1.0 Results of the Explorative Interviews 7.5.4.1.1 Creativity - teachers' defmitions 7.5.4.1.2 Creativity - the present education system 7.5.4.1.3 Intelligence and creativity- teachers' views
69 70 71-87 71 71 73 74 75 76 78 78 80 80 81 82 85 86 88-102 88 88 88 89 89 90 91 91 92 92 92 93 93 94 96 96 97 98 98 100 100 100 101 103-113 103 103 103 104 105 105 106 107 107 107 108 109 109 109 110 110
6
7.5.4.1.4 Creativity- school subjects 7.5.4.1.5 Criteria for identifying creative children in the classroom 7.5.4.1.6 Importance of creativity in education- teachers opinion 7.5.4.1.7 Obstacles to development of creativity - teachers' views 7.5.5.0 Piloting the Teachers' Questionnaire (TQ) 7.5.6.0 Piloting the Check-list for Headteacher (CFHT) 7.6.0 Summary and conclusion
Chapter-VIII Research Design and Methodology 8.0.0 Introduction 8.1.0 A framework for the present investigation 8.1.1 Organisational Variables and Creativity 8.1.2 Background Variables - Creativity 8.1.3 Students' Cognitive & Motivational Characteristics (SCMC) - Creativity 8.1.4 Data analysis 8.2.0.Research Method 8.2.1. Normative Survey Research 8.2.2. Characteristics of Normative Survey Research 8.3.0 Sampling procedure for the main study 8.3.1 Students' Biographies 8.3.2 Teachers' Biographies 8.4.0. Procedure for data collection 8.4.1 Student Information Sheet (SIS) 8.4.2 Creative thinking tests 8.4.3. Teachers' Encouragement Scale (TES) 8.4.4. Interviewing procedure, recording and transcribing 8.4.5 Teachers' Questionnaire (TQ) 8.4.6 The classroom observation scheduled (COS) 8.4.7 The Check-List for Headteacher (CFHT) 8.5.0 Reliability and validity of the instruments 8.5.1.1 Reliability of the verbal and non-verbal test creativity 8.5.1.2 Validity of the creative thinking tests 8.5.1.3. Factor Validity of Verbal and Non-verbal Creativity 8.5.2.1 Reliability of the TES 8.5.2.2 Intrinsic Validity or Index of Reliability ofTES 8.5.2.3 Content validity of the TES 8.5.2.4 The construct validity of the TES items 8.5.3. Reliability and Validity of the Interview data 8.5.4. Reliability and Validity of the Teachers Questionnaire (TQ) 8.5.4.1 Factor Analysis ofTQ 8.6.0 Summary
Chapter IX Analysis of Teacher's Questionnaire and Interviews 9.1. 0 Introduction 9.2.0 The main results of the teachers questionnaire and interviews 9.2.1 Sources of knowledge about creative thinking 9.2.2 Support needed for teachers in order to improve their knowledge about Creative Thinking 9.2.3 Teachers' defmition of Creative Thinking (CT) 9.2.4 Development of creativity through teaching - teachers views 9.2.5 Can all children be taught to be creative thinkers? -Teachers' views 9.2.6 Intelligence and Creative Thinking - Teachers' views 9.2.7 Teachers' opinion towards school subjects and creativity 9.2.8 Teachers' assessment criteria for identifying creative children in the classroom 9.2.9 The importance of creativity and reasons given by the teachers for its development
in school children 9.2.10 Methods of encouraging creativity in the classroom used by teachers 9.2.11 How teachers can develop creative thinking 9.2.12 Factors which assist in developing creative thinking among the students 9.2.13 Obstacles in developing creative thinking among secondary school children 9.2.13.1 Obstacles at School level 9.2.13.2 Obstacles at student level
7
111 111 111 112 112 113 113 114-139 114 114 114 115 117 117 118 118 118 119 120 121 125 126 126 126 127 128 129 129 130 131 131 133 134 135 135 136 136 137 138 139 140-171 140 140 140 143 145 146 147 148 150 152 154
157 159 160 161 162 163

9.2.13.3 Obstacles at teachers' level 9.2.14 Teachers' attitude towards the encouragement of creative thinking among the students 9.2.15 Teachers' attitude towards the present examination system in Andhra Pradesh 9.2.16 Teachers' attitude towards the present curriculum in Andhra Pradesh 9.2 .17 The suggestions made by the teachers for developing creativity 9.3.0 Summary
Chapter X Data Analysis of the students' creative thinking 10.0 Introduction
10.1. o. Procedure for conversion raw scores into standardised scores 10.2.0 The nature of the distribution of verbal and non-verbal creative thinking test scores 10.2.1 Frequency distribution of verbal test of creative thinking (VTCT)
and its components (standardised scores) 10.2.2 Frequency distribution of scores on non-verbal test of creative thinking (NVTCT)
and its components (standardised scores) 10.2.3 Frequency distribution of Composite creativity scores 10.3.0 Student background research questions. 10.3.1. The students' personal background data analysis 10.3.1.1. Sex differences in creative thinking 10.3.3 Age group differences in creativity 10. 3A. Students' parental background data analysis 10.3.5 Fathers' education and children's creativity 10.3.6. Mothers' education and children's creativity 10.3.7 Fathers' occupations and children's creativity 10.3.8 Mothers' occupations and their children's creativity 10.3.9 Fathers' income and children's creativity 10.3.10. Mothers' income and their children's creativity 10A.0 Organisational factors and students' creativity 10A.1 The impact of medium of instruction on students creative thinking 10A.2 The influence of school type (gender) on students' creative thinking 10A.3 Comparison of girls in co-educational schools with those in girls' schools,
and boys in boys' schools with those in co-educational schools 10.5.0. Cognitive and motivational factors and students creativity 10.5.1 Levels of students' creativity -subjects which students liked 10.5.2 Levels of students' creativity -subjects disliked 10.5.3 Level of students' creativity -Occupation chosen 1O.5A Level of students' creativity -good classroom experiences 10.5.5 Levels of students' creativity -bad classroom experiences 10.6.0 Summary
Chapter XI Data Analysis of the Teacher Encouragement Scale and School Activities 11.0 Introduction 11.1 The Sample distribution for TES 11.2 Analysis of TES items 11.3 Nature of the distribution ofTES Scores 11A.0 Factor Analysis of the TES 11.5.0 Formulation of sub-summated scales 11.6.0 Analysis ofTES in relation to selected variables 11.7.1 Sex and Teacher Encouragement 11.7.2 Medium ofInstruction and Teacher Encouragement 11.7.3 Type of school and Teacher encouragement 11.7 A Students' level of creative thinking and TES
Section II 11.8.0 Analysis of School Activities 11.8.1 Expressive and Explorative Activities 11.8.2 Exhibiting Art and related activities. 11.8.3 Handicraft and related activities 11.8A Outings and related activities 11.8.5 Competitive and Voluntary activities 11.8.6 Decorative and Artistic Activities
8
164 166 167 168 170 171 172-208 172 172 173
173
174 177 177 178 178 180 182 183 184 187 187 190 190 193 194 195
196 198 198 200 201 203 205 207 209-238 209 209 210 210 212 214 214 215 216 217 218
220 221 224 225 226 228 229

Section - TIl 11.9.0 The Exploratory Model of the correlates of creative thinking (CT) 11.9.1 Multiple Regression Analysis: 11.9.2.0 Path Analysis 11.9.2.1 Structural Equations 11. 10 Summary
Chapter XII Summary, Conclusions, Implications and Suggestions 12.1 A brief summary of the study 12.2.0 Findings, conclusions and discussion of the results of the study 12.2.1 Towards a model of creative thinking 12.2.2 Teachers views and attitudes towards creative thinking 12.2.3 Students' performance in creative thinking and its relations with selected variables 12.2.4 Students' perceptions of their teachers' classroom behaviour as measured by TES 12.2.5 .Schoo1 activities 12.3.0 Recommendations 12.4.0 Limitations and suggestions for further research:
List of Tables
231 231 234 235 238
9
239-265 239 242 242 242 249 257 258 262 264
Pages
Table 5.1 : The most favoured characteristics by various cultural groups in different studies 83 Table 5.2 : The least favoured characteristics by various cultural groups in different studies 84 Table - 7.1 The emolment in the pilot study School for Year 1996-97 104 Table 7.2: The distribution of teachers working at the pilot study school 104 Table 7.3: The subject-wise distribution of teachers who participated in the pilot study 104 Tab1e-7.4: The distribution of teachers by sex, age, experience, academic
and professional qualifications 105 Table-7.5: Literacy, economic and occupational status of the parents
( frequencies with percentages) 106 Table-7.6: Calculation of Chi-square (X2) values for TES items 108 Table-8.1 Frequency distribution of sample by medium of instruction
and type of school (sex wise) 121 Table-8.2 Frequency distribution of sample by gender and age 121 Table-8.3 The overall composition of the sample characteristics-sex, age,
experience, qualifications and taught subjects 124 Table-8.4 The overall composition of the interview sample characteristics- sex, age,
experience, qualifications and teachers' labelling. 125 Table-8.5 Test-retest reliability offactor scores and the total creativity scores(N=75) 131 Table-8.6 Validity coefficients for factor scores and the total creativity scores against teacher ratings 131 Table-8.7 Correlation coefficients of test items with the activity total scores and grand total 132 Table-8.8 Correlation coefficients between test activities and total scores of verbal and non verbal creativity133 Table-8.9: Correlation coefficient among various factors of verbal and non-verbal creativity scores of the
sample(N=373) and medium wise. 134 Table-8.10: Split-half reliability ofTES(N=373) 135 Table-8.lI : Correlation coefficients between TES items and total score on TES 136 Table-9.1: Inclusion of creative thinking in teacher training 141 Table-9.2: Sources of acquired knowledge about the development of creative thinking 141 Table-9.3: The special training programmes / seminars / refresher courses attended by the teachers (N=40) 142 Table-9.4: The relevance of the course content to the attended by the teachers (N=40) 142 Table-9.5: Support needed for teachers to improve their knowledge about CT+ 144 Table-9.6: The Teachers' definition of creative thinking 145 Text Box :9.2.3.1. Definition of Creative thinking -Teachers' Views 146 Text Box: 9.2.6.l.Intelligence and creative thinking-Teachers' views 149 Table-9.7: Teachers' opinion concerning the subjects which help in the promotion of creativity 151 Table-9.8: Criteria for identifying creative children in the classroom 153 Text Box No. 9.2.9.1 Importance of creative thinking in school education 155 Table-9.9: Distribution of teachers' responses on the importance of creativity and reasons for developing
creativity among the students 156 Table-9.10: Methods of encouraging creativity in the classroom 158 Table-9.11: Teachers' agreement with factors' assist to creativity development among the students 161 Table-9.12: Obstacles to creativity development at school level 163

10
Table-9.13: Obstacles to creativity development at student level 164 Table-9.14: Obstacles to creativity development at Teacher level 165 Table-9.15: Mean scores, SDs, and F-ratio (or t-values) of creativity encouragement 166
Scores of the teachers in relation to sex, age, experience, and qualification Table-9.16: Teachers' attitude towards the present curriculum in Andhra Pradesh (India) 169 Table-9 .17: Mean scores and SDs of the teachers' opinion on curriculum emphasis in Andhra Pradesh 169 Table-9 .18: The distribution of teachers' responses on promotion of creativity (N=88) 170 Table-9.19: Suggestions made by the teachers for the development of creativity among the students 170 Table-1 0.1 :The means and standard deviations of raw scores for verbal and non-verbal creativity
Components 172 Table-10.2: Frequency distribution and descriptive statistics of verbal creative thinking
test (standardised scores) 173 Table-10.3: Frequency distribution and descriptive statistics of non-verbal creative thinking
test (standardised scores) 174 Table-10.4: Frequency distribution and descriptive statistics of composite creativity
scores ( standardised scores) 177 Table 10.5: Inter-correlations between students' personal background variables and Creative Thinking 178 Table-10.6: Mean scores, SDs, SEM and t-values for creative thinking of subjects (Ss) in relation to 179
their sex Table-10.7: Mean scores, SDs, SEM and F-values for creative thinking of subjects (Ss) in relation to age. 181 Table-10.8: Inter-correlations between students' parental background variables and creative thinking 182 Table-10.9: Mean scores, SDs, SEM and F-values for creative thinking of subjects (Ss) in relation to
the father education levels. 185 Table-1 0.1 0: Mean scores, SDs, SEM and F-values for creative thinking of subjects (Ss)
in relation to the Mother education levels. 186 Table-1 0.11: Mean scores, SDs, SEM and F-values for creative thinking of subjects (Ss)
in relation to the fathers' occupationallevels.(N=373) 188 Table-1 0.12: Mean scores, SDs, SEM and F-values for creative thinking of subjects (Ss)
in relation to the mothers' occupational levels. 189 Table-10.13: Mean scores, SDs, SEMand F-values for creative thinking of subjects (Ss)
in relation to the father s' income levels. 191 Table-1O.14: Mean scores, SDs, SEM and F-values for creative thinking of subjects (Ss)
in relation to the mothers' income levels. 192 Table 10.15: Inter-correlations between organisational variables and creative thinking (N=373) 194 Table-10.16: Mean scores, SDs, SEM and t-values for creative thinking of subjects (Ss)
in relation to their medium of instruction 194 Table-10.17: Mean scores, SDs, SEMand t-values for creative thinking of subjects (Ss)
in relation to the type of the school. 196 Table-1 0.18: Mean scores, SDs, SEM and F-values of Creative Thinking of subjects (Ss)
in relation to the type of the school 197 Table 10-19: Academic subjects liked by students, with their level of creative thinking 198 Table -10.20: Academic subjects disliked by students, with their level of creative thinking 200 Table-1O.21: Students Occupational choices by their level of creative thinking 202 Table- 10.22: Students' good experiences in the classroom in relation to their level of creative thinking 204 Table- 10.23: Students' bad experiences in the classroom in relation to their level of creative thinking 206 Table-11.1: The distribution of students by school and taught subjects. 209 Table-11.2: The Itemwise responses for the Teacher Encouragement scale (TES). 210 Table-11.3: Frequency distribution and descriptive statistics of TES 211 Table-11.4 : Principal Component Analysis (PCA) and Varirnax Rotation of TES 212 Table-11.5 The summated sub-scales ofTES and its basic statistics 214 Table-11.6: Correlations of selected variables with TES and its sub-scales 215 Table 11.7: Mean Scores, SDs, SEm and t-values of TES of subjects (SS) in relation to their Sex. 216 Table 11.8: Mean Scores, SDs, SEm and t-values ofTES of subjects (SS) in relation to their Medium of
instruction 217 Table -11.9: Mean Scores, SDs, SEm and F-ratio ofTES of subjects (SS) in relation to the type
of the school (sex wise) 218 Table -11.10: Mean scores, SDs, SEm and F-ratio ofTES of subjects (SS) in relation to the level of students'
creativity 219 Table: 11.11 : Expression and Exploration Activities organised in the schools 223

11
Table: 11.12: Exhibiting Art and related activities organised in the schools 225 Table: 11.13 Handicraft and related activities organised in the schools 226 Table 11.14 Outing and trips related activities organised in the schools 227 Table: 11.15 Competitive and Voluntary activities organised in the schools 228 Table: 11.16 Decorative and artistic activities organised in the schools 230 Table 11.17: Stepwise multiple regression analysis of combined variables (background, organisational 232
and cognitive and motivational variables) with creative thinking as the dependent variable (XI4)
Table 11.18 Multiple Regression with school activities as the dependent variables 233
Table 11.19 Multiple Regression with Teacher Encouragement (TES) as the dependent variable 233 Table 11.20: Summary of direct and indirect effect of explanatory variables on creative thinking (CT) 237 List of figures Figure 2.1 4Ps (Person, Process, Product and Press) 29 Figure 6.1 Flow chart of translation process-Phase one 102 Figure 6.2 Flow chart of translation process-Phase two 102 Figure 8.1. The scheme of the present research 116 Figure 8.2: Distribution of sample by Medium of Instruction and Type of School 122 Figure 8.3: Distribution of the sample by gender and age 122 Figure 804: Frequency distribution of the teachers by Sex, Age and Experience 123 Figure 8.5: Frequency distribution of the teachers by qualification and taught subjects 123 Fig-1O.1: Original and smoothed frequency polygon of verbal creativity, based on data given in table-1 0.2 175 Fig.-10.2 Original and smoothed frequency polygon of non-verbal creativity, 175
based on data given in table-1O.3 Fig.-10.3 Original and smoothed frequency polygon of composite creativity based on data
given in table-lOA 176 Fig-ILl: Original and Smoothed frequency polygon based on data given in tab1e-11.3 211 Fig.11.2 Path Coefficients 234 Fig. NO. 11.3: A Model for the correlates of creative thinking 236 Pictures Picture No. l(a) .. Carrying books is no problem ... We are studying in Indian schools 368 Picture No.1 (b). We have found a place for these big heavy bags ... But where is the place for us to write? 368 Picture No. 2(a) We don't mind how congested is this classroom ..... we are in the government school 369 Picture No. 2(b) How unlucky we are! we have no benches to seat and no desks to write 369 Picture No. 2(c) How unlucky we are! we have no benches to sit on and no desks to write on. 370 Picture No. 3(a) How lucky we are! we have at least benches to sit on and desks to write on. 370 Picture No. 3(b) How lucky we are! we have at least benches to sit on and desks to write on. 371 Picture No 4( a) No dining room ........... this is the Verandah of our school 371 Picture No 4(b) No dining room .......... this is the Verandah of our school 372 Picture No.5(a) This is our traditional classroom ... We are busy taking notes 372 Picture No.5(b) This is our traditional classroom ... We are listening seriously to the lesson 373 Picture No.5(c) This our traditional classroom ... We are listening seriously to the lesson 373
References 266-288
Appendices 289-373
12
Chapter I
Introduction
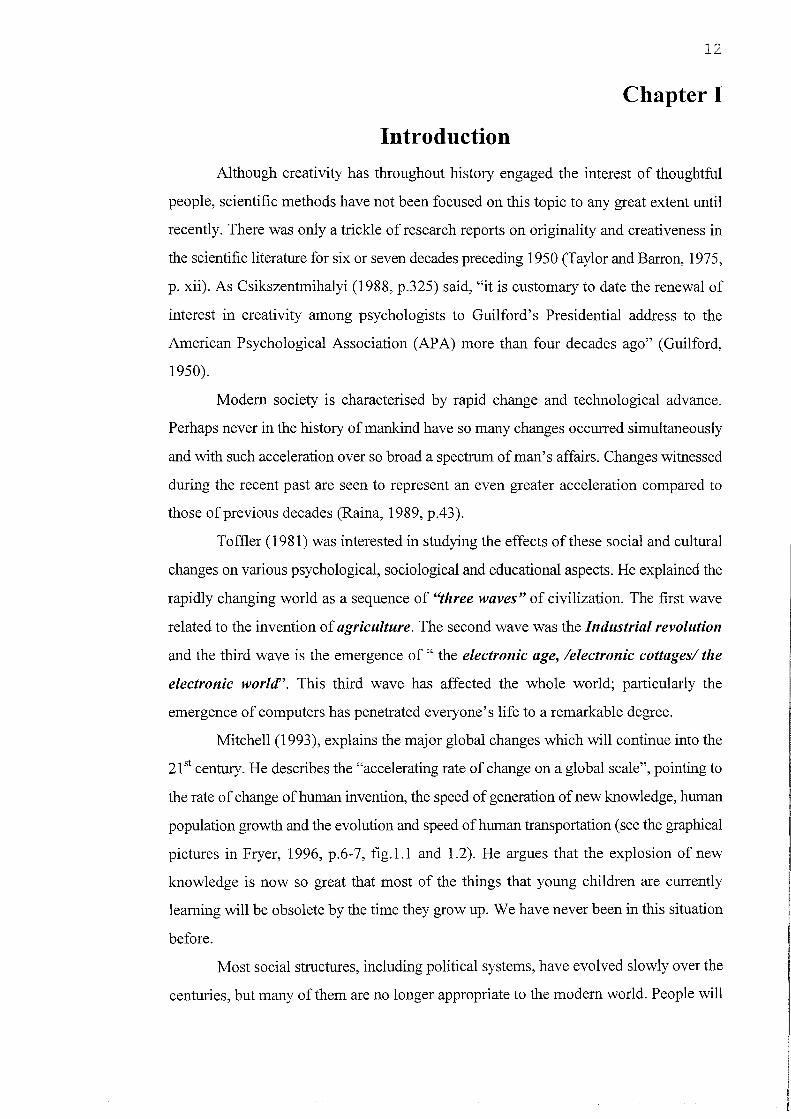
Although creativity has throughout history engaged the interest of thoughtful
people, scientific methods have not been focused on this topic to any great extent until
recently. There was only a trickle of research reports on originality and creativeness in
the scientific literature for six or seven decades preceding 1950 (Taylor and Barron, 1975,
p. xii). As Csikszentmihalyi (1988, p.325) said, "it is customary to date the renewal of
interest in creativity among psychologists to Guilford's Presidential address to the
American Psychological Association (APA) more than four decades ago" (Guilford,
1950).
Modem society is characterised by rapid change and technological advance.
Perhaps never in the history of mankind have so many changes occurred simultaneously
and with such acceleration over so broad a spectrum of man's affairs. Changes witnessed
during the recent past are seen to represent an even greater acceleration compared to
those of previous decades (Raina, 1989, p.43).
Toffler (1981) was interested in studying the effects ofthese social and cultural
changes on various psychological, sociological and educational aspects. He explained the
rapidly changing world as a sequence of "three waves" of civilization. The first wave
related to the invention of agriculture. The second wave was the Industrial revolution
and the third wave is the emergence of" the electronic age, /electronic cottages/ the
electronic world". This third wave has affected the whole world; particularly the
emergence of computers has penetrated everyone's life to a remarkable degree.
Mitchell (1993), explains the major global changes which will continue into the
21 st century. He describes the "accelerating rate of change on a global scale", pointing to
the rate of change of human invention, the speed of generation of new knowledge, human
population growth and the evolution and speed of human transportation (see the graphical
pictures in Fryer, 1996, p.6-7, fig. 1. 1 and 1.2). He argues that the explosion of new
knowledge is now so great that most of the things that young children are currently
learning will be obsolete by the time they grow up. We have never been in this situation
before.
Most social structures, including political systems, have evolved slowly over the
centuries, but many of them are no longer appropriate to the modem world. People will

13
need to be both flexible and resourceful if they are to adjust to the "rapid
multidimensional transformation of social, political, economic, demographic and cultural
aspects of life" and increasing globalization CAyman, 1993 cited in Fryer, 1996, p.5).
Creative people will be a valuable resource in the rapid process of change, and
especially of technological change, which has gripped our world in recent years. The
systems which shape even day-to- day life are becoming so complex that the presence of
highly able thinkers, capable of dealing comfortably both with modem technology and
also with breathtakingly complex interactions between natural and manmade systems, is
rapidly becoming a prerequisite for the maintenance of a way of life which is fit for
human beings C McLeod and Cropley, 1989, p.12)
The world is changing so fast that past "truths" often mislead instead of help. No
longer is it easy to apply past truths to the problems of the present and the future. Today's
world "calls for new approaches to experience, both in acquiring it and in using what we
already have" (Stevens, 1963,p. 56). As Botkin, Elmandja, & Malitza (1979) have said,
"humankind must learn to make new and useful adaptations to the emerging challenges
in our global environment". They emphasise that "innovative learning is a necessary
means of preparing individuals and societies to act in concert in new situations, especially
those that have been, and continue to be, created by humanity itself' (p.12).
It is obviously impossible to prepare today's school children to cope with all the
demands they will encounter in their lives (Torrance, 1965, p.12). In this view of the
future, traditional responses to the demand for education that are essentially quantitative
and knowledge-based are no longer appropriate. It is not enough to supply each child
early in life with a store of knowledge to be drawn on from then on. Each individual must
be equipped to seize learning opportunities throughout life, both to broaden her or his
knowledge, skills and attitudes, and to adapt to a changing, complex and inter-dependent
world (UNESCO, 1996, p.85).
If it is to succeed in its tasks, education must be organised around four
fundamental types of learning which, throughout a person's life, will be the pillars of
knowledge: learning to know, that is acquiring the instruments of understanding; learning
to do, so as to be able to act creatively on one's environment; learning to live together,
so as to participate and co-operate with other people in all human activities; and learning
to be, an essential progression which proceeds from the previous three. Of course, these
four paths of knowledge all form a whole, because there are many points of contact,

14
intersection and exchange among them (p.86).
Fryer (1996, p.5) suggests that "to cope with the demands of the future, people
will have to be quick - thinking, flexible and imaginative. They will need to be
competent in producing effective solutions to unfamiliar problems, in unclear situations.
If creativity development were to have the same status in education as it does in the
corporate setting, then children would be in a much better position to cope with these
kinds of challenges".
As Toffler (1974) argued, "the future requires flexibility and the power to adapt
quickly, rather than an ability to respond to behavioural problems in terms of carefully
transmitted, rigid conduct codes" (p.193). Those responsible for future policy will need
to be skilled in making difficult decisions both wisely and quickly. This may seem far
removed from the everyday life of the classroom, but people who can make such
decisions may soon be in short supply, unless we educate for the future now (Fryer, 1996,
p.5). Thus, the role of the school and teachers is to enable students to function at their
maximum capacity and independently.
Moreover, in the light ofthe 'knowledge explosion' which is taking place, and the
consequent need for the ever wider use of human scientific and technological ingenuity,
it has become essential that each nation makes the best possible use of all its intellectual
resources if it is even to maintain its position in the modem world. It may well be that the
nation which emerges from the next few decades in the most desirable position will be
the one which does this best (Cropley, 1967,p.19). We are in the middle of a 'brains race'
which has made the process of education a matter of increasing importance to
communities. To compete with other countries, the state will need to encourage the
individual to think creatively about as the yet unforeseen problems of society and the
world, in the light of facts and concepts yet to be discovered (Crutchfield, 1967, p.198).
The psychological investigation of creativity may help shed light on how we can
find new solutions to old or continuing problems. These call for a more creative type of
thinking (Isaksen, Murdock and et aI, 1993). Many of these challenges are of the utmost
importance because they deal with our survival. Not only is creativity important for our
survival as a human race, it can also help us better understand how the individual can
reach higher levels of productivity and satisfaction.
By the middle of this century, the importance of creativity in education was in
some places beginning to be realised. This was due to the ever-increasing influence of

15
developing industries and technological advancements. This influence indicated the
necessity of preparing individuals who could perform tasks of high quality and could
think for themselves in a constructive manner, and take the right decisions when a
number of alternatives faced them. It was suggested that the minds of schoolchildren
should be developed to cope with these complexities. Creativity in children should be
encouraged in order that they may become successful members of society (Chaube and
Chaube, 1994, p.383).
As we enter the twenty- first century, children and teachers must be able to
progress and succeed in their rapidly changing learning or working environment. They
need to learn new techniques, skills and knowledge for adapting to the changing
environment throughout their life. Otherwise frustration will develop when they are
unable to adjust to the new conditions. Hence, greater attention has to be paid to the
quality of education and to preparation for life in a rapidly changing and often technology
- dominated world. (UNESCO, 1996, p.126). 'The world is changing in all spheres:
scientific and technological, political, economic, social and cultural. So educating the
young to meet these challenges has become a priority objective for every society' (World
Education Report '98 UNESCO, 1998, p.16).
1.1 Creativity in Education
Basic education is an indispensable 'passport to life' that will enable people to
choose what they do, to share in building the collective future and to continue to learn
(UNESCO, 1996, p.118). 'The time to learn is now the whole lifetime, not just during the
period of childhood and youth' (UNECSO, 1998, p.16). As Silberman (1973) said
"education should prepare people not just to earn a living but to live a life- a creative,
humane, and sensitive life. This means that the schools must provide a liberal,
humanizing education" (p.114).
Education is not a preparation for later life; it is an aspect of life itself (p.115). If
one of the long-term purposes of education is to prepare children to take their places in
our fast-changing society, they will need open, flexible minds and the ability to combine
information in new ways (Iverson, 1982, p.694). As Chadha (1990) said, "we will
certainly need a different kind of thinking process to be able to live in the world which
changes at a much faster pace and with more greater complexity" (p.85). "The climate
of future-focused schooling is especially important because of the need to motivate
children to make a sustained effort both to attain a better world of tomorrow and to create

16
a realistic place for themselves in such a world" (Toffler, 1974, p.192).
If education is about educating people for the workplace, then creative skills and
creative thinkers are much needed (Beetlestone, 1998, p.143). In many countries in the
1990s there is a growing sense that education is the key to the future, and that the
challenges and jobs of tomorrow will require an education of better quality than that
which most students receive today (World Education Report, 1998, p.48). In India the
Review Committee ofNPE'86 (1990,3.6.0: p.21) also emphasised that
"Education should pave the way for enhanced awareness, greater openness, and ability and courage to question, and toughness to search for solutions. In other words, initial education is to be afundamental experience, a starter for enabling the individual to enter effectively and creatively into the many tasks and challenges of life. It is not a toolbox that slhe would carry through life, in the belief that all eventualities can be dealt with, with the aid of the tools in the box! That is why certificate or degree education can be so misleading (as it often has been) about the real role and purpose of education".
But in present day educational systems, emphasis has been put on the learning of
factual information. To a great extent, passing or failing in an examination depends upon
the mastery or memorisation of bits of information that are already known to the
instructor (Lowenfeld and Brittain, 1982, p.3; Bowes, 1986, pp.116-118; Chadha, 1990,
pp.84-85).
Freeman (1985, p.13) rightly points out:
"Schools which have a name for being 'the best' are often those which have the most examination passes, and which have chosen to emphasize what of their teaching the tests assess. The effect on education of this routine and these predetermined goals are often to diminish the sparkle and excitement of discovery in learning, which is so vital to creative endeavour. However, gifted children may well do either more than the teacher expects, or something quite different, and thus put paid to the best laid educational plans ".
According to Alencar, (1993) "Education which emphasises reproduction of
existing knowledge is a strongly negative influence on creative thinking" (p.93). Bloom
(1958) pessimistically says, "There is some reason to believe that the educational system
as it prevails today can reduce originality and creativity. This negative effect on creativity
is most marked when examinations, instructional materials and instructional processes
all emphasise learning by rote and when goals of teachers, parents and children are
primarily centred on getting over one examination hurdle after another".
1.2.0 Why creative thinking is essential?
Creative expression is essential for leading a happy life. Since the dawn of
civilization, man has experienced the greatest pleasure and bliss by adopting creative

17
values in his life. In addition the future of our civilization depends upon the quality of the
creative imagination of the next generation (Torrance, 1962b, p.33). According to
Torrance in teaching all students should be provided with opportunities for creative
expression, so that they are turned into contented, balanced and happy citizens. Torrance
(1965, p.1 0) outlines that "creative thinking is indeed a powerful force. It has given us
the alphabet, printing, radio, television, computers, spacecraft, great art, architecture,
music, and literature. It has given us our great advances in scientific discovery and
medicine. It has also given us war, plunder, crime, and the smashed atom".
Creativity is essentially a human phenomenon. It is a process in man which helps
him to achieve dignity and meaning in life. As Bruner (1962) argues, the 'creative act
may bring man to a new dignity' (p.2), Toynbee (1964) considers creativity as man's
greatest asset. He points out that "to give a fair chance to potential creativity is a matter
of life and death for any society. The creative power planted in a minority of mankind has
to do duty for all the marvellous physical assets that are built into every specimen of
Man's non-human, fellow creatures"(pA). It is essential that "the nation should become
concerned about all of its potential human resources, especially aware of the waste and
loss of such resources in each person" (Taylor, 1978, p.39). It has been observed by
manpower specialists that countries may not be able to sustain economic growth unless
all the reserves of the talent in the population are actively sought out and developed
through educational channels (Raina, 1985).
Creativity enormously affects the scientific progress and commercial life of the
nations. Taylor (1964, p.2) realised that "creative acts affect enormously not only
scientific progress, but society in general. Those nations who learn best how to identify,
develop, and encourage the creative potential in their people may find themselves in very
advantageous positions". Floistad (J 993,p.206) argues that the overall purpose of
creativity is to improve the quality of life in the society, local or global, in which it
operates. As Mcleod and Cropley (1989, p.12) said, if society fails to make the most of
this one human asset, or if, worse still, it perversely sets itself to stifle it, man is throwing
away his birthright of being lord of creation and is condemning himself to be, instead, the
least effective species on the face ofthis planet" (p.4). If society is not only to survive but
to continue to enjoy a high quality of life, vast resources of giftedness need to be
mobilized in the arts, in Social Sciences, in Philosophy, etc.
18
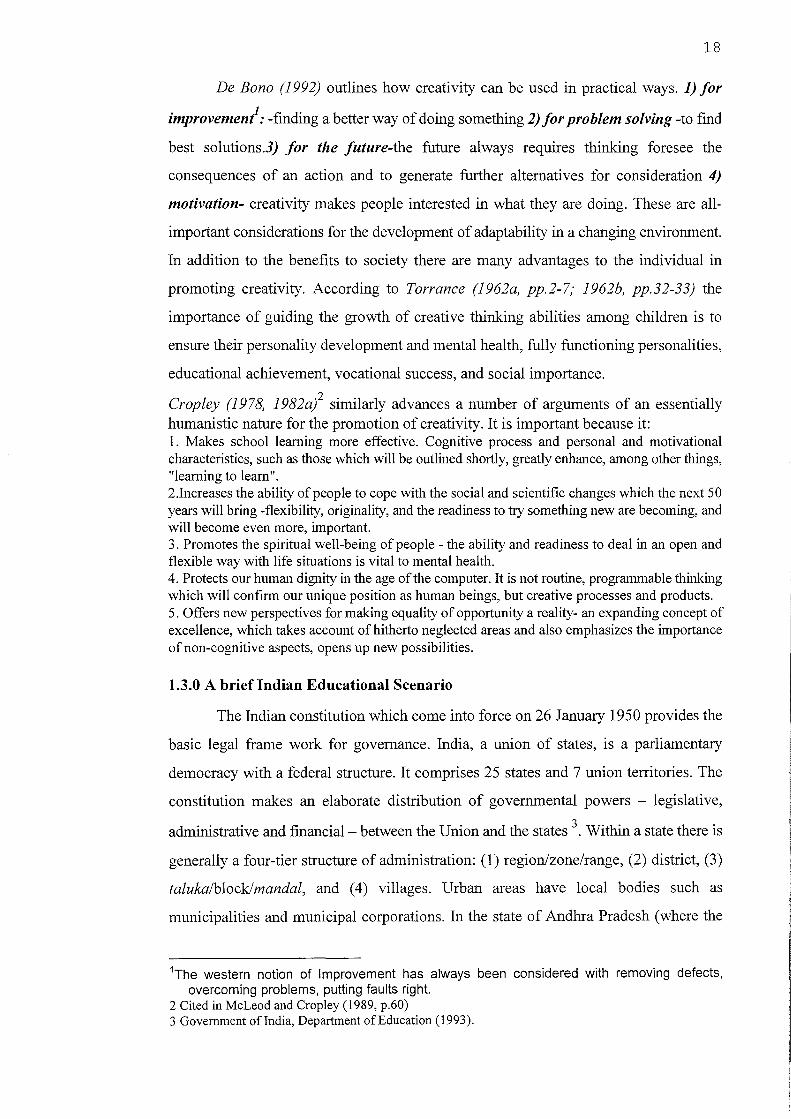
De Bono (1992) outlines how creativity can be used in practical ways. 1) for
improvemenf: -finding a better way of doing something 2) for problem solving -to find
best solutions.3) for the future-the future always requires thinking foresee the
consequences of an action and to generate further alternatives for consideration 4)
motivation- creativity makes people interested in what they are doing. These are all
important considerations for the development of adaptability in a changing environment.
In addition to the benefits to society there are many advantages to the individual in
promoting creativity. According to Torrance (1962a, pp.2-7; 1962b, pp.32-33) the
importance of guiding the growth of creative thinking abilities among children is to
ensure their personality development and mental health, fully functioning personalities,
educational achievement, vocational success, and social importance.
Cropley (1978, 1982a/ similarly advances a number of arguments of an essentially humanistic nature for the promotion of creativity. It is important because it: 1. Makes school learning more effective. Cognitive process and personal and motivational characteristics, such as those which will be outlined shortly, greatly enhance, among other things, "learning to learn". 2.Increases the ability of people to cope with the social and scientific changes which the next 50 years will bring -flexibility, originality, and the readiness to try something new are becoming, and will become even more, important. 3. Promotes the spiritual well-being of people - the ability and readiness to deal in an open and flexible way with life situations is vital to mental health. 4. Protects our human dignity in the age of the computer. It is not routine, programmable thinking which will confirm our unique position as human beings, but creative processes and products. 5. Offers new perspectives for making equality of opportunity a reality- an expanding concept of excellence, which takes account of hitherto neglected areas and also emphasizes the importance of non-cognitive aspects, opens up new possibilities.
1.3.0 A brief Indian Educational Scenario
The Indian constitution which come into force on 26 January 1950 provides the
basic legal frame work for governance. India, a union of states, is a parliamentary
democracy with a federal structure. It comprises 25 states and 7 union territories. The
constitution makes an elaborate distribution of governmental powers - legislative,
administrative and financial- between the Union and the states 3. Within a state there is
generally a four-tier structure of administration: (1) region/zone/range, (2) district, (3)
talukalblocklmandal, and (4) villages. Urban areas have local bodies such as
municipalities and municipal corporations. In the state of Andhra Pradesh (where the
1The western notion of Improvement has always been considered with removing defects, overcoming problems, putting faults right.
2 Cited in McLeod and Cropley (1989, p.60) 3 Government ofIndia, Department of Education (1993).

19
study was carried out), the system of Panchayatiraj operates, generally with a three-tier
structure oflocal self-government at the village (Grampanchayati), MandaI (or Block)
(MandaI Praja Parishad) and district (Zilla Praja Parishad) levels.
India is the second most populated country in the world, with 846.30 million
people, of whom males and females were 439.23 and 407.07 millions respectively (1991
census). Any understanding of Indian society has to begin with an appraisal of its
diversity. The diversity is a product both of historical as well as geographical factors.
India has been a meeting ground of races and cultures from very ancient times. The
Indian population comprises people belonging to variety of races, speaking a multitude
of tongues, and professing virtually all the major world religions. This diversity reminds
one of the extraordinary complexity and uniqueness of Indian society 4.
The Directive Principle contained in Article 45 of the constitution enjoins that
"the state shall endeavour to provide, within a period of ten years from the
commencement of this constitution (1950), for free and compulsory education for all
children until they complete the age of fourteen years." Article 350-A lays down that"
it shall be the endeavour of every state and of every local authority within the state to
provide adequate facilities for instruction in the mother-tongue at the primary stage of
education for children belonging to linguistic minority groups".
The objective of incorporating education in the Concurrent List was to facilitate
the evolution of all-India policies in the field of education. The union government has set
up a number of resource institutions at the national level (eg. NCERT, NIEPA, CIlL,
CIEFL) for assisting and advising the union and the state governments, formulation and
implementing the policies and programmes in the field of education.
1.3.1 Organisation and structure of the education system in India and Andhra Pradesh
Decisions regarding the organisation and structure of education are largely the
concern of the states. Each state independently determines the educational structures to
be adopted. As envisaged by NPE 1968, a broadly uniform educational pattern (10+2+3)
has emerged all over the country, comprising ten years of basic school education followed
by two years of higher secondary (intermediate) education and three years of education
for obtaining the first university degree.
A child is normally admitted to class I at the age of six and is expected to
4 Raina (1993, p 305).

20
complete class V at the age of + 11 years, class VIII at the age of + 14 years, class X at the
age of + 16 years and class XII (Intermediate) at the age of + 18 years. The educational
structure in India with levels and duration of each level and the normal age of entry to
each level is given in the Appendix-AI.
The National Policy on Education (NPE) 1986, is a landmark in Indian education.
Based on an in-depth review of the Indian educational system and evolved through a
consensual process, it provides a comprehensive framework to guide the development of
education. The two major schemes of the Department of Education (India), Operation
Black Board (OBB-1986) and District Institute of Education and Training (DIETs-1988)
have dramatically changed the school education scenario. The project, popular in India
and abroad, called the' Andhra Pradesh Primary Education Project (APPEP), was
implemented in two phases with the financial assistance ofODA of UK since 1983 (See
Appendix-AI). A subsequent project called the District Primary Education Programme
(DPEP) has been launched and similar participatory structures have been setup at district
level.
1.4.0 Need for the present Investigation:
In view of the importance of creativity in all walks of life, including educational
settings, there is a need to explore the field scientifically and with greater rigour. Despite
the increase in recent research, much is not known and still requires investigation.
Craft and Dugal (1997) have argued that "the end of the twentieth century is
witnessing a massive shift in attitudes to and the importance of, creativity and
imagination in our everyday lives and domains of knowledge. We need transformation,
at both a personal and a system level. The fragmentary nature of our post-modem
existence means that in many ways the mores and shared traditions are mixed and
confused. Multiple possibilities exist for us in adopting, for example, spiritual, social,
economic and technological identities and actions. In many areas we have no models to
follow and have to work out what the possibilities are as we go along"(p.I04).
The issue of the development of creativity among school children is challenging
to teachers, schools, and educational administrators as well as for researchers in the field
of education and psychology. Often in many countries of the world, teachers have been
criticised and schools blamed for not providing the necessary environment for nurturing
creativity among students. The emphasis of the education system is generally more
focused on examination results rather than the actual process of learning (Lownfeld and

21
Brittain, 1982; Freeman, 1985; Bowes 1986; Raina, 1989, Chadha, 1990; Alencar, 1993).
As far as India is concerned many educational researchers, Education
Commissions and Committees have criticised educational practices which have typically
failed to foster creativity among students and ignored the development of imagination and
independent thinking. As long ago as 1952-53, the Secondary Education Commission
(1952-53) in India commented
"this education was too bookish and mechanical, stereotyped and rigidly uniform and did not cater to the different aptitudes of pupil or to pupils of different aptitudes. Nor did it develop those basic qualities of discipline, co-operation and leadership which were calculated to make them function as useful citizens. The stress of examinations, the overcrowded syllabus, the methods of teaching and the lack of proper material amenities tended to make education a burden rather than ajoyous experience to the youthful mind." (P.20)
Later in the 1960s, the Indian Education Commission (1964-66: 9.5: P 240)
reported:
"A dearth of component and trained manpower is now felt in nearly every branch of national life, and is probably one of the biggest bottlenecks to progress". Further, the Commission recommended that 'sustained and energetic' research is needed in recognition of talent and its development. Because "talent is the most valuable asset a country can have", the search for talent must be a continuous process and has to be taken up at all stages, particularly at the secondary stage which is the most crucial.
A document "Challenge of education -a policy perspective" (The Government of
India, 1985, 1.29,pp 11-12) stated:
"It has been noticed that the vast majority of students are not exposed to challenges which would develop their potential for creativity and innovation because the whole system of education is characterised by class work and examinations which emphasize rote learning and repetitive exercises. Undoubtedly, this will require the overhaul of pedagogic methodology as well as the curricula and textual materials. These, however, will not be enough. Something will have to be done to change the orientation, work-ethic, knowledge and skills of teachers, who will have to function much more creatively in a learning rather than a teaching environment, in which they will have to struggle continuously with new ideas as well as new technologies" .
More recently, the Review Committee of NPE'86 (1990, p. v), expressed dissatisfaction with the present education system in India; it said,
"our formal system remains confined to the four walls of a school or college. It is tied down to textbooks and examinations. Even then the books are unreadable and the examinations totally unreliable. The courses of study are so framed that the students are not equipped with any productive skills. Whatever education they receive cuts them off from their natural and social environment. They become aliens to their own community. They lose faith in life itself p.
Addressing an International Conference at Delhi (India) in January, 1986 (cited
in Hussain, 1988), Dr. Raja Ramanna, Chairman of the Atomic Energy Commission, cast
doubt on the contribution of formal education to creative development in children. He
rightly posed the question: Are children being exposed to too much knowledge in the
rapid advancing world today at the cost of stunting their creativity? Education must not
only aim at intellectual development but also at creative expression.

22
Similar views were expressed by the vice-chancellor of Bombay University, an
eminent sociologist (Gore,1985 cited in Raina, 1993, p.309) while addressing the 60th
Annual Meeting of the Association of Indian universities. "It is my submission that for
the vast majority ofthe students and teachers involved in it, our education system does
not provide a creative experience". He further elaborates:
"Much of education at school and college level has tended to emphasize the printed word and has failed to provide for the interaction between the student and different aspects of his environment which would make those words meaningful. Children learn poetry and memorise the words without the imagery communicating itself to them. A boy studying even in a rural school will learn about the maj or crops of the state from his geography book, but will not relate the names of the crops to what he sees around him. For some reason the link between the printed word and one's own experience is not established so that there is neither a sense of discovery and affIrmation or questioning of what has been said in the book. Our education has tended to emphasize examinations rather than learning or teaching".
There seems to be a gap between intentions and practices. One of the stated
objectives of primary education in India, outlined by the National Council for Educational
Research and Training (NCERT, 1975), is that "the child should be able to express itself
freely in creative activities and should acquire habits of self learning". But the present
educational system and its unrealistic syllabi are so taxing to growing children that their
creative imagination is suppressed and blocked most of the time. The whole focus of
teaching learning practices is on examinations and grades, with added emphasis on
covering a large amount of the syllabus; teaching is mostly done to deliver rather than to
derive meaning (Raina, 1989, p.l04). A lot of emphasis is placed on convergent thinking
at the cost of divergent thinking. It is difficult to speculate on the use of textbooks or the
other teaching practices followed, but generally they do not appear to develop creativity.
A student has to carry a school bag, containing textbooks, exercise books, class
work and rough workbook (in the class), and home workbooks for the whole day (eight
periods\ In addition s/he has to carry a water bottle, lunch box and raincoat or umbrella.
Altogether a student carries about 8-10 kgs from home to school and back again daill.
"Their school bag is becoming bulkier every day and every three months it has to be
replaced by a bigger bag" (Srivastava, 1994, p.15). "This problem is often picturesquely
presented as creating hunchbacks out of the school children and as relieving the children
of the joys of learning - literally making the learning process burdensome" (Review
Committee ofNPE-1986 (1990, p.298).
5 Three languages (English, Hindi and Telugu), Mathematics, Sciences (Bio + Physical), Social Studies (Geography, History, Civics etc.,), General Knowledge, Moral studies or SUPW or Games. 6 See Appendix Picture N os.l-3

23
As the courses are extensive m their coverage, so the homework is
proportionately heavy. After coming home children are busy studying and cannot go to
the playgrounds. Even if they do play, their parents pressure them to come home and
study so that they can get higher marks in their frequent class tests. The student is
constantly under pressure and being forced to compete even after the school day (Raina,
1989, p.103). "Leisure has become a highly scarce commodity in the child's, especially
the urban child's, life. The child's innate nature and capacities have no opportunity to
find expression in a daily routine which permits no time to play, to enjoy simple
pleasures, and to explore the world" (NAC7, 1993). Many committees and commissions
have made numerous recommendations to reduce the academic burden on students. But
nothing has been implemented.
In addition, in India, research on creativity has mainly focussed on the
construction of tests of creativity and correlational studies of creativity with self-concept,
intelligence, personality and achievement motivation. There have been no in-depth
studies considering the effects of schooling on creativity, or ofteachers' perceptions of
creativity or how to promote it. A study ofteachers' views and attitudes in India towards
the promotion of creativity is important to provide evidence to assist in promoting
change. A number of comparative studies of government and private schools have
reported the performance of private schools students as higher than government school
students in creative thinking ability. However, none of them addressed the reasons why
there was such underachievement in government schools.
This research is designed to answer some of the questions arising in relation to
creativity in education. In India, particularly in government schools where the majority
of the urban and rural poor students study, facilities are poor compared to the private
schools. Private schools collect huge amounts of fees and donations from parents to help
them survive in the competitive world. Studying in a government school is not a curse,
pupils should not be victimised and they should be provided with all the facilities
necessary on a par with private schools.
Nowadays the 'privatisation' of schooling encourages and gives licence to the
privileged classes. This is not a problem only in India. It is becoming a world-wide issue
and challenge for governments or community schools every where. Poor people cannot
afford to go to private schools. Nevertheless they are entitled to quality education.
7 National Advisory Committee headed by Prof. Yaspal, 1993.
24
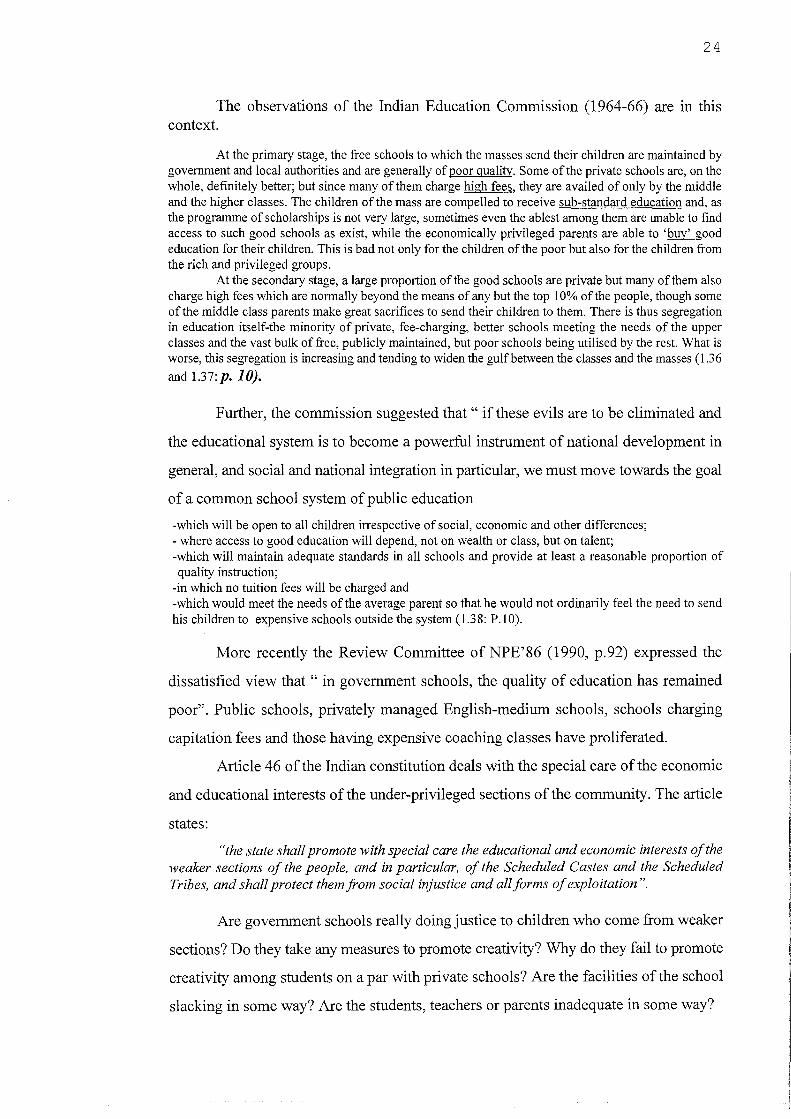
The observations of the Indian Education Commission (1964-66) are in this context.
At the primary stage, the free schools to which the masses send their children are maintained by government and local authorities and are generally of poor quality. Some ofthe private schools are, on the whole, defmitely better; but since many of them charge high fees, they are availed of only by the middle and the higher classes. The children of the mass are compelled to receive sub-standard education and, as the programme of scholarships is not very large, sometimes even the ablest among them are unable to find access to such good schools as exist, while the economically privileged parents are able to 'buy' good education for their children. This is bad not only for the children of the poor but also for the children from the rich and privileged groups.
At the secondary stage, a large proportion of the good schools are private but many of them also charge high fees which are normally beyond the means of any but the top 10% of the people, though some of the middle class parents make great sacrifices to send their children to them. There is thus segregation in education itself-the minority of private, fee-charging, better schools meeting the needs of the upper classes and the vast bulk of free, publicly maintained, but poor schools being utilised by the rest. What is worse, this segregation is increasing and tending to widen the gulf between the classes and the masses (l.36
and 1.37: p. 10).
Further, the commission suggested that" if these evils are to be eliminated and
the educational system is to become a powerful instrument of national development in
general, and social and national integration in particular, we must move towards the goal
of a common school system of public education
-which will be open to all children irrespective of social, economic and other differences; - where access to good education will depend, not on wealth or class, but on talent; -which will maintain adequate standards in all schools and provide at least a reasonable proportion of quality instruction;
-in which no tuition fees will be charged and -which would meet the needs of the average parent so that he would not ordinarily feel the need to send his children to expensive schools outside the system (1.38: P.lO).
More recently the Review Committee of NPE'86 (1990, p.92) expressed the
dissatisfied view that" in government schools, the quality of education has remained
poor". Public schools, privately managed English-medium schools, schools charging
capitation fees and those having expensive coaching classes have proliferated.
Article 46 of the Indian constitution deals with the special care of the economic
and educational interests of the under-privileged sections ofthe community. The article
states:
"the state shall promote with special care the educational and economic interests of the weaker sections of the people, and in particular, of the Scheduled Castes and the Scheduled Tribes, and shall protect them from social injustice and all forms of exploitation n.
Are government schools really doing justice to children who come from weaker
sections? Do they take any measures to promote creativity? Why do they fail to promote
creativity among students on a par with private schools? Are the facilities of the school
slacking in some way? Are the students, teachers or parents inadequate in some way?

25
The findings of this research will contribute to our understanding of creativity in
India. This research will help teachers particularly, but educational administrators and
planners, and parents as well. The findings may be useful in suggesting desirable changes
which may be brought about in the learning environment to create a conducive climate
in classrooms, develop positive attitudes among the teachers, and suggest remedies for
the present problems.
1.5.0 Aims of the present study
The present study aims to explore the conditions for facilitating creativity
prevailing in government schools. The main focus of this research firstly, is to explore
teachers' views of creativity and how it can be developed. This includes teachers'
knowledge and understanding of creative thinking, the support perceived by teachers to
be needed improve their knowledge and understanding, teachers' definitions of creative
thinking, the assessment criteria they adopt for identifying the creative child in the
classroom, the perceived importance of creativity in schools, the factors which they
believe assist and affect students creativity, their attitudes towards the encouragement of
creativity, and suggestions made by teachers for promoting creativity in government
schools.
Secondly, the aim is to study the relationship between creative thinking8 and the
students' personal background variables (sex, age) and parental background
(education, occupation and income). Thirdly, to explore the relation between measures
of creativity and cognitive and motivational variables including students' interests (as
shown by liking and disliking school subjects and career aspirations), perceptions (about
their teachers) and classroom experiences (good and bad). Fourthly, to study the
relationship between measures of creativity and organisational or school variables
including type of school (gender), medium of instruction, activities organised by schools
in order to promote creativity in children. Finally, the study enquires whether an
exploratory model can be developed to describe the relationships between students'
personal background variables, cognitive and motivational variables and organisational
or school variables.
8 0 Verbal test of creative thinking as measured by Prof. Baqer Mehdi 6 Non-verbal test of creative thinking as measured by Prof. Baqer Mehdi @ The total scores (standardised scores) of the above two tests

The thesis will explore these issues within the following structure.
1.6.0. A brief resume of the succeeding chapters.
26
Chapter II deals with conceptual understandings of the term 'creativity' in the
light of the various theories which have been propounded. The controversies concerning
the nature of the relationship between creativity and intelligence are explored.
Chapters III, IV and V review the literature in the field of creativity from which
is derived a conceptual framework. Chapter III deals with the identification of the creative
child, the measurement of creativity at school level, creativity-related variables e.g. age,
grade, sex, SES, type of school. Chapter IV discusses the role of the school, curricular
and extra-curricular activities, and the environment needed to promote creativity. Chapter
V throws light on the role of the teacher, how a teacher can encourage creativity and
teachers' views and attitudes towards creativity.
Chapter VI describes the design and development of the research instruments, and
the translation procedures. Chapter VII describes the pilot work carried out, item analysis,
scoring procedures, analysis of pilot data and the trends of the results.
In Chapter VIII the research design and methodology are described. This chapter
discusses the research framework, methodology, sample selection, procedures followed
in data collection, validity and reliability of the instruments and the statistical techniques
used for the data analysis.
Chapters IX to XI report the findings. Chapter IX reports the analysis of the
teachers' questionnaire and interviews. Chapter X reports the nature of the distribution
of creativity scores and analysis of students' creativity test scores. The analysis of data
is mainly based on the background, organisational and cognitive and motivational
variables. Chapter Xl deals with the analysis of the teachers' encouragement scale (TES),
the schools' activities data and the exploratory model of the correlates of creative
thinking.
Finally, Chapter XlI contains a brief summary of the findings, the relationship of
the findings with earlier literature, and their educational implications, and discusses the
limitations of the study and possibilities for further research.
27
Chapter-II
Creativity-A theoretical approaches
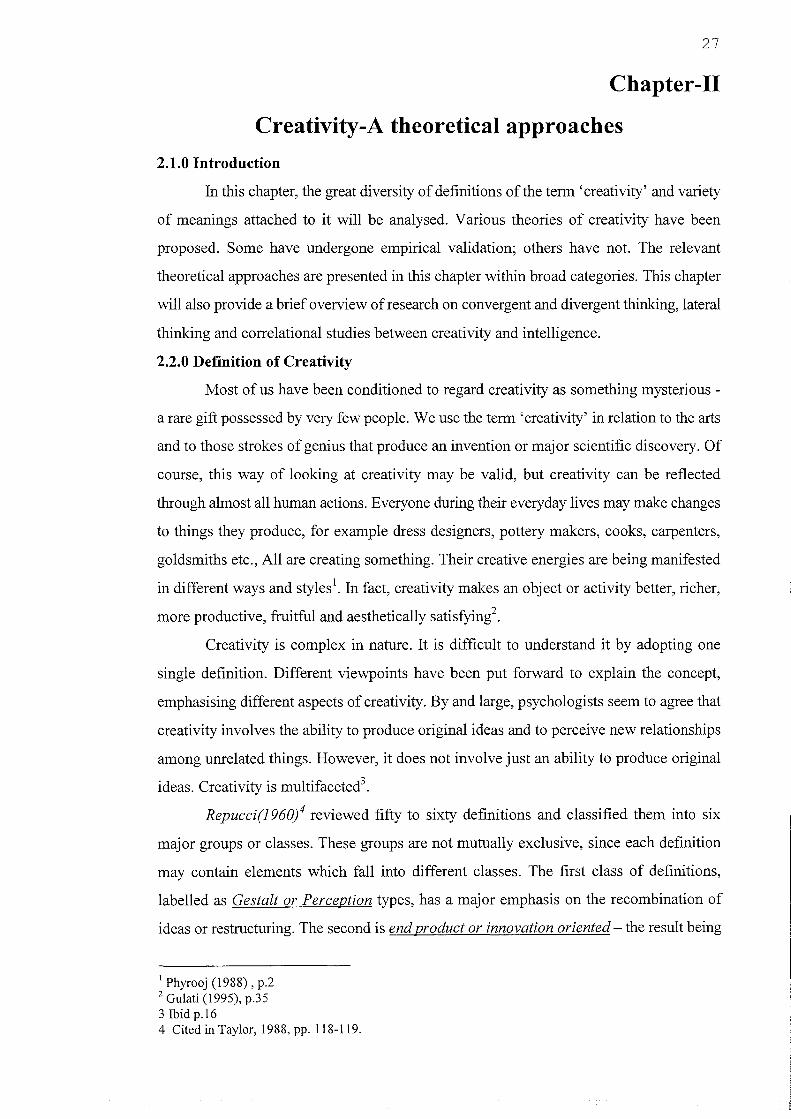
2.1.0 Introduction
In this chapter, the great diversity of definitions of the term 'creativity' and variety
of meanings attached to it will be analysed. Various theories of creativity have been
proposed. Some have undergone empirical validation; others have not. The relevant
theoretical approaches are presented in this chapter within broad categories. This chapter
will also provide a brief overview of research on convergent and divergent thinking, lateral
thinking and correlational studies between creativity and intelligence.
2.2.0 Definition of Creativity
Most of us have been conditioned to regard creativity as something mysterious -
a rare gift possessed by very few people. We use the term 'creativity' in relation to the arts
and to those strokes of genius that produce an invention or major scientific discovery. Of
course, this way of looking at creativity may be valid, but creativity can be reflected
through almost all human actions. Everyone during their everyday lives may make changes
to things they produce, for example dress designers, pottery makers, cooks, carpenters,
goldsmiths etc., All are creating something. Their creative energies are being manifested
in different ways and styles!. In fact, creativity makes an object or activity better, richer,
more productive, fruitful and aesthetically satisfying2.
Creativity is complex in nature. It is difficult to UfIderstand it by adopting one
single definition. Different viewpoints have been put forward to explain the concept,
emphasising different aspects of creativity. By and large, psychologists seem to agree that
creativity involves the ability to produce original ideas and to perceive new relationships
among unrelated things. However, it does not involve just an ability to produce original
ideas. Creativity is multifaceted3.
Repucci(1960l reviewed fifty to sixty definitions and classified them into six
major groups or classes. These groups are not mutually exclusive, since each definition
may contain elements which fall into different classes. The first class of definitions,
labelled as Gestalt or Perception types, has a major emphasis on the recombination of
ideas or restructuring. The second is end product or innovation oriented - the result being
1 Phyrooj (1988) , p.2 2 Gulati (1995), p.35 3Ibidp.16 4 Cited in Taylor, 1988, pp. 118-119.
28
something new, a product, an idea or an object. The third class is Aesthetic or Expressive
with the_emphasis upon self-expression; the fourth group of definitions is characterised as
Psychoanalytic or Dynamic. These define creativity in terms of certain interactional
strength ratios of the id, ego and superego. A fifth class, called Solution thinking,
emphasises the thinking process rather than the actual solution of the problem. The last
class is labelled Varia simply because there is no easy way of characterising these
definitions.
Creativity research, rather than having one universal definition, has used a variety
of definitions, theories and assessment approaches. Despite the apparent confusion and
contradictions resulting from the use of multiple definitions, some degree of agreement has
been reached5.
Welsch(1980l reviewed 22 definitions of creativity and proposed the following
definition
Creativity is the process of generating unique products by transformation of
existing products. These products, tangible and intangible, must be unique only to the
creator, and must meet the criteria of purpose and value established by the creator.
A widely known and accepted concept of creativity, called the 'Four P' model, is
based on the assumption that creativity can be defined as a holistic multi-dimensional
concept. Rhodes (1961, p.307) developed a framework for a unifying approach to
creativity; he collected 56 different definitions (40 of creativity and 16 of imagination) and
observed that these definitions overlapped and intertwined, forming four strands. These
strands were the creative person (clustered around personality-related traits and the mental
ability of the person to create something new), the creative process (the function of the
mind in creating ideas in the creative person. e.g. searching, combining and synthesising),
the creative product (the outcome or product being original, unique, valuable and novel),
and the creative press (or environment) (the influence ofthe ecological press on the person
and upon his mental processes and outcomes). Similarly, Mooney (1963, p.331)
hypothesised a conceptual model for integrating four main approaches in the identification
of creative talent: 1) the environment, 2) the person, 3) the process, and 4) the product
(p.331). Further, Isaksen (1987) extended Rhodes's approach when he introduced the
concept of the "4 Ps" (Creative Person, Creative Process, Creative Product and Creative
Press (environment)) of creativity as an overlapping Venn diagram (see fig-2.1).
5 Isaksen, Murdock and et aI, 1993, pp.18-19. 6 Ibid p.18

29
Firestien, (1993,p.262) argues that when investigating the creative product, it is
important to understand that the creative product, the artefact, the outcome of a creative
endeavour, does not occur in a vacuum. Researchers artificially isolate the creative product
to study it. But people work with processes and in environments that can either be
supportive or non-supportive of their creative endeavours. The results of their work-the
products-are introduced to environments (press) and subsequently change those
environments.
FiJLue 2.1 : 4 P: (PenClII, PrClcen, PrCldLict alld Pren )
SClLlrce: Firediell, 1993, p. 26 2
2.2.1 Creative persons
Some personality-oriented psychologists conceive creativity in terms of the person.
Considerations of the creative person typically fall into three general categories: (A)
cognitive characteristics (B) personality and motivational qualities and (C) special events
or, experiences during one's development (Tardif & Sternberg, 1988). It is generally
acknowledged that people are creative within particular domains of endeavour, even
though those who are creative in different domains may share common traits. Thus, one . may be a creative biologist, but a very uncreative novelist, or vice versa. Domain
specificity is a major consideration when describing creative persons (Sternberg, 1988;
Walberg, 1988). It relates to other characteristics such as using one's existing knowledge
in the domain as a base to create new ideas, being alert to novelty, and finding gaps in
domain knowledge (Sternberg 1988; Torrance,1966 ; Walberg, 1983). Although it is
generally agreed that creative individuals are creative within limited domains, various
explanations have been offered for why individuals differ in their propensities toward and
abilities in their domains of speciality.

30
(A) The cognitive characteristics that are shared by creative people, regardless
of domain, can be grouped into three sets: the traits, abilities, and processing styles that
creative individuals use and possess (Tardif and Sternberg, 1988). (i) Traits that are
commonly said to be associated with creative individuals include relatively high
intelligence, originality, articulateness and verbal fluency, and a good imagination. (ii)
Cognitive abilities include the ability to think metaphorically, flexibility and skill in
making decisions, independence of judgement, coping well with novelty, logical thinking
skills, internal visualisation, the ability to escape perceptual sets and entrenchment in
particular ways of thinking, and finding order in chaos. (iii) the approach to problems (i.e.,
style) includes using wide categories and images, a preference for non-verbal
communication, building new structures, questioning norms and assumptions in the
domain, being alert to novelty and gaps in knowledge, and using existing knowledge as a
base for new ideas.
B) The most commonly mentioned personality or motivational characteristics are
a willingness to confront hostility and take intellectual risks, being open to new
experiences, curiosity and growth (Barron, 1988, Torrance,1988), discipline and
commitment to one's work, high intrinsic motivation, being task-focused, a high degree of
self-organisation and competence in meeting optimal challenges (Hennessey &
Amabile, 1988).
Some additional characteristics mentioned less often include tolerance for
ambiguity, a tendency to play with ideas, valuing originality and creativity (Walberg, 1988),
unconventionality in behaviour, experiencing deep emotions, intuitiveness, seeking
interesting situations and some degree of conflict between self-criticism and self
confidence (Barron, 1988).
Aspects of the characteristics of a creative person can have an impact on others in
their immediate surroundings. However, Feldman (1988) and Gardner (1988) both suggest
that what distinguishes creative individuals is their lack of fit to their environment. They
are often also seen to be withdrawn, reflective and preoccupied, avoiding interpersonal
contact and social demands.
C) The study of creative individual's lives has revealed that they often have features
of their developmental history in common. Environmental factors which may be important
are being first-born (Simonton, 1987), losing one or both parents early in life, experiencing
unusual situations and being reared in a rich and stimulating home environment which
provides diverse experiences. Creative children tend to be happier with books than with

31
people, like school, do well, and learn outside of class for a large part of their education
(Walberg, 1988).
2.2.2 Creativity as Product:
Creativity has also been defined in terms of products. Product-oriented
psychologists give primary importance to the product. If the product is considered creative,
then the person who made it may be considered creative. The products of creativity can
include behaviours, performances, ideas, things and other kinds of output, through any
channel or type of expression (I'aylor, 1988,p.104). Parnes (J 966) defines creative
behaviour as that 'which demonstrates both uniqueness and value in its product'
Creative products can be solutions to problems, responses to creativity tests, or
explanations for phenomena. The products are novel- they are not imitations, nor are they
mass-produced (Perkins, 1988; Taylor, 1988; Torrance, 1988). A creative act is one in
which 'something new is produced- an idea or an object including a new form of
arrangement of old elements. The new creation must contribute to the solution of some
problem' (Wilson, Guilford and Christenson, 1974, p.208). Features that may be more
relevant to scientific creativity and creative problem-solving are that the products should
show sensitivity to gaps in existing knowledge (Langley & Jones, 1988; Torrance, 1988).
Guilford (1957) suggested that an individual's potential for being creative related
to his or her readiness to produce novel ideas. This includes the production of old ideas in
new forms. This readiness depends upon information in memory and appropriate
dispositions to enable him or her to make use of it in new ways (pp.69-95). Many writers
see creativity as the ability to bring something new into existence (Barron, 1969; Stein,
1960; May, 1959; Stagner and Karwoski, 1973; Dehaan and Havighurst, 1957; Drevdahl,
1956; Maslow, 1959; Johnson-Laird, 1993).
Those who subscribe to analytical creativity, however, feel that knowledge ofthe
creative behaviours within the process of creating an end product is vital to future
productivity. Ghiselin (J 952) proclaims that "insight into the processes of invention can
increase the efficiency of almost any developed and active intelligence (p.ll)".
2.2.2.1 Criteria for establishing creativity:
The judgement of end products raises many questions of major importance. Should
the decisions made by teachers judge students against themselves and their previous
productivity, or are the norms of society applied in evaluating the worth of their efforts?
(Shallcross, 1981, p.9).
Where an end product is concerned, for instance, how will teachers judge whether

32
or not it is creative? There are two opposing schools of thought. One says that if it is new
to the person who has produced it, it is creative. That in spite of the fact that the product
has existed before, having been created by someone else or by numerous others. It is new
to this individual at this time in his or her life and therefore is a creative product. The
opposing school maintains that in order for an end product to be considered creative, it
must not have existed before and it must meet particular criteria that will set it apart from
anything that has been produced previously. These criteria include novelty or unusualness,
appropriateness to the context in which it is placed, and transformation of materials or
ideas that overcome conventional constraints. End products can also vary greatly as to
intent. Two extremes, for example, are products intended to serve a functional purpose and
those that are aesthetic expressions (eg Shallcross, 1981, p.8).
According to Johnson-Laird (1993) creative thinking must not be produced by
recall from memory, rote computation or any other simple deterministic process.
Gowan, Demos and Torrance (1 967,p. 44) define human problem-solving as
creative to the extent that one or more of the following conditions are satisfied: first, if the
product of the thinking has novelty and value either for the thinker or for his society;
second, if the thinking is unconventional, in the sense that it requires modification or
rejection of previously-accepted ideas. Third, we call thinking creative if it requires high
motivation and persistence, taking place either over a considerable span of time or at a high
intensity. And finally, we tend to call thinking creative if it deals with or solves a problem
which, initially, as it was posed, was vague and ill-defined, so that part ofthe task of the
creative thinker was to formulate the problem itself, to give it structure.
Torrance (1965, p.6) outlines criteria indicating a lack of novelty or a lack of
invention: 1. changes requiring only mechanical skill; 2. change in size; 3.duplication of
parts of a device; 4. omission of an element of a device or step of a method; 5. reversal of
parts; 6. change of material; 7. use of an old process or method to a different but analogous
object or material; 8. making a device adjustable; 9. change in an element of an old
combination; 10. aggregation of elements.
Besemer and Treffinger(1981) reviewed the criteria of creativity set out in the
literature (about 125) and classified them into three general dimensions: 1. Novelty; this
refers to the newness of the product in terms of processes, techniques, materials, concepts
and so on. The product would be judged for originality and germinal and transformational
qualities. 2. Resolution - includes criteria which pertain to the correctness or rightness of
the solution to the problematic situation. The product would be judged for logical,

33
appropriate, adequate, useful and valuable. 3. Elaboration and synthesis - the degree to
which the product combines unlike elements into a refined developed, coherent whole,
statement or unit. This includes the notions of expressiveness, complexity, being well
crafted, attractiveness, sense of wholeness or completeness and elegance.
The criteria for establishing creativity are multi-dimensional and appear to depend
not only on the end-product but also on the process involved (Murray, 1959; Parnes, 1967;
Stein, 1974&1975; Brunnelle, 1970; Arnold, 1963).
2.2.3 Creativity as Process:
The orientation of process-oriented psychologists is towards understanding the
process of thinking that leads to the emergence of creative products. If the creative process
is understood, then efforts can be made to develop such thinking among children. Rogers
(1954, p.139; 1959, p.71) defined the creative process "as the emergence in action of a
novel relational product, growing out of the uniqueness of the individual on the one hand,
and the materials, events, people or circumstances of his life on the other". According to
Ghiselin (1952), creativity is a process of change and development in the psychic life of
an individual leading to invention (p.I2-13).
Mackinnon (1962, p.485) argues that creativity is "a process extended in time and
characterised by originality, adaptiveness and realisation" and fulfils at least three
conditions 7
. Hallman(1963) has analysed the creative act into five major components: (1)
it is a whole act, a unitary instance of behaviour; (2) it terminates in the production of
objects or of forms of living which are distinctive; (3) it evolves out of certain mental
process; (4) it co-varies with specific personality transformation and (5) it occurs within
a particular kind of environment (p.I7).
A number of authors outline steps in creative thinking. For instance, Graham Walls
(1926) proposes four steps: preparation (gathering information), incubation (allows
solutions, ideas to mature), illumination (emerging of solutions, ideas etc), and verification
(testing the solutions, ideas etc., and adapting them to other situations). Osborn (1948)
proposes five stages which are similar to those of Walls. 1. orientation (picking out the
problem); 2. preparation (gathering relevant material the organisation effort); 3. analysis
and Ideation (seeking possible solutions); 4. incubation ( a time lag for the mind to
7 (1) It is novel or at the very least statistically infrequent. But novelty and originality of thought or action, while a necessary aspect of creativity, is not sufficient. If a response is to lay claim to being a part of the creative process, it must to some extent be adaptive to, or of, reality. (2) A creative process must serve to solve a problem, fit a situation or accomplish some recognisable goal. And (3) true creativeness involves a sustaining of the original insight, an evaluation and elaboration of it, a developing of it to the full.

34
synthesise the problem and solution); and 5. evaluation (putting the pieces together and
verifying the solutions through further testing for evaluation). Rossman (1931) proposes
seven steps in creative activity. 1. A need or difficulty is observed. 2. The problem is
formulated. 3. Available information is surveyed. 4. Solutions are formulated. 5. Solutions
are critically examined 6. New ideas are formulated and 7. The new ideas are tested.
The differences in these descriptions are largely maters of detail. All describe a
similar overall progression.
"Creative thinking", according to Torrance (1962), " is the process of sensing gaps
or disturbing, missing elements, forming ideas or hypotheses concerning them; and testing
these hypotheses". Subsequently, Torrance (1966) and Torrance and Myers (1970) have
defined creativity as " .... a process of becoming sensitive to problems, deficiencies, gaps
in knowledge, missing elements, disharmonies and so on; bring together available
information; defining the difficulty or identifying the missing element; searching for
solutions; making guesses or formulating hypotheses about the deficiencies testing and re
testing these hypotheses, and modifying and re-testing them; perfecting them; and finally
communicating the results" (p.22).
This formulation stresses the higher cognitive processes which Sternberg (1985)
formulates as metacognitive. He describes metacomponents as higher order control
processes used for executive planning, monitoring, and evaluation of one's performance
in a task. Among the metacognitive processes which are important for creativity are: 1.
Recognition that a problem of some kind exists; 2. definition of just what the nature of the
problem is; 3. selection of a set of strategies or combination of strategies which are relevant
to the task; 4. selection of one or more mental representation for information; 5. decision
on how to allocate attentional (e.g. time) resources; 6. solution monitoring; and 7. being
sensitive to internal & external feedback concerning the quality of task performance (pp.
99-105).
2.2.4 Creative press (or places)
Press may be considered as the interaction between persons and their environment.
Creative places or environments include domains, fields and contexts. These can be seen
to affect creativity through the general contributions and resources available to the
individual, special effects and the nature of creative expression within a domain. These
either promote or inhibit creativity (Tradif and Sternberg, 1988,p.439). Further, fields
provide peers who evaluate and confirm creativity in their domains (Barron, 1988) while
also protecting and freeing the developmental creative products and individuals from the

35
less congenial evaluations that may come from members of the general public
(Torrance,1988). Fields also affect the motivation of individuals working within them
(Amabile, 1983).
Creative acts cannot be understood from a psychological perspective alone. The
unit of analysis must be the individual as part of his or her cultural environment. According
to the logic of a part-whole structure, the primary focus must be on the cultural-historical
context that makes the creative act possible and meaningful (Floistad, 1993, P.203-206).
Particular social and historical contexts are seen by some to be influential. Creativity can
be viewed an outcome of these (eg. Csikszentmihalyi, 1988, p.325). Alternatively,
creativity can be seen as independent of any context beyond that with which it is
immediately associated (eg. Weisberg, 1988).
2.2.5 Levels of Creativity
A few investigators have contended that it is necessary to consider levels of
creativity. Ghiselin (1963, p.42-43) divides creativity into two broad levels:(1) primary and
(2) secondary. Primary creativity includes altering the universe of meaning itself, by
introducing in it some new element of meaning or some new order of significance, or more
commonly both (e.g. Einstein's theory of relativity, Freud's psychoanalytic theory, Piaget's
theory of child development, Binet's intelligence tests). Creativity at the secondary level
"gives further development to an established body of meaning through initiating some
advance in its use" (E.g. Terman who refined the Binet intelligence test).
Taylor (1959, pp.55-61) has also sought to reconcile some of the apparent
differences in opinion concerning creativity by suggesting that creativity operates in terms
of various levels. He suggests five levels: l.expressive creativity: involving independent
expression where skills, originality, and the quality of the product are unimportant. The
spontaneous drawings of children are examples of expressive creativity. 2. Productive
creativity: artistic or scientific products where there is a tendency to restrict and control
free play and to develop techniques for producing finished works or products. 3. Inventive
creativity: this is the creative world of inventors, explorers and discoverers, those who seek
new ways of using old things, where ingenuity is displayed with materials, methods, and
techniques 4. Innovative creativity: Improvement through modification with a great deal
of an abstract conceptualising skill 5. Emergenative creativity: in rare instances an entirely
new principle or assumption, around which new schools flourish, emerges at a most
fundamental and abstract level.
Taylor pointed out that many people have the fifth level in mind when they talk
36
about creativity. Because this fifth level is so rare, the lower levels are usually involved in
most investigations of creative behaviour. The discussion oflevels is helpful in explaining
that though all can be creative, they will not be at the same level of creativity. The majority
will be creative at the lower levels (particularly children) and only a few people will reach
the higher levels (Gulati, 1995, p.32).
2.3.0 Associationistic approach to creativity
Associative theory, as developed by Mednick (1962) defines the creative thinking
process as "forming new combinations of associative elements which either meet specified
requirements or are in some way useful (p.221)". He described three ways (Serendipity,
Similarity and Mediation8
) in which "mutually remote" ideas could be brought together
to obtain a creative solution. Mednick's ideas gained some empirical support from the
apparent validity ofthe Remote Associates Test (RAT), which was constructed on the basis
of the theory.
However, perhaps because of a general disenchantment with associative theories
of thinking, this approach has not been further developed. Koestler's (1966) bisociative
theory9 allows more complexity to mental organisation than Mednick's associative theory.
He claims that a creative act involves linking together two previously unconnected "frames
of reference" or "two separate entities". He proposes that creativeness is simply a process
of arranging well - known facts into new relationships so that results may be achieved more
effectively. The connection nearly always occurs as a flash of insight and is the result of
subconscious thought processes (c.f. Kohler's theory of insight)
Similarly Wallach and Kogan(1965) propose the associative basis of the creative
process, suggesting that "creativity involves the ability to produce more associations and
to produce more that are unique (p.14-15)". A similar view is asserted by Cartier (1976),
that "there is only one way in which a person acquires a new idea: by the combination or
association of two or more ideas he already has into a new juxtaposition in such a manner
as to discover a relationship among them of which he was not previously aware. An idea
is a fit of associations".
8 (a) Serendipity: refers to any chance contiguity of associative elements in the environment that leads one to a creative insight. (b) Similarity: associative elements of the stimuli that evoke those elements is a second route by which associations may occur. (c) Mediation: common elements, typically through the use of symbols (p.221-22). The third process (mediation) which leads to creative associations 9 Koestler (1966, p.105-08) explained his Bisociative theory with the example of Archimedes's case; how he solved the problem of measuring the volume of a Crown (fIrst frame ofreference-MJ) and the bathing (second frame ofreference-Mz), flow of thoughts (mz) leads to locating the target (T- the method of measuring volume of Crown) by linking (L) through a verbal concept ('rise of water level equals melting down of the solid body).

37
2.4.0 Psychoanalytic Approach to Creativity
According to the psychoanalytic theorists, creativity is the result of overcoming
problems, usually those that begin in childhood. The creative person is viewed as someone
who has had a traumatic experience which he or she dealt with by allowing conscious and
unconscious ideas to mingle into an innovative resolution of the trauma. The creative act
is seen as transforming an unhealthy psychic state into a healthy one (Dacey, 1929, p.43).
Freud (1906,1958) argues that the creative process depends mainly on defence
mechanisms, which are unconscious attempts to prevent the awareness of unpleasant or
unacceptable ideas. Because defence mechanisms prevent an accurate perception of the
world and because they use up psychic energy, they usually interfere with creative
productivity. He believed that although most defence mechanisms interfere with the
creative act, the mechanism he called sublimation is actually the primary cause of
creativity. He strongly believed that "people are only motivated to be creative when they
cannot directly fulfil their sexual needs" (cited in Dacey, 1989, p.43). According to Freud
creative activity is a form of daydreaming.
A close associate of Freud for a while, lung (1928) also believed that the
unconscious plays a vital role in high-level creativity but in contrast creativity is seen as
emanating from the collective unconscious of the individual and it is this linking-in with
the racial memory which gives masterpieces their universal significance. It is from this
collective unconscious that the greatest inventions, theories, art and other new
achievements are drawn. This process is what lends continuity to human existence.
Disagreeing with Freud and lung, Adler (1927) developed the compensatory theory
of creativity. He considered that creative power was necessary in each individual as the
third power, in addition to heredity and environment, which combines the innate
potentialities and environmental influences into a movement toward the overcoming of
obstacles in one's life path. All individuals manifest themselves to be unique in thinking,
feeling, speaking or acting. Even when two individuals do the same thing, the approach
may not be same. He says that creativity is "supremely useful, and those who are more
creative are more useful for purposes of serving a social function".
One psychoanalytic position has been developed by Kris (1952, 53) who
emphasizes the role of the preconscious during the creative process, in particular the degree
of preconscious elaboration of ideas from which a sudden 'solution' or 'inspiration' may
emerge into conscious. Kris asserted that the defence mechanism of regression is involved
in the creative act. When a person is able to regress to a childlike frame of mind the

38
barriers between the conscious and unconscious mind are weakened and the unconscious
material is more readily available to awareness. This material frequently contains the germs
of creative insights. May (1975) asserted that, "creativeness is the unconscious (ie,
mindless awareness) breaking through into consciousness (ie, mindful understanding)". He
further defined creativity as "the encounter of the intensively conscious human being with
his or her world". Creativity "requires an intensity of emotion, a heightened vitality .. .!
choose to call it a rage". Kubie (1958) viewed creativity as a healthy process. According
to him, creativity is the result of preconscious rather than unconscious thought. He believed
that the preconscious is the wellspring of creative thought.
Psychoanalytic theorists have emphasised the unconscious rather than the
conscious. They suggest that creative people tend to suffer from emotional disturbances
and are prone to be mentally ill. An extreme position argues that "creativity is next to
madness" (Dacey, 1989, p.54). Though the source of creative thought may be unconscious,
it is necessary for these thoughts to become conscious, otherwise they remain unrecognised
and incommunicable (eg.Kris, Kubie and May).
2.5.0 Humanistic or Holistic Approach to creativity
In contrast to those adopting psychoanalytic approaches, humanistic psychologists
feel that the creative person is emotionally healthy and sensitive to the needs and the
capabilities of hislher unconscious to produce creative ideas. They equat creativity with
mental health. "They give least importance to unconscious drives and compensation for
deficits in the personality and much more credit to positive, self-fulfilling tendencies"
(Dacey, 1989, p.50). According to them, creativity develops throughout life and can be
cultivated throughout the life span.
Maslow (1957) believed that human beings have six basic instincts 10, which
manifest themselves as needs. The first four are "deficiency" needs, because it is possible
to satisfy them to the point that we are no longer deficient. When we feel hungry, it is
possible to eat enough so that the need is fulfilled. At the highest level, the process of self
actualization is closely analogous to creativity. Self-actualization is seen as a manifestation
of the life forces, which govern the creative process of nature. Personality itself is regarded
as an emerging creative product. Free of neurosis, self-actualizing people are more likely
to be creative. They are likely to achieve peak experiences, moments of unselfish ecstasy.
10 (1) Physiological (2) Safety (3) Belongingness and love (4) Esteem (5) Aesthetic needs (6) Selfactualisation.
39
A creative act was seen by Rogers (1954,59) as motivated by the individual's
desire to expand and grow, and hence 'form new relationships to the environment'.
Therefore the creative individual needs to fulfil three!! inner conditions (1959, p.34).
Fromm (1955,59) described creativity as largely a matter of having the right set of
attitudes. He suggested five!2 relevant attitudes that can be fostered at any point in life. In
his view creativity stems from the basic human need to rise above one's instinctive nature.
This need in tum orients the individual toward productivity and away from self
centredness. As Fromm put it :" In the act of creation humans transcend themselves as
creatures, raise themselves beyond the passivity and accidentalness of their existence into
the realm of purposefulness and freedom" (1955, p.29).
Humanistic theorists' believe that humans, not divine, cosmic, or other forces
determine their own fate. This is not to say that humanism is atheistic, but that self-reliance
is a natural human trait. Rogers and Maslow take a holistic approach since they see the
creative product as the result of an interaction between the creative person and hislher
situation. "They see creativity as more conscious, cognitive and intentional than do the
psychoanalysts" (Dacey, 1989, p.54). The humanistic concept is that creativity is born
through a striving for the highest possibilities in life, rather than as a defence against
neurosIs.
2.6.0 Gruber's Piagetian approach
Like Koestler, Gruber (1980) has analysed Darwin's evolutionary theory from a
Piagetian 13 point of view. Gruber points to the long time periods involved in developing
significant new ideas. Gruber emphasizes the slowness of changes according to Darwins's
system of ideas, and interprets the process of the changes in terms of Piagetian notions
such as assimilation (incorporation of new information into existing conceptual structures)
and accommodation (changes in conceptual structure brought about by new information).
Gruber argues that what appear to be dramatic breaks with the past, can be seen as the
culmination of numerous small changes. This approach places " moments of insight"
11 (A) An openness to experience -lack of rigidity and permeability of boundaries in concepts, perceptions, and hypotheses, also a tolerance for ambiguity where ambiguity exists. (B) The ability to evaluate -evaluation lies within the individual in his/ her own organic reaction to and appraisal of his / her product. (C) The ability to toy with elements and concepts - it is from the spontaneous toying and exploration that arise hunches, the creative seeing oflife in a new and significant way (Rogers, 1959, p.34).
12 1. The capacity to be puzzled or surprised, 2. the ability to concentrate, 3. an objective knowledge of self, 4. the ability to accept conflicts and tensions resulting from polarity, and 5. the willingness to let go of security, such as parental support (see Dacey, 1989, p.52-53). 13 Piagetian theory, of course, mainly was concerned with the development of concepts in children, but Gruber shows that the approach can be usefully applied to conceptual growth in adults.

40
within their long-term context and would suggest that little understanding of high order
creativity will result from laboratory studies of small-scale problem-solving. "If this
approach is accepted, laboratory analysis of high level creativity would seem to be ruled
out in favour of meticulous case studies".(Gilhooly, 1982, p.148).
2.7.0. Information processing approach to creativity
The information processing approach has been dominant (since the early 1960' s)
in cognitive psychology; the main stimulus for the development of this approach to
thinking was the arrival of the computers. This approach takes the computer as its key
metaphor for the mind, seeing people as computer-like systems that code, store, retrieve
and transform information (Gilhooly, 1982, p.10-1S). Information-processing technologists
describe thinking as 'dynamic processes'. They equate the architecture of the brain with
the computer and explain the process of thinking in terms of computer programming
(algorithms and flowcharts). Simon (1966) has indicted how the information processing
approach might tackle the topic of creativity in science. Thinking is seen as a hierarchical
organization of elementary process carried out one at a time.
He argues that incubation and inspiration phenomena may be explained in terms
of two mechanisms. The first is called familiarization14; the second is called selective
forgetting15• In a problem-solving programme, the solution efforts are guided and
controlled by a hierarchy or "tree" of goals and sub-goals. Thus, the subject starts out with
the goal of solving the original problem. In trying to reach this goal, s/he generates a sub
goal. If the sub-goal is achieved, s/he may then return to the now-modified original goal.
If difficulties arise in achieving the sub-goal, sub-sub goals may be set up to deal with
them. Thus the course of problem-solving, then, involves continuous interaction between
goals and information in long-term memory. In the course of pursuing goals, information
is added to long-term memory. This information, in turn., helps to determine what new
goals and sub-goals will be set up. When the problem is set aside, the goal information is
lost and has to be reconstructed again. However, when the problem is taken up again, there
is better information about the problem than the first time. This may lead to a quick
solution where the previous attempts did not.
In a similar manner, Weisberg (1986,p.90) suggested that creative solutions
develop as problem solvers acquire information indicating that their initial solutions were
inadequate. In attempting to overcome these inadequacies, individuals try things they have
14 Familiarization is a storing process, building up a representation ofthe problem and relevant information in long term (permanent) memory.

41
not tried before. Further, he points out that the initial attempt to solve a problem depends
relatively directly on what the person knows about the problem when he or she starts
working. Changes in the way the person approaches the problem (that is, "restructurings")
occur in response to information that becomes available as the person works on the
problem. That is, restructurings are not intuitive leaps into the unknown, but responses to
changes in the problem. Finally, novel solutions to problems also arise in response to
information that becomes available as the person works on the problem.
2.8.0 Boden's Impossibility theory
Boden (1990, pp.31-32; 1994, pp.76-77) distinguishes two senses of creativity. One
is psychological (P-creativity), the other historical (H-creativity). A valuable idea is P
creative if the person in whose mind it arises could not16 have had it before; it does not
matter how many times other people have already had the same idea. By contrast, a
valuable idea is H-creative if it is P-creative and no one else, in all human history, has ever
had it before.
2.9.0 Convergent-Divergent thinking and Creative thinking
The interest of psychology in creativity is relatively recent. The work of Guilford
is usually seen as the starting point for deliberate and explicit research on creativity.
Guilford (1950,57,61,67,68,86) viewed creativity in terms of his theory ofthe structure of
the intellect, derived from factor analytic procedures (five intellectual operations -
cognition, memory, convergent thinking, divergent thinking and evaluation). Creativity is
not seen as a unitary trait, but rather a collection of interacting and complementary,
component abilities, all of which may enter into creative thinking. All genuine problem
solving is creative and most, if not all, creative thinking is problem solving. Both problem
-solving and creativity are productive thinking, which includes both convergent and
divergent abilities. In convergent thinking the person follows the prevailing mode of
thought, information and action to arrive at one right answer, which could be attained by
other individuals also. Divergent thinking enables the individual to be more flexible and
fluent, involving a richer flow of ideas and resulting in some novel or creative solution.
Divergent thinking abilities can be defined as the means the individual has for
expressing whatever creativity he possesses. Guilford (1950,1962) maintains that these
abilities are somewhat general and can be applied to a variety of tasks. They are not
15 Related with forgetting; for example if a sub-goal is achieved it can be forgotten. 16 The 'could not' is defmed in terms of what the person's mental representations and processes allow. So creativity always requires some mental restructuring. This restructuring can take various forms, but it must be defined in computational terms. For example, a creative solution to a problem space, or the devising of

42
associated with particular subject matter or disciplines. According to Guilford, these
abilities together constitute creative thinking. The distinctive aspect of creative thinking
is divergent thinking, which is characterized by, among other things, flexibility, originality
and fluency. The meaning and scoring procedures for originality, elaboration and flexibility
are explained in chapter VI.
2.10.0 Lateral thinking and creativity
According to De Bono (1992), "lateral thinking" is directly concerned with two
senses, one of which is specific and the other more general 17 • He argues that creativity has
a very wide and confused meaning. There are elements of "newness" and of "bringing
something into being" and even elements of "value". There may be several entirely
different processes involved in this wide definition of "creativity"; the term "lateral
thinking" is, however, very precise. Lateral thinking is concerned with changing concepts
and perceptions.
Divergent thinking is but one aspect of lateral thinking. Divergent thinking is
interested in multiple possibilities, just like lateral thinking, but that is only one aspect of
lateral thinking. The relationship between lateral thinking and creativity is overlapping.
The term "lateral thinking" is reserved for the specific techniques and tools that are put
forward as a systematic way of getting new ideas and new concepts. Creative thinking is
concerned with new concepts and new ideas (p 56).
2.11.0 Creativity and Intelligence:
The relationship between intelligence and creativity has been reported to be highly
significant. However, at the same time this is highly controversial. Guilford(1968) clearly
distinguishes between the intellectual operations of 'divergent thinking' (creative process)
and convergent thinking (which represents Intelligence). Generally it is accepted that the
path to creativity lies through intelligence. Hudson (1966) has explored the statistical
relation between measures of divergent and convergent thinking (or of 'creativity' and
'intelligence') and of the circumstances in which the two traits are more or less
independent, with special reference to the 'threshold' theory. Empirical findings suggest
that intelligence and creativity are statistically significant and positively correlated (eg.
Dhailwal and Saini, 1976; Gulati, 1979; Guptha, K. K., 1979; Muddu, 1982; Patel and
Joshi, 1978; Sharma, K. N, 1972; Bedi, 1974; Singh, Mathur and Sexena, 1977;
a new technique (a heuristic) for directing the search for the solution to a particular part of the space. 17 Specific: A set of systematic techniques used for changing concepts and perceptions and
generating new ones. General: Exploring multiple possibilities and approaches instead of pursuing a single approach.(p 55).

43
Gupta,G.S., 1979; Qureshi, 1980; Srivastava and Thomas, 1991), but some researchers
have reported that there is no significant relationship between creativity and intelligence
(eg. Getzels and Jackson, 1962; Wallach and Kogan (1965); Sansanwal and Jarial, 1979;
Yamamato, 1964; Mehdi, 1977; Sharma, A. K., 1979; Chadha and Sen, 1981).
The bulk of the evidence points to the independence of creativity from
conventional measures of intelligence (Gakhar and Kaura, 1976-77, Cropley, 1966). More
accurately, there is a marked discontinuity between lower and higher IQ, so that little or
no creativity occurs at levels below a high average (say, IQ 120) and above that point the
correlation is negligible (Barron, 1963). That is, although highly creative people are
typically high in intelligence, the reverse does not necessarily hold true, Sharma (1971) ,
in his study of both rural and urban high schools, reported some rise in creativity with
intelligence. Further, he reported a consistent rise in creativity of the lower IQ levels but
after 120 IQ the relationship demonstrated inconsistent fluctuations. Similar findings have
been reported by MacKinnon (1962), Venkat Rami Reddy and Balakrishna Reddy(1983),
Fuchs-Beauchamp, Karnes and Johnson (1993). However, the kinds of correlation outlined
would occur even ifthe correlation between IQ and creativity were high, as a result of the
restriction of range resulting from concentrating on those with IQs over 120. For example,
Torrance (1966) reported that the correlation of creativity scores with IQ was 0.50 for
children with IQ scores below 120, but only 0.20 for children with IQs above 120, if
correlations across the whole ability range were in reality 0.80.
Dutt, Bountra and Sabhrawal (1977) showed a curvilinear relationship between
creativity and intelligence. To a certain extent they go together but thereafter take different
directions. As such, highly creative students need not necessarily be highly intelligent as
welL As McNemar (1964, p.879) pointed out, high IQ is no guarantee of creativity, but a
low IQ means that it is impossible.
2.12.0 Summary and Conclusions
To summarise, creativity has different meanings, at different times and in different
contexts. Generally creativity has been discussed in terms of its end product, the creative
person, and also of the creative process and creative environments. However, creativity has
not been precisely defined in the context of the schooL Much research has concentrated on
the relationships between creativity and intelligence in school and this is a matter of
considerable debate. One way to explore creativity in the school context would be to see
how teachers perceive creativity.

44
Chapter-III
Creative Thinking and Its Development in Students
3.1.0 Introduction
In chapters III, IV & V, the relevant literature will be reviewed to provide a
backdrop for understanding the present status of research pertaining to the different
variables included in this study, to fonnulate ideas and to provide a conceptual framework
for the study. The present chapter examines the research examining the identification of
creative children, the measurement of creativity, and its relationship to age, sex, SES,
grade, and type of school. Chapters IV & V discuss the role of the school and teachers in
promoting creative thinking among the children.
3.2.0 Is Every Child Creative?
According to Dean (1976), everyone is born with some creative ability. In some
individuals there is a strong drive to work in a particular area or medium which helps him
/ her to acquire the knowledge and techniques s/he needs. In others the ability may be more
general and its flowering depends very much on the opportunities s/he meets and the
encouragement s/he receives. Beetlestone (1998) optimistically says, "every person has
creativity to a greater or lesser degree, and all children are capable of rearranging ideas and
generating meaning in original ways" (p.95).
If we do nothing at all about creativity, then obviously creative ability can only
depend on natural talent. But if we provide training, structures, and systematic techniques,
then we may be able to raise the general level of creative ability. Some people will still be
much better than others, but everyone can acquire some creative skill (De Bono, 1992).
Creativity refers to some sort of originality to be found in anyone. This is not
restricted only to great persons in the fields of science, fine arts, music, and the various
disciplines of the humanities and social sciences. In fact, grains of creativity might be
inherent in any individual in any sphere of activity. A carpenter, a mason, a modeller, a
painter or a designer generally shows some unique originality in his/her art (Chaube and
Chaube, 1994, p.380). In fact, all the remains or symbols of great civilizations and cultures
are only marks of the originality or creative activity of the creator concerned. It is one of
the functions of education to recognise the seeds of creativity in the child and to organise
situations for developing it.
However, like all human characteristics, there is enonnous variability in creativity
between individuals and within groups. It follows then that some children are more creative

45
than others. When creativity is thought of as a trait that is normally distributed in the
population, it can be argued that teachers have a responsibility to foster the creativity of
every child and to consider how this can be done in all areas of the curriculum (Poole,
1979, Beetlestone, 1998, p.34). The teacher has the basis for introducing children to new
experiences and for developing innate curiosity and exploratory, manipulative behaviour
(Poole, 1979).
To view creativity as a special quality which occurs only in some people-something
more elitist and esoteric possessed only by a few-is to deny for the majority of children the
opportunity to develop as individuals as fully as possible. A 4-year-old or a 12-year-old can
be highly 'creative' provided hislher activities are viewed as relevant to them rather than
to recorded knowledge; that is, the commonplace can be placed in new (and creative)
combinations that may not be absolutely new but are very new, even completely foreign,
to the individual producing them (Poole, 1979).
3.3.0 How to Identify a creative child
Although all children have the capacity to be creative, some may be more creative
than others. As Gulati (1995, p.32) said, though "all can be creative, they will not be at the
same level of creativity". Then, what are the characteristics of classroom behaviours which
are considered to be exceptionally creative?
Passi (1989, p.3) identified some of the exceptional classroom behaviours of
creative children from a literature survey for the purpose of training teachers. The
exceptionally creative child - tries to be original in his thinking, action or behaviour; puts
uncomfortable questions to the teacher; does not always agree with what the teacher says
or does; persists in or argues for his own point of view; identifies problems in the
questions put or solutions given by the teacher; and tries to give as many answers as
possible to broad/open questions put by the teacher. Cropley (1967) says, exceptionally
creative pupils can be a problem for teachers. They make unexpected responses, do strange
things, create diversions, ask embarrassing questions.
It is not difficult for a teacher to identify exceptionally creative children, if slhe is
alert and careful in observing children's behaviour inside and outside the classroom. There
are some broad indicators of creative children. According to Passi a teacher should observe
the following: (Passi, 1989, p.6)
.... - Does the child easily adapt to any situation at home, school or outside?
.... - Does the child think highly of himselflherself and hislher abilities?
.... - Does the child exhibit an urge to continuously improve hislher own performance?
.... - Is the child not disturbed easily, while working in challenging situations?

46
... - Does the child strive to do hislher best in whatever task is assigned to him, not giving up easily?
... - Does the child take risks in various activities?
... - Does the child act according to his own will?
... - Is the child more anxious than others in solving problems faced by him?
... - Does the child not get confused when situations posed appear apparently logical or unconnected?
... - Does the child show an ability to withstand stress without this affecting his behaviour?
... - Is the child enthusiastic to work on the task assigned?
3.4.0 Measurement of Creative Thinking at High School Level
Creative people are an asset to society, as they lead to all-round intellectual,
cultural and industrial development. It is a fundamental duty of schools and other
educational institutions to identify such people at an early age and provide them with the
opportunity to be creative (Dey, 1986, p.68). Torrance (1962a, 1962b) considers that a
creative individual may be identified through measuring creativity. Measurement of
creativity may be important because: it enhances our understanding ofthe human mind and
personality, is helpful in individual teaching, guides mental growth and gives an indication
of mental health, provides clues for arranging remedial programmes, helps in the
evaluation of programmes and the need for guidance in future.
Torrance (1964) commented that of the different educational levels, the high school
years have been the most neglected in creativity research. Information has accumulated
concerning the pre-school and elementary school years because of interest in the 'creative
imagination'. But educators appear to have had much less interest in the 'creative
imagination' of high school students. Information has also accumulated concerning
creativity during the college years, because many outstanding creative scientists, writers
and performers of many kinds began their productivity during these years and because it
has been deemed appropriate for colleges to produce professionally trained people who
make creative contributions. No such expectations exist for high schools.
Devices for assessing the creative thinking abilities of high school pupils tend to
be group-administered tests with verbal stimuli requiring verbal responses. Although some
of the devices originally developed for use with children have been extended into or
through the high school years, most of the instruments used with high school students were
initially developed for use with college students or adults (Torrance, 1962a, pp30-31).
Any test which purports to assess creativity should have the potential to tap the
ability of the individual to associate and utilise information in new and different ways. The
approach to the measurement of creativity is largely determined by the manner in which

47
it is defined.
There are a variety of tests of creativity, which have evolved through research into
the nature of creativity and educational uses in assessment. Tests tend to be measures of
aspects of creativity as seen from different theoretical and conceptual starting points. Most
are based directly or indirectly on Guilford's idea of divergent thinking. Divergent thinking
(DT) is the ability to generate many different responses to an open-ended question and can
lead to a range of possible solutions to the problems. The responses are scored for fluency,
flexibility, originality and degree of elaboration.
Getzels and Jackson (1962) constructed 5 tests to measure creativity, known as (a)
word association test (b) uses for things (c) hidden shapes (d) fables (e) make up problems.
Wallach and Kogan (1965) also developed tests of creativity: (a) instant test (b) alternate
uses test ( c) similarities test (d) pattern meaning test and (e) line meaning test. Also,
Mednick and Mednick (1967) developed the Remote Associates Test (RAT) as a means
of assessing individual differences in creativity. In this test, each of the 30 items consists
of 3 words, known to be mutually remote. The subject's task is to produce a fourth word,
which is a common associate of all 3 remote words. For example: railroad, girl, class: here
the fourth word working associatively links these words as working on the railroad,
working girl and working class (p.227). This test did not have the wide-ranging impact of
divergent-thinking tests like the Torrance Tests of creativity (Rose & Lin,1984).
The most used test is that of Torrance (1966), called the Minnesota Test of
Creative Thinking (MTCT). Sub-tests ofMTCT are divided into three different categories:
I. Verbal tasks using verbal stimuli. Sub-tests:(I) Unusual uses task (ii) Impossibilities task (iii) Consequence task (iv)
"Just suppose" test (v) Situations task (vi) Common problems task (vii) Improvements task (viii) Mother Hubbard problem (ix) Cow jumping problem (x) Imaginative stories task
II. Verbal tasks using nonverbal stimuli.
Sub-tests: (I) Ask and guess test (ii) Product improvement task (iii) Unusual uses task
III. Non-Verbal Tasks:
Sub-tests: (I) Circles and Squares task (ii) Picture construction task (iii) Incomplete figures task.
According to one comprehensive survey of creativity research (Torrance &
Presbury, 1984), the Torrance tests have been used in three-quarters of all recently
published studies of creativity involving elementary and secondary school students, and
40% of all creativity studies with college students and adults. The Torrance tests dominate
the field of creativity research to such an extent that, in what was intended as a
48
comprehensive meta-analytic evaluation of the long-term effects of various creativity
training programmes, only studies that employed the Torrance tests were included (Rose
& Lin, 1984) (in Baer, 1993, p.15).
Early work on creativity tests by Getzels and Jackson (1962) showed that groups
of bright adolescents could be found who scored relatively high on IQ tests and relatively
low on tests such as Guilford's uses of a brick, or vice versa. The two groups did not differ
in scholastic achievement. However, not only did Getzels and Jackson fail to validate their
'creativity tests', they also failed to show that either IQ or 'creativity' predicted scholastic
achievement, because they did not check the later performance of individuals who scored
high or low on both tests. Subsequent work with similar tests, in particular the Torrance
Tests of Creative Thinking (TTCT of Torrance, 1966), has shown that tests can be
produced that correlate moderately well with later measures of creative achievement, with
some correlations in the range 0.4 to 0.6. (Torrance, 1988).
Torrance's (1966) original tests provide separate fluency, flexibility, originality and
elaboration scores, as well as an overall creativity index. The most recent scoring system
(Torrance, 1990), although more complex, is not a major theoretical departure from earlier
systems (see Bear, 1993, p.15). These scores can be used separately, as measures of the
component skills of divergent thinking, or combined into an overall divergent thinking
index score. Torrance discouraged the use of a composite score, recommending instead that
the sub-scales be interpreted "in relation to one another" (Torrance, 1974, PP 56-57).
Kogan (1983, p.637) reported that fluency scores (quantity of responses) and the other
"quality" scores (flexibility, originality, and elaboration) correlate so highly (ranged from
.65 to .84) that "a strong case can obviously be made for exclusive reliance on the more
easily storable ideational-fluency index".
Different investigators have used different types of criteria to assess or identify
creative potential. All these identifying methods have been summarised by Getzels and
Madaus (1969) under 5 categories:
1. Achievement: Highly recognised achievement, like a Nobel prize or any other marks of outstanding accomplishment as an index of creativity (eg.Ghiselin, 1952).
2. Ratings: Evaluation by peers, teachers, superiors, experts, etc., (eg Mackinnon, 1964; Drevdahl,1964). 3. Intelligence: Performance on intelligence tests-superior IQ as a criterion (eg., Terman, 1925). 4. Personality: Evaluation of personality characteristics in relation to a priori profile of creative personality
(eg. Cattell and Drevdahl, 1955). 5. Creativity test scores: Performance on creativity tests such as those developed by Flanagam(1958),
Buhl(1960), Guilford and Merrifield(1960), Mednick and Mednick (1964), Torrance (1964) and others. There is still debate about whether these tests measure several divergent thinking
skills or just one general divergent thinking skill. Despite this uncertainty, the widespread
use of the Torrance tests has led scores on these tests to become the de facto operational

49
definition (or definitions, if sub-scale scores are used) of divergent thinking. There is an
even more crucial uncertainty about the Torrance tests, however, that focuses on their
validity as measures of creativity (Baer, 1993, p.16). Not everyone agrees that creativity
can be assessed by a general paper-pencil test. Task-oriented psychologists, Amabile
(1983) and Baer (1993) emphasise a task-specific view of creativity. They have suggested
that the cognitive abilities underlying creative performance differ from task to task. The
solution to this is to allow experts in their respective field to judge the product for
creativity, using a consensual assessment technique. Consensual assessment of creative
performance is neither difficult nor mysterious. Students can write poems which can be
assessed by judges who know something about poetry. Amabile has shown that with
student work, the ratings of teachers and of poets differ very little (1982,1983). However,
it is important that raters do not know whose products they are rating and that the same
judges evaluate all products. It is also wise to have multiple raters when possible, and to
have more than one sample of each student's work.
Another difficulty with psychological tests, whether verbal or non-verbal, is that
they may be culturally loaded and as such are not wholly applicable to different cultures
(they are not "culture fair"). According to Floistad (1993, p. 203) people are part of their
cultural environments; their creative acts are expressions of their own powers, as well as
expressions of the factors in their cultural environment. Consequently, people's creativity
cannot properly be studied without taking into account their cultural environments. As this
study is set in India, we must ask what tests of creativity have been developed in that
culture.
In India, two pioneering tests of creativity Baqer Mehdi (1973,1985) and Passi
(1973) are extensively used. Similar to the above two tests Sudhir and Khiangte (1991)
have recently developed a tool for the tribal cultures of India. Majumdar (1973) developed
a scientific creativity test, and Kundly (1977) developed a creativity test in Marathi to
assess the literary creativity of school children. Passi (1973) also developed a battery which
consists of six sub-tests (verbal and non-verbal) for higher secondary school students.
The Baqer Mehdi tests of creative thinking (1973,1985) were constructed by
combining the ideas of Guilford, Torrance, and Mednick and Mednick. They include both
verbal and non-verbal creativity. Many researchers have used these tests. eg., Tiwari,
Govind and Archana (1978), Prasad, V (1979), Singh, R. .P. (1980), Singh, D (1978),
Mehra and Singh (1982), Agarwal and Kumari (1982), Bhoodev Singh (1981), Mahender
Reddy (1989), and Agarwal (1992). . . .

50
3.5.0 Creative thinking and its development in students
Like any other mental ability, creativity has its characteristic developmental trends
which have been studied extensively. These trends have been established largely through
a cross-sectional approach in which the creativity levels of children in different age groups
have been studied (Guilford, 1964).
The developmental curves for most of the abilities thought to be involved in
creative thinking follow a pattern which is quite different from most other aspects of
human growth (Torrance, 1962a). Reviewing a number of earlier studies on the growth
of creativity and giving results from many studies conducted by himself at Minnesota.
Torrance (1962a) has described the developmental trends of boys and girls in creative
thinking abilities.
3.5.1 Creative thinking- Age-wise development
Torrance (1962a, pp.84-105) observed that from eight to twelve years the child
continues to develop hislher imagination and can use hislher skills creatively in many
areas. After twelve years of age to fourteen, the spirit of adventure reigns supreme in both
social and emotional fields. The skills involved in creative problem solving are slowly
learnt during this period, though adventure still occupies an important part in life.
However, peer acceptance and the unstable nature of interest and aptitudes may dampen
the creativity of sixteen-year-old boys and girls. At sixteen to eighteen years youth is full
of optimistic aspirations and considers arts and social activity as a means of emiching
living. The individual develops the ability to channel his emotional energy, creatively and
to solve problems of a complex nature. Subsequently Torrance (1967) observed a
developmental pattern, noting increases in divergent abilities from preadolescence to
adolescence. If divergent thinking, like other cognitive skills, becomes more accomplished
throughout childhood and adolescent years, then we ought to observe age-associated
increases in divergent thinking abilities consistently among young people of varied
backgrounds.
Based on cross-sectional data collected in the United States, Jaquish and Ripple
(1980) reported significant developmental increases in fluency and flexibility from
preadolescence (mean age=l1) to adolescence (mean age=16). In India, Sudhir Kumar
(1992) studied students belonging to high (~ 15) and low age groups « 15). No significant
difference was found between those groups in creative thinking ability.

51
3.5.2 Creative thinking - Grade-wise development
According to Torrance (1962a) there is an observed steady growth from grade one
to three; then a slump between third and fourth grades, and a little recovery during 5th and
6th grades. Another slump occurs between the sixth and the seventh grade, after which there
is again an almost steady growth until near the end of the high school years. Many
explanations have been given to explain the setback in the growth of creative abilities at
the fourth, seventh and eleventh grade levels respectively. According to Torrance these
declines may be explained in terms of" ..... reactions to a new stage of development or each
transitional state in education" .
In India, following Torrance, Kishore (1981) tried to explore developmental trends
by using creativity measures and revealed a consistent increase from Grades VI to VIII (i.e.
from age 11 to 13). After this period there appeared a general decline, except for
non-verbal elaboration up to the age of fifteen (i.e. Grade X). Elaboration showed a
tendency to develop with maturity and experience. The graphical displays revealed that the
period of greatest potential productivity was found to lie between the ages 13 and 14.
Another study by Gakhar (1974) revealed that (i) the fluency and flexibility scores
of the students showed an upward trend from IX to X grade which was followed by a
decline from X to XI grade. (ii) The interaction effects of grades and sex were not found
effective in accounting for the significant variances with regard to fluency, flexibility,
originality, and total creativity of the students. (iii) The girls exhibited a significant
increase in creativity from classes IX to X, followed by a significant decrease from class
X to XI. But Gupta's (1979) results revealed no significant difference in the creativity
scores of male and female students (N=496) of classes IX, X, XI and XII. Contradictory
results were also shown by larial and Sharma (1980), in that students (N=200) of X grade
were significantly superior to the students of IX grade in fluency and total creativity,
whereas, no significant differences were found in the flexibility and originality scores of
the students of these two grades. In their subsequent research (1981 b) they found no
significant difference, except in flexibility in the Fluency, Originality and Total creativity
scores of IX and X grade students.
3.5.3 Creative thinking and sex differences
The topic of sex differences in creativity has intrigued generations of psychologists
and educational researchers. Despite considerable research there are still contradictory
views about sex differences in creativity. Some studies have shown the superiority of males

52
over females, others the reverse; some have reported non-significant differences between
males and females.
The view that sex is related to the creativity of pre-school children is reported by
Bolen (1976), Westra (1978), Torrance (1980), Smith (1990). Also many researchers in
India, (Acharyulu and Yasudhara, 1984; Singh, A, 1991; and Srivastava and Thomas,
1991) reported the same findings.
Strauss and Strauss (1968) in a wider cross-cultural study observed clear cut sex
differences in American and Indian student populations. In both societies, boys were
significantly more creative than girls. They further established that the gaps were wider in
Indians than Americans. This was attributed to the degree of cultural and social uplift of
females in American society. Mar'I (1971) found that Arab male rural subjects of viii grade
scored significantly higher than females in nine scores out of thirteen drawn from the
battery of Torrance tests of creative thinking (TTCT).
Andrews (1930) reported that girls reached the high point oftheir imagination one
year earlier than boys, while Starkwather and Cowling's (1963) found that girls scored
higher, though not significantly so, on flexibility while boys scored higher than girls on
the measures of originality and elaboration.
Kershner and Ledger (1985) found that sex was highly significant in relation to
creativity. Girls scored higher than boys did on several creativity sub-tests. Jaquish and
Ripple (1980) reported adolescent sex differences in divergent thinking which are
consistent with a general position regarding the tendency for females to perform better than
males on verbal tasks. Ogletree (1968) conducted a study on a large sample of 1165 sixth
grade girls and boys from England, Scotland and Germany. He found that English and
German girls were significantly higher on both verbal and non-verbal creativity, but in
Scotland girls were not significantly higher than boys, though their mean on figural
creativity score was higher.
In three separate studies, Torrance (1961;1963;1965) found a number of
differences between the sexes on his measures of creative thinking ability. In general, girls
excelled boys on all verbal tests, especially after the fourth grade. But boys were superior
to girls in a creative thinking task-involving experimentation with science toys. Markewitz
(1984) reported that males excelled female on originality, flexibility and total creativity
scores.

53
3.5.3.1 Studies on Verbal Creative thinking
Studies in India on gender differences undertaken by the researchers Prakash
(1966) Raina(1969), Rawat and Agarwal (1977), Passi(1972), Badrinath and Satyanaryana
(1979), Shanna (1979), Dhannangadan (1981), and Shukla (1982) showed that boys were
superior to girls on all aspects of verbal creativity. Boys performed better than girls on the
originality dimension (eg. Badrinath and Satyanaryana, 1979; Awasthy, 1979). In fluency
also boys have been reported as superior (Awasthy,1979; larial and Shanna, 1981a).
Some studies have reported that girls are more creative than boys in all dimensions
of verbal creative thinking (Passi,1972; Hussain ,1974; Rawat and Garg,1977; Chadha and
Sen, 1981; larial, 1981; Ahmed, 1987) while girls' domination in the originality dimension
has been reported by larial and Shanna (1981a) and Singh(1981).
No statistically significant sex differences were reported on the dimensions of
verbal creativity by Phatak (1962), Tharnmaprateep (1976), and Rasool (1977). In fluency
(Badrinath and Satyanaryana, 1979) or the flexibility dimensions (larial and Sharma.,
1981a, Badrinath and Satyanaryana, 1979).
3.5.3.2 Studies on Non-verbal Creative thinking
In some studies of non-verbal creative thinking boys' scores have been shown to
be significantly higher than girls (Raina,1969; Dharmangadan,1981) while in others girls
have been shown to score higher than boys (Passi,1972; Bedi, 1974; Channon,1974). Singh
(1978) reported that the girls were superior to boys in originality, fluency and elaboration
of non-verbal creative thinking.
Some studies have found no sex differences in non-verbal creativity
(eg.Vohra,1975; Badrinath and Satyanaryana, 1979; Singh, 1993). While Singh (1978)
found no sex difference in flexibility of non-verbal creativity.
The evidence regarding gender differences is inconclusive. This may be due to the
role of other factors affecting performance. The socio-cultural environment and the
technical advancement of society, SES, incentives at home, the school environment, the
availability of resources for creative output, personality characteristics and other such
factors may be important. Thus, gender in itself should not be treated in isolation, as a
determining factor in creativity.
3.5.4. Creative thinking and Socio-Economic Status (SES)
The term "socio-economic status" refers to an individual's position in a society
which is determined by wealth, occupation and social class (English and English, 1958).

54
Ogletree and Ujlaki (1973) reported a positive correlation between social class status and
creativity. The creativity scores of the upper class were significantly higher than those of
the middle and lower class samples. Smith (1965) found that among fifth grade white
children in Pittsburgh, the middle class performed significantly better on verbal tasks, but
the lower class excelled on non-verbal items.
Getzels and Jackson (1962) categorised their sample l from private schools into two
experimental groups, a high creative group and a high IQ group2. They studied school
performance, motivation for achievement and career aspirations. They analysed career
aspirations and categorised them into conventional (lawyer, doctor, professor) and
unconventional (adventurer, inventor, writer) categories. They found that high creative
children gave a significantly greater proportion of unconventional career aspirations than
did the high IQ's (16% and 62% respectively) (Getzels and Jackson ,1962, pp 57-58).
The parents of the high IQ child also tended to have a somewhat higher educational
level than the parents of the high creativity child. But what is perhaps more noteworthy is
the greater specialised training of both the mother and the father of those with high IQ's.
A greater proportion ofthe high IQ fathers than of the high creativity fathers were found
in academic or educational occupations. But, despite their greater professional training, a
somewhat greater proportion of the mothers of the high IQ children than of the high
creativity children were exclusively house-wives and did not hold other full or part-time
jobs. It would seem that the mothers of high IQ subjects had more time to devote to their
children than the mothers of the highly creative subjects. High IQ mothers were in fact
likely to be more vigilant about the "correct" upbringing of their children than the high
creativity mothers (Getzels and Jackson ,1962, pp.62-64).
In India, Sharan (1986) has shown that socio-economic status is a mental construct,
a degree of esteem or lack of esteem which people in a society display towards on
individual. High socio-economic status, therefore, indicates a high income, high status
occupation and adequate living conditions, whereas, low socio-economic status refers to
poor income, low occupation and inadequate living conditions. High socio-economic status
is considered to provide a healthy and enriched stimulating environment in which
personality may develop appropriately, whereas children of low-income groups may
N=449: 245 boys; 204 girls- Grade 6th through the senior year of high school) 2 1. The High Creativity Group: These were subjects in the top 20% on the creativity measures but
below the top 20% in IQ (N=26). 2. The High Intelligent Group: The top 20% in IQ, but below the top 20% on the creativity measures
(N=28) (p.20).
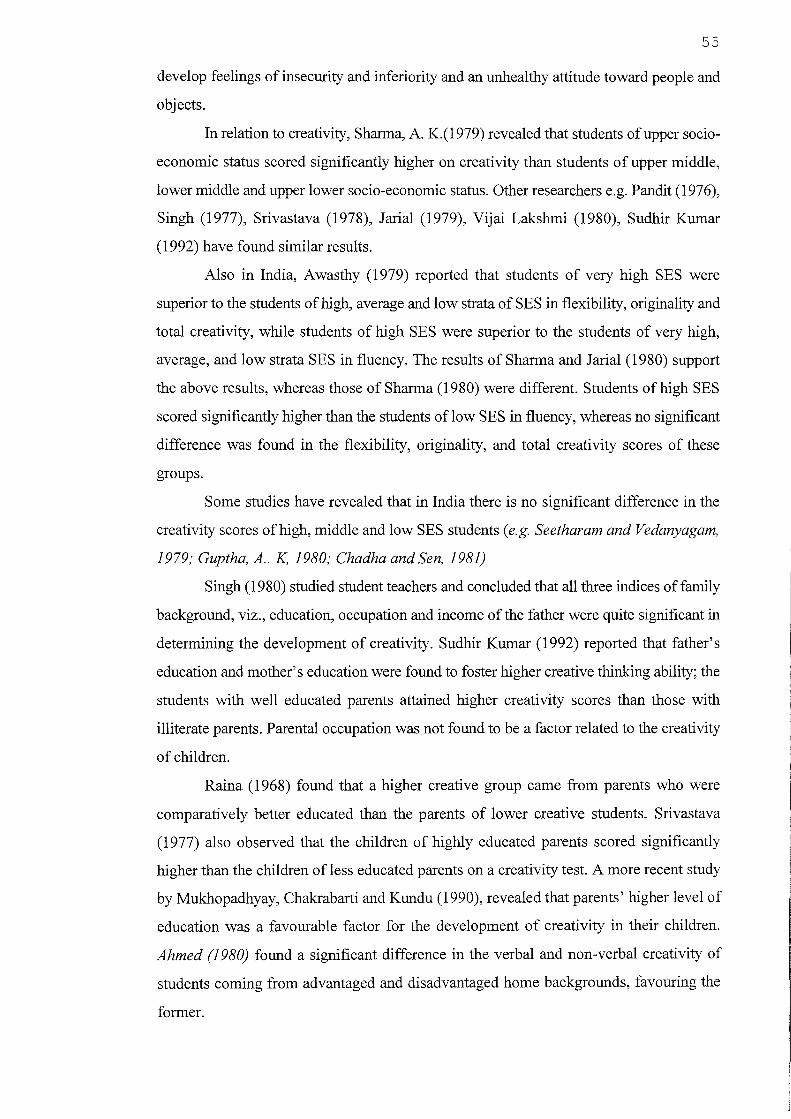
55
develop feelings of insecurity and inferiority and an unhealthy attitude toward people and
objects.
In relation to creativity, Sharma, A. K.(1979) revealed that students of upper socio
economic status scored significantly higher on creativity than students of upper middle,
lower middle and upper lower socio-economic status. Other researchers e.g. Pandit (1976),
Singh (1977), Srivastava (1978), Jarial (1979), Vijai Lakshmi (1980), Sudhir Kumar
(1992) have found similar results.
Also in India, Awasthy (1979) reported that students of very high SES were
superior to the students of high, average and low strata of SES in flexibility, originality and
total creativity, while students of high SES were superior to the students of very high,
average, and low strata SES in fluency. The results of Sharma and Jarial (1980) support
the above results, whereas those of Sharma (1980) were different. Students of high SES
scored significantly higher than the students oflow SES in fluency, whereas no significant
difference was found in the flexibility, originality, and total creativity scores of these
groups.
Some studies have revealed that in India there is no significant difference in the
creativity scores of high, middle and low SES students (e.g. Seetharam and Vedanyagam,
1979; Guptha, A .. K, 1980; Chadha and Sen, 1981)
Singh (1980) studied student teachers and concluded that all three indices of family
background, viz., education, occupation and income of the father were quite significant in
determining the development of creativity. Sudhir Kumar (1992) reported that father's
education and mother's education were found to foster higher creative thinking ability; the
students with well educated parents attained higher creativity scores than those with
illiterate parents. Parental occupation was not found to be a factor related to the creativity
of children.
Raina (1968) found that a higher creative group came from parents who were
comparatively better educated than the parents of lower creative students. Srivastava
(1977) also observed that the children of highly educated parents scored significantly
higher than the children of less educated parents on a creativity test. A more recent study
by Mukhopadhyay, Chakrabarti and Kundu (1990), revealed that parents' higher level of
education was a favourable factor for the development of creativity in their children.
Ahmed (1980) found a significant difference in the verbal and non-verbal creativity of
students coming from advantaged and disadvantaged home backgrounds, favouring the
former.

56
Overall, the research in India tends to suggest that there is a relationship between
SES, parental education and creativity.
3.5.5 Creative thinking - different types of schools
The effect of different kinds of schooling has been subject to many investigations,
Ezekeil (1966) found democratic school administration fostered creativity and initiative in
teachers and broadened understanding on the part of all concerned. Haddon and Lytton
(1968) found that traditional schools emphasized convergent thinking and authoritarian
learning, while in informal or progressive or open schools the emphasis was on self
initiated learning and creative abilities.
The majority of studies in India indicate that type of school is a significant factor
in developing creativity. Rastogi (1967) and Chatterjee (1970) both found that the students
of well-equipped and advantaged schools did better on creativity tests than students of ill
equipped schools. Sultana Ahmed (1980) studied different types of schools, viz., extremely
advantaged schools, slightly disadvantaged schools and extremely disadvantaged schools
(The schools' category was defined in relation to the adequacy of buildings, library,
furniture, teacher-pupil ratio, sports facilities etc.). It was found that pupils in the extremely
advantaged schools scored higher on creativity.
A study by Sehgal (1978) revealed that the students of model schools were more
creative than those of government and private schools. Sharma (1982) explored the
relationship of creativity with certain background, psychological and organisational factors
of students of government, private, aided, public and central schools. The study concluded
that creativity was significantly related to organisational variables like the management of
schools. Another study by Agarwal (1992) compared four types of schools and concluded
that Kendriya Vidyalays (managed by central government) were most creative; next in
order were the students of public, government (managed by state government) and aided
schools (grant maintained). The type of educational administration in a school is a
significant factor in the development of creativity. The efforts of Kendriya Vidyalays get
due rewards in the form of the growth of creative potential of their students.
A study by Gupta (1978) in four higher secondary schools (Government and
private) revealed that the students of private schools scored significantly higher than the
students of government schools in different dimensions of verbal and non-verbal creativity.
All dimensions of creativity were significantly higher for the male and female students of
private schools than the male and female students of government schools. Also, Mahender
Reddy (1989) studied the type of the school (private or govt.) as one of the variables. He

57
found that the students from private schools were superior in all aspects of creativity over
government school students. Boys' and girls' scores from both types of school significantly
differed.
Only one study, by Dwivedi and Sharma (1987), has been conducted on 40 IX class
students studying in Government High Schools, Bikaner in Rajasthan (India). The main
objective ofthe study was to investigate those factors which inhibit or enhance the level
of creative thinking amongst high school boys. Three groups of factors were considered.
It was concluded that the orthodox nature of the family, its economic background, family
disputes, an inability to converse fluently due to language difficulty, a lack of adequate
teaching aids, a lack of opportunities to do creative work and a lack of new knowledge in
the classroom were some of the important factors which affected creative thinking amongst
high school boys.
Many studies in India have focused on comparing government schools with other
schools. This exception (Dwivedi and Sharma, 1987) concentrated on government schools.
But their study is inadequate in many ways. A comprehensive study with a large sample
comprising students, teachers and head teachers is needed to develop a deeper
understanding of the real situation and emerging issues and problems in government
schools.
3.6.0 Summary and conclusions:
Every child possesses at least some creativity. Its development depends upon how
teachers identify and foster it. Teachers' interest in it seems to be important. Other
evidence relating individual characteristics and creativity shows that: 1) creativity increases
with age up to a particular age level beyond which it starts decreasing;. 2) the relationship
between grade levels and creativity is inconsistent; 3) the evidence regarding gender and
creativity is unclear; 4). SES influences creativity; usually the higher the level the greater
the creativity; and 5). Students studying in government schools in India perform poorly
when compared with other type of schools.
It would seem that there is a need for a study which attempts to take account of all
of these factors in considering creativity. Further, it is necessary to study the causes for
underachievement in government schools in India. The role of the school and the views of
teachers working in the schools may be important. The succeeding two chapters will
discuss the literature relating to the role ofthe school and teachers in promoting creativity.
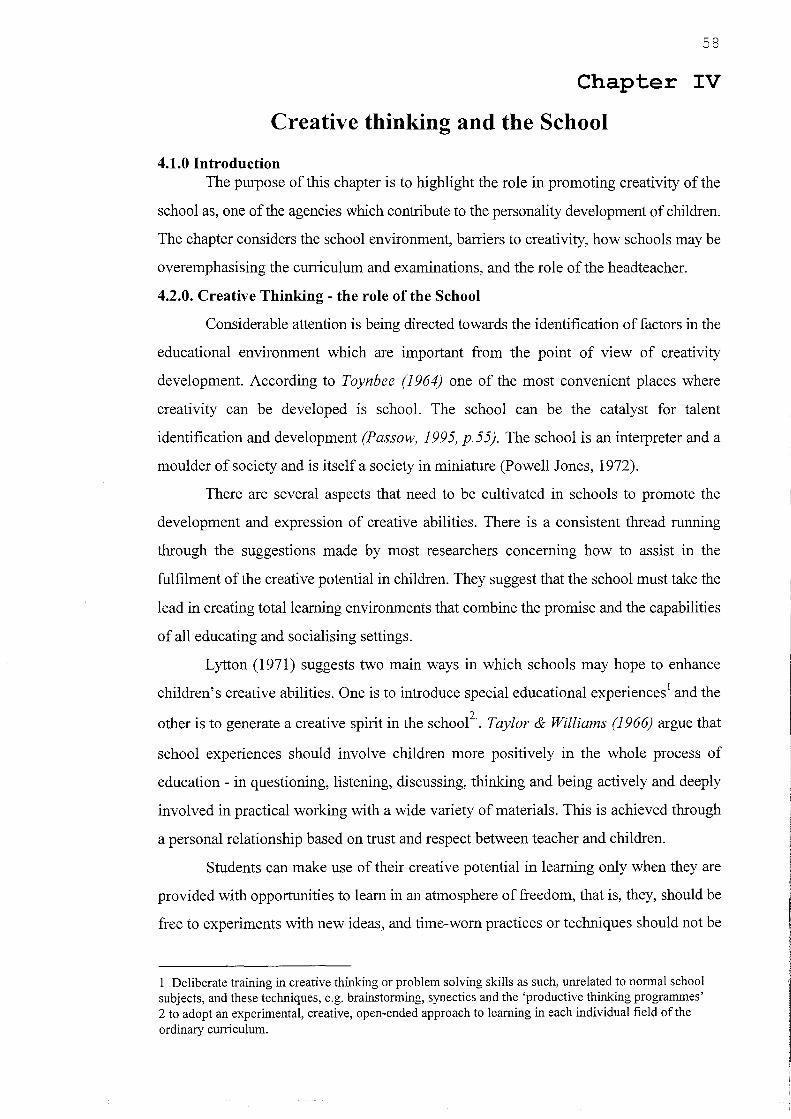
58
Chapter IV
Creative thinking and the School
4.1.0 Introduction The purpose of this chapter is to highlight the role in promoting creativity of the
school as, one of the agencies which contribute to the personality development of children.
The chapter considers the school environment, barriers to creativity, how schools may be
overemphasising the curriculum and examinations, and the role of the headteacher.
4.2.0. Creative Thinking - the role of the School
Considerable attention is being directed towards the identification of factors in the
educational environment which are important from the point of view of creativity
development. According to Toynbee (I964) one of the most convenient places where
creativity can be developed is school. The school can be the catalyst for talent
identification and development (Passow, 1995, p.55). The school is an interpreter and a
moulder of society and is itself a society in miniature (Powell Jones, 1972).
There are several aspects that need to be cultivated in schools to promote the
development and expression of creative abilities. There is a consistent thread running
through the suggestions made by most researchers concerning how to assist in the
fulfilment of the creative potential in children. They suggest that the school must take the
lead in creating total learning environments that combine the promise and the capabilities
of all educating and socialising settings.
Lytton (1971) suggests two main ways in which schools may hope to enhance
children's creative abilities. One is to introduce special educational experiences! and the
other is to generate a creative spirit in the schooI2
.. Taylor & Williams (I966) argue that
school experiences should involve children more positively in the whole process of
education - in questioning, listening, discussing, thinking and being actively and deeply
involved in practical working with a wide variety of materials. This is achieved through
a personal relationship based on trust and respect between teacher and children.
Students can make use of their creative potential in learning only when they are
provided with opportunities to learn in an atmosphere of freedom, that is, they, should be
free to experiments with new ideas, and time-worn practices or techniques should not be
1 Deliberate training in creative thinking or problem solving skills as such, unrelated to normal school subjects, and these techniques, e.g. brainstorming, synectics and the 'productive thinking programmes' 2 to adopt an experimental, creative, open-ended approach to learning in each individual field of the ordinary curriculum.
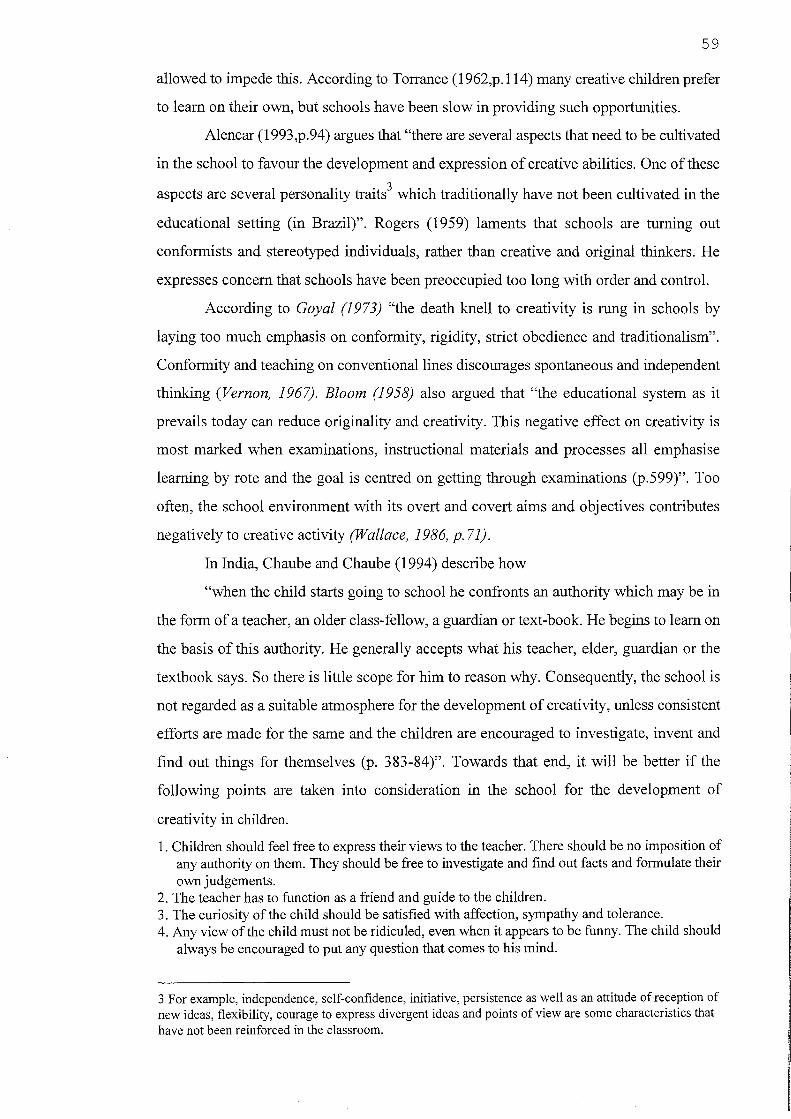
59
allowed to impede this. According to Torrance (1962,p.114) many creative children prefer
to learn on their own, but schools have been slow in providing such opportunities.
Alencar (1993,p.94) argues that "there are several aspects that need to be cultivated
in the school to favour the development and expression of creative abilities. One of these
aspects are several personality traits3 which traditionally have not been cultivated in the
educational setting (in Brazil)". Rogers (1959) laments that schools are turning out
conformists and stereotyped individuals, rather than creative and original thinkers. He
expresses concern that schools have been preoccupied too long with order and control.
According to Goyal (1973) "the death knell to creativity is rung in schools by
laying too much emphasis on conformity, rigidity, strict obedience and traditionalism".
Conformity and teaching on conventional lines discourages spontaneous and independent
thinking (Vernon, 1967). Bloom (1958) also argued that "the educational system as it
prevails today can reduce originality and creativity. This negative effect on creativity is
most marked when examinations, instructional materials and processes all emphasise
learning by rote and the goal is centred on getting through examinations (p.599)". Too
often, the school environment with its overt and covert aims and objectives contributes
negatively to creative activity (Wallace, 1986, p. 71).
In India, Chaube and Chaube (1994) describe how
"when the child starts going to school he confronts an authority which may be in
the form of a teacher, an older class-fellow, a guardian or text-book. He begins to learn on
the basis of this authority. He generally accepts what his teacher, elder, guardian or the
textbook says. So there is little scope for him to reason why. Consequently, the school is
not regarded as a suitable atmosphere for the development of creativity, unless consistent
efforts are made for the same and the children are encouraged to investigate, invent and
find out things for themselves (p. 383-84)". Towards that end, it will be better if the
following points are taken into consideration in the school for the development of
creativity in children.
1. Children should feel free to express their views to the teacher. There should be no imposition of any authority on them. They should be free to investigate and find out facts and formulate their own judgements.
2. The teacher has to function as a friend and guide to the children. 3. The curiosity of the child should be satisfied with affection, sympathy and tolerance. 4. Any view of the child must not be ridiculed, even when it appears to be funny. The child should
always be encouraged to put any question that comes to his mind.
3 For example, independence, self-confidence, initiative, persistence as well as an attitude of reception of new ideas, flexibility, courage to express divergent ideas and points of view are some characteristics that have not been reinforced in the classroom.

60
5. The curriculum for the child should be such as to allow ample scope for investigation and experimentation. The child should not be required only to memorise the contents of the course.
6. Teaching in the class should not be subordinated to examination, otherwise the child will become busy in preparing himself for examination and will become blind to the grains of creativity inherent in him.
Schools in India have generally ignored and have been almost indifferent to the
area of man's creative abilities (Agarwal 1992, p.26). It is generally agreed that school
programmes are not giving due place to the educational experiences and proper
environments which are conducive to the development of creative potential. This may be
due to an unawareness of the importance of creative talent in relation to national
development, or to inadequate understanding of the creative process on the part of teachers,
difficulties in identifying creative children or a lack of knowledge of factors which inhibit
and accelerate the development of creativity.
Chakraborthy (1992) concluded that in Indian schools no attempt is made by the
teachers to encourage divergent thinking abilities of children. Such an absence of effort to
promote the creative thinking abilities of pupils may be attributable to the scanty
knowledge of teachers about the nature of talent and strategies for its development (p.177).
The scientists, industrialists, politicians, artists, writers and medical researchers of the
future are currently in the schools, yet present educational practices typically fail to foster
creative growth among them; they perhaps even stifle the imagination of students.
4.3.0. Creativity - School Environment
Creativity does not blossom in a vacuum. The creative mind interacts vigorously
with the nexus of supportive and stimulating factors in the environment, whether at home
or at school (Weisberg and Springer, 1967). As Lowenfeld and Brittain (1982, p.70)
suggest, "Creativity does not just happen. It is an essential part of the learning process".
A stimulating school environment, proper physical facilities, and a free atmosphere help
in fostering creativity among children (Passi,1989, p.10). Adequate resources, i.e., better
buildings and equipment, and a greater range of opportunities are needed to promote
creativity (Woods, 1990, p.51). But Woods also argues that sometimes an element of
hardship is required.
According to Stein (1974) stimulating creativity involves not only stimulating the
individual but also affecting hislher social milieu and the people in it. If those around the
creating person do not value creativity, if they do not provide the necessary supportive
environment, if they do not accept creative work when it is completed, then it is likely that
the creative individual's efforts will encounter serious if not insurmountable obstacles.

61
Rogers (1954, p.147-49; 1959, pp. 78-80) outlines two environmental conditions
that are conducive to maximizing people's creative abilities: (1 ) psychological safet/ and
(2) psychological freedoms. Creativity depends upon many environmental factors
particularly related to home, school and community. As Passi (1989, p.7) says the
atmosphere at home, at school, in the community and in the culture to which the child
belongs may be authoritarian. Such an atmosphere demands that he behaves according to
elders' 'expectations', not permitting him to question them. This can become a barrier for
creative development The family environment is also a considerable influence 6 on the
development of creativity and personality traits (Getzels & Jackson, 1962, Domino, 1979,
Sloane, 1985, Passow, 1995).
Freeman, Hale and Cheshire (1985) emphasise that creativity is fostered in an
environment where the child is emotionally secure and encouraged to take risks with new
and unfamiliar ideas. Free and imaginative play is an essential requirement for the free
growth of cognitive and affective functioning, but this must also be allied to the sensitive
and unobtrusive intervention ofthe teacher or parent, which extends and encourages the
child's questioning. Creative thinking demands self-confidence, and an environment which
promotes free thinking and acceptance of new ideas (p.100). Beetlestone (1998, pp.107-08)
also emphasises three aspects oflearning climates (or environments) to foster children's
creativity: 1. the physical climate (created through the organisation and management of
space and resources); 2. the intellectual climate (which provides the appropriate degree
of stimulation and challenge), and 3. the emotional climate (wherein the leamer's needs
are met).
Csikszentmihalyi (1988) says "we cannot study creativity by isolating individuals
and their work from the social and historical milieu in which their actions are carried out".
He argues that creativity is never the result of individual action alone; it is the product of
three main shaping forces: 1). field (social institution), 2). cultural domain (preserved and
transmitted for future generations), and 3). individual (who brings change in the field and
domain) (p. 325). Further, he criticises the person-centred view of creativity (see in
4 Psychological safety means: (i) a sense of their own inherent worth; (ii) a climate in which highly judgmental evaluation of them is absente to minimize threat and need for defensiveness); and (iii) a feeling that they are receiving empathic understanding (to convince them that teachers appreciate what they are feeling and doing from their own point of view).
5 Psychological freedom means a permissive attitude toward people's symbolic and productive expression, allowing them to think, feel and be whatever coincides with their innermost goals.
6 For example child rearing practices, parents' personality characteristics, parents' expectation toward the children, their degree of acceptance, encouragement, respect for the children's ideas, feelings, and questions, freedom of expression, and autonomy.

62
Alencer, 1993, p.93), stating, for example, that "to study creativity by focusing on the
individual alone is like trying to understand how an apple tree produces fruit by looking
only at the tree, and ignoring the sun and the soil that support its life".
4.3.1 Barriers to Creative Thinking
Adams (1979) explains that "the conceptual blocks are mental walls that block the
creative problem solver from correctly perceiving a problem or conceiving its solution
(p.ll)". 1) Perceptual blocks -one's past experience makes it difficult for one to look at a
problem from various viewpoints. As long as one is locked within one viewpoint,
producing the original ideas required to solve a difficult problem will be impossible (p.13).
2) Cultural and environmental blocks - cultural blocks are acquired by exposure to a given
set of cultural patterns. Environmental blocks are imposed by our immediate social and
physical environment. (For example, lack of economic or organizational support to bring
ideas into action, lack of cooperation I acceptance and trust among colleagues, autocratic
bossism. p.3l). 3). Emotional blocs - Insecurity, fear of making a mistake, failing, or taking
a risk (fear of punishment for mistakes, fear among the students in giving answers), since
production of a creative idea involves taking risks (p.53), and 4). Intellectual and
expressive blocks - inflexible or inadequate use of problem-solving strategies, or
inadequate information before being the problem. Expressive blocks include inadequate
language skill to express or record ideas (p.63).
Hill(1992) examined the environmental barriers to creative expression. These
include lack of freedom, inappropriate reward systems, and insufficient resources and time.
Environment stimulants to creative expression include freedom, sufficient resources and
time, enthusiastic management, a non-threatening and collaborative atmosphere,
recognition and reward, and challenge. As Bowes (1986, p.12l) has argued, creative
potential is blocked by the nature of a formal and hidden curriculum which de-powers the
individual and by a climate of learning characterised by fear of failure and loss of self
esteem. The challenge cannot be met by curriculum reform alone. Sound innovation
requires a facilitative climate in which both young people and teachers can enjoy "freedom
to learn" and realise their creative potential
Hallman (1967, p.325) listed some of the inhibitors to creativity in schools. They
include pressures to conform to teacher-chosen goals and activities, standardized routines
and tests or an inflexible curriculum; authoritarian attitudes and environment; domination
of teachers of pupils for any reason, threats of any kind, fears which may be engendered
of failure to obtain right answers; over-emphasis on grades or rewards; and insistence on

63
or demand for fixed and predetermined answers.
As Hurlock (1978) pointed out, the most common hazards for developing creativity
include failure to detect creativity in time to stimulate it when it is developing,
unfavourable social attitudes toward creativity and conditions in the home and school that
are unfavourable to its development (p.348). The school, by not providing adequate
facilities, instructional materials and freedom to teachers and students, may create another
barrier. In the classroom, if a teacher is not providing opportunities for children for free
thinking, expression and actions, to that extent s/he is hindering the development of
creativity (Passi, 1989, p.7). Such a classroom teacher is generally concerned with
maintaining discipline, completion of the course, confining work to textbooks, over
emphasising rote learning, criticising children for wrong answers, not posing many open
ended questions nor allowing students to put questions and so on (Ibid, p.7).
4.4.0. Creativity - Curriculum in secondary schools
The term "curriculum" is applied to those ideas and experiences chosen by the
school for use by the students for the achievement of established goals. Traditionally the
curriculum is viewed as a number of subjects to be mastered by the learner. Curricula or
courses of study describe the ground which pupil and teacher try to cover to attain the
objectives of education. However, in a broad sense the curriculum does not mean only the
academic subjects traditionally taught, but includes the totality of experiences which a
child receives at the school under the guidance of teachers (Singh, B. P, 1991, p.1).
Curriculum is a means by which we put an educational proposal into practice. It is
concerned with the entire context of pupil-curriculum-teacher relationships (Singh, B.P
1991, p.34). "Curriculum is conceived of as the whole ofthe interacting forces of the total
environment provided for pupils by the school and the pupil's experiences in that
environment" (Anderson, 1956), which can meet pupil's needs and can also assist in
helping him or her adjust to hislher socio-cultural climate (Singh, B. P., 1991, p.158). The
curriculum must help students in developing skills, interests and habits which may be
helpful to them as individuals and for the society in which they will have to live.
Aggarwal (1990) suggested that those activities should be included In the
curriculum which enable the child to exercise his creative and constructive powers. One
objective of education is to discover and to develop special interests and aptitudes. For
instance, the Review Committee NPE'86 (1990) suggested that the curriculum should be
a self-sufficient package of knowledge, aptitude and skills with which the child can go into
the 'world of work' and continue self-learning throughout life (p.299).
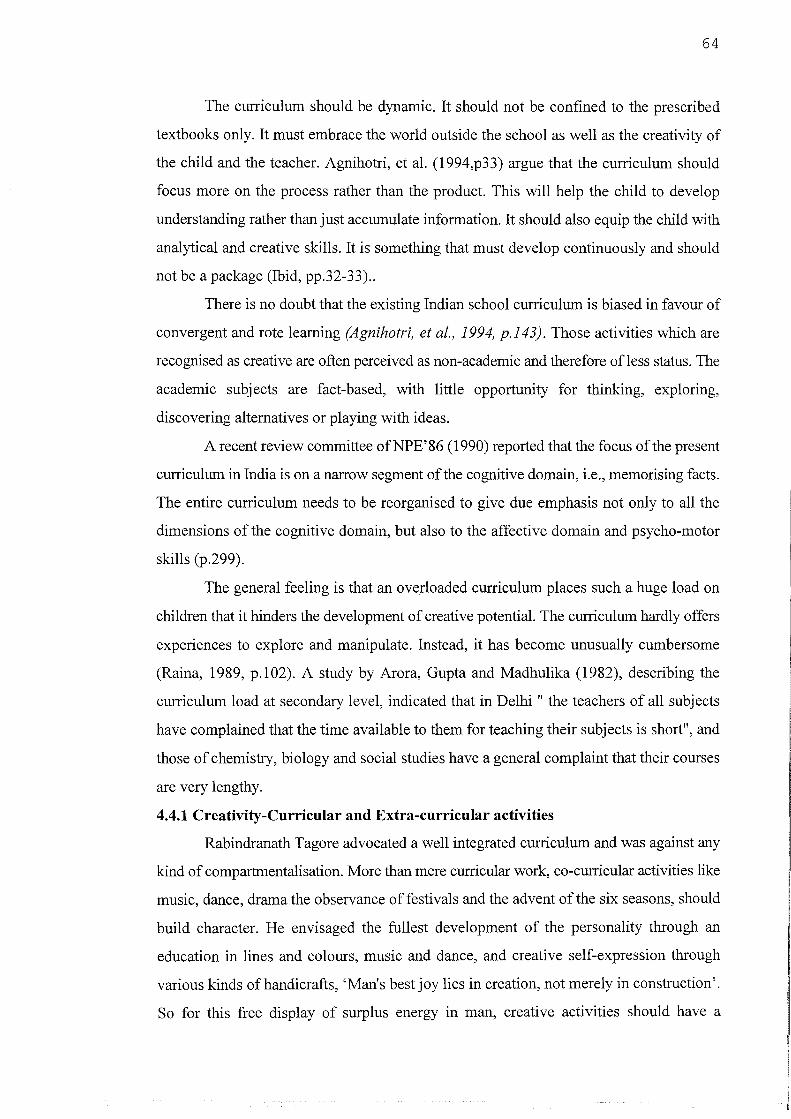
64
The curriculum should be dynamic. It should not be confined to the prescribed
textbooks only. It must embrace the world outside the school as well as the creativity of
the child and the teacher. Agnihotri, et al. (1994,p33) argue that the curriculum should
focus more on the process rather than the product. This will help the child to develop
understanding rather than just accumulate information. It should also equip the child with
analytical and creative skills. It is something that must develop continuously and should
not be a package (Ibid, pp.32-33) ..
There is no doubt that the existing Indian school curriculum is biased in favour of
convergent and rote learning (Agnihotri, et at., 1994, p.143). Those activities which are
recognised as creative are often perceived as non-academic and therefore of less status. The
academic subjects are fact-based, with little opportunity for thinking, exploring,
discovering alternatives or playing with ideas.
A recent review committee ofNPE'86 (1990) reported that the focus of the present
curriculum in India is on a narrow segment of the cognitive domain, i.e., memorising facts.
The entire curriculum needs to be reorganised to give due emphasis not only to all the
dimensions of the cognitive domain, but also to the affective domain and psycho-motor
skills (p.299).
The general feeling is that an overloaded curriculum places such a huge load on
children that it hinders the development of creative potential. The curriculum hardly offers
experiences to explore and manipulate. Instead, it has become unusually cumbersome
(Raina, 1989, p.102). A study by Arora, Gupta and Madhulika (1982), describing the
curriculum load at secondary level, indicated that in Delhi" the teachers of all subjects
have complained that the time available to them for teaching their subjects is short", and
those of chemistry, biology and social studies have a general complaint that their courses
are very lengthy.
4.4.1 Creativity-Curricular and Extra-curricular activities
Rabindranath Tagore advocated a well integrated curriculum and was against any
kind of compartmentalisation. More than mere curricular work, co-curricular activities like
music, dance, drama the observance of festivals and the advent of the six seasons, should
build character. He envisaged the fullest development of the personality through an
education in lines and colours, music and dance, and creative self-expression through
various kinds of handicrafts, 'Man's best joy lies in creation, not merely in construction'.
So for this free display of surplus energy in man, creative activities should have a

65
prominent place. It spares education from degenerating into a lifeless bookishness devoid
of the joy which should permeate every moment of learning (see Mukhopadyaya, 1958,
p.78).
The Indian Education Commission (1964-66) emphasised the importance of "co
curricular activities such as debates and dramas which have more of the quality of play
than of work and which give greater opportunities for creative self-expression. Every
school should organise a variety of such programmes so that every child in it may be able
to take up something suited to his tastes and interests" (p.207). Also, Muddu (1981)
suggested that the flexible curriculum, democratic administration through students'
councils and committees, scientific and recreational hobbies, magazines, drama, writing
competitions, painting competitions, debates, poetical symposia and other cultural
activities, excursions and tours etc., go a long way to developing the creative potential of
children.
A recent experimental study in India by Shan (1992), with a group of students who
were taught science using various curricular activities, namely, brainstorming, problem
solving, project and quiz, gained significantly in their verbal fluency, flexibility,
originality, elaboration, non-verbal originality, total non-verbal creative thinking and total
creative thinking as compared to the group of students taught through traditional lecture
methods.
4.4.2 Creativity and status of art education in India
The structure, curriculum pattern and time allocation for the different sub-stages
of school education apply in general throughout India (see APP-A2). Of course, there are
greater variations in the domain of non-scholastic areas such as work experience or socially
useful project work (SUPW); health and physical education, arts, moral education etc. In
the majority of schools SUPW and physical education are non-examination areas, but in
some states these are treated as subjects for external examination. There are wide
variations in the context as well as the status of art in the school curriculum. In some
states, only drawing is taught in the name of 'art', while in others music, dance etc. have
also been brought under the scope of art (Singh, B. S., 1991, P.10).
Art education, however, remains one of the most neglected areas of the school
curriculum in India. At the middle and secondary level, a few schools have introduced
some skill-oriented practices in visual and performing arts and crafts which are taught on
the basis of strict mechanical rules and copy-work. In fact it is not art, but a "drawing"
subject under one of the SUPW activities which are provided in various states' syllabi. Its

66
various activities like 'object drawing', 'memory drawing', 'scenery making', etc., are the
stereotyped art programmes practised in most of the schools. Students are expected to copy
the drawing of some objects from the sketches drawn by the teacher on the black-board
(Raina, 1989,p.103). The natural flair of the child for creative work is thus crippled by
enforcing 'set rules' and 'copy methods' through dubious forms of the 'drawing' subject in
schools (p.104).
Developing aesthetic appreciation and creativity through participation in artistic
activities is one of the objectives at secondary school level in India. As Raja Gopal (1967)
said, the neglect of the arts in education impoverishes the educational process and leads
to a decline in aesthetic tastes and values. With regard to co-curricular activities, there are
certain activities such as hobbies of different kinds, debates, and staging of plays, all of
which have more of the quality of play than of work and give greater opportunities for
creative expression (p.47) ..
4.5.0 Experimentation and creative work in secondary schools
The Report of the Review Committee on the Curriculum for the Ten Year School
(1977, PP 22, cited in Singha, B.S., 1991) suggested that teachers should be made aware
of the areas of experimentation which require their creative effort, with help through
guidebooks, frequent seminars and conferences. This is essential to foster new ideas and
to sustain interest. If teaching conditions are made reasonably congenial, creative and
experimental work will develop and thrive.
The committee made further recommendations. (i) Teachers should encourage
children's own initiatives, independent inquiry, thoughts and ideas by respecting their
humble expression. Also children should be exposed to a variety of situations and materials
for keener observation and close analysis. (ii) Books on art, copying from others' art work,
colouring books or how-to-do series on art should not be recommended, as they adversely
affect the imaginative and creative growth of children by promoting uniformity.
4.6.0. Is creativity found only in some subjects?
To develop creative thinking calls for new ways in which subject matter is to be
presented. Understanding that most of the creative - thinking abilities are in the divergent
thinking category, the teacher can seek opportunities to call for divergent thinking. The
teacher who is alert to opportunities to stimulate creative thinking, whatever the course,
can very likely find such occasions (Guilford, 1962). Massialas & Zevin (1967)
demonstrated how creative behaviours can be encouraged in the teaching of any subject
through the use of open - ended discussions and problem solving.

67
Opportunities for teaching creative skills are by no means limited to courses in art.
Such opportunities are perhaps most obviously encountered in courses in the sciences, in
composition and in mathematics (Guilford 1962). According to Fisher (1990) we have
traditionally thought of creativity as a function of the arts but not of maths and science. But
any activity that involves imagination and originality can be regarded as creative. Maslow
(1959) argued that 'a first rate soup is more creative than a second rate painting (p.84)'.
Karl Popper (1968) wrote that every scientific discovery contains 'irrational elements' or
'creative intuition'. Einstein maintained that the most beautiful thing we can experience
is the mysterious. It is the source of all true art and science. Works of art and scientific
inquiry are both explorations, looking at different aspects of nature; both require
imagination, reason and emotional involvement (Fisher, 1990).
4.7.0 Creativity- Teaching Aids
Spontaneous role-playing provides a common experience for all members of the
group and the raw materials for creative production. Torrance (1965) explained that both
commercial and home-made recordings can be used for this purpose. Pictures, films, a
radio broadcast, a TV programme or similar media are also useful. Foster (1971) pointed
out that the use of educational games which call for imaginative and individual solutions
has great potential for creative development. Poole (1979) suggested that the teacher
should encourage children to play with picture cards, film strips and posters, word play,
and imaginative verbal games that stir their imagination (p.81-84).
In India, Passi (1989) argued that one should use teaching aids judiciously. Let
there be learning which stimulates exploration and creative thinking. Do not let the aids
hamper or curb the imagination, curiosity, inquisitiveness of children which are some of
the essential components of creative thinking (p. 8). A recent study of Sudhir Kumar
(1992) revealed that exposure to mass media seemed to have a positive significant effect
on the creative thinking ability of children. The students exposed most to the media had
an advantage over the less exposed students in their creative disposition. The students with
literary interests gained superiority in creative thinking when compared to those with social
and cultural interests. In India, teaching aids which encourage creativity, are conspicuous
by their absence in schools. While advanced countries have their classrooms full of
sophisticated gadgets, many schools in India lack even the facilities of good blackboards
(Singha, H. S., 1991, p.6).

68
4.8.0 Creativity - School Examinations
Goodale (1970) argues that traditional exams disembowel creative processes
completely, since they usually demand memory processes only and offer little opportunity
for divergent production or evaluation. Little wonder that so many teachers complain that
students do not think, when as a matter of fact teachers do not ask the kind of questions
that require thinking or give the student time to do so if s/he does have the opportunity.
Rowe (1974) found that teachers typically wait 1 second or less where the time required
to respond after being asked a high level question is 3 to 5 seconds.
In India, the total teaching and learning perspective in schools is stereotyped and
vitiated by excessive emphasis on rote-learning at the cost of real understanding (Singha,
H. S.,1991). The focus seems to be passing the examination rather than acquisition of
proper skills, knowledge, interests, attitudes and habits. The main method used in schools
is 'chalk and talk', with the result that the involvement of children remains limited and they
do not develop a spirit of enquiry and scientific attitude. The great emphasis on convergent
thinking leaves_hardly any scope for independent thinking and judgement (p.6).
Arora, Gupta and Madhulika (1982) reported that the academic situation IS
characterized by the predominance of examinations, with test results as the main objective
in schools. "The basic orientation ofteachers' teaching is to prepare students for the annual
examination. The results also confirm that the amount of homework assigned by the
teachers far exceeds the limit of the optimum desirable time for homework. In fact, with
so much strain on the child, there is hardly any scope left for him to develop creative
capacities. The curriculum smothers creativity rather than developing it".
In this context it is worth quoting comments from the Secondary Education
Commission (1952-53, p.147):
"the examinations today dictate the curriculum instead of following it, prevent any experimentation, hamper the proper treatment of subjects and sound methods of teaching, foster a dull uniformity rather than originality, encourage the average pupil to concentrate too rigidly upon too narrow a field and thus help him to develop wrong values in education. Pupils assess education in terms of success in examinations. The teachers are forced to attend to what can be examined; and to do that with success they often have to 'spoonfeed' their pupils rather than encourage habits of independent study".
The Government's document on policy perspective in education (1985, p.9) also
blamed the examinations:
"no description of the contemporary educational scenario can be complete without a reference to the examination system since it decides, not only the fate of students, but also the content, orientation as well as the quality of education at all levels. Apart from evaluating examinees on the basis of rote learning and memorising, their annual periodicity creates an environment in which students tend to while away their time for most part of the year and gear themselves to work for the last three or four months. For obvious reasons, lack of continuity in application results in the building up of unbearable pressures at the end of the year, which [md expression in boycott of examinations, leakage of question papers, mass-copying, payment of bribes to evaluators and other unethical practices. Consequently, degrees and grades do not generally

69
command credibility as a whole with the public as well as employers in the public and private sectors, and the whole process of higher education has become warped, disoriented and dysfunctional, producing a large number of unemployable young men and women".
The role of education seems to have become so narrow that all it means is the
student answering a set of questions at the end of the year. This attitude oflearning by rote
starts from school (Raina, 1989). Most Indian teachers believe that fear of the rod or the
examination results in more learning. They appear to favour authoritative teaching or
learning by authority (p. 8). They believe that this sort of teaching is most effective and
economic. The present examinations-whether public or school based-represent the triumph
of a distorted view of education, one which sees it as generating a qualificationist society
respecting qualifications more than real learning. These examinations influence every
aspect of school life, teaching, learning the use of leisure time, and emphasis on co
curricular activities, in fact, the entire personality development of the child (Singha, H.S,
1991, pp.138-39). Almost 10 years later, the situation has hardly changed.
As Agnihotri, et al (1994) suggest, evaluation or assessment should be
comprehensive in nature. It involves all aspects of the teaching-learning situation and not
just the learner. It should help us to understand both the strengths and weaknesses of the
learners and teachers, and plan teaching materials and programmes.
4.9.0 Creative Thinking - Role of the headteacher
The role of the headteacher in fostering creativity in the school is crucial. An
attitude of flexibility in the administration of time schedules, space factors and
implementation of the curriculum as well as an interpretation of curricular requirements
is essential to the success of developing creativity (Gulati, 1995). Opportunities and
resources need to be provided for teachers and pupils to go on excursions or to visit
exhibitions or field trips to enrich their knowledge and experience of the world outside the
school in relation to what they learn within a classroom.
The headteacher plays a vital role as an academic leader and reformer at the school
level. S/he should have both teaching competency and administrative abilities. S/he has to
be an effective functionary, s/he must be a working example to his assistants. It is essential
that s/he must teach, however minimal the quantity may be. Otherwise the teachers may
comment behind his/her back. "S/he gave up teaching years ago. S/he dare not step into a
classroom and give a lesson. How can s/he come and tell us what we should teach or how
we ought to teach?" (see Raja Gopal, 1972).
The headteacher who is open minded and innovative, shows initiative, and is
sensitive to problems, through knowledge of the school environment can nurture creativity

70
within the school in the teachers and pupils. According to Passi (1989, p. 11), the
atmosphere in the school influences the creativity of the child. The interaction of the
teacher with the principal develops this atmosphere. In order to have a good atmosphere
in the school, the principal can:
~ Provide easy access to the teachers and students ~ Focus the work according to the capacity of the teachers. ~ Recognise and appreciate the potentialities of teachers. ~ Be sensitive to the problem of the teachers.
Torrance (1962, p. 206)) suggests that the school principal can help in guiding
creative talent in school: He can: 1. let teachers know that he respects creativity and
creative teaching; 2. use some regular system for obtaining teachers' ideas and tolerate
disagreement with his own ideas; 3.encourage experimentation and avoid loading teachers
with too many extra duties; 4. make the school atmosphere an exciting, adventurous one;
5. make it easy for the new teacher to generate new ideas and stimulate the staff; and 6.
maintain frequent communication with individual teachers but let them make most
decisions alone.
4.10.0 Summary and Conclusions:
The school is the catalyst for talent identification and development. It should
provide a supportive and stimulating environment, and a free atmosphere for fostering
creativity among the children. The curriculum does not mean only the teaching of academic
subjects traditionally. It should include activities which enable the child to exercise his
creative abilities. Cross-curricular activities like music, dance, drama, debates, excursions
and tours etc., are helpful in developing creativity among students. Art education is one of
the most neglected areas of a school curriculum in India. The emphasis on examinations
stresses convergent rather than divergent thinking. The curriculum and examinations
appear to influence children's creativity. The headteacher also appears to be influential in
relation to the kind of environment generated in the school. However, a number of
questions remain to be asked.
1) What are the inhibitors to creativity in government schools in India?
2) Is the present Indian curriculum at secondary stage suitable for the development of
creativity?
3) Is there any room for the development of creativity in the present examination system?
4) What types of activities (curricular and non-curricular) are organised by the government
schools as a whole to promote creativity among the students?

71
Chapter V
Creative Thinking and the Teacher
5.1.0 Introduction
This chapter focuses on the role of the teacher in fostering creativity among school
children. It considers on how a teacher can encourage creativity, teachers' classroom
questioning, and teachers' knowledge and understanding of creativity. Empirical studies on
teachers' views and attitudes towards creative teaching and learning will provide a background
for understanding the present status of research in the field of creativity.
5.2.0. Creative thinking - role of the teachers
Teachers need to teach their students how it is possible to reapply, transform and
reshape techniques and pieces of information which can then be applied to new situations for
which they were not originally intended. A given question often has many answers and it is
possible to react to the same situation in a variety of ways. Major goals of classroom
instruction should be to encourage children to recognize new possibilities for solving problems
and actively to seek alternative solutions. McLeod and Cropley (1989, p.177) emphasised that
such a policy has implications not only for students but also for teachers, who can no longer
function as the single source of all wisdom, dictating what is relevant and what is not, and
making all judgements about quality, but must be willing to depart from the lesson plan, to
look at answers which are not in the textbook and so on.
Hildreth (1966) highlights the role of the teacher as mentor: one who excites the
student and makes him I her want to keep on exploring even after the closing school bell rings
(pp.4 70-71). The teacher's primary goal is not to impart information, but to show the student
how to learn as he responds to thought provoking problems (p.223). Wallace (1986, p.76) says
that, the teacher is the guide, the prompter, and the change-agent. The teacher opens up new
avenues of interest, demonstrates new techniques of working or performing, shows how great
minds have thought, and helps the child to evaluate his work.
The teacher serves as facilitator rather than director of learning (Rogers,1959;78-79;
Wallace,1986, p.72). To facilitate learning the teacher must be a genuine human being, must
be able to interact with children in such a way as to demonstrate human concern, must build
a relationship of mutual trust with students and must demonstrate empathic understanding in
72
dealing with children.
According to Duric(1989) teachers must also learn to be creative in their educational
activity. If the teachers are not creative, it is not possible to them to develop the pupils'
creativity. The educational process in school is a bipolar process. One pole is formed by the
teacher, the other by the pupil. There should be an interaction between them; they should
influence each other mutually.
According to Torrance (1963), the creative classroom is an ideal centre, a place where
students and teachers are excited about learning and open to experience, where there is respect
for the individual student and his ideas. Such felt respect from an authority figure fosters
self-respect and self-discovery in the student. As Raina (1989) argues, the classroom has to
become a place where the exciting experience of exploring and discovering meaning is the
central activity. This obviously will give the student a chance of holding and presenting his
meanings without ridicule or attack, and the privilege of seeing things the way he does,
according to his own intellectual cognitive style (p.137).
The teacher is responsible for the child's working environment and must see that there
is a good deal in it likely to stimulate and interest in children (Dean, 1976). Slhe must also take
children out of school or stir and stimulate them through discussion or stories, or pose
questions or problems, so that they are motivated to create. S/he must take children's ideas
seriously and when time allows, talk with individuals in the attempt to discover how they see
what they are doing. As Goodale (1970) recognised the teacher's success or failure lies in his
capacity and ability to reach, catch and promote potential creativity in pupils. He has to
identify this creativity, reach it, and provide a congenial environment and a warm and friendly
atmosphere that promotes creativity. Teaching can playa pivotal role in shaping children's
creativity.
Freire (1972,p.58) characterizes much teaching as " ... an act of depositing in which the
students are the depositors and the teacher is the depositor...". Such a teaching method, adds
Freire, forces students to be the patient receivers of deposits by their teachers, deposits which
they are expected to memorize and repeat.
But creative teaching is always constructive. Rote memory and blind imitation are not
encouraged, whereas special emphasis is laid on independent thinking. Imitation is the greatest
enemy of creativity. Efforts need to be made to ensure that students do not remain passive
listeners but are active. In place of obedience and conformity, qualities like self-confidence

73
and originality are inculcated in the students. In addition, they are alerted to current problems,
and efforts are made to develop an experimental attitude in them so as to enable them to find
appropriate solutions to problems. For this, the teacher will have to understand the
characteristics of creative children, so that he can identify such children and help them in
cultivating their creative potentialities.
5.3.0 What Is the Teacher's Role in Fostering Creativity ?
Teachers who wish to foster creativity in children must discover the individual child's
interests and talents and establish an environment that promotes their expression (Hill, 1992;
Wallace, 1986, p.76). Teachers should develop a sensitivity to observing traits that indicate
creativity. These traits include flexibility, originality, openness, risk-taking, curiosity,
imagination, independence and tolerance of ambiguity (Hill, 1992).
Torrance (1968,1970,1975; Torrance and Myers, 1974) in a series of studies, and
other creativity-oriented educators (Barber and Holden, 1977), suggested the following ideas
for fostering creative thinking and originality among children: respecting children's right to
initiate their own learning efforts, questions and ideas; taking time to plan for imaginative
activities; holding free-wheeling discussions, brainstorming sessions and sharing with students
one's own activities involving aesthetic and creative expression; encouraging children's
awareness and sensitivity regarding environment stimuli.
Bjerstedt's (1 976)-survey research project studied creativity in schools, one of the aims
being a survey of the opinions of teachers on how to promote creativity in schools. The project
included an unstructured survey of the views of about 300 people, a structured survey of the
opinions of350 people 1 and classroom observations. One of the main findings was that it is
possible to stimulate aspects of creativity by fairly simple means, using specific types of study
materials. Bjerstedt and his col!eaguei found that the teachers tended to define creative ability
in terms of "independent work", "richness of ideas", "originality" and "the ability to combine".
According to Poole (1979 ,P .12), there are at least four important roles which the
teacher can play in fostering creativity in children. The first relates to teacher attitudes. An
open, receptive and accepting attitude by the teacher is indeed very important if creativity is
to thrive and flourish in classrooms. Secondly, Classroom organisation. Some children tend
to be boundary-breakers and produce more creative responses when they are forced to break
1 "key teachers" consultants or planners of in-service teachers training

74
through old conceptions and ideas in order to find newness. The astute teacher therefore looks
across curriculum boundaries to patterns of organisation that are sufficiently diverse to enable
children's creativity to be given organisational support, as in learning experiences, materials,
setting within groups.
Thirdly, the teacher can be seen as the constructor of curriculum experiences. If traits
such as imagination, curiosity, a quest for novelty, and inventiveness are to be developed, the
construction of appropriate curricular experiences by the teacher is of vital importance.
Fourthly, the teacher has to be able to recognise originality and reward it. Children can
become hostile if all their 'creations' are highly evaluated by the teacher. Self-monitoring is
to be encouraged; the teacher must nonetheless select the creative products of a child's output
which can be objectively as well as subjectively evaluated.
According to Powell Jones (1972, p.24) the teacher needs to become a fully original,
thinking, functioning personality, with an active awareness of divergent learning experiences,
and flexibility in his/her thinking and methods. Cropley (1967) argues that teachers who have
more knowledge of divergent thinking and associated concepts subsequently permit a higher
level of creativity in their students, even if they make no special and conscious effort to
encourage it. Patterning or modelling of creative behaviour on the part of a teacher, then, is
a potent factor in fostering creativity in students. According to Alencar (1993, p.94) "teachers
agree on the importance of fostering creativity but in general, teachers do not offer adequate
conditions for the development of creative capacity".
5.4.0 Who is the CreativeTeacher?
The research evidence suggests that a creative teacher maintains a dynamic balance
which demands alertness, perception, and critical thinking while teaching in a way which
involves the full use of the intellect, emotions, the senses and intuition. S/he is often non
conforming, independent, and questions traditional practices (Wallace, 1986, p.73). S/he
encourages and facilitates creative development and functioning among his pupils. S/he is a
humanist and an honest, trusting person (Torrance and Myers, 1974, p.317). The creative
teacher can create opportunities for creativity through arranging activities. e.g. field trips,
special days, pictures, dramatizations, pets and animals, and growing plants. The creative
teacher causes ideas to develop, and these ideas can become the substance of the creative
2 Ibid

75
productions of children (Torrance, 1965, pp. 304).
According to Hallman (1967, pp. 327-330; 1971, pp. 220-224) the creative teacher
provides for self-initiated learning and sets up a non-authoritarian learning environment. If the
teacher is authoritarian slhe discourages decision-making on the part of pupils. The creative
teacher encourages creative thought processes. Slhe stimulates pupils to seek for new
connections among data, to associate, imagine, think up tentative solutions to problems at
hand, make wild guesses, hitchhike ideas, build on the ideas of others and point these ideas
in new directions. Slhe allows students to take intellectual risks, to speculate on the basis of
inconclusive information, to probe for structural and spatial relationships among things.
The creative teacher also promotes intellectual flexibility, encourages self-evaluation
of individual progress and achievement, helps the student to become more sensitive to the
moods and feelings of other people, to all external stimuli, and social and personal problems
as well as academic ones, to public issues, and even to the commonplace and the unknown.
To encourage divergent thinking, a creative instructor will maintain an easy
willingness to consider any question, any topic, any time. Thus, a good teacher is seen by his
students as a "creative observer" (Hughes, 1969), according to Eric Barnes (1956), who
describes one from a student's view point: "He is perceptive, kind, appreciative, sometimes
critical, but always detached. When he is on the sidelines, one's task immediately takes on new
meaning and dignity".
According to Cornelius and Casler (1991) a creative teacher provides opportunities for
students to explore and manipulate a wide variety of materials, props and ideas. Slhe also
provides for self-initiated learning and activity on the part of the child and gives "think" time
to the child so that they can reflect and make choices that are fun and meaningful (p.l 03). The
research literature supports the position that creativity indeed can be taught, but that it cannot
be taught by the traditional, authoritarian methods. Creative procedures cannot be prescribed
nor can they be written into lesson plans; yet creative teaching is the best way, perhaps the only
way, to promote creative behaviour on the part of pupils (Hallman, 1971, p.327).
5.5.0 Non-Creative teachers
The non-creative classroom by comparison is one in which the teacher is authoritarian,
rigid, dominated by time, insensitive to pupils' emotional needs, unwilling to give of
themselves, preoccupied with discipline and the giving of information (Wallace, 1986,p. 72).
A non-creative teacher becomes a giver of knowledge rather than a motivator of learning

76
(Singha, H. S., 1991). An insecure teacher who uses his position of authority to bolster his ego
is not likely to welcome the challenges posed by creative thinking. He is apt to interpret the
creative student's questioning, doubting and challenging as insubordination, where as a teacher
must be able to gain satisfaction from a new idea created by one of his students (Sanders,
1966, P.137).
5.6.0 What can teachers do to develop creativity?
Creativity in recent years has become an ideal of democratic living and institutions.
Strongly supported by humanistic psychologists is the assumption that all people have creative
potential, so the challenge for society and schools is to develop methods for releasing and
developing their potential. Many researchers see creativity as a 'complex set of human
attributes which can be enhanced by deliberate efforts' (Amabile, 1987; Parnes, 1987;
Torrance,1987).
Creativity-oriented educators, Torrance and Myers (1974), have argued that creative
behaviour does not have to be left to chance. They describe some deliberate, disciplined
methods for increasing the chances that creative behaviour will occur in the classroom (p.1 00).
They emphasise that deliberate methods of creative problem solving tend to increase the
chances of finding original solutions. But they argue that other skills are also required for
creative problem solving, such as accurate observation and awareness skills, questioning,
maintaining ideas, and predictions (p.83).
According to Foster (1971), "the teacher is a crucial factor in nurturing creative
responses. Much potential is only realised if the teacher is able to recognise creative behaviour,
and is subsequently sympathetic towards it and makes active efforts to cater for it and
encourage it" (p.1S7). This will probably best be accomplished in an atmosphere where the
individual is respected and genuine participation is encouraged, the teacher joining in and
carefully guiding the pupil's thinking so that further original ideas are the outcome. A most
important factor in encouraging children to use their creative abilities is that the teacher should
really believe that all pupils are capable of achieving a high level creative functioning. In
psychological terms, 'teacher expectation must be high' (Foster, 1971, p. 38).
Cropley (1982)3 identified two basic underlying principles: acceptance and
acknowledgement. Acceptance involves a willingness on the part of teachers to take seriously
3 Cited in Me Leod and Cropley (1989).
77
ideas which depart from the everyday or conventional. Acknowledgement requires teachers
not only to tolerate the efforts of highly able children but also to make it clear that they
welcome such efforts and regard them as important, necessary and praiseworthy.
Freeman, Butcher and Christie (1968) conclude that 'creative development can be
enhanced through the use of discovery methods'. They emphasise that school and home
environments should give 'free rein and a ready response to the explorations of the child'.
Mc.Leod and Cropley (1989) argue that teachers can often help children by giving everybody
a chance to speak up in class and avoiding hurting people's feelings (p.178). The teacher is
expected to respond to the creative needs ofthe learner, know the learner, build creative skills,
and go beyond textbooks, classrooms, and curricula (Torrance, 1970). There is an essential
tension in the curiosity and search for the truth that characterises creative learning. Much more
than a permissive environment is necessary. Teaching in creative ways "requires involvement
and commitment- the most sensitive and alert kind of guidance and direction, absorbed
listening, fending off disparagement and ridicule, and making honest efforts seem worthwhile
enough to assure continued effort" (Torrance and Myers, 1974, p.13).
The research indicates that the following are positively conducive to creative
functioning.
IF Help children become more sensitive to environmental stimuli and acquisition of knowledge in a variety of fields (Torrance, 1962b). Avoid over-emphasising textual information. Whenever possible provide for supplementary material, books and other experiences (Passi, 1989).
IF Provide stimulation to promote creative learning by students. Creative learning involves skills of inquiry, research and problem solving. Here, the learner raises questions, makes guesses, tests the guesses, corrects errors and arrives at conclusions (Passi, 1989). Encourage experimentation and spontaneity. Make available resources for working and encourage manipulation of objects and ideas (Torrance, 1962a).
IF Encourage or reward or respect creative effort in the form of unusual and imaginative ideas. Appreciate openly whenever a child expresses creative behaviour like asking unusual questions, giving an unusual idea, taking self-initiated actions etc. It is not always necessary to reward only the expected answers (Torrance, 1962a and 1965; Wallace, 1986; Passi, 1989).
IF Encourage the habit of working out the full implications of ideas and develop skills of constructive criticism and encourage self-evaluated and self-initiated learning (Torrance, 1962b; Wallace, 1986). Encourage children to pursue their hobbies. Discourage rote learning or memorisation of facts by children (Passi, 1989).
IF Develop a creative classroom atmosphere (Torrance, 1962b). Do not make sarcastic and insulting remarks about children. Such remarks create a threatening atmosphere in the classroom. Remember that the classroom atmosphere should be stimulating and responsive (Passi, 1989). 'Efficient organisation' in the classroom will be concerned with basic order and routine. The organisation of pupils' learning will be extremely flexible, allowing individual choice, discrimination and judgement (Foster, 1971).

78
IF Show your pupils that their ideas have value (Torrance, 1962a and 1965). A good pupil- teacher relationship is essential (Wallace, 1986; Foster, 1971). Use of humour releases creative thinking (Wallace, 1986). The teacher must be a good listener, receptive to ideas, able to respond positively and build up the self-concept. Group activities and competition should not be used as the main spur to effort (Foster, 1971).
IF Allow children to pursue as much as they want without bothering themselves about giving the expected solution or answer (Passi, 1989). Allow pupils do something "for practice" without the threat of evaluation (Torrance, 1962a and 1965).
IF Avoid telling pupils everything and do not insist on correct answers. Allow the child to think and express freely and explore facts for themselves wherever possible between do their best without giving hints for the solution (Passi, 1989). Begin from where the pupils are, not where the teacher thinks they ought to be. Let the pupils go to where they want rather than where the teacher thinks they ought to go. Problems should be given which can be solved in groups. Collaboration is important and often gives rise to new ideas that can be developed by individuals. A team-teaching approach is likely to be fruitful. The team could profitably include students, aides and auxiliaries (Foster, 1971).
IF Brainstorming stimulates creative thinking. This can be a group or an individual activity (Wallace, 1986; Foster, 1971). Imaginative and supervised creative activities might foster the development of creative imagination better than undirected freedom of action (Markey, 1935; Mock, 1970).
A study by Wodtke (1963,1964 and 1965) used a creativity test to examine residual
gains of pupils over one school year in classes of highly controlling 4 as compared to low
controlling teachers5. The results reveal that the pupils of low controlling teachers achieved
higher gains on verbal creativity, verbal fluency and flexibility and the pupils of the high
controlling teachers achieved higher gains on non-verbal elaboration. Wodtke's experimental
studies concluded that the pupils of highly controlling teachers exhibit less self-initiated verbal
behaviour, and achieve lower gains on measures of verbal creativity than those of more
permissive teachers (Ibid, p.62-63). In particular, it has been argued by Torrance (1962a) that
directive teaching practices do not provide an optimal environment for encouraging creativity,
and that such environments may in fact suppress the development of creative abilities.
According to this point of view, the classroom behaviour of highly creative students may
conflict with the practices of highly directive teachers.
5.7.0 Creativity - Teachers classroom questioning behaviour
5.7.1 Importance of open-ended questions
Questioning is the most common communication behaviour used in teaching. Teachers
use questioning strategies to review, to check on learning, to probe thought processes, to pose
4 Pupils work strictly as directed, they do not choose assignments, movement and inter-pupil communication is controlled by the teacher, and whatever happen is done with the consent of the teacher. 5 Permits pupils to move around and interact freely, gives considerable choice in assignments, asks the pupils to express their own opinions and plan the work on their own.

79
problems, to seek out alternative solutions, and to challenge students to think critically and
reflect on issues or values they have not previously considered. It is not surprising that
questions have been labelled as "the single most influential teaching act" (Taba, Liven& Elzey,
1964)
Landau (1985, p. 379-80), rightly explained the importance of questioning behaviour
'By encouraging questions, we can help keep children's nature curiosity alive, stimulate their
imagination and sense of adventure, and at the same time keep the learning process enjoyable.
Once children enjoy learning, they become more involved in the subject, and venture to ask
questions; all of which leads to its continuing enjoyment and progress. Though obviously we
can't assist children with knowledge ofthe future, we can help them acquire the mental means
to deal with it more effectively'. Further, Landau says, questioning pushes an individual's
present knowledge to its limits so that he has to think again, thus challenging his potential, and
the greater the potential, the more powerful the challenge must be to be effective. Landau
argues that it is important, though, to teach children to ask questions which are not based only
on passively accepted knowledge, but which are dynamic and future-oriented. Such questions
will help to close the gap between what is studied by the child today and what will be needed
by the adult.
Every creative act begins with questions, but the questions must be operationa16
and
open-ended 7 questions. Questions which are settled by citing already known facts hinder
creativeness and restrict discussion. They hinder creative efforts because they make
information a tool by which the teacher dominates rather than one which makes for inquiry and
discovery (Hallman, 1967 & 1971). One of the most gratifying results of open-ended
questioning is that pupils discover that they have worthwhile ideas. These questions not only
stimulate free-thinking but also secure the participation of many children (Passi, 1989, p.8).
Open-ended questions that feature original thinking can do a great deal for a child's self
concept, and they can also help the teacher (Torrance and Myers, 1974, P.194). Open questions
allow children to voice their own ideas and encourage children to get involved in the process
of investigation (Craft, 1997, p.4 7).
6 Operational questions initiate the creative endeavour because they lead to exploration; they foster curiosity and stimulate connotative tendencies.
7 Any question that invites a great diversity of responses or divergent thinking. Open-ended questioning involves the pupil in thinking of possible and going off into different directions to fmd an answer, instead of striving for one "correct" or "accepted" answer.
80
5.7.2 What research says about the usage of open-ended question by the teachers
Research (Gall, 1984; Hare & Pullman, 1980) has demonstrated that 80 percent of
questions used in classrooms ask students to do something other than think (60 % require
recall; 20 % are procedural). The findings of a classroom observation study by Bjerstedt and
his colleagues (1976) on thought processes showed that processes were reproductive (66.4%),
convergent (24.9%), divergent (3.9%) and evaluation (4.8%). The lessons were heavily
teacher-dominated, student initiatives only comprised about 8% during an average lesson (p.8).
Also, the research of Cunningham (1987) has shown that only 5% of the divergent questions
used in the classroom.
Ellis (1993) claimed that high-divergent questioni encourage creative thinking.
Further, research has indicated that in order for students to benefit from high-level divergent
questions they need the freedom to generate unique, new, or imaginative ideas. Thus, an
atmosphere where there is opportunity to explore a variety of ideas without constraints or
pressure to give "correct" answers is required (Sund & Carin, 1978). Students may be required
to elaborate, make divergent associations, point out implications, or do open predicting
Provocative questions improve the quality of pupils' learning (Torrance and Myers,
1974, P. 219-220). Studies of classroom behaviour, unhappily, indicate that provocative
questions are rarely asked at any level of education. One study (Fowlkes, 1962), for example,
showed that over 90 percent of the questions asked by junior high school social studies
teachers call only for the reproduction of textbook information.
5.8.0 Instruction for Creativity-Teachers Knowledge and understanding
For the teacher who is concerned about promoting creativity in students, a knowledge
of the various abilities contributing to creativity may be important. If we wish to develop
certain skills, it is very important to have knowledge ofthe nature of those skills. Unless we
know what a skill is like we do not have a very clear goal at which to aim (Guilford 1962).
Alencar (1993, p. 95) indicates that some teachers are not aware of techniques such as
brainstorming, synectics, and attribute listing, which can promote creativity.
Williams (1966a) administered a questionnaire to more than five hundred teachers
across the United States just beginning training. He reported that these teachers did not
understand what was meant by the term 'creativity' and that they had difficulty in identifying
8 These questions have students formulate generalisations and give diverse, Original, or novel responses.

81
creative talent in pupils. This study was replicated by Eberle (1966) and reported the same
results. Abraham (1966) also reported that many teachers do not understand and are not
prepared to cope with scholarly discussion of convergent and divergent thinking and complex
concepts of pupils' intellectual abilities.
In India, Raina and Raina (1981, p.103-08) studied 45 teacher educators' knowledge
of research findings and materials on creativity. They used the 'Information awareness
checklist,9 which was developed by Williams (1966a). The study revealed that they were most
aware of the need of creativity for their classroom teaching to have innovations, and had a
desire to have their pupils to think divergently and expect pupils to be creative at the same
time as learning subject-matter content. The results also revealed that by and large the teacher
educators did not possess sufficient knowledge or were not sufficiently aware of the creativity
and creativity movement in the field of education and psychology.
Wallace (1986, p.71) has also argued that although theories of creativity abound,
teachers are still no nearer to understanding what creativity actually is nor what the creative
process is. We are still a long way from understanding the basic mechanisms of thinking, to
say nothing of the complex process of creativity.
5.9.0 Creative thinking - Teachers' Views and Definitions
Just as studies of teacher's views of creativity seem to be quite rare, so do research
reports on creativity from Eastern Europe. However, Popescu-Nevianu and Cretsu (1986)10
combine these two elements in a study of Bucharest maths and Latin teachers. This explores
the teachers' attitudes to innovation. The number of respondents is not stated, but we are told
that their combined experience amounts to "up to five hundred years". This research reveals
an interesting paradox in that the Romanian teachers did not value initiative in them-selves,
but valued it highly in others. Indeed they appeared to be modest, have poor self-concepts and
prefer traditional teaching styles.
In the most comprehensive British study by Fryer (1989), the teachers were asked to
tick every item listed in a given table which matched their view of creativity. Results indicate
that the most teachers see creativity mainly in terms of Imagination (88.7%), originality (80%)
and self-expression (73.7%). Only half the sample regards divergence (50.8%) as synonymous
9 The checklist includes questions on tests and teaching materials by Torrance; Guilford model, Bruner and Bloom; on reports of Piaget's [mdings and general questions about divergent and productive thinking. 10 Cited in Fryer and Collings (1991) and Fryer (1996)
82
with creativity. Furthermore, the convergent process involved in creative thinking is not much
acknowledged. Only 10.2% think that convergence accords with their view of creativity. The
study revealed that the factors most assisting the development of creativity in the teachers'
view were building pupils confidence, encouraging pupils to ask questions, a creative teacher
and some free choice at home. The major obstacles perceived by the teachers were inadequate
resources, inadequate preparation time, over-large classes, excessive teaching and non
teaching workloads, and unsuitable accommodation.
5.10.0 Creative thinking - Teachers' attitude
Torrance (1965) used his Ideal Pupil checklist to explore the attitude of over a
thousand teachers from the United States, Germany, India, Greece and the Philippines (see
table-5.1). He concluded that teachers in all five cultures valued the creative child
insufficiently. They may be unduly rewarding courtesy, doing work on time, obedience,
popularity and willingness to accept the judgement of authorities. However, there have been
replications of this study by Raina and Raina (1971) with one hundred teacher educators
(male=84 and female=16, avg.age=36 years) of the State of Rajasthan (India) and Ohuche
(1986) with Igbo (minorities) teachers (male=72, female=55; avg.age=30 years; avg.exp=7.1
years) in Nigeria. The results of both studies show that teachers attach a great deal of
importance to industriousness, sincerity, obedience and meeting deadlines. The same attitudes
held by the Indian teachers was reflected in the study of Torrance (1965). Ohuche argues that
the Nigerian educational system is highly competitive and examination results oriented so the
teachers strive to prepare students to excel in examinations. As is the custom in their culture,
conformity, obedience and consideration for others are required (p.192-194). Similarly, Raina
and Raina argue that the system of education in India is greatly authoritarian and traditional.
The society is conservative and authoritarian, and obedience and sincerity are demanded. The
creative person must be open to new ideas, but must examine everything before he accepts it
as his own. This quality of intellectual honesty, sincerity and independence is not compatible
with a conformist society dominated by external examinations. This intellectual quality will
bring the individual into conflict and make the creative child isolated (Raina and Raina, 1971,
p.305).

83
A very recent study in the UK, Fryer (1996/1 used a sample of 1028 teachers drawn
from 57 schools (school teachers N=792, male=229, female=563 and 24 incomplete), and
colleges (education lecturers N=207, male=87, female=120) in the United Kingdom. The study
T bI 51 Th a e , : emos tf avoure d h C t . f b arac ens lCS )~ vanous cu It . d'n ura groups m 1 eren t t d' s u les, Studied by Torrance (1965) Raina & Ohuche Fryer
Raina (1971) (1986) (1996) Sample drawn form Teachers Teacher Secondary School &
Educators School college teachers teachers
Sample Size (N) 264 94 375 94 147 100 127 1028
S.No Characteristics til <l)
;>, c c <l) '5.. .::! '" E '" u E '"
.... <l) <l)
C/) .... :.a <l) :.c :.a bIl ~ <l) ....
Z :::J 0 c 0 ~ c :::J - -
1 Adventurous - 10 - - - - - -2 Affectionate - - 9 - 10 - 8 -3 Altruistic - - - 8 - - - -4 Attempts difficult tasks - 5 - - - - - -5 Considerate of others 4 - - - 5 2 4 1 6 Courteous - - 4 10 3 5 7 -7 Curious 2 7 1 - - 9 - 5 8 Determination 7 - 10 - - - - -9 Does work on time - - 3 - 6 6 - -10 Energetic - - - 1 - - - -11 Healthy - 9 5 7 4 - 6 -12 Independent in judgement - 6 - - - - - -13 Independent thinking 1 4 - - - 10 - 4 14 Industrious 5 3 8 - 1 1 1 -15 N on conforming - - - 5 - - - -16 Obedient - - 2 - 2 4 3 -17 Receptive to other's ideas 6 - - - - 3 - -18 Remember well - - - 6 8 - - -19 Self confident - - 6 9 7 - 5 3 20 Self-starter 8 8 7 - - - - -21 Sense of humour 3 2 - - - - - -22 Sincere 9 1 - 4 - 8 2 -23 Socially well adjusted - - - - - - - 2 24 Strive for distant goals - - - 2 - - - -25 Thorough 10 - - 3 - - - -26 W ell liked by peers - - - - - 7 - -27 Willing to accept - - - - 9 - - -
judgements of authorities
was designed to provide a comprehensive map of teachers' views on creativity, together with
a more detailed investigation of the views of a representative sub-sample. Following
unstructured exploratory interviews and pilot work, a teachers' questionnaire was devised
11 More details and results were reported in Fryer (1996) and Fryer and Collings (1991)
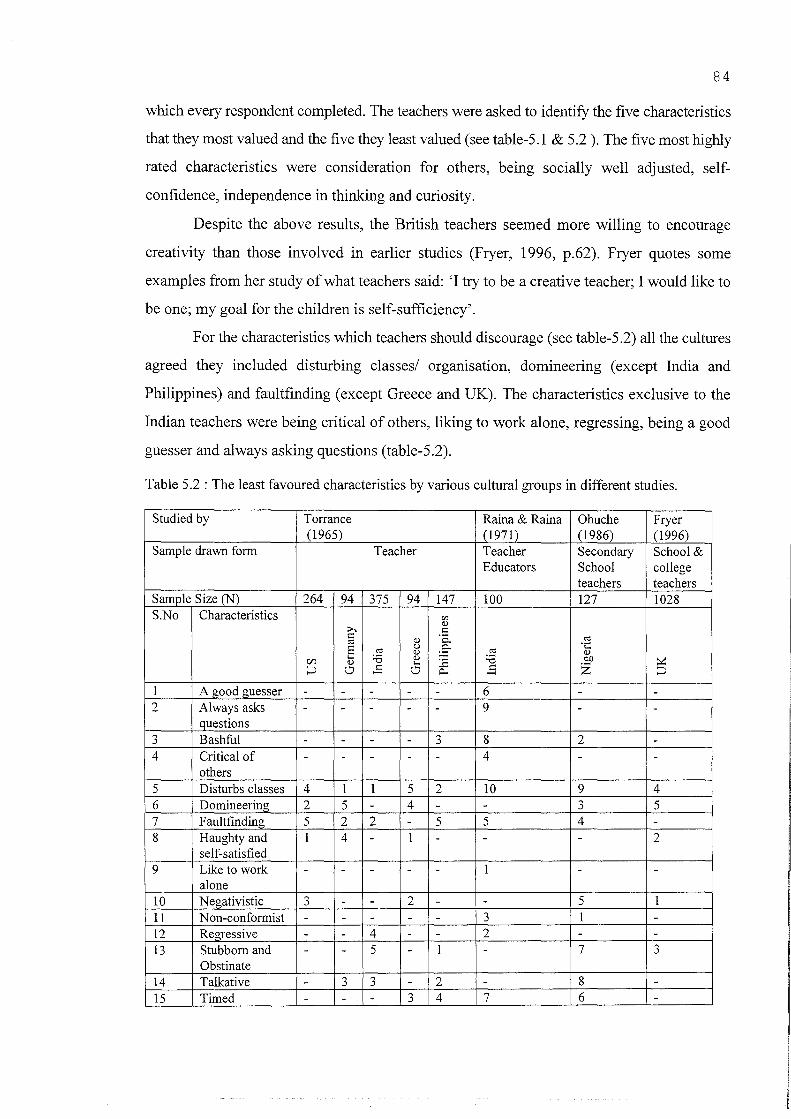
84
which every respondent completed. The teachers were asked to identifY the five characteristics
that they most valued and the five they least valued (see table-S.1 & S.2 ). The five most highly
rated characteristics were consideration for others, being socially well adjusted, self
confidence, independence in thinking and curiosity.
Despite the above results, the British teachers seemed more willing to encourage
creativity than those involved in earlier studies (Fryer, 1996, p.62). Fryer quotes some
examples from her study of what teachers said: 'I try to be a creative teacher; I would like to
be one; my goal for the children is self-sufficiency'.
For the characteristics which teachers should discourage (see table-S.2) all the cultures
agreed they included disturbing classes/ organisation, domineering (except India and
Philippines) and faultfinding (except Greece and UK). The characteristics exclusive to the
Indian teachers were being critical of others, liking to work alone, regressing, being a good
guesser and always asking questions (table-S.2).
Table 5.2 : The least favoured characteristics by various cultural groups in different studies.
Studied by Torrance Raina & Raina Ohuche Fryer (1965) (1971) (1986) (1996)
Sample drawn form Teacher Teacher Secondary School & Educators School college
teachers teachers Sample Size (N) 264 94 375 94 147 100 127 1028 S.No Characteristics ell
<l) ;>. t:: t::
<l) '0.. o:s o:s .;:: E o:s u E o:s <l) <l)
r/) '- :.0 <l) :a :.0 OIl ~ <l) '- Z ;:J CJ t:: CJ p... t:: ;:J - -1 A goodguesser - - - - - 6 - -2 Always asks - - - - - 9 - -
questions 3 Bashful - - - - 3 8 2 -4 Critical of - - - - - 4 - -
others 5 Disturbs classes 4 1 1 5 2 10 9 4 6 Domineering 2 5 - 4 - - 3 5 7 Faultfinding 5 2 2 - 5 5 4 -8 Haughty and 1 4 - 1 - - - 2
self-satisfied 9 Like to work - - - - - 1 - -
alone 10 Negativistic
,., - - 2 - - 5 1 .J
11 Non-conformist - - - - - 3 1 -12 R~gressive - - 4 - - 2 - -13 Stubborn and - - 5 - 1 - 7 3
Obstinate 14 Talkative - 3 3 - 2 - 8 -15 Timed - - - 3 4 7 6 -

85
As teachers consistently evoke attitudes and reactions in students which are similar to
their own attitudes (Tausch, 1960), it is vitally important for the beneficial growth of the child
that the teacher's attitude be favourable (Mirman, 1964). Torrance (1965) demonstrated that
a positive attitude to creativity among teachers fosters creativity in pupils.
It is generally believed that the favourable I positive attitude of teachers towards
creative children's learning and teaching plays a vital role in promoting creativity.
Unfavourable or negative attitudes of teachers will depress the children's creative thinking
(Sing and Das, 1989, p.120). Singh (1985) has found unfavourable attitudes of high school
teachers towards creative learning and teaching.
Again the same researcher (Singh and Das, 1989) attempted to assess the attitude of
teachers of 60 pre-higher secondary i.e. primary and junior high school teachers, 60 higher
secondary teachers and 60 post-higher secondary, teachers i.e., first degree and Postgraduate
teachers towards creative learning and teaching. The purposive sampling technique was used
to select a sample. The revised 50 items scale entitled "opinions on creative learning and
teaching" developed by Torrance and Phillips (1972) was used to assess the attitude ofthe
teachers, irrespective of their age, sex, teaching experience etc., two junior high schools, four
higher secondary schools and two Postgraduate colleges of Agra city (India).
In this study all the teachers have favourable attitudes towards creative learning, but
unfavourable attitude towards creative teaching (except in the case of post-higher secondary
teachers). They conclude that teachers wish their pupils to learn creativity but they do not like
to teach pupils in a creative manner. It shows that either they do not know creative methods
of teaching or do not have the will to teach creatively. In the case of post-higher secondary
teachers, they may have favourable attitudes because they recognize the worth of creativity in
education.
5.11.0 Training in creativity
Treffinger, Ripple and Dacey (1968) studied teachers' attitudes to creativity with their
14-items survey instrumentl2, which was administered to teachers and administrators (N=250)
from public and parochial schools of New York city. They conducted an in-service programme
12 There were 14 items on the attitude survey instrument, 11 items were presented as statements, to which the respondents indicate agreement or disagreement on a 5-piont Likert-type scale (Strongly Agree, Agree, Undecided, Disagree and Strongly Disagree), the other three items were to evaluate the truth of a statement, rather than agreement or disagreement, using a similar 5- point scale.

86
(for four days) on creativity13 as a treatment in their pre and post-test design. The results reveal
that in-service education programmes in creative problem solving made a valuable
contribution to the professional development of participants; facilitated teachers' ability to
identify creative pupils; and increased understanding and more favourable attitudes about
creative problem-solving abilities.
An attempt has been made by Tan-Willman (1981) to determine the attitudes of
Canadian student teachers (33 male and 101 female) to creativity. The same 14-items
instrument of Treffmger, Ripple and Dacey (1968) was used, but only 11 items were presented
to the respondents to indicate their agreement on a 5-piont Likert-type Scale. The results
reflect more favourable then unfavourable attitudes toward creativity. Although the
respondents agreed to the need for teaching creative thinking and to the notions that many of
us possess creativity and that pupils' ability to think creatively and to solve problems can
improve through direct instruction, they are not quite decided whether creative people are
born, not made, and whether it is wise or necessary to teach children to become more creative.
5.12.0 Summary and Conclusion:
It is evident from the above literature that a teacher can promote creativity if s/he is
willing to do it. A positive, open, receptive and accepting attitude, a congenial environment,
a warm and friendly atmosphere, value given to students' responses, and encouraging self
initiated learning promote creativity in pupils. Teacher disapproval ofthe classroom behaviour
of creative pupils may result in the suppression of such behaviour and encourage pupil
conformity. The possibility that creative pupils may become apathetic about school and
become classroom behaviour problems as a result of conflict with the demands of the directive
teacher has also been suggested (e.g. Wodtke, Torrance).
According to Fryer and Collings (1991a), British teachers see creativity mainly in
terms of imagination, originality, and self-expression. Does this definition of creativity apply
to all cultures? Does teachers' perception of creative children vary from one culture to
another? The present study intends to explore the Indian teachers' definition of creativity and
attitude towards its development. What is the attitude of Indian teachers towards creativity and
its development among the school children? Do they encourage creativity in the classroom?
13 Informal discussions and formal lectures (about an hour) on current theoretical approaches to creativity, problem-solving, recent research on creativity in children and adults, and the personality correlates of creative ability. Innovative instructional materials were also demonstrated and discussed.

87
What are the obstacles they find in fostering creativity?
Chapters II, III, IV and V have reviewed the literature on creativity examining its
conceptual development in students, its place in schools and how it is perceived and valued
by teachers. This review has revealed that the context of creativity is important in encouraging
its development. This has clear implications for education. Research in India has largely
neglected the role of schools and teachers in the development of creativity in students. This
thesis will attempt to redress this balance.
Chapter VI will explore the methodology which may be appropriate for achieving this
end. The specific research questions which are to be considered are:
1.1 What is the teachers' definition for creativity? Do all teachers value creativity?
1.2 Do the teachers think that creative thinking develops through teaching?
1.3 To what extent can Indian teachers encourage creative thinking in the classroom?
1.4 How might teachers develop creativity? What are the problems experienced by the teachers
in developing creativity?
1.5 What is the Indian teachers' opinion on the present examinations and curriculum in
relation to creativity development?
2.1 Do the students of Government schools differ significantly on measures of creative
thinking in relation to their background, organizational, and cognitive and motivational
variables?
2.2 What is the students' perception about their teachers' classroom behaviour and their
teaching methods?
3.0 What types of activities are organised by the schools in order to promote creativity?
4.0 What is the exploratory model of creative thinking ability?

88
Chapter-VI
Design and Development of the Research Instruments
6.1.0 Introduction
In this chapter the methodological issues, procedures and processes followed in the
development of the research instruments will be explained. The Tests of Creative Thinking
(verbal and non-verbal) were constructed and standardised by Mehdi (1973, 1985) in India on
rural and urban samples and have been extensively used throughout India. These tests are
suitable for secondary school students. Information about and description of all the instruments
developed specifically for this study, and translation and back translations are presented in this
chapter.
6.2.0 Methodological issues regarding development of the instruments
6.2.1 The Interview as a research tool
Interviewing provides access to the context of people's behaviour and thereby provides
a way for the researcher to understand the meaning of that behaviour (Seidman, 1991). The
interview allows flexibility in questioning the respondent. It provides opportunity to guide the
respondent in his interpretation of the questions (Gorden, 1975).
According to Cohen and Manion (1985) the structured interview is one in which the
content and procedures are organised in advance. This means that the sequence and wording
of the questions are determined by means of a schedule, and the interviewer is left with little
freedom to make modifications. It is therefore characterised by being closed. In contrast the
unstructured interview is open, having greater flexibility and freedom.
The chief disadvantage of unstructured responses concerns the matter of quantification.
Data yielded in an unstructured way is more difficult to code and quantify than data in a
structured response (Cohen and Manion, 1985).
In comparison with questionnaire interviews often have high response rates and also
they offer the opportunity to correct misunderstandings and to carry out observations and
ratings while controlling for incompleteness and for answering in sequence. Interviewers can
also often succeed with respondents who have reading or language difficulties. But interviews
are expensive and time-consuming to conduct and to process, there are always the risks of

89
interviewer bias, and interviews are usually too expensive to use with a widely dispersed
sample (Oppenheim, 1992, p.1 02).
6.2.2 The questionnaire as a research instrument
The questionnaire is economic in respect of time and money and can provide a type of
anonymity which is not provided by interviews. Respondents with busy schedules may not
have time for interviews. A questionnaire is more flexible, giving scope to the respondents to
complete it whenever they can. Questionnaires also collect information from a large sample
and there is no pressure on the respondent for an immediate answer as there is in interviews.
Of course, devising a questionnaire is not an easy task. Much time is required for
designing the questions, making sure the wording is clear, thinking through the categories of
response to each question, piloting and re-drafting. (eg. Munn and Drever, 1990).
Questionnaires have to be composed and piloted, improved and then tried out again, often
several times over, until the researcher is certain that they can do the job for which they are
needed (Oppenheim, 1992, p47).
As Fowler (1993) argues, survey instrument design has two components- deciding what
to measure, and designing and testing questions that will be good measures. The first step is
to define the survey objectives, though those objectives may be revised according to
subsequent question testing. Then the process of choosing and testing questions takes place.
Fowler also suggests some steps involved in the survey instrument development process:
O-Focus group discussions @-Drafting a tentative set of questions into a survey instrument @-Individuallaboratory interviews O-Putting questions into a survey instrument 0-Pre-testing using an approximation of proposed data collection procedures.
6.2.3 Focus Group discussions
The focus group is a special type of group in terms of purpose, size, composition and
procedure (Krueger, 1994, p.6). This group involves a small group of people specifically
selected to explore the range of beliefs and attitudes in the study population (Fowler,1993).
The participants are invited together at a set time and place to discuss a specific issue.
As Fowler (1993) said, "before writing a draft of structured set of questions, it almost
always is valuable to conduct focused discussions with people who are in the study population
about the issues to be studied. The primary purpose of these discussions is to compare the
reality about which respondents will be answering questions with abstract concepts embedded

90
in the study objectives. The general protocol is to discuss people's perceptions, experiences,
and perhaps feelings related to what is to measured in the survey".
6.3.4 Selection of Open or closed questions:
Proponents of the use of open questions argue that they allow respondents to say what
is really on their minds without being influenced by suggestions from the researcher, whereas
closed questions lock respondents into arbitrarily limited alternatives (Foddy, 1993, p127).
Questionnaires with defmed response choices have a major disadvantage in that the respondent
will be limited by the choice offered.
But answers to open questions are often less complete than answers to corresponding
closed questions (Foddy, 1993). If open items are used, respondents may be unwilling to write
their answers, for one reason or another (Cohen and Manion, 1985).
The inescapable, overall conclusion that one is forced to reach is that it is dangerous to
argue that open questions necessarily produce more valid results than closed questions. On the
other side of the coin, it is equally dangerous to argue that closed questions are more efficient
- especially if the time taken to develop appropriate sets of response options is taken into
account (Foddy, 1993,p150).
Closed questions help the respondents to decide what sort of responses are appropriate,
and pre-set response options inevitably act as prompts which help respondents recall
information that they might otherwise forget (Foddy, 1993). For closed questions, all
respondents answer the question in the same way, the answers can be meaningfully compared,
respondents find it easier to answer and analysis is easier (Foddy, 1993).
Schuman and Presser (1979a), contend that closed questions do not suggest invalid
answers to questions, as long as the alternatives that are presented to respondents have been
properly developed through pilot work, with open questions followed by pre-testing to ensure
that the set of response options is appropriate in the sense that all of the required categories,
and no inappropriate categories, have been included.
The compromise position as suggested by Lazarsteed (1944), is that open questions
should be used at the initial stage of a project, so that the appropriate response categories could
be identified for use with closed questions, and also, at later stages in the research, to throw
light on apparently deviant answers to the closed questions.
Further, Lazarsteed (1944) argued that the respondents', motivations can be adequately
explored with closed questions provided that they are well grounded in the results of pilot

91
work based on open questions. Beginning with open questions in the pilot work and use the
resulting responses as a basis for developing meaningful and exhaustive sets of response
alternatives for closed questions is one way to balance the advantages of both approaches.
Methodologists who have considered the issue have tended to settle on the compromise
position that a judicious mix of open and closed questions is best (eg. Khan and Cannell,
1957).
6.3.0. Instruments developed for the study.
The list of the instrwnents is given below. The structure of the instrwnents is discussed
in detail.
1. Interview Scheduled For Teachers (ISFT)** 2. Teachers Questionnaire (TQ)** 3. Student Information sheet (SIS)** 4. Verbal Test of Creative Thinking by Baqer Mehdi (VTCT)** 5. Non-verbal Test of Creative Thinking by Baqer Mehdi (NVTCT)** 6. Teachers Encouragement Scale (TES)** 7. Classroom Observation Scheduled (COS)** 8. Check-list For Head Master (CFHM) * *
6.3.1 Interview Scheduled For Teachers (ISFT)
Exploratory interviews might provide the richest qualitative data and the prospect of
gaining a deeper understanding of the issues, but analysis of qualitative data from a large
sample is time conswning. So initially, semi-structured interviews with a few teachers yielded
clues about the kinds of items / responses to be included in the main survey questionnaire. The
advantage of a survey questionnaire is that it enables data to be collected from a larger sample.
Also, the main purpose of these interviews was to understand teachers' views and the
relevance ofthe questions to the problem. For the interviews a tentative interview schedule
was prepared (see Appendix B5). The questions used in the interviews were open-ended, since
the researcher's aim was to obtain material to develop a questionnaire as well as to get deeper
insights into the teachers' knowledge or answers. The open-ended questions were flexible and
allowed the interviewer to probe for more depth of information.
The purpose of the interview was explained briefly in terms the respondent could
understand, and in a manner which covered all the types of questions which were going to be
asked. If the initial explanation is too narrow or vague, the respondent may not be able to relate
•• These abbreviations are used in this study.

92
certain questions with the stated purpose (Gorden, 1975, p.265). While explaining the purpose
of the research, the interviewer should make assurances that what is said in the interview will
be treated confidentially (Bogdan and Biklen, 1992, p.97). The more detailed procedure of the
interviews will be explained in Chapter VIII, 8.4.4.
In structured interviews teachers were given freedom to talk about the issues, even if the
items were not covered in the schedule. Interviews therefore gave a depth of information
regarding regular classroom practices and problems in their implementation. The practical
difficulties and feasibility of the development of creativity in schools could be expressed
through discussions with teachers. This enabled the development of the questionnaire.
6.3.2 0 Development of Teachers' Questionnaire
6.3.2.1 Designing the Teachers' Questionnaire
As discussed earlier (6.2.3), in the present research a panel of four persons l in the field
of education and psychology teaching at colleges of education and University College of
Education, Osmania University, at Hyderabad2 were brought together to discuss the
development of creativity in school children and to share their ideas, experiences and
perceptions. The group members influenced each other by responding to ideas and comments
in the discussion. This focus group's discussion facilitated the development of questions for
interviews with teachers.
A written draft of open-ended questions, which were carefully selected and phrased in
advance to elicit the maximum amount of information, was used as base for discussions.
Discussion was facilitated and encouraged, to invite comments of all types - both positive and
negative. A non-participant teacher acted as note-taker. Careful and systematic analysis of the
discussions provided clues and insights (Krueger, 1994, p.6). Members' comments on drafts
of questions, and their other suggestions, were most helpful in designing questions, and
ensuring their logical and sequential flow.
6.3.2.3 Drafting the Teachers Questionnaire (TQ)
Before finalising the draft of the TQ, two exploratory interviews were conducted for
adding any possible items or deleting irrelevant items in the TQ. The results are presented in
chapter VII, 7.5.4.0. Most of the statements used in the interviews were included in the TQ.
The existing literature, focus groups and exploratory interviews gave insight into certain
I Small groups of 4 or 5 participants (compose of homogeneous) afford more opportunity to share ideas and easily accommodated(See Krueger,l994,p.l7)

93
questions and assumptions. A tentative questionnaire was developed from these and circulated
among five experts3 in the Psychology and Education department for their comments.
Precautions were taken to minimise the common errors that normally occur. The draft was
slightly modified according to the comments and suggestions given by the experts before pilot
work.
6.3.3.0 Student Information Sheet (SIS)
This information sheet includes preliminary data about the students, that is, name of the
student, name of the school, sex, age, class, mother tongue, religion and caste. Parental
education, occupation and income were also included in the SIS. This information was
required to explore the parental background of the government school students and enable
correlation between students' creativity and parental background.
The students were also asked to name any three school subjects4 they liked, any three
subjects they disliked and three jobs which they would like to do. They were also asked the
reasons for their choices. Lastly, two questions were asked to explore their experiences, good
and bad, in the classroom (see Appendix-B3).
The responses to these questions enabled exploration of the differences in interests and
experiences of high and low creativity scorers.
6.3.4.0 Verbal and Non-verbal Tests of Creative Thinking by Baqer Mehdi There are very few examples in Indian schools of activities where children are able to
demonstrate their creativity. As most of their work involving writing it seemed appropriate to
assess creativity using paper & pencil tests.
The Operational Definition of Students' creativity by Baqer Mehdi
Students' creativity is considered to be the creative ability of students represented by their scores
on various factors of verbal and non-verbal creativity such as originality, fluency, flexibility and
elaboration as measured by Mehdi (1973,1985).
As it is used in this study, the term, "creativity" refers to a fairly specific type of
cognitive ability reflected in performance on a series of paper-and-pencil tasks. The
instruments were printed in the form of examination-type booklets and were administered to
a class of students in exactly the fashion to which they were quite accustomed in connection
with taking academic examinations. A premium was put upon writing facility in that, by virtue
2 Hyderabad is the capital city of Andhra Pradesh where the fieldwork was carried out. Andhra Pradesh is one of the states in south India. 3 Two supervisors of the researcher; the research tutor, doctoral center, IOE, Director; Creativity in Education research project, School of
Education, The OU, Milton Keynes and a retired secondary school English teacher (migrated from India) who possessed a PhD degree. 4 There are totally six subjects at secondary level. They are 1. Telugu 2. Hindi 3. English 4. Mathematics 5. Sciences (Physical + Biological)
6. Social studies.
94
of the group administration of the test, a student's "answers" to the "questions" were to be
written down by him / her in the test booklet (eg. Getzels and Jackson, 1962, p.16; Wallach
and Kogan, 1965, p. 21).
Beqer Mehdi's Tests (1973,1975,1985 a &b) of creative thinking, both verbal and non
verbal, were adapted for the present research. There are four verbal tests, viz., Consequences
Test, Unusual Uses, New Relationships and Product Improvement, and three non-verbal tests,
viz., Picture Construction, Picture Completion, Triangles and Ellipses. The description of the
tests and scoring procedures is presented in the following sections. Due to the rapid
advancement of knowledge and exposure to modem technology while scoring, if some new
responses were obtained by the researcher, they were noted down separately. Originality,
fluency, and flexibility dimensions for the verbal test, and originality and elaboration
dimensions for the non-verbal test were worked out.
6.3.4.1 The description of the activities in the Verbal Test of Creative Thinking (VTCT)
The verbal test of creativity includes four sub-tests, namely, the Consequences Test (15
minutes), the Unusual (or Novel) Uses test (12 minutes), the New Relationships (or Similarity)
test (15 minutes), and the Product improvement test (6 minutes). Thus, the time required for
the total test is 48 minutes in addition to the time necessary for giving instructions, passing out
test booklets to the subjects and collecting them back (see Appendix B1).
1) Consequences Test: The basis of this activity is Guilford's consequences test or
Torrance's 'Just suppose" activity. The tasks included are based on things familiar to Indian
children but are presented in the form of a hypothetical situation e.g. 1. What would happen
if man could fly like the birds? 2. What would happen if your school was put on wheels?
3.What would happen if man did not require any food to eat? The tasks confront the students
with a situation where there are a large number of possible responses to a hypothetical
situation. This implies cause and effect thinking. The number of relevant responses produced
by the subject yields a measure of his ideational fluency, the number of shifts in the thinking
trends of the consequences gives the measure of verbal flexibility, and the statistical frequency
of the response or the departure in thinking from the commonplace gives the measure of
originality.
Subjects are instructed to think of as many consequences of the given situation in the test
as they can, and write them under each situation in the space provided. The situations are
hypothetical and hence minimise the effects of experience. They also provide the subject with

95
an unlimited opportunity to make responses. This test provides an opportunity for the subject's
free play of imagination and originality. Various examples are given in the test booklet to
acquaint subjects with the nature of the test. Four minutes are given for each problem.
2. Unusual Uses: The basic idea of these tasks comes from Guildford's Brick Uses test
or Torrance's Tin Can Uses test, or Cardboard Boxes Uses test. Common things like water, a
wooden stick and a piece of stone are used as stimuli to let the subject's thinking diverge. The
activity appears playful to the child but leads him/her to a train of thought, which will yield
many novel responses. The number of relevant responses gives the measure of one's ideational
fluency, the number of thought categories, gives the measure of verbal flexibility, and the
number of uncommon responses gives the measure of originality.
The Unusual Uses test contains the names of three common subjects, such as a piece of
stone, a wooden stick, and water-and the testee is asked to write as many novel, interesting and
unusual uses of these objects as possible in the test booklet given to pupils. The test is a
measure of a subject's ability to retrieve items of information from hislher personal
information or ability to think about the problem in a novel and original way. It attempts to
measure whether the subject can shift his frame of reference to use the environment in an
original manner.
3.New Relationships: Mednick worked extensively with word associations, and his
definition of creativity is based upon the remoteness of such associations. In this activity,
articles of daily use with which the child is quite familiar are used so as to enable him to think
more naturally about the relationships between two apparently dissimilar objects. The items
in this activity provide possibilities for scoring responses for fluency, flexibility, and
originality in the same fashion as the Unusual Uses test.
The New Relationships test consists of three pairs of words which are apparently
different: tree and house, chair and ladder, and air and water. The subject is required to think
of and report on all possible relationships between the two objects of each pair of words in the
space provided. The test provides an opportunity for the free play of imagination and
originality of the testees.
4.Product Improvement: This test of verbal imagination is similar to the one found in
Torrance's Product Improvement activity. Torrance used a picture of a toy monkey, but in this
test the subject is only asked to imagine a figure of a toy horse and then give responses which
would indicate what he would do to make it more interesting and unusual for a child to play

96
with. The task stimulates the child's imagination and encourages divergent thinking. Apart
from ideational fluency, the test also measures flexibility and originality.
6.3.4.2 The scoring procedure for the test
As there are no right or wrong responses for the test, each item is scored for originality,
flexibility and fluency. The summary of the scores and procedure for converting raw scores
into standard scores (T-scores) are explained in chapter X (see 10.1)
Verbal Originality Scores- Originality is represented by the uncommonness of a given
response. Responses given by less than 5% of the group are included and are given different
weights. The weights have to be determined on the basis of the following scheme: if a
response has been given by 0.1 % to 0.99% of respondents, the response will get an originality
score is 5; ifthe response is 1 to 1.99% originality score is 4; if response rate is 2 to 2.99% the
originality score is 3; if the response 3 to 3.99% the originality score 2; ifresponse between
4 and 4.99% originality score is 1. Responses given by 5% or more of respondents will get an
originality score of zero.
Verbal Flexibility Scores- Flexibility is represented by a person's ability to produce
differences in trend of thought. All ideas which differ in approach or trend are treated as one
for purposes of flexibility scoring. Thus, if five ideas are produced and all belong to only one
category of approach or thought trend, the score for flexibility will be one, but if all of the five
ideas are based on five different approaches or thought trends, then the flexibility score will
be 5. There could be an intermediate score for flexibility, depending on the number of
categories of thought trends to which the responses belong.
Verbal Fluency Scores- In scoring for fluency, the scorer goes through the responses to
the item in question carefully and strikes off those which are irrelevant and / or have been
repeated. The remaining number of responses is the fluency score.
6.3.5.0 Non-Verbal Test of Creative Thinking (NVTCT)
The non-verbal test of creative thinking is intended to measure the individual's ability
to deal with figural content in a creative manner. Three types of activity are used for this
purpose, viz., picture construction (10 minutes), picture completion (15 minutes), and triangles
and ellipses (10 minutes). The total time required for administering the test is 35 minutes, in
addition to the time necessary for giving instructions, passing out booklets and collecting them
back (see Appendix B2)

97
6.3.5.1. The description of the activities in the test
1. Picture Construction Activity- Picture construction has long been used as a measure
of a child's creative thinking. Torrance used this test in his battery of creativity tests, but in a
slightly different manner. Here the subject is provided with a fixed structure, which he can
convert to a meaningful picture, by building on his own imagination. Children vary in their
responses to these stimuli, both in terms of elaboration and originality of response. This
activity allows for unrestricted fluency of ideas, which may enable the subject to use his
unconscious mind to help him to construct a picture which is relevant to his thought and
personality structure.
In the picture construction activity, the testee is required to construct two simple
geometrical figures, a semi-circle and a rhombus, and to construct an elaborate picture using
each figure as an integral part. The subject may tum the page to use the figure in any way he
likes for making the picture. Emphasis is put on originality and elaboration. Originality is
emphasised by instructing the subject that he should try to make as novel a picture as possible,
such that no one else will be able to produce a similar one. Elaboration is emphasised by the
instruction that the subject may add as many details as he thinks necessary in order to make
the picture tell as complete and as interesting a story as possible.
2.Picture Completion Activity-This activity has also been used by a number of
psychologists to study the personality and thought patterns of children. In terms of Gestalt
Psychology, "an incomplete figure sets up in an individual tension to complete it in the
simplest and easiest way possible. Thus, to produce an original response, the subject has
usually to control his tensions and delay gratification of this impulse to closure" (Torrance,
1966). The test can be scored for originality and elaboration.
This activity consists of 10 line drawings which can be made into meaningful pictures
of different objects. The subject is asked to make a picture which no one else will be able to
think of. He is also asked to give an interesting and suitable title to each picture he makes.
3. Triangles and Ellipses Activity- This activity is based on the idea of Torrance's
parallel lines and circles, where repeated figures are given and the subject's novelty is assessed
by the construction of different types of figures from the given structure. Generally, non
creative subjects fail to construct new patterns, whereas creative subjects originate new
patterns and also elaborate.
In this activity, the subject is provided with 7 triangles and 7 ellipses and required to

98
construct different meaningful pictures based on two given stimuli. The subject is encouraged
to make multiple associations to a single stimulus.
6.3.5.2. The scoring procedure of the test
As there are no right or wrong responses in the test, each item is to be scored for
originality and elaboration. Activity III, viz., Triangles and Ellipses, may be scored for
flexibility, as the testee is asked to make different pictures from the same given stimulus.
However, the test constructor confined scores to elaboration and originality for the non-verbal
test, so that the flexibility of the non-verbal score was not used in this study. However, the
scoring of titles is optional.
Non-verbal Originality: The same scoring procedure is applicable for originality, as
explained in 6.3.4.2.
Non-verbal Elaboration: Elaboration is represented by a person's ability to add pertinent
details (more ideas) to the minimum and primary response to the stimulus figure. The
minimum and the primary response to the stimulus figure is that response which gives
essential meaning to the picture. The response title often indicates exactly what the student is
trying to make. Responses, which can be reasonably interpreted and identified, should be
scored. Some times the response represents an abstract idea instead of a concrete 0 bj ect. If the
figure is not relevant and meaningful, it is ignored. The total elaboration score includes 1 for
primary response, plus 1 score each for all the additional details which are given.
6.3.6.0 The Development of Teachers' Encouragement Scale (TES)
This scale was developed by the investigator to measure the degree of encouragement
given by the teachers in their classrooms. It is mainly concerned with classroom questioning,
teacher behaviour and the freedom given to the students. The literature on teachers' classroom
questioning behaviour by Ellis (1993), Perrott (1982), and Cohen(1976) and guidelines for
promotion of creativity by Torrance(1962,1962b, 1965), Torrance and Myers(1974),
Foster(1971), and Passi (1989) were used to develop a tool to measure encouragement in
quantitative terms. The investigator constructed a rating scale covering the following relevant
important areas (Appendix F).
1. Accepting students' feelings in the classroom (Question numbers 2, 22) 2. Classroom questioning (Question numbers 6, 7, 20, 21) 3. Teachers' praise and criticism (Question numbers 8, 9) 4. Teacher-pupil relationships (Question numbers 10, 11, 12, 13, 14)
5. Organisation of classroom activities (Question numbers 4,5, 17, 18, 19) 6. Encouragement/discouragement of students' interests and other activities.
(Question numbers 1,3, 15, 16)
99
The wording of items in the scale was made as clear as possible and technical terms
were kept to a minimum. The students were asked to rate their teachers in the classroom using
the five point scale Always, Usually, Often, Sometimes and Never. If an item given in the
scale was positive then the scores were awarded in the order 4,3,2,1 and 0 respectively; if the
item in the scale was negative than the reverse procedure was followed. The total score gives
an indication of the degree of freedom and encouragement in the classroom. A low score
indicates a lack of freedom and encouragement. The scale should be administered in the
absence of teachers because this may affect the freedom of the students in marking their
responses.
Survey work with school children requires additional care in piloting and fieldwork. For
example, interviewing children in a school presents the problem of overcoming the children's
possible fear of strangers and getting genuine and valid responses; also there are the logistics
oflessons and break-times to cope with. Further, after the third or fourth interview every child
in the school will have heard a (probably inaccurate) version of the questions being asked!
Group - administered questionnaires can overcome some of these problems, at least with
children above the age of nine or ten. (see Oppenheim, 1992).
Even then, very great care is required in the pilot stages, and it is best to have several
field workers present in each classroom to help with spelling, to answer questions and to
distribute and collect questionnaires. Bearing these precautions in mind, and with a promise
of confidentiality, excellent results can be obtained quite rapidly from large numbers of school
children with the use of pre-coded questionnaires and other closed techniques
(Oppenheim,1992).
Some of the items in the teacher encouragement scale (TES) were very sensitive. It
might prove embarrassing for students to give honest answers. All the students were given pre
coded numbers on the TES, so that they need not write their names. A guarantee of anonymity,
can do much to overcome these problems.

100
6.3.7.0 Classroom Observation Schedule (COS)
A review of the literature indicated no suitable instrument available for the purpose of
this study. Most research which focuses on classroom interaction analysis has used the
Flanders Interaction Analysis and Category System (FIACS), Verbal Interaction Category
System (VICS), Bale IS R. E. Interaction Process Analysis, Reciprocal Category System (RCS),
and Equivalent Talk Category System (ETC). Instruments developed by Perrott (1982), and
Rubovits (cited in Cohen, 1976) were also reviewed.
The research questions indicated a need to observe the classroom environment, as it may
influence pupils' creativity. The classroom environment includes many things, but most
important in relation to creativity may be student-teacher relationships, interpersonal
relationships among the students, students' attitudes towards school subjects and the method
of teaching, students' perceptions about teachers, and the physical characteristics of the class.
For the purpose of this study (see Appendix B7) a frequency recording schedule was
developed. With this COS the researcher observed the classes of teachers who were scored
high or low by their students on the teacher encouragement scale (TES)(see6.3.6.0).
6.3.8.0 Check-list For Head Teachers (CFHT)
Derived from the literature review, and form discussions with teacher educators in
London and India, a checklist was developed of activities supposed to enhance creative
thinking among the school children. Headteacher was asked to complete the checklist. Some
open questions were also provided in the checklist, to allow further elaboration (see Appendix
B8).
6.4.0 Translation of the research instruments
All the research instruments were designed in the English language. As English medium
and Telugu (one ofthe South Indian languages) schools were to be included, these required
translation. In India, especially in Andhra Pradesh where the study was undertaken, three
languages are spoken from upper primary level. They are Telugu5, Hindi6 and English7.
Because some pupils and teachers teaching and learning in schools where English was not the
primary language were felt to be less fluent in English than those from English speaking
5 Mother tongue or spoken language of majority people in the state of Andhra Pradesh in south India. 6 The national language ofIndia, studying as second language at school level. 7 International language, studying as third language at school level.

101
schools, it was decided to translate the instruments from English (source language) to Telugu
(target language).
6.4.1. The procedure of the translation method followed in the study
The translation process8 took place in two phases. In phase one, the researcher (translator
A) translated all the instruments from the English original version into Telugu. The Telugu
version was given to one colleague (translator B), who has knowledge of psychology and
education as well as the local language, working as a lecturer in the Dept. of Education,
Kakatiya University (India), to translate from the Telugu version into English. The colleague
back translated9 from Telugu into English independently without referring to the original
English version.
The researcher conferred with colleagues to clear up errors occurring in translation. In
translation, some of the psychological and technical terms were difficult. Telugu AcademylO
textbooks of psychology and education, prepared for Telugu medium students, were consulted
as were the Academy Dictionaries of English and Telugu for local usage of words. The flow
chart (Fig. 1 ) explains the translation process and how the original source was checked to
rectify the errors if any.
In phase two, the researcher (translator A) translated the revised English version into
Telugu. The translated Telugu copy was supplied to a lecturer working in the State Council
of Educational Research and Training (SCERT) for independent translation. The same
procedure was followed as in phase one. The flow chart (fig. 2) explains the translation
process of the second phase.
Finally, the recent translated versions were compared and inconsistencies discussed, to
establish that the translated version was equivalent in every aspect to the original English
version and that the instruments could now be piloted.
After development of the instruments they were piloted. This will be discussed in the
succeeding chapter (VII).
8 Brislin, Lonner and Thorndike (1973), pp.38 9 Ibid p. 40 10 The state government established it for the benefit of local people. It undertakes the job of printing all academic and non-academic books
in Telugu language.

I N P U T
-l ... s:u P :::l
VI R iii -0 o· C :::l
E S S c
0 .. ~ VI C It! ... .....
.lo:: 0 It! III
0 U T p
U T
English Original Source Language
Telugu (Target Language)
English (Source language)
Review (Decision)
102
English Revised Version
Figure 6.1. Flow chart of translation process-
I N English Revised Version P (Source language) U T
P R o C E S S
o U T P U T
c o
Telugu (Target Language)
~ Translator -c VI C It! ... .....
.lo:: o It! III English
(Source language)
Review (Decision)
Figure 6.2. Flow chart of translation process-
English & Telugu Final Versions

103
Chapter VII
Pilot study - Process and Procedure 7.1.0. Introduction
This chapter explains the purpose and procedure of the pilot study, and the
administration of the instruments. The item analyses 1 of all the instruments is presented,
analysis and the results where they are relevant to the main study.
7.2.0 Purpose of the pilot study
The aim of piloting is to ensure that the instruments to be used are appropriate. It
involves asking a small sample to work through the questionnaire! test in the presence of
the researcher and then give feedback to the researcher. The pilot helps in establishing how
long the questionnaire takes to answer, difficulties in the wording of questions and any
general points. According to the comments, the questionnaire can then be re-drafted (Munn
& Drever,1990).
Piloting can help not only with the wording of questions but also with the ordering
of question sequences and the reduction of non-response rates. The pre-test is a try-out of
the questionnaire to see how it works and whether changes are necessary before the start
of the full-scale study. The pre-test provides a means of identifying and solving unforeseen
problems in the administration of the questionnaire, such as its phrasing, sequence or
length. It may also indicate the need for additional questions or the elimination of others
(Kidder, 1981, p.162).
Piloting can also provide a set of multiple choices that will fit the range of answers
to be expected and that will reduce, if not eliminate, the loss of information. Whether the
questions are put in open or closed form will partly be decided by whether it is possible to
provide a set of suitable multiple-choice answers. Pilot work sometimes offers the
possibility of choosing quite subtle questions, thus avoiding the expense and possible
distortion of coding (Oppenheim, 1992,p.117).
7.3.0. Procedure of the conducted Pilot Study
After the development of the research tools, a pilot study was conducted on a small
sample to test the feasibility of the research questions, and research instruments and to
explore the trend of the results. Permission was obtained from the relevant authorities to
undertake the research. One school was randomly selected for the pilot study.
1 The item analysis was done by using chi-square(X2) and Pearson correlation coe~fi~ient(r). Creativity test item scores and activity scores were correlated with the grand total from the creatIvIty tests.
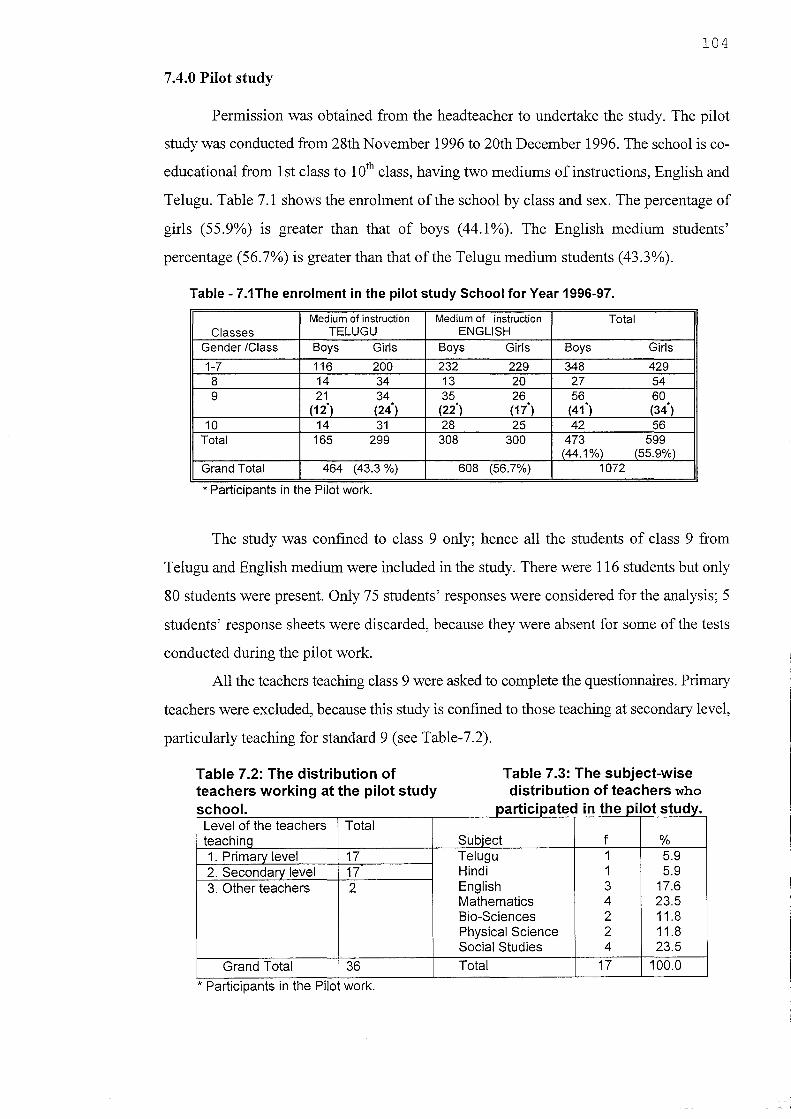
104
7.4.0 Pilot study
Permission was obtained from the headteacher to undertake the study. The pilot
study was conducted from 28th November 1996 to 20th December 1996. The school is co
educational from 1 st class to 10th class, having two mediums of instructions, English and
Telugu. Table 7.1 shows the enrolment of the school by class and sex. The percentage of
girls (55.9%) is greater than that of boys (44.1%). The English medium students'
percentage (56.7%) is greater than that of the Telugu medium students (43.3%).
Table - 7.1The enrolment in the pilot study School for Year 1996-97.
Medium of instruction Medium of instruction Total Classes TELUGU ENGLISH
Gender /Class Boys Girls Boys Girls Boys Girls
1-7 116 200 232 229 348 429 8 14 34 13 20 27 54 9 21 34 35 26 56 60
(12') (24") (22') (17") (41") (34") 10 14 31 28 25 42 56
Total 165 299 308 300 473 599 (44.1 %) (55.9%)
Grand Total 464 (43.3 %) 608 (56.7%) 1072 ..
* Participants In the Pilot work.
The study was confined to class 9 only; hence all the students of class 9 from
Telugu and English medium were included in the study. There were 116 students but only
80 students were present. Only 75 students' responses were considered for the analysis; 5
students' response sheets were discarded, because they were absent for some of the tests
conducted during the pilot work.
All the teachers teaching class 9 were asked to complete the questionnaires. Primary
teachers were excluded, because this study is confined to those teaching at secondary level,
particularly teaching for standard 9 (see Table-7.2).
Table 7.2: The distribution of teachers working at the pilot study
h I sc 00.
Level of the teachers Total teaching 1. Primary level 17 2. Secondary level 17 3. Other teachers 2
Grand Total 36 . .
* Participants In the Pilot work .
Table 7.3: The subject-wise distribution of teachers who rf· t d" th "I t t d pa IClpa e In e PI 0 s U IY.
Subject f % Telugu 1 5.9 Hindi 1 5.9 English 3 17.6 Mathematics 4 23.5 Bio-Sciences 2 11.8 Physical Science 2 11.8 Social Studies 4 23.5
Total 17 100.0

105
The 17 questionnaires were distributed among the teachers with the help of the
headteacher (see procedure for data collection in Chapter VIII, 8.6.4.0). All the
questionnaires (100%) were completed and returned to the researcher.
The sample included in the study covered all the subjects taught at secondary level.
Table-7.3 shows that there were more Mathematics and Social studies teachers than others.
The percentage of Telugu and Hindi teachers is much less because the teachers of Telugu
and English teach students from both languages.
Table7.4 shows that of 17 schoolteachers in the pilot study sample, 4 (23.5%) were
male and 13 (76.5 %) were female. The proportions of male and female schoolteachers
working in Hyderabad District2 at secondary level are 21.3% (2,703) and 78.7% (10,003)
respectively, so this sample was rather skewed towards female teachers.
Table-7.4: The distribution of teachers by sex, age, experience, academic and f I IT f pro esslona qua I Ica Ions.
Academic Professional Sex f Age f Experience f Qualifications f Qualifications f
Male 4 <30 7 <10yrs 8 AG 13 PG 13 Female 13 >30 10 >10yrs 9 APG 3 PPG 4
PhD 1
AG = Academic Graduates (BNBScl B.Com) PG = Professional Graduates (B.Ed IBOL) APG = Academic Postgraduates (MNMScl M.Com) PPG = Professional Postgraduates (MEd/MOL)
The teachers' age was spread from 20 to 50 years. Seven teachers were under 30
years of age and 10 teachers were above 30 years of age. As for experience, there were
more teachers with above 10 years, experience. 13 teachers were graduates and only 4
teachers were postgraduates.
7.5.0.Procedure for the pilot study
7.5.1 Piloting the Student Information Sheet (SIS)
The same procedure was adopted for the pilot study as was explained in chapter
VIII (8.6.1). The SIS is very easy to understand and students found it simple to answer the
items in it. When informal discussions were conducted with the students, it became
apparent that many did not have information about their parents. When the purpose and
importance of the study was explained, the students were asked to gather the information
regarding their parent's education, income and occupation, to enable them to fill in the SIS
easily. The information given by the students was validated with the help of the school
authorities. They verified where possible information about parental background. To
2.The Commissioner & Director of School Education, Educational Statistics-1995-96, Government of Andhra radesh, Hyderabad.

106
understand the parental background of students in the pilot study, the data from SIS were
analysed and presented in the form of frequencies and percentages.
7.5.1.1 Item analysis offhe SIS
Table7.5 indicates that only 16% of fathers had completed their college education,
56% their school education, whereas only 4% of mothers had studied at college level, 40%
at school level and 20% were literate. The illiteracy percentages of fathers and mothers
were 14.7% and 36.0% respectively. Generally the parents' education level was very low.
The data in the same table (7.5) reveal that 5.3% of the fathers' had no income,
Table - 7.5: Literacy, economic and occupational status of the parents ( frequencies with p ercentages)
Education ." ~ s: 'if? Income ." 'if? III 0 0 III s: s: s:
~ ~ ~
1. Graduation and above 6 8.0 3 4.0 1. No earnings 4 5.3 2. Intermediate 6 8.0 0 0.0 2. Below RS.1 000 21 28.0 3. School education** 42 56.0 30 40.0 3. RS.1 001 - Rs.3000 35 46.7 4. Literate 10 13.3 15 20.0 4.Rs.3000 and above 15 20.0 5. Illiterates 11 14.7 26 36.0
Occupational Category + Father %
1. Professional and related workers 1 1.3 [social worker(1)]
2. Engineering, technical and related workers 1 1.3 [Technicians(1 )]
3. Administrative, executive and managerial workers - -4. Clerical and related workers 14 18.8
[accountants(2), superintendents(1), clerks(7), typists(1), tele.operators(1), attenders (2)]
5. Sales workers 9 12.0
[merchants & shopkeepers (9)]; [merchants & shopkeepers(1 l] 6. Service workers
[police(3), cooker(1), Washerman(1)] 5 6.7
7. Farmers, fishermen and related workers 1 1.3 [farmer(1)] [Ag. Labour(1 l]
8. Production and Transport equipment operators 40 53.3 [carpenters(4), drivers(5), rickshaw puller (1) labourers(12), railway workers(7),
factory workers (11)]; [printing(1), Tailors(5), labourers(2) facto[:y workers(3)] 9. Dependents
4 5.3 (No job) [(Housewife)] 75 100
Includes primary to secondary + National Classification of Occupations (1963,1991), as adopted by the Office of
Registrar General and Census Commission for India, Ministry of Home Affairs, Govt. of India, 1991. __ Underline applicable to mothers only ? One student's mother expired
s: 'if? 0 s: ~
59 80.0 13 17.4 1 1.3 1 1.3
Mot % her
0 0.0
0 0.0
- -0 0.0
1 1.4
0 0.0
1 1.4
11 14.8
61 82.4 747 100
28% had below Rs.I000, 46.7% had between Rs.I00I-Rs.3000, and only 20.0% had above
Rs. 3,000 per month. As for the mothers' income, 80% of them were not earning, because
they were housewives (see table7.5, house wives 82.4%),17.4% of them earned below
Rs.I000, 1.3% between Rs.I00I-Rs.3000, and 1.3% above Rs.3000.
The data in table7.5 shows that the parents of the sample belonged to the lower
groups of occupations. Most fathers were production and transport equipment operators
(53.3%), clerical (18.8%) and sales workers (12.0%). 6.7% of them were service workers

107
and 5.3% were unemployed. Very few represent other categories of jobs (only 1.3%). The
same table shows that 82.4% of mothers were housewives, 14.8% of them were involved
in tailoring, or were labourers or factory workers. Table 7.5 shows that the students
studying in government schools have parents whose occupational background is very poor.
The other items in the SIS for example, liking and disliking school subjects,
preferring a particular job, good and bad experiences of school and reasons for them were
responded to fully. This indicates that all the items were understood except Question No.ll
in SIS. The alternatives provided for this Question were not adequate. Students indicated
the need for an option to show whether their father / mother had died3 or whether they
were unemployed. An alternative, "No earnings", was added to Question-II.
7.5.2.0 Piloting the creative thinking tests
The verbal and non-verbal tests of creativity, in both English and Telugu booklets,
were given to the students (N=75) with the necessary instructions (for more details see
Chap.-VIII, 8.4.2). The completed answer booklets were scored and the scores were
validated using correlations.
7.5.2.1 Scoring Procedure and Validity of the items
Although the scoring procedure for the test is standardised, and the criterion for
working out originality weights is also described in the manuals, it is difficult to have a
fully standardised and objective scoring key. Since a major principle of creativity tests is
that there are no specified answers, it is impossible to develop a list of highly original
responses that have never before been made (Sushma, 1995). Hence, universal weights are
not possible for scoring originality. Originality in this study was therefore scored by
adopting the procedure that it was first necessary to record the frequency of a particular
response in the group as a whole. This frequency was then converted to a percentage of
subjects who gave that particular response and weight was assigned on the basis of that
percentage. Less common responses were given greater weight as these were considered
to be more original (see the scoring procedure in Chapter VI (6.3.4.2 and 6.3.5.2) and
Appendix Cl & C2 for originality weights).
7.5.3.0 Piloting the Teachers Encouragement Scale (TES)
The TES was developed specially for this research project. It was designed for the
students to rate the extent to which their teachers encouraged creativity in the classroom
3 While entering the parental background in SIS one girl suddenly started weeping. When the researcher inquired for the reason, she said her mother had died and she asked me where she could mark. It took couple of minutes every body to settle down. That was an unforeseen problem.

108
(for more details see Chap VIII, 8.4.3). Five subject teachers using the English medium
were rated by an average of 8 students (N=39), 7 teachers were rated by an average of 5
students (N=36) from the Telugu medium class 9. The items in the TES were analysed.
7.5.3.1 Item analysis of the TES
The purpose of item analysis in this instance is to make comparisons between
respondents' performance on individual items and their score on the instrument as a whole.
This technique is used to select from a pool of items those which will most effectively
obtain the relevant information, and to eliminate the less efficient items from the
instrument. Otherwise the existence of insufficient items reduces reliability by reducing the
variance narrowing the gap between high and low scores (Henerson and et aI, 1978).
The chi-square (X?) values for all the items were calculated to test the significance
of each item. They are presented in table 7.6. The chi-square test provides a means of
comparing experimentally obtained results with those to be expected theoretically from
some hypothesis. The difference between observed and expected frequencies is squared and
divided by the expected number in each case. The sum of these quotients is, chi-square (X2)
(Garrett, 1981, pp.253-54). The equation for chi-square (X2) is stated as follows:
X2 = L [ (fo- fei Ife] fa = observed frequency; fe = expected frequency
The more closely the observed results approximate to the expected, the smaller the
Table-7.6: Calculation of Chi-square (X<) values for TES items Q.N N S 0 U A Tot X< Q.No N S 0 U A Tot XL
a
1 2 19 6 14 34 75 41.81''' 12 11 29 6 5 24 75 31.60~
2 8 30 9 15 12 74 21.54$ 13 7 6 6 7 48 74 93.16$ 3 15 23 15 18 3 74 14.65£ 14 16 12 5 25 16 74 14.24£ 4 11 25 16 12 8 72 12.03£ 15 9 7 10 13 35 74 35.73$ 5x 11 19 12 10 21 73 6.93# 16 7 16 9 9 31 72 27.17$ 6 10 7 4 18 36 75 44.00$ 17 7 35 6 9 17 74 39.51$ 7 3 9 8 23 29 72 33.83$ 18 37 17 3 11 5 73 51.18$ 8 8 24 17 9 16 74 11.54@ 19 9 19 10 12 24 74 11.27$ 9 10 4 2 12 47 75 89.87$ 20 14 28 8 10 14 74 16.54£ 10 12 18 8 8 27 73 17.75£ 21 x 20 15 12 20 7 74 8.30# 11 12 15 10 12 26 75 10.93@ 22 7 33 7 15 12 74 31.14$
N=Never S=Sometimes O=Often U=Usually A=Always X Items eliminated for main study
$ Significant at 0.001 level (X2 ~ 18.46; Ferguson(1981) p.522.) £ Significant at 0.01(X2 ~ 13.28) ; @ Significant at 0.05 level (X2 ~ 9.49) # Not significant (X2
< 9.49 ).
chi-square and the closer the agreement between observed data and the hypothesis being
tested. Contrariwise, the larger the chi-square the greater the probability of a real
divergence of the experimentally observed from the expected results.

109
The X2 -values were computed with SPSS4. The number ofdf=(r-l)*(c-l) in which
r is the number of rows and c is the number of columns in which the data are tabulated.
Here the df=(2-1)*(5-1)=1 *4=4. The X2-values and significance levels are presented in the
table-7.6. All the items are statistically significant, except Questions 5 & 21.These two
items were dropped from the test for the main study.
7.5.4.0 Explorative Interviews
The purpose of the interviews was to confirm whether the questions included in the
interview schedule and teachers' questionnaire were appropriate. The interviews provided
the opportunity to include any other key items which might emerge.
The interviewer used, primarily, open-ended questions. The major task was to build
upon and explore the participants' responses to the questions (e.g. Seidman, 1991). The goal
was to have the participant reconstruct his or her experience within the topic under study
and concentrate on the details of the participants' present experience in the topic area of the
study.
The qualitative interview explains the life world of the individual and their relation
to it. It works with words and not with numbers (Kvale,1996). It has been widely taken for
granted that qualitative, in-depth interviews should precede the formulation of fixed-choice
questions, so that response categories will reflect the respondents' worlds rather than the
researchers' (Coverse, 1984).
For the purpose of this study, two teachers were interviewed independently. A
Mathematics (male) and English (female) teacher agreed to be interviewed. They were
aged between 40 and 50 years and had experience of teaching for between 15 and 20 years.
They were also very enthusiastic about participating in a discussion on creative thinking.
The procedure for the interviews was explained in Chapter VIII, 8.4.4.
7.5.4.1.0 Results of the Explorative Interviews
7.5.4.1.1 Creativity - teachers' definitions
The male mathematics teacher's definition of creative thinking was
Creative Thinking is actually self-expression or expression of original ideas or to bring out inner talents that are present in a student.
The English teacher said that creativity means that students may not be good in
their ideas but they may be somewhat different. They should think on their own, they
should find out alternative suggestions for the given problem. Her definition of creative
4 . Statistical Package for Social Sciences (SPSS)

110
thinking was:
Creative Thinking includes original thoughts other than the routine type, new ideas, which may not be the same as previous established thinking. It also includes divergent thinking.
7.5.4.1.2 Creativity - the present education system
Further, she criticised the present system, saying that "I don't find any chance or
very little chance being given to students to express their opinions. Usually the system is
fully compartmentalised and no scope is given to students for creative thinking.
We are restricting the brains of students. We do not give them any chance to come out with their original ideas. The answers are dictated and of course, the answers are learnt by heart and they write exams, like this ... it goes on. But after completion of their academic learning, when they come out openly for their career prospects or for anything; not only after secondary level but even after the completion of graduation or anything, when they are taking competitive exams or when they are attending interviews, their thinking or their general knowledge or their comprehensive understanding of things around is not as encouraging as it is expected to be.,
The Mathematics teacher also expressed his concern that nowadays creative
thinking is rare in schools, because the syllabus is vast and the curriculum does not
encourage it. The curriculum should be child - oriented; then it can give scope for students
to express their own ideas, their own solutions for the different problems that they come
across in their education.
Regarding their knowledge, both the teachers said that they had not been given any
special training on creativity but that this topic was included in educational psychology in
their training course. They also said that they acquired knowledge about creativity through
their own interest by reading journals and newspapers and about the latest trends in
education.
The Mathematics teacher said that he also learnt from his own experience in the
teaching profession. He suggested that 'teaching is nothing but learning and the teacher is
nothing but a learner throughout his life and in this learning process 1 have learnt a lot in
the field of creativity'.
7.5.4.1.3 Intelligence and creativity- teachers' views
In response to the relationship between Intelligence and creativity the English
teacher reported, 'I don't think intelligence and creativity are separate entities. Intelligence
does not mean only being bookish; intelligence means adjusting oneself to one's
surroundings, and finding solutions to problems, so intelligence includes creative thinking.
If you take out the academic part, there is some kind of creative thinking in every
child because the child is very imaginative, so there is a spark of creative thinking in the
child. The thing is, it is dormant, and it is not made to come out.

111
According to the maths teacher, intelligence and creativity are quite different things
and an intelligent student may not be creative and a creative student may not be intelligent.
Further, he distinguished between the two as follow:
Creative thinking is something which has nothing to do with previous knowledge. Some new situation is given and from that a creative child may bring out many things, but an intelligent child thinking may be only in one line, maybe what he learns from the teacher or maybe from his parents or he knows something. And he has the solution only in one way, where as a creative boy maybe has many solutions.
7.5.4.1.4 Creativity- school subjects
When asked about school
subjects, the English teacher said
that creativity cannot be developed
through subjects alone, but has to
be encouraged by the teacher.
- (Mathematics Teacher)
In spite of that, where & whenever, if the teacher is interested to develop skill in the students, while teaching in the class, let it be mathematics or let it be science, or let it be language, if the teacher is interested, he/she can develop at least a little bit of interest in her students thinking. -(English Teacher)
The Mathematics teacher said 'teachers should act as guides to bring out talent'.
Further, he thought that creative
thinking could not be taught, but it
can be brought out from the inner
talents of the students. The maths
teacher also expressed similar ideas.
He suggested that developing
I think each and every subject has its own way of developing creativity. Even languages, maybe also have their own way, and of course when it comes to mathematics and sciences especially in science the scope is greater, but it does not mean that languages are not important. We cannot say one subject is less important or more important.
- (Mathematics Teacher)
creativity depends on the attitude of students and teachers.
7.5.4.1.5 Criteria for identifying creative children in the classroom
The teachers were able to identify creative children in the classroom. Their
identifying criteria were as follows.
"The way students come out with the problem, the way they come out with the solutions, the way they come out with their answers, the way they respond to the given situations"
- (English Teacher). "The way of responding, the way of answering, the way of expressing doubts and questions.
Not only this, their way of answering examination papers is different, their way of developing solutions or solving problems from other students papers. Last year we had one girl like that. She was doing something that I had taught and doing more than I had taught" - (Mathematics Teacher).
7.5.4.1.6 Importance of creativity in education- teachers opinion
The English teacher said that more importance should be attached to creativity. "If
we encourage the children to come out with their own opinions or solutions they become
good citizens of the country and we will have a better society tomorrow".

112
The Mathematics teacher also agreed about the importance of creativity. He said,
"education is not to make them pass the examination, education is for the all round development of the whole personality. In that respect what we are doing is, we are not teaching them, we are training them and we are not making or guiding them to bring out their own talents. All students have less or more IQ, they are intelligent; the thing is, we are only creating situations to bring out their intelligence but not the creative thoughts or thinking".
The English teacher explained how she introduces structures. While she is teaching,
she uses open-ended questions. e.g. if you were the Prime Minister or if you won the
lottery. She also uses questions such as why and how? So instead of routine answers or the
given answers children can suggest new solutions. They may be afraid of looking stupid,
but we should encourage them to express their opinions without fear to speak openly, so
that it will help them in the future.
7.5.4.1.7 Obstacles to development of creativity - teachers' views
Regarding the obstacles to the development of creativity, the English teacher said
that "teachers are bound to teach according to the prescribed syllabus and prepare the
children for examination, because good performance in examinations is the ultimate aim
of students and teachers. Academic excellence is over-emphasised because jobs are linked
with degrees, irrespective of creative thinking and intelligence ".
Further, she reported that this is in the child's mind. We suggest to them that "if you
want to get a job or anything you should have a certificate". Unless you have this
qualification, you can't get ajob. We stamp such ideas on them for ages. So a child should
be made to realise that there are still openings in society where s/he can develop his skill
and at the same time stand on his own.
The mathematics teacher
expressed similar views. He also
reported that the first and foremost
problem was lack of financial support
in government schools and a lack of
equipment in science and mathematics.
We have to rush through the syllabus (vast) and while rushing, we don't think much. We fail to give thought to creative thinking and this the examination pattern is such, as well as that it does not expect creative thinking. Only a student who mugs up well will get very good marks but a really intelligent or creative students falls back' -(Mathematics teacher)
7.5.5.0 Piloting the Teachers' Questionnaire (TQ)
According to Fowler (1993) every questionnaire should be pre-tested, no matter
how skilled the researcher. Virtually every questionnaire could be changed in some way to
make it easier for respondents and interviews to meet the researcher's objectives.
A pre-test is also helpful to find out how long it takes to complete a questionnaire.
The length of a self-administered questionnaire affects costs, and response rates vary with
the population being studied and the topic (Fowler, 1993).

113
The drafted questionnaire was personally given to all the teachers teaching in
standard nine, with the help of the headteacher. The teachers were asked to complete all the
items in the questionnaire, and the investigator led a discussion about it. Respondents were
asked to identify any confusing and difficult items. The discussion about the meaning of
each item was also useful. It helped to identify questions that respondents might have
misunderstood or misinterpreted, as well as the format or design problems of the
questionnaire. The detailed procedure of administration is explained in chap VIII, 8.4.5.
The teachers responded satisfactorily to all of the items except for one question (No
7). The instruction for question 7 (in Part F, Appendix B6) was rephrased from please tick
as many as apply to "Please rank 1 to 5".
7.5.6.0 Piloting the Check-list for Headteacher (CFHT)
The Headteacher ofthe school was asked to complete the list (See APP-B8) which
consists of26 items and mark the activities organised by the school. The HM marked 12
items (4,6,7,8,10,18,19,20,23,24,25 and 26) which were organised in the school. Most of
them were very common activities organised by schools e.g. debates, essay competitions,
games, SUPW, NCC, cultural activities, school/classroom decorations. The less common
activities in India were: preparation and display of wall posters, visits to historical
monuments, museums, excursions, student presentations, assisting pupils in participating
in activities which were interesting for them, and school prize days. 14 items (1, 2, 3, 5, 9,
11, 12, 13, 14, 15, 16, 17,21 and 22) were marked as needing to be organised in the school.
None of the items were marked as impractical or not feasible in the school.
The purpose of completing the checklist was to detect and remove any ambiguities,
and to ascertain the range of possible responses in the study. The responses showed some
ambiguities because some statements were double barrelled. The checklist was re
structured by re-ordering and re-phrasing the statements (See App. B8 & B9). Two more
statements were also included in the checklist, information regarding the library (Q.No.17)
and laboratory (Q.No.16) facilities.
7.6.0 Summary and conclusion The pilot study results enabled changes to be made so that all the test items were
clearly worded and easy to understand. Correlations between test items, total activity
scores, and other factors were calculated. All the correlation coefficients were significant.
The pilot study results reveal that the students attending government schools come
from poor parental educational backgrounds; most of the mothers were housewives and
unemployed. The parents' occupational background was generally poor.

Chapter-VIII
Research Design and Methodology
8.0.0 Introduction
114
This chapter deals with the methodology, the framework of the research, the final
selection ofthe sample and procedures for data collection. Finally, the reliability and validity
of the instruments will be discussed.
8.1.0 A framework for the present investigation
From the literature review undertaken in chapters II, III, IV and V it seems that
students' background variables like sex, age, SES, school type etc, teacher perceptions of
pupils, the perceived role and attitudes of the teachers towards creative children, and the role
of the school in promoting creativity all playa part in determining measured creativity.
These are set out in figure 8.1.
The variables selected for this study have been classified as Organisational Variables
(OVs)* Background Variables (BVs)* and Students' Cognitive & Motivational
Characteristics (SCMC) *. Creative thinking is the dependent variable. The data analysis
procedures are also explained in this framework. Quantitative and qualitative data analysis
techniques are used in the study. The variables included as OV s in this study are (1) Type
of school (medium) (2) Type of school (gender). BVs include students' sex, age, parental
education, occupation, and income; teachers' sex, age, teaching experience, qualifications,
and their teaching subjects; and School extra-curricular activities. Students' Cognitive &
Motivational Characteristics (SCMC) include students' interests, students' perceptions
towards their teachers, teachers' perceptions towards the students, and attitude towards
creativity.
8.1.1 Organisational Variables and Creativity
The behaviour of individuals is influenced by the interaction between their personal
characteristics and those of the institution. Objective indices like management and type of
school will contribute to the general atmosphere prevalent in the school (e.g. Sharma, K;
1991). Forehand and Gilmer (1969) have defined 'behaviour' as a "function of the interaction
between personal characteristics and environmental variables". They have considered
'climate' as a set of organisational properties, which may influence the individuals in an
organisation. In a study of school climate and creativity, Goyal (1973) found the favourable

115
effect of school climate on development of creativity.
Study of the school and classroom environment is particularly important because
these are a major socialising agency for students. The learning environment in the classroom
includes interpersonal relationships among the students, relationships between students and
their teachers, students' interests, and achievements.
A review of the research on creativity reveals that there are very few investigations
of the various school environmental factors conducive to the development of creativity.
Organisational variables such as type of school (gender) and medium of instruction at school
level have been taken up in this research to identify their influence on students' creativity.
Schools are classified as Boys', Girls' and Co-educational on the basis of the sex of
the pupils' population. Since sex of students has been studied as an independent variable and
found to be related significantly to creativity (see 3.5.3), it is likely that the type of school
(gender) will also be significantly related to creativity.
According to Sharma, K (1991 ,p.132) students of co-educational schools were found
to be more creative than those of unisex schools, probably because of lesser restrictions
imposed by parents on children attending co-educational schools. These children also tend
to have fewer conflicts regarding the opposite sex. The literature review revealed that this
variable has not been investigated extensively in relation to creativity.
Regarding the medium of instruction, Naidu (1987) concluded in his research that
there was a significant difference between the students who were studying in the English
medium and the students who were studying in the Telugu medium, in their educational
achievement in the subjects of English, Science and Social Studies, in pre and post-teaching
situations. Based on the mean values obtained, the students who were studying in the
English medium proved to be better achievers in all of the above subjects when compared
to the Telugu medium students.
The medium of instruction has been studied relatively little in relation to creativity
in the Indian context, although it is an important factor to consider. It is therefore included
in this study.
8.1.2 Background Variables - Creativity
The research studies available on sex differences in creativity show diverse [mdings
(see 3.8.3), which makes generalisation impossible and gender therefore an important
variable to consider.
* These abbreviations are used in this study.

116
Organisation ~ Background ~ Students' Cognitive & """- Data Analysis I ~
al Variables ~ Variables
~ Motivational Characteristics Out come
~
~ ,,. ~Ir ,Ir ,
Type of the Students Intervening Dependent Quantitative ~iable Data
School Sex, Age, Variables Creative Analysis Medium wise Parental
Education Interests l+ Thinking ~ Occupation
~ K Parametric
English Medium Income Non-parametric Telugu Medium Perceptions r--. -Definition
V' -Importance Teachers Attitudes -Identification Type of the .. r--. Qualitative .. Sex, Age, f--+ criteria
School Experience, -Encouragement Data Sex wise Qualification,
V -Factors assisting Analysis -Factors affecting
Boys School Categories Girls
~ Extra- Comparisons
Co-education curricular Activities
Fig.8.1. The scheme of the present research

117
Social class differences in creativity have also been explored in a large number
of studies, but the evidence has not been unequivocal (Sharma, K., 1991). Taking into
consideration the diversity in fmdings about the relationship between socio-economic status
(SES) and creativity (see 3.5.4), it has been decided to explore the relationship between
creativity and parental education, occupation and income levels separately.
8.1.3 Students' Cognitive & Motivational Characteristics (SCMC) - Creativity
A number of studies have been reported in the literature regarding the relationship
between creativity and cognitive & motivational characteristics such as intelligence,
personality dimensions, achievement- motivation, self-concept, academic achievement etc.,.
Very few studies have explored the relationships between creativity and other variables like
students' interests, teacher encouragement and behaviour in the classroom as perceived by
students, and teachers' attitude towards creativity and its development among the students.
The review of the literature shows that most research has been undertaken on the
behaviour of the teacher and teachers' perceptions in relation to creativity; hardly any work
has been reported on the perceptions of the teachers' behaviour by their students in relation
to their gender, medium of instruction, type of school and level of students' creativity. It is
also of interest to explore the school subjects, occupational choices, experiences in the
classroom and parental backgrounds of children, with high and low measured creativity.
8.1.4 Data analysis
The data was analysed quantitatively and qualitatively. Descriptive statistics and
qualitative findings are often presented (Mercurio, 1979) and used together (Fielding and
Fielding, 1986). It is common, for example, in designing questionnaires to do open-ended
interviews first. But in-depth observations can be used to discover why two variables are
statistically related (Bogdan and Biklen, 1992, pp.42).
The researcher used available statistical techniques that are relevant and most
commonly used in education and psychological research. Statistical techniques were decided
in relation to the type of the data that were collected and also those appropriate to answer
the research questions.
If the data were nominal, simple statistics utilising categories and comparisons were
explored for example the frequencies, and proportion / percentage of cases in each category
(e.g. male or female). Under certain conditions, a Chi-square (X2) test (non-parametric test)
was applied to test hypotheses regarding the distribution of cases among categories
Interval measurement assumes equal distance between the data on a continuous
118
munerical scale. The interval scale is the first truly quantitative scale. The common
parametric statistical tests applicable to data in an interval scale, for example Mean, SD,
Critical Ratio (CR), Analysis ofYariance (ANOYA), Correlation(r) and Multiple(R) were
used. For extraction of factors, Factor Analysis, and to calculate the direct and indirect of
the affecting variables Path Analysis, were applied.
The research proposed assumes that creative thinking (dependent variable) of
students is a function of the combined effects of background, organisational and cognitive
and motivational characteristics.
8.2.0.Research Method
There are different methods of educational research that are very commonly used in
the field of Education. The difference in methodology is largely due to the difference in
purpose and approach. Normative Survey (or Survey) is one of the methods suitable for this
study.
8.2.1. Normative Survey Research
The method of research which concerns itself with the present phenomena in terms
of conditions, practices, beliefs, processes, relationships or trends is variously termed as the
'Normative Survey' or 'Survey'.
The survey approach to educational research is one of the most commonly used
approaches. It is adopted in studying local as well as state, national, and international aspects
of education. It goes beyond the mere gathering and tabulation of data. It involves
interpretation, comparison and generalisation - all directed towards a proper understanding
and solution of significant educational problems.
Such research involves describing, recording, analysing, and interpreting conditions
or contrasts and attempts to discover relationships between existing non-manipulated
variables (Best and Kahn, 1989,p.4). It focuses our attention towards existing educational
problems and also suggests ways of meeting them. Survey studies can collect three types of
information. (1) What exists? (2) What do we want? (3) How to get there?
8.2.2. Characteristics of Normative Survey Research
1. Normative survey research is concerned not only with the characteristics of
individuals but also those of the whole population or a sample thereof. 2. It collects data
from a relatively large number of subjects. 3.1t provides information useful to the solution
of local problems. 4.1ts scope is vast. 5. A survey may be qualitative or quantitative.
6.Descriptions may be either verbal or expressed in mathematical terms.

119
8.3.0 Sampling procedure for the main study
The sample for the main study was selected in two stages. In the first stage, the
selection of schools was made. In stage two, students and teachers were chosen from the
selected schools. Nine schools were selected in total from the current list of Government
schools in Hyderabad, Andhra Pradesh (India).
Hyderabad is a large city and the capital of Andhra Pradesh (AP), a state in India,
being 217 sq.kms in area and 31lakhs in population (see Appendix-A3, TableA3-T1). There
are a total of 7,896 high schools in the state of AP (71, 055 in India); among them 887
schools are government schools (Appendix A3 Table A3-T3 & T5). In Hyderabad, 452 high
schools work under various managements, among them 98 are government high schools
(Appendix A3, Table-A3-T7). The government of AP divided all these schools into seven
zones for administrative convenience. These schools are widely scattered throughout the
city. It would be quite impractical randomly to select students and spend an inordinate
amount of time travelling about in order to test them. By cluster sampling, we can randomly
select a specific number of schools and test all the children in those selected schools (Cohen
and Manion, 1994, p.88).
In three zones out of seven, the government high schools attached to Junior Colleges,
in the Secundrabad and Sanathnagar Zones were purposively selected for this study. The
factors considered in selecting these schools were the living conditions and similar social
background of the sample to be selected, administrative and travelling convenience,
minimising the cost and time and achieving an adequate sample. These zones also have
many schools clustered together, and the sample contains subjects with characteristics
similar to the population as a whole.
Initially all the 98 Government schools were divided into subgroups or strata on the
basis of medium of instruction and type of the school (Appendix-A3, Table-A3-T7). From
the above three zones, by using a disproportionate stratified sampling technique (due to the
non-availability of schools in some strata and the great variation in the strata) it was possible
to get more of the sample from one stratum than an other and to achieve an adequate sample
to compare the students' creativity in relation to their sex, medium of instruction and gender
type of the school. Initially an attempt was made to select co-educational schools, followed
by unisex schools, using simple random techniques within the stratum to reach the target
sample size (above 300). Nine schools were eventually chosen, of which three used English
as a medium, four Telugu and two both Telugu and English media (Appendix A3, table-A3-
T8).

120
In the Secondary Schools there are stages comprising classes from VIII to X; the
age of the students is between 14 and 16 (See Appendix AI). Among these three classes, IX
class was chosen because VIII class students have just entered from Upper Primary to
Secondary and they have therefore been little exposed to the teaching and environment of
the school. The X class students were not selected, as they have to take a public
examination. The students of X class and the teachers teaching them are preoccupied with
preparation for examinations and completion of the syllabus. The students of IX class get
an automatic promotion 1 to the next class so there is less pressure on them than on VIII and
X class students.
F or these reasons the present sample was selected from the ninth standard. The
students of class IX studying in government schools in Hyderabad were considered as the
population. The students' sample was drawn from nine schools as explained above. All the
IX class students were included from each school where there was only one section (or
class). In the case of more classes (IXA, IXB, IXC ...... ) in the school, the random number
selection procedure was followed (Best and Kahn ,1989, pp.12-13 and Fox, 1969, pp.234-
35). For this, the available list of all students from all sections studying in that school was
assembled (Fox, 1969)2, and a number assigned for each student from 1 to the end of the
list. The list simply served as the basis for assigning a number to each member of the
population. By using the table of random numbers, on average about 40 students were
selected from a school.
All the Head teachers and the teachers teaching class IX students were selected for
this study, which was carried out between January 1997 and the end of April 1997.
8.3.1 Students' Biographies
From the above process, a total of 373 students were selected with 33% of them
coming from English medium schools, 44% of them coming from Telugu medium schools
and 23% of them coming from English and Telugu medium schools. The frequency
distribution of the Medium of instruction by type of school is shown in table 8.1 and figure
8.2. The same table reveals that 15.8% are from boys' schools, 32.7% coming from girls'
schools, and 23.6% boys and 27.6% girls from co-educational schools. Altogether the
1 In Andhra Pradesh, the non-detention system of education is implemented for transfer from primary to secondary (except VII and X classes). In this system every student gets promotion ifhe fulfils requirements of attendance and a minimum percent of marks in monthly and annual examinations.
2 Fox(1969) says, " It makes no difference how the list was made up. It could be alphabetical, it could be in order of ascending size, or it could be a list made up as we recalled the names of the schools".

121
percentage of girls (60.6) exceeds the percentage of boys (39.4).
Table-8.1: Frequency distribution of sample by medium of instruction and type of school ( sex wise)
Type of the School
Boys Girls Co-education Total % Medium of instruction Boys Girls 1. English 47 76 - - 123 (33.0%) 2. Telugu - - 60 104 164 (44.0%) 3.English and Telugu - 25(EM) 28(TM) 11(EM) 86 (23.0%)
10(TM) 12(EM) Total 47 111 100 115 373
(12.6%) (29.8%) (26.8%) (30.8%) (100.0%) EM= English Medium; TM= Telugu Medium Note: numbers within brackets ( ) indicates percentages.
Table 8.2 and figure 8.3 shows that the students' age varied from 12 to 17 years and
the average age was 14 years. 87.1 % of the girls were between 12-14 years and only 12.9%
between 15-17 years, whereas the percentages of boys between 12-14 years and 15-17 years
were 54.4% and 45.6% respectively. The findings indicate that either girls started school
earlier than the boys or they were more successful in examinations without any repetition
of classes.
Table-8.2: Frequency distribution of sample by gender and age
SexIYears 12 Yrs 13 Yrs
1.Girls Row % 9 (4.0) 60 (26.5)
Column % (100) (72.3)
2.Boys Row% o (0.0) 23 (15.6)
Column % (0.0) (27.7)
Total (%) 9 (100) 83 (100)
8.3.2 Teachers' Biographies
(A) Questionnaire:
14 Yrs 15 Yrs 16 Yrs
128 (56.6) 25 (11.1) 2 (0.9)
(69.2) (34.2) (10.5)
57 (38.8) 48 (32.7) 17 (11.5)
(30.8) (65.8) (89.5)
185 (100) 73 (100) 19 (100)
17Yrs Total
2 (0.9) 226 (100)
(50.0) (60.6)
2 (1.4) 147 (100)
(50.0) (39.4)
4 (100) 373 (100)
It was intended to collect basic background information about the teachers' sample
to enable analysis of the teachers' views in relation to their background variables. This was
covered in part A 'Teacher's Biography' of the Teachers Questionnaire. The following
tables present the demographic variables Sex, Age, Experience, Academic and Professional
qualifications, and taught subjects. The figures also show the major differences between sub
samples (See fig.8.4 and 8.5).

122
Figure-8.2: Distribution of sample by Medium of Instruction and Type of School
1a> Co-Girls
F 1m r e ro q u e ED n c 4) i e a> s
a 1 2 3
English Telugu English & Telugu
Medium of Instruction
120 Fig.-8.3 : Distribution of the sample by gender and
100
U) 80 CD .-U C CD 60 ~ C'" CD a... 40 u.
20
0 12 Yrs 13 Yrs 14 Yrs 15 Yrs 16 Yrs 17 Yrs
Age in Years

123
FigureS.4: Frequency distribution of the teachers by Sex, Age and Experience
F r e q u e n c
e s
70 60 50 40
30 20 10
0
Sex 1 2
Age
Teachers variables
3 Ex erience
Fig.-8.5: Frequency distribution of the teachers by qualification and taught subjects
so
70
60
11) 50 .!!! (J s:: ~ 40 tT ~ u.. 30
20
10
o 1.Academic 2. Professional
Teachers' variables
AG= Academic Graduates APG= Academic Postgraduates PPG= Professional Postgraduates T= Telugu H= Hindi B= Biological sciences P= Physical Sciences
3. Taught Subjects
PG = Professional Graduates E= English M= Mathematics S= Social Studies

124
It can be seen from table 8.3 that out of 88 teachers in the main study, 25
(28.4%) were male and 63 (71.6%) were female. The sample was skewed towards female
teachers, but if we look at the population of the teachers working in Hyderabad3 it is clear
that there was not any sample selection bias, since the proportions of male and female school
teachers working at secondary level are 21.3% and 78.7% respectively.
Age is spread between 20 and 60 years; the majority ofthe teachers belonged to the
age group 41-50 years (47.7%). About 20% of the teachers were between 31-40 years of age,
whereas the other age groups the below 30 Years and between 51-60 years groups, were
15.9% and 17.1 %, respectively. As for years of experience, the majority ofteachers (56.8%)
had teaching experience ofless than 20 years, and 43.2% of them had more than 20 years
of experience.
From the same table 8.3, it is clear that almost all the teachers were academically
and professionally qualified. The majority of the teachers (58%) held Bachelor degrees
(B.AlB.Sc'/B.Com) and 42% were Postgraduates (M.AIM.Sc'/ M.Com). For their
professional training, most of them (81.6%) had Bachelor degrees (BEdlBOL 4
) and only
18.4% were postgraduates (MEdlMOL5). It is also evident from the same table that the
sample is composed of teachers representing, all the subjects taught at secondary level. An
equal number of teachers are (20.5% - 31.8%) included from all subjects in the study,
except Hindi (only 8%).
Table-8.3: The overall composition of the sample characteristics-sex, age, experience, IT f d t ht b· t qua I Ica Ions an aug I su IJec s
Sex f (%) Age f (%) Experience f (%)
1. Male 25 (28.4) < 30 Yrs 14 (15.9) < 10 Yrs 24 (27.3) 2. Female 63 (71.6) 31- 40 Yrs 17 (19.3) 11 - 20 Yrs 26 (29.5)
41- 50 Yrs 42 (47.7) 21 - 30 Yrs 20 (22.7) 51- 60 Yrs 15 (17.1) > 30 Yrs 18 (20.5)
Academic Professional Taught Qualifications (f) (%) Qualifications (f) (%) Subjects f (%)
1.Telugu (T) 18 (20.5) Graduates 51 (58.0) Graduates 72 (81.8) 2.Hindi (H) 7 (8.0) Postgraduates 37 (42.0) Postgraduates 16 (18.2) 3.English (E) 28 (31.8)
4.Mathematics (M) 20 (22.7) 5.Bio-Sciences(B) 21 (23.9) 6.Physical sciences(P) 21 (23.9) 7.Social Studies(S) 19 (21.6)
134* * 46 Teachers teaching more than one subject (Multiple responses)
3 See Appendix-A3, Ttable-A3-T4. It shows that out of 12,706 teachers, 10,003 (78.7%) were female and only 2,703(21.3%) were male.
4 Bachelor of Oriental Languages which is an essential qualification for language teachers ofTelugu
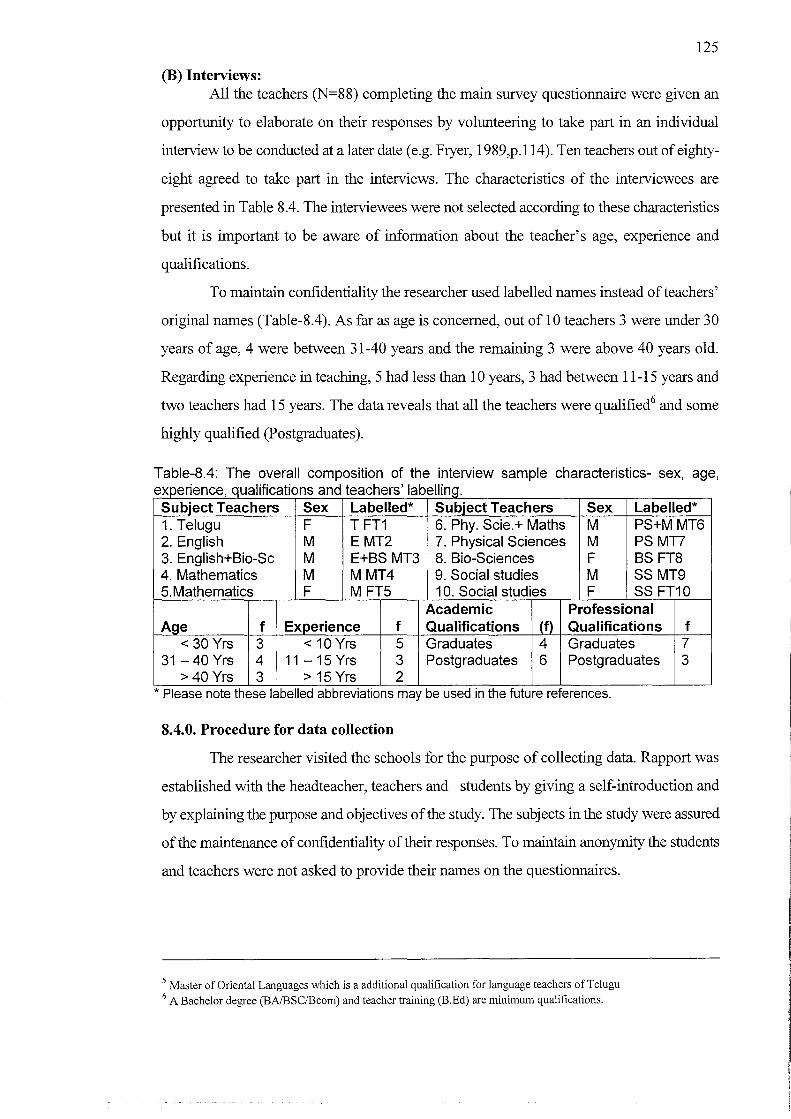
125
(B) Interviews: All the teachers (N=88) completing the main survey questionnaire were given an
opportunity to elaborate on their responses by volunteering to take part in an individual
interview to be conducted at a later date (e.g. Fryer, 1989,p.114). Ten teachers out of eighty
eight agreed to take part in the interviews. The characteristics of the interviewees are
presented in Table 8.4. The interviewees were not selected according to these characteristics
but it is important to be aware of information about the teacher's age, experience and
qualifications.
To maintain confidentiality the researcher used labelled names instead of teachers'
original names (Table-8.4). As far as age is concerned, out of 10 teachers 3 were under 30
years of age, 4 were between 31-40 years and the remaining 3 were above 40 years old.
Regarding experience in teaching, 5 had less than 10 years, 3 had between 11-15 years and
two teachers had 15 years. The data reveals that all the teachers were qualified6 and some
highly qualified (Postgraduates).
Table-8.4: The overall composition of the interview sample characteristics- sex, age, IT r d t h ' I b II" experience, qua I Ica Ions an eac ers a e Ing.
Subject Teachers Sex Labelled* Subject Teachers Sex Labelled* 1. Telugu F T FT1 6. Phy. Scie. + Maths M PS+M MT6 2. English M EMT2 7. Physical Sciences M PSMT7 3. English+Bio-Sc M E+BS MT3 8. Bio-Sciences F BS FT8 4. Mathematics M MMT4 9. Social studies M SSMT9 5. Mathematics F M FT5 10. Social studies F SS FT10
Academic Professional Age f Experience f Qualifications (f) Qualifications f
< 30 Yrs 3 < 10 Yrs 5 Graduates 4 Graduates 7 31-40 Yrs 4 11 -15 Yrs 3 Postgraduates 6 Postgraduates 3
> 40 Yrs 3 > 15 Yrs 2 * Please note these labelled abbreviations may be used In the future references.
8.4.0. Procedure for data collection
The researcher visited the schools for the purpose of collecting data. Rapport was
established with the headteacher, teachers and students by giving a self-introduction and
by explaining the purpose and objectives of the study. The subjects in the study were assured
of the maintenance of confidentiality of their responses. To maintain anonymity the students
and teachers were not asked to provide their names on the questionnaires.
5 Master of Oriental Languages which is a additional qualification for language teachers ofTelugu 6 A Bachelor degree (BAIBSClBcom) and teacher training (B.Ed) are minimum qualifications.

126
8.4.1 Student Information Sheet (SIS)
The SIS was distributed among the students of class IX. The students were asked to
fill in the columns for name, school name, parental background, etc., The other questions
asked in SIS were explained. After the general instructions had been given, the researcher
confirmed that the children understood. The students were allowed to ask any questions
regarding the SIS during the session. The researcher was present throughout to answer
questions.
The SIS was administered in the morning session, with English medium students in
the first hour and with Telugu medium students in the next hour. These precautions were
adhered to strictly, to avoid consultation between students of both media until they had
completed the activities. Forty minutes' time was given for the students to complete the SIS.
The two versions of the instruments i.e., English and Telugu, were used during the pilot /
main study for the different media students. They are also asked to write their responses
either in English or in their mother tongue, Telugu. The headteacher, class teachers and
students co-operated during the entire study.
8.4.2 Creative thinking tests
The standardised creative thinking tests (both verbal and non-verbal) and the
translated Telugu version both verbal and non-verbal were administered to IX standard
students in normal classroom conditions with good light and ventilation with the help of the
headteacher and class teacher. Students being tested were seated sufficiently far apart to
prevent copying. The researcher explained briefly why the tests were being administered and
emphasised the personal value of the tests for all the students, so that they would be
motivated to complete them.
Special instructions were given to the group. Students were asked to read the
directions given in the booklet, and the researcher read them again aloud. Each student was
given one Verbal Creative Thinking Test booklet. The test booklets provided a place for the
responses to each activity. The booklets were scored according to the procedure explained
in the previous chapter (6.3.4.2 & 6.3.5.2). The non-verbal test of creative thinking was
conducted on the next working day. The whole pilot / main study work was carried out in
the morning sessions only, to avoid boredom and to hold the interest of the students.
8.4.3. Teachers' Encouragement Scale (TES)
This scale was administered in the normal classroom with the same students as
mentioned earlier. The students of English were asked to rate all their subject teachers. The
same procedure was adopted with Telugu medium students. The students were discouraged

127
from writing their name on the TES. The TE scale was pre-coded with the list of
students. The code numbers were randomly given. Later the corresponding names were
decoded by the researcher. This was done to maintain confidentiality. While administering
the instrument the researcher was present in the classroom to clarify any doubts about filling
in the scale. No teachers were present, as the presence of teachers might have greatly
affected the responses made. A discussion with some students about the difficulty of
questions and their meaning was helpful in modifying the instrument in the pilot study.
8.4.4. Interviewing procedure, recording and transcribing.
The researcher negotiated with teachers a time and place for the interviews. Most
of the interviews were conducted in the school during school hours when the teachers were
free from teaching, either in the staff-room or in other rooms where there was availability
of electricity7 and the environment was suitable for interviews i.e., light, ventilation, proper
seating arrangement, no external disturbances. The interviews took one to two hours,
including preparation and follow-up. The teachers felt comfortable and expressed their
views without any anxiety. They were confident that their suggestions would be taken
seriously and hoped that the necessary arrangements would be made as soon as possible by
the government. They were unhappy with the present conditions prevailing in government
schools and hoped that the study would help them to present their views representing the
education world and open the government's eyes.
After the pilot study, the researcher decided not to take copious notes while
interviewing the teachers. Some notes were taken to stress that their views were considered
to be very important and to be usable if the tape recorder stopped working. Tape recorders
cannot be completely trusted (Krueger, 1994, p.111).
As Gorden (1975) said,
"Intense note taking may distract the interviewer from his task of observing and listening to the respondent. Also, the respondent may feel the interviewer should not neglect him and should show more spontaneous appreciation. When a few notes are taken, the respondent may feel that, when interviewer is writing, something important has been said (p.272).
Further he says the tape recorder is an excellent tool on the initial exploratory interviewing and subsequent pre-testing of the interview schedule" (p. 2 73).
The researcher recorded the interviews with the consent of the teachers. They were
told the advantages of recording interviews on tapes, how note-taking distracted attention
and how the respondent found it difficult to listen while note-taking. Steps were taken to
7 Some schools do not have electricity in the classes and some schools have been disconnected (ex G.H.S Lalapet) due to the non-payment of bills. The researcher used batteries while recording.

128
ensure confidentiality and the kinds of assurances were given that are appropriate to give
to respondents. As Oppenheim (1992) writes, 'adequate trust and rapport between
interviewer and respondent is probably the single most important method of reducing bias '.
'The relationship between researcher and teachers was friendly but not a friendship (Oakley,
1981).
The researcher used a large battery-operated tape recorder with a separate
microphone. Some school did not have proper electricity connections in all rooms. Some
recorders with built-in-microphones can also muffle the sound and make transcribing
difficult (Seidman, 1991). Built in microphones on cassette recorders tend to have limited
sensitivity (Krueger, 1994, p.12) and the small batteries' life is less so the interview
recording may be interrupted, creating tension for the interviewer about the recording.
The researcher has translated verbatim the spoken words into a written text to study.
Each word a participant speaks reflected his or her consciousness (Vygotsky, 1987). The
other benefit of tape-recording is to preserve the words of the participant. If something is not
clear in a transcript, the researcher can return to the source and check for accuracy (Seidman,
1991). The participants can feel assured that there is a record of what they have said, and
have more confidence that their words will be treated responsibly. The researcher who did
the interviews did the transcribing. Through this process the interviewer becomes aware of
the amount of missing information and is strongly motivated to probe more persistently in
subsequent interviews (Gorden, 1975, p.276).
8.4.5 Teachers' Questionnaire (TQ)
The TQ is not very long, but considerable time is required to go through it and to
write responses for the open-ended questions. The teachers were given the questionnaires
to work on at their leisure (Gorden, 1975, p.307). Sufficient time of one to two weeks was
given to the teachers to complete the TQ as they were busy with their regular classroom
teaching and they had to finish their syllabus by the second/third week of March'97. The
students of X class have to attend public examinations i.e., S.S.C8
in March. All the teachers
included in the study were teaching X standard as well as standard IX. The teachers were
told individually how to fill in the questionnaire, as all the teachers were not available at one
time. While filling in their TQ, they were requested neither to consult other teachers nor to
see their completed TQ. They were asked to fill the TQ in independently. The reasons for
8 Secondary School Certificate (SSC) is the public examination, which tenninates school education and carries the minimum qualification for entering in to the college education.

129
this were explained. They were given liberty to ask any questions, where they did not
understand. The TQs were provided in two languages, i.e., English and Telugu. They could
choose any language according to their proficiency and could write in either of the
languages.
8.4.6 The classroom observation scheduled (COS)
The researcher observed some of the classrooms, to assess the teaching behaviour
of the teachers using the classroom observation schedule (COS). The researcher observed
twelve teachers' classes, those scoring high (6) and low (6) mean scores on the Teacher
Encouragement Scale (TES) as assessed by their students. The teachers were teaching four
different school subjects at secondary level. The researcher was not an expert on all of these
subjects. For this reason, it was difficult to judge each teacher and every aspect of the lesson
at a single attempt. The researcher also recorded the lesson on audio-tapes. The microphone
recorded the teacher talk, not the students' talk.
It became apparent that it would be difficult to analyse classroom behaviour without
the students' and teachers' interaction. Context and facial expressions are also missing on
the tapes. It was not possible without video to play back to recheck or re-code the data. It
was also difficult to establish inter-rater reliability of the observation without videotapes.
The researcher because aware that video recording would be the way to overcome this
difficulty. However video recording can change the entire environment and affect the
participants' spontaneity. It also requires several cameras with operators to swing cameras
quickly to follow the flow of conversation and is therefore very expensive. For these reasons
it was not used.
Classroom observation is complex and for observing different teachers' behaviour
a team of experts in each school subject may be needed to judge properly. Due to these
problems the data analysis of the classroom observation was dropped from the research. It
was not in any case the main area of the present research. It was only planned in order to
cross check the Teacher Encouragement Scale (TES) data.
8.4.7 The Check-List for Headteacher (CFHT)
The 26 items check list was supplied to all the headteachers of the nine schools.
They took one week to two weeks to complete it, due to their administrative and supervision
responsibilities. The directions for completion were explained to them and afterwards the
researcher clarified doubts. If the response was ambiguous, the researcher rectified
immediately.

130
8.5.0 Reliability and validity of the instruments.
Ross and Stanley (1955) comment that the ideal test tells the truth consistently.
Truthfulness is related to test validity. The two concepts, reliability and validity, are closely
interrelated as the two reflect the test's efficiency. A test may be reliable without being valid
but it is not quantitatively valid unless it is also reliable (Greene, Jorgenso and Gerberich,
1948). A highly valid test is also highly reliable because its correlation with a criterion is
limited by its own index of reliability. Thus reliability puts an upper limit to the validity of
a test (Remmers and Gage 1955).
Reliability: Reliability is the degree to which a test consistently measures whatever
it measures. The more reliable a test is, the more confidence we can have that the scores
obtained from the administration of the test are essentially the same scores that would be
obtained if the test were re-administered (Gay, 1990). Reliability is therefore consistency in
securing accurate scores and consistency implies repeatability or reproducibility (Heim,
1954). Indeed, the more consistent the test scores are the higher is the reliability coefficient
of the test.
Test reliability is often expressed in terms of a reliability coefficient. A reliability
coefficient refers to the extent to which a test is internally consistent (ie., the accuracy of
measurement) and it refers also the extent to which a test yields consistent results on testing
and re-testing (Heim,1954).
The various measures of reliability coefficients are (i) test-retest method (ii) split
half (iii) parallel or alternate forms and (iv) rational equivalence (Kuder-Richardson
method).
Validity: The validity of the instruments or techniques used in gathering the data is crucial
to the validity of the conclusions that are derived from surveys. To the extent that the
instruments used are not valid- and one must remember that validity applies to a particular
situation under specific conditions- the results obtained cannot be interpreted nor can
generalisations be reached (Mouly, 1964, p.235). As Garrett (1981, p.354) said, 'Validity
is a relative term. A test is valid for a particular purpose or in a particular situation-it is not
generally valid' .
We know that every test is constructed with a purpose viz., to provide a measure of
a defmed variable. We may define validity as the degree to which this purpose is attained.
Validity is the quality of a data-gathering instrument or procedure that enables it to
determine what it was designed to determine (Best, 1983,p.153). In other words, validity
refers to the ability of a test to measure what it is supposed to measure. Validity is also

referred to as " the extent to which the procedure actually accomplishes what it seeks to
accomplish or measure what it seek to measure" (Fox, 1969,p.367).
8.5.1.1 Reliability of the verbal and non-verbal tests of creativity
131
The test-retest reliability ofthe creativity scores and also the total scores were obtained on
a small sample (N=75).
Table-8.5: Test-retest reliability off actor scores and the total creativity scores (N=75) Creativity Originality Fluency Flexibility Elaboration Total creativity score
Verbal .856 .954 .931 .970
Non-verbal .880 .910 .918
As will be seen the reliabilities of verbal and non-verbal scores and also total verbal
creativity scores are high, ranging from 0.856 to 0.970. These values are highly satisfactory.
Similarly all the reliabilities of the factor scores and also the total non-verbal creativity
scores are high, ranging from 0.880 to 0.918.
The author of this instrument (Prof. Baqer Mehdi) has established the inter-scorer
reliabilities oftest scripts in the range of 0.751 to .925 (for verbal) and 0.725 to 0.910 (for
non-verbal).
8.5.1.2 Validity of the creative thinking tests
Different researchers use different procedures to establish the validity of their
creativity tests (Joseph, 1993). According to Treffinger, et aL,(1971) each instrument of a
creativity test mirrors the particular set of beliefs and perceptions of its developer concerning
the nature of creativity. Passi (1979), Venkat Rami Reddy and Balakrishna Reddy (1983),
and Joseph (1993) have correlated creativity test scores with intelligence test scores obtained
on Raven's Progressive Matrices (RPM) to establish the concurrent validity of the
instrument. Misra (1986) validated his tests with teachers' ratings and the correlations with
his creativity test scores.
The validity coefficients against the teacher ratings for each factor and total creativity
scores as reported by the constructor are given in table 8.6. The validity coefficient for factor
Table-8.6 Validity coefficients for factor scores and the total creativity scores against te h f ac er ra Ings
Creativity Originality fluency flexibility Elaboration Total Creativity
Verbal 0.34** 0.40** 0.32* - 0.39*
Non-verbal 0.33** - - 0.35** 0.39* ..
** == Significant at 0.01 * == Significant at 0.05

132
scores and the total verbal creativity scores are high enough (p<0.01) to place confidence
in the use of the test. The test constructor reported that higher correlations with teacher
ratings are usually not obtained due to the unreliability of the ratings (Mehdi, 1973, 85).
Getzels and Jackson (1962) asked the teachers to rate all the students in the school on the
given criterion. They found that "teachers favour high achievers who are high IQ's, but not
high achievers who are highly creative" (p.31). So teachers' ratings may not be reliable.
Item Validity: Each item was scored for fluency, flexibility, elaboration and originality by
the present researcher. The raw scores for each item were converted into T Scores (see
Chapter-X, 10.1.0) with mean of 50 and SD 10, and were added up to get the total score for
each item. The item scores were then correlated, first, with the total activity scores, and then
with the grand total i.e., the total of all four activities. The correlations for each mediums of
the students (English and Telugu) were also computed separately and presented in the same
table.
Table 8.7 shows that for the whole sample (N=373)(1) the items in each activity
Table - 8.7: Correlation coefficients of test items with the activity total scores and grand total
~ ;::;: ;::;: (1)
Verbal creative thinking (1)
Non-verbal creative thinking <. 3 3 ~
en en
Corr.With Ac.Tot Corr.With Gr.Tot Corr.With Ac.Tot Corr.With Gr.Tot EM TM Tot EM TM Tot EM TM Tot EM TM Tot
1 .86~ .86~ .86~ .74 ~ .71~ .72~ 1 .74" .82" .79~ .25" .36" .32:); I 2 .74$ .66$ .69$ .69 $ .53$ .61$ 2 .65$ .69$ .67$ .21£ .32$ .27$
3 .72$ .82$ .78$ .63 $ .74$ .69$
1 .82" .76" .79" .69" .60" .64" 1 .30" A8" A1" .30" A8" .30" II 2 .80$ .76$ .78$ .66$ .50$ .58$ 2 .38$ AO$ .39$ .38$ AO$ .32$
3 .76$ .67$ .72$ .66$ A6$ .56$ 3 .27$ A3$ .37$ .27$ A3$ .27$ 4 .29$ AO$ .35$ .29$ AO$ .33$ 5 A3$ A4$ A4$ A3$ A4$ .38$
6 .36$ .32$ .33$ .36$ .32$ .24$ 7 .29$ A1 $ .37$ .29$ A1 $ .28$ 8 A2$ .33$ .36$ A2$ .33$ .31$ 9 .36$ A7$ A3$ .36$ A7$ .35$ 10 .35$ .39$ .37$ .35$ .39$ .25$
1 .78" .73" .76" .61" .54" .61" 1 .69'" .75'" .72'" .52'" .59:ti .55:ti 2 .83$ .70$ .75$ .70$ A8$ .58$ 2 .82$ .86$ .84$ .63$ .67$ .65$
III 3 .82$ .79$ .81$ .63$ .62$ .62$
IV 1 1.00 1.00 1.00 .64" .52" .59" TM= Telugu medlum(N=202) EM= EnglIsh medlum(N=171) Tot - Total (TM+EM) $$ Perfect correlation $ Significant at 0.001 £ Significant at 0.01 @ Significant at 0.05
correlate highly with the activity total, indicating that together they are measuring the same
thing. (2) The correlation with the grand total is also high, again pointing to the fact that the
items are highly internally consistent. In regard to Telugu and English medium, all the item

scores were highly or moderately correlated with activity and grand total scores. The 'r'
values were all significant (levels ranged from 0.05 to 0.001).
133
Correlations in Table-8.8 show a significantly high degree of relationship between
the activities and the creativity scores. The correlations range from 0.58 to 0.86 for verbal
creativity and from 0.40 to 0.80 for non-verbal creativity for the whole sample (N=373). For
English and Telugu medium the verbal creativity range was 0.63 to 0.88 and 0.52 to 0.85;
the non-verbal creativity range was 0.33 to 0.76 and 0.45 to 0.82 respectively.
Table - 8.8: Correlation coefficients between test activities and total scores of verbal and non verbal creativity.
Activity Verbal creativity Non-verbal creativitY English Telugu Total English Telugu Total Medium Medium (N=373) Medium Medium (N=373) (N=171) (N=202) (N=171) (N=202)
I .88-} .85~ .86~ .33:» .45~ .40~
II .84$ .71$ .77$ .74$ .82$ .80$ III .82$ .75$ .78$ .76$ .78$ .77$
IV .63$ .52$ .59$ ..
$ Significant at 0.001
8.5.1.3. Factor Validity of Verbal and Non-verbal Creativity
The correlations between the different factors of verbal and non-verbal creativity,
the total verbal, total non-verbal creativity, and composite creativity scores are given in
table-8.9.
The correlations in the table-8.9 show a significantly high degree of relationship
between verbal creativity factors and the total verbal creativity scores (p<0.001). The
correlations range from .78 to .97. The inter-correlations range of the author (Baqer Mehdi,
1983) for verbal creativity ranged from .776 to .966 for urban and .435 to .828 for rural
samples.
The correlations are much higher than would be expected on the basis of results
obtained by Guilford in his factor analytic studies of the structure of intellect. That they are
as high as this may be due to the high verbal component present in each factor.
All the correlations in Table-8.9 show significant degrees of relationship between
non-verbal creativity factors and total non-verbal creativity (p<0.00l to p<0.05). The
correlations range from 0.38 to 0.83. The inter-correlations reported in the manual are .533
to .875 for the urban and .356 to .604 range for the rural sample.
All the correlations in Table-8.9 show a significant degree of relationship between
verbal creativity factors and non-verbal creativity factors (p<0.001 to p<0.05). The
correlation between the verbal and the non-verbal tests of creativity based on the total
creativity scores was found to be 0.33. The test constructor reported a correlation of .456 for

134
the urban and .356 for the rural samples.
This indicates that while the two tests are measuring the same construct, namely,
creative, they provide somewhat different information about it. The test constructor
recommends that both the tests should be used to give more complete information about the
creativity of an individual. Validity studies indicate which type of creativity score is more
specifically related to creative performance in a particular field (Mehdi, 1985).
Table - 8.9: Correlation coefficient among various factors of verbal and non-verbal creativity scores of the sample (N=373) and medium wise.
Verbal creativity Non-verbal creativity
Factors Originality Fluency Flexibility Total Originality Elabo- Total Compo-ration site
V- Originality - .74" .78" .90" .26" .23' .29' .78' V-fluency .82$ - .95$ .95$ .31$ .31$ .36$ .85$
(.78$) - - - - - - -V- flexibility .84$ .98$ - .97$ .34$ .32$ .39$ .87$
(.81$) (.96$) - - - - - -
V-Total .92$ .97$ .98$ - .32$ .30$ .36$ .88$
(.91 $) (.96$) (.97$) - - - - -NV- Originality .21"- .22"- .20(f!! .22"- - .47" .86' .65·
(.24$) (.26$) (.27$) (.27$) - - - -NV- Elaboration .20£ .31$ .26$ .27£ .22£ - .86$ .64$
(.21 $) (.30$) (.29$) (.28$) (.38$) - - -NV- Total .26$ .33$ .29$ .31$ .79$ .77$ - .75$
(.27$) (34$) (.34$) (.33$) (.83$) (.83$) - -Composite .85" .92' .91' .93" .48' .51' .63' -----(Verbal + (.81 $) (.88$) (.89$) (.91 $) (.58$) (.58$) (.67$)
Non-verbal) . . .. .. $ Significant level at 0.001 £ Significant level at 0.01 @ Significant level at 0.05
Note: In the table, the values above the principal diagonal are the correlations(r) of Telugu Medium (N=202) and the values within the brackets are the whole sample(N=373) correlations(r) while those below the principal diagonal are the correlations(r) of English Medium (N=171).
8.5.2.1 Reliability of the TES
A Cronbach Alpha is used to estimate the internal consistency index of a set of
Likert scale items. This ranges between 0 and 1. Higher Alpha indicates high reliability of
a test. All the 20 items were entered and the Cronbach Alpha9 was calculated. The reliability
coefficient of the TES was found to be 0.75 for the 20 items (for parts see table-8.1 0).
The other method the Spearman-Brown Split for reliability, can also be used to
estimate reliability from a single administration of a single form of a test. The test is split
into two halves; the first half is called odd items and second half even items. This produces
9 The Alpha values were calculated by the SPss software package by using k k
formula a = k I (k-I)[I-LVJNtl or a=k I (k-I)[I-LS2JI S2t] i=l i=l
Where k= number of items; ViCor S2j) is the variance of item 'i'

135
two scores for each pupil. Correlation of these two sets of scores yields the reliability
coefficient. The reliability coefficient for the TES was 0.70. This coefficient indicates the
degree to which consistent results are obtained from the two halves of the scale.
Table-8.10: Split-half reliability of TES(N=373)
Splites Items Alpha Alpha for Spearman-Brown Split-half whole test For Two parts For whole test
Part 1 10 .71 .75 .54 0.70 Part 2 10 .50
8.5.2.2 Intrinsic Validity or Index of Reliability of TES
The intrinsic validity of a test is directly related to reliability. The degree to which
a test measures what it measures may be called its "intrinsic validity". It is indicated by the
square root of the reliability coefficient (Guilford, 1 965) and is also designated as the "index
of reliability".
The correlation between a set of obtained scores and their corresponding true counter
parts is given by the formula.
r]oo= ~ r]oo = the correlation of obtained true scores. r]] = reliability coefficient of the test.
So the index of reliability of the TES is .y 0.70 = 0.84. Therefore 0.84 is the highest
correlation, which the present TES is capable of yielding in its present form.
8.5.2.3 Content validity of the TES
The content validity of the TES was determined by six experts in the field of
Education and Psychology (as explained in Chap-VI, 6.3.2.3). They were asked to comment
first whether the items measured teacher encouragement in the classroom, secondly whether
there was sufficient coverage of items and the language used. The items were scrutinised by
the judges, who were conversant with classroom teaching and had knowledge of creativity
and its development. The suggestions given by them were incorporated in to the TES before
the final data collection. Some sentences were rephrased, although no new information was
added.
Vt(or S2t) is the variance of total test for the 'k' items.

136
8.5.2.4 The construct validity of the TES items
The construct validity of the TES was established through Pearson's correlation. The
internal consistency or homogeneity of the items involves the product-moment Pearson
correlation of the items with the total scale scores. Hence, the Pearson correlations(r)
between items and TES were computed. If an item is measuring similar traits to the main
scale TES then it should correlate positively with it. The higher the correlation coefficient,
the stronger the relationship and therefore the validity ofthe items.
The correlation matrix (Table-8.ll) indicates that almost all the TES items had
significant high correlations with the total scores of the TES. The correlation indices ranged
between 0.23 and 0.58. The highest correlation was between item 10 and the total score,
while the lowest was between item 15 and the total score. Item 10 was, " Does the teacher
have good relations with students?" while item 15 was, "Does the teacher discourage you
from following your own interests?"
T able-8 11 . Correlation coefficients between TES items and total score on TES Item No. Carr. with total Item No. Carr. with total Item No. Carr. with total
score on TES score on TES score on TES 1 0.54 9 0.38 17 0.37 2 0.48 10 0.58 18 0.37 3 0.37 11 0.53 19 0.49 4 0.44 12 0.46 20 0.33 5 Deleted 13 0.50 21 Deleted 6 0.24 14 0.35 22 0.48 7 0.27 15 0.23 8 0.42 16 0.49
$ = Significant at 0.001 level (df=371)
Another more detailed analysis to examine the construct validity of the instrument,
TES was attempted through factor analysis of all the 20 items. Firstly, Principal Component
Analysis (PCA) was employed to extract the latent trait or the underlying factors of the TES
items. The results of the PCA are presented in chapter-XI, 11.4.0. All the items tend to
cluster together and all of them were loaded significantly on the factors that emerged. This
provides some evidence for the validity of these items.
8.5.3. Reliability and Validity of the Interview data
According to Harnmersly, M (1992,p67) 'Reliability refers to the degree of
consistency with which instances are assigned to the same category by different observers
or by the same observer on different occasions'.
In relation to the interview, care was taken that every respondent should understand
the questions (in the interview schedule) in the same way. The answers were also coded. to

reduce error. Wherever possible, a group data-analysis session was held to listen to
audio-recordings to compare the transcripts.
137
The responses for the open-ended questions were coded by an agreed set of
categories. This pre-arranged coding strategylO was approved in the group data-analysis
sessions with the assistance of other researchers and lecturers in the Psychology and
Education. The Inter-rater reliability methodll was used to ensure reliability of the interview
data analysis, for this purpose two research students were trained to use highly standardised
procedures and asked to code the transcripts independently. Their level of agreement was
high.
8.5.4. Reliability and Validity ofthe Teachers Questionnaire (TQ)
The items of the teachers' questionnaire was based on the literature survey (Chap-II
to V), the personal experience of the researcher and exploratory interviews. Reliability
refers to the extent to which measurement results are free of unpredictable kinds of error
(Henerson and etal, 1978). Methods for demonstrating an instrument's reliability -whether
the instrument is long and intricate or is composed of a single question- involve comparison
of one administration with another administration to the same people. This is followed by
calculation of a 'reliability coefficient'; a high coefficient shows stability, and a small
coefficient shows the influence of error (p.146)
As it was not possible to ask teachers to answer the same questions on two different
occasions, because of their busy teaching schedule, the researcher had no opportunity to
conduct repeated measures of reliability.
While preparing the TQ the researcher took some precautions which affected the
validity of the instrument. They concerned the clarity of directions, the wording of questions,
and length of the questionnaire in the pilot study. The pilot study ensured that the items
included in TQ yielded the information required, and gave an opportunity to the researcher
to detect and remove ambiguities and to determine the range of possible answers.
Five expertsl2 in the field of Education and Psychology determined the content
validity of the TQ. The professor of education and special officer for textbooks, Govt. of
10 Pre-arranged coding strategy:- at the very beginning the present researcher developed some categories on the basis of pilot study results and from thorough text analysis of final data.
II Inter-rater reliability method this involves giving the same data to a number of analysts (or raters) and asking them to analyse it according to an agreed set of categories. Their reports are then examined and any differences discussed and ironed out.
12 The same five experts mentioned in chapter VI, p.93.

138
A.P, Hyderabad, also determined the validity of the instrument and the suitability of the
culture and language of the questionnaire. They reviewed each item and their comments
were very positive. They agreed that the items ofTQ covered all the aspects of creativity and
its development. Suggestions were made about rephrasing some of the statements which
were ambiguous. No new aspects were added to the questionnaires. Some encouraging
evidence for the validity of the new measure is provided by the results of the factor analysis
of the main study data.
8.5.4.1 Factor Analysis of TQ
A more detailed analysis to examine the construct validity of the Teachers
Questionnaire could be attempted through factor analysis of the items included in the TQ.
Two basic empirical approaches are available to extract or generate a new set of factors.
They are (1) Principal Component Analysis (2) Factor Analysis. In factor analysis, a
mathematical model is set up, and the factors can only be estimated, whereas in component
analysis we are simply transforming the original variables (or items) into a new set of linear
combinations (the principal components). Both methods often yield similar results. But
component analysis is a psychologically sound procedure and it is simpler mathematically,
relatively speaking, than factor analysis (Stevens, 1992, p.375). Also, the factor
indeterminacy issue associated with common factor analysis (Steiger, 1979) is a troublesome
feature.
In the present study Principal Component Analysis and Varimax Rotation were
applied to each batch of Likert-type items in the TQ, to examine the common trait or traits
which would provide evidence for the validity of these items and justify their inclusion in
the questionnaire (see e.g. Fryer, 1989). The purpose of rotation is to achieve a configuration
of loadings having the qualities collectively known as simple structure which, loosely
conceived, is the set of loadings that show the maximum number of tests loading on the
minimum number of factors. The idea is that the fewer the factors that are involved in
accounting for the correlations among a group of tests, the easier it is to invest those factors
with psychological meaning (Kinnear and Gray, 1997, p.31 0) The factors are rotated to
maximise the relationships between the variables and some of the factors. The most
common method is Varimax, a rotation method which maintains independence among the
mathematical factors (Ibid, p.31 0); this rotation is to clean up the factors (Kaiser, 1960) and
generally makes interpretation of the resulting factors easier (Stevens, 1992, p.380). It is the
default option in SPSS.
All the Likert-items in question 6 (part-D) were factor analysed to examine the

139
common trait or traits. Only factors having an Eigenvalue greater than 1 were
considered. Altogether five factors were extracted which explained 66.9% of the variance.
The factor-wise variations are presented in Table E1-T1 (see App. E1). The factors were
called 'teaching for self-reliance, 'responsive', 'question-expanded thinking', 'building
confidence and relations' and 'supportive environment'.
Similarly, in Part-D, questions 7, 8 and 9 were also subjected to factor analysis. For
Q.no.-7, altogether 66.7% of variance was explained, three factors emerged and were
labelled as "lack of facilities', 'inadequate freedom' and 'lack of support' (E1-T2). For
Question 8, 57.1 % of variation was explained by two factors. They were labelled,
'unmotivated and lacking confidence', and 'passive and unequal abilities' (Table-EI-T3).
For Question 9, about 75% of variance was explained and three factors were extracted. They
were' lack of recognition and stress, 'lack of knowledge of creativity, and 'lack of
experience and confidence' (see Table-EI-T4).
When factor analysis was applied to Part E, a total of 60% of the variance was
explained and four factors emerged. They were labelled 'permissive and stimulating',
'exposing to different activities', the 'creative teacher and his methods of teaching', and
'authoritative' (Table-E1-T5). For Part F, 64.7% of variance was explained and two factors
were extracted. They were labelled 'scope for creativity in the curriculum' and 'suitability
of curriculum (Table-El-T6).
8.6.0 Summary
This chapter has described methodological issues. The scheme of the present
research was explained under three broad classified variables: that is, Organisational,
Background and cognitive and motivational characteristics of students.
The normative survey was selected as the research method, and a sample was drawn
from nine schools by using different sampling techniques. The procedures followed for
collecting data were explained in detail. The reliability of each instrument was established
by applying a variety of methods. Similarly, the validity of the instruments was determined
through the available validating approaches.
The succeeding three chapters (IX, X and Xl) deal with the data analysis. The next
chapter-IX is concerned with the analysis of teachers' interviews and questionnaire data.

140
Chapter IX
Analysis of Teacher's Questionnaire and Interviews
9.1.0 Introduction
This chapter is concerned with the analysis of the Teachers' Questionnaire (TQ)
and interviews with the teachers. The analysis and interpretation of the teachers
questionnaire (quantitative data) and interviews (qualitative data) will complement each
other. The purpose of conducting the interviews was to collect more detailed information
to strengthen and support the information collected through the TQ data, and to assist in
validation. The design of the Interview schedule and TQ and scoring procedures were
discussed in the previous chapter (VI).
9.2.0 The main results of the teachers questionnaire and interviews 9.2.1 Sources of knowledge about creative thinking
As already explained in chapter-VIII (8.3.2),88 teachers completed the teachers'
questionnaire and ten teachers were interviewed. Among the 10 teachers, one teacher had
comprehensive knowledge of creativity, six teachers had good knowledge and the rest of
the three teachers had some knowledge.
The interview data revealed that 8 teachers out of 10 had acquired their knowledge
of creativity through teacher training. These teachers said that the topic of creativity was
included in teacher training in Educational Psychology. A female teacher of biological
sciences and male teacher of physical sciences said that it was mentioned in bio-Sciences
and physical sciences while they were attending orientation classes by State Council of
Educational Research and Training (SCERT) on the 'Improvisation of apparatus '. The
remaining two teachers had learned through books and practical and personal experience.
From Table 9.1 it is evident that a very high percentage of teachers (89.8) said that
the development of creative thinking among the students was included in their teacher
training. The X2 value (55.68) indicates that this is a significant proportion at 0.0001 level.
This topic was covered in Educational Psychology (51.3%), Mathematics (15.4%),
Biological Sciences (12.8%) and English (12.8%). A very low percentage (1.3%) of the
teachers said that CT + was included in Art & Music.
From Table 9.2, it can be seen that a high percentage of the teachers (48.9%)
acquired the knowledge about CT+ from their own interest in reading books and Journals
(48.9) and special training programmes (44.7%). The rest of the teachers had acquired their

141
knowledge through attending seminars I conferences (23.4%), refresher courses (17%),
from colleagues and friends (17%) and from teachers' guides & supplementary material
(10.6). A small percentage of the teachers (4.3%) had acquired knowledge through
listening to the radio and TV.
Table-9.1: Inclusion of creative thinking in teacher training
Yes 79 (89.8) Xl 01: Inclusion of CT+ in teacher training. No 9 (10.2) 55.68:!>
02: CT+ included in the subjects f % of cases* 1. Educational psychology 40 51.3 2. Mathematics 12 15.4 3. Bio-Sciences 10 12.8 4. English 10 12.8 5. Physical sciences 9 11.5 6. Social studies 7 9.0 7. Telugu 6 7.7 8. Hindi 2 2.6 9. Curriculum Development & Technology 2 2.6 10. Philosophical foundation of education 1 1.3 11. SUPW 1 1.3 12. Art & Music 1 1.3
101* CT - Creative thinking; * - Total Multiple responses (78 valid cases); $ = Significant at 0.0001 SUPW = Social Useful Productive Work Note: Percentages were calculated on the basis of total valid cases but not on total multiple
Table-9.2: Sources of acquired knowledge about the development of creative thO k· In Ing
Sources f % of Cases
1. Own interest in reading books & Journals 23 48.9 2. Special training programmes 21 44.7 3. Seminars I Conferences 11 23.4 4. Refresher courses 8 17.0 5. Colleagues and friends 8 17.0 6. Teacher guides & Supplementary material 5 10.0 7. Listening to Radio and TV 2 4.3
78* * = Total Multiple responses (47 Valid cases) Note: Percentages were calculated on the basis of total valid cases but not on total multiple responses.
Further, the teachers (N=40) who had attended special training I seminars I
conferences I refresher courses stated the names of the course organisers and nature of the
content of the course. Table 9.3 demonstrates that 95% of the teachers said that emphasis
was given to CT + in their special training Iseminarsl refresher courses. The same table
reveals the list of educational organisations providing courses for teachers. A majority of
the teachers (28.9%) were trained in Colleges of Education, which are particularly meant
for training secondary teachers. 15.8% of teachers were trained from each of the following
organisations: SCERT, APPEp l and DEO. The other organisations, NCERT and NPE 86,
1 The Andhra Pradesh Primary Education Project was implemented during the period Jan.1985-May

142
trained 10.5% and 7.9% respectively. The DIETs2 and Director, Bala Bhavan organised
a very small percentage (2.6%).
Table-9.3: The special training programmes I seminars I refresher courses attended by the teachers (N=40)
Emphasis of CT+ in school children in training programmes / refresher Yes No courses attended 38 (95%) 2 (5%)
Courses orqanised by f % of cases 1. Colleges of Education 11 28.9 2. State Council of Educational Research and Training (SCERT) 6 15.8 3. Andhra Pradesh Primary Education Project (APPEP) 6 15.8 4. District Educational Officer (DEO) 6 15.8 5. National Council of Educational Research and Training (NCERT) 4 10.5 6. National Policy on Education-1986 3 7.9 7. District Institute of Education and Training(DIET) 1 2.6 8. Director, Bal Bhavan 1 2.6
38 + CT : Creative Thinking
The content of the courses (Table 9.4) conducted by the organisations (Tab1e-9.3)
was received as relevant & satisfactory (46.7%) and based on learning by doing (20%).
Courses were also helpful to in demonstrating new trends in teaching (6.7%), and
identifying & developing CT+ of students (6.7%). A very small percentage of teachers said
that the content was designed to attract the students to understand the subject (3.3%),
relevant to problem solving (3.3%) and encouraged group discussions (3.3%). Only 6.7%
of teachers said it was not relevant to the classroom teaching.
Table-9.4 : The relevance of the course content to the attended by the teachers (N=40) The content of the course was f %
1 content was satisfactory & relevant to classroom teaching 14 46.7 2 Based on learning by doing 6 20.0 3 To improve teaching methods in a new trends 2 6.7 4 Identifying & Developing CT + of students 2 6.7 5 To attract students to understand the subject 1 3.3 6 Very relevant to the problem solving 1 3.3 7 Encouraging group discussions 1 3.3 8 Suitable to the needs of the learners 1 3.3 9 Not relevant to classroom teaching 2 6.7
30
In the interviews, four teachers said that they had attended some special training
programmes organised by the National Institute for the Mentally Handicapped at Delhi,
SCERT and APPEP at Hyderabad. One teacher reported that he had received 'inputs'
through lectures on Intelligence and Creativity given by Psychology professors. One of the
1989 (for more details see Appendix-A 1 (sec. A 1.3). 2 These Institutes are meant for train the primary teachers and Organises some special programmes for teachers (see Appendix-A 1 (sec.A 1.3).

143
teachers, who had not attended any training programmes said 'we haven't had any
opportunity so far' to attend any training courses.
In the interviews, the teachers were asked about their knowledge of creative
techniques and their application in teaching. Three teachers said they had some knowledge
of brainstorming but had not applied it in the classroom. The rest of the teachers said they
had no knowledge about brainstorming.
A Physical Sciences and Mathematics Male Teacher (PS+M MT6) said, "We were told something about brainstorming. In brainstorming some brief discussion on a problem is made by a whole group and in a relaxed condition, a free manner, whatever comes to mind even a silly solution but in a limited time. All unusual answers are put together and a novel solution is obtained".
He further commented, 'We were taught about and discussed creativity in a general wLry
but not concerning the subject. When we come to the subject here I think a teacher required afew model lessons in a particular subject, keeping in mind developing creativity in the child pertaining to that particular subject. As I am dealing with maths and science we need afew model lessons and along with that some materials that have been acquired, like books and some lessons on how creativity can be developed'.
While explaining his failure to apply the technique in the class: "First of all, we are supposed to complete our syllabus and there is a problem of the strength
of the class. For applying this brainstorming technique, I think, it requires separate time for the teacher, he need not concentrate on teaching his subject".
A male Mathematics teacher (M MT4) and female Biological Sciences teacher (BS FT8) said that they had also only 'theoretical knowledge' of creativity.
9.2.2 Support needed for teachers in order to improve their knowledge about Creative Thinking
While talking in the interviews about the support they needed, eight teachers out
of ten suggested that some special training was necessary for teachers. In addition to that
three teachers said that seminars/ refresher courses were required and another three said
books. Of the other two teachers, one suggested 'frequent training classes', and other
suggested 'lectures from eminent psychologists' as important for teachers to improve their
knowledge about creativity.
A male teacher, teaching English and Biological Sciences (E+BS MT3) strongly
emphasised training for teachers:
A special trainingfor teachers on creative thinking is required. We, most of the time in our training (B.Ed), oriented ourselves in the methodology of teaching subjects rather than psychological factors. We need special orientation from colleges of education and eminent persons from the field of Psychology, and also people who have worked with students for the past 10 to 15 years, who have a lot of experience with students, people from SCERT and NCERT, who have extensively worked in this area. If they give us their theoretical knowledge and their research findings, I think we will be better able to use it in the classroom situation. A male Mathematics teacher (M MT4) also emphasised creativity training for teachers
and was much worried about the lack of knowledge among teachers:
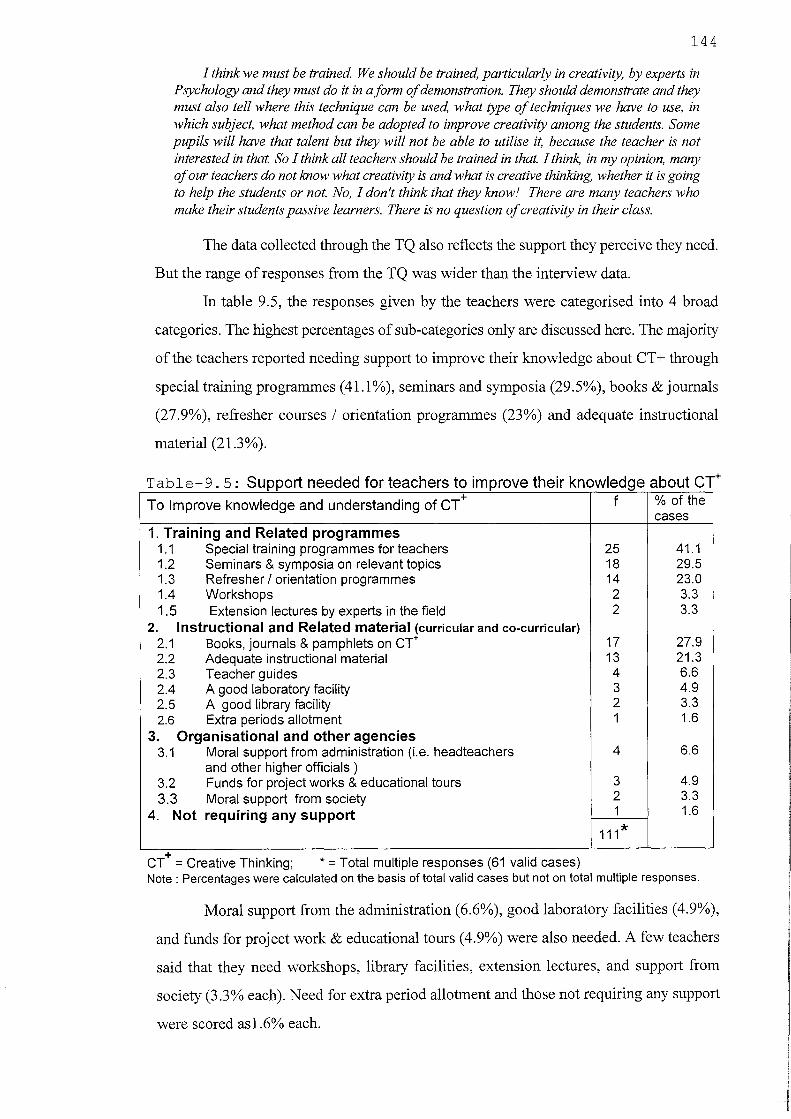
144
I think we must be trained. We should be trained, particularly in creativity, by experts in Psychology and they must do it in a form of demonstration. They should demonstrate and they must also tell where this technique can be used, what type of techniques we have to use, in which subject, what method can be adopted to improve creativity among the students. Some pupils will have that talent but they will not be able to utilise it, because the teacher is not interested in that. So I think all teachers should be trained in that I think, in my opinion, many of our teachers do not know what creativity is and what is creative thinking, whether it is going to help the students or not. No, I don't think that they know! There are many teachers who make their students passive learners. There is no question of creativity in their class.
The data collected through the TQ also reflects the support they perceive they need.
But the range of responses from the TQ was wider than the interview data.
In table 9.5, the responses given by the teachers were categorised into 4 broad
categories. The highest percentages of sub-categories only are discussed here. The majority
of the teachers reported needing support to improve their knowledge about CT + through
special training programmes (41.1 %), seminars and symposia (29.5%), books & journals
(27.9%), refresher courses I orientation programmes (23%) and adequate instructional
material (21.3%).
Table-9. 5: Support needed for teachers to improve their knowledge about CT+
To Improve knowledge and understanding of CT+ f % of the cases
1. Training and Related programmes 1.1 Special training programmes for teachers 25 41.1 1.2 Seminars & symposia on relevant topics 18 29.5 1.3 Refresher / orientation programmes 14 23.0 1.4 Workshops 2 3.3 1.5 Extension lectures by experts in the field 2 3.3
2. Instructional and Related material (curricular and co-curricular) 2.1 Books, journals & pamphlets on CT+ 17 27.9 2.2 Adequate instructional material 13 21.3 2.3 Teacher guides 4 6.6 2.4 A good laboratory facility 3 4.9 2.5 A good library facility 2 3.3 2.6 Extra periods allotment 1 1.6
3. Organisational and other agencies 3.1 Moral support from administration (i.e. headteachers 4 6.6
and other higher officials) 3.2 Funds for project works & educational tours 3 4.9
3.3 Moral support from society 2 3.3
4. Not requiring any support 1 1.6
111*
CT+ = Creative Thinking; * = Total multiple responses (61 valid cases) Note: Percentages were calculated on the basis of total valid cases but not on total multiple responses.
Moral support from the administration (6.6%), good laboratory facilities (4.9%),
and funds for proj ect work & educational tours (4.9%) were also needed. A few teachers
said that they need workshops, library facilities, extension lectures, and support from
society (3.3% each). Need for extra period allotment and those not requiring any support
were scored as1.6% each.

145
9.2.3 Teachers' definition of Creative Thinking (CT)
The various definitions of creativity given by the teachers in the interviews are
presented in the Text Box - 9.2.3.1. These qualitative definitions reflect similar definitions
to those in table-9.6.
The social studies teacher (SS FTI0) described creativity as 'an inspiration' while
the mathematics Teacher (MFT5) said it was 'an imaginative thought'. The male teacher
of English (E MT2) and the social studies teacher (SS MT9) defined creative thinking as
'seeing connections' and 'combining ideas' respectively. The bio-sciences teacher (BS
FTS) simply described it as 'stimulating inventiveness'. The other male teacher of
Mathematics (M MT4) thought in terms of 'intuition'.
A female Telugu teacher (T FTl) thought that creative thinking is a 'thinking
process' while an English and Biological Sciences teacher (E+BS MT3) described
creativity as 'divergent thinking' .
A Physical sciences teacher (PS MT7) believed that creativity is to 'dig out new
ideas or make-up new things'. A Physical Sciences and Mathematics teacher (pS+M MT6)
also gave similar definitions that creativity is to 'create or produce new ideas'.
The TQ data in the table 9.6 demonstrates a range of teachers' views on creative
thinking. The teachers (N=88) were asked to rank 15 items in the TQ in their order of
importance from 1 to 15 according to their view ofCT+. The scores assigned to each aspect
T bl 96Th T h 'd f T a e- . : e eac ers e Inllon 0 f crea Ive In mg r thO k· Creative thinking is Mean score SD
1. Inspiration 61.41 15.93 2. Imagination 61.28 16.72 3. Original ideas 58.00 15.70 4. Self-expression 56.85 17.70 5. Thinking process 56.83 17.90 6. Divergent thinking 49.82 17.37 7. Innovation 49.24 12.91 8. Combining ideas 48.69 15.93 9. Solving problems 47.31 14.64
10. Seeing connections 46.63 13.60 11. Intuition 45.54 16.56 12. Valuable ideas 44.43 20.58 13. Invention/Discovery 44.30 14.27 14. Aesthetic products 40.18 24.27 15. Unconscious process 28.42 13.18
of creative thinking were used to calculate mean scores and SDs. The conversion of ranks
into scores and the calculation procedure is explained in Appendix D2.
Inspiration and Imagination is placed first (each mean=61); Original ideas
(mean=58) is second; self-expression and thinking process (each Mean=56), and Divergent
thinking and Innovation (each Mean=49) were placed third and fourth respectively.
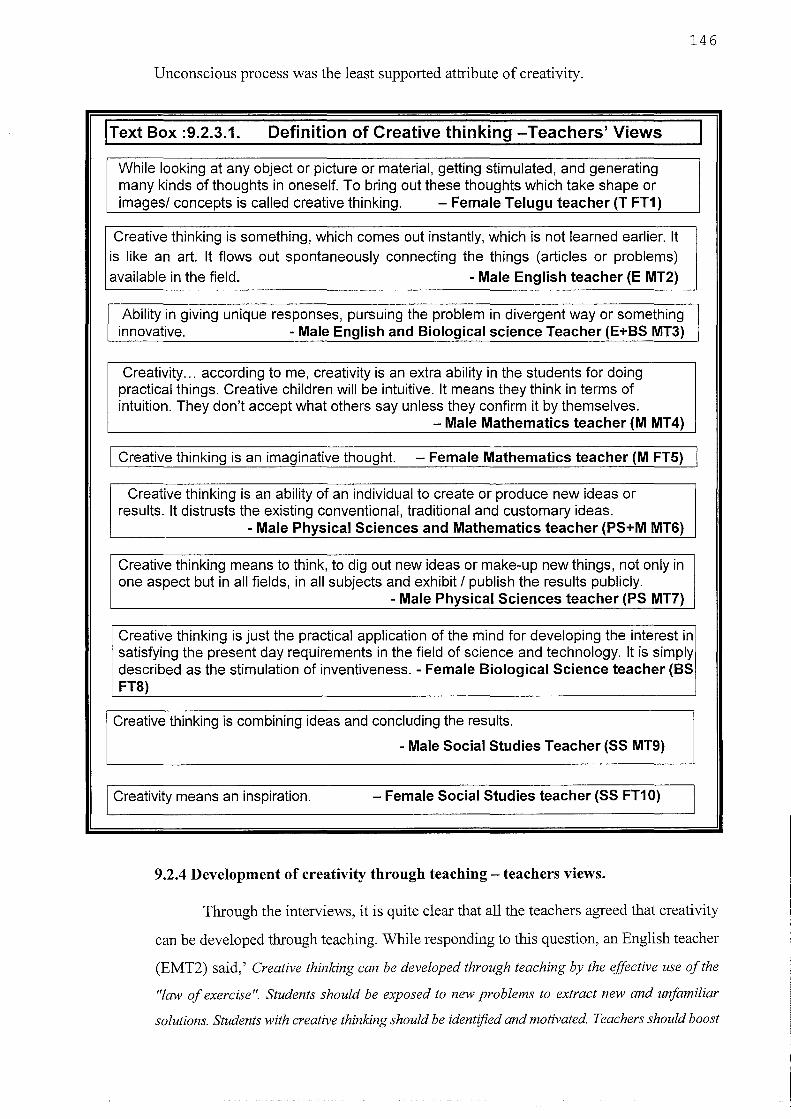
Unconscious process was the least supported attribute of creativity.
IText Box :9.2.3.1. Definition of Creative thinking -Teachers' Views
While looking at any object or picture or material, getting stimulated, and generating many kinds of thoughts in oneself. To bring out these thoughts which take shape or images/ concepts is called creative thinking. - Female Telugu teacher (T FT1)
Creative thinking is something, which comes out instantly, which is not learned earlier. It is like an art. It flows out spontaneously connecting the things (articles or problems)
available in the field. - Male English teacher (E MT2)
Ability in giving unique responses, pursuing the problem in divergent way or something innovative. - Male English and Biological science Teacher (E+BS MT3)
Creativity ... according to me, creativity is an extra ability in the students for doing practical things. Creative children will be intuitive. It means they think in terms of intuition. They don't accept what others say unless they confirm it by themselves.
- Male Mathematics teacher (M MT4)
I Creative thinking is an imaginative thought. - Female Mathematics teacher (M FTS)
Creative thinking is an ability of an individual to create or produce new ideas or results. It distrusts the existing conventional, traditional and customary ideas.
- Male Physical Sciences and Mathematics teacher (PS+M MTS)
Creative thinking means to think, to dig out new ideas or make-up new things, not only in one aspect but in all fields, in all subjects and exhibit / publish the results publicly.
- Male Physical Sciences teacher (PS MT7)
146
Creative thinking is just the practical application of the mind for developing the interest in satisfying the present day requirements in the field of science and technology. It is simply described as the stimulation of inventiveness. - Female Biological Science teacher (BS FTS)
Creative thinking is combining ideas and concluding the results.
- Male Social Studies Teacher (SS MT9)
Creativity means an inspiration. - Female Social Studies teacher (SS FT1 0)
9.2.4 Development of creativity through teaching - teachers views.
Through the interviews, it is quite clear that all the teachers agreed that creativity
can be developed through teaching. While responding to this question, an English teacher
(EMT2) said,' Creative thinking can be developed through teaching by the effective use of the
"law of exercise". Students should be exposed to new problems to extract new and unfamiliar
solutions. Students with creative thinking should be identified and motivated. Teachers should boost

147
their confidence by giving a variety of problems constantly'.
A mathematics teacher (M MT4) explained how teachers can develop creativity:
It all depends on the teachers. Different teachers will have a different knack, and adopt different methods. First of all they have to identifY which children are creative. As I said, all children are not creative. They may be intelligent but they may not be creative because creativity differs from intelligence to a great extent. So they must adopt certain methods and improvisations. As a science teacher I suggest, they must ask the students to give a rough idea about a certain improvisation and ask them to implement and develop it. So that will help a long way, they will understand the theory and they will peifect that after they create a certain object, a certain gadget and a certain device.
Two teachers, a Mathematics teacher (M FTS) said, 'By asking divergent questions
in teaching' and a Physical Sciences and Mathematics teacher (PS+M MT6) said, 'giving
more scope to students to ask about their doubts'. The other Physical sciences teacher (PS
MT7) said 'By asking students to prepare some apparatus. For example if you ask them
to prepare spring balance. Some children may use rubber instead of a spring, realising the
mechanism of elasticity.
A Biological science teacher (BS FT8) said that being a professional by giver of
information, a teacher could only provide CT during teaching. A male teacher, teaching
social studies (SS MT9) said to 'some extent we can develop CT+ through teaching. A
teacher of English and Biological Sciences (E+BS MT3) responded that "It is not only
developed through teaching but it can also be developed through training in some activities or by
organising some programmes. So they will become motivated".
According to the Telugu teacher (T FTl) creativity can be developed through
picture drawing and playing with objects. Another teacher of social studies (SS FTIO)
said, 'By asking questions, using visual aids, discussions and telling the life histories of great
persons'.
9.2.5 Can all children be taught to be creative thinkers? -Teachers' views Five teachers out often said it is not possible to develop creative thinking among
all students. The remaining five teachers agreed that creativity can be developed in all
children but certain conditions must be fulfilled. A female Biological science teacher (BS
FT8) said, 'it is possible when teachers and parents co-operate with the child'. A male
Physical Sciences and Mathematics teacher (PS+M MT6) responded positively and said,
"Yes. It is possible, because every normal child has some ability to think and if properly treated this
means creative thinking that is divergent thinking. I think, it is possible to teach every child to be a
creative thinker".
A similar view was also expressed by a Mathematics Teacher (M MT 4) said, "WelLan element of creativity is there among all students. That level can be improved and they can be trained to be creative thinkers but levels will definitely differ, because I imagine that creativity is

148
an inborn trait but it can be polished It can be nurtured It can be bettered, if not hundred percent, to a certain extent, to the best of the ability of the child".
Two teachers expressed different and extreme views. They were:
It is a difficult subject. We can't say that every child can be taught to be a creative thinker. It depends on the school environment and the living conditions of the students at home. A poor child with his empty stomach can't think. He always thinks, how to get food first? A child with all facilities (from a rich family) may try to think creatively and their parents also encourage developing this type of thinking. It also depends upon the teachers' encouragement. -(PS MT7)
It is a very controversial issue. What I feel is that some students may not have creativity. But all creative children may not be intelligent. And also all intelligent pupils may not be creative. When we see some of the literature, they say all people have creativity. Creativity shows or manifests in different areas. Some show creativity in arts, some shows it in sports and some show it in literature. So maybe all students have creativity; the only thing is to identify them and we have to channel them for their better life and for their constructive things. -(E+ BSMT3)
9.2.6 Intelligence and Creative Thinking - Teachers' views
In the interviews the teachers were asked to distinguish between intelligence and
creativity. If they thought that these were two different attributes then they were asked to
explain how they were different. This question was not asked in the Teachers
Questionnaire.
From the data presented in Box 9.2.6.1, it is evident that except for one Biological
Sciences teacher (BS FT8), all the teachers perceived that intelligence and creativity are
different. As a Telugu teacher (T FT1) described it 'intelligence is a skill, and creativity
means 'imagination '. According to an English teacher (E MT2), intelligence is the capacity
for retention and reproduction of knowledge and creativity is an inborn talent. The view
of the English and Biological teacher (E+BS MT3) recognises that 'this is a very
controversial issue '.
A mathematics teacher (M MT4), who possessed a Master's degree in teaching,
recollected his reading and said that 'all intelligent people need not be creative but the
other way round is correct'. According to a PS and Mathematics teacher (PS+M MT6) who
also has a Master's degree, intelligence is synonymous with convergent thinking and
creative thinking is synonymous with divergent thinking. A Social Studies teacher (SS
MT9) also expressed a similar view: that intelligence is some sort of extraordinary
knowledge, and creative thinking is divergent thinking.
Two teachers, of mathematics (M FTS) and Social Studies (SS FT10), felt that
Intelligence and creativity are different. A Physical Sciences teacher suggested that it
depends how we measure them.
A Biological science teacher (BS FT8) expressed a different view in comparison

149
with all of the above teachers. She said, 'both are implications a/knowledge and they are
processed in the mind, so there is not much difference between them '.
Text Box: 9.2.6.1.1ntelligence and creative thinking-Teachers' views
They are separate aspects. Creativity means imaginative thinking. Intelligence means skill. - Female Telugu teacher (T FT1)
Intelligence and creative thinking are two different aspects. Intelligence is the capacity to understand, retain and reproduce the given knowledge, whereas creative thinking cannot be learned. It is a born talent. Creative thinkers are born, not made.
- Male English teacher (E MT2)
No. This is what I heard, what I read from books, there is no correlation between intelligence and creativity. A creative child may not be intelligent and at the same time an intelligent student may not be creative. This is a very controversial issue.
- Male English and Biological science teacher (E+BS MT3)
No, I think they are different. Intelligence, as we know, is some thing to do with your I.Q (Intelligent Quotient). So all intelligent people need not to be creative but the other way round is correct, this means all creative thinkers are those who have creativity; they are intelligent. So one side is true, so intelligence is required for being creative but all intelligent people need not be creative.
- Male Mathematics teacher (M MT4)
I Creativity and intelligence are different aspects. - Female Mathematics teacher (M FTS)
In earlier days creativity and intelligence were synonymous. Intelligent people were considered to be creative also but when it comes to my view, creativity and intelligence slightly differ. For example creativity is synonymous to divergent thinking and intelligence is synonymous to convergent thinking. In the present system, convergent thinking is given a lot more importance than divergent thinking. - Male Physical Sciences and Mathematics teacher (PS+M MTS)
In my view creativity and intelligence are different aspects. They should be considered as two separate aspects. Mainly, it also depends on how we measure creativity and intelligence to say whether they are the same aspects or different. - Male Physical Sciences teacher (PS MT7)
Intelligence is an ability to learn and understand. Creative thinking is ability to express ideas only. Both are aspects (same) of the mind's activity where application of knowledge is required. Hence there is not much difference. - Female Biological Science teacher (BS FTS)
Intelligence is some sort of extraordinary knowledge and creative thinking is divergent thinking or combining ideas. - Male Social Studies teacher (SS MT9)
Creativity and Intelligence are different aspects. - Female Social Studies teacher (SS FT1 0)
In response to the question, are all intelligent students creative? five teachers said
'No' and two said 'Not always '. The other three teachers expressed different views, a

150
female Telugu teacher (F FTI) said, 'All intelligent students may possess at least some
creativity'. According to the Physical Sciences and Mathematics teacher (PS+M MT6) 'It
need not be true! That is, an intelligent child may not be creative and a creative child may
not be intelligent. Because intelligence and creativity have a very low correlation '.
A physical sciences teacher (PS MT7) explained the relationship between
intelligence and creativity referring his classroom experience:
"When I observed some of the students in the class who were treated as "intelligent students" by many of us on the basis of their academic record, they lacked creativity. The creative children fail to reach the top of the class (securing highest marks), because their ideas, their energies are rather diverted. Due to this divergence they lose their interest in studies so that they may not be intelligent. If we take marks as a criteria for intelligence, naturally creative children score less marks. We observe a deficiency of creativity in those students who score highly in academic achievement i.e., marks".
Further, he explained how the creative children are victims in the examinations:
"The creative students may write their answers in a different way or express/explain in different ways for the same question. Here teachers should pay attention and encourage the creativity of the student. If the teacher crosses out the answer which is divergent and not exactly the same as in the textbook, it is the fault of the teacher but not the student".
9.2.7 Teachers' opinion towards school subjects and creativity
All ten teachers interviewed in this study disagreed that creativity is developed only
in the teaching of the subjects Arts and Music.
A male teacher of physical science (PS MT7) posed the question, "Why should we
suppose that creativity is only in Arts and Music? It is a wrong assumption that creativity
can be developed only through arts and music. There are so many subjects. Even in
science, a student can have a scientific temper, he can make a robot or crane by combining
all the objects he has. This also can be said to be creativity ".
As another physical sciences and mathematics teacher (PS+M MT6) said, "Of
course, teaching Arts and Music may have the intention of developing creative thinking but
with other school subjects also we can develop creative thinking, like Mathematics and
Science ".
The mathematics teacher (M MT4) was optimistic about the development of
creativity in all subjects. He said, 'This factor can be improved in all subjects. There is no
subject ... in even, I think in Physical Education training also there is every chance that
creativity can be induced among the students '.
An English and biological teacher (E+BS MT3) said, "No, it is shown in different
areas, not only arts and music but also it is shown in different areas". A similar view was
also expressed by the biological sciences teacher (BS FT8) that "Creativity can be
developed not only in Arts & Music but also in almost all fields of life, in the aesthetic fields

151
and also in the teaching-learning process".
Asked to indicate to school subjects which playa key role in developing creativity,
four out of ten said, 'all subjects'. Among them, a mathematics teacher (M MT4)
elaborated that "Yah! In all subjects, All subjects, particularly in drawing, arts ... because
creativity is a general term. It's not associated with anything, a person who has skill can
create wonderful things though he may not be educated but he will create. One who is
educated of course has got better, more chances of doing these things".
F our more teachers said, 'mathematics', in addition to mathematics two teachers
said that Science would also develop creativity. Surprisingly, among the four teachers, two
were teaching subjects other than mathematics that is English and social studies.
A female biological science teacher (BS FT8) said that crafts and manual training
can also playa key role in creativity development. A male teacher, teaching English and
biological sciences (E+BS MT3), said that 'other subjects, science, literature (English) and
also sports could also be creative. Para-academic areas like projects, seminars,
discussions, debates, elocution, and self-expression, role-play also play a vital role, as well
as arts and music '.
From the Teachers' Questionnaire (table-9.7) it is quite clear that the teachers
agreed (77%) that creativity can be promoted by all the school subjects, not only art and
music. The X2-value (25.39) shows significance at 0.0001 level. Science (58%) and
mathematics (30%) are considered to be the subjects which contribute most, followed by
Social Studies (28%). 20% of the teachers named all subjects, 8% SUPW and 6% extra
curricular activities. A very small percentage of them named all languages (4%); Telugu
(2%) and Games (2%) will contribute in promoting creativity.
T bl 9 7 T h a e- . eac ers opinion concerning th b· t h· h hi· th e su )Jec s W IC elpm f f f ity e promo Ion 0 crea IV Yes 20 (23.0%) XL.
Q: Do you think that only the subjects like art and music promotes CT +?
No 67 (77.0%) 25.39:ji
The subjects promote creativity in the high school f % of cases curriculum 1. Science 29 58.0 2. Mathematics 15 30.0 3. Social studies 14 28.0 4. All Subjects 10 20.0 5. Social Useful Productive Work (SUPW) 4 8.0 6. Co-curricular activities 3 6.0 7. All languages 2 4.0 8. Telugu 1 2.0 9. Games 1 2.0
79 .. * = Multiple responses ( 50 valid cases); $ = Significant at 0.0001 level Note: Percentages were calculated on the basis of total valid cases but not on total multiple
152
9.2.8 Teachers' assessment criteria for identifying creative children in the classroom
In the interviews with the teachers it was revealed that all the teachers (100%) felt
able to identify creative children in their nonnal traditional classroom teaching. The criteria
they gave for the identification of creative children in the classroom are now discussed.
A Telugu teacher (T TFl) identified creative children on the basis of 'students'
interests and skills'. A social studies teacher (SS MT9) said, 'on students' responses '. A
teacher of English (E MT2) believed that "the child who gives different (entirely new and
different) solutions to problems is creative".
Another Social studies teacher (SS FTIO) identified children through their
perfonnance in competitions for example essay writing, drawing and painting, or Quiz
etc.,. A biological science teacher (BS FT8) identified them on the basis of the expression
of children's inborn talent as shown through paper and cane handicrafts and needlework
crafts (for girls).
A PS and mathematics teacher (pS+M MT6) explained his observations about how
creative children are curious in class:
When we start general discussion or the subject is being taught, these students are very curious. They want to find out what would be next? What sir would be explaining? They will try to find out novel ideas, which they will apply in daily life.
A teacher of English and BS (E+BS MT3) explained his classroom experiences
which are similar to those described above:
'The questions they pose are very unusual. At that moment I might not able to give an answer because of other factors, but at the end of the class I realised that the questions asked by these students were really of a very creative nature. In my Biology class, they ask me questions like, why this is like this? Why not like this? Is there any other possibility to do this? or they suggest alternations to be made. Even in language, they always try to see some other equivalent meanings. If I ask them a question, they will give an answer in a different way but when we look into that at another level or another angle, we see that answer is correct. Ifee! that this thinking may be reflective or may be divergent.
Another teacher of PS (PS MT7), shed light on his practical experience with
creative children:
I generally recognise creative children. When I start discussion on anything, they give a variety of responses. This is one way of identifying children. The other way is by asking the students to prepare something. For example we could explain how a lever functions. Then ask the students, can you use this in a different way? Do you make this type of thing? When we ask this type of questions, children start thinking about it. The creative children never leave it easily and take it as a challenge. They will come up with something within two to three days.
A mathematics teacher (M MT4) said, 'I have identified them but I cannot do justice to them, as certain factors are necessary, certain requirements are there which we alone can 't fulfil. They pose completely different questions, extraordinary questions, they talk in terms of doing things. When we state some theory about some thing, then we always have questions from them. Some inquisitive questions, which will make us, which, will force us to think so that we can easily identify them. Of course they can be intelligent. We can say that the students are intelligent but the questions that they pose may not be relevant to classroom teaching. So sometimes, on one or two occasions I had to ask

153
for pardon from the students and SCO' that 1 will be telling you about this after thinking it over the next dCO'. So their questions indicate that they have a creative mind and we can nurture them. They will give ideas. which a teacher may not have.
From the Teachers' Questionnaire (table 9.8) also it is evident that 82.1 % of
teachers feel capable of identifying the creative children in their regular classrooms, and
only 17.9% feel unable to identify them. They were also given criteria for identifying
creative children in their classroom. The responses were categorised into 5 major
Table-9.8: Criteria for identifying creative children in the classroom
Yes 69 (82.1%)
Q. Have you identified any creative children in your classroom? No 15 (17.9%)
x2 34.71$
Criteria for identifying creative children f % of cases
1. Students' performance in curricular and non-curricular activities 1.1 Preparation of different types of models 8 13.6 1.2 Cultural activities 5 8.5 1.3 Drawing and painting 5 8.5 1.4 Writing imaginative stories 3 5.1 1.5 Assignment test 2 3.4 1.6 Writing songs of their won 1 1.7 1.7 Writing essays of their own 1 1.7
2. Students' classroom questioning 2.1 Students' asking unusual/thought provoking questions 5 8.5 2.2 Students' raising genuine doubts 2 3.4
3. Students' classroom responses 3.1 Gives novel ideas / solutions rather than routine ideas 9 15.3 3.2 Curious to know about new topics 7 11.9 3.3 Gives immediate responses 6 10.2 3.4 Gives unusual responses 5 8.5 3.5 Gives original and valuable ideas 3 5.1 3.6 Gives divergent responses 3 5.1 3.7 Solve problems easily 3 5.1
4. Students' personality characteristics 4.1 Student's interests & aptitude 4 6.8 4.2 Student's habits 1 1.7 4.3 Student's Intelligence 1 1.7
5. Through teacher initiation 5.1 Asking questions by teacher 3 5.1 5.2 Encouraging open discussions 2 3.4 5.3 Keen observation and gives attention 1 1.7
* 86
.. * = Multiple responses (59 valid cases); $ = Slgmflcant at 0.0001 level. Note: Percentages were calculated on the basis of total valid cases but not on total multiple responses.
categories.
The teachers identify creative children on the basis of them giving novel ideas or
solutions rather than routine ideas (15.3%), preparing different types of models and crafts
(13.6%), curiosity to know about new topics (11.9%) and giving immediate responses

154
(10.2%).8.5% of teachers responded that identification occurred through cultural activities,
drawing and painting, ways of asking unusual or thought provoking questions and giving
unusual responses.
Students' interests & aptitudes (6.8%), writing imaginative stories, giving original
and valuable ideas, divergent responses and solving problems easily (each 5.1 %) were also
considered as criteria for the identification of creative children.
9.2.9 The importance of creativity and reasons given by the teachers for its development in school children
The data showed that of the teachers interviewed all recognised the importance of
creativity. All teachers positively responded that the improvement of creativity among
school children was necessary for their better life in the future. The teachers' views
regarding the importance of creativity are presented in the Text Box No. 9.2.9.1.
A female teacher of Telugu (T FTl) said, 'it is necessary in everyday life andfor
the future too'. An English and BS teacher (E+BS MT3) perceived that creative children
may show alternatives or make alterations to the existing system or may give new ideas to
the world. So creativity is useful not only for the student as an individual but also for
society.
Similar views were also expressed by the PS and mathematics teacher (PS+M
MT6), and a physical sciences teacher (PS MT7) that 'Highly creative people are very
useful to our country'. However not all agreed. 'It is needed but not so important' (SS
MT9).
An English teacher (E MT2) said it was important to 'polish inherent talent'. Two
female teachers, one of mathematics (M FT5) said, 'it helps children to adapt and improve
themselves in an ever changing environment and challenges the world' and the other a
biological sciences teacher (BS FT8) suggested that it was important 'to achieve certain
goals of life in the field of education. A male teacher of mathematics (M MT4) said that
'it is not always important but the development o(creativity is the duty o[the teacher.
Another female teacher of social studies (SS FT10) expressed her feeling that "if
we develop creative thinking in children their thinking ability and imagination will be
increased and lead to novel views ".
The Teacher's Questionnaire data (table-9.9) reflects that of the interviews. Most
teachers agreed that it was important to develop creativity (88.6%), 9.1% said it was
moderately important but only 2.3% said it was not very important and none of the teachers

155
said it was not at all important. The reasons given for the development of creativity may
be divided into 4 major categories. They are presented in Table-9.9.
Text Box No: 9.2.9.1 Importance of creative thinking in school education]]
Yes. Creativity is very necessary to students in everyday life. It is also necessary in future life, so the development of creativity is needed from a young age.
- Female Telugu Teacher (T FT1)
Yes. It is important, hidden (talent) like diamonds among the stones can be polished and made to shine brightly. - Male English Teacher (E MT2)
Yes. It is important. This level of students' creativity is nurtured and promoted. If it is channelled properly, tomorrow the same students' may go on to give new ideas to the world. They may show some alternatives/alterations in the existing system or something innovative in the world. They may bring changes in existing system or in the unit. If this creativity is properly nurtured at school level then they will develop through out same attitude and develop a scientific temper. This will be useful for him not only as a person but also it is useful for society.
- Male English and Biological Science Teacher (E+BS MT3)
Very important, I think that is the duty of the teacher. Over looking it (creativity) he or she, not taking in to account, he/she is not doing full justice to the students. Of course creativity will not be there among all students. From an academic point of view they may have certain skills, certain creative abilities, which if we do not find out if we do not discover I think it's a shortcoming of the teacher. So definitely creativity will be there. It can be developed
- Male Mathematics Teacher (M MT4)
It is very important. It helps children to adapt and improve themselves in the ever-changing environment and challenges of the world. - Female Mathematics Teacher (M FT5)
Yes. It is aiming the allround development of the child, and in every child some measure of creativity exists. It should be nurtured. So that each individual child is unique and helpful to the society. - Male Physical Sciences and Mathematics Teacher (PS+M MT6)
Developing creativity among the students is the most important. That students pass with first class results is not our only aim. If you develop creativity among the students tomorrow it will be very useful to our country. We need highly creative people in big industries, research and development areas. - Male Physical Sciences Teacher (PS MT7)
Development of creative thinking among school students is important as it keeps the student motivated to be on the track to achieve a certain goal of life in the field of education.
- Female Biological Science Teacher (BS FTS)
The development of creative thinking among the students is needed but not so important. I - Male Social Studies Teacher (SS MT9)
I Yes. If we develop creative thinking in children their thinking ability, imaginative ability will be increased and lead to novel views. - Female Social Studies Teacher (SS FT10)
The majority of the teachers indicated that creativity is important to meet challenges

156
and solve day-to-day problems (20.3%), to develop independent thinking (18.8%) and to
bring out hidden talents (17.4%). 13% of the teachers said it was important for the
development of knowledge, 11.6% that it leads to self-expression. Responses which
indicated that it leads to original idea generation, discoveries, inventions and innovations,
to avoid passive teaching learning processes and for advancement in all fields were 7.2%
each.
Table-g.g: Distribution of teachers' responses on the importance of creativity and reasons f d I' f' h d t or eve oping crea IVlty among t e stu en s
Development of creative thinking is f % of XZ
cases (Chi-square) t:xtremely Important 28 31.8 Very important 50 56.8 64.36$ Moderately important 8 9.1 Not very important 2 2.3 Not at all important 0 0.0 Reasons for giving importance to developing creativity f % of cases among secondary school students 1. Educational value
1.1 To develop independent thinking 13 18.8 1.2 To bring out the hidden talents of the students 12 17.4 1.3 To avoid passive teaching-learning process 5 7.2 1.4 For academic excellence 4 5.8 1.5 To develop scientific attitudes among the students 3 4.3
2. Future - problem solving use 2.1 To meet challenges and solve day to day problems 14 20.3 2.2 To think about and compare life situations 4 5.8 2.3 Promotes liveliness and harmony 2 2.9
3. Advancement in knowledge 3.1 For the development of knowledge 9 13.0 3.2 For advancement in all fields 5 7.2
(technical, economic, political, & cultural.) 4. Leads to bringing something into existence
4.1 Creativity leads to self-expression 8 11.6 4.2 Creativity leads to original idea generation 5 7.2 4.3 Creativity leads to discoveries/inventions/innovations 5 7.2 4.4 Creativity leads to experimentation 3 4.3 4.5 Creativity leads to imagination 3 4.3 4.6 Creativity leads to curiosity 2 2.9
97 ..
$= Significant at 0.001; *: Multiple responses (69 valid cases)
Some selective teachers views' found in the Teachers Questionnaire are also quoted
here as examples.
The aim of education is not creating robots, but humans with flesh & blood, who can think on their own. It solves the problems facing present societies to a greater extent.
(English teacher,jemaie, aged 51-55 yrs. and expo 31 and above)
Creativity is very important among the school children. They are the future builders of the nation.
(Teiugu teac/zer,jemaie, aged 46-50 yrs, expo 26-30)

157
In this present world of science and technology, it is very important to make the students highly competitive.
(English and social studies teacher, male, aged 41-45 Yrs. and expo 11-15)
9.2.10 Methods of encouraging creativity in the classroom used by teachers
The interviews indicated that almost all of the teachers wish to encourage creativity
among their students. They were also asked to give reasons why they would like to
encourage the children to be creative.
A Telugu teacher (T FTl) emphasised the encouragement of creativity because it
was useful in future life to learn a vocation and assist in employment. An English teacher
(E MT2) thought that it was useful 'not only in their academic work but also in their life
to achieve higher goals '. Similar views were expressed by the Biological science teacher
(BS FT8), "I encourage them to achieve a certain goals of life ".
A teacher of social studies (SS FTIO) said, 'I encourage them to progress in all
round development and they will become good citizens infuture life '. A female teacher of
mathematics (M FT5) said that she encouraged them 'by providing them some chance to
come out with their opinions '.
A male teacher, teaching PS (PS MT7) said, "Sure, I like to encourage.
Development of creativity is compulsory. Teachingfor children to think infour different
ways is better than a rote memory learning method". Another PS and mathematics teacher
(PS+M MT6) suggested that:
"This is the right age for students and right time for us to develop creativity among the students. Each individual is a unique person and he has some unique ideas in his mind If we try to nurture this need it may be that individual will turn out to be a great help to society. It is the teachers' responsibility to develop creativity among the children when they are young".
The English and BS teacher (E+BS MT3) realised the necessity of encouragement
and he said:
Yes. Because I know what are the consequences or the results and benefits that we get from creativity. Through creativity we see whatever innovations today we see. In this world they may be all due to the product of creativity. So we should see that the students can come out with a new idea or novel response or some originality in their answers. I do encourage them because this may be the right place for them to develop.
Further he explained how he behaved in the classroom with them:
Definitely, I encourage children. Because I know creativity should be nurtured and it should be promoted Sometimes I have tried to clarify doubts, sometimes I have said, 'your question is very good', and also I have tried to give reinforcement. I try to maintain a conducive atmosphere in the class and also encourage asking such questions in the future too.
A mathematics teacher (M MT4) stressed the role of the teacher in encouraging the
children. He said:
Education is the all round development of a child Creativity is one of the factors of the
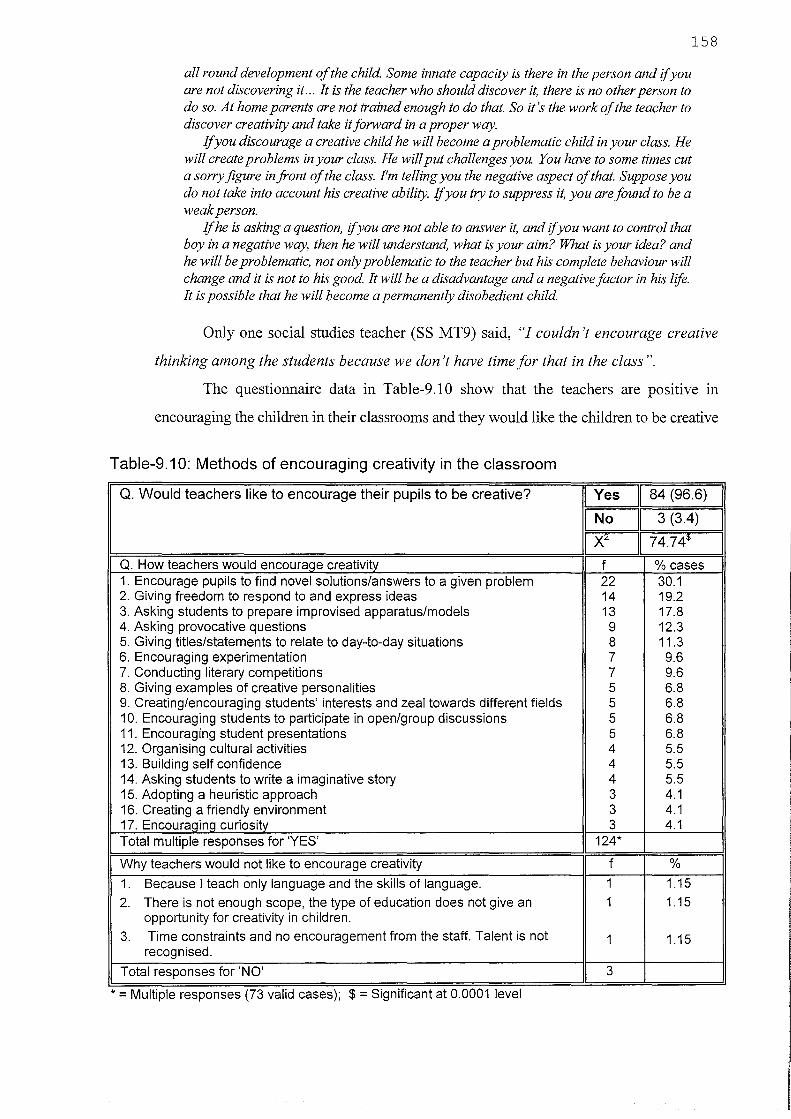
158
all round development of the child Some innate capacity is there in the person and if you are not discovering it ... It is the teacher who should discover it, there is no other person to do so. At home parents are not trained enough to do that. So it's the work of the teacher to discover creativity and take it forward in a proper w£:ry .
.if you discourage a creative child he will become a problematic child in your class. He will create problems in your class. He will put challenges you. You have to some times cut a sorry figure in front of the class. I'm telling you the negative aspect of that. Suppose you do not take into account his creative ability . .if you try to suppress it, you are found to be a weak person.
.if he is asking a question, if you are not able to answer it, and if you want to control that boy in a negative mOl, then he will understand, what is your aim? What is your idea? and he will be problematic, not only problematic to the teacher but his complete behaviour will change and it is not to his good It will be a disadvantage and a negative factor in his life. It is possible that he will become a permanently disobedient child
Only one social studies teacher (SS MT9) said, "/ couldn't encourage creative
thinking among the students because we don't have time for that in the class ".
The questionnaire data in Table-9.10 show that the teachers are positive m
encouraging the children in their classrooms and they would like the children to be creative
Table-9.10: Methods of encouraging creativity in the classroom
Q. Would teachers like to encourage their pupils to be creative? I Yes I 84 (96.6)
I No I 3 (3.4)
X<:: I 74.74$
Q. How teachers would encourage creativity f % cases 1. Encourage pupils to find novel solutions/answers to a given problem 22 30.1 2. Giving freedom to respond to and express ideas 14 19.2 3. Asking students to prepare improvised apparatus/models 13 17.8 4. Asking provocative questions 9 12.3 5. Giving titles/statements to relate to day-to-day situations 8 11.3 6. Encouraging experimentation 7 9.6 7. Conducting literary competitions 7 9.6 8. Giving examples of creative personalities 5 6.8 9. Creating/encouraging students' interests and zeal towards different fields 5 6.8 10. Encouraging students to participate in open/group discussions 5 6.8 11. Encouraging student presentations 5 6.8 12. Organising cultural activities 4 5.5 13. Building self confidence 4 5.5 14. Asking students to write a imaginative story 4 5.5 15. Adopting a heuristic approach 3 4.1 16. Creating a friendly environment 3 4.1 17. Encouraging curiosity 3 4.1 Total multiple responses for 'YES' 124*
Why teachers would not like to encourage creativity f %
1. Because I teach only language and the skills of language. 1 1.15
2. There is not enough scope, the type of education does not give an 1 1.15 opportunity for creativity in children.
3. Time constraints and no encouragement from the staff. Talent is not 1 1.15 recognised.
Total responses for 'NO' 3 ..
* = Multiple responses (73 valid cases); $ = Significant at 0.0001 level
I

159
(96.6%). Only 3.4% would not like to encourage creativity. The X2-value 74.74 indicates
a significant trend of opinion at 0.0001 level. The teachers were asked to mention some of
the methods they adopt in the classrooms to enable their children to be creative. These are
presented in the same table.
The table shows that the teachers encourage their students to find novel solutions
on answers to problems (30.1 %), give freedom to respond to and express ideas freely
(19.2%) and ask them to prepare improvised apparatus/models (17.8%). Asking
provocative questions (12.3%), giving titles on statements to relate to day today situations
(11.3%), encouraging experimentation, and conducting literary competitions scored 9.6%
each. A very small percentage of teachers adopted heuristic approaches, created a friendly
environment or encouraged curiosity. These totalled 4.1 % each. Three teachers did not
encourage creativity. The reasons are presented in Table 9.10.
Some typical selected responses from the TQ are cited below:
By creating a conducive environment in the class. Encouraging pupils to ask questions and building self-confidence among the students.
(physical science teacher, Male, aged 26-30;exp. 6-10.)
Exposing them to situations that bring out the creative talent of the children. (Social Studies Teacher, Female; aged 41-45; exp.11-15)
By encouraging them to participate in various activities and involving them in open discussions, so that their views can be recognised.
(physical science Teacher, Female; aged 26-30; exp.1-5)
9.2.11 How teachers can develop creative thinking
One hundred percent of the teachers expressed the views that a teacher can develop
creativity among the students by adopting different techniques in the classroom.
Three teachers expressed similar views; a teacher of Telugu (T FT1) said, "we can
develop creative thinking in students from sports, cultural activities and literary
competition"; the biology teacher (BS FT8) said, "by showing experiments, film strips,
improvisation of apparatus"; and the social studies teacher (SS FT10) said, "by organising
cultural activities, games, writing songs & singing competitions".
An English teacher (E MT2) said, "First, teachers should identify the talent, they
should polish the rough ends. Students exhibiting creative thinking should be constantly
exposed to a variety of problems and teachers should instil confidence in the students to
be creative in their thinking".
A PS and mathematics teacher (PS+M MT6) suggests how a teacher can develop
creativity:
By asking many divergent questions. Apart from his teaching lesson he can spend some
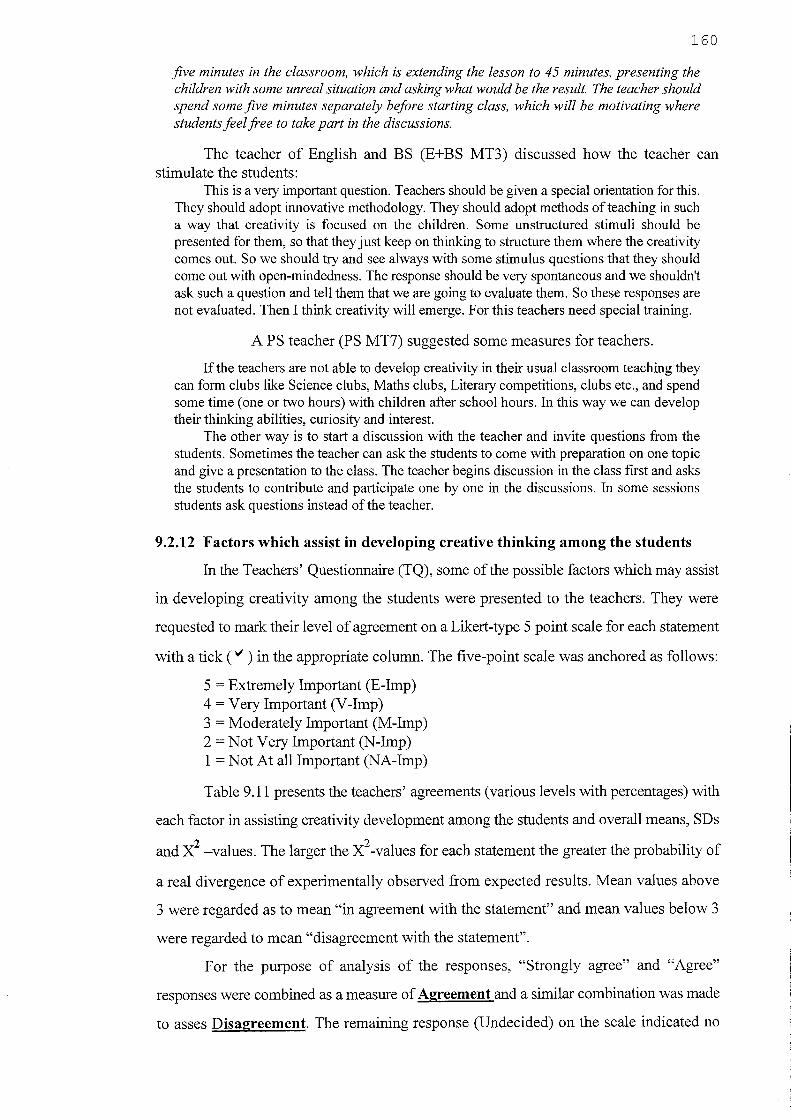
160
five minutes in the classroom, which is extending the lesson to 45 minutes, presenting the children with some unreal situation and asking what would be the result. The teacher should spend some five minutes separately before starting class, which will be motivating where students feel free to take part in the discussions.
The teacher of English and BS (E+BS MT3) discussed how the teacher can stimulate the students:
This is a vel)' important question. Teachers should be given a special orientation for this. They should adopt innovative methodology. They should adopt methods of teaching in such a way that creativity is focused on the children. Some unstructured stimuli should be presented for them, so that they just keep on thinking to structure them where the creativity comes out. So we should tl)' and see always with some stimulus questions that they should come out with open-mindedness. The response should be vel)' spontaneous and we shouldn't ask such a question and tell them that we are going to evaluate them. So these responses are not evaluated. Then I think creativity will emerge. For this teachers need special training.
A PS teacher (PS MT7) suggested some measures for teachers.
If the teachers are not able to develop creativity in their usual classroom teaching they can form clubs like Science clubs, Maths clubs, Literal)' competitions, clubs etc., and spend some time (one or two hours) with children after school hours. In this way we can develop their thinking abilities, curiosity and interest.
The other way is to start a discussion with the teacher and invite questions from the students. Sometimes the teacher can ask the students to come with preparation on one topic and give a presentation to the class. The teacher begins discussion in the class first and asks the students to contribute and participate one by one in the discussions. In some sessions students ask questions instead of the teacher.
9.2.12 Factors which assist in developing creative thinking among the students
In the Teachers' Questionnaire (TQ), some of the possible factors which may assist
in developing creativity among the students were presented to the teachers. They were
requested to mark their level of agreement on a Likert-type 5 point scale for each statement
with a tick ( >I ) in the appropriate column. The five-point scale was anchored as follows:
5 = Extremely Important (E-Imp) 4 = Very Important (V -Imp) 3 = Moderately Important (M-Imp) 2 = Not Very Important (N-Imp) 1 = Not At all Important (NA-Imp)
Table 9.11 presents the teachers' agreements (various levels with percentages) with
each factor in assisting creativity development among the students and overall means, SDs
and X2 -values. The larger the X2 -values for each statement the greater the probability of
a real divergence of experimentally observed from expected results. Mean values above
3 were regarded as to mean "in agreement with the statement" and mean values below 3
were regarded to mean "disagreement with the statement".
For the purpose of analysis of the responses, "Strongly agree" and "Agree"
responses were combined as a measure of Agreement and a similar combination was made
to asses Disagreement. The remaining response (Undecided) on the scale indicated no
161
opinion (eg. Treffinger, et al , 1968; Fryer, 1989 & 1996).
Almost all teachers agreed that "building self-confidence" (96.5%)*, will assist in
developing creativity. Other factors, " a creative teacher (94.3%)" "good teacher-pupil
relationships (95.4%)" and "encouraging experimentation (87.2%)" were considered
important in developing creative thinking. Only 36.7% of teachers agreed (the same
percentage 36.7% disagreed) that "informal teaching" will assist in development of
creativity (the scale mean is also <3). All fifteen X2-values are significant at 0.001 level.
This indicates that the trend of the teachers' opinion is significant for all the fifteen factors
Table -9.11: Teachers' agreement with factors' assist to creativity development among the students L 1ft eve 0 agreemen
...::: ~ ]'
Factors bJl 8 0 ::>
::Ii .....l Cl"
.2 '" C ~~ ~~ § ,
>~ '"B~ 5~ '" 0 <'1:.2
:r: ~ .....l :> ~ C/l :><:2-I.Building self-confidence among the 46.0 50.5 2.3 1.0 0.0 4.41 .60 75.81$ students
2. A creative teacher 48.3 46.0 4.6 1.1 0.0 4.41 .64 68.45$ 3. Good teacher pupil relationships 46.0 49.4 2.3 1.1 1.1 4.38 .70 111.56$ 4. Encouraging experimentation 43.0 44.2 10.5 1.2 1.2 4.27 .79 82.37$ 5. Developing curiosity 35.6 56.3 6.9 1.1 0.0 4.26 .64 69.28$ 6. Treating students imaginative ideas with 37.5 51.1 9.1 2.3 0.0 4.24 .71 56.64$
respect 7. Supportive home environment 37.9 47.1 14.9 0.0 0.0 4.23 .69 14.35$ 8. Encourage pupils to ask questions 32.6 52.3 14.0 1.2 0.0 4.16 .70 51.40$ 9. Treating students questions with respect 32.2 54.0 11.5 2.3 0.0 4.16 .71 55.39$ 10. Setting interesting tasks 33.3 41.4 21.8 2.3 1.1 4.03 .87 56.85$ 11. Teaching self-initiation to the students 23.3 54.7 14.0 8.1 0.0 3.93 .84 44.33$ 12. Teachers asking provocative questions 27.1 49.4 9.4 11.8 2.4 3.87 1.02 59.77$ 13. Providing exciting and adventurous 33.7 36.0 17.4 7.0 5.8 3.85 1.14 35.40$
school atmosphere 14. Teaching self-evaluation to the students 15.3 56.5 21.2 5.9 1.2 3.79 .82 81.06$ 15. Teachers asking open- ended questions 21.2 42.4 27.1 8.2 1.2 3.74 .93 44.35$ 16. Informal teaching 8.9 27.8 26.6 17.7 19.0 2.90 1.26 9.29#
$= Significant at 0.001 #= Not significant at 0.05
except the informal teaching factor (X2=9.29#).
9.2.13 Obstacles in developing creative thinking among secondary school children.
The teachers were asked in the interview to identify the major obstacles to
developing creativity that they experienced in the schools at various levels i.e., school,
teacher and student. The same question was also asked in the Teachers Questionnaire (TQ).
In the TQ, a list of some possible obstacles to creativity development among the students
at school level, student level and teacher level was presented to the teachers. They were
asked to indicate on the given 5-point scale their agreement with each statement (See App.
H, Q.Nos.7, 8 and 9). The responses given by the teachers are presented in tables 9.12, 9.13
* Note: All the percentages within the brackets including the Very high and high percentages.

162
and 9.14.
9.2.13.1 Obstacles at School level A Telugu teacher stated that the 'School environment is not good'. The teacher
teaching social studies (SS FT10) said there are 'inadequate resources at school '. The PS
teacher (PS MT7) mentioned a similar problem of resources:
In my opinion the main obstacle in government schools is lack of resources at school. Lack of time is also one of the obstacles. This school is a shift school. It runs from 12.30 PM to 5. 00 PM Moreover, children come from different parts of the city, so after the school they have to run to catch the city buses, which are overcrowded and some times they need to stand on foot board or swing on the door handles.
If we try to collect some donations for developmental activities then there are so many criticisms and allegations. So nobody takes an interest or initiates it. Even if anybody is willing to take an interest to do some thing then s/he will get no encouragement or cooperation. There are many extraneous factors, which discourage us.
Two other teachers (E MT2 and SS MT9) perceived that 'a time-bound syllabus
is a major obstacle '. A female mathematics teacher (M FTS) said, "the syllabus is very
vast. Because of the syllabus teachers are in a hurry to complete the syllabus. I don't think
teachers have that much time to use different methods to solve the problems".
Some obstacles experienced by the biological sciences teacher mentioned were
Short periods, lack of laboratory facilities for science subjects and a shortage of budget.
The teacher of English and BS (E+BS MT3) blamed the administration and
government policies:
At school level, the administration, that is the headteacher, who is the head of the institution should first of all understand what is creativity. He should acquaint himself with the techniques of creativity. He himself should know whether creativity is a process or a product. Then, we can achieve good results. The top people, those sitting at the higher levels, if they provide an opportunity or freedom for teachers then teachers can express themselves freely and openly; if they perceive things in the right spirit the same can be inculcated in the students. Government policies are one of the reasons for keeping down creativity at school level. For example, pressurising the teachers for completion of the syllabus and other work! which detracts from teaching, etc.,
Further he said that freedom for teachers and students in the classroom is required:
If the head of the institution permits, if he gives us freedom in the classroom then at least sometimes we come out of teaching subject matter and try to include some psychological factors in teaching (e.g. intelligence, creativity, personality etc.,). For that I believe that" knowledge about creativity should also given to the head of the institution because until he understands he can not give freedom to the teachers.
A Mathematics teacher (MMT4) said, 'At school level means the school administration. Society is running the school, the
government or other people. They must provide all such infrastructure in the school. Of course, this infrastructure may not be required in full but definitely it is required to a certain extent.
In the Teacher Questionnaire the most often cited constraints at school level were
3 Enumeration, Frequent election duties, etc.,

163
inadequate resources (80.5%)*, instructional materials (85.1%) and conflicts with
curriculum demands (76.3%). They also strongly agreed that unsuitable accommodation
(75%) and inadequate funds (72.3%) created problems. Only 53.5% of teachers said their
head- teachers were not supportive (see table-9.l2).
T bl 912 Ob t r 't a e- s ac es to crea IVlty deve opment at sc h 00 level
~ ::J? ~ '<l i1 0 ;:: til
School level tE ~ ~ 0 ::l Q) ,.J cr" ... '{'
Q ..=: ::l ;:: Q § OJ) til N:.2 Q)
tE ::: 0 Q) Q) Q > ~ ,.J > :E r/) ~8
1. Inadequate resources at school 36.8 43.7 9.2 9.2 1.1 4.06 .97 62.25$ 2. Inadequate instructional material 29.9 55.2 4.6 10.3 0.0 4.05 .88 54.4i 3. Conflicting curriculum demands 33.8 42.5 12.5 11.3 0.0 3.99 .96 23.30$ 4. Inadequate funds 28.9 43.4 7.2 19.3 1.2 3.80 1.10 43.42$ 5. Unsuitable accommodation 23.9 51.1 4.5 19.3 1.1 3.77 1.06 69.50$ 6. Inadequate support from the parents 30.7 38.6 11.4 14.8 4.5 3.76 1.17 35.30$ 7. Over-large classes 27.9 41.9 4.7 19.8 5.8 3.66 1.24 42.02$ 8. Inadequate freedom for teachers to pursue 28.7 37.9 8.0 16.1 9.2 3.61 1.31 29.26$
creative activities 9. Inadequate support from society 19.5 41.4 17.2 19.5 2.3 3.56 1.09 33.86$ 10. Inadequate freedom for students to pursue 27.1 36.5 5.9 22.4 8.2 3.52 1.32 28.24$
creative activities 11. Inadequate support from the Head teacher 14.0 39.5 12.8 23.3 10.5 3.23 1.25 24.58$ 12 Other responses
1. Due to examination orientation (N=I) 100.0 0.0 0.0 0.0 0.0 5.0 0.0 -2. The system of evaluation (N= 1) 100.0 0.0 0.0 0.0 0.0 5.0 0.0 -
$- Significant at 0.001
9.2.13.2 Obstacles at student level
At student level, a female teacher, teaching social studies (SS FT10) reported as an
obstacle 'unequal aptitudes among the students '. A mathematics (M FT5) teacher
complained that "at student level, the present situation in our school is that most of the
students come from very poor backgrounds, financially. In addition some of them have
only single parents who are employees and they are illiterate; facilities at home are nil.
So their emotions are totally disturbed. They come here because their parents send them.
Even if we try to give some innovative ideas and to develop creativity they are not in a
position to respond".
In a similar way a biological sciences teacher (BS FT8) said that "children belong
to illiterate families and many are undernourished children coming from low status
families ".
The obstacles quoted in the Teachers Questionnaire (TQ) (table-1 0.13) suggests
that students' lack of experience (76.1 %)* , passive participation in the classrooms (72.7%),
a tendency to rote learning (71.8%), unmotivated students (70.9%), and poorly performing
students (70.5%) are obstacles. Only 55.2% of the teachers said that students have too
* Note: All the percentages within the brackets including the Very high and high percentages

164
much homework. Some ofthe obstacles mentioned by the teachers under "other" are also
presented in the table.
Table-9.13: Obstacles to creativity development at student level
..c :i: ~
Students level OJ ro I ~
0 :::l ...J
C 0-
~ ..c :::l ~ «l
~~ ~~ ro
~~ .2>~ ~~ Q) Cl N:.c
:r: ::;,0 ...J ::;:: (j) XU
1. Students are not well motivated 26.7 44.2 8.1 19.8 1.2 3.76 1.10 48.42~ 2. Students participate passively 21.6 51.1 12.5 9.1 5.7 3.74 1.08 59.50$ 3. Students tend to rote leam 35.3 36.5 4.7 10.6 12.9 3.71 1.39 37.29$ 4. Students lack of experience 13.6 62.5 4.5 15.9 3.4 3.67 1.01 104.61$ 5. Students perform poorly 12.5 58.0 4.5 20.5 4.5 3.53 1.09 86.89$ 6. Students lack confidence 19.3 47.7 5.7 19.3 8.0 3.51 1.23 49.27$ 7. Students have too much home- 20.7 34.5 4.6 33.3 6.9 3.29 1.31 34.67$
work 8. Other responses 1. Lack of creative 100.0 0.0 0.0 0.0 0.0 5.0 0.00 -atmosphere(N=1 ) 100.0 0.0 0.0 0.0 0.0 5.0 0.00 -2. Over-emphasis on academic
excellence (N=1) 100.0 0.0 0.0 0.0 0.0 5.0 0.00 -3. Poor family back ground (N=1) 100.0 0.0 0.0 0.0 0.0 5.0 0.00 -4. No parental carel encouragement
(N=2) ..
$= Significant at 0.001 level
9.2.13.3 Obstacles at teachers' level
At the teachers' level the obstacles presented included the stress on completion of
the syllabus and examination performance, heavy work loads and a lack of recognition of
their work. For instance, a PS Teacher (PS MT7) said that "In the present situation a
teacher's hands are tied tightly. He is unable to develop creativity. The main reasons are
not enough time and a vast syllabus ".
A female mathematics teacher (M FTS) expressed a similar view. In the present-day
classroom teachers have a heavy workload and must finish the syllabus etc. The teacher feels that he
has to complete his duties first, sidelining the students' interest. Most of the time teachers engage in
the lecture method and often the child is a silent spectator.
The teacher of English and BS (E+BS MT3) pointed out that 'At teacher level,
teachers may not have adequate knowledge of creativity. Teachers should be properly trained. The
teachers should see that new methods of teaching are deployed in the classroom and must
encourage students. They should accept whatever answer students give with an open mind. The
teachers should not insult the student whenever divergent responses occur on some particular
issues.
A mathematics teacher (M MT4) said, "the key person here is the teacher. If the
teacher is not willing to give importance to creativity thinking, no body can help. I don't
blame the student that much here because he doesn't knOw. He doesn't know that he has got
* Note: All the percentages within the brackets including the Very high and high percentages

165
that ability unless and until it is nurtured".
When the researcher drew attention to teachers' complaints against the vast syllabus and time pressure he said
Of course, the syllabus is there. I'm also dealing with such subjects, where the maximum syllabus is there maths, English, and sciences. Creative thinking does not require extra time as such. You can ask one or two questions in the class itself For this, as I said, training is required The teacher should get himself acquainted with what this is (creativity). When the teachers complain that the syllabus is too much and there is no time to do it, it is not true. It means that those teachers do not really know what creative thinking is Otherwise they would not pose this question.
I think that creative thinking can be developed during teaching. It does not require separate time or separate energy. Of course, technique is required A technique for the teachers is required Only a few children will be creative. We can develop them. We can do that after the period also. Like in mathematics, children may have the skill of solving riddles, doing mathematics puzzles and all those things. You do it in the class. You identifY children, make a small group or organise a club and ask them to participate, stay after school hours, half an hour or so. And give them some work. That way they can get recognition and they can take more and more interest in such things.
Table 9.14 exhibits the perceived teacher-level obstacles in developing creativity
among the students. According to the data, they perceive that they are under stress in
completing the syllabus (86.2%). They emphasise preparing students for examinations
Table-9.14: Obstacles to creativity development at Teacher level
3: , Teacher level ~ "<f!- iE ~
0 :c ~ 0 ...J C ~ ::J 0
~ .r::. .r::. en 3: ~ ro ro Q) OJ OJ
:5 ~ Q) Q) 0 N ::J
I I 0 ~ :2 0" > ...J > 0 (j) x en
1. Teachers' stress on completing the syllabus 40.2 46.0 2.3 5.7 5.7 4.09 1.09 78.50~
2. Teachers' over emphasis on preparing 31.0 56.3 0.0 8.0 4.6 4.01 1.03 59.90$ students for examinations
3. Heavy teaching work-load 29.9 46.0 5.7 16.1 2.3 3.85 1.10 56.74$ 4. Lack of recognition of teachers' creative 26.7 44.2 9.3 14.0 5.8 3.72 1.18 42.26$ work 18.8 52.9 9.4 14.1 4.7 3.67 1.08 62.35$ 5. Lack of recognition of teachers' work in
promoting students' creativity 12.5 54.5 5.7 23.9 3.4 3.49 1.09 76.77$ 6. Inadequate preparation time for teachers 20.5 39.8 3.4 21.6 14.8 3.30 1.40 30.64$ 7. Lack of knowledge about creativity among
teachers 13.6 44.3 5.7 27.3 9.1 3.26 1.26 44.39$ 8. Lack of understanding about creativity
among teachers 4.9 34.6 9.9 37.0 13.6 2.80 1.20 35.36$ 9. Lack of experience among teachers 2.3 32.6 9.3 40.7 15.1 2.66 1.15 44.58$ 10. Lack of confidence among teachers 11. Other responses 100.0 0.0 0.0 0.0 0.0 5.00 0.00 -
1.Lack of self-evaluation of the 100.0 0.0 0.0 0.0 0.0 5.00 0.00 -teachers(N=1 )
2.Lack of training programmes(N=1)
(87.3%) and a heavy teaching workload (75.9%), a lack of recognition of teachers' work
in promoting students' creativity (71.7%) and a lack of recognition of teachers' creative
work (70.9%) as the major obstacles for teachers in promoting creativity in the formal
school system.
Only 39.5% of the teachers agreed that teachers have a lack of experience or lack
of understanding about creativity (57.9%) but 34.9% said that teachers are lacking
confidence.

166
9.2.14 Teachers' attitude towards the encouragement of creative thinking among the students.
Table 10.15 reports the teachers' attitudes towards the encouragement of students'
creativity development in relation to the teachers' sex, age, experience and educational
qualifications.
The teachers were asked to indicate their level of agreement with 16 statements
regarding the encouragement of creativity. All the positive statements were awarded 5, 4,
3, 2, and 1 scores; negative statements were awarded 1, 2, 3, 4, and 5 scores. The
maximum score is 80 (16x5) the minimum 16 (16x1). Addition of all 16-item scores gives
the individual teacher's score. Means, SDs, and F-ratios/t-values were calculated for the
purpose of analysis.
Based on the t-value (0.07)(see table-9.15), there were no statistically significant
differences between male and female attitudes, although the female mean score (63.37) is
marginally higher than the male (63.24). In the case of age and experience, no significant
differences were found, although the lower age groups and less experienced teachers' mean
scores were higher than their counter parts.
Table-9.15: Mean scores, SOs, and F-ratio (or t-values) of creativity encouragement S f th t h . 1ft . d IT f n cores 0 e eac ers In re a Ion 0 sex, age, experience, an qua I Ica 10
Variable Category N Mean SO SEm F-ratio I t-Value
Sex 1. Male 25 63.24 8.25 1.65 2. Female 63 63.37 7.80 0.98 t= 0.07#
Age 1. < 10 Yrs 14 66.36 6.81 1.82 2. 31-40Yrs 17 65.18 9.30 2.25 F= 1.55# 3. 41-50Yrs 42 62.12 8.54 1.32 4. 51- 60 Yrs 15 61.80 3.23 0.84
Experience 1. < 10 Yrs 24 65.92 8.34 1.70 2. 11-20 Yrs 26 63.85 6.79 1.33 3. 21-30 Yrs 26 60.27 8.71 1.70 F= 2.31# 4. 31-40 Yrs 12 63.67 5.58 1.61
Qualification Graduates 72 63.33 7.90 0.93 Professional Postgraduates 16 63.31 8.06 2.01 t= 0.01# Qualifications Graduates 51 62.39 8.06 1.70 Academic Postgraduates 37 64.62 7.55 1.68 t=1.32#
.. # = Not Significant

167
9.2.15 Teachers' attitude towards the present examination system in Andhra Pradesh.
In the interviews, the teachers were asked about the role of examinations in
developing creative thinking among students. All teachers (100%) were unhappy with the
present examination system.
For instance a male English Teacher (E MT2) said that 'examinations are bookish.
There is no room for creativity '. A PS and Mathematics teacher (PS+M MT6) said, 'they
do not give any scope for create thinking because they encourages convergent thinking '.
Three teachers (T FTl, SS MT9 and SS FTIO) argued that the examination pattern
should be modified to develop a view of the development of creative thinking; and another
teacher of biological sciences (BS FT8) said, 'examinations should give scope for the
students to express their ideas '.
An English and BS teacher (E+BS MT3) was unhappy with the examination system
and said,
'In the examination pattern, sometimes creativity is not shown. They may be asked straightforward questions. Usually students will mug up the question and answers; simply they reproduce. So their creativity is not evaluated. I think, the present examination system does not take much account of creativity. They should be given questions in a very open-ended way and allow students to express their own opinions. So the present system, I think, needs some modification to promote creativity '.
Similar criticism was also made by the PS teacher (PS MT7): We can't asses even 0.01 percent of creativity of a child through our present examination
pattern. The questions asked in the examinations are rote-memory based. They never consider giving questions to develop creative thinking. I observed some instances where teachers strikeoff the answers without kindness, if a student writes answers in a creative way. If the teacher has some knowledge of creativity then he will appreciate the various types of answers. If the answer script goes to the teacher who doesn't know about creativity, the creative students will be definitely victimised. So while we sometimes encourage and appreciate students who do these things in the classroom, we discourage them from writing in the examinations, because we don't know who is going to mark their papers and we don't know about the examiner's way of thinking or mood. So we are sometimes enthusiastic to develop creativity among the students but the examination system works to suppress creativity.
A mathematics (M MT4) teacher was also not happy with the present examination system:
Of course, I agree that the present curriculum is framed in such a way that our present system of evaluation must be blamed. What students learn throughout the year, they have to just vomit it out in just two and half-hours. In foreign countries this is not the method. They take the whole performance of the child through out the year and they give grades and then in the end they will form the result. I think that is the best technique.
As far as creativity is concerned, we can accommodate creative thinking in every class and in every subject, every time. How to test creativity? How can we include this in the exams or separate testing that is to be done? I don't think it can be recommended, because this factor is not common in all students. I may be wrong also, because I do not have much knowledge about how to examine creativity. How to test it after they have acquired it? How to put them to test? As far as the examination system in our state is concerned it is full of loopholes. Much can be done, provided teachers co-operate, because the teachers are the main people. If they take an interest, wonders can be done. If they do not take an interest, things may remain the same.

168
9.2.16 Teachers' attitude towards the present curriculum in Andhra Pradesh.
Generally the teachers viewed the curriculum is overloaded. For instance, two
teachers (EMT2 & SS MT9) said that the present curriculum was unhelpful in developing
creative thinking. A PS and mathematics teacher (PS+M MT6) said that 'the present
curriculum is examination oriented'. While "the curriculum needs to be changed to
develop creative thinking" was the view of a social studies teacher (SS FTIO). The Telugu
teacher (T FTl) reported, "the lessons should be given more scope for thinking '. A similar
view expressed by a BS teacher (BS FT8): 'the present curriculum is not up to the required
standard, as it does not provide subjects like art, music, craft and manual training. Extra
lessons are required for all these activities".
A physical science teacher (PS MT7) complained that the
present curriculum is not useful in any way. The syllabus is very vast. This vast syllabus aims to teach subject content, and the development of creativity and related activities are given least importance. The preparation of a text should be attractive to a child, after reading the book the child must be stimulated Suppose a child reads one principle and its applications then he must start thinking, can I prepare any thing based on this principle? How can I apply this principle for other occasions? It is better to develop this type of thinking among the children. But the present textbooks are not like that. They always concentrate on questions and answers. The questions asked after each lesson are also not helpful in developing thinking.
A female mathematics teacher (M FTS) also indicated that
The present curriculum in science is ok. It develops the reasoning ability of the child and new ways of thinkingfor the child But in mathematics I don't think it is suitable for developing creative thinking. Mostly the child has to reproduce only the formulas and apply the formulas to solve the problems and is not given any scope to apply new knowledge or new ways of thinking to solve problems. So the mathematics curriculum has to be changed, because it only uses formulas in most of the syllabus.
A male mathematics teacher (M MT4) commented that 'of course, the present
curriculum has given recognition to creative thinking but not to the desired extent '.
A male teacher of English and BS (E+BS MT3) was very optimistic about the
present curriculum. He said, 'From the curriculum point of view, I don't think that there is much
required for creativity, because curriculum planners and designers who have designed the
curriculum must have kept creativity in view. The only thing is, we should dig it out. We should see
how it could be made creative. To make things creative a teacher should be creative. A creative
teacher makes things creative. So maybe the curriculum does not require much change.
The Teachers' Questionnaire data (table-9.16) show the teachers' opinions on the
present curriculum at secondary level. they provide evidence of strong agreement with all
the statements. Almost all teachers (84.9%) agreed that the curriculum is overloaded in all
or most of the subjects. 74.7% teachers agreed that it was inflexible, 67.9% of them agreed

169
that no scope was given to students' self-evaluation and self-initiated learning. Many also
agreed that no emphasis is given for creative activities in the curriculum (64.7%) and that
the teaching methods are not appropriate (61.7%).
46.5% of teachers agreed that the curriculum is suitable and caters for the needs of
wide range ofleamers and their learning environment. 39.3% of teachers disagreed with
this statement, 14.3% ofteachers were unsure about it.
Table -9.16: Teachers' attitude towards the present curriculum in Andhra Pradesh (India)
Present curriculum at secondary level ~ ~ ~ ~ cf'. ~ 0 0
~~ 0
i::'~ c . ...!.. C'O i::'-C -c
~ ro (\).~ OJ CO (\) 0 (\) 0 N-C:::l >I I :::l
0 >..J ~ C/) >< 0 0-..J ~(/)
1. Emphasis is not given to creative 26.1 38.6 6.8 18.2 9.1 3.55 1.31 30.30~ activities 13.8 60.9 6.9 12.6 5.7 3.64 1.06 93.17$ 2. Not flexible for students to pursue their
creative activities 17.9 50.0 8.3 22.6 1.2 3.61 1.06 58.86$ 3. Not enough scope for students' self-
evaluation and self-initiated leaming 22.1 62.8 3.5 8.1 3.5 3.92 0.95 108.42$ 4. Overloaded in all or most of the subjects 3.6 42.9 14.3 36.9 2.4 3.08 1.02 59.69$ 5. Suitable and caters for the needs of wide
range of learners and their leaming environment 14.0 47.7 4.7 29.1 4.7 3.37 1.18 58.30$
6. Teaching methods are not appropriate to learn creatively .
. .
The teachers were asked to rank from 1 to 5 the emphasis of the present curriculum.
The ranks were converted into the scores by following the procedure explained in chapter
VIII. The scores for each multiple response were added, and mean scores and SDs were
calculated.
Table 9.17 reveals that the teachers strongly expressed a view that the present
curriculum gives great emphasis to knowledge (mean 72.46), more than other aspects.
With the mean score 56.05 understanding stood in second place. Least importance was
perceived to be given to application, skills and attitudes.
Table - 9.17: Mean scores and SDs of the teachers' opinion on curriculum emphasis in Andhra Pradesh
Curriculum emphasis is on Mean scores SO 1. Knowledge 72.46 7.65 2. Understanding 56.05 10.27 3. Application 44.81 12.03 4. Skills 44.26 9.63 5. Attitudes 30.39 11.72
Table 9.18 shows that 54.5% of teachers preferred that the curriculum should be
activity-centred, 52.3% of them said it should be child-centred. Only 26.1 % said it should
be teacher-centred but learner-based. 9.1 % of the teachers said the curriculum should be

170
teacher-centred or examination-centred, but only 1.1 % said it should be examination
centred.
Table-9.18: The distribution of teachers' responses on promotion of creativity (N=88 Promotion of creative thinking is possible if f % of cases 1. Activity-centred 48 54.5 2. Child-centred 46 52.3 3. Teacher-centred but learner-based 23 26.1 4. Teacher-centred 8 9.1 5. Examination-centred 1 1.1
126* * Multiple responses (88 valid cases). Note: Percentages were calculated on the basis of total valid cases but not on the total multiple rA~n()n~A~
9.2.17 The suggestions made by the teachers for developing creativity
The teachers who were interviewed (N= 10) were asked to give suggestions for the
development of creative thinking among the students. Instead of presenting their ideas
individually, their suggestions have been summarised in simple numerical values or
frequencies. Their responses are presented in the table-9.19 in the form of frequencies.
Table-9.19: Suggestions made by the teachers for the development of creativity among the students
S.No. Suggestions given by the teachers % of f teachers
1 Freedom of expression for the students 5 50 2 The syllabus must be flexible and according to the need of the students' 3 30
present-day world. 3 Class size must be reduced 3 30 4 The syllabus must be reduced 2 20 5 No shift system of schooling 2 20 6 Asking students to do different types of things with material and 2 20
manipulation of objects and ideas 7 Applying new creative techniques in the classroom. 2 20
e.g. brainstorming 8 Academic freedom for the teachers 2 20 9 Reintroducing the deleted subjects like craft, material training, drawing and 1 10
painting 10 A fixed percentage of the portion in the textbook should be allotted to a 1 10
lesson. 11 Some marks should be allotted in all subjects 1 10 12 Rote learning should be discouraged 1 10 13 Providing congenial atmosphere in the class 1 10 14 Organising educational and science fares 1 10 15 Organising outings for children 1 10 16 Teaching self-evaluation 1 10 17 Encouraging group discussions 1 10 18 Insufficient time for the teachers 1 10 19 Teachers could use different teaching methods like discovery, problem - 1 10
solving etc. 20 Teacher - student relations should be strengthen 1 10 21 Teacher should be open-minded and approachable to the students 1 10 22 Teachers themselves creative 1 10
Total multiple responses 35* * = Total multIple responses (10 valId cases) Note: Percentages were calculated on the basis of total valid cases but not on the total multiple responses.

171
Five teachers (50%) of the teachers suggested that "freedom of expression to the
students' was important. Three teachers (30%) said, 'the syllabus must be flexible and
according to the students present-day needs' and another three teachers (30%) said, "class
size must be reduced".
Some suggestions were made by two teachers (20%), they were: (1) reduction of
syllabus; (2) abolish the shift school system; (3) ask students to do different types of things
with material and manipulation of objects and ideas; (4) apply new creative techniques, and
(5) freedom for teachers. Some suggestions made by single teachers are also presented in
the table 9.19.
A teacher ofPS and mathematics said,
First of all, to develop creative thinking the teacher himself should be creative, and try to learn the methods of creativity. That means, how to develop creative thinking? Then he can put it in to practice. But for this the size of the class is not encouraging. The present size of the class is nearly 60, maybe it should be reduced to 30 to 35.
Further he suggests that the teacher should give incentive and reinforcement to the creative effort of the child and encourage the child to freely express his views. It can be planned or unplanned activity. The teacher can use the discovery method or problem-solving methods, provided class size is less and there are fewer restrictions by management
A mathematics teacher (M MT4) suggested that "educational psychologists, subject
experts and teachers should work together and should design a portion of the text book, in order to
improve creative thinking".
9.3.0 Summary
This chapter has described the data from the interviews with teachers and the
questionnaire. It indicates that teachers in government schools in India generally view
creativity as something inspirational or imagination which is based on cognition. They claim
to be able to recognise it in pupils, have varied views about its relationship to intelligence and
believe that it can be developed in all school subjects. They believe that it is important for
individual development and for society in the future and have a range of suggestions for its
promotion with school. However they feel that obstacles include a lack of resources,
materials, the curriculum and examination system, appropriate accommodation, too large
class sizes and a general lack of freedom in teaching and of support for developing creativity.
Pupils tend to be unmotivated, passive, lack experience and confidence and perform poorly;
generally adopting rote learning. In addition they indicate that teachers require more training,
particularly to develop practical creative ideas. The next chapter will explore the findings
relating to students' creative thinking.

172
Chapter X
Data Analysis of the students' creative thinking
10.0 Introduction
The aims of this chapter are to explore the data on the children's creative thinking.
The results of the verbal and non-verbal tests of creative thinking are presented in the
following manner: conversion of raw scores to standard scores, followed by the frequency
distribution of scores. Then the analysis of the both test scores will be discussed according
to the aims and research questions posed. The results are presented under three broad
categories: (i) students' background variables; (ii) organisational related variables and (iii)
cognitive and motivational related variables.
10.1.0. Procedure for conversion raw scores into standardised scores
373 students' test scripts were scored as explained in chapter VI (6.3.4.2 and
6.3.5.2). As there are no right or wrong responses in the tests, each item was scored for
originality, fluency and flexibility for verbal creativity, as well as originality and
elaboration for non-verbal creativity. The means and standard deviations (SD) of raw
scores of (a) components of verbal creativity and (b) components of non-verbal creativity
were obtained, and are presented in the following table 10.1:
Table-1 0.1 :The means and standard deviations of raw scores for verbal and non-verbal creativity t componen s
Descriptive Verbal Verbal Verbal Non-verbal Non-verbal Statistics Originality Fluency Flexibili!y o rjainality Elaboration Mean 17.28 25.27 18.35 12.03 27.08 SD 15.08 10.71 7.44 6.65 9.27
The composite creativity scores are based on standard scores instead of raw scores.
This is necessary because the standard deviation of the components of creativity raw scores
sometimes markedly varies, and if raw scores are added up the ranking will be greatly
affected (see Mehdi, 1973 and 1985).
The means and SDs were calculated for all the components of creativity and are
presented in Table-l0.l. They were used to convert different components of raw scores
into standard scores (T -scores) by using the following formula:
T = 50 + 10Z--------(Fl)
T = standard scores; Z = [(X - M) / SD] X = raw scores; M = Mean of the raw score; SD = standard deviation of the raw scores.

T
173
To obtain the overall or total verbal creativity score, its components, the verbal
originality, verbal fluency and verbal flexibility raw scores, were independently converted
into T-scores (standard scores) first and then added. Similarly, to obtain non-verbal
creativity scores, its components, non-verbal originality and elaboration raw scores were
independently converted into T-scores and then added (Wallach and Kogan, 1965, p.59;
Mehdi, 1973 & 85, p.22). Finally, to obtain the composite scores as a creative thinking
index score, the total verbal and total non-verbal scores were added.
10.2.0 The nature of the distribution of verbal and non-verbal creative thinking test scores
For the purpose of statistical analysis data were grouped. The standard scores of
verbal originality, fluency, flexibility and total verbal creativity obtained for the 373 pupils
of standard IX are presented in Table 10.2 in the form of frequency distribution and
descriptive statistics. Similarly for the non-verbal and composite creativity scores,
frequency distribution and descriptive statistics are presented in Table 10.3.
10.2.1 Frequency distribution of verbal test of creative thinking (VTCT) and its components (standardised scores)
The descriptive statistics for the verbal test of creative thinking (VTCT) are given in
Table-10.2. The mean, median and mode of VTCT were 150.0, 147.0 and 90.3
respectively. The SD of the VTCT is 28.5. The maximum score obtained by the sample is
253.0 while the minimum score obtained is 90.3, giving a range of 162.7. To determine the
.95 and .99 confidence interval limits of the population means, the Standard Error of Mean
able-10.2: Frequency distribution and descriptive statistics of verbal creative thinki~ testjstandardised scores)
~
ro - ~ ~ ro
2: ~ - 2: roc ro - ~ (lJ (lJ 2 ~ ~ 2 .0 ~ > » "0»
£~ ~ .0
~ .... » :';::::;(j (lJ 0 ~ .... » c ro » c ~3 » (lJ_ , _0 , Ctl c '<=c 0..._ _ro _ 0 > .s: - c Ctl c ro:O s~ - (lJ "C 1i) Ctl C Ctl c ro:O 00 Ctl._ 00
ro~ o :::l -ro:g .00) .0 (lJ €"x o ._ .0 .- .o(lJ e 'x 0 00 00 ECT OCT 00-Ctl Co"L:: .... :::l Ctl o~ (lJ2l
"-.~ .... :::l (lJ~ -(lJ Z
0 (lJ- (lJ~ 0
:::l (lJ E (lJ (lJ .... (lJ- 0 .... C/) >0 >LL >LL 1-0 0.;:: C/).;:: oC/) >0 >LL >LL I- 0
1 20 - 29 0 9 12 90 - 109 19 19 28.3 Minimum 38.5 26.4 25.3 90.3 2 30 - 39 43 47 41 110- 129 66 85 67.3 Maximum 100.2 77.8 75.1 253.0 3 40 - 49 182 136 142 130 - 149 117 202 89.0 Mean 50.0 50.0 50.0 150.0 4 50 - 59 95 110 115 150 - 169 84 286 83.3 Median 47.8 49.6 49.5 147.0 5 60 - 69 34 65 56 170 - 189 49 335 54.3 Mode 38.5 51.6 45.5 90.3 6 70 - 79 16 6 7 190 - 209 30 365 28.3 SO 10.0 10.0 10.0 28.5 7 80 - 89 1 210 - 229 6 371 12.3 SEM 0.52 .52 0.5 1.5 8 90 - 99 1 230 - 249 1 372 2.7 Skewness 1.37 .00 -.03 .43 9 100 - 109 1 250 - 269 1 373 0.7 Kurtosis 2.41 - .22 -.18 .16
373 373 373 373
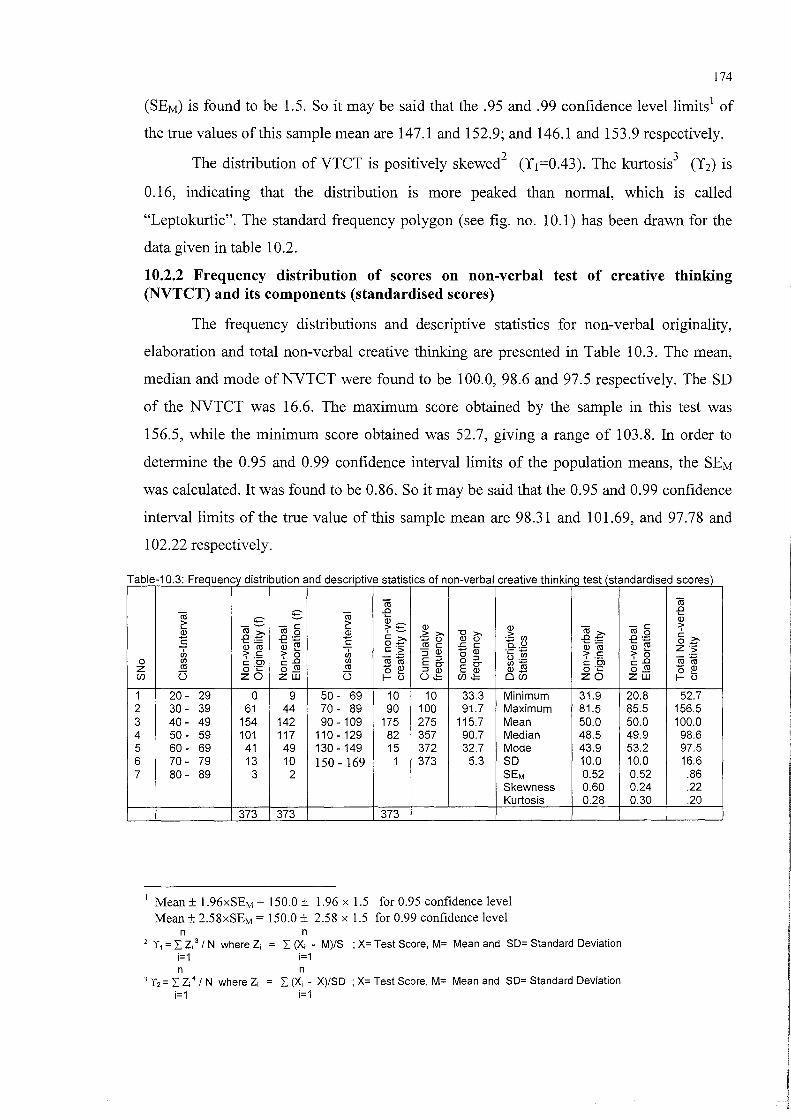
174
(SEM) is found to be 1.5. So it may be said that the .95 and .99 confidence level limits 1 of
the true values of this sample mean are 147.1 and 152.9; and 146.1 and 153.9 respectively.
The distribution of VTCT is positively skewed2
(Yl=0.43). The kurtosis3 (Y2) is
0.16, indicating that the distribution is more peaked than normal, which is called
"Leptokurtic". The standard frequency polygon (see fig. no. 10.1) has been drawn for the
data given in table 10.2.
10.2.2 Frequency distribution of scores on non-verbal test of creative thinking (NVTCT) and its components (standardised scores)
The frequency distributions and descriptive statistics for non-verbal originality,
elaboration and total non-verbal creative thinking are presented in Table 10.3. The mean,
median and mode of NVTCT were found to be 100.0, 98.6 and 97.5 respectively. The SD
of the NVTCT was 16.6. The maximum score obtained by the sample in this test was
156.5, while the minimum score obtained was 52.7, giving a range of 103.8. In order to
determine the 0.95 and 0.99 confidence interval limits of the population means, the SEM
was calculated. It was found to be 0.86. So it may be said that the 0.95 and 0.99 confidence
interval limits of the true value of this sample mean are 98.31 and 101.69, and 97.78 and
102.22 respectively.
Table-10.3: Frequency distribution and descriptive statistics of non-verbal creative thinking test (standardised scores)
ro S - .0
ro c;:::- co Wc;:::-2: -~ - C 2: a.> a.>
2 co>. co 0 2 :::-~ >>. "0>. ~r.l £::= .0 .- c>. :';::::;0 a.> 0 C ... - C o~
I a.> co a.> ~ J; C > co C .r::c 0..._
?£: :::- 0 "Sa.> -a.> "C en en ro~ o ::J en en E ::J 0.-
0 COl c.o 00" en-Z co O"i.:: o~ co - a.> ::JO" E a.> a.> 12 (3 (3 o ... ()~ (J) zO ZLLJ 1-0 (J).!:: O(J)
1 20 - 29 0 9 50 - 69 10 10 33.3 Minimum 2 30 - 39 61 44 70 - 89 90 100 91.7 Maximum 3 40 - 49 154 142 90 - 109 175 275 115.7 Mean 4 50 - 59 101 117 110- 129 82 357 90.7 Median 5 60 - 69 41 49 130 - 149 15 372 32.7 Mode 6 70 - 79 13 10 150 - 169 1 373 5.3 SD 7 80 - 89 3 2 SEM
Skewness Kurtosis
373 373 373
1 Mean ± 1.96xSEM = 150.0 ± 1.96 x 1.5 for 0.95 confidence level Mean ± 2.58xSEM = 150.0 ± 2.58 x 1.5 for 0.99 confidence level
n n
ro>. .0 -L...:=
a.> co ? .~ COl O"i:: zO
31.9 81.5 50.0 48.5 43.9 10.0 0.52 0.60 0.28
2 11 = z: Zi 3/ N where Zi = z: (Xi - M)/S ; X= Test Score, M= Mean and SO= Standard Deviation ~1 ~1
n 3 12 = z: Zi 4 / N where Zi
i=1
n z: (Xi - Xl/SO ; X= Test Score, M= Mean and SO= Standard Deviation
i=1
ro .0
03 - C :::-co 0
C >. .0 .-... - 0_ a.> ~ Z .:;; > 0
ro~ '.0 §~ - a.> o ... ZLLJ I- 0
20.8 52.7 85.5 156.5 50.0 100.0 49.9 98.6 53.2 97.5 10.0 16.6 0.52 .86 0.24 .22 0.30 .20

f/)
140
120
100 f/) (I)
(.)
c: 80 (I)
~ 60 C"
(I) :r...
LL 40
20
0
200
180
160
140
.~ 120 (.) c: ~ 100 C" ~ 80
LL 60
40
20
o
Fig-10.1: Original and smoothed frequency polygon of verbal creativity, based on data iven in table-10.2
99.5 119.5 139.5 159.5 179.5 199.5 219.5 239.5 259.5
Mid-values
Fig.-10.2 Original and smoothed frequency polygon of non-verbal creativity, based on data given in table-10.3
Mid -va lues
175

180
160
140
GJ20
~oo CD
~O CD '-u..60
40
20
0
Fig.-10.3 Original and smoothed frequency polygon of com[X>site creativity based on data given in table-1 0.4
159.5 199.5 239.5 279.5 319.5 359.5 399.5
Mid-values
176

177
The Skewness (Y I) of the distribution of the NVTCT scores has been found to be
0.22. This distribution is positively skewed. The Kurtosis (Y2) of the frequency distribution
is found to be 0.20. The distribution is leptokurtic; it is slightly more peaked than the
normal (see figure no. 10.2).
10.2.3 Frequency distribution of Composite creativity scores
The total verbal and non-verbal test scores were added to obtain the composite
creativity scores. The maximum and minimum scores obtained by the pupils were 382.4
and 143.0 respectively. The range of the scores was 239.4. The mean, median and mode
obtained by the whole sample on the creative thinking test (Verbal + Non-verbal tests of
creative thinking) were 250.0,248.2 and 143.0 respectively. The SD was 37.4.
Table-10.4: Frequency distribution and descriptive statistics of composite creativity scores standardised scores) SNo Composite Cumulative Smoothed Descriptive Composite
Class-I nterval Creativity frequency frequency Statistics Creativity Scores (f) scores
1 140 - 179 8 8 26.7 Minimum 143.0 2 180-219 72 80 77.7 Maximum 382.4 3 220 - 259 153 233 109.3 Mean 250.0 4 260 - 299 103 336 97.0 Median 248.2 5 300 - 339 35 371 46.3 Mode 143.0 6 340 - 379 1 372 12.3 SD 37.4 7 380 - 419 1 373 0.7 SEM 1.9
Skewness .27 Kurtosis .002
373
The skewness (Y1) for the composite creativity scores IS 0.27, indicating the
distribution is positively skewed. Kurtosis of the distribution was found to be 0.002,
therefore the distribution of scores is normal (see fig.-10.3). In order to determine the 0.95
and 0.99 confidence interval limits of the population mean, the SEM was calculated and
found to be 1.9. The true values of the sample mean at 0.95 and 0.99 confidence interval
limits were found to be 246.3 and 253.7,and 245.1 and 254.9 respectively.
10.3.0 Student background research questions. The students' background variables studied are divided into two categories, (i)
Students' personal data and (ii) Students' parental background for the presentation of the
data analysis results. Students' personal variables include sex and age, whereas students'
parental variables include education, occupation and income.
Statistical techniques were used to find out whether there was any significant
difference between the means. If the F-ratio or t-value is significant either at 0.01 level or at

178
0.05 level, the null hypothesis (NH) is rejected and the difference between the means is
taken to be the real difference and not a difference due to either chance error or sampling
error. If the F-ratio or t-value is insignificant, then the null hypothesis (NH) is retained.
10.3.1. The students' personal background data analysis
An interval level measure was subject to statistical analysis to find out the
correlation pattern of age with creative thinking. A correlation matrix (table-l 0.5) showed a
negative significant relation (r=-O.13; p<0.05) with Age. A negative relationship with age
indicates that as students get older creativity decreases.
Table 10.5: Inter-correlations between students' personal background variables and Creative Thinking (N=373)
Variable 1. Age 2. Creative Thinking 1. Age 1.00 -.l3* 2. Creative Thinking (CT) 1.00 *** = SIgnIficant at 0.001 * = SIgmficant at 0.05 # = Not SIgnIficant
10.3.1.1. Sex differences in creative thinking Verbal originality, verbal fluency, verbal flexibility, and total verbal creativity (total
of the three components) of the subjects were analysed separately in relation to the sex of
the students. The findings are presented in Table 10.6. Similarly, non-verbal originality,
non-verbal elaboration, total non-verbal creativity (total of the two components) and
Composite creativity (total of verbal + non-verbal scores) were also analysed and are
presented in the same table. The same pattern of presentation will be followed for the other
variables in this entire chapter/study.
From table 10.6, it can be seen that there is at-value of2.17, which is significant at
0.05 level. It is therefore inferred that there is a significant difference between girls and
boys on verbal originality. Boys were better in verbal originality than girls. The t-values for
verbal fluency, flexibility and total verbal creativity were found to be 0.32, 0.44 and 0.80
respectively; which were not significant even at 0.05 level. This indicates that the boys and
girls do not differ significantly.
The mean difference for non-verbal originality was found to be highly significant
between girls and boys (t =3.17; p<O.OI). This implies that boys are stronger on non-verbal
originality than girls. As for non-verbal elaboration, girls (M=50.88) performed better than
boys (M=48.64); the t-value 2.12 (p<0.05) confirms the difference between girls and boys.
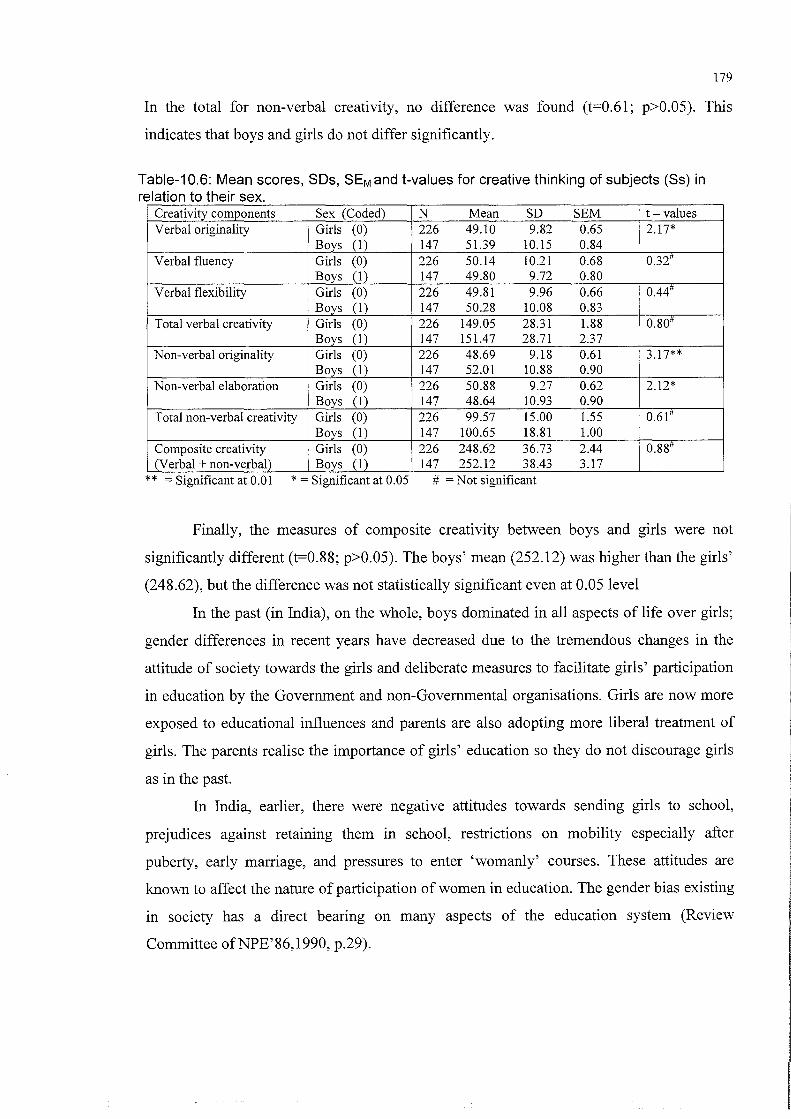
179
In the total for non-verbal creativity, no difference was found (t=0.61; p>O.OS). This
indicates that boys and girls do not differ significantly.
Table-10.6: Mean scores, 80s, 8EM and t-values for creative thinking of subjects (8s) in relation to their sex
Creativity components Sex (Coded) N Mean SD SEM t - values Verbal originality Girls (0) 226 49.10 9.82 0.65 2.17*
Boys (1) 147 51.39 10.15 0.84 Verbal fluency Girls (0) 226 50.14 10.21 0.68 0.32#
Boys (1) 147 49.80 9.72 0.80 Verbal flexibility Girls (0) 226 49.81 9.96 0.66 0.44#
Boys (1) 147 50.28 10.08 0.83 Total verbal creativity Girls (0) 226 149.05 28.31 1.88 0.80#
Boys (1) 147 151.47 28.71 2.37 Non-verbal originality Girls (0) 226 48.69 9.18 0.61 3.17**
Boys (1) 147 52.01 10.88 0.90 Non-verbal elaboration Girls (0) 226 50.88 9.27 0.62 2.12*
Boys (1) 147 48.64 10.93 0.90 Total non-verbal creativity Girls (0) 226 99.57 15.00 1.55 0.61#
Boys (1) 147 100.65 18.81 1.00 Composite creativity Girls (0) 226 248.62 36.73 2.44 0.88# (Verbal + non-verbal) Boys (1) 147 252.12 38.43 3.17
** = Slgmficant at 0.01 * = Significant at 0.05 # = Not significant
Finally, the measures of composite creativity between boys and girls were not
significantly different (t=0.88; p>O.OS). The boys' mean (2S2.12) was higher than the girls'
(248.62), but the difference was not statistically significant even at O.OS level
In the past (in India), on the whole, boys dominated in all aspects of life over girls;
gender differences in recent years have decreased due to the tremendous changes in the
attitude of society towards the girls and deliberate measures to facilitate girls' participation
in education by the Government and non-Governmental organisations. Girls are now more
exposed to educational influences and parents are also adopting more liberal treatment of
girls. The parents realise the importance of girls' education so they do not discourage girls
as in the past.
In India, earlier, there were negative attitudes towards sending girls to school,
prejudices against retaining them in school, restrictions on mobility especially after
puberty, early marriage, and pressures to enter 'womanly' courses. These attitudes are
known to affect the nature of participation of women in education. The gender bias existing
in society has a direct bearing on many aspects of the education system (Review
Committee ofNPE'86,1990, p.29).

180
Discrimination between sons and daughters is gradually diminishing. Earlier, more
freedom was given to sons than daughters. Now the imposition of rigid restrictions and
certain conforming patterns of behaviour on girls by the society and culture is less strong
compared to the earlier years. Girls have now entered into the competitive world and
compete with boys in all fields. Hence, it is not surprising that girls can compete with boys
even on creative performance.
10.3.3 Age group differences in creativity
Table 10.5 shows that age is significantly and negatively related (-.13, p<0.05) with
creative thinking. To investigate which age groups significantly differed from the others,
ANOVA was performed. The results are presented in table-1 0.7. The mean differences
between the groups are also presented in the last column with an asterisk mark (*). This
pattern of presentation will be followed to show the 'mean differences' in this entire
chapter/study.
Table 10.7 exhibits the mean scores, SDs and F-ratios for creative thinking and its
components in different age groups. There are significant differences in mean scores for
verbal originality among the different age groups (F= 2.51; p<0.05). The 15 years age
group scored less than all other groups but a statistically significant difference was found
only with the 13 and 14 years age groups.
An examination of the same table shows that the F-ratios of verbal fluency (F=5.59,
p<O.OOOl), verbal flexibility (F=5.12, p<O.OOOl), and total verbal creativity (F=4.63,
p<O.OOl), were highly significant. This indicates a significant difference between the mean
scores of the different age groups.
It may be seen from the same table that F-ratios for non-verbal originality (F=1.14),
elaboration (F=2.10) and total non-verbal creativity (F=1.30) were not significantly
different even at 0.05 level. This indicates that a non-significant mean difference was found
among these groups.
As for composite creativity, the F-ratio was found to be 3.49, which is significant at
0.01 level. This shows significant mean differences among the groups between 15 years
and 14 years old students.

181
Table-10.7: Mean scores, 8Ds, 8EM and F-values for creative thinking of subjects (8s) in relation to a ~e.
Creativity components Age Group N Mean SD SEM F - ratio Mean df = 5/367 differences
G4 G1-12Yrs 9 48.49 4.90 1.63 G2- 13 Yrs 83 50.13 10.01 1.10 G2 *
Verbal originality G3- 14 Yrs 185 51.02 10.41 0.77 2.51* G3 * G4-15Yrs 73 46.76 7.90 0.92 G5-16 Yrs 19 53.37 12.85 2.95 G6- 17 Yrs 4 47.00 7.78 3.89
G4 G1- 12 Yrs 9 49.75 4.38 1.46 G2-13 Yrs 83 51.06 8.74 0.96 G2 *
Verbal fluency G3-14 Yrs 185 51.57 10.36 0.76 5.59**** G3 * G4-15Yrs 73 45.00 9.15 1.07 G5-16 Yrs 19 51.12 11.09 2.54 G6- 17 Yrs 4 42.28 7.89 3.94
G4 G1- 12 Yrs 9 50.87 5.82 1.94 G2- 13 Yrs 83 50.87 8.31 0.91 G2 * G3-14 Yrs 185 51.37 10.35 0.76 5.12**** G3 *
Verbal flexibility G4-15Yrs 73 45.09 9.45 1.11 G5-16 Yrs 19 52.43 11.65 2.67 G6-17 Yrs 4 44.15 8.71 4.36
G4 G1-12Yrs 9 149.11 12.14 4.05 G2- 13 Yrs 83 152.06 25.28 2.77 4.63*** G2 *
Total verbal creativity G3- 14 Yrs 185 153.95 29.48 2.17 G3 * G4-15Yrs 73 136.86 25.31 2.96 G5-16 Yrs 19 156.93 34.92 8.01 G6- 17 Yrs 4 133.43 23.57 11.79 G1-12Yrs 9 44.44 12.65 4.21 G2- 13 Yrs 83 50.97 10.04 1.10 G3- 14 Yrs 185 49.87 9.76 0.72 1.14#
Non-verbal originality G4-15Yrs 73 50.02 9.77 1.14 G5-16 Yrs 19 51.06 11.42 2.62 G6-17 Yrs 4 43.19 10.74 5.37 G1- 12 Yrs 9 50.63 10.25 3.42 G2- 13 Yrs 83 51.86 9.71 1.07 G3- 14 Yrs 185 50.27 9.96 0.73 2.10#
Non-verbal elaboration G4-15Yrs 73 48.69 11.03 1.29 G5-16 Yrs 19 44.58 5.73 1.31 G6- 17 Yrs 4 46.68 3.18 1.59 G1- 12 Yrs 9 95.07 21.00 7.00 G2- 13 Yrs 83 102.83 16.05 1.76
Total non-verbal G3-14 Yrs 185 100.13 16.12 1.18 1.30# creativity G4-15Yrs 73 98.70 18.17 2.13
G5-16 Yrs 19 95.64 14.64 3.36 G6-17 Yrs 4 89.87 13.44 6.72
G4 G1-12Yrs 9 244.18 23.24 7.75
Composite creativity G2-13 Yrs 83 254.90 33.76 3.71 3.49** (Verbal + non-verbal) G3- 14 Yrs 185 254.09 38.66 2.84 G3 *
G4-15Yrs 73 235.56 35.38 4.14 G5-16Yrs 19 252.57 41.34 9.48 G6-17 Yrs 4 223.29 32.06 16.03
**** = SignIficant at 0.0001 *** = SignIficant at 0.001 ** - SignIficant at 0.01 * = Significant at 0.05 # = Not significant
Note: Mean differences between groups shown with asterisk mark (*).
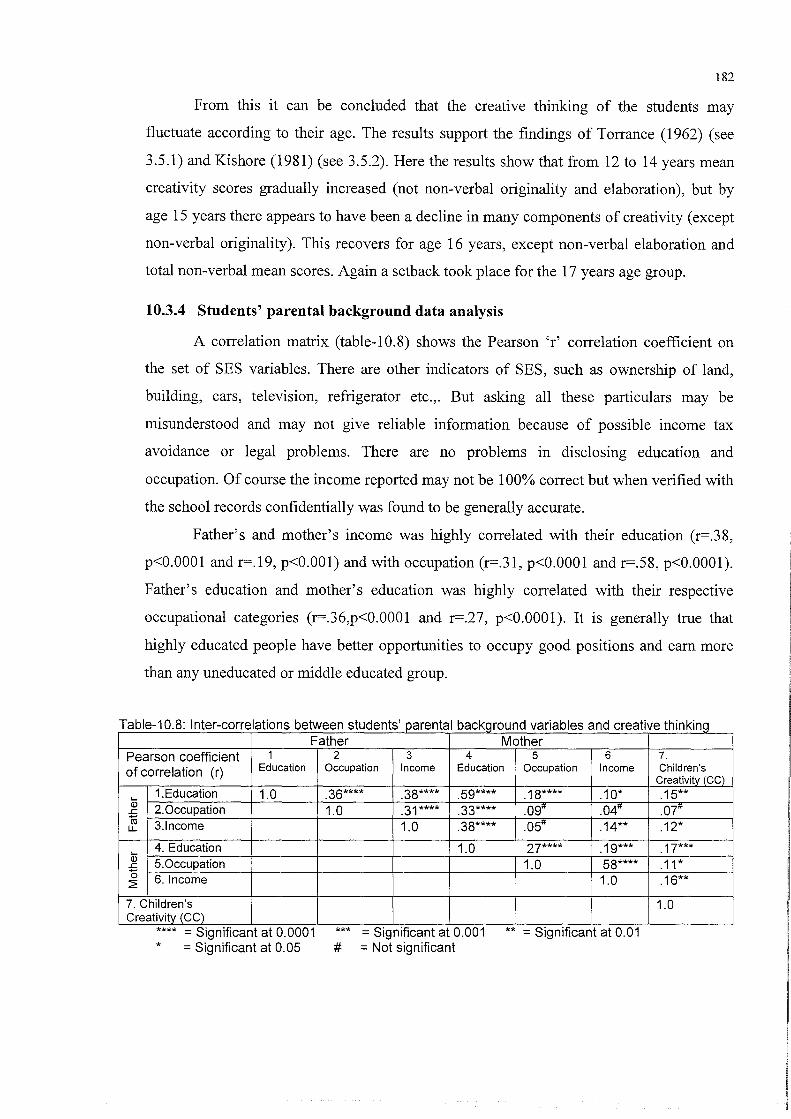
182
From this it can be concluded that the creative thinking of the students may
fluctuate according to their age. The results support the findings of Torrance (1962) (see
3.5.1) and Kishore (1981) (see 3.5.2). Here the results show that from 12 to 14 years mean
creativity scores gradually increased (not non-verbal originality and elaboration), but by
age 15 years there appears to have been a decline in many components of creativity (except
non-verbal originality). This recovers for age 16 years, except non-verbal elaboration and
total non-verbal mean scores. Again a setback took place for the 17 years age group.
10.3.4 Students' parental background data analysis
A correlation matrix (table-10.8) shows the Pearson 'r' correlation coefficient on
the set of SES variables. There are other indicators of SES, such as ownership of land,
building, cars, television, refrigerator etc.,. But asking all these particulars may be
misunderstood and may not give reliable information because of possible income tax
avoidance or legal problems. There are no problems in disclosing education and
occupation. Of course the income reported may not be 100% correct but when verified with
the school records confidentially was found to be generally accurate.
Father's and mother's income was highly correlated with their education (r=.38,
p<O.OOOl and r=.19, p<O.OOl) and with occupation (r=.31, p<O.OOOl and r=.58, p<O.OOOl).
Father's education and mother's education was highly correlated with their respective
occupational categories (r=.36,p<0.0001 and r=.27, p<O.OOOl). It is generally true that
highly educated people have better opportunities to occupy good positions and earn more
than any uneducated or middle educated group.
T bl 108 I t If a e- n er-corre a Ions btw e t d t' t I b k een s u en s paren a ac cgroun d . bl varia es an d f thO k' crea Ive In Ing Father Mother
Pearson coefficient 1
of correlation (r) Education
L.. 1.Education 1.0
Q) 2. Occupation .c
10 3.lncome L.L
4. Education Q;
S.Occupation .c 0 6. Income ~
7. Children's Creativity (CC)
.. **** = Significant at 0.0001 * = Significant at 0.05
2 3 4 Occupation Income Education
.36**** .38**** .59**** 1.0 .31**** .33****
1.0 .38****
1.0
.. *** = Significant at 0.001 # = Not significant
5 6 Occupation Income
.18**** .10*
.09" .04"
.05" .14**
27**** .19*** 1.0 58****
1.0
.. ** - Significant at 0.01
7. Children's
Creativity (CC) .15** .ot, .12*
.17***
.11*
.16**
1.0
183
A high correlation between father's education and mother's education (r=.S9,
p<O.OOOl) reflects Indian socio-cultural practices. In India, normally marriages are settled
by elders looking at various factors like education, occupation and earnings. For example, a
highly educated person looks for a highly educated bride. Of course there are some
exceptions.
As for creativity, it was found that it correlated highly with mother's education (r=
.17; p<O.OOl), mother's income (r= .16; p<O.Ol) and father's education (r=.lS; p<O.Ol),
moderately with mother's occupation (r= .11; p<O.OS) and father's income (r= .12; p<O.OS).
There was no significant relation with father's occupation.
Further analysis, ANOVA, was applied to study the variance in creative thinking.
The results of the ANOVA and the mean differences between the groups are presented in
the tables 10.9 to 10.14, along with their mean scores, SDs, standard error of mean (SEM)
and weights (ranging from 0-7) or the codes given.
10.3.5 Fathers' education and children's creativity
Table-10.9 indicates that only 26.3% of fathers completed their college education
(Inter to PO). The remaining 73.7% completed school education or less. Among these 6.8%
of fathers of the government school students were illiterate.
The analysis of variance (AN OVA) was performed to see whether significant mean
differences existed among the students in relation to their fathers' education level. The F
ratio 4.71 shows that the differences in verbal originality were statistically significant at
0.0001 level between groups of students based on their fathers' educational qualifications.
The 'mean differences' between the groups are presented in Table 10.9. The F-ratio for
verbal fluency was found to be 1.82, which is not significant at O.OS level. But differences
were found in verbal flexibility (F=2.40, p<0.05) and total verbal creativity (F=2.97,
p<.Ol).
An examination of the same table of F-ratio of non-verbal originality (F=3.01)
indicates significant differences at 0.01 level. The 'mean differences' between the groups
are shown in the same table. However the F-ratios of non-verbal and total non-verbal
creativity scores were not significant, even at O.OS level.
As for composite creativity (verbal + non-verbal), the F-ratio was found to be 3.32
which is significant at 0.01 level. There were significant differences between the groups.

184
Except for the group whose fathers were illiterate, there was a significant increase
in the mean score obtained by the students whose fathers had higher education levels.
Generally, better education in fathers relates to greater creativity. Why the children with
illiterate fathers do not fall into this pattern is not clear and requires further research.
10.3.6 Mothers' education and children's creativity
The data presented in Table 10.10 reveals that 6.7% of mothers completed college
education (Inter to PG) and 93.3% of mothers completed their school education or less.
Among them 25.7% were illiterate.
An analysis of variance (ANOVA) was performed to see whether any significant
mean differences existed among the students on the basis of their mothers' educational
qualifications (see table 10.10). The F-ratio 4.83 for verbal originality indicates significant
mean differences among the groups whose mothers had different educational backgrounds.
The F-ratio for verbal fluency was found to be 1.58, which is not significant at 0.05 level.
But mean differences were found in verbal flexibility (F=2.20, p<0.05) and total verbal
creativity (F=2.89, p<O.Ol).
As shown in the same table, F-ratios for non-verbal originality, elaboration and total
non-verbal creativity were 0.86, 0.83 and 0.79 respectively. This indicates that there is no
significant difference among the groups whose mothers have different educational
backgrounds.
Lastly, an analysis of variance was performed on the composite creativity scores in
order to examine the variation in the means obtained by the students whose mothers had
different educational backgrounds (table-1 0.1 0). The F -ratio 2.16 shows a significant mean
difference at 0.05 level. Overall, the greater the level of the mother's education the higher
the level of verbal creativity. This did not apply to non-verbal creativity, where the
difference was insignificant. Even in verbal creativity, the relationship was not always
linear.

185
Table-10.9: Mean scores, SDs, SEM and F-values for creative thinking of subjects (Ss) in relation to the father education levels
Creativity Father education N Mean SD SEM F - ratio Mean components Level (Weights) df= 6/365 differences
G1- Illiterate (1 ) 26 48.49 7.85 1.54 G5 G6 G2- Primary (or lower) (2) 78 48.05 7.34 0.83 G2 * * G3- Upper Primary (3) 48 47.91 7.63 1.10 G3 *
Verbal originality G4- Secondary (4) 122 48.96 9.93 0.90 4.71**** G4 * G5- Intermediate (5) 31 54.29 10.43 1.87 G6- Graduates (6) 55 54.00 12.16 1.64 G7- Postgraduates (7) 12 56.56 16.00 4.62 G1- Illiterate (1 ) 26 52.15 7.77 1.52 G2- Primary (or lower) (2) 78 48.46 9.33 1.06 G3- Upper Primary (3) 48 48.15 8.83 1.27
Verbal fluency G4- Secondary (4) 122 49.42 10.30 0.93 1.82# G5- Intermediate (5) 31 52.16 9.99 1.79 G6- Graduates (6) 55 52.60 10.84 1.46 G7- Postgraduates (7) 12 52.08 13.48 3.89 G1- Illiterate (1 ) 26 50.82 7.07 1.39 G5 G6 G2- Primary (or lower) (2) 78 48.13 9.07 1.03 G2 * * G3- Upper Primary (3) 48 47.93 8.82 1.27 G3 * * G4- Secondary (4) 122 49.49 10.36 0.94 2.40* G4 *
Verbal flexibility G5- Intermediate (5) 31 53.30 10.55 1.89 G6- Graduates (6) 55 52.98 10.67 1.44 G7- Postgraduates (7) 12 52.22 13.43 3.88 G1- Illiterate (1 ) 26 151.46 21.02 4.12 G5 G6 G2- Primary (or lower) (2) 78 144.64 24.44 2.77 G2 * * G3- Upper Primary (3) 48 143.99 23.80 3.44 G3 * *
Total verbal G4- Secondary (4) 122 147.86 28.93 2.62 G4 * *
creativity G5- Intermediate (5) 31 159.74 29.46 5.29 2.97** G6- Graduates (6) 55 159.57 32.31 4.36 G7 - Postgraduates (7) 12 160.86 41.53 11.99 G1- Illiterate (1 ) 26 53.02 10.26 2.01 G1 G6 G7 G2- Primary (or lower) (2) 78 49.47 9.82 1.11 G2 * * G3- Upper Primary (3) 48 49.49 10.92 1.58 G3 *
Non-verbal G4- Secondary (4) 122 48.13 8.67 0.78 3.01** G4 * * *
originality G5- Intermediate (5) 31 50.49 9.14 1.64 G5 * G6- Graduates (6) 55 51.71 10.88 1.47 G6 * G7- Postgraduates (7) 12 58.60 12.79 3.69 G1- Illiterate (1 ) 26 53.03 13.59 2.67 G2- Primary (or lower) (2) 78 48.78 9.70 1.10 G3- Upper Primary (3) 48 49.67 11.09 1.60
Non-verbal G4- Secondary (4) 122 49.45 9.46 0.86 1.15#
elaboration G5- Intermediate (5) 31 52.28 10.41 1.87 G6- Graduates (6) 55 51.07 8.95 1.21 G7- Postgraduates (7) 12 47.57 6.73 1.94 G1- Illiterate (1 ) 26 106.05 21.37 4.19 G2- Primary (or lower) (2) 78 98.25 16.65 1.89
Total non-verbal G3- Upper Primary (3) 48 99.15 18.73 2.70
creativity G4- Secondary (4) 122 97.59 15.23 1.37 1.87# G5- Intermediate (5) 31 102.77 16.51 2.97 G6- Graduates (6) 55 102.78 14.68 1.98 G7- Postgraduates (7) 12 106.18 14.23 4.11 G 1- Illiterate (1 ) 26 257.51 34.92 6.85 G5 G6 G7 G2- Primary (or lower) (2) 78 242.90 34.15 3.87 G2 * * *
Composite G3- Upper Primary (3) 48 243.15 32.17 4.64 G3 * * *
creativity (Verbal G4- Secondary (4) 122 245.44 36.47 3.30 3.32** G4 * *
+ non-verbal) G5- Intermediate (5) 31 262.51 39.92 7.17 G6- Graduates (6) 55 262.35 39.56 5.33 G7- Postgraduates (7) 12 267.03 52.49 15.15
**** = Significant at 0.0001 *** - Significant at 0.001 ** - Significant at 0.01 * = Significant at 0.05 # = Not significant

186
Table-1 0.1 0: Mean scores, SDs, SEM and F-values for creative thinking of subjects (Ss) in relation to the Mother education levels
Creativity Mother education N Mean SO SEM F - ratio Mean components Level (weights) Of = 6 / 366 differences
G1-llliterate (1 ) 96 48.61 7.47 0.76 G1 G2 G3 G2- Primary (or lower) (2) 131 48.87 8.73 0.76 G3- Upper Primary (3) 38 48.24 8.80 1.43
Verbal originality G4- Secondary (4) 83 51.54 11.04 1.21 4.83**** G5- Intermediate (5) 12 58.93 17.85 5.15 G5 * * * G6- Graduates (6) 10 57.44 13.26 4.19 G7- Postgraduates (7) 3 63.52 25.63 14.80 G1- Illiterate (1 ) 96 48.53 9.18 0.94 G2- Primary (or lower) (2) 131 49.68 9.77 0.85 G3- Upper Primary (3) 38 48.86 9.35 1.52
Verbal fluency G4- Secondary (4) 83 51.46 10.76 1.18 1.58# G5- Intermediate (5) 12 55.04 11.31 3.27 G6- Graduates (6) 10 52.64 11.77 3.72 G7 - Postgraduates (7) 3 56.28 15.71 9.07 G1-llliterate (1 ) 96 48.33 9.15 0.93 G1 G2 G3 G2- Primary (or lower) (2) 131 49.44 9.27 0.81 G3- Upper Primary (3) 38 48.96 10.01 1.62 2.20* G4- Secondary (4) 83 51.83 10.99 1.21
Verbal flexibility G5- Intermediate (5) 12 56.14 10.81 3.12 G5 * * * G6- Graduates (6) 10 52.49 12.97 4.10 G7- Postgraduates (7) 3 57.15 13.46 7.77 G1- Illiterate (1 ) 96 145.46 24.20 2.47 G1 G2 G3 G2- Primary (or lower) (2) 131 147.99 26.45 2.31 G3- Upper Primary (3) 38 146.07 26.46 4.29
Total verbal G4- Secondary (4) 83 154.83 31.29 3.43 2.89**
creativity G5- Intermediate (5) 12 170.11 39.27 11.34 G5 * * * G6- Graduates (6) 10 162.57 36.34 11.49 G7- Postgraduates (7) 3 176.95 54.26 31.33 G1- Illiterate (1 ) 96 49.81 10.44 1.07 G2- Primary (or lower) (2) 131 49.19 10.10 0.88 G3- Upper Primary (3) 38 51.26 8.62 1.40
Non-verbal G4- Secondary (4) 83 50.06 8.90 0.98 0.86#
originality G5- Intermediate (5) 12 53.59 11.76 3.40 G6- Graduates (6) 10 54.02 12.86 4.07 G7- Postgraduates (7) 3 45.95 20.53 11.85 G 1- Illiterate (1 ) 96 49.94 11.06 1.13 G2- Primary (or lower) (2) 131 49.13 9.47 0.83 G3- Upper Primary (3) 38 52.81 7.95 1.29
Non-verbal G4- Secondary (4) 83 50.02 10.12 1.11 0.83#
elaboration G5- Intermediate (5) 12 50.72 11.85 3.42 G6- Graduates m 10 48.62 11.31 3.58 G7- Postgraduates 3 54.95 3.79 2.19 G1- Illiterate (1 ) 96 99.75 18.67 1.91 G2- Primary (or lower) (2) 131 98.32 16.12 1.41
Total non-verbal G3- Upper Primary (3) 38 104.07 13.33 2.16
creativity G4- Secondary (4) 83 100.08 15.27 1.68 0.79# G5- Intermediate (5) 12 104.31 19.32 5.58 G6- Graduates (~i 10 102.63 19.06 6.03 G7- Postgraduates 3 100.89 23.93 13.81 G1- Illiterate (1 ) 96 245.21 34.85 3.56 G1 G2 G3 G2- Primary (or lower) (2) 131 246.31 34.85 3.05
Composite G3- Upper Primary (3) 38 250.14 30.47 4.94 2.16*
creativity (Verbal G4- Secondary (4) 83 254.91 38.98 4.28 G5- Intermediate (5) 12 274.42 56.35 16.27 G5 * * * + non-verbal) G6- Graduates (6) 10 265.20 51.08 16.15 G7 - Postgraduates ~7) 3 277.84 76.77 44.33
**** = Significant at 0.0001 ** = = Significant at 0.01 *- Significant at 0.05 # = Not significant

187
10.3.7 Fathers' occupations and children's creativity
The fathers' occupations were classified under eight categories on the basis of the
National Classification ofOccupations4. Table 10.11 shows the fathers' occupations of the
students (N=373) in the government schools. Mostly, fathers were working as production
and transport equipment operators (137 or 36.7%), clerical & related workers (67 or 18%),
sales workers (6S or 17.4%) or service workers (SS or 14.8%). Very few (each category
less than 7%) of them represented other categories, for example professional, engineering,
technical & related workers, administrative, executive and managerial workers, dependents,
and Farmers, fishermen & related workers. The majority of the fathers' occupations were
low in status (see Appendix E3).
The main reason for undertaking these lower cadre occupations could be their low
level of education. If we examine Table 9.9, 274 (or 73.S%) students' fathers had studied
only up to secondary school level. In general, higher level occupations, either in
Government or non-government organisations, are offered on the basis of education and
further promotions are made on either acquisition of additional qualifications or experience.
Table 10.11 reveals non-significant differences in mean scores of verbal originality
(F=0.79, p>O.OS), fluency (F=0.63, p>O.OS), flexibility (F=0.79, p>O.OS) and total verbal
creativity (F=0.7S, p>O.OS) among groups with different fathers' occupation levels.
It can also be seen from the same table that the F-ratios for non-verbal originality
(F=I.20, p>O.OS), non-verbal elaboration (F=0.78, p>O.OS) and total non-verbal creativity
(F=0.48, p>O.OS) did not significantly differ at O.OS level. This indicates that the fathers'
occupation does not influence their child's creativity.
As far as composite creativity was concerned, the obtained mean differences among
the different groups were not significantly different (F=0.46, p>O.OS).
10.3.8 Mothers' occupations and their children's creativity The mothers' occupations were classified under the same categories as fathers'
occupational categories. Table 10.12 shows that 83.9% of the mothers' were house
wives/dependents. Only 8% of the mothers were doing production and transport equipment
operators' jobs. The rest were doing other categories of jobs, like service work, sales work,
clerical and related, and professional, engineering, technical & related work (each category
was less than 3%) (see Appendix E3).
4 National Classification of Occupations (1963, 1991) as adopted by the Office of Registrar General and Census Commission for India, Ministry of Home Affairs, Govt of India, 1991.

Table-1 0.11: Mean scores, SOs, SEM and F-values for creative thinking of subjects (Ss) in relation to the fathers' occupationallevels.(N=373)
Creativity component Fathers' occupational N Mean SD SEM F -ratio Mean s levels (weights) df= 7/365 differences
GO- Dependents (0) 14 47.68 8.07 2.16 G1- Production & Transport (1 ) 137 48.99 8.74 0.75 G2- Farmers, Fisherman (2) 7 48.96 9.48 3.58 0.79#
Verbal G3- Service workers (3) 55 51.08 9.60 1.29 originality G4- Sales workers (4) 65 49.59 9.76 1.21
G5- Clerical & related (5) 67 51.16 11.65 1.42 G6- Administrative
~~~ 4 52.96 10.21 5.10
G7- Professional & Technical 24 52.36 14.04 2.87 GO- Dependents (0) 14 47.68 10.29 2.75 G1- Production & Transport (1 ) 137 49.65 9.62 0.82 G2- Farmers, Fisherman (2) 7 46.81 11.03 4.17 0.63#
Verbal G3- Service workers (3) 55 51.60 9.89 1.33 fluency G4- Sales workers (4) 65 49.00 10.48 1.30
G5- Clerical & related (5) 67 50.67 10.06 1.23 G6- Administrative
~~~ 4 51.15 8.97 4.49
G7- Professional & Technical 24 51.30 11.13 2.27 GO- Dependents (0) 14 47.51 9.70 2.59 G1- Production & Transport (1 ) 137 49.24 9.32 0.80 0.79# G2- Farmers, Fisherman (2) 7 46.27 11.00 4.16 G3- Service workers (3) 55 51.83 9.75 1.32
Verbal G4- Sales workers (4) 65 49.59 11.48 1.42 flexibility G5- Clerical & related (5) 67 50.75 9.87 1.21
G6- Administrative ~~~ 4 51.55 8.81 4.41 G7- Professional & Technical 24 51.38 10.72 2.19 GO- Dependents (0) 14 142.88 27.09 7.24 G1- Production & Transport (1 ) 137 147.88 26.26 2.24 G2- Farmers, Fisherman (2) 7 142.04 30.13 11.39
Total G3- Service workers (3) 55 154.51 27.23 3.67 0.75# verbal G4- Sales workers (4) 65 148.18 30.06 3.73 creativity G5- Clerical & related (5) 67 152.58 30.27 3.70
G6- Administrative ~~~
4 155.66 27.32 13.66 G7- Professional & Technical 24 155.04 34.58 7.06 GO- Dependents (0) 14 53.39 12.52 3.35 G1- Production & Transport (1 ) 137 49.42 9.35 0.80 G2- Farmers, Fisherman (2) 7 51.03 15.86 5.99
Non-verbal G3- Service workers (3) 55 49.60 10.39 1.40 1.20# originality G4- Sales workers (4) 65 50.02 10.30 1.28
G5- Clerical & related (5) 67 49.35 8.19 1.00 G6- Administrative (6) 4 61.23 8.00 4.00 G7- Professional & Technical (7) 24 51.83 12.68 2.59 GO- Dependents (0) 14 48.22 10.41 2.78 G1- Production & Transport (1 ) 137 50.37 9.31 0.80 G2- Farmers, Fisherman (2) 7 46.22 15.96 6.03 0.78#
Non-verbal G3- Service workers (3) 55 49.44 10.05 1.35 elaboration G4- Sales workers (4) 65 51.36 11.63 1.44
G5- Clerical & related (5) 67 50.20 9.61 1.17 G6- Administrative ~~~ 4 50.99 8.36 4.18 G7- Professional & Technical 24 46.81 8.16 1.67 GO- Dependents (0) 14 101.61 20.00 5.35 G1- Production & Transport (1 ) 137 99.79 15.49 1.32
Total non- G2- Farmers, Fisherman (2) 7 97.24 29.80 11.26 verbal G3- Service workers (3) 55 99.04 17.11 2.31 0.48# creativity G4- Sales workers (4) 65 101.38 18.59 2.31
G5- Clerical & related (5) 67 99.55 14.75 1.80 G6- Administrative ~~~ 4 112.22 11.00 5.50 G7- Professional & Technical 24 98.65 15.67 3.20 GO- Dependents (0) 14 244.49 39.58 10.58 G1- Production & Transport (1 ) 137 247.67 34.99 2.99
Composite G2- Farmers, Fisherman (2) 7 239.28 45.23 17.10 creativity G3- Service workers (3) 55 253.55 34.84 4.70 0.46# (Verbal + G4- Sales workers (4) 65 249.56 40.00 4.96 non-verbal) G5- Clerical & related (5) 67 252.13 37.99 4.64
G6- Administrative (6) 4 267.88 37.43 18.72 G7- Professional & Technical (7) 24 253.69 46.21 9.43
£ Significant at 0.01 # Not significant
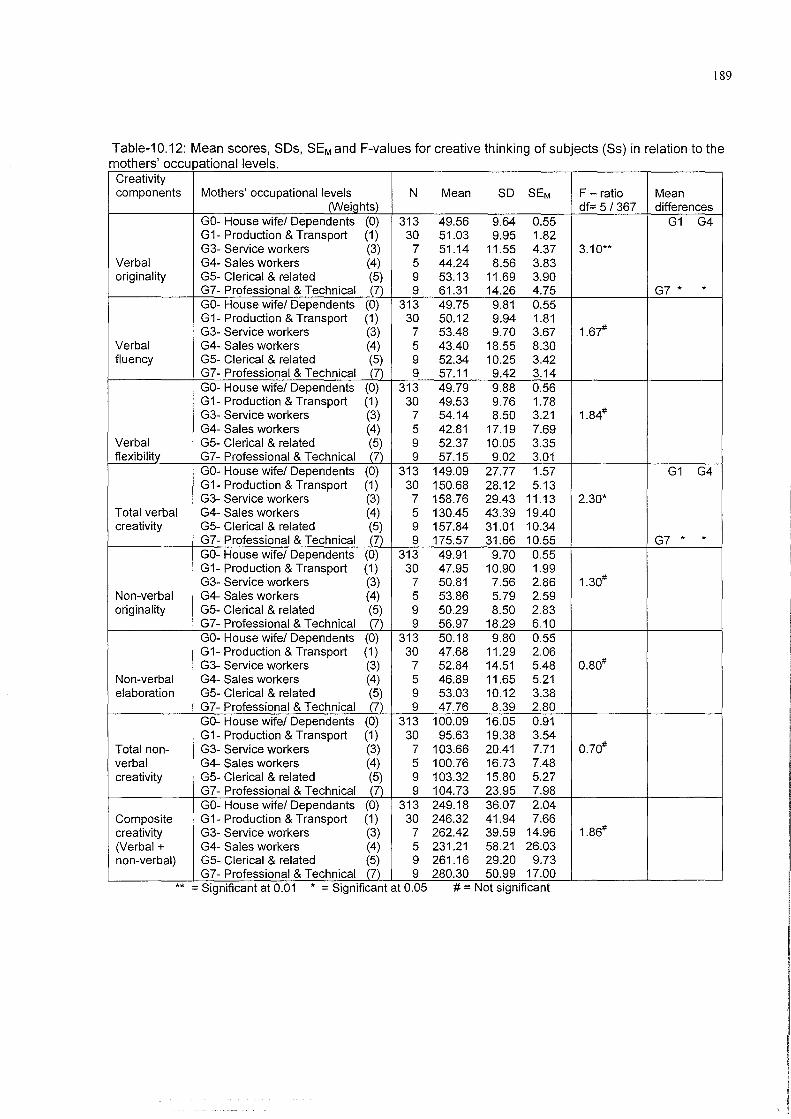
189
Table-10.12: Mean scores, 8Ds, 8EM and F-values for creative thinking of subjects (8s) in relation to the h' . I mot ers occu patlonal leve s.
Creativity components Mothers' occupational levels N Mean SD SEM F - ratio Mean
(Weights) df= 5!367 differences GO- House wife! Dependents (0) 313 49.56 9.64 0.55 G1 G4 G1- Production & Transport (1 ) 30 51.03 9.95 1.82 G3- Service workers (3) 7 51.14 11.55 4.37 3.10**
Verbal G4- Sales workers (4) 5 44.24 8.56 3.83 originality G5- Clerical & related (5) 9 53.13 11.69 3.90
G7- Professional & Technical (7) 9 61.31 14.26 4.75 G7 * * GO- House wife! Dependents (0) 313 49.75 9.81 0.55 G1- Production & Transport (1 ) 30 50.12 9.94 1.81 G3- Service workers (3) 7 53.48 9.70 3.67 1.67#
Verbal G4- Sales workers (4) 5 43.40 18.55 8.30 fluency G5- Clerical & related (5) 9 52.34 10.25 3.42
G7- Professional & Technical (7) 9 57.11 9.42 3.14 GO- House wife! Dependents (0) 313 49.79 9.88 0.56 G1- Production & Transport (1 ) 30 49.53 9.76 1.78 G3- Service workers (3) 7 54.14 8.50 3.21 1.84# G4- Sales workers (4) 5 42.81 17.19 7.69
Verbal G5- Clerical & related (5) 9 52.37 10.05 3.35 flexibility G7- Professional & Technical (7) 9 57.15 9.02 3.01
GO- House wife! Dependents (0) 313 149.09 27.77 1.57 G1 G4 G1- Production & Transport (1 ) 30 150.68 28.12 5.13 G3- Service workers (3) 7 158.76 29.43 11.13 2.30*
Total verbal G4- Sales workers (4) 5 130.45 43.39 19.40 creativity G5- Clerical & related (5) 9 157.84 31.01 10.34
G7- Professional & Technical .(7) 9 175.57 31.66 10.55 G7 * * GO- House wife! Dependents (0) 313 49.91 9.70 0.55 G1- Production & Transport (1 ) 30 47.95 10.90 1.99 G3- Service workers (3) 7 50.81 7.56 2.86 1.30#
Non-verbal G4- Sales workers (4) 5 53.86 5.79 2.59 originality G5- Clerical & related (5) 9 50.29 8.50 2.83
G7- Professional & Technical (7) 9 56.97 18.29 6.10 GO- House wife! Dependents (0) 313 50.18 9.80 0.55 G1- Production & Transport (1 ) 30 47.68 11.29 2.06 G3- Service workers (3) 7 52.84 14.51 5.48 0.80#
Non-verbal G4- Sales workers (4) 5 46.89 11.65 5.21 elaboration G5- Clerical & related (5) 9 53.03 10.12 3.38
G7- Professional & Technical (7) 9 47.76 8.39 2.80 GO- House wife! Dependents (0) 313 100.09 16.05 0.91 G1- Production & Transport (1 ) 30 95.63 19.38 3.54
Total non- G3- Service workers (3) 7 103.66 20.41 7.71 0.70# verbal G4- Sales workers (4) 5 100.76 16.73 7.48 creativity G5- Clerical & related (5) 9 103.32 15.80 5.27
G7- Professional & Technical (7) 9 104.73 23.95 7.98 GO- House wife! Dependants (0) 313 249.18 36.07 2.04
Composite G1- Production & Transport (1 ) 30 246.32 41.94 7.66 creativity G3- Service workers (3) 7 262.42 39.59 14.96 1.86# (Verbal + G4- Sales workers (4) 5 231.21 58.21 26.03 non-verbal) G5- Clerical & related (5) 9 261.16 29.20 9.73
G7- Professional & Technical (7) 9 280.30 50.99 17.00 ** - Significant at 0.01 * - Significant at 0.05 # - Not Significant

190
The F-ratio 3.10 for verbal originality indicates significant mean differences among
the groups whose mothers had different occupational backgrounds. No significant
differences were found for verbal fluency (F=1.67, p>0.05) or verbal flexibility (1.84,
p>0.05). However, a significant difference was found for total verbal creativity (F=2.30,
p<0.05).
Non-significant differences were found for non-verbal originality (F=1.30, p>0.05),
non-verbal fluency (F=0.80, p>0.05) and total non-verbal creativity (F=0.70, p>0.05).
Finally a non-significant mean difference was also found in composite creativity
(F=1.86, p>0.05). Generally, where mothers are working in higher level occupations their
children's verbal creativity is higher. This does not apply to non-verbal creativity.
10.3.9 Fathers' income and children's creativity
The data in Table-10.13 reveal that 4.8% of the fathers' had no income, 27.1% had
below Rs. 1000,48.5% had between Rs. 1001-Rs.3000, and 19.6% had above Rs. 3000 per
month. When these were used to compare creativity scores, the F-ratio for verbal
originality was found to be 2.68, which is significant at 0.05 level. However the F-ratios for
verbal fluency (F=0.88, p>0.05), flexibility (F=1.29, p>0.05) total verbal creativity
(F=1.61, p>0.05) were not significant even at 0.05 level.
With regard to the total non-verbal creativity (F=0.55, p>0.05) and its components
originality (F=1.05, p>0.05) and elaboration (F=0.71, p>0.05), the differences in means
were also not significant.
As far as composite creativity was concerned, the F -ratio was found to be 1.19
which was not significant even at 0.05 level. Fathers' income, overall, does not appear to
influence their children's measured creativity.
10.3.10 Mothers' income and their children's creativity
The data in Table-10.14 reveal that 70.5% of the mothers were not earnmg
anything. Many were neither well educated nor in good occupations. When we examine
Tables 10.10 and 10.12 it is clear that the majority (93.7%) of the mothers had only
completed school education and 83.9% ofthem were housewives.

Table-1 0.13: Mean scores, SDs, SEM and F-values for creative thinking of subjects (Ss) in relation to the father s' income levels
Creativity Fathers' income N Mean SO SEM F - ratio Mean components levels (Weiqhts) df= 6/366 differences
GO- No income (0) 18 46.64 8.24 1.94 G1 G1- below Rs1000 (1 ) 101 47.96 7.53 0.75
Verbal G2- Rs1001-2000 (2) 97 50.00 9.27 0.94 originality G3- Rs 2001-3000 (3) 84 50.97 10.67 1.16 2.68*
G4- Rs 3001-4000 (4) 42 51.01 11.20 1.73 G5- Rs 4001-5000 (5) 18 52.72 13.86 3.27 G6- Rs 5001-above (6) 13 57.26 15.05 4.17 G7 * GO- No income (0) 18 46.58 10.78 2.54 G1- below Rs1000 (1 ) 101 49.42 9.23 0.92
Verbal G2- Rs1001-2000 (2) 97 49.86 10.04 1.02 fluency G3- Rs 2001-3000 (3) 84 50.92 9.31 1.02
G4- Rs 3001-4000 (4) 42 50.10 11.32 2.67 0.88# G5- Rs 4001-5000 (5) 18 50.01 11.32 2.67 G6- Rs 5001-above (6) 13 54.06 13.94 3.87 GO- No income (0) 18 46.39 10.36 2.44 G1- below Rs1000 (1 ) 101 48.74 8.85 0.88
Verbal G2- Rs1001-2000 (2) 97 49.90 10.00 1.02 flexibility G3- Rs 2001-3000 (3) 84 51.11 9.57 1.04 1.29#
G4- Rs 3001-4000 (4) 42 50.97 11.34 1.75 G5- Rs 4001-5000 (5) 18 50.58 11.05 2.60 G6- Rs 5001-above (6) 13 54.18 13.50 3.75 GO- No income (0) 18 139.62 28.43 6.70 G1- below Rs1000 (1 ) 101 146.13 24.06 2.39
Total verbal G2- Rs1001-2000 (2) 97 149.77 27.72 2.81 creativity G3- Rs 2001-3000 (3) 84 153.00 28.08 3.06 1.61#
G4- Rs 3001-4000 (4) 42 152.09 32.25 4.98 G5- Rs 4001-5000 (5) 18 153.31 34.58 8.15 G6- Rs 5001-above (6) 13 165.50 40.46 11.22 GO- No income (0) 18 52.38 11.43 2.69 G1- below Rs1000 (1 ) 101 49.12 9.29 0.92
Non-verbal G2- Rs1001-2000 (2) 97 51.26 10.58 1.07 originality G3- Rs 2001-3000 (3) 84 48.85 10.66 1.16 1.05#
G4- Rs 3001-4000 (4) 42 49.10 8.26 1.27 G5- Rs 4001-5000 (5) 18 52.88 8.31 1.96 G6- Rs 5001-above (6) 13 50.53 11.51 3.19 GO- No income (0) 18 48.78 10.19 2.40 G1- below Rs1000 (1 ) 101 50.29 9.25 0.92
Non-verbal G2- Rs1001-2000 (2) 97 48.96 10.47 1.06 elaboration G3- Rs 2001-3000 (3) 84 50.68 11.22 1.22 0.71#
G4- Rs 3001-4000 (4) 42 48.94 8.36 1.29 G5- Rs 4001-5000 (5) 18 52.67 9.02 2.13 G6- Rs 5001-above (6) 13 52.40 10.25 2.84 GO- No income (0) 18 101.15 17.85 4.21 G1- below Rs1000 (1 ) 101 99.41 15.92 1.58
Total non- G2- Rs1001-2000 (2) 97 100.21 17.49 1.78 verbal G3- Rs 2001-3000 (3) 84 99.53 18.69 2.04 0.55# creativity G4- Rs 3001-4000 (4) 42 98.03 12.30 1.90
G5- Rs 4001-5000 (5) 18 105.55 13.81 3.26 G6- Rs 5001-above (6) 13 102.94 15.66 4.34 GO- No income (0) 18 240.78 38.73 9.13 G1- below Rs1000 (1 ) 101 245.53 32.26 3.21
Composite G2- Rs1001-2000 (2) 97 249.98 38.38 3.90 creativity G3- Rs 2001-3000 (3) 84 252.53 37.19 4.06 1.19# (Verbal + G4- Rs 3001-4000 (4) 42 250.12 38.98 6.01 non-verbal) G5- Rs 4001-5000 (5) 18 258.86 44.16 10.41
G6- Rs 5001-above (6) 13 268.44 49.21 13.65 * = Significant at 0.05 # = Not significant
191
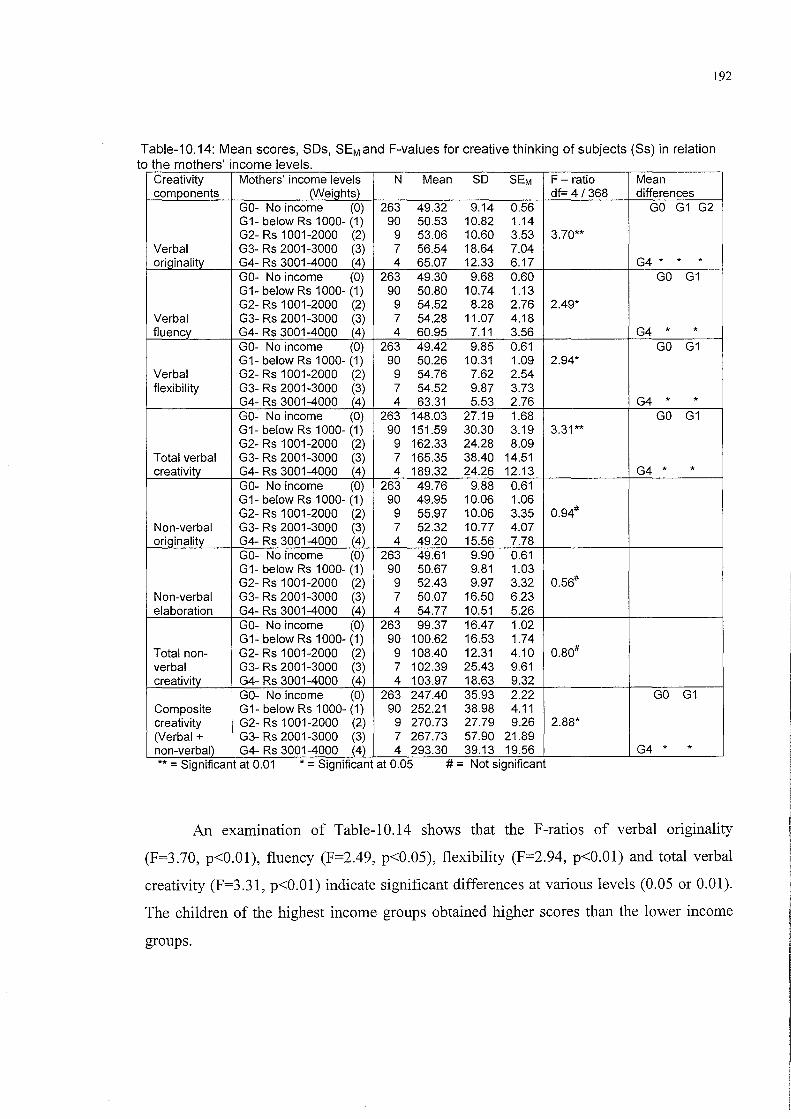
192
Table-1 0.14: Mean scores, SDs, SEM and F-values for creative thinking of subjects (Ss) in relation to the mothers' income levels
Creativity Mothers' income levels N Mean SO SEM F - ratio Mean components (Weights) df= 4/368 differences
GO- No income (0) 263 49.32 9.14 0.56 GO G1 G2 G1- below Rs 1000- (1) 90 50.53 10.82 1.14 G2- Rs 1001-2000 (2) 9 53.06 10.60 3.53 3.70**
Verbal G3- Rs 2001-3000 (3) 7 56.54 18.64 7.04 originality G4- Rs 3001-4000 (4) 4 65.07 12.33 6.17 G4 * * *
GO- No income (0) 263 49.30 9.68 0.60 GO G1 G1- below Rs 1000- (1) 90 50.80 10.74 1.13 G2- Rs 1001-2000 (2) 9 54.52 8.28 2.76 2.49*
Verbal G3- Rs 2001-3000 (3) 7 54.28 11.07 4.18 fluency G4- Rs 3001-4000 (4) 4 60.95 7.11 3.56 G4 * *
GO- No income (0) 263 49.42 9.85 0.61 GO G1 G1- below Rs 1000- (1) 90 50.26 10.31 1.09 2.94*
Verbal G2- Rs 1001-2000 (2) 9 54.76 7.62 2.54 flexibility G3- Rs 2001-3000 (3) 7 54.52 9.87 3.73
G4- Rs 3001-4000 (4) 4 63.31 5.53 2.76 G4 * * GO- No income (0) 263 148.03 27.19 1.68 GO G1 G1- below Rs 1000- (1) 90 151.59 30.30 3.19 3.31** G2- Rs 1001-2000 (2) 9 162.33 24.28 8.09
Total verbal G3- Rs 2001-3000 (3) 7 165.35 38.40 14.51 creativity G4- Rs 3001-4000 (4) 4 189.32 24.26 12.13 G4 * *
GO- No income (0) 263 49.76 9.88 0.61 G1- below Rs 1000- (1) 90 49.95 10.06 1.06 G2- Rs 1001-2000 (2) 9 55.97 10.06 3.35 0.94#
Non-verbal G3- Rs 2001-3000 ~~~ 7 52.32 10.77 4.07 originality G4- Rs 3001-4000 4 49.20 15.56 7.78
GO- No income (0) 263 49.61 9.90 0.61 G1- below Rs 1000- (1) 90 50.67 9.81 1.03 G2- Rs 1001-2000 (2) 9 52.43 9.97 3.32 0.56#
Non-verbal G3- Rs 2001-3000 ~~~
7 50.07 16.50 6.23 elaboration G4- Rs 3001-4000 4 54.77 10.51 5.26
GO- No income (0) 263 99.37 16.47 1.02 G1- below Rs 1000- (1) 90 100.62 16.53 1.74
Total non- G2- Rs 1001-2000 (2) 9 108.40 12.31 4.10 0.80# verbal G3- Rs 2001-3000 (3) 7 102.39 25.43 9.61 creativity G4- Rs 3001-4000 (4) 4 103.97 18.63 9.32
GO- No income (0) 263 247.40 35.93 2.22 GO G1 Composite G1- below Rs 1000- (1) 90 252.21 38.98 4.11 creativity G2- Rs 1001-2000 (2) 9 270.73 27.79 9.26 2.88* (Verbal + G3- Rs 2001-3000
~~~ 7 267.73 57.90 21.89
non-verbal) G4- Rs 3001-4000 4 293.30 39.13 19.56 G4 * * ** = Significant at 0.01 * - Significant at 0.05 # - Not significant
An examination of Table-lO.14 shows that the F-ratios of verbal originality
(F=3.70, p<O.Ol), fluency (F=2.49, p<0.05), flexibility (F=2.94, p<O.Ol) and total verbal
creativity (F=3.31, p<O.Ol) indicate significant differences at various levels (0.05 or 0.01).
The children of the highest income groups obtained higher scores than the lower income
groups.
193
Non-significant mean differences were found for non-verbal originality (F=0.94,
p>O.OS), elaboration (F=0.S6, p>O.OS) and total non-verbal creativity (F=0.80, p>O.OS).
As far as composite creativity was concerned, the F-ratio was found to be 2.88
which was significant at O.OS level. The highest income group (Rs 3001-4000) scored the
highest and the lowest income group (no income) achieved the least mean score on
composite creativity. Again, the main influence appear to be on verbal rather than non
verbal creativity.
10.4.0 Organisational factors and students' creativity
Statistical analyses were undertaken to examine the relationship between
organisational factors and creativity scores. The inter-correlations in Table 10.1S indicate
that medium of instruction was significantly related (p<O.OS) to the creativity score
(composite). The negative relationships (r= -.12) can be interpreted as indicating that the
students from Telugu medium schools (dummy code=O) performed better than those from
English medium schools (dummy code=l). To explore this further, a t-test analysis was
performed. These findings are presented in table-l O.1S. The type of school (categorical
independent variable) has three groups: girls' schools, boys' schools and co-educational
schools. These three groups were coded by assigning an arbitrary number. The simplest
method of creating a dummy variable is to assign 1 's to subjects of a group one wishes to
identify and O's to all other subjects. This system of allocating 1 's and O's to create dummy
vectors for the three groups was followed (see Kerlinger and Pedhazur, 1973,p.10S-07;
Cohen and Cohen, 1983, p.183-93). The necessary and sufficient number of vectors to code
group membership is equal to the number of groups or categories, minus one. So here our
groups/categories are three (k=3). We need to create only two (k-1 or 3-1) vectors. They
were named by type of school as TS-Girls, when the girls' schools were coded as '1'.
Similarly, the type of school was named as TS-Boys when boys' schools were coded as '1'.
Medium of instruction had a significant relationship with type of school (TS-Girls) r=.S9
(p<0.001) and (TS-Boys) r=.41 (p<0.001).
The correlation between type of school (girls) and creativity (composite score) is
negatively related (r=-O.OS). This indicates that the girls schools' (coded as '1 ') mean score
5 Normally the sign of relationship (± r) indicates direction of the relationship. But with dummy variables indicates simply whether the mean of the present group (coded as '1' ) is larger (positive) or smaller (negative) than the mean of absent group (coded as '0') (see Cohen and Cohen, 1983, pp. 36 & 186)
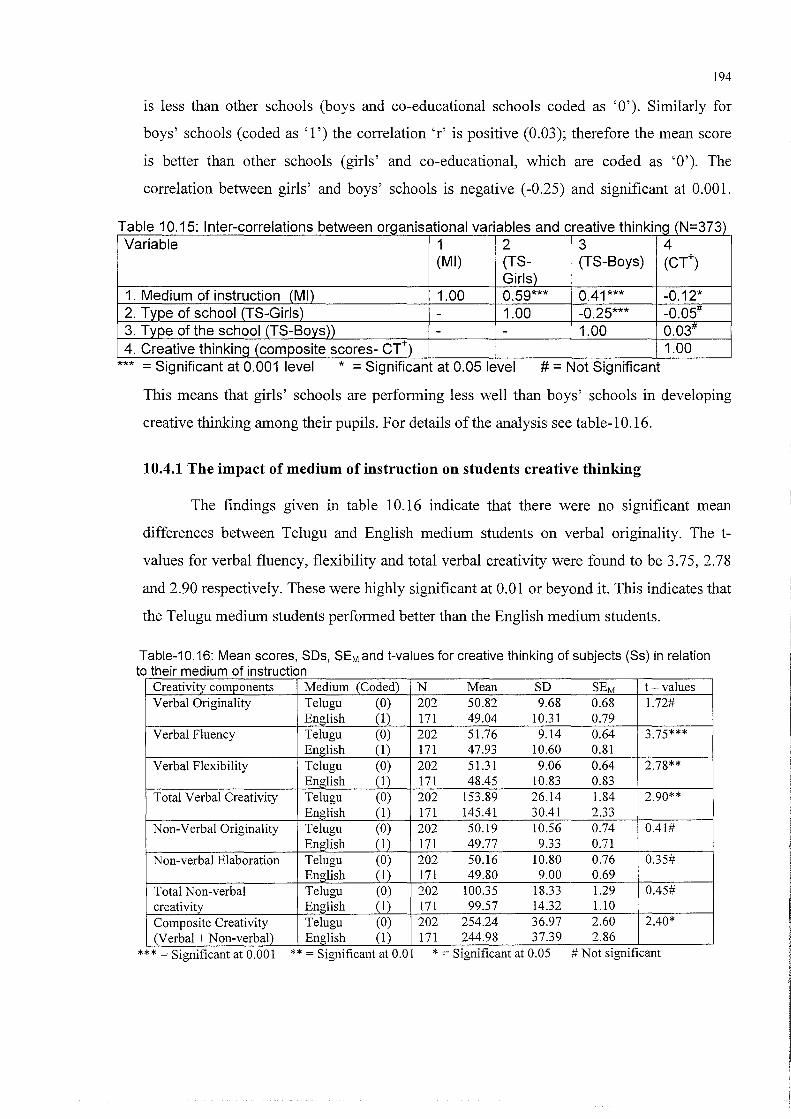
194
is less than other schools (boys and co-educational schools coded as '0'). Similarly for
boys' schools (coded as '1') the correlation 'r' is positive (0.03); therefore the mean score
is better than other schools (girls' and co-educational, which are coded as '0'). The
correlation between girls' and boys' schools is negative (-0.25) and significant at 0.001.
Table 10.15: Inter-correlations between organisational variables and creative thinking (N=373) Variable 1 2 3 4
(MI) (TS- (TS-Boys) (CT+) Girls)
1. Medium of instruction (MI) 1.00 0.59*** 0.41 *** -0.12* 2. Type of school (TS-Girls) - 1.00 -0.25*** -0.05# 3. Type of the school (TS-Boys» - - 1.00 0.03# 4. Creative thinking (composite scores- CT+) 1.00
. . .. *** = Significant at 0.001 level * = Significant at 0.05 level
. . # = Not Significant
This means that girls' schools are performing less well than boys' schools in developing
creative thinking among their pupils. For details of the analysis see table-l0.16.
10.4.1 The impact of medium of instruction on students creative thinking
The findings given in table 10.16 indicate that there were no significant mean
differences between Telugu and English medium students on verbal originality. The t
values for verbal fluency, flexibility and total verbal creativity were found to be 3.75, 2.78
and 2.90 respectively. These were highly significant at 0.01 or beyond it. This indicates that
the Telugu medium students performed better than the English medium students.
Table-10.16: Mean scores, SOs, SEM and t-values for creative thinking of subjects (Ss) in relation to their medium of instruction
Creativity components Medium (Coded) N Mean SD SEM t- values Verbal Originality Telugu (0) 202 50.82 9.68 0.68 1.72#
English (1) 171 49.04 10.31 0.79 Verbal Fluency Telugu (0) 202 51.76 9.14 0.64 3.75***
English (1) 171 47.93 10.60 0.81 Verbal Flexibility Telugu (0) 202 51.31 9.06 0.64 2.78**
English (1) 171 48.45 10.83 0.83 Total Verbal Creativity Telugu (0) 202 153.89 26.14 1.84 2.90**
English (1) 171 145.41 30.41 2.33 N on-Verbal Originality Telugu (0) 202 50.19 10.56 0.74 0.41#
English (1) 171 49.77 9.33 0.71 Non-verbal Elaboration Telugu (0) 202 50.16 10.80 0.76 0.35#
English (1) 171 49.80 9.00 0.69 Total Non-verbal Telugu (0) 202 100.35 18.33 1.29 0.45# creativity English (1) 171 99.57 14.32 1.10 Composite Creativity Telugu (0) 202 254.24 36.97 2.60 2.40* (Verbal + Non-verbal) En~lish (1) 171 244.98 37.39 2.86
*** = Significant at 0.001 ** = Slgmficant at 0.01 * = Slgmficant at 0.05 # Not slgmficant

195
The same table also shows that the Telugu medium students seem to have the edge
over their counterparts (English medium) with regard to their mean scores for non-verbal
originality, elaboration and total non-verbal creativity. However, the mean difference is not
statistically significant even at O.OS level of confidence.
Finally, on composite creativity, the Telugu medium students were observed to be
more creative in comparison to the English medium students (t=2.40; p<O.OS).
The overall picture that emerged from the findings (table 10.16) with regard to the
creativity of Telugu and English medium students suggests that English medium students
are performing less well than their counterparts. This may be because they are handicapped
in expressing their flow of ideas (fluency) and variety of ideas (flexibility). As far as
uncommon or unique responses (originality) are concerned, they did not differ significantly
on either verbal or non-verbal originality dimensions. This indicates that where students
have a bilingual background the English medium students were less able to express their
ideas fluently.
10.4.2 The influence of school type (gender) on students' creative thinking
Table10.17 shows no significant differences among the students from girls, boys
and co-educational schools on verbal originality (F=2.S7; p> O.OS) fluency (F=1.06;
p>O.OS), flexibility (F=1.60; p>O.OS) or total verbal creativity (F=1.61 ;p>O.OS). The
differences in the means of verbal creativity scores of different type of school students'
may be due to chance factor.
Non-significant differences were found in the mean scores for non-verbal
originality (F=2.32; p>O.OS) and total non-verbal creativity (F=0.34; p>0.05) among the
girls', boys' and co-educational schools. A difference was found in non-verbal elaboration
(F=S.S6; p<O.Ol). Further analysis indicated that the mean scores were significantly higher
for girls' schools in comparison to those of boys' and co-educational schools. However, a
significant mean difference was found between girls' (G1) and boys' schools (G2) only.
Finally, in composite creativity, the obtained mean differences among the girls',
boys and co-educational schools were not significant (F=0.S7; p>O.OS).
Further, of particular interest, is the analysis of data from girl students who are
studying with boys in co-educational schools. This is important because many parents in
India still hesitate to send girls to co-educational institutions. The reason could be either
lack of female teachers or fears about lack of security in co-educational schools.
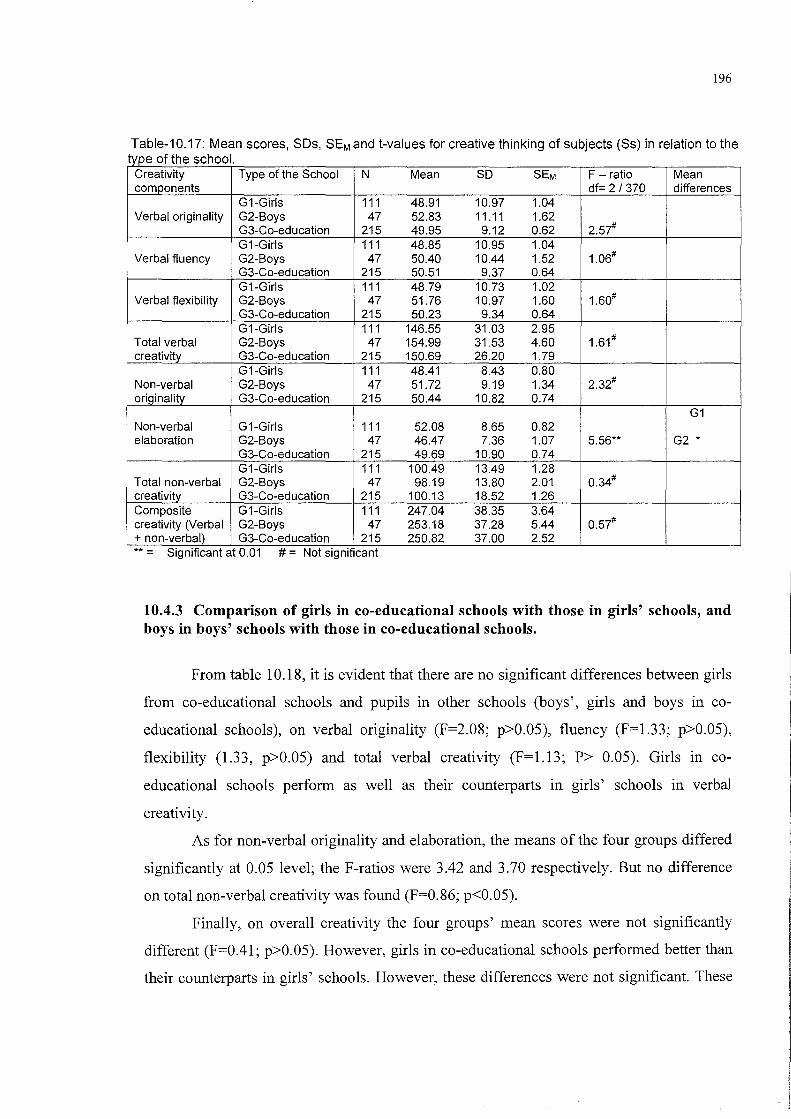
196
Table-1 0.17: Mean scores, 8Ds, 8EM and t-values for creative thinking of subjects (8s) in relation to the t f th h I ~eo esc 00.
Creativity Type of the School N Mean SD SEM F - ratio Mean comJlonents df= 2/370 differences
G1-Girls 111 48.91 10.97 1.04 Verbal originality G2-Boys 47 52.83 11.11 1.62
G3-Co-education 215 49.95 9.12 0.62 2.57# G1-Girls 111 48.85 10.95 1.04
Verbal fluency G2-Boys 47 50.40 10.44 1.52 1.06# G3-Co-education 215 50.51 9.37 0.64 G1-Girls 111 48.79 10.73 1.02
Verbal flexibility G2-Boys 47 51.76 10.97 1.60 1.60# G3-Co-education 215 50.23 9.34 0.64 G1-Girls 111 146.55 31.03 2.95
Total verbal G2-Boys 47 154.99 31.53 4.60 1.61# creativity G3-Co-education 215 150.69 26.20 1.79
G1-Girls 111 48.41 8.43 0.80 Non-verbal G2-Boys 47 51.72 9.19 1.34 2.32# originality G3-Co-education 215 50.44 10.82 0.74
G1 Non-verbal G1-Girls 111 52.08 8.65 0.82 elaboration G2-Boys 47 46.47 7.36 1.07 5.56** G2 *
G3-Co-education 215 49.69 10.90 0.74 G1-Girls 111 100.49 13.49 1.28
Total non-verbal G2-Boys 47 98.19 13.80 2.01 0.34# creativity G3-Co-education 215 100.13 18.52 1.26 Composite G1-Girls 111 247.04 38.35 3.64 creativity (Verbal G2-Boys 47 253.18 37.28 5.44 0.57# + non-verbal) G3-Co-education 215 250.82 37.00 2.52 ** = Significant at 0.01 # = Not significant
10.4.3 Comparison of girls in co-educational schools with those in girls' schools, and boys in boys' schools with those in co-educational schools.
From table 10.18, it is evident that there are no significant differences between girls
from co-educational schools and pupils in other schools (boys', girls and boys in co
educational schools), on verbal originality (F=2.08; p>0.05), fluency (F=1.33; p>0.05),
flexibility (1.33, p>0.05) and total verbal creativity (F=1.13; P> 0.05). Girls in co
educational schools perform as well as their counterparts in girls' schools in verbal
creativity.
As for non-verbal originality and elaboration, the means of the four groups differed
significantly at 0.05 level; the F-ratios were 3.42 and 3.70 respectively. But no difference
on total non-verbal creativity was found (F=0.86; p<0.05).
Finally, on overall creativity the four groups' mean scores were not significantly
different (F=0.41; p>0.05). However, girls in co-educational schools performed better than
their counterparts in girls' schools. However, these differences were not significant. These

197
small differences may be due to the girls in co-educational schools coping better with
classmates (male and female) and having good interpersonal relations with them, mixed
staff (male and female); having fewer restrictions and impositions and more flexibility and
freedom with teachers, parents and society. Particularly in Indian culture, girls have more
constraints on their roles. For example, they must conform to social customs, there is
discrimination between son and daughter, they are prevented from doing some types of
tasks, there are strict limits on talking to male teachers or male students, and strict controls
over girls' participation in out-of- school activities in the evenings or late at night, due to
security problems. The evidence presented here suggests that co-education does not have a
negative effect on girls' creativity.
Table-1 0.18: Mean scores, 80s, 8EM and F-values of Creative Thinking of subjects (8s) in relation to t f h he type a the sc 001.
Creativity Type of the School N Mean SO SEM F - ratio Mean components df= 3/369 differences
Girls 111 48.91 10.97 1.04 Verbal Boys 47 52.83 11.11 1.62 originality Girls in Co-education 115 49.28 8.62 0.80 2.08#
Boys in Co-education 100 50.71 9.65 0.96 Girls 111 48.85 10.95 1.04
Verbal Boys 47 50.40 10.44 1.52 fluency Girls in Co-education 115 51.38 9.31 0.86 1.33#
Boys in Co-education 100 49.51 9.39 0.94 Girls 111 48.79 10.73 1.01
Verbal Boys 47 51.76 10.97 1.60 flexibility Girls in Co-education 115 50.79 9.10 0.84 1.33#
Boys in Co-education 100 49.58 9.62 0.96 Girls 111 146.55 31.03 2.95
Total verbal Boys 47 154.99 31.53 4.60 creativity Girls in Co-education 115 151.46 25.30 2.36 1.13#
Boys in Co-education 100 149.81 27.30 2.73 Girls 111 48.41 8.43 0.80 G1
Non-verbal Boys 47 51.71 9.19 1.34 originality Girls in Co-education 115 48.96 9.87 0.92 3.42*
Boys in Co-education 100 52.15 11.63 1.16 G4 * Girls 111 52.08 8.65 0.82 G1
Non-verbal Boys 47 46.47 7.36 1.07 G2 * elaboration Girls in Co-education 115 49.72 9.74 0.91 3.70*
Boys in Co-education 100 49.66 12.15 1.22 Girls 111 100.49 13.49 1.28
Total non- Boys 47 98.19 13.80 2.01 verbal Girls in Co-education 115 98.68 16.34 1.52 0.86# creativity Boys in Co-education 100 101.81 20.72 2.07
Girls 111 247.04 38.35 3.64 Composite Boys 47 253.18 37.28 5.44 creativity Girls in Co-education 115 250.13 35.20 3.28 0.41# (Verbal + Boys in Co-education 100 251.61 39.13 3.91 non-verbal) * = SignIficant at 0.05 # Not SignIficant

198
10.5.0 Cognitive and motivational factors and students creativity
The students were asked to write down any three school subjects6 that they liked,
any three subjects that they disliked, and any three careers they would prefer. They were
also asked to give reasons for their preferences. Lastly, they were asked to write about their
good and bad experiences in the classroom (see Appendix B3). These responses given by
the students were 'multiple' and qualitative. No statistical treatment was given to the data
except to categorise it and give percentages.
10.5.1 Levels of students' creativity -subjects which students liked
Table 10.19 gives the six subjects most commonly available as curriculum subjects
at secondary school level in Andhra Pradesh as well as in India. For the purpose of
comparison, the sample was classified into three groups 7 ; they were labelled as High
Creative (HC), Average Creative (AC) and Low Creative (LC), on the basis of composite
test scores on the tests of creative thinking.
T bl 10 19 A d b' ·th th . I I f rk db t d a e - ca emlc su lJects I e lY s u ents, WI elr eve 0 creative thO k' In Ing Subject (Coded) Level of creative thinking Total
High Average Low f %
f % f % f % 1. Telugu (1 ) 28 (45.2) 129 (52.2) 30 (47.6) 187 (50.3) 2. Hindi (2) 23 (37.1) 125 (50.6) 35 (55.6) 183 (49.2) 3. English (3) 40 (64.5) 146 (59.1) 40 (63.5) 226 (60.8) 4. Mathematics (4) 32 (51.6) 117 (47.4) 25 (39.7) 174 (46.8) 5. Science** (5) 33 (53.2) 86 (34.8) 20 (31.7) 139 (37.4) 6. Social Studies (6) 30 (48.4) 113 (45.7) 28 (44.4) 171 (46.0) Total multiple responses 186 716 178 1080 Total Valid cases 62 247 63 372
Note: Percentages Within brackets were calculated on the baSIS of total valid cases but not on total multiple responses
** Includes Bio-Sciences and Physical Sciences
The students (N=373) were asked to name any three school subjects which they
liked. The expected possible multiple responses were (373 X 3=1119), but due to some
non-responses a total of 1080 (96.5%) multiple responses emerged. The percentages within
the brackets in the table were calculated for each column, considering the valid cases but
not the multiple responses (see table 10.19). Students were also asked to explain the
6 There are a total of six subjects at secondary level. They are 1. Telugu 2. Hindi 3. English 4. Mathematics 5. Sciences (Physical + Biological) 6. Social studies.

199
reasons why they liked each particular subject. The reasons given for choosing individual
subjects were collected under the same question (see App-B3, Q.No. 12(1». The multiple
responses were broken down in respect of sub-samples (called groups) and are presented in
the tables E2-T1, E2-T2 & E3-T3 (see Appendix E2).
In terms of subjects most liked overall (N=373), first, the subject of English
language showed a high degree of agreement (60.8%); second, Telugu (50.3%); followed
by Hindi (49.2%). There is an interesting observation within the data that all three groups,
HC, AC and LC liked English; the percentages were 64.5,59.1 and 63.5% respectively.
The most striking differences in liking subjects were found between the HC group
and rest of the groups (AC and LC, including total sample). The HC group liked Science
(53.2%) and Mathematics (51.6%); the AC group liked Telugu (52.2%) and Hindi (50.6%);
the LC group liked Hindi (55.6%) and Telugu (47.6).
The common reasons given by all the groups for liking English were: "interesting
teaching", "lessons easy to understand", and "interesting stories" (see APP-E2, table-E2-
T1). Exclusive reasons given by the HC group, compared with the LC group, were: "using
new words", "it is an international language", "introduced by the British", "helpful in
higher education", and "can be used in future life / daily life".
Table E2 - T2 (in APP. E2) breaks down the reasons given by the High Creative
(HC) group for liking Science and Mathematics. The frequency (f) shows the number of
times each kind of response was given. The higher percentages of reasons (frequencies) for
liking Science given by the HC group were: "to become a doctor", "there are interesting
experiments and discoveries", "one learns about living beings", "understanding nature /
environment", "interesting teaching", "learning about the history of scientists and
inventions", "opening the door to new knowledge".
Similarly, the reasons for liking mathematics given by the HC group were: "finding
solutions to the problems gives enjoyment, creates interest and enthusiasm", "subject
lessons are easy to understand", "it is easy to learn, it is full of fun", "full of formulas and
symbols", and "interesting teaching" (see table-E2-T2 in App-E2).
The reasons given by the Low Creative (LC) group for liking Telugu and Hindi are
presented in table E2-T3 (APP. E2). The common reasons mentioned for both subjects
7 The High Creative (HC) group (N=62) composed those scored above Mean + 1 SD (250+37.4=287.4); the Low creative (LC) group (N=63) those scored below Mean-1SD (250-37.4=212.6); and the Average Creative (AC) group (N=247) those scored between Mean-1SD and Mean+ lSD (212.6 to 287.4)

200
were: "it is our mother tongue / communicative language", "subject lessons are easy to
understand", "we are able to read", "it has very interesting stories" and "teachers teach
interestingly". In addition, the LC group considered Hindi as enjoyable because it is easy to
learn, and they think that Telugu has interesting poetry.
There were some differences between the different creative groups regarding their
reasons for liking subjects, but overall liking a subject depends upon understanding it and
the teacher teaching interestingly.
10.5.2 Levels of students' creativity -subjects disliked
The students (N=373) were asked to name any three subjects they disliked and were
also asked to give the reasons why they disliked that particular subject (see App-B3, Q.No.
12(2)). Table-lO.20 provides the details.
T b I f a Ie -10.20: Academic su )Jects disliked by students, Wit their leve 0 creative thin InQ Level of creative thinking Total
Subjects (Coded) High Average Low
f %
f % f % f % 1. Telugu (1 ) 29 (49.2) 95 (40.7) 24 (40.7) 148 (41.9) 2 Hindi (2) 30 (50.8) 98 (41.7) 23 (39.0) 151 (42.8) 3 English (3) 17 (28.8) 82 (34.9) 22 (37.3) 121 (34.3) 4 Mathematics (4) 27 (45.8) 117 (49.8) 33 (55.9) 177 (50.1) 5 Science* (5) 25 (42.5) 145 (61.7) 39 (66.1) 209 (59.2) 6 Social Studies (6) 28 (47.5) 107 (45.5) 25 (42.4) 160 (45.3) Total multiple responses 156 644 166 966 Total valid cases 59 235 59 353
Note: Percentages wlthm brackets were calculated on the baSIS of total valid cases but not on total multiple responses * includes bio-sciences and physical sciences
In general, the subjects disliked by the whole sample (N=373), were first, science
(59.2%); second, mathematics (50.1 %); lastly social studies (45.3%).
Disparities were found in disliking subjects between the High Creative (HC) and the
Average Creative (AC) and Low Creative (LC) groups. The HC group disliked Hindi
(50.8%) and Telugu (49.2%); the AC group disliked Science (61.7%) and Mathematics
(49.8%) as did the LC group Science (66.1 %) and Mathematics (55.9%).
There is an important observation that Social Studies was disliked by all three
groups HC, AC and LC; their percentages were 47.5, 45.5 and 42.4 respectively. The main
reasons for disliking Social Studies were: "no interest in a subject", "it is a boring subject",
"it is hard to learn", "I can't understand the subject", "teachers do not teach it well",
201
"lengthy answers are required" and "it is difficult to remember the years" (see table E2-T4
in Appendix E2).
The exclusive reasons given by the HC group compared to the LC group were:
"don't like history, "don't like politics", and "geography".
Table E2-T5 (App. E2) breaks down the reasons gIven by the HC group for
disliking the subjects Hindi and Telugu. The most common reasons were "no interest" and
"can't understand the subject". Besides these, other particular reasons given for disliking
Hindi were: "the problem of reading", "it is not my mother tongue" and "it is not an
important subject nowadays". Similarly, the reasons for disliking Te1ugu were: a "dislike of
poetry", "it is a difficult subject", "there is so much grammar", and "a lack of interest in
knowing the language".
The reasons given by the Low Creative (LC) group for disliking Science and
Mathematics are presented in table E2-T6 (in APP. E2). The common reasons disclosed
were: "can't understand the subject", "no interest in the subject", "the sums are difficult"
and "the teachers do not teach it well". Besides these, one of the reasons given for Science
was that "it was hard to learn".
Though differences were found in the reasons given by the three creative groups,
the main reasons for disliking subjects were "lack of understanding of the subject" and "no
interest in the subj ect".
10.5.3 Level of students' creativity -Occupation chosen
The students were asked to indicate three future occupational choices on the
Students Information Sheet (SIS). With the data collected through SIS, the researcher was
able to examine, first, the extent to which the sample as a whole, aspired to different kinds
of occupation; and secondly, to compare the three groups: High Creative (HC), Average
Creative (AC) and Low Creative (LC).
A wide range of occupations was chosen by the whole sample (N=373). They are
presented in Table 10.21. A high percentage of pupils chose two occupations: Doctor
(66.4%) and Teacher (55.6%); followed by Lawyer (17.4%), Engineer (16.8%) and Police
Constable (15.4%). A smaller percentage chose Business (8.8%), Army Officer (5.5%) and
Nurse (5.2%).
When comparing the three groups (HC, AC and LC) it is evident from the analysis
that each group had similar aspirations. The top five occupations (> 10%) chosen by all

202
three groups, were the same, even maintaining the rank order. The occupations (with ranks)
were: Doctor (1), Teacher (2), Lawyer (3 or 3.5 for HC), Engineer (4 or 3.5 for HC) and
Police Constable (5).
Table-1021 Students Occupational choices by their level of creative thinking
Jobs liked by the students 1.0 Production and Transport operators 1.1 Bookbinder 1.2 Screen printing 1.3 Driver 1.4 Tailor 2.0 Farmers, Fisherman and related workers 2.1 Farmer 3.0 Service workers 3.1 Police Sub-Inspector 3.2 Police Constable 3.3 CID 3.4 Customs officer 3.5 Nurse 3.6 Air hostess 3.7 Watchmen I Gatekeeper 4.0 Sales workers 4.1 Newspaper agent 4.2 Milkman 4.3 Business 5.0 Clerical and related workers 5.1 Accountant 5.2 Receptionist 5.3 Typist 5.4 Bus Conductor 5.5 Office Messenger
(Coded) (1 )
(2)
(3)
(4)
(5)
6.0 Administrative, executive and managerial (6) workers
6.1 District Collector 6.2 Factory Manager 6.3 Bank Manager 6.4 Income Tax Officer 6.5 Administrative & Executive Officer 7.1 Professional, Technical and related workers (7) 7. 1 Doctor 7. 2 Teacher 7. 3 Lecturer 7. 4 Scientist 7. 5 Judge 7. 6 Lawyer 7. 7 Army Officer 7. 8 Sports Coach 7. 9 Political Leader 7.10 Charity Worker 7.11 Chartered accountant 7.12 Artist 7.13 Engineer 7.14 Pilot 7.15 Airforce Officer 7.16 Navy Officer 7.17 Computer Professional 7.18 Mechanic 7.19 Electrician 7.20 Technician Total multiple responses Total valid cases
High
1 ( 1.6)
2 ( 3.2)
2 ( 3.2) 7 (11.3)
4 ( 6.5) 1 ( 1.6)
5 ( 8.1)
4 ( 6.5)
1 ( 1.6) 1 ( 1.6)
41 (66.1) 33 (53.2)
3 ( 4.8)
11 (17.7) 4 ( 6.5)
3 ( 4.8) 1 ( 1.6)
11 (17.7) 7 (11.3)
2 ( 3.2)
2 ( 3.2) 146
62
Level of creative thinking Total Average Low f (%)
1 ( 0.4) 1 ( 0.4) 4 ( 1.6) 7 ( 2.9)
2 ( 0.8)
8 ( 3.3) 36 (14.8)
3 ( 1.2) 1 ( 0.4)
13 ( 5.3) 1 ( 0.4) 1 ( 0.4)
21 ( 8.6)
1 ( 0.4) 1 ( 0.4) 8 ( 3.3) 1 ( 0.4) 2 ( 0.8)
10 ( 4.1) 1 ( 0.4) 2 ( 0.8)
1 ( 0.4)
160 (65.8) 144 (59.3)
2 ( 0.8) 5 ( 2.1) 1 ( 0.4)
42 (17.3) 16 ( 6.6)
1 ( 0.4) 3 ( 1.2) 2 ( 0.8) 2 ( 0.8) 3 ( 1.2)
41 (16.9) 8 ( 3.3) 4 ( 1.6) 1 ( 0.4) 4 ( 1.6) 4 ( 1.6) 4 ( 1.6)
573
243
2 ( 3.4) 2 ( 3.4)
1 ( 1.7)
13 (22.4)
2 ( 3.4)
1 ( 1.7) 1 ( 1.7) 6 (10.3)
1 ( 1.7)
2 ( 3.4) 1 ( 1.7) 1 ( 1.7)
1 ( 1.7)
40 (69.0) 25 (43.1)
1 ( 1.7) 10 (17.2)
9 (15.5)
1 ( 1.7) 2.( 3.4)
122
58
1 ( 0.3) 2 ( 0.6) 6 ( 1.7)
11 ( 3.0)
3 ( 0.8)
10 ( 2.8) 56 (15.4)
3 ( 0.8) 1 ( 0.3)
19 ( 5.2) 2 ( 0.6)
1 ( 0.3)
1 ( 0.3) 1 ( 0.3)
32 ( 8.8)
2 ( 0.6) 1 ( 0.3)
10 ( 2.8) 2 ( 0.6) 3 ( 0.8)
14 ( 3.9) 1 ( 0.3) 2 ( 0.6) 1 ( 0.3) 3 ( 0.8)
241 (66.4) 202 (55.6)
2 ( 0.6) 8 ( 2.2) 2 ( 0.6)
63 (17.4) 20 ( 5.5)
1 ( 0.3) 6 ( 1.7) 3 ( 0.8) 2 ( 0.6) 3 ( 0.8)
61 (16.8) 15 ( 4.1)
4 ( 1.1) 1 ( 0.3) 6 ( 1.7) 5 ( 1.4) 6 ( 1.7) 2 ( 0.6)
841
363 Note: Percentages wlthm that brackets were calculated on the baSIS of total valid cases but not on total multiple responses

203
Exclusive and specific occupations chosen by the HC group when compared to the
LC group were: Pilot (11.3%), District Collector (6.5%), Army Officer (6.5%), Scientist
(4.8%), Political Leader (4.8%), Computer Professional (3.2%), Technician (3.2%) and
Sub-Inspector of Police (3.2%). A very small percentage of HC students chose the
occupations of Air hostess, Charity Worker and Screen-printing.
The qualitative data was analysed (see Table E2-T7 in Appendix E2), as were the
reasons given for choosing individual occupations, with reference to the whole sample
(N=373) first, followed by the three sub-sample groups (HC, AC and LC). The most
common reasons given by the whole sample and all three groups (HC, AC and LC) for
liking the occupation of Doctor were: to treat poor patients, serve poor people and having
this ambition from childhood. Besides these, exclusive reasons given by the HC group
when compared to the LC group were to 'defend the nation', 'liking science subjects' and
'a good job for me'.
Common reasons given for choosing Teaching by the whole sample and the three
groups (HC, AC and LC) were: 'liking to teach students', 'educating the illiterate and
poor', 'guiding students', 'teaching students well' and 'enjoying being with children'. A
small percentage of the HC group gave specific and rare reasons compared to LC group.
They were: 'to develop the country', to 'eradicate illiteracy', 'it is easy to get this job', 'it is
a unusual job in the world', and 'it is my parents' ambition'.
The top reasons for liking the occupation of Lawyer given by the whole sample (N=
373) and the three groups (HC, AC and LC) were to provide justice for poor people and to
serve poor people. A specific and high percentage of HC group mentioned, 'to maintain
law and order', and a small percentage said, 'to punish criminals'.
The whole sample and the three groups (HC, AC and LC) perceived being a police
constable favourably because it enabled them 'to catch thieves', 'defend the nation' and to
'punish criminals'. The reasons given for liking an Engineering career by the whole sample
(N= 373) and the three groups were: 'planning & designing buildings and bridges', 'to earn
a lot of money', and 'it is a good job for me'. A specific reason given by HC group was
'liking the subject like mathematics'.
10.5.4 Levels of students' creativity -good classroom experiences
The students were asked to write about their good experiences in the classroom.
From this open-ended question, 332 multiple responses emerged. These responses were
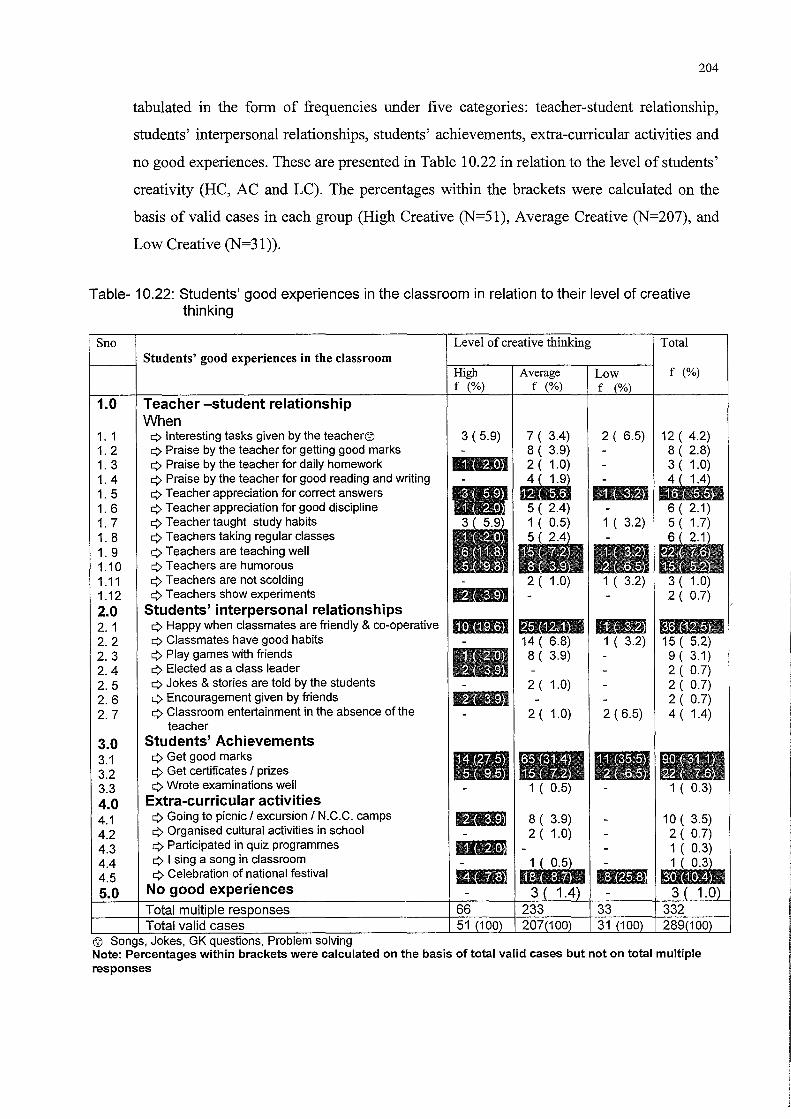
204
tabulated in the form of frequencies under five categories: teacher-student relationship,
students' interpersonal relationships, students' achievements, extra-curricular activities and
no good experiences. These are presented in Table 10.22 in relation to the level of students'
creativity (HC, AC and LC). The percentages within the brackets were calculated on the
basis of valid cases in each group (High Creative (N=51), Average Creative (N=207), and
Low Creative (N=31)).
205
Form Table-l0.22, it is clear that 99% of students have had good experiences in
their classrooms. The experiences were related to academic as well as non-academic
activities. A high percentage of students as a whole, and the three sub groups (HC, AC and
LC), described good experiences in their classroom as "getting good marks", "happiness
when classmates are friendly & co-operative", a "celebration of national festivals", "getting
certificates or prizes", "when teachers are teaching well", "when teachers are humorous"
and "receiving teachers' appreciation for correct answers".
It is worth noting the specific and unique experiences of the HC group when
compared to the LC group. The experiences were: when teachers demonstrate experiments,
going on picnics, excursions or NCC camps, when encouragement is given by friends,
when elected as class leader. Small percentage responses of the HC group experiences
were: praise by the teacher for daily homework, playing with friends, teacher appreciation
for good discipline, teachers taking regular classes, and participation in quiz programmes.
This indicates that there is a lot of pressure on all groups to obtain' good marks'.
The percentage for HC (27.5%) is less than for AC (31.4%) and LC (35.5%). There is little
emphasis on the spirit of enquiry or scientific temperament; they are 'addicted' to school;
achievement. This was their main goal and purpose of school life. Their main aim was to
get good marks rather than acquire special or real skills, interests and knowledge.
10.5.5 Levels of students' creativity -bad classroom experiences
Table 10.23 indicates that 96.2% of the students had had bad experiences in the
classroom. When the students were asked to report on their bad experiences in the
classroom, a total of 375 multiple responses for this open-ended question emerged. They
were classified under six categories in the form of frequencies. The main categories were:
teacher-student relationship, students' interpersonal relationships, students' failures, extra
curricular activities, classroom climate and no bad experiences.
A high percentage of students as a whole (N=373) and from the three groups (HC,
AC and LC) expressed their common bad experiences in the classroom as 'not getting good
marks in exams'. This clearly again indicates a strong feeling of the importance of
'academic marks' among the students. Other bad experiences were students' misbehaviour
in the classroom, indiscipline, corporal and other punishment for indiscipline, teachers
scolding for indiscipline, unhappiness when classmates were not friendly or co-operative
and not getting certificates or prizes.

206
Table- 10.23: Students' bad experiences in the classroom in relation to their level of creative thinkin
SNo Level of creative thinking Total Students' bad experiences in the classroom High Average Low
f (%) f (%) f % f (%)
1.0 Teacher -student relationships Corporal and other punishments*
1. 1 ¢ for in-discipline mDll-i) mlDE .. aim 1.2 ¢ for not doing home work 8 (3.9) 1 (3.3) 9 ( 3.1) 1.3 ¢ for less marks in exams 1 ( 0.5) 1 ( 0.3) 1.4 ¢ for not giving correct answers illID 1 ( 0.3) 1.5 ¢ for poor reading and writing 1 ( 0.5) 1 ( 0.3)
Teachers 1.6 ¢ scolding for indiscipline ffBIIBj .. ~m 1.7 ¢ scolding for not doing homework 8 ( 3.9) 9 ( 3.1) 1.8 ¢ scolding for less marks in exams 6 ( 2.9) 2 ( 6.7) 8 ( 2.7) 1.9 ¢ scolding for not giving correct answers 1 ( 0.5) 1 ( 0.3) 1.10 ¢ get angry + and insult in the classroom 3 ( 1.5) 1 (3.3) 4 ( 1.4) 1.11 ¢ leave the school - 4 ( 2.0) 7 ( 2.4) 1.12 ¢ are not teaching well 3 ( 1.5) 4 ( 1.4) 1.13 ¢ appreciate only intelligent stUdents 3 ( 1.5) 4 ( 1.4) 1.14 ¢ sleeping in the classroom 2 ( 1.0) 2 ( 0.7) 1.15 ¢ give more homework 1( 1.8) 4 ( 2.0) 2 (6.7) 7 ( 2.4) 2.0 Students interpersonal relationships
Unhappy when 2.1 ¢ Classmates are not friendly I co-operative tmEl HI:II gm BEEj 2.2 ¢ friends suspecting 1 ( 1.8) 1 ( 0.5) 2 ( 0.7) 2. 3 Friends leave the school = 1 1. 3 ( 1.5) 4 ( 1.4) 2.4 Friends are jealousy 1 ( 0.5) 3 ( 1.0) 2. 5 Friends quarrel and get separated 10 ( 4.9) 16 ( 5.5) 2.6 Insulted by friends
~ mr'd~ 2. 7 Students misbehave® in the classroom gUl) • •• 11m 2. 8 Students misbehave with teachers 3 ( 1.5) 1 (3.3) 4 ( 1.4) 2. 9 Students misbehave· with other students 2 ( 3.5) 7 ( 3.4) 2 ( 6.7) 11 ( 3.8) 2.10 Class leader domination and partiality 3 ( 5.3) 5 ( 2.4) 1 ( 3.3) 9 ( 3.1) 3.0 Students' failures 3.1 Guilty feeling for poor performance
~ ~ ~ 3.2 Not getting good marks in exams taDj , . . 3.3 Failed in some subjects
"I~ ~ 3.4 Not get ting certificates I prizes gb) adBj 4.0 Co-curricular activities 4.1 No proper games (eg. Cricket, Hockey etc.,) 1 ( 1.8) 1 ( 0.5) 1 ( 3.3) 3 ( 1.0) 5.0 Classroom climate 5.1 Indiscipline in the class gUlj !lUj 5.2 Can't understand lesson 2 ( 3.5) 1 ( 3.3) 5.3 No regular classes 2 ( 3.5) 6.0 6. No bad ex erience 1 ( 1.8)
Total multi Ie res onses 73 Total Valid cases 57
Note: Percentages within that brackets were calculated on the basis of total valid cases but not on total multiple responses * Standing on bench or outside the class, running round the play ground etc., + For grammatical mistakes and irregular attendance - Teachers transferred I retired I expired I sick. = Friends transferred to other school or left the school ® Fighting, shouting, quarrelling, talking while teacher teaching. .to Teasing or beating
207
Besides the above, it is most important to examine the specific bad experiences of
High Creative children in the classroom when compared to the Low Creative children.
High creative group students have had bad experiences when friends quarrel and are
separated, teachers leave the school, there are no regular classes, friends are jealous,
teachers do not teach well, appreciate only intelligent students, corporal and other
punishment is given for not giving correct answers and teachers scold for not doing
homework.
10.6.0 Summary
This chapter has explored the factors affecting measured creativity in the students
and how different levels of creativity affect students' perceptions of school subjects and
future occupations. The findings showed no overall gender differences in creativity, though
there were fluctuations with age. Overall creativity scores were related to children's
parental background, with better education, occupation and income leading to higher levels
of creativity. When parents were considered separately there were exceptions. The children
of illiterate fathers seemed to score more highly than those with more education. Why this
might be so is not clear. With regard to the mother, the better educated the mother the
higher the level of verbal creativity. This did not apply to non-verbal creativity. Fathers'
occupation did not influence creativity, but for mothers, where higher levels of occupations
were held, children tended to have better verbal creativity. Similarly was the mother's
income, not the father's which differentiated verbal but not non-verbal creativity.
The school factors explored showed that girls' schools were less successful overall
in developing creativity. Girls in co-educational schools performed in a similar manner to
girls in separate schools. The medium of instruction had a profound influence on creativity
scores. Telugu medium students performed better, perhaps because they could more easily
express themselves in Telugu.
There was a tendency for students to prefer classes in English rather than
mathematics and science, but there were differences between high, average and low
creative groups. The higher creative group preferred mathematics and science more than
the lower creative groups. The reasons given for liking subjects often related to the quality
of the teaching and the degree of understanding of the student, i.e. whether the subject was
perceived as difficult. In relation to occupation selection, preferred professions were high

208
status, ego doctor, teacher, lawyer and engineer. This was true across all groups. There was
considerable variety in the reasons given, from altruistic ones to financial.
Classroom experiences, good and bad, tended to focus very much on the
achievements of students in tests and examinations, although there were some differences
between HC, AC and LC groups. The high creative groups were more concerned with
teaching quality and the atmosphere in the classroom.

209
Chapter XI
Data Analysis of the Teacher Encouragement Scale and School Activities
11.0 Introduction
In this present chapter, the data results are discussed in three sections. Section I
deals with the analysis of the Teacher Encouragement scale (TES). In this section the
sample distribution for TES will be presented first, followed by the analysis of TES items,
nature of the distribution of TES scores, factor analysis of TES, and analysis of TES in
relation to selected variables i.e. sex, medium of instruction, type of school (boys or girls)
and the three levels of students' creativity. Section II deals with activities organised by
schools as a whole to promote creativity, and in section III an attempt has been to explore
the relationship between creative thinking and some of its correlates.
11.1 The Sample distribution for TES
In class 9, the student's age would normally vary from l3 to 15 years (see Chapter
VIII, table 8.2). Research has shown that students in this age group are better judges in
rating their teachers' behaviour in the classroom than outside observers (Naidu, 1987). As
the students meet their subject teacher daily, they also know the merits and demerits of
each and every subject teacher; and the behaviour patterns and interactive processes of
these teachers in classroom situations.
A total of 373 IX class students were asked to rate their teachers. Table-l1.1
explains the school and subject sample distribution. The entire range of subject teachers in
the schools was covered. The percentage of subject teachers ranged from 11.8% to 16.4%.
T bl 11 1 Th d· t ·b f f t d t b h a e- e IS n U Ion 0 5 U en 5 )y 5C 00 an d t ht b· t augl 5U )lec 5.
School Telu~u Hindi En~lish Maths BS PS SS Total % 1 6 4 6 6 6 - 7 35 ( 9.4) 2 9 8 8 9 8 - 9 51 (13.7) 3 4 7 6 7 8 7 5 44 (11.8) 4 6 6 6 6 7 7 7 45 (12.1 ) 5 5 5 5 4 2 4 5 30 ( 8.0) 6 5 5 8 8 7 6 6 45 (12.1 ) 7 6 7 3 5 3 5 3 32 ( 8.6) 8 11 - 6 11 7 6 6 47 (12.6) 9 3 2 4 5 8 14 8 44 (11.8)
Total 55 44 52 61 56 49 56 373 (100.0) (14.7) (11.8) (13.9) (16.4} (15.0) (13.1 ) (15.0)
BS = Biological SCiences PS= PhYSical SCiences SS= Social Studies

210
11.2 Analysis ofTES items
The frequencies, X2 values, Mean and SDs of each item of the TES are presented in
Table 11.2. The X2 values indicate that all the items are significant (beyond the 0.001)
level, except item 4 (which is significant at 0.01 level). The item means range from 1.19 to
3.22, while SDs range from 1.22 to 1.49. Item 9, 'Does the teacher criticise you for no
good reason in the classroom?' has the highest mean; while the second highest mean item
is 13, 'Do you trust the teacher?'. The items with lowest and second lowest means are item
18, 'Does the teacher encourage you to discus things in groups?' and item 22, 'Are the
students' ideas/suggestions used during classroom discussion?'
Table-11.2: The Itemwise responses for the Teacher Encouragement scale (TES).
Q.No N S 0 U A TOTAL XL (df=4) Mean SD
+1 23 134 30 45 141 373 180.5 'v 2.39 1.45 +2 24 101 41 90 117 373 86.10/ 2.47 1.35 +3 97 99 52 68 55 371 27.40/ 1.69 1.41 +4 72 100 73 69 56 370 13.9£ 1.83 1.35 +5 - - - - - - - - --6 200 79 38 28 28 373 287.20/ 3.06 1.27 -7 191 79 27 37 37 371 251.5'" 2.94 1.37 +8 39 102 35 75 119 370 75.1'" 2.36 1.44 -9 234 54 36 29 20 373 434.1'v 3.22 1.22 +10 46 49 36 47 194 372 241.7'" 2.79 1.49 +11 43 104 39 53 132 371 92.9'" 2.34 1.48 +12 49 145 42 74 60 370 93.1'v 1.87 1.33 +13 20 49 26 40 234 369 441.80/ 3.14 1.31 -14 65 130 41 69 65 370 59.6'" 2.17 1.39 -15 191 72 32 42 28 365 254.7'" 2.98 1.33 +16 45 65 44 82 129 365 67.2'" 2.51 1.44 +17 35 127 40 44 125 371 121.10/ 2.26 1.46 +18 154 103 40 36 38 371 150.1'" 1.19 1.34 +19 41 73 35 68 154 371 121.9'" 2.60 1.46 +20 60 148 38 73 51 370 101.3'" 1.75 1.32 +21 - - - - - - - - -+22 83 133 51 53 52 372 67.4'" 1.62 1.35
.. + = Positive Items - = Negative Items \j! = Significant at 0.0001 level. £ = Significant at 0.01 level
11.3 Nature of the distribution ofTES Scores
The TES consists of 20 items; each item statement is anchored with a 5-point scale
'Always', 'Usually', 'Often', 'Sometimes', and 'Never'. The positive items (1, 2, 3, 4, 8,
10, 11, 12, 13, 16, 17, 18, 19, 20, 22) were responded to in the order 4,3,2,1, and 0; the
negative items (6,7,9,14,15) were responded to in the reverse order, 0,1,2,3, and 4. The
highest possible score that could be obtained is 80 and the lowest possible score is O.

211
For the purpose of statistical analysis the data were grouped. The scores obtained
for the 373 pupils of standard IX who marked the TES are presented in the form of a
frequency distribution in Table-I 1.3 .
Table-11.3: Frequency distribution and descriptive statistics of TES
Class Frequency Cumulative Smooth Descriptive Statistics Interval (f) (f) frequen9'
10-19 5 5 7.7 Mean = 46.86 Minimum = 14 20-29 18 23 32.0 Median = 46.00 Maximum = 75 30-39 73 96 72.0 Mode = 42.00 Range = 61 40-49 125 221 99.7 SO = 11.40 Skewness= -.03 50-59 101 322 89.3 Variance = 129.96 Kurtosis = -.14 60-69 42 364 50.7 SEM = 0.59 70-79 9 373 17.0 Total 373
The descriptive statistics for the TES are given in Table-I 1.3 . The mean, median
and mode of the TES were 46.86,46.00 and 42.00 respectively. The SD of the scale was
140
120
en 100 (J.)
'(3 80 c
(J.) :::J 60 0-(J.) .... IL 40
20
0
Fig-11.1: Original and Smoothed frequency polygon based on data given in table-11.3
120
100
80
60
40
20
0 14.5 24.5 34.5 44.5 54.5 64.5 74.5
Mid-Values
11.40. The maximum score obtained by the sample was 75 while the minimum score
obtained was 14, giving a range of 6l. To determine the .95 and .99 confidence interval
limits of the population means, the Standard Error of Mean (SEM) was calculated. This was
found to be 0.59. The .95 and .99 confidence levellimitsl
of the true values of this sample
1 Mean ± 1.96xSEM = 46.86 ± 1.96 x 0.59 for 0.95 confidence level Mean ± 2.58xSEM = 46.86 ± 2.58 x 0.59 for 0.99 confidence level

212
mean are 45.70 and 48.02; and 45.33 and 48.38 respectively. A standard frequency
polygon (see figure No.l1.1) has been drawn from the data given in table 11.3. The result
indicates that the distribution is only slightly negatively skewed (Skewness = -.03). In this
distribution Kurtosis is -0.14, which indicates distribution of the scores is platykurtic (fig.
11.1 ).
11.4.0 Factor Analysis of the TES
A factor analysis procedure had been employed in order to identify the latent or
common traits of the items in the TES and also to see whether the selection of items had
been justified. Another reason was to formulate a series of summated scales in order to
compare the views of students in relation to the selected variables. So, firstly, Principal
Component Analysis (PCA) was employed to extract the latent trait or the underlying
factors of the 20 TES items. Secondly, Varimax Rotation was used to maximise the
relationships between the variables and some of the factors.
Table-ll.4 shows the result of the PCA where the Eigenvalues and the percentage
of variance extracted by the factors are shown. Only factors having Eigenvalues greater
than 1 were considered for the proposed analysis (Kaiser, 1960). The results of Varimax
Rotation for the extraction of the underlying traits are presented in the same table. In this
rotation, the axes were turned about the origin until an alternative position of the loadings
Table-11.4 : Principal Com~onent Analysis JPCAI and Varimax Rotation of TES Principal Component Analysis of TES Rotated Factor matrix of TES Factors Eigenvalue Percent of Cumulative Factors Items Factor
variance percent loadinQ Q10 .74 Q11 .72
1 3.71 18.5 18.5 1 Q13 .57 Q12 .52 Q19 .39 Q3 .70 Q4 .66
2 1.70 8.5 27.0 2 Q1 .61 Q2 .53 Q8 .33 Q22 .64
3 1.30 6.5 33.5 3 Q18 .62 Q20 .50
4 1.22 6.1 39.6 4 Q_6 .70 Q 7 .68 Q17 .66
5 1.16 5.8 45.4 5 Q16 .43 Q 15 -.66
6 1.01 5.0 50.4 6 Q_14 .76 Q 9 .67

213
was reached. Only the maximum values of item loading (greater than 0.30) with respect to
their factors are presented in Table 11.4, to facilitate interpretation.
Altogether, 6 factors emerged with Eigenvalues above 1. These explain 50.4% of
the variance. The first factor extracted had an Eigenvalue of 3.71 and accounts for 18.5%
of the variance. The second factor had an Eigenvalue 1.70 and accounts for 8.5% of
variance. Factors 3, 4, 5 and 6 extracted account for 6.5%,6.1%,5.8% and 5.0% of the
variance respectively.
Factor one: The five items in factor one reflect relationships between teacher and
students: teachers having good relations with students, teachers being friendly with
students, students trusting in the teacher, teachers being humorous with students, and
teachers encouraging students to participate in classroom activities. The significant
loadings ranged from 0.74 to 0.39. This factor may be called "Teacher-Pupil relations ".
The remaining five factors, which did not meet the criterion of accounting for at
least 1 0% of the variance, will be explored here to create summated scales which could be
used in an analysis of TES in relation to students' personal, cognitive and motivational,
and organisational variables.
Factor two: This factor contains five items related to teachers directing students in
the classroom: encouraging students to take decisions, creating imaginative situations,
encouraging independent thinking, encouraging students to ask any type of question and
praising openly new ideas expressed by students. This factor could be identified as
"Teacher-Initiation".
The third factor had significant loadings rangmg from 0.64 to 0.50 related to
organisation of classroom activities. The items were students' ideas or suggestions being
used during classroom discussions, encouraging discussion in groups and students asking
questions. This factor was called "Classroom organisation"
The fourth factor describes "teachers '-attention" m the classroom: becoming
anxious about unexpected questions and ignoring the students when they raise questions.
The significant scores on factor five are students getting the chance to speak in the class
and the teacher giving interesting examples from different fields. High negative scores
indicate disagreement with " Does the teacher discourage you from following your own
interests? This factor is called "Creating Interest".
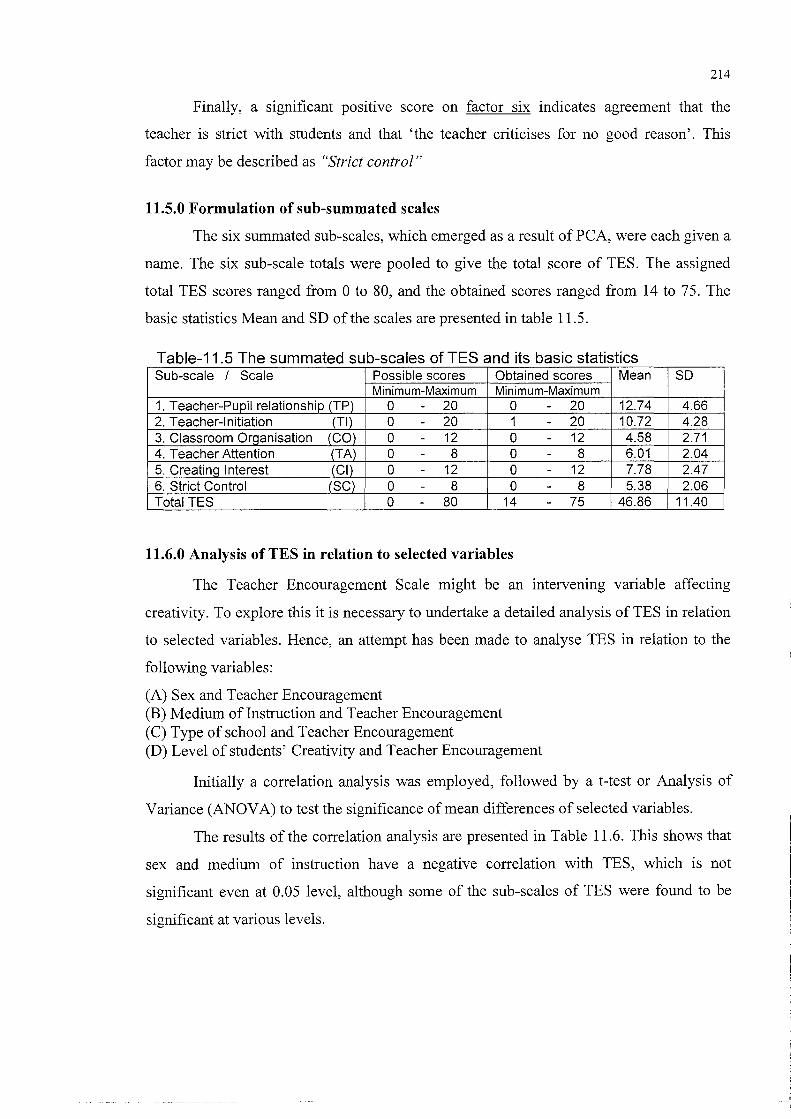
214
Finally, a significant positive score on factor six indicates agreement that the
teacher is strict with students and that 'the teacher criticises for no good reason'. This
factor may be described as "Strict control"
11.5.0 Formulation of sub-summated scales
The six summated sub-scales, which emerged as a result of PCA, were each given a
name. The six sub-scale totals were pooled to give the total score of TES. The assigned
total TES scores ranged from 0 to 80, and the obtained scores ranged from 14 to 75. The
basic statistics Mean and SD of the scales are presented in table 11.5.
Table-11 5 The summated sub-scales of TES and its basic statistics Sub-scale / Scale Possible scores Obtained scores Mean SO
Minimum-Maximum Minimum-Maximum 1. Teacher-Pupil relationship (TP)- 0 - 20 0 - 20 12.74 4.66 2. Teacher-Initiation (TI) 0 - 20 1 - 20 10.72 4.28 3. Classroom Organisation (CO) 0 - 12 0 - 12 4.58 2.71 4. Teacher Attention (TA) 0 - 8 0 - 8 6.01 2.04 5. Creating Interest -(cT) 0 - 12 0 - 12 7.78 2.47 6. Strict Control (SC) 0 - 8 0 - 8 5.38 2.06 Total TES 0 - 80 14 - 75 46.86 11.40
11.6.0 Analysis of TES in relation to selected variables
The Teacher Encouragement Scale might be an intervening variable affecting
creativity. To explore this it is necessary to undertake a detailed analysis ofTES in relation
to selected variables. Hence, an attempt has been made to analyse TES in relation to the
following variables:
(A) Sex and Teacher Encouragement (B) Medium ofInstruction and Teacher Encouragement (C) Type of school and Teacher Encouragement (D) Level of students' Creativity and Teacher Encouragement
Initially a correlation analysis was employed, followed by a t-test or Analysis of
Yariance (ANOY A) to test the significance of mean differences of selected variables.
The results of the correlation analysis are presented in Table 11.6. This shows that
sex and medium of instruction have a negative correlation with TES, which is not
significant even at 0.05 level, although some of the sub-scales of TES were found to be
significant at various levels.

215
Type of school consists of three groups, Girls', Boys' and Co-educational schools,
which enabled creation of two dummy vectors2. The correlation matrix shows that the
Girls' schools had a negative relationship with TES (-O.OS; p>O.OS), which is not
statistically significant. For Boys' schools (coded as '1 ') the relationship was positive
(r=.14) and highly significant. The mean (S1.00) for boys school students was higher than
the mean scores of students from co-educational schools (46.41) and girls (4S.96)
The correlation (r=.22) between students' level of creative thinking as
measured by Tests of Creative thinking3 and TES was highly significant at 0.001 level.
The correlations between TES sub-scales and level of creative thinking were also
significant at various levels. The positive relationship may be interpreted as: the greater the
teacher encouragement, the higher the level of the students' creative thinking.
Table-11 6· Correlations of selected variables with TES and its sub-scales Variable TP TI CO TA CI SC Total
TES 1.Sex -.11 * .00!l' -.12* .08!l' _.03!l' -.09'" _.08!l'
2.Midium of instruction -.08'" .19*** -.09"' -.22*** .08"' -.21*** _.06" 3. Type of School (TS-Girls) _.00!l' .00!l' .04 -.22*** .01!l' -.10'" _.05!l'
4. Type of School (TS-Boys) .05"' .31*** _.09# .02"' .13* -.06# .14** 5. Level of creativity .12* .14** .03'" .24*** .14** .14** .22*** Total TES .78*** .71*** .58*** .33*** .61*** .44*** 1.00 ..
. TP =Teacher-Pupil relationship TI =Teacher-Inltlatlon CO = Classroom Organisation TA =Teacher Attention CI = Creating Interest SC =Strict Control
* significant at 0.05 level ** significant at 0.01 level *** significant at 0.001 level
Further, an attempt has been made to probe into the question of variance between
TES and selected variables. ANOVA or t-tests were used to find the mean differences.
These are presented in Tables-II. 7 to 11.10.
11.7.1 Sex and Teacher Encouragement
A t-test analysis to look into the differences in mean between the boys and girls
was attempted. The results are revealed in table 11.7. On the overall assessment of Teacher
Encouragement Scale (TES) girls and boys did not significantly differ (t=1.49, p>O.OS),
although the girls' mean (47.S6) was slightly higher than the boys' mean (4S.77).
2 For more details of coding and creating dummy variables see Chapter X, sec. 10.4.0. 3 Verbal test of creative thinking as measured by Prof. Baqer Mehdi and non-verbal test of creative thinking as measured by Prof. Baqer Mehdi
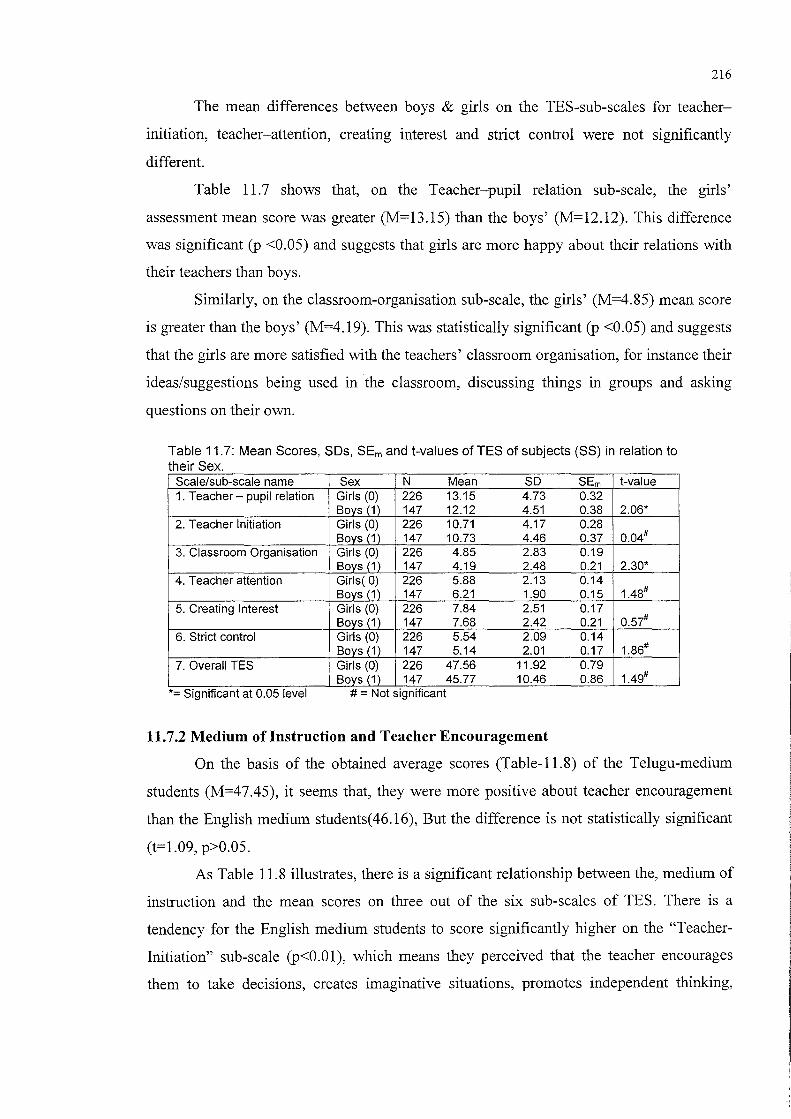
216
The mean differences between boys & girls on the TES-sub-scales for teacher
initiation, teacher-attention, creating interest and strict control were not significantly
different.
Table 11.7 shows that, on the Teacher-pupil relation sub-scale, the girls'
assessment mean score was greater (M=13.1S) than the boys' (M=12.12). This difference
was significant (p <O.OS) and suggests that girls are more happy about their relations with
their teachers than boys.
Similarly, on the classroom-organisation sub-scale, the girls' (M=4.8S) mean score
is greater than the boys' (M=4.19). This was statistically significant (p <O.OS) and suggests
that the girls are more satisfied with the teachers' classroom organisation, for instance their
ideas/suggestions being used in the classroom, discussing things in groups and asking
questions on their own.
Table 11.7: Mean Scores, SDs, SEm and t-values of TES of subjects (SS) in relation to their Sex
Scale/sub-scale name Sex N Mean SO SEm t-value 1. Teacher - pupil relation Girls (0) 226 13.15 4.73 0.32
Boys (1) 147 12.12 4.51 0.38 2.06* 2. Teacher Initiation Girls (0) 226 10.71 4.17 0.28
Boys (1) 147 10.73 4.46 0.37 0.04# 3. Classroom Organisation Girls (0) 226 4.85 2.83 0.19
Boys (1) 147 4.19 2.48 0.21 2.30* 4. Teacher attention Girls( 0) 226 5.88 2.13 0.14
Boys (1) 147 6.21 1.90 0.15 1.48# 5. Creating Interest Girls (0) 226 7.84 2.51 0.17
Boys (1) 147 7.68 2.42 0.21 0.57# 6. Strict control Girls (0) 226 5.54 2.09 0.14
Boys (1) 147 5.14 2.01 0.17 1.86# 7. Overall TES Girls (0) 226 47.56 11.92 0.79
Boys (1) 147 45.77 10.46 0.86 1.49# *= Significant at 0.05 level # = Not significant
11.7.2 Medium of Instruction and Teacher Encouragement
On the basis of the obtained average scores (Table-l1.8) of the Telugu-medium
students (M=47.4S), it seems that, they were more positive about teacher encouragement
than the English medium students( 46.16), But the difference is not statistically significant
(t=1.09, p>O.OS.
As Table 11.8 illustrates, there is a significant relationship between the, medium of
instruction and the mean scores on three out of the six sub-scales of TES. There is a
tendency for the English medium students to score significantly higher on the "Teacher
Initiation" sub-scale (p<0.01), which means they perceived that the teacher encourages
them to take decisions, creates imaginative situations, promotes independent thinking,
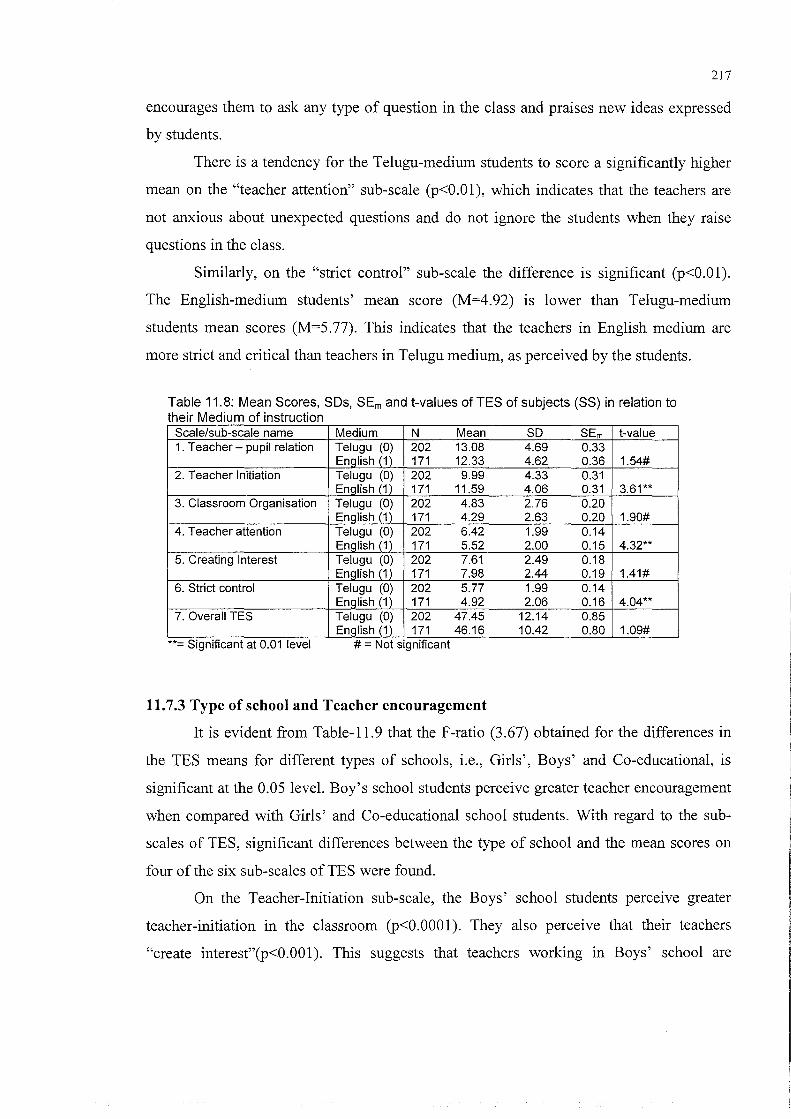
217
encourages them to ask any type of question in the class and praises new ideas expressed
by students.
There is a tendency for the Telugu-medium students to score a significantly higher
mean on the "teacher attention" sub-scale (p<0.0l), which indicates that the teachers are
not anxious about unexpected questions and do not ignore the students when they raise
questions in the class.
Similarly, on the "strict control" sub-scale the difference is significant (p<0.01).
The English-medium students' mean score (M=4.92) is lower than Telugu-medium
students mean scores (M=5.77). This indicates that the teachers in English medium are
more strict and critical than teachers in Telugu medium, as perceived by the students.
Table 11.8: Mean Scores, SDs, SEm and t-values of TES of subjects (SS) in relation to their Medium of instruction
Scale/sub-scale name Medium N Mean SO SEm t-value 1. Teacher - pupil relation Telugu (0) 202 13.08 4.69 0.33
EnQlish (1) 171 12.33 4.62 0.36 1.54# 2. Teacher Initiation Telugu (0) 202 9.99 4.33 0.31
EnQlish (1) 171 11.59 4.06 0.31 3.61** 3. Classroom Organisation Telugu (0) 202 4.83 2.76 0.20
EnQlish (1) 171 4.29 2.63 0.20 1.90# 4. Teacher attention Telugu (0) 202 6.42 1.99 0.14
EnQlish (1) 171 5.52 2.00 0.15 4.32** 5. Creating Interest Telugu (0) 202 7.61 2.49 0.18
English (1) 171 7.98 2.44 0.19 1.41# 6. Strict control Telugu (0) 202 5.77 1.99 0.14
English (1) 171 4.92 2.06 0.16 4.04** 7. Overall TES Telugu (0) 202 47.45 12.14 0.85
English (1) 171 46.16 10.42 0.80 1.09# **::: Significant at 0.01 level # ::: Not significant
11.7.3 Type of school and Teacher encouragement
It is evident from Table-l 1.9 that the F-ratio (3.67) obtained for the differences in
the TES means for different types of schools, i.e., Girls', Boys' and Co-educational, is
significant at the 0.05 level. Boy's school students perceive greater teacher encouragement
when compared with Girls' and Co-educational school students. With regard to the sub
scales of TES, significant differences between the type of school and the mean scores on
four of the six sub-scales of TES were found.
On the Teacher-Initiation sub-scale, the Boys' school students perceive greater
teacher-initiation in the classroom (p<0.0001). They also perceive that their teachers
"create interest"(p<O.OOl). This suggests that teachers working in Boys' school are

218
perceived as creating interest among the students and encouraging the students to be self
reliant to a greater extent than those in girls or co-educational schools.
With regard to the sub-scales for "teacher attention" and "strict control", the
students from co-educational schools scored higher means 6.34 and 5.61 respectively,
Table -11.9: Mean Scores, SOs, SEm and F-ratio of TES of subjects (SS) in relation to the type of the school (sex wise)
Scale/sub-scale Type of N Mean SD SEm F-ratio Mean name the school 1. Teacher - pupil GI-Girls III 12.71 4.54 0.44 relation G2-Boys 47 13.33 3.88 0.57 0.42#
G3-Co-edu 215 12.63 4.88 0.33 G1-Girls 111 10.75 3.89 0.37 G2
2. Teacher Initiation G2-Boys 47 14.20 3.93 0.58 20.66**** G1 * G3-Co-edu 215 9.94 4.18 0.29 G3 *
3. Classroom G1-Girls 111 4.75 2.68 0.26 Organisation G2-Boys 47 3.96 2.35 0.35 1.48#
G3-Co-edu 215 4.63 2.79 0.19 G1-Girls 111 5.34 2.02 0.19 G1
4. Teacher attention G2-Boys 47 6.11 1.90 0.28 G2 * G3-Co-edu 215 6.34 2.01 0.14 9.14*** G3 * G1-Girls 111 7.81 2.52 0.25 G2
5. Creating Interest G2-Boys 47 8.59 2.28 0.34 3.16* G3-Co-edu 215 7.58 2.46 0.17 G3 * G1-Girls 111 5.08 2.14 0.20 G1
6. Strict control G2-Boys 47 5.04 2.11 0.31 3.19* G3-Co-edu 215 5.61 1.99 0.14 G3 * G1-Girls III 45.96 10.39 0.99 G2
7. Overall TES G2-Boys 47 51.00 9.27 l.35 3.67* Gl * G3-Co-edu 215 46.41 12.12 0.82 G3 *
**** Significant at 0.0001 level ***Significant at 0.001 level *Significant at 0.05 level
when compared to their counterparts. The F-ratios for "teacher-attention" scale and "Strict
control" scales are found to be 9.14 (p<0.001) and 3.19 (p<0.05) respectively. This
indicates that the teachers working in co-educational institutions are perceived as more
flexible and more attentive in the classroom.
11.7.4 Students' level of creative thinking and TES.
The correlation (r=.22, p<O.OOl) between level of creativity and teachers'
encouragement as measured by TES was highly significant at 0.001 level( see table-1 1.6).
Further, Analysis of Variance (AN OVA) was applied to see the mean differences among
the three categories of low, average and high creativity. The classification into the three
groups was explained in Chapter X, in sec. 10.5.1.
Table 11.10 shows that the TES mean scores of low, average and high creativity
groups were 43.00,46.68 and 51.47 respectively. There seem to be differences in the mean
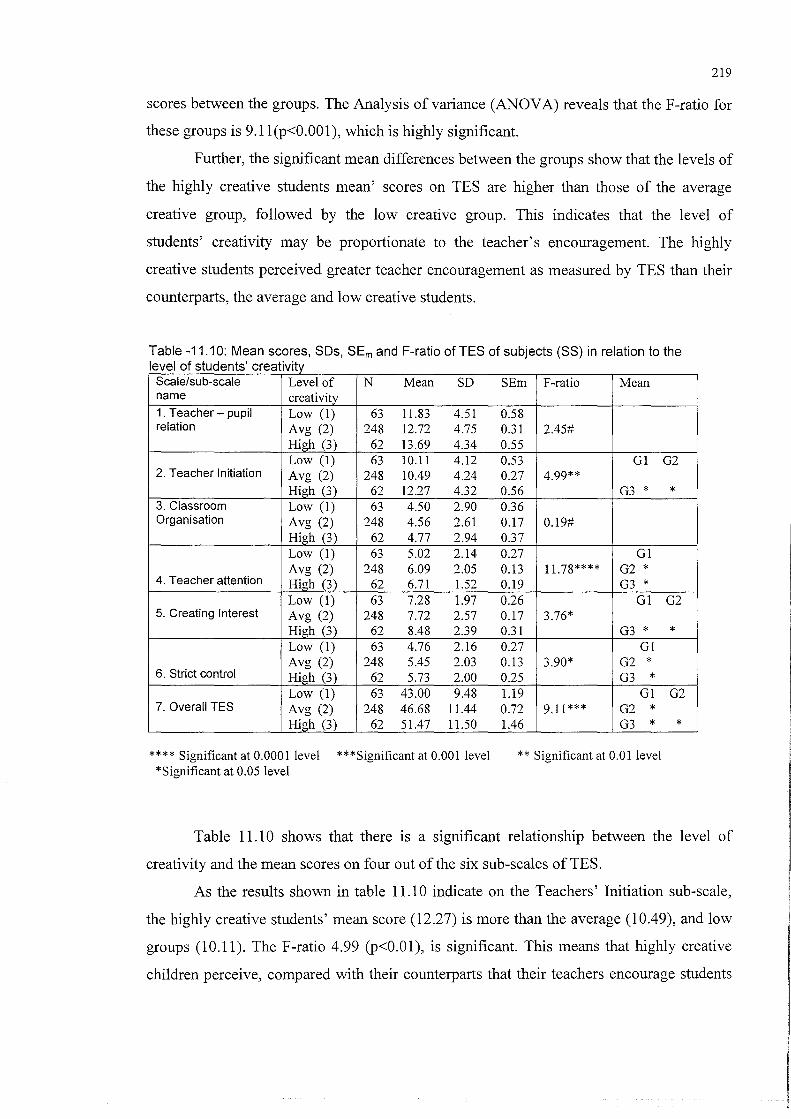
219
scores between the groups. The Analysis of variance (ANOVA) reveals that the F-ratio for
these groups is 9.11(p<0.001), which is highly significant.
Further, the significant mean differences between the groups show that the levels of
the highly creative students mean' scores on TES are higher than those of the average
creative group, followed by the low creative group. This indicates that the level of
students' creativity may be proportionate to the teacher's encouragement. The highly
creative students perceived greater teacher encouragement as measured by TES than their
counterparts, the average and low creative students.
Table -11.10: Mean scores, 80s, 8Em and F-ratio of TE8 of subjects (88) in relation to the I 1ft d ' eve 0 s u ents creativity
Scale/sub-scale Level of N Mean SD name creativity 1. Teacher - pupil Low (1) 63 11.83 4.51 relation Avg (2) 248 12.72 4.75
High (3) 62 13.69 4.34 Low (1) 63 10.11 4.12
2. Teacher Initiation Avg (2) 248 10.49 4.24 High (3) 62 12.27 4.32
3. Classroom Low (1) 63 4.50 2.90 Organisation Avg (2) 248 4.56 2.61
High (3) 62 4.77 2.94 Low (1) 63 5.02 2.14 Avg (2) 248 6.09 2.05
4. Teacher attention High (3) 62 6.71 1.52 Low (1) 63 7.28 1.97
5. Creating Interest Avg (2) 248 7.72 2.57 High (3) 62 8.48 2.39 Low (1) 63 4.76 2.16 Avg (2) 248 5.45 2.03
6. Strict control High (3) 62 5.73 2.00 Low (1) 63 43.00 9.48
7. Overall TES Avg (2) 248 46.68 11.44 High (3) 62 51.47 11.50
**** Significant at 0.0001 level ***Significant at 0.001 level *Significant at 0.05 level
SEm F-ratio Mean
0.58 0.31 2.45# 0.55 0.53 G1 G2 0.27 4.99** 0.56 G3 * * 0.36 0.17 0.19# 0.37 0.27 G1 0.13 11.78**** G2 * 0.19 G3 * 0.26 Gl G2 0.17 3.76* 0.31 G3 * * 0.27 Gl 0.13 3.90* G2 * 0.25 G3 * 1.19 G1 G2 0.72 9.11 *** G2 * 1.46 G3 * *
** Significant at 0.01 level
Table 11.10 shows that there is a significant relationship between the level of
creativity and the mean scores on four out of the six sub-scales ofTES.
As the results shown in table 11.10 indicate on the Teachers' Initiation sub-scale,
the highly creative students' mean score (12.27) is more than the average (10.49), and low
groups (10.11). The F-ratio 4.99 (p<0.01), is significant. This means that highly creative
children perceive, compared with their counterparts that their teachers encourage students

220
to take decisions, create imaginative situations in the class, encourage them to think
independently, encourage them to ask any type of question, and praise them for new ideas.
With regard to the "teacher-attention" sub-scale, the F-ratio was found to be 11.78.
This is highly significant at 0.0001 level. This indicates that highly creative children
perceive that their teachers do not ignore them when they raise questions and the teachers
are not anxious when they ask unexpected questions, when compared to their counterparts
in average and low creative groups.
For the sub-scale "creating interest", the F-ratio was found to be 3.76, which is
significant (p<0.05). The high mean score for the highly creative group (8.48) indicates
that they perceive that their teachers give more interesting examples from different fields,
that they have the opportunities to speak and that they are not discouraged from following
their own interests, when compared to the average and low creative groups.
Finally, on the "strict control" scale, the F-ratio was found to be 3.90, which is
significant at 0.05 level. The highly creative groups mean score (5.73) is higher than those
of the average (5.45) and low creative groups (4.76). This means that low and average
creative group students felt that the teachers were stricter with them and criticised them
more for no good reason, when compared with the high creative group.
Section II
11.8.0 Analysis of School Activities
In this section the activities organised by the schools for the promotion of creativity
are discussed under six broad categories. The relevant activities have been brought
together into categories to enable meaningful interpretation of the results. The questions
added and the organisation of the categories are based on the relevant literature which will
be briefly considered at the beginning of each section.
Teaching within school alone may not be adequate in this rapidly changing world;
provision needs to be is made for students to be aware of and learn from the outer world.
Learning can take place out of school as well as in school. Teachers should help students'
in discovering different things in the local environment (community) first, and relate these
learning experiences to normal classroom lessons. This will give real meaning and context
to the students' experience as well as contributing to their understanding of particular
subjects and topics.
UNESCO (1996) emphasise the provision of opportunities for children as follows:

"It is therefore important to provide children and young people with every possible opportunity for discovery and experiment - aesthetic, artistic, sporting, scientific, cultural and social - as well as appealing introductions to the creation of their contemporaries or earlier generations. Art and poetry, too often taught in a way that has become more utilitarian than cultural, should again be given more importance in schools then is commonly the case in many countries. The desire to develop the imagination and creativity should also result in higher regard being paid to oral culture and knowledge derived from the child's or adults' experience" (p. 95).
221
It is also appropriate to mention Harrison's (1970, p.9) view on how learning takes
place out of the school:
There is a growing concern to widen children's horizons. The cloistered idea of education is out and more and more people realise that a child is more likely to learn to live creatively in the world if he has not been separated from that world while he is growing up. This does not of course detract from the great importance of education in school but underlines the idea that education at home, in the club, the street, the museum and the library is just as fruitful and that parents and teachers need to consider the child's environment as a whole.
11.8.1 Expressive and Explorative Activities
"Creativity involves expressing ideas and feelings and using a range of ways to do"
(Beetlestone, 1998, p.2). It involves making: using the imagination, creating, composing,
authorship, musical skill, performance, planning, constructing, building technical skills and
large and small scale output - it is almost like a production line (pp. 2-3).
Taking account of these perspectives, schools need to organise expreSSive and
explorative activities for promoting the talents of their students. Mathematics clubs,
Science clubs or other subject clubs are helpful in encouraging pupils to carry out their
ideas. As Kids' Clubs Network suggest (1992, p.S) 'an out-of-school club is a centre of
child development through socialisation, play, relaxation and recreation'.
These clubs may be formed with interested students under the supervision of the
subject teacher/s, on the school premises to enhance the child's security. These clubs may
open after school hours between 4.30 PM to 6.30 PM in the evening and also in school
holidays from 10.00 AM to 4.00 PM or they can negotiate a timing suitable for the
students and teachers. Of course these timings may not suit shift schools which close in
early afternoons. These can fix their own timings
The clubs may be divided into groups, depending on how many members they
have, to undertake projects, to visit important sites in or outside the city under the
supervision and direction of the subject teacher. Here the teacher acts as chief organiser,
advisor and general consultant.
222
Presentations in seminars or in classrooms gIve an opportunity for students to
express their ideas, their project results or content from any school curriculum subject. In
such presentations the students may prepare and use OHP transparencies, handouts, wall
posters, models, etc., to make the presentation impressive and attractive. A presentation
involves many things which need to be considered: the aim of the presentation / purpose
(the Why), the content/ message (the What), the audience / classmates (the Who), the
learning method (the How) and the learning environment (the When (time) and Where
(location)) (see Herring, 1996,p.147-48).
Further, as Herring said, the quality of an oral presentation, gIven suitably
structured and intellectually coherent content, depends on its delivery. The ability of pupils
to deliver oral presentations will very much depend on what experience they have had in
making presentations in their school career (p.148)
The library occupies a generalist position in the information network, as a place
where students expect to be able to find things out. The laboratory allows the students to
explore, experiment and opens the doors for new avenues. This is the place where students
can search for truth, find solutions to many unanswered questions, search for concrete
evidences and draw conclusions. The laboratory gives scope for students to formulate their
hypotheses or assumptions and test them. Literature will enrich the imagination, the
intellect, and will be an experience in their lives. Entering the realm of books fires the
child's imagination.
The recent innovation of the Internet has brought about a revolution in the world of
information technology. The Internet is a source of information, like a vast library which
holds bundles of information in the form of texts, graphics, sound, video etc. The Internet
also provides searching facilities for exploring or seeking information from all over the
world.
To assess the provision of such resources in the schools, the head teachers were
asked whether or not Science and Mathematics clubs were established for encouraging
pupils to explore ideas in their schools, and if not, whether they should be established. Out
of nine schools, four schools (44%) said that they had Science and Mathematics clubs.
However, there was a high level of agreement (100%) for the need to establish clubs in the
school. A total of 78% (7 schools) said that they assisted pupils in participating in activities
of student interest inside and outside the school, and special lectures/programmes to inspire
the students were organised by eminent personalities in different fields (e.g. Artists,

223
Musicians, Scientists, Writers etc.). There were very few schools (22%) which organised
Science fairs and Exhibitions, but about 80% of the schools participated in Science fairs
and Exhibitions (see table 11.11).
A small percentage of schools (33%) were able to organise seminars and encourage
student presentations in the school or class. A large number of schools failed to provide
library facilities (89%) and laboratory facilities (78%). All the schools failed to provide
computer facilities or publish school magazines to encourage students' publications.
T bl 11 11 E a e: xpresslon an dE f AfT xp ora Ion C IVI les organise d· th In h esc 00 S Organised in the Need to be
an Statement school organised in the 0 school
Yes (%) No (%) Yes (%) No (%)
1. Encouraging pupils to explore ideas through (i) Science clubs 4 (44) 5 (56) 5 (100)* (ii) Maths clubs 4 (44) 5 (56) 5 (100)*
2. Assist pupils in participating in the activities of their 7 (78) 2 (22) 1 (50) interest in and outside the school
3. Organisation of (i) Science fairs 2 (22) 7 (78) 7 (100)* (ii) Exhibitions 2 (22) 7 (78) 7 (100)* Participation in (i) Science fairs 7 (78) 2 (22) 2 (100)* (ii) Exhibitions 7 (78) 2 (22) 2 (100)*
4. Special lectures/Programmes organised to inspire the 7 (78) 2 (22) 2 (100)* students by eminent personalities in different fields ego artists, musicians, scientists, writers etc.,.
5. Organised / Encouraged (i) Seminars, 3 (33) 6 (67) 6 (100)* (ii) Student presentations in the school/class 3 (33) 6 (67) 6 (100)*
etc.,
6 School magazines to encourage students publications 0 (00) 9 (100) 9 (100)*
15 Computers provided for the students 0 (00) 9 (100) 8 (89) 1 (11) (eg. Computer applications.! Internet / Computer games)
16 Laboratory facilities available for the students in the 2 (22) 7 (78) 7 (100)* school
17 Library facilities provided for the students in the 1 (11 ) 8 (89) 7 (88)* 2 (22) school
Note: Percentages WithIn the brackets were rounded to Integers * Percentages calculated on the basis of 'No' responses to 'Organised in the school'
224
11.8.2 Exhibiting Art and related activities.
Schools can also make successful use of visiting artists. These artists may be local
artists, those who are undertaking art work or art courses, craftsmen and technicians. Such
visits will greatly encourage students' curiosity and enthusiasm. The purposes of teaching
of art to children are: to develop their artistic skills drawing, painting, printing, use of
colour, use of textiles, 3-D modelling; develop their visual perception, visual literacy and
appreciation; develop appreciation of the work of other artists from a variety of cultures
and styles, and give opportunity for personal expression and creative endeavour. Central to
art education is to develop observational skill and drawing- sketching, drafting, and editing
(Piotrowski, 1994,p.138-40).
It is also important to make the classroom more interesting for the students. This
may be possible by providing displays on the wall, which will attract the attention of the
children and encourage them to think. These displays can promote flashbacks to previous
thoughts, strengthen ideas or lead to the generation of spontaneous ideas. Beetlestone
(1998, pp.73-74) emphasises the use of displays and how they enhance the creative
process:
Teachers should use displays to
- show that children's work is valued and enhance individual self-esteem; - provide an audience for work to be viewed critically, developing the skills needed for aesthetic appreciation; - provide chances for children to do their own displays, increasing a feeling of ownership and aesthetic
discrimination; - and enable interaction so children can learn through enactive as well as iconic and symbolic modes,
promoting a feeling of ownership of the displays.
The exhibition of students' own artwork, and of other school students' artwork or
visits to other schools can develop a competitive spirit among students. It is also important
that the practice of reproduction of the works of master artists by the students is facilitated
to promote understanding of the meaning of the picture. They need to start thinking, why
that picture is considered important? Why is it unique? These activities can encourage a
strong desire of inspiration to produce such work on their own.
Chapman (1997, pp.l14-15) explains the learning sequence in four processes4 and
applies this to painting:
4 The learning sequence divides into four processes which are interconnected and interact with each other. They are perceiving (sensing, receiving, experiencing); transforming (thinking, feeling, imagination, intuition

225
When painting a landscape (expressing), a child is observing and absorbing a scene in the natural environment (perceiving); thinking about the way the scene might be interpreted or changed to achieve the desired effect (transforming); and standing back to view, analyse, criticize and reflect upon the work as it progresses and when it is completed (appreciating).
The headteachers were asked about the promotion of creative activities in their
school. Table 11.12 shows that, drawing and painting, were the most common activities
conducted in the schools (67%). But about 70% of schools failed to 'exhibit or display
student artwork in school' and 'exhibit / display other schools' artwork or visit other
schools'. They also failed to do 'reproduce the works of master artists (89%) by the
students' and 'reproduce the work of their school students by other students' (100%).
Further, they failed to organise videos pictures (100%), slide shows (67%) or film shows
(56%).
T bl 11 12 E h·bT Art d ltd f T a e: x I ling an re a e ac IVI les organise d· th In h esc 00 S. Organised in the Need to be
school organised in the Q.No Statement school
Yes (%) No (%) Yes (%) No (%)
7 Exhibition I display of students' art works in the school. 3 (33) 6 (67) 6 (100)*
8 Exhibition I display of other school student's art work or 3 (33) 6 (67) 6 (100)* visit to other schools
9 (i) Reproduction of the works of master artists by the 1 (11 ) 8 (89) 7 (88)* 1 (11)* students
(ii) Reproduction of your school students' art works 0 (00) 9 (100) 7 (78)* by other students
10 Organised shows for the students (i) Films 4 (44) 5 (56) 4 (80)* (ii) Slides 3 (33) 6 (67) 5 (83)* (iii) Videos 0 (00) 9 (100) 6 (67)*
11 Drawing and painting activities 6 (67) 3 (33) 3 (100)* Note: Percentages Within the brackets were rounded to Integers * Percentages calculated on the basis of 'No' responses to 'Organised in the school'
11.8.3 Handicraft and related activities
Constructing or designing with different materials can help in pupils'
understanding of shapes. Through handcraft and related activities pupils can gain greater
knowledge and understanding about what they are doing. The children are not only
actively participating but also work themselves in a practical way. As Moyles (1989, p.79)
argues, natural materials such as wood, clay, sand and water lend themselves to free
and problem-solving); expressing (revealing thoughts, feelings and understanding in artistic form); and appreciating (reflecting, analysing, criticizing and valuing art).

226
exploration and to the development of children's imaginative interpretation. They have
properties which 'are highly conducive to creative play'.
From table 11.13, it can be seen that about 70% of schools encouraged students in
construction and design using clay, plaster of Paris, wood etc. More than 50% of schools
trained their students in embroidery, knitting etc. A high percentage (88%) of schools
failed to provide opportunities for the students to make masks and puppets.
T bl 11 13 H d' ft d ltd f T a e: an Icra an re a e ac IVI les organise d' th In h esc 00 S Organised in the Need to be organised
Qno Statement school in the school Yes % No % Yes % No %
12 Masks and puppets made from paper bags, paper 2 (22) 7 (88) 6 (86)* 1 (14)* mache (paper strips pasting layer after layer I paper pulp) and other materials.
13 Constructions and designs with clay, plaster of 6 (67) 3 (33) 1 (33)* 1 (33)* Paris, wood etc.,
14 Embroidery, knitting, etc., 5 (56) 4 (44) 3 (75)* Note: Percentages within the brackets were rounded to Integers * Percentages calculated on the basis of 'No' responses to 'Organised in the school'
11.8.4 Outings and related activities
"Museums are treasure-houses. These treasures may have been brought from the
end of the earth; they may be things of today or of long ago; they may be natural things or
man-made things" (Harrison, 1973,p.6). Elegantly designed 'Cabinets of Curiosity' or
'Closets of Rarities' housed these early collections (Adams, 1989,p.1). Museums are in a
unique position to alleviate ignorance and to foster and satisfy interest (DES, 1973,p.8).
"Museums and galleries offer the visitor a scintillating array of the treasures of
man's past. Treasures in various forms, ranging through man's highest artistic
achievements, his scientific discoveries, his progress in technology, his means of travel,
exploration and discovery, his everyday life, his struggles with his own kind and natural
background" (UNESCO, 1973,p.23). Museums for demonstration and exploration of
man's origins, history and achievements, artistic, technical or scientific, particularly in a
regional or local context, can both encourage a sense of continuity with the past and help to
explain the context of local society in a time of social change and technological advance
(DES, 1973, p.8).
Museums can fire the imagination; they can set standards and widen horizons; they
can help to develop the ability to concentrate, explore and observe; above all they can be
enjoyed (Harrison, 1970,p.11-12). By imaginative displays and interpretation museums can

227
impart knowledge, provoke questions, stimulate thought and lead their visitors on to
further study (DES, 1973,p.8).
Through visiting art galleries / art exhibitions students can realise the importance of
art and how people have enjoyed art throughout history and across cultures. Children may
notice and give attention to general structures and specific details. They should be
encouraged to look at shapes in order to discern patterns, line, similarities and differences.
They should then analyse and describe their observations. Often this is done by sketching
and drawing (Piotrowski, 1994, p.139).
Field trips are a most important device for studying community resources5. Field
trips provide not only an interesting approach to learning but also one that provides
answers to many of students' queries (Khan, 1980, pp. 15-16). Field trips or excursions can
provide opportunities to learn through experience and direct contact with the field. They
also offer excitement, pleasure and curiosity to the children.
The majority of the schools arranged visits to historical monuments (78%) and
museums (78%). From table 11.14 it is also evident that many secondary schools do not
have any sort of outdoor activities going on. Schools mostly failed to visit art galleries
(100%), craftsmen work places (89%), technicians' work places (89%), artists work places
(67%) and art exhibitions (56%). These results indicate that the schools give little
importance to art-related activities.
T bl 11 140 f a e u mg an d . ltd f T triPS re a e ac IVI les organise d· th In h esc 00 S Organised in the school Need to be organise
Qno Statement in the school Yes (%) No (%) Yes (%)* No
18 Visits to 1. Historical monuments 7 (78) 2 (22) 2 (100)* 2. Art galleries 0 (00) 9 (100) 6 (67)* 1 (11)* 3. Museums 7 (78) 2 (22) 2 (100)* 4. Art exhibitions 4 (44) 5 (56) 3 (60)* 5. Local artists Work places 3 (33) 6 (67) 4 (67)* 6. Craftsmen's work places 1 (11 ) 8 (89) 5 (63)* 7. Technicians' work places 1 (11 ) 8 (89) 5 (63)*
19 Organised 1. Field trips 3 (33) 6 (67) 5 (83)* 2. Educational Tours I Excursions 6 (67) 3 (33) 2 (67)*
Note: Percentages Within the brackets were rounded to Integers * Percentages calculated on the basis of 'No' responses of 'Organised in the school'
5 For example the community's natural resources, the industries, services and occupations, the physical setting of the community, streets and transport system.

228
The majority of schools (67%) organised educational tours and excurslOns.
However 67% of schools failed to organise field trips.
11.8.5 Competitive and Voluntary activities
Games and sports have long been assumed to influence character and conduct.
Teamwork helps children to get along with others. It instils into them a spirit of
sportsmanship. Social ties strengthen and pupils learn the lesson that to obey is as important
as to give orders. Straight forwardness, endurance and fairness can result from games
playing. Games can improve physical health, which in its turn can pave the way for moral
health. In the case of inter-school competition, the child can learn the lesson of loyalty, team
spirit and love (Khan, 1980, p.20). Games can be helpful in channelling the energies,
developing high competitive spirit, developing the tendency of looking for various possible
solutions in challenging situations and struggling determinedly to achieve a goal. Of course
they may not always achieve these ends. Head teachers were asked questioned about
competitive and voluntary activities in their schools.
The data in table 11.15 indicate that a high percentage of schools were able to
conduct debates (100%) and essay competitions (89%) for their students. Besides these
about 90% of the schools were successful in providing games and sports but only 56% of
the schools provided opportunities for athletics. As for "voluntary social activities', most
schools failed to run NSS, NCC and Scouts (89% each). Generally they also did not
provide vocational training for students (67%) or socially useful productive work (56%).
T bl 11 15 C a e: tT ompe live an d V I t f T o un ary ac IVI les organise d' th In h esc 00 S Organised in the school Need to be organise
Qno Statement in the school Yes (%) No (%) Yes (%) No (%)
20 1. Debate 9 (100) 0 (00) 2. Essay competition 8 (89) 1 (11 ) 1 (100)*
21 1. Sports 8 (89) 1 (11 ) 1 (100)* 2. Athletics 5 (56) 4 (44) 2 (50)* 3. Games 8 (89) 1 (11 ) 1 (100)*
22 (i) National Service Scheme (NSS) 1 (11 ) 8 (89) 8 (100)* (ii) National Cadet Corps (NCC) 1 (11 ) 8 (89) 8 (100)*
(iii) Scouts 1 (11 ) 8 (89) 8 (100)*
23 1. Socially Useful Productive Work (SUPW) 4 (44) 5 (56) 5 (100)* 2. Vocational training 3 (3~ 6 1671 6 1100)*
Note: Percentages Within the brackets were rounded to Integers * Percentages calculated on the basis of , No' responses to 'Organised in the school'

229
11.8.6 Decorative and Artistic Activities
School grounds offer a potentially limitless range of experiences and opportunities
for the children. Children spend a great deal of their childhood in school grounds (Titman,
1994, p.103).
Titman writes that 'an ideal playground is a place for doing, a place for thinking, a
place for feeling and a place for being'. While explaining school grounds as a place for
thinking, he writes that they can provide intellectual stimulation, things which can be
discovered and studied and learned about by pupils themselves and with friends. This
allows pupils to explore, discover and understand more about the world they live in (p.58).
Gardening has obvious benefits to physical development, which in tum affects
creative development (Beetlestone, 1998, p.122). It provides opportunities to create new
plant life and thus to stimulate children's spiritual and emotional development. Working
outside provides a sensory environment where children are exposed to changes in light,
temperature and elements of weather and to a range of auditory and visual images. The
visual perspective is wider, further distances are involved and thus the child's focus is
broadened. Gardening is also a social experience in which children have a chance to create
something collaboratively and to share their creative experience (p.124).
The true nature of educational drama lies in the exploration and communication of
ideas, issues, subject content, themes, stories and feelings through participatory action and
imagination. "Drama is not only to train the children to be actors, but can enable them to
learn in a way which is active, experimental and memorable" (Clipson-Boyles, 1997). It
can be used as a learning method. It also provides strong and meaningful contexts for
evaluation and reflection (pp.204-05). "Providing for imaginative exploration of ideas
through play and drama is essential for developing creativity" (Beetlestone, 1998, p.89).
Further, Beetlestone explains that role-play helps children to bridge the gap between
fantasy and reality. Imagination often takes us into the realm of fantasy. In role-play
children can tryout new versions of their characters (pp. 77-78).
If creativity is about expressing inner ideas, feelings and emotions then it is also
about children's play - the normal way in which the young will express their ideas. "We
can use playas a bridge between the world of the imagination and world of reality" (Ibid,
p.79). Similarly mono-actions, fancy dress and singing can help in the discipline of groups,
as they involve shared tasks, planning, co-operation and the presentation of information
verbally or symbolically.
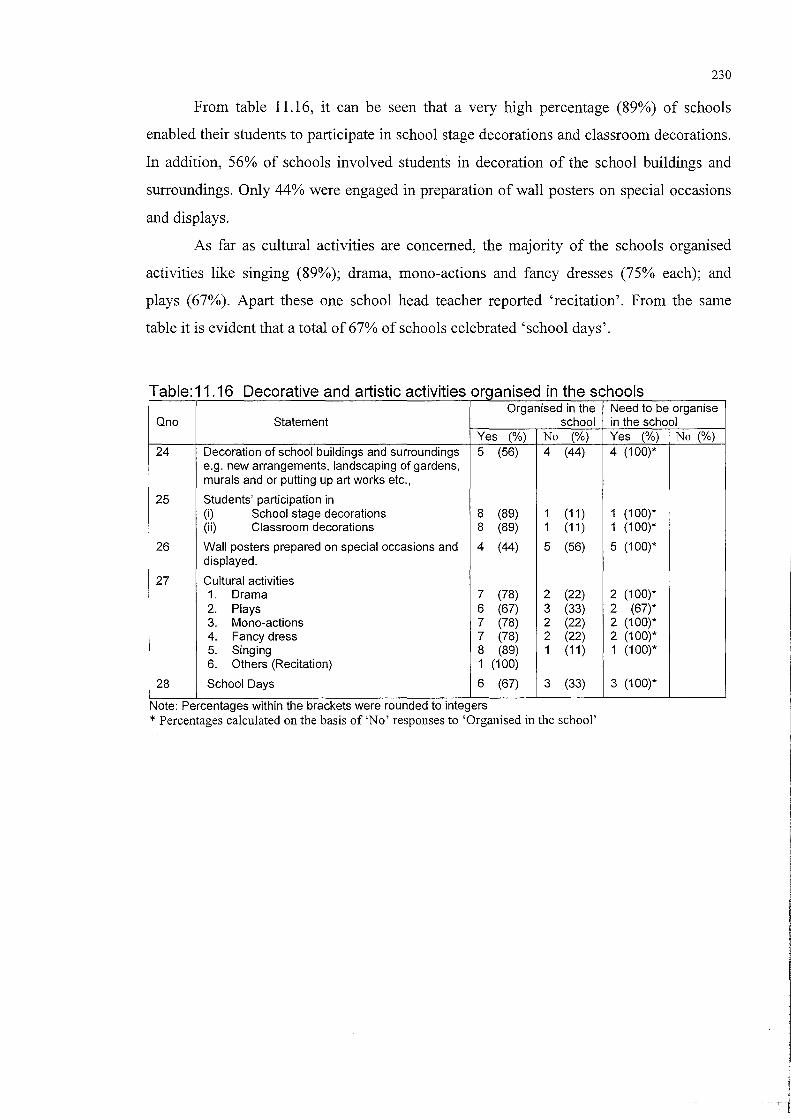
230
From table 11.16, it can be seen that a very high percentage (89%) of schools
enabled their students to participate in school stage decorations and classroom decorations.
In addition, 56% of schools involved students in decoration of the school buildings and
surroundings. Only 44% were engaged in preparation of wall posters on special occasions
and displays.
As far as cultural activities are concerned, the majority of the schools organised
activities like singing (89%); drama, mono-actions and fancy dresses (75% each); and
plays (67%). Apart these one school head teacher reported 'recitation'. From the same
table it is evident that a total of 67% of schools celebrated 'school days'.
T bl 11 16 0 a e: f eeora Ive an d rf f f T a IS Ie ae IVI les organise d· th In h e se 00 S Organised in the Need to be organise
Qno Statement school in the school Yes (%) No (%) Yes (%) No (%)
24 Decoration of school buildings and surroundings 5 (56) 4 (44) 4 (100)* e.g. new arrangements, landscaping of gardens, murals and or putting up art works etc.,
25 Students' participation in (i) School stage decorations 8 (89) 1 (11 ) 1 (100)* (ii) Classroom decorations 8 (89) 1 (11 ) 1 (100)*
26 Wall posters prepared on special occasions and 4 (44) 5 (56) 5 (100)* displayed.
27 Cultural activities 1. Drama 7 (78) 2 (22) 2 (100)* 2. Plays 6 (67) 3 (33) 2 (67)* 3. Mono-actions 7 (78) 2 (22) 2 (100)* 4. Fancy dress 7 (78) 2 (22) 2 (100)* 5. Singing 8 (89) 1 (11 ) 1 (100)* 6. Others (Recitation) 1 (100)
28 School Days 6 (67) 3 (33) 3 (100)*
Note: Percentages WIthin the brackets were rounded to Integers * Percentages calculated on the basis of 'No' responses to 'Organised in the school'

231
Section - III
11.9.0 The Exploratory Model of the correlates of creative thinking (CT)
To predict the variables contributing to developing creative thinking among the
Indian school students, initially, a Stepwise Multiple Regression Analysis was performed.
As already mentioned in Chapter VIII, the variables were divided into three categories:
background, organisational and cognitive and motivational. The variables under these
categories were combined to study their relative contribution to developing creative
thinking. The formulated hypothesis is that variation in creative thinking is a function of
the variables classified under the above categories.
11.9.1 Multiple Regression Analysis:
The process of constructing a linear equation that will predict the values of a target
(dependent) variable from knowledge of specified values of a regressor (Independent
variable) can readily be extended to situations where we have data on two or more
independent variables. The construction of a linear regression equation with two or more
independent variables (or regressors) on the right hand side is known as Multiple
Regression.
There are two approaches to multiple regreSSIOn. In simultaneous multiple
regression, all the available independent variables are entered in the equation directly. In
Stepwise Multiple Regression, the independent variables are added to (or taken away from)
the equation one at a time, the order of entry (or removal) being determined by statistical
considerations. Despite the appeal of the second approach, however, there is the
disconcerting fact that the addition of another 'Independent' variable can completely
change the apparent contributions of the other regressors to the variance of score on the
dependent variable (Kinnear and Gray, 1997,p.262)
Initially, those variables which were hypothesised to have an effect on creative
thinking were entered into a Stepwise Multiple Regression equation where creative
thinking was regressed on the selected variables. A total of 14 variables, were considered
for the Multiple Regression Analysis. Some of the variables, such as students'
occupational choices, liking and disliking of subjects, good and bad school experiences
etc., were discarded because they had multiple responses. In addition, entering too many

232
variables into the regression equation creates a more complex analysis which can be
difficult to interpret6. The coding of the variables in this model is given in Appendix-E4.
Table-II.I7 shows selected parts of the output (SPSS) for the forward stepwise
regression of creative thinking (dependent variable) on all the 13 regressors (independent
variables). Out of 13, only 4 independent variables were entered by SPSS into the
regression equation. The remaining 9 variables did not reach the criteria (see note under
table 11.17 for the list of variables). In this analysis, variables with the F -ratio smaller than
4.0 were not entered into the equation. The variable with the highest correlation with the
dependent variable was entered into the equation first.
Table 11.17: Stepwise multiple regression analysis of combined variables (background, organisational and cognitive and motivational variables) with creative thinking as the dependent variable (X14)
""0 <1> (/) ""0
Variables in the equation C :Oc_ ~c::_ ca.Q a5 .- 0 C "'0 W._ E ° OO .~ c (/) () ro (/) () C !!!~:E -g~E Q) (/) OJ <1> ro OJ <1> EN 0 c <1> 0 _<1>0 ::JC::() U)C::() ~o:: ~
'& u ....
[3 SE[3 Beta 0:: E.!: , -LL "0
1. School activities (X13) 200.73 2.08 0.25 0.40 0.40 0.16 - 70.18*** 1/371 2. Mother education (~) 185.87 5.25 1.27 0.19 0.44 0.19 0.03 45.16*** 2/370 3. Teacher 167.70 0.48 0.15 0.15 0.47 0.22 0.03 34.02*** 3/369
encouragement (X12) 4. Mother income (Xa) 167.08 6.04 2.40 0.12 0.48 0.23 0.01 27.46*** 4/368
C = Constant; ~= Regression coefficient; SE~ = Standard Error of Regression Coefficient; Beta = Standard regression coefficient; df = degrees of freedom; *** = Significant at 0.001 Note: Sex (X1); Age (X2); Father Education (X3), Occupation (Xs), and Income (X7); Mother Occupation (Xs); Medium of Instruction (Xg); and Type of the school (two Dummy variables-TS-Boys (XlO) and TSGirls (X11 )) were not entered in the equation.
In the first step, school activities (X13) contributed 16% of the variance. In the
second and third steps, mother's education (~) and teacher encouragement (xd as
perceived by the students contributed another 3% each. In the final step, mother's income
(Xg) was entered, providing an additional 1 % contribution. The total contribution of all
these independent variables yielded a maximum contribution of 23% for the prediction of
creativity in students.
The above regression analysis suggests that school activities, mother's education,
teacher encouragement and mother's income are the most important factors in determining
a student's creativity. The correlations of the above factors with creativity were also very
6 Ifsix 'liking subjects' and 'disliking subjects' were included, five vectors would be needed for each set.

T
233
high and significant above the 0.001 level; they were 0.40, 0.18, 0.23 and 0.16
respectively.
In the next stage, school activities were regressed on all variables (excluding
creative thinking). The result of the multiple regression is presented in table 11.18.
Table 11 18 Multiple Regression with schoo activities as the dependent variables
Variables in the equation
1. Medium of Instruction (X9)
2. Type of the school dummy (TS-Boys-X1o) 3. Sex (X1)
4. Type of school dummy ((TS-Girls-X11)
c
26.05
26.04 28.58
27.73
-5.18
7.07 -5.81
5.60
0.70
1.09
0.76 1.15
Beta
-0.36
0.33 -0.40
0.36
0:::
0.36
0.47 0.57
0.61
0.13
0.22 0.33
0.37
N 0::: .!: C Ql E ~ u c
0.09 0.11
0.04
55.40***
51.91 *** 59.48***
53.33***
1/371
2/370 3/369
4/368
C = Constant; ~= regression coefficient; SE~ = standard error of regression coefficient; Beta = standard regression coefficient; df = degrees of freedom; *** = significant at 0.001
The results indicate that medium of instruction contributed 13 %, and type of school
(dummy TS-boys-Xro) 9% of variance in the organisation of school activities. Sex and type
of school (dummy TS-girls-Xll) contributed another 11 % and 4% respectively. Altogether
the variance explained by the four variables on school activities was 37%.
In the next stage, teacher encouragement was regressed on the remaining variables,
which were expected to have significant effects on it. Table-ll.19 reveals that five
able 11.19 Multiple Regression with Teacher Encouragement TES) as the dependent variable Variables in the equation
"0 Ql
C en "0 'Oc Ql c N ~o- ~.Q C 0:::: rn._ c "OcnQl ~ en Ql £ c:: m'- rn en·o rnQl~ -g~:i: C en t5l Q) rn Cl Ql Q) C Ql 0 _Qlo
E 0 ::JO:::u U)O:::u Q) ~ .....
/3 SE/3 Beta N tl C I -0:::: 0:::: - LL "0
1. School activities (X13) 39.74 0.30 0.08 0.19 0.19 0.04 - 13.77*** 1/371 2. Type of School 39.77 4.00 1.75 0.12 0.22 0.05 0.01 9.58*** 2/370 Dummy TS-Boys-X1O 3. Sex (X1) 41.66 -3.66 1.34 -0.16 0.26 0.07 0.02 8.99*** 3/369 4. Medium of instruction (Xg) 47.20 -4.29 1.60 -0.19 0.29 0.09 0.02 8.66*** 4/368 5. Father education (X3) 45.01 0.80 0.80 0.11 0.31 0.10 0.01 7.95*** 5/367
.. C = Constant; ~= regression coefficient; SE~ = standard error of RegreSSion coefficient; Beta = standard regression coefficient; df = degrees of freedom; *** = significant at 0.001

234
variables had a significant effect on teacher encouragement. School activities contributed
4% of the variance, sex and medium of instruction contributed 2% each; and type of the
school (dummy bOyS-XIO) and father's education (X3) added another small contribution of
1 % each. Altogether, 10% of the variance was accounted for by these five variables.
11.9.2.0 Path Analysis
Path Analysis was developed by Sewall Wright as a method for studying the direct
and indirect effects of variables hypothesised as the causes of variables treated as effects.
In Wright's words: ...... "the method of path coefficients is not intended to accomplish the
impossible task of deducing causal relations from the values of the correlation coefficients.
It is intended to combine the quantitative information given by the correlations with such
qualitative information as may be at hand on causal relations to give quantitative
interpretations" (Wright, 1934, p.193)
The advantage of using Path Analysis is that it provides a means by which the
nature of the problem addressed by an empirical study may be summarised. The path
diagram is a useful device for displaying graphically the pattern of causal relations among
a set of variables. In the causal model, a distinction is made between exogenous and
endogenous variables. An exogenous variable is a variable whose variability is assumed to
be determined by causes outside the causal model. An endogenous variable, on the other
hand, is one whose variation is explained by exogenous or endogenous variables in the
system.
Path Coefficients: a path coefficient indicates the direct effect of a variable hypothesised as
a cause of a variable taken effect (Pedhazur, 1982). The symbol for a path coefficient is P
with two subscripts, the first indicating the effect (or dependent variable) and the second
SUbscript indicating the cause (the independent
variable). Accordingly P32 indicates the direct
effect of variable 2 on variable3.
The assumption about the causal order
or direction is explicitly represented by the
direction of the arrow, and the assumption of
closure is explicitly indicated by the absence of
a connecting line between X and the latent
variable Ey which represents all the residual
X
Ey
PYE Pyx H'
.. Y r
PyX =..J l-R2YX Fig.ll.2 Path Coefficients

235
causes of Y. The latter assumption is sometimes called the assumption of independent
error or independent disturbances.
Beta weight, express the change in the dependent variable, expressed in standard
deviation units, that would be produced by a positive increment of one standard deviation
in the independent variable concerned (Kinnear and Gray, 1977, p.262).
The path coefficients can be represented by either the ordinary regressIOn
coefficients or standardised betas. It is customary to use the Beta values (Nie and etal.,
1975,p.387). The path coefficients represented in the model (Fig.No. 11.3) were Beta
weights drawn from the tables-ll.17, 11.18 and 11.19. The straight lines with the
arrowheads indicate the direction of effect. This usage is partly due to Wright's original
formulation and partly due to conveniences of interpretation. It is also customary to
estimate path coefficients from latent variables (i.e., all residual causes) associated with Xi
by -Y1-R2 , where the multiple R is that part of the regression equation in which Xi is the
dependent variable and all causally prior variables are used as predictors.
In this model, X12 and X13 were endogenous variables (or mediating) while the
rest of the variables were exogenous variables.
11.9.2.1 Structural Equations
Each endogenous (dependent) variable in a causal model may be represented by an
equation consisting of the variables upon which it is assumed to be dependent, and a term
representing residuals or variables not under consideration in the given model (Kerlinger
and Pedhazur, 1973, p.310). For each independent variable in the equation there is a path
coefficient indicating the amount of expected change in the dependent variable as a result
of a unit change in the independent variable. The exogenous variables were represented by
their residuals (eI,e2,e3 ...... ).
The equations for the ten explanatory variables expressed in the standard score
form (Z-score) are:
ZI = el (1) Z3 = e3 (2) Z4= e4 (3) Zs= es (4) Z9 = e9 (5) ZIO= eiO (6) Zll=ell (7) Z12= P12 1 ZI + P12 3 Z3 + P12 9 Z9 + P12 10 ZIO +P12 13 Z13 +e12 (8) Z13= P13 1 ZI + P13 9 Z9 + P13 10 ZIO + P13 11 Zll + e13 (9) ZI4= PI4I ZI + PI43 Z3 + PI44 Z4 + PI4S Zs + PI4 9 Z9 +
P I4 IO ZIO + PI411 Zll + PI4I2 ZI2 + P I4 13 Z13 + eI4 (10)

Organisational Variables
Medium of Instruction
-.36
Background Variables
Mother's
Income (Xs)
Mother's
Education (X.)
Father's
Education (X3)
Sex (Xl)
-AD -.19
.11
-.16
.19 Type of V .12 school
(Boys-XIO) I-- .33 School -... Activities (X 13)
~ Type of .36 school
/' (Girls-XU)
.12
.19
Cognitive and motivational Variables
AD
236
Dependent Variable
.15 -----. Creative thinking (X14)
Fig. NO. 11.3: A Model for the correlates of creative thinking
Note: Age (X2), Father occupation (XS), Mother occupation (X6) and Father income (X7) were not included in this model because they were not entered in the multiple regression equations.
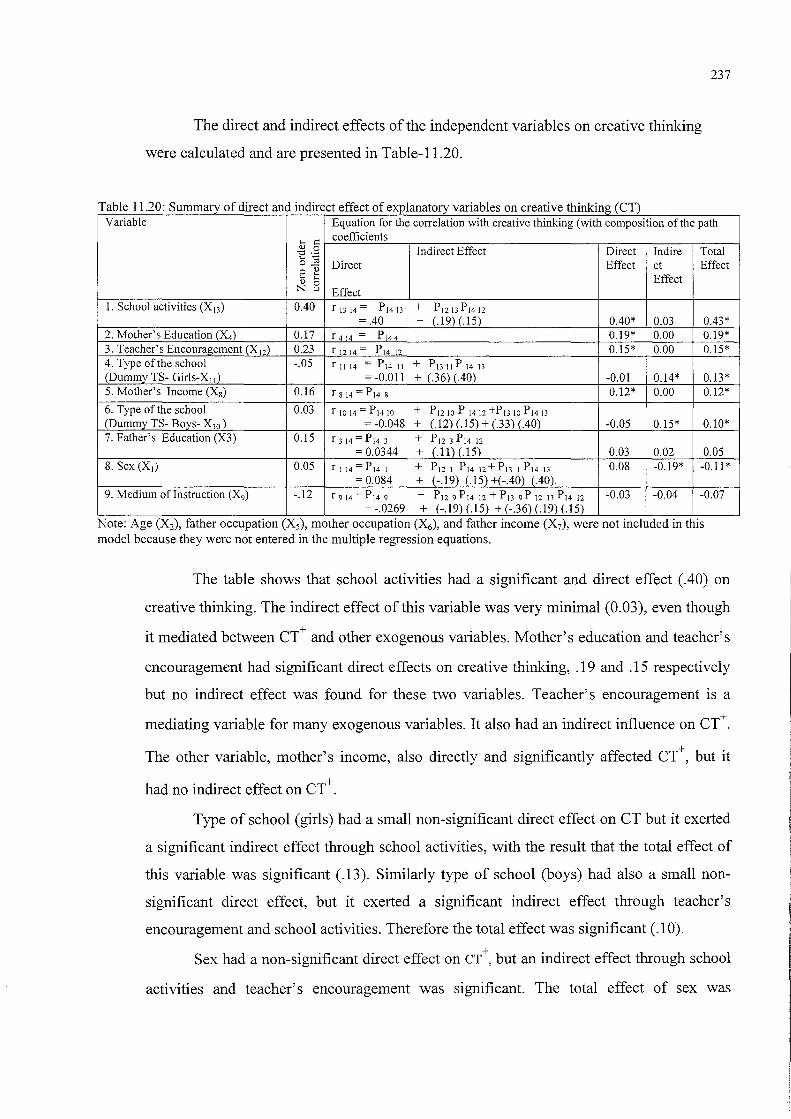
The direct and indirect effects of the independent variables on creative thinking
were calculated and are presented in Table-ll.20.
237
T bIll 20 S a e ummaryo fd· rrec an m rrect e ffi ect 0 f . bl expJanatory vana es on creative t hink" (CT) mg Variable Equation for the correlation with creative thinking (with composition of the path
... ::: coefficients <tl 0 Indirect Effect Direct Indire Total "0.-... t;:;
Direct Effect Effect o_ ct o <tl
k> b Effect N 8 Effect
I. School activities (X 13) 0.40 r 13 14 = P1413 + P12 13 PI4 12 = .40 + (.19) (.15) 0.40* 0.03 0.43*
2. Mother's Education (X4) 0.17 r 414 = PI44 0.19* 0.00 0.19* 3. Teacher's Encouragement (Xd 0.23 r 1214 = PI412 0.15* 0.00 0.15* 4. Type of the school -.05 rll14 = PI411 + P13I1 P 14]3 (Dummy TS- Girls-XII) = -0.011 + (.36) (.40) -0.01 0.14* 0.13* 5. Mother's Income (Xs) 0.16 r s 14 = PI4 S 0.12* 0.00 0.12* 6. Type of the school 0.03 r1014=P14JO + P12 JO P 1412 +P]3 10 P14 ]3 (Dummy TS- Boys- XIO ) = -0.048 + (.12) (.15) + (.33) (.40) -0.05 0.15* 0.10* 7. Father's Education (X3) 0.15 r 3 14 = PI4 3 + P12 3 PI4 12
= 0.0344 + (.11) (.15) 0.03 0.02 0.05 8. Sex (XI) 0.05 r 114 = PI4 I + P12 I PI4 12 + P]3 I PI4 13 0.08 -0.19* -0.11 *
= 0.084 + (-.19) (.15) +(-.40) (.40). 9. Medium ofInstruction (Xg) -.12 r 9 14 = PI4 9 + P12 9 PI4 12 + P]3 gP 1213 PI4 12 -0.03 -0.04 -0.07
= -.0269 + (-.19) (.15) + (-.36) (.19) (.15) Note: Age (X2), father occupatIOn (Xs), mother occupatIOn (X6), and father mcome (X7), were not mcluded m thIS model because they were not entered in the multiple regression equations.
The table shows that school activities had a significant and direct effect (.40) on
creative thinking. The indirect effect of this variable was very minimal (0.03), even though
it mediated between CT+ and other exogenous variables. Mother's education and teacher's
encouragement had significant direct effects on creative thinking, .19 and .15 respectively
but no indirect effect was found for these two variables. Teacher's encouragement is a
mediating variable for many exogenous variables. It also had an indirect influence on CT+.
The other variable, mother's income, also directly and significantly affected CT+, but it
had no indirect effect on CT+.
Type of school (girls) had a small non-significant direct effect on CT but it exerted
a significant indirect effect through school activities, with the result that the total effect of
this variable was significant (.13). Similarly type of school (boys) had also a small non
significant direct effect, but it exerted a significant indirect effect through teacher's
encouragement and school activities. Therefore the total effect was significant (.10).
Sex had a non-significant direct effect on CT +, but an indirect effect through school
activities and teacher's encouragement was significant. The total effect of sex was

238
significant (-.11). It indicated that boys have been found to score higher in creativity than
girls. Father's education and medium of instruction had neither direct nor indirect effects
on CT. Their total effects were also not significant.
To summarise all variables included in the model, creative thinking (XI4) seems to
be largely influenced by activities organised in schools (X13), mother's education (N) and
teacher's encouragement (X12), and is moderately influenced by type of school (TS-Girls
X I1), mother's income (Xs), type of school (TS-Boys-XIO) and sex (Xl). Father's education
(X3) and medium of instruction (X9) seem to have non-significant effects on creative
thinking. The total variance explained in this exploratory model was 23 %. The variance
explained is less than it might have been, because of non-inclusion of some factors, for
example students' cognitive and motivational factors.
11.10 Summary
In this chapter the teacher encouragement scale was analysed, revealing that pupils'
perspectives on teacher encouragement fall into 6 main factors: teacher-pupil relations,
teacher initiation, classroom organisation, teachers' attention, creating interest and strict
control. Scores on pupils' perceptions of teacher encouragement were related to measured
creativity, suggesting that teacher behaviour may have an effect on creativity. An analysis
was also undertaken of the extra-curricular activities provided by schools which may
promote creativity. Differences were found between schools in the extent to which these
activities were provided.
Multiple regression analysis and path analysis were undertaken to determine the
relationships between the variables measured and creative thinking. A multiple R of .48
was obtained in regressing school activities (0.40), mother's education (0.19), teachers'
encouragement (0.15) and mother's income (0.12) on measured creative thinking. The
more sophisticated model developed through path analysis demonstrated the direct
influences of other variables on school activities and teacher encouragement. These
included father's education, sex, medium of instruction and type of schoolboys or girls.
The final chapter of the thesis will discuss these findings.

239
Chapter XII
Summary, Conclusions, Implications and Suggestions
12.1 A brief summary of the study
The present research is an attempt to explore the promotion of creativity among
secondary school students in India, particularly in government schools in the state of
Andhra Pradesh. The research was designed to look at government schools in greater
detail than had previously been the case, because the literature survey revealed that
these schools were under-performing not only in relation to academic performance but
also in developing creative abilities among the students when compared to private
school students.
The arguments for the development of creativity among school students, the
place and importance of creativity in education and the need for the present
investigation were discussed in chapter 1. Definitions of creativity and the variety of
meanings attached it to were also analysed. Theoretical approaches were briefly
presented in chapter II, and the succeeding chapters (III to V) considered the relevant
literature in the field of creativity and its development in students. These chapters
addressed the issues of the measurement of creativity and related factors, for instance,
age, grade, sex, SES and type of the school (Chapter III); creativity and the role of the
school (Chapter IV); and creativity and the role of the teacher (Chapter V).
The main purposes of the study were to examine students' performance III
creative thinking ability in relation to selected variables, and to consider teachers'
views and attitudes towards the development of creativity. The study also examined
teachers' behaviour as perceived by their students and activities organised in schools to
promote creativity. The main aims of the research were as follows:
Aims In brief To explore 1. Indian teachers' views of creativity and how it can be developed. 2. Whether differences exist in measures of creative thinking, as measured by Prof.
Baqer Mehdi, in relation to students personal background variables, cognitive and motivational variables and organisational or school variables.
3. Students' perceptions of their teachers' classroom behaviour and teaching methods. 4. What activities are organised by schools in order to promote creativity. 5. Whether an exploratory model can be developed to describe the relationships between students' personal background variables, cognitive and motivational variables and organisational variables.
The data was collected by using a set of eight tools. Two tests of 'Creative
Thinking' (Verbal and non-verbal) constructed and standardised by Baqer Mehdi
(1973, 1985) on rural and urban samples in India were adopted for the study. The

240
Student Information Sheet (SIS) was devised to collect students' background data; the
Teachers' Encouragement Scale (TES) measured the degree of encouragement given by
the teachers as perceived by their pupils. The Teacher's Questionnaire (TQ) and
Interview schedule for Teachers (ISFT) were developed to explore teachers views on
creativity (see Chapter VI). A Classroom Observation Scheduled was developed for the
purpose of classroom observation but due to technical problems this data was not
analysed. In addition to this, information regarding 'out of school activities' was
collected from the schools through a checklist developed for the head teachers.
These instruments were drafted in English and translated into the Telugu
language, which is the official language of the state of Andhra Pradesh. After the
development of the research tools, the researcher conducted a pilot study on a small
sample (N=75) from one government high school having both teaching media, English
and Telugu, to test the feasibility of the research questions and the clarity of the
instruments (Chapter VII). Item responses were carefully examined to see how the
respondents performed. Accordingly, modifications were made to the instruments. In
the item analysis of TES a Chi-square (X2) test was applied. From the TES two items
were dropped from the main study, due to the non-significant values for those two
items.
Drawing on the literature review of creativity and the pilot study experience, the
researcher developed a framework for the research, where the variables were classified
as Organisational Variables (OVs), Background Variables (BVs), and Cognitive and
Motivational Variables (CMVs).
A survey approach was used for the investigation. The sample for the main
study was selected in two stages. In the first stage, the selection of schools was made.
In stage two, students and teachers were chosen from the selected schools. A total of
nine schools was selected from the current list of the government high schools in
Hyderabad (Andhra Pradesh, India) by applying a stratified sampling technique. All
subject teachers teaching for standard nine, and all the students of standard nine, were
included in this study, if the school had one class of students. In the case of more
classes in the school, a random number selection procedure was followed.
From the above process, a total of 373 students and 88 teachers was selected.
The students' sample included both boys (N=147) and girls (N=226) studying in
government boys', girls' and co-educational schools. The teachers' sample comprised
25 males and 63 females (Chapter VIII).

241
To establish the reliability and validity of the instruments, varIOUS methods
were applied. The test-retest reliability coefficients for the verbal and non-verbal tests
of creativity (including their components) were high, ranging from 0.856 to 0.970 and
0.88 to 0.918 respectively. The item validity coefficients were highly or moderately
correlated with the activity and grand total scores (the 'r' values significant levels
ranged from 0.05 to 0.001). There was also a high level of correlation between
activities and verbal creativity scores Cr' ranged from 0.58 to 0.86). Similarly, a high
relationship was found between activities and non-verbal creativity ('r' form 0.40 to
0.80). Factor validity of verbal and non-verbal creativity was established by correlating
scores with factors. All the correlations were highly significant.
A Cronbach's Alpha was used to estimate the reliability coefficient for the
Teachers Encouragement Scale (TES). It was found to be 0.75. The method of
Spearman-Brown Split for reliability was also adopted. The reliability coefficient for
the whole test was 0.70, which indicated internal consistency. The intrinsic validity of
the TES was found to be 0.84. In addition content validity and construct validity were
also established. For construct validity, all the items were correlated with the total
scores ofTES. They ranged between 0.23 and 0.58.
A more detailed analysis to examine the construct validity of the TES was
attempted through factor analysis of all 20 items. Firstly, the Principal Component
Analysis (PCA) was employed, to extract the latent trait or the underlying factors of the
20 TES items. This was followed by the most common method, Varimax Rotation, to
maximise the relationships between the variables and some of the factors.
To establish the reliability of the interview data , an inter-rater reliability
method was adopted. The reliability and validity of the Teachers' Questionnaire were
established by monitoring the clarity of directions and the wording of questions. A
factor analysis was also performed to provide evidence for construct validity.
The data was analysed by applying various quantitative and qualitative
approaches. Various statistical techniques 1 were employed in the analysis of the data,
and the results were presented in Chapters IX through XI.
1 1). Categorisation and Comparisons. 2) Simple statistics: Frequencies, percentages, date representation through the Graphs etc., 3) Descriptive statistics: Mean, Median, Mode, Standard Deviation (SD), Standard Error of Mean (SEM), Skewness, Kurtosis. 4) Chi-square (X2) test. 5) Product moment correlation of coefficient (r). 7). t-test analysis (Critical Ration (CR». 8). Analysis of Variance (ANOVA or F-ratio). 9). Multiple Regression Analysis (Multiple'R'). 10) Factor Analysis. 11). Path Analysis

242
12.2.0 Findings, conclusions and discussion of the results of the study
12.2.1 Towards a model of creative thinking
A major focus of the study was identifying the variables most influential on
creative thinking ability with a view to representing a model of the correlates of
creativity among secondary school students in India. The method adopted was 'path
analysis' chosen to study the direct and indirect effects of variables and display
graphically the pattern of relations among the selected variables. The purpose of Path
Analysis was to explain to, specify and quantify the effects on selected variables on
creative thinking.
To construct the model, a regression analysis was undertaken. The result
showed that when school activities were entered first, the multiple correlation
coefficient (R) was .40 (16% of variance). In step 2 and step 3, mother's education and
teacher encouragement contributed another 3% each. In step 4, only 1% was
contributed by mother's income level. Altogether the variance explained by the four
variables on creative thinking ability was 23%. School activities (Xl3) and teacher
encouragement (Xu) were found to mediate between the exogenous variables and
creative thinking ability.
Overall, creative thinking (X14) seems to be directly and largely influenced by
activities organised in the schools (0.40), mother's education (0.19) and teacher
encouragement (0.15), and mother's income (0.12). It is indirectly influenced by type
of the school-TS-girls (0.14), type of the school-TS-boys (0.15) and sex (-0.19). In the
model, father's education (0.05) and medium of instruction (-0.07) seem to have non
significant effects on creative thinking, although these emerged in a comparative
analysis. In the next sections these various aspects will be considered.
12.2.2 Teachers views and attitudes towards creative thinking
The majority of Indian teachers reported that the topic of creative thinking was
included in their teacher training, mainly under the auspices of Educational Psychology.
In the Fryer (1989) study, the majority of British teachers who recalled creativity
development being included in their training said that this was in the arts (Fryer, 1996,
p.3). The Indian teachers reported that creativity was hardly included in the arts. Art
education remains one on the most neglected areas of the school curriculum in India
(Raina, 1989; Raja Gopal, 1967; Singh, B. S, 1991) and in teacher training colleges.
243
The results obtained in this study indicated that very few teachers received
training in creative thinking. There is a need to improve competency and knowledge of
creativity through full time courses or in-service training. It is worth noting the
suggestion made by the Review Committee ofNPE'86 (1990):
Re-organise the teacher training programmes with a view to equipping the teachers with an understanding of how to identify and nurture children with special talent or aptitude within the same classroom. A special emphasis would need to be given to enable talented children to develop at a faster pace in both scholastic and non-scholastic domains in every classroom in ways that encourage a non-competitive environment (p.l 08}. There is no provision for organised and periodic in-service education of teachers. In-service programmes are not effectively done; there is poor coordination and monitoring of in-service education programmes. Catering for all types of students during teaching practice is not taken care of(pp.300-301).
The research (table 9.5) revealed that there is a need to organise special training
programmes, conferences, seminars and symposia, orientation and refresher courses,
workshops, books and journals for teachers in order to update their knowledge and
understanding of the development of creativity among students.
The overall knowledge and understanding of the teachers with regard to creativity
seems to be good. They also have positive views and attitudes. Their knowledge is very
limited about the use of creative techniques in the classroom, for instance brainstorming,
and synectics. Their training needs centre on being able to apply creative techniques in
normal classrooms while teaching. For that, they need demonstrations, workshops, and
model lessons in particular subjects which focus on developing creativity in the child.
The conceptions of creative thinking of the Indian teachers in the study were
similar to those identified among British teachers by Fryer (1989). Creativity was seen as
inspiration, imagination, having original ideas and self-expression by both groups. The
Indian teachers viewed creative thinking as a process, divergent thinking and innovation.
Unconscious processes were ranked lowest. It seems that like British teachers, the Indian
teachers' view is closer to the humanistic rather than the psychoanalytic approach.
From the interviews and questionnaire analysis, it was apparent that the teachers
were also able to distinguish between creativity and intelligence. Almost all the
teachers perceived that intelligence and creativity were different. They perceived
intelligence as synonymous with convergent thinking and creative thinking with
divergent thinking. The teachers' way of thinking reflects the work of Guilford (1968),
Wallach and Kogan (1965) and Getzels and Jackson (1962). They also perceive that
intelligence is a skill whereas creative thinking is 'imagination'.
All the teachers recognised the importance of creativity in education, in the
interviews and in the Teachers' Questionnaire. In their view, emphasising the
importance of the development of creativity assists pupils in meeting challenges,
solving day-to-day problems, developing independent thinking, and bringing out

244
hidden talents (see table 9.9). Besides these, in the interview data other interesting
reasons were found for developing creativity. They were: -helping children to adapt and improve themselves in an ever-changing environment and meet the
challenges of the world. - achieving certain goals of life in the field of education - developing thinking ability, increasing imagination, and acquiring novel views.
The research has revealed that creativity can be developed through teaching by
adopting a variety of methods; for example, by providing students with new problems
to generate new and unfamiliar solutions, through the improvisation of apparatus, by
asking divergent questions in teaching, giving more scope to students to ask questions,
through training in activities or organising programmes, through visual aids,
discussions and telling life-histories of great persons. In the interview data analysis
(9.2.11), other techniques to be adopted in the classroom were outlined. They were: - showing experiments, film strips, - organising cultural activities, games & sports, writing songs, literary & singing competitions; - forming Science, Mathematics, Literature and other subject clubs; - presenting children with some unreal situation and asking what would be the result; - presenting unstructured stimuli to the students to encourage them to structure them or promote open-
mindedness; - adopting innovative methodology by the teachers.
Beetlestone (1998) argues that there are two types of teachers. Type one
teachers see creativity as a rare and original gift which few children possess. They look
expectantly for the spark of creative genius. They know they themselves are not
creative geniuses, but they are ever hopeful for their pupils. The second type of teacher
sees creativity all around them in everyday activity (p.94). We can see both types of
teachers in the present study. About fifty percent of the teachers disagreed with the
possibility of developing creative thinking in all children. The remainder agreed that
creativity could be developed in all the children, but certain conditions had to be
fulfilled. They believed that it depended on many factors: the school environment,
living conditions, teachers' encouragement, and the co-operation of parents.
In response to the question, Are all intelligent students creative? About 50%
said 'no' and 20% said 'Not always '. As one teacher said, 'it need not be true! Another
said 'All intelligent students may possess at least some creativity '. Another teacher
expressed concern that highly intelligent children get good marks, but creative children
achieve less because their divergent ideas lead them to lose interest in academic
achievement.
The results indicate that the majority of teachers were able to identify creative
children in their normal classroom teaching. The criteria they gave in the interview and
questionnaire was discussed in detail in chapter IX (section 9.2.8 and table 9.8). They
were also positive about encouraging the children in their classrooms to be creative. The
teachers' methods of encouraging creativity in the classroom were presented in chapter
IX (see 9.2.10 and table 9.10). No significant differences were found in teachers' attitude
245
towards the encouragement of students' creativity development in relation to
demographic factors like sex, age, experience and educational qualifications (see table-
9.15).
Comparing Indian teachers' views with the British teachers studied by Fryer
(1996, p.75) with regard to the factors assisting in the development of creativity first in
both cultures was 'building self-confidence'. Having a creative teacher was viewed by
both groups as second and third respectively. Indian teachers perceived good pupil
relations, encouraging experimentation, and developing curiosity as important factors.
They did not believe that 'informal teaching' assists in developing creativity (table 9.11).
It is obvious that in a formal traditional teaching system, particularly in India, the
teachers are restricted to working within the boundaries or within the framework of the
curriculum. So the teachers might be accustomed to teach formally rather informally.
The study showed that Indian teachers are often enthusiastic to develop creativity
among their students, but they fail to do because they find many obstacles at various
levels, teacher, student and school. The major obstacles at teacher level were found to be
the overloaded syllabus, the stress on completion of the syllabus, an over-emphasis on
preparing the students for examinations, a heavy teaching work load, a lack of time, lack
of reco gnition and appreciation of teachers' work, great emphasis on the lecture method
and inadequate training in creativity and its development.
The teachers believed that the obstacles at students level were: the students
'lack of experience and their participation in the classroom as passive, silent spectators;
a tendency to rote learn; a lack of motivation; general poor performance; unequal
aptitudes; poor family background; no parental care or encouragement; and parental
illiteracy.
The teachers reported, as constraining at school level, obstacles such as
inadequate resources, instructional materials, conflicts with curricular demands,
unsuitable accommodation and inadequate funds. In the interviews, obstacles identified
were lack of time for teachers, an overloaded syllabus, short periods (short time for
lessons)". lack of laboratory facilities, government policies, lack of knowledge among
the administrators, pressure on teachers for completion of the syllabus, and other
distractions from teaching like enumeration, and frequent election duties.
Surprisingly, the results are similar to the those from the British teachers (Fryer,
1996, p.1 0 1). Inadequate resources, inadequate preparation time, over-large classes,
excessive non-teaching workload, excess teaching load and unsuitable accommodation
were major obstacles reported in British educational institutions.

246
Some validation of the Indian teachers' reports comes from observations made by
the researcher inside and outside of the classroom during the fieldwork. Classrooms were
often congested or overcrowded, and there was a lack of furniture (see Pictures 2(a, b &
c); 5 (a». In some schools the girls and boys sit on benches with desks while in others
they sit on the floor, without desks to write on (See Pictures 3(a & b); 5 (b & c); 2 (a, b &
c)- in Appendices). No electrification was found in the majority of the schools. In some
schools the power supply was stopped because of overdue bills. Some schools do not
even have proper toilets, and if they exist they are not always properly maintained.
Students do not have a place to eat their lunch-packs and they have to bring their own
water bottles. They often eat their lunch in the classroom, on the school Verandas or in
the playgrounds (see Pictures from 4(a) and 4(b) in Appendix).
The present study reflects the findings of the survey results of the World
Education Report (UNESCO, 1998) in fourteen countries2. In the majority of the
countries surveyed, the average classroom is not much more than a designated meeting
place for a teacher and a group of pupils: in 10 out of the 14 countries, one third or more
of the pupils were gathered into classrooms without a usable chalkboard and without a
teacher's table. The situation is only marginally better with respect to a chair for the
teacher. In virtually all countries there are no teaching aids such as wall charts, and
almost no pupil will ever see a world map. In 8 out of the 14 countries, 90% of the pupils
attend schools which do not have electricity; almost as many attend schools without
piped water and one-third or more of the pupils attend schools which do not have any
water at all. In over 90% (mainly in Africa) the pupils do not have a desk or writing
place, as distinct from just a place to sit (p.55).
As the World Education Report (UNESCO, 1998, p.55) pointed out, "if education
is to be expected to help the poor to lift themselves out of poverty, then in the poorest
countries education itself needs first to be lifted out of poverty". From this perspective,
structural adjustment programmes designed to eliminate wastage in public service could
usefully be complemented by investment in the physical infrastructure of education:
providing schools with water and electricity and reasonably solid walls and roofs, plus
furniture and of course textbooks and other teaching materials.
The school curriculum has a central place in the process of schooling. It is
necessary to emphasise that a school curriculum is not just a syllabus where the
contents are fitted into a timetable for the purpose of teaching and learning. The school
2 Bangladesh, Benin, Bhutan, Burkina Faso, Cape Verde, Equatorial Guinea, Ethiopia, Madagascar, Maldives, Nepal, Togo, Uganda, U. Rep. Of Tanzania and Zambia.
247
curriculum should be seen as a series of planned activities, which result in learning, and
in which the teacher plays a crucial role. The learning activities take place mainly in
school but can often be extended to home and community (Thomas, 1994).
This extended view of the curriculum gives the role of schooling, and its
relationship with the cultural development of the community, a pivotal position in
linking the culture of the school and that of the community. In this sense it may be
argued that the school curriculum has an even more central part to play in the
interrelationship between educational and cultural development (Ibid. p.38).
Thomas argued in his curriculum learning modee, that curricula should be
planned according to the cultural context of the learner including the learner's preferred
language, family background, religious persuasion, styles of thinking as well as
reference to certain cultural customs which might affect a child's learning set.
Thomas argues that cultural customs should be considered while preparing the
syllabus. Similarly, in India, Singh, B.P (1991) argues that "the culture, the customs
and the community environment must be reflected in the curriculum and it must help
the student in developing skills, interests and habits which may be helpful to them as
individuals and for the society in which they will have to live"(p.36). Unfortunately, in
India, this is often not the case. The contents from developed countries and cultures are
adopted without filtering and are often culturally out of context and irrelevant. For
instance, Srivastava (1994) has argued that "the textbooks are not written from the
child's viewpoint and its contents are irrelevant. Even the textbooks used for teaching
of mother tongue are written in such stylised diction that the children cannot be
expected to see the language used in them as their own" (p.17). Moreover, it is
restricting the teachers to work within the boundaries or framework. The time is also
very limited for teaching of subjects within the time; also there are so many unexpected
holidays4. This may cause delays in covering the syllabus, and may force the teachers
to finish the syllabus with greater speed.
The present curriculum in Andhra Pradesh was criticised by the teachers. Most of
the teachers expressed the view that the secondary school curriculum is not only rigid
and overloaded in all or most of the subjects, but also leaves no room for creative
students to express or display their talents. It is not suitable to cater for the needs of a
wide range of learners and their learning environment. No scope is given to students'
3 A Curriculum Learning Model comprises three inter linked elements. They are Leamer Background, Leamer-Teacher Interaction and Learning Outcome (p.39). 4 Students or teacher strikes, communal and rivalry violences, disasters, conducting regular and frequent exams in the school and the Public examinations (SSC, Intermediate)

248
self-evaluation and self-initiation of learning. It is completely examination-oriented.
The methods are not appropriate to develop creatively. The curriculum emphasis is on
knowledge acquisition rather than attempting to develop independent thinking.
Nonetheless, the teachers prefer an activity centred and child centred approach in the
curriculum.
The NPE' 86 Review committee (1990) made the same observation:
"The problem faced by school education in today's context is near-exclusive emphasis on knowledge through theory alone. Even when theory is taught, its teaching remains barren and partial due to the pedagogic constraint of divorcing knowledge from practice. The accent is to be on integration of theoretical knowledge with skills, attitudes, productive work, social responsibility and creativity. Education is to be linked with the emerging problems of the world of work. For this purpose, the method of project work should be an integral feature of the educational process"(p.2ll).
A teacher of mathematics rightly remarked about the mathematics syllabus: '1
don't think it suitable for developing creative thinking. Mostly the child has to
reproduce only the formulas and apply the formulas to solve the problems and is not
given any scope to apply new knowledge or new ways of thinking to solve the
problems'.
The present study revealed in the interviews that the teachers are compelled to
rush through the syllabus to complete it. They are keen to encourage creativity and would
like extra periods to undertake some creative work. The time given for teaching the
subject content is itself inadequate. Each subject teacher needs at least one period per
week on a rotation basis to work together with students and the resource teacher in the
resource room. Teachers and students would enjoy the benefits of a flexible schedule (no
pressure and hurry in completing lessons). Working with resource and subject teachers,
students would get more benefit from exchanging their views in an informal way, and
enjoy the experience of teaching in two different environments5. They could explore and
discover independently or collaboratively from all kinds of resources available to them.
All the teachers were dissatisfied with the present examination system and
practices in the schools. A male teacher of English said, 'Examinations are bookish, no
room for creativity'. One teacher blamed what students learn through out the year.
"They have to just vomit it out in just two and half-hours". The teachers also said that
the questions were straightforward, and responses could be rote memory based. These
examinations do not take account of creativity, or properly evaluate students' creativity.
The teacher of physical sciences said, '1 observed some instances where the teachers
strike off the answers without kindness, if students write answers in a creative way'.
5 Two different settings are 1) The normal classroom and 2) the Resource Room

249
It is clearly understood that there is a need for modification in the entire
evaluation system, providing a climate in which external evaluation is sometimes absent.
"Evaluation is always a threat, always creates a need for defensiveness, always means
that some portion of experience must be denied to awareness (Rogers, 1959, p.79).
External evaluation is threatening and as a result tends to shut off from awareness some
area of experience. This reduces a person's ability to think beyond the obvious, the safe,
the familiar (Torrance and Myers, 1974, p.1 05). Instead of asking closed questions, open
ended questions should be included to elicit more explanations and a greater variety of
responses from the students rather than insisting on single responses. In the final result,
the performance of the whole year in various activities should be considered, instead of
only examination marks.
The headteacher should also attempt to make hislher teachers realise that they are
respected not only as individuals but also as important partners in the development of the
school. There must be a feeling of general acceptance, respect and support among the
headteacher and teachers (Raja Gopal, 1972). The headteacher should provide
opportunities for the teachers to work together in planning programmes for the
improvement of instruction.
One of the teachers argued in the interview that knowledge of creativity is
essential for educational administrators at the highest level and head teachers at school
level. They must realise the importance of creativity. Only then will they take appropriate
measures to develop creative skills to assist the child in his future life.
12.2.3 Students' performance in creative thinking and its relations with selected variables
The study revealed that the majority of the students studying in government
schools came from poor and disadvantaged backgrounds. Poverty compels parents to
send their children to government schools since they provide a completely free
education! The pupils' fathers had hardly completed school education (about 75%) and
about 7% were illiterates. Of the mothers 94% had completed secondary education or
less, but about 26% were illiterates. Their parents were unemployed, production and
transport operators, clerical and related workers or service and related workers. About
84% of the mothers were housewives or dependants. A small percentage of fathers
(6.4%) and mothers (only 2.4%) were doing professional jobs. Their income levels
indicate their poverty. 70.5% of mothers earned nothing. They were housewives.
Due to poverty, poor families require children to work looking after animals or
taking care of younger siblings. On some occasions, children need to share the
responsibilities of parents, This may force the students to drop out of school. This

250
constitutes a major problem for the government. Review Committee NPE'86 (1990)
observed that "among poor families, the economic role of the girl child and her
responsibilities in the household are obstacles to schooling" (p.29). The education of
girls is in a very real sense linked to the availability of water, fuel, fodder and child
care facilities for individual families. As much as 29% of the entire time of a girl-child
in rural areas is spent in the collection of fuel, and 20% in fetching water. Care of
siblings also accounts for a significant proportion of a girl's time. This is particularly so
in poor families. For instance, it was observed that in eastern UP, 30% of the household
burden and 20% ofthe agricultural work is shared by girl children (p.31).
The issue of gender is especially interesting in this study, in that girls and boys
were not significantly different in creative thinking (in composite scores). But in relation
to originality (verbal and non-verbal) girls performed more poorly than boys (p < 0.05
and p < 0.01 respectively). These results are similar those of Badrinath and Satyanaryana
(1979). As far as non-verbal elaboration was concerned, girls were found to be better
than boys (p <0.05). Similar results were also reported by Singh (1978).
In this study, the creative thinking of the students fluctuated according to their
age. The same observation was made by Torrance (1962) and Kishore (1981). The mean
scores gradually increased from 12 to 14 years of age, declined at the age of 15 years,
then recovered for age 16. A setback again took place for the 17 years age group.
Torrance (1962a, pp. 98-100) explains that between the ages of 14 and 16 much
imaginative activity seems to be focused on a future career. Interests and aptitudes are
developed rapidly, but are still rather unstable. Pupils worry about peer acceptance, and
fears cause them to avoid situations which involve exploration or testing of their
abilities.
The home influence is a significant factor in encouraging the development of
creative thinking (Weisberg and Springer, 1967, p.120-134). Home is the centre of
learning and family is the contributing agent to child's creativity. Suitable parental care
and encouragement of the children will definitely enhance creativity.
There are many studies which indicate that the SES of the students is directly
proportionate to creativity (see 3.5.4 in chap.-III). In this study, father's and mother's
occupations did not influence their children's creativity. Regarding parents' education,
the findings of the present study the results of Raina (1968), Srivastava (1977), Singh
(1980), Mukhopadyay, Chakrabarti and Kundu (1990), and Sudhir Kumar (1992), who
found that where parents had a higher level of education this was a favourable factor for
the development of creativity in their children. Analysis of variance revealed different

251
effects of father's education level (p<0.05) (table 10.9) but in the multiple regression
analysis it neither influenced directly nor indirectly. Multiple regression analysis showed
that mother's education and income showed a direct and significant effect on their
children's creative thinking (see the exploratory correlate model; tables 10.10 and 10.14).
As King (1990) argues, "a more educated mother raises a healthier family; she
can better apply improved hygiene and nutrition practices. She may have fewer and
better-educated children, she is more productive at home and in the workplace and is
better able to get further education". Women's enhanced ability to earn an income to
support their families is becoming increasingly important, as more become heads of
households and enter the labour force in search of paid work. "Indeed, failure to raise
women's education to a par with men's exacts a high development cost- - in lost
opportunities to raise productivity and income, and improve the quality of life". The level
of schooling that women have achieved is only one aspect of female education affecting a
country's development (p.1).
If the intention of the government and the schools is to develop the competency
of the students attending them then they should jointly plan at least some programmes for
educating and assisting in improving the earning power of women. In this process,
voluntary organisations can also be encouraged to play an important role as catalyst
between Government, school and parents. If necessary some classes at the weekend may
be arranged to educate women in small-scale6 industries and marketing.
While this may put an extra burden on schools, it may be worthwhile for the
future. It may also encourage parents to show concern and regard for the school. They
may come forward to help the school in many ways. It will also help in developing
rapport with the school. The responsibility of the school is not only to teach the children
it should also hold responsibility for building and developing the nation.
Two major issues facing parents concern whether to send their children to a
school with English or Telugu as the medium of instruction, and to what type of school
they should send the girls, single sex or co-educational. In India it is very expensive to
send children to English-medium schools. However, Naidu (1987) reported that the
students who were studying in English medium proved to be better achievers than
Telugu-medium students in academic subjects. In this study, the teachers did not perceive
the medium of instruction as an issue, although the study suggests that the Telugu
medium students have been observed to be more creative (overall) in comparison to the
English medium students (P< 0.05) on creativity (composite score). It seems possible that
6 Garments, knitted goods and laces, pickles, jams, tomato-sauce, butter, cheese, curd, snakes and sweets.

252
the English-medium students were handicapped in expressmg their flow of ideas
(fluency) and variety of ideas (flexibility). No significant differences were found in
uncommon or unique responses (originality). Although both students in both media have
come from a bilingual background, the students taught in their mother tongue (Telugu)
have an advantage over others in expressing their ideas fluently.
Studies have shown that bilingual children, relative to monolingual controls,
show definite advantages on measures of "cognitive flexibility", "creativity" or
"divergent thought" (Torrance et aI, 1970; Ben-Zeev, 1972; Scott, 1973; Carringer,
1974; Lambert, 1977). But the degree of proficiency that can be acquired in learning a
language at school depends not only in the number of years during which it is learnt but
also on the motivation of the student, the stage at which it is studied, the types of
teachers and equipment provided and the methods of teaching adopted (Indian
Education Commission 1964-66, p.192). A study in Great Britain (McEven, Gipps and
Sumner, 1975) revealed that children's progress in learning English does not depend on
their formal English teaching alone. There are other factors: (1) language spoken at
home (2) pre-school experience/ English spoken at school and (3) social class. This
study showed that Asian children who speak some English at home have a distinct
advantage in terms of using the language over those who never or rarely do so (Ibid,
p.110). Children who had received pre-school education were better at English than
those who had not (Ibid, p.16). The deficiency of the bilinguals was due to the
experimental groups lack of involvement in English life and culture (Ibid, p.14).
Learning through a foreign medium compels the students to concentrate on
cramming instead of mastering the subject matter (Indian Education Commission 1964-
66, p. 13). In the present study, students of English medium probably get little help
from the home because of parents' illiteracy and the parents are not native speakers of
English. Other reasons could be lack of English usage at school, switching from one
medium to another7, lack of teachers to teach in the English medium, incompetent
teaching and a lack of confidence among the students.
Non-significant differences were found among the girls', boys' and co
educational school students on creativity (composite scores). Further analysis was carried
out to see whether the achievement of girls studying in co-educational schools was better
than that of students in unisex schools (boys or girls) and boys in co-educational schools.
No significant differences were found. However, girls in co-educational schools
7 Some students attend pre-school at Telugu medium schools; after some time they switch over to English medium schools. This is possible at school level or college level.

253
performed better than girls in single sex schools, but they did not achieve more than the
boys (from boys' and co-educational schools). This may be due to the girls in co
educational schools having to deal with greater emerging problems and having less
impositions on their roles (see 10.4.3).
A high percentage of students as a whole and in all three sub-groups (High,
Average and Low creative groups) described their good experiences in the classroom as
when they were given good marks or certificates/prizes. Students felt very bad when
they were not able to get good marks in examinations (see table 10.22 & 10.23). This
clearly indicates the academic pressure they are under. This includes highly creative
children who were found to be 'addicted to school achievement'. They perceive
academic failure as a bad experience in the class, and struggle for academic excellence,
which is their main goal and interest in life.
These results contradict and question the study of Wallach and Kogan (1965).
They observed, that especially low-creativity and high-intelligence children were
found to be 'addicted' to school achievement. Academic failure was perceived by them
as catastrophic, so that they continually strove for academic excellence in order to
avoid the possibility of pain. This was their main goal and interest in life" (p.303).
This study suggests that whether the children's creativity is high or low,
academic pressure is great where the teaching-learning process is a traditional one.
Particularly, in India, teachers and parents always stress to children the importance of
success in examinations. Their main aim is to secure the highest rank in examinations.
Every child feels the pressure towards academic achievement rather than acquiring
creative skills.
Studies of homework have shown that quality of work may be more important
than quantity and that where the load is very great children may suffer from exhaustion
& stress (Hallam & Cowan, 1998). Young children in particular must be free from the
imposition of too much pressure of academic work, and should undertake some
practically oriented activities rather than only theoretical lessons.
When we examined the students' bad experiences in classrooms as a whole
(N=373), they were unhappy when classmates were not friendly or co-operative, did
not like students' misbehaviour in the classroom, indiscipline, corporal and other
punishment by the teachers for in-discipline, and teachers scolding for indiscipline. In
addition, the high creative group had negative experiences when corporal and other
punishment was given for not giving correct answers, teachers scolded for not doing
homework and teachers were angry and insulting in the classroom. The creative

254
children also felt badly when teachers left the school, did not teach well, when there
were no regular classes, when friends quarrelled and were separated, and friends were
jealous.
Corporal punishment and an authoritarian atmosphere still prevail in schools in
India (see table-l0.23) which makes children fearful and may block their creative
expression. Teachers should avoid corporal punishment, scolding and criticising. The
teacher should provide a free, friendly and supportive learning environment in the
classroom to avoid the passive participation of students. In this context, the observation
of Review committee ofNPE'86 (1990) is appropriate to quote:
In a social and educational set-up like ours where the relationship between the teacher and the taught is still largely authoritarian, the general tendency is to suppress any urges and interests that deviate from the class norm. The first requirement for the promotion of talent, therefore, is for the teacher to create an atmosphere of free expression in the classroom and to provide opportunities for creative work (p.241).
As Torrance and Myers (1974, p.lOS) emphasise, the relationship ofthe teacher,
to the pupil is extremely important. In a creative teacher-pupil relationship, the teacher
must be willing to permit one thing to lead to another, and should not be disturbed
when a pupil asks an unexpected question or proposes a surprising solution. The
relationship is dominated by love and kindly concern. Discipline may be strict but not
punitive or cruel. The pupil must feel that the teacher is "on his side", otherwise things
can go badly awry (p.l OS).
In creating favourable conditions for learning and thinking, care should be
exercised to see that pupils are reasonably comfortable, both physically and
psychologically (Ibid, p.lOS). Rogers argues that permissiveness gives the individual
complete freedom to think, to feel, to be, whatever is most inward within himself. It
fosters openness, and the playful and spontaneous juggling of precepts, concepts and
meanings, which is a part of creativity (Rogers, 1959, p.SO). A teacher adapts
classroom procedures to the students' interests and ideas wherever possible. This also
means allowing time for students to think about developing their creative ideas in a
climate of mutual respect and acceptance. This means a delicate balance between
psychological safety and freedom, so that pupils are prepared to take risks (George,
1992, p.29-30).
Students should be gIVen opportunities and it should be made clear that
whatever ideas they give will be accepted in a very supportive way and whatever the
opinion they have, it should be expressed freely. They should also be provided with an
atmosphere where they can feel comfortable. They must also think that answers to

255
questions will not be ridiculed and may sometimes be kept confidential. At the same
time they need encouragement to go beyond the syllabus and think about other areas.
Teachers need to understand learners' needs, should behave positively and
supportively, open up new avenues and exploit every opportunity for learning. As
George (1992) argues, the teacher is the facilitator, the resource manager, the
enthusiast, the guide, the prompter, and the agent of change. The teacher can provide a
warm, supportive atmosphere and allow children to make choices and to be a part of
decision making process (p.30). Teachers increasingly recognise the need to adopt
more creative strategies towards the management of the curriculum and to consider
contexts which provide a more creative framework for teaching and learning. They are
often keen to encourage children to be more creative and to develop strategies they can
use to support and extend children's natural creative energies (Beetlestone, 1998, p.6).
As Powell Jones (1972) argues the teacher must help pupils to discover their strengths
and give them opportunities to experiment and to try out various ways of developing
their abilities (p.28). Teachers should encourage the students to engage with tasks and
give them scope for exploration. Open-ended tasks must be provided to the students
and their creative efforts should be encouraged and rewarded.
Challenging activities could be organised on an individual basis or through
group work. These can be planned or unplanned activities. Groups may be formed on
the basis of abilities, shared interests and curiosity of the individuals. By assigning
activities a teacher can build self-confidence among the students by supervising and
helping in completing activities. The teacher can give incentives or reinforce the
creative effort of the child in freely expressing his views. Students not only get the
satisfaction of participation but motivate themselves and come forward to attempt other
unassigned activities in their future life.
As Beetlestone (1998) explains, creativity as a form of learning can help to
explain and interpret abstract concepts by involving skills such as curiosity,
inventiveness, exploration, wonder and enthusiasm, which are all qualities young
children have in abundance. These aspects can be harnessed by giving children greater
technical mastery and wider vision so that creativity can inform all other learning (p.2).
The aims of the Swedish school curriculum, as mentioned by Bjerstedt (1976,
p.3), suggest that "students should be encouraged and trained to make their own
combinations, to draw their own conclusions, to design and create, to experiment and
make discoveries. Problem sensitivity, ability in innovative thinking and independent
creation are important characteristics". As Freeman (1985, p.17) has argued, problem

256
solving skills should be built in to teaching in many subject areas, so that the pupils are
obliged to think for themselves. The skills of communicating what they have found are
as important as the discoveries themselves, and should be taught and practiced in
schools.
"Creative teaching can be seen as the same as good practice, yet good practice
is not necessarily creative teaching. Creative teaching involves a complex interplay
between the child, the teacher and the context in such a way that each element is
pushing forward, seeking new boundaries, striving towards new territories, always
looking to extend in the search for something new" (Beetlestone, 1998). Probably no
subject or course is without its opportunities to teach creatively; and all learning will be
more exciting, thrilling and meaningful with imaginative teaching. In this system self
initiated activity on the part of the learner is encouraged, and unique as well as
conforming achievements are rewarded. Effective learning is characterised by personal
expression, personal experience and personal discovery, and the educator accepts what
the learner produces while trying to enlarge his background and enhancing his skills
(Powell Jones, 1972, pp.1 06-1 07).
Science and mathematics can foster sustainable human development. They are
also among the most appropriate subjects through which creative ability can be
developed effectively. "Science and Technology have made many seemingly
impossible things possible (Review Committee of NPE' 86, 1990, p.22). An effective
programme of Social Studies is also essential for the development of good citizenship
and emotional integration (p.636).
The majority of the teachers perceive that the teaching of arts and music may be
used for developing creative thinking, but creativity can be developed through all the
school subjects, particularly science, mathematics and social studies. The highly
creative students were shown to enjoy science and mathematics (table-1 0.1 9). These
HC group children realised the importance of the subjects and were concerned with the
quality of teaching and classroom atmosphere. They were also interested in science
because it involving experiments and discoveries, is concerned with living beings,
includes history of scientists and inventions, helps in understanding understand the
natural environment and opens the door to new knowledge. Similarly, mathematics
gives solutions to problems. This can give enjoyment, create interest and enthusiasm,
and is full of fun and full of formulas and symbols (see Appendix E2, table E2-T2).
Unfortunately, the majority of the students (except the highly creative children)
disliked science, mathematics and social studies (see table 10.20). Educators in India

257
need to consider how they might change these attitudes. The most common reason given
for liking lessons was that they were taught interestingly by the teachers. Disliking a
subject depended on the 'degree of understanding of the subject' and 'lack of interest in
the subject'.
To inculcate interest among the students, teachers need to evolve imaginative
methods. "Methods of teaching mathematics and science should be modernised, stressing
the investigatory approach and the understanding of basic principles. Guide materials
should be made available to help teachers adopt this approach. Laboratory work will be
considerably important. There should be flexibility in the curriculum in order to cater to
the special needs of the gifted" (Report of the Indian Education Commission 1964-66
p.636). Acquiring knowledge by itself does not lead to creativity.
12.2.4 Students' perceptions of their teachers' classroom behaviour as measured by
TES
The overall scores on the Teacher Encouragement Scale (TES) showed no
significant difference between girls and boys. But in the sub-scale analysis of TES, it
was found that the girls were happier than the boys with the teachers' classroom
organisation and teacher-pupil relations.
No significant differences were exhibited on the overall TES scores (p>O.05)
between the Telugu and English medium students' assessment of their teachers
encouragement. However, significant differences were found on teacher initiation
(p<O.Ol), teacher attention (P<O.Ol), and strict control (p<O.Ol). English medium
students were positive about teacher initiation, but unhappy with the level of teacher
attention and the teachers' strict control over the students.
Wodtke (1974 & 1975) concluded that pupils of highly controlling teachers
exhibit less self-initiated verbal behaviour, and achieve lower gains on measures of
verbal creativity than those of more permissive teachers. In the present study, the
English medium students felt that their teachers were very strict. This could be the
cause for under-achievement of English medium students compared with Telugu
medium students. Providing a friendly environment, making a stand for mutual
understanding and respecting the dignity and worth of the individual can promote
creativity (Torrance, 1962a).
A significant difference was found between girls', boys' and co-educational
school pupils in assessing their teachers on TES scale (p<O.05). Students from boys'
schools were more favourable towards the teacher encouragement than the other two
categories of school students. There exist a notable significant differences among the

258
three type of schools students in the sub-scales teacher initiation (p<O.OOOl) and
teacher attention (p<0.001) were found. The differences were also found in other sub
scales 'creating interest' and 'strict control' but they were statistically significant only
at 0.05 level.
The result reveals that the three groups, high, average, and low creative groups
were significantly differed (p < 0.001) on TES. It indicates that the highly creative
students had more favourable attitudes towards teacher encouragement as perceived by
students than their counterparts of average and low creative groups. It indicates that
level of students' creativity proportionate to the teacher encouragement. The correlation
analysis (r=. 22, p< 0.001) was shown a positive correlation between teacher
encouragement (as measured by TES) and their students creativity. In the multiple
regression analysis, teacher encouragement (TES) was found to be largely influencing
the students creative thinking (see the exploratory correlate model). This result reflect
the arguments of Torrance and Myers (1974, p.83), Powell Jones (1972, p.24), Passi
(1989, pp.8-9) and Poole (1979, p.12) that teachers' efforts in encouraging children to
use their creative abilities, receptive and accepting attitude of the teachers play an
important role in fostering creativity in children.
12.2.5 .School activities
The majority of schools (about 80%) provided opportunities for pupils to
participate in extra-curricular activities, but there was wide variation in the specific
provision made.
Powell Jones (1972) emphasised that "it is important that children should be
provided with sufficient variety of materials and experiences to give them a wide
choice of activities for their leisure time. Increased attention must be attached to direct
instruction in drama, film, the art and crafts and sports as an essential part of everyday
leaming"(p.l08).
In India, it is not possible to provide all facilities in every classroom because of
financial constraints. However, the school can at least provide a common Resource
Room 8 for all the students in the school. This would be less expensive than providing
facilities to all the classes in the school. The Resource Room might contain printed
resources (books, magazines, newspapers, charts, maps and so on.,), special facilities
(TV, video, slides, films, etc.,), special collections (animate and inanimate),
information and retrieval systems (files, databases, personal computers etc.,).

259
laboratory equipment going beyond everyday needs (microscopes, telescopes, ovens
etc.,) and a whole range of materials to allow experience with topics of special interest.
Such a room would have the function of a library, with elements of laboratory,
workshop and studio.
SUPW9 and other activities like knitting, embroidery work, displaying artwork of
the students could also be arranged in the room. Some lessons might be taught in the
room, allowing exploration of new ways of learning. The resource room should be
supervised by a resource teacher who has or should have skills in educational diagnosis,
prescription and prescriptive teaching (McLeod and Cropley, 1989, pp.207-08). The
resource teacher would co-operate and jointly plan with the student's regular subject
teachers. The room would be regularly opened during school hours, and after school (a
couple of hours) to enable the students to visit the room. The children could also visit
during the lunch break, and in leisure time, and those not participating in games may also
visit the room instead of wandering in the school grounds or on the Verandah.
Computer education, of course, is important because computerisation has become
part and parcel of technologies contributing to development in every sphere (Review
Committee of NPE'86, 1990, p.286). Computer applications have an important role in
maintaining interest, developing curiosity and fostering the desire to master problem
situations (McLeod and Cropley, 1989). They also provide various possibilities for
group learning, and self and peer evaluation. Computer networks, or teamwork at the
terminal, open up prospects for communication, joint planning, mutual help and moral
support.
None of the schools had a computer (see table-11.12). Training ofteachers in the
use of computers has been inadequate, and computer learning is not reflected in the
timetables of the students. Computer learning should be made an integral part of the
timetable. It is linked to SUPW for which generally two periods in a week are provided
in the school system (Review Committee NPE'86, 1990, pp.286-287). Computers could
be provided in the resource room and used as a 'teaching aid'.
A high percentage of schools said that their students participated in school stage
decorations, classroom decorations, decoration of school buildings and surroundings
and preparation of wall posters on special occasions and displays (only 44%).
Schools could take the opportunity to extend this, to make school a world in
miniature, a place where discovery exploration and enquiry can take place. School
8 See McLeod and Cropley, 1989, p 207-8. 9 Socially Useful Productive Work (SUPW)
260
grounds should be planned with the same attention to detail as the school buildings
(Titman, 1994). The school should offer lots of opportunities for involving the children
in decorating school building and gardens. This develops a sense of responsibility for
the maintenance, care and protection of that which has been created. Attitude and
behavioural changes can also take place among the children because of greater
involvement and participation. The teachers should made very clear to the children the
importance of being involved, of doing things themselves; this in itself may make them
"proud" of the outcome, almost regardless of how good it is (Titman, 1994).
Children's physical and emotional development can be nurtured alongside their
creative growth by making full use of natural resources. For teachers 'nature' provides
ample, free resources which can be used to enhance learning across the curriculum. It
provides opportunities for developing creative skills, such as close observation. The
outside area of a school - sharing the complex interrelatedness of nature itself - can
provide a rich source for cross-curricular projects, meeting not only curriculum targets
but also enhancing the quality of life for learners - and teachers. The learning context
can be enhanced by landscaping grounds and making use of surrounding natural
facilities (Titman, 1994, p.l40-141).
The majority of the schools arranged visits to historical monuments (78%),
museums (78%), and educational tours/ excursions (67%). But they failed to arrange
visit to art galleries (100%); workplaces of craftsman (89%), workplaces of technicians
(89%), and workplaces of local artists (67%); art exhibitions (56%) and field trips
(67%).
Perry (1992) has argued that a successful museum experience that leads to
learning includes six factors: 1). curiosity- the visitor is surprised and intrigued; 2).
confidence- the visitor has a sense of competence; 3). challenge- the visitor perceives
that there is something to work towards; 4). control- the visitor has a sense of self
determination and control. 5). play-the visitor experiences sensory enjoyment and
playfulness; 6). communication- the visitor engages in meaningful social interaction
(p.9). "Visitors do learn in the museum. Museum experience is tremendous; powerful,
emiching, even life-changing moments are possible in museums (Hein, 1998, p.179).
As Bryant (1961, p 11) said, 'Many curators underline the main purpose of the visit-that
it should be enjoyable both as a social occasions and as part of interesting work, that the
children should know that the exhibits are evidence for something, and that they must
both select and interpret what they see'.

261
Children's efforts cam be directed in the museum and provide a basis for follow
up work in school. Worksheets provoke questions and discussion and so provide a far
more valuable vehicle for imparting knowledge than the formal lecture given in a
classroom atmosphere with children sitting in rows. (UNESCO, 1973, p.27)
Simply organising field trips or visiting other places is also not enough; the
opportunity should be given to the students to discuss and interpret the information
collected during the field trips. In studying the community and having contact with it,
students feel that they are involved and playing a role in solving community problems.
The community will feel that is not a separate institution but a functional part of its own
organisation, contributor to its physical and moral growth (Khan, 1980, p.18). The
community, if involved in the planning, will also help in raising funds and recruiting
participants. Efforts have to be put into mobilising funds from different sources.
It is appropriate to quote some of the observations made by the Review
committee ofNPE' 86 (1990) that:
"the majority of our schools, whether urban or rural, Government or Private, the average school remains divorced from the community. There are already many rules and conditions for recognition and affiliation of a school. The committee suggested that one of the essential conditions be the school would engage itself in meaningful and on-going development work with the community. The linkage (or bond) of school with the community will manifest itself in collaborating with the community for provision or support of various kind of services. This kind of open-ended community and bridge building, breaking the traditional barriers, based on gender, group, caste, religion or language is seen as an important role of education" ( pp.24-25).
Like many other studies, the present study indicates that there is a need for
involvement of parents fully in the process of educating the children. Bastiani and
W olfendale (1996) emphasise the role of parents and teachers' mutual understandings.
Teachers can share their learning objectives with parents and those willing to work on
creative tasks such as modelling or cooking, bringing in artefacts, talking about their
experiences or helping with tasks like costume design or productions. For this "contact
between parents and teachers needs to be a two-way process, from home to school and
from school to home. Inadequate communication between the two may considerably
hinder the scholastic progress of the child. This is especially true when considering
creative work" (Powell Jones, 1992, p.32). Powell further suggests that the teacher
must act as interpreter of the child's work to his parents, who can mistakenly stifle
creative growth through imposing adult standards and ideas on him and attempting to
correct anything which does not conform to a conventional standard. This contact must
be maintained in Parent-Teacher Associations (PTA), open days, school visits, home
visits, planned home-school conferences and study groups.

262
Parents should be invited to school often, to discuss or share their ideas in
relation to the progress of their children and school (which is very common in British
schools). The school should organise Social Evenings at regular intervals, perhaps two
or three times a year depending upon the response from the parents. Frequent visits to
school will develop a good rapport and concern about the school. This may also
develop positive attitudes towards the school rather than parents misunderstandinglO the
school.
Particularly in India, the parents
of students attending government schools
are busy during the daytime with their
routine work. So contacts with school are
negligible. Teachers and parents do not
A Community School would mean that the school is not only teaching the children from the community or area that it serves but is organically linked with the community, has emotional attachment with it, and hence is actively involved with and extends itself into the life and concerns of the community.
know each other and there is a wide gap in communication between them. As the above
Committee (Ibid, p.24) commented, "the teachers, by and large, see themselves as
responsible for teaching certain assigned subjects and doing certain other assigned tasks. They
have little or no links with the concerns and situations of the community in which the school is
placed andfor the people, whose children they teach. This 'alienation' has to be put to an end.
We see the imperative need for every school to be, in the real sense, a 'Community School '.
12.3.0 Recommendations
As a result of this study, designed to investigate the promotion of creativity
among secondary school children in India and from the literature survey the following
recommendations are made.
1. Provision should be made for further training or in-service training about creativity for the
teachers teaching at various levels, i.e., primary, secondary and college, to enable them to
acquire the necessary skills to promote creativity, to develop knowledge of new trends in
thinking about creativity and motivating students to be creative. Specialised courses
concentrating on one subject/area and refresher courses which introduce teachers to new
curricula and techniques should be organised frequently. Teachers may then become well
informed and familiar with the latest developments in education, information and
communication technology through the mode of distance and continuing education.
10 Misunderstanding, lack of understanding between parents and the school. Parents think that "the teachers are paid employees, they are not doing a proper job, students are not taught well". In their terms school is an isolated socialising agency. Teachers think, "Parents never care about their children's studies and shown little concern for School. Hence, the school is isolated day by day from society.
263
2. Teachers should be given freedom to experiment with new creative techniques in the
classroom. Their creative work should be recognised and rewarded. Teachers can use the
discovery method or problem-solving method, provided class size is restricted. The shift
system of school should be abolished to enable teachers and students to work before and
after the school hours. If necessary, time spent at school could be increased.
3. A good teacher - pupil relationship needs to be established in schools. Teachers need to
create a friendly and affectionate environment in the class. They need to avoid the
terrorising the students by the use of corporal punishment and try to keep a healthy
rapport with pupils. The prejudice, bias and intolerant nature of teachers can spoil the
entire situation in schools.
4. Provision may be also made for students' presentations in class and enabling them to
write imaginative stories, poems, draw cartoons or pictures and build models by using
various materials. Children should be provided with a sufficient variety of materials and
experiences to give them a wide choice of activities for their leisure time.
S . Teachers can identify the children who have curiosity and interest in particular areas and
can form subject clubs e.g. science clubs, mathematics clubs and cultural and literary
clubs or committees. Teachers need to build-up confidence among students to take up
projects or encourage the children to become involved in practical activities. This can be
done after school hours.
6. Teachers and parents should make every effort to make their children independent and
self-reliant in order to express their creativity. Children must be free from the imposition
of too much pressure of academic work, and ample opportunities need to be provided for
freedom of expression by respecting their thoughts and ideas, developing curiosity and
encouraging experimentation.
7. Schools should maintain rapport with parents through PTA!! and try to make occasions
where the parents can become involved in the education process and let them share
responsibility for their child's development. The parents should be fully informed about
the importance of developing creativity and the role that they can play in promoting it,
and helping their children in future careers selection.
8. Extra-curricular activities like drama, film, the art and crafts and sports are an essential
part of everyday learning. Conducting debates 12, brainstorming 13 and synectics!4 are very
important for developing creativity.
11 Parent- teachers Association 12 The process of debate provides practice in organising, developing and presenting ideas in an orderly
and efficient manner. Debate forces the students to look at the situation from all sides, to react quickly, defend and attack I respond to the issues before them.

264
9. The school should provide the infrastructure facilities, adequate instructional materials, a
high quality of teaching, and provide an exciting and adventurous atmosphere for the
children. School should also give proper guidance; encouraging children to undertake
creative work by organising stimulating creative activities and exposing the children to
the outer world by conducting educational tours and field trips.
10. The majority of the schools suffer from lack of funds. The government should assist these
schools by providing greater funds. Schools can also conduct 'fund raising activities,15
through the help of PTA. Schools can also generate funds through donations or by
inviting, honouring or convincing industrialists in the area to contribute.
11. The study reveals that all most all schools have neither libraries nor laboratories. Where
they exist they lack either materials or staff and are inoperative. In the fieldwork it was
also observed that a negligible percentage of teachers have been appointed for art or craft
and are assigned work most of the time which is other than what they are supposed to do.
lt is recommended that all libraries and laboratories should be merged into a 'resource
room' and art and craft teachers and librarians may be trained as resource teachers if they
have sufficient knowledge of science to arrange practicals. Resource teachers may also
be newly appointed and these teachers will help in their respective fields in the resource
room.
12. The curriculum should be flexible and according to the students' present day world needs.
At secondary level, the syllabus must be reduced and a fixed portion should be allotted in
order to improve creative thinking.
12.4.0 Limitations and suggestions for further research
1. Correlation does not indicate causality.
2. Lack of classroom observation to validate TES.
3. This research has some limitations. The first is that the sample of the teachers (88),
though varied in terms of age, qualifications experiences, and taught subjects, is too small
to allow one to make strong generalisations, based on the findings of the study, to the rest
of the teachers in India.
4. The study was limited to surveymg the government teachers' attitude towards the
development of creative thinking at secondary level, particularly for IX class. Further
13 Brainstorming is a group activity: the members of the group are seated in a circle and encouraged to call out their ideas for given tasks, listing all the possible ideas and each member of the group ranks the importance of the listed ideas in order of preference. Finally they summarise the results.
14 Synectics is a procedure for bringing together elements which do not seem to belong together. It seeks to systematise the process of seeing connections between elements of experience and knowledge, which are not normally regarded as belonging together.
15 For example summer fairs, national and international evenings, by inviting artists various fields like games and sports, film industry or local artists.

265
research may be carried out with all the teachers working in all types of school e.g.
private, residential, municipal and Zilla Praja Parishads 16.
5. In this investigation, an attempt was made to analyse the creative thinking abilities of
IX class students studying in Government Telugu and English medium schools. This
study was restricted to the urban schools of Hyderabad, capital city of Andhra Pradesh
(India). Similar studies should be conducted on students belonging to Hindi and Urdu
medium schools to know the effect of medium of instruction on creativity. The
instruments used for measuring creativity in this study could be developed, instead of
translating into the Telugu language if time and resources permit.
6. A checklist was supplied for the headteachers regarding the activities organised in the
schools. Qualitative research could be undertaken to supplement the research exploring
administrative and practical problems relates to promoting creativity in schools.
7. Qualitative research could also explore with parents of the students could have provided
a comprehensive understanding of the home environment, child rearing practices,
students activities at home, attitudes of the parents towards the school and children's
progress.
8. A comparative study of central and state schools; rural and urban samples; ethnic and
non-ethnic groups, various language groups, and different cultural background groups
living in different parts of the India could also be carried out, with large samples to
generalise the results.
9. A similar study might also be conducted with primary students and teachers, in order to
understand the promotion of creativity at primary school level.
10. Examination papers of all subjects could be analysed at secondary levels i.e. VIII to X,
to provide a complete picture of how examinations hamper creativity.
11. Ideas for curriculum reform expressed by the teachers could be explored.
12. Further research could attempt to determine the pattern of interrelationships between
creative thinking, intelligence, academic ability and other variables (not included in the
present study) to develop a more comprehensive model of creativity.
16 Schools functioning under Local Bodies.

266
REFERENCES
Abdulla, K. B. (1994). The critical reading and thinking abilities of Malay secondary school pupils in Singapore. Unpublished Ph.D. thesis, University of London. pp.276-290.
Abraham,W. (1966). Common sense and the talented. National Education Association, Acent on Talent, November.
Abramson, J. E. (1927). d'Etalonnage de Deux Tests d'Imagination et d'Observation. Journal de Psychologie, pp. 370-379.
Acharyulu, S. T., and Yasudhara, P. (1984). Assessment of Creative thinking abilities of pre-school children through spontaneous drawings. Psychological Studies, 29 (2), 192-196.
Adams, G. (1989). Museums & Galleries. A teachers' Hand book. London: Hutchinson, p.I-2.
Adams, J. L (1979). Conceptual block busting, 2nd ed New York: Norton, pp.11-13, 31, 53,63.
Adler, A. (1927). The practice and theory ofIndividual Psychology. New York: Harcourt Bruce.
Agarwal, K. P. (1992). Development of Creativity in Indian Schools some related issues. New Delhi: Concept Published Company, pp 18-19,26-27,44-45,56-57, 140-141.
Agarwal, S., and Kumari, S. (1982). A correlational study of risk-taking and creativity with special reference to sex difference. Indian Educational Review, 17 (3), pp. 104-109.
Aggarwal (1986). National Policy on Education-1986: An Appraisal. Delhi: Doaba House, p.139.
Aggarwal, J. C (1990). Curriculum reforms in India world overview. Delhi: Doaba House, P.73.
Aggarwal, J. C. (1991). Ramamurti Report, 1990 on National policy on Education in India: Major recommendations, Evaluation and corrective measures. New Delhi: Doaba House, pp. 67,297-98.
Aggarwal, Y. P. (1988). Statistical Methods Concepts, Application and Computation. New Delhi: Sterling Publishers Private Limited, p 292.
Agnihotri, R. Ketal. (1994). PRASHIKA : Eklayya's Innovative Experiment in primary Education. Delhi: Ratna Sagar Pvt. Ltd. p30-32, 143.
A Handbook for teachers of basic school (1960). New Delhi: Ministry of Education, Govt. ofIndia, p 9
Ahmed, A. (1987). Sex and community as determinants of creativity. Experiments in Education, pp.15, 11,218-222.
Ahmed, S. (1980). Effect ofsocio-cultural disadvantage on creative thinking. Journal of Psychological Researches, Vol. 24, No.2, pp 96-106.
Alencar, E. M. L. S. (1993). Thinking in the future: the need to promote creativity in the educational context. Gifted Education International vol. 9, pp. 93-96.
Amabile, T.M. (1982). Social Psychology of Creativity: A consensual assessment technique. Journal of Personality and Social Psychology, 43, pp. 997-1013.
Amabile,T. M. (1983). The social psychology of creativity. New York: Springer-Verlag. Amabile,T.M. (1987) 'The motivation to be creative' in S. G. Isaksen.(Ed.) Frontiers of
creativity research: beyond the basics (pp. 223-254). Buffallo, NY: Bearly Limited. Anderson, H. H. (Ed.). (1959), Creativity and its cultivation. New York: Harper & Row. Anderson, H. H. (1965). On the meaning of Creativity. In H. H. Anderson (Ed.). Creativity
in Childhood and Adolescence.(pp. 46-61) .. Palo Alto, California: Science and Behaviour Books.

Anderson, V. E. (1956). Principles and Procedures of curriculum improvement, p.9. Andhra Pradesh Primary School Project, (1986). A Draft Handbook for Teachers.
Hyderabad (India): The Project Director, Primary school Project pp.1-10.
267
Andrews, E. G. (1930). The Development of imagination in the pre-school children. University of Lowa studies in Character, 3(4).
Arnold, J. E. (1963). Creative Imagination: A course in mechanical engineering. Paper presented at Regional Meeting of ASEE. University ofVermountfall Mimeographed.
Arora, G. L., Gupta, B. P., and Madhulika. (1982, cited in Raina, 1989, p. 102). Comparison of curriculum load at the secondary stage in different states (Delhi, Haryana, Maharasthra, Kerala). New Delhi: National Council of Educational Research and Training (NCERT).
Ausubel, D. (1963). The psychology of meaningful verbal learning, in Introduction to School Learning. New York: Grunc, p 99.
Awasthy, M. (1979). A study of creativity, intelligence, scholastic achievement and the factors of socio-economic status. Unpublished M.Ed. dissertation, Indore (India): Indore University.
Awasthi, J. P., and Sharma, M (1988). Classical Indian Philosophies and their practices in Education. Agra (India): National Psychological corporation pp. 166-68.
Ayman,1. (1993, cited in Fryer, 1996, pp. 4-5). Dialogues of transitions to a global society. Paper given at the president's convocation, creative Education Foundation, Buffalo, NY.
Badrinath, S., and Satyanarayana, S. B. (1979). Correlates of creative thinking of high school students. Creativity Newsletter, Vol. 7 & 8, No.2 & 1.
Baer, J. (1993). Why you shouldn't trust creativity Tests. Educational Leadership. Dec-Jan, pp.80-83.
Baer, J. (1993). Creativity and divergent thinking: A task specific approach. NJ: Lawrence Erlbaum Associates, Publishes, pp. 11-23.
Barbe, W. B & Renzulli, J. S. (1975). Psychology and Education of the Gifted. New York : Irvington Publishers, Inc.
Barber, P. and Holden, C. (1977). Is it possible to be a creative teacher? Instructor, 87 September, pp. 76.
Barkan, M. (1960). Through Art to Creativity. Boston: Allyn and Bacon, Inc. Barlett, F. C. (1958). Thinking-An experimental and social study. London: Allen & Unwin. Barnes, D. (1972). Language and Learning in the classroom. In Asher Cashdan (Ed.).
Language in Education. London: Routlege and Kegan Paul. Barnes, E. W. (1956). The man who lived twice: The biography of Edward Sheldon. New
York: Scribners. Barron, F. (1957). Originality in Relation to Personality and Intellect. Journal of
Personality, pp. 25, 730-742. Barron, F. (1963). The Psychology of creativity. In encyclopaedia Britannica. New York:
Encyclopaedia Britannica, Inc., Vol. 6, pp. 711-712. Barron, F. (1969). Creative person and creative process. New York: Holt, Rinchart and
Winston Inc. Barron, F. (1988). Putting creativity to work. In R. J. Sternberg (Ed.), The nature of
creativity. Cambridge: Cambridge University Press, pp. 76-98. Basemess, S. P and Treffinger, D. J (1981). Analysis of creative products: review and
synthesis. The journal of creative behaviour, VoLl5; No.3, pp 158-77. Bastiani, J., and Wolfendale, S. (eds.). Home-school work in Britain, London: David
Fulton. Bedi, R. K (1974). Experimental attitude and creativity. Unpublished M.Ed. dissertation,
Indore: Indore University.

268
Beetlestone, F., (1998). Creative children, Imaginative Teaching. Buckingham (UK): Open University press, pp. 1-7,40-45, 73-78, 88-94, 108-113, 121-135, 143.
Ben-Zeev, S.(1972) (cited in Hornby, 1977). The influence of bilingualism on cognitive development and cognitive strategy. Unpublished doctoral dissertation, University of Chicago.
Best, J. W. (1983). Research in Education (4th ed.). New Delhi: Prentice Hall of India Private Limited, p.153.
Best, J. W., and Kahn, J. V. (1989). Research in Education (6th ed). New Jersey: Prentice Hall, Englewood clifts. pp.24-25.
Biggs, J. B., and Moore, P. (1993). The process of Learning. New York: Prentice Hall. Bjerstedt, A. (1976). Explorations in creativity. Didakometry Sociometry, Vol. 8, No.2,
pp.3-19. Bloom, B. S. (1958). Quoted in R. L. Ebel (Ed.). Encyclopaedia of Educational Research
(4th ed.). London: The Macmillan Co, 1969, p.599. Boden, M. A. (1990). The creative Mind: Myths and Mechanisms. London: Weidenfeld
& Nicolson, pp. 31-37. Boden, M. A. (Ed.). (1994). Dimensions of Creativity. London: A Bradford Book, The
MIT press, pp.76-77. Bogdan, R. C. and Biklen, S. K (1992). Qualitative Research for Education: An
Introduction to theory and Methods. (2nd ed.). Boston: Allyn and Bacon, p.42. Bolen, L. M. (1976). Effects of race, sex and kinder garden attendance on the creative
thinking on second graders. Unpublished paper, Department of Psychology, Eastern Carolina University, Greeville, N.C.
Botkin, J. W., Elmandja, M., and Malitza, M. (1979). No limits to learning: Bringing the human gap-A report to the club of Rome. Oxford: Pergamon, p. 12.
Bowes, M. (1986). Education for Creativity: Implications for secondary schools. Pastoral care, June 1986, Vol.4, No.2, pp. 116-121.
Brislin, R. W., Lonner, W. J., and Thorndike. (1973). Cross-cultural Research Methods: comparative studies in behavioural science. New York: John Wiley & sons.
Brown, F. G. (1983). Principles of Educational Tests and Psychological Testing (3 rd ed), New York: Holt, Reinhart and Winston pp 218-220, 140-141.
Brunelle, E. A. (1970). Creative Intelligence and Freshmen English Problem Journal of Genetic Psychology, 1971, 118-3-12.
Bruner. (1960). The Process of Education. Cambridge. Mass: Harvard University Press. Bruners, J. S. (1962). The conditions of creativity. In H. E. Gruber, G. Terrell and M.
Wortheimer (eds.), Contemporary approaches to creative thinking. New York: Atherton press, pp. 1-30.
Bryant, M. E. (1961). The Museum and the school. London: The Historical Association, pp.11-12.
Buch, M. B. (1972-78). Second Survey of Research in Education. Baroda: Baroda Center of Advanced Study in Education. pp 245-272.
Butcher, H. T. (1972). Divergent Thinking and Creativity. In W. D. Wall and V. P. Varma, (Eds.). Advanced Educational Psychology, London: University of London Press Ltd. pp 87-91.
Cartier, F. A. (1976). Quotation on the back page of The Journal of creative Behaviour, Vol. 1 0, No.4.
Carringer, D. C (1974). Creative thinking abilities of Mexican youth: The relationship of bilingualism. Journal of cross-cultural Psychology, Vol. 5, No.4, December, 1974, pp.492-503.

269
Chadha, N. K., and Sen, A. K. (1981). Creativity as a function of intelligence, socioeconomic status and sex among the 12th grade school students. Journal of Educational Psychology, Vol.39, No.1, 52-56.
Chada, N. K. (1990). Creativity, Intelligence and scholastic Achievement: A Residual study. Indian Educational Review, Vol. XXV No.3, pp. 81-86.
Chakraborty, B. D. (1992). Eduction of the Creative Children. Delhi: Konark Publishers Pvt Ltd, pp. 8, 15-30, 177.
Channon, C. E. (1974). The effect ofregine on divergent thinking scores. British Journal of Educational psychology, 44, 89-91.
Chapman, J. (1997). Art. In K. Ashcroft and D. Palacio (Eds.), Implementing the primary curriculum: A Teacher's Guide. London: The Palmer Press, pp.114-15.
Chari, A. (1962). Priorities in curriculum Research. New Delhi: Central Institute of Education, N.C.E.R.T., p. l.
Chatterjee, B. B. (1970). Explanation of Some Structural Components of Creativity through Projective Tests, Varanasi: Gandhian Institute of Studies
Chatterjee, B. B. (1975). Learning to think. Journal ofIndian Education, 1 (2) 8-12. Chaube, S. P., and Chaube, A. (1994). Educational psychology. Agra (India): Lakshmi
Narain Agarwal educational publishers, pp. 383-384. Clipson-Boyles, S. (1997). Drama. In K. Ashcroft and D. Placio (Eds). Implementing the
primary curriculum. A teacher's Guide, London: The Falmer Press, pp. 204-05. Cohen, J., and Cohen, P. (1983). Applied Multiple Regression I correlation Analysis for
the Behavioural Sciences (2nd ed.). New Jersey: Lawrence Erlbaum Associates, Publishers, pp.183-193.
Cohen, L., and Manion (1985). Research Methods in Education, (2nd ed). London: Croom Helm.
Colvin, S. S. (1902). Invention versus From in English Composition: An Indicative Study, Pedagogical Seminar, 9, 393-421.
Cormack, M. (1961). She who rides a peacock. Bombay: Asia Publishing House. Cornelius, G., and Casler, 1. (1991). Enhancing creativity in young children: Strategies for
teachers. Early child development and care, Vol. 72 pp. 99-106. Coverse, J. M. (1984). Strong Arguments and weak Evidence: The open/Closed
Questioning Controversy of the 1940's. Public opinion Quaterly, 48, 267-282. Craft, A. (1997). But some subjects just aren't creative ... In A. Craft and et al (eds.). Can
you Teach Creativity? Nottingham (England): Education Now, p.47. Craft, A., and Dugal, 1. (1997). Challenges to vision and creativity. In Anna craft and et
al. Can you teach creativity? Nottingham (England): Education Now, pp. 104-105. Crockenberg, S. B. (1972). Creative tests: A boon or boon doggIe for education? Review
of educational Research, 42, 27-45. Cronbach, L. J. (1968). Intelligence? Creativity? A parsimonious reinterpretation of the
Wallach-Kogan data. Am. educ. Res. J., 5,491-512. Cropley, A. J. (1966). Creativity and Intelligence. British journal of Educational
Psychology, 36, 259-266. Cropley, A. J. (1967). Creativity. London: Longmans, p.19. Cropley, A. J. (1978, cited in McLeod, and Cropley, 1989, p. 60). Unterricht Chne
Schablone. Ravensburg: Maier. Cropley, A. J. (1982, cited in McLeod, and Cropley, 1989, p. 60). Kreativitat and
Erziehung. Munich: Reinhardt. Cropley, A. J. (1993). More ways than one: Fostering creativity. NJ: Abelex Publishing
Corporation, pp. 79-8l. Cropley, A. J. and Maslany, G. W. (1969). Reliability and factorial validity of the Wallach
Kogan creativity test. British Journal of Psychology, 60, pp 395-398.

270
Crutchfield, R. S. (1967). Instructing the individual in creative thinking. In Ross L. Mooney and Taher A. Razik (Eds.) Explorations in creativity. New York: Harper and Row, pp.196-205.
Csikszentimihalyi, M. (1988). Society, culture and person: A systems view of creativity. In Sternberg, R. J. (Ed.), The nature of creativity (pp. 325-339). Cambridge: Cambridge University Press, pp. 325-39.
Cummingham, R. T. (1987). What kind of question is that? In W. Wilen (Ed), Questions, questioning techniques, and effective teaching (pp 67-94). Washington D. C: National Education Association.
Dacey, J. S. (1989). Fundamentals of creative thinking. Toronto: D.C. Heath and company pp.42-53.
Dean, Joan (1976). Being creative. Education (3-31) Vol. 4, No.1 pp. 23-24. De Bono, E. (1992). Serious creativity. London: Harper Collins publishers, pp 55-56, 69-
73. Degarmo, C. (1911). Interest and education. New York: Macmillan. DeHaan, R. F., and Havighurst, R. J. (1957). Educating Gifted children. Chicago: Chicago
University Press. Deo, P., and Gupta, A. K. (1975). What is Creativity bridging different Views.
Unpublished paper MIER, Jammu. Department of Education And Science (1973). Provincial Museums & Galleries. London:
Her Majesty's Stationary Officer (HMSO), p. 8. Department of Education and Science (1989a). Mathematics in the National Curriculum.
London: Her Majesty's Stationary Officer (HMSO). Department of Education and Science (1989b). Science in the National Curriculum.
London: Her Majesty's Stationary Officer (HMSO). Dewey, J. (1916): Democracy and Education, New York: Macmillan. Dewing, K. (1970). The reliability and validity of selected tests of creative thinking in a
sample of seventh grade west Australian children, the British Journal of Educational Psychology, Vo1.40, 35-42.
Dey, P. (1986). Measurement of creative ability: An Investigation. Indian Educational Review, Vol. XXI, No.1, pp. 68-75.
Dhailwal, A. S. and Saini, B. S. (1976). Relationship of creativity with over and under academic achievement. Psychological studies, Vol.21 , No.2, pp 30-40.
Dharmangadan, B. (1981). Creativity in relation to Sex, Age and Locale. Psychological Studies, Vol.26, N.1, pp.28-33
Domino, G. (1979). Creativity and the home environment. Gifted Child Quarterly, 23(4), 818-828.
Donald, W. M. (1963). The Nature and Nature of Creative Talent. American Psychologist, 16 July, pp. 484-495.
Drevdahl,1. E. (1956). Factors of Importance for Creativity. Journal of clinical psychology. Vo1.l2, pp. 22,23-26.
Dunkin M J. Biddle B. J. (1974). The study of teaching. New York: Holt, Rinehart & Winston.
Duric, Ladislav (1979). Essentials of educational psychology. London: Jessica Kingsley Publishers in association with UNESCO. pp. 101-115.
Dutt, N. K. and Lal, G. (1977). The Creative Potential and Education. Ambala: Indian Books Agency, pp 40-52.
Dutt, N. K., Bountra, P., and Sabhrawal, V. K. (1977). A study of creativity in relation to intelligence, extroversion and neuroticism. Indian Educational Review, Vol.8, No.2, pp 81-85
271
Dwivedi S. K. and Sharma B .M.(1987). An investigation into the factors: Affecting Creative Amongst the High Schools Boys. Journal of the Institute of Educational Research. The Institute of Educational Research, Madras (India), Vol.No.11, No.3, September.
Eberle, R. F. (1966 cited in Treffinger, Ripple and Dacay). Teaching for creativeproductive thinking through subject matter content. State of Illinois Bulletin to: Edwardsville (IlL). Community schools, community Unit District 7, (Unpublished).
Ebel, R. L., and FrisbIe, D. A. (1991). Essentials of Educational Measurement, (5th ed.), New Delhi: Prentice, Hall ofIndia Private Limited pp. 76, 225, 232.
Ellermeyer, D. (1993). Enhancing creativity through play: A discussion of parental and environmental factors. Early Child Development and Care, Vol.93, pp.57-63.
Ellis, K. (1993). Teacher questioning behaviour and student learning: What research says to teachers. A paper presented at the convention the western states communication Association Albuquerque, New Mexico.
Ellis, R. S. (1965). Educational Psychology of Problem Approach. New Delhi: Affiliated Eastwest Press Pvt. Ltd. p. 220.
English, H. B and English, A. C (1958). A comprehensive Dictionary of Psychology and Psycho-analytical Terms, NY: David Mokay.
Ervin, S. and Osgood. C. E. (1954). Alternative measures of bilingualism. J. of Abnormal and Social Psychology, 49: 139-146.
Ezekeil, (1966, cited in Agarwal, K. P., 1992). Development of Creativity in Indian Schools some related issues. New Delhi: Concept Published Company, pp 43-44.
Feldman (1988). Creativity: dreams, insights and transformations. In R. J. Sternberg (Ed.), The nature of creativity. Cambridge: Cambridge University press, pp. 271-297.
Ferguson, G. A (1981). Statistical Analysis in Psychology and education (5th ed.). NY: McGraw-Hill Book company. pp 522.
Fielding, N. G and Fielding, J. L (1986). Linking data, Newbury Park, CA; sage. Firestien, R.L. (1993). The power of product. In Scott, G. Isaksen, Mary C. Murdock
(eds.). Understanding and Recognizing Creativity: The emergence ofa Discipline. New Jersey: Ablex Publishing Corporation, pp. 261-277.
Firestien, R. L., and Treffinger, D. J. (1983). Ownership and converging: Essential ingredients of creative problem solving. Journal of creative Behavior, 17(1),32-38.
Fisher, R. (1990). Teaching children to think. Oxford: Basil Blackwell. Floistad, G. (1993). Creativity, Past, Present and Future: A Philosophical Perspective. In
Scott G. Isaksen, Mary C. Murdock, Roger L. Firestien and Donald J. Treffinger (Eds.), Understanding and Recognizing Creativity: The emergence of a Discipline. New Jersey: Ablex Publishing Corporation. pp.203-206, 261-262.
Foddy, W. (1993). Constructing questions for interviews and questionnaires: theory and practice in social research. Cambridge University press.
Foster, J. (1971). Creativity and the Teacher. Basingstoke London: Macmillan Education Ltd. pp. 40-44, 138 -145, 155-157.
Fowler, F. J (1993). Survey research methods. (2nd ed.). Applied social research methods series Volume I.California: Sage Publications, Inc.
Fowlkes, J.G. (1962). The Wisconsin Improvement Program-Teacher Education and Local School Systems. Madison, Wisconsin: University of Wisconsin.
Fox, D. J. (1969). The Research Process in Education. New York: Holt, Rinehart and Winston, Inc., p.367.
Freeman, Hale and Cheshire. (1985). The early years: preparation for creative thinking. Gifted Education International, Vol. 3, pp. 100-104.
Freeman, J., Butcher, H. J., and Christie. (1968). Creativity: A selective review of research (2nd ed.). London: Society for Research into Higher Education Ltd.

272
Freeman, J. (1985). A pedagogy for the Gifted. In 1. Freeman (Ed.). The Psychology of Gifted Children: Perspectives on development and Education. Chichester: John Wiley & Sons, pp.1-19.
Freire, P. (1972). Pedagogy of the oppressed. New York: The Seabury Press. Freud, S. (1958). On creativity and unconscious, NY: Harper. Fritz, R. L. (1958). An Evaluation of Scholastic Achievement of Students Attending Half
Day Sessions in the Seventh Grade. Unpublished research paper. Minneapolis, Minnesota: University of Minnesota.
Fromm, E. (1955,59). Cited in Dacey, Johns. (1989). Fundamentals of creative thinking, Toronto, D. C. Heath and company. pp52-53.
Fryer, M. (1989). Teachers' views on creativity. Unpublished PhD thesis, Leeds: Leeds metropolitan University.
Fryer, M., and Collings, J. A. (1991). Teachers Views about creativity. British Journal of Educational Psychology, 61, pp 207-219.
Fryer, M. (1996). Creative teaching and learning London: Paul Chapman Publishing Ltd. Fuchs-Beauchamp, K. D., and Karnes, M. B., and Johnson, L. T. (1993). Creativity and
Intelligence in pre-schoolers. Gifted child Quarterly, Vol.37, No.3, pp. 113-117 .. Gakhar, S. (1974). Creativity in relation to Age and sex. Journal of Education and
Psychology, Vol. 32, No.3. Gakhar, S., and Kaura, N. (1976-77). Creativity Intelligence: A study of structural
relationship and threshold hypothesis. Creativity Newsletter, Vol.5 and 6, No.1 and 2, pp. 27-37.
Gakhar, S., Paramjit, and Pushpa. (1980). Situational Influence on Creative Thinking in relation to Intelligence. Trends in Education, Vol.6, No.1, pp. 5-12.
Gakhar, and Sudesh. (1974). Creativity in relation to age and sex, Journal of Education and Psychology, 1974,32(3), pp. 133-139.
Gall, M. D. (1984). Synthesis of research on teachers' questioning. Educational Leadership, 40-47.
Gallagher, 1. 1., and Aschner, M. J. (1963). A Preliminary Report on Analyses of Classroom Interaction. Merrill-Palmer Quarterly, 9, 183-194.
Gardner, H. (1988). Creative lives and creative works: a synthetic scientific approach. In R. J. Sternberg (Ed). The nature of creativity, Cambridge: Cambridge University Press, pp. 298-321.
Garnham,A. and o akhill , J. (1994). Thinking and Reasoning. Oxford: Blackwell Publishers, pp. 241-250.
Garrett, H. E. (1962). Statistics in Psychology and Education. Bombay: Allied Pacific Private Limited.
Garrett, H. E. (1981). Statistics in Psychology and Education, Bombay: Vakils, Feffer and Simons Limited, pp. 349 & 354.
Garretts, S. (1976). Putting our whole brain to use: a fresh look at the creative process. The Journal of creative Behaviour, Vol. 10, No.4, pp. 239-249.
Gay, L. R. (1990) Educational Research (3rd ed.), Merrill: An Imprint of Macmillan Publishing Company, pp. 135, 139.
George, D. (1992). The challenge of the able child. London: David Fulton Publisher, 29-30.
Getzels, J. W. and Jackson, P. W. (1958). The meaning of Giftedness - An Examination of an Expanding Concept, Phi Delta Kappan, Vol. 40, N02, pp.75-77.
Getzels, J. W., and Jackson, P. W. (1962). Creativity and intelligence: Explorations with gifted students. New York: John Wiley & sons, Inc., pp. 20, 56-64.
273
Getzels, J. w., and Madaus, G. F. (1969). Encyclopaedia of Educational research: A project of the American educational research association. The Macmillan Company, collierMacmillan limited, London, pp. 267-273.
Ghiselin, B. (Ed.) (1952). The creative process. New York: A Mentor Book form New American library, p. 11,293.
Ghiselin, B. (Ed.). (1955). The creative process. New York: Mentor. Ghiselin, B. (1963). Ultimate criteria for two levels of creativity. In C. W. Taylor and F.
Barron (Eds.). Scientific creativity: Its recognition and development, New York: Robert E. Krieger Publishing Company, pp. 30-43.
Gilhooly, K. J. (1982). Thinking: Directed, undirected and creative. London: Academic press Inc. (London) LTD. pp. 10-15, 123-149.
Goldenson, R. M. (1984). Longman dictionary of psychology and psychiatry. New York: A Walter, D. Glanze Book.
Goodale, R. A (1970). Methods for encouraging creativity in the classroom. Journal of creative Behaviour, Vol. 4. No.2, pp.91-102.
Gorden, R. L (1975). Interviewing: strategy, techniques and tactics. Revised Edition, Illinois: The Dorsey press Homewood, pp. 76-77.
Gore, M. S. (1985). Creativity in higher education. New Frontiers in Education. 15, 98-103.
Government of India, Ministry of Education (1952-53). Report of the Secondary Education Commission (Oct. 1952 to June 1953, headed by A L. Mudaliar). New Delhi: Govt. of India, Ministry of Education document.
Government of India, Ministry of Education (1966). Report ofthe Education Commission 1964-66: Education & National Development (1st ed.) headed by D. S. Kothari, New Delhi: Government ofIndia Press, pp. 240-242.
Government of India, Ministry of Education, (1985). Challenge of education - a policy perspective. pp. 11-12.
Government of India, Ministry of Human Resource Development (1990). Report of the committee for Review of National Policy on Education-1986 (headed by Acharya Ramamurti). New Delhi: Government ofIndia Press.
Government of India, Department of Education, (1993). Education for All the Indian Scene, pp. 1-10,60.
Gowan, J. C., Demos, G., and Torrance, E.P. (1967). Creativity: Its Educational Implications, New York: John Willy & Sons, Inc., p. 44.
Gowan,1. C., and Torrance, E. P. (1965). An intercultural study of non-verbal ideational fluency. Gifted Child, Quarterly, Vol. 9, pp. 13-15.
Gowan, 1. K., and Torrance. E. P. (Eds.). (1979). Educating the Ablest, Itasca Illinois: F. E. peacock, pp. 58-79.
Goyal, R. P. (1973). Creativity and school climate. An exploratory study. Journal of Psychological researches, pp. 77-80.
Greene, H. A, Jorgenso, A. N., and Gerberich, G. R (1948). Measuring and Evaluation in the Elementary schools, New York: the Obyssey Press Inc., p.61.
Gronlund, M. A, and Linn, 1. E. (1990). Measurement and Evaluation in Teaching (6th Ed), New York: Macmillan Publishing Company, pp. 81-82.
Grote, J. et al. (1969). Untersuchungen zur Kreativitat. Zeitschrift fur Padagogik, 15, pp 135-171.
Gruber, H. E. (1980). Darwin on man: A psychological study of scientific creativity, (2nd
ed.). University of Chicago press, pp. 144, 148, 149. Guilford, J. P. (1950). Creativity. Am.Psychol., Vol. 5, pp. 444-454. Guilford, J. P. (1956). Structure of intellect. Psychological Bulletin, Vol. 53, pp. 267-93.
274
Guilford, J. P. (1957). A revised structure of Intellect (report of psychological Lab.No.19). Los Angeles: University of Southern California, pp. 69-95.
Guilford, J. P. (1961). Creative-Thinking Abilities of Ninth-Grade Students. Paper presented at annual meeting of American Educational Research Association, Chicago.
Guilford, J. P. (1962). Creativity: Its Measurement and Development. In S. J. Parnes, and H. F. Harding (Eds.). A source Book for Creative Thinking, New York: Charles Scribner's Sons.
Guilford, J. P. (1964). Three Faces of Intellect, Ripple, Richward E. (Eds.) Learning and Human Abilities: Educational Psychology, New York: Harper and Row, Publishers, pp.46-63.
Guilford, J. P. (1967). The Nature of Human Intelligence. New York: McGraw-Hill Book company, p. 166.
Guilford, J. P. (1968). Intelligence, creativity and their Educational implications California: Robert R. Knapp, Publisher.
Guilford, J. P. (1986). Creative Talents: Their Nature, Use and Development, Buffalo, NY: Bearly.
Gulati, S. (1979). Creativity as a function of Intelligence, Artistic Aptitude and Neuroticism. Educational Trends, VoLl4, No.1, pp. 35-44.
Gulati, S. (1995) (ed.).Education for creativity: A Research book for Teacher Educators. New Delhi: National council of Educational Research and Training (NCERT), pp. 16,30,35, 73-74.
Gupta, A. K. (1978). A Study of Pupil Creativity in two Institutional Settings, Creativity NewsLetter, Vol.7, No. I.
Gupta, A. K. (1980). A Factorial Study of Verbal and Non-Creativity, Intelligence and Socio-economic Status. Jammu: Model Institute of Education and Research, (ICSSR financed).
Gupta, G. S. (1979). A Comparative Psychological Study of Creativity of Indian Adolescents Students at Various Educational Levels. Indian Psychological Review, Vol. 18, No.1 & 4, pp. 42-44.
Gupta, K. K. (1979). Creativity, Intelligence and Achievement. The Educational Review, Vol. 85, No. 11, pp. 208-212.
Haddon, F. A., and Lytton, H. (1968). Teaching approach and the development of divergent thinking abilities in primary schools. British Journal of Educational Psychology, pp. 38, 171-80.
Hallam, S and Cowan, R. (1998). Is homework important for increasing educational attainment? Paper presented at the annual conference of the Education section of the British Psychological Society, September 1998, Exeter.
Hallman, R. J. (1963). The necessary and sufficient conditions of creativity. Journal of Humanistic psychology. Vol. 3, No.1, spring pp. 14-23.
Hallman, R. J. (1967). Techniques of creative teaching. The journal of creative behaviour, VoLl, No.3, pp.325-326.
Hallman, R. J. (1971). Techniques of creative teaching. Reproduced in G. A. Davis and J. A. Scott, (Eds) Training Creative Thinking, New York: Holt, Rinehart and Winston, Inc. pp 220-224.
Hammersley, M. (1992). What's Wrong with Ethnography: Methodological Explorations. London: Routledge, p. 67.
Handlin, O. (1962). Are Colleges Killing Education? Atlantic, CCIX, pp. 41-45. Hansen, K. H. (1951). High School Teaching, N. J: Prentice Hall, Inc. pp. 195-200. Hare, V. C., and Pullman, C. A. (1980). Teacher questioning: A Verification and
extension. Journal of Reading behaviour, Vol. 12, pp. 69-72.

275
Harms. (1939). A Test for Types of Formal Creativity. Paper read during the 47th annual meeting of American Psychological Association, Sept. 1939. Psychological Bulletin, 36, pp. 526-527.
Harrison, M. (1970). Learning out of school. A teacher's Guide to the educational use of museums. London: Ward Lock Educational Ltd., pp. 9-12.
Harrison, M. (1973). Museums and Galleries. London: Routledge and Kegan Paual, p.6. Hasan, P. and Butcher, H. J. (1966). Creativity and intelligence. A partial replication with
Scottish children of Getzels and Jackson's study. British Journal of Psychology, Vol. 57, pp 129-135.
Hawes, H and Stephens, D (1990). Questions of Quality: primary Education and development. Longman.
Heim, A. W. (1954). Appraisal ofIntelligence. New York: Holt, p. 68. Heim, H. J. Butcher (1970). Divergent thinking and creativity, In W. D. Wall and V. P.
Varma (Ed.) Advances In Educational Psychology, London: University of London Press Ltd., pp 85-90.
Hein, G.E. (1998). Learning in the Museum. London: Routledge, pp. 151-179. Heinelt, G. (1974). Kreative Lehrer-Kreative schuler. Freiburg: Herder. Henerson, M. E, Morris, L. L., and Gibbon, C. T. (1978). How to Measure Attitudes.
London: Sage Publications, pp. 86-88, 146-56. Hennessey, B. A., and Amabile, J. M. (1988). The conditions of creativity. In R. J.
Sternberg (ed.), The nature of creativity. Cambridge: Cambridge University Press, pp. 11-38.
Herring, J. E. (1996). Teaching Information Skills in Schools. London: Library Association Publishing, pp. 147-48.
Hildreth, G. H. (1966). Introduction to the Gifted, New York: McGraw Hill. Hill, R. (1992). Finding creativity for children. Paper prepared for leadership accessing
symposium, Lafayette, In, march 4-5. Hornby, P. A. (Ed.). (1977). Bilingualism: psychological, social, and educational
implications. New York: Academic press, Inc. pp. 15-27. Howieson, N. (1984). Is Western Australia neglecting the creative potential of its youth?
Paper presented at the 1984 Annual Conference of the Australian Psychological Society, Perth, August 1984, 12-17.
Hudson (1966). Contrary imaginations. London: Methuen. Hughes, H. K. (1969). The enhancement of creativity. The Journal of creative Behaviour,
Vol.3, No.2, pp. 73-83. Hurlock, E. B. (1978). Developmental psychology (4th ed.). New York: McGraw Hill, pp.
324-350. Hussain, M. G. (1974). Creativity and Sex differences, Psychological Studies, V01.19,
No.2, pp. 127-129. Hussain, S. (1988). Creativity: Concept and findings. Delhi: Moti1al Banarsidass, pp. xi,
26-28. Hutchinson, E. D. (1941). The Nature ofInsight. Psychiatry. Vol. 4, pp. 31-43. Hutchinson, E. D. (1949). How to think creatively. Nashville: Abingdon press, 97. Isaacs, A. (1970). Editorial: Some Qualms about Giftedness. Gifted Child Quarterly~ 14,
pp. 109-113. Isaksen, S. G. (Ed.). (1987). Frontiers of creativity research: Beyond the basics. Buffalo,
NJ: Bearly Limited. Isaksen, S. G., and Murdock, M. C. (1993). The emergence of a Discipline: Issues and
Approaches to the study of creativity. In Scott G. Isaksen et al. (Eds.), Understanding and Recognising Creativity, NJ: Ablex Publishing Corporation, PP 3,16.

276
Isaksen, S. G., and Murdock, M. C. et al. (Eds.). (1993). Understanding and recognising creativity: The emergence of a Discipline. NJ: Ablex Publishing Corporation. p. 18.
Isaksen, S. G., and Treffinger, D. J. (1985). Creative problem solving: The basic course. Buffalo, New York: Bearly Limited.
Iverson, B. (1982, cited in Ellermeyer, 1993). Play, Creativity and Schools today. Phi Delta Kappan, Vol. 63, No. 10, pp. 693-94.
Jacobs, J. C. (1972). Teacher Attitude Toward Gifted Children. The Gifted Child Quarterly, Vol. XVI, pp. 23-27.
Jacobs, J. F., and Pierce. M., L. (1965). Bilingualism and creativity. Elementary English 40: pp. 499-503.
James, W. (1918). The principles of psychology. New York: Dover Publications, Inc. Jaquish, G. A., Ripple, R. E. (1980). Divergent thinking and self-esteem in preadolescents
and adolescents. Journal of Youth and Adolescence, Vol. 9 No.2, pp. 143-152. Jaquish, G. A., Ripple, R. E. (1984). Adolescent Divergent Thinking: A Cross-Cultural
Perspective. Journal of Cross-Cultural Psychology, Vol. 15 No.1, March 1984 pp. 94-104.
Jarial, G. S. (1979). Verbal creative thinking among the students with different Socioeconomic status backgrounds and Birth orders. Psycho-Lingua, Vol. 9, No.2, pp 85-90.
Jarial, G. S. (1981). Creativity, Intelligence and Academic Achievement - Their relationships and different with reference to Sex and Academic subjects. Journal of Education and Psychology, Vo1.39, No.2, pp. 91-93.
Jarial, G. S., and Sharma, A. K. (1980). An investigation into the interactional effects of Intelligence and Grade levels on creativity and its components. Journal of the Institute of Educational Research, Vol. 4, No.3, pp. 15-19.
Jarial, G. S., and Sharma, A. K. (1981a). Sex roles in Verbal Creative Thinking Abilities. Psycho-Lingua, Vol. 11, No.1, pp. 15-18.
Jarial, G. S., and Sharma, A. K. (1981b). Effect of Personality types, Grade levels and their Interaction upon creativity and its components. The Educational Review.
Jean, E. L. (1993). A Comparison of the Torrance Test of creative thinking, teacher rating of creativity and observations of creative problem solving in natural settings. M. A. Psychology, Unpublished Dissertation.
Johnson, L. V. (1977). Perceptions of Children's Oral Language. Language Arts Vol. 54, no. 3, pp. 266-271.
Johnson-Laird, P. N. (1993). Human and Machine Thinking. Hillsdale, NJ: Lawrence Erlbaum Associates, chapter 3.
Joseph, P. (1993). Differentiating characteristics of High and Low creative children. Unpublished Doctoral Thesis Thirupathi (India): S. V. University.
Jung, C. (1928). On the relation of analytical psychology to poetic art, In C. Jung (Ed.). Contributions to analytic psychology. New York: Harcourt.
Kaiser, H. F. (1960). The application of electronic computers to factor analysis.:. Educational and Psychological measurement, pp. 20, 141-151.
Kerlinger, F. N., and Pedhazur, E. J. (1973). Multiple Regression in Behavioural Research. New York: Holt, Rinehart and Winston, Inc., pp. 105-108.
Kershner, J. R., and Ledger, E. (1985) Effect of sex, Intelligence and Style of thinking on creativity. Journal of personality and social Psychology, Vol. 48, No.4, pp.1 033-40.
Khan, A. (1980). Supervision in Secondary Schools. New Delhi: Arya Book Depot, pp. 10-20.
Khan, R. L., and Cannell, C. F. (1957). The Dynamics of Interviewing. Theory Technique and cases, New York: Wiley.
277
Kidder, L. H., Selltix, W., and Cook's (1981). Research Methods in Social Relations (4th
ed.), New York: Holt, Rinehart and Winston. Kids' Club Network (1992). Out of School in School!. London: Kids clubs Network. King, E. M. (1990). Educating Girls and Women: Investing in Development. Washington:
The World Bank, pp. 1-17. Kinnear, P. R., and Gray, C. D. (1997). SPSS for Windows: Made simple (2nd ed.). East
Sussex (UK): Psychology Press, Publishers, pp. 260-272. Kishore, G. (1981). A Developmental Study of Creativity in relation to Certain Personality
Correlates, Ph.D., Psy., AMU. Koestler, A. (1966). The act of creation. The Danube edition London: Hutchinson of
London, pp. 105-08. Kogan, N. (1983). Stylistic variation in childhood and adolescence: Creativity, metaphor,
and cognitive styles. In P. H. Mussen (ed.). Hand book of child psychology: Vol.3, (4th edn.) cognitive development pp. 630-706.
Krause, R. (1972). Kreativitat. Munich: Goldman. Krause, R. (1977). Produktives Denken bei Kindem. Weinheim: Beltz. Kris, E. (1952). Psychoanalytic explorations in art. New York: International universities
press, Inc. Kris, E. (1953). Psychoanalysis and the study of creative Imagination. Bulletin of New
York: Academy of Medicines, pp. 334-351. Krueger, R. A. (1994). Focus Groups: A Practical Guide for Applied Research (2nd ed.).
London: SAGE Publications, Thousand Oaks, pp. 6-10,49. Kubie, L. S. (1958). Neurotic distortion of the creative Process. Lawrence: University of
Kansas Press. Kundley, M. B. (1977). A Test of Literary Creativity in Marathi. Doctoral Thesis, Nagpur:
Nagpur University. Kundu, C. L. (1978). Mental Abilities and School Curriculum. Kurukshetra. Vishal
Publications, pp. 1-15. Kvale, S. (1996). Interviews: An introduction to Qualitative Research Interviewing.
Thousand Oaks, London: Sage publications, pp. 32,98-103,241. Lambert, W. E. (1977). The effects of Bilingualism on the Individual: cognitive and socio
cultural consequences. In P. A. Hornby (ed.). Bilingualism: Psychological Social and Educational Implications. New York: Academic press, Inc., pp. 15-27.
Landau, E. (1985). Creative Questioning for the Future. In Joan Freeman (Ed.). The Psychology of Gifted children: Perspectives on Development and Education. Chichester: John Wiley & sons, pp. 379-392.
Landry, R. G. (1970). The relationship of second language learning to divergent thinking abilities of students in urban schools. Ann Arbor, Mich: University Microfilms.
Langley, p., and Jones, R. (1988). A computational model of scientific insight. In R. J. Sternberg (ed.). The nature of creativity. Cambridge: Cambridge University press, pp. 177-20l.
Lazarsteld, P. F. (1944). The controversy over Detailed Interviews - An offers for Negotiation, Public opinion quarterly, Vol. 8, pp. 38-60.
Levin, M. J. (1978). Psychology: A biographical approach, New York: Mc Graw-Hill, p. 31l.
Levin, T., and Long, R. (1981). Effective instruction Washington, D. C: Association for supervision and curriculum Development.
Lichter, S. 0., Rapien, E. B, Seibert, F. M., and Sklansky, M. O. (1962). The Drop-outs. New York: Free Press.
Lowenfeld, V., and Brittain, W. (1982). Creative and Mental Growth, (6th ed.). New York: Macmillian.

278
Lytton, H. (1971). Creativity and Education. London: Routledge & Kegan Paul pp. 98-99. Mackenzie, G. N. (1965). Power and politics in curricular change. Education & Psychology
Review, p. 132. Mackinnon, D. W. (1962). The nature and nurture of creative talent. American
Psychologist, 17, pp. 484-495. Mahender Reddy, S. (1989). The development of Reasoning and Creativity among the
ninth standard students. Unpublished M.phil thesis, Annamalai university, (India). Majumdar, S. K. (1973). Scientific Creativity. New Delhi: N.C.E.R.T, (Mimeographed). Mar'I, S. K. (1971). Creativity of American and Arab Rural youth: A cross-cultural study,
Dissertation Abstract International, 31, 12, 6407-A. Marjoram, T. (1988). Teaching Able Children. London: Kogan Page. Markewitz, D. A. (1984). The influence of Creative Intervention Training on the
adjustment potential of Kinder garden Children. DAI, Vol. 44 No.2, pp. 36-38. Markey, F. V. (1935). Imaginative Behavior in Pre-School Children. New York: Bureau
of Publications, Teachers College, Columbia University. Maslow, A. H. (1957). Motivation and personality (2nd ed.). New York: Harper & Row
Publishers, pp.35-58. Maslow, A. H. (1959). Creativity in Self-actualizing people. In .H. H. Anderson (Ed.),
Creativity and its Cultivation. New York: Harper & Bros. pp. 83-95. Maslow, A. H. (1971). The Farther Reaches of Human Nature. New York: Viking Press. Massialas, B. G. and Zevin, J. (1967). Creative encounters in the classroom. NY: Wiley. Mathur, S. S. (1981). Educational Psychology. Agra: Vinod Pustak Mandir, pp. 411,423. May, R. (1959). The Nature of Creativity. In H. H. Anderson (Ed.), Creativity and its
cultivation. New York: Harper & Row, pp. 55-68. May, R .(1975). The courage to create. New York: Norton. McEwen, E. C., Gipps, C. V., and Sumner, R. (1975). Language Proficiency in the multi
racial junior school: a comparative study. Great Britain: National Foundation for Educational Research (in England and Wales) publishing company, pp. 1-17, 108-11l.
McGuire, c., Hindsman, E., King, F. J., and Jennings, E. (1961). Dimensions of Talented Behaviour. Educational and Psychological Measurement, Vol. 21, pp. 3-38.
McLeod, J., and Cropley, A. (1989). Fostering Academic Excellence. Oxford: Pergamon Press pp. 12-15,58-66, 70-75, 175-178.
McNemar, Q. (1964). Lost: Our Intelligence? Why? American Psychologist, Vol. 19, pp 871-882.
Mednich, S. A. (1962). The associative basis of the creative process. Psychological review, 69, pp. 220-232.
Mednick, S. A. (1964). Continual Association as a function oflevel of Creativity and type of verbal stimulus. Journal of Abnormal and Social Psychology Vol. 69, pp. 511-515.
Mehdi, B. (1973, 85a). Manual of Verbal Test of Creative Thinking (2nd ed.). Aligarh: Publisher Mrs. Q. Fatima, Distributers: National Psychological Corporation, Agra.
Mehdi, B. (1973, 85a). Manual of Non-verbal Test of Creative Thinking (2nd ed.). Aligarh: Publisher Mrs. Q. Fatima, Distributors: National Psychological Corporation, Agra.
Mehdi, B. (1977). Creativity, Intelligence and Achievement - A correlational study. Psychological studies, Vol.22, No.1, pp. 55-62.
Mehra, P.G. and Singh, S. A. (1982). A correlational study of intelligence and various components of creativity, LS.P.T. Journal of Research, Vol. 66 No. 21 pp. 15-2l.
Mercurio, J. A. (1979). Community involvement in co-operative decision making: some lessons learned. Educational Evaluation and policy Analysis, Vol. 6, pp. 37-46.

279
Mirman, N. (1964). Teacher Qualifications for Educating the Gifted. Gifted Child Quarterly, Vol. 8, pp. 123-128.
Misra, K. S. (1986). Effect of home and school environment on scientific creativity. Agra: National Psychological Corporation.
Mitchell, E. (1993, cited in Fryer, 1996, pp. 5-8). Paradigms for transformation to a meaningful global future. Address to the 1993 Presidents' Convocation, creative Education Foundation, Buffalo, NY.
Mock, R. (1970). Education and Imagination. London: Chatto and Windus. Mouly, G. J. (1964). The science of Educational Research. New Delhi: Eurasia Publishing
House Pvt. Ltd. p. 235. Mooney, R. L. (1963). A conceptual model for integrating four approaches to the
identification of creative talent. In C. W. Taylor & F. Barron (eds.). Scientific Creativity: Its recognition and development New York: Wiley, pp. 331-340.
Moyles, J. R. (1989). Just playing? The role and status of play in early childhood education. Milton Keynes (UK): Open University Press, pp. 68-80.
Muddu, V. (1981). A study of some personality correlates of Intelligence and Creative Abilities among High school students in Andhra Pradesh, Indian Educational Review, Vol. XVI, No.2, pp. 77-83.
Muddu, V. (1982). Relationship between Creative abilities (Dimensions) Creativity and Intelligence. Experiments in Education, 1982, Vol. 9, No.2, pp. 189-191.
Mukhopadhyaya, B. N. (1958). Educational philosophy of Rabindranath Togore. Studies in education and psychology, Delhi: Central Institute of Education.
Mukhopadhyay, K. K., Chakrabarti, P. K., and Kundu, R. (1990). Creative Development ofthe children: Effects of Parental Sex, IEducation and Hobbies. Indian Educational Review, XXV, No.3, pp. 75-80.
Munn, P., and Drever, E. (1990). Using Questionnaires in Small-Scale Research: A teachers' Guide, Edinburgh: The Scottish council for Research in Education.
Murray, H. A. (1959). Vicissitudes of creativity. In H. H. Anderson (ed.). Creativity and its cultivation. New York: Harper, pp. 96-118.
Naidu, R. V. (1987). Teachers' Behaviour and Students' Learning: A study of classroom Intraction, Hyderabad: Ramakrishna press.
N.C.E.R.T. (1975). The curriculum for the ten-year school: A frame work. New Delhi. Neff, G. (1975). Kreativitat in schule and Gesellschaft. Ravensburg: Maier. Nie, N. H., and et al. (1975. SPSS. 2nd edition. New York: McGRaw-Hill, Book company,
p.387. Oakley, A. (1981). Interviewing women: A contradiction in terms. In Robert, H. (Ed.).
Doing feminist research. Boston: Routledge and kegan paul. O'Brien, M. A., Elder, R. A., Putnam, P., and Sewell, M. R. (1954). Developing Creativity
in Children's Use of Imagination: Nursery, Ages Two and Three, Union College Studies in Character Research, Vol. 1, No.5, January.
Ogletree, E. J. (1968). A Cross cultural exploratory study of the creativeness of Steiner and State school pupils in England, Scotland and Germany, Dissertation Abstracts, Vol. 29, No.2, 516A.
Ogletree, E. J. (1971). A cross-cultural examination of the creative thinking ability of public and private school pupils in England, Scotland and Germany. Journal of Social Psychology, 83, pp. 301-302.
Ogletree, E. J., and Ujlaki, W. (1973). Effects of Social class status on Tests of Creative Behaviour. The Journal of Educational Research, Vol.67, No.4, Dec.
Ohuche, N. M. (1986). The ideal pupil as perceived by Nigerian (Igbo.) teachers and Torrance's creative personality. International Review of Education, Vol. 32, pp. 191-96.
280
Oppenheim, A. N. (1992). Questionnaire design, Interviewing and Attitude Measurement (new ed.). London: Pinter publishers.
Osborn, A. F. (1948). Your creative power: How to use imagination, New York: Charles Scribner's Sons.
Pandit, R. (1976). A Study of Creativity in relation to adjustment, socio-economic status and scholastic achievement of the students. Unpublished M.Ed. Dissertation, Indore: Indore University.
Paplia, D. E. and Olds, S. W. (1987). Psychology. New York: Mc Graw-Hill, p. 296. Parnes, S. J. (1962). Do you really understand Brainstarming? In S. J. Parnes and H. F.
Harding (eds.). A source Book for creative thinking. New York: Charles Scribner's sons, pp. 283-290.
Parnes, S. J. (1966). Work book for creative problem solving institutes and courses, creative education foundation, Buffalo.
Parnes, S. J. (1967). Creative bahaviour work Book. New York: Scribner's sons. Parnes, S. J. (1987). The creative studies project. In S. G. Isacsen (ed.), Frontiers of
creativity research Beyond the basics. Buffalo, NY: Bearly, pp. 156-188. Parnes, S. J., and Meadow, A. (1959). Effects of 'Brainstorming' instructions on Creative
Problems-Solving by Trained and Untrained subjects. Journal of Educational Psychology, 50,171-76.
Parnes, S. J., Noller, R. B., & Biondi, A. M. (1977). Guide to creative action. New York: Charles Scribner.
Passi, B. K. (1972). An Exploratory Study of Creativity and its relationship with Intelligence and Achievement in School Subjects at Higher Secondary Stage, Ph.D. Edu., Pan. U. (unpublished).
Passi, B. K. (1973). Passi tests of creativity (Verbal and Non-verbal). Agra (India): National Psychological Corporation.
Passi, B. K. (1979). Passi Tests of Creativity (Versal and non-versal). Agra: National Psychological Corporation.
Passi, B. K. (1989). What research says to classroom teachers. Developing Creative Thinking Workshop Organised by Navodaya Vidyalaya Samithti, New Delhi and Devi Ahilya Vishwavidyalaya, Indore, pp. 1-13.
Passi, B. K., Sansanwal, D. N. and Jarial, G. S. (1982). Creativity in Education: Its correlates (1 st ed.). Agra (India): National Psychological Corporation, pp. 1-10,43-52, 85-95, 99.
Passow, A. H and Schiff, J. H. (1995). Families and Communities: essential resources for nurturing giftedness and talent. Gifted Education International VoLlO, pp. 52-55.
Patel, A. S., and Joshi, R. J. (1978). An enquiry into the relation of creativity to Intellectual Giftedness. Indian Journal of Psychology, Vol. 53, No.3, pp. 140-144.
Patrick, C. (1935). Creative Thought in Poets. Archives of Psychology, No. 178. Pedhazur, E. J. (1982). Mulitple Regression in Behavioural Research, Exploration and
Prediction, (2nd ed). New York: Holt, Rinehart and Winston. Perkins, D. N. (1988). The possibility of invention. In R. J. Sternberg (Ed.). The nature of
creativity. Cambridge: Cambridge University Press, pp. 362-385. Perrott, E. (1982). Effective Teaching: a practical guide to improve your teaching. London:
Longman. p. 93-109. Perry, D.L. (1992). Designing Exhibits that Motivate. Association of Science Technology
Centres, News Letter, 20 (1) : 9-10, 12. Phathak, P. (1962). Experimental study of creativity and intelligence and school
achievement. Psychol.Studies, Mysore: Vol. 7, pp. 1-9. Phyrooj, K. (1988). A study of development of creativity and Scientific Attitude, M.Ed.,
dissertation, Edn., S. V. University, pp. 2, 49-50.

281
Piers, E. V., Jacqueline, M. D., and Quackenbush. J. F. (1960). The Identification of Creativity in Adolescents. Journal of Educational Psychology, Vol. 51, pp. 346-351.
Piotrowski, J. (1994). Art for Everyone's Sake. In M. Harrison (Ed.), Beyond the Core Curriculum: co-ordinating the other foundation subjects in Primary schools. Plymouth (UK): Northcote House, pp. 137-151.
Poole, M. (1979). Creativity Across the Curriculum. Sydney George Allen & UNWIN pp. 9, 12-15,81-84.
Popescu, Nevianu. P., and Cretsu, T. (1986 cited in Fryer and Collings 1991). Study of teachers' creative abilities. Rev. Roumaine Sci. Social., Vol. 30, 129-34.
Popper, K. (1968). The Logic of scientific Discovery. London: Hutchinson, p. 32. Powell Jones, T. (1972). Creative Learning in Perspective. London: University of London
Press Ltd. pp. 6-7,24-25, 108-110. Prakash, A. O. (1966). Understanding the Fourth Grade Slump: A study of the creative
thinking Abilities of Indian Children. Master's Dissertation, university of Minnesota. Prakash Srivastava, G. N. (1987). Recent trends in Educational Psychology (1 st ed.). Agra
(India): Psychological Research cell Tiwari Kothi, pp. 107-122. Prasad, V. (1979). Promotion of creativity and achievement by discovery method. Indian
Educational Review, Vol. 14, No.4, pp. 86-94. Qureshi, A. N. (1980): A Study of Creativity in Relation to Intelligence, Manifest Anxiety
and Level of Aspiration of High School Girls, Ph.D. Psy., Agra U. Raina, K. K. (1968). A study into the Effect of Competition on Creativity. Gifted Child
Quarterly, Vol. 12, No.4 pp. 217-270. Raina, M. K. (1969). A Study of Sex Differences in Creativity in India. The Journal of
Creative Behaviour, Vol.3, No.2, Spring. Raina, M. K. (1980). Creativity research: International perspective. New Delhi: National
Council of Educational Research and Training. Raina, M. K. (1985). India: Education of the gifted. G/C/T, 39, 44-46. Raina, M. K. (1989). Social Change & Changes in Creative Functioning. New Delhi:
National Council of Educational Research and Training, pp. 8-9,25-29, 100-122, 131-138.
Raina, M. K. (1993). Perspectives on the Giffted and Talented disadvantaged in India. In B. Wallace and H. B. Adams (eds.). World-wide perspectives on the Gifted Disadvantaged. Ox on (UK): AB Academic publishers, pp. 304-329.
Raina, M. K., and Raina, V. K. (1981). Teacher-educator competency in creativity, Indian Educational Review, Vol. XVI, No.3, pp. 103-109.
Raina, T. N., and Raina, M. K. (1971). Perception of Teacher educators in India about the Ideal Pupil. The Journal of Educational Research, Vol. 64, No.7, pp. 303-306.
Raja Gopal, M. V. (1967). Kothari commission on school education - A recapitulation and Review, Machilipatnam (INDIA), Telugu Vidyarthi Prachuranalu, pp 47.
Raja Gopal, M. V. (1972). Perspectives in Indian Education. Machilipatnam (India): Telugu Vidyarthi Prachuranalu, pp. 59-75.
Rao, P. (1976). Creative Thinking training nine-year old schools children 'unpublished Master's dissertation, Delhi:University of Delhi.
Rasool, G. (1977). A study of divergent thinking of school-going children. Creativity Newsletter, Vol.6, No.2, pp 23-26.
Rastogi, (1967) and Chatterji, (1976) cited in Agarwal, K. P. (1992). Development of Creativity in Indian Schools some related issues. New Delhi: Concept Published Company, pp. 44-45.
Rawat, M. S., and Agarwal, (1977). A Study of Creative Thinking with reference to Intelligence, Age, Sex, Communities and Income groups. Indian Psychological Review, Vo1.l4, No.2, pp. 36-40.
282
Rawat, M. S. and Garg, K. K. (1977). A study of Creativity and Level of Aspiration of High School students. Indian Psychological Review, Vol. 14, No.2, p. 51-53.
Remmers, and Gage, (1955). Educational Measurement and Evaluation. Revised Edition, New York: Harper and Brothers Publishers, p. 132.
Report of the Review Committee on the Curriculum for the Ten Year School, (1977). New Delhi: Ministry of Education & Social Welfare, Government ofIndia.
Repucci, L. C. (1960). Definitions of creativity. In Sternberg R. S. (Ed). The nature of creativity. Cambridge: Cambridge university press, pp. 118-119.
Rhodes, M. (1961). An analysis of creativity. Phi Delta Kappan, Vol. XLII, No.7, pp.305-310.
Roe, A. (1959). Personal Problems and Science, in Taylor, C. W. (Ed.). The Third University of Utah Research Conference on the Identification of Creative Scientific Talent. Salt Lake City: University of Utah Press, pp. 202-212.
Rogers, C. R .(1954). Towards a theory of creativity, in P. E. Vernon (Ed.) (1970). Creativity, penguin, Harmondsworth, pp. 139, 147-149.
Rogers, C. R. (1959). Toward a Theory of Creativity. In H. H. Anderson (Ed.). Creativity and its Cultivation. New York: Harper & Bros, pp. 69-82.
Rose, and Lin, (1984 cited in Baer, J. 1993). Creativity and divergent thinking: A task specific approach. NJ: Lawrence Erlbaum Associates, publishers, pp 15-16.
Ross, C. C., and Stanley, J. C. (1955). Measurment in Today's Schools, New York: Prentice Hall Inc., p.122.
Rossman, J. (1931). The psychology of the inventer. Washington: Investors Publishing Company.
Rowe, M. B. (1974). Pausing Phenomena: Influence on the quality of instruction. Journal of psycho linguistic Research, Vol. 3, No.3, pp. 203-23.
Sanders, N. M. (1966). Classroom questions: What kinds? New York: Harper and Row. Sansanwal, D. N., and Jarial, G. S. (1979). Creativity and its components in relation to
different levels of Intelligence and Academic subjects among High School Students. Asian Journal of Psychology and Education. VolA, NO.3.
Schuman, H., and Presser.S. (1979a), The open and closed Question, American Socialogical review, Vol. 44, pp. 692-712.
Scoot, S. (1973). (cited in Hornby, 1977). The relation of divergent thinking to bilingualism: cause or effect. Unpublished research report, McGill University.
Seetharam, R. and Vedanyagam, E. G. (1979). Creativity and Socio-economic status. Journal of the Institute of Educational Research, Vol. 3, No.4, pp. 35-37.
Sehgal, K. (1978). School Systems as related to creativity of Students. The Progress of Education, Vol. 52 No. 10 & 11, pp. 207-21l.
Seidman, 1. E. (1991). Interviewing as Qualitative Research: A Guide for Research in Education and the Social Sciences, New York: Teachers college press, pp. 4, 9-14, 87.
Shallcross, D. 1. (1981). Teaching Creative Behaviour How to teach creativity to children of all Ages, New Jersey; Prentice -Hall, Inc., Engle wood cliffs, pp. 8-11.
Shan, Hans Raj (1992). Effectiveness of certain Curricular Activities in the Development of Creative thinking of High school students of Backward Hilly Region of Jammu, PhD., Abstract, (Himachal Pradesh University, 1989). Indian Educational Review, XXVII, No.2, pp. 68-73.
Sharan, P. (1986). A study of familial and personalistic under - currents of creativity, unpublished Ph.D. thesis, Patna, Bihar (India):Patna University.
Sharma, A. K. (1979). A Study of creativity in relation to intelligence, personality, socioeconomic status and sex of the high school students of Indore city, unpublished M.Ed. dissertation, Indore: Indore University.

283
Sharma, A. K. (1980). Creativity and its components as affected by Socio-economic status and Personality. Experiments in Education, Vol. 8, No.7, pp. 129-33.
Sharma, A. K., and Jarial, G. S. (1980). Factorial study of the effect ofSES, Grade levels and their interaction upon Creativity and its components. Trends in Education, Vol. 7, No.1 & 2, pp. 37-42.
Sharma, K. (1982). A study of creativity with certain background psychological and organisational factors among students of higher secondary schools of Delhi. Doctoral thesis, Faculty of Education, Jamia Millia Islamia.
Sharma, K. (1991). Creativity and related factors, Agra: National Psychological Corporation, pp. 22-24, 42-60, 120-131.
Sharma, K. N. (1971). Creativity as function ofIntelligence, Interest and Culture, Ph.D. Psy., Agra: Agra U.
Sharma, K .N. (1972). Creativity as a function of Intelligence, Psychological Studies, Vol. 17, No.1 & 2, pp. 64-67.
Sharma, K. N. (1979). Multi-trait, multidimensional approach to creativity, Creativity Newsletter, Vol. 7 & 8, No.281.
Shouksmith, G. (1970). Intelligence, Creativity and Cognitive Style. London: Batsford. Shukla Praksash Chandra. (1982). A study of creativity in relation to sex locality and
school subjects. Indian Education Review (N.C.E.R.T.) Vol. XVII, No.2, April. Silberman, C. E. (1973). Crisis in the classroom. London: The Remaking of American
Education. Wild wood House Ltd., pp. 114-115. Silverman, D. (1993). Interpreting Qualitative Data: Methods for Analysing Talk, Text and
Interaction. London: Sage Publications, pp. 148-49. Simon, H. A. (1966). Scientific discovery and the Psychology of problem solving. In R.
G. Colodny (eds.). Mind and cosmos: Essays in contemporary Science and Philosophy, Pittsburgh: University of Pittsburgh University Press.
Simonton, D. K. (1987). Developmental antecedents of achieved eminence. Annals of child Development, 5, 131-169.
Simonton, D. K. (1988). Creativity, leadership and chance In Sternberg (1988). The nature of creativity, pp. 386-426.
Singh, A. (1981). A study of creativity in school teachers as measured by Mehdi's test in relation to their self concept, attitude towards teaching and classroom verbal interaction. Indian Educational Review, Vol. 15, No.1, pp. 66-69.
Singh, A. (1991). An exploratory study of the creativity developments among pre-school children. Unpublished master's dissertation. University of Awadh.
Singh, B. (1981). Scientific creativity and personality. Published Ph.D thesis, Agra: National Psychological Corporation.
Singh, B. (1993). Measurement of Creativity in Young Children, Ambala Cantt: The Associated Publishers (1st ed.), pp. 55-57, 114-116.
Singh, B. P. (1991). Secondary school Curriculum In Indi~ Delhi: Penman Publishers, pp. 1-10, 30-36.
Singh, D. (1978). A study of the personality correlates of creative children (15+) studying Science subjects. Unpublished PhD. Thesis Bhopal University.
Singh, R. J. (1977). An investigation into the psychological make up and sociological back ground of creative and noncreative student - teachers. Doctoral thesis, Lucknow: Lucknow University.
Singh, R. J. (1980). Teacher creativity and family back ground. A study of relationship. Asian Journal of Psychology and Education, Vol. 6, No.3, pp. 42-48.
Singh, R. P. (1978). Divergent thinking abilities and Personality dimensions of Bright adolescent boys and girls: a Comparative study. Indian Educational Review, Vol. 13, No.4, pp. 82-91.

284
Singh, R. P. (1980). A study of creativity in relation to adjustment, frustration and level of aspiration. Indian Educational Review, Vol. 15, No.3, pp. 85-88.
Singh, R. P. (1985). Attitudes of high school teachers towards creative learning and teaching, Prachi-Journal of psycho-cultural Dimensions, Vol. 1, pp. 7-12.
Singh, R. P., and Das, M. (1989). Attitude of teachers towards creative learning and Teaching. Indian Educational Review, vol. Xxiv, No.2, pp. 120-124.
Singh, L., Tripathi, B. S., and Jyotsna. (1978). Creativity and Intelligence. Indian Psychological Review, Vol. 19, No. 3&4, pp 24-29.
Singh, R. B., Mathur, S. R., and Sexena, S. (1977). Creativity as related to Intelligence, Achievement and Security-Insecurity. Indian Psychological Review, Vol. 14, No.3, pp.84-88.
Singha, H. S. (1991). School Education in India. New Delhi: Sterling Publishers Private Limited, pp. 6-7,29, 138-139.
Slone, K. D. (1985). Home influence on talent development. In B. S. Bloom (ed.). Developing talent in young people. New York: Ballantyne Books, pp. 439-476.
Smith, D. E. (1990). The Social and emotional functioning of creative pre-schoolers. Dissertation Abstract International, Vol. 40, No. 12, pp. 38-46.
Smith, R. M. (1965). The relationship of creativity to social class. Pittsburgh: University of Pittsburgh, (co-operative Res. Rep. No. 2250).
Srivastava, M. N. P. (1994). The Burden of Bnowledge. The Hindustan Times. Published in Pratyush, Bihar Education project, Patna: July - Oct. pp. 15-18.
Srivastava, R. (1978). Creativity as a function of birth-order, socio-economic status and personality types.Joumal of Education and Psychology, Vol. 41, No.3, pp. 113-117.
Srivastava, S. S. (1977). Creativity as related to birth order and number of siblings. Indian Psychological Review, Vol. 14, No.2, pp. 1-4.
Srivastava, S., and Thomas, A. (1991). Creativity of pre-school children-effect of sex, age, birth order and Intelligence. Jr. of psychological Researches, Vol. 36, No.2, pp. 92-98.
Stagner, R., and Karwoski, T. F. (1973). Quoted by L. D. Crow and A. Crow, Educational Psychology, New Delhi: Eurasia Publishing House, p. 314.
Starkwather, E. K., and Cowling, F.G. (1963). The measurement of conforming and noncontaining behavior in pre-school children. Proceedings of Okland Academy of Science, Vol. 64, No. 44, pp. 164-180.
Steiger, J. H. (1979). Factor indeterminancy in the 1930s and the 1970s: Some interesting paralles. Psychometrica, pp. 44, 157-167.
Stein, M. 1. (1953). Creativity and Culture. Journal of Psychology, Vol. XXXVI pp. 311-322.
Stein, M. 1., and Shirley Heinze (eds.). (1960). Creativity and individual Chicago: free press.
Stein, M. 1. (1974). Stimulating Creativity, Vol. I, Individual Procedures, New York: Academic Press, XI, XII, pp 40-52,.
Stein, M. 1. (1975). A transactional approach to creativity. In C. W. Taylor, and F. Barran, (Eds.). Scientific creativity. Its recognition and development, New York: Robert E. Krieger publishing Huntington, pp. 217-227.
Stephenson, W. (1949). Testing School Children. London: Longmans, Green&Co. Sternberg, R. J. (1985). Beyond 10: A triarchic theory of human intelligence. Cambridge
University Press, pp. 99-105. Sternberg, R. J. (ed.). (1988). The nature of creativity. Cambridge: Cambridge University
press, pp. 118-119,429-440. Stevens, J. (1992). Applied multivariate Statistics for the Social Sciences (2nd ed.). New
Jersey: Lawrence Erlbaum Associates, publishers, pp. 374-407.

285
Stevens, L. A (1963, cited in Torrance, 1965, p.12). Experience is not the best Teacher pageant, Vol. XIX, september, pp. 54-60.
Strauss, J. H., and Strauss, M. A. (1968). Family Roles and sex differences in creativity in Bombay and Minneopolis: Jr. of Marriage and Family Life, 30, pp. 46-53.
Sudhir Kumar, M. A. (1992). Socio-educational correlates of creativity among secondary school students in Arunachal. Indian Educational Review, XXVII, No.1, pp. 98-106.
Sudhir, M. A, and Khiangte, V. (1991). Testing Creativity in India. The journal of creative behaviour, Vol. 25, No.1, pp. 27-33.
Sultana Ahmed. (1980). Effect of Socio-Cultural disadvantages on creative thinking. Journal of psychological Researchers, Vol. 24, No.2, pp. 96-106.
Sund, R. B., and Carin, A (1978). Creative questioning and sensitive listening techniques: A self concept approach. Columbus: OH: Charles E. Merrill.
Taba, H., Levine, S., and Elzey, F. (1964). Thinking in elementary school children. U. S. office of Education, Department of Health, Education and welfare, Co-operative Research project No. 1574, San Francisco state college.
Tan-Willman, C. (1981). Canadian student teachers' attitudes about creativity. Psychol. Rep., 48, 49-50.
Tardif, T. Z., and Sternberg, R. J. (1988). What do we know about creativity? In R. J. Sternberg. The Nature of Creativity. Cambridge: Cambridge University Press, pp. 429-440.
Taush, A (1960). Empirische Untersuchungen Uber Die Wirkung Verschiedner Eriehungshalt Ungen im Erlebnis Von Kinder. Z. Exp. Ang. Psychol., 7, 472-491.
Taylor, C. W. (1964). Introduction in C. W. Taylor (Ed.). Creativity: Progress and Potential. New York: McGraw-Hill, p.2.
Taylor, C. W. (1978). How many types of giftedness can your program tolerate? Journal of Creative Behaviour, 12,39-51.
Taylor, C. W. (1988). Various approaches to and definitions of creativity. In Sternberg (Ed.). The Nature of Creativity. Cambridge: Cambridge University Press, pp. 99-121.
Taylor, C. W. and Williams, F. E. (Eds). (1966). Instructional Media and Creativity. The proceedings of the sixth Utah creativity Research conference held at Torrey Pines Inn, LaJolla, California. New York: John wiley and sons, Inc., pp. 43-70.
Taylor, C. W., and Barron, F. (1975). Scientific creativity: Its recognision and Development. New York: Robert E. Krieger Publishing company, pp. xiii.
Taylor, 1. A (1959). The Nature of Creative Process. In P. Smith (Ed.). Creativity an examination of the creative process. New York: Hastings House, publishers, pp.51-82.
Taylor, 1. A, and Getzels, 1. W. (eds.). (1975). Perspectives in creativity. Chicago: Aldine publishing company, pp. 6-7.
Tharnmaprateep, V. (1976). A Comparative Study of Creativity of Indian Students (Baroda) and Thai students (Nakornsawan) of Grade IX. Unpublished M.Ed. dissertation, Baroda: The M. S. University of Baroda.
Thomas, E (1994). Education, schooling and culture: Some International perspectives. In Elwyn Thomas (Ed.). International perspectives on culture and schooling: A symposium proceedings. London: DICE, IOE, University of London, pp.38-40.
Titman, W. (1994). Special places, Special People: The hidden curriculum of school grounds. Surrey (UK): WWWFUK (World wide Fund for Nature I Learning through Landscapes, pp. 3-4, 88, 92, 103.
Tiwari, Govind, and Archana. (1978). Study of sex differences in Creative Thinking. Indian Psychological Review, Vol. 16, No. 3&4, pp. 13-19.
Toffler, A (1974). Learning for tomorrow: The role of the future in Education. New York: Random House, pp. 192-193.

286
Toffler, A. (1981). The third wave. London: PanBooks in association with Collins. Torrance, E. P. (1960 b). Creativity: Second Minnesota Conference on Gifted Children.
Minneapolis, Minnesota: Centre for Continuation Study, University of Minnesota. Torrance, E. P. (1961). Factors affecting creative thinking in children interim research
report. Merrill-Palmer Quar., 7, 171-180. Torrance, E. P. (1962a). Guiding creative talent. N.J: Prentice-Hall, Inc. pp. 2-7, 30-31, 84-
103,193-195,206. Torrance, E. P. (1962b). Developing Creative Thinking Through School Experiences. In
S. J. Pames and H. F. Harding (Eds.), A Source Book for Creative Thinking, New York: Charles Scribner's Sons, pp.31-47.
Torrance, E. P. (1963). Education and the creative potential. Minneapolis: University of Minnesota Press.
Torrance, E. P. (1963). Explorations in Creative thinking in the early school years. A progress report. In C. W. Taylor and F. Barron (Eds.). Scientific Creativity: Its Recognition and development, New York: John Willey.
Torrance, E. P. (1964). Education and Creativity, In C. Taylor (Ed.), Creativity: Progress and Potential, New York: McGRAW-Hill Book Company, pp. 50-128.
Torrance, E. P. (1965). Rewarding creative Behaviour experiments in classroom creativity, NJ: Prentice-Hall, Inc. pp. 6-12.
Torrance, E. P. (1966). Torrance Tests of Creative Thinking: Norms technical manual Princeton NJ: Personnel Press.
Torrance, E. P. (1967). Understanding the fourth grade slump in creative thinking (Research project 994). Washington, Dc: U. S. Department of Health, Education and Welfare, Office of Education.
Torrance, E. P. (1967). The Minnesota studies of creative behaviour: National and International extensions. Journal of Creative Behaviour, Vol. 1, pp. 137-154.
Torrance. (1969). Torrance Tests of Creative Thinking: Norms technical manual (Research edition), Princeton, NJ: Personal Press.
Torrance, E. P. (1970). Encouraging creativity in the class room. Lowa: William C. Brown. Torrance, E. P. (1974). The Torrance tests of creative thinking: Norms-technical manual.
Benseville, IL: Scholastic Testing Service. Torrance, E. P. (1975). Motivation and creativity. In E. P.Torance and W. F. White (eds.),
Issues and Advances in Educational Psychology, Itasca: F. E. Peacock. Torrance, E. P. (1980). Thinking creatively in action and Movement. Athens, G. A.
Georgia Studies of Creative Behaviour, Georgia: University of Georgia. Torrance, E. P. (1983). Creativity in the classroom. Washington, D. C: National
Educational Foundation. Torrance, E. P. (1987). Teaching for creativity in S. G. Isacsen, (Ed.), Frontiers of
creativity research: Beyond the basics. Buffalo, NY: Bearly. Torrance, E. P. (1988). The nature of creativity as manifest in its testing. In R. J. Sternberg
(Ed.), The Nature of creativity: Contemporary Psychological Perspectives. Cambridge: Cambridge University Press, pp.43-75.
Torrance, E. P. (1990). The Torrance Tests of creativity thinking: Norms-Technical manual. Bensonville, Ill: Scholastic Testing service.
Torrance, E. P.,and et al (1970). Creative functioning of monolingual and bilingual children in Singapore: Jr. ofEdu. Psychology Vol. 61, pp. 72-75.
Torrance, E. P., and Gupta, R. (1964). Development and Evaluation of Recorded Programmed Experiences in Creative Thinking in the Fourth Grade. Minneapolis: Bureau of Educational Research, University of Minnesota, Mimeographed.

287
Torrance, E. P. and Myers, R. E. (1974). Creative Learning & Teaching. (6th print) New York: Dodd, Mead & Company, pp. 13,22,37, 83, 156, 189, 195,219-238,252-55,289.
Torrance, E. P., and Philips, V. K. (1972). Preliminary Norms - Technical Manual for opinions on creative Learning and Teaching. Athens: Georgia studies of Creative Behaviour
Torrance, E. P., and Presbury J. (1984 cited in Baer, J, 1993). The criteria of success used in 242 recent experimental studies of creativity. Creative child and Adult Quarterly, Vol. 9, pp. 238-243.
Toynbee, A. (1964). Is America neglecting her creative minority? In C. W. Taylor (Ed.), Widening horizons in creativity. The proceedings of the Fifth Utah Creativity Research Conference New York: John Wiley & Sons, p. 4.
Treffinger, D. J., Ripple, R. E., and Dacey, J. S. (1968). Teachers' attitudes about creativity. The Journal of Creative Behaviour, Vol. 2, pp. 242-248.
UNESCO. (1973). Museums, imagination and education. Paris: UNESCO, pp. 23-24. UNESCO. (1996). Learning: The treasure within Report to UNESCO of the International
commission on education for the twenty-first century. Paris: UNESCO Publishing.pp.85-96.
UNESCO. (1998). World education report: Teachers and teaching in a changing world. Paris~UNESCO Publishing, 16-22, 48-49,54-56,63-67, 71-94.
Vander Zanden, J. W. (1980). Educational psychology: In theory and practice. New York: Random House, pp. 160-165.
Venkatarami Reddy A., and Balakrishna Reddy. (1983). Creativity and Intelligence. Psychological Studies, Vol. 28, pp 20-24.
Vernon, M. D. (1948). The Development of Imaginative Construction in Children, British Journal of Psychology, Vol. 39, pp.l02-111.
Vernon, P. E. (1967). Psychological Studies of Creativity. Journal of Child Psycho and Psychiatry, Vol. 8, pp. 153-166.
Vernon, P. E. (1967a). A Cross-cultural Study of Creativity Tests with II-year old boys. New Research in Education, Vol. 1, pp. 135-46.
Vijai Lakshmi. (1980). Academic Achievement and Socio-economic Status as predictors of Creative Talent. Journal of Psychological Researches, Vol.24, (1).
Vohra, I. N. (1975). A study of non-verbal creativity in relation to socio-economic status, age, sex, medium of instruction and personality characteristics amongst the pupils of English and Gujarati Medium of'Bazm-E-Hidayat' primary school from Baroda city: unpublished M.Ed. dissertation, M. S. University.
Vygotsky, L (1987). Thought and Language (A. Kozulin, ed.). Cambridge, M. A: MIT press.
Walberg, H. J. (1983). Scientific literacy and economic productivity in international perspective. Daedalus, Vol. 112, No.2, pp. 1-28.
Walberg, H. J. (1988). Creativity and talent as learning. In R. J. Sternberg, (Ed.). The nature of Creativity, Cambridge: Cambridge University Press.
Walker, P. C. (1970). A Study of creativity among Mexican School Children. Dissertation Abstract International, Vol. 30, No.2, p. 650.
Wallace, B. (1986). Creativity: Some definitions: the creative personality; the creative process, the creative classroom. Gifted Education International. Vol. 4, No.2, pp. 68-73.
Wallach, M. A., and Kogan, N. (1965). Modes of thinking in young children: A study of the creativity - intelligence, Distinction. New York: Holt Rinehart & Winston, Inc. pp. 14-15.
Wallach, M. A., and Wing, C. W. (1969). The Talented Student. New York: Holt, Rinchart

288
and Winston. Wallas, G. (1926). The Art of Thought. In P. E. Vernon (ed.) (1970). Creativity.
Middlesex, (England): Penguin Books, pp. 91-106. Weisberg, R. (1986). Creativity: Genius and other myths. New York: W. H. Z. Freeman
and company, pp. 57-59, 90. Weisberg, R. W. (1988). Problem solving and creativity. In R. J. Sternberg, (Ed.), The
nature of Creativity. Cambridge: Cambridge University Press, pp. 148-176. Weisberg, P. S., and Springer, K. (1967). Environmental factors in creative function. In R.
Mooney and T. Razik (Eds.), Exploration in Creativity. New York: Harper & Row, pp.120-134.
Welsch, P. K. (1980 cited in Isaksen and Murdock, et a11993, p. 18). The nurturance of creative behaviour in educational environments: A comprehensive curriculum approach- Unpublished Doctoral dissertation, University of Michigan. U. K.
Westra, D. (1978). An exploratory study of creative thinking in pre-kindergarten children from two selected settings with implications for teachers education, DAI, 39A, 40-43.
Williams, F. E. (1966). Training children to be creative may have little effect on original classroom performance. California Journal of Educational Research, 17, pp. 73-79
Williams, F. E. (1966a cited in Raina & Raina 1981). Information awareness checklist. St. Paul, Minnesota: Macalester College.
William, J. and Corsini, David A. (1976). (Y. Conneicut) creativity, intelligence and moral development in college women. Journal of Creativity Behaviour, Vol. 10, No.4, pp 276-284.
Wilson, R. C. Guilford, 1. P., and Christensen, P. R. (1974). Quoted by N. K. Dutt, Psychological Foundation of Education, Delhi: Doaba House, p 208.
Wodtke, K. H. (1963). A study ofthe Reliability and Validity of Creativity Tests at the Elementary School Level. Doctoral Dissertation. Utah: University of Utah.
Wodtke, K. H. (1964). Some data on Reliability and Validity of Creativity Tests at the Elementary school level. Educational and Psychological Measurement. V ol. XXV , pp. 339-408.
Wodtke, K. H. (1965). Teacher classroom control, pupil creativity, and pupil classroom behaviour. The Journal of Experimental Education, Vol. 34, No.1, pp. 59-65.
Woods, P. (1990). Teacher Skills and Strategies. London: The Falmer press, pp. 51. Wright, S. (1934). The Method of Path Coefficients. Annals of Mathematical Statistics,
5, 161-215. Yamamato, K. (1964). Creative thinking thoughts on Research, Exceptional children, Vol.
30, No.9, pp. 403-410. Yamamato, K. (1965): Effects of restriction of range and test unreliability on correlation
between measures of intelligence and creative thinking. British Journal of Educational Psychology, Vol. 35, pp. 300-305.
Young, R. E. (1984). Teaching equals indoctrination: The dominant epistemic practice of our schools. British Journal of Educational studies, Vol. 32, No.3, pp. 220-28.

Appendix-AI 289
Appendix-A 1
A1.1 : Various Schemes and projects in Andhra Pradesh (INDIA).
The Department of Education (DOE, India) established the Operation Blackboard
(OBB) scheme in 1986, this scheme provides grants to states to construct an additional
classroom and post an additional teacher in single-teacher schools, requiring that half the
teachers posted be women. It also provides grants to finance the purchase and distribution
by the state of a pre-determined, standardised package of teaching materials and aids.
(World Bank,1997)1
The DOE, India established a scheme of District Institutes of Education and
Training (DIETs, 1988) by converting existing teacher Training Institutes (TTl's) or
creating new ones in the rural districts. All the DIETS follow a standard organisational
model, with departments for teacher education and training planning and management,
research and evaluation, curriculum and materials development, educational technology
and work experience education (World Bank, 1997)
Andhra Pradesh Primary Education Project (APPEP)
This project is being implemented in Andhra Pradesh since April 1983 with the
assistance of Overseas Development Administration (ODA) of U.K. The objective of the
project is to improve the quality of primary education in the project area by (i) enhancing
the professional competence of teachers and supervisors of primary schools through an
HRD programme which emphasises child-centred learning and (ii) assisting construction
of primary school buildings. The project covers all the primary schools in the state and
envisages an outlay of Rs.31.2 million over the period 1990-92 (Government of India,
Department of Education, 1993).
I Source: World Bank (1977). Development in practice Primary Education in India. Washington a World
Publication, 1997, p21.

5
"cI § I
"cI c; ~
~ ~
Appendix-AI 290
Structure of Education in India
I v
(Source: Development of Education in India 1990-1992) (in Government of India, Dept. of Education (1993), p.5
VIII IX x XII xv XVII
6 7 11 14 15 16 18 21 23 24 25 ..- Elementary Education ~Secondary Education---'~"''''I---- Higher Education --------1.~
& ~ Compulsory Education~
Undergraduate P.GUni M.Phil I PhD I PRIMARY UPPER Courses SCHOOL PRIMARY B M.
SCHOOL Ed Ed
>< ~ c;
Open University :::
M.E 1M. Tech I @ 0 B.E I B.Tech ":g >< 0 u
I u 0 M.B.B.S ~ ~ >- M.D/M.S
<C CI) --Q....l ~ c5 .§ ZO Primary
00 °OIU U::r: Z::r:"g Teacher ~U ~UU Training CI) CI) Cl)CI)<C
TECHNICAL SCHOOLS ITI'S & Polytechnics ITI'S
OPEN SCHOOL OPEN NON- SCHOOL FORMAL CENTERS
NON-FORMAL CENTERS
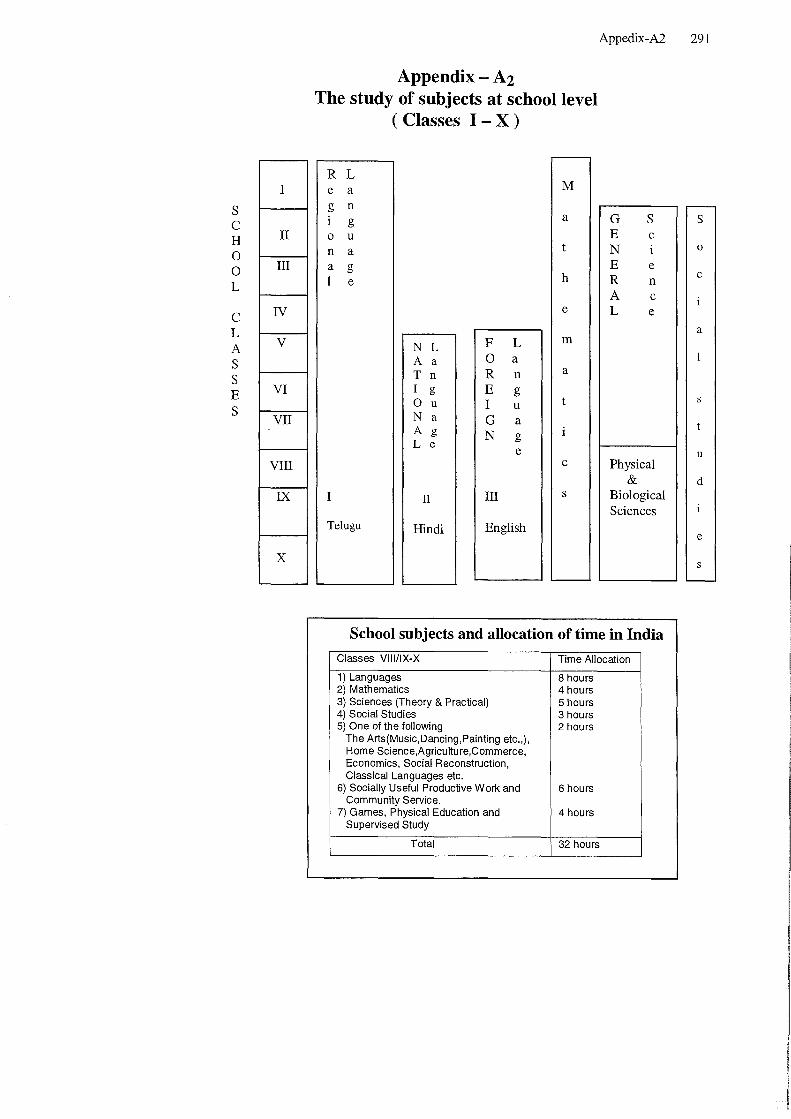
S C H o o L
C L A S S E S
I
II
III
IV
V
VI
VII
VIII
IX
X
Appedix-A2 291
Appendix - A2 The study of subjects at school level
(Classes I - X )
R L e a M
g n i g a G S S
0 u E c n a N 0
a g E e h c
I e R n A c
e L e
a
N L F L m
A a 0 a T n R n a
I g E g o u I u N a G a A 0- N '" g L e
e u c Physical
& d I II III s Biological
Sciences Telugu Hindi English
e
School subjects and allocation of time in India
Classes VIIIIIX-X Time Allocation
1) Languages 8 hours 2) Mathematics 4 hours 3) Sciences (Theory & Practical) 5 hours 4) Social Studies 3 hours 5) One of the following 2 hours
The Arts(Music,Dancing,Painting etc.,), Home Science,Agriculture,Commerce, Economics, Social Reconstruction, Classical Languages etc.
6) Socially Useful Productive Work and 6 hours Community Service.
7) Games, Physical Education and 4 hours Supervised Study
Total 32 hours

Appendix-A3 292
Appendix-A3 Table-A3-T1 : Andhra Pradesh at a glance (India Vs Andhra Pradesh).
Ar N fD' t . t N fI h'b' d '11 d D fl' 1991. ea, 0.0 IS fIC S, 0.0 n lIte VI ages an ensity 0 popu atIon -
Hyderabad" Andhra Pradesh" India'
1. Area (in Sq.KM) 217 275045 3287263
2. No. of Districts - 23 503
3. No. of inhabited villages - 26613 556310
4. Density 14499 242 274 (population)
5. Population 3145939~ 6.6508 (crores)~ 84.6302 (crores) ~ Male 1627249~ 3.3725 (crores) ~ 43.9230 (crores) ~ Female 1518690~ 3.2783 (crores) ~ 40.7072 (crores) ~
6. Literacy rate 71.52 44.09 52.21 Male 78.90 55.13 64.13 Female 63.56 32.72 39.29
.. • Annual report 1995-96: Mirustry of Human Resource Development; Department of Education,
Govt of India - 1996, pp. 239, 242. ** Selected Educational Statistics 1995-96; commissioner & Director of school Education,
Andhra Pradesh, Hyderabad (As on 30-09-95). ~ Population an according to 1991 census.
Table-A3-T2: Enrolment in schools- India Vs Andhra Pradesh (1995-96)
Country / Sex Pre- Primary Upper High Higher State primary primary school secondary
Boys 62256958 24513275 15748656
India* Girls 46786705 15774565 8400752 Total 109043663 40287840 24149408
Andhra Boys 506 2934923 1113211 1995768 51219 Pradesh" Girls 495 2548617 885594 1419056 41275
Total 1001 5483540 1998805 3414824 92494
Boys - 35119 65261 198784 7994 Hyderabad' Girls - 36688 61765 206143 8922 .
Total 71807 127026 404927 16916 -Sources * Annual Report 1995-96, Govt. of India (1996). ** Selected Educational Statistics 1995-96: Commissioner & Director of school Education, Andhra Pradesh, Hyderabad (As on 30-09-95).
Total
101290751 70172014 171462765
6095627 4895037 10990664
307158 313518 620676
Table-A3-T3: Educational Institutions in India Vs Andhra Pradesh 1995-96.
Country/ Primary Middle High Higher Colleges Engineering State Schools Schools Schools Secondary &
Medical
India * 590421 171216 71055 23588 6569 721
Andhra 49125 7298 7896 87 Pradesh**
I Hyderabad** I 481 I 296 I 452 I 11 I I . .
* Selected EducatIonal StatIstIcs Govt. of IndIa, 1995-96 . ** Selected Educational Statistics 1995-96: Commissioner & Director of school Education,
Andhra Pradesh, Hyderabad (As on 30-09-95).
Universities
215
17
I 4 I
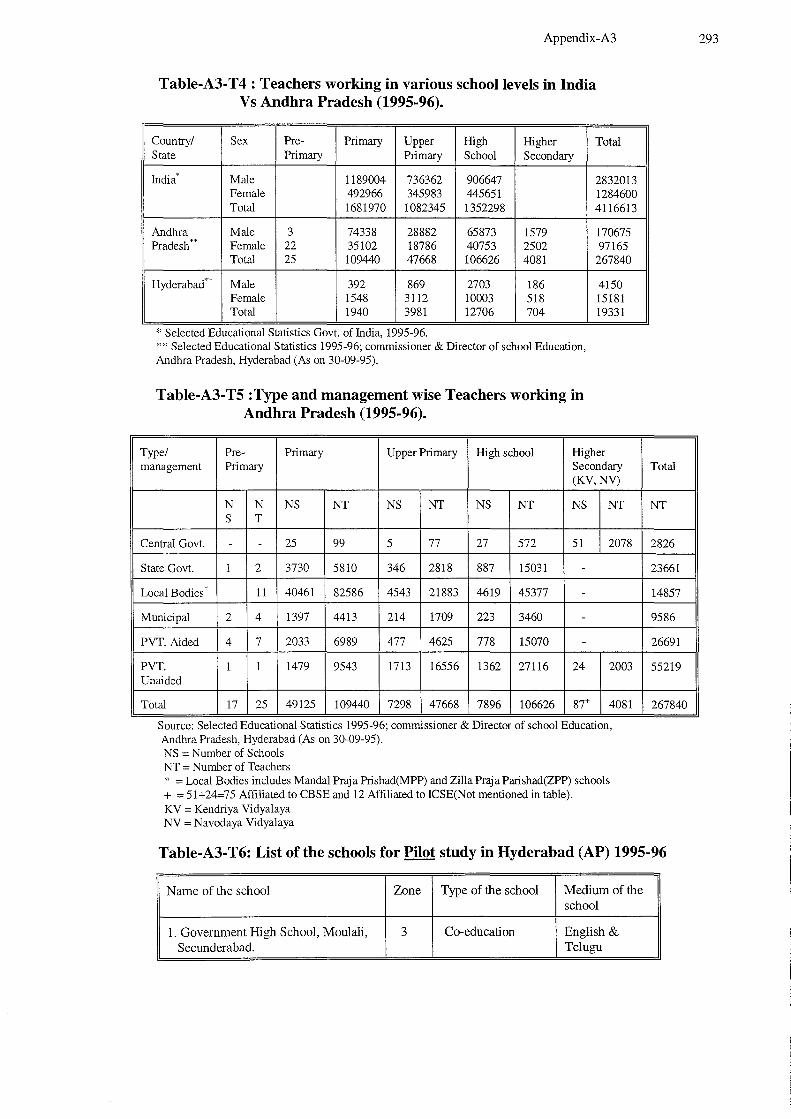
Appendix-A3
Table-A3-T4 : Teachers working in various school levels in India V s Andhra Pradesh (1995-96).
Country/ Sex Pre- Primary Upper High Higher State Primary Primary School Secondary
India"' Male 1189004 736362 906647 Female 492966 345983 445651 Total 1681970 1082345 1352298
Andhra Male 3 74338 28882 65873 1579 Pradesh'* Female 22 35102 18786 40753 2502
Total 25 109440 47668 106626 4081
Hyderabad** Male 392 869 2703 186 Female 1548 3112 10003 518 Total 1940 3981 12706 704
* Selected Educational Statistics Govt. of India, 1995-96. ** Selected Educational Statistics 1995-96; commissioner & Director of school Education, Andhra Pradesh, Hyderabad (As on 30-09-95).
Table-A3-T5 :Type and management wise Teachers working in Andhra Pradesh (1995-96).
Total
2832013 1284600 4116613
170675 97165
267840
4150 15181 19331
Type/ Pre- Primary Upper Primary High school Higher management Primary Secondary
(KV,NV)
N N NS NT NS NT NS NT NS NT S T
Central Govt. - - 25 99 5 77 27 572 51 2078
State Govt. 1 2 3730 5810 346 2818 887 15031 -
Local Bodies * 11 40461 82586 4543 21883 4619 45377 -
Municipal 2 4 1397 4413 214 1709 223 3460 -
PVT. Aided 4 7 2033 6989 477 4625 778 15070 -
PVT. 1 1 1479 9543 1713 16556 1362 27116 24 2003 Unaided
Total 17 25 49125 109440 7298 47668 7896 106626 87+ 4081 ..
Source: Selected EducatIOnal StatJ.stJ.cs 1995-96; COmITIlSSIOner & DIrector of school EducatJ.on, Andhra Pradesh, Hyderabad (As on 30-09-95). NS = Number of Schools NT = Number of Teachers * = Local Bodies includes MandaI Praja Prishad(MPP) and Zilla Praja Parishad(ZPP) schools + = 51+24=75 Affiliated to CBSE and 12 Affiliated to ICSE(Not mentioned in table). KV = Kendriya Vidyalaya NV = Navodaya Vidyalaya
Total
NT
2826
23661
14857
9586
26691
55219
267840
Table-A3-T6: List of the schools for Pilot study in Hyderabad (AP) 1995-96
Name of the school Zone Type of the school Medium of the school
1. Government High School, Moulali, 3 Co-education English & Secunderabad. Te1ugu
293
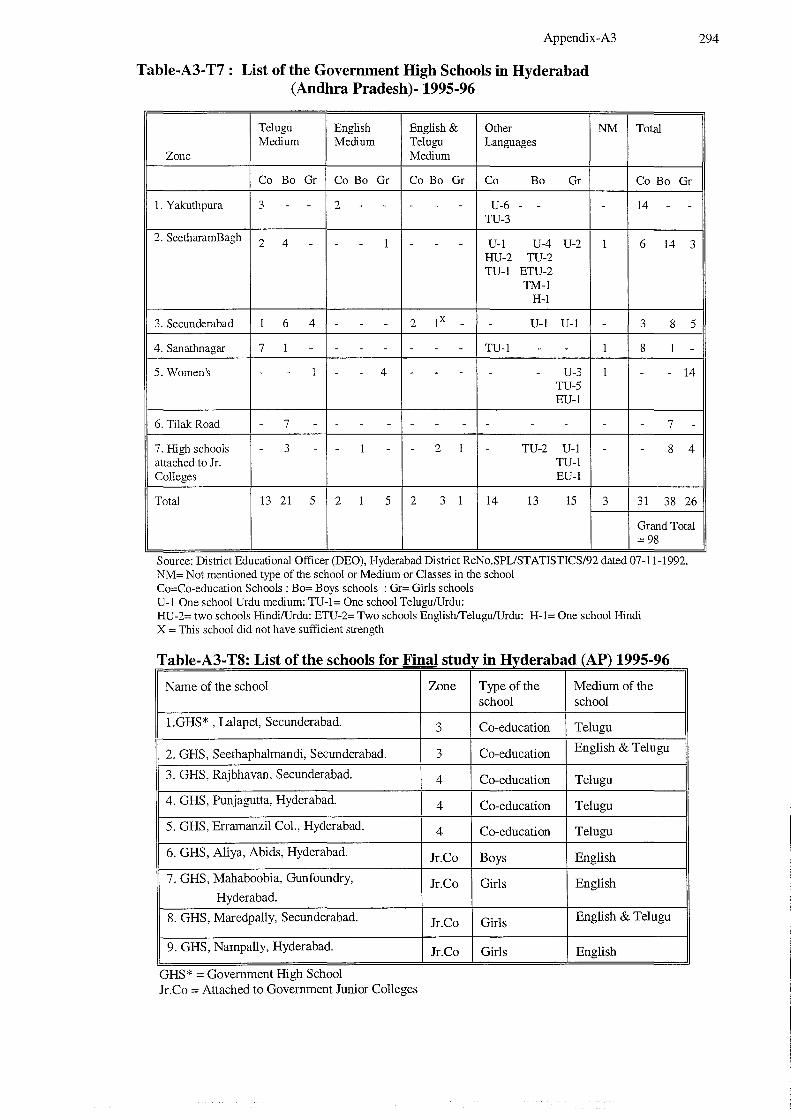
Appendix-A3
Table-A3-T7: List of the Government High Schools in Hyderabad (Andhra Pradesh)- 1995-96
Telugu English English & Other Medium Medium Telugu Languages
Zone Medium
Co Eo Gr Co Eo Gr Co Eo Gr Co Eo Gr
l. Yakuthpura 3 - - 2 - - - - - U-6 - -TU-3
2. SeetharamEagh 2 4 - - - 1 - - - U-l U-4 U-2 HU-2 TU-2 TU-l ETU-2
TM-l H-l
3. Secunderabad 1 6 4 - - - 2 IX - - U-l U-l
4. Sanathnagar 7 1 - - - - - - - TU-l - -
5. Women's - - 1 - - 4 - - - - - U-3 TU-5 EU-l
6. Tilak Road - 7 - - - - - - - - - -
7. High schools - 3 - - 1 - - 2 1 - TU-2 U-l attached to Jr. TU-l Colleges EU-l
Total 13 21 5 2 1 5 2 3 1 14 13 15
NM
-
1
-
1
1
-
-
3
Total
Co Eo Gr
14 - -
6 14 3
3 8 5
8 1 -- - 14
- 7 -
- 8 4
31 38 26
Grand Total = 98
Source: District Educational Officer (DEO), Hyderabad District RcNo.SPLlSTATISTICS/92 dated 07-11-1992. NM= Not mentioned type of the school or Medium or Classes in the school Co=Co-education Schools: Eo: Eoys schools : Gr= Girls schools U-l One school Urdu medium: TU-l= One school TelugulUrdu: HU-2= two schools HindilUrdu: ETU-2= Two schools EnglishlTelugulUrdu: H-l= One school Hindi X = This school did not have sufficient strength
T bl A3 T8 LO t fth a e- - : IS 0 esc 00 s or ma s U lym ly4 era a -hIt FO ltd ° H d b d (AP) 1995 96
Name of the school Zone Type of the Medium of the school school
l.GHS* , Lalapet, Secunderabad. 3 Co-education Telugu
2. GHS, Seethaphalmandi, Secunderabad. 3 Co-education English & Telugu
3. GHS, Rajbhavan, Secunderabad. 4 Co-education Telugu
4. GHS, Punjagutta, Hyderabad. 4 Co-education Telugu
5. GHS, Errarnanzil Col., Hyderabad. 4 Co-education Telugu
6. GHS, Aliya, Abids, Hyderabad. Jr.Co Boys English
7. GHS, Mahaboobia, Gunfoundry, Jr.Co Girls English Hyderabad.
8. GHS, MaredpaIly, Secunderabad. Jr.Co Girls English & Telugu
9. GHS, Nampally, Hyderabad. Jr.Co Girls English
GHS* = Government High School Jr.Co = Attached to Government Junior Colleges
294

Appendix-Bl
Confidential
Dr. BAQER MEHDI M. A. (Columbia), Ph. D. (Alig~rn) Professor of Education
N.C.E. R. T., New Delhl·110016 T. M. No. 458715
H·
Name-
Class- School/~
Father's/Guardian's nam@
Home address-
Age-
Oc;cupatlon- .
Data.,;-
GENERAL INSTRUCTIONS
295
Jew
In this booklet you will find mentioned soma interesting 'problems which w\!lrequlre the use of your thinking ability· and imagination to solve them. The'purpose Is to see how quicklysnd imagInatively you can think under Situations which require novel ways of dealing with them. Read each problem carefunyand apply your best thinking In giving the responses. Write your responses either in Engljsh or iri your mother tongue, Responses have to be given briefly but clearly in the sp.ace provided. under each ,prDbIem.; Give a serial number to 8ach of your responses. There are no righf or wro'ng . responses to any of these problem. Give a serial numb.eT to each of your rasponses. The.re are no right or wrong responses to any of these problems. Therefore use your imagination tothink.of as many responses .a~ you ca~ •.
The problems are divided inj.o Four Activities. Each Activjtv is separately timed. Within the time-limit for each ActivitV. you may work "On th3diffarant problanH according to V01.lrspeed.· When you finish !:>ne problem, go to the next. If necessary, you mlY return to the previoLls O!l~ aglin .for any addition yeu wauld like to make. Remember that you hlV~ not to go the next.Actlvity until .tha time'tonne first ActivltVisover and you are told to proceed further.
At the end you will be given 5 minutes extra tima, which you may use at any prablem ~f any Activity in which you want to do addlUanal work.
Please do not omit any problem.
Estd. : 1971 . Phone: 63551
. _2 .. 5
,.. P'SYCHOhOGICftL ~ CORPORftT.ION 4/230 KACHERI GHAT, AGIlA. ·282 004~INPIA)
® 1985~ 91 1 92. All rights reserved. R.productloninany. f0rm is II vIQlation of ttle Copyright Act,

296
[ 2 ]
Activity: 1 What will happe.n, if ..••••.• " DIRECTIONS;
1. On this and the next page, you have been given some situations which will app.iir to. y.Uhllpossjble. You have to think what would happen if such sltuationsactuaily arise •..
2. Give as many Ideas as may come to your mind but try to ,tnink'es many novel iclaas8S you possible.Cl1In. Idlas which you think no one else might have ihought of what wouJd ~ the best. \:Vrite y,,.ur ~e~ponses In the apace provided for.
3, You will be given to HI MINUTES fOl'.t~ls activity; 'Aft~r every five minutes you-will bi:) told'thHime so that you may move on to the next problem in the activity.
An example haa been given which will help you fo to knowwha~ YOLlnalfe.toClo.
EXAMPLE:' Que!tion I What will happen if birds and anlma~sstart speaking iike man 7 Rftpon, .. : (I) This world will change Into a different kind of society.
(Ii) New leaders will emerge '(rom. amongst tl1~ ,animals. {lilt It 'a possible that II donkey will. become our leader: (Iv) ,It is aliOPfi)Sslblethat he becomes ourp;im9,minist~, (v) Men mllY ccnfide their secre.ts,to.·theKanimaUrlendi. &te·.
------~----~--~--------~------------------~--------------------~~.--~~-PROMBtEMS 1----
1. Wh~t will hOippen if man flies like. &irds ?

297
:3 ,
~. What witl happen If your school is put on wheels?
:3. What well haltJlen if man does not require any food to eel?

298
14 )
Activjty ~. 2 ' NOVEL USES~ OF THIN:G:S DIREC'JIONS .
1. On this and the next page, you have been' ~Iven names of certain things which could be u?sd in many different ways. You have to thil)k in how many dlfferentand new waysthe things may be. used.
2, Write as many uses as you can, but do try to think also th()se which are novel, that is, those which Y9U' thtnk no one else might have:th,ought of. .
3: You will be giveR 12 MINUTES for this 'activity: After',every fO,urminut~ you will be told the$tJfueso that you may move on to the next item in the activity. ' , "
Below is given an example vvhi~h wilL help you to know what you ,have t<> do.
Example: News-paper.
Uses: (I) To read the news; (ii) To make paper toys. liii) Tbget protection from the sun. (Iv) To wrap something. , ,(v) yo ,cover a dirty place; etc. '
PROBLEMS :-
1. Piece of stone

299
5 1 2. Wooden stick
3. Water

300
[ 6 I
Activity: S SIMILARITIES DIRECTIONS:
1. Gn this and the rlQxt page, you have bGaoglven pairs of world which can be related to.~.h ether Irl many different" ways. You have to think In how many different and new waysa~theyrelated. '
. 2. Write as many relationships as' you can, but also:try to think those which are 'novel, thatis"tbostw~lcA you think no one else mlQht have thought of.
3. You will be given 15 MINUTES for this activity. After avery 5 minutes yo~ willbe toldth,tm. Mihat YOU may move on to the next problem In the activity.
Below is given an example which will help you to know what you have to do.
Example: Man and animal
Relationship: (i) Both have life; (Ii) Both need food and water.
(ill) Both can fall ill. '(Iv) Both are afraid of 'enemy~ (v) Both have the e~perience of feeling cold and hQt, etc.
PROBLEMS ~-
t Tree and House

301
7 J
2. Chair and Ladder
3. Air and Water

302
[ 8]
ActivHy : 4 Making Things More Int~resting ,and Useful . t .
DIRECTIONS
Just keep In mind a simple lllQdal:of rhorse. ' You have to1imagine,In what ways you-can ~hange this simple model Into an interesting and novel one for' children to playV'ith~' You may think ot addmg$ny number of' parts or accessories in order to make ItraaHy interesting and fascinating for children.; Ddnot
bother about the cost of. the new parts or.accessories that you wou,ld Ii~e to use in order make the toy model interesting and faSCinating for children,
Write all the ideas which come to your mJnd In uariaJ order "in ,the space given below.
'You will be given 6 minutes for this activity.

Item 1.
Item ~,
Item 3.
Total
Item 1.
Item I.
Item 3.
Total
Item I,
Item 2,
Item 3.
'Total
Item 1.
303
TeW Fluency Elelii>iJity . __ ~ __ Originaliti" -----------'---------'''- ._-'t-.-..... -.-:.-----~~ ........ --'-_..: ..... :........_-~!'''"''"---..,. '''~.
, ...... ".10.
-----~------'-~-~ .. ---.----- ._--'-- ----- -.------
AC11VITY n Fluency
. ...... '.".'"
.. ... " ,.~"
~.--~....:.......------
." ...... . ----~--
ACTIVITY III
Fluency Flexibility
__ ..... 1< ... ... ~.1 .......
ca •••••••
• '4~ .~.,. . ...... .
ACTITITY IV
Fluency Fle:libility Originality
SCORE SUMMARY
Fluency Flexibility • Originality
--------------------~--------~-----------~~~------Activity I
Activity II
Aet1vity W
Activity IT
Grand Total
."' ..... .
.... , .... •••• i( •••
... to .. ~ •••
..... ..::--...
• See back pag6 for furthed1utructlonr regardi"g originality scoring'.

304
ORIO.INAlITV SCORI.NO FOR RESPONS.ES NOT MENTIONED IN THE RESPONSE LIST
,For any novel response Dot menti!)q~!ljD~:tlIei,!resJ:l'onlle;"U!~en ~,;the manual, first of all briefly note
I'."A :in tlle space provided below givinglbe-IllJalOer or the actifity and the item.towhieh it belongs; 'fheni
after 10.0 hav~ ICOred all the test scriptS; give it a sco~ ;acco(dJng to the scheme given. in the manual· and note the ICOre in the appropriilte Colwlln in .tlie ScoringSheet.lnan·prob3:biUty.:Jh~~ewilrbe very few such responses.,
. ..' .'. . .' . ,. Urig\n. ~f,: Ac:ti~ity Item Response . Score ...

Dr. Baqer Mehdi (Aligarh)
Name -
Date of Birth -
Name of Institution -
Father's Name -
City -
Appendix-B2
Age -
State -
. Class
Sex -
Occupation -
Date -
305
TCF (English Version)
--_._------------------------'
INSTRUCTIONS Creative thinking has played a very important role in man's life. People have achieved great things
with the help of their thinking and imagination. In this booklet you will fInd some interesting figures which will require the use of your imagination in working \\iLii them. The purpose is to see how quickly and imaginatively you can work with these figures in order to make interesting pictures out of them. Take the given figure as the base and then draw a novel and interesting picture on that base. Apply your best thinking in drawing the pictures. Draw the picture from your imagination and give an appropriate title to it to explain what you have drawn. There are no right at wrong drawings. You are to use your imagination as much as you can to give us as elaborate and interesting a picture as possible.
The tasks in this booklet are divided into THREE ACfIVITIES. Each ACTIVITY is separately timed. Within the time limit fonhe activity you may work on the different drawings according to your speed. When you finish one drawing, go to the next in the same ACTIVITY. If necessary, you may return to the previous one again for any addition you want to make in your drawing. Remember that you have not to go to the next ACTIVITY until the time for the first ACTIVITY is over and you are told to proceed further.
At the end, you will be given 5 MINUTES EXTRA time which you may use to add new ideas to any drawing of any activity in which you want to do additional work.
Please do not omit any task. Start your work only when you are told to do so.
Estd: 1971 Phone: 364926
NATIONAL PSYCHOLOGICAL CORPORATION 4/230, Kacheri Ghat, AGRA - 282 004 (INDIA)
C 1913, 87 All rights reserved. Reproduction in:i.ny form isa violation of Copyright Act. Thinking Creativity by
FIGURES (reF) ".

306
[2]
Activity 1 PICTURE CONSTRUCTION
Directions
On the following page you have been given two simple line drawings. Using them as a base or a part you have to draw pictures which you consider both novel and interesting. You can turn the page in any way you like to begin to draw your picture. Think of a picture which you feel no one else would be able to make. Try to add as many ideas as you can to make the picture interesting and novel.
When you have completed the picture, give a title to it in the space provided for. Try to make the title as interesting and unusual as possible', which will show how imaginatively you can think.
You need not give much attention to accuracy and beauty of the picture. What is more important is that how novel and interesting is the picture you have drawn. Copying will not be of any help.
You will be given 10 minutes to complete this ACTIVITY. You will be told the time, after 5 minutes so that you may move on to the next item in the ACTIVITY.
You will find that the figure given at your left has been used as a part in both the pictures. In the first picture, it has been used as a cap, and the other as hollow in the tree. You have to make only one picture with one part.
Example:- c=)
Title: A man gazing a pig.
(You will notice that here the page has been turned around to make the picture)
Title:A bird's n'est in the hal/ow oj a tree.
306

307
[3 J
1.
Title:
2.
Title:
307
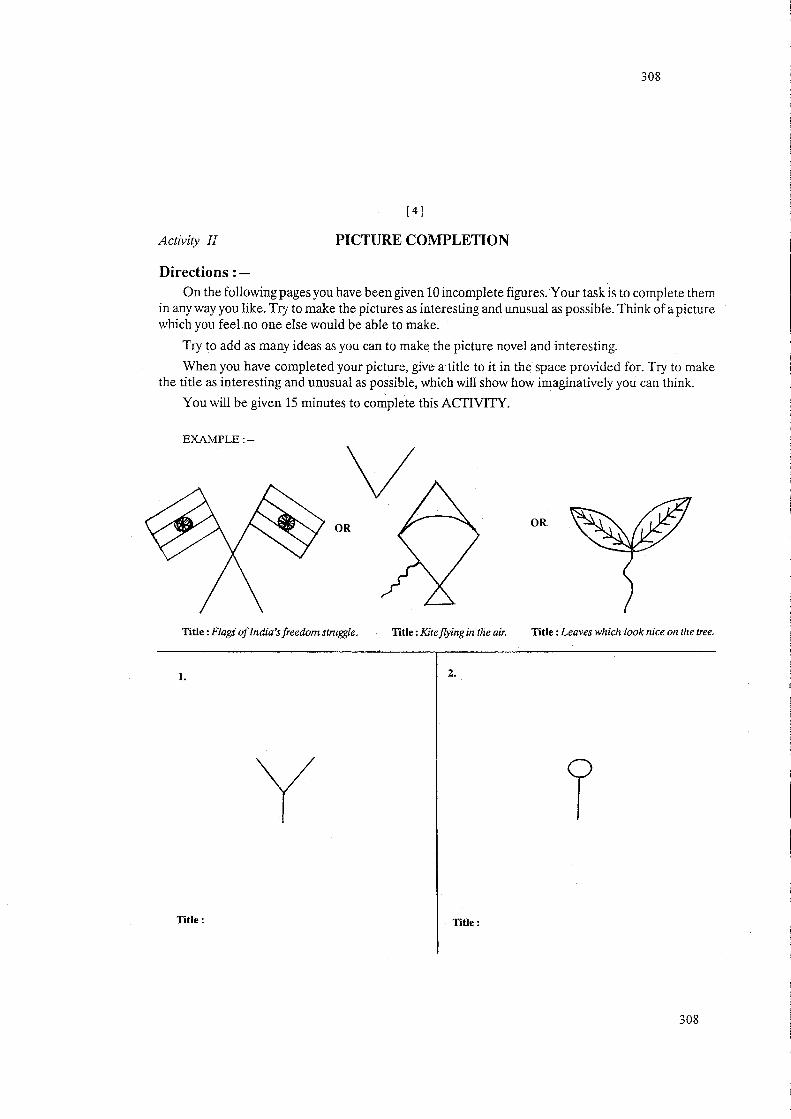
308
[4 J
Activity II PICTURE COMPLETION
Directions: -On the following pages you have been given 10 incomplete figures. Your task is to complete them
in any way you like. Tf"J to make the pictures as interesting and unusual as possible. Think of a picture which you feel no one else would be able to make.
Try to add as many ideas as you can to make the picture novel and interesting.
When you have completed your picture, give a title to it in the space provided for. Try to make the title as interesting and unusual as possible, which will show how imaginatively you can think.
You will be given 15 minutes to complete this ACTIVITY.
EXAMPLE:-
v OR OR
Title: Flags of India's freedom stmggle. Title: Kite flying in the air. Title: Leaves which look nice on the tree.
1. 2.
y Title: Title:
308
309
51
3. 4.
Title: Title:
6. 5.
I I I
Title: Title:
309

310
[ 6 ]
7. 8.
Title: Title:
10. 9.
< Title: Title:
310

311
{7J
Activity III Triangles and Ellipses
Directions: -On the following pages you have been given two types of geometrical figures, namely a triangle
and an ellipse. You can think of many objects or pictures which you can make with the help of these two figures using them as the main part.
You have to make each picture as interesting and unusual as possible. Each picture should be different from the other and must convey a complete idea. Try to think of objects which no one else might have thought of. After completing each picture give a title to it in the space provided. Try to make the title as interesting as possible which will show how imaginatively you can think.
It is not necessary that you first finish all the triangles, and then go to the ellipses. When you find that no new ideas are coming to you on triangles, immediately move on to ellipses. Try to make as novel and interesting pictures as possible.
You will be given 10 minutes to complete this ACTIVITY.
1. 2.
Title: Title:
311

312
[8 )
3. 4.
Title : Title:
6. 5.
Title: Title:
312

313
7. 8.
Title: Title:
10. 9.
o o
Title: Title:
313

314
[ 10]
11. 12.
o o
Title: Title:
14. 13.
o o
Title: Title:
314

315
SCORING SHEET
TCF ACTIVITY I
Elaboration (N) Elaboration M Originality (N) Originality M Item 1.
Item 2.
Total
ACTIVITY IT
Elaboration (N) Elaboration M Originality (N) Originality M Item 1.
Item 2.
Item 3.
Item 4.
Item 5.
Item 6.
Item 7.
Item 8.
Item 9.
Item 10.
Total
ACTIVITYll
Elaboration (N) Elaboration (V) Originality (N) Originality (1/)
Triangles
Ellipses
Total
SCORE SUMMARY
Elaboration (N) Elaboration M Originality (N) Originality M Activity I
Activity II
Activity III
Grand Total
• See back page for further instructions regarding originality scorin}!.
315

316
ORIGINALITY SCORING FOR RESPONSES NOT MENTIONED.IN THE RESPONSE LIST
For any ·novel response not mentioned in the response list given in the manual, first of all brietly note it down in the space provided below giving the number of the activity and the item to which it belongs. Then, after you have scored all the test scripts, give it a score according to the scheme given in the manual and note the score in the appropriate column in the Scoring Sheet. In all probability, there will be very few such responses.
I Activi~~: I~~~-~~-----------------R-e-s-p-o-ns-e-------------------'--~-~-~r-i~-a-lit-y--'
i
316

Appendix-B3 317
Appendix-B3
Students Information Scheduled (SIS)
1. My name .........................
2. My school Name ••••••••••••••••••••••
3. My sex male 0 female 0
4. My age in years
5. My class IX Section- AlB/C/D/E
6. My mother tongue Telugu 0 Hindi 0 Urdu 0 Others 0
7. My religion: Hindu 0 Muslim 0 Christian 0 Others 0
8. My caste : OC 0 BC 0 SC 0 ST 0
9. Please indicate the highest educational level attained by
your parents
Father Mother o 0 Post-Doctoral o 0 Doctoral degree (PhD) o 0 Master's Degree ( MAlMSc/MCom/MBA) o 0 Bachelor's Degree (BAlBSc/BCom/BBA) o 0 Intermediate/HSC/PUC/Polytechnic Diploma/lTI o 0 SSC/SSLC/ITI o 0 Middle/Elementary o 0 Primary o 0 Literate o 0 Illiterate
10.(A) What is your father's occupation? ------------(Write in the given blank- e.g. Doctor, Teacher ••• ,)
(B) What is your mother's occupation? ------------(Write in the given blank- e.g. Housewife, Nurse ••• ,)

Appendix-B3 318
11. Please indicate monthly income of your parents Father Mother Income Levels
D D No Earnings
D D Rs 1000 & below
D D Rs 1001 - 2000 D D Rs 2001 - lOOO D D Rs lO01 - 4000 D D Rs 4001 - 5000 D D Rs 5001 & above
12. My interests:
12.1. Write any three school subjects you like and give the
reasons why you like them
1 ..•••......••.... 2 ........... . :I .•••••••••.......
12.2. Write any three school subjects you don't like and give the reasons why you dislike them
1 ••......•.......• 2 •••••••••••• :I .•••••••.........
12.l. Write any three jobs you would like to do when you enter the job market and why you like them
1 .••.......••.... ~ ••........... :5 ••••••••••••••••••
12.4. Briefly describe your good experiences in your classroom
12.5. Briefly describe your bad experiences in your classroom

Appendix-B4
Appendix-B4 Teachers Encouragement Scale
(Assessed by Students)
319
This scale is developed for research purposes only. It contains statements about practices which could take place in your classroom. You will be asked how often each practice actually takes place. Put a tick mark ( v) in the box for an appropriate answer. Your responses will be confidential.
If you have any doubts about the questions don~t hesitate to ask. Be sure to give an answer to all questions.
1. Does the teacher encourage you to think independently? Always 0 Usually 0 Often 0 Sometimes 0 Never 0
2. Does the teacher encourage you to ask any type of question in the classroom?
Always 0 Usually 0 Often 0 Sometimes 0 Never 0
3. Does the teacher encourage students to take decisions when problems occur?
Always 0 Usually 0 Often 0 Sometimes 0 Never 0
4. Does the teacher create imaginative situations in the classroom? Always 0 Usually 0 Often 0 Sometimes 0 Never 0
6. Do you find that the teacher becomes anxious when any unexpected questions are asked?
Always 0 Usually 0 Often 0 Sometimes 0 Never 0
7. Does the teacher ignore students when they raise questions? Always 0 Usually 0 Often 0 Sometimes 0 Never 0
8. Does the teacher praise students openly whenever new ideas are
expressed? Always 0 Usually 0 Often 0 Sometimes 0 Never 0
9. Does the teacher criticise you for no good reason in the classroom?
Always 0 Usually 0 Often 0 Sometimes 0 Never 0

Appendix -B4 320
10. Does the teacher have good relations with students? Always D Usually D Often D Sometimes D Never D
11. Do you find that the teacher is friendly with students? Always D Usually D Often D Sometimes D Never D
12. Do you find that the teacher is humorous with students? Always D Usually D Often D Sometimes D Never D
13. Do you trust the teacher? Always D Usually D Often D Sometimes D Never D
14. Is the teacher strict with students? Always D Usually D Often D Sometimes D Never D
15. Does the teacher discourage you from following your own interests?
Always D Usually D Often D Sometimes D Never D
16. Does the teacher give examples from different fields that interest you?
Always D Usually D Often D Sometimes D Never D
17. Does every student get a chance to speak in class? Always D Usually D Often D Sometimes D Never D
18. Does the teacher encourage you to discuss things in groups? Always D Usually D Often D Sometimes D Never D
19. Does the teacher encourage you to participate in classroom activities?
Always D Usually D Often D Sometimes D Never D
20. Do students ask the teacher questions on their own? Always D Usually D Often D Sometimes D Never D
22. Are the students' ideas/suggestions used during classroom discussions?
Always D Usually D Often D Sometimes D Never D

Appenclix -B5
Appendix-B5
Schedule of questions for teachers ( The exploratory case studies)
Q1. Please give a brief description of creative thinking.
Prompt: What does it mean?
Q2. Please briefly outline what you think creative thinking is.
321
Q3. What is your level of knowledge about creative thinking and its development among the students?
Prompt: Comprehensive knowledge 0 Good knowledge 0 Some knowledge 0 Only known by name 0 Totally unknown 0
Q4. Where did you acquire this knowledge?
Prompt: Sources of getting this knowledge ego Training, books, ?
Q5. Do you have knowledge of any creative techniques in teaching?
Prompt: ego Brainstorming or synectics
Q6. Have you applied any creative techniques in your classroom?
Prompt: (If yes) What type of techniques?
Q7. Was developing students' creative thinking included in your teacher training?
Prompt: (If yes) in which subject was it included?
Q8. Have you attended any special training programmes or seminars in order to develop creative thinking in school students?
Prompt: (If yes) by whom was it organised?
Q9. What support do you need in order to improve your knowledge and understanding of creative thinking ?
QI0. How do you think that creative thinking is developed through teaching?
Q1l. Do you think that all children can be taught to be creative thinkers?
Prompt: (If yes) Could you Please explain how?
Q12. Do you think that Intelligence and creative thinking are different or aspects of the same?
Q13. Could you please explain how they are different?

Appendix-B5 322
Q14. Are all intelligent students creative?
Q15. Do you think that creativity is developed only in the teaching of the subjects Arts & Music ?
Q16. Are there any other school subjects which play a key role in developing creativity?
Q17. Have you Identified any creative children in your classroom?
Prompt: (If yes) On what basis (Criteria) do you identify them?
Q18. Do you think that the development of creative thinking among the school students is important?
Prompt: If Yes, why? If No, Why not?
Q19. Would you like to encourage creative thinking among your students?
Prompt: If Yes, why would you like to?
If No, Why wouldn't you like to?
Q20. How can teachers can develop creative thinking among the students?
Q21. What barriers / Obstacles do you find in developing students' creative thinking?
Prompt: At different levels ego School, Student, Teacher
Q22. What is your opinion about the role of the present examinations in developing creative thinking?
Q23. What is your opinion about the role of the present curriculum in developing creative thinking?
Q24. What suggestions would you recommend to develop creative thinking among
the students?

Appendix-B6 323
Appendix-B6
Teachers Questionnaire on Creative thinking
Part-A :Teacher's Biography
1. Your Name
2. Sex Male D Female D
3. Your age in years
20·25 D 26·30 D 31·40 D 41·45 D
46·50 D 51·55 D 56·60 D
4. Your teaching: 1·5 D 6·10 D 11·15 D 16·20 D
experience in 21·25 D 26·30 D 31 and above D
Years
5. Your educational qualifications Academic Year of Professional
Passing
Year of Passing
Undergraduate D
(Intermediate)
Undergraduate D
(T T CI UGD/Pandit)
Graduate D Graduate D
(BAI BCom IBSc) (BEd/BPEd/Pandit)
Postgraduate D Postgraduate D
(MAl Mcom IMsc) (M.Ed/MPEd) If you have any other qualifications please specify ••••••••••••••••
6. Type of school you are working in Government D Private D Govt·Aided D
7. Please state the level you are teaching at
Primary D Secondary D
8. Please state the subjects you are actually teaching 1. Telugu D 6. Physical Sciences D
2.Hindi D 7. Social Studies D
3.English D 8. Art D
4.Mathematics D 9. Music D
5.Bio·Science D 10. Physical Education D
11.Any other subject(please specify) ______ _

Appendix-B6 324
PART -B:Sources of knowledge about creative thinking
1. Was developing students' creative thinking included YES/NO in your teacher training?
2. If YES in which sujects it was included?
3. If it was not included in your teacher training programe then where have you acquired knowledge about the development of creative thinking?
1. Special training programmes 2. Refresher courses 3. Seminars/ Conferences 4. Colleagues and friends
D
D
D
D
5. Teacher guides and supplementary materials D 6. Own interest in reading books and journals D
7. Other sources (please specify) ••••••••••••
4. Was creative thinking in school children emphasised in any training programmes/refresher courses you have attended? Yes/No
If yes to Q.No.4
4.1 please state who organised the course
4.2 How was the content of the course relevant to your classroom teaching?
5. What type of support do you think you need to improve your knowledge of how to teach creative thinking?
6. What type of support do you think you need to improve your understanding of creative thinking?

Appendix-B6 325
PART -C : Defining creative thinking
1. Please consider the following list and rank them in order of importance 1 to 15 in relation to your view of creative thinking. Use number 1 to indicate your first choice.
Aspects Rank
1. Aesthetic products
2. Combining Ideas
3. Divergent thinking
4. Imagination
5. Innovation
6. Invention/Discovery
7. Inspiration
8. Intuition
9. Original Ideas
10. Self-expression
11. Seeing connections
12. Solving problems
13. Thinking process
14. Unconscious processes
15. Valuable ideas
Other (Please State)
2. Do you think that creative thinking is promoted only by subjects like Art and Music.
Yes/No
3. If NO , which other subjects in the high school curriculum do you think promote creativity among the students, and how?
4. Have you identified any creative children in your
classroom?
5. If yes, how do you identify them as creative children?
Yes/No
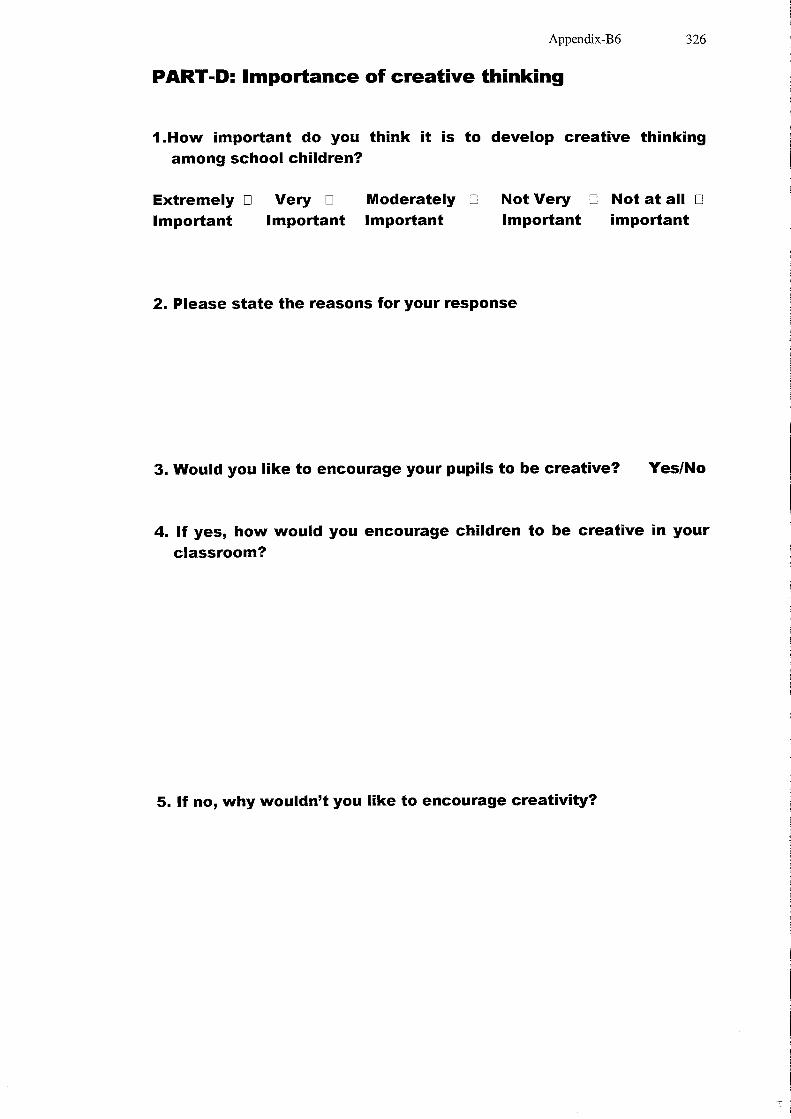
Appendix-B6 326
PART-D: Importance of creative thinking
i.How important do you think it is to develop creative thinking among school children?
Extremely D Very D Moderately D Not Very D Not at all D Important Important Important Important important
2. Please state the reasons for your response
3. Would you like to encourage your pupils to be creative? Yes/No
4. If yes, how would you encourage children to be creative in your
classroom?
5. If no, why wouldn't you like to encourage creativity?

Appendix-B6 327
6. Here are some possible factors which may assist in developing creative thinking among students. How important do you think each of these is in developing creative thinking? For each statement place a tick (-,J ) in the appropriate column.
Note: Please read E-Imp = Extremely Important
V-Imp = VelY Important M-Imp = Moderately Important NV-Imp = Not VelY Important NA-Imp = Not At all Important
91 ~ ~ 1: ~ Statement
§" §" §" §" ~ ~ ~ ~ ~ ~
1. Providing an exciting and adventurous school atmosphere
2. Having good teacher-pupil relationships
3. Building self-confidence among the students
4. The pupils having a supportive home environment
5. Encouraging pupils to ask questions
6. Teachers asking open-ended questions
7. Teachers asking provocative questions
8. Treating students' questions with respect
9. Treating students' imaginative ideas with respect
10.Developing curiosity
11.Encouraging experimentation
12.Setting interesting tasks
13.Teaching self-initiation to the students
14.Teaching self-evaluation to the students
1S.lnformal teaching
16.A creative teacher
17.Any other( Please specify)

Appendix-B6 328
7. Below are listed some possible obstacles to students developing creative thinking at school level. Please read each statement then put one tick (""') to indicate the extent to which you agree that these factors prevent the development of creative thinking.
School Level
1 Inadequate resources at school
2 Unsuitable accommodation
3 Over-large classes
4 Inadequate funds
5 Inadequate support from the headteacher
6 Inadequate support from the parents
7 Inadequate support from society
8 Inadequate instructional materials
9 Inadequate freedom for teachers to pursue creative activities
10 Inadequate freedom for students to pursue creative activities
11 Conflicting curriculum demands
12 Any other(Please specify)
,.(1) ca .. ""'I ""'I (D 0 (D :::s ca
-<
c: :::s a. (D n it (D a.
8. Below are listed some possible student-level obstacles to the development of creative thinking. Please read each statement, then put one tick (""') to indicate the extent to which you agree that these factors prevent the development of creative thinking.
~~ ,. c: a ~ ~ ca :::s Cij'
~ a ""'I a. (D Q)
I i (D :::s (D (D ca ca !!, ~ Student Level -< a. (D
(D
a.
1 Students are not well motivated
2 Students lack confidence
I 3 Students have too much home-work

Appendix-B6 329
:! :I> c:: a acn ca ::::s iii' -... ""I ""I ""I a. en a CD 0 CD CD
D)
~ ::::s Student Level CD ::::s CD ca ca !!. ""I ""I ca ~ a. CD CD -
CD CD CD '< a.
4 Students participate passively
5 Students tend to rote learn
6 Students perform poorly 7 Students lack experience
8 Any other ( Please specify)
9. Please find listed below some of the obstacles at Teacher level which may prevent the development of creative thinking in students. Please read each statement, then put one tick bl) to indicate the extent to which you agree that they may prevent the development of creative thinking.
Teacher Level :l>cn :I> c:: a acn ca .. ca ::::s iii' _ ...
""I ""I ""I a. en ""I CD 0 CD D) D) 0 CD ::::s CD CD ca ca ::::s ca n ""I ""I ca ~
_. CD CD -a. CD CD '< CD a.
1. Lack of knowledge about creativity among teachers
2. Lack of understanding about creativity among teachers
3. Teachers' over-emphasis on preparing students for examinations
4. Teachers' stress on completing the
syllabus
5. Inadequate preparation time for
teachers
6. Lack of confidence among teachers
7. Lack of experience among teachers
8. Lack of recognition of teachers' creative work
9. Lack of recognition of teachers work in promoting students' creativity
10. Heavy teaching work-load
11. Any other (Please specify)

Appendix-B6 330
PART-E: Your opinion about encouragement of creative thinking
Please indicate the level of your agreement with each statement by placing tick mark(-i>.Please put only one tick for each question.
Note: Please read E-Imp = Extremely Important V-Imp = VelJ'lmportant M-Imp = Moderately Important NV-Imp = Not VelJ'lmportant NA-Imp = Not At all Important
Statement I1t ~ ~ ~ Z §' §' §' §' » • -'ti 'ti 'ti 'ti :I
-a
1. Students should be encouraged to be more sensitive to a wide range of environment stimuli
2. Students should be encouraged to manipulate objects
13. Students should be encouraged to try out various possible solutions to the problem
4. Students should be permitted to judge! evaluate themselves which is the best among the solutions to a problem
5. Teachers should be tolerant when students present a variety of answer rather than single answer
6. The teacher should expect and encourage unusual answers in the classroom
7. Teachers should encourage students to exchange their ideas
8. Teachers should be friendly with students
9. Teachers should be authoritative rather than non-authoritative
10. Teacher should reward students' imaginative efforts
11. Teachers should respect students' thoughts and ideas

Appendix-B6 331
Statement ." ~ ~ ~ z i' i' r i' ~ -'\:i "ti '\:i :I
"a
12. Teachers should encourage students to think independently
13. Students should be exposed to a variety of types of situations
14. Teachers own creativity helps in nurturing creative thinking 15. Teachers should encourage students to further refine their ideas
16. Students' ability to think creatively can be improved through direct instruction.
PART-F: your opinion about the present curriculum
Do you agree or disagree with the following statements about the present curriculum? Please tick appropriate box.
Present curriculum at Secondary level ~~ J> C a atA c.a :::s iij'
_ ... ""'I ""'I
~ C. en ""'I
CD 0 D) D) 0 CD :::s CD CD c.a c.a :::s c.a !2. ""'I ""'I c.a ~ c. CD CD -
CD CD CD '< C.
1. Proper emphasis is not given in the curriculum to creative activities.
2. The curriculum is not flexible enough to allow the student to pursue their creative activities
3. The curriculum does not give enough scope for the students' self· evaluation and self·initiated learning
4. The curriculum is overloaded in all
or most of the subjects.

Appendix-B6 332
Present curriculum at Secondary level J>cn J> C 0 ocn u:z ... u:z :::s iii' _ ....
""I ""I ""I 12. en a CD 0 CD CD I» ~ :::s CD :::s CD u:z u:z !!. ""I ""I u:z -< 12. CD CD -
CD CD CD '< 12.
5. The curriculum is suitable and caters for the needs of a wide range of learners and their learning environment
6. The methods of teaching are not appropriate to meet the needs of students to learn creatively.
7. The curriculum emphasises:(please rank 1 to 5)
1. Knowledge 0 4. Application 0
2. Skills 0 5. Attitude 0
3. Understanding 0 6. Other 0
(Please specify---------)
8. The promotion of creative thinking is possible if the curriculum is (Please tick the appropriate box)
1. Child-centred 0 4. Teacher-centred 0
2. Teacher-centred 0 5. Activity-centred 0
but learner-based
3. Examination-centred 0 6. Other 0
(Please specify---------

Appendix-B7 333
Appendix-B7
Observation Schedule of teacher's behaviour Observation period: One period (45 minutes)
Number of frequencies
Types of reinforcement 1234567891011 12 Total
1.Attends to students' opinion
2.lgnores students' ideas
3.Accepts students' ideas ego Yes or I see
4.Encourages pupils to participate by using cues such as nodding of head, smiling and patting.
5.Rewards pupils who give partially correct answers ego Good attempt
6.Builds on or asks questions of pupils who have contributed ideas
7. Clarifies ideas of students'
8.Elaborates on ideas of students
9.lnsists on correct responses
10.Criticises positively
11.Criticises negatively scolding, threatening
12.Asks closed questions
13 Asks open questions

Appendix-B8
Appendix-B8
ACTIVITIES ORGANISED BY THE SCHOOL (To be filled by headteacher)
Activities
1. Exhibitions of students' art work in the school. Organised in the school 0 Need to organise in the school 0
2. *Exhibition of other school students' art work or visit to other schools. Organised in the school 0 Need to organise in the school 0
3. Reproduction of the works of master artists by the students. Organised in the school 0 Need to organise in the school 0
4. Wall posters prepared on special occasions and displayed. Organised in the school 0 Need to organise in the school 0
334
5. *Masks and Puppets made from paper bags, paper mache (Paper strips pasting layer after layer land paper pulp) and other materials.
Organised in the school 0 Need to organise in the school 0
6. Students' participation in school stage and classroom decorations Organised in the school 0 Need to organise in the school 0
7. *Visits to historical monuments, art galleries, museums, art exhibitions and places of local artists, craftsman, technicians Organised in the school 0 Need to organise in the school 0
8. *Field trips/ tours/ excursions Organised in the school 0 Need to organise in the school 0
9. *Films, slides and reproduction of student's art works. Organised in the school 0 Need to organise in the school 0
10. * Cultural activities ego drama, plays, mono-actions, fancy-dress, singing etc., Organised in the school 0 Need to organise in the school 0
11. *Drawing and painting activities Organised in the school 0 Need to organise in the school 0
12. * Constructions and designs with clay, plaster of Paris, wood etc., Organised in the school 0 Need to organise in the school 0
13. *Embroidery, knitting, etc., Organised in the school 0 Need to organise in the school 0
* Please strike out whichever is not applicable
334

Appendix-B8
ACTIVITIES ORGANISED BY THE SCHOOL (To be filled by headteacher)
Activities
335
14. * Decoration of school buildings and surroundings e.g. new arrangements, landscaping of gardens, murals and or putting up art works etc., Organised in the school 0 Need to organise in the school 0
15. * Computer Games Organised in the school 0 Need to organise in the school 0
16. *Encouraging pupils to explore ideas through Science, Maths clubs and other subject clubs Organised in the school 0 Need to organise in the school 0
17*Speciallectures/Programmes organised to inspire the students by eminent personalities in different fields ego artists, musicians, scientists, writers. Organised in the school 0 Need to organise in the school 0
18. *Debate, Essay Competition, Organised in the school 0 Need to organise in the school 0
19.5eminars, Student presentations etc., Organised in the school 0 Need to organise in the school 0
20. Assist pupils in participating in the activities of their interest in and outside the school
Organised in the school 0 Need to organise in the school 0
21. School magazines to encourage students' publications Organised in the school 0 Need to organise in the school 0
22. * Organisation of and participation in science fairs and exhibitions Organised in the school 0 Need to organise in the school 0
23. * Sports / Athletics / Games Organised in the school 0 Need to organise in the school 0
24.* NSS/ NCC/Scout Organised in the school 0 Need to organise in the school 0
25. SUPW /Occasional training Organised in the school 0 Need to organise in the school 0
26. School Days Orf?anised in the school 0 Need to or~anise in the school 0
* Please strike out whichever is not applicable
If some of the items are not applicable or not feasible in your school, please strike out the items and give reasons why.
335

ONo 1
*2
3
4
5
6
7
*8 9
10
11
Appendix-B9
ACTIVITIES ORGANISED BY THE SCHOOL (To be filled by headteacher)
Organised Statements the school
Activities orqanised Yes No Encouraging pupils to explore ideas through (i) Science clubs (ii) Maths clubs (iii) Other subject clubs (if any)
................................. Assist pupils in participating in the activities of their interest in and outside the school Organisation of (i) Science fairs
(ii) Exhibitions Participation in (i) Science fairs
(ii) Exhibitions Special lectures / Programmes organised to inspire the students by eminent personalities in different fields e.g. Artists, Musicians, Scientists, Writers. etc., If YES please specify ........................................................ ........................................................ ...................................................... Organised / Encouraged (i) Seminars for students (ii) Student presentations in the school /
class etc., School magazines to encourage students' publications Exhibition / display of students' artwork in the school. Exhibition / display of other school students' art work or visit to other schools (i) Reproduction of the works of master artists by the students. (ii) Reproduction of your school students art works by the other students Organised the shows for the students (i) Films (ii) Slides (iii) Video Drawing and painting activities
* Please strike out whichever is not applicable
Appendix-B9 336
in Need to be organised in the school Yes No

ACTIVITIES ORGANISED BY THE SCHOOL ( To be filled by headteacher)
Organised Statements the school
Appendix-B9 337
in Need to be organised in the school
ONo Activities organised Yes No Yes No *12 Masks and Puppets made from paper bags,
paper mache (Paper strips pasting layer after layer land paper pulp) and other materials.
*13 Constructions I designing models with clay, plaster of Paris, wood etc.,
14 Embroidery, knitting, etc., 15 Computers Provided for the students
(eg. Computer applicationsl Internet I Computer Games)
16 Laboratory facilities available for the students in the school (If Yes please mention the type of facilities
provided) ~ ..........................................................................................
.................................................
................................................
17 Library facilities provided for the students in the school (If Yes please mention the type of facilities provided) ............................................... ............................................... ...............................................
18 Visits to 1. Historical monuments 2. Art galleries 3. Museums 4. Art exhibitions 5. Places of local artists 6. Places of craftsman 7. Places of Technicians
19 Organised 1. Field trips 2. Educational Tours I Excursions
* Please strike out whichever IS not applicable

Appendix-B9 338
ACTIVITIES ORGANISED BY THE SCHOOL (To be filled by headteacher)
Organised in Need to be Statements the school organised in
the school ONo Activities organised Yes No Yes No 20 (i) Debate
(ii) Essay competition 21 (i) Sports
(ii) Athletics (iii) Games
22 (i) NSS (ii) NCC (iii) Scouts
23 (i) SUPW (ii) Vocational training
24 Decoration of school buildings and surroundings (e.g. new arrangements, landscaping of gardens, murals and or puttinq up art works etc.,)
25 Students' participation in (i) School stage decorations (ii) Classroom decorations
26 Wall posters prepared on special occasions and displayed. (If yes please specify the occasions) ...................................................... ...................................................... ......................................................
27 Cultural activities (i) Drama (ii) Plays (iii) Mono-actions (iv) Fancy-dress (v) Singing (vi) Others (Please specify)
28 School Day celebration * Please strike out whIchever IS not applicable
NOTE: If some of the items are not applicable or feasible in your school, please strike out the items and give reasons why.

Appendix-Cl 339
Appendix-Cl Responses on the Verbal Creativity Test Items
Note: EG% = English medium girls (N=112) EB% = English medium boys (N=59) TG% = Telugu medium girs (N=114) TB% = Telugu medium boys (N=88))
Tot % = Total (both media) (N=373) Ori. Wei.= Originality weight.
Activity - I : Consequences test
Activity - I (1) What will happen if man flies like birds? Responses EG EB TG TB TOT Ori.
% % % % % Wei. A - Effect on Transport and Travel
AI. Disuse of vehicles 28.6 50.8 42.1 27.3 35.9 -A2. Disuse of Aeroplanes 14.3 32.2 24.6 18.2 21.2 -A3. Disuse of Parachute 1.8 0.0 0.0 1.1 0.8 5 A4. Ease in travel 7.1 16.9 27.2 17.0 17.2 -A5. Disuse of inventions 0.0 0.0 1.8 4.5 1.6 4 A6. Railway dept. may Be closed 3.6 10.2 5.3 3.4 5.1 -A 7. Transport Co. may not Progress 0.9 6.8 7.9 4.5 4.8 1 A8. Air travel Corp. may be closed 0.0 3.4 0.0 0.0 0.5 5 A9. Vehicle manufacturing company will go in loss 0.0 0.0 1.8 0.0 0.5 5 AID. River transport may be closed 0.0 1.7 0.0 1.1 0.5 5 B - Effect on communication B 1. Disuse of telephone 0.0 0.0 1.1 0.0 0.5 5 B2. Disuse of Postal communication 6.3 0.0 1.1 2.3 2.9 3 B3. Disuse of telegraphy 0.0 1.7 0.0 0.0 0.3 5 C - Effect on Living Habits CI. No walking 1.8 1.7 3.5 2.3 2.4 3 C2. No use of stairs 1.8 0.0 0.0 0.0 0.5 5 C3. Living on trees possible 2.7 13.6 10.5 3.4 7.0 -C4. Happy and joyful 8.9 5.1 8.8 3.4 7.0 -C5. No need to work for food 6.3 0.0 15.8 6.8 8.3 -C6. No need of clothes 1.8 0.0 0.9 2.3 1.3 4 C7. Legs will become weak 0.9 0.0 0.9 0.0 0.5 5 D - Thrill of New Experience Dl. Moon travel made easy 1.8 1.7 19.3 12.5 9.7 -D2. Travel to fairy land 2.7 1.7 8.8 6.8 5.4 -D3. Travel to other Countries 0.9 8.5 5.3 5.7 4.6 1 D4. Travel to beautiful places will become easy 13.4 10.2 8.8 8.0 10.2 -D5. Travel to other planets with in the reach every body 1.8 1.8 0.0 8.8 9.1 -D6. Visiting to heaven possible 1.8 0.0 1.8 0.0 1.1 4 D7. To discover new places 0.0 0.0 0.9 2.3 0.8 5 E - Man-Bird Relation E1. Competition between species 0.0 0.0 0.0 1.1 0.3 5 E2. New friendships 0.9 3.4 1.8 1.1 1.6 4 E3. Hostility with birds 0.9 1.7 0.0 2.3 1.1 4 E4. New type of relations between man and birds will develop 8.9 1.7 5.3 4.5 5.6 -E5. New types of game between man and birds possible 0.9 0.0 0.0 0.0 0.3 5 F - Self - Defence Fl. Safety from dangerous animals 2.7 1.7 0.9 2.3 1.9 4 F2. Safety from floods 0.0 0.0 3.3 1.1 1.3 4 F3. No security oflife 0.0 3.4 0.0 1.1 0.8 5 F4. Safety from earthquakes 0.0 3.4 0.0 0.0 0.5 5 G - Biological changes G 1. Legs will become shorter 0.9 0.0 0.0 0.0 0.3 5 G2. Tail will be developed 0.0 1.7 0.0 0.0 0.3 5 G3. Wings will be developed 6.3 1.7 7.9 2.3 5.1 -G4. Brain will become more alert 0.0 0.0 0.0 0.0 0.3 5 G5. Man will lay eggs like bird 2.7 1.7 0.0 0.0 1.1 4 G6. Weight and size will decrease 0.9 1.7 0.0 0.0 0.5 5 G7. New type of bodily chan_ges 0.9 3.4 4.4 2.3 2.7 3

Appendix-Cl 340
Activity - I (1) What will happen if man flies like birds? Responses EG EB TG TB TOT Origi.
% % % % % WeiJZ. H - Overcoming Hurdles HI. No need for bridge and roads 4.5 3.4 5.3 1.1 3.S 2 H2. Going to hill top easier 0.0 5.1 2.6 1.1 1.9 4 H3. Plucking of fruits from trees possible 2.7 3.4 S.S 4.5 5.1 -H4. Hunting will become easy 1.S 10.2 0.0 5.7 3.5 2 H5. No farming 0.9 0.0 1.S 1.1 1.1 4 H6. No cooking 0.0 3.4 0.0 0.0 0.5 5 H7. Catch kites easily 0.0 1.7 0.0 0.0 0.3 5 HS. Crossing the ocean will become easier 0.0 0.0 0.0 1.1 0.3 5 I - Effect on sports, Games Recreation n. New sky games will be developed 1.S 1.7 1.S 1.1 1.6 4 12. Competition in flying 0.0 0.0 0.0 1.1 0.3 5 J - Observation facility .T 1. Can see from above 0.0 0.0 7.9 5.7 3.S 2 12. Spotting lost persons easier 0.0 0.0 0.9 2.3 O.S 5 .T3. Spotting the lost animals 0.9 0.0 0.0 1.1 0.5 5 .T4. Spotting flood affected animals 0.0 0.0 0.0 1.1 0.3 5 .T5. Watching the crops easier 5.4 3.4 S.S 2.3 5.4 -J6. Watching the different persons on duty 0.0 0.0 4.4 0.0 1.3 4 17. Watching the animals grazing 0.0 0.0 1.4 0.0 0.5 5 K - Effect on economy K1. Saving of money in travel 0.0 3.4 0.0 1.1 O.S 5 K2. Loss to automobile industry 0.0 0.0 0.0 1.1 0.3 5 K3. Save time in travel 1.S 5.1 1.S 1.1 2.1 3 K4. No money spend for food 0.9 0.0 0.9 0.0 0.5 5 K5. No own property 0.0 0.0 0.0 1.1 0.3 5 K6. No Financial organisations 1.S 0.0 0.0 0.0 0.5 5 K7. No business markets 1.S 0.0 3.5 1.1 1.9 4 KS. Loss to the Govt.travelling revenue 0.0 1.7 0.9 1.1 O.S 5 K9. No use of electricity 0.0 0.0 0.9 0.0 0.3 5 K10. New type of industries are making 0.9 0.0 0.0 0.0 0.3 5
type of special soap to wash the wings K1l. New type of tourism without ticket 9.S 1.7 5.3 6.S 6.4 -K12. Petrol will become cheaper 6.3 6.S 1.S S.O 5.4 -L - Legal and Administrative Implications Ll. More thefts 0.0 1.7 0.0 2.3 O.S 5 L2. More illegal crossing into other's territory 3.6 5.1 0.0 0.0 1.9 4 M - Problems of traffic control MI. Need for new rules 0.9 1.7 0.9 0.0 O.S 5 M2. No traffic jams 2.7 3.4 3.5 4.5 3.5 2 M3. Crowding in air 3.6 S.5 2.6 9.1 5.4 -M4. Possibilities of more accidents 0.0 1.7 0.9 1.1 O.S 5 M5. No need to traffic signals 0.0 0.0 3.5 0.0 1.1 4 M6. Possibility ofless accidents on the ground 2.7 1.7 I.S 2.3 2.1 3 M7. Possibility of more accidents in the air 2.7 1.7 0.9 2.3 1.9 4 MS. Setting up of new department for traffic control 0.0 3.4 0.0 1.1 O.S 5 M9. New type of rules for air traffic control 0.0 3.4 0.0 1.1 O.S 5 MlO. Pollution free world 0.0 0.0 11.4 9.1 5.6 -N - Social and Political Consequences N1. New pattern of society will be evolved 33.9 S.5 14.0 13.6 19.0 -N2. Less number suicides 0.0 0.0 0.0 1.1 0.3 5 N3. New types of Housing problems I.S 1.7 5.3 4.5 3.5 2 N4. More importance to trees 1.S 5.1 0.9 0.0 1.6 4 N5. Least importance for house 7.1 3.4 15.S S.O 9.4 -N6. No permanent neighbours 0.0 1.7 0.0 0.0 0.3 5 N7. Need new type of prisons 0.0 1.7 0.0 0.0 0.3 5 NS. No difference between poor and rich 0.9 0.0 0.9 0.0 0.5 5 N9. No fundamental rights 0.9 0.0 0.0 0.0 0.3 5 N1O. No difference between man and birds 7.1 5.1 16.7 9.1 10.2 -NIL New type of elections with birds participation 5.4 0.0 1.S 0.0 2.1 3 N 12. Leaders will emelXe in birds 1.S 0.0 0.0 3.4 1.3 4

Appendix-Cl 341
Activity - I (1) What will happen if man flies like birds? Responses EG EB TG TB TOT Origi.
% % % % % Weig. o -Psychological Consequences 01. Tensions reduced 2.7 1.7 6.1 3.4 3.8 2 Q - Effect on the nature of war Q 1. New type of wars in the air will be fought 2.7 0.0 1.8 1.1 1.6 4 Q2. New Defence Problems 0.0 1.7 0.0 0.0 0.3 5 R -Effect on atmosphere R 1. The volume of air will change 4.5 0.0 0.0 1.1 1.6 4 R2. More air pollution due to overcrowding 0.9 0.0 0.9 0.0 0.5 5 R3. Population will less on earth 7.1 10.2 10.5 2.3 7.5 -S - Sky 51. Man can flying in the sky 18.8 27.1 17.5 13.6 18.5 -52. Possibility of meetings in the sky 0.0 0.0 0.0 1.1 0.3 5 53. New Schools emerge in the sky 1.8 1.7 0.0 2.3 1.3 4 U -Effect on education U1. No formal Schools 0.9 1.7 2.6 1.1 1.6 4 U2. No late to Schools and Offices 2.7 1.7 0.9 1.1 1.6 4 U3. New languages will emerge 3.6 0.0 1.8 0.0 1.6 4 ACTIVITY -1(2) What will happen if your school is put on wheels ? A - Educational Implications AI. Rural population benefited 0.0 0.0 3.5 2.3 1.6 4 A2. Increase in mobility 25.9 37.3 57.0 48.9 42.6 -A3. Ease in study 2.7 0.0 0.0 0.0 0.8 5 A4. New concepts of education may develop 1.8 0.0 0.9 4.5 1.9 4 A5. More attraction for school corning 3.6 6.8 6.1 4.5 5.1 -A6. Education through actual observation of environment. 16.1 11.9 4.4 5.7 9.4 -A7. Increase in school fees 0.9 0.0 0.0 0.0 0.3 5 A8. Pupil afraid to come school 5.4 1.7 4.4 4.5 4.3 1 B - Problem of Location B1. No address 8.9 11.9 10.5 4.5 8.8 -B2. Difficulty in searching school 8.9 23.7 15.8 9.1 13.4 -B3. Wastage of time in collecting all children from different 0.9 5.1 0.0 1.1 1.6 4
places C - Traffic Problem C1. Traffic jams, etc. 3.6 10.2 2.6 1.1 3.8 2 C2. Accidents 0.9 8.5 1.8 0.0 2.1 3 C3. Broad roads will be required 1.8 3.4 0.0 1.1 1.3 4 C4. More accidents and deaths 0.0 0.0 0.9 1.1 0.5 5 C5. Hijacking School easy 0.0 0.0 1.8 3.4 1.3 4 D - Inconveniences and Hazards D 1. Reading inconvenience 12.5 13.6 26.3 12.5 16.9 -D2. Black board falling 0.0 0.0 0.9 2.3 0.8 5 D3. Electricity connections 5.4 0.0 0.9 1.1 2.1 3 D4. Water supply 2.7 0.0 0.0 0.0 0.8 5 D5. No plantation 0.9 0.0 0.9 0.0 0.5 5 D6. Writing inconvenience 0.9 0.0 0.9 0.0 0.5 5 D7. At the time strike it will be thrown into the Village pond 1.8 0.0 0.9 0.0 0.8 5 E - Psychological Effect E1. Lack of concentration 2.7 6.8 7.9 10.2 6.7 -E2. Less boredom 0.0 0.0 0.0 1.1 0.3 5 E3. No food export and Import 0.0 0.0 0.0 1.1 0.3 5 F - Social consequences Fl. Will bring people and places nearer 5.4 10.2 7.9 12.5 8.6 -G - Economic Implications G 1. Saving of money 0.9 1.7 0.0 0.0 0.5 5 G2. No school bus 5.4 15.3 10.5 5.7 8.6 -G3. Distinguish problem between school and bus 0.0 6.8 0.0 1.1 1.3 4 G4. Income to repair shops 0.0 1.7 0.0 0.0 0.3 5 G5. Increase of vehicle industries 0.9 0.0 0.0 0.0 0.3 5 H - Special Advantages to Pupil HI. No late corning 1.8 1.7 0.0 0.0 0.8 5 H2. Ease in corning 0.0 0.0 0.0 2.3 0.5 5

Appendix-Cl 342
ACTIVITY -1(2) What will happen ifvour school is put on wheels? Responses EG EB TG TB TOT Originality
% % % % % Weight H3. No walking 0.0 0.0 3.5 2.3 1.6 4 H4. School would comes to the house 4.5 18.6 8.8 18.2 11.3 -I - Effect on School Building n. Cracking of walls 3.6 6.8 1.8 2.3 3.2 2 12. Fall down 13.4 3.4 7.9 3.4 7.8 -13. New light building material will be developed 1.8 0.0 0.0 1.1 0.8 5 J - Amusement 11. Recreation 1.8 5.1 1.8 0.0 1.9 4 12. Tours 5.4 3.4 4.4 4.5 4.6 1 13. More picnics 3.6 0.0 0.0 1.1 1.3 4 14. More sight seeing 8.0 1.7 2.6 5.7 4.8 1 K - Miscellaneous Kl. Transport Corporations will go in loss 0.9 0.0 0.9 0.0 0.5 5 K2. More expenditure on the repairing of roads 0.0 0.0 0.9 0.0 0.3 5 K3. Parents will be worried about the safety their children 0.9 0.0 0.0 0.0 0.3 5 K4. Safety from floods 0.0 0.0 0.9 4.5 1.3 4 K5. Sports and games will not continue 0.9 3.4 0.0 1.1 1.1 4 ACTIVITY -1(3) What will happen if man does not re{ uire any food to eat? A - Social Consequences AI. No begging 0.9 0.0 4.4 1.1 1.9 4 A2. No food problem 3.6 8.5 7.9 15.9 8.6 -A3. Relief to poor 3.6 1.7 6.1 1.1 3.5 2 A4. No population problem 0.9 3.4 2.6 10.2 4.0 1 A5. No feeding problem 0.9 0.0 0.0 1.1 0.5 5 A6. No famines 0.0 0.0 2.6 3.4 1.6 4 A7. Norobbing 2.7 0.0 4.4 3.4 2.9 3 A8. No deaths of sacks 1.8 1.7 0.9 1.1 1.3 4 A9. No bribing 0.0 0.0 0.0 1.1 0.3 5 A10. No rich and poor 0.9 1.7 3.5 3.4 2.4 3 All. Less hostility among people 1.8 1.7 1.8 1.1 1.6 4 A12. No world wars 0.0 0.0 0.9 0.0 0.3 5 A13. No strikes in offices and industries 0.0 0.0 0.9 0.0 0.3 5 A14. Business of eatables will go off 1.8 6.8 7.0 1.1 4.0 1 A15. Fruits and vegetables will be spoiled 2.7 5.1 3.5 2.3 3.2 2 A16. Food markets will be closed 5.4 0.0 0.9 0.0 1.9 4 B- Effect on Man's Morals and Religion B 1. No hoarding 0.0 0.0 4.4 0.0 1.3 4 B2. More honesty 0.0 0.0 2.6 9.1 2.9 3 B3. No jealousy 0.0 0.0 0.9 1.1 0.5 5 B4. No fasting 0.0 0.0 0.9 0.0 0.3 5 B5. More sincerity 0.0 1.7 0.0 0.0 0.3 5 B6. No hunting 0.0 0.0 3.5 5.7 2.4 3 B7. Animal kingdom will grow in abundance 0.0 1.7 0.0 2.3 0.8 5 C - Changes in Scientific Research C1. No agricultural research 0.9 0.0 7.9 3.4 3.5 2 C2. Chemical research will take new tum 0.0 0.0 1.8 0.0 0.5 5 C3. No doctor 0.0 0.0 0.9 0.0 0.3 5 D - Effect on Human Biology and Physique D 1. Man will become machine 0.9 1.7 0.9 0.0 0.8 5 D2. Live by water alone 2.7 0.0 7.0 2.3 3.5 2 D3. No digestive system 0.9 1.7 6.1 4.5 3.5 2 D4. Lazy 9.8 10.2 10.5 11.4 10.5 -D6. Helpful to handicapped 0.0 1.7 0.0 0.0 0.3 5 D7. Man depend on oxygen 0.9 3.4 1.8 1.1 1.6 4 D8. Human figure will change 1.8 1.7 0.9 . 2.3 1.6 4 D9. Size of stomach will change 0.9 0.0 0.0 1.1 0.5 5 DlO. Human life without food is impossible 55.4 50.8 43.0 34.1 45.8 -E - Effect on Economy and Occupation El. No farming 21.4 22.0 36.8 22.7 26.5 -E2. No hotel 0.9 1.7 0.0 2.3 1.1 4

Appendix-Cl 343
ACTIVITY -IQl What will happen if man does not req uire any food to eat? Responses EG EB TG TB TOT Originality
% % % % % Weight E3. No unemployment 0.0 0.0 1.8 0.0 0.5 5 E4. No food export and import 0.0 0.0 0.9 0.0 0.3 5 E5. More cotton (Commercial crops) 0.0 0.0 0.9 0.0 0.3 5 E6. Save money 5.4 13.6 7.0 8.0 7.8 -E7. More scientific discoveries 0.0 0.0 0.0 1.1 OJ 5 F - Effect on Sanitation F1. Disuse oflavatory 0.0 0.0 0.9 0.0 0.3 5 F2. Decrease in pollution 0.0 0.0 0.9 0.0 0.5 5 F3. Clean streets 0.9 0.0 0.0 0.0 0.3 5 G - Amusement & Recreation G1. Joy oflife reduced 0.9 3.4 0.9 0.0 1.1 4 G2. Ease in long travel 0.0 1.7 0.9 2.3 1.1 4 G3. No need to do any job or work 35.7 39.0 35.1 27.3 34.0 -H -Psychological Implications HI. Deprivation 0.0 0.0 0.9 0.0 0.3 5 H2. Lack of motivation 18.8 10.2 0.9 5.7 8.8 -H3. Less worries 7.1 3.4 5.3 8.0 6.2 -I - Miscellaneous Responses II. More time to study 0.9 0.0 0.9 4.5 1.6 4 12. Animal's position Improved 0.0 0.0 0.9 0.0 0.3 5 B. Saving oftime 0.0 1.7 0.9 1.1 0.8 5 14. More progress 0.0 3.4 0.0 0.0 0.5 5 15. Nowar 0.0 0.0 0.9 0.0 0.3 5 16. Increase forests and plants 0.9 3.4 2.6 5.7 2.9 3 17. More time to pray to god 0.0 1.7 1.8 0.0 0.8 5 18. No lunch bell in School 0.9 0.0 0.0 0.0 0.3 5 19. No afraid of floods 0.0 0.0 4.4 0.0 1.1 4 IlO. No Govt. subsidies on food 0.9 3.4 5.3 2.3 2.9 3 Ill. Diseases will decrease 2.7 1.7 1.8 1.1 1.9 4 Il2. No cooking 2.7 0.0 0.9 1.1 1.3 4 Il3. No pickle making 0.0 1.7 0.0 0.0 0.3 5 I14. Pattern oflife will change 0.9 1.7 0.0 0.0 0.5 5 Il5. Utensil factories will go 0.9 1.7 2.6 0.0 1.3 4 Il6. No kitchen in the houses 0.9 0.0 0.0 0.0 0.3 5 J- Amusement Jl. Tours 4.5 6.8 0.0 0.0 2.4 3 J2. More sight seeing 0.0 3.4 0.0 0.0 0.5 5
Activity-II Unusual uses: Problem:-l. Piece of stone
A - Games and play AI. Doll 14.3 3.4 7.9 4.5 8.3 -A2. Throw in air 8.0 0.0 9.6 3.4 6.2 -A3. Wave in water 0.0 3.4 4.4 1.1 2.1 3 A4. As cricket ball 2.7 1.7 0.0 1.1 1.3 4 A5. As a hokey ball 2.7 1.7 0.0 0.0 1.1 4 B - Instrumental Use B1. Fire 28.6 8.7 22.8 10.2 19.3 -B2. Grinding 1.8 1.7 4.4 3.4 2.9 3 B3. Sharpening 0.9 1.7 2.6 1.1 1.6 4 B4. Plucking 3.6 3.4 0.0 1.1 1.9 4 B5. Mirror 0.9 0.0 0.0 0.0 0.3 5 B6. To drive away the cattle 0.9 3.4 0.0 0.0 0.8 5 B7. To drive away the birds 0.0 1.7 0.0 0.0 0.3 5 B8. Hunting birds and animals. 4.5 10.2 3.5 6.8 5.6 -C - Anti Social Use Cl. Hurting 24.1 33.9 7.0 6.8 16.4 -C2. Damaging 4.5 1.7 0.0 1.1 1.9 4 C3. weapons 1.8 5.1 2.6 8.0 4.0 1 C4. Use for Adulterate 1.8 1.7 5.3 0.0 2.4 3 D - Building Purpose D1. Repair 0.0 0.0 0.9 0.0 0.3 5 D2. Plugging holes 6.3 13.6 3.5 4.5 6.2 -

Appendix-Cl 344
Activity-II Unusual uses: Problem:-l. Piece of stone Responses EG EB TG TB TOT Origi.
% % % % % Weig. D3. For making the house 67.9 78.0 68.4 71.6 70.5 -D4. For making gitty pieces 16.1 33.9 24.6 27.3 24.1 -D5. For making cement 1.8 0.0 1.6 5.7 2.4 3 D6. To railway track support 0.9 0.0 2.6 2.3 1.6 4 D7. Use in construction Projects & river banks 0.9 5.1 2.6 2.3 2.4 3 E - Defence Use E1. Defence 1.8 5.1 1.8 3.4 2.7 3 F - Decoration F1. As a show piece 16.1 32.2 16.7 14.8 18.5 -F2. As a present 0.0 0.0 0.9 2.3 0.8 5 F3. To build path 0.9 3.4 19.3 12.5 9.7 -F4. To make statues 17.0 1.7 39.5 27.3 23.9 -F5. Painting with different colours 0.9 0.0 0.0 3.4 1.1 4 F6. Statue of the goddess 6.3 1.7 12.3 4.5 7.0 -G - Weights G 1. As paper weight 2.7 6.8 5.3 5.7 4.8 1 H - Scientific Use HI. To perform practical tests 1.8 1.7 0.9 1.1 1.3 4 H2. For sharpening the knife 0.0 1.7 0.9 0.0 0.5 5 H3. For finding the depth of water 0.9 0.0 0.9 0.0 0.5 5 I - Writing Use 11. For writing 1.8 1.7 2.6 0.0 1.6 4 J - Use as Support J1. Support 4.5 11.9 8.8 4.5 7.0 -K - Miscellaneous Kl. As a weight for measuring weight 0.9 1.7 0.9 2.3 1.3 4 K2. For cleaning utensils 0.0 0.0 0.0 1.1 0.3 5 K3. To make a chulha (Hearth) 3.6 1.7 3.5 1.1 2.7 3 K4. Design flour 0.0 0.0 0.9 1.1 0.5 5 K5. Make utensils 0.0 0.0 2.6 2.3 1.3 4 K6. For makiI1& the diamonds 0.9 5.1 8.8 3.4 4.6 1 PROBLEM: 2. Wooden stick A - Self-defence AI. Saving life 0.0 1.7 0.0 1.1 0.5 5 A2. Protection of wealth and property 1.8 1.7 0.9 4.5 2.1 3 A3. To drive away the dacoits and thieves 0.0 5.1 1.8 0.0 1.3 4 B - Anti-social Purpose B 1. For hurting others 7.1 11.9 0.9 4.5 5.4 -B2. As a weapon 1.8 6.8 1.8 3.4 2.9 3 C - As an accessory C1. For writing 0.9 0.0 0.0 2.3 0.8 5 C2. Plucking 0.9 1.7 0.9 2.3 1.3 4 C3. Flag hoisting 0.0 1.7 0.9 0.0 0.5 5 C4. For dusting the coat and clothes. 0.0 1.7 0.0 0.0 0.3 5 C5. For thrashing out the com 0.9 0.0 0.0 1.1 0.5 5 C6. For driving away the dogs & animals 2.7 3.4 0.9 5.7 2.9 3 C7. For fishing in water 0.0 3.4 0.0 0.0 0.5 5 D - Support D1. For supporting 2.7 16.9 5.3 14.8 8.6 -D2. Hanging things 0.9 3.4 1.8 1.1 1.6 4 D3. Support for an old man 12.9 15.3 13.2 23.9 15.8 -D4. Support for the invalid 0.9 1.7 10.5 9.1 5.9 -E - Games & sports E1. Use as pole vault 0.9 3.4 0.9 1.1 1.3 4 E2. Magic stick 0.9 1.7 0.0 0.0 0.5 5 E3. To leam stick playing (Gatka) 0.9 0.0 0.0 0.0 0.3 5 E4. To play hockey & cricket with the stick 2.7 11.9 3.5 9.1 5.9 -E5. To play Gullidanda (play with long and small sticks) 0.0 1.7 1.8 4.5 1.9 4 F - Decoration F1. As baton 1.8 8.5 1.8 3.4 3.2 2 F2. Gift pieces 3.6 3.4 7.0 4.5 4.8 1

Appendix-CI 345
PROBLEM: 2. Wooden stick Responses EG EB TG TB TOT Orig.
% % % % % Weig. F3. Toys 24.1 5.1 33.3 18.2 22.5 -F4. kites 0.0 0.0 0.0 1.1 0.3 5 G - Measurement G1. As foot 1.8 1.7 0.0 1.1 1.1 4 G2. For measuring length 3.6 3.4 5.3 3.4 4.0 1 G3. For measuring cloth etc 0.0 0.0 0.9 0.0 0.3 5 H - Domestic Use HI. House building & huts 62.5 44.1 72.8 56.8 61.4 -H2. Furniture 73.2 37.3 53.5 36.4 52.8 -H3. To make hole 0.0 0.0 0.9 1.1 0.5 5 H4. Burning & cooking 25.0 54.2 26.3 25.0 30.0 -H5. Ladder 6.3 3.4 1.8 5.7 4.3 1 H6. Support to railway track 0.0 0.0 3.5 2.3 1.6 4 H7. Photo Frames 0.9 0.0 0.0 0.0 0.3 5 H8. Cot 1.8 0.0 7.0 4.5 3.8 2 I - Miscellaneous 11. Built rivers bridge 0.9 5.1 1.8 3.4 2.4 3 I2. For driving cattle 1.8 0.0 0.0 1.1 0.8 5 I3. Punishing the students 21.4 50.8 13.2 20.5 23.3 -14. Making perfumes 3.6 0.0 2.6 1.1 2.1 3 15. Paper making 0.9 0.0 12.3 8.0 5.9 -16. Pens and pencils making 6.3 5.1 7.9 3.4 5.9 -17. Hammer handle 0.0 0.0 0.0 1.1 0.3 5 J - Making things J1. Boats 7.1 5.1 6.1 11.4 7.5 -12. Flute 0.9 0.0 1.8 0.0 0.8 5 J3. Beat the drum 0.0 0.0 0.0 1.1 0.3 5 J4. Making coal 0.0 1.7 0.0 1.1 0.5 5 J5. Mixing 0.0 0.0 1.8 2.3 1.1 4 J6. Bullock cart 3.6 3.4 2.6 1.1 2.7 3
PROBLEM: 3. Water A - Saving of fife AI. Man 68.1 54.2 54.4 53.4 58.4 -A2. Animal 38.4 20.3 39.5 26.1 33.0 -A3. Plant 41.1 39.0 36.0 19.3 34.0 -B - For Cleaning Purposes B1. Washing clothes 30.4 32.2 12.3 17.0 22.0 -B2. Bath 28.6 28.8 15.8 18.2 22.3 -B3. Cleaning wounds 0.9 1.7 0.9 1.1 1.1 4 B4. Cleaning (general) 7.1 11.9 6.1 9.1 8.0 -B5. Sprinkling before brooming 0.9 0.0 0.0 0.0 0.3 5 B6. Washing the floor 14.3 8.5 7.0 4.5 8.8 -C - Play and Fun Cl. Swimming 2.7 11.9 0.0 3.4 3.5 2 C2. Sailing 1.8 1.7 2.6 9.1 3.8 2 C3. Fountains 0.0 1.7 0.9 0.0 0.5 5 C4. Throwing on others 0.9 0.0 0.0 0.0 0.3 5 C5. Playing with colours in Holi (Festival) 1.8 1.7 0.9 0.0 1.1 4 D - Industrial Uses D1. Solvent 0.9 1.7 3.5 3.4 2.4 3 D2. Steam 2.7 1.7 7.0 9.1 5.4 -D3. Ice 0.0 0.0 0.9 4.5 1.3 4 D4. Mixing 2.7 3.4 2.6 1.1 2.4 3 D5. Used in the preparation of chemical compounds 3.6 6.8 10.5 5.7 6.7 -D6. In the preparation of medicines 0.9 1.7 2.6 1.1 1.6 4 D7. Vehicles cooling the machinery 1.8 3.4 1.8 4.5 2.7 3 E - Destructive Use E1. Killing 0.0 3.4 0.0 1.1 0.8 5 E2. Floods 0.9 0.0 0.0 0.0 0.3 5 F - Domestic and Everyday Use F1. Extinguisher 1.8 5.1 0.9 4.5 2.7 3

Appendix-Cl 346
PROBLEM: 3. Water
Responses EG EB TG TB TOT Originality % % % % % Weight
F2. Cooking 0.9 1.7 3.5 5.7 2.9 3 F3. Kneading the flour 0.9 3.4 0.9 0.0 1.1 4 F4. Bring the unconscious person to senses 0.0 0.0 0.0 1.1 0.3 5 F5. Making sweet drinks 2.7 5.1 0.9 1.1 2.1 3 G - Miscellaneous Uses G 1. Irrigation 24.1 20.3 38.6 27.3 28.7 -G2. Digestion 0.0 0.0 0.0 1.1 0.3 5 G3. Drinking 25.0 39.0 26.3 14.8 25.2 -G4. Cooking 26.8 22.0 8.8 6.8 15.8 -G5. To see image in water 0.0 0.0 1.8 0.0 0.5 5 G6. Producing salt 2.7 1.7 9.6 10.2 6.4 -G7. Use in building construction 17.9 20.3 19.3 19.3 19.0 -G8. For producing electricity 13.4 20.3 41.2 37.5 28.7 -G9. Used in science experiments 3.6 0.0 0.0 0.0 1.1 4 G 10. Essential for evaporation and then 0.9 1.7 9.6 12.5 6.4 -
for the formation of cloud G 11. For breeding fishes 2.7 1.7 8.8 10.2 6.2 -G12. In aquarium 0.0 0.0 1.8 1.1 0.8 5 Similarities: 1. Tree and House A - Commonness in Physical Characteristics AI. Rigidity 7.1 5.1 7.9 4.5 6.4 -A2. Strength 0.0 0.0 2.6 1.1 1.1 4 A3. Can be demolished 3.6 15.3 6.1 4.5 6.4 -A4. Need ground 5.4 5.1 0.0 4.5 3.5 2 AS. Have foundation 0.9 1.7 5.3 5.7 3.5 2 A6. Have climatic effect 3.6 1.7 3.5 2.3 2.9 3 A 7. Can be burnt 0.9 5.1 0.9 0.0 1.3 4 A8. Both taller than man 0.0 1.7 0.0 0.0 0.3 5 A9. Not fall in ill 0.0 1.7 0.0 0.0 0.3 5 AID. Both can build by human being 0.0 1.7 1.8 2.3 1.3 4 All. Both are not afraid of enemy 0.9 0.0 0.9 1.1 0.8 5 A12. Both occupy space 0.0 0.0 0.0 1.1 0.3 5 A13. Both have definite shape and size 0.0 0.0 1.8 1.1 0.8 5 A14. Both have wood content 9.8 6.8 9.6 10.2 9.4 -B - Place of Frequent Visits B 1. For birds 2.7 6.8 24.6 6.8 11.0 -B2. For evil spirits 0.9 1.7 0.9 1.1 1.1 4 B3. Forman 1.8 0.0 1.8 0.0 1.1 4 B4. For animal 0.9 0.0 0.9 0.0 0.5 5 B5. For insects 0.0 0.0 0.0 1.1 0.3 5 B6. Tired Travellers 0.9 l.7 0.9 0.0 0.8 5 B7. Strangers 0.0 0.0 0.9 0.0 0.3 5 C - Shelter C1. Living 45.5 39.0 55.3 35.2 45.0 -C2. For shade 39.3 33.9 67.5 68.2 53.9 -C3. For hiding 0.9 1.7 6.1 6.8 4.0 1 C4. Protect against enemies and thieves 2.7 1.7 5.3 3.4 3.5 2 C5. As a protection against rain and storm 16.1 16.9 27.2 33.0 23.6 -D - Place for Entertainment D1. Debates 0.0 0.0 0.9 0.0 0.3 5 E - Educational use E1. Both can be used as a class room 0.0 0.0 0.9 1.1 0.5 5 E2. For organizing debate competition in both 0.0 0.0 0.9 0.0 0.3 5 F - Miscellaneous Fl. Both require water in the beginning stage 7.1 5.1 7.0 3.4 5.9 -
of development F2. Both have limited life 0.0 1.7 1.8 0.0 0.8 5 F3. Both are affected by storms 3.6 6.8 5.3 3.4 4.6 1 F4. No talking 0.9 5.1 1.8 1.1 l.9 4

Appendix-Cl 347
Similarities: 2. Chair and Ladder Responses EG EB TG TB TOT Originality
% % % % % Weight A -Commonness in Physical Characteristics AI. Breakability 3.6 13.6 3.5 2.3 4.8 1 A2. Made of wood 17.9 40.7 43.0 39.8 34.3 -A3. Both have legs 0.0 1.7 3.5 4.5 2.4 3 A4. May fall down 0.0 0.0 0.9 1.1 0.5 5 AS. Moveable 2.7 0.0 2.6 1.1 1.9 4 A6. Not movable itself 0.9 5.1 4.4 4.5 3.5 2 A 7. Made of steel 0.0 0.0 1.8 1.1 0.8 5 A8. Both have definite shape and size 0.9 0.0 0.0 0.0 0.3 5 A9. Both occupy space 0.0 1.7 1.8 1.1 1.1 4 A10. Both can be damaged 0.0 0.0 0.9 0.0 0.3 5 All. With care life of both can be extended 0.0 1.7 0.9 0.0 0.5 5 B - Commonness in Everyday Use B1. Sitting 53.6 54.2 58.8 67.0 58.4 -B2. Climbing 65.2 54.2 77.2 75.0 69.4 -B3. Stand 0.0 0.0 0.0 1.1 0.3 5 C - Use in Games C1. Games 0.0 0.0 2.6 0.0 0.8 5 C2. Sports 0.0 0.0 1.8 1.1 0.8 5 D - Sundry Responses D1. Lifeless 12.5 15.3 9.6 5.7 10.5 -E - Miscellaneous E1. Both are used for cleaning houses 6.3 0.0 0.9 3.4 2.9 3 E2. Both are bad conductors of electricity 0.0 1.7 0.0 1.1 0.5 5 E3. Both can be burnt 0.9 3.4 0.9 1.1 1.3 4 E4. Both are made by the carpenter 2.7 6.8 2.6 8.0 4.6 1 E5. Both are use painting 11.6 1.7 6.1 11.4 8.3 -Similarities: 3. Air and Water A - Essential for life AI. Essential 54.5 57.6 64.9 54.5 58.2 -A2. Useful 10.7 3.4 2.6 5.7 5.9 -A3. Essential for animal, men and plants 36.6 23.7 19.3 29.5 27.6 -A4. Both are transparent 0.0 0.0 1.8 0.0 0.5 5 B - Commonness in Chemical Properties B 1. Can be mixed 0.9 1.7 3.5 9.1 3.8 2 B2. Both have oxygen 13.4 27.1 9.6 3.4 12.1 -B3. Fluid 0.0 0.0 0.0 1.1 0.3 5 B4. Fluent flow 0.0 3.4 1.8 5.7 2.4 3 B5. No size 0.0 0.0 1.8 0.0 0.5 5 B6. Expand on heating 0.0 0.0 0.0 1.1 0.3 5 B7. Found everywhere 1.8 3.4 3.5 2.3 2.7 3 B8. Both can be impure 0.9 1.7 5.3 3.4 2.9 3 B9. Both can be used in cool drinks 0.0 3.4 0.0 0.0 0.5 5 B 1 O. Both can not have colour and smell 2.7 6.8 6.1 1.1 4.0 1 B 11. Both have weight 1.8 0.0 0.9 1.1 1.1 4 B 12. Both occupy space 1.8 0.0 0.0 1.1 0.8 5 B 13. No shape 0.0 3.4 2.6 2.3 1.9 4 C - Medimn of Transfer C1. Disease 2.7 0.0 1.8 1.1 1.6 4 C2. Micro germs 0.0 0.0 5.3 2.3 2.1 3 C3. Virus 0.0 0.0 1.8 1.1 0.8 5 D - Agents of Change D1. Climatic 0.0 0.0 6.1 1.1 2.1 3 D2. Cooling agent 0.0 3.4 1.8 1.1 1.3 4 D3. Both melt some things 0.9 0.0 0.9 0.0 0.5 5 E - Extinguisher E1. To extinguish fire 0.9 0.0 0.9 3.4 1.3 4 F - Industrial uses Fl. Used in chemistry 0.0 0.0 1.8 0.0 0.5 5 F2. Used in Science Laboratory 0.9 1.7 1.8 2.3 1.6 4 F3. Both are used in scientific experiments 0.0 0.0 0.0 0.0 0.3 5
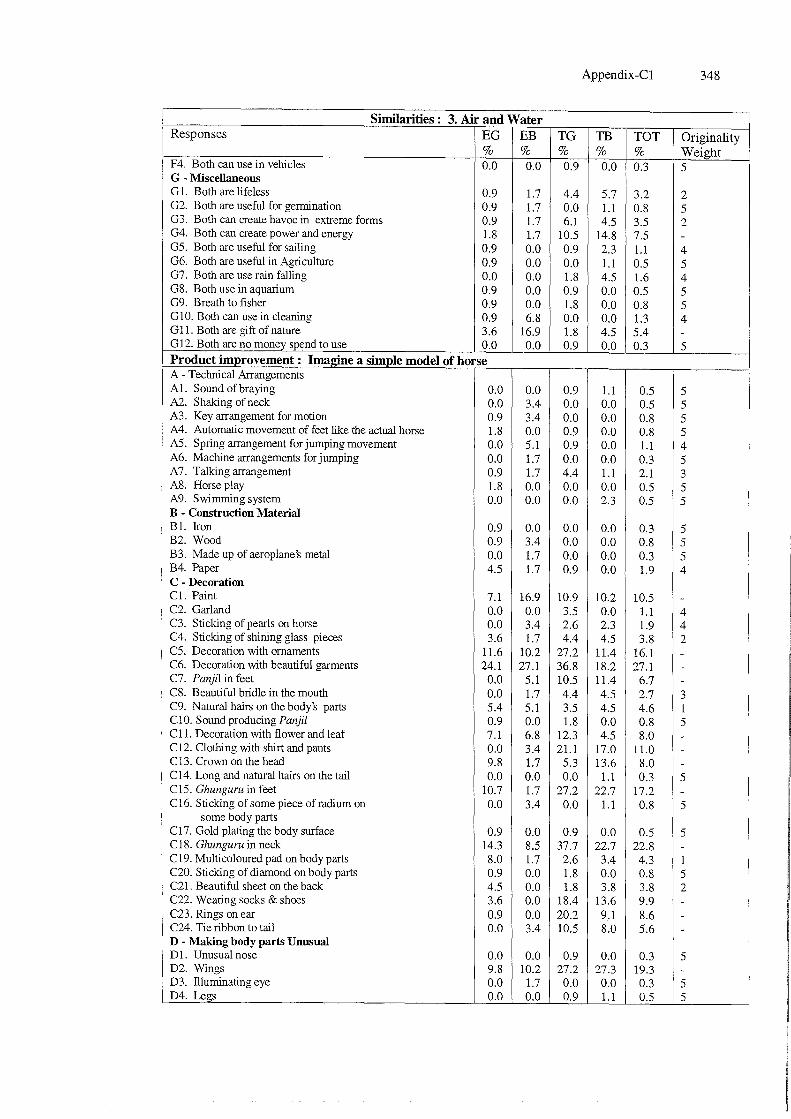
Appendix-Cl 348
Similarities: 3. Air and Water Responses EO EB TO TB TOT Originality
% % % % % Weight F4. Both can use in vehicles 0.0 0.0 0.9 0.0 0.3 5 G - Miscellaneous G 1. Both are lifeless 0.9 1.7 4.4 5.7 3.2 2 G2. Both are useful for gennination 0.9 1.7 0.0 1.1 0.8 5 G3. Both can create havoc in extreme forms 0.9 1.7 6.1 4.5 3.5 2 G4. Both can create power and energy 1.8 1.7 10.5 14.8 7.5 -G5. Both are useful for sailing 0.9 0.0 0.9 2.3 1.1 4 G6. Both are useful in Agriculture 0.9 0.0 0.0 1.1 0.5 5 G7. Both are use rain falling 0.0 0.0 1.8 4.5 1.6 4 G8. Both use in aquarium 0.9 0.0 0.9 0.0 0.5 5 G9. Breath to fisher 0.9 0.0 1.8 0.0 0.8 5 G 10. Both can use in cleaning 0.9 6.8 0.0 0.0 1.3 4 GIl. Both are gift of nature 3.6 16.9 1.8 4.5 5.4 -G 12. Both are no money spend to use 0.0 0.0 0.9 0.0 0.3 5 Product improvement: lma2ine a simple model of horse A - Technical Arrangements AI. Sound of braying 0.0 0.0 0.9 1.1 0.5 5 A2. Shaking of neck 0.0 3.4 0.0 0.0 0.5 5 A3. Key arrangement for motion 0.9 3.4 0.0 0.0 0.8 5 A4. Automatic movement of feet like the actual horse 1.8 0.0 0.9 0.0 0.8 5 AS. Spring arrangement for jumping movement 0.0 5.1 0.9 0.0 1.1 4 A6. Machine arrangements for jumping 0.0 1.7 0.0 0.0 0.3 5 A7. Talking arrangement 0.9 1.7 4.4 1.1 2.1 3 A8. Horse play 1.8 0.0 0.0 0.0 0.5 5 A9. Swimming system 0.0 0.0 0.0 2.3 0.5 5 B - Construction Material B1. Iron 0.9 0.0 0.0 0.0 0.3 5 B2. Wood 0.9 3.4 0.0 0.0 0.8 5 B3. Made up of aeroplane's metal 0.0 1.7 0.0 0.0 0.3 5 B4. Paper 4.5 1.7 0.9 0.0 1.9 4 C - Decoration C1. Paint 7.1 16.9 10.9 10.2 10.5 -C2. Garland 0.0 0.0 3.5 0.0 1.1 4 C3. Sticking of pearls on horse 0.0 3.4 2.6 2.3 1.9 4 C4. Sticking of shining glass pieces 3.6 1.7 4.4 4.5 3.8 2 C5. Decoration with ornaments 11.6 10.2 27.2 11.4 16.1 -C6. Decoration with beautiful garments 24.1 27.1 36.8 18.2 27.1 -C7. Panjil in feet 0.0 5.1 10.5 11.4 6.7 -C8. Beautiful bridle in the mouth 0.0 1.7 4.4 4.5 2.7 3 C9. Natural hairs on the body's parts 5.4 5.1 3.5 4.5 4.6 1 ClO. Sound producing Panjil 0.9 0.0 1.8 0.0 0.8 5 C11. Decoration with flower and leaf 7.1 6.8 12.3 4.5 8.0 -C12. Clothing with shirt and pants 0.0 3.4 21.1 17.0 11.0 -C13. Crown on the head 9.8 1.7 5.3 13.6 8.0 -C14. Long and natural hairs on the tail 0.0 0.0 0.0 1.1 0.3 5 C15. Ghunguru in feet 10.7 1.7 27.2 22.7 17.2 -C 16. Sticking of some piece of radium on 0.0 3.4 0.0 1.1 0.8 5
some body parts C17. Gold plating the body surface 0.9 0.0 0.9 0.0 0.5 5 C18. Ghunguru in neck 14.3 8.5 37.7 22.7 22.8 -C19. Multicoloured pad on body parts 8.0 1.7 2.6 3.4 4.3 1 C20. Sticking of diamond on body parts 0.9 0.0 1.8 0.0 0.8 5 C21. Beautiful sheet on the back 4.5 0.0 1.8 3.8 3.8 2 C22. Wearing socks & shoes 3.6 0.0 18.4 13.6 9.9 -C23. Rings on ear 0.9 0.0 20.2 9.1 8.6 -C24. Tie ribbon to tail 0.0 3.4 10.5 8.0 5.6 -D - Making body parts Unusual D 1. Unusual nose 0.0 0.0 0.9 0.0 0.3 5 D2. Wings 9.8 10.2 27.2 27.3 19.3 -D3. llluminating eye 0.0 1.7 0.0 0.0 0.3 5 D4. Legs 0.0 0.0 0.9 1.1 0.5 5
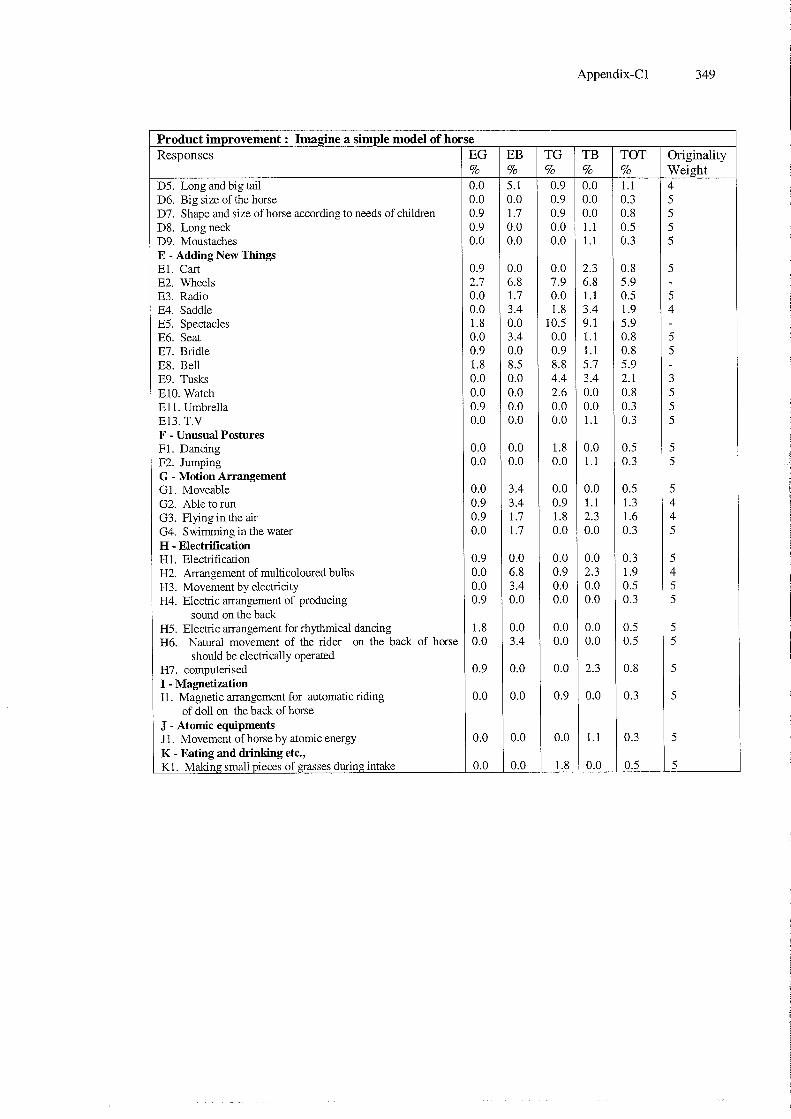
Appendix-Cl 349
Product improvement: Imagine a simple model of horse Responses EG EB TG TB TOT Originality
% % % % % Weight D5. Long and big tail 0.0 5.1 0.9 0.0 1.1 4 D6. Big size of the horse 0.0 0.0 0.9 0.0 0.3 5 D7. Shape and size of horse according to needs of children 0.9 1.7 0.9 0.0 0.8 5 D8. Long neck 0.9 0.0 0.0 1.1 0.5 5 D9. Moustaches 0.0 0.0 0.0 1.1 0.3 5 E - Adding New Things El. Cart 0.9 0.0 0.0 2.3 0.8 5 E2. Wheels 2.7 6.8 7.9 6.8 5.9 -E3. Radio 0.0 1.7 0.0 1.1 0.5 5 E4. Saddle 0.0 3.4 1.8 3.4 1.9 4 E5. Spectacles 1.8 0.0 10.5 9.1 5.9 -E6. Seat 0.0 3.4 0.0 1.1 0.8 5 E7. Bridle 0.9 0.0 0.9 1.1 0.8 5 E8. Bell 1.8 8.5 8.8 5.7 5.9 -E9. Tusks 0.0 0.0 4.4 3.4 2.1 3 ElO. Watch 0.0 0.0 2.6 0.0 0.8 5 Ell. Umbrella 0.9 0.0 0.0 0.0 0.3 5 E13. T.V 0.0 0.0 0.0 1.1 0.3 5 F - Unusual Postures Fl. Dancing 0.0 0.0 1.8 0.0 0.5 5 F2. Jumping 0.0 0.0 0.0 1.1 0.3 5 G - Motion Arrangement 01. Moveable 0.0 3.4 0.0 0.0 0.5 5 02. Able to run 0.9 3.4 0.9 1.1 1.3 4 03. Flying in the air 0.9 1.7 1.8 2.3 1.6 4 04. Swimming in the water 0.0 1.7 0.0 0.0 0.3 5 H - Electrification HI. Electrification 0.9 0.0 0.0 0.0 0.3 5 H2. Arrangement of multicoloured bulbs 0.0 6.8 0.9 2.3 1.9 4 H3. Movement by electricity 0.0 3.4 0.0 0.0 0.5 5 H4. Electric arrangement of producing 0.9 0.0 0.0 0.0 0.3 5
sound on the back H5. Electric arrangement for rhythmical dancing 1.8 0.0 0.0 0.0 0.5 5 H6. Natural movement of the rider on the back of horse 0.0 3.4 0.0 0.0 0.5 5
should be electrically operated H7. computerised 0.9 0.0 0.0 2.3 0.8 5 I - Magnetization II. Magnetic arrangement for automatic riding 0.0 0.0 0.9 0.0 0.3 5
of doll on the back of horse J - Atomic equipments J 1. Movement of horse by atomic energy 0.0 0.0 0.0 1.1 0.3 5 K - Eating and drinking etc., K1. Making; small pieces of grasses during intake 0.0 0.0 1.8 0.0 0.5 5

350
Appendix-C2
Appendix-C2 Responses in the Non-verbal Creativity Test items.
Note: EG = English medium girls (N=112) TG = Telugu medium girs (N=114)
Tot % = Total (both media) (N=373)
EB = English medium boys (N=59) TB = Telugu medium boys (N=88))
Orig. Wei.= Originality weight.
Activity 1-(1) : Picture Construction
Activity 1-(1 : Picture Construction Response Response
OJ .~ OJ '0 -0 ~ -0 ~ E-< E-< ~
-B OJ
~ -B OJ oil
" ff " co 0 -0 " CO " CO 0 -0 .;::: W E-< E-< CO E-< W W E-< E-< CO E-< 0
I Balloon 0 0 I I 2 0.54 5 24 Ladies hand 2 I 0 0 3 0.80 5 2 Basket 3 0 3 2 8 2.14 3 bag 3 Boat 0 I I I 3 0.80 5 25 Loud-speaker 0 0 0 I I 0.27 5 4 Bucket 0 0 I 0 I 0.27 5 26 Moon 0 0 0 I I 0.27 5 5 Bulb shade I I 0 0 2 0.54 5 27 MosquitolBee 0 0 0 I I 0.27 5 6 Cage 0 0 1 1 2 0.54 5 28 Mushroom 0 0 0 1 1 0.27 5 7 Cartoon 2 0 1 0 3 0.80 5 29 Parachute 3 0 2 1 6 l.61 4 8 Cave 1 0 0 0 1 0.27 5 30 Post Box 5 3 0 0 8 2.14 3 9 Clock 0 1 0 0 I 0.27 5 31 Pot 0 0 3 0 3 0.80 5 10 Coconut 0 0 0 1 I 0.27 5 32 Protractor 5 2 2 2 11 2.95 3 II Cup I 0 4 2 7 l.88 4 (Geometrical 12 Earthen lamp 1 0 4 I 6 l.61 4 .Instrument for 13 Face 0 1 5 10 16 4.29 I measuring angles) 14 Flowerpot 3 I 7 0 11 2.95 3 33 Sun 14 11 9 24 58 15.55 -15 Fruit 1 0 0 0 1 0.27 5 34 Top 0 0 0 1 1 0.27 5 16 Geometrical 0 1 1 1 3 0.80 5 35 Tortoise 5 1 4 0 10 2.68 3
Figure 36 Umbrella 4 2 I 0 7 l.88 4 17 Hand fan 1 0 1 1 3 0.80 5 37 Wheel 0 I 0 0 1 0.27 5 18 Hat 2 4 0 4 10 2.68 3 38 WindowlDoor 0 2 1 0 3 0.80 5 19 Head 15 7 12 7 41 10.99 - 39 Wire mesh 0 0 1 0 1 0.27 5 20 Helmet 2 1 0 0 3 0.80 5 o Irrelevant or 20 7 27 8 62 16.62 -21 Hut 11 5 13 7 36 9.65 - meaningless 22 Ice cream 4 2 4 7 17 4.56 1 figures 23 Igloo 6 4 4 3 17 4.56 1
Activity 1-(2) : Picture Construction I Board 3 2 1 4 10 2.68 3 13 Mat 3 0 2 0 5 1.34 4 2 Book 2 0 0 I 3 0.80 5 14 RCC building 3 2 2 I 8 2.14 3 3 Box 12 10 12 6 30 10.72 - slab 4 Cartoon 1 0 1 0 2 0.54 5 15 Sweet 2 0 1 0 3 0.80 5 5 Chair 0 0 5 5 10 2.68 3 16 Table 10 7 7 16 40 10.72 -6 Cuboid 0 1 0 0 I 0.27 5 17 Tent 0 3 0 3 6 l.61 4 7 Diamond 2 6 0 3 II 2.95 3 18 Tin 10 4 10 13 37 9.92 -8 Fish 10 I 15 I 27 7.24 - 19 Washing 0 I 0 0 I 0.27 5 9 Hut 0 4 4 4 12 3.22 2 machine 10 Ice piece 0 I 0 0 1 0.27 5 20 Wrist watch 0 0 0 I I 0.27 5 II Kite 9 5 9 7 30 8.04 - o Irrelevant or 44 12 45 23 124 33.24 -12 Leaf I 0 0 0 1 0.27 5 meaningless
figures

351
Appendix-C2
Activity 11-(1) : Picture Completion
Activity 11- 1) : Picture Completion Response Response
0:; .ii3 "Ei .ii3 -0 ~ ~ 0 :::R ~ f--; f--; 0
;9 0:; ·51 ;9 0:; :§ " c:o " c:o 0 -0 .;:;
" c:o " c:o 0 -0 .... ~ ~ f--; f--; c:o f--; 0 ~ ~ f--; f--; c:o f--; 0
1 Arrow 0 1 0 2 3 0.80 5 11 Hut 7 7 9 4 27 7.24 -2 Bell (in 0 0 1 0 1 0.27 5 12 Leaf 7 0 5 0 12 3.22 2
temple) 2 13 Plant 20 1 22 11 54 14.48 -3 Book 0 1 5 7 13 3.47 5 14 Shirt 10 7 4 4 25 6.70 -4 Bulb-shade 0 0 2 0 2 0.54 5 15 Sign-board 0 2 0 1 3 0.80 5 5 Butterfly 2 0 1 0 3 0.80 5 16 Stethoscope 0 0 1 0 1 0.27 5 6 Fencing 0 1 0 0 1 0.27 4 17 Temple 0 0 0 1 1 0.27 5 7 Flag/ 2 2 0 1 5 1.34 - 18 Tin 0 0 0 2 2 0.54 5
Lamppost 5 19 Toy 1 0 0 0 1 0.27 5 8 Funnel 9 6 5 5 25 6.70 5 20 Tree with 3 2 3 3 11 2.95 3 9 Hive 1 0 0 0 1 0.27 flowers/fruits 10 Hunting 0 0 0 1 1 0.27 o Irrelevant or 50 29 56 46 181 48.53 -instrument - Meaningless (Y-shaped) figures
Activity 11-(2) : Picture Completion 1 Bell 1 1 0 0 2 0.54 5 12 Lollipop 0 0 0 1 1 0.27 5 2 Bulb 1 1 1 5 8 2.14 3 13 Man 1 2 4 9 16 4.29 1 3 Butterfly 0 1 6 0 7 1.88 4 14 Mango 1 1 0 0 2 0.50 5
/Insect 15 Mike 0 0 0 1 1 0.27 5 4 Drum beater 0 0 1 2 3 0.80 5 16 Pendulum 0 0 4 1 5 1.34 4 5 Dumbbell 0 6 0 2 8 2.14 3 17 Plant I 0 7 4 12 3.22 2 6 Fan 3 0 0 2 5 1.34 4 18 Rattle 0 0 0 1 I 0.27 5 7 Flower 79 24 52 27 182 48.79 - (Playing thing) 8 Flowerpot 1 0 1 0 2 0.54 5 19 Screw 0 0 0 1 1 0.27 5 9 Handle for 0 1 0 0 1 0.27 5 20 Stick 1 1 1 2 5 1.34 4
pump 21 Stool 0 1 0 0 1 0.27 5 10 Hand 3 0 0 0 3 0.80 5 o Irrelevant or 11 13 20 21 65 17.43 -
pump Meaningless 11 Key 9 7 17 9 42 11.26 - figures
Activity 11-(3) : Picture Completion 1 Balloon 5 1 2 0 8 2.14 3 11 Ground nut 0 0 1 0 1 0.27 5 2 Bird 0 0 1 1 2 0.54 5 12 Insect 6 1 6 1 14 3.75 2 3 Bunch of 5 0 3 0 8 2.14 3 13 Parachute 0 8 7 11 26 6.97 -
grapes 14 Speed 0 0 0 1 1 0.27 5 4 Butterfly 2 0 0 0 2 0.54 5 breaker 5 Chain 0 0 1 0 1 0.27 5 15 Tamarind 1 7 2 2 12 3.22 2 6 Cloud 33 12 42 38 125 33.51 - 16 Temple 0 2 0 0 2 0.54 5 7 Elephant 2 0 0 3 5 1.34 4 17 Tree 2 1 3 1 7 1.88 4 8 Face 0 1 4 1 6 1.61 4 18 Umbrella 23 13 3 7 46 12.33 -9 Flower pot 0 0 2 0 2 0.54 5 o Irrelevant or 33 12 37 21 103 27.61 -10 Folded 0 I 0 1 2 0.54 5 Meaningless hand figures
Activity 11-(4) : Picture Completion 1 Balloon 6 0 5 0 11 2.95 3 8 Dumbbell 3 0 1 3 7 1.88 4 2 Bat 8 0 5 2 15 4.02 1 9 Earthen lamp 0 0 1 0 1 0.27 5 3 Beaker 2 3 3 3 11 2.95 3 10 Face 1 0 4 2 7 1.88 4 4 Bird head 2 I 0 2 5 1.34 4 11 Fruit 4 1 3 1 9 2.41 3
& Mouth 12 Guitar 0 1 0 0 1 0.27 5
5 Blouse 0 I 2 1 4 1.07 4 13 Hand fan 1 0 0 0 1 0.27 5
6 Bottle 0 0 0 2 2 0.54 5 14 Hanger 0 0 0 1 1 0.27 5
7 Cap 0 0 0 2 2 0.54 5 15 Hook 0 0 1 0 1 0.27 5

352
Appendix-C2
Activi!y 11- 4) : Picture Completion Response Response
t;; . ., t;; . ., 0 ~ 0 ~ E- ~ E- ~ .s t;; '5b ..c t;; '5b
0 c:o 0 c:o 0 0 .;:: 0 c:o 0 c:o 0 0 .;:: W W E- E- c:o E- O W W E- E- c:o E- O
16 Key 6 3 4 1 14 3.75 2 25 Scythe 24 11 12 19 66 17.69 -17 Lollipop 4 0 1 1 6 1.61 4 26 Snake charmer's 0 1 0 0 1 0.27 5 18 Magnifying 2 6 3 1 12 3.22 2 flute
glass 27 Spectacles 0 3 2 2 7 1.88 4 19 Man 8 3 1 2 14 3.75 2 28 Spoon 2 1 5 3 11 2.95 3 20 Net (fishes) 0 0 1 0 1 0.27 5 29 Tree 0 2 6 1 9 2.41 3 21 Phone receiver 0 2 1 0 3 0.80 5 o Irrelevant or 38 16 50 36 140 37.53 -22 Question mark 0 3 0 1 4 1.07 4 Meaningless figures 23 Roller 0 1 0 0 1 0.27 5 24 Sauce pan with 1 0 3 2 6 1.61 4 handle
Activity 11- 5) : Picture Completion 1 Arrow 0 0 0 2 2 0.54 5 8 Temple 3 0 0 0 3 0.80 5 2 Books row 1 4 5 5 15 4.02 1 9 Train passing over 0 0 1 0 1 0.27 5 3 Gift 0 2 5 2 9 2.41 3 the bridge box/Box 80 32 67 44 223 59.79 - 10 Water-fall 1 0 0 0 1 0.27 5 4 Hut 0 0 1 1 2 0.54 5 o Irrelevant or 27 21 33 33 114 30.56 -5 Lamp-post 0 0 1 1 2 0.54 5 Meaningless figures 6 Motor car 0 0 1 0 1 0.27 5 7 Table
Activity 11-(6) : Picture Completion 1 Birthday 7 0 1 1 9 2.41 3 10 Garden 10 0 5 4 19 5.09 -candles 0 0 2 0 2 0.54 5 11 Half shirt 1 0 0 0 1 0.27 5 2 Book 2 0 5 4 11 2.95 3 12 Leader's munch 0 0 0 1 1 0.27 5 3 Building 1 1 1 0 3 0.80 5 13 Rain 3 8 8 4 23 6.17 -4 Bulb shade 1 1 0 0 2 0.50 5 14 Tree and stick 3 0 2 4 9 2.41 3 5 Cells 0 1 0 1 2 0.50 5 15 Wall 12 4 14 10 40 10.72 -6 Crown 2 1 8 7 18 4.83 1 o Irrelevant or 65 32 64 50 211 56.57 -7 Design 0 1 0 1 2 0.54 5 Meaningless figures 8 E(letter) 5 10 4 1 20 5.36 -9 Flag post
Activity 11-(7) : Picture Completion 1 Animal 1 0 2 3 6 1.61 4 9 Man 9 5 15 8 37 9.92 -2 Basket 1 0 1 1 3 0.80 5 10 Rope 4 3 3 3 13 3.49 2 3 Bottle 0 1 0 1 2 0.54 5 11 Shell 1 0 0 4 5 1.34 4 4 Creeper 0 0 1 0 1 0.27 5 12 Snake 18 7 4 6 35 9.38 -5 Earthen lamp 12 2 6 8 28 7.51 - 13 Telephone 0 0 0 3 3 0.80 5 6 Hot pack 5 0 1 1 7 1.88 4 wire/wire 7 Insect 4 0 0 1 5 1.34 4 o Irrelevant or 56 41 78 48 223 59.79 -8 Lotus 1 0 3 1 5 1.34 4 Meaningless figures
Activity 11-(8) : Picture Completion 1 Animal 12 3 6 8 29 7.77 - 7 Insect 7 0 3 1 11 2.95 3 2 Bird 27 19 25 21 82 24.66 - 8 Leaf 1 0 1 0 2 0.54 5 3 Face (human) 22 12 29 27 90 24.13 - 9 Map 2 0 2 4 8 2.14 3 4 Fish 6 0 1 4 11 2.95 3 10 Trunk 0 0 0 1 1 0.27 5 5 Fish 0 1 0 0 1 0.27 5 o Irrelevant or 34 24 44 22 124 33.24 -6 Flower 1 0 3 0 4 1.07 4 Meaningless figures

353
Appendix-C2
Activity 11- 9 : Picture Completion Response Response ." C;; ." 'E -0 ~
~ 0 :::R ~
f-< f-< 0 c ..c: C;; :§9 -5 C;; '51
0 CO 0 CO -0 -0 '" 0 CO 0 CO 0 -0 ·c w W f-< f-< CO f-< 0 W W f-< f-< CO f-< 0
1 Arrow 2 13 1 14 30 8.04 - 16 Kite 4 5 8 3 20 5.36 -2 Bat 0 0 0 1 1 0.27 5 17 Leaves 2 0 1 0 3 0.80 5 3 Bird 3 1 4 3 11 2.95 3 18 M (letter) 0 0 1 0 1 0.27 5 4 Board 1 1 0 0 2 0.54 5 19 Pencil 3 1 1 2 7 1.88 4 5 Cap 1 1 2 0 4 1.07 4 20 Rat 0 0 3 3 6 1.61 4 6 Cartoon 3 1 1 2 7 1.88 4 21 Rocket 2 1 0 2 5 1.34 4 7 Chair 0 0 0 2 2 0.54 5 22 Star 1 0 1 4 6 1.61 4 8 Cone 0 0 1 0 1 0.27 5 23 Sweet 0 1 1 0 2 0.54 5 9 Drum (nagara) 0 1 0 1 2 0.54 5 24 Table 0 1 4 4 9 2.41 3 10 Fish 33 6 23 4 66 17.69 - 25 Tent 0 0 0 3 3 0.80 5 11 Flag 0 0 2 2 4 1.07 4 26 Tin 0 1 0 0 1 0.27 5 12 Flower pot 2 0 0 0 2 0.54 5 27 Triangle 0 0 0 1 1 0.27 5 13 Flower vase 1 0 1 0 2 0.54 5 o Irrelevant or 52 18 50 33 153 41.02 -14 Funnel 0 0 0 1 1 0.27 5 Meaningless 15 House (hut) 2 7 9 3 21 5.63 - figures
Activity 11-(10) : Picture Com i1letion 1 Animal 0 0 1 3 4 1.07 4 10 Shoe 0 0 0 1 1 0.27 5 2 Bird 14 9 21 6 50 13.40 - 11 Snake 12 10 1 14 37 9.92 -3 Creeper 1 1 0 0 2 0.54 5 12 S pectacl es 0 2 1 0 3 0.80 5 4 Fish 3 4 7 4 18 4.83 1 13 Trident 0 0 0 1 1 0.27 5 5 Jug 4 2 4 4 14 3.75 2 14 Tube 1 0 1 0 2 0.54 5 6 Leaf 1 2 1 1 5 1.34 4 15 Vegetable 5 1 3 1 10 2.68 3 7 Mango 17 0 16 6 39 10.46 - o Irrelevant or 52 28 56 46 182 48.79 -8 Rope 0 0 2 1 3 0.80 5 Meaningless 9 Seed 2 0 0 0 2 0.54 5 figures
Activity 111-(1): Trian~::des 1 A (letter) 0 0 1 0 1 0.27 5 25 Hut 91 36 76 49 252 67.56 -2 Aeroplane 0 2 0 0 2 0.54 5 26 Kite 32 6 24 7 69 18.50 -3 Amulet 18 5 4 11 38 10.19 - 27 Lamp shade 2 1 0 0 3 0.80 5 4 Arrow 8 13 3 14 38 10.19 - 28 Letter-box 4 2 0 9 15 4.02 1 5 Bag 2 0 6 0 8 2.14 3 29 Nib 0 3 0 0 3 0.80 5 6 Balance 0 1 0 1 2 0.54 5 30 Pencil 7 2 0 1 10 2.68 3 7 Bed lamp 0 0 2 0 2 0.54 5 31 Post 0 0 2 0 2 0.54 5 8 Bell 2 0 2 3 7 1.88 4 32 Purse 2 0 2 1 5 1.34 4 9 Bicycle frame 0 0 0 2 2 0.54 5 33 Rocket 21 7 4 16 48 12.87 -10 Cap 29 9 30 19 87 23.32 - 34 Sign-board 4 2 6 3 15 4.02 1 11 Cartoon 52 17 26 22 117 31.37 - 35 Snack 4 2 1 2 9 2.41 3 12 Chariot 0 0 1 0 1 0.27 5 36 Star 51 21 46 30 148 39.68 -13 Clock 2 2 3 3 10 2.68 3 37 Sweet 1 2 3 2 8 2.14 3 14 Cone 1 1 1 0 3 0.80 5 38 Symbol 0 0 1 0 1 0.27 5 15 Design 11 2 19 7 39 10.46 - 39 Tape 1 0 0 0 1 0.27 5 16 Diamond 5 5 2 7 19 5.09 - 40 Temple 7 4 5 13 29 7.77 -
17 Drum(Nagara) 1 0 2 2 5 1.34 4 41 Tent 2 4 9 4 19 5.09 -18 Fire cracker 8 16 20 25 69 18.50 - 42 Top 1 5 3 1 10 2.68 3 19 Fish 19 3 15 10 47 12.60 - 43 Tree 11 3 11 4 29 7.77 -20 Flower pot 23 5 33 1 61 16.35 - 44 Wrist watch 0 0 2 2 4 1.07 4 21 Funnel 4 1 4 2 11 2.95 3 45 Writing 1 0 0 0 1 0.27 5 22 Geometrical 3 7 8 1 19 5.09 - board figure o Irrelevant or 354 225 420 340 1339 - -23 Harpoon 0 0 0 1 1 0.27 5 meaningless 24 Hat 0 0 0 1 1 0.27 5 figures

354
Appendix-C2
Activity 111-(2): Ell~ses Response .;:; Response .;:;
c; ~
c; ~ -0 :f? -0 :f? E-< 0 d E-< 0 d
...c:: c; ·51 ...c:: c; ·51 0 c:o 0 c:o -0 -0 ·c 0 c:o 0 c:o -0 -0 ·c Ul Ul E-< E-< c:o E-< 0 Ul Ul E-< E-< c:o E-< 0
1 Animal 20 10 10 8 48 12.87 - 46 Lid 1 0 0 0 1 0.27 5 2 Bag 0 0 1 0 1 0.27 5 47 Lock/key 0 0 0 4 4 l.07 4 3 Bangle 3 2 2 1 8 2.14 3 48 Mirror 0 3 1 0 4 l.07 4 4 Basket 5 7 5 6 23 6.17 - 49 Musical 8 3 0 0 11 2.95 3 5 Battery cell 0 1 0 0 1 0.27 5 Instrument 6 Button 0 0 1 0 1 0.27 5 50 Nest 4 4 3 0 11 2.95 3 7 Beaker 2 2 3 5 12 3.22 2 51 Net 7 1 4 5 17 4.56 I 8 Bearing 0 2 0 0 2 0.54 5 52 Number 8 0 0 2 0 2 0.54 5 9 Bell 0 I 1 3 5 l.34 4 53 Pitcher 0 0 0 1 1 0.27 5 10 Bird 16 1 10 5 32 8.58 - 54 Plate 8 5 8 3 24 6.43 -11 Bottle 3 0 9 2 14 3.75 2 55 Pond 0 I 0 1 2 0.54 5 12 Bucket 14 6 17 21 58 15.55 - 56 Pot 40 15 51 32 138 37.00 -13 Cocoons 3 0 0 0 3 0.80 5 57 Q alphabet 0 0 1 0 1 0.27 5 14 Chocolate 2 0 0 2 4 l.07 4 58 Ring 3 2 4 4 13 3.49 2 15 Clock 6 11 14 3 34 9.12 - 59 Shaving 0 0 0 1 1 0.27 5 16 Coconut 0 0 1 1 2 0.54 5 brush 17 Coin 1 0 0 1 2 0.54 5 60 Shuttle cock 0 2 0 0 2 0.54 5 18 Cone 1 6 0 0 7 l.88 4 61 Sieve 0 0 2 2 4 l.07 4 19 Cup 34 1 35 21 91 24.40 - 62 Sign-board 0 1 0 2 3 0.80 5 20 Cylinder 1 5 4 1 11 2.95 3 63 Soap 2 0 7 2 11 2.95 3 21 Design 1 0 6 0 7 l.88 4 64 Solar 3 2 1 2 8 2.14 3 22 DishN esse I 15 4 15 18 52 13.94 - systemlUniverse 23 Drum 0 1 0 0 1 0.27 5 65 Spectacles 8 1 0 4 13 3.49 2 (Nagara) 66 Spoon 2 0 0 0 2 0.54 5 24 Earthen 6 3 5 8 22 5.90 - 67 Stone I 6 5 3 15 4.02 1 lamp/lamp 68 SunlMoon 17 5 27 22 71 19.03 -25 Egg 38 19 33 23 113 30.29 - 69 Sweets 4 1 5 0 10 2.68 3 26 Elephant 3 0 0 0 3 0.80 5 70 Swimming 0 0 1 2 3 0.80 5 27 Eye 7 1 2 2 12 3.22 2 pool 28 Face 34 11 37 23 105 28.15 - 71 table 15 4 11 5 35 9.38 -29 Fan 3 4 0 7 14 3.75 2 72 Tablet 1 0 2 0 3 0.80 5 30 Filter 0 1 0 1 2 0.54 5 73 Tape 0 0 0 1 1 0.27 5 31 Flag post 1 0 1 0 2 0.54 5 recorder 32 Flower 44 8 58 7 114 30.56 - 74 Tennis bat / 8 4 0 6 18 4.83 1 33 Flower pot 9 2 1 7 19 5.09 - Shuttle bat 34 Fruit 9 1 7 3 20 5.36 - 75 Tin 20 3 25 9 57 15.28 -35 Funnel 0 0 1 1 2 0.54 5 76 Top 1 3 0 1 5 l.34 4 36 Geometrical 0 1 0 1 2 0.54 5 77 Torch lens 1 0 0 1 2 0.54 5 figure 78 Tub 2 0 1 1 4 l.07 4 37 Glass 21 9 31 20 81 21.72 - 79 Tube 0 2 5 2 9 2.41 3 38 Head dress 7 0 1 3 11 2.95 3 80 Vase 1 0 4 0 5 l.34 4 39 Ice cream 4 3 6 9 22 5.90 - 81 Vegetable 22 4 23 3 52 13.94 -40 Insect 5 5 10 2 22 5.90 - 82 Water Drum 5 2 6 18 23 6.17 -41 Joker 3 10 6 2 21 5.63 - 83 Well 3 5 11 8 27 7.24 -cap/Cap 84 Wheel 7 5 4 8 24 6.43 -42 Jug 20 1 19 5 45 12.06 - 85 Wrist watch 4 7 4 14 29 7.77 -43 Key 2 2 0 2 6 l.61 4 o Irregular or 246 181 226 233 886 - -44 Kids bank 0 0 1 0 1 0.27 5 meaningless 45 Kidney 0 0 I 0 I 0.27 5 figures

Appendix-Dl 355
APPENDIX-Dl
Pilot Study Results
Table - 01-T1 : Correlation of Test items with the Total Activity Scores and Grand total (N= 75)
Verbal Creative thinking Non-Verbal Creative thinking
Activity Item Corr. with Corr. With Item Corr. With Corr. With activity total grand total activity total grand total
1 0.858' 0.832' 1 0.833' 0.456'
I 2 0.791$ 0.714$ 2 0.748$ 0.362$ 3 0.833$ 0.752$
1 0.813' 0.703' 1 0.464' 0.401'
II 2 0.884$ 0.698$ 2 0.499$ 0.400$ 3 0.837$ 0.711$ 3 0.414$ 0.375$
4 0.528$ 0.329£ 5 0.323£ 0.363$ 6 0.306£ 0.314£ 7 0.394$ 0.277@ 8 0.489$ 0.380$ 9 0.630$ 0.535$ 10 0.451$ 0.394$
1 0.792' 0.503' 1 0.697' 0.562$
III 2 0.732$ 0.639$ 2 0.892$ 0.613$ 3 0.799$ 0.667$
IV 1 1.00" 0.516'
$$ Perfect correlation ..
$ Significant at 0.001 . .
£ Significant at 0.01 ..
@ Significant at 0.05
Table -01-T2 : Correlation between test activities and total scores of Verbal and non verbal creativity.
Activity Verbal creativity Non-verbal creativity I 0.931$ 0.520$
II 0.825$ 0.829$ III 0.776$ 0.739$ IV 0.516$
.. $ Significant at 0.001
Table - 01.T3: Correlation coefficient among various factors of verbal and non-verbal creativity scores of the sample N=75
Verbal creativity Non-verbal creativity
Factors Originality Fluency Flexibility Total Originality Elaboration Total
Verbal originality -Verbal fluency .834$ -Verbal flexibility .837$ .972$ -Verbal total .928$ .975$ .976$ -Non-verbal .340" AOO:!> A05:!> . 398:!> -Originality ·292@ .348£ .371£ .351£ .354£ -Non-verbal .384£ .455$ .472$ 0455$ .823$ .823$ -Elaboration
Composite . 844:!> .908:!> .916:!> . 927:!> . 639:!> .605:!> . 756:!> (Verbal + Non-
verbal)
Table -7.17:Mean, SO and Range scores of Creativity and its components (N = 75)
Creativity components Mean SD Range Mini Maxi
Verbal Originality 20.05 15.60 0 - 67 Verbal Fluen9' 26.45 12.82 0 - 57 Verbal Flexibility 18.97 9.22 0 - 40 Non-Verbal Originality 13.53 9.22 0 - 45 Non-Verbal Elaboration 28.48 9.22 9 - 65

Appendix -D2 356
Appendix-D2
D2.1 : Procedure for changing order of ranks into numerical scores
All the teachers were asked to rank the order of importance 1 to 15 from the list
given in relation to their view of creative thinking, and to use number 1 to indicate their
first choice. The ranks given by them were converted into score form by following the
formula explained below.
It is often desirable to transmute orders of merit into units of amount or "scores". This may
be done by means of tables, if we are justified in assuming normality for the trait. To
illustrate, suppose 15 factors have been ranked by the teachers in order of importance for
creativity definition, the most important being ranked 1, the least important for them being
ranked 15. The formula for converting ranks into scores as follows:
percent position! = [lOO(R - 0.5)] / N
R = Rank given by an individual
N = Number of Individuals ranked
Suppose one teacher ranked all the 15(1 through 15) order of preferences, rank 1
has a percent position of [100 (1-0.5)]/15 or 3.33, and the score from the table-492 is 85.
Similarly rank 15 has a percent position of [100(15-0.5)]/15 or 96.66, and the score from
the same table-492 score is 15. In this way all the ranks from 2 to 14 were converted into
scores.
To make conversion very simple for future use, the researcher prepared a
conversion table which is presented in table-D2-Tl. This table is used in the teachers
questionnaire (see App.-H, Part-C, Q.no.l) for defining creativity definition and also used
in Part-F for Q. no.7.
Example: Suppose a teacher makes his definition of creativity by giving his order of preferences from 1 to 15. For example he ranked 'imagination' as 1, 'original ideas' was ranked as 2, 'self-expression' ranked as 3 ...... in this way he marked 'unconscious process' as his 15th preference. Here, when the teacher has ranked all items (1-15), the respective scores for each item can be drawn from the table-D2-Tl. The 'Imagination' score is 85 (rank 1), the 'original ideas' score is 75 (2nd rank), and the 'self-expression' (3rd) score is 69. The unconscious process will score only 15 (15th rank). If the teacher ranks 1 to 14 the
1 Garrett,H.E 1981, pp.330-333
2 Ibid p.329

Appendix-D2 357
row scores 1-14 (table-D2-Tl) and if the teacher ranks only 1 to 5 then the scores (row 1-5) will be given for items with respect to their ranks. Table-D2-Tl explains the calculation procedure for 'imagination'. Suppose 17 teachers ranked the 'imagination', giving it different ranks, they have been converted into scores from tables-D2-T 1.
Table-D2-Tl: Conversion table from order of ranks into numerical scores Items Ranks and their respective scores ranked 1 2 3 4 5 6 7 8 9 10 11 12 13 14 15 Min-Max
1
1-2
1-3
1-4
1-5
1-6
1-7
1-8
1-9
1-10
1-11
1-12
1-13
1-14
1-15
50
63 37
69 50 31
72 56 43 27
75 60 50 39 24
77 63 54 45 36 22
78 65 57 50 42 34 21
80 67 59 53 47 40 32 20
80 68 61 55 50 44 38 31 19
81 70 63 57 52 47 42 36 29 18
82 71 64 59 54 50 45 40 35 28 17
83 72 66 60 56 52 47 43 39 33 27 16
84 73 66 62 57 53 50 46 42 37 32 26 15
84 74 68 63 59 55 51 48 44 40 36 31 25 15
85 75 69 64 60 57 53 50 47 43 40 36 31 25 15
All of the ratings have been transmuted and the scores are combined and the
Average (64.00) and Standard Deviation (18.97) were also calculated (see table-D2-T2).
The range of the scores was between 15 and 85. The same calculation procedure was used
for the rest of items included in the definition of creative thinking.
T bl 02 T2 I a e- " f "t magma Ion I em score, an d"t M IS eanan dSt d dd "f an ar eVla Ion
Teacher Max. ranks Rank Score Teacher Max. ranks given Rank Score Number given by the given Number by the teacher given
teacher 1 1 - 12 1 83 10 1 - 15 1 85 2 1 - 15 12 36 11 1 - 15 3 69 3 1 - 15 7 53 12 1 - 15 2 75 4 1 - 15 8 50 13 1 - 15 1 85 5 1 - 15 3 69 14 1 - 15 3 69 6 1 - 15 5 60 15 1 - 15 3 69 7 1 - 15 2 75 16 1 - 15 15 15 8 1 - 15 1 85 17 1 - 5 3 50 9 1 - 15 5 60
Mean = 64.00 SO =18.97

Appendex-El
Appendix-El
Table-E1-T1: Principal Component Analysis and Factors extracted from Varimax rotation of Qno.6 (Part-D) of Teachers Questionnaire (TQ)
Principal Component Analysis of TQ Rotated Factor matrix of TQ Factors Eigenvalue Percent of Cumulative Factors Labelled Items Factor
variance percent loading Q12 .87
I Q13 .77 I 4.75 29.7 29.7 Teaching for self-reliance Q11 .61
Q15 .59 Q14 .58
II Q8 .76 II 1.84 11.5 41.2 Responsive Q9 .68
Q10 .66 III Q6 .83
III 1.69 10.6 51.8 Question-Expanded Q7 .69 thinkinq Q5 .67 IV Q2 .85
IV 1.27 8.0 59.8 Building confidence and Q16 .63 relations Q3 .62 V Q4 .82
V 1.14 7.1 66.9 Supportive environment Q1 .76
Table-E1-T2: Principal Component Analysis and Factors extracted from Varimax rotation of Qno.7 (Part-D) of Teachers Questionnaire (TQ)
Principal Component Analysis of TQ Rotated Factor matrix of TQ Factors Eigenvalue Percent of Cumulative Factors Labelled Items Factor
variance percent loadinq Q1 .82
I Q3 .75 I 4.33 39.4 39.4 Lack of facilities Q4 .74
Q2 .66 Q8 .63
II Q9 .85 II 1.75 15.9 55.3 Inadequate freedom Q10 .84
Q11 .83 III Q6 .88
III 1.25 11.4 66.7 Lack of support Q7 .87 Q5 .43
Table-E1-T3: Principal Component Analysis and Factors extracted from Varimax rotation of Qno 8 (Part-D) of Teachers Questionnaire (TQ)
Principal Component Analysis of TQ Rotated Factor matrix of TQ Factors Eigenvalue Percent of Cumulative Factors Labelled Items Factor
variance percent loading Q5 .80
I. Q7 .78 I 2.69 38.4 38.4 Unmotivated and lack Q4 .72
of confidence Q6 .54
Q1 .88 II 1.31 18.7 57.1 II. Passive and Q3 .73
une_qual abilities Q2 .51
358

Appendex-El
Table-E1-T4: Principal Component Analysis and Factors extracted from Varimax rotation of Qno.9 (Part-D) of Teachers Questionnaire (TQ)
Principal Component Analysis of TO Rotated Factor matrix of TO Factors Eigenvalue Percent of Cumulative Factors Labelled Items Factor
variance percent loadinq 08 .84
I 09 .83 I 4.22 42.2 42.2 Lack of recognition and 04 .72
stress 05 .72 010 .66
II 01 .89 II 2.09 20.9 63.1 Lack of knowledge of 02 .83
creativity 03 .72 III 06 .88
III 1.13 11.3 74.4 Lack of experience and 07 .88 confidence
Table-E1-T5: Principal Component Analysis and Factors extracted from Varimax rotation of Part-E of Teachers Questionnaire
Principal Component Analysis of TO Rotated Factor matrix of TO Factors Eigenvalue Percent of Cumulative Factors Labelled Items Factor
variance percent loadinq E12 .74 E8 .70
I 5.32 33.2 33.2 I E5 .69 Permissive and E6 .67 stimulating E7 .63
E15 .58 E4 .55 E10 .77
II II Exposing to different E3 .70 1.68 10.5 43.7 activities E2 .66
E1 .53 E11 .51 E16 .82
III 1.40 8.7 52.5 III. Creative teacher and E13 .68 his methods of teaching E14 .59
1.21 7.6 60.1 E9 -.87 IV IV. 'Authoritative' .
359
Table-E1-T6: Principal Component Analysis and Factors extracted from Varimax rotation of Part-F of Teachers Questionnaire
Principal Component Analysis of TO Rotated Factor matrix of TO Factors Eigenvalue Percent of Cumulative Factors Labelled Items Factor
variance percent loading F1 .82
I F3 .80 I 2.83 47.1 47.1 Scope for creativity in F2 .77
curriculum F6 .68 F4 .62
II II 1.05 17.6 64.7 Suitability of curriculum F5 .89

Appendix-E2 360
Appendix-E2
Table-E2-T1 : The reasons given by the high, average and low creative groups for their liking subjects
The reasons given by the high and low r---___ L_ev_erl_of_C_r_e_au_·v_e_t_hi_n...,.ki_·n-'-'--g ___ -i Total creative groups for liking subjects :English High Average Low
f % f % f % 3. 1 Talking look very nice - 2 ( 1.6) 1 ( 3.0) 3. 2 Talking with elders, principal, teachers - 4 ( 3.3) -3. 3 New words usage 3 ( 8.1) 3. 4 It is full of grammar 1 ( 2.7) 3. 5 It has very interesting stories 2 ( 5.4) 3. 6 Able to speak 2 ( 5.4) 3. 7 International language 4 (10.8) 3. 8 Interesting poetry 1 (2.7) 3. 9 Polite language -3.10 Introduced by the British 2 ( 5.4) 3.11 Medium of instruction -3.12 To visit foreign countries 2 ( 5.4) 3.13 Able to read -3.14 Able to write -3.15 Easy to learn 2 ( 5.4) 3.16 Subject lessons are easy to understand 6 (16.2) 3.17 Teacher teaches interestingly 9 (24.3) 3.18 Childhood ambition to learn it. 1 ( 2.7) 3.19 To get good marks -3.20 Taught at home and every body like at home -3.21 Helpful in higher education 1 ( 2.7) 3.22 Use in future life / daily life 1 ( 2.7) 3.23 Develop General KnowledQe -Total Valid cases 37 (100)
11 ( 9.0) 14 (11.5)
6 ( 4.9) 4 ( 3.3) 1 ( 0.8) 5 ( 4.1) 1 ( 0.1) 2 ( 1.6) 4 ( 3.3) 4 ( 3.3) 2 ( 1.6) 5 ( 4.1)
12 ( 9.8) 38 (31.2)
2 ( 1.6) 1 ( 0.8) 1 ( 0.8)
1 ( 0.8) 2 ( 0.8)
122 (100)
2 ( 6.1) 4(12.1) 2 ( 6.1)
1 ( 3.0) 4 (12.1)
1 ( 3.0) 2 ( 6.1) 1 ( 3.0) 1 ( 3.0) 1 ( 3.0) 7 (21.2) 5 (15.2) 1 ( 3.0)
33 (100)
f % 3 ( 1.6) 4 ( 2.1) 3 ( 1.6)
14 ( 7.3) 20 (10.4) 10 ( 5.2)
8 ( 4.2) 3 ( 1.6) 9 ( 4.7) 3 ( 1.6) 3 ( 1.6) 8 ( 4.2) 5 ( 2.6) 3 ( 1.6) 8 ( 4.2)
25 (13.0) 52 (27.1)
4 ( 2.1) 1 ( 0.5) 1 ( 0.5) 1 ( 0.5) 2 ( 1.0) 2 ( 1.0)
192 (100) Note: The percentages within those brackets were calculated on the basis of column totals
a e- - " e reasons given ,y e I~ -crea Ive group or elr I mg su IJec s " T bl E2 T2 Th b th h" h f f th" I"k" b" t The reasons given by the High creative The reasons given by the High creative group for liking subject: Science f % group for liking subject: Maths f % 5.1 Experiments and discoveries 6 (20.7) 4.1 To know the geometry 1 ( 3.7) 5.2 To know about living beings 4 (13.8) 4.2 To become Engineer 1 ( 3.7) 5.3 To become a doctor 6 (20.7) 4.3 To know the Accounts/ Expenditures 1 ( 3.7) 5.4 To know the liquids, solids and gases 1 ( 3.4) 4.4 It is full of fun 2 ( 7.4) 5.5 To understand nature / environment 3 (10.3) 4.5 It is queen of all subjects 1 ( 3.7) 5.6 To open the new doors to the new 2 ( 6.9) 4.6 Able to solve the problems 1 ( 3.7)
knowledge 4.7 Solutions to the problems give 5 (18.5) 5.7 Easy to learn 1 ( 3.4) enjoyment / create interest! enthusiasm 5.8 Subject lessons are easy to understand 1 ( 3.4) 4.8 Helpful in business 1 ( 3.7) 5.9 Teacher teaches interestingly 2 ( 6.9) 4.9 Easy to learn 3(11.1) 5.10 Use in future life / daily life 1 ( 3.4) 4.10 Subject lessons are easy to understand 5 (18.5) 5.11 To know the history of scientists and 2 ( 6.9) 4.11 Teacher teaches interestingly 2 ( 7.4) his inventions 4.12 Like from childhood 1 ( 3.7)
4.13 Use in future life / daily life 1 ( 3.7) 4.14 Full of formulas and symbols 2 ( 7.4)
Total Multiple responses 29 (100) Total Multiple responses 27 (100) Note: The percentages within those brackets were calculated on the basis of column totals

Appendix-E2 361
T bl E2 T3 Th b th I f f h' rk' b' a e- - . e reasons given y e ow-crea Ive group or t elr I Inq su Jects . Reasons given by the Low- creative group for Reasons given by the Low-creative group liking subject: Hindi f % for liking subject: Telugu f %
2.1 Mother tongue/ Communicative language 6 (21.4) 1.1 Mother tongue/ Communicative 11 (36.7) 2.2 It has very interesting stories 2 ( 7.1) language 2.3 National language 1 ( 3.6) 1.2 It has very interesting stories 2 ( 6.7) 2.4 Able to read 2 ( 7.1) 1.3 Interesting poetry 4 (13.3) 2.5 Easy to learn 5 (17.9) 1.4 Sanskrit words in it 1 ( 3.3) 2.6 Subject lessons are easy to understand 6 (21.4) 1.5 Able to read 4 (13.3) 2.7 Teacher teaches interestingly 5 (17.9) 1.6 Able to write -2.8 Like from childhood 1 ( 3.6) 1.7 Easy to learn 1 ( 3.3)
1.8 Subject lessons are easy to understand 4 (13.3) 1.9 Teacher teaches interestingly 2 ( 6.7) 1.10 Like from childhood 1 ( 3.3)
Total Multiple responses 28 (100) Total Multiple responses 30 (100) Note: The percentages within those brackets were calcnlated on the basis of column totals
Table-E2-T4 : The reasons given by the high, average and low creative groups for their disliking subjects
Reasons given by the students for disliking subjects Level of Creative thinkinc Total : Social Studies High Average Low
f % f % f % f % 6.1 Difficult in remembering years 2 ( 7.4) 3 ( 3.3) 2 (11.8) 7 ( 5.2) 6.2 Geography 1 ( 3.7) 2 ( 2.2) - 3 ( 2.2) 6.3 Do not like politics 3 (11.1) 4 ( 4.4) - 7 ( 5.2) 6.4 Do not like history 4 (14.8) 14 (14.4) - 18 (13.3) 6.5 Hard to learn 2 ( 7.4) 11 (12.1) 1 ( 5.9) 14 (1004) 6.6 Difficult subject - 2 ( 2.2) 1 ( 5.9) 3 ( 2.2) 6.7 Boring subjects 4 (14.8) 12 (13.2) 3 (17.6) 19 (14.1) 6.8 No interest in subject 5 (18.5) 14 (15.4) 3 (17.6) 22 (16.3) 6.9 No stories in the subject - 1 ( 1.1) 1 (5.9) 2 ( 1.5) 6.10 Difficult to remember the formulas - 2 ( 2.2) 1 (5.9) 3 ( 2.2) 6.11 Full book is about maps - 1 ( 1.1) - 1 ( 0.7) 6.12 Lengthy answers 1 ( 3.7) 5 ( 5.5) 1 ( 5.9) 7 ( 5.2) 6.13 Dislike from childhood 1 ( 3.7) 1 ( 1.1) - 2 ( 1.5) 6.14 Can't understand the subject 1 ( 3.7) 9 ( 9.9) 1 ( 5.9) 11 ( 8.1) 6.15 Teachers are not teaching well 3 (11.1) 5 ( 5.5) 1 ( 5.9) 9 ( 6.7) 6.16 Getting less marks in the examinations - - 1 ( 5.9) 1 ( 0.7) 6.17 Teachers don't take classes regularly - 3 ( 3.3) 1 ( 5.9) 4 ( 3.0) 6.18 Not important subject nowadays - 1 ( 1.1) - 1 ( 0.7) 6.19 Too much syllabus - 1 ( 1.1) - 1 ( 0.7) Total Valid cases 27 (100) 91 (100) 17 (100) 135 (100)
Note: The percentages within those brackets were calculated on the basis of column totals

Appendix-E2 362
T bl E2 T5 Th a e- - e reasons given b th h" h f f th· d· I"k" )y e Ig -crea Ive group or elr IS ling su b· jects Reasons given by the High creative group for Reasons given by the High creative liking subject: Hindi f % group for liking subject: Telugu f % 2.1 Problem of speaking 1 ( 3.7) 1.1 Problem of reading 1 ( 3.8) 2.2 Problem of reading 4 (14.8) 1.2 problem of writing 2 ( 7.7) 2.3 problem of writing 1 ( 3.7) 1.3 So much grammar 3 (11.5) 2.4 So much grammar 1 ( 3.7) 1.4 Dislike poetry 6 (23.1) 2.5 It is not mother tongue 3 (11.1) 1 .5 It is not mother tongue 1 ( 3.8) 2.6 Boring subject 2 ( 7.4) 1.6 A lack of interest in knowing the 2 ( 7.7) 2.7 No interest in subject 7 (25.9) language. 2.8 Can't understand the subject 3 (11.1) 1.7 It is a difficult subject 3 (11.5) 2.9 Getting less marks in the examinations 1 ( 3.7) 1.8 Boring subject 1 ( 3.8) 2.10 Teachers don't take classes regularly 1 ( 3.7) 1.9 No interest in subject 2 ( 7.7) 2.11 Not important subject nowadays 2 ( 7.4) 1.10 Can't understand the subject 2 ( 7.7) 2.12 Not learning any thing new. 1 ( 3.7) 1.11 Teachers are not teaching well 1 ( 3.8)
1.12 Too much homework 1 ( 3.8) 1.13 Not important subject nowadays 1 ( 3.8)
Total Multiple responses 27 (100) Total Multiple responses 26 (100) Note: The percentages within those brackets were calculated on the basis of column totals
T bl E2 T6 Th a e- - e reasons given b th I y e f f th· d· I"k" b· t ow-crea Ive group or elr IS ling SU jec S Reasons given by the Low creative group Reasons given by the Low- creative group for liking subject: Science f % for liking subject: Mathematics f % 5.1 Sums are difficult 2 ( 9.1) 4.1 Sums are difficult 3 (14.3) 5.2 Chemical actions and reactions 1 ( 4.5) 4.2 Unable to solve the problems 1 ( 4.8) 5.3 Hard to learn 4 (18.2) 4.3 Boring subjects 1 ( 4.8) 5.4 No interest in subject 4(18.2) 4.4 No interest in subject 4(19.1) 5.5 No stories in the subject 1 ( 4.5) 4.5 No stories in the subject 1 ( 4.8) 5.6 Dislike from childhood 1 ( 4.5) 4.6 Can't understand the subject 7 (33.3) 5.7 Can't understand the subject 6 (27.5) 4.7 Teachers are not teaching well 3 (14.3) 5.8 Teachers are not teaching well 2 ( 9.1) 4.8 Teachers don't take classes regularly 1 ( 4.8) 5.9 Teachers don't take classes regularly 1 ( 4.5)
Total Multiple responses 22 (100) 21 (100) Note: The percentages within those brackets were calculated on the basIs of column totals

Appendix -E2 363
Table-E2-T7 : The reasons given by the high, average and low creative groups for their liking f . I h . uture occupatlona c olces
The reasons given by the High and low creative Level of Creative thinkin Total groups for liking Job :Doctor High Average Low
f % f % f % f % 7.1.1 To treat poor patients 16 (42.1) 72 (50.3) 17 (60.7) 105 (50.2) 7.1.2 Serve poor people 14 (36.8) 58 (40.6) 8 (28.6) 80 (38.3) 7.1.3 Defend the nation 4 (10.5) 5 ( 3.5) - 9 ( 4.3) 7.1.4 Social Worker - 1 ( 0.7) - 1 ( 0.5) 7.1.5 A good job for me 1 ( 2.6) - - 1 ( 0.5) 7.1.6 Respected job for me - 1 ( 0.7) - 1 ( 0.5) 7.1.7 To earn a lot of money - 1 ( 0.7) - 1 ( 0.5) 7.1.8 Hard to get jobs in these days - - 1 ( 3.6) 1 ( 0.5) 7.1.9 Ambition from childhood 2 ( 5.3) 1 ( 0.7) 1 ( 3.6) 4 ( 1.9) 7.1 .10 Parents' ambition - 3 ( 2.1) 1 ( 3.6) 4 ( 1.9) 7.1.11 I like subiects like Science subiects 1 ( 2.6) 1 i 0.7) - 2 ( 1.0)
38 (100%) 143 (100%) 28 (100 %) 209 (100 %) The reasons given by the High and low High Average Low Total creative groups for liking Job :Teacher f % f % f % f %
7.2.1 To develop the country 1 ( 3.0) - - 1 ( 0.6) 7.2.2 To teach the students well 4 (12.1) 9 ( 7.4) 1 ( 5.3) 14 ( 8.1) 7.2.3 Like to teach students 11 (33.3) 58 (47.9) 9 (47.4) 78 (45.1) 7.2.4 To guide the students 6 (18.2) 18 (14.5) 1 ( 5.3) 25 (14.5) 7.2.5 To educate the illiterate and poor 6 (18.2) 26 (21.5) 7 (36.8) 39 (22.5) 7.2.6 Enjoying being with children 1 ( 3.0) 5 ( 4.1) 1 (5.3) 7 ( 4.0) 7.2.7 Eradication of illiteracy 1 ( 3.0) - - 1 ( 0.6) 7.2.8 Easy to get this job 1 ( 3.0) - - 1 ( 0.6) 7.2.9 A good job for me - 2 ( 1.7) - 2 ( 1.2) 7.2.10 Respected job - 1 ( 0.8) - 1 ( 0.6) 7.2.11 Necessary for me - 1 ( 0.8) - 1 ( 0.6) 7.2.12 Unusual job in the world 1 ( 3.0) - - 1 ( 0.6) 7.2.13 Parents' ambition 1 ( 3.0) - - 1 ( 0.6) 7.2.14 Liking subjects like Science/ Maths - 1 ( 0.8) - 1 ( 0.6)
33 (100 %) 121 (100 %) 19 (100 %) 173 (100 %)_ The reasons given by the High and low creative High Average Low Total groups for liking Job: Lawyer f % f % f % f %
7.6.1 Serve poor people 1 (i0.0) 6 (15.8) 1 (20.0) 8 (15.1) 7.6.2 To maintain law and order 6 (60.0) 7 (18.4) - 13 (24.5) 7.6.3 Justice for poor people 2 (20.0) 12 (31.6) . 4 (80.0) 18 (34.0) 7.6.4 To punish criminals 1 (10.0) 4 (10.5) - 5 ( 9.4) 7.6.5 To argue in the court - 7 (18.4) - 7 (13.2) 7.6.6 Respected job - 1 ( 2.6) - 1 ( 1.9) 7.6.7 Ambition from childhood - 1 i 2.6) - 1 ( 1.9)
10 (100 %) 38 (100 %) 5 (100 %) 53 (100 %) The reasons given by the High and low creative High Average Low Total
groups for liking Job: Police constable f % f % f % f %
3.2.1 Serve poor people - 4 (12.9) - 4 ( 7.8) 3.2.2 Defend the nation 3 (42.9) 8 (25,8) 3 (23.1) 14 (27.S) 3.2.3 To maintain law and order - 2 ( 6.5) 2 (15.4) 4 ( 7.8) 3.2.4 Justice for poor people - - 1 ( 7.7) 1 ( 2.0) 3.2.5 To punish criminals 1 (14.3) 2 ( 6.5) 2 (15.4) 5 ( 9.8) 3.2.6 To catch thieves 3(42.9) 11 (35.5) 5 (38.5) 19 (37.3) 3.2.7 A good job for me - 1 ( 3.2) - 1 ( 2.0) 3.2.8 Ambition from childhood - 2 ( 6.5) - 2 ( 3.9) 3.2.9 Family profession - 1 i 3.2) - 1 ( 2.0)
7 (100 %) 31 (100 %) 13 (100 %) 51 (100 %) The reasons given by the High and low creative High Average Low Total
groups for liking Job: Engineer f % f % f % f 0/0
7.13.1 Serve poor people - 1 ( 3.4) - 1 ( 2.3) 7.13.2 A good job for me 1 (11.1) 3 (10.3) 1 (20.0) 5 (11.6) 7.13.3 Respected job - 1 ( 3.4) 1 (20.0) 2 ( 4.7) 7.13.4 To earn a lot of money 1 (11.1) 3 (i0.3) 1 (20.0) 5 (11.6) 7.13.5 Ambition from childhood - 2 ( 6.9) - 2 ( 4.7) 7.13.6 Parents' ambition - 1 ( 3.4) - 1 ( 2.3) 7.13.7 Planing & designing buildings and bridges 5 (55.6) 17 (58.6) 2 (40.0) 24 (55.8) 7.13.8 Liking subjects like Mathematics 2 (22.2) 1 i 3.4) - 3 ( 7.0)
9 (100 %) 29 (100 %) 5 (100 %) 43 (100 %)
Note: The percentages wIthm those brackets were calculated on the basIs of column totals

Appendix -E3 364
Appendix-E3 Table E3-Tl: Occupations of parents of government school students
(8 I· ampJe III the present study) SNO Occupation Father Mother
Occupation % Occupation % 1 Doctor 4 1.1 - -2 Teacher 5 1.3 9 2.4 3 Lawyer 1 .3 - -4 Engineer 1 .3 - -5 Mechanic 6 1.6 - -6 Electrician 3 .8 - -7 Technician 4 1.1 - -8 Factory Manager 2 .5 - -9 Adm.& Executive Officer 2 .5 - -
10 Accountant 2 .5 - -11 Typist 2 .5 - -12 Conductor 3 .8 - -13 Office messenger 19 5.1 7 1.9 14 Telephone Operator 4 1.1 - -15 Clerk 37 9.9 2 .5 16 Business 52 13.9 4 1.1 17 Sales man 3 .8 - -18 Agents InsurancelRTA 3 .8 - -19 Merchants and Shopkeepers 7 1.9 1 .3 20 Police / Detective 18 4.8 - -21 Nurse 5 1.3 4 1.1 22 Watchman and Gate keepers 18 4.8 - -23 Postman 1 .3 - -24 Fireman 1 .3 - -25 Home guards and Security 2 .5 - -26 Butler 2 .5 - -27 Cooker 2 .5 1 .3 28 Barber 2 .5 - -29 Washer man / Dhobi 3 .8 - -30 Priest 1 .3 - -31 Farmer 6 1.6 - -32 Fisherman 1 .3 - -33 Screen Printing /printing 4 1.1 1 .3 34 Driver 29 7.8 - -35 Tailor 17 4.6 16 4.3 36 Carpenter 16 4.3 - -37 Plumber 2 .5 - -38 Gold smith 2 .5 - -39 Contractor 2 .5 - -40 Painter 5 1.3 - -41 Rickshawpuller 2 .5 - -42 Laborer 8 2.1 7 1.9 43 Railway worker 8 2.1 - -44 Photographer 1 .3 - -45 Factory worker 37 9.9 5 1.3 46 Supervisors and foreman 4 1.1 - -47 Dependent 14 3.8 - -48 Housewife - - 313 83.9 49 Sweeper - - 2 .5 50 Agriculture labourers - - 1 .3
373 100 373 100

Appendix-E4 365
APPENDIX-E4
Variables coded for the model
1) Sex (X1): Girls were coded as '0' and boys as '1'.
2) Age (X2): The students' age was considered in Years (eg. 12, 13, 14 ... )
3) Father Education (X3): The weights (1 to 7) were given according to their education levels (See Chap.-IX, table-9.B).
4) Mother Education (X4): The weights (1 to 7) were given according to their education levels (See Chap.-IX, table-9.9)
5) Father Occupation (Xs): The weights (0 to 7) were given according to their education levels (See Chap.-IX, table-9.1 0)
6) Mother Occupation (Xs): The weights (0 to 7) were given according to their education levels (See Chap.-IX, table-9.11)
7) Father Income (X7): The weights (0 to 6) were given according to their education levels (See Chap.-IX, table-9.12)
8) Mother Income (Xa): The weights (0 to 4) were given according to their education levels (See Chap.-IX, table-9.13)
9) Medium of Instruction (Xg): Telugu was coded as '0' and English coded as '1 '.
10 Type of the school Dummy (Girls-X1o) and 11) Type of the school Dummy (80yS-X11): This categorical independent variable has three groups called Girls Schools, Boys Schools and Co-education schools. These three groups were coded by assigning an arbitrary number. For this, the simplest method of creating a dummy variable is to assign 1 's to subjects of a group one wish to identify and O's to all other subjects. The system of 1 's and O's to create dummy vectors for the three groups was followed (see Kerlinger and Pedhazur, 1973,p.105-06; Cohen and Cohen, 1983, p.183-93).
12 Teachers' Encouragement as perceived by students' (X12): The scores obtained from Teacher Encouragement Scale (TES) administered to the pupil.
13. School Activities (X13): '1' is assigned for 'Yes' and '0' for the 'No'. The total scores obtained for the school activities were 11 minimum and 34 is the maximum.
14. Creative thinking ability (Dependent variable-X14): Composite scores for creative thinking were obtained by adding Verbal and Non-verbal Tests of Creative thinking developed by Baqer Mehdi.

Appendix -E5 366
Appedix-ES
Wallach and Kogan(l965) examined the inter-relationship between high and low
creativity. Their sample of 151 pupils (70 boys and 81 girls: Age 10-11 years old)
comprised the entire fifth grade population of a suburban New England Public School
system, whose SES was middle-class categories who divided into four groups. The index
scores of creativity and intelligence were dichotomized at their median and called "high" if
they fell in the upper half of the distribution, "low" if they fell in the lower half (p.58-59).
1. The 'High Creativity- High Intelligence' children could exercise both control
and freedom, showing both adult-like and childlike kinds of behaviour.
2. The 'High Creativity-Low Intelligence' group were in angry conflict with
themselves and their school environment, and beset by feelings of
unworthiness and inadequacy. In a stress-free context, however, they could
blossom forth cognitively.
3. The 'Low Creativity-High intelligence' children were found to be 'addicted' to
school achievement. Academic failure would be perceived by them as
catastrophic, so that they must continually strive for academic excellence in
order to avoid the possibility of pain. Such academic excellence was their main
goal and interest in life.
4. The 'Low Creativity-Low intelligence' group were basically bewildered; these
children engage in various defensive manoeuvres, ranging from useful
adaptations such as intensive social activity to regressions such as passivity or
psychosomatic symptoms (p.303).

Appendix-E6 367
Appendix-E6
Teachers views on governments schools and its drawbacks
It is appropriate to note the views of the Mathematics teachers in the interviews to understand the real situation in the government schools of Andhra Pradesh.
Mainly, I think, both the students and teachers in government schools are responsible for the low peiformance of the students in creativity tests when compared to private schools. In private schools they have smaller classes and they have the necessary equipment and management is also strict with the teachers. Management will tell teachers to develop creative abilities in the children whereas in the govt. schools, I don't think, the management is so strict with the teachers and the management doesn't have any concern about developing such activities. So the teacher does not show that much interest in a govt. school to develop creativity thinking among the students. Where as a private school teacher although less qualified than a govt. schoolteacher, uses all the techniques he knows and tries to develop creative thinking. Because of the material he has and because of the encouragement he gets from the management. But that is the reverse of what is happening in the govt. school. We don't have proper materials, which are required. Management does not take that much care. As a result the teacher does not show any interest in students developing creativity. One more thing is, in private schools usually the children come from well to do families. They get encouragement from their families. Their parents are well educated, so they just give them the necessary push, which is required to develop creative ideas. But in govt. schools the children are mostly from backward areas, economically. They are not well off. So as a result their mind is not stable. So they can't think in a new way. Always they will be tensed-up. So this is actually one hindrance, which constrains creativity development among the govt school children.
The other Mathematics teacher interviewed expressed similar views regarding the government schools when the researcher explained that private school students perform better in creativity tests.
The intelligence, the creative abilities, natural abilities are distributed irrespective of the economical standard of children. Generally children with low economic status come to govt. schools and with good economic background those children go to private schools. So in private schools, of course, you can generalise and say that in private school these factors are given more importance. The reasons are obvious. The teachers take interest ... of course not all. In private schools also all teacher do not ... many of the private schools are there ... where in they only encourage learning things by heart and then put it on paper during the exam. So many unhealthy trends are found in private schools also. Well, the comparative studies with private schools might have been conducted, I don't know what cross section has been studied. I have not found that creative thinking could not be developed in govt. schools, that is a wrong notion. Provided the circumstances are good there is no difference between private school students and govt. school students by nature. It is the environment or the teachers, I always being a teacher, I give first importance to teacher. When a student is not upto the mark, I think that 75% responsibility lies with the teachers, remaining 25% is with others. In my experience, I have found that in govt schools teachers will do their minimum required. Forget about creativity thinking. It is a higher aspect. The fundamental things we are supposed to do, they do not do it. As such there is no difference between innate talents of children. Only thing is we may not be properly trained. Management takes more interest in private schools. The government does not take interest in this type of training. They are concerned about improving results. The government has concern about literacy campaigning and other things but not the fundamental things in schools.

PICTURES Picturesl(a) & l(b) 368
Picture No. 1(a) .. Carrying books is no problem ... We are studying in Indian schools
Picture No.1 (b). We have found a place for these big heavy bags .... But where is the place for us to write?
PHOTOGRAPH REDACTED DUE TO THIRD PARTY RIGHTS OR OTHER LEGAL ISSUES
PHOTOGRAPH REDACTED DUE TO THIRD PARTY RIGHTS OR OTHER LEGAL ISSUES

Pictures- 2(a) & 2(b) 269
Picture No.2(a) We don't mind how congested is this classroom ..... we are in the government school
Picture No. 2(b) How unlucky we are! we have no benches to seat and no desks to write
PHOTOGRAPH REDACTED DUE TO THIRD PARTY RIGHTS OR OTHER LEGAL ISSUES
PHOTOGRAPH REDACTED DUE TO THIRD PARTY RIGHTS OR OTHER LEGAL ISSUES

Pictures -2(c) & 3(a) 270
Picture No. 2(c) How unlucky we are! we have no benches to sit on and no desks to write on.
Picture No. 3(a) How lucky we are! we have at least benches to sit on and desks to write on.
PHOTOGRAPH REDACTED DUE TO THIRD PARTY RIGHTS OR OTHER LEGAL ISSUES
PHOTOGRAPH REDACTED DUE TO THIRD PARTY RIGHTS OR OTHER LEGAL ISSUES

Pictures- 3(b) & 4(a) 271
Picture No. 3(b) How lucky we are! we have at least benches to sit on and desks to write on.
Picture No 4(a) No dining room ........... this is the Verandah of our school
PHOTOGRAPH REDACTED DUE TO THIRD PARTY RIGHTS OR OTHER LEGAL ISSUES
PHOTOGRAPH REDACTED DUE TO THIRD PARTY RIGHTS OR OTHER LEGAL ISSUES

Pictures-4(b) & 5 (a) 272
Picture No 4(b) No dining room .. .. .... . . this is the Verandah of our school
Picture No.5(a) This is our traditional classroom ... We are busy taking notes
PHOTOGRAPH REDACTED DUE TO THIRD PARTY RIGHTS OR OTHER LEGAL ISSUES
PHOTOGRAPH REDACTED DUE TO THIRD PARTY RIGHTS OR OTHER LEGAL ISSUES

Pictures- 5(b) & 5(c) 273
Picture No.5(b) This is our traditional classroom ... We are listening seriously to the lesson
Picture No.5(c) This our traditional classroom ... We are listening seriously to the lesson
PHOTOGRAPH REDACTED DUE TO THIRD PARTY RIGHTS OR OTHER LEGAL ISSUES
PHOTOGRAPH REDACTED DUE TO THIRD PARTY RIGHTS OR OTHER LEGAL ISSUES