
Hydrogen in N-Methylacetamide: Positions and dynamics of the hydrogen atoms using neutron scattering
Upload
independentCategory
view
1download
0
i n t e r n a t i o n a l j o u r n a l o f h y d r o g e n e n e r g y 3 4 ( 2 0 0 9 ) 2 3 5 – 2 4 4
Avai lab le a t www.sc iencedi rec t .com
j ourna l homepage : www.e lsev ier . com/ loca te /he
Review
Experimental design methods for fermentativehydrogen production: A review
Jianlong Wang*, Wei Wan
Laboratory of Environmental Technology, INET, Tsinghua University, Beijing 100084, PR China
a r t i c l e i n f o
Article history:
Received 10 August 2008
Received in revised form
5 October 2008
Accepted 6 October 2008
Available online 18 November 2008
Keywords:
Experimental design
Fermentative hydrogen production
Factorial design
Central composite design
* Corresponding author. Tel.: þ86 10 6278484E-mail address: [email protected]
0360-3199/$ – see front matter ª 2008 Interndoi:10.1016/j.ijhydene.2008.10.008
a b s t r a c t
This review summarized the experimental design methods used to investigate the effects
of various factors on fermentative hydrogen production processes, including one-factor-at-
a-time design, full factorial design, Taguchi design, Plackett–Burman design, central
composite design and Box–Behnken design. Each design method was briefly introduced,
followed by the introduction of its analysis. In addition, the advantages and disadvantages
of each design method were briefly discussed. Moreover, the application of each design
method to the study of fermentative hydrogen production was analyzed and discussed.
Based on the discussion in this review, an experimental design strategy for optimizing
fermentative hydrogen production processes was proposed. In the end, the software
packages that can carry out the above mentioned factorial design and analysis were briefly
introduced.
ª 2008 International Association for Hydrogen Energy. Published by Elsevier Ltd. All rights
reserved.
1. Introduction such as organic wastes. Moreover, compared with photosyn-
Environmental pollution due to the use of fossil fuels as well
as their shortfall makes it necessary to find alternative energy
sources that are environmentally friendly and renewable.
Hydrogen satisfies the above requirements because it
produces only water, when it is combusted as a fuel or con-
verted to electricity. Among various hydrogen production
processes, biological method is known to be less energy
intensive, for it can be carried out at ambient temperature and
pressure. Biological method mainly includes photosynthetic
hydrogen production and fermentative hydrogen production.
The efficiency of photosynthetic hydrogen production is low
and it cannot be operated in the absence of light, while
fermentative hydrogen production can produce hydrogen
continuously without light using various kinds of substrates
3; fax: þ86 10 62771150.(J. Wang).ational Association for H
thetic hydrogen production, fermentative hydrogen produc-
tion has higher hydrogen production efficiency, higher
hydrogen production stability, higher feasibility for industri-
alization, simpler control requirement and lower operating
costs. Thus fermentative hydrogen production is more
feasible and widely used. In addition, it is of great significance
to produce hydrogen from organic wastes by fermentative
hydrogen production, because it plays the dual role of waste
reduction and energy production. Therefore fermentative
hydrogen production has been received increasing attention
in recent years [1–5].
A fermentative hydrogen production process can be con-
ducted by using either pure cultures or mixed cultures.
However, in a fermentative hydrogen production process
using mixed cultures, the hydrogen produced by hydrogen-
ydrogen Energy. Published by Elsevier Ltd. All rights reserved.

i n t e r n a t i o n a l j o u r n a l o f h y d r o g e n e n e r g y 3 4 ( 2 0 0 9 ) 2 3 5 – 2 4 4236
producing bacteria can be consumed by hydrogen-consuming
bacteria. Thus, in order to harness hydrogen from a fermen-
tative hydrogen production process, the seed sludge often
needs a pretreatment to suppress as much hydrogen-
consuming bacterial activity as possible while still preserving
the activity of the hydrogen-producing bacteria [2].
Experimental design can be regarded as a process by which
certain factors are selected and deliberately varied in
a controlled manner to obtain their effects on a response of
interest, often followed by the analysis of the experimental
results. According to the number of the factors to be investi-
gated at a time, the experimental design can be classified into
two categories: one-factor-at-a-time design (single-factor
design) and factorial design (multiple-factor design) [6].
Experimental design is of great importance to a fermen-
tative hydrogen production process, because the process is
very complex and influenced by many factors such as
hydrogen-producing bacteria, substrates, inorganic nutri-
ents, operational conditions of the bioreactors and so on,
thus an appropriate experimental design can be used to
study the effects of various factors on the process to make it
better understood and even optimized to improve its
performance [5].
This review attempts to summarize the experimental
design that was used to investigate the effects of various
factors on fermentative hydrogen production processes. The
reviewed experimental design included one-factor-at-a-time
design, full factorial design, Taguchi design, Plackett–Burman
design, central composite design and Box–Behnken design.
Each design was briefly introduced, followed by the intro-
duction of its analysis and application to the study of
fermentative hydrogen production.
2. One-factor-at-a-time design
One-factor-at-a-time design is a traditional design, which
investigates one-factor-at-a-time, while keeping the levels of
other factors constant. The level of the factor to be investi-
gated is then changed over a desired range to study its effects
on a response. After the experimental results are obtained,
certain graphs are usually constructed showing how
a response is affected by the one factor studied. Since one-
factor-at-a-time design is easy to operate and analyze, it has
been widely used to study the effects of various factors on
fermentative hydrogen production processes. Table 1
summarizes a number of studies using one-factor-at-a-time
design to study the effects of various factors on fermentative
hydrogen production processes. For example, Kim et al.
investigated the effects of sucrose concentration on fermen-
tative hydrogen production using one-factor-at-a-time
design, with several graphs being plotted to show the effects
of sucrose concentration on hydrogen yield, hydrogen
production rate and specific hydrogen production rate, and
then concluded that the optimal sucrose concentration for
fermentative hydrogen production was 30 g COD/L. Since they
investigated only one factor, namely sucrose concentration, at
a time in that study, while keeping the levels of other factors
constant, it was easy for them to conduct the experimental
design and analyze the obtained results [12].
However, one-factor-at-a-time design has two main
drawbacks. For one thing, it does not take into consideration
the interactions among different factors, which cannot guar-
antee the optimal conditions identified by it to be optimal,
especially when the interactions among different factors are
significant. For example, Kim et al. investigated the effects of
only one factor, namely sucrose concentration on fermenta-
tive hydrogen production using one-factor-at-a-time design,
and ignored the interactions between sucrose concentration
and other factors such as temperature [12]. For another, it
involves a relatively large number of experiments, which
makes it laborious and time-consuming to carry out the
experiments, especially when the number of factors is large
[34]. For example, Chittibabu et al. investigated, respectively,
the effects of inoculum size, initial medium pH, initial
substrate concentration, temperature and dilution rate on
hydrogen productivity using one-factor-at-a-time design,
with around 30 runs of experiments being conducted [8].
3. Factorial design
On the contrary, factorial design is able to study the effects of
more than one factor at two or more levels. The experimental
design generally includes various combinations of different
factor levels, which enables it to depict the interactions
among different factors and to be more efficient to deal with
a large number of factors, compared with one-factor-at-a-
time design. Factorial design can be classified into two cate-
gories: full factorial design and fractional factorial design [34].
Since coded factor levels provide a uniform framework to
investigate the effects of a factor in any experimental context,
while the actual factor levels depend on a particular factor to
be studied, factorial design is usually given in the form of
coded factor levels [35]. One can assign each actual factor level
to the corresponding coded factor level of a factorial design
when using it. The analysis and the model-fitting for a facto-
rial design can be performed based on either the coded factor
levels or the actual factor levels. However, in almost all situ-
ations, the coded factor level analysis is preferable, because in
a coded factor level analysis, the model coefficients are
dimensionless and thus directly comparable, which make it
very effective to determine the relative size of factor effects
[36]. In this review, the models are expressed based on coded
factor levels. Such models can be expressed based on actual
factor levels when necessary.
3.1. Full factorial design
In a full factorial design, every combination of each factor
level is tested. For example, the number of runs for a three-
factor full factorial design is a� b� c, which indicates that, the
first factor is tested at a levels, the second factor is tested at
b levels, while the third factor is tested at c levels. The number
of runs for a full factorial design of n factors, each at a levels is
an. The most commonly used full factorial design is two-level
design, which can be denoted by 2n when there are n factors
[34]. Sometimes, an appropriate polynomial model can be
used to describe the effects of the factors studied on
a response and then optimize the response when necessary.
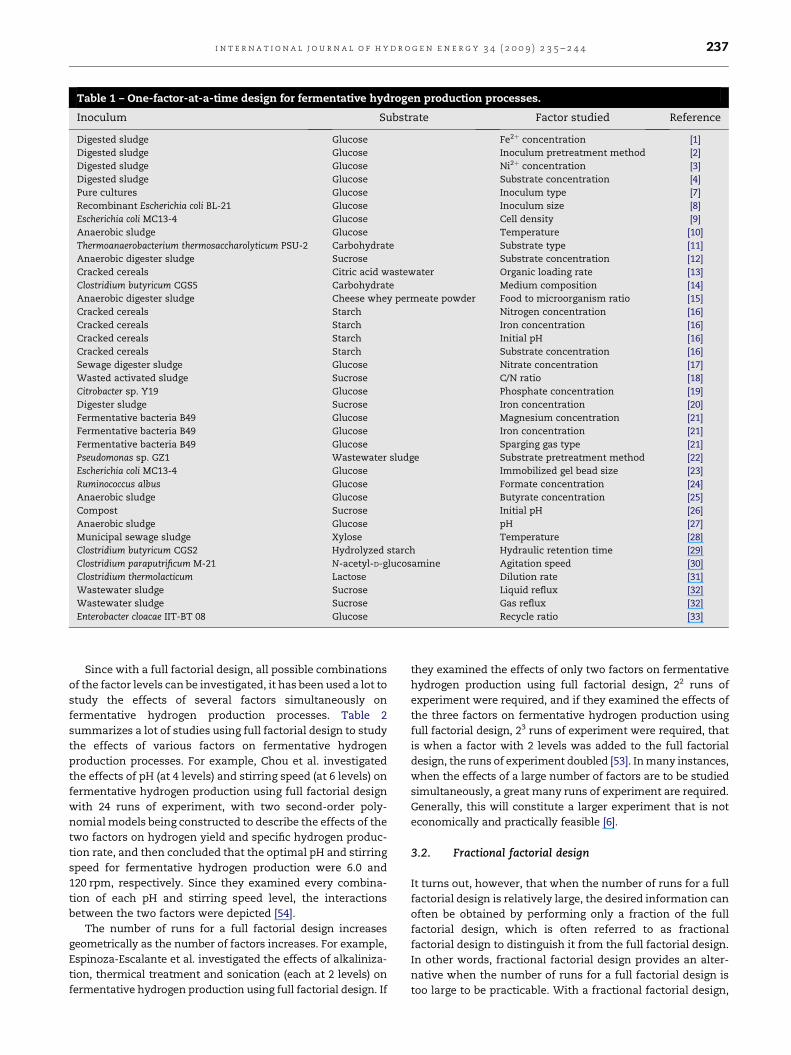
Table 1 – One-factor-at-a-time design for fermentative hydrogen production processes.
Inoculum Substrate Factor studied Reference
Digested sludge Glucose Fe2þ concentration [1]
Digested sludge Glucose Inoculum pretreatment method [2]
Digested sludge Glucose Ni2þ concentration [3]
Digested sludge Glucose Substrate concentration [4]
Pure cultures Glucose Inoculum type [7]
Recombinant Escherichia coli BL-21 Glucose Inoculum size [8]
Escherichia coli MC13-4 Glucose Cell density [9]
Anaerobic sludge Glucose Temperature [10]
Thermoanaerobacterium thermosaccharolyticum PSU-2 Carbohydrate Substrate type [11]
Anaerobic digester sludge Sucrose Substrate concentration [12]
Cracked cereals Citric acid wastewater Organic loading rate [13]
Clostridium butyricum CGS5 Carbohydrate Medium composition [14]
Anaerobic digester sludge Cheese whey permeate powder Food to microorganism ratio [15]
Cracked cereals Starch Nitrogen concentration [16]
Cracked cereals Starch Iron concentration [16]
Cracked cereals Starch Initial pH [16]
Cracked cereals Starch Substrate concentration [16]
Sewage digester sludge Glucose Nitrate concentration [17]
Wasted activated sludge Sucrose C/N ratio [18]
Citrobacter sp. Y19 Glucose Phosphate concentration [19]
Digester sludge Sucrose Iron concentration [20]
Fermentative bacteria B49 Glucose Magnesium concentration [21]
Fermentative bacteria B49 Glucose Iron concentration [21]
Fermentative bacteria B49 Glucose Sparging gas type [21]
Pseudomonas sp. GZ1 Wastewater sludge Substrate pretreatment method [22]
Escherichia coli MC13-4 Glucose Immobilized gel bead size [23]
Ruminococcus albus Glucose Formate concentration [24]
Anaerobic sludge Glucose Butyrate concentration [25]
Compost Sucrose Initial pH [26]
Anaerobic sludge Glucose pH [27]
Municipal sewage sludge Xylose Temperature [28]
Clostridium butyricum CGS2 Hydrolyzed starch Hydraulic retention time [29]
Clostridium paraputrificum M-21 N-acetyl-D-glucosamine Agitation speed [30]
Clostridium thermolacticum Lactose Dilution rate [31]
Wastewater sludge Sucrose Liquid reflux [32]
Wastewater sludge Sucrose Gas reflux [32]
Enterobacter cloacae IIT-BT 08 Glucose Recycle ratio [33]
i n t e r n a t i o n a l j o u r n a l o f h y d r o g e n e n e r g y 3 4 ( 2 0 0 9 ) 2 3 5 – 2 4 4 237
Since with a full factorial design, all possible combinations
of the factor levels can be investigated, it has been used a lot to
study the effects of several factors simultaneously on
fermentative hydrogen production processes. Table 2
summarizes a lot of studies using full factorial design to study
the effects of various factors on fermentative hydrogen
production processes. For example, Chou et al. investigated
the effects of pH (at 4 levels) and stirring speed (at 6 levels) on
fermentative hydrogen production using full factorial design
with 24 runs of experiment, with two second-order poly-
nomial models being constructed to describe the effects of the
two factors on hydrogen yield and specific hydrogen produc-
tion rate, and then concluded that the optimal pH and stirring
speed for fermentative hydrogen production were 6.0 and
120 rpm, respectively. Since they examined every combina-
tion of each pH and stirring speed level, the interactions
between the two factors were depicted [54].
The number of runs for a full factorial design increases
geometrically as the number of factors increases. For example,
Espinoza-Escalante et al. investigated the effects of alkaliniza-
tion, thermical treatment and sonication (each at 2 levels) on
fermentative hydrogen production using full factorial design. If
they examined the effects of only two factors on fermentative
hydrogen production using full factorial design, 22 runs of
experiment were required, and if they examined the effects of
the three factors on fermentative hydrogen production using
full factorial design, 23 runs of experiment were required, that
is when a factor with 2 levels was added to the full factorial
design, the runs of experiment doubled [53]. In many instances,
when the effects of a large number of factors are to be studied
simultaneously, a great many runs of experiment are required.
Generally, this will constitute a larger experiment that is not
economically and practically feasible [6].
3.2. Fractional factorial design
It turns out, however, that when the number of runs for a full
factorial design is relatively large, the desired information can
often be obtained by performing only a fraction of the full
factorial design, which is often referred to as fractional
factorial design to distinguish it from the full factorial design.
In other words, fractional factorial design provides an alter-
native when the number of runs for a full factorial design is
too large to be practicable. With a fractional factorial design,
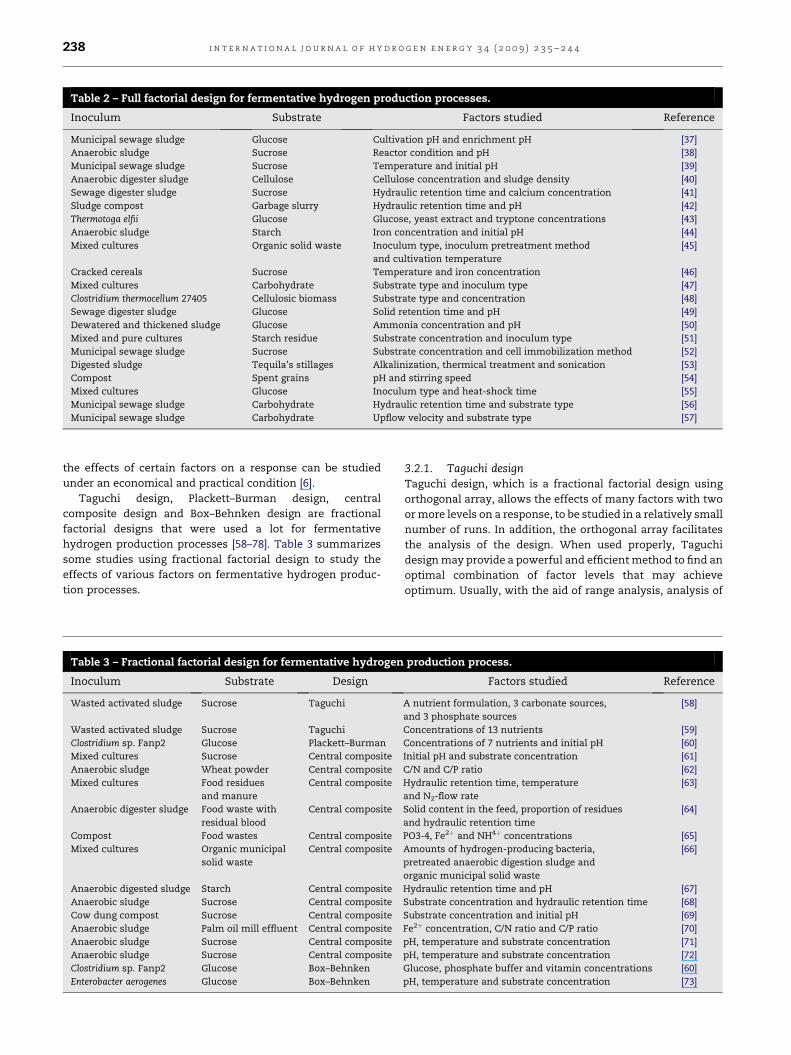
Table 2 – Full factorial design for fermentative hydrogen production processes.
Inoculum Substrate Factors studied Reference
Municipal sewage sludge Glucose Cultivation pH and enrichment pH [37]
Anaerobic sludge Sucrose Reactor condition and pH [38]
Municipal sewage sludge Sucrose Temperature and initial pH [39]
Anaerobic digester sludge Cellulose Cellulose concentration and sludge density [40]
Sewage digester sludge Sucrose Hydraulic retention time and calcium concentration [41]
Sludge compost Garbage slurry Hydraulic retention time and pH [42]
Thermotoga elfii Glucose Glucose, yeast extract and tryptone concentrations [43]
Anaerobic sludge Starch Iron concentration and initial pH [44]
Mixed cultures Organic solid waste Inoculum type, inoculum pretreatment method
and cultivation temperature
[45]
Cracked cereals Sucrose Temperature and iron concentration [46]
Mixed cultures Carbohydrate Substrate type and inoculum type [47]
Clostridium thermocellum 27405 Cellulosic biomass Substrate type and concentration [48]
Sewage digester sludge Glucose Solid retention time and pH [49]
Dewatered and thickened sludge Glucose Ammonia concentration and pH [50]
Mixed and pure cultures Starch residue Substrate concentration and inoculum type [51]
Municipal sewage sludge Sucrose Substrate concentration and cell immobilization method [52]
Digested sludge Tequila’s stillages Alkalinization, thermical treatment and sonication [53]
Compost Spent grains pH and stirring speed [54]
Mixed cultures Glucose Inoculum type and heat-shock time [55]
Municipal sewage sludge Carbohydrate Hydraulic retention time and substrate type [56]
Municipal sewage sludge Carbohydrate Upflow velocity and substrate type [57]
i n t e r n a t i o n a l j o u r n a l o f h y d r o g e n e n e r g y 3 4 ( 2 0 0 9 ) 2 3 5 – 2 4 4238
the effects of certain factors on a response can be studied
under an economical and practical condition [6].
Taguchi design, Plackett–Burman design, central
composite design and Box–Behnken design are fractional
factorial designs that were used a lot for fermentative
hydrogen production processes [58–78]. Table 3 summarizes
some studies using fractional factorial design to study the
effects of various factors on fermentative hydrogen produc-
tion processes.
Table 3 – Fractional factorial design for fermentative hydrogen
Inoculum Substrate Design
Wasted activated sludge Sucrose Taguchi
Wasted activated sludge Sucrose Taguchi
Clostridium sp. Fanp2 Glucose Plackett–Burman
Mixed cultures Sucrose Central composite
Anaerobic sludge Wheat powder Central composite
Mixed cultures Food residues
and manure
Central composite
Anaerobic digester sludge Food waste with
residual blood
Central composite
Compost Food wastes Central composite
Mixed cultures Organic municipal
solid waste
Central composite
Anaerobic digested sludge Starch Central composite
Anaerobic sludge Sucrose Central composite
Cow dung compost Sucrose Central composite
Anaerobic sludge Palm oil mill effluent Central composite
Anaerobic sludge Sucrose Central composite
Anaerobic sludge Sucrose Central composite
Clostridium sp. Fanp2 Glucose Box–Behnken
Enterobacter aerogenes Glucose Box–Behnken
3.2.1. Taguchi designTaguchi design, which is a fractional factorial design using
orthogonal array, allows the effects of many factors with two
or more levels on a response, to be studied in a relatively small
number of runs. In addition, the orthogonal array facilitates
the analysis of the design. When used properly, Taguchi
design may provide a powerful and efficient method to find an
optimal combination of factor levels that may achieve
optimum. Usually, with the aid of range analysis, analysis of
production process.
Factors studied Reference
A nutrient formulation, 3 carbonate sources,
and 3 phosphate sources
[58]
Concentrations of 13 nutrients [59]
Concentrations of 7 nutrients and initial pH [60]
Initial pH and substrate concentration [61]
C/N and C/P ratio [62]
Hydraulic retention time, temperature
and N2-flow rate
[63]
Solid content in the feed, proportion of residues
and hydraulic retention time
[64]
PO3-4, Fe2þ and NH4þ concentrations [65]
Amounts of hydrogen-producing bacteria,
pretreated anaerobic digestion sludge and
organic municipal solid waste
[66]
Hydraulic retention time and pH [67]
Substrate concentration and hydraulic retention time [68]
Substrate concentration and initial pH [69]
Fe2þ concentration, C/N ratio and C/P ratio [70]
pH, temperature and substrate concentration [71]
pH, temperature and substrate concentration [72]
Glucose, phosphate buffer and vitamin concentrations [60]
pH, temperature and substrate concentration [73]

Path of steepest ascent
Design center
5
10
15
20
20
25
25
30
30
35
35
40
40
xi
xj
Fig. 1 – Contour plot of a response and the path of steepest
ascent.
i n t e r n a t i o n a l j o u r n a l o f h y d r o g e n e n e r g y 3 4 ( 2 0 0 9 ) 2 3 5 – 2 4 4 239
variance or analysis of signal-to-noise ratio, the key factors
that have significant effects on a response can be identified
and the best factor levels for a given process can be deter-
mined from the pre-determined factor levels [76].
As shown in Table 3, among the reviewed studies, two
studies used Taguchi design. For example, Lin and Lay
studied the effects of 13 nutrient concentrations on fermen-
tative hydrogen production using a Taguchi design. Based on
the analysis of the experimental results, they determined
that magnesium, sodium, zinc and iron were important trace
metals affecting hydrogen production and identified the best
nutrient levels for the fermentative hydrogen production
process from the pre-determined factor levels [59]. However,
the true optimal factor levels may not be guaranteed using
Taguchi design, because the true optimal factor levels may be
different from the corresponding pre-determined factor
levels [76].
3.2.2. Plackett–Burman designIn reality, there may be a great number of factors influencing
a process, but it does not mean that all the factors have
significant effects on it. More often than not, the factors that
influence the process greatly may be paid greater attention
than those that influence it slightly, because the former are
essential to the successful operation of the process. Thus, the
first step to optimize a process is to identify which factors
have significant effects on the process.
Plackett–Burman design, which is a two-level fractional
factorial design developed by Plackett and Burman, has been
extensively used to screen important factors for further
investigation [34]. In addition, the number of runs for
a Plackett–Burman design is equal to a multiple of 4. Plackett–
Burman design can examine up to n¼N� 1 factors in an
experiments with N runs and it works for all such N up to 100,
except for 92 [35]. If the number of factors to be examined is
less than n¼N� 1, a subset of Plackett–Burman design for N
runs can be used. Sometimes, some replications are per-
formed to estimate the experimental errors.
A first-order polynomial model (Eq. (1)) is usually used to
describe the effects of various factors on it based on the
experimental results from a Plackett–Burman design.
y ¼ b0 þXk
i¼1
bixi (1)
where y is the response, b0 is the constant and bi is the linear
coefficient, and xi is the coded factor levels.
Based on the analysis of variance (ANOVA) of the estimated
model, the significant factors can be identified [74,75].
As shown in Table 3, among the reviewed studies, only the
study by Pan et al. used Plackett–Burman design to study the
effects of 8 factors on fermentative hydrogen production and
then screened 3 factors (glucose, phosphate buffer and
vitamin solution) that had significant effects on the specific
hydrogen production potential for further study based on
analysis of the experimental results [60].
3.2.3. Method of steepest ascentFrequently, the initial estimate of the optimal conditions for
a bioprocess is far from the actual optimum. Thus, the second
step for optimization is to locate the region of factor levels that
produce optimal conditions. The method of steepest ascent is
a simple and economically efficient procedure developed to
move the experimental region of a response in the direction of
the maximum change toward the optimum. Of course, if
minimization of a response is desired, then this method is
referred to as the method of steepest descent. The factors
screened by the Plackett–Burman design can be further
investigated using this method.
In order to obtain the path of steepest ascent for various
factors, a first-order polynomial model (Eq. (1)) is usually used
to fit the experimental data obtained from a factorial design
such as a Plackett–Burman design. The path of steepest ascent
is perpendicular to the contour plots of the response based on
the estimated first-order polynomial model, and moves bi
units in the xi direction for every bj units in the xj direction.
Equivalently, the path has a movement of bj/bi units in xj for
every 1 unit movement in xi. Fig. 1 shows the contour plot of
a response with varying only two factor levels, while keeping
other factor levels constant, and the corresponding path of
steepest ascent [35].
The path of steepest ascent starts from the design center of
the factorial design building the first-order polynomial model
and ends until no further improvement can be achieved in the
response, which indicates that the region of optimal response
is in the neighborhood of that condition [35].
Among the reviewed studies, only the studies by Pan et al.
and Lay used the method of steepest ascent to search the
region of factor levels that produce optimal conditions for
further optimization of fermentative hydrogen production
processes [60,67]. For example, Pan et al. used the method of
steepest ascent to find the design centers of glucose, phos-
phate buffer and vitamin solution for further optimization [60].
3.2.4. Central composite design and Box–Behnken designOnce the region of optimal response is identified by the
method of steepest ascent, it is often necessary to charac-
terize the response in that region. Central composite design

i n t e r n a t i o n a l j o u r n a l o f h y d r o g e n e n e r g y 3 4 ( 2 0 0 9 ) 2 3 5 – 2 4 4240
and Box–Behnken design are widely used experimental
designs for response surface methodology to estimate
a second-order polynomial approximation to a response in
that region.
Central composite design is a five-level fractional factorial
design developed by Box and Wilson [77]. The design usually
consists of a 2n full factorial design, 2� n axial designs and m
central designs. The axial design is identical to the central
design except for one factor, which will take on levels either
above the high level or below the low levels of the 2n full
factorial design [35]. For example, Thong et al. studied the
effects of Fe2þ concentration, C/N ratio and C/P ratio on
fermentative hydrogen production using a central composite
design. They concluded that the presence of 257 mg Fe2þ/L, C/
N ratio of 74 and C/P ratio of 559 were optimal for simulta-
neous hydrogen production and COD (chemical oxygen
demand) removal, and Fe2þ concentration and C/N ratio had
the greatest interactive effect on hydrogen production, while
C/N and C/P ratio gave more profound interactive effect on
COD removal [70].
Box–Behnken design is a three-level fractional factorial
design developed by Box and Behnken [78]. The design can be
thought of as a combination of a two-level factorial design
with an incomplete block design. In each block, a certain
number of factors are put through all combinations for the
factorial design, while other factors are kept at the central
levels. It usually includes some central designs. For example,
Pan et al. studied the effects of glucose, phosphate buffer and
vitamin solution on fermentative hydrogen production using
a Box–Behnken design. They concluded that glucose and
vitamin solution, and glucose and phosphate buffer had
interactive effects on hydrogen production and the optimal
conditions were glucose 23.75 g/L, phosphate buffer
0.159 mol/L and vitamin solution 13.3 mL/L [60]. Box–Behnken
design provides an economical alternative to the central
composite design, because it has less factor levels than the
central composite design and does not contain extreme high
or extreme low levels. For example, Pan et al. studied the
effects of 3 factors, namely glucose, phosphate buffer and
vitamin solution (each at 3 levels), on fermentative hydrogen
production using a Box–Behnken design in 15 runs of experi-
ment [60], while Thong et al. studied the effects of 3 factors,
namely Fe2þ concentration, C/N ratio and C/P ratio (each at 5
levels), on fermentative hydrogen production using a central
composite design in 20 runs of experiment [70].
For response surface methodology, a second-order poly-
nomial model (Eq. (2)) is usually proposed to describe the
Fig. 2 – Surface plot (a) and cont
effects of various factors on a response based on experimental
results from a central composite design or Box–Behnken
design.
y ¼ b0 þXk
i¼1
bixi þXk
i¼1
biix2i þ
X
i<j
bijxixj (2)
where y is the response, b0 is the constant and bi is the linear
coefficient, bii is quadratic coefficient, bij is the interactive
coefficient and xi is the coded factor level.
As shown in Fig. 2, the estimated second-order polynomial
model can be displayed as a surface plot and a contour plot, by
varying only two factor levels, while keeping other factor
levels constant.
The surface plot and contour plot will visually show the
response over a region of interesting factor levels. In addition,
they will indicate how sensitive the response is to the change
of each factor levels and to what degree the factors interplay
as they affect the response.
Based on the analysis of variance (ANOVA) of the estimated
model, terms which have significant effects on the response
can be determined. In addition, with the aid of the regression
model, the optimal response can be estimated by calculating
the derivatives of the model.
For example, Jo et al. investigated the effects of glucose
concentration, temperature and pH on the hydrogen produc-
tion using a Box–Behnken design for response surface meth-
odology. A second-order polynomial model was used to
describe the effects of the three factors on the hydrogen
production rate. Several surface plots and contour plots were
plotted to visually show the effects of the three factors on the
hydrogen production rate. Based on the analysis of variance of
the estimated model, they concluded that glucose concen-
tration, temperature and pH all had interactive effects on the
hydrogen production rate. In addition, with the aid of the
regression model, the optimum conditions obtained by them
were glucose concentration 118.06 mmol/L, temperature 38 �C
and pH 6.13 [73].
As shown in Table 3, central composite design has been
used more widely for fermentative hydrogen production
processes, compared with Box–Behnken design. Since Box–
Behnken design provides an economical alternative to the
central composite design, using it in the study of fermentative
hydrogen production is recommended.
3.2.5. Neural network and genetic algorithmIn recent years, as a mathematical representation of the
neurological functioning of a brain, neural network, which is
our plot, (b) for a response.
i n t e r n a t i o n a l j o u r n a l o f h y d r o g e n e n e r g y 3 4 ( 2 0 0 9 ) 2 3 5 – 2 4 4 241
able to describe the interactive effects of various factors on
a complicated process, has been applied successfully in
a multivariate non-linear process as a useful tool to
construct models. It has been shown that a neural network
model is more accurate than a second-order polynomial
model as it represents the non-linearities in a much better
way [79,80].
A neural network model can be considered as the objective
function for the purpose of optimization. However, using
conventional optimization techniques such as gradient-based
methods to optimize a neural network model is not a simple
task because it is difficult to calculate the derivatives of the
model. Genetic algorithm, which is based on the principles of
evolution through natural selection, that is, the survival of the
fittest strategy, has established itself as a powerful search and
optimization technique to solve problems with objective
functions that are not continuous or differentiable. In recent
years, genetic algorithm based on a neural network model has
been applied successfully to optimize complicated bio-
processes [79,80].
In addition, Nagata and Chu showed that the optimal
solution identified by response surface methodology was not
guaranteed to be optimal due to the poor modeling ability of
the second-order polynomial model, while a neural network
model had a much higher modeling ability than it, and the
optimal solution identified by the genetic algorithm based on
a neural network model was much better than that identified
by response surface methodology [80].
In a word, the genetic algorithm based on a neural network
model is a better optimization method than response surface
methodology. To the best of our knowledge, however, the
genetic algorithm based on a neural network model has not
been used to optimize a fermentative hydrogen production
process, thus using it for such purpose is recommended.
3.2.6. Multiple-response optimizationMoreover, many experiments involve the optimization of two
or more conflicting responses, that is, the optimization of one
response usually worsens the optimization of other responses.
Simultaneous optimization of multiple responses involves
first building an appropriate model for each response and then
trying to find a set of operating conditions that in some sense
optimizes all responses or at least keeps them in desired
ranges.
One useful approach to multiple-response optimization is
the method of desirability function [36]. The general approach
is to first convert each response yi into an individual desir-
ability function di that ranges from 0 to 1. If the response yi is
at its goal or target, then di¼ 1, while if the response is outside
an acceptable range, then di¼ 0. Then the design factor levels
are chosen to maximize the overall desirability D (Eq. (3)),
which is the geometric mean of all the individual desirability
functions.
D ¼ ðd1 � d2 �/� dmÞ1=m (3)
In other words, the simultaneous optimization of several
responses can be achieved by determining the maximum of
the overall desirability. Thus, the simultaneous optimization
of several responses can be reduced to maximizing a single
response: the overall desirability.
Among the reviewed studies, Espinoza-Escalante et al. and
Cuetos et al. used the method of desirability function to opti-
mize several responses simultaneously for fermentative
hydrogen production processes [53,64], while most other
studies optimized several responses separately for fermenta-
tive hydrogen production processes. For example, Espinoza-
Escalante et al. optimized several responses, namely COD
increment, total sugar consumption, acetic acid increment
rate, propionic acid increment rate, butyric acid increment
rate and hydrogen accumulated production simultaneously
for a fermentative hydrogen production process using the
method of desirability function. Several second-order poly-
nomial models were used to describe the effects of alkalin-
ization, thermical treatment and sonication on the above
responses, and then each response was converted into an
individual desirability function. Subsequently, the geometric
mean of the individual desirability functions was built to form
the overall desirability. In the end, it was observed that the
higher overall desirability value was achieved when Tequila’s
stillages were pretreated at the alkalinization of 7, thermical
treatment of 150 �C/30 min and sonication of 47 kHz/30 min,
which were the global optimal conditions for the above
responses obtained by them [53]. Otherwise, without multiple-
response optimization, they would have had to optimize the
above responses separately.
Thus, when there are many responses to be optimized,
using the method of desirability function to optimize several
responses simultaneously for fermentative hydrogen
production processes is highly recommended.
4. Recommended experimentaldesign strategy
From the above analysis in this review, the following experi-
mental design strategy for optimizing a fermentative
hydrogen production process is highly recommended.
First of all, Plackett–Burman design is used to screen the
key factors of a fermentative hydrogen production process for
further study. And then, the method of steepest ascent is used
to approach the vicinity of the optimal conditions. Subse-
quently, central composite design or Box–Behnken design for
response surface methodology can be used to estimate the
relationship between a response and these key factors at the
vicinity of optimum and then locate the optimal conditions
based on a second-order polynomial model [36].
Among the reviewed studies, only the study by Pan et al.
first used Plackett–Burman design to study the effects of 8
factors on fermentative hydrogen production and then
screened 3 key factors (glucose, phosphate buffer and vitamin
solution). And then they used the method of steepest ascent to
find the design centers of the three factors for Box–Behnken
design. Subsequently, they used Box–Behnken design for
response surface methodology to study the effects of the three
factors on fermentative hydrogen production and concluded
that the optimal conditions for fermentative hydrogen
production were glucose 23.75 g/L, phosphate buffer
0.159 mol/L and vitamin solution 13.3 mL/L [60].
Moreover, the genetic algorithm based on a neural
network model can be used for optimizing a fermentative

i n t e r n a t i o n a l j o u r n a l o f h y d r o g e n e n e r g y 3 4 ( 2 0 0 9 ) 2 3 5 – 2 4 4242
hydrogen production process when necessary. In addition, if
there are many responses to be optimized for the process,
optimizing simultaneously these responses is highly
recommended.
5. Software packages for factorial design andanalysis
So far, several commercial software packages such as Design-
Expert (Stat-Ease, Inc., USA), Minitab (Minitab, Inc., USA) and
so on are able to conduct the above mentioned factorial design
such as Taguchi design, Plackett–Burman design, central
composite design and Box–Behnken design and their analysis.
Take using Minitab for example, as for the Plackett–Bur-
man design, one can first use Minitab to generate a Plackett–
Burman design with the corresponding high levels and low
levels for each factor. And then one can perform the experi-
ment and collect the response data. After that, one can fit the
response data using a first-order polynomial model and then
analyze the model to determine which factors have significant
effects on the responses for further optimization. As for the
Box–Behnken design, one can first use Minitab to generate
a Box–Behnken design with the corresponding high levels and
low levels for each factor. And then one can perform the
experiment and collect the response data. After that, one can
fit the response data using a second-order polynomial model
and then analyze the model to determine which factors have
significant effects on the response. If one tries to optimize one
response or multiple responses at the same time, one can first
set the goal (such as maximum and minimum) for each
response to be optimized and then conduct the optimization.
For example, Pan et al. conducted a Plackett–Burman
design and analysis, as well as Box–Behnken design and
analysis using Minitab [60]. Each software package has its
unique character, thus it is up to the user to decide which one
is more suitable.
The training of a neural network and the optimization of
a fermentative hydrogen production process by genetic algo-
rithm based on a neural network model can be performed by
the software package of Matlab (Mathworks, Inc., USA) using
its neural network toolbox and genetic algorithm toolbox,
respectively.
In addition, multiple-response optimization for response
surface methodology by the method of desirability function
can be performed either by the software package of Design-
Expert or the software package of Minitab.
Furthermore, multiple-response optimization for several
responses based on neural network models can be carried out
by genetic algorithm using the software package of Matlab.
Acknowledgements
We are grateful to the precious comments and careful
correction made by anonymous reviewers. We would also like
to thank the National Natural Science Foundation of China for
financially supporting this research under Contract No.
50325824.
r e f e r e n c e s
[1] Wang JL, Wan W. Effect of Fe2þ concentrations onfermentative hydrogen production by mixed cultures. Int JHydrogen Energy 2008;33:1215–20.
[2] Wang JL, Wan W. Comparison of different pretreatmentmethods for enriching hydrogen-producing cultures fromdigested sludge. Int J Hydrogen Energy 2008;33:2934–41.
[3] Wang JL, Wan W. Influence of Ni2þ concentration onbiohydrogen production. Bioresour Technol 2008;99:8864–8.
[4] Wang JL, Wan W. The effect of substrate concentration onbiohydrogen production by using kinetic models. Sci ChinaSer B – Chem 2008;51:1110–7.
[5] Li CL, Fang HHP. Fermentative hydrogen production fromwastewater and solid wastes by mixed cultures. Crit Rev EnvSci Technol 2007;37:1–39.
[6] Luftig JT, Jordan VS. Design of experiments in qualityengineering. NY: McGraw-Hill; 1998.
[7] Ito T, Nakashimada Y, Kakizono T, Nishio N. High-yieldproduction of hydrogen by Enterobacter aerogenes mutantswith decreased a-acetolactate synthase activity. J BiosciBioeng 2004;97:227–32.
[8] Chittibabu G, Nath K, Das D. Feasibility studies on thefermentative hydrogen production by recombinantEscherichia coli BL-21. Process Biochem 2006;41:682–8.
[9] Ishikawa M, Yamamura S, Ikeda R, Takamura Y, Sode K,Tamiya E, et al. Development of a compact stacked flatbedreactor with immobilized high-density bacteria for hydrogenproduction. Int J Hydrogen Energy 2008;33:1593–7.
[10] Mu Y, Zheng XJ, Yu HQ, Zhu RF. Biological hydrogenproduction by anaerobic sludge at various temperatures. Int JHydrogen Energy 2006;31:780–5.
[11] O-Thong S, Prasertsan P, Karakashev D, Angelidaki I.Thermophilic fermentative hydrogen production by thenewly isolated Thermoanaerobacterium thermosaccharolyticumPSU-2. Int J Hydrogen Energy 2008;33:1204–14.
[12] Kim SH, Han SK, Shin HS. Effect of substrate concentrationon hydrogen production and16S rDNA-based analysis of themicrobial community in a continuous fermenter. ProcessBiochem 2006;41:199–207.
[13] Yang HJ, Shao P, Lu TM, Shen JQ, Wang DF, Xu ZN, et al.Continuous bio-hydrogen production from citric acidwastewater via facultative anaerobic bacteria. Int J HydrogenEnergy 2006;31:1306–13.
[14] Chen WM, Tseng ZJ, Lee KS, Chang JS. Fermentativehydrogen production with Clostridium butyricum CGS5isolated from anaerobic sewage sludge. Int J HydrogenEnergy 2005;30:1063–70.
[15] Yang PL, Zhang RH, McGarvey JA, Benemann JR. Biohydrogenproduction from cheese processing wastewater by anaerobicfermentation using mixed microbial communities. Int JHydrogen Energy 2007;32:4761–71.
[16] Liu GZ, Shen JQ. Effects of culture and medium conditions onhydrogen production from starch using anaerobic bacteria. JBiosci Bioeng 2004;98:251–6.
[17] Kim JO, Kim YH, Yeom SH, Song BK, Kim IH. Enhancingcontinuous hydrogen gas production by the addition ofnitrate into an anaerobic reactor. Process Biochem 2006;41:1208–12.
[18] Lin CY, Lay CH. Carbon/nitrogen-ratio effect on fermentativehydrogen production by mixed microflora. Int J HydrogenEnergy 2004;29:41–5.
[19] Oh YK, Seol EH, Kim JR, Park S. Fermentative biohydrogenproduction by a new chemoheterotrophic bacteriumCitrobacter sp. Y19. Int J Hydrogen Energy 2003;28:1353–9.
[20] Lee YJ, Miyahara T, Noike T. Effect of iron concentration onhydrogen fermentation. Bioresour Technol 2001;80:227–31.

i n t e r n a t i o n a l j o u r n a l o f h y d r o g e n e n e r g y 3 4 ( 2 0 0 9 ) 2 3 5 – 2 4 4 243
[21] Wang XJ, Ren NQ, Xiang WS, Guo WQ. Influence of gaseousend-products inhibition and nutrient limitations on thegrowth and hydrogen production by hydrogen-producingfermentative bacterial B49. Int J Hydrogen Energy 2007;32:748–54.
[22] Guo L, Li XM, Bo X, Yang Q, Zeng GM, Liao DX, et al. Impactsof sterilization, microwave and ultrasonication pretreatmenton hydrogen producing using waste sludge. BioresourTechnol 2008;99:3651–8.
[23] Ishikawa M, Yamamura S, Takamura Y, Sode K, Tamiya E,Tomiyama M. Development of a compact high-densitymicrobial hydrogen reactor for portable bio-fuel cell system.Int J Hydrogen Energy 2006;31:1484–9.
[24] Ntaikou I, Gavala HN, Kornaros M, Lyberatos G. Hydrogenproduction from sugars and sweet sorghum biomass usingRuminococcus albus. Int J Hydrogen Energy 2008;33:1153–63.
[25] Zheng XJ, Yu HQ. Inhibitory effects of butyrate on biologicalhydrogen production with mixed anaerobic cultures. JEnviron Manage 2005;74:65–70.
[26] Khanal SK, Chen WH, Li L, Sung S. Biological hydrogenproduction: effects of pH and intermediate products. Int JHydrogen Energy 2004;29:1123–31.
[27] Fang HHP, Liu H. Effect of pH on hydrogen production fromglucose by a mixed culture. Bioresour Technol 2002;82:87–93.
[28] Lin CY, Wu CC, Hung CH. Temperature effects onfermentative hydrogen production from xylose using mixedanaerobic cultures. Int J Hydrogen Energy 2008;33:43–50.
[29] Chen SD, Lee KS, Lo YC, Chen WM, Wu JF, Lin CY, et al. Batchand continuous biohydrogen production from starchhydrolysate by Clostridium species. Int J Hydrogen Energy2008;33:1803–12.
[30] Evvyernie D, Yamazaki S, Morimoto K, Karita S, Kimura T,Sakka K, et al. Identification and characterization ofClostridium paraputrificum M-21, a chitinolytic, mesophilicand hydrogen-producing bacterium. J Biosci Bioeng 2000;89:596–601.
[31] Collet C, Adler N, Schwitzguebel JP, Peringer P. Hydrogenproduction by Clostridium thermolacticum during continuousfermentation of lactose. Int J Hydrogen Energy 2004;29:1479–85.
[32] Lee KS, Lo YS, Lo YC, Lin PJ, Chang JS. Operation strategies forbiohydrogen production with a high-rate anaerobic granularsludge bed bioreactor. Enzyme Microb Technol 2004;35:605–12.
[33] Kumar N, Das D. Continuous hydrogen production byimmobilized Enterobacter cloacae IIT-BT 08 usinglignocellulosic materials as solid matrices. Enzyme MicrobTechnol 2001;29:280–7.
[34] Kennedy M, Krouse D. Strategies for improving fermentationmedium performance: a review. J Ind Microbiol Biotechnol1999;23:456–75.
[35] Kuehl RO. Design of experiments: statistical principles ofresearch design and analysis. Pacific Grove (CA): DuxburyPress; 2000.
[36] Montgomery DC. Design and analysis of experiments. NY:John Wiley & Sons; 2005.
[37] Chen CC, Lin CY, Lin MC. Acid-base enrichment enhancesanaerobic hydrogen production process. Appl MicrobiolBiotechnol 2002;58:224–8.
[38] Wang Y, Mu Y, Yu HQ. Comparative performance of twoupflow anaerobic biohydrogen-producing reactors seededwith different sludges. Int J Hydrogen Energy 2007;32:1086–94.
[39] Wu KJ, Chang JS. Batch and continuous fermentativeproduction of hydrogen with anaerobic sludge entrapped ina compositepolymericmatrix.Process Biochem2007;42:279–84.
[40] Lay JJ. Biohydrogen generation by mesophilic anaerobicfermentation of microcrystalline cellulose. BiotechnolBioeng 2001;74:280–7.
[41] Chang FY, Lin CY. Calcium effect on fermentative hydrogenproduction in an anaerobic up-flow sludge blanket system.Water Sci Technol 2006;54:105–12.
[42] Ueno Y, Sasaki D, Fukui H, Haruta S, Ishii M, Igarashi Y.Changes in bacterial community during fermentativehydrogen and acid production from organic waste bythermophilic anaerobic microflora. J Appl Microbiol 2006;101:331–43.
[43] van Niel EWJ, Budde MAW, de Haas GG, van der Wal FJ,Claassen PAM, Stams AJM. Distinctive properties of highhydrogen producing extreme thermophiles,Caldicellulosiruptor saccharolyticus and Thermotoga elfii. Int JHydrogen Energy 2002;27:1391–8.
[44] Yang HJ, Shen JQ. Effect of ferrous iron concentration onanaerobic bio-hydrogen production from soluble starch. Int JHydrogen Energy 2006;31:2137–46.
[45] Valdez-Vazquez I, Rios-Leal E, Munoz-Paez KM, Carmona-Martınez A, Poggi-Varaldo HM. Effect of inhibition treatment,type of inocula, and incubation temperature on batch H2
production from organic solid waste. Biotechnol Bioeng 2006;95:342–9.
[46] Zhang YF, Shen JQ. Effect of temperature and ironconcentration on the growth and hydrogen production ofmixed bacteria. Int J Hydrogen Energy 2006;31:441–6.
[47] Kalogo Y, Bagley DM. Fermentative hydrogen gas productionusing biosolids pellets as the inoculum source. BioresourTechnol 2008;99:540–6.
[48] Levin DB, Islam R, Cicek N, Sparling R. Hydrogen productionby Clostridium thermocellum 27405 from cellulosic biomasssubstrates. Int J Hydrogen Energy 2006;31:1496–503.
[49] Lin CY, Chang RC. Hydrogen production during the anaerobicacidogenic conversion of glucose. J Chem Technol Biotechnol1999;74:498–500.
[50] Salerno MB, Park W, Zuo Y, Logan BE. Inhibition ofbiohydrogen production by ammonia. Water Res 2006;40:1167–72.
[51] Yokoi H, Saitsu A, Uchida H, Hirose J, Hayashi S, Takasaki Y.Microbial hydrogen production from sweet potato starchresidue. J Biosci Bioeng 2001;91:58–63.
[52] Wu SY, Lin CN, Chang JS, Lee KS, Lin PJ. Microbial hydrogenproduction with immobilized sewage sludge. Biotechnol Prog2002;18:921–6.
[53] Espinoza-Escalante FM, Pelayo-Ortiz C, Gutierrez-Pulido H,Gonzalez-Alvarez V, Alcaraz-Gonzalez V, Bories A. Multipleresponse optimization analysis for pretreatments ofTequila’s stillages for VFAs and hydrogen production.Bioresour Technol 2008;99:5822–9.
[54] Chou CH, Wang CW, Huang CC, Lay JJ. Pilot study of theinfluence of stirring and pH on anaerobes converting high-solid organic wastes to hydrogen. Int J Hydrogen Energy 2008;33:1550–8.
[55] Hu B, Chen SL. Pretreatment of methanogenic granules forimmobilized hydrogen fermentation. Int J Hydrogen Energy2007;32:3266–73.
[56] Chen CC, Lin CY. Using sucrose as a substrate in ananaerobic hydrogen-producing reactor. Adv Environ Res2003;7:695–9.
[57] Wu KJ, Chang CF, Chang JS. Simultaneous production ofbiohydrogen and bioethanol with fluidized-bed and packed-bed bioreactors containing immobilized anaerobic sludge.Process Biochem 2007;42:1165–71.
[58] Lin CY, Lay CH. Effects of carbonate and phosphateconcentrations on hydrogen production using anaerobicsewage sludge microflora. Int J Hydrogen Energy 2004;29:275–81.
[59] Lin CY, Lay CH. A nutrient formulation for fermentativehydrogen production using anaerobic sewage sludgemicroflora. Int J Hydrogen Energy 2005;30:285–92.

i n t e r n a t i o n a l j o u r n a l o f h y d r o g e n e n e r g y 3 4 ( 2 0 0 9 ) 2 3 5 – 2 4 4244
[60] Pan CM, Fan YT, Xing Y, Hou HW, Zhang ML. Statisticaloptimization of process parameters on biohydrogenproduction from glucose by Clostridium sp. Fanp2. BioresourTechnol 2008;99:3146–54.
[61] van Ginkel S, Sung S, Lay JJ. Biohydrogen production asa function of pH and substrate concentration. EnzymeMicrob Technol 2001;35:4726–30.
[62] Argun H, Kargi F, Kapdan IK, Oztekin R. Biohydrogenproduction by dark fermentation of wheat powder solution:effects of C/N and C/P ratio on hydrogen yield and formationrate. Int J Hydrogen Energy 2008;33:1813–9.
[63] Karlsson A, Vallin L, Ejlertsson J. Effects of temperature,hydraulic retention time and hydrogen extraction rate onhydrogen production from the fermentation of food industryresidues and manure. Int J Hydrogen Energy 2008;33:953–62.
[64] Cuetos MJ, Gomez X, Escapa A, Moran A. Evaluation andsimultaneous optimization of bio-hydrogen productionusing 32 factorial design and the desirability function. J PowSour 2007;169:131–9.
[65] Lay JJ, Fan KS, Hwang JI, Chang JI, Hsu PC. Factors affectingthe hydrogen production from food wastes by Clostridium-rich composts. J Environ Eng 2005;131:595–602.
[66] Lay JJ, Lee YJ, Noike T. Feasibility of biological hydrogenproduction form organic fraction of municipal solid waste.Water Res 1999;33:2579–86.
[67] Lay JJ. Modeling and optimization of anaerobic digestedsludge converting starch to hydrogen. Biotechnol Bioeng2000;68:269–78.
[68] Zhao BH, Yue ZB, Zhao QB, Mu Y, Yu HQ, Harada H, et al.Optimization of hydrogen production in a granule-basedUASB reactor. Int J Hydrogen Energy 2008;33:2454–61.
[69] Fan YT, Li CL, Lay JJ, Hou HW, Zhang GS. Optimization ofinitial substrate and pH levels for germination of sporinghydrogen-producing anaerobes in cow dung compost.Bioresour Technol 2004;91:189–93.
[70] O-Thong S, Prasertsan P, Intrasungkha N, Dhamwichukorn S,Birkeland NK. Optimization of simultaneous thermophilicfermentative hydrogen production and COD reduction frompalm oil mill effluent by Thermoanaerobacterium-rich sludge.Int J Hydrogen Energy 2008;33:1221–31.
[71] Mu Y, Wang G, Yu HQ. Response surface methodologicalanalysis on biohydrogen production by enriched anaerobiccultures. Enzyme Microb Technol 2006;38:905–13.
[72] Wang G, Mu Y, Yu HQ. Response surface analysis to evaluatethe influence of pH, temperature and substrateconcentration on the acidogenesis of sucrose-richwastewater. Biochem Eng J 2005;23:175–84.
[73] Jo JH, Lee DS, Park D, Choe W, Park JM. Optimization of keyprocess variables for enhanced hydrogen production byEnterobacter aerogenes using statistical methods. BioresourTechnol 2008;99:2061–6.
[74] Plackett RL, Burman JP. The design of multifactorialexperiments. Biometrika 1946;33:305–25.
[75] Weuster-Botz D. Experimental design for fermentationmedia development: statistical design or global randomsearch? J Biosci Bioeng 2000;90:473–83.
[76] Antony J. Taguchi or classical design of experiments: a.perspective from a practitioner. Sens Rev 2006;26:227–30.
[77] Box GEP, Wilson KB. On the experimental attainment ofoptimum conditions. J Roy Stat Soc B 1951;13:1–45.
[78] Box GEP, Behnken DW. Some new three-level designs for thestudy of quantitative variables. Technometrics 1960;2:455–75.
[79] He L, Xu YQ, Zhang XH. Medium factors optimization andfermentation kinetics for phenazine-1-carboxylic acidproduction by Pseudomonas sp. M18G. Biotechnol Bioeng2008;100:250–9.
[80] Nagata Y, Chu KH. Optimization of a fermentation mediumusing neural networks and genetic algorithms. BiotechnolLett 2003;25:1837–42.
Copyright © 2022 FDOKUMEN