Experimental and numerical investigation on a two-phase natural circulation test facility
12
Experimental and Numerical Investigation on Torsional Strengthening of Reinforced Concrete Beams Using FRP Sheets El Mostafa Higazy 1 and Mahmoud El-Kateb 2 ABSTRACT Environmentally-induced degradation, aging, service load augmentation among a multitude of other constructional and serviceability sources of risk, deemed the repair and strengthening of civil structures a crucial necessity. Bridge and building elements are customarily subjected to significant torsional moments that affect the design, and may require strengthening. FRP composites have shown great promise as a state-of-the-art material in flexural and shear strengthening as external reinforcement. However, its applicability in torsional strengthening of RC beams, have received lesser attention, in terms of both experimental and numerical research. The main objectives of the current study are to investigate, experimentally and analytically, the torsional behavior of RC beams strengthened with externally bonded fiber reinforced polymer (FRP) sheets, and to identify the influence of the investigated parameters affecting the torsional behavior on the effectiveness and feasibility of strengthening. The experimental program recounts an overall investigation of torsional strengthening of five rectangular reinforced concrete beams with externally bonded carbon fiber-reinforced polymer (CFRP) sheets under the effect of combined flexure, shear and torsion. Specimens are strengthened with CFRP composite wraps. The main parameters investigated are the CFRP warps spacing and number of plies. The concrete grade and steel reinforcement ratio are kept constant for all specimens. In the experimental findings, the increase in the ultimate torsional moment for different strengthening configurations, performance improvement and crack patterns are presented. In the analytical part of this research, an analysis was carried out on the experimental findings and then a numerical simulation was carried out using non-linear finite element (FE) modeling. Results are compared and discussed with experimental findings. Finally, a parametric study was conducted to cover wider range of variables includes; full wrapping of beams, using glass fiber reinforced polymer (GFRP), and using square beam section as a higher torsional stiffness. Keywords: Strengthening; Numerical analysis; Reinforced concrete; Beams; Torsion; FRP 1 Structural Engineering Dept., Faculty of Engineering, Ain Shams University, Egypt. E-mail: [email protected] 2 Structural Engineering Dept., Faculty of Engineering, Ain Shams University, Egypt. E-mail: [email protected] 1. INTRODUCTION In recent decades, due to aging of most structures and for sustainability of satisfactory performance of the existing structural system, repair and strengthening of bridges, buildings, and other civil engineering structures have become necessary. Generally, most structures require repair and strengthening for several reasons such as; environmentally induced degradation, increases in service loads, changes in use of the structure, design and/or construction errors, changes in design code regulations, and seismic retrofits. Particularly, some reinforced concrete (RC) elements such as beams may be deficient in torsional shear capacity and in need of strengthening. These deficiencies may occur for several reasons, such as insufficient stirrups resulting from construction errors or inadequate design, reduction in the effective steel area due to corrosion, or increased demand due to a change in occupancy. In current practice, torsional strengthening of concrete members is achieved by one of the following methods; 1) increasing the member cross-sectional area combined with adding of transverse reinforcement, 2) using externally bonded steel plates and pressure grouting the gap between plate and concrete element, and 3) applying an axial load to the member by post- tensioning. Although these methods will continue to be used in many more instances, fiber reinforced polymer (FRP) composites provide another option for strengthening. FRP composites have shown great promise as a state-of-the-art material in flexural and shear strengthening as external reinforcement. Studies of flexural and shear strengthening of RC beams using FRP have been formed since the early nineties of the last century. However, little attention has been paid
Transcript of Experimental and numerical investigation on a two-phase natural circulation test facility

Experimental and Numerical Investigation on Torsional Strengthening of Reinforced Concrete Beams Using FRP Sheets
El Mostafa Higazy1 and Mahmoud El-Kateb2
ABSTRACT
Environmentally-induced degradation, aging, service load augmentation among a multitude of other constructional and serviceability sources of risk, deemed the repair and strengthening of civil structures a crucial necessity. Bridge and building elements are customarily subjected to significant torsional moments that affect the design, and may require strengthening. FRP composites have shown great promise as a state-of-the-art material in flexural and shear strengthening as external reinforcement. However, its applicability in torsional strengthening of RC beams, have received lesser attention, in terms of both experimental and numerical research. The main objectives of the current study are to investigate, experimentally and analytically, the torsional behavior of RC beams strengthened with externally bonded fiber reinforced polymer (FRP) sheets, and to identify the influence of the investigated parameters affecting the torsional behavior on the effectiveness and feasibility of strengthening. The experimental program recounts an overall investigation of torsional strengthening of five rectangular reinforced concrete beams with externally bonded carbon fiber-reinforced polymer (CFRP) sheets under the effect of combined flexure, shear and torsion. Specimens are strengthened with CFRP composite wraps. The main parameters investigated are the CFRP warps spacing and number of plies. The concrete grade and steel reinforcement ratio are kept constant for all specimens. In the experimental findings, the increase in the ultimate torsional moment for different strengthening configurations, performance improvement and crack patterns are presented. In the analytical part of this research, an analysis was carried out on the experimental findings and then a numerical simulation was carried out using non-linear finite element (FE) modeling. Results are compared and discussed with experimental findings. Finally, a parametric study was conducted to cover wider range of variables includes; full wrapping of beams, using glass fiber reinforced polymer (GFRP), and using square beam section as a higher torsional stiffness. Keywords: Strengthening; Numerical analysis; Reinforced concrete; Beams; Torsion; FRP
1 Structural Engineering Dept., Faculty of Engineering, Ain Shams University, Egypt. E-mail: [email protected] 2 Structural Engineering Dept., Faculty of Engineering, Ain Shams University, Egypt. E-mail: [email protected]
1. INTRODUCTION
In recent decades, due to aging of most structures and for sustainability of satisfactory performance of the existing structural system, repair and strengthening of bridges, buildings, and other civil engineering structures have become necessary. Generally, most structures require repair and strengthening for several reasons such as; environmentally induced degradation, increases in service loads, changes in use of the structure, design and/or construction errors, changes in design code regulations, and seismic retrofits. Particularly, some reinforced concrete (RC) elements such as beams may be deficient in torsional shear capacity and in need of strengthening. These deficiencies may occur for several reasons, such as insufficient stirrups resulting from construction errors or inadequate design, reduction in the effective steel area due to
corrosion, or increased demand due to a change in occupancy. In current practice, torsional strengthening of concrete members is achieved by one of the following methods; 1) increasing the member cross-sectional area combined with adding of transverse reinforcement, 2) using externally bonded steel plates and pressure grouting the gap between plate and concrete element, and 3) applying an axial load to the member by post-tensioning. Although these methods will continue to be used in many more instances, fiber reinforced polymer (FRP) composites provide another option for strengthening. FRP composites have shown great promise as a state-of-the-art material in flexural and shear strengthening as external reinforcement. Studies of flexural and shear strengthening of RC beams using FRP have been formed since the early nineties of the last century. However, little attention has been paid

to its applicability in torsional strengthening of RC beams in terms of experimental [1], [2], [3] and numerical research [4], [5] due to the specialized nature of the problem and the difficulties in conducting realistic tests and representative analyses. This paper attempts to fill the gap in that area by investigating the torsional behavior of RC beams strengthened with externally bonded CFRP sheets (wraps) under the effect of combined flexure, shear and torsion. Rectangular cross sections were adopted in the current study. The main objective of the current study is to identify the influence of the investigated parameters affecting the torsional behavior on the effectiveness and feasibility of strengthening. Also, a numerical analysis was carried out on the test specimens to verify the experimental results. Straus7; a non-linear finite element analysis software has been used to simulate the full-scale beams in both linear and nonlinear ranges of response up to failure and the results are compared with the experimental finding. The
results as will be shown later are in reasonable agreement with the experiments for the ultimate torques and ultimate deformations. Finally, a parametric study was carried out using the FE software to simulate wider range of variables. The parametric study included; full wrapping of beams as an additional value of wrap spacing, using GFRP in wrapping instead of CFRP, and studying square beam section as a higher value of beam torsional stiffness.
2. EXPERIMENTAL PROGRAM
2.1 Specimen’s Details
The experimental program recounts an overall investigation of five rectangular reinforced concrete beams (120 x 300mm). All beams are 3100 mm long. The dimensions of the test specimens and the reinforcement details are shown in Figure 1.
3100
3#16
1#16
2#10
2#10
5#6/m
5#6/m
5#6/m
3#16
1#16
120
300
Figure 1: Dimensions and reinforcement details of test specimens
The main parameters investigated are the CFRP composite wrap spacing and the number of plies. One specimen was kept without strengthening as control specimen, while other specimens were strengthened with 100 mm width CFRP composite all around wraps which were placed at spacing of 100 mm and 150 mm using one layer and two layers of the CFRP composites. The compressive strength of concrete (fc
`) was 20 MPa and was kept constant for all specimens. The wrapping scheme is shown in Figure 2 and Test specimen matrix is listed in Table 1. In this research, Sikawrap Hex 230C CFRP
sheets and Sikadur 330 impregnation resin were used. All materials are supplied by Sika. The mechanical properties of the CFRP sheets are given in Table 2. In preparation of the reinforced concrete beam for fiber wrapping, the edges were rounded so that there were no sharp corners that would contribute to the reduction of the fiber strength.
Figure 2: The wrapping scheme

Table 1: Test specimen matrix
Specimen Wrap spacing No. of layers
BR1 Control specimen
BR2 3100
100150100150100150100150100 100 400400
1 ply
BR3 3100
100150100150100150100150100 100 400400
2 plies
BR4 100100
3100300 100 100 100 100 100 100 100 100 100 100 100 100 300
1 ply
BR5 100100
3100300 100 100 100 100 100 100 100 100 100 100 100 100 300
2 plies
Table 2: Mechanical properties of CFRP sheets
Thickness (mm)
Tensile Strength MPa
Tensile Modulus MPa
Ultimate Strain %
0.12 4,100 231,000 1.70
2.2 Test Setup
Specimens were eccentrically loaded with two concentrated loads at third points of the beam span. Eccentric loads were transferred to the beam using two steel jackets specially designed to accommodate and transfer the applied load without being failed or distorted. Beams were fixed from both ends to the laboratory rigid steel
frame against vertical and transverse displacements but were free to have other displacements. A load cell was placed in the middle of the two steel jackets to divide the applied load on both loading points equally using a rigid steel beam. A diagrammatic sketch for the test setup is shown in Figure 3.
Fixation bolts
Fixation bolts
Specimen
Steel jacketSteel jacket
Lab. steel frame
Load cell Lab. steel frame
Steel jacket
Rigid beam
Rigid beam
Load cell
Sec. (2-2)
2
2
1
1
Sec. (1-1)
Elevation
Figure 3: Diagrammatic sketch of the test setup
2.3 Instrumentation
Displacement transducers were the main devices used for measuring the imposed and resulting displacements in the test. Linear variable displacement transducers (LVDTs) of maximum gauge length of 100mm and precision of 1/100 of mm were used to measure the various types of displacement that make up the total displacements of the specimens. The combination of LVDTs was installed at the loading location, and at support to measure the components of displacement in two directions, in order to evaluate the angle of rotation of the beam.
Electrical strain gauges were the main
instrumentation used for measuring the strains during the test. Three electrical strain gauges with 10mm gauge length were bonded to the longitudinal and transverse reinforcement bars in appropriate locations. In addition, two strain gauges were bonded to each CFRP wrap on its both sides. Also, two strain rosettes were set on the specimen side in the loaded part to evaluate the principal strains in concrete. All the LVDTs and strain gauges were connected to a channel box. Then, all the data were recorded by a computer controlled data acquisition system on load intervals of 5.0 kN. Figure 4 shows a specimen while being tested and prior to failure.

Figure 4: Specimen BR2 prior to failure
3. EXPERIMENTAL RESULTS
3.1 Deformational Behavior
The deformational behavior studied in this section emphasis relationship between the torsional moment carried by the test specimen versus the maximum twist angle of the specimen cross section which has found to be at loading location. The ultimate twist angle, the corresponding torsional moment and the maximum strain in FRP wraps for all specimens are listed in Table 3. Also, the torsional moment – twist angle relationships for all specimens are plotted in Figure 5.
Table 3: Summary of results
Beam Maximum twist angle (Degrees)
Ultimate torsional moment (kN.m)
Max. strain in FRP
wraps ()
BR1 3.852 10.80 NA
BR2 3.606 11.25 7041
BR3 3.206 11.70 4044
BR4 3.284 11.70 6293
BR5 3.48 12.60 3971
The deformational behavior of all specimens followed the same trend and it was noticeable that the FRP wraps had no effect on beam stiffness in early loading stages. Specimen BR1, which is the rectangular control specimen in this research, followed almost a linear behavior for the first six loading steps up to a twist angle of 0.369o (about 9.6% of the
maximum twist angle) then followed a parabolic trend up to failure at maximum twist angle of 3.852o and a corresponding torsional moment of 9.18 kN.m. Specimen BR2, which had the lowest amount of FRP wraps in rectangular beams, followed almost a linear behavior up to a twist angle of 0.367o (about 10.2% of the maximum twist angle) then followed a parabolic trend up to failure at maximum twist angle of 3.606o and a corresponding torsional moment of 10.80 kN.m. The torsional capacity of BR2 was improved to 104.2% of that of the control specimen while the failure twist angle was reduced to 78.5% of the twist angle in control specimen at same loading level. Specimens BR3 and BR4 almost showed an identical behavior and deformation values. Specimen BR3 failed at maximum twist angle of 3.206o and a corresponding torsional moment of 9.95 kN.m. The torsional capacity of BR3 was improved to 108.3% of that of the control specimen while the twist angle was reduced to 72.5% of the ultimate twist angle in control specimen at same loading level. BR4 failed at maximum twist angle of 3.283o and a corresponding torsional moment of 9.95 kN.m. The torsional capacity of BR4 was improved to 108.3% of that of the control specimen while the twist angle was reduced to 73.2% of the ultimate twist angle in control specimen at same loading level. Specimen BR5, which had the largest amount of FRP wraps in rectangular beams, showed, as expected, the best behavior. It was deformed linearly up to a twist angle of 0.363o (about 10.5% of the maximum twist angle) then followed a parabolic 10.71 kN.m. The torsional capacity of BR5 was improved to 116.7% of that of the control specimen while the twist angle was reduced to 66.4% of the ultimate twist angle in

control specimen at same loading level. Comparing specimens BR2 and BR3, shows improving the torsional capacity by nearly 9.2% (from 11.25 kN.m to 11.7 kN.m) and decrease in maximum twist angle by 11.1% (from 3.606o to 3.206o). Also, comparing specimens BR4 and BR5, shows improving the torsional capacity by nearly 9.2% (from 11.7 kN.m to 12.6 kN.m) which is the same ratio achieved by comparing BR2 and BR3. Comparing specimens BR2 and BR4, shows improving the torsional capacity by nearly 9.2% (from 11.25 kN.m to 11.7 kN.m) and decrease in maximum twist angle by 8.96% (from 3.606o to 3.283o).
0.0
1.0
2.0
3.0
4.0
5.0
6.0
7.0
8.0
9.0
10.0
11.0
12.0
13.0
0.0 0.2 0.4 0.6 0.8 1.0 1.2 1.4 1.6 1.8 2.0 2.2 2.4 2.6 2.8 3.0 3.2 3.4 3.6 3.8 4.0
Twist angle (Deg.)
To
rsio
nal
mo
men
t (k
N.m
)
BR1
BR2
BR3
BR4
BR5
Figure 5: Torsional moment versus twist angle relationships
3.2 Crack Patterns
The control specimens showed a wider range of crack propagation and a faster rate of crack progression than other specimens due to the absence of any FRP wrapping along the beam. All the strengthened specimens showed almost the same trend of crack progression, this could be attributed to the relatively similar wrapping scheme and the identical type of reinforcement details. Although, final stages of loading prior to failure showed slightly different cracking behavior. Diagonal cracks initiated and propagated through the loaded third of the beam from the loading point towards the support. At twist of nearly 75% of the ultimate twist, cracks were completely developed. In subsequent loading steps, there was a gradual built-up of cracks preceded by widening of existing cracks and loss of stiffness. Also, delamination of FRP wraps was noticed at failure. A sample of crack pattern is shown in Figure 6.
Figure 6: Crack pattern
4. ANALYSIS
fib Bulletin 14 [6] states that an externally bonded FRP wraps will provide contribution to the torsional capacity only if full wrapping around the element’s cross section is applied, so that the tensile forces carried by the FRP on each side of the cross section may form a continuous loop. Ultimate torsional moment calculations are based on the fiber orientation and the mode of failure. In case where the FRP wraps are in vertical (transverse) direction of the beam, and diagonal cracks are assumed to be inclined 45o to the longitudinal beam axis, the contribution of FRP wraps to ultimate torsional moment is determined by using the effective strain in the fibers and can be predicted by the following expression:
Mt frp = 2 frp Afrp Efrp Ac / S (1)
Where frp is the strain in fiber; AFRP is the area of FRP wrap; EFRP is the modulus of elasticity of the FRP material; AC is the gross area of the concrete cross section; S is the center to center spacing of FRP wraps. Also, the ultimate torsional moment of the reinforced concrete beam cross section (Tu) can be determined by the ACI 318-08 [7], using equation (11-18) as follows:
)66.0()7.1
()( `22
2c
w
c
oh
hu
w
u fdb
V
A
pT
db
V
(2)
Where variables are as stated in the ACI 318. Then the total ultimate torsional moment capacity of a strengthened beam cross section can be determined using equations (1) and (2) as follows:
Mt calc = Mt frp + Tu (3)
Table 4 lists a comparison between the calculated value of the ultimate torsional moment and the experimental value, all in kN.m. Calculated values showed relatively good
agreement with the measured values.
Table 4: Comparison between calculated and test results
Specimen Mt frp Tu Mt Calc Mt Experimental Variation
BR2 5.42 4.81 10.23 11.25 -9.1%
BR3 6.18 4.81 10.99 11.70 -6.1%
BR4 6.06 4.81 10.87 11.70 -7.1%
BR5 7.92 4.81 12.73 12.60 1.1%
5. NUMERICAL MODELING
Generally, Numerical modeling of FRP strengthened reinforced concrete beams is difficult as the model must respond to the nonlinear behavior of reinforced concrete such as concrete cracking, concrete plasticity, concrete crushing, and yielding of reinforcing steel, in addition to the elastic behavior of carbon fibers. Straus7; a non-linear finite element (FE) analysis software [8] was used to simulate the experimental program explained previously.
5.1 Elements and Material Modeling
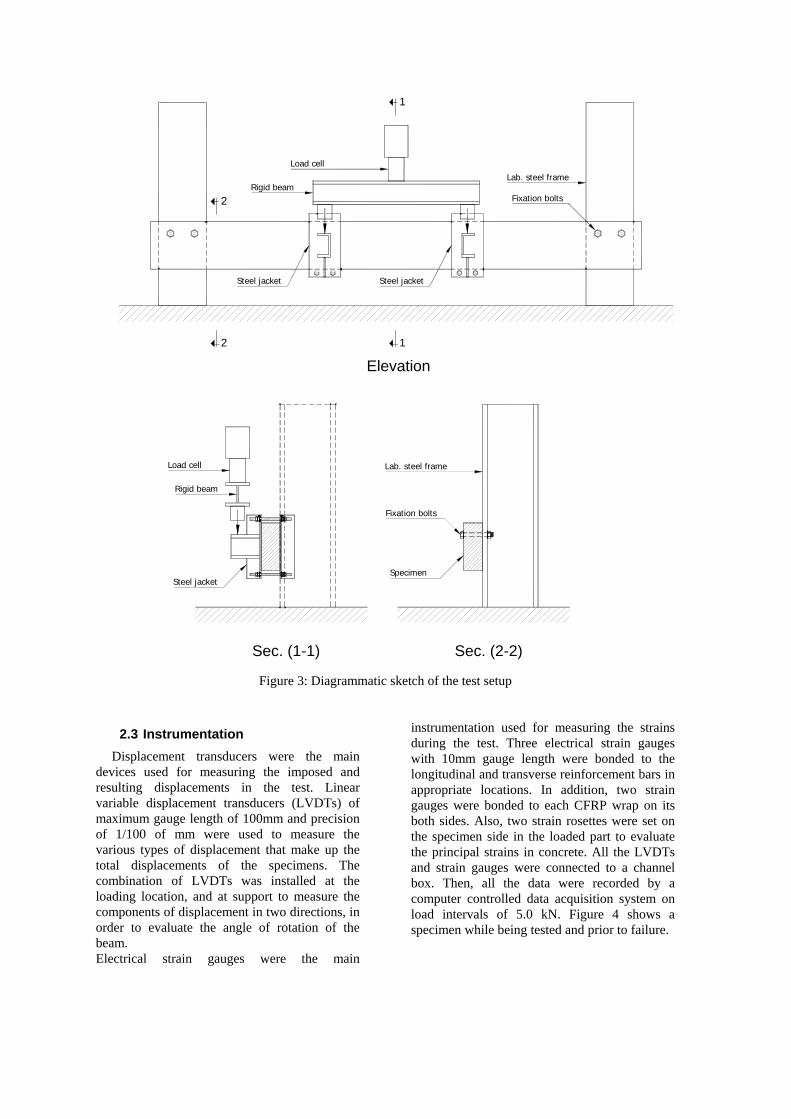
Three dimensional 8-node brick elements (Hexa8) were used for concrete. The concrete material model was chosen as non-linear isotropic with Poisson's ratio equals 0.20 and Drucker Prager yield criterion. Cohesion and friction angle of concrete used in Drucker Prager yield criterion were calculated based on the compressive and tensile strength on concrete cubes and prisms tested in lab during experimental program. Two dimensional truss elements (Beam2) were used for steel reinforcement. The properties of both mild and high tensile steel were modeled using idealized stress-strain curves. Perfect bond was assumed between concrete and the embedded steel bars. CFRP strips were modeled as linear behavior (Cutoff) element with no bending stiffness, in which material modulus and maximum tensile force carried by element are entered. Maximum tensile force depends on the CFRP width and thickness. Prefect bond was assumed between the CFRP strips and concrete as debonding was unlikely expected because of the overlapping of strips. The lever arm was modeled using two rigid steel plate perpendiculars to beam section at location of applied loads. Meshing of concrete elements, lever arm, loading and reinforcement cage are shown in Figure 6.
Figure 6: Meshing of concrete beam and reinforcement cage
5.2 Results of Numerical Modeling
The torsional moment – twist angle relationships of all specimens followed the same trend of the experimental results with slight deviations that will be discussed here after. Beam BR1 followed almost a linear behavior for the first three loading steps up to a twist angle of 0.207o (about 4.92% of the maximum twist angle) then followed a parabolic trend up to failure at ultimate twist angle of 4.196o and a corresponding torsional moment of 10.5 kN.m. Beam BR2 followed almost a linear behavior up to a twist angle of 0.186o (about 3.97% of the maximum twist angle) then followed a parabolic trend up to failure at ultimate twist angle of 4.683o and a corresponding torsional moment of 11.55 kN.m. The torsional capacity of BR2 was improved to 110% of that of the control

specimen while the twist angle was reduced to 80.1% of the ultimate twist angle in control specimen at same loading level. Beam BR3 failed at ultimate twist angle of 4.165o and a corresponding torsional moment of 11.55 kN.m. The torsional capacity of BR3 was improved to 110% of that of the control specimen while the twist angle was reduced to 75.2% of the ultimate twist angle in control specimen at same loading level. Beam BR4 failed at maximum twist angle of 3.74o and a corresponding torsional moment of 12.6 kN.m. The torsional capacity of BR4 was improved to 120% of that of the control specimen while the twist angle was reduced to 52% of the maximum twist angle in control specimen at same loading level. Beam BR5 failed at maximum twist angle of 4.132o and a corresponding torsional moment of 13.65 kN.m. The torsional capacity of BR5 was improved to 130% of that of the control specimen while the twist angle was reduced to 48.3% of the maximum twist angle in control specimen at same loading level. Comparing the results of beams BR2 and BR3, shows decrease in maximum twist angle by 11.1% (from 4.683o to 4.165o). Comparing beams BR4 and BR5, shows improving the torsional capacity by nearly 8.6% (from 12.6 kN.m to 13.65 kN.m) and increasing stiffness by decrease in twist angle at same loading level by 11.4% (from 3.74o to 3.314o). Comparing beams BR2 and BR4, shows improving the torsional capacity by nearly 9.1%
(from 11.55 kN.m to 12.6 kN.m) and decrease in maximum twist angle by 20.1% (from 4.683o to 3.74o). Comparing beams BR3 and BR5, shows improving the torsional capacity by nearly 10.2% (from 11.55 kN.m to 13.65 kN.m) and increasing stiffness by decrease in twist angle at same loading level by 36.7% (from 4.165o to 2.635o). Comparing beams BR3 and BR4, shows improving the torsional capacity by nearly 9.1% (from 11.55 kN.m to 12.6 kN.m) and decrease in maximum twist angle by 10.2% (from 4.165o to 3.74o). The torsional moment – twist angle relationships for all specimens are plotted in Figure 7. The values of maximum twist angles and ultimate torsional moments for all beams are compared in Table 5.
0.0
1.0
2.0
3.0
4.0
5.0
6.0
7.0
8.0
9.0
10.0
11.0
12.0
13.0
14.0
0.00 0.25 0.50 0.75 1.00 1.25 1.50 1.75 2.00 2.25 2.50 2.75 3.00 3.25 3.50 3.75 4.00 4.25 4.50 4.75
Twist Angle (Deg.)
To
rsio
nal
Mo
me
nt
(kN
.m)
BR1
BR2
BR3
BR4
BR5
Figure 7: Torsional moment versus twist angle relationships – FE results
Table 5: Comparison between calculated and test results
Ultimate torsional moment (kN.m) Maximum twist angle (Deg.) Beam
Exp. FE Deviation Exp. FE Deviation
BR1 10.8 10.5 -2.8% 3.852 4.196 8.9%
BR2 11.25 11.55 2.7% 3.606 4.683 29.9%
BR3 11.7 11.55 -1.3% 3.206 4.165 29.9%
BR4 11.7 12.6 7.7% 3.284 3.74 13.9%
BR5 12.6 13.65 8.3% 3.48 4.132 18.7%
The overall response of all beams resulting from the FE modeling shows good agreement with the experimental results. The values of ultimate torsional moments predicted by the FE modeling are relatively close and comparable to that from experimental work. However, the prediction of the maximum twist angle is higher than the experimental values, sometimes by wide ranges, especially in beams BR2 and BR3. This could be attributed to the fixed stress-deformation concept used in the concrete model in the FE software
which leads to deficiency in prediction the post peak response properly. As a better presentation for the deviation of FE modeling to the experimental results, the torsional moment versus twist angle relationship for each beam is displayed in Figure 8.

0.0
1.0
2.0
3.0
4.0
5.0
6.0
7.0
8.0
9.0
10.0
11.0
0.00 0.25 0.50 0.75 1.00 1.25 1.50 1.75 2.00 2.25 2.50 2.75 3.00 3.25 3.50 3.75 4.00 4.25
Twist Angle (Deg.)
To
rsio
na
l M
om
en
t (k
N.m
)
FE
Exp.
0.0
1.0
2.0
3.0
4.0
5.0
6.0
7.0
8.0
9.0
10.0
11.0
12.0
0.00 0.25 0.50 0.75 1.00 1.25 1.50 1.75 2.00 2.25 2.50 2.75 3.00 3.25 3.50 3.75 4.00 4.25
Twist Angle (Deg.)
To
rsio
na
l M
om
en
t (k
N.m
)
FE
Exp.
0.0
1.0
2.0
3.0
4.0
5.0
6.0
7.0
8.0
9.0
10.0
11.0
12.0
0.00 0.25 0.50 0.75 1.00 1.25 1.50 1.75 2.00 2.25 2.50 2.75 3.00 3.25 3.50 3.75 4.00 4.25
Twist Angle (Deg.)
To
rsio
na
l M
om
en
t (k
N.m
)
FE
Exp.
0.0
1.0
2.0
3.0
4.0
5.0
6.0
7.0
8.0
9.0
10.0
11.0
12.0
13.0
0.00 0.25 0.50 0.75 1.00 1.25 1.50 1.75 2.00 2.25 2.50 2.75 3.00 3.25 3.50 3.75 4.00
Twist Angle (Deg.)
To
rsio
na
l M
om
en
t (k
N.m
)
FE
Exp.
0.0
1.0
2.0
3.0
4.0
5.0
6.0
7.0
8.0
9.0
10.0
11.0
12.0
13.0
14.0
0.00 0.25 0.50 0.75 1.00 1.25 1.50 1.75 2.00 2.25 2.50 2.75 3.00 3.25 3.50 3.75 4.00 4.25
Twist Angle (Deg.)
To
rsio
na
l M
om
en
t (k
N.m
)
FE
Exp.
Figure 8: Torsional moment versus twist angle
relationship for each beam
6. PARAMETRIC STUDY
A parametric study was carried out using Straus7 to widen the range of investigated parameters on different aspects. First, 2 additional rectangular beams with no CFRP wrap spacing (i.e. fully wrapped) were simulated and encountered with the 5 simulated test specimens. The 2 additional beams, B6 and B7, were wrapped using one and two plies of CFRP respectively. The The single ply fully wrapped beam had a higher capacity than the 100mm spacing beam by 8.3% and had a lower twist angle at same loading level by 10.7%. While the 2 plies fully wrapped beam had a higher capacity than the 100mm spacing beam by 7.7% and had a lower twist angle at same loading level by 14.7%. The torsional moment versus twist angle relationships of simualated CFRP wrapped beams are shown in Figure 10. and the values of ultimate torsional moments and maximum twist angles for Beams B6 and B7 are listed in Table 6.
Figure 9: Meshing of beams B6 and B7
BR1
BR2BR3
BR4
BR5BR6
BR7
0.0
1.0
2.0
3.0
4.0
5.0
6.0
7.0
8.0
9.0
10.0
11.0
12.0
13.0
14.0
15.0
0.00 0.25 0.50 0.75 1.00 1.25 1.50 1.75 2.00 2.25 2.50 2.75 3.00 3.25 3.50 3.75 4.00 4.25 4.50 4.75 5.00
Twist Angle (Deg.)
To
rsio
nal
Mo
men
t (k
N.m
)
BR1
BR2
BR3
BR4
BR5
BR6
BR7
Figure 10: Torsional moment versus twist angle relationship of simulated CFRP wrapped beams
Table 6: Results of beams B6 and B7
Beam Ultimate torsional moment (kN.m)
Maximum twist angle (Deg.)
BR6 13.65 4.107 BR7 14.70 4.169
BR1
BR2
BR3
BR4
BR5

The second aspect in the parametric study is to investigate the same seven beams (B1 to B7) but wrapped with GFRP wraps. The mechanical properties of the GFRP used in this simulation are listed in Table 7.
Table 7: Mechanical properties of GFRP wraps
Tensile Strength MPa
Tensile Modulus MPa
Ultimate Strain %
1,500 72,000 2.0
Results showed almost identical performance to those were wrapped with CFRP sheets and a performance improvement from beam to another close to what achieved with CFRP beams. Generally, GFRP beams showed larger rotations than CFRP beams by ranges from 10 to 22.8%. Results of simulated GFRP wrapped beams are listed in Table 8 and the torsional moment versus twist angle relationships are shown in Figure 11.
Table 8: Results of GFRP beams
Beam Ultimate torsional moment (kN.m)
Maximum twist angle (Deg.)
BR1 10.5 4.196 BR2G 10.5 3.774 BR3G 11.55 5.055 BR4G 12.6 4.536 BR5G 12.6 4.069 BR6G 12.6 4.122 BR7G 13.65 4.607
BR1BR2G
BR3G
BR4GBR5GBR6G
BR7G
0.0
1.0
2.0
3.0
4.0
5.0
6.0
7.0
8.0
9.0
10.0
11.0
12.0
13.0
14.0
0.00 0.25 0.50 0.75 1.00 1.25 1.50 1.75 2.00 2.25 2.50 2.75 3.00 3.25 3.50 3.75 4.00 4.25 4.50 4.75 5.00 5.25
Twist Angle (Deg.)
To
rsio
nal
Mo
men
t (k
N.m
)
BR1
BR2G
BR3G
BR4G
BR5G
BR6G
BR7G
Figure 11: Torsional moment versus twist angle relationship of simulated GFRP wrapped beams
Finally, a new square beam section (300 x 300mm) was simulated in order to investigate the effect of changing the beam torsional stiffness on the performance improvement. The square section was simulated for the seven CFRP beams only with the same variables of ply spacing and number of plies. Figure 12 shows the meshing of the square section beams.
Figure 12: Meshing of square section beams
Square section beams showed close but not identical performance to that of rectangular beams. And the performance improvement from beam to another was different to what achieved with rectangular beams. Results of simulated square section beams are listed in Table 9 and the torsional moment versus twist angle relationships are shown in Figure 13.
Table 9: Results of square section beams
Beam Ultimate torsional moment (kN.m)
Maximum twist angle (Deg.)
BS1 18.85 2.132 BS2 20.3 2.188 BS3 21.75 2.575 BS4 23.2 2.546 BS5 23.2 2.200 BS6 24.65 2.525 BS7 26.1 2.509
BS1
BS2 BS3
BS4BS5
BS6
BS7
0.0
2.0
4.0
6.0
8.0
10.0
12.0
14.0
16.0
18.0
20.0
22.0
24.0
26.0
28.0
0.00 0.20 0.40 0.60 0.80 1.00 1.20 1.40 1.60 1.80 2.00 2.20 2.40 2.60
Twist Angle (Deg.)
To
rsio
nal
Mo
men
t (k
N.m
)
BS1
BS2
BS3
BS4
BS5
BS6
BS7
Figure 13: Torsional moment versus twist angle relationship of simulated square section beams
7. CONCLUSIONS
An experimental and analytical program comprised testing and FE numerical modeling of five rectangular cross section reinforced concrete beams was conducted to evaluate the efficiency and feasibility of strengthening beams subjected

to torsion using CFRP wraps. And a parametric study was carried out using the FE software to simulate wider range of variables including; full wrapping of beams as an additional value of wrap spacing, using GFRP in wrapping instead of CFRP, and using square beam section. Based on the obtained experimental results, the following conclusions can be furnished:
Strengthening reinforced concrete rectangular beams subjected to torional loads using CFRP wraps helped in improving the overall performance of strengthened beams.
Strengthening beams with CFRP wraps helped in improving the torsional capacity of tested beams up to 116.7% of its non-strengthened value.
Strengthening beams with CFRP wraps helped in increasing the torsional stiffness by decreasing the twist angle – at same loading level - up to 66.4% of its non-strengthened value without significant decrease in ductility.
Adding a second ply of CFRP wraps to the single ply strengthened rectangular beams helped in improving the torsional capacity by 9.2% and increasing the torsional stiffness by decreasing the maximum twist angle by 11.1%.
Decreasing the spacing of CFRP wraps from 150mm to 100mm helped in improving the torsional capacity by 9.2% and increasing the torsional stiffness by decreasing the twist angle by 9%.
There is no effect of CFRP wraps on beam torsional stiffness in loading stages before cracking and in early loading stages after cracking.
Even with lower amount of FRP, using single ply of wraps with smaller wrap spacing helped to achieve almost the same improvement in performance of that when using two plies of wraps with larger wrap spacing.
Based on the numerical and parametric study results, the following conclusions can be furnished:
Strengthening rectangular beams with CFRP wraps helped in improving the torsional capacity up to 140% of its non-strengthened value.
Strengthening rectangular beams with CFRP wraps helped in increasing the torsional stiffness by decreasing the twist angle – at same loading level - up to 44.3% of its non-strengthened value.
Using the single ply of wraps with
smaller wrap spacing improved the performance by nearly 10% of that when using two plies of wraps with larger wrap spacing. Hence, it is more economic and feasible.
Strengthening beams with CFRP wraps showed higher improvement of the torsional capacity than using GFRP wraps by ranges from 7.7 to 10%.
Strengthening beams with CFRP wraps showed higher improvement of the torsional stiffness than using GFRP wraps by decreasing the twist angle – at same loading level – by ranges from 11.1 to 23.3%.
Strengthening square section beams with CFRP wraps helped in improving the torsional capacity up to 138.5% of its non-strengthened value.
Strengthening square section beams with CFRP wraps helped in increasing the torsional stiffness by decreasing the twist angle – at same loading level - up to 39.8% of its non-strengthened value.
Adding a second ply of CFRP wraps to the single ply strengthened rectangular beams helped in improving the torsional capacity up to 7.1% and increasing the torsional stiffness by decreasing the maximum twist angle up to 13.6%.
Decreasing the spacing of CFRP wraps from 150mm to 100mm helped in improving the torsional capacity up to 14.3% and increasing the torsional stiffness by decreasing the twist angle up to 14.6%.
There is no effect of CFRP wraps on square beam torsional stiffness in loading stages before cracking.
Further experimental and FE modeling similar to this research is recommended.
REFERENCES
[1] A. Ghobarah, M. N. Ghorbel, and S. E. Chidiac, "Upgrading Torsional Resistance of Reinforced Concrete Beams Using Fiber-Reinforced Polymer", Journal of Composites for Construction ASCE, Vol. 6, No. 4, November 1, 2002. pp. 257-263
[2] Adrian K. Y. Hii and Riadh Al-Mahaidi, "Torsional Capacity of CFRP Strengthened Reinforced Concrete Beams", Journal of Composites for Construction ASCE, Vol. 11, No. 1, February 1, 2007. pp. 71-80
[3] Saravanan Panchacharam and Abdeldjelil Belarbi, "Torsional Behavior of Reinforced Concrete Beams Strengthened With FRP
Composites", First FIB Congress, Osaka, Japan, October 13-19, 2002
[4] Mehran Ameli, Hamid R. Ronagh, and Peter F. Dux, "Behavior of FRP Strengthened Reinforced Concrete Beams Under Torsion", Journal of Composites for Construction ASCE, Vol. 11, No. 2, April 1, 2007. pp. 192-200
[5] Adrian K.Y. Hii, and Riadh Al-Mahaidi, "An Experimental and Numerical Investigation on Torsional Strengthening of Solid and Box-Section RC Beams using CFRP Laminates", Composite Structures Volume 75, Issues 1-4, September 2006. pp. 213-221
[6] fib Bulletin 14. “Externally bonded FRP reinforcement for RC structures”, fib - International Federation for Structural Concrete, Lausanne, Switzerland. 2001
[7] American Concrete Institute (ACI) Committee 318. (2008). “Building,code requirements for structural concrete.” ACI 318-08, American Concrete Institute, Detroit.
[8] Straus7 manual, Edition 2, January 2002, G+D Computing