Evolutionary Interrogation of Human Biology in Well-Annotated Genomic Framework of Rhesus Macaque
16
Article Evolutionary Interrogation of Human Biology in Well-Annotated Genomic Framework of Rhesus Macaque Shi-Jian Zhang, y,1 Chu-Jun Liu, y,1 Peng Yu, y,1 Xiaoming Zhong, 1 Jia-Yu Chen, 1 Xinzhuang Yang, 1 Jiguang Peng, 1 Shouyu Yan, 1 Chenqu Wang, 1 Xiaotong Zhu, 1 Jingwei Xiong, 1 Yong E. Zhang, 2 Bertrand Chin-Ming Tan, 3 and Chuan-Yun Li* ,1 1 Beijing Key Laboratory of Cardiometabolic Molecular Medicine, Institute of Molecular Medicine, Peking University, Beijing, China 2 Key Laboratory of Zoological Systematics and Evolution, Institute of Zoology, Chinese Academy of Sciences, Beijing, China 3 Department of Biomedical Sciences and Graduate Institute of Biomedical Sciences, College of Medicine, Chang Gung University, Tao-Yuan, Taiwan y These authors contributed equally to this work. *Corresponding author: E-mail: [email protected]. Associate editor: Katja Nowick Abstract With genome sequence and composition highly analogous to human, rhesus macaque represents a unique reference for evolutionary studies of human biology. Here, we developed a comprehensive genomic framework of rhesus macaque, the RhesusBase2, for evolutionary interrogation of human genes and the associated regulations. A total of 1,667 next- generation sequencing (NGS) data sets were processed, integrated, and evaluated, generating 51.2 million new functional annotation records. With extensive NGS annotations, RhesusBase2 refined the fine-scale structures in 30% of the ma- caque Ensembl transcripts, reporting an accurate, up-to-date set of macaque gene models. On the basis of these anno- tations and accurate macaque gene models, we further developed an NGS-oriented Molecular Evolution Gateway to access and visualize macaque annotations in reference to human orthologous genes and associated regulations (www. rhesusbase.org/molEvo). We highlighted the application of this well-annotated genomic framework in generating hypo- thetical link of human-biased regulations to human-specific traits, by using mechanistic characterization of the DIEXF gene as an example that provides novel clues to the understanding of digestive system reduction in human evolution. On a global scale, we also identified a catalog of 9,295 human-biased regulatory events, which may represent novel elements that have a substantial impact on shaping human transcriptome and possibly underpin recent human phenotypic evolution. Taken together, we provide an NGS data-driven, information-rich framework that will broadly benefit geno- mics research in general and serves as an important resource for in-depth evolutionary studies of human biology. Key words: human evolution, rhesus macaque, human-specific trait, next-generation sequencing, human regulation, RhesusBase. Introduction Rhesus macaque, with its genome sequence and composition highly analogous to human, is an emerging model organism that provides a unique perspective for evolutionary studies of human biology (Gibbs et al. 2007). Several recent studies have highlighted rhesus macaque as a unique model for defining and elucidating human-specific genes and functional net- works (Knowles and McLysaght 2009; Toll-Riera et al. 2009; Li, Zhang, et al. 2010; Xie et al. 2012), and for further under- standing, the evolutionary and functional relevance of human regulations individually and as a whole (Hudson and Snyder 2006; Wray 2007; Brawand et al. 2011; Barbosa-Morais et al. 2012; Shibata et al. 2012; Ramaswami et al. 2013). These lines of evidence lend support to the hypothesis that noncoding regulatory elements may contribute substantially to the phe- notypic differences between humans and other primate spe- cies (Wray 2007). Despite these unique advantages, several unresolved issues have limited current use of the rhesus macaque model in evolutionary research—inadequate functional genomics annotations, error-prone gene models, and lack of a platform for visualizing and assessing high- throughput data generated by next-generation sequencing (NGS). A genomic context of rhesus macaque, equipped with comprehensive functional annotations, accurate ma- caque gene models, and NGS-oriented genomic framework for high-throughput data handling, would therefore provide a strong basis for the evolutionary studies of human biology. To address these key questions, we previously reported the “RhesusBase,” the first knowledgebase for macaque functional genomics (Zhang et al. 2013). Through this database, we ex- tensively refined macaque gene models and integrated ma- caque functional annotations at the genome-wide level (Zhang et al. 2013). Although RhesusBase has been successful in supporting research in this field, only limited NGS data sets were integrated into the database, and RNA-seq data from only one macaque animal were used for gene model revisions. Because of the rapid accumulation of high-throughput data derived from various NGS technologies, further incorporation ß The Author 2014. Published by Oxford University Press on behalf of the Society for Molecular Biology and Evolution. This is an Open Access article distributed under the terms of the Creative Commons Attribution Non-Commercial License (http:// creativecommons.org/licenses/by-nc/3.0/), which permits non-commercial re-use, distribution, and reproduction in any medium, provided the original work is properly cited. For commercial re-use, please contact [email protected] Open Access Mol. Biol. Evol. 31(5):1309–1324 doi:10.1093/molbev/msu084 Advance Access publication February 27, 2014 1309
Transcript of Evolutionary Interrogation of Human Biology in Well-Annotated Genomic Framework of Rhesus Macaque
Article
Evolutionary Interrogation of Human Biology inWell-Annotated Genomic Framework of Rhesus MacaqueShi-Jian Zhang,y,1 Chu-Jun Liu,y,1 Peng Yu,y,1 Xiaoming Zhong,1 Jia-Yu Chen,1 Xinzhuang Yang,1
Jiguang Peng,1 Shouyu Yan,1 Chenqu Wang,1 Xiaotong Zhu,1 Jingwei Xiong,1 Yong E. Zhang,2 BertrandChin-Ming Tan,3 and Chuan-Yun Li*,1
1Beijing Key Laboratory of Cardiometabolic Molecular Medicine, Institute of Molecular Medicine, Peking University, Beijing, China2Key Laboratory of Zoological Systematics and Evolution, Institute of Zoology, Chinese Academy of Sciences, Beijing, China3Department of Biomedical Sciences and Graduate Institute of Biomedical Sciences, College of Medicine, Chang Gung University,Tao-Yuan, TaiwanyThese authors contributed equally to this work.
*Corresponding author: E-mail: [email protected].
Associate editor: Katja Nowick
Abstract
With genome sequence and composition highly analogous to human, rhesus macaque represents a unique reference forevolutionary studies of human biology. Here, we developed a comprehensive genomic framework of rhesus macaque, theRhesusBase2, for evolutionary interrogation of human genes and the associated regulations. A total of 1,667 next-generation sequencing (NGS) data sets were processed, integrated, and evaluated, generating 51.2 million new functionalannotation records. With extensive NGS annotations, RhesusBase2 refined the fine-scale structures in 30% of the ma-caque Ensembl transcripts, reporting an accurate, up-to-date set of macaque gene models. On the basis of these anno-tations and accurate macaque gene models, we further developed an NGS-oriented Molecular Evolution Gateway toaccess and visualize macaque annotations in reference to human orthologous genes and associated regulations (www.rhesusbase.org/molEvo). We highlighted the application of this well-annotated genomic framework in generating hypo-thetical link of human-biased regulations to human-specific traits, by using mechanistic characterization of the DIEXFgene as an example that provides novel clues to the understanding of digestive system reduction in human evolution. Ona global scale, we also identified a catalog of 9,295 human-biased regulatory events, which may represent novel elementsthat have a substantial impact on shaping human transcriptome and possibly underpin recent human phenotypicevolution. Taken together, we provide an NGS data-driven, information-rich framework that will broadly benefit geno-mics research in general and serves as an important resource for in-depth evolutionary studies of human biology.
Key words: human evolution, rhesus macaque, human-specific trait, next-generation sequencing, human regulation,RhesusBase.
IntroductionRhesus macaque, with its genome sequence and compositionhighly analogous to human, is an emerging model organismthat provides a unique perspective for evolutionary studies ofhuman biology (Gibbs et al. 2007). Several recent studies havehighlighted rhesus macaque as a unique model for definingand elucidating human-specific genes and functional net-works (Knowles and McLysaght 2009; Toll-Riera et al. 2009;Li, Zhang, et al. 2010; Xie et al. 2012), and for further under-standing, the evolutionary and functional relevance of humanregulations individually and as a whole (Hudson and Snyder2006; Wray 2007; Brawand et al. 2011; Barbosa-Morais et al.2012; Shibata et al. 2012; Ramaswami et al. 2013). These linesof evidence lend support to the hypothesis that noncodingregulatory elements may contribute substantially to the phe-notypic differences between humans and other primate spe-cies (Wray 2007). Despite these unique advantages, severalunresolved issues have limited current use of the rhesusmacaque model in evolutionary research—inadequate
functional genomics annotations, error-prone gene models,and lack of a platform for visualizing and assessing high-throughput data generated by next-generation sequencing(NGS). A genomic context of rhesus macaque, equippedwith comprehensive functional annotations, accurate ma-caque gene models, and NGS-oriented genomic frameworkfor high-throughput data handling, would therefore provide astrong basis for the evolutionary studies of human biology.
To address these key questions, we previously reported the“RhesusBase,” the first knowledgebase for macaque functionalgenomics (Zhang et al. 2013). Through this database, we ex-tensively refined macaque gene models and integrated ma-caque functional annotations at the genome-wide level(Zhang et al. 2013). Although RhesusBase has been successfulin supporting research in this field, only limited NGS data setswere integrated into the database, and RNA-seq data fromonly one macaque animal were used for gene model revisions.Because of the rapid accumulation of high-throughput dataderived from various NGS technologies, further incorporation
� The Author 2014. Published by Oxford University Press on behalf of the Society for Molecular Biology and Evolution.This is an Open Access article distributed under the terms of the Creative Commons Attribution Non-Commercial License (http://creativecommons.org/licenses/by-nc/3.0/), which permits non-commercial re-use, distribution, and reproduction in any medium,provided the original work is properly cited. For commercial re-use, please contact [email protected] Open AccessMol. Biol. Evol. 31(5):1309–1324 doi:10.1093/molbev/msu084 Advance Access publication February 27, 2014 1309
of new data sets may significantly aid the refinement of rhesusmacaque genome sequence and gene models and help com-pensate for individual variability in genomes and transcrip-tomes. In addition, the increasing attention to RhesusBasedata brought to light the urgent need for a more user-friendlygenomic framework that allows productive NGS data acces-sion, visualization, and management.
Following the rapid pace of NGS technology development,here we report RhesusBase2 with the integration of 1,667 NGSdata sets (>48.7 billion processed reads) and about 51.2 mil-lion new functional annotation records. With one order ofmagnitude increase in database size, we re-evaluated the ma-caque gene models in RhesusBase and released an accurateand up-to-date version. Particularly, we highlighted theunique evolutionary model of rhesus macaque for primatecomparative analysis, by providing a user-friendly, NGS-oriented genomic framework to visualize and access macaqueannotations for human orthologous genes and the associatedregulations. In this macaque genomic framework, we identi-fied a catalog of 9,295 human-biased regulatory events thathave a substantial impact on shaping human transcriptome,supporting the hypothesis that novel regulatory elementsmay constitute an important part of human phenotypic evo-lution (King and Wilson 1975; Wray 2007; Carroll 2008;Shibata et al. 2012). Through establishing a unique andwell-annotated genomic context of rhesus macaque,RhesusBase2 provides a comprehensive framework for in-depth evolutionary studies of human genes and the associ-ated regulations.
Results
An NGS Data-Driven, Information-Rich Core Databasefor Rhesus Macaque
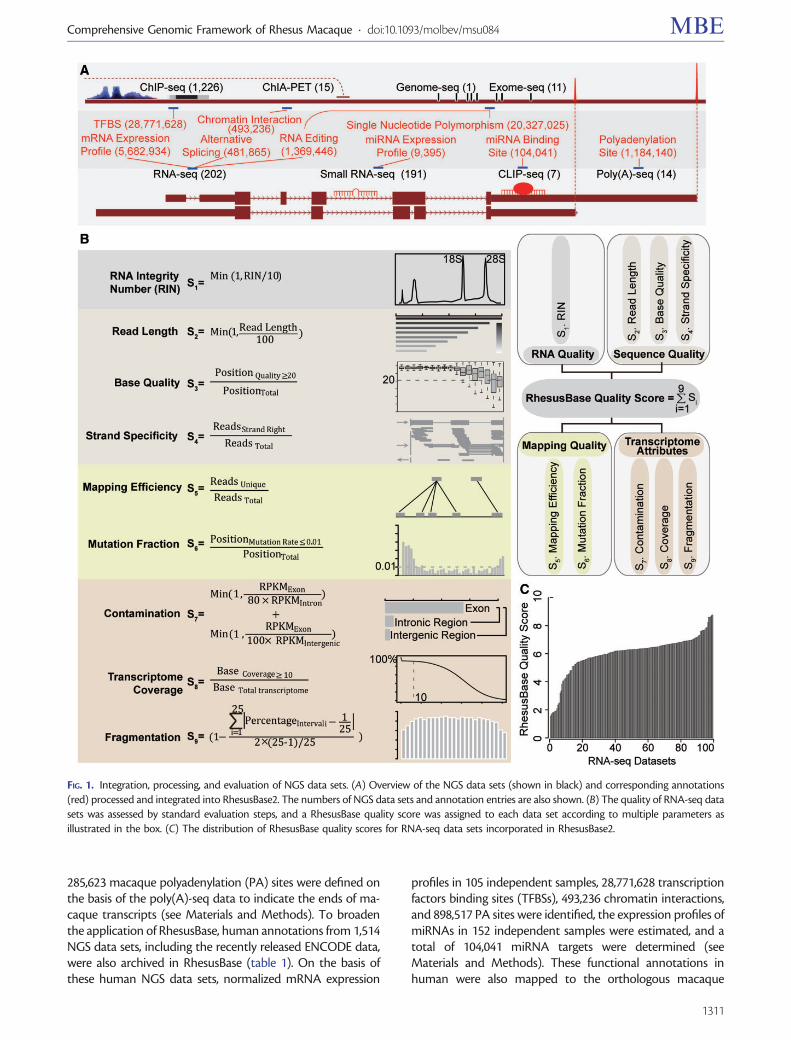
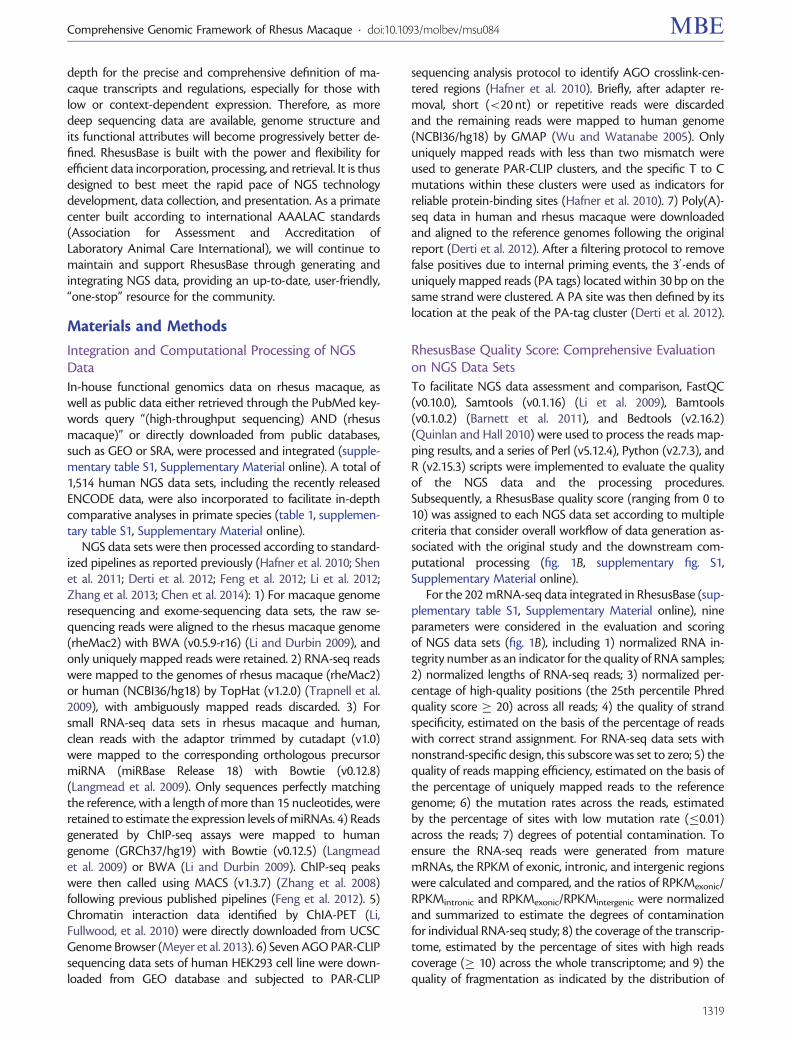
To expand the utility of rhesus macaque in primate compar-ative studies, we first set out to process and integrate 1,667NGS data sets in human and rhesus macaque (fig. 1A, seeMaterials and Methods, supplementary table S1,Supplementary Material online). These data, aimed to providein-depth physical and functional annotations of the rhesusmacaque genome, represented studies that cover multiplegene regulatory mechanisms, such as genome or exome rese-quencing for population-wide DNA polymorphism, RNA-seqand poly(A)-seq for gene expression and structure, smallRNA-seq for microRNA (miRNA) expression profile, as wellas CLIP (cross-linking immunoprecipitation)-seq, ChIA-PET(chromatin interaction analysis paired-end tags), and ChIP(chromatin immunoprecipitation)-seq for gene expressionregulation (table 1, supplementary table S1, SupplementaryMaterial online). The sources and meta-data for all NGS datasets archived in the current version of RhesusBase are sum-marized in supplementary table S1, Supplementary Materialonline.
To provide quality assessment of these NGS data, eachdata set was processed and evaluated by following standard-ized computational pipelines and procedures, and subse-quently assigned a RhesusBase quality score (ranging from 0to 10) according to multiple criteria that consider overall
workflow of data generation and processing (see Materialsand Methods, supplementary table S1, SupplementaryMaterial online). Taking RNA-seq data, for example, a dataset with high RhesusBase quality score requires that 1) theRNA sample was prepared with optimal quality as indicatedby the RNA Integrity Number; 2) sufficiently long reads weregenerated, with adequate base quality and strand specificity(for strand-specific RNA-seq); 3) there was a high rate foruniquely mapped reads and low mismatch rate across eachbase; 4) the RNA-seq assay was well performed with littlecontamination, as shown by enriched reads density atexonic regions, sufficient coverage of the whole transcrip-tome, and uniform read distribution across each transcript(fig. 1B, see Materials and Methods). Subscores of each eval-uation were then summarized and normalized to generatethe RhesusBase quality score for the NGS data set (fig. 1B andC, supplementary table S1, Supplementary Material online).
For other categories of NGS data sets integrated, theRhesusBase quality score was assigned to each data set ac-cording to a similar scoring system that considers attributessuch as the sample quality, sequencing quality, mapping qual-ity, and the degree to which the data set agrees with itsknown biological attributes (see Materials and Methods, sup-plementary fig. S1 and table S1, Supplementary Materialonline). Particularly, considering the differences of the se-quencing platforms, experimental designs, and data qualities,we provided the percentile rank of the RhesusBase qualityscore among the same category of NGS data set in the samespecies, to allow RhesusBase users to set their own thresholdsfor NGS data quality control (ranging from 0 to 100, seeMaterials and Methods, supplementary table S1,Supplementary Material online). In general, NGS data setswith higher RhesusBase quality score and higher percentilerank are more reliable. RhesusBase thus offers a comprehen-sive quantitative evaluation system for multiple categories ofNGS data sets (supplementary table S1, SupplementaryMaterial online).
From these highly selected and processed NGS data sets, atotal of 58,423,710 functional records were generated andincorporated in RhesusBase2, representing approximatelyone order of magnitude more NGS annotation entries com-pared with the previous version (fig. 1A, table 2). On thegenome level, 14,028,737 macaque polymorphism sites(equivalent to 20,327,025 entries) were identified on thebasis of public resources (Fang et al. 2011; Sayers et al.2012), as well as in-house NGS data from macaquegenome/exome resequencing (see Materials and Methods).On the transcriptome level, normalized mRNA expressionprofiles and alternative splicing events were compiled fromRNA-seq data sets on a wide range of tissues and cell lines inrhesus macaque (see Materials and Methods). Combininginformation at these two levels, we also identified 14,118 po-tential RNA editing sites (equivalent to 1,369,446 entries) inrhesus macaque that introduce differences between RNA andits corresponding DNA sequence (see Materials andMethods). With respect to gene expression regulation, theexpression profiles of more than 1,000 miRNAs were esti-mated based on 39 independent samples, and a list of
1310
Zhang et al. . doi:10.1093/molbev/msu084 MBE
285,623 macaque polyadenylation (PA) sites were defined onthe basis of the poly(A)-seq data to indicate the ends of ma-caque transcripts (see Materials and Methods). To broadenthe application of RhesusBase, human annotations from 1,514NGS data sets, including the recently released ENCODE data,were also archived in RhesusBase (table 1). On the basis ofthese human NGS data sets, normalized mRNA expression
profiles in 105 independent samples, 28,771,628 transcriptionfactors binding sites (TFBSs), 493,236 chromatin interactions,and 898,517 PA sites were identified, the expression profiles ofmiRNAs in 152 independent samples were estimated, and atotal of 104,041 miRNA targets were determined (seeMaterials and Methods). These functional annotations inhuman were also mapped to the orthologous macaque
FIG. 1. Integration, processing, and evaluation of NGS data sets. (A) Overview of the NGS data sets (shown in black) and corresponding annotations(red) processed and integrated into RhesusBase2. The numbers of NGS data sets and annotation entries are also shown. (B) The quality of RNA-seq datasets was assessed by standard evaluation steps, and a RhesusBase quality score was assigned to each data set according to multiple parameters asillustrated in the box. (C) The distribution of RhesusBase quality scores for RNA-seq data sets incorporated in RhesusBase2.
1311
Comprehensive Genomic Framework of Rhesus Macaque . doi:10.1093/molbev/msu084 MBE
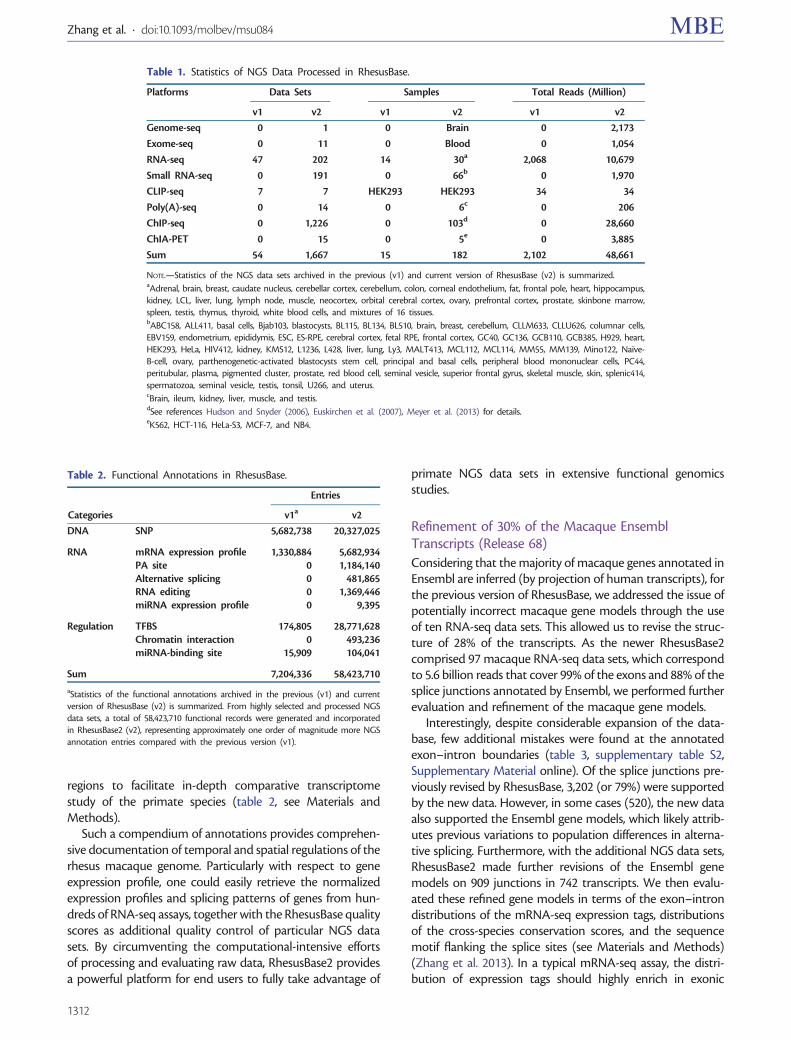
regions to facilitate in-depth comparative transcriptomestudy of the primate species (table 2, see Materials andMethods).
Such a compendium of annotations provides comprehen-sive documentation of temporal and spatial regulations of therhesus macaque genome. Particularly with respect to geneexpression profile, one could easily retrieve the normalizedexpression profiles and splicing patterns of genes from hun-dreds of RNA-seq assays, together with the RhesusBase qualityscores as additional quality control of particular NGS datasets. By circumventing the computational-intensive effortsof processing and evaluating raw data, RhesusBase2 providesa powerful platform for end users to fully take advantage of
primate NGS data sets in extensive functional genomicsstudies.
Refinement of 30% of the Macaque EnsemblTranscripts (Release 68)
Considering that the majority of macaque genes annotated inEnsembl are inferred (by projection of human transcripts), forthe previous version of RhesusBase, we addressed the issue ofpotentially incorrect macaque gene models through the useof ten RNA-seq data sets. This allowed us to revise the struc-ture of 28% of the transcripts. As the newer RhesusBase2comprised 97 macaque RNA-seq data sets, which correspondto 5.6 billion reads that cover 99% of the exons and 88% of thesplice junctions annotated by Ensembl, we performed furtherevaluation and refinement of the macaque gene models.
Interestingly, despite considerable expansion of the data-base, few additional mistakes were found at the annotatedexon–intron boundaries (table 3, supplementary table S2,Supplementary Material online). Of the splice junctions pre-viously revised by RhesusBase, 3,202 (or 79%) were supportedby the new data. However, in some cases (520), the new dataalso supported the Ensembl gene models, which likely attrib-utes previous variations to population differences in alterna-tive splicing. Furthermore, with the additional NGS data sets,RhesusBase2 made further revisions of the Ensembl genemodels on 909 junctions in 742 transcripts. We then evalu-ated these refined gene models in terms of the exon–introndistributions of the mRNA-seq expression tags, distributionsof the cross-species conservation scores, and the sequencemotif flanking the splice sites (see Materials and Methods)(Zhang et al. 2013). In a typical mRNA-seq assay, the distri-bution of expression tags should highly enrich in exonic
Table 1. Statistics of NGS Data Processed in RhesusBase.
Platforms Data Sets Samples Total Reads (Million)
v1 v2 v1 v2 v1 v2
Genome-seq 0 1 0 Brain 0 2,173
Exome-seq 0 11 0 Blood 0 1,054
RNA-seq 47 202 14 30a 2,068 10,679
Small RNA-seq 0 191 0 66b 0 1,970
CLIP-seq 7 7 HEK293 HEK293 34 34
Poly(A)-seq 0 14 0 6c 0 206
ChIP-seq 0 1,226 0 103d 0 28,660
ChIA-PET 0 15 0 5e 0 3,885
Sum 54 1,667 15 182 2,102 48,661
NOTE.—Statistics of the NGS data sets archived in the previous (v1) and current version of RhesusBase (v2) is summarized.aAdrenal, brain, breast, caudate nucleus, cerebellar cortex, cerebellum, colon, corneal endothelium, fat, frontal pole, heart, hippocampus,kidney, LCL, liver, lung, lymph node, muscle, neocortex, orbital cerebral cortex, ovary, prefrontal cortex, prostate, skinbone marrow,spleen, testis, thymus, thyroid, white blood cells, and mixtures of 16 tissues.bABC158, ALL411, basal cells, Bjab103, blastocysts, BL115, BL134, BL510, brain, breast, cerebellum, CLLM633, CLLU626, columnar cells,EBV159, endometrium, epididymis, ESC, ES-RPE, cerebral cortex, fetal RPE, frontal cortex, GC40, GC136, GCB110, GCB385, H929, heart,HEK293, HeLa, HIV412, kidney, KMS12, L1236, L428, liver, lung, Ly3, MALT413, MCL112, MCL114, MM55, MM139, Mino122, Naı̈ve-B-cell, ovary, parthenogenetic-activated blastocysts stem cell, principal and basal cells, peripheral blood mononuclear cells, PC44,peritubular, plasma, pigmented cluster, prostate, red blood cell, seminal vesicle, superior frontal gyrus, skeletal muscle, skin, splenic414,spermatozoa, seminal vesicle, testis, tonsil, U266, and uterus.cBrain, ileum, kidney, liver, muscle, and testis.dSee references Hudson and Snyder (2006), Euskirchen et al. (2007), Meyer et al. (2013) for details.eK562, HCT-116, HeLa-S3, MCF-7, and NB4.
Table 2. Functional Annotations in RhesusBase.
Entries
Categories v1a v2
DNA SNP 5,682,738 20,327,025
RNA mRNA expression profile 1,330,884 5,682,934PA site 0 1,184,140Alternative splicing 0 481,865RNA editing 0 1,369,446miRNA expression profile 0 9,395
Regulation TFBS 174,805 28,771,628Chromatin interaction 0 493,236miRNA-binding site 15,909 104,041
Sum 7,204,336 58,423,710
aStatistics of the functional annotations archived in the previous (v1) and currentversion of RhesusBase (v2) is summarized. From highly selected and processed NGSdata sets, a total of 58,423,710 functional records were generated and incorporatedin RhesusBase2 (v2), representing approximately one order of magnitude more NGSannotation entries compared with the previous version (v1).
1312
Zhang et al. . doi:10.1093/molbev/msu084 MBE
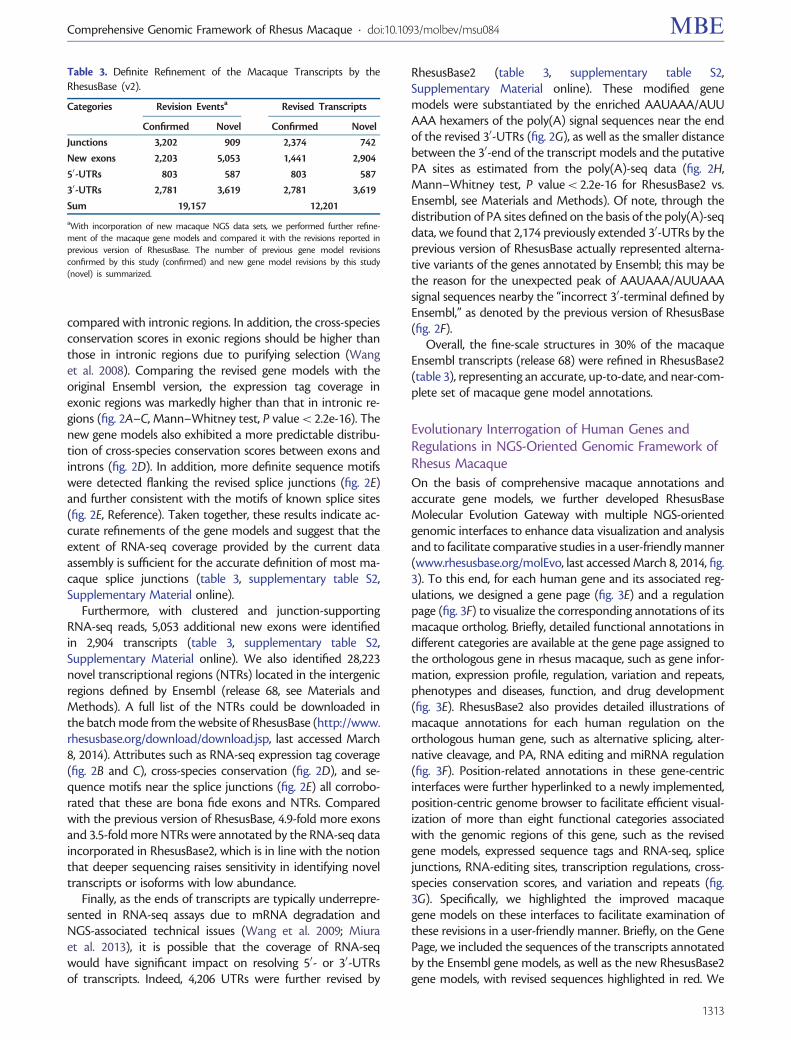
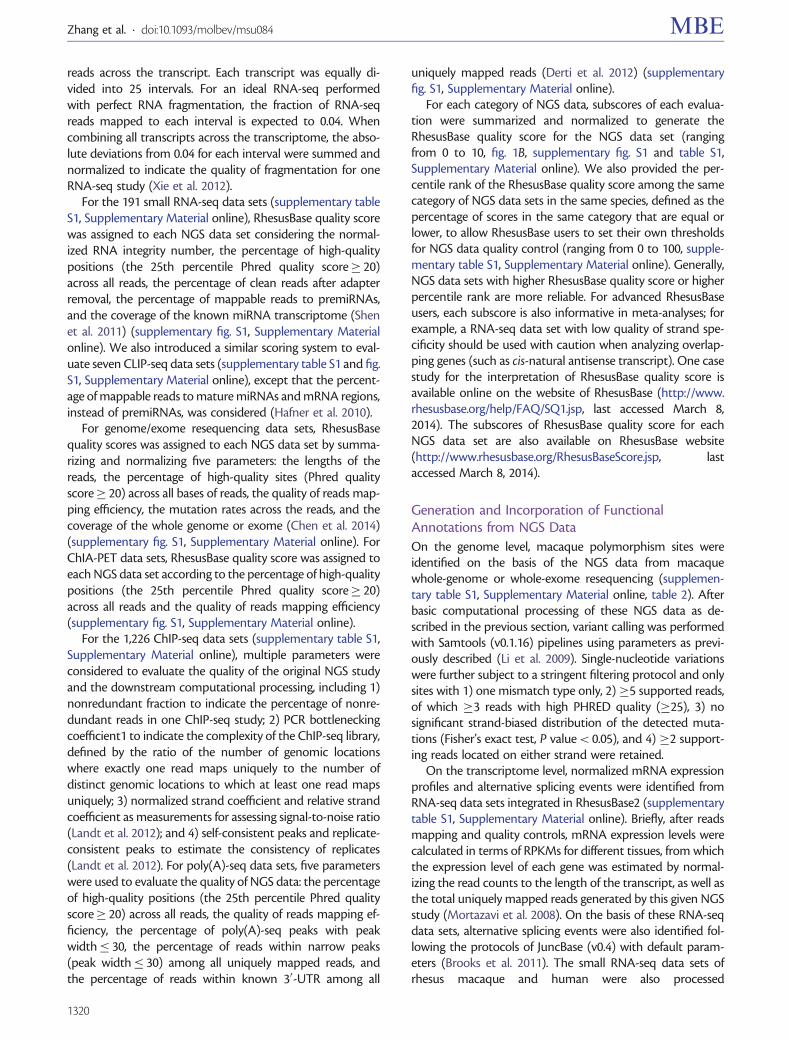
compared with intronic regions. In addition, the cross-speciesconservation scores in exonic regions should be higher thanthose in intronic regions due to purifying selection (Wanget al. 2008). Comparing the revised gene models with theoriginal Ensembl version, the expression tag coverage inexonic regions was markedly higher than that in intronic re-gions (fig. 2A–C, Mann–Whitney test, P value< 2.2e-16). Thenew gene models also exhibited a more predictable distribu-tion of cross-species conservation scores between exons andintrons (fig. 2D). In addition, more definite sequence motifswere detected flanking the revised splice junctions (fig. 2E)and further consistent with the motifs of known splice sites(fig. 2E, Reference). Taken together, these results indicate ac-curate refinements of the gene models and suggest that theextent of RNA-seq coverage provided by the current dataassembly is sufficient for the accurate definition of most ma-caque splice junctions (table 3, supplementary table S2,Supplementary Material online).
Furthermore, with clustered and junction-supportingRNA-seq reads, 5,053 additional new exons were identifiedin 2,904 transcripts (table 3, supplementary table S2,Supplementary Material online). We also identified 28,223novel transcriptional regions (NTRs) located in the intergenicregions defined by Ensembl (release 68, see Materials andMethods). A full list of the NTRs could be downloaded inthe batch mode from the website of RhesusBase (http://www.rhesusbase.org/download/download.jsp, last accessed March8, 2014). Attributes such as RNA-seq expression tag coverage(fig. 2B and C), cross-species conservation (fig. 2D), and se-quence motifs near the splice junctions (fig. 2E) all corrobo-rated that these are bona fide exons and NTRs. Comparedwith the previous version of RhesusBase, 4.9-fold more exonsand 3.5-fold more NTRs were annotated by the RNA-seq dataincorporated in RhesusBase2, which is in line with the notionthat deeper sequencing raises sensitivity in identifying noveltranscripts or isoforms with low abundance.
Finally, as the ends of transcripts are typically underrepre-sented in RNA-seq assays due to mRNA degradation andNGS-associated technical issues (Wang et al. 2009; Miuraet al. 2013), it is possible that the coverage of RNA-seqwould have significant impact on resolving 50- or 30-UTRsof transcripts. Indeed, 4,206 UTRs were further revised by
RhesusBase2 (table 3, supplementary table S2,Supplementary Material online). These modified genemodels were substantiated by the enriched AAUAAA/AUUAAA hexamers of the poly(A) signal sequences near the endof the revised 30-UTRs (fig. 2G), as well as the smaller distancebetween the 30-end of the transcript models and the putativePA sites as estimated from the poly(A)-seq data (fig. 2H,Mann–Whitney test, P value< 2.2e-16 for RhesusBase2 vs.Ensembl, see Materials and Methods). Of note, through thedistribution of PA sites defined on the basis of the poly(A)-seqdata, we found that 2,174 previously extended 30-UTRs by theprevious version of RhesusBase actually represented alterna-tive variants of the genes annotated by Ensembl; this may bethe reason for the unexpected peak of AAUAAA/AUUAAAsignal sequences nearby the “incorrect 30-terminal defined byEnsembl,” as denoted by the previous version of RhesusBase(fig. 2F).
Overall, the fine-scale structures in 30% of the macaqueEnsembl transcripts (release 68) were refined in RhesusBase2(table 3), representing an accurate, up-to-date, and near-com-plete set of macaque gene model annotations.
Evolutionary Interrogation of Human Genes andRegulations in NGS-Oriented Genomic Framework ofRhesus Macaque
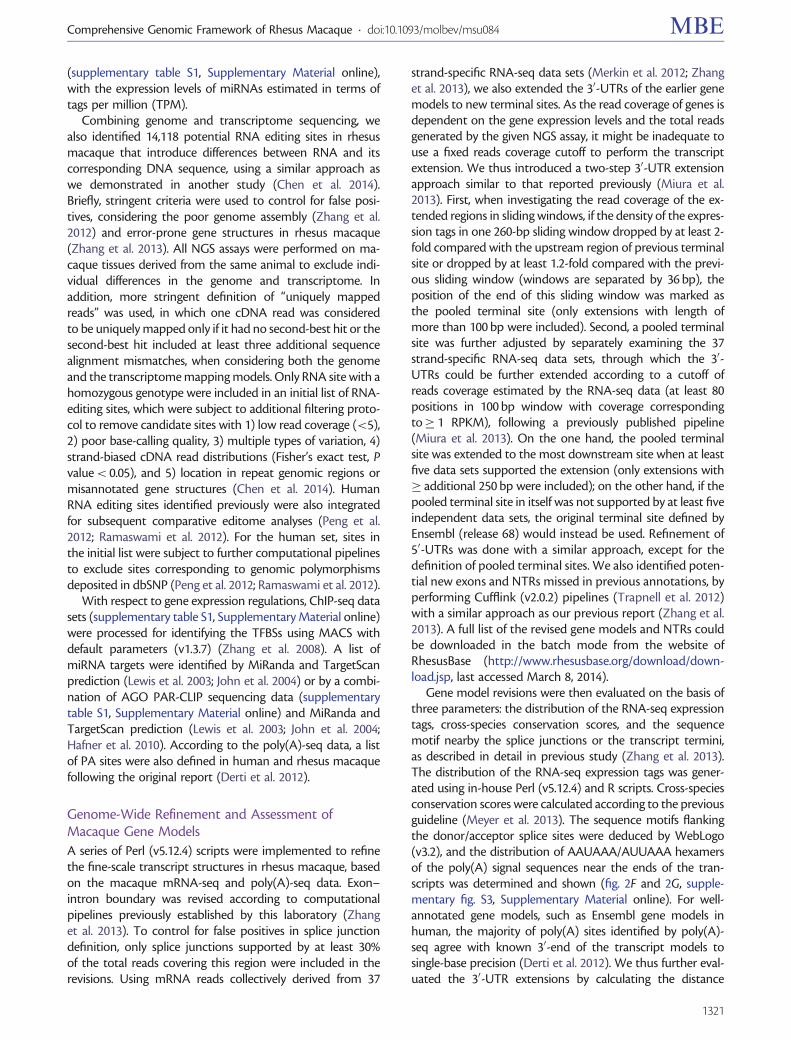
On the basis of comprehensive macaque annotations andaccurate gene models, we further developed RhesusBaseMolecular Evolution Gateway with multiple NGS-orientedgenomic interfaces to enhance data visualization and analysisand to facilitate comparative studies in a user-friendly manner(www.rhesusbase.org/molEvo, last accessed March 8, 2014, fig.3). To this end, for each human gene and its associated reg-ulations, we designed a gene page (fig. 3E) and a regulationpage (fig. 3F) to visualize the corresponding annotations of itsmacaque ortholog. Briefly, detailed functional annotations indifferent categories are available at the gene page assigned tothe orthologous gene in rhesus macaque, such as gene infor-mation, expression profile, regulation, variation and repeats,phenotypes and diseases, function, and drug development(fig. 3E). RhesusBase2 also provides detailed illustrations ofmacaque annotations for each human regulation on theorthologous human gene, such as alternative splicing, alter-native cleavage, and PA, RNA editing and miRNA regulation(fig. 3F). Position-related annotations in these gene-centricinterfaces were further hyperlinked to a newly implemented,position-centric genome browser to facilitate efficient visual-ization of more than eight functional categories associatedwith the genomic regions of this gene, such as the revisedgene models, expressed sequence tags and RNA-seq, splicejunctions, RNA-editing sites, transcription regulations, cross-species conservation scores, and variation and repeats (fig.3G). Specifically, we highlighted the improved macaquegene models on these interfaces to facilitate examination ofthese revisions in a user-friendly manner. Briefly, on the GenePage, we included the sequences of the transcripts annotatedby the Ensembl gene models, as well as the new RhesusBase2gene models, with revised sequences highlighted in red. We
Table 3. Definite Refinement of the Macaque Transcripts by theRhesusBase (v2).
Categories Revision Eventsa Revised Transcripts
Confirmed Novel Confirmed Novel
Junctions 3,202 909 2,374 742
New exons 2,203 5,053 1,441 2,904
50-UTRs 803 587 803 587
30-UTRs 2,781 3,619 2,781 3,619
Sum 19,157 12,201
aWith incorporation of new macaque NGS data sets, we performed further refine-ment of the macaque gene models and compared it with the revisions reported inprevious version of RhesusBase. The number of previous gene model revisionsconfirmed by this study (confirmed) and new gene model revisions by this study(novel) is summarized.
1313
Comprehensive Genomic Framework of Rhesus Macaque . doi:10.1093/molbev/msu084 MBE
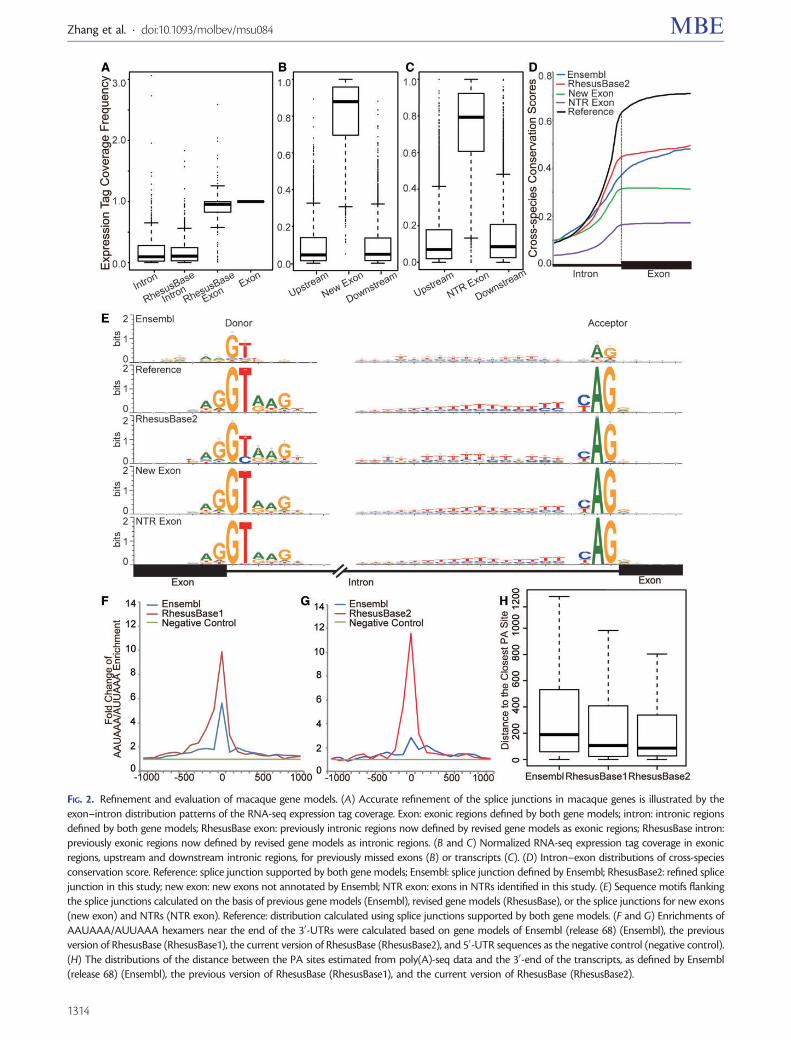
FIG. 2. Refinement and evaluation of macaque gene models. (A) Accurate refinement of the splice junctions in macaque genes is illustrated by theexon–intron distribution patterns of the RNA-seq expression tag coverage. Exon: exonic regions defined by both gene models; intron: intronic regionsdefined by both gene models; RhesusBase exon: previously intronic regions now defined by revised gene models as exonic regions; RhesusBase intron:previously exonic regions now defined by revised gene models as intronic regions. (B and C) Normalized RNA-seq expression tag coverage in exonicregions, upstream and downstream intronic regions, for previously missed exons (B) or transcripts (C). (D) Intron–exon distributions of cross-speciesconservation score. Reference: splice junction supported by both gene models; Ensembl: splice junction defined by Ensembl; RhesusBase2: refined splicejunction in this study; new exon: new exons not annotated by Ensembl; NTR exon: exons in NTRs identified in this study. (E) Sequence motifs flankingthe splice junctions calculated on the basis of previous gene models (Ensembl), revised gene models (RhesusBase), or the splice junctions for new exons(new exon) and NTRs (NTR exon). Reference: distribution calculated using splice junctions supported by both gene models. (F and G) Enrichments ofAAUAAA/AUUAAA hexamers near the end of the 30-UTRs were calculated based on gene models of Ensembl (release 68) (Ensembl), the previousversion of RhesusBase (RhesusBase1), the current version of RhesusBase (RhesusBase2), and 50-UTR sequences as the negative control (negative control).(H) The distributions of the distance between the PA sites estimated from poly(A)-seq data and the 30-end of the transcripts, as defined by Ensembl(release 68) (Ensembl), the previous version of RhesusBase (RhesusBase1), and the current version of RhesusBase (RhesusBase2).
1314
Zhang et al. . doi:10.1093/molbev/msu084 MBE
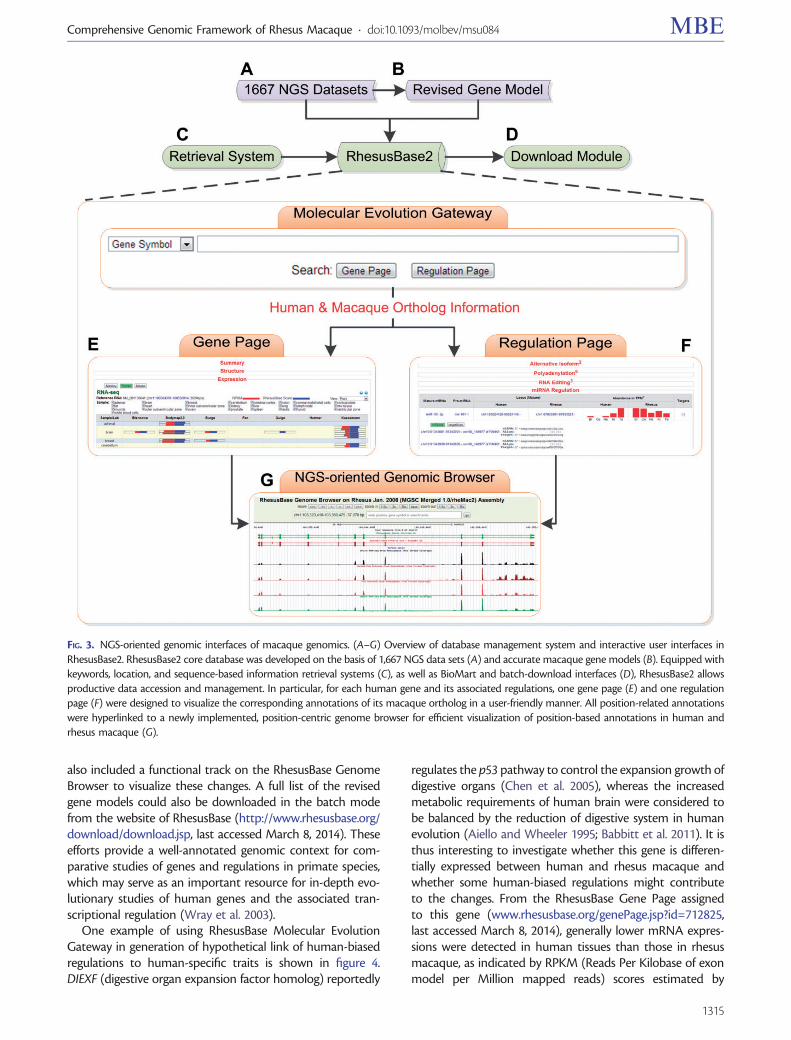
also included a functional track on the RhesusBase GenomeBrowser to visualize these changes. A full list of the revisedgene models could also be downloaded in the batch modefrom the website of RhesusBase (http://www.rhesusbase.org/download/download.jsp, last accessed March 8, 2014). Theseefforts provide a well-annotated genomic context for com-parative studies of genes and regulations in primate species,which may serve as an important resource for in-depth evo-lutionary studies of human genes and the associated tran-scriptional regulation (Wray et al. 2003).
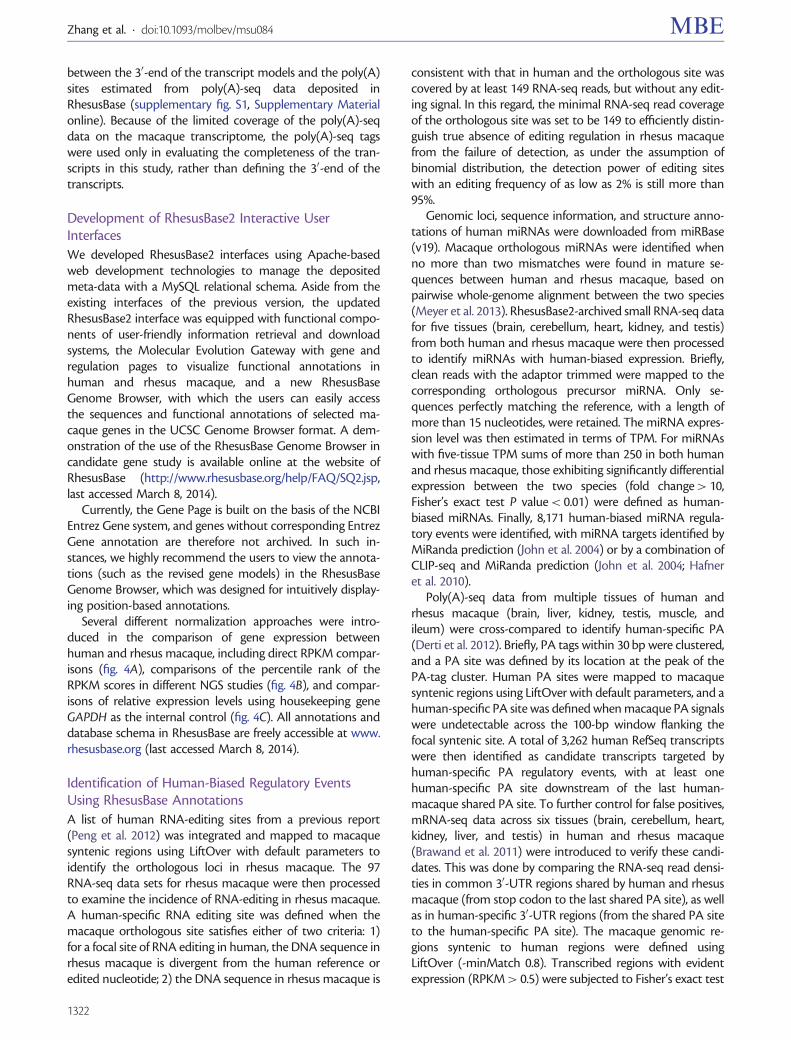
One example of using RhesusBase Molecular EvolutionGateway in generation of hypothetical link of human-biasedregulations to human-specific traits is shown in figure 4.DIEXF (digestive organ expansion factor homolog) reportedly
regulates the p53 pathway to control the expansion growth ofdigestive organs (Chen et al. 2005), whereas the increasedmetabolic requirements of human brain were considered tobe balanced by the reduction of digestive system in humanevolution (Aiello and Wheeler 1995; Babbitt et al. 2011). It isthus interesting to investigate whether this gene is differen-tially expressed between human and rhesus macaque andwhether some human-biased regulations might contributeto the changes. From the RhesusBase Gene Page assignedto this gene (www.rhesusbase.org/genePage.jsp?id=712825,last accessed March 8, 2014), generally lower mRNA expres-sions were detected in human tissues than those in rhesusmacaque, as indicated by RPKM (Reads Per Kilobase of exonmodel per Million mapped reads) scores estimated by
FIG. 3. NGS-oriented genomic interfaces of macaque genomics. (A–G) Overview of database management system and interactive user interfaces inRhesusBase2. RhesusBase2 core database was developed on the basis of 1,667 NGS data sets (A) and accurate macaque gene models (B). Equipped withkeywords, location, and sequence-based information retrieval systems (C), as well as BioMart and batch-download interfaces (D), RhesusBase2 allowsproductive data accession and management. In particular, for each human gene and its associated regulations, one gene page (E) and one regulationpage (F) were designed to visualize the corresponding annotations of its macaque ortholog in a user-friendly manner. All position-related annotationswere hyperlinked to a newly implemented, position-centric genome browser for efficient visualization of position-based annotations in human andrhesus macaque (G).
1315
Comprehensive Genomic Framework of Rhesus Macaque . doi:10.1093/molbev/msu084 MBE
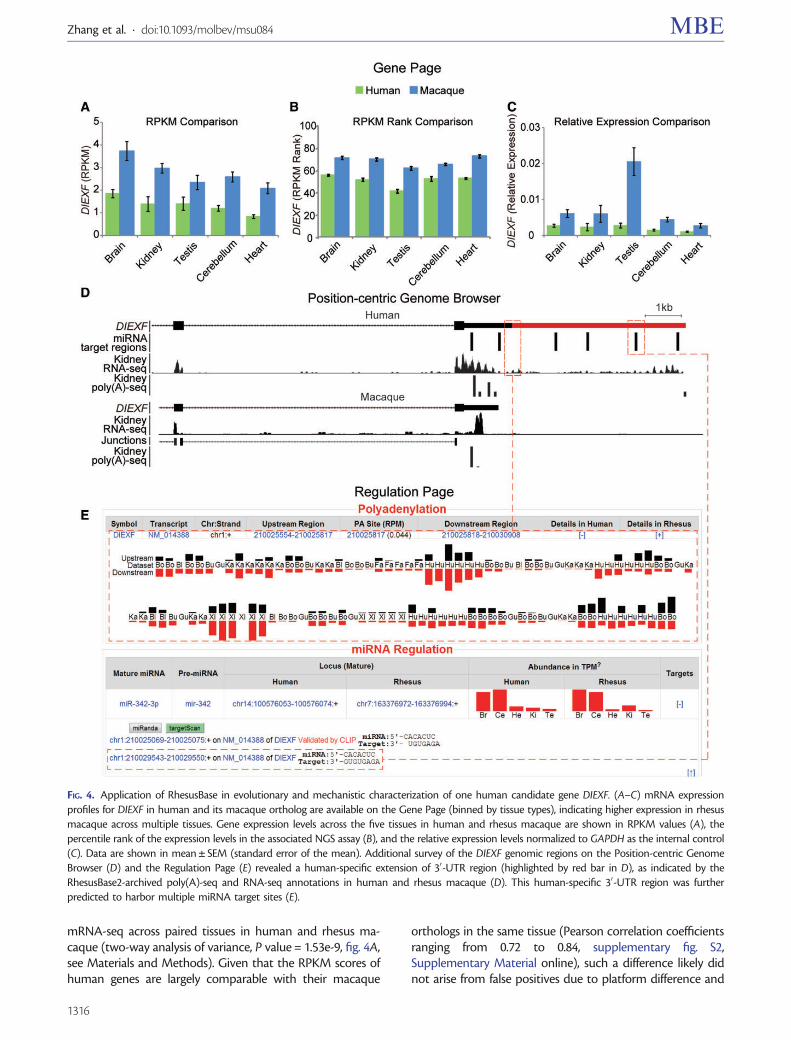
mRNA-seq across paired tissues in human and rhesus ma-caque (two-way analysis of variance, P value = 1.53e-9, fig. 4A,see Materials and Methods). Given that the RPKM scores ofhuman genes are largely comparable with their macaque
orthologs in the same tissue (Pearson correlation coefficientsranging from 0.72 to 0.84, supplementary fig. S2,Supplementary Material online), such a difference likely didnot arise from false positives due to platform difference and
FIG. 4. Application of RhesusBase in evolutionary and mechanistic characterization of one human candidate gene DIEXF. (A–C) mRNA expressionprofiles for DIEXF in human and its macaque ortholog are available on the Gene Page (binned by tissue types), indicating higher expression in rhesusmacaque across multiple tissues. Gene expression levels across the five tissues in human and rhesus macaque are shown in RPKM values (A), thepercentile rank of the expression levels in the associated NGS assay (B), and the relative expression levels normalized to GAPDH as the internal control(C). Data are shown in mean ± SEM (standard error of the mean). Additional survey of the DIEXF genomic regions on the Position-centric GenomeBrowser (D) and the Regulation Page (E) revealed a human-specific extension of 30-UTR region (highlighted by red bar in D), as indicated by theRhesusBase2-archived poly(A)-seq and RNA-seq annotations in human and rhesus macaque (D). This human-specific 30-UTR region was furtherpredicted to harbor multiple miRNA target sites (E).
1316
Zhang et al. . doi:10.1093/molbev/msu084 MBE
technological noise. Besides direct RPKM comparisons, thepercentile rank of the expression level of this gene in eachRNA-seq assay, also shown on the Gene Page, further con-firmed the differential expression of DIEXF between humanand rhesus macaque (two-way analysis of variance, Pvalue< 2e-16, fig. 4B, see Materials and Methods).Specifically, from the Gene Page, we also provided theRPKM score of extensively used housekeeping gene for indi-vidual RNA-seq data set for an alternative normalization ap-proach of calculating the relative expression levels, as in thereal-time PCR assays (see Materials and Methods). In this case,cross-species comparisons using relative expression levels nor-malized to GAPDH also revealed differential expression ofDIEXF between human and rhesus macaque (two-way anal-ysis of variance, P value = 2.37e-06, fig. 4C).
Additional survey of the DIEXF genomic regions in theposition-centric RhesusBase Genome Browser revealed ahuman-specific extension of the 30-UTR length, illustratedby the RhesusBase2-archived poly(A)-seq and RNA-seq anno-tations in human and rhesus macaque (fig. 4D). Interestingly,from the regulation page for DIEXF (www.rhesusbase.org/molEvo/hrRegu.jsp?type=symbol&value=DIEXF, lastaccessed March 8, 2014), we further found that thishuman-specific 30-UTR region harbors multiple predictedmiRNA target sites (fig. 4E). Collectively, RhesusBase2 inter-faces facilitate comprehensive assessment of interlinked generegulations across primate species and, in the case of DIEXF,provide additional clues on its down-regulation in human andits possible evolutionary implications in digestive system re-duction in human as proposed by the “expensive tissue hy-pothesis” (Aiello and Wheeler 1995; Babbitt et al. 2011).
Human-Biased Regulations Shape the UniqueTranscriptome in Human
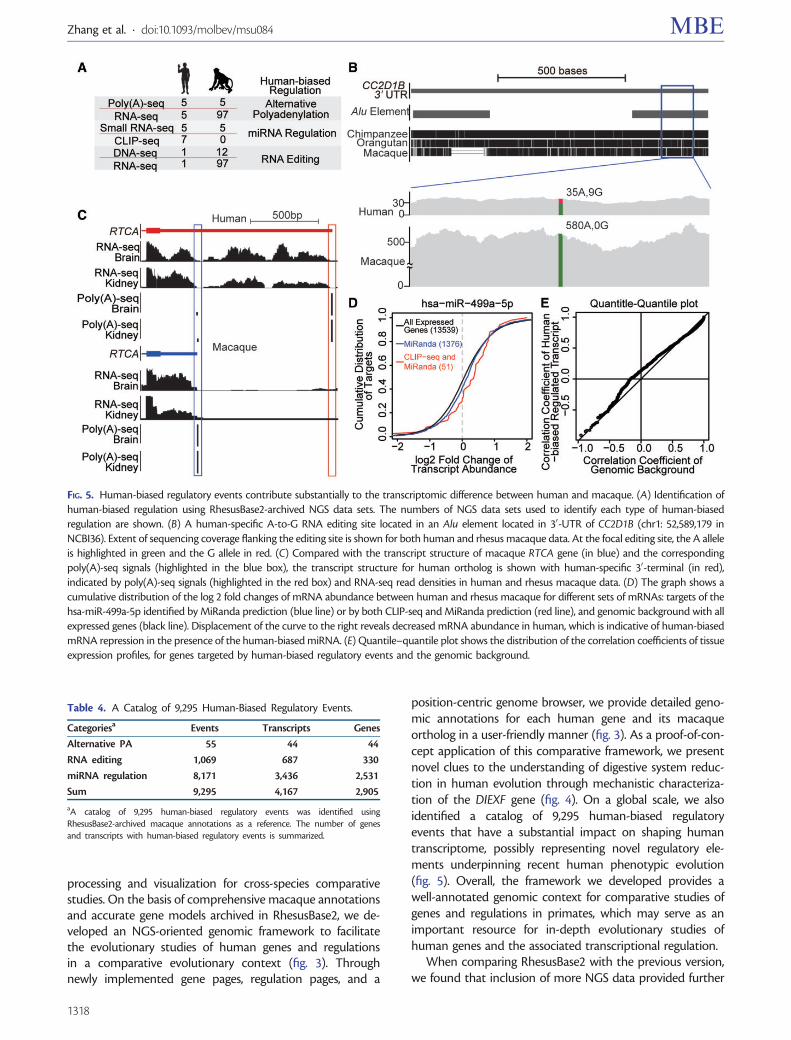
On a global scale, as proof-of-concept demonstration ofRhesusBase2 in evolutionary interrogation of human biology,we identified a catalog of 9,295 human-biased regulatoryevents using RhesusBase2-archived macaque annotations asa reference (fig. 5A, table 4). First, by combining RNA-seq datawith the corresponding genome resequencing data, we iden-tified 1,069 human-specific RNA-editing sites (see Materialsand Methods, fig. 5B). Second, through integrating RNA-seqand poly(A)-seq data for characterizing transcript ends, weidentified 55 human-specific alternative cleavage and PAevents that create longer transcripts (see Materials andMethods, fig. 5C). Third, small RNA-seq and CLIP-seq togetherpinpointed 8,171 human-biased miRNA regulatory events(see Materials and Methods, fig. 5D). In all these cases (sup-plementary table S3, Supplementary Material online), thehuman-biased regulatory events were defined with statisticalconfidence, given that the average genome and transcrip-tome coverage in rhesus macaque was usually deeper thanthat in the human (fig. 5A).
Although most protein-coding genes show highly con-served tissue expression profiles across primate species, asillustrated by high correlation coefficients (Barbosa-Moraiset al. 2012), genes targeted by these human-biased regulatory
events exhibited significantly lower correlation in tissue-specific expression between human and macaque, whencompared with the genomic background (fig. 5E). Thesemore recently evolved regulatory events thus may have asubstantial contribution in shaping the human transcrip-tome, providing additional evidence that noncoding regula-tory elements may contribute substantially to the phenotypicdifferences between humans and other primate species(Wray 2007).
Discussion
Functional Features of RhesusBase2 in AnnotatingMacaque Genome and Gene Models
Despite the unique advantages of rhesus macaque in evolu-tionary studies of human genes and regulations, inadequatefunctional genomics annotations and error-prone genemodels limited current use of this model. Prior toRhesusBase, Ensembl, National Center for BiotechnologyInformation (NCBI), and the University of California–SantaCruz (UCSC) Genome Browser were the three main resourcesfor macaque annotations, the majority of which were puta-tively predicted due to the limited functional genomic datafor rhesus macaque. With the development of the first rhesusmacaque database, and now the significantly expandedsecond version, RhesusBase2 represents the most compre-hensive resource to date for the macaque genomic annota-tions (fig. 1, table 2). Particularly with respect to geneexpression profiles, RhesusBase2 extensively compiled high-throughput transcriptome sequencing data from 97 macaqueRNA-seq experiments covering 18 tissues in 38 individuals, aswell as 105 human RNA-seq experiments covering 25 tissues(fig. 1, table 2). Functional genomics information such as mi-croarray data from BioGPS (Wu et al. 2009) and in situ hy-bridization data from Allen Brain Atlas (Jones et al. 2009) werealso merged and integrated, which are largely missing in otheronline resources. RhesusBase2 thus broadens the scope ofunderstanding of the macaque genome structure andfunctions.
In contrast to the Ensembl gene models, which mainly relyon ab initio or comparative genomics-guided predictions,RhesusBase, and now the significantly expanded second ver-sion, applied in-depth experimental data (e.g., RNA-seq) forsignificant refinement of rhesus macaque gene models (fig. 2,table 3). Consequently, we found that about 30% of the ma-caque transcripts were previously misannotated by Ensembl(release 68). Although it remains a formal possibility that yetmore NGS data are still needed for complete delineation oftranscriptome components, RhesusBase2 represents an accu-rate, up-to-date, and near-complete set of macaque genemodel annotations (fig. 2, table 3).
A Comparative Genomic Framework for EvolutionaryInterrogation of Human Genes and Regulations
Although public databases such as Ensembl, NCBI, and UCSCGenome Browser have established web servers to access andanalyze macaque data, they are not tailored specifically forany particular species, especially in terms of NGS data
1317
Comprehensive Genomic Framework of Rhesus Macaque . doi:10.1093/molbev/msu084 MBE
processing and visualization for cross-species comparativestudies. On the basis of comprehensive macaque annotationsand accurate gene models archived in RhesusBase2, we de-veloped an NGS-oriented genomic framework to facilitatethe evolutionary studies of human genes and regulationsin a comparative evolutionary context (fig. 3). Throughnewly implemented gene pages, regulation pages, and a
position-centric genome browser, we provide detailed geno-mic annotations for each human gene and its macaqueortholog in a user-friendly manner (fig. 3). As a proof-of-con-cept application of this comparative framework, we presentnovel clues to the understanding of digestive system reduc-tion in human evolution through mechanistic characteriza-tion of the DIEXF gene (fig. 4). On a global scale, we alsoidentified a catalog of 9,295 human-biased regulatoryevents that have a substantial impact on shaping humantranscriptome, possibly representing novel regulatory ele-ments underpinning recent human phenotypic evolution(fig. 5). Overall, the framework we developed provides awell-annotated genomic context for comparative studies ofgenes and regulations in primates, which may serve as animportant resource for in-depth evolutionary studies ofhuman genes and the associated transcriptional regulation.
When comparing RhesusBase2 with the previous version,we found that inclusion of more NGS data provided further
Table 4. A Catalog of 9,295 Human-Biased Regulatory Events.
Categoriesa Events Transcripts Genes
Alternative PA 55 44 44
RNA editing 1,069 687 330
miRNA regulation 8,171 3,436 2,531
Sum 9,295 4,167 2,905
aA catalog of 9,295 human-biased regulatory events was identified usingRhesusBase2-archived macaque annotations as a reference. The number of genesand transcripts with human-biased regulatory events is summarized.
FIG. 5. Human-biased regulatory events contribute substantially to the transcriptomic difference between human and macaque. (A) Identification ofhuman-biased regulation using RhesusBase2-archived NGS data sets. The numbers of NGS data sets used to identify each type of human-biasedregulation are shown. (B) A human-specific A-to-G RNA editing site located in an Alu element located in 30-UTR of CC2D1B (chr1: 52,589,179 inNCBI36). Extent of sequencing coverage flanking the editing site is shown for both human and rhesus macaque data. At the focal editing site, the A alleleis highlighted in green and the G allele in red. (C) Compared with the transcript structure of macaque RTCA gene (in blue) and the correspondingpoly(A)-seq signals (highlighted in the blue box), the transcript structure for human ortholog is shown with human-specific 30-terminal (in red),indicated by poly(A)-seq signals (highlighted in the red box) and RNA-seq read densities in human and rhesus macaque data. (D) The graph shows acumulative distribution of the log 2 fold changes of mRNA abundance between human and rhesus macaque for different sets of mRNAs: targets of thehsa-miR-499a-5p identified by MiRanda prediction (blue line) or by both CLIP-seq and MiRanda prediction (red line), and genomic background with allexpressed genes (black line). Displacement of the curve to the right reveals decreased mRNA abundance in human, which is indicative of human-biasedmRNA repression in the presence of the human-biased miRNA. (E) Quantile–quantile plot shows the distribution of the correlation coefficients of tissueexpression profiles, for genes targeted by human-biased regulatory events and the genomic background.
1318
Zhang et al. . doi:10.1093/molbev/msu084 MBE
depth for the precise and comprehensive definition of ma-caque transcripts and regulations, especially for those withlow or context-dependent expression. Therefore, as moredeep sequencing data are available, genome structure andits functional attributes will become progressively better de-fined. RhesusBase is built with the power and flexibility forefficient data incorporation, processing, and retrieval. It is thusdesigned to best meet the rapid pace of NGS technologydevelopment, data collection, and presentation. As a primatecenter built according to international AAALAC standards(Association for Assessment and Accreditation ofLaboratory Animal Care International), we will continue tomaintain and support RhesusBase through generating andintegrating NGS data, providing an up-to-date, user-friendly,“one-stop” resource for the community.
Materials and Methods
Integration and Computational Processing of NGSData
In-house functional genomics data on rhesus macaque, aswell as public data either retrieved through the PubMed key-words query “(high-throughput sequencing) AND (rhesusmacaque)” or directly downloaded from public databases,such as GEO or SRA, were processed and integrated (supple-mentary table S1, Supplementary Material online). A total of1,514 human NGS data sets, including the recently releasedENCODE data, were also incorporated to facilitate in-depthcomparative analyses in primate species (table 1, supplemen-tary table S1, Supplementary Material online).
NGS data sets were then processed according to standard-ized pipelines as reported previously (Hafner et al. 2010; Shenet al. 2011; Derti et al. 2012; Feng et al. 2012; Li et al. 2012;Zhang et al. 2013; Chen et al. 2014): 1) For macaque genomeresequencing and exome-sequencing data sets, the raw se-quencing reads were aligned to the rhesus macaque genome(rheMac2) with BWA (v0.5.9-r16) (Li and Durbin 2009), andonly uniquely mapped reads were retained. 2) RNA-seq readswere mapped to the genomes of rhesus macaque (rheMac2)or human (NCBI36/hg18) by TopHat (v1.2.0) (Trapnell et al.2009), with ambiguously mapped reads discarded. 3) Forsmall RNA-seq data sets in rhesus macaque and human,clean reads with the adaptor trimmed by cutadapt (v1.0)were mapped to the corresponding orthologous precursormiRNA (miRBase Release 18) with Bowtie (v0.12.8)(Langmead et al. 2009). Only sequences perfectly matchingthe reference, with a length of more than 15 nucleotides, wereretained to estimate the expression levels of miRNAs. 4) Readsgenerated by ChIP-seq assays were mapped to humangenome (GRCh37/hg19) with Bowtie (v0.12.5) (Langmeadet al. 2009) or BWA (Li and Durbin 2009). ChIP-seq peakswere then called using MACS (v1.3.7) (Zhang et al. 2008)following previous published pipelines (Feng et al. 2012). 5)Chromatin interaction data identified by ChIA-PET (Li,Fullwood, et al. 2010) were directly downloaded from UCSCGenome Browser (Meyer et al. 2013). 6) Seven AGO PAR-CLIPsequencing data sets of human HEK293 cell line were down-loaded from GEO database and subjected to PAR-CLIP
sequencing analysis protocol to identify AGO crosslink-cen-tered regions (Hafner et al. 2010). Briefly, after adapter re-moval, short (<20 nt) or repetitive reads were discardedand the remaining reads were mapped to human genome(NCBI36/hg18) by GMAP (Wu and Watanabe 2005). Onlyuniquely mapped reads with less than two mismatch wereused to generate PAR-CLIP clusters, and the specific T to Cmutations within these clusters were used as indicators forreliable protein-binding sites (Hafner et al. 2010). 7) Poly(A)-seq data in human and rhesus macaque were downloadedand aligned to the reference genomes following the originalreport (Derti et al. 2012). After a filtering protocol to removefalse positives due to internal priming events, the 30-ends ofuniquely mapped reads (PA tags) located within 30 bp on thesame strand were clustered. A PA site was then defined by itslocation at the peak of the PA-tag cluster (Derti et al. 2012).
RhesusBase Quality Score: Comprehensive Evaluationon NGS Data Sets
To facilitate NGS data assessment and comparison, FastQC(v0.10.0), Samtools (v0.1.16) (Li et al. 2009), Bamtools(v0.1.0.2) (Barnett et al. 2011), and Bedtools (v2.16.2)(Quinlan and Hall 2010) were used to process the reads map-ping results, and a series of Perl (v5.12.4), Python (v2.7.3), andR (v2.15.3) scripts were implemented to evaluate the qualityof the NGS data and the processing procedures.Subsequently, a RhesusBase quality score (ranging from 0 to10) was assigned to each NGS data set according to multiplecriteria that consider overall workflow of data generation as-sociated with the original study and the downstream com-putational processing (fig. 1B, supplementary fig. S1,Supplementary Material online).
For the 202 mRNA-seq data integrated in RhesusBase (sup-plementary table S1, Supplementary Material online), nineparameters were considered in the evaluation and scoringof NGS data sets (fig. 1B), including 1) normalized RNA in-tegrity number as an indicator for the quality of RNA samples;2) normalized lengths of RNA-seq reads; 3) normalized per-centage of high-quality positions (the 25th percentile Phredquality score � 20) across all reads; 4) the quality of strandspecificity, estimated on the basis of the percentage of readswith correct strand assignment. For RNA-seq data sets withnonstrand-specific design, this subscore was set to zero; 5) thequality of reads mapping efficiency, estimated on the basis ofthe percentage of uniquely mapped reads to the referencegenome; 6) the mutation rates across the reads, estimatedby the percentage of sites with low mutation rate (�0.01)across the reads; 7) degrees of potential contamination. Toensure the RNA-seq reads were generated from maturemRNAs, the RPKM of exonic, intronic, and intergenic regionswere calculated and compared, and the ratios of RPKMexonic/RPKMintronic and RPKMexonic/RPKMintergenic were normalizedand summarized to estimate the degrees of contaminationfor individual RNA-seq study; 8) the coverage of the transcrip-tome, estimated by the percentage of sites with high readscoverage (� 10) across the whole transcriptome; and 9) thequality of fragmentation as indicated by the distribution of
1319
Comprehensive Genomic Framework of Rhesus Macaque . doi:10.1093/molbev/msu084 MBE
reads across the transcript. Each transcript was equally di-vided into 25 intervals. For an ideal RNA-seq performedwith perfect RNA fragmentation, the fraction of RNA-seqreads mapped to each interval is expected to 0.04. Whencombining all transcripts across the transcriptome, the abso-lute deviations from 0.04 for each interval were summed andnormalized to indicate the quality of fragmentation for oneRNA-seq study (Xie et al. 2012).
For the 191 small RNA-seq data sets (supplementary tableS1, Supplementary Material online), RhesusBase quality scorewas assigned to each NGS data set considering the normal-ized RNA integrity number, the percentage of high-qualitypositions (the 25th percentile Phred quality score� 20)across all reads, the percentage of clean reads after adapterremoval, the percentage of mappable reads to premiRNAs,and the coverage of the known miRNA transcriptome (Shenet al. 2011) (supplementary fig. S1, Supplementary Materialonline). We also introduced a similar scoring system to eval-uate seven CLIP-seq data sets (supplementary table S1 and fig.S1, Supplementary Material online), except that the percent-age of mappable reads to mature miRNAs and mRNA regions,instead of premiRNAs, was considered (Hafner et al. 2010).
For genome/exome resequencing data sets, RhesusBasequality scores was assigned to each NGS data set by summa-rizing and normalizing five parameters: the lengths of thereads, the percentage of high-quality sites (Phred qualityscore� 20) across all bases of reads, the quality of reads map-ping efficiency, the mutation rates across the reads, and thecoverage of the whole genome or exome (Chen et al. 2014)(supplementary fig. S1, Supplementary Material online). ForChIA-PET data sets, RhesusBase quality score was assigned toeach NGS data set according to the percentage of high-qualitypositions (the 25th percentile Phred quality score� 20)across all reads and the quality of reads mapping efficiency(supplementary fig. S1, Supplementary Material online).
For the 1,226 ChIP-seq data sets (supplementary table S1,Supplementary Material online), multiple parameters wereconsidered to evaluate the quality of the original NGS studyand the downstream computational processing, including 1)nonredundant fraction to indicate the percentage of nonre-dundant reads in one ChIP-seq study; 2) PCR bottleneckingcoefficient1 to indicate the complexity of the ChIP-seq library,defined by the ratio of the number of genomic locationswhere exactly one read maps uniquely to the number ofdistinct genomic locations to which at least one read mapsuniquely; 3) normalized strand coefficient and relative strandcoefficient as measurements for assessing signal-to-noise ratio(Landt et al. 2012); and 4) self-consistent peaks and replicate-consistent peaks to estimate the consistency of replicates(Landt et al. 2012). For poly(A)-seq data sets, five parameterswere used to evaluate the quality of NGS data: the percentageof high-quality positions (the 25th percentile Phred qualityscore� 20) across all reads, the quality of reads mapping ef-ficiency, the percentage of poly(A)-seq peaks with peakwidth� 30, the percentage of reads within narrow peaks(peak width� 30) among all uniquely mapped reads, andthe percentage of reads within known 30-UTR among all
uniquely mapped reads (Derti et al. 2012) (supplementaryfig. S1, Supplementary Material online).
For each category of NGS data, subscores of each evalua-tion were summarized and normalized to generate theRhesusBase quality score for the NGS data set (rangingfrom 0 to 10, fig. 1B, supplementary fig. S1 and table S1,Supplementary Material online). We also provided the per-centile rank of the RhesusBase quality score among the samecategory of NGS data sets in the same species, defined as thepercentage of scores in the same category that are equal orlower, to allow RhesusBase users to set their own thresholdsfor NGS data quality control (ranging from 0 to 100, supple-mentary table S1, Supplementary Material online). Generally,NGS data sets with higher RhesusBase quality score or higherpercentile rank are more reliable. For advanced RhesusBaseusers, each subscore is also informative in meta-analyses; forexample, a RNA-seq data set with low quality of strand spe-cificity should be used with caution when analyzing overlap-ping genes (such as cis-natural antisense transcript). One casestudy for the interpretation of RhesusBase quality score isavailable online on the website of RhesusBase (http://www.rhesusbase.org/help/FAQ/SQ1.jsp, last accessed March 8,2014). The subscores of RhesusBase quality score for eachNGS data set are also available on RhesusBase website(http://www.rhesusbase.org/RhesusBaseScore.jsp, lastaccessed March 8, 2014).
Generation and Incorporation of FunctionalAnnotations from NGS Data
On the genome level, macaque polymorphism sites wereidentified on the basis of the NGS data from macaquewhole-genome or whole-exome resequencing (supplemen-tary table S1, Supplementary Material online, table 2). Afterbasic computational processing of these NGS data as de-scribed in the previous section, variant calling was performedwith Samtools (v0.1.16) pipelines using parameters as previ-ously described (Li et al. 2009). Single-nucleotide variationswere further subject to a stringent filtering protocol and onlysites with 1) one mismatch type only, 2)�5 supported reads,of which �3 reads with high PHRED quality (�25), 3) nosignificant strand-biased distribution of the detected muta-tions (Fisher’s exact test, P value< 0.05), and 4) �2 support-ing reads located on either strand were retained.
On the transcriptome level, normalized mRNA expressionprofiles and alternative splicing events were identified fromRNA-seq data sets integrated in RhesusBase2 (supplementarytable S1, Supplementary Material online). Briefly, after readsmapping and quality controls, mRNA expression levels werecalculated in terms of RPKMs for different tissues, from whichthe expression level of each gene was estimated by normal-izing the read counts to the length of the transcript, as well asthe total uniquely mapped reads generated by this given NGSstudy (Mortazavi et al. 2008). On the basis of these RNA-seqdata sets, alternative splicing events were also identified fol-lowing the protocols of JuncBase (v0.4) with default param-eters (Brooks et al. 2011). The small RNA-seq data sets ofrhesus macaque and human were also processed
1320
Zhang et al. . doi:10.1093/molbev/msu084 MBE
(supplementary table S1, Supplementary Material online),with the expression levels of miRNAs estimated in terms oftags per million (TPM).
Combining genome and transcriptome sequencing, wealso identified 14,118 potential RNA editing sites in rhesusmacaque that introduce differences between RNA and itscorresponding DNA sequence, using a similar approach aswe demonstrated in another study (Chen et al. 2014).Briefly, stringent criteria were used to control for false posi-tives, considering the poor genome assembly (Zhang et al.2012) and error-prone gene structures in rhesus macaque(Zhang et al. 2013). All NGS assays were performed on ma-caque tissues derived from the same animal to exclude indi-vidual differences in the genome and transcriptome. Inaddition, more stringent definition of “uniquely mappedreads” was used, in which one cDNA read was consideredto be uniquely mapped only if it had no second-best hit or thesecond-best hit included at least three additional sequencealignment mismatches, when considering both the genomeand the transcriptome mapping models. Only RNA site with ahomozygous genotype were included in an initial list of RNA-editing sites, which were subject to additional filtering proto-col to remove candidate sites with 1) low read coverage (<5),2) poor base-calling quality, 3) multiple types of variation, 4)strand-biased cDNA read distributions (Fisher’s exact test, Pvalue< 0.05), and 5) location in repeat genomic regions ormisannotated gene structures (Chen et al. 2014). HumanRNA editing sites identified previously were also integratedfor subsequent comparative editome analyses (Peng et al.2012; Ramaswami et al. 2012). For the human set, sites inthe initial list were subject to further computational pipelinesto exclude sites corresponding to genomic polymorphismsdeposited in dbSNP (Peng et al. 2012; Ramaswami et al. 2012).
With respect to gene expression regulations, ChIP-seq datasets (supplementary table S1, Supplementary Material online)were processed for identifying the TFBSs using MACS withdefault parameters (v1.3.7) (Zhang et al. 2008). A list ofmiRNA targets were identified by MiRanda and TargetScanprediction (Lewis et al. 2003; John et al. 2004) or by a combi-nation of AGO PAR-CLIP sequencing data (supplementarytable S1, Supplementary Material online) and MiRanda andTargetScan prediction (Lewis et al. 2003; John et al. 2004;Hafner et al. 2010). According to the poly(A)-seq data, a listof PA sites were also defined in human and rhesus macaquefollowing the original report (Derti et al. 2012).
Genome-Wide Refinement and Assessment ofMacaque Gene Models
A series of Perl (v5.12.4) scripts were implemented to refinethe fine-scale transcript structures in rhesus macaque, basedon the macaque mRNA-seq and poly(A)-seq data. Exon–intron boundary was revised according to computationalpipelines previously established by this laboratory (Zhanget al. 2013). To control for false positives in splice junctiondefinition, only splice junctions supported by at least 30%of the total reads covering this region were included in therevisions. Using mRNA reads collectively derived from 37
strand-specific RNA-seq data sets (Merkin et al. 2012; Zhanget al. 2013), we also extended the 30-UTRs of the earlier genemodels to new terminal sites. As the read coverage of genes isdependent on the gene expression levels and the total readsgenerated by the given NGS assay, it might be inadequate touse a fixed reads coverage cutoff to perform the transcriptextension. We thus introduced a two-step 30-UTR extensionapproach similar to that reported previously (Miura et al.2013). First, when investigating the read coverage of the ex-tended regions in sliding windows, if the density of the expres-sion tags in one 260-bp sliding window dropped by at least 2-fold compared with the upstream region of previous terminalsite or dropped by at least 1.2-fold compared with the previ-ous sliding window (windows are separated by 36 bp), theposition of the end of this sliding window was marked asthe pooled terminal site (only extensions with length ofmore than 100 bp were included). Second, a pooled terminalsite was further adjusted by separately examining the 37strand-specific RNA-seq data sets, through which the 30-UTRs could be further extended according to a cutoff ofreads coverage estimated by the RNA-seq data (at least 80positions in 100 bp window with coverage correspondingto� 1 RPKM), following a previously published pipeline(Miura et al. 2013). On the one hand, the pooled terminalsite was extended to the most downstream site when at leastfive data sets supported the extension (only extensions with� additional 250 bp were included); on the other hand, if thepooled terminal site in itself was not supported by at least fiveindependent data sets, the original terminal site defined byEnsembl (release 68) would instead be used. Refinement of50-UTRs was done with a similar approach, except for thedefinition of pooled terminal sites. We also identified poten-tial new exons and NTRs missed in previous annotations, byperforming Cufflink (v2.0.2) pipelines (Trapnell et al. 2012)with a similar approach as our previous report (Zhang et al.2013). A full list of the revised gene models and NTRs couldbe downloaded in the batch mode from the website ofRhesusBase (http://www.rhesusbase.org/download/down-load.jsp, last accessed March 8, 2014).
Gene model revisions were then evaluated on the basis ofthree parameters: the distribution of the RNA-seq expressiontags, cross-species conservation scores, and the sequencemotif nearby the splice junctions or the transcript termini,as described in detail in previous study (Zhang et al. 2013).The distribution of the RNA-seq expression tags was gener-ated using in-house Perl (v5.12.4) and R scripts. Cross-speciesconservation scores were calculated according to the previousguideline (Meyer et al. 2013). The sequence motifs flankingthe donor/acceptor splice sites were deduced by WebLogo(v3.2), and the distribution of AAUAAA/AUUAAA hexamersof the poly(A) signal sequences near the ends of the tran-scripts was determined and shown (fig. 2F and 2G, supple-mentary fig. S3, Supplementary Material online). For well-annotated gene models, such as Ensembl gene models inhuman, the majority of poly(A) sites identified by poly(A)-seq agree with known 30-end of the transcript models tosingle-base precision (Derti et al. 2012). We thus further eval-uated the 30-UTR extensions by calculating the distance
1321
Comprehensive Genomic Framework of Rhesus Macaque . doi:10.1093/molbev/msu084 MBE
between the 30-end of the transcript models and the poly(A)sites estimated from poly(A)-seq data deposited inRhesusBase (supplementary fig. S1, Supplementary Materialonline). Because of the limited coverage of the poly(A)-seqdata on the macaque transcriptome, the poly(A)-seq tagswere used only in evaluating the completeness of the tran-scripts in this study, rather than defining the 30-end of thetranscripts.
Development of RhesusBase2 Interactive UserInterfaces
We developed RhesusBase2 interfaces using Apache-basedweb development technologies to manage the depositedmeta-data with a MySQL relational schema. Aside from theexisting interfaces of the previous version, the updatedRhesusBase2 interface was equipped with functional compo-nents of user-friendly information retrieval and downloadsystems, the Molecular Evolution Gateway with gene andregulation pages to visualize functional annotations inhuman and rhesus macaque, and a new RhesusBaseGenome Browser, with which the users can easily accessthe sequences and functional annotations of selected ma-caque genes in the UCSC Genome Browser format. A dem-onstration of the use of the RhesusBase Genome Browser incandidate gene study is available online at the website ofRhesusBase (http://www.rhesusbase.org/help/FAQ/SQ2.jsp,last accessed March 8, 2014).
Currently, the Gene Page is built on the basis of the NCBIEntrez Gene system, and genes without corresponding EntrezGene annotation are therefore not archived. In such in-stances, we highly recommend the users to view the annota-tions (such as the revised gene models) in the RhesusBaseGenome Browser, which was designed for intuitively display-ing position-based annotations.
Several different normalization approaches were intro-duced in the comparison of gene expression betweenhuman and rhesus macaque, including direct RPKM compar-isons (fig. 4A), comparisons of the percentile rank of theRPKM scores in different NGS studies (fig. 4B), and compar-isons of relative expression levels using housekeeping geneGAPDH as the internal control (fig. 4C). All annotations anddatabase schema in RhesusBase are freely accessible at www.rhesusbase.org (last accessed March 8, 2014).
Identification of Human-Biased Regulatory EventsUsing RhesusBase Annotations
A list of human RNA-editing sites from a previous report(Peng et al. 2012) was integrated and mapped to macaquesyntenic regions using LiftOver with default parameters toidentify the orthologous loci in rhesus macaque. The 97RNA-seq data sets for rhesus macaque were then processedto examine the incidence of RNA-editing in rhesus macaque.A human-specific RNA editing site was defined when themacaque orthologous site satisfies either of two criteria: 1)for a focal site of RNA editing in human, the DNA sequence inrhesus macaque is divergent from the human reference oredited nucleotide; 2) the DNA sequence in rhesus macaque is
consistent with that in human and the orthologous site wascovered by at least 149 RNA-seq reads, but without any edit-ing signal. In this regard, the minimal RNA-seq read coverageof the orthologous site was set to be 149 to efficiently distin-guish true absence of editing regulation in rhesus macaquefrom the failure of detection, as under the assumption ofbinomial distribution, the detection power of editing siteswith an editing frequency of as low as 2% is still more than95%.
Genomic loci, sequence information, and structure anno-tations of human miRNAs were downloaded from miRBase(v19). Macaque orthologous miRNAs were identified whenno more than two mismatches were found in mature se-quences between human and rhesus macaque, based onpairwise whole-genome alignment between the two species(Meyer et al. 2013). RhesusBase2-archived small RNA-seq datafor five tissues (brain, cerebellum, heart, kidney, and testis)from both human and rhesus macaque were then processedto identify miRNAs with human-biased expression. Briefly,clean reads with the adaptor trimmed were mapped to thecorresponding orthologous precursor miRNA. Only se-quences perfectly matching the reference, with a length ofmore than 15 nucleotides, were retained. The miRNA expres-sion level was then estimated in terms of TPM. For miRNAswith five-tissue TPM sums of more than 250 in both humanand rhesus macaque, those exhibiting significantly differentialexpression between the two species (fold change> 10,Fisher’s exact test P value< 0.01) were defined as human-biased miRNAs. Finally, 8,171 human-biased miRNA regula-tory events were identified, with miRNA targets identified byMiRanda prediction (John et al. 2004) or by a combination ofCLIP-seq and MiRanda prediction (John et al. 2004; Hafneret al. 2010).
Poly(A)-seq data from multiple tissues of human andrhesus macaque (brain, liver, kidney, testis, muscle, andileum) were cross-compared to identify human-specific PA(Derti et al. 2012). Briefly, PA tags within 30 bp were clustered,and a PA site was defined by its location at the peak of thePA-tag cluster. Human PA sites were mapped to macaquesyntenic regions using LiftOver with default parameters, and ahuman-specific PA site was defined when macaque PA signalswere undetectable across the 100-bp window flanking thefocal syntenic site. A total of 3,262 human RefSeq transcriptswere then identified as candidate transcripts targeted byhuman-specific PA regulatory events, with at least onehuman-specific PA site downstream of the last human-macaque shared PA site. To further control for false positives,mRNA-seq data across six tissues (brain, cerebellum, heart,kidney, liver, and testis) in human and rhesus macaque(Brawand et al. 2011) were introduced to verify these candi-dates. This was done by comparing the RNA-seq read densi-ties in common 30-UTR regions shared by human and rhesusmacaque (from stop codon to the last shared PA site), as wellas in human-specific 30-UTR regions (from the shared PA siteto the human-specific PA site). The macaque genomic re-gions syntenic to human regions were defined usingLiftOver (-minMatch 0.8). Transcribed regions with evidentexpression (RPKM> 0.5) were subjected to Fisher’s exact test
1322
Zhang et al. . doi:10.1093/molbev/msu084 MBE
with P value of 0.05 used to indicate a significant difference inread distributions between human and rhesus macaque.Finally, 44 human transcripts were identified as targets ofhuman-specific PA regulations—these showed significantlydifferent human-macaque distributions of reads flankingthe last shared PA site in all tests (at least two independenttests were needed), as well as low expression signals(RPKM< 1.0) in macaque genomic regions that are syntenicto putative human-specific extension regions, as indicated by97 RhesusBase2-archived mRNA-seq data sets.
For genes targeted by human-biased regulations, the tissueexpression profiles in human and rhesus macaque were de-termined as described previously (Xie et al. 2012). The Pearsoncorrelation coefficients between the RPKM scores in the cor-responding tissues were calculated, and the distribution ofcorrelation coefficients was visualized using R (v2.15.3) scripts.
Supplementary MaterialSupplementary tables S1–S3 and figures S1 and S2 are avail-able at Molecular Biology and Evolution online (http://www.mbe.oxfordjournals.org/).
Acknowledgments
C.-Y.L. conceived the idea and designed the study. S.-J.Z., C.-J.L., and P.Y. performed most of the experiments. X.Z., J.-Y.C.,X.Y., J.P., S.Y., C.W., J.X., Y.E.Z., and X.Z. performed part of theexperiments. S.-J.Z., C.-J.L., P.Y., and X.Z. analyzed the data andperformed the statistical analyses. C.-Y.L. and B.C.-M.T. wrotethe paper. All authors read and approved the final manu-script. The authors thank Dr Heping Cheng at PekingUniversity and Dr Qing-Rong Liu at the National Institutesof Health (USA) for insightful suggestions. This work wassupported by grants from the National Key Basic ResearchProgram of China (2013CB531200, 2012CB518004), BeijingJoint Research Program of Scientific Research and GraduateStudent Training, the National Natural Science Foundation ofChina (31171269, 31221002) , the National Science Council(NSC102-2321-B-182-007), and the National Health ResearchInstitute (NHRI-EX103-10321SI).
ReferencesAiello LC, Wheeler P. 1995. The expensive-tissue hypothesis—the brain
and the digestive system in human and primate evolution. CurrAnthropol. 36:199–221.
Babbitt CC, Warner LR, Fedrigo O, Wall CE, Wray GA. 2011. Genomicsignatures of diet-related shifts during human origins. Proc Biol Sci.278:961–969.
Barbosa-Morais NL, Irimia M, Pan Q, Xiong HY, Gueroussov S, Lee LJ,Slobodeniuc V, Kutter C, Watt S, Colak R, et al. 2012. The evolu-tionary landscape of alternative splicing in vertebrate species. Science338:1587–1593.
Barnett DW, Garrison EK, Quinlan AR, Stromberg MP, Marth GT. 2011.BamTools: a C ++ API and toolkit for analyzing and managingBAM files. Bioinformatics 27:1691–1692.
Brawand D, Soumillon M, Necsulea A, Julien P, Csardi G, Harrigan P,Weier M, Liechti A, Aximu-Petri A, Kircher M, et al. 2011. The evo-lution of gene expression levels in mammalian organs. Nature 478:343–348.
Brooks AN, Yang L, Duff MO, Hansen KD, Park JW, Dudoit S, Brenner SE,Graveley BR. 2011. Conservation of an RNA regulatory map betweenDrosophila and mammals. Genome Res. 21:193–202.
Carroll SB. 2008. Evo-devo and an expanding evolutionary synthesis: agenetic theory of morphological evolution. Cell 134:25–36.
Chen J, Ruan H, Ng SM, Gao C, Soo HM, Wu W, Zhang Z, Wen Z, LaneDP, Peng J. 2005. Loss of function of def selectively up-regulatesDelta113p53 expression to arrest expansion growth of digestiveorgans in zebrafish. Genes Dev. 19:2900–2911.
Chen JY, Peng Z, Zhang R, Yang XZ, Bertrand CT, Fang H, Liu CJ, Shi M,Ye ZQ, Zhang YE, et al. 2014. RNA editome in rhesus macaqueshaped by purifying selection. PLoS Genet. 10(4):e1004274.
Derti A, Garrett-Engele P, Macisaac KD, Stevens RC, Sriram S,Chen R, Rohl CA, Johnson JM, Babak T. 2012. A quantitativeatlas of polyadenylation in five mammals. Genome Res. 22:1173–1183.
Euskirchen GM, Rozowsky JS, Wei CL, Lee WH, Zhang ZD, Hartman S,Emanuelsson O, Stolc V, Weissman S, Gerstein MB, et al. 2007.Mapping of transcription factor binding regions in mammaliancells by ChIP: comparison of array- and sequencing-based technol-ogies. Genome Res. 17:898–909.
Fang X, Zhang Y, Zhang R, Yang L, Li M, Ye K, Guo X, Wang J, Su B.2011. Genome sequence and global sequence variation mapwith 5.5 million SNPs in Chinese rhesus macaque. GenomeBiol. 12:R63.
Feng J, Liu T, Qin B, Zhang Y, Liu XS. 2012. Identifying ChIP-seq enrich-ment using MACS. Nat Protoc. 7:1728–1740.
Gibbs RA, Rogers J, Katze MG, Bumgarner R, Weinstock GM, Mardis ER,Remington KA, Strausberg RL, Venter JC, Wilson RK, et al. 2007.Evolutionary and biomedical insights from the rhesus macaquegenome. Science 316:222–234.
Hafner M, Landthaler M, Burger L, Khorshid M, Hausser J, BerningerP, Rothballer A, Ascano M Jr, Jungkamp AC, Munschauer M,et al. 2010. Transcriptome-wide identification of RNA-bindingprotein and microRNA target sites by PAR-CLIP. Cell 141:129–141.
Hudson ME, Snyder M. 2006. High-throughput methods of regulatoryelement discovery. Biotechniques 41:673, 675, 677 passim.
John B, Enright AJ, Aravin A, Tuschl T, Sander C, Marks DS. 2004. HumanMicroRNA targets. PLoS Biol. 2:e363.
Jones AR, Overly CC, Sunkin SM. 2009. The Allen Brain Atlas: 5 years andbeyond. Nat Rev Neurosci. 10:821–828.
King MC, Wilson AC. 1975. Evolution at two levels in humans andchimpanzees. Science 188:107–116.
Knowles DG, McLysaght A. 2009. Recent de novo origin of humanprotein-coding genes. Genome Res. 19:1752–1759.
Landt SG, Marinov GK, Kundaje A, Kheradpour P, Pauli F, Batzoglou S,Bernstein BE, Bickel P, Brown JB, Cayting P, et al. 2012. ChIP-seqguidelines and practices of the ENCODE and modENCODE consor-tia. Genome Res. 22:1813–1831.
Langmead B, Trapnell C, Pop M, Salzberg SL. 2009. Ultrafast andmemory-efficient alignment of short DNA sequences to thehuman genome. Genome Biol. 10:R25.
Lewis BP, Shih IH, Jones-Rhoades MW, Bartel DP, Burge CB. 2003.Prediction of mammalian microRNA targets. Cell 115:787–798.
Li CY, Zhang Y, Wang Z, Cao C, Zhang PW, Lu SJ, Li XM, Yu Q, Zheng X,Du Q, et al. 2010. A human-specific de novo protein-coding geneassociated with human brain functions. PLoS Comput Biol. 6:e1000734.
Li G, Fullwood MJ, Xu H, Mulawadi FH, Velkov S, Vega V, Ariyaratne PN,Mohamed YB, Ooi HS, Tennakoon C, et al. 2010. ChIA-PET tool forcomprehensive chromatin interaction analysis with paired-end tagsequencing. Genome Biol. 11:R22.
Li G, Ruan X, Auerbach RK, Sandhu KS, Zheng M, Wang P, Poh HM, GohY, Lim J, Zhang J, et al. 2012. Extensive promoter-centered chromatininteractions provide a topological basis for transcription regulation.Cell 148:84–98.
Li H, Durbin R. 2009. Fast and accurate short read alignment withBurrows-Wheeler transform. Bioinformatics 25:1754–1760.
Li H, Handsaker B, Wysoker A, Fennell T, Ruan J, Homer N, Marth G,Abecasis G, Durbin R. 2009. The Sequence Alignment/Map formatand SAMtools. Bioinformatics 25:2078–2079.
1323
Comprehensive Genomic Framework of Rhesus Macaque . doi:10.1093/molbev/msu084 MBE
Merkin J, Russell C, Chen P, Burge CB. 2012. Evolutionary dynamics ofgene and isoform regulation in Mammalian tissues. Science 338:1593–1599.
Meyer LR, Zweig AS, Hinrichs AS, Karolchik D, Kuhn RM, Wong M,Sloan CA, Rosenbloom KR, Roe G, Rhead B, et al. 2013. The UCSCGenome Browser database: extensions and updates 2013. NucleicAcids Res. 41:D64–D69.
Miura P, Shenker S, Andreu-Agullo C, Westholm JO, Lai EC. 2013.Widespread and extensive lengthening of 3’ UTRs in the mamma-lian brain. Genome Res. 23:812–825.
Mortazavi A, Williams BA, McCue K, Schaeffer L, Wold B. 2008. Mappingand quantifying mammalian transcriptomes by RNA-Seq. NatMethods. 5:621–628.
Peng Z, Cheng Y, Tan BC, Kang L, Tian Z, Zhu Y, Zhang W, Liang Y, HuX, Tan X, et al. 2012. Comprehensive analysis of RNA-Seq datareveals extensive RNA editing in a human transcriptome. NatBiotechnol. 30:253–260.
Quinlan AR, Hall IM. 2010. BEDTools: a flexible suite of utilities forcomparing genomic features. Bioinformatics 26:841–842.
Ramaswami G, Lin W, Piskol R, Tan MH, Davis C, Li JB. 2012. Accurateidentification of human Alu and non-Alu RNA editing sites. NatMethods. 9:579–581.
Ramaswami G, Zhang R, Piskol R, Keegan LP, Deng P, O’Connell MA, LiJB. 2013. Identifying RNA editing sites using RNA sequencing dataalone. Nat Methods. 10:128–132.
Sayers EW, Barrett T, Benson DA, Bolton E, Bryant SH, Canese K,Chetvernin V, Church DM, Dicuccio M, Federhen S, et al. 2012.Database resources of the National Center for BiotechnologyInformation. Nucleic Acids Res. 40:D13–D25.
Shen Y, Lv Y, Huang L, Liu W, Wen M, Tang T, Zhang R, Hungate E, Shi S,Wu CI. 2011. Testing hypotheses on the rate of molecular evolutionin relation to gene expression using microRNAs. Proc Natl Acad SciU S A. 108:15942–15947.
Shibata Y, Sheffield NC, Fedrigo O, Babbitt CC, Wortham M, Tewari AK,London D, Song L, Lee BK, Iyer VR, et al. 2012. Extensive evolutionarychanges in regulatory element activity during human origins areassociated with altered gene expression and positive selection.PLoS Genet. 8:e1002789.
Toll-Riera M, Bosch N, Bellora N, Castelo R, Armengol L, Estivill X, AlbaMM. 2009. Origin of primate orphan genes: a comparative genomicsapproach. Mol Biol Evol. 26:603–612.
Trapnell C, Pachter L, Salzberg SL. 2009. TopHat: discovering splice junc-tions with RNA-Seq. Bioinformatics 25:1105–1111.
Trapnell C, Roberts A, Goff L, Pertea G, Kim D, Kelley DR, Pimentel H,Salzberg SL, Rinn JL, Pachter L. 2012. Differential gene and transcriptexpression analysis of RNA-seq experiments with TopHat andCufflinks. Nat Protoc. 7:562–578.
Wang ET, Sandberg R, Luo S, Khrebtukova I, Zhang L, Mayr C,Kingsmore SF, Schroth GP, Burge CB. 2008. Alternative isoform reg-ulation in human tissue transcriptomes. Nature 456:470–476.
Wang Z, Gerstein M, Snyder M. 2009. RNA-Seq: a revolutionary tool fortranscriptomics. Nat Rev Genet. 10:57–63.
Wray GA. 2007. The evolutionary significance of cis-regulatory muta-tions. Nat Rev Genet. 8:206–216.
Wray GA, Hahn MW, Abouheif E, Balhoff JP, Pizer M, Rockman MV,Romano LA. 2003. The evolution of transcriptional regulation ineukaryotes. Mol Biol Evol. 20:1377–1419.
Wu C, Orozco C, Boyer J, Leglise M, Goodale J, Batalov S, Hodge CL,Haase J, Janes J, Huss JW 3rd, et al. 2009. BioGPS: an extensible andcustomizable portal for querying and organizing gene annotationresources. Genome Biol. 10:R130.
Wu TD, Watanabe CK. 2005. GMAP: a genomic mapping and alignmentprogram for mRNA and EST sequences. Bioinformatics 21:1859–1875.
Xie C, Zhang YE, Chen JY, Liu CJ, Zhou WZ, Li Y, Zhang M, Zhang R,Wei L, Li CY. 2012. Hominoid-specific de novo protein-codinggenes originating from long non-coding RNAs. PLoS Genet. 8:e1002942.
Zhang SJ, Liu CJ, Shi M, Kong L, Chen JY, Zhou WZ, Zhu X, Yu P, Wang J,Yang X, et al. 2013. RhesusBase: a knowledgebase for the monkeyresearch community. Nucleic Acids Res. 41:D892–D905.
Zhang X, Goodsell J, Norgren RB Jr. 2012. Limitations of the rhesus ma-caque draft genome assembly and annotation. BMC Genomics 13:206.
Zhang Y, Liu T, Meyer CA, Eeckhoute J, Johnson DS, Bernstein BE,Nusbaum C, Myers RM, Brown M, Li W, et al. 2008. Model-basedanalysis of ChIP-Seq (MACS). Genome Biol. 9:R137.
1324
Zhang et al. . doi:10.1093/molbev/msu084 MBE