Infinium monkeys: Infinium 450K array for the Cynomolgus macaque (Macaca fascicularis)

doi: 10.1152/jn.00252.2012108:2101-2114, 2012. First published 25 July 2012;J Neurophysiol
P. Christiaan Klink, Anna Oleksiak, Martin J. M. Lankheet and Richard J. A. van Wezelresponses in macaque area MTIntermittent stimulus presentation stabilizes neuronal
You might find this additional info useful...
60 articles, 20 of which you can access for free at: This article citeshttp://jn.physiology.org/content/108/8/2101.full#ref-list-1
including high resolution figures, can be found at: Updated information and serviceshttp://jn.physiology.org/content/108/8/2101.full
can be found at: Journal of Neurophysiology about Additional material and informationhttp://www.the-aps.org/publications/jn
This information is current as of February 22, 2013.
http://www.the-aps.org/. 20814-3991. Copyright © 2012 the American Physiological Society. ESSN: 1522-1598. Visit our website attimes a year (twice monthly) by the American Physiological Society, 9650 Rockville Pike, Bethesda MD
publishes original articles on the function of the nervous system. It is published 24Journal of Neurophysiology
at Radboud U
niv Nijm
egen on February 22, 2013
http://jn.physiology.org/D
ownloaded from
Intermittent stimulus presentation stabilizes neuronal responses in macaquearea MT
P. Christiaan Klink,1,2 Anna Oleksiak,1,2 Martin J. M. Lankheet,3 and Richard J. A. van Wezel1,2,4,5
1Functional Neurobiology, Helmholtz Institute, Utrecht University, Utrecht, The Netherlands; 2Division of Pharmacology,Utrecht Institute for Pharmaceutical Sciences, Utrecht University, Utrecht, The Netherlands; 3Experimental Zoology,Wageningen University, Wageningen, The Netherlands; 4Biomedical Signals and Systems, MIRA, Twente University,Enschede, The Netherlands; and 5Department of Biophysics, Donders Institute for Brain, Cognition and Behaviour,Radboud University, Nijmegen, The Netherlands
Submitted 23 March 2012; accepted in final form 24 July 2012
Klink PC, Oleksiak A, Lankheet MJ, van Wezel RJ. Intermittentstimulus presentation stabilizes neuronal responses in macaque areaMT. J Neurophysiol 108: 2101–2114, 2012. First published July 25,2012; doi:10.1152/jn.00252.2012.—Repeated stimulation impactsneuronal responses. Here we show how response characteristics ofsensory neurons in macaque visual cortex are influenced by theduration of the interruptions during intermittent stimulus presentation.Besides effects on response magnitude consistent with neuronal ad-aptation, the response variability was also systematically influenced.Spike rate variability in motion-sensitive area MT decreased wheninterruption durations were systematically increased from 250 to2,000 ms. Activity fluctuations between subsequent trials and Fanofactors over full response sequences were both lower with longerinterruptions, while spike timing patterns became more regular. Thesevariability changes partially depended on the response magnitude, butanother significant effect that was uncorrelated with adaptation-in-duced changes in response magnitude was also present. Reducedresponse variability was furthermore accompanied by changes inspike-field coherence, pointing to the possibility that reduced spikingvariability results from interactions in the local cortical network.While neuronal response stabilization may be a general effect ofrepeated sensory stimulation, we discuss its potential link with thephenomenon of perceptual stabilization of ambiguous stimuli as aresult of interrupted presentation.
ambiguous stimuli; motion; variability; visual cortex; spike-field co-herence
REPETITION IS IMPORTANT for perceptual learning and memory,but it remains largely unclear how sensory neurons alter theirresponse characteristics when they are exposed to repeatedstimulation. Studies on the effects of repetition in the brainpredominantly address the reduction of response magnitudeknown as adaptation or fatigue (Grill-Spector et al. 2006; Kohn2007; Mayo and Sommer 2008). However, behavioral andcomputational studies on the conscious perception of intermit-tently presented ambiguous visual stimuli suggest that repeatedstimulus presentations can have much more elaborate effectson neuronal response characteristics than might be initiallyexpected from straightforward fatigue (Leopold et al. 2002;Noest et al. 2007).
Ambiguous stimuli are patterns that contain equal sensoryevidence for multiple, mutually exclusive perceptual interpre-
tations. When these patterns are viewed continuously, percep-tion lapses into fluctuations between alternative stimulus inter-pretations. Temporarily removing an ambiguous pattern fromview severely reduces the number of perceptual fluctuationsand stabilizes perception into one of the possible stimulusinterpretations (Klink et al. 2008; Kornmeier et al. 2007;Leopold et al. 2002; Orbach et al. 1966; Pearson and Brascamp2008). This phenomenon is dubbed perceptual stabilization orperceptual memory, and it has been demonstrated with variousdistinct ambiguous patterns (Klink et al. 2008; Pearson andBrascamp 2008) even when several different patterns arepresented in interleaved sequences (Maier et al. 2003).
The occurrence and depth of perceptual stabilization cru-cially depend on the duration for which a stimulus is removedfrom view (Klink et al. 2008). Long interruptions (�1.0 s)stabilize perceptual sequences to a single interpretation,whereas short interruptions (�0.5 s) destabilize perception andcause increases in the frequency of perceptual alternations.Perceptual stabilization may be related to increased neuronalresponsiveness and/or to reduced neuronal response variability.Whereas stimulus presentation duration and repetition areknown to affect neuronal adaptation and fatigue, it is currentlyunknown how the duration of temporary stimulus removalinfluences the neuronal response to repeated stimuli. Here werecorded spikes and local field potentials (LFPs) from neuronsin motion-sensitive visual area MT of two macaque monkeyswhile they viewed intermittently presented visual motion stim-uli that were removed from view for durations that variedbetween 250 and 2,000 ms.
If MT neurons take part in encoding the subjective perceptsof ambiguous structure-from-motion (SFM) stimuli (Bradleyet al. 1998; Parker 2007) and periodically removing suchstimuli from view stabilizes perception into one specific inter-pretation (Klink et al. 2008; Leopold et al. 2002), then responsepatterns might be hypothesized to “stabilize” under thesecircumstances as well. A recent analysis of response variabilitydynamics in multiple cortical areas, including MT, demon-strated that stimulus onset consistently reduces across-trialvariability, implying that cortical circuits become more stablewhen driven (Churchland et al. 2010). Response variabilityalso decreases when stimuli are actively attended (Mitchellet al. 2007) or when natural stimuli are presented repeatedly(Yao et al. 2007). Building upon these findings, we hypothe-size that the depth of perceptual stabilization may reflect ageneral, time-limited neuronal response stabilization effect that
Address for reprint requests and other correspondence: P. C. Klink, Depts. ofNeuromodulation & Behaviour/Vision & Cognition, Netherlands Institute forNeuroscience, Royal Netherlands Academy of Arts and Sciences. Meibergdreef47, 1105 BA Amsterdam, The Netherlands (e-mail: [email protected]).
J Neurophysiol 108: 2101–2114, 2012.First published July 25, 2012; doi:10.1152/jn.00252.2012.
21010022-3077/12 Copyright © 2012 the American Physiological Societywww.jn.org
at Radboud U
niv Nijm
egen on February 22, 2013
http://jn.physiology.org/D
ownloaded from
is promoted by an increased involvement of the local corticalcircuits. On a neuronal basis, such a mechanism could manifestitself in a decrease of across-trial response variability.
MATERIALS AND METHODS
Responses were obtained from 94 neurons in two adult male rhesusmacaques (Macaca mulatta; 46 and 48 cells, respectively) weighing8–12 kg. Before the experiments, both monkeys were surgicallyimplanted with a head-holding device and stainless steel recordingchamber (Crist Instruments, Hagerstown, MD) that provided access toarea MT. Monkeys were trained to sit in a custom-made primate chairwith their head fixed and maintain their gaze within a 2°-diametervirtual fixation window surrounding a white rectangular spot (0.5° �0.5°, 102 cd/m2) on the screen that was located at a distance of 65.0cm from the eyes. Upon successful fixation, the fixation spot turnedred (19 cd/m2) and stimulus presentation commenced. The monkeywas periodically (every few seconds, similar for all blocks) rewardedwith liquid drops for maintaining fixation. Eye positions were contin-uously recorded with an infrared video eye tracker sampling at 500 Hz(EyeLink; SR Research, Osgoode, ON, Canada). Whenever the mon-key broke fixation, stimulus presentation stopped and the continuousfixation timer on which reward delivery was based was reset. Allsurgical and experimental procedures complied with Dutch and Eu-ropean laws and guidelines and were approved by the Utrecht Uni-versity Animal Experiments Review Committee. Appropriate mea-sures were taken to minimize pain and discomfort for the animals.
Electrophysiology. For each recording session, a Parylene-insu-lated tungsten microelectrode (0.1- to 2.0-M� impedance) was man-ually inserted through a stainless steel guide tube that passed the dura.This electrode was then slowly advanced with a hydraulic micropo-sitioner (David Kopf Instruments, Tujunga, CA). Area MT wasidentified by the recording position and depth, the transitions betweengray matter, white matter, and sulci, and the functional properties ofneurons encountered along the electrode track. The extracellularlyrecorded signal was preamplified 1,000 times (Bak Electronics, Ger-mantown, MD), and 50-Hz noise was removed with an adaptive filter(HumBug, Quest Scientific). The raw signal was then split into twostreams, one of which was sampled and saved at 4 kHz with a CED1401 data acquisition system together with Spike2 software (Cam-bridge Electronic Design) to allow off-line analysis of the LFP trace.The other stream was band-pass filtered (with a Krohn-Hite 3362filter) between 0.1 and 2.0 kHz, after which action potentials fromsingle neurons were detected with a window discriminator (BakElectronics). Spike times were collected at a 2-kHz resolution with aMacintosh G4 computer equipped with a National Instruments PCI-1200 data acquisition board.
When an MT neuron was isolated, direction selectivity was initiallyassessed with a contralaterally presented wide-field motion stimuluscomprised of high-density white dots that were coherently movingagainst a black background in eight different, pseudorandomly alter-nating directions. The size and location of the neuron’s receptive fieldwere then mapped by manually moving a bar of light across the visualfield. Finally, the precise direction tuning and preferred speed of theneuron were determined by presenting additional moving dot patternswithin the determined receptive field.
Visual stimuli. Stimuli were generated with custom-written soft-ware on a Macintosh G4 computer and presented on a 21-in. monitorrunning at a resolution of 1,024 � 768 pixels and a refresh rate of 100Hz. All stimuli consisted of 200 white dots (102 cd/m2) presented ona black background (�0.01 cd/m2). The individual dot size was0.2° � 0.2°, and the entire stimulus size was 6.7° � 6.7°. Stimuli weredisplayed in blocks that contained sequences of up to 120 stimuluspresentations (trials) that each lasted 500 ms. The duration of theoff-period between stimulus presentations was fixed within a block ofpresentations and pseudorandomly chosen from four possible dura-
tions (250, 500, 1,000 or 2,000 ms; Fig. 1A). Maintaining roughly thesame number of stimulus presentations within a block while varyingthe intermittent blank intervals has the advantage of keeping the totalamount of stimulation that a neuron receives in blocks of stimuluspresentations with different blank durations approximately constant.This, however, comes at the cost of having longer blocks (in seconds)with increasing blank durations. We checked the possible confound-ing effects of different block durations and did not find any (seeControl for block and fixation duration and RESULTS).
For the ambiguous SFM cylinder stimulus, dots were randomlypositioned at each stimulus onset to mimic the two-dimensionalprojection of a three-dimensional transparent cylinder. During the 500ms that this cylinder was presented, the dots coherently moved with anunlimited dot lifetime simulating a rotating cylinder. The speed of thesimulated rotation was chosen to match the neuron’s preferred speed,and the axis of rotation was orthogonal to the neuron’s preferred andnull directions, causing one half of the dots to move in the preferreddirection and the other half in the null direction. To avoid confoundingeffects of attention (Klink et al. 2008; Kornmeier et al. 2009; Mitchellet al. 2004), flash suppression (Sengpiel et al. 1995; Sheinberg andLogothetis 1997; Wolfe 1984), or flash facilitation (Brascamp et al.2007), we did not include disambiguated stimuli in the sequences ofambiguous stimuli or ask the monkeys to report their percepts. Whilethis approach has the disadvantage of not knowing which perceptcorresponds to which neural trace, we believe that reducing theconfounding influence of attention allows a cleaner investigation ofthe neuronal consequences of long sequences of stimulus presenta-tions with different removal period durations. The two secondarystimuli were 1) a dynamic random dot pattern (coherence 0%) forwhich all dots had a single frame dot lifetime and a randomizedstarting position on every presentation and 2) an opaque SFM cylinderthat was similar to the primary ambiguous cylinder, but here only the100 dots that moved in the neuron’s preferred direction were pre-sented on the screen.
Data analysis. Both the raw LFP trace and the spike times wereexported to MATLAB (The MathWorks, Natick, MA) for furtheranalysis. Only responses to stimulus presentations that were part of anuninterrupted sequence (no breaks in fixation) of at least three sub-sequent stimulus presentations were included in further analyses.Peristimulus time histograms (PSTHs) of the spiking activity werecalculated with a bin width of 10 ms, aligned to each stimulus onset.For calculations of average activities, we assumed a fixed 50-msresponse latency and defined the neuronal response to the stimulus asthe activity in a 500-ms time window after the 50-ms latency. The first200-ms period of this response window was defined as the transientphase of the response, while the remaining 300-ms period was definedas the sustained phase of the response (Fig. 1B, inset, top).
Raw Fano factors (FFs) were obtained per cell for every combina-tion of stimulus and off-duration by dividing the mean spike countover individual stimulus responses by the variance over these sameresponses in a 70-ms sliding window moving with 10-ms increments(1 PSTH bin). Additionally, we also calculated FFs by computing alinear regression between the mean spike count and the spike countvariance of all cells for each sliding window position (Churchlandet al. 2010). The slope of this regression analysis provides an alter-native estimate of the variance to mean ratio. Such regression analysiswas also performed on a randomly picked subset of the cells that hadan equal overall mean spike count for all off-durations within one ofthe stimulus types. The “mean-matched” FF (Churchland et al. 2010)obtained from such a subset of the data is strongly resistant to FFchanges that are primarily driven by variations in the mean spikecount rather than in variability. While some quantitative differences inFF dynamics were observed between these three different analyses,the qualitative pattern was highly consistent. We therefore report onlythe results from the first-mentioned, cell-based, FF determination.
The spiking activity in the 100 ms preceding stimulus presentationwas compared with the activity in the period between 50 and 150 ms
2102 INTERMITTENT STIMULI STABILIZE MT RESPONSES
J Neurophysiol • doi:10.1152/jn.00252.2012 • www.jn.org
at Radboud U
niv Nijm
egen on February 22, 2013
http://jn.physiology.org/D
ownloaded from
after stimulus onset on a trial-by-trial basis. A receiver operantcharacteristic (ROC) analysis was performed on the obtained activitydistributions, and the area under the ROC curve (AUC) was taken asa measure of stimulus detection sensitivity (Green and Swets 1966).
A local activity contrast (LAC) was calculated by dividing theabsolute difference in spike count between subsequent trials by theirmean spike count. Since this measure turned out to be stronglycorrelated with the average spike count on the included trials, wederived the theoretical relationship between these two variables underthe assumption of Poisson spiking (Bair et al. 1994; Maimon andAssad 2009). This relationship was then used to divide each recordedLAC value by the expected value of LAC (�LAC�) at each level ofactivity. If this ratio is 1.0, the observed LAC corresponds to theexpected LAC for Poisson spiking. LAC values � 1.0 indicate moretrial-to-trial spiking variability than a Poisson process, whereas LACvalues � 1.0 indicate that the spike counts in subsequent trials aremore regular than a Poisson process.
To calculate the behavior of LAC under the null hypothesis ofPoisson firing (Eq. 1) with spike rate �, we focus on the absolute spikecount difference � between subsequent trials at a fixed total spikecount n (Eqs. 2 and 3). Expressed in these terms, the LAC can bedefined as denoted in Eq. 4.
p�k� � �ke�� ⁄ k ! (1)
� � k1 � k2 (2)
n � k1 � k2 (3)
LAC � 2��� ⁄ n (4)
A useful classical result is that the conditional spike count distri-bution for a trial (k1) under a fixed total spike count n is the binomialdistribution of k1 hits in n attempts with probability 0.5 (Eq. 5). Fixedn also implies that the spike count difference � is directly related toboth the single trial spike count and the total spike count (Eq. 6). Asa result, the distribution of � is a scaled and shifted version of the trialspike count binomial, such that it has mean zero and variance n.
�[k1|n] � 2�n� n
k1� (5)
� � 2k1 � n (6)
For reasonably large spike counts, this � distribution becomesGaussian, so we can easily compute the expected spike count differ-ence (Eq. 7), and the expected LAC, conditional upon the total spikecount (Eq. 8). Trivially, one can also express the result in terms of thespike count mean: m � n/2.
No.
of c
ells
-20 0 20 400
10
2010
26
ΔSpikes/s (off2000ms- off250ms)-10 0 2010
6
24
ΔSpikes/s (off2000ms- off250ms)-20 0 40 6020
D μ = 14.50*
*p[μ
> 0
] < .0
01μ = 6.66*μ = 7.40*
ΔSpikes/s (off2000ms- off250ms)
40 80 120 160 2000
40
80
120
160
200
Spi
kes/
s (o
ff 2000
ms)
Spikes/s (off250ms)
C
40 80 120 160 200Spikes/s (off250ms)
40 80 120 160 200Spikes/s (off250ms)
Stimulus on
ST
0 200 400 600
0.2
0.4
0.6
0.8
1.0
0 200 400 600 0 200 400 600Time (ms) Time (ms) Time (ms)
Nor
mal
ized
spi
ke- r
ate Stimulus on
Latency:50 ms
ST
Stimulus on
ST
off (ms)250500
10002000
off (ms)250500
10002000
off (ms)250500
10002000
B
etc.
Stimuluson
500 ms
Variable off-duration (fixed per block)
250 ms500 ms
1000 ms2000 ms
A
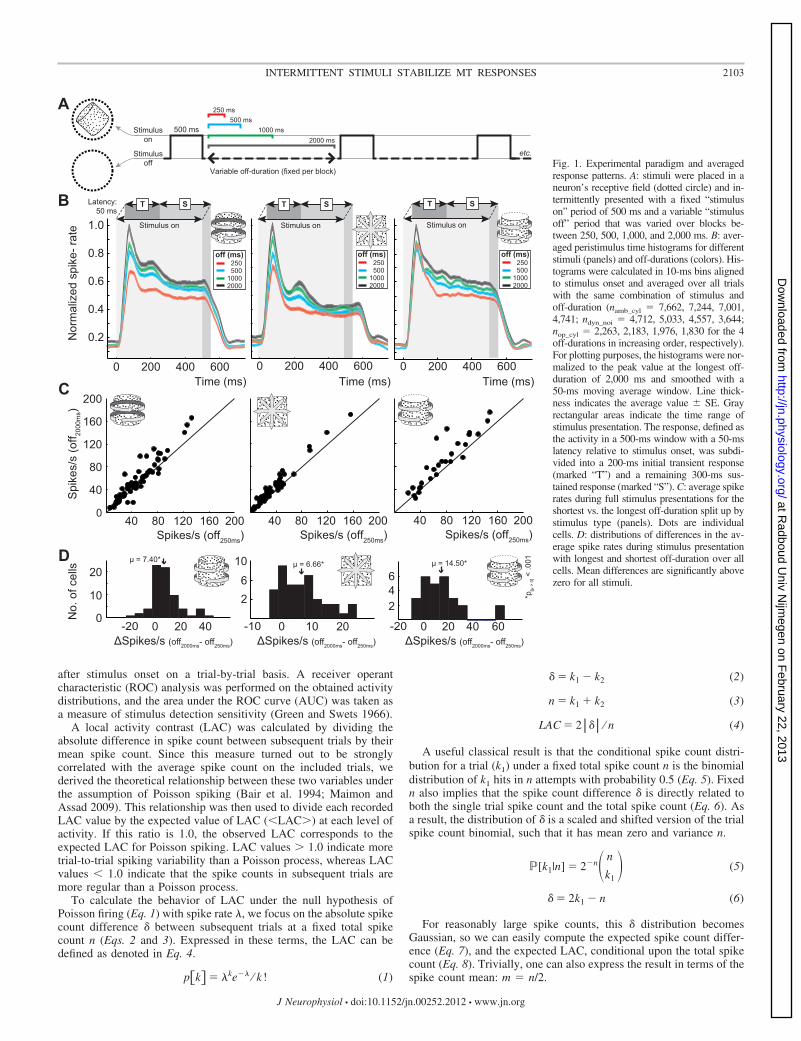
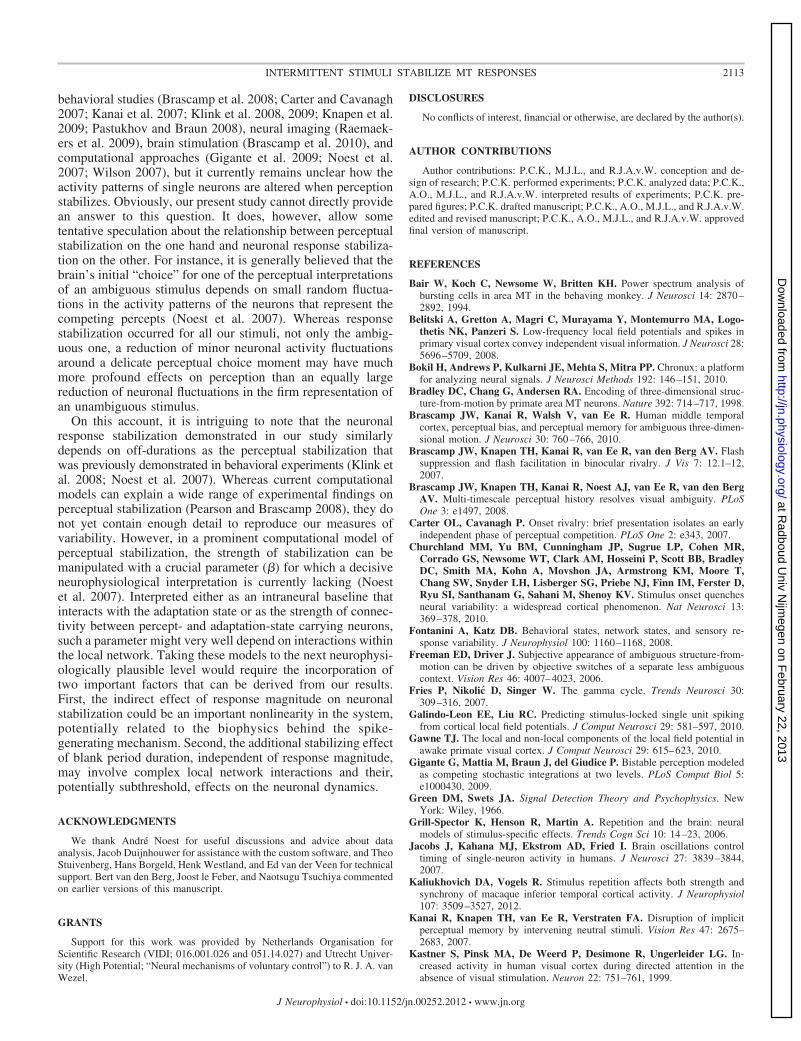
Stimulusoff Fig. 1. Experimental paradigm and averaged
response patterns. A: stimuli were placed in aneuron’s receptive field (dotted circle) and in-termittently presented with a fixed “stimuluson” period of 500 ms and a variable “stimulusoff” period that was varied over blocks be-tween 250, 500, 1,000, and 2,000 ms. B: aver-aged peristimulus time histograms for differentstimuli (panels) and off-durations (colors). His-tograms were calculated in 10-ms bins alignedto stimulus onset and averaged over all trialswith the same combination of stimulus andoff-duration (namb_cyl � 7,662, 7,244, 7,001,4,741; ndyn_noi � 4,712, 5,033, 4,557, 3,644;nop_cyl � 2,263, 2,183, 1,976, 1,830 for the 4off-durations in increasing order, respectively).For plotting purposes, the histograms were nor-malized to the peak value at the longest off-duration of 2,000 ms and smoothed with a50-ms moving average window. Line thick-ness indicates the average value � SE. Grayrectangular areas indicate the time range ofstimulus presentation. The response, defined asthe activity in a 500-ms window with a 50-mslatency relative to stimulus onset, was subdi-vided into a 200-ms initial transient response(marked “T”) and a remaining 300-ms sus-tained response (marked “S”). C: average spikerates during full stimulus presentations for theshortest vs. the longest off-duration split up bystimulus type (panels). Dots are individualcells. D: distributions of differences in the av-erage spike rates during stimulus presentationwith longest and shortest off-duration over allcells. Mean differences are significantly abovezero for all stimuli.
2103INTERMITTENT STIMULI STABILIZE MT RESPONSES
J Neurophysiol • doi:10.1152/jn.00252.2012 • www.jn.org
at Radboud U
niv Nijm
egen on February 22, 2013
http://jn.physiology.org/D
ownloaded from
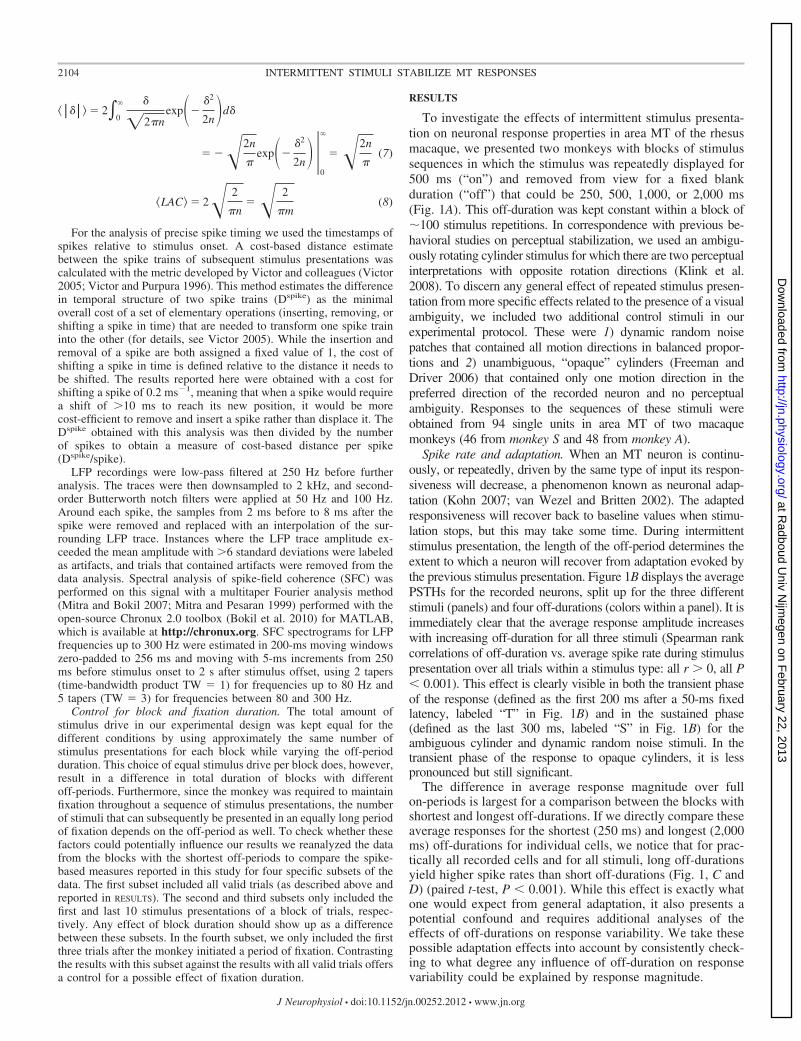
����� � 2�0
� �
�2�nexp��
�2
2n�d�
� �2n
�exp��
�2
2n�0
�
�2n
�(7)
�LAC� � 2 2
�n� 2
�m(8)
For the analysis of precise spike timing we used the timestamps ofspikes relative to stimulus onset. A cost-based distance estimatebetween the spike trains of subsequent stimulus presentations wascalculated with the metric developed by Victor and colleagues (Victor2005; Victor and Purpura 1996). This method estimates the differencein temporal structure of two spike trains (Dspike) as the minimaloverall cost of a set of elementary operations (inserting, removing, orshifting a spike in time) that are needed to transform one spike traininto the other (for details, see Victor 2005). While the insertion andremoval of a spike are both assigned a fixed value of 1, the cost ofshifting a spike in time is defined relative to the distance it needs tobe shifted. The results reported here were obtained with a cost forshifting a spike of 0.2 ms�1, meaning that when a spike would requirea shift of �10 ms to reach its new position, it would be morecost-efficient to remove and insert a spike rather than displace it. TheDspike obtained with this analysis was then divided by the numberof spikes to obtain a measure of cost-based distance per spike(Dspike/spike).
LFP recordings were low-pass filtered at 250 Hz before furtheranalysis. The traces were then downsampled to 2 kHz, and second-order Butterworth notch filters were applied at 50 Hz and 100 Hz.Around each spike, the samples from 2 ms before to 8 ms after thespike were removed and replaced with an interpolation of the sur-rounding LFP trace. Instances where the LFP trace amplitude ex-ceeded the mean amplitude with �6 standard deviations were labeledas artifacts, and trials that contained artifacts were removed from thedata analysis. Spectral analysis of spike-field coherence (SFC) wasperformed on this signal with a multitaper Fourier analysis method(Mitra and Bokil 2007; Mitra and Pesaran 1999) performed with theopen-source Chronux 2.0 toolbox (Bokil et al. 2010) for MATLAB,which is available at http://chronux.org. SFC spectrograms for LFPfrequencies up to 300 Hz were estimated in 200-ms moving windowszero-padded to 256 ms and moving with 5-ms increments from 250ms before stimulus onset to 2 s after stimulus offset, using 2 tapers(time-bandwidth product TW � 1) for frequencies up to 80 Hz and5 tapers (TW � 3) for frequencies between 80 and 300 Hz.
Control for block and fixation duration. The total amount ofstimulus drive in our experimental design was kept equal for thedifferent conditions by using approximately the same number ofstimulus presentations for each block while varying the off-periodduration. This choice of equal stimulus drive per block does, however,result in a difference in total duration of blocks with differentoff-periods. Furthermore, since the monkey was required to maintainfixation throughout a sequence of stimulus presentations, the numberof stimuli that can subsequently be presented in an equally long periodof fixation depends on the off-period as well. To check whether thesefactors could potentially influence our results we reanalyzed the datafrom the blocks with the shortest off-periods to compare the spike-based measures reported in this study for four specific subsets of thedata. The first subset included all valid trials (as described above andreported in RESULTS). The second and third subsets only included thefirst and last 10 stimulus presentations of a block of trials, respec-tively. Any effect of block duration should show up as a differencebetween these subsets. In the fourth subset, we only included the firstthree trials after the monkey initiated a period of fixation. Contrastingthe results with this subset against the results with all valid trials offersa control for a possible effect of fixation duration.
RESULTS
To investigate the effects of intermittent stimulus presenta-tion on neuronal response properties in area MT of the rhesusmacaque, we presented two monkeys with blocks of stimulussequences in which the stimulus was repeatedly displayed for500 ms (“on”) and removed from view for a fixed blankduration (“off”) that could be 250, 500, 1,000, or 2,000 ms(Fig. 1A). This off-duration was kept constant within a block of�100 stimulus repetitions. In correspondence with previous be-havioral studies on perceptual stabilization, we used an ambigu-ously rotating cylinder stimulus for which there are two perceptualinterpretations with opposite rotation directions (Klink et al.2008). To discern any general effect of repeated stimulus presen-tation from more specific effects related to the presence of a visualambiguity, we included two additional control stimuli in ourexperimental protocol. These were 1) dynamic random noisepatches that contained all motion directions in balanced propor-tions and 2) unambiguous, “opaque” cylinders (Freeman andDriver 2006) that contained only one motion direction in thepreferred direction of the recorded neuron and no perceptualambiguity. Responses to the sequences of these stimuli wereobtained from 94 single units in area MT of two macaquemonkeys (46 from monkey S and 48 from monkey A).
Spike rate and adaptation. When an MT neuron is continu-ously, or repeatedly, driven by the same type of input its respon-siveness will decrease, a phenomenon known as neuronal adap-tation (Kohn 2007; van Wezel and Britten 2002). The adaptedresponsiveness will recover back to baseline values when stimu-lation stops, but this may take some time. During intermittentstimulus presentation, the length of the off-period determines theextent to which a neuron will recover from adaptation evoked bythe previous stimulus presentation. Figure 1B displays the averagePSTHs for the recorded neurons, split up for the three differentstimuli (panels) and four off-durations (colors within a panel). It isimmediately clear that the average response amplitude increaseswith increasing off-duration for all three stimuli (Spearman rankcorrelations of off-duration vs. average spike rate during stimuluspresentation over all trials within a stimulus type: all r � 0, all P� 0.001). This effect is clearly visible in both the transient phaseof the response (defined as the first 200 ms after a 50-ms fixedlatency, labeled “T” in Fig. 1B) and in the sustained phase(defined as the last 300 ms, labeled “S” in Fig. 1B) for theambiguous cylinder and dynamic random noise stimuli. In thetransient phase of the response to opaque cylinders, it is lesspronounced but still significant.
The difference in average response magnitude over fullon-periods is largest for a comparison between the blocks withshortest and longest off-durations. If we directly compare theseaverage responses for the shortest (250 ms) and longest (2,000ms) off-durations for individual cells, we notice that for prac-tically all recorded cells and for all stimuli, long off-durationsyield higher spike rates than short off-durations (Fig. 1, C andD) (paired t-test, P � 0.001). While this effect is exactly whatone would expect from general adaptation, it also presents apotential confound and requires additional analyses of theeffects of off-durations on response variability. We take thesepossible adaptation effects into account by consistently check-ing to what degree any influence of off-duration on responsevariability could be explained by response magnitude.
2104 INTERMITTENT STIMULI STABILIZE MT RESPONSES
J Neurophysiol • doi:10.1152/jn.00252.2012 • www.jn.org
at Radboud U
niv Nijm
egen on February 22, 2013
http://jn.physiology.org/D
ownloaded from
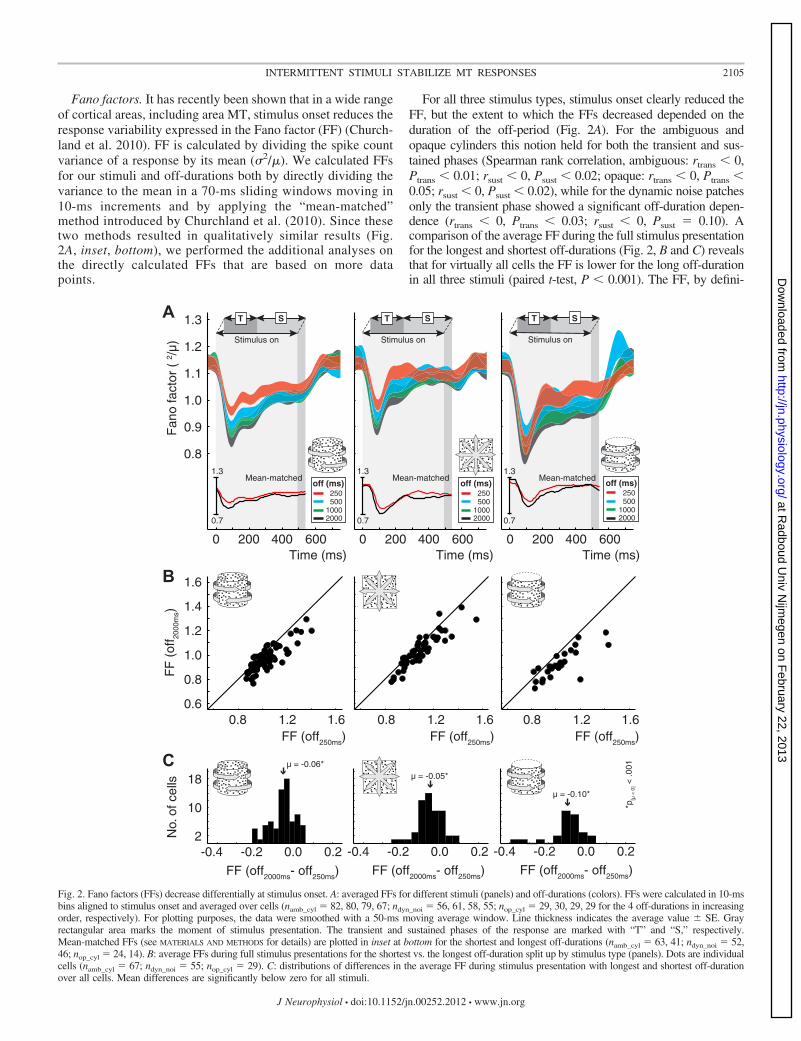
Fano factors. It has recently been shown that in a wide rangeof cortical areas, including area MT, stimulus onset reduces theresponse variability expressed in the Fano factor (FF) (Church-land et al. 2010). FF is calculated by dividing the spike countvariance of a response by its mean (2/). We calculated FFsfor our stimuli and off-durations both by directly dividing thevariance to the mean in a 70-ms sliding windows moving in10-ms increments and by applying the “mean-matched”method introduced by Churchland et al. (2010). Since thesetwo methods resulted in qualitatively similar results (Fig.2A, inset, bottom), we performed the additional analyses onthe directly calculated FFs that are based on more datapoints.
For all three stimulus types, stimulus onset clearly reduced theFF, but the extent to which the FFs decreased depended on theduration of the off-period (Fig. 2A). For the ambiguous andopaque cylinders this notion held for both the transient and sus-tained phases (Spearman rank correlation, ambiguous: rtrans � 0,Ptrans � 0.01; rsust � 0, Psust � 0.02; opaque: rtrans � 0, Ptrans �0.05; rsust � 0, Psust � 0.02), while for the dynamic noise patchesonly the transient phase showed a significant off-duration depen-dence (rtrans � 0, Ptrans � 0.03; rsust � 0, Psust � 0.10). Acomparison of the average FF during the full stimulus presentationfor the longest and shortest off-durations (Fig. 2, B and C) revealsthat for virtually all cells the FF is lower for the long off-durationin all three stimuli (paired t-test, P � 0.001). The FF, by defini-
ST
Stimulus on
ST ST
Stimulus onStimulus on
0 200 400 600
0.8
0.9
1.0
1.1
1.2
1.3
0 200 400 600 0 200 400 600
off (ms)250500
10002000
Fan
o fa
ctor
(2 /
µ)
Time (ms) Time (ms) Time (ms)
A
off (ms)250500
10002000
off (ms)250500
10002000
0.8 1.2 1.6 0.8 1.2 1.60.8 1.2 1.60.6
0.8
1.0
1.2
1.4
1.6
FF
(of
f 2000
ms)
FF (off250ms) FF (off250ms) FF (off250ms)
B
-0.4 -0.2 0.0 0.22
10
18µ = -0.06*
µ = -0.05*
µ = -0.10*
*p[µ
< 0
] < .0
01
-0.4 -0.2 0.0 0.2 -0.4 -0.2 0.0 0.2
No.
of c
ells
FF (off2000ms- off250ms) FF (off2000ms- off250ms) FF (off2000ms- off250ms)
C
Mean-matched Mean-matched Mean-matched1.3
0.7
1.3
0.7
1.3
0.7
Fig. 2. Fano factors (FFs) decrease differentially at stimulus onset. A: averaged FFs for different stimuli (panels) and off-durations (colors). FFs were calculated in 10-msbins aligned to stimulus onset and averaged over cells (namb_cyl � 82, 80, 79, 67; ndyn_noi � 56, 61, 58, 55; nop_cyl � 29, 30, 29, 29 for the 4 off-durations in increasingorder, respectively). For plotting purposes, the data were smoothed with a 50-ms moving average window. Line thickness indicates the average value � SE. Grayrectangular area marks the moment of stimulus presentation. The transient and sustained phases of the response are marked with “T” and “S,” respectively.Mean-matched FFs (see MATERIALS AND METHODS for details) are plotted in inset at bottom for the shortest and longest off-durations (namb_cyl � 63, 41; ndyn_noi � 52,46; nop_cyl � 24, 14). B: average FFs during full stimulus presentations for the shortest vs. the longest off-duration split up by stimulus type (panels). Dots are individualcells (namb_cyl � 67; ndyn_noi � 55; nop_cyl � 29). C: distributions of differences in the average FF during stimulus presentation with longest and shortest off-durationover all cells. Mean differences are significantly below zero for all stimuli.
2105INTERMITTENT STIMULI STABILIZE MT RESPONSES
J Neurophysiol • doi:10.1152/jn.00252.2012 • www.jn.org
at Radboud U
niv Nijm
egen on February 22, 2013
http://jn.physiology.org/D
ownloaded from
tion, depends both on the mean and the variance of the neuralresponse. The observed differences in FF for the different off-period durations could thus be compromised by the difference inresponse magnitude that also varied with the off-period duration.To control for this potential confound, we performed an additionalanalysis of variance with the average spike count as a continuouspredictor variable and the off-period as a categorical predictorvariable. This specific analysis tells us whether response magni-tude significantly influenced the FF and, if so, the proportions ofthe total variance in FF explained by response magnitude andoff-period duration, respectively. The result revealed that responsemagnitude was not a significant factor for the observed differences inFF (ANCOVA, Pamb_cyl � 0.53, Pdyn_noi � 0.44, Popa_cyl � 0.74).
It has been argued that the drop in FF at stimulus onset reflectssome kind of stabilization of cortical networks when they aredriven (Churchland et al. 2010). Furthermore, it has been demon-strated that the decline in FF when a stimulus enters the receptivefield of a V4 neuron is stronger when this stimulus is attended thanwhen it is not attended (Mitchell et al. 2007). This suggests thatattention may cause an additional reduction of response variabilitythat facilitates a maximized neuronal signal-to-noise ratio (Mitch-ell et al. 2007). Our results demonstrate that such a strongerdecrease in neuronal response variability similarly exists forintermittent stimulus presentations without explicit attentionaldemands but with increasingly longer off-durations.
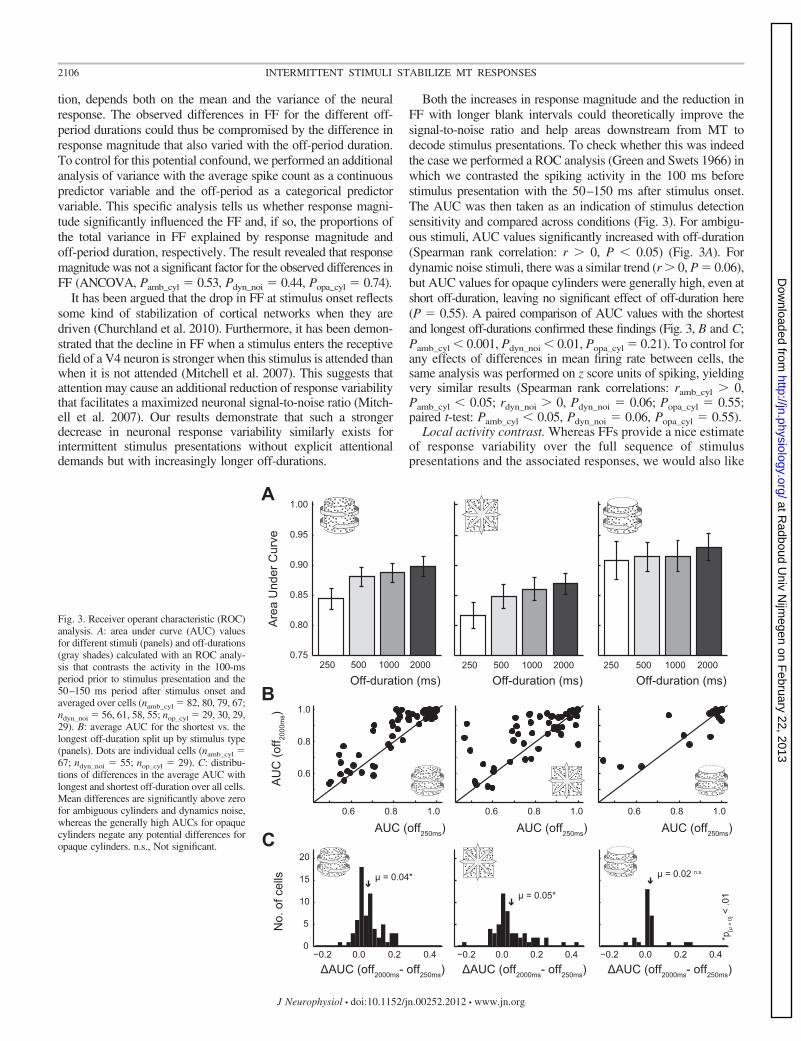
Both the increases in response magnitude and the reduction inFF with longer blank intervals could theoretically improve thesignal-to-noise ratio and help areas downstream from MT todecode stimulus presentations. To check whether this was indeedthe case we performed a ROC analysis (Green and Swets 1966) inwhich we contrasted the spiking activity in the 100 ms beforestimulus presentation with the 50–150 ms after stimulus onset.The AUC was then taken as an indication of stimulus detectionsensitivity and compared across conditions (Fig. 3). For ambigu-ous stimuli, AUC values significantly increased with off-duration(Spearman rank correlation: r � 0, P � 0.05) (Fig. 3A). Fordynamic noise stimuli, there was a similar trend (r � 0, P � 0.06),but AUC values for opaque cylinders were generally high, even atshort off-duration, leaving no significant effect of off-duration here(P � 0.55). A paired comparison of AUC values with the shortestand longest off-durations confirmed these findings (Fig. 3, B and C;Pamb_cyl � 0.001, Pdyn_noi � 0.01, Popa_cyl � 0.21). To control forany effects of differences in mean firing rate between cells, thesame analysis was performed on z score units of spiking, yieldingvery similar results (Spearman rank correlations: ramb_cyl � 0,Pamb_cyl � 0.05; rdyn_noi � 0, Pdyn_noi � 0.06; Popa_cyl � 0.55;paired t-test: Pamb_cyl � 0.05, Pdyn_noi � 0.06, Popa_cyl � 0.55).
Local activity contrast. Whereas FFs provide a nice estimateof response variability over the full sequence of stimuluspresentations and the associated responses, we would also like
−0.2 0.0 0.2 0.4 −0.2 0.0 0.2 0.4 −0.2 0.0 0.2 0.4
μ = 0.04*
μ = 0.05*
μ = 0.02 n.s.
*p[μ
> 0
] < .0
1
ΔAUC (off2000ms- off250ms) ΔAUC (off2000ms- off250ms) ΔAUC (off2000ms- off250ms)
20
5
10
15
0
No.
of c
ells
C
1.0
0.6
0.8
1.00.6 0.8 1.00.6 0.8 1.00.6 0.8
AU
C (o
ff 2000
ms)
AUC (off250ms) AUC (off250ms) AUC (off250ms)
B
0.75
0.80
0.85
0.90
0.95
1.00
250 500 1000 2000250 500 1000 2000250 500 1000 2000
Off-duration (ms)Off-duration (ms)Off-duration (ms)
Are
a U
nder
Cur
ve
A
Fig. 3. Receiver operant characteristic (ROC)analysis. A: area under curve (AUC) valuesfor different stimuli (panels) and off-durations(gray shades) calculated with an ROC analy-sis that contrasts the activity in the 100-msperiod prior to stimulus presentation and the50–150 ms period after stimulus onset andaveraged over cells (namb_cyl � 82, 80, 79, 67;ndyn_noi � 56, 61, 58, 55; nop_cyl � 29, 30, 29,29). B: average AUC for the shortest vs. thelongest off-duration split up by stimulus type(panels). Dots are individual cells (namb_cyl �67; ndyn_noi � 55; nop_cyl � 29). C: distribu-tions of differences in the average AUC withlongest and shortest off-duration over all cells.Mean differences are significantly above zerofor ambiguous cylinders and dynamics noise,whereas the generally high AUCs for opaquecylinders negate any potential differences foropaque cylinders. n.s., Not significant.
2106 INTERMITTENT STIMULI STABILIZE MT RESPONSES
J Neurophysiol • doi:10.1152/jn.00252.2012 • www.jn.org
at Radboud U
niv Nijm
egen on February 22, 2013
http://jn.physiology.org/D
ownloaded from
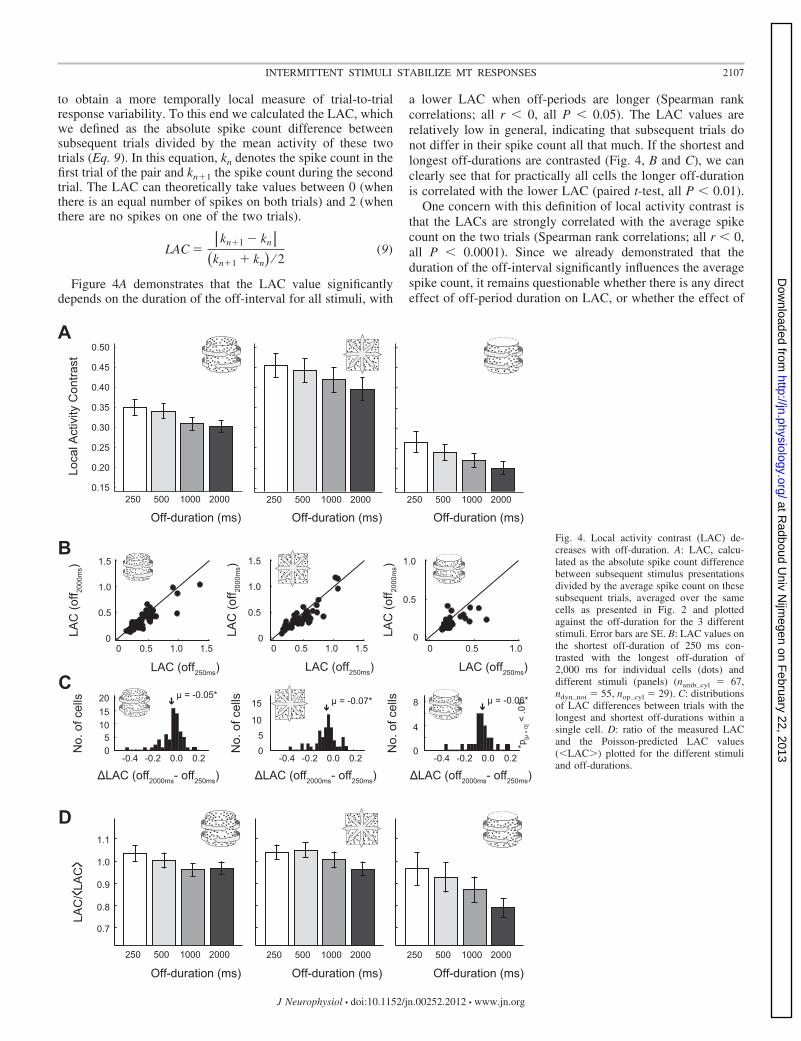
to obtain a more temporally local measure of trial-to-trialresponse variability. To this end we calculated the LAC, whichwe defined as the absolute spike count difference betweensubsequent trials divided by the mean activity of these twotrials (Eq. 9). In this equation, kn denotes the spike count in thefirst trial of the pair and kn1 the spike count during the secondtrial. The LAC can theoretically take values between 0 (whenthere is an equal number of spikes on both trials) and 2 (whenthere are no spikes on one of the two trials).
LAC ��kn�1 � kn�
�kn�1 � kn� ⁄ 2(9)
Figure 4A demonstrates that the LAC value significantlydepends on the duration of the off-interval for all stimuli, with
a lower LAC when off-periods are longer (Spearman rankcorrelations; all r � 0, all P � 0.05). The LAC values arerelatively low in general, indicating that subsequent trials donot differ in their spike count all that much. If the shortest andlongest off-durations are contrasted (Fig. 4, B and C), we canclearly see that for practically all cells the longer off-durationis correlated with the lower LAC (paired t-test, all P � 0.01).
One concern with this definition of local activity contrast isthat the LACs are strongly correlated with the average spikecount on the two trials (Spearman rank correlations; all r � 0,all P � 0.0001). Since we already demonstrated that theduration of the off-interval significantly influences the averagespike count, it remains questionable whether there is any directeffect of off-period duration on LAC, or whether the effect of
250 500 1000 2000250 500 1000 2000250 500 1000 20000.15
0.20
0.25
0.30
0.35
0.40
0.45
0.50
Loca
l Act
ivity
Con
trast
A
Off-duration (ms)Off-duration (ms)Off-duration (ms)
0 0.5 1.0 1.50
0.5
1.0
1.5
0 0.5 1.0 1.50
0.5
1.0
1.5
0 0.5 1.00
0.5
1.0
LAC (off250ms)
LAC
(off 20
00m
s)
B
LAC (off250ms) LAC (off250ms)
-0.4 -0.2 0.0 0.2 -0.4 -0.2 0.0 0.2 -0.4 -0.2 0.0 0.2
20
51015
05
10
15
0
8
4
0No.
of c
ells
LAC
(off 20
00m
s)N
o. o
f cel
ls
LAC
(off 20
00m
s)N
o. o
f cel
ls
ΔLAC (off2000ms- off250ms) ΔLAC (off2000ms- off250ms) ΔLAC (off2000ms- off250ms)
μ = -0.05* μ = -0.07* μ = -0.06*
*p[μ
< 0
] < .0
1
C
0.7
0.8
0.9
1.0
1.1
D
LAC
/ <LAC
>
250 500 1000 2000250 500 1000 2000250 500 1000 2000
Off-duration (ms)Off-duration (ms)Off-duration (ms)
Fig. 4. Local activity contrast (LAC) de-creases with off-duration. A: LAC, calcu-lated as the absolute spike count differencebetween subsequent stimulus presentationsdivided by the average spike count on thesesubsequent trials, averaged over the samecells as presented in Fig. 2 and plottedagainst the off-duration for the 3 differentstimuli. Error bars are SE. B: LAC values onthe shortest off-duration of 250 ms con-trasted with the longest off-duration of2,000 ms for individual cells (dots) anddifferent stimuli (panels) (namb_cyl � 67,ndyn_noi � 55, nop_cyl � 29). C: distributionsof LAC differences between trials with thelongest and shortest off-durations within asingle cell. D: ratio of the measured LACand the Poisson-predicted LAC values(�LAC�) plotted for the different stimuliand off-durations.
2107INTERMITTENT STIMULI STABILIZE MT RESPONSES
J Neurophysiol • doi:10.1152/jn.00252.2012 • www.jn.org
at Radboud U
niv Nijm
egen on February 22, 2013
http://jn.physiology.org/D
ownloaded from
off-period is a completely indirect effect that acts through achange in response magnitudes. To answer this question, weagain performed an analysis of variance with response magni-tude incorporated as a continuous grouping variable. Thisanalysis revealed that a significant proportion of the variance inLAC could indeed be explained by differences in response mag-nitude (ANCOVA, all P � 0.01; �amb_cyl
2 � 0.12, �dyn_noi2 �
0.15, �opa_cyl2 � 0.07). The off-period duration by itself, however,
did also have a small but highly significant influence on the LAC(all P � 0.01; �amb_cyl
2 � 0.02, �dyn_noi2 � 0.01, �opa_cyl
2 � 0.03),meaning that the difference in observed LAC for the differentoff-periods does not solely depend on the difference in responsemagnitude.
We may visualize the remaining effect of off-period durationindependent of response magnitude by estimating the expectedrelation between response magnitude and LAC. This relationcan be approximated if we assume that our neuron’s spikecounts (k) resemble independent samples from the same Pois-son distribution (Bair et al. 1994; Maimon and Assad 2009).The assumption of Poisson spiking is, of course, an oversim-plification and inconsistent with neuronal response featuressuch as bursting or refractoriness. It is further challenged byour findings of off-duration-dependent FFs, but it is neverthe-less a very common interpretation of the spike generationmechanism that may provide an indication of the dependenceof the LAC on off-duration. The Poisson-predicted LAC valuescan be derived to follow Eq. 10 (for details on the derivationsee METHODS AND MATERIALS).
�LAC� �2
���k1 � k2 � 2�(10)
With this predicted LAC, we can calculate the ratio of themeasured and predicted LAC for every pair of trials individu-ally (LAC/�LAC�). A value smaller than 1.0 would indicateless variability in trial-to-trial spike counts than predicted for aPoisson process, whereas a value larger than 1.0 would imply
more variability. Consistent with our FF findings, Fig. 4Ddemonstrates that LAC/�LAC� decrease with increasing off-duration, indicating that indeed trial-to-trial variability is lowerwhen stimulus sequences are presented with longer intermittentblank intervals. For ambiguous cylinders and dynamic noise,LAC/�LAC� is above 1.0 for the shortest off-interval andbelow 1.0 for the longest off-periods. The resolution of per-ceptual ambiguity in the former and broad motion directioncontent of the latter could be responsible for this higher initialtrial-to-trial variability that appears to stabilize when blankdurations increase. The opaque cylinders that contain only onemotion direction and no inherent ambiguities show an overalllower LAC/�LAC�, but the stabilizing effect of increasingoff-duration is also clearly present there.
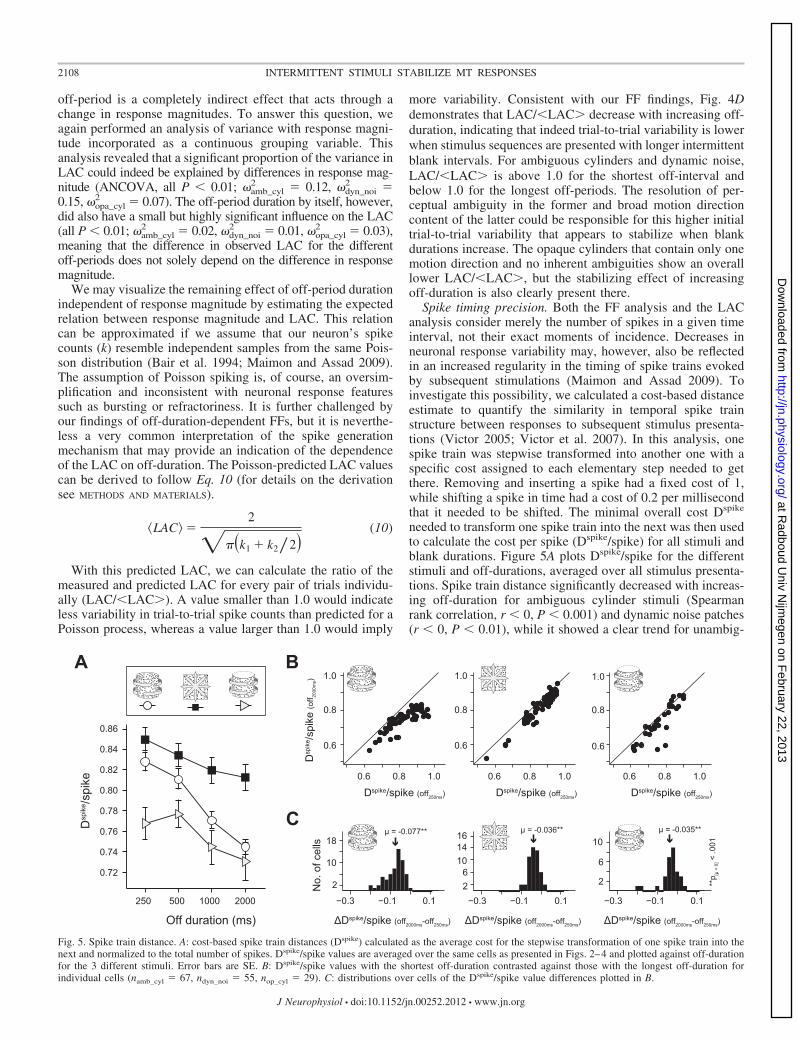
Spike timing precision. Both the FF analysis and the LACanalysis consider merely the number of spikes in a given timeinterval, not their exact moments of incidence. Decreases inneuronal response variability may, however, also be reflectedin an increased regularity in the timing of spike trains evokedby subsequent stimulations (Maimon and Assad 2009). Toinvestigate this possibility, we calculated a cost-based distanceestimate to quantify the similarity in temporal spike trainstructure between responses to subsequent stimulus presenta-tions (Victor 2005; Victor et al. 2007). In this analysis, onespike train was stepwise transformed into another one with aspecific cost assigned to each elementary step needed to getthere. Removing and inserting a spike had a fixed cost of 1,while shifting a spike in time had a cost of 0.2 per millisecondthat it needed to be shifted. The minimal overall cost Dspike
needed to transform one spike train into the next was then usedto calculate the cost per spike (Dspike/spike) for all stimuli andblank durations. Figure 5A plots Dspike/spike for the differentstimuli and off-durations, averaged over all stimulus presenta-tions. Spike train distance significantly decreased with increas-ing off-duration for ambiguous cylinder stimuli (Spearmanrank correlation, r � 0, P � 0.001) and dynamic noise patches(r � 0, P � 0.01), while it showed a clear trend for unambig-
0.6 0.8 1.0
0.6
0.8
1.0
Dspike/spike (off250ms)
Dsp
ike /s
pike
(off 20
00m
s)
0.6 0.8 1.0
Dspike/spike (off250ms)
0.6 0.8 1.0
Dspike/spike (off250ms)
B
0.6
0.8
1.0
0.6
0.8
1.0
C
250 500 1000 2000
0.72
0.74
0.76
0.78
0.80
0.82
0.84
0.86
Off duration (ms)
Dsp
ike /s
pike
A
−0.3 −0.1 0.1
2
10
18
No.
of c
ells
26
1014
2
6
1016
−0.3 −0.1 0.1 −0.3 −0.1 0.1
μ = -0.077** μ = -0.036** μ = -0.035**
**p [μ
< 0
] < .0
01
ΔDspike/spike (off2000ms-off250ms) ΔDspike/spike (off2000ms-off250ms)ΔDspike/spike (off2000ms-off250ms)
Fig. 5. Spike train distance. A: cost-based spike train distances (Dspike) calculated as the average cost for the stepwise transformation of one spike train into thenext and normalized to the total number of spikes. Dspike/spike values are averaged over the same cells as presented in Figs. 2–4 and plotted against off-durationfor the 3 different stimuli. Error bars are SE. B: Dspike/spike values with the shortest off-duration contrasted against those with the longest off-duration forindividual cells (namb_cyl � 67, ndyn_noi � 55, nop_cyl � 29). C: distributions over cells of the Dspike/spike value differences plotted in B.
2108 INTERMITTENT STIMULI STABILIZE MT RESPONSES
J Neurophysiol • doi:10.1152/jn.00252.2012 • www.jn.org
at Radboud U
niv Nijm
egen on February 22, 2013
http://jn.physiology.org/D
ownloaded from
uous opaque cylinder stimuli (r � 0, P � 0.07). Interestingly,the average Dspike/spike values for the unambiguous opaquecylinder are a lot lower than for the dynamic random noisepatches, while Dspike/spike values for ambiguous cylinders aresimilar to those of dynamic noise at short blank intervals butmore similar to those of opaque cylinders at long blankperiods. This transition may be related to the fact that inter-mittently presented ambiguous stimuli are perceptually unsta-ble at short off-periods (high perceptual alternation probability)but become increasingly stable with longer stimulus interrup-tions (high perceptual repetition probability).
When the average Dspike/spike values of the shortest andlongest off-periods are contrasted for individual cells (Fig. 5, Band C), the Dspike/spike value for the longest off-period islower in most cells for all three stimuli, an effect that issignificant for the population of recorded neurons (pairedt-tests, all P � 0.001). We again checked whether the Dspike/spike differences for the different off-periods were merely anindirect effect of the differences in spike count or whether theoff-period duration had an additional effect by performing ananalysis of variance with average spike count as a continuousgrouping variable. While this analysis revealed that the cost-based spike train distance was for a significant proportioninfluenced by response magnitude (ANCOVA, all P � 0.001;�amb_cyl
2 � 0.05, �dyn_noi2 � 0.38, �opa_cyl
2 � 0.50), an addi-tional effect of off-duration independent of response magnitudewas highly significant as well (all P � 0.01; �amb_cyl
2 � 0.21,�dyn_noi
2 � 0.05, �opa_cyl2 � 0.04).
Control for block and fixation duration. Sequences of stim-ulus presentations with different intermittent off-durationswere kept equally long in terms of number of stimulus repeti-tions. Consequently, they differed in their total duration and inthe average number of stimuli presented during a continuousperiod of uninterrupted fixation. To control whether thesedifferences could have affected our results, the data fromblocks with the shortest off-periods were reanalyzed to allow acomparison of the spike-based measures reported in this studyamong four subsets of the data. The first subset included allvalid trials (as described above in RESULTS). The second andthird subsets controlled for the effect of block duration andonly included the first and last 10 stimulus presentations of ablock of trials, respectively. The fourth subset included onlythe first three trials after the monkey initiated a period offixation and offers a control for a possible fixation durationeffect.
While we did find some adaptation effects on response mag-nitude (first 10 trials vs. last 10 trials: Pamb_cyl � 0.01, Pdyn_noi �028, Popa_cyl � 0.05; first 3 trials after fixation onset vs. all trials:Pamb_cyl � 0.01, Pdyn_noi � 0.23, Popa_cyl � 0.22), there were noeffects on any of the variability measures. FFs were not signifi-cantly different between the first and last 10 trials of a block(Pamb_cyl � 0.50, Pdyn_noi � 0.27, Popa_cyl � 0.71), or betweenthe subset of trials right after fixation compared with the fullset of trials (Pamb_cyl � 0.09, Pdyn_noi � 0.20, Popa_cyl � 0.41).The same was true for the Dspike/spike (first 10 trials vs. last 10trials: Pamb_cyl � 0.69, Pdyn_noi � 0.95, Popa_cyl � 0.66; first 3trials after fixation onset vs. all trials: Pamb_cyl � 0.27, Pdyn_noi �0.82, Popa_cyl � 0.56) and the LAC (first 10 trials vs. last 10 trials:Pamb_cyl � 0.89, Pdyn_noi � 0.70, Popa_cyl � 0.41; first 3 trials afterfixation onset vs. all trials: Pamb_cyl � 0.68, Pdyn_noi � 0.57,
Popa_cyl � 0.38). These controls provide a relatively good indica-tion that the difference in block duration between different off-period conditions and/or the number of stimulus presentationsduring a continuous period of fixation did not have a significantimpact on our results.
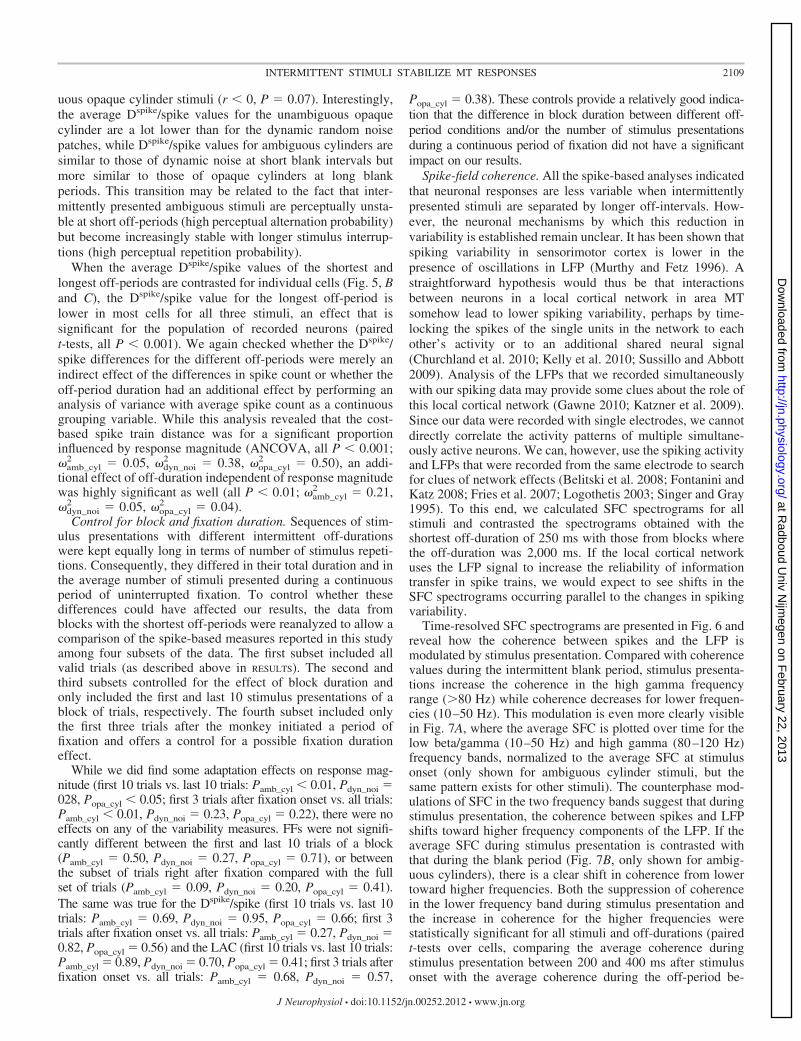
Spike-field coherence. All the spike-based analyses indicatedthat neuronal responses are less variable when intermittentlypresented stimuli are separated by longer off-intervals. How-ever, the neuronal mechanisms by which this reduction invariability is established remain unclear. It has been shown thatspiking variability in sensorimotor cortex is lower in thepresence of oscillations in LFP (Murthy and Fetz 1996). Astraightforward hypothesis would thus be that interactionsbetween neurons in a local cortical network in area MTsomehow lead to lower spiking variability, perhaps by time-locking the spikes of the single units in the network to eachother’s activity or to an additional shared neural signal(Churchland et al. 2010; Kelly et al. 2010; Sussillo and Abbott2009). Analysis of the LFPs that we recorded simultaneouslywith our spiking data may provide some clues about the role ofthis local cortical network (Gawne 2010; Katzner et al. 2009).Since our data were recorded with single electrodes, we cannotdirectly correlate the activity patterns of multiple simultane-ously active neurons. We can, however, use the spiking activityand LFPs that were recorded from the same electrode to searchfor clues of network effects (Belitski et al. 2008; Fontanini andKatz 2008; Fries et al. 2007; Logothetis 2003; Singer and Gray1995). To this end, we calculated SFC spectrograms for allstimuli and contrasted the spectrograms obtained with theshortest off-duration of 250 ms with those from blocks wherethe off-duration was 2,000 ms. If the local cortical networkuses the LFP signal to increase the reliability of informationtransfer in spike trains, we would expect to see shifts in theSFC spectrograms occurring parallel to the changes in spikingvariability.
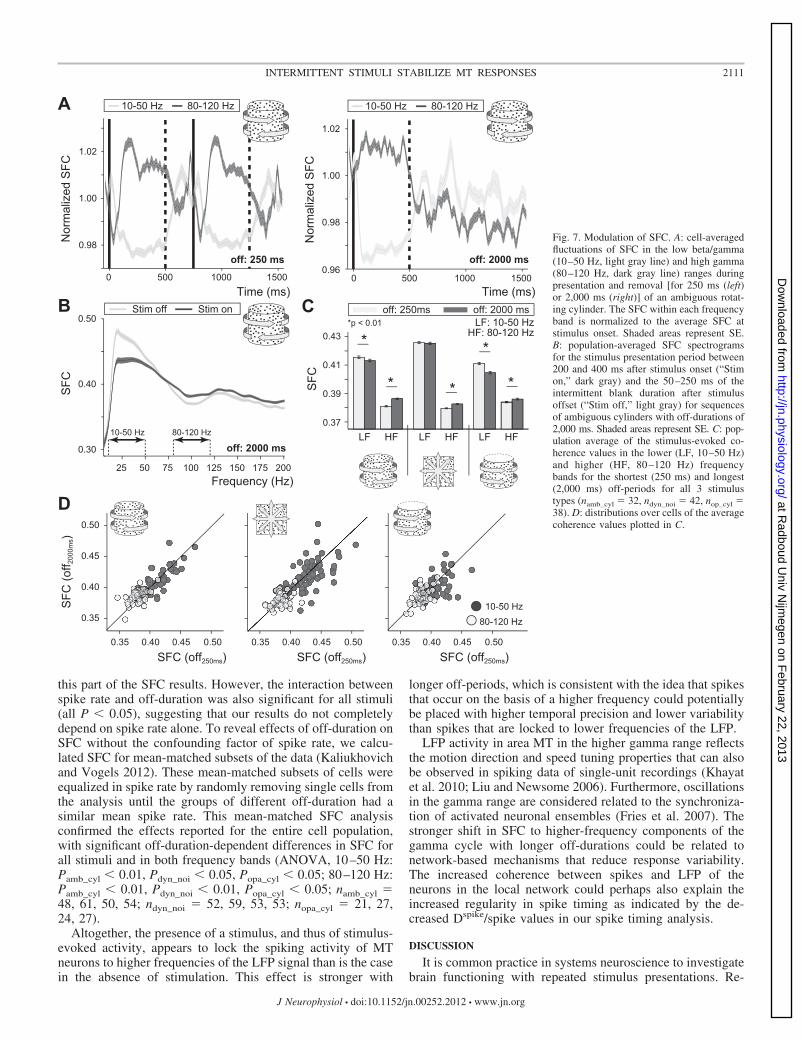
Time-resolved SFC spectrograms are presented in Fig. 6 andreveal how the coherence between spikes and the LFP ismodulated by stimulus presentation. Compared with coherencevalues during the intermittent blank period, stimulus presenta-tions increase the coherence in the high gamma frequencyrange (�80 Hz) while coherence decreases for lower frequen-cies (10–50 Hz). This modulation is even more clearly visiblein Fig. 7A, where the average SFC is plotted over time for thelow beta/gamma (10–50 Hz) and high gamma (80–120 Hz)frequency bands, normalized to the average SFC at stimulusonset (only shown for ambiguous cylinder stimuli, but thesame pattern exists for other stimuli). The counterphase mod-ulations of SFC in the two frequency bands suggest that duringstimulus presentation, the coherence between spikes and LFPshifts toward higher frequency components of the LFP. If theaverage SFC during stimulus presentation is contrasted withthat during the blank period (Fig. 7B, only shown for ambig-uous cylinders), there is a clear shift in coherence from lowertoward higher frequencies. Both the suppression of coherencein the lower frequency band during stimulus presentation andthe increase in coherence for the higher frequencies werestatistically significant for all stimuli and off-durations (pairedt-tests over cells, comparing the average coherence duringstimulus presentation between 200 and 400 ms after stimulusonset with the average coherence during the off-period be-
2109INTERMITTENT STIMULI STABILIZE MT RESPONSES
J Neurophysiol • doi:10.1152/jn.00252.2012 • www.jn.org
at Radboud U
niv Nijm
egen on February 22, 2013
http://jn.physiology.org/D
ownloaded from
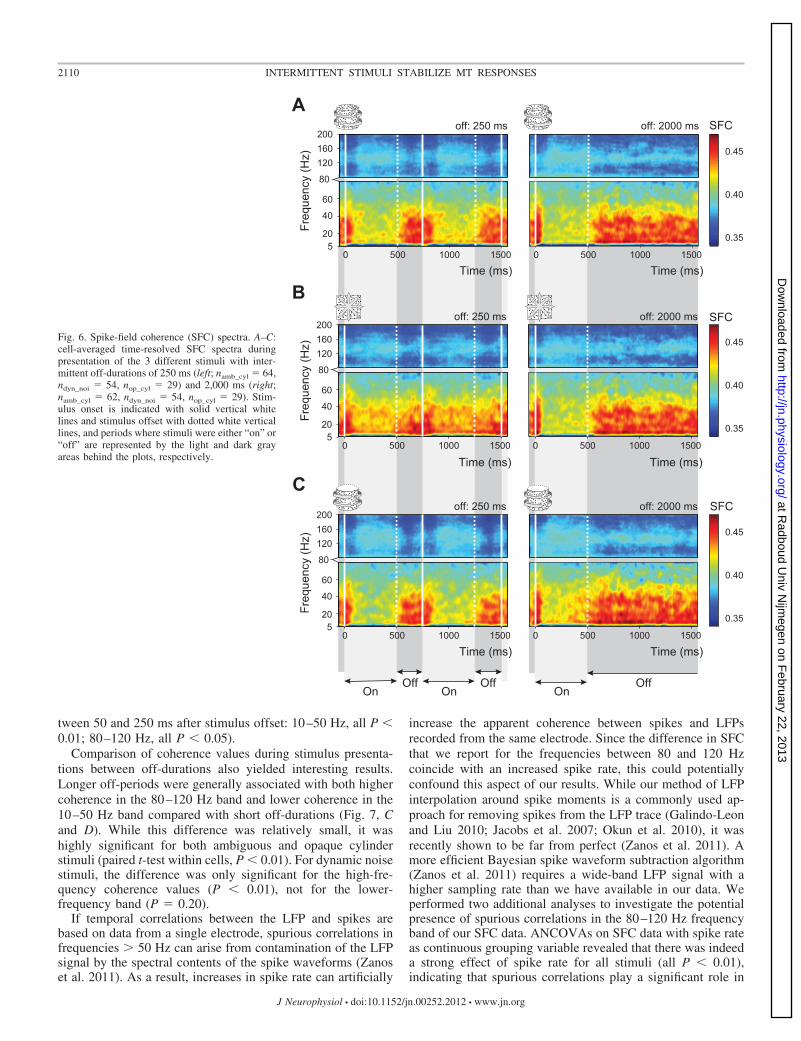
tween 50 and 250 ms after stimulus offset: 10–50 Hz, all P �0.01; 80–120 Hz, all P � 0.05).
Comparison of coherence values during stimulus presenta-tions between off-durations also yielded interesting results.Longer off-periods were generally associated with both highercoherence in the 80–120 Hz band and lower coherence in the10–50 Hz band compared with short off-durations (Fig. 7, Cand D). While this difference was relatively small, it washighly significant for both ambiguous and opaque cylinderstimuli (paired t-test within cells, P � 0.01). For dynamic noisestimuli, the difference was only significant for the high-fre-quency coherence values (P � 0.01), not for the lower-frequency band (P � 0.20).
If temporal correlations between the LFP and spikes arebased on data from a single electrode, spurious correlations infrequencies � 50 Hz can arise from contamination of the LFPsignal by the spectral contents of the spike waveforms (Zanoset al. 2011). As a result, increases in spike rate can artificially
increase the apparent coherence between spikes and LFPsrecorded from the same electrode. Since the difference in SFCthat we report for the frequencies between 80 and 120 Hzcoincide with an increased spike rate, this could potentiallyconfound this aspect of our results. While our method of LFPinterpolation around spike moments is a commonly used ap-proach for removing spikes from the LFP trace (Galindo-Leonand Liu 2010; Jacobs et al. 2007; Okun et al. 2010), it wasrecently shown to be far from perfect (Zanos et al. 2011). Amore efficient Bayesian spike waveform subtraction algorithm(Zanos et al. 2011) requires a wide-band LFP signal with ahigher sampling rate than we have available in our data. Weperformed two additional analyses to investigate the potentialpresence of spurious correlations in the 80–120 Hz frequencyband of our SFC data. ANCOVAs on SFC data with spike rateas continuous grouping variable revealed that there was indeeda strong effect of spike rate for all stimuli (all P � 0.01),indicating that spurious correlations play a significant role in
off: 250 ms off: 2000 ms
off: 250 ms off: 2000 ms
off: 250 ms off: 2000 ms
OnOff
OnOff
OnOff
0 500 1000 1500
80
120160200
0.35
0.40
0.45
0.35
0.40
0.45
0.35
0.40
0.45
SFC
SFC
SFC
Freq
uenc
y (H
z)Fr
eque
ncy
(Hz)
Freq
uenc
y (H
z)
20
40
60
50 500 1000 1500
A
B
C
0 500 1000 1500
80
120160200
20
40
60
50 500 1000 1500
0 500 1000 1500
80
120160200
20
40
60
50 500 1000 1500
Time (ms) Time (ms)
Time (ms) Time (ms)
Time (ms) Time (ms)
Fig. 6. Spike-field coherence (SFC) spectra. A–C:cell-averaged time-resolved SFC spectra duringpresentation of the 3 different stimuli with inter-mittent off-durations of 250 ms (left; namb_cyl � 64,ndyn_noi � 54, nop_cyl � 29) and 2,000 ms (right;namb_cyl � 62, ndyn_noi � 54, nop_cyl � 29). Stim-ulus onset is indicated with solid vertical whitelines and stimulus offset with dotted white verticallines, and periods where stimuli were either “on” or“off” are represented by the light and dark grayareas behind the plots, respectively.
2110 INTERMITTENT STIMULI STABILIZE MT RESPONSES
J Neurophysiol • doi:10.1152/jn.00252.2012 • www.jn.org
at Radboud U
niv Nijm
egen on February 22, 2013
http://jn.physiology.org/D
ownloaded from
this part of the SFC results. However, the interaction betweenspike rate and off-duration was also significant for all stimuli(all P � 0.05), suggesting that our results do not completelydepend on spike rate alone. To reveal effects of off-duration onSFC without the confounding factor of spike rate, we calcu-lated SFC for mean-matched subsets of the data (Kaliukhovichand Vogels 2012). These mean-matched subsets of cells wereequalized in spike rate by randomly removing single cells fromthe analysis until the groups of different off-duration had asimilar mean spike rate. This mean-matched SFC analysisconfirmed the effects reported for the entire cell population,with significant off-duration-dependent differences in SFC forall stimuli and in both frequency bands (ANOVA, 10–50 Hz:Pamb_cyl � 0.01, Pdyn_noi � 0.05, Popa_cyl � 0.05; 80–120 Hz:Pamb_cyl � 0.01, Pdyn_noi � 0.01, Popa_cyl � 0.05; namb_cyl �48, 61, 50, 54; ndyn_noi � 52, 59, 53, 53; nopa_cyl � 21, 27,24, 27).
Altogether, the presence of a stimulus, and thus of stimulus-evoked activity, appears to lock the spiking activity of MTneurons to higher frequencies of the LFP signal than is the casein the absence of stimulation. This effect is stronger with
longer off-periods, which is consistent with the idea that spikesthat occur on the basis of a higher frequency could potentiallybe placed with higher temporal precision and lower variabilitythan spikes that are locked to lower frequencies of the LFP.
LFP activity in area MT in the higher gamma range reflectsthe motion direction and speed tuning properties that can alsobe observed in spiking data of single-unit recordings (Khayatet al. 2010; Liu and Newsome 2006). Furthermore, oscillationsin the gamma range are considered related to the synchroniza-tion of activated neuronal ensembles (Fries et al. 2007). Thestronger shift in SFC to higher-frequency components of thegamma cycle with longer off-durations could be related tonetwork-based mechanisms that reduce response variability.The increased coherence between spikes and LFP of theneurons in the local network could perhaps also explain theincreased regularity in spike timing as indicated by the de-creased Dspike/spike values in our spike timing analysis.
DISCUSSION
It is common practice in systems neuroscience to investigatebrain functioning with repeated stimulus presentations. Re-
A
off: 2000 msoff: 250 ms
Time (ms)
10-50 Hz 80-120 Hz
0 500 1000 1500
0.98
1.00
1.02
0.96
0.98
1.00
1.02
0 500 1000 1500
Nor
mal
ized
SFC
Nor
mal
ized
SFC
Time (ms)
10-50 Hz 80-120 Hz
Frequency (Hz)
off: 2000 ms
25 50 75 100 125 150 175 200
0.30
0.40
0.50
SFC
B
10-50 Hz 80-120 Hz
Stim off Stim on
0.37
0.39
0.41
0.43
LF HF LF HF LF HF
off: 250ms off: 2000 msCLF: 10-50 Hz
HF: 80-120 Hz*
* *
*
*
*p < 0.01S
FC
0.35 0.40 0.45 0.50
0.35
0.40
0.45
0.50
0.35 0.40 0.45 0.50 0.35 0.40 0.45 0.50
SFC (off250ms) SFC (off250ms)SFC (off250ms)
SFC
(off 2
000m
s)
10-50 Hz80-120 Hz
D
Fig. 7. Modulation of SFC. A: cell-averagedfluctuations of SFC in the low beta/gamma(10–50 Hz, light gray line) and high gamma(80–120 Hz, dark gray line) ranges duringpresentation and removal [for 250 ms (left)or 2,000 ms (right)] of an ambiguous rotat-ing cylinder. The SFC within each frequencyband is normalized to the average SFC atstimulus onset. Shaded areas represent SE.B: population-averaged SFC spectrogramsfor the stimulus presentation period between200 and 400 ms after stimulus onset (“Stimon,” dark gray) and the 50–250 ms of theintermittent blank duration after stimulusoffset (“Stim off,” light gray) for sequencesof ambiguous cylinders with off-durations of2,000 ms. Shaded areas represent SE. C: pop-ulation average of the stimulus-evoked co-herence values in the lower (LF, 10–50 Hz)and higher (HF, 80 –120 Hz) frequencybands for the shortest (250 ms) and longest(2,000 ms) off-periods for all 3 stimulustypes (namb_cyl � 32, ndyn_noi � 42, nop_cyl �38). D: distributions over cells of the averagecoherence values plotted in C.
2111INTERMITTENT STIMULI STABILIZE MT RESPONSES
J Neurophysiol • doi:10.1152/jn.00252.2012 • www.jn.org
at Radboud U
niv Nijm
egen on February 22, 2013
http://jn.physiology.org/D
ownloaded from
sponses are generally averaged over trials to obtain an estimateof the mean response magnitude. However, the timing ofrepeated stimulus presentation can profoundly influence theevoked responses on individual trials. Whereas the straightfor-ward reduction of responsiveness known as adaptation orfatigue has been known for a long time, our novel resultsdemonstrate a more complex effect of intermittent motionstimulus presentation on neuronal response patterns. Wheninterruptions between stimulus presentations of a standardduration were systematically increased, neuronal responsevariability became increasingly smaller. We carefully checkedwhether the adaptation-driven response magnitude effects suf-ficed to explain the response variability effects. Even thoughresponse magnitudes were sometimes correlated with the vari-ability measures, there was always an additional effect ofoff-duration that was independent of response magnitude.These response stabilization effects independent of magnitudeeffects could be observed in spike rate variability measures,both over sequences of tens of stimulus presentations andbetween pairs of directly subsequent trials, as well as in thevariability of precise spike timing patterns.
Network-driven variability reduction. A decline in neuralvariability in response to stimulus presentation has recentlybeen demonstrated to occur with a broad range of stimuli andin many cortical areas of both anesthetized and awake behav-ing monkeys (Churchland et al. 2010). In this particular study,data from multielectrode recordings suggest that the reductionin variability is a network property, implying some stimulus-driven stabilization effect within cortical circuits. Gammaoscillations have long been suggested to play a role in thesynchronization of neuronal activity within a cortical circuit(Fries et al. 2007), and the presence of gamma oscillations hasbeen shown to reduce spiking variability in sensorimotor cor-tex (Murthy and Fetz 1996). In area MT, similar synchroniza-tion effects may very well underlie the observed reduction inresponse variability, even in measures as subtle as precisespike timing. Our SFC analysis suggests that the occurrence ofspikes during stimulus presentation is more strongly synchro-nized to LFP oscillation in the high gamma frequency range(80–120 Hz) than during intermittent blank durations. Thisincrease in SFC at high frequencies is accompanied by adecrease in coherence at lower beta/gamma frequencies(10–50 Hz), indicating a stimulus-evoked shift in the SFC.Furthermore, this shift toward SFC in higher LFP frequenciesis more pronounced for longer off-durations where spikingvariability was also shown to be lower, suggesting that thealtered SFC may somehow be responsible for the more regularspiking patterns.
Functionally, a reduction of response variability improvesthe signal-to-noise ratio of the neural code and allows a morereliable information transfer between neurons or processingstages. This potential role for reduced variability is supportedby the finding that attention enhances the reliability of neuronalresponses in area V4 of the macaque more strongly by reducingvariability than by increasing response magnitude (Mitchellet al. 2007). In our study, we did not ask the monkey to reportperception because we wanted to record neuronal activity thatprimarily related to the visual stimulation. While we believethat there is no reason to assume a systematic influence ofattention with this paradigm, it is theoretically possible that themonkeys’ attentional load covaried with the off-duration and
that at least some of the effects of off-duration are related tothese differences in attentional load. It has been shown that inarea MT stimulus-driven power increases in the gamma rangeof the LFP are stronger for attended than for unattended stimuli(Khayat et al. 2010). A multitaper analysis with the samesettings as in the SFC analysis was performed on the LFP dataalone and revealed no differences in stimulus-driven gamma-power (20–100 Hz) increases between the shortest and longestoff-durations for any of our stimuli (paired t-test across cells,Pamb_cyl � 0.24, Pdyn_noi � 0.98, Popa_cyl � 0.08). We alsoanalyzed whether any hints of attentional load differencesbetween off-durations could be extracted from the animal’s eyemovement data and found no differences in either eye positionor horizontal eye movement distance relative to the stimulusposition (all P � 0.11). Vertical eye movements were notinformative because they were heavily contaminated by pupildilation differences in response to the changes in luminanceevoked by stimulus presentation. As a final control for anypossible effects of attention, we compared baseline spikingrates over the different off-durations. Attention has previouslybeen shown to increase baseline spiking rates and fMRI BOLDsignal in several extrastriate areas (Kastner et al. 1999; Luck etal. 1997; Williford and Maunsell 2006), but no such differ-ences were apparent in our data (ANOVA, all P � 0.54).Whereas these analyses do not definitively eliminate the pos-sibility of an influence of the animal’s attentional state on ourfindings, the absence of any statistical differences does renderit unlikely that attention played a crucial role in reducingresponse variability in our experiments.
While previous studies demonstrate that the mere presenceof a stimulus reduces neuronal variability (Churchland et al.2010) and that attended stimuli evoke responses with lowervariability than unattended stimuli (Mitchell et al. 2007), ourresults demonstrate that stimulus-evoked variability reductionsalso crucially depend on the timing with which the drivingstimuli are presented. This suggests that standard network-driven response stabilization is a time-consuming process thatstabilizes the activity patterns of individual neurons morestrongly when it is given more time to reorganize itself duringthe blank duration. Moreover, since all the basic effects wereport in this study are seen with all three stimuli, neuronalresponse stabilization might be a generic cortical mechanismthat facilitates the efficient encoding of repeated stimuluspresentations by increasing the signal-to-noise ratio of theneural code. It would therefore be interesting to investigate thetemporal evolution of response stabilization within the localcortical network by simultaneously recording the responses ofmany neurons while they are being stimulated with sequencesof stimuli separated by systematically varied blank durations.The hypothesis of a network-driven reduction in responsevariability also predicts that the spontaneous activity precedingstimulus presentation should become more regular. Unfortu-nately, the spontaneous activity we recorded in the presentstudy was of too low a magnitude to reliably test this pre-diction.
Perceptual stabilization. This neurophysiological study ofthe effect of interstimulus blank duration on neuronal responseproperties was inspired by the psychophysical phenomenon ofperceptual stabilization (Klink et al. 2008; Leopold et al.2002). Over the last few years, insightful results about thenature of perceptual stabilization have been obtained with
2112 INTERMITTENT STIMULI STABILIZE MT RESPONSES
J Neurophysiol • doi:10.1152/jn.00252.2012 • www.jn.org
at Radboud U
niv Nijm
egen on February 22, 2013
http://jn.physiology.org/D
ownloaded from
behavioral studies (Brascamp et al. 2008; Carter and Cavanagh2007; Kanai et al. 2007; Klink et al. 2008, 2009; Knapen et al.2009; Pastukhov and Braun 2008), neural imaging (Raemaek-ers et al. 2009), brain stimulation (Brascamp et al. 2010), andcomputational approaches (Gigante et al. 2009; Noest et al.2007; Wilson 2007), but it currently remains unclear how theactivity patterns of single neurons are altered when perceptionstabilizes. Obviously, our present study cannot directly providean answer to this question. It does, however, allow sometentative speculation about the relationship between perceptualstabilization on the one hand and neuronal response stabiliza-tion on the other. For instance, it is generally believed that thebrain’s initial “choice” for one of the perceptual interpretationsof an ambiguous stimulus depends on small random fluctua-tions in the activity patterns of the neurons that represent thecompeting percepts (Noest et al. 2007). Whereas responsestabilization occurred for all our stimuli, not only the ambig-uous one, a reduction of minor neuronal activity fluctuationsaround a delicate perceptual choice moment may have muchmore profound effects on perception than an equally largereduction of neuronal fluctuations in the firm representation ofan unambiguous stimulus.
On this account, it is intriguing to note that the neuronalresponse stabilization demonstrated in our study similarlydepends on off-durations as the perceptual stabilization thatwas previously demonstrated in behavioral experiments (Klink etal. 2008; Noest et al. 2007). Whereas current computationalmodels can explain a wide range of experimental findings onperceptual stabilization (Pearson and Brascamp 2008), they donot yet contain enough detail to reproduce our measures ofvariability. However, in a prominent computational model ofperceptual stabilization, the strength of stabilization can bemanipulated with a crucial parameter ( ) for which a decisiveneurophysiological interpretation is currently lacking (Noestet al. 2007). Interpreted either as an intraneural baseline thatinteracts with the adaptation state or as the strength of connec-tivity between percept- and adaptation-state carrying neurons,such a parameter might very well depend on interactions withinthe local network. Taking these models to the next neurophysi-ologically plausible level would require the incorporation oftwo important factors that can be derived from our results.First, the indirect effect of response magnitude on neuronalstabilization could be an important nonlinearity in the system,potentially related to the biophysics behind the spike-generating mechanism. Second, the additional stabilizing effectof blank period duration, independent of response magnitude,may involve complex local network interactions and their,potentially subthreshold, effects on the neuronal dynamics.
ACKNOWLEDGMENTS
We thank André Noest for useful discussions and advice about dataanalysis, Jacob Duijnhouwer for assistance with the custom software, and TheoStuivenberg, Hans Borgeld, Henk Westland, and Ed van der Veen for technicalsupport. Bert van den Berg, Joost le Feber, and Naotsugu Tsuchiya commentedon earlier versions of this manuscript.
GRANTS
Support for this work was provided by Netherlands Organisation forScientific Research (VIDI; 016.001.026 and 051.14.027) and Utrecht Univer-sity (High Potential; “Neural mechanisms of voluntary control”) to R. J. A. vanWezel.
DISCLOSURES
No conflicts of interest, financial or otherwise, are declared by the author(s).
AUTHOR CONTRIBUTIONS
Author contributions: P.C.K., M.J.L., and R.J.A.v.W. conception and de-sign of research; P.C.K. performed experiments; P.C.K. analyzed data; P.C.K.,A.O., M.J.L., and R.J.A.v.W. interpreted results of experiments; P.C.K. pre-pared figures; P.C.K. drafted manuscript; P.C.K., A.O., M.J.L., and R.J.A.v.W.edited and revised manuscript; P.C.K., A.O., M.J.L., and R.J.A.v.W. approvedfinal version of manuscript.
REFERENCES
Bair W, Koch C, Newsome W, Britten KH. Power spectrum analysis ofbursting cells in area MT in the behaving monkey. J Neurosci 14: 2870–2892, 1994.
Belitski A, Gretton A, Magri C, Murayama Y, Montemurro MA, Logo-thetis NK, Panzeri S. Low-frequency local field potentials and spikes inprimary visual cortex convey independent visual information. J Neurosci 28:5696–5709, 2008.
Bokil H, Andrews P, Kulkarni JE, Mehta S, Mitra PP. Chronux: a platformfor analyzing neural signals. J Neurosci Methods 192: 146–151, 2010.
Bradley DC, Chang G, Andersen RA. Encoding of three-dimensional struc-ture-from-motion by primate area MT neurons. Nature 392: 714–717, 1998.
Brascamp JW, Kanai R, Walsh V, van Ee R. Human middle temporalcortex, perceptual bias, and perceptual memory for ambiguous three-dimen-sional motion. J Neurosci 30: 760–766, 2010.
Brascamp JW, Knapen TH, Kanai R, van Ee R, van den Berg AV. Flashsuppression and flash facilitation in binocular rivalry. J Vis 7: 12.1–12,2007.
Brascamp JW, Knapen TH, Kanai R, Noest AJ, van Ee R, van den BergAV. Multi-timescale perceptual history resolves visual ambiguity. PLoSOne 3: e1497, 2008.
Carter OL, Cavanagh P. Onset rivalry: brief presentation isolates an earlyindependent phase of perceptual competition. PLoS One 2: e343, 2007.
Churchland MM, Yu BM, Cunningham JP, Sugrue LP, Cohen MR,Corrado GS, Newsome WT, Clark AM, Hosseini P, Scott BB, BradleyDC, Smith MA, Kohn A, Movshon JA, Armstrong KM, Moore T,Chang SW, Snyder LH, Lisberger SG, Priebe NJ, Finn IM, Ferster D,Ryu SI, Santhanam G, Sahani M, Shenoy KV. Stimulus onset quenchesneural variability: a widespread cortical phenomenon. Nat Neurosci 13:369–378, 2010.
Fontanini A, Katz DB. Behavioral states, network states, and sensory re-sponse variability. J Neurophysiol 100: 1160–1168, 2008.
Freeman ED, Driver J. Subjective appearance of ambiguous structure-from-motion can be driven by objective switches of a separate less ambiguouscontext. Vision Res 46: 4007–4023, 2006.
Fries P, Nikolic D, Singer W. The gamma cycle. Trends Neurosci 30:309–316, 2007.
Galindo-Leon EE, Liu RC. Predicting stimulus-locked single unit spikingfrom cortical local field potentials. J Comput Neurosci 29: 581–597, 2010.
Gawne TJ. The local and non-local components of the local field potential inawake primate visual cortex. J Comput Neurosci 29: 615–623, 2010.
Gigante G, Mattia M, Braun J, del Giudice P. Bistable perception modeledas competing stochastic integrations at two levels. PLoS Comput Biol 5:e1000430, 2009.
Green DM, Swets JA. Signal Detection Theory and Psychophysics. NewYork: Wiley, 1966.
Grill-Spector K, Henson R, Martin A. Repetition and the brain: neuralmodels of stimulus-specific effects. Trends Cogn Sci 10: 14–23, 2006.
Jacobs J, Kahana MJ, Ekstrom AD, Fried I. Brain oscillations controltiming of single-neuron activity in humans. J Neurosci 27: 3839–3844,2007.
Kaliukhovich DA, Vogels R. Stimulus repetition affects both strength andsynchrony of macaque inferior temporal cortical activity. J Neurophysiol107: 3509–3527, 2012.
Kanai R, Knapen TH, van Ee R, Verstraten FA. Disruption of implicitperceptual memory by intervening neutral stimuli. Vision Res 47: 2675–2683, 2007.
Kastner S, Pinsk MA, De Weerd P, Desimone R, Ungerleider LG. In-creased activity in human visual cortex during directed attention in theabsence of visual stimulation. Neuron 22: 751–761, 1999.
2113INTERMITTENT STIMULI STABILIZE MT RESPONSES
J Neurophysiol • doi:10.1152/jn.00252.2012 • www.jn.org
at Radboud U
niv Nijm
egen on February 22, 2013
http://jn.physiology.org/D
ownloaded from

Katzner S, Nauhaus I, Benucci A, Bonin V, Ringach DL, Carandini M.Local origin of field potentials in visual cortex. Neuron 61: 35–41, 2009.
Kelly RC, Smith MA, Kass RE, Lee TS. Local field potentials indicatenetwork state and account for neuronal response variability. J ComputNeurosci 29: 567–579, 2010.
Khayat PS, Niebergall R, Martinez-Trujillo JC. Frequency-dependent at-tentional modulation of local field potential signals in macaque area MT. JNeurosci 30: 7037–7048, 2010.
Klink PC, van Ee R, Nijs MM, Brouwer GJ, Noest AJ, van Wezel RJ.Early interactions between neuronal adaptation and voluntary control deter-mine perceptual choices in bistable vision. J Vis 8: 16.1–16.18, 2008.
Klink PC, Noest AJ, Holten V, van den Berg AV, van Wezel RJ. Occlusion-related lateral connections stabilize kinetic depth stimuli through perceptualcoupling. J Vis 9: 20.1–20.20, 2009.
Knapen T, Brascamp J, Adams WJ, Graf EW. The spatial scale ofperceptual memory in ambiguous figure perception. J Vis 9: 16.1–16.12,2009.
Kohn A. Visual adaptation: physiology, mechanisms, and functional benefits.J Neurophysiol 97: 3155–3164, 2007.
Kornmeier J, Ehm W, Bigalke H, Bach M. Discontinuous presentation ofambiguous figures: how interstimulus-interval durations affect reversal dy-namics and ERPs. Psychophysiology 44: 552–560, 2007.
Kornmeier J, Hein CM, Bach M. Multistable perception: when bottom-upand top-down coincide. Brain Cogn 69: 138–147, 2009.
Leopold DA, Wilke M, Maier A, Logothetis NK. Stable perception ofvisually ambiguous patterns. Nat Neurosci 5: 605–609, 2002.
Liu J, Newsome WT. Local field potential in cortical area MT: stimulustuning and behavioral correlations. J Neurosci 26: 7779–7790, 2006.
Logothetis NK. The underpinnings of the BOLD functional magnetic reso-nance imaging signal. J Neurosci 23: 3963–3971, 2003.
Luck SJ, Chelazzi L, Hillyard SA, Desimone R. Neural mechanisms ofspatial selective attention in areas V1, V2, and V4 of macaque visual cortex.J Neurophysiol 77: 24–42, 1997.
Maier A, Wilke M, Logothetis NK, Leopold DA. Perception of temporallyinterleaved ambiguous patterns. Curr Biol 13: 1076–1085, 2003.
Maimon G, Assad JA. Beyond Poisson: increased spike-time regularityacross primate parietal cortex. Neuron 62: 426–440, 2009.
Mayo JP, Sommer MA. Neuronal adaptation caused by sequential visualstimulation in the frontal eye field. J Neurophysiol 100: 1923–1935, 2008.
Mitchell JF, Stoner GR, Reynolds JH. Object-based attention determinesdominance in binocular rivalry. Nature 429: 410–413, 2004.
Mitchell JF, Sundberg KA, Reynolds JH. Differential attention-dependentresponse modulation across cell classes in macaque visual area V4. Neuron55: 131–141, 2007.
Mitra PP, Bokil H. Observed Brain Dynamics. New York: Oxford Univ.Press, 2007.
Mitra PP, Pesaran B. Analysis of dynamic brain imaging data. Biophys J 76:691–708, 1999.
Murthy VN, Fetz EE. Synchronization of neurons during local field potentialoscillations in sensorimotor cortex of awake monkeys. J Neurophysiol 76:3968–3982, 1996.
Noest AJ, van Ee R, Nijs MM, van Wezel RJ. Percept-choice sequencesdriven by interrupted ambiguous stimuli: a low-level neural model. J Vis 7:10.1–10.14, 2007.
Okun M, Naim A, Lampl I. The subthreshold relation between cortical localfield potential and neuronal firing unveiled by intracellular recordings inawake rats. J Neurosci 30: 4440–4448, 2010.
Orbach J, Zucker E, Olson R. Reversibility of the Necker cube. VII.Reversal rate as a function of figure-on and figure-off duration. Percept MotSkills 17: 615–618, 1966.
Parker A. Binocular depth perception and the cerebral cortex. Nat RevNeurosci 8: 379–391, 2007.
Pastukhov A, Braun J. A short-term memory of multi-stable perception. J Vis8: 1–14, 2008.
Pearson J, Brascamp JW. Sensory memory for ambiguous vision. TrendsCogn Sci 12: 334–341, 2008.
Raemaekers M, van der Schaaf ME, van Ee R, van Wezel RJ. WidespreadfMRI activity differences between perceptual states in visual rivalry arecorrelated with differences in observer biases. Brain Res 1252: 161–171,2009.
Sengpiel F, Blakemore C, Harrad R. Interocular suppression in the primaryvisual cortex: a possible neural basis of binocular rivalry. Vision Res 35:179–195, 1995.
Sheinberg DL, Logothetis NK. The role of temporal cortical areas inperceptual organization. Proc Natl Acad Sci USA 94: 3408–3413, 1997.
Singer W, Gray CM. Visual feature integration and the temporal correlationhypothesis. Annu Rev Neurosci 18: 555–586, 1995.
Sussillo D, Abbott LF. Generating coherent patterns of activity from chaoticneural networks. Neuron 63: 544–557, 2009.
Victor JD, Goldberg DH, Gardner D. Dynamic programming algorithms forcomparing multineuronal spike trains via cost-based metrics and alignments.J Neurosci Methods 161: 351–360, 2007.
Victor JD, Purpura KP. Nature and precision of temporal coding in visualcortex: a metric-space analysis. J Neurophysiol 76: 1310–1326, 1996.
Victor JD. Spike train metrics. Curr Opin Neurobiol 15: 585–592, 2005.van Wezel RJ, Britten KH. Motion adaptation in area MT. J Neurophysiol
88: 3469–3476, 2002.Williford T, Maunsell JH. Effects of spatial attention on contrast response
functions in macaque area V4. J Neurophysiol 96: 40–54, 2006.Wilson HR. Minimal physiological conditions for binocular rivalry and rivalry
memory. Vision Res 47: 2741–2750, 2007.Wolfe JM. Reversing ocular dominance and suppression in a single flash.
Vision Res 24: 471–478, 1984.Yao H, Shi L, Han F, Gao H, Dan Y. Rapid learning in cortical coding of
visual scenes. Nat Neurosci 10: 772–778, 2007.Zanos TP, Mineault PJ, Pack CC. Removal of spurious correlations between
spikes and local field potentials. J Neurophysiol 105: 474–486, 2011.
2114 INTERMITTENT STIMULI STABILIZE MT RESPONSES
J Neurophysiol • doi:10.1152/jn.00252.2012 • www.jn.org
at Radboud U
niv Nijm
egen on February 22, 2013
http://jn.physiology.org/D
ownloaded from
Copyright © 2022 FDOKUMEN