Heading encoding in the macaque ventral intraparietal area (VIP)

1931
q 2003 The Society for the Study of Evolution. All rights reserved.
Evolution, 57(8), 2003, pp. 1931–1946
DIVERSIFICATION OF SULAWESI MACAQUE MONKEYS: DECOUPLED EVOLUTIONOF MITOCHONDRIAL AND AUTOSOMAL DNA
BEN J. EVANS,1,2 JATNA SUPRIATNA,3,4 NOVIAR ANDAYANI,3 AND DON J. MELNICK1
1Department of Ecology, Evolution and Environmental Biology and Center for Environmental Research and Conservation,1200 Amsterdam Avenue, Columbia University, New York 10027
2Section of Integrative Biology, Patterson Laboratories, University of Texas, Austin, Texas 78712E-mail: [email protected]
3Center for Biodiversity and Conservation Studies, Fakultas Matematika dan Ilmu Pengethuan Alam, University of Indonesia,Depok, Java 16424
4Conservation International Indonesia, Taman Margasatua Raya 61, Jakarta, Indonesia
Abstract. In macaque monkeys, females are philopatric and males are obligate dispersers. This social system isexpected to differently affect evolution of genetic elements depending on their mode of inheritance. Because of this,the geographic structure of molecular variation may differ considerably in mitochondrial DNA (mtDNA) and inautosomal DNA (aDNA) in the same individuals, even though these genomes are partially co-inherited. On theIndonesian island of Sulawesi, macaque monkeys underwent an explosive diversification as a result of range frag-mentation. Today, barriers to dispersal have receded and fertile hybrid individuals can be found at contact zonesbetween parapatric species. In this study, we examine the impact of range fragmentation on Sulawesi macaque mtDNAand aDNA by comparing evolution, phylogeography, and population subdivision of each genome. Our results suggestthat mtDNA is paraphyletic in some species, and that mtDNA phylogeography is largely consistent with a pattern ofisolation by distance. Autosomal DNA, however, is suggestive of fragmentation, in that interspecific differentiationacross most contact zones is significant but intraspecific differentiation between contact zones is not. Furthermore, inmtDNA, most molecular variation is partitioned between populations within species but in aDNA most variation ispartitioned within populations. That mtDNA has a different geographic structure than aDNA (and morphology) inthese primates is a probable consequence of (1) a high level of ancestral polymorphism in mtDNA, (2) differencesbetween patterns of ancestral dispersal of matrilines and contemporary dispersal of males, and (3) the fact that femalephilopatry impedes gene flow of macaque mtDNA.
Key words. Microsatellites, philopatry, phylogeny, population genetics, Southeast Asia.
Received August 13, 2002. Accepted February 18, 2003.
In an ideal population, the effective population sizes of hap-loid and uniparentally inherited genetic elements such as mi-tochondrial DNA (mtDNA) and Y-chromosome DNA (yDNA)are one fourth that of diploid, biparentally inherited autosomalDNA (aDNA). Under ideal circumstances, lineage sorting oc-curs more quickly on average in mtDNA than aDNA, andpolymorphic lineages of mtDNA are expected to fix beforepolymorphic lineages of aDNA (Birky 1991; Palumbi and Cip-riano 1998). However, some characteristics of social animalsocieties alter ratios among the effective population sizes (Ne)of mtDNA, yDNA, and aDNA from ideal expectations (Ches-ser and Baker 1996; Hoelzer 1997) and increase the probabilityof ancestral polymorphism in mtDNA.
Macaque monkeys, for example, are unusual in the extremedegree to which they adhere to a common mammalian be-havioral paradigm, that of female philopatry and obligatemale migration. Sexually contrasting sedentism and dispersalcan affect the distribution of diversity in different geneticelements, depending on their mode of inheritance (Melnickand Hoelzer 1992). Since females remain in natal groups andnatal locations for the duration of their lives, diversity ofmtDNA is low among females from the same social groupbut can be high among different groups, even when they arenear to one another (Hoelzer et al. 1994). Conversely, thediversity of aDNA tends to be homogenized among nearbygroups by male dispersal (Melnick 1988). Molecular diversityin yDNA also tends to be more dispersed in macaques thanmtDNA (Evans et al. 2001, 2003) and exhibits less paraphylywithin macaque species than does mtDNA (Tosi et al. 2000).
Since population subdivision increases Ne, female philopatrycoupled with male dispersal can increase Ne of mtDNA to agreater degree than it increases Ne of aDNA (Wright 1931;Hoelzer 1997).
In macaques, a female-biased adult sex ratio also increasesthe Ne of mtDNA but decreases the Ne of aDNA relative toa population with equal numbers of males and females. Dis-persal and changing social groups is not an easy task formales; it is associated with a high variation in male repro-ductive success and even death (Dittus 1975; de Ruiter et al.1992; Van Noordwijk and Van Schaik 2002). Field studiessuggest that the adult sex ratio of macaque social groupsaverages three females to one male and can be as high asnine to one, even though at birth the ratio is more or lessequal (Melnick and Pearl 1987).
Large Ne of mtDNA is associated with long coalescencetimes, an increased lineage-sorting period, and an increasedprobability that ancestral polymorphisms are retained in apopulation (Birky 1991; Chesser and Baker 1996; Hoelzer etal. 1998). Because of ancestral polymorphism, mtDNA ge-nealogies may not reflect true relationships among species(Melnick et al. 1993), and could also cause the phylogeog-raphy of variation in mtDNA to differ substantially fromaDNA.
Sulawesi Macaques
Asian macaques can be divided into four species groupsbased on genital morphology (Fooden 1976). The silenus

1932 BEN J. EVANS ET AL.
group includes Macaca silenus, M. nemestrina, and the Su-lawesi macaques; M. sylvanus, the only African member ofthis genus, is appropriately placed in a separate group (Delson1980; Tosi et al. 2000). Macaca silenus inhabits southwesternIndia. Macaca nemestrina ranges from eastern India throughSoutheast Asia to the islands of Borneo and Sumatra and hasthree subspecies: M. n. leonina on mainland Asia north ofthe Isthmus of Kra, M. n. nemestrina on Peninsular Malaysia,Sumatra, and Borneo (but not Java), and M. n. pagensis onthe Mentawai Islands (Fooden 1975).
An explosive diversification of macaques on Sulawesi re-sulted in a large number of species being endemic to thissmall island. The number of recognized macaque species onSulawesi ranges from four (Groves 1980) to seven (Fooden1969; Albrecht 1978) or eight (Buttikofer 1917). Fooden(1969) allies Buttiikofer’s (1917) species Cynopithecus ton-sus with Macaca tonkeana. Groves (1980) downgrades M.hecki to a subspecies of M. tonkeana, M. nigrescens to asubspecies of M. nigra, and M. brunnescens to a subspeciesof M. ochreata based on inferred intergradation at contactzones of these taxa. Hybrids and backcrosses of macaquespecies are fertile for multiple generations (Bernstein andGordon 1980) and hybrids have been observed at the contactzones between parapatric species on Sulawesi (Ciani et al.1989; Watanabe and Matsumura 1991; Watanabe et al. 1991a;Bynum et al. 1997; Evans et al. 2001).
No land has connected Sulawesi to other large islands forabout 50 million years (Hall 1996, 1998). Sulawesi was anarchipelago for a portion of its geological evolution and vi-cariance at macaque contact zones forced similar patterns ofendemism among unrelated sympatric fauna on a fine geo-graphic scale (Fooden 1969; Hall 1998; Whitten et al. 2002;Evans et al. 2003). In the recent past, inundation of ocean,large rivers, or unproductive forests posed barriers to dis-persal at the locations of macaque contact zones (Evans etal. 2001; Whitten et al. 2002). Much of Sulawesi was recentlyuplifted (Bergman et al. 1996) and today dispersal acrossmost macaque contact zones is probably less impeded byvicariant barriers.
Goals
In this study we compared patterns of differentiation andlevels of subdivision in mtDNA and aDNA of all species ofSulawesi macaque to (1) evaluate genetic structure of ge-nomes with different modes of inheritance in a group of socialmammal species and (2) examine population structure andbiogeography of the Sulawesi macaques. Because macaquespecies are interfertile, we consider the Sulawesi macaquesa set of subdivided populations among which gene flow ispossible via hybridization. Contemporary genetic affinitiesamong these taxa might be due either to shared ancestry orto recent gene flow. Genetic affinities resulting from sharedancestry may not correspond with current geography, butrecent gene flow is expected to occur between parapatricpopulations or, if allopatric, via intervening populations in astepping-stone fashion.
This study used mtDNA sequences and aDNA microsatelliteallele frequencies to evaluate and compare geographic struc-ture in each genome. Mitochondrial DNA sequences are an-
alyzed with a phylogenetic approach using maximum-likeli-hood and Bayesian methods, and with a population geneticapproach using nested clade analysis. Autosomal microsatel-lite allele frequencies are analyzed with a population geneticapproach using FST. The distributions of molecular variationin mtDNA and aDNA are directly compared using an analysisof molecular variance (Excoffier et al. 1992).
MATERIALS AND METHODS
Genetic Samples
Most genetic samples were obtained from pet animals fromIndonesia. Samples were obtained primarily in the form ofplucked hairs that were stored in tubes at room temperatureuntil they could be frozen. Information about the origin ofthe animal, duration in captivity, and method of capture, wasobtained from the owners, if known. Most of these pets werecaught by the owner or a relative, and thus of known origin(Figs. 1, 2). In a few cases the precise origin of an animalwas not known although species designation was still pos-sible. Some additional samples were obtained from wild an-imals as described in Evans et al. (2001). DNA was extractedwith the Qiagen (Valencia, CA) DNA extraction kit accordingto the manufacturer’s protocol.
We obtained mtDNA sequence from 183 individuals in-cluding 153 Sulawesi macaques and 30 individuals from oth-er areas as described below. Sulawesi individuals also weregenotyped for eight microsatellite loci. The following num-bers of individuals were analyzed from each Sulawesi spe-cies: 25 M. maura, 23 M. tonkeana west, 18 M. tonkeana east,21 M. ochreata, 16 M. brunnescens, 27 M. hecki, 13 M. ni-grescens, and 10 M. nigra. Of these, sequences and allelicdata from 25 M. maura, 19 M. tonkeana west, and eight M.tonkeana east individuals were obtained from Evans et al.(2001). Mitochondrial DNA sequences were also obtainedfrom 24 pets of M. n. nemestrina from Borneo and Sumatra(Fig. 1; field codes gumgum, suka, sepilok, SW 10, PM665,PF1200, PM1202, PM1203, PF1204, PM1205, PM1206,PF1207, PF1208, PF1209, PM1210, PM1211, PF1212,PM1213, PF1214, PM1215, PF3002, PM3003, PF3004,PM3005). Zoo animals provided samples of M. silenus fromsouthwestern India (field code 108806), M. nemestrina leon-ina from Thailand (field code Thail.1A), and M. nemestrinapagensis from the Mentawai Islands (field code 820; Fig. 1).Mitochondrial DNA sequences of M. fascicularis from Bor-neo and Java (field codes PM666 and 34), and M. sinica fromSri Lanka DNA (field code 716) were used as outgroups.
Phylogenetic Analysis of Mitochondrial DNA
A 412 base pair portion of the 39 end of the 12S ribosomalmtDNA gene was sequenced using PCR primers and conditionsdescribed elsewhere (Evans et al. 2001; Tosi et al. 2002), andaligned by eye. Unique sequences have been submitted to Gen-bank (accession numbers: AF383991–AF383997, AF3834003–AF384021, and AY206504–AY206550). Sequences from non-hybrid individuals in Evans et al. (2001) were included, but notsequences from Evans et al. (1999) due to lack of homologyamong characters and terminals; this study uses a different geneand many different samples from those in Evans et al. (1999).

1933DIVERSIFICATION OF SULAWESI MACAQUES
FIG. 1. Sampling locations of Macaca nemestrina from mainland Asia, Sumatra and the Mentawai Islands, and Borneo. Samples of M.silenus from India, M. fascicularis from Java and Borneo, and two M. n. nemestrina samples of ambiguous provenance on Borneo arenot shown. Bornean samples were collected from northern (N), western (W), eastern (E) and southeastern (SE) portions of the island.Dotted line corresponds with the landsea margin when sea level was 120 meters lower during the Pleistocene (Voris 2000).
To test for an appropriate model of evolution for model-basedphylogenetic analysis, we used Modeltest version 3.06 (Posadaand Crandall 1998). Likelihood-ratio (Goldman 1993) and Akai-ke tests (Akaike 1974) selected different models of evolution,TrNef 1 I 1 G and GTR 1 I 1 G, respectively. We performeda maximum-likelihood search using the first, simpler model foranalysis, which assumes equal base frequencies and an equalsubstitution rate for transversions but different rates for bothtransition classes. Using this model of evolution, a successiveapproximation search was performed to estimate a maximum-likelihood topology (Swofford et al. 1996) using PAUP* version4 (Swofford 2002). Starting parameter values estimated from aneighbor-joining tree were used in an initial maximum-likeli-hood search. Then parameters were re-estimated from the re-sulting tree and the search was repeated with these new param-eters. This procedure was repeated until the resulting tree wasidentical in topology to that from the previous iteration. Non-parametric bootstrap values were obtained by setting parametervalues of the TrNef 1 I 1 G model to values estimated fromthe likelihood tree, then performing 500 replicates of nonpara-metric bootstrapping with random addition of taxa and nearest-neighbor interchange branch swapping.
Preliminary Bayesian analysis of these sequences sug-gested that when a G distribution was used to model among-site rate heterogeneity, the resulting trees have excessivelylong branch lengths (mean substitutions per site ..1), even
though tree topologies and posterior probabilities of brancheswere similar with or without this parameter. For this reason,Bayesian analysis was performed without the G parameterusing the HKY 1 I model of evolution. Three separate Mor-kov Chain Monte Carlo (MCMC) runs were performed start-ing from random trees for each of four simultaneous chains.Runs were five million generations with a burn-in of onemillion generations, default prior distributions for model pa-rameters, and the differential heating parameter set to 0.2.The joint posterior probabilities and parameter estimates ofeach run were congruent, suggesting the chains were run fora sufficient number of generations to adequately sample theposterior probability landscape.
Tests of Alternative Phylogenetic Hypotheses forMitochondrial DNA
Macaca tonkeana west, M. tonkeana east, and M. hecki haveparaphyletic mtDNA; each species carries at least two non-sister mtDNA lineages (see below; Fig. 3). To test whetherthese data are consistent with a hypothesis of mtDNA mono-phyly in each species/population, we used a parametric boot-strap procedure (Hillis et al. 1996; Huelsenbeck et al. 1996;Goldman et al. 2000). We also used a parametric bootstraptest to evaluate the hypotheses of monophyly of all SulawesimtDNA sequences with respect to other silenus groupmtDNA sequences.

1934 BEN J. EVANS ET AL.
FIG. 2. Sampling locations of Sulawesi macaques. M, W, E, O, B, H, C, and N refer to M. maura, M. tonkeana west, M. tonkeana east,M. ochreata, M. brunnescens, M. hecki, M. nigrescens, and M. nigra, respectively. Samples are indicated by field codes listed in theAppendix and in Evans et al. (2001). A total of 25 M. maura samples were obtained from wild-caught animals from two locations (Evanset al. 2001). Dotted lines indicate the approximate location of the border between mtDNA assemblages A and C and between assemblagesD and E in Fig. 3. Additional samples of unknown provenance are listed in the Appendix.
We simulated 100 datasets with Seq-Gen version 1.2.6(Rambaut and Grassly 1997) under a most-parsimonious treeconsistent with the hypothesis of monophyly, using a modelof evolution that was selected with a likelihood-ratio test(GTR 1 I 1 G was selected for each test). Since many equallyparsimonious trees met the constraint, a subset of 5000 treeswas sorted under the JC69 model (Jukes and Cantor 1969)and the most likely tree in this subset was selected for sim-ulation. A P-value was obtained by comparing the observedlength difference of trees constrained and unconstrained forthe null hypothesis to the distribution of length differencesfrom the simulated data.
Nested Clade Analysis of Mitochondrial DNA
We used nested clade analysis (NCA; Templeton et al.1987; Templeton 1998) to test the null hypothesis of no geo-
graphical association among Sulawesi mtDNA sequences andto explain significant associations with hypotheses of geneflow and population history. Nested clade analysis uses in-formation about space (the geographic distribution of hap-lotypes) and time (the hierarchy of nested clades) to testwhether a phylogeographic pattern is consistent with hy-potheses of range fragmentation, isolation by distance, orrange expansion (Templeton 2002).
TCS version 1.13 (Clement et al. 2000) was used to con-struct a statistical parsimony haplotype network amongmtDNA sequences (Templeton et al. 1992). A 95% parsi-monious network linked 67 unique sequences from the Su-lawesi macaques and Bornean M. n. nemestrina but not se-quences from M. fascicularis, M. silenus, or other M. nemes-trina. Only Sulawesi sequences of known provenance wereused in NCA (n 5 139 individuals; 59 unique sequences);
1935DIVERSIFICATION OF SULAWESI MACAQUES
FIG. 3. Maximum-likelihood analysis of mtDNA. Topology of likelihood tree is almost identical to that from the Bayesian analysis.Terminals are labeled with field codes (see Materials and Methods; Fig. 2) of one individual that carries each unique sequence. The totalnumber of individuals that carry each unique sequence is indicated in parentheses if more than one. For Macaca n. nemestrina sequencesfrom Borneo, labels after field codes refer to regions of Borneo, as indicated in Figure 1. Five bold letters refer to mtDNA assemblagesthat were used to compare differentiation of mtDNA and aDNA. Bayesian posterior probabilities (HKY 1 I model) and nonparametricbootstrap values over 50 are above branches.
sequences of Bornean M. n. nemestrina and Sulawesi se-quences of unknown provenance were treated as hypotheticalnodes.
To identify nested clades, sequences that differed by asingle step were clustered in ‘‘one-step’’ clades by starting
at terminal branches and proceeding inwards, then ‘‘two-step’’ clades were grouped, again starting from terminalbranches and treating one-step clades as single entities(Templeton et al. 1987; Templeton and Sing 1993; Tem-pleton 1998). This procedure was repeated until a single

1936 BEN J. EVANS ET AL.
FIG. 4. A 95% statistical parsimony network of Sulawesi macaques and Bornean Macaca n. nemestrina. Numbers refer to field codesin Materials and Methods and Fig. 2. Individuals not used in the NCA analysis are in parentheses. One-step clades are connected bythick lines. Other nesting designs were also examined but these did not radically alter the composition of higher-level nested clades.Species with sequences that are dispersed in the network are indicated as follows: M. tonkeana west sequences have a thick border aroundeach box, M. tonkeana east sequences have a thick border and shading, and M. hecki sequences have shading.
multistep clade encompassed the entire network. For eachhaplotype and nested clade, the average distance from thegeographic center of its distribution (Dc) and the averagedistance from the geographic center of its sister nestedclades (Dn) were calculated in kilometers using Geodis ver-
sion 2.0 (Posada et al. 2000) based on overland distances(5700 measurements between 76 collection localities, Fig.2). For nested clades with significant values, biogeograph-ical interpretations were based on the inference key in Tem-pleton (1998).

1937DIVERSIFICATION OF SULAWESI MACAQUES
Autosomal Microsatellites
Sulawesi individuals were genotyped for eight of the nineautosomal microsatellites used in Evans et al. (2001). At theD12S1075 locus, a nontarget PCR product of length 265 basepairs was present in some individuals; this band was notincluded in the analyses. Alleles at this locus were not suc-cessfully genotyped in four individuals and were coded asmissing data. Locus D17S1290, used in Evans et al. (2001),was not used in this study because artifact bands were presentin some species. Allele size was estimated with Gene Scansoftware (ver 3.1; Applied Biosystems, Foster City, CA). Fortetrameric and dimeric loci, allele sizes were rounded to in-tegers four or two units apart, respectively. Allele sizes atthese loci are listed in Evans et al. (2001) and in the Ap-pendix.
Hardy-Weinberg Equilibrium
Hardy-Weinberg equilibrium (HWE) is an idealized ge-netic condition characterized by the random union of allelesat a neutral locus in an infinitely large population. Testingfor HWE can offer insight into selection, outbreeding, in-breeding, ‘‘null’’ alleles (that cause homozygote excess dueundetected alleles), and the Wahlund effect (homozygote ex-cess due to pooling of genetically subdivided populations).For populations not in HWE, the overall population structurecan be underestimated if alleles that are genotyped are understabilizing selection, or overestimated if these alleles are un-der diversifying selection. We used a Markov chain methodto obtain an unbiased estimate of the probability of HWE ofautosomal microsatellite alleles in each population (Genepop,10000 dememorizations, 1000 batches, and 10000 iterationsper batch; Raymond and Rousset 1995). The sequential Bon-ferroni correction was applied for a posteriori significancetesting (a 5 0.05, k 5 8 tests; Rice 1989).
Population Subdivision of Autosomal Microsatellites
We estimated population subdivision with an unbiased es-timator of FST (Weir and Cockerham 1984) calculated fromautosomal microsatellite allele frequency data. FST evaluatespopulation structure based on variation in allele frequencies(Wright 1965), whereas another estimator, RST, relies on astepwise mutation model of microsatellite evolution to es-timate population structure (Slatkin 1995). We use FST ratherthan RST because the former performs better when samplesizes are small to moderate with low numbers of loci (Gag-giotti et al. 1999).
An exact P-value of the null hypothesis that the FST es-timate is not significantly different from zero was obtainedwith 1000 permutation tests using Arlequin, version 2.0(Schneider et al. 2000) and the sequential Bonferroni cor-rection was applied for a posteriori significance testing (a 50.05, k 5 15 independent tests; Rice 1989).
If variation in mtDNA and aDNA is similarly distributed,population subdivision of aDNA should be small betweengroups with closely related mtDNA lineages and large be-tween groups with distantly related mtDNA lineages. To testthis, we estimated intraspecific and interspecific genetic dif-ferentiation based on FST of aDNA between populations
grouped by mtDNA sequence assemblages (Fig. 3). In M.tonkeana east, intraspecific subdivision was evaluated be-tween 11 individuals carrying mtDNA clade A and sevenindividuals carrying mtDNA clade C (Fig. 3). In M. hecki,intraspecific subdivision was evaluated between 18 individ-uals carrying mtDNA from clade D and nine individuals car-rying mtDNA from assemblage E (Fig. 3). This test was notpossible for intraspecific comparisons within M. tonkeanawest because almost all individuals (n 5 22) in this popu-lation have mtDNA in clade B; paraphyly in this populationis due to a sequence carried by only one individual (individualPM514; Fig 3). Interspecific population subdivision was eval-uated by comparing populations with closely related mtDNA;individuals carrying mtDNA from clade A were comparedto those with B and individuals carrying mtDNA from cladeC were compared to those with D.
Analysis of Molecular Variance
To directly compare the distribution of molecular variationin mtDNA and aDNA at different population hierarchies, weperformed analysis of molecular variance (AMOVA; Excof-fier et al. 1992) on each dataset using Arlequin version 2.0(Schneider et al. 2000). Two hierarchies (A and B) weretested; Hierarchy A is based on the mtDNA phylogeny andHierarchy B is based on differentiation of aDNA.
In Hierarchy A, populations were defined on the basis ofgroups of mitochondrial DNA sequences as depicted in Fig.3. Thus there were two populations in M. hecki, two in M.tonkeana east, and one population in M. nigra, M. nigrescens,M. tonkeana west, M. ochreata, M. brunnescens, and M. mau-ra. Species sensu Fooden (1969) define the next hierarchy,‘‘groups’’, except that M. tonkeana was split into a west andan east population following Evans et al. (2001). In HierarchyB, species defined the first hierarchy, and species with un-differentiated aDNA were united into groups for the nexthierarchy (see below; Table 1); M. nigra and M. nigrescensform a group and M. tonkeana west and M. ochreata formeda group. In both hierarchies, pairwise differences among se-quences were used for AMOVA analysis of mtDNA and FSTwas used for AMOVA analysis of aDNA microsatellite ge-notypes. Because AMOVA analysis of mtDNA under Hier-archy B produced a negative (nonsignificant) among-groupvariance component, these data were reanalyzed without thegroup hierarchy (P. Smouse, pers. comm.).
RESULTS
Mitochondrial DNA Phylogeny
A total of 74 unique mtDNA sequences were identified.The topologies of maximum-likelihood and Bayesian anal-yses were almost identical; all clades in a 50% consensusBayesian tree were also in the likelihood topology. Theseanalyses suggest that mtDNA of M. nemestrina is polyphy-letic, although sequences from Borneo are monophyletic, andsequences from Sulawesi are paraphyletic with respect tosequences from Bornean M. n. nemestrina (Fig. 3).
Both likelihood and Bayesian analyses fail to recover phy-logenies that resolve basal relationships among the Sulawesimacaques with high confidence. Sequences in M. hecki, M.

1938 BEN J. EVANS ET AL.
TABLE 1. Pairwise FST among species of Sulawesi macaque. All FST-values are significant before sequential Bonferroni correction (a5 0.05, k 5 28 tests) except where indicated with an asterisk, and after Bonferroni correction except where indicated (†). In pairwisecomparisons with Macaca maura, estimates from all loci are on the left and estimates excluding locus D22S345 are on the right.
M. mauraM. tonkeana
westM. tonkeana
east M. ochreata M. brunnescens M. hecki M. nigrescens M. nigra
M. mauraM. tonkeana westM. tonkeana eastM. ochreataM. brunnescensM. heckiM. nigrescensM. nigra
—0.1286/0.05030.1508/0.06830.1289/0.05330.1323/0.04800.1526/0.06030.1502/0.07020.1394/0.0491
—0.05550.01218*†0.05080.03830.02800.0262
—0.04860.07940.05880.05200.0662
—0.03320.05370.04800.0397
0.08610.06280.0525
—0.03790.0421
—0.02239† —
tonkeana east, and M. tonkeana west are paraphyletic, as re-ported in Evans et al. (1999), and all 13 individuals of M.nigrescens have an identical sequence (Fig. 3). In M. hecki,a paraphyletic assemblage of sequences is restricted to thesouthern portion of the distribution of this species and aseparate clade of sequences in this species exists in the north-ern part of its distribution. In M. tonkeana east, clades arealso geographically structured. All individuals except PM538that carry mtDNA from clade C are from the extreme easterntip of central Sulawesi (east of the city of Luwuk) and allindividuals except PM547 that carry mtDNA from clade Aare from the area west of Luwuk but east of the Bongka River(Figs. 2, 3). This result is geographically expected in thatclade A is sister to clade B of the parapatric population ofM. tonkeana west, but is surprising in that clade C is sisterto clade D of northern M. hecki, a geographically distantpopulation (Figs. 2, 3).
Sequences of M. ochreata and M. brunnescens are mono-phyletic with respect to other Sulawesi macaques, but notreciprocally monophyletic with respect to each other. One M.ochreata individual, PM701, had a mtDNA sequence that wasidentical to three individuals of M. brunnescens but this in-dividual was of ambiguous provenance and may actually bea representative of M. brunnescens. Weak support exists formonophyly of M. nigra mtDNA, whereas Evans et. al. (1999)concluded that this taxon has paraphyletic mtDNA.
Tests of Phylogenetic Hypotheses
When mtDNA sequences of M. hecki, M. tonkeana east, orM. tonkeana west are constrained to be monophyletic, themost-parsimonious trees are two, four, and four steps longer,respectively, than the unconstrained tree length of 188 steps.The hypothesis of monophyly is rejected by a parametricbootstrap test of the latter two constrained topologies (P ,0.01; P , 0.01, respectively) but is equivocal or not signif-icant (Rice 1989) when M. hecki sequences are constrainedto be a clade (P 5 0.05).
When mtDNA sequences from Sulawesi are constrained tobe a clade, the resulting trees are only one step longer thanthe unconstrained trees and monophyly of Sulawesi 12SmtDNA sequences is not rejected (P 5 0.42). Phylogeneticanalyses of sequences in Evans et al. (1999) from the ND3,ND4L, and ND4 genes also suggest Sulawesi mtDNA is para-phyletic, although this relationship was not well supportedby nonparametric bootstrap values. When those data were
constrained to include Sulawesi monophyly, the most par-simonious tree was 19 steps longer (Evans et al. 1999). Aparametric bootstrap test with the ND3, ND4, and ND4L datarejects the hypothesis of Sulawesi mtDNA monophyly (P 50.00). Thus, although phylogenetic analyses of both datasetssuggest paraphyly of Sulawesi mtDNA with respect to Bor-nean M. n. nemestrina, parametric bootstrap tests differ onwhether these sequences reject the hypothesis of monophylyof Sulawesi macaque mtDNA.
Nested Clade Analysis of Mitochondrial DNA
Sequences from Bornean M. n. nemestrina, M. nigra, M.nigrescens, M. maura, and M. ochreata are clustered intoconspecific groups in a haplotype network (Fig. 4). However,sequences of M. tonkeana west, M. tonkeana east, M. hecki,and M. brunnescens are dispersed in the network (Fig. 4, 5).A five-step clade encompasses the entire network. Sequencesfrom M. ochreata, M. tonkeana west, M. tonkeana east, andM. hecki are spread among multiple four-step clades, whereassequences from the other species are not.
Nested clade analysis of these sequences recovered sig-nificant deviations from the null hypothesis of no geographicstructure in six nested clades, one of which includes the totalnetwork (comprehensive statistical results of this analysis areavailable from B. J. Evans; Fig. 5). A three-step clade thatincludes all M. maura sequences and two M. ochreata se-quences is consistent with range fragmentation. All othersignificant deviations suggest isolation by distance (IBD),range expansion, or long distance dispersal. A two-step cladethat includes some M. tonkeana west sequences and a two-step clade that includes some M. ochreata sequences andsome M. brunnescens sequences are each consistent with IBD.A three-step clade that includes most sequences from M.tonkeana west and some from M. tonkeana east is consistentwith IBD with some long distance dispersal. A four-step cladethat includes most sequences from M. tonkeana west, somefrom M. tonkeana east, and all from M. nigra is consistentwith contiguous range expansion. The total cladogram of allSulawesi mtDNA sequences is consistent with IBD (Fig. 5).
Hardy-Weinberg Equilibrium
Tests for HWE suggest that locus D22S345 has significantdeficiency of heterozygotes in M. hecki (P 5 0.0011, k 5 8tests, FIS 5 0.323) and locus D4S243 has a deficiency of

1939DIVERSIFICATION OF SULAWESI MACAQUES
FIG. 5. Nested clades and phylogeographic inferences from nested clade analysis. Species designations are abbreviated as in Fig. 2with R referring to Bornean M. n. nemestrina sequences. Only nested clades with significant inferences are shown. The number of eachclade refers to the nesting hierarchy, a dash, and an arbitrary clade number. Inferences are indicated with abbreviations: IBD, isolationby distance; FR, fragmentation; LDD, long-distance dispersal; CRE, contiguous range expansion. The insert depicts a simplified topologyand species in the total cladogram that includes six four-step clades.
heterozygotes in M. brunnescens (P 5 0.0042, k 5 8 tests,FIS 5 0.404). To test the impact of deleting these loci onestimates of population structure, FST was recalculated witheach of these loci excluded from the data. When locusD4S243 is deleted, pairwise FST estimates between M. brun-nescens and other species are similar, and differ by an averageof 0.006. When locus D22S345 is deleted, only the compar-ison between M. maura and M. hecki differs substantially;other comparisons were similar and differ by an average of
20.018. However, M. maura is fixed for a single private alleleat locus D22S345; when this locus is excluded, FST betweenM. maura and all other populations is approximately half thatcalculated when this locus is included (Table 1). Thus, a largeimpact of this locus on FST estimates between M. hecki andM. maura is due to a lack of polymorphism in M. maura atlocus D22S345, and not to the deviation from HWE expec-tations at this locus in M. hecki (Table 1).
We do not know what caused deviations from HWE among

1940 BEN J. EVANS ET AL.
TABLE 2. Analysis of molecular variance of mitochondrial and autosomal DNA under Hierarchies A and B (see text for description).P is the probability of having a more extreme variance component and f-statistic than observed by chance alone. Significant f-statisticsare indicated with an asterisk. Negative among-group variance components are indicated with ns (not significant).
Hierarchy AVariance
components % total f-statistics P
mtDNAAmong groupsAmong populations within groupsWithin populations
0.011964.389121.34686
0.2176.3623.43
fCT 5 0.00208fSC 5 0.76519*fST 5 0.76568*
0.49658,0.00001,0.00001
aDNAAmong groupsAmong populations within groupsWithin populations
0.250590.007433.09313
7.480.22
92.3
fCT 5 0.07478*fSC 5 0.00240*fST 5 0.07700*
,0.00001,0.00001,0.00001
Hierarchy BVariance
components % total f-statistics P
mtDNAAmong groupsAmong populations within groupsWithin populations
ns3.789691.96908
ns65.8134.19
ns—
fST 5 0.658071
ns—
,0.00001
aDNAAmong groupsAmong populations within groupsWithin populations
0.214330.055673.09416
6.371.65
91.97
fCT 5 0.06371*fSC 5 0.01768*fST 5 0.08026*
0.00978,0.00001,0.00001
1 Because the among-group variance component is negative, data were reanalyzed without the group hierarchy.
some loci in some populations. Tests of intraspecific popu-lation structure in M. hecki do not show evidence of subdi-vision (see below), suggesting that the Wahlund effect is notthe source of homozygote excess in this species. Macacahecki individuals from the southern part of its distributionalso have significant homozygote excess (P 5 0.0045, FIS 50.489) raising the possibility that there are null alleles in thispopulation or that there is selection against some allelic com-binations.
Since the exclusion of loci not in HWE has a negligibleimpact on estimates of population structure, we use the com-plete dataset to estimate population subdivision between pop-ulations.
Population Subdivision of Autosomal DNA
In pairwise comparisons between species before Bonfer-roni correction, FST between all populations is significantexcept the comparison between M. tonkeana and M. ochreata(Table 1; P 5 0.0831). After Bonferroni correction (k 5 28tests) FST between M. nigra and M. nigrescens is also notsignificantly different from zero (Table 1; P 5 0.0283).
Intraspecific subdivision between aDNA of two pairs ofpopulations with paraphyletic mtDNA is not significant:within M. tonkeana east, FST between populations A and C(Fig. 3) is equal to 0.0069 (P 5 0.39) and within M. hecki,FST between populations D and E (Fig. 3) is equal to 20.001(P 5 0.49). In contrast, interspecific subdivision betweenaDNA of two pairs of populations with monophyletic mtDNAis significant: FST between part of M. tonkeana east and thenorthern population of M. hecki, populations C and D (Fig.3), is significant (FST 5 0.055, P 5 0.000) and FST betweenM. tonkeana east individuals from population A and M. ton-keana west from population B (Fig. 3) is significant (FST 50.048, P 5 0.000).
Analysis of Molecular Variance
Analysis of molecular variance of mtDNA and aDNA sug-gests that molecular variation is differently partitioned ineach genome in both hierarchies we tested (Table 2). In bothhierarchies, most (66 or 76%) molecular variation in mtDNAis among populations within groups (species), whereas inaDNA only a small amount (about 1 or 2%) is among pop-ulations within groups. In both hierarchies, much more var-iation is within populations in aDNA (about 92%) comparedto mtDNA (23 or 34%). The total variation that is partitionedamong species is not significantly different from a randomdistribution in mtDNA in both hierarchies, but is significantlynonrandom and accounts for about 7% of variation in aDNA(Table 2).
DISCUSSION
Mitochondrial DNA Evolution in Silenus Group Macaques
Mitochondrial DNA relationships suggest an ancestor ofall silenus group macaques was initially distributed on Su-matra and Borneo prior to dispersal to the Mentawai Islands,the Western Ghats, and Sulawesi (Figs. 3, 6; Tosi et al. 2003).During periods of low sea level associated with glaciations,the Sunda Region (Borneo, Sumatra, Java, Peninsular Ma-laysia) was a large peninsula that extended southeast fromAsia (Fig. 1; Kloss 1929; Heaney 1986). An ephemeral landbridge connected the Mentawai Islands to Sumatra (Voris2000) and could have provided a corridor for dispersal of anancestor of M. n. pagensis. An ancestor of M. silenus wasprobably isolated from other silenus group macaques by acontraction of suitable habitat for this group (Fooden 1975).
Founder effects and bottlenecks affect populations withsmall Ne more severely than those with large Ne. This couldhave facilitated differentiation of M. n. pagensis, M. silenus,
1941DIVERSIFICATION OF SULAWESI MACAQUES
FIG. 6. Hypothesized evolution of silenus group mtDNA andaDNA. (A) The mtDNA phylogeny suggests that the silenus groupancestor originated in the Sunda Region. Cladogenesis gave rise tolineage 1 in the west and lineage 2 in the east. (B) Range expansionthrough mainland Asia, the Mentawai Islands, and Sulawesi wasassociated with further diversification of these lineages (1a and 1b,2a and 2b). Lines indicate sites of three early vicariance events inthe silenus group and an arrow represents possible male-mediatedgene flow of aDNA that homogenized morphology without affectingmtDNA phylogeography. (C) Current distribution of silenus groupspecies (sensu Delson 1980) and simplified mtDNA relationshipsthat resulted from additional vicariance between Macaca silenusand M. n. leonina and M. n. pagensis and Sumatran M. n. nemestrina.
and the Sulawesi macaques in small isolated habitats whilecomparatively large populations on Sumatra and Borneo re-mained undifferentiated. Gene flow via male migration acrossthe Sunda Peninsula when it was land positive also couldhave homogenized variation in nuclear DNA and morphologyin ancestors of M. n. nemestrina on Sumatra and Borneowithout altering mtDNA phylogeography (Fig. 6). In fact,nuclear DNA in M. n. nemestrina from Borneo and Sumatramay actually be more closely related than the mtDNA phy-logeny would suggest (Tosi et al. 2003). The mtDNA phy-logeny (Fig. 3, 6) is not suggestive of cladogenesis of M.silenus before differentiation of M. nemestrina subspecies assuggested by others (Abegg and Thierry 2002). However, itis possible that nuclear DNA relationships conflict with themtDNA genealogy, as they do in the Sulawesi macaques.
Sulawesi mtDNA sequences appear to be paraphyletic withrespect to M. n. nemestrina from Borneo although the hy-pothesis of monophyly of these sequences is not rejected bythe 12S mtDNA sequences. Paraphyly of Sulawesi mtDNAhas been previously reported, and a parametric bootstrap testof the ND3, ND4L, and ND4 dataset of Evans et al. (1999)rejects the hypothesis of monophyly. One explanation formtDNA paraphyly is that macaques dispersed to Sulawesimore than once (Takenaka et al. 1987; Evans et al. 1999).However, mtDNA paraphyly could also stem from coloni-zation of Sulawesi by an ancestor with polymorphic mtDNA(Evans et al. 1999). Other studies of aDNA and yDNA sup-port monophyly of the Sulawesi macaques (Tosi et al. 2000;Deinard and Glen Smith 2001; Tosi et al. 2003). For thisreason, it seems possible that the Sulawesi macaques may bea monophyletic lineage even though they carry a paraphyleticassemblage of mtDNA.
Sulawesi Macaque Mitochondrial DNA
Mitochondrial DNA sequences of M. hecki, M. tonkeanaeast, and M. tonkeana west are paraphyletic (Fig. 3). Theserelationships are similar to results from other mtDNA studies(Evans et al. 1999; Tosi et al. 2003) and are supported byparametric bootstrap tests. Although multiple lines of evi-dence suggest that Sulawesi was fragmented at or near thesites of macaque contact zones (Hall 2001; Whitten et al.2002; Evans et al. 2003a), most significant intraspecific, in-terspecific, and entire island phylogeographic patterns of Su-lawesi macaque mtDNA are congruent with a pattern of iso-lation by distance with some range expansion. Of the sixnested clades with significant inferences, five cross at leastone macaque contact zone. However, NCA recovered evi-dence of fragmentation in only one nested clade that includessequences of M. maura and some M. ochreata. The TempeDepression, which lies between the ranges of these species,is known to have been underwater in the recent past (Hall2001; Whitten et al. 2002) and a sharp transition of macaquemtDNA sequences exists across this region (Evans et al.2001).
One explanation for the results of NCA is that this analysisfailed to detect signs of fragmentation at most contact zoneseven though they are in fact present. Indeed, some aspectsof macaque mtDNA phylogeography do suggest fragmenta-tion. For example, boundaries of many mtDNA clades cor-

1942 BEN J. EVANS ET AL.
respond with macaque contact zones that coincide with pu-tative sites of fragmentation in other taxa (Evans et al. 2003a).Another explanation for NCA results is that a stochastic pat-tern generated by incomplete lineage sorting has been erro-neously interpreted as a deterministic outcome of a phylo-geographic process, such as isolation by distance (Knowlesand Maddison 2002). In general, however, these results sug-gest that the molecular signatures of fragmentation at mostcontact zones are subtle in Sulawesi macaque mtDNA, if theyexist at all.
Analysis of molecular variance of mtDNA suggests thatvariation across Sulawesi macaque contact zones (amonggroups) does not significantly deviate from random expec-tations. Instead, most mtDNA variation is distributed as dif-ferences among populations within species or, to a lesserextent, within populations (Table 2). Divergent, nonsistermtDNA lineages are present in populations with low or non-significant differentiation of aDNA. In Hierarchy A this isthe case in populations of M. hecki and M. tonkeana east andin Hierarchy B divergent mtDNA lineages are present in M.nigra and M. nigrescens and in M. tonkeana west and M.ochreata.
Sulawesi Macaque Autosomal DNA
In M. hecki and M. tonkeana east, intraspecific subdivisionof aDNA is not significant between populations grouped bymtDNA assemblages (Fig. 3). In contrast, interspecific sub-division of aDNA is significant in most comparisons, evenwhen these comparisons are between species with closelyrelated mtDNA. Similarly, within the range of each macaquespecies, morphology is not differentiated, but on either sideof contact zones morphology changes abruptly (Groves 1980;Ciani et al. 1989; Watanabe and Matsumura 1991; Watanabeet al. 1991a,b; Bynum et al. 1997). Most molecular variationin aDNA is either within populations or among species (Table2). Only a small component of variation in aDNA is amongpopulations as defined by mtDNA assemblages (Table 2).This is not to suggest that intraspecific relationships amongaDNA are necessarily monophyletic or that isolation by dis-tance does not influence the geographic structure in aDNA.However, it does suggest that past fragmentation at Sulawesimacaque contact zones had a significant impact on the dis-tribution of molecular variation in aDNA and that the dis-tribution of molecular variation in aDNA differs substantiallyfrom the distribution of molecular variation in mtDNA.
Decoupled Evolution of Mitochondrial and Autosomal DNA
In a social system with female philopatry, male dispersal,and high variance in reproductive success in males, the Ne
of mtDNA can be larger than that of aDNA or yDNA (Chesserand Baker 1996), thereby increasing the probability of an-cestral polymorphism in mtDNA relative to that probabilityin aDNA or yDNA. Additionally, the probability of paraphylyis greatest early in the origin of a species (Neigel and Avise1986). Thus, in macaques, paraphyly may be more likely inmtDNA than aDNA or yDNA, and also more likely in a youngthan an old species.
Strict female philopatry can geographically anchor mtDNAlineages without a pronounced effect on gene flow of aDNA.
In M. n. nemestrina, for example, ancestral routes of femaledispersal probably differed from modern routes of male-me-diated gene flow of aDNA, and the genealogy of mtDNAdoes not reflect modern genetic affinities in nuclear DNA(Tosi et al. 2003). In Sulawesi macaques, range fragmentationand female philopatry both impede gene flow of mtDNA,whereas range fragmentation and male dispersal have op-posite effects on gene flow of aDNA. This causes the impactof range fragmentation to be more pronounced in aDNA andmorphology than in mtDNA in these animals.
Empirical examples of differing relationships among ma-caque mtDNA and nuclear DNA have been reported. In Ma-caca mulatta, mtDNA sequences from eastern Asia are moreclosely related to the eastern island species M. fuscata (Japan)and M. cyclopis (Taiwan) than to conspecific M. mulatta se-quences from western Asia (Melnick et al. 1993). Y-chro-mosome DNA of M. mulatta is monophyletic with respect toM. fuscata and M. cyclopis (Tosi et al. 2000), suggestingcohesiveness of this species is maintained by male migration.In M. arctoides, conflicting phylogenetic relationships amongmtDNA and yDNA suggest a possible hybrid origin of thisspecies from a cross between M. fascicularis and an ancestorof M. assemensis and M. thibetana (Tosi et al. 2000). In M.maura, divergent mtDNA clades are fixed in nearby popu-lations but autosomal loci are not significantly differentiated(Evans et al. 2001).
Sulawesi Biogeography
If all macaque species on Sulawesi were completely iso-lated for the same duration of time, since the effect of driftis most powerful in small populations, one would expectspecies with small Ne to be most divergent from one another.However, two species with small census estimates (Bynumet al. 1999), M. nigra and M. nigrescens, are morphologicallymore similar to one another than to other species (Fooden1969; Albrecht 1978) and their aDNA is not significantlydifferentiated (Table 1). This suggests that vicariance at eachmacaque contact zone was not of equal magnitude; isolationof M. nigrescens from M. nigra was of shorter duration and/or of higher genetic permeability. That M. tonkeana west andM. ochreata are not significantly differentiated could be dueto a smaller impact of genetic drift on these comparativelylarge populations (Bynum et al. 1999) and/or vicariance ofshorter duration or higher genetic permeability.
Other animals also show a lower level of molecular dif-ferentiation on either side of the M. nigra-M. nigrescens con-tact zone than across other contact zones. Toads (Bufo ce-lebensis) and at least three species of fanged frogs (Limno-nectes) have endemic mtDNA lineages in each of the rangesof these species that are not as divergent from one anotheras are comparisons between lineages that exist in the rangesof other macaque species (Evans et al. 2003). Calls of tarsiersare similar in the ranges of M. nigra and M. nigrescens, butdifferent from those in other macaque ranges (Shekelle et al.1997). Flying lizards (Draco) are also less differentiatedacross the M. nigra-M. nigrescens contact zone than acrossother macaque hybrid zones (McGuire 2002).

1943DIVERSIFICATION OF SULAWESI MACAQUES
Conclusions
Sex-specific differences in dispersal, reproduction, and lon-gevity are expected to differently affect the Ne of genetic el-ements depending on their mode of inheritance. Animals withstrict female philopatry and obligate male dispersal offer anempirical test of these expectations since the probability ofancestral polymorphism in mtDNA increases with an increas-ing Ne of this genome. Indeed, mtDNA is polyphyletic amongthe Sulawesi macaques and other silenus group species andsubspecies. Additionally, in the Sulawesi macaques the geneticsignature of fragmentation is less apparent in mtDNA than inaDNA, and divergent paraphyletic mtDNA lineages are carriedby at least three species even though these species have littleor no intraspecific differentiation. The differential impact ofthe macaque social system on mtDNA genealogy and aDNApopulation structure underscores the general utility of usinginformation from multiple genomes in studies of evolutionarygenetics (Avise and Ball 1990).
ACKNOWLEDGMENTS
We thank M. I. Setiadi, S. M. Lesono, H. Liu, and G.Prabowo for field assistance, and the Indonesian Institute forSciences (LIPI) and the Department of Forestry for permis-sion and permits for research in Indonesia. We acknowledgethe National Zoo in Washington, D. C., the Dusit Zoo inBangkok, Thailand, the Bukittinggi Zoo in Indonesia and Dr.W. P. J. Dittus for providing genetic samples. We thank D.Cannatella, L. Excoffier, M. Kirkpatrick, J. C. Morales, D.Posada, H. Prohl, P. Smouse, A. Templeton, A. Tosi, D.Zwickl, and anonymous reviewers for helpful comments, andD. Zwickl for assistance with analysis. This research wasfunded by grants from the Wenner-Gren Foundation, the Cen-ter for Environmental Research and Conservation, the Centerfor Applied Biodiversity Science at Conservation Interna-tional, and the National Science Foundation.
LITERATURE CITED
Abegg, C., and B. Thierry. 2002. Macaque evolution and dispersalin insular south-east Asia. Biol. J. Linn. Soc. 75:555–576.
Akaike, H. 1974. A new look at the statistical model identification.IEEE Trans. Autom. Contr. 19:716–723.
Albrecht, G. H. 1978. The craniofacial morphology of the Sulawesimacaques, multivariate approaches to biological problems. Pp.1–151 in F. S. Szalay, ed. Contributions to primatology. Karger,Basel, Switzerland.
Avise, J. C., and R. M. Ball. 1990. Principles of genealogical con-cordance in species concepts and biological taxonomy. Oxf.Surv. Evol. Biol. 7:45–67.
Bergman, S. C., D. Q. Coffield, J. P. Talbot, and R. A. Garrard.1996. Tertiary tectonic and magmatic evolution of western Su-lawesi and the Makassar Strait: evidence for a Miocene conti-nent-continent collision. Pp. 391–429 in R. Hall and D. Blundell,eds. Tectonic evolution of Southeast Asia. Geological Society,London.
Bernstein, I., and T. Gordon. 1980. Mixed taxa introductions, hy-brids, and macaque systematics. Pp. 125–147 in D. G. Lindburg,ed. The macaques: studies in ecology, behavior and evolution.Van Nostrand Reinhold Co., New York.
Birky, C. W. 1991. Evolution and population genetics of organellegenes: mechanisms and models. Pp. 112–134 in R. K. Selander,A. G. Clark, and T. S. Whittam, eds. Evolution at the molecularlevel. Sinauer, Sunderland, MA.
Buttikofer, J. 1917. Die kurzschwanz affen von celebes. Zool. Med-ed. (Leiden) 3:1–86.
Bynum, E. L., D. Z. Bynum, and J. Supriatna. 1997. Confirmationand location of the hybrid zone between wild populations of
Macaca tonkeana and Macaca hecki in Central Sulawesi, In-donesia. Am. J. Primatol. 43:181–209.
Bynum, E. L., A. K. Kohlhass, and A. H. Pramono. 1999. Conser-vation status of Sulawesi macaques. Trop. Biodiv. 6:123–144.
Chesser, R. K., and R. J. Baker. 1996. Effective sizes and dynamicsof uniparentally and diparentally inherited genes. Genetics 144:1225–1235.
Ciani, A., R. Stanton, W. Scheffrahn, and B. Sampurno. 1989. Ev-idence of gene flow between Sulawesi macaques. Am. J. Pri-matol. 17:257–270.
Clement, M., D. Posada, and K. A. Crandall. 2000. TCS: a computerprogram to estimate gene genealogies. Mol. Ecol. 9:257–270.
de Ruiter, J. R., W. Scheffrahn, G. J. J. M. Trommelen, A. G.Uitterlinden, R. D. Martin, and J. A. R. A. M. Van Hoof. 1992.Male social rank and reproductive success in wild long-tailedmacaques. Pp. 175–191 in R. D. Martin, A. F. Dixon, and E. J.Wickings, eds. Paternity in primates: genetic tests and theories.Karger, Basel, Switzerland.
Deinard, A., and D. Glen Smith. 2001. Phylogenetic relationshipsamong the macaques: evidence from the nuclear locus NRAMP1.J. Hum. Evol. 41:45–59.
Delson, E. 1980. Fossil macaques, phyletic relationships and a sce-nario of development. Pp. 10–30 in D. G. Lindburg, ed. Themacaques: studies in ecology, behavior, and evolution. Van Nos-trand Reinhold, New York.
Dittus, W. 1975. Population dynamics of the toque macaque, Ma-caca sinica. Pp. 125–152 in R. H. Tuttle, ed. Socioecology andpsychology of primates. Mounton, The Hague, The Netherlands.
Evans, B. J., J. C. Morales, J. Supriatna, and D. J. Melnick. 1999.Origin of the Sulawesi macaques (Cercopithecidae, Macaca) asinferred from a mitochondrial DNA phylogeny. Biol. J. Linn.Soc. 66:539–560.
Evans, B. J., J. Supriatna, and D. J. Melnick. 2001. Hybridizationand population genetics of two macaque species in Sulawesi,Indonesia. Evolution 55:1686–1702.
Evans, B. J., J. Supriatna, N. Andayani, M. I. Setiadi, D. C. Can-natella, and D. J. Melnick. 2003. Monkeys and toads define areasof endemism on Sulawesi. Evolution 57:1436–1443.
Evans, B. J., R. M. Brown, J. A. McGuire, J. Supriatna, N. An-dayani, A. Diesmos, D. T. Iskandar, D. J. Melnick, and D. C.Cannatella. 2003. Phylogenetics of fanged frogs (Anura; Rani-dae; Limnonectes): testing biogeographical hypotheses at theAsian–Australian faunal zone interface. Syst. Biol. In press.
Excoffier, L., P. E. Smouse, and J. M. Quattro. 1992. Analysis ofmolecular variance inferred from metric distances among DNAhaplotypes: application to human mitochondrial DNA restrictiondata. Genetics 131:479–491.
Fooden, J. 1969. Taxonomy and evolution of the monkeys of Cel-ebes (Primates: Cercopithecidae). S. Karger, Basel, Switzerland.
———. 1975. Taxonomy and evolution of liontail and pigtail ma-caques (Primates: Cercopithecidae). Fieldiana Zool. 67:1–169.
———. 1976. Provisional classification and key to the living spe-cies of macaques (Primates: Macaca). Folia Primatol. 25:225–236.
Gaggiotti, O. E., O. Lange, K. Rassman, and C. Gliddon. 1999. Acomparison of two indirect methods for estimating average lev-els of gene flow using microsatellite data. Mol. Ecol. 8:1513–1520.
Goldman, N. 1993. Statistical tests of models of DNA substitution.J. Mol. Evol. 36:182–198.
Goldman, N., J. P. Anderson, and A. G. Rodrigo. 2000. Likelihood-based tests of topologies in phylogenetics. Syst. Biol. 49:652–670.
Groves, C. P. 1980. Speciation in Macaca: the view from Sulawesi.Pp. 84–124 in D. G. Lindburg, ed. The macaques: studies inecology, behavior, and evolution. Van Nostrand Reinhold Co.,New York.
Hall, R. 1996. Reconstructing Cenozoic SE Asia. Pp. 153–184 inR. Hall and D. Blundell, eds. Tectonic evolution of SoutheastAsia. Geological Society of London Special Publication no. 106.
———. 1998. The plate tectonics of Cenozoic SE Asia and thedistribution of land and sea. Pp. 99–131 in R. Hall and D. J.Holloway, eds. Biogeography and geological evolution of South-east Asia. Backhuys Publishers, Leiden, The Netherlands.
———. 2001. Cenozoic reconstructions of SE Asia and the SWPacific: changing patterns of land and sea. Pp. 35–56 in I. Met-calfe, J. Smith, M. Morwood, and I. Davidson, eds. Faunal and

1944 BEN J. EVANS ET AL.
floral migrations and evolution in SE Asia-Australia. Swets andZeitlinger Publishers, Lisse, The Netherlands.
Heaney, L. R. 1986. Biogeography of mammals in SE Asia: esti-mates of rates of colonization, extinction, and speciation. Biol.J. Linn. Soc. 28:127–165.
Hillis, D. M., B. K. Mable, and C. Moritz. 1996. Applications ofmolecular systematics: the state of the field and a look to thefuture. Pp. 515–543 in D. M. Hillis, C. Moritz, and B. K. Mable,eds. Molecular systematics. Sinauer, Sunderland, MA.
Hoelzer, G. A. 1997. Inferring phylogenies from mtDNA variation:mitochondrial-gene trees versus nuclear-gene trees revisited.Evolution 51:622–626.
Hoelzer, G. A., W. Dittus, M. V. Ashley, and D. J. Melnick. 1994.The local distribution of highly divergent mitochondrial DNAhaplotypes in toque macaques (Macaca sinica) at Polonnaruwa,Sri Lanka. Mol. Ecol. 3:451–458.
Hoelzer, G. A., J. Wallman, and D. J. Melnick. 1998. The effectsof social structure, geographical structure, and population sizeon the evolution of mitochondrial DNA: II. Molecular clocksand the lineage sorting period. J. Mol. Evol. 47:21–31.
Huelsenbeck, J. P., D. M. Hillis, and R. Jones. 1996. Parametricbootstrapping in molecular phylogenetics: applications and per-formance. Pp. 19–45 in J. D. Ferraris and S. R. Palumbi, eds.Molecular zoology: advances, strategies, and protocols. Wiley-Liss, New York.
Jukes, T. H., and C. R. Cantor. 1969. Evolution of protein mole-cules. Pp. 21–123 in H. N. Munro, ed. Mammalian protein me-tabolism. Academic Press, New York.
Kloss, C. B. 1929. The zoo-geographical boundaries between Asianand Australia and some oriental sub-regions. Bull. Raffles Mus.2:1–10.
Knowles, L. L., and W. P. Maddison. 2002. Statistical phylogeog-raphy. Mol. Ecol. 11:2623–2635.
McGuire, J. A. 2002. Bayesian phylogenetics and biogeography ofthe Dracolineatus group. P. 212 in Program book and abstractsof the joint meeting of ichythologists and herpetologists, 3–8July, Kansas City, KS.
Melnick, D. J. 1988. The genetic structure of a primate species:rhesus and other cercopithecine monkeys. Int. J. Primatol. 9:195–231.
Melnick, D. J., and G. A. Hoelzer. 1992. Differences in male andfemale macaque dispersal lead to contrasting distributions ofnuclear and mitochondrial DNA variation. Int. J. Primatol. 13:379–393.
Melnick, D. J., and M. C. Pearl. 1987. Cercopithecines in multimalegroups: genetic diversity and population structure. Pp. 121–134in D. L. C. B. B. Smuts, R. M. Seyfarth, R. W. Wrangham, andT. T. Struhsaker, ed. Primate societies. Univ. of Chicago Press,Chicago, IL.
Melnick, D. J., G. A. Hoelzer, R. Absher, and M. V. Ashley. 1993.MtDNA diversity in rhesus monkeys reveals overestimates ofdivergence time and paraphyly with neighboring species. Mol.Biol. Evol. 10:282–295.
Neigel, J. E., and J. C. Avise. 1986. Phylogenetic relationships ofmitochondrial DNA under various demographic models of spe-ciation. Pp. 515–534 in E. Nevo and S. Karlin, eds. Evolutionaryprocesses and theory. Academic Press, New York.
Palumbi, S. R., and F. Cipriano. 1998. Species identification usinggenetic tools: the value of nuclear and mitochondrial gene se-quences in whale conservation. J. Hered. 89:459–464.
Posada, D., and K. A. Crandall. 1998. Modeltest: testing the modelof DNA substitution. Bioinformatics 14:817–818.
Posada, D., K. A. Crandall, and A. R. Templeton. 2000. Geodis: Aprogram for the cladistic nested analysis of the geographicaldistribution of genetic haplotypes. Mol. Ecol. 9:487–488.
Rambaut, A., and N. C. Grassly. 1997. Seq-Gen: an application forthe Monte Carlo simulation of DNA sequence evolution alongphylogenetic trees. Comput. Appl. Biosci. 13:235–238.
Raymond, M., and F. Rousset. 1995. Genepop program, version3.1b: a population genetics software for exact tests and ecu-menicism. J. Hered. 86:248–249.
Rice, W. R. 1989. Analyzing tables of statistical tests. Evolution43:223–225.
Schneider, S., D. Roessli, and L. Excoffier. 2000. Arlequin: A soft-
ware for population genetics data analysis. University of Geneva,Geneva.
Shekelle, M., S. M. Leksono, L. L. S. Ichwan, and Y. Masala. 1997.The natural history of the tarsiers of North and Central Sulawesi.Sulawesi Primate Newsletter 4:3–8.
Slatkin, M. 1995. A measure of population subdivision based onmicrosatellite allele frequencies. Genetics 139:457–462.
Swofford, D. L. 2002. Phylogenetic analysis using parsimony (*and other methods). Ver. 4. Sinauer, Sunderland, MA.
Swofford, D., G. J. Olsen, P. J. Waddell, and D. M. Hillis. 1996.Phylogenetic inference. Pp. 407–514 in D. M. Hillis, C. Moritz,and B. K. Mable, eds. Molecular systematics. 2d ed. Sinauer,Sunderland, MA.
Takenaka, O., M. Hotta, B. Suryoboto, and E. Brotoisworo. 1987.Origin and evolution of the Sulawesi macaques. Complete aminoacid sequences of seven B chains of three molecular types. Pri-mates 28:99–109.
Templeton, A. R. 1998. Nested clade analysis of phylogeographicdata: testing hypotheses about gene flow and population history.Mol. Ecol. 7:381–397.
———. 2002. Out of Africa again and again. Nature 416:45–51.Templeton, A. R., and C. F. Sing. 1993. A cladistic analysis of
phenotypic associations with haplotypes inferred from restric-tion endonuclease mapping. IV. Nested analysis with cladogramuncertainty and recombination. Genetics 134:659–669.
Templeton, A. R., E. Boerwinkle, and C. F. Sing. 1987. A cladisticanalysis of phenotypic associations with haplotypes inferredfrom restriction endonuclease mapping. I. Basic theory and ananalysis of alcohol dehydrogenase activity in Drosophila. Ge-netics 117:343–351.
Templeton, A. R., K. A. Crandall, and C. F. Sing. 1992. A cladisticanalysis of phenotypic associations with haplotypes inferredfrom restriction endonuclease mapping and DNA sequence data.III. Cladogram estimation. Genetics 132:619–633.
Tosi, A. J., J. C. Morales, and D. J. Melnick. 2000. Comparison ofY-chromosome and mtDNA phylogenies leads to unique infer-ences of macaque evolutionary history. Mol. Phylogenct. Evol.17:133–144.
Tosi, A. J., J. C. Morales, and D. J. Melnick. 2002. Macaca fas-cicularis Y-chromosome and mitochondrial markers indicate in-trogression with Indochinese M. mulatta and a biogeographicbarrier in the Isthmus of Kra. Int. J. Primatol. 23:161–178.
Tosi, A. J., J. C. Morales, and D. M. Melnick. 2003. Paternal,maternal, and biparental molecular markers provide unique win-dows onto the evolutionary history of macaque monkeys. Evo-lution. 57:1419–1435.
Van Noordwijk, M. A., and C. P. Van Schaik. 2002. Career moves:transfer and rank challenge decisions by male long-tailed ma-caques. Behaviour 138:359–395.
Voris, H. 2000. Maps of Pleistocene sea levels in Southeast Asia:shorelines, river systems and time durations. J. Biogeog. 27:1153–1167.
Watanabe, K., and S. Matsumura. 1991. The borderlands and pos-sible hybrids between three species of macaques, M. nigra, M.nigrescens, and M. hecki, in the northern peninsula of Sulawesi.Primates 32:365–369.
Watanabe, K., S. Matsumura, T. Watanabe, and Y. Hamada. 1991a.Distribution and possible intergradation between Macaca ton-keana and M. ochreata at the borderland of the species in Su-lawesi. Primates 32:385–389.
Watanabe, K., K. Lapasere, and R. Tantu. 1991b. External char-acteristics and associated developmental changes in two speciesof Sulawesi macaques, Macaca tonkeana and M. hecki, withspecial reference to hybrids and the borderland between the spe-cies. Primates 32:61–76.
Weir, B. S., and C. C. Cockerham. 1984. Estimating F-statistics forthe analysis of population structure. Evolution 38:1358–1370.
Whitten, T., G. S. Henderson, and M. Mustafa. 2002. The ecologyof Sulawesi. Periplus Editions Ltd., Hong Kong.
Wright, S. 1931. Evolution in Mendelian populations. Genetics 28:114–138.
———. 1965. The interpretation of population structure by F-sta-tistics with special regard to systems of mating. Evolution 19:395–420.
Corresponding Editor: A. Yoder

1945DIVERSIFICATION OF SULAWESI MACAQUES
APPENDIX
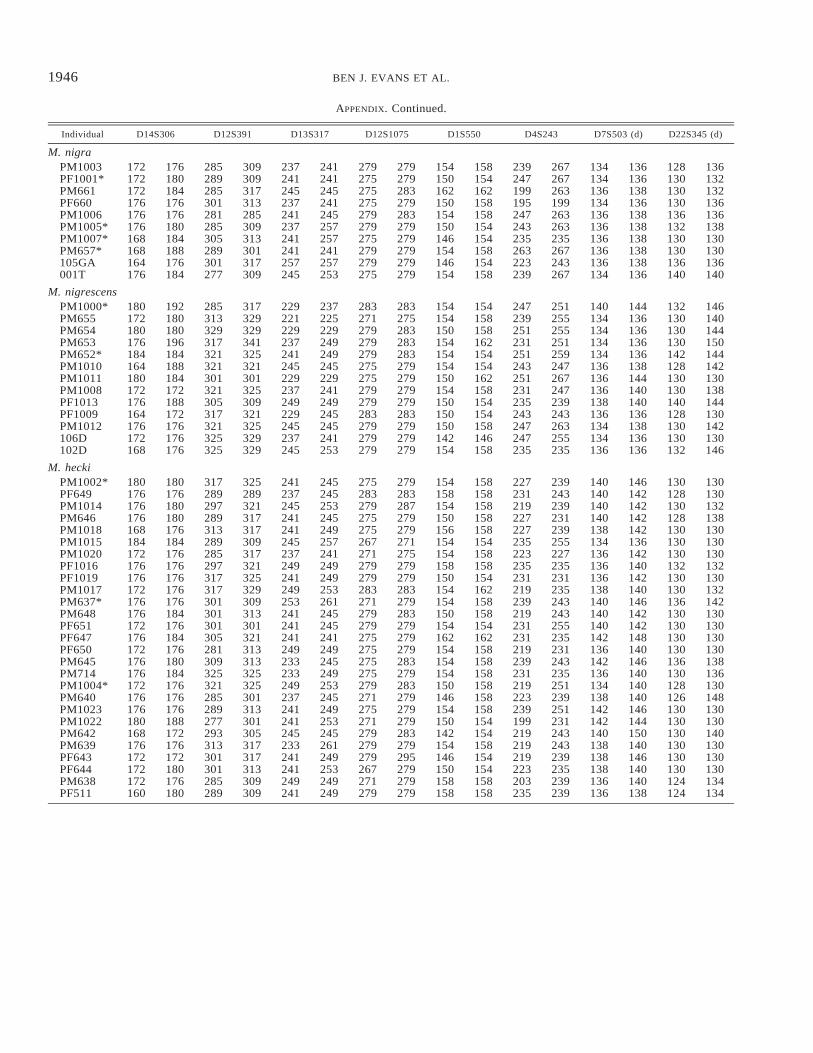
Microsatellite allele sizes of Sulawesi macaques at eight autosomal loci. Loci are tetrameric and dimeric (d); na indicates alleles forwhich amplification was not achieved. Data for other individuals are reported in Evans et al. (2001). Field samples followed by anasterisk are of unknown provenance.
Individual D14S306 D12S391 D13S317 D12S1075 D1S550 D4S243 D7S503 (d) D22S345 (d)
M. tonkeana westPM512PM513PF515PM558
156184160160
188188164180
329265305313
337329305321
241245241237
249253245253
nanana
279
nanana
279
158154154158
162158158158
203207223231
207223239235
138140134136
140140138138
128146128130
130146130132
M. tonkeana eastPM576*PM526*PF535PF539PF543PM546PM548PM551PM552PF3000
176172176176176180176172180176
176188180188184192176180184188
301321281321317273305321273321
305333357333317317345333333333
245237237245241241249249253245
245245257249257245253249257249
na275279279279279279279279279
na287287287287279287279279279
150150158154154154150150154154
162150162158154154154158154158
215223227219195211211219219219
223223235223227223231227227223
136136140136138142134140132136
138136142142142146136142136142
140136140142140142142138140130
142142144142144150142138142142
M. ochreataPF575PF571PM572PF573PM574PF577PF590PF591PM596PM595PM624PM700PM701*PM702PM703PM706PM711PM712PM609*PM704PM586
168164172164172168160160168160176176168180176176156172172158176
180168172168176192180172184180176180176184188184176184180176180
289289285305289301317273321293329289297293305297305301301313297
301297289313305309317301321309333309305329317301309329333325297
217233245221221241241237237241233245241237241233237225241241233
233241245237241241245245237245253245249245245241245237241245241
275267275279275275267275275275279275283275267267267279267275267
279275279279279287279279283279283283283287275279275283271279267
150162154154146158158154158154154158158154158158162158158154158
154162154158146158158162162158158158162158158158162158158154158
231215207231187211211179243211223203187191211211191219255179203
263243231251243219239191243243235207231223239243227231259235211
136140136146140136138136138136136136128140136144136136138136138
138140146146146146144138138138138146136146136146146136138138138
140144142146130144138142136144142130134138136132142130130138132
142148142148148146142146142146142134142138144136144136138142138
M. brunnescensPM2000PM2001PM2002PM2003PM2004PM2005PM2006PF2007PM2008*PM2009PF2010PF2011PM2012PF2013PF707PM708
176172168172180172168168168168172168176172164176
180172172184184184176176196184176168176188176184
321293305297297321313309301313289297301289309289
321297309297305321329321305321301301333317313297
245241229245217241229233249241225249237225225225
249245249257245245241245253241245253249245249241
275275287271271271267267267271267271271275275279
279275287279271275275279267279275271275275275279
158150166162150154158158154154154150154154154158
162150166162154158158158154182158158158158158182
191211211191199191203191199191207207195195191191
191211211191207203215207211191207227203195191195
136136136136136136136136136136136138132136136132
136144136138136136138138136136138144136136136136
130130128136128130136140138130136130130130130136
138140136138142138138142140140136136136142138138
1946 BEN J. EVANS ET AL.
APPENDIX. Continued.
Individual D14S306 D12S391 D13S317 D12S1075 D1S550 D4S243 D7S503 (d) D22S345 (d)
M. nigraPM1003PF1001*PM661PF660PM1006PM1005*PM1007*PM657*105GA001T
172172172176176176168168164176
176180184176176180184188176184
285289285301281285305289301277
309309317313285309313301317309
237241245237241237241241257245
241241245241245257257241257253
279275275275279279275279279275
279279283279283279279279279279
154150162150154150146154146154
158154162158158154154158154158
239247199195247243235263223239
267267263199263263235267243267
134134136134136136136136136134
136136138136138138138138138136
128130130130136132130130136140
136132132136136138130130136140
M. nigrescensPM1000*PM655PM654PM653PM652*PM1010PM1011PM1008PF1013PF1009PM1012106D102D
180172180176184164180172176164176172168
192180180196184188184172188172176176176
285313329317321321301321305317321325325
317329329341325321301325309321325329329
229221229237241245229237249229245237245
237225229249249245229241249245245241253
283271279279279275275279279283279279279
283275283283283279279279279283279279279
154154150154154154150154150150150142154
154158158162154154162158154154158146158
247239251231251243251231235243247247235
251255255251259247267247239243263255235
140134134134134136136136138136134134136
144136136136136138144140140136138136136
132130130130142128130130140128130130132
146140144150144142130138144130142130146
M. heckiPM1002*PF649PM1014PM646PM1018PM1015PM1020PF1016PF1019PM1017PM637*PM648PF651
180176176176168184172176176172176176172
180176180180176184176176176176176184176
317289297289313289285297317317301301301
325289321317317309317321325329309313301
241237245241241245237249241249253241241
245245253245249257241249249253261245245
275283279275275267271279279283271279279
279283287279279271275279279283279283279
154158154150156154154158150154154150154
158158158158158154158158154162158158154
227231219227227235223235231219239219231
239243239231239255227235231235243243255
140140140140138134136136136138140140140
146142142142142136142140142140146142142
130128130128130130130132130130136130130
130130132138130130130132130132142130130
PF647PF650PM645PM714PM1004*PM640PM1023PM1022PM642PM639PF643PF644PM638PF511
176172176176172176176180168176172172172160
184176180184176176176188172176172180176180
305281309325321285289277293313301301285289
321313313325325301313301305317317313309309
241249233233249237241241245233241241249241
241249245249253245249253245261249253249249
275275275275279271275271279279279267271279
279279283279283279279279283279295279279279
162154154154150146154150142154146150158158
162158158158158158158154154158154154158158
231219239231219223239199219219219223203235
235231243235251239251231243243239235239239
142136142136134138142142140138138138136136
148140146140140140146144150140146140140138
130130136130128126130130130130130130124124
130130138136130148130130140130130130134134
Copyright © 2022 FDOKUMEN