Author's personal copy Decoupled warming and monsoon precipitation in East Asia over the last...
10
This article appeared in a journal published by Elsevier. The attached copy is furnished to the author for internal non-commercial research and education use, including for instruction at the authors institution and sharing with colleagues. Other uses, including reproduction and distribution, or selling or licensing copies, or posting to personal, institutional or third party websites are prohibited. In most cases authors are permitted to post their version of the article (e.g. in Word or Tex form) to their personal website or institutional repository. Authors requiring further information regarding Elsevier’s archiving and manuscript policies are encouraged to visit: http://www.elsevier.com/copyright
Transcript of Author's personal copy Decoupled warming and monsoon precipitation in East Asia over the last...

This article appeared in a journal published by Elsevier. The attachedcopy is furnished to the author for internal non-commercial researchand education use, including for instruction at the authors institution
and sharing with colleagues.
Other uses, including reproduction and distribution, or selling orlicensing copies, or posting to personal, institutional or third party
websites are prohibited.
In most cases authors are permitted to post their version of thearticle (e.g. in Word or Tex form) to their personal website orinstitutional repository. Authors requiring further information
regarding Elsevier’s archiving and manuscript policies areencouraged to visit:
http://www.elsevier.com/copyright

Author's personal copy
Decoupled warming and monsoon precipitation in East Asia over thelast deglaciation
Francien Peterse a,⁎, Maarten A. Prins b, Christiaan J. Beets b, Simon R. Troelstra b, Hongbo Zheng c,Zhaoyan Gu d, Stefan Schouten a, Jaap S. Sinninghe Damsté a
a NIOZ Royal Netherlands Institute for Sea Research, Department of Marine Organic Biogeochemistry, PO Box 59, 1790 AB Den Burg, Texel, The Netherlandsb VU University Amsterdam, Faculty of Earth and Life Sciences, Amsterdam, The Netherlandsc School of Earth Science and Engineering, Nanjing University, Nanjing 210093, Chinad Institute of Geology and Geophysics, Chinese Academy of Sciences, Beijing 100029, China
a b s t r a c ta r t i c l e i n f o
Article history:Received 9 June 2010Received in revised form 11 October 2010Accepted 7 November 2010Available online 4 December 2010
Editor: P. DeMenocal
Keywords:East Asian monsoonair temperaturebranched glycerol dialkyl glycerol tetraether(GDGT) membrane lipidloesspaleoclimatedeglaciation
Our understanding of the continental climate development in East Asia is mainly based on loess–paleosolsequences and summer monsoon precipitation reconstructions based on oxygen isotopes (δ18O) ofstalagmites from several Chinese caves. Based on these records, it is thought that East Asian SummerMonsoon (EASM) precipitation generally follows Northern Hemisphere (NH) summer insolation. However,not much is known about the magnitude and timing of deglacial warming on the East Asian continent. In thisstudy we reconstruct continental air temperatures for central China covering the last 34,000 yr, based on thedistribution of fossil branched tetraether membrane lipids of soil bacteria in a loess–paleosol sequence fromthe Mangshan loess plateau. The results indicate that air temperature varied in phase with NH summerinsolation, and that the onset of deglacial warming at ~19 kyr BP is parallel in timing with other continentalrecords from e.g. Antarctica, southern Africa and South-America. The air temperature increased from ~15 °C atthe onset of the warming to a maximum of ~27 °C in the early Holocene (~12 kyr BP), in agreement with thetemperature increase inferred from e.g. pollen and phytolith data, and permafrost limits in central China.Comparison of the tetraether membrane lipid-derived temperature record with loess–paleosol proxy recordsand stalagmite δ18O records shows that the strengthening of EASM precipitation lagged that of deglacialwarming by ca. 3 kyr. Moreover, intense soil formation in the loess deposits, caused by substantial increasesin summer monsoon precipitation, only started around 12 kyr BP (ca. 7 kyr lag). Our results thus show thatthe intensification of EASM precipitation unambiguously lagged deglacial warming and NH summerinsolation, and may contribute to a better understanding of the mechanisms controlling ice ageterminations.
© 2010 Elsevier B.V. All rights reserved.
1. Introduction
Oxygen isotope (δ18O) records of stalagmites from several caves inChinahaveyieldedwell dated, high-resolution records of the timingandamplitude of changes in East Asian Summer Monsoon (EASM)precipitation during the last four glacial–interglacial cycles (e.g. Chenget al., 2009; Dykoski et al., 2005; Wang et al., 2001, 2008; Yuan et al.,2004). Generally, these records revealed that the EASM followsNorthern Hemisphere (NH) insolation patterns. Similarly, variousclimate-proxy records derived from loess–paleosol sequences fromthe Chinese Loess Plateau have also documented changes in EASMprecipitation (e.g. An, 2000; Heslop et al., 1999; Porter and An, 1995;Sun andHuang, 2006;Wuet al., 2002). The build-up of the loess plateau
relates to changes in monsoon intensity, varying temperature andmoisture conditions; loess is mainly deposited during cool and dryperiods, as a result of an intensified winter monsoon, whereas soilformation takes place predominantly during the warmer and wetterperiods with strengthened summer monsoon (Porter and An, 1995).The loess–paleosol records, as well as the stalagmite proxy recordsmatch the climatic changes in the North Atlantic that are recorded inGreenland ice-core records (Chen et al., 1997; Porter and An, 1995).
Although a large number of speleothem and loess records doc-umenting EASM intensity have been generated, only little is known onthe development of atmospheric temperature over the East Asiancontinent in relation to changes inmonsoon precipitation intensity. Soilformation in loess sequences, caused by a substantial increase insummer monsoon precipitation, has been found to lag NH insolation(Heslop et al., 1999; Porter, 2001; Stevens et al., 2007). However, soilformation is not only stimulated by intensified summer monsoonprecipitation, but by higher temperatures as well (Jenny, 1941).
Earth and Planetary Science Letters 301 (2011) 256–264
⁎ Corresponding author. Tel.: +31 222 369569; fax: +31 222 319674.E-mail address: [email protected] (F. Peterse).
0012-821X/$ – see front matter © 2010 Elsevier B.V. All rights reserved.doi:10.1016/j.epsl.2010.11.010
Contents lists available at ScienceDirect
Earth and Planetary Science Letters
j ourna l homepage: www.e lsev ie r.com/ locate /eps l

Author's personal copy
To gain more insight into the exact timing and amplitude of easternAsian continental temperature changes over the last glacial termination,we used the recently developed MBT/CBT (methylation of branchedtetraethers/cyclisation of branched tetraethers) paleothermometer,based on branched glycerol dialkyl glycerol tetraethers (GDGTs)(Weijers et al., 2007b), in a loess–paleosol sequence of the Mangshanloess plateau (Fig. 1) to reconstruct a continuous temperature record forthis area. BranchedGDGTs aremembrane lipids frombacteria that occurubiquitously in soils and peat (Weijers et al., 2006, 2007b), and airtemperatures can be reconstructed based on their distribution using theMethylation index of Branched Tetraethers (MBT) and the Cyclisationratio of Branched Tetraethers (CBT) (Weijers et al., 2007b). The MBT/CBT proxy works well in geothermally heated soils (Peterse et al.,2009b) and branched GDGT distributions have been shown to reflectthe adiabatic cooling of air along altitude gradients (Hren et al., 2010;Peterse et al., 2009a; SinningheDamsté et al., 2008). Also, when appliedto marine surface sediments, branched GDGT-derived temperaturesshow good agreement with the annual mean air temperature of theadjacent river drainage basins (Rueda et al., 2009;Weijers et al., 2007a).
The paleosol–loess sequence from the Mangshan loess plateauinvestigated here mainly receives its sediment from the nearby HuangHe floodplain (Yellow River), which has a relatively humid climatecompared to the Central Loess Plateau. The availablemoisture enhancessoil formation, and values of the branched and isoprenoid tetraether(BIT) index, that quantifies the content of soil-derived organicmatter ina system, are therefore high for these soils (typically N0.8; Hopmanset al., 2004). This makes the sequence suitable for the application of theMBT/CBT proxy. This area is also ideal for a high-resolution reconstruc-
tion, as sedimentation rates are generally high (17 to 29 cm/kyr duringthe last 34 kyr; Prins et al., 2009; Zheng et al., 2007).
2. Material and methods
2.1. Sites and sampling
The Mangshan loess plateau lies 25 km west of Zhengzhou on thesouth bank of the Huang He (Fig. 1). The loess plateau is about 18 km inlength (W–E) and 5 km in width (N–S), with its highest point reachingapproximately 150 m above the Huang He floodplain. The Mangshanplateau receives ~645 mm precipitation per year, about 70% of whichfalls during the summer monsoon season (May–September). The airtemperature is ~2 °C during the winter (December–February) andvaries between 20 °C (May) and 27 °C (July) during the summermonsoon season. The mean annual air temperature is 15 °C (WMO,2007). For this study, the upper part of the loess-pedogenic complex,covering the S0 (Holocene paleosol), L1 (last glacial loess deposit), andS1 (last interglacial paleosol) layers, has been sampled at two locations.The northern loess section, MS2006 (34°57.5′N, 113°22.2′ E; Fig. 1C), isexposed on the northern slope of the Mangshan plateau, where theHuang He river and local gullies have cut through the loess, forming avalleywith steep cliffs. The section is ~59 m thick andwas continuouslysampled in 36 partly-overlapping, freshly-dug, vertical trenches at a 5-cm resolution (Prins et al., 2009). At a southern location, two sectionshave been sampled, MS2008W (34°56.4′ N, 113°22.2′ E) and MS2008E(34°56.1′ N, 113°22.4′ E; Fig. 1C). SectionsMS2008W andMS2008E are~34 and ~14 m thick, respectively, and were sampled in total in 26
Fig. 1. Overview maps showing (A) China with the locations of the Mangshan Loess Plateau (white dot) and the Hulu, Sanbao, and Dongge caves (black dots), (B) the Chinese LoessPlateau, the Mo Us Desert and the North China Plain (NCP), and (C) the studied Mangshan loess sections. A blow up of the insert in (B) is shown in (C), and modified from Prins et al.(2009).
257F. Peterse et al. / Earth and Planetary Science Letters 301 (2011) 256–264

Author's personal copy
partly-overlapping vertical trenches at a 10-cm resolution. From fieldobservations it is clear that the top part of the MS2008W section (0 to45 cm) is disturbed by ploughing, as also evidenced by grain size data.
2.2. Magnetic susceptibility, organic matter and carbonate analysis
Samples were oven dried at 50 °C, lightly ground and aliquots of~8 g were analyzed using a Bartington MS2 magnetic susceptibilitymeter at the School of Ocean and Earth Sciences, Tongji University.The organic matter and carbonate content of the samples wereanalyzed using a Leco TGA 601 at the VU University Amsterdam.Aliquots of ~2 g of the samples prepared for magnetic susceptibilityanalysis were used for thermo-gravimetric analysis (TGA).
2.3. Grain size analysis
Prior to the grain size measurement the samples were preparedaccording to the methods described by Konert and Vandenberghe(1997). Briefly, about 1–2 g of bulk sediment was pre-treated withsolutions of 30% H2O2 and 1 N HCl in deinonized water to removeorganicmatter and carbonates, respectively. In case of a violent reaction,additional aliquots of H2O2 and/or HCl solution were added to ensurecomplete removal of organic matter and/or carbonates. Consequently,the results reflect the grain size distribution of the siliciclastic loessfraction. All measurements were performed on a Fritsch Analysette 22laser particle sizer at the VU University Amsterdam. The variation inmean grain size for this particular instrument has been shown to beb0.5% (Jonkers et al., 2009). Grain size distributions were reported with56 size classes between 0.15 and 2000 μm.
2.4. MBT/CBT analysis
Branched GDGTs were analyzed in the upper 5.9 m of sectionMS2008E and the upper 4.8 m of section MS2008W, using highperformance liquid chromatography/atmospheric pressure chemicalionization-mass spectrometry (HPLC/APCI-MS) as described bySchouten et al. (2007), with minor modifications in the instrumentsettings, as mentioned below. The loess samples from the MS2008Wsequence were freeze-dried. All loess samples from MS2008W andMS2008E were then homogenized with a mortar and pestle, andextracted (3×5 min) with a dichloromethane (DCM):methanol (9:1,v/v) mixture using an accelerated solvent extractor (ASE 200, Dionex)at 100 °C and 7.6×10⁶ Pa. The total extracts were dried using a rotaryevaporator under near vacuum, then dissolved in DCM and passedover a NaSO4 column to remove any remaining water. Knownamounts of an internal C46 GDGT standard were added according toHuguet et al. (2006). Separation of the extracts in apolar and polarfractions was done by passing them over an activated Al2O3 columnusing hexane:DCM (9:1, v/v) and DCM:MeOH (1:1, v/v), respectively.The polar fraction (containing the branched GDGTs and the internalstandard) was dried under N2, ultrasonically dissolved in hexane:isopropanol (99:1, v/v) and filtered over a 0.45 μm PTFE filter. Thepolar fractions were concentrated to about 3 mg/ml prior to analysisby HPLC/APCI-MS on an Agilent 1100 series LC/MSD SL. Separation ofthe branched GDGTswas achieved on an Alltech Prevail Cyano column(150 mm×2.1 mm; 3 μm). The compounds were eluted isocraticallywith 90% A and 10% B for 5 min (flow rate 0.2 ml/min), and then witha linear gradient to 16% B for 34 min, where A=hexane andB=hexane:isopropanol (9:1, v/v). The injection volume was 10 μlfor each sample. Selective ion monitoring of the [M+H]+ of thedifferent GDGTs was used to detect and quantify them. Absolutequantificationwasachievedby calculating the area of the correspondingpeaks in the chromatograms, comparing themwith the peak area of theinternal standard, and correcting them for the different response factors(cf. Huguet et al., 2006).
Air temperatures were calculated based on the MBT and CBTindices and the following transfer function as defined byWeijers et al.(2007b):
MBT = 0:122 + 0:187 × CBT + 0:020 × MAT r2 = 0:77� �
: ð1Þ
The average analytical reproducibility of the MBT and CBT indices,based on duplicate injections of a selected set of loess samples on theHPLC/APCI-MS, is 0.003 for theMBT index and 0.004 for the CBT index,resulting in an analytical error in temperature estimates of ca. 0.2 °C.The error introduced due to scatter in the calibration of Eq. (1) ismuchlarger, ca. 5 °C (Weijers et al., 2007c), however, this uncertainty can beconsidered mainly systematic, and is caused by the global spread ofthe soils in the calibration set and the accompanying variation inenvironmental parameters. When the proxy is applied on a relativelysmall scale, like here on theMangshan plateau, this systematic error islikely to be much smaller. However, an exact estimate of the error isdifficult to constrain, given that a local calibration of the MBT/CBTproxy is not available. Nevertheless, absolute temperature estimatesshould be interpreted with caution.
3. Results and discussion
3.1. Age model
The age model of the Mangshan loess–paleosol sequences is basedon the correlation of loess proxy records, i.e. magnetic susceptibility,carbonate content and grain size characteristics, with the U–230Th datedoxygen isotope records from Dongge, Sanbao and Hulu caves in centralChina (Fig. 1A). The EASM δ18O record is dominated by 23,000-year-long cycles that are synchronous (within dating errors) with summerinsolation at 65°N (Berger, 1978), and the cycles are punctuated bymillennial-scale strong summermonsoon events (Chinese interstadials;Cheng et al., 2006) andweak summermonsoon events (correlativewithNorth Atlantic cold events, i.e. the Heinrich events; Wang et al., 2001).The ages of these events are exceptionally well constrained and maythus, as suggested by Wang et al. (2008), serve as benchmarks forcorrelating and calibrating climate records. The assumed matchbetween the East Asian monsoon proxy records from the Mangshanloess–paleosol sequences and the Chinese speleothem records isindependently supported by radiocarbon dating of fossil carbonateshells of land snails from a loess sequence close to site MS2006 for thetime interval ~15–41 kyr BP (Fig. 2; Gu et al., 2009).
To match the proxy records of the Mangshan loess–paleosolsequence with the EASM δ18O record, the carbonate and magneticsusceptibility records are used as tracers of soil development duringhumid interstadial and interglacial periods (cf. Maher and Thompson,1992; Fig. 2). Consequently, carbonate minima and magnetic suscep-tibility maxima are correlated in time with the Chinese interstadials(speleothem δ18O minima). The grain size profile is a tracer of eoliandust input, where clay contentminima reflect periods of enhanced dustinput and intensified winter monsoon, and is assumed to covary withthe Chinese stadials (speleothem δ18Omaxima). Hence,matching of theloess proxy records of section MS2006 with the Sanbao/Huluspeleothem δ18O record results in the age model shown in Fig. 2. Theagemodels of sectionsMS2008WandMS2008E, that correlate verywellto section MS2006 (Supplementary Figure 1), have been constructed ina similar way.
3.2. Continental air temperature record
The upper 5.9 m of loess–paleosol sequence MS2008E (Fig. 1C)corresponds to the last 34 kyr according to our age model. BranchedGDGTs were detected throughout the whole loess–paleosol profile.Their concentrations vary between 1 and 13 ng GDGTs/g dry weight
258 F. Peterse et al. / Earth and Planetary Science Letters 301 (2011) 256–264

Author's personal copy
loess (Table 1), and are higher in the paleosol layer than in the loesslayer. Although atmospheric dust from the loess plateau has not beenanalyzed, branched GDGTswere below detection limit in a dust samplefrom near the West coast of Central Africa, suggesting that thesecomponents are unlikely to be transported through the atmosphere inlarge amounts (Hopmans et al., 2004). Thus, the branched GDGTs arelikely produced in situ in the loess–paleosol sequence, and theMBT/CBTrecord, therefore, reflects local conditions of theMangshan plateau area.
Calculation of the MBT and CBT indices and application of Eq. (1)for the whole sequence, resulted in a continuous air temperaturerecord for the period covered by the MS2008E sequence (Fig. 3B;Table 1). The MBT/CBT-derived temperature for the upper layer ofMS2008E compares well with the average present-day air tempera-ture (~24 °C) of the summer season (May–September) on the
Mangshan plateau area (Fig. 3B), indicating that our record is mostlikely representing mean summer air temperatures. Although it is stillunknown what group of bacteria is responsible for the production ofbranched GDGTs, and what their season of optimum growth is,microorganisms in general require moisture to live and grow. Sincethe Mangshan plateau receives over 70% of the annual amount ofprecipitation during the summer season (WMO, 2007), it is likely thatthis season is most suitable for bacterial productivity and thus theproduction of the branched GDGTs.
The MBT/CBT record reveals that summer air temperatures in theMangshan plateau area were on average ~17 °C during the last glacialperiod,with aminimumof about14 °Cduring the LastGlacialMaximum(LGM; ~21 kyr BP). The onset of deglacial warming around 19 kyr BPshown by our record matches with Antarctic warming (Fig. 4E), and is
0
10
20
30
40
50
60
Dep
th (
m)
S0
S1
L1
L2
15 10 5 0
Carbonate (weight%)
0 5 10 15
MS (SI/g)
Age (kyrBP)
60
50
40
30
20
10
0
0 10 20 30 40 50 60 70 80 90 100 110 120 130 140
0 10 20 30 40 50 60 70 80 90 100 110 120 130 140
Age (kyrBP)
-5
-6
-7
-8
-9
-10
-11
-12
18
10 15 20 25 30
H1
A0A14 A20
A4 A8 A12 A16 A19 A21 A22 A23 B0
H3H2 H5H4 H6
Holocene
B C
A
Fig. 2. Age model of the Mangshan loess record MS2006 based on correlation with the U–Th-dated Sanbao/Hulu speleothem δ18O record of Wang et al., 2008 over the past ~131 kyrBP. (A) Time versus δ18O in the Sanbao (red, stalagmite SB11; green, SB23; yellow, SB25-1; pink, SB22; dark blue, SB3; purple, SB10 and orange, SB26) and Hulu cave (three differenthues of lighter blue, PD, D and L) records (Wang et al., 2008). For comparison, the Hulu δ18O record is plotted 1.6‰more negative to account for the higher δ18O values in the Hulurecord compared to the Sanbao record (cf. Wang et al., 2008). Marine-isotope stages (Holocene/MIS1–MIS6), Heinrich events (H1–H6; Wang et al., 2001) and Chinese interstadials(cf. Cheng et al., 2006) are indicated. (B) Magnetic susceptibility, carbonate content (weight %) and grain size (expressed as clay content) compared to paleosol (S0 and S1) and loess(L1 and L2) stratigraphy in sections MS2006 (Prins et al., 2009). (C) Age–depth profile for loess record MS2006. Grey lines indicate the location of the ‘age-control points’ used to tiethe loess to the speleothem record. Red open circles indicate the radiocarbon dates of land snails (Gu et al., 2009; Table 3).
259F. Peterse et al. / Earth and Planetary Science Letters 301 (2011) 256–264

Author's personal copy
similar in timingwithmid-latitude glacier retreat at the end of the LGM,as indicated by 10Be exposure dates of boulders in moraines on bothnorthern and southernhemispheres (Schaeffer et al., 2006).Also, TEX86-inferred lake surface temperature reconstructions for lakes Malawi andTanganyika suggest a similar timing of deglacial warming in southernAfrica (Powers et al., 2005; Tierney et al., 2008), while atmosphericwarming in tropical central Africa, reconstructed with the MBT/CBTproxy, may have started slightly later (Weijers et al., 2007a; Fig. 4D).
The reconstructed summer air temperatures in the Mangshanplateau area show an increase from ~15 °C at the onset of deglacialwarming to ~27 °C at the beginning of the Holocene (~12 kyr BP),with an average rate of almost 2 °C/kyr. The difference between thepresent-day mean summer temperature (~24 °C) and the recon-structed air temperature during the LGM (~17 °C) is in agreementwith other studies from this region: estimates based on pollen studiesand permafrost limits in central China suggest 7–10 °C cooler airtemperatures during the LGM (Zhou et al., 1998), whereas otherpollen assemblage (Sun et al., 1997) or phytolith-based (Lu et al.,2007) temperature reconstructions suggest that the air temperatureat that time was 4.5–9 °C cooler than present.
Maximum air temperatures on the Mangshan plateau occurred atthe loess (L1) to paleosol (S0) transition that marks the beginning ofthe Holocene (Fig. 3). During the Holocene climatic optimum, whichwas around 6–7 kyr BP for this part of China (An, 2000), airtemperatures were ca. 3 °C higher compared to present. Thistemperature difference is slightly larger than the ca. 1 °C suggestedby the modelling study of Tao et al. (2010), although the proxy datathat they use to compare their model with, suggest 2–3 °C highertemperatures (Tao et al., 2010 and reference therein), which is againin agreement with the MBT/CBT-derived record. Similar temperatureestimates are reported based on pollen records (Zhou et al., 1998;1–6 °C warmer than present, depending on the geographical location),and phytoliths (Lu et al., 2007; 1–2 °C warmer than present).
Evidence for the robustness of our temperature record, next to thegenerally good fit with previously published temperature estimatesand trends, is provided by the analysis of the upper 4.8 m of thenearby loess–paleosol sequence MS2008W (Fig. 1C). According to ourage model, this sequence covers the last 16 kyr. Since the top 45 cm isdisturbed because of ploughing, the upper 3 samples are excludedfrom the discussion. The branched GDGT concentrations variedbetween 2 and 27 ng/g dwt loess (Table 2), showing the samevariations with depth as seen in the MS2008E sequence. Comparisonof the two resulting temperature records shows a similar timing andmagnitude of deglacial warming, as well as absolute temperatureestimates (Fig. 4B,C; Table 2).
3.2. Comparison with NH summer insolation, loess–paleosol proxyrecords and stalagmite δ18O records
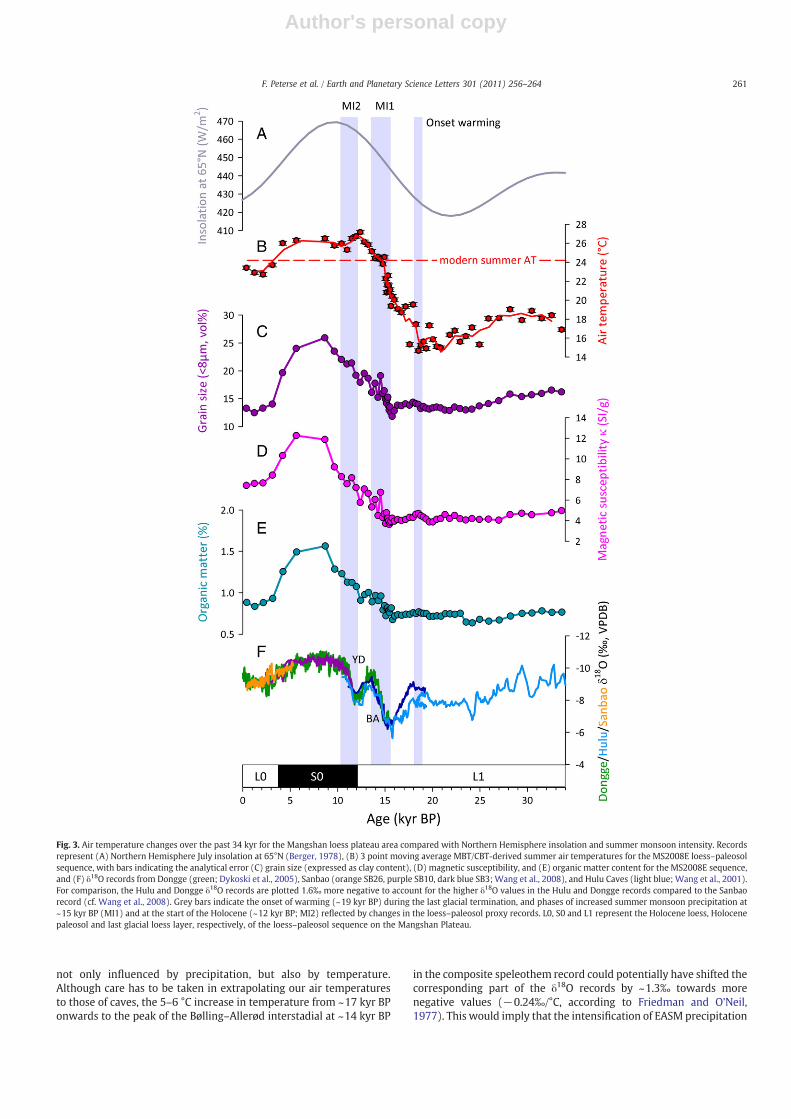
Our MBT/CBT record shows that summer air temperatures at theMangshan plateau area have developed in phase with NH summerinsolation throughout the whole record (Fig. 3), and that the onset ofatmospheric warming is parallel in timing with that on Antarctica.Interestingly, the clay fraction, magnetic susceptibility, and organiccarbon content that were measured for the MS2008E sequence, lagthe onset of atmospheric warming, and start to only slowly increasefrom ~16 kyr BP onwards (Monsoon Intensification 1, Fig. 3; Table 1).This implies that during the first period of significant warming, theclimate at the Mangshan plateau was still relatively dry, and limitedsoil formation was taking place, like previously suggested byWu et al.(2002) based on mollusc studies. Pedogenic processes intensified atthe start of the Holocene (~12 kyr BP), resulting in the formation ofthe S0 paleosol. This signifies that only then summer monsoonprecipitation intensified to such an extent that conditions becamesubstantially wetter (Monsoon Intensification 2, Fig 3), as is alsoshown in other Chinese loess records (Stevens et al., 2007). Similarlags have been reported for Africa, where deglacial warming after theLGM seems to coincide with the temperature increase in Antarctica,but where the onset of increased precipitation, in contrast, matcheswith northern hemisphere climatic changes (Gasse, 2000; Tierneyet al., 2008).
The considerable continental warming during the last glacialtermination (up to 13 °C), may potentially have had an imprint on theδ18O values recorded by the Chinese cave stalagmites, as this signal is
Table 1Depth, age, grain size (clay content), magnetic susceptibility (MS), organic matter (OM),branched GDGT abundance, and MBT/CBT-derived temperatures of paleosol–loesssequence MS2008E.
Depth(cm)
Age(kyr BP)
b8 μm(%)
MS OM(%)
Branched GDGTs(ng/g dwt loess)
MBT/CBT-derived MAT(°C)
3.75 0.4 13.3 7.4 0.9 1.5 23.43.85 1.3 12.5 7.6 0.8 1.6 22.93.95 2.2 13.3 7.7 0.9 1.8 22.74.05 3.2 14.0 8.4 0.9 3.1 23.74.15 4.2 19.7 10.3 1.3 6.3 26.04.25 5.7 24.0 12.3 1.5 13.1 26.34.35 8.7 25.9 11.9 1.6 11.9 26.54.45 9.7 23.5 9.2 1.3 10.8 25.84.55 10.4 22.0 8.3 1.2 9.6 26.04.65 11.0 21.2 7.6 1.1 10.6 25.34.75 11.5 21.4 8.2 1.1 8.2 26.54.85 12.0 19.2 7.2 1.1 11.0 26.74.95 12.4 17.9 5.8 0.9 6.0 27.25.05 12.8 19.5 7.1 1.0 3.9 26.15.15 13.2 18.7 6.7 1.0 3.2 25.85.25 13.6 16.1 5.3 0.9 2.5 25.15.35 14.0 17.8 6.1 1.0 3.0 24.45.45 14.3 15.2 4.5 0.9 1.7 24.65.55 14.6 19.1 6.7 1.0 1.9 24.35.65 14.8 16.0 4.3 0.8 2.5 23.85.75 15.0 16.4 4.7 0.8 2.8 24.55.85 15.1 14.9 3.7 0.7 1.2 22.35.95 15.2 14.2 4.8 0.8 1.8 20.86.05 15.3 14.9 4.2 0.8 2.7 21.66.15 15.3 15.3 4.2 0.8 2.5 22.66.25 15.4 13.7 4.0 0.8 2.0 21.56.35 15.5 12.9 3.6 0.8 2.0 20.96.45 15.5 13.5 3.8 0.8 2.0 21.16.55 15.7 12.5 3.9 0.8 2.1 19.46.65 15.8 11.8 4.2 0.7 2.1 20.46.75 16.0 12.8 3.9 0.7 1.6 20.06.85 16.3 13.8 4.1 0.7 1.6 19.16.95 16.7 13.7 4.0 0.7 1.7 18.77.05 17.2 14.1 4.1 0.7 1.7 19.37.15 17.6 13.8 4.3 0.7 3.1 15.37.25 18.0 14.4 4.3 0.8 2.6 19.57.35 18.3 14.1 4.6 0.7 2.7 17.57.45 18.5 14.0 4.7 0.8 4.0 14.77.55 18.8 13.2 4.5 0.8 2.4 15.37.65 19.1 13.6 4.3 0.8 2.0 15.67.75 19.4 13.3 4.2 0.7 1.7 14.97.85 19.7 13.1 3.9 0.7 1.3 17.37.95 20.1 13.4 3.9 0.7 1.4 15.98.05 20.5 13.5 4.1 0.7 2.5 15.18.15 20.9 13.3 4.2 0.7 2.4 15.08.25 21.3 12.9 4.6 0.7 2.0 13.58.35 21.8 12.9 4.2 0.7 1.9 16.38.45 22.4 13.5 4.5 0.7 1.0 16.88.55 22.9 13.2 4.2 0.8 0.8 15.68.65 23.5 13.0 4.1 0.6 1.6 16.28.75 24.2 13.1 4.2 0.6 0.9 17.18.85 25.0 13.7 4.1 0.7 2.1 15.38.95 25.9 14.1 4.2 0.7 1.8 18.19.05 27.0 14.6 4.0 0.7 1.5 18.19.15 28.2 15.8 4.6 0.7 2.4 19.09.25 29.4 15.4 4.7 0.8 2.7 17.99.35 30.5 15.7 4.6 0.8 1.8 18.99.45 31.5 15.9 –a 0.8 2.2 18.19.55 32.6 16.5 4.8 0.8 2.3 18.49.65 33.6 16.2 5.0 0.8 2.9 16.9
a Not determined.
260 F. Peterse et al. / Earth and Planetary Science Letters 301 (2011) 256–264
Author's personal copy
not only influenced by precipitation, but also by temperature.Although care has to be taken in extrapolating our air temperaturesto those of caves, the 5–6 °C increase in temperature from ~17 kyr BPonwards to the peak of the Bølling–Allerød interstadial at ~14 kyr BP
in the composite speleothem record could potentially have shifted thecorresponding part of the δ18O records by ~1.3‰ towards morenegative values (−0.24‰/°C, according to Friedman and O'Neil,1977). This would imply that the intensification of EASM precipitation
Fig. 3. Air temperature changes over the past 34 kyr for the Mangshan loess plateau area compared with Northern Hemisphere insolation and summer monsoon intensity. Recordsrepresent (A) Northern Hemisphere July insolation at 65°N (Berger, 1978), (B) 3 point moving average MBT/CBT-derived summer air temperatures for the MS2008E loess–paleosolsequence, with bars indicating the analytical error (C) grain size (expressed as clay content), (D) magnetic susceptibility, and (E) organic matter content for the MS2008E sequence,and (F) δ18O records from Dongge (green; Dykoski et al., 2005), Sanbao (orange SB26, purple SB10, dark blue SB3; Wang et al., 2008), and Hulu Caves (light blue; Wang et al., 2001).For comparison, the Hulu and Dongge δ18O records are plotted 1.6‰ more negative to account for the higher δ18O values in the Hulu and Dongge records compared to the Sanbaorecord (cf. Wang et al., 2008). Grey bars indicate the onset of warming (~19 kyr BP) during the last glacial termination, and phases of increased summer monsoon precipitation at~15 kyr BP (MI1) and at the start of the Holocene (~12 kyr BP; MI2) reflected by changes in the loess–paleosol proxy records. L0, S0 and L1 represent the Holocene loess, Holocenepaleosol and last glacial loess layer, respectively, of the loess–paleosol sequence on the Mangshan Plateau.
261F. Peterse et al. / Earth and Planetary Science Letters 301 (2011) 256–264

Author's personal copy
during the initial stages of deglacial warming (Fig. 3; MI 1) wouldhave been less intense than suggested by the δ18O records. Thesubstantial decrease in speleothem δ18O values at the Younger Dryasto Holocene transition is only accompanied by minor air temperaturechanges, suggesting a large increase in EASM precipitation (Fig. 3;MI 2). This agrees well with the observed formation of the S0 paleosol,starting at ~12 kyr BP in our loess–paleosol record, as well as in otherloess–paleosol records (Porter, 2001; Stevens et al., 2007). Thus, itseems that temperature has indeed affected the stalagmite δ18Orecord, especially during times of rapid and large changes, i.e. duringMI1.
Our records indicate that there is a considerable delay (up to~7 kyr) in the intensification of EASM precipitation compared tocontinental warming and NH insolation. Several complexmechanismshave been put forward to explain the delayed response of EASMprecipitation during glacial terminations. For example, latent heatexport from the Southern Hemisphere Indian Ocean as well as glacialboundary conditions could have delayed the EASM onset (Clemensand Prell, 2007; Liu et al., 2006). It has also been hypothesized that thelag may have been caused by cold anomalies generated bydisintegrating ice sheets and sea-ice formation in the North Atlanticregion (Cheng et al., 2009). This would have generated a colder North
Fig. 4. Air temperature changes over the past 34 kyr for two loess–paleosol sequences from the Mangshan loess plateau area compared with Northern Hemisphere insolation, airtemperatures from tropical Africa, and Antarctic and Arctic climate signals. Records represent (A) Northern Hemisphere July insolation at 65°N (Berger, 1978), (B) 3 point movingaverage MBT/CBT-derived air temperatures for the MS2008E and (C) the MS2008W loess–paleosol sequence, with bars indicating the analytical error. Disturbed samples from theMS2008W section are coloured black. (D) Air temperatures for the Congo Basin (Weijers et al., 2007a), (E) the EPICA Dome C δD record indicative of Antarctic air temperaturechanges (Jouzel et al., 2007) and (F) the Greenland Ice Sheet Project 2 (GISP2) δ18O record indicative of Greenland air temperature fluctuations (Stuiver and Grootes, 2000).
262 F. Peterse et al. / Earth and Planetary Science Letters 301 (2011) 256–264

Author's personal copy
Atlantic that, through atmospheric teleconnections, has led to aweakening of the East Asian summer monsoon intensity. The recordsfrom the Mangshan plateau indicate that over the last deglaciation,intensification of the East Asian summer monsoon was mainlyinfluenced by northern hemisphere climatic changes, whereasatmospheric warming coincides with the temperature increase onAntarctica. Our results thus support the statistical evaluation of thecontrols of East Asian monsoon variability by Rohling et al. (2009),who suggested a southern hemisphere ‘push’ during glacial timeswhen the monsoon is weak, i.e. between ~28 and ~16 kyr BP.
Regardless of the exact mechanisms, our data suggest that thefactors controlling the onset of deglacial atmospheric warming andthe intensification of EASM precipitation may have been different.Generation of MBT/CBT records in high sedimentation rate loess–paleosol sequences, such as those from the Mangshan Plateau, nowoffers the opportunity to constrain the timing and magnitude ofcontinental temperature changes in eastern Asia. They can be used to
obtain a more accurate assessment of hydrological and thermalchanges in this climatologically important area.
Conclusions
The application of theMBT/CBT proxy on paleosol–loess sequencesfrom the Mangshan loess plateau has resulted in a continuous, high-resolution air temperature record that provides an insight in theclimate development of eastern Asia during the last 34,000 yr. Therecord shows that the onset of deglacial atmospheric warming issimilar in timing with previous continental temperature records frome.g. Antarctica and Africa, and that air temperature varied in phasewith Northern Hemisphere summer insolation. However, deglacialintensification of the East Asian Summer Monsoon, based on loessproxy records obtained from the same paleosol–loess sequence andδ18O speleothem records, clearly lagged that of warming by N3 kyr.Intense soil formation (i.e. development of the Holocene paleosol S0),depending on both higher temperatures and available moisture, evenlagged deglacial warming by ~7 kyr. Our data and new MBT/CBT-derived temperature records may give us the opportunity to betterunderstand the driving forces of deglacial warming and the monsoonsystem in eastern Asia.
Supplementarymaterials related to this article can be found onlineat doi:10.1016/j.epsl.2010.11.010.
Acknowledgements
We would like to thank two anonymous reviewers and Dr.DeMenocal for constructive comments. We also like to thank MartinKonert, Patrick Bacon, Ilse Kamerling, Wouter Wester, Noortje Dijkstra,Daniel Rits, Noortje Vroomans, WieskeWentink, HugoWester from VUUniversity Amsterdam, Huang Xiangtong, Bin Zhou, KeWang, Jia Juntaofrom Tongji University, and Ellen Hopmans, Jort Ossebaar, AncheliqueMets, and Jaap van der Meer from Royal NIOZ for discussion andassistance with lab and fieldwork. MAP, CJB, SRT, HZ and ZG thank theKNAW for financial support (PSA-E-02, 06CDP041 and 08CDP021projects). JSSD and SS received funding from the ERC projectPACEMAKER. This is publication number DW-2010-1010 of the DarwinCenter for Biogeosciences, which partially funded this project.
References
An, Z., 2000. The history and variability of the East Asian paleomonsoon climate.Quatern. Sci. Rev. 19, 171–187.
Berger, A.L., 1978. Long-term variations of caloric insolation resulting from the Earth'sorbital elements. Quatern. Res. 9, 139–167.
Chen, F.H., Bloemendal, J., Wang, J.M., Oldfield, F., 1997. High-resolution multi-proxyclimate records from Chinese loess: evidence for rapid climatic changes over thelast 75 kyr. Palaeogeogr. Palaeocl. 130, 323–335.
Cheng, H., Edwards, L., Wang, Y., Kong, X., Ming, Y., Kelly, M.J., Wang, X., Gallup, C.D., Liu,W., 2006. A penultimate glacial monsoon record from Hulu Cave and two phaseglacial terminations. Geology 34, 217–220.
Cheng, H., Edwards, R.L., Broecker, W.S., Denton, G.H., Kong, X., Wang, Y., Zhang, R.,Wang, X., 2009. Ice age terminations. Science 326, 248–252.
Clemens, S.C., Prell, W.L., 2007. The timing of orbital-scale Indian monsoon changes.Quatern. Sci. Rev. 26, 275–278.
Dykoski, C.A., Edwards, R.L., Cheng, H., Yuan, D., Cai, Y., Zhang, M., Lin, Y., Qing, J., An, Z.,Revenaugh, J., 2005. A high-resolution, absolute-dated Holocene and deglacialAsian monsoon record from Dongge Cave, China. Earth Planet. Sc. Lett. 233, 71–86.
Friedman, I., O'Neil, J.R., 1977. Data of geochemistry, I. In: Friedman, O'Neil, J.R. (Eds.), U.S.Geological Survey (USGS) Professional Paper 440-KK, KK1-12, USGS,Washington, DC.
Gasse, F., 2000. Hydrological changes in the African tropics since the Last GlacialMaximum. Quatern. Sci. Rev. 19, 189–211.
Gu, Z., Liu, Z., Xu, B., Wu, N., 2009. Stable carbon and oxygen isotopes in land snailcarbonate shells from a last glacial loess sequence and their implications ofenvironmental changes. Quatern. Sci. 29, 13–22 (in Chinese with English abstract).
Heslop, D., Shaw, J., Bloemendal, J., Chen, F., Wang, J., Parker, E., 1999. Sub-millennialscale variations in East Asian monsoon systems recorded by dust deposits from thenorth-western Chinese Loess Plateau. Phys. Chem. Earth 24, 785–792.
Hopmans, E.C., Weijers, J.W.H., Schefuß, E., Herfort, L., Sinninghe Damsté, J.S., Schouten,S., 2004. A novel proxy for terrestrial organic matter in sediments based onbranched and isoprenoid tetraether lipids. Earth Planet. Sc. Lett. 224, 107–116.
Table 2Depth, age, branched GDGT abundance, and MBT/CBT-derived temperatures ofpaleosol–loess sequence MS2008W.
Depth(cm)
Age(kyr BP)
Branched GDGTs(ng/g dwt loess)
MBT/CBT-derived MAT(°C)
0.05a 0.4 13.3 17.20.15a 1.1 12.8 21.00.25a 1.9 9.9 22.90.55 3.7 14.2 25.70.65 4.2 13.7 25.40.75 4.6 15.4 26.00.85 5.1 21.9 27.71.15 7.2 26.8 27.71.45 9.1 17.5 27.31.55 9.5 9.1 27.41.85 10.5 7.0 27.02.05 11.2 7.6 26.42.15 11.5 6.9 26.52.25 11.9 3.5 23.52.35 12.3 3.0 24.62.45 12.7 4.0 25.32.75 13.9 3.0 22.82.85 14.3 2.6 22.82.95 14.6 5.8 22.93.05 14.8 2.2 19.73.15 15.0 3.1 20.83.25 15.0 2.7 18.83.35 15.1 3.3 22.63.45 15.2 2.7 19.73.75 15.4 2.1 18.93.85 15.5 3.0 19.03.95 15.5 5.2 19.44.05 15.6 3.8 18.24.15 15.6 1.6 19.74.25 15.6 3.0 17.34.35 15.7 2.4 18.54.45 15.7 3.6 18.24.55 15.7 2.1 16.34.65 15.8 3.8 15.14.75 15.8 1.8 14.6
a Disturbed sample.
Table 3Calibrated radiocarbon dates of fossil aragonitic land snail shells in the MS2006 loess–paleosol sequence, inferred from Gu et al. (2009).
Depth(m)
Snail shells, calibrated age(kyr)
Error
2.175 14.6 1.14.975 22.1 1.17.775 24.3 1.310.075 28.2 1.311.525 33.3 2.113.825 40.9 4.4
263F. Peterse et al. / Earth and Planetary Science Letters 301 (2011) 256–264

Author's personal copy
Hren, M.T., Pagani, M., Erwin, D.M., Brandon, M., 2010. Biomarker reconstruction of theearly Eocene paleotopography and paleoclimate of the northern Sierra Nevada.Geology 38, 7–10.
Huguet, C., Hopmans, E.C., Febo-Ayala, W., Thompson, D.H., Sinninghe Damsté, J.S.,Schouten, S., 2006. An improved method to determine the absolute abundance ofglycerol dibiphytanyl glycerol tetraether lipids. Org. Geochem. 37, 1036–1041.
Jenny, H., 1941. Factors of Soil Formation. McGraw-Hill, New York.Jonkers, L., Prins, M.A., Brummer, G.-J., Konert, M., Lougheed, B.C., 2009. Experimental
insights into laser diffraction particle sizing of fine-grained sediments for use inpalaeoceanography. Sedimentology 56, 2192–2206.
Jouzel, J., Masson-Delmotte, V., Cattani, O., Dreyfus, G., Falourd, S., Hoffmann, G.,Minster, B., Nouet, J., Barnola, J.M., Chappellaz, J., Fischer, H., Gallet, J.C., Johnsen, S.,Leuenberger, M., Loulergue, L., Luethi, D., Oerter, H., Parrenin, F., Raisbeck, G.,Raynaud, D., Schilt, A., Schwander, J., Selmo, E., Souchez, R., Spahni, R., Stauffer, B.,Steffensen, J.P., Stenni, B., Stocker, T.F., Tison, J.L., Werner, M., Wolff, E.W., 2007.Orbital and millennial Antarctic climate variability over the past 800,000 years.Science 317, 793–796.
Konert,M., Vandenberghe, J., 1997. Comparisonof laser grain size analysiswithpipette andsieve analysis: a solution for the underestimation of the clay fraction. Sedimentology44, 523–535.
Liu, X., Liu, Z., Kutzbach, J.E., Clemens, S.C., Prell, W.L., 2006. Hemispheric insolationforcing of the Indian Ocean and Asian Monsoon: local versus remote impacts.J. Climate 19, 6195–6208.
Lu, H.-Y.,Wu, N.-Q., Liu, K.-B., Jiang, H., Liu, T.-S., 2007. Phytoliths as quantitative indicatorsfor the reconstruction of past environmental conditions in China II: palaeoeviron-mental reconstruction in the Loess Plateau. Quatern. Sci. Rev. 26, 759–772.
Maher, B.A., Thompson, R., 1992. Paleoclimatic significance of the mineral magneticrecord of the Chinese loess and paleosols. Quatern. Res. 37, 155–170.
Peterse, F., van der Meer, M.T.J., Schouten, S., Jia, G., Ossebaar, J., Blokker, J., SinningheDamsté, J.S., 2009a. Assessment of soiln-alkane δD andbranched tetraethermembranelipid distributions as tools for paleoelevation reconstruction. Biogeoscience 6,2799–2807.
Peterse, F., Schouten, S., van der Meer, J., van der Meer, M.T.J., Sinninghe Damsté, J.S.,2009b. Distribution of branched tetraether lipids in geothermally heated soils:implications for the MBT/CBT temperature proxy. Org. Geochem. 40, 201–205.
Porter, S.C., 2001. Chinese loess record of monsoon climate during the last glacial–interglacial cycle. Earth Sci. Rev. 54, 115–128.
Porter, S.C., An, Z., 1995. Correlation between climate events in the North Atlantic andChina during the last glaciations. Nature 375, 305–308.
Powers, L.A., Johnson, T.C., Werne, J.P., Castañeda, I.C., Hopmans, E.C., SinningheDamsté, J.S., Schouten, S., 2005. Large temperature variability in the southernAfrican tropics since the Last Glacial Maximum. Geophys. Res. Lett. 32, L08706.
Prins, M.A., Zheng, H., Beets, K., Troelstra, S., Bacon, P., Kamerling, I., Wester, W., Konert,M., Huang, X., Ke, W., Vandenberghe, J., 2009. Dust supply from river floodplains:the case of the lower Huang He (Yellow River) recorded in a loess–palaeosolsequence from the Mangshan Plateau. J. Quatern. Sci. 24, 75–84.
Rohling, E.J., Liu, Q.S., Roberts, A.P., Stanford, J.D., Rasmussen, S.O., Langen, P.L., Siddall, M.,2009. Controls on the East Asian monsoon during the last glacial cycle, based oncomparison between Hulu Cave and polar ice-core records. Quatern. Sci. Rev. 28,3291–3302.
Rueda, G., Rosell-Melé, A., Escala, M., Gyllencreutz, R., Backman, J., 2009. Comparison ofinstrumental and GDGT-based estimates of sea surface and air temperatures fromthe Skagerrak. Org. Geochem. 40, 287–291.
Schaeffer, J.M., Denton, G.H., Barrell, D.J.A., Ivy-Ochs, S., Kubik, P.W., Andersen, B.G.,Philips, F.M., Lowell, T.V., Schluchter, C., 2006. Near-synchronous interhemi-
spheric termination of the last glacial maximum in mid-lattitudes. Science 312,1510–1513.
Schouten, S., Huguet, C., Hopmans, E.C., Sinninghe Damsté, J.S., 2007. Improvedanalytical methodology of the TEX86 paleothermometry by high performanceliquid chromatography/atmospheric pressure chemical ionization-mass spectrom-etry. Anal. Chem. 79, 2940–2944.
Sinninghe Damsté, J.S., Ossebaar, J., Schouten, S., Verschuren, S., 2008. Altitudinal shiftsin the branched tetraether lipid distribution in soil from Mt. Kilimanjaro(Tanzania): implications for the MBT/CBT continental palaeothermometer. Org.Geochem. 39, 1072–1076.
Stevens, T., Thomas, D.S.G., Armitage, S.J., Lunn, H.R., Lu, H., 2007. Reinterpreting climateproxy records from late Quaternary Chinese loess: a detailed OSL investigation. EarthSci. Rev. 80, 111–136.
Stuiver, M., Grootes, P.M., 2000. GISP2 oxygen isotope ratios. Quatern. Res. 53, 277–283.Sun, J., Huang, X., 2006. Half-precessional cycles recorded in Chinese loess: response to
low-latitude insolation forcing during the last glaciation. Quatern. Sci. Rev. 25,1065–1072.
Sun, X., Song, C., Wang, F., Sun, M., 1997. Vegetation history of the loess plateau of chinaduring the last 1000,000 years based on pollen data. Quatern. Int. 37, 25–36.
Tao, W., Huijun, W., Dabang, J., 2010. Mid-Holocene East Asian summer climate assimulated by the PMIP2 models. Palaeogeogr. Palaeoclimatol. Palaeoecol. 288,93–102.
Tierney, J.E., Russell, J.M., Huang, Y., Sininghe Damsté, J.S., Hopmans, E.C., Cohen, A.S.,2008. Northern hemisphere controls on tropical southeast African climate duringthe past 60,000 years. Science 322, 252–255.
Wang, Y.J., Cheng, H., Edwards, R.L., An, Z.S., Wu, J.Y., Shen, C.-C., Dorale, J.A., 2001. Ahigh-resolution absolute-dated late Pleistocene monsoon record from Hulu Cave,China. Science 294, 2345–2348.
Wang, Y., Cheng, H., Edwards, R.L., Kong, X., Shao, X., Chen, S., Wu, J., Jiang, X., Wang, X.,An, Z., 2008. Millenial- and orbital-scale changes in the East Asian monsoon overthe past 224,000 years. Nature 451, 1090–1093.
Weijers, J.W.H., Schouten, S., Spaargaren, O.C., Sinninghe Damsté, J.S., 2006. Occurrenceand distribution of tetraether membrane in soils: implications for the use of the BITindex and the TEX86 SST proxy. Org. Geochem. 37, 1680–1693.
Weijers, J.W.H., Schefuß, E., Schouten, S., Sinninghe Damsté, J.S., 2007a. Coupled thermaland hydrological evolution of tropical Africa over the last deglaciation. Science 315,1701–1704.
Weijers, J.W.H., Schouten, S., van den Donker, J.C., Hopmans, E.C., Sinninghe Damsté, J.S.,2007b. Environmental controls on bacterial tetraether membrane lipid distribution insoils. Geochim. Cosmochim. Acta 71, 703–713.
Weijers, J.W.H., Schouten, S., Sluijs, A., Brinkhuis, H., Sinninghe Damsté, J.S., 2007c.Warm arctic continents during the Palaeocene–Eocene thermal maximum. EarthPlanet. Sc. Lett. 261, 230–238.
WMO, 2007. World Meteorological Organization. http://worldweather.wmo.int. On-lineavailable.
Wu, N., Liu, T., Liu, X., Gu, Z., 2002. Mollusk record of millennial climate variability in theLoess Plateau during the Last Glacial Maximum. Boreas 31, 20–27.
Yuan, D., Cheng, H., Edwards, R.L., Dykoski, C.A., Kelly, M.J., Zhang, M., Qing, J., Lin, Y.,Wang, Y., Wu, J., Dorale, J.A., An, Z., Cai, Y., 2004. Timing, duration and transitions ofthe last interglacial Asian monsoon. Science 304, 575–578.
Zheng, H., Huang, X., Ji, J., Liu, R., Zeng, Q., Jiang, F., 2007. Ultra-high rates of loesssedimentation at Zhengzhou since Stage 7: implication for the Yellow River erosionof the Sanmen Gorge. Geomorphology 85, 131–142.
Zhou, Z., Baoyin, Y., Petit-Maire, N., 1998. Paleoenvironments in China during the LastGlacial Maximum and the Holocene Optimum. Episodes 21, 152–158.
264 F. Peterse et al. / Earth and Planetary Science Letters 301 (2011) 256–264