Evidence of anisotropic magnetic polarons in La 0.94 Sr 0.06 MnO 3 by neutron scattering and...
11
arXiv:cond-mat/9910361v2 [cond-mat.str-el] 29 Feb 2000 Evidence of anisotropic magnetic polarons in La 0.94 Sr 0.06 MnO 3 by neutron scattering and comparison with Ca-doped manganites M. Hennion 1 , F. Moussa 1 , G. Biotteau 1 , J. Rodr´ ıguez-Carvajal 1 , L. Pinsard 2 and A. Revcolevschi 2 1 - Laboratoire L´ eon Brillouin, CEA-CNRS, CE Saclay, 91191 Gif sur Yvette Cedex France 2 - Laboratoire de Physico-Chimie des Solides Universit´ e Paris-Sud 91405 Orsay Cedex France (Phys. Rev. B Volume 61, Number 13, 1 April 2000) Elastic and inelastic neutron scattering experiments have been performed in a La0.94Sr0.06MnO3 un- twinned crystal, which exhibits an antiferromagnetic canted magnetic structure with ferromagnetic layers. The elastic small q scattering exhibits a modulation with an anisotropic q-dependence. It can be pictured by ferromagnetic inhomogeneities or large magnetic polarons with a platelike shape, the largest size (≈17 ˚ A) and largest inter-polaron distance (≈ 38 ˚ A) being within the ferromagnetic layers. Comparison with observations performed on Ca-doped samples, which show the growth of the magnetic polarons with doping, suggests that this growth is faster for the Sr than for the Ca substitution. Below the gap of the spin wave branch typical of the AF layered magnetic structure, an additional spin wave branch reveals a ferromagnetic and isotropic coupling, already found in Ca-doped samples. Its q-dependent intensity, very anisotropic, closely reflects the ferromagnetic correlations found for the static clusters. All these results agree with a two-phase electronic seg- regation occurring on a very small scale, although some characteristics of a canted state are also observed suggesting a weakly inhomogeneous state. PACS numbers: 74.50.C, 75.30.K, 25.40.F, 61.12 I. INTRODUCTION In the simple ionic picture of La 1-x B x MnO 3 (B=Sr 2+ , Ca 2+ , or Ba 2+ ), upon increasing x, the Mn 3+ ions char- acterized by three t 2g and one e g electrons are gradu- ally replaced by Mn 4+ with empty e g orbitals. These compounds have attracted much attention due to their anomalous transport, magnetic and structural proper- ties. The low-doping range of these compounds preceding the ferromagnetic and metallic phase is far from being fully explored, and the mechanism driving the metal- insulator transition is still unclear. On the theoretical side, the situation is rather controversial. Two pictures have been proposed. In the model of de Gennes 1 , the competition between the AF superexchange and the fer- romagnetic double-exchange couplings associated with the hole hopping 2 , results in a canted state. In con- trast with this picture, several authors have found that an inhomogeneous representation of ferromagnetic hole-rich regions (called ferrons or ferromagnetic polarons), within an antiferromagnetic hole-poor medium, could be more favorable than that of a canted state 3–6 . Similar results have been obtained by Monte-Carlo simulations 8–10 . This picture of ferromagnetic polaron, here, differs from the spin polaron picture discussed by Kasuya 7 , which consists of a ferromagnetic cloud surrounding one hole. In La 1-x Ca x MnO 3 , interesting observations have been recently reported: a ”static” ferromagnetic modulation has been observed at small wave-vectors q, interpreted in terms of magnetic inhomogeneities or droplets, with a distribution analogous to that of a liquid 11 . More- over, below the gap of the spin wave branch with an anisotropic dispersion typical of the AF layered struc- ture, an additional spin wave branch with an isotropic dispersion was observed 11–13 . Whether these findings are restricted to Ca substitution, in relation with the stronger induced lattice distortion, or are more general, is an important question. The present study carried out on Sr-substituted samples sheds light on this issue. Sr is known to induce a smaller distortion of the Mn-O-Mn bonds than Ca, resulting in a higher hopping probabil- ity, t, for the e g holes. Therefore, in the ferromagnetic and metallic state, at large x values, the ferromagnetic transition temperature is much higher for Sr than for Ca substitution. This enhanced ferromagnetic character can also be seen at smaller x, by a shift of the critical concentration x c for the metal-insulator transition. For instance, the x Sr =0.175 sample is metallic 14,15 , whereas the x Ca =0.194 one is still insulating 16 . Previous inelas- tic neutron measurements on low doped La 1-x Sr x MnO 3 , with x=0.05 17 and 0.09 18 , have reported a single spin wave branch, with AF interplane and F in-plane mag- netic couplings. The present study, carried out on an untwinned x Sr =0.06 sample, reveals two additional features. Below the temperature of the magnetic transition, a ferromag- netic modulation of the intensity of neutron scattering can be observed at small q, similarly to our previous observations in one Ca-substituted sample 11 . The un- twinned sample reveals the anisotropic character of this modulation. The size of the inhomogeneities is about twice as larger (17 ˚ A) within the ferromagnetic layers as perpendicularly to them, indicating platelets instead of droplets. Furthermore, an additional spin wave branch is observed with an isotropic dispersion curve, charac- teristic of a ferromagnetic coupling. The q dependence of the corresponding susceptibility, along the two main symmetry directions, reflects closely the correlations of the static inhomogeneities, showing the same anisotropy. This study confirms the general character of our previous 1
-
Upload
independent -
Category
Documents
-
view
0 -
download
0
Transcript of Evidence of anisotropic magnetic polarons in La 0.94 Sr 0.06 MnO 3 by neutron scattering and...

arX
iv:c
ond-
mat
/991
0361
v2 [
cond
-mat
.str
-el]
29
Feb
2000
Evidence of anisotropic magnetic polarons in La0.94Sr0.06MnO3 by neutron scattering
and comparison with Ca-doped manganites
M. Hennion1, F. Moussa1, G. Biotteau1, J. Rodrıguez-Carvajal1, L. Pinsard2 and A. Revcolevschi2
1 - Laboratoire Leon Brillouin, CEA-CNRS, CE Saclay, 91191 Gif sur Yvette Cedex France
2 - Laboratoire de Physico-Chimie des Solides Universite Paris-Sud 91405 Orsay Cedex France
(Phys. Rev. B Volume 61, Number 13, 1 April 2000)
Elastic and inelastic neutron scattering experiments have been performed in a La0.94Sr0.06MnO3 un-twinned crystal, which exhibits an antiferromagnetic canted magnetic structure with ferromagneticlayers. The elastic small q scattering exhibits a modulation with an anisotropic q-dependence. Itcan be pictured by ferromagnetic inhomogeneities or large magnetic polarons with a platelike shape,the largest size (≈17A) and largest inter-polaron distance (≈ 38A) being within the ferromagneticlayers. Comparison with observations performed on Ca-doped samples, which show the growth ofthe magnetic polarons with doping, suggests that this growth is faster for the Sr than for the Casubstitution. Below the gap of the spin wave branch typical of the AF layered magnetic structure,an additional spin wave branch reveals a ferromagnetic and isotropic coupling, already found inCa-doped samples. Its q-dependent intensity, very anisotropic, closely reflects the ferromagneticcorrelations found for the static clusters. All these results agree with a two-phase electronic seg-regation occurring on a very small scale, although some characteristics of a canted state are alsoobserved suggesting a weakly inhomogeneous state.
PACS numbers: 74.50.C, 75.30.K, 25.40.F, 61.12
I. INTRODUCTION
In the simple ionic picture of La1−xBxMnO3 (B=Sr2+,Ca2+, or Ba2+), upon increasing x, the Mn3+ ions char-acterized by three t2g and one eg electrons are gradu-ally replaced by Mn4+ with empty eg orbitals. Thesecompounds have attracted much attention due to theiranomalous transport, magnetic and structural proper-ties. The low-doping range of these compounds precedingthe ferromagnetic and metallic phase is far from beingfully explored, and the mechanism driving the metal-insulator transition is still unclear. On the theoreticalside, the situation is rather controversial. Two pictureshave been proposed. In the model of de Gennes1, thecompetition between the AF superexchange and the fer-romagnetic double-exchange couplings associated withthe hole hopping2, results in a canted state. In con-trast with this picture, several authors have found that aninhomogeneous representation of ferromagnetic hole-richregions (called ferrons or ferromagnetic polarons), withinan antiferromagnetic hole-poor medium, could be morefavorable than that of a canted state3–6. Similar resultshave been obtained by Monte-Carlo simulations8–10.This picture of ferromagnetic polaron, here, differs fromthe spin polaron picture discussed by Kasuya7, whichconsists of a ferromagnetic cloud surrounding one hole.
In La1−xCaxMnO3, interesting observations have beenrecently reported: a ”static” ferromagnetic modulationhas been observed at small wave-vectors q, interpretedin terms of magnetic inhomogeneities or droplets, witha distribution analogous to that of a liquid11. More-over, below the gap of the spin wave branch with ananisotropic dispersion typical of the AF layered struc-ture, an additional spin wave branch with an isotropicdispersion was observed11–13. Whether these findings
are restricted to Ca substitution, in relation with thestronger induced lattice distortion, or are more general,is an important question. The present study carried outon Sr-substituted samples sheds light on this issue. Sris known to induce a smaller distortion of the Mn-O-Mnbonds than Ca, resulting in a higher hopping probabil-ity, t, for the eg holes. Therefore, in the ferromagneticand metallic state, at large x values, the ferromagnetictransition temperature is much higher for Sr than forCa substitution. This enhanced ferromagnetic charactercan also be seen at smaller x, by a shift of the criticalconcentration xc for the metal-insulator transition. Forinstance, the xSr=0.175 sample is metallic14,15, whereasthe xCa=0.194 one is still insulating16. Previous inelas-tic neutron measurements on low doped La1−xSrxMnO3,with x=0.0517 and 0.0918, have reported a single spinwave branch, with AF interplane and F in-plane mag-netic couplings.
The present study, carried out on an untwinnedxSr=0.06 sample, reveals two additional features. Belowthe temperature of the magnetic transition, a ferromag-netic modulation of the intensity of neutron scatteringcan be observed at small q, similarly to our previousobservations in one Ca-substituted sample11. The un-twinned sample reveals the anisotropic character of thismodulation. The size of the inhomogeneities is abouttwice as larger (17A) within the ferromagnetic layers asperpendicularly to them, indicating platelets instead ofdroplets. Furthermore, an additional spin wave branchis observed with an isotropic dispersion curve, charac-teristic of a ferromagnetic coupling. The q dependenceof the corresponding susceptibility, along the two mainsymmetry directions, reflects closely the correlations ofthe static inhomogeneities, showing the same anisotropy.This study confirms the general character of our previous
1

observations. The density of the platelets which is muchlower than the hole density confirms a picture of an elec-tronic phase segregation on the scale of two tens of A.Comparison with the previously studied Ca-substitutedsample (xCa=0.08) and with a new one with a smallerxCa value (xCa=0.05) reported here , brings up to de-duce that the ferromagnetism induced by hole doping isenhanced upon Sr substitution. Such an enhancement isobserved both in the size of the ferromagnetic polaronsand in the characteristics of the spin dynamics.
The rest of the paper is organized as follows: In sectionII the magnetic structure is determined. In section III Aand B, elastic diffuse scattering data at small angle andaround the (110) Bragg peak are reported. In section IV,the spin dynamics is investigated. Finally, in section V,the overall results are discussed.
II. MAGNETIC STRUCTURE
Experiments have been carried out on the three-axisspectrometer 4F1, installed on a cold source at the re-actor Orphee (Laboratoire Leon Brillouin), on an un-twinned single crystal of La0.94Sr0.06MnO3 (0.1 cm3),grown by a floatting zone method. The nominal x=0.06value agrees with x deduced from the lattice param-eters reported in1920. The structure is orthorhombic(c/
√2 < a < b) with Pbnm symmetry. The temperature
dependence of (110), (001) and (112) Bragg-peak inten-sities was studied. The τ=(001) Bragg-peak intensitydetermines a long range antiferromagnetic order belowTN=130K (see Fig. 1-a). The evolution of the τ=(112)Bragg peak intensity, very sensitive to the occurence offerromagnetism because of its small nuclear intensity, de-termines a long range ferromagnetic order at TK=124 K,smaller than TN (see Fig 1-b, c). The absence of anymagnetic component below TK in the (002) Bragg peakintensity, indicates that the ferromagnetic spin compo-nent is along [001] (geometrical factor). Therefore anaverage canted state is defined below TK , which consistsof ferromagnetic layers in the (a, b) plane, antiferromag-netically stacked along c, and with a weak ferromagneticspin component along c as sketched in Fig. 1-d. Thetwo transition temperatures agree with the phase dia-gram of Ca-doped samples13 being between those foundfor xCa=0.05 and xCa=0.08. However, an interesting dif-ference between the two systems appears for the spindeviation or canting angle θ deduced from the weak fer-romagnetic component. From the (112) Bragg peak in-tensity, an average deviation angle θ from b towards cof 130 is determined at T=15K; this value is the same asthat found for xCa=0.08, and much larger than the value,θ=50, determined for xCa=0.05. Therefore, the increaseof the canted angle θ, upon increasing x, is faster for aSr substitution than for a Ca one. It is worth-notingthat the Bragg-peak intensities define an average mag-netization m but do not inform about its homogeneous
or inhomogeneous character. The inhomogeneities con-tribute to diffuse scattering between Bragg peaks whichis studied below.
40 60 80 100 120 140T(K)
1.5
2.0
2.5
3.0
3.5
4.0(112) Intensity
(c)
0 20 40 60 80 100 120 140 160T(K)
0
2
4
6
8
(001) Intensity
(a)
0 50 100 150 200 250T(K)
1.0
1.5
2.0
2.5
3.0
3.5
4.0
Inte
nsity
(ar
bitr
ary
units
)
(112) Intensity
(b)
Inte
nsity
(ar
bitr
ary
units
) C(d)
b
m
θ
FIG. 1. a) Temperature variation of the intensity of (a)the (001) Bragg peak defining TN (130K) , and (b, c) the(112) Bragg peak defining TK= (124K). In (d), the drawingrepresents the average magnetic structure.
III. ELASTIC DIFFUSE SCATTERING
Elastic (hω=0) diffuse scattering measurements, whichgive access to short-range ordered correlations, have beenperformed at several temperatures along several Q-pathsin the reciprocal lattice, with Q=q+τ . In section A, dif-fuse scattering intensity close to the direct beam τ=(000)is reported along the main symmetry directions. In sec-tion B, diffuse scattering around τ=(110) is reportedalong the same q directions.
These two types of experiments appear complemen-tary. The scattering intensity close to the direct beamis more easily modelized, but, because of the geometricalfactor, the [001] symmetry direction is unobservable. Incontrast, this direction can be observed close to τ=(110).We also compare the diffuse scattering close to τ=(110)with that measured close to τ=(220), where, due to theMn magnetic form factor, the magnetic intensity is ex-pected to decrease. Finally, antiferromagnetic correla-tions have also been measured close to τ=(001) alongthe [001] direction and reported in section C.
A. Ferromagnetic short-range order studied close toτ=(000)
1) Experiment
2
0.0 0.1 0.2 0.3 0.4 0.5q(A−1)
−1
0
1
2
Inte
nsity
(bar
ns/M
n)
q//[001]
(b)
0.0 0.2 0.4 0.6q(A−1)
0
1
2ba
rns/
Mn
q//[110]q//[112]
(a)
0
100
200
Neu
tron
Cou
nts/
549s
125
0
250
Neu
tron
Cou
nts/
549s
Inte
nsity
ξ //
d m
0
z(c)
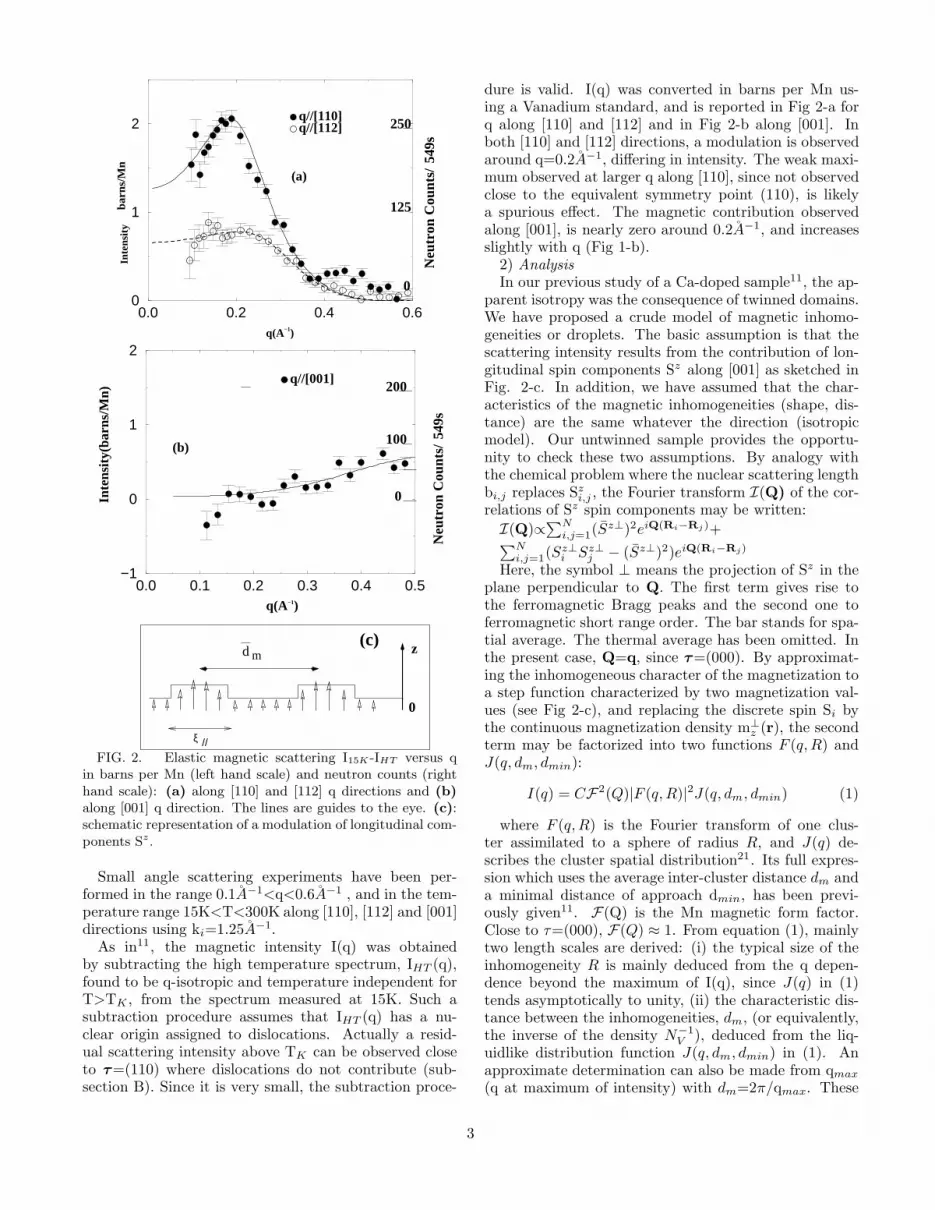
FIG. 2. Elastic magnetic scattering I15K -IHT versus qin barns per Mn (left hand scale) and neutron counts (righthand scale): (a) along [110] and [112] q directions and (b)along [001] q direction. The lines are guides to the eye. (c):schematic representation of a modulation of longitudinal com-ponents Sz.
Small angle scattering experiments have been per-formed in the range 0.1A−1<q<0.6A−1 , and in the tem-perature range 15K<T<300K along [110], [112] and [001]directions using ki=1.25A−1.
As in11, the magnetic intensity I(q) was obtainedby subtracting the high temperature spectrum, IHT (q),found to be q-isotropic and temperature independent forT>TK , from the spectrum measured at 15K. Such asubtraction procedure assumes that IHT (q) has a nu-clear origin assigned to dislocations. Actually a resid-ual scattering intensity above TK can be observed closeto τ=(110) where dislocations do not contribute (sub-section B). Since it is very small, the subtraction proce-
dure is valid. I(q) was converted in barns per Mn us-ing a Vanadium standard, and is reported in Fig 2-a forq along [110] and [112] and in Fig 2-b along [001]. Inboth [110] and [112] directions, a modulation is observedaround q=0.2A−1, differing in intensity. The weak maxi-mum observed at larger q along [110], since not observedclose to the equivalent symmetry point (110), is likelya spurious effect. The magnetic contribution observedalong [001], is nearly zero around 0.2A−1, and increasesslightly with q (Fig 1-b).
2) AnalysisIn our previous study of a Ca-doped sample11, the ap-
parent isotropy was the consequence of twinned domains.We have proposed a crude model of magnetic inhomo-geneities or droplets. The basic assumption is that thescattering intensity results from the contribution of lon-gitudinal spin components Sz along [001] as sketched inFig. 2-c. In addition, we have assumed that the char-acteristics of the magnetic inhomogeneities (shape, dis-tance) are the same whatever the direction (isotropicmodel). Our untwinned sample provides the opportu-nity to check these two assumptions. By analogy withthe chemical problem where the nuclear scattering lengthbi,j replaces Sz
i,j , the Fourier transform I(Q) of the cor-relations of Sz spin components may be written:
I(Q)∝∑N
i,j=1(Sz⊥)2eiQ(Ri−Rj)+
∑Ni,j=1(S
z⊥i Sz⊥
j − (Sz⊥)2)eiQ(Ri−Rj)
Here, the symbol ⊥ means the projection of Sz in theplane perpendicular to Q. The first term gives rise tothe ferromagnetic Bragg peaks and the second one toferromagnetic short range order. The bar stands for spa-tial average. The thermal average has been omitted. Inthe present case, Q=q, since τ=(000). By approximat-ing the inhomogeneous character of the magnetization toa step function characterized by two magnetization val-ues (see Fig 2-c), and replacing the discrete spin Si bythe continuous magnetization density m⊥
z (r), the secondterm may be factorized into two functions F (q, R) andJ(q, dm, dmin):
I(q) = CF2(Q)|F (q, R)|2J(q, dm, dmin) (1)
where F (q, R) is the Fourier transform of one clus-ter assimilated to a sphere of radius R, and J(q) de-scribes the cluster spatial distribution21. Its full expres-sion which uses the average inter-cluster distance dm anda minimal distance of approach dmin, has been previ-ously given11. F(Q) is the Mn magnetic form factor.Close to τ=(000), F(Q) ≈ 1. From equation (1), mainlytwo length scales are derived: (i) the typical size of theinhomogeneity R is mainly deduced from the q depen-dence beyond the maximum of I(q), since J(q) in (1)tends asymptotically to unity, (ii) the characteristic dis-tance between the inhomogeneities, dm, (or equivalently,the inverse of the density N−1
V ), deduced from the liq-uidlike distribution function J(q, dm, dmin) in (1). Anapproximate determination can also be made from qmax
(q at maximum of intensity) with dm=2π/qmax. These
3

two parameters are included in the scale factor C of (1),C = (γr0)
2|∆mz⊥|2NV V2, (γ, r0 being constants for neu-tron scattering). The only free parameter when fittingis the squared magnetic contrast |∆mz⊥|2, given by thedifference of the magnetizations between the two regions(sketched in Fig. 2-c). In this model, the intensity isvery sensitive to the size (R enters at the power 6 in theconstant C for a spherical shape through the squared vol-ume V 2). Therefore, in an isotropic model, the scatter-ing intensity I(q) changes only by the geometrical factoras the q direction varies, decreasing by ≈1/2 from [110](perpendicular to c) to [112], down to zero along [001].
Comparison of these predictions with observations ofFig. 2-a and Fig. 2-b, leads to the following conclusions.The striking result is the absence of any intensity in therange 0.1<q<0.2 A−1 along [001], where the maximumof intensity was observed in twinned samples. This con-firms the assignment of this magnetic scattering to Sz
spin components. The increasing intensity at larger qindicates short-range antiferromagnetic correlations (theAF Bragg peak (001) is located at q=0.83A−1 in Fig 2).They will be discussed in section C. Along [110] and [112],the scattering intensities do not only differ by a simplegeometrical factor, but also by some anisotropy in their qdependence. The slower q dependence of I(q) beyond themaximum, for q along [112] indicates a smaller size alongthe [112] direction (at ≈ 450 from c) suggesting a stillsmaller size along the [001]direction. Diffuse scatteringexperiments close to τ=(110) reported in section B willcharacterize this anisotropy.
In the absence of any anisotropic model, a semi-quantitative description can be made, using the equa-tion (1) to fit I(q) along the [110] direction only. The fit(continuous line in Fig 2-a) provides a correlation length2R=ξ//≈17A and a density of clusters NV which cor-responds to an inter-cluster distance which is twice thediameter value. The low density of the ferromagneticclusters cannot be explained by the picture proposed fordiluted chalcogenide alloys7 where a single electron fer-romagnetically polarizes the neighbor spins but ratherindicates an electronic phase separation. In the rest ofthe paper, these ferromagnetic inhomogeneities are calledferromagnetic clusters or large ferromagnetic polarons inan equivalent way.
In Fig. 3, I(q) for xSr=0.06 is compared with I(q) forxCa=0.0811 and xCa=0.05, in absolute units, for q alongthe [110] direction and at T=15K. For the Ca-substitutedsamples, a factor 2/3 takes into account the fact thatone domain out of three does not contribute (e.g. wereport 3/2 I(q), I(q) being displayed in11). We estimatea possible error of 10% in the intensities, due to the factthat they are corrected for sample transmission which iscalculated instead of measured.
Considering first the two Ca-substituted samples, theanalysis (dashed and dot-dashed lines) shows the growthof the clusters with xCa from ≈ 14A to ≈ 17A as xCa
varies from 0.05 to 0.08. In addition, there is a smallshift of qmax with xCa, interpreted as an increase of
the cluster density. The increase of the intensity by afactor two nearly agrees with equation (1) , being 30%smaller than expected. Interestingly, when comparingthe xSr=0.06 sample to the two Ca-substituted ones, themaximum intensity of I(q) (≈ 2 barns/Mn) and the q de-pendence beyond qmax nearly coincide with the values ofthe xCa=0.08 case. Within the above model (continuousand dot-dashed lines), it indicates that the cluster size isthe same in the two samples. We note a small shift of theqmax value between both samples, also observed in theraw data around τ=(110), reported in the inset of Fig.3 in reduced lattice units (rlu), which could indicate aslightly smaller cluster density in the xSr=0.06 sample.
It results from the analysis of these three samples,that the intensity seems to be mainly determined bythe size, in agreement with the model given by equa-tion (1). This also indicates that the magnetic contrastvalue is the same in the three samples. As previouslyreported11, the value deduced from the scale factor Cin (1), |∆mz⊥|≈0.7µB is surprisingly small. This couldresult from an overestimate of the volume due to theshape anisotropy, the [110] direction corresponding to thelargest size. Moreover, a slow decrease of the magneti-zation starting from the core of the polaron, as sketchedin Fig. 2-c, is more realistic than the step function ofthe present model. We indicate that NMR experimentsunder an applied field suggest that some spins are fullyferromagnetic22.
In conclusion of the above analysis, the size of the clus-ter, at a given x, depends on the chemical dopant, beinglarger for Sr than for Ca. This outlines the role of thehopping probability ”t”, regulated by the mean Mn-O-Mn bond angle, to define the size.
0.00 0.20 0.40 0.60q(A−1)
0.0
0.5
1.0
1.5
2.0
Inte
nsity
(ba
rns/
Mn)
x(Ca)0.08x(Ca)=0.05x(Sr)=0.06
0.6 0.7 0.8 0.9 1.0[ζζ0]
0
500
1000In
ten
sity
xCa=0.08xSr=0.06
T=17K
FIG. 3. Magnetic scattering intensity versus q inbarns/Mn. Full circles: xSr=0.06, open circles: xCa=0.08and open squares: xCa=0.05. The continuous, dot-dashedand dashed lines are fits with the model (see the text). Inset:diffuse scattering (raw data) close to the (110) Bragg peak inequivalent reduced lattice units (rlu). Full circles: xSr=0.06,open circles: xCa=0.08. The continuous lines are guides forthe eyes.
4

B. Ferromagnetic short-range order studied close toτ=(110)
Diffuse scattering intensity has been measured close toτ=(110) for main symmetry directions and as a functionof temperature, using the incident neutron wavevectorki=1.55A−1.
0.0 0.2 0.4q(A−1)
100
300
500
700
Neu
tron
Cou
nts/
417s T=200K
TC=130KT=80KT=50KT=16K
0.0 0.2 0.4 0.6q(A−1)
100
200
300
400
Neu
tron
Cou
nts/
407s
lasr05.GA001.xmgr
T=16KT=200K
q//[001]
0.0 0.2 0.4q(A−1)
100
300
500
700
Neu
tron
Cou
nts/
417s T=15K
q//[112]
q//[110]
(b)
(c)
(a)
FIG. 4. a: Raw intensity versus q, converted in A−1. q in
rlu has been deduced from q=Q-τ , τ=(110). a: along [110],(0.4,0.4,0)<Q<(1,1,0). b: along [001], (1,1,0)<Q<(1,1,0.85)and c: along [112], (1,1,0)<Q< (1.3,1.3,0.6). The continuouslines are fits with a gaussian (modulation ) and delta func-tions (Bragg peak) except at 130K in (a) where a lorentzianfunction is used. In b, the gaussian component, corrected forthe geometrical factor, is shown by a dotted curve.
In Fig. 4 a-c, raw data are reported as a function ofq in A−1, for q//[110] (a), q//[001] (b) and q//[112] (c)at several temperatures. Here q is defined with respectto the (110) Bragg peak. Along [110], a modulation ofI(q) appears very well-defined at 16K. It agrees with theobservations reported close to τ=(000) (Fig. 2), consid-ering that slight differences may be expected due to thesubtraction procedure. Along [112] and [001] a modu-lation of I(q) is also clearly seen at 16K, growing belowthe transition temperature, but with a smaller amplitude.Note the change of scale in both coordinates between Fig.4-a and Fig. 4-b. Along [001], beyond q=0.55A−1, theincreasing intensity corresponds to the tail of the short-range antiferromagnetic order as q approaches the AF(111) Bragg-peak.
By neglecting the displacement of Mn atoms, we canuse the same analysis as that performed in section A.Since Sz⊥ in equation (1) is the spin component per-pendicular to Q= q+τ with τ=(110), all directions areobservable. Moreover, the corrections due to the geomet-rical factor can be neglected (cf Fig. 4-b).
All features indicate that the ferromagnetic corre-lations which define the ferromagnetic cluster have asmaller extension along [001] (antiferromagnetic stackingof the layers) than along [110] (within the ferromagneticlayer). Assuming that all q directions within the ferro-magnetic layers are equivalent, such an anisotropy definesa plate-like shape for the inhomogeneities or that of anellipsoid of revolution with main axes ξ//, ξ//, ξ⊥. Sincefew directions have been studied, the q-dependences havebeen fitted independently with a gaussian function as anapproximation of the F(q,R) function used in section A.Along [001], the q dependence beyond qmax determines atypical size ξ⊥≈7A (≈ 2 Mn-Mn distances), nearly twiceas small as the value ξ//≈17A found along [110]. Theorigin of this anisotropy will be discussed below, in rela-tion with the anisotropic double exchange due to the AFlayered structure.
In addition, the qmax value at the maximum of inten-sity is larger along [001] (q≈ 0.25A−1) than along [110](≈ 0.18A−1). We deduce an approximate inter-clusterdistance dm=2π/qmax smaller along [001] (≈ 25A), thanalong [110] (≈38A).
The behaviour with temperature has been mainly stud-ied for q along [110] (see Fig. 4-a). As T increases, adecrease of the intensity is observed.
The decrease of the elastic scattering does not resultfrom a dynamical broadening. This was checked by en-ergy scans at one constant q value, using the energy
5

resolution 40µeV (using an incident neutron wavevectorki=1.1 A−1). Therefore, the signal remains ”elastic” ,even for our best energy resolution up to TK . Close toTK a large scattering intensity enters in our finite experi-mental window, as shown in Fig 4-a at T=130K. It can befitted by a lorentzian function, and is attributed to crit-ical scattering. Above TK a residual bump of intensitypersists, centered at q=0. In conclusion, the scatteringintensity attributed to ferromagnetic polarons vanishesby approaching TK as does the ferromagnetic Bragg-peakintensity. The evolution of the q-dependence with tem-perature is difficult to determine, except at small q wherea shift of qmax to q=0 is observed. The residual scatter-ing above TK suggests that some electronic segregation,which, in the temperature range T<TK gives rise to theferromagnetic clusters, could also persist above TK . Ac-tually, such a persistence can be better studied from thetemperature evolution of the unusual spin dynamics, aswas reported for the Ca substituted samples13.
0.6 0.7 0.8 0.9 1.0[ζζ0]
0
200
400
600
800
Neu
tron
Cou
nts
q=Q−τ, τ=(220)q=Q−τ, τ=(110)
T=15K
FIG. 5. Comparison between diffuse scattering observedalong [110], around τ=(110) (empty circles) and (220) (fullcircles) using ki=2.662A
−1. Close to τ=(110), only a modu-lation fitted by a Gaussian (continuous line) is observed withthe Bragg peak (dotted line). Close to τ=(220), a new com-ponent (dotted dashed line) is observed in addition to themagnetic modulation (dashed line).
Finally, in Fig 5, the diffuse scattering along [110]observed around τ=(110) and τ=(220) are compared,both being measured in the same experimental condi-tions (ki=2.662A−1). The modulation does not readilyappear around τ=(220). Actually, besides the contribu-tion of the Bragg peak, I(q) consists of a q-modulated in-tensity, twice smaller than that observed around τ=(110)(dashed line), superimposed to a huge intensity at smallerq, approximated by a lorentzian function (dotted -dashedline). The decrease of the modulated intensity with Qas τ increases from (110) to (220), agrees with the de-crease of the squared Mn 3+ magnetic form factor, F(Q)2
in equation (1), emphasizing the magnetic origin of themodulation. The lorentzian contribution, since not ob-
served around τ=(110), has no magnetic origin. It revealsa deviation from the perfect atomic long range order.Deviations from atomic positions give rise to a nuclearintensity varying with Q2, whatever their isolated or seg-regated character23. We recall that diffraction measure-ments performed on a very large Q range, and using apair distribution function have determined two distinctMn-O distances attributed to Mn4+ and Mn3+24, andtherefore a disorder for the oxygen positions. The presentobservation could be related to this disorder.
C. Antiferromagnetic short-range order
As a feed-back effect of the ferromagnetic inhomo-geneities described above, we also expect to observe someAF short-range correlations within the canted AF layeredstructure. Elastic diffuse scattering has been measuredalong [001], close to the antiferromagnetic Bragg-peakτ=(001) at T=16K and T>TN (T=200K) and reportedin Fig. 6. There, due to the geometrical factor, onlycorrelations of spin components transverse to the [001]direction (Sx, Sy) are measured. Actually, below TK ,a diffuse scattering intensity grows. At 16K, the inten-sity consists of a weak modulation in the same q rangeas in Fig. 4-b, superimposed to a q-lorentzian intensityat the foot of the Bragg-peak. This latter reveals anadditional magnetic disorder, corresponding to a weakdeviation from the AF ordering on a scale larger thanthe ferromagnetic cluster (≈130A from the q-linewidth).It likely corresponds to some rotation of the transversecomponents in the (a, b) plane around their mean b di-rection, which is an additional degree of freedom for thesespin components.
0.0 0.1 0.2 0.3 0.4 0.5q(A−1)
0
100
200
300
400
500
Neu
tron
Cou
nts/
425s
T=16KT=200K
q=Q−τ
τ=(001)
FIG. 6. Scattering intensity versus q in A−1 along [001],
with q=Q-τ , τ=(001): filled circle: T=16K empty circle:T=200K. Data at 16K are fitted by the sum of a delta func-tion (dotted curve) for the Bragg peak with a lorentzian(long-dashed line) and a gaussian (small-dashed line) func-tions.
6

IV. SPIN WAVES
In the previous section, we have described an inho-mogeneous state from a phenomenological point of view:cluster size, shape anisotropy etc. The determination ofthe magnetic excitations allows a better understanding ofthis peculiar magnetic state. Moreover, in the absence oftwinned domains, the magnon intensities can be preciselydetermined, bringing new important informations. Sincewe have already studied them in the Ca-doped samples,we can get a quantitative comparison between the twosystems.
1.0 1.2 1.4 1.6 1.8 2.0 (0,0,ζ)
0
1
2
3
Ene
rgy
(meV
)
T=50K
������������������������
1.0 1.2(ζ,ζ,0)
0
1
2
3
FIG. 7. Dispersion curves of spin waves for q along [001]and along [110]. Filled symbols correspond to the high energyspin wave branch, and empty ones to the low energy one. Thecontinuous lines are guides for the eye. The arrows point thegap value of the low-energy branch for xCa=0.05 (upper one)and xCa=0.08 (lower one).
Inelastic neutron scattering experiments were per-formed on the spectrometer 4F1, at constant final neu-tron wavevectors kf=1.55A−1 and kf=1.3A−1 at 50Kand 15K. Energy spectra for excitations in creation modeprocess have been fitted by a lorentzian function as spec-tral function, convoluted with the spectrometer resolu-tion:
S(Q, hω) = AF(Q)2hω(1 + n(hω))χ(Q)×
Γ(q)
(hω − hω(q))2 + Γ(q)21
π(2)
From the fits, the energy modes ω(q), their dampingΓ(q) and the energy integrated intensity χ(Q) are deter-mined. This latter parameter contains the geometricalform factor and any Q dependence related to the sym-metry of the magnetic structure. Since the modes areunderdamped, the choice of the spectral function doesnot affect the results. n(hω) is the Bose population fac-tor.
To benefit from the increase of intensity related to thethermal population factor, the two main-symmetry di-rections [001] and [110] have been fully studied at 50K,whereas only the [001] direction has been studied at 15K.
In Fig. 7, hω(q) are reported for q in rlu along [001]and [110] directions at T=50K, focusing on the energyrange below 3 meV. The scale in abscissa has been cho-sen to allow a direct comparison of the two directionsin A−1 units. The similarities of the dispersion curveswith previous observations in Ca-substituted samples arestriking12,13: two dispersive spin-wave branches are ob-served. One with a large gap and an anisotropic disper-sion, characteristic of the AF layered structure. Cor-responding spectra are shown in Fig 8-a for direction[001].The other one, with a small gap and an isotropicdispersion, is observed at nuclear Bragg-peaks only. It ischaracteristic of a ferromagnetic coupling. Along [001],it levels up at the zone boundary (001.5), and lies be-low the gap of the former (see the hatched area alongthe [001] direction in Fig. 7). Corresponding spectra areshown in Fig. 8-b, and 8-c for directions [001] and [110]respectively.
By fitting the high energy branch along [001] with adispersion relation deduced from a Heisenberg hamilto-nian as in the pure system25, we determine an interlayer”effective” antiferromagnetic coupling (J2=-0.3 meV atT=15K), strongly reduced with respect to the undopedsystem25 (J2=-0.58 meV at T=15K). Along [110], highenergy measurements are lacking to determine the J1
coupling, which was found to increase slightly with x inCa-doped samples13.
The low-energy spin wave branch has been analyzedwith a phenomenological quadratic law at small q,hω=Dq2 +hω0 (D = 6JSa2
0, if J is the first neighborcoupling). The fit determines h ω0=0.54±0.02 meV andD=10 meVA2 at 15K in both directions.
Γ(q), which characterizes the excitation damping ofthe low-energy branch, obeys well a quadratic law, iden-tical for the [001] and [110] directions (see Fig. 9 for the[001] direction).
The Q dependence of the energy-integrated intensity,χ(Q), reveals several new features.
1) The q-dependence of the low energy branch, mea-sured in the same Brillouin zone (centered at τ=(002))strongly differs for q//[001] and for q//[110]. This isillustrated in Fig. 10, where the two q directions arecompared. The fit with a q lorentzian lineshape (con-tinuous lines in Fig. 10) yields correlation ranges along[110] and along [001] of 19A and 4 A, respectively. Thisq-dependence is reminiscent of the ferromagnetic corre-lations ξ// and ξ⊥ obtained for the static ferromagneticclusters. Because of the strong decrease of the intensityalong [110], the low-energy spin wave branch could notbe measured beyond some q value (ζ= 1.15 in Fig. 6),which is far from the zone boundary (ζ= 1.5) along thisdirection.
(2) The intensity of the magnetic excitations of thelow energy branch is twice larger for measurements inthe Brillouin zone centered at τ=(002), than in that cen-tered at τ=(110). This is illustrated in Fig. 8-d, for oneq value. Interestingly, this factor 2 corresponds to thegeometrical factor expected for spin fluctuations trans-
7

verse to the c axis, namely, the direction of ferromag-netism in this sample. This finding agrees with the as-signment of the low-energy spin-wave branch to the newferromagnetism induced by doping. We mention that,in our previous study of Ca-substituted samples13, thereported measurements have suggested a different con-clusion (intensity larger around (110) than (002)). Thisdifference is likely not real, but related to the difficulty ofseparating the domain contributions in twinned samples.
(3) Finally, we outline the absence of any intensityfor magnetic excitations of the high energy branch atτ=(002). This is illustrated in Fig. 10, where the fullsquares show the decrease of the spin wave intensities ofthe high energy branch from (001) to (002) along the [001]direction. This variation is a consequence of the symme-try of the antiferromagnetic layered structure. Therefore,we can assign the high energy branch to spins (or spincomponents) with the antiferromagnetic A type struc-ture. Accordingly, along [001], the intensity of the highenergy branch, maximum at (001) (full squares) and theintensity of the low energy one, maximum at (002) (opencircles) have complementary q-dependences. At interme-diate q, both types of excitations can be observed (seeζ=1.4 and 1.5 in reduced units in Fig 8-a).
The spin dynamics of the xSr=0.06 sample has alsobeen compared to that of the xCa=0.05 and 0.08 samples.
In Fig. 11, the dispersion of the low energy branchalong [001] is reported for xCa=0.05 (open squares),xCa=0.08 (open circles) and xSr=0.06 (full circles), allmeasurements being performed at T=15K.
0
2 0 0
4 0 0
6 0 0
8 0 0
1 0 0 0
1 2 0 0
0 . 5 1 1 . 5 2 2 . 5 3 3 . 5 4
ζ=1.5
ζ=1.4
ζ=1.3
ζ=1.2
ζ=1.1
ζ=1
Ne
utr
on
C
ou
nts
/26
7
se
c.
Energy (meV)
La0 . 9 4
S r0 . 0 6
MnO3
T=50 KQ//[00ζ]
0
1 0 0
2 0 0
3 0 0
4 0 0
0 0 . 5 1 1 . 5 2
ζ=1.6
ζ=1.7
ζ=1.8
ζ=1.9
ζ=2
Ne
utr
on
C
ou
nts
/34
3s
Energy (meV)
La0 . 9 4
S r0 . 0 6
MnO3
T=50 KQ//[00ζ]
(b)
0.0 0.5 1.0 1.5Energy (meV)
0
100
200
300
400
Neu
tron
Cou
nts
(700
s) Q=(0.05 0.05 2)
Q=(1.05 1.05 0)
0.0 0.5 1.0 1.5Energy(meV)
0
100
200
300
Neu
tron
Cou
nts/
700s
ζ=1.025ζ=1.05ζ=1.075ζ=1.1
Q//[110]
T=50K
(c)
(d)
T=50K
(a)
8

FIG. 8. Energy scans at constant Q a): along [001] atkf=1.55A
−1, b): along [001] at kf=1.3A−1, c) along [110]
with kf = 1.3A−1, d) along [110] in two different Brillouin
zones. The continuous lines are fits with a lorentzian functionconvoluted with the spectrometer resolution.
0.0 0.1 0.2 0.3 0.4q(A−1)
0.0
0.1
0.2
0.3
0.4
0.5
0.6
Γ(m
eV)
xSr=0.06 q//[001]
T=50K
FIG. 9. Linewidth of the low-energy spin wave modes Γversus q for q along [001] at T=50K.
1.0 1.2 1.4 1.6 1.8 2.0[0,0,ζ]
0
100
200
300
400
500
600
Ene
rgy
inte
grat
ed in
tens
ity
lower energy q//[001]lower energy q//[110]upper energy q//[001]
FIG. 10. q dependence of the magnon peak intensity at50K: along [001] for the high energy branch (filled squares)and the low energy branch (empty circles) and along [110]for the low energy branch starting from (002), and reportedin equivalent units of rlu [001] (filled circles).The continuouslines are a guide for the eyes.
0.0 0.1 0.2 0.3 0.4 0.5(0,0,ζ)
0.0
0.5
1.0
1.5
2.0
Ene
rgy(
meV
)
xSr=0.06xCa=0.08xCa=0.05
T=15K
FIG. 11. Dispersion of the low energy branch along [001]at T=15K for xCa=0.05 (empty squares) xCa=0.08 (emptycircles) and xSr=0.06 (full circles).
This comparison reveals that the low energy branchof xSr=0.06 corresponds very precisely to that measuredin the xCa=0.08 sample, well distinct from that in thexCa=0.05 sample. For instance, the gap value ω0=0.55meV, is twice smaller than the value (0.91 meV) foundat xCA=0.05. The same shift with x can be seen, con-sidering the value determined by EPR measurements26,namely ω0=0.74 meV for xSr=0.05, significantly smallerthan that measured at the same hole concentration in theCa-substituted sample (0.91meV). This enhancement ofthe ferromagnetism upon doping with Sr can also be seenwhen considering the antiferromagnetic coupling (”ef-fective” magnetic coupling J2) deduced from the highenergy branch, which is the same as that found forxCa=0.08.
We conclude that the characteristics of the low energybranch (gap and ferromagnetic coupling), as well as thoseof the high energy branch, evolve faster with x for Srdoping than for Ca doping. Moreover, the shift with x (≈2%) is the same when comparing the spin dynamics andthe evolution of the static ferromagnetic clusters (sectionIII-B). Therefore, a relation exists between the size ofthe ferromagnetic cluster and the ferromagnetic couplingor the gap value defined by the low-energy spin wavebranch.
In this comparison, we also note that the large gapvalue of the high energy branch, 1.86 meV at T=15K,is, within our accuracy, the same as the gap value thatwas determined in Ca-doped samples, which is constantin the 0.05 ≤ xCa ≤ 0.1 concentration range11,13. Cor-respondingly, the value of the low energy branch at thezone boundary appears also fixed (see at (001.5) in Fig.11), so that the spin wave lies below the gap of the highenergy branch, in a separated energy range.
Preliminary results in LaMnO3+δ confirm the generalcharacter of these observations.
V. DISCUSSION AND CONCLUSION
In this paper, we have shown that all the unusual staticand dynamical features found in the Ca doped samples,also exist with Sr doping, confirming the general charac-ter of our previous observations.
The analysis which takes into account the anisotropy ofthe spatial distribution, indicates a density of ferromag-netic clusters ≈ 25 times smaller than the hole density.This suggests a picture of an electronic phase segrega-tion with hole-rich regions, as a general feature of the lowdoping state. The absence of any chemical segregation,checked by X-rays for one Ca-doped sample (x=0.08),confirms this electronic origin. However, the ferromag-netic component deduced from the Bragg-peak intensities
9

cannot be explained by the volume fraction of ferromag-netic clusters only, suggesting that a small ferromagneticcomponent also exists within the matrix.
The two new results are: 1) anisotropy of the ferro-magnetic cluster shape, indicating platelets rather thandroplets, 2) anisotropy of the dynamic susceptibility,which contrasts with the isotropy of the dispersion curve.Both features have been observed thanks to the absenceof twinning in our sample.
The anisotropy of the ferromagnetic cluster shape mustbe a consequence of the AF layered magnetic structureand of the double-exchange coupling of Zener2 which fa-vors the hole hopping within the ferromagnetic layer.The layered structure is related to the cooperative Jahn-Teller effect which lifts the degeneracy of the eg state27,28.The optimal size of the cluster can be defined from thecompetition between the kinetic energy of the eg holewhich is favored by the growth of the ferromagnetic clus-ter, and the long-range coulomb energy, which unfavorsthe electronic segregation3. The enhanced ferromagneticcharacter induced by the Sr dopant with respect to theCa dopant, confirms the role of some structural parame-ter for determining the hopping probability or the kineticenergy.
Turning now to the spin dynamics, we observe a coex-istence of two spin wave branches, the high energy one,typical of superexchange coupling, and the low energyone indicating a ferromagnetic and isotropic coupling.From the spin-wave intensities observed at the (002) and(110) Bragg peaks, we can assign the high energy branchto spins (or spin components) with the AF A-type struc-ture, and the low energy one to spins (or spin compo-nents) ferromagnetically aligned along c.
The fast decrease of the AF inter-layer coupling along[001], defined by the high-energy spin wave branch, andassigned to superexchange coupling, agrees well with pre-vious experimental results17. This evolution character-izes an increasing ferromagnetic character, showing thatthe spin coupling , typical of the antiferromagnetic lay-ered structure in which the clusters are embedded, is verysensitive to the doping x. Specially, this variation withx, can be explained within a model27, which does notassume any electronic phase segregation and does notconsider the canted state.
However, such a model cannot explain the low-energyspin-wave branch. The interesting result, concerningthis low-energy spin wave branch, is the perfect isotropyof the corresponding dispersion (and of the damping),within this AF layered magnetic structure. Moreover,the q-dependent susceptibility, strongly anisotropic, re-flects closely the anisotropic shape of the ferromagneticstatic clusters. All these characteristics lead to connectthese magnetic excitations with the ferromagnetic hole-rich regions.
The absence of any cut-off size effect or any anomalyat qmax in the dispersion curve, in contrast with the caseof the stripe picture for instance29, prevents a true in-homogeneous picture. Rather, it suggest that these spin
waves are coherent through the antiferromagnetic matrix.The long-range ferromagnetic order, found in the system(canted state) is certainly responsible for that. More-over, the origin of the small energy gap and its evolutionwith x, could be understood by using general conceptsof second order phase transitions. This allows to makesome predictions for the evolution with x of χ(q, ω) inω-q space. We recall that, as x increases, the small gapenergy at q=0 decreases and the strength of the ferro-magnetic coupling defined by the q-dependence increases.Therefore, the gap value at x could characterize a ”dis-tance” towards a critical xc value at T=0. This criticalconcentration would correspond to a uniform ferromag-netic state. Within such an approach, the new dynamicalsusceptibility χ (ω,q) can be described as a precursor ef-fect of this ”uniform” ferromagnetic and metallic phase.The isotropy of the new ferromagnetic coupling indicatesthat, in this region, the magnetic unit cell is the smallperovskite cube, as in the metallic phase occurring atx>xc.
The new ferromagnetic coupling is likely induced byitinerant eg holes. Therefore, in spite of the macro-scopic insulating character of the low-doped samples,band models3–5,8–103031 which consider itinerant eg holesin addition to localized spins, should be used.
This precursor dynamics is expected to disappear atthe metallic transition where the hole-rich and hole-poorregions melt into a single phase. Actually, at xSr=0.3, asingle spin dynamics is observed with a vanishingly smallgap value32. This will be discussed in a further paper onCa substituted samples where the spin dynamics at thetransition has been studied in a detailed way33.
Finally, we have outlined that, within our experimen-tal accuracy, the large gap of the high energy branch andthe magnon energy of the low-energy branch at the zoneboundary (001.5) appear to be fixed at some general val-ues. Moreover, the low energy branch lies below the gapof the high energy one (see the hatched area in Fig. 7), ina separated energy range. This latter peculiar feature hassimilarities with observations in La2NiO4.11
34, where itis discussed in terms of host-host and impurity-host cou-plings, by analogy with the single impurity problem35. Itis worth-noting that, unlike the case of La2NiO4.11, thetwo spin wave branches appear in two distinct symmetrypoints in the reciprocal space (001) and (002), definingtwo magnetic coupling of opposite sign along c. The com-petition between these two magnetic couplings could beresponsible for this separation in energy.
In conclusion, the static and dynamic spin correlationsin low-doped manganites characterize a picture of two-magnetic regions, confirming an electronic phase segre-gation. However, the existence of a long range ferromag-netic order indicates that the ferromagnetic regions areconnected through the matrix leading to a non uniformcanted state. Moreover, the spin dynamics assigned tothe AF spins or spin components, is strongly sensitiveto the doping, acquiring a stronger ferromagnetic char-acter as x increases. Therefore, some homogeneous and
10

inhomogeneous characteristics are actually observed to-gether, whereas they are exclusive in all the theoreticalmodels. This leads to a weakly inhomogeneous picture.Its true origin remains to be clarified.
ACKNOWLEDGEMENTS
We are very indebted to P. A. Lindgard, F. Onufrieva,
Y. Sidis, L. P. Gor’kov, S. Ishihara , A. M. Oles and M.Kagan for fruitful discussions.
1 P. G. de Gennes Phys. Rev.118, 141 (1960)2 C. Zener Phys. Rev. 82, 403 (1951)3 E. L. Nagaev Phys. Status Solidi B 186, 9 (1994) and Phys.Rev B 60 455 (1999)
4 L. P. Gor’kov Physics-Uspekhi 42 589 (1998) and L. P.Gor’kov and V. Z. Krezin JETP Lett. 67, 985 (1998)
5 M.Kagan, D. I. Khomskii and M.Mostovoy Europ. Phys.Journ. B 12 (1999)
6 D. Arovas and F. Guinea Phys. Rev B 58, 9150 (1998)7 T. Kasuya, A. Yanase Review of Modern Phys. 40 684(1968)
8 S. Yunoki, A. Moreo and E. Dagotto Phys. Rev. Lett. 81,5612 (1998)
9 A. Moreo S. Yunoki and E. Dagotto Science 283,203 (1999)10 H. Yi, J. Yu and S. I. Lee Eur.Phys. J. B. 7,509 (1999)11 M. Hennion, F. Moussa, G. Biotteau, J. Rodriguez-
Carvajal, L. Pinsard and A. Revcolevschi Phys. Rev. Lett.81 1957 (1998)
12 M. Hennion, F. Moussa, J. Rodriguez-Carvajal L. Pinsardand A. Revcolevschi Phys. Rev. B 56 R497 (1997)
13 F. Moussa, M. Hennion, G. Biotteau, J. Rodriguez-Carvajal, L. Pinsard and A. Revcolevschi to be publishedin Phys. Rev. B 60 (1999) November
14 A. A. Mukhin, V. Yu Ivanov, V. D. Travkin, S. P. Lebedev,A. Pimenov, A. Loidl, A. M. Balbashov JETP Lett. 68, 356(1998)
15 Y. Moritomo A. Asamitsu Y. Tokura Phys. Rev B 56,12190(1997)
16 J. Dho, I. Kim, S. Lee J. H. Lung and T. W. Noh Phys.Rev B 59 492 (1999)
17 K. Hirota, N. Kaneko, A. Nishizawa and Y. Endoh J. Phys.Soc. Japan 65 3736 (1996) and K. Hirota, N. Kaneko, A.Nishizawa, Y. Endoh, M. C. Martin and G. Shirane PhysicaB 237-238 36 (1997)
18 A. H. Moudden, L. Vassiliu-Doloc, L. Pinsard, A.Revcolevschi Physica B 241-243 276 (1998)
19 A. Urushibara, Y. Moritomo, T. Arima, A. Asamitsu, G.Kido and Y. Tokura Phys. Rev B 51 14103 (1995)
20 H. Kawano, R. Kogimoto, M. Kubota and H. Yoshizawa53 Phys. Rev. B 53, R 14709 (1996)
21 A. Guinier and G. Fournet ”Small angle scattering of Xrays” Ed. by John Wiley and Sons (1955)
22 G. Allodi, R. De Renzi, M. Solzi, M. W. Pieper. K.Kamenev and M. Hennion Annual Meeting of the ItalianNational Institute of Physics of the Matter (INFM) Cata-nia June (1999)
23 P. A. Dederichs J. of Phys. F 3 473 (1973) and Phys. Rev.B 4 1041(1971)
24 D. Louca, T. Egami, E. L. Brosha, H. Roder and A. R.Bishop Phys. Rev. B 56 R8475 (1997)
25 F. Moussa, M. Hennion, G. Biotteau, J. Rodriguez-Carvajal, L. Pinsard and A. Revcolevschi Phys. Rev. B.54 (1996) 15149
26 V. Yu Ivanov, V. D. Travkin, A. A. Mukhin, S. P. Lebedev,A. A. Volkov, A. Pimenov, A. Loidl, A. M. Balbashov andA. V. Mozhaev J. of Applied Physics 83, 7180 (1998).
27 L F. Feiner and A. M. Oles Physica B 259-261, 796 (1999)28 D. Feinberg, P. Germain, M. Grilli and G. Seibold Phys.
Rev. B 57 R5583 (1998)29 J. M. Tranquada, P. Wochner and D. J. Buttrey Phys. Rev.
Lett. 79 2133 (1997)30 A. J. Millis, B. I. Shraiman and R. Mueller Phys. Rev.
Lett.74,5144 (1995)31 S. Ishihara, J. Inoue and S. Maekawa Phys. Rev. B 55,
8280 (1997)32 M. C. Martin, G. Shirane, K. Hirota, Y. Moritomo and Y.
Tokura Phys. Rev B 53, 14285 (1996)33 G. Biotteau, M. Hennion, F. Moussa, J. Rodriguez-
Carvajal, L. Pinsard and A. Revcolevschi to be publishedin Phys. Rev. B.
34 K. Nakajima and Y. Endoh J. of Phys. Soc. of Japan 67(1998) 1552
35 T. Tonegawa Prog. Theor. Phys. 40 (1968) 1195
11