Avalanches in anisotropic sheared granular media
10
arXiv:0801.0862v1 [cond-mat.mtrl-sci] 6 Jan 2008 Granular Matter manuscript No. (will be inserted by the editor) Andr´ es A. Pe ˜ na · Sean McNamara · Pedro G. Lind · Hans J. Herrmann Avalanches in anisotropic sheared granular media Received: date Abstract We study the influence of particle shape anisotro- py on the occurrence of avalanches in sheared granular me- dia. We use molecular dynamic simulations to calculate the relative movement of two tectonic plates. Our model con- siders irregular polygonal particles constituting the material within the shear zone. We find that the magnitude of the avalanches is approximately independent on particle shape and in good agreement with the Gutenberg-Richter law, but the aftershock sequences are strongly influenced by the par- ticle anisotropy yielding variations on the exponent charac- terizing the empirical Omori’s law. Our findings enable one to identify the presence of anisotropic particles at the macro- mechanical level only by observing the avalanche sequences of real faults. In addition, we calculate the probability of oc- currence of an avalanche for given values of stiffness or fric- tional strength and observe also a significant influence of the particle anisotropy. 1 Introduction Natural earthquakes are one of the most catastrophic events in nature [1] with deep social implications, in terms of hu- man casualties and economic loss. Considerable efforts have been made to understand the earthquake dynamics and the underlying mechanisms prior to their occurrence [2; 3; 4; 5], either through experimental studies [6; 7; 8] or through par- ticle based numerical models [9; 10; 11; 12] of the relative motion of tectonic plates [1; 13; 14]. However, in most of the existing numerical models of earthquake fault the gouge is represented by discs [11; 12] or spheres [15]. The dynamics of such material within the A.A. Pe˜ na, S. McNamara, P.G. Lind Institute for Computational Physics, Universit¨ at Stuttgart, Pfaffen- waldring 27, D-70569 Stuttgart, Germany E-mail: [email protected] H.J. Herrmann Departamento de F´ ısica, Universidade Federal do Cear´ a, 60451-970 Fortaleza, Cear´ a, Brazil; Computational Physics, IfB, HIF E12, ETH H¨ onggerberg, CH-8093 Z¨ urich, Switzerland fault is thought to control the stick-slip instability that char- acterizes earthquake process. An understanding of its prop- erties is, therefore, vital to understand earthquake dynam- ics [16]. For instance, the existence of the gouge within the fault has been proposed to explain the low dissipation on shear zones, providing new insight into the heat flow para- dox [17]. In this case, the reduction of the macroscopic fric- tion and consequently, the heat generation is attributed to the deformational patterns such as rolling of particles [11; 12]. In laboratory experiments by Maron [8], the influence of par- ticle characteristics has also been studied. They found that frictional strength and stability of the granular shear zone is influenced by particle shape, size distribution and their evo- lution through particle crushing. Therefore, to model fault gouges one must also include different grain characteristics. In this paper, we use a model of polygonal particles [18; 19] to address the influence of anisotropy in granular media. We study the situation of two tectonic plates with bound- aries parallel to the direction along which the tectonic plates move – so-called transform boundaries [1; 14]. One of the most well known examples of such boundaries is the San Andres Fault in California where the Pacific plate and the North American plate are moving in opposite directions. In this particular case, the relative motion of the plates is about 40 mm/year, and thus the strain accumulation rate is around 3·10 −7 per year [20]. Further, different from previous studies [10], our model considers anisotropic particle shapes. The response of the system is characterized by discrete events or avalanches whose size covers many orders of magnitude, similar to the so-called crackling noise of physical systems [21]. We find that the magnitude of the avalanches is indepen- dent of the particle shape and in agreement with the Guten- berg-Richter law [22]. On the contrary, the distribution of the waiting times described by the Omori’s law [23] strongly depends on shape anisotropy. From this result, we raise the hypothesis of identifying at the macro-mechanical level the presence of anisotropic particles within the gouge, only by studying the temporal avalanche sequences. We further ar- gue that the existence of this anisotropic gouge in fault zones
-
Upload
independent -
Category
Documents
-
view
0 -
download
0
Transcript of Avalanches in anisotropic sheared granular media

arX
iv:0
801.
0862
v1 [
cond
-mat
.mtr
l-sci
] 6
Jan
2008
Granular Matter manuscript No.(will be inserted by the editor)
Andr es A. Pena · Sean McNamara · Pedro G. Lind · Hans J. Herrmann
Avalanches in anisotropic sheared granular media
Received: date
Abstract We study the influence of particle shape anisotro-py on the occurrence of avalanches in sheared granular me-dia. We use molecular dynamic simulations to calculate therelative movement of two tectonic plates. Our model con-siders irregular polygonal particles constituting the materialwithin the shear zone. We find that the magnitude of theavalanches is approximately independent on particle shapeand in good agreement with the Gutenberg-Richter law, butthe aftershock sequences are strongly influenced by the par-ticle anisotropy yielding variations on the exponent charac-terizing the empirical Omori’s law. Our findings enable oneto identify the presence of anisotropic particles at the macro-mechanical level only by observing the avalanche sequencesof real faults. In addition, we calculate the probability ofoc-currence of an avalanche for given values of stiffness or fric-tional strength and observe also a significant influence of theparticle anisotropy.
1 Introduction
Natural earthquakes are one of the most catastrophic eventsin nature [1] with deep social implications, in terms of hu-man casualties and economic loss. Considerable efforts havebeen made to understand the earthquake dynamics and theunderlying mechanisms prior to their occurrence [2; 3; 4; 5],either through experimental studies [6; 7; 8] or through par-ticle based numerical models [9; 10; 11; 12] of the relativemotion of tectonic plates [1; 13; 14].
However, in most of the existing numerical models ofearthquake fault the gouge is represented by discs [11; 12]or spheres [15]. The dynamics of such material within the
A.A. Pena, S. McNamara, P.G. LindInstitute for Computational Physics, Universitat Stuttgart, Pfaffen-waldring 27, D-70569 Stuttgart, GermanyE-mail: [email protected]
H.J. HerrmannDepartamento de Fısica, Universidade Federal do Ceara, 60451-970Fortaleza, Ceara, Brazil;Computational Physics, IfB, HIF E12, ETH Honggerberg, CH-8093Zurich, Switzerland
fault is thought to control the stick-slip instability thatchar-acterizes earthquake process. An understanding of its prop-erties is, therefore, vital to understand earthquake dynam-ics [16]. For instance, the existence of the gouge within thefault has been proposed to explain the low dissipation onshear zones, providing new insight into the heat flow para-dox [17]. In this case, the reduction of the macroscopic fric-tion and consequently, the heat generation is attributed tothedeformational patterns such as rolling of particles [11; 12].In laboratory experiments by Maron [8], the influence of par-ticle characteristics has also been studied. They found thatfrictional strength and stability of the granular shear zone isinfluenced by particle shape, size distribution and their evo-lution through particle crushing. Therefore, to model faultgouges one must also include different grain characteristics.
In this paper, we use a model of polygonal particles [18;19] to address the influence of anisotropy in granular media.We study the situation of two tectonic plates with bound-aries parallel to the direction along which the tectonic platesmove – so-called transform boundaries [1; 14]. One of themost well known examples of such boundaries is the SanAndres Fault in California where the Pacific plate and theNorth American plate are moving in opposite directions. Inthis particular case, the relative motion of the plates is about40 mm/year, and thus the strain accumulation rate is around3·10−7 per year [20]. Further, different from previous studies[10], our model considers anisotropic particle shapes. Theresponse of the system is characterized by discrete eventsor avalanches whose size covers many orders of magnitude,similar to the so-called crackling noise of physical systems[21].
We find that the magnitude of the avalanches is indepen-dent of the particle shape and in agreement with the Guten-berg-Richter law [22]. On the contrary, the distribution ofthe waiting times described by the Omori’s law [23] stronglydepends on shape anisotropy. From this result, we raise thehypothesis of identifying at the macro-mechanical level thepresence of anisotropic particles within the gouge, only bystudying the temporal avalanche sequences. We further ar-gue that the existence of this anisotropic gouge in fault zones

2
Fig. 1 Schematic representation of a particle contact. The overlappingareaa is indicated by the shaded zone.
might also explain the variation of the decay of the after-shock sequences observed in nature.
In addition, we also compute the conditional probabilityfor an avalanche to occur, and found that it decreases log-arithmically with the stiffness. This exponential decay alsodepends on particle shape, since anisotropic samples are ableto mobilize a higher frictional strength when compared toisotropic samples. For a given value of mobilized strengthanisotropic samples also exhibit lower probability of failure.Finally, we propose some microstructural features that couldhelp to explain the occurrence of avalanches.
We start in Sec. 2 by describing in detail our model ofirregular particles as well as the details of our numerical ex-periment. In Sec. 3 we characterize and study the system re-sponse. In Secs. 4 and 5 we address the influence of particleanisotropy on the frequency distribution of avalanches andon the width of the time interval where aftershocks occur.The weakening and stability of the system is investigated inSec. 6, and in Sec. 7 the main conclusions are discussed.
2 The model
We consider a two dimensional model of convex polygons torepresent the grains of the granular material on a mesoscopicscale. The samples consist of isotropic and anisotropic par-ticles in order to study the influence of particle shape aniso-tropy on the response of a granular packing under very slowshear.
The deformation of the grains is modeled by letting themoverlap, as sketched in Fig. 1. When two polygons overlap,the intersection points between their edges can be defined.The segment that connects these points,P1 and P2, givesthe contact lineS = P1P2. The contact force is given by
fc = f
e + fv, wheref
e andfv are the elastic and viscous
contribution.The elastic part of the contact force is decomposed as
fe = fe
nnc + fet tc, wherenc and tc are the unitary vectors
perpendicular and parallel to the contact lineS respectively.The normal elastic force is calculated asfe
n = −knδ, wherekn is the normal stiffness, andδ the deformation length de-fined in terms of the overlapping areaa and the length ofthe contact line,δ = a/|S|. The friction force is given by anelastic forcefe
t = −ktξ proportional to the elastic displace-mentξ at each contact, withkt the tangential stiffness. Theelastic displacementξ is updated asξ = ξ′ +v
ct∆t, whereξ′
is the previous length of the spring,∆t is the time step of themolecular dynamic simulation, andvc
t the tangential compo-nent of the relative velocityvc at the contact. The length ofthe tangential springξ may increase during the time that theconditionf t
e < µfne is satisfied. The sliding condition is en-
forced keeping constant the elastic displacementξ when theCoulomb limit conditionf c
t = µf cn is reached andµ is the
interparticle friction coefficient.The viscous force is calculated asf
v = −mνvc, wherem is the effective mass of the two particles in contact andν the damping coefficient. This force takes into account thedissipation at the contact and it is necessary to maintain thenumerical stability of the method.
A suitable closed set of material parameters for this modelis the ratiokt/kn, together with the value of the normal stiff-nesskn, the interparticle frictionµ, and the ratioǫt/ǫn be-tween the tangential and normal restitution coefficients.
The random generation of the particles is done by meansof a Voronoi tessellation using a reference square lattice,yielding a set of nearly isotropic polygons. By distorting thesquare lattice in the horizontal and vertical directions, weend up with elongated (i.e. anisotropic) particles. The ratiobetween the stretching and contracting factors gives us theaverage aspect ratioλ of the polygons, that is used to char-acterize the anisotropic shape of the particles.
In Fig. 2 the different initial sample configurations areshown. The isotropic configuration is depicted in Fig. 2a,and the anisotropic ones in Fig. 2b for particles stretched inthe same direction of shearing (horizontal direction, sampleH) and in Fig. 2c for particles stretched perpendicularly tothe shear direction (vertical direction, sample V).
We use samples of two different sizes, with 256(16×16)and 1024(32 × 32) particles. Periodic boundary conditionsare imposed in horizontal direction. A constant horizontal
(a) (b) (c)
Fig. 2 (Color online) Samples of(a) isotropic polygons (λ = 1) and(b) elongated polygons stretched either in the horizontal direction (λ =2.3 H) or (c) in the vertical direction (λ = 2.3 V).
3
h
γ
x
y
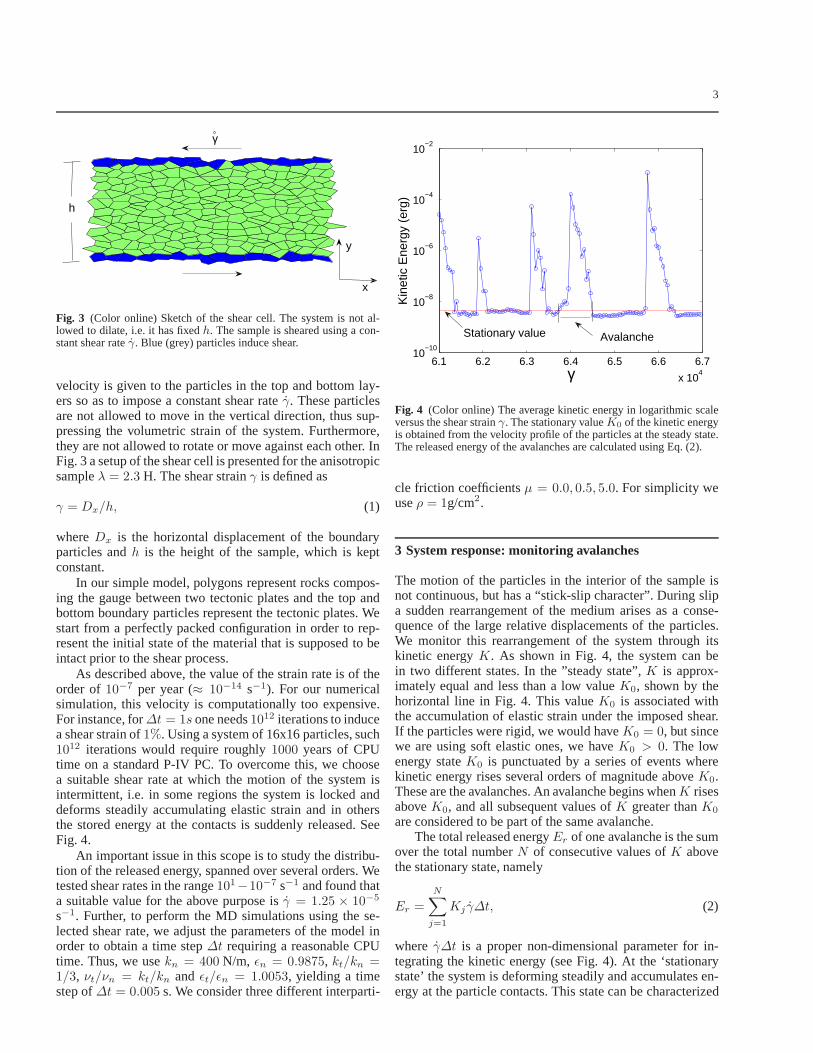
Fig. 3 (Color online) Sketch of the shear cell. The system is not al-lowed to dilate, i.e. it has fixedh. The sample is sheared using a con-stant shear rateγ. Blue (grey) particles induce shear.
velocity is given to the particles in the top and bottom lay-ers so as to impose a constant shear rateγ. These particlesare not allowed to move in the vertical direction, thus sup-pressing the volumetric strain of the system. Furthermore,they are not allowed to rotate or move against each other. InFig. 3 a setup of the shear cell is presented for the anisotropicsampleλ = 2.3 H. The shear strainγ is defined as
γ = Dx/h, (1)
whereDx is the horizontal displacement of the boundaryparticles andh is the height of the sample, which is keptconstant.
In our simple model, polygons represent rocks compos-ing the gauge between two tectonic plates and the top andbottom boundary particles represent the tectonic plates. Westart from a perfectly packed configuration in order to rep-resent the initial state of the material that is supposed to beintact prior to the shear process.
As described above, the value of the strain rate is of theorder of10−7 per year (≈ 10−14 s−1). For our numericalsimulation, this velocity is computationally too expensive.For instance, for∆t = 1s one needs1012 iterations to inducea shear strain of1%. Using a system of 16x16 particles, such1012 iterations would require roughly1000 years of CPUtime on a standard P-IV PC. To overcome this, we choosea suitable shear rate at which the motion of the system isintermittent, i.e. in some regions the system is locked anddeforms steadily accumulating elastic strain and in othersthe stored energy at the contacts is suddenly released. SeeFig. 4.
An important issue in this scope is to study the distribu-tion of the released energy, spanned over several orders. Wetested shear rates in the range101−10−7 s−1 and found thata suitable value for the above purpose isγ = 1.25 × 10⁻⁵
s−1. Further, to perform the MD simulations using the se-lected shear rate, we adjust the parameters of the model inorder to obtain a time step∆t requiring a reasonable CPUtime. Thus, we usekn = 400 N/m, ǫn = 0.9875, kt/kn =1/3, νt/νn = kt/kn and ǫt/ǫn = 1.0053, yielding a timestep of∆t = 0.005 s. We consider three different interparti-
6.1 6.2 6.3 6.4 6.5 6.6 6.7
x 104
10−10
10−8
10−6
10−4
10−2
Kin
etic
Ene
rgy
(erg
)
γ
Stationary value Avalanche
Fig. 4 (Color online) The average kinetic energy in logarithmic scaleversus the shear strainγ. The stationary valueK0 of the kinetic energyis obtained from the velocity profile of the particles at the steady state.The released energy of the avalanches are calculated using Eq. (2).
cle friction coefficientsµ = 0.0, 0.5, 5.0. For simplicity weuseρ = 1g/cm2.
3 System response: monitoring avalanches
The motion of the particles in the interior of the sample isnot continuous, but has a “stick-slip character”. During slipa sudden rearrangement of the medium arises as a conse-quence of the large relative displacements of the particles.We monitor this rearrangement of the system through itskinetic energyK. As shown in Fig. 4, the system can bein two different states. In the ”steady state”,K is approx-imately equal and less than a low valueK0, shown by thehorizontal line in Fig. 4. This valueK0 is associated withthe accumulation of elastic strain under the imposed shear.If the particles were rigid, we would haveK0 = 0, but sincewe are using soft elastic ones, we haveK0 > 0. The lowenergy stateK0 is punctuated by a series of events wherekinetic energy rises several orders of magnitude aboveK0.These are the avalanches. An avalanche begins whenK risesaboveK0, and all subsequent values ofK greater thanK0
are considered to be part of the same avalanche.The total released energyEr of one avalanche is the sum
over the total numberN of consecutive values ofK abovethe stationary state, namely
Er =
N∑
j=1
Kj γ∆t, (2)
where γ∆t is a proper non-dimensional parameter for in-tegrating the kinetic energy (see Fig. 4). At the ‘stationarystate’ the system is deforming steadily and accumulates en-ergy at the particle contacts. This state can be characterized
4
1.565 1.57 1.57510
−8
10−7
10−6
10−5
10−4
10−3
10−2
γ
Kin
etic
Ene
rgy
(erg
)
Figs. (c) − (d)
(a)
1.565 1.57 1.5750.3
0.32
0.34
0.36
0.38
0.4
0.42
Fs /
Fn
γ
(b)Figs. (c) − (d)
γ = 1.5672
(c)
γ = 1.5672
(d)
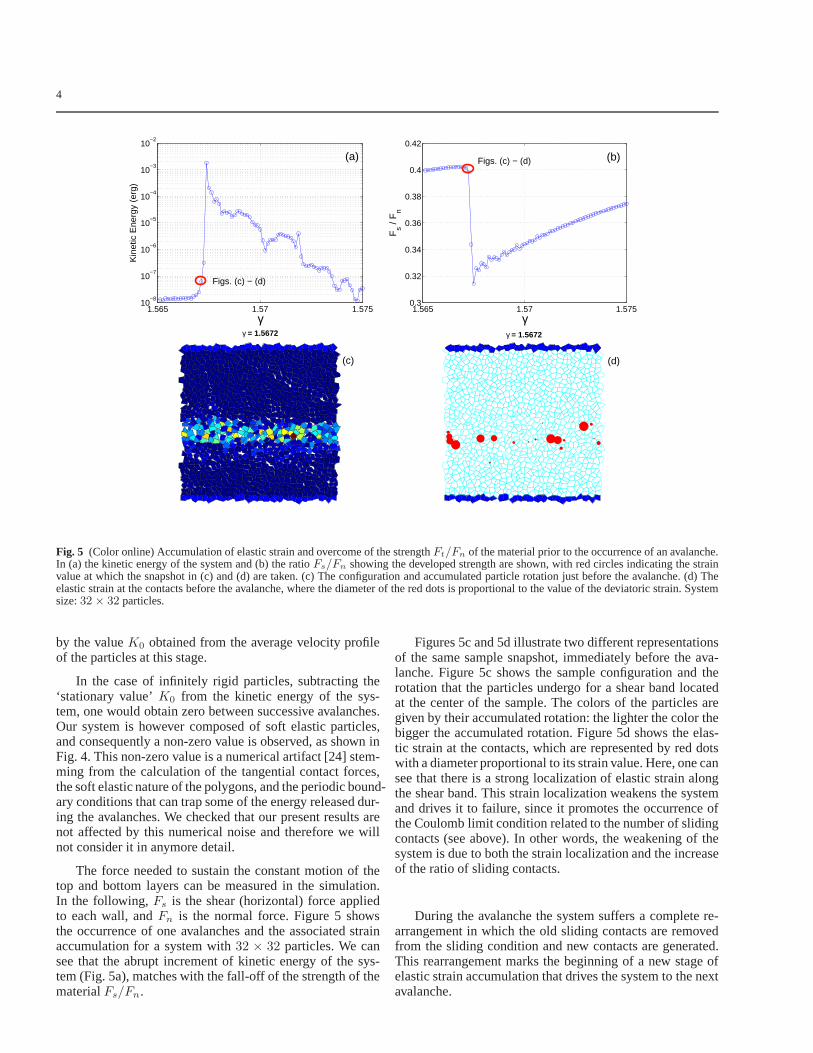
Fig. 5 (Color online) Accumulation of elastic strain and overcomeof the strengthFt/Fn of the material prior to the occurrence of an avalanche.In (a) the kinetic energy of the system and (b) the ratioFs/Fn showing the developed strength are shown, with red circles indicating the strainvalue at which the snapshot in (c) and (d) are taken. (c) The configuration and accumulated particle rotation just before the avalanche. (d) Theelastic strain at the contacts before the avalanche, where the diameter of the red dots is proportional to the value of thedeviatoric strain. Systemsize:32 × 32 particles.
by the valueK0 obtained from the average velocity profileof the particles at this stage.
In the case of infinitely rigid particles, subtracting the‘stationary value’K0 from the kinetic energy of the sys-tem, one would obtain zero between successive avalanches.Our system is however composed of soft elastic particles,and consequently a non-zero value is observed, as shown inFig. 4. This non-zero value is a numerical artifact [24] stem-ming from the calculation of the tangential contact forces,the soft elastic nature of the polygons, and the periodic bound-ary conditions that can trap some of the energy released dur-ing the avalanches. We checked that our present results arenot affected by this numerical noise and therefore we willnot consider it in anymore detail.
The force needed to sustain the constant motion of thetop and bottom layers can be measured in the simulation.In the following,Fs is the shear (horizontal) force appliedto each wall, andFn is the normal force. Figure 5 showsthe occurrence of one avalanches and the associated strainaccumulation for a system with32 × 32 particles. We cansee that the abrupt increment of kinetic energy of the sys-tem (Fig. 5a), matches with the fall-off of the strength of thematerialFs/Fn.
Figures 5c and 5d illustrate two different representationsof the same sample snapshot, immediately before the ava-lanche. Figure 5c shows the sample configuration and therotation that the particles undergo for a shear band locatedat the center of the sample. The colors of the particles aregiven by their accumulated rotation: the lighter the color thebigger the accumulated rotation. Figure 5d shows the elas-tic strain at the contacts, which are represented by red dotswith a diameter proportional to its strain value. Here, one cansee that there is a strong localization of elastic strain alongthe shear band. This strain localization weakens the systemand drives it to failure, since it promotes the occurrence ofthe Coulomb limit condition related to the number of slidingcontacts (see above). In other words, the weakening of thesystem is due to both the strain localization and the increaseof the ratio of sliding contacts.
During the avalanche the system suffers a complete re-arrangement in which the old sliding contacts are removedfrom the sliding condition and new contacts are generated.This rearrangement marks the beginning of a new stage ofelastic strain accumulation that drives the system to the nextavalanche.

5
10−10
10−5
100
100
105
1010
Er (erg) / γ ∆t
D (
Er )
/ (b
in w
idth
)
λ = 1.0 (1)λ = 1.0 (2)λ = 1.0 (3)c = − 0.87
(a)
10−10
10−5
100
105
1010
Er (erg) / γ ∆t
D (
Er )
/ (b
in w
idth
)
λ = 1.0c = −0.87λ = 2.3 Hc = −0.82λ = 2.3 Vc = −0.88
(b)
Fig. 6 (Color online) Log-log plot of the number of avalanches versustheir released energyEr for (a) different configurations of isotropicparticles and(b) for differentλ values. Hereµ = 0.5 and the systemhas16 × 16 particles. Logarithmic binning is used.
4 The Gutenberg-Richter law in anisotropic granularmedia
The distribution of earthquake magnitude is described by theGutenberg-Richter law [22]. This law states that the numbern of earthquakes of magnitudeM is proportional ton ∼10−bM . Typically, the value ofb is equal to1 at most places,but may vary between0.8 and 1.5 [25]. As we will see,the exponentb will be an invariant property describing theoccurrence of avalanches associated with sudden rearrange-ments of granular media under very slow shear.
To this end, we study the possible influence of the for-mation and evolution of the shear band on the distributionD(Er) of the released energyEr during an earthquake. Sincethe magnitude of an earthquake is defined as the logarithmof the released energy apart proper constants one findsn ∼E−c
r , with the exponentc varying typically in the range0.8 <c < 1.1 [25].
10−10
10−5
100
100
105
1010
Er (erg) / γ ∆t
D (
Er )
/ (b
in w
idth
)
µ = 0.5c = −0.87µ = 0.0c = −1.00µ = 5.0c = −0.98
(a)
10−10
10−5
100
100
105
1010
Er (erg) / γ ∆t
D (
Er )
/ (b
in w
idth
)
λ = 1.0c = −1.00λ = 2.3 Hc = −1.00λ = 2.3 Vc = −1.05
(b)
Fig. 7 (Color online) The distributionD(Er) of the released energyEr when(a) varying interparticle friction coefficientµ with fixedλ =1 and(b) when varyingλ with fixed µ = 0. The system has16 × 16particles and logarithmic binning is used.
In Figure 6a we show the distributionD(Er) for threedifferent initial configurations of isotropic samples, corre-sponding to different seeds for the Voronoi Tessellation. Allthe distributions collapse and show a power law behaviorover almost six orders of magnitude with an exponent ofc = 0.87 for the fitted straight line, which is within the ob-served range of values of the Gutenberg-Richter law.
In Fig. 6b, the distributions for both isotropic and aniso-tropic particles are shown. Similarly, for all samples, thedatasets are well fitted by a power law with an exponentc rang-ing from 0.82 to 0.89, indicating a weak influence of theparticle shape on the distribution of the released energy. Thepower law holds over six orders of magnitude.
Similar exponents (0.80 < c < 0.95) are obtained forother system sizes in both isotropic and anisotropic casesand for the case when one considers the distribution for in-dividual particles. From such results, one concludes that in-dependent of the anisotropy there is a scale invariance of thesystem response according to the Gutenberg-Richter law.

6
102
103
104
105
106
10−4
10−3
10−2
10−1
100
101
Waiting time t (s)
n(t)
/bin
wid
th
λ = 1.0λ = 2.3 Hλ = 2.3 V
Fig. 8 (Color online) Distributionn(t) of waiting times for the se-quence of aftershocks in the numerical simulation. Isotropic sampleλ = 1 and anisotropic samplesλ = 2.3 are presented. The system has16 × 16 particles.
We also study the influence of the friction coefficientµ.In Fig. 7a the distributions for the isotropic samples with dif-ferent friction coefficients are plotted. The effect of frictionin both cases is to slightly increase the exponentc, whichholds for nearly seven orders of magnitude. The distribu-tions for isotropic and anisotropic samples withµ = 0 arepresented in Fig. 7b where no influence of particle shape isobserved.
5 Waiting times and Omori’s law
Earthquakes usually occur as part of a sequence of events,in which the largest event is called the mainshock and theevents prior and after the mainshock are foreshocks and af-tershocks respectively [13]. The empirical law that describesthe behavior of the temporal sequence of avalanches is calledOmori’s law, and states that the numbern(t) of aftershocksdecreases with the inverse of the time intervalt spannedfrom the last mainshock as
n(t) =d
(1 + t)p(3)
whered is an empirical constant andp varies in the range0.7 < p < 1.5 [13] with the most typical values around one.
Before performing the calculation of waiting times of af-tershocks in the system evolution, we have also to preciselydefine ‘mainshock’. Our definition is based on empirical ob-servations [13]. A new event is considered mainshock onlywhen its released energy is larger than1/10 of the releasedenergy of the last mainshock. When this happens the se-quence of the aftershocks from the previous mainshock isconsidered to be finished and a new sequence is calculated.
In Fig. 8 the distribution of waiting times for isotropicand anisotropic systems are shown. Over more than three
orders of magnitude all the numerical results can be fittedusing the expression in Eq. (3), with exponentsp = 1.57 forλ = 1, p = 1.61 for λ = 2.3 V, andp = 0.83 for λ = 2.3 H.While for λ = 2.3 H one observes an exponent within thetypical range found in fault gouges, forλ = 1 andλ = 2.3V one finds a clear deviation from the observed values. Thisindicates not only that anisotropy should be ubiquitous infault gouges, but also that the most stable configurations arethe most common, as explained below.
Using this influence of the initial configuration of aniso-tropic samples on the stability of the system, we will next ex-plain how to detect at the macro-mechanical level the pres-ence of anisotropic particles within the gouge.
The anisotropic sampleλ = 2.3 H with particles orientedparallel to the shear direction exhibits a more stable configu-ration, than the other two casesλ = 1 andλ = 2.3 V. In thissample, the induced torque on the particles is minimized andthe main deformation modes, sliding and rolling of the parti-cles, are highly suppressed by the fixed boundary conditionsallowing no dilation in vertical direction. The hindrance ofthe deformation modes produces a larger temporal stabilityand also a larger mechanical stability. The larger temporalstability makes the occurrence of the events less frequent intime, i.e. a slower decay of the waiting times. The largermechanical stability results in a smaller probability of fail-ure for a given value of stiffness as discussed in Sec. 6 be-low. On the contrary, the configuration of anisotropic sam-plesλ = 2.3 V, with particles oriented perpendicular to theshear direction, maximizes the induced torque on the par-ticles and results in a less stable configuration. This con-figuration yields smaller temporal and mechanical stability.The smaller temporal stability is observed in the decay ofthe waiting times, that is slightly faster than the one of theisotropic sample. The smaller mechanical stability of sampleλ = 2.3 V is manifested in the larger probability of failurefor a given value of stiffness compared to the other samples.
Therefore, by looking at the decay rate of the aftershocksequences one might be able to explain the variation of theexponentp in realistic earthquake sequences, by the exis-tence of anisotropic gouge in the fault zone. It is importanttosay that for a more realistic representation of the earthquakeprocess the crushing of particles should also be taken intoaccount. Nevertheless, the absence of particle crushing isasuitable approximation for the case of young fault gouges.
6 Weakening and mechanical stability of the system
In this section we study the relationship between the occur-rence of avalanches and the weakening of the system. Theweakening process results from the release of energy due toprevious accumulation of strain at the contact level and con-tacts reaching the sliding condition.
In Fig. 9 we show the relative number of sliding contactsns, the stored energy at the contactsEs and the total kineticenergyEr. The stored elastic energyEs at the contacts iscalculated asEs = 1/2 (knδ2 + ktξ
2), whereδ andξ are

7
0
5
10
15
ns (
%)
330
340
350
360
370
Es (
erg)
12.5 12.52 12.54 12.56 12.58 12.6 12.6210
−10
10−5
γ
K (
erg)
Fig. 9 (Color online) Evolution of the relative numberns of sliding contacts, the energyEs stored at the contacts and the total kinetic energyEr as a function of the shear strainγ, for an isotropic sample (λ = 1).
the spring elongations in the normal and tangential direc-tions respectively. Figure 9 shows that between avalanchesthe relative number of sliding contacts increases with theshear strain. It makes the system weaker and indicates thatthe system is constantly accumulating elastic energyEs atthe contacts. The weakening of the system persists until fail-ure, where the kinetic energy increases by several orders ofmagnitude. At this stage, the structure of the system is rear-ranged, the stored energy at the contacts is released and thecontacts do not fulfill the sliding condition. All the eventsinthe kinetic energy are associated with both drops in the rations and drops in the stored energy.
At the macromechanical level the weakening of the sys-tem is observed by looking at the evolution of the shearstress with the shear strain. After each stress drop the systemexperiences a rearrangement. This new configuration pro-duces a temporal stability, in which the strength builds up.At this stage the system sticks and the accumulation of straintakes place. In this softening regime the system approachesfailure and when the strength of the material is overcome,the system slips.
The mechanical stability of the system is studied throughthe stiffness value∆τ/∆γ that the system presents at fail-ure. To this end, we calculate the conditional probabilityP (AE |∆τ/∆γ) for the occurrence of an avalanche eventAE
given a stiffness value∆τ/∆γ. Since data only provides thecomplementary conditional probabilityP (∆τ/∆γ|AE) weuse the Bayes theorem [26], to obtain
P (AE |∆τ/∆γ) =P (∆τ/∆γ|AE)P (AE)
P (∆τ/∆γ). (4)
Having a certain time incrementdt in the data, the con-ditional probabilityP (∆τ/∆γ|AE) gives the probability ofobserving a stiffness value∆τ/∆γ at t − dt when at timet an avalanche (symbolized byAE) occurs. The conditionalprobability takes into account all the avalanchesAE withina total time interval of5 · 106 s. To this end, we discretizethe total time interval in time increments ofdt = ∆γ/γ.Since the shear rateγ = 1.25 · 10−5 s−1 and∆γ = 0.0016,the time increment isdt = 128 s is also constant in oursimulation. We select the samedt for both isotropic andanisotropic systems. The probabilityP (AE) is fraction be-tween the total number of avalanches and the total number oftime increments, and similarlyP (∆τ/∆γ) is the probabil-ity distribution of∆τ/∆γ. In Fig. 10, the conditional prob-abilities P (AE |∆τ/∆γ) and P (∆τ/∆γ|AE) for both theisotropic systemλ = 1 and the anisotropic systemλ = 2.3are shown. For all the samples, the conditional probabilityP (AE |∆τ/∆γ) decreases logarithmically with the stiffness:the stiffer the system the smaller is the probability of failure,as shown in Fig 10a, yielding
P (AE |∆τ/∆γ) ∼ q log (∆τ/∆γ). (5)
Further, from Figs. 10a and 10b, anisotropic samples com-pared to the isotropic ones explore a different range of stiff-ness at failure due to the larger rotational frustration that theelongated particles undergo. This is specially true for parti-cles oriented along the shear direction (λ = 2.3 H), due toits more stable structure. The exponents of the tail of the dis-tributions areq = −42.1 for λ = 1, q = −28.6 for λ = 2.3V andq = −30.78 for λ = 2.3 H (see Fig. 10a).

8
10−4
10−3
10−2
10−1
100
0
0.1
0.2
0.3
0.4
0.5
0.6
0.7
∆τ / ∆γ
P(A
E |
∆τ /
∆γ)
λ = 1.0
λ = 2.3 H
λ = 2.3 V
(a)
10−4
10−3
10−2
10−1
100
0
0.05
0.1
0.15
∆τ / ∆γ
P(∆
τ / ∆
γ | A
E )
λ = 1.0
λ = 2.3 H
λ = 2.3 V
(b)
Fig. 10 (Color online) Conditional probability distributions (a)P (AE|∆τ/∆γ) of the occurrence of an avalancheAE given a stiff-ness∆τ/∆γ and (b)P (∆τ/∆γ|AE) of having a stiffness∆τ/∆γ atthe occurrence of an avalanche. System size16 × 16. Isotropicλ = 1and anisotropic samplesλ = 2.3 are presented. LabelsH andV cor-respond to horizontal and vertical samples.
The same analysis can be performed for the occurrenceof an avalancheAE given a force ratioFs/Fn value. InFigure 11, the conditional probabilitiesP (AE |Fs/Fn) andP (Fs/Fn|AE) for the same cases as in Fig. 10. As shownin Fig. 11a, the conditional probabilityP (AE |Fs/Fn) in-creases approximately linearly withFs/Fn: The higher themobilized strengthFs/Fn the higher the probability of fail-ure. In general, the anisotropic samples are able to mobi-lize higher frictional strength than the isotropic sample and,for the same force ratio, present a lower probabilityP (AE |Fs/Fn). This is certainly due to the influence of particleshape anisotropy on the global strength of the material [19].
The probability distributionP (Fs/Fn|AE) shown in -Fig. 11b of having a force ratioFs/Fn at the occurrenceof an avalancheAE follows typically a normal distribution,
0.1 0.2 0.3 0.4 0.5 0.6 0.70
0.05
0.1
0.15
0.2
0.25
0.3
Force ratio (Fs/F
n)
P(A
E |
Fs/F
n)
λ = 1.0
λ = 2.3 H
λ = 2.3 V
(a)
0.1 0.2 0.3 0.4 0.5 0.6 0.70
0.05
0.1
0.15
Force ratio (Fs/F
n)
P(F
s/Fn |
AE)
λ = 1.0
λ = 2.3 H
λ = 2.3 V(b)
Fig. 11 (Color online) Conditional probability distributions (a)P (AE|Fs/Fn) of the occurrence of an avalancheAE given a fric-tional strengthFs/Fn and (b)P (Fs/Fn|AE) of having a frictionalstrengthFs/Fn at the occurrence of an avalanche. System size16×16.Isotropic λ = 1 and anisotropic samplesλ = 2.3 are presented.LabelsH andV correspond to horizontal and vertical samples. TheP (Fs/Fn|AE) follows a normal distribution, except for sampleλ =2.3 V. Solid lines represent the normal distribution of the data.
with a mean value larger in the anisotropic samples. Con-sidering only the anisotropic cases, while one observes thesame mean, the standard deviation is larger for the less stableconfiguration V, as expected.
Finally, in Figure 12 the sliding contact rations and thestiffness at failure of the system are presented. The stiffnessis also compared to the released energy of the avalanches.Although no clear correlation between the parameters canbe observed, the maximum value of stiffness that the sys-tem can present is bounded byns, as illustrated in Fig. 12a.Largerns implies smaller stiffness. In Fig. 12b one sees aweak correlation between the stiffness and the released en-ergy, with a slight tendency ofEr increasing with the stiff-

9
10−4
10−2
100
0
0.05
0.1
0.15
0.2
0.25
0.3
(kN/m)
n
∆τ / ∆γ
s
(a)
10−4
10−2
100
10−10
10−8
10−6
10−4
10−2
(kN/m)∆τ / ∆γ
Er
(erg
)
(b)
Fig. 12 (Color online) Relationship between (a) sliding contact rations vs. stiffness at failure, (b) released energyEr of the avalanche vsstiffness at failure. Data correspond to an isotropic sample with size16 × 16 particles.
ness. From these observations, it is clear that the accumula-tion of strain at the contacts is not the only important agentin the weakening process. Therefore, additional ingredientshave to be taken into account for a more exhaustive analysis.
7 Concluding remarks
In this paper we highlighted the importance of particle shapeon the occurrence of avalanches in granular systems. To thisend, we used shear cells with periodic boundary conditionsto mimic the behavior of tectonic faults with fixed bound-aries.
We found that the dynamics of the granular system ischaracterized by discrete avalanches spanning several orderof magnitude similar to crackling noise [2; 21]. We calcu-lated the probability distribution of the energy released inavalanches, and found it to be in very good agreement with
the Gutenberg-Richter law for samples with different parti-cle anisotropy and different system sizes. Consequently theexponent of the released energy distribution can be seen asan invariant property of such systems.
We also studied the temporal distribution of event se-quences after a mainshock. We found that the number of af-tershocks decreases with a power of the inverse of time. Wecould fit the sequences of waiting times of the aftershockswith the empirical expression and obtained exponents in therange0.7 < p < 1.6, similarly to what is observed in real ob-servations according to Omoris law. The anisotropic sampleH exhibits a larger temporal stability making the temporaloccurrence of the avalanches sparser, due to its larger frus-tration of rotation in the corresponding initial configuration.
The larger temporal stability observed at the macro-me-chanical level can be therefore taken as an indication of theexistence of anisotropic material within the shear zone. Thiscould potentially explain the variation of the exponentp ob-served in realistic earthquake sequences.
The dynamics of the system was also related to the stick-slip process [27; 28]. When one avalanche begins the systemslips, while between two successive avalanches, the systemsticks, accumulates elastic energy, and becomes weaker be-cause of the increase of the sliding contactsns. We charac-terized the weakening of the system by the stiffness∆τ/∆γand derived the conditional probabilityP (AE |∆τ/∆γ) foran avalanche to occur given a stiffness value∆τ/∆γ. Wefound thatP (AE |∆τ/∆γ) decreases logarithmically withthe stiffness and with a decay rate larger for isotropic sam-ples than for anisotropic ones. Concerning frictional strengthwe found that the probability of an avalanche to occur in-creases with the force ratioFs/Fn.
The results concerning the conditional probabilities un-covered that anisotropic samples can explore a wider rangeof stiffnesses and force ratios than the isotropic sample. Thisis due to the larger kinematic constraint that anisotropic par-ticles undergo during shear. Further, in general, since theini-tial configuration corresponding to sample H is the most sta-ble configuration with respect to shearing, it is the one withlower probability of failure.
In previous works concerning the avalanches in granu-lar piles [29; 30], some avalanche precursors associated tothe onset of fluidized regions of sliding contacts were found.These fluidized regions were located in the weak networkof contacts. This weak network comprises contacts trans-mitting forces smaller than the average force and thereforehas a minimal contribution to the stress state [31; 32]. It isknown that [29; 32; 33], while the strong contact network isresponsible for the strength and stability of the packing, theweak contact network plays an important role in the destabi-lization process. In this scope, since precursors are expectedto be related to sharp changes in the micro-structure of thegranular packing [34], it would be important to study alsothe network of contact forces as a function of the anisotropy,in particular as a function of the major axis orientation.
Finally, although the results from our numerical modelshow good agreement with the processes observed in na-

10
ture, we are aware of the challenges to have a more realis-tic simulation of fault zones [36]. In future work one shouldalso extend this approach to the three-dimensional case, con-sider the development of transparent (or absorbing) bound-ary condition, since the acoustic emission after an avalancheare trapped due to the periodic boundary conditions, andalso implement the grain fragmentation, since natural earth-quakes result from the combined effect of frictional instabil-ities and rock fragmentation.
Acknowledgements The authors thank L. Arcangelis for useful dis-cussions and also the support by German-Israeli Foundationand byDeutsche Forschungsgemeinschaft, under the project HE2732781. PGLthanks support byDeutsche Forschungsgemeinschaft, under the projectLI 1599/1-1. HJH thanks the Max Planck prize.
References
1. Bolt BA (2005), Earthquakes. W.H. Freeman and Company, NewYork.
2. Sykes LR, Shaw BE and Scholz CH (1999) Rethinking earthquakeprediction. Pure Appl. Geophys., 155: 207-232.
3. Donze F, Mora P and Magnier S.-A. (1994) Numerical simulationof faults and shear zones. Geophys. J. Int., 116: 46-52.
4. Mora P and Place D (2002) Stress correlation function evolution inlattice solid elasto-dynamic models of shear and fracture zones andearthquake prediction. Pure Appl. Geophys., 159: 2413-2427.
5. Ramos O, Altshuler E, Maløy KJ (2007) Predicting power lawdis-tributed avalanches: implications for earthquake forecast. Privatereport.
6. Summers R and Byerlee JD (1977) A note on the effect of faultgouge composition on the stability of frictional sliding. Int. J. RockMech. Min. Sci., 14: 155-160.
7. Marone C (1998) Laboratory-derived friction laws and their appli-cation to seismic faulting. Annual Review of Earth and PlanetarySciences, 26: 643-696.
8. Mair K, Frye KM and Marone C (2002) Influence of grain charac-teristics on the friction of granular shear zones. J. Geophys. Res.,107: 2219.
9. Mora P and Place D (1994) Simulation of the frictional stick-slipinstability. Pageoph., 143: 61.
10. Tillemans HJ and Herrmann HJ (1995) Simulating deformationsof granular solids under shear. Physica A, 217: 261-288.
11. Mora P and Place D (1999) The weakness of earthquake faults.Geophys. Res. Lett., 26: 123-126.
12. Alonso-Marroquın F, Vardoulakis I, Herrmann HJ, Weatherley D,and Mora P (2006) Effect of rolling on dissipation in fault gouges.Phys. Rev. E, 74: 031306.
13. Scholz CH (2002) The mechanics of earthquakes and faulting.Cambridge Univ. Press, Cambridge.
14. Turcotte DL and Schubert G (2002) Geodynamics. CambridgeUniversity Press, Cambridge.
15. Abe S, Latham S and Mora P (2006) Dynamic rupture in a 3-dparticle-based simulation of a rough planar fault. Pure Appl. Geo-phys., 163: 1881-1892.
16. Wilson B, Dewers T, Reches Z and Brune J (2005) Particle sizeand energetics of gouge from earthquake rupture zone. Nature, 434:749-752.
17. Mora P and Place D (1998) Numerical simulation of earthquakefaults with gouge: toward a comprehensive explanation for the heatflow paradox. J. Geophys. Res., 103: 21067-21089.
18. Pena AA, Lizcano A, Alonso-Marroquın F and Herrmann HJ(2007) Biaxial test simulations using a packing of polygonal par-ticles. Int. J. Numer. Anal. Meth. Geomech., accepted.
19. Pena AA, Garcıa-Rojo R and Herrmann HJ (2007) Influenceofparticle shape on sheared dense granular media. Granular Matter,9: 279-291.
20. Kanamori H and Brodsky EE (2001) The physics of earthquakes.Physics today, 54: 34-40.
21. Sethna JP, Dahmen KA and Myers CR (2001) Crackling noise.Nature, 410: 242-250.
22. Gutenberg B and Richter CF (1954) Seismicity of the EarthandAssociated Phenomena. Princeton Uni. Press, Princeton.
23. Omori F (1895) On the aftershocks of earthquakes.J. Coll. Sci. Imper. Univ. Tokyo, 7: 111.
24. Pena AA, Lind PG, McNamara S and Herrmann HJ (2007) Nu-merical improvement of the discrete element method appliedtoshear of granular media. Submitted to Acta Mechanica, cond-matarXiv:0709.3716v1.
25. Chakrabarti KB and Benguigui LG (1997) Statistical physics offracture and breakdown in disordered systems. Clarendon, Oxford.
26. Papoulis A (2002) Probability, random variables, and stochasticprocesses. McGraw-Hill, Boston.
27. Nasuno S, Kudrolli A, Bank A, and Gollub JP (1998) Time-resolved studies of stick-slip friction in sheared granular layers.Phys. Rev. E, 58: 2161-2171.
28. Feder HJS and Feder J (1991) Self-organized criticalityin a stick-slip process. Phys. Rev. Lett., 66: 2669-2672.
29. Staron L and Radjai F (2005) Friction versus texture at the ap-proach of a granular avalanche. Phys. Rev. E, 72: 041308.
30. Staron L, Vilotte JP and Radjai F (2002) Preavalanche instabilitiesin a granular pile. Phys. Rev. Lett., 89: 204302.
31. Radjai F, Jean M, Moreau JJ and Roux S (1996) Force distributionin dense two-dimensional granular systems. Phys. Rev. Lett., 77:274.
32. Radjai F, Wolf DE, Jean M and Moreau JJ (1998) Bimodal char-acter of stress transmission in granular packings. Phys. Rev. Lett.,80: 61-64.
33. Majmudar TS and Behringe RP (2005) Contact force measure-ments and stress-induced anisotropy in granular materials. Nature,435: 1079-1082.
34. Staron L, Radjai F and Vilotte JP (2006) Granular micro-structureand avalanche precursors. J. Stat. Mech., P07014.
35. Peters JF, Muthuswamy M, Wibowo J and Tordesillas A (2005)Characterization of force chains in granular material. Phys. Rev. E,72: 041307.
36. Alonso-Marroquin F, Pena AA, Herrmann HJ and Mora P (2007)Simulation of shear bands using polygonal particles. Discrete Ele-ment Methods (DEM) Conference..