Sheared rock joints: Dependence of damage zones on morphological anisotropy
14
To cite this paper: Int. J. Rock Mech. & Min. Sci. 34:3-4, paper No. 258. Copyright © 1997 Elsevier Science Ltd Copyright © 1997 Elsevier Science Ltd Int. J. Rock Mech. & Min. Sci. Vol. 34, No. 3-4, 1997 ISSN 0148-9062 To cite this paper: Int. J. RockMech. &Min. Sci. 34:3-4, Paper No. 258 SHEARED ROCK JOINTS : DEPENDENCE OF DAMAGE ZONES ON MORPHOLOGICAL ANISOTROPY J. Rissl; S. Gentier2; C~ Archambault 3; R. Flamand 3 1 CDGA, universit6 Bordeaux I, Av. des facult6s, 33405 Talence, France 2 BRGM DR, BP 6009, 45060 Orl6ans France 3 CERM UQAC, Boulevard de l'universit6 Chicoutimi, Qu6bec Canada ABSTRACT The objective of this work is to determine the 3D structural morphological factors such as position, elevation, extension, and dipping of asperities, and relative position of asperities that are essential to analyze the shear behavior of rock joints. A series of shear test was performed at three normal stresses (7, 14 and 21 Mpa) with identical cement mortar replicas of a natural fracture. For each normal stress, under the same shear rate, shear displacement was stopped at five different values. The shear tests were performed at four different directions. After each shear test, grey level images of both, upper and lower walls of the replicas, were acquired using a CCD camera. Then, using a segmentation method we have developed, the damaged areas are identified in such a way that damaged contours can be superposed on a topographic map. Results of the investigation include a set of images showing both the morphology of the joint and the specific position of each damaged asperity. Numerical data are also available. Copyright © 1997 Elsevier Science Ltd KEYWORDS Fracture Morphology • Geostatistics • Image Analysis • Jointed Rock Masses • Kriging • Rock Joint • Roughness • Shear Behavior • Shear Test INTRODUCTION The mechanical behavior of jointed rock masses is highly dependent on sliding on discrete rock discontinuities. The geometric properties of fracture surface and associated microstructural features contain quantitative information concerning the processes that lead to stability of rock masses. Therefore, the visual observations and the quantification of the features developed on the sliding surfaces of the discontinuities are of main interest to determine the shear behavior of rock joints during shearing. As joint surfaces are not flat, contact areas between the two surfaces of a joint are essentially dependent on the normal loads and amounts and direction of sliding. To understand the mechanical behavior of rock joints during shear displacement, the progressive degradation and gouge material produced on an irregular anisotropic joint has to be analyzed and quantified. The progressive degradation and gouge material production observed on an irregular anisotropic joint is compared to various experimental conditions including normal stress, shear direction and shear displacement. This paper is a contribution to the characterization of damaged zones occurring during shear tests with ISSN 0148-9062
Transcript of Sheared rock joints: Dependence of damage zones on morphological anisotropy
To cite this paper: Int. J. Rock Mech. & Min. Sci. 34:3-4, paper No. 258. Copyright © 1997 Elsevier Science Ltd
Copyright © 1997 Elsevier Science Ltd
Int. J. Rock Mech. & Min. Sci. Vol. 34, No. 3-4, 1997 ISSN 0148-9062
To cite this paper: Int. J. RockMech. &Min. Sci. 34:3-4, Paper No. 258
S H E A R E D R O C K JOINTS : D E P E N D E N C E OF D A M A G E Z O N E S ON M O R P H O L O G I C A L A N I S O T R O P Y
J. R i s s l ; S. G e n t i e r 2 ; C~ A r c h a m b a u l t 3; R . F l a m a n d 3
1 CDGA, universit6 Bordeaux I, Av. des facult6s, 33405 Talence, France
2 BRGM DR, BP 6009, 45060 Orl6ans France
3 CERM UQAC, Boulevard de l'universit6 Chicoutimi, Qu6bec Canada
A B S T R A C T
The objective of this work is to determine the 3D structural morphological factors such as position, elevation, extension, and dipping of asperities, and relative position of asperities that are essential to analyze the shear behavior of rock joints. A series of shear test was performed at three normal stresses (7, 14 and 21 Mpa) with identical cement mortar replicas of a natural fracture. For each normal stress, under the same shear rate, shear displacement was stopped at five different values. The shear tests were performed at four different directions. After each shear test, grey level images of both, upper and lower walls of the replicas, were acquired using a CCD camera. Then, using a segmentation method we have developed, the damaged areas are identified in such a way that damaged contours can be superposed on a topographic map. Results of the investigation include a set of images showing both the morphology of the joint and the specific position of each damaged asperity. Numerical data are also available.
Copyright © 1997 Elsevier Science Ltd
K E Y W O R D S
F r a c t u r e M o r p h o l o g y • Geostat i s t i cs • I m a g e A n a l y s i s • Jo in ted R o c k M a s s e s • Kr ig ing • R o c k Jo int • R o u g h n e s s • Shear B e h a v i o r • Shear Test
I N T R O D U C T I O N
The mechanical behavior of jointed rock masses is highly dependent on sliding on discrete rock discontinuities. The geometric properties of fracture surface and associated microstructural features contain quantitative information concerning the processes that lead to stability of rock masses. Therefore, the visual observations and the quantification of the features developed on the sliding surfaces of the discontinuities are of main interest to determine the shear behavior of rock joints during shearing. As joint surfaces are not flat, contact areas between the two surfaces of a joint are essentially dependent on the normal loads and amounts and direction of sliding. To understand the mechanical behavior of rock joints during shear displacement, the progressive degradation and gouge material produced on an irregular anisotropic joint has to be analyzed and quantified. The progressive degradation and gouge material production observed on an irregular anisotropic joint is compared to various experimental conditions including normal stress, shear direction and shear displacement.
This paper is a contribution to the characterization of damaged zones occurring during shear tests with
ISSN 0148-9062
To cite this paper: Int. J. Rock Mech. & Min. Sci. 34:3-4, paper No. 258. Copyright © 1997 Elsevier Science Ltd
various normal stresses, shear directions and shear displacements. This characterization is based on the acquisition of grey level images of the joint surfaces followed by segmentation which enables someone to identify the damaged zones and generate binary images. The damaged areas were identified in such a way that the damaged contours can be superimposed on a topographic map of the corresponding joint wall. Then it would be possible to determine the 3D structural morphological factors such as the position, elevation, extension and dipping of asperities, and the relative position of asperities that are essential to analyze the shear behavior of rock joints.
SURFACE TOPOGRAPHY OF THE FRACTURE
The original sample
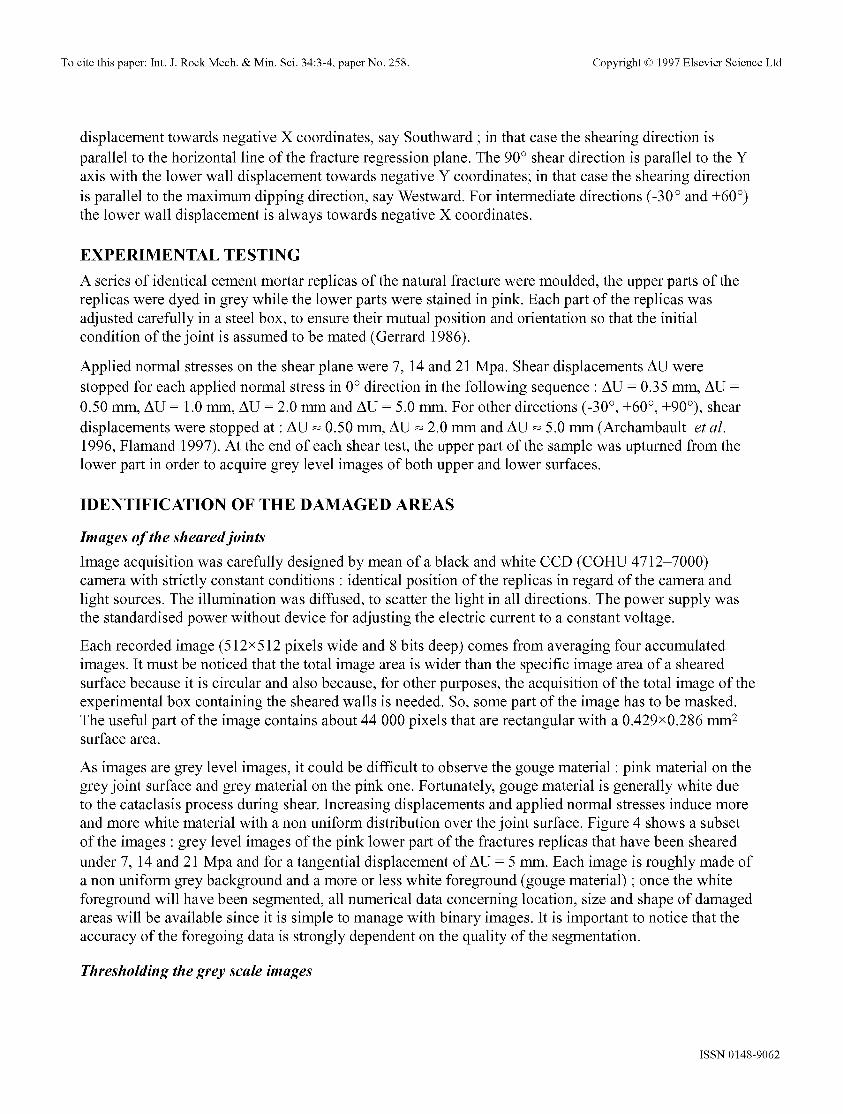
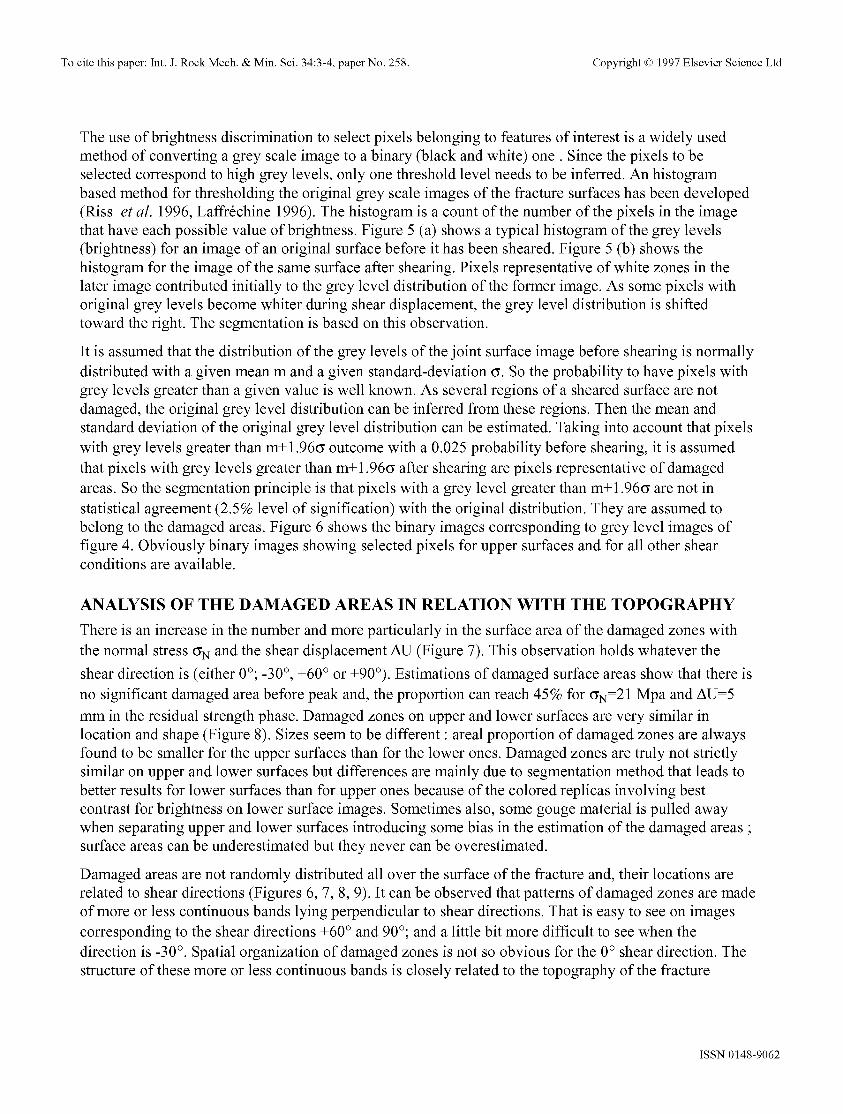
A cylindrical sample was drilled perpendicular to the regional mean plane of a natural tension fracture in a granite (Gentler 1986). The sample contains a part of the fracture at middle height ; the sample diameter is 90 mm (Figure 1). The morphology of each side of the fracture was investigated by studying profiles heights z = f(x, y) that were recorded with a profilometer. Profiles were recorded at the same positions on both, upper and lower joint wall surface ; five equidistant profiles (15.26mm apart) and additional profiles were recorded with a constant step AX=0.5mm in four directions {0 °, -30 °, +60 °, +90°}. The total number of recorded points is respectively 4096 for the lower surface and 4041 for the upper surface.
A statistical analysis of the linear regression ofz values in regard ofx and y shows that the mean plane (regression plane) dips slightly (5 °) in a direction quite perpendicular to the 0 ° direction (272°). The roughness of the joint surfaces computed by the mean of the residual v a r i a n c e SZz,yx is equal to 20% of
the total variance of z values.
Modeling the surface topography
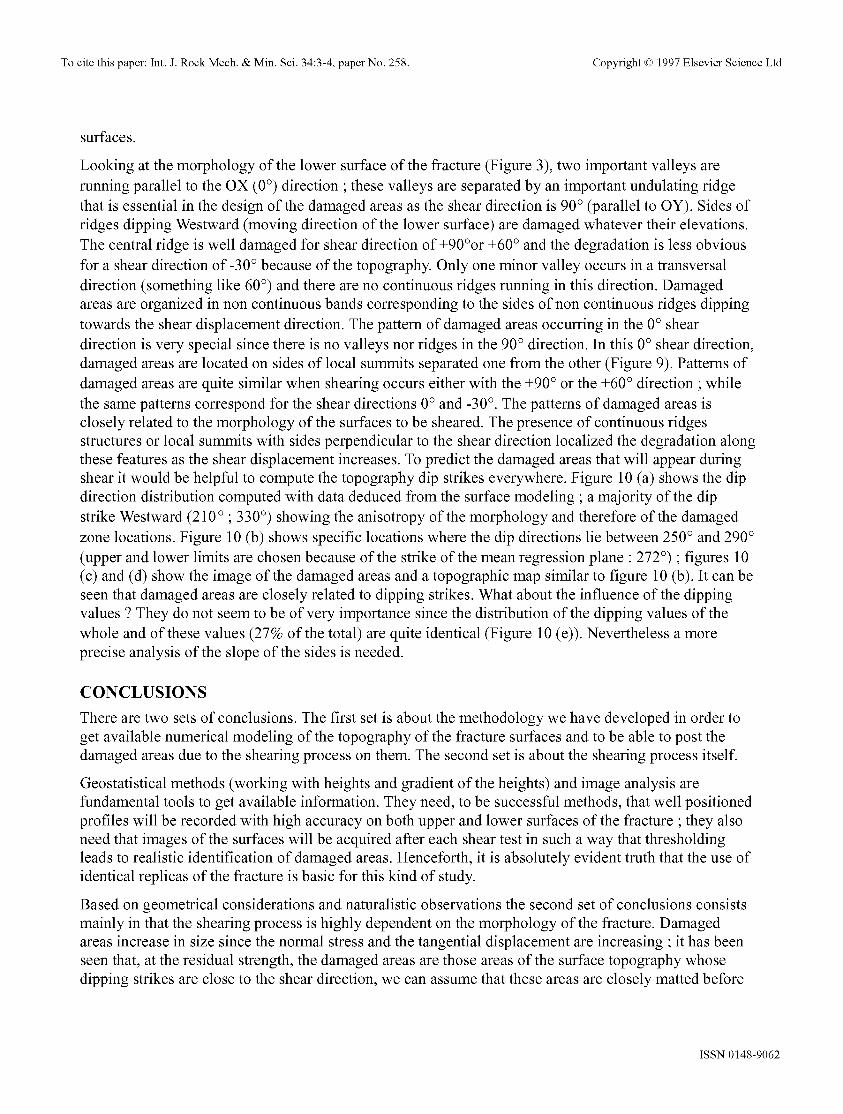
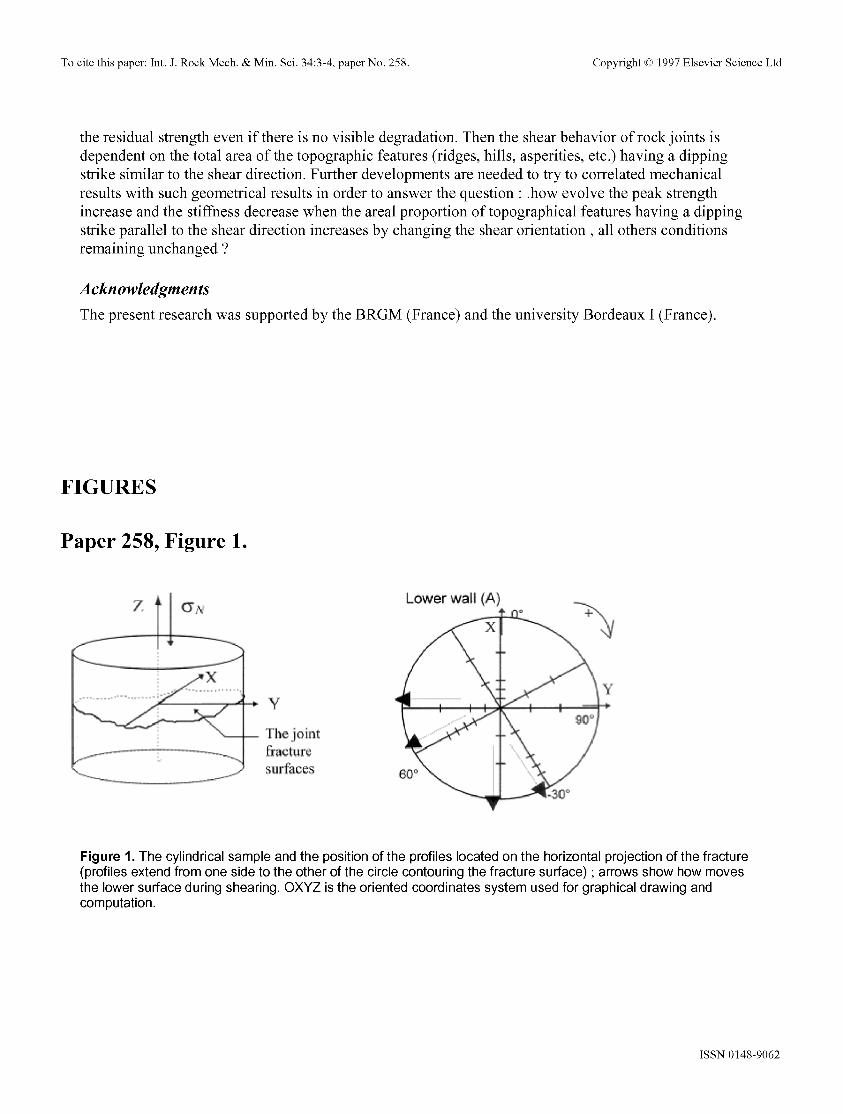
The spatial features of the fracture can be studied by means of a geostatistical approach (Chilbs, Gentier 1992). The overall objective of a geostatistical approach is to characterize the spatial variations of the topography and to take these variations into account for the modeling of the fracture (kriging : unbiased linear estimator with a minimal quadratic error for z ). After the experimental variograms of elevations Z and first derivatives Z' have been calculated, good variogram modeling was obtained by fitting both of them (Figure 2). A good fit of the two variograms is obtained by defining the theoretical model with three nested models (gaussian, spherical and quadratic rational models (Flamand 1997)). No major differences have been detected while modeling lower or upper surfaces (Figure 3).
The kriging modeling, even if local fluctuations are smoothed is a good method to visualize the surface topography and to infer data about the surface roughness : local dipping, maximum elevation, etc. The irregularity and the anisotropy of the rough fracture is clearly outlined : the surfaces look like a topographic landscape with hills and valleys where local summits and watersheds can be identified. Since a careful method had been used for recording of points at the same location on the two surfaces, it is possible to compute the volume between the upper and the lower surface. As an example, the volume of the voids between the two surfaces is 2686.34 mm 3 when less than 1% of the surface areas are in contact ; so, the mean aperture of the void is 0.485mm (these results are computed for a cylindrical sample with a 42 mm diameter and an edge of the grid equals 2 mm).
It must be noticed here, that the 0 ° shear direction is parallel to the X axis, with the lower wall
ISSN 0148-9062
To cite this paper: Int. J. Rock Mech. & Min. Sci. 34:3-4, paper No. 258. Copyright © 1997 Elsevier Science Ltd
displacement towards negative X coordinates, say Southward ; in that case the shearing direction is parallel to the horizontal line of the fracture regression plane. The 90 ° shear direction is parallel to the Y axis with the lower wall displacement towards negative Y coordinates; in that case the shearing direction is parallel to the maximum dipping direction, say Westward. For intermediate directions (-30 ° and +60 °) the lower wall displacement is always towards negative X coordinates.
EXPERIMENTAL TESTING
A series of identical cement mortar replicas of the natural fracture were moulded, the upper parts of the replicas were dyed in grey while the lower parts were stained in pink. Each part of the replicas was adjusted carefully in a steel box, to ensure their mutual position and orientation so that the initial condition of the joint is assumed to be mated (Gerrard 1986).
Applied normal stresses on the shear plane were 7, 14 and 21 Mpa. Shear displacements AU were stopped for each applied normal stress in 0 ° direction in the following sequence : AU = 0.35 mm, AU = 0.50 mm, AU = 1.0 ram, AU = 2.0 mm and AU = 5.0 ram. For other directions (-30 °, +60 °, +90°), shear displacements were stopped at : AU ~ 0.50 mm, AU ~ 2.0 mm and AU ~ 5.0 mm (Archambault et al. 1996, Flamand 1997). At the end of each shear test, the upper part of the sample was upturned from the lower part in order to acquire grey level images of both upper and lower surfaces.
IDENTIFICATION OF THE DAMAGED AREAS
Images of the sheared joints
Image acquisition was carefully designed by mean of a black and white CCD (COHU 4712-7000) camera with strictly constant conditions : identical position of the replicas in regard of the camera and light sources. The illumination was diffused, to scatter the light in all directions. The power supply was the standardised power without device for adjusting the electric current to a constant voltage.
Each recorded image (512x512 pixels wide and 8 bits deep) comes from averaging four accumulated images. It must be noticed that the total image area is wider than the specific image area of a sheared surface because it is circular and also because, for other purposes, the acquisition of the total image of the experimental box containing the sheared walls is needed. So, some part of the image has to be masked. The useful part of the image contains about 44 000 pixels that are rectangular with a 0.429x0.286 mm 2 surface area.
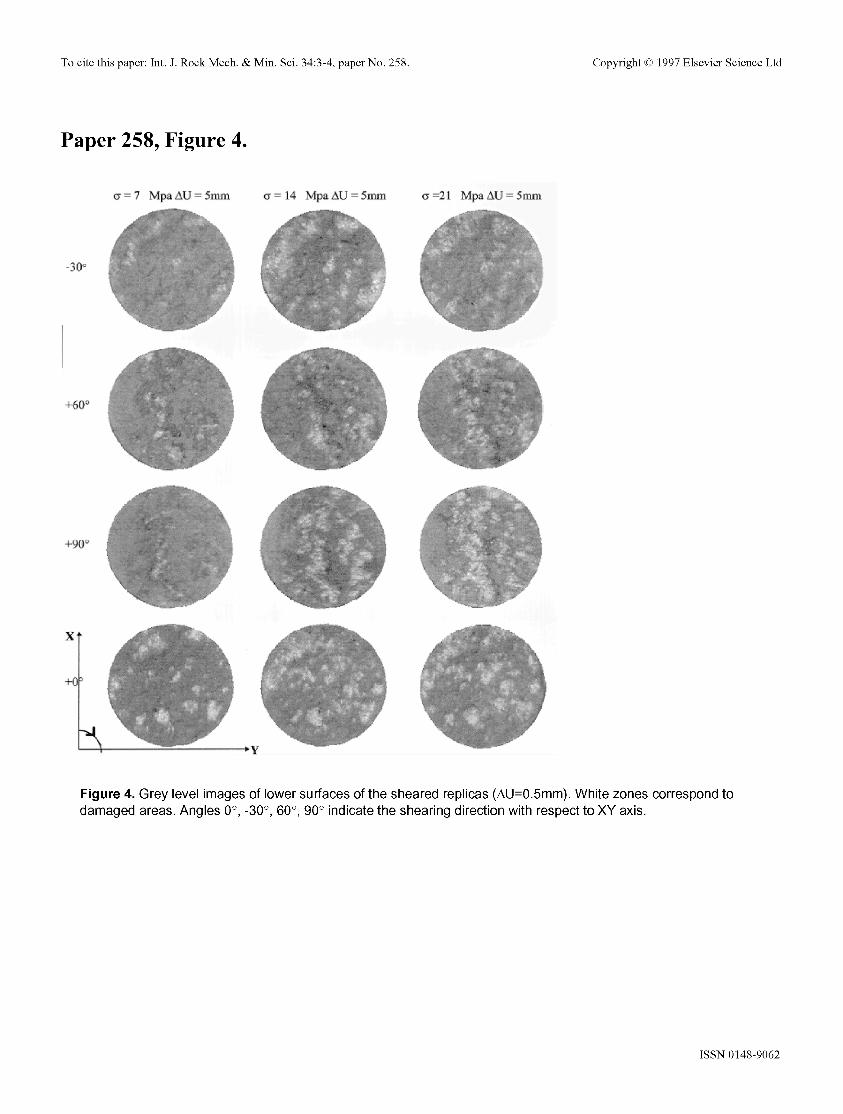
As images are grey level images, it could be difficult to observe the gouge material : pink material on the grey joint surface and grey material on the pink one. Fortunately, gouge material is generally white due to the cataclasis process during shear. Increasing displacements and applied normal stresses induce more and more white material with a non uniform distribution over the joint surface. Figure 4 shows a subset of the images : grey level images of the pink lower part of the fractures replicas that have been sheared under 7, 14 and 21 Mpa and for a tangential displacement of AU -- 5 mm. Each image is roughly made of a non uniform grey background and a more or less white foreground (gouge material) ; once the white foreground will have been segmented, all numerical data concerning location, size and shape of damaged areas will be available since it is simple to manage with binary images. It is important to notice that the accuracy of the foregoing data is strongly dependent on the quality of the segmentation.
Thresholding the grey scale images
ISSN 0148-9062
To cite this paper: Int. J. Rock Mech. & Min. Sci. 34:3-4, paper No. 258. Copyright © 1997 Elsevier Science Ltd
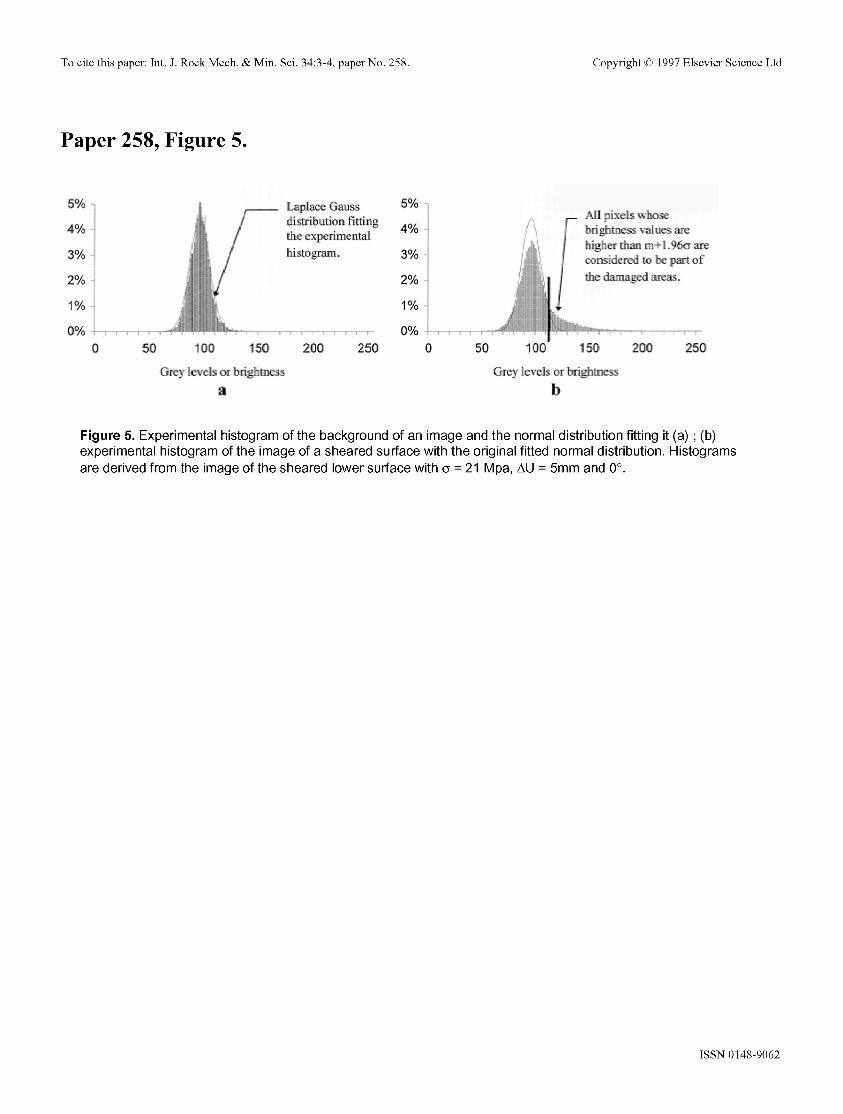
The use of brightness discrimination to select pixels belonging to features of interest is a widely used method of converting a grey scale image to a binary (black and white) one. Since the pixels to be selected correspond to high grey levels, only one threshold level needs to be inferred. An histogram based method for thresholding the original grey scale images of the fracture surfaces has been developed (Riss et al. 1996, Laffr6chine 1996). The histogram is a count of the number of the pixels in the image that have each possible value of brightness. Figure 5 (a) shows a typical histogram of the grey levels (brightness) for an image of an original surface before it has been sheared. Figure 5 (b) shows the histogram for the image of the same surface after shearing. Pixels representative of white zones in the later image contributed initially to the grey level distribution of the former image. As some pixels with original grey levels become whiter during shear displacement, the grey level distribution is shifted toward the right. The segmentation is based on this observation.
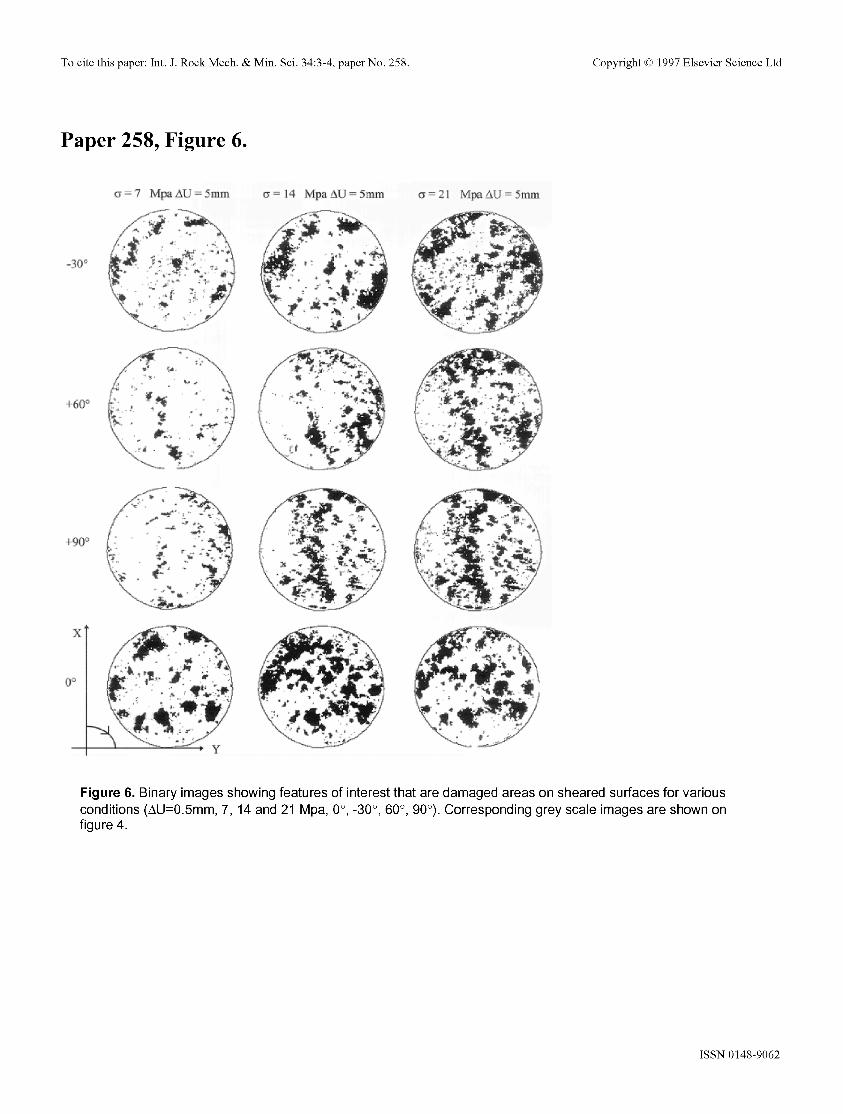
It is assumed that the distribution of the grey levels of the joint surface image before shearing is normally distributed with a given mean m and a given standard-deviation (y. So the probability to have pixels with grey levels greater than a given value is well known. As several regions of a sheared surface are not damaged, the original grey level distribution can be inferred from these regions. Then the mean and standard deviation of the original grey level distribution can be estimated. Taking into account that pixels with grey levels greater than m+1.96(y outcome with a 0.025 probability before shearing, it is assumed that pixels with grey levels greater than m+1.96(y after shearing are pixels representative of damaged areas. So the segmentation principle is that pixels with a grey level greater than m+1.96(y are not in statistical agreement (2.5% level of signification) with the original distribution. They are assumed to belong to the damaged areas. Figure 6 shows the binary images corresponding to grey level images of figure 4. Obviously binary images showing selected pixels for upper surfaces and for all other shear conditions are available.
ANALYSIS OF THE DAMAGED AREAS IN RELATION WITH THE TOPOGRAPHY
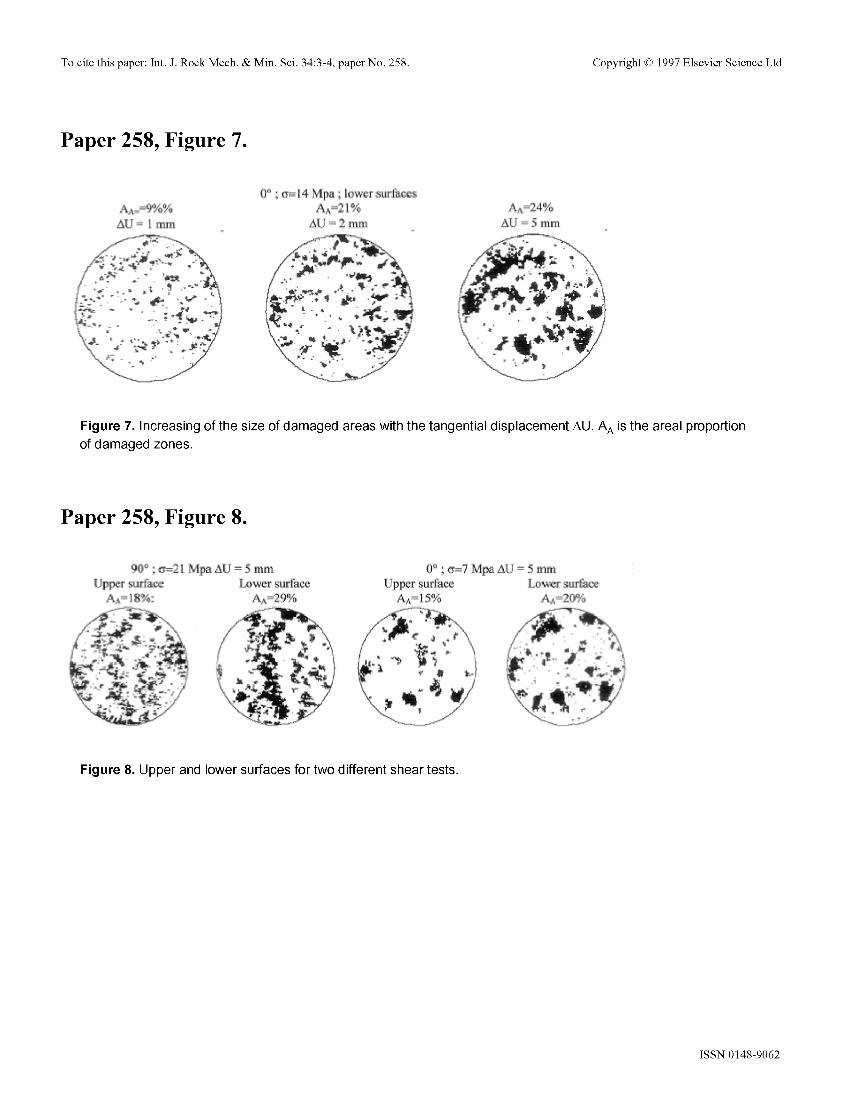
There is an increase in the number and more particularly in the surface area of the damaged zones with the normal stress (YN and the shear displacement AU (Figure 7). This observation holds whatever the
shear direction is (either 0°; -30 °, +60 ° or +90°). Estimations of damaged surface areas show that there is no significant damaged area before peak and, the proportion can reach 45% for (yN=21 Mpa and AU=5
mm in the residual strength phase. Damaged zones on upper and lower surfaces are very similar in location and shape (Figure 8). Sizes seem to be different : areal proportion of damaged zones are always found to be smaller for the upper surfaces than for the lower ones. Damaged zones are truly not strictly similar on upper and lower surfaces but differences are mainly due to segmentation method that leads to better results for lower surfaces than for upper ones because of the colored replicas involving best contrast for brightness on lower surface images. Sometimes also, some gouge material is pulled away when separating upper and lower surfaces introducing some bias in the estimation of the damaged areas ; surface areas can be underestimated but they never can be overestimated.
Damaged areas are not randomly distributed all over the surface of the fracture and, their locations are related to shear directions (Figures 6, 7, 8, 9). It can be observed that patterns of damaged zones are made of more or less continuous bands lying perpendicular to shear directions. That is easy to see on images corresponding to the shear directions +60 ° and 90°; and a little bit more difficult to see when the direction is -30 °. Spatial organization of damaged zones is not so obvious for the 0 ° shear direction. The structure of these more or less continuous bands is closely related to the topography of the fracture
ISSN 0148-9062
To cite this paper: Int. J. Rock Mech. & Min. Sci. 34:3-4, paper No. 258. Copyright © 1997 Elsevier Science Ltd
surfaces.
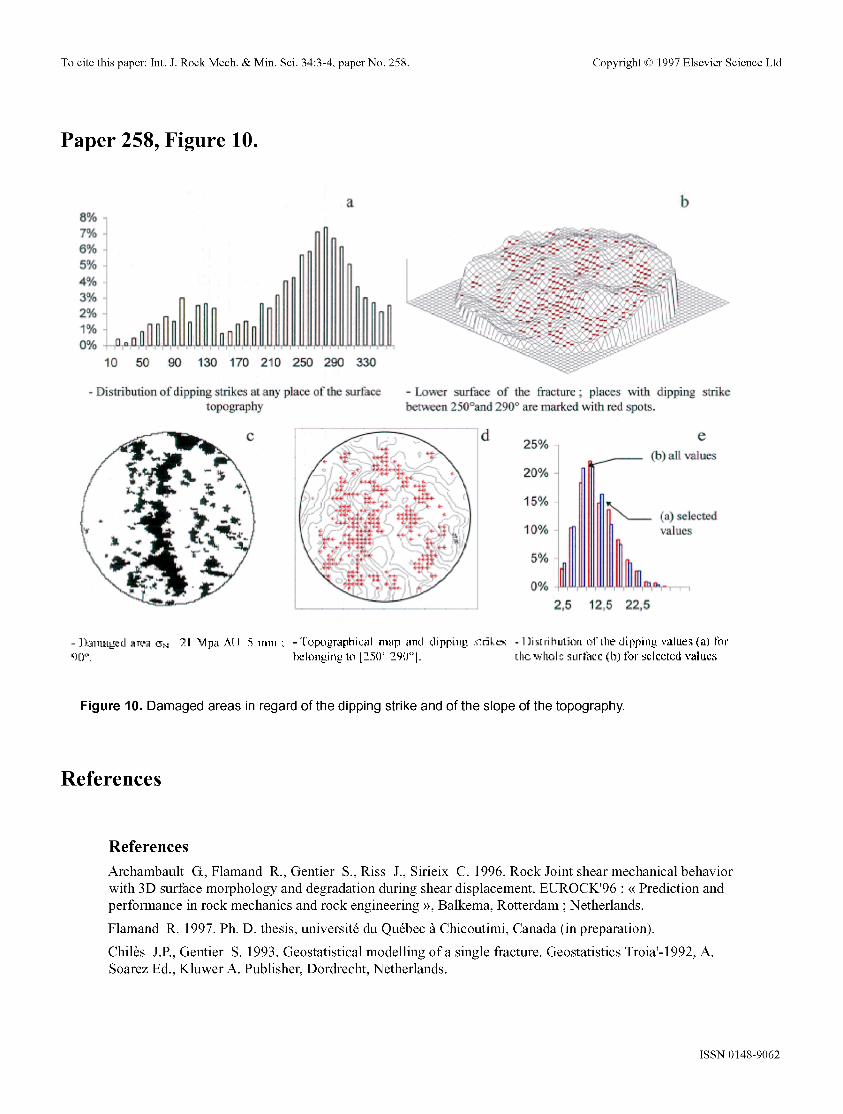
Looking at the morphology of the lower surface of the fracture (Figure 3), two important valleys are running parallel to the OX (0 °) direction ; these valleys are separated by an important undulating ridge that is essential in the design of the damaged areas as the shear direction is 90 ° (parallel to OY). Sides of ridges dipping Westward (moving direction of the lower surface) are damaged whatever their elevations. The central ridge is well damaged for shear direction of +90°or +60 ° and the degradation is less obvious for a shear direction of-30 ° because of the topography. Only one minor valley occurs in a transversal direction (something like 60 ° ) and there are no continuous ridges running in this direction. Damaged areas are organized in non continuous bands corresponding to the sides of non continuous ridges dipping towards the shear displacement direction. The pattern of damaged areas occurring in the 0 ° shear direction is very special since there is no valleys nor ridges in the 90 ° direction. In this 0 ° shear direction, damaged areas are located on sides of local summits separated one from the other (Figure 9). Patterns of damaged areas are quite similar when shearing occurs either with the +90 ° or the +60 ° direction ; while the same patterns correspond for the shear directions 0 ° and -30 °. The patterns of damaged areas is closely related to the morphology of the surfaces to be sheared. The presence of continuous ridges structures or local summits with sides perpendicular to the shear direction localized the degradation along these features as the shear displacement increases. To predict the damaged areas that will appear during shear it would be helpful to compute the topography dip strikes everywhere. Figure 10 (a) shows the dip direction distribution computed with data deduced from the surface modeling ; a majority of the dip strike Westward (210 ° ; 330 °) showing the anisotropy of the morphology and therefore of the damaged zone locations. Figure 10 (b) shows specific locations where the dip directions lie between 250 ° and 290 ° (upper and lower limits are chosen because of the strike of the mean regression plane : 272 °) ; figures 10 (c) and (d) show the image of the damaged areas and a topographic map similar to figure 10 (b). It can be seen that damaged areas are closely related to dipping strikes. What about the influence of the dipping values ? They do not seem to be of very importance since the distribution of the dipping values of the whole and of these values (27% of the total) are quite identical (Figure 10 (e)). Nevertheless a more precise analysis of the slope of the sides is needed.
C O N C L U S I O N S
There are two sets of conclusions. The first set is about the methodology we have developed in order to get available numerical modeling of the topography of the fracture surfaces and to be able to post the damaged areas due to the shearing process on them. The second set is about the shearing process itself.
Geostatistical methods (working with heights and gradient of the heights) and image analysis are fundamental tools to get available information. They need, to be successful methods, that well positioned profiles will be recorded with high accuracy on both upper and lower surfaces of the fracture ; they also need that images of the surfaces will be acquired after each shear test in such a way that thresholding leads to realistic identification of damaged areas. Henceforth, it is absolutely evident truth that the use of identical replicas of the fracture is basic for this kind of study.
Based on geometrical considerations and naturalistic observations the second set of conclusions consists mainly in that the shearing process is highly dependent on the morphology of the fracture. Damaged areas increase in size since the normal stress and the tangential displacement are increasing ; it has been seen that, at the residual strength, the damaged areas are those areas of the surface topography whose dipping strikes are close to the shear direction, we can assume that these areas are closely matted before
ISSN 0148-9062
To cite this paper: Int. J. Rock Mech. & Min. Sci. 34:3-4, paper No. 258. Copyright © 1997 Elsevier Science Ltd
the residual strength even if there is no visible degradation. Then the shear behavior of rock joints is dependent on the total area of the topographic features (ridges, hills, asperities, etc.) having a dipping strike similar to the shear direction. Further developments are needed to try to correlated mechanical results with such geometrical results in order to answer the question : .how evolve the peak strength increase and the stiffness decrease when the areal proportion of topographical features having a dipping strike parallel to the shear direction increases by changing the shear orientation, all others conditions remaining unchanged ?
Acknowledgments The present research was supported by the BRGM (France) and the university Bordeaux I (France).
FIGURES
Paper 258, Figure 1.
2"
---,--,_____. - . . .
. . . . . . . . . . . . . . . . . : / i . . . . . . . . . . . . 2 , y
The joint ['[acturc ~uJ'faces
Lower wall (A) - i
Figure 1. The cylindrical sample and the position of the profiles located on the horizontal projection of the fracture (profiles extend from one side to the other of the circle contouring the fracture surface) ; arrows show how moves the lower surface during shearing. OXYZ is the oriented coordinates system used for graphical drawing and computation.
ISSN 0148-9062
To cite this paper: Int. J. Rock Mech. & Mm. Sci. 34:3-4, paper No. 258. Copyright © 1997 Elsevier Science Ltd
Paper 258, Figure 2.
o,7 0,6 0,5 0,4~ 0 .3
0.2
0.1 II mnn
3
0 IC, 20 30
l o l ~ g r a p h >, t'l~e.ghr s]
0 , 0 6
0,04
0 , 0 2
0 , 0 0
0 10 2 0 3 0
I']r~[ derivadvc.~
F i g u r e 2 . E x p e r i m e n t a l ( d a r k l i n e s ) a n d t h e o r e t i c a l v a r i o g r a m s o f f r a c t u r e p r o f i l e s , d i r e c t i o n 0 ° l o w e r s u r f a c e ) .
Paper 258, Figure 3.
Z
• - , . . - .
{: ppL'r ~url?tL'e
1 'L
, ' I1.1.
I "
Va,lc3 ..v ¢,~X <'.,,tr~,l mn_,.~ \ /
t , - , , - : . : ~ , | . . . . . . ii,,st rid~,.e
~',,q k'v ~ .',f.'.SJ )~. 5x)5.~.£ <zb C r": f>';'~ s ¢ 2Y,." ",.'~'c~',', - , < ~ . - . :;2,f~<-.!~>.-~f-,, z~.-,, ~ . . , z " ,~4.'.. "..~. ~ ; " ~'~..'/~ ~4 . " :~ . '~ZC-:, , '~'', '." ' , " .- "
• . x , - , : . " - " - ¢ " < - " - ' . - . " 5 . ' " : - = , ~ - ~ . - " " - , ' : " " " / . " %.-" " ' - " : ,......- ~ .,~ .-'.___/:.,,-~-: ?<~>..~..'..~.-:-.,., . , . . , . . , . :> -,.... • ....~.";'2.'k.,<d;//,-ry-:".~:,."..>:.,'~:5.'.~-.~. <.~.~;<_~4;' , t: .....
• . . . . : . , - . ' .£: / . / .~t~-S,; , ;@~.~,. ,?.~/,<, ' .v: ; , , . / .H.%¢~-=~ " . t ~ Z , ' . . - } ~ '. ~ - : . . ..'.:.11:::.~'~'~,','~'.. ",',".".",'Y.t"..",'.,",: ";." ..: ~" :."" " '....'.',~': " I t . : ' : < ' - " " -
• .-..-..,..c-~.,'~,, ..-~'?./..'/",...,- , . . . ,-.. , , . . . . . . ' . . . . > ..... I - '-"-'-s-'--'." ':..:.~.::.'.-#~,'.1~_"~.~ < , ..'.,"4,s','/;~.>_.:.".<,<'~ <-.:~ >~-;~ I ~.~--b.Lc.-- "
.:.-iSt / % ~ < / ~ y ~ . ~ : . : { : ;:r- ,. : ; - : . , , ":~., ~..~,'.//,./d : ~ r,X/~ '- - .- I" . - : A . , ....... ~ S ' : ~ ";'~'-< . . . . - ' Y a i l c',
. . i t . " ' . . . ' . . ' . . " ~ . - ' ~ ¢ " " v " . . ~ . ~ - -
" f " ~ q { i : ~ - , - - < ' - . : " ..'.' ~× - - ' - " - - - . . . . I..._,.----~ ¥ ,.,..,..,..
I x:~'cJ ~urJhcc
F i g u r e 3 . S u r f a c e t o p o g r a p h y c a l c u l a t e d b y k r i g i n g .
ISSN 0148-9062
T o c i t e t h i s p a p e r : In t . J. R o c k M e c h . & M m . Sc i . 3 4 : 3 - 4 , p a p e r N o . 2 5 8 . C o p y r i g h t © 1 9 9 7 E l s e v i e r S c i e n c e L t d
Paper 258, Figure 4.
_ 3 ~ ~-
- 7 M p a A U - g m m
.... ~..~,-.;~...._ ~.:~~.~ :~- • ....,,..-
.......:.:. :;,,~,:~ ,...:},t.~ .....:.. ~.....~ . .~~-~........, .: .~,
'.',:.- . .~.:/ - ... ,~:~-, , .~ "=.
".. .:'-,, ::":,: -~ 2 :.,~....,;,::;. ." ., , ~ - ~ ' . ? ' ....?.
• . . . . . _ .
~.,2~, . ; , . " '.~
L . " . " ~ - ••~. "2 •• •
, . . . . . ~ ~ , ' , ~ , I ~ ' ~'%~ .' "
- . . ~ , ~ e ~ ~::-, " ~ 4 - • - " ~ ' ~ " . . . . . . . ' • k. ",-"-,-'- .~E:e-;'u.~: ~ - ' . . . '
• ~ ~,~.:.,~'. =..~ : ," .... ..,~ .,.'.~<..,,,~_~ ,g~.,
+50 ~
..... "#~ ~ i ~ :~,.,~ • ~,: ~::.: ~i~: . ~ : ~ : ~ , ~ : . ~ : ~ ,
~ ! ~ r ~ ~:. ,. ' ,~..~ ~ ~.~".~:~.-:'., ." ~ " . ,
-~::- .:.:~ ~.::.,.:-,~• ~ , , :.~
- ~ N . . - - .4 - ' "~ . ~ , - ' . . ~ ' . ~ . . C - - .
~ ~ , ~ ' ~ . % . . ' / a , " -..
, ~ ~ u~.:~.'~,'~... ~;.'-"~-!:,I~ t 1 ~ ~ . . '..,. . ~ ; ; , , ~ _,e~..~.. ,~ : - .~ .. g ~ y - , , ~ ¢ : ,,7g:~:.-~ ~K~. ,.: . ~ ; ~ ~ ~; ~ ~ % ' ~ ~ .
< : ~ , - i r~ ' " . :e~ ~ ~ ::~/~
+911 ~
,.-~-.:.::...;;:i~: .. .. - ~ . :~ .~¢; . . . , , -.
. = ~ . ~ : " t ' ~ ~ . . . ~ . : -~ , ,~
, . . ~ - . ' . . ~ . ~ , L . ' . "" : , . •
• .' . . ~ : ~;~~:~:,~.~'..~. ' • " ":;~ ~ ' ~ ~ : . . ~ , : " 4 - '
. : . : .g~- . " . ~ . . . ' . . ~ . " ' . " . ' r . . " . , .~ r~ ~ . < ~ . , . : - ~ . . . , .
'., ~ :_~:.:i; ~-~ "
" 4 : '.&., :-;:.,...~.~'"
. . ~ - ~ ' ~ ; -:~.~'.;.. . ~ < : . -.:,~, ~ ~ ...:.
~ , ~ . .
x[ ~ , !,~ ~: : . . . ~.::.::"%~:~:, ":..~. ! ~: ,~/.~,. ~,~ ..::..-:~ !~ ~ . ~ : . ~ ¢ ~ . . . ~:. ~,,~. ~/. _~...,,:._ ......:.._. ,-.. • " : - ' ~ ~ Z : ~ ; ~ , i . , . - ~ . . ~ . ~ ; ' . . : ' ~
~ / ~ ~ e ~ - ~ ' . . : . ~ ; ~ . . ~ ~.. ,.,~,~:.-:..~ ,?
,.__~- .. .~.. :.:~;_f.. ,
~ , ¥
- 2 1 M p a . \ U - .~m,~,
, . ~ ~., , , . .~ , . . ' - : . . ~ :~ ~...~" •
.... -. . -~ ; , 3~ . -~ * , , ~? ' . , , • , . , .~ . ~ : ~ . . . ~ . , ~ . _ , ,.-
, . . . . . . ~'.~:~ . . . , . : . . . , . . . . . . > . 2 : .........: ~.:.,.:.., . , - .
~ . . ~ <,.,~;. ~ , ",.\ o.., : .~::. . ,.:.-..,~-~ .,,.
. . . - . .
, ~". . ~ " : ' . . . . .
~:~ ~ ,~ ~ , ~
?: -: ~ . .~
.. ~~.. : . :_.
• . 4 . - . . . : , ; . . , . . = , . - / , .
- ,9 ' ~ ~ - ~ ' " • • : . 1 t ~ . . , .:,~..: " ..-.. . ~ ' . ~ - k ; ~ . " '
• ; ~ ' "H~ , , . . . . . ' ~ ~ • "
~. - ' . : -£ ,
: . ~ - 2 .
• . .~fl/~...:.,l~-~,-:. .".~?,~ " • - ~. ~ , . . . .=., r. ~.~. , i ,.-~,.%~ " "4~ ..."~',.~ ..'=~ .
• ~:~, . . . . ,~3f . : '~ .o . . . . . . . . ~ . , . ~
• .,.,:?g~d~:~, :.. ] -:=..~~ ; % . . @ ~ : . . . ' 7
.-: ~,.~:..~o.~..% ~.:.~: :.-- -~,, :.,_,.;g)! ~.~-:::--
F igure 4. Grey level images of lower surfaces of the sheared replicas (AU=0.5mm). White zones correspond to damaged areas. Angles 0 °, -30 °, 60 °, 90 ° indicate the shear ing direction with respect to X Y axis.
I S S N 0 1 4 8 - 9 0 6 2
To cite this paper: Int. J. Rock Mech. & Min. Sci. 34:3-4, paper No. 258. Copyright © 1997 Elsevier Science Ltd
Paper 258, Figure 5.
5%
4%
3%
2%
1%
0%
. .
. . . . . ti L 13 50 100 150 5O
Circy Icvc[s or bdgb|l~CS~
a
Li~pl~l~" Gau~s 5% ~i £trLb.ltJ~n tit.t[ ng 4% t.lt¢ c~!>cri mental
histo gf~l i , ~ ~.,/o
2%
1%
0% 2[?0 250 0
F
t
" : L j ' . .
lOO
ALL nixels wLtosc br]ghtnes's values are higher dtm/ m i 1.9(J~ are
constd¢rcd to l'~ I~r t o f
dtc danmgcd ~rc~ .
1S 0 200 250
G ~ 2 [c~c]s er bri~hlncss
b
Figure 5. Experimental histogram of the background of an image and the normal distribution fitting it (a) ; (b) experimental histogram of the image of a sheared surface with the original fitted normal distribution. Histograms are derived from the image of the sheared lower surface with (~ = 21 Mpa, AU = 5mm and 0 °.
ISSN 0148-9062
To c i t e th i s paper : Int. J. R o c k M e c h . & Min . Sci . 34:3-4 , p a p e r No . 258 . C o p y r i g h t © 1997 E l s e v i e r S c i e n c e L t d
Paper 258, Figure 6.
_30 ~
~: - 7 NIpa ,"~.I.." - - JEIIITI
l ~ '::,:!~"W',~ '),-~< :,:#)
-~ . ...?~
t" : "~.,
~60 o
+9 I ) ~
o: I ~ - " • ,~ .'ll_'z.::lt. i
cy - 14 M p a AU - 5 r a m a -" 2 I Mr~a..4,L, - 5 m m
i--. . , ' "~ _~i~
/•,.{/__-"lli, : ~ .~,:,::,. ,, ,, :,,t:~,,
Figure 6. Binary images showing features of interest that are damaged areas on sheared surfaces for various conditions (AU=0.5mm, 7, 14 and 21 Mpa, 0 °, -30 °, 60 °, 90°). Corresponding grey scale images are shown on figure 4.
I S S N 0 1 4 8 - 9 0 6 2
To cite th i s paper : Int. J. R o c k M e c h . & Min . Sci. 34:3-4 , p a p e r N o . 258 . C o p y r i g h t © 1997 E l s e v i e r S c i e n c e L td
Paper 258, Figure 7.
A[.I = I m r n
iI i ~ , ] ~ I ~ i " I ~
.I.%~... - .'. ~ ~ . . ~ " "~l 3
• ,,i~-" , - , ; _ ~ , " ~ ' j
\ . , , . , .. , . . . . , , , . . ~ " . ~ /
(]" ; ~ - L 4 NIpa ; L~.wcr ~Ltrta¢cs
, . % = 2 1 % .A ~ =2 4 %
,.~l .' = 2 m m At.2 = 5 rnrn
, , . , - , . - ~ /
. .
' - - - . . a . , , . , ~ - ~ \ - - . . " ' ~ ~ . . . i , - - . - ' ~ ~ "
Figure 7. Increasing of the size of damaged areas with the tangential displacement AU. A A is the areal proportion of damaged zones.
Paper 258, Figure 8.
9tY' " ,3"=2 [ [M.p0. ALI -- _5 [nt~'.
U p p c r ~tlrliLe¢
..\.~ 1 8 % :
~". " ~ , , \
" ~ I , ~ - ,¢" ~A- '~ ' , , ~ . ~ g ~ • .: • e~' ". ;_,~ . ~ - " L , . - . s'
0" ', ~ - 7 .%1[N &i.I = 5 m , n
[ ~ w c r s u r t h c e L p p c r s u r f a c e 1 , o ~ z r su rfi~o:
• . ,. , / ; ~ , ! ; , .' :~'r..~" ~ ::, ' / " ~ ; ; ~ i I I ~ ~ ~ '~
• . . . .
\ - l l " , ~ m l l [ , , ~ / , / '
Figure 8. Upper and lower surfaces for two different shear tests.
I S S N 0 1 4 8 - 9 0 6 2

To cite this paper : Int. J. R o c k Mech . & Min. Sci. 34:3-4, p a p e r No . 258. C o p y r i g h t © 1997 Elsev ie r Sc ience Ltd
P a p e r 2 5 8 , F i g u r e 9 .
j - . . . . . .
• ~ . . , . , " ~ . ~ . . . ~ . : . . . - _ - . . . . : . ~ . . .
. . . . " . " .,..-:-. ~ . ' : ' ~ .4, , . ;- . . '~ , .~. ~ '~;~. . . . .~ ..-:: ~ ..:..~.~.:. ; , ~ - ..~ . , '~"'-- '! ~,.::. b : . :~:. . , : : / ~ . ~ ,:~
• - ' : : ' : J , ' - ' . . ' ~ - ~ - 2 4 ' " • ~ ' ~ ' " " .. . ~ . . ~ ; : , . , 1 - . ' : . ' ~ L-.:...:. • - . . - . . . . . . . ; ~" :'~.%..',;. " . . ' " " , • • . - ~ . . d " . ~ . " " ~ [ . . . . . . . " " " : . ~ / ~ . . = " t : d - . - . . : : . . . " < ~ ' ~ :' ~ . : " : : " "
: " : - ~ v<~.~....,,~-:>X: :: :" '.'"" ...... " . . . '~L.:.:~2:. ~ :" .... :
• ...... ." ~_..~_,-'...". •. .....'. • . ' . . . . " . : . - . . . : . . : . . . . .
- . . . . : . " : . : . : ,
0" ; ~ = 7 M p a A/U = 5 t u r n
• ... . . . . : . . . : . . ~ • : , . ~ . ~ . ~ . .
• • ./,~:-.,".~.~':"~"..i:: '::::L~, .~':,~: .,.-.k. • - : : [ / : ~ : > . " ? - : ~ 4 ~ . . :'". ' " . ~ - ' ~ . • ...x...., B:-...... • " - : " - : - : " . " ~ - - Z . ~ * . . . x @ . ~ 2 . . . . . . . j " ' ~ : , " . . . . • " I t 1 : . . . . . . . . . . .
' : : ; : : . : i ; / / - :~"~;av . . : . i : : . : : " . : ; : :~~ .~ . . : ', ) : . : - . , ; : :
- . . - . • . - . . . . . . . . . . - . - . . . : •
'"": i.] :': :: ': : ::':""
0 - " ; ~ = 2 l M p a ALJ - S l~m
Figure 9. Increasing sizes of damaged areas on the lower surface of the fracture ; notice that some damaged parts of the transversal valley are not segmented.
I S S N 0148-9062
To cite this paper: Int. J. Rock Mech. & Min. Sci. 34:3-4, paper No. 258. Copyright © 1997 Elsevier Science Ltd
Paper 258, Figure 10.
8% 7% 6¾ 5% 4 %
3~'~ 2% 1% 0%
10 50 90 130 l-gO 2"0
ill 250 290
IHI I 330
- . . . ~ ._~ . , . . . . . . , -_- . _' y:: . _:_fi:_-._ - -,__ i ....
. . . , -,,..=
• :-"" - --"-.--.=.'C- "-:--:Z -.,i .: - , In i ... . ::--- =2: . - : ; - ~ - ' : ~ - ~ - • - -_ - : - ~,.
- - . - _
b
- ) i ~ l r i b , t R i o n £~t dipsnir~, .51rikt,~ at any pF~¢¢ 01" the surli~ce ~ opc.,gral;hy
- L , o w c r surla¢.tc c.~l 1he IractLir,c : pl.ac:,;5 with r,:,jp#]i~ 5,rlb.t hclV~¢rt ZS0°amJ 200 ° ~lrc Til~.trkk~.~ with r~,~l ~p~.~l~,
d ~- ----~'~ 25% / \ .'-.+ ~ ~. ~ .
/ ',. -.",.,.,i.'~~.""i,~, ,. 2 0 %
. ~ ' ' A , - , . 1 5 %
2.5
',,-'a['.lcs
[[] [i-I R~ _
I:Z 5 22.5
- Damaged ar~'a c~s 21 MI-J~L A(I 5, lrnln , -'[c,[x~graphical m~p innr, I dipph~g .~:r-]k,_~ -l?is[riI~utiort t.~lthe dipping ~.alueg (a) t~' q[)o. t~ltb~lgir~ to [250: 29':Y'1. the whole SLIr~hcC ([3) 1~1 sclcctc~ valUeS
Figure 10. Damaged areas in regard of the dipping strike and of the slope of the topography.
References
References
A r c h a m b a u l t O., F l a m a n d R., Oen t ie r S., Riss J., Sir ieix C. 1996. R o c k Joint shear m e c h a n i c a l b e h a v i o r wi th 3D sur face m o r p h o l o g y and degrada t ion dur ing shear d i sp lacement . E U R O C K ' 9 6 : << Pred ic t ion and p e r f o r m a n c e in rock m e c h a n i c s and r o c k eng ineer ing >>, Ba lkema , R o t t e r d a m ; Nether lands .
F l a m a n d R. 1997. P h . D . thesis, univers i t6 du Qu6bec fi Chicout imi , C a n a d a (in prepara t ion) .
Chil~s J.P., Oen t ie r S. 1993. Oeos ta t i s t ica l mode l l i ng o f a s ingle fracture. Oeos ta t i s t ics Troia ' -1992, A. Soarez Ed., K l u w e r A. Publ isher , Dordrech t , Nether lands .
ISSN 0148-9062
To cite this paper: Int. J. Rock Mech. & Mm. Sci. 34:3-4, paper No. 258. Copyright © 1997 Elsevier Science Ltd
Gentier S. 1986. Morphologie et comportement hydrom6canique d'une fracture naturelle dans un granite sous contrainte normale. Th~se d'universit6, Orl6ans, France.
Gerrard C. 1986. Shear failure of rock joints : appropriate constraints for empirical relations. International Journal of Rock Mechanics and Mining Sciences, 23:6, 421-429.
Laffr6chine K. 1996. Comportement m6canique des 6pontes d'une fracture. Rapport de stage de DEA, DEA PAE3S, 1NPL, Nancy, France.
Riss J., Gentier S., Laffr6chine K., Flamand R., Archambault G. 1997. Binary images of sheared rock joints. Microscopy Microanalysis Microstructures, to appear.
ISSN 0148-9062