
structural dynamics of modular bridge expansion joints ...
377
STRUCTURAL DYNAMICS OF MODULAR BRIDGE EXPANSION JOINTS RESULTING IN ENVIRONMENTAL NOISE EMISSIONS AND FATIGUE Eric John Ancich A thesis submitted in fulfilment of the requirements for the Degree of Doctor of Philosophy (By Publication) Faculty of Engineering and Information Technology University of Technology, Sydney Australia February 2011
-
Upload
khangminh22 -
Category
Documents
-
view
0 -
download
0
Transcript of structural dynamics of modular bridge expansion joints ...
STRUCTURAL DYNAMICS OF MODULAR BRIDGE EXPANSION
JOINTS RESULTING IN ENVIRONMENTAL NOISE EMISSIONS AND FATIGUE
Eric John Ancich
A thesis submitted in fulfilment of the requirements for the Degree of Doctor of Philosophy (By Publication)
Faculty of Engineering and Information Technology University of Technology, Sydney
Australia
February 2011


ACKNOWLEDGEMENTS
Firstly, I would like to express my sincere gratitude to my principal supervisor,
Professor Bijan Samali for his guidance and inspiration in all aspects throughout
my study. His unselfish help and kindly advice have been invaluable.
I am extremely grateful to Dr. Khalid Aboura for his valuable advice and
assistance with the mathematical formulation of the Elliptical Loading Model.
I also acknowledge the contributions of the co-authors of the various papers set
out in Appendices A-N.
Special mention needs to be made of the role of the Roads and Traffic Authority
of NSW (RTA) in funding the research and the assistance of many RTA
colleagues in facilitating that research.
Finally, the results reported in this thesis would not have been possible were it not
for the involvement of my RTA colleague, Mr Gordon Chirgwin. He single-
handedly negotiated the funding gauntlet and was always able to ensure that the
necessary funds were available for whatever experimental tangent I proposed.
With the benefit of hindsight, it is clear that these experimental tangents led
directly to the development of the high damping bearing solution that was used to
successfully fatigue proof the modular bridge expansion joint installed in the
western abutment of Anzac Bridge. However, at the time, these tangents were
generally regarded as highly unconventional.
ii
PUBLICATIONS
The following technical papers have been published based on the work in this
thesis:
Journal Publications:
1. Ancich E.J., Chirgwin G.J. and Brown S.C. (2006). Dynamic Anomalies in a
Modular Bridge Expansion Joint, Journal of Bridge Engineering, Vol. 11, No. 5,
541-554.
2. Ancich E.J. and Brown S.C. (2004). Engineering Methods of Noise Control
for Modular Bridge Expansion Joints, Acoustics Australia, Vol. 32, No. 3, 101-
107.
Conference Papers:
3. Ancich E.J. and Brown S.C. (2009). Premature Fatigue Failure in a
Horizontally Curved Steel Trough Girder Bridge, Proc. International Association
for Bridge & Structural Engineering (IABSE) Symposium, Bangkok, Thailand.
4. Ancich E.J., Chirgwin G.J., Brown S.C. & Madrio H. (2009). Fatigue
Implications of Growth in Heavy Vehicle Loads and Numbers on Steel Bridges,
Proc. International Association for Bridge & Structural Engineering (IABSE)
Symposium, Bangkok, Thailand.
5. Ancich E.J., Chirgwin G.J., Brown S.C. & Madrio H. (2009). Fatigue
Sensitive Cope Details in Steel Bridges and Implications from Growth in Heavy
Vehicle Loads and Numbers, Proc. 7th Austroads Bridge Conference, Auckland,
New Zealand.
6. Ancich E.J. (2007). Dynamic Design of Modular Bridge Expansion Joints by
the Finite Element Method, Proc. International Association for Bridge &
Structural Engineering (IABSE) Symposium, Weimar, Germany.
iii
7. Ancich E.J., Forster G. and Bhavnagri V. (2006). Modular Bridge Expansion
Joint Specifications and Load Testing, Proc. 6th Austroads Bridge Conference,
Perth, Western Australia, Australia.
8. Ancich E.J. and Bradford P. (2006). Modular Bridge Expansion Joint
Dynamics, Proc. 6th World Congress on Joints, Bearings, and Seismic Systems for
Concrete Structures, Halifax, Nova Scotia, Canada.
9. Ancich E.J. and Chirgwin G.J. (2006). Fatigue Proofing of an In-service
Modular Bridge Expansion Joint, Proc. 6th World Congress on Joints, Bearings,
and Seismic Systems for Concrete Structures, Halifax, Nova Scotia, Canada.
10. Ancich E.J. and Bhavnagri V. (2006). Fatigue Comparison of Modular Bridge
Expansion Joints Using Multiple Bridge Design Code Approaches, Proc. 6th
World Congress on Joints, Bearings, and Seismic Systems for Concrete
Structures, Halifax, Nova Scotia, Canada.
11. Ancich E.J., Brown S.C. and Chirgwin G.J. (2004). The Role of Modular
Bridge Expansion Joint Vibration in Environmental Noise Emissions and Joint
Fatigue Failure, Proc. Acoustics 2004 Conference, Surfers Paradise, Queensland,
Australia, 135-140.
12. Ancich E.J. and Brown S.C. (2004). Modular Bridge Joints – Reduction of
noise emissions by use of Helmholtz Absorber, Proc. 5th Austroads Bridge
Conference, Hobart, Tasmania, Australia.
13. Ancich E.J., Brown S.C. and Chirgwin G.J. (2004). Modular Deck Joints –
Investigations into structural behaviour and some implications for new joints,
Proc. 5th Austroads Bridge Conference, Hobart, Tasmania, Australia.
Internal Reports:
14. Ancich E.J. (2000). A Study of the Environmental Noise Generation &
Propagation Mechanisms of Modular Bridge Expansion Joints, RTA
Environmental Technology Report No. 000203, Roads & Traffic Authority of
NSW, Sydney, NSW, Australia.
iv
TABLE OF CONTENTS
Certificate of Authorship/Originality……………………………………………i
Acknowledgements................................................................................................ ii
Publications........................................................................................................... iii
List of Tables ......................................................................................................... x
List of Figures ....................................................................................................... xi
Notations ............................................................................................................. xiii
Abstract ................................................................................................................ xv
Chapter 1 What Are Modular Bridge Expansion Joints? 1.1 Introduction ................................................................................................. 1
1.2 Types of Bridge Expansion joints ............................................................... 1
1.3 Summary ..................................................................................................... 6
Chapter 2 Modular Bridge Expansion Joint Noise 2.1 Generation & Propagation........................................................................... 7
2.2 Noise Control Methods ............................................................................... 8
2.2.1 Helmholtz Absorber.................................................................... 9
2.2.2 Partial Encapsulation .................................................................. 9
2.2.3 Noise Reducing Plates .............................................................. 11
2.3 Summary ................................................................................................... 16
v
Chapter 3
Structural Dynamics Investigation 3.1 Introduction ............................................................................................... 17
3.2 Experimental Modal Analysis................................................................... 21
3.3 Finite Element Modelling.......................................................................... 23
3.4 Coupled Centre Beam Resonance ............................................................. 26
3.5 Strain Gauge Measurements...................................................................... 29
3.5.1 Strain Gauge Locations............................................................. 30
3.5.2 Test Vehicle Loading................................................................ 30
3.5.3 Truck Slow Roll........................................................................ 32
3.5.4 Truck Pass-bys.......................................................................... 32
3.5.5 Strain and Displacement Measurements................................... 33
3.5.6 Strain Measurement Results ..................................................... 33
3.6 Vibration Induced Fatigue......................................................................... 35
3.7 High Damping Bearings............................................................................ 36
3.7.1 Post Installation Studies............................................................ 40
3.8 Summary ............................................................................................ 43
Chapter 4 Elliptical Loading Model 4.1 Introduction ............................................................................................... 45
4.2 An Elliptical Loading Model..................................................................... 46
4.2.1 Model Definition ...................................................................... 47
4.3 Summary ................................................................................................... 49
vi
Chapter 5 Conclusions and Suggestions for Future Work 5.1 Conclusions ............................................................................................... 50
5.2 Suggestions for Future Work .................................................................... 51
5.2.1 MBEJ Noise Generation & Abatement .................................... 51
5.2.2 Elliptical Loading Model .......................................................... 52
References ...........................................................................................53
Journal Papers Based on This Thesis...............................................63
Appendix A
Ancich E.J. (2000). A Study of the Environmental Noise Generation &
Propagation Mechanisms of Modular Bridge Expansion Joints, RTA
Environmental Technology Report No. 000203, Roads & Traffic Authority of
NSW, Sydney, NSW, Australia.
Appendix B
Ancich E.J. and Brown S.C. (2004a). Modular Bridge Joints – Reduction of noise
emissions by use of Helmholtz Absorber, Proc. 5th Austroads Bridge Conference,
Hobart, Tasmania, Australia.
Appendix C
Ancich E.J., Brown S.C. and Chirgwin G.J. (2004). The Role of Modular Bridge
Expansion Joint Vibration in Environmental Noise Emissions and Joint Fatigue
Failure, Proc. Acoustics 2004 Conference, Surfers Paradise, Queensland,
Australia, 135-140.
Appendix D
Ancich E.J. and Brown S.C. (2004b). Engineering Methods of Noise Control for
Modular Bridge Expansion Joints, Acoustics Australia, Vol. 32, No. 3, 101-107.
vii
Appendix E
Ancich E.J., Brown S.C. and Chirgwin G.J. (2004). Modular Deck Joints –
Investigations into structural behaviour and some implications for new joints,
Proc. 5th Austroads Bridge Conference, Hobart, Tasmania, Australia.
Appendix F
Ancich E.J. and Bhavnagri V. (2006). Fatigue Comparison of Modular Bridge
Expansion Joints Using Multiple Bridge Design Code Approaches, Proc. 6th
World Congress on Joints, Bearings, and Seismic Systems for Concrete
Structures, Halifax, Nova Scotia, Canada.
Appendix G
Ancich E.J. and Chirgwin G.J. (2006). Fatigue Proofing of an In-service Modular
Bridge Expansion Joint, Proc. 6th World Congress on Joints, Bearings, and
Seismic Systems for Concrete Structures, Halifax, Nova Scotia, Canada.
Appendix H
Ancich E.J. and Bradford P. (2006). Modular Bridge Expansion Joint Dynamics,
Proc. 6th World Congress on Joints, Bearings, and Seismic Systems for Concrete
Structures, Halifax, Nova Scotia, Canada.
Appendix I
Ancich E.J., Forster G. and Bhavnagri V. (2006). Modular Bridge Expansion
Joint Specifications and Load Testing, Proc. 6th Austroads Bridge Conference,
Perth, WA, Australia.
Appendix J
Ancich E.J., Chirgwin G.J. and Brown S.C. (2006). Dynamic Anomalies in a
Modular Bridge Expansion Joint, Journal of Bridge Engineering, Vol. 11, No. 5,
541-554 (With permission from ASCE).
Appendix K
Ancich E.J. (2007). Dynamic Design of Modular Bridge Expansion Joints by the
Finite Element Method, Proc. International Association for Bridge & Structural
Engineering (IABSE) Symposium, Weimar, Germany.
viii
Appendix L
Ancich E.J., Chirgwin G.J., Brown S.C. & Madrio H. (2009). Fatigue Sensitive
Cope Details in Steel Bridges and Implications from Growth in Heavy Vehicle
Loads and Numbers, Proc. 7th Austroads Bridge Conference, Auckland, New
Zealand.
Appendix M
Ancich E.J. and Brown S.C. (2009). Premature Fatigue Failure in a Horizontally
Curved Steel Trough Girder Bridge, Proc. International Association for Bridge &
Structural Engineering (IABSE) Symposium, Bangkok, Thailand.
Appendix N
Ancich E.J., Chirgwin G.J., Brown S.C. & Madrio H. (2009). Fatigue
Implications of Growth in Heavy Vehicle Loads and Numbers on Steel Bridges,
Proc. International Association for Bridge & Structural Engineering (IABSE)
Symposium, Bangkok, Thailand.
ix

List of Tables
Table 3.1 Summary of modal frequencies and damping (% of Critical)...........22
Table 3.2 Summary of natural modal frequencies – Anzac Bridge MBEJ.…..24
Table 3.3 Target & actual test truck pass-by speeds………..………….….….32
Table 3.4 Summary of resulting strains, stresses and DAF’s……………..….33
Table 3.5 Comparison of prototype bearing test results………………….…..39
Table 3.6 Measurement results over comparable two-week periods…….…...41
x
List of Figures Figure 1.1 Typical cross-section of a roller shutter joint…………………...2
Figure 1.2 Example of a multiple support bar MBEJ design….……………..3
Figure 1.3 Example of a single support bar MBEJ design…………………..4
Figure 1.4 Steel spring centreing mechanism at Cowra (NSW)……………..5
Figure 1.5 Failed elastomeric springs at Taree (NSW) also showing
compression
set…………………………………………………………….…….5
Figure 2.1 Helmholtz absorber installation at Tom Ugly’s Bridge….……….9
Figure 2.2a Partially encapsulated joint – Itztal Bridge (Germany)……..…..10
Figure 2.2b Partial MBEJ encapsulation……………………………..………10
Figure 2.3a Bolted sinus plates…….…………………………………..…….11
Figure 2.3b Welded rhombic plates……………………………………….....11
Figure 2.4 Noise reduction comparison……………………………………12
Figure 2.5 Sealed aluminium finger joint………………………………….14
Figure 2.6 Karuah MBEJ during installation……………………….………..15
Figure 3.1 Anzac Bridge MBEJ support bar bearings…………….……..…18
Figure 3.2 Centre beam cracking – 3rd Lake Washington Bridge…..………20
Figure 3.3 Established fatigue crack patterns – multiple support bar designs
……………………………………………………..…….……….21
Figure 3.4 Mode 1 @ 71 Hz…………………………………………………22
Figure 3.5 Plot of virtual wheel load force profile…………………….……25
Figure 3.6 Sample force time history for a 62 km/hr drive over (Anzac).....25
Figure 3.7 Manifestation of coupled centre beam resonance…..………..…26
Figure 3.8 Quasi-static strain……………………………………………..…27
Figure 3.9 Plan view eastbound kerbside lane - six strain gauge locations (SG1
to SG6)………….……………………………………………..…29
Figure 3.10 Test vehicle loading arrangement…………..…………………...30
Figure 3.11 Elevation of modular expansion joint and nominal test truck
position……………………………………………….……….….31
Figure 3.12 Distorted upper support bar bearing………………………….…..37
xi

Figure 3.13 Time-dependent failure probability for a welded connection
between centre beam and support bar – OEM
Condition…………………………………….…………..…….…40
Figure 3.14 Time-dependent failure probability for a welded connection
between centre beam and a support bar – Prototype #3……….…41
Figure 4.1 Characteristic half-sine wave impulsive load……....................….45
xii
Notations flim Stress at limit state for fatigue
f*u Computed Stress for ultimate design load
ft Tyre pulse frequency (Hz)
fp Wheel/beam pass frequency (Hz)
V Vehicle speed (m/s)
G Spacing between centre beams (m)
Lp Sound Pressure Level (dB)
Leq Equivalent Continuous Sound Pressure Level (dB)
Lt Tyre patch length (m)
b Width of the centre beam top flange (m)
ϖ Forcing radian frequency (rads/s)
ωn Natural radian frequency (rads/s)
Bm Effective mass of the centre beam
Vm Effective mass of the vehicle
( )P t Unit vehicle (pulse) excitation with a maximum value of 1
P Sound pressure (Pa)
Pref Reference pressure (20µPa)
0x Co-ordinate of the first beam node
Tt∆ Tyre pulse duration
N Number of centre beams
f*f Computed stress for fatigue design load
Фf Capacity reduction factor
H Longitudinal live load
Wx Axle load
Wxu Factored axle load for strength design
Wxf Factored axle load for fatigue design
χ Dynamic amplification factor (DAF)
γu Strength limit state factor
γf Fatigue limit state factor
β Distribution factor
flim Fatigue stress range limit
xiii
fTH Fatigue threshold limit
Js,max Maximum joint opening at serviceability limit state
Js,min Minimum joint opening at serviceability limit state
Jf Joint opening at fatigue limit state
εdyn Strain range due to the vehicle travelling at designated speed (peak-to-peak)
εstat Strain range due to vehicle travelling at crawl (slow roll) speed (zero-to-peak)
δdyn Maximum displacement due to the vehicle travelling at designated speed
δstat Maximum displacement due to the vehicle travelling at crawl (slow roll)
speed
DAF Dynamic amplification factor
MBEJ Modular bridge expansion joint
OEM Original equipment manufacturer
RTA Roads & Traffic Authority of NSW (Australia)
xiv
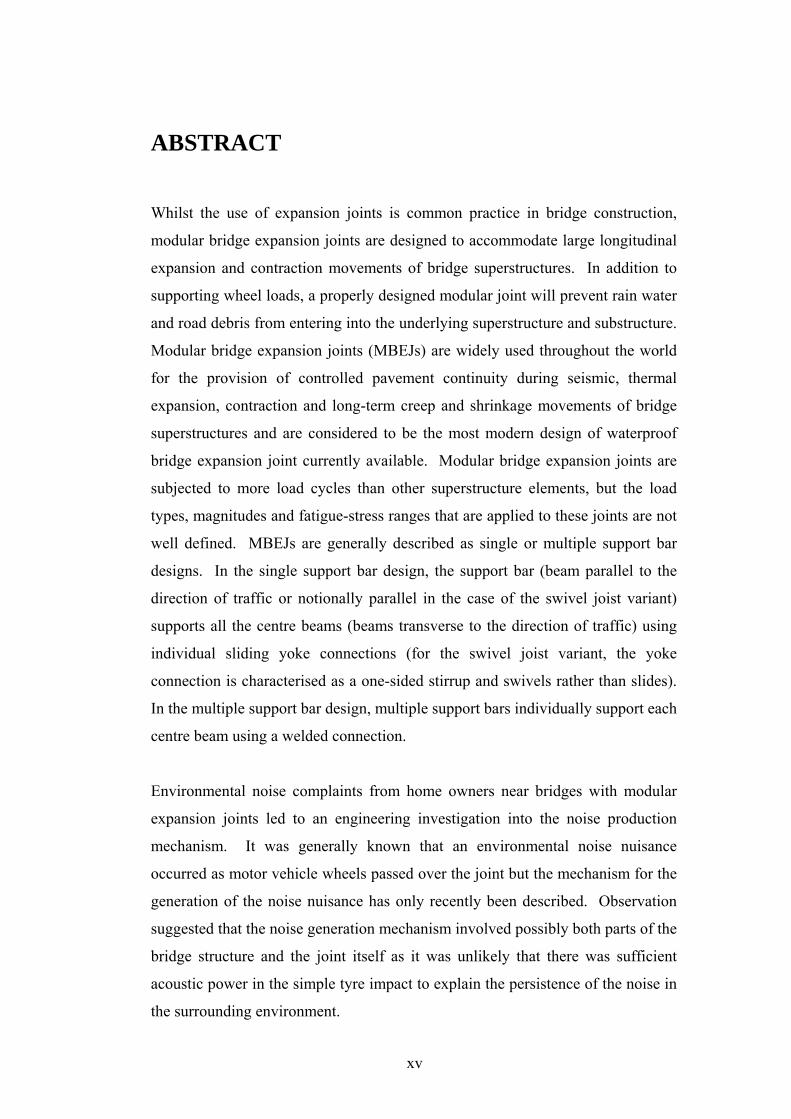
ABSTRACT
Whilst the use of expansion joints is common practice in bridge construction,
modular bridge expansion joints are designed to accommodate large longitudinal
expansion and contraction movements of bridge superstructures. In addition to
supporting wheel loads, a properly designed modular joint will prevent rain water
and road debris from entering into the underlying superstructure and substructure.
Modular bridge expansion joints (MBEJs) are widely used throughout the world
for the provision of controlled pavement continuity during seismic, thermal
expansion, contraction and long-term creep and shrinkage movements of bridge
superstructures and are considered to be the most modern design of waterproof
bridge expansion joint currently available. Modular bridge expansion joints are
subjected to more load cycles than other superstructure elements, but the load
types, magnitudes and fatigue-stress ranges that are applied to these joints are not
well defined. MBEJs are generally described as single or multiple support bar
designs. In the single support bar design, the support bar (beam parallel to the
direction of traffic or notionally parallel in the case of the swivel joist variant)
supports all the centre beams (beams transverse to the direction of traffic) using
individual sliding yoke connections (for the swivel joist variant, the yoke
connection is characterised as a one-sided stirrup and swivels rather than slides).
In the multiple support bar design, multiple support bars individually support each
centre beam using a welded connection.
Environmental noise complaints from home owners near bridges with modular
expansion joints led to an engineering investigation into the noise production
mechanism. It was generally known that an environmental noise nuisance
occurred as motor vehicle wheels passed over the joint but the mechanism for the
generation of the noise nuisance has only recently been described. Observation
suggested that the noise generation mechanism involved possibly both parts of the
bridge structure and the joint itself as it was unlikely that there was sufficient
acoustic power in the simple tyre impact to explain the persistence of the noise in
the surrounding environment.
xv
Engineering measurements were undertaken at two bridges and subsequent
analysis led to the understanding that dominant frequency components in the
sound pressure field inside the void below the joint were due to excitation of
structural modes of the joint and/or acoustic modes of the void. This initial
acoustic investigation was subsequently overtaken by observations of fatigue
induced cracking in centre beams and the welded support bar connection. A
literature search revealed little to describe the structural dynamics behaviour of
MBEJs but showed that there was an accepted belief amongst academic
researchers dating from around 1973 that the loading was dynamic. In spite of
this knowledge, some Codes-of-Practice and designers still use a static or quasi-
static design with little consideration of the dynamic behaviour, either in the
analysis or the detailing. In an almost universal approach to the design of modular
bridge expansion joints, the various national bridge design codes do not envisage
that the embedded joint may be lightly damped and could vibrate as a result of
traffic excitation. These codes only consider an amplification of the static load to
cover sub-optimal installation impact, poor road approach and the dynamic
component of load. The codes do not consider the possibility of free vibration
after the passage of a vehicle axle.
Codes also ignore the possibilities of vibration transmission and response
reinforcement through either following axles or loading of subsequent
components by a single axle. What the codes normally consider is that any
dynamic loading of the expansion joint is most likely to result from a sudden
impact of the type produced by a moving vehicle ‘dropping’ onto the joint due to
a difference in height between the expansion joint and the approach pavement.
In climates where snow ploughs are required for winter maintenance, the
expansion joint is always installed below the surrounding pavement to prevent
possible damage from snow plough blades. In some European states (viz.
Germany), all bridge expansion joints are installed some 3-5mm below the
surrounding pavement to allow for possible wear of the asphaltic concrete. In
other cases, height mismatches may occur due to sub-optimal installation.
xvi
However, in the case of dynamic design, there are some major exceptions with
Standards Australia (2004) noting that for modular deck joints “…the dynamic
load allowance shall be determined from specialist studies, taking account of the
dynamic characteristics of the joint…” It is understood that the work reported in
Appendices B-E was instrumental in the Standards Australia committee decisions.
Whilst this Code recognizes the dynamic behavior of MBEJs, there is no guidance
given to the designer on the interpretation of the specialist study data. AASHTO
(2004), Austrian Guideline RVS 15.45 (1999) and German Specification TL/TP-
FÜ 92 (1992) are major advancements as infinite fatigue cycles are now specified
and braking forces considered but there is an incomplete recognition of the
possibility of reinforcement due to in-phase (or notionally in-phase) excitation or
the coupled centre beam resonance phenomenon described in Chapter 3.
This thesis investigates the mechanism for noise generation and propagation
through the use of structural dynamics to explain both the noise generation and the
significant occurrence of fatigue failures world-wide. The successful fatigue
proofing of an operational modular joint is reported together with the introduction
of an elliptical loading model to more fully explain the observed fatigue failure
modes in the multiple support bar design.
xvii
CHAPTER 1
What are Modular Bridge Expansion Joints?
1.1 Introduction
Above a certain length, all bridges require some provision for expansion and
contraction. In the simplest case, the bridge deck and its supporting sub-structure
will expand or contract due to the normal day/night temperature fluctuations and
for the greater temperature fluctuations associated with the different seasons. For
Portland cement concrete structures, provision must also be made for long-term
effects such as creep and shrinkage. Concrete creep is normally defined as the
deformation of the structure under sustained load. Basically, long term pressure
or stress on concrete can make it change shape. The main component of this
deformation usually occurs in the direction the force is being applied. Like a
concrete column becoming more compressed or a beam bending. Creep does not
necessarily cause concrete to fail or break apart and is allowed for when concrete
structures are designed. It is, however, a property of concrete that is poorly
understood and only recently have bridge design codes made adequate provision
for the effects of creep.
1.2 Types of Bridge Expansion joints
Ramberger (2002) provides a comprehensive summary of the most common types
of bridge expansion joints. For bridges with large continuous spans, such as
Sydney’s Anzac Bridge (main span 345m), the requisite provision for expansion
could be anywhere from 500mm to several metres and this expansion space must
be filled in a suitable way to permit vehicular traffic to cross the gap.
Historically, only two designs of expansion joints were capable of fulfilling this
requirement. The oldest design is the roller shutter joint and more recently the
modular bridge expansion joint (MBEJ). Figure 1.1 shows a typical cross-section
of a roller shutter joint.
1
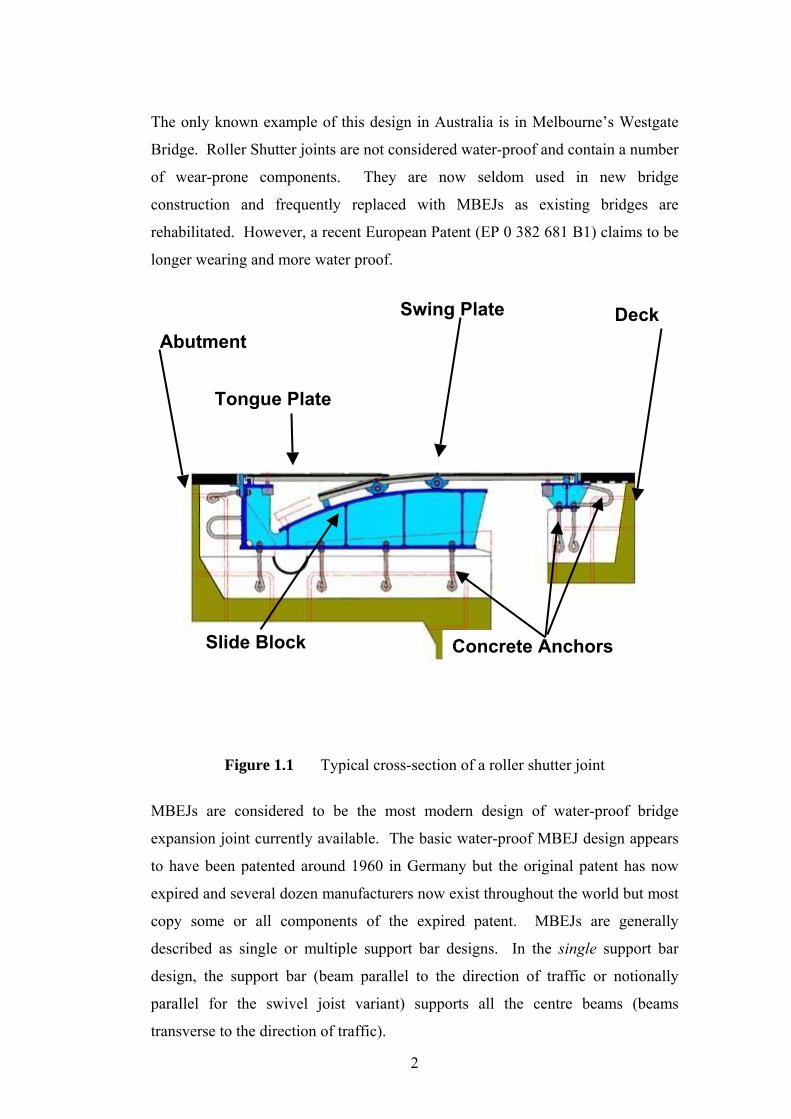
The only known example of this design in Australia is in Melbourne’s Westgate
Bridge. Roller Shutter joints are not considered water-proof and contain a number
of wear-prone components. They are now seldom used in new bridge
construction and frequently replaced with MBEJs as existing bridges are
rehabilitated. However, a recent European Patent (EP 0 382 681 B1) claims to be
longer wearing and more water proof.
Swing Plate
M
e
t
e
c
d
d
p
t
Abutment
Tongue Plate
Concrete AnchorsSlide Block
Figure 1.1 Typical cross-section of a roller shutter joint
BEJs are considered to be the most modern design of water-pr
xpansion joint currently available. The basic water-proof MBEJ desi
o have been patented around 1960 in Germany but the original paten
xpired and several dozen manufacturers now exist throughout the worl
opy some or all components of the expired patent. MBEJs are
escribed as single or multiple support bar designs. In the single s
esign, the support bar (beam parallel to the direction of traffic or
arallel for the swivel joist variant) supports all the centre beam
ransverse to the direction of traffic).
2
Deck
oof bridge
gn appears
t has now
d but most
generally
upport bar
notionally
s (beams
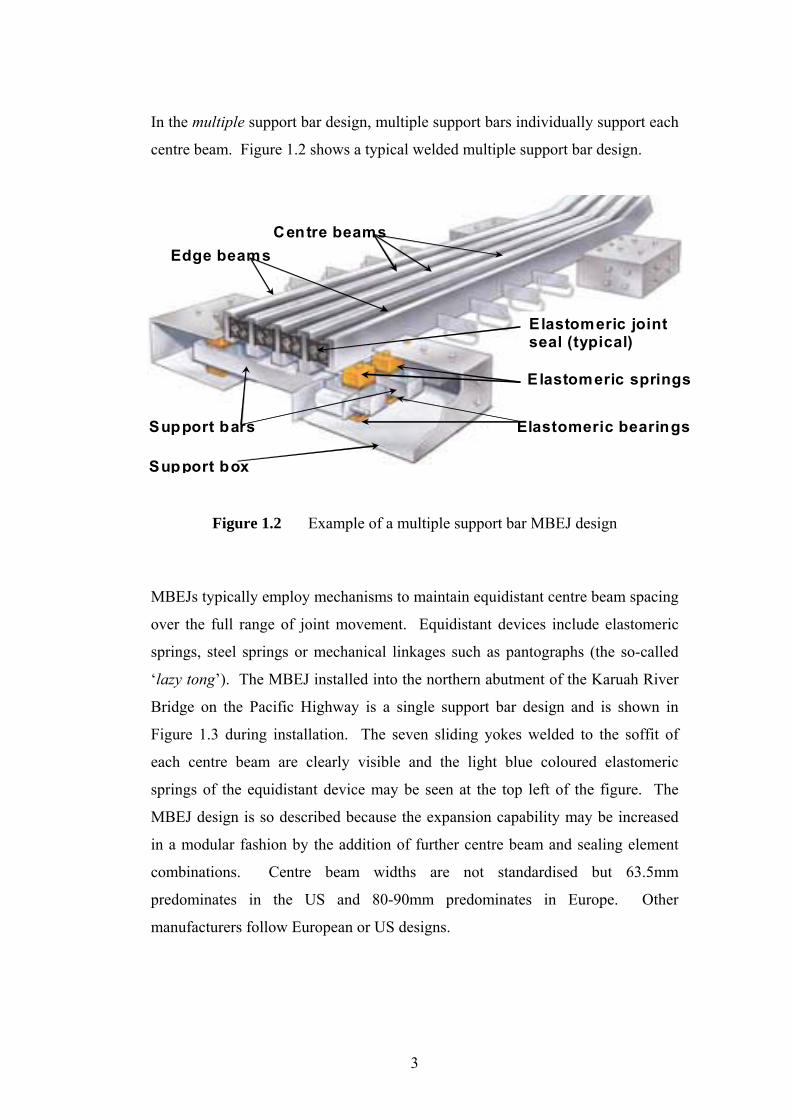
In the multiple support bar design, multiple support bars individually support each
centre beam. Figure 1.2 shows a typical welded multiple support bar design.
Edge beams Centre beams
Elastomeric springs
Support bars
Elastomeric joint seal (typical)
Elastomeric bearings
Support box
Figure 1.2 Example of a multiple support bar MBEJ design
MBEJs typically employ mechanisms to maintain equidistant centre beam spacing
over the full range of joint movement. Equidistant devices include elastomeric
springs, steel springs or mechanical linkages such as pantographs (the so-called
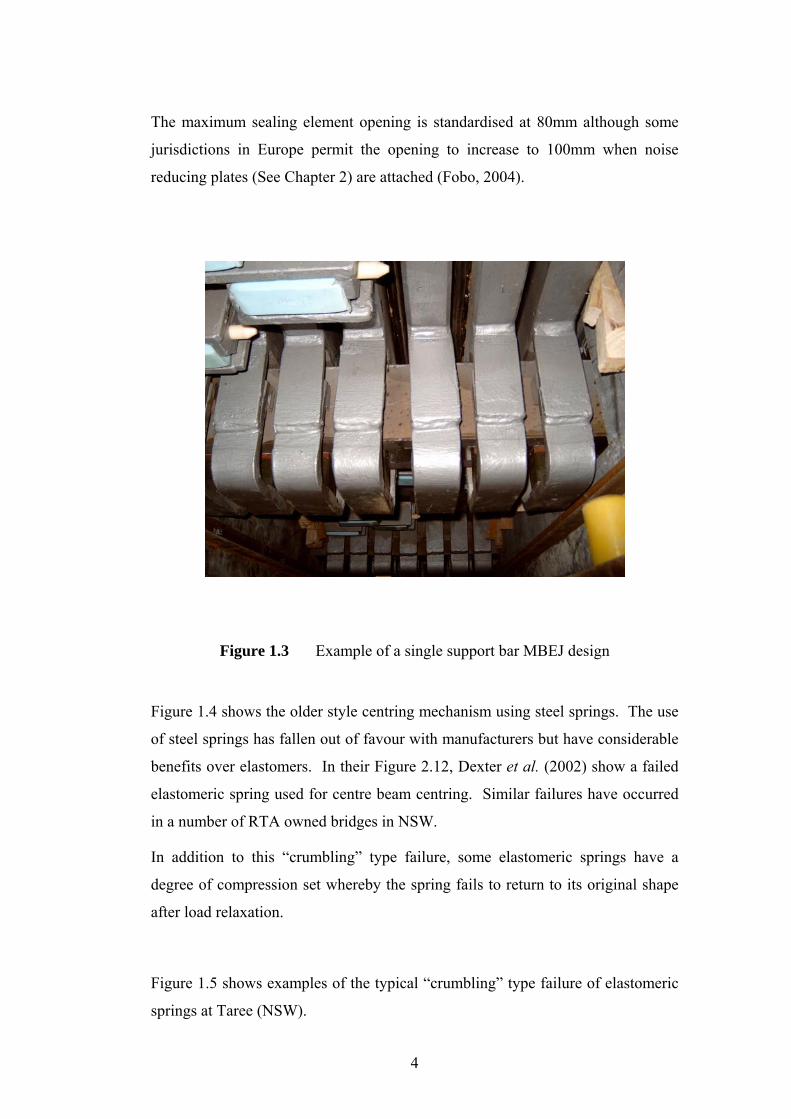
‘lazy tong’). The MBEJ installed into the northern abutment of the Karuah River
Bridge on the Pacific Highway is a single support bar design and is shown in
Figure 1.3 during installation. The seven sliding yokes welded to the soffit of
each centre beam are clearly visible and the light blue coloured elastomeric
springs of the equidistant device may be seen at the top left of the figure. The
MBEJ design is so described because the expansion capability may be increased
in a modular fashion by the addition of further centre beam and sealing element
combinations. Centre beam widths are not standardised but 63.5mm
predominates in the US and 80-90mm predominates in Europe. Other
manufacturers follow European or US designs.
3
The maximum sealing element opening is standardised at 80mm although some
jurisdictions in Europe permit the opening to increase to 100mm when noise
reducing plates (See Chapter 2) are attached (Fobo, 2004).
Figure 1.3 Example of a single support bar MBEJ design
Figure 1.4 shows the older style centring mechanism using steel springs. The use
of steel springs has fallen out of favour with manufacturers but have considerable
benefits over elastomers. In their Figure 2.12, Dexter et al. (2002) show a failed
elastomeric spring used for centre beam centring. Similar failures have occurred
in a number of RTA owned bridges in NSW.
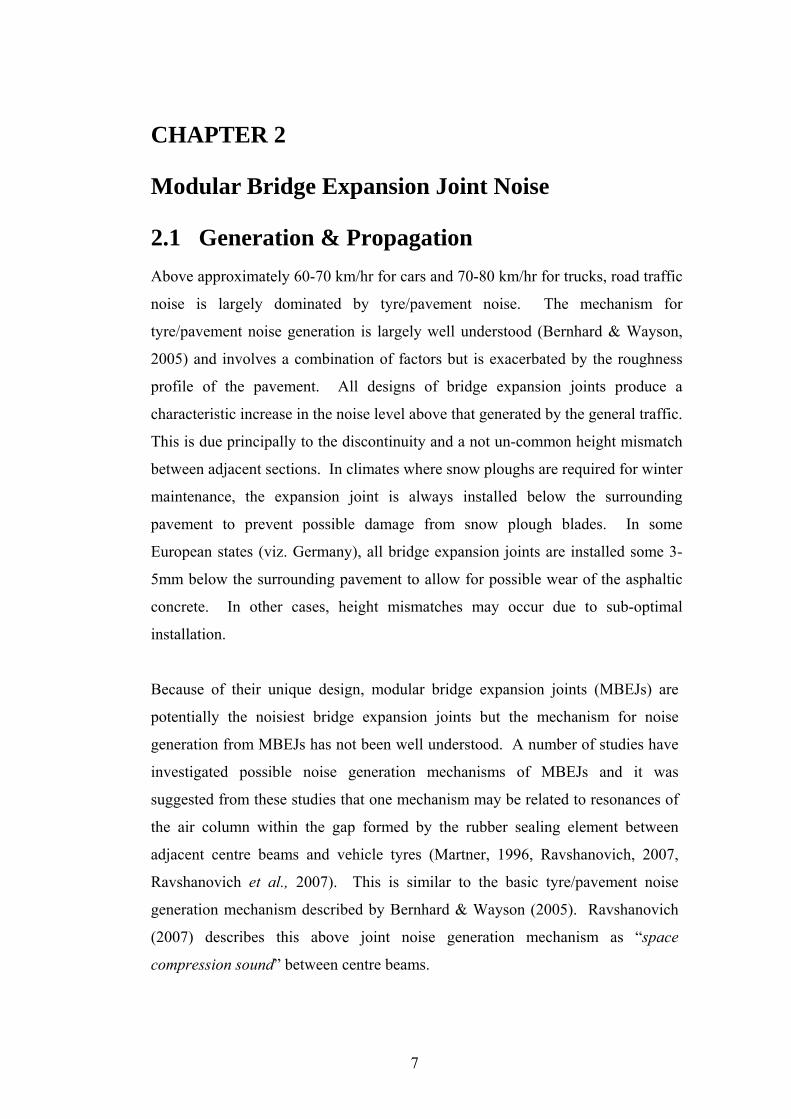
In addition to this “crumbling” type failure, some elastomeric springs have a
degree of compression set whereby the spring fails to return to its original shape
after load relaxation.
Figure 1.5 shows examples of the typical “crumbling” type failure of elastomeric
springs at Taree (NSW).
4
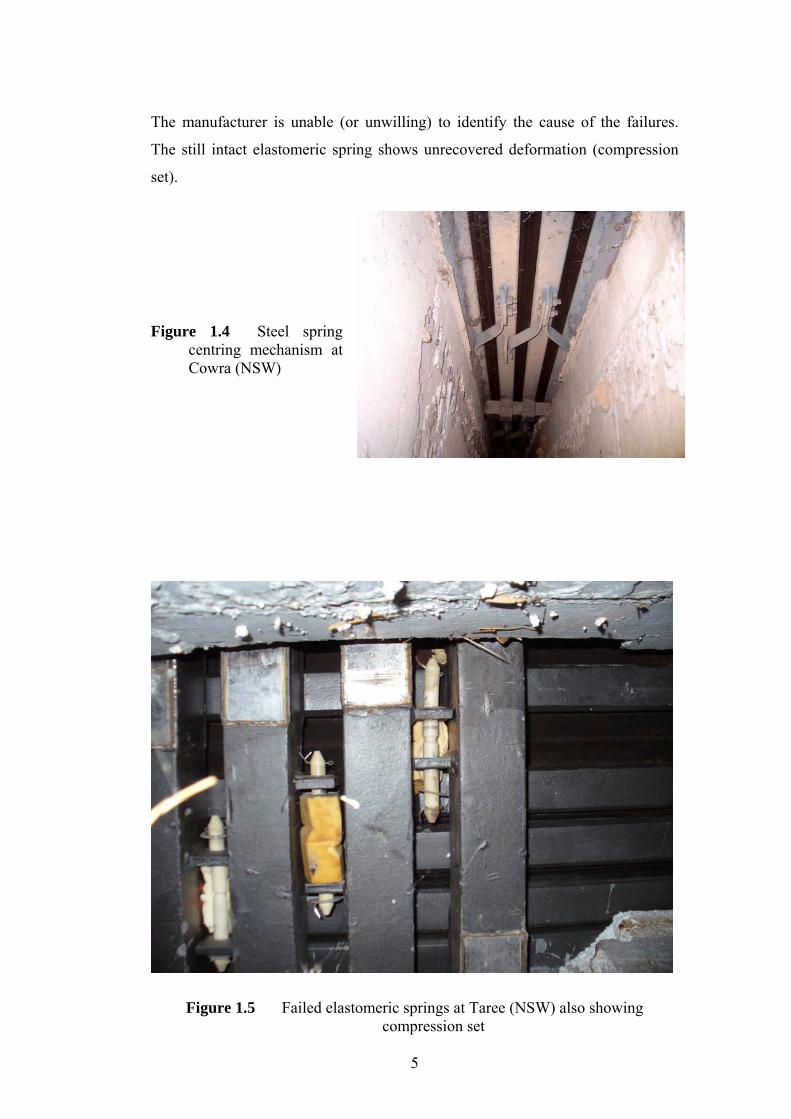
The manufacturer is unable (or unwilling) to identify the cause of the failures.
The still intact elastomeric spring shows unrecovered deformation (compression
set).
Figure 1.4 Steel spring centring mechanism at Cowra (NSW)
Figure 1.5 Failed elastomeric springs at Taree (NSW) also showing compression set
5

1.3 Summary The need for expansion joints in bridges has been outlined and the typical designs
of large movement bridge expansion joints discussed. The joint design known as
the MBEJ has been shown to be the preferred design where water proofness was
required. MBEJs were shown to come in two typical variations and the methods
for achieving and maintaining equal centre beam spacing identified.
6
CHAPTER 2
Modular Bridge Expansion Joint Noise
2.1 Generation & Propagation Above approximately 60-70 km/hr for cars and 70-80 km/hr for trucks, road traffic
noise is largely dominated by tyre/pavement noise. The mechanism for
tyre/pavement noise generation is largely well understood (Bernhard & Wayson,
2005) and involves a combination of factors but is exacerbated by the roughness
profile of the pavement. All designs of bridge expansion joints produce a
characteristic increase in the noise level above that generated by the general traffic.
This is due principally to the discontinuity and a not un-common height mismatch
between adjacent sections. In climates where snow ploughs are required for winter
maintenance, the expansion joint is always installed below the surrounding
pavement to prevent possible damage from snow plough blades. In some
European states (viz. Germany), all bridge expansion joints are installed some 3-
5mm below the surrounding pavement to allow for possible wear of the asphaltic
concrete. In other cases, height mismatches may occur due to sub-optimal
installation.
Because of their unique design, modular bridge expansion joints (MBEJs) are
potentially the noisiest bridge expansion joints but the mechanism for noise
generation from MBEJs has not been well understood. A number of studies have
investigated possible noise generation mechanisms of MBEJs and it was
suggested from these studies that one mechanism may be related to resonances of
the air column within the gap formed by the rubber sealing element between
adjacent centre beams and vehicle tyres (Martner, 1996, Ravshanovich, 2007,
Ravshanovich et al., 2007). This is similar to the basic tyre/pavement noise
generation mechanism described by Bernhard & Wayson (2005). Ravshanovich
(2007) describes this above joint noise generation mechanism as “space
compression sound” between centre beams.
7
In the late 1990’s, the Roads and Traffic Authority of NSW (RTA) received
environmental noise complaints from homeowners near bridges with MBEJs with
one house being some 500 metres from the bridge in a semi-rural environment.
This suggested that the noise generation mechanism involved possibly both parts
of the bridge structure and the joint itself as it was unlikely that there was
sufficient acoustic power in the simple tyre impact or temperature and wind
gradients to explain the persistence of the noise in the surrounding environment.
MBEJs as a source of environmental noise have been identified by Martner
(1996), Barnard & Cuninghame (1997) and Fobo (2004) but little was known
about the generation and propagation mechanism although Barnard &
Cuninghame (1997) pointed to the possible role of acoustic resonances.
An experimental investigation was undertaken into the noise production and
propagation mechanism and the investigation identified modal vibration
frequencies of the MBEJ coupling with acoustic resonances in the chamber cast
into the bridge abutment below the MBEJ (See Ancich, 2000, Ancich & Brown,
2004a, Ancich et al., 2004 and Ancich & Brown, 2004b) – also see Appendices
A-D) with Ravshanovich (2007); Ravshanovich et al. (2007) and Matsumoto et
al. (2007) appearing to have come to the same conclusion independently.
Subsequent work by Ghimire (2007), Ghimire et al. (2007), Ghimire et al. (2008),
Ghimire (2008) and Ghimire et al. (2009) has confirmed this earlier work both
analytically by the use of Boundary Element Method (BEM) modelling and
experimentally.
2.2 Noise Control Methods There are three basic engineering noise control methods available. These are:
• Helmholtz Absorber in the abutment void space below the MBEJ;
• Partial acoustic encapsulation of the MBEJ; and
• Attachment of “noise-reducing plates” to the top surface of the edge and
centre beams.
8
2.2.1 Helmholtz Absorber
The successful use of a Helmholtz absorber was reported by Ancich & Brown
(2004a), Ancich et al. (2004) and Ancich & Brown (2004b) (See also Appendices
B-D).
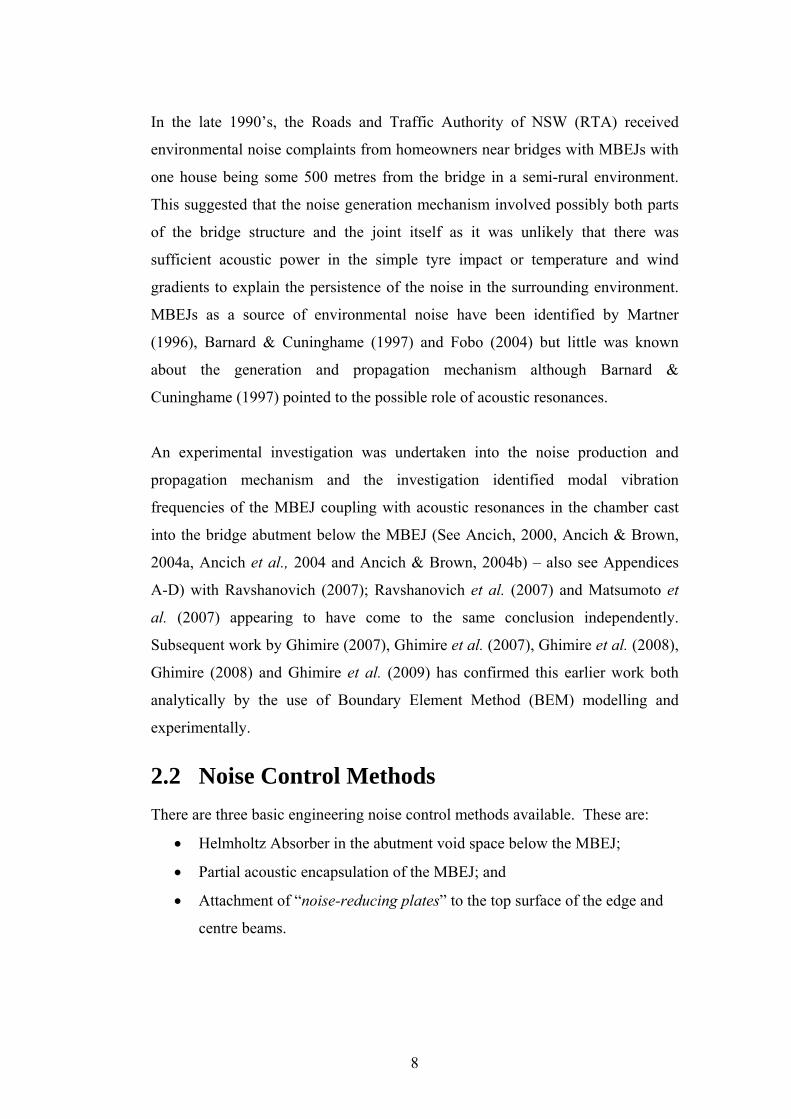
This noise control method is particularly attractive to Bridge Asset Owners as a
retrofit option. The reported noise reduction of 9-10 dBA is equal to or better
than the other known methods. Figure 2.1 shows the trialled installation at Tom
Ugly’s Bridge in Sydney.
Figure 2.1 Helmholtz absorber installation at Tom Ugly’s Bridge
The limitation of a Helmholtz absorber installation is that it requires an initial
experimental investigation to identify the modal frequencies of the MBEJ and
sufficient clear space in the abutment void to allow installation. Because the
method must be tailored to each bridge/MBEJ combination, it is not attractive to
MBEJ manufacturers.
2.2.2 Partial Encapsulation
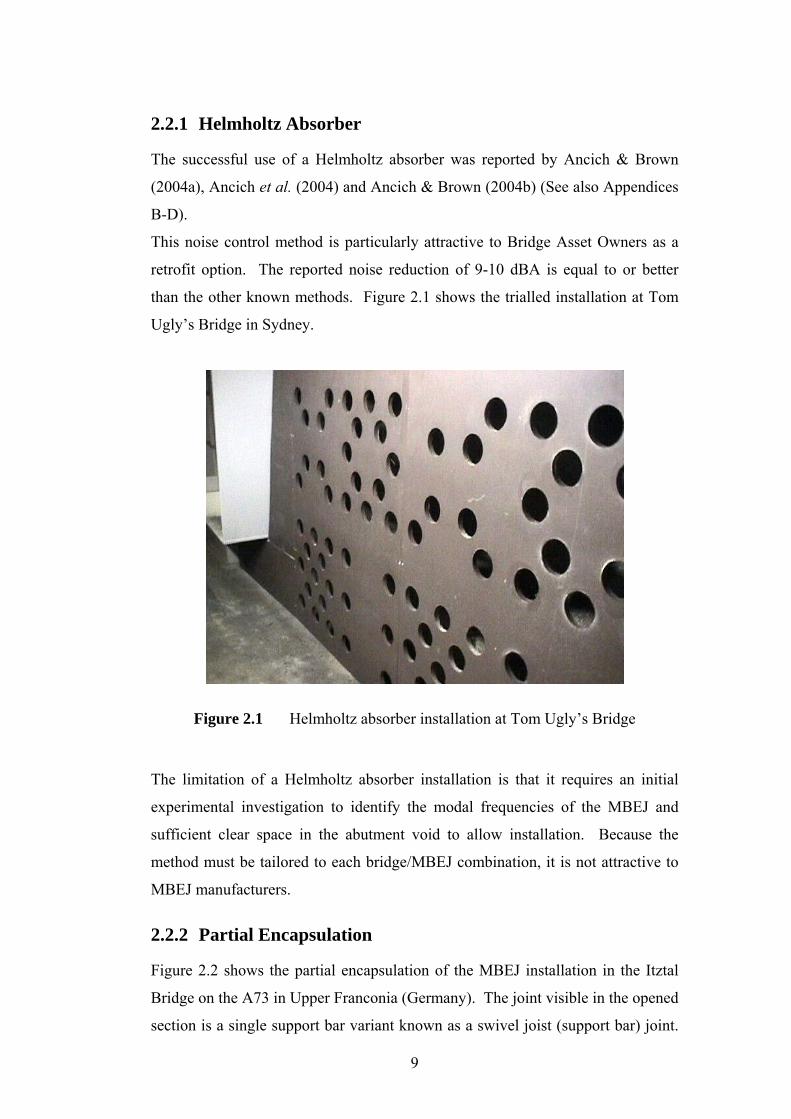
Figure 2.2 shows the partial encapsulation of the MBEJ installation in the Itztal
Bridge on the A73 in Upper Franconia (Germany). The joint visible in the opened
section is a single support bar variant known as a swivel joist (support bar) joint.
9
In this type of design, centre beam equidistance is maintained by a mechanical
linkage that is an integral part of the design. The swivelling joists (support bars)
are free to rotate over a limited arc and as they rotate, the attached centre beams
move apart or come together in a uniform manner.
Figure 2.2(a) Partially encapsulated joint – Itztal
Bridge (Germany)
(Courtesy Maurer-Söhne GmbH)
Figure 2.2(b) Partial MBEJ encapsulation
(Courtesy Maurer-Söhne GmbH)
By partially encapsulating the joint and lining the encapsulation with acoustically
absorbent material, the reverberant noise level above the roadway is reduced.
Also, the noise produced by the vibration of the joint entering the void space is
partially absorbed and partially reflected by the enclosure. If the vibration
induced noise is sufficiently reduced there will be a reduction in the amplification
from coupling with acoustic resonances in the chamber cast into the bridge
abutment below the MBEJ. Whilst partial encapsulation is a viable noise
abatement option, it does limit the ease with which the MBEJ may be periodically
inspected.
10
2.2.3 Noise Reducing Plates
Martner (1996) discussed the noise reduction obtained by welding triangular or
diamond shaped steel elements to the top surface of centre beams. The reported
results appear to relate to early experiments to develop the noise reducing plates
now offered by a number of manufacturers. However, current designs all appear
to be variations of a common theme.
They all appear to work by minimising or reducing the discontinuity between
adjacent centre beams so that the noise resulting from the tyre impact and
resulting sidewall vibration (viz. Section 2.1) is reduced because there is no longer
a longitudinal gap between adjacent centre beams for the vehicle tyre to cross.
This reduced tyre impact then translates into reduced centre beam vibration and a
lessened interaction between the modal frequencies of the joint and acoustic
resonances in the chamber cast into the bridge abutment below the MBEJ.
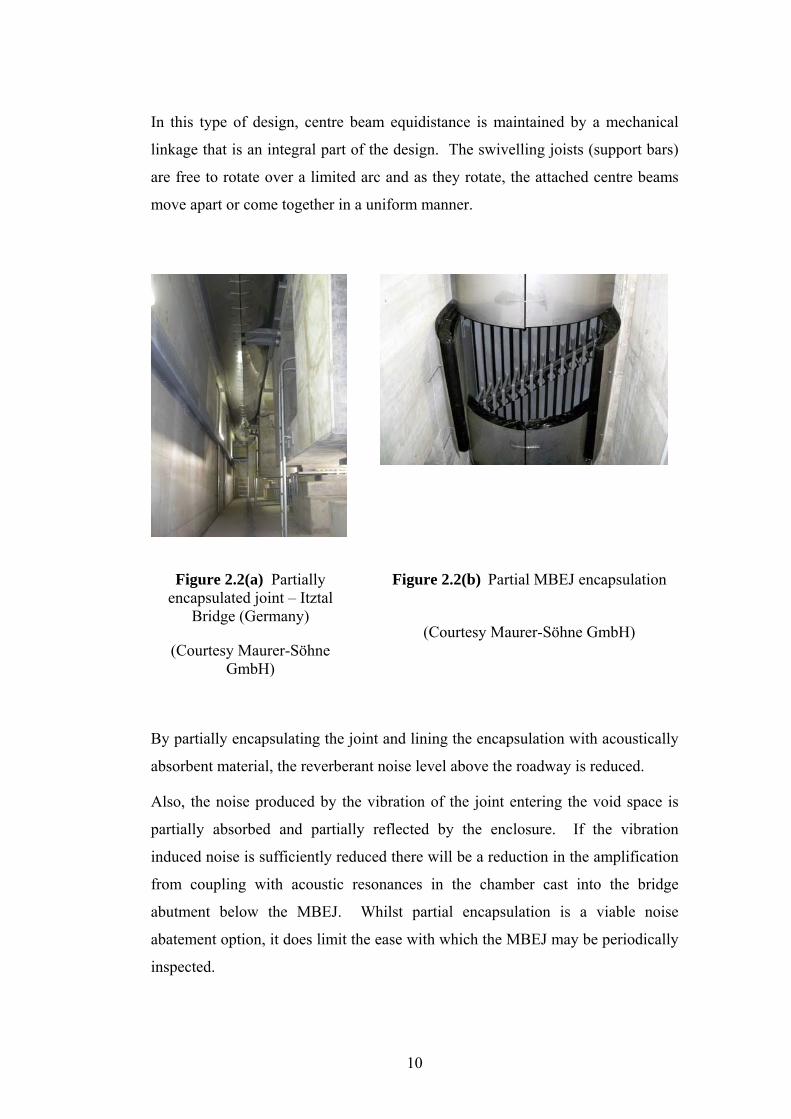
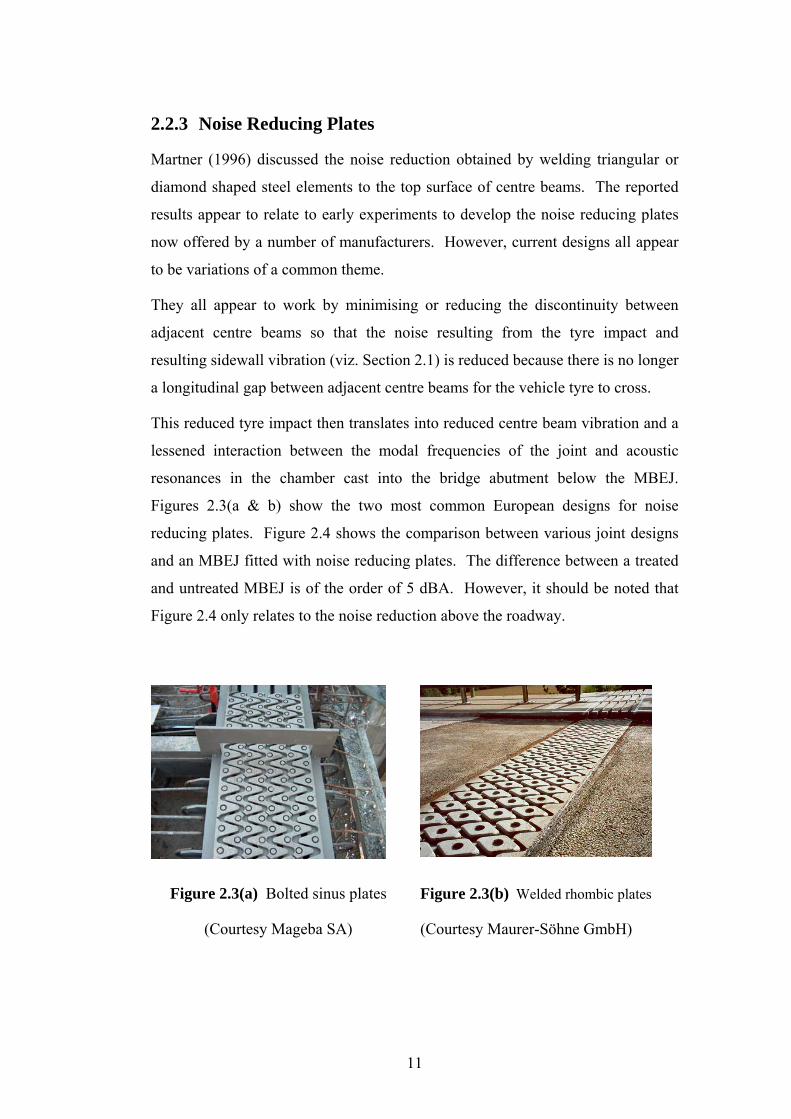
Figures 2.3(a & b) show the two most common European designs for noise
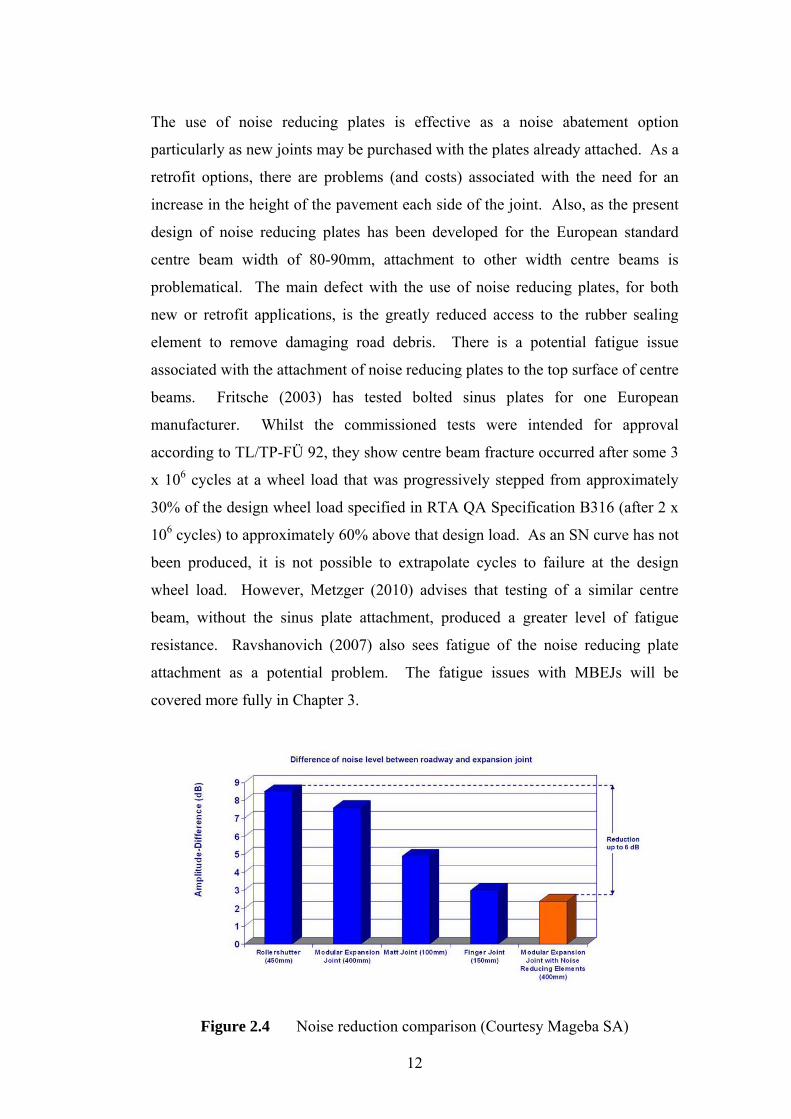
reducing plates. Figure 2.4 shows the comparison between various joint designs
and an MBEJ fitted with noise reducing plates. The difference between a treated
and untreated MBEJ is of the order of 5 dBA. However, it should be noted that
Figure 2.4 only relates to the noise reduction above the roadway.
Figure 2.3(a) Bolted sinus plates
(Courtesy Mageba SA)
Figure 2.3(b) Welded rhombic plates
(Courtesy Maurer-Söhne GmbH)
11
The use of noise reducing plates is effective as a noise abatement option
particularly as new joints may be purchased with the plates already attached. As a
retrofit options, there are problems (and costs) associated with the need for an
increase in the height of the pavement each side of the joint. Also, as the present
design of noise reducing plates has been developed for the European standard
centre beam width of 80-90mm, attachment to other width centre beams is
problematical. The main defect with the use of noise reducing plates, for both
new or retrofit applications, is the greatly reduced access to the rubber sealing
element to remove damaging road debris. There is a potential fatigue issue
associated with the attachment of noise reducing plates to the top surface of centre
beams. Fritsche (2003) has tested bolted sinus plates for one European
manufacturer. Whilst the commissioned tests were intended for approval
according to TL/TP-FÜ 92, they show centre beam fracture occurred after some 3
x 106 cycles at a wheel load that was progressively stepped from approximately
30% of the design wheel load specified in RTA QA Specification B316 (after 2 x
106 cycles) to approximately 60% above that design load. As an SN curve has not
been produced, it is not possible to extrapolate cycles to failure at the design
wheel load. However, Metzger (2010) advises that testing of a similar centre
beam, without the sinus plate attachment, produced a greater level of fatigue
resistance. Ravshanovich (2007) also sees fatigue of the noise reducing plate
attachment as a potential problem. The fatigue issues with MBEJs will be
covered more fully in Chapter 3.
Figure 2.4 Noise reduction comparison (Courtesy Mageba SA)
12

Watson and Delattre (2008) present a noise level comparison between an MBEJ
manufactured and installed in accordance with the RTA’s QA Specification B316
and a new generation of finger plate joint described as a Sealed Aluminium Finger
Joint (SAFJ) as shown in Figure 2.5. In their Table 1, they show a measurement
result (at 100m) for the MBEJ of Leq = 80 dBA and for the SAFJ (at 200m) of Leq
= 74 dBA. The measurement results for both joints are considered to be in the
acoustic far-field. Accordingly, the measurement at 100m may be corrected for
the difference in distance using Equation 1.
∆Lp = 20 log10( 21
dd ) (1)
where, ∆Lp = Difference in noise levels
d1 = First measurement distance
d2 = Second measurement distance
Using Equation 1 it will be seen that, at a common distance of 200m, both
measurements are equal.
Whilst it may seem surprising that an MBEJ and a finger plate joint have virtually
identical noise emissions at 200m (considering the greater difference shown in
Figure 2.4), the hypothesis is presented that the low noise emissions of the
reported MBEJ are entirely due to the greater centre beam and support bar
stiffnesses required to comply with RTA QA Specification B316 and the high
standard of the installation.
13
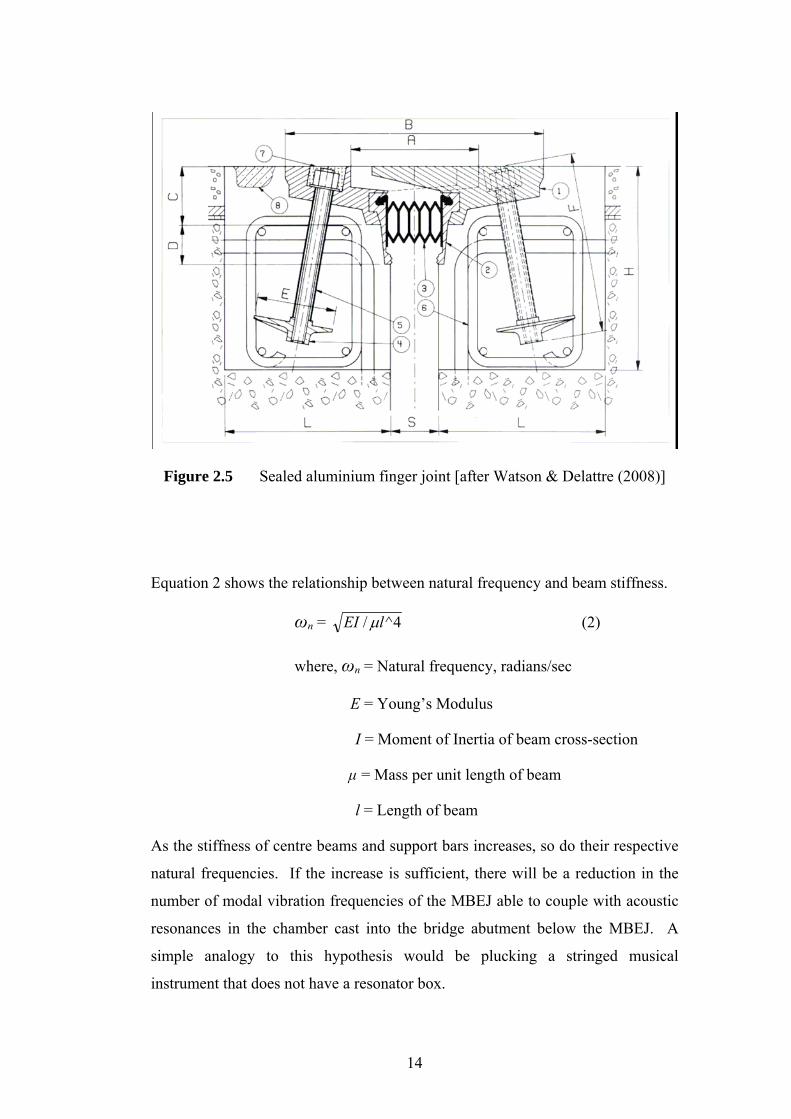
Figure 2.5 Sealed aluminium finger joint [after Watson & Delattre (2008)]
Equation 2 shows the relationship between natural frequency and beam stiffness.
ωn = 4^/ lEI µ (2)
where, ωn = Natural frequency, radians/sec
E = Young’s Modulus
I = Moment of Inertia of beam cross-section
µ = Mass per unit length of beam
l = Length of beam
As the stiffness of centre beams and support bars increases, so do their respective
natural frequencies. If the increase is sufficient, there will be a reduction in the
number of modal vibration frequencies of the MBEJ able to couple with acoustic
resonances in the chamber cast into the bridge abutment below the MBEJ. A
simple analogy to this hypothesis would be plucking a stringed musical
instrument that does not have a resonator box.
14
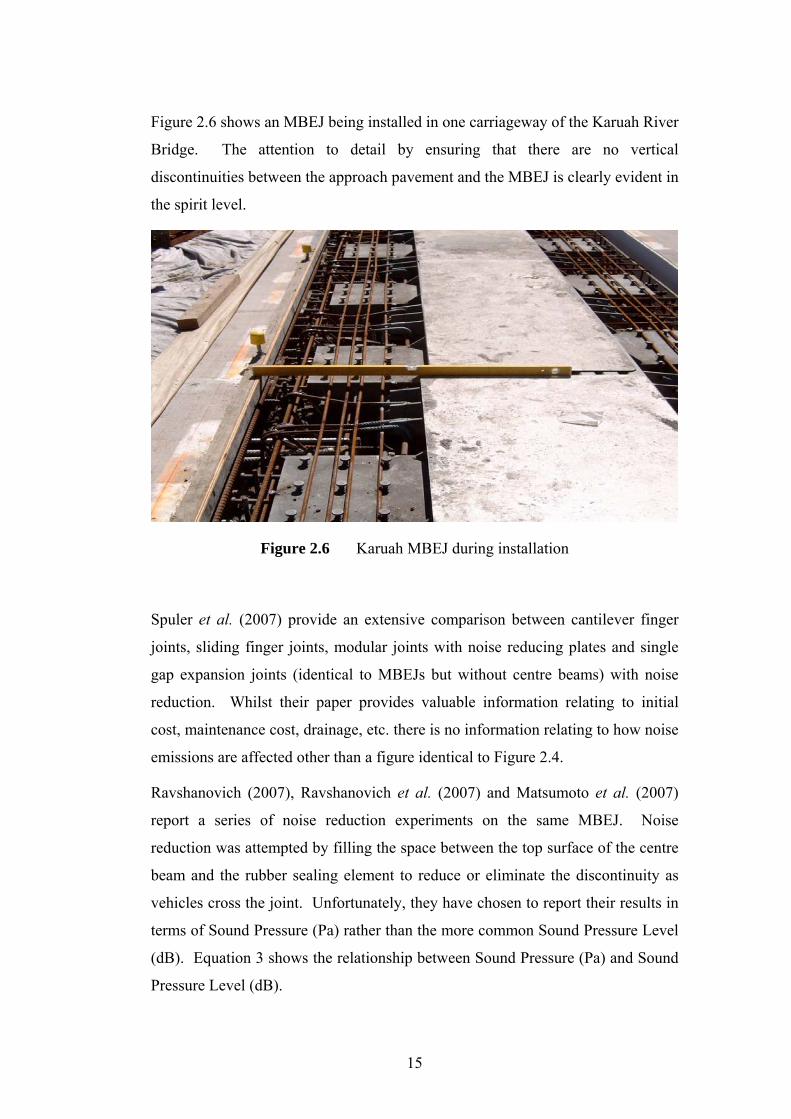
Figure 2.6 shows an MBEJ being installed in one carriageway of the Karuah River
Bridge. The attention to detail by ensuring that there are no vertical
discontinuities between the approach pavement and the MBEJ is clearly evident in
the spirit level.
Figure 2.6 Karuah MBEJ during installation
Spuler et al. (2007) provide an extensive comparison between cantilever finger
joints, sliding finger joints, modular joints with noise reducing plates and single
gap expansion joints (identical to MBEJs but without centre beams) with noise
reduction. Whilst their paper provides valuable information relating to initial
cost, maintenance cost, drainage, etc. there is no information relating to how noise
emissions are affected other than a figure identical to Figure 2.4.
Ravshanovich (2007), Ravshanovich et al. (2007) and Matsumoto et al. (2007)
report a series of noise reduction experiments on the same MBEJ. Noise
reduction was attempted by filling the space between the top surface of the centre
beam and the rubber sealing element to reduce or eliminate the discontinuity as
vehicles cross the joint. Unfortunately, they have chosen to report their results in
terms of Sound Pressure (Pa) rather than the more common Sound Pressure Level
(dB). Equation 3 shows the relationship between Sound Pressure (Pa) and Sound
Pressure Level (dB).
15
Lp = 20 log (p/pref) (3)
where Lp = Sound Pressure Level, dB
p = Sound Pressure, Pa
pref = Reference Sound Pressure, 0.00002 Pa
Direct comparison with other reported results is further complicated as the Sound
Pressure results are unweighted. Approximate conversion of their measurements
to Sound Pressure Level suggests that Ravshanovich (2007), Ravshanovich et al.
(2007) and Matsumoto et al. (2007) have achieved noise reductions (above the
joint) of the order of 5-10 dB. This is broadly in line with other reported results.
2.3 Summary The noise generation and propagation mechanisms for MBEJs have been
identified and discussed. Noise generation was shown to have an above joint
component where the mechanism was virtually identical to the more general
tyre/pavement noise generation.
There was also a below joint component to the noise and this was shown to
involve modal vibration frequencies of the MBEJ coupling with acoustic
resonances in the chamber cast into the bridge abutment below the MBEJ. There
were three basic engineering noise control methods shown to be available and
these were discussed together with their relative merits.
16
CHAPTER 3
Structural Dynamics Investigation
3.1 Introduction Whilst the use of expansion joints is common practice in bridge construction,
modular bridge expansion joints (MBEJs) are designed to accommodate large
longitudinal expansion and contraction movements and rotations of bridge
superstructures. In addition to supporting wheel loads, a properly designed
modular joint will prevent rainwater and road debris from entering into the
underlying superstructure and substructure. MBEJs are subjected to more load
cycles than other superstructure elements, but the load types, magnitudes and
fatigue-stress ranges that are applied to these joints are not well defined (Dexter et
al., 1997).
Structural dynamics studies were carried out on the MBEJ installed in the western
abutment of Sydney’s Anzac Bridge which was opened to traffic on 4th December
1995. The Anzac Bridge is a cable-stayed bridge spanning a portion of Sydney
Harbour on the western approach to the Central Business District and is of
reinforced/prestressed concrete construction carrying 8 lanes of traffic and a
combined pedestrian/bicycle way. The 805 metre long concrete structure
comprises six spans with three cable-stayed central spans. With a main span of
345 metres, the bridge is the longest span cable-stayed bridge in Australia. There
are two MBEJs installed into Anzac Bridge. A small 3-seal joint is located in the
deck at Pier 1 and a larger 9-seal joint is located in the western abutment.
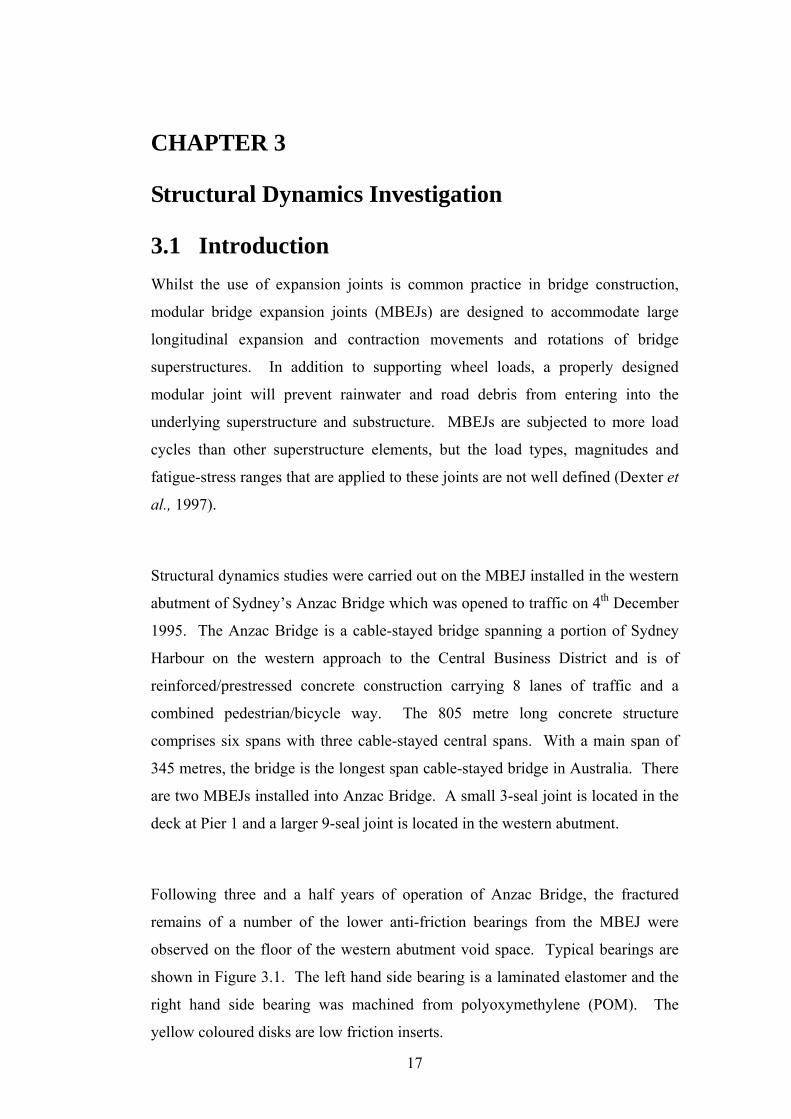
Following three and a half years of operation of Anzac Bridge, the fractured
remains of a number of the lower anti-friction bearings from the MBEJ were
observed on the floor of the western abutment void space. Typical bearings are
shown in Figure 3.1. The left hand side bearing is a laminated elastomer and the
right hand side bearing was machined from polyoxymethylene (POM). The
yellow coloured disks are low friction inserts.
17
The absence of these lower anti-friction bearings, which were discovered during a
routine inspection, would cause bending moments in the supported centre beams
to be at least doubled due to the increased unsupported span.
There is little in the published literature to describe the structural dynamics
behaviour of MBEJs, however Ostermann (1991) reported the theoretical and
practical dynamic response of a MBEJ and Roeder (1993) reported the results of
an analytical modal analysis study (FEM) of a swivel joist design MBEJ.
Figure 3.1 Anzac Bridge MBEJ support bar bearings
Roeder noted that “…the modes were closely spaced, and many hundreds would
be needed to include the predominate portion of the mass in three-dimensional
vibration…”
18

However, this observation is considered to only apply to the swivel joist design.
Earlier, Köster (1986) had set out the principal dynamic aspects of good design
and argued against the prevailing static design philosophy with the comment
“…Static calculations often lead to contrary solutions when trying to reach a
higher level of security for a bridge by assuming fictitious and higher loads. The
reason is that stiffer constructions are less elastic which causes them to react
harder to wheel impacts than an elastic construction would…” Subsequent
researchers (Tschemmernegg, 1973 & 1991, Agarwal, 1991, Roeder, 1995, Dexter
et al., 1997, Crocetti, 2001) had repeatedly noted that the loading was dynamic in
spite of many Bridge Design Codes used throughout the world still specifying a
static or quasi-static load case. Roeder (1993) noted that the dynamic response of
MBEJs was complex and field measurements of the dynamic response would
assist in evaluating the dynamic behaviour. This recommendation was adopted
and an experimental modal analysis study (Ewins, 1999) was undertaken to gain a
better understanding of the structural dynamics behaviour of the Anzac Bridge
MBEJ.
Schwammenhoefer (2001) reported that the Federal Ministry of Transport
(Austria) had experienced premature fatigue failure of MBEJs and had replaced
joints for both serviceability (fatigue) and noise protection (excessive
environmental noise generation) reasons. MBEJ are also known to have been
replaced in recent years in both Canada and the USA for predominantly
serviceability reasons. Possibly the highest profile in-service failure involved the
3rd Lake Washington Bridge in Seattle, USA. Approximately 6 months after the
bridge was opened to traffic in 1989, the asset owner (Washington State
Department of Transportation) received numerous noise complaints about the
expansion joints. Some relatively minor shim adjustments of the elastomeric
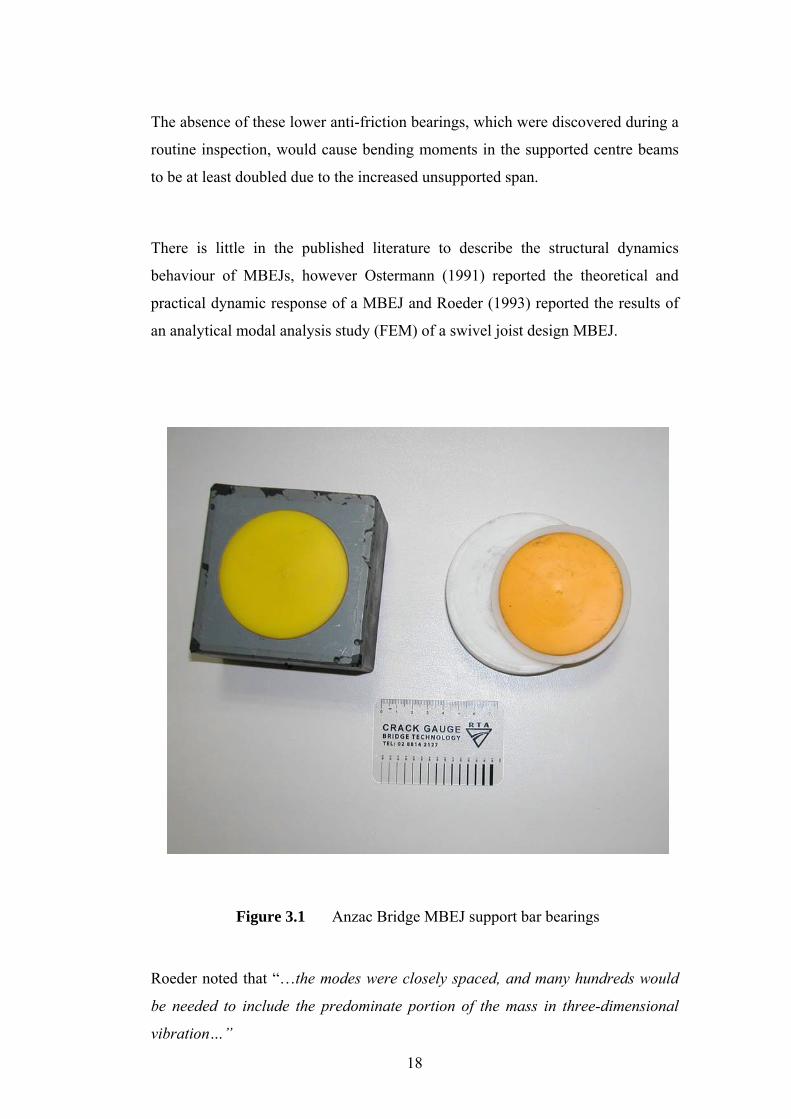
bearings were undertaken but within one year, cracks in the centre beams similar
to Figure 3.2 were observed.
19
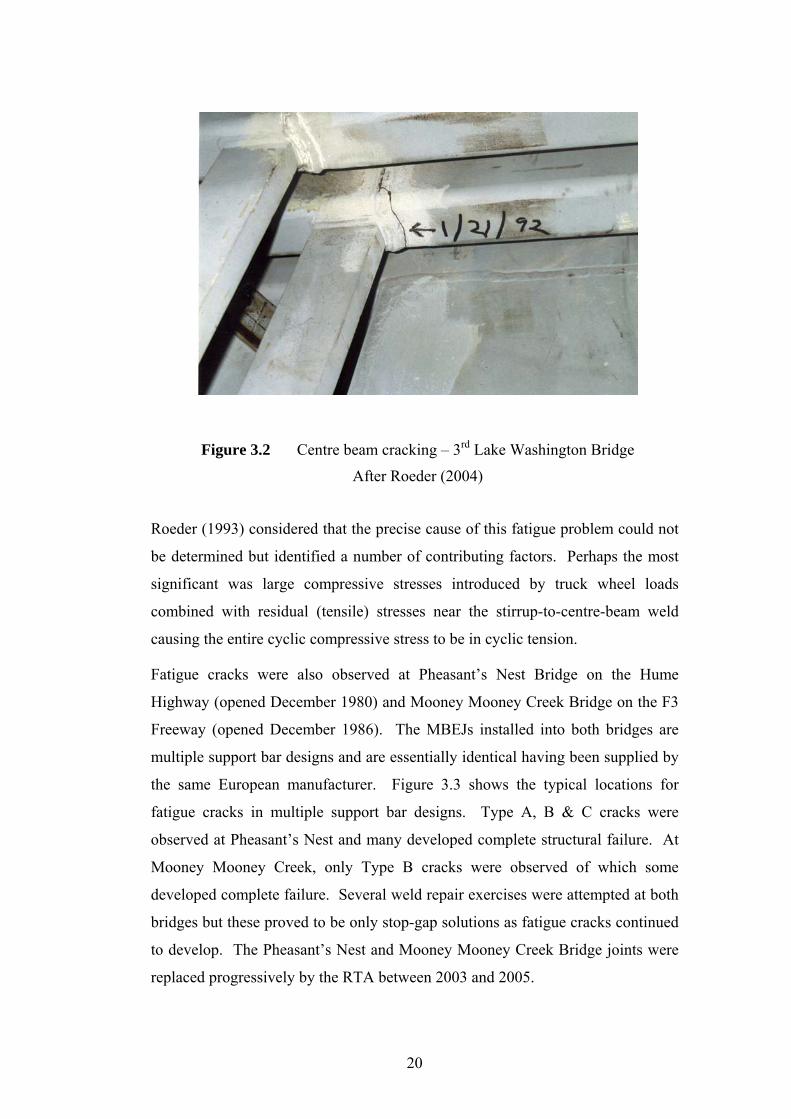
Figure 3.2 Centre beam cracking – 3rd Lake Washington Bridge
After Roeder (2004)
Roeder (1993) considered that the precise cause of this fatigue problem could not
be determined but identified a number of contributing factors. Perhaps the most
significant was large compressive stresses introduced by truck wheel loads
combined with residual (tensile) stresses near the stirrup-to-centre-beam weld
causing the entire cyclic compressive stress to be in cyclic tension.
Fatigue cracks were also observed at Pheasant’s Nest Bridge on the Hume
Highway (opened December 1980) and Mooney Mooney Creek Bridge on the F3
Freeway (opened December 1986). The MBEJs installed into both bridges are
multiple support bar designs and are essentially identical having been supplied by
the same European manufacturer. Figure 3.3 shows the typical locations for
fatigue cracks in multiple support bar designs. Type A, B & C cracks were
observed at Pheasant’s Nest and many developed complete structural failure. At
Mooney Mooney Creek, only Type B cracks were observed of which some
developed complete failure. Several weld repair exercises were attempted at both
bridges but these proved to be only stop-gap solutions as fatigue cracks continued
to develop. The Pheasant’s Nest and Mooney Mooney Creek Bridge joints were
replaced progressively by the RTA between 2003 and 2005.
20
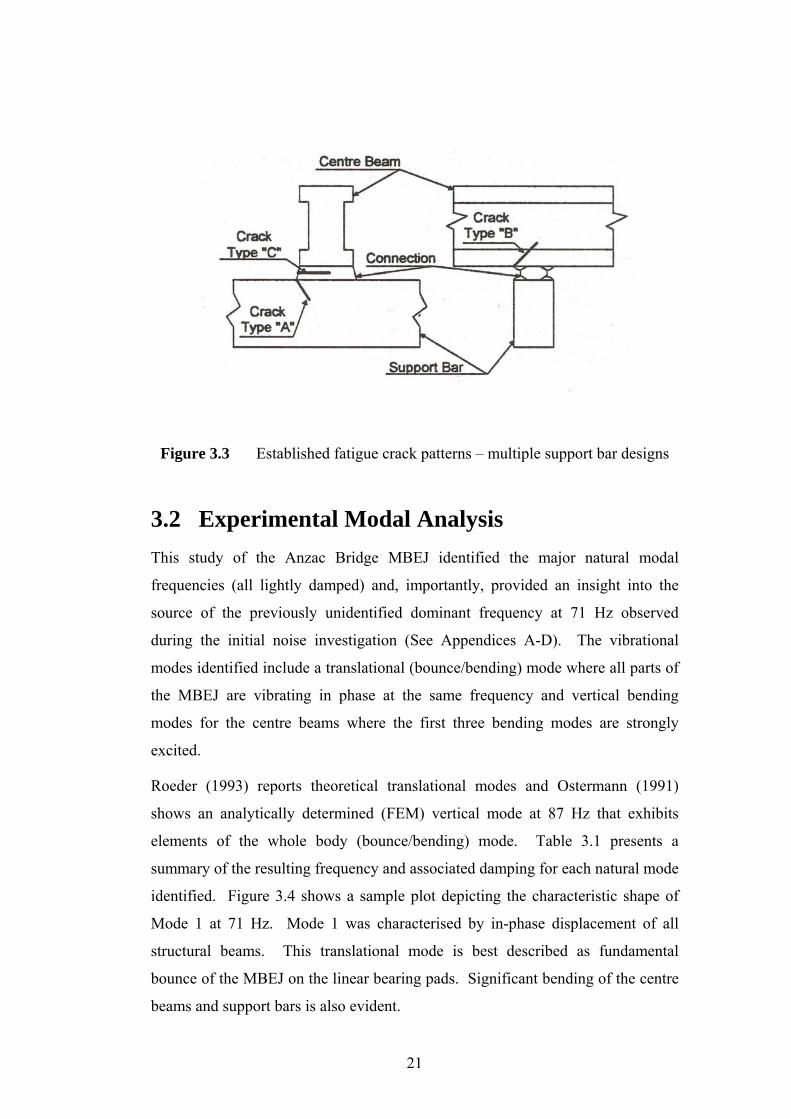
Figure 3.3 Established fatigue crack patterns – multiple support bar designs
3.2 Experimental Modal Analysis This study of the Anzac Bridge MBEJ identified the major natural modal
frequencies (all lightly damped) and, importantly, provided an insight into the
source of the previously unidentified dominant frequency at 71 Hz observed
during the initial noise investigation (See Appendices A-D). The vibrational
modes identified include a translational (bounce/bending) mode where all parts of
the MBEJ are vibrating in phase at the same frequency and vertical bending
modes for the centre beams where the first three bending modes are strongly
excited.
Roeder (1993) reports theoretical translational modes and Ostermann (1991)
shows an analytically determined (FEM) vertical mode at 87 Hz that exhibits
elements of the whole body (bounce/bending) mode. Table 3.1 presents a
summary of the resulting frequency and associated damping for each natural mode
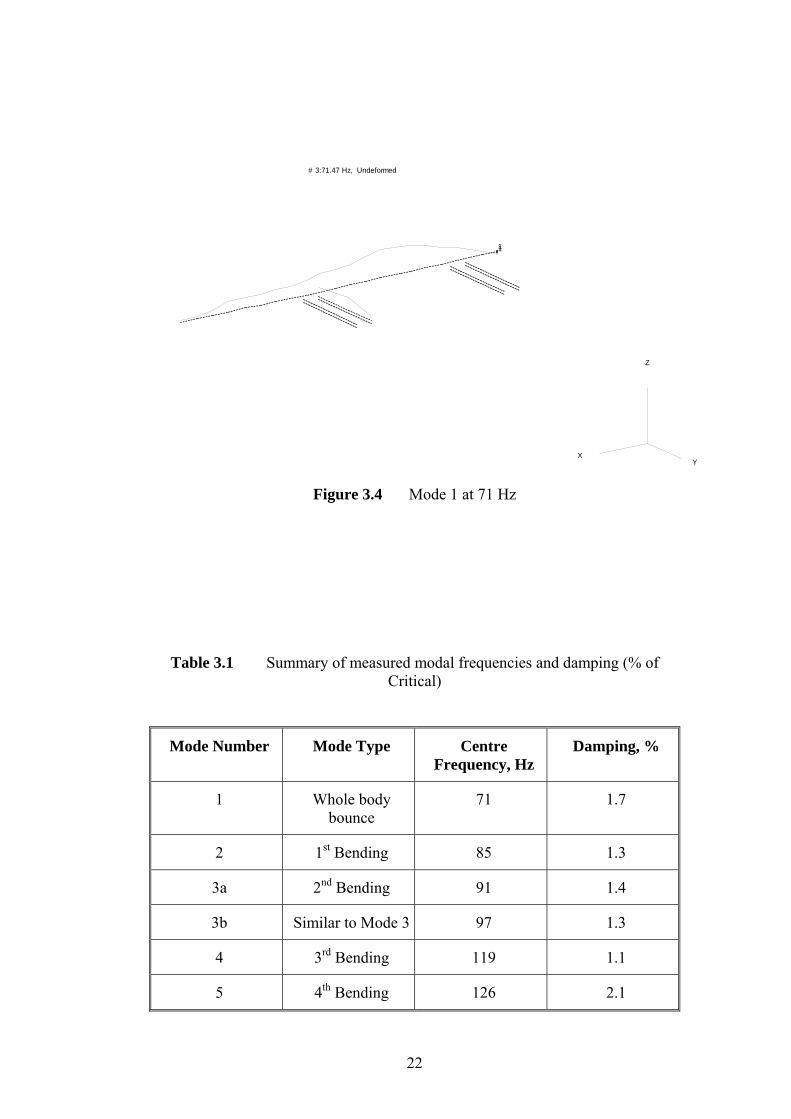
identified. Figure 3.4 shows a sample plot depicting the characteristic shape of
Mode 1 at 71 Hz. Mode 1 was characterised by in-phase displacement of all
structural beams. This translational mode is best described as fundamental
bounce of the MBEJ on the linear bearing pads. Significant bending of the centre
beams and support bars is also evident.
21
XY
Z
11
# 3:71.47 Hz, Undeformed
Figure 3.4 Mode 1 at 71 Hz
Table 3.1 Summary of measured modal frequencies and damping (% of Critical)
Mode Number Mode Type Centre Frequency, Hz
Damping, %
1 Whole body bounce
71 1.7
2 1st Bending 85 1.3
3a 2nd Bending 91 1.4
3b Similar to Mode 3 97 1.3
4 3rd Bending 119 1.1
5 4th Bending 126 2.1
22
It is particularly interesting to note that the translational mode and the first centre
beam bending mode are predominantly excited by typical traffic flow.
Furthermore, Table 3.1 confirms that typical traffic across the MBEJ excites the
joint at the identified natural modes.
3.3 Finite Element Modelling A finite element (FE) model of the Anzac Bridge MBEJ was developed using
NASTRAN (MSC Visual Nastran for Windows 2003). The Anzac Bridge MBEJ
consists of two interleaved single support bar structures and previous
experimental modal analysis studies (Appendix J) had demonstrated only very
light, almost negligible coupling between the two structures. The FE model
developed was a representation of one complete single support bar structure,
comprising six support bars and four centre beams. Support bars and centre
beams were represented by beam elements. The precise centre beam and support
bar cross sections were mapped and section properties developed by NASTRAN.
The centre beam-to-support bar yoke connection was represented by a MDOF
spring/damper element. Support bar springs and bearings were also represented
by MDOF spring/damper elements. The modelling is more fully described in
Appendix K.
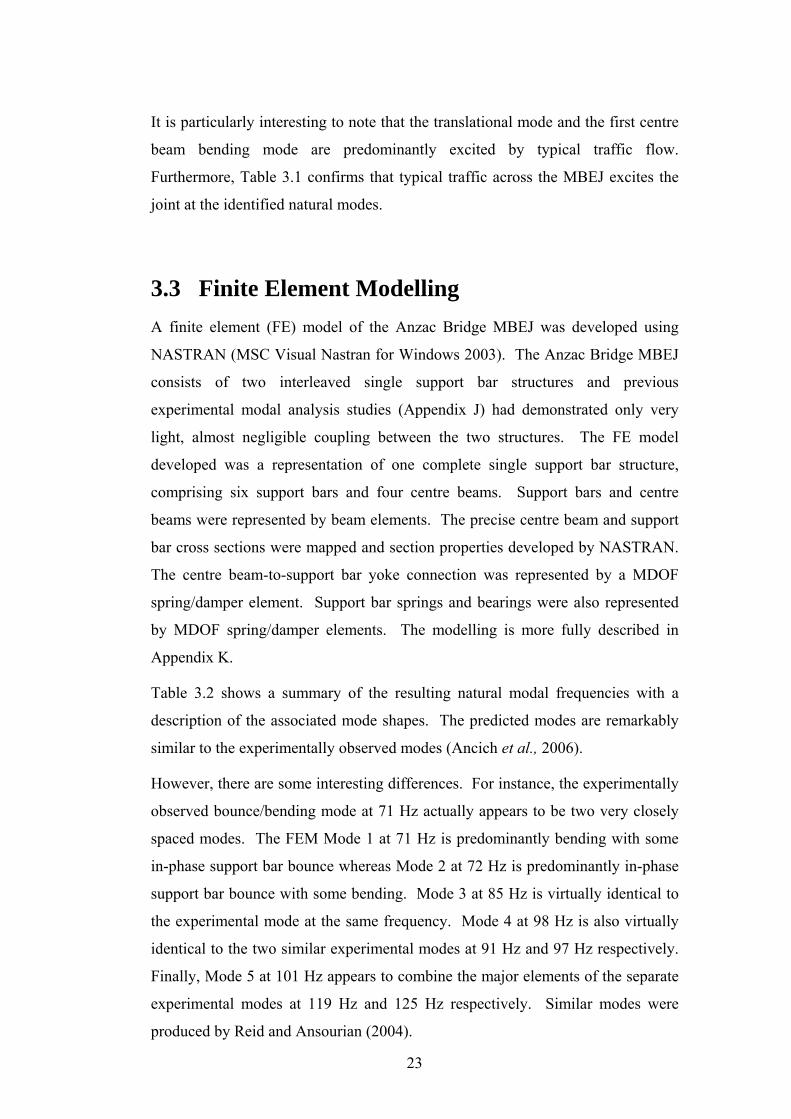
Table 3.2 shows a summary of the resulting natural modal frequencies with a
description of the associated mode shapes. The predicted modes are remarkably
similar to the experimentally observed modes (Ancich et al., 2006).
However, there are some interesting differences. For instance, the experimentally
observed bounce/bending mode at 71 Hz actually appears to be two very closely
spaced modes. The FEM Mode 1 at 71 Hz is predominantly bending with some
in-phase support bar bounce whereas Mode 2 at 72 Hz is predominantly in-phase
support bar bounce with some bending. Mode 3 at 85 Hz is virtually identical to
the experimental mode at the same frequency. Mode 4 at 98 Hz is also virtually
identical to the two similar experimental modes at 91 Hz and 97 Hz respectively.
Finally, Mode 5 at 101 Hz appears to combine the major elements of the separate
experimental modes at 119 Hz and 125 Hz respectively. Similar modes were
produced by Reid and Ansourian (2004).
23
Table 3.2 Summary of analytical natural modal frequencies – Anzac Bridge MBEJ
Mode No Mode Shape Description
Natural frequency from
FEM, Hz
Natural frequency of similar mode
from EMA, Hz
1 Fundamental
Bounce/Bending 71
71
2 Fundamental
Bounce/Bending 72
Not Identified
3 First Centre Beam Vertical
Bending Mode 85 85
4 Second Vertical Centre Beam
Bending 98 91
5 Third Vertical Centre Beam
Bending 101 97
In order to more confidently predict the dynamic amplification factors associated
with modular joint structures, a procedure was developed that utilized measured
strain data to simulate the force time history of a vehicle drive over.
A typical slow roll strain time history was ‘calibrated’ to simulate a force time
history. This single time history was replicated at time spacings to match the
approximate trailer tri-axle spacing of 1.2m. Figure 3.5 shows a plot of this
virtual wheel load force profile and Figure 3.6 shows a sample force time history
for a 62-km/hr drive over. A time delay was applied to the time history for each
centre beam to represent the appropriate drive over speed and nominal 1.2m axle
spacing. It is interesting to note that whilst most studies (including Appendix K)
have used an essentially sinusoidal waveform input (half sine), Roeder (1993)
used a triangular waveform.
24
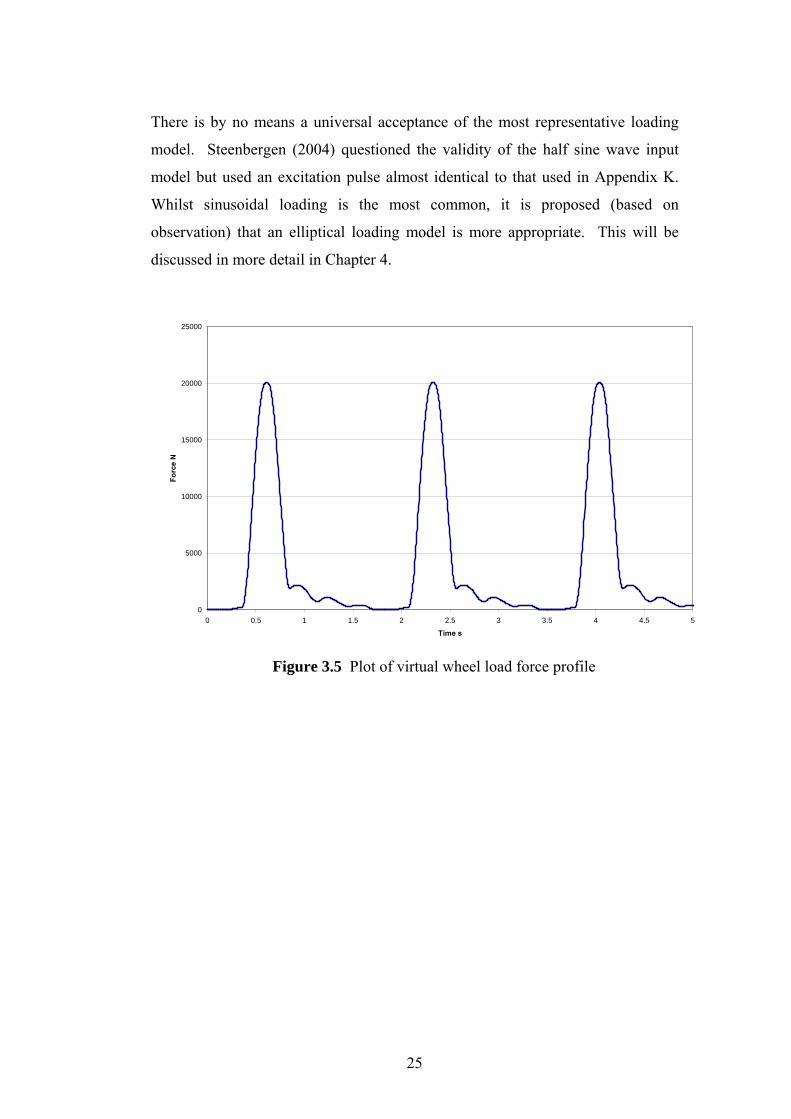
There is by no means a universal acceptance of the most representative loading
model. Steenbergen (2004) questioned the validity of the half sine wave input
model but used an excitation pulse almost identical to that used in Appendix K.
Whilst sinusoidal loading is the most common, it is proposed (based on
observation) that an elliptical loading model is more appropriate. This will be
discussed in more detail in Chapter 4.
0
5000
10000
15000
20000
25000
0 0.5 1 1.5 2 2.5 3 3.5 4 4.5 5
Time s
Forc
e N
Figure 3.5 Plot of virtual wheel load force profile
25
0
5000
10000
15000
20000
25000
0 0.05 0.1 0.15 0.2 0.25
Time s
Forc
e N
Beam 1 Beam 2 Beam 3 Beam 4
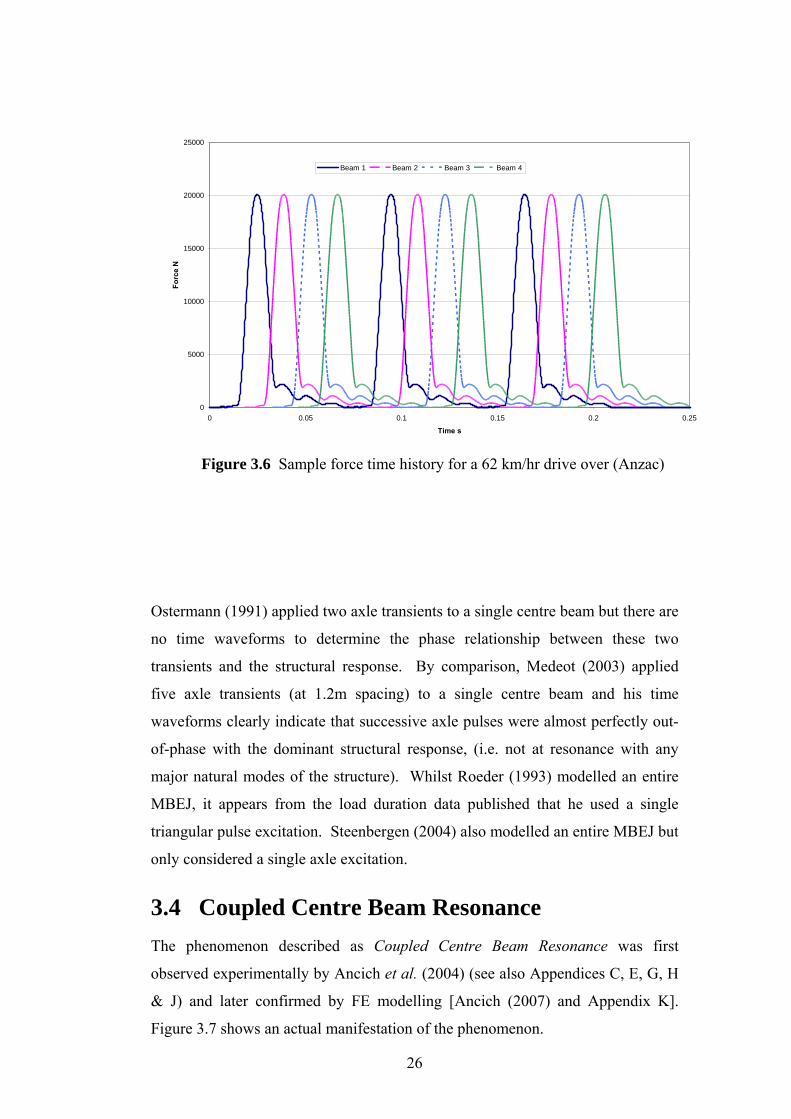
Figure 3.6 Sample force time history for a 62 km/hr drive over (Anzac)
Ostermann (1991) applied two axle transients to a single centre beam but there are
no time waveforms to determine the phase relationship between these two
transients and the structural response. By comparison, Medeot (2003) applied
five axle transients (at 1.2m spacing) to a single centre beam and his time
waveforms clearly indicate that successive axle pulses were almost perfectly out-
of-phase with the dominant structural response, (i.e. not at resonance with any
major natural modes of the structure). Whilst Roeder (1993) modelled an entire
MBEJ, it appears from the load duration data published that he used a single
triangular pulse excitation. Steenbergen (2004) also modelled an entire MBEJ but
only considered a single axle excitation.
3.4 Coupled Centre Beam Resonance The phenomenon described as Coupled Centre Beam Resonance was first
observed experimentally by Ancich et al. (2004) (see also Appendices C, E, G, H
& J) and later confirmed by FE modelling [Ancich (2007) and Appendix K].
Figure 3.7 shows an actual manifestation of the phenomenon.
26
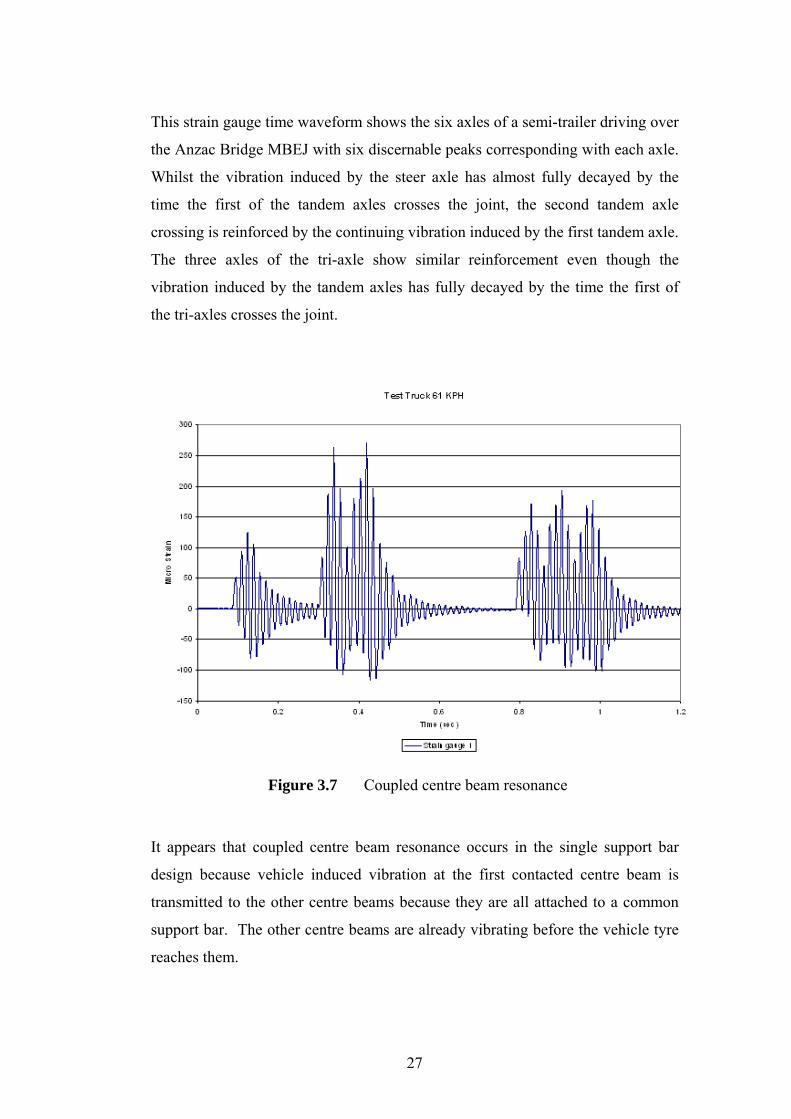
This strain gauge time waveform shows the six axles of a semi-trailer driving over
the Anzac Bridge MBEJ with six discernable peaks corresponding with each axle.
Whilst the vibration induced by the steer axle has almost fully decayed by the
time the first of the tandem axles crosses the joint, the second tandem axle
crossing is reinforced by the continuing vibration induced by the first tandem axle.
The three axles of the tri-axle show similar reinforcement even though the
vibration induced by the tandem axles has fully decayed by the time the first of
the tri-axles crosses the joint.
Figure 3.7 Coupled centre beam resonance
It appears that coupled centre beam resonance occurs in the single support bar
design because vehicle induced vibration at the first contacted centre beam is
transmitted to the other centre beams because they are all attached to a common
support bar. The other centre beams are already vibrating before the vehicle tyre
reaches them.
27
In a similar fashion, vibrational energy feeds back to the first and subsequent
centre beams after the vehicle tyre has crossed them for as long as there are
remaining centre beams. A simple analogy might be a guitar where all six strings
are tuned to produce the same musical note. Plucking any string induces resonant
vibration in the other five.
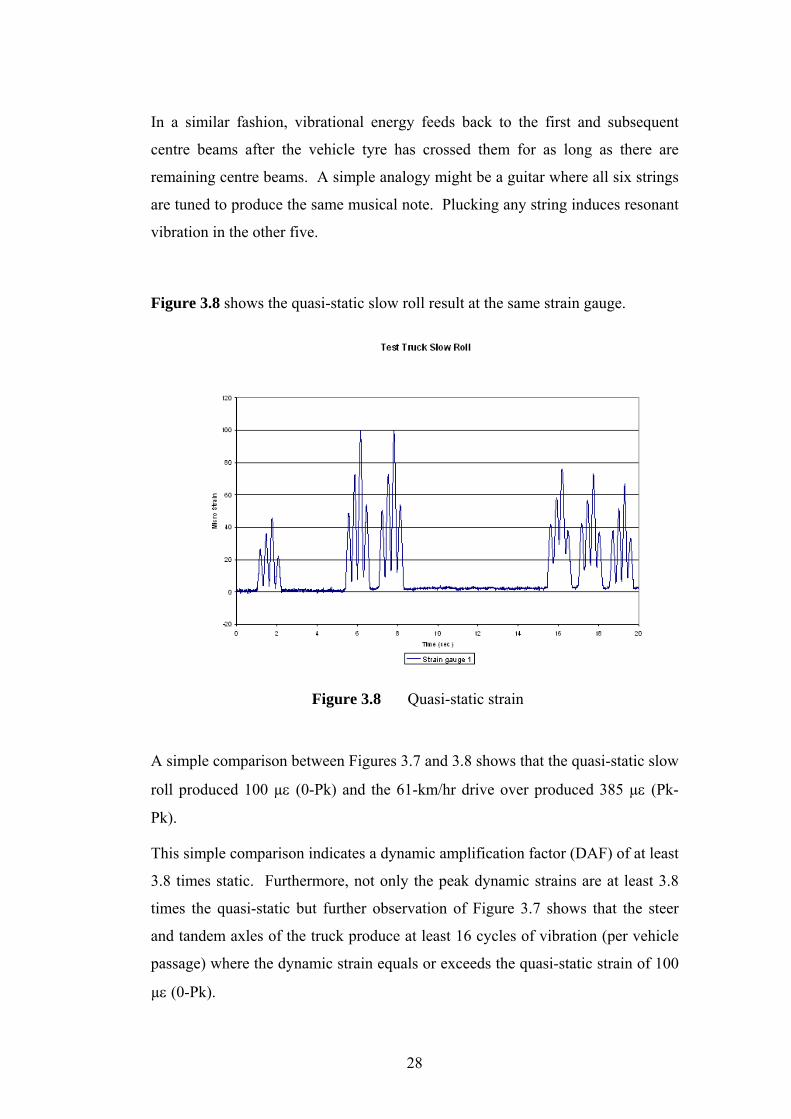
Figure 3.8 shows the quasi-static slow roll result at the same strain gauge.
Figure 3.8 Quasi-static strain
A simple comparison between Figures 3.7 and 3.8 shows that the quasi-static slow
roll produced 100 µε (0-Pk) and the 61-km/hr drive over produced 385 µε (Pk-
Pk).
This simple comparison indicates a dynamic amplification factor (DAF) of at least
3.8 times static. Furthermore, not only the peak dynamic strains are at least 3.8
times the quasi-static but further observation of Figure 3.7 shows that the steer
and tandem axles of the truck produce at least 16 cycles of vibration (per vehicle
passage) where the dynamic strain equals or exceeds the quasi-static strain of 100
µε (0-Pk).
28
Similarly, the tri-axles of the trailer produce at least 14 cycles of vibration (per
vehicle passage) where the dynamic strain equals or exceeds the quasi-static strain
of 100 µε (0-Pk). The simple addition of these events shows that each heavy
vehicle passage, of the load configuration of the test vehicle, produces around 30
vibration cycles where the dynamic strain equals or exceeds the quasi-static strain
of 100 µε (0-Pk). This is attributed to coupled centre beam resonance.
The phenomenon is almost entirely restricted to the single support bar design and
was confirmed by FEM as the basis of the dynamic behaviour.
For the phenomenon of coupled centre beam resonance to manifest, it is
considered that multiple in-phase axle pulses need to be applied to the full joint.
Whilst some in-service load configurations may result in notionally out-of-phase
excitation, notionally in-phase excitation will frequently occur and is clearly a
worst-case for fatigue assessment. Furthermore, it is highly likely that at least 1 in
every 10,000 heavy goods vehicles will be at the maximum permissible axle
loading and travelling at a speed such that the MBEJ is excited partially or
notionally in-phase. It was found experimentally that the impact of coupled centre
beam resonance may be mitigated by damping and this will be discussed further in
Section 3.6 to follow.
3.5 Strain Gauge Measurements A series of static and dynamic strain gauge tests were undertaken on the Anzac
Bridge MBEJ to clarify modular expansion joint strains and dynamic response.
These results are reported in Appendices E & J.
The main aims of the strain gauge measurements were to:
1. Measure strains in critical modular expansion joint elements at potential areas
of high stress, as indicated by an experimental modal analysis.
2. Measure static strains for a test vehicle loaded to the maximum legal axle load
for Australia.
29
3. Measure dynamic strains for the same test vehicle over a range of vehicle
speeds.
4. Determine maximum measured dynamic amplification factors.
5. Determine maximum measured dynamic stress, both positive (same sense as
static) and negative (opposite sense to static).
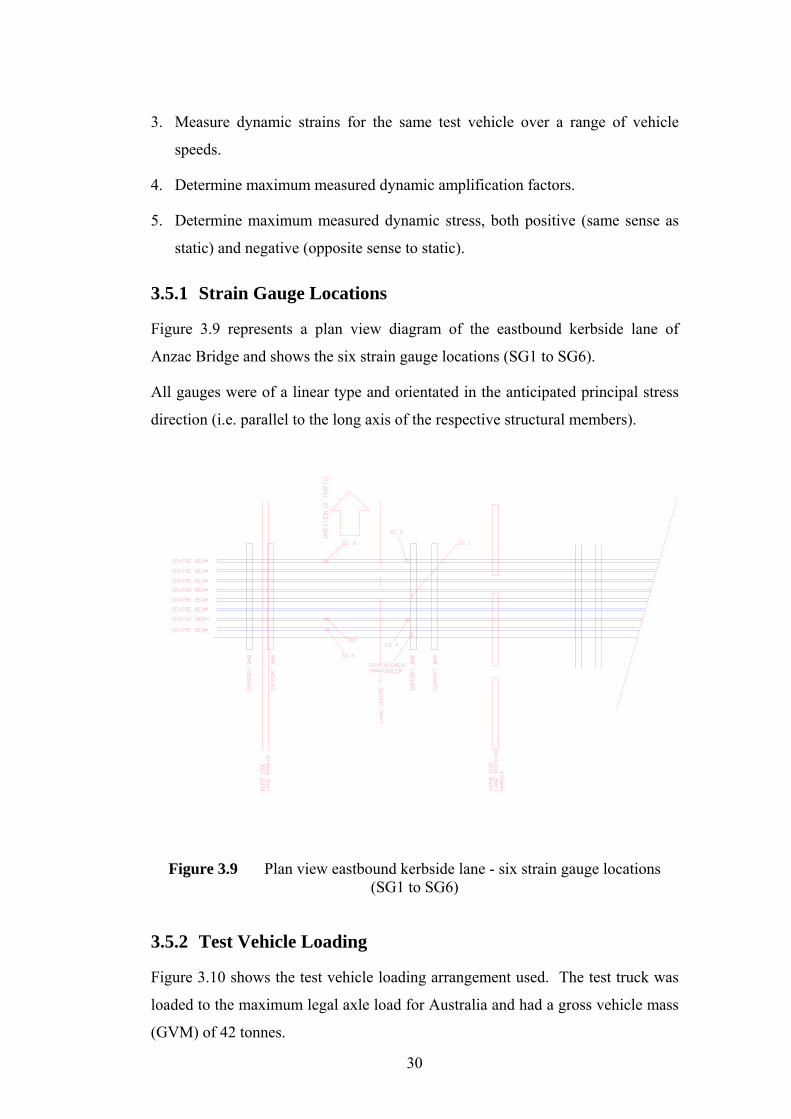
3.5.1 Strain Gauge Locations
Figure 3.9 represents a plan view diagram of the eastbound kerbside lane of
Anzac Bridge and shows the six strain gauge locations (SG1 to SG6).
All gauges were of a linear type and orientated in the anticipated principal stress
direction (i.e. parallel to the long axis of the respective structural members).
Figure 3.9 Plan view eastbound kerbside lane - six strain gauge locations (SG1 to SG6)
3.5.2 Test Vehicle Loading
Figure 3.10 shows the test vehicle loading arrangement used. The test truck was
loaded to the maximum legal axle load for Australia and had a gross vehicle mass
(GVM) of 42 tonnes.
30
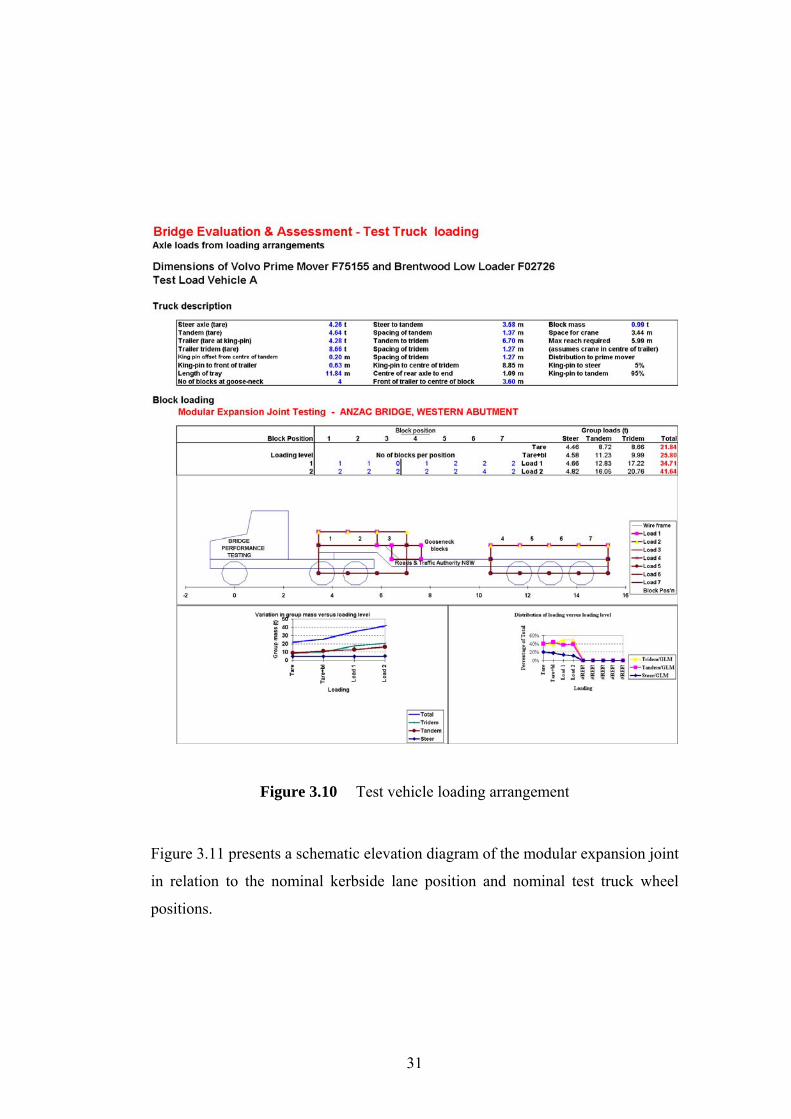
Figure 3.10 Test vehicle loading arrangement
Figure 3.11 presents a schematic elevation diagram of the modular expansion joint
in relation to the nominal kerbside lane position and nominal test truck wheel
positions.
31
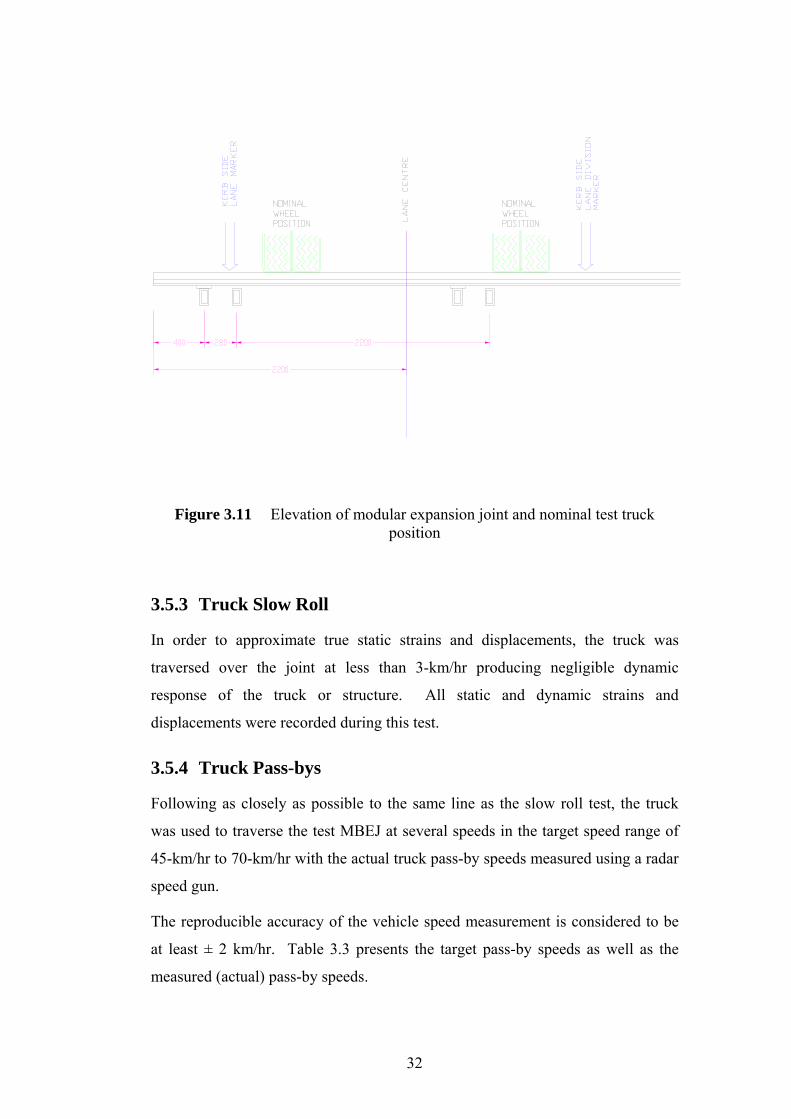
Figure 3.11 Elevation of modular expansion joint and nominal test truck position
3.5.3 Truck Slow Roll
In order to approximate true static strains and displacements, the truck was
traversed over the joint at less than 3-km/hr producing negligible dynamic
response of the truck or structure. All static and dynamic strains and
displacements were recorded during this test.
3.5.4 Truck Pass-bys
Following as closely as possible to the same line as the slow roll test, the truck
was used to traverse the test MBEJ at several speeds in the target speed range of
45-km/hr to 70-km/hr with the actual truck pass-by speeds measured using a radar
speed gun.
The reproducible accuracy of the vehicle speed measurement is considered to be
at least ± 2 km/hr. Table 3.3 presents the target pass-by speeds as well as the
measured (actual) pass-by speeds.
32
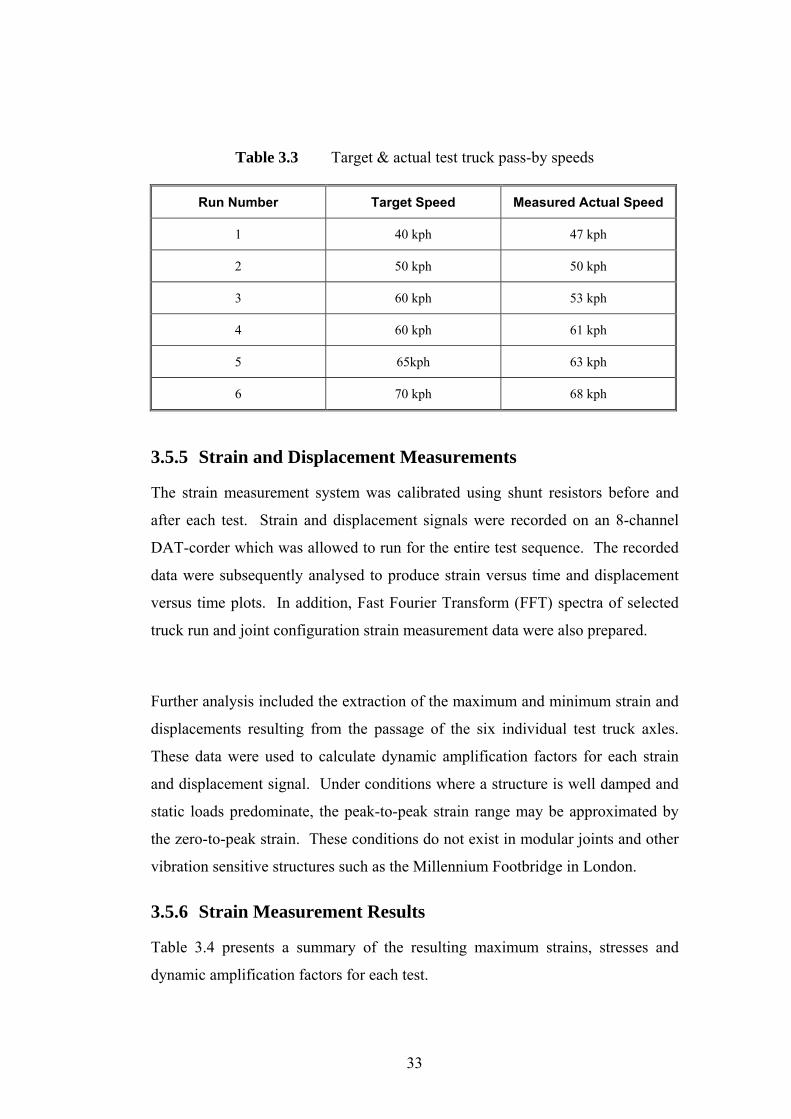
Table 3.3 Target & actual test truck pass-by speeds
Run Number Target Speed Measured Actual Speed
1 40 kph 47 kph
2 50 kph 50 kph
3 60 kph 53 kph
4 60 kph 61 kph
5 65kph 63 kph
6 70 kph 68 kph
3.5.5 Strain and Displacement Measurements
The strain measurement system was calibrated using shunt resistors before and
after each test. Strain and displacement signals were recorded on an 8-channel
DAT-corder which was allowed to run for the entire test sequence. The recorded
data were subsequently analysed to produce strain versus time and displacement
versus time plots. In addition, Fast Fourier Transform (FFT) spectra of selected
truck run and joint configuration strain measurement data were also prepared.
Further analysis included the extraction of the maximum and minimum strain and
displacements resulting from the passage of the six individual test truck axles.
These data were used to calculate dynamic amplification factors for each strain
and displacement signal. Under conditions where a structure is well damped and
static loads predominate, the peak-to-peak strain range may be approximated by
the zero-to-peak strain. These conditions do not exist in modular joints and other
vibration sensitive structures such as the Millennium Footbridge in London.
3.5.6 Strain Measurement Results
Table 3.4 presents a summary of the resulting maximum strains, stresses and
dynamic amplification factors for each test.
33
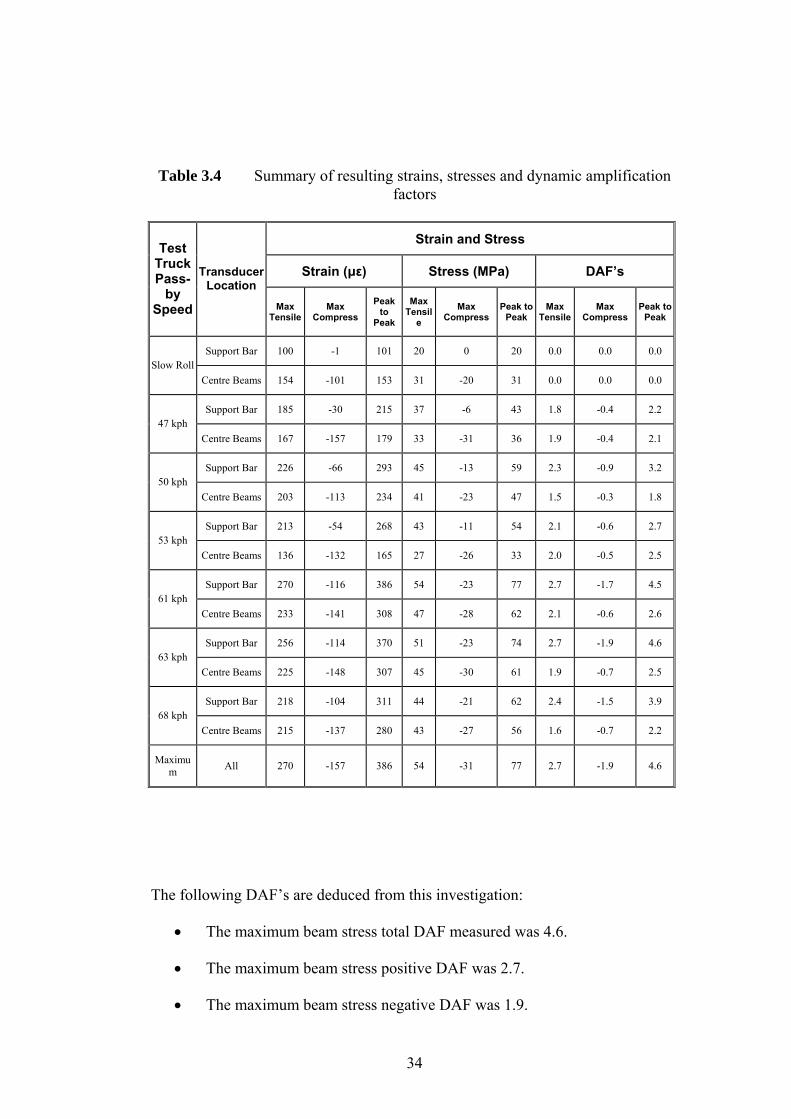
Table 3.4 Summary of resulting strains, stresses and dynamic amplification
factors
Strain and Stress
Strain (µε) Stress (MPa) DAF’s
Test Truck Pass-
by Speed
Transducer Location
Max Tensile
Max Compress
Peak to
Peak
Max Tensil
e Max
Compress Peak to
Peak Max
Tensile Max
Compress Peak to
Peak
Support Bar 100 -1 101 20 0 20 0.0 0.0 0.0 Slow Roll
Centre Beams 154 -101 153 31 -20 31 0.0 0.0 0.0
Support Bar 185 -30 215 37 -6 43 1.8 -0.4 2.2 47 kph
Centre Beams 167 -157 179 33 -31 36 1.9 -0.4 2.1
Support Bar 226 -66 293 45 -13 59 2.3 -0.9 3.2 50 kph
Centre Beams 203 -113 234 41 -23 47 1.5 -0.3 1.8
Support Bar 213 -54 268 43 -11 54 2.1 -0.6 2.7 53 kph
Centre Beams 136 -132 165 27 -26 33 2.0 -0.5 2.5
Support Bar 270 -116 386 54 -23 77 2.7 -1.7 4.5 61 kph
Centre Beams 233 -141 308 47 -28 62 2.1 -0.6 2.6
Support Bar 256 -114 370 51 -23 74 2.7 -1.9 4.6 63 kph
Centre Beams 225 -148 307 45 -30 61 1.9 -0.7 2.5
Support Bar 218 -104 311 44 -21 62 2.4 -1.5 3.9 68 kph
Centre Beams 215 -137 280 43 -27 56 1.6 -0.7 2.2
Maximum All 270 -157 386 54 -31 77 2.7 -1.9 4.6
The following DAF’s are deduced from this investigation:
• The maximum beam stress total DAF measured was 4.6.
• The maximum beam stress positive DAF was 2.7.
• The maximum beam stress negative DAF was 1.9.
34
These DAF’s are clearly well in excess of existing bridge codes and were a major
influence with members of the committee producing the Australian Bridge Design
Code, AS 5100-2004.
Preliminary fatigue analysis predicted support bar and centre beam failures after 2
x 107 and 3.8 x 10⁶ pass-bys respectively of vehicles loaded similarly to the test
truck, i.e. maximum legal axle loads. The maximum total dynamic amplification
of support bar linear bearing displacement (i.e. compression) was 4.0. The
maximum positive dynamic amplification of support bar linear bearing
displacement was 2.2. The maximum negative dynamic amplification of support
bar linear bearing displacement was 1.9. These higher than previously
documented DAF’s are most likely a major cause of both structural fatigue
cracking as well as fracture and loss of linear bearing pads.
High negative support bar vertical displacement amplification, due to resonance of
natural structural modes of the modular expansion joint and traffic forcing
frequency is likely to cause uplift of the support bar and at times break contact
with the lower linear bearing pad. This may allow the lower linear bearing pad to
eventually dislodge. Alternatively, where the support bar is excessively restrained
from uplift by elastomeric bearings, the high restraint forces may prevent proper
sliding. This may distort and dislodge the upper compression spring allowing the
lower linear bearing to ultimately dislodge (see Figure 3.12).
3.6 Vibration Induced Fatigue The role of vibration in inducing fatigue in MBEJs is shown in Appendices C, H
& J with the link to specific forcing frequencies (Beam Pass & Tyre Pulse
frequencies) set out in Appendix C and Ghimire et al., (2009). Additional
vibration induced fatigue studies are shown in Appendices L, M & N. Heywood
et al., (2002) identified the link between road profile unevenness and bridge
damage. More recently, Xie et al., (2009) investigated the dynamic behaviour of
a curved steel box girder bridge due to vehicle-induced vibration at a strip-seal
expansion joint (essentially an MBEJ without a centre beam).
35
Whilst the dynamics of curved steel box girder bridges are reasonably well
understood (Ancich & Brown, 2009, Huang, 2008, Okeil & El-Tawil, 2004 and
Sennah & Kennedy, 2001), Xie et al., (2009) do not appear to have been aware of
this earlier work and largely limit their investigation to the roughness of the road
profile. Ancich & Brown (2009) found the presence of a longitudinal profile with
periodic corrugations of approximately 1.2 metres in length in the deck of a
curved steel trough girder bridge. These corrugations were considered to explain
results in which a 15 km/hr test vehicle pass-by speed produced the maximum
dynamic strains. Whilst this vehicle speed was relatively low, the tested bridge
was in a 50 km/hr speed zone and it was concluded that a 15km/hr speed
differential between heavy vehicles passing on the bridge could produce the same
dynamic response due to beating.
The importance of minimising height mismatches between the approach pavement
and an expansion joint is clearly evident in the Karuah River Bridge MBEJ
installation shown in Figure 2.6.
3.7 High Damping Bearings A statistically based reliability analysis of the as-built Anzac Bridge MBEJ was
undertaken by Reid & Ansourian (2004) and concluded that, without intervention,
the joint would probably develop fatigue cracks approximately 13 years after the
bridge was opened to traffic and that 8 of those fatigue years had already expired.
As the critical MBEJ was cast into the western abutment of Anzac Bridge, there
was no possibility of reducing the risk of premature fatigue failure either by
decreasing the allowable loads, increasing the section properties of the structural
steel members, or by reducing the unsupported spans. However, measurements of
the structural dynamic properties of the joint indicated that the joint was lightly
damped and this low level of damping was a major contribution to the measured
dynamic amplification factor (DAF) of 4.6. The challenge was, therefore, how to
add significant levels of damping to an existing structure without major
modification.
36
Ancich & Chirgwin (2006) (see Appendix G) reported that modification of the
structural dynamics of the Anzac Bridge MBEJ, by tuned mass dampers or
damping coupled mass absorbers, was investigated and a trial of damping coupled
mass absorbers was undertaken. Whilst the trial demonstrated that reductions in
working stress of up to 30% were possible, the cost was very high and future
maintenance access would be seriously impeded by the absorbers.
The damping coupled mass absorber trial confirmed that the provision of
additional damping was a viable solution and that the most convenient and cost-
effective locations for damping additions were the elastomeric bearings and
springs installed at the ends of each support bar. Observation of the operation of
the joint suggested that bearing failure resulted from the support bar bouncing on
the lower bearing after the top bearing was dislodged.
Figure 3.12 shows a typically distorted top bearing prior to dislodgement.
37
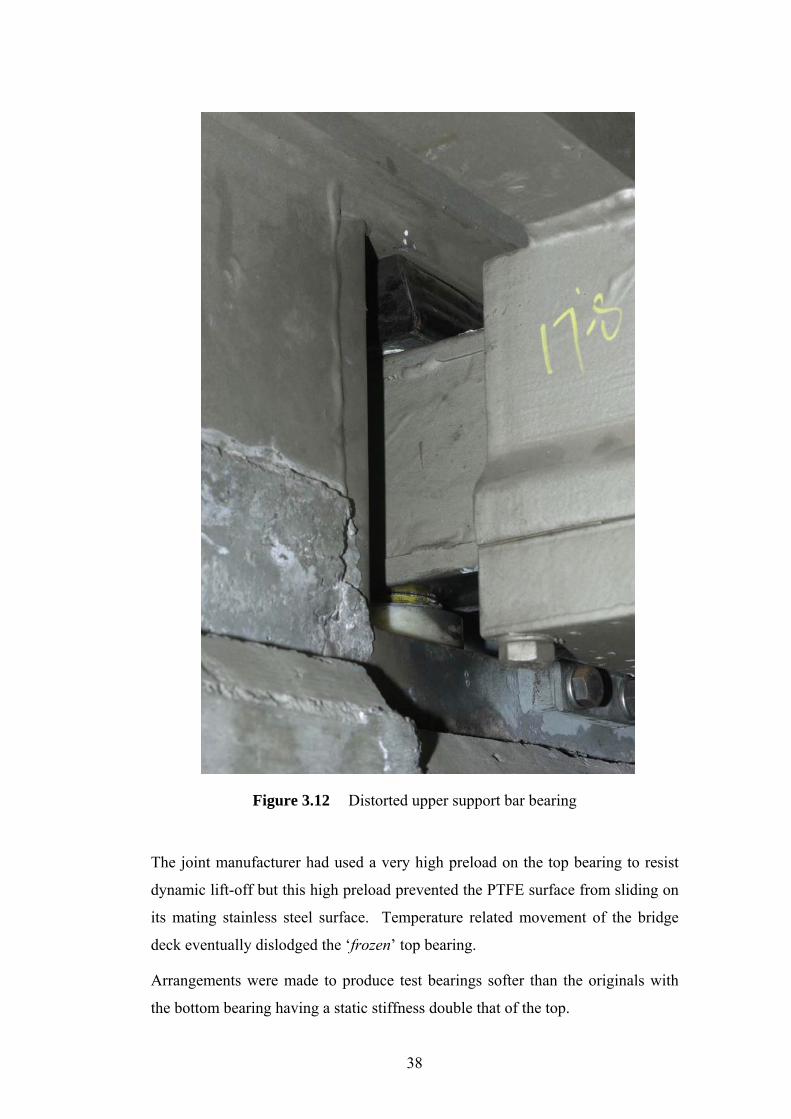
Figure 3.12 Distorted upper support bar bearing
The joint manufacturer had used a very high preload on the top bearing to resist
dynamic lift-off but this high preload prevented the PTFE surface from sliding on
its mating stainless steel surface. Temperature related movement of the bridge
deck eventually dislodged the ‘frozen’ top bearing.
Arrangements were made to produce test bearings softer than the originals with
the bottom bearing having a static stiffness double that of the top.
38
The net effect of this change was to decrease the preload and allow the prototype
elastomeric bottom bearing to ‘follow’ the support bar when it was rebounding.
This modification may appear counter-intuitive to many involved in the
specification or supply of MBEJs.
An initial trial was undertaken using steel/rubber laminated elastomeric
bearings/springs modelled on the original top bearing (spring) and replacing the
original two-piece POM bearing with a dimensionally similar laminated
elastomeric bearing. These prototypes were produced using natural rubber and
installed then tested in an identical manner to the original bearings using both
experimental modal analysis and dynamic strain gauge measurements. This trial
demonstrated that reductions in working stress of up to 30% were possible for
support bars and up to 20% for centre beams. In addition, it was immediately
apparent from the experimental modal analysis (EMA) results that the modal
damping had also increased.
Some thought was directed at methods of increasing the non-linearity of the
bearings. Davidson (2002) identified specialized synthetic polymer formulations
offering very high levels of elastic-plastic hysteresis damping. As all damping
converts kinetic energy to heat, a temperature rise in operational bearings was a
potential problem, particularly if the temperature reached was high enough to
cause pyrolysis of the synthetic polymer.
Two further trials were undertaken using the test prototype design but changing
the elastomer to different formulations of synthetic high damping rubbers. One
was medium damping to minimize heat build-up and the other full high damping.
The EMA and dynamic strain gauge measurements were repeated and Table 3.5
shows the comparative results obtained for the three prototypes and the original
equipment manufacturer (OEM) bearings. Prototype #3 was clearly superior with
around a 30% reduction in the peak-to-peak stress range for both centre beams
and support bars. The peak DAF was also reduced by around 30%. Prototype #3
used the full high damping synthetic polymer. The anticipated heat build-up did
not occur. Comparison measurements between modified and un-modified bearings
showed that temperature increase was minimal.
39
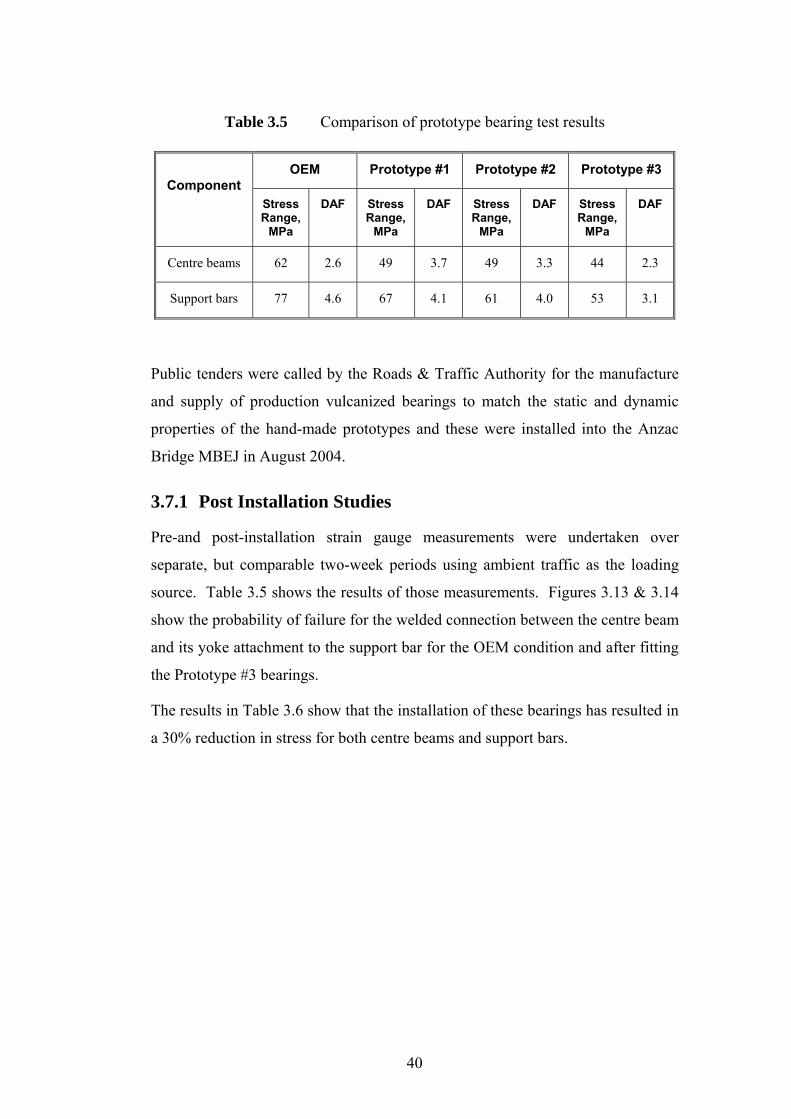
Table 3.5 Comparison of prototype bearing test results
OEM Prototype #1 Prototype #2 Prototype #3 Component
Stress Range,
MPa
DAF Stress Range,
MPa
DAF Stress Range,
MPa
DAF Stress Range,
MPa
DAF
Centre beams 62 2.6 49 3.7 49 3.3 44 2.3
Support bars 77 4.6 67 4.1 61 4.0 53 3.1
Public tenders were called by the Roads & Traffic Authority for the manufacture
and supply of production vulcanized bearings to match the static and dynamic
properties of the hand-made prototypes and these were installed into the Anzac
Bridge MBEJ in August 2004.
3.7.1 Post Installation Studies
Pre-and post-installation strain gauge measurements were undertaken over
separate, but comparable two-week periods using ambient traffic as the loading
source. Table 3.5 shows the results of those measurements. Figures 3.13 & 3.14
show the probability of failure for the welded connection between the centre beam
and its yoke attachment to the support bar for the OEM condition and after fitting
the Prototype #3 bearings.
The results in Table 3.6 show that the installation of these bearings has resulted in
a 30% reduction in stress for both centre beams and support bars.
40
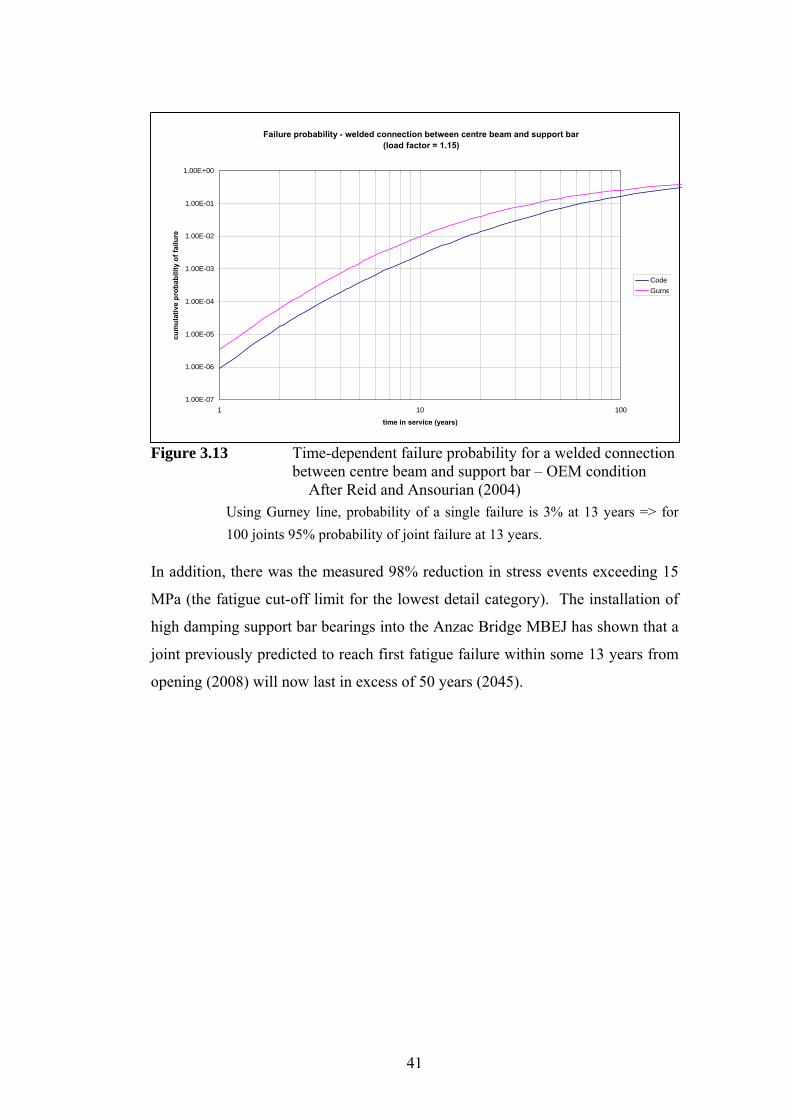
F
Failure probability - welded connection between centre beam and support bar
I
M
h
j
o
igure 3.13 Time-dependent failure probability for a welded connection between centre beam and support bar – OEM condition
(load factor = 1.15)
1.00E-07
1.00E-06
1.00E-05
1.00E-04
1.00E-03
1.00E-02
1.00E-01
1.00E+00
1 10 100
time in service (years)
cum
ulat
ive
prob
abili
ty o
f fai
lure
CodeGurne
After Reid and Ansourian (2004) Using Gurney line, probability of a single failure is 3% at 13 years => for 100 joints 95% probability of joint failure at 13 years.
n addition, there was the measured 98% reduction in stress events exceeding 15
Pa (the fatigue cut-off limit for the lowest detail category). The installation of
igh damping support bar bearings into the Anzac Bridge MBEJ has shown that a
oint previously predicted to reach first fatigue failure within some 13 years from
pening (2008) will now last in excess of 50 years (2045).
41
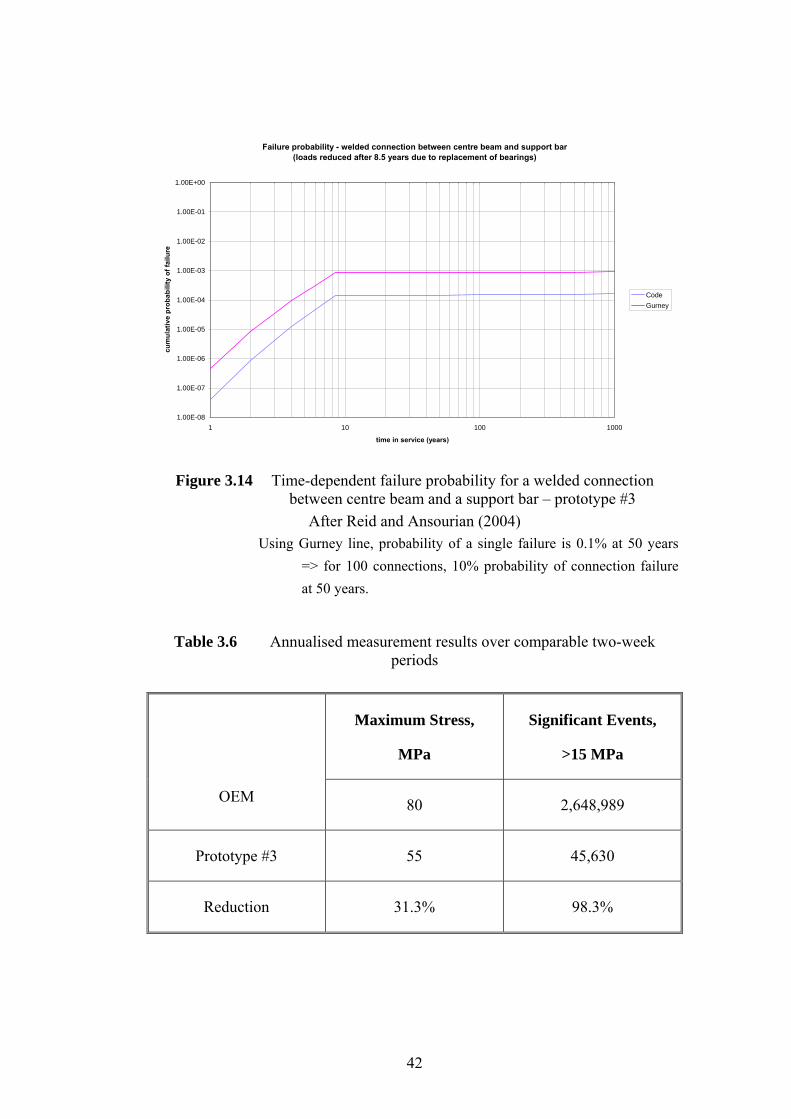
Failure probability - welded connection between centre beam and support bar
(loads reduced after 8.5 years due to replacement of bearings)
1.00E-08
1.00E-07
1.00E-06
1.00E-05
1.00E-04
1.00E-03
1.00E-02
1.00E-01
1.00E+00
1 10 100 1000
time in service (years)
cum
ulat
ive
prob
abili
ty o
f fai
lure
CodeGurney
Figure 3.14 Time-dependent failure probability for a welded connection between centre beam and a support bar – prototype #3
After Reid and Ansourian (2004) Using Gurney line, probability of a single failure is 0.1% at 50 years
=> for 100 connections, 10% probability of connection failure at 50 years.
Table 3.6 Annualised measurement results over comparable two-week periods
Maximum Stress,
MPa
Significant Events,
>15 MPa
OEM 80 2,648,989
Prototype #3 55 45,630
Reduction 31.3% 98.3%
42
3.8 Summary
Experimental modal analysis and dynamic strain gauge studies were performed on
the single support bar MBEJ installed in Anzac Bridge. The studies showed that
for this joint (unmodified):
• The joint was very lightly damped (<2% of critical damping).
• The lowest frequency mode excited was a quasi-translational
(bounce/bending) mode at 71 Hz.
• Due to access restrictions, horizontal modal data could not be acquired in
sufficient detail to identify horizontal bending or torsional modes.
• The support bars and centre beams were acting dynamically as if simply
supported.
It is considered that the dynamic response of this MBEJ is mainly due to coupled
centre beam resonance and this is seen as a design characteristic of all single
support bar designs. Static and dynamic strain gauge studies showed that for this
joint (unmodified):
• The DAF is up to 4.6 for the fully laden test vehicle.
• This DAF is not necessarily the worst case as every possible vehicle speed
and joint opening combination was not tested.
• Damping is important in the dynamic behaviour.
• The number of effective cycles of load due to vibration for each vehicle
passage is very high.
• High uplift forces are generated within the joint under vehicle loading.
These results were used to develop high damping elastomeric support bar bearings
and the installation of these bearings resulted in a 30% reduction in stress for both
centre beams and support bars and reduce the uplift forces with consequent
benefits on bearing retention.
A wholly unexpected benefit was the measured 98% reduction in stress events
exceeding 15 MPa.
43

The installation of high damping support bar bearings into the Anzac Bridge
MBEJ has ensured that a joint previously predicted to reach probable first fatigue
failure within some 5 years from a 2004 study will now last in excess of 50 years.
These results should be of interest to bridge asset owners and bridge designers as
this approach offers a cost-effective alternative to total joint replacement provided
fatigue cracking has not yet occurred. It should also be of interest to specifiers
and suppliers, as they can now specify and supply joints that will last the lifetime
of the bridge by using a dynamics approach to the design.
44
CHAPTER 4
Elliptical Loading Model
4.1 Introduction
There is by no means a universal acceptance of the most representative loading
model. Steenbergen (2004) questioned the validity of the half sine wave input
model but used an excitation pulse almost identical to that used in Appendix K. It
is interesting to note that whilst most studies (including Appendix K) have used
an essentially sinusoidal waveform input (half sine). Ostermann (1991) applied
two axle transients to a single centre beam but there are no time waveforms to
determine the phase relationship between these two transients and the structural
response. By comparison, Medeot (2003) applied five axle transients (at 1.2m
spacing) to a single centre beam and his time waveforms clearly indicate that
successive axle pulses were almost perfectly out-of-phase with the dominant
structural response, (i.e. not at resonance with any major natural modes of the
structure). Whilst Roeder (1993) modelled an entire modular bridge expansion
joint (MBEJ), it appears from the load duration data published that Roeder (1993)
used a single triangular pulse excitation. Steenbergen (2004) also modelled an
entire MBEJ but only considered a single axle excitation. The most common
loading model for loads in the vertical direction is shown by Figure 4.1.
45
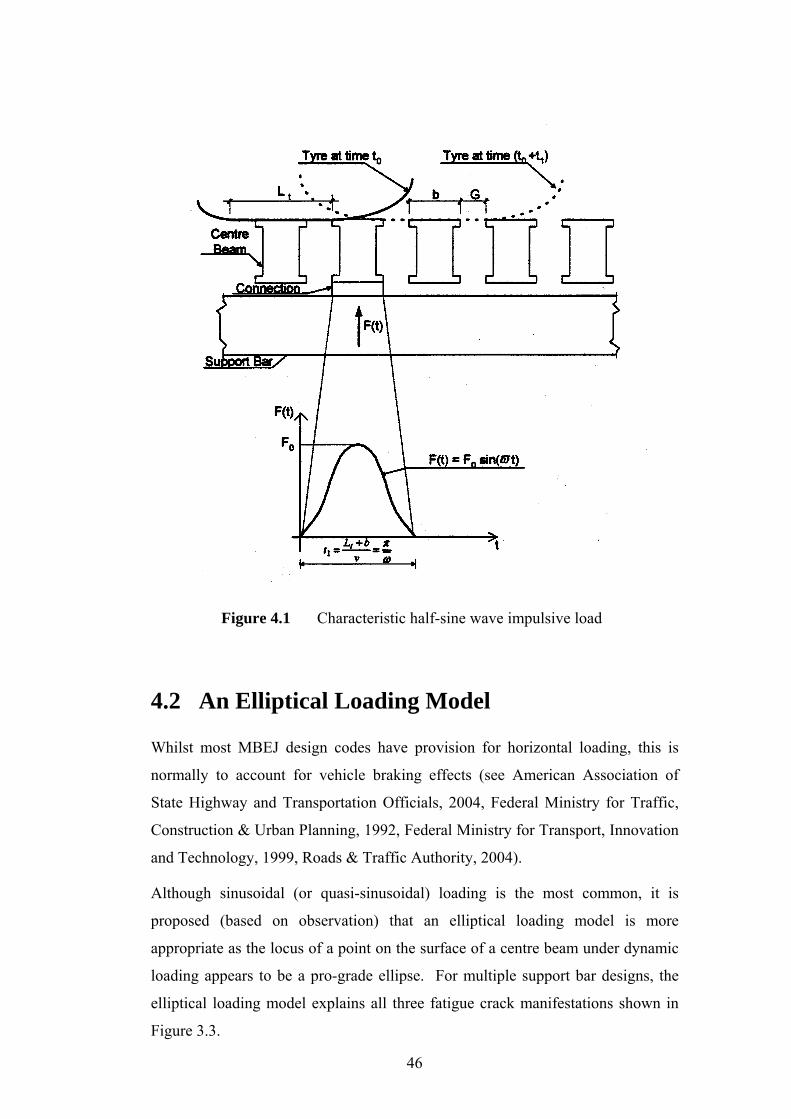
Figure 4.1 Characteristic half-sine wave impulsive load
4.2 An Elliptical Loading Model
Whilst most MBEJ design codes have provision for horizontal loading, this is
normally to account for vehicle braking effects (see American Association of
State Highway and Transportation Officials, 2004, Federal Ministry for Traffic,
Construction & Urban Planning, 1992, Federal Ministry for Transport, Innovation
and Technology, 1999, Roads & Traffic Authority, 2004).
Although sinusoidal (or quasi-sinusoidal) loading is the most common, it is
proposed (based on observation) that an elliptical loading model is more
appropriate as the locus of a point on the surface of a centre beam under dynamic
loading appears to be a pro-grade ellipse. For multiple support bar designs, the
elliptical loading model explains all three fatigue crack manifestations shown in
Figure 3.3.
46

The position with respect to single support bar designs is unclear as there is very
little in the literature about fatigue failure except for the 3rd Lake Washington
Bridge in the US (Roeder, 1993 & 1995). Figure 3.2 shows fatigue cracking, in a
swivel joist variant of the single support bar design, that may also be explained by
the elliptical loading model. The observed cracking originated in the toe of the
weld used to connect the one-sided stirrup to the centre beam.
Roeder (1993) considers that fatigue testing of a similar connection by Pattis &
Tschemmernegg (1992) was not indicative of the fatigue behaviour of this joint
because it did not develop the crack pattern and failure mode observed for the 3rd
Lake Washington Bridge joint. He added that the test did not reflect the flexibility
of the joint with respect to horizontal loads. Roeder does not report consideration
of an elliptical loading model. However, such a model is considered to address
the reported shortcomings of the Pattis & Tschemmernegg (1992) test.
4.2.1 Model Definition
The author has previously described the modes of vibration of MBEJ components
(see Appendices A-E, H, J, & K). These modes of vibration (both analytical and
experimental) are consistent with simple harmonic motion and include both
horizontal and vertical modes. The general solution for a harmonic oscillator in
two or more dimensions is an ellipse.
By definition, an ellipse is a smooth closed curve that is symmetric about its
horizontal and vertical axes. The distance between antipodal points on the ellipse,
or pairs of points whose midpoint is at the centre of the ellipse, is maximum along
the major axis, and a minimum along the perpendicular minor axis.
Unlike the elliptical orbits of the planets as described by Kepler, however, these
"harmonic orbits" have the centre of attraction at the geometric centre of the
ellipse, and have fairly simple equations of motion.
By adapting the loading model illustrated in Figure 4.1, it can be shown that in the
vertical direction, the loading may be expressed by Equation 4:
X(t) = α sin ϖt (4)
47

and in the horizontal direction by Equation 5:
Y(t) = β sin ϖt (5)
Where, α and β are the respective amplitudes.
By definition, an ellipse is a two dimensional closed curve that satisfies Equation
6:
2
2
ax + 2
2
by = 1 (6)
The ellipse is described by two lengths, a and b. The longer axis, a, is called the
semi-major axis and the shorter, b, is called the semi-minor axis.
The parameters of an ellipse are also often given as the semi-major axis, a, and
the eccentricity, e,
e = 2
2
1ab
− (7)
and the flattening, f,
f = 1 − ba
(8)
In the above equations, two untested assumptions have been made. First, that the
origin of the x-y co-ordinates is at the centre of the ellipse. Second, that the longer
axis (major axis) of the ellipse is the x-axis. This assumption has been made
because MBEJ centre beams are more flexible in the x-direction resulting in
greater deflection relative to the y-direction. The assumption that the major axis is
the x-axis needs additional research as the major axis may, after testing, be found
to be inclined at an angle somewhere between 00 and 900 to the x-axis for a
specific MBEJ or class of MBEJs.
McConnell (2010) reported dynamic measurements on a swivel joist variant of the
single support bar design and noted that, in addition to the normally expected
vertical loading, that there was also horizontal loading and horizontal mode
excitation. However, the horizontal loading could not be quantified due to
measurement limitations.
48
The elliptical loading model explains both the horizontal and vertical components
from the reported accelerating and braking vehicles. Mc Connell (2010) appears
to confirm the elliptical loading model experimentally as he notes “…and appears
as though the wheel was pushing the beam away as the wheels left the beam…”
4.3 Summary
Whilst sinusoidal (or quasi-sinusoidal) loading models for the design of MBEJs
are the most common, an elliptical loading model is proposed as being more
appropriate as the locus of a point on the surface of an MBEJ centre beam under
dynamic loading appears to be a pro-grade ellipse and the general solution for a
harmonic oscillator in two or more dimensions is also an ellipse.
Although the generalised properties of the ellipse may be described, it is not yet
possible to describe the properties of an ellipse as they apply to a specific MBEJ
or class of MBEJs. This aspect of the elliptical loading model is clearly a fruitful
area for further research.
49
CHAPTER 5
Conclusions and Suggestions for Future Work
5.1 Conclusions
It was shown in Chapter 2 that the noise produced by vehicles traversing modular
bridge expansion joints (MBEJs) has a high frequency "above joint" component
and a low frequency "below joint" component. The “above joint" noise was
related to tyre/pavement noise generation and involved a combination of factors
but was exacerbated by the roughness profile of the pavement, longitudinal
discontinuities and a not un-common height mismatch between the expansion
joint and the adjacent pavement. The “below joint” noise largely resulted from
modal vibration frequencies of the MBEJ coupling with acoustic resonances in the
chamber cast into the bridge abutment below the MBEJ. From an environmental
perspective, low frequency noise is likely to be of more concern as the higher
frequencies are more rapidly attenuated due to atmospheric and ground
absorption, barriers, etc.
It was also shown that there were three basic engineering noise control methods
available with the attachment of “noise-reducing” plates to the top surface of the
edge and centre beams being the noise control method favoured by MBEJ
manufacturers because this method could be fitted to the expansion joint at the
place of manufacture. There is no information in the scientific literature relating
to how the noise reducing plates are effective other than a small number of reports
detailing the quantum of noise reduction.
In Chapter 3, experimental modal analysis and dynamic strain gauge studies were
performed on the single support bar MBEJ installed in Anzac Bridge to
understand the structural dynamics. It was considered that the dynamic response
of this MBEJ was mainly due to coupled centre beam resonance and this was seen
as a design characteristic of all single support bar designs. Static and dynamic
strain gauge studies showed that for this joint (unmodified) the DAF was up to 4.6
for the fully laden test vehicle.
50
These results were used to develop high damping elastomeric support bar bearings
and the installation of these bearings resulted in a 30% reduction in stress for both
centre beams and support bars and reduced the uplift forces with consequent
benefits on bearing retention. A wholly unexpected benefit was the measured 98%
reduction in stress events exceeding 15 MPa. The installation of high damping
support bar bearings into the Anzac Bridge MBEJ has ensured that a joint
previously predicted to reach probable first fatigue failure within some 5 years
from a 2004 study will now last in excess of 50 years. These results should be of
interest to bridge asset owners and bridge designers as this approach offers a cost-
effective alternative to total joint replacement provided fatigue cracking has not
yet occurred.
In Chapter 4, the various loading models were outlined and discussed. Whilst
sinusoidal (or quasi-sinusoidal) loading is the most common, it was proposed
(based on observation) that an elliptical loading model is more appropriate as the
locus of a point on the surface of a centre beam under dynamic loading is a pro-
grade ellipse and the general solution for a harmonic oscillator in two or more
dimensions is also an ellipse.
5.2 Suggestions for Future Work
5.2.1 MBEJ Noise Generation & Abatement
The hypothesis was offered in Chapter 2 that the various proprietary shapes of
noise reducing plates all appear to work by minimising or reducing the
discontinuity between adjacent centre beams so that the noise resulting from the
tyre impact and resulting sidewall vibration (viz. Section 2.1) is reduced because
there is no longer a longitudinal gap between adjacent centre beams for the
vehicle tyre to cross. However, the action of the noise reducing plates appears to
be limited to the “above joint” noise component. It is recommended that
additional experimental and computational work needs to be undertaken in order
to understand how noise reducing plates affect the “below joint” noise generation.
51
5.2.2 Elliptical Loading Model
The concept of an elliptical loading model for MBEJs is somewhat unique and has
not previously been discussed in the scientific literature. It is recommended that
additional experimental and computational work needs to be undertaken in order
to fully develop the elliptical loading model into a form suitable for the MBEJ
design process and to incorporate the model into the relevant national and
international design codes. In formulating the elliptical loading model, it was
assumed that the origin of the x-y co-ordinates is at the centre of the ellipse. And
secondly, that the longer axis (major axis) of the ellipse is the x-axis. This second
assumption was made because MBEJ centre beams are more flexible in the x-
direction resulting in greater deflection relative to the y-direction. The assumption
that the major axis is the x-axis needs additional research as the major axis may,
after testing, be found to be inclined at an angle somewhere between 00 and 900 to
the x-axis for a specific MBEJ or class of MBEJs.
52
REFERENCES
Agarwal A.C. (1991). Static And Dynamic Testing Of A Modular Expansion Joint
In The Burlington Skyway, Paper presented at the 3rd World Congress on Joint
Sealing and Bearing Systems for Concrete Structures, Toronto, Ontario, Canada,
1-22.
American Association of State Highway and Transportation Officials (1969).
Standard Specification for Highway Bridges, AASHTO, 14th Edition,
Washington, DC, USA.
American Association of State Highway and Transportation Officials (1973).
Standard Specification for Highway Bridges, AASHTO, 15th Edition,
Washington, DC, USA.
American Association of State Highway and Transportation Officials (2004).
AASHTO LRFD Bridge Design Specifications, SI Units, 3rd Ed., Washington, DC,
USA.
Ancich E.J. (2000). A Study of the Environmental Noise Generation &
Propagation Mechanisms of Modular Bridge Expansion Joints, RTA
Environmental Technology Report No. 000203, Roads & Traffic Authority of
NSW, Sydney, NSW, Australia, 9 pp.
Ancich E.J., Brown S.C. & Chirgwin G.J. (2004). Modular Deck Joints –
Investigations into structural behaviour and some implications for new joints,
Proc. 5th Austroads Bridge Conference, Hobart, Tasmania, Australia.
Ancich E.J. & Brown S.C. (2004). Modular Bridge Joints – Reduction of noise
emissions by use of Helmholtz Absorber, Proc. 5th AUSTROADS Bridge
Engineering Conference, Hobart, Tasmania, Australia.
Ancich E.J., Brown S.C. & Chirgwin G.J. (2004). The Role of Modular Bridge
Expansion Joint Vibration in Environmental Noise Emissions and Joint Fatigue
Failure, Proc. Acoustics 2004 Conference, Surfers Paradise, Qld., Australia, 135-
140.
53

Ancich E.J. and Brown S.C. (2004). Engineering Methods of Noise Control for
Modular Bridge Expansion Joints, Acoustics Australia, 32(3), 101-107.
Ancich E. J. & Bhavnagri V. (2006). Fatigue Comparison of Modular Bridge
Expansion Joints Using Multiple Bridge Design Code Approaches, Proc. 6th
World Congress on Joints, Bearings and Seismic Systems for Concrete Structures,
Halifax, Nova Scotia, Canada.
Ancich E.J. & Chirgwin G.J. (2006). Fatigue Proofing of an In-service Modular
Bridge Expansion Joint, Proc. 6th World Congress on Joints, Bearings & Seismic
Systems for Concrete Structures, Halifax, Nova Scotia, Canada.
Ancich E.J., Chirgwin G.J. and Brown S.C. (2006). Dynamic Anomalies in a
Modular Bridge Expansion Joint, Journal of Bridge Engineering, 11(5), 541-554.
Ancich E.J. (2007). Dynamic Design of Modular Bridge Expansion Joints by the
Finite Element Method, Proc. International Association for Bridge & Structural
Engineering (IABSE) Symposium, Weimar, Germany.
Ancich E.J. and Brown S.C. (2009). Premature Fatigue Failure in a Horizontally
Curved Steel Trough Girder Bridge, Proc. International Association for Bridge &
Structural Engineering (IABSE) Symposium, Bangkok, Thailand.
Ancich E.J., Chirgwin G.J., Brown S.C. & Madrio H. (2009). Fatigue
Implications of Growth in Heavy Vehicle Loads and Numbers on Steel Bridges,
Proc. International Association for Bridge & Structural Engineering (IABSE)
Symposium, Bangkok, Thailand.
Ancich E.J., Chirgwin G.J., Brown S.C. & Madrio H. (2009). Fatigue Sensitive
Cope Details in Steel Bridges and Implications from Growth in Heavy Vehicle
Loads and Numbers, Proc. 7th Austroads Bridge Conference, Auckland, New
Zealand.
Anon. (1999). Microstran User Manual Version 7, Engineering Systems Pty Ltd,
Sydney, NSW, Australia.
Anon. (2001). Geräuschminderung an Fahrbahnübergängen in Lamellenbauweise
durch wellenförmigen Fugenverlauf, Maurer Info Nr. 24, Maurer Söhne, Munich,
Germany, 10 pp (In German).
54
Barnard C.P. & Cuninghame J.R. (1997). Improving the Performance of Bridge
Expansion Joints: Bridge Deck Expansion Joint Working Group Final Report,
TRL Report 236, Transport Research Laboratory, Crowthorne, Berkshire, UK, 92
pp.
Bernhard, R. J. and Wayson R. L. (2005). An Introduction to Tire/Pavement
Noise, Publication SQDH 2005-1, Institute for Safe, Quiet and Durable
Highways, Purdue University, West Lafayette, Indiana, USA.
Brown S.C. (2005). Vibration and Fatigue Investigation Taree Bypass Modular
Expansion Joint, Report 10-1788-R4, Richard Heggie Associates Pty Ltd (now
SLR Consulting Australia Pty Ltd), Lane Cove, NSW, Australia. (Unpublished
report prepared for the Roads & Traffic Authority of NSW).
Brown S.C. (2005). Measurement of Static and Dynamic Strains Taree Bypass
Bridge Modular Expansion Joint, Report 10-1788-R5, Richard Heggie Associates
Pty Ltd (now SLR Consulting Australia Pty Ltd), Lane Cove, NSW, Australia.
(Unpublished report prepared for the Roads & Traffic Authority of NSW).
Brown S.C. (2005). Modal Analysis Karuah Bypass Bridge Modular Expansion
Joint, Report 10-1788-R21, Richard Heggie Associates Pty Ltd (now SLR
Consulting Australia Pty Ltd), Lane Cove, NSW, Australia. (Unpublished report
prepared for the Roads & Traffic Authority of NSW).
Brown S. C. (2005). Measurement of Static and Dynamic Strains: Karuah Bypass
Bridge, Karuah NSW Modular Expansion Joint, Report 10-1788-R20, Richard
Heggie Associates Pty Ltd (now SLR Consulting Australia Pty Ltd), Lane Cove,
NSW, Australia. (Unpublished report prepared for the Roads & Traffic Authority
of NSW).
Boyd A.L., Schmidt B.R. & Thornton P.B. (1982). Loading and Impact Effects on
Mine Haul Road Bridges, MWP Technical Quarterly No. 4, Macdonald Wagner &
Priddle Pty Ltd (now Aurecon Pty Ltd), Sydney, NSW, Australia, 7-15.
Chaallal O., Sieprawski G. & Guizani L. (2006). Fatigue performance of modular
expansion joints for bridges, Canadian Journal of Civil Engineering, Vol. 33, No.
8, 921-932.
Clough, R. and Penzien, J. (1975). Dynamics of Structures, McGraw-Hill.
55

Crocetti R. (2001). On some Fatigue Problems Related to Steel Bridges, PhD
Dissertation, Chalmers University of Technology, Göteborg, Sweden.
Crocetti R. & Edlund B (2001). Fatigue Performance of Modular Bridge
Expansion Joints, Chalmers University of Technology, Göteborg, Sweden.
Crocetti R. & Edlund B. (2003). Fatigue Performance of Modular Bridge
Expansion Joints, J. Perform. Constr. Facil., ASCE, 17(4), 167-176.
Davidson G. (2002). (Ludowici Ltd.). Personal Communication.
Deutsches Institut für Normung (1985). Road and foot bridges; design loads, DIN
1072 -1985, Berlin, Germany.
Dexter R.J., Connor R.J. & Kaczinski M.R., (1997). Fatigue Design of Modular
Bridge Expansion Joints, NCHRP Report 402, Transportation Research Board,
National Research Council, Washington, DC, USA.
Dexter R.J., Osberg C.B. & Mutziger M.J. (2001). Design, Specification,
Installation, and Maintenance of Modular Bridge Expansion Joint Systems,
Journal of Bridge Engineering, 6(6), 529-538.
Dexter R.J., Mutziger M.J. & Osberg C.B. (2002). Performance Testing for
Modular Bridge Joint Systems, NCHRP Report 467, Transportation Research
Board, National Research Council, Washington, DC, USA.
Edlund B. and Crocetti R. (2007). Bridge expansion joints – design for
movements, performance and durability, Proc. International Association for
Bridge & Structural Engineering (IABSE) Symposium, Weimar, Germany.
Embleton T.F.W. (1988). Mufflers, Noise and Vibration Control – Revised
Edition ed. L.L. Beranek, Institute of Noise Control Engineering, Indianapolis,
Indiana, USA, 362-405.
European Commission (1992). Design of Steel Structures, EN 1993 Eurocode 3
Section 9, Fatigue, Brussels, Belgium.
European Patent Office (1993). Rollverschluss-Fahrbahnübergang, insbesondere
für Dilationsfugen von Brücken, EP 0 382 681 B1, Paris, France.
Ewins D.J. (1999). Modal Testing: Theory, Practice & Application (2nd Edition),
Research Studies Press, Hertfordshire, UK, 163-276.
56
Federal Ministry for Transport, Innovation and Technology (1999). Expansion
Joints for Bridges, Austrian Guideline RVS 15.45, Draft, version 1, Vienna,
Austria.
Federal Ministry for Traffic, Construction & Urban Planning (1992). Technical
delivery and inspection specifications for watertight expansion joints of road and
foot bridges, TL/TP-FÜ 92, Bonn, Germany. Non-revised translation (draft 1),
provided by the German Association of Joint and Bearing Manufacturers
[Vereinigung der Hersteller von Fahrbahnübergängen und (Brücken) Lagern].
Fobo W. (2004). Noisy Neighbours, Bridge Design & Engineering, 35, 75.
French S. (2005). Review of Cracking Remediation Reports and Recommended
Remediation Scope, Report 024-P1164-009-01, Burns & Roe Worley Pty Ltd
(now Worley Parsons Pty Ltd), Sydney, NSW, Australia, 10 pp. (Unpublished
report prepared for the Roads & Traffic Authority of NSW).
Fritsche G. (2003). Dynamische Versuche zur Betriebstauglichkeit
aufgeschraubter Fingerplatten Regelprüfung nach TL/TP-FÜ 92 für
Fahrbahnübergänge mit geräushmindernder Oberfläche (Dynamic tests for
operational integrity of screwed finger plates – Approval according to TL/TP-FÜ
92 for expansion joint with noise reducing surface), Bericht Nr.: 38/2003;
be38_03.doc, University of Innsbruck, Innsbruck, Austria (Unpublished report
prepared for Mageba SA) (in German).
Fu G., Feng J., Delelbab W., Moses F., Cohen H. & Mertz D. (2008). Impact of
Commercial Vehicle Weight Change on Highway Bridge Infrastructure, J. Bridge
Engineering, ASCE, 13(6), 556-564.
Gargett D., Hossain A & Cosgrove D. (2006). Interstate Freight on States’ Roads,
Proc. 29th Australasian Transport Research Forum, Surfers Paradise, Queensland,
Australia, 2006.
Ghimire J.P. (2007). A Numerical Investigation of Noise Generation and
Radiation from Bridge Modular Expansion Joint: Dependence on Frequency and
Direction, Proc. Of the Ninth International Summer Symposium, JSCE,
Yokohama, Japan.
57
Ghimire J.P., Matsumoto Y. and Yamaguchi H. (2007). Vibro-acoustic analysis
of noise generation from a full-scale model of modular bridge expansion joint,
Proc. InterNoise 2007, Istanbul, Turkey.
Ghimire J.P., Matsumoto Y. and Yamaguchi H. (2008). Vibro-acoustic analysis
of noise generation from a full-scale model of modular bridge expansion joint,
Noise Control Eng. J., 56 (6), 442-450.
Ghimire J.P. (2008). Numerical investigation of noise generation and radiation
from modular expansion joint, PhD Thesis, Saitama University, Tokyo, Japan.
Ghimire J.P., Matsumoto Y., Yamaguchi H. and Kurahashi I. (2009). Numerical
investigation of noise generation and radiation from an existing modular
expansion joint between prestressed concrete bridges, Journal of Sound &
Vibration, Vol 328, Issue 1-2, 129-147 (DOI: 10.1016/j.jsv.2009.07.016).
Heywood R., Prem H. & McLean J. (2002). Guide to Road Profile Unevenness
and Bridge Damage, Report AP-T13, Austroads, Sydney, NSW, Australia, 33 pp.
Heywood R., Brandis A. & Land K. (2004). Bridge over Darling River at
Wilcannia: Design Review of Steel Trough Girder Web Crack Repairs, Report
14024, Texcel Pty Ltd, Brisbane, Qld., Australia, 40 pp (Unpublished report
prepared for the Roads & Traffic Authority of NSW).
Huang D. (2008). Full-Scale Test and Analysis of a Curved Steel-Box Girder
Bridges, J. Bridge Engineering, ASCE, 13(5), 492-500.
Imam B.M., Righiniotis T.D. & Chryssanthopoulos M.K (2008). Probabilistic
Fatigue Evaluation of Riveted Railway Bridges, J. Bridge Engineering, ASCE,
13(3), 237-244.
Jones D.I.G. (1967). Effect of Isolated Tuned Dampers on Response of Multispan
Structures. J. Aircraft, Vol. 4, No. 4, 343-346.
Kaczinski M.R. (2004). (D.S. Brown Co., Inc.). Personal Communication.
Köster, W. (1986). The Principle of Elasticity for Expansion Joints, Joint Sealing
and Bearing Systems for Concrete Structures, ACI SP-94, American Concrete
Institute, Detroit, Michigan, USA, 675-711.
58
Leendertz J., Weber F., Volk B. and Nagel O. (2007). Dynamic behaviour of
modular expansion joints, Proc. International Association for Bridge & Structural
Engineering (IABSE) Symposium, Weimar, Germany.
MacDougall C., Green M. F. and Schillinglaw S. (2006). Fatigue Damage of Steel
Bridges Due to Dynamic Vehicle Loads, Journal of Bridge Engineering, Vol. 11,
No. 3, 320–328 [DOI: 10.1061/(ASCE)1084-0702(2006)11:3(320)].
Martner O. (1996). Noise Emission of Constructions for Bridge-To-Road
Crossings, Proc. Inter-Noise 96, Liverpool, UK, 211-214.
Matsumoto Y., Yamaguchi H., Tomida N., Kato T., Uno Y., Hiromoto Y. &
Ravshanovich K.A. (2007). Experimental investigation of noise generated by
modular expansion joint and its control, Journal of the Japan Society of Civil
Engineers, Division A, 63(1), 75-92 (In Japanese).
McConnell R. (2010). Insitu Dynamic Testing of Swivel Joist Modular Expansion
Joints installed in the Go Between Bridge, Report 86524, Arup Pty Ltd, Brisbane,
Qld., Australia, 41 pp (Unpublished report prepared for the Hale Street Link
Alliance).
Medeot R. (2003). Impact Analysis of Maurer Expansion Joints: DS640 Swivel
joist joint and D240 girder grid joint, Selvazzano, Italy, 38 pp (Unpublished report
prepared for Maurer Söhne GmbH & Co. KG).
Metzger S. (2010). (Mageba SA). Personal Communication.
Morassi A. & Tonon S. (2008). Dynamic Testing for Structural Identification of a
Bridge, J. Bridge Engineering, ASCE, 13(6), 573-585.
Mothe R.N. (2006). Partial Continuity in Prestressed Concrete Girder Bridges
with Jointless Decks, MSc Thesis, Louisiana State University, Baton Rouge,
Louisiana, USA.
NAASRA (1976). National Association of Australian State Road Authorities 1976
Bridge Design Specification, National Association of Australian State Road
Authorities, Sydney, NSW Australia.
Okeil A.M. & El-Tawil S. (2004). Warping Stresses in Curved Box Girder
Bridges: Case Study, J. Bridge Engineering, ASCE, 9(5), 487-496.
59
Ostermann M., (1991). Beanspruchung von elastisch gelagerten
Fahrbahnübergängen unter Radstoßeinwirkung (Stresses in elastically supported
modular expansion joints under wheel load impact), Bauingenieur 66, Springer-
Verlag, 381-389 (In German).
Pattis A., & Tschemmernegg, F (1992). Fatigue Testing and Design of Modular
Expansion Joints – The Brown/Maurer SWIVEL JOIST System – Repair
Proposals for 3rd Lake Washington Bridge, Short version of an unpublished
report, University of Innsbruck, Innsbruck, Austria.
Pritchard R.W. (2004). (Qld Dept of Transport & Main Roads). Personal
Communication.
Purvis R. (2003). Bridge Deck Joint Performance – A Synthesis of Highway
Practice, NCHRP Synthesis 319, Transportation Research Board, National
Research Council, Washington, DC, USA.
Ramberger G., (2002). Structural Bearings and Expansion Joints for Bridges,
Structural Engineering Documents 6, International Association for Bridge and
Structural Engineering (IABSE), Zurich, Switzerland.
Ravshanovich K.A., Yamaguchi H., Matsumoto Y., Tomida N. & Uno S. (2007).
Mechanism of noise generation from a modular expansion joint under vehicle
passage, Engineering Structures, Elsevier Science Ltd, UK, 29(9), 2206–2218.
Ravshanovich K.A. (2007). Noise generation mechanism of modular expansion
joints in highway bridges, PhD Thesis, Saitama University, Tokyo, Japan.
Reid S. & Ansourian P. (2004). Reliability Analysis of Expansion Joint in Anzac
Bridge, Investigation Report S1427, Centre for Advanced Structural Engineering,
University of Sydney, NSW, Australia, (Unpublished report prepared for the
Roads & Traffic Authority of NSW).
Roads & Traffic Authority of NSW. (2004). RTA QA Specification B316 –
Modular Bridge Expansion Joints. Sydney, NSW, Australia.
(http://www.rta.nsw.gov.au/doingbusinesswithus/specifications/bridgeworks.html)
Roads & Traffic Authority of NSW. (2008). Blueprint - RTA Corporate Plan 2008
to 2012, RTA Publication 07.329, Sydney, NSW, Australia.
60
Roeder C.W. (1993). Fatigue Cracking in Modular Expansion Joints, Research
Report WA-RD 306.1, Washington State Transportation Center, Seattle,
Washington, USA, 53 pp.
Roeder C.W. (1995). Field Measurements of Dynamic Wheel Loads on Modular
Expansion Joints, Research Report WA-RD 369.1, Washington State
Transportation Center, Seattle, Washington, USA, 66 pp.
Roeder C.W., Macrae G.A., Arima K., Crocker P.N. & Wong S.D. (1998).
Fatigue Cracking of Riveted Steel Tied Arch and Truss Bridges, Research Report
WA-RD 447.1, Washington State Transportation Center, Seattle, Washington,
USA.
Roeder C.W., Macrae G.A., Kalogiros A.Y. & Leland A. (2001). Fatigue
Cracking of Riveted, Coped, Stringer-to-Floorbeam Connections, Research
Report WA-RD 494.1, Washington State Transportation Center, Seattle,
Washington, USA.
Roeder C.W. (2004). (Uni. of Washington). Personal Communication.
Roeder C.W., Macrae G.A., Leland A. & Rospo A. (2005). Extending the Fatigue
Life of Riveted Coped Stringer Connections, J. Bridge Engineering, ASCE, 10(1),
69-76.
Roberts W.S. and Heywood R.J. (2004). Fatigue-It Will Change Our Culture,
Proc. 5th Austroads Bridge Conference, Hobart, Tasmania, Australia.
Schwammenhoefer F. (2001). (Min. of Transport, Austria). Personal
Communication.
Sennah K.M. & Kennedy J.B. (2001). State-of-the-Art in Design of Curved Box-
Girder Bridges, J. Bridge Engineering, ASCE, 6(3), 159-167.
Shigley J.E. & Mischke C.R. (1981). Mechanical Engineering Design (5th
Edition), McGraw-Hill, New York, USA, 185.
Spuler T., Moor G. & Urich B. (2007). Expansion joints with noise reduction –
will recent developments become widespread across Europe?, Proc. International
Association for Bridge & Structural Engineering (IABSE) Symposium, Weimar,
Germany.
61
Standards Australia (2004). Australian Standard AS5100.4 – 2004, Bridge Design
Part 4: Bearings and deck joints, Sydney, NSW, Australia.
Steenbergen M.J.M.M. (2004). Dynamic response of expansion joints to traffic
loading, Engineering Structures, Elsevier Science Ltd, UK, 26(12), 1677-1690.
Tschemmernegg F. (1973). Messung von Vertikal- und Horizontallasten beim
Anfahren, Bremsen und Überrollen von Fahrzeugen auf einem Fahrbahnübergang
(Measurement of Vertical and Horizontal Loads due to Accelerating, Braking, and
Rolling Vehicles on an Expansion Joint), Der Bauingenieur, 48, Heft 9, Springer-
Verlag, 326-330 (In German).
Tschemmernegg F. (1991). The Design of Modular Expansion Joints, Proc. 3rd
World Congress on Joint Sealing and Bearing Systems for Concrete Structures,
Toronto, Ontario, Canada, 67-86.
Watson R.J. & Delattre X. (2008). A Low Noise, Large Movement Expansion
Joint System for Concrete Bridges, Proc. PCI-FHWA National Bridge
Conference, Precast/Prestressed Concrete Institute, Chicago, Illinois, USA.
Whitton R. J. (2003). Strengthening Options/Load Capacity – Bridge Over the
Darling River at Wilcannia, RTA Technical Services Report, Roads & Traffic
Authority, Sydney, NSW, Australia, 23 pp.
Xie X., Wu D.Y., Wang J.F., Zhang S.Q. and Zhou Y.J. (2009). Dynamical
behaviour of steel box girder bridges due to vehicle-induced vibration at
expansion joint, J. Zhejiang University (Engineering Science), Vol 43, No 10,
1923-1930 (DOI: 10.3785/j.issn.1008-983X.2009.10.030) (In Chinese).
62
Journal Papers Based on This Thesis
The following Journal papers have been published based on the work in this thesis:
Journal Publications:
Ancich E.J., Chirgwin G.J. and Brown S.C. (2006). Dynamic Anomalies in a
Modular Bridge Expansion Joint, Journal of Bridge Engineering, ASCE, 11 (5), 541-
554.
Ancich E.J. and Brown S.C. (2004). Engineering Methods of Noise Control for
Modular Bridge Expansion Joints, Acoustics Australia, 32 (3), 101-107.

Appendix A
Ancich E.J. (2000). A Study of the Environmental Noise Generation & Propagation
Mechanisms of Modular Bridge Expansion Joints, RTA Environmental Technology
Report No. 000203, Roads & Traffic Authority of NSW, Sydney, NSW, Australia.

Acoustical Assessment
A Study of the Environmental Noise Generation & Propagation Mechanisms of Modular Bridge Expansion Joints.
Prepared for: RTA Operations, Technical Services – Bridge Section
Prepared by:
RTA Operations, Environmental Technology Level 3, 52 Rothschild Avenue
Rosebery NSW 2018 Ph: 9662 5048
Fax: 9662 5045 email: [email protected]
September 2000

Document Controls
Report No 001 Prepared For: Mr. Greg Forster Operations Technical Services - Bridge 52 Rothschild Avenue Rosebery NSW 2018
Prepared By: Environmental Technology Branch RTA Operations Directorate 52 Rothschild Avenue Rosebery NSW 2018
Business Unit Environmental Technology
Project No. 000203 NM Modular Bridge Expansion Joints
Document description A Study of the Environmental Noise Generation & Propagation Mechanisms of Modular Bridge Expansion Joints
Name Signed Date
Approving Manager Eric Ancich
Person managing this document Person(s) writing this document
Eric Ancich Eric Ancich
Location CARMS File
G:\…\environ\projects\proj9900\0203\0203_2.doc M1699
Client Reference Status Date M1469 Final 1.0 8 September 2000
RTA Operations Directorate AS/NZS ISO 9001 QEC 7443 Standards Australia
Table of Contents Page 1.0 Introduction 1 2.0 Modular Bridge Expansion Joints & 1
Environmental Noise 3.0 Measurement Procedure 2 4.0 Results & Discussion 1 5.0 Noise Abatement Options 7 6.0 Conclusion 8 7.0 References & Further Reading 9
Noise Abatement Options Modular Bridge Expansion Joints
1.0 Introduction Whilst the use of expansion joints is common practice in bridge construction, modular bridge expansion joints are designed to accommodate large longitudinal expansion and contraction movements of bridge superstructures. In addition to supporting wheel loads, a properly designed modular joint will prevent rain water and road debris from entering into the underlying superstructure and substructure. Modular bridge expansion joints are subjected to more load cycles than other superstructure elements, but the load types, magnitudes and fatigue-stress ranges that are applied to these joints are not well defined (Dexter et al 1997). It is known that an environmental noise nuisance occurs as motor vehicle wheels pass over the joint but the mechanism for the generation of the noise nuisance is not known. Environmental Technology Branch was engaged by Technical Services, Bridge Section to determine how the noise nuisance originates and is subsequently propagated into the surrounding environment. Modular bridge expansion joints built into the Georges River (Tom Ugly’s) Bridge and Anzac Bridge were selected for the study due to their proximity and ease of access. Engineering measurements were made under operational conditions to determine how the noise nuisance originates and is subsequently propagated into the surrounding environment. The study involved collaboration between RTA Operations, Environmental Technology, OLSAN Consulting (Dr. Stephen Samuels) and the University of NSW, School of Mechanical and Manufacturing Engineering (Assoc. Prof. Bob Randall and Mr. Russell Overhall). 2.0 Modular Bridge Expansion Joints & Environmental Noise There is evidence from environmental noise nuisance complaints received by the RTA that the sound produced by the impact of a motor vehicle tyre with modular bridge expansion joints is audible at least 500 metres from the bridge. This observation suggests that the noise generation mechanism involves possibly both parts of the bridge structure and the joint itself as it is unlikely that there is sufficient acoustic power in the simple tyre impact to explain the persistence of the noise in the surrounding environment. The hypothesis was developed by the writer (following an inspection of the southern abutment, South Channel bridge, Taree Bypass) that tyre impacts vibrationally excite modular bridge expansion joints thereby producing noise that is amplified within the bridge superstructure (due to resonance) and then propagated into the surrounding environment. 3.0 Measurement Procedure To test the hypothesis described above, simultaneous noise and vibration measurements, at the Georges River (Tom Ugly’s) and Anzac Bridges, were recorded and analysed.
Environmental Technology Page 1
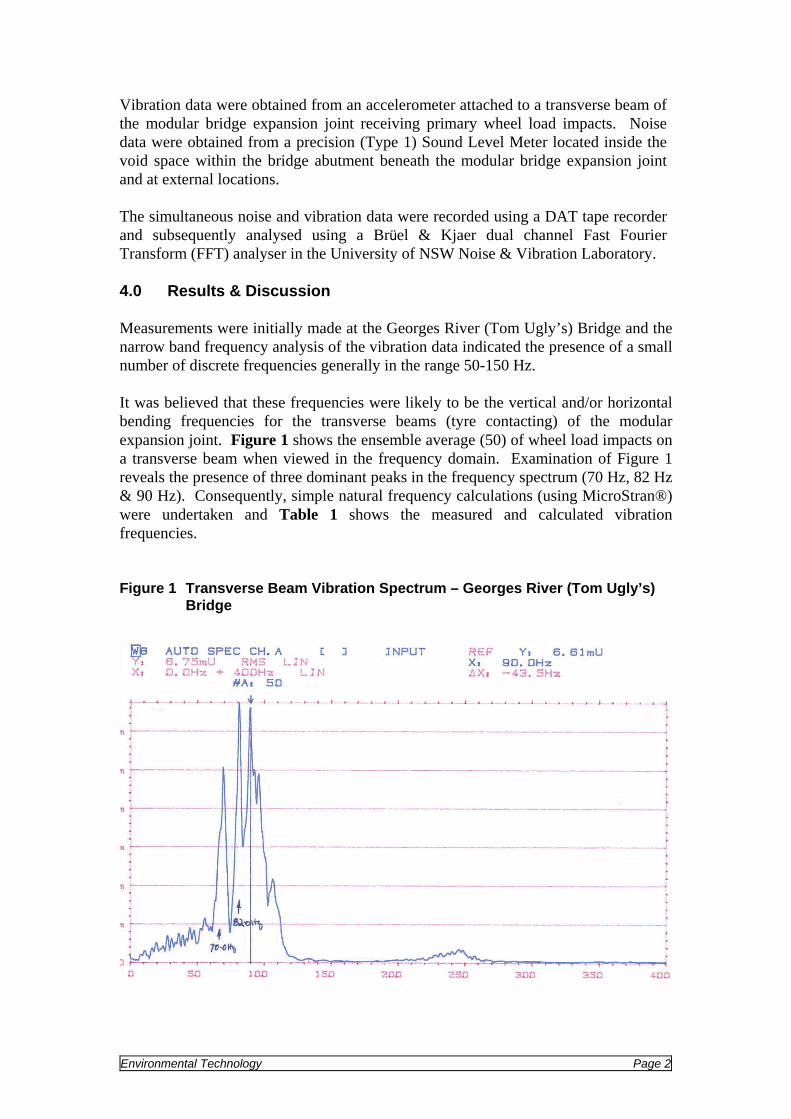
Vibration data were obtained from an accelerometer attached to a transverse beam of the modular bridge expansion joint receiving primary wheel load impacts. Noise data were obtained from a precision (Type 1) Sound Level Meter located inside the void space within the bridge abutment beneath the modular bridge expansion joint and at external locations. The simultaneous noise and vibration data were recorded using a DAT tape recorder and subsequently analysed using a Brüel & Kjaer dual channel Fast Fourier Transform (FFT) analyser in the University of NSW Noise & Vibration Laboratory. 4.0 Results & Discussion Measurements were initially made at the Georges River (Tom Ugly’s) Bridge and the narrow band frequency analysis of the vibration data indicated the presence of a small number of discrete frequencies generally in the range 50-150 Hz. It was believed that these frequencies were likely to be the vertical and/or horizontal bending frequencies for the transverse beams (tyre contacting) of the modular expansion joint. Figure 1 shows the ensemble average (50) of wheel load impacts on a transverse beam when viewed in the frequency domain. Examination of Figure 1 reveals the presence of three dominant peaks in the frequency spectrum (70 Hz, 82 Hz & 90 Hz). Consequently, simple natural frequency calculations (using MicroStran®) were undertaken and Table 1 shows the measured and calculated vibration frequencies. Figure 1 Transverse Beam Vibration Spectrum – Georges River (Tom Ugly’s)
Bridge
Environmental Technology Page 2
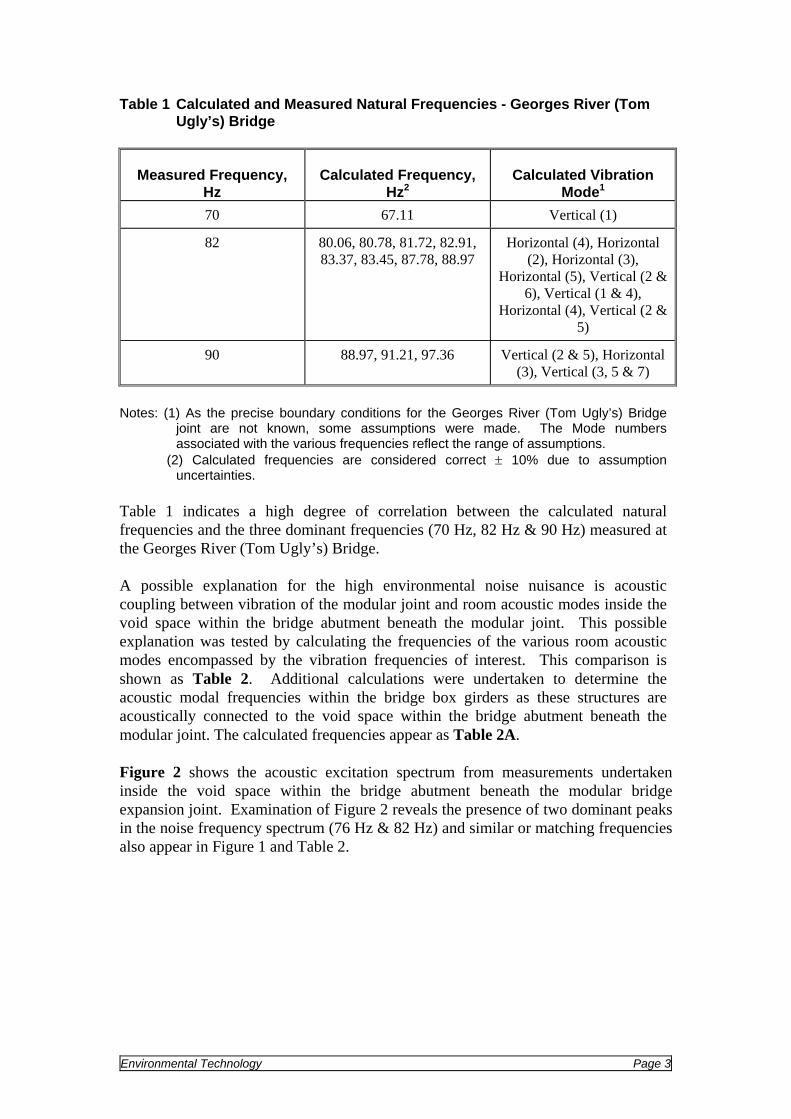
Table 1 Calculated and Measured Natural Frequencies - Georges River (Tom Ugly’s) Bridge
Measured Frequency, Hz
Calculated Frequency, Hz2
Calculated Vibration Mode1
70 67.11 Vertical (1)
82 80.06, 80.78, 81.72, 82.91, 83.37, 83.45, 87.78, 88.97
Horizontal (4), Horizontal (2), Horizontal (3),
Horizontal (5), Vertical (2 & 6), Vertical (1 & 4),
Horizontal (4), Vertical (2 & 5)
90 88.97, 91.21, 97.36 Vertical (2 & 5), Horizontal (3), Vertical (3, 5 & 7)
Notes: (1) As the precise boundary conditions for the Georges River (Tom Ugly’s) Bridge
joint are not known, some assumptions were made. The Mode numbers associated with the various frequencies reflect the range of assumptions.
(2) Calculated frequencies are considered correct ± 10% due to assumption uncertainties.
Table 1 indicates a high degree of correlation between the calculated natural frequencies and the three dominant frequencies (70 Hz, 82 Hz & 90 Hz) measured at the Georges River (Tom Ugly’s) Bridge. A possible explanation for the high environmental noise nuisance is acoustic coupling between vibration of the modular joint and room acoustic modes inside the void space within the bridge abutment beneath the modular joint. This possible explanation was tested by calculating the frequencies of the various room acoustic modes encompassed by the vibration frequencies of interest. This comparison is shown as Table 2. Additional calculations were undertaken to determine the acoustic modal frequencies within the bridge box girders as these structures are acoustically connected to the void space within the bridge abutment beneath the modular joint. The calculated frequencies appear as Table 2A. Figure 2 shows the acoustic excitation spectrum from measurements undertaken inside the void space within the bridge abutment beneath the modular bridge expansion joint. Examination of Figure 2 reveals the presence of two dominant peaks in the noise frequency spectrum (76 Hz & 82 Hz) and similar or matching frequencies also appear in Figure 1 and Table 2.
Environmental Technology Page 3
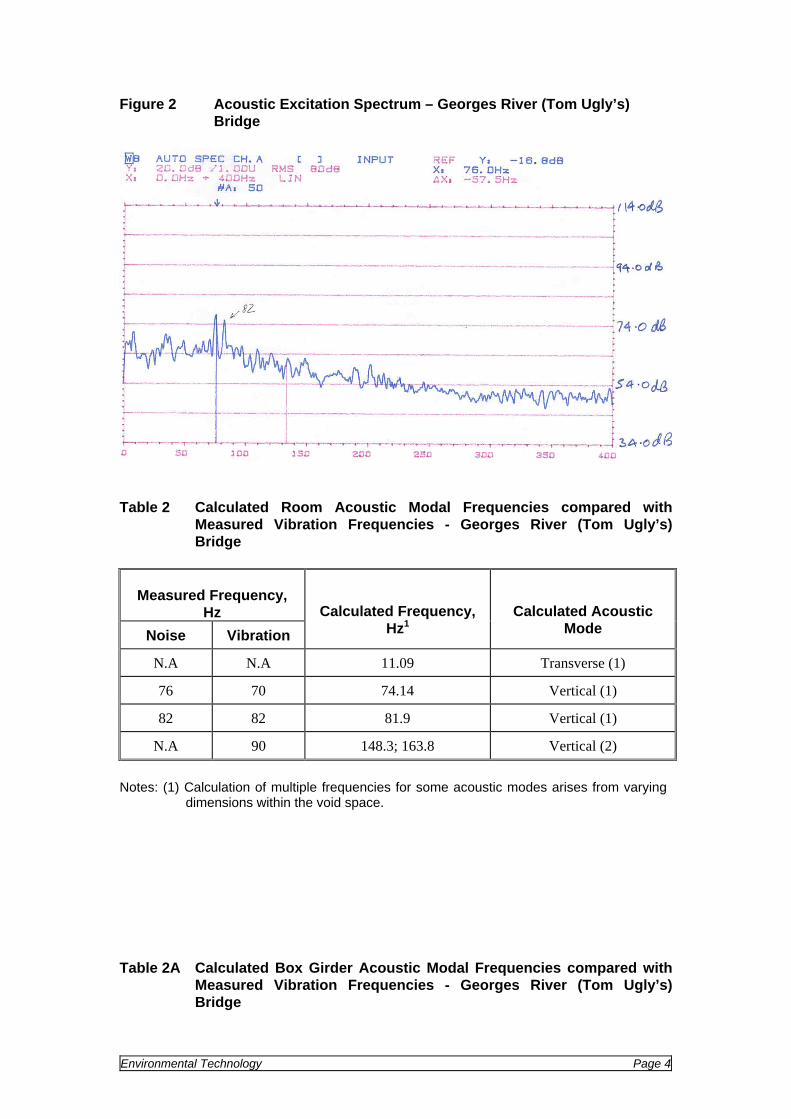
Figure 2 Acoustic Excitation Spectrum – Georges River (Tom Ugly’s) Bridge
Table 2 Calculated Room Acoustic Modal Frequencies compared with
Measured Vibration Frequencies - Georges River (Tom Ugly’s) Bridge
Measured Frequency, Hz
Noise Vibration Calculated Frequency,
Hz1Calculated Acoustic
Mode
N.A N.A 11.09 Transverse (1)
76 70 74.14 Vertical (1)
82 82 81.9 Vertical (1)
N.A 90 148.3; 163.8 Vertical (2)
Notes: (1) Calculation of multiple frequencies for some acoustic modes arises from varying
dimensions within the void space. Table 2A Calculated Box Girder Acoustic Modal Frequencies compared with
Measured Vibration Frequencies - Georges River (Tom Ugly’s) Bridge
Environmental Technology Page 4
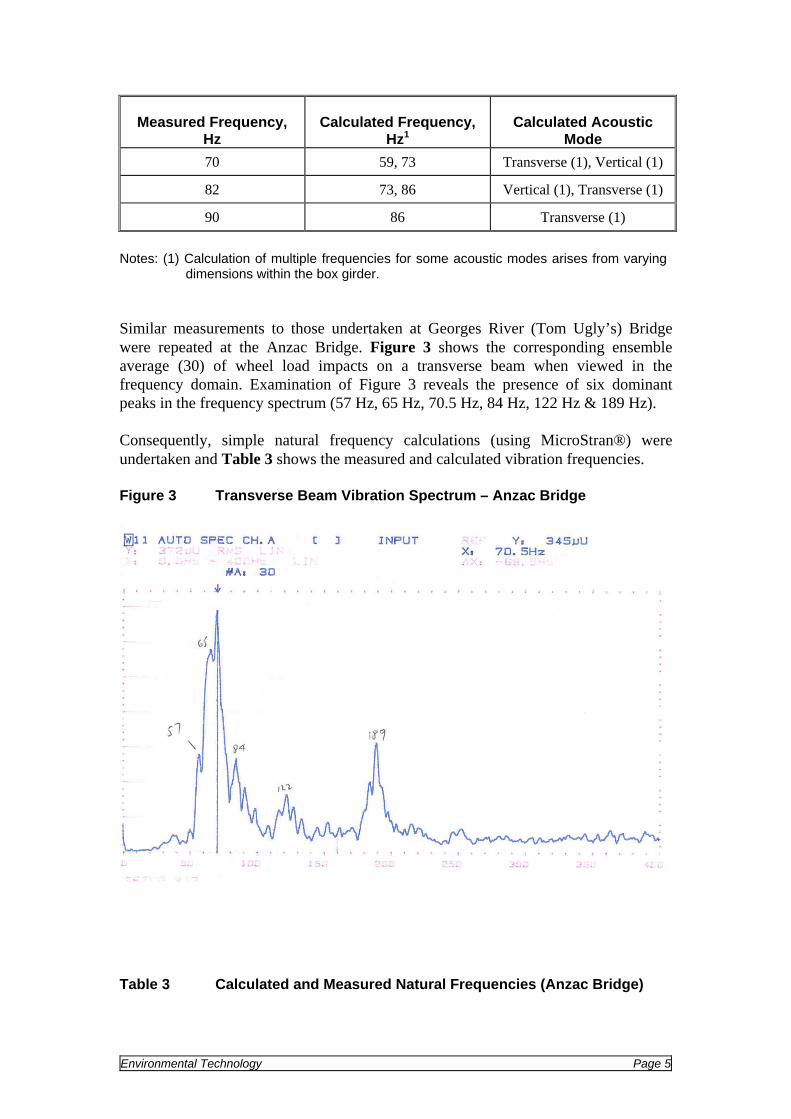
Measured Frequency, Hz
Calculated Frequency, Hz1
Calculated Acoustic Mode
70 59, 73 Transverse (1), Vertical (1)
82 73, 86 Vertical (1), Transverse (1)
90 86 Transverse (1)
Notes: (1) Calculation of multiple frequencies for some acoustic modes arises from varying
dimensions within the box girder. Similar measurements to those undertaken at Georges River (Tom Ugly’s) Bridge were repeated at the Anzac Bridge. Figure 3 shows the corresponding ensemble average (30) of wheel load impacts on a transverse beam when viewed in the frequency domain. Examination of Figure 3 reveals the presence of six dominant peaks in the frequency spectrum (57 Hz, 65 Hz, 70.5 Hz, 84 Hz, 122 Hz & 189 Hz). Consequently, simple natural frequency calculations (using MicroStran®) were undertaken and Table 3 shows the measured and calculated vibration frequencies. Figure 3 Transverse Beam Vibration Spectrum – Anzac Bridge
Table 3 Calculated and Measured Natural Frequencies (Anzac Bridge)
Environmental Technology Page 5
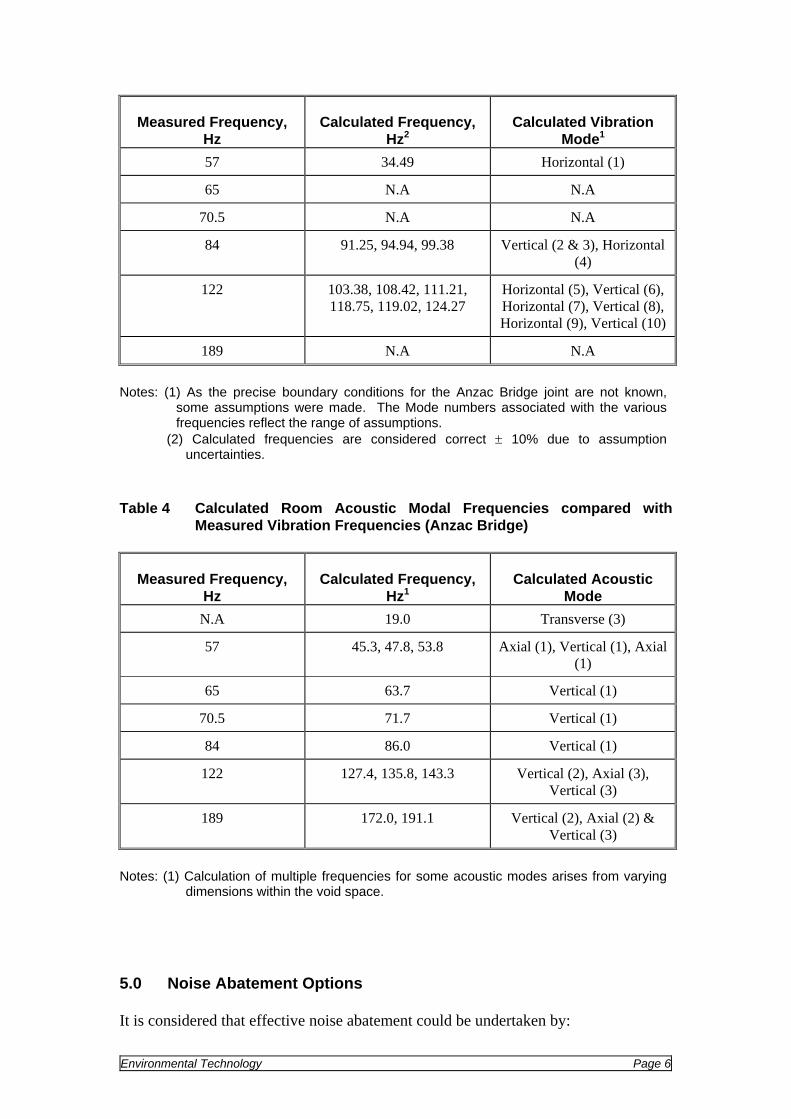
Measured Frequency, Hz
Calculated Frequency, Hz2
Calculated Vibration Mode1
57 34.49 Horizontal (1)
65 N.A N.A
70.5 N.A N.A
84 91.25, 94.94, 99.38 Vertical (2 & 3), Horizontal (4)
122 103.38, 108.42, 111.21, 118.75, 119.02, 124.27
Horizontal (5), Vertical (6), Horizontal (7), Vertical (8), Horizontal (9), Vertical (10)
189 N.A N.A
Notes: (1) As the precise boundary conditions for the Anzac Bridge joint are not known,
some assumptions were made. The Mode numbers associated with the various frequencies reflect the range of assumptions.
(2) Calculated frequencies are considered correct ± 10% due to assumption uncertainties.
Table 4 Calculated Room Acoustic Modal Frequencies compared with
Measured Vibration Frequencies (Anzac Bridge)
Measured Frequency, Hz
Calculated Frequency, Hz1
Calculated Acoustic Mode
N.A 19.0 Transverse (3)
57 45.3, 47.8, 53.8 Axial (1), Vertical (1), Axial (1)
65 63.7 Vertical (1)
70.5 71.7 Vertical (1)
84 86.0 Vertical (1)
122 127.4, 135.8, 143.3 Vertical (2), Axial (3), Vertical (3)
189 172.0, 191.1 Vertical (2), Axial (2) & Vertical (3)
Notes: (1) Calculation of multiple frequencies for some acoustic modes arises from varying
dimensions within the void space. 5.0 Noise Abatement Options It is considered that effective noise abatement could be undertaken by:
Environmental Technology Page 6
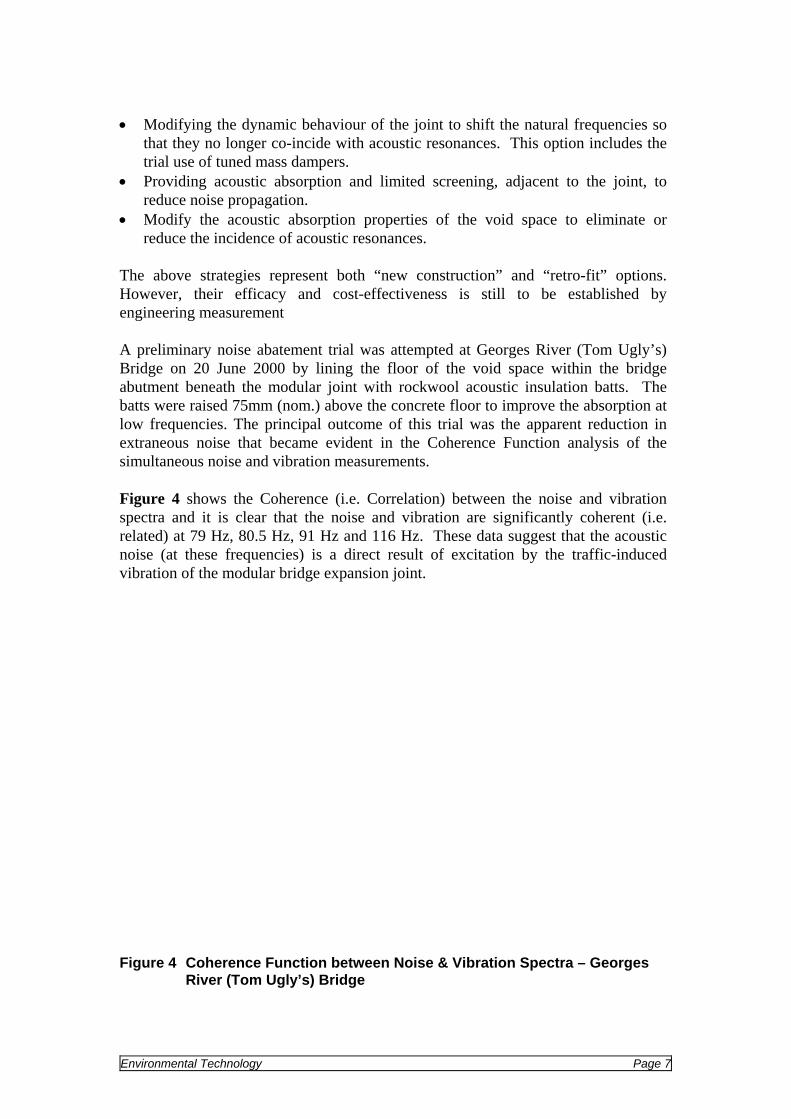
• Modifying the dynamic behaviour of the joint to shift the natural frequencies so
that they no longer co-incide with acoustic resonances. This option includes the trial use of tuned mass dampers.
• Providing acoustic absorption and limited screening, adjacent to the joint, to reduce noise propagation.
• Modify the acoustic absorption properties of the void space to eliminate or reduce the incidence of acoustic resonances.
The above strategies represent both “new construction” and “retro-fit” options. However, their efficacy and cost-effectiveness is still to be established by engineering measurement A preliminary noise abatement trial was attempted at Georges River (Tom Ugly’s) Bridge on 20 June 2000 by lining the floor of the void space within the bridge abutment beneath the modular joint with rockwool acoustic insulation batts. The batts were raised 75mm (nom.) above the concrete floor to improve the absorption at low frequencies. The principal outcome of this trial was the apparent reduction in extraneous noise that became evident in the Coherence Function analysis of the simultaneous noise and vibration measurements. Figure 4 shows the Coherence (i.e. Correlation) between the noise and vibration spectra and it is clear that the noise and vibration are significantly coherent (i.e. related) at 79 Hz, 80.5 Hz, 91 Hz and 116 Hz. These data suggest that the acoustic noise (at these frequencies) is a direct result of excitation by the traffic-induced vibration of the modular bridge expansion joint. Figure 4 Coherence Function between Noise & Vibration Spectra – Georges
River (Tom Ugly’s) Bridge
Environmental Technology Page 7
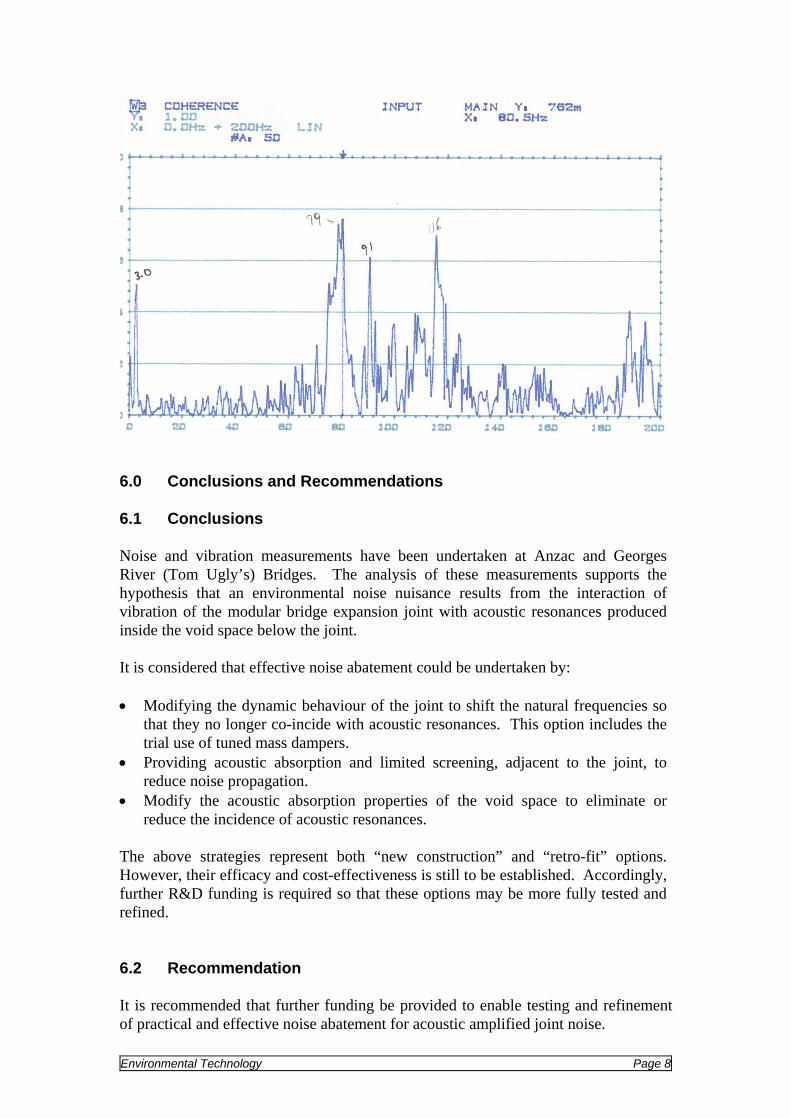
6.0 Conclusions and Recommendations 6.1 Conclusions Noise and vibration measurements have been undertaken at Anzac and Georges River (Tom Ugly’s) Bridges. The analysis of these measurements supports the hypothesis that an environmental noise nuisance results from the interaction of vibration of the modular bridge expansion joint with acoustic resonances produced inside the void space below the joint. It is considered that effective noise abatement could be undertaken by: • Modifying the dynamic behaviour of the joint to shift the natural frequencies so
that they no longer co-incide with acoustic resonances. This option includes the trial use of tuned mass dampers.
• Providing acoustic absorption and limited screening, adjacent to the joint, to reduce noise propagation.
• Modify the acoustic absorption properties of the void space to eliminate or reduce the incidence of acoustic resonances.
The above strategies represent both “new construction” and “retro-fit” options. However, their efficacy and cost-effectiveness is still to be established. Accordingly, further R&D funding is required so that these options may be more fully tested and refined. 6.2 Recommendation It is recommended that further funding be provided to enable testing and refinement of practical and effective noise abatement for acoustic amplified joint noise.
Environmental Technology Page 8

7.0 References & Further Reading Beranek L.L. (Ed.) (1988): Noise and Vibration Control. Institute of Noise Control Engineering, Washington, DC, USA. Dexter R.J., Connor R.J. & Kaczinski M.R. (1997): Fatigue Design of Modular Bridge Expansion Joints. Report 402, National Cooperative Highway Research Program, Transportation Research Board, Washington, DC, USA. Jones D.I.G. (1967): Effect of Isolated Tuned Dampers on Response of Multispan Structures. J. Aircraft, Vol. 4, No. 4, pp343-346. Martner O. (1996): Noise Emission of Constructions for Bridge-To-Road Crossings. Proc. Inter-Noise 96, pp211-214, Liverpool, UK.
Environmental Technology Page 9

Appendix B
Ancich E.J. and Brown S.C. (2004a). Modular Bridge Joints – Reduction of noise
emissions by use of Helmholtz Absorber, Proc. 5th Austroads Bridge Conference,
Hobart, Tasmania, Australia.

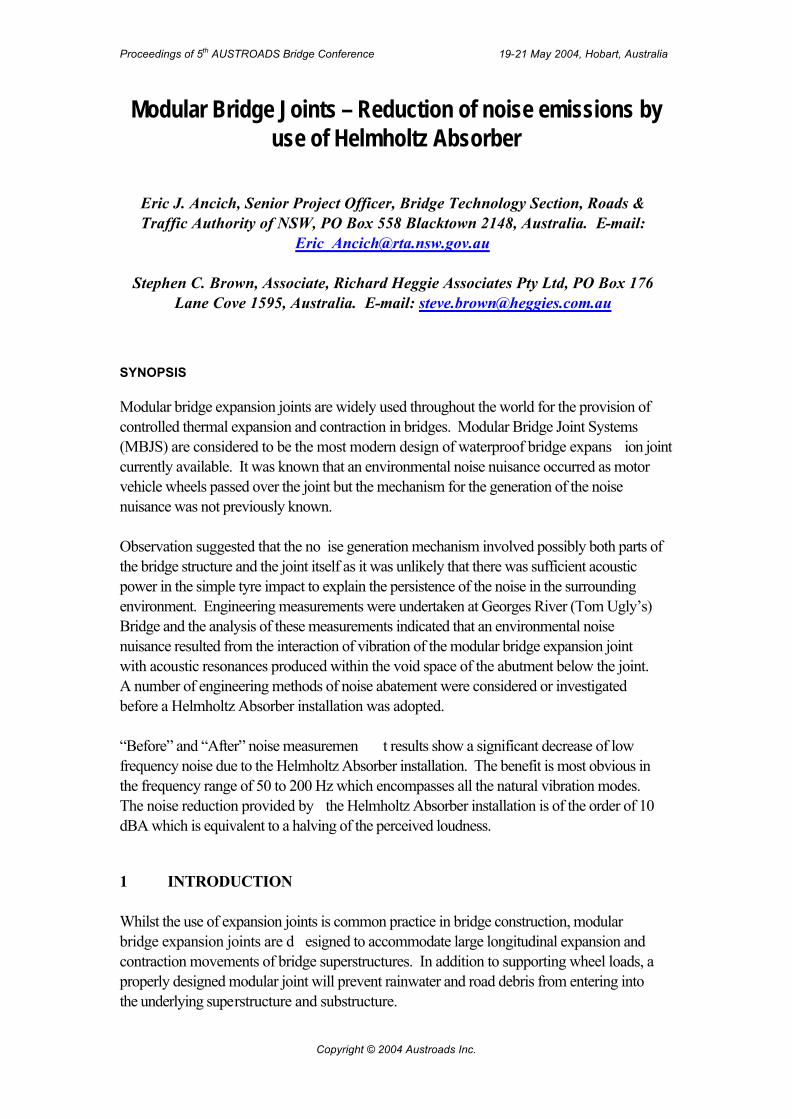
Proceedings of 5th AUSTROADS Bridge Conference 19-21 May 2004, Hobart, Australia
Copyright © 2004 Austroads Inc.
Modular Bridge Joints – Reduction of noise emissions by use of Helmholtz Absorber
Eric J. Ancich, Senior Project Officer, Bridge Technology Section, Roads & Traffic Authority of NSW, PO Box 558 Blacktown 2148, Australia. E-mail:
Stephen C. Brown, Associate, Richard Heggie Associates Pty Ltd, PO Box 176 Lane Cove 1595, Australia. E-mail: [email protected]
SYNOPSIS Modular bridge expansion joints are widely used throughout the world for the provision of controlled thermal expansion and contraction in bridges. Modular Bridge Joint Systems (MBJS) are considered to be the most modern design of waterproof bridge expans ion joint currently available. It was known that an environmental noise nuisance occurred as motor vehicle wheels passed over the joint but the mechanism for the generation of the noise nuisance was not previously known. Observation suggested that the no ise generation mechanism involved possibly both parts of the bridge structure and the joint itself as it was unlikely that there was sufficient acoustic power in the simple tyre impact to explain the persistence of the noise in the surrounding environment. Engineering measurements were undertaken at Georges River (Tom Ugly’s) Bridge and the analysis of these measurements indicated that an environmental noise nuisance resulted from the interaction of vibration of the modular bridge expansion joint with acoustic resonances produced within the void space of the abutment below the joint. A number of engineering methods of noise abatement were considered or investigated before a Helmholtz Absorber installation was adopted. “Before” and “After” noise measuremen t results show a significant decrease of low frequency noise due to the Helmholtz Absorber installation. The benefit is most obvious in the frequency range of 50 to 200 Hz which encompasses all the natural vibration modes. The noise reduction provided by the Helmholtz Absorber installation is of the order of 10 dBA which is equivalent to a halving of the perceived loudness. 1 INTRODUCTION Whilst the use of expansion joints is common practice in bridge construction, modular bridge expansion joints are d esigned to accommodate large longitudinal expansion and contraction movements of bridge superstructures. In addition to supporting wheel loads, a properly designed modular joint will prevent rainwater and road debris from entering into the underlying superstructure and substructure.
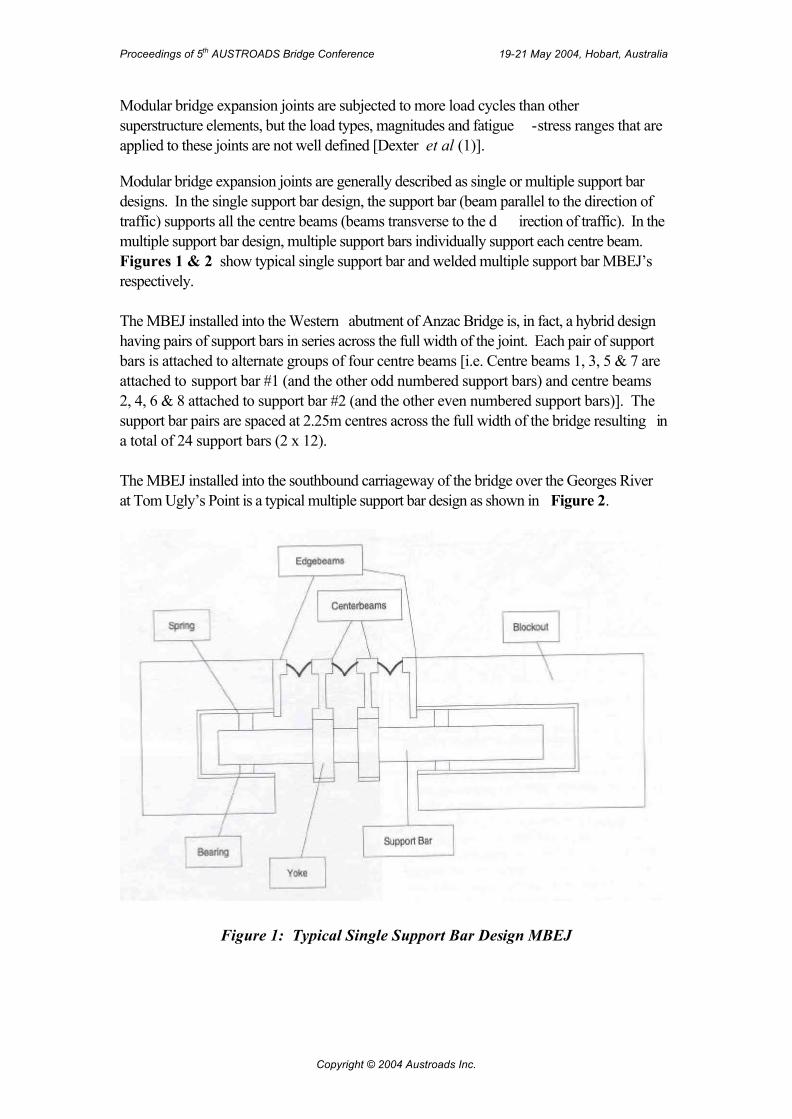
Proceedings of 5th AUSTROADS Bridge Conference 19-21 May 2004, Hobart, Australia
Copyright © 2004 Austroads Inc.
Modular bridge expansion joints are subjected to more load cycles than other superstructure elements, but the load types, magnitudes and fatigue -stress ranges that are applied to these joints are not well defined [Dexter et al (1)].
Modular bridge expansion joints are generally described as single or multiple support bar designs. In the single support bar design, the support bar (beam parallel to the direction of traffic) supports all the centre beams (beams transverse to the d irection of traffic). In the multiple support bar design, multiple support bars individually support each centre beam. Figures 1 & 2 show typical single support bar and welded multiple support bar MBEJ’s respectively. The MBEJ installed into the Western abutment of Anzac Bridge is, in fact, a hybrid design having pairs of support bars in series across the full width of the joint. Each pair of support bars is attached to alternate groups of four centre beams [i.e. Centre beams 1, 3, 5 & 7 are attached to support bar #1 (and the other odd numbered support bars) and centre beams 2, 4, 6 & 8 attached to support bar #2 (and the other even numbered support bars)]. The support bar pairs are spaced at 2.25m centres across the full width of the bridge resulting in a total of 24 support bars (2 x 12). The MBEJ installed into the southbound carriageway of the bridge over the Georges River at Tom Ugly’s Point is a typical multiple support bar design as shown in Figure 2.
Figure 1: Typical Single Support Bar Design MBEJ
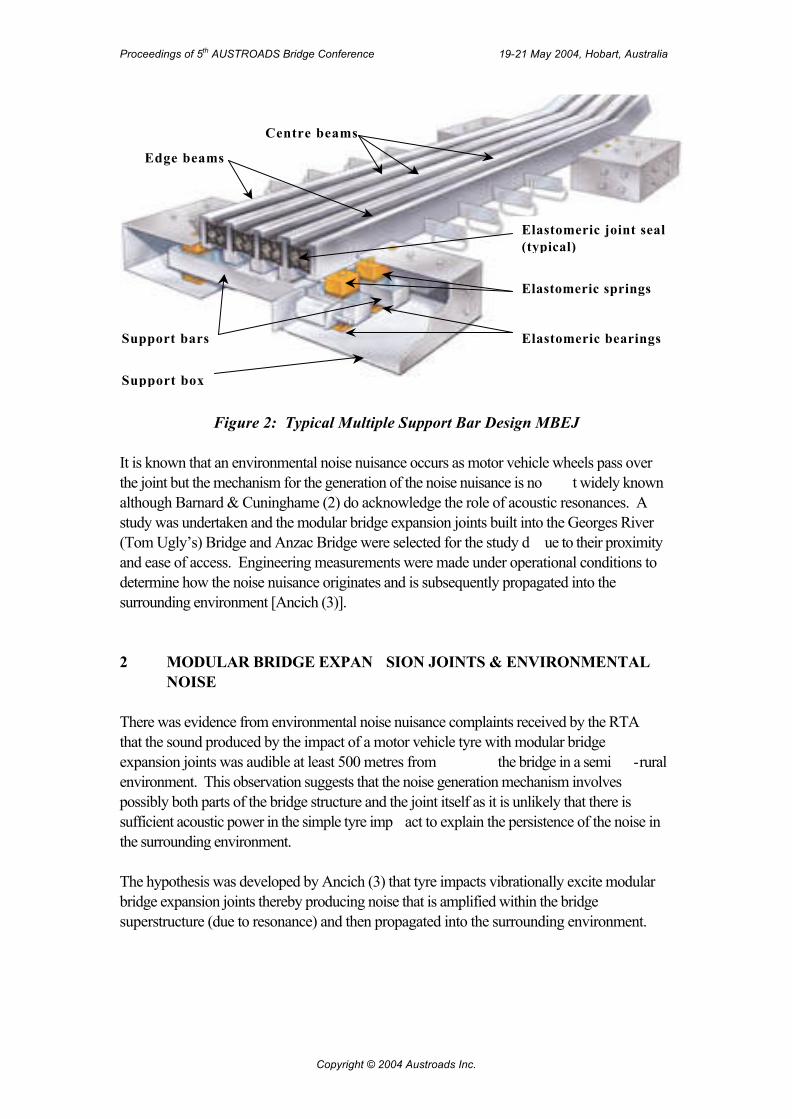
Proceedings of 5th AUSTROADS Bridge Conference 19-21 May 2004, Hobart, Australia
Copyright © 2004 Austroads Inc.
Edge beams
Centre beams
Elastomeric springs
Support bars
Elastomeric joint seal(typical)
Elastomeric bearings
Support box
Figure 2: Typical Multiple Support Bar Design MBEJ It is known that an environmental noise nuisance occurs as motor vehicle wheels pass over the joint but the mechanism for the generation of the noise nuisance is no t widely known although Barnard & Cuninghame (2) do acknowledge the role of acoustic resonances. A study was undertaken and the modular bridge expansion joints built into the Georges River (Tom Ugly’s) Bridge and Anzac Bridge were selected for the study d ue to their proximity and ease of access. Engineering measurements were made under operational conditions to determine how the noise nuisance originates and is subsequently propagated into the surrounding environment [Ancich (3)]. 2 MODULAR BRIDGE EXPAN SION JOINTS & ENVIRONMENTAL
NOISE There was evidence from environmental noise nuisance complaints received by the RTA that the sound produced by the impact of a motor vehicle tyre with modular bridge expansion joints was audible at least 500 metres from the bridge in a semi -rural environment. This observation suggests that the noise generation mechanism involves possibly both parts of the bridge structure and the joint itself as it is unlikely that there is sufficient acoustic power in the simple tyre imp act to explain the persistence of the noise in the surrounding environment. The hypothesis was developed by Ancich (3) that tyre impacts vibrationally excite modular bridge expansion joints thereby producing noise that is amplified within the bridge superstructure (due to resonance) and then propagated into the surrounding environment.
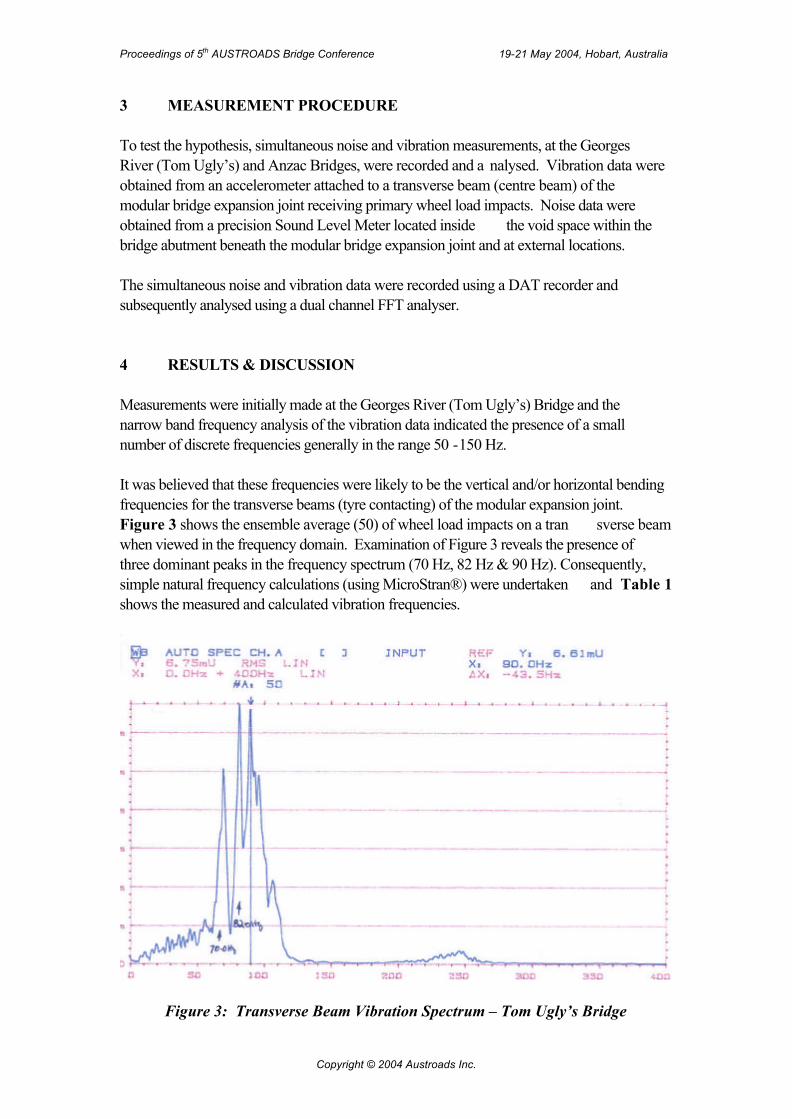
Proceedings of 5th AUSTROADS Bridge Conference 19-21 May 2004, Hobart, Australia
Copyright © 2004 Austroads Inc.
3 MEASUREMENT PROCEDURE To test the hypothesis, simultaneous noise and vibration measurements, at the Georges River (Tom Ugly’s) and Anzac Bridges, were recorded and a nalysed. Vibration data were obtained from an accelerometer attached to a transverse beam (centre beam) of the modular bridge expansion joint receiving primary wheel load impacts. Noise data were obtained from a precision Sound Level Meter located inside the void space within the bridge abutment beneath the modular bridge expansion joint and at external locations. The simultaneous noise and vibration data were recorded using a DAT recorder and subsequently analysed using a dual channel FFT analyser. 4 RESULTS & DISCUSSION Measurements were initially made at the Georges River (Tom Ugly’s) Bridge and the narrow band frequency analysis of the vibration data indicated the presence of a small number of discrete frequencies generally in the range 50 -150 Hz. It was believed that these frequencies were likely to be the vertical and/or horizontal bending frequencies for the transverse beams (tyre contacting) of the modular expansion joint. Figure 3 shows the ensemble average (50) of wheel load impacts on a tran sverse beam when viewed in the frequency domain. Examination of Figure 3 reveals the presence of three dominant peaks in the frequency spectrum (70 Hz, 82 Hz & 90 Hz). Consequently, simple natural frequency calculations (using MicroStran®) were undertaken and Table 1 shows the measured and calculated vibration frequencies.
Figure 3: Transverse Beam Vibration Spectrum – Tom Ugly’s Bridge
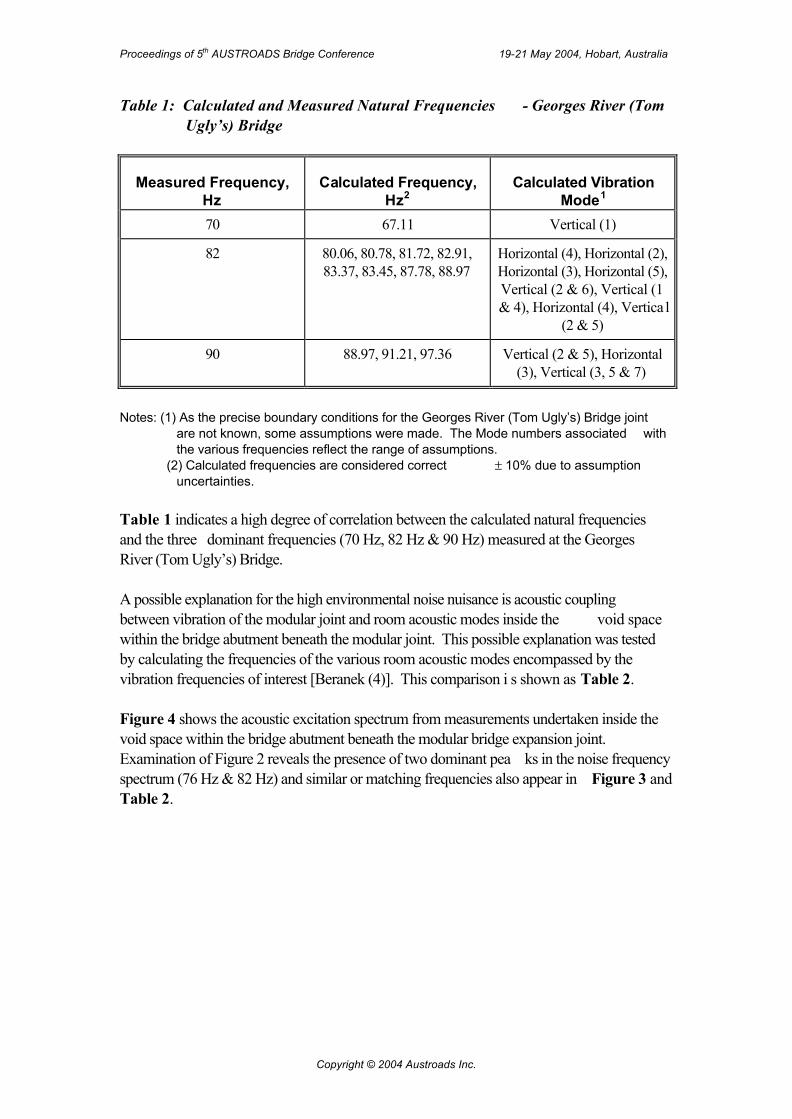
Proceedings of 5th AUSTROADS Bridge Conference 19-21 May 2004, Hobart, Australia
Copyright © 2004 Austroads Inc.
Table 1: Calculated and Measured Natural Frequencies - Georges River (Tom Ugly’s) Bridge
Measured Frequency, Hz
Calculated Frequency, Hz2
Calculated Vibration Mode1
70 67.11 Vertical (1)
82 80.06, 80.78, 81.72, 82.91, 83.37, 83.45, 87.78, 88.97
Horizontal (4), Horizontal (2), Horizontal (3), Horizontal (5), Vertical (2 & 6), Vertical (1 & 4), Horizontal (4), Vertica l
(2 & 5)
90 88.97, 91.21, 97.36 Vertical (2 & 5), Horizontal (3), Vertical (3, 5 & 7)
Notes: (1) As the precise boundary conditions for the Georges River (Tom Ugly’s) Bridge joint
are not known, some assumptions were made. The Mode numbers associated with the various frequencies reflect the range of assumptions.
(2) Calculated frequencies are considered correct ± 10% due to assumption uncertainties.
Table 1 indicates a high degree of correlation between the calculated natural frequencies and the three dominant frequencies (70 Hz, 82 Hz & 90 Hz) measured at the Georges River (Tom Ugly’s) Bridge. A possible explanation for the high environmental noise nuisance is acoustic coupling between vibration of the modular joint and room acoustic modes inside the void space within the bridge abutment beneath the modular joint. This possible explanation was tested by calculating the frequencies of the various room acoustic modes encompassed by the vibration frequencies of interest [Beranek (4)]. This comparison i s shown as Table 2. Figure 4 shows the acoustic excitation spectrum from measurements undertaken inside the void space within the bridge abutment beneath the modular bridge expansion joint. Examination of Figure 2 reveals the presence of two dominant pea ks in the noise frequency spectrum (76 Hz & 82 Hz) and similar or matching frequencies also appear in Figure 3 and Table 2.
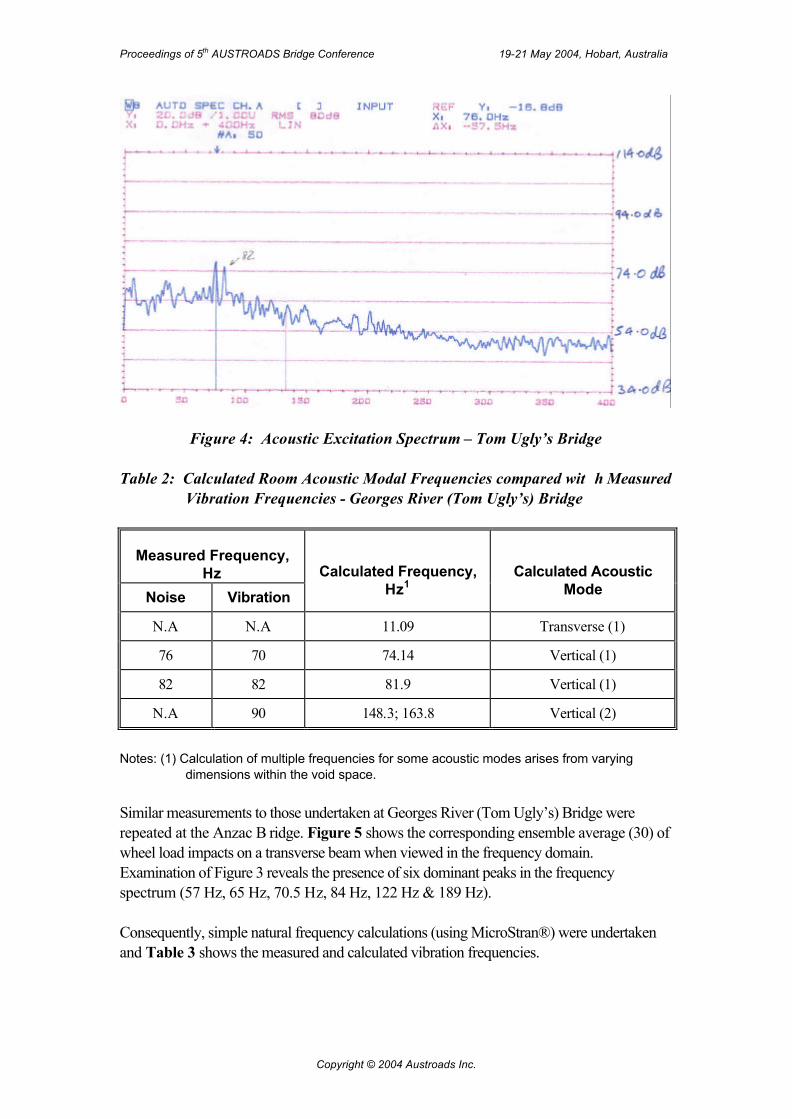
Proceedings of 5th AUSTROADS Bridge Conference 19-21 May 2004, Hobart, Australia
Copyright © 2004 Austroads Inc.
Figure 4: Acoustic Excitation Spectrum – Tom Ugly’s Bridge Table 2: Calculated Room Acoustic Modal Frequencies compared wit h Measured
Vibration Frequencies - Georges River (Tom Ugly’s) Bridge
Measured Frequency, Hz
Noise Vibration Calculated Frequency,
Hz1 Calculated Acoustic
Mode
N.A N.A 11.09 Transverse (1)
76 70 74.14 Vertical (1)
82 82 81.9 Vertical (1)
N.A 90 148.3; 163.8 Vertical (2)
Notes: (1) Calculation of multiple frequencies for some acoustic modes arises from varying
dimensions within the void space. Similar measurements to those undertaken at Georges River (Tom Ugly’s) Bridge were repeated at the Anzac B ridge. Figure 5 shows the corresponding ensemble average (30) of wheel load impacts on a transverse beam when viewed in the frequency domain. Examination of Figure 3 reveals the presence of six dominant peaks in the frequency spectrum (57 Hz, 65 Hz, 70.5 Hz, 84 Hz, 122 Hz & 189 Hz). Consequently, simple natural frequency calculations (using MicroStran®) were undertaken and Table 3 shows the measured and calculated vibration frequencies.
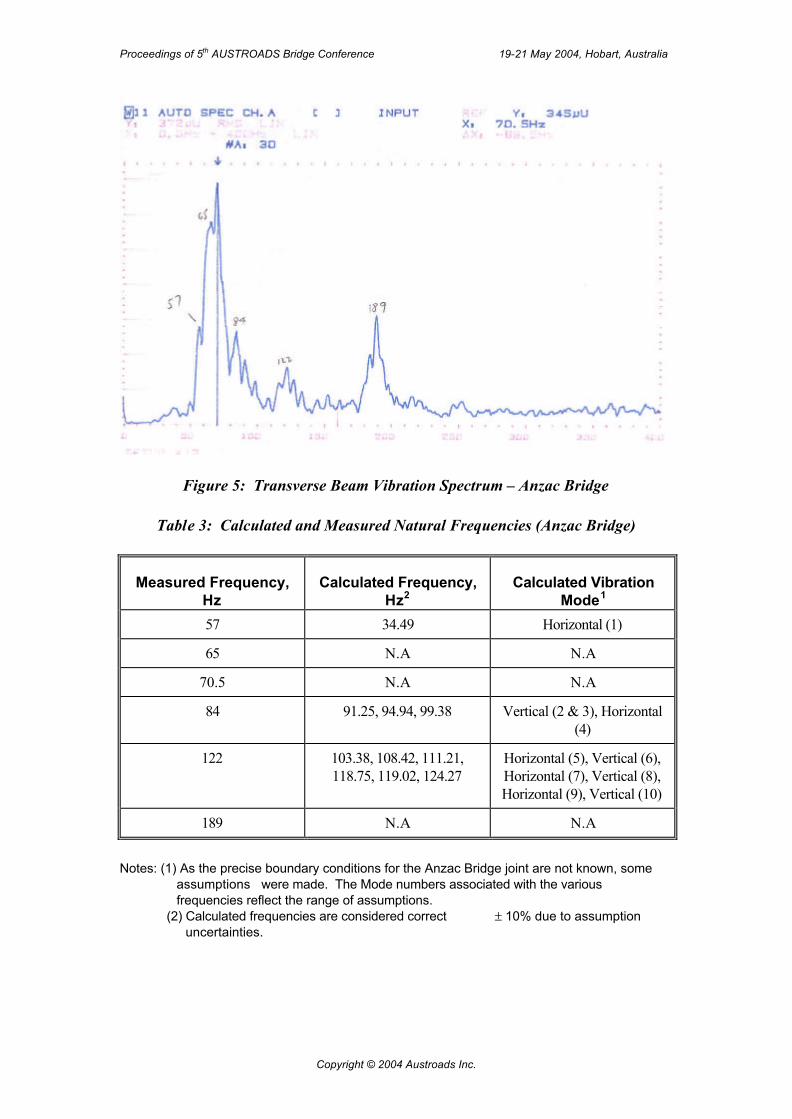
Proceedings of 5th AUSTROADS Bridge Conference 19-21 May 2004, Hobart, Australia
Copyright © 2004 Austroads Inc.
Figure 5: Transverse Beam Vibration Spectrum – Anzac Bridge
Table 3: Calculated and Measured Natural Frequencies (Anzac Bridge)
Measured Frequency, Hz
Calculated Frequency, Hz2
Calculated Vibration Mode1
57 34.49 Horizontal (1)
65 N.A N.A
70.5 N.A N.A
84 91.25, 94.94, 99.38 Vertical (2 & 3), Horizontal (4)
122 103.38, 108.42, 111.21, 118.75, 119.02, 124.27
Horizontal (5), Vertical (6), Horizontal (7), Vertical (8), Horizontal (9), Vertical (10)
189 N.A N.A
Notes: (1) As the precise boundary conditions for the Anzac Bridge joint are not known, some
assumptions were made. The Mode numbers associated with the various frequencies reflect the range of assumptions.
(2) Calculated frequencies are considered correct ± 10% due to assumption uncertainties.
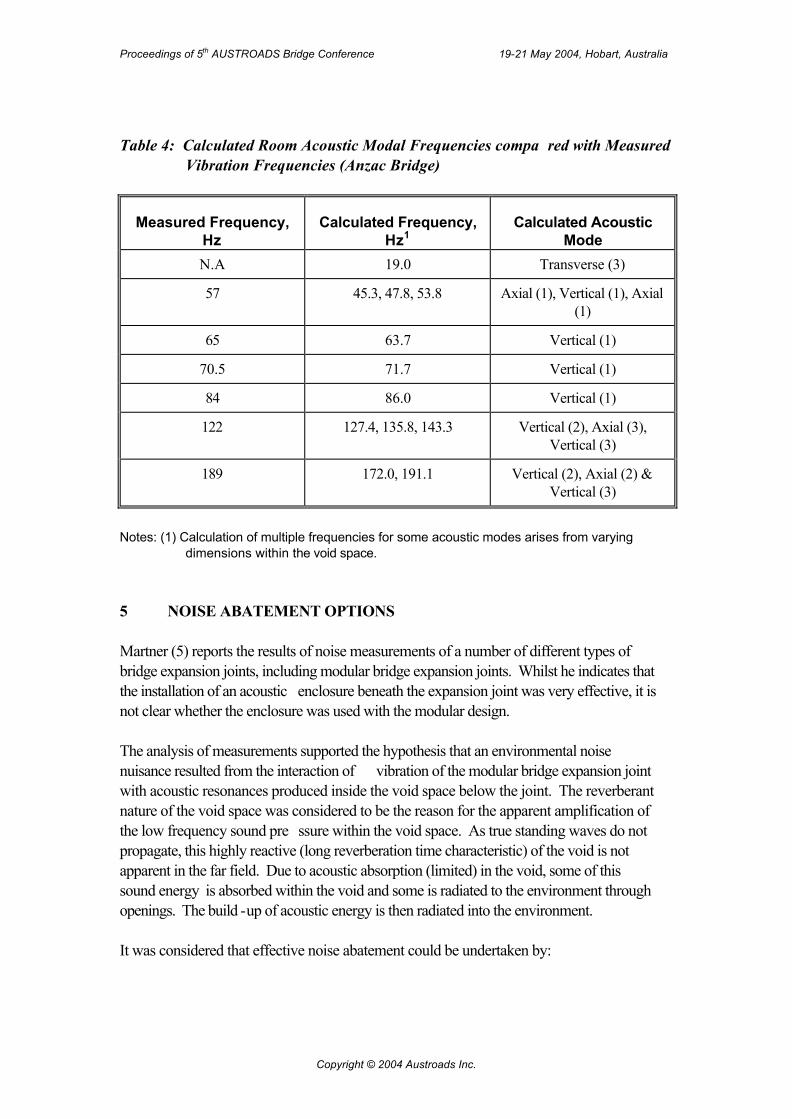
Proceedings of 5th AUSTROADS Bridge Conference 19-21 May 2004, Hobart, Australia
Copyright © 2004 Austroads Inc.
Table 4: Calculated Room Acoustic Modal Frequencies compa red with Measured
Vibration Frequencies (Anzac Bridge)
Measured Frequency, Hz
Calculated Frequency, Hz1
Calculated Acoustic Mode
N.A 19.0 Transverse (3)
57 45.3, 47.8, 53.8 Axial (1), Vertical (1), Axial (1)
65 63.7 Vertical (1)
70.5 71.7 Vertical (1)
84 86.0 Vertical (1)
122 127.4, 135.8, 143.3 Vertical (2), Axial (3), Vertical (3)
189 172.0, 191.1 Vertical (2), Axial (2) & Vertical (3)
Notes: (1) Calculation of multiple frequencies for some acoustic modes arises from varying
dimensions within the void space. 5 NOISE ABATEMENT OPTIONS Martner (5) reports the results of noise measurements of a number of different types of bridge expansion joints, including modular bridge expansion joints. Whilst he indicates that the installation of an acoustic enclosure beneath the expansion joint was very effective, it is not clear whether the enclosure was used with the modular design. The analysis of measurements supported the hypothesis that an environmental noise nuisance resulted from the interaction of vibration of the modular bridge expansion joint with acoustic resonances produced inside the void space below the joint. The reverberant nature of the void space was considered to be the reason for the apparent amplification of the low frequency sound pre ssure within the void space. As true standing waves do not propagate, this highly reactive (long reverberation time characteristic) of the void is not apparent in the far field. Due to acoustic absorption (limited) in the void, some of this sound energy is absorbed within the void and some is radiated to the environment through openings. The build -up of acoustic energy is then radiated into the environment. It was considered that effective noise abatement could be undertaken by:

Proceedings of 5th AUSTROADS Bridge Conference 19-21 May 2004, Hobart, Australia
Copyright © 2004 Austroads Inc.
• Modifying the dynamic b ehaviour of the joint to shift the natural frequencies so that they no longer co -incide with acoustic resonances. This option included the trial use of tuned mass dampers.
• Providing acoustic absorption and limited screening, adjacent to the joint, to redu ce noise propagation.
• Modifying the acoustic absorption properties of the void space to eliminate or reduce the incidence of acoustic resonances.
The above strategies represent both “new construction” and “retro -fit” options. However, their efficacy and cost-effectiveness is still to be established by engineering measurement A preliminary noise abatement trial was attempted at Georges River (Tom Ugly’s) Bridge on 20 June 2000 by lining the floor of the void space within the bridge abutment beneath the mod ular joint with rockwool insulation batts. The batts were raised 75mm (nom.) above the concrete floor to improve the absorption at low frequencies. The principal outcome of this trial was the apparent reduction in extraneous noise that became evident in the Coherence Function analysis of the simultaneous noise and vibration measurements. There were initial plans to design and test Option 1. However, this option was ultimately not pursued. Although tuned mass dampers (TMD) would likely provide an effectiv e noise reduction, these devices were not strongly advocated due to the high number of natural modes present and hence a high number of TMD’s needing to be fitted and tuned [Jones (6)]. An alternative to the TMD concept would be the use of broadband dampi ng coupled mass absorbers. The probable disadvantage of this approach being the requirement for a significant mass attachment to each centre beam. Due to resonances within the void space, the use of acoustic absorption and limited screening, adjacent to the joint was not considered practical. Consequently, only Option 3 was investigated. This investigation was undertaken using two different approaches. Firstly, the simple addition of acoustic absorption into the void space was tested. Noise measuremen ts were conducted on 4 May 2001 at which time trial acoustical absorption material had been installed over the floor of the void below the expansion joint. The absorption was arranged in a 100 mm thick layer over the floor area of the void and raised 75 mm (nominally) above the floor surface (to optimise low frequency sound absorption). Whilst the above deck (Locations 1 and 2 – Figure 3) and the side (Location 3) measurements show no significant change in the noise spectra, Locations 4 and 5 show a significant increase in the low frequency bands when the trial absorption was removed. As the measurements at Location 5 (from within the void space) are the result of sound pressure due to both propagating sound energy as well as non -propagating standing waves, the results at Location 4 provide a better indication of the effect on the emitted (propagating) noise. The second approach involved the construction of a Helmholtz Absorber within the
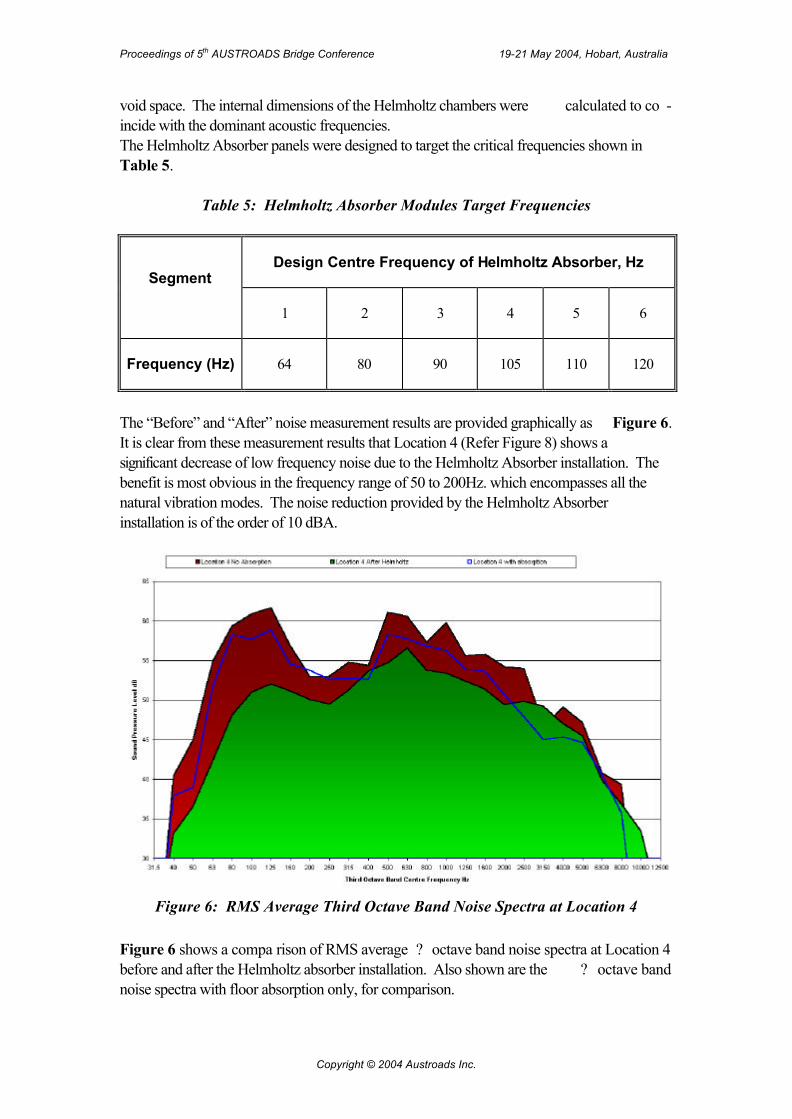
Proceedings of 5th AUSTROADS Bridge Conference 19-21 May 2004, Hobart, Australia
Copyright © 2004 Austroads Inc.
void space. The internal dimensions of the Helmholtz chambers were calculated to co -incide with the dominant acoustic frequencies. The Helmholtz Absorber panels were designed to target the critical frequencies shown in Table 5.
Table 5: Helmholtz Absorber Modules Target Frequencies
Design Centre Frequency of Helmholtz Absorber, Hz Segment
1 2 3 4 5 6
Frequency (Hz) 64 80 90 105 110 120
The “Before” and “After” noise measurement results are provided graphically as Figure 6. It is clear from these measurement results that Location 4 (Refer Figure 8) shows a significant decrease of low frequency noise due to the Helmholtz Absorber installation. The benefit is most obvious in the frequency range of 50 to 200Hz. which encompasses all the natural vibration modes. The noise reduction provided by the Helmholtz Absorber installation is of the order of 10 dBA.
Figure 6: RMS Average Third Octave Band Noise Spectra at Location 4
Figure 6 shows a compa rison of RMS average ? octave band noise spectra at Location 4 before and after the Helmholtz absorber installation. Also shown are the ? octave band noise spectra with floor absorption only, for comparison.
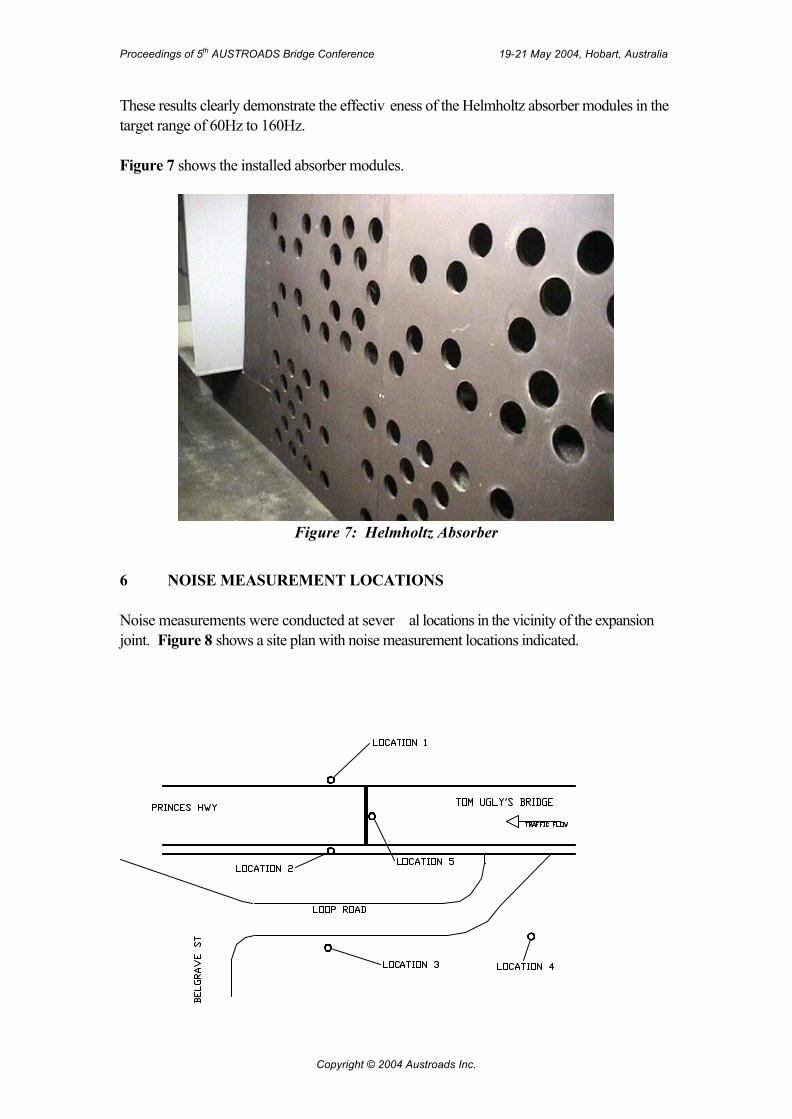
Proceedings of 5th AUSTROADS Bridge Conference 19-21 May 2004, Hobart, Australia
Copyright © 2004 Austroads Inc.
These results clearly demonstrate the effectiv eness of the Helmholtz absorber modules in the target range of 60Hz to 160Hz. Figure 7 shows the installed absorber modules.
Figure 7: Helmholtz Absorber
6 NOISE MEASUREMENT LOCATIONS Noise measurements were conducted at sever al locations in the vicinity of the expansion joint. Figure 8 shows a site plan with noise measurement locations indicated.

Proceedings of 5th AUSTROADS Bridge Conference 19-21 May 2004, Hobart, Australia
Copyright © 2004 Austroads Inc.
Figure 8: Site Plan Showing Noise Measurement Locations 7 CONCLUSION Noise and vibration meas urements have been undertaken at Anzac and Georges River (Tom Ugly’s) Bridges. The analysis of these measurements supported the hypothesis that an environmental noise nuisance results from the interaction of vibration of the modular bridge expansion joint with acoustic resonances produced inside the void space below the joint. The trial addition of acoustic absorption batts into the void space of Tom Ugly’s Bridge was considered to be only marginally effective for noise control and was not pursued. Howev er, the installed Helmholtz Absorber at Tom Ugly’s Bridge has reduced the modular expansion joint induced low frequency “booming” noise emissions by up to 10 dB. The character of the noise emission from the underside of the bridge deck would no longer be classified as tonal and hence the likelihood of modular expansion joint related noise complaints has been significantly reduced. The use of Helmholtz Absorbers at other bridges with modular expansion joints is considered to be viable as an engineering met hod of noise control. ACKNOWLEDGEMENT The authors wish to thank the Chief Executive of the Roads and Traffic Authority of NSW (RTA) for permission to publish this paper. The opinions and conclusions expressed in this paper do not necessarily reflect the views of the RTA. REFERENCES 1. DEXTER R.J., CONNOR R.J. & KACZINSKI M.R.: “Fatigue Design of Modular
Bridge Expansion Joints ”. NCHRP Report 402, Transportation Research Board, National Research Council, 1997, 128 pp.
2. BARNARD C.P. & CUNINGHAME J.R. : “Improving the Performance of Bridge Expansion Joints: Bridge Deck Expansion Joint Working Group Final Report”. TRL Report 236, Transport Research Laboratory, 1997, 92 pp.
3. ANCICH E.J.: “A Study of the Environmental Noise Generation & Propagation Mechanisms of Modular Bridge Expansion Joints” . RTA Environmental Technology Report No. 000203, Roads & Traffic Authority of NSW, September, 2000.
4. BERANEK L.L. (Ed.): “ Noise and Vibration Control – Revised Edition” . Institute of Noise Control Engineering, 1988, 672 pp.
5. MARTNER O.: “Noise Emission of Constructions for Bridge -To-Road Crossings ”. Proc. Inter-Noise 96, pp 211-214.
6. JONES D.I.G.: “Effect of Isolated Tuned Dampers on Response of Multispan

Proceedings of 5th AUSTROADS Bridge Conference 19-21 May 2004, Hobart, Australia
Copyright © 2004 Austroads Inc.
Structures”. J. Aircraft, Vol. 4, No. 4, 1967, pp 343-346.

Appendix C
Ancich E.J., Brown S.C. and Chirgwin G.J. (2004). The Role of Modular Bridge
Expansion Joint Vibration in Environmental Noise Emissions and Joint Fatigue
Failure, Proc. Acoustics 2004 Conference, Surfers Paradise, QLD, Australia, 135-
140.
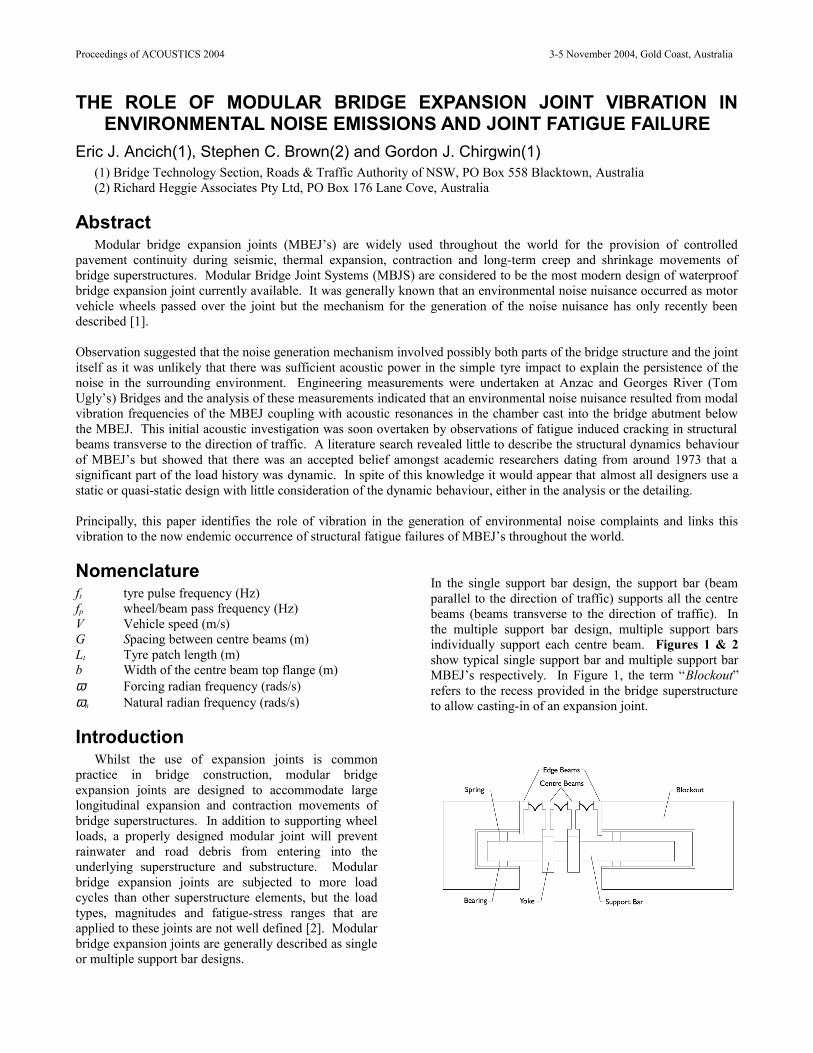
Proceedings of ACOUSTICS 2004 3-5 November 2004, Gold Coast, Australia
THE ROLE OF MODULAR BRIDGE EXPANSION JOINT VIBRATION IN ENVIRONMENTAL NOISE EMISSIONS AND JOINT FATIGUE FAILURE
Eric J. Ancich(1), Stephen C. Brown(2) and Gordon J. Chirgwin(1)(1) Bridge Technology Section, Roads & Traffic Authority of NSW, PO Box 558 Blacktown, Australia(2) Richard Heggie Associates Pty Ltd, PO Box 176 Lane Cove, Australia
AbstractModular bridge expansion joints (MBEJ’s) are widely used throughout the world for the provision of controlled
pavement continuity during seismic, thermal expansion, contraction and long-term creep and shrinkage movements of bridge superstructures. Modular Bridge Joint Systems (MBJS) are considered to be the most modern design of waterproof bridge expansion joint currently available. It was generally known that an environmental noise nuisance occurred as motor vehicle wheels passed over the joint but the mechanism for the generation of the noise nuisance has only recently been described [1].
Observation suggested that the noise generation mechanism involved possibly both parts of the bridge structure and the joint itself as it was unlikely that there was sufficient acoustic power in the simple tyre impact to explain the persistence of the noise in the surrounding environment. Engineering measurements were undertaken at Anzac and Georges River (Tom Ugly’s) Bridges and the analysis of these measurements indicated that an environmental noise nuisance resulted from modal vibration frequencies of the MBEJ coupling with acoustic resonances in the chamber cast into the bridge abutment below the MBEJ. This initial acoustic investigation was soon overtaken by observations of fatigue induced cracking in structural beams transverse to the direction of traffic. A literature search revealed little to describe the structural dynamics behaviour of MBEJ’s but showed that there was an accepted belief amongst academic researchers dating from around 1973 that a significant part of the load history was dynamic. In spite of this knowledge it would appear that almost all designers use a static or quasi-static design with little consideration of the dynamic behaviour, either in the analysis or the detailing.
Principally, this paper identifies the role of vibration in the generation of environmental noise complaints and links this vibration to the now endemic occurrence of structural fatigue failures of MBEJ’s throughout the world.
Nomenclatureft tyre pulse frequency (Hz)fp wheel/beam pass frequency (Hz)V Vehicle speed (m/s)G Spacing between centre beams (m)Lt Tyre patch length (m)b Width of the centre beam top flange (m)ω Forcing radian frequency (rads/s)ωn Natural radian frequency (rads/s)
IntroductionWhilst the use of expansion joints is common
practice in bridge construction, modular bridge expansion joints are designed to accommodate large longitudinal expansion and contraction movements of bridge superstructures. In addition to supporting wheel loads, a properly designed modular joint will prevent rainwater and road debris from entering into the underlying superstructure and substructure. Modular bridge expansion joints are subjected to more load cycles than other superstructure elements, but the load types, magnitudes and fatigue-stress ranges that are applied to these joints are not well defined [2]. Modular bridge expansion joints are generally described as single or multiple support bar designs.
In the single support bar design, the support bar (beam parallel to the direction of traffic) supports all the centre beams (beams transverse to the direction of traffic). In the multiple support bar design, multiple support bars individually support each centre beam. Figures 1 & 2 show typical single support bar and multiple support bar MBEJ’s respectively. In Figure 1, the term “Blockout” refers to the recess provided in the bridge superstructure to allow casting-in of an expansion joint.
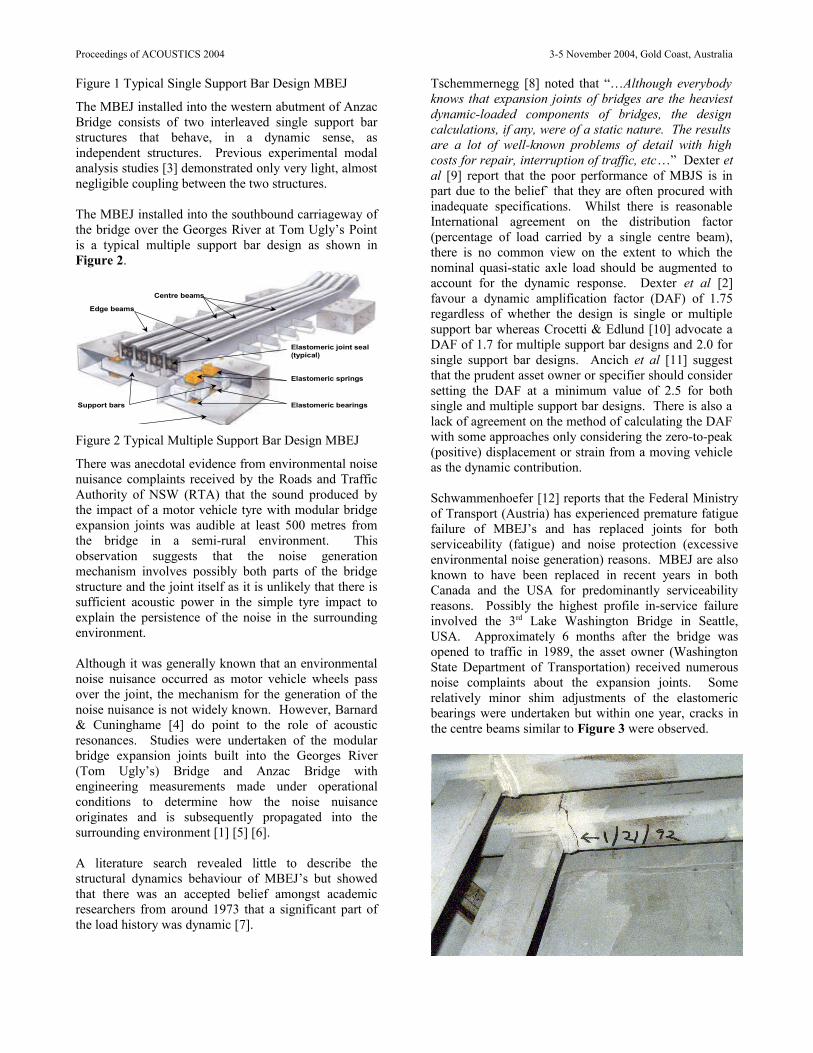
Proceedings of ACOUSTICS 2004 3-5 November 2004, Gold Coast, Australia
Figure 1 Typical Single Support Bar Design MBEJ
The MBEJ installed into the western abutment of Anzac Bridge consists of two interleaved single support bar structures that behave, in a dynamic sense, as independent structures. Previous experimental modal analysis studies [3] demonstrated only very light, almost negligible coupling between the two structures.
The MBEJ installed into the southbound carriageway of the bridge over the Georges River at Tom Ugly’s Point is a typical multiple support bar design as shown in Figure 2.
Edge beams
Centre beams
Elastomeric springs
Support bars
Elastomeric joint seal (typical)
Elastomeric bearings
Support box
Figure 2 Typical Multiple Support Bar Design MBEJ
There was anecdotal evidence from environmental noise nuisance complaints received by the Roads and Traffic Authority of NSW (RTA) that the sound produced by the impact of a motor vehicle tyre with modular bridge expansion joints was audible at least 500 metres from the bridge in a semi-rural environment. This observation suggests that the noise generation mechanism involves possibly both parts of the bridge structure and the joint itself as it is unlikely that there is sufficient acoustic power in the simple tyre impact to explain the persistence of the noise in the surrounding environment.
Although it was generally known that an environmental noise nuisance occurred as motor vehicle wheels pass over the joint, the mechanism for the generation of the noise nuisance is not widely known. However, Barnard & Cuninghame [4] do point to the role of acoustic resonances. Studies were undertaken of the modular bridge expansion joints built into the Georges River (Tom Ugly’s) Bridge and Anzac Bridge with engineering measurements made under operational conditions to determine how the noise nuisance originates and is subsequently propagated into the surrounding environment [1] [5] [6].
A literature search revealed little to describe the structural dynamics behaviour of MBEJ’s but showed that there was an accepted belief amongst academic researchers from around 1973 that a significant part of the load history was dynamic [7].
Tschemmernegg [8] noted that “…Although everybody knows that expansion joints of bridges are the heaviest dynamic-loaded components of bridges, the design calculations, if any, were of a static nature. The results are a lot of well-known problems of detail with high costs for repair, interruption of traffic, etc…” Dexter et al [9] report that the poor performance of MBJS is in part due to the belief` that they are often procured with inadequate specifications. Whilst there is reasonable International agreement on the distribution factor (percentage of load carried by a single centre beam), there is no common view on the extent to which the nominal quasi-static axle load should be augmented to account for the dynamic response. Dexter et al [2] favour a dynamic amplification factor (DAF) of 1.75 regardless of whether the design is single or multiple support bar whereas Crocetti & Edlund [10] advocate a DAF of 1.7 for multiple support bar designs and 2.0 for single support bar designs. Ancich et al [11] suggest that the prudent asset owner or specifier should consider setting the DAF at a minimum value of 2.5 for both single and multiple support bar designs. There is also a lack of agreement on the method of calculating the DAF with some approaches only considering the zero-to-peak (positive) displacement or strain from a moving vehicle as the dynamic contribution.
Schwammenhoefer [12] reports that the Federal Ministry of Transport (Austria) has experienced premature fatigue failure of MBEJ’s and has replaced joints for both serviceability (fatigue) and noise protection (excessive environmental noise generation) reasons. MBEJ are also known to have been replaced in recent years in both Canada and the USA for predominantly serviceability reasons. Possibly the highest profile in-service failure involved the 3rd Lake Washington Bridge in Seattle, USA. Approximately 6 months after the bridge was opened to traffic in 1989, the asset owner (Washington State Department of Transportation) received numerous noise complaints about the expansion joints. Some relatively minor shim adjustments of the elastomeric bearings were undertaken but within one year, cracks in the centre beams similar to Figure 3 were observed.
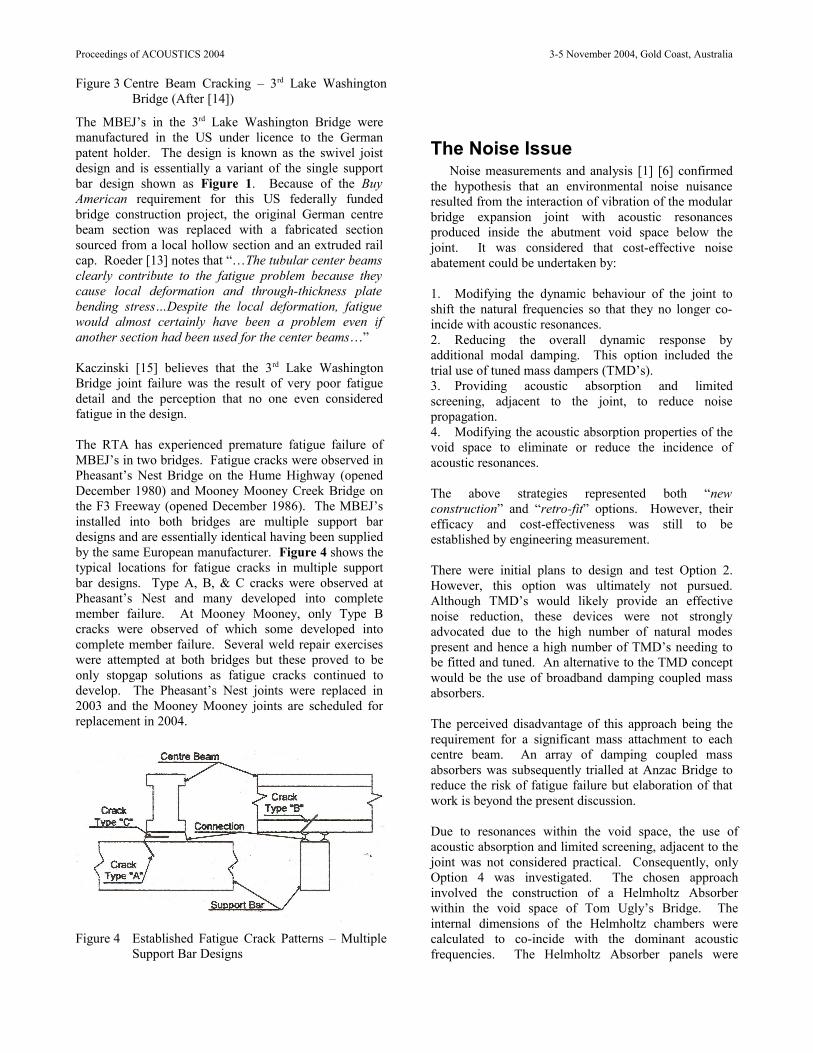
Proceedings of ACOUSTICS 2004 3-5 November 2004, Gold Coast, Australia
Figure 3 Centre Beam Cracking – 3rd Lake Washington Bridge (After [14])
The MBEJ’s in the 3rd Lake Washington Bridge were manufactured in the US under licence to the German patent holder. The design is known as the swivel joist design and is essentially a variant of the single support bar design shown as Figure 1. Because of the Buy American requirement for this US federally funded bridge construction project, the original German centre beam section was replaced with a fabricated section sourced from a local hollow section and an extruded rail cap. Roeder [13] notes that “…The tubular center beams clearly contribute to the fatigue problem because they cause local deformation and through-thickness plate bending stress…Despite the local deformation, fatigue would almost certainly have been a problem even if another section had been used for the center beams…”
Kaczinski [15] believes that the 3rd Lake Washington Bridge joint failure was the result of very poor fatigue detail and the perception that no one even considered fatigue in the design.
The RTA has experienced premature fatigue failure of MBEJ’s in two bridges. Fatigue cracks were observed in Pheasant’s Nest Bridge on the Hume Highway (opened December 1980) and Mooney Mooney Creek Bridge on the F3 Freeway (opened December 1986). The MBEJ’s installed into both bridges are multiple support bar designs and are essentially identical having been supplied by the same European manufacturer. Figure 4 shows the typical locations for fatigue cracks in multiple support bar designs. Type A, B, & C cracks were observed at Pheasant’s Nest and many developed into complete member failure. At Mooney Mooney, only Type B cracks were observed of which some developed into complete member failure. Several weld repair exercises were attempted at both bridges but these proved to be only stopgap solutions as fatigue cracks continued to develop. The Pheasant’s Nest joints were replaced in 2003 and the Mooney Mooney joints are scheduled for replacement in 2004.
Figure 4 Established Fatigue Crack Patterns – Multiple Support Bar Designs
The Noise IssueNoise measurements and analysis [1] [6] confirmed
the hypothesis that an environmental noise nuisance resulted from the interaction of vibration of the modular bridge expansion joint with acoustic resonances produced inside the abutment void space below the joint. It was considered that cost-effective noise abatement could be undertaken by:
1. Modifying the dynamic behaviour of the joint to shift the natural frequencies so that they no longer co-incide with acoustic resonances.2. Reducing the overall dynamic response by additional modal damping. This option included the trial use of tuned mass dampers (TMD’s).3. Providing acoustic absorption and limited screening, adjacent to the joint, to reduce noise propagation.4. Modifying the acoustic absorption properties of the void space to eliminate or reduce the incidence of acoustic resonances.
The above strategies represented both “new construction” and “retro-fit” options. However, their efficacy and cost-effectiveness was still to be established by engineering measurement.
There were initial plans to design and test Option 2. However, this option was ultimately not pursued. Although TMD’s would likely provide an effective noise reduction, these devices were not strongly advocated due to the high number of natural modes present and hence a high number of TMD’s needing to be fitted and tuned. An alternative to the TMD concept would be the use of broadband damping coupled mass absorbers.
The perceived disadvantage of this approach being the requirement for a significant mass attachment to each centre beam. An array of damping coupled mass absorbers was subsequently trialled at Anzac Bridge to reduce the risk of fatigue failure but elaboration of that work is beyond the present discussion.
Due to resonances within the void space, the use of acoustic absorption and limited screening, adjacent to the joint was not considered practical. Consequently, only Option 4 was investigated. The chosen approach involved the construction of a Helmholtz Absorber within the void space of Tom Ugly’s Bridge. The internal dimensions of the Helmholtz chambers were calculated to co-incide with the dominant acoustic frequencies. The Helmholtz Absorber panels were
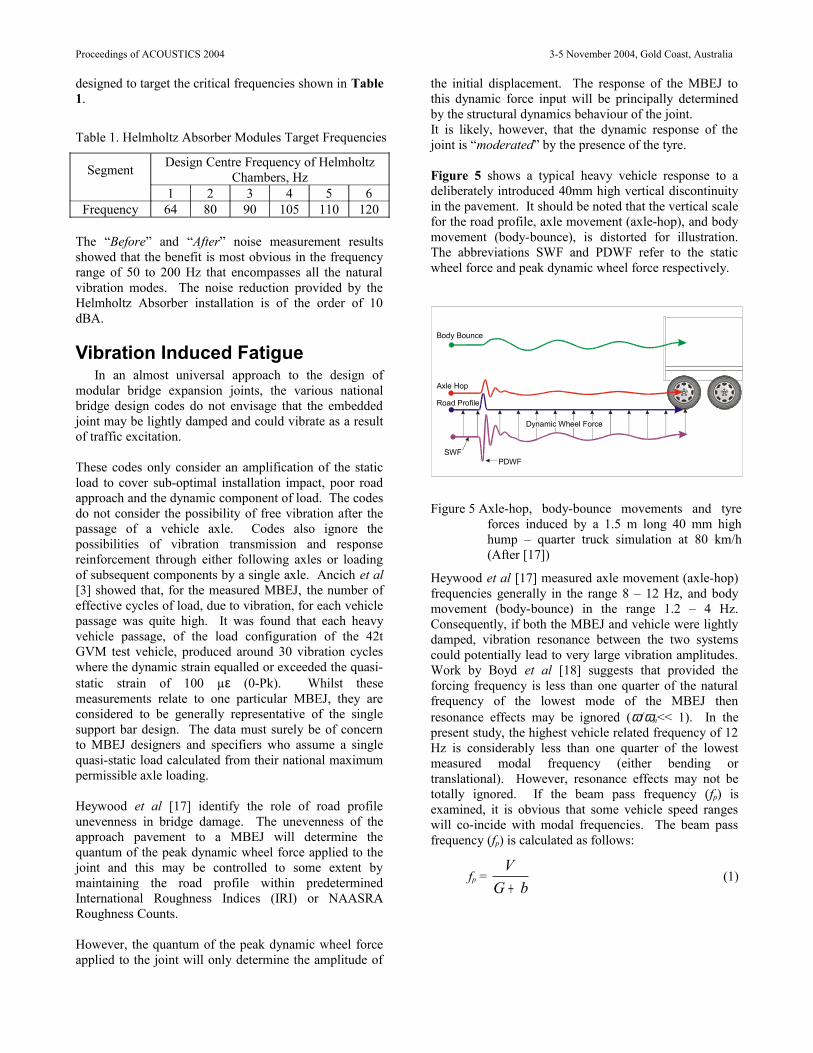
Proceedings of ACOUSTICS 2004 3-5 November 2004, Gold Coast, Australia
designed to target the critical frequencies shown in Table 1.
Table 1. Helmholtz Absorber Modules Target Frequencies
Segment Design Centre Frequency of Helmholtz Chambers, Hz
1 2 3 4 5 6Frequency 64 80 90 105 110 120
The “Before” and “After” noise measurement results showed that the benefit is most obvious in the frequency range of 50 to 200 Hz that encompasses all the natural vibration modes. The noise reduction provided by the Helmholtz Absorber installation is of the order of 10 dBA.
Vibration Induced FatigueIn an almost universal approach to the design of
modular bridge expansion joints, the various national bridge design codes do not envisage that the embedded joint may be lightly damped and could vibrate as a result of traffic excitation.
These codes only consider an amplification of the static load to cover sub-optimal installation impact, poor road approach and the dynamic component of load. The codes do not consider the possibility of free vibration after the passage of a vehicle axle. Codes also ignore the possibilities of vibration transmission and response reinforcement through either following axles or loading of subsequent components by a single axle. Ancich et al [3] showed that, for the measured MBEJ, the number of effective cycles of load, due to vibration, for each vehicle passage was quite high. It was found that each heavy vehicle passage, of the load configuration of the 42t GVM test vehicle, produced around 30 vibration cycles where the dynamic strain equalled or exceeded the quasi-static strain of 100 µε (0-Pk). Whilst these measurements relate to one particular MBEJ, they are considered to be generally representative of the single support bar design. The data must surely be of concern to MBEJ designers and specifiers who assume a single quasi-static load calculated from their national maximum permissible axle loading.
Heywood et al [17] identify the role of road profile unevenness in bridge damage. The unevenness of the approach pavement to a MBEJ will determine the quantum of the peak dynamic wheel force applied to the joint and this may be controlled to some extent by maintaining the road profile within predetermined International Roughness Indices (IRI) or NAASRA Roughness Counts.
However, the quantum of the peak dynamic wheel force applied to the joint will only determine the amplitude of
the initial displacement. The response of the MBEJ to this dynamic force input will be principally determined by the structural dynamics behaviour of the joint.It is likely, however, that the dynamic response of the joint is “moderated” by the presence of the tyre.
Figure 5 shows a typical heavy vehicle response to a deliberately introduced 40mm high vertical discontinuity in the pavement. It should be noted that the vertical scale for the road profile, axle movement (axle-hop), and body movement (body-bounce), is distorted for illustration. The abbreviations SWF and PDWF refer to the static wheel force and peak dynamic wheel force respectively.
Dynamic Wheel Force
Body Bounce
Road Profile
PDWFSWF
Axle Hop
Figure 5 Axle-hop, body-bounce movements and tyre forces induced by a 1.5 m long 40 mm high hump – quarter truck simulation at 80 km/h (After [17])
Heywood et al [17] measured axle movement (axle-hop) frequencies generally in the range 8 – 12 Hz, and body movement (body-bounce) in the range 1.2 – 4 Hz. Consequently, if both the MBEJ and vehicle were lightly damped, vibration resonance between the two systems could potentially lead to very large vibration amplitudes. Work by Boyd et al [18] suggests that provided the forcing frequency is less than one quarter of the natural frequency of the lowest mode of the MBEJ then resonance effects may be ignored (ω/ωn<< 1). In the present study, the highest vehicle related frequency of 12 Hz is considerably less than one quarter of the lowest measured modal frequency (either bending or translational). However, resonance effects may not be totally ignored. If the beam pass frequency (fp) is examined, it is obvious that some vehicle speed ranges will co-incide with modal frequencies. The beam pass frequency (fp) is calculated as follows:
fp = bG
V+
(1)
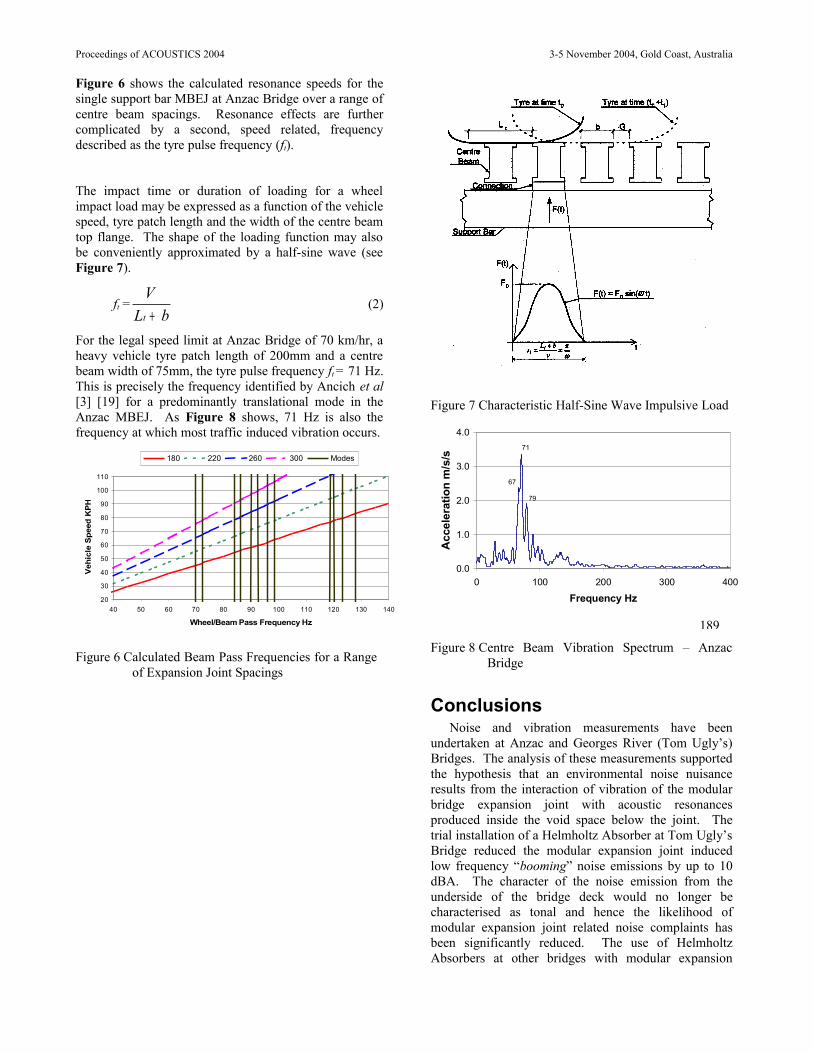
Proceedings of ACOUSTICS 2004 3-5 November 2004, Gold Coast, Australia
Figure 6 shows the calculated resonance speeds for the single support bar MBEJ at Anzac Bridge over a range of centre beam spacings. Resonance effects are further complicated by a second, speed related, frequency described as the tyre pulse frequency (ft).
The impact time or duration of loading for a wheel impact load may be expressed as a function of the vehicle speed, tyre patch length and the width of the centre beam top flange. The shape of the loading function may also be conveniently approximated by a half-sine wave (see Figure 7).
ft =bL
Vt +
(2)
For the legal speed limit at Anzac Bridge of 70 km/hr, a heavy vehicle tyre patch length of 200mm and a centre beam width of 75mm, the tyre pulse frequency ft = 71 Hz. This is precisely the frequency identified by Ancich et al [3] [19] for a predominantly translational mode in the Anzac MBEJ. As Figure 8 shows, 71 Hz is also the frequency at which most traffic induced vibration occurs.
20
30
40
50
60
70
80
90
100
110
40 50 60 70 80 90 100 110 120 130 140
Wheel/Beam Pass Frequency Hz
Veh
icle
Spe
ed K
PH
180 220 260 300 Modes
Figure 6 Calculated Beam Pass Frequencies for a Range of Expansion Joint Spacings
Figure 7 Characteristic Half-Sine Wave Impulsive Load
0.0
1.0
2.0
3.0
4.0
0 100 200 300 400
Frequency Hz
Acc
eler
atio
n m
/s/s
71
67
79
Figure 8 Centre Beam Vibration Spectrum – Anzac Bridge
ConclusionsNoise and vibration measurements have been
undertaken at Anzac and Georges River (Tom Ugly’s) Bridges. The analysis of these measurements supported the hypothesis that an environmental noise nuisance results from the interaction of vibration of the modular bridge expansion joint with acoustic resonances produced inside the void space below the joint. The trial installation of a Helmholtz Absorber at Tom Ugly’s Bridge reduced the modular expansion joint induced low frequency “booming” noise emissions by up to 10 dBA. The character of the noise emission from the underside of the bridge deck would no longer be characterised as tonal and hence the likelihood of modular expansion joint related noise complaints has been significantly reduced. The use of Helmholtz Absorbers at other bridges with modular expansion
189
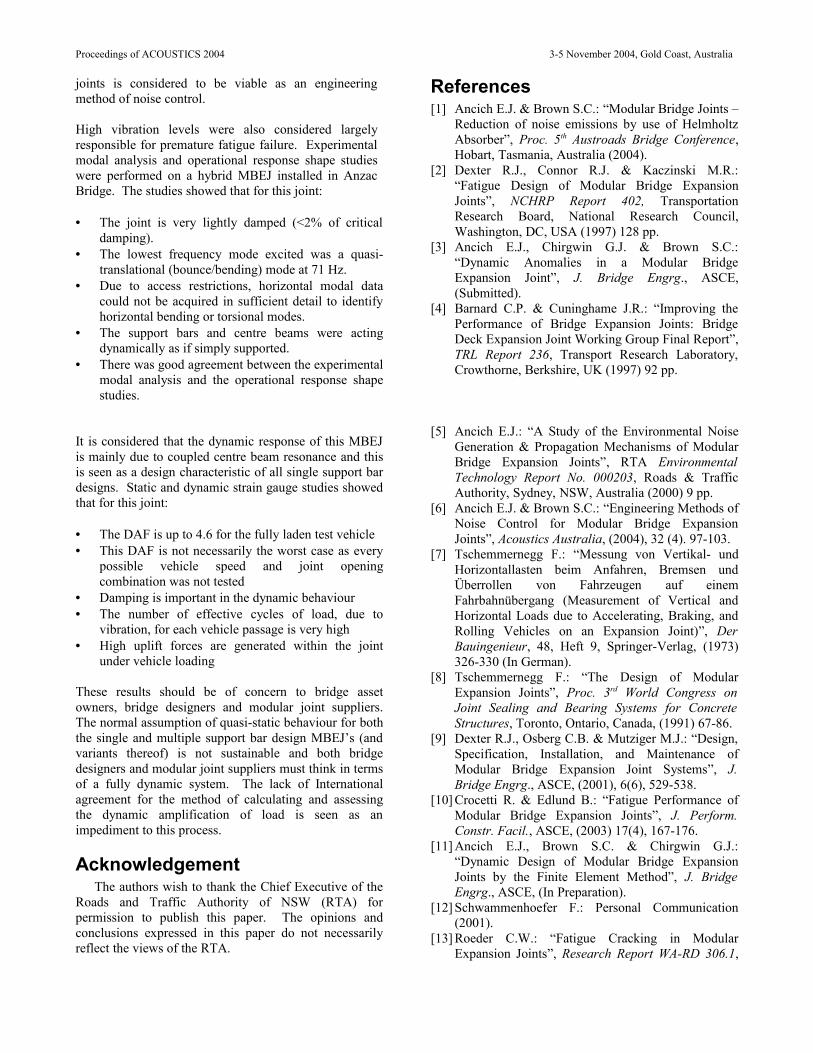
Proceedings of ACOUSTICS 2004 3-5 November 2004, Gold Coast, Australia
joints is considered to be viable as an engineering method of noise control.
High vibration levels were also considered largely responsible for premature fatigue failure. Experimental modal analysis and operational response shape studies were performed on a hybrid MBEJ installed in Anzac Bridge. The studies showed that for this joint:
• The joint is very lightly damped (<2% of critical damping).
• The lowest frequency mode excited was a quasi-translational (bounce/bending) mode at 71 Hz.
• Due to access restrictions, horizontal modal data could not be acquired in sufficient detail to identify horizontal bending or torsional modes.
• The support bars and centre beams were acting dynamically as if simply supported.
• There was good agreement between the experimental modal analysis and the operational response shape studies.
It is considered that the dynamic response of this MBEJ is mainly due to coupled centre beam resonance and this is seen as a design characteristic of all single support bar designs. Static and dynamic strain gauge studies showed that for this joint:
• The DAF is up to 4.6 for the fully laden test vehicle• This DAF is not necessarily the worst case as every
possible vehicle speed and joint opening combination was not tested
• Damping is important in the dynamic behaviour• The number of effective cycles of load, due to
vibration, for each vehicle passage is very high• High uplift forces are generated within the joint
under vehicle loading
These results should be of concern to bridge asset owners, bridge designers and modular joint suppliers. The normal assumption of quasi-static behaviour for both the single and multiple support bar design MBEJ’s (and variants thereof) is not sustainable and both bridge designers and modular joint suppliers must think in terms of a fully dynamic system. The lack of International agreement for the method of calculating and assessing the dynamic amplification of load is seen as an impediment to this process.
AcknowledgementThe authors wish to thank the Chief Executive of the
Roads and Traffic Authority of NSW (RTA) for permission to publish this paper. The opinions and conclusions expressed in this paper do not necessarily reflect the views of the RTA.
References[1] Ancich E.J. & Brown S.C.: “Modular Bridge Joints –
Reduction of noise emissions by use of Helmholtz Absorber”, Proc. 5th Austroads Bridge Conference, Hobart, Tasmania, Australia (2004).
[2] Dexter R.J., Connor R.J. & Kaczinski M.R.: “Fatigue Design of Modular Bridge Expansion Joints”, NCHRP Report 402, Transportation Research Board, National Research Council, Washington, DC, USA (1997) 128 pp.
[3] Ancich E.J., Chirgwin G.J. & Brown S.C.: “Dynamic Anomalies in a Modular Bridge Expansion Joint”, J. Bridge Engrg., ASCE, (Submitted).
[4] Barnard C.P. & Cuninghame J.R.: “Improving the Performance of Bridge Expansion Joints: Bridge Deck Expansion Joint Working Group Final Report”, TRL Report 236, Transport Research Laboratory, Crowthorne, Berkshire, UK (1997) 92 pp.
[5] Ancich E.J.: “A Study of the Environmental Noise Generation & Propagation Mechanisms of Modular Bridge Expansion Joints”, RTA Environmental Technology Report No. 000203, Roads & Traffic Authority, Sydney, NSW, Australia (2000) 9 pp.
[6] Ancich E.J. & Brown S.C.: “Engineering Methods of Noise Control for Modular Bridge Expansion Joints”, Acoustics Australia, (2004), 32 (4). 97-103.
[7] Tschemmernegg F.: “Messung von Vertikal- und Horizontallasten beim Anfahren, Bremsen und Überrollen von Fahrzeugen auf einem Fahrbahnübergang (Measurement of Vertical and Horizontal Loads due to Accelerating, Braking, and Rolling Vehicles on an Expansion Joint)”, Der Bauingenieur, 48, Heft 9, Springer-Verlag, (1973) 326-330 (In German).
[8] Tschemmernegg F.: “The Design of Modular Expansion Joints”, Proc. 3rd World Congress on Joint Sealing and Bearing Systems for Concrete Structures, Toronto, Ontario, Canada, (1991) 67-86.
[9] Dexter R.J., Osberg C.B. & Mutziger M.J.: “Design, Specification, Installation, and Maintenance of Modular Bridge Expansion Joint Systems”, J. Bridge Engrg., ASCE, (2001), 6(6), 529-538.
[10] Crocetti R. & Edlund B.: “Fatigue Performance of Modular Bridge Expansion Joints”, J. Perform. Constr. Facil., ASCE, (2003) 17(4), 167-176.
[11] Ancich E.J., Brown S.C. & Chirgwin G.J.: “Dynamic Design of Modular Bridge Expansion Joints by the Finite Element Method”, J. Bridge Engrg., ASCE, (In Preparation).
[12] Schwammenhoefer F.: Personal Communication (2001).
[13] Roeder C.W.: “Fatigue Cracking in Modular Expansion Joints”, Research Report WA-RD 306.1,
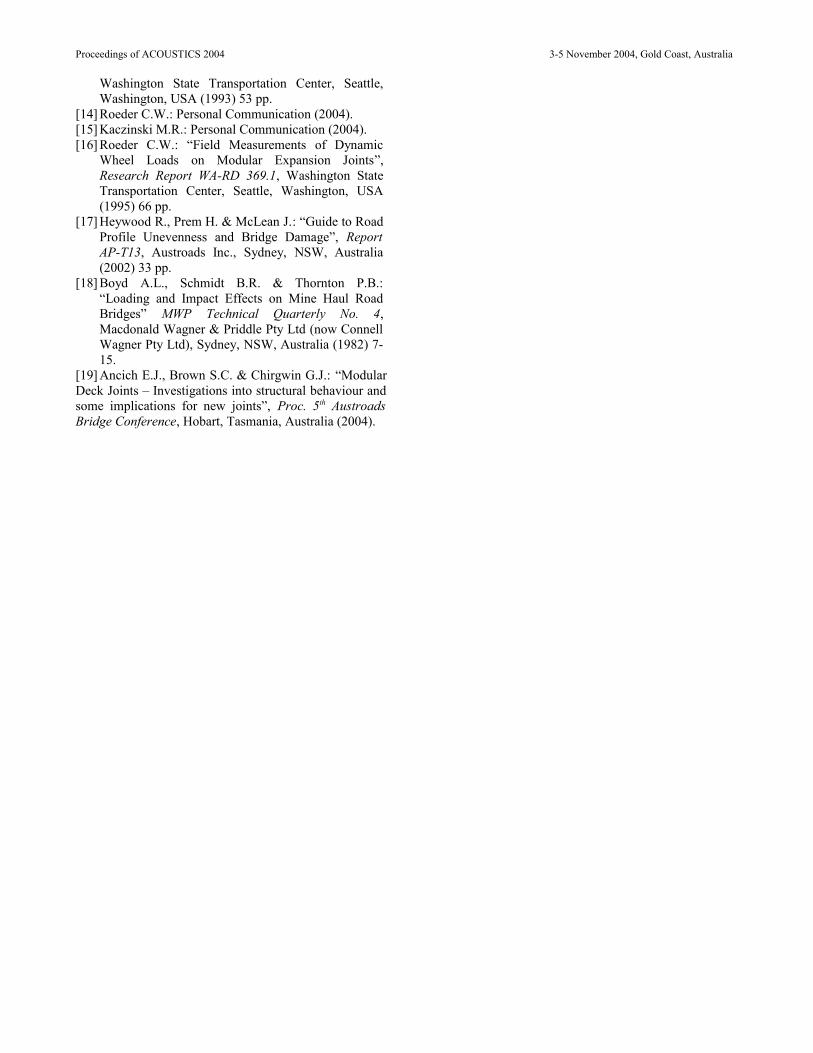
Proceedings of ACOUSTICS 2004 3-5 November 2004, Gold Coast, Australia
Washington State Transportation Center, Seattle, Washington, USA (1993) 53 pp.
[14] Roeder C.W.: Personal Communication (2004).[15] Kaczinski M.R.: Personal Communication (2004).[16] Roeder C.W.: “Field Measurements of Dynamic
Wheel Loads on Modular Expansion Joints”, Research Report WA-RD 369.1, Washington State Transportation Center, Seattle, Washington, USA (1995) 66 pp.
[17] Heywood R., Prem H. & McLean J.: “Guide to Road Profile Unevenness and Bridge Damage”, Report AP-T13, Austroads Inc., Sydney, NSW, Australia (2002) 33 pp.
[18] Boyd A.L., Schmidt B.R. & Thornton P.B.: “Loading and Impact Effects on Mine Haul Road Bridges” MWP Technical Quarterly No. 4, Macdonald Wagner & Priddle Pty Ltd (now Connell Wagner Pty Ltd), Sydney, NSW, Australia (1982) 7-15.
[19] Ancich E.J., Brown S.C. & Chirgwin G.J.: “Modular Deck Joints – Investigations into structural behaviour and some implications for new joints”, Proc. 5th Austroads Bridge Conference, Hobart, Tasmania, Australia (2004).
Appendix D
Ancich E.J. and Brown S.C. (2004b). Engineering Methods of Noise Control for
Modular Bridge Expansion Joints, Acoustics Australia, Vol. 32, No. 3, 101-107.
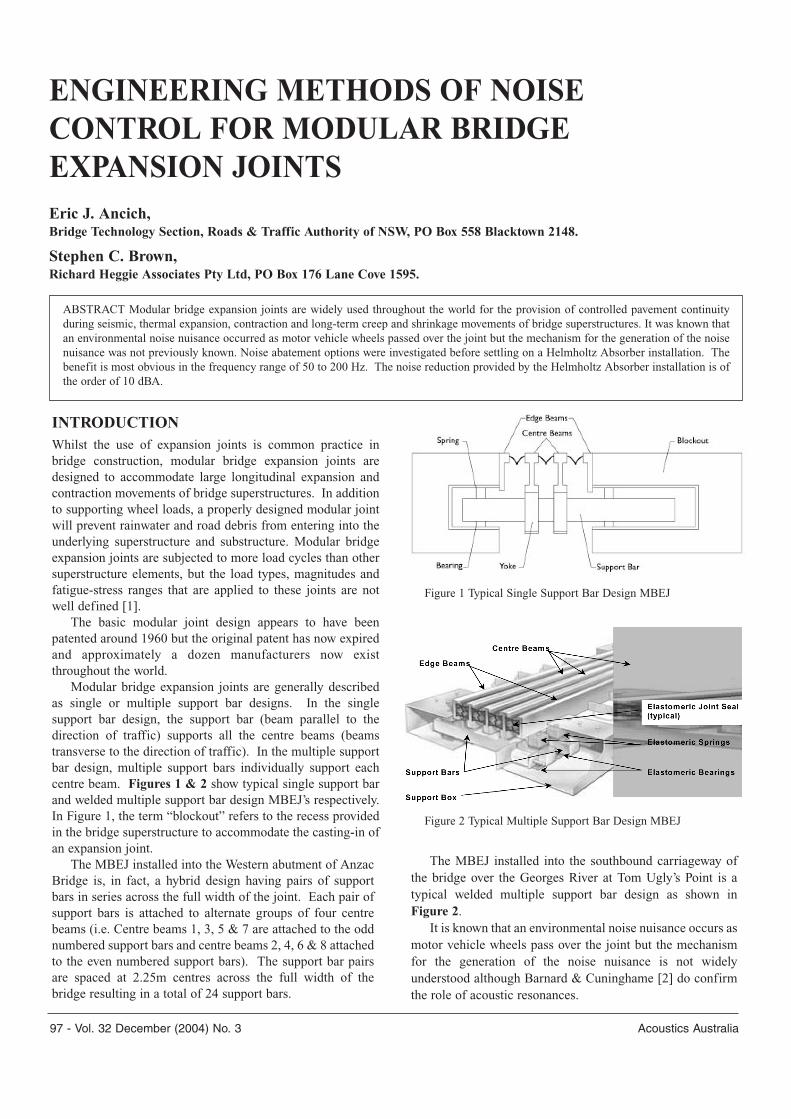
97 - Vol. 32 December (2004) No. 3 Acoustics Australia
INTRODUCTIONWhilst the use of expansion joints is common practice inbridge construction, modular bridge expansion joints aredesigned to accommodate large longitudinal expansion andcontraction movements of bridge superstructures. In additionto supporting wheel loads, a properly designed modular jointwill prevent rainwater and road debris from entering into theunderlying superstructure and substructure. Modular bridgeexpansion joints are subjected to more load cycles than othersuperstructure elements, but the load types, magnitudes andfatigue-stress ranges that are applied to these joints are notwell defined [1].
The basic modular joint design appears to have beenpatented around 1960 but the original patent has now expiredand approximately a dozen manufacturers now existthroughout the world.
Modular bridge expansion joints are generally describedas single or multiple support bar designs. In the singlesupport bar design, the support bar (beam parallel to thedirection of traffic) supports all the centre beams (beamstransverse to the direction of traffic). In the multiple supportbar design, multiple support bars individually support eachcentre beam. Figures 1 & 2 show typical single support barand welded multiple support bar design MBEJ’s respectively.In Figure 1, the term “blockout” refers to the recess providedin the bridge superstructure to accommodate the casting-in ofan expansion joint.
The MBEJ installed into the Western abutment of AnzacBridge is, in fact, a hybrid design having pairs of supportbars in series across the full width of the joint. Each pair ofsupport bars is attached to alternate groups of four centrebeams (i.e. Centre beams 1, 3, 5 & 7 are attached to the oddnumbered support bars and centre beams 2, 4, 6 & 8 attachedto the even numbered support bars). The support bar pairsare spaced at 2.25m centres across the full width of thebridge resulting in a total of 24 support bars.
ENGINEERING METHODS OF NOISECONTROL FOR MODULAR BRIDGEEXPANSION JOINTSEric J. Ancich,Bridge Technology Section, Roads & Traffic Authority of NSW, PO Box 558 Blacktown 2148.
Stephen C. Brown,Richard Heggie Associates Pty Ltd, PO Box 176 Lane Cove 1595.
ABSTRACT Modular bridge expansion joints are widely used throughout the world for the provision of controlled pavement continuityduring seismic, thermal expansion, contraction and long-term creep and shrinkage movements of bridge superstructures. It was known thatan environmental noise nuisance occurred as motor vehicle wheels passed over the joint but the mechanism for the generation of the noisenuisance was not previously known. Noise abatement options were investigated before settling on a Helmholtz Absorber installation. Thebenefit is most obvious in the frequency range of 50 to 200 Hz. The noise reduction provided by the Helmholtz Absorber installation is ofthe order of 10 dBA.
Figure 1 Typical Single Support Bar Design MBEJ
Figure 2 Typical Multiple Support Bar Design MBEJ
The MBEJ installed into the southbound carriageway ofthe bridge over the Georges River at Tom Ugly’s Point is atypical welded multiple support bar design as shown inFigure 2.
It is known that an environmental noise nuisance occurs asmotor vehicle wheels pass over the joint but the mechanismfor the generation of the noise nuisance is not widelyunderstood although Barnard & Cuninghame [2] do confirmthe role of acoustic resonances.
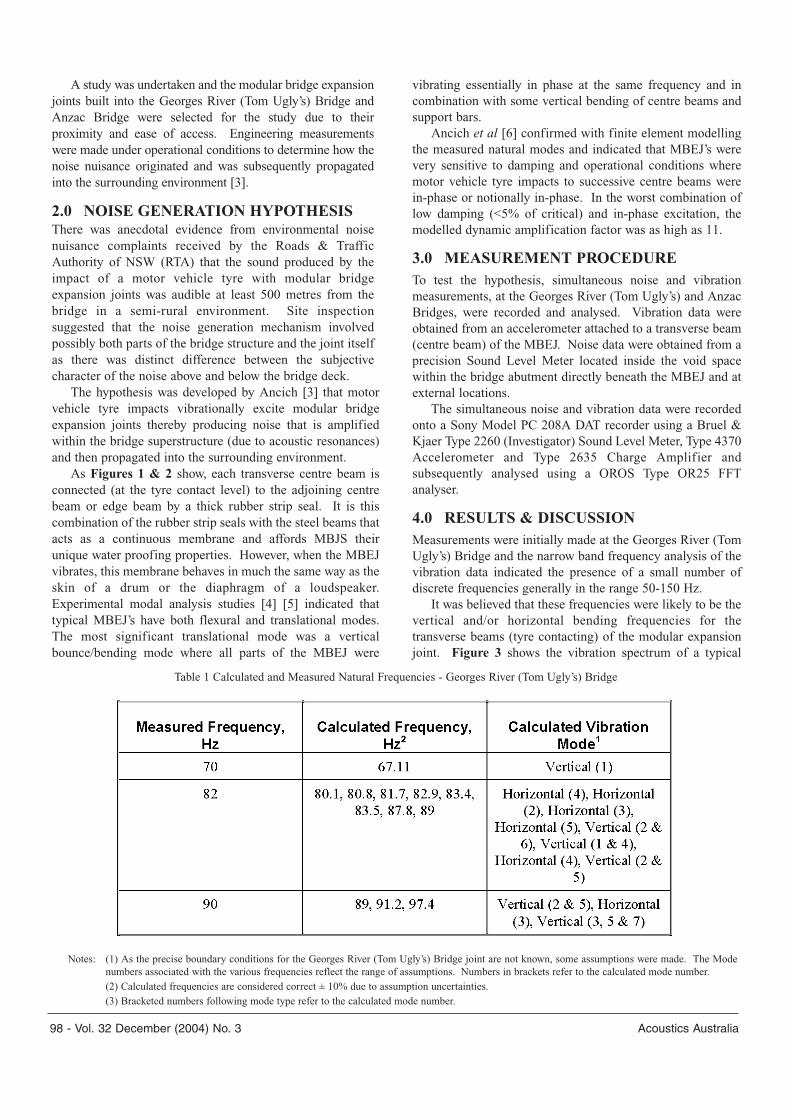
98 - Vol. 32 December (2004) No. 3 Acoustics Australia
A study was undertaken and the modular bridge expansionjoints built into the Georges River (Tom Ugly’s) Bridge andAnzac Bridge were selected for the study due to theirproximity and ease of access. Engineering measurementswere made under operational conditions to determine how thenoise nuisance originated and was subsequently propagatedinto the surrounding environment [3].
2.0 NOISE GENERATION HYPOTHESISThere was anecdotal evidence from environmental noisenuisance complaints received by the Roads & TrafficAuthority of NSW (RTA) that the sound produced by theimpact of a motor vehicle tyre with modular bridgeexpansion joints was audible at least 500 metres from thebridge in a semi-rural environment. Site inspectionsuggested that the noise generation mechanism involvedpossibly both parts of the bridge structure and the joint itselfas there was distinct difference between the subjectivecharacter of the noise above and below the bridge deck.
The hypothesis was developed by Ancich [3] that motorvehicle tyre impacts vibrationally excite modular bridgeexpansion joints thereby producing noise that is amplifiedwithin the bridge superstructure (due to acoustic resonances)and then propagated into the surrounding environment.
As Figures 1 & 2 show, each transverse centre beam isconnected (at the tyre contact level) to the adjoining centrebeam or edge beam by a thick rubber strip seal. It is thiscombination of the rubber strip seals with the steel beams thatacts as a continuous membrane and affords MBJS theirunique water proofing properties. However, when the MBEJvibrates, this membrane behaves in much the same way as theskin of a drum or the diaphragm of a loudspeaker.Experimental modal analysis studies [4] [5] indicated thattypical MBEJ’s have both flexural and translational modes.The most significant translational mode was a verticalbounce/bending mode where all parts of the MBEJ were
vibrating essentially in phase at the same frequency and incombination with some vertical bending of centre beams andsupport bars.
Ancich et al [6] confirmed with finite element modellingthe measured natural modes and indicated that MBEJ’s werevery sensitive to damping and operational conditions wheremotor vehicle tyre impacts to successive centre beams werein-phase or notionally in-phase. In the worst combination oflow damping (<5% of critical) and in-phase excitation, themodelled dynamic amplification factor was as high as 11.
3.0 MEASUREMENT PROCEDURETo test the hypothesis, simultaneous noise and vibrationmeasurements, at the Georges River (Tom Ugly’s) and AnzacBridges, were recorded and analysed. Vibration data wereobtained from an accelerometer attached to a transverse beam(centre beam) of the MBEJ. Noise data were obtained from aprecision Sound Level Meter located inside the void spacewithin the bridge abutment directly beneath the MBEJ and atexternal locations.
The simultaneous noise and vibration data were recordedonto a Sony Model PC 208A DAT recorder using a Bruel &Kjaer Type 2260 (Investigator) Sound Level Meter, Type 4370Accelerometer and Type 2635 Charge Amplifier andsubsequently analysed using a OROS Type OR25 FFTanalyser.
4.0 RESULTS & DISCUSSIONMeasurements were initially made at the Georges River (TomUgly’s) Bridge and the narrow band frequency analysis of thevibration data indicated the presence of a small number ofdiscrete frequencies generally in the range 50-150 Hz.
It was believed that these frequencies were likely to be thevertical and/or horizontal bending frequencies for thetransverse beams (tyre contacting) of the modular expansionjoint. Figure 3 shows the vibration spectrum of a typical
Table 1 Calculated and Measured Natural Frequencies - Georges River (Tom Ugly’s) Bridge
Notes: (1) As the precise boundary conditions for the Georges River (Tom Ugly’s) Bridge joint are not known, some assumptions were made. The Modenumbers associated with the various frequencies reflect the range of assumptions. Numbers in brackets refer to the calculated mode number.(2) Calculated frequencies are considered correct ± 10% due to assumption uncertainties.(3) Bracketed numbers following mode type refer to the calculated mode number.
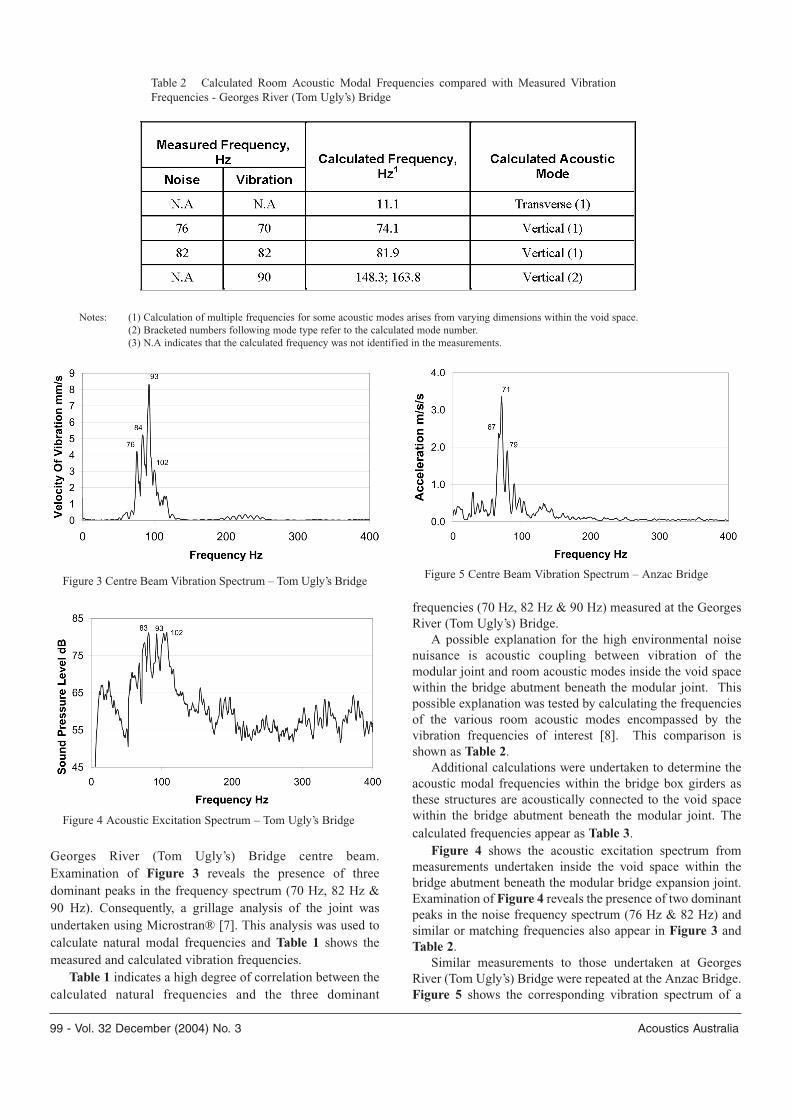
99 - Vol. 32 December (2004) No. 3 Acoustics Australia
Georges River (Tom Ugly’s) Bridge centre beam.Examination of Figure 3 reveals the presence of threedominant peaks in the frequency spectrum (70 Hz, 82 Hz &90 Hz). Consequently, a grillage analysis of the joint wasundertaken using Microstran® [7]. This analysis was used tocalculate natural modal frequencies and Table 1 shows themeasured and calculated vibration frequencies.
Table 1 indicates a high degree of correlation between thecalculated natural frequencies and the three dominant
frequencies (70 Hz, 82 Hz & 90 Hz) measured at the GeorgesRiver (Tom Ugly’s) Bridge.
A possible explanation for the high environmental noisenuisance is acoustic coupling between vibration of themodular joint and room acoustic modes inside the void spacewithin the bridge abutment beneath the modular joint. Thispossible explanation was tested by calculating the frequenciesof the various room acoustic modes encompassed by thevibration frequencies of interest [8]. This comparison isshown as Table 2.
Additional calculations were undertaken to determine theacoustic modal frequencies within the bridge box girders asthese structures are acoustically connected to the void spacewithin the bridge abutment beneath the modular joint. Thecalculated frequencies appear as Table 3.
Figure 4 shows the acoustic excitation spectrum frommeasurements undertaken inside the void space within thebridge abutment beneath the modular bridge expansion joint.Examination of Figure 4 reveals the presence of two dominantpeaks in the noise frequency spectrum (76 Hz & 82 Hz) andsimilar or matching frequencies also appear in Figure 3 andTable 2.
Similar measurements to those undertaken at GeorgesRiver (Tom Ugly’s) Bridge were repeated at the Anzac Bridge.Figure 5 shows the corresponding vibration spectrum of a
Notes: (1) Calculation of multiple frequencies for some acoustic modes arises from varying dimensions within the void space.(2) Bracketed numbers following mode type refer to the calculated mode number.(3) N.A indicates that the calculated frequency was not identified in the measurements.
Table 2 Calculated Room Acoustic Modal Frequencies compared with Measured VibrationFrequencies - Georges River (Tom Ugly’s) Bridge
Figure 3 Centre Beam Vibration Spectrum – Tom Ugly’s Bridge
Figure 4 Acoustic Excitation Spectrum – Tom Ugly’s Bridge
Figure 5 Centre Beam Vibration Spectrum – Anzac Bridge
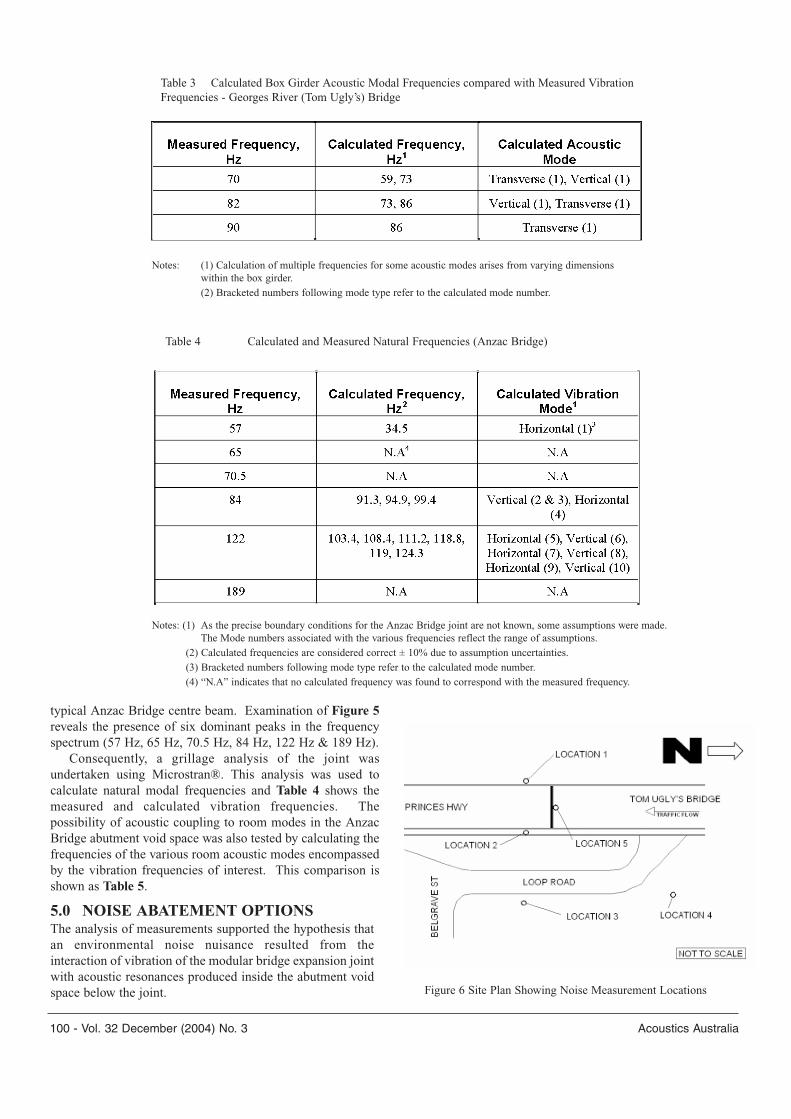
100 - Vol. 32 December (2004) No. 3 Acoustics Australia
typical Anzac Bridge centre beam. Examination of Figure 5reveals the presence of six dominant peaks in the frequencyspectrum (57 Hz, 65 Hz, 70.5 Hz, 84 Hz, 122 Hz & 189 Hz).
Consequently, a grillage analysis of the joint wasundertaken using Microstran®. This analysis was used tocalculate natural modal frequencies and Table 4 shows themeasured and calculated vibration frequencies. Thepossibility of acoustic coupling to room modes in the AnzacBridge abutment void space was also tested by calculating thefrequencies of the various room acoustic modes encompassedby the vibration frequencies of interest. This comparison isshown as Table 5.
5.0 NOISE ABATEMENT OPTIONSThe analysis of measurements supported the hypothesis thatan environmental noise nuisance resulted from theinteraction of vibration of the modular bridge expansion jointwith acoustic resonances produced inside the abutment voidspace below the joint.
Table 3 Calculated Box Girder Acoustic Modal Frequencies compared with Measured VibrationFrequencies - Georges River (Tom Ugly’s) Bridge
Notes: (1) Calculation of multiple frequencies for some acoustic modes arises from varying dimensionswithin the box girder.(2) Bracketed numbers following mode type refer to the calculated mode number.
Table 4 Calculated and Measured Natural Frequencies (Anzac Bridge)
Notes: (1) As the precise boundary conditions for the Anzac Bridge joint are not known, some assumptions were made. The Mode numbers associated with the various frequencies reflect the range of assumptions.
(2) Calculated frequencies are considered correct ± 10% due to assumption uncertainties.(3) Bracketed numbers following mode type refer to the calculated mode number.(4) “N.A” indicates that no calculated frequency was found to correspond with the measured frequency.
Figure 6 Site Plan Showing Noise Measurement Locations
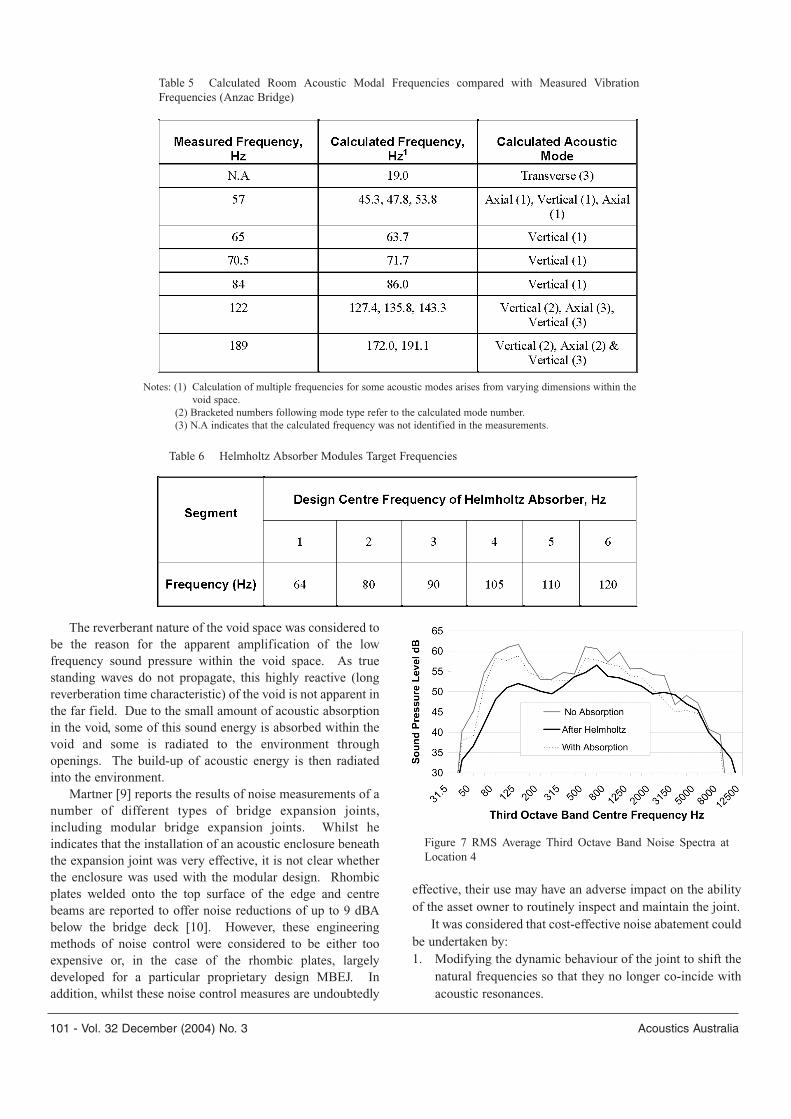
101 - Vol. 32 December (2004) No. 3 Acoustics Australia
The reverberant nature of the void space was considered tobe the reason for the apparent amplification of the lowfrequency sound pressure within the void space. As truestanding waves do not propagate, this highly reactive (longreverberation time characteristic) of the void is not apparent inthe far field. Due to the small amount of acoustic absorptionin the void, some of this sound energy is absorbed within thevoid and some is radiated to the environment throughopenings. The build-up of acoustic energy is then radiatedinto the environment.
Martner [9] reports the results of noise measurements of anumber of different types of bridge expansion joints,including modular bridge expansion joints. Whilst heindicates that the installation of an acoustic enclosure beneaththe expansion joint was very effective, it is not clear whetherthe enclosure was used with the modular design. Rhombicplates welded onto the top surface of the edge and centrebeams are reported to offer noise reductions of up to 9 dBAbelow the bridge deck [10]. However, these engineeringmethods of noise control were considered to be either tooexpensive or, in the case of the rhombic plates, largelydeveloped for a particular proprietary design MBEJ. Inaddition, whilst these noise control measures are undoubtedly
effective, their use may have an adverse impact on the abilityof the asset owner to routinely inspect and maintain the joint.
It was considered that cost-effective noise abatement couldbe undertaken by:1. Modifying the dynamic behaviour of the joint to shift the
natural frequencies so that they no longer co-incide withacoustic resonances.
Table 5 Calculated Room Acoustic Modal Frequencies compared with Measured VibrationFrequencies (Anzac Bridge)
Notes: (1) Calculation of multiple frequencies for some acoustic modes arises from varying dimensions within thevoid space.
(2) Bracketed numbers following mode type refer to the calculated mode number.(3) N.A indicates that the calculated frequency was not identified in the measurements.
Table 6 Helmholtz Absorber Modules Target Frequencies
Figure 7 RMS Average Third Octave Band Noise Spectra atLocation 4
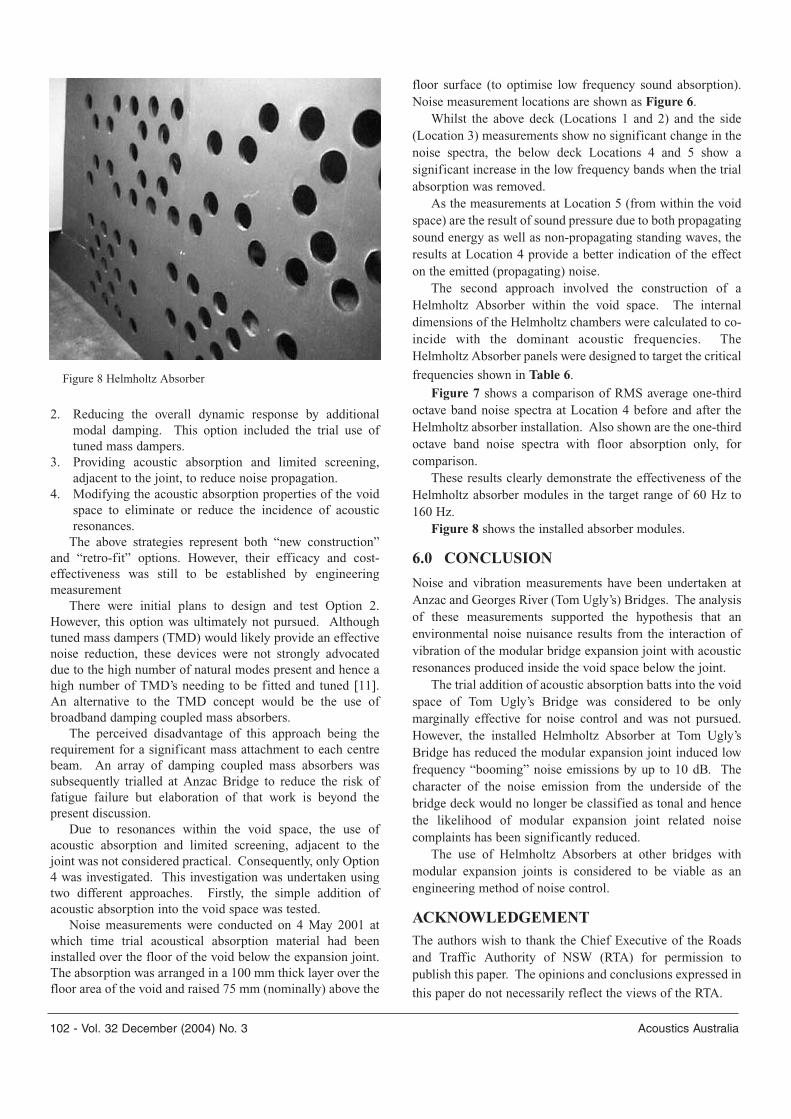
102 - Vol. 32 December (2004) No. 3 Acoustics Australia
2. Reducing the overall dynamic response by additionalmodal damping. This option included the trial use oftuned mass dampers.
3. Providing acoustic absorption and limited screening,adjacent to the joint, to reduce noise propagation.
4. Modifying the acoustic absorption properties of the voidspace to eliminate or reduce the incidence of acousticresonances.
The above strategies represent both “new construction”and “retro-fit” options. However, their efficacy and cost-effectiveness was still to be established by engineeringmeasurement
There were initial plans to design and test Option 2.However, this option was ultimately not pursued. Althoughtuned mass dampers (TMD) would likely provide an effectivenoise reduction, these devices were not strongly advocateddue to the high number of natural modes present and hence ahigh number of TMD’s needing to be fitted and tuned [11].An alternative to the TMD concept would be the use ofbroadband damping coupled mass absorbers.
The perceived disadvantage of this approach being therequirement for a significant mass attachment to each centrebeam. An array of damping coupled mass absorbers wassubsequently trialled at Anzac Bridge to reduce the risk offatigue failure but elaboration of that work is beyond thepresent discussion.
Due to resonances within the void space, the use ofacoustic absorption and limited screening, adjacent to thejoint was not considered practical. Consequently, only Option4 was investigated. This investigation was undertaken usingtwo different approaches. Firstly, the simple addition ofacoustic absorption into the void space was tested.
Noise measurements were conducted on 4 May 2001 atwhich time trial acoustical absorption material had beeninstalled over the floor of the void below the expansion joint.The absorption was arranged in a 100 mm thick layer over thefloor area of the void and raised 75 mm (nominally) above the
floor surface (to optimise low frequency sound absorption).Noise measurement locations are shown as Figure 6.
Whilst the above deck (Locations 1 and 2) and the side(Location 3) measurements show no significant change in thenoise spectra, the below deck Locations 4 and 5 show asignificant increase in the low frequency bands when the trialabsorption was removed.
As the measurements at Location 5 (from within the voidspace) are the result of sound pressure due to both propagatingsound energy as well as non-propagating standing waves, theresults at Location 4 provide a better indication of the effecton the emitted (propagating) noise.
The second approach involved the construction of aHelmholtz Absorber within the void space. The internaldimensions of the Helmholtz chambers were calculated to co-incide with the dominant acoustic frequencies. TheHelmholtz Absorber panels were designed to target the critical
frequencies shown in Table 6.Figure 7 shows a comparison of RMS average one-third
octave band noise spectra at Location 4 before and after theHelmholtz absorber installation. Also shown are the one-thirdoctave band noise spectra with floor absorption only, forcomparison.
These results clearly demonstrate the effectiveness of theHelmholtz absorber modules in the target range of 60 Hz to160 Hz.
Figure 8 shows the installed absorber modules.
6.0 CONCLUSION
Noise and vibration measurements have been undertaken atAnzac and Georges River (Tom Ugly’s) Bridges. The analysisof these measurements supported the hypothesis that anenvironmental noise nuisance results from the interaction ofvibration of the modular bridge expansion joint with acousticresonances produced inside the void space below the joint.
The trial addition of acoustic absorption batts into the voidspace of Tom Ugly’s Bridge was considered to be onlymarginally effective for noise control and was not pursued.However, the installed Helmholtz Absorber at Tom Ugly’sBridge has reduced the modular expansion joint induced lowfrequency “booming” noise emissions by up to 10 dB. Thecharacter of the noise emission from the underside of thebridge deck would no longer be classified as tonal and hencethe likelihood of modular expansion joint related noisecomplaints has been significantly reduced.
The use of Helmholtz Absorbers at other bridges withmodular expansion joints is considered to be viable as anengineering method of noise control.
ACKNOWLEDGEMENTThe authors wish to thank the Chief Executive of the Roadsand Traffic Authority of NSW (RTA) for permission topublish this paper. The opinions and conclusions expressed in
this paper do not necessarily reflect the views of the RTA.
Figure 8 Helmholtz Absorber
103 - Vol. 32 December (2004) No. 3 Acoustics Australia
REFERENCES1. R.J. Dexter, R.J. Connor & M.R. Kaczinski, “Fatigue Design of
Modular Bridge Expansion Joints” NCHRP Report 402,Transportation Research Board, National Research Council,Washington, DC, USA (1997) 128 pp.
2. C.P. Barnard & J.R. Cuninghame, “Improving the Performance ofBridge Expansion Joints: Bridge Deck Expansion Joint WorkingGroup Final Report” TRL Report 236, Transport ResearchLaboratory, Crowthorne, Berkshire, UK (1997) 92 pp.
3. E.J. Ancich, “A Study of the Environmental Noise Generation &Propagation Mechanisms of Modular Bridge Expansion Joints”RTA Environmental Technology Report No. 000203, Roads &Traffic Authority of NSW, Sydney (2000) 9 pp.
4. E.J. Ancich, G.J. Chirgwin & S.C. Brown, “Dynamic Anomaliesin a Modular Bridge Expansion Joint” J. Bridge Engrg., ASCE,(Submitted).
5. E.J. Ancich, S.C. Brown & G.J. Chirgwin, “Modular Deck Joints– Investigations into structural behavior and some implicationsfor new joints” Proc. 5th AUSTROADS Bridge Conference,Hobart, Tasmania (2004) 15 pp.
6. E.J. Ancich, S.C. Brown & G.J. Chirgwin, “Dynamic Design ofModular Bridge Expansion Joints by the Finite Element Method”J. Bridge Engrg., ASCE, (In Preparation).
7. Anon., “Microstran User Manual Version 7”, Engineering SystemsPty Ltd, Sydney (1999).
8. T.F.W. Embleton, “Mufflers” in Noise and Vibration Control –Revised Edition ed. L.L. Beranek, Institute of Noise ControlEngineering, Washington (1988) pp 362-405.
9. O. Martner, “Noise Emission of Constructions for Bridge-To-RoadCrossings” Proc. Inter-Noise 96, Liverpool, UK, 211-214 (1996).
10. Anon., “Geräuschminderung an Fahrbahnübergängen inLamellenbauweise durch wellenförmigen Fugenverlauf ” MaurerInfo Nr. 24, Maurer Söhne, Munich, Germany (2001) 10 pp (InGerman).
11. D.I.G. Jones, “Effect of Isolated Tuned Dampers on Response ofMultispan Structures” J. Aircraft, Vol. 4, No. 4, 343-346 (1967).

Appendix E
Ancich E.J., Brown S.C. and Chirgwin G.J. (2004). Modular Deck Joints –
Investigations into structural behaviour and some implications for new joints, Proc.
5th Austroads Bridge Conference, Hobart, Tasmania, Australia.

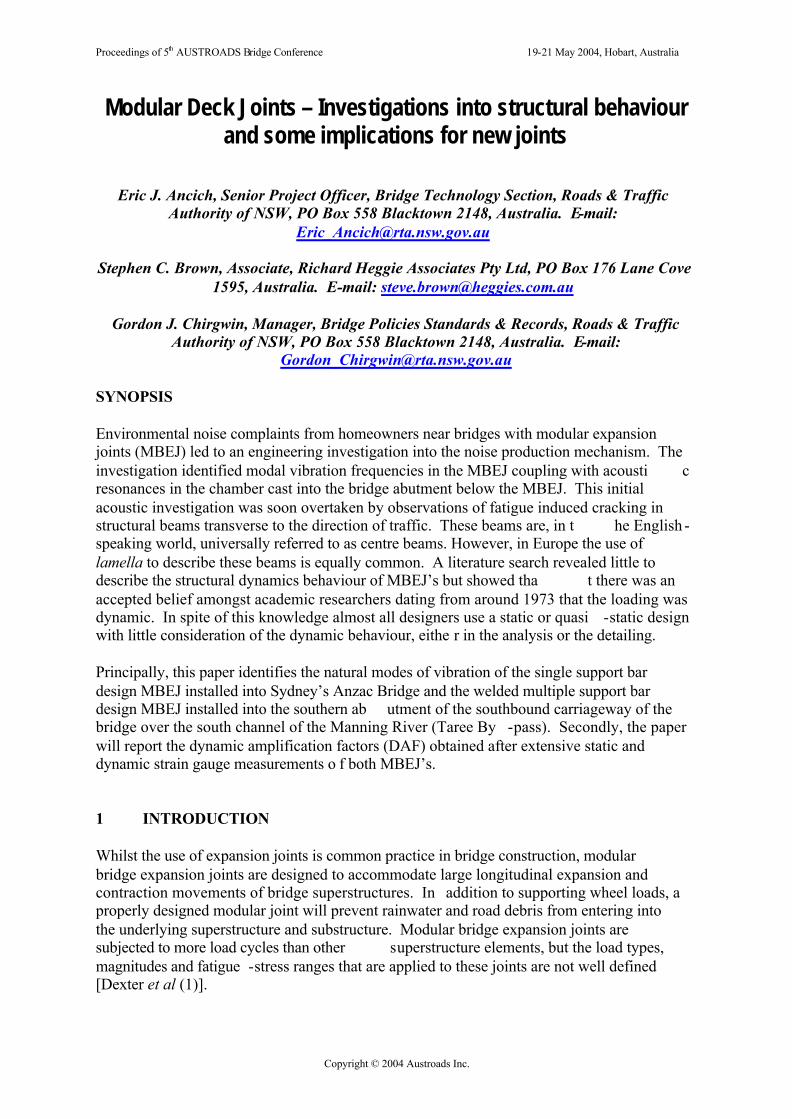
Proceedings of 5th AUSTROADS Bridge Conference 19-21 May 2004, Hobart, Australia
Copyright © 2004 Austroads Inc.
Modular Deck Joints – Investigations into structural behaviour and some implications for new joints
Eric J. Ancich, Senior Project Officer, Bridge Technology Section, Roads & Traffic Authority of NSW, PO Box 558 Blacktown 2148, Australia. E-mail:
Stephen C. Brown, Associate, Richard Heggie Associates Pty Ltd, PO Box 176 Lane Cove 1595, Australia. E-mail: [email protected]
Gordon J. Chirgwin, Manager, Bridge Policies Standards & Records, Roads & Traffic
Authority of NSW, PO Box 558 Blacktown 2148, Australia. E-mail: [email protected]
SYNOPSIS Environmental noise complaints from homeowners near bridges with modular expansion joints (MBEJ) led to an engineering investigation into the noise production mechanism. The investigation identified modal vibration frequencies in the MBEJ coupling with acousti c resonances in the chamber cast into the bridge abutment below the MBEJ. This initial acoustic investigation was soon overtaken by observations of fatigue induced cracking in structural beams transverse to the direction of traffic. These beams are, in t he English -speaking world, universally referred to as centre beams. However, in Europe the use of lamella to describe these beams is equally common. A literature search revealed little to describe the structural dynamics behaviour of MBEJ’s but showed tha t there was an accepted belief amongst academic researchers dating from around 1973 that the loading was dynamic. In spite of this knowledge almost all designers use a static or quasi -static design with little consideration of the dynamic behaviour, eithe r in the analysis or the detailing. Principally, this paper identifies the natural modes of vibration of the single support bar design MBEJ installed into Sydney’s Anzac Bridge and the welded multiple support bar design MBEJ installed into the southern ab utment of the southbound carriageway of the bridge over the south channel of the Manning River (Taree By -pass). Secondly, the paper will report the dynamic amplification factors (DAF) obtained after extensive static and dynamic strain gauge measurements o f both MBEJ’s. 1 INTRODUCTION Whilst the use of expansion joints is common practice in bridge construction, modular bridge expansion joints are designed to accommodate large longitudinal expansion and contraction movements of bridge superstructures. In addition to supporting wheel loads, a properly designed modular joint will prevent rainwater and road debris from entering into the underlying superstructure and substructure. Modular bridge expansion joints are subjected to more load cycles than other superstructure elements, but the load types, magnitudes and fatigue -stress ranges that are applied to these joints are not well defined [Dexter et al (1)].
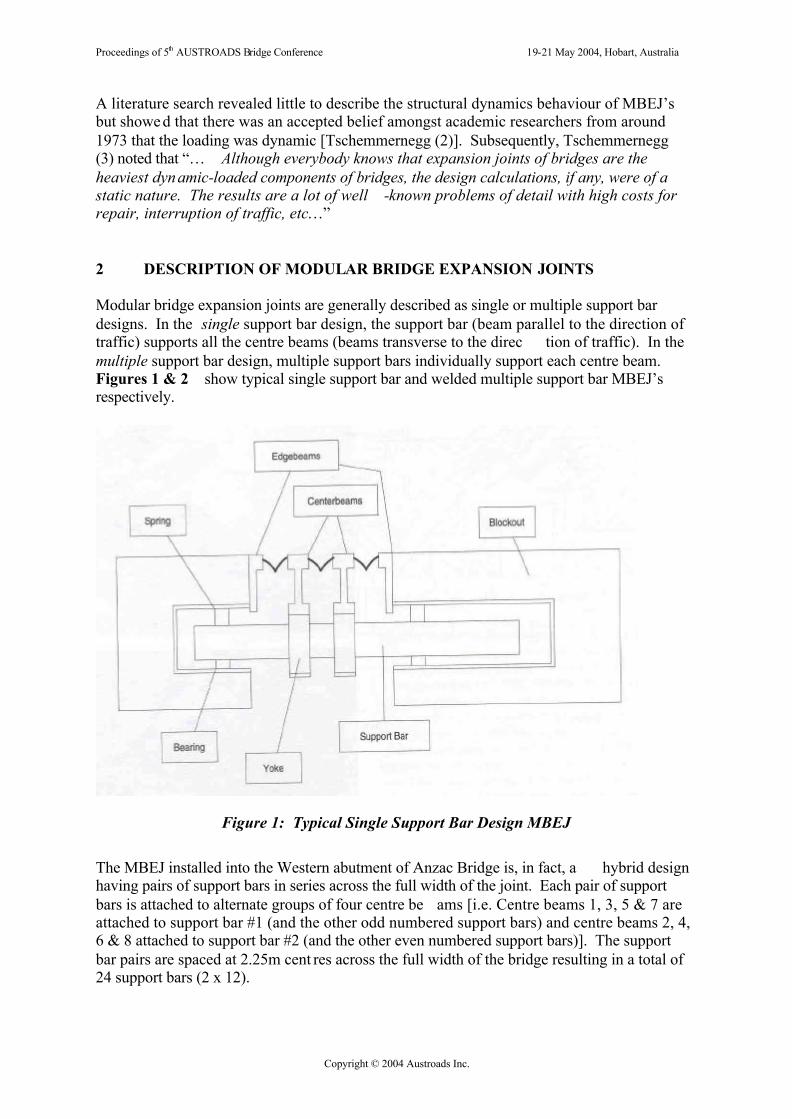
Proceedings of 5th AUSTROADS Bridge Conference 19-21 May 2004, Hobart, Australia
Copyright © 2004 Austroads Inc.
A literature search revealed little to describe the structural dynamics behaviour of MBEJ’s but showe d that there was an accepted belief amongst academic researchers from around 1973 that the loading was dynamic [Tschemmernegg (2)]. Subsequently, Tschemmernegg (3) noted that “… Although everybody knows that expansion joints of bridges are the heaviest dyn amic-loaded components of bridges, the design calculations, if any, were of a static nature. The results are a lot of well -known problems of detail with high costs for repair, interruption of traffic, etc…” 2 DESCRIPTION OF MODULAR BRIDGE EXPANSION JOINTS Modular bridge expansion joints are generally described as single or multiple support bar designs. In the single support bar design, the support bar (beam parallel to the direction of traffic) supports all the centre beams (beams transverse to the direc tion of traffic). In the multiple support bar design, multiple support bars individually support each centre beam. Figures 1 & 2 show typical single support bar and welded multiple support bar MBEJ’s respectively.
Figure 1: Typical Single Support Bar Design MBEJ
The MBEJ installed into the Western abutment of Anzac Bridge is, in fact, a hybrid design having pairs of support bars in series across the full width of the joint. Each pair of support bars is attached to alternate groups of four centre be ams [i.e. Centre beams 1, 3, 5 & 7 are attached to support bar #1 (and the other odd numbered support bars) and centre beams 2, 4, 6 & 8 attached to support bar #2 (and the other even numbered support bars)]. The support bar pairs are spaced at 2.25m cent res across the full width of the bridge resulting in a total of 24 support bars (2 x 12).
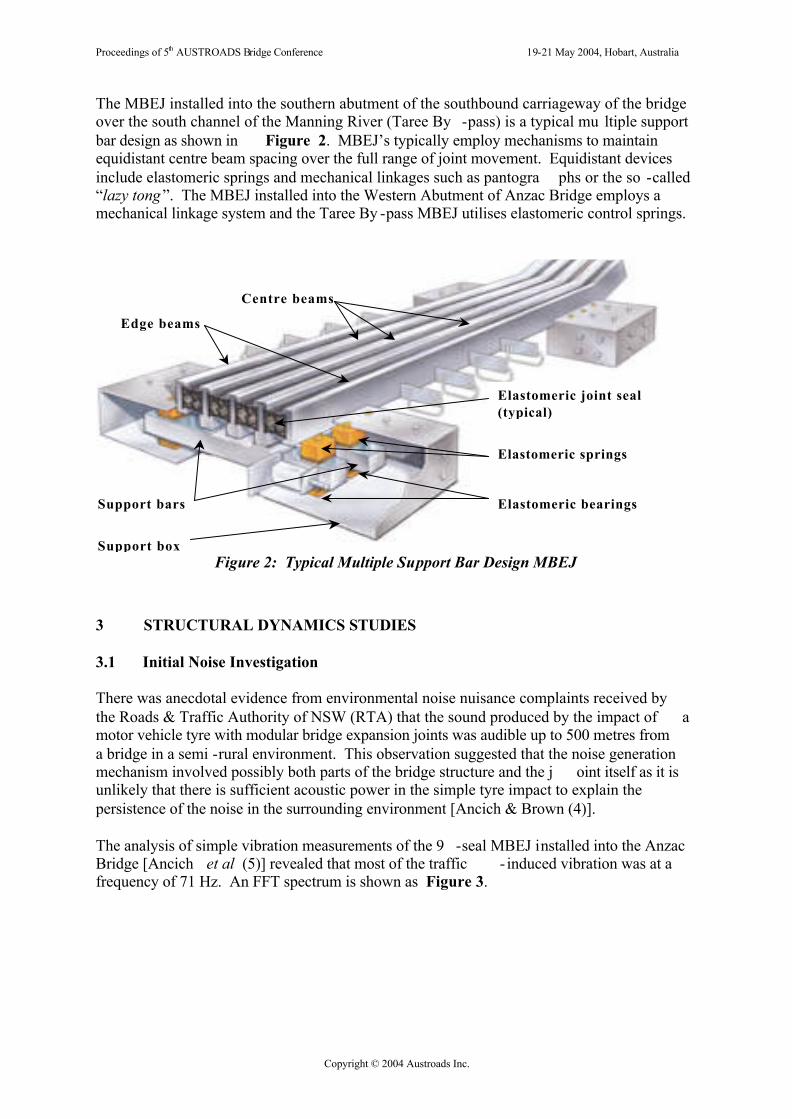
Proceedings of 5th AUSTROADS Bridge Conference 19-21 May 2004, Hobart, Australia
Copyright © 2004 Austroads Inc.
The MBEJ installed into the southern abutment of the southbound carriageway of the bridge over the south channel of the Manning River (Taree By -pass) is a typical mu ltiple support bar design as shown in Figure 2. MBEJ’s typically employ mechanisms to maintain equidistant centre beam spacing over the full range of joint movement. Equidistant devices include elastomeric springs and mechanical linkages such as pantogra phs or the so -called “lazy tong”. The MBEJ installed into the Western Abutment of Anzac Bridge employs a mechanical linkage system and the Taree By -pass MBEJ utilises elastomeric control springs.
Edge beams
Centre beams
Elastomeric springs
Support bars
Elastomeric joint seal(typical)
Elastomeric bearings
Support box Figure 2: Typical Multiple Support Bar Design MBEJ
3 STRUCTURAL DYNAMICS STUDIES 3.1 Initial Noise Investigation There was anecdotal evidence from environmental noise nuisance complaints received by the Roads & Traffic Authority of NSW (RTA) that the sound produced by the impact of a motor vehicle tyre with modular bridge expansion joints was audible up to 500 metres from a bridge in a semi -rural environment. This observation suggested that the noise generation mechanism involved possibly both parts of the bridge structure and the j oint itself as it is unlikely that there is sufficient acoustic power in the simple tyre impact to explain the persistence of the noise in the surrounding environment [Ancich & Brown (4)]. The analysis of simple vibration measurements of the 9 -seal MBEJ installed into the Anzac Bridge [Ancich et al (5)] revealed that most of the traffic - induced vibration was at a frequency of 71 Hz. An FFT spectrum is shown as Figure 3.
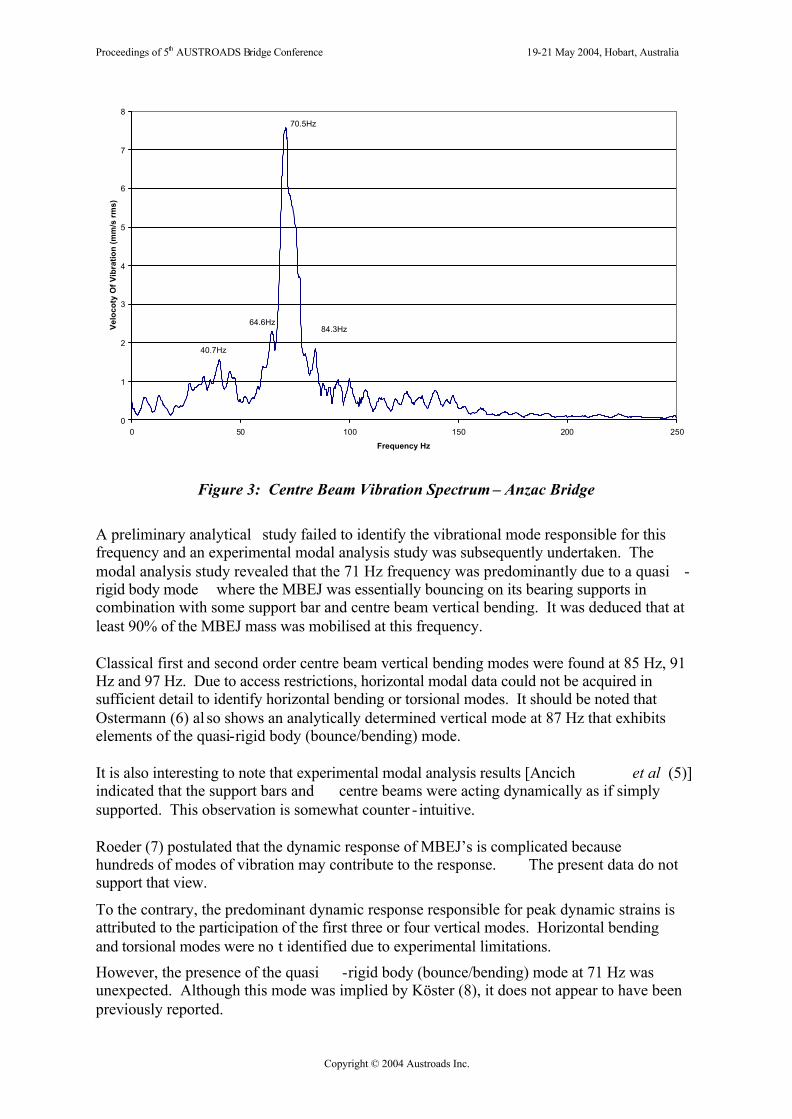
Proceedings of 5th AUSTROADS Bridge Conference 19-21 May 2004, Hobart, Australia
Copyright © 2004 Austroads Inc.
0
1
2
3
4
5
6
7
8
0 50 100 150 200 250
Frequency Hz
Velo
coty
Of V
ibra
tion
(mm
/s rm
s)70.5Hz
84.3Hz64.6Hz
40.7Hz
Figure 3: Centre Beam Vibration Spectrum – Anzac Bridge A preliminary analytical study failed to identify the vibrational mode responsible for this frequency and an experimental modal analysis study was subsequently undertaken. The modal analysis study revealed that the 71 Hz frequency was predominantly due to a quasi -rigid body mode where the MBEJ was essentially bouncing on its bearing supports in combination with some support bar and centre beam vertical bending. It was deduced that at least 90% of the MBEJ mass was mobilised at this frequency. Classical first and second order centre beam vertical bending modes were found at 85 Hz, 91 Hz and 97 Hz. Due to access restrictions, horizontal modal data could not be acquired in sufficient detail to identify horizontal bending or torsional modes. It should be noted that Ostermann (6) al so shows an analytically determined vertical mode at 87 Hz that exhibits elements of the quasi-rigid body (bounce/bending) mode. It is also interesting to note that experimental modal analysis results [Ancich et al (5)] indicated that the support bars and centre beams were acting dynamically as if simply supported. This observation is somewhat counter - intuitive. Roeder (7) postulated that the dynamic response of MBEJ’s is complicated because hundreds of modes of vibration may contribute to the response. The present data do not support that view.
To the contrary, the predominant dynamic response responsible for peak dynamic strains is attributed to the participation of the first three or four vertical modes. Horizontal bending and torsional modes were no t identified due to experimental limitations. However, the presence of the quasi -rigid body (bounce/bending) mode at 71 Hz was unexpected. Although this mode was implied by Köster (8), it does not appear to have been previously reported.
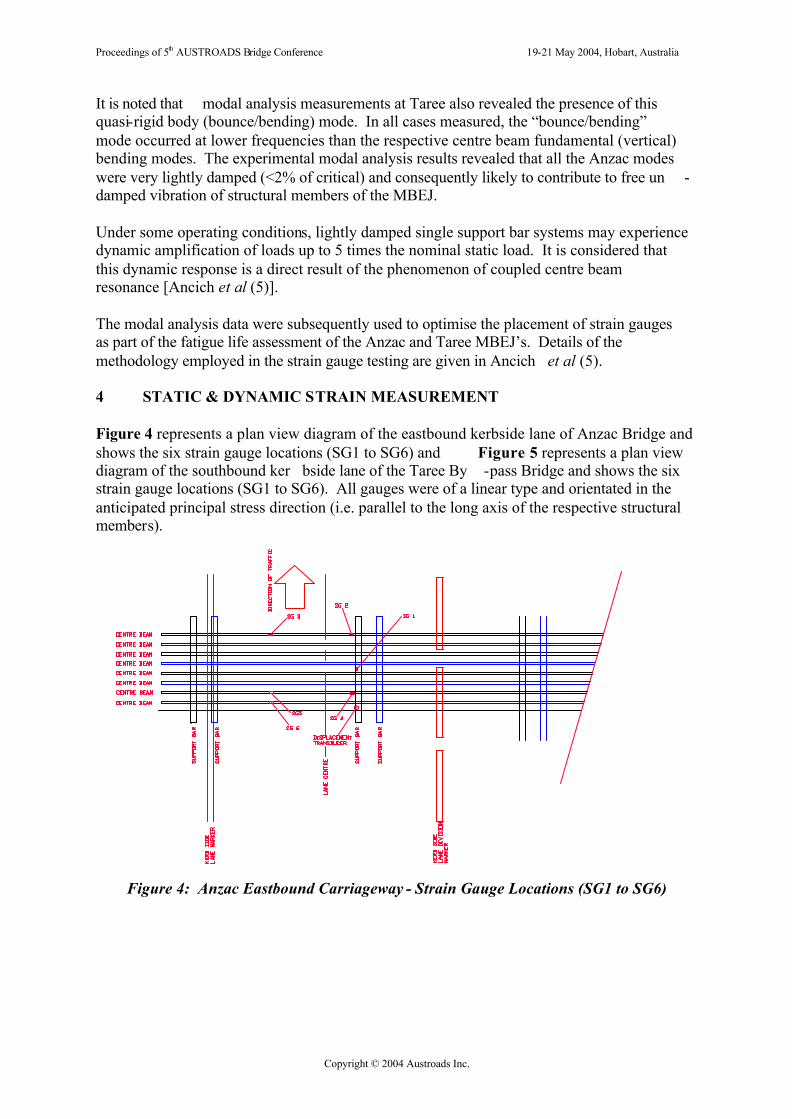
Proceedings of 5th AUSTROADS Bridge Conference 19-21 May 2004, Hobart, Australia
Copyright © 2004 Austroads Inc.
It is noted that modal analysis measurements at Taree also revealed the presence of this quasi-rigid body (bounce/bending) mode. In all cases measured, the “bounce/bending” mode occurred at lower frequencies than the respective centre beam fundamental (vertical) bending modes. The experimental modal analysis results revealed that all the Anzac modes were very lightly damped (<2% of critical) and consequently likely to contribute to free un -damped vibration of structural members of the MBEJ. Under some operating conditions, lightly damped single support bar systems may experience dynamic amplification of loads up to 5 times the nominal static load. It is considered that this dynamic response is a direct result of the phenomenon of coupled centre beam resonance [Ancich et al (5)]. The modal analysis data were subsequently used to optimise the placement of strain gauges as part of the fatigue life assessment of the Anzac and Taree MBEJ’s. Details of the methodology employed in the strain gauge testing are given in Ancich et al (5). 4 STATIC & DYNAMIC STRAIN MEASUREMENT Figure 4 represents a plan view diagram of the eastbound kerbside lane of Anzac Bridge and shows the six strain gauge locations (SG1 to SG6) and Figure 5 represents a plan view diagram of the southbound ker bside lane of the Taree By -pass Bridge and shows the six strain gauge locations (SG1 to SG6). All gauges were of a linear type and orientated in the anticipated principal stress direction (i.e. parallel to the long axis of the respective structural members).
Figure 4: Anzac Eastbound Carriageway - Strain Gauge Locations (SG1 to SG6)
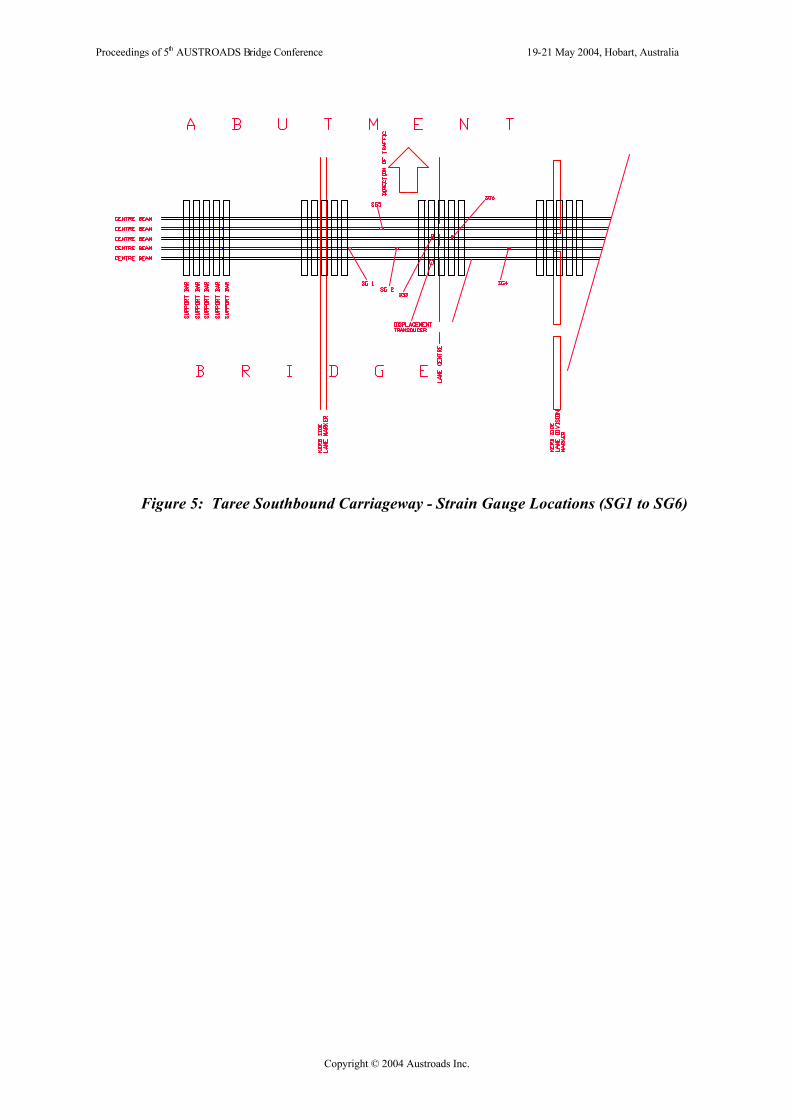
Proceedings of 5th AUSTROADS Bridge Conference 19-21 May 2004, Hobart, Australia
Copyright © 2004 Austroads Inc.
Figure 5: Taree Southbound Carriageway - Strain Gauge Locations (SG1 to SG6)
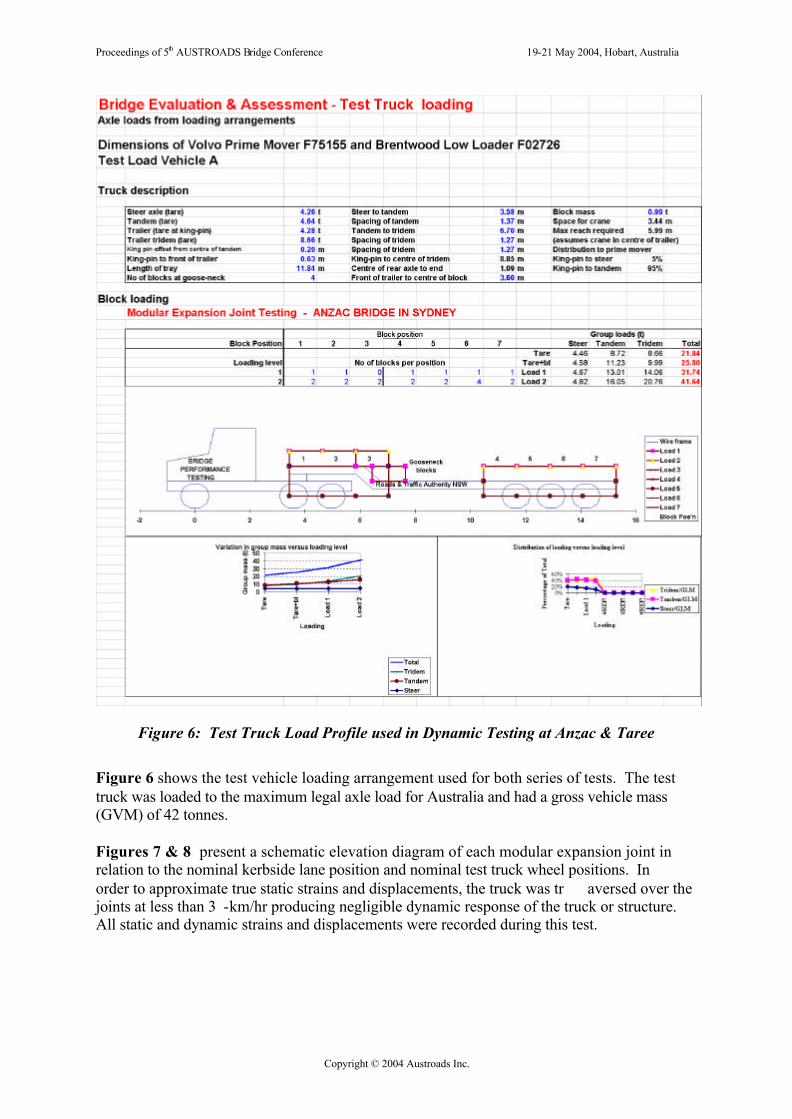
Proceedings of 5th AUSTROADS Bridge Conference 19-21 May 2004, Hobart, Australia
Copyright © 2004 Austroads Inc.
Figure 6: Test Truck Load Profile used in Dynamic Testing at Anzac & Taree
Figure 6 shows the test vehicle loading arrangement used for both series of tests. The test truck was loaded to the maximum legal axle load for Australia and had a gross vehicle mass (GVM) of 42 tonnes. Figures 7 & 8 present a schematic elevation diagram of each modular expansion joint in relation to the nominal kerbside lane position and nominal test truck wheel positions. In order to approximate true static strains and displacements, the truck was tr aversed over the joints at less than 3 -km/hr producing negligible dynamic response of the truck or structure. All static and dynamic strains and displacements were recorded during this test.
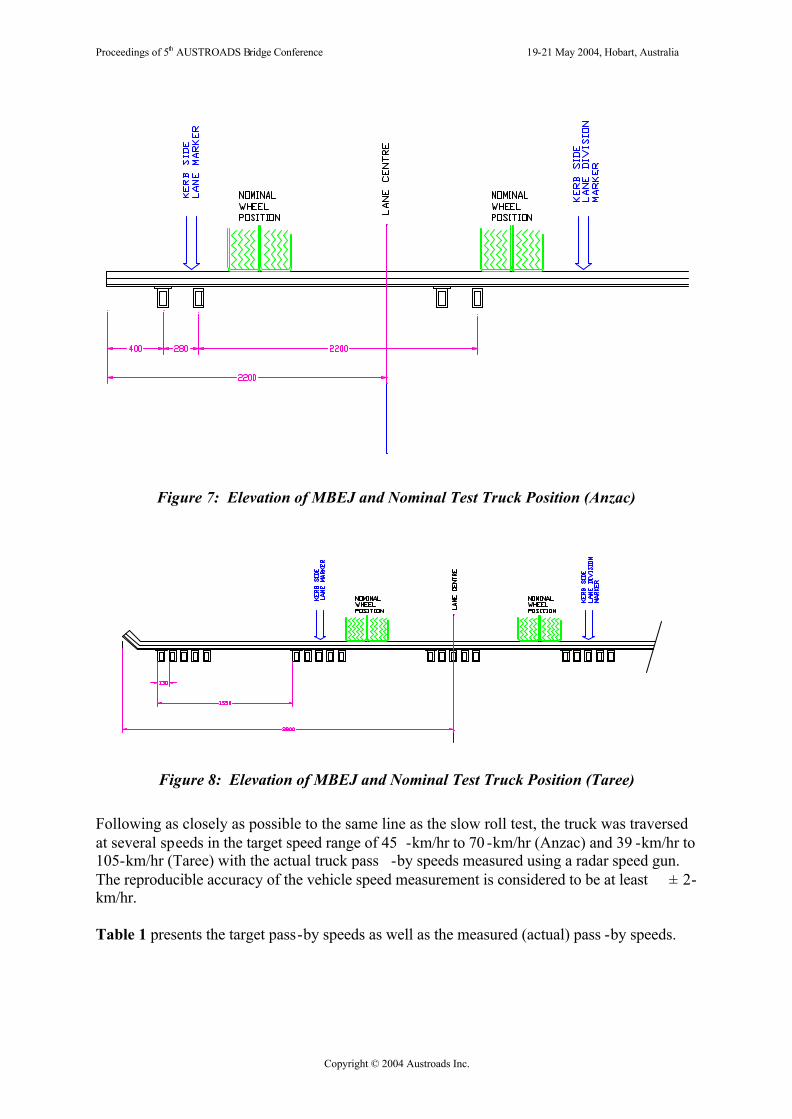
Proceedings of 5th AUSTROADS Bridge Conference 19-21 May 2004, Hobart, Australia
Copyright © 2004 Austroads Inc.
Figure 7: Elevation of MBEJ and Nominal Test Truck Position (Anzac)
Figure 8: Elevation of MBEJ and Nominal Test Truck Position (Taree) Following as closely as possible to the same line as the slow roll test, the truck was traversed at several speeds in the target speed range of 45 -km/hr to 70 -km/hr (Anzac) and 39 -km/hr to 105-km/hr (Taree) with the actual truck pass -by speeds measured using a radar speed gun. The reproducible accuracy of the vehicle speed measurement is considered to be at least ± 2-km/hr. Table 1 presents the target pass-by speeds as well as the measured (actual) pass -by speeds.
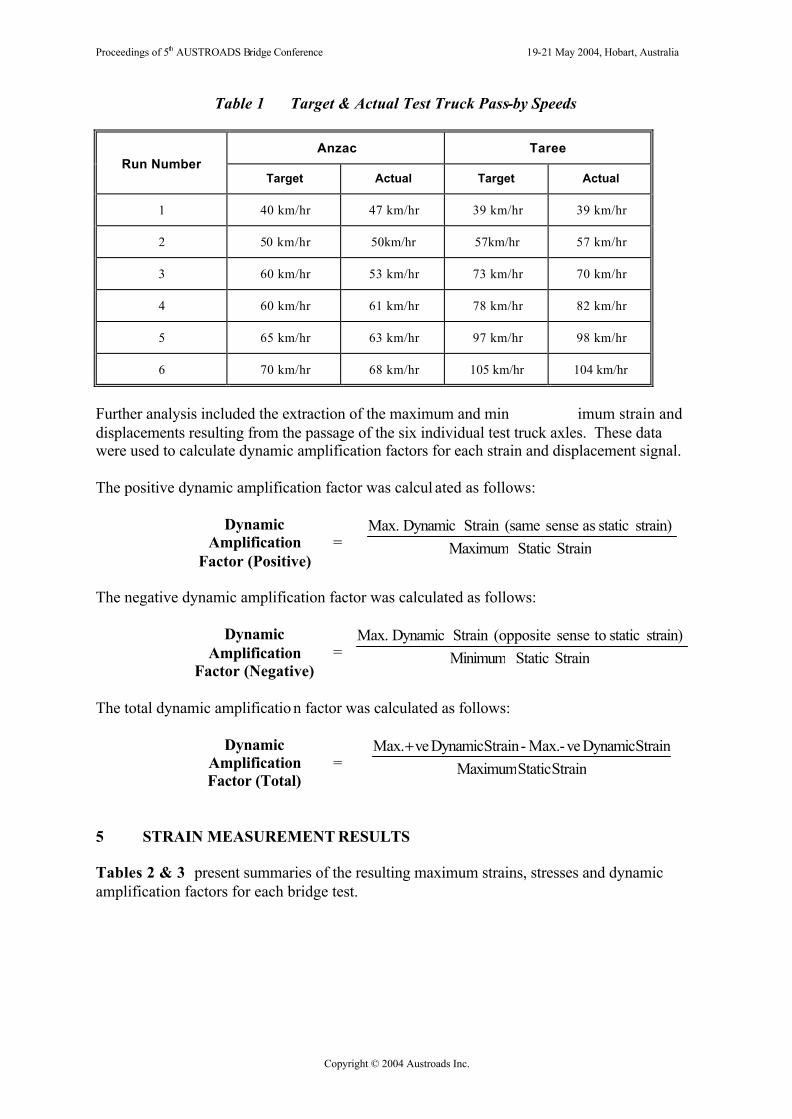
Proceedings of 5th AUSTROADS Bridge Conference 19-21 May 2004, Hobart, Australia
Copyright © 2004 Austroads Inc.
Table 1 Target & Actual Test Truck Pass-by Speeds
Anzac Taree Run Number
Target Actual Target Actual
1 40 km/hr 47 km/hr 39 km/hr 39 km/hr
2 50 km/hr 50km/hr 57km/hr 57 km/hr
3 60 km/hr 53 km/hr 73 km/hr 70 km/hr
4 60 km/hr 61 km/hr 78 km/hr 82 km/hr
5 65 km/hr 63 km/hr 97 km/hr 98 km/hr
6 70 km/hr 68 km/hr 105 km/hr 104 km/hr
Further analysis included the extraction of the maximum and min imum strain and displacements resulting from the passage of the six individual test truck axles. These data were used to calculate dynamic amplification factors for each strain and displacement signal. The positive dynamic amplification factor was calcul ated as follows:
Dynamic Amplification
Factor (Positive) = Strain Static Maximum
strain) static as sense (sameStrain Dynamic Max.
The negative dynamic amplification factor was calculated as follows:
Dynamic Amplification
Factor (Negative) = Strain Static Minimum
strain) static tosense (oppositeStrain Dynamic Max.
The total dynamic amplificatio n factor was calculated as follows:
Dynamic Amplification Factor (Total)
= Strain Static MaximumStrain Dynamic ve- Max. -Strain Dynamic ve Max.+
5 STRAIN MEASUREMENT RESULTS Tables 2 & 3 present summaries of the resulting maximum strains, stresses and dynamic amplification factors for each bridge test.
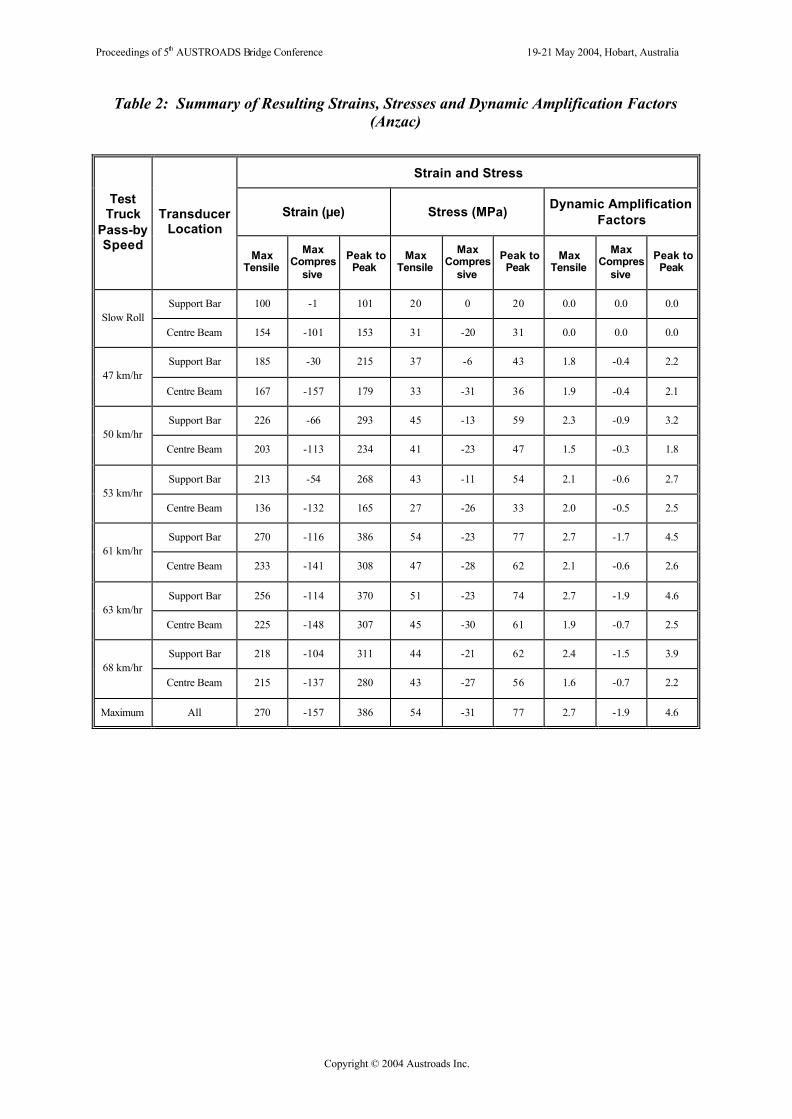
Proceedings of 5th AUSTROADS Bridge Conference 19-21 May 2004, Hobart, Australia
Copyright © 2004 Austroads Inc.
Table 2: Summary of Resulting Strains, Stresses and Dynamic Amplification Factors (Anzac)
Strain and Stress
Strain (µe) Stress (MPa) Dynamic Amplification Factors
Test Truck
Pass-by Speed
Transducer Location
Max Tensile
Max Compres
sive Peak to Peak
Max Tensile
Max Compres
sive Peak to Peak
Max Tensile
Max Compres
sive Peak to Peak
Support Bar 100 -1 101 20 0 20 0.0 0.0 0.0 Slow Roll
Centre Beam 154 -101 153 31 -20 31 0.0 0.0 0.0
Support Bar 185 -30 215 37 -6 43 1.8 -0.4 2.2 47 km/hr
Centre Beam 167 -157 179 33 -31 36 1.9 -0.4 2.1
Support Bar 226 -66 293 45 -13 59 2.3 -0.9 3.2 50 km/hr
Centre Beam 203 -113 234 41 -23 47 1.5 -0.3 1.8
Support Bar 213 -54 268 43 -11 54 2.1 -0.6 2.7 53 km/hr
Centre Beam 136 -132 165 27 -26 33 2.0 -0.5 2.5
Support Bar 270 -116 386 54 -23 77 2.7 -1.7 4.5 61 km/hr
Centre Beam 233 -141 308 47 -28 62 2.1 -0.6 2.6
Support Bar 256 -114 370 51 -23 74 2.7 -1.9 4.6 63 km/hr
Centre Beam 225 -148 307 45 -30 61 1.9 -0.7 2.5
Support Bar 218 -104 311 44 -21 62 2.4 -1.5 3.9 68 km/hr
Centre Beam 215 -137 280 43 -27 56 1.6 -0.7 2.2
Maximum All 270 -157 386 54 -31 77 2.7 -1.9 4.6
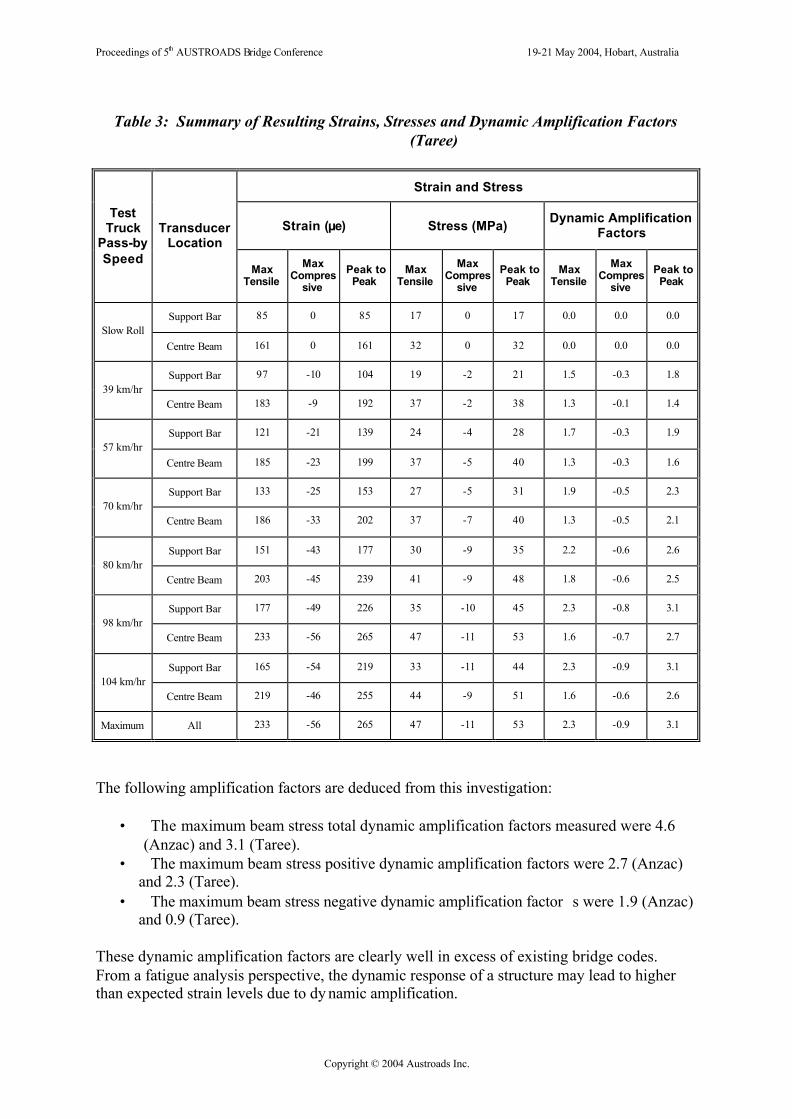
Proceedings of 5th AUSTROADS Bridge Conference 19-21 May 2004, Hobart, Australia
Copyright © 2004 Austroads Inc.
Table 3: Summary of Resulting Strains, Stresses and Dynamic Amplification Factors
(Taree)
Strain and Stress
Strain (µe) Stress (MPa) Dynamic Amplification Factors
Test Truck
Pass-by Speed
Transducer Location
Max Tensile
Max Compres
sive Peak to Peak
Max Tensile
Max Compres
sive Peak to Peak
Max Tensile
Max Compres
sive Peak to Peak
Support Bar 85 0 85 17 0 17 0.0 0.0 0.0 Slow Roll
Centre Beam 161 0 161 32 0 32 0.0 0.0 0.0
Support Bar 97 -10 104 19 -2 21 1.5 -0.3 1.8 39 km/hr
Centre Beam 183 -9 192 37 -2 38 1.3 -0.1 1.4
Support Bar 121 -21 139 24 -4 28 1.7 -0.3 1.9 57 km/hr
Centre Beam 185 -23 199 37 -5 40 1.3 -0.3 1.6
Support Bar 133 -25 153 27 -5 31 1.9 -0.5 2.3 70 km/hr
Centre Beam 186 -33 202 37 -7 40 1.3 -0.5 2.1
Support Bar 151 -43 177 30 -9 35 2.2 -0.6 2.6 80 km/hr
Centre Beam 203 -45 239 41 -9 48 1.8 -0.6 2.5
Support Bar 177 -49 226 35 -10 45 2.3 -0.8 3.1 98 km/hr
Centre Beam 233 -56 265 47 -11 53 1.6 -0.7 2.7
Support Bar 165 -54 219 33 -11 44 2.3 -0.9 3.1 104 km/hr
Centre Beam 219 -46 255 44 -9 51 1.6 -0.6 2.6
Maximum All 233 -56 265 47 -11 53 2.3 -0.9 3.1
The following amplification factors are deduced from this investigation:
• The maximum beam stress total dynamic amplification factors measured were 4.6 (Anzac) and 3.1 (Taree).
• The maximum beam stress positive dynamic amplification factors were 2.7 (Anzac) and 2.3 (Taree).
• The maximum beam stress negative dynamic amplification factor s were 1.9 (Anzac) and 0.9 (Taree).
These dynamic amplification factors are clearly well in excess of existing bridge codes. From a fatigue analysis perspective, the dynamic response of a structure may lead to higher than expected strain levels due to dy namic amplification.
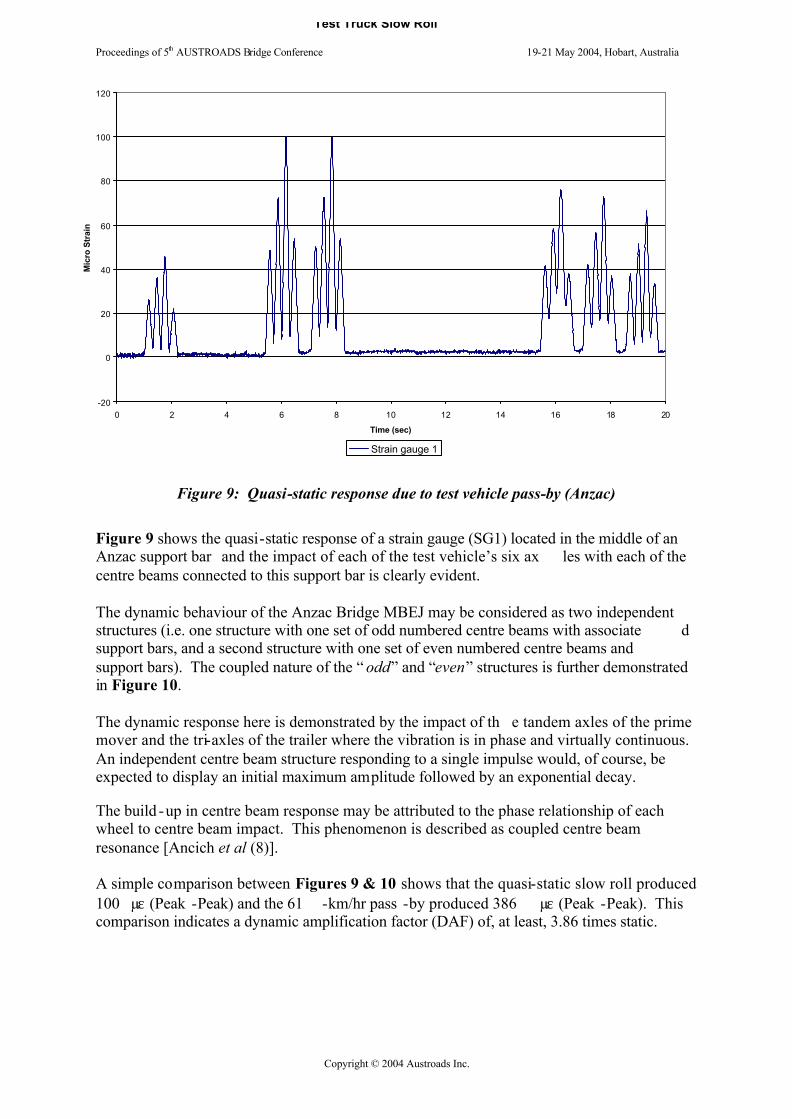
Proceedings of 5th AUSTROADS Bridge Conference 19-21 May 2004, Hobart, Australia
Copyright © 2004 Austroads Inc.
Figure 9: Quasi-static response due to test vehicle pass-by (Anzac)
Figure 9 shows the quasi-static response of a strain gauge (SG1) located in the middle of an Anzac support bar and the impact of each of the test vehicle’s six ax les with each of the centre beams connected to this support bar is clearly evident. The dynamic behaviour of the Anzac Bridge MBEJ may be considered as two independent structures (i.e. one structure with one set of odd numbered centre beams with associate d support bars, and a second structure with one set of even numbered centre beams and support bars). The coupled nature of the “ odd” and “even” structures is further demonstrated in Figure 10. The dynamic response here is demonstrated by the impact of th e tandem axles of the prime mover and the tri-axles of the trailer where the vibration is in phase and virtually continuous. An independent centre beam structure responding to a single impulse would, of course, be expected to display an initial maximum amplitude followed by an exponential decay. The build -up in centre beam response may be attributed to the phase relationship of each wheel to centre beam impact. This phenomenon is described as coupled centre beam resonance [Ancich et al (8)]. A simple comparison between Figures 9 & 10 shows that the quasi-static slow roll produced 100 µε (Peak -Peak) and the 61 -km/hr pass -by produced 386 µε (Peak -Peak). This comparison indicates a dynamic amplification factor (DAF) of, at least, 3.86 times static.
Test Truck Slow Roll
-20
0
20
40
60
80
100
120
0 2 4 6 8 10 12 14 16 18 20
Time (sec)
Mic
ro S
trai
n
Strain gauge 1
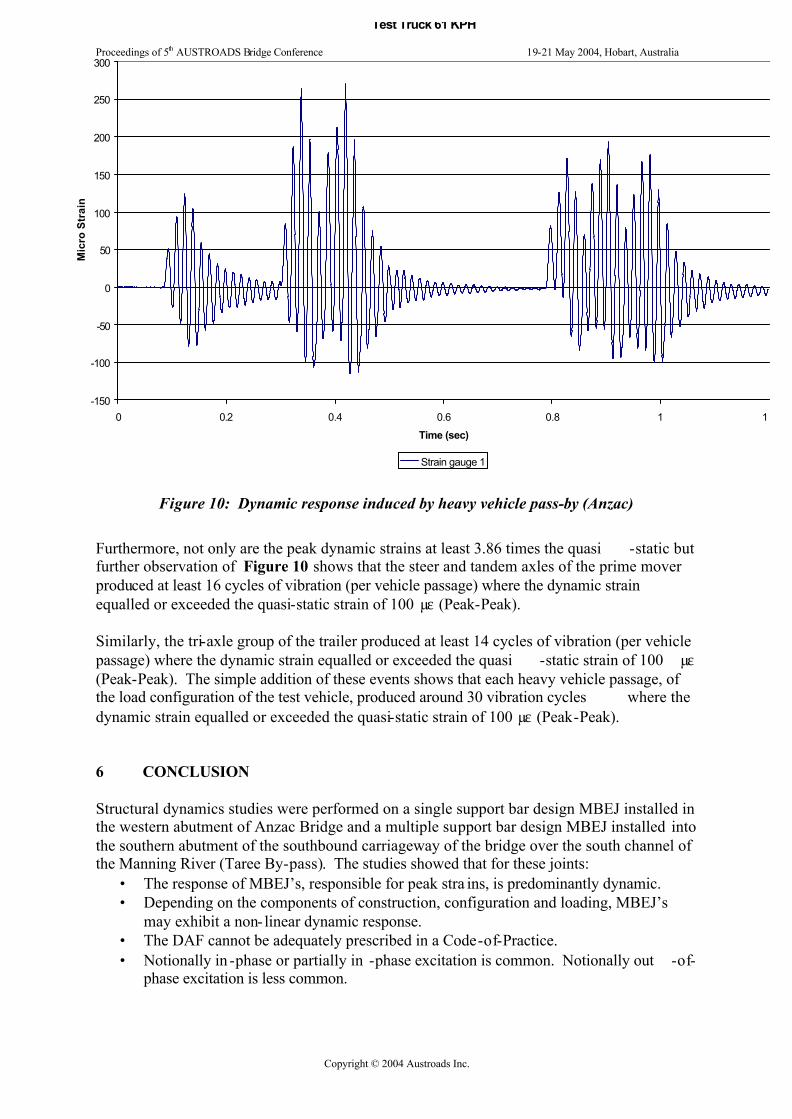
Proceedings of 5th AUSTROADS Bridge Conference 19-21 May 2004, Hobart, Australia
Copyright © 2004 Austroads Inc.
Figure 10: Dynamic response induced by heavy vehicle pass-by (Anzac)
Furthermore, not only are the peak dynamic strains at least 3.86 times the quasi -static but further observation of Figure 10 shows that the steer and tandem axles of the prime mover produced at least 16 cycles of vibration (per vehicle passage) where the dynamic strain equalled or exceeded the quasi-static strain of 100 µε (Peak-Peak). Similarly, the tri-axle group of the trailer produced at least 14 cycles of vibration (per vehicle passage) where the dynamic strain equalled or exceeded the quasi -static strain of 100 µε (Peak-Peak). The simple addition of these events shows that each heavy vehicle passage, of the load configuration of the test vehicle, produced around 30 vibration cycles where the dynamic strain equalled or exceeded the quasi-static strain of 100 µε (Peak-Peak). 6 CONCLUSION Structural dynamics studies were performed on a single support bar design MBEJ installed in the western abutment of Anzac Bridge and a multiple support bar design MBEJ installed into the southern abutment of the southbound carriageway of the bridge over the south channel of the Manning River (Taree By-pass). The studies showed that for these joints:
• The response of MBEJ’s, responsible for peak stra ins, is predominantly dynamic. • Depending on the components of construction, configuration and loading, MBEJ’s
may exhibit a non- linear dynamic response. • The DAF cannot be adequately prescribed in a Code-of-Practice. • Notionally in -phase or partially in -phase excitation is common. Notionally out -of-
phase excitation is less common.
Test Truck 61 KPH
-150
-100
-50
0
50
100
150
200
250
300
0 0.2 0.4 0.6 0.8 1 1.2
Time (sec)
Mic
ro S
trai
n
Strain gauge 1

Proceedings of 5th AUSTROADS Bridge Conference 19-21 May 2004, Hobart, Australia
Copyright © 2004 Austroads Inc.
• The DAF for single support bar design MBEJ’s (and variants thereof) is damping dependent and has a lower limit of 2.5 and an upper limit exceeding 5.
• The DAF for multiple support b ar design MBEJ’s is also damping dependent (but to a lesser extent) and has a lower limit of 2 and an upper limit exceeding 3.
• However, for any joint (both single & multiple support bar designs) the DAF achieved in service will depend on a number of factor s including, joint configuration, number of exciting axles and the extent to which the manufacturer is able to incorporate damping into the design.
• Dynamic Finite Element Models must be used in design. The calibration must be to real loads operating at speeds that will give rise to notionally in -phase excitation.
• Steel components should be designed for infinite fatigue cycles. • It is easier to estimate the extreme values of dynamic load response than to estimate
the weighted mean value of dynamic load respo nse. Hence, design should be done using extreme values coupled with CAFL properties of steel.
The widely held assumption of quasi -static behaviour for single and multiple support bar design MBEJ’s (and variants thereof) is not sustainable and both bridge designers and modular joint suppliers must think in terms of a fully dynamic system. ACKNOWLEDGEMENT The authors wish to thank the Chief Executive of the Roads and Traffic Authority of NSW (RTA) for permission to publish this paper. The opinions and c onclusions expressed in this paper do not necessarily reflect the views of the RTA. REFERENCES 1. DEXTER R.J., CONNOR R.J. & KACZINSKI M.R.: “Fatigue Design of Modular Bri dge
Expansion Joints ”, NCHRP Report 402, Transportation Research Board, National Research Council, 1997, 128 pp.
2. TSCHEMMERNEGG F.: “ Messung von Vertikal - und Horizontallasten beim Anfahren, Bremsen und Überrollen von Fahrzeugen auf einem Fahrbahnübergäng (Measurement of Vertical and Horizontal Loads due to Accelerating, Braking, and Rolling Vehicles on an Expansion Joint)", Der Bauingenieur , 48, Heft 9, Springer -Verlag, 1973, pp 326 -330 (In German).
3. TSCHEMMERNEGG F.: “ The Design of Modular Expansion Joints ”. Proc. 3rd World Congress on Joint Sealing and Bearing Systems for Concret e Structures , American Concrete Institute, 1991, pp 67-86.
4. ANCICH E.J. & BROWN S.C.: “Modular Bridge Joints – Reduction of noise emissions by use of Helmholtz Absorber”. Proc. 5th AUSTROADS Bridge Conference, May, 2004.
5. ANCICH E.J., CHIRGWIN G.J. & BROWN S.C.: “Dynamic Anomalies in a Modular Bridge Expansion Joint”, J. Bridge Engrg., ASCE, (Submitted), 2004.
6. OSTERMANN M. (1991): “Beanspruchung von elastisch gelagerten Fahrbahnübergängen unter Radstoßeinwirkung (Stresses in elastically supported mod ular expansion joints under wheel load impact)”, Bauingenieur, 66, Springer-Verlag, 1991, pp 381-389 (In German).
7. ROEDER C.W.: “Fatigue Cracking in Modular Expansion Joints”, Research Report WA -RD 306.1, Washington State Transportation Commission, 1993, 53 pp.

Proceedings of 5th AUSTROADS Bridge Conference 19-21 May 2004, Hobart, Australia
Copyright © 2004 Austroads Inc.
8. KÖSTER W. (1986): “ The Principle of Elasticity for Expansion Joints ”, Proc. 2nd World Congress on Joint Sealing and Bearing Systems for Concrete Structures , ACI SP -94, American Concrete Institute, 1986, pp 675-711.
Appendix F
Ancich E.J. and Bhavnagri V. (2006). Fatigue Comparison of Modular Bridge
Expansion Joints Using Multiple Bridge Design Code Approaches, Proc. 6th World
Congress on Joints, Bearings, and Seismic Systems for Concrete Structures, Halifax,
Nova Scotia, Canada.


Proc. 6th World Congress on Joints, Bearings, and Seismic Systems for Concrete Structures, Halifax, Nova Scotia, Canada, September, 2006
FATIGUE COMPARISON OF MODULAR BRIDGE EXPANSION
JOINTS USING MULTIPLE BRIDGE DESIGN CODE APPROACHES
Eric J. Ancich and Viraf Bhavnagri
Engineering Technology Branch, Roads & Traffic Authority of NSW, PO Box 3035,
Parramatta NSW 2124 Australia.
BIOGRAPHY
Eric Ancich is a Senior Project Engineer with the Roads & Traffic Authority (RTA) of NSW
(Australia). He has over 20 years experience in acoustics, vibration and structural dynamics.
For the last six years he has directed the structural dynamics studies of six RTA road bridges
to determine the mechanism causing environmental noise emissions and the premature
fatigue induced failure of modular expansion joints.
Viraf Bhavnagri is a Contract Project Engineer who has been working in the Bridge
Specification and Rehabilitation Unit of the Roads and Traffic Authority of NSW (RTA)
since March 2002. Prior to that he has worked for 20 years in a number of consulting
engineering firms on the design of road and rail bridges in Australia.
ABSTRACT
Modular bridge expansion joints (MBEJ’s) are considered to be the most modern design of
waterproof bridge expansion joint currently available; nevertheless, there have been endemic
occurrences of structural fatigue failures of MBEJ’s throughout the world. Whilst there was
an accepted belief amongst academic researchers from around 1973 that a significant part of
the load history of the MBEJ was dynamic, international bridge design codes continued to
base the design requirements around quasi-static principles without fully embracing the
highly dynamic response of the MBEJ to transient traffic loading until 2004.
1
Proc. 6th World Congress on Joints, Bearings, and Seismic Systems for Concrete Structures, Halifax, Nova Scotia, Canada, September, 2006
Similarly, it would appear that almost all MBEJ designers use a static or quasi-static design
with little consideration of the dynamic behavior, either in the analysis or the detailing. Work
done in the RTA over the past six years work has identified a major defect in the quasi-static
load case assumption used universally in bridge design codes. The defect has now been
recognized in Australian Standard AS5100:20041 and the RTA has recently produced a
specification (RTA QA Specification B316)2 for modular expansion joints, which includes a
number of design requirements based on dynamic analysis for these joints. Subsequent to the
installation of MBEJ’s designed in accordance with this specification in bridges on the
Karuah Bypass, the RTA conducted an experimental study of the dynamic response of the
joint to the passage of a truck at different speeds. The results showed that the dynamic
amplification factor (DAF) specified in RTA B316 was in good agreement with measured
values.
The RTA also made a comparative study of the design of the MBEJ in accordance with
design codes of different countries that had tendered for the design. Calculations showed that
there are quite significant differences in the results obtained in accordance with different
codes, based on the DAF and other requirements prescribed by these specifications. Most
international codes also leave a number of factors un-specified; hence, tendered designs
cannot be evaluated on a uniform basis. RTA B316 has incorporated several design
requirements to eliminate this lacuna.
Keywords: Bridges; expansion joints; fatigue; vibration; structural dynamics; AASTHO;
Austrian Code; German Code
2
Proc. 6th World Congress on Joints, Bearings, and Seismic Systems for Concrete Structures, Halifax, Nova Scotia, Canada, September, 2006
1.0 INTRODUCTION
The Roads and Traffic Authority of NSW (RTA) designs and maintains a number of bridges
in the State of New South Wales in Australia. During recent work on the rehabilitation or
new installations of MBEJ’s on some of their bridges, the design and construction
requirements for these joints have been reviewed and a specification has been developed for
the design, production, and installation of these joints. The Australian Bridge Design Code1
(AS 5100:2004) has also recently been revised and some clauses on design of modular
expansion joints have been added. The strength, serviceability and fatigue limit state
requirements of the design have to conform to this code. For the installation of modular
expansion joints on two of RTA’s bridges recently, tenders were received from a number of
international manufacturers. This opportunity was taken to review the designs of the joints
done in accordance with the codes of the respective countries and a comparative study of the
code requirements was made, while formulating the RTA B316 specification2. However, as
different international specifications prescribe different design loads, dynamic amplification
factors, wheel load distribution factors, acceptance criteria for fatigue stresses, etc, the end
results of these variables acting in combination are not directly evident. For the comparative
study, one of the above-mentioned modular joints was chosen as a typical example for
analysis in accordance with the requirements of the international specifications of each of the
tendered designs and the end results were compared by means of the following two ratios:
(a) The fatigue stress ratio, f*f / (φf flim), which compares the fatigue design stress with the
limit state stress, and
(b) The strength ratio, f*u / (φu fy), which compares the ultimate design stress with the yield
strength.
3
Proc. 6th World Congress on Joints, Bearings, and Seismic Systems for Concrete Structures, Halifax, Nova Scotia, Canada, September, 2006
If either ratio is greater than 1.0, the component is inadequate. A small ratio indicates that the
member size is adequate in accordance with the specification for which it is designed.
However, if the member size is reduced and/or the specification under estimates the true load
or dynamic response of the structure, then this would probably result in eventual fatigue
failure.
The typical example is analysed in accordance with the following documents:
1. RTA QA Specification B316 (December, 2004) / AS 5100.4
2. AASHTO LRFD, 20044
3. Austrian Guideline RVS 15.455
4. German Specification TL/TP-FÜ 926
Calculations are based on the versions that were current in 2004. The American
specifications are based on the work done by Dexter et al3 and were subsequently
incorporated into AASHTO LRFD4.
2 DESIGN REQUIREMENTS
The structure selected for the analysis is a single support bar system shown in Figure 1. The
support bars are placed on elastomeric bearings for which the spring stiffness values were
given by the supplier. For the comparative study the center beams are analyzed as continuous
beams on rigid supports, in accordance with the recommendations of AASHTO.
Subsequently it was decided to investigate the effect of elastic supports on the bending
moments in the center beams. The difference in bending moments due to elastic supports and
rigid supports was found to be quite significant. This is discussed further in the Section 4 of
this paper. The axle load is placed in the most adverse position for each effect. A minimum
distance from the curb is specified but other lane markings are ignored.
4

Proc. 6th World Congress on Joints, Bearings, and Seismic Systems for Concrete Structures, Halifax, Nova Scotia, Canada, September, 2006
As the wheel contact area is generally large enough to load three center beams, the combined
stiffness of three center beams is considered.
The joint is analyzed in accordance with the four above-mentioned specifications. Salient
items of these specifications are summarized in Table 1 in a consistent format.
The important issues are as follows:
(a) The axle load (Wx) is applied in accordance with the appropriate specifications.
Results are factored by a dynamic amplification factor (DAF) (χ); hence the dynamic
design axle load is given by
W*x = χ Wx (1)
For the strength limit state, Wx is factored by γu and for the fatigue limit state, by γf.
(b) In RTA B316 it is recognised that the dynamic effects on modular joints result in
upward as well downward amplification; hence both values are defined separately and
it is specified that
χdn = 0.67χ and χup = 0.33χ (2)
For strength design, only χdn is considered whereas for fatigue design χ is considered.
A major requirement of RTA B316 is that the DAF be based on a dynamic analysis.
Three options are specified:
(i) Use the simplified design method in accordance with AASHTO4, with χ = 2.0 for
multiple support bar systems and χ = 2.5 for single support bar systems.
(ii) Perform an experimental modal analysis to determine χ.
(iii) Perform a dynamic analysis using a three-dimensional finite element model,
previously calibrated by experimental modal analysis and strain gauge data for a
similar MBEJ, to compute χup and χdn .
5
Proc. 6th World Congress on Joints, Bearings, and Seismic Systems for Concrete Structures, Halifax, Nova Scotia, Canada, September, 2006
Therefore a quasi-static analysis is not ruled out but the penalty is a higher value of
DAF.
(c) The axle load applied to one center beam is given by
W1x = β Wx (3)
where β is termed “The Distribution Factor”.
In RTA B316, β is given by
β = (Bc + gc)/Lw (4)
with notation as defined in the Appendix. The justification for this formula is presented
in Item 3.2.3.
(d) The longitudinal load due to acceleration or braking is specified as a fraction (η) of the
axle load. AASHTO specifies a value of η = 0.2 in general, based on measurements
made by Dexter et al3, with appropriate modifications for steeper gradients, and/or
unusual braking situations. AS5100 specifies a rather conservative value of 0.35 for all
situations and RTA B316 has to comply with that requirement. However, observations
have shown that dynamic effects in the horizontal direction are effectively damped and
the vertical and horizontal peak effects do not always occur simultaneously. Therefore,
whereas in the other specifications the dynamic longitudinal load due to tractive forces
must be taken equal to ηχWx., in RTA B316 it is specified as only ηWx. for fatigue
analysis and ηχdnWx., for strength design.
(e) The fatigue stress range limit (flim) is specified by Codes for certain standard types of
connections. Several types of welded connections in MBEJs cannot be readily
classified into these standard types. The welded connection between center beams and
support bars in multiple support bar systems has been treated in detail in AASHTO
LRFD and the type of cracking to which the welds are susceptible has been categorised
6
Proc. 6th World Congress on Joints, Bearings, and Seismic Systems for Concrete Structures, Halifax, Nova Scotia, Canada, September, 2006
as Types A, B and C cracking. Other Codes have not dealt with this subject. To avoid
ambiguities in the interpretation of Code recommendations of unclassified details by
different designers, the values of flim have been specified in RTA B316 for different
types of welded connections provided in MBEJs, as shown in Table 2. Comparison has
also been attempted with the AASHTO recommendations in Table 2. The comparison
is not straightforward, as the approach to fatigue design is slightly different in
AASHTO and AS5100. The AASHTO LRFD detail categories are based on the
“fatigue threshold limit” (fTH); for infinite cycles of the design load, it is recommended
that flim= fTH/2. In accordance with AS 5100 for infinite cycles of the design load, it is
specified that flim= f5, the stress at the cut-off limit. Moreover, the stress range-load
cycle curves are not identical in the two documents and fTH in AASHTO does not occur
at the same number of stress cycles for all categories. Meaningful comparison is only
possible at stresses corresponding to 2×10⁶ stress cycles (f2), beyond which the curves
diverge. This stress is termed the Detail Category Number in AS 5100.
(f) The span of the support bar varies with the joint opening and it is accepted that the joint
openings for the limit states of strength, serviceability, and fatigue should be different.
In AS 5100 the temperature movements are calculated for the serviceability limit state,
based on specified extreme temperature ranges. For the ultimate limit state, these
values have to be factored by 1.25. Movements due to creep and shrinkage also have to
be appropriately factored. For the limit state of fatigue, the recommendation by Dexter
et al3 is to take the fatigue joint opening as the average of the maximum and minimum
values. In the German and Austrian specifications the opening is left undefined. In
RTA B316 the concept of the root-mean-cubed value for the fatigue design joint
opening is introduced and the joint opening for the fatigue limit state is given by
( )3 3max,
3min, ssf JJJ += (5)
7
Proc. 6th World Congress on Joints, Bearings, and Seismic Systems for Concrete Structures, Halifax, Nova Scotia, Canada, September, 2006
where Js,max and Js,min are the maximum and minimum joint openings for the
serviceability limit state.
This recommendation is based on the logic that fatigue damage varies as the 3rd to 5th
power of the stress and stress varies linearly with the span for a concentrated load.
Hence the root-mean-cubed value should give a better approximation than the
arithmetic mean. Note that in accordance with Equation 2, the distribution factor also
varies with the joint opening.
All the above requirements have been interpreted for the three international specifications and
expressed in the same format as RTA B316, for ready comparison, in Table 1.
3 EXAMPLE
3.1 Data A modular joint comprising a single support bar system with five center beams was recently
installed on the twin bridges over Mooney Mooney Creek and was analyzed for the
comparative study. Details of the joint are shown in Figure 1. Data used for the analyses is
summarised in Table 3. The parameters that vary when applying the provisions of the
different specifications are listed and compared in Table 4.
3.2 Results Results for each member of the modular joint and critical connections are summarized in
Table 5. The stress ratios and strength ratios are the highest in almost all cases for design in
accordance with the RTA B316 specification and the lowest for the AASHTO specification.
This indicates that the RTA specification is the most demanding whereas if member sizes are
reduced to bring stress ratios closer to unity and the assumptions on which the factors are
based are not met, there is risk of fatigue failure. Comments on some of the items follow.
8
Proc. 6th World Congress on Joints, Bearings, and Seismic Systems for Concrete Structures, Halifax, Nova Scotia, Canada, September, 2006
3.2.1 Axle loads The AASHTO specification uses not only a reduced axle load for fatigue but further factors it
down for fatigue stress calculations. However, values cannot be compared directly because
the limiting criteria for fatigue are also different. The axle loads in the German specification6
are based on DIN10727. For bridge Class 60/30, a heavy lorry (SLW) with 3 axles of 200 kN
each is specified. The factors applicable to this axle load in accordance with DIN 1072 and
TL/TP-FÜ, are given in Table 1. The stress range limit is 0.8f3, which is much higher than f5.
In the Austrian guideline5 the stress range limit is f5, like the Australian standard, but the axle
load is slightly less. Measurements of axle loads on Australian roads8 indicates a consistent
trend of increasing axle loads with time and a reasonably conservative value should be used
to comply with projected increases over a 100 year service life. The fatigue stress ratio
f*f/φflim enables comparison of the overall effect of the axle load, DAF and stress range limit
for the example in Table 5 and shows that RTA B316 is the most demanding and the Austrian
specification is a close second.
3.2.2 Dynamic Amplification For the Mooney Mooney Creek Bridge MBEJ, the successful tenderer submitted a dynamic
finite element analysis giving a value of χ = 2.5, which was accepted as it was equivalent to
the default DAF value.
3.2.3 Distribution Factor The axle load (Wx) acts on more than one center beam and the maximum load carried by one
center beam is βWx. Dexter et al3 have assessed β by means of measurements on four
bridges (refer Table 6) and compared measured values with values calculated by
Tschemmernegg’s method and their proposed method, which is incorporated in AASHTO.
The values of β recommended by AASHTO are based only on the top width of the
centerbeams. Values recommended by Tschemmernegg are presented as a set of curves
9

Proc. 6th World Congress on Joints, Bearings, and Seismic Systems for Concrete Structures, Halifax, Nova Scotia, Canada, September, 2006
based on the width of the centerbeams as well as the gaps. Equation 4 is based on the
simplified assumption that the tyre pressure is uniform and the tyre spans as a beam across
the gap between the centerbeams. The wheel load per unit length of tyre contact area is
W/Lw and the load applied to a center beam is therefore (Bc+gc)W/Lw. It is reasonable to
expect that although the bending stiffness of a tyre tread is negligible, its resistance to shear
deformation will enable it to span across a small gap. None of the three methods appear to
give fully satisfactory results for all four of the bridges tested, as apparent from Table 6.
However, inclusion of Bc as well as gc in the formula for β allows the designer to introduce
more center beams to carry the load if the center beam section is found to be inadequate,
whereas this is not possible with the AASHTO recommendation. Equation 4 is much more
easily incorporated into a spreadsheet than Tschemmernegg’s non-linear graphs, hence it is
preferred. In any case, upper and lower bounds are prescribed for β (0.8 and 0.5 respectively)
in RTA B316, in accordance with AASHTO, hence excessive discrepancies between the
recommendations are avoided.
In the German specification a constant value of 0.6 is specified and the Austrian specification
refers to Tschemmernegg’s recommendations.
3.2.4 Yoke The method of designing the yoke and connections is specified in AASHTO and has been
followed for this example. There are no requirements in the German and Austrian
specifications.
3.2.5 Connections The method of designing welded connections of center beam to support bars in multiple
support bar systems is specified in detail in AASHTO and has been adopted in RTA B316.
For this MBEJ, the yoke provides a sliding connection between the center beam and the
support bar. Slider plates are welded to the support bars and the welds should be carefully
10

Proc. 6th World Congress on Joints, Bearings, and Seismic Systems for Concrete Structures, Halifax, Nova Scotia, Canada, September, 2006
prepared and fatigue stresses checked. Center beams are kept at equidistant spacing by some
type of spring-buffer system. There may be cleats welded to the center beams to connect the
buffers and the welding degrades the fatigue resistance of the center beam. The force
transmission system in the buffers should be considered and additional stresses due to these
forces combined with the flexural stress in the center beam. These aspects are not dealt with
in any of the specifications other than RTA B316. Results in Table 2 indicate that some of
the welded connection details as originally proposed did not satisfy fatigue stress range
limitations and had to be modified. Another critical item is the strength of the top plate of the
box housing the support bar bearings, which is directly subjected to wheel load with very
limited concrete cover above it. None of the specifications draw attention to this item.
4 TESTING
An MBEJ similar to the one in the example was tested to measure the dynamic response to a
loaded truck run at different speeds over the joint. Details of the joint are identical to those
shown in Figures 1a and 1c and only the spans of the center beams are slightly different, as
shown in Figure 2. The joint was installed in a 594 meter long concrete box girder bridge
forming part of the as then unopened Karuah Bypass on the Pacific Highway linking the state
capitals of Sydney and Brisbane.
4.1 Experimental Modal Analysis
An experimental modal analysis study9,10 (EMA) was undertaken to gain a better
understanding of the structural dynamics behavior of the Karuah River MBEJ. The EMA
measurement defines the natural frequencies and mode shapes of a structure and allows an
estimate of the energy involved in each mode.
11
Proc. 6th World Congress on Joints, Bearings, and Seismic Systems for Concrete Structures, Halifax, Nova Scotia, Canada, September, 2006
These measurements involved the simultaneous measurement of the input force and the
vibration response. In the Karuah River Bridge tests11, force over the frequency range of
interest was imparted to the structure using a force hammer. The vibration response was
measured at selected locations using accelerometers attached to the structure by a magnetic
base. The input force and vibration response at each location were measured simultaneously
using the two-channel Fast Fourier Transform (FFT) analyzer. Frequency Response
Functions (FRF’s) for each measurement were stored on the hard disk drive of a personal
computer. This study identified eight natural modes with frequencies ranging from 44 Hz to
183 Hz. The vibrational modes identified include a translational (bounce/bending) mode
where all parts of the MBEJ are vibrating in phase at the same frequency. Roeder12 reports
theoretical translational modes and Ostermann13 shows an analytically determined (FEM)
vertical mode at 87 Hz that exhibits elements of the whole body (bounce/bending) mode.
Table 7 presents a summary of the experimentally determined frequency and associated
damping for each natural mode identified in the EMA. Figure 2 shows a sample plot
depicting the characteristic shape of Mode 1 at 44 Hz. Mode 1 was characterized by in-phase
displacement of all structural beams. This translational mode is best described as
fundamental bounce of the MBEJ on the linear bearing pads. Significant translation and
bending of the center beams and support bars is also evident up to Mode 5 at 133 Hz. The
first true vertical bending mode occurs at 149 Hz (Mode 6).
4.2 Dynamic Strain Gage Measurements
The modal analysis data were used to optimize the placement of strain gages as part of the
fatigue life assessment of the Karuah MBEJ14. Figure 4 presents a plan view diagram of the
southbound curbside lane of Karuah River Bridge and shows the six strain gauge locations
(SG1 to SG6). All gauges were of a linear type and orientated in the anticipated principal
stress direction (i.e. parallel to the long axis of the respective structural members).
12
Proc. 6th World Congress on Joints, Bearings, and Seismic Systems for Concrete Structures, Halifax, Nova Scotia, Canada, September, 2006
The measurement instrumentation was selected with a data sampling rate of 25 kHz. This
was sufficient to ensure that frequencies up to 10 kHz were sampled accurately. The test
truck was loaded to the maximum legal axle load for Australia and had a gross vehicle mass
(GVM) of 42 tonnes (92,400 lbs). Figure 5 presents a schematic elevation diagram of the
modular expansion joint in relation to the nominal curbside lane position and the nominal
test truck wheel positions. In order to approximate true static strains and displacements, the
truck was traversed over the joints at less than 3 km/hr thereby producing negligible
dynamic response of the truck or structure. All static and dynamic strains and displacements
were recorded during this test. Following as closely as possible to the same line as the slow
roll test, the truck was traversed at several speeds in the target speed range of 45 km/hr to
70 km/hr with the actual truck pass-by speeds measured using a Laser speed gun. The
reproducible accuracy of the vehicle speed measurement is considered to be better than
± 2 km/hr. As the position of the test vehicle on the joint was critical for the reliability and
reproducibility of the test results, a procedure was developed using a bead of water
dispersible paste (standard toothpaste) on the top surface of the first center beam to mark the
vehicle passage. Figure 6 shows a typical application. Table 8 presents the target pass-by
speeds as well as the measured (actual) pass-by speeds.
The results of strain gage testing are shown a Table 9. It is interesting to note that the peak
DAF shown in Table 9 is 3.2. For this table, the DAF is defined as follows:
DAF = statε
εdyn (3)
where DAF = dynamic amplification factor
εdyn = Strain range due to the vehicle traveling at designated speed (peak-to-peak)
εstat = Strain range due to vehicle traveling at crawl (slow roll) speed (zero-to-peak).
13

Proc. 6th World Congress on Joints, Bearings, and Seismic Systems for Concrete Structures, Halifax, Nova Scotia, Canada, September, 2006
It is noted that a DAF of this magnitude is significantly higher than any current design code
requirement, except B3162. It is recommended that designers should use 80% of the peak
empirical DAF. For the Karuah By-pass MBEJ, this would equate to a design DAF of 2.56.
The design calculations for this joint used a DAF of 2.5.
4.3 Static Analysis As dynamic amplification factors are applied to the static analysis, validating the static
analysis beam model is important. The slow roll test results for Runs 1, 2 and 3 enable
comparison of test results with static analysis. An average value of 3.0 m is adopted in the
analysis for the measured distance of the wheel from the curb, which varies from 2.9 m to
3.1 m (Table 8). The modeled beam represents the combined stiffness of 3 center beams and
the distribution factor was estimated from gap measurements to be 0.37. Figure 3 shows the
continuous beam model and truck loading.
Computed stresses at mid spans are correlated with stresses calculated from strains measured
by gauges SG1 at support and SG6 at mid span (Figure 5) assuming E = 200 GPa. Results
are shown in Table 10. Due to the short spans involved, the bending moment gradients are
steep and discrepancies in the locations of the strain gauge and the computed stress location
could account for the inaccuracies in the results. Computations were carried out for rigid as
well as elastic supports. The spring support stiffness of 49 MN/m results in a maximum
support deflection of only 0.5 mm but the elastic deflection of supports causes very
significant changes in the longitudinal variation of stresses in the center beams. This aspect
has not received adequate attention in any of the specifications. The worked examples by
Dexter et al3 are based on analysis of continuous beams on rigid supports. Comparison of the
limited results in Table 10 indicates that the analysis based on elastic supports gives better
agreement with the measured values. The current load test was primarily aimed at assessing
dynamic effects and this aspect needs to be given more attention in future tests.
14
Proc. 6th World Congress on Joints, Bearings, and Seismic Systems for Concrete Structures, Halifax, Nova Scotia, Canada, September, 2006
CONCLUSION
The Roads and Traffic Authority NSW has recently formulated a specification (RTA B316)
for design of modular bridge expansion joints (MBEJs). In this paper the specification has
been compared with three other specifications-AASHTO LRFD, the German and Austrian
specifications. Detailed requirements of these specifications have been interpreted and
concisely presented, item by item, in Table 1 in consistent format and notation, for ready
comparison. Salient features and differences have been discussed in Section 2. Limiting
stress ranges for details critical in fatigue have been specified and compared with AASHTO
recommendations.
RTA B316 requires that the dynamic amplification factors used for design be based on
dynamic analysis, which has been formerly validated by test measurements on another
similar joint. Measurements carried out by the RTA over the past few years have consistently
found that the DAF’s prescribed by most codes are frequently exceeded. Calculations
required by RTA B316 are more complex than those illustrated in the design examples
presented by Dexter et al3 but with modern electronic computing facilities, this does not
present any problem. Using the most appropriate model for each effect is the primary
consideration. Where the support bars rest on compressible bearings, analysis of the center
beam as a continuous beam on elastic supports gives substantially different results from the
assumption of rigid supports. Different joint openings for the three limit states of
serviceability, fatigue and ultimate strength are considered in the analysis. Attention must be
given to all connection details as these can often be more critical for fatigue than the main
members.
In RTA B316 the limiting stress ranges for connections of slider plates, yoke members, cleats
for buffers provided for maintaining equidistant spacing of center beams, etc, have been
15

Proc. 6th World Congress on Joints, Bearings, and Seismic Systems for Concrete Structures, Halifax, Nova Scotia, Canada, September, 2006
specified. Strength of the top plate of the support box housing, which is directly subjected to
wheel loads, is another critical item. Design of an MBEJ provided for the twin bridges over
Mooney Mooney Creek has been carried out in accordance with the four specifications and
results compared with the help of a stress ratio equal to the ratio of the computed stress to the
stress at the corresponding limit state. Ratios exceeding 1.0 indicate that the member or
detail is inadequate. However, an unduly small ratio for any item resulting from one
specification compared to another may indicate a shortcoming in the specification rather than
a license to reduce the member size. The RTA B316 specification demanded the most
conservative design for the example of the joint at Mooney Mooney. The Austrian
specification was next, whereas AASHTO was the least demanding.
A dynamic load test was conducted for an MBEJ installed for the Karuah By-pass, which is
very similar to the one analyzed at Mooney Mooney. The test demonstrated the high values
of DAF’s obtained, which were close to those required by RTA B316 and substantially
greater than those recommended by the other specifications. Although peak values of DAF’s
may be discounted (use 80%) for fatigue analysis, factoring down the axle load as well as the
DAF for fatigue design may result in designs prone to fatigue failure. The cost of using
larger section members is trivial compared to the cost of rehabilitating a failed MBEJ. The
comparison between computed and measured stresses for the Karuah By-pass MBEJ (quasi-
static analysis) indicated a very close level of agreement, particularly when center beams
were modeled on elastic supports.
ACKNOWLEDGEMENT
The authors wish to thank the Chief Executive of the Roads and Traffic Authority of NSW
(RTA) for permission to publish this paper. The opinions and conclusions expressed in this
paper do not necessarily reflect the views of the RTA.
16
Proc. 6th World Congress on Joints, Bearings, and Seismic Systems for Concrete Structures, Halifax, Nova Scotia, Canada, September, 2006
REFERENCES
1. Standards Australia, Australian Standard AS5100.4 – 2004, Bridge Design Part 4:
Bearings and deck joints, Sydney, Australia, 2004.
2. Roads & Traffic Authority of NSW. RTA QA Specification B316 – Modular Bridge
Expansion Joints. Sydney, Australia, 2004.
(http://www.rta.nsw.gov.au/doingbusinesswithus/specifications/bridgeworks/)
3. Dexter R.J., Connor R.J. & Kaczinski M.R., “Fatigue Design of Modular Bridge
Expansion Joints”, NCHRP Report 402, Transportation Research Board, National
Research Council, Washington, DC, USA, 1997, 128 pp.
4. American Association of State Highway and Transportation Officials (AASHTO)
AASHTO LRFD Bridge Design Specifications, SI Units, 3rd Ed., Washington, DC, USA,
2004.
5. “Expansion Joints for Bridges”, Austrian Guideline RVS 15.45, Draft, version 1,
Vienna, Austria, 1999.
6. TL/TP-FÜ 92, “Technical delivery and inspection specifications for watertight
expansion joints of road and foot bridges”, Federal Ministry of Transport (BMV),
Bonn, Germany, 1992. Non-revised translation (draft 1), provided by the German
Association of Joint and Bearing Manufacturers [Vereinigung der Hersteller von
Fahrbahnübergängen und (Brücken) Lagern].
7. DIN 1072 (1985) “Road and foot bridges; design loads”, German Standards Institution.
8. Roberts W.S. and Heywood R.J., “Fatigue-It Will Change Our Culture”, Proc. 5th
Austroads Bridge Conference, Hobart, Tasmania, Australia, May 2004.
9. Ewins D.J., “Modal Testing: Theory, Practice & Application (2nd Edition)”, Research
Studies Press, Hertfordshire, UK, 1999, pp.163-276.
17
Proc. 6th World Congress on Joints, Bearings, and Seismic Systems for Concrete Structures, Halifax, Nova Scotia, Canada, September, 2006
10. Ancich E.J., Brown S.C. & Chirgwin G.J., “The Role of Modular Bridge Expansion
Joint Vibration in Environmental Noise Emissions and Joint Fatigue Failure”, Proc.
Acoustics 2004 Conference, Surfers Paradise, Qld., Australia, 2004, pp 135-140.
11. Brown S.C., “Modal Analysis Karuah Bypass Bridge Modular Expansion Joint”, Report
10-1788-R21, Richard Heggie Associates Pty Ltd (now Heggies Australia Pty Ltd),
Lane Cove, Australia, 2005 (Unpublished report prepared for the Roads & Traffic
Authority of NSW).
12. Roeder C.W., “Fatigue Cracking in Modular Expansion Joints”, Research Report WA-
RD 306.1, Washington State Transportation Center, Seattle, WA, USA, 1993, 53 pp.
13. Ostermann M., “Beanspruchung von elastisch gelagerten Fahrbahnübergängen unter
Radstoßeinwirkung (Stresses in elastically supported modular expansion joints under
wheel load impact)”, Bauingenieur 66, Springer-Verlag, 1991, pp 381-389 (In German).
14. Brown S.C., “Measurement of Static and Dynamic Strains: Karuah Bypass Bridge,
Karuah NSW Modular Expansion Joint”, Report 10-1788-R20, Richard Heggie
Associates Pty Ltd (now Heggies Australia Pty Ltd), Lane Cove, Australia, 2005
(Unpublished report prepared for the Roads & Traffic Authority of NSW).
15. Ancich E.J. & Chirgwin G.J. “Fatigue Proofing of an In-service Modular Bridge
Expansion Joint”, Proc. 6th World Congress on Joints, Bearings & Seismic Systems for
Concrete Structures, Halifax, Nova Scotia, Canada, 2006.
18

Proc. 6th World Congress on Joints, Bearings, and Seismic Systems for Concrete Structures, Halifax, Nova Scotia, Canada, September, 2006
APPENDIX: NOTATION
ax = width of axle, center to center of tyre footprint
dcs = depth from road surface to mid-depth of support bar
f* = computed stress for design load
f3 = constant stress range fatigue limit
f5 = stress at cut-off limit
flim = stress at limit state for fatigue
fTH = fatigue threshold stress as per AASHTO LRFD
gc = gap between center beams at appropriate joint opening
nf = number of cycles to limit state for fatigue
Bs = width of support bar
Bc = width of center beam
Bw = width of tyre footprint in direction perpendicular to traffic
Ds = depth of support bar
Dc = depth of center beam
E = modulus of elasticity
H = Horizontal force due to acceleration or braking of vehicle
J = joint opening at top (clear gap between edge beams)
Ks = spring stiffness of each support in continuous beam model
Lb = span of support bar c/c bearings
Lw = length of tyre footprint in direction parallel to traffic
Wx = static axle load
19

Proc. 6th World Congress on Joints, Bearings, and Seismic Systems for Concrete Structures, Halifax, Nova Scotia, Canada, September, 2006
W1x = static axle load applied to one center beam
W*x = dynamic design axle load
α = dynamic load allowance (DLA) as a fraction of static load
β = distribution factor (fraction of wheel load carried by one center beam)
χ = dynamic amplification factor (DAF)
χup = upward component of DAF
χdn = downward component of DAF
χmod = DAF obtained by experimental modal analysis
η = ratio of horizontal load to vertical load
φ = capacity reduction factor
γ = load factor
σ = stress due to static loads
Subscripts:
avg = average
max = maximum
min = minimum
f = value for fatigue design
u = value for ultimate strength design
s = value at serviceability
Abbreviation
DAF dynamic amplification factor
MBEJ modular bridge expansion joint
20

Proc. 6th World Congress on Joints, Bearings, and Seismic Systems for Concrete Structures, Halifax, Nova Scotia, Canada, September, 2006
RTA Roads and Traffic Authority NSW
21
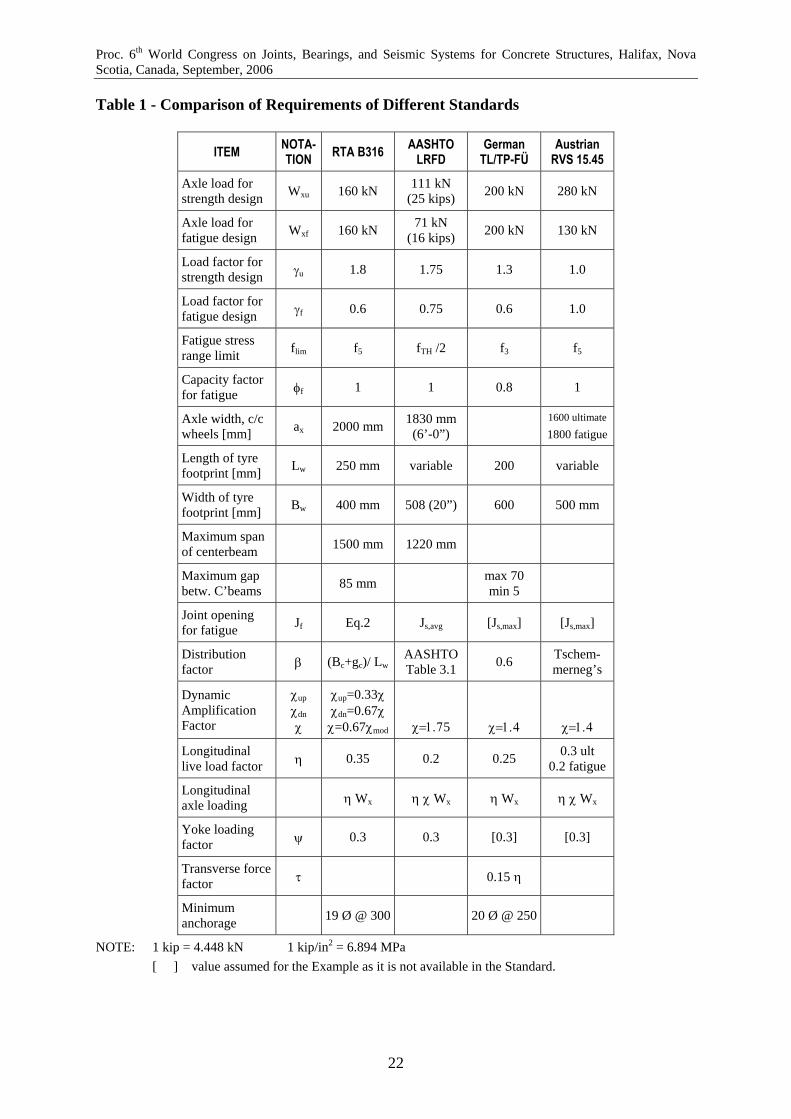
Proc. 6th World Congress on Joints, Bearings, and Seismic Systems for Concrete Structures, Halifax, Nova Scotia, Canada, September, 2006
Table 1 - Comparison of Requirements of Different Standards
ITEM NOTA-TION RTA B316 AASHTO
LRFD German
TL/TP-FÜ Austrian
RVS 15.45
Axle load for strength design Wxu 160 kN 111 kN
(25 kips) 200 kN 280 kN
Axle load for fatigue design Wxf 160 kN 71 kN
(16 kips) 200 kN 130 kN
Load factor for strength design γu 1.8 1.75 1.3 1.0
Load factor for fatigue design γf 0.6 0.75 0.6 1.0
Fatigue stress range limit flim f5 fTH /2 f3 f5
Capacity factor for fatigue φf 1 1 0.8 1
Axle width, c/c wheels [mm] ax 2000 mm 1830 mm
(6’-0”) 1600 ultimate 1800 fatigue
Length of tyre footprint [mm] Lw 250 mm variable 200 variable
Width of tyre footprint [mm] Bw 400 mm 508 (20”) 600 500 mm
Maximum span of centerbeam 1500 mm 1220 mm
Maximum gap betw. C’beams 85 mm max 70
min 5
Joint opening for fatigue Jf Eq.2 Js,avg [Js,max] [Js,max]
Distribution factor β (Bc+gc)/ Lw
AASHTO Table 3.1 0.6 Tschem-
merneg’s
Dynamic Amplification Factor
χup
χdn
χ
χup=0.33χχdn=0.67χ
χ=0.67χmod
χ=1.75
χ=1.4
χ=1.4
Longitudinal live load factor η 0.35 0.2 0.25 0.3 ult
0.2 fatigue
Longitudinal axle loading η Wx η χ Wx η Wx η χ Wx
Yoke loading factor ψ 0.3 0.3 [0.3] [0.3]
Transverse force factor τ 0.15 η
Minimum anchorage 19 Ø @ 300 20 Ø @ 250
NOTE: 1 kip = 4.448 kN 1 kip/in2 = 6.894 MPa [ ] value assumed for the Example as it is not available in the Standard.
22
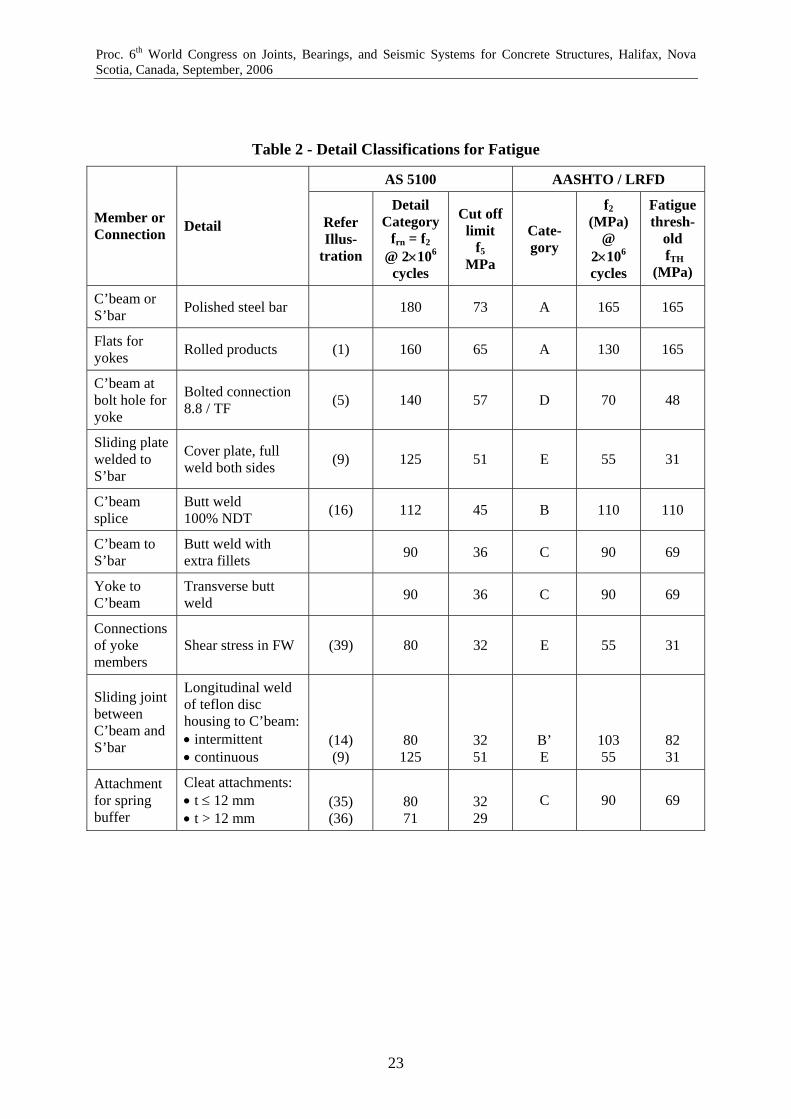
Proc. 6th World Congress on Joints, Bearings, and Seismic Systems for Concrete Structures, Halifax, Nova Scotia, Canada, September, 2006
Table 2 - Detail Classifications for Fatigue
AS 5100 AASHTO / LRFD
Member or Connection Detail Refer
Illus-tration
Detail Category
frn = f2 @ 2×10⁶
cycles
Cut off limit
f5 MPa
Cate-gory
f2 (MPa)
@ 2×10⁶
cycles
Fatigue thresh-
old fTH
(MPa)
C’beam or S’bar Polished steel bar 180 73 A 165 165
Flats for yokes Rolled products (1) 160 65 A 130 165
C’beam at bolt hole for yoke
Bolted connection 8.8 / TF (5) 140 57 D 70 48
Sliding plate welded to S’bar
Cover plate, full weld both sides (9) 125 51 E 55 31
C’beam splice
Butt weld 100% NDT (16) 112 45 B 110 110
C’beam to S’bar
Butt weld with extra fillets 90 36 C 90 69
Yoke to C’beam
Transverse butt weld 90 36 C 90 69
Connections of yoke members
Shear stress in FW (39) 80 32 E 55 31
Sliding joint between C’beam and S’bar
Longitudinal weld of teflon disc housing to C’beam: • intermittent • continuous
(14) (9)
80 125
32 51
B’ E
103 55
82 31
Attachment for spring buffer
Cleat attachments: • t ≤ 12 mm • t > 12 mm
(35) (36)
80 71
32 29
C 90 69
23
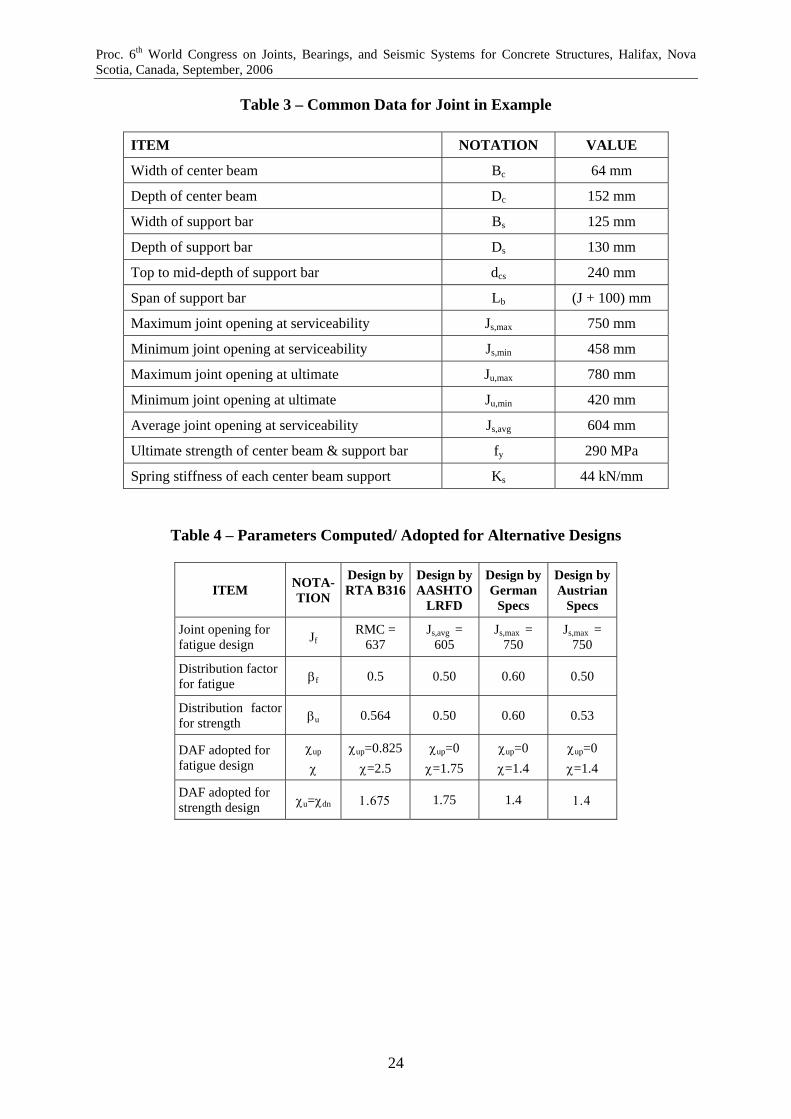
Proc. 6th World Congress on Joints, Bearings, and Seismic Systems for Concrete Structures, Halifax, Nova Scotia, Canada, September, 2006
Table 3 – Common Data for Joint in Example
ITEM NOTATION VALUE
Width of center beam Bc 64 mm
Depth of center beam Dc 152 mm
Width of support bar Bs 125 mm
Depth of support bar Ds 130 mm
Top to mid-depth of support bar dcs 240 mm
Span of support bar Lb (J + 100) mm
Maximum joint opening at serviceability Js,max 750 mm
Minimum joint opening at serviceability Js,min 458 mm
Maximum joint opening at ultimate Ju,max 780 mm
Minimum joint opening at ultimate Ju,min 420 mm
Average joint opening at serviceability Js,avg 604 mm
Ultimate strength of center beam & support bar fy 290 MPa
Spring stiffness of each center beam support Ks 44 kN/mm
Table 4 – Parameters Computed/ Adopted for Alternative Designs
ITEM NOTA-TION
Design byRTA B316
Design byAASHTO
LRFD
Design byGerman
Specs
Design by Austrian
Specs
Joint opening for fatigue design Jf
RMC = 637
Js,avg = 605
Js,max = 750
Js,max = 750
Distribution factor for fatigue βf 0.5 0.50 0.60 0.50
Distribution factor for strength βu 0.564 0.50 0.60 0.53
DAF adopted for fatigue design
χup
χ
χup=0.825 χ=2.5
χup=0 χ=1.75
χup=0 χ=1.4
χup=0 χ=1.4
DAF adopted for strength design χu=χdn 1.675 1.75 1.4 1.4
24
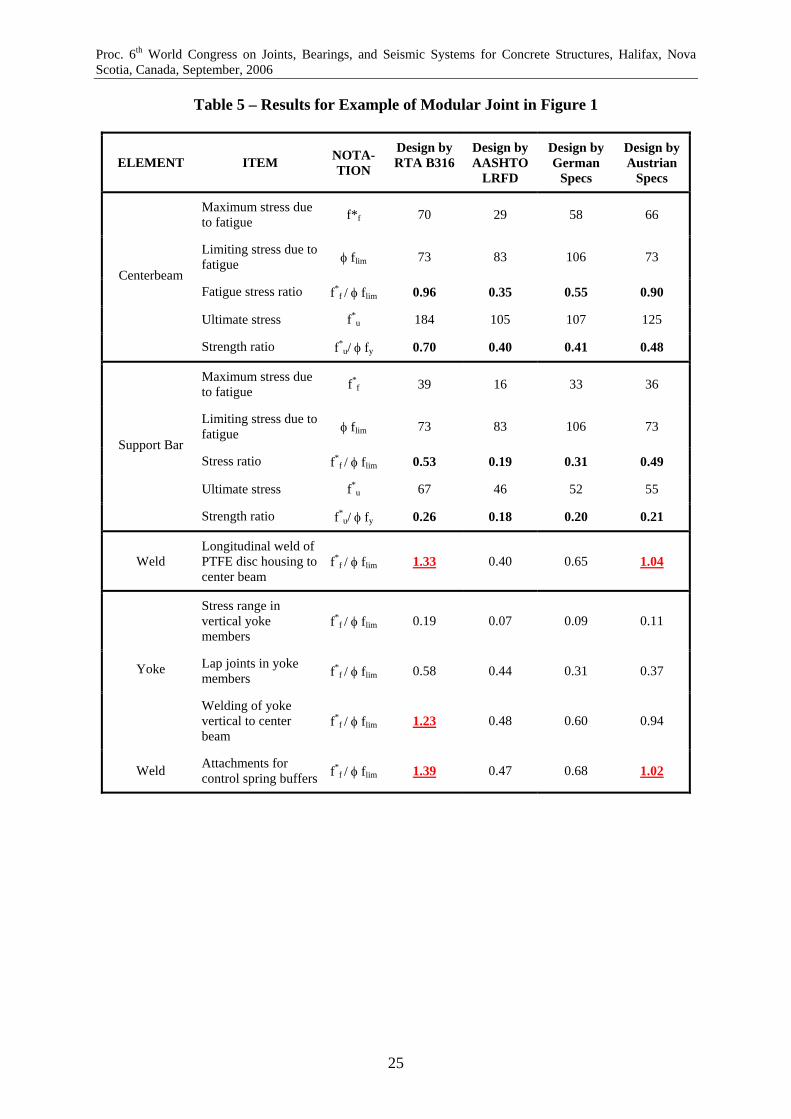
Proc. 6th World Congress on Joints, Bearings, and Seismic Systems for Concrete Structures, Halifax, Nova Scotia, Canada, September, 2006
Table 5 – Results for Example of Modular Joint in Figure 1
ELEMENT ITEM NOTA-TION
Design byRTA B316
Design byAASHTO
LRFD
Design by German
Specs
Design byAustrian
Specs
Maximum stress due to fatigue f*f 70 29 58 66
Limiting stress due to fatigue φ flim 73 83 106 73
Fatigue stress ratio f*f / φ flim 0.96 0.35 0.55 0.90
Ultimate stress f*u 184 105 107 125
Centerbeam
Strength ratio f*u/ φ fy 0.70 0.40 0.41 0.48
Maximum stress due to fatigue f*
f 39 16 33 36
Limiting stress due to fatigue φ flim 73 83 106 73
Stress ratio f*f / φ flim 0.53 0.19 0.31 0.49
Ultimate stress f*u 67 46 52 55
Support Bar
Strength ratio f*u/ φ fy 0.26 0.18 0.20 0.21
Weld Longitudinal weld of PTFE disc housing to center beam
f*f / φ flim 1.33 0.40 0.65 1.04
Stress range in vertical yoke members
f*f / φ flim 0.19 0.07 0.09 0.11
Lap joints in yoke members f*
f / φ flim 0.58 0.44 0.31 0.37 Yoke
Welding of yoke vertical to center beam
f*f / φ flim 1.23 0.48 0.60 0.94
Weld Attachments for control spring buffers f*
f / φ flim 1.39 0.47 0.68 1.02
25
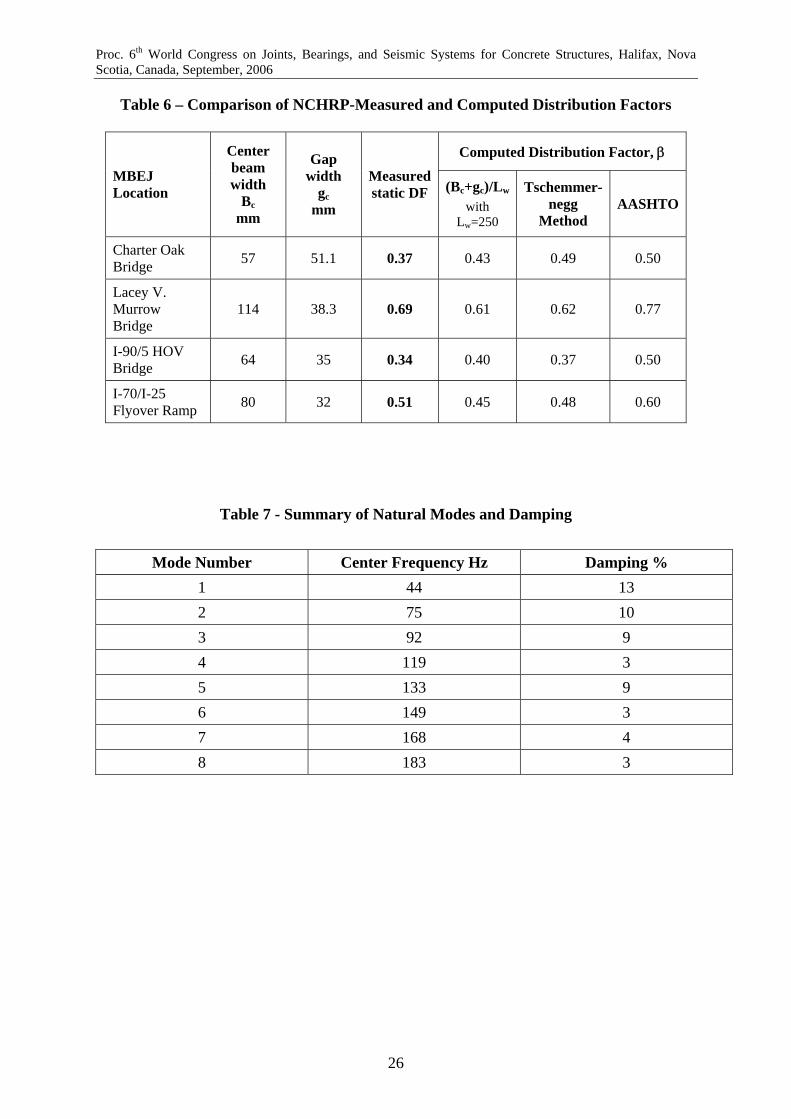
Proc. 6th World Congress on Joints, Bearings, and Seismic Systems for Concrete Structures, Halifax, Nova Scotia, Canada, September, 2006
Table 6 – Comparison of NCHRP-Measured and Computed Distribution Factors
Computed Distribution Factor, β MBEJ Location
Center beam width
Bc mm
Gap width
gc mm
Measured static DF (Bc+gc)/Lw
with Lw=250
Tschemmer-negg
Method AASHTO
Charter Oak Bridge 57 51.1 0.37 0.43 0.49 0.50
Lacey V. Murrow Bridge
114 38.3 0.69 0.61 0.62 0.77
I-90/5 HOV Bridge 64 35 0.34 0.40 0.37 0.50
I-70/I-25 Flyover Ramp 80 32 0.51 0.45 0.48 0.60
Table 7 - Summary of Natural Modes and Damping
Mode Number Center Frequency Hz Damping % 1 44 13 2 75 10 3 92 9 4 119 3 5 133 9 6 149 3 7 168 4 8 183 3
26
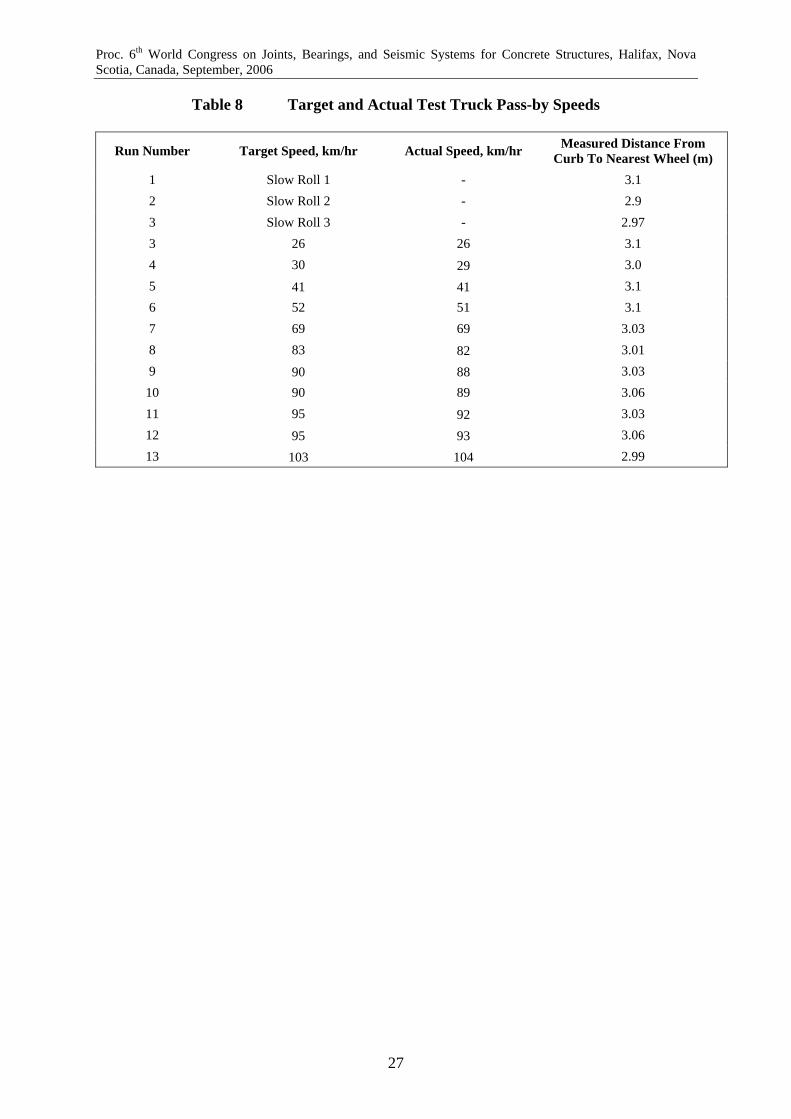
Proc. 6th World Congress on Joints, Bearings, and Seismic Systems for Concrete Structures, Halifax, Nova Scotia, Canada, September, 2006
Table 8 Target and Actual Test Truck Pass-by Speeds
Run Number Target Speed, km/hr Actual Speed, km/hr Measured Distance From Curb To Nearest Wheel (m)
1 Slow Roll 1 - 3.1 2 Slow Roll 2 - 2.9 3 Slow Roll 3 - 2.97 3 26 26 3.1 4 30 29 3.0 5 41 41 3.1 6 52 51 3.1 7 69 69 3.03 8 83 82 3.01 9 90 88 3.03
10 90 89 3.06 11 95 92 3.03 12 95 93 3.06 13 103 104 2.99
27
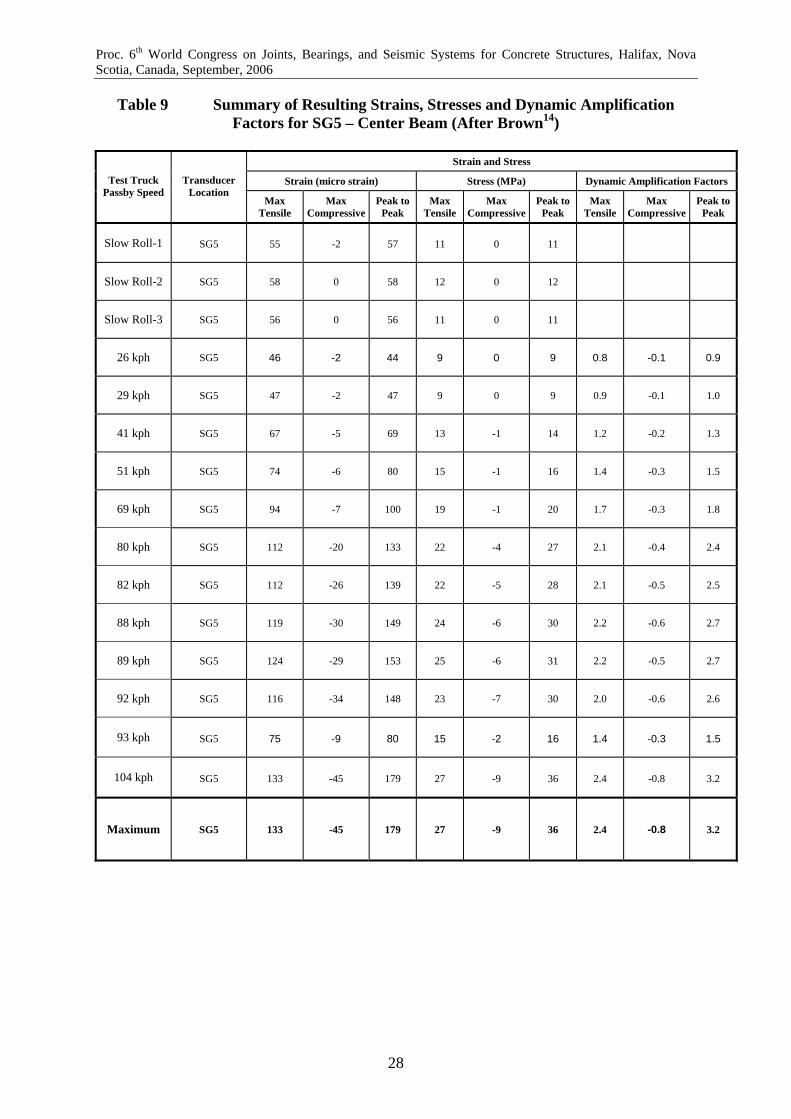
Proc. 6th World Congress on Joints, Bearings, and Seismic Systems for Concrete Structures, Halifax, Nova Scotia, Canada, September, 2006
Table 9 Summary of Resulting Strains, Stresses and Dynamic Amplification Factors for SG5 – Center Beam (After Brown14)
Strain and Stress
Strain (micro strain) Stress (MPa) Dynamic Amplification Factors Test Truck Passby Speed
Transducer Location
Max Tensile
Max Compressive
Peak to Peak
Max Tensile
Max Compressive
Peak to Peak
Max Tensile
Max Compressive
Peak to Peak
Slow Roll-1 SG5 55 -2 57 11 0 11
Slow Roll-2 SG5 58 0 58 12 0 12
Slow Roll-3 SG5 56 0 56 11 0 11
26 kph SG5 46 -2 44 9 0 9 0.8 -0.1 0.9
29 kph SG5 47 -2 47 9 0 9 0.9 -0.1 1.0
41 kph SG5 67 -5 69 13 -1 14 1.2 -0.2 1.3
51 kph SG5 74 -6 80 15 -1 16 1.4 -0.3 1.5
69 kph SG5 94 -7 100 19 -1 20 1.7 -0.3 1.8
80 kph SG5 112 -20 133 22 -4 27 2.1 -0.4 2.4
82 kph SG5 112 -26 139 22 -5 28 2.1 -0.5 2.5
88 kph SG5 119 -30 149 24 -6 30 2.2 -0.6 2.7
89 kph SG5 124 -29 153 25 -6 31 2.2 -0.5 2.7
92 kph SG5 116 -34 148 23 -7 30 2.0 -0.6 2.6
93 kph SG5 75 -9 80 15 -2 16 1.4 -0.3 1.5
104 kph SG5 133 -45 179 27 -9 36 2.4 -0.8 3.2
Maximum SG5 133 -45 179 27 -9 36 2.4 -0.8 3.2
28
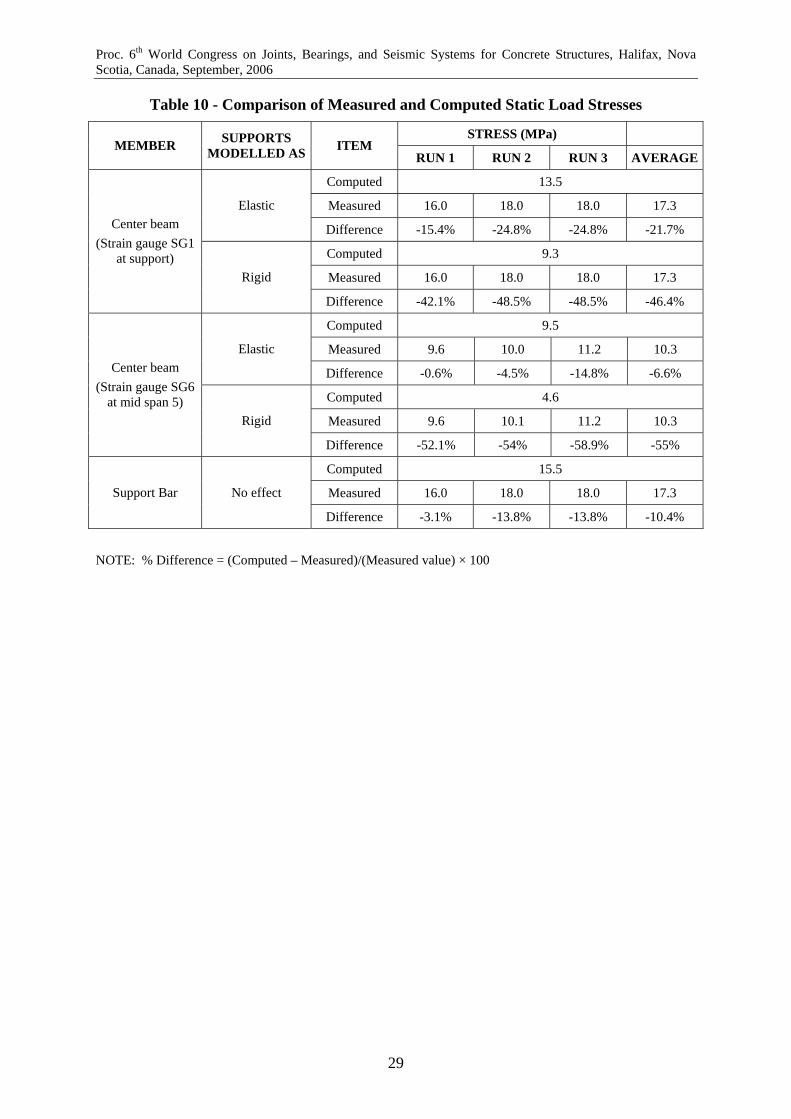
Proc. 6th World Congress on Joints, Bearings, and Seismic Systems for Concrete Structures, Halifax, Nova Scotia, Canada, September, 2006
Table 10 - Comparison of Measured and Computed Static Load Stresses
STRESS (MPa) MEMBER SUPPORTS
MODELLED AS ITEM RUN 1 RUN 2 RUN 3 AVERAGE
Computed 13.5
Measured 16.0 18.0 18.0 17.3 Elastic
Difference -15.4% -24.8% -24.8% -21.7%
Computed 9.3
Measured 16.0 18.0 18.0 17.3
Center beam (Strain gauge SG1
at support) Rigid
Difference -42.1% -48.5% -48.5% -46.4%
Computed 9.5
Measured 9.6 10.0 11.2 10.3 Elastic
Difference -0.6% -4.5% -14.8% -6.6%
Computed 4.6
Measured 9.6 10.1 11.2 10.3
Center beam (Strain gauge SG6
at mid span 5) Rigid
Difference -52.1% -54% -58.9% -55%
Computed 15.5
Measured 16.0 18.0 18.0 17.3 Support Bar No effect
Difference -3.1% -13.8% -13.8% -10.4%
NOTE: % Difference = (Computed – Measured)/(Measured value) × 100
29
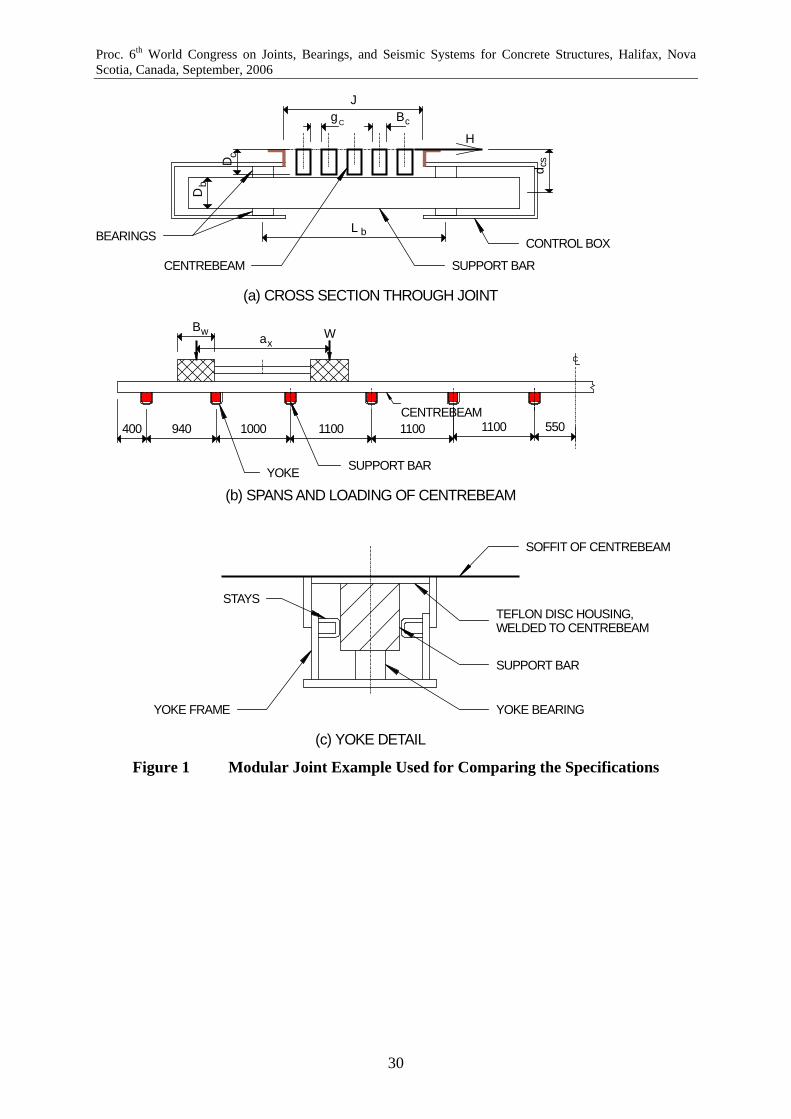
Proc. 6th World Congress on Joints, Bearings, and Seismic Systems for Concrete Structures, Halifax, Nova Scotia, Canada, September, 2006
CENTREBEAM400 940 1000 1100 1100 1100 550
axBw W
JBc
SUPPORT BARYOKE
gC
bL
d cs
bD
H
D c
SOFFIT OF CENTREBEAM
TEFLON DISC HOUSING, WELDED TO CENTREBEAM
SUPPORT BAR
YOKE BEARINGYOKE FRAME
STAYS
SUPPORT BAR
CONTROL BOX
CENTREBEAM
BEARINGS
(a) CROSS SECTION THROUGH JOINT
(b) SPANS AND LOADING OF CENTREBEAM
(c) YOKE DETAIL
Figure 1 Modular Joint Example Used for Comparing the Specifications
30
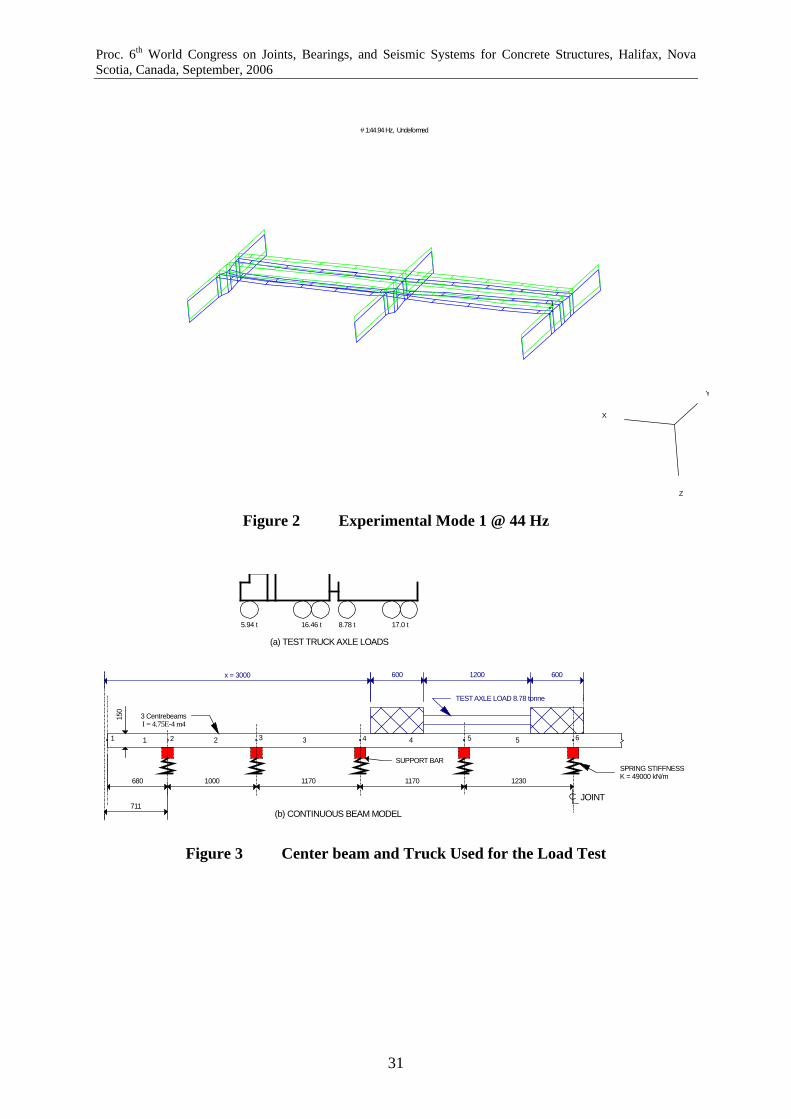
Proc. 6th World Congress on Joints, Bearings, and Seismic Systems for Concrete Structures, Halifax, Nova Scotia, Canada, September, 2006
X
Y
Z
11
# 1:44.94 Hz, Undeformed
Figure 2 Experimental Mode 1 @ 44 Hz
x = 3000 600 1200 600
SUPPORT BAR
680 1000 1170 1170 1230
150
1 2 3 4 5
3 Centrebeams
TEST AXLE LOAD 8.78 tonne
5.94 t 16.46 t 8.78 t 17.0 t
(a) TEST TRUCK AXLE LOADS
(b) CONTINUOUS BEAM MODEL
I = 4.75E-4 m4
SPRING STIFFNESSK = 49000 kN/m
JOINT
1 2 3 4 5 6
711
Figure 3 Center beam and Truck Used for the Load Test
31
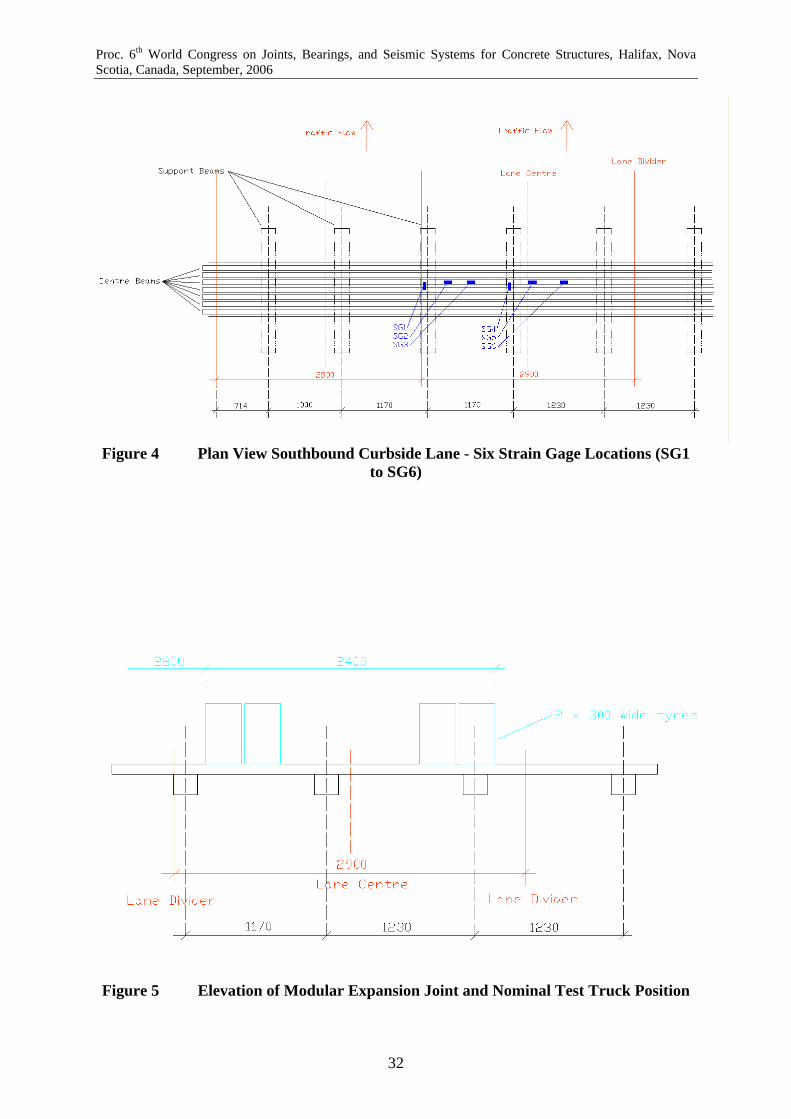
Proc. 6th World Congress on Joints, Bearings, and Seismic Systems for Concrete Structures, Halifax, Nova Scotia, Canada, September, 2006
Figure 4 Plan View Southbound Curbside Lane - Six Strain Gage Locations (SG1
to SG6)
Figure 5 Elevation of Modular Expansion Joint and Nominal Test Truck Position
32
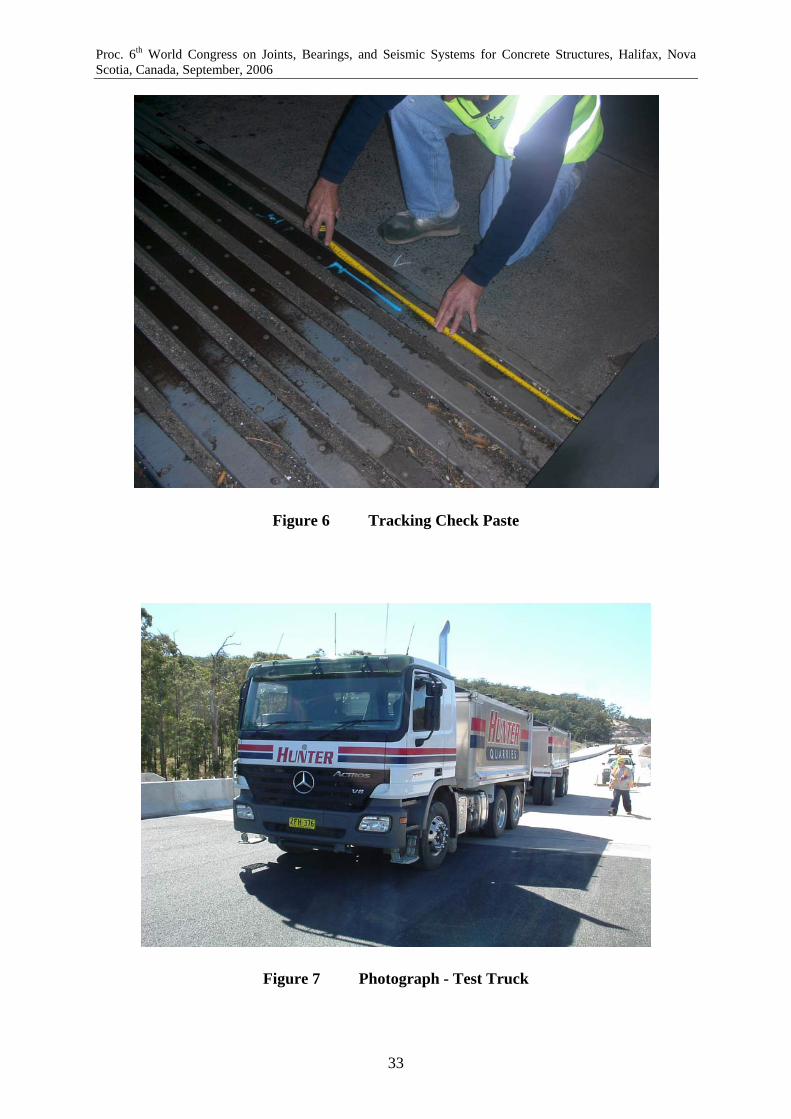
Proc. 6th World Congress on Joints, Bearings, and Seismic Systems for Concrete Structures, Halifax, Nova Scotia, Canada, September, 2006
Figure 6 Tracking Check Paste
Figure 7 Photograph - Test Truck
33
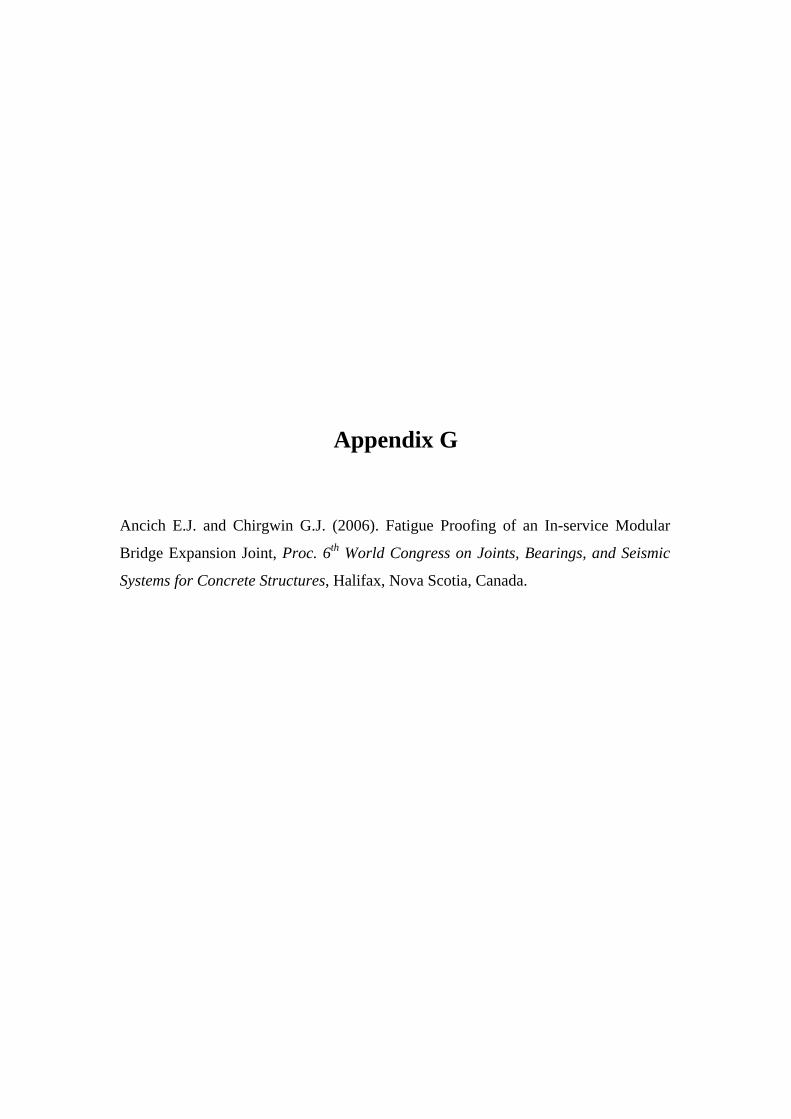
Appendix G
Ancich E.J. and Chirgwin G.J. (2006). Fatigue Proofing of an In-service Modular
Bridge Expansion Joint, Proc. 6th World Congress on Joints, Bearings, and Seismic
Systems for Concrete Structures, Halifax, Nova Scotia, Canada.

Proc. 6th World Congress on Joints, Bearings, and Seismic Systems for Concrete Structures, Halifax, Nova Scotia, Canada, September, 2006
Fatigue Proofing of an In-service Modular Bridge Expansion Joint
Eric J. Ancich and Gordon J. Chirgwin
BIOGRAPHY
Eric Ancich is a Senior Project Engineer with the Roads & Traffic Authority (RTA) of NSW
(Australia). He has over 20 years experience in acoustics, vibration, and structural dynamics.
For the last six years he has managed the structural dynamics studies of six RTA road bridges
to determine the mechanism causing environmental noise emissions and the premature
fatigue induced failure of modular expansion joints. It is considered that this work has
identified a major defect in the quasi-static load case assumption used universally in bridge
design codes.
Gordon Chirgwin is the Manager Bridge Policy, Standards and Records with the Road and
Traffic Authority of NSW (Australia). He holds a Masters Degree in Engineering Science
and has over thirty years experience encompassing all facets of professional engineering in
roads and bridges, including twelve years in his current role. He represents the Authority in a
number of forums. He has managed research into a number of facets of bridge engineering,
and has authored over thirty technical papers.
ABSTRACT
In an almost universal approach to the design of the modular bridge expansion joint (MBEJ),
the various national bridge design codes do not envisage that the embedded joint may be
lightly damped and could vibrate as a result of traffic excitation. These codes consider only
an amplification of the static load to cover sub-optimal installation impact, poor road
approach, and the dynamic component of load. The codes do not consider the possibility of
free vibration after the passage of a vehicle axle. Codes also ignore the possibilities of
vibration transmission and response reinforcement through either following axles or loading
1

Proc. 6th World Congress on Joints, Bearings, and Seismic Systems for Concrete Structures, Halifax, Nova Scotia, Canada, September, 2006
of subsequent components by a single axle. Dynamic strain gauge measurements were made
on a 9-seal MBEJ installed in Sydney’s Anzac Bridge using a 42t GVM test vehicle. At
some speeds it was found that each vehicle passage produced around 30 vibration cycles
where the peak-to-peak strain equalled or exceeded the quasi-static strain of 100 µε and that
the dynamic strain maxima were 4-5 times greater than the quasi-static strain.
A series of trials were conducted using a range of prototype support bar bearings and
compression springs before a design was selected for installation. Post-installation
measurements confirmed stress reductions such that the fatigue damage that would have
occurred in any pre-modification year would now take well over 50 years to occur.
Keywords: Bridges; expansion joints; fatigue; vibration; structural dynamics; dynamic strain
INTRODUCTION
Whilst the use of expansion joints is common practice in bridge construction, modular bridge
expansion joints (MBEJs) are designed to accommodate large longitudinal expansion and
contraction movements of bridge superstructures. In addition to supporting wheel loads, a
properly designed modular joint will prevent rainwater and road debris from entering into the
underlying superstructure and substructure. Modular bridge expansion joints are generally
described as single or multiple support bar designs. In the single support bar design, the
support bar (beam parallel to the direction of traffic) supports all the center beams (beams
transverse to the direction of traffic). In the multiple support bar design, multiple support
bars individually support each center beam. Figure 1 shows a typical single support bar
design MBEJ similar to the one installed in Sydney’s Anzac Bridge. In Figure 1, the term
‘Blockout’ refers to the recess provided in the bridge superstructure to allow casting-in of an
expansion joint. The MBEJ installed into the western abutment of Anzac Bridge consists of
two interleaved single support bar structures that behave, in a dynamic sense, as independent
2

Proc. 6th World Congress on Joints, Bearings, and Seismic Systems for Concrete Structures, Halifax, Nova Scotia, Canada, September, 2006
structures. Previous experimental modal analysis studies1 demonstrated only very light,
almost negligible coupling between the two structures.
Sydney’s Anzac Bridge was opened to traffic on 4th December 1995. The name Anzac is an
acronym derived from Australian and New Zealand Army Corps and it was by this name that
Australian troops participating in the First World War were known.
Anzac Bridge is a cable-stayed bridge spanning a portion of Sydney Harbor on the western
approach to the central business district and is of reinforced concrete construction carrying 8
lanes of traffic and a combined pedestrian/bicycle way. The 805 meter long concrete
structure comprises six spans with three cable-stayed central spans. With a main span of 345
meters, the bridge is the longest span cable-stayed bridge in Australia. There are two
MBEJ’s installed into Anzac Bridge, a small 3-seal joint in the deck (Pier 1) and a larger 9-
seal joint located in the western abutment. The fatigue proofing studies reported here relate
to this latter joint. Anzac Bridge currently carries 130,000 vehicles each day including some
800 commuter bus journeys carrying approximately 25,000 passengers. By 2011, when the
joint would probably otherwise have been due for major repair or replacement, daily traffic
volumes are predicted to have risen to 170,000. Should this joint fail and require total
replacement, the direct cost to the RTA is conservatively estimated at $AU5 million. There
are also large community costs associated with the full replacement of this joint, such as
traffic disruption, increased travel times, increased pollution, etc. Community savings by
avoiding replacement are estimated at a further $AU10 million. The RTA currently has over
25 MBEJs in its inventory. The cost of replacing the RTA’s inventory of MBEJs following
premature fatigue failure is estimated at $AU50 million. The lessons learnt have been
incorporated into new projects to ensure that the problem of fatigue failure of modular bridge
expansion joints has been eliminated effectively.
3
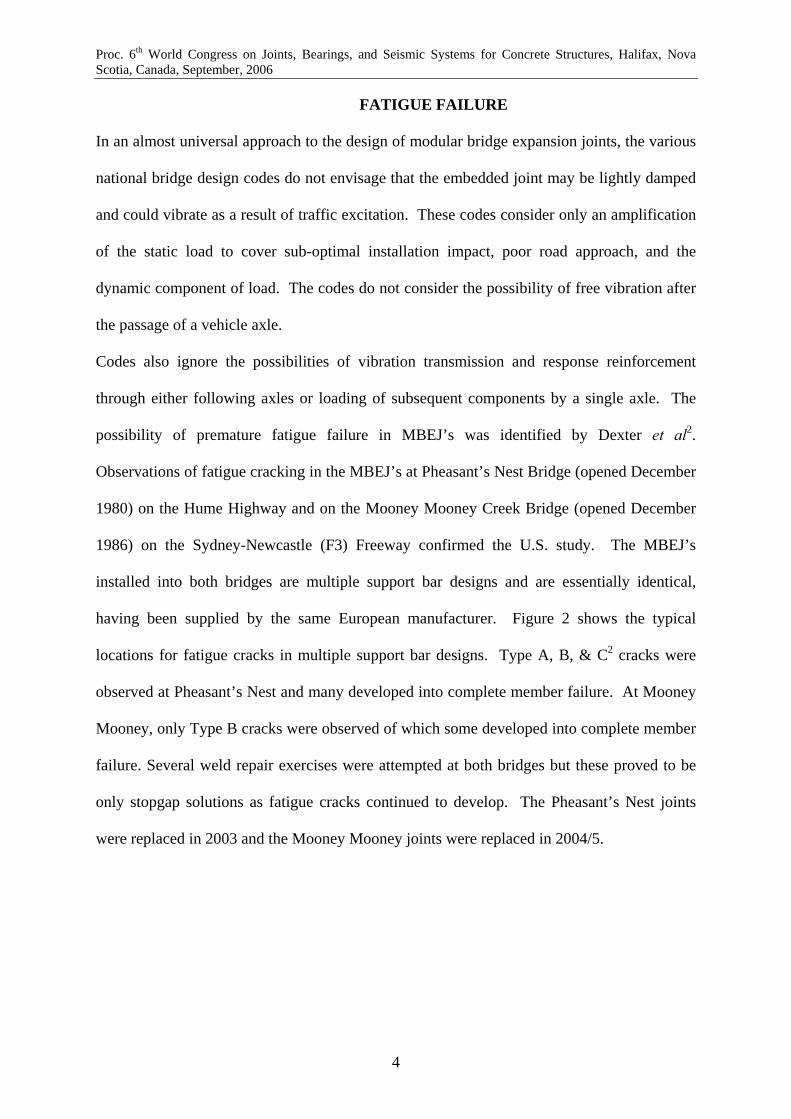
Proc. 6th World Congress on Joints, Bearings, and Seismic Systems for Concrete Structures, Halifax, Nova Scotia, Canada, September, 2006
FATIGUE FAILURE
In an almost universal approach to the design of modular bridge expansion joints, the various
national bridge design codes do not envisage that the embedded joint may be lightly damped
and could vibrate as a result of traffic excitation. These codes consider only an amplification
of the static load to cover sub-optimal installation impact, poor road approach, and the
dynamic component of load. The codes do not consider the possibility of free vibration after
the passage of a vehicle axle.
Codes also ignore the possibilities of vibration transmission and response reinforcement
through either following axles or loading of subsequent components by a single axle. The
possibility of premature fatigue failure in MBEJ’s was identified by Dexter et al2.
Observations of fatigue cracking in the MBEJ’s at Pheasant’s Nest Bridge (opened December
1980) on the Hume Highway and on the Mooney Mooney Creek Bridge (opened December
1986) on the Sydney-Newcastle (F3) Freeway confirmed the U.S. study. The MBEJ’s
installed into both bridges are multiple support bar designs and are essentially identical,
having been supplied by the same European manufacturer. Figure 2 shows the typical
locations for fatigue cracks in multiple support bar designs. Type A, B, & C2 cracks were
observed at Pheasant’s Nest and many developed into complete member failure. At Mooney
Mooney, only Type B cracks were observed of which some developed into complete member
failure. Several weld repair exercises were attempted at both bridges but these proved to be
only stopgap solutions as fatigue cracks continued to develop. The Pheasant’s Nest joints
were replaced in 2003 and the Mooney Mooney joints were replaced in 2004/5.
4

Proc. 6th World Congress on Joints, Bearings, and Seismic Systems for Concrete Structures, Halifax, Nova Scotia, Canada, September, 2006
STRUCTURAL DYNAMICS STUDIES
(a) Experimental Modal Analysis
During the first few years of operation of Anzac Bridge, the fractured remains of a number of the
lower anti-friction bearings from the MBEJ were observed on the floor of the western abutment void
space. The lower anti-friction bearings supplied with the joint were not elastomeric but rather a two-
piece ‘cup & cone’ design machined from polyoxymethylene (POM). The absence of these lower
anti-friction bearings, which were discovered during a routine inspection, would cause bending
moments in the supported center beams to be at least doubled due to the increased unsupported span.
It was considered that the simple replacement of the failed components would not identify the failure
mechanism or assist with a remaining fatigue life assessment. Clearly, an engineering investigation
was necessary. There was little in the published literature to describe the structural dynamics
behavior of MBEJ’s. However, Ostermann3 reported the theoretical and empirical dynamic response
of a MBEJ and Roeder4 reported the results of an analytical modal analysis study (FEM) of a swivel
joist design MBEJ. Roeder noted that “…the modes were closely spaced, and many hundreds (of
modes) would be needed to include the predominate portion of the mass in three-dimensional
vibration…” However, this observation is considered to only apply to the swivel joist design.
Roeder4 noted that the dynamic response of MBEJ’s was complex and field measurements of the
dynamic response would assist in evaluating the dynamic behavior. Accordingly, an experimental
modal analysis study5 (EMA) was undertaken to gain a better understanding of the structural
dynamics behavior of the critical Anzac MBEJ. The EMA measurement defines the natural
frequencies and mode shapes of a structure and allows an estimate of the energy involved in each
mode. These measurements involve the simultaneous measurement of input force and vibration
response. In the Anzac Bridge tests, force over the frequency range of interest was imparted to the
structure using a force hammer.
5
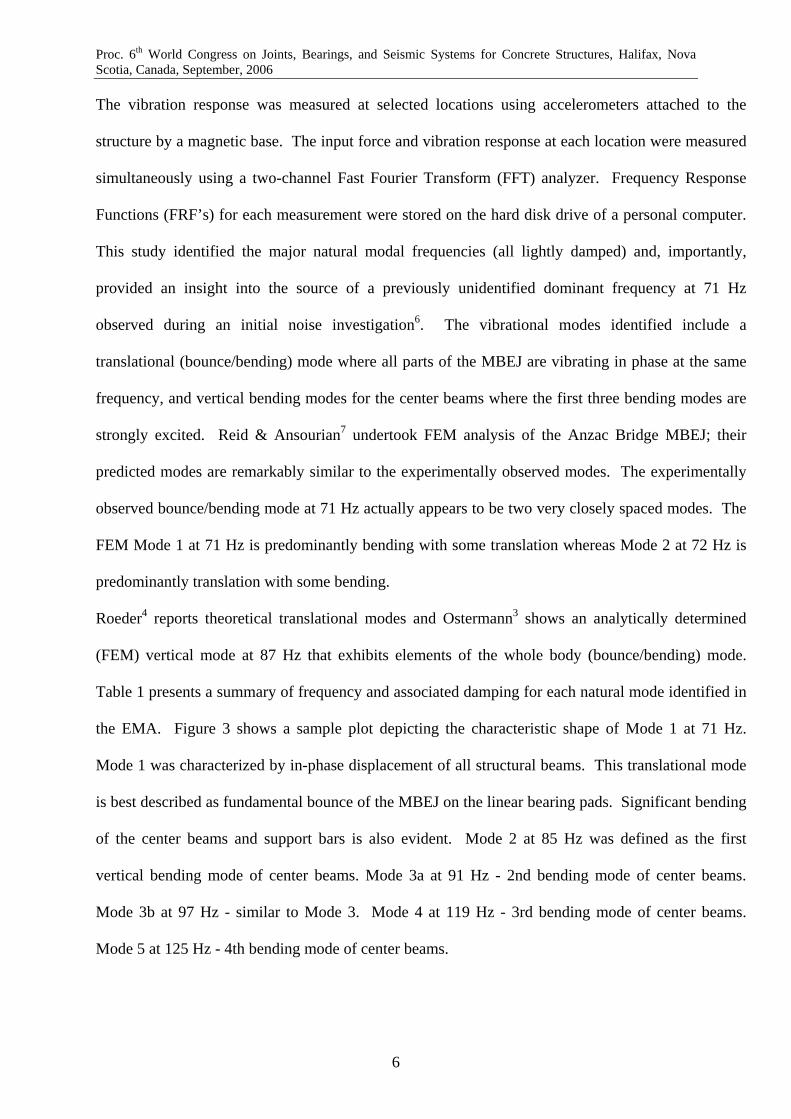
Proc. 6th World Congress on Joints, Bearings, and Seismic Systems for Concrete Structures, Halifax, Nova Scotia, Canada, September, 2006
The vibration response was measured at selected locations using accelerometers attached to the
structure by a magnetic base. The input force and vibration response at each location were measured
simultaneously using a two-channel Fast Fourier Transform (FFT) analyzer. Frequency Response
Functions (FRF’s) for each measurement were stored on the hard disk drive of a personal computer.
This study identified the major natural modal frequencies (all lightly damped) and, importantly,
provided an insight into the source of a previously unidentified dominant frequency at 71 Hz
observed during an initial noise investigation6. The vibrational modes identified include a
translational (bounce/bending) mode where all parts of the MBEJ are vibrating in phase at the same
frequency, and vertical bending modes for the center beams where the first three bending modes are
strongly excited. Reid & Ansourian7 undertook FEM analysis of the Anzac Bridge MBEJ; their
predicted modes are remarkably similar to the experimentally observed modes. The experimentally
observed bounce/bending mode at 71 Hz actually appears to be two very closely spaced modes. The
FEM Mode 1 at 71 Hz is predominantly bending with some translation whereas Mode 2 at 72 Hz is
predominantly translation with some bending.
Roeder4 reports theoretical translational modes and Ostermann3 shows an analytically determined
(FEM) vertical mode at 87 Hz that exhibits elements of the whole body (bounce/bending) mode.
Table 1 presents a summary of frequency and associated damping for each natural mode identified in
the EMA. Figure 3 shows a sample plot depicting the characteristic shape of Mode 1 at 71 Hz.
Mode 1 was characterized by in-phase displacement of all structural beams. This translational mode
is best described as fundamental bounce of the MBEJ on the linear bearing pads. Significant bending
of the center beams and support bars is also evident. Mode 2 at 85 Hz was defined as the first
vertical bending mode of center beams. Mode 3a at 91 Hz - 2nd bending mode of center beams.
Mode 3b at 97 Hz - similar to Mode 3. Mode 4 at 119 Hz - 3rd bending mode of center beams.
Mode 5 at 125 Hz - 4th bending mode of center beams.
6
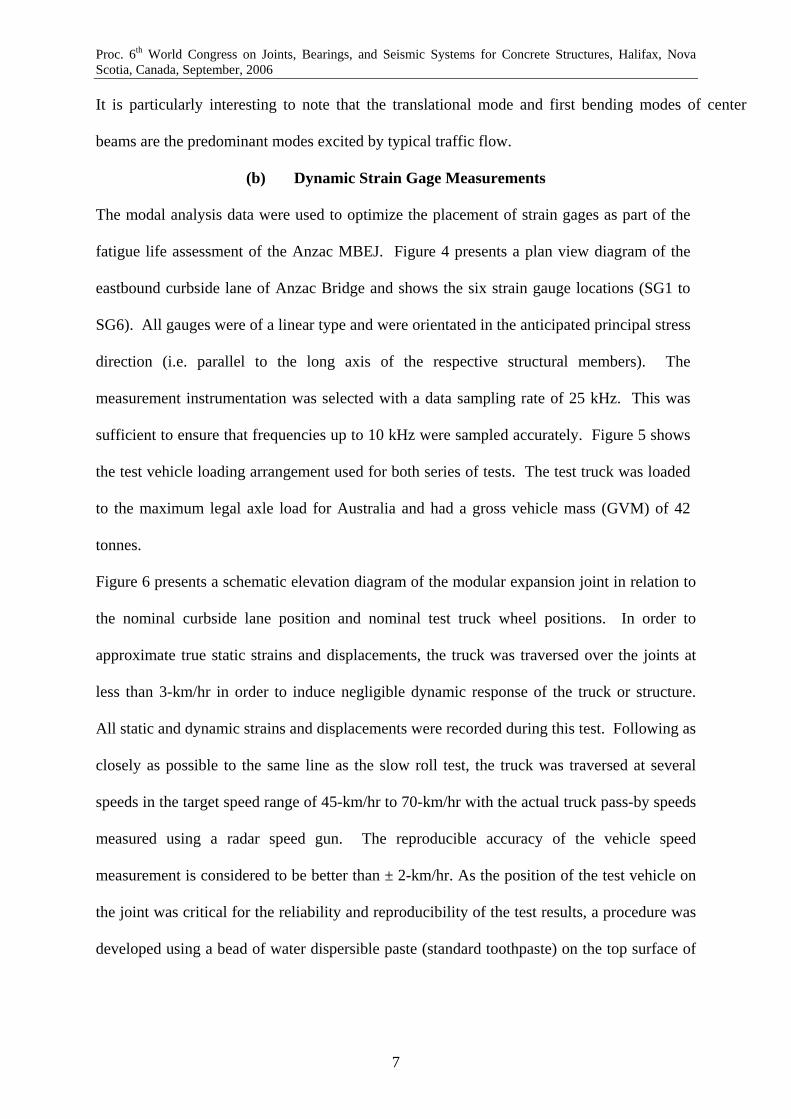
Proc. 6th World Congress on Joints, Bearings, and Seismic Systems for Concrete Structures, Halifax, Nova Scotia, Canada, September, 2006
It is particularly interesting to note that the translational mode and first bending modes of center
beams are the predominant modes excited by typical traffic flow.
(b) Dynamic Strain Gage Measurements
The modal analysis data were used to optimize the placement of strain gages as part of the
fatigue life assessment of the Anzac MBEJ. Figure 4 presents a plan view diagram of the
eastbound curbside lane of Anzac Bridge and shows the six strain gauge locations (SG1 to
SG6). All gauges were of a linear type and were orientated in the anticipated principal stress
direction (i.e. parallel to the long axis of the respective structural members). The
measurement instrumentation was selected with a data sampling rate of 25 kHz. This was
sufficient to ensure that frequencies up to 10 kHz were sampled accurately. Figure 5 shows
the test vehicle loading arrangement used for both series of tests. The test truck was loaded
to the maximum legal axle load for Australia and had a gross vehicle mass (GVM) of 42
tonnes.
Figure 6 presents a schematic elevation diagram of the modular expansion joint in relation to
the nominal curbside lane position and nominal test truck wheel positions. In order to
approximate true static strains and displacements, the truck was traversed over the joints at
less than 3-km/hr in order to induce negligible dynamic response of the truck or structure.
All static and dynamic strains and displacements were recorded during this test. Following as
closely as possible to the same line as the slow roll test, the truck was traversed at several
speeds in the target speed range of 45-km/hr to 70-km/hr with the actual truck pass-by speeds
measured using a radar speed gun. The reproducible accuracy of the vehicle speed
measurement is considered to be better than ± 2-km/hr. As the position of the test vehicle on
the joint was critical for the reliability and reproducibility of the test results, a procedure was
developed using a bead of water dispersible paste (standard toothpaste) on the top surface of
7
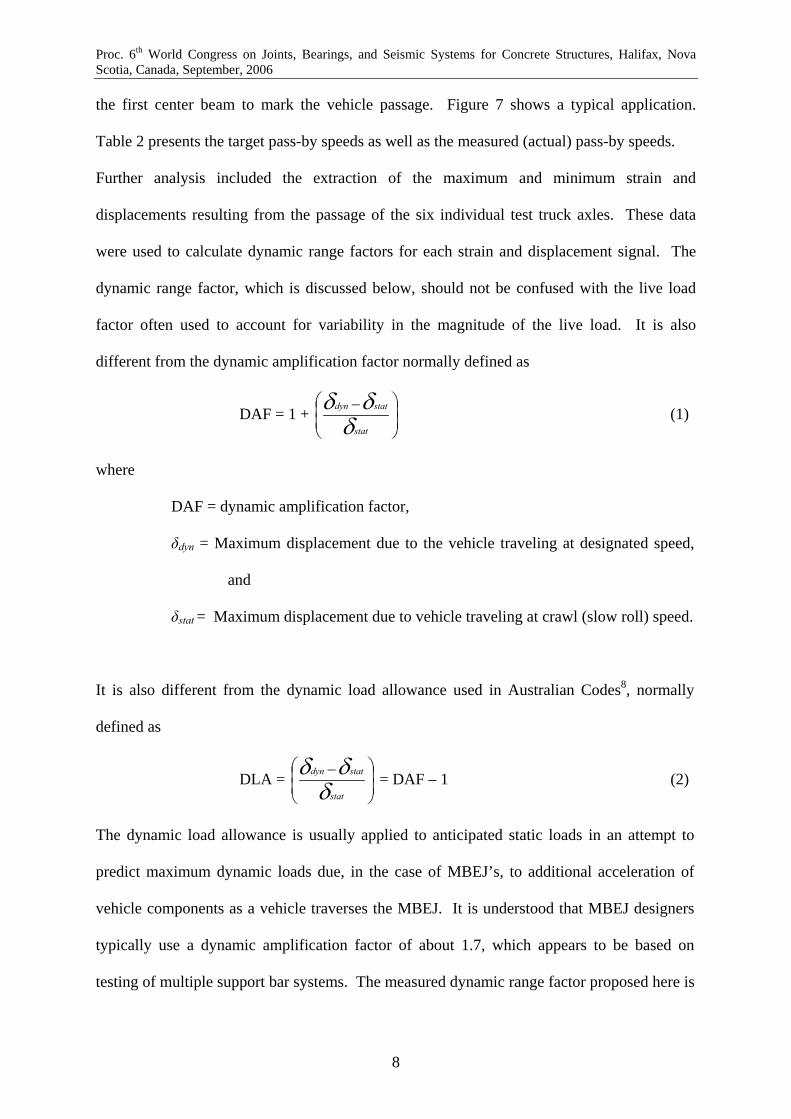
Proc. 6th World Congress on Joints, Bearings, and Seismic Systems for Concrete Structures, Halifax, Nova Scotia, Canada, September, 2006
the first center beam to mark the vehicle passage. Figure 7 shows a typical application.
Table 2 presents the target pass-by speeds as well as the measured (actual) pass-by speeds.
Further analysis included the extraction of the maximum and minimum strain and
displacements resulting from the passage of the six individual test truck axles. These data
were used to calculate dynamic range factors for each strain and displacement signal. The
dynamic range factor, which is discussed below, should not be confused with the live load
factor often used to account for variability in the magnitude of the live load. It is also
different from the dynamic amplification factor normally defined as
DAF = 1 + ⎟⎟⎠
⎞⎜⎜⎝
⎛ −
stat
statdyn
δδδ (1)
where
DAF = dynamic amplification factor,
δdyn = Maximum displacement due to the vehicle traveling at designated speed,
and
δstat = Maximum displacement due to vehicle traveling at crawl (slow roll) speed.
It is also different from the dynamic load allowance used in Australian Codes8, normally
defined as
DLA = ⎟⎟⎠
⎞⎜⎜⎝
⎛ −
stat
statdyn
δδδ = DAF – 1 (2)
The dynamic load allowance is usually applied to anticipated static loads in an attempt to
predict maximum dynamic loads due, in the case of MBEJ’s, to additional acceleration of
vehicle components as a vehicle traverses the MBEJ. It is understood that MBEJ designers
typically use a dynamic amplification factor of about 1.7, which appears to be based on
testing of multiple support bar systems. The measured dynamic range factor proposed here is
8
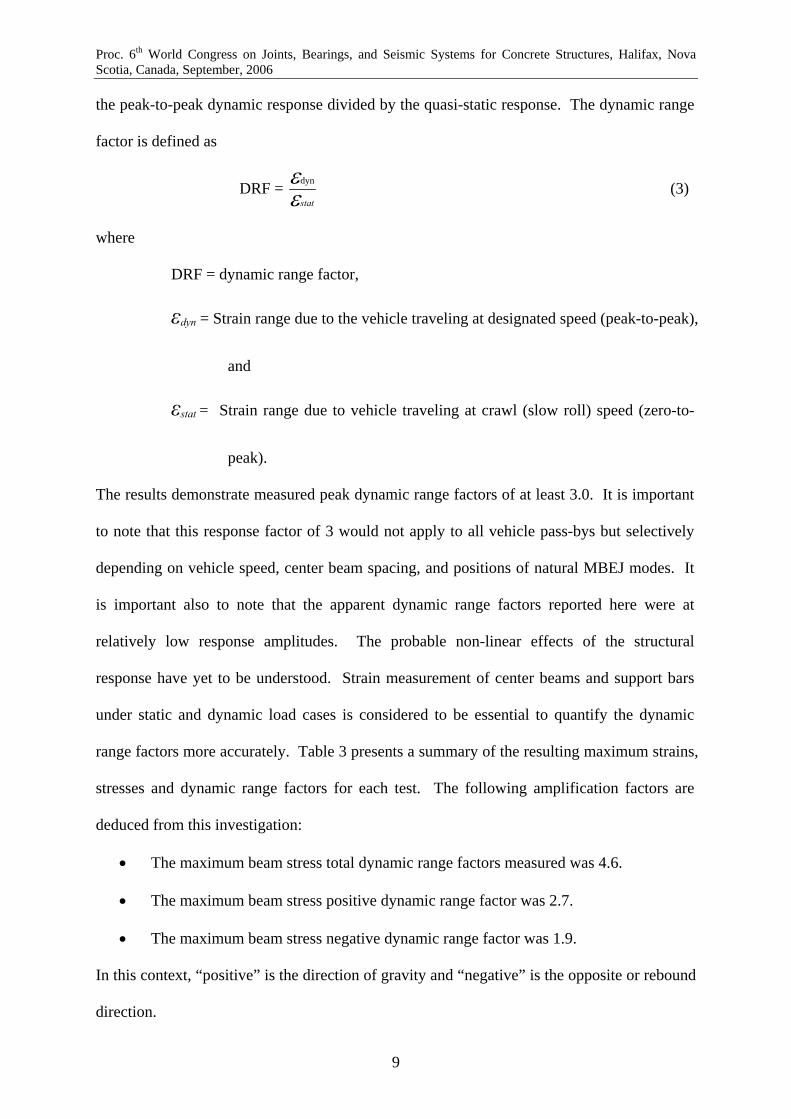
Proc. 6th World Congress on Joints, Bearings, and Seismic Systems for Concrete Structures, Halifax, Nova Scotia, Canada, September, 2006
the peak-to-peak dynamic response divided by the quasi-static response. The dynamic range
factor is defined as
DRF = statε
εdyn (3)
where
DRF = dynamic range factor,
εdyn = Strain range due to the vehicle traveling at designated speed (peak-to-peak),
and
εstat = Strain range due to vehicle traveling at crawl (slow roll) speed (zero-to-
peak).
The results demonstrate measured peak dynamic range factors of at least 3.0. It is important
to note that this response factor of 3 would not apply to all vehicle pass-bys but selectively
depending on vehicle speed, center beam spacing, and positions of natural MBEJ modes. It
is important also to note that the apparent dynamic range factors reported here were at
relatively low response amplitudes. The probable non-linear effects of the structural
response have yet to be understood. Strain measurement of center beams and support bars
under static and dynamic load cases is considered to be essential to quantify the dynamic
range factors more accurately. Table 3 presents a summary of the resulting maximum strains,
stresses and dynamic range factors for each test. The following amplification factors are
deduced from this investigation:
• The maximum beam stress total dynamic range factors measured was 4.6.
• The maximum beam stress positive dynamic range factor was 2.7.
• The maximum beam stress negative dynamic range factor was 1.9.
In this context, “positive” is the direction of gravity and “negative” is the opposite or rebound
direction.
9
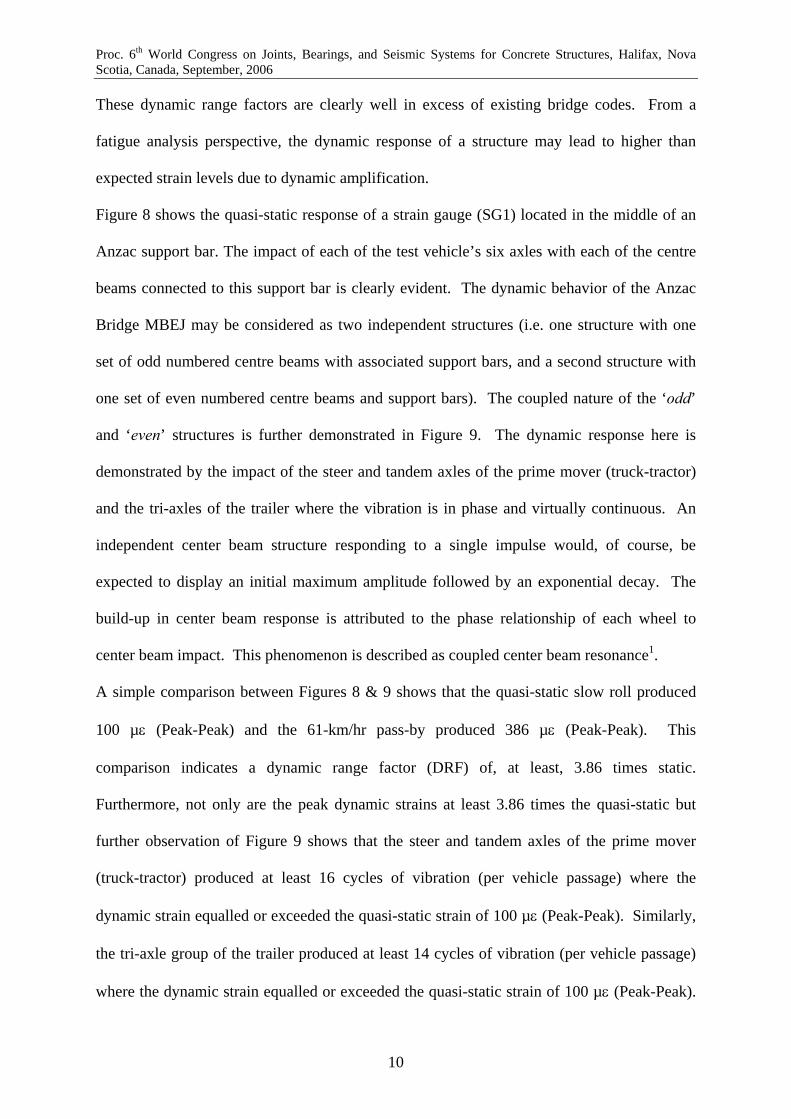
Proc. 6th World Congress on Joints, Bearings, and Seismic Systems for Concrete Structures, Halifax, Nova Scotia, Canada, September, 2006
These dynamic range factors are clearly well in excess of existing bridge codes. From a
fatigue analysis perspective, the dynamic response of a structure may lead to higher than
expected strain levels due to dynamic amplification.
Figure 8 shows the quasi-static response of a strain gauge (SG1) located in the middle of an
Anzac support bar. The impact of each of the test vehicle’s six axles with each of the centre
beams connected to this support bar is clearly evident. The dynamic behavior of the Anzac
Bridge MBEJ may be considered as two independent structures (i.e. one structure with one
set of odd numbered centre beams with associated support bars, and a second structure with
one set of even numbered centre beams and support bars). The coupled nature of the ‘odd’
and ‘even’ structures is further demonstrated in Figure 9. The dynamic response here is
demonstrated by the impact of the steer and tandem axles of the prime mover (truck-tractor)
and the tri-axles of the trailer where the vibration is in phase and virtually continuous. An
independent center beam structure responding to a single impulse would, of course, be
expected to display an initial maximum amplitude followed by an exponential decay. The
build-up in center beam response is attributed to the phase relationship of each wheel to
center beam impact. This phenomenon is described as coupled center beam resonance1.
A simple comparison between Figures 8 & 9 shows that the quasi-static slow roll produced
100 µε (Peak-Peak) and the 61-km/hr pass-by produced 386 µε (Peak-Peak). This
comparison indicates a dynamic range factor (DRF) of, at least, 3.86 times static.
Furthermore, not only are the peak dynamic strains at least 3.86 times the quasi-static but
further observation of Figure 9 shows that the steer and tandem axles of the prime mover
(truck-tractor) produced at least 16 cycles of vibration (per vehicle passage) where the
dynamic strain equalled or exceeded the quasi-static strain of 100 µε (Peak-Peak). Similarly,
the tri-axle group of the trailer produced at least 14 cycles of vibration (per vehicle passage)
where the dynamic strain equalled or exceeded the quasi-static strain of 100 µε (Peak-Peak).
10
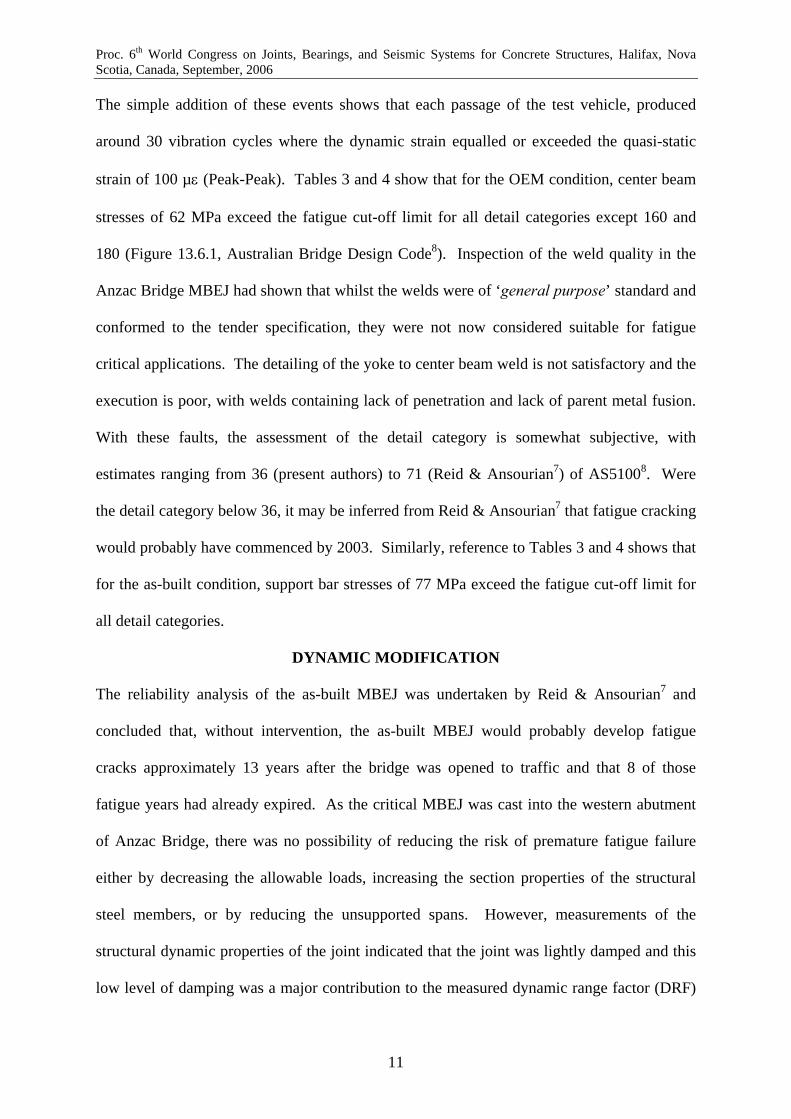
Proc. 6th World Congress on Joints, Bearings, and Seismic Systems for Concrete Structures, Halifax, Nova Scotia, Canada, September, 2006
The simple addition of these events shows that each passage of the test vehicle, produced
around 30 vibration cycles where the dynamic strain equalled or exceeded the quasi-static
strain of 100 µε (Peak-Peak). Tables 3 and 4 show that for the OEM condition, center beam
stresses of 62 MPa exceed the fatigue cut-off limit for all detail categories except 160 and
180 (Figure 13.6.1, Australian Bridge Design Code8). Inspection of the weld quality in the
Anzac Bridge MBEJ had shown that whilst the welds were of ‘general purpose’ standard and
conformed to the tender specification, they were not now considered suitable for fatigue
critical applications. The detailing of the yoke to center beam weld is not satisfactory and the
execution is poor, with welds containing lack of penetration and lack of parent metal fusion.
With these faults, the assessment of the detail category is somewhat subjective, with
estimates ranging from 36 (present authors) to 71 (Reid & Ansourian7) of AS51008. Were
the detail category below 36, it may be inferred from Reid & Ansourian7 that fatigue cracking
would probably have commenced by 2003. Similarly, reference to Tables 3 and 4 shows that
for the as-built condition, support bar stresses of 77 MPa exceed the fatigue cut-off limit for
all detail categories.
DYNAMIC MODIFICATION
The reliability analysis of the as-built MBEJ was undertaken by Reid & Ansourian7 and
concluded that, without intervention, the as-built MBEJ would probably develop fatigue
cracks approximately 13 years after the bridge was opened to traffic and that 8 of those
fatigue years had already expired. As the critical MBEJ was cast into the western abutment
of Anzac Bridge, there was no possibility of reducing the risk of premature fatigue failure
either by decreasing the allowable loads, increasing the section properties of the structural
steel members, or by reducing the unsupported spans. However, measurements of the
structural dynamic properties of the joint indicated that the joint was lightly damped and this
low level of damping was a major contribution to the measured dynamic range factor (DRF)
11
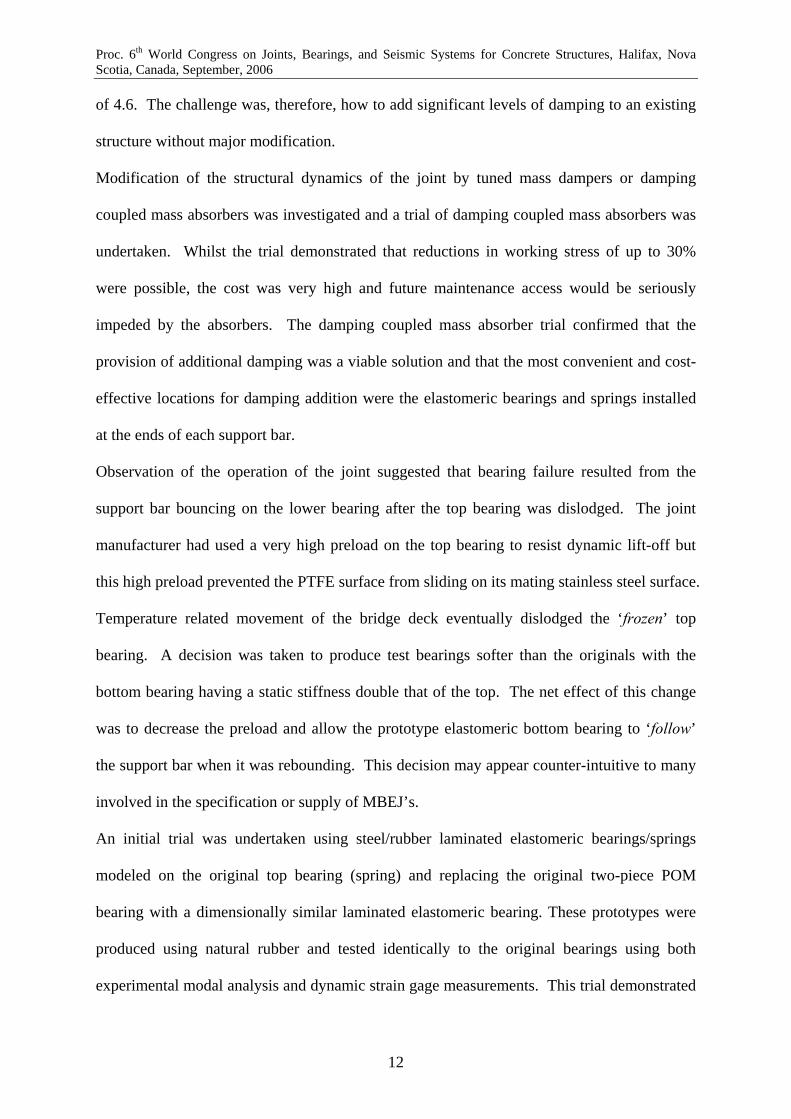
Proc. 6th World Congress on Joints, Bearings, and Seismic Systems for Concrete Structures, Halifax, Nova Scotia, Canada, September, 2006
of 4.6. The challenge was, therefore, how to add significant levels of damping to an existing
structure without major modification.
Modification of the structural dynamics of the joint by tuned mass dampers or damping
coupled mass absorbers was investigated and a trial of damping coupled mass absorbers was
undertaken. Whilst the trial demonstrated that reductions in working stress of up to 30%
were possible, the cost was very high and future maintenance access would be seriously
impeded by the absorbers. The damping coupled mass absorber trial confirmed that the
provision of additional damping was a viable solution and that the most convenient and cost-
effective locations for damping addition were the elastomeric bearings and springs installed
at the ends of each support bar.
Observation of the operation of the joint suggested that bearing failure resulted from the
support bar bouncing on the lower bearing after the top bearing was dislodged. The joint
manufacturer had used a very high preload on the top bearing to resist dynamic lift-off but
this high preload prevented the PTFE surface from sliding on its mating stainless steel surface.
Temperature related movement of the bridge deck eventually dislodged the ‘frozen’ top
bearing. A decision was taken to produce test bearings softer than the originals with the
bottom bearing having a static stiffness double that of the top. The net effect of this change
was to decrease the preload and allow the prototype elastomeric bottom bearing to ‘follow’
the support bar when it was rebounding. This decision may appear counter-intuitive to many
involved in the specification or supply of MBEJ’s.
An initial trial was undertaken using steel/rubber laminated elastomeric bearings/springs
modeled on the original top bearing (spring) and replacing the original two-piece POM
bearing with a dimensionally similar laminated elastomeric bearing. These prototypes were
produced using natural rubber and tested identically to the original bearings using both
experimental modal analysis and dynamic strain gage measurements. This trial demonstrated
12
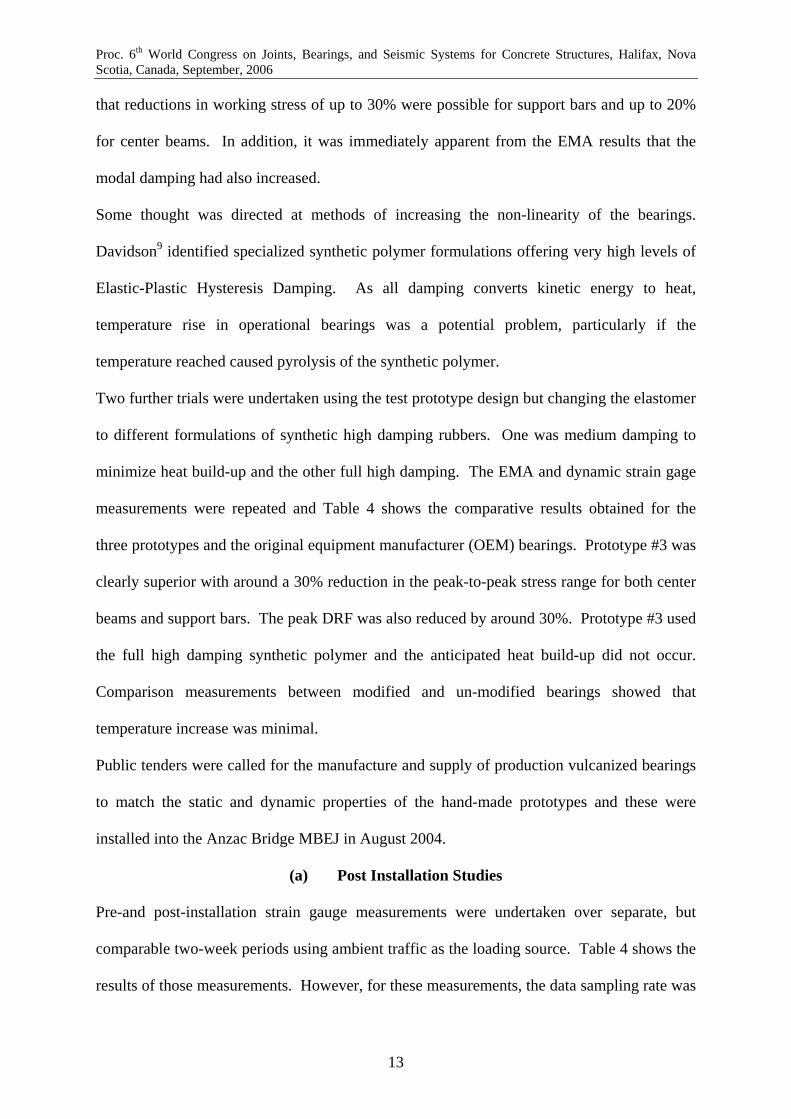
Proc. 6th World Congress on Joints, Bearings, and Seismic Systems for Concrete Structures, Halifax, Nova Scotia, Canada, September, 2006
that reductions in working stress of up to 30% were possible for support bars and up to 20%
for center beams. In addition, it was immediately apparent from the EMA results that the
modal damping had also increased.
Some thought was directed at methods of increasing the non-linearity of the bearings.
Davidson9 identified specialized synthetic polymer formulations offering very high levels of
Elastic-Plastic Hysteresis Damping. As all damping converts kinetic energy to heat,
temperature rise in operational bearings was a potential problem, particularly if the
temperature reached caused pyrolysis of the synthetic polymer.
Two further trials were undertaken using the test prototype design but changing the elastomer
to different formulations of synthetic high damping rubbers. One was medium damping to
minimize heat build-up and the other full high damping. The EMA and dynamic strain gage
measurements were repeated and Table 4 shows the comparative results obtained for the
three prototypes and the original equipment manufacturer (OEM) bearings. Prototype #3 was
clearly superior with around a 30% reduction in the peak-to-peak stress range for both center
beams and support bars. The peak DRF was also reduced by around 30%. Prototype #3 used
the full high damping synthetic polymer and the anticipated heat build-up did not occur.
Comparison measurements between modified and un-modified bearings showed that
temperature increase was minimal.
Public tenders were called for the manufacture and supply of production vulcanized bearings
to match the static and dynamic properties of the hand-made prototypes and these were
installed into the Anzac Bridge MBEJ in August 2004.
(a) Post Installation Studies
Pre-and post-installation strain gauge measurements were undertaken over separate, but
comparable two-week periods using ambient traffic as the loading source. Table 4 shows the
results of those measurements. However, for these measurements, the data sampling rate was
13

Proc. 6th World Congress on Joints, Bearings, and Seismic Systems for Concrete Structures, Halifax, Nova Scotia, Canada, September, 2006
reduced to 2.5 kHz to conserve hard disk space. Nonetheless, the sampling rate was
sufficient to record transients up to 1 kHz. Figures 10 & 11 show the probability of failure
for the welded connection between the center beam and its yoke attachment to the support bar
for the OEM condition and after fitting the Prototype #3 bearings. The results in Table 5
show that the installation of these bearings has resulted in a 30% reduction in stress for both
center beams and support bars. In addition, there was the measured 98% reduction in stress
events exceeding 15 MPa (the fatigue cut-off limit for the lowest detail category). The
installation of high damping support bar bearings into the Anzac Bridge MBEJ has shown
that a joint previously predicted to reach first fatigue failure within some 13 years from
opening (5 years from this study) will now last in excess of 50 years.
CONCLUSION
Experimental Modal Analysis and dynamic strain gage studies were performed on the single
support bar MBEJ installed in Anzac Bridge. The studies showed that for this joint
(unmodified):
• The joint is very lightly damped (<2% of critical damping).
• The lowest frequency mode excited was a quasi-translational (bounce/bending) mode at
71 Hz.
• Due to access restrictions, horizontal modal data could not be acquired in sufficient detail
to identify horizontal bending or torsional modes.
• The support bars and centre beams were acting dynamically as if simply supported.
It is considered that the dynamic response of this MBEJ is mainly due to coupled centre beam
resonance and this is seen as a design characteristic of all single support bar designs. Static
and dynamic strain gauge studies showed that for this joint (unmodified):
• The DRF is up to 4.6 for the fully laden test vehicle
14

Proc. 6th World Congress on Joints, Bearings, and Seismic Systems for Concrete Structures, Halifax, Nova Scotia, Canada, September, 2006
• This DRF is not necessarily the worst case as every possible vehicle speed and joint
opening combination was not tested
• Damping is important in the dynamic behavior
• The number of effective cycles of load due to vibration for each vehicle passage is very
high
• High uplift forces are generated within the joint under vehicle loading.
These results were used to develop high damping elastomeric support bar bearings and the
installation of these bearings resulted in a 30% reduction in stress for both center beams and
support bars and reduce the uplift forces with consequent benefits on bearing retention.
A wholly unexpected benefit was the measured 98% reduction in stress events exceeding 15
MPa. The installation of high damping support bar bearings into the Anzac Bridge MBEJ has
ensured that a joint previously predicted to reach probable first fatigue failure within some 5
years from this study will now last in excess of 50 years. These results should be of interest
to bridge asset owners and bridge designers as this approach offers a cost-effective alternative
to total joint replacement provided fatigue cracking has not yet occurred. It should also be of
interest to specifiers and suppliers, as they can now specify and supply joints that will last the
lifetime of the bridge by using a dynamics approach to the design.
ACKNOWLEDGEMENT
The authors wish to thank the Chief Executive of the Roads and Traffic Authority of NSW
(RTA) for permission to publish this paper. The opinions and conclusions expressed in this
paper do not necessarily reflect the views of the RTA.
15
Proc. 6th World Congress on Joints, Bearings, and Seismic Systems for Concrete Structures, Halifax, Nova Scotia, Canada, September, 2006
REFERENCES
1. Ancich E.J., Brown S.C. & Chirgwin G.J., “Modular Deck Joints – Investigations into
structural behavior and some implications for new joints”, Proc. 5th Austroads Bridge
Conference, Hobart, Tasmania, Australia, 2004.
2. Dexter R.J., Connor R.J. & Kaczinski M.R., “Fatigue Design of Modular Bridge
Expansion Joints”, NCHRP Report 402, Transportation Research Board, National
Research Council, Washington, DC, USA, 1997, 128 pp.
3. Ostermann M., “Beanspruchung von elastisch gelagerten Fahrbahnübergängen unter
Radstoßeinwirkung (Stresses in elastically supported modular expansion joints under
wheel load impact)”, Bauingenieur 66, Springer-Verlag, 1991, pp 381-389 (In German).
4. Roeder C.W., “Fatigue Cracking in Modular Expansion Joints”, Research Report WA-RD
306.1, Washington State Transportation Center, Seattle, WA, USA, 1993, 53 pp.
5. Ewins D.J., “Modal Testing: Theory, Practice & Application (2nd Edition)”, Research
Studies Press, Hertfordshire, UK, 1999, pp.163-276.
6. Ancich E.J., Brown S.C. & Chirgwin G.J., “The Role of Modular Bridge Expansion Joint
Vibration in Environmental Noise Emissions and Joint Fatigue Failure”, Proc. Acoustics
2004 Conference, Surfers Paradise, Qld., Australia, 2004, pp 135-140.
7. Reid S. & Ansourian P., “Reliability Analysis of Expansion Joint in Anzac Bridge”,
Investigation Report S1427, Centre for Advanced Structural Engineering, University of
Sydney, Australia, 2004 (Unpublished report prepared for the Roads & Traffic Authority
of NSW).
8. Standards Australia, Australian Standard AS5100.4 – 2004, Bridge Design Part 4:
Bearings and deck joints, Sydney, Australia, 2004
9. Davidson G. (Ludowici Ltd.), Personal Communication, 2002.
16
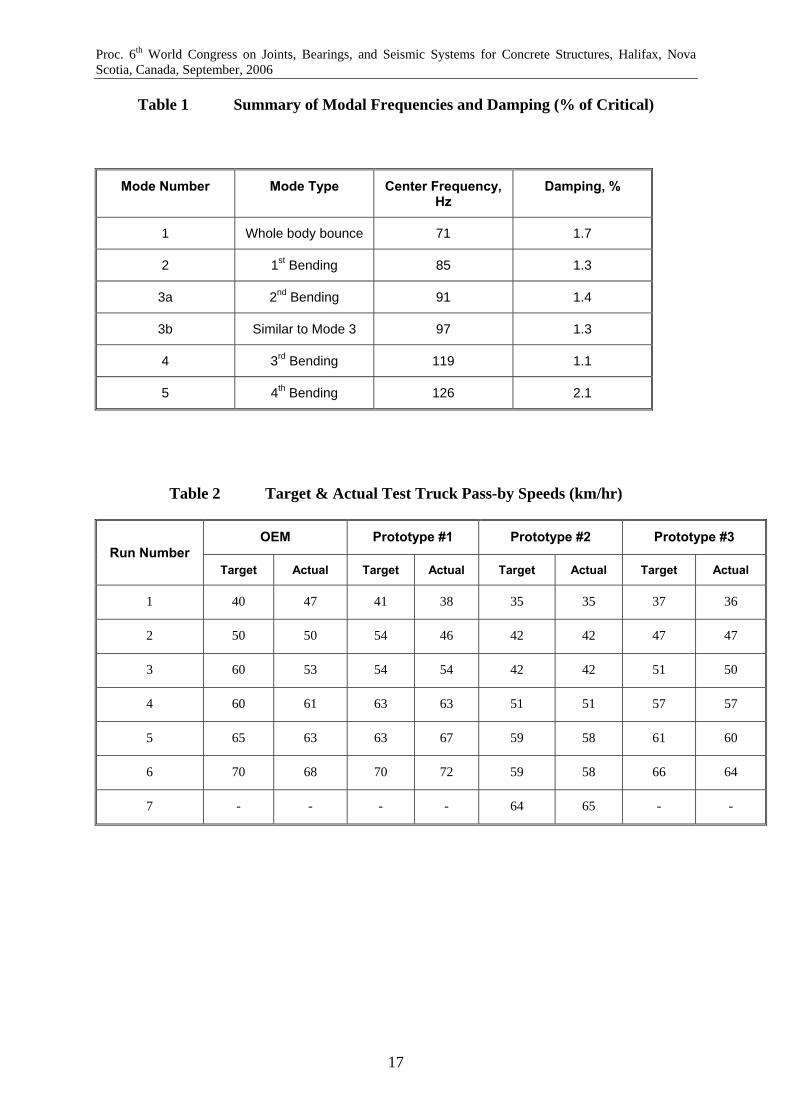
Proc. 6th World Congress on Joints, Bearings, and Seismic Systems for Concrete Structures, Halifax, Nova Scotia, Canada, September, 2006
Table 1 Summary of Modal Frequencies and Damping (% of Critical)
Mode Number Mode Type Center Frequency, Hz
Damping, %
1 Whole body bounce 71 1.7
2 1st Bending 85 1.3
3a 2nd Bending 91 1.4
3b Similar to Mode 3 97 1.3
4 3rd Bending 119 1.1
5 4th Bending 126 2.1
Table 2 Target & Actual Test Truck Pass-by Speeds (km/hr)
OEM Prototype #1 Prototype #2 Prototype #3 Run Number
Target Actual Target Actual Target Actual Target Actual
1 40 47 41 38 35 35 37 36
2 50 50 54 46 42 42 47 47
3 60 53 54 54 42 42 51 50
4 60 61 63 63 51 51 57 57
5 65 63 63 67 59 58 61 60
6 70 68 70 72 59 58 66 64
7 - - - - 64 65 - -
17
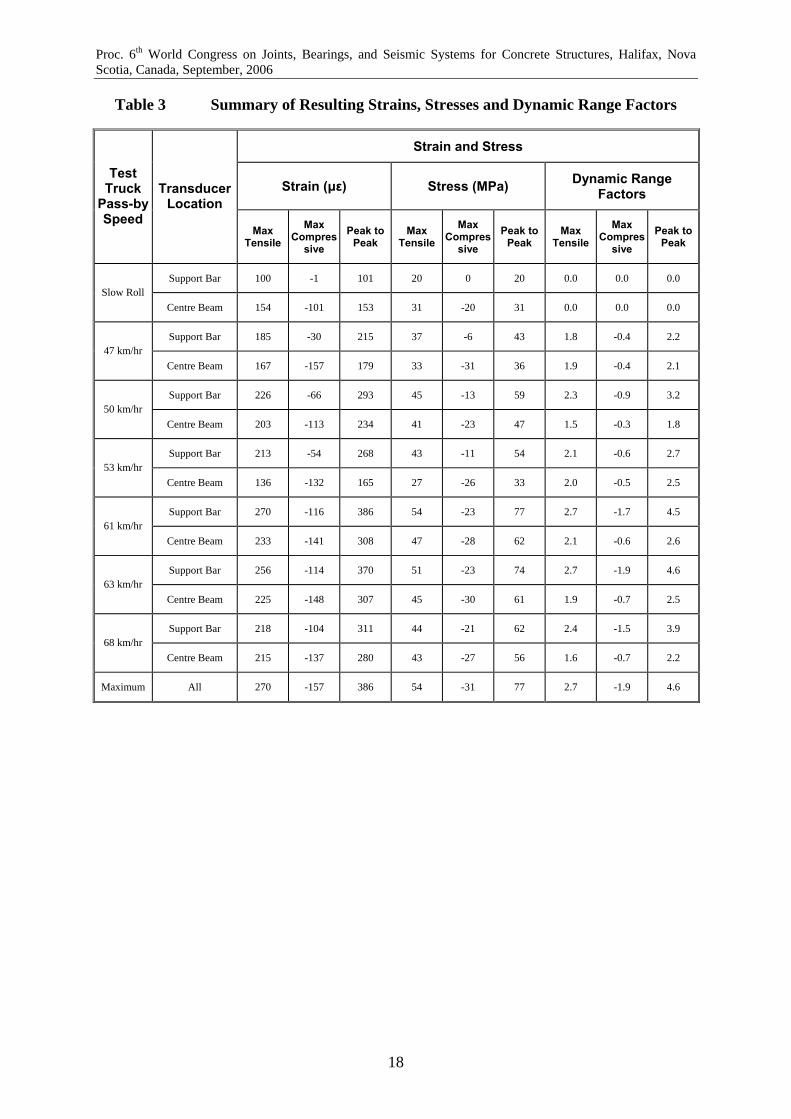
Proc. 6th World Congress on Joints, Bearings, and Seismic Systems for Concrete Structures, Halifax, Nova Scotia, Canada, September, 2006
Table 3 Summary of Resulting Strains, Stresses and Dynamic Range Factors
Strain and Stress
Strain (µε) Stress (MPa) Dynamic Range Factors
Test Truck
Pass-by Speed
Transducer Location
Max Tensile
Max Compres
sive
Peak to Peak
Max Tensile
Max Compres
sive
Peak to Peak
Max Tensile
Max Compres
sive
Peak to Peak
Support Bar 100 -1 101 20 0 20 0.0 0.0 0.0 Slow Roll
Centre Beam 154 -101 153 31 -20 31 0.0 0.0 0.0
Support Bar 185 -30 215 37 -6 43 1.8 -0.4 2.2 47 km/hr
Centre Beam 167 -157 179 33 -31 36 1.9 -0.4 2.1
Support Bar 226 -66 293 45 -13 59 2.3 -0.9 3.2 50 km/hr
Centre Beam 203 -113 234 41 -23 47 1.5 -0.3 1.8
Support Bar 213 -54 268 43 -11 54 2.1 -0.6 2.7 53 km/hr
Centre Beam 136 -132 165 27 -26 33 2.0 -0.5 2.5
Support Bar 270 -116 386 54 -23 77 2.7 -1.7 4.5 61 km/hr
Centre Beam 233 -141 308 47 -28 62 2.1 -0.6 2.6
Support Bar 256 -114 370 51 -23 74 2.7 -1.9 4.6 63 km/hr
Centre Beam 225 -148 307 45 -30 61 1.9 -0.7 2.5
Support Bar 218 -104 311 44 -21 62 2.4 -1.5 3.9 68 km/hr
Centre Beam 215 -137 280 43 -27 56 1.6 -0.7 2.2
Maximum All 270 -157 386 54 -31 77 2.7 -1.9 4.6
18
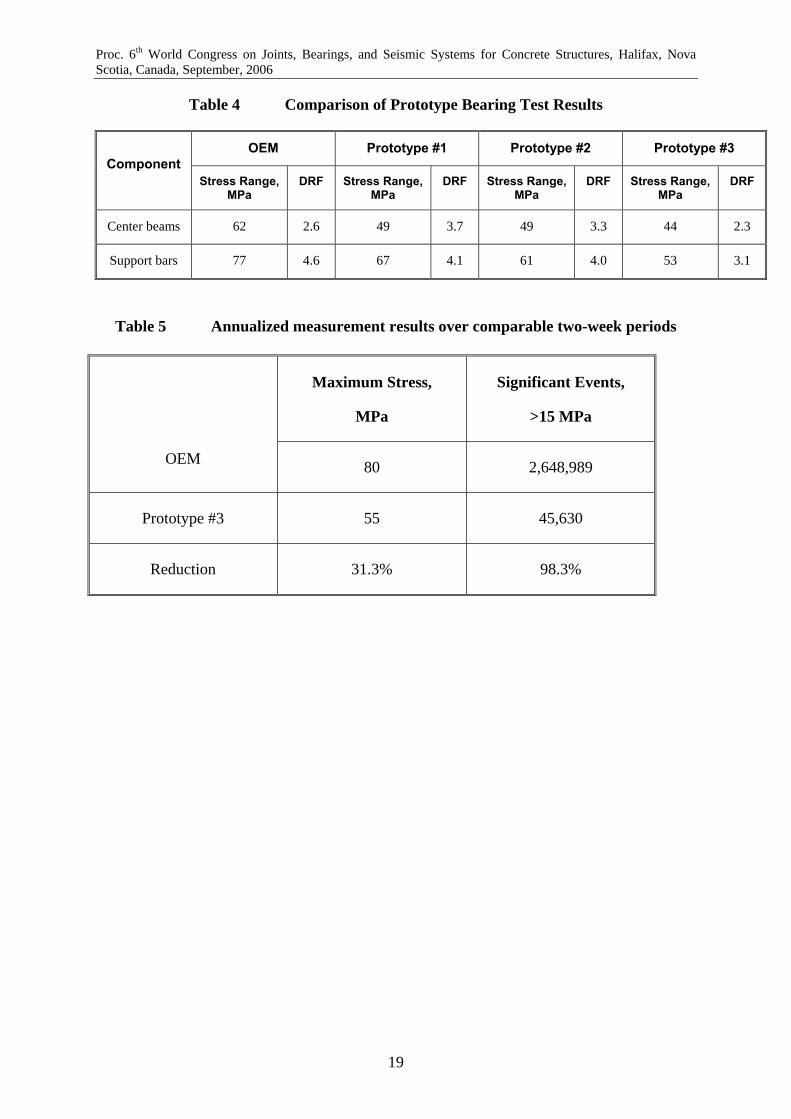
Proc. 6th World Congress on Joints, Bearings, and Seismic Systems for Concrete Structures, Halifax, Nova Scotia, Canada, September, 2006
Table 4 Comparison of Prototype Bearing Test Results
OEM Prototype #1 Prototype #2 Prototype #3 Component
Stress Range, MPa
DRF Stress Range, MPa
DRF Stress Range, MPa
DRF Stress Range, MPa
DRF
Center beams 62 2.6 49 3.7 49 3.3 44 2.3
Support bars 77 4.6 67 4.1 61 4.0 53 3.1
Table 5 Annualized measurement results over comparable two-week periods
Maximum Stress,
MPa
Significant Events,
>15 MPa
OEM 80 2,648,989
Prototype #3 55 45,630
Reduction 31.3% 98.3%
19
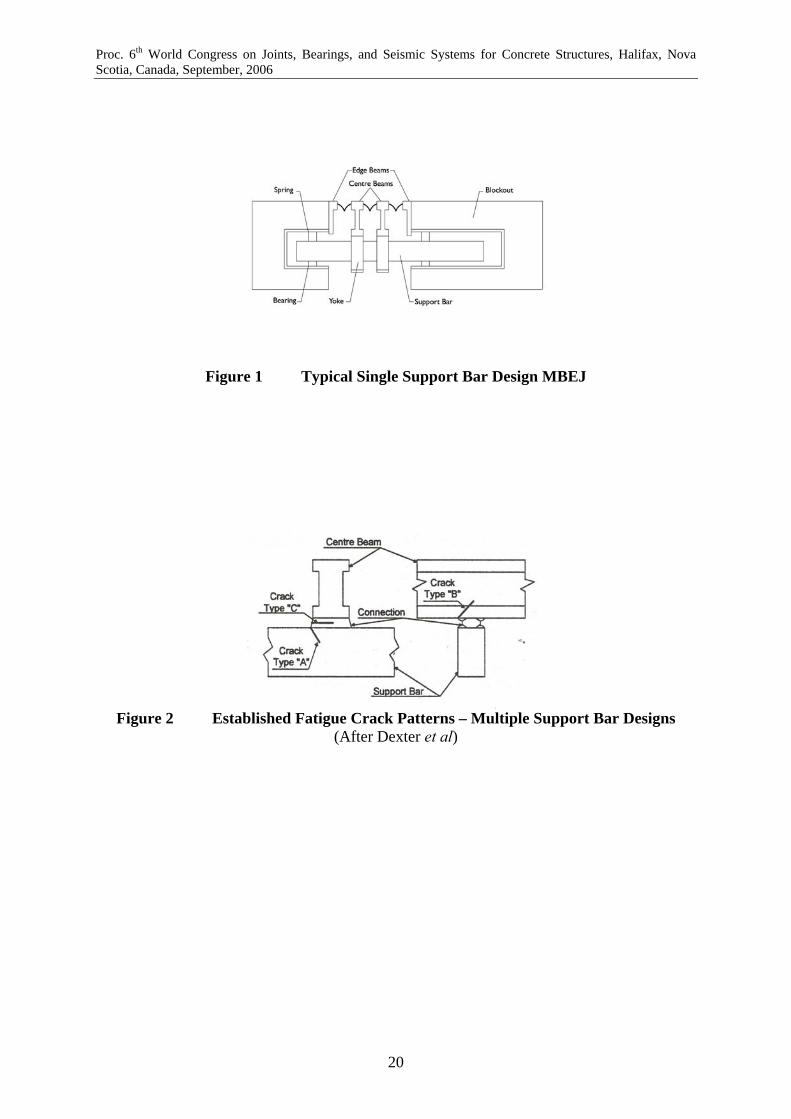
Proc. 6th World Congress on Joints, Bearings, and Seismic Systems for Concrete Structures, Halifax, Nova Scotia, Canada, September, 2006
Figure 1 Typical Single Support Bar Design MBEJ
Figure 2 Established Fatigue Crack Patterns – Multiple Support Bar Designs
(After Dexter et al)
20
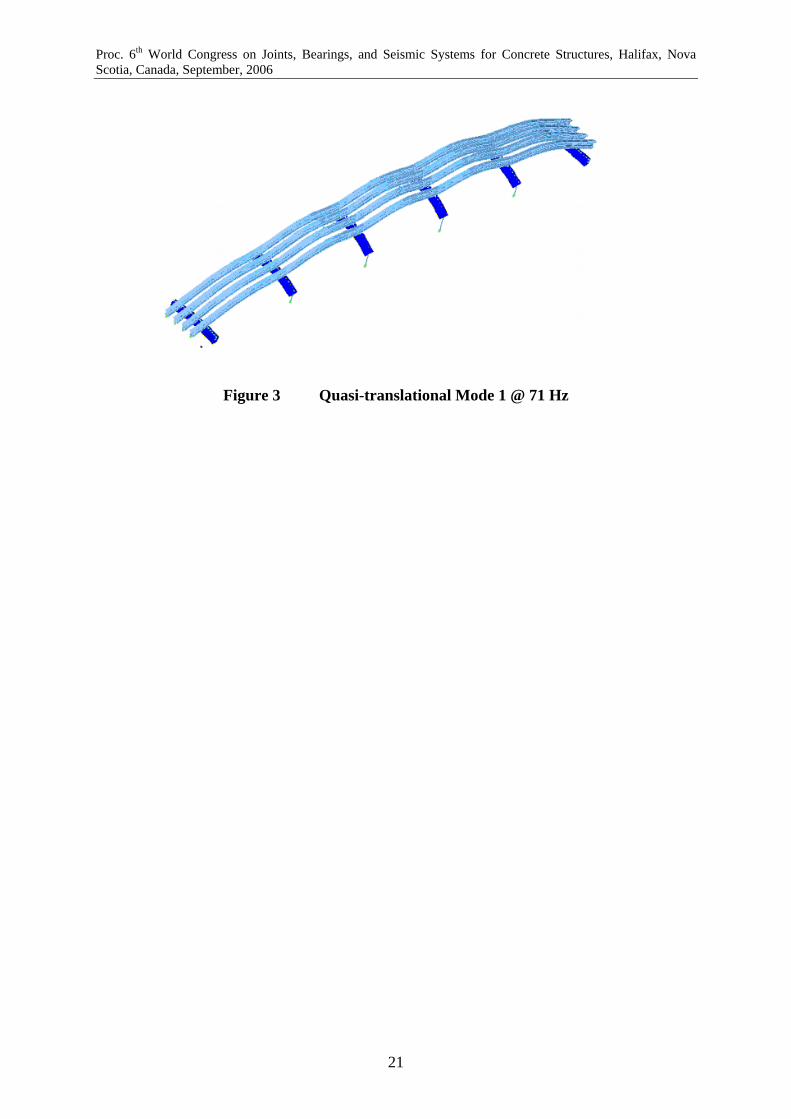
Proc. 6th World Congress on Joints, Bearings, and Seismic Systems for Concrete Structures, Halifax, Nova Scotia, Canada, September, 2006
Figure 3 Quasi-translational Mode 1 @ 71 Hz
21
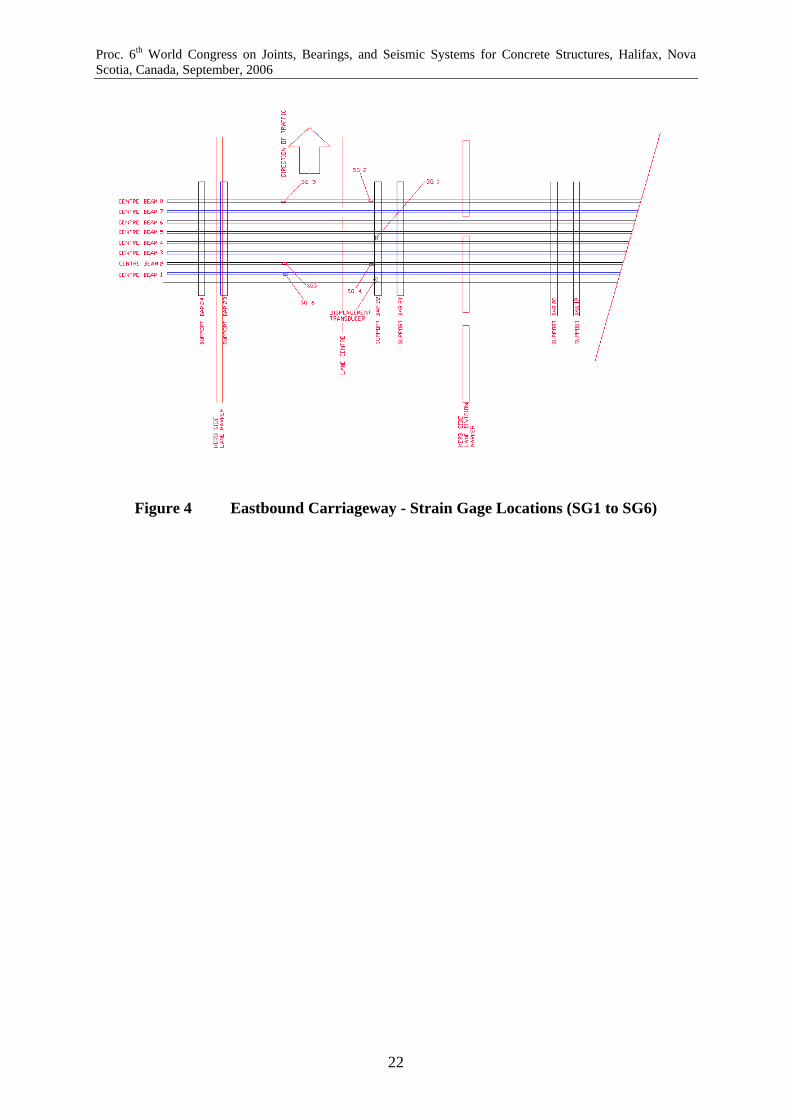
Proc. 6th World Congress on Joints, Bearings, and Seismic Systems for Concrete Structures, Halifax, Nova Scotia, Canada, September, 2006
Figure 4 Eastbound Carriageway - Strain Gage Locations (SG1 to SG6)
22
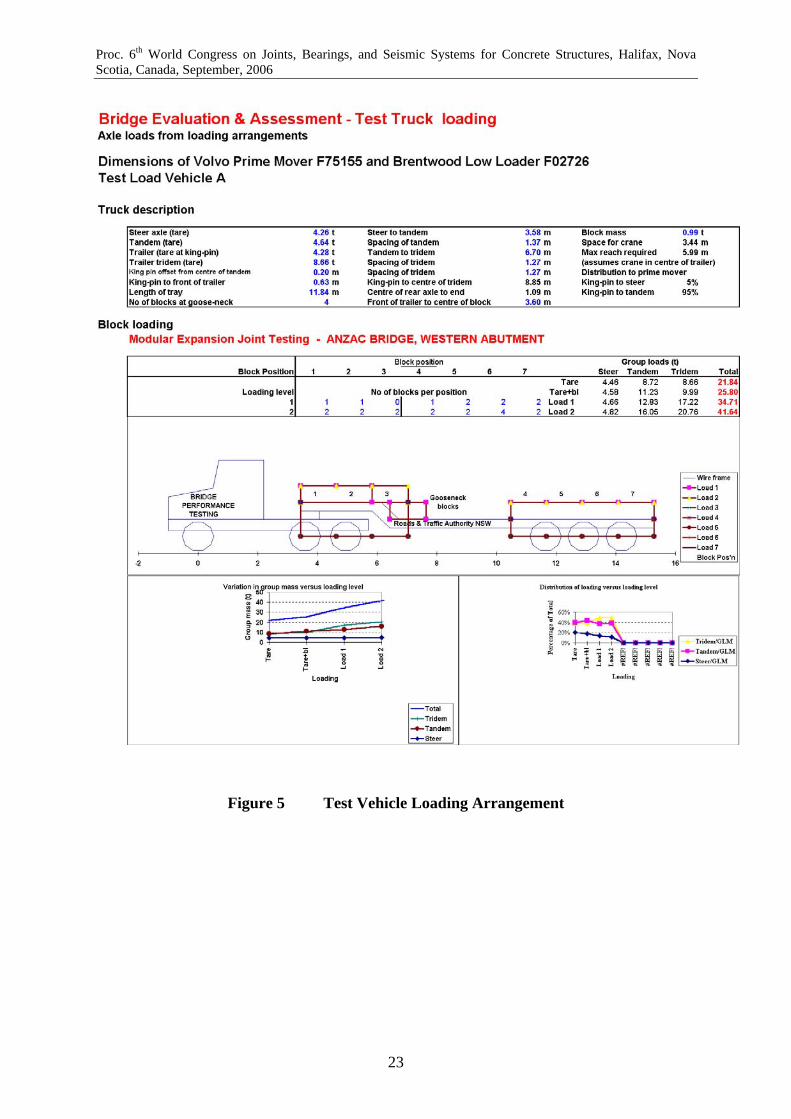
Proc. 6th World Congress on Joints, Bearings, and Seismic Systems for Concrete Structures, Halifax, Nova Scotia, Canada, September, 2006
Figure 5 Test Vehicle Loading Arrangement
23
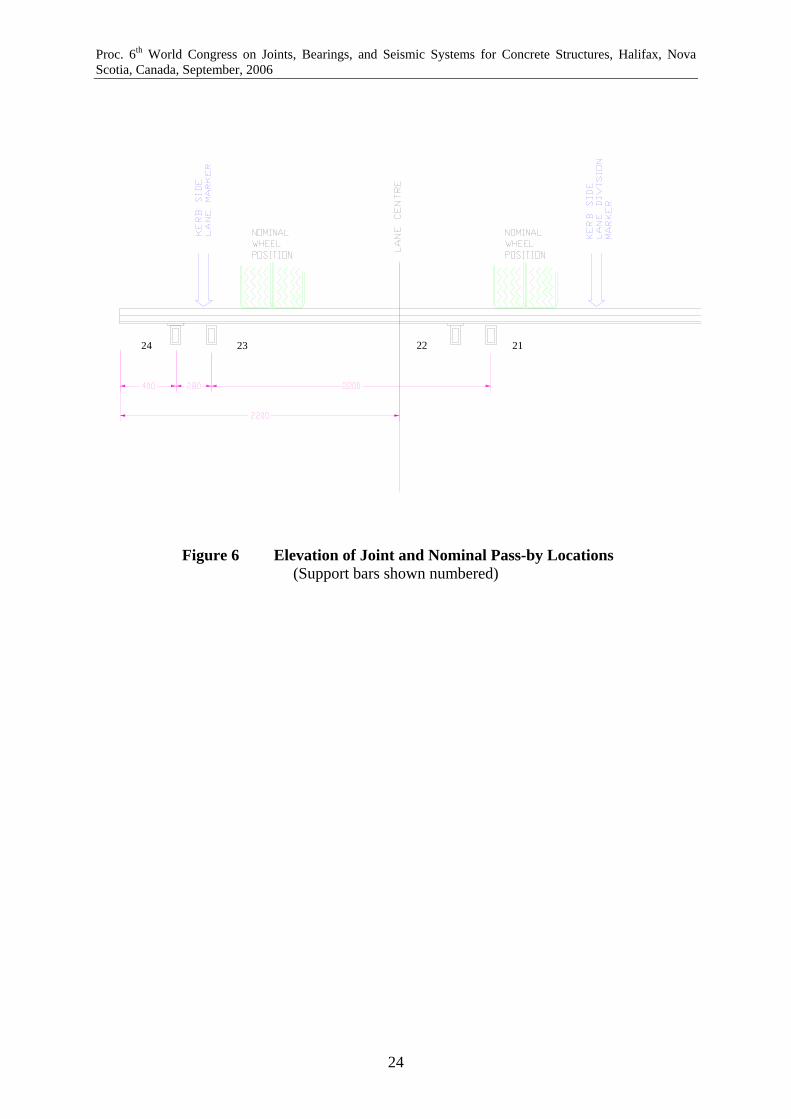
Proc. 6th World Congress on Joints, Bearings, and Seismic Systems for Concrete Structures, Halifax, Nova Scotia, Canada, September, 2006
24 23 21
Figure 6 Elevation of Joint an(Support bars show
24
22
d Nominal Pass-by Locations n numbered)
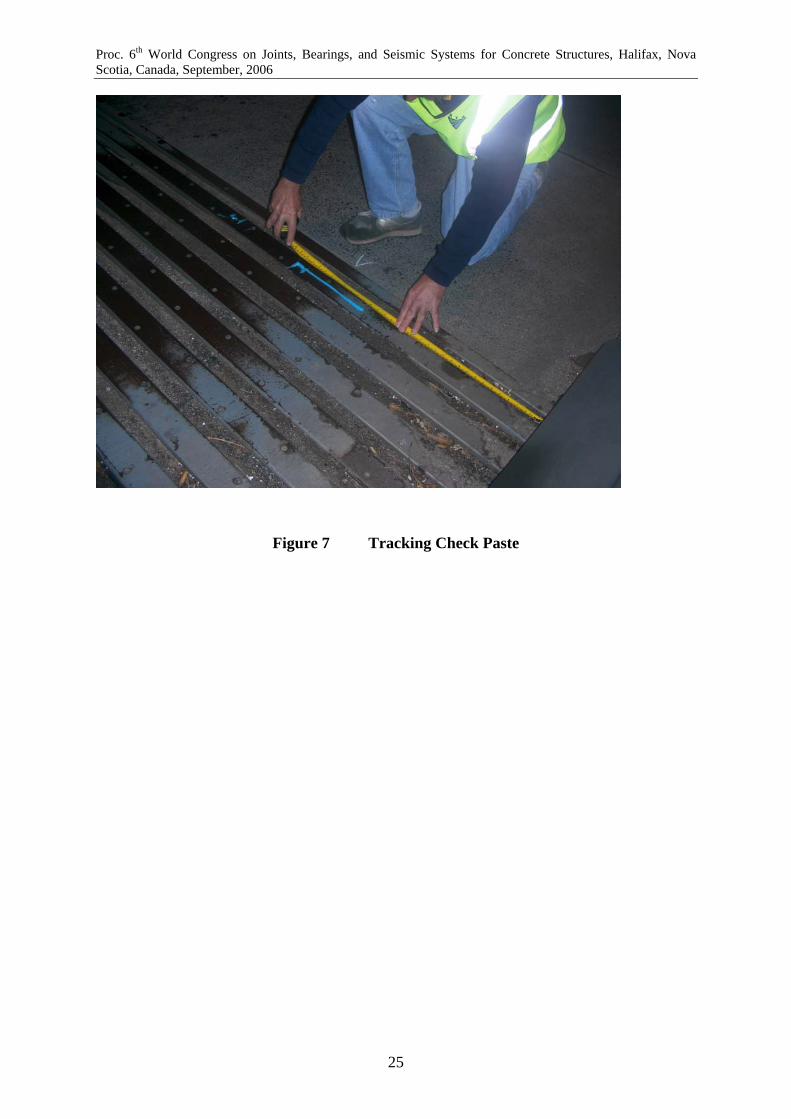
Proc. 6th World Congress on Joints, Bearings, and Seismic Systems for Concrete Structures, Halifax, Nova Scotia, Canada, September, 2006
Figure 7 Tracking Check Paste
25
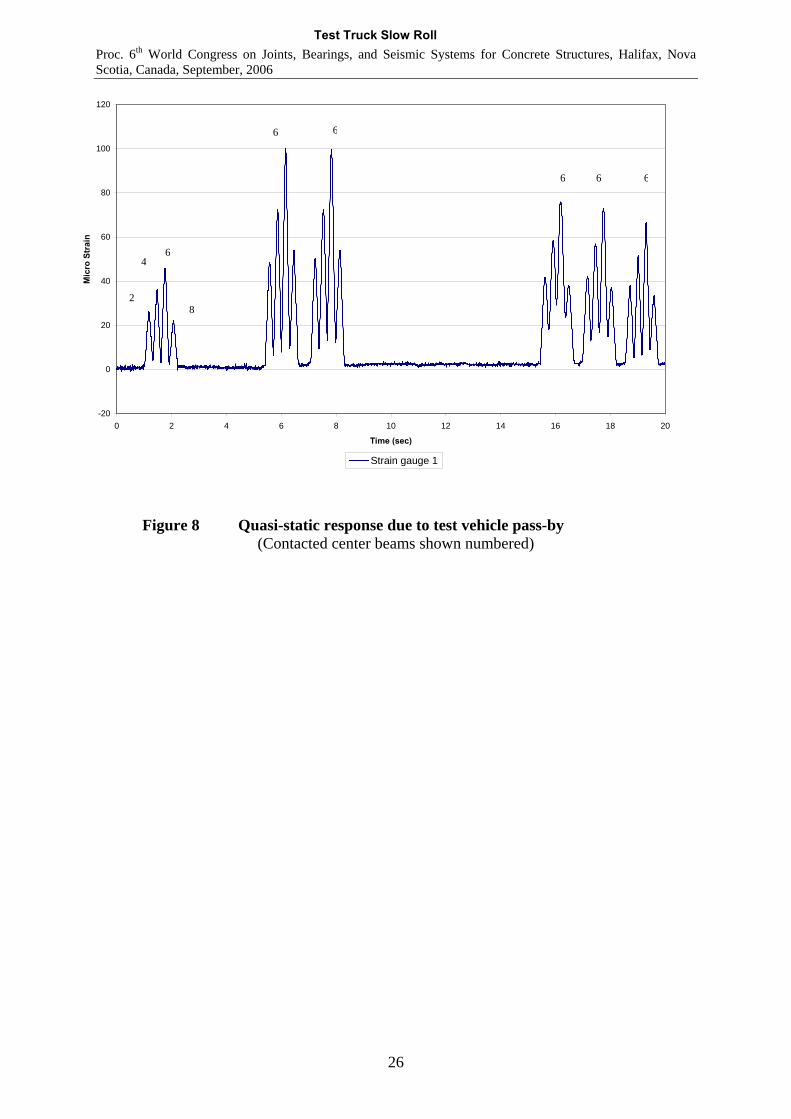
Proc. 6th World Congress on Joints, Bearings, and Seismic Systems for Concrete Structures, Halifax, Nova Scotia, Canada, September, 2006
Test Truck Slow Roll
-20
0
20
40
60
80
100
120
0
Mic
ro S
trai
n
666
6
2
4
Fig
6
2 4
8
ure 8 Qua(C
6
6 8 10 12 14 16 18 20
Time (sec)
Strain gauge 1
si-static response due to test vehicle pass-by ontacted center beams shown numbered)
26
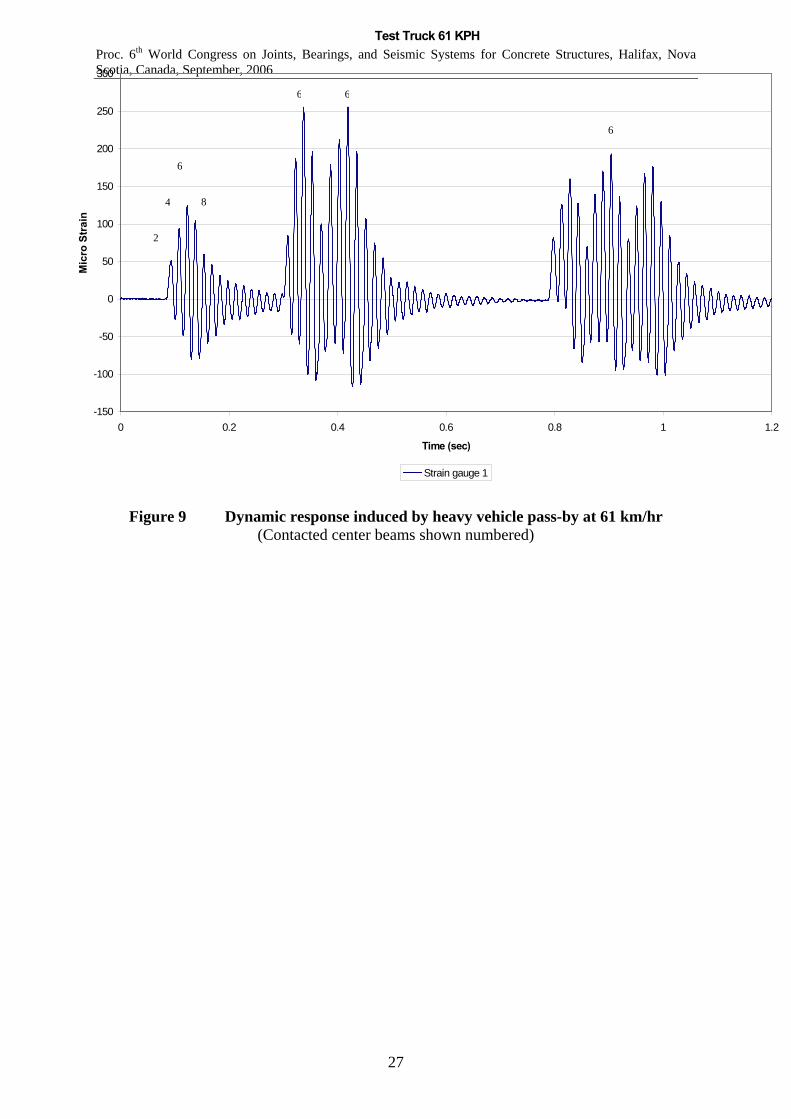
Proc. 6th World Congress on Joints, Bearings, and Seismic Systems for Concrete Structures, Halifax, Nova Scotia, Canada, September, 2006
Test Truck 61 KPH
-150
-100
-50
0
50
100
150
200
250
300
0 0.2 0.4 0.6 0.8 1 1.2
Time (sec)
Mic
ro S
trai
n
Strain gauge 1
6
66
8
6
4
2
Figure 9 Dynamic response induced by heavy vehicle pass-by at 61 km/hr
(Contacted center beams shown numbered)
27
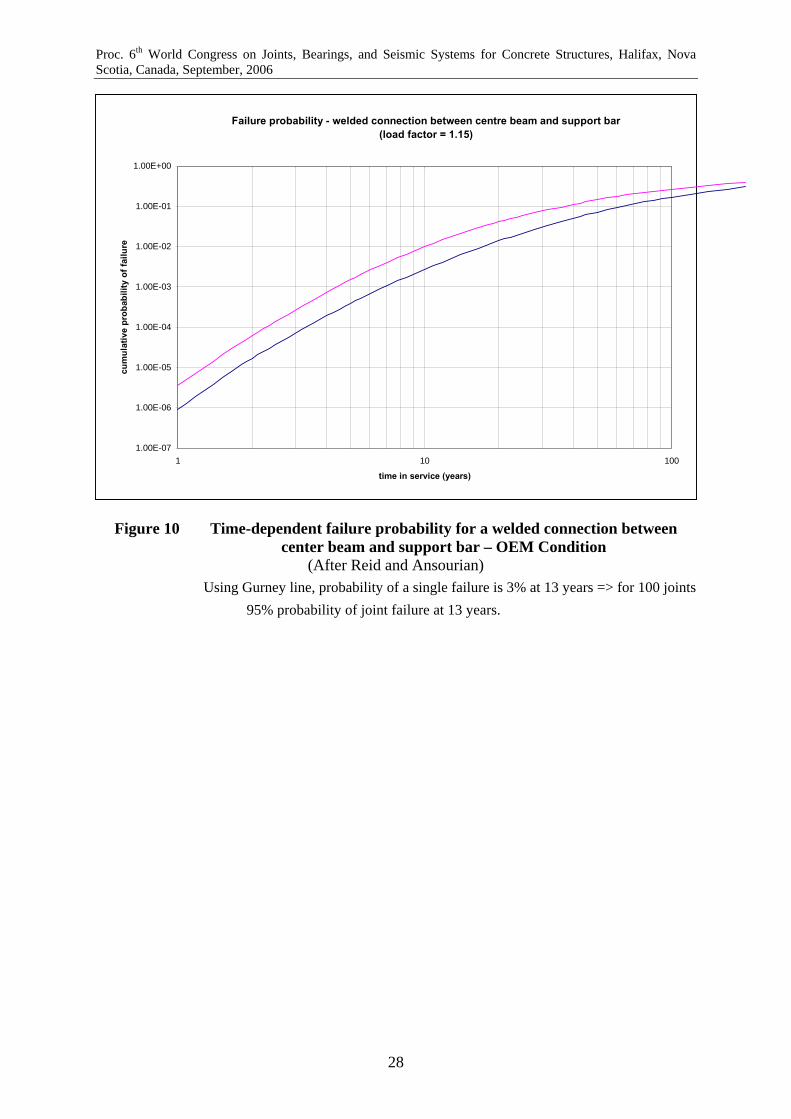
Proc. 6th World Congress on Joints, Bearings, and Seismic Systems for Concrete Structures, Halifax, Nova Scotia, Canada, September, 2006
Failure probability - welded connection between centre beam and support bar(load factor = 1.15)
1.00E-07
1.00E-06
1.00E-05
1.00E-04
1.00E-03
1.00E-02
1.00E-01
1.00E+00
1 10
time in service (years)
cum
ulat
ive
prob
abili
ty o
f fai
lure
100
Figure 10 Time-dependent failure probability for a welded connection between center beam and support bar – OEM Condition
(After Reid and Ansourian) Using Gurney line, probability of a single failure is 3% at 13 years => for 100 joints
95% probability of joint failure at 13 years.
28
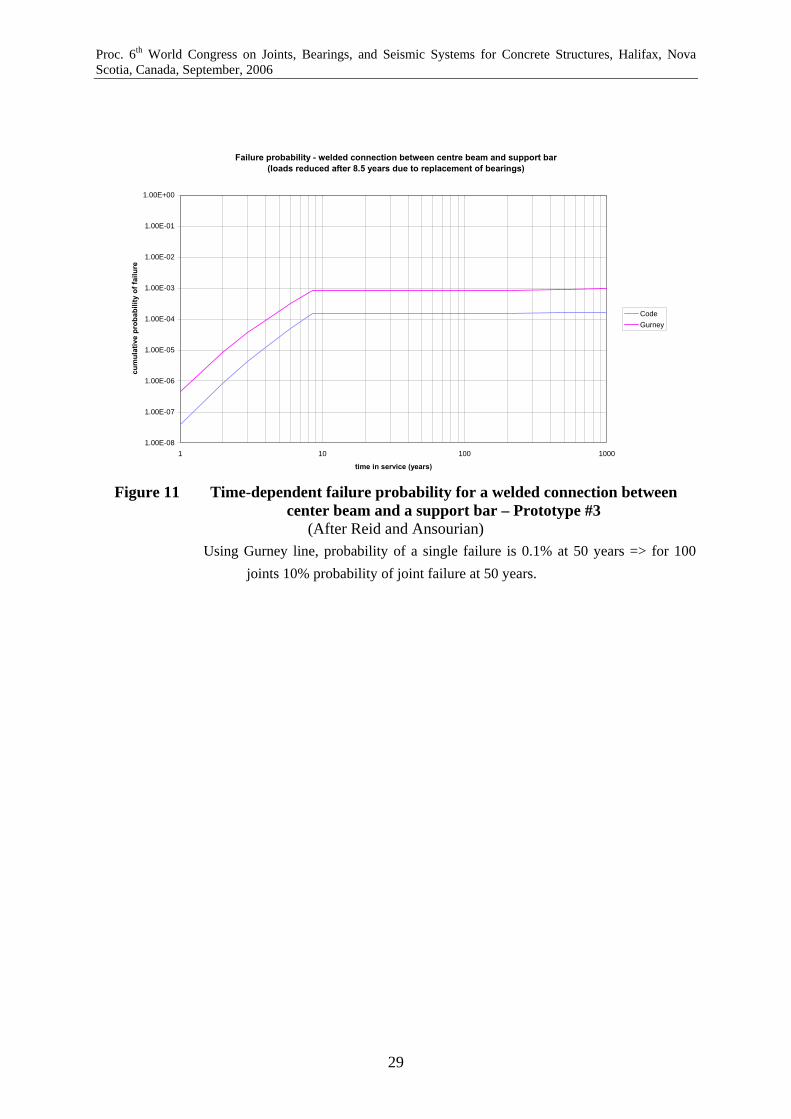
Proc. 6th World Congress on Joints, Bearings, and Seismic Systems for Concrete Structures, Halifax, Nova Scotia, Canada, September, 2006
Failure probability - welded connection between centre beam and support bar(loads reduced after 8.5 years due to replacement of bearings)
1.00E-08
1.00E-07
1.00E-06
1.00E-05
1.00E-04
1.00E-03
1.00E-02
1.00E-01
1.00E+00
1 10 100 1000
time in service (years)
cum
ulat
ive
prob
abili
ty o
f fai
lure
CodeGurney
Figure 11 Time-dependent failure probability for a welded connection between
center beam and a support bar – Prototype #3 (After Reid and Ansourian)
Using Gurney line, probability of a single failure is 0.1% at 50 years => for 100 joints 10% probability of joint failure at 50 years.
29
Appendix H
Ancich E.J. and Bradford P. (2006). Modular Bridge Expansion Joint Dynamics,
Proc. 6th World Congress on Joints, Bearings, and Seismic Systems for Concrete
Structures, Halifax, Nova Scotia, Canada.

Proc. 6th World Congress on Joints, Bearings, and Seismic Systems for Concrete Structures, Halifax, Nova Scotia, Canada, September, 2006
MODULAR BRIDGE EXPANSION JOINT DYNAMICS
Eric J. Ancich1 and Paul Bradford2
(1) Technology & Technical Services Branch, Roads & Traffic Authority of NSW, PO
Box 3035, Parramatta NSW 2124 Australia.
(2) Watson Bowman Acme Corp., 95 Pineview Drive, Amherst, NY 14068
BIOGRAPHY
Eric Ancich is a Senior Project Engineer with the Roads & Traffic Authority (RTA) of NSW
(Australia). He has over 20 years experience in acoustics, vibration and structural dynamics.
For the last six years he has managed the structural dynamics studies of six RTA road bridges
to determine the mechanism causing environmental noise emissions and the premature
fatigue induced failure of modular expansion joints. It is considered that this work has
identified a major defect in the quasi-static load case assumption used universally in bridge
design codes.
Paul Bradford is a product development engineer with 17 years experience in the design and
analysis of bridge bearings and bridge expansion joints.
ABSTRACT
Recent experimental modal analysis (EMA) work by an Australian State Government Road
Agency [Roads and Traffic Authority of NSW (RTA)] has enabled the development of
calibrated FEA modular bridge expansion joint (MBEJ) models. Previously a relatively
unexplored topic, this combination of FEA/EMA transient analyses helps reveal the
underlying dynamic structure applicable to general classes of MBEJs.
1
Proc. 6th World Congress on Joints, Bearings, and Seismic Systems for Concrete Structures, Halifax, Nova Scotia, Canada, September, 2006
Such dynamic characteristics as fundamental mode shapes, energy storage, damping effects,
resonance, dynamic amplification factors, and dynamic stiffness in elastomeric support
elements can be parametrically studied for design guidance. Many questions, such as why
large joints have higher failure rates, how the dynamic amplification factor is affected by box
spacing and bearing stiffness, what causes joint resonance, how it is prevented, what is the
tire impact factor due to increased momentum, why joints do not move significantly in a
horizontal sense when impacted, etc., can be derived and answered. The paper summarizes
recent advances in the area of modular bridge expansion joint dynamics, focusing on FEA
and EMA analyses. The experimental and theoretical confirmation of the single support bar
phenomenon of coupled center beam resonance is also discussed.
Keywords: Bridges; expansion joints; fatigue; vibration; structural dynamics; dynamic strain
INTRODUCTION
Experimental Modal Analysis1 (EMA) field tests have been performed on several modular
joints located in the State of New South Wales, Australia, under the supervision of the Roads
and Traffic Authority (RTA). Modulars were of the single support bar and multiple support
bar designs. The motivation for undertaking field testing had its roots in the failure of three
joints, including the dual support bar design of the Anzac Bridge modulars, in Sydney
Australia. Significant component damage on this structure suggested a failure mode of high
cycle fatigue. Subsequent EMA testing confirmed this hypothesis, that the root of failure lay
with the joint’s poor dynamic characteristics, namely low damping (1.2%) and near
resonance dynamic amplifications. The Anzac Bridge modulars, along with several other
joints in the region, were characterized dynamically through the use of field testing using a
calibrated truck.
2
Proc. 6th World Congress on Joints, Bearings, and Seismic Systems for Concrete Structures, Halifax, Nova Scotia, Canada, September, 2006
This paper focuses on two of these installations, the Anzac Bridge in Sydney (Figure 1) and
the Taree Bypass located just outside the township of Taree, north of Newcastle (Figure 2).
There are four bridges in the Taree Bypass, each with two MBEJ’s. The subject joint is in the
southern abutment of the southbound bridge over the south channel of the Manning River.
Geometry for the six axle RTA calibrated truck is shown in Figure 3. As can be seen, the
truck is of the single-dual-tri axle configuration, allowing researchers to gain a better insight
into multiple excitation joint dynamics. The 16.05 metric ton (35.4 kip) dual and 20.76
metric ton (45.8 kip) tri-axle loads correspond roughly to AASHTO2 HS16 tandem axle and
tri-axle loads, respectively. The modular expansion joint for the Taree Bypass testing was a 6
cell multiple support bar design. In the multiple support bar (MSB) design, each centerbeam
is welded to a separate support bar, which in turn is supported on flexible bearings housed
within steel boxes embedded within the deck slabs. The function of the centerbeam is to
support vehicular loading with an elastomeric seal used to prevent water/debris intrusion to
the structure. Equidistance springs are used to keep the seal gaps evenly spaced as the
structure expands and contracts. The support bar bearings perform a variety of functions, not
the least important of which are to add damping essential in mitigating resonance effects and
absorbing vehicular impact. Bearings can have a significant effect on a joint’s dynamic
characteristics, as detailed further in this paper.
Dynamic Strain Gage Study
The MSB strain gage layout is shown in Figures 4 and 5, positioned at locations just under
the truck wheel excitations. Continuous beam analyses show that peak moments often occur
in the exterior support box regions, since many MSB designs utilize equal (or nearly so) box
spacing. The measurement instrumentation was selected with a data sampling rate of 25 kHz
and this was sufficient to ensure that frequencies up to 10 kHz were sampled accurately.
3
Proc. 6th World Congress on Joints, Bearings, and Seismic Systems for Concrete Structures, Halifax, Nova Scotia, Canada, September, 2006
Transient response for two different truck passes at strain gage #6 (support bar) are shown in
Figures 7 and 8. The single-dual-tri axle tire pulse set is clearly evident, as is the increasing
dynamic character with increasing velocity. The 104 km/hr trace shows the most dynamic
behavior, for two reasons, increased vehicle momentum and proximity of the tire pulses to
the joint’s natural frequencies. Negative strain values indicate that the bottom of the
centerbeam enters compression after being loaded in tension, i.e. the centerbeam is
rebounding dynamically. Examination of Figure 8, for gage #6 (support bar), shows a peak-
to-peak value of 155.7 microstrain (με) for axle #6 compared with a quasi-static (slow roll)
value of 51.6 με. This is equivalent to a DAF of 3.02, where the DAF is defined as the peak-
to-peak strain range at the designated vehicle speed (104 km/hr) divided by the zero-to-peak
strain range at slow roll. Further examination of Figure 8 shows the effect of in-phase (or
notionally in-phase) excitation where the joint vibration has not fully decayed before
subsequent axle excitation. The DAF values for each axle of the tri-axle set are 2.1, 2.7 and
3.02. Similar, but lower values were obtained for centerbeams. Strain gage #4 (centerbeam)
showed a peak DAF of 1.94 (191.7 με/98.8 με) at axle #6, significantly greater than the DAF
of 1.4 at axle #4. It should be noted that the tested MBEJ is in a long section of controlled
access road where the legal speed limit is 110 km/hr. These dynamic amplification factors
are clearly not in agreement with the 1.75 value recommended in AASHTO2. However, even
higher values were measured at Anzac Bridge. The MBEJ installed into the western
abutment of Anzac Bridge consists of two interleaved single support bar structures that
behave, in a dynamic sense, as independent structures. Previous EMA studies demonstrated
only very light, almost negligible coupling between the two structures.
4

Proc. 6th World Congress on Joints, Bearings, and Seismic Systems for Concrete Structures, Halifax, Nova Scotia, Canada, September, 2006
Figure 9 shows the quasi-static response of a strain gauge (SG1) located in the middle of an
Anzac support bar and the impact of each of the test vehicle’s six axles with each of the
centre beams connected to this support bar is clearly evident. The dynamic behaviour of the
Anzac Bridge MBEJ may be considered as two independent structures (i.e. one structure with
one set of odd numbered centerbeams with associated support bars, and a second structure
with one set of even numbered centerbeams and support bars). The coupled nature of the
“odd” and “even” structures is further demonstrated in Figure 10. The dynamic response here
is demonstrated by the impact of the tandem axles of the tractor and the tri-axles of the trailer
where the vibration is in phase and virtually continuous. An independent centerbeam
structure responding to a single impulse would, of course, be expected to display an initial
maximum amplitude followed by an exponential decay. The build-up in centerbeam
response may be attributed to the phase relationship of each wheel to centerbeam impact.
This phenomenon is described as coupled centerbeam resonance3. A simple comparison
between Figures 9 & 10 shows that the quasi-static slow roll produced 100 µε (Peak-Peak)
and the 61-km/hr pass-by produced 386 µε (Peak-Peak). This comparison indicates a
dynamic amplification factor (DAF) of at least 3.86 times static.
Furthermore, not only are the peak dynamic strains at least 3.86 times the quasi-static but
further observation of Figure 10 shows that the steer and tandem axles of the tractor produced
at least 16 cycles of vibration (per vehicle passage) where the dynamic strain equalled or
exceeded the quasi-static strain of 100 µε (Peak-Peak). Similarly, the tri-axle group of the
trailer produced at least 14 cycles of vibration (per vehicle passage) where the dynamic strain
equalled or exceeded the quasi-static strain of 100 µε (Peak-Peak).
The Coupled Centerbeam Resonance phenomenon occurs in the single support bar design when all centerbeams attached to a support bar vibrate virtually simultaneously when the excitation is in-phase or notionally in-phase.
5
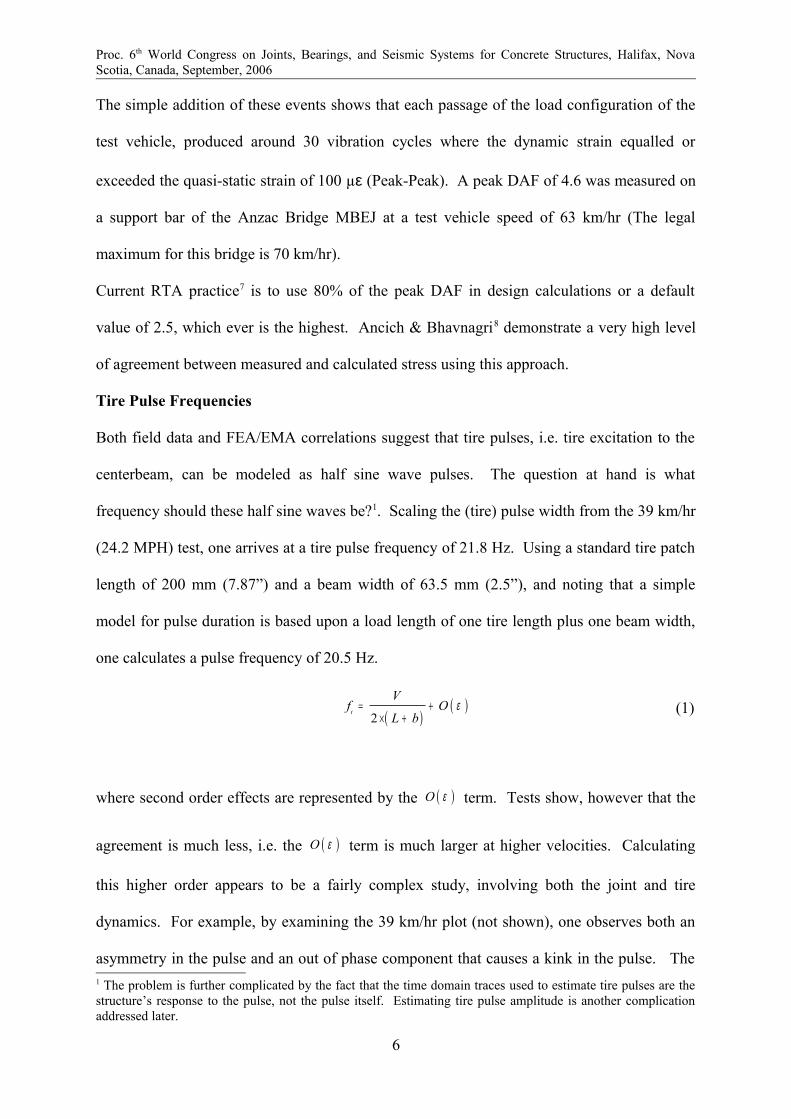
Proc. 6th World Congress on Joints, Bearings, and Seismic Systems for Concrete Structures, Halifax, Nova Scotia, Canada, September, 2006
The simple addition of these events shows that each passage of the load configuration of the
test vehicle, produced around 30 vibration cycles where the dynamic strain equalled or
exceeded the quasi-static strain of 100 µε (Peak-Peak). A peak DAF of 4.6 was measured on
a support bar of the Anzac Bridge MBEJ at a test vehicle speed of 63 km/hr (The legal
maximum for this bridge is 70 km/hr).
Current RTA practice7 is to use 80% of the peak DAF in design calculations or a default
value of 2.5, which ever is the highest. Ancich & Bhavnagri8 demonstrate a very high level
of agreement between measured and calculated stress using this approach.
Tire Pulse Frequencies
Both field data and FEA/EMA correlations suggest that tire pulses, i.e. tire excitation to the
centerbeam, can be modeled as half sine wave pulses. The question at hand is what
frequency should these half sine waves be?1. Scaling the (tire) pulse width from the 39 km/hr
(24.2 MPH) test, one arrives at a tire pulse frequency of 21.8 Hz. Using a standard tire patch
length of 200 mm (7.87”) and a beam width of 63.5 mm (2.5”), and noting that a simple
model for pulse duration is based upon a load length of one tire length plus one beam width,
one calculates a pulse frequency of 20.5 Hz.
( )( )
2t
Vf O
L bε= +
× +(1)
where second order effects are represented by the ( )O ε term. Tests show, however that the
agreement is much less, i.e. the ( )O ε term is much larger at higher velocities. Calculating
this higher order appears to be a fairly complex study, involving both the joint and tire
dynamics. For example, by examining the 39 km/hr plot (not shown), one observes both an
asymmetry in the pulse and an out of phase component that causes a kink in the pulse. The 1 The problem is further complicated by the fact that the time domain traces used to estimate tire pulses are the structure’s response to the pulse, not the pulse itself. Estimating tire pulse amplitude is another complication addressed later.
6
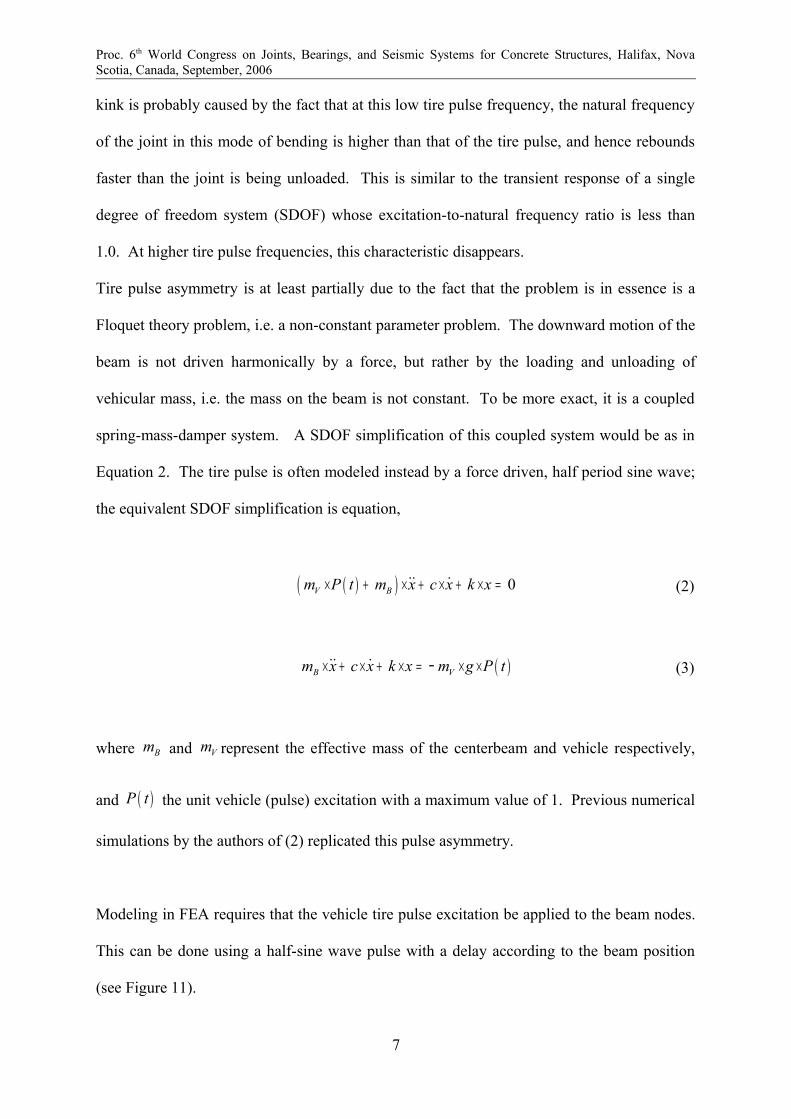
Proc. 6th World Congress on Joints, Bearings, and Seismic Systems for Concrete Structures, Halifax, Nova Scotia, Canada, September, 2006
kink is probably caused by the fact that at this low tire pulse frequency, the natural frequency
of the joint in this mode of bending is higher than that of the tire pulse, and hence rebounds
faster than the joint is being unloaded. This is similar to the transient response of a single
degree of freedom system (SDOF) whose excitation-to-natural frequency ratio is less than
1.0. At higher tire pulse frequencies, this characteristic disappears.
Tire pulse asymmetry is at least partially due to the fact that the problem is in essence is a
Floquet theory problem, i.e. a non-constant parameter problem. The downward motion of the
beam is not driven harmonically by a force, but rather by the loading and unloading of
vehicular mass, i.e. the mass on the beam is not constant. To be more exact, it is a coupled
spring-mass-damper system. A SDOF simplification of this coupled system would be as in
Equation 2. The tire pulse is often modeled instead by a force driven, half period sine wave;
the equivalent SDOF simplification is equation,
( )( ) 0V Bm P t m x c x k x× + × + × + × =˙˙ ˙ (2)
( )B Vm x c x k x m g P t× + × + × = − × ×˙̇ ˙ (3)
where Bm and Vm represent the effective mass of the centerbeam and vehicle respectively,
and ( )P t the unit vehicle (pulse) excitation with a maximum value of 1. Previous numerical
simulations by the authors of (2) replicated this pulse asymmetry.
Modeling in FEA requires that the vehicle tire pulse excitation be applied to the beam nodes.
This can be done using a half-sine wave pulse with a delay according to the beam position
(see Figure 11).
7

Proc. 6th World Congress on Joints, Bearings, and Seismic Systems for Concrete Structures, Halifax, Nova Scotia, Canada, September, 2006
( ) ( ) 0 0sin 2 T Tx x x xP t A f t U t U t t
v vπ − − = × × − + ∆ − ÷ ÷
(4)
0x is the coordinate of the first beam node, v vehicle velocity, Tf the tire passing frequency,
and Tt∆ the tire pulse duration. The tire pulse duration and tire passing frequency can be
calculated using the tire patch length (L) and the vehicle’s velocity;
TLtv
∆ = (5)
12 2T
T
vft L
= =×∆ (6)
For beam node row i, equally spaced at x∆ across the joint,
( ) ( ) 0 0sin 2i T Tx i x x i xP t A f t U t U t t
v vπ ∆ × − ∆ × − = × × − + ∆ − ÷ ÷
(7)
Equation 7 synchronizes the beam excitations, forming a tire pulse train that replicates a tire
moving across a joint (Figure 12). When the joint is fully loaded, the summation of the
pulses must equal the tire load, i.e. a constant. As Figure 12 shows, this is clearly not the
case if unit pulses of unit magnitude are used.
Also, Figure 12 shows that that although the load is close to constant, it is not exact. This
shows that the sine pulse model for vehicle excitation is an approximation that can be
improved upon if so desired. For the purposes of FEA modeling however, it is usually close
8

Proc. 6th World Congress on Joints, Bearings, and Seismic Systems for Concrete Structures, Halifax, Nova Scotia, Canada, September, 2006
enough. It should be noted that as the beam node spacing becomes smaller and smaller, the
variation in total load decreases, such that at very small spacings the load is essentially
constant. This characteristic suggests that the shape of the tire pulse changes somewhat with
beam spacing. The constant A in Equation 7 is used to scale the individual beam pulses such
that the total load on the joint equals that of the tire. This can be found by evaluating the
series expression for the total tire loading;
( ) ( ) 0 0
1sin 2
N
T T Ti
x i x x i xP t A f t U t U t tv v
π=
∆ × − ∆ × − = × × − + ∆ − ÷ ÷ ∑ (8)
where N is the total number of beams. Noting that the joint is fully loaded when the first tire
has completely passed over the first beam, i.e. after Tt∆ means that,
( ) 1T TP t∆ = (9)
Evaluating Equation 8 at Tt t= ∆ gives,
( )1
1 sin 2p
Ti
xA f p iv
π=
∆ = × − ÷ ∑ (10)
where p is the total number of pulses in the tire passing time Tt∆ .
Lpx
=∆
(11)
The finite series in Equation 10 can be evaluated; solving for A gives,
9
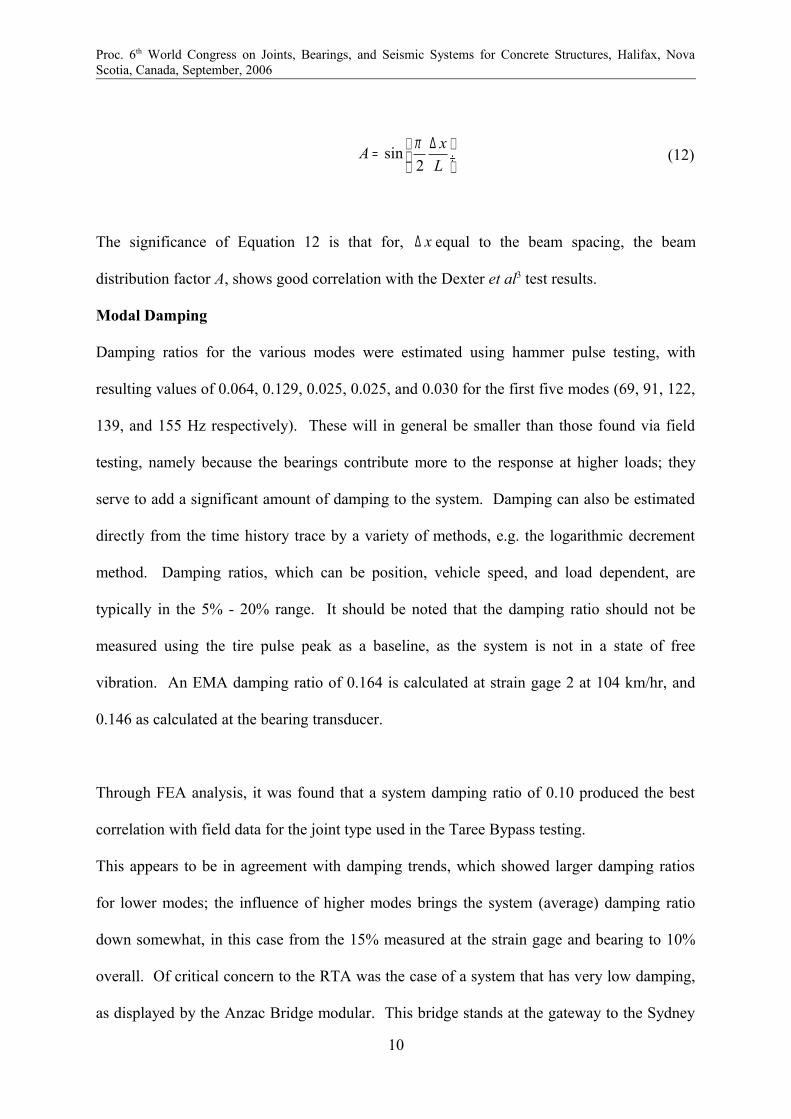
Proc. 6th World Congress on Joints, Bearings, and Seismic Systems for Concrete Structures, Halifax, Nova Scotia, Canada, September, 2006
sin2
xAL
π ∆ = ÷ (12)
The significance of Equation 12 is that for, x∆ equal to the beam spacing, the beam
distribution factor A, shows good correlation with the Dexter et al3 test results.
Modal Damping
Damping ratios for the various modes were estimated using hammer pulse testing, with
resulting values of 0.064, 0.129, 0.025, 0.025, and 0.030 for the first five modes (69, 91, 122,
139, and 155 Hz respectively). These will in general be smaller than those found via field
testing, namely because the bearings contribute more to the response at higher loads; they
serve to add a significant amount of damping to the system. Damping can also be estimated
directly from the time history trace by a variety of methods, e.g. the logarithmic decrement
method. Damping ratios, which can be position, vehicle speed, and load dependent, are
typically in the 5% - 20% range. It should be noted that the damping ratio should not be
measured using the tire pulse peak as a baseline, as the system is not in a state of free
vibration. An EMA damping ratio of 0.164 is calculated at strain gage 2 at 104 km/hr, and
0.146 as calculated at the bearing transducer.
Through FEA analysis, it was found that a system damping ratio of 0.10 produced the best
correlation with field data for the joint type used in the Taree Bypass testing.
This appears to be in agreement with damping trends, which showed larger damping ratios
for lower modes; the influence of higher modes brings the system (average) damping ratio
down somewhat, in this case from the 15% measured at the strain gage and bearing to 10%
overall. Of critical concern to the RTA was the case of a system that has very low damping,
as displayed by the Anzac Bridge modular. This bridge stands at the gateway to the Sydney
10
Proc. 6th World Congress on Joints, Bearings, and Seismic Systems for Concrete Structures, Halifax, Nova Scotia, Canada, September, 2006
CBD. The joint’s problems not only slowed traffic, but also produced an explosive type
noise upon vehicular loading that reverberated across the area. The RTA suspected that high
cycle fatigue was the cause of component damage (welds, bearings, steel members, etc.).
Suspicions were confirmed when measurements showed that the very low damping ratio
(1.2%) led to very high dynamic amplification factors,(up to 4.6 at support bars) producing
stress ranges that lay within the finite stress range for fatigue life. Lack of resilience and
damping in the support box bearings was found to be the root cause of all this damage. The
lower support box bearings were essentially rigid in the vertical direction with little or no
impact absorption capability. Support bar “hopping”, the characteristic in which the support
bar rebounds so strongly that it comes off its supports, was observed. Increasing the
downward force applied by the retention springs was counter-productive, as the resulting
increased friction caused spring distortion and eventual dislodgement.
EMA Vertical Mode Shapes and Modal Frequencies for Taree
The first few mode shapes can be categorized generally as vertical, horizontal, axial, or
torsional. Figure 13 shows the extracted vertical mode shapes and frequencies from the
experimental modal analysis, with a controlled input using a 2 kg hammer pulse. Figure 14
shows mode shapes and frequencies for vehicular loading. Frequency correlation is good
between the two, though some differences are observed between the shapes.
The first mode is a cantilever wagging type mode. Its frequency reflects the length of the
cantilever, the flexibility of the centerbeam, and to some extent the flexibility of the support
bearings. The authors have found excellent agreement using the lumped parameter equation
for the first mode frequency of a fixed end cantilever beam,
11
Proc. 6th World Congress on Joints, Bearings, and Seismic Systems for Concrete Structures, Halifax, Nova Scotia, Canada, September, 2006
( ) 2
0.56C
E If
AL ρ
×=
×+ ∆(13)
L is the length of the cantilever, ∆ is the length beyond the bearing at which the beam
rotation is zero. Together they make up a dynamic length of the cantilever. This length can
be easily extracted from FEA, or estimated using the bearing stiffness - the stiffer the bearing
the smaller the ∆ . Since this mode often lies in the tire pulse frequency range, it has the
potential to produce large DAFs. Although the cantilever region is oft neglected in design
based on the assumption that the ADT (average daily traffic) will be low in this region, it’s
dynamic susceptibility points to the use of short cantilevers as good design practice.
The second RTA mode is described by the RTA as a “vertical bounce” or “whole body”
mode, is essentially the fundamental mode of the joint (in the vertical direction). If the
centerbeam and support bar were perfectly rigid, this would be a purely translational rigid
body mode. This a little difficult to see from the impact testing, a little easier to see in the tire
pulse testing, but becomes very clear in the FEA analysis. Its frequency can be estimated
using the mass of the centerbeam and support bars along with the total bearing dynamic
stiffness in simple SDOF equation form,
12
b bear
Tot
n kfmπ×=
×(14)
where beark is the dynamic stiffness of the bearing, and bn is the number of the support bars
and Totm is the total mass of the centerbeam and support bars. If the joint is large and/or the
support bars are flexible, support bar dynamics needs to be considered as well. The system
can be modeled as a 2 DOF series combination of the bar/bearing mass and the centerbeam
12

Proc. 6th World Congress on Joints, Bearings, and Seismic Systems for Concrete Structures, Halifax, Nova Scotia, Canada, September, 2006
mass. Using structural dynamics methods for distributed systems, the frequency equations
for the two components of the 2 DOF system can be derived. The fundamental frequency for
a continuous beam with rigid supports ( cbf ) is;
2317300 cb
cbfS
ρ= × (15)
The natural frequency of the bar/bearing system ( bbf ) can be found using the method of
generalized coordinates and an assumed mode shape:
max
42 3
3
( )( )
122
5 1216
bear
bear
y xx
y
x EIx x L kEI
k
L
Lψ = =
× − × + +
+(16)
with a generalized mass and stiffness,
2
0
( )L
uM m x dxψ= ×∫ (17)
[ ] 2 2
0
( ) 2 (0)L
bearK EI x dx kψ ψ′′= × + × ×∫ (18)
with 12bb
Kf Mπ= . The integrations are simple but algebraically messy. Using canonical
transformations for a two degree of freedom system and the first term of its binomial
expansion, it can be shown that the first mode of the bar/bearing/centerbeam system can be
approximated as Equation 19. Figure 15 shows a plot of the system’s first mode frequency as
a function of the support bar bearing stiffness for a typical 8 seal system.
cbf fα= × (19)
when
12 2
1 1cb cb
bb sb
f W
f Wα
−
= + × +
÷ ÷ ÷ (20)
13

Proc. 6th World Congress on Joints, Bearings, and Seismic Systems for Concrete Structures, Halifax, Nova Scotia, Canada, September, 2006
where Wcb and Wsb are the weight of one centerbeam span length or one support bar,
respectively. This frequency is an important dynamic characteristic of the joint. It
establishes a dynamic baseline that supplies a big piece of the qualitative behavior puzzle.
One recipe for a well performing joint is a high first mode frequency (e.g. above 100 Hz)
together with good separation between the first and second modes (e.g. 30%). The joint
configuration that produces these modal characteristics is one of a stiff steel member network
in conjunction with resilient bearings. Examination of time history traces indicates that there
is significant first mode participation in the total response.
Mode shapes of two adjacent bars are shown in Figure 14. Light coupling is observed, as
should be probably expected; the tremendous impulse load applied to one beam will be
transferred to a much lesser extent in the others. Loads are transferred from one centerbeam
to the next via the following load path: support bar 1> bearing 1>support box 1>bearing
2>support bar 2>beam 2. As the means of communication between bars is through the
bearings and support box, stiffer bearings and mode flexible support boxes will increase this
coupling. Figure 16 gives another perspective of this coupling, a simultaneous time history
trace of two centerbeams.
CONCLUSIONS
The dynamics of MBEJs are not clearly understood at this time. EMA lends many insights
that help guide design and FEA modeling. Accurate correlation is difficult because of several
reasons, not the least being that the problem is in essence a variable mass problem of more
14
Proc. 6th World Congress on Joints, Bearings, and Seismic Systems for Concrete Structures, Halifax, Nova Scotia, Canada, September, 2006
than one degree of freedom. Common mode shapes for multiple support bar expansion joints
are identified, as well as methods to predict the first mode frequencies and tire pulse
parameters. The negative effects of hard support box bearings are seen to exacerbate
dynamic effects in lack of damping and in promoting proximity to resonance. Cross
coupling in multiple support bar configurations is in general minimal, but does have the
potential to be problematic (depending upon the support box transfer function and bearing
response).
The issue of appropriate design DAF values clearly needs more work and there is a gaping
need for a universal DAF definition, particularly in fatigue prone situations where full stress
reversals need to be addressed.
ACKNOWLEDGEMENT
The authors wish to thank the Chief Executive of the Roads and Traffic Authority of NSW
(RTA) for permission to publish this paper. The opinions and conclusions expressed in this
paper do not necessarily reflect the views of the RTA.
REFERENCES
1. Ewins D.J., “Modal Testing: Theory, Practice & Application (2nd Edition)”, Research
Studies Press, Hertfordshire, UK, 1999, pp.163-276.
2. American Association of State Highway and Transportation Officials (AASHTO)
AASHTO LRFD Bridge Design Specifications, SI Units, 3rd Ed., Washington, DC, USA,
2004.
3. Ancich E.J., Brown S.C. & Chirgwin G.J., “Modular Deck Joints – Investigations into
structural behavior and some implications for new joints”, Proc. 5th Austroads Bridge
Conference, Hobart, Tasmania, Australia, 2004.
15
Proc. 6th World Congress on Joints, Bearings, and Seismic Systems for Concrete Structures, Halifax, Nova Scotia, Canada, September, 2006
3. Dexter R.J., Connor R.J. & Kaczinski M.R., “Fatigue Design of Modular Bridge
Expansion Joints”, NCHRP Report 402, Transportation Research Board, National
Research Council, Washington, DC, USA, 1997, 128 pp.
4. Ostermann M., “Beanspruchung von elastisch gelagerten Fahrbahnübergängen unter
Radstoßeinwirkung (Stresses in elastically supported modular expansion joints under
wheel load impact)”, Bauingenieur 66, Springer-Verlag, 1991, pp 381-389 (In German).
5. Roeder C.W., “Fatigue Cracking in Modular Expansion Joints”, Research Report WA-RD
306.1, Washington State Transportation Center, Seattle, WA, USA, 1993, 53 pp.
6. Ancich E.J., Brown S.C. & Chirgwin G.J., “The Role of Modular Bridge Expansion
Joint Vibration in Environmental Noise Emissions and Joint Fatigue Failure”, Proc.
Acoustics 2004 Conference, Surfers Paradise, Qld., Australia, 2004, pp 135-140.
7. Roads & Traffic Authority of NSW. RTA QA Specification B316 – Modular Bridge
Expansion Joints. Sydney, Australia, 2004.
8. Ancich E. J. & Bhavnagri V., “Fatigue Comparison of Modular Bridge Expansion Joints Using
Multiple Bridge Design Code Approaches”, Proc. 6th World Congress on Joints, Bearings
and Seismic Systems for Concrete Structures, Halifax, Nova Scotia, Canada, 2006.
9. Standards Australia, Australian Standard AS5100.4 – 2004, Bridge Design Part 4:
Bearings and deck joints, Sydney, Australia, 2004
10. Clough, R. and Penzien, J., Dynamics of Structures, McGraw-Hill, 1975.
11. Brown S.C., “Vibration and Fatigue Investigation Taree Bypass Modular Expansion
Joint”, Report 10-1788-R4, Richard Heggie Associates Pty Ltd, Lane Cove, Australia,
2005 (Unpublished report prepared for the Roads & Traffic Authority of NSW).
12. Brown S.C., “Measurement of Static and Dynamic Strains Taree Bypass Bridge Modular
Expansion Joint”, Report 10-1788-R5, Richard Heggie Associates Pty Ltd, Lane Cove,
16

Proc. 6th World Congress on Joints, Bearings, and Seismic Systems for Concrete Structures, Halifax, Nova Scotia, Canada, September, 2006
Australia, 2005 (Unpublished report prepared for the Roads & Traffic Authority of
NSW).
17
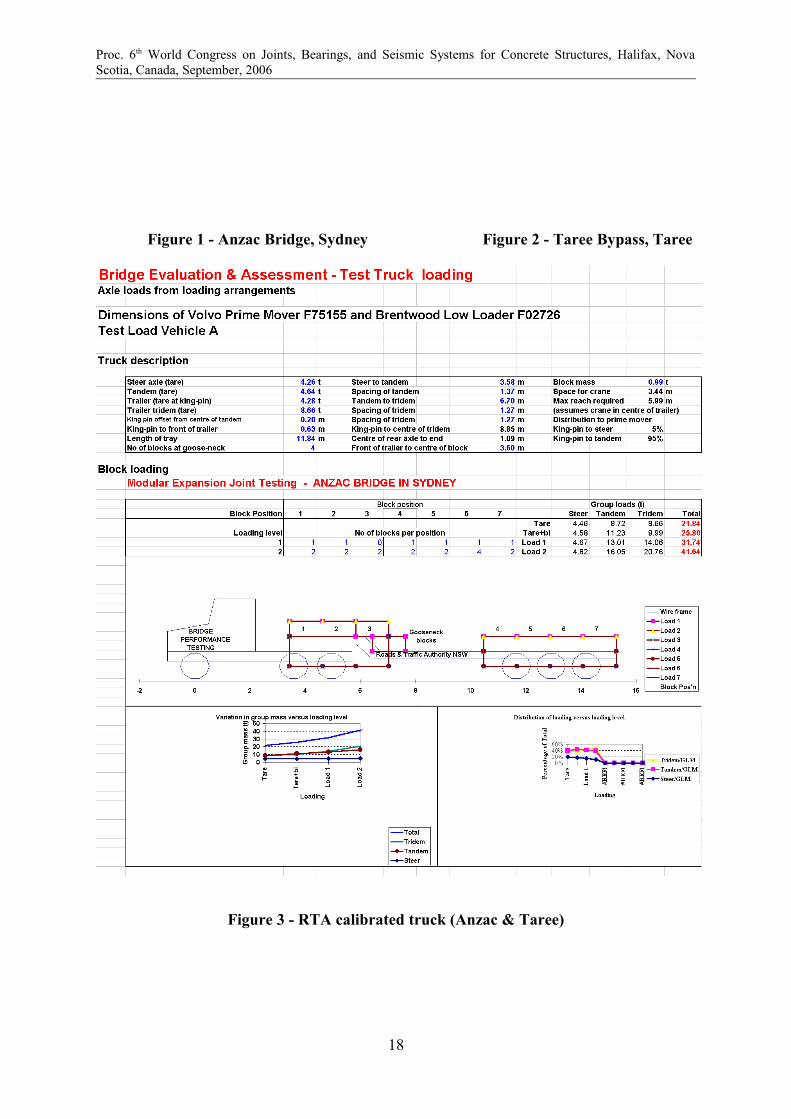
Proc. 6th World Congress on Joints, Bearings, and Seismic Systems for Concrete Structures, Halifax, Nova Scotia, Canada, September, 2006
Figure 1 - Anzac Bridge, Sydney Figure 2 - Taree Bypass, Taree
Figure 3 - RTA calibrated truck (Anzac & Taree)
18
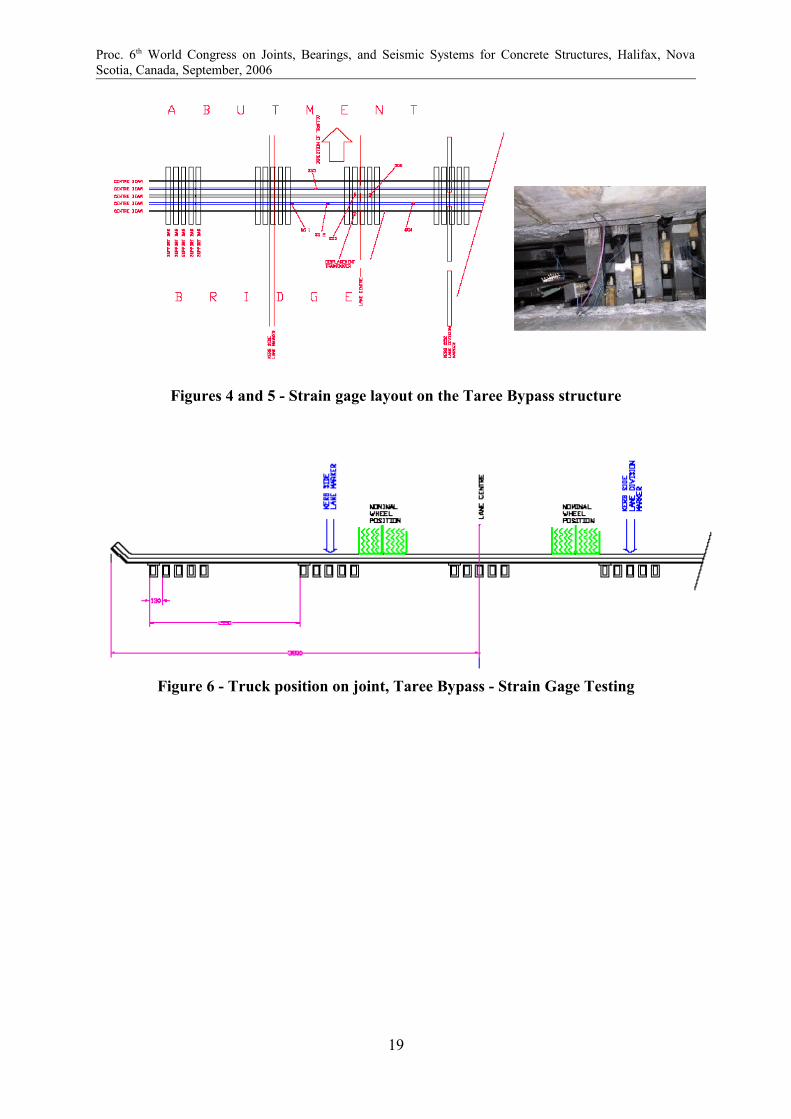
Proc. 6th World Congress on Joints, Bearings, and Seismic Systems for Concrete Structures, Halifax, Nova Scotia, Canada, September, 2006
Figures 4 and 5 - Strain gage layout on the Taree Bypass structure
Figure 6 - Truck position on joint, Taree Bypass - Strain Gage Testing
19
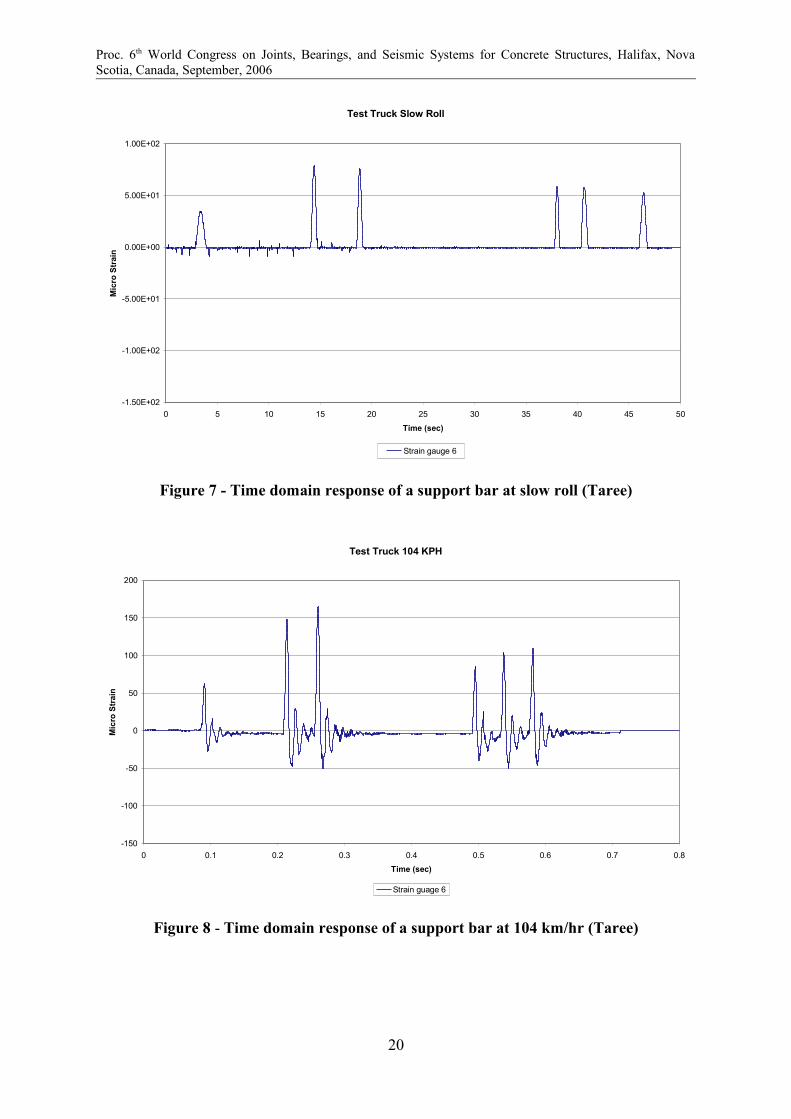
Proc. 6th World Congress on Joints, Bearings, and Seismic Systems for Concrete Structures, Halifax, Nova Scotia, Canada, September, 2006
Test Truck Slow Roll
-1.50E+02
-1.00E+02
-5.00E+01
0.00E+00
5.00E+01
1.00E+02
0 5 10 15 20 25 30 35 40 45 50
Time (sec)
Mic
ro S
trai
n
Strain gauge 6
Figure 7 - Time domain response of a support bar at slow roll (Taree)
Test Truck 104 KPH
-150
-100
-50
0
50
100
150
200
0 0.1 0.2 0.3 0.4 0.5 0.6 0.7 0.8
Time (sec)
Mic
ro S
trai
n
Strain guage 6
Figure 8 - Time domain response of a support bar at 104 km/hr (Taree)
20
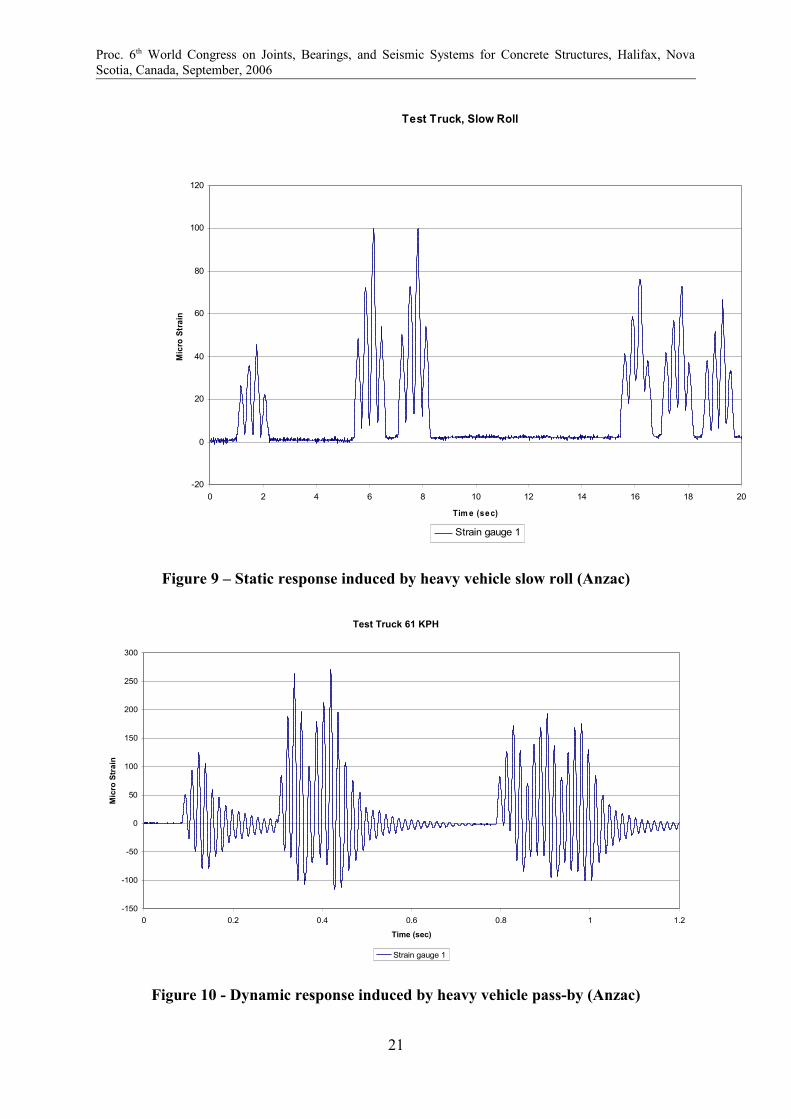
Proc. 6th World Congress on Joints, Bearings, and Seismic Systems for Concrete Structures, Halifax, Nova Scotia, Canada, September, 2006
Test Truck, Slow Roll
-20
0
20
40
60
80
100
120
0 2 4 6 8 10 12 14 16 18 20
Tim e (sec)
Mic
ro S
trai
n
Strain gauge 1
Figure 9 – Static response induced by heavy vehicle slow roll (Anzac)
Test Truck 61 KPH
-150
-100
-50
0
50
100
150
200
250
300
0 0.2 0.4 0.6 0.8 1 1.2
Time (sec)
Mic
ro S
trai
n
Strain gauge 1
Figure 10 - Dynamic response induced by heavy vehicle pass-by (Anzac)
21
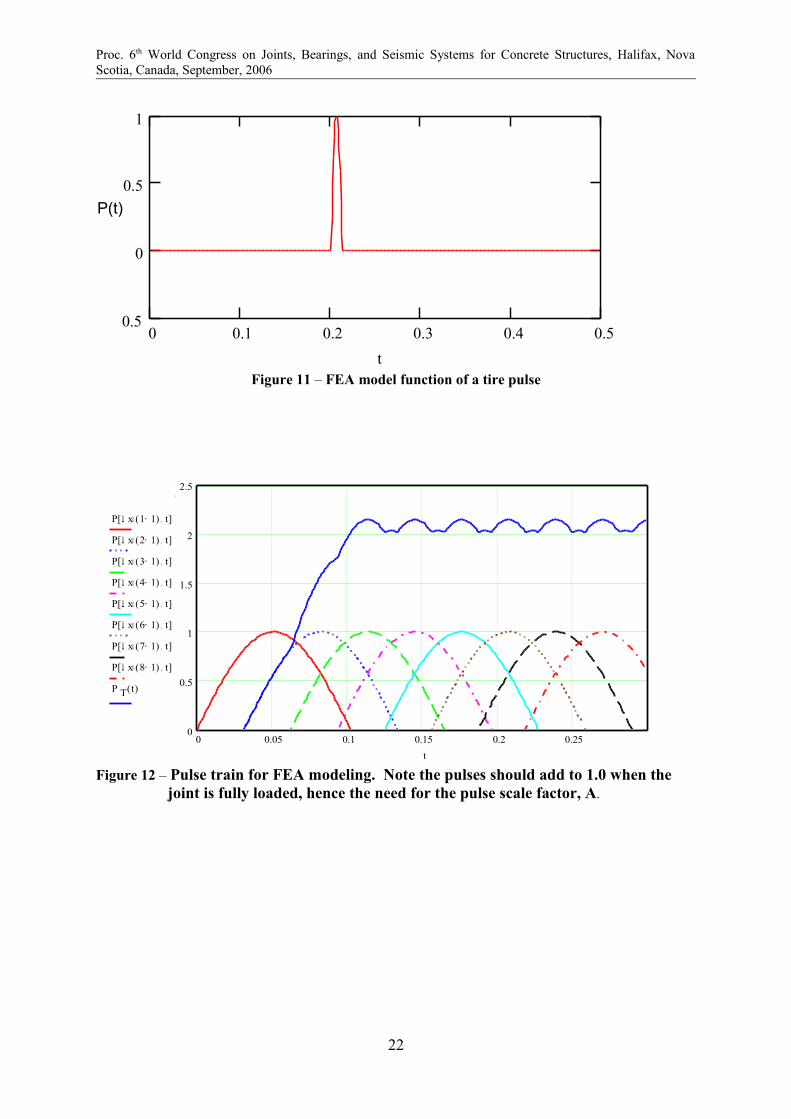
Proc. 6th World Congress on Joints, Bearings, and Seismic Systems for Concrete Structures, Halifax, Nova Scotia, Canada, September, 2006
0 0.1 0.2 0.3 0.4 0.50.5
0
0.5
10.998
1.959− 10 15−×
P i t( )
0.50 t
P(t)
Figure 11 – FEA model function of a tire pulse
0 0.05 0.1 0.15 0.2 0.250
0.5
1
1.5
2
2.52.147
0
P ∆ x 1 1−( )× t,[ ]
P ∆ x 2 1−( )× t,[ ]
P ∆ x 3 1−( )× t,[ ]
P ∆ x 4 1−( )× t,[ ]
P ∆ x 5 1−( )× t,[ ]
P ∆ x 6 1−( )× t,[ ]
P ∆ x 7 1−( )× t,[ ]
P ∆ x 8 1−( )× t,[ ]
P T t( )
.30 t
Figure 12 – Pulse train for FEA modeling. Note the pulses should add to 1.0 when the joint is fully loaded, hence the need for the pulse scale factor, A.
22
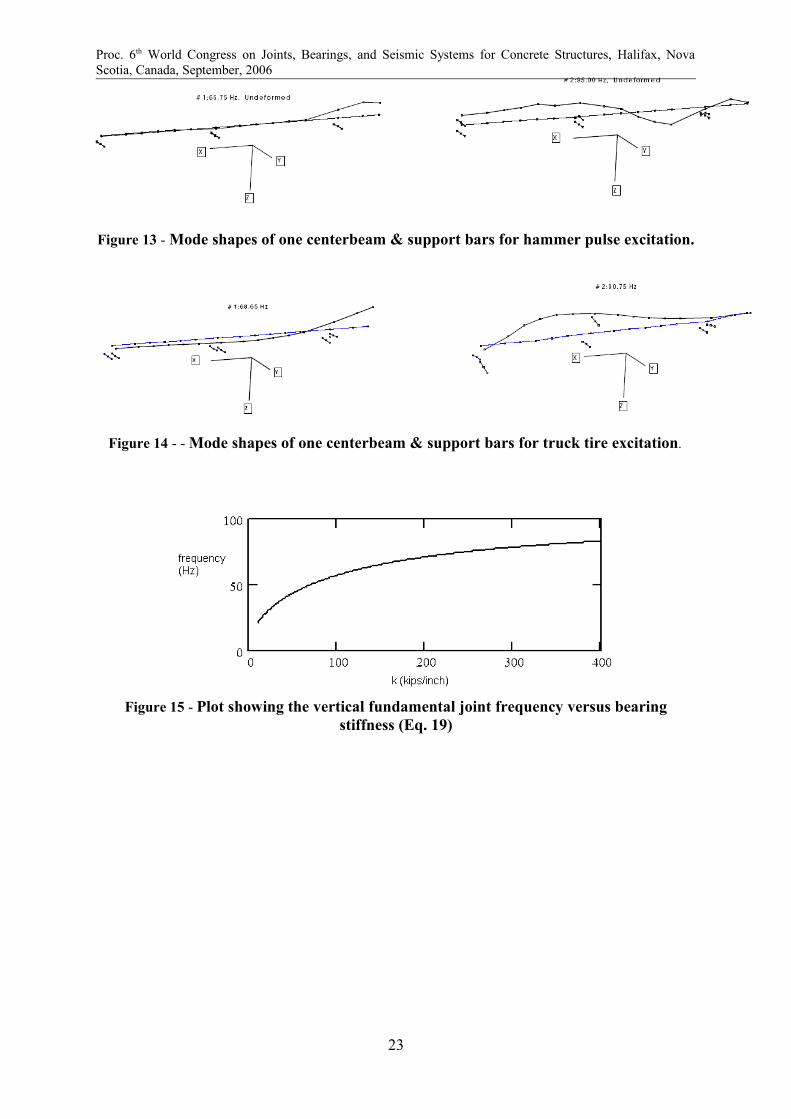
Proc. 6th World Congress on Joints, Bearings, and Seismic Systems for Concrete Structures, Halifax, Nova Scotia, Canada, September, 2006
Figure 13 - Mode shapes of one centerbeam & support bars for hammer pulse excitation.
Figure 14 - - Mode shapes of one centerbeam & support bars for truck tire excitation.
Figure 15 - Plot showing the vertical fundamental joint frequency versus bearing stiffness (Eq. 19)
23
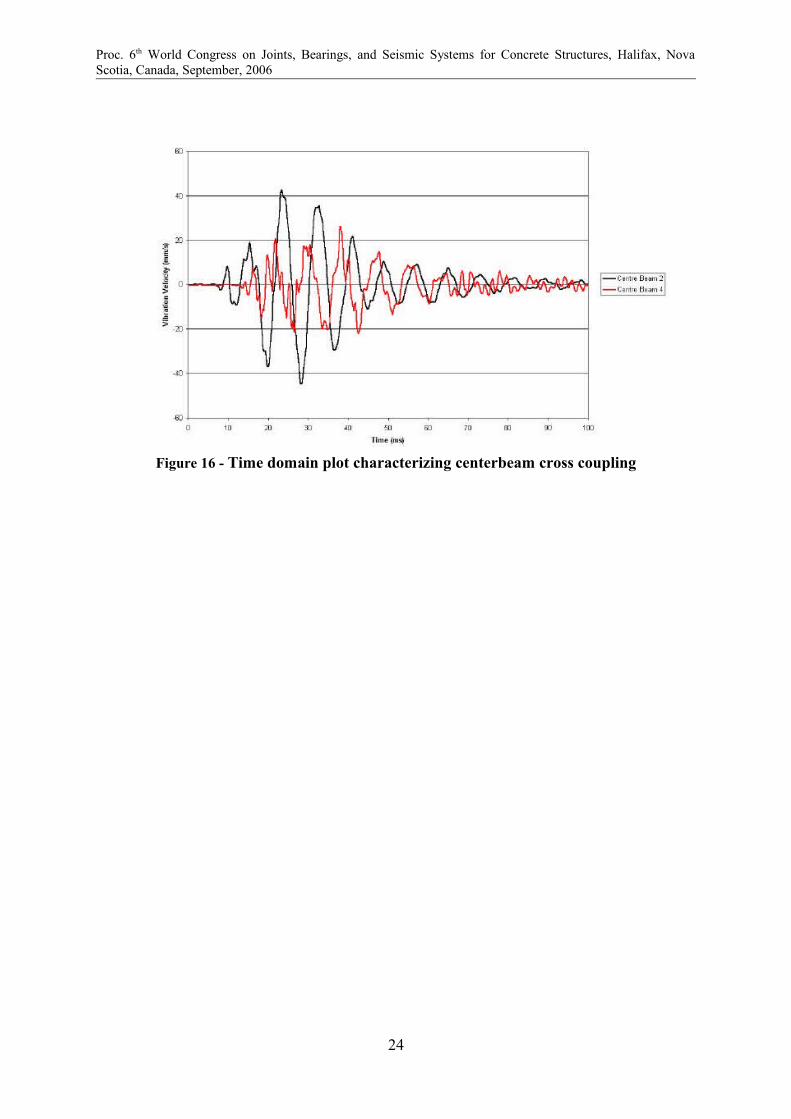
Proc. 6th World Congress on Joints, Bearings, and Seismic Systems for Concrete Structures, Halifax, Nova Scotia, Canada, September, 2006
Figure 16 - Time domain plot characterizing centerbeam cross coupling
24
Appendix I
Ancich E.J., Forster G. and Bhavnagri V. (2006). Modular Bridge Expansion Joint
Specifications and Load Testing, Proc. 6th Austroads Bridge Conference, Perth, WA,
Australia.

Modular Bridge Expansion Joint Specifications and Load Testing
Eric Ancich, Greg Forster and Viraf Bhavnagri
Bridge Engineering, Roads & Traffic Authority of NSW
SYNOPSIS
The Roads and Traffic Authority of NSW (RTA) B316 specification covers the design, fabrication, testing, supply and installation of modular bridge expansion joints (MBEJs). It specifies dynamic analysis and testing of MBEJs and allows lower dynamic amplification factors (DAFs) for such analyses than for designs carried out using quasi-static analysis. RTA B316 specifies detailed checking of fatigue stress ranges for connections, which can be more critical than the main joint elements. In this paper, features of the RTA B316 specification are compared to those of the AASHTO LRFD, German and Austrian specifications, using as case studies MBEJ designs submitted to RTA in tenders for its bridgeworks contracts. Analysis of the MBEJ in accordance with these four specifications showed that RTA B316 was the most demanding and the AASHTO LRFD specification was the least conservative. One of the installed MBEJs was subsequently tested by running a truck over it at different speeds. The test results showed that the higher DAFs prescribed by the RTA specification are realistic. Where support bars rest on elastomeric bearings, it is critical to model the stiffnesses of the spring supports correctly as this significantly affects the bending moments in the centre beams.
INTRODUCTION
The Roads and Traffic Authority of NSW maintains all bridges on the classified road network in New South Wales, and has recently replaced deficient modular bridge expansion joints (MBEJs) on two sets of twin bridges (at Mooney Mooney Creek on the F3 Sydney-Newcastle Freeway and Pheasants Nest on the F5 South-Western Freeway) and installed new MBEJs on the Mooney Mooney Creek bridges and on four newly constructed bridges on the Karuah Bypass on the Pacific Highway. During this work the design and fabrication requirements for these joints were reviewed and the RTA’s specification (RTA B316[1]) for the design, fabrication, testing, supply and installation of these joints was revised. Strength, serviceability and fatigue limit state designs for bridge expansion joints must conform to the Australian Bridge Design Code[2] (AS 5100:2004), but RTA B316 specifies the design of MBEJ in greater detail. Tenders were received from some international manufacturers for the supply of MBEJs on RTA bridges over Mooney Mooney Creek and on the Karuah Bypass recently.
Modular Bridge Expansion Joint Specifications and Load Testing – Ancich, Forster & Bhavnagri 1
The opportunity was taken to review the joint designs in accordance with the design codes of the countries from which the joints would be supplied and a comparative study of the code requirements made whilst considering revisions necessary to RTA B316. These specifications were compared:
• RTA B316 (Draft Ed2/Rev0)[1]
• AASHTO LRFD, 2004[3]
• Austrian Guideline RVS 15.45[4]
• German Specification TL/TP-FÜ 92[5] As the dynamic amplification factor (DAF) is one of the major unknowns in the behaviour of MBEJs (the current version of AS5100.4 specifies for MBEJs that this should be determined from specialist studies) this aspect has received special attention in RTA B316. To assess the DAF of the MBEJs installed on the Karuah Bypass bridges a load test was conducted. Salient test results are described in this paper, and have generally confirmed that the DAFs specified by the other specifications are on the low side whereas the values and procedures specified in RTA B316 for evaluating the DAF are justified. In the quasi-static analyses commonly used for MBEJ design that model the centre beam spanning over the support bars, the results are factored by the DAF to obtain the design values. It is therefore important to model the continuous beam correctly. Where the support bars rest on elastomeric bearings, the stiffness of the supports has a significant effect on the bending moments in the centre beam. This is demonstrated by analysis of the MBEJ studied and compared with results of strain gauging during joint testing.
1 COMPARISON OF SPECIFICATIONS
Aspects of the specifications compared are given in Table 1. RTA B316 complies with AS5100 requirements where these aspects have been specified. Some comments on the compared aspects follow.
1.1 AXLE LOADS AND FATIGUE STRESS RANGES
The greatest discrepancy in the four specifications is in the axle loads and the associated load factors for strength and fatigue. The factored axle loads for fatigue design vary widely but cannot be compared directly as the limiting fatigue stress ranges are different. To enable direct comparison, the studied MBEJ was analysed in accordance with the four specifications and the ratio of the calculated fatigue stress range to the limiting stress range (f*f / flim) compared. The limiting stress range depends on the fatigue detail classification. This is not straightforward, as several of the connections in MBEJs cannot be readily classified in accordance with the fatigue detail categories given in AS 5100.6.
Modular Bridge Expansion Joint Specifications and Load Testing – Ancich, Forster & Bhavnagri 2
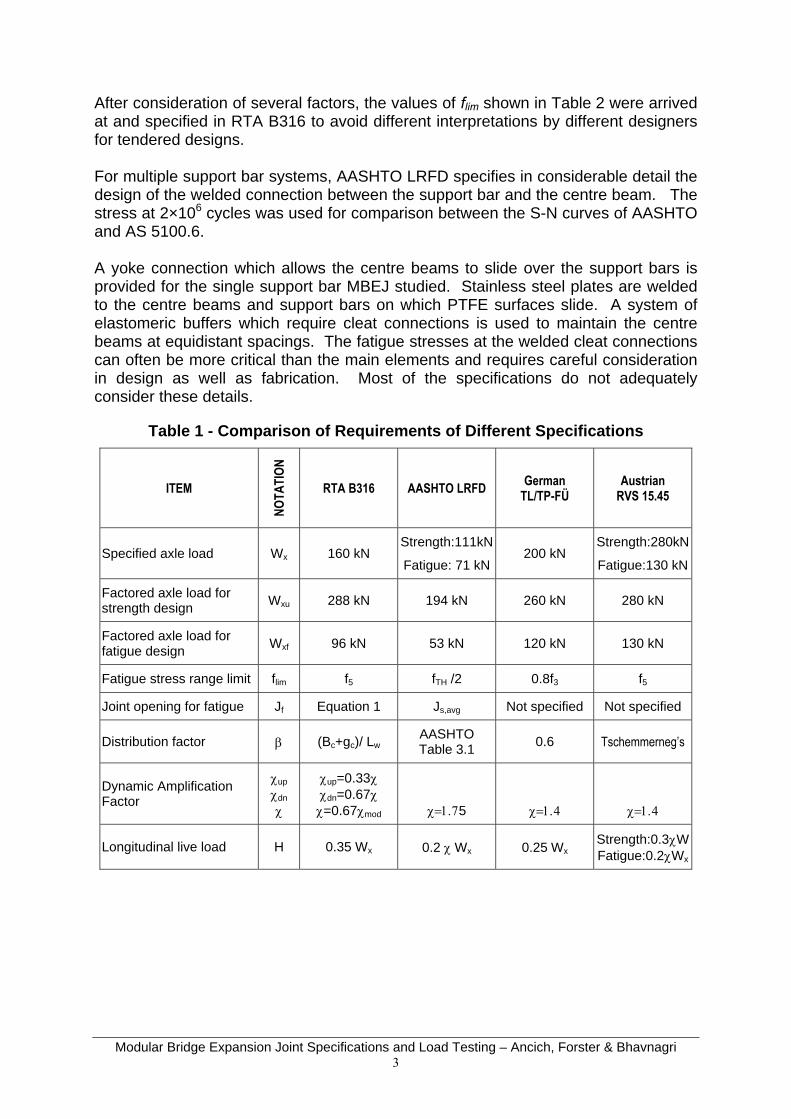
After consideration of several factors, the values of flim shown in Table 2 were arrived at and specified in RTA B316 to avoid different interpretations by different designers for tendered designs. For multiple support bar systems, AASHTO LRFD specifies in considerable detail the design of the welded connection between the support bar and the centre beam. The stress at 2×10⁶ cycles was used for comparison between the S-N curves of AASHTO and AS 5100.6. A yoke connection which allows the centre beams to slide over the support bars is provided for the single support bar MBEJ studied. Stainless steel plates are welded to the centre beams and support bars on which PTFE surfaces slide. A system of elastomeric buffers which require cleat connections is used to maintain the centre beams at equidistant spacings. The fatigue stresses at the welded cleat connections can often be more critical than the main elements and requires careful consideration in design as well as fabrication. Most of the specifications do not adequately consider these details.
Table 1 - Comparison of Requirements of Different Specifications
ITEM
NOTA
TION
RTA B316 AASHTO LRFD German TL/TP-FÜ
Austrian RVS 15.45
Specified axle load Wx 160 kN Strength:111kN
Fatigue: 71 kN 200 kN
Strength:280kN
Fatigue:130 kN
Factored axle load for strength design Wxu 288 kN 194 kN 260 kN 280 kN
Factored axle load for fatigue design Wxf 96 kN 53 kN 120 kN 130 kN
Fatigue stress range limit flim f5 fTH /2 0.8f3 f5
Joint opening for fatigue Jf Equation 1 Js,avg Not specified Not specified
Distribution factor β (Bc+gc)/ LwAASHTO Table 3.1 0.6 Tschemmerneg’s
Dynamic Amplification Factor
χup χdn
χ
χup=0.33χ χdn=0.67χ
χ=0.67χmod
χ=1.75
χ=1.4
χ=1.4
Longitudinal live load H 0.35 Wx 0.2 χ Wx 0.25 WxStrength:0.3χWFatigue:0.2χWx
Modular Bridge Expansion Joint Specifications and Load Testing – Ancich, Forster & Bhavnagri 3
1.2 DYNAMIC AMPLIFICATION
A significant difference between the specifications is the DAF defined as χ = 1 + α, where α is the dynamic load allowance in AS 5100. In RTA B316 the upward and downward components are specified separately, as only the downward component needs be considered for strength design whereas the overall stress range is considered for fatigue design. Where other specifications give a single DAF value (refer to Table 1), RTA B316 specifies that χ be determined from a dynamic modal analysis. Three options are specified in RTA B316: (i) Use the simplified design method in accordance with AASHTO LRFD, with
χ = 2.0 for multiple support bar systems and χ = 2.5 for single support bar systems.
(ii) Perform an experimental modal analysis to determine χmod. (iii) Perform dynamic analysis using a three-dimensional finite element model which
has been previously calibrated by experimental modal analysis and strain gauge test data for a similar MBEJ to compute χup and χdn.
In RTA B316, quasi-static analysis is not ruled out but is penalised with a higher DAF value.
1.3 LONGITUDINAL LOADS
Longitudinal loads due to traction and braking are expressed as a factor (η) of the vertical loads. Measurements by Dexter et al[6] indicate η = 0.2 in normal situations, increasing to η = 0.35 in locations where hard braking is expected. RTA B316 complies with the conservative value of 0.35 specified in AS 5100 for all situations. The DAF is not applied to the longitudinal loads because peaks due to transverse and vertical vibrations seldom occur simultaneously and transverse vibrations are quickly damped out.
1.4 JOINT OPENING
The joint opening affects the stresses in the support bars. AASHTO LRFD specifies an average joint opening for fatigue design whereas the German and Austrian specifications leave it unspecified. RTA B316 specifies that the joint opening for fatigue design (Jf) be given by
( )3 3max,
3min,2
1ssf JJJ += (1)
where Js,min and Js,max are the minimum and maximum joint openings, respectively, for the serviceability limit state. Equation 1 is based on the concept that fatigue damage varies as the 3rd (to 5th) power of the stress whereas stress due to a concentrated wheel load varies linearly as the span.
Modular Bridge Expansion Joint Specifications and Load Testing – Ancich, Forster & Bhavnagri 4

Table 2 - Detail Classifications for Fatigue
Member or Connection Detail
Refer Illustration
in AS 5100.6
Detail Category
frn
Cut off limitf5
MPa
Centre beam or support bar Polished steel bar 180 73
Flats for yokes Rolled products (1) 160 65
Centre beam at bolt hole for yoke
Bolted connection 8.8 / TF (5) 140 57
Sliding plate welded to support bar
Cover plate, full weld both sides (9) 125 51
Centre beam splice Butt weld 100% NDT (16) 112 45
Centre beam to support bar
Butt weld with extra fillets
(Type A, B or C cracking) 90 36
Yoke to centre beam Transverse butt weld 90 36
Connections of yoke members
Shear stress in fillet welds (39) 80 32
Sliding joint between centre beam and support bar
Longitudinal weld of Teflon disc housing to centre beam • intermittent • continuous
(14) (9)
80 125
32 51
Attachment for spring buffer
Cleat attachments: • t ≤ 12 mm • t > 12 mm (35) (36)
80 71
32 29
1.5 DISTRIBUTION FACTOR
The wheel load (Wx) is generally applied to more than one centre beam and the maximum load on one centre beam (W1x) is given by
xx WW β=1 (2)
where β is defined as the “Distribution Factor”. In RTA B316 this is given by
w
cc
LgB +
=β 0.5 ≤ β ≤ 0.8 (3)
where Bc = width of centre beam at top
gc = gap between centre beams at appropriate joint opening
Lw = length of tyre footprint in direction parallel to traffic There is considerable uncertainty in the assessment of the distribution factor and apart from the proposed formula, which is based on the concept of tributary area, other methods have been proposed by Dexter et al[6], who compared these with those of Tschemmernegg[7]. A comparison of the different methods was made by
Modular Bridge Expansion Joint Specifications and Load Testing – Ancich, Forster & Bhavnagri 5
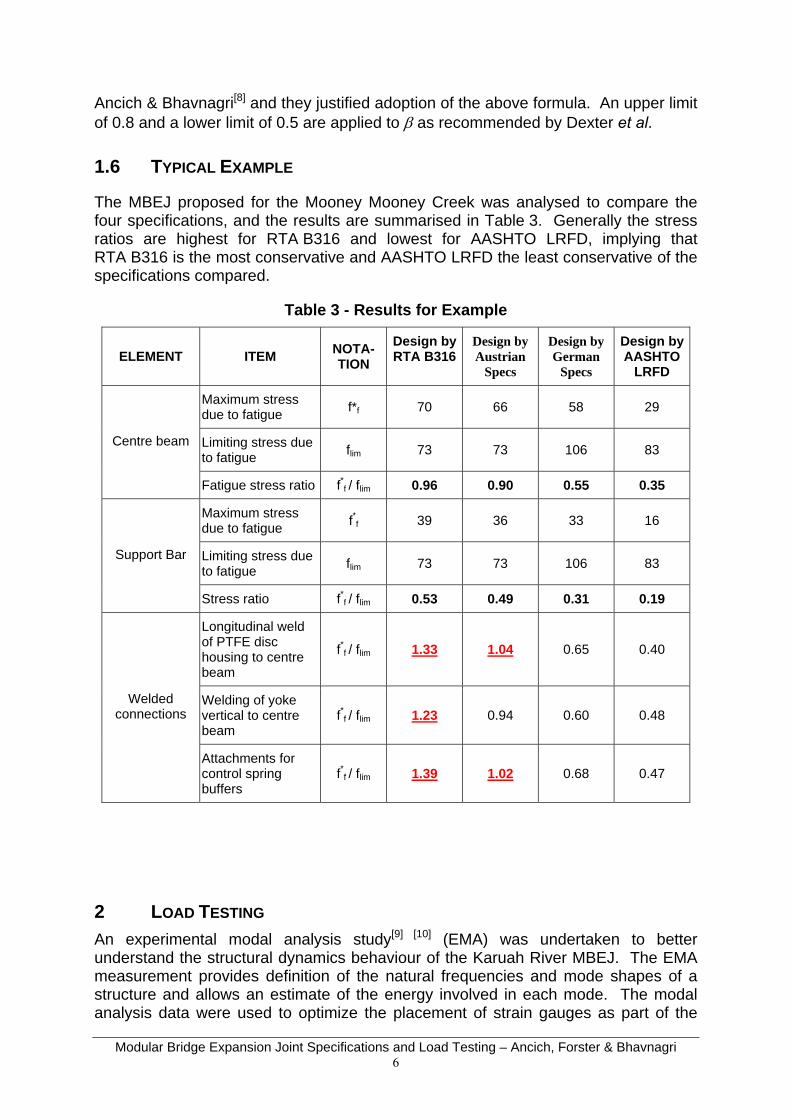
Ancich & Bhavnagri[8] and they justified adoption of the above formula. An upper limit of 0.8 and a lower limit of 0.5 are applied to β as recommended by Dexter et al.
1.6 TYPICAL EXAMPLE
The MBEJ proposed for the Mooney Mooney Creek was analysed to compare the four specifications, and the results are summarised in Table 3. Generally the stress ratios are highest for RTA B316 and lowest for AASHTO LRFD, implying that RTA B316 is the most conservative and AASHTO LRFD the least conservative of the specifications compared.
Table 3 - Results for Example
ELEMENT ITEM NOTA-TION
Design byRTA B316
Design byAustrian
Specs
Design by German
Specs
Design byAASHTO
LRFD
Maximum stress due to fatigue f*f 70 66 58 29
Limiting stress due to fatigue flim 73 73 106 83 Centre beam
Fatigue stress ratio f*f / flim 0.96 0.90 0.55 0.35
Maximum stress due to fatigue f*f 39 36 33 16
Limiting stress due to fatigue flim 73 73 106 83 Support Bar
Stress ratio f*f / flim 0.53 0.49 0.31 0.19
Longitudinal weld of PTFE disc housing to centre beam
f*f / flim 1.33 1.04 0.65 0.40
Welding of yoke vertical to centre beam
f*f / flim 1.23 0.94 0.60 0.48 Welded
connections
Attachments for control spring buffers
f*f / flim 1.39 1.02 0.68 0.47
2 LOAD TESTING An experimental modal analysis study[9] [10] (EMA) was undertaken to better understand the structural dynamics behaviour of the Karuah River MBEJ. The EMA measurement provides definition of the natural frequencies and mode shapes of a structure and allows an estimate of the energy involved in each mode. The modal analysis data were used to optimize the placement of strain gauges as part of the
Modular Bridge Expansion Joint Specifications and Load Testing – Ancich, Forster & Bhavnagri 6
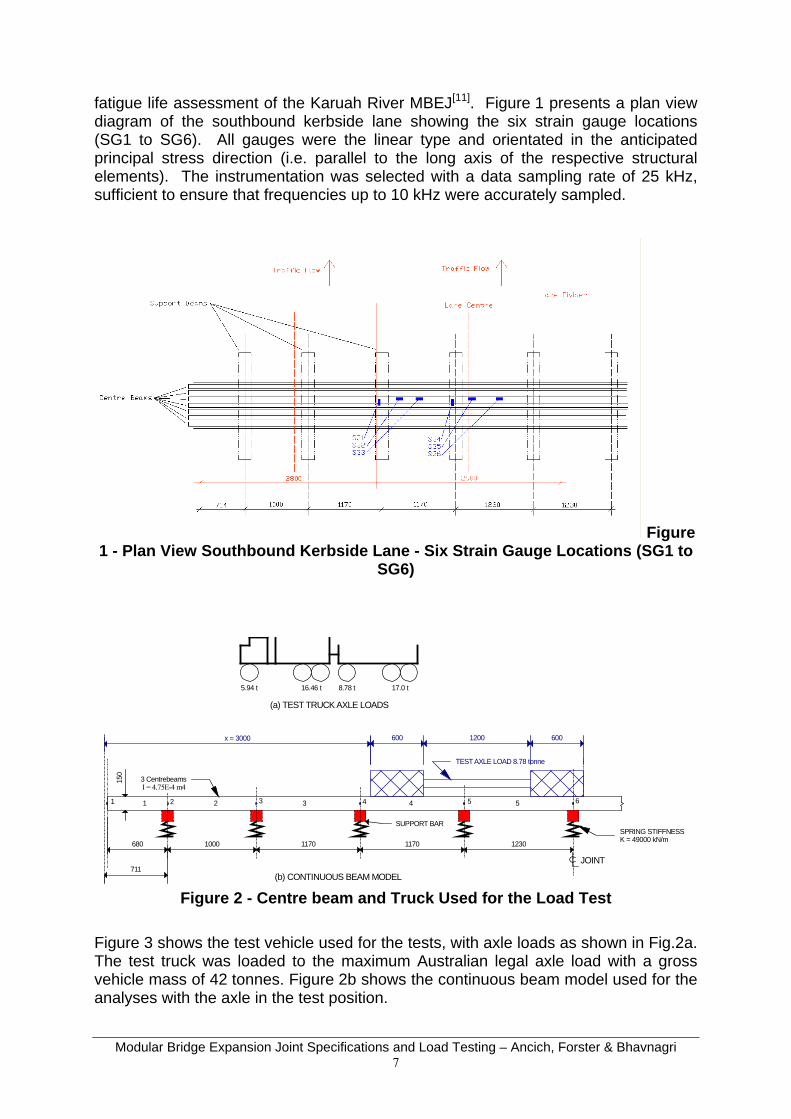
fatigue life assessment of the Karuah River MBEJ[11]. Figure 1 presents a plan view diagram of the southbound kerbside lane showing the six strain gauge locations (SG1 to SG6). All gauges were the linear type and orientated in the anticipated principal stress direction (i.e. parallel to the long axis of the respective structural elements). The instrumentation was selected with a data sampling rate of 25 kHz, sufficient to ensure that frequencies up to 10 kHz were accurately sampled.
Figure 1 - Plan View Southbound Kerbside Lane - Six Strain Gauge Locations (SG1 to
SG6)
x = 3000 600 1200 600
SUPPORT BAR
680 1000 1170 1170 1230
150
1 2 3 4 5
3 Centrebeams
TEST AXLE LOAD 8.78 tonne
5.94 t 16.46 t 8.78 t 17.0 t
(a) TEST TRUCK AXLE LOADS
(b) CONTINUOUS BEAM MODEL
I = 4.75E-4 m4
SPRING STIFFNESSK = 49000 kN/m
JOINT
1 2 3 4 5 6
711
Figure 2 - Centre beam and Truck Used for the Load Test
Figure 3 shows the test vehicle used for the tests, with axle loads as shown in Fig.2a. The test truck was loaded to the maximum Australian legal axle load with a gross vehicle mass of 42 tonnes. Figure 2b shows the continuous beam model used for the analyses with the axle in the test position.
Modular Bridge Expansion Joint Specifications and Load Testing – Ancich, Forster & Bhavnagri 7
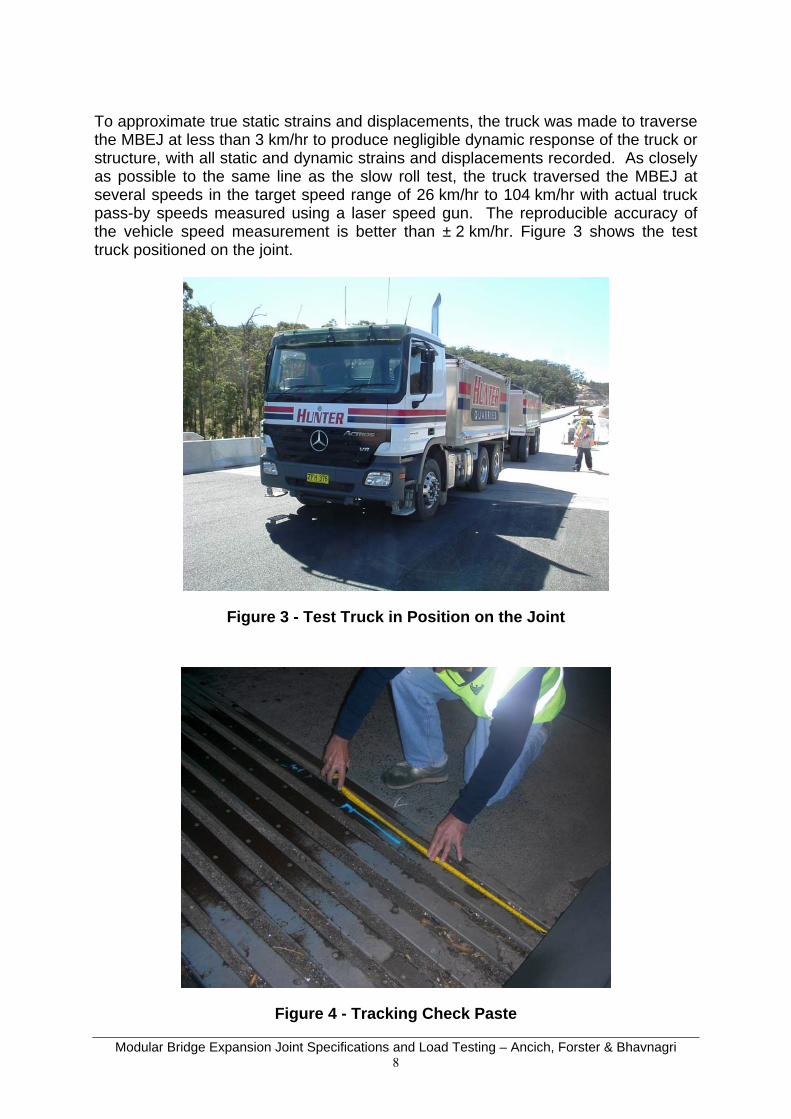
To approximate true static strains and displacements, the truck was made to traverse the MBEJ at less than 3 km/hr to produce negligible dynamic response of the truck or structure, with all static and dynamic strains and displacements recorded. As closely as possible to the same line as the slow roll test, the truck traversed the MBEJ at several speeds in the target speed range of 26 km/hr to 104 km/hr with actual truck pass-by speeds measured using a laser speed gun. The reproducible accuracy of the vehicle speed measurement is better than ± 2 km/hr. Figure 3 shows the test truck positioned on the joint.
Figure 3 - Test Truck in Position on the Joint
Figure 4 - Tracking Check Paste
Modular Bridge Expansion Joint Specifications and Load Testing – Ancich, Forster & Bhavnagri 8
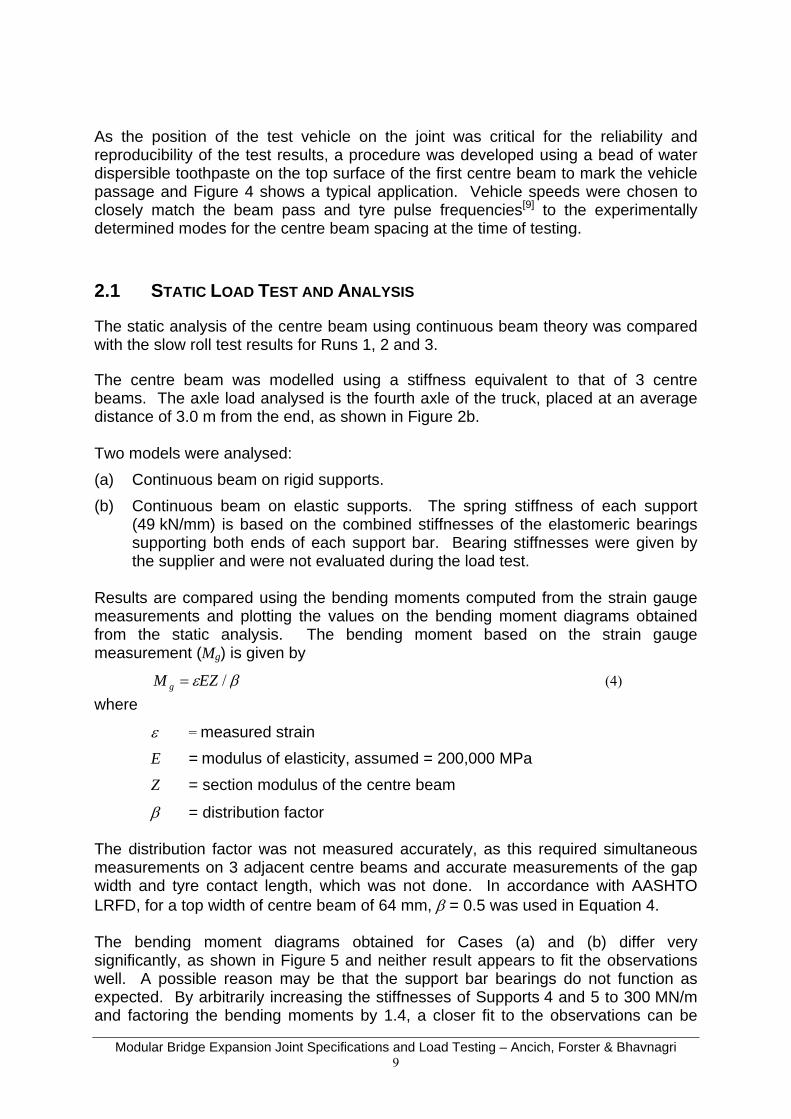
As the position of the test vehicle on the joint was critical for the reliability and reproducibility of the test results, a procedure was developed using a bead of water dispersible toothpaste on the top surface of the first centre beam to mark the vehicle passage and Figure 4 shows a typical application. Vehicle speeds were chosen to closely match the beam pass and tyre pulse frequencies[9] to the experimentally determined modes for the centre beam spacing at the time of testing.
2.1 STATIC LOAD TEST AND ANALYSIS
The static analysis of the centre beam using continuous beam theory was compared with the slow roll test results for Runs 1, 2 and 3. The centre beam was modelled using a stiffness equivalent to that of 3 centre beams. The axle load analysed is the fourth axle of the truck, placed at an average distance of 3.0 m from the end, as shown in Figure 2b. Two models were analysed: (a) Continuous beam on rigid supports. (b) Continuous beam on elastic supports. The spring stiffness of each support
(49 kN/mm) is based on the combined stiffnesses of the elastomeric bearings supporting both ends of each support bar. Bearing stiffnesses were given by the supplier and were not evaluated during the load test.
Results are compared using the bending moments computed from the strain gauge measurements and plotting the values on the bending moment diagrams obtained from the static analysis. The bending moment based on the strain gauge measurement (Mg) is given by
βε /EZM g = (4)
where
ε = measured strain E = modulus of elasticity, assumed = 200,000 MPa Z = section modulus of the centre beam
β = distribution factor The distribution factor was not measured accurately, as this required simultaneous measurements on 3 adjacent centre beams and accurate measurements of the gap width and tyre contact length, which was not done. In accordance with AASHTO LRFD, for a top width of centre beam of 64 mm, β = 0.5 was used in Equation 4. The bending moment diagrams obtained for Cases (a) and (b) differ very significantly, as shown in Figure 5 and neither result appears to fit the observations well. A possible reason may be that the support bar bearings do not function as expected. By arbitrarily increasing the stiffnesses of Supports 4 and 5 to 300 MN/m and factoring the bending moments by 1.4, a closer fit to the observations can be
Modular Bridge Expansion Joint Specifications and Load Testing – Ancich, Forster & Bhavnagri 9
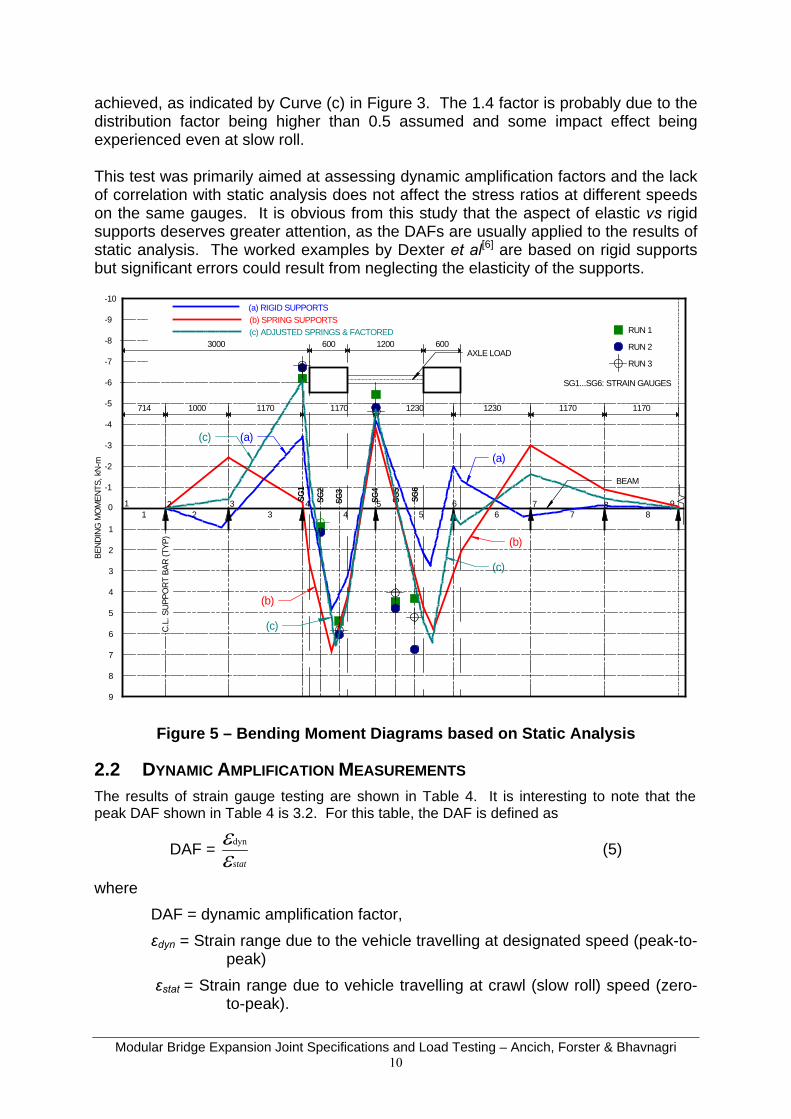
achieved, as indicated by Curve (c) in Figure 3. The 1.4 factor is probably due to the distribution factor being higher than 0.5 assumed and some impact effect being experienced even at slow roll. This test was primarily aimed at assessing dynamic amplification factors and the lack of correlation with static analysis does not affect the stress ratios at different speeds on the same gauges. It is obvious from this study that the aspect of elastic vs rigid supports deserves greater attention, as the DAFs are usually applied to the results of static analysis. The worked examples by Dexter et al[6] are based on rigid supports but significant errors could result from neglecting the elasticity of the supports.
714 1000 1170 1170 1230 1230 1170 1170
1 2 3 4 5 6 7 8 9
RUN 1
RUN 2
RUN 3
SG1
SG2
SG3
SG4
SG5
SG6
(a) RIGID SUPPORTS(b) SPRING SUPPORTS
-1
-2
-3
-4
1
2
3
4
5
6
7
-5
-6
-7
-8
-9
-10
8
9
01 2 3 4 5 6 7 8
AXLE LOAD
BEND
ING
MO
MEN
TS, k
N-m
SG1...SG6: STRAIN GAUGES
C.L
. SU
PPO
RT B
AR (T
YP)
BEAM
3000 600 1200 600(c) ADJUSTED SPRINGS & FACTORED
(c)
(b)
(b)
(c)
(a)
(a)
(c)
Figure 5 – Bending Moment Diagrams based on Static Analysis
2.2 DYNAMIC AMPLIFICATION MEASUREMENTS The results of strain gauge testing are shown in Table 4. It is interesting to note that the peak DAF shown in Table 4 is 3.2. For this table, the DAF is defined as
DAF = statε
εdyn (5)
where DAF = dynamic amplification factor, εdyn = Strain range due to the vehicle travelling at designated speed (peak-to-
peak) εstat = Strain range due to vehicle travelling at crawl (slow roll) speed (zero-
to-peak).
Modular Bridge Expansion Joint Specifications and Load Testing – Ancich, Forster & Bhavnagri 10
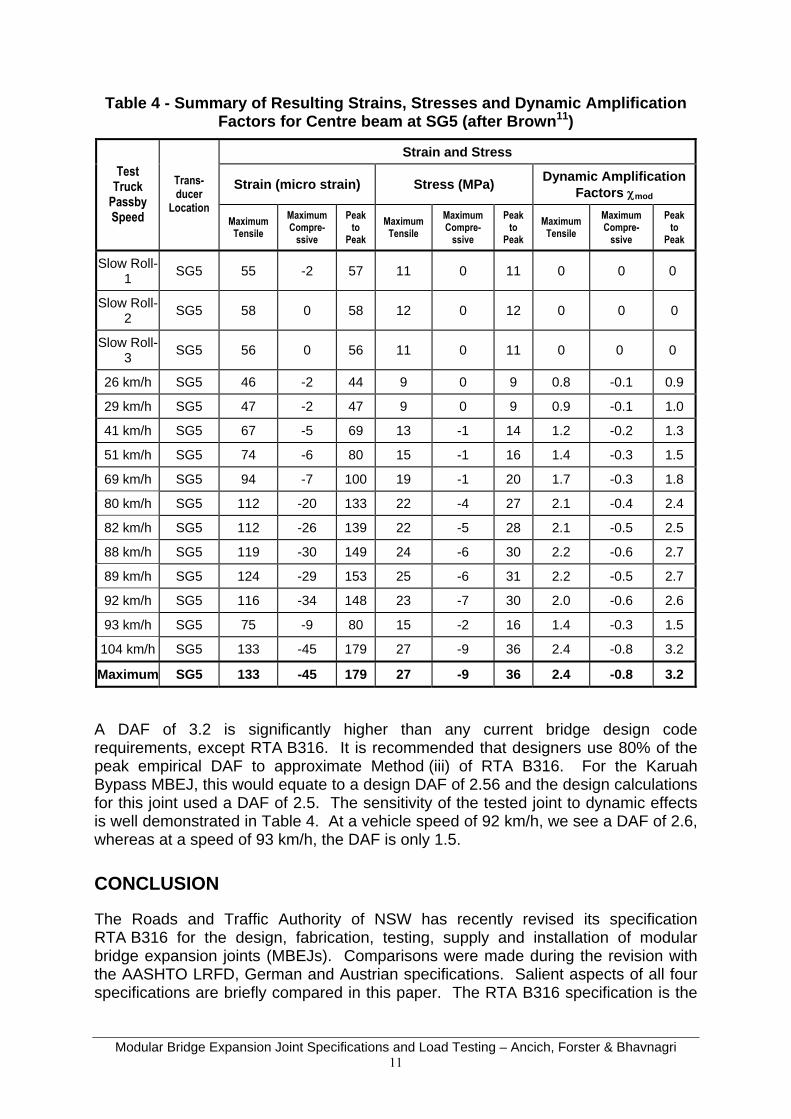
Table 4 - Summary of Resulting Strains, Stresses and Dynamic Amplification Factors for Centre beam at SG5 (after Brown11)
Strain and Stress
Strain (micro strain) Stress (MPa) Dynamic Amplification Factors χmod
Test Truck
Passby Speed
Trans-ducer
Location Maximum
Tensile Maximum Compre-
ssive
Peak to
Peak Maximum
Tensile Maximum Compre-
ssive
Peak to
Peak Maximum
Tensile Maximum Compre-
ssive
Peak to
Peak
Slow Roll-1 SG5 55 -2 57 11 0 11 0 0 0
Slow Roll-2 SG5 58 0 58 12 0 12 0 0 0
Slow Roll-3 SG5 56 0 56 11 0 11 0 0 0
26 km/h SG5 46 -2 44 9 0 9 0.8 -0.1 0.9
29 km/h SG5 47 -2 47 9 0 9 0.9 -0.1 1.0
41 km/h SG5 67 -5 69 13 -1 14 1.2 -0.2 1.3
51 km/h SG5 74 -6 80 15 -1 16 1.4 -0.3 1.5
69 km/h SG5 94 -7 100 19 -1 20 1.7 -0.3 1.8
80 km/h SG5 112 -20 133 22 -4 27 2.1 -0.4 2.4
82 km/h SG5 112 -26 139 22 -5 28 2.1 -0.5 2.5
88 km/h SG5 119 -30 149 24 -6 30 2.2 -0.6 2.7
89 km/h SG5 124 -29 153 25 -6 31 2.2 -0.5 2.7
92 km/h SG5 116 -34 148 23 -7 30 2.0 -0.6 2.6
93 km/h SG5 75 -9 80 15 -2 16 1.4 -0.3 1.5
104 km/h SG5 133 -45 179 27 -9 36 2.4 -0.8 3.2
Maximum SG5 133 -45 179 27 -9 36 2.4 -0.8 3.2
A DAF of 3.2 is significantly higher than any current bridge design code requirements, except RTA B316. It is recommended that designers use 80% of the peak empirical DAF to approximate Method (iii) of RTA B316. For the Karuah Bypass MBEJ, this would equate to a design DAF of 2.56 and the design calculations for this joint used a DAF of 2.5. The sensitivity of the tested joint to dynamic effects is well demonstrated in Table 4. At a vehicle speed of 92 km/h, we see a DAF of 2.6, whereas at a speed of 93 km/h, the DAF is only 1.5.
CONCLUSION
The Roads and Traffic Authority of NSW has recently revised its specification RTA B316 for the design, fabrication, testing, supply and installation of modular bridge expansion joints (MBEJs). Comparisons were made during the revision with the AASHTO LRFD, German and Austrian specifications. Salient aspects of all four specifications are briefly compared in this paper. The RTA B316 specification is the
Modular Bridge Expansion Joint Specifications and Load Testing – Ancich, Forster & Bhavnagri 11
most conservative whereas the AASHTO LRFD specification is the least conservative. Dynamic load testing conducted by the RTA on the MBEJ treated in this paper and on other MBEJs indicates that the higher dynamic amplification factors specified in RTA B316 are justified. The Mooney Mooney Creek MBEJ studied indicates that fatigue stresses at welded connections and details could be more critical than for the main elements. RTA B316 requires analysis of all MBEJ details and specifies limiting fatigue stress ranges for typical connections. A dynamic load test was conducted on an MBEJ installed for the Karuah Bypass, which is very similar to the one analysed for Mooney Mooney Creek. The test demonstrated that high DAF values obtained are close to those required by RTA B316 and are substantially greater than those specified by the other specifications compared. Although the peak values of DAF used for design may be discounted to 80% of the measured values for fatigue design, factoring down the axle loads as well as the DAF may result in designs prone to fatigue failure. Static analysis of the load tested centre beam indicates that continuous beam analyses of centre beams assuming rigid supports could yield significant errors if the supports are elastic. Elasticity of the supports for a single support bar system is due to the support bars resting on elastomeric bearings. It is considered that the conservatism in MBEJ designs conforming to the RTA B316 specification is justified considering the enormous cost of replacing failed MBEJs compared to the marginal increase in costs of MBEJs supplied with larger sized elements and higher quality fabrication.
ACKNOWLEDGEMENT
The authors wish to thank the Chief Executive of the Roads and Traffic Authority NSW for permission to publish this paper. The opinions and conclusions expressed in this paper do not necessarily reflect the views of the RTA.
Modular Bridge Expansion Joint Specifications and Load Testing – Ancich, Forster & Bhavnagri 12
REFERENCES
1. Roads & Traffic Authority of NSW., RTA QA Specification B316 – Modular Bridge Expansion Joints Ed2/Rev0, Sydney, Australia, December 2004.
2. Standards Australia, Australian Standard AS5100 – 2004, Part 2: Design loads, Part 4: Bearings and deck joints, Part 6: Steel and composite construction, Sydney, Australia, 2004
3. American Association of State Highway and Transportation Officials (AASHTO) AASHTO LRFD Bridge Design Specifications, SI Units, 3rd Ed., Washington, DC, USA, 2004.
4. “Expansion Joints for Bridges”, Austrian Guideline RVS 15.45, Draft, version 1, Vienna, Austria, 1999.
5. TL/TP-FÜ 92, “Technical delivery and inspection specifications for watertight expansion joints of road and foot bridges”, Federal Ministry of Transport (BMV), Bonn, Germany, 1992. Non-revised translation (draft 1), provided by the German Association of Joint and Bearing Manufacturers [Vereinigung der Hersteller von Fahrbahnübergängen und (Brücken) Lagern].
6. DEXTER R.J., CONNOR R.J. & KACZINSKI M.R., “Fatigue Design of Modular Bridge Expansion Joints”, NCHRP Report 402, Transportation Research Board, National Research Council, Washington, DC, USA, 1997, 128 pp.
7. TSCHEMMERNEGG F., “The Design of Modular Expansion Joints”, Proc. 3rd World Congress on Joint Sealing and Bearing Systems for Concrete Structures (Toronto, Canada), American Concrete Institute, Detroit, Michigan, USA, 67-86, 1991.
8. ANCICH E.J., & BHAVNAGRI V.S., “A Case Study Comparison of Fatigue in Modular Bridge Expansion Joints Using Multiple Bridge Design Code Approaches and Empirical Data”, Proc. 6th World Congress on Joints, Bearings & Seismic Systems for Concrete Structures, Halifax, Nova Scotia, Canada, 2006.
9. ANCICH E.J., BROWN S.C. & CHIRGWIN G.J., “The Role of Modular Bridge Expansion Joint Vibration in Environmental Noise Emissions and Joint Fatigue Failure”, Proc. Acoustics 2004 Conference, Surfers Paradise, Qld, Australia, 2004, pp 135-140.
10. EWINS D.J., “Modal Testing: Theory, Practice & Application (2nd Edition)”, Research Studies Press, Hertfordshire, UK, 1999, pp.163-276.
11. BROWN S.C., “Measurement of Static and Dynamic Strains: Karuah Bypass Bridge, Karuah NSW Modular Expansion Joint”, Report 10-1788-R20, Richard Heggie Associates Pty Ltd (now Heggies Australia Pty Ltd), Lane Cove, NSW, Australia, 2005 (Unpublished report prepared for the Roads & Traffic Authority of NSW).
Modular Bridge Expansion Joint Specifications and Load Testing – Ancich, Forster & Bhavnagri 13
Appendix J
Ancich E.J., Chirgwin G.J. and Brown S.C. (2006). Dynamic Anomalies in a
Modular Bridge Expansion Joint, Journal of Bridge Engineering, Vol. 11, No. 5, 541-
554 (With permission from ASCE).

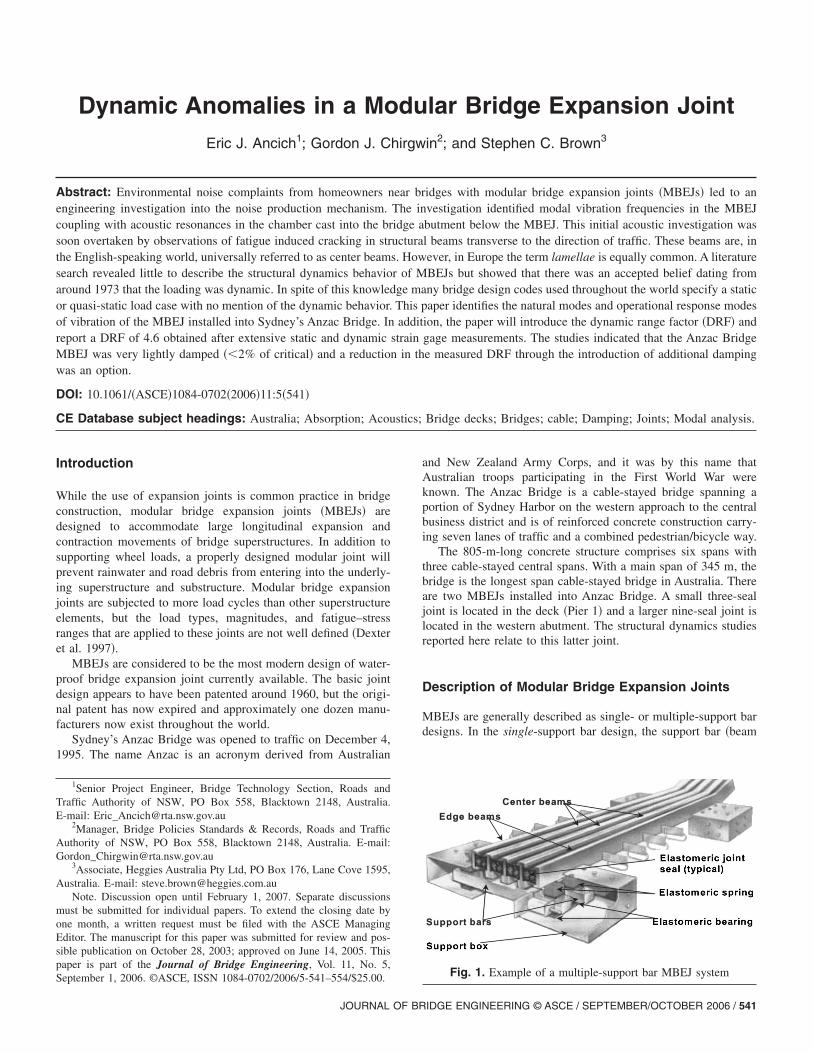
Dynamic Anomalies in a Modular Bridge Expansion JointEric J. Ancich1; Gordon J. Chirgwin2; and Stephen C. Brown3
Abstract: Environmental noise complaints from homeowners near bridges with modular bridge expansion joints �MBEJs� led to anengineering investigation into the noise production mechanism. The investigation identified modal vibration frequencies in the MBEJcoupling with acoustic resonances in the chamber cast into the bridge abutment below the MBEJ. This initial acoustic investigation wassoon overtaken by observations of fatigue induced cracking in structural beams transverse to the direction of traffic. These beams are, inthe English-speaking world, universally referred to as center beams. However, in Europe the term lamellae is equally common. A literaturesearch revealed little to describe the structural dynamics behavior of MBEJs but showed that there was an accepted belief dating fromaround 1973 that the loading was dynamic. In spite of this knowledge many bridge design codes used throughout the world specify a staticor quasi-static load case with no mention of the dynamic behavior. This paper identifies the natural modes and operational response modesof vibration of the MBEJ installed into Sydney’s Anzac Bridge. In addition, the paper will introduce the dynamic range factor �DRF� andreport a DRF of 4.6 obtained after extensive static and dynamic strain gage measurements. The studies indicated that the Anzac BridgeMBEJ was very lightly damped ��2% of critical� and a reduction in the measured DRF through the introduction of additional dampingwas an option.
DOI: 10.1061/�ASCE�1084-0702�2006�11:5�541�
CE Database subject headings: Australia; Absorption; Acoustics; Bridge decks; Bridges; cable; Damping; Joints; Modal analysis.
Introduction
While the use of expansion joints is common practice in bridgeconstruction, modular bridge expansion joints �MBEJs� aredesigned to accommodate large longitudinal expansion andcontraction movements of bridge superstructures. In addition tosupporting wheel loads, a properly designed modular joint willprevent rainwater and road debris from entering into the underly-ing superstructure and substructure. Modular bridge expansionjoints are subjected to more load cycles than other superstructureelements, but the load types, magnitudes, and fatigue–stressranges that are applied to these joints are not well defined �Dexteret al. 1997�.
MBEJs are considered to be the most modern design of water-proof bridge expansion joint currently available. The basic jointdesign appears to have been patented around 1960, but the origi-nal patent has now expired and approximately one dozen manu-facturers now exist throughout the world.
Sydney’s Anzac Bridge was opened to traffic on December 4,1995. The name Anzac is an acronym derived from Australian
1Senior Project Engineer, Bridge Technology Section, Roads andTraffic Authority of NSW, PO Box 558, Blacktown 2148, Australia.E-mail: [email protected]
2Manager, Bridge Policies Standards & Records, Roads and TrafficAuthority of NSW, PO Box 558, Blacktown 2148, Australia. E-mail:[email protected]
3Associate, Heggies Australia Pty Ltd, PO Box 176, Lane Cove 1595,Australia. E-mail: [email protected]
Note. Discussion open until February 1, 2007. Separate discussionsmust be submitted for individual papers. To extend the closing date byone month, a written request must be filed with the ASCE ManagingEditor. The manuscript for this paper was submitted for review and pos-sible publication on October 28, 2003; approved on June 14, 2005. Thispaper is part of the Journal of Bridge Engineering, Vol. 11, No. 5,
September 1, 2006. ©ASCE, ISSN 1084-0702/2006/5-541–554/$25.00.JOURNAL OF BR
and New Zealand Army Corps, and it was by this name thatAustralian troops participating in the First World War wereknown. The Anzac Bridge is a cable-stayed bridge spanning aportion of Sydney Harbor on the western approach to the centralbusiness district and is of reinforced concrete construction carry-ing seven lanes of traffic and a combined pedestrian/bicycle way.
The 805-m-long concrete structure comprises six spans withthree cable-stayed central spans. With a main span of 345 m, thebridge is the longest span cable-stayed bridge in Australia. Thereare two MBEJs installed into Anzac Bridge. A small three-sealjoint is located in the deck �Pier 1� and a larger nine-seal joint islocated in the western abutment. The structural dynamics studiesreported here relate to this latter joint.
Description of Modular Bridge Expansion Joints
MBEJs are generally described as single- or multiple-support bardesigns. In the single-support bar design, the support bar �beam
Fig. 1. Example of a multiple-support bar MBEJ system
IDGE ENGINEERING © ASCE / SEPTEMBER/OCTOBER 2006 / 541
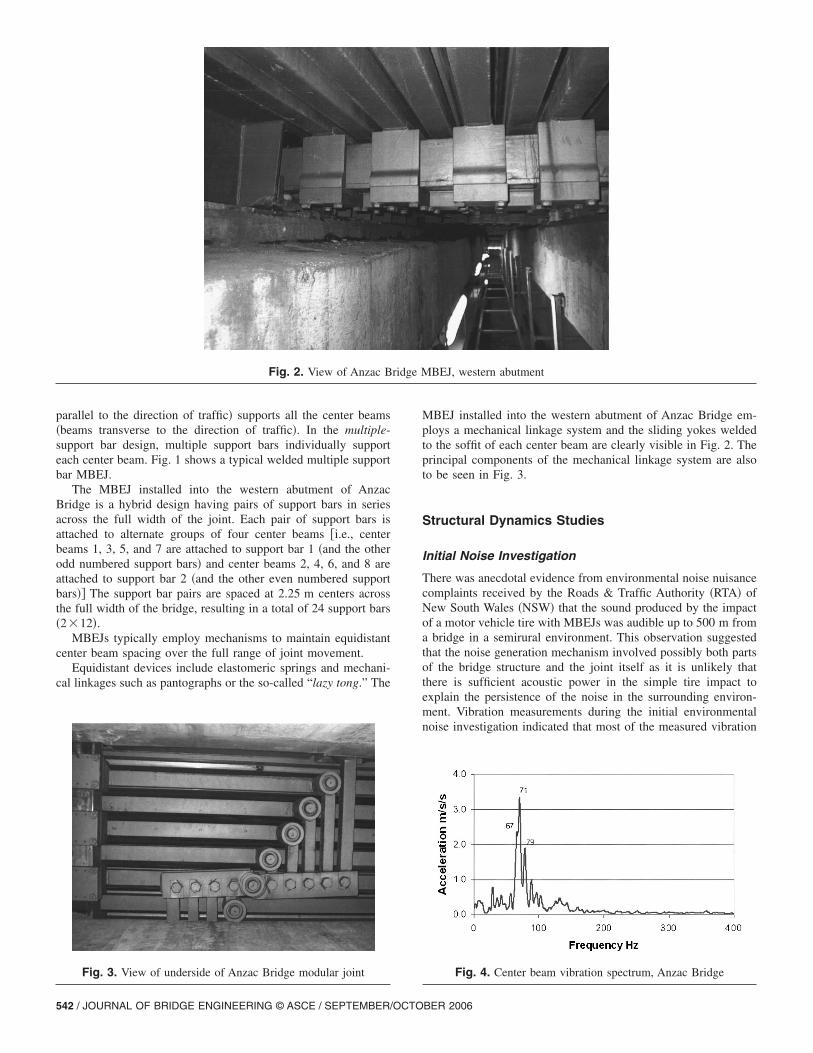
parallel to the direction of traffic� supports all the center beams�beams transverse to the direction of traffic�. In the multiple-support bar design, multiple support bars individually supporteach center beam. Fig. 1 shows a typical welded multiple supportbar MBEJ.
The MBEJ installed into the western abutment of AnzacBridge is a hybrid design having pairs of support bars in seriesacross the full width of the joint. Each pair of support bars isattached to alternate groups of four center beams �i.e., centerbeams 1, 3, 5, and 7 are attached to support bar 1 �and the otherodd numbered support bars� and center beams 2, 4, 6, and 8 areattached to support bar 2 �and the other even numbered supportbars�� The support bar pairs are spaced at 2.25 m centers acrossthe full width of the bridge, resulting in a total of 24 support bars�2�12�.
MBEJs typically employ mechanisms to maintain equidistantcenter beam spacing over the full range of joint movement.
Equidistant devices include elastomeric springs and mechani-cal linkages such as pantographs or the so-called “lazy tong.” The
Fig. 2. View of Anzac B
Fig. 3. View of underside of Anzac Bridge modular joint
542 / JOURNAL OF BRIDGE ENGINEERING © ASCE / SEPTEMBER/OCTO
MBEJ installed into the western abutment of Anzac Bridge em-ploys a mechanical linkage system and the sliding yokes weldedto the soffit of each center beam are clearly visible in Fig. 2. Theprincipal components of the mechanical linkage system are alsoto be seen in Fig. 3.
Structural Dynamics Studies
Initial Noise Investigation
There was anecdotal evidence from environmental noise nuisancecomplaints received by the Roads & Traffic Authority �RTA� ofNew South Wales �NSW� that the sound produced by the impactof a motor vehicle tire with MBEJs was audible up to 500 m froma bridge in a semirural environment. This observation suggestedthat the noise generation mechanism involved possibly both partsof the bridge structure and the joint itself as it is unlikely thatthere is sufficient acoustic power in the simple tire impact toexplain the persistence of the noise in the surrounding environ-ment. Vibration measurements during the initial environmentalnoise investigation indicated that most of the measured vibration
BEJ, western abutment
Fig. 4. Center beam vibration spectrum, Anzac Bridge
ridge M
BER 2006
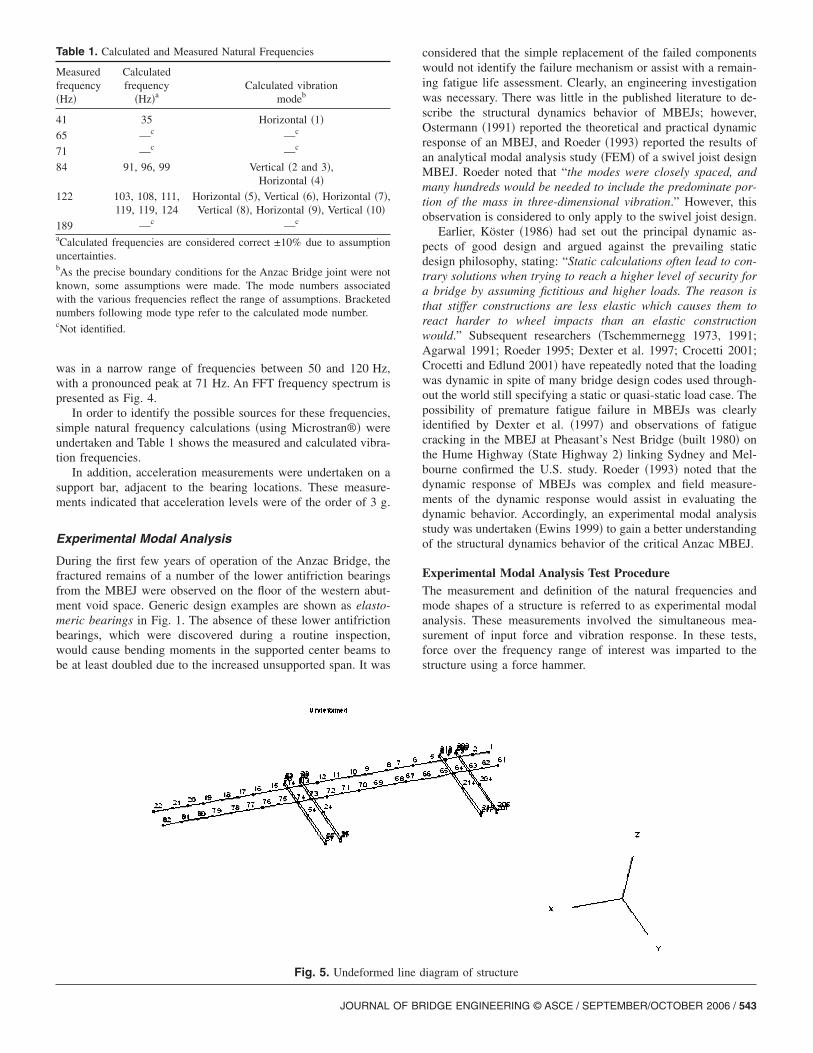
was in a narrow range of frequencies between 50 and 120 Hz,with a pronounced peak at 71 Hz. An FFT frequency spectrum ispresented as Fig. 4.
In order to identify the possible sources for these frequencies,simple natural frequency calculations �using Microstran®� wereundertaken and Table 1 shows the measured and calculated vibra-tion frequencies.
In addition, acceleration measurements were undertaken on asupport bar, adjacent to the bearing locations. These measure-ments indicated that acceleration levels were of the order of 3 g.
Experimental Modal Analysis
During the first few years of operation of the Anzac Bridge, thefractured remains of a number of the lower antifriction bearingsfrom the MBEJ were observed on the floor of the western abut-ment void space. Generic design examples are shown as elasto-meric bearings in Fig. 1. The absence of these lower antifrictionbearings, which were discovered during a routine inspection,would cause bending moments in the supported center beams tobe at least doubled due to the increased unsupported span. It was
Table 1. Calculated and Measured Natural Frequencies
Measuredfrequency�Hz�
Calculatedfrequency
�Hz�aCalculated vibration
modeb
41 35 Horizontal �1�
65 —c —c
71 —c —c
84 91, 96, 99 Vertical �2 and 3�,Horizontal �4�
122 103, 108, 111,119, 119, 124
Horizontal �5�, Vertical �6�, Horizontal �7�,Vertical �8�, Horizontal �9�, Vertical �10�
189 —c —c
aCalculated frequencies are considered correct ±10% due to assumptionuncertainties.bAs the precise boundary conditions for the Anzac Bridge joint were notknown, some assumptions were made. The mode numbers associatedwith the various frequencies reflect the range of assumptions. Bracketednumbers following mode type refer to the calculated mode number.cNot identified.
Fig. 5. Undeformed
JOURNAL OF BR
considered that the simple replacement of the failed componentswould not identify the failure mechanism or assist with a remain-ing fatigue life assessment. Clearly, an engineering investigationwas necessary. There was little in the published literature to de-scribe the structural dynamics behavior of MBEJs; however,Ostermann �1991� reported the theoretical and practical dynamicresponse of an MBEJ, and Roeder �1993� reported the results ofan analytical modal analysis study �FEM� of a swivel joist designMBEJ. Roeder noted that “the modes were closely spaced, andmany hundreds would be needed to include the predominate por-tion of the mass in three-dimensional vibration.” However, thisobservation is considered to only apply to the swivel joist design.
Earlier, Köster �1986� had set out the principal dynamic as-pects of good design and argued against the prevailing staticdesign philosophy, stating: “Static calculations often lead to con-trary solutions when trying to reach a higher level of security fora bridge by assuming fictitious and higher loads. The reason isthat stiffer constructions are less elastic which causes them toreact harder to wheel impacts than an elastic constructionwould.” Subsequent researchers �Tschemmernegg 1973, 1991;Agarwal 1991; Roeder 1995; Dexter et al. 1997; Crocetti 2001;Crocetti and Edlund 2001� have repeatedly noted that the loadingwas dynamic in spite of many bridge design codes used through-out the world still specifying a static or quasi-static load case. Thepossibility of premature fatigue failure in MBEJs was clearlyidentified by Dexter et al. �1997� and observations of fatiguecracking in the MBEJ at Pheasant’s Nest Bridge �built 1980� onthe Hume Highway �State Highway 2� linking Sydney and Mel-bourne confirmed the U.S. study. Roeder �1993� noted that thedynamic response of MBEJs was complex and field measure-ments of the dynamic response would assist in evaluating thedynamic behavior. Accordingly, an experimental modal analysisstudy was undertaken �Ewins 1999� to gain a better understandingof the structural dynamics behavior of the critical Anzac MBEJ.
Experimental Modal Analysis Test ProcedureThe measurement and definition of the natural frequencies andmode shapes of a structure is referred to as experimental modalanalysis. These measurements involved the simultaneous mea-surement of input force and vibration response. In these tests,force over the frequency range of interest was imparted to thestructure using a force hammer.
iagram of structure
line dIDGE ENGINEERING © ASCE / SEPTEMBER/OCTOBER 2006 / 543
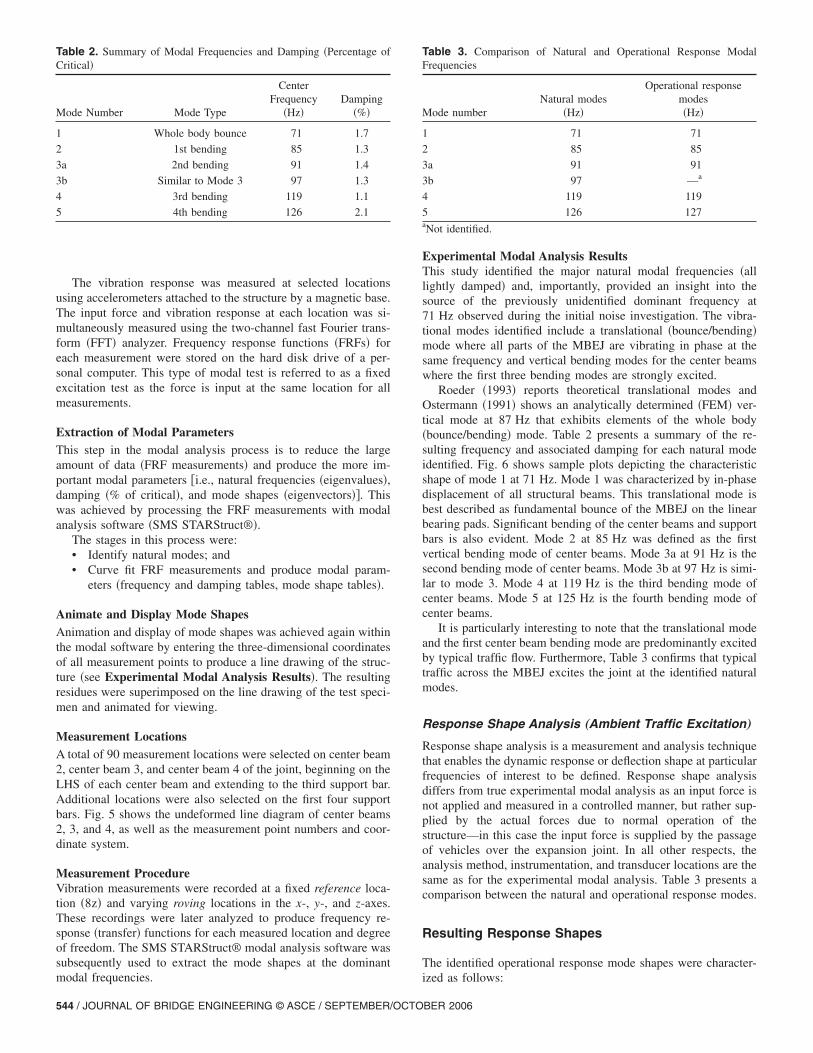
The vibration response was measured at selected locationsusing accelerometers attached to the structure by a magnetic base.The input force and vibration response at each location was si-multaneously measured using the two-channel fast Fourier trans-form �FFT� analyzer. Frequency response functions �FRFs� foreach measurement were stored on the hard disk drive of a per-sonal computer. This type of modal test is referred to as a fixedexcitation test as the force is input at the same location for allmeasurements.
Extraction of Modal ParametersThis step in the modal analysis process is to reduce the largeamount of data �FRF measurements� and produce the more im-portant modal parameters �i.e., natural frequencies �eigenvalues�,damping �% of critical�, and mode shapes �eigenvectors��. Thiswas achieved by processing the FRF measurements with modalanalysis software �SMS STARStruct®�.
The stages in this process were:• Identify natural modes; and• Curve fit FRF measurements and produce modal param-
eters �frequency and damping tables, mode shape tables�.
Animate and Display Mode ShapesAnimation and display of mode shapes was achieved again withinthe modal software by entering the three-dimensional coordinatesof all measurement points to produce a line drawing of the struc-ture �see Experimental Modal Analysis Results�. The resultingresidues were superimposed on the line drawing of the test speci-men and animated for viewing.
Measurement LocationsA total of 90 measurement locations were selected on center beam2, center beam 3, and center beam 4 of the joint, beginning on theLHS of each center beam and extending to the third support bar.Additional locations were also selected on the first four supportbars. Fig. 5 shows the undeformed line diagram of center beams2, 3, and 4, as well as the measurement point numbers and coor-dinate system.
Measurement ProcedureVibration measurements were recorded at a fixed reference loca-tion �8z� and varying roving locations in the x-, y-, and z-axes.These recordings were later analyzed to produce frequency re-sponse �transfer� functions for each measured location and degreeof freedom. The SMS STARStruct® modal analysis software wassubsequently used to extract the mode shapes at the dominant
Table 2. Summary of Modal Frequencies and Damping �Percentage ofCritical�
Mode Number Mode Type
CenterFrequency
�Hz�Damping
�%�
1 Whole body bounce 71 1.7
2 1st bending 85 1.3
3a 2nd bending 91 1.4
3b Similar to Mode 3 97 1.3
4 3rd bending 119 1.1
5 4th bending 126 2.1
modal frequencies.
544 / JOURNAL OF BRIDGE ENGINEERING © ASCE / SEPTEMBER/OCTO
Experimental Modal Analysis ResultsThis study identified the major natural modal frequencies �alllightly damped� and, importantly, provided an insight into thesource of the previously unidentified dominant frequency at71 Hz observed during the initial noise investigation. The vibra-tional modes identified include a translational �bounce/bending�mode where all parts of the MBEJ are vibrating in phase at thesame frequency and vertical bending modes for the center beamswhere the first three bending modes are strongly excited.
Roeder �1993� reports theoretical translational modes andOstermann �1991� shows an analytically determined �FEM� ver-tical mode at 87 Hz that exhibits elements of the whole body�bounce/bending� mode. Table 2 presents a summary of the re-sulting frequency and associated damping for each natural modeidentified. Fig. 6 shows sample plots depicting the characteristicshape of mode 1 at 71 Hz. Mode 1 was characterized by in-phasedisplacement of all structural beams. This translational mode isbest described as fundamental bounce of the MBEJ on the linearbearing pads. Significant bending of the center beams and supportbars is also evident. Mode 2 at 85 Hz was defined as the firstvertical bending mode of center beams. Mode 3a at 91 Hz is thesecond bending mode of center beams. Mode 3b at 97 Hz is simi-lar to mode 3. Mode 4 at 119 Hz is the third bending mode ofcenter beams. Mode 5 at 125 Hz is the fourth bending mode ofcenter beams.
It is particularly interesting to note that the translational modeand the first center beam bending mode are predominantly excitedby typical traffic flow. Furthermore, Table 3 confirms that typicaltraffic across the MBEJ excites the joint at the identified naturalmodes.
Response Shape Analysis „Ambient Traffic Excitation…
Response shape analysis is a measurement and analysis techniquethat enables the dynamic response or deflection shape at particularfrequencies of interest to be defined. Response shape analysisdiffers from true experimental modal analysis as an input force isnot applied and measured in a controlled manner, but rather sup-plied by the actual forces due to normal operation of thestructure—in this case the input force is supplied by the passageof vehicles over the expansion joint. In all other respects, theanalysis method, instrumentation, and transducer locations are thesame as for the experimental modal analysis. Table 3 presents acomparison between the natural and operational response modes.
Resulting Response Shapes
The identified operational response mode shapes were character-
Table 3. Comparison of Natural and Operational Response ModalFrequencies
Mode numberNatural modes
�Hz�
Operational responsemodes�Hz�
1 71 71
2 85 85
3a 91 91
3b 97 —a
4 119 119
5 126 127aNot identified.
ized as follows:
BER 2006
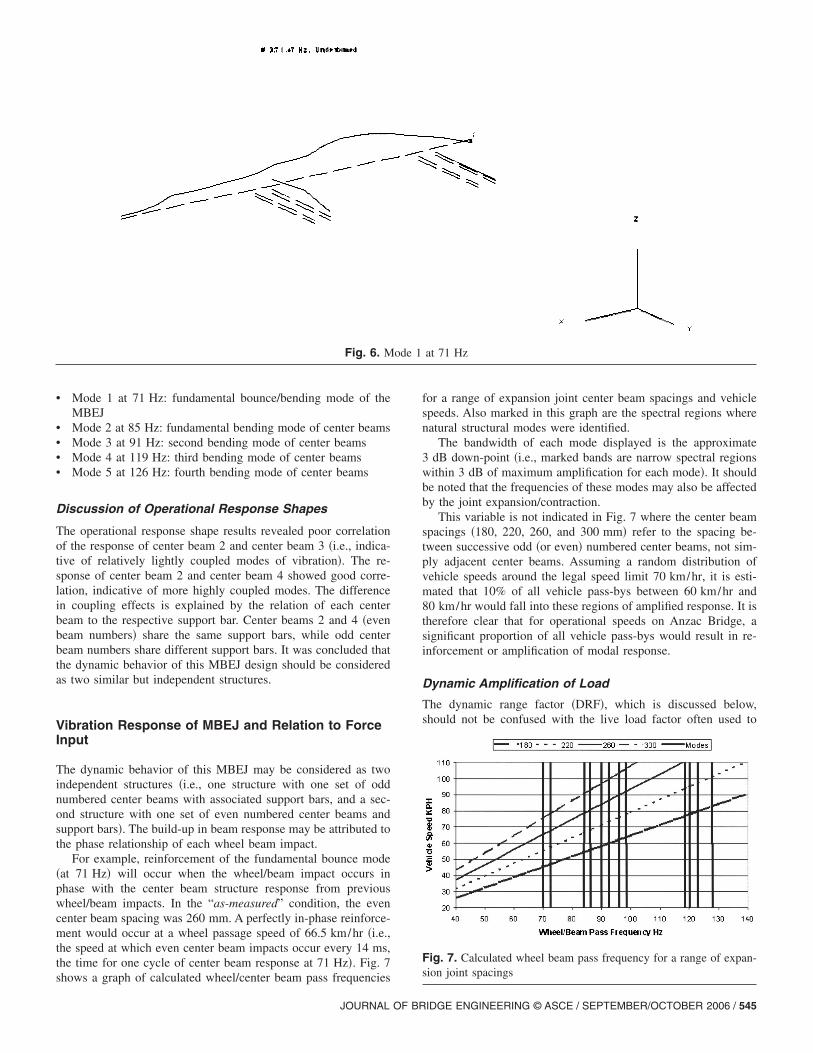
• Mode 1 at 71 Hz: fundamental bounce/bending mode of theMBEJ
• Mode 2 at 85 Hz: fundamental bending mode of center beams• Mode 3 at 91 Hz: second bending mode of center beams• Mode 4 at 119 Hz: third bending mode of center beams• Mode 5 at 126 Hz: fourth bending mode of center beams
Discussion of Operational Response Shapes
The operational response shape results revealed poor correlationof the response of center beam 2 and center beam 3 �i.e., indica-tive of relatively lightly coupled modes of vibration�. The re-sponse of center beam 2 and center beam 4 showed good corre-lation, indicative of more highly coupled modes. The differencein coupling effects is explained by the relation of each centerbeam to the respective support bar. Center beams 2 and 4 �evenbeam numbers� share the same support bars, while odd centerbeam numbers share different support bars. It was concluded thatthe dynamic behavior of this MBEJ design should be consideredas two similar but independent structures.
Vibration Response of MBEJ and Relation to ForceInput
The dynamic behavior of this MBEJ may be considered as twoindependent structures �i.e., one structure with one set of oddnumbered center beams with associated support bars, and a sec-ond structure with one set of even numbered center beams andsupport bars�. The build-up in beam response may be attributed tothe phase relationship of each wheel beam impact.
For example, reinforcement of the fundamental bounce mode�at 71 Hz� will occur when the wheel/beam impact occurs inphase with the center beam structure response from previouswheel/beam impacts. In the “as-measured” condition, the evencenter beam spacing was 260 mm. A perfectly in-phase reinforce-ment would occur at a wheel passage speed of 66.5 km/hr �i.e.,the speed at which even center beam impacts occur every 14 ms,the time for one cycle of center beam response at 71 Hz�. Fig. 7
Fig. 6. M
shows a graph of calculated wheel/center beam pass frequencies
JOURNAL OF BR
for a range of expansion joint center beam spacings and vehiclespeeds. Also marked in this graph are the spectral regions wherenatural structural modes were identified.
The bandwidth of each mode displayed is the approximate3 dB down-point �i.e., marked bands are narrow spectral regionswithin 3 dB of maximum amplification for each mode�. It shouldbe noted that the frequencies of these modes may also be affectedby the joint expansion/contraction.
This variable is not indicated in Fig. 7 where the center beamspacings �180, 220, 260, and 300 mm� refer to the spacing be-tween successive odd �or even� numbered center beams, not sim-ply adjacent center beams. Assuming a random distribution ofvehicle speeds around the legal speed limit 70 km/hr, it is esti-mated that 10% of all vehicle pass-bys between 60 km/hr and80 km/hr would fall into these regions of amplified response. It istherefore clear that for operational speeds on Anzac Bridge, asignificant proportion of all vehicle pass-bys would result in re-inforcement or amplification of modal response.
Dynamic Amplification of Load
The dynamic range factor �DRF�, which is discussed below,should not be confused with the live load factor often used to
at 71 Hz
Fig. 7. Calculated wheel beam pass frequency for a range of expan-sion joint spacings
ode 1
IDGE ENGINEERING © ASCE / SEPTEMBER/OCTOBER 2006 / 545
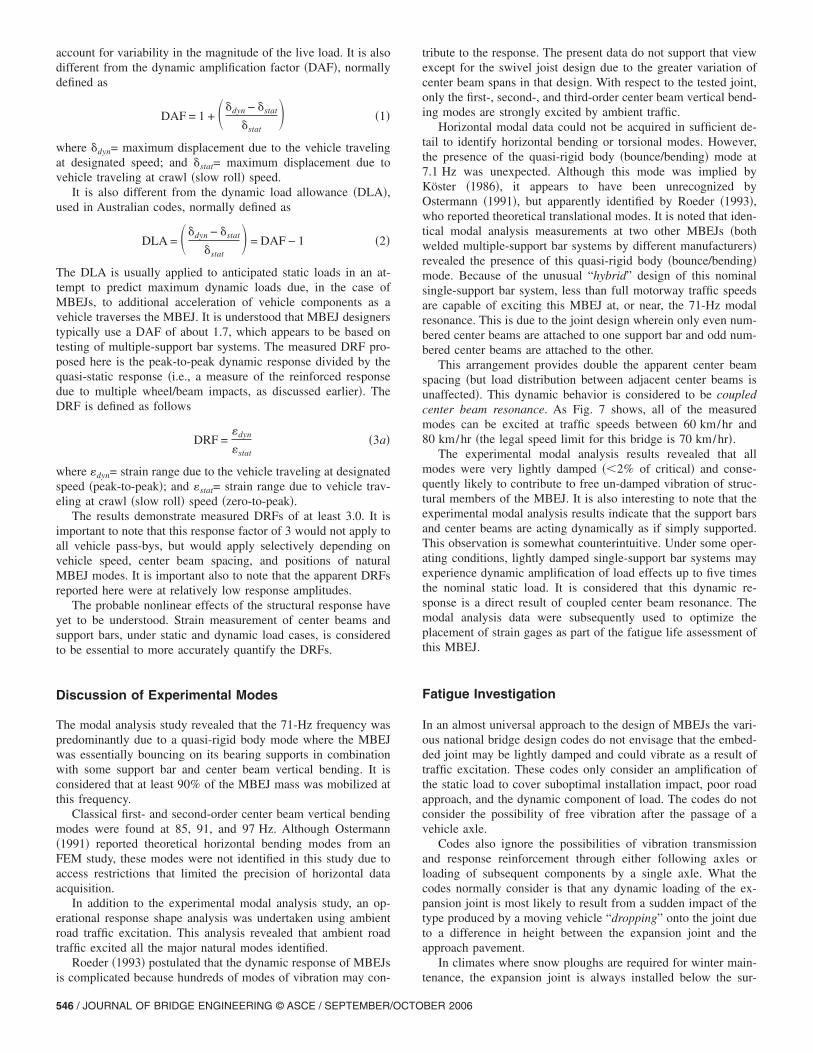
account for variability in the magnitude of the live load. It is alsodifferent from the dynamic amplification factor �DAF�, normallydefined as
DAF = 1 + ��dyn − �stat
�stat� �1�
where �dyn= maximum displacement due to the vehicle travelingat designated speed; and �stat= maximum displacement due tovehicle traveling at crawl �slow roll� speed.
It is also different from the dynamic load allowance �DLA�,used in Australian codes, normally defined as
DLA = ��dyn − �stat
�stat� = DAF − 1 �2�
The DLA is usually applied to anticipated static loads in an at-tempt to predict maximum dynamic loads due, in the case ofMBEJs, to additional acceleration of vehicle components as avehicle traverses the MBEJ. It is understood that MBEJ designerstypically use a DAF of about 1.7, which appears to be based ontesting of multiple-support bar systems. The measured DRF pro-posed here is the peak-to-peak dynamic response divided by thequasi-static response �i.e., a measure of the reinforced responsedue to multiple wheel/beam impacts, as discussed earlier�. TheDRF is defined as follows
DRF =�dyn
�stat�3a�
where �dyn= strain range due to the vehicle traveling at designatedspeed �peak-to-peak�; and �stat= strain range due to vehicle trav-eling at crawl �slow roll� speed �zero-to-peak�.
The results demonstrate measured DRFs of at least 3.0. It isimportant to note that this response factor of 3 would not apply toall vehicle pass-bys, but would apply selectively depending onvehicle speed, center beam spacing, and positions of naturalMBEJ modes. It is important also to note that the apparent DRFsreported here were at relatively low response amplitudes.
The probable nonlinear effects of the structural response haveyet to be understood. Strain measurement of center beams andsupport bars, under static and dynamic load cases, is consideredto be essential to more accurately quantify the DRFs.
Discussion of Experimental Modes
The modal analysis study revealed that the 71-Hz frequency waspredominantly due to a quasi-rigid body mode where the MBEJwas essentially bouncing on its bearing supports in combinationwith some support bar and center beam vertical bending. It isconsidered that at least 90% of the MBEJ mass was mobilized atthis frequency.
Classical first- and second-order center beam vertical bendingmodes were found at 85, 91, and 97 Hz. Although Ostermann�1991� reported theoretical horizontal bending modes from anFEM study, these modes were not identified in this study due toaccess restrictions that limited the precision of horizontal dataacquisition.
In addition to the experimental modal analysis study, an op-erational response shape analysis was undertaken using ambientroad traffic excitation. This analysis revealed that ambient roadtraffic excited all the major natural modes identified.
Roeder �1993� postulated that the dynamic response of MBEJs
is complicated because hundreds of modes of vibration may con-546 / JOURNAL OF BRIDGE ENGINEERING © ASCE / SEPTEMBER/OCTO
tribute to the response. The present data do not support that viewexcept for the swivel joist design due to the greater variation ofcenter beam spans in that design. With respect to the tested joint,only the first-, second-, and third-order center beam vertical bend-ing modes are strongly excited by ambient traffic.
Horizontal modal data could not be acquired in sufficient de-tail to identify horizontal bending or torsional modes. However,the presence of the quasi-rigid body �bounce/bending� mode at7.1 Hz was unexpected. Although this mode was implied byKöster �1986�, it appears to have been unrecognized byOstermann �1991�, but apparently identified by Roeder �1993�,who reported theoretical translational modes. It is noted that iden-tical modal analysis measurements at two other MBEJs �bothwelded multiple-support bar systems by different manufacturers�revealed the presence of this quasi-rigid body �bounce/bending�mode. Because of the unusual “hybrid” design of this nominalsingle-support bar system, less than full motorway traffic speedsare capable of exciting this MBEJ at, or near, the 71-Hz modalresonance. This is due to the joint design wherein only even num-bered center beams are attached to one support bar and odd num-bered center beams are attached to the other.
This arrangement provides double the apparent center beamspacing �but load distribution between adjacent center beams isunaffected�. This dynamic behavior is considered to be coupledcenter beam resonance. As Fig. 7 shows, all of the measuredmodes can be excited at traffic speeds between 60 km/hr and80 km/hr �the legal speed limit for this bridge is 70 km/hr�.
The experimental modal analysis results revealed that allmodes were very lightly damped ��2% of critical� and conse-quently likely to contribute to free un-damped vibration of struc-tural members of the MBEJ. It is also interesting to note that theexperimental modal analysis results indicate that the support barsand center beams are acting dynamically as if simply supported.This observation is somewhat counterintuitive. Under some oper-ating conditions, lightly damped single-support bar systems mayexperience dynamic amplification of load effects up to five timesthe nominal static load. It is considered that this dynamic re-sponse is a direct result of coupled center beam resonance. Themodal analysis data were subsequently used to optimize theplacement of strain gages as part of the fatigue life assessment ofthis MBEJ.
Fatigue Investigation
In an almost universal approach to the design of MBEJs the vari-ous national bridge design codes do not envisage that the embed-ded joint may be lightly damped and could vibrate as a result oftraffic excitation. These codes only consider an amplification ofthe static load to cover suboptimal installation impact, poor roadapproach, and the dynamic component of load. The codes do notconsider the possibility of free vibration after the passage of avehicle axle.
Codes also ignore the possibilities of vibration transmissionand response reinforcement through either following axles orloading of subsequent components by a single axle. What thecodes normally consider is that any dynamic loading of the ex-pansion joint is most likely to result from a sudden impact of thetype produced by a moving vehicle “dropping” onto the joint dueto a difference in height between the expansion joint and theapproach pavement.
In climates where snow ploughs are required for winter main-
tenance, the expansion joint is always installed below the sur-BER 2006
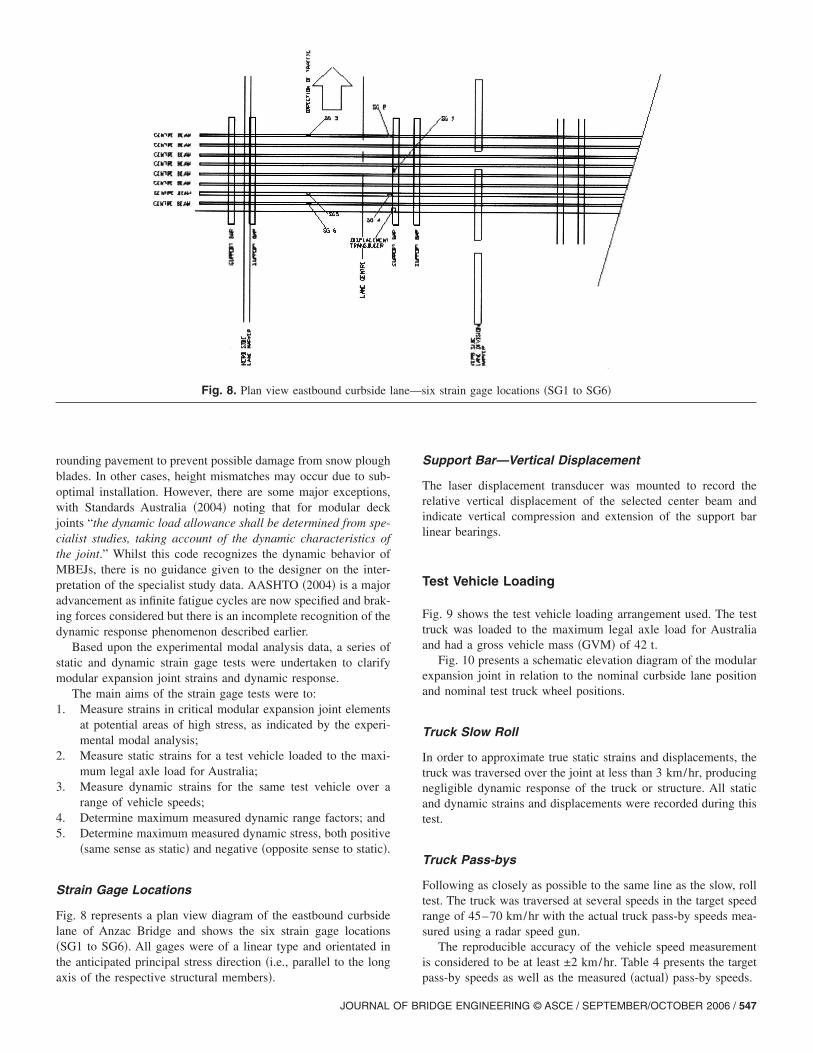
rounding pavement to prevent possible damage from snow ploughblades. In other cases, height mismatches may occur due to sub-optimal installation. However, there are some major exceptions,with Standards Australia �2004� noting that for modular deckjoints “the dynamic load allowance shall be determined from spe-cialist studies, taking account of the dynamic characteristics ofthe joint.” Whilst this code recognizes the dynamic behavior ofMBEJs, there is no guidance given to the designer on the inter-pretation of the specialist study data. AASHTO �2004� is a majoradvancement as infinite fatigue cycles are now specified and brak-ing forces considered but there is an incomplete recognition of thedynamic response phenomenon described earlier.
Based upon the experimental modal analysis data, a series ofstatic and dynamic strain gage tests were undertaken to clarifymodular expansion joint strains and dynamic response.
The main aims of the strain gage tests were to:1. Measure strains in critical modular expansion joint elements
at potential areas of high stress, as indicated by the experi-mental modal analysis;
2. Measure static strains for a test vehicle loaded to the maxi-mum legal axle load for Australia;
3. Measure dynamic strains for the same test vehicle over arange of vehicle speeds;
4. Determine maximum measured dynamic range factors; and5. Determine maximum measured dynamic stress, both positive
�same sense as static� and negative �opposite sense to static�.
Strain Gage Locations
Fig. 8 represents a plan view diagram of the eastbound curbsidelane of Anzac Bridge and shows the six strain gage locations�SG1 to SG6�. All gages were of a linear type and orientated inthe anticipated principal stress direction �i.e., parallel to the long
Fig. 8. Plan view eastbound curbside l
axis of the respective structural members�.
JOURNAL OF BR
Support Bar—Vertical Displacement
The laser displacement transducer was mounted to record therelative vertical displacement of the selected center beam andindicate vertical compression and extension of the support barlinear bearings.
Test Vehicle Loading
Fig. 9 shows the test vehicle loading arrangement used. The testtruck was loaded to the maximum legal axle load for Australiaand had a gross vehicle mass �GVM� of 42 t.
Fig. 10 presents a schematic elevation diagram of the modularexpansion joint in relation to the nominal curbside lane positionand nominal test truck wheel positions.
Truck Slow Roll
In order to approximate true static strains and displacements, thetruck was traversed over the joint at less than 3 km/hr, producingnegligible dynamic response of the truck or structure. All staticand dynamic strains and displacements were recorded during thistest.
Truck Pass-bys
Following as closely as possible to the same line as the slow, rolltest. The truck was traversed at several speeds in the target speedrange of 45–70 km/hr with the actual truck pass-by speeds mea-sured using a radar speed gun.
The reproducible accuracy of the vehicle speed measurementis considered to be at least ±2 km/hr. Table 4 presents the target
six strain gage locations �SG1 to SG6�
ane—pass-by speeds as well as the measured �actual� pass-by speeds.
IDGE ENGINEERING © ASCE / SEPTEMBER/OCTOBER 2006 / 547
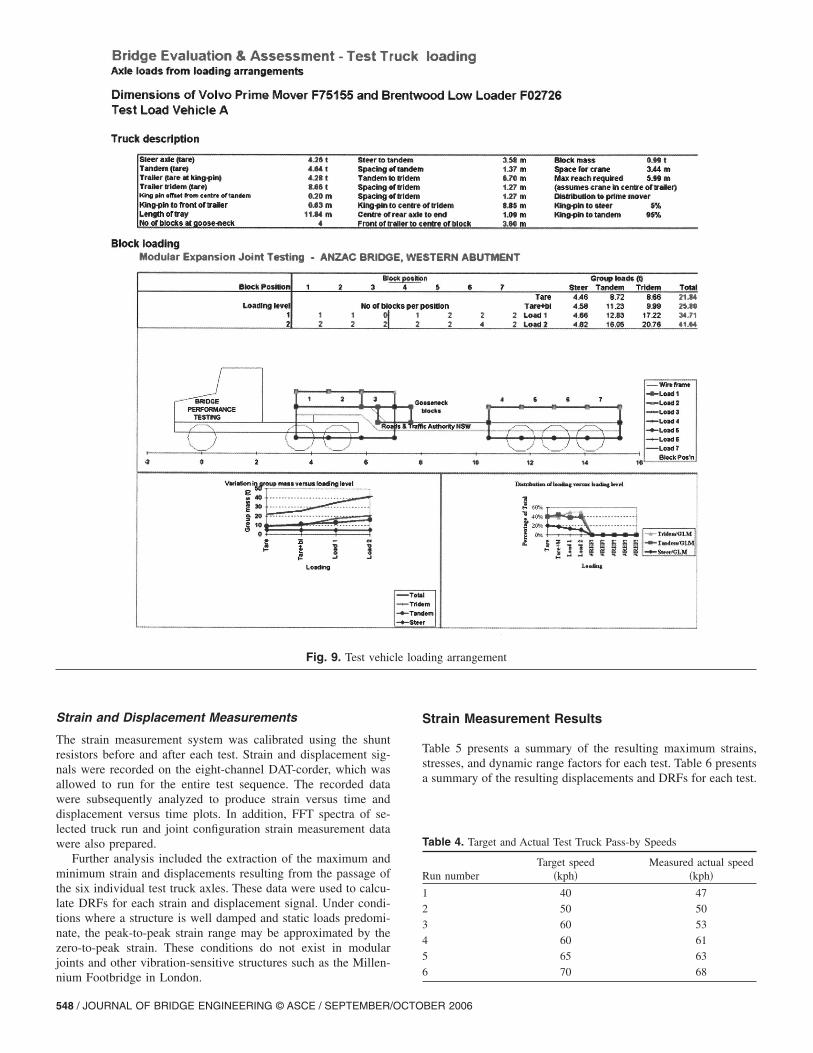
Strain and Displacement Measurements
The strain measurement system was calibrated using the shuntresistors before and after each test. Strain and displacement sig-nals were recorded on the eight-channel DAT-corder, which wasallowed to run for the entire test sequence. The recorded datawere subsequently analyzed to produce strain versus time anddisplacement versus time plots. In addition, FFT spectra of se-lected truck run and joint configuration strain measurement datawere also prepared.
Further analysis included the extraction of the maximum andminimum strain and displacements resulting from the passage ofthe six individual test truck axles. These data were used to calcu-late DRFs for each strain and displacement signal. Under condi-tions where a structure is well damped and static loads predomi-nate, the peak-to-peak strain range may be approximated by thezero-to-peak strain. These conditions do not exist in modularjoints and other vibration-sensitive structures such as the Millen-
Fig. 9. Test vehic
nium Footbridge in London.
548 / JOURNAL OF BRIDGE ENGINEERING © ASCE / SEPTEMBER/OCTO
Strain Measurement Results
Table 5 presents a summary of the resulting maximum strains,stresses, and dynamic range factors for each test. Table 6 presentsa summary of the resulting displacements and DRFs for each test.
Table 4. Target and Actual Test Truck Pass-by Speeds
Run numberTarget speed
�kph�Measured actual speed
�kph�
1 40 47
2 50 50
3 60 53
4 60 61
5 65 63
6 70 68
ding arrangement
le loaBER 2006
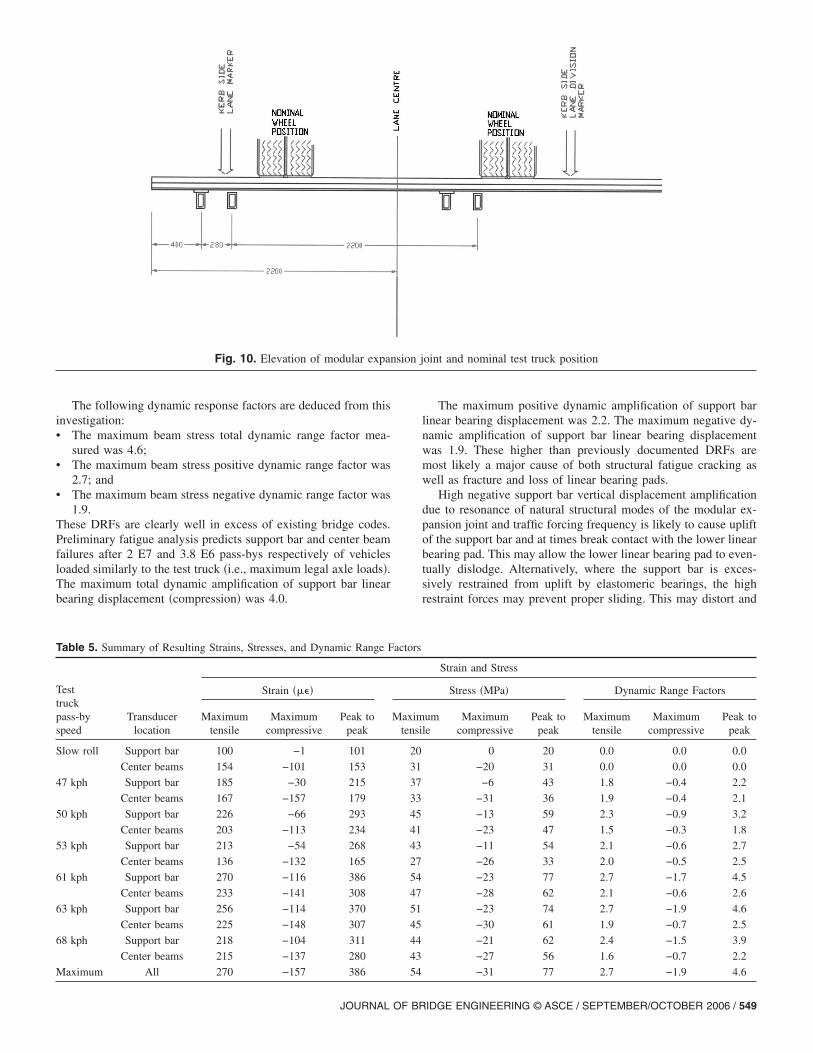
The following dynamic response factors are deduced from thisinvestigation:• The maximum beam stress total dynamic range factor mea-
sured was 4.6;• The maximum beam stress positive dynamic range factor was
2.7; and• The maximum beam stress negative dynamic range factor was
1.9.These DRFs are clearly well in excess of existing bridge codes.Preliminary fatigue analysis predicts support bar and center beamfailures after 2 E7 and 3.8 E6 pass-bys respectively of vehiclesloaded similarly to the test truck �i.e., maximum legal axle loads�.The maximum total dynamic amplification of support bar linearbearing displacement �compression� was 4.0.
Fig. 10. Elevation of modular expan
Table 5. Summary of Resulting Strains, Stresses, and Dynamic Range F
Testtruckpass-byspeed
Transducerlocation
Strain ����
Maximumtensile
Maximumcompressive
Peak topeak
Slow roll Support bar 100 −1 101
Center beams 154 −101 153
47 kph Support bar 185 −30 215
Center beams 167 −157 179
50 kph Support bar 226 −66 293
Center beams 203 −113 234
53 kph Support bar 213 −54 268
Center beams 136 −132 165
61 kph Support bar 270 −116 386
Center beams 233 −141 308
63 kph Support bar 256 −114 370
Center beams 225 −148 307
68 kph Support bar 218 −104 311
Center beams 215 −137 280
Maximum All 270 −157 386
JOURNAL OF BR
The maximum positive dynamic amplification of support barlinear bearing displacement was 2.2. The maximum negative dy-namic amplification of support bar linear bearing displacementwas 1.9. These higher than previously documented DRFs aremost likely a major cause of both structural fatigue cracking aswell as fracture and loss of linear bearing pads.
High negative support bar vertical displacement amplificationdue to resonance of natural structural modes of the modular ex-pansion joint and traffic forcing frequency is likely to cause upliftof the support bar and at times break contact with the lower linearbearing pad. This may allow the lower linear bearing pad to even-tually dislodge. Alternatively, where the support bar is exces-sively restrained from uplift by elastomeric bearings, the highrestraint forces may prevent proper sliding. This may distort and
oint and nominal test truck position
Strain and Stress
Stress �MPa� Dynamic Range Factors
umle
Maximumcompressive
Peak topeak
Maximumtensile
Maximumcompressive
Peak topeak
0 20 0.0 0.0 0.0
−20 31 0.0 0.0 0.0
−6 43 1.8 −0.4 2.2
−31 36 1.9 −0.4 2.1
−13 59 2.3 −0.9 3.2
−23 47 1.5 −0.3 1.8
−11 54 2.1 −0.6 2.7
−26 33 2.0 −0.5 2.5
−23 77 2.7 −1.7 4.5
−28 62 2.1 −0.6 2.6
−23 74 2.7 −1.9 4.6
−30 61 1.9 −0.7 2.5
−21 62 2.4 −1.5 3.9
−27 56 1.6 −0.7 2.2
−31 77 2.7 −1.9 4.6
sion j
actors
Maximtensi
20
31
37
33
45
41
43
27
54
47
51
45
44
43
54
IDGE ENGINEERING © ASCE / SEPTEMBER/OCTOBER 2006 / 549
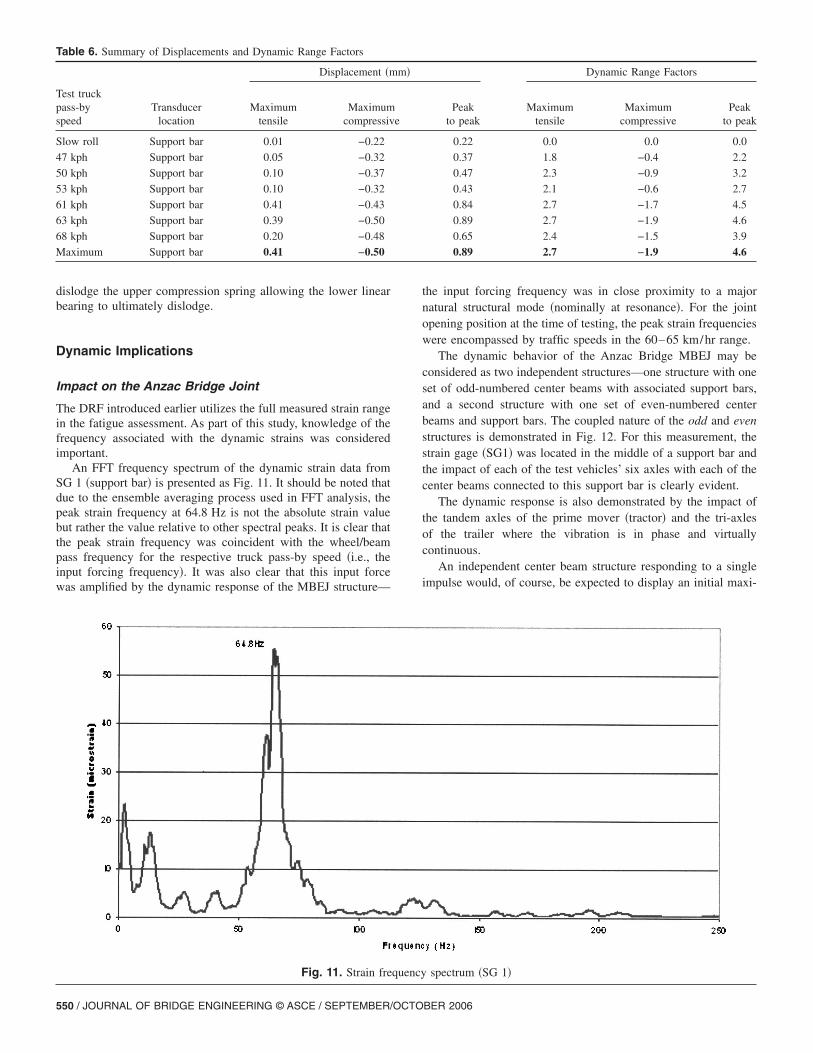
6
M
dislodge the upper compression spring allowing the lower linearbearing to ultimately dislodge.
Dynamic Implications
Impact on the Anzac Bridge Joint
The DRF introduced earlier utilizes the full measured strain rangein the fatigue assessment. As part of this study, knowledge of thefrequency associated with the dynamic strains was consideredimportant.
An FFT frequency spectrum of the dynamic strain data fromSG 1 �support bar� is presented as Fig. 11. It should be noted thatdue to the ensemble averaging process used in FFT analysis, thepeak strain frequency at 64.8 Hz is not the absolute strain valuebut rather the value relative to other spectral peaks. It is clear thatthe peak strain frequency was coincident with the wheel/beampass frequency for the respective truck pass-by speed �i.e., theinput forcing frequency�. It was also clear that this input forcewas amplified by the dynamic response of the MBEJ structure—
Table 6. Summary of Displacements and Dynamic Range Factors
Displacement �m
Test truckpass-byspeed
Transducerlocation
Maximumtensile
Maximumcompressiv
Slow roll Support bar 0.01 −0.22
47 kph Support bar 0.05 −0.32
50 kph Support bar 0.10 −0.37
53 kph Support bar 0.10 −0.32
61 kph Support bar 0.41 −0.43
63 kph Support bar 0.39 −0.50
8 kph Support bar 0.20 −0.48
aximum Support bar 0.41 −0.50
Fig. 11. Strain fre
550 / JOURNAL OF BRIDGE ENGINEERING © ASCE / SEPTEMBER/OCTO
the input forcing frequency was in close proximity to a majornatural structural mode �nominally at resonance�. For the jointopening position at the time of testing, the peak strain frequencieswere encompassed by traffic speeds in the 60–65 km/hr range.
The dynamic behavior of the Anzac Bridge MBEJ may beconsidered as two independent structures—one structure with oneset of odd-numbered center beams with associated support bars,and a second structure with one set of even-numbered centerbeams and support bars. The coupled nature of the odd and evenstructures is demonstrated in Fig. 12. For this measurement, thestrain gage �SG1� was located in the middle of a support bar andthe impact of each of the test vehicles’ six axles with each of thecenter beams connected to this support bar is clearly evident.
The dynamic response is also demonstrated by the impact ofthe tandem axles of the prime mover �tractor� and the tri-axlesof the trailer where the vibration is in phase and virtuallycontinuous.
An independent center beam structure responding to a singleimpulse would, of course, be expected to display an initial maxi-
Dynamic Range Factors
Peakto peak
Maximumtensile
Maximumcompressive
Peakto peak
0.22 0.0 0.0 0.0
0.37 1.8 −0.4 2.2
0.47 2.3 −0.9 3.2
0.43 2.1 −0.6 2.7
0.84 2.7 −1.7 4.5
0.89 2.7 −1.9 4.6
0.65 2.4 −1.5 3.9
0.89 2.7 −1.9 4.6
spectrum �SG 1�
m�
e
quency
BER 2006
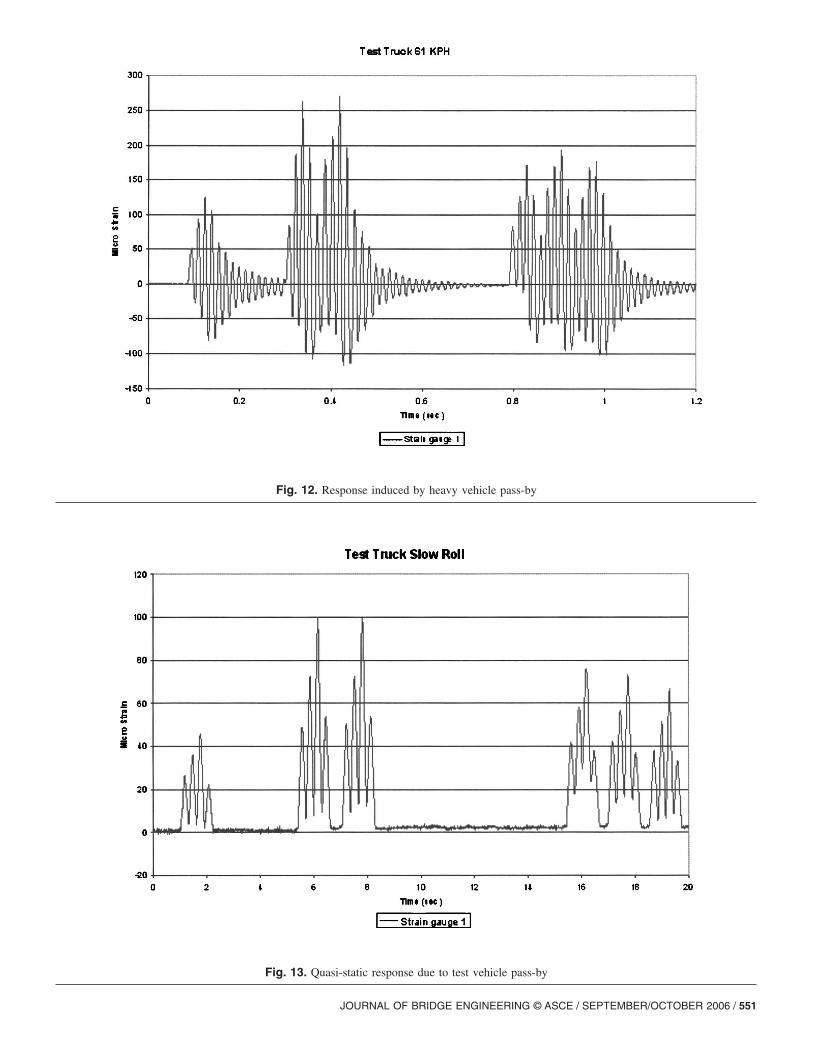
Fig. 13. Quasi-static response due to test vehicle pass-by
Fig. 12. Response induced by heavy vehicle pass-by
JOURNAL OF BRIDGE ENGINEERING © ASCE / SEPTEMBER/OCTOBER 2006 / 551
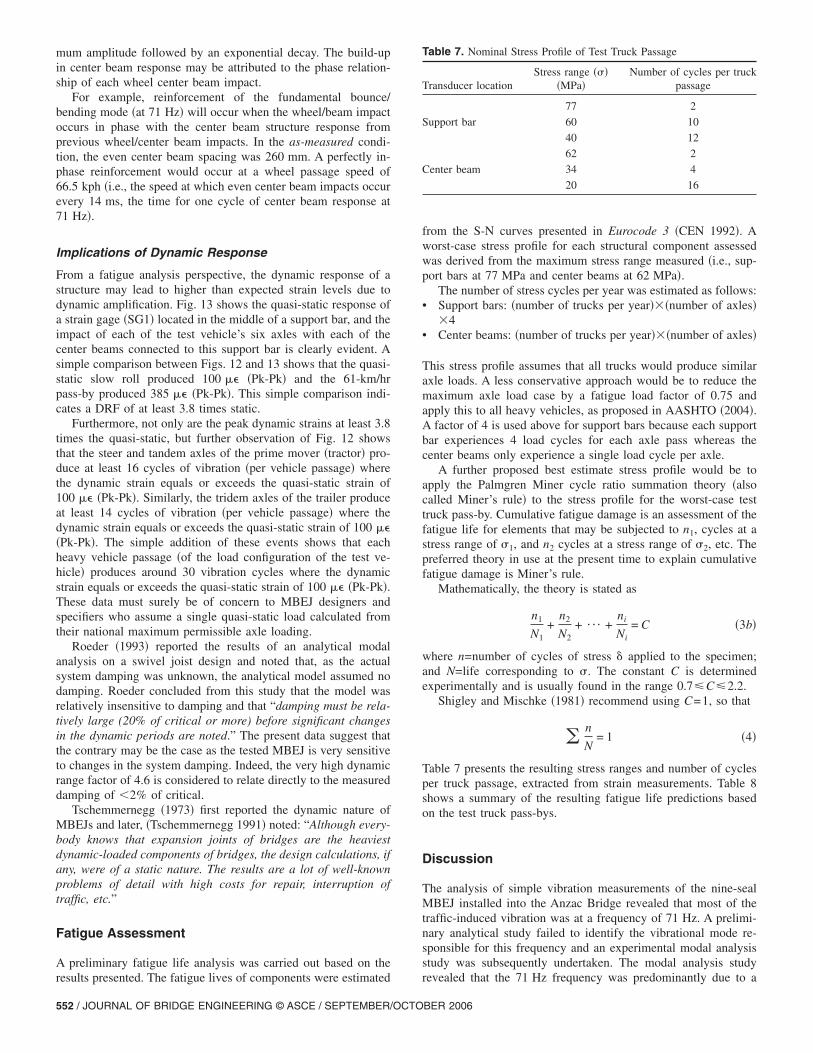
mum amplitude followed by an exponential decay. The build-upin center beam response may be attributed to the phase relation-ship of each wheel center beam impact.
For example, reinforcement of the fundamental bounce/bending mode �at 71 Hz� will occur when the wheel/beam impactoccurs in phase with the center beam structure response fromprevious wheel/center beam impacts. In the as-measured condi-tion, the even center beam spacing was 260 mm. A perfectly in-phase reinforcement would occur at a wheel passage speed of66.5 kph �i.e., the speed at which even center beam impacts occurevery 14 ms, the time for one cycle of center beam response at71 Hz�.
Implications of Dynamic Response
From a fatigue analysis perspective, the dynamic response of astructure may lead to higher than expected strain levels due todynamic amplification. Fig. 13 shows the quasi-static response ofa strain gage �SG1� located in the middle of a support bar, and theimpact of each of the test vehicle’s six axles with each of thecenter beams connected to this support bar is clearly evident. Asimple comparison between Figs. 12 and 13 shows that the quasi-static slow roll produced 100 �� �Pk-Pk� and the 61-km/hrpass-by produced 385 �� �Pk-Pk�. This simple comparison indi-cates a DRF of at least 3.8 times static.
Furthermore, not only are the peak dynamic strains at least 3.8times the quasi-static, but further observation of Fig. 12 showsthat the steer and tandem axles of the prime mover �tractor� pro-duce at least 16 cycles of vibration �per vehicle passage� wherethe dynamic strain equals or exceeds the quasi-static strain of100 �� �Pk-Pk�. Similarly, the tridem axles of the trailer produceat least 14 cycles of vibration �per vehicle passage� where thedynamic strain equals or exceeds the quasi-static strain of 100 ���Pk-Pk�. The simple addition of these events shows that eachheavy vehicle passage �of the load configuration of the test ve-hicle� produces around 30 vibration cycles where the dynamicstrain equals or exceeds the quasi-static strain of 100 �� �Pk-Pk�.These data must surely be of concern to MBEJ designers andspecifiers who assume a single quasi-static load calculated fromtheir national maximum permissible axle loading.
Roeder �1993� reported the results of an analytical modalanalysis on a swivel joist design and noted that, as the actualsystem damping was unknown, the analytical model assumed nodamping. Roeder concluded from this study that the model wasrelatively insensitive to damping and that “damping must be rela-tively large (20% of critical or more) before significant changesin the dynamic periods are noted.” The present data suggest thatthe contrary may be the case as the tested MBEJ is very sensitiveto changes in the system damping. Indeed, the very high dynamicrange factor of 4.6 is considered to relate directly to the measureddamping of �2% of critical.
Tschemmernegg �1973� first reported the dynamic nature ofMBEJs and later, �Tschemmernegg 1991� noted: “Although every-body knows that expansion joints of bridges are the heaviestdynamic-loaded components of bridges, the design calculations, ifany, were of a static nature. The results are a lot of well-knownproblems of detail with high costs for repair, interruption oftraffic, etc.”
Fatigue Assessment
A preliminary fatigue life analysis was carried out based on the
results presented. The fatigue lives of components were estimated552 / JOURNAL OF BRIDGE ENGINEERING © ASCE / SEPTEMBER/OCTO
from the S-N curves presented in Eurocode 3 �CEN 1992�. Aworst-case stress profile for each structural component assessedwas derived from the maximum stress range measured �i.e., sup-port bars at 77 MPa and center beams at 62 MPa�.
The number of stress cycles per year was estimated as follows:• Support bars: �number of trucks per year���number of axles�
�4• Center beams: �number of trucks per year���number of axles�
This stress profile assumes that all trucks would produce similaraxle loads. A less conservative approach would be to reduce themaximum axle load case by a fatigue load factor of 0.75 andapply this to all heavy vehicles, as proposed in AASHTO �2004�.A factor of 4 is used above for support bars because each supportbar experiences 4 load cycles for each axle pass whereas thecenter beams only experience a single load cycle per axle.
A further proposed best estimate stress profile would be toapply the Palmgren Miner cycle ratio summation theory �alsocalled Miner’s rule� to the stress profile for the worst-case testtruck pass-by. Cumulative fatigue damage is an assessment of thefatigue life for elements that may be subjected to n1, cycles at astress range of �1, and n2 cycles at a stress range of �2, etc. Thepreferred theory in use at the present time to explain cumulativefatigue damage is Miner’s rule.
Mathematically, the theory is stated as
n1
N1+
n2
N2+ ¯ +
ni
Ni= C �3b�
where n=number of cycles of stress � applied to the specimen;and N=life corresponding to �. The constant C is determinedexperimentally and is usually found in the range 0.7�C�2.2.
Shigley and Mischke �1981� recommend using C=1, so that
� n
N= 1 �4�
Table 7 presents the resulting stress ranges and number of cyclesper truck passage, extracted from strain measurements. Table 8shows a summary of the resulting fatigue life predictions basedon the test truck pass-bys.
Discussion
The analysis of simple vibration measurements of the nine-sealMBEJ installed into the Anzac Bridge revealed that most of thetraffic-induced vibration was at a frequency of 71 Hz. A prelimi-nary analytical study failed to identify the vibrational mode re-sponsible for this frequency and an experimental modal analysisstudy was subsequently undertaken. The modal analysis study
Table 7. Nominal Stress Profile of Test Truck Passage
Transducer locationStress range ���
�MPa�Number of cycles per truck
passage
Support bar
77 2
60 10
40 12
Center beam
62 2
34 4
20 16
revealed that the 71 Hz frequency was predominantly due to a
BER 2006
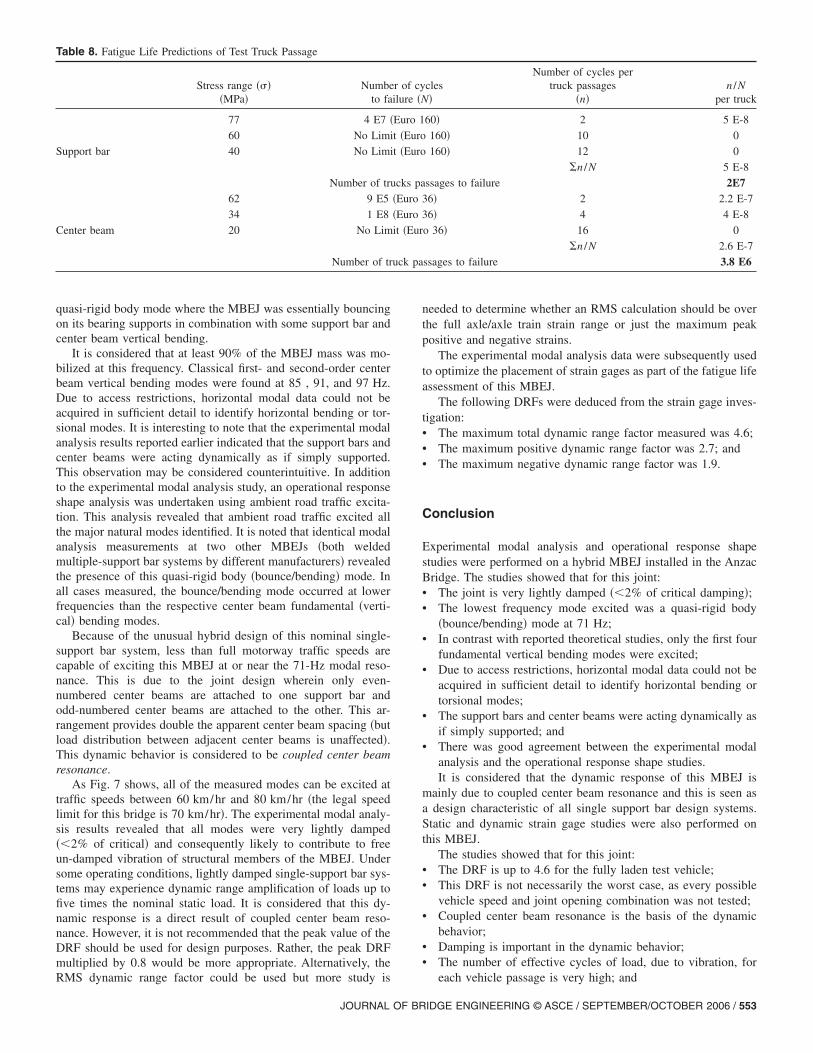
quasi-rigid body mode where the MBEJ was essentially bouncingon its bearing supports in combination with some support bar andcenter beam vertical bending.
It is considered that at least 90% of the MBEJ mass was mo-bilized at this frequency. Classical first- and second-order centerbeam vertical bending modes were found at 85 , 91, and 97 Hz.Due to access restrictions, horizontal modal data could not beacquired in sufficient detail to identify horizontal bending or tor-sional modes. It is interesting to note that the experimental modalanalysis results reported earlier indicated that the support bars andcenter beams were acting dynamically as if simply supported.This observation may be considered counterintuitive. In additionto the experimental modal analysis study, an operational responseshape analysis was undertaken using ambient road traffic excita-tion. This analysis revealed that ambient road traffic excited allthe major natural modes identified. It is noted that identical modalanalysis measurements at two other MBEJs �both weldedmultiple-support bar systems by different manufacturers� revealedthe presence of this quasi-rigid body �bounce/bending� mode. Inall cases measured, the bounce/bending mode occurred at lowerfrequencies than the respective center beam fundamental �verti-cal� bending modes.
Because of the unusual hybrid design of this nominal single-support bar system, less than full motorway traffic speeds arecapable of exciting this MBEJ at or near the 71-Hz modal reso-nance. This is due to the joint design wherein only even-numbered center beams are attached to one support bar andodd-numbered center beams are attached to the other. This ar-rangement provides double the apparent center beam spacing �butload distribution between adjacent center beams is unaffected�.This dynamic behavior is considered to be coupled center beamresonance.
As Fig. 7 shows, all of the measured modes can be excited attraffic speeds between 60 km/hr and 80 km/hr �the legal speedlimit for this bridge is 70 km/hr�. The experimental modal analy-sis results revealed that all modes were very lightly damped��2% of critical� and consequently likely to contribute to freeun-damped vibration of structural members of the MBEJ. Undersome operating conditions, lightly damped single-support bar sys-tems may experience dynamic range amplification of loads up tofive times the nominal static load. It is considered that this dy-namic response is a direct result of coupled center beam reso-nance. However, it is not recommended that the peak value of theDRF should be used for design purposes. Rather, the peak DRFmultiplied by 0.8 would be more appropriate. Alternatively, the
Table 8. Fatigue Life Predictions of Test Truck Passage
Stress range ����MPa�
Numbeto fa
Support bar
77 4 E7 �
60 No Limi
40 No Limi
Number of tru
Center beam
62 9 E5
34 1 E8
20 No Lim
Number of tr
RMS dynamic range factor could be used but more study is
JOURNAL OF BR
needed to determine whether an RMS calculation should be overthe full axle/axle train strain range or just the maximum peakpositive and negative strains.
The experimental modal analysis data were subsequently usedto optimize the placement of strain gages as part of the fatigue lifeassessment of this MBEJ.
The following DRFs were deduced from the strain gage inves-tigation:• The maximum total dynamic range factor measured was 4.6;• The maximum positive dynamic range factor was 2.7; and• The maximum negative dynamic range factor was 1.9.
Conclusion
Experimental modal analysis and operational response shapestudies were performed on a hybrid MBEJ installed in the AnzacBridge. The studies showed that for this joint:• The joint is very lightly damped ��2% of critical damping�;• The lowest frequency mode excited was a quasi-rigid body
�bounce/bending� mode at 71 Hz;• In contrast with reported theoretical studies, only the first four
fundamental vertical bending modes were excited;• Due to access restrictions, horizontal modal data could not be
acquired in sufficient detail to identify horizontal bending ortorsional modes;
• The support bars and center beams were acting dynamically asif simply supported; and
• There was good agreement between the experimental modalanalysis and the operational response shape studies.It is considered that the dynamic response of this MBEJ is
mainly due to coupled center beam resonance and this is seen asa design characteristic of all single support bar design systems.Static and dynamic strain gage studies were also performed onthis MBEJ.
The studies showed that for this joint:• The DRF is up to 4.6 for the fully laden test vehicle;• This DRF is not necessarily the worst case, as every possible
vehicle speed and joint opening combination was not tested;• Coupled center beam resonance is the basis of the dynamic
behavior;• Damping is important in the dynamic behavior;• The number of effective cycles of load, due to vibration, for
cles�
Number of cycles pertruck passages
�n�n /N
per truck
60� 2 5 E-8
160� 10 0
160� 12 0
n /N 5 E-8
ssages to failure 2E736� 2 2.2 E-7
36� 4 4 E-8
o 36� 16 0
n /N 2.6 E-7
ssages to failure 3.8 E6
r of cyilure �N
Euro 1
t �Euro
t �Euro
cks pa
�Euro
�Euro
it �Eur
uck pa
each vehicle passage is very high; and
IDGE ENGINEERING © ASCE / SEPTEMBER/OCTOBER 2006 / 553
• High uplift forces are generated within the joint under vehicleloading.These results should be of concern to bridge asset owners,
bridge designers, and modular joint suppliers. The normal as-sumption of quasi-static behavior for the single-support bar de-sign MBEJ �and variants thereof� is not sustainable and bothbridge designers and modular joint suppliers must think in termsof a fully dynamic system.
Acknowledgment
The writers wish to thank the Chief Executive of the Roads andTraffic Authority of NSW �RTA� for permission to publish thispaper. The opinions and conclusions expressed in this paper donot necessarily reflect the views of the RTA.
References
AASHTO. �2004�. AASHTO LRDF Bridge Design Specifications, SlUnits, 3rd Ed., Washington, D.C.
Agarwal, A. C. �1991�. “Static and dynamic testing of a modular expan-sion joint in the Burlington Skyway,” Proc., 3rd World Congress onJoint Sealing and Bearing Systems for Concrete Structures, AmericanConcrete Institute, Detroit.
Crocetti, R. �2001�. “On some fatigue problems related to steel bridges,”Ph.D. thesis, Chalmers Univ. of Technology, Göteborg, Sweden.
Crocetti, R., and Edlund, B. �2001�. “Fatigue performance of modularbridge expansion joints,” Chalmers Univ. of Technology, Göteborg,Sweden.
Dexter, R. J., Connor, R. J., and Kaczinski, M. R. �1997�. “Fatigue design
554 / JOURNAL OF BRIDGE ENGINEERING © ASCE / SEPTEMBER/OCTO
in modular bridge expansion joints,” Report 402, National Coopera-tive Highway Research Program, Transportation Research Board,Washington, D.C.
European Committee for Standardization �CEN�. �1992�. “Design of steelstructures, section 9”. Eurocode 3, Brussels.
Ewins, D. J. �1999�. Modal testing: Theory, practice & application, 2ndEd., Research Studies Press, Hertfordshire, UK, 163–276.
Köster, W. �1986�. “The principle of elasticity for expansion joints,” JointSealing and Bearing Systems for Concrete Structures, ACI SP-94,American Concrete Institute, Detroit, 675–711.
Ostermann, M. �1991�. “Beanspruchung von elastisch gelagerten Fahr-bahnübergängen unter Radstoßeinwirkung �“Stresses in elasticallysupported modular expansion joints under wheel load impact”�.”Bauingenieur, Springer-Verlag, 381–389 �in German�.
Roeder, C. W. �1993�. “Fatigue cracking in modular expansion joints,”Research Report WA-RD 306.1, Washington State Transportation Cen-ter, Seattle.
Roeder, C. W. �1995�. “Field measurements of dynamic wheel loads onmodular expansion joints,” Research Report WA-RD 369.1, Washing-ton State Transportation Center, Seattle.
Shigley, J. E., and Mischke, C. R. �1981�. “Mechanical engineering de-sign,” 5th Ed., McGraw-Hill, New York.
Standards Australia. �2004�. Australian standard AS5100.4–2004, BridgeDesign Part 4: Bearing and deck joints, Sydney, NSW, Australia.
Tschemmernegg, F. �1973�. “Messung von Vertikal und Horizontallastenbeim Anfahren, Bremsen und Überrollen von Fahrzeugen auf einemFahrbahnübergang �“Measurement of vertical and horizontal loadsdue to accelerating, braking, and rolling vehicles on an expansionjoint”�.” Bauingenieur, 48, Heft 9, Springer-Verlag, 326–330 �in Ger-man�.
Tschemmernegg, F. �1991�. “The design of modular expansion joints,”Proc., 3rd World Congress on Joint Sealing and Bearing Systems forConcrete Structures, American Concrete Institute, Detroit, 67–86.
BER 2006

Appendix K
Ancich E.J. (2007). Dynamic Design of Modular Bridge Expansion Joints by the
Finite Element Method, Proc. International Association for Bridge & Structural
Engineering (IABSE) Symposium, Weimar, Germany.

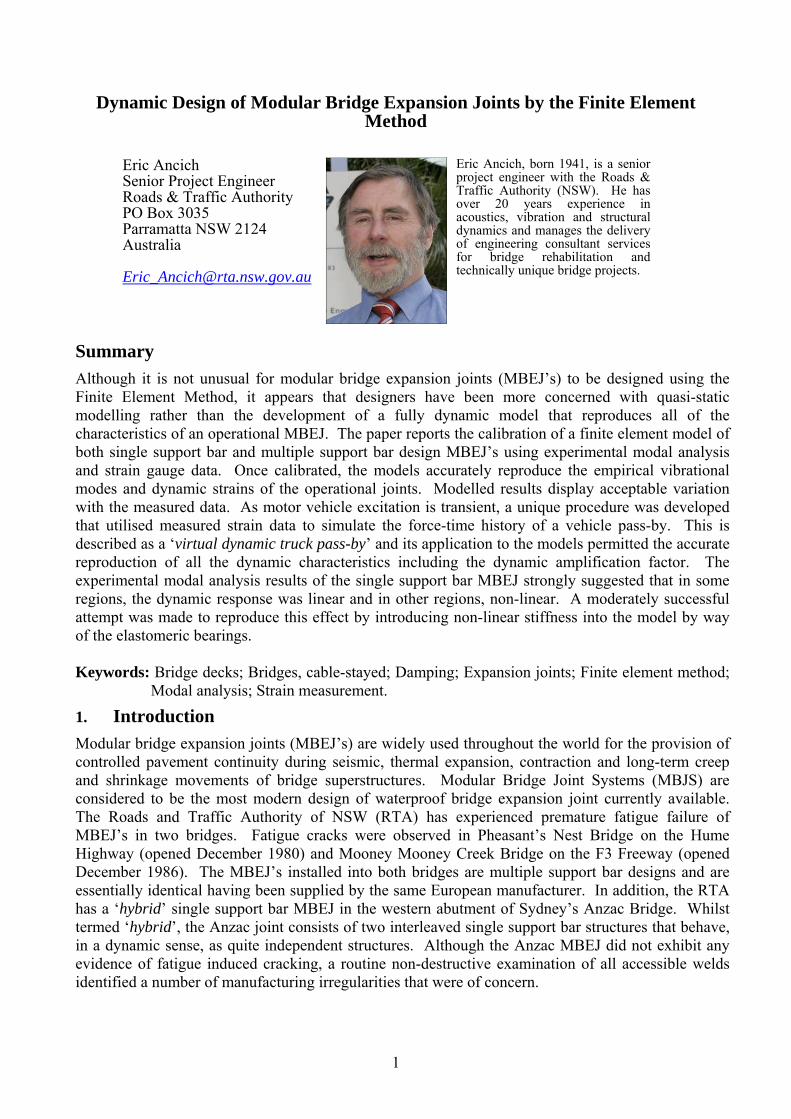
1
Dynamic Design of Modular Bridge Expansion Joints by the Finite Element Method
Eric Ancich
Senior Project Engineer Roads & Traffic Authority PO Box 3035 Parramatta NSW 2124 Australia [email protected]
Eric Ancich, born 1941, is a senior project engineer with the Roads & Traffic Authority (NSW). He has over 20 years experience in acoustics, vibration and structural dynamics and manages the delivery of engineering consultant services for bridge rehabilitation and technically unique bridge projects.
Summary Although it is not unusual for modular bridge expansion joints (MBEJ’s) to be designed using the Finite Element Method, it appears that designers have been more concerned with quasi-static modelling rather than the development of a fully dynamic model that reproduces all of the characteristics of an operational MBEJ. The paper reports the calibration of a finite element model of both single support bar and multiple support bar design MBEJ’s using experimental modal analysis and strain gauge data. Once calibrated, the models accurately reproduce the empirical vibrational modes and dynamic strains of the operational joints. Modelled results display acceptable variation with the measured data. As motor vehicle excitation is transient, a unique procedure was developed that utilised measured strain data to simulate the force-time history of a vehicle pass-by. This is described as a ‘virtual dynamic truck pass-by’ and its application to the models permitted the accurate reproduction of all the dynamic characteristics including the dynamic amplification factor. The experimental modal analysis results of the single support bar MBEJ strongly suggested that in some regions, the dynamic response was linear and in other regions, non-linear. A moderately successful attempt was made to reproduce this effect by introducing non-linear stiffness into the model by way of the elastomeric bearings. Keywords: Bridge decks; Bridges, cable-stayed; Damping; Expansion joints; Finite element method;
Modal analysis; Strain measurement.
1. Introduction Modular bridge expansion joints (MBEJ’s) are widely used throughout the world for the provision of controlled pavement continuity during seismic, thermal expansion, contraction and long-term creep and shrinkage movements of bridge superstructures. Modular Bridge Joint Systems (MBJS) are considered to be the most modern design of waterproof bridge expansion joint currently available. The Roads and Traffic Authority of NSW (RTA) has experienced premature fatigue failure of MBEJ’s in two bridges. Fatigue cracks were observed in Pheasant’s Nest Bridge on the Hume Highway (opened December 1980) and Mooney Mooney Creek Bridge on the F3 Freeway (opened December 1986). The MBEJ’s installed into both bridges are multiple support bar designs and are essentially identical having been supplied by the same European manufacturer. In addition, the RTA has a ‘hybrid’ single support bar MBEJ in the western abutment of Sydney’s Anzac Bridge. Whilst termed ‘hybrid’, the Anzac joint consists of two interleaved single support bar structures that behave, in a dynamic sense, as quite independent structures. Although the Anzac MBEJ did not exhibit any evidence of fatigue induced cracking, a routine non-destructive examination of all accessible welds identified a number of manufacturing irregularities that were of concern.
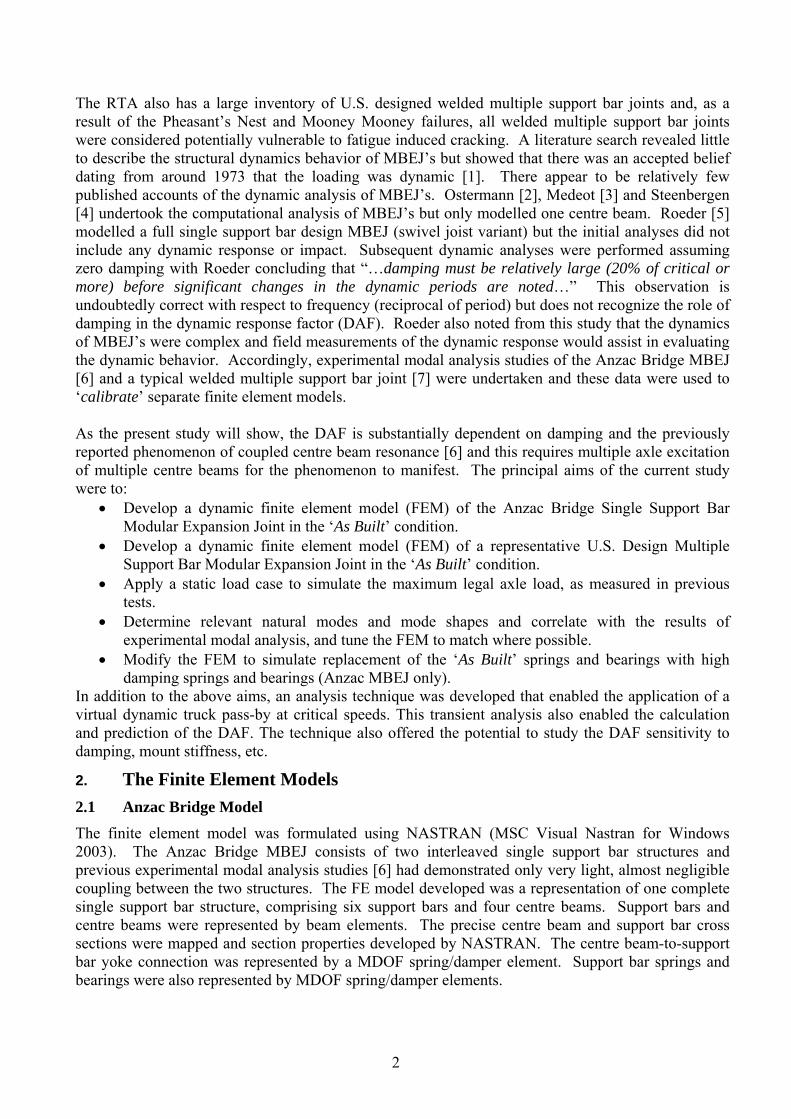
2
The RTA also has a large inventory of U.S. designed welded multiple support bar joints and, as a result of the Pheasant’s Nest and Mooney Mooney failures, all welded multiple support bar joints were considered potentially vulnerable to fatigue induced cracking. A literature search revealed little to describe the structural dynamics behavior of MBEJ’s but showed that there was an accepted belief dating from around 1973 that the loading was dynamic [1]. There appear to be relatively few published accounts of the dynamic analysis of MBEJ’s. Ostermann [2], Medeot [3] and Steenbergen [4] undertook the computational analysis of MBEJ’s but only modelled one centre beam. Roeder [5] modelled a full single support bar design MBEJ (swivel joist variant) but the initial analyses did not include any dynamic response or impact. Subsequent dynamic analyses were performed assuming zero damping with Roeder concluding that “…damping must be relatively large (20% of critical or more) before significant changes in the dynamic periods are noted…” This observation is undoubtedly correct with respect to frequency (reciprocal of period) but does not recognize the role of damping in the dynamic response factor (DAF). Roeder also noted from this study that the dynamics of MBEJ’s were complex and field measurements of the dynamic response would assist in evaluating the dynamic behavior. Accordingly, experimental modal analysis studies of the Anzac Bridge MBEJ [6] and a typical welded multiple support bar joint [7] were undertaken and these data were used to ‘calibrate’ separate finite element models. As the present study will show, the DAF is substantially dependent on damping and the previously reported phenomenon of coupled centre beam resonance [6] and this requires multiple axle excitation of multiple centre beams for the phenomenon to manifest. The principal aims of the current study were to:
• Develop a dynamic finite element model (FEM) of the Anzac Bridge Single Support Bar Modular Expansion Joint in the ‘As Built’ condition.
• Develop a dynamic finite element model (FEM) of a representative U.S. Design Multiple Support Bar Modular Expansion Joint in the ‘As Built’ condition.
• Apply a static load case to simulate the maximum legal axle load, as measured in previous tests.
• Determine relevant natural modes and mode shapes and correlate with the results of experimental modal analysis, and tune the FEM to match where possible.
• Modify the FEM to simulate replacement of the ‘As Built’ springs and bearings with high damping springs and bearings (Anzac MBEJ only).
In addition to the above aims, an analysis technique was developed that enabled the application of a virtual dynamic truck pass-by at critical speeds. This transient analysis also enabled the calculation and prediction of the DAF. The technique also offered the potential to study the DAF sensitivity to damping, mount stiffness, etc.
2. The Finite Element Models 2.1 Anzac Bridge Model The finite element model was formulated using NASTRAN (MSC Visual Nastran for Windows 2003). The Anzac Bridge MBEJ consists of two interleaved single support bar structures and previous experimental modal analysis studies [6] had demonstrated only very light, almost negligible coupling between the two structures. The FE model developed was a representation of one complete single support bar structure, comprising six support bars and four centre beams. Support bars and centre beams were represented by beam elements. The precise centre beam and support bar cross sections were mapped and section properties developed by NASTRAN. The centre beam-to-support bar yoke connection was represented by a MDOF spring/damper element. Support bar springs and bearings were also represented by MDOF spring/damper elements.
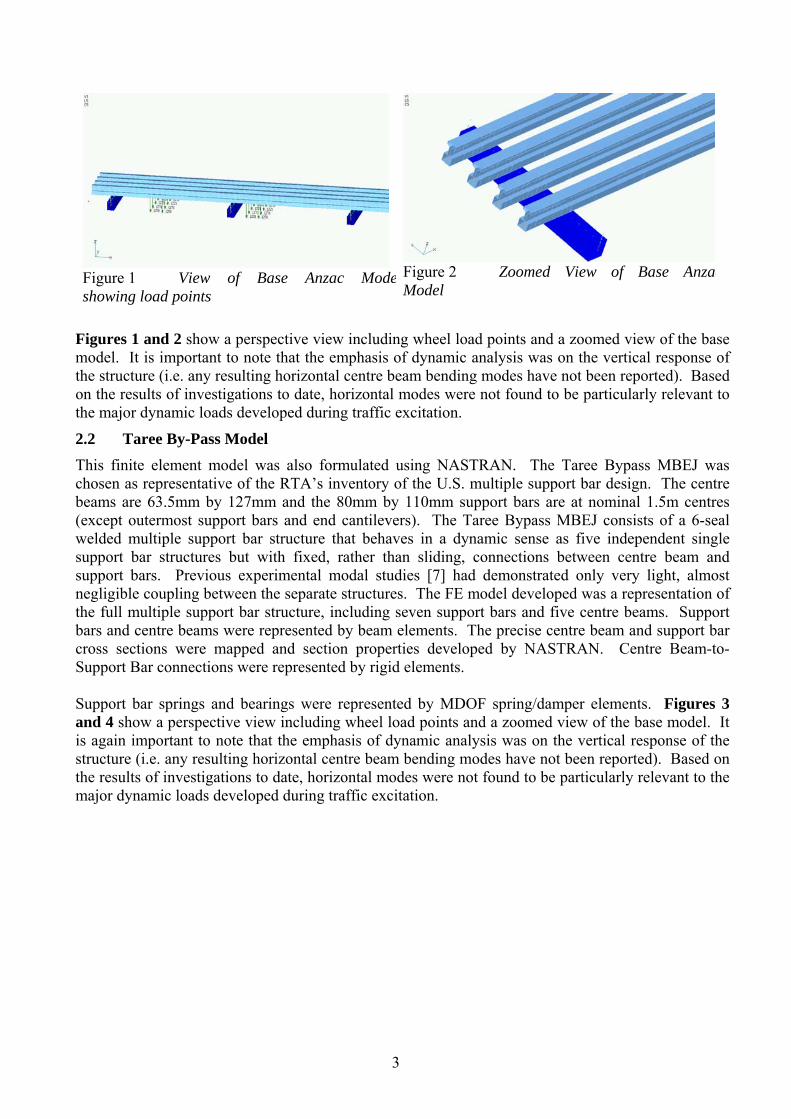
3
Figure 1 View of Base Anzac Modeshowing load points
Figure 2 Zoomed View of Base AnzacModel
Figures 1 and 2 show a perspective view including wheel load points and a zoomed view of the base model. It is important to note that the emphasis of dynamic analysis was on the vertical response of the structure (i.e. any resulting horizontal centre beam bending modes have not been reported). Based on the results of investigations to date, horizontal modes were not found to be particularly relevant to the major dynamic loads developed during traffic excitation.
2.2 Taree By-Pass Model This finite element model was also formulated using NASTRAN. The Taree Bypass MBEJ was chosen as representative of the RTA’s inventory of the U.S. multiple support bar design. The centre beams are 63.5mm by 127mm and the 80mm by 110mm support bars are at nominal 1.5m centres (except outermost support bars and end cantilevers). The Taree Bypass MBEJ consists of a 6-seal welded multiple support bar structure that behaves in a dynamic sense as five independent single support bar structures but with fixed, rather than sliding, connections between centre beam and support bars. Previous experimental modal studies [7] had demonstrated only very light, almost negligible coupling between the separate structures. The FE model developed was a representation of the full multiple support bar structure, including seven support bars and five centre beams. Support bars and centre beams were represented by beam elements. The precise centre beam and support bar cross sections were mapped and section properties developed by NASTRAN. Centre Beam-to-Support Bar connections were represented by rigid elements. Support bar springs and bearings were represented by MDOF spring/damper elements. Figures 3 and 4 show a perspective view including wheel load points and a zoomed view of the base model. It is again important to note that the emphasis of dynamic analysis was on the vertical response of the structure (i.e. any resulting horizontal centre beam bending modes have not been reported). Based on the results of investigations to date, horizontal modes were not found to be particularly relevant to the major dynamic loads developed during traffic excitation.
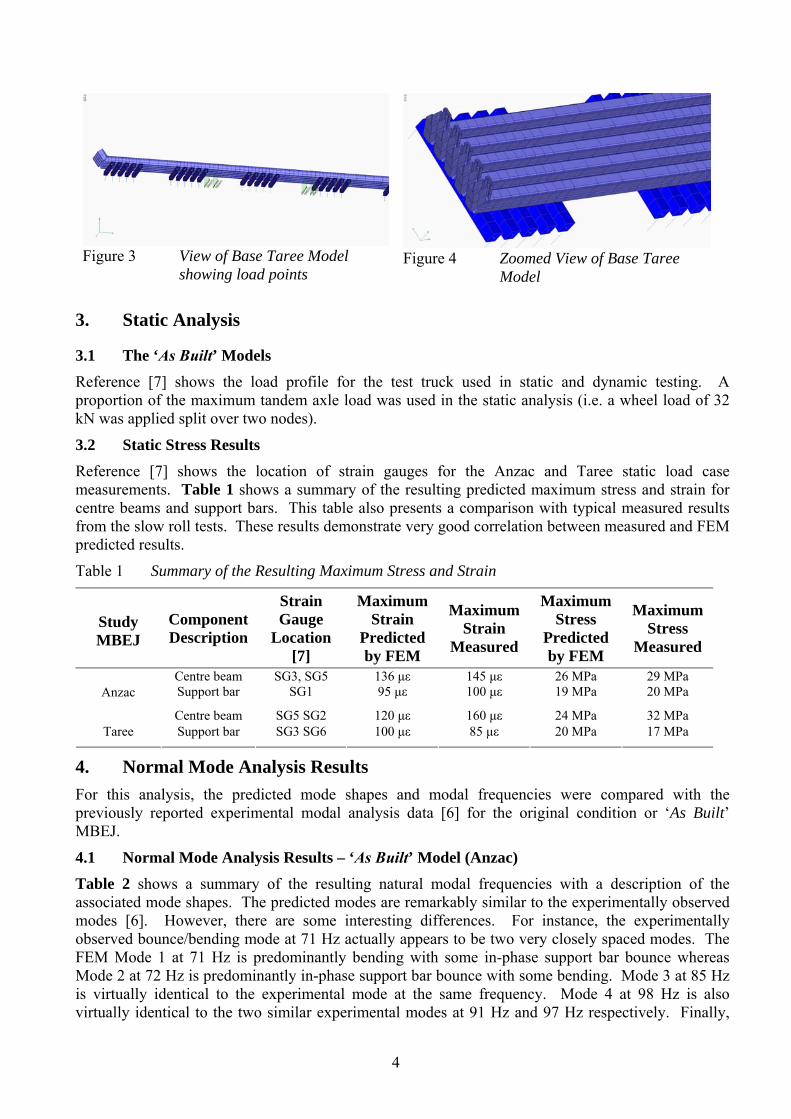
4
Figure 3 View of Base Taree Model showing load points
Figure 4 Zoomed View of Base Taree Model
3. Static Analysis
3.1 The ‘As Built’ Models Reference [7] shows the load profile for the test truck used in static and dynamic testing. A proportion of the maximum tandem axle load was used in the static analysis (i.e. a wheel load of 32 kN was applied split over two nodes).
3.2 Static Stress Results Reference [7] shows the location of strain gauges for the Anzac and Taree static load case measurements. Table 1 shows a summary of the resulting predicted maximum stress and strain for centre beams and support bars. This table also presents a comparison with typical measured results from the slow roll tests. These results demonstrate very good correlation between measured and FEM predicted results.
Table 1 Summary of the Resulting Maximum Stress and Strain
Study MBEJ
Component Description
Strain Gauge
Location [7]
Maximum Strain
Predicted by FEM
Maximum Strain
Measured
Maximum Stress
Predicted by FEM
Maximum Stress
Measured
Centre beam SG3, SG5 136 με 145 με 26 MPa 29 MPa Anzac Support bar SG1 95 με 100 με 19 MPa 20 MPa
Centre beam SG5 SG2 120 με 160 με 24 MPa 32 MPa Taree Support bar SG3 SG6 100 με 85 με 20 MPa 17 MPa
4. Normal Mode Analysis Results For this analysis, the predicted mode shapes and modal frequencies were compared with the previously reported experimental modal analysis data [6] for the original condition or ‘As Built’ MBEJ.
4.1 Normal Mode Analysis Results – ‘As Built’ Model (Anzac) Table 2 shows a summary of the resulting natural modal frequencies with a description of the associated mode shapes. The predicted modes are remarkably similar to the experimentally observed modes [6]. However, there are some interesting differences. For instance, the experimentally observed bounce/bending mode at 71 Hz actually appears to be two very closely spaced modes. The FEM Mode 1 at 71 Hz is predominantly bending with some in-phase support bar bounce whereas Mode 2 at 72 Hz is predominantly in-phase support bar bounce with some bending. Mode 3 at 85 Hz is virtually identical to the experimental mode at the same frequency. Mode 4 at 98 Hz is also virtually identical to the two similar experimental modes at 91 Hz and 97 Hz respectively. Finally,
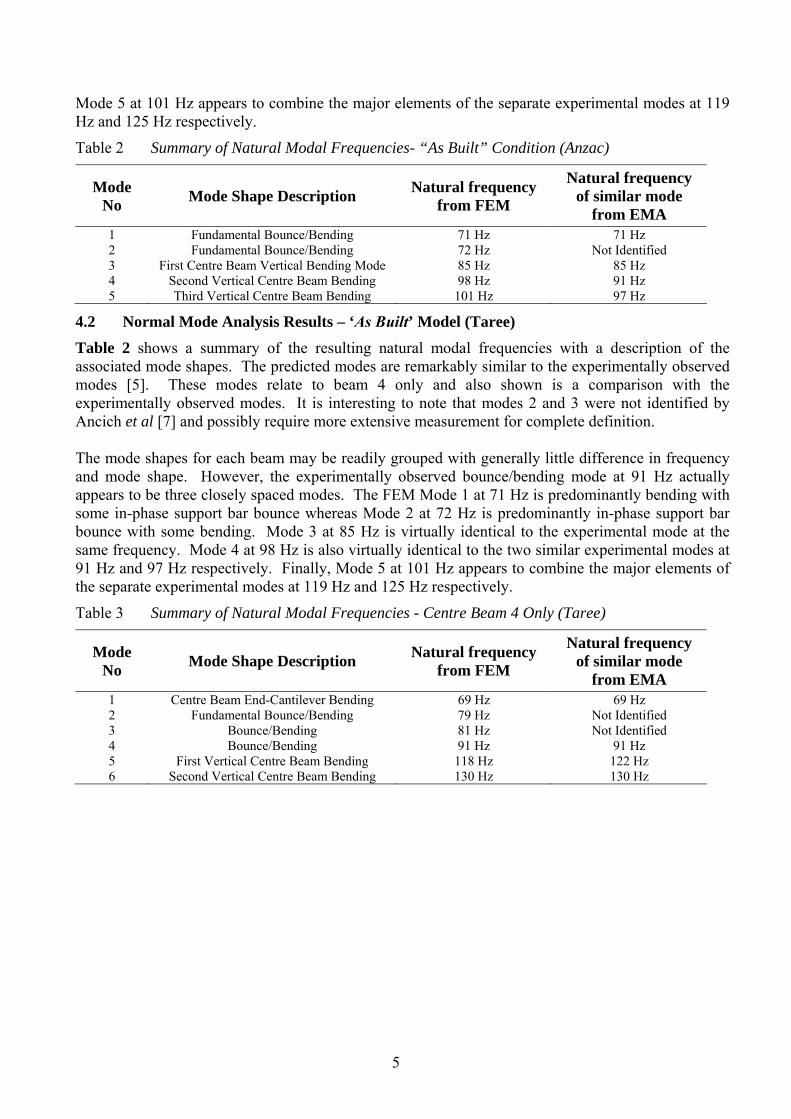
5
Mode 5 at 101 Hz appears to combine the major elements of the separate experimental modes at 119 Hz and 125 Hz respectively.
Table 2 Summary of Natural Modal Frequencies- “As Built” Condition (Anzac)
Mode No Mode Shape Description Natural frequency
from FEM
Natural frequency of similar mode
from EMA 1 Fundamental Bounce/Bending 71 Hz 71 Hz 2 Fundamental Bounce/Bending 72 Hz Not Identified 3 First Centre Beam Vertical Bending Mode 85 Hz 85 Hz 4 Second Vertical Centre Beam Bending 98 Hz 91 Hz 5 Third Vertical Centre Beam Bending 101 Hz 97 Hz
4.2 Normal Mode Analysis Results – ‘As Built’ Model (Taree) Table 2 shows a summary of the resulting natural modal frequencies with a description of the associated mode shapes. The predicted modes are remarkably similar to the experimentally observed modes [5]. These modes relate to beam 4 only and also shown is a comparison with the experimentally observed modes. It is interesting to note that modes 2 and 3 were not identified by Ancich et al [7] and possibly require more extensive measurement for complete definition. The mode shapes for each beam may be readily grouped with generally little difference in frequency and mode shape. However, the experimentally observed bounce/bending mode at 91 Hz actually appears to be three closely spaced modes. The FEM Mode 1 at 71 Hz is predominantly bending with some in-phase support bar bounce whereas Mode 2 at 72 Hz is predominantly in-phase support bar bounce with some bending. Mode 3 at 85 Hz is virtually identical to the experimental mode at the same frequency. Mode 4 at 98 Hz is also virtually identical to the two similar experimental modes at 91 Hz and 97 Hz respectively. Finally, Mode 5 at 101 Hz appears to combine the major elements of the separate experimental modes at 119 Hz and 125 Hz respectively.
Table 3 Summary of Natural Modal Frequencies - Centre Beam 4 Only (Taree)
Mode No Mode Shape Description Natural frequency
from FEM
Natural frequency of similar mode
from EMA 1 Centre Beam End-Cantilever Bending 69 Hz 69 Hz 2 Fundamental Bounce/Bending 79 Hz Not Identified 3 Bounce/Bending 81 Hz Not Identified 4 Bounce/Bending 91 Hz 91 Hz 5 First Vertical Centre Beam Bending 118 Hz 122 Hz 6 Second Vertical Centre Beam Bending 130 Hz 130 Hz
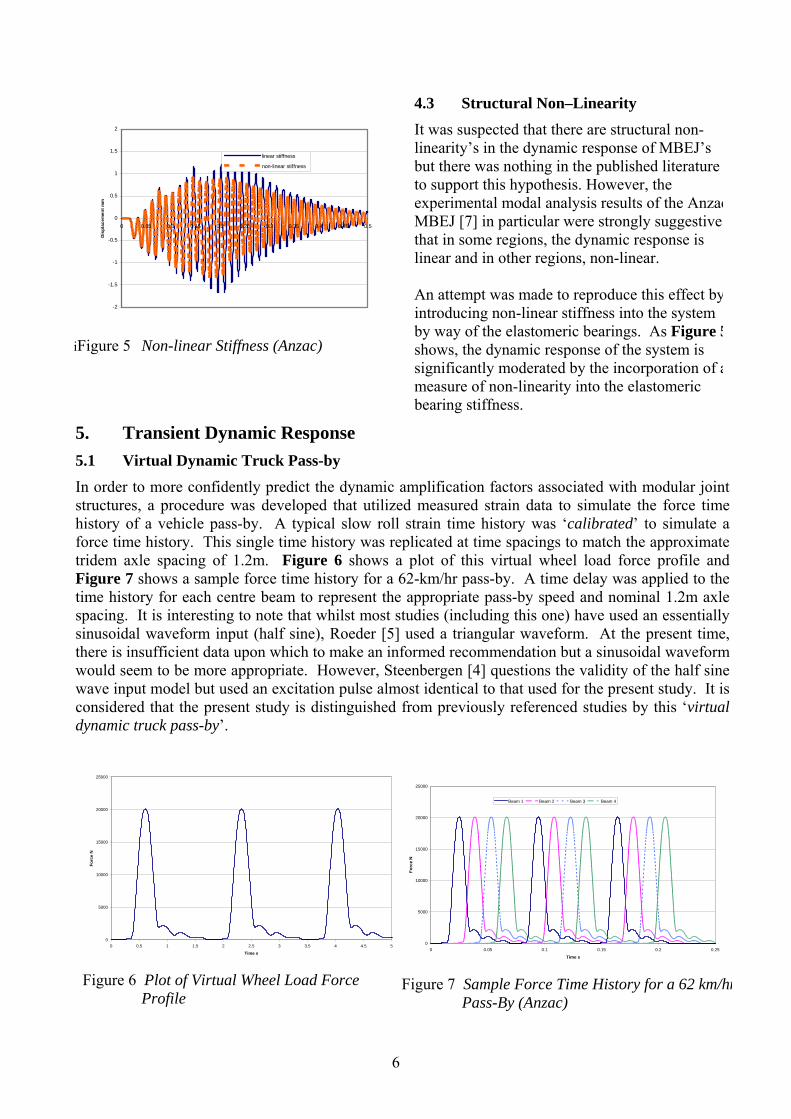
6
-2
-1.5
-1
-0.5
0
0.5
1
1.5
2
0 0.05 0.1 0.15 0.2 0.25 0.3 0.35 0.4 0.45 0.5
Dis
plac
emen
t mm
linear stiffness
non-linear stiffness
iFigure 5 Non-linear Stiffness (Anzac)
4.3 Structural Non–Linearity It was suspected that there are structural non-linearity’s in the dynamic response of MBEJ’s but there was nothing in the published literature to support this hypothesis. However, the experimental modal analysis results of the AnzacMBEJ [7] in particular were strongly suggestive that in some regions, the dynamic response is linear and in other regions, non-linear. An attempt was made to reproduce this effect byintroducing non-linear stiffness into the system by way of the elastomeric bearings. As Figure 5shows, the dynamic response of the system is significantly moderated by the incorporation of ameasure of non-linearity into the elastomeric bearing stiffness.
5. Transient Dynamic Response 5.1 Virtual Dynamic Truck Pass-by In order to more confidently predict the dynamic amplification factors associated with modular joint structures, a procedure was developed that utilized measured strain data to simulate the force time history of a vehicle pass-by. A typical slow roll strain time history was ‘calibrated’ to simulate a force time history. This single time history was replicated at time spacings to match the approximate tridem axle spacing of 1.2m. Figure 6 shows a plot of this virtual wheel load force profile and Figure 7 shows a sample force time history for a 62-km/hr pass-by. A time delay was applied to the time history for each centre beam to represent the appropriate pass-by speed and nominal 1.2m axle spacing. It is interesting to note that whilst most studies (including this one) have used an essentially sinusoidal waveform input (half sine), Roeder [5] used a triangular waveform. At the present time, there is insufficient data upon which to make an informed recommendation but a sinusoidal waveform would seem to be more appropriate. However, Steenbergen [4] questions the validity of the half sine wave input model but used an excitation pulse almost identical to that used for the present study. It is considered that the present study is distinguished from previously referenced studies by this ‘virtual dynamic truck pass-by’.
0
5000
10000
15000
20000
25000
0 0.5 1 1.5 2 2.5 3 3.5 4 4.5 5
Time s
Forc
e N
Figure 6 Plot of Virtual Wheel Load Force Profile
0
5000
10000
15000
20000
25000
0 0.05 0.1 0.15 0.2 0.25
Time s
Forc
e N
Beam 1 Beam 2 Beam 3 Beam 4
Figure 7 Sample Force Time History for a 62 km/hrPass-By (Anzac)
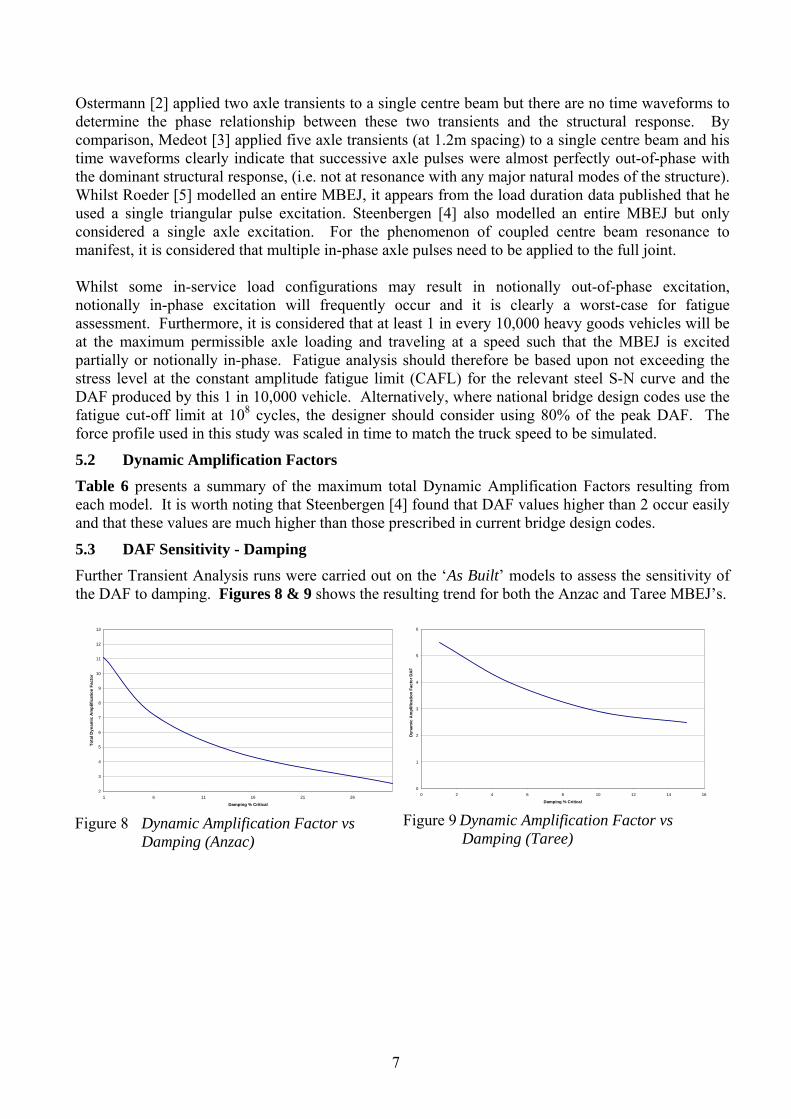
7
Ostermann [2] applied two axle transients to a single centre beam but there are no time waveforms to determine the phase relationship between these two transients and the structural response. By comparison, Medeot [3] applied five axle transients (at 1.2m spacing) to a single centre beam and his time waveforms clearly indicate that successive axle pulses were almost perfectly out-of-phase with the dominant structural response, (i.e. not at resonance with any major natural modes of the structure). Whilst Roeder [5] modelled an entire MBEJ, it appears from the load duration data published that he used a single triangular pulse excitation. Steenbergen [4] also modelled an entire MBEJ but only considered a single axle excitation. For the phenomenon of coupled centre beam resonance to manifest, it is considered that multiple in-phase axle pulses need to be applied to the full joint. Whilst some in-service load configurations may result in notionally out-of-phase excitation, notionally in-phase excitation will frequently occur and it is clearly a worst-case for fatigue assessment. Furthermore, it is considered that at least 1 in every 10,000 heavy goods vehicles will be at the maximum permissible axle loading and traveling at a speed such that the MBEJ is excited partially or notionally in-phase. Fatigue analysis should therefore be based upon not exceeding the stress level at the constant amplitude fatigue limit (CAFL) for the relevant steel S-N curve and the DAF produced by this 1 in 10,000 vehicle. Alternatively, where national bridge design codes use the fatigue cut-off limit at 108 cycles, the designer should consider using 80% of the peak DAF. The force profile used in this study was scaled in time to match the truck speed to be simulated.
5.2 Dynamic Amplification Factors Table 6 presents a summary of the maximum total Dynamic Amplification Factors resulting from each model. It is worth noting that Steenbergen [4] found that DAF values higher than 2 occur easily and that these values are much higher than those prescribed in current bridge design codes.
5.3 DAF Sensitivity - Damping Further Transient Analysis runs were carried out on the ‘As Built’ models to assess the sensitivity of the DAF to damping. Figures 8 & 9 shows the resulting trend for both the Anzac and Taree MBEJ’s.
2
3
4
5
6
7
8
9
10
11
12
13
1 6 11 16 21 26
Damping % Critical
Tota
l Dyn
amic
Am
plifi
catio
n Fa
ctor
Figure 8 Dynamic Amplification Factor vs Damping (Anzac)
0
1
2
3
4
5
6
0 2 4 6 8 10 12 14 16
Damping % Critical
Dyn
amic
Am
plifi
catio
n Fa
ctor
DA
F
Figure 9 Dynamic Amplification Factor vs
Damping (Taree)
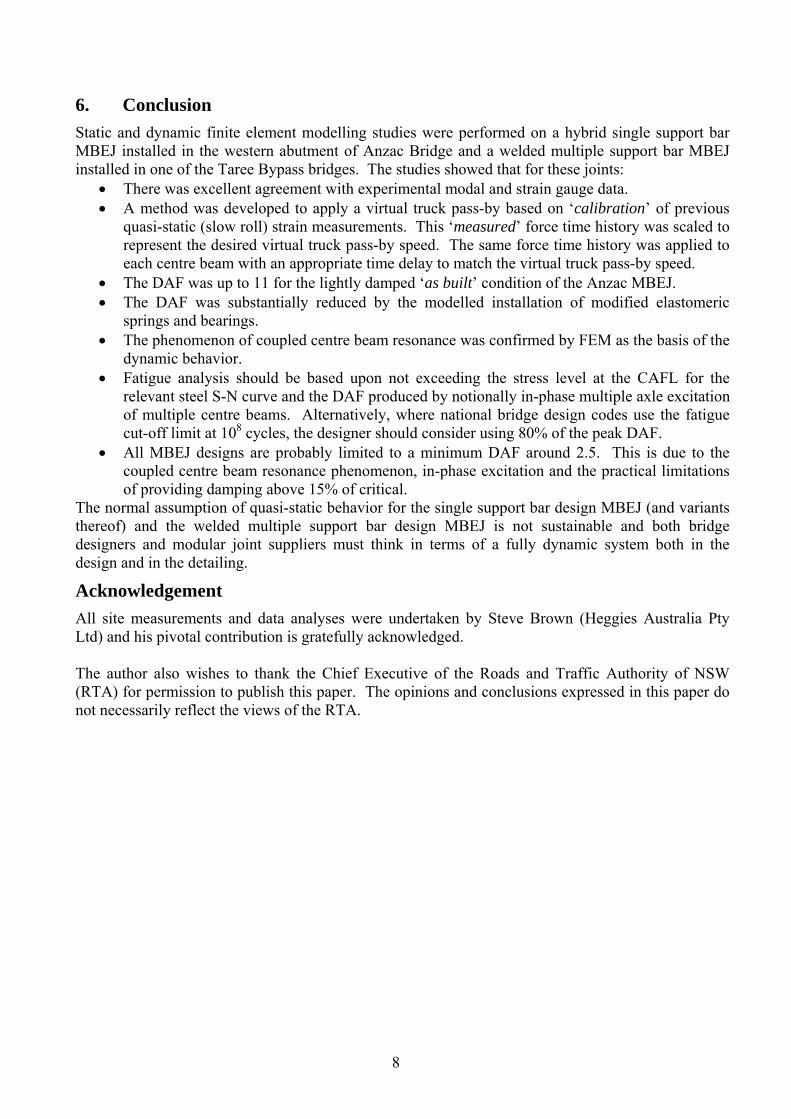
8
6. Conclusion Static and dynamic finite element modelling studies were performed on a hybrid single support bar MBEJ installed in the western abutment of Anzac Bridge and a welded multiple support bar MBEJ installed in one of the Taree Bypass bridges. The studies showed that for these joints:
• There was excellent agreement with experimental modal and strain gauge data. • A method was developed to apply a virtual truck pass-by based on ‘calibration’ of previous
quasi-static (slow roll) strain measurements. This ‘measured’ force time history was scaled to represent the desired virtual truck pass-by speed. The same force time history was applied to each centre beam with an appropriate time delay to match the virtual truck pass-by speed.
• The DAF was up to 11 for the lightly damped ‘as built’ condition of the Anzac MBEJ. • The DAF was substantially reduced by the modelled installation of modified elastomeric
springs and bearings. • The phenomenon of coupled centre beam resonance was confirmed by FEM as the basis of the
dynamic behavior. • Fatigue analysis should be based upon not exceeding the stress level at the CAFL for the
relevant steel S-N curve and the DAF produced by notionally in-phase multiple axle excitation of multiple centre beams. Alternatively, where national bridge design codes use the fatigue cut-off limit at 108 cycles, the designer should consider using 80% of the peak DAF.
• All MBEJ designs are probably limited to a minimum DAF around 2.5. This is due to the coupled centre beam resonance phenomenon, in-phase excitation and the practical limitations of providing damping above 15% of critical.
The normal assumption of quasi-static behavior for the single support bar design MBEJ (and variants thereof) and the welded multiple support bar design MBEJ is not sustainable and both bridge designers and modular joint suppliers must think in terms of a fully dynamic system both in the design and in the detailing.
Acknowledgement All site measurements and data analyses were undertaken by Steve Brown (Heggies Australia Pty Ltd) and his pivotal contribution is gratefully acknowledged. The author also wishes to thank the Chief Executive of the Roads and Traffic Authority of NSW (RTA) for permission to publish this paper. The opinions and conclusions expressed in this paper do not necessarily reflect the views of the RTA.
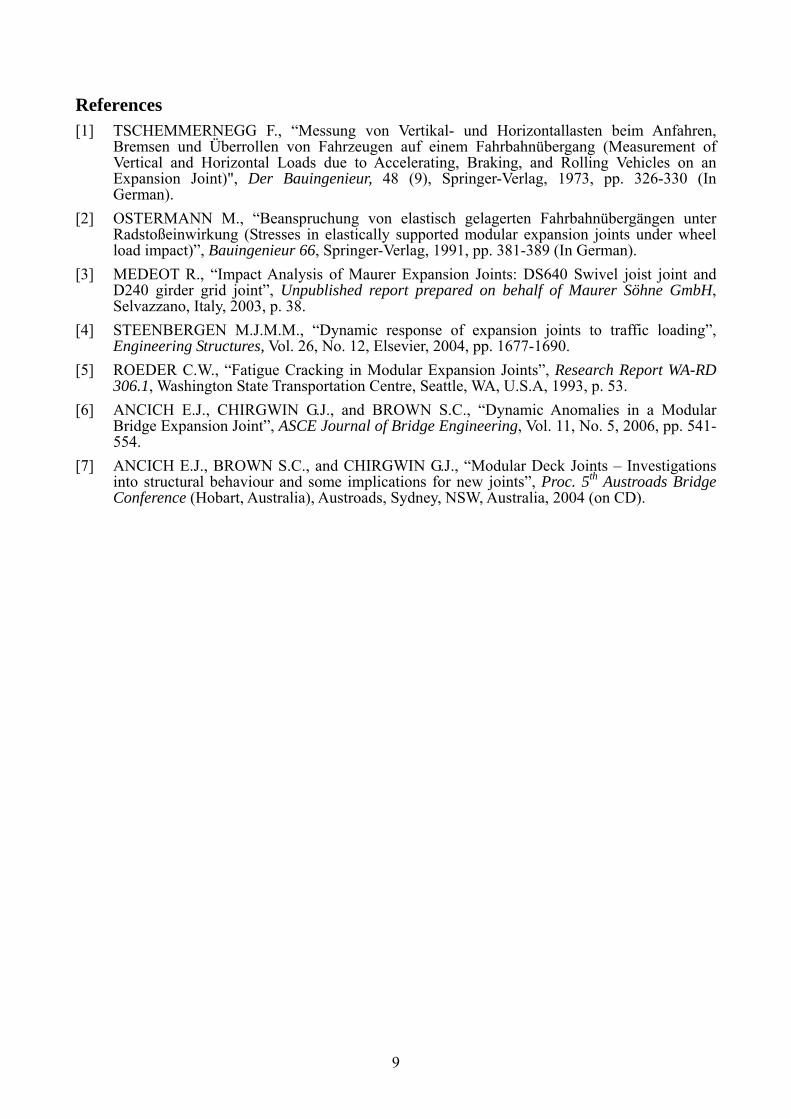
9
References [1] TSCHEMMERNEGG F., “Messung von Vertikal- und Horizontallasten beim Anfahren,
Bremsen und Überrollen von Fahrzeugen auf einem Fahrbahnübergang (Measurement of Vertical and Horizontal Loads due to Accelerating, Braking, and Rolling Vehicles on an Expansion Joint)", Der Bauingenieur, 48 (9), Springer-Verlag, 1973, pp. 326-330 (In German).
[2] OSTERMANN M., “Beanspruchung von elastisch gelagerten Fahrbahnübergängen unter Radstoßeinwirkung (Stresses in elastically supported modular expansion joints under wheel load impact)”, Bauingenieur 66, Springer-Verlag, 1991, pp. 381-389 (In German).
[3] MEDEOT R., “Impact Analysis of Maurer Expansion Joints: DS640 Swivel joist joint and D240 girder grid joint”, Unpublished report prepared on behalf of Maurer Söhne GmbH, Selvazzano, Italy, 2003, p. 38.
[4] STEENBERGEN M.J.M.M., “Dynamic response of expansion joints to traffic loading”, Engineering Structures, Vol. 26, No. 12, Elsevier, 2004, pp. 1677-1690.
[5] ROEDER C.W., “Fatigue Cracking in Modular Expansion Joints”, Research Report WA-RD 306.1, Washington State Transportation Centre, Seattle, WA, U.S.A, 1993, p. 53.
[6] ANCICH E.J., CHIRGWIN G.J., and BROWN S.C., “Dynamic Anomalies in a Modular Bridge Expansion Joint”, ASCE Journal of Bridge Engineering, Vol. 11, No. 5, 2006, pp. 541-554.
[7] ANCICH E.J., BROWN S.C., and CHIRGWIN G.J., “Modular Deck Joints – Investigations into structural behaviour and some implications for new joints”, Proc. 5th Austroads Bridge Conference (Hobart, Australia), Austroads, Sydney, NSW, Australia, 2004 (on CD).

Appendix L
Ancich E.J., Chirgwin G.J., Brown S.C. & Madrio H. (2009). Fatigue Sensitive Cope
Details in Steel Bridges and Implications from Growth in Heavy Vehicle Loads and
Numbers, Proc. 7th Austroads Bridge Conference, Auckland, New Zealand.


Fatigue Sensitive Cope Details in Steel Bridges and Implications from Growth in Heavy Vehicle Loads and
Numbers
Eric Ancich1, Steve Brown2, Gordon Chirgwin1 and Huber Madrio1
1. Roads & Traffic Authority of NSW, PO Box 3035, Parramatta NSW 2124 2. Heggies Pty Ltd, PO Box 176, Lane Cove NSW 1595
SYNOPSIS
It is known that 75% of the total Australian road freight task passes through NSW and the Pacific Highway is a major recipient of this freight. There are numerous crossings of major rivers between Newcastle and the Queensland border and until the late 1960’s, steel bridges were preferred as lift spans could be easily incorporated in the design. Over the past 10-15 years, heavy vehicle numbers using the Pacific Highway have increased dramatically, with a stepwise increase in 2001 and exponential growth of about 2% per year otherwise. This growth has been matched by a parallel exponential growth in loads and an even faster growth in axle group repetitions due to the greater utilisation of B-doubles and tri-axle semi-trailers. Three bridges along the Pacific Highway exhibiting fatigue cracking were investigated using a structural dynamics based approach. The investigations revealed numerous compression/tension stress reversals for each heavy vehicle transit. Whilst the dynamic amplification factor (DAF) for a single controlled heavy vehicle transit was comparable with current Codes, the load effect for fatigue from uncontrolled heavy vehicle traffic significantly exceeds the value that would be predicted using the test vehicle factored for dynamic effects and multiple presence. A cost effective fatigue life extension modification was proposed and tested on one of the bridges in this study. This “compliant fastener” modification in concept reduces the out of plane bending resistance at the stringer-to-cross girder connection, and hence reduces the stress range experienced by the fasteners and cope. In the bridge that was experiencing multiple fatigue and fastener failures every month, no further failures have been recorded in the three years subsequent to installation of the modification.
INTRODUCTION
The Roads and Traffic Authority of NSW (RTA) maintains some 5,000 bridges on the classified road network in New South Wales. Coped stringer to cross girder connections are a common feature of steel truss road bridges in NSW and the RTA has in excess of 60 such bridges. The design is, however, dynamically sub-optimal and a number of bridges along the Pacific Highway are exhibiting fatigue related cracking. The design is further complicated by un-explained variations in implementation. In some bridge designs, an attempt was made to reinstate the coped stringer top flange across the cross girder by bolting or riveting a thick steel plate to each stringer top flange.
Fatigue Sensitive Cope Details in Steel Bridges and Implications from Growth in Heavy Vehicle Loads and Numbers – Ancich, Brown, Chirgwin & Madrio

Where used, the connection plate has resisted fatigue cracking around the copes but the bridges using the detail only used it for alternate cross girders. Cracking was first observed in the riveted cope connections of Macksville Bridge in 2004. At the time, it was not realised that the cracking was fatigue related. Rather, given the age of the bridge (built 1930’s) and changes to the size and volume of heavy vehicles, progressive overloading was considered to be the cause. Subsequently, routine inspections of the 1960’s era Kempsey Bridge (See Figure 1) identified a number of coped stringer-to-cross girder connections where some of the rivets in the top two rows had been lost. The lost rivets were replaced with high strength bolts and following inspections revealed that the replacement bolts were failing in as little as 6-months. Some failed bolts were recovered and submitted for metallurgical examination. This examination revealed characteristic evidence of fatigue failure (See Figure 2). A literature review indicated that steel bridge designers of this era gave little or no consideration to fatigue. Fatigue design provisions, as we largely know them today, may be traced to AASHTO 1 from 1973. Roeder et al 2 reported similar connection details in US bridges and noted that whilst they were designed as pinned connections they should be regarded as partially restrained connections as they have limited rotational restraint. Fu et al 3 report Australian, Canadian and United States studies of the impact of increased heavy vehicle loading on bridge infrastructure. They concluded that these investigations used largely deterministic approaches and tended to exclude fatigue effects. Imam et al 4 undertook a largely theoretical study of riveted rail bridges in the UK. They concluded that fatigue life estimates exhibit the highest sensitivity to detail classification, to S-N predictions in the region of high endurances, and to model uncertainty. This highlighted the importance of field monitoring for old bridges approaching the end of their useful life. Whilst it was known that 75% of the total Australian road freight task passed through NSW 5, 6 and the Pacific Highway was a major recipient of this freight, little was known about actual heavy vehicle loading on the Pacific Highway. Analysis of weigh-in-motion (WIM) data from Pacific Highway sites indicated that over the past 10-15 years, heavy vehicle numbers using the Pacific Highway have increased dramatically, with a stepwise increase in 2001 and exponential growth of about 2% per year otherwise. This growth has been matched by a parallel exponential growth in loads and an even faster growth in axle group repetitions due to the greater utilisation of B-doubles and tri-axle semi-trailers. A detailed consideration of this traffic data indicates that fatigue has only become important since 1990, but that in the period 1990 to 2004 some 90% of the fatigue life of the deck stringer connection may have been used. The present study reports extensive dynamic measurements and FE modelling of Kempsey Bridge. The FE model was calibrated 7 using dynamic measurements and then used for a series of “what if” studies. Whilst the optimum solution was shown to be the connection plate over the cross girder, there were major difficulties with implementation as the bridge could not be taken out of service. An alternative solution was devised that involved removing the top two rows of rivets in the stringer/cross girder connection and replacing the removed rivets with “compliant” fasteners.
Fatigue Sensitive Cope Details in Steel Bridges and Implications from Growth in Heavy Vehicle Loads and Numbers – Ancich, Brown, Chirgwin & Madrio
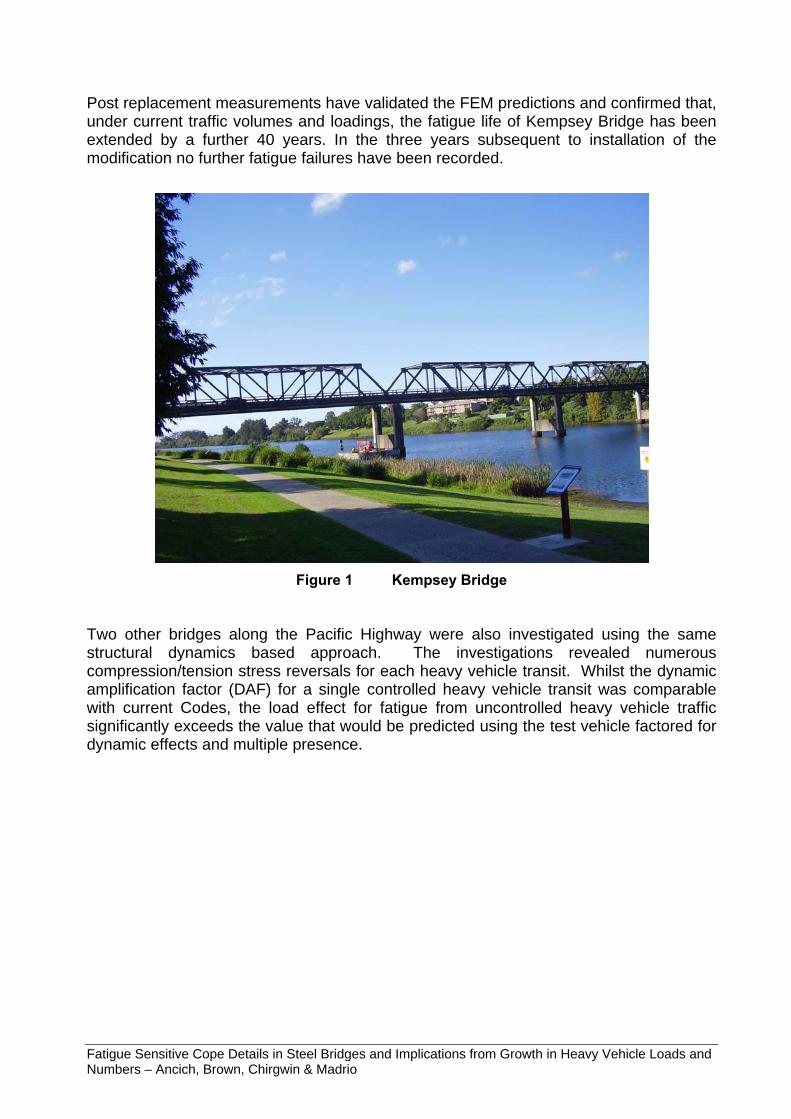
Post replacement measurements have validated the FEM predictions and confirmed that, under current traffic volumes and loadings, the fatigue life of Kempsey Bridge has been extended by a further 40 years. In the three years subsequent to installation of the modification no further fatigue failures have been recorded.
Figure 1 Kempsey Bridge
Two other bridges along the Pacific Highway were also investigated using the same structural dynamics based approach. The investigations revealed numerous compression/tension stress reversals for each heavy vehicle transit. Whilst the dynamic amplification factor (DAF) for a single controlled heavy vehicle transit was comparable with current Codes, the load effect for fatigue from uncontrolled heavy vehicle traffic significantly exceeds the value that would be predicted using the test vehicle factored for dynamic effects and multiple presence.
Fatigue Sensitive Cope Details in Steel Bridges and Implications from Growth in Heavy Vehicle Loads and Numbers – Ancich, Brown, Chirgwin & Madrio
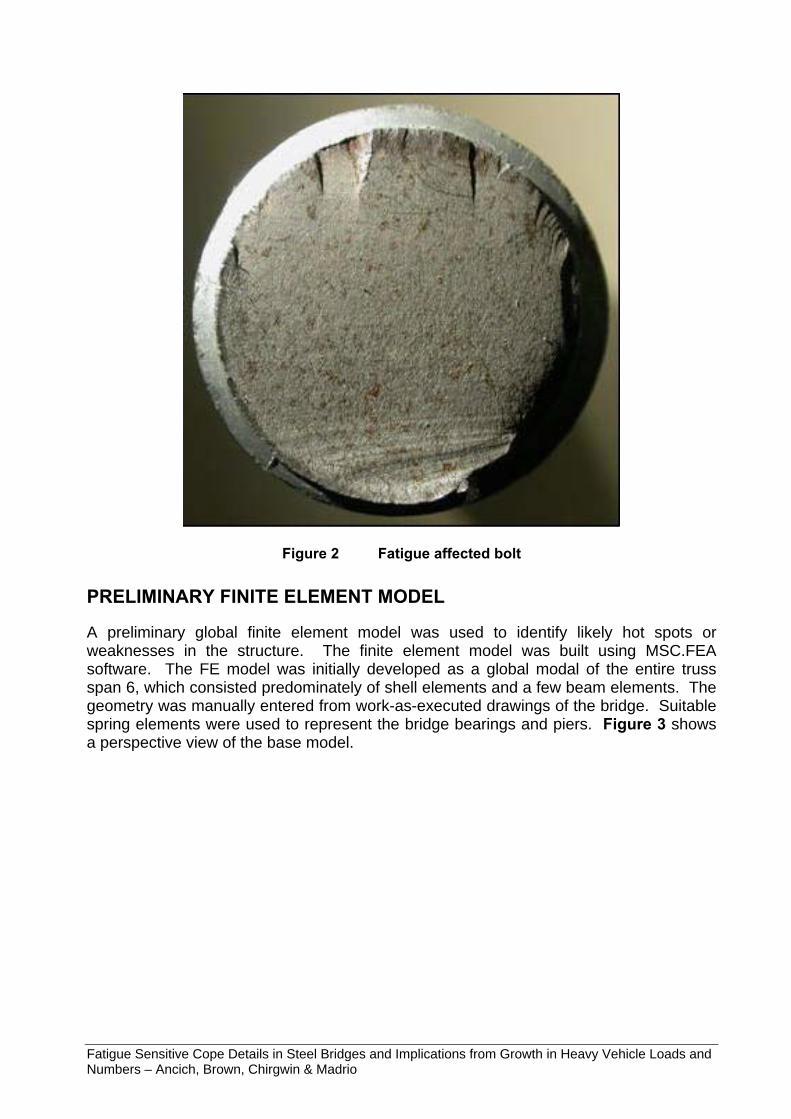
Figure 2 Fatigue affected bolt
PRELIMINARY FINITE ELEMENT MODEL
A preliminary global finite element model was used to identify likely hot spots or weaknesses in the structure. The finite element model was built using MSC.FEA software. The FE model was initially developed as a global modal of the entire truss span 6, which consisted predominately of shell elements and a few beam elements. The geometry was manually entered from work-as-executed drawings of the bridge. Suitable spring elements were used to represent the bridge bearings and piers. Figure 3 shows a perspective view of the base model.
Fatigue Sensitive Cope Details in Steel Bridges and Implications from Growth in Heavy Vehicle Loads and Numbers – Ancich, Brown, Chirgwin & Madrio
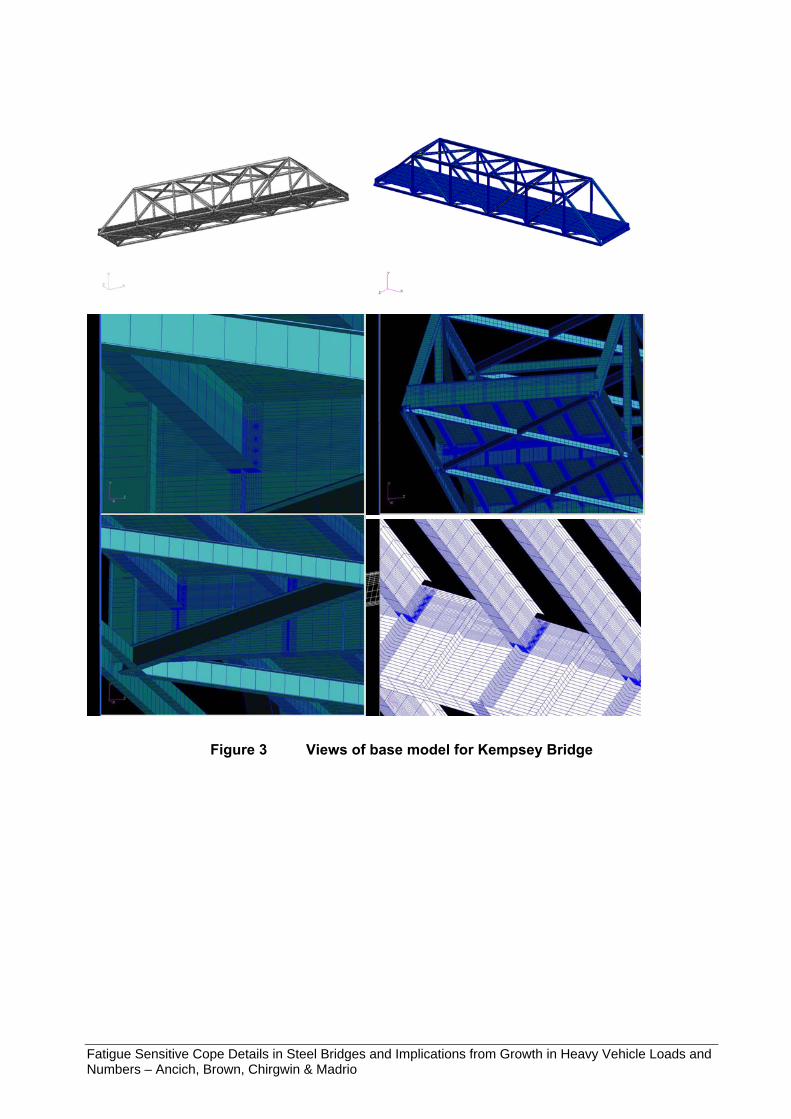
Figure 3 Views of base model for Kempsey Bridge
Fatigue Sensitive Cope Details in Steel Bridges and Implications from Growth in Heavy Vehicle Loads and Numbers – Ancich, Brown, Chirgwin & Madrio
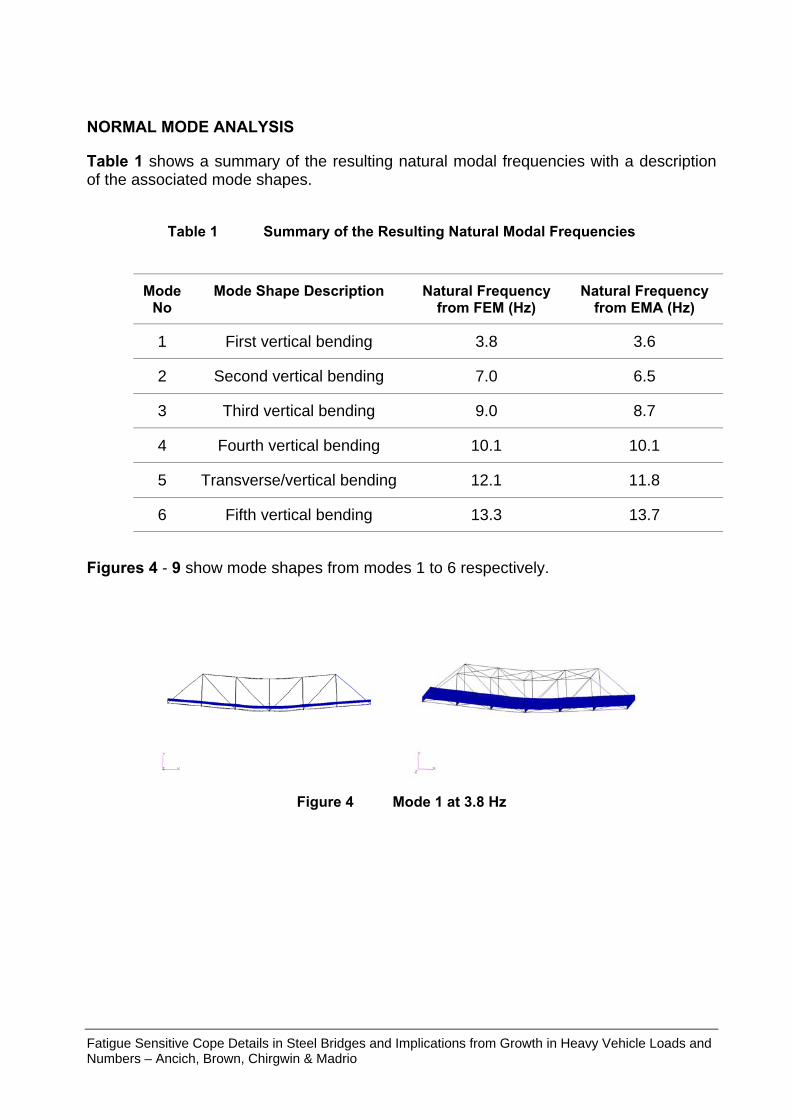
NORMAL MODE ANALYSIS
Table 1 shows a summary of the resulting natural modal frequencies with a description of the associated mode shapes.
Table 1 Summary of the Resulting Natural Modal Frequencies
Mode No
Mode Shape Description Natural Frequency from FEM (Hz)
Natural Frequency from EMA (Hz)
1 First vertical bending 3.8 3.6
2 Second vertical bending 7.0 6.5
3 Third vertical bending 9.0 8.7
4 Fourth vertical bending 10.1 10.1
5 Transverse/vertical bending 12.1 11.8
6 Fifth vertical bending 13.3 13.7
Figures 4 - 9 show mode shapes from modes 1 to 6 respectively.
Figure 4 Mode 1 at 3.8 Hz
Fatigue Sensitive Cope Details in Steel Bridges and Implications from Growth in Heavy Vehicle Loads and Numbers – Ancich, Brown, Chirgwin & Madrio
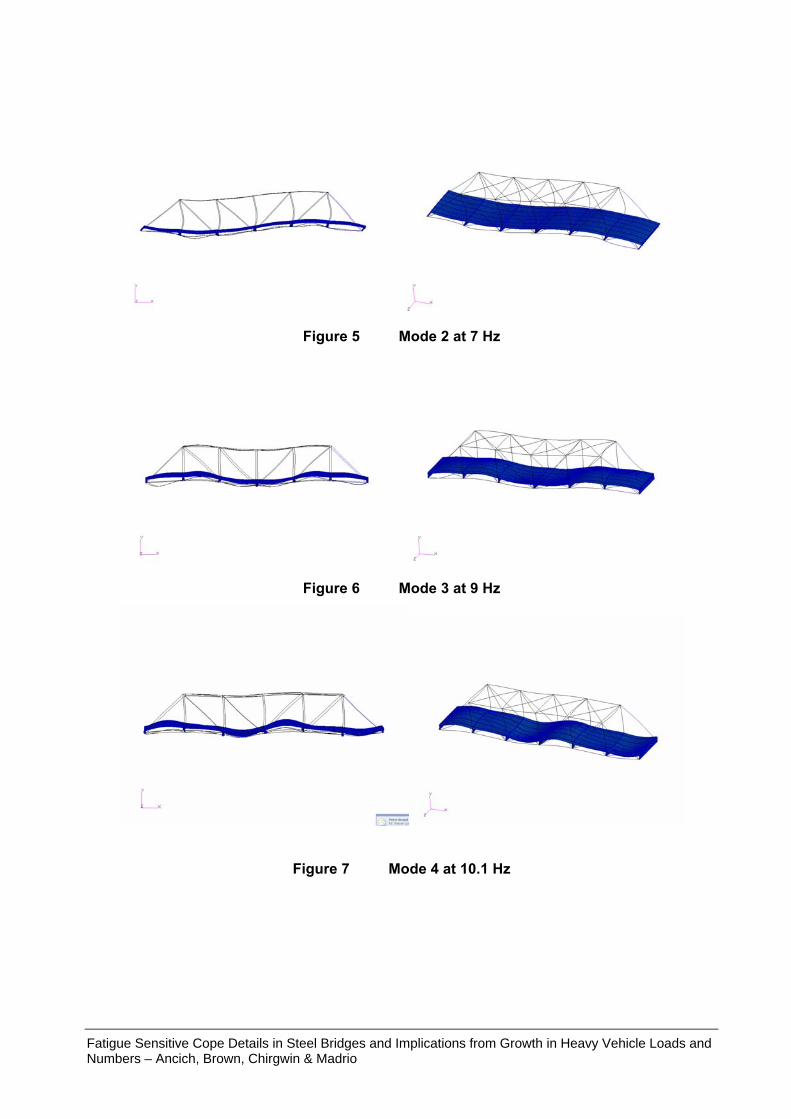
Figure 5 Mode 2 at 7 Hz
Figure 6 Mode 3 at 9 Hz
Figure 7 Mode 4 at 10.1 Hz
Fatigue Sensitive Cope Details in Steel Bridges and Implications from Growth in Heavy Vehicle Loads and Numbers – Ancich, Brown, Chirgwin & Madrio
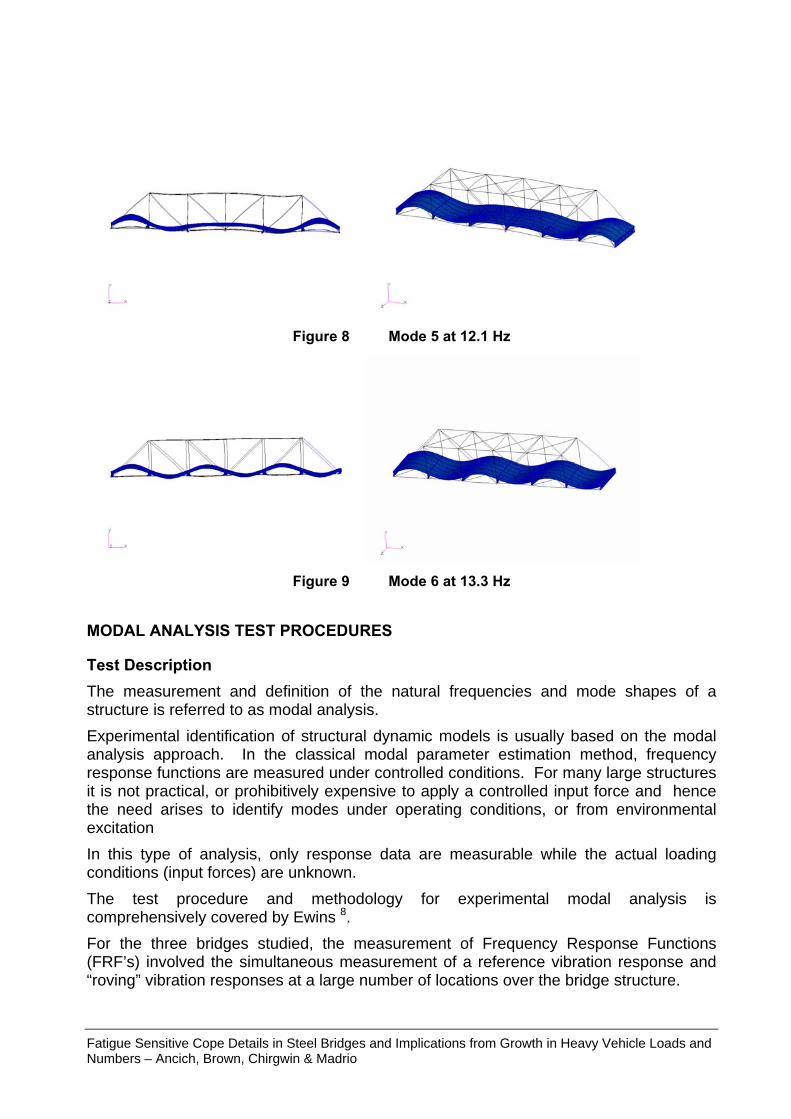
Figure 8 Mode 5 at 12.1 Hz
Figure 9 Mode 6 at 13.3 Hz
MODAL ANALYSIS TEST PROCEDURES
Test Description The measurement and definition of the natural frequencies and mode shapes of a structure is referred to as modal analysis. Experimental identification of structural dynamic models is usually based on the modal analysis approach. In the classical modal parameter estimation method, frequency response functions are measured under controlled conditions. For many large structures it is not practical, or prohibitively expensive to apply a controlled input force and hence the need arises to identify modes under operating conditions, or from environmental excitation In this type of analysis, only response data are measurable while the actual loading conditions (input forces) are unknown. The test procedure and methodology for experimental modal analysis is comprehensively covered by Ewins 8. For the three bridges studied, the measurement of Frequency Response Functions (FRF’s) involved the simultaneous measurement of a reference vibration response and “roving” vibration responses at a large number of locations over the bridge structure.
Fatigue Sensitive Cope Details in Steel Bridges and Implications from Growth in Heavy Vehicle Loads and Numbers – Ancich, Brown, Chirgwin & Madrio
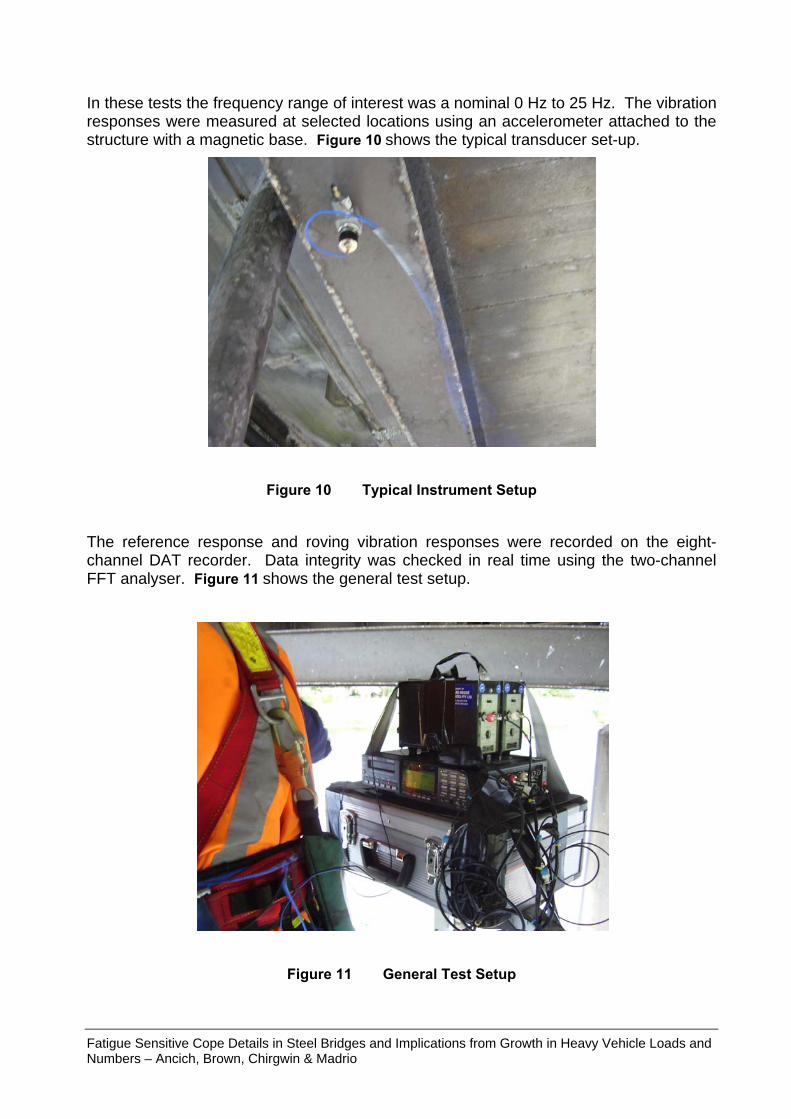
In these tests the frequency range of interest was a nominal 0 Hz to 25 Hz. The vibration responses were measured at selected locations using an accelerometer attached to the structure with a magnetic base. Figure 10 shows the typical transducer set-up.
Figure 10 Typical Instrument Setup
The reference response and roving vibration responses were recorded on the eight-channel DAT recorder. Data integrity was checked in real time using the two-channel FFT analyser. Figure 11 shows the general test setup.
Figure 11 General Test Setup
Fatigue Sensitive Cope Details in Steel Bridges and Implications from Growth in Heavy Vehicle Loads and Numbers – Ancich, Brown, Chirgwin & Madrio
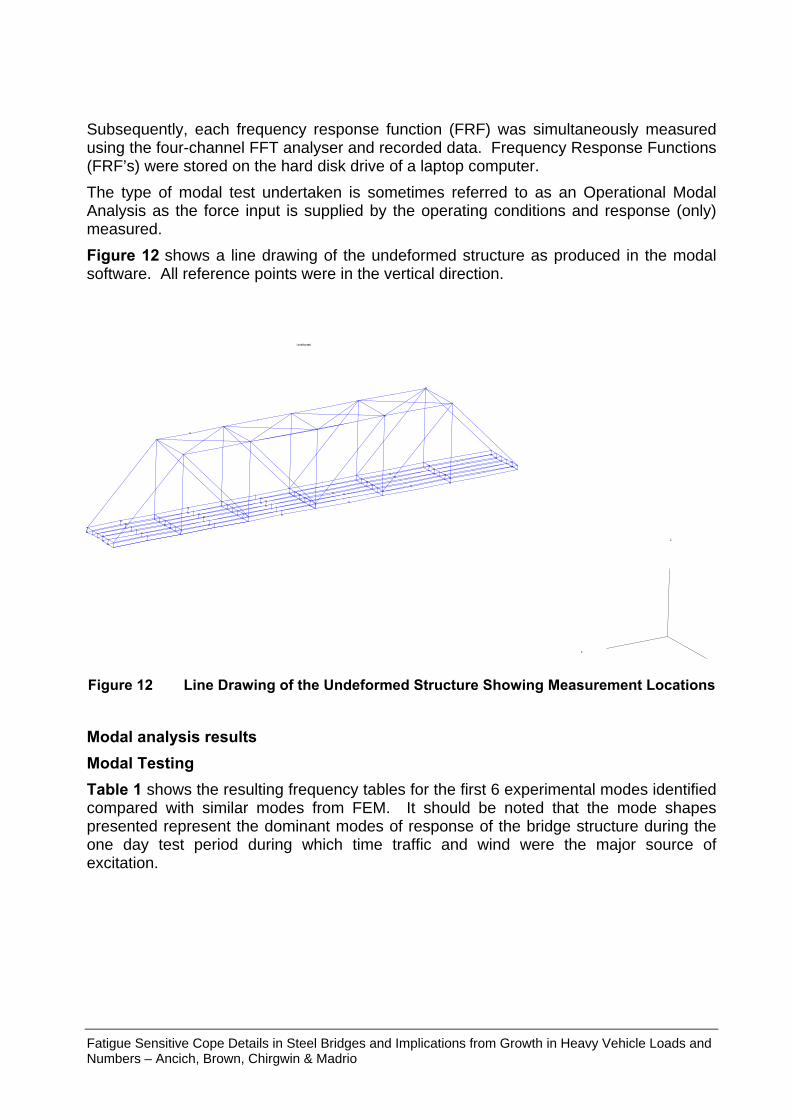
Subsequently, each frequency response function (FRF) was simultaneously measured using the four-channel FFT analyser and recorded data. Frequency Response Functions (FRF’s) were stored on the hard disk drive of a laptop computer. The type of modal test undertaken is sometimes referred to as an Operational Modal Analysis as the force input is supplied by the operating conditions and response (only) measured. Figure 12 shows a line drawing of the undeformed structure as produced in the modal software. All reference points were in the vertical direction.
X
Z
Undeformed
Figure 12 Line Drawing of the Undeformed Structure Showing Measurement Locations
Modal analysis results Modal Testing Table 1 shows the resulting frequency tables for the first 6 experimental modes identified compared with similar modes from FEM. It should be noted that the mode shapes presented represent the dominant modes of response of the bridge structure during the one day test period during which time traffic and wind were the major source of excitation.
Fatigue Sensitive Cope Details in Steel Bridges and Implications from Growth in Heavy Vehicle Loads and Numbers – Ancich, Brown, Chirgwin & Madrio
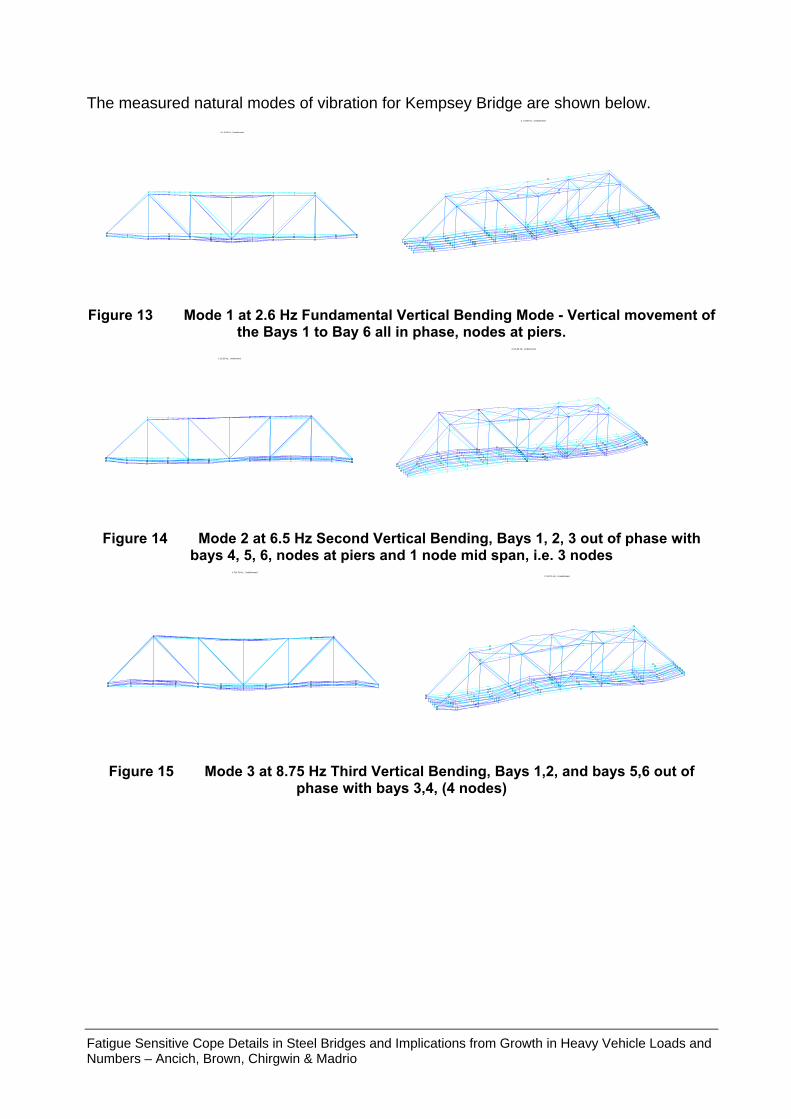
The measured natural modes of vibration for Kempsey Bridge are shown below. # 1:3.59 Hz, Undeformed
# 1:3.59 Hz, Undeformed
Figure 13 Mode 1 at 2.6 Hz Fundamental Vertical Bending Mode - Vertical movement of
the Bays 1 to Bay 6 all in phase, nodes at piers. # 2:6.56 Hz, Undeformed
# 2:6.56 Hz, Undeformed
Figure 14 Mode 2 at 6.5 Hz Second Vertical Bending, Bays 1, 2, 3 out of phase with
bays 4, 5, 6, nodes at piers and 1 node mid span, i.e. 3 nodes # 3:8.75 Hz, Undeformed
# 3:8.75 Hz, Undeformed
Figure 15 Mode 3 at 8.75 Hz Third Vertical Bending, Bays 1,2, and bays 5,6 out of
phase with bays 3,4, (4 nodes)
Fatigue Sensitive Cope Details in Steel Bridges and Implications from Growth in Heavy Vehicle Loads and Numbers – Ancich, Brown, Chirgwin & Madrio
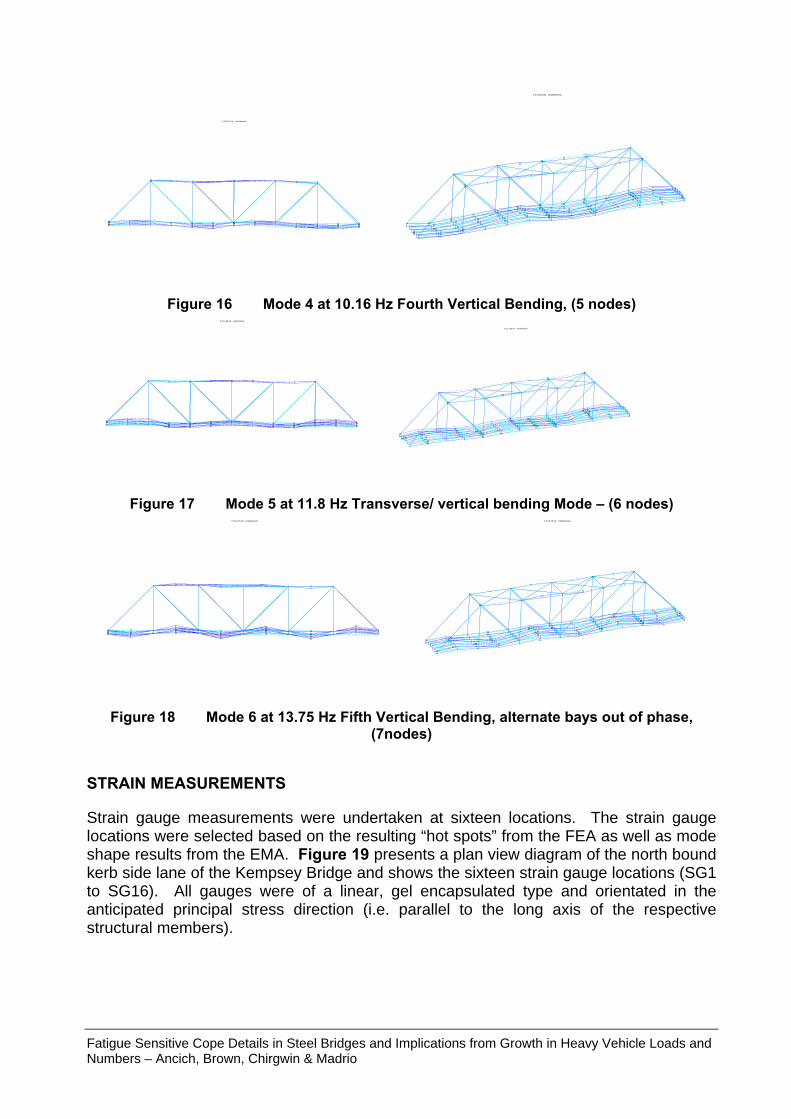
# 4:10.16 Hz, Undeformed
# 4:10.16 Hz, Undeformed
Figure 16 Mode 4 at 10.16 Hz Fourth Vertical Bending, (5 nodes)
# 5:11.88 Hz, Undeformed
# 5:11.88 Hz, Undeformed
Figure 17 Mode 5 at 11.8 Hz Transverse/ vertical bending Mode – (6 nodes)
# 6:13.75 Hz, Undeformed # 6:13.75 Hz, Undeformed
Figure 18 Mode 6 at 13.75 Hz Fifth Vertical Bending, alternate bays out of phase,
(7nodes)
STRAIN MEASUREMENTS
Strain gauge measurements were undertaken at sixteen locations. The strain gauge locations were selected based on the resulting “hot spots” from the FEA as well as mode shape results from the EMA. Figure 19 presents a plan view diagram of the north bound kerb side lane of the Kempsey Bridge and shows the sixteen strain gauge locations (SG1 to SG16). All gauges were of a linear, gel encapsulated type and orientated in the anticipated principal stress direction (i.e. parallel to the long axis of the respective structural members).
Fatigue Sensitive Cope Details in Steel Bridges and Implications from Growth in Heavy Vehicle Loads and Numbers – Ancich, Brown, Chirgwin & Madrio
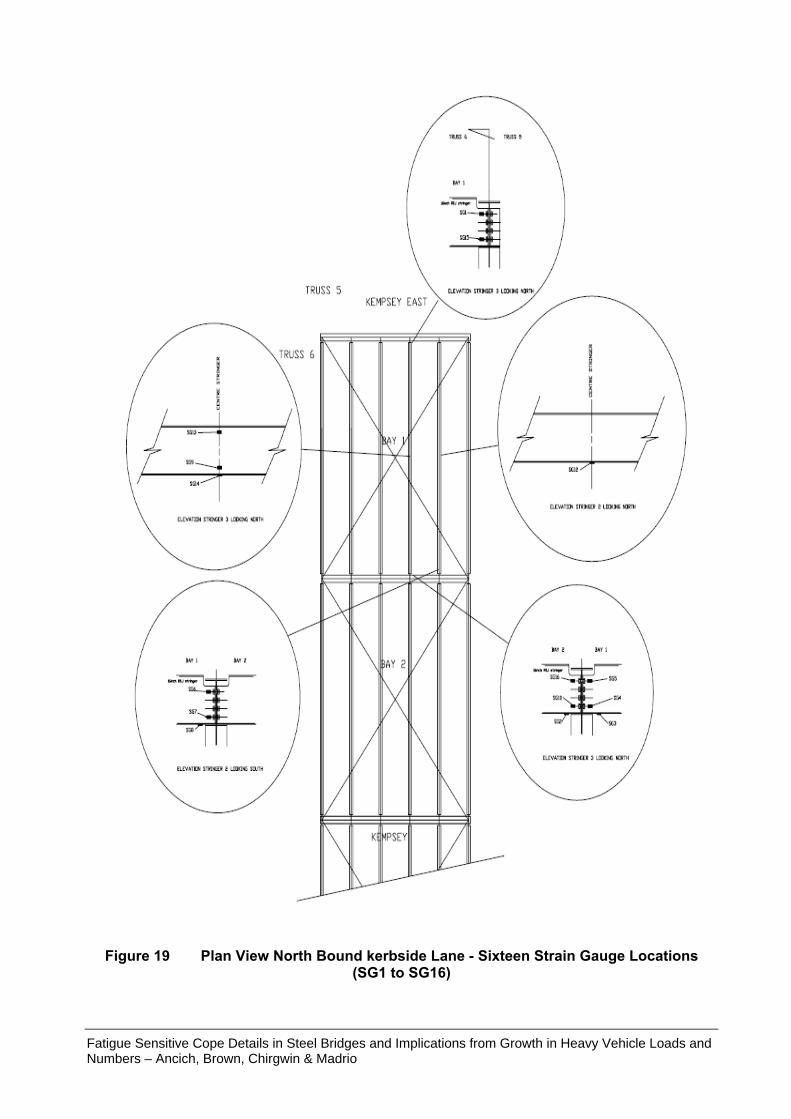
Figure 19 Plan View North Bound kerbside Lane - Sixteen Strain Gauge Locations (SG1 to SG16)
Fatigue Sensitive Cope Details in Steel Bridges and Implications from Growth in Heavy Vehicle Loads and Numbers – Ancich, Brown, Chirgwin & Madrio
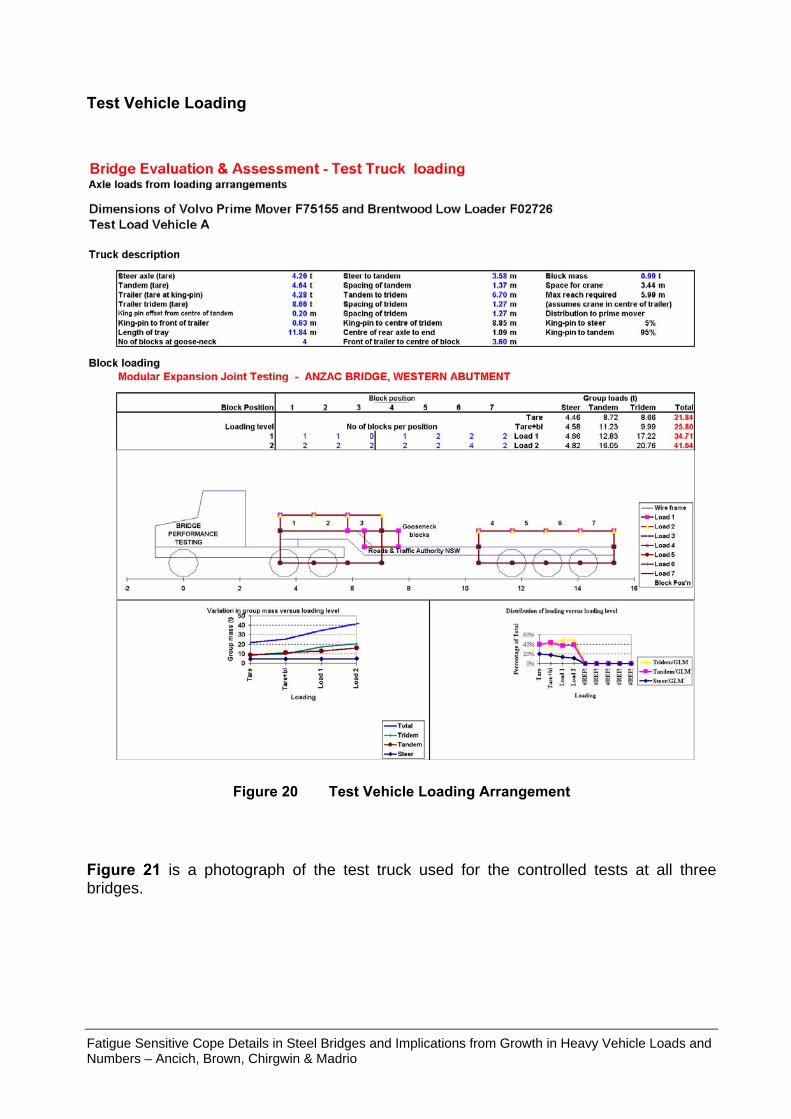
Test Vehicle Loading
Figure 20 Test Vehicle Loading Arrangement
Figure 21 is a photograph of the test truck used for the controlled tests at all three bridges.
Fatigue Sensitive Cope Details in Steel Bridges and Implications from Growth in Heavy Vehicle Loads and Numbers – Ancich, Brown, Chirgwin & Madrio
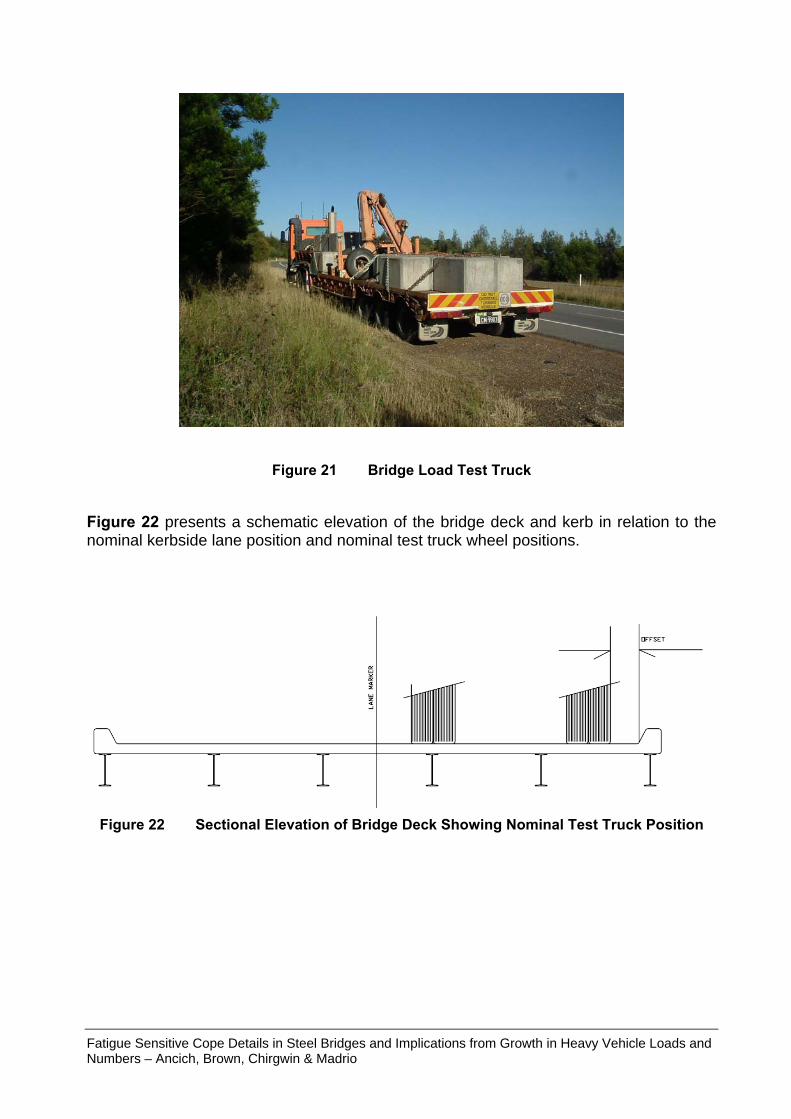
Figure 21 Bridge Load Test Truck
Figure 22 presents a schematic elevation of the bridge deck and kerb in relation to the nominal kerbside lane position and nominal test truck wheel positions.
Figure 22 Sectional Elevation of Bridge Deck Showing Nominal Test Truck Position
Fatigue Sensitive Cope Details in Steel Bridges and Implications from Growth in Heavy Vehicle Loads and Numbers – Ancich, Brown, Chirgwin & Madrio
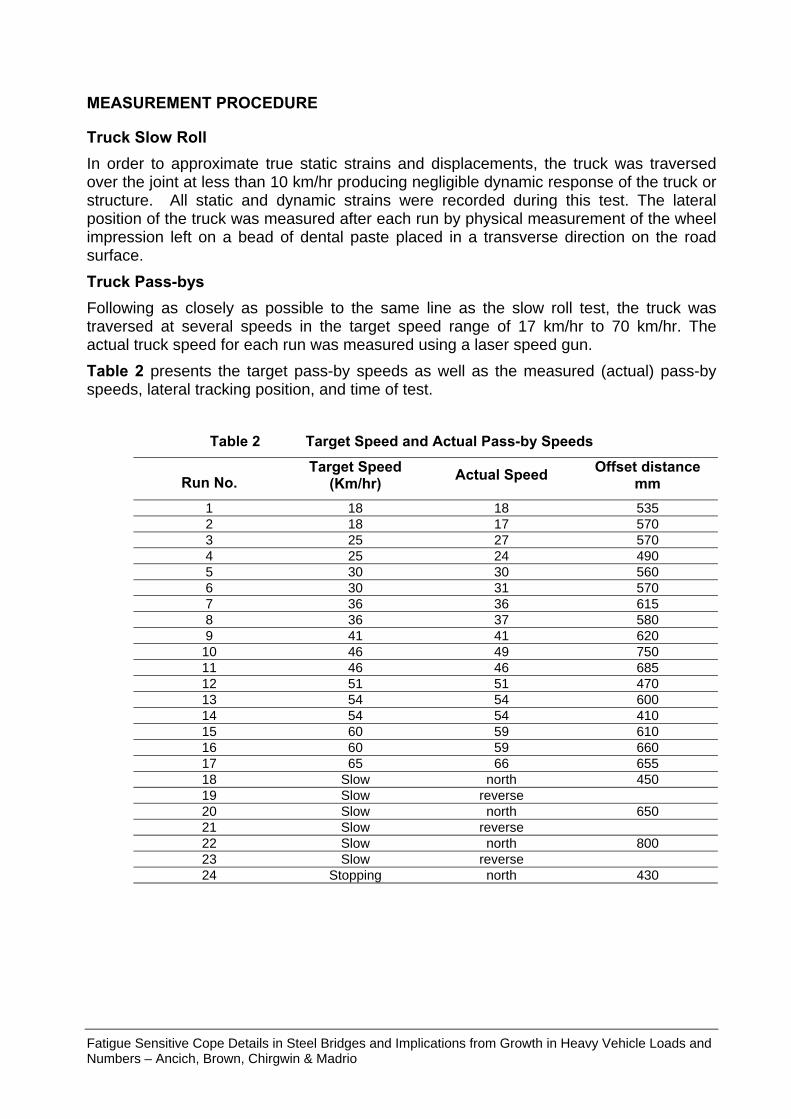
MEASUREMENT PROCEDURE
Truck Slow Roll In order to approximate true static strains and displacements, the truck was traversed over the joint at less than 10 km/hr producing negligible dynamic response of the truck or structure. All static and dynamic strains were recorded during this test. The lateral position of the truck was measured after each run by physical measurement of the wheel impression left on a bead of dental paste placed in a transverse direction on the road surface. Truck Pass-bys Following as closely as possible to the same line as the slow roll test, the truck was traversed at several speeds in the target speed range of 17 km/hr to 70 km/hr. The actual truck speed for each run was measured using a laser speed gun. Table 2 presents the target pass-by speeds as well as the measured (actual) pass-by speeds, lateral tracking position, and time of test.
Table 2 Target Speed and Actual Pass-by Speeds
Run No. Target Speed
(Km/hr) Actual Speed Offset distance mm
1 18 18 535 2 18 17 570 3 25 27 570 4 25 24 490 5 30 30 560 6 30 31 570 7 36 36 615 8 36 37 580 9 41 41 620 10 46 49 750 11 46 46 685 12 51 51 470 13 54 54 600 14 54 54 410 15 60 59 610 16 60 59 660 17 65 66 655 18 Slow north 450 19 Slow reverse 20 Slow north 650 21 Slow reverse 22 Slow north 800 23 Slow reverse 24 Stopping north 430
Fatigue Sensitive Cope Details in Steel Bridges and Implications from Growth in Heavy Vehicle Loads and Numbers – Ancich, Brown, Chirgwin & Madrio
STRAIN MEASUREMENT RESULTS
Strain signals were sampled at a rate of 1 kHz and allowed to run for the entire test sequence. The calibrated strain data was stored directly to disk on a Laptop via an Ethernet connection. The data was subsequently analysed to produce strain versus time plots. Further analysis included the extraction of the maximum and minimum strain resulting from the passage of the six individual test truck axles. These data were used to calculate dynamic range factors for each strain signal, the calculations were performed for each strain gauge location for each individual axle as well as for all axles. The positive dynamic amplification factor was calculated as follows:
Dynamic Amplification Factor (Positive)
= Strain Static Maximumstatic) as sense (sameStrain Dynamic Maximum
The negative dynamic range factor was calculated as follows: Dynamic Amplification Factor (Negative)
= Strain Static Maximumstatic) as sense (oppositeStrain Dynamic Maximum
The total dynamic range factor was calculated as follows: Dynamic Amplification Factor
= Strain Static MaximumStrain Dynamic Minimum -Strain Dynamic Maximum
Note: The Maximum Static Strain used in the denominator of the above equations was the maximum of the two closest slow roll lateral position results which straddled the lateral position for the run in question. This procedure was used to reduce the possibility of DAF over estimation.
Fatigue Sensitive Cope Details in Steel Bridges and Implications from Growth in Heavy Vehicle Loads and Numbers – Ancich, Brown, Chirgwin & Madrio
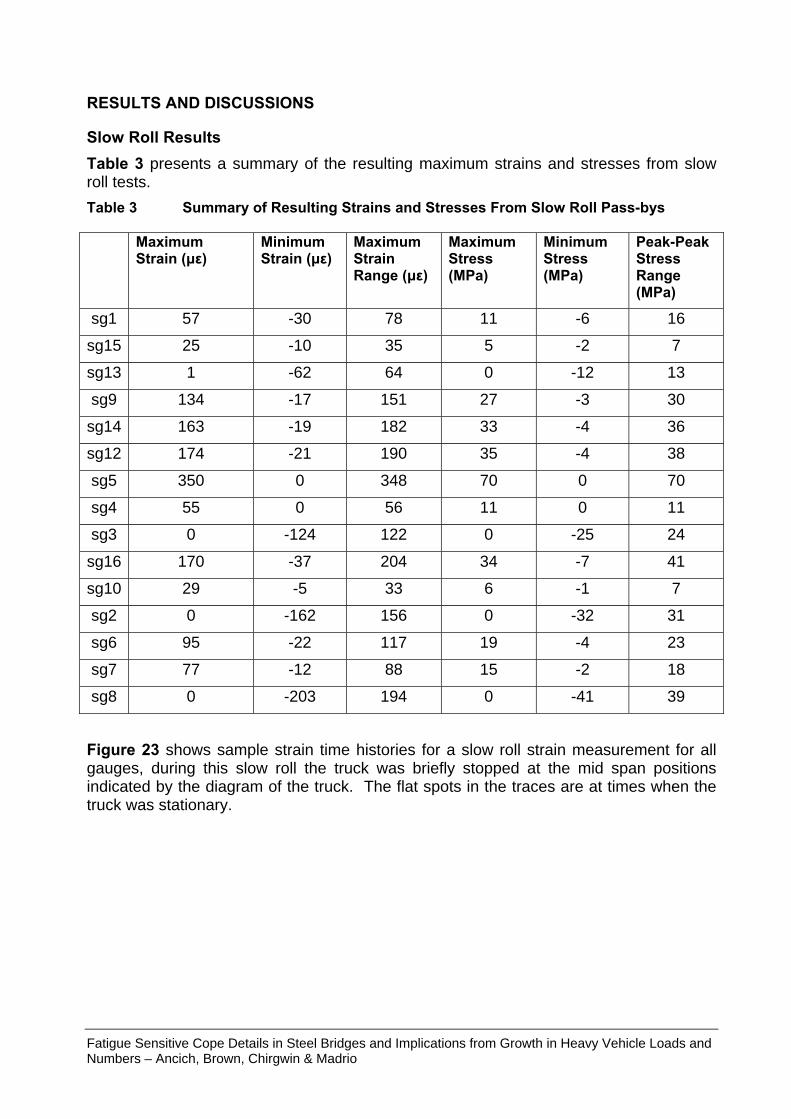
RESULTS AND DISCUSSIONS
Slow Roll Results Table 3 presents a summary of the resulting maximum strains and stresses from slow roll tests. Table 3 Summary of Resulting Strains and Stresses From Slow Roll Pass-bys Maximum
Strain (µε) Minimum Strain (µε)
Maximum Strain Range (µε)
Maximum Stress (MPa)
Minimum Stress (MPa)
Peak-Peak Stress Range (MPa)
sg1 57 -30 78 11 -6 16
sg15 25 -10 35 5 -2 7
sg13 1 -62 64 0 -12 13
sg9 134 -17 151 27 -3 30
sg14 163 -19 182 33 -4 36
sg12 174 -21 190 35 -4 38
sg5 350 0 348 70 0 70
sg4 55 0 56 11 0 11
sg3 0 -124 122 0 -25 24
sg16 170 -37 204 34 -7 41
sg10 29 -5 33 6 -1 7
sg2 0 -162 156 0 -32 31
sg6 95 -22 117 19 -4 23
sg7 77 -12 88 15 -2 18
sg8 0 -203 194 0 -41 39
Figure 23 shows sample strain time histories for a slow roll strain measurement for all gauges, during this slow roll the truck was briefly stopped at the mid span positions indicated by the diagram of the truck. The flat spots in the traces are at times when the truck was stationary.
Fatigue Sensitive Cope Details in Steel Bridges and Implications from Growth in Heavy Vehicle Loads and Numbers – Ancich, Brown, Chirgwin & Madrio
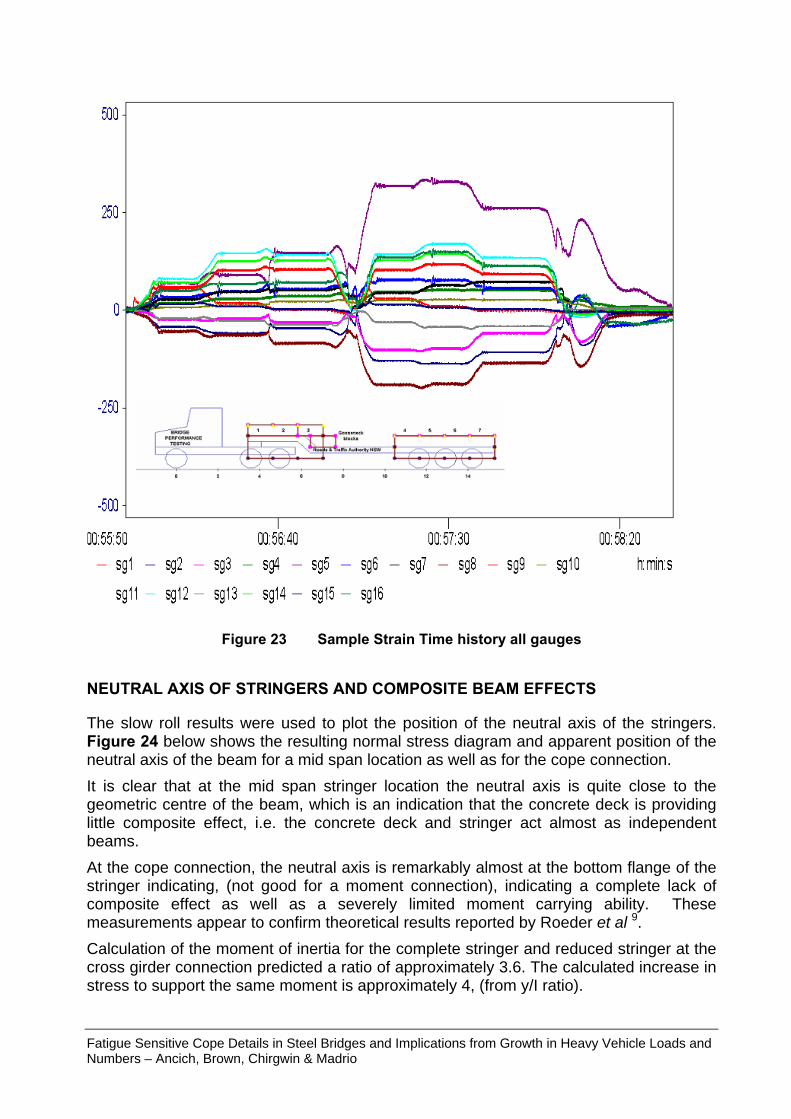
Figure 23 Sample Strain Time history all gauges
NEUTRAL AXIS OF STRINGERS AND COMPOSITE BEAM EFFECTS
The slow roll results were used to plot the position of the neutral axis of the stringers. Figure 24 below shows the resulting normal stress diagram and apparent position of the neutral axis of the beam for a mid span location as well as for the cope connection. It is clear that at the mid span stringer location the neutral axis is quite close to the geometric centre of the beam, which is an indication that the concrete deck is providing little composite effect, i.e. the concrete deck and stringer act almost as independent beams. At the cope connection, the neutral axis is remarkably almost at the bottom flange of the stringer indicating, (not good for a moment connection), indicating a complete lack of composite effect as well as a severely limited moment carrying ability. These measurements appear to confirm theoretical results reported by Roeder et al 9. Calculation of the moment of inertia for the complete stringer and reduced stringer at the cross girder connection predicted a ratio of approximately 3.6. The calculated increase in stress to support the same moment is approximately 4, (from y/I ratio).
Fatigue Sensitive Cope Details in Steel Bridges and Implications from Growth in Heavy Vehicle Loads and Numbers – Ancich, Brown, Chirgwin & Madrio
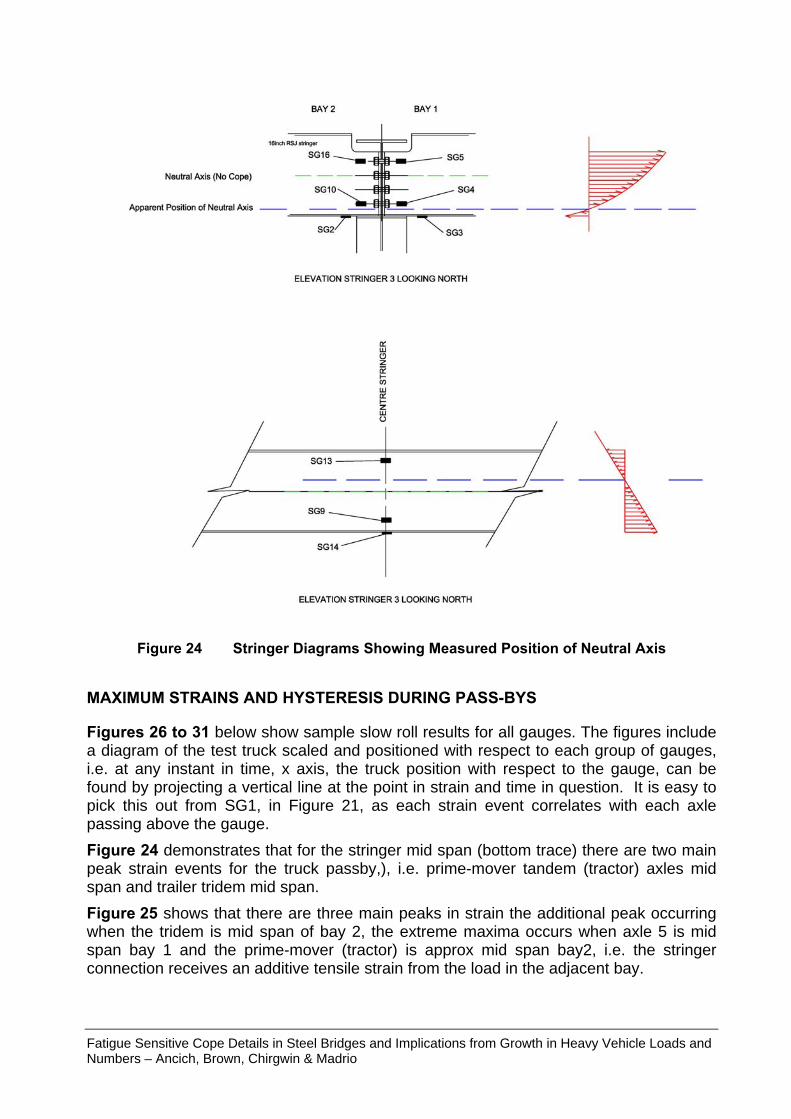
Figure 24 Stringer Diagrams Showing Measured Position of Neutral Axis
MAXIMUM STRAINS AND HYSTERESIS DURING PASS-BYS
Figures 26 to 31 below show sample slow roll results for all gauges. The figures include a diagram of the test truck scaled and positioned with respect to each group of gauges, i.e. at any instant in time, x axis, the truck position with respect to the gauge, can be found by projecting a vertical line at the point in strain and time in question. It is easy to pick this out from SG1, in Figure 21, as each strain event correlates with each axle passing above the gauge. Figure 24 demonstrates that for the stringer mid span (bottom trace) there are two main peak strain events for the truck passby,), i.e. prime-mover tandem (tractor) axles mid span and trailer tridem mid span. Figure 25 shows that there are three main peaks in strain the additional peak occurring when the tridem is mid span of bay 2, the extreme maxima occurs when axle 5 is mid span bay 1 and the prime-mover (tractor) is approx mid span bay2, i.e. the stringer connection receives an additive tensile strain from the load in the adjacent bay.
Fatigue Sensitive Cope Details in Steel Bridges and Implications from Growth in Heavy Vehicle Loads and Numbers – Ancich, Brown, Chirgwin & Madrio
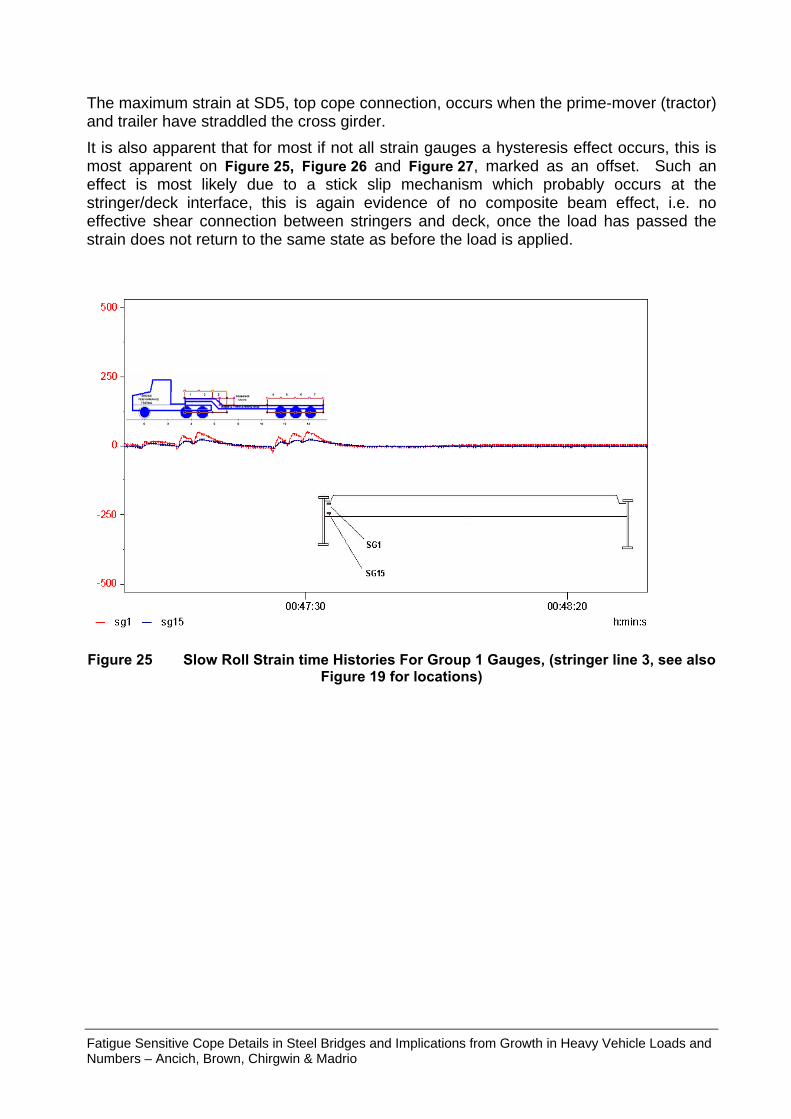
The maximum strain at SD5, top cope connection, occurs when the prime-mover (tractor) and trailer have straddled the cross girder. It is also apparent that for most if not all strain gauges a hysteresis effect occurs, this is most apparent on Figure 25, Figure 26 and Figure 27, marked as an offset. Such an effect is most likely due to a stick slip mechanism which probably occurs at the stringer/deck interface, this is again evidence of no composite beam effect, i.e. no effective shear connection between stringers and deck, once the load has passed the strain does not return to the same state as before the load is applied.
Figure 25 Slow Roll Strain time Histories For Group 1 Gauges, (stringer line 3, see also
Figure 19 for locations)
Fatigue Sensitive Cope Details in Steel Bridges and Implications from Growth in Heavy Vehicle Loads and Numbers – Ancich, Brown, Chirgwin & Madrio
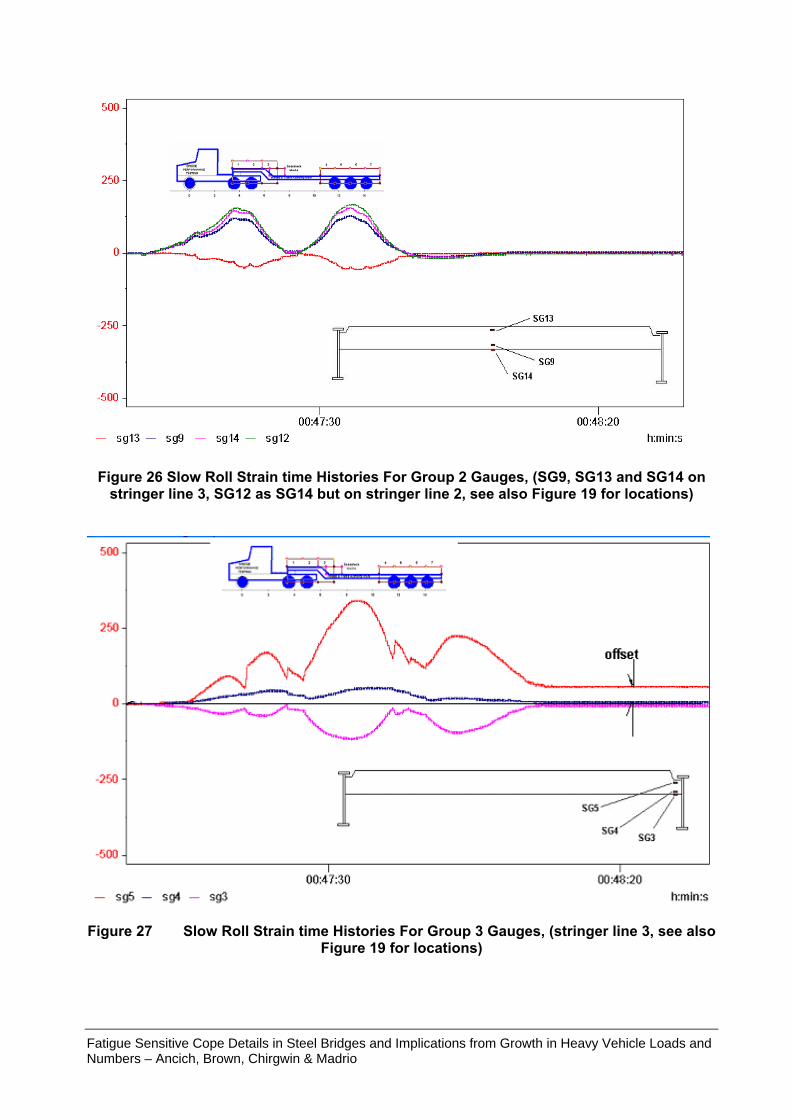
Figure 26 Slow Roll Strain time Histories For Group 2 Gauges, (SG9, SG13 and SG14 on
stringer line 3, SG12 as SG14 but on stringer line 2, see also Figure 19 for locations)
Figure 27 Slow Roll Strain time Histories For Group 3 Gauges, (stringer line 3, see also
Figure 19 for locations)
Fatigue Sensitive Cope Details in Steel Bridges and Implications from Growth in Heavy Vehicle Loads and Numbers – Ancich, Brown, Chirgwin & Madrio
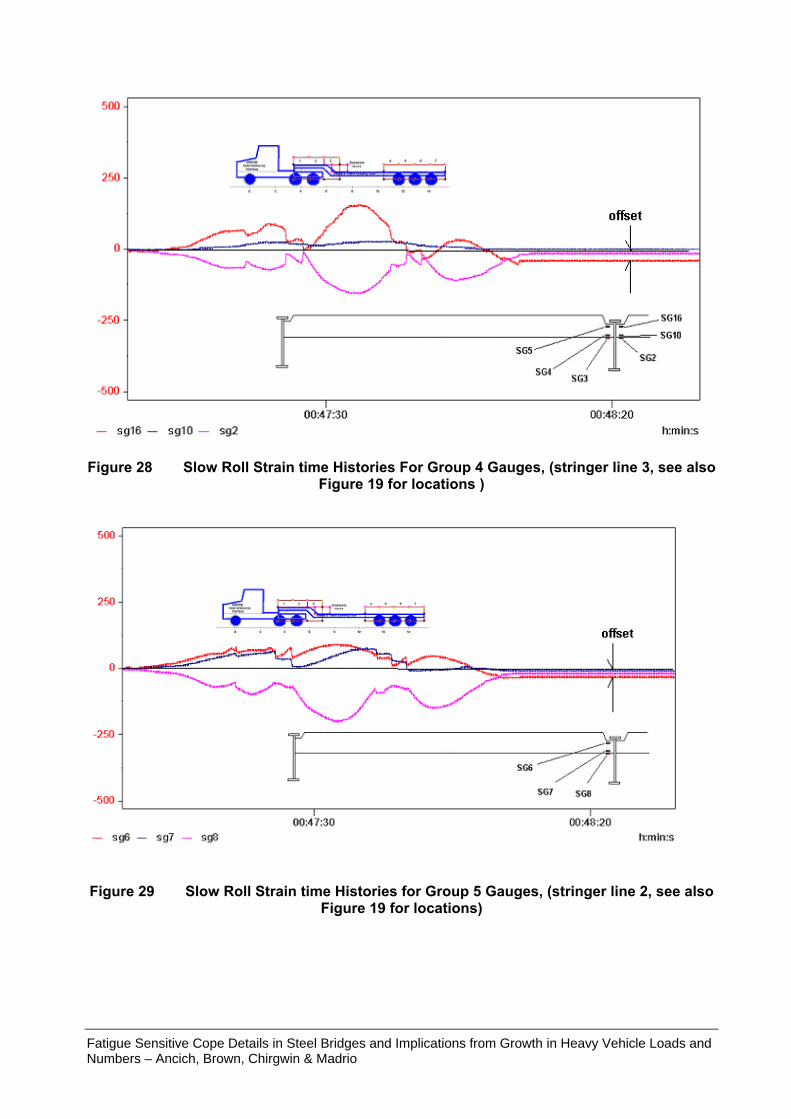
Figure 28 Slow Roll Strain time Histories For Group 4 Gauges, (stringer line 3, see also
Figure 19 for locations )
Figure 29 Slow Roll Strain time Histories for Group 5 Gauges, (stringer line 2, see also
Figure 19 for locations)
Fatigue Sensitive Cope Details in Steel Bridges and Implications from Growth in Heavy Vehicle Loads and Numbers – Ancich, Brown, Chirgwin & Madrio
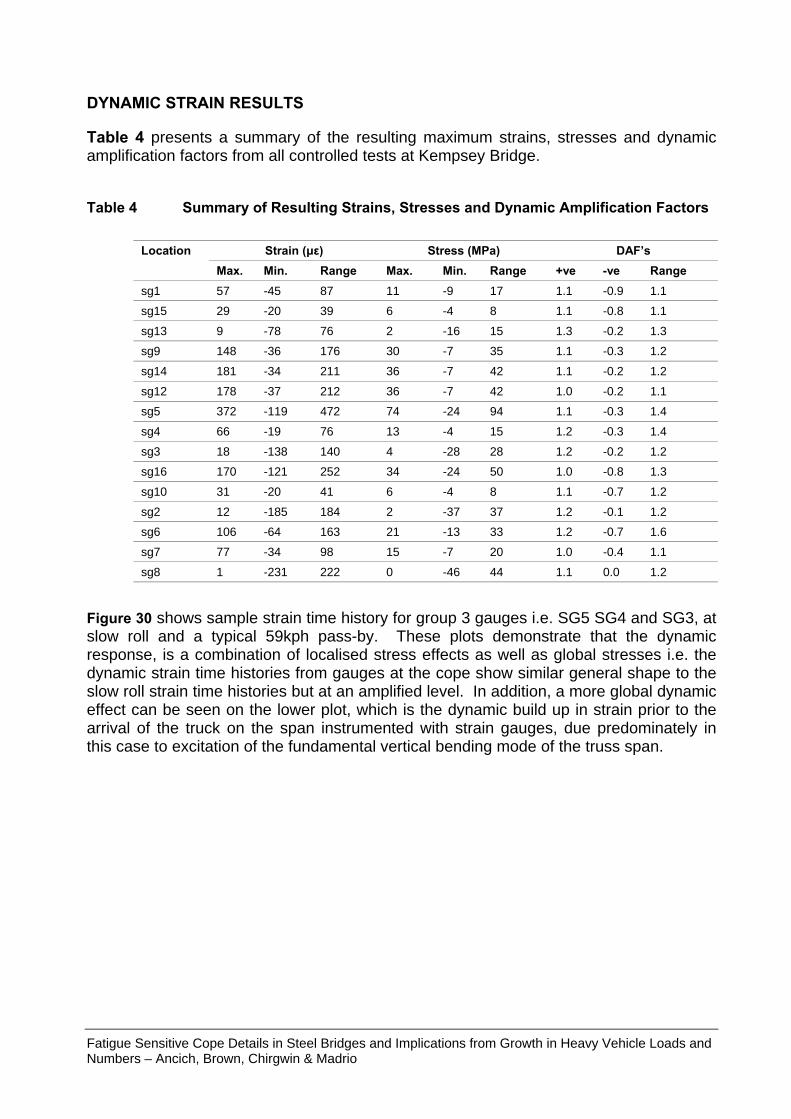
DYNAMIC STRAIN RESULTS
Table 4 presents a summary of the resulting maximum strains, stresses and dynamic amplification factors from all controlled tests at Kempsey Bridge. Table 4 Summary of Resulting Strains, Stresses and Dynamic Amplification Factors
Strain (µε) Stress (MPa) DAF’s Location Max. Min. Range Max. Min. Range +ve -ve Range
sg1 57 -45 87 11 -9 17 1.1 -0.9 1.1
sg15 29 -20 39 6 -4 8 1.1 -0.8 1.1
sg13 9 -78 76 2 -16 15 1.3 -0.2 1.3
sg9 148 -36 176 30 -7 35 1.1 -0.3 1.2
sg14 181 -34 211 36 -7 42 1.1 -0.2 1.2
sg12 178 -37 212 36 -7 42 1.0 -0.2 1.1
sg5 372 -119 472 74 -24 94 1.1 -0.3 1.4
sg4 66 -19 76 13 -4 15 1.2 -0.3 1.4
sg3 18 -138 140 4 -28 28 1.2 -0.2 1.2
sg16 170 -121 252 34 -24 50 1.0 -0.8 1.3
sg10 31 -20 41 6 -4 8 1.1 -0.7 1.2
sg2 12 -185 184 2 -37 37 1.2 -0.1 1.2
sg6 106 -64 163 21 -13 33 1.2 -0.7 1.6
sg7 77 -34 98 15 -7 20 1.0 -0.4 1.1
sg8 1 -231 222 0 -46 44 1.1 0.0 1.2
Figure 30 shows sample strain time history for group 3 gauges i.e. SG5 SG4 and SG3, at slow roll and a typical 59kph pass-by. These plots demonstrate that the dynamic response, is a combination of localised stress effects as well as global stresses i.e. the dynamic strain time histories from gauges at the cope show similar general shape to the slow roll strain time histories but at an amplified level. In addition, a more global dynamic effect can be seen on the lower plot, which is the dynamic build up in strain prior to the arrival of the truck on the span instrumented with strain gauges, due predominately in this case to excitation of the fundamental vertical bending mode of the truss span.
Fatigue Sensitive Cope Details in Steel Bridges and Implications from Growth in Heavy Vehicle Loads and Numbers – Ancich, Brown, Chirgwin & Madrio
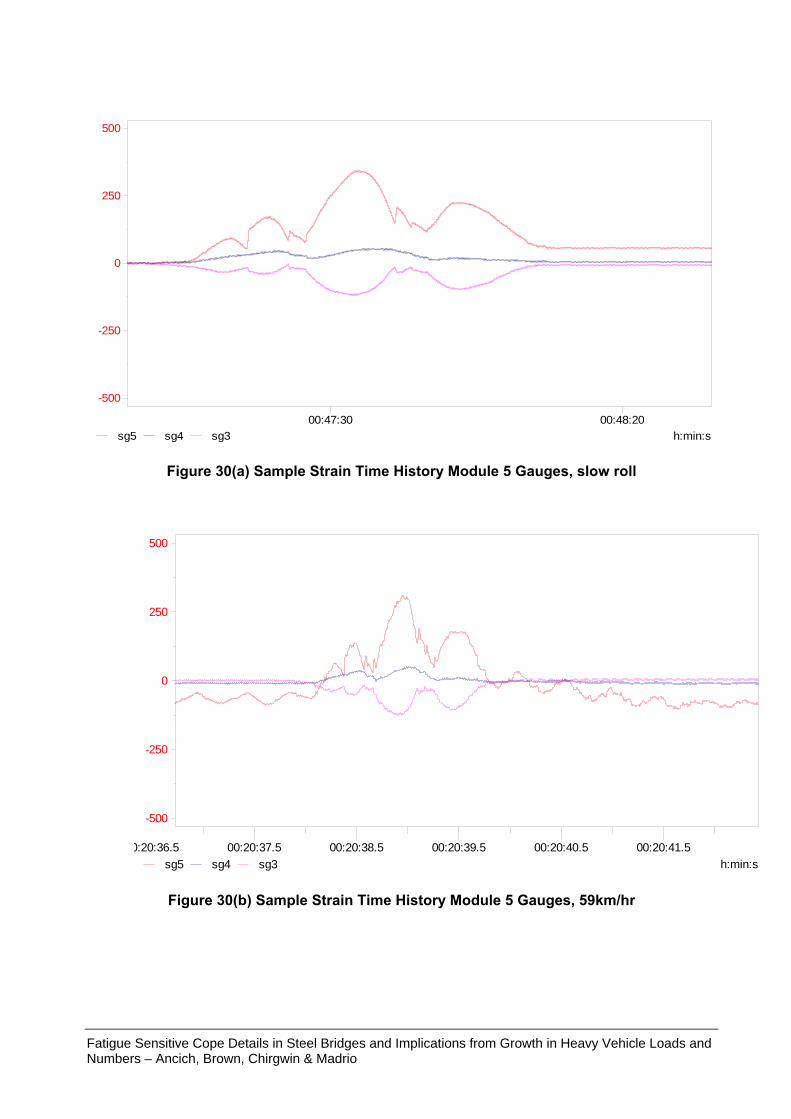
h:min:s00:47:30 00:48:20
500
250
0
-250
-500
sg5 sg4 sg3
Figure 30(a) Sample Strain Time History Module 5 Gauges, slow roll
h:min:s0:20:36.5 00:20:37.5 00:20:38.5 00:20:39.5 00:20:40.5 00:20:41.5
500
250
0
-250
-500
sg5 sg4 sg3
Figure 30(b) Sample Strain Time History Module 5 Gauges, 59km/hr
Fatigue Sensitive Cope Details in Steel Bridges and Implications from Growth in Heavy Vehicle Loads and Numbers – Ancich, Brown, Chirgwin & Madrio

LONG TERM STRAIN MEASUREMENTS AND RAIN FLOW CYCLE COUNTING
Table 5 below shows an abridged summary of the maximum strain range recorded for each gauge from the controlled (legal axle load and legal speed) pass-bys and from the uncontrolled 7 days of traffic for all three tested bridges. It is apparent from these results that analysis or fatigue design based on legal load limits alone would very much under estimate the actual dynamic service loads.
Fatigue Sensitive Cope Details in Steel Bridges and Implications from Growth in Heavy Vehicle Loads and Numbers – Ancich, Brown, Chirgwin & Madrio
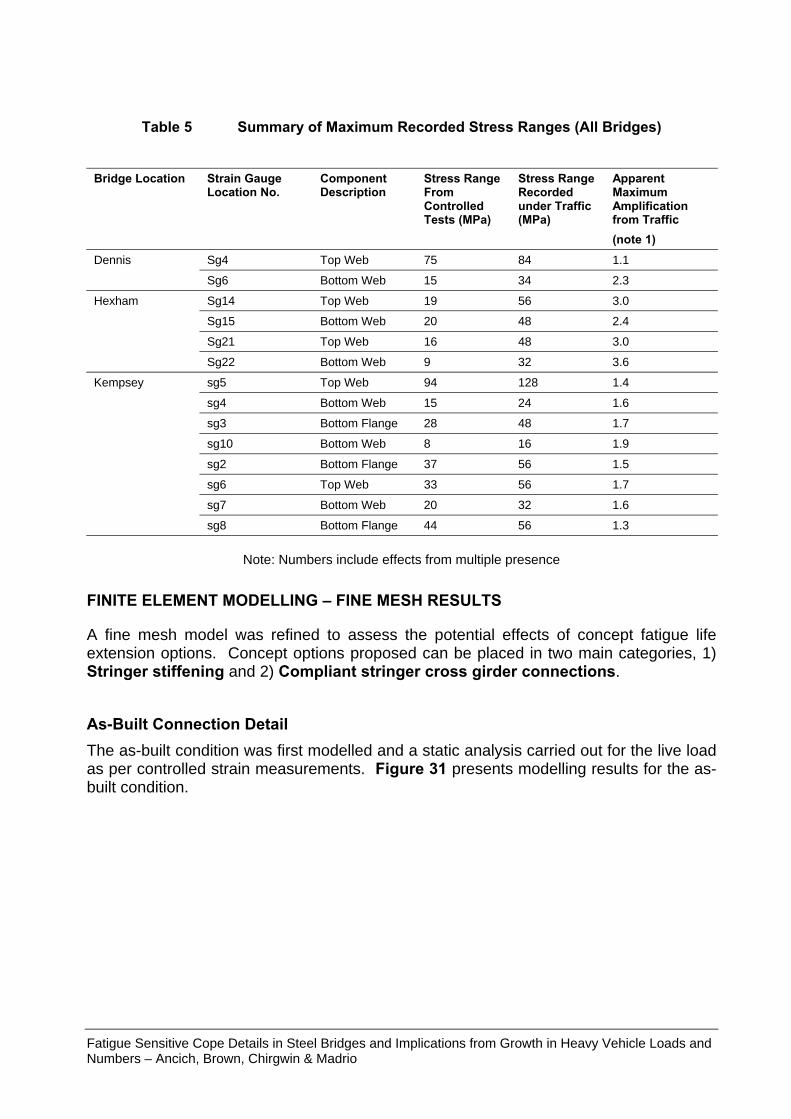
Table 5 Summary of Maximum Recorded Stress Ranges (All Bridges)
Bridge Location Strain Gauge Location No.
Component Description
Stress Range From Controlled Tests (MPa)
Stress Range Recorded under Traffic (MPa)
Apparent Maximum Amplification from Traffic (note 1)
Sg4 Top Web 75 84 1.1 Dennis
Sg6 Bottom Web 15 34 2.3
Sg14 Top Web 19 56 3.0
Sg15 Bottom Web 20 48 2.4
Sg21 Top Web 16 48 3.0
Hexham
Sg22 Bottom Web 9 32 3.6
sg5 Top Web 94 128 1.4
sg4 Bottom Web 15 24 1.6
sg3 Bottom Flange 28 48 1.7
sg10 Bottom Web 8 16 1.9
sg2 Bottom Flange 37 56 1.5
sg6 Top Web 33 56 1.7
sg7 Bottom Web 20 32 1.6
Kempsey
sg8 Bottom Flange 44 56 1.3
Note: Numbers include effects from multiple presence
FINITE ELEMENT MODELLING – FINE MESH RESULTS
A fine mesh model was refined to assess the potential effects of concept fatigue life extension options. Concept options proposed can be placed in two main categories, 1) Stringer stiffening and 2) Compliant stringer cross girder connections. As-Built Connection Detail The as-built condition was first modelled and a static analysis carried out for the live load as per controlled strain measurements. Figure 31 presents modelling results for the as-built condition.
Fatigue Sensitive Cope Details in Steel Bridges and Implications from Growth in Heavy Vehicle Loads and Numbers – Ancich, Brown, Chirgwin & Madrio
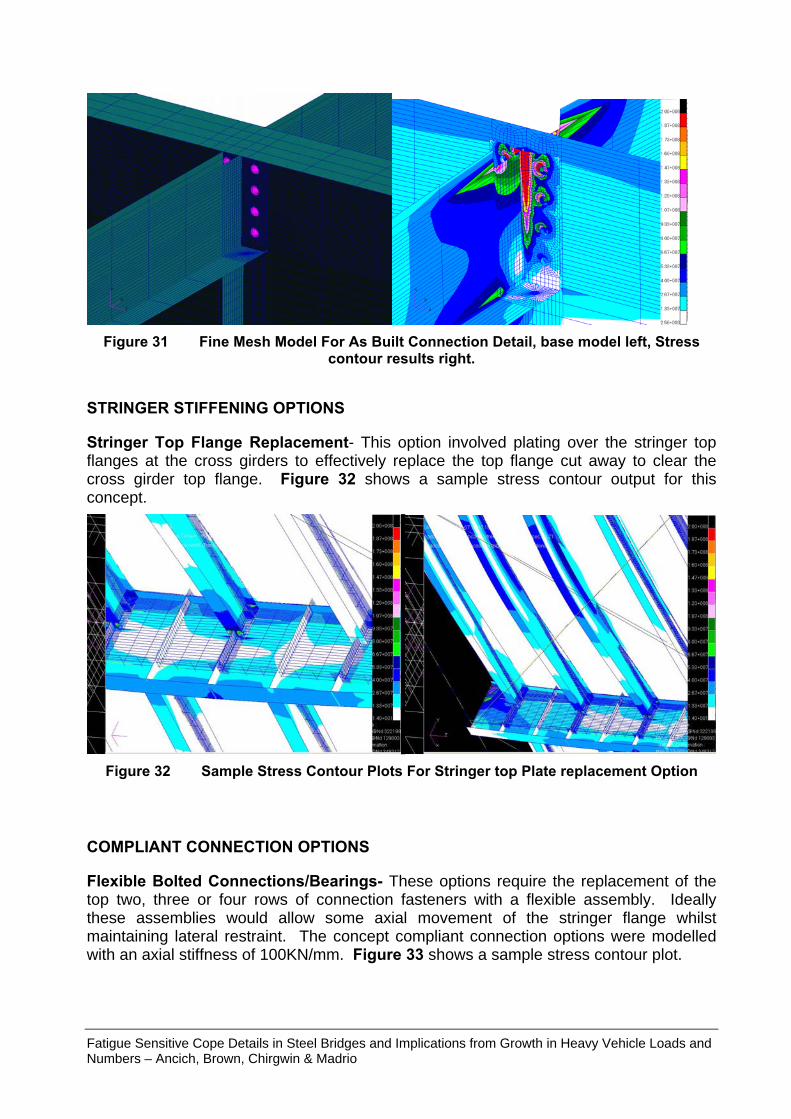
Figure 31 Fine Mesh Model For As Built Connection Detail, base model left, Stress
contour results right.
STRINGER STIFFENING OPTIONS
Stringer Top Flange Replacement- This option involved plating over the stringer top flanges at the cross girders to effectively replace the top flange cut away to clear the cross girder top flange. Figure 32 shows a sample stress contour output for this concept.
Figure 32 Sample Stress Contour Plots For Stringer top Plate replacement Option
COMPLIANT CONNECTION OPTIONS
Flexible Bolted Connections/Bearings- These options require the replacement of the top two, three or four rows of connection fasteners with a flexible assembly. Ideally these assemblies would allow some axial movement of the stringer flange whilst maintaining lateral restraint. The concept compliant connection options were modelled with an axial stiffness of 100KN/mm. Figure 33 shows a sample stress contour plot.
Fatigue Sensitive Cope Details in Steel Bridges and Implications from Growth in Heavy Vehicle Loads and Numbers – Ancich, Brown, Chirgwin & Madrio
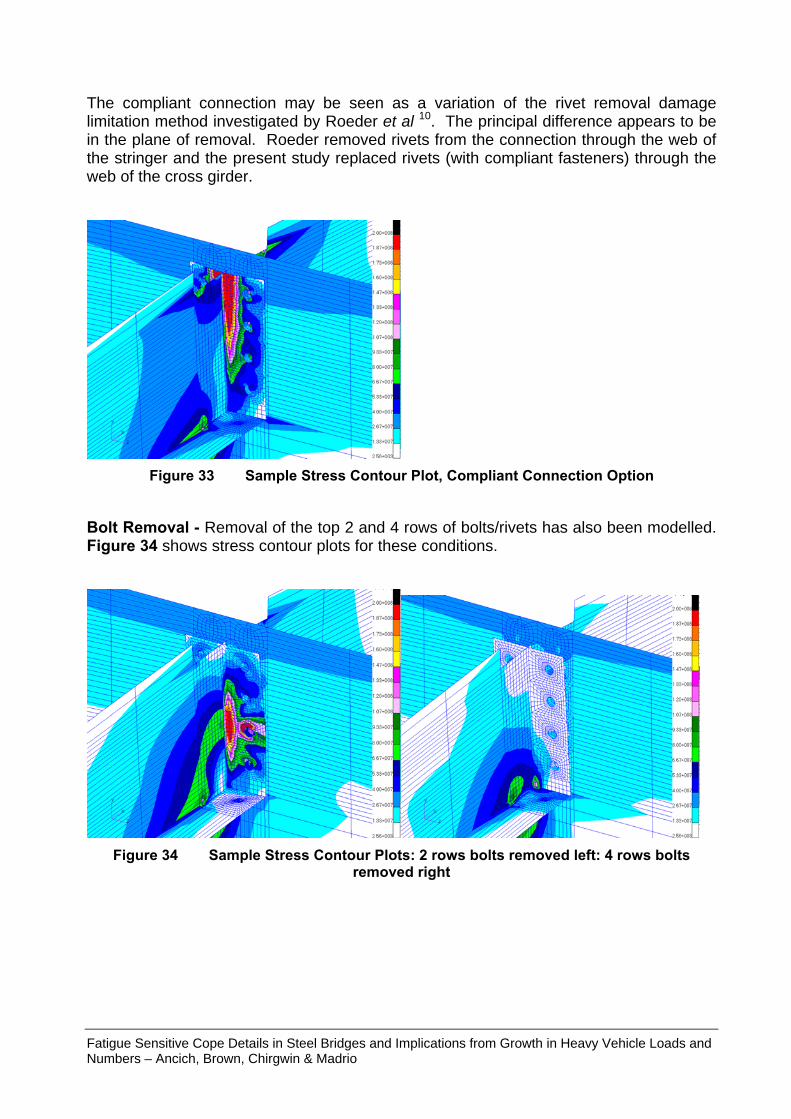
The compliant connection may be seen as a variation of the rivet removal damage limitation method investigated by Roeder et al 10. The principal difference appears to be in the plane of removal. Roeder removed rivets from the connection through the web of the stringer and the present study replaced rivets (with compliant fasteners) through the web of the cross girder.
Figure 33 Sample Stress Contour Plot, Compliant Connection Option
Bolt Removal - Removal of the top 2 and 4 rows of bolts/rivets has also been modelled. Figure 34 shows stress contour plots for these conditions.
Figure 34 Sample Stress Contour Plots: 2 rows bolts removed left: 4 rows bolts
removed right
Fatigue Sensitive Cope Details in Steel Bridges and Implications from Growth in Heavy Vehicle Loads and Numbers – Ancich, Brown, Chirgwin & Madrio
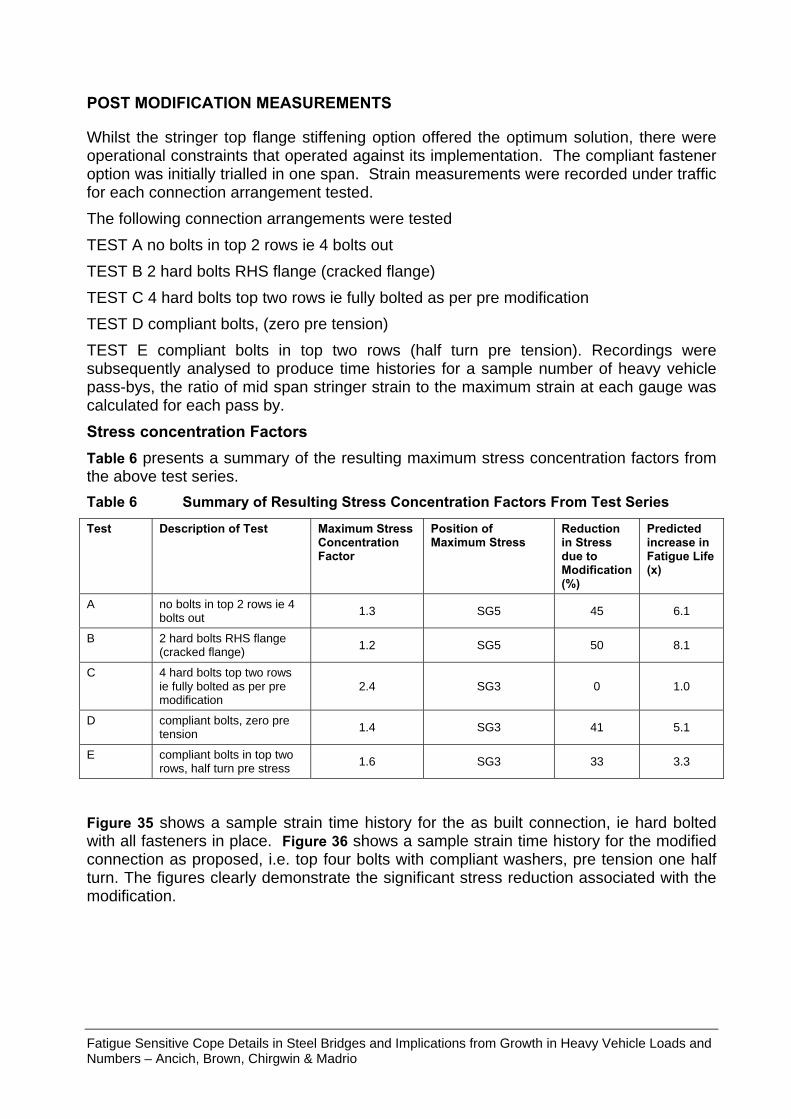
POST MODIFICATION MEASUREMENTS
Whilst the stringer top flange stiffening option offered the optimum solution, there were operational constraints that operated against its implementation. The compliant fastener option was initially trialled in one span. Strain measurements were recorded under traffic for each connection arrangement tested. The following connection arrangements were tested TEST A no bolts in top 2 rows ie 4 bolts out TEST B 2 hard bolts RHS flange (cracked flange) TEST C 4 hard bolts top two rows ie fully bolted as per pre modification TEST D compliant bolts, (zero pre tension) TEST E compliant bolts in top two rows (half turn pre tension). Recordings were subsequently analysed to produce time histories for a sample number of heavy vehicle pass-bys, the ratio of mid span stringer strain to the maximum strain at each gauge was calculated for each pass by. Stress concentration Factors Table 6 presents a summary of the resulting maximum stress concentration factors from the above test series. Table 6 Summary of Resulting Stress Concentration Factors From Test Series
Test Description of Test Maximum Stress Concentration Factor
Position of Maximum Stress
Reduction in Stress due to Modification (%)
Predicted increase in Fatigue Life (x)
A no bolts in top 2 rows ie 4 bolts out 1.3 SG5 45 6.1
B 2 hard bolts RHS flange (cracked flange) 1.2 SG5 50 8.1
C 4 hard bolts top two rows ie fully bolted as per pre modification
2.4 SG3 0 1.0
D compliant bolts, zero pre tension 1.4 SG3 41 5.1
E compliant bolts in top two rows, half turn pre stress 1.6 SG3 33 3.3
Figure 35 shows a sample strain time history for the as built connection, ie hard bolted with all fasteners in place. Figure 36 shows a sample strain time history for the modified connection as proposed, i.e. top four bolts with compliant washers, pre tension one half turn. The figures clearly demonstrate the significant stress reduction associated with the modification.
Fatigue Sensitive Cope Details in Steel Bridges and Implications from Growth in Heavy Vehicle Loads and Numbers – Ancich, Brown, Chirgwin & Madrio
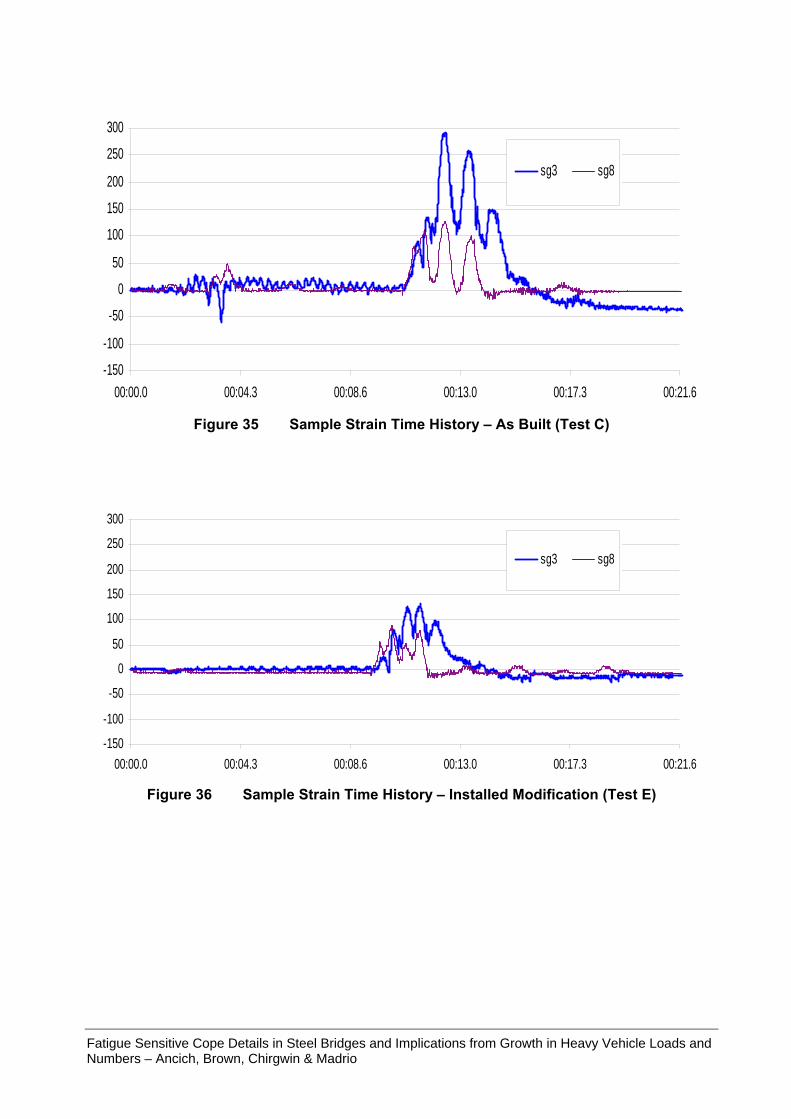
-150
-100
-50
0
50
100
150
200
250
300
00:00.0 00:04.3 00:08.6 00:13.0 00:17.3 00:21.6
sg3 sg8
Figure 35 Sample Strain Time History – As Built (Test C)
-150
-100
-50
0
50
100
150
200
250
300
00:00.0 00:04.3 00:08.6 00:13.0 00:17.3 00:21.6
sg3 sg8
Figure 36 Sample Strain Time History – Installed Modification (Test E)
Fatigue Sensitive Cope Details in Steel Bridges and Implications from Growth in Heavy Vehicle Loads and Numbers – Ancich, Brown, Chirgwin & Madrio

TRAFFIC DATA ANALYSIS Analysis of Weigh-In-Motion (WIM) Data The load spectrum data for each WIM station were converted to the ADESA applicable to relevant bridges using the minus rule. The resulting Average Daily Equivalent Standard Axle (ADESA) load spectra were then plotted to structure the initial data groups. The data groups listing were individually tested using F-test and Student T-test, and statistically analysed for homogeneity using ANOVA. The data groups were subjected to a follow-up test using Tukey’s Test. Final grouping of data was done after a series of follow-up tests. An attempt was also made to transform the weighted percentages of the resulting ADESA load spectra into arcsin values for each WIM station. All samples of the arcsin transformed ADESA percentages were then analysed using ANOVA. The results showed that the data were homogeneous.
Calculation of ESA from WIM Data The ESA applicable to bridges based on WIM data for the first half of 2006 was calculated using the minus rule formula, derived as follows:
Where:
Nf =Equivalent standard axle (ESA) for the period
Li = Mass of Axles x Number in group
Lf = Standard Load (160 kN, assumed)
Proportional Correlation
ni = Count for the period
NV = Total number of Vehicles
NG = Total Groups
ii f
if
ff
imi
i f
misc
iscisc
f
msc
sc
mf
nLLN
LfLf
ffN
nN
ffn
nff
∑
∑
∑
⎟⎟⎠
⎞⎜⎜⎝
⎛=
∝∝
××=
=
××=
××=
3
63
3
63
3
633
102
102
102
A
f
G
f
V
f
NN
NN
NN
NA = Total Axles
Cumulative ESA data for the period 1980-2006 are shown graphically as Figure 37. These data confirm the exponential growth in loads and an even faster growth in axle group repetitions due to the greater utilisation of B-doubles and tri-axle semi-trailers. The ESA approach differs from the truck weight histogram (TWH) and wheel weight histogram (WWH) method suggested by Fu et al 6. However, the methodology is considered to be broadly similar.
Fatigue Sensitive Cope Details in Steel Bridges and Implications from Growth in Heavy Vehicle Loads and Numbers – Ancich, Brown, Chirgwin & Madrio
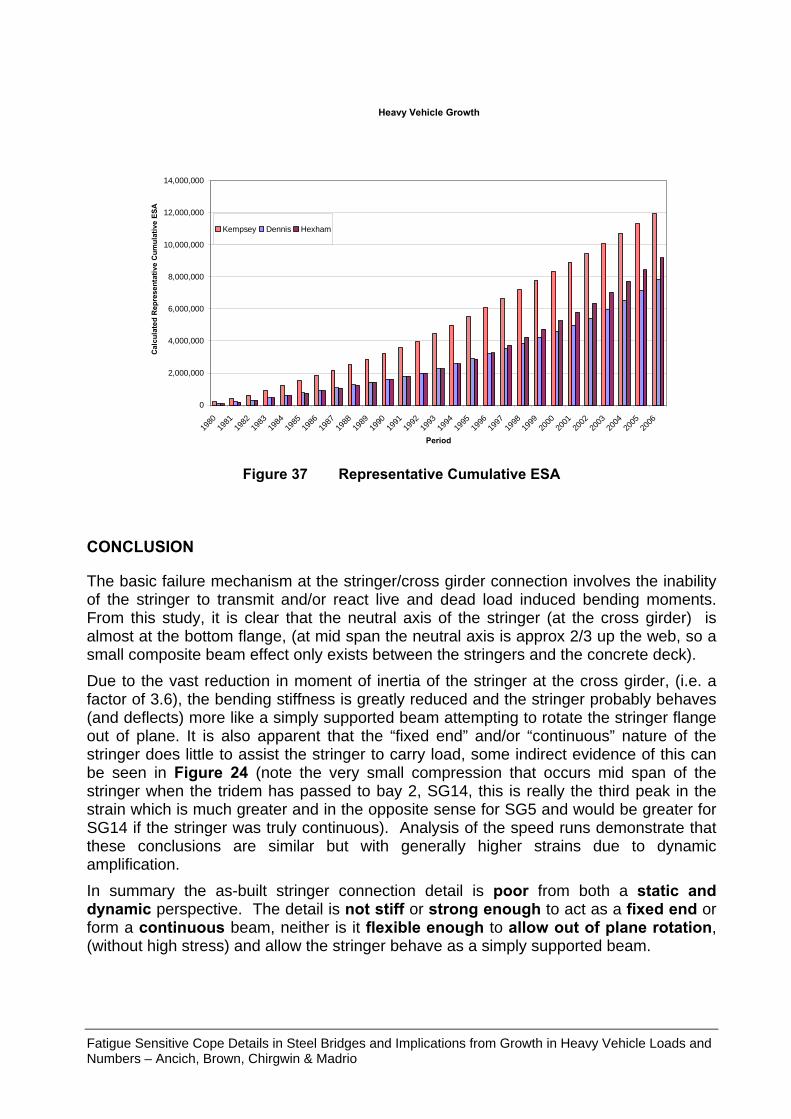
Heavy Vehicle Growth
0
2,000,000
4,000,000
6,000,000
8,000,000
10,000,000
12,000,000
14,000,000
1980
1981
1982
1983
1984
1985
1986
1987
1988
1989
1990
1991
1992
1993
1994
1995
1996
1997
1998
1999
2000
2001
2002
2003
2004
2005
2006
Period
Cal
cula
ted
Rep
rese
ntat
ive
Cum
ulat
ive
ESA
Kempsey Dennis Hexham
Figure 37 Representative Cumulative ESA
CONCLUSION
The basic failure mechanism at the stringer/cross girder connection involves the inability of the stringer to transmit and/or react live and dead load induced bending moments. From this study, it is clear that the neutral axis of the stringer (at the cross girder) is almost at the bottom flange, (at mid span the neutral axis is approx 2/3 up the web, so a small composite beam effect only exists between the stringers and the concrete deck). Due to the vast reduction in moment of inertia of the stringer at the cross girder, (i.e. a factor of 3.6), the bending stiffness is greatly reduced and the stringer probably behaves (and deflects) more like a simply supported beam attempting to rotate the stringer flange out of plane. It is also apparent that the “fixed end” and/or “continuous” nature of the stringer does little to assist the stringer to carry load, some indirect evidence of this can be seen in Figure 24 (note the very small compression that occurs mid span of the stringer when the tridem has passed to bay 2, SG14, this is really the third peak in the strain which is much greater and in the opposite sense for SG5 and would be greater for SG14 if the stringer was truly continuous). Analysis of the speed runs demonstrate that these conclusions are similar but with generally higher strains due to dynamic amplification. In summary the as-built stringer connection detail is poor from both a static and dynamic perspective. The detail is not stiff or strong enough to act as a fixed end or form a continuous beam, neither is it flexible enough to allow out of plane rotation, (without high stress) and allow the stringer behave as a simply supported beam.
Fatigue Sensitive Cope Details in Steel Bridges and Implications from Growth in Heavy Vehicle Loads and Numbers – Ancich, Brown, Chirgwin & Madrio
Possible solutions for this problem that have been identified thus far are placed in two main categories Stiffening, which would include the top flange replacement concepts as well as the stringer truss type stiffening, such concepts would take bending stresses away from the stringer/cross girder connections and/or reduce mid span stringer deflections as well as out of plane rotation, bolts/rivets would probably remain as is. Compliant Fastening, i.e. concepts which allow the out of plane rotation at the stringer support points and allow the stringer to act more as a simply supported beam, have a clear advantage of much lower cost than the stiffening options, and were achieved with access from under the bridge, i.e. no lane closures. Analysis of weigh-in-motion (WIM) data confirm that bridge loadings are increasing due to exponential growth in loads and an even faster growth in axle group repetitions due to the greater utilisation of B-doubles and tri-axle semi-trailers. These data and the apparent load effect for fatigue from uncontrolled heavy vehicle traffic significantly exceeds the value that would be predicted using the test vehicle factored for dynamic effects and multiple presence.
ACKNOWLEDGEMENT
The authors wish to thank the Chief Executive of the Roads and Traffic Authority NSW for permission to publish this paper. The opinions and conclusions expressed in this paper do not necessarily reflect the views of the RTA.
REFERENCES
1. AASHTO, “Standard Specification for Highway Bridges”, American Association of State Highway and Transportation Officials, 15th Edition, Washington, DC, USA, 1973.
2. ROEDER C.W., MACRAE G.A., ARIMA K., CROCKER P.N. & WONG S.D., “Fatigue Cracking of Riveted Steel Tied Arch and Truss Bridges”, Research Report WA-RD 447.1, Washington State Transportation Center, Seattle, USA, 1998.
3. Roads & Traffic Authority of NSW. “Blueprint - RTA Corporate Plan 2008 to 2012”, RTA Publication 07.329, Sydney, Australia, 2008.
4. IMAM, B.M., RIGHINIOTIS T.D. & CHRYSSANTHOPOULOS M.K., “Probabilistic Fatigue Evaluation of Riveted Railway Bridges”, J. Bridge Engineering, ASCE, 13(3), 237-244, 2008.
5. GARGETT D., HOSSAIN A. & COSGROVE D., “Interstate Freight on States’ Roads”, Proc. 29th Australasian Transport Research Forum, Surfers Paradise, Australia, 2006.
6. FU G., FENG J., DEKELBAB W., MOSES F., COHEN H. & MERTZ D., “Impact of Commercial Vehicle Weight Change on Highway Bridge Infrastructure”, J. Bridge Engineering, ASCE, 13(6), 556-564, 2008.
Fatigue Sensitive Cope Details in Steel Bridges and Implications from Growth in Heavy Vehicle Loads and Numbers – Ancich, Brown, Chirgwin & Madrio
7. MORASSI A. & TONON S., “Dynamic Testing for Structural Identification of a Bridge”, J. Bridge Engineering, ASCE, 13(6), 573-585, 2008.
8. EWINS D.J. “Modal Testing: Theory, Practice & Application (2nd Edition)”, Research Studies Press, Hertfordshire, UK, 163-276, 1999.
9. ROEDER C.W., MACRAE G.A., KALOGIROS A.Y. & LELAND A., “Fatigue Cracking of Riveted, Coped, Stringer-to-Floorbeam Connections”, Research Report WA-RD 494.1, Washington State Transportation Center, Seattle, USA, 2001.
10. ROEDER C.W., MACRAE G.A., LELAND A. & ROSPO A., “Extending the Fatigue Life of Riveted Coped Stringer Connections”, J. Bridge Engineering, ASCE, 10(1), 69-76, 2005.
Fatigue Sensitive Cope Details in Steel Bridges and Implications from Growth in Heavy Vehicle Loads and Numbers – Ancich, Brown, Chirgwin & Madrio

Appendix M
Ancich E.J. and Brown S.C. (2009). Premature Fatigue Failure in a Horizontally
Curved Steel Trough Girder Bridge, Proc. International Association for Bridge &
Structural Engineering (IABSE) Symposium, Bangkok, Thailand.

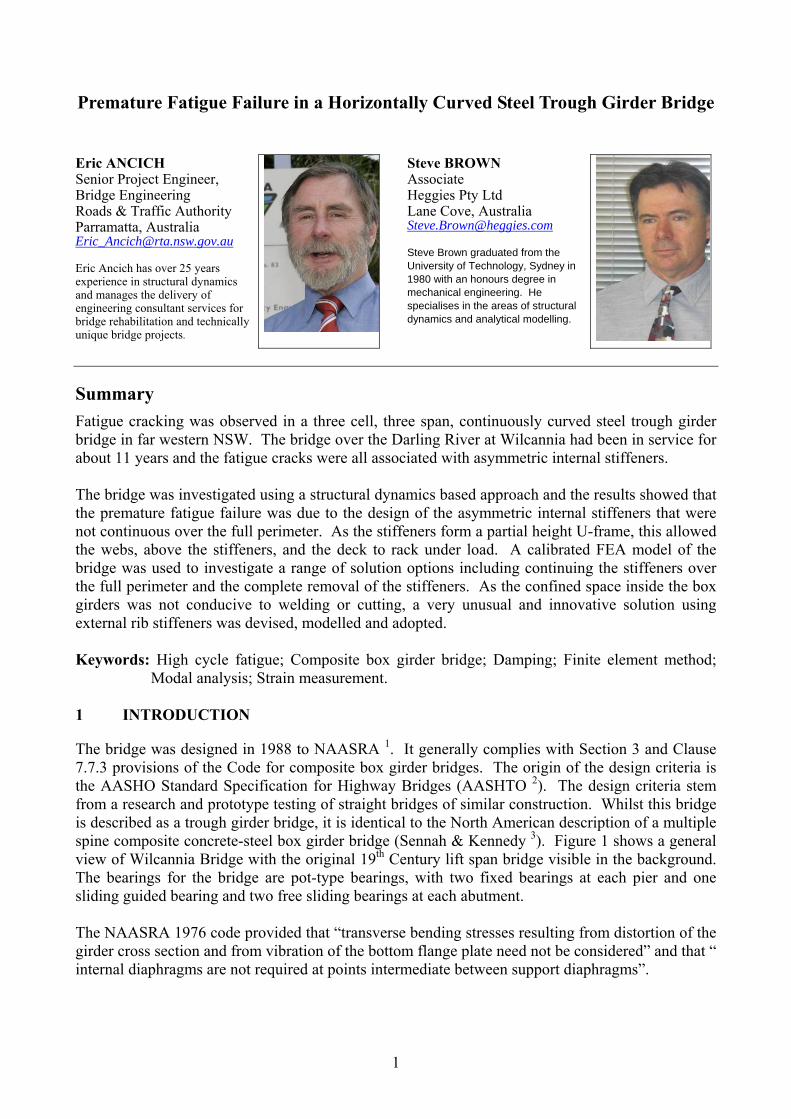
Premature Fatigue Failure in a Horizontally Curved Steel Trough Girder Bridge Eric ANCICH Senior Project Engineer, Bridge Engineering Roads & Traffic Authority Parramatta, Australia [email protected] Eric Ancich has over 25 years experience in structural dynamics and manages the delivery of engineering consultant services for bridge rehabilitation and technically unique bridge projects.
Steve BROWN Associate Heggies Pty Ltd Lane Cove, Australia [email protected] Steve Brown graduated from the University of Technology, Sydney in 1980 with an honours degree in mechanical engineering. He specialises in the areas of structural dynamics and analytical modelling.
Summary Fatigue cracking was observed in a three cell, three span, continuously curved steel trough girder bridge in far western NSW. The bridge over the Darling River at Wilcannia had been in service for about 11 years and the fatigue cracks were all associated with asymmetric internal stiffeners. The bridge was investigated using a structural dynamics based approach and the results showed that the premature fatigue failure was due to the design of the asymmetric internal stiffeners that were not continuous over the full perimeter. As the stiffeners form a partial height U-frame, this allowed the webs, above the stiffeners, and the deck to rack under load. A calibrated FEA model of the bridge was used to investigate a range of solution options including continuing the stiffeners over the full perimeter and the complete removal of the stiffeners. As the confined space inside the box girders was not conducive to welding or cutting, a very unusual and innovative solution using external rib stiffeners was devised, modelled and adopted. Keywords: High cycle fatigue; Composite box girder bridge; Damping; Finite element method;
Modal analysis; Strain measurement. 1 INTRODUCTION
The bridge was designed in 1988 to NAASRA 1. It generally complies with Section 3 and Clause 7.7.3 provisions of the Code for composite box girder bridges. The origin of the design criteria is the AASHO Standard Specification for Highway Bridges (AASHTO 2). The design criteria stem from a research and prototype testing of straight bridges of similar construction. Whilst this bridge is described as a trough girder bridge, it is identical to the North American description of a multiple spine composite concrete-steel box girder bridge (Sennah & Kennedy 3). Figure 1 shows a general view of Wilcannia Bridge with the original 19th Century lift span bridge visible in the background. The bearings for the bridge are pot-type bearings, with two fixed bearings at each pier and one sliding guided bearing and two free sliding bearings at each abutment. The NAASRA 1976 code provided that “transverse bending stresses resulting from distortion of the girder cross section and from vibration of the bottom flange plate need not be considered” and that “ internal diaphragms are not required at points intermediate between support diaphragms”.
1
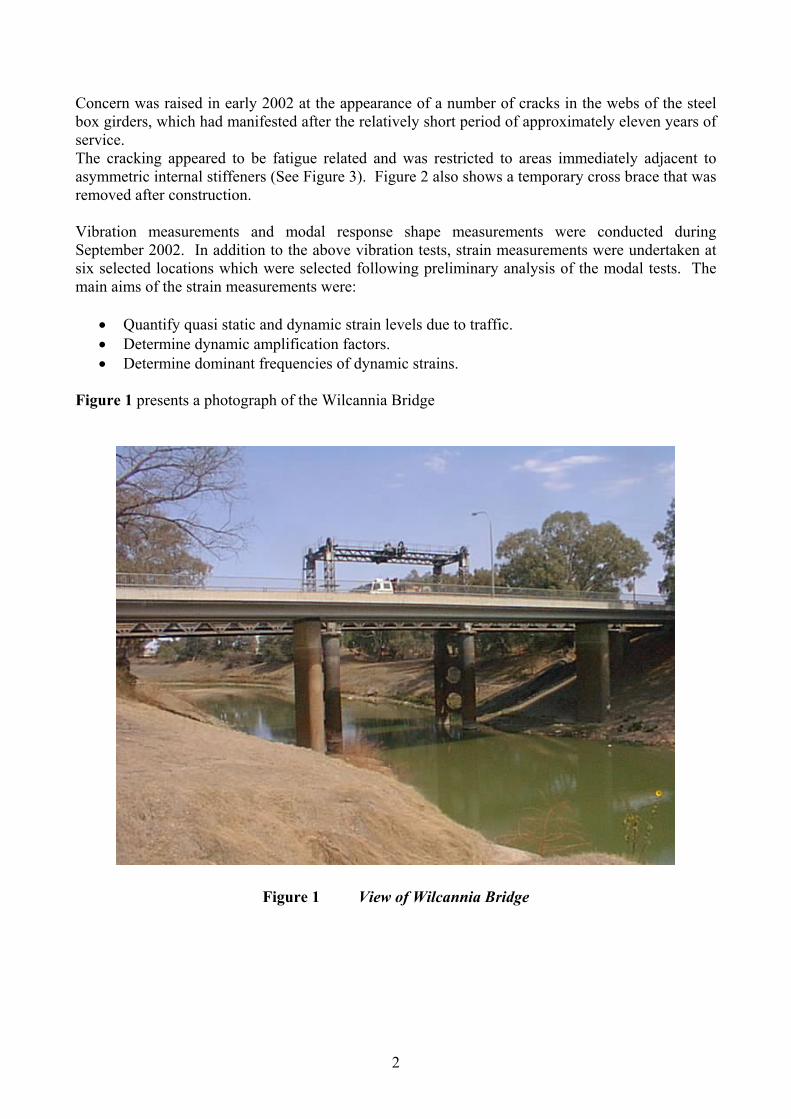
Concern was raised in early 2002 at the appearance of a number of cracks in the webs of the steel box girders, which had manifested after the relatively short period of approximately eleven years of service. The cracking appeared to be fatigue related and was restricted to areas immediately adjacent to asymmetric internal stiffeners (See Figure 3). Figure 2 also shows a temporary cross brace that was removed after construction. Vibration measurements and modal response shape measurements were conducted during September 2002. In addition to the above vibration tests, strain measurements were undertaken at six selected locations which were selected following preliminary analysis of the modal tests. The main aims of the strain measurements were:
• Quantify quasi static and dynamic strain levels due to traffic. • Determine dynamic amplification factors. • Determine dominant frequencies of dynamic strains.
Figure 1 presents a photograph of the Wilcannia Bridge
Figure 1 View of Wilcannia Bridge
2
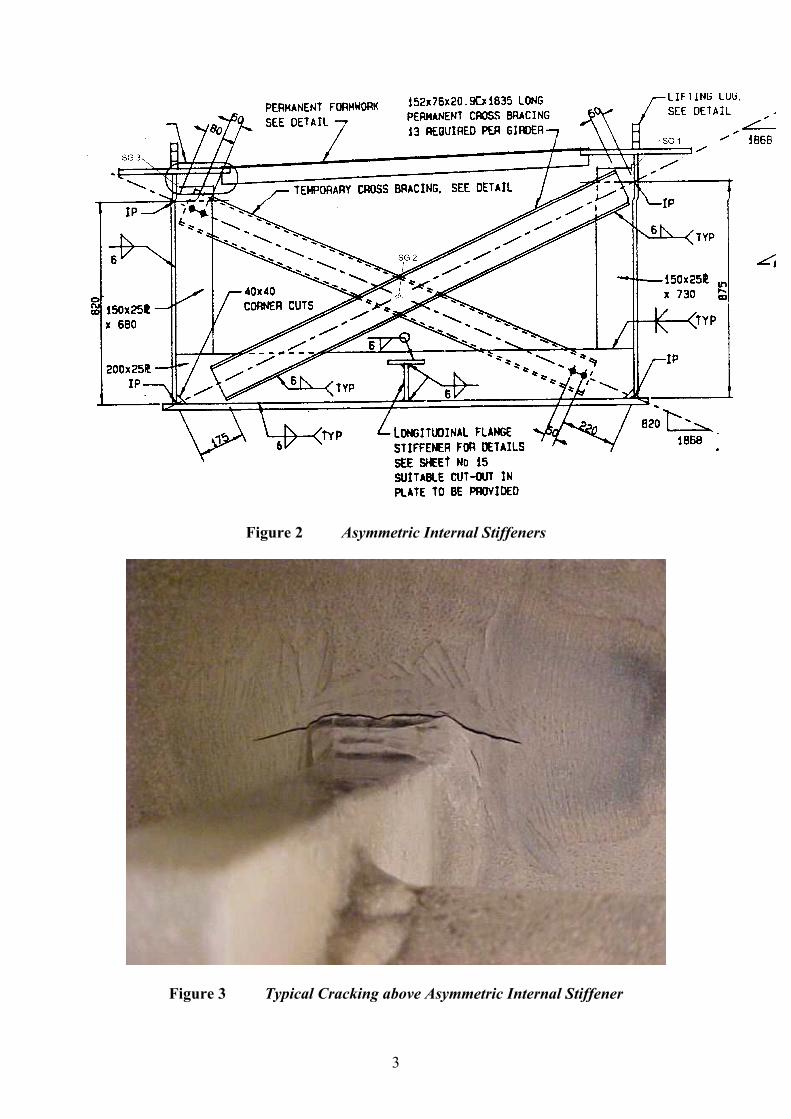
Figure 2 Asymmetric Internal Stiffeners
Figure 3 Typical Cracking above Asymmetric Internal Stiffener
3
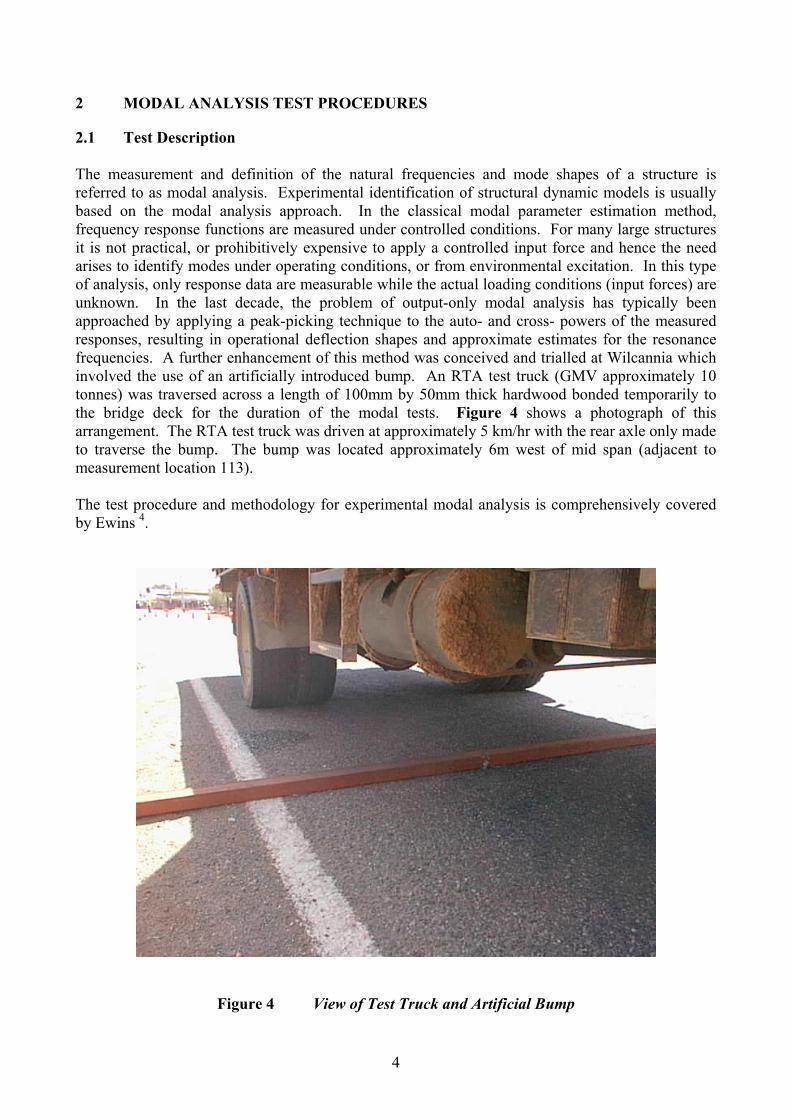
2 MODAL ANALYSIS TEST PROCEDURES
2.1 Test Description The measurement and definition of the natural frequencies and mode shapes of a structure is referred to as modal analysis. Experimental identification of structural dynamic models is usually based on the modal analysis approach. In the classical modal parameter estimation method, frequency response functions are measured under controlled conditions. For many large structures it is not practical, or prohibitively expensive to apply a controlled input force and hence the need arises to identify modes under operating conditions, or from environmental excitation. In this type of analysis, only response data are measurable while the actual loading conditions (input forces) are unknown. In the last decade, the problem of output-only modal analysis has typically been approached by applying a peak-picking technique to the auto- and cross- powers of the measured responses, resulting in operational deflection shapes and approximate estimates for the resonance frequencies. A further enhancement of this method was conceived and trialled at Wilcannia which involved the use of an artificially introduced bump. An RTA test truck (GMV approximately 10 tonnes) was traversed across a length of 100mm by 50mm thick hardwood bonded temporarily to the bridge deck for the duration of the modal tests. Figure 4 shows a photograph of this arrangement. The RTA test truck was driven at approximately 5 km/hr with the rear axle only made to traverse the bump. The bump was located approximately 6m west of mid span (adjacent to measurement location 113). The test procedure and methodology for experimental modal analysis is comprehensively covered by Ewins 4.
Figure 4 View of Test Truck and Artificial Bump
4
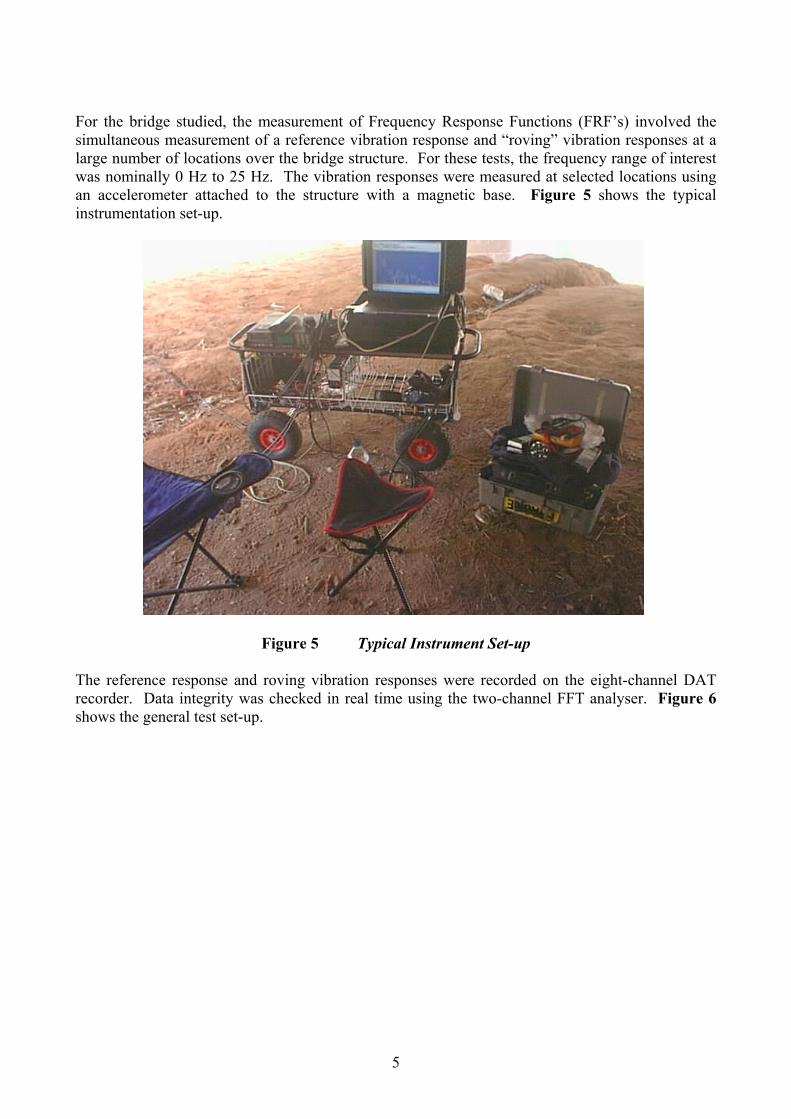
For the bridge studied, the measurement of Frequency Response Functions (FRF’s) involved the simultaneous measurement of a reference vibration response and “roving” vibration responses at a large number of locations over the bridge structure. For these tests, the frequency range of interest was nominally 0 Hz to 25 Hz. The vibration responses were measured at selected locations using an accelerometer attached to the structure with a magnetic base. Figure 5 shows the typical instrumentation set-up.
Figure 5 Typical Instrument Set-up
The reference response and roving vibration responses were recorded on the eight-channel DAT recorder. Data integrity was checked in real time using the two-channel FFT analyser. Figure 6 shows the general test set-up.
5
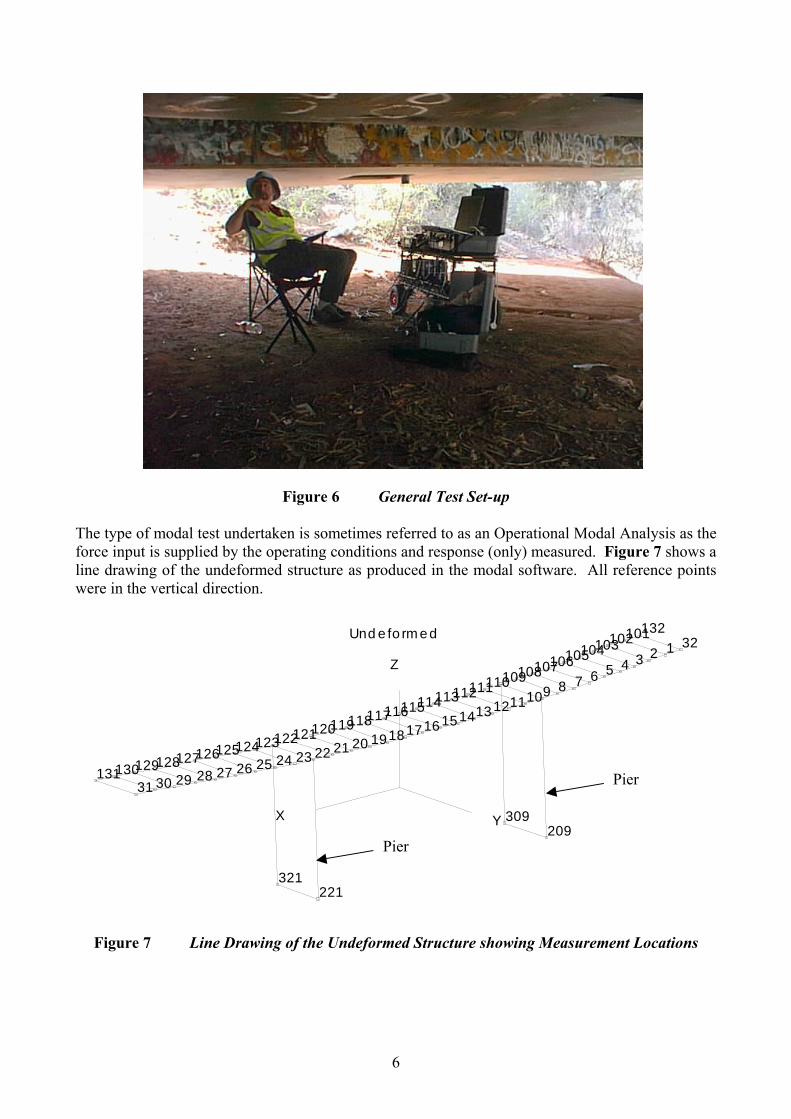
Figure 6 General Test Set-up
The type of modal test undertaken is sometimes referred to as an Operational Modal Analysis as the force input is supplied by the operating conditions and response (only) measured. Figure 7 shows a line drawing of the undeformed structure as produced in the modal software. All reference points were in the vertical direction.
X Y
Z12345678910111213141516171819202122232425262728293031
32101102103104105106107108109110111112113114115116117118119120121122123124125126127128129130131
132
209
221
309
321
Und e fo rm ed
Pier
Pier
Figure 7 Line Drawing of the Undeformed Structure showing Measurement Locations
6
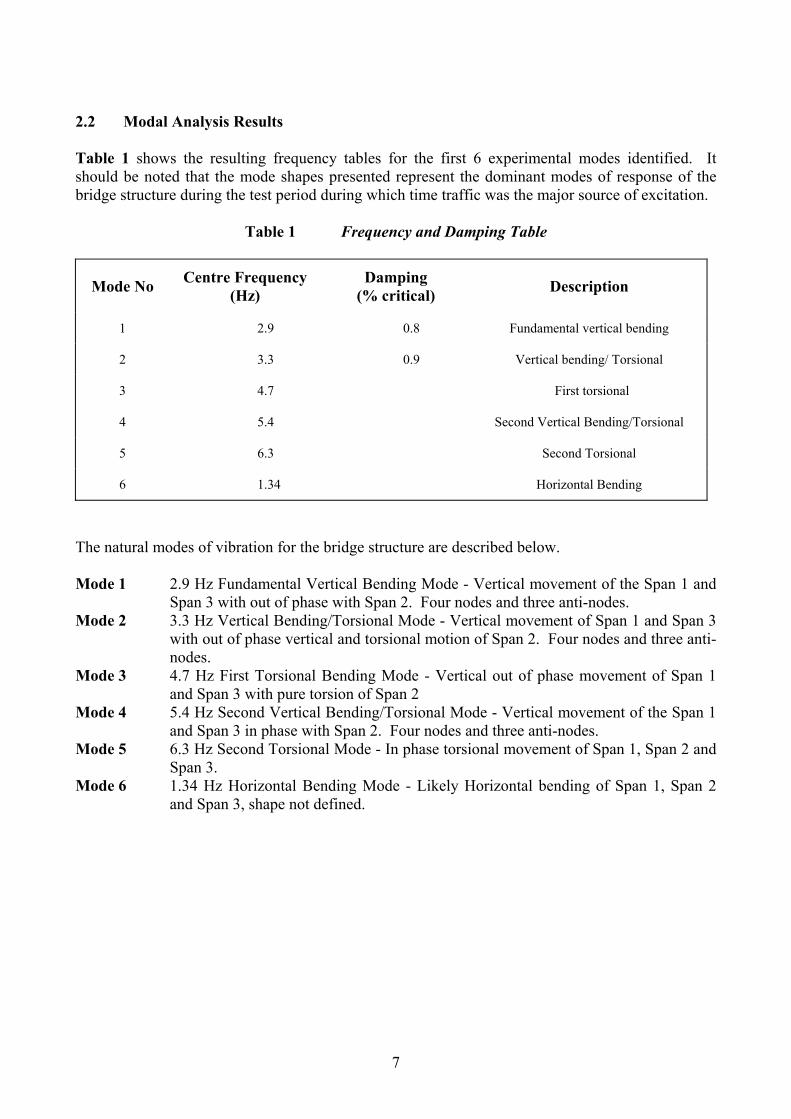
2.2 Modal Analysis Results Table 1 shows the resulting frequency tables for the first 6 experimental modes identified. It should be noted that the mode shapes presented represent the dominant modes of response of the bridge structure during the test period during which time traffic was the major source of excitation.
Table 1 Frequency and Damping Table
Mode No Centre Frequency (Hz)
Damping (% critical) Description
1 2.9 0.8 Fundamental vertical bending
2 3.3 0.9 Vertical bending/ Torsional
3 4.7 First torsional
4 5.4 Second Vertical Bending/Torsional
5 6.3 Second Torsional
6 1.34 Horizontal Bending
The natural modes of vibration for the bridge structure are described below. Mode 1 2.9 Hz Fundamental Vertical Bending Mode - Vertical movement of the Span 1 and
Span 3 with out of phase with Span 2. Four nodes and three anti-nodes. Mode 2 3.3 Hz Vertical Bending/Torsional Mode - Vertical movement of Span 1 and Span 3
with out of phase vertical and torsional motion of Span 2. Four nodes and three anti-nodes.
Mode 3 4.7 Hz First Torsional Bending Mode - Vertical out of phase movement of Span 1 and Span 3 with pure torsion of Span 2
Mode 4 5.4 Hz Second Vertical Bending/Torsional Mode - Vertical movement of the Span 1 and Span 3 in phase with Span 2. Four nodes and three anti-nodes.
Mode 5 6.3 Hz Second Torsional Mode - In phase torsional movement of Span 1, Span 2 and Span 3.
Mode 6 1.34 Hz Horizontal Bending Mode - Likely Horizontal bending of Span 1, Span 2 and Span 3, shape not defined.
7
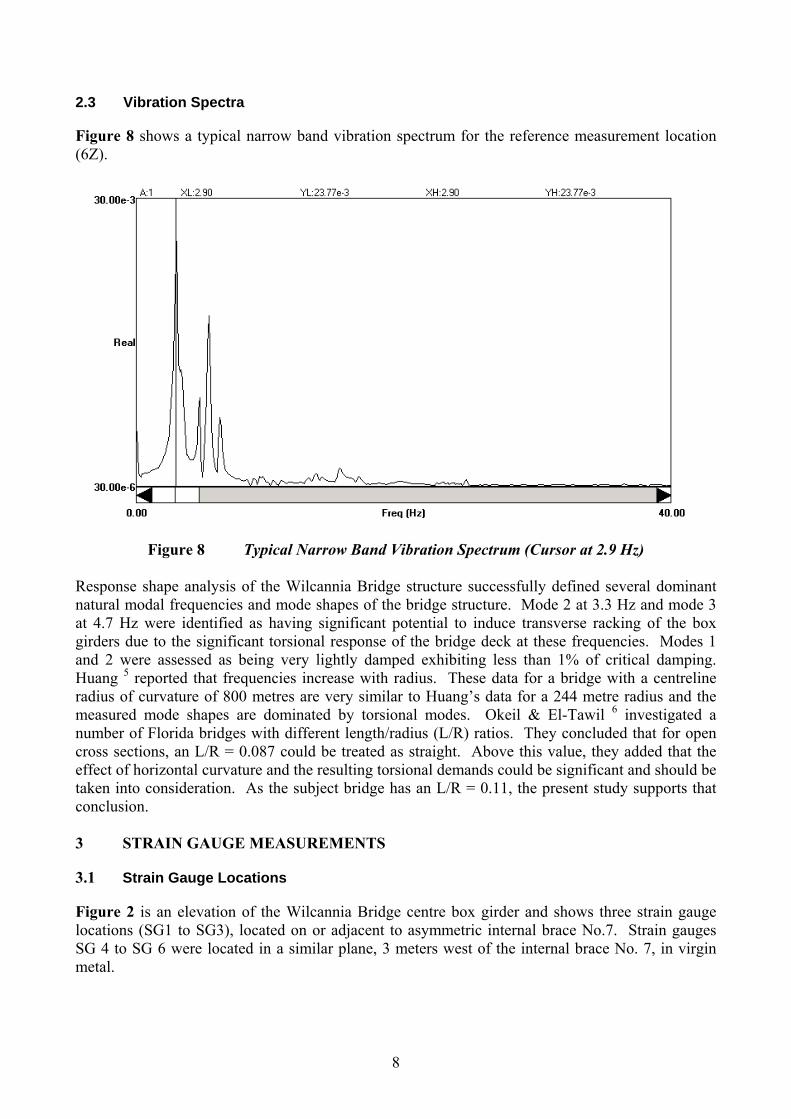
2.3 Vibration Spectra
Figure 8 shows a typical narrow band vibration spectrum for the reference measurement location (6Z).
Figure 8 Typical Narrow Band Vibration Spectrum (Cursor at 2.9 Hz) Response shape analysis of the Wilcannia Bridge structure successfully defined several dominant natural modal frequencies and mode shapes of the bridge structure. Mode 2 at 3.3 Hz and mode 3 at 4.7 Hz were identified as having significant potential to induce transverse racking of the box girders due to the significant torsional response of the bridge deck at these frequencies. Modes 1 and 2 were assessed as being very lightly damped exhibiting less than 1% of critical damping. Huang 5 reported that frequencies increase with radius. These data for a bridge with a centreline radius of curvature of 800 metres are very similar to Huang’s data for a 244 metre radius and the measured mode shapes are dominated by torsional modes. Okeil & El-Tawil 6 investigated a number of Florida bridges with different length/radius (L/R) ratios. They concluded that for open cross sections, an L/R = 0.087 could be treated as straight. Above this value, they added that the effect of horizontal curvature and the resulting torsional demands could be significant and should be taken into consideration. As the subject bridge has an L/R = 0.11, the present study supports that conclusion. 3 STRAIN GAUGE MEASUREMENTS
3.1 Strain Gauge Locations
Figure 2 is an elevation of the Wilcannia Bridge centre box girder and shows three strain gauge locations (SG1 to SG3), located on or adjacent to asymmetric internal brace No.7. Strain gauges SG 4 to SG 6 were located in a similar plane, 3 meters west of the internal brace No. 7, in virgin metal.
8
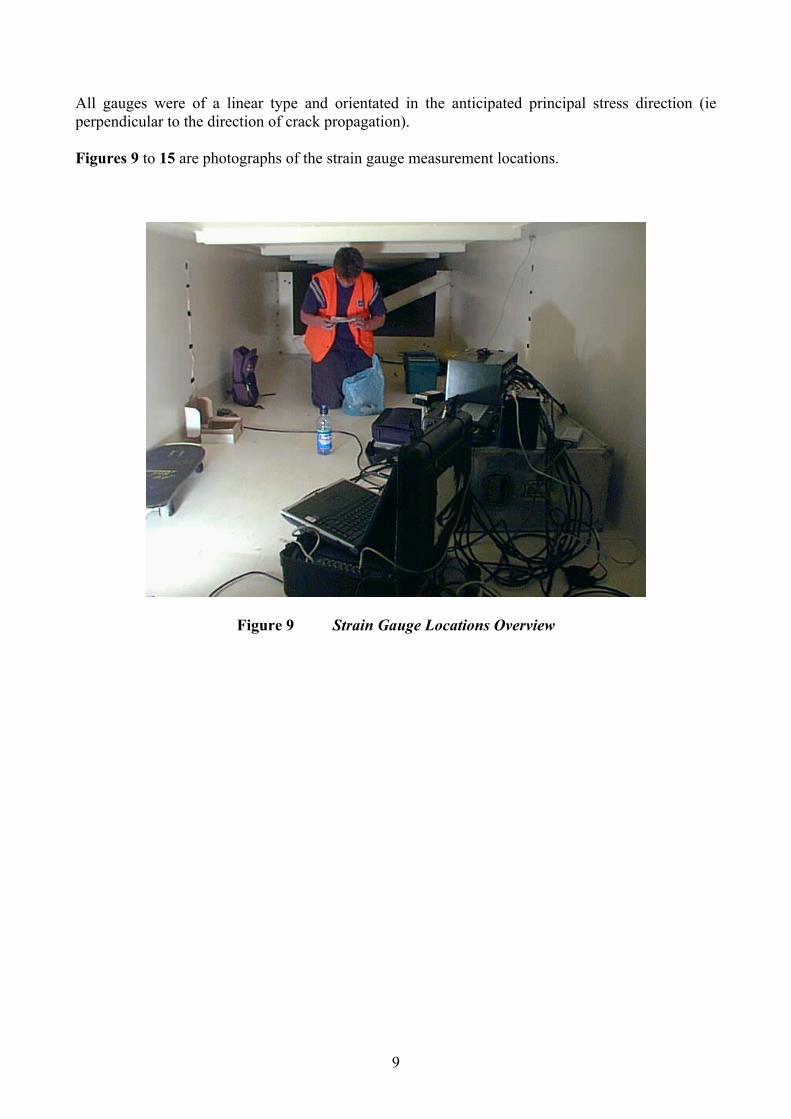
All gauges were of a linear type and orientated in the anticipated principal stress direction (ie perpendicular to the direction of crack propagation). Figures 9 to 15 are photographs of the strain gauge measurement locations.
Figure 9 Strain Gauge Locations Overview
9
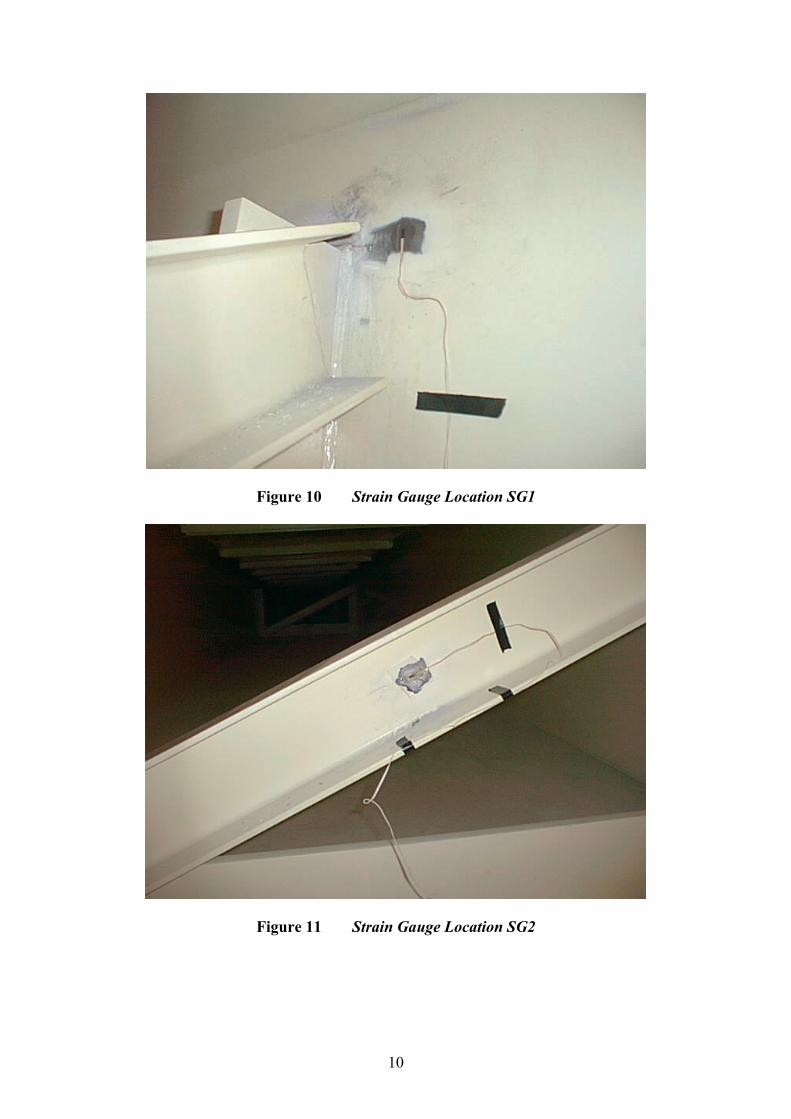
Figure 10 Strain Gauge Location SG1
Figure 11 Strain Gauge Location SG2
10
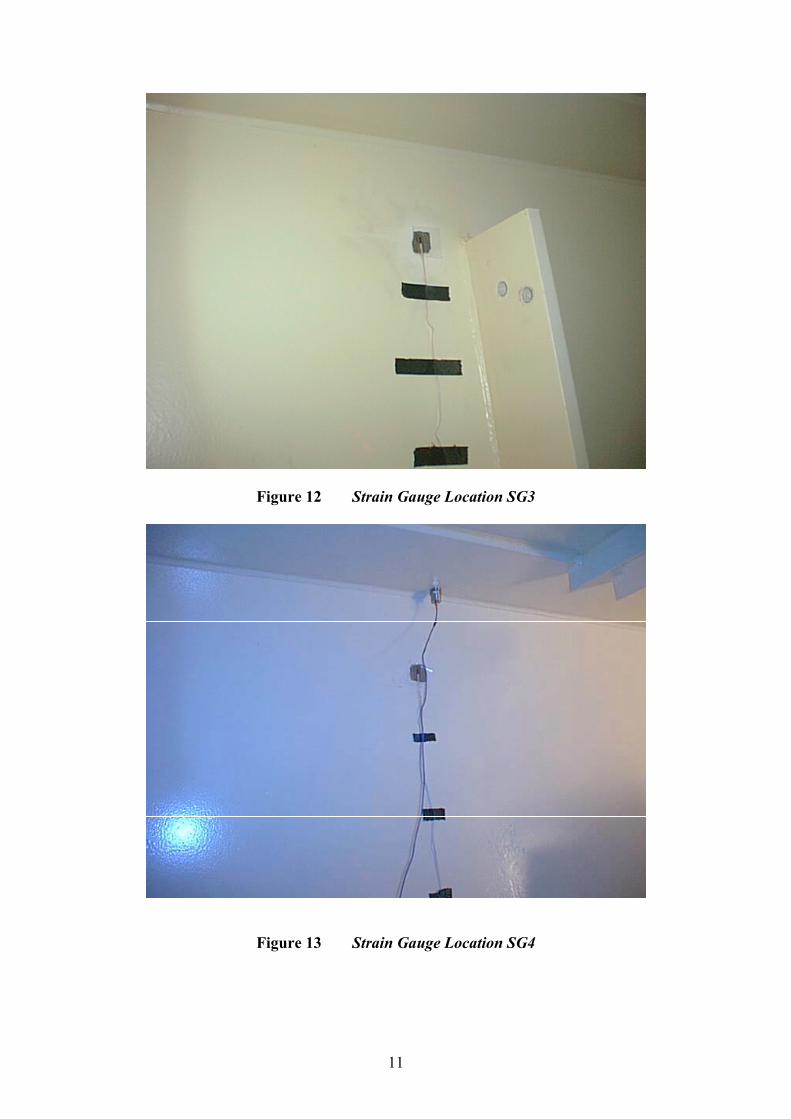
Figure 12 Strain Gauge Location SG3
Figure 13 Strain Gauge Location SG4
11
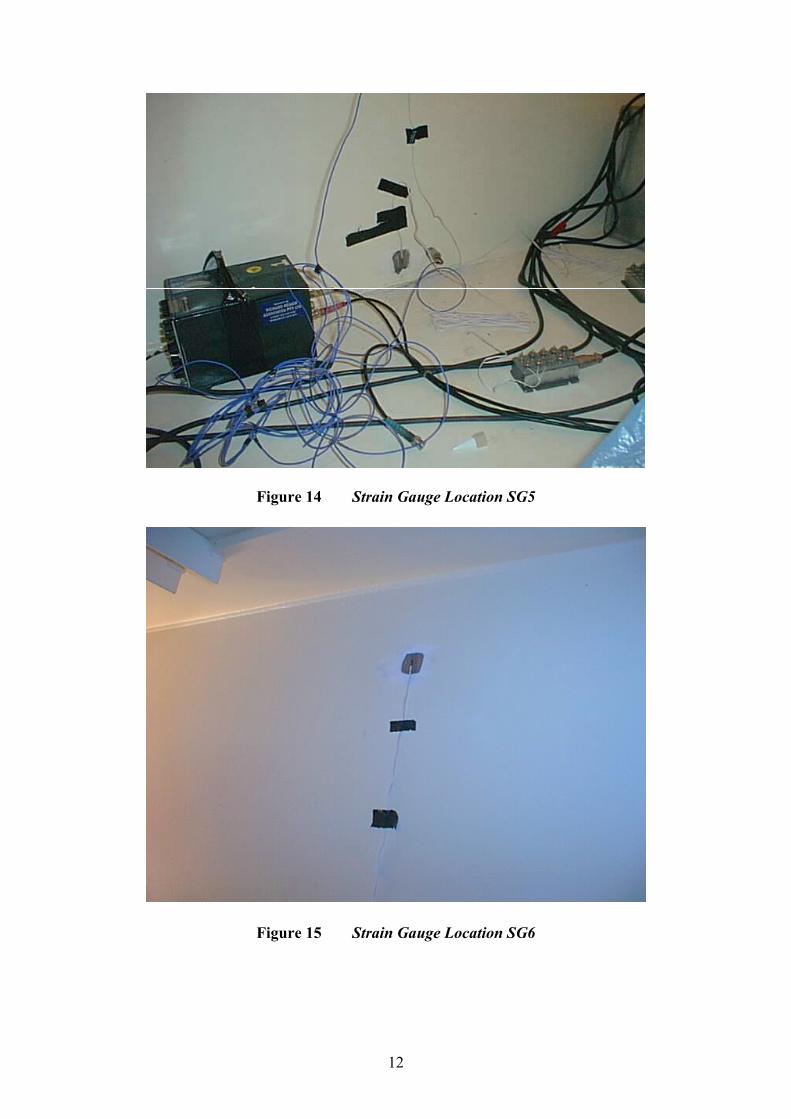
Figure 14 Strain Gauge Location SG5
Figure 15 Strain Gauge Location SG6
12
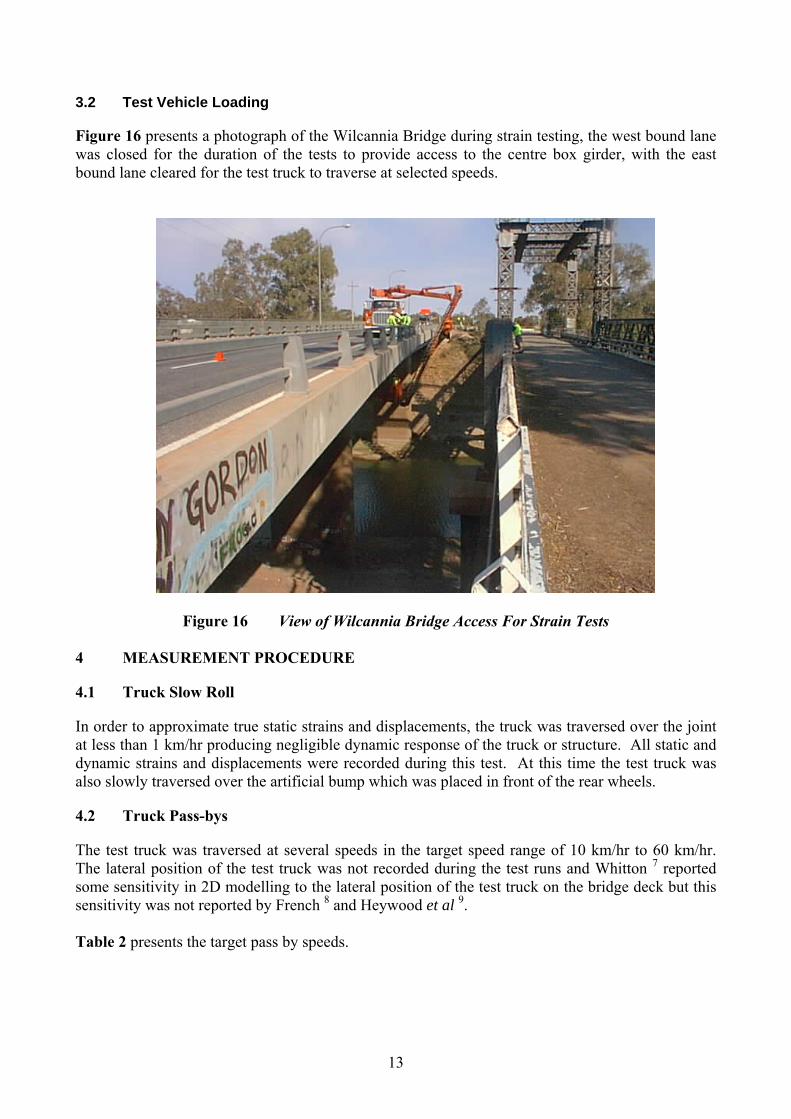
3.2 Test Vehicle Loading
Figure 16 presents a photograph of the Wilcannia Bridge during strain testing, the west bound lane was closed for the duration of the tests to provide access to the centre box girder, with the east bound lane cleared for the test truck to traverse at selected speeds.
Figure 16 View of Wilcannia Bridge Access For Strain Tests 4 MEASUREMENT PROCEDURE
4.1 Truck Slow Roll
In order to approximate true static strains and displacements, the truck was traversed over the joint at less than 1 km/hr producing negligible dynamic response of the truck or structure. All static and dynamic strains and displacements were recorded during this test. At this time the test truck was also slowly traversed over the artificial bump which was placed in front of the rear wheels.
4.2 Truck Pass-bys
The test truck was traversed at several speeds in the target speed range of 10 km/hr to 60 km/hr. The lateral position of the test truck was not recorded during the test runs and Whitton 7 reported some sensitivity in 2D modelling to the lateral position of the test truck on the bridge deck but this sensitivity was not reported by French 8 and Heywood et al 9. Table 2 presents the target pass by speeds.
13
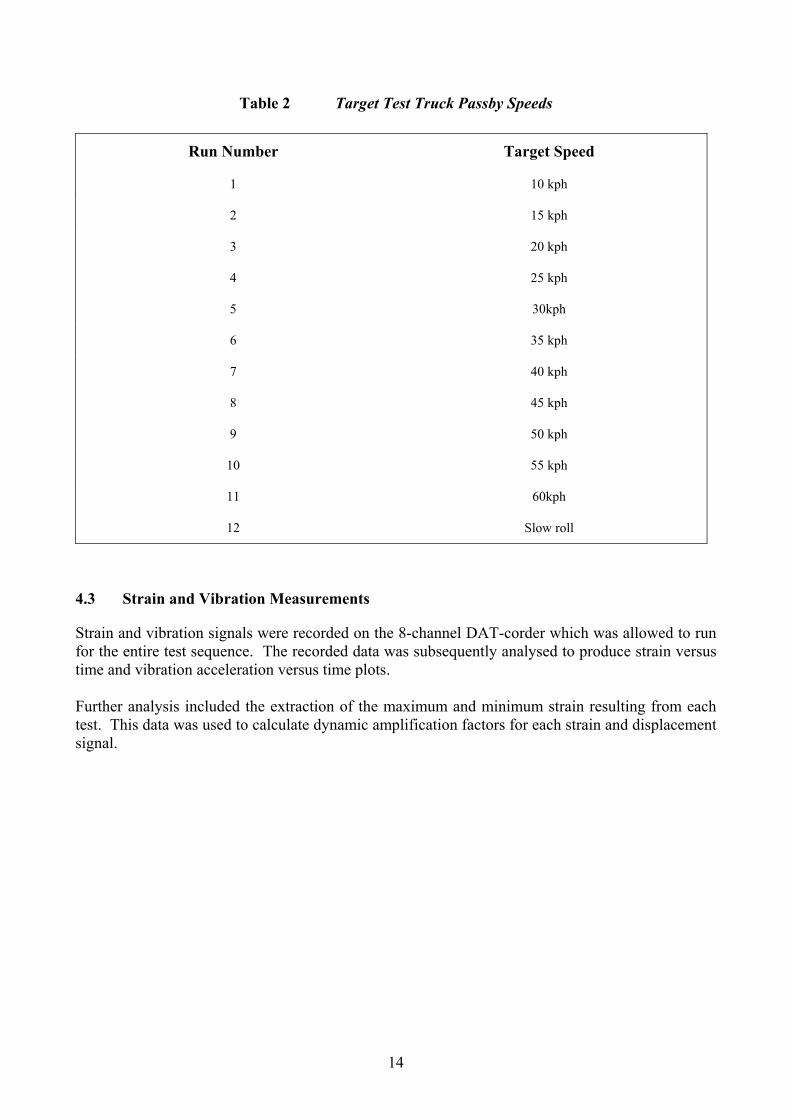
Table 2 Target Test Truck Passby Speeds
Run Number Target Speed
1 10 kph
2 15 kph
3 20 kph
4 25 kph
5 30kph
6 35 kph
7 40 kph
8 45 kph
9 50 kph
10 55 kph
11 60kph
12 Slow roll
4.3 Strain and Vibration Measurements
Strain and vibration signals were recorded on the 8-channel DAT-corder which was allowed to run for the entire test sequence. The recorded data was subsequently analysed to produce strain versus time and vibration acceleration versus time plots. Further analysis included the extraction of the maximum and minimum strain resulting from each test. This data was used to calculate dynamic amplification factors for each strain and displacement signal.
14

The positive dynamic amplification factor was calculated as follows:
Dynamic Amplification Factor (Positive) =
Strain Static Maximumstatic) as sense (sameStrain Dynamic Maximum
The negative dynamic amplification factor was calculated as follows:
Dynamic Amplification Factor (Negative) =
Strain Static Maximumstatic) as sense (oppositeStrain Dynamic Maximum
The total dynamic amplification factor was calculated as follows:
Dynamic Amplification Factor (Total) = Strain Static Maximum
Strain Dynamic Minimum -Strain Dynamic Maximum
5 RESULTS AND DISCUSSIONS
Table 3 presents a summary of the resulting maximum strains, stresses and dynamic amplification factors for each test. It should be noted that dynamic amplification factor (DAF) is the same as the impact factor plus 100%. Huang 10 undertook static and dynamic strain gauge testing using a calibrated (known axle weight) truck but his results do not identify whether the dynamic strains are associated with any particular modes. Figure 17 shows that most strain is associated with mode 2 that has a significant torsional component.
15
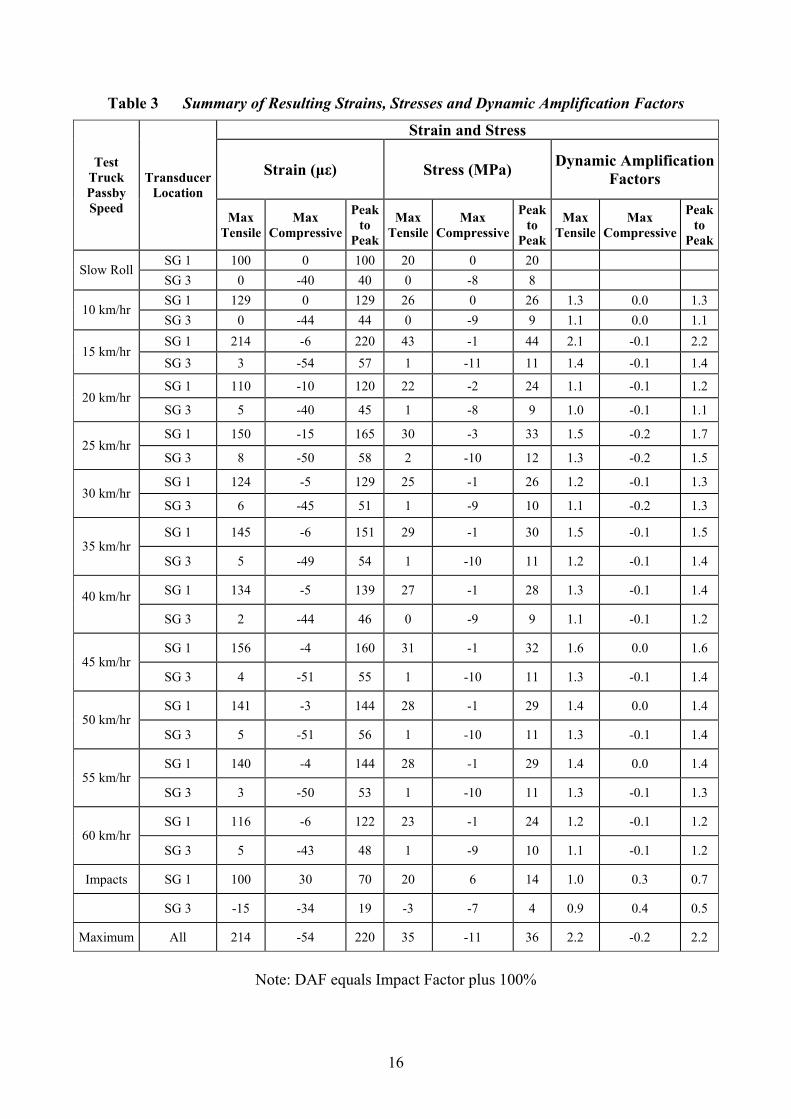
Table 3 Summary of Resulting Strains, Stresses and Dynamic Amplification Factors
Strain and Stress
Strain (µε) Stress (MPa) Dynamic Amplification Factors
Test Truck Passby Speed
Transducer Location
Max Tensile
Max Compressive
Peak to
Peak
Max Tensile
Max Compressive
Peak to
Peak
Max Tensile
Max Compressive
Peak to
PeakSG 1 100 0 100 20 0 20
Slow Roll SG 3 0 -40 40 0 -8 8 SG 1 129 0 129 26 0 26 1.3 0.0 1.3
10 km/hr SG 3 0 -44 44 0 -9 9 1.1 0.0 1.1 SG 1 214 -6 220 43 -1 44 2.1 -0.1 2.2
15 km/hr SG 3 3 -54 57 1 -11 11 1.4 -0.1 1.4
SG 1 110 -10 120 22 -2 24 1.1 -0.1 1.2 20 km/hr
SG 3 5 -40 45 1 -8 9 1.0 -0.1 1.1
SG 1 150 -15 165 30 -3 33 1.5 -0.2 1.7 25 km/hr
SG 3 8 -50 58 2 -10 12 1.3 -0.2 1.5
SG 1 124 -5 129 25 -1 26 1.2 -0.1 1.3 30 km/hr
SG 3 6 -45 51 1 -9 10 1.1 -0.2 1.3
SG 1 145 -6 151 29 -1 30 1.5 -0.1 1.5 35 km/hr
SG 3 5 -49 54 1 -10 11 1.2 -0.1 1.4
SG 1 134 -5 139 27 -1 28 1.3 -0.1 1.4 40 km/hr SG 3 2 -44 46 0 -9 9 1.1 -0.1 1.2
SG 1 156 -4 160 31 -1 32 1.6 0.0 1.6 45 km/hr
SG 3 4 -51 55 1 -10 11 1.3 -0.1 1.4
SG 1 141 -3 144 28 -1 29 1.4 0.0 1.4 50 km/hr
SG 3 5 -51 56 1 -10 11 1.3 -0.1 1.4
SG 1 140 -4 144 28 -1 29 1.4 0.0 1.4 55 km/hr
SG 3 3 -50 53 1 -10 11 1.3 -0.1 1.3
SG 1 116 -6 122 23 -1 24 1.2 -0.1 1.2 60 km/hr
SG 3 5 -43 48 1 -9 10 1.1 -0.1 1.2
Impacts SG 1 100 30 70 20 6 14 1.0 0.3 0.7
SG 3 -15 -34 19 -3 -7 4 0.9 0.4 0.5
Maximum All 214 -54 220 35 -11 36 2.2 -0.2 2.2
Note: DAF equals Impact Factor plus 100%
16
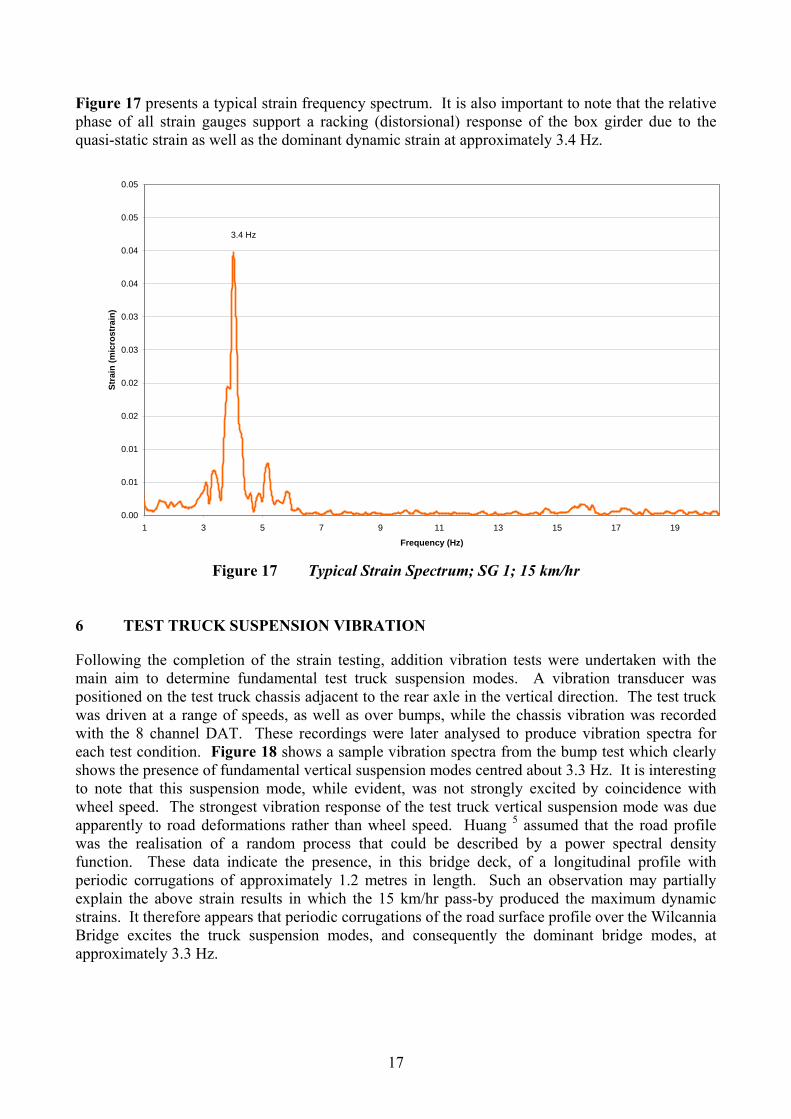
Figure 17 presents a typical strain frequency spectrum. It is also important to note that the relative phase of all strain gauges support a racking (distorsional) response of the box girder due to the quasi-static strain as well as the dominant dynamic strain at approximately 3.4 Hz.
0.00
0.01
0.01
0.02
0.02
0.03
0.03
0.04
0.04
0.05
0.05
1 3 5 7 9 11 13 15 17 19
Frequency (Hz)
Stra
in (m
icro
stra
in)
3.4 Hz
Figure 17 Typical Strain Spectrum; SG 1; 15 km/hr
6 TEST TRUCK SUSPENSION VIBRATION
Following the completion of the strain testing, addition vibration tests were undertaken with the main aim to determine fundamental test truck suspension modes. A vibration transducer was positioned on the test truck chassis adjacent to the rear axle in the vertical direction. The test truck was driven at a range of speeds, as well as over bumps, while the chassis vibration was recorded with the 8 channel DAT. These recordings were later analysed to produce vibration spectra for each test condition. Figure 18 shows a sample vibration spectra from the bump test which clearly shows the presence of fundamental vertical suspension modes centred about 3.3 Hz. It is interesting to note that this suspension mode, while evident, was not strongly excited by coincidence with wheel speed. The strongest vibration response of the test truck vertical suspension mode was due apparently to road deformations rather than wheel speed. Huang 5 assumed that the road profile was the realisation of a random process that could be described by a power spectral density function. These data indicate the presence, in this bridge deck, of a longitudinal profile with periodic corrugations of approximately 1.2 metres in length. Such an observation may partially explain the above strain results in which the 15 km/hr pass-by produced the maximum dynamic strains. It therefore appears that periodic corrugations of the road surface profile over the Wilcannia Bridge excites the truck suspension modes, and consequently the dominant bridge modes, at approximately 3.3 Hz.
17
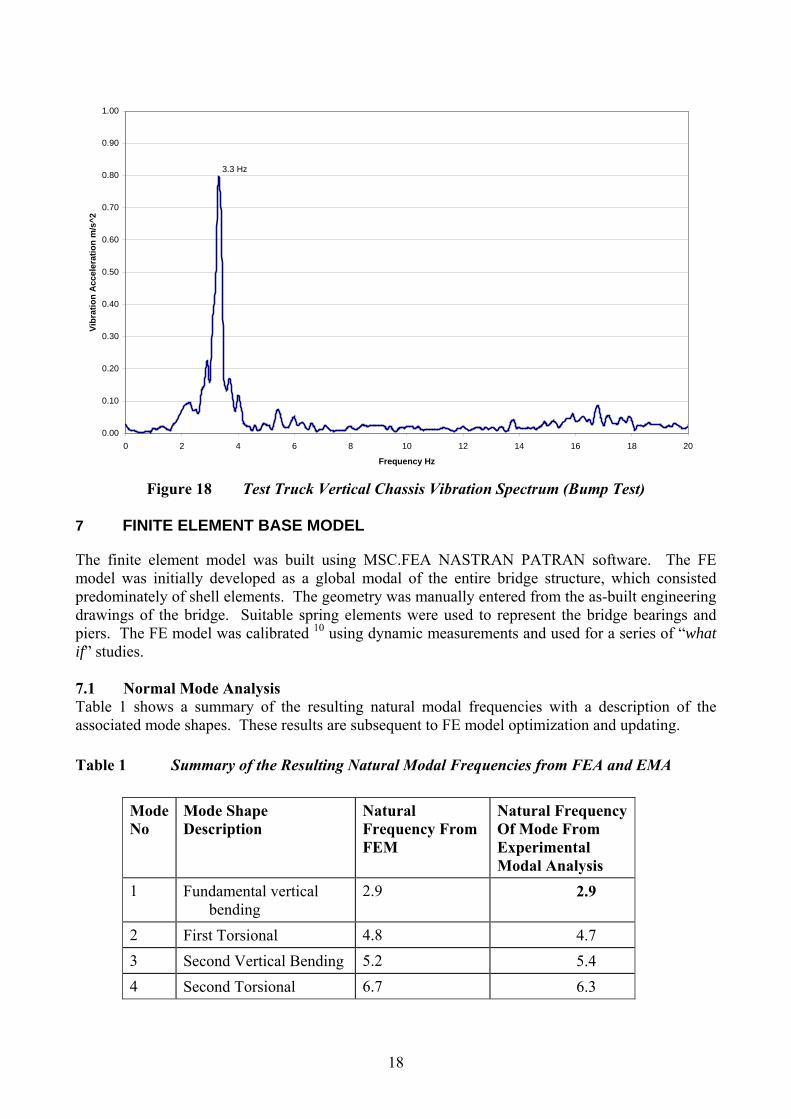
0.00
0.10
0.20
0.30
0.40
0.50
0.60
0.70
0.80
0.90
1.00
0 2 4 6 8 10 12 14 16 18 2
Frequency Hz
Vibr
atio
n A
ccel
erat
ion
m/s
^2
3.3 Hz
0
Figure 18 Test Truck Vertical Chassis Vibration Spectrum (Bump Test)
7 FINITE ELEMENT BASE MODEL
The finite element model was built using MSC.FEA NASTRAN PATRAN software. The FE model was initially developed as a global modal of the entire bridge structure, which consisted predominately of shell elements. The geometry was manually entered from the as-built engineering drawings of the bridge. Suitable spring elements were used to represent the bridge bearings and piers. The FE model was calibrated 10 using dynamic measurements and used for a series of “what if” studies. 7.1 Normal Mode Analysis Table 1 shows a summary of the resulting natural modal frequencies with a description of the associated mode shapes. These results are subsequent to FE model optimization and updating. Table 1 Summary of the Resulting Natural Modal Frequencies from FEA and EMA
Mode No
Mode Shape Description
Natural Frequency From FEM
Natural Frequency Of Mode From Experimental Modal Analysis
1 Fundamental vertical bending
2.9 2.9
2 First Torsional 4.8 4.7 3 Second Vertical Bending 5.2 5.4 4 Second Torsional 6.7 6.3
18
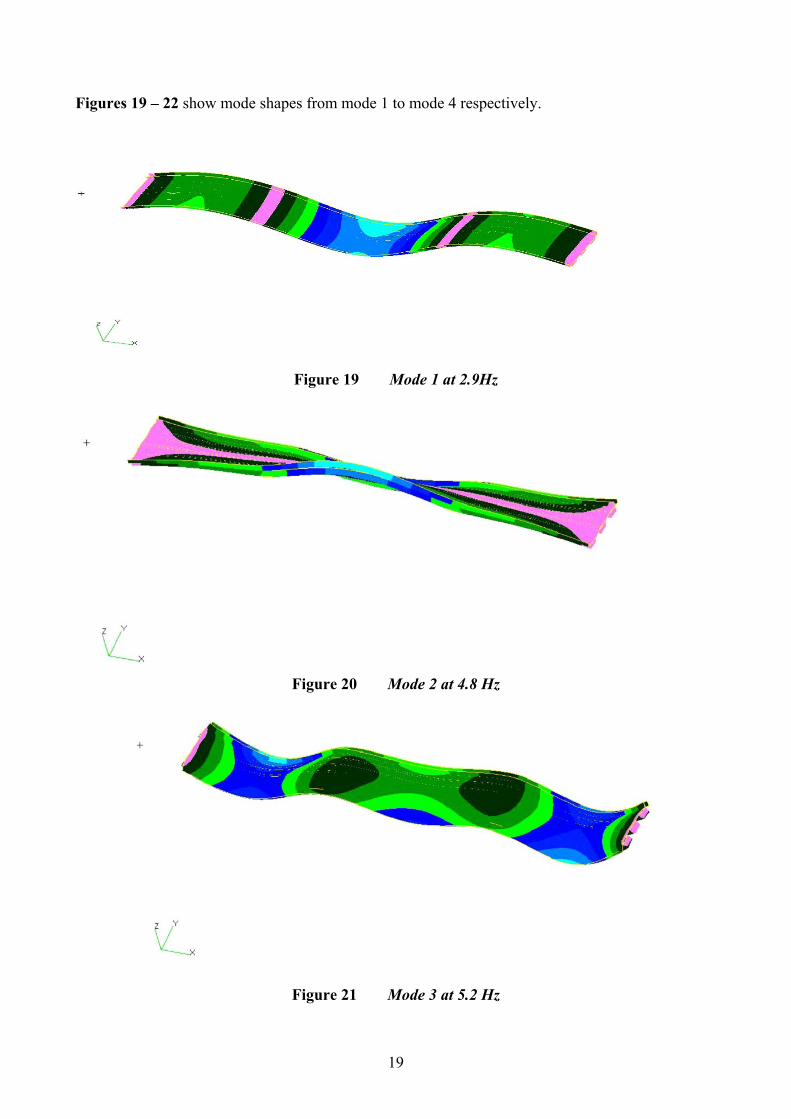
Figures 19 – 22 show mode shapes from mode 1 to mode 4 respectively.
Figure 19 Mode 1 at 2.9Hz
Figure 20 Mode 2 at 4.8 Hz
Figure 21 Mode 3 at 5.2 Hz
19
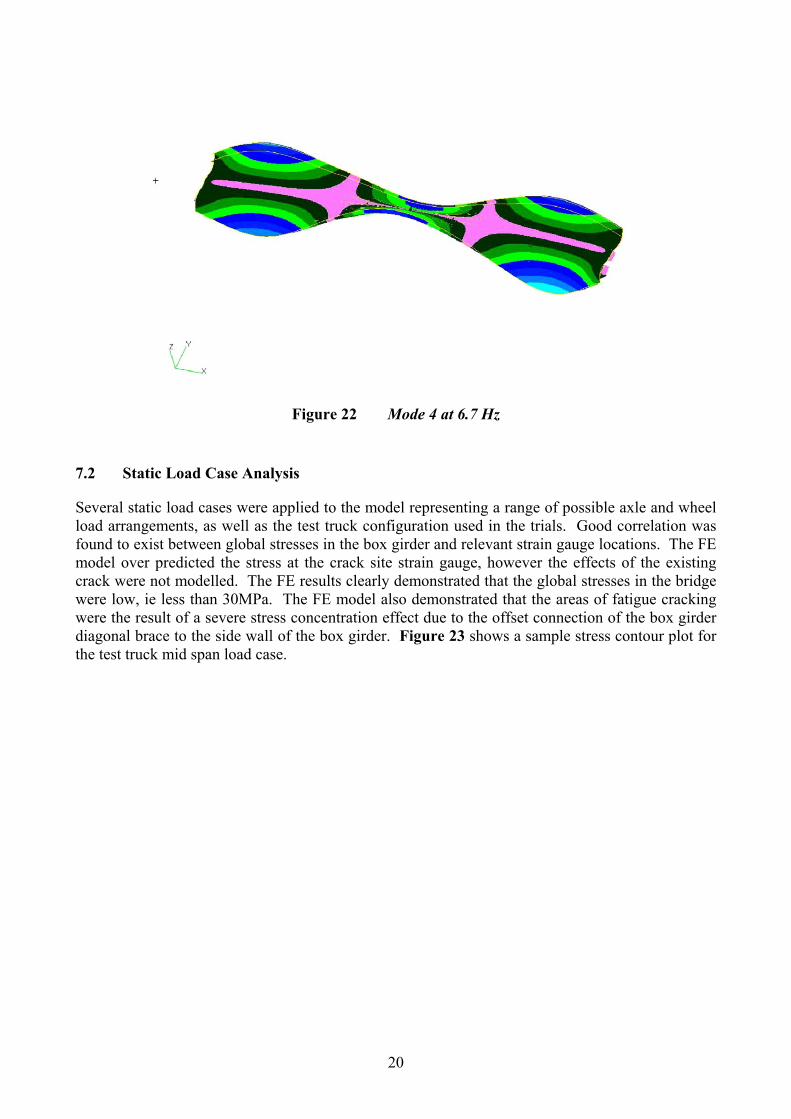
Figure 22 Mode 4 at 6.7 Hz
7.2 Static Load Case Analysis
Several static load cases were applied to the model representing a range of possible axle and wheel load arrangements, as well as the test truck configuration used in the trials. Good correlation was found to exist between global stresses in the box girder and relevant strain gauge locations. The FE model over predicted the stress at the crack site strain gauge, however the effects of the existing crack were not modelled. The FE results clearly demonstrated that the global stresses in the bridge were low, ie less than 30MPa. The FE model also demonstrated that the areas of fatigue cracking were the result of a severe stress concentration effect due to the offset connection of the box girder diagonal brace to the side wall of the box girder. Figure 23 shows a sample stress contour plot for the test truck mid span load case.
20
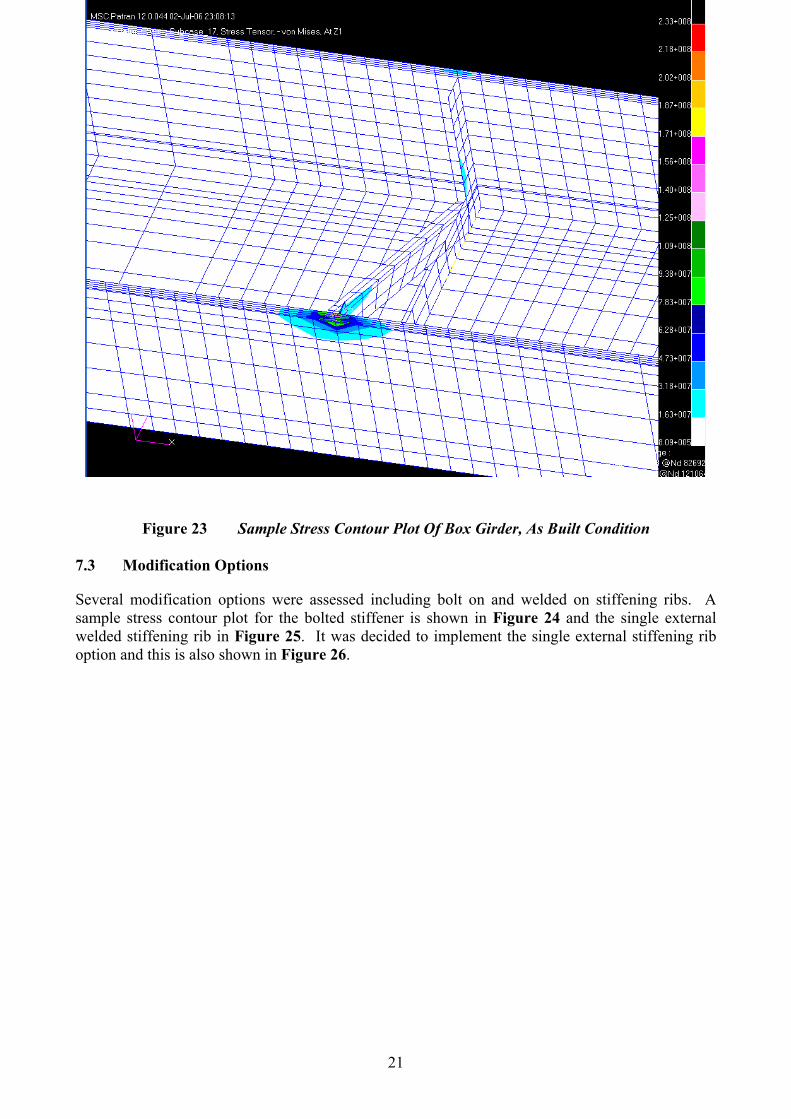
Figure 23 Sample Stress Contour Plot Of Box Girder, As Built Condition 7.3 Modification Options
Several modification options were assessed including bolt on and welded on stiffening ribs. A sample stress contour plot for the bolted stiffener is shown in Figure 24 and the single external welded stiffening rib in Figure 25. It was decided to implement the single external stiffening rib option and this is also shown in Figure 26.
21
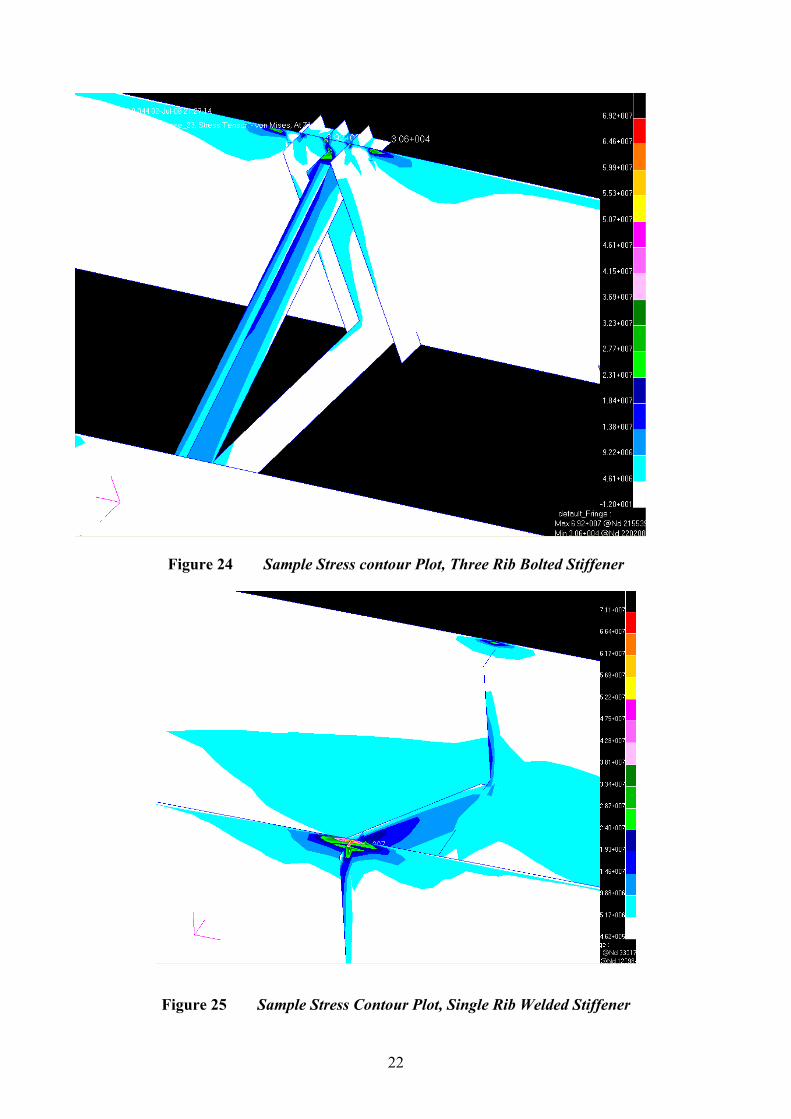
Figure 24 Sample Stress contour Plot, Three Rib Bolted Stiffener
Figure 25 Sample Stress Contour Plot, Single Rib Welded Stiffener
22
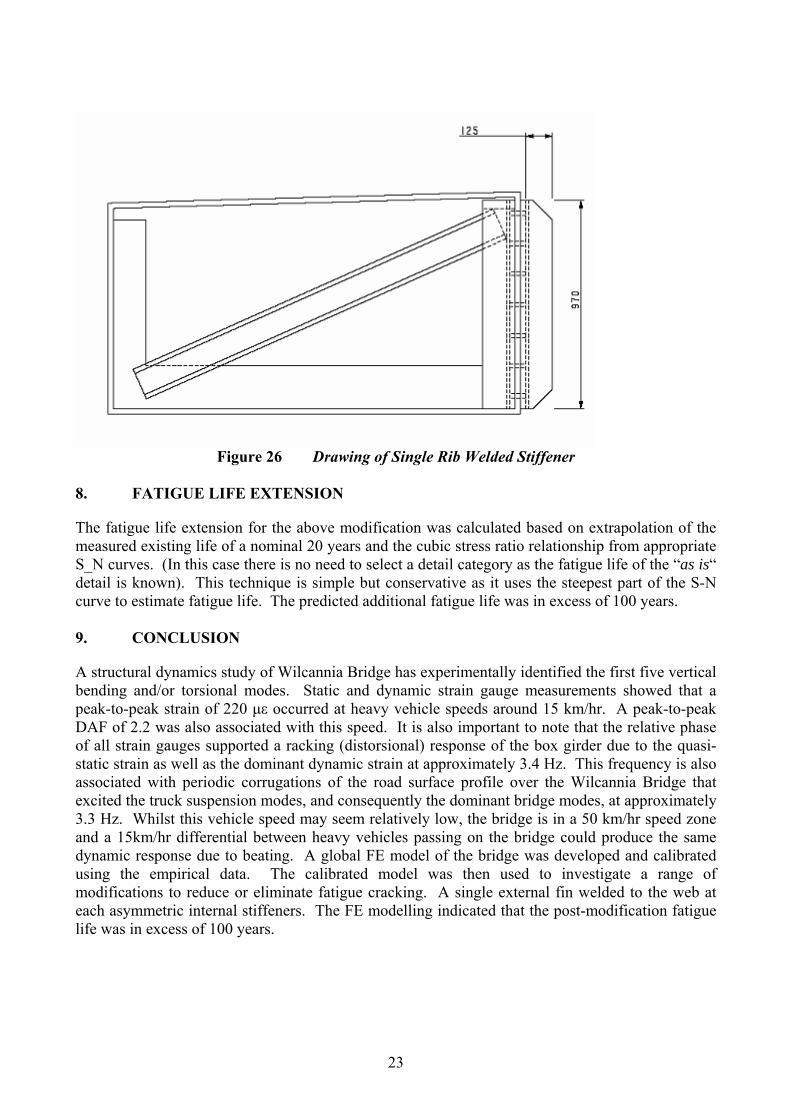
Figure 26 Drawing of Single Rib Welded Stiffener
8. FATIGUE LIFE EXTENSION
The fatigue life extension for the above modification was calculated based on extrapolation of the measured existing life of a nominal 20 years and the cubic stress ratio relationship from appropriate S_N curves. (In this case there is no need to select a detail category as the fatigue life of the “as is“ detail is known). This technique is simple but conservative as it uses the steepest part of the S-N curve to estimate fatigue life. The predicted additional fatigue life was in excess of 100 years. 9. CONCLUSION
A structural dynamics study of Wilcannia Bridge has experimentally identified the first five vertical bending and/or torsional modes. Static and dynamic strain gauge measurements showed that a peak-to-peak strain of 220 µε occurred at heavy vehicle speeds around 15 km/hr. A peak-to-peak DAF of 2.2 was also associated with this speed. It is also important to note that the relative phase of all strain gauges supported a racking (distorsional) response of the box girder due to the quasi-static strain as well as the dominant dynamic strain at approximately 3.4 Hz. This frequency is also associated with periodic corrugations of the road surface profile over the Wilcannia Bridge that excited the truck suspension modes, and consequently the dominant bridge modes, at approximately 3.3 Hz. Whilst this vehicle speed may seem relatively low, the bridge is in a 50 km/hr speed zone and a 15km/hr differential between heavy vehicles passing on the bridge could produce the same dynamic response due to beating. A global FE model of the bridge was developed and calibrated using the empirical data. The calibrated model was then used to investigate a range of modifications to reduce or eliminate fatigue cracking. A single external fin welded to the web at each asymmetric internal stiffeners. The FE modelling indicated that the post-modification fatigue life was in excess of 100 years.
23
ACKNOWLEDGEMENT The author wishes to thank the Chief Executive of the Roads and Traffic Authority of NSW (RTA) for permission to publish this paper. The opinions and conclusions expressed in this paper do not necessarily reflect the views of the RTA. REFERENCES
[1] NAASRA, “National Association of Australian State Road Authorities 1976 Bridge Design Specification", National Association of Australian State Road Authorities, Sydney, NSW Australia, 1976
[2] AASHTO, “Standard Specification for Highway Bridges”, American Association of State Highway and Transportation Officials, 14th Edition, Washington, DC, USA, 1969.
[3] SENNAH K.M. & KENNEDY J.B., “State-of-the-Art in Design of Curved Box-Girder Bridges”, J. Bridge Engineering, ASCE, 6(3), 159-167, 2001.
[4] EWINS D.J. “Modal Testing: Theory, Practice & Application (2nd Edition)”, Research Studies Press, Hertfordshire, UK, 163-276, 1999.
[5] HUANG D., “Dynamic Analysis of Steel Curved Box Girder Bridges”, J. Bridge Engineering, ASCE, 6(6), 506-513, 2001.
[6] OKEIL A.M. & EL-TAWIL S., “Warping Stresses in Curved Box Girder Bridges: Case Study”, J. Bridge Engineering, ASCE, 9(5), 487-496, 2004
[7] WHITTON R. J., “Strengthening Options/Load Capacity – Bridge Over the Darling River at Wilcannia”, RTA Technical Services Report, Roads & Traffic Authority, Sydney, NSW, Australia, (2003), 23 pp.
[8] FRENCH S., “Review of Cracking Remediation Reports and Recommended Remediation Scope”, Report 024-P1164-009-01, Unpublished Report by Burns & Roe Worley Pty Ltd submitted to Roads & Traffic Authority of NSW, Sydney, Australia, 2005, 10 pp.
[9] HEYWOOD R., BRANDIS A. & LAND K., “Bridge over Darling River at Wilcannia: Design Review of Steel Trough Girder Web Crack Repairs” Report 14024, Unpublished Report by Texcel Pty Ltd submitted to Roads & Traffic Authority of NSW, Brisbane, Australia, 2004, 40 pp.
[10] HUANG D., “Full-Scale Test and Analysis of a Curved Steel-Box Girder Bridges”, J. Bridge Engineering, ASCE, 13(5), 492-500, 2008
[11] MORASSI A. & TONON S., “Dynamic Testing for Structural Identification of a Bridge”, J. Bridge Engineering, ASCE, 13(6), 573-585, 2008.
24

Appendix N
Ancich E.J., Chirgwin G.J., Brown S.C. & Madrio H. (2009). Fatigue Implications of
Growth in Heavy Vehicle Loads and Numbers on Steel Bridges, Proc. International
Association for Bridge & Structural Engineering (IABSE) Symposium, Bangkok,
Thailand.


Fatigue Implications of Growth in Heavy Vehicle Loads and Numbers on Steel Bridges
Eric ANCICH Senior Project Engineer Roads & Traffic Authority Parramatta, NSW, Australia [email protected]
Steve BROWN Associate Heggies Pty Ltd Lane Cove, NSW, Australia [email protected]
Gordon CHIRGWIN Supervising Bridge Engineer (Durability & Materials) Roads & Traffic Authority Parramatta, NSW, Australia [email protected]
Huber MADRIO Project Engineer Roads & Traffic Authority Parramatta, NSW, Australia [email protected]
SUMMARY
It is known that 75% of the total Australian road freight task passes through NSW and the Pacific Highway is a major recipient of this freight. There are numerous crossings of major rivers between Newcastle and the Queensland border and until the late 1960’s, steel bridges were preferred as lift spans could be easily incorporated in the design. Over the past 10-15 years, heavy vehicle numbers using the Pacific Highway have increased dramatically, with a stepwise increase in 2001 and exponential growth of about 2% per year otherwise. This growth has been matched by a parallel exponential growth in loads and an even faster growth in axle group repetitions due to the greater utilisation of B-doubles and tri-axle semi-trailers. Three bridges along the Pacific Highway were investigated using a structural dynamics based approach. The investigation revealed numerous compression/tension stress reversals for each heavy vehicle transit. Whilst the dynamic amplification factor (DAF) for a single controlled heavy vehicle transit was comparable with current Codes, the load effect for fatigue from uncontrolled heavy vehicle traffic significantly exceeds the value which would be predicted using the test vehicle factored for dynamic effects and multiple presence. Keywords: Steel Truss Bridge; High cycle fatigue; Damping; Finite element method; Modal
analysis; Strain measurement. 1. INTRODUCTION
The Roads and Traffic Authority of NSW (RTA) maintains some 5,000 bridges on the classified road network in New South Wales. Coped stringer to cross girder connections are a common feature of steel truss road bridges in NSW and the RTA has in excess of 60 such bridges. The design is, however, dynamically sub-optimal and a number of bridges along the Pacific Highway are exhibiting fatigue related cracking. The design is further complicated by un-explained variations in implementation. In some bridge designs, an attempt was made to reinstate the coped stringer top flange across the cross girder by bolting or riveting a thick steel plate to each stringer top flange.

Where used, the connection plate has resisted fatigue cracking around the copes but the bridges using the detail only used it for alternate cross girders. Cracking was first observed in the riveted cope connections of Macksville Bridge in 2004. At the time, it was not realised that the cracking was fatigue related. Rather, given the age of the bridge (built 1930’s) and changes to the size and volume of heavy vehicles, progressive overloading was considered to be the cause. Subsequently, routine inspections of the 1960’s era Kempsey Bridge (See Figure 1) identified a number of coped stringer-to-cross girder connections where some of the rivets in the top two rows had been lost. The lost rivets were replaced with high strength bolts and following inspections revealed that the replacement bolts were failing in as little as 6-months. Some failed bolts were recovered and submitted for metallurgical examination. This examination revealed characteristic evidence of fatigue failure (See Figure 2). A literature review indicated that steel bridge designers of this era gave little or no consideration to fatigue. Fatigue design provisions, as we largely know them today, may be traced to AASHTO 1 from 1973. Roeder et al 2 reported similar connection details in US bridges and noted that whilst they were designed as pinned connections they should be regarded as partially restrained connections as they have limited rotational restraint. Fu et al 3 report Australian, Canadian and United States studies of the impact of increased heavy vehicle loading on bridge infrastructure. They concluded that these investigations used largely deterministic approaches and tended to exclude fatigue effects. Imam et al 4 undertook a largely theoretical study of riveted rail bridges in the UK. They concluded that fatigue life estimates exhibit the highest sensitivity to detail classification, to S-N predictions in the region of high endurances, and to model uncertainty. This highlighted the importance of field monitoring for old bridges approaching the end of their useful life. Whilst it was known that 75% of the total Australian road freight task passed through NSW 5, 6 and the Pacific Highway was a major recipient of this freight, little was known about actual heavy vehicle loading on the Pacific Highway. In addition, until the late twentieth century, the main freight route from Sydney and Newcastle to Brisbane was via the inland New England Highway route. Analysis of weigh-in-motion (WIM) data from Pacific Highway sites indicated that over the past 10-15 years, heavy vehicle numbers using the Pacific Highway have increased dramatically, with a stepwise increase in 2001 and exponential growth of about 2% per year otherwise. This growth has been matched by a parallel exponential growth in loads and an even faster growth in axle group repetitions due to the greater utilisation of B-doubles and tri-axle semi-trailers. A detailed consideration of this traffic data indicates that fatigue has only become important since 1990, but that in the period 1990 to 2004 some 90% of the theoretical fatigue life of the deck stringer connection had been used. The present study reports extensive dynamic measurements and FE modelling of Kempsey Bridge. The FE model was calibrated 7 using dynamic measurements and then used for a series of “what if” studies. Whilst the optimum solution was shown to be the connection plate over the cross girder, there were major difficulties with implementation as the bridge could not be taken out of service. An alternative solution was devised that involved removing the top two rows of rivets in the stringer/cross girder connection and replacing the removed rivets with “compliant” fasteners.
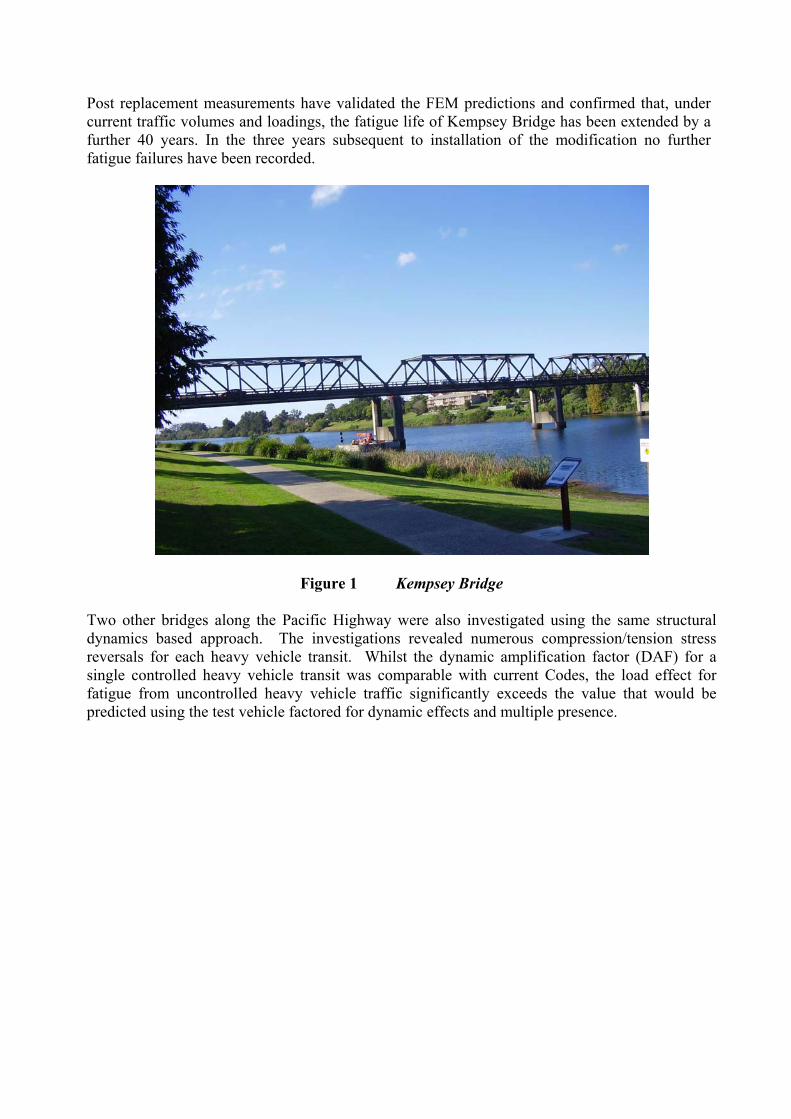
Post replacement measurements have validated the FEM predictions and confirmed that, under current traffic volumes and loadings, the fatigue life of Kempsey Bridge has been extended by a further 40 years. In the three years subsequent to installation of the modification no further fatigue failures have been recorded.
Figure 1 Kempsey Bridge Two other bridges along the Pacific Highway were also investigated using the same structural dynamics based approach. The investigations revealed numerous compression/tension stress reversals for each heavy vehicle transit. Whilst the dynamic amplification factor (DAF) for a single controlled heavy vehicle transit was comparable with current Codes, the load effect for fatigue from uncontrolled heavy vehicle traffic significantly exceeds the value that would be predicted using the test vehicle factored for dynamic effects and multiple presence.
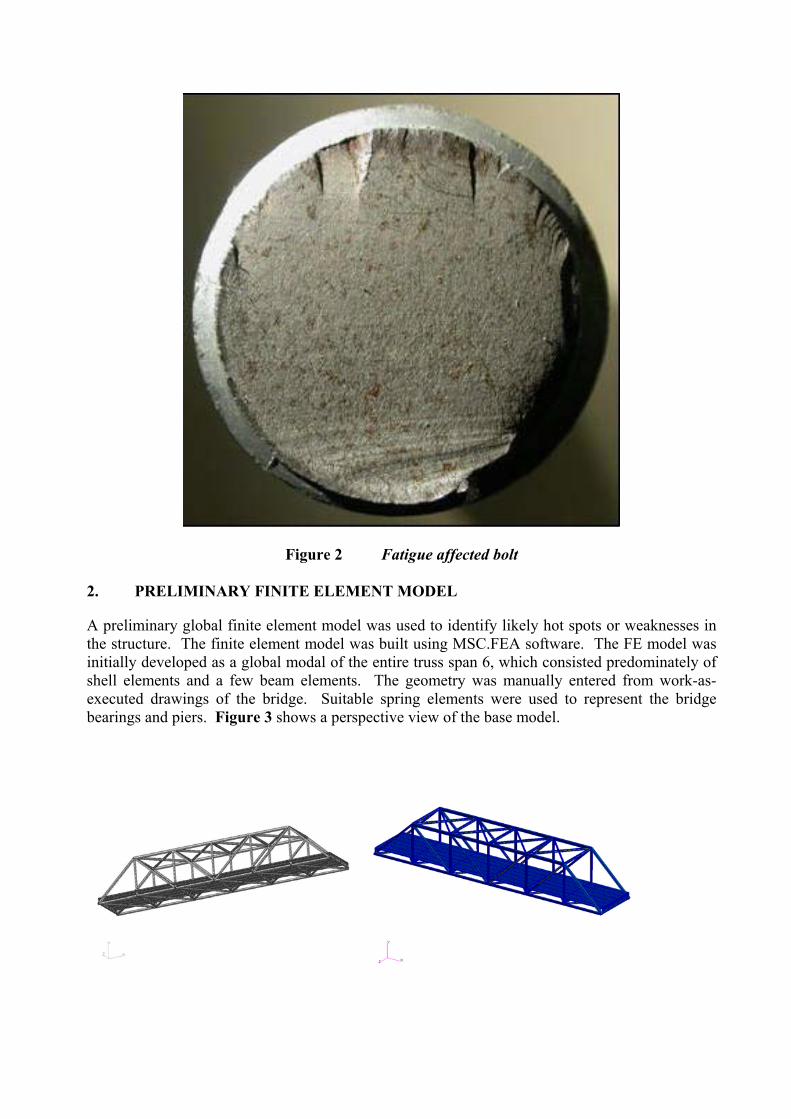
Figure 2 Fatigue affected bolt
2. PRELIMINARY FINITE ELEMENT MODEL
A preliminary global finite element model was used to identify likely hot spots or weaknesses in the structure. The finite element model was built using MSC.FEA software. The FE model was initially developed as a global modal of the entire truss span 6, which consisted predominately of shell elements and a few beam elements. The geometry was manually entered from work-as-executed drawings of the bridge. Suitable spring elements were used to represent the bridge bearings and piers. Figure 3 shows a perspective view of the base model.
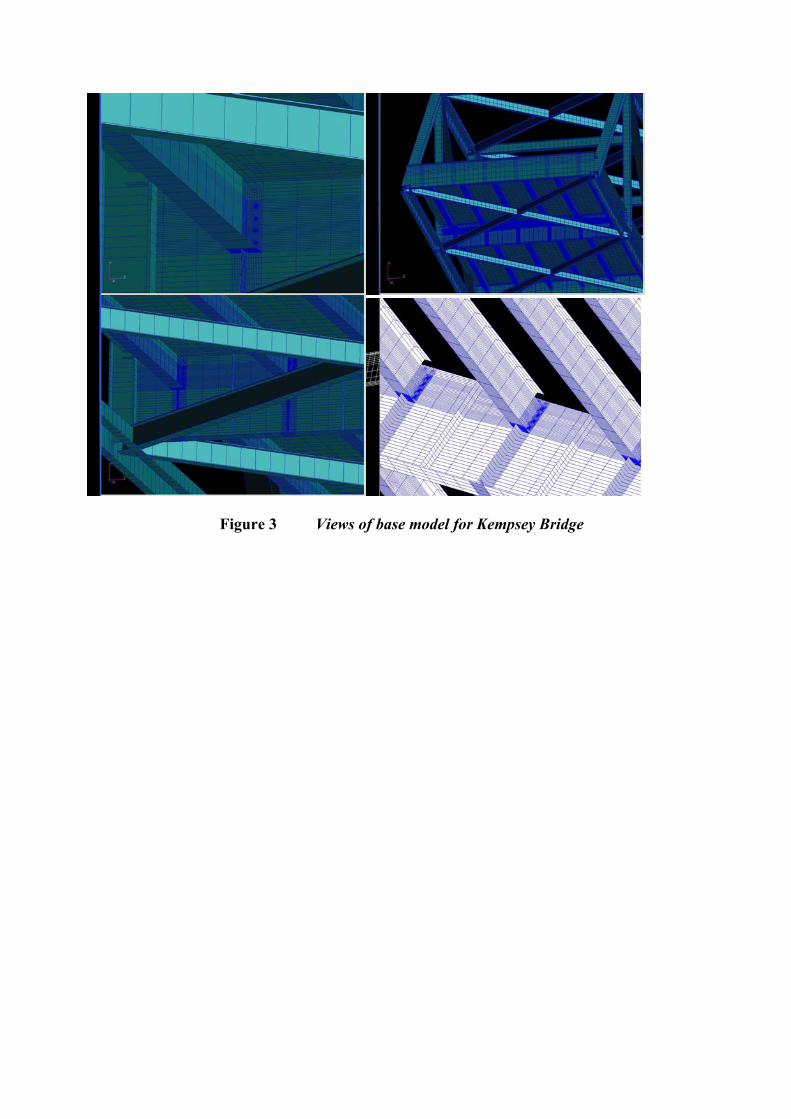
Figure 3 Views of base model for Kempsey Bridge
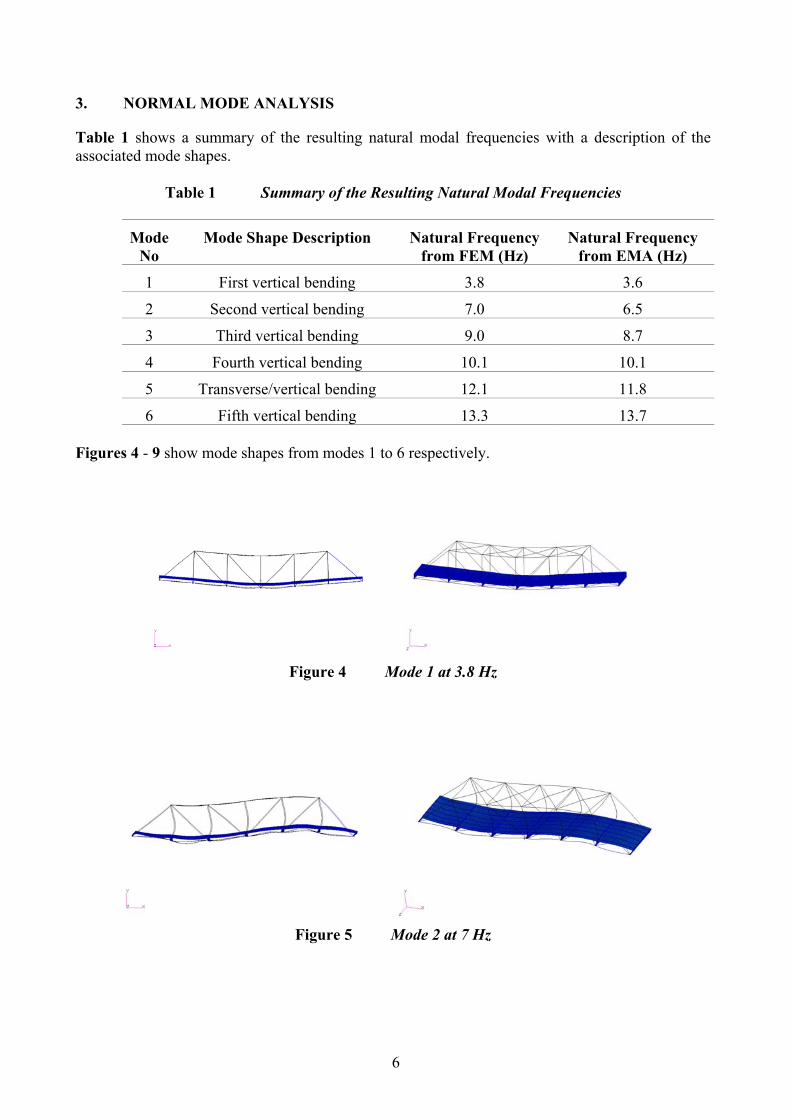
3. NORMAL MODE ANALYSIS
Table 1 shows a summary of the resulting natural modal frequencies with a description of the associated mode shapes.
Table 1 Summary of the Resulting Natural Modal Frequencies
Mode No
Mode Shape Description Natural Frequency from FEM (Hz)
Natural Frequency from EMA (Hz)
1 First vertical bending 3.8 3.6
2 Second vertical bending 7.0 6.5
3 Third vertical bending 9.0 8.7
4 Fourth vertical bending 10.1 10.1
5 Transverse/vertical bending 12.1 11.8
6 Fifth vertical bending 13.3 13.7 Figures 4 - 9 show mode shapes from modes 1 to 6 respectively.
Figure 4 Mode 1 at 3.8 Hz
Figure 5 Mode 2 at 7 Hz
6
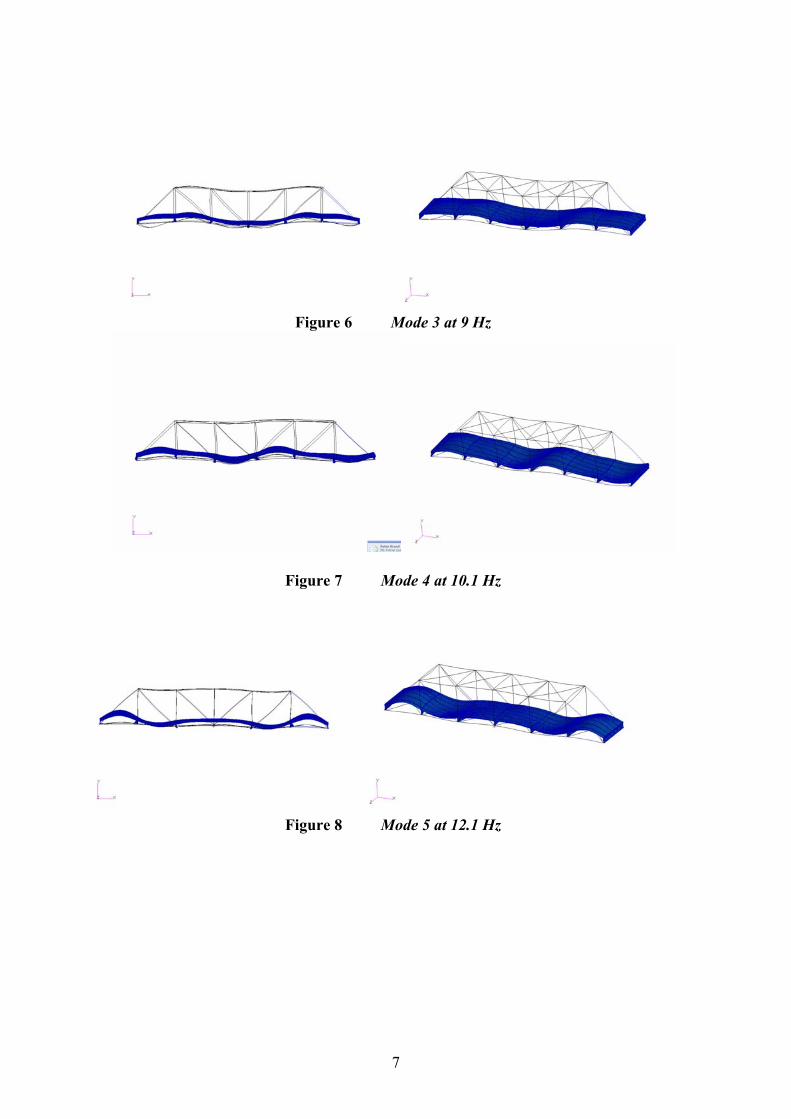
Figure 6 Mode 3 at 9 Hz
Figure 7 Mode 4 at 10.1 Hz
Figure 8 Mode 5 at 12.1 Hz
7
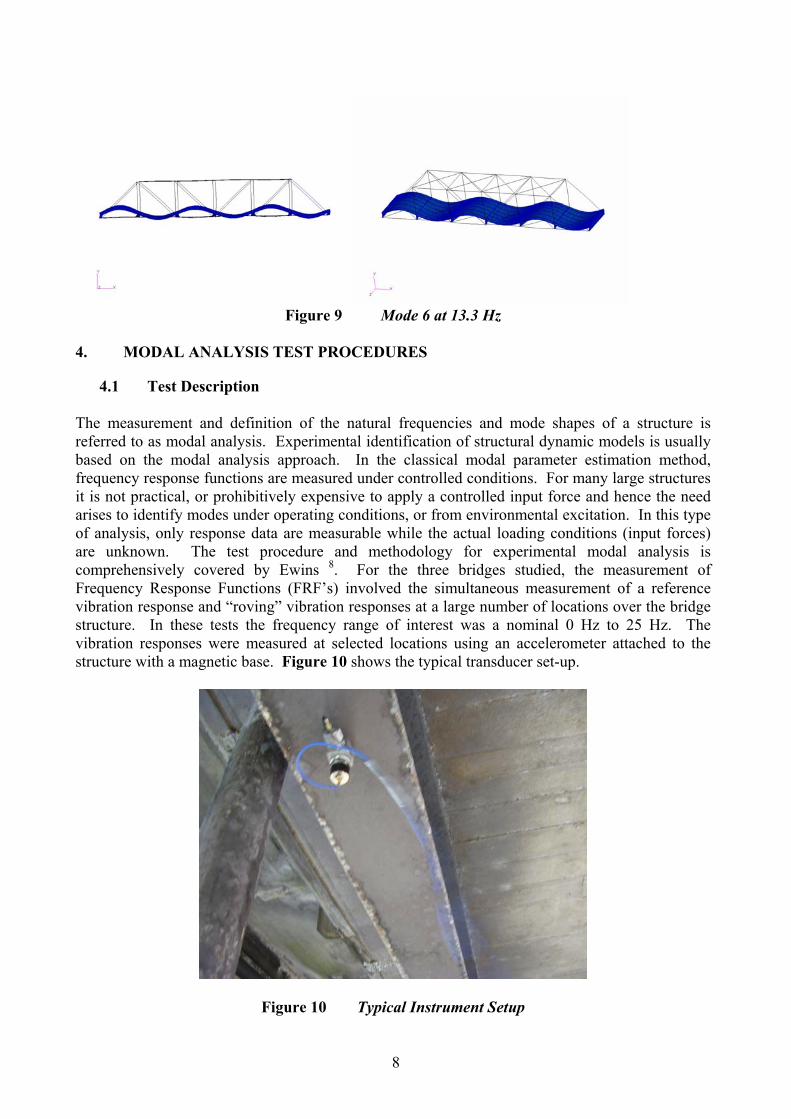
Figure 9 Mode 6 at 13.3 Hz
4. MODAL ANALYSIS TEST PROCEDURES
4.1 Test Description The measurement and definition of the natural frequencies and mode shapes of a structure is referred to as modal analysis. Experimental identification of structural dynamic models is usually based on the modal analysis approach. In the classical modal parameter estimation method, frequency response functions are measured under controlled conditions. For many large structures it is not practical, or prohibitively expensive to apply a controlled input force and hence the need arises to identify modes under operating conditions, or from environmental excitation. In this type of analysis, only response data are measurable while the actual loading conditions (input forces) are unknown. The test procedure and methodology for experimental modal analysis is comprehensively covered by Ewins 8. For the three bridges studied, the measurement of Frequency Response Functions (FRF’s) involved the simultaneous measurement of a reference vibration response and “roving” vibration responses at a large number of locations over the bridge structure. In these tests the frequency range of interest was a nominal 0 Hz to 25 Hz. The vibration responses were measured at selected locations using an accelerometer attached to the structure with a magnetic base. Figure 10 shows the typical transducer set-up.
Figure 10 Typical Instrument Setup
8
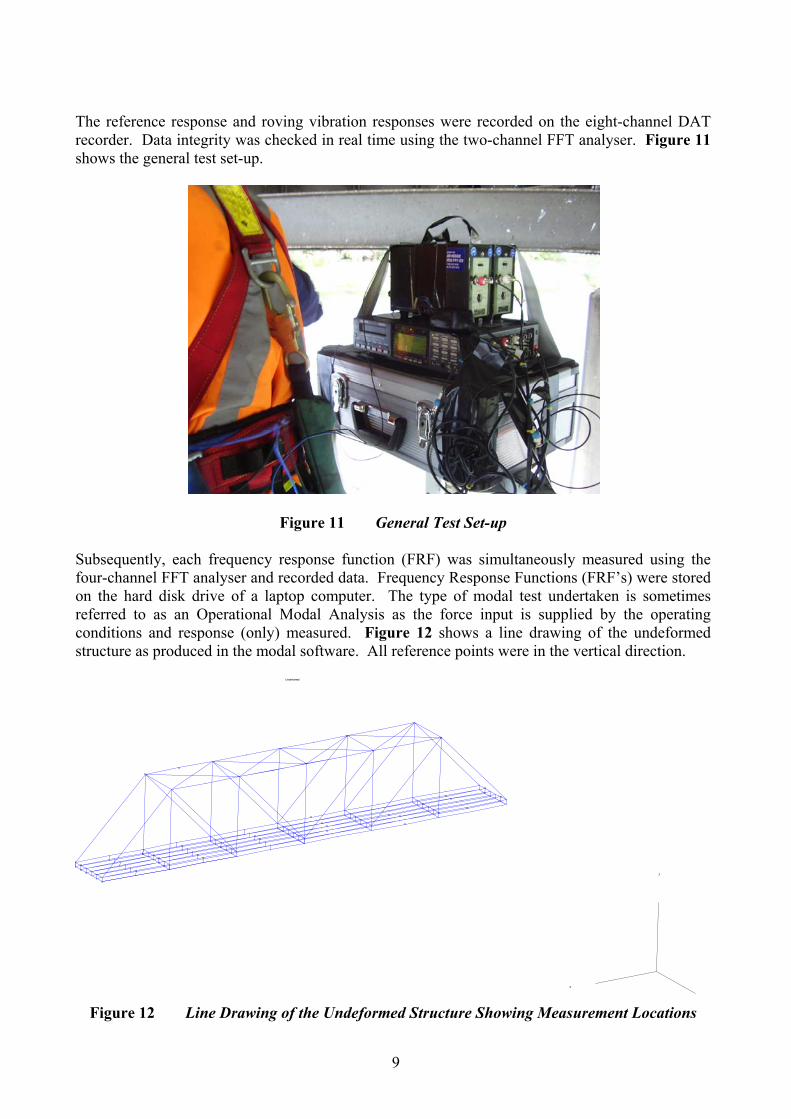
The reference response and roving vibration responses were recorded on the eight-channel DAT recorder. Data integrity was checked in real time using the two-channel FFT analyser. Figure 11 shows the general test set-up.
Figure 11 General Test Set-up Subsequently, each frequency response function (FRF) was simultaneously measured using the four-channel FFT analyser and recorded data. Frequency Response Functions (FRF’s) were stored on the hard disk drive of a laptop computer. The type of modal test undertaken is sometimes referred to as an Operational Modal Analysis as the force input is supplied by the operating conditions and response (only) measured. Figure 12 shows a line drawing of the undeformed structure as produced in the modal software. All reference points were in the vertical direction.
X
Z
Undeformed
Figure 12 Line Drawing of the Undeformed Structure Showing Measurement Locations
9
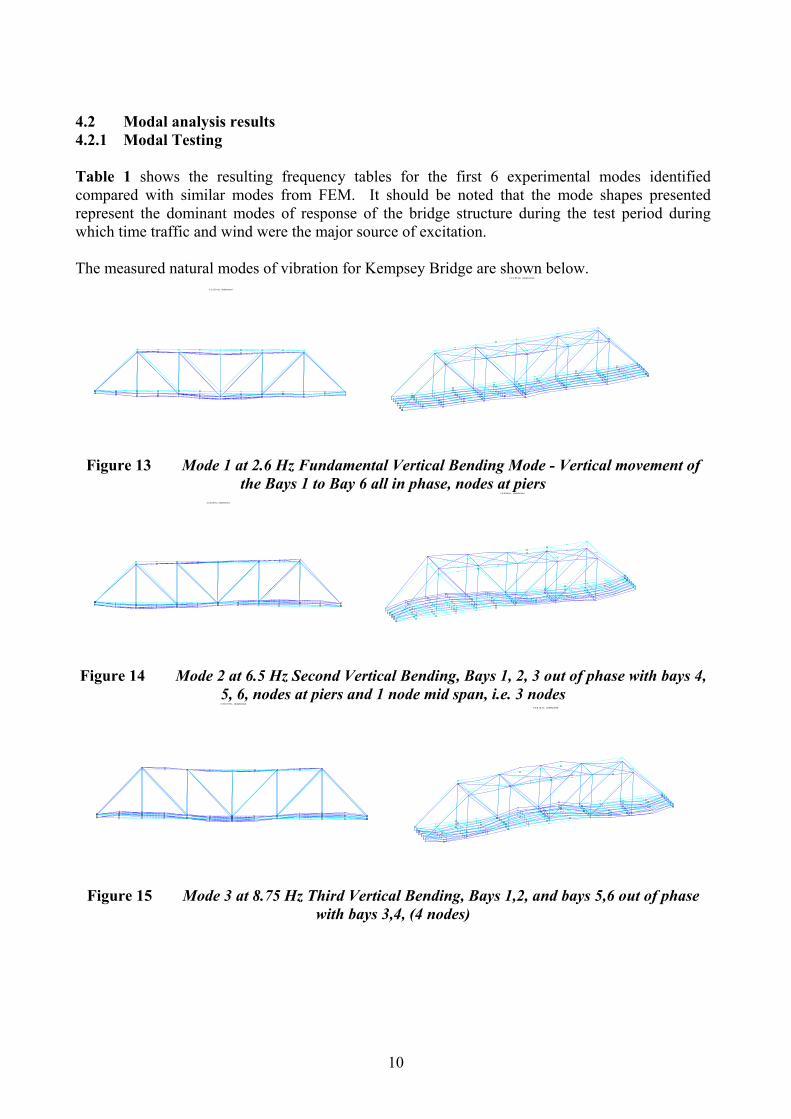
4.2 Modal analysis results 4.2.1 Modal Testing Table 1 shows the resulting frequency tables for the first 6 experimental modes identified compared with similar modes from FEM. It should be noted that the mode shapes presented represent the dominant modes of response of the bridge structure during the test period during which time traffic and wind were the major source of excitation. The measured natural modes of vibration for Kempsey Bridge are shown below.
# 1:3.59 Hz, Undeformed
# 1:3.59 Hz, Undeformed
Figure 13 Mode 1 at 2.6 Hz Fundamental Vertical Bending Mode - Vertical movement of
the Bays 1 to Bay 6 all in phase, nodes at piers # 2:6.56 Hz, Undeformed
# 2:6.56 Hz, Undeformed
Figure 14 Mode 2 at 6.5 Hz Second Vertical Bending, Bays 1, 2, 3 out of phase with bays 4,
5, 6, nodes at piers and 1 node mid span, i.e. 3 nodes # 3:8.75 Hz, Undeformed
# 3:8.75 Hz, Undeformed
Figure 15 Mode 3 at 8.75 Hz Third Vertical Bending, Bays 1,2, and bays 5,6 out of phase
with bays 3,4, (4 nodes)
10
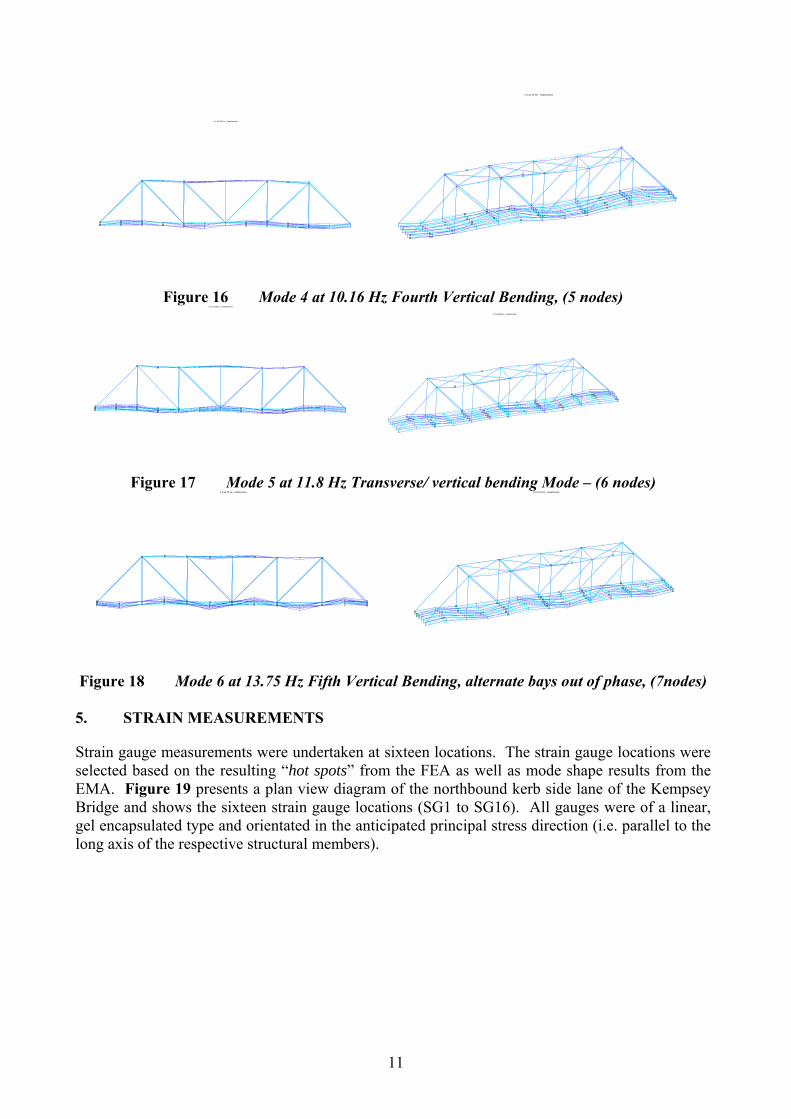
# 4:10.16 Hz, Undeformed
# 4:10.16 Hz, Undeformed
Figure 16 Mode 4 at 10.16 Hz Fourth Vertical Bending, (5 nodes)
# 5:11.88 Hz, Undeformed
# 5:11.88 Hz, Undeformed
Figure 17 Mode 5 at 11.8 Hz Transverse/ vertical bending Mode – (6 nodes)
# 6:13.75 Hz, Undeformed # 6:13.75 Hz, Undeformed
Figure 18 Mode 6 at 13.75 Hz Fifth Vertical Bending, alternate bays out of phase, (7nodes)
5. STRAIN MEASUREMENTS
Strain gauge measurements were undertaken at sixteen locations. The strain gauge locations were selected based on the resulting “hot spots” from the FEA as well as mode shape results from the EMA. Figure 19 presents a plan view diagram of the northbound kerb side lane of the Kempsey Bridge and shows the sixteen strain gauge locations (SG1 to SG16). All gauges were of a linear, gel encapsulated type and orientated in the anticipated principal stress direction (i.e. parallel to the long axis of the respective structural members).
11
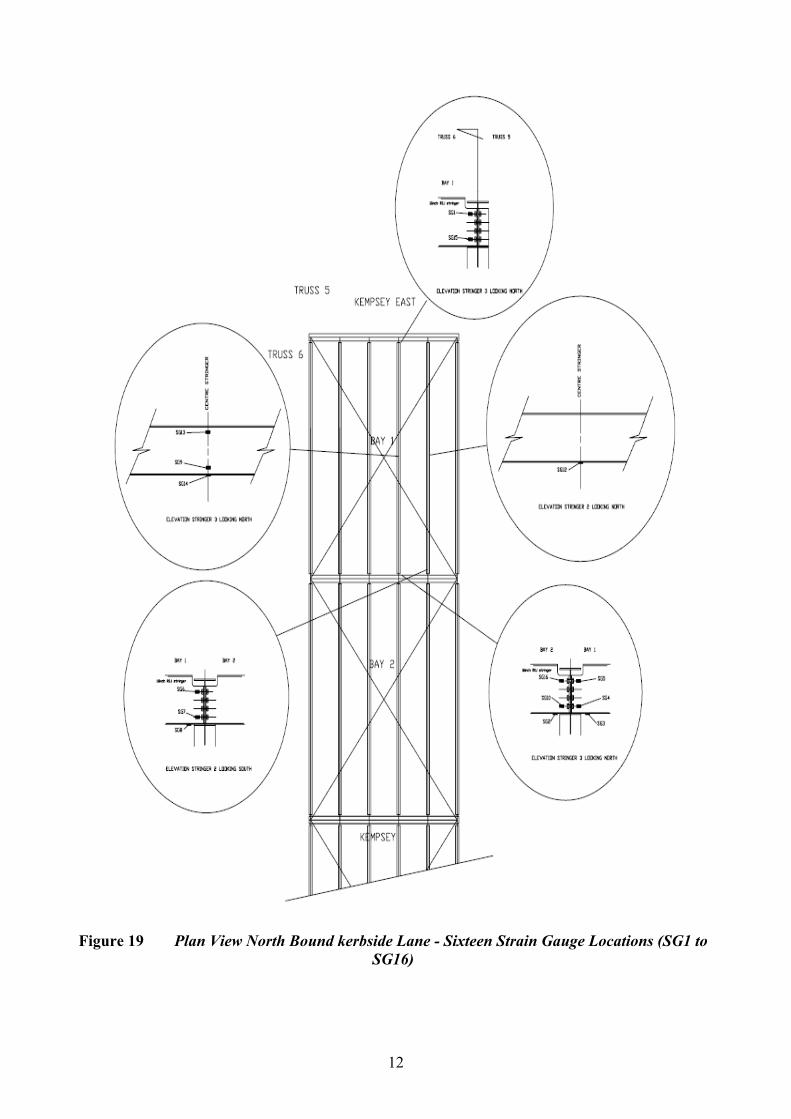
Figure 19 Plan View North Bound kerbside Lane - Sixteen Strain Gauge Locations (SG1 to
SG16)
12
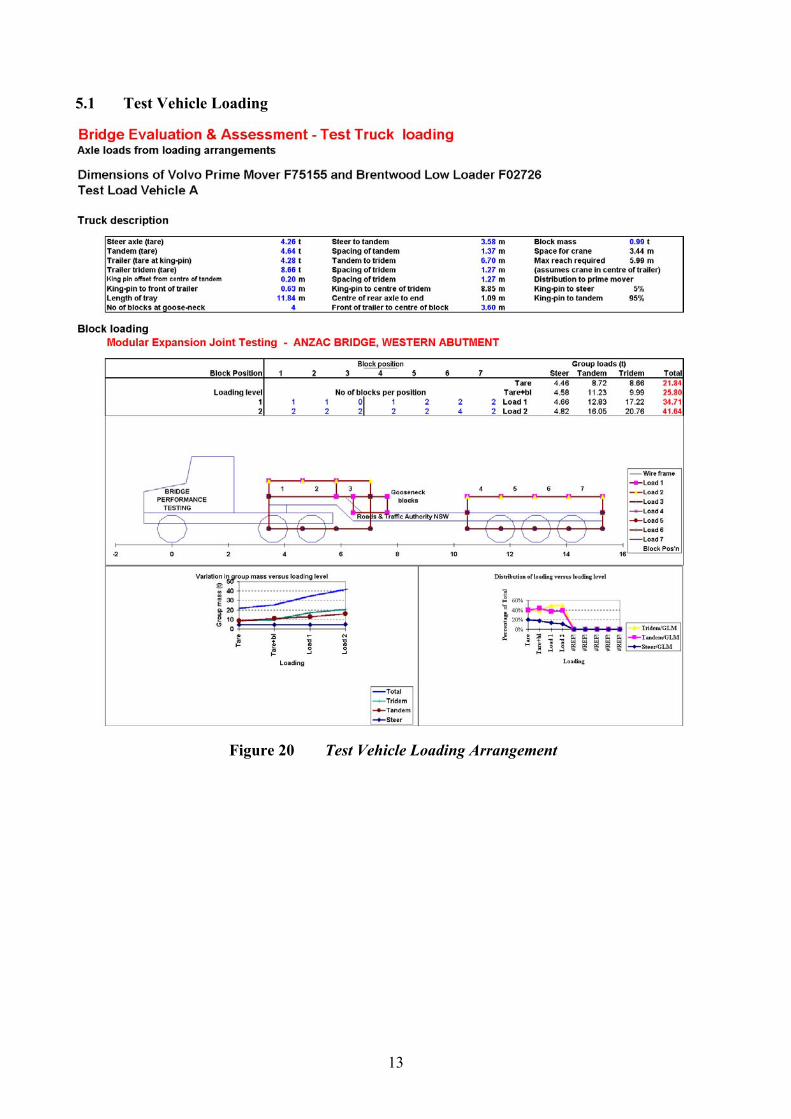
5.1 Test Vehicle Loading
Figure 20 Test Vehicle Loading Arrangement
13
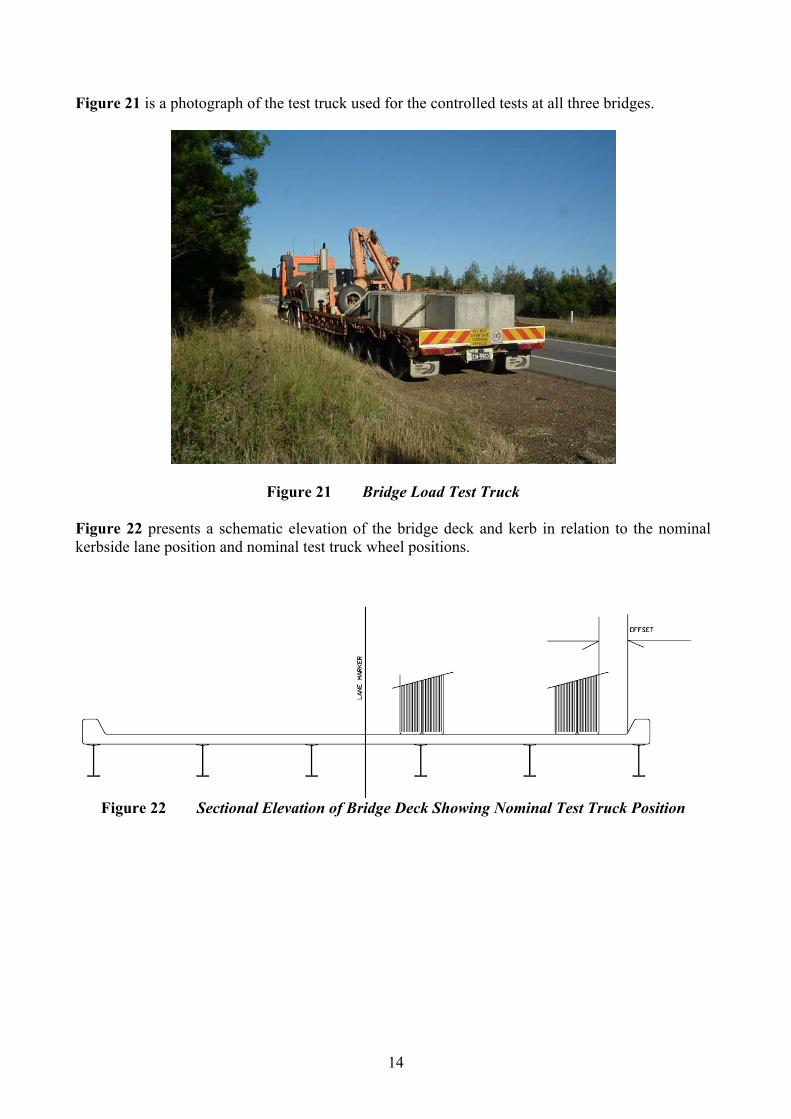
Figure 21 is a photograph of the test truck used for the controlled tests at all three bridges.
Figure 21 Bridge Load Test Truck Figure 22 presents a schematic elevation of the bridge deck and kerb in relation to the nominal kerbside lane position and nominal test truck wheel positions.
Figure 22 Sectional Elevation of Bridge Deck Showing Nominal Test Truck Position
14
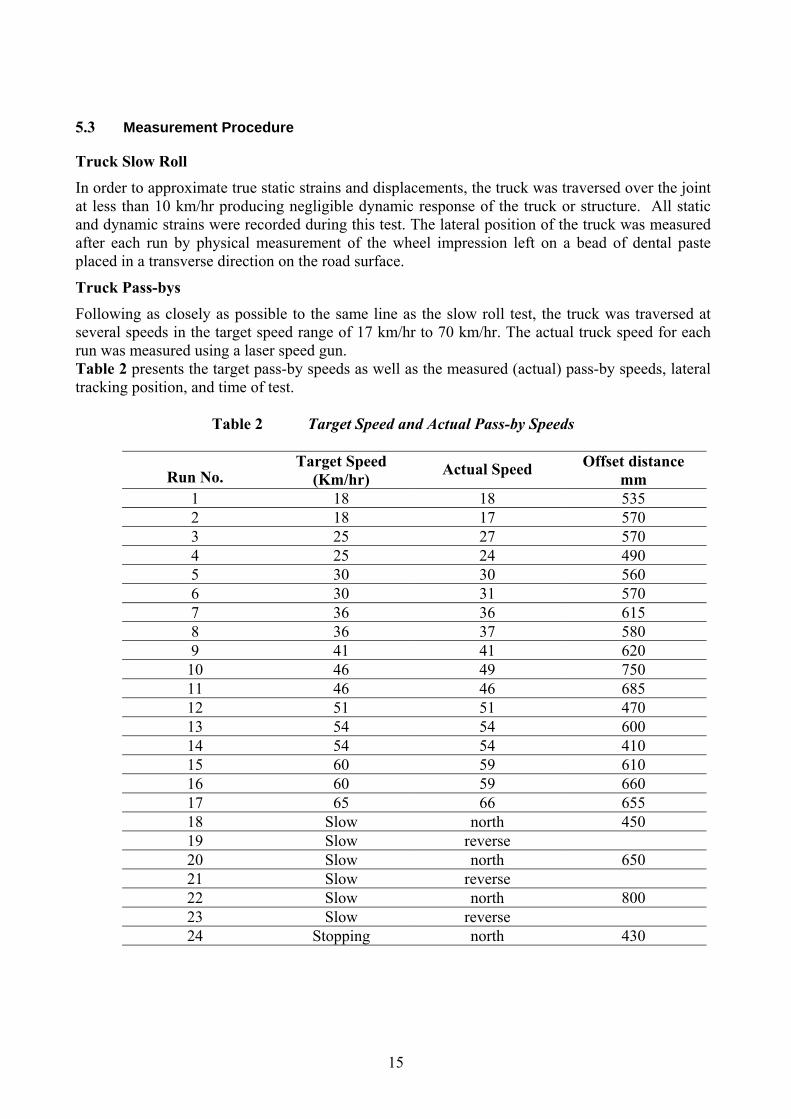
5.3 Measurement Procedure
Truck Slow Roll In order to approximate true static strains and displacements, the truck was traversed over the joint at less than 10 km/hr producing negligible dynamic response of the truck or structure. All static and dynamic strains were recorded during this test. The lateral position of the truck was measured after each run by physical measurement of the wheel impression left on a bead of dental paste placed in a transverse direction on the road surface.
Truck Pass-bys Following as closely as possible to the same line as the slow roll test, the truck was traversed at several speeds in the target speed range of 17 km/hr to 70 km/hr. The actual truck speed for each run was measured using a laser speed gun. Table 2 presents the target pass-by speeds as well as the measured (actual) pass-by speeds, lateral tracking position, and time of test.
Table 2 Target Speed and Actual Pass-by Speeds
Run No. Target Speed
(Km/hr) Actual Speed Offset distance mm
1 18 18 535 2 18 17 570 3 25 27 570 4 25 24 490 5 30 30 560 6 30 31 570 7 36 36 615 8 36 37 580 9 41 41 620 10 46 49 750 11 46 46 685 12 51 51 470 13 54 54 600 14 54 54 410 15 60 59 610 16 60 59 660 17 65 66 655 18 Slow north 450 19 Slow reverse 20 Slow north 650 21 Slow reverse 22 Slow north 800 23 Slow reverse 24 Stopping north 430
15
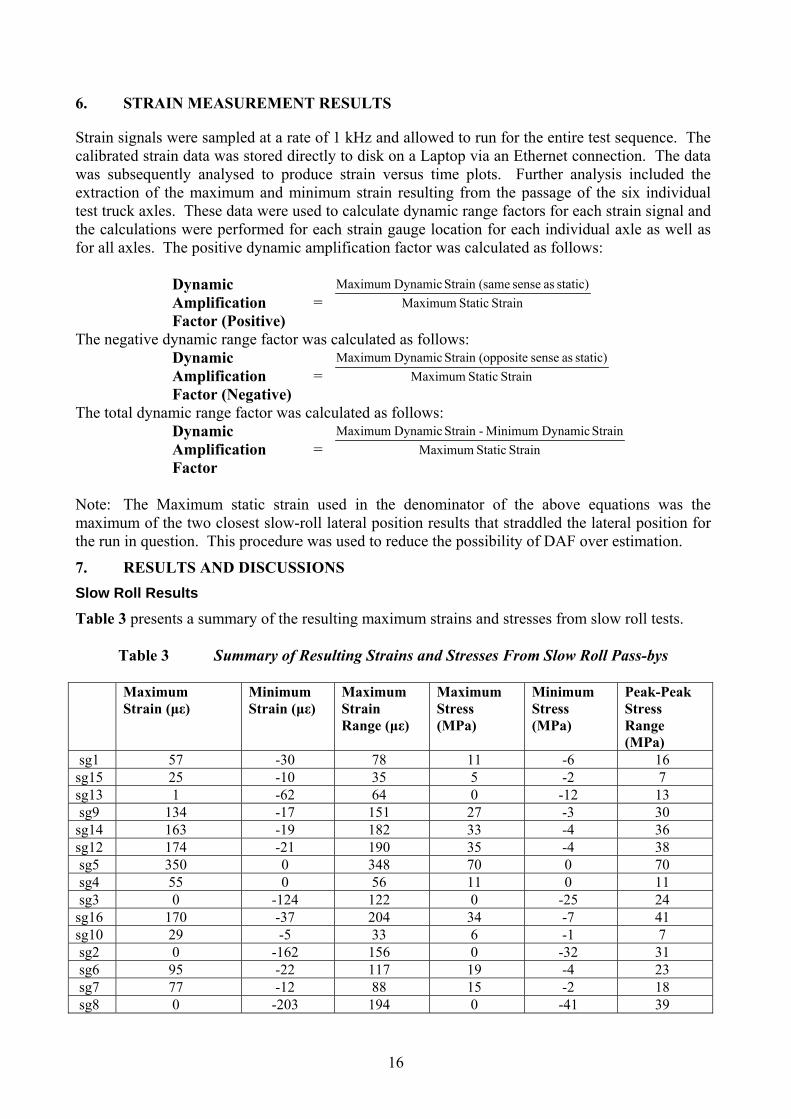
6. STRAIN MEASUREMENT RESULTS
Strain signals were sampled at a rate of 1 kHz and allowed to run for the entire test sequence. The calibrated strain data was stored directly to disk on a Laptop via an Ethernet connection. The data was subsequently analysed to produce strain versus time plots. Further analysis included the extraction of the maximum and minimum strain resulting from the passage of the six individual test truck axles. These data were used to calculate dynamic range factors for each strain signal and the calculations were performed for each strain gauge location for each individual axle as well as for all axles. The positive dynamic amplification factor was calculated as follows:
Dynamic Amplification Factor (Positive)
= Strain Static Maximumstatic) as sense (sameStrain Dynamic Maximum
The negative dynamic range factor was calculated as follows: Dynamic Amplification Factor (Negative)
= Strain Static Maximumstatic) as sense (oppositeStrain Dynamic Maximum
The total dynamic range factor was calculated as follows: Dynamic Amplification Factor
= Strain Static MaximumStrain Dynamic Minimum -Strain Dynamic Maximum
Note: The Maximum static strain used in the denominator of the above equations was the maximum of the two closest slow-roll lateral position results that straddled the lateral position for the run in question. This procedure was used to reduce the possibility of DAF over estimation.
7. RESULTS AND DISCUSSIONS Slow Roll Results
Table 3 presents a summary of the resulting maximum strains and stresses from slow roll tests.
Table 3 Summary of Resulting Strains and Stresses From Slow Roll Pass-bys Maximum
Strain (µε) Minimum Strain (µε)
Maximum Strain Range (µε)
Maximum Stress (MPa)
Minimum Stress (MPa)
Peak-Peak Stress Range (MPa)
sg1 57 -30 78 11 -6 16 sg15 25 -10 35 5 -2 7 sg13 1 -62 64 0 -12 13 sg9 134 -17 151 27 -3 30
sg14 163 -19 182 33 -4 36 sg12 174 -21 190 35 -4 38 sg5 350 0 348 70 0 70 sg4 55 0 56 11 0 11 sg3 0 -124 122 0 -25 24
sg16 170 -37 204 34 -7 41 sg10 29 -5 33 6 -1 7 sg2 0 -162 156 0 -32 31 sg6 95 -22 117 19 -4 23 sg7 77 -12 88 15 -2 18 sg8 0 -203 194 0 -41 39
16
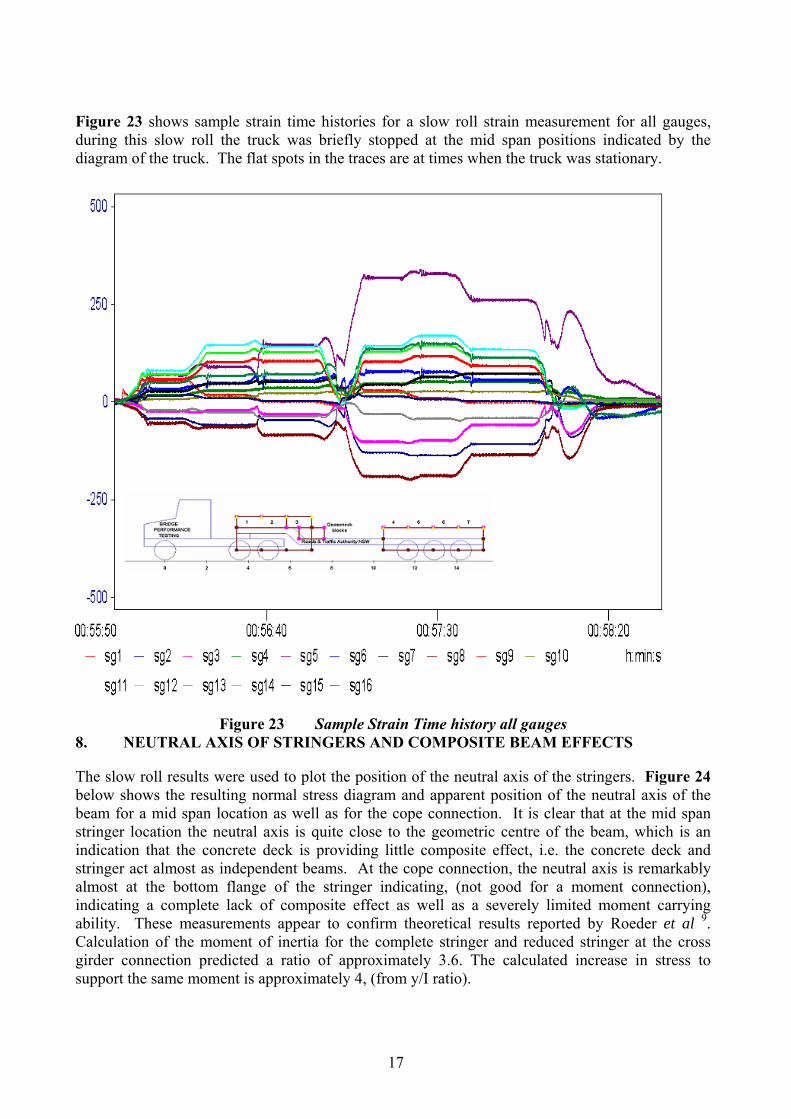
Figure 23 shows sample strain time histories for a slow roll strain measurement for all gauges, during this slow roll the truck was briefly stopped at the mid span positions indicated by the diagram of the truck. The flat spots in the traces are at times when the truck was stationary.
Figure 23 Sample Strain Time history all gauges
8. NEUTRAL AXIS OF STRINGERS AND COMPOSITE BEAM EFFECTS
The slow roll results were used to plot the position of the neutral axis of the stringers. Figure 24 below shows the resulting normal stress diagram and apparent position of the neutral axis of the beam for a mid span location as well as for the cope connection. It is clear that at the mid span stringer location the neutral axis is quite close to the geometric centre of the beam, which is an indication that the concrete deck is providing little composite effect, i.e. the concrete deck and stringer act almost as independent beams. At the cope connection, the neutral axis is remarkably almost at the bottom flange of the stringer indicating, (not good for a moment connection), indicating a complete lack of composite effect as well as a severely limited moment carrying ability. These measurements appear to confirm theoretical results reported by Roeder et al 9. Calculation of the moment of inertia for the complete stringer and reduced stringer at the cross girder connection predicted a ratio of approximately 3.6. The calculated increase in stress to support the same moment is approximately 4, (from y/I ratio).
17
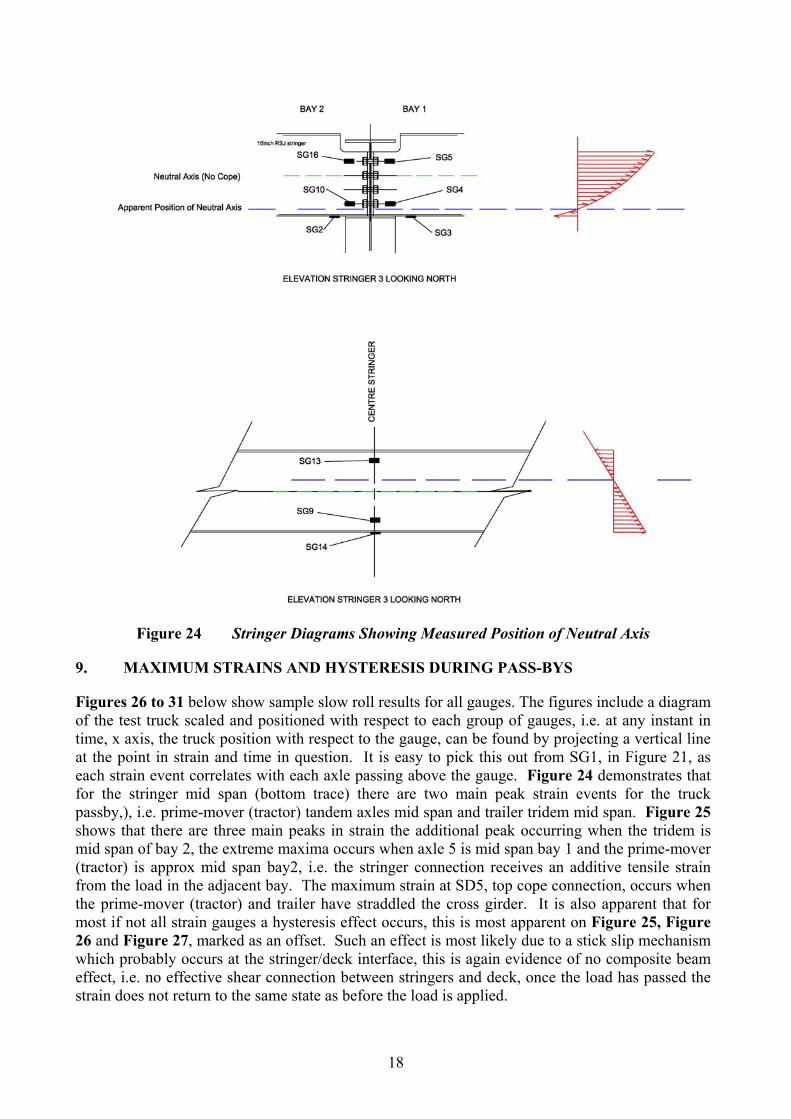
Figure 24 Stringer Diagrams Showing Measured Position of Neutral Axis
9. MAXIMUM STRAINS AND HYSTERESIS DURING PASS-BYS
Figures 26 to 31 below show sample slow roll results for all gauges. The figures include a diagram of the test truck scaled and positioned with respect to each group of gauges, i.e. at any instant in time, x axis, the truck position with respect to the gauge, can be found by projecting a vertical line at the point in strain and time in question. It is easy to pick this out from SG1, in Figure 21, as each strain event correlates with each axle passing above the gauge. Figure 24 demonstrates that for the stringer mid span (bottom trace) there are two main peak strain events for the truck passby,), i.e. prime-mover (tractor) tandem axles mid span and trailer tridem mid span. Figure 25 shows that there are three main peaks in strain the additional peak occurring when the tridem is mid span of bay 2, the extreme maxima occurs when axle 5 is mid span bay 1 and the prime-mover (tractor) is approx mid span bay2, i.e. the stringer connection receives an additive tensile strain from the load in the adjacent bay. The maximum strain at SD5, top cope connection, occurs when the prime-mover (tractor) and trailer have straddled the cross girder. It is also apparent that for most if not all strain gauges a hysteresis effect occurs, this is most apparent on Figure 25, Figure 26 and Figure 27, marked as an offset. Such an effect is most likely due to a stick slip mechanism which probably occurs at the stringer/deck interface, this is again evidence of no composite beam effect, i.e. no effective shear connection between stringers and deck, once the load has passed the strain does not return to the same state as before the load is applied.
18
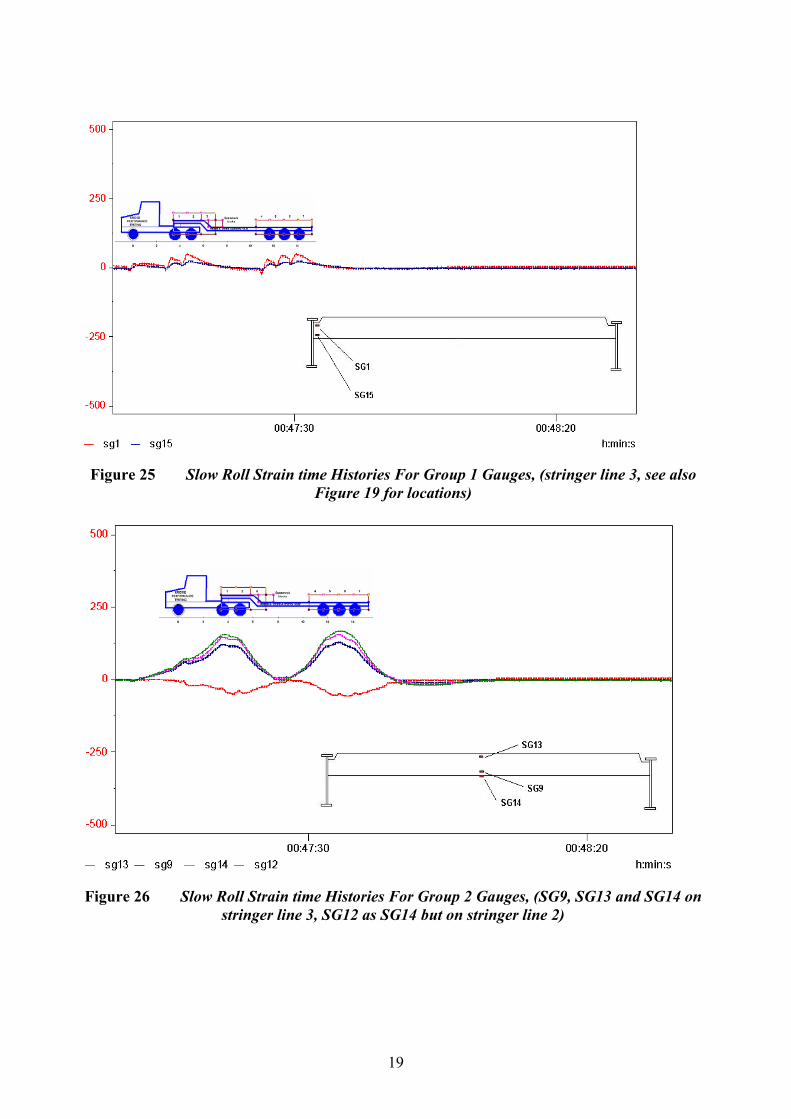
Figure 25 Slow Roll Strain time Histories For Group 1 Gauges, (stringer line 3, see also
Figure 19 for locations)
Figure 26 Slow Roll Strain time Histories For Group 2 Gauges, (SG9, SG13 and SG14 on
stringer line 3, SG12 as SG14 but on stringer line 2)
19
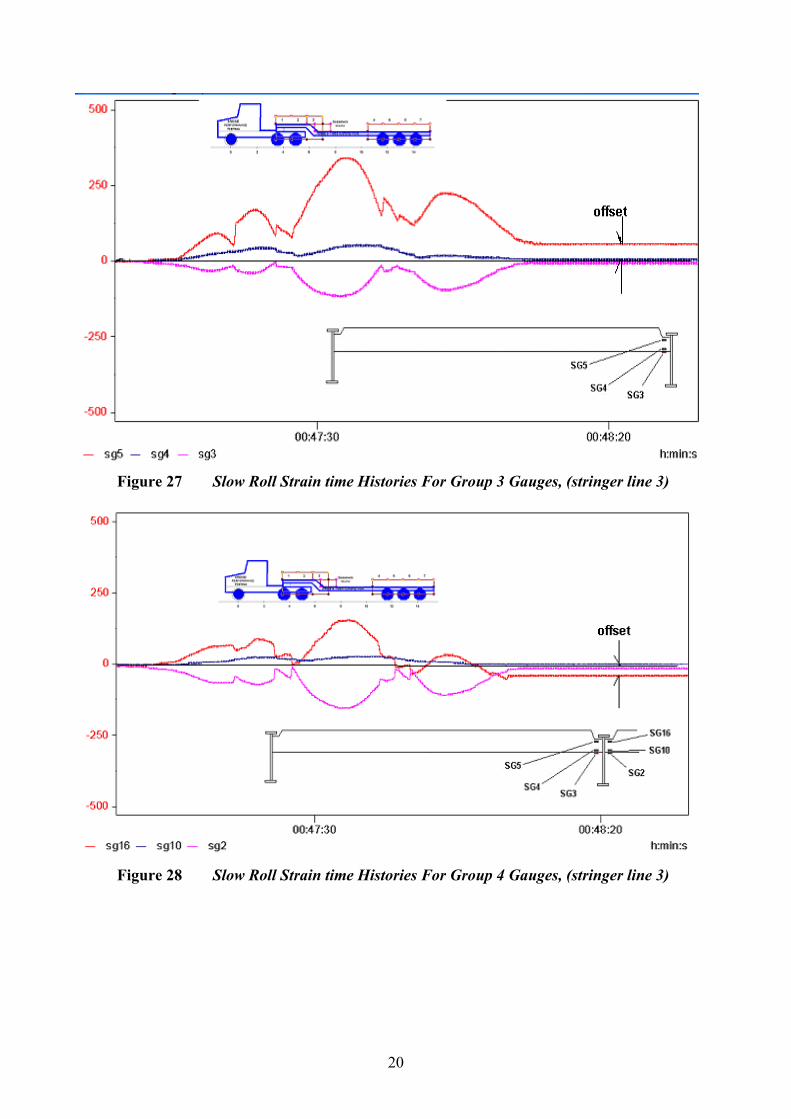
Figure 27 Slow Roll Strain time Histories For Group 3 Gauges, (stringer line 3)
Figure 28 Slow Roll Strain time Histories For Group 4 Gauges, (stringer line 3)
20
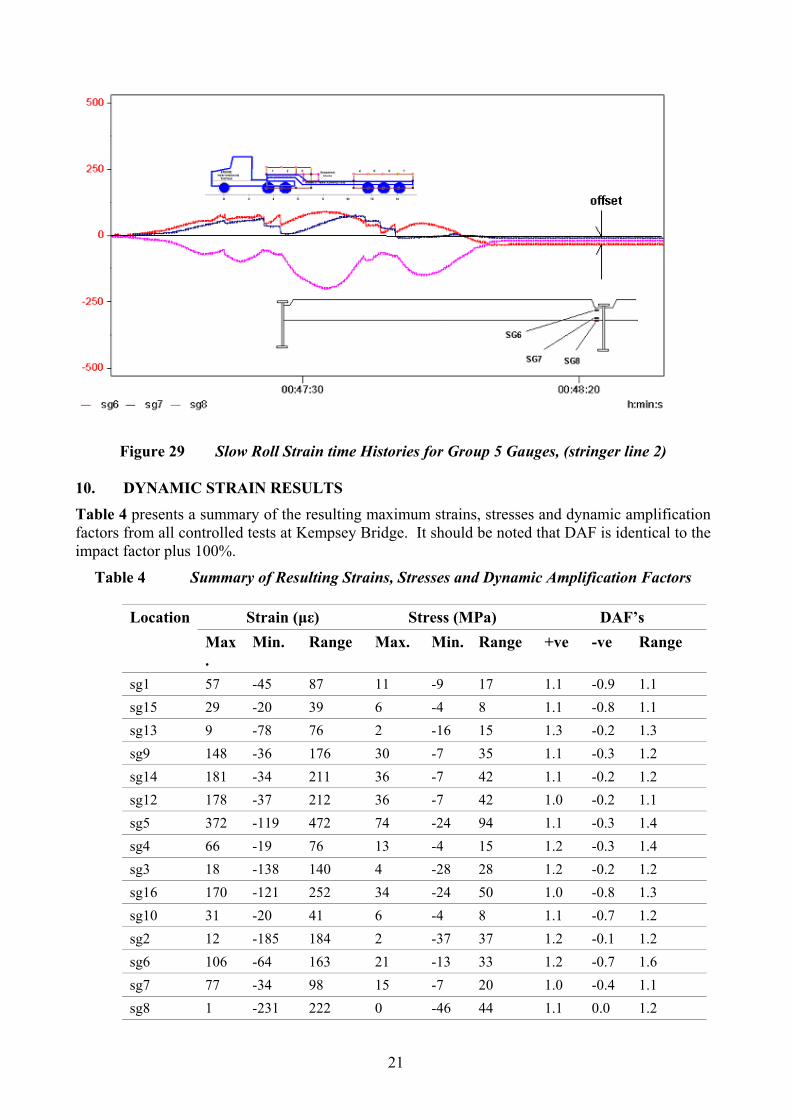
Figure 29 Slow Roll Strain time Histories for Group 5 Gauges, (stringer line 2)
10. DYNAMIC STRAIN RESULTS Table 4 presents a summary of the resulting maximum strains, stresses and dynamic amplification factors from all controlled tests at Kempsey Bridge. It should be noted that DAF is identical to the impact factor plus 100%.
Table 4 Summary of Resulting Strains, Stresses and Dynamic Amplification Factors
Strain (µε) Stress (MPa) DAF’s Location Max.
Min. Range Max. Min. Range +ve -ve Range
sg1 57 -45 87 11 -9 17 1.1 -0.9 1.1 sg15 29 -20 39 6 -4 8 1.1 -0.8 1.1 sg13 9 -78 76 2 -16 15 1.3 -0.2 1.3 sg9 148 -36 176 30 -7 35 1.1 -0.3 1.2 sg14 181 -34 211 36 -7 42 1.1 -0.2 1.2 sg12 178 -37 212 36 -7 42 1.0 -0.2 1.1 sg5 372 -119 472 74 -24 94 1.1 -0.3 1.4 sg4 66 -19 76 13 -4 15 1.2 -0.3 1.4 sg3 18 -138 140 4 -28 28 1.2 -0.2 1.2 sg16 170 -121 252 34 -24 50 1.0 -0.8 1.3 sg10 31 -20 41 6 -4 8 1.1 -0.7 1.2 sg2 12 -185 184 2 -37 37 1.2 -0.1 1.2 sg6 106 -64 163 21 -13 33 1.2 -0.7 1.6 sg7 77 -34 98 15 -7 20 1.0 -0.4 1.1 sg8 1 -231 222 0 -46 44 1.1 0.0 1.2
21
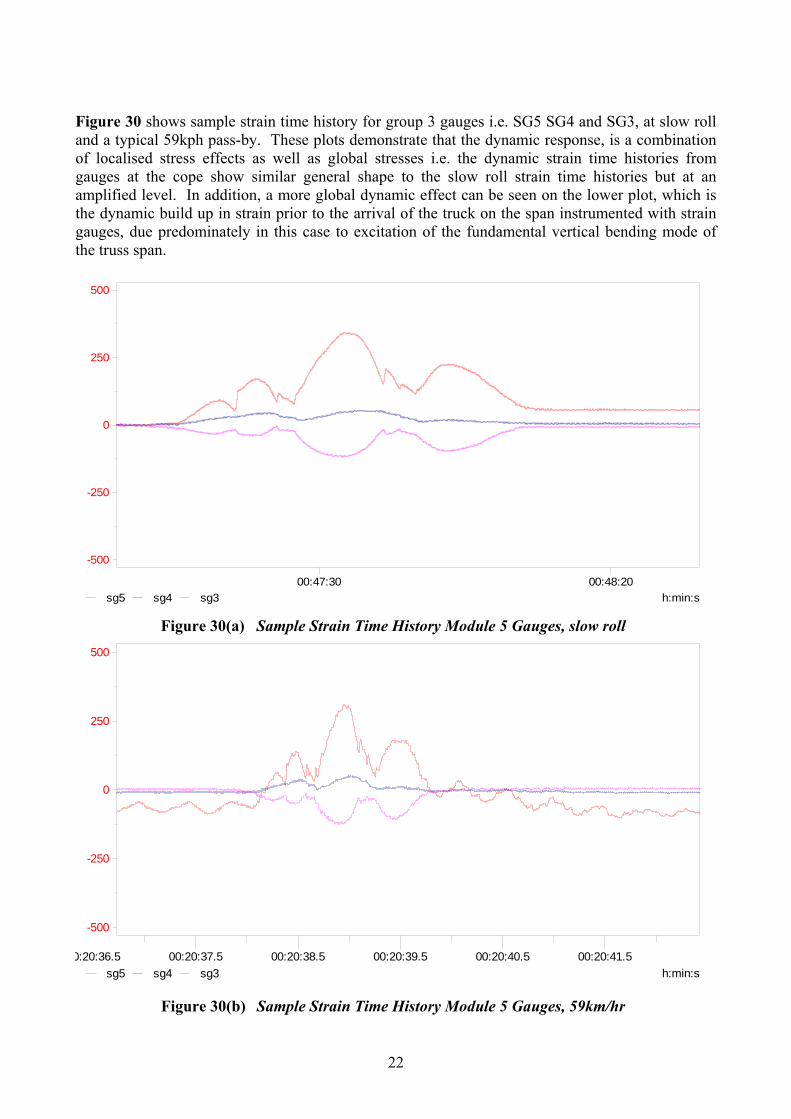
Figure 30 shows sample strain time history for group 3 gauges i.e. SG5 SG4 and SG3, at slow roll and a typical 59kph pass-by. These plots demonstrate that the dynamic response, is a combination of localised stress effects as well as global stresses i.e. the dynamic strain time histories from gauges at the cope show similar general shape to the slow roll strain time histories but at an amplified level. In addition, a more global dynamic effect can be seen on the lower plot, which is the dynamic build up in strain prior to the arrival of the truck on the span instrumented with strain gauges, due predominately in this case to excitation of the fundamental vertical bending mode of the truss span.
h:min:s00:47:30 00:48:20
500
250
0
-250
-500
sg5 sg4 sg3
Figure 30(a) Sample Strain Time History Module 5 Gauges, slow roll
h:min:s0:20:36.5 00:20:37.5 00:20:38.5 00:20:39.5 00:20:40.5 00:20:41.5
500
250
0
-250
-500
sg5 sg4 sg3
Figure 30(b) Sample Strain Time History Module 5 Gauges, 59km/hr
22

11. LONG TERM STRAIN MEASUREMENTS AND RAIN FLOW CYCLE COUNTING
Table 5 below shows an abridged summary of the maximum strain range recorded for each gauge from the controlled (legal axle load and legal speed) pass-bys and from the uncontrolled 7 days of traffic for all three tested bridges. It is apparent from these results that analysis or fatigue design based on legal load limits alone would very much under estimate the actual dynamic service loads.
23
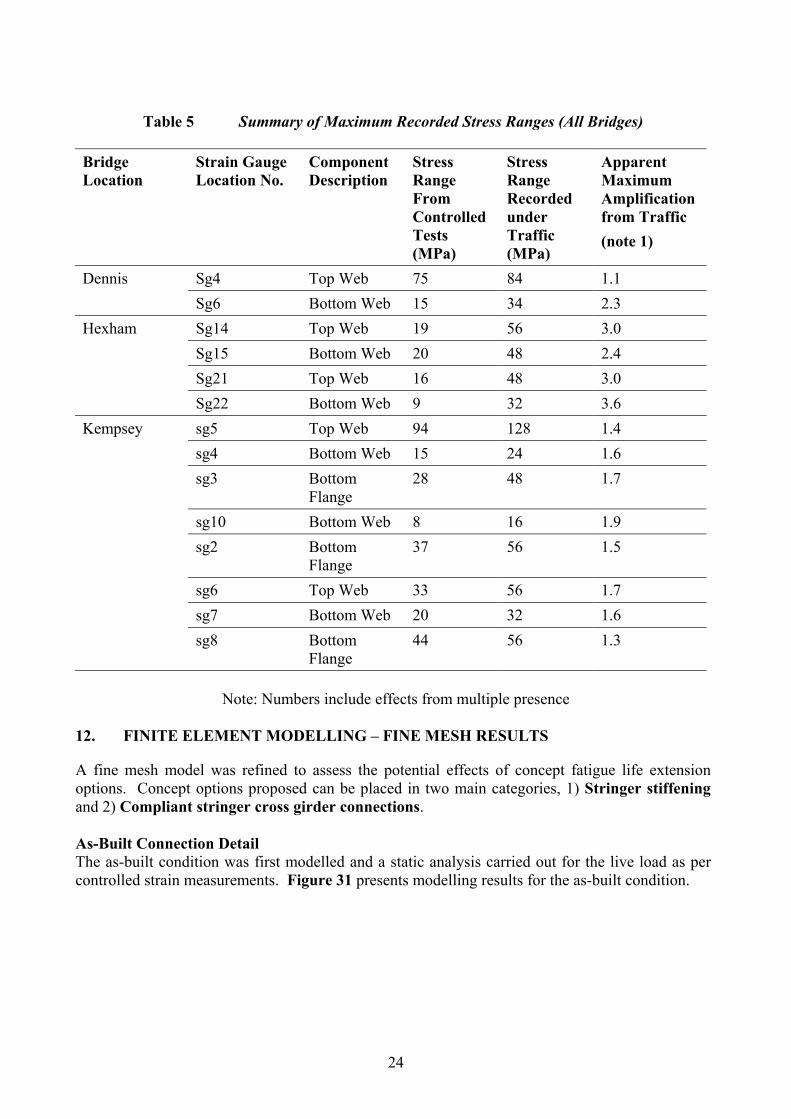
Table 5 Summary of Maximum Recorded Stress Ranges (All Bridges)
Bridge Location
Strain Gauge Location No.
Component Description
Stress Range From Controlled Tests (MPa)
Stress Range Recorded under Traffic (MPa)
Apparent Maximum Amplification from Traffic (note 1)
Sg4 Top Web 75 84 1.1 Dennis Sg6 Bottom Web 15 34 2.3 Sg14 Top Web 19 56 3.0 Sg15 Bottom Web 20 48 2.4 Sg21 Top Web 16 48 3.0
Hexham
Sg22 Bottom Web 9 32 3.6 sg5 Top Web 94 128 1.4 sg4 Bottom Web 15 24 1.6 sg3 Bottom
Flange 28 48 1.7
sg10 Bottom Web 8 16 1.9 sg2 Bottom
Flange 37 56 1.5
sg6 Top Web 33 56 1.7 sg7 Bottom Web 20 32 1.6
Kempsey
sg8 Bottom Flange
44 56 1.3
Note: Numbers include effects from multiple presence
12. FINITE ELEMENT MODELLING – FINE MESH RESULTS
A fine mesh model was refined to assess the potential effects of concept fatigue life extension options. Concept options proposed can be placed in two main categories, 1) Stringer stiffening and 2) Compliant stringer cross girder connections. As-Built Connection Detail The as-built condition was first modelled and a static analysis carried out for the live load as per controlled strain measurements. Figure 31 presents modelling results for the as-built condition.
24
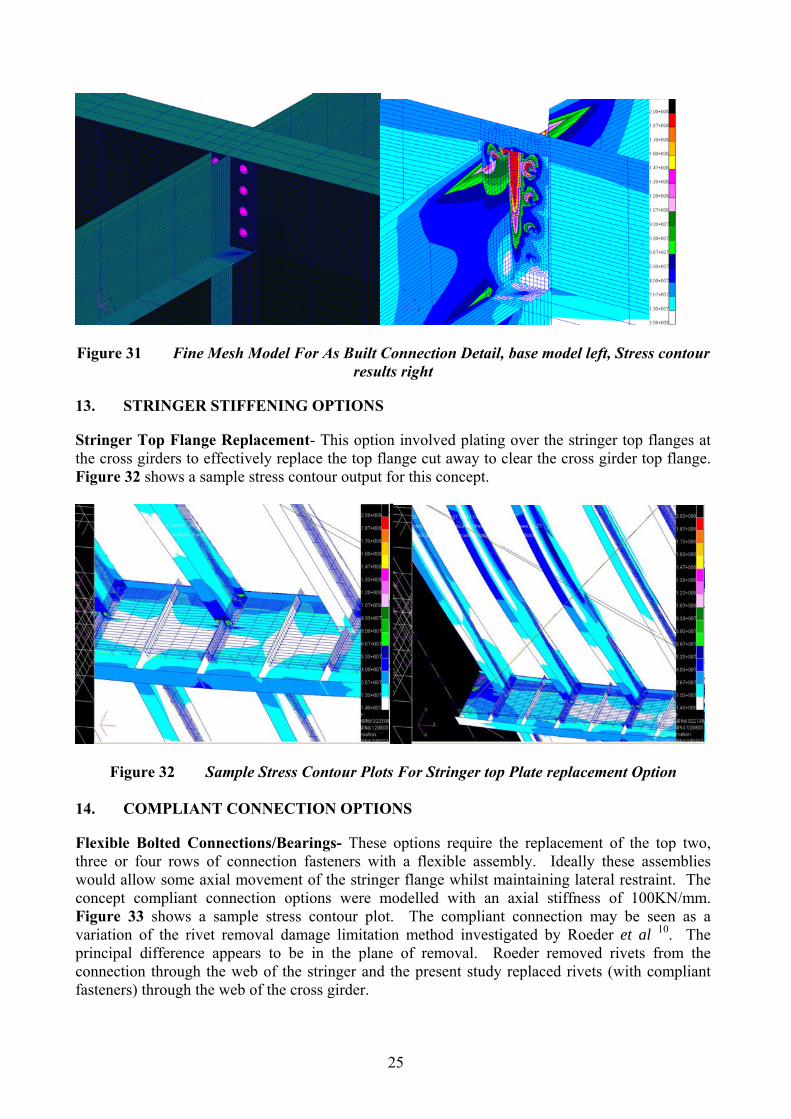
Figure 31 Fine Mesh Model For As Built Connection Detail, base model left, Stress contour results right
13. STRINGER STIFFENING OPTIONS
Stringer Top Flange Replacement- This option involved plating over the stringer top flanges at the cross girders to effectively replace the top flange cut away to clear the cross girder top flange. Figure 32 shows a sample stress contour output for this concept.
Figure 32 Sample Stress Contour Plots For Stringer top Plate replacement Option 14. COMPLIANT CONNECTION OPTIONS
Flexible Bolted Connections/Bearings- These options require the replacement of the top two, three or four rows of connection fasteners with a flexible assembly. Ideally these assemblies would allow some axial movement of the stringer flange whilst maintaining lateral restraint. The concept compliant connection options were modelled with an axial stiffness of 100KN/mm. Figure 33 shows a sample stress contour plot. The compliant connection may be seen as a variation of the rivet removal damage limitation method investigated by Roeder et al 10. The principal difference appears to be in the plane of removal. Roeder removed rivets from the connection through the web of the stringer and the present study replaced rivets (with compliant fasteners) through the web of the cross girder.
25
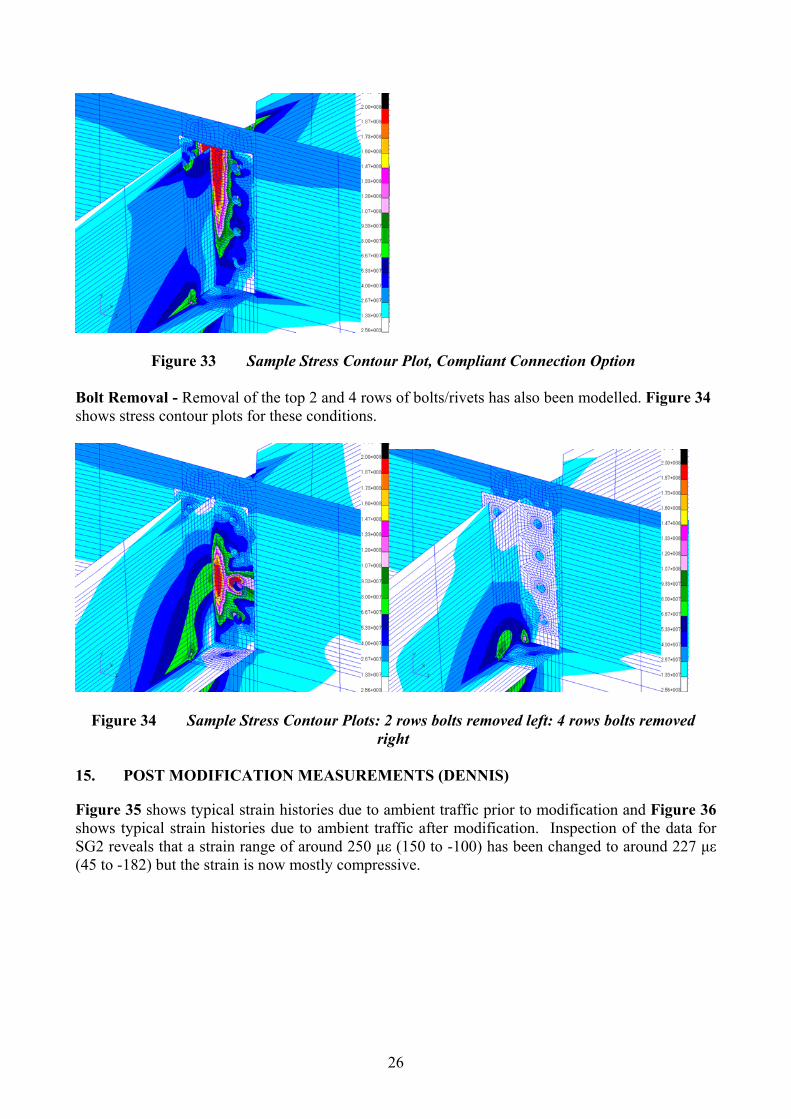
Figure 33 Sample Stress Contour Plot, Compliant Connection Option Bolt Removal - Removal of the top 2 and 4 rows of bolts/rivets has also been modelled. Figure 34 shows stress contour plots for these conditions.
Figure 34 Sample Stress Contour Plots: 2 rows bolts removed left: 4 rows bolts removed right
15. POST MODIFICATION MEASUREMENTS (DENNIS)
Figure 35 shows typical strain histories due to ambient traffic prior to modification and Figure 36 shows typical strain histories due to ambient traffic after modification. Inspection of the data for SG2 reveals that a strain range of around 250 µε (150 to -100) has been changed to around 227 µε (45 to -182) but the strain is now mostly compressive.
26
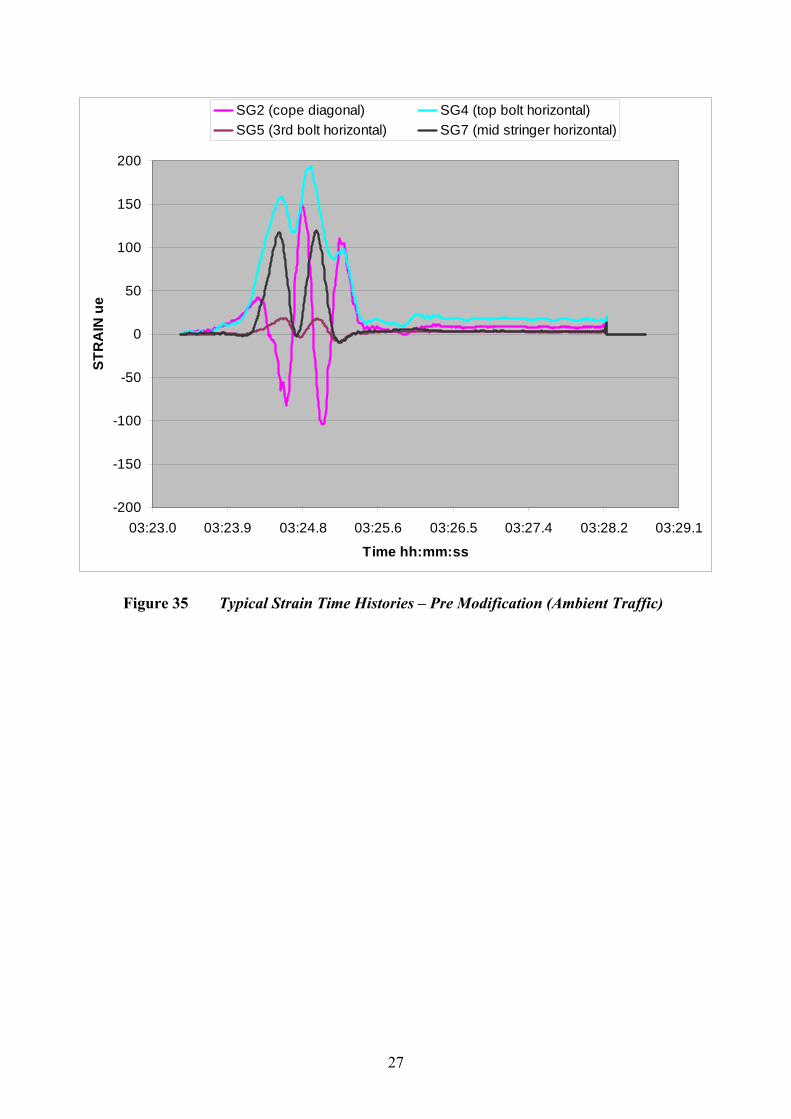
-200
-150
-100
-50
0
50
100
150
200
03:23.0 03:23.9 03:24.8 03:25.6 03:26.5 03:27.4 03:28.2 03:29.1
Time hh:mm:ss
STR
AIN
ue
SG2 (cope diagonal) SG4 (top bolt horizontal)SG5 (3rd bolt horizontal) SG7 (mid stringer horizontal)
Figure 35 Typical Strain Time Histories – Pre Modification (Ambient Traffic)
27
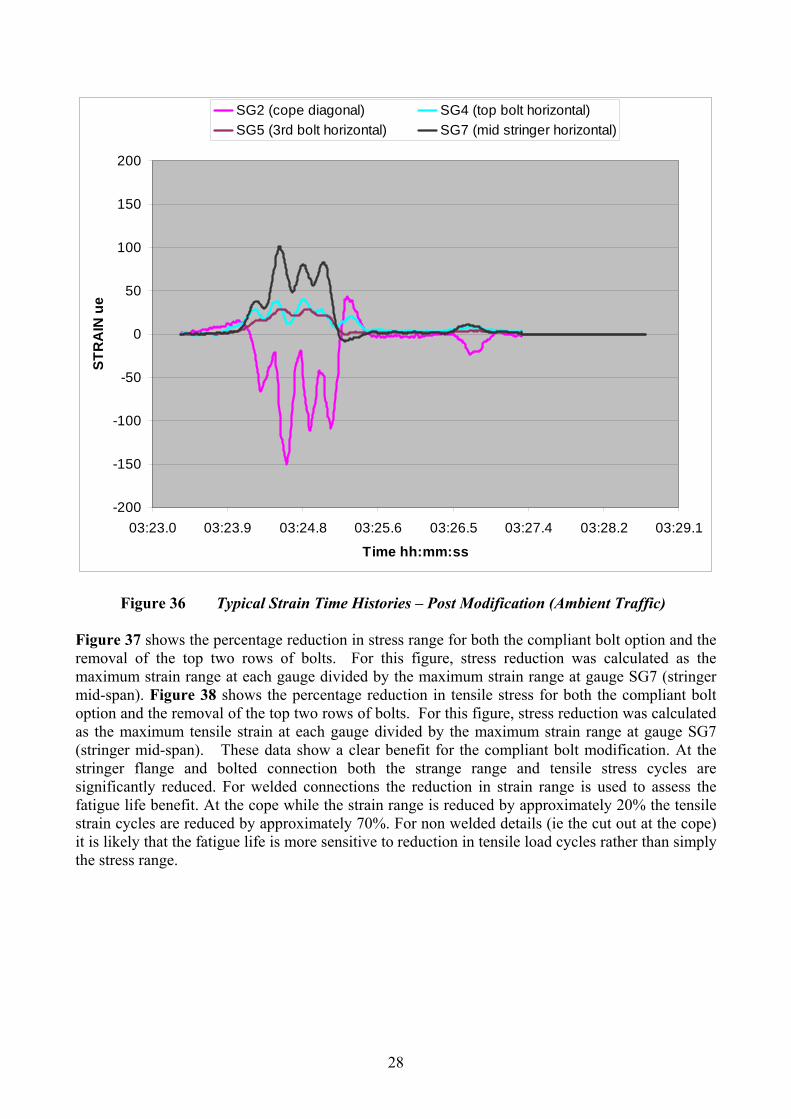
-200
-150
-100
-50
0
50
100
150
200
03:23.0 03:23.9 03:24.8 03:25.6 03:26.5 03:27.4 03:28.2 03:29.1
Time hh:mm:ss
STR
AIN
ue
SG2 (cope diagonal) SG4 (top bolt horizontal)SG5 (3rd bolt horizontal) SG7 (mid stringer horizontal)
Figure 36 Typical Strain Time Histories – Post Modification (Ambient Traffic) Figure 37 shows the percentage reduction in stress range for both the compliant bolt option and the removal of the top two rows of bolts. For this figure, stress reduction was calculated as the maximum strain range at each gauge divided by the maximum strain range at gauge SG7 (stringer mid-span). Figure 38 shows the percentage reduction in tensile stress for both the compliant bolt option and the removal of the top two rows of bolts. For this figure, stress reduction was calculated as the maximum tensile strain at each gauge divided by the maximum strain range at gauge SG7 (stringer mid-span). These data show a clear benefit for the compliant bolt modification. At the stringer flange and bolted connection both the strange range and tensile stress cycles are significantly reduced. For welded connections the reduction in strain range is used to assess the fatigue life benefit. At the cope while the strain range is reduced by approximately 20% the tensile strain cycles are reduced by approximately 70%. For non welded details (ie the cut out at the cope) it is likely that the fatigue life is more sensitive to reduction in tensile load cycles rather than simply the stress range.
28
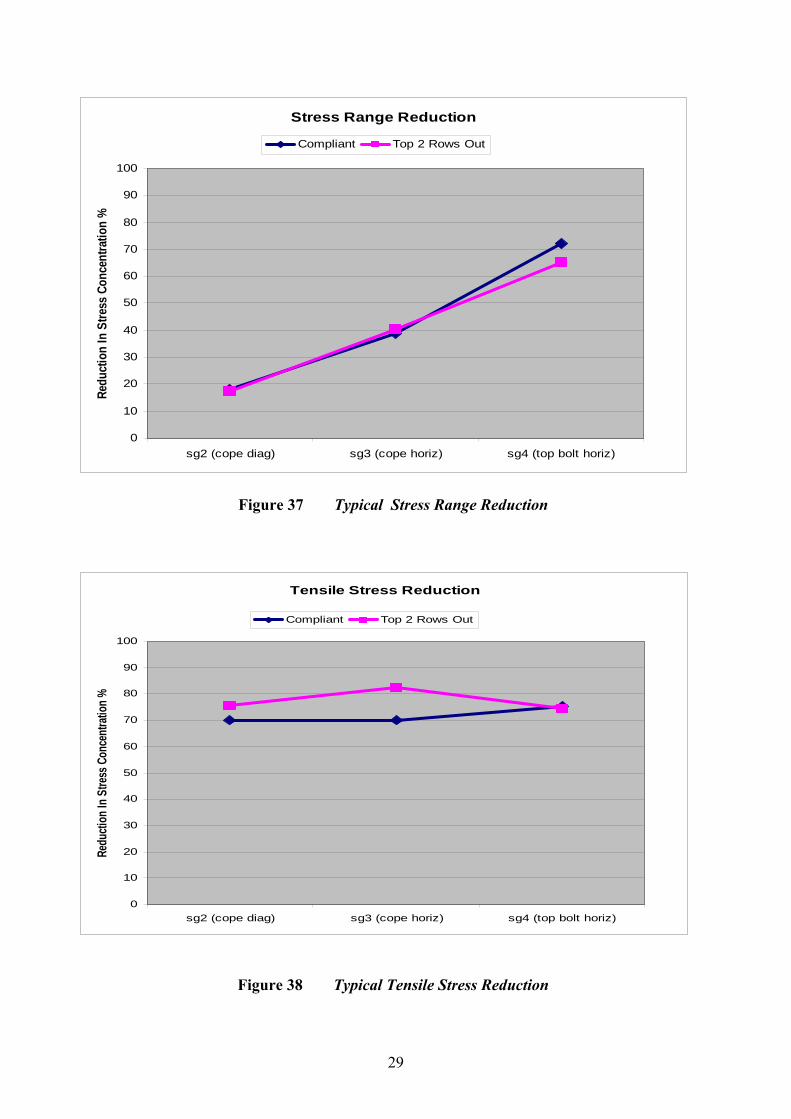
Stress Range Reduction
0
10
20
30
40
50
60
70
80
90
100
sg2 (cope diag) sg3 (cope horiz) sg4 (top bolt horiz)
Redu
ctio
n In
Stre
ss C
once
ntra
tion
%
Compliant Top 2 Rows Out
Figure 37 Typical Stress Range Reduction
Tensile Stress Reduction
0
10
20
30
40
50
60
70
80
90
100
sg2 (cope diag) sg3 (cope horiz) sg4 (top bolt horiz)
Redu
ction
In S
tress
Con
centr
ation
%
Compliant Top 2 Rows Out
Figure 38 Typical Tensile Stress Reduction
29
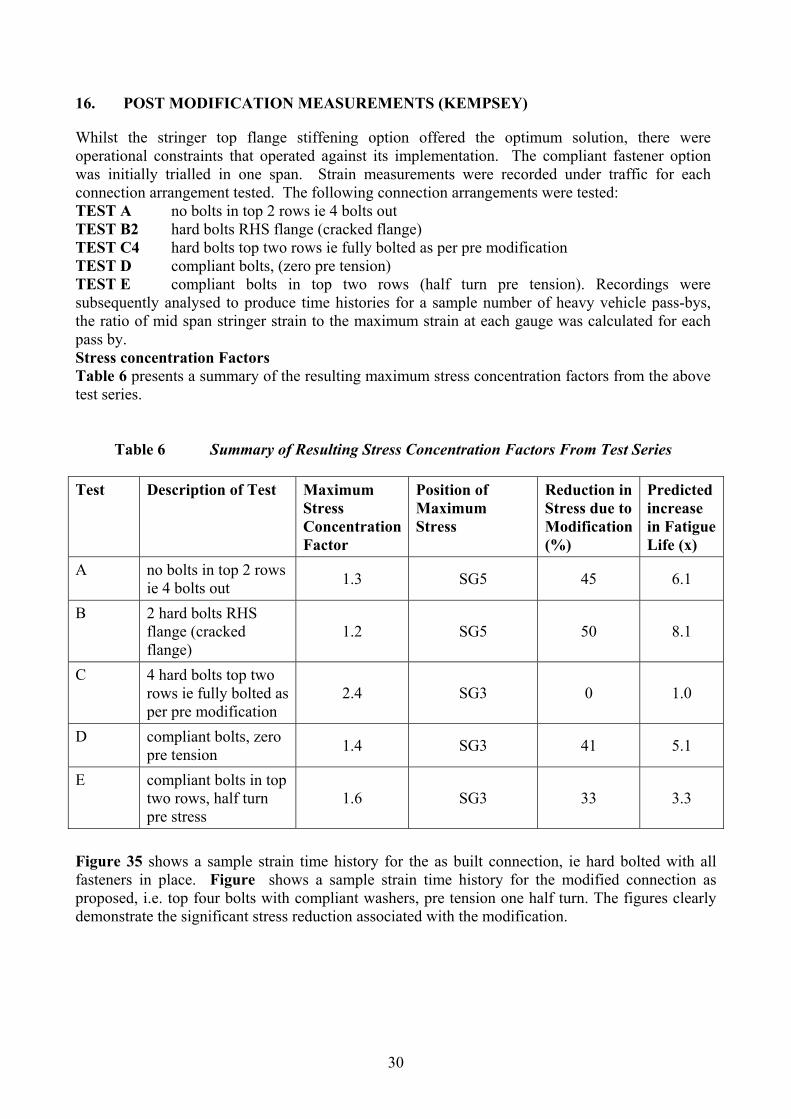
16. POST MODIFICATION MEASUREMENTS (KEMPSEY)
Whilst the stringer top flange stiffening option offered the optimum solution, there were operational constraints that operated against its implementation. The compliant fastener option was initially trialled in one span. Strain measurements were recorded under traffic for each connection arrangement tested. The following connection arrangements were tested: TEST A no bolts in top 2 rows ie 4 bolts out TEST B2 hard bolts RHS flange (cracked flange) TEST C4 hard bolts top two rows ie fully bolted as per pre modification TEST D compliant bolts, (zero pre tension) TEST E compliant bolts in top two rows (half turn pre tension). Recordings were subsequently analysed to produce time histories for a sample number of heavy vehicle pass-bys, the ratio of mid span stringer strain to the maximum strain at each gauge was calculated for each pass by. Stress concentration Factors Table 6 presents a summary of the resulting maximum stress concentration factors from the above test series.
Table 6 Summary of Resulting Stress Concentration Factors From Test Series Test Description of Test Maximum
Stress Concentration Factor
Position of Maximum Stress
Reduction in Stress due to Modification (%)
Predicted increase in Fatigue Life (x)
A no bolts in top 2 rows ie 4 bolts out 1.3 SG5 45 6.1
B 2 hard bolts RHS flange (cracked flange)
1.2 SG5 50 8.1
C 4 hard bolts top two rows ie fully bolted as per pre modification
2.4 SG3 0 1.0
D compliant bolts, zero pre tension 1.4 SG3 41 5.1
E compliant bolts in top two rows, half turn pre stress
1.6 SG3 33 3.3
Figure 35 shows a sample strain time history for the as built connection, ie hard bolted with all fasteners in place. Figure shows a sample strain time history for the modified connection as proposed, i.e. top four bolts with compliant washers, pre tension one half turn. The figures clearly demonstrate the significant stress reduction associated with the modification.
30
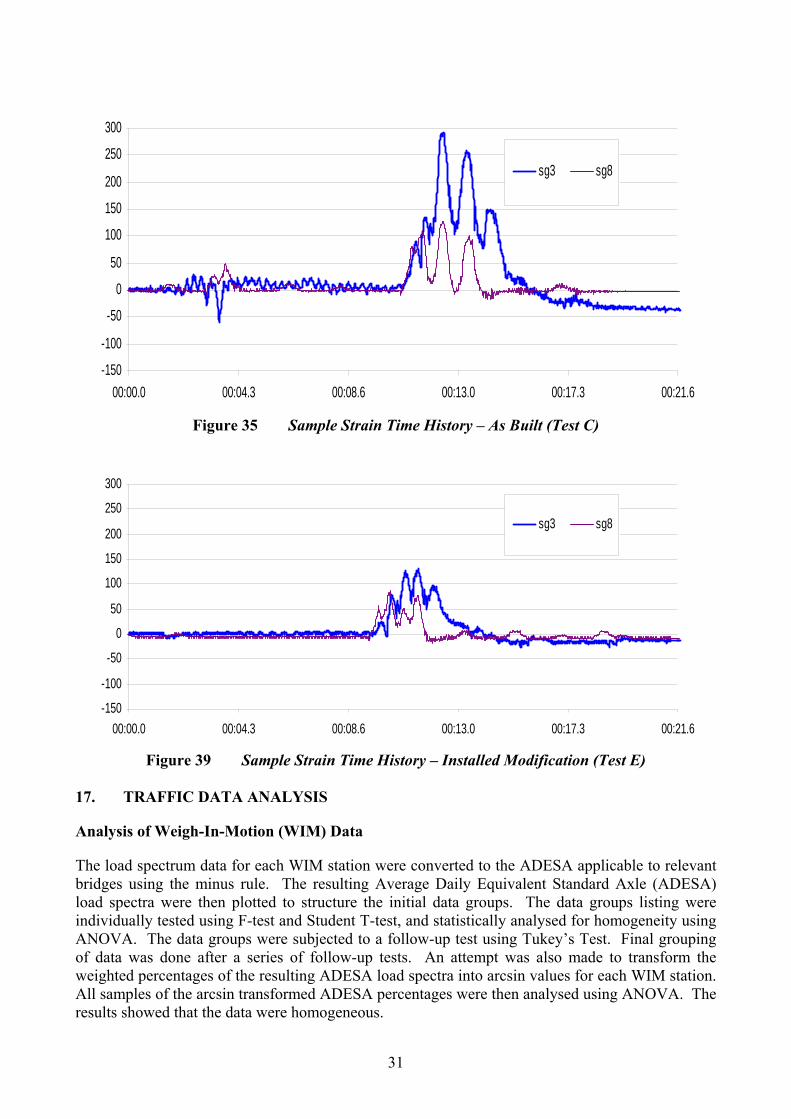
-150
-100
-50
0
50
100
150
200
250
300
00:00.0 00:04.3 00:08.6 00:13.0 00:17.3 00:21.6
sg3 sg8
Figure 35 Sample Strain Time History – As Built (Test C)
-150
-100
-50
0
50
100
150
200
250
300
00:00.0 00:04.3 00:08.6 00:13.0 00:17.3 00:21.6
sg3 sg8
Figure 39 Sample Strain Time History – Installed Modification (Test E)
17. TRAFFIC DATA ANALYSIS
Analysis of Weigh-In-Motion (WIM) Data
The load spectrum data for each WIM station were converted to the ADESA applicable to relevant bridges using the minus rule. The resulting Average Daily Equivalent Standard Axle (ADESA) load spectra were then plotted to structure the initial data groups. The data groups listing were individually tested using F-test and Student T-test, and statistically analysed for homogeneity using ANOVA. The data groups were subjected to a follow-up test using Tukey’s Test. Final grouping of data was done after a series of follow-up tests. An attempt was also made to transform the weighted percentages of the resulting ADESA load spectra into arcsin values for each WIM station. All samples of the arcsin transformed ADESA percentages were then analysed using ANOVA. The results showed that the data were homogeneous.
31

Calculation of ESA from WIM Data
The ESA applicable to bridges based on WIM data for the first half of 2006 was calculated using the minus rule formula, derived as follows:
Where:
Nf =Equivalent standard axle (ESA) for the period
Li = Mass of Axles x Number in group
Lf = Standard Load (160 kN, assumed)
Proportional Correlation
ni = Count for the period
NV = Total number of Vehicles
NG = Total Groups
ii f
if
ff
imi
i f
misc
iscisc
f
msc
sc
mf
nLLN
LfLf
ffN
nN
ffn
nff
∑
∑
∑
⎟⎟⎠
⎞⎜⎜⎝
⎛=
∝∝
××=
=
××=
××=
3
63
3
63
3
633
102
102
102
A
f
G
f
V
f
NN
NN
NN
NA = Total Axles
Cumulative ESA data for the period 1980-2006 are shown graphically as Figure 37. These data confirm the exponential growth in loads and an even faster growth in axle group repetitions due to the greater utilisation of B-doubles and tri-axle semi-trailers. The ESA approach differs from the truck weight histogram (TWH) and wheel weight histogram (WWH) method suggested by Fu et al 6. However, the methodology is considered to be broadly similar.
32
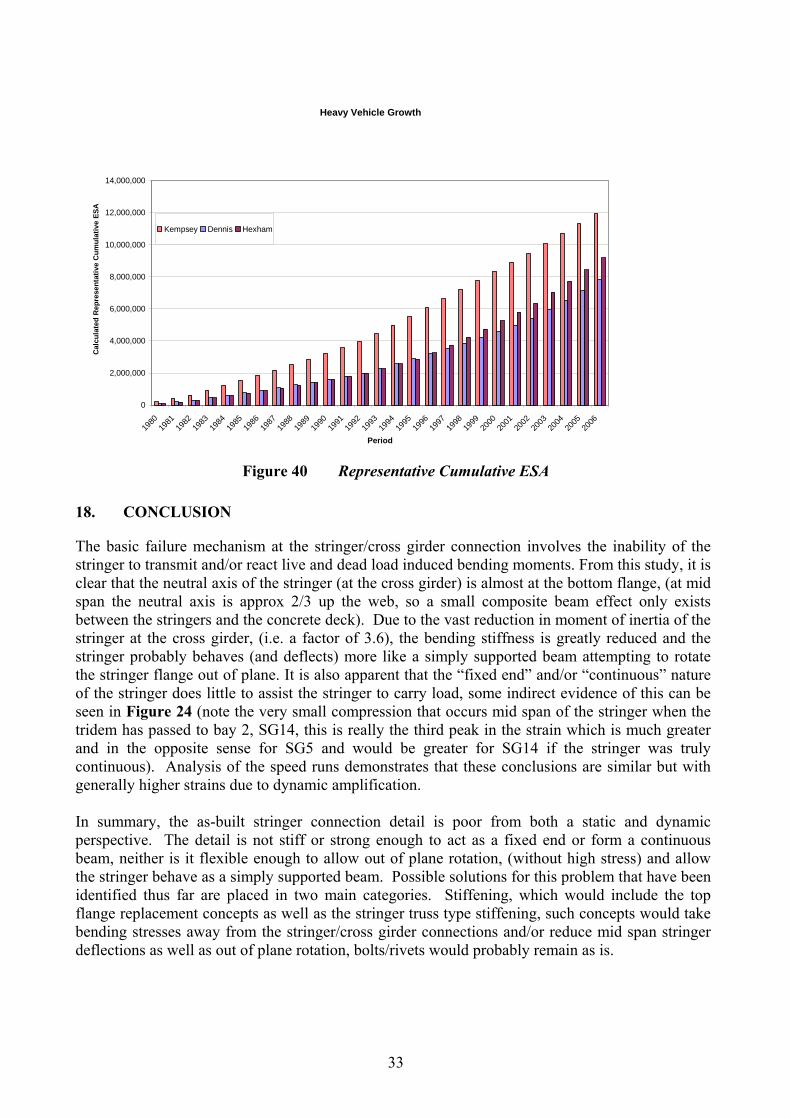
Heavy Vehicle Growth
0
2,000,000
4,000,000
6,000,000
8,000,000
10,000,000
12,000,000
14,000,000
1980
1981
1982
1983
1984
1985
1986
1987
1988
1989
1990
1991
1992
1993
1994
1995
1996
1997
1998
1999
2000
2001
2002
2003
2004
2005
2006
Period
Cal
cula
ted
Rep
rese
ntat
ive
Cum
ulat
ive
ESA
Kempsey Dennis Hexham
Figure 40 Representative Cumulative ESA
18. CONCLUSION
The basic failure mechanism at the stringer/cross girder connection involves the inability of the stringer to transmit and/or react live and dead load induced bending moments. From this study, it is clear that the neutral axis of the stringer (at the cross girder) is almost at the bottom flange, (at mid span the neutral axis is approx 2/3 up the web, so a small composite beam effect only exists between the stringers and the concrete deck). Due to the vast reduction in moment of inertia of the stringer at the cross girder, (i.e. a factor of 3.6), the bending stiffness is greatly reduced and the stringer probably behaves (and deflects) more like a simply supported beam attempting to rotate the stringer flange out of plane. It is also apparent that the “fixed end” and/or “continuous” nature of the stringer does little to assist the stringer to carry load, some indirect evidence of this can be seen in Figure 24 (note the very small compression that occurs mid span of the stringer when the tridem has passed to bay 2, SG14, this is really the third peak in the strain which is much greater and in the opposite sense for SG5 and would be greater for SG14 if the stringer was truly continuous). Analysis of the speed runs demonstrates that these conclusions are similar but with generally higher strains due to dynamic amplification. In summary, the as-built stringer connection detail is poor from both a static and dynamic perspective. The detail is not stiff or strong enough to act as a fixed end or form a continuous beam, neither is it flexible enough to allow out of plane rotation, (without high stress) and allow the stringer behave as a simply supported beam. Possible solutions for this problem that have been identified thus far are placed in two main categories. Stiffening, which would include the top flange replacement concepts as well as the stringer truss type stiffening, such concepts would take bending stresses away from the stringer/cross girder connections and/or reduce mid span stringer deflections as well as out of plane rotation, bolts/rivets would probably remain as is.
33
Compliant Fastening, i.e. concepts which allow the out of plane rotation at the stringer support points and allow the stringer to act more as a simply supported beam, have a clear advantage of much lower cost than the stiffening options, and were achieved with access from under the bridge, i.e. no lane closures. Analysis of weigh-in-motion (WIM) data confirm that bridge loadings are increasing due to exponential growth in loads and an even faster growth in axle group repetitions due to the greater utilisation of B-doubles and tri-axle semi-trailers. These data and the apparent load effect for fatigue from uncontrolled heavy vehicle traffic significantly exceed the value that would be predicted using the test vehicle factored for dynamic effects and multiple presence.
ACKNOWLEDGEMENT
The authors wish to thank the Chief Executive of the Roads and Traffic Authority NSW for permission to publish this paper. The opinions and conclusions expressed in this paper do not necessarily reflect the views of the RTA.
REFERENCES
1. AASHTO, “Standard Specification for Highway Bridges”, American Association of State Highway and Transportation Officials, 15th Edition, Washington, DC, USA, 1973.
2. ROEDER C.W., MACRAE G.A., ARIMA K., CROCKER P.N. & WONG S.D., “Fatigue Cracking of Riveted Steel Tied Arch and Truss Bridges”, Research Report WA-RD 447.1, Washington State Transportation Center, Seattle, USA, 1998.
3. Roads & Traffic Authority of NSW. “Blueprint - RTA Corporate Plan 2008 to 2012”, RTA Publication 07.329, Sydney, Australia, 2008.
4. IMAM, B.M., RIGHINIOTIS T.D. & CHRYSSANTHOPOULOS M.K., “Probabilistic Fatigue Evaluation of Riveted Railway Bridges”, J. Bridge Engineering, ASCE, 13(3), 237-244, 2008.
5. GARGETT D., HOSSAIN A. & COSGROVE D., “Interstate Freight on States’ Roads”, Proc. 29th Australasian Transport Research Forum, Surfers Paradise, Australia, 2006.
6. FU G., FENG J., DEKELBAB W., MOSES F., COHEN H. & MERTZ D., “Impact of Commercial Vehicle Weight Change on Highway Bridge Infrastructure”, J. Bridge Engineering, ASCE, 13(6), 556-564, 2008.
7. MORASSI A. & TONON S., “Dynamic Testing for Structural Identification of a Bridge”, J. Bridge Engineering, ASCE, 13(6), 573-585, 2008.
8. EWINS D.J. “Modal Testing: Theory, Practice & Application (2nd Edition)”, Research Studies Press, Hertfordshire, UK, 163-276, 1999.
9. ROEDER C.W., MACRAE G.A., KALOGIROS A.Y. & LELAND A., “Fatigue Cracking of Riveted, Coped, Stringer-to-Floorbeam Connections”, Research Report WA-RD 494.1, Washington State Transportation Center, Seattle, USA, 2001.
10. ROEDER C.W., MACRAE G.A., LELAND A. & ROSPO A., “Extending the Fatigue Life of Riveted Coped Stringer Connections”, J. Bridge Engineering, ASCE, 10(1), 69-76, 2005.
34