Soil production limits and the transition to bedrock-dominated landscapes
Experimental study of bedrock erosion by granular flows*
Leslie Hsu,1 William E. Dietrich,1 and Leonard S. Sklar2
Received 21 February 2007; revised 24 October 2007; accepted 12 December 2007; published 5 April 2008.
[1] Field studies suggest that bedrock incision by granular flows may be the primaryprocess cutting valleys in steep, unglaciated landscapes. An expression has beenproposed for debris flow incision into bedrock which posits that erosion rate depends onstresses due to granular interactions at the snout of debris flows. Here, we explore thisidea by conducting laboratory experiments to test the hypothesis that bedrock erosion isrelated to grain collisional stresses which scale with shear rate and particle size. Weplaced granular material in a 56-cm-diameter rotating drum to explore the relationshipbetween erosion of a synthetic bedrock sample and variables such as grain size, shearrate, water content, and bed strength. Grain collisional stresses are estimated as theinertial stress using the product of the squares of particle size and vertical shear rate.Our uniform granular material consisted of 1-mm sand and quartzite river gravel withmeans of 4, 6, or 10 mm. In 67 experimental runs, the eroded depth of the bed samplevaried with inertial stresses in the granular flow to a power less than 1.0 and inverselywith the bed strength. The flows tended to slip on smooth boundaries, resulting inhigher erosion rates than no-slip cases. We found that lateral wall resistance generatedshear across the channel, producing two cells whose widths depended on wallroughness. While the hypothesized inertial stress dependency is supported with thesedata, wear mechanics needs to account for grain dynamics specifically at the snout andpossibly to include lateral shear effects.
Citation: Hsu, L., W. E. Dietrich, and L. S. Sklar (2008), Experimental study of bedrock erosion by granular flows, J. Geophys. Res.,
113, F02001, doi:10.1029/2007JF000778.
1. Introduction
[2] As rock avalanches and debris flows surge downsteep valleys, they entrain loose material [e.g., Dietrichand Dunne, 1978; Pierson, 1980; Suwa and Okuda, 1980;Hungr et al., 1984; Benda, 1990] and generate granularcollisions with the bed, which can cause visible wear andplucking of the underlying bedrock [Stock and Dietrich,2003; Papa et al., 2004; Stock et al., 2005; Stock andDietrich, 2006]. These mass failure events fall under thegeneral category of granular flows, gravity-driven masses ofdiscrete solids with an interstitial fluid [Campbell, 1990].The mass removal by granular flow erosion into bedrock isminor compared to loose debris entrainment, but could bethe dominant process cutting valleys into steep landscapes[e.g., Stock and Dietrich, 2003]. During debris flow pas-sage, video cameras have recorded huge boulders sliding onand colliding with the bed [Swartz and McArdell, 2005],force plates have documented large normal and shear stress
values [McArdell et al., 2007], and ultrasonic gauges havemeasured significant ground vibrations [e.g., Arattano andMoia, 1999; Arattano and Franzi, 2004; Itakura et al.,2005, and references therein; Huang et al. 2007], all obser-vations suggesting potentially significant collision-drivenerosion. Concrete check dams in debris-flow-dominatedchannels exhibit grooves, knicks, and missing blocks (seeFigure S1 in the auxiliary material).1 Field studies haveshown that after a debris flow’s passage, its channels canbe swept clean to bedrock [e.g., Dietrich and Dunne, 1978;DeGraff, 1994; Howard, 1998; May and Gresswell, 2003;Stock and Dietrich, 2003; Jakob et al., 2005], then buried bycolluvium in the following months instead of worn further byfluvial action [Stock et al., 2005]. This suggests that somesteep bedrock channels may be exposed to greater amounts ofgranular wear than fluvial wear. There is also evidence ofgranular wear into bedrock by pyroclastic flows, another typeof granular flow [e.g., Sparks et al., 1997;Calder et al., 2000;Grunewald et al., 2000]. Thus, abundant evidence exists forerosion of bedrock channels by particle collisions in granularflows. We note that erosion and entrainment of loose collu-vium by granular flows have been measured and modeled[e.g., Berti et al., 2000; Egashira et al., 2001; Itoh et al.,2003;Rickenmann et al., 2003;Wang et al., 2003;Papa et al.,2004; Hungr et al., 2005] but are not the focus of this paper.
1Auxiliary materials are available in the HTML. doi:10.1029/2007JF000778.
JOURNAL OF GEOPHYSICAL RESEARCH, VOL. 113, F02001, doi:10.1029/2007JF000778, 2008ClickHere
for
FullArticle
1Department of Earth and Planetary Science, University of California,Berkeley, California, USA.
2Department of Geosciences, San Francisco State University, SanFrancisco, California, USA.
Copyright 2008 by the American Geophysical Union.0148-0227/08/2007JF000778$09.00
*For easy readability, this PDF has been reprocessed to include thecorrections to the article as originally published. doi:10.1029/2008JF001048.
F02001 1 of 21
[3] In addition to field observations, analysis of scalingrelationships between channel slope and drainage areasuggests a distinct topographic signature that differentiatesareas dominated by granular flows from areas dominated byfluvial flows. These channel slope drainage area relation-ships from varied geographic locations exhibit a break inslope, which appears to reflect a change in erosionalmechanism from granular/debris flow incision to fluvialincision into bedrock [Stock and Dietrich, 2003]. Typically,there is a power law trend in low-gradient, fluvially dom-inated regimes, but at slopes steeper than �10%, there maybe little or no channel steepening with decreasing drainagearea [Seidl and Dietrich, 1992; Montgomery and Foufoula-Georgiou, 1993; Lague and Davy, 2003]. Hence, thesesteeper channels may not follow a simple power lawrelationship [Stock and Dietrich, 2003]. The location ofthe scaling break at or above a slope of 10% coincides withthe slope at which debris flow deposits are commonlyfound, signifying a transition from debris flow incision todeposition [Stock and Dietrich, 2003].[4] Though abundant research exists on bedrock incision
by fluvial flows, the above observations imply that land-scape evolution models in hilly and mountainous areasrequire a separate theory for bedrock incision by granularflows. For bouldery debris flows, Stock and Dietrich [2006]have proposed that the coarse, fluid-poor snout should exertthe greatest collisional stress on the underlying bedrock,while the relatively fluid-rich, finer-grained tails may be lessimportant to channel wear. In the coarse-grained snout, thelarge boulders impact the bedrock channel, causing abrasionand surface fatigue wear. Surface fatigue causes fracturesthat coalesce and form removable material, leading tobedrock erosion [e.g., Momber, 2004; Stock and Dietrich,2006, and references therein]. Hence the important variablesthat strongly influence erosion rates are the bouldery snoutlength, particle size, and particle dynamics in the snout. Wehypothesize that the fracture generation and bedrock re-moval by surface fatigue wear is related to localized normalstresses exerted on the bed, which in turn scale with the bulkinertial stresses generated in the flow. Other importantvariables are bed roughness, degree of weathering andfracturing of the bedrock and the debris flow frequency,which varies with network structure. Hence the predictederosion rate depends not only on local physics of graincollisions with the bed, but also the network structure andassociated frequency of landsliding. Stock and Dietrich[2006] summarize field and literature observations thatindirectly support this hypothesis. Key untested assump-tions in the model are that bedrock wear rate is proportionalto grain collisional stresses, and that these stresses can beapproximated by the product of the squares of both particlegrain size and shear rate (inertial stresses, in the sense ofBagnold [1954] and Iverson [1997]). Here we will use theterm inertial stress when we calculate stresses using thisproduct.[5] Our goal is to explain bedrock incision rates through
the mechanical processes involved in erosion by grainsinteracting with the boundary. Understanding the mecha-nisms causing erosion of the bed is important because smalldifferences in the nature of the bed and the granular flowcomposition could have large effects on the amount of basalwear. For example, in some cases there is evidence of
intense damage after passage of a flow, but in others theflow passes over grass and pavement with little to no effect[e.g., Perez, 2001]. In this paper we explore granular wearof bedrock and its controlling variables by first brieflyreviewing the relevant theory on granular flows then report-ing the results of physical modeling experiments in arotating drum. We find a power law relation between theexperimental bedrock erosion and a nondimensional inertialstress term which includes the product of the squares ofgrain size and shear rate normalized by the square of thetensile strength of the bedrock. Experiments also reveal thatbed roughness and water content of the flow affect thetendency for the mass to slide, which increases erosion ratewhen it occurs. Our observations suggest that the inertialstress model may be an inadequate approximation forcollisional stresses that drive bedrock wear. We explorethree simple models based on grain motion: snout impact,zero slip, and sliding block. Although our data cannotdistinguish which model best explains the erosion in thedrum, the analysis points to the need for further study of thelocal mechanics of wear erosion.
1.1. Theoretical Framework
[6] Iverson [1997] and others, following the work ofBagnold [1954], Savage and Hutter [1989], and Campbell[1990], have proposed that the grain collisional stress inhigh flow rates can be estimated as
si ¼ nsrsD2p
@u
@z
� �2
ð1Þ
where si (Pa) is referred to as the inertial stress (followingBagnold’s [1954] and Iverson’s [1997] terminology), ns(dimensionless) is volumetric solids concentration, rs(kg m�3) is solid particle density, Dp (m) is particlediameter, u (m s�1) is velocity, and z (m) is distance fromthe bed. The application of equation (1) to calculate inertialstress from field or flume observations is challenging. Mostcommonly, it is assumed that the velocity gradient term, @u/@z, can be represented by the typical flow velocity dividedby the total flow depth [e.g., Iverson, 1997; Iverson andVallance, 2001; Iverson et al., 2004]. In some cases, z isbetter constrained as the depth of the shear band within theflow, giving a larger shear rate value [e.g., Parsons et al.,2001]. Especially problematic is determining Dp, thecharacteristic grain diameter. According to Bagnold [1954],grain size enters the problem in several roles: the scale for themass of the particle of interest, the scale for the verticalspacing between shear layers, the scale for the number ofparticles per bed area, and the scale for the number ofcollisions per unit time. In heterogeneous grain mixtures, it isnot obvious that one grain size would serve as the scale for allof these terms, though one could argue that there is aneffective grain size, De, whose mass and concentrationcapture the characteristics of the size distribution [Stock andDietrich, 2006]. Since the Dp term is squared, the choicebetween using the smaller size fraction or the larger sizefraction as the representative diameter can change the inertialstress estimation by several orders of magnitude. Acommonly used rule is to define the solid fraction as thoseparticles that settle out during the duration of the flow, themean diameter of this thus defined solid fraction is used forDp [O’Brien and Julien, 1988; Iverson, 1997].
F02001 HSU ET AL.: BEDROCK EROSION BY GRANULAR FLOWS
2 of 21
F02001
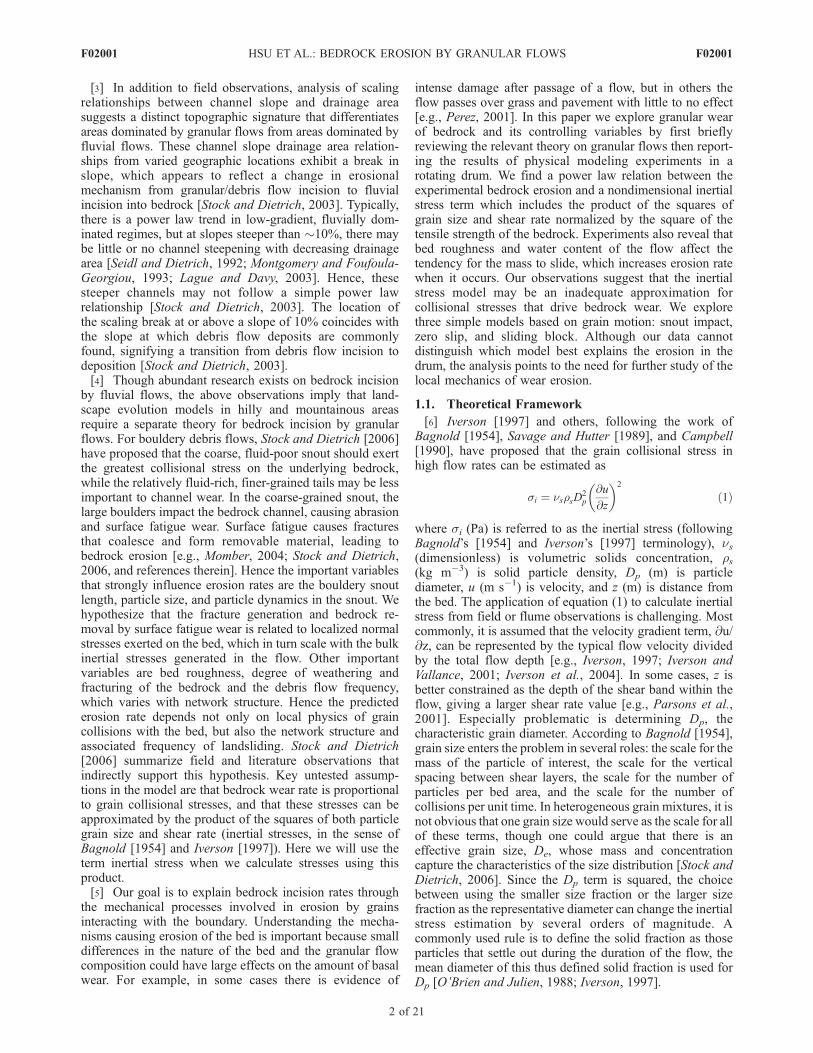
[7] The collisional stress and shear in the flow is alsoaffected by the amount of basal slip that occurs betweengranular particles and the bed. Although it is difficult toobserve the internal structure of the debris flow, there areend-members that have been hypothesized [e.g., Parsons etal., 2001] (Figure 1). In the all-slip case, the basal grainsslide along the bed at the same velocity as the entire verticalcolumn (Figure 1a). This case is like a sliding block, andhas been proposed for large rockslides and rock avalancheswhose deposits have preserved structural features of theoriginal source rock during the flow [e.g., Shreve, 1968; VanGassen and Cruden, 1989]. At the other extreme, there is noslip at the bed and the velocity profile increases to amaximum at the surface, creating high internal shear(Figure 1b). Commonly it has been argued, however, thatmost of the shear is close to the bed, and the interior regionis close to a plug flow (Figure 1d) [Hubert and Filipov,1989; Savage and Hutter, 1989; Genevois et al., 2001;Parsons et al., 2001; Bi et al., 2005; Brewster et al., 2005].[8] These diverse styles of basal interaction generate
different normal stresses on the channel bed, and it seemsthat the style is largely situation-specific. Theoretical studiesand modeling of natural granular flow velocity profilesoften have a no-slip condition at the bed [e.g., Whipple,1997; Azanza et al., 1999; Hotta and Ohta, 2000; Remaitreet al., 2005]. But measured profiles in experiments often donot have zero velocity at the bed, especially with unrough-
ened beds and spherical particles for chutes [e.g., Azanza etal., 1999; Hanes and Walton, 2000; Louge and Keast, 2001;Ancey, 2002; Iverson et al., 2004]. However, in chute flowswhere the bed is sufficiently rough, or particles and veloc-ities sufficiently small, zero velocity at the bed has beenobserved and modeled [e.g., Parsons et al., 2001; Silbert etal., 2001; Andreotti et al., 2002; Iverson et al., 2004].[9] Erosion of the bed probably depends on the mecha-
nism of movement at the boundary. Sliding wear (all-slip) isdescribed by Archard’s law,
ev ¼kWx
Hð2Þ
where ev (length3) is eroded volume, k (dimensionless) is a
nondimensional wear coefficient dependent on the materialsin contact, W (mass � length/time2) is the applied load,x (length) is the sliding distance, andH (mass/length� time2)is the hardness of the surface being worn away. In terms of anerosion rate, this can be written as
� @z
@t¼ kpnV
Hð3Þ
where �@z/@t (length/time) is the bed wear rate, pn (mass/length� time2) is the normal pressure, and V (length/time) isthe sliding velocity.[10] For low-slip, collision-dominated wear, Stock and
Dietrich [2006] proposed a rate law to express the long-termerosion of successive debris flows:
� @z
@t¼ K0K1
T20
EeffFð Þ
f L cos qbð ÞnsrsD2e
us
h
� �wh inð4Þ
where K0 (dimensionless) is a constant of proportionalitythat relates bulk inertial normal stresses to higher excursionsof inertial normal stress, K1 is a proportionality constantbetween rock resistance and incision rate that has dimen-sions that vary with w and n so that the right side of theexpression has units of erosion rate, T0 (Pa) is the tensilestrength of the bedrock, Eeff (Pa) is the elastic modulus ofthe bedrock, F (m) is a function of the fracture spacing ofthe bedrock and size of eroding boulders, f (a�1) is thefrequency of flows over the bedrock per annum, De (m) isthe effective grain size, us (m s�1) is the surface velocity,h (m) is the flow height, L (m) is the length of the erodingflow, and w and n are empirical exponents. L represents thelength of the bouldery snout only. De, the effective grainsize, is defined as the particle size that characterizes thecollisional normal stress that causes bedrock lowering undercoarse-grained debris flow fronts [Stock and Dietrich,2006]. Therefore, De may be significantly larger than themean grain size of the flow. In this study, we usehomogeneously sized grain flows and therefore De = Dp.The square dependency on tensile strength was demon-strated by Sklar and Dietrich [2001].
1.2. Measurements and Modeling
[11] Following Stock and Dietrich [2006], we proposethat the erosion rate scales with the normal stresses causedby the bulk inertial stress of the flow. Measurement of thenormal force on the bed for experimental granular chuteflow has been carried out by Iverson [1997] and Ahn et al.
Figure 1. Illustration of different velocity profiles ofgranular flows for different basal behavior. The verticaldotted line represents the zero-velocity line; the dashedline is the schematic velocity profile. (a) A flow with fullslip at the base moves like a sliding block. (b) A flow withzero slip at the base experiences internal shear. (c) Partialslip at the base is an intermediate state with positivevelocity at the base. (d) Plug flow with no slip at the basehas a nonlinear velocity profile with most of the shearconcentrated near the bed.
F02001 HSU ET AL.: BEDROCK EROSION BY GRANULAR FLOWS
3 of 21
F02001
[1991]. Iverson found high-frequency fluctuations in thenormal stress measurement, assumed to be related to gran-ular impacts. In natural channels, normal stresses on the bedhave been reported by Berti et al. [2000] (12–17 kPa,excursions 2 kPa) and McArdell et al. [2007] (5–20 kPa,excursions 2 kPa). The size of the sensor plate andfrequency of measurement affects the ability to resolve localgrain bed contact stresses [Iverson, 1997]. Our hypothesis forbedrock erosion relates to local instantaneous point loads thatare better measured by smaller plates and greater frequencythan those reported in the literature for natural flows. Hence,we further hypothesize that the high local grain collisionalstresses scale with the bulk inertial stress as defined inequation (1).[12] Authors have employed different approaches for
modeling stresses and erosion at the base of a granularflow, with no general agreement so far. One method is toscale bedrock erosion with a bed shear stress value, similarto the assumption used in many bedrock incision models forfluvial flows [e.g., Howard and Kerby, 1983; Whipple andTucker, 1999]. For example, Howard [1998] assumed thatbedrock erosion by debris flows and rock avalanches isproportional to shear stress exerted on the bed. The shearstress is calculated from the Coulomb model, with a linearrelationship between maximum shearing strength, tf, andnormal stress, sn, on the failure plane:
tf ¼ cþ sn tanF ð5Þ
where c (Pa) is cohesion and F (degrees) is the frictionangle. Howard [1998] reasoned that weathering decreasesthe bed cohesion value and when the surface shear exceedsa threshold value for erosion, mass loss occurs. Pitman et al.[2003] also employed a friction law at the basal contactsurface to calculate the shear stress caused by the overlyingflow. They proposed that if the shear stress exceeds athreshold value, then the erosion rate scales with anempirical factor fitted to experimental results. Many modelsassume that changes in z direction momentum are smallcompared to the static weight of the mass, such that verticalstresses other than the static normal stress are neglected [e.g.,Savage and Hutter, 1989]. In terrain-fitted coordinates,centripetal acceleration accounts for much, but not all, ofthe vertical acceleration [Iverson and Denlinger, 2001;Pudasaini et al., 2005]. In Cartesian coordinates, anestimation of vertical stresses over an irregular bed has beenaccomplished by modeling stresses on the bed from basalsliding as the sum of a normal component fromweight and anadditional term associated with vertical acceleration due tothe topography of the channel [Denlinger and Iverson, 2004].[13] Many different flume designs have been used to
examine granular flow phenomena, including straightchutes [e.g., Savage, 1984; Ahn et al., 1991; Iverson,1997; Azanza et al., 1999; Parsons et al., 2001], conveyorbelt flumes [e.g., Davies, 1990; Hubl and Steinwendtner,2000; Tognacca and Minor, 2000; Perng et al., 2006], ‘‘racetrack’’ flumes [e.g., Hampton, 1975] and vertically rotating(drum) flumes [e.g., Huizinga, 1996; Jan and Chen, 1997;Hotta and Ohta, 2000; Tai et al., 2000; Gray, 2001; Longoand Lamberti, 2002; Kaitna and Rickenmann, 2005]. Forbedrock erosion experiments, the most useful characteristicof a flume is the ability to sustain long periods of flow over
an erodible sample, long enough to accomplish measurablewear. We chose the vertically rotating drum design specif-ically for this reason that it provides long-term flow.Recirculating chute flumes can also provide long periodsof flow, but do not generate a distinct flow with a snout andtail, which may have different eroding properties. In a drum,there is also the ability to adjust the velocity easily. Major[1997] noted that assumptions about the velocity profile ofthe flow and slip at the drum bed cause uncertainty ininterpreting data from vertically rotating drums. Here weuse the common approximation that the velocity gradientcan be estimated as the velocity difference between thesurface and the bed divided by the flow thickness [e.g.,Iverson, 1997]. We note when there is observable slip at thebed and focus on estimating the average stress on theboundary from the mean flow properties.[14] Because of the industrial applications of rotating
drums, numerous descriptions of granular media in drumsexist in the engineering and physics literature [e.g., Ristow,1996; Buchholtz and Poschel, 1997; Boateng, 1998; Ding etal., 2001]. Of relevance to our problem, there is descriptionof the wear of liners in industrial ball mills [Radziszewskiand Tarasiewicz, 1993a, 1993b; Radziszewski, 1997]. Inthese studies, the rate of metal liner wear is modeled as afunction of the total normal force, which has gravitational,centrifugal, and compression (slip) components. Thesestudies typically use thick fills in which internal graindynamics (rather than boundary effects) prevail. Nonethe-less, we can use these studies to guide our analysis ofvelocity profiles and solid-fluid interactions.
1.3. Scaling the Experiments
[15] In order to relate experimental studies to field con-ditions, as we propose to do, the relative importance ofinertial, viscous, and frictional forces in the experimentalflows must match that found in nature [Iverson, 1997;Denlinger and Iverson, 2001; Iverson et al., 2004]. Inertialforces arise from short-term collisions between the grains,viscous forces dominate when the fluid viscosity is high,and frictional forces occur when there are sustained contactsbetween grains. The ratios of these forces are described bythe Bagnold and Savage nondimensional numbers, whichwe evaluated in our experiments and compared with thevalues for natural granular flows.[16] The Bagnold number is a measure of the ratio of
inertial to viscous stresses in a granular flow. As representedby Iverson [1997], it is
NBag ¼nsrsD
2p@u@z
nf m�
nsrsD2push
nf mð6Þ
where nf (dimensionless) is the volume fraction of fluid, m(Pa s) is the fluid viscosity, and other terms are aspreviously defined.[17] To quantify the relative importance of inertial
stresses, Savage and Hutter [1989] proposed the ratio ofinertial to total normal stresses:
NSH ¼rsD
2p
Uh
� �2pT
ð7Þ
where U (m s�1) is the velocity difference across the shearlayer and pT (N) is the total normal stress.
F02001 HSU ET AL.: BEDROCK EROSION BY GRANULAR FLOWS
4 of 21
F02001

[18] Iverson and Denlinger [2001] defined the Savagenumber as the ratio of inertial to gravitational (or frictional)stresses:
NSav ¼rsD
2p
@u@z
� �2rs � rf
� �gh
0@
1A ð8Þ
Natural debris flows tend to be inertially dominated if abovea threshold value of 0.1. Most natural flows may not betruly inertial but are frictional or transitional to inertial iffines poor (e.g., the snout), and frictional to viscous if finesrich (e.g., the body) [Campbell, 2002, 2005]. Though thesenondimensional numbers are defined strictly for steady,uniform flows, a comparison of their relative values areuseful in scaling experiments and comparing natural andexperimental flows.
2. Experimental Approach
[19] Our experiments tested the hypothesis that erosionrate by granular flows scales with inertial stress in the flow,as represented in equation (1). We first performed experi-ments with single grain sizes, bimodal grain mixtures, andcoarse mixtures with clay-rich fluid matrix to explore thequalitative behavior of flows in the drum. Then we focusedour quantitative assessment using data with single grainsizes and simple dry or water-saturated conditions. Asdiscussed in Section 1.1, this minimizes uncertainties asso-ciated with determining the effective grain size (becauseDe = Dp) and solid fraction ns. Flows with more natural grainsize distributions, including clay and silt, will be conductedafter the relation for homogenous flows are established.
2.1. Experiments Using a Drum
[20] Our drum is made from a section of PVC pipe withan inner diameter of 56 cm. Both sidewalls are composed of
Plexiglas, bounding a 15 cm wide channel. In order tomeasure erosion caused by the granular flows, an erodiblesample is inserted into the drum bed, flush with the surface(Figure 2). As the drum rotates, the sample passes under thegranular flow repeatedly. The flat sample area exposed tothe flow is 2.5 cm (downstream) by 10 cm (cross stream).The downstream dimension was chosen to minimize bedcurvature while exceeding the length of the largest flowparticle (1 cm). The magnitude of erosion was determinedby weighing the erodible sample block before and after theexperiment and obtaining the mass loss.[21] There are several consequences of using a drum for
debris flow erosion experiments. First, at sufficiently highrotation rates, centrifugal force may become significant.Consider a single grain in contact with the bed of therotating drum that is not slipping relative to the bed. Inthe steady state case of uniform rotational motion, the grainexperiences a centripetal acceleration as a result of movingin a circle with a constant speed. This centripetal acceler-ation is an artifact of the drum geometry and we haveattempted to minimize this effect by keeping the drumvelocity, and thus the magnitude of the centripetal acceler-ation and force, low.[22] In our experiments, the radius of the drum rdrum is
28 cm and the maximum tangential velocity of the drum bedudrum is 0.8 m s�1, leading to a maximum centripetalacceleration of
aC ¼ u2drumrdrum
¼ 2:3 m=s2 ð9Þ
Thus, the magnitude of the centripetal acceleration felt bythe grain is, at most, 23% of that of the gravitationalacceleration (9.81 m s�2) felt by the grain.[23] Second, the drum bed is continuously curved, influ-
encing the bed and surface slope of the granular flow. Thebasal slope is used to correct the normal component to thebed for calculations of stress. Stock and Dietrich [2006]include a bed slope effect on the inertial stress term toaccount for the presumed lower impact magnitude andfrequency on steeper slopes. In natural steep channels thebed slope is far from constant, having knickpoints, but is notas strongly and consistently concave as a drum bed. In adrum, the basal contact below the flow is on a continuouslyconcave slope, and in our small rotating drum, covers arange up to 90 arc degrees (Figure 3). Different authors havedealt with the bed curvature in varying ways. To calculatethe total normal stress exerted on a drum bed by thegranular flow, Holmes et al. [1993] divided the flow intosmall vertical sections and summed the stress on eachsection using their respective basal angles. To arrive at asingle ‘‘representative’’ slope, Kaitna and Rickenmann[2005] took the tangential slope to the drum beneath thecenter of mass of the flow. The surface slope is used incalculations of shear stress exerted on the bed by the flow.Iverson and Vallance [2001] used the angle of surfaceinclination in their expression for intergranular normalstress on planes at depth, because the surface slope deter-mines the pressure gradient driving the flow. To addressirregular topography, Denlinger and Iverson [2004] includ-ed the influence of changes in z momentum due to topo-graphic variations. They defined total vertical acceleration,
Figure 2. Illustration of the vertically rotating drum usedto conduct bed erosion experiments. An erodible sample isfixed into the bed of the drum, its surface level with thebed. As the drum with radius rdrum rotates at speed udrum,the granular flow of height h and length L0 passes over theerodible surface area, Ablock, exerting erosive stresses onthe sample. Erosion is measured by mass differencing thesample block before and after an experiment.
F02001 HSU ET AL.: BEDROCK EROSION BY GRANULAR FLOWS
5 of 21
F02001

g0, to include both gravitational acceleration and down slopeand centripetal accelerations arising from irregularly shapedchannels. In the drum geometry, the normal stress on thebed would be larger than on a straight chute (g0 > g) becausethe flow is decelerating vertically due to impingementagainst the concave–up bed. Therefore, we might expectmore erosion to occur in the drum than in a chute geometryexperiment.[24] In our experiments, we measured both the average
surface slope, qs, and the basal slope at the snout, qb(Figure 4). Consider a flow of constant depth in the drum,the normal stress under the flow is greatest at the flow frontbecause cos qb is maximum. Because the flow depth actuallytapers at the front, this effect is diminished. In the no-slipcase (Figures 1b and 1d), the collisional stresses occur onlyat the snout. There are collisional stresses farther backwithin the flow due to grain to grain collision, but wehypothesize (following others) that these normal stressesare minor compared to those which occur at the snout,
Figure 3. Outlines of granular flows with differentcomposition in the rotating drum. (a) Dry gravel, (b) water-saturated gravel, (c) dry sand, (d) gravel, sand, and mud(kaolinite and water), and (e) sand and mud. For a constantdrum velocity of 0.55 m s�1, dry and water-saturated gravelflows (Figures 3a and 3b) occupy higher positions in thedrum while flows with clayey matrix (Figures 3d and 3e) andsmaller grain size (Figure 3c) tend to lower the mean basalslope of the flow.
Figure 4. (a) Slopes measured on the flow in the drum.Legend: 1, surface slope, qs; 2, basal slope qb, at snout;3, shear layer slope, qt. Here, the surface slope and shearlayer slope are parallel. (b) Semiquantitative velocity vectorsfor a dry gravel flow in the drum, derived from observingparticles in digital videos. (c) Velocity vectors for a water-saturated flow in the drum. The solid curved line representsthe schematic velocity profile, and the straight dotted linerepresents the zero velocity position in the laboratory frame.(d) Schematic illustrating that for constant drum velocity, drygravel flows have faster surface velocities and greatervelocity gradient between the surface and base of the flowthan water-saturated flows.
F02001 HSU ET AL.: BEDROCK EROSION BY GRANULAR FLOWS
6 of 21
F02001

where particles may tumble down the snout and collide withthe bed, or may remain bouncing directly on the bed for aconsiderable travel distance. Hence, as Stock and Dietrich[2006] proposed, we anticipate most erosion occurs as thesnout sweeps across the bedrock. If no sliding occurs behindthe flow front, and the only erosion occurs in impacts at thefront, then the angle between the surface and basal slope atthe snout is the fundamentally important slope. The basalslope at the snout is between 0� and 10� for all of ourexperiments, which would modify the stress values by amaximum of cos 10� = 0.98. Because this value is very closeto 1, we do not include it in our formulation of normalstresses. Basal slopes would need to exceed 25� to modify thenormal stress by 10%. The surface slope was approximatelylinear with the exception of when sand was used.[25] A third consequence of a drum is that material cannot
deposit behind the flow or laterally in levees. The grains arecontinually recirculated in the flow, and hence we cannotexamine depositional effects on debris flow processes. None-theless, purely erosive flows do occur in steep, canyon rivers.[26] In summary, drum curvature effects on bedrock wear
rate by granular flows appear to be minor. None of ourcalculations depend explicitly on the surface slope, whichwe can measure. Neither do any of our calculations varysignificantly with the basal slope, which we can alsodocument. However, we might expect more erosion to occurin the drum than in a chute geometry experiment because ofthe concave-up geometry of the bed.
2.2. Testing the Hypothesis of Erosion by InertialStresses in a Drum
[27] In a drum, the total length of the flow (Ltot) thatpasses over the sample block during the total period of theexperiment (texp) is the product of the instantaneous length(L0) and the number of times the drum is rotated. Tocompare experiments with differing total lengths, we non-dimensionalize erosion by dividing the average erodeddepth by the total flow length:
e0 ¼ ed
Ltot¼ em=Ablockrblockð Þ
Lotexpudrum=2prdrum� � ð10Þ
where e0 is dimensionless erosion, ed (m) is the averageeroded depth of the sample block after an experiment andLtot (m) is the total length of the flow over the erodiblesample during the experiment. The average eroded depth,ed, is calculated from the net eroded mass, em (kg) dividedby the area of the sample block, Ablock (m
2) and the densityof the block, rblock (kg m�3). The total length, Ltot, is
calculated as the length of the individual flow, L0 (m)multiplied by the total period of the experiment, texp (sec),divided by the time per rotation, 2prdrum/udrum (whererdrum (m) is the circumference of the drum, and udrum (m s�1)is the speed of rotation of the drum).[28] To compare erosion rate with estimated inertial stress
and measured bedrock strength we simplify the Stockerosion hypothesis (equation (4)) to
� @z
@t¼ K0K1
T20
Eeff
L nsrsD2e
us � ub
h
� �2 �n
ð11Þ
where ub (m s�1) is the basal velocity of the granular flow.The term @z/@t is the lowering rate for one experiment. Weneglect the fracture term, F, because we use an erodiblesamplematerial that is not susceptible tomacrofracturing.Wealso leave out the frequency term, f, because our experimentsrepresent continuous flows of varying lengths, not discreteflows with a recurrence interval. We use Eeff = 2 � 109 Pa[Stock and Dietrich, 2006]. Because our flows do not havegrain size-distinct snouts, L is equivalent to Ltot in the drumfor the duration of one experiment. The exponent w inequation (4) is assumed to be 2 following the inertial stressdefinition in equation (1), the hypothesis of Stock andDietrich [2006], and experimental results of Hanes andInman [1985].[29] Using [ed per texp = @z/@t] and [Ltot = L], we can
arrange equations (10) and (11) to write
em
Ablockrblock
�Lotexpudrum
2prdrum¼ K0K1
Eeff
T20
nsrsD2e
us � ub
h
� �2 �n
ð12Þ
where the left-hand side is the nondimensional erosion rate,e0, and the right-hand side is a reduced form of thenondimensional number Nerosion proposed by Stock andDietrich [2006]. To apply equation (12) to our drumexperiments, we made the assumption that the meanvelocity and the maximum depth (hmax) would scale theinertial stresses in the flow. For no-slip cases, the meanvelocity equals surface minus basal speed, us–ub. We alsouse the particle diameter Dp, for the effective diameter, De,because we have homogeneous grain size distributions. Wethus hypothesize that erosion is proportional to the quantityNSNIS (strength-normalized inertial stress):
NSNIS ¼ nsrsD2e
@u
@z
� �2Eeff
T20
� nsrsD2e
us � ub
h
� �2 Eeff
T20
ð13Þ
2.3. Experimental Variables
[30] We conducted erosion experiments in which wevaried grain size (Dp), water content (which affects us),drum speed (udrum), bedrock strength (T0), and bed rough-ness (which affects ub). Because the small size of the flumepresented both space and scaling issues, we did not attemptto instrument the bed with normal load sensors for directlymeasuring the bed stresses. Hence, our test relies on theassumptions in equation (12) regarding approximationsused to estimate inertial stress.[31] The homogeneous granular flows were composed of
gravel with mean diameter of 4, 6, or 10 mm or sand with a
Table 1. Erodible Sample Block Tensile Strength
Blocka Strength, kPa SD,b kPa N Points
10A 814 209 1010B 592 83 810C 653 281 715A 310 13 815B 316 22 815C 268 55 820A 407 23 10aNumber in the block name represents the silica sand:cement ratio (e.g.,
10:1, 15:1, 20:1). Measured by Brazilian tensile strength test.bSD, standard deviation.
F02001 HSU ET AL.: BEDROCK EROSION BY GRANULAR FLOWS
7 of 21
F02001
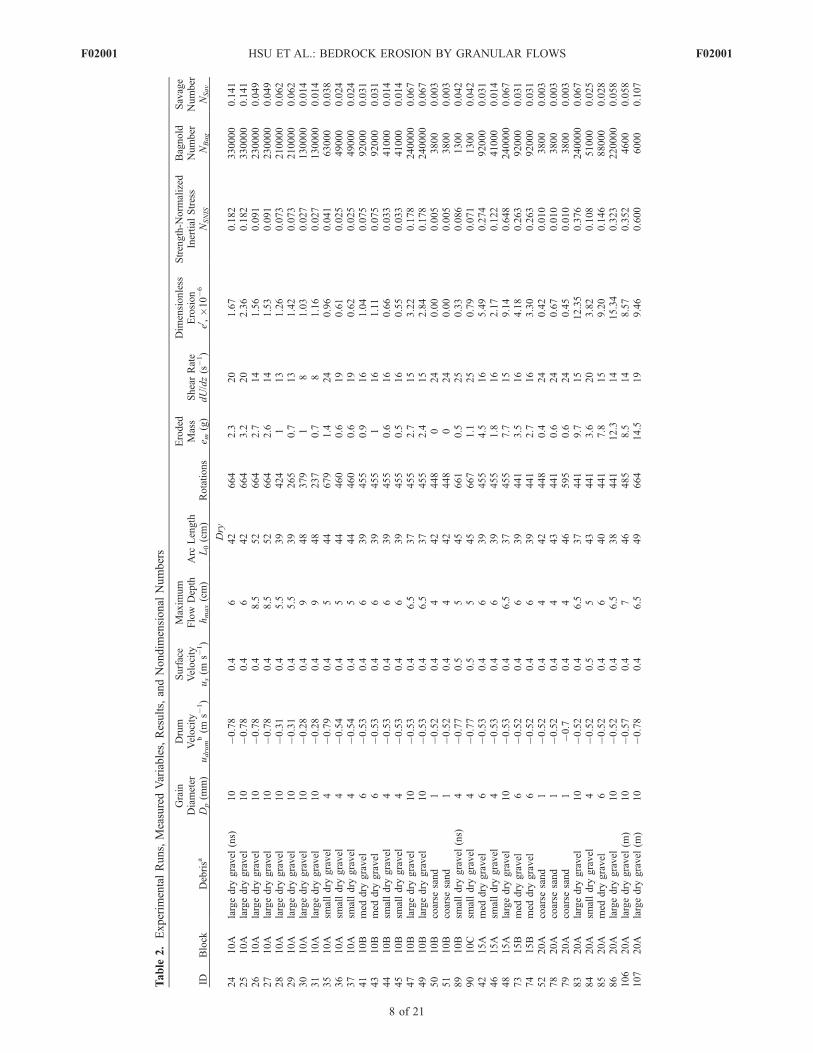
Table
2.Experim
entalRuns,MeasuredVariables,Results,andNondim
ensional
Numbers
IDBlock
Debrisa
Grain
Diameter
Dp(m
m)
Drum
Velocity
udrumb(m
s�1)
Surface
Velocity
us(m
s�1)
Maxim
um
Flow
Depth
hmax(cm)
Arc
Length
L0(cm)
Rotations
Eroded
Mass
e m(g)
ShearRate
dU/dz(s�1)
Dim
ensionless
Erosion
e0,�10�6
Strength-N
orm
alized
Inertial
Stress
NSNIS
Bagnold
Number
NBag
Savage
Number
NSav
Dry
24
10A
largedry
gravel
(ns)
10
�0.78
0.4
642
664
2.3
20
1.67
0.182
330000
0.141
25
10A
largedry
gravel
10
�0.78
0.4
642
664
3.2
20
2.36
0.182
330000
0.141
26
10A
largedry
gravel
10
�0.78
0.4
8.5
52
664
2.7
14
1.56
0.091
230000
0.049
27
10A
largedry
gravel
10
�0.78
0.4
8.5
52
664
2.6
14
1.53
0.091
230000
0.049
28
10A
largedry
gravel
10
�0.31
0.4
5.5
39
424
113
1.26
0.073
210000
0.062
29
10A
largedry
gravel
10
�0.31
0.4
5.5
39
265
0.7
13
1.42
0.073
210000
0.062
30
10A
largedry
gravel
10
�0.28
0.4
948
379
18
1.03
0.027
130000
0.014
31
10A
largedry
gravel
10
�0.28
0.4
948
237
0.7
81.16
0.027
130000
0.014
35
10A
smalldry
gravel
4�0.79
0.4
544
679
1.4
24
0.96
0.041
63000
0.038
36
10A
smalldry
gravel
4�0.54
0.4
544
460
0.6
19
0.61
0.025
49000
0.024
37
10A
smalldry
gravel
4�0.54
0.4
544
460
0.6
19
0.62
0.025
49000
0.024
41
10B
med
dry
gravel
6�0.53
0.4
639
455
0.9
16
1.04
0.075
92000
0.031
43
10B
med
dry
gravel
6�0.53
0.4
639
455
116
1.11
0.075
92000
0.031
44
10B
smalldry
gravel
4�0.53
0.4
639
455
0.6
16
0.66
0.033
41000
0.014
45
10B
smalldry
gravel
4�0.53
0.4
639
455
0.5
16
0.55
0.033
41000
0.014
47
10B
largedry
gravel
10
�0.53
0.4
6.5
37
455
2.7
15
3.22
0.178
240000
0.067
49
10B
largedry
gravel
10
�0.53
0.4
6.5
37
455
2.4
15
2.84
0.178
240000
0.067
50
10B
coarse
sand
1�0.52
0.4
442
448
024
0.00
0.005
3800
0.003
51
10B
coarse
sand
1�0.52
0.4
442
448
024
0.00
0.005
3800
0.003
89
10B
smalldry
gravel
(ns)
4�0.77
0.5
545
661
0.5
25
0.33
0.086
1300
0.042
90
10C
smalldry
gravel
4�0.77
0.5
545
667
1.1
25
0.79
0.071
1300
0.042
42
15A
med
dry
gravel
6�0.53
0.4
639
455
4.5
16
5.49
0.274
92000
0.031
46
15A
smalldry
gravel
4�0.53
0.4
639
455
1.8
16
2.17
0.122
41000
0.014
48
15A
largedry
gravel
10
�0.53
0.4
6.5
37
455
7.7
15
9.14
0.648
240000
0.067
73
15B
med
dry
gravel
6�0.52
0.4
639
441
3.5
16
4.18
0.263
92000
0.031
74
15B
med
dry
gravel
6�0.52
0.4
639
441
2.7
16
3.30
0.263
92000
0.031
52
20A
coarse
sand
1�0.52
0.4
442
448
0.4
24
0.42
0.010
3800
0.003
78
20A
coarse
sand
1�0.52
0.4
443
441
0.6
24
0.67
0.010
3800
0.003
79
20A
coarse
sand
1�0.7
0.4
446
595
0.6
24
0.45
0.010
3800
0.003
83
20A
largedry
gravel
10
�0.52
0.4
6.5
37
441
9.7
15
12.35
0.376
240000
0.067
84
20A
smalldry
gravel
4�0.52
0.5
543
441
3.6
20
3.82
0.108
51000
0.025
85
20A
med
dry
gravel
6�0.52
0.4
640
441
7.8
15
9.20
0.146
88000
0.028
86
20A
largedry
gravel
10
�0.52
0.4
6.5
38
441
12.3
14
15.34
0.323
220000
0.058
106
20A
largedry
gravel
(m)
10
�0.57
0.4
746
485
8.5
14
8.57
0.352
4600
0.058
107
20A
largedry
gravel
(m)
10
�0.78
0.4
6.5
49
664
14.5
19
9.46
0.600
6000
0.107
F02001 HSU ET AL.: BEDROCK EROSION BY GRANULAR FLOWS
8 of 21
F02001
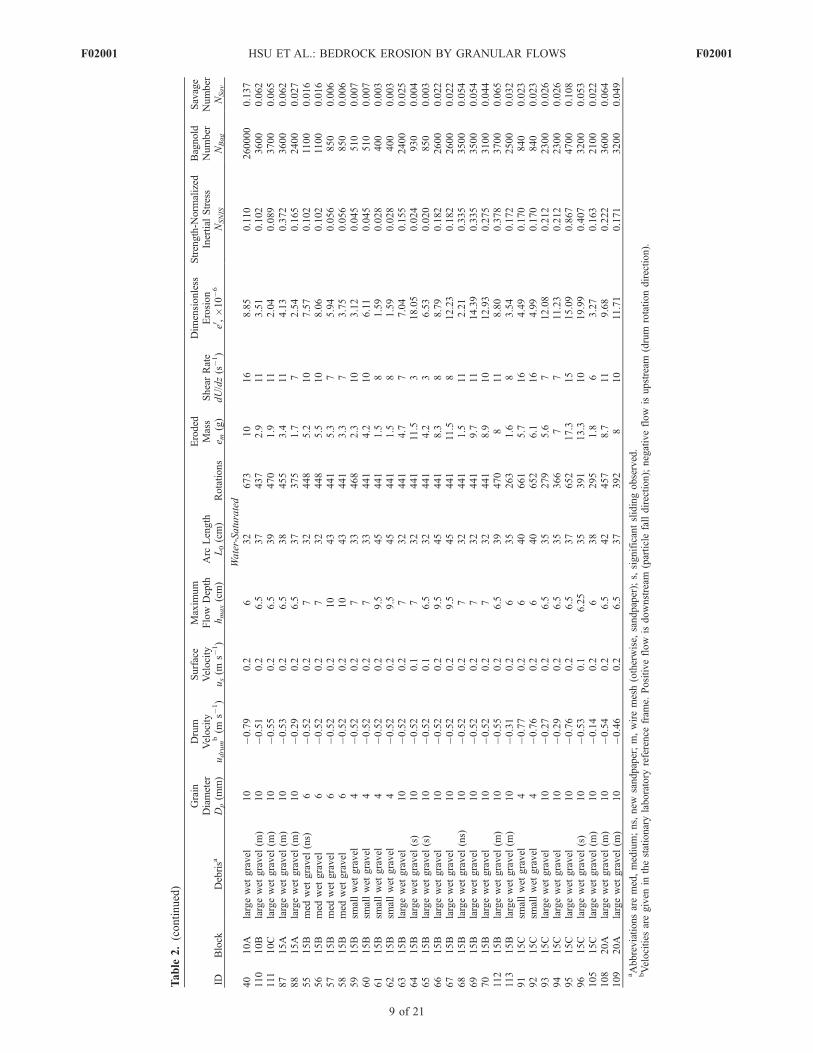
Table
2.(continued)
IDBlock
Debrisa
Grain
Diameter
Dp(m
m)
Drum
Velocity
udrumb(m
s�1)
Surface
Velocity
us(m
s�1)
Maxim
um
Flow
Depth
hmax(cm)
Arc
Length
L0(cm)
Rotations
Eroded
Mass
e m(g)
ShearRate
dU/dz(s�1)
Dim
ensionless
Erosion
e0,�10�6
Strength-N
orm
alized
Inertial
Stress
NSNIS
Bagnold
Number
NBag
Savage
Number
NSav
Water-Saturated
40
10A
largewet
gravel
10
�0.79
0.2
632
673
10
16
8.85
0.110
260000
0.137
110
10B
largewet
gravel
(m)
10
�0.51
0.2
6.5
37
437
2.9
11
3.51
0.102
3600
0.062
111
10C
largewet
gravel
(m)
10
�0.55
0.2
6.5
39
470
1.9
11
2.04
0.089
3700
0.065
87
15A
largewet
gravel
(m)
10
�0.53
0.2
6.5
38
455
3.4
11
4.13
0.372
3600
0.062
88
15A
largewet
gravel
(m)
10
�0.29
0.2
6.5
37
375
1.7
72.54
0.165
2400
0.027
55
15B
med
wet
gravel
(ns)
6�0.52
0.2
732
448
5.2
10
7.57
0.102
1100
0.016
56
15B
med
wet
gravel
6�0.52
0.2
732
448
5.5
10
8.06
0.102
1100
0.016
57
15B
med
wet
gravel
6�0.52
0.2
10
43
441
5.3
75.94
0.056
850
0.006
58
15B
med
wet
gravel
6�0.52
0.2
10
43
441
3.3
73.75
0.056
850
0.006
59
15B
smallwet
gravel
4�0.52
0.2
733
468
2.3
10
3.12
0.045
510
0.007
60
15B
smallwet
gravel
4�0.52
0.2
733
441
4.2
10
6.11
0.045
510
0.007
61
15B
smallwet
gravel
4�0.52
0.2
9.5
45
441
1.5
81.59
0.028
400
0.003
62
15B
smallwet
gravel
4�0.52
0.2
9.5
45
441
1.5
81.59
0.028
400
0.003
63
15B
largewet
gravel
10
�0.52
0.2
732
441
4.7
77.04
0.155
2400
0.025
64
15B
largewet
gravel
(s)
10
�0.52
0.1
732
441
11.5
318.05
0.024
930
0.004
65
15B
largewet
gravel
(s)
10
�0.52
0.1
6.5
32
441
4.2
36.53
0.020
850
0.003
66
15B
largewet
gravel
10
�0.52
0.2
9.5
45
441
8.3
88.79
0.182
2600
0.022
67
15B
largewet
gravel
10
�0.52
0.2
9.5
45
441
11.5
812.23
0.182
2600
0.022
68
15B
largewet
gravel
(ns)
10
�0.52
0.2
732
441
1.5
11
2.21
0.335
3500
0.054
69
15B
largewet
gravel
10
�0.52
0.2
732
441
9.7
11
14.39
0.335
3500
0.054
70
15B
largewet
gravel
10
�0.52
0.2
732
441
8.9
10
12.93
0.275
3100
0.044
112
15B
largewet
gravel
(m)
10
�0.55
0.2
6.5
39
470
811
8.80
0.378
3700
0.065
113
15B
largewet
gravel
(m)
10
�0.31
0.2
635
263
1.6
83.54
0.172
2500
0.032
91
15C
smallwet
gravel
4�0.77
0.2
640
661
5.7
16
4.49
0.170
840
0.023
92
15C
smallwet
gravel
4�0.76
0.2
640
652
6.1
16
4.99
0.170
840
0.023
93
15C
largewet
gravel
10
�0.27
0.2
6.5
35
279
5.6
712.08
0.212
2300
0.026
94
15C
largewet
gravel
10
�0.29
0.2
6.5
35
366
77
11.23
0.212
2300
0.026
95
15C
largewet
gravel
10
�0.76
0.2
6.5
37
652
17.3
15
15.09
0.867
4700
0.108
96
15C
largewet
gravel
(s)
10
�0.53
0.1
6.25
35
391
13.3
10
19.99
0.407
3200
0.053
105
15C
largewet
gravel
(m)
10
�0.14
0.2
638
295
1.8
63.27
0.163
2100
0.022
108
20A
largewet
gravel
(m)
10
�0.54
0.2
6.5
42
457
8.7
11
9.68
0.222
3600
0.064
109
20A
largewet
gravel
(m)
10
�0.46
0.2
6.5
37
392
810
11.71
0.171
3200
0.049
aAbbreviationsaremed,medium;ns,new
sandpaper;m,wiremesh(otherwise,
sandpaper);s,significantslidingobserved.
bVelocities
aregiven
inthestationarylaboratory
reference
fram
e.Positiveflow
isdownstream
(particlefalldirection);negativeflow
isupstream
(drum
rotationdirection).
F02001 HSU ET AL.: BEDROCK EROSION BY GRANULAR FLOWS
9 of 21
F02001
mean diameter of 1 mm. The quartzite gravel had highstrength and experienced little breakdown during the experi-ments. We used only two states of water content – dry orcompletely water-saturated. For water-saturated (alsoreferred to as ‘‘wet’’) flows we added water until the porespaces between the grains were full or the water ran out thefront of the snout during drum rotation.[32] Rotation speed of the drum varied from 0.1 to
0.8 m s�1 (5–27 RPM). The upper value was limited tokeep the centrifugal force significantly less than the grav-itational force (see section 2.1). Maximum flow depth, hmax,measured at the flow center, varied from 4.5 to 10 cm withthe low value chosen to keep the flow deeper than severalgrain diameters and the high value chosen to keep width todepth ratios comparable to natural flows (i.e., 2:1 to 8:1;e.g., as reported by Stock and Dietrich [2006]).[33] Following the technique developed by Sklar and
Dietrich [2001], we used a synthetic bedrock composedof silica sand and cement. This weaker sample bedrockeroded more readily than natural rocks, shortening theexperimental duration needed to produce measurable wear.The erodible samples were cast into blocks 20� 30� 10 cmand later cut into flume-ready samples. The ratio of sand tocement varied from 10:1 to 20:1 which provided a factor ofthree in the tensile strength range (268–814 kPa) asmeasured using the Brazilian tensile splitting test (Table 1).[34] The nondimensional Bagnold and Savage numbers
for our experiments were calculated with a solid volumefraction of ns = 0.55, which was the measured static solidvolume fraction for all homogeneous size distributions ofour sediment. The volume fractions were determined bymass measurement, using rs, density of the solid particles(quartzite), = 2650 kg m�3 and rf, density of the fluid(water), = 1000 kg m�3. For the nondimensional numbercalculations we used m, viscosity = 0.0002 Pa s for air and0.001 Pa s for water, and qb, basal slope (at the snout) = 10�.[35] When the drum bed was left as the original smooth
PVC surface, the granular mass typically experienced full-
slip motion. In order to induce internal shearing andcollisional stresses, the bed was roughened with sandpaper(80–100 grit) or wire mesh with 6-mm grid spacing.
2.4. Experimental Procedure
[36] To test the hypothesis that erosion varied withestimated inertial stress and measured rock strength asdescribed by equation (12), we conducted 67 experimentalruns, 35 dry and 32 water-saturated (Table 2). The proce-dure for each experiment was as follows: An erodible blockwas weighed and placed in the flume, its top surface levelwith the flume bed. The total mass of grains and fluid in theflow was weighed and placed in the drum. Rotation wasinitiated at a prescribed drum rotation speed. During the run,we documented the position and length of the flow in thedrum. Longitudinal profiles of the flow surface were madeby taking digital photographs and videos of the flowthrough the Plexiglas sidewall, then tracing the surface ofthe flow. The flow depth varied along the length of the flow,so for a repeatable characteristic depth measurement, wemeasured the maximum depth, hmax, which occurred mid-way between the snout and tail. Although particle motion atthe sidewall may be different from that in the center of theflow [e.g., Davies, 1990; Hanes and Walton, 2000], wetracked the sidewall velocities for comparison with similarmeasurements in other studies. We noted if the flowexperienced any slip at the bed. Following equation (12),we measured the surface and bed velocities to estimate thevelocity gradient. Surface velocities were obtained bytiming a colored particle placed in the plan view centerlineof the flow and bed velocities were determined by trackingbed particles in side-view videos of the flow. The durationof the experiment was chosen to be long enough to obtainsignificant wear, but not so long that the erodible blockdegraded significantly beneath the flume bed. At the end ofeach run, the block was removed, examined for wear marks,and weighed. Wet blocks used in saturated flows were alsoweighed on subsequent days until they equilibrated to theirdry weight. Typically only one run was obtained from thesame block before it was replaced due to extensive wear, butwhen possible, we obtained multiple runs from the sameblock to test repeatability.
3. Results
3.1. Flow Dynamics
[37] We observed side-view flow dynamics through theclear Plexiglas sidewall and plan view dynamics fromabove the flow. Initially, sediment was placed at the lowestpoint in the drum. As the drum began to spin, the sedimentfollowed the bed in the direction of the spin until the angleof internal friction was exceeded, then avalanched to anequilibrium position. Figures 3 and 4 show flow outlinesderived from photographs of experiments. The tail of theflow mass reaches highest in the drum for dry sand and drygravel, and progressively less for wet gravel, muddy graveland muddy sand (Figure 3). Hence, the position is related tothe friction between the grains and the bed and the porepressure in the flow. Shifts in the equilibrium position ofthe flow occurred due to small irregularities in the bottomroughness, even at the millimeter scale. Initially, somesurging occurred as the result of overlapping sandpaper
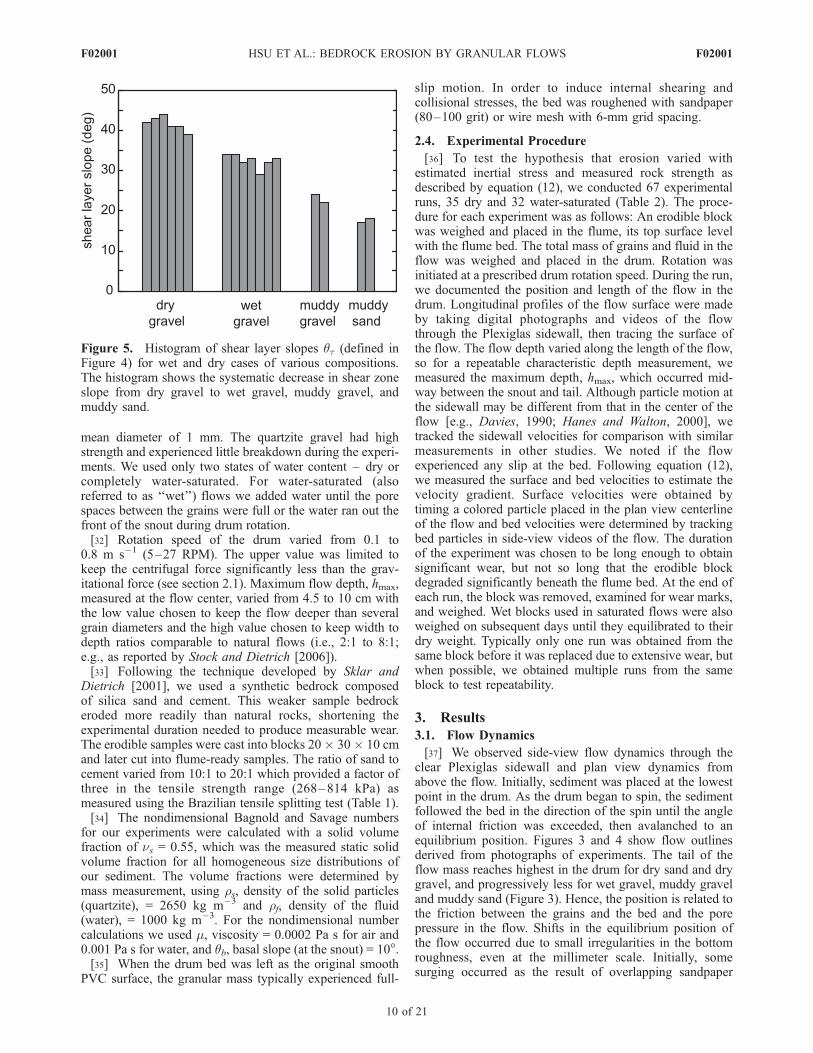
Figure 5. Histogram of shear layer slopes qt (defined inFigure 4) for wet and dry cases of various compositions.The histogram shows the systematic decrease in shear zoneslope from dry gravel to wet gravel, muddy gravel, andmuddy sand.
F02001 HSU ET AL.: BEDROCK EROSION BY GRANULAR FLOWS
10 of 21
F02001

liner, and subsequently we eliminated overlapping to min-imize bed irregularities. The surging was noticed as a noisewith the same periodicity as the irregularities in the bed.Sand flows and smaller grain sizes reacted more strongly tothe bed irregularities than gravel flows, presumably because
the scale of the irregularity was larger with respect to sand-sized particles than to gravel particles.[38] The longitudinal profile tapered at the snout and tail
and was relatively straight in the middle, but the taperingvaried with wetness and mud content (Figures 3 and 4).Kinks in the surface slope occurred in some of the dry sandflows. The sand flows had the greatest number of grainsover the flow depth and therefore followed more apprecia-bly the curvature of the bed. In all cases, the flow frontgradually tapered to one or two grain diameters deep.[39] For large gravel, a constant drum velocity of 0.5 m s�1
(18 RPM), and a constant volume of 1500 cm3, the averagesurface slope angles for dry, wet, and muddy matrix (kaolin-ite clay and water) were 43�, 33�, and 23�, respectively(Figure 5). At the same time, the arc length of the bed coveredby the flow diminished from 31, to 28, to 22 cm. For muddysand, the surface slope decreased to about 10� and covered anarc length of 26 cm. Changing the volume of the flow did notsignificantly change the average surface angle. The observedvariation in slope is roughly consistent with reduction ineffective normal stress with increasing pore fluid pressure fora simple Coulomb material as suggested by Iverson andVallance [2001].[40] At the bed, there was generally a no-slip condition.
In a few cases, some slip occurred at the bed when thesandpaper was worn by many experiments. The conse-quence of a no-slip condition is that a strong conveyor-belt-like circulation forms with respect to the center of massof the stationary flow (Figure 4). Particles at the bed movedtoward the tail at the drum rotation speed, while particlesnear the surface moved downslope relative to the approx-imately stationary position of the flow, as reported in drumexperiments with similar fill fractions by Tai et al. [2000].In the shear zone (Figure 4), there is a change in direction ofparticle motion–surface particles move toward the bed inthe front half of the flow and near bed particles movetoward the surface in the back half of the flow. Hence,vertical motion is not restricted to just the snout and the tail.The maximum down-slope velocity occurred at the surface
Table 3. Nondimensional Numbers for Experimental and Natural Debris Flowsa
Parameter
DrumExperiment,Dry (TS)
DrumExperiment,Wet (TS)
Large USGSFlume(I&V)
Small USGSFlume(I&V)
ConveyorBelt
Flume (D)
StraightChute
Flume (P)
Yake DakeDebris Flow(I&D, T)
Elm RockAvalanche(I&D, H)
AcquabonaDebris
Flow (B)
Grain diameter (m) Dp 0.01 0.01 0.01 0.006 0.004 0.0001 0.2 0.5 0.2Shear rate (s�1) @u/@z 20 10 50 30 11 10 3 5 4Density solid
(kg m�3)rs 2650 2650 2700 2650 1400 2650 2600 2400 2650
Density fluid(kg m�3)
rf 1 1000 1000 1000 1000 1100 1200 2 1200
Viscosity fluid (Pa s) m 2 � 10�5 0.001 0.01 0.001 0.001 0.5 0.1 2 � 10�5 0.1Volume fraction solid
(dimensionless)ns 0.55 0.55 0.6 0.5 0.56 0.6 0.6 0.5 0.6
Volume fraction fluid(dimensionless)
nf 0.45 0.45 0.4 0.5 0.44 0.4 0.4 0.5 0.4
Basal slope (deg) qb 10 10 31 18 10 13 15 3 18Height of flow (m) h 0.05 0.05 0.2 0.04 0.04 0.06 2 10 2Bagnold number
(equation (6))NBag 3.24 � 105 3.24 � 103 2.03 � 103 2.86 � 103 3.14 � 102 7.95 � 10�4 4.68 � 103 1.50 � 108 6.36 � 103
Savage number(equation (8))
NSav 8.17 � 10�2 3.28 � 10�2 2.03 � 10�1 1.33 � 10�1 1.73 � 10�2 2.91 � 10�6 3.41 � 10�2 6.38 � 10�2 5.97 � 10�2
aTS, this study; I&V, Iverson and Vallance [2001]; D, Davies [1990]; P, Parsons et al. [2001]; I&D, Iverson and Denlinger [2001]; T, Takahashi [1991];H, Hsu [1975]; B, Berti et al. [1999, 2000].
Figure 6. Plan view of the surface velocity structure of amuddy flow composed of gravel (12% by mass), sand(70%), clay (3%), and water (15%). Semiquantitativevectors are derived from observing particles in a digitalvideo. Wall friction at the sides of the flow lead to a patternof maximum velocity at the axis of divergence (dashed linelabeled ‘‘a’’) and 3-D circulation at the sides. When grainsreach the flow front or sidewall, they drop down beneath thesurface flow and are recirculated to the tail of the flow. Thisphoto illustrates the effect of different wall roughness, thetop (right bank) wall (labeled b) is wood, and the bottom(left bank) wall (labeled c) is Plexiglas. The rougher woodproduces a greater drag on the flow and greater influencethan the Plexiglas. The flume was later modified to havetwo Plexiglas walls.
F02001 HSU ET AL.: BEDROCK EROSION BY GRANULAR FLOWS
11 of 21
F02001

of the flow, as described in numerous other natural andexperimental observations [e.g., Johnson and Rodine, 1984;Campbell, 1990; Boateng, 1998; Hotta and Ohta, 2000;Longo and Lamberti, 2002].[41] Surface velocity us, differs from the mean flow veloc-
ity in the drum frame, u, which equals us–ub. Surface velocityus and basal velocity ub are measured relative to the fixedlaboratory reference frame, with positive values in the down-slope direction. For no-slip cases, ub = udrum, but if there isslip, then jubj < judrumj. The surface velocity was only faintlysensitive to drum speed or grain size, but varied strongly withpresence of water or mud in the interstices of the solid grains.This was likely due to the surface tension between grainsfrom the water [Tognacca and Minor, 2000]. Dry sedimentsurface velocities averaged 0.4 m s�1, while water-saturatedsediment surface velocities averaged 0.2 m s�1. This impliesthat the drum rotated the mass to a position where thehorizontal pressure gradient induced flow, and the speed ofgrainmotion was set by internal grain dynamics. For the samedrum speed udrum of 0.5 m s�1 (18 RPM), the ratio of thesurface velocity to the drum velocity us/udrum is �0.8 (±0.04one standard deviation) for dry flows, and �0.3 (±0.09) forsaturated flows. The negative sign indicates that the drum andsurface velocities are in opposite directions. Increasing thedrum rotation speed increased the shear rate but not dramat-ically the surface speed of the particles. This implies that thethicknesses of the down-slope and up-slope moving layers ofthe flow adjusted to satisfy mass conservation.[42] If the flow was deep enough, a static zone developed
in the upslope-headed near-bed particles. Here, the particleshad the same rotational velocity as the drum i.e., zerovelocity in the drum reference frame. This condition isreferred to in drum studies as the passive region, in contrastto the active shearing levels [Boateng, 1998; Longo andLamberti, 2002]. The thicker the flow depth in the drum, thegreater the passive zone [Longo and Lamberti, 2002]. Thickpassive regions in the bottom half of the depth seemunlikely in natural granular flows, and occur in the drumduring unrealistic width-depth ratios. Therefore we kept ourflows thin, and the passive zone was essentially only onegrain thick for the gravel flows.[43] The surface velocity field was strongly affected by
the sidewalls. This influence has been reported in nature[e.g., Berti et al., 2000; Swartz and McArdell, 2005] andlaboratory experiments [e.g., Hanes and Walton, 2000;Parsons et al., 2001; du Pont et al., 2003; Bi et al.,2005]. Conversely, several studies propose that wall effectsare negligible in their experiments [e.g., Forterre andPouliquen, 2001; Jain et al., 2002; Tegzes et al., 2002].The wall resistance resulted in lateral flow circulation, amaximum down-slope velocity midway between the walls,and a distinct topographic trough along the centerlineassociated with the flow divergence there for muddy flows(Figure 6). In contrast to the roughened bed, particles slidagainst the walls i.e., there was finite slip at the sidewalls.We did not roughen the walls, as we did the bed surface,because we wanted to make observations through the clearPlexiglas. For most of our experiments, both walls werePlexiglas to provide symmetric wall effects. But in our firstexperiments, the back wall was wood and the front wall wasPlexiglas. This asymmetry in wall friction caused a widerlateral shear zone on the rougher wooden wall (Figure 6).
Figure 7. (a) Plot of eroded depth, ed, per revolutionversus estimated inertial stresses, si, (equation (1)) for dryconditions and three synthetic bedrock strengths (silica sandto cement ratio: strong 10:1 (circles, y = (8 � 10�8)x0.67),moderate 15:1 (triangles, y = (2 � 10�7)x0.82), weak 20:1(squares, y = (3 � 10�7)x0.90). The experimentalidentification numbers (Table 2) for each data point (andall subsequent figures) are specified in Table S1. The deptheroded per revolution is calculated from the mass loss, em,during the experiment, the number of revolutions, thedensity, rblock, and the exposed surface area of the erodiblesample, Ablock, equation (10). For the two stronger samples,erosion rate was nearly linearly dependent on the estimatedinertial stress. (b) Plot of dimensionless erosion, e0, versusestimated inertial stress, si, (equation (1)). Dimensionlesserosion, e0, is the eroded depth, ed, normalized by thelength of the passing flow, Ltot. Silica sand to cement ratio:strong 10:1 (circles, y = (2 � 10�7)x0.67), moderate 15:1(triangles, y = (5 � 10�7)x0.86), weak 20:1 (squares, y =(6 � 10�7)x0.94). Experiments in the drum show a trendof increasing dimensionless erosion with increasingestimated inertial stresses. The vertical scatter betweendifferent symbols reflects the change in erodible samplestrength which is controlled by silica to cement ratio. SeeTable 4 for regression statistics.
F02001 HSU ET AL.: BEDROCK EROSION BY GRANULAR FLOWS
12 of 21
F02001
[44] For heterogeneous flows of sand and gravel, thelarger particles tended to stay near the front of the flow,where they bounced, rolled, and tended to move to thesidewalls, allowing the sand to extend furthest to the snoutat the centerline. This was a result of wall friction, theupslope-moving walls tended to drag larger grains backtoward the tail of the flow, where they reentered the centralflow and traveled quickly to the front.
3.2. Scaling and Erosion
[45] Bagnold numbers for our experiments ranged from430 to 330,000 with a dry flow mean of 110,000 and asaturated flow mean of 10,000 (Table 2). The Savagenumber, NSav (equation (8)) ranged from 0.003 to 0.17,with a dry mean of 0.041 and a saturated mean of 0.036.Although these values do not place the flows into theinertial regime by the measure of the Savage number, theyare very similar to those for other experimental and naturalgranular flows (Table 3) [Stock and Dietrich, 2006].[46] During the approximately 25 min duration of each
run, individual flows (32 to 52 cm in arc length) would passover the erodible blocks 250 to 675 times. Net erosionvaried from virtually no wear to up to 2.9 mm (14.5 g). Thedry flows had higher surface velocities and tended to wear adimpled pattern into the block, suggesting a dominance ofcollisional wear over sliding wear. After some of the wetflows, the blocks exhibited grooves oriented in the flowdirection, suggesting sliding wear.[47] For dry flows, eroded depth per revolution was
nearly linearly proportional to the estimated inertial stressdefined in equation (1) and increased with decreasingbedrock strength (Figure 7a). The exponents change onlyslightly when the regression is recalculated for the dimen-sionless erosion, e0 (Figure 7b and Table 4).
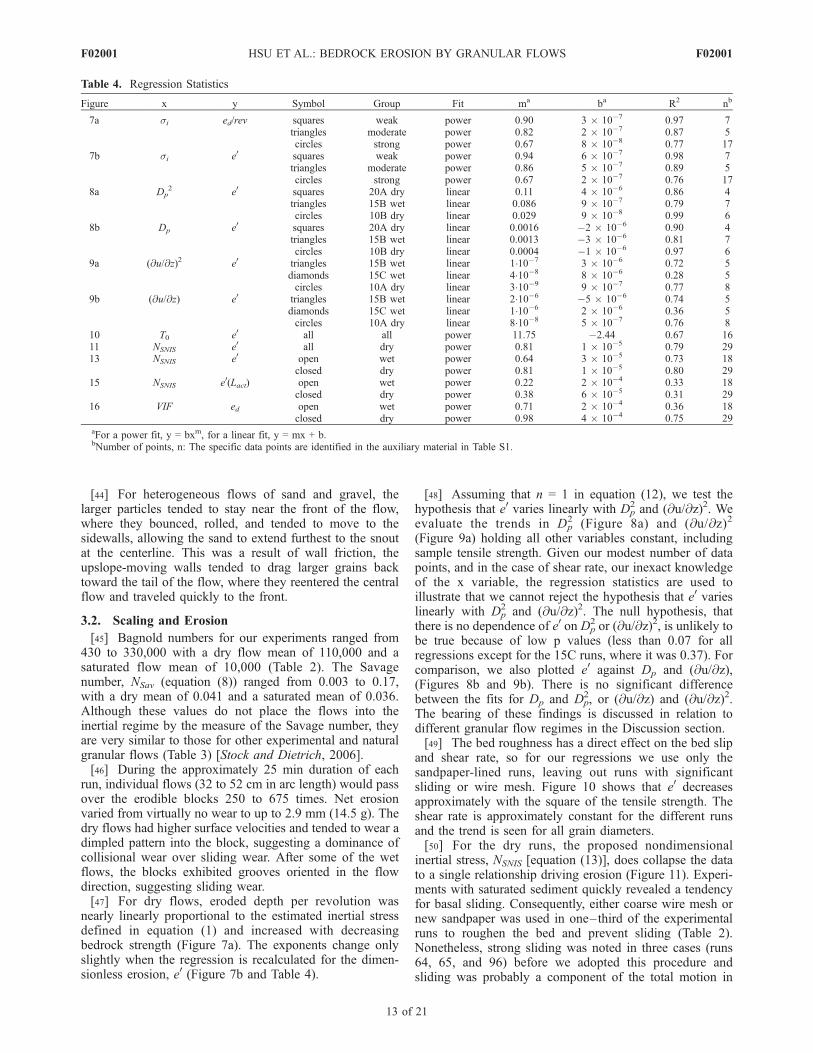
[48] Assuming that n = 1 in equation (12), we test thehypothesis that e0 varies linearly with Dp
2 and (@u/@z)2. Weevaluate the trends in Dp
2 (Figure 8a) and (@u/@z)2
(Figure 9a) holding all other variables constant, includingsample tensile strength. Given our modest number of datapoints, and in the case of shear rate, our inexact knowledgeof the x variable, the regression statistics are used toillustrate that we cannot reject the hypothesis that e0 varieslinearly with Dp
2 and (@u/@z)2. The null hypothesis, thatthere is no dependence of e0 on Dp
2 or (@u/@z)2, is unlikely tobe true because of low p values (less than 0.07 for allregressions except for the 15C runs, where it was 0.37). Forcomparison, we also plotted e0 against Dp and (@u/@z),(Figures 8b and 9b). There is no significant differencebetween the fits for Dp and Dp
2, or (@u/@z) and (@u/@z)2.The bearing of these findings is discussed in relation todifferent granular flow regimes in the Discussion section.[49] The bed roughness has a direct effect on the bed slip
and shear rate, so for our regressions we use only thesandpaper-lined runs, leaving out runs with significantsliding or wire mesh. Figure 10 shows that e0 decreasesapproximately with the square of the tensile strength. Theshear rate is approximately constant for the different runsand the trend is seen for all grain diameters.[50] For the dry runs, the proposed nondimensional
inertial stress, NSNIS [equation (13)], does collapse the datato a single relationship driving erosion (Figure 11). Experi-ments with saturated sediment quickly revealed a tendencyfor basal sliding. Consequently, either coarse wire mesh ornew sandpaper was used in one–third of the experimentalruns to roughen the bed and prevent sliding (Table 2).Nonetheless, strong sliding was noted in three cases (runs64, 65, and 96) before we adopted this procedure andsliding was probably a component of the total motion in
Table 4. Regression Statistics
Figure x y Symbol Group Fit ma ba R2 nb
7a si ed/rev squares weak power 0.90 3 � 10�7 0.97 7triangles moderate power 0.82 2 � 10�7 0.87 5circles strong power 0.67 8 � 10�8 0.77 17
7b si e0 squares weak power 0.94 6 � 10�7 0.98 7triangles moderate power 0.86 5 � 10�7 0.89 5circles strong power 0.67 2 � 10�7 0.76 17
8a Dp2 e0 squares 20A dry linear 0.11 4 � 10�6 0.86 4
triangles 15B wet linear 0.086 9 � 10�7 0.79 7circles 10B dry linear 0.029 9 � 10�8 0.99 6
8b Dp e0 squares 20A dry linear 0.0016 �2 � 10�6 0.90 4triangles 15B wet linear 0.0013 �3 � 10�6 0.81 7circles 10B dry linear 0.0004 �1 � 10�6 0.97 6
9a (@u/@z)2 e0 triangles 15B wet linear 1�10�7 3 � 10�6 0.72 5diamonds 15C wet linear 4�10�8 8 � 10�6 0.28 5circles 10A dry linear 3�10�9 9 � 10�7 0.77 8
9b (@u/@z) e0 triangles 15B wet linear 2�10�6 �5 � 10�6 0.74 5diamonds 15C wet linear 1�10�6 2 � 10�6 0.36 5circles 10A dry linear 8�10�8 5 � 10�7 0.76 8
10 T0 e0 all all power 11.75 �2.44 0.67 1611 NSNIS e0 all dry power 0.81 1 � 10�5 0.79 2913 NSNIS e0 open wet power 0.64 3 � 10�5 0.73 18
closed dry power 0.81 1 � 10�5 0.80 2915 NSNIS e0(Lact) open wet power 0.22 2 � 10�4 0.33 18
closed dry power 0.38 6 � 10�5 0.31 2916 VIF ed open wet power 0.71 2 � 10�4 0.36 18
closed dry power 0.98 4 � 10�4 0.75 29aFor a power fit, y = bxm, for a linear fit, y = mx + b.bNumber of points, n: The specific data points are identified in the auxiliary material in Table S1.
F02001 HSU ET AL.: BEDROCK EROSION BY GRANULAR FLOWS
13 of 21
F02001
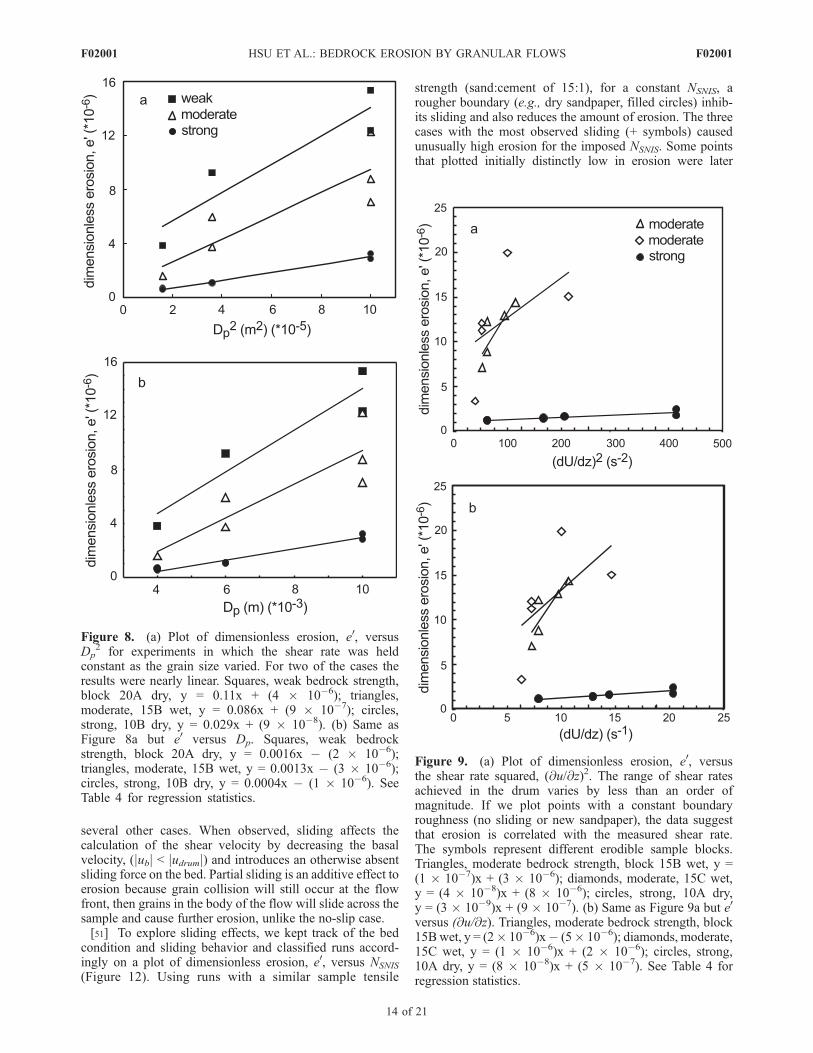
several other cases. When observed, sliding affects thecalculation of the shear velocity by decreasing the basalvelocity, (jubj < judrumj) and introduces an otherwise absentsliding force on the bed. Partial sliding is an additive effect toerosion because grain collision will still occur at the flowfront, then grains in the body of the flow will slide across thesample and cause further erosion, unlike the no-slip case.[51] To explore sliding effects, we kept track of the bed
condition and sliding behavior and classified runs accord-ingly on a plot of dimensionless erosion, e0, versus NSNIS
(Figure 12). Using runs with a similar sample tensile
strength (sand:cement of 15:1), for a constant NSNIS, arougher boundary (e.g., dry sandpaper, filled circles) inhib-its sliding and also reduces the amount of erosion. The threecases with the most observed sliding (+ symbols) causedunusually high erosion for the imposed NSNIS. Some pointsthat plotted initially distinctly low in erosion were later
Figure 8. (a) Plot of dimensionless erosion, e0, versusDp
2 for experiments in which the shear rate was heldconstant as the grain size varied. For two of the cases theresults were nearly linear. Squares, weak bedrock strength,block 20A dry, y = 0.11x + (4 � 10�6); triangles,moderate, 15B wet, y = 0.086x + (9 � 10�7); circles,strong, 10B dry, y = 0.029x + (9 � 10�8). (b) Same asFigure 8a but e0 versus Dp. Squares, weak bedrockstrength, block 20A dry, y = 0.0016x � (2 � 10�6);triangles, moderate, 15B wet, y = 0.0013x � (3 � 10�6);circles, strong, 10B dry, y = 0.0004x � (1 � 10�6). SeeTable 4 for regression statistics.
Figure 9. (a) Plot of dimensionless erosion, e0, versusthe shear rate squared, (@u/@z)2. The range of shear ratesachieved in the drum varies by less than an order ofmagnitude. If we plot points with a constant boundaryroughness (no sliding or new sandpaper), the data suggestthat erosion is correlated with the measured shear rate.The symbols represent different erodible sample blocks.Triangles, moderate bedrock strength, block 15B wet, y =(1 � 10�7)x + (3 � 10�6); diamonds, moderate, 15C wet,y = (4 � 10�8)x + (8 � 10�6); circles, strong, 10A dry,y = (3 � 10�9)x + (9 � 10�7). (b) Same as Figure 9a but e0
versus (@u/@z). Triangles, moderate bedrock strength, block15Bwet, y = (2� 10�6)x� (5� 10�6); diamonds, moderate,15C wet, y = (1 � 10�6)x + (2 � 10�6); circles, strong,10A dry, y = (8 � 10�8)x + (5 � 10�7). See Table 4 forregression statistics.
F02001 HSU ET AL.: BEDROCK EROSION BY GRANULAR FLOWS
14 of 21
F02001
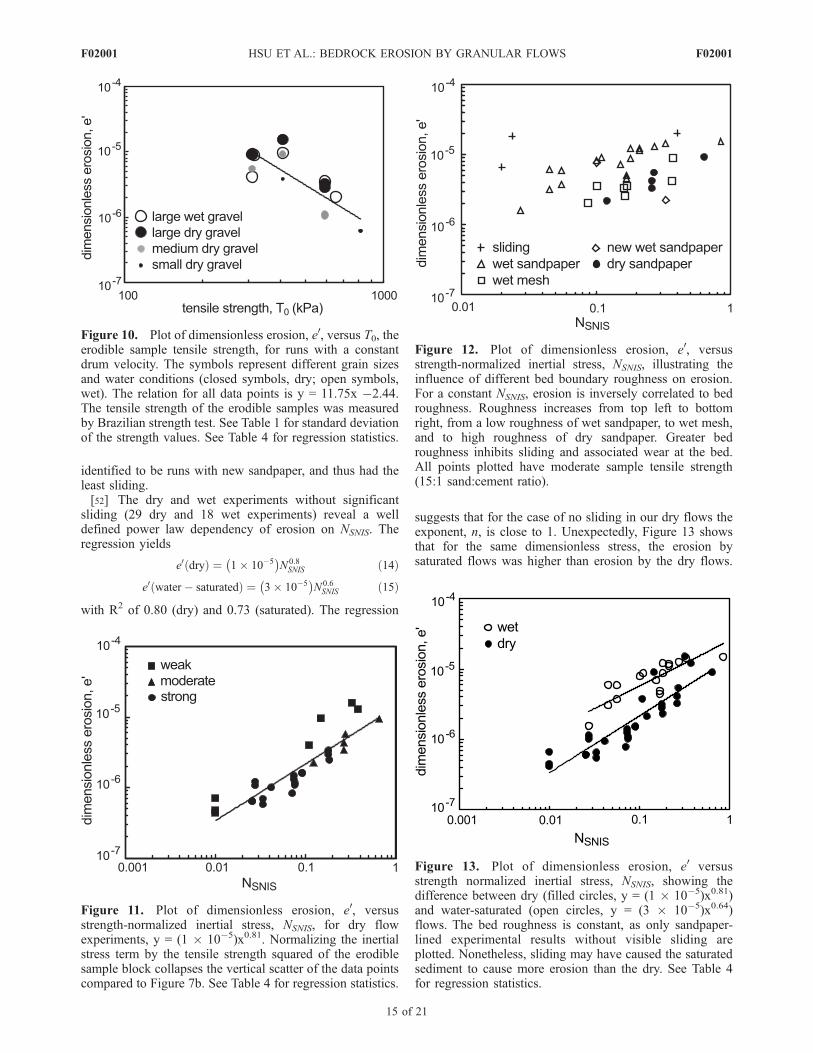
identified to be runs with new sandpaper, and thus had theleast sliding.[52] The dry and wet experiments without significant
sliding (29 dry and 18 wet experiments) reveal a welldefined power law dependency of erosion on NSNIS. Theregression yields
e0 dryð Þ ¼ 1� 10�5� �
N 0:8SNIS ð14Þ
e0 water � saturatedð Þ ¼ 3� 10�5� �
N0:6SNIS ð15Þ
with R2 of 0.80 (dry) and 0.73 (saturated). The regression
suggests that for the case of no sliding in our dry flows theexponent, n, is close to 1. Unexpectedly, Figure 13 showsthat for the same dimensionless stress, the erosion bysaturated flows was higher than erosion by the dry flows.
Figure 10. Plot of dimensionless erosion, e0, versus T0, theerodible sample tensile strength, for runs with a constantdrum velocity. The symbols represent different grain sizesand water conditions (closed symbols, dry; open symbols,wet). The relation for all data points is y = 11.75x �2.44.The tensile strength of the erodible samples was measuredby Brazilian strength test. See Table 1 for standard deviationof the strength values. See Table 4 for regression statistics.
Figure 11. Plot of dimensionless erosion, e0, versusstrength-normalized inertial stress, NSNIS, for dry flowexperiments, y = (1 � 10�5)x0.81. Normalizing the inertialstress term by the tensile strength squared of the erodiblesample block collapses the vertical scatter of the data pointscompared to Figure 7b. See Table 4 for regression statistics.
Figure 12. Plot of dimensionless erosion, e0, versusstrength-normalized inertial stress, NSNIS, illustrating theinfluence of different bed boundary roughness on erosion.For a constant NSNIS, erosion is inversely correlated to bedroughness. Roughness increases from top left to bottomright, from a low roughness of wet sandpaper, to wet mesh,and to high roughness of dry sandpaper. Greater bedroughness inhibits sliding and associated wear at the bed.All points plotted have moderate sample tensile strength(15:1 sand:cement ratio).
Figure 13. Plot of dimensionless erosion, e0 versusstrength normalized inertial stress, NSNIS, showing thedifference between dry (filled circles, y = (1 � 10�5)x0.81)and water-saturated (open circles, y = (3 � 10�5)x0.64)flows. The bed roughness is constant, as only sandpaper-lined experimental results without visible sliding areplotted. Nonetheless, sliding may have caused the saturatedsediment to cause more erosion than the dry. See Table 4for regression statistics.
F02001 HSU ET AL.: BEDROCK EROSION BY GRANULAR FLOWS
15 of 21
F02001

Some of this difference may be due to the wear properties ofour sample blocks under wet and dry conditions. Wetting ofconcrete decreases the compressive strength, though oftenconsidered negligible [e.g., Popovics, 1998], but there areno data to suggest that wetting affects tensile strength(which influences erodibility). Despite eliminating caseswhere sliding was evident or very likely, we propose thatthe higher erosion rates in the wet case are due to partialsliding of bed particles. If this interpretation is correct, inaddition to the fact that many water-saturated runs had lowSavage number scaling, then the dry case is the most directtest of the hypothesis that erosion scales with inertial stress.
4. Discussion
[53] Our experiments show that the bedrock incision rateincreases with the particle diameter and is moderatelydependent on the shear rate. Although these experimentsrepresent considerable simplifications of natural granularflows, their similarities with natural flow scaling support therelevance of our findings to the field. The characteristics ofour experimental flows are shown with data from naturaland laboratory flows in Table 3. The scaling of the particlesize and channel width:depth are similar to those found innature [Stock and Dietrich, 2006]. The nondimensionalnumbers that characterize the inertial, viscous, and frictionalforces for our experiments are also similar to those for naturaldry flows and close to those for natural water-saturated flows.[54] Some salient differences between our experiments
and nature are the uniform grain size, absence of clays, andfluid properties. As mentioned previously, we purposelysimplified our flows so we could specify the effective grainsize, De = Dp. Nonetheless, our goal was to test a mecha-nistic hypothesis for the control of bedrock erosion, andmake observations of the grain dynamics and their interac-tion with the bed.[55] Muddy flows in the drum developed lower surface
slopes, had significantly lower shear rates (due to lowersurface velocities), and correspondingly, generated lowercollisional stresses for the same drum rotation speed thandry or water saturated granular flows. Because of concernsabout scaling relationships, especially with regard to dy-namic pore pressure development [Iverson, 1997], erosionalmeasurements are not reported for our muddy runs. Arecently completed 4-m-diameter flume will allow us,however, to use 1:1 scale materials to explore the dynamicsand resulting erosion of these complex flows. The largerflume will also help to decrease possible edge effects on theerodible sample, which will be several times longer than thelength of the largest particle diameter.[56] On the basis of field observations, Stock and Dietrich
[2006] proposed that the excursions from the static load(impacts from large boulders in the coarse snout of thedebris flow) perform the erosion. In contrast, the staticeffective solid normal stress would be
ss ¼ nsrs � nf rf� �
gh cos qbð Þ � p ð16Þ
where p (Pa) is the nonequilibrium component ofintergranular fluid pressure. The maximum static normalstress for the dry flows in the drum ranges from 0.56 to1.3 kPa and for the wet flows ranges from 0.58 to 1.0 kPa.
Fluid pore pressure, p, may modify the effective stress onthe bed, but because we do not have a measure of this, ourvalue is an approximation for the saturated flows. Peak solidstatic normal stress is estimated to be 23–93 kPa forselected flows measured in nature [Stock and Dietrich,2006]. Solid inertial stress calculated by equation (1) rangesfrom 0.0008 to 0.60 kPa in the drum and 0.3 to 4 kPa inselected flows in nature. Hence, as shown by many others,the inertial stresses are a small fraction the total normalstress. In the absence of sliding, however, the static normalstress is a quasi-steady load, whereas the inertial stresses,especially arising from the tumbling of particles at thesnout, create dynamic point loads that can lead to surfacefatigue and rock fracturing [Stock and Dietrich, 2006].[57] While our procedure for calculating the inertial stress
is consistent with methods used by others in field studies, itis nonetheless very simplified, especially with regard to theestimate of the velocity gradient, @u/@z, and the relevanceof this shear rate to the scale of stresses at the snout.Qualitative observations in the drum indicate that thevelocity profile is not linear, and, as noted above, in thewet cases sliding at the base may be common. The shearrate was also higher than that reported from field studiesusing roughly the same calculation procedure but wassimilar to other smaller-scale flume studies (Table 3).Perhaps the most significant approximation is the assump-tion that the estimated inertial stress in the body of the flow(based on maximum depth and estimated from the square ofthe shear rate and particle grain size) gives an adequate scalefor the local collisional stresses for particles arriving at andbouncing in the snout.[58] The importance of sliding was not anticipated, and
published field data provide little quantification of boundarysliding in grain and debris flows. In typical bedrock chutesin mountainous terrain it seems reasonable to propose thatsliding occurs, but knickpoints and channel roughness mayprevent prolonged sliding. Debris flows typically entrain thecolluvium stored in the steep channels as they sweepdownslope and scour to bedrock. It may be that the water-rich tails of many debris flows tend to drive particle slidingon the bedrock surface that was scoured clear by the snout.Video records of debris flows do show cases in which thelargest boulders in the flow appear to be sliding fordurations that could produce centimeters-long grooves.Field observations on bedrock wear features after debrisflows [Stock and Dietrich, 2006] suggest, however, frac-ture-bounded blocks are removed by glancing blows fromboulders, and that perhaps erosion by debris flows is muchmore effective in the coarse snouts, where large boulderimpacts prevail, than in the post snout body, where slidingwear may predominate. We did see concentration of largegrains at the flow front in our qualitative drum experimentswith a heterogeneous grain size distribution of 4 cmdiameter grains in addition to 1 cm gravel, sand, and clay,but we focused here on single grain size flows whendocumenting erosion. In so doing, our observations mayhave diminished the relative importance of collisionalstresses of large grains at the snout.[59] The lateral circulation effects (Figure 6) that arose in
the drum due to wall resistance are important to the flowdynamics and stresses on the bed, and occurs in naturalflows as well [e.g., Berti et al., 2000]. We note that (1) flows
F02001 HSU ET AL.: BEDROCK EROSION BY GRANULAR FLOWS
16 of 21
F02001

in the field also experience lateral boundary resistance,(2) the width to depth ratio in this flume (�2:1) does occurin small, bedrock canyon debris flows [Stock and Dietrich,2006], and (3) inspection of videos recording grain move-ment suggests that boulders move more slowly near thebank, and in fact, this near bank resistance may contribute totheir deposition [Arattano and Marchi, 2000; Swartz andMcArdell, 2005]. The laterally directed flow circulation maycontribute to wall erosion in bedrock, as evidenced bysevere degradation in the sidewalls of check dams in debrisflow channels (Figure S2 in the auxiliary material).[60] While support for the collision stress driven bedrock
erosion is provided here, additional improvements are
possible. First, our analysis uses the entire instantaneouslength of the flow, L0, to scale the duration of inertialstresses. In the prevailing no-slip case, this is inaccurate,as most of the collisions of large boulders with the bedoccur at the snout (Figure 14a). Even without enforcementof the no-slip condition, recirculation of large grains at thefront may occur [Iverson, 2005, Figure 6.6]. Stock andDietrich [2006] hypothesize that the appropriate lengthscale is the length of the granular front. Although we donot have a coarser granular front in our uniform grain sizeflows, observations in the drum suggest, roughly, that thezone of active bouncing at the snout varies with grain size,with it being about six times the grain size in the dry caseand about three times the grain size in the wet case. Thissuggests a reformulation of e0 (equation (10)) using Lact (theactive length of the particle bouncing at the snout) instead ofL0. Figure 15 shows that this estimation actually reducesthe correlation between erosion and inertial stress. It is notclear whether this is because of the imprecise estimate ofthe active length, or because of other effects, such as theimportance of sliding wear or the incompleteness of thebulk inertial stress hypothesis. In addition, because Lactincreases with larger grain diameters and faster drumspeeds, it tends to covary with the inertial stress, weaken-ing the dependency between e0 and NSNIS.[61] The low Savage numbers and the direct observations
of grain motion suggest that in these experiments theassumption of an inertial stress dominance is not wellsupported. Inertial flows are defined as having only instan-taneous bimodal collisions, but enduring contacts betweenparticles are evident in our experiments and in naturalgranular flows. Also, recent literature has pointed out someshortcomings in the stress and shear rate relations found in
Figure 14. Illustration of the three different cases of basallayer dynamics for modeling erosion. Darkest gray grainsindicate grains causing erosion at the instant of timerepresented, lighter grains indicate grains that will causeerosion at some later point in time. (a) Snout impact model.Large grains recirculate in the snout and impact the bed,causing wear. Smaller grains behind the snout are too smalland cause negligible erosion compared to the snout. Lact isthe active eroding length, the only part of the flow causingwear. (b) Zero-slip model. A surface layer of grains tumblesdown the snout and strikes the bed, causing erosion, thenare entrained in the recirculation toward the tail. No wearoccurs in the body of the flow because there is no slip on thebed. This case is similar to erosion by saltating grains, theeroding length scale is Dp, the particle diameter. (c) Slidingblock model. All grains at the bottom of the flow slide alongthe bed and cause wear, the active eroding length is theentire arc length of the flow, L0.
Figure 15. Dimensionless erosion, e0 versus strengthnormalized inertial stress, NSNIS, using the visually estimatedactive eroding length, Lact, instead of the entire length L0, inthe calculation of e0. Dry (filled circles, y = (6 � 10�5)x0.38)and water-saturated (open circles, y = 0.0002x0.22) flows.Because Lact increases with larger grain diameters and fasterdrum speeds, it tends to covary with the inertial stress,weakening the dependency between e0 andNSNIS. See Table 4for regression statistics.
F02001 HSU ET AL.: BEDROCK EROSION BY GRANULAR FLOWS
17 of 21
F02001
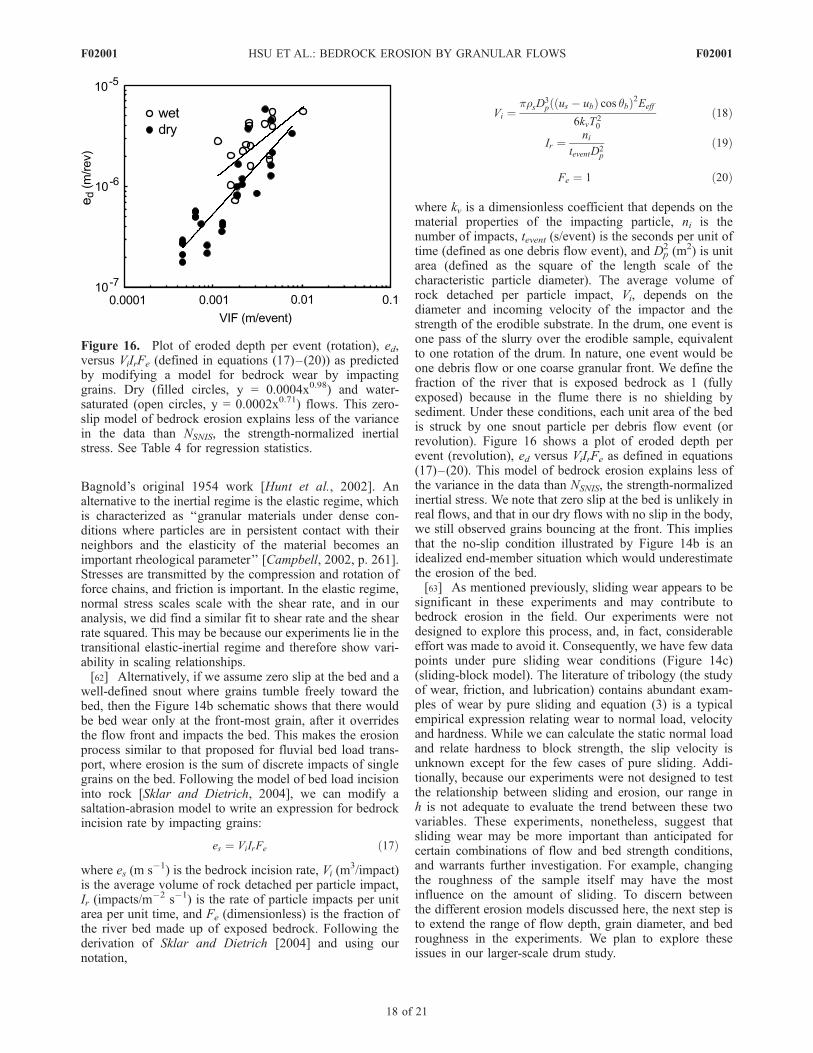
Bagnold’s original 1954 work [Hunt et al., 2002]. Analternative to the inertial regime is the elastic regime, whichis characterized as ‘‘granular materials under dense con-ditions where particles are in persistent contact with theirneighbors and the elasticity of the material becomes animportant rheological parameter’’ [Campbell, 2002, p. 261].Stresses are transmitted by the compression and rotation offorce chains, and friction is important. In the elastic regime,normal stress scales scale with the shear rate, and in ouranalysis, we did find a similar fit to shear rate and the shearrate squared. This may be because our experiments lie in thetransitional elastic-inertial regime and therefore show vari-ability in scaling relationships.[62] Alternatively, if we assume zero slip at the bed and a
well-defined snout where grains tumble freely toward thebed, then the Figure 14b schematic shows that there wouldbe bed wear only at the front-most grain, after it overridesthe flow front and impacts the bed. This makes the erosionprocess similar to that proposed for fluvial bed load trans-port, where erosion is the sum of discrete impacts of singlegrains on the bed. Following the model of bed load incisioninto rock [Sklar and Dietrich, 2004], we can modify asaltation-abrasion model to write an expression for bedrockincision rate by impacting grains:
es ¼ ViIrFe ð17Þ
where es (m s�1) is the bedrock incision rate, Vi (m3/impact)
is the average volume of rock detached per particle impact,Ir (impacts/m�2 s�1) is the rate of particle impacts per unitarea per unit time, and Fe (dimensionless) is the fraction ofthe river bed made up of exposed bedrock. Following thederivation of Sklar and Dietrich [2004] and using ournotation,
Vi ¼prsD
3p us � ubð Þ cos qbð Þ2Eeff
6kvT20
ð18Þ
Ir ¼ni
teventD2p
ð19Þ
Fe ¼ 1 ð20Þ
where kv is a dimensionless coefficient that depends on thematerial properties of the impacting particle, ni is thenumber of impacts, tevent (s/event) is the seconds per unit oftime (defined as one debris flow event), and Dp
2 (m2) is unitarea (defined as the square of the length scale of thecharacteristic particle diameter). The average volume ofrock detached per particle impact, Vi, depends on thediameter and incoming velocity of the impactor and thestrength of the erodible substrate. In the drum, one event isone pass of the slurry over the erodible sample, equivalentto one rotation of the drum. In nature, one event would beone debris flow or one coarse granular front. We define thefraction of the river that is exposed bedrock as 1 (fullyexposed) because in the flume there is no shielding bysediment. Under these conditions, each unit area of the bedis struck by one snout particle per debris flow event (orrevolution). Figure 16 shows a plot of eroded depth perevent (revolution), ed versus ViIrFe as defined in equations(17)–(20). This model of bedrock erosion explains less ofthe variance in the data than NSNIS, the strength-normalizedinertial stress. We note that zero slip at the bed is unlikely inreal flows, and that in our dry flows with no slip in the body,we still observed grains bouncing at the front. This impliesthat the no-slip condition illustrated by Figure 14b is anidealized end-member situation which would underestimatethe erosion of the bed.[63] As mentioned previously, sliding wear appears to be
significant in these experiments and may contribute tobedrock erosion in the field. Our experiments were notdesigned to explore this process, and, in fact, considerableeffort was made to avoid it. Consequently, we have few datapoints under pure sliding wear conditions (Figure 14c)(sliding-block model). The literature of tribology (the studyof wear, friction, and lubrication) contains abundant exam-ples of wear by pure sliding and equation (3) is a typicalempirical expression relating wear to normal load, velocityand hardness. While we can calculate the static normal loadand relate hardness to block strength, the slip velocity isunknown except for the few cases of pure sliding. Addi-tionally, because our experiments were not designed to testthe relationship between sliding and erosion, our range inh is not adequate to evaluate the trend between these twovariables. These experiments, nonetheless, suggest thatsliding wear may be more important than anticipated forcertain combinations of flow and bed strength conditions,and warrants further investigation. For example, changingthe roughness of the sample itself may have the mostinfluence on the amount of sliding. To discern betweenthe different erosion models discussed here, the next step isto extend the range of flow depth, grain diameter, and bedroughness in the experiments. We plan to explore theseissues in our larger-scale drum study.
Figure 16. Plot of eroded depth per event (rotation), ed,versus ViIrFe (defined in equations (17)–(20)) as predictedby modifying a model for bedrock wear by impactinggrains. Dry (filled circles, y = 0.0004x0.98) and water-saturated (open circles, y = 0.0002x0.71) flows. This zero-slip model of bedrock erosion explains less of the variancein the data than NSNIS, the strength-normalized inertialstress. See Table 4 for regression statistics.
F02001 HSU ET AL.: BEDROCK EROSION BY GRANULAR FLOWS
18 of 21
F02001
5. Conclusions
[64] We conducted experiments in a rotating drum toexplore how the erosion rate of homogeneous bedrockvaries with one-dimensional, average inertial stress valuesfor the case of dry and water-saturated single grain sizeflows. Our data indicate a strong dependence of erosion ongrain diameter and a moderate dependence on the shear rateof the flow. As Sklar and Dietrich [2001] found in fluvialexperiments, we found that granular flow erosion varies asthe inverse of bedrock tensile strength squared. Hence, wefound correlation between measured bedrock erosion andthe bedrock strength-normalized inertial stress parameter(equation (13)). However, even in this simplified case,observations of lateral circulation effects and sliding suggestthat the inertial stress dependency may be insufficient. Slipoccurs, more commonly in water-saturated than dry flows,and surprisingly seems to cause more wear despite thereduction in the shear rate.[65] While approximate inertial stress estimates based on
average shear rate can serve as an indicator of erosion rates,it seems likely, as previously suggested, that a significantproportion of the wear occurs just in the coarse granularsnout. The flow average inertial stress values may provide apoor indication of stresses in the snout, especially becausenot all experimental flows in this study or in nature lie in theinertial regime. These experiments highlight the need formore theory and observation of the dynamic loading pro-cesses at the snout. To make this analysis more mechanistic,we need direct measurements of the dynamic normalloading on the boundary and associated velocity profiles.Using a recently constructed 4-m-diameter rotating drum,we intend to study flow dynamics and bedrock wear withnatural-scale debris flow materials. Our small drum experi-ments encourage further data gathering of inertial stressesand wear, but they also point to the need to documentsliding, the conditions that induce it, and the wear it causes.Another goal is to better understand the bedrock fractureproperties, hence future work with an erodible material thatfractures in blocks or plates would be enlightening.
Notation
Ablock area of erodible sample, m2.ac centripetal acceleration, m s�2.c cohesion of the bed, Pa.
Dp particle diameter, m.De effective particle diameter, m.Eeff effective elastic modulus of fractured rock, Pa.e0 dimensionless erosion.
e0(Lact) dimensionless erosion calculated with Lactinstead of L0.
ed average eroded depth of sample block in oneexperiment, m.
em mass of eroded material from sample block inone experiment, kg.
es bedrock erosion rate from a saltation-abrasionmodel [Sklar and Dietrich, 2004], m/event.
ev eroded volume, m3.f frequency of debris flows over a given reach per
annum, a�1.
F function of fracture spacing of bedrock channel[Stock and Dietrich, 2006], m.
Fe fraction of bed exposed to erosion.g gravitational constant, m s�2.g0 total vertical acceleration [Denlinger and
Iverson, 2004], m s�2.H hardness of eroding material, Pa.h debris flow surge head depth, m.
hmax maximum height of flow in drum, m.Ir rate of particle impacts, per unit time per unit
area, time�1 m�2.K0 dimensionless constant of proportionality that
relates bulk inertial normal stresses to higherexcursions of inertial normal stress.
K1 constant of proportionality between rockresistance and incision rate.
k constant of proportionality in wear equations.kv dimensionless coefficient that depends on
the material properties of the impacting particle(equation (18)).
L length of debris flow granular front, m.Lact instantaneous active eroding length of the flow
in the drum, m.Ltot total length of flow for a drum experiment, m.L0 instantaneous length of flow for a drum
experiment, m.NBag Bagnold number (ratio of solid inertial normal
stress to fluid viscous stress).Nerosion nondimensional number representing ratio of
path-integrated bulk inertial solid stresses torock resistance [Stock and Dietrich, 2006].
NSav Savage number (ratio of solid inertial normalstress to solid frictional stress).
NSNIS strength-normalized inertial stress number.n exponent on the inertial stress term in
equations (11) and (12).ni number of impacts.p fluid pressure, Pa.pn normal pressure, Pa.pT total normal stress, Pa.
rdrum radius of experimental drum, m.T0 rock tensile strength, Pa.t time, s.
tevent duration of one debris flow event, s/event.texp duration of erosion experiment, s.U velocity difference across the shear layer, m s�1.u velocity, m s�1.ub basal streamwise (along slope) velocity of debris
flow, m s�1.us surface streamwise (along slope) velocity of
debris flow, m s�1.udrum tangential drum velocity, m s�1.
V sliding velocity (Archard’s law), m s�1.Vi average volume of rock detached per particle
impact, m3/impact.W applied load, N.w exponent on the shear rate approximation
(equation (4)).x sliding distance of the applied load in Archard’s
law, m.z height above bed, m.
@u/@z shear strain rate of debris flow, s�1.
F02001 HSU ET AL.: BEDROCK EROSION BY GRANULAR FLOWS
19 of 21
F02001

@z/@t bedrock surface lowering rate, m a�1.(meters per annum).
F friction angle, degrees.tf shear strength of bed, Pa.m viscosity of phase defined as fluid in debris
flow, Pa s.nf volumetric fluid concentration.ns volumetric solids concentration.qb basal slope angle of flow, degrees.qs surface slope angle of flow, degrees.qt shear layer slope, degrees.rs solid particle density, kg m�3.rf fluid density, kg m�3.
rblock erodible sample density, kg m�3.si solid normal inertial normal stress, Pa.sn normal stress, Pa.ss effective static normal stress, Pa.
[66] Acknowledgments. The authors would like to thank StuartFoster, John Potter, Judd Goodman, Kevin Wecht, Jessica Fadde, andJeffrey Moore for help with the experiments. Richard Iverson providedadvice about experimental procedures and analyses and gave valuablecomments on an earlier draft of this paper. We thank Kelin Whipple, GregTucker, and an anonymous reviewer for comments that improved the paper.This work was supported by the STC program of the National ScienceFoundation via the National Center for Earth-surface Dynamics under theagreement EAR-0120914.
ReferencesAhn, H., C. E. Brennen, and R. H. Sabersky (1991), Measurements ofvelocity, velocity fluctuation, density, and stresses in chute flows ofgranular materials, Trans. ASME, 58, 792–803.
Ancey, C. (2002), Dry granular flows down an inclined channel: Experi-mental investigations on the frictional-collisional regime, Phys. Rev. E,65, 011304.
Andreotti, B., A. Daerr, and S. Douady (2002), Scaling laws in granularflows down a rough plane, Phys. Fluids, 14(1), 415–418.
Arattano, M., and L. Franzi (2004), Analysis of different water-sedimentflow processes in a mountain torrent, Nat. Hazards Earth Syst. Sci., 4,783–791.
Arattano, M., and L. Marchi (2000), Video-derived velocity distributionalong a debris flow surge, Phys. Chem. Earth, Part B, 25(9), 781–784.
Arattano, M., and F. Moia (1999), Monitoring the propagation of a debrisflow along a torrent, Hydrol. Sci., 44(5), 811–823.
Azanza, E., F. Chevoir, and P. Moucheront (1999), Experimental study ofcollisional granular flows down an inclined plane, J. Fluid Mech., 400,199–227.
Bagnold, R. A. (1954), Experiments on a gravity-free dispersion of largesolid spheres in a Newtonian fluid under shear, Proc. R. Soc. London, Ser.A, 225(1160), 49–63.
Benda, L. (1990), The influence of debris flows on channels and valleyfloors in the Oregon Coast Range, U.S.A., Earth Surf. Processes Land-forms, 15, 457–466.
Berti, M., R. Genevois, A. Simoni, and P. R. Tecca (1999), Field observationsof a debris flow event in the Dolomites, Geomorphology, 29, 256–274.
Berti, M., R. Genevois, R. LaHusen, A. Simoni, and P. R. Tecca (2000),Debris flow monitoring in the Acquabona Watershed on the Dolomites(Italian Alps), Phys. Chem. Earth, Part B, 25(9), 707–715.
Bi, W., R. Delannay, P. Richard, N. Taberlet, and A. Valance (2005), Two-and three-dimensional confined granular chute flows: Experimental andnumerical results, J. Phys. Condens. Matter, 17, S2457–S2480.
Boateng, A. A. (1998), Boundary layer modeling of granular flow in thetransverse plane of a partially filled rotating cylinder, Int. J. MultiphaseFlow, 24(3), 499–521.
Brewster, R., G. S. Grest, J. W. Landry, and A. J. Levine (2005), Plug flowand the breakdown of Bagnold scaling in cohesive granular flows, Phys.Rev. E, 72, 061301.
Buchholtz, V., and T. Poschel (1997), Force distribution and comminutionin ball mills, in Friction, Arching, Contact Dynamics, edited by D. E.Wolf and P. Grassberger, pp. 265–273, World Sci., Singapore.
Calder, E. S., R. S. J. Sparks, and M. C. Gardeweg (2000), Erosion, trans-port and segregation of pumice and lithic clasts in pyroclastic flows
inferred from ignimbrite at Lascar Volcano, Chile, J. Volcanol. Geotherm.Res., 104, 201–235.
Campbell, C. S. (1990), Rapid granular flows, Annu. Rev. Fluid Mech., 22,57–92.
Campbell, C. S. (2002), Granular shear flows at the elastic limit, J. FluidMech., 465, 261–291.
Campbell, C. S. (2005), Stress-controlled elastic granular shear flows,J. Fluid Mech., 539, 273–297.
Davies, T. R. H. (1990), Debris-flow surges—Experimental simulation,J. Geol. N. Z., 29(1), 18–46.
DeGraff, J. V. (1994), The geomorphology of some debris flows in thesouthern Sierra Nevada, California, Geomorphology, 10, 231–252.
Denlinger, R. P., and R. M. Iverson (2001), Flow of variably fluidizedgranular masses across three-dimensional terrain: 2. Numerical predic-tions and experimental tests, J. Geophys. Res., 106, 553–566.
Denlinger, R. P., and R. M. Iverson (2004), Granular avalanches acrossirregular three-dimensional terrain: 1. Theory and computation, J. Geo-phys. Res., 109, F01014, doi:10.1029/2003JF000085.
Dietrich, W. E., and T. Dunne (1978), Sediment budget for a small catch-ment in mountainous terrain, Z. Geomorphol., 29, 191–206.
Ding, Y. L., J. P. K. Seville, R. Forster, and D. J. Parker (2001), Solidsmotion in rolling mode rotating drums operated at low to medium rota-tional speeds, Chem. Eng. Sci., 56, 1769–1780.
du Pont, S. C., P. Gondret, B. Perrin, and M. Rabaud (2003), Granularavalanches in fluids, Phys. Rev. Lett., 90(4), 044301.
Egashira, S., T. Itoh, and H. Takeuchi (2001), Transition mechanism ofdebris flows over rigid bed to over erodible bed, Phys. Chem. Earth,Part B, 26(2), 169–174.
Forterre, Y., and O. Pouliquen (2001), Longitudinal vortices in granularflows, Phys. Rev. Lett., 86(26), 5886–5889.
Gray, J. M. N. T. (2001), Granular flow in partially filled slowly rotatingdrums, J. Fluid Mech., 441, 1–29.
Genevois, R., A. Galbaro, and P. R. Tecca (2001), Image analysis for debrisflow properties estimation, Phys. Chem. Earth, Part C, 26(9), 623–631.
Grunewald, U., R. S. J. Sparks, S. Kearns, and J. C. Komorowski (2000),Friction marks on blocks from pyroclastic flows at the Soutriere Hillsvolcano, Montserrat: Implications for flow mechanisms, Geology, 28(9),827–830.
Hampton, M. A. (1975), Competence of fine-grained debris flows, J. Sedi-ment. Petrol., 45(4), 834–844.
Hanes, D. M., and D. L. Inman (1985), Observations of rapidly flowinggranular-fluid materials, J. Fluid Mech., 150, 357–380.
Hanes, D. M., and O. R. Walton (2000), Simulations and physical measure-ments of glass spheres flowing down a bumpy incline, Powder Technol.,109, 133–144.
Holmes, R. R., R. J. Huizinga, S. M. Brown, and H. E. Jobson (1993),Laboratory procedures and data reduction techniques to determine rheo-logic properties of mass flows, U.S. Geol. Surv. Water Resour. Invest.Rep., 93–4123, 19 pp.
Hotta, N., and T. Ohta (2000), Pore-water pressure of debris flows, Phys.Chem. Earth, Part B, 25(4), 381–385.
Howard, A. D. (1998), Long profile development of bedrock channels:Interaction of weathering, mass wasting, bed erosion, and sedimenttransport, in Rivers Over Rock: Fluvial Processes in Bedrock Channels,Geophys. Monogr. Ser., vol. 107, edited by E. E. Wohl and K. J.Tinkler, pp. 297–319, Washington, D. C.
Howard, A. D., and G. Kerby (1983), Channel changes in badlands, Geol.Soc. Am. Bull., 94, 739–752.
Hsu, K. J. (1975), Catastrophic debris streams (sturzstroms) generated byrockfalls, Geol. Soc. Am. Bull, 86, 129–140.
Huang, C. J., H. Y. Yin, C. Y. Chen, C. H. Yeh, and C. L. Wang (2007),Ground vibrations produced by rock motions and debris flows, J. Geo-phys. Res., 112, F02014, doi:10.1029/2005JF000437.
Hubert, J. F., and A. J. Filipov (1989), Debris-flow deposits in alluvial fanson the west flank of the White Mountains, Owens Valley, California,U.S.A., Sediment. Geol., 61, 177–205.
Hubl, J., and H. Steinwendtner (2000), Estimation of rheological propertiesof viscous debris flow using a belt conveyor, Phys. Chem. Earth, Part B,25(9), 751–755.
Huizinga, R. J. (1996), Verification of vertically rotating flume using non-Newtonian fluids, J. Hydraul. Eng., 122(8), 456–459.
Hungr, O., G. C. Morgan, and R. Kellerhals (1984), Quantitative analysis ofdebris torrent hazards for design of remedial measures, Can. Geotech. J.,21, 663–677.
Hungr, O., S. McDougall, and M. Bovis (2005), Entrainment of material bydebris flows, in Debris-Flow Hazards and Related Phenomena, edited byM. Jakob and O. Hungr, pp. 135–155, Springer, New York.
Hunt, M. L., R. Zenit, C. S. Campbell, and C. E. Brennen (2002), Revisit-ing the 1954 suspension experiments of R. A. Bagnold, J. Fluid Mech.,452, 1–24.
F02001 HSU ET AL.: BEDROCK EROSION BY GRANULAR FLOWS
20 of 21
F02001
Itakura, Y., H. Inaba, and T. Sawada (2005), A debris-flow monitoringdevices and methods bibliography, Nat. Hazards Earth Syst. Sci., 5,971–977.
Itoh, T., K. Miyamoto, and S. Egashira (2003), Numerical simulation ofdebris flow over erodible bed, in Debris-Flow Hazards Mitigation:Mechanics, Prediction, and Assessment, edited by D. Rickenmannand C. L. Chen, pp. 457–468, Millpress, Rotterdam, Netherlands.
Iverson, R. M. (1997), The physics of debris flows, Rev. Geophys., 35(3),245–296.
Iverson, R. M. (2005), Debris-flow mechanics, in Debris-Flow Hazards andRelated Phenomena, edited by M. Jakob and O. Hungr, pp. 105–131,Springer, New York.
Iverson, R. M., and R. P. Denlinger (2001), Flow of variably fluidizedgranular masses across three-dimensional terrain: 1. Coulomb mixturetheory, J. Geophys. Res., 106(B1), 537–552.
Iverson, R. M., and J. W. Vallance (2001), New views of granular massflows, Geology, 29(2), 115–118.
Iverson, R. M., M. Logan, and R. P. Denlinger (2004), Granular avalanchesacross irregular three-dimensional terrain: 2. Experimental tests, J. Geo-phys. Res., 109, F01015, doi:10.1029/2003JF000084.
Jain, N., J. M. Ottino, and R. M. Lueptow (2002), An experimental study ofthe flowing granular layer in a rotating tumbler, Phys. Fluids, 14(2),572–582.
Jakob, M., M. Bovis, and M. Oden (2005), The significance of channelrecharge rates for estimating debris-flow magnitude and frequency, EarthSurf. Processes Landforms, 30, 755–766.
Jan, C. D., and J. C. Chen (1997), Application of a vertically rotating flumeto study the flow behavior of sediments (in Chinese), J. Chin. Soil WaterConserv., 28(2), 157–164.
Johnson, A. M., and J. R. Rodine (1984), Debris flow, in Slope Instability,edited by D. Brunsden and D. B. Prior, pp. 257–361, John Wiley,Hoboken, N. J.
Kaitna, R., and D. Rickenmann (2005), Debris flow experiments in a ver-tically rotating drum, Geophys. Res. Abstr., 7, 07959.
Lague, D., and P. Davy (2003), Constraints on the long-term colluvialerosion law by analyzing slope-area relationships at various tectonic up-lift rates in the Siwaliks Hills (Nepal), J. Geophys. Res., 108(B2), 2129,doi:10.1029/2002JB001893.
Longo, S., and A. Lamberti (2002), Grain shear flow in a rotating drum,Exp. Fluids, 32, 313–325.
Louge, M. Y., and S. C. Keast (2001), On dense granular flows down flatfrictional inclines, Phys. Fluids, 13(5), 1213–1233.
Major, J. J. (1997), Verification of vertically rotating flume using non-Newtonian fluids (comment), J. Hydraul. Eng., 123(10), 936–937.
May, C. L., and R. E. Gresswell (2003), Spatial and temporal patterns ofdebris-flow deposition in the Oregon Coast Range, USA, Geomorphol-ogy, 57(3–4), 135–149, doi:10.1016/S0169-555X(03)00086-2.
McArdell, B. W., P. Bartelt, and J. Kowalski (2007), Field observations ofbasal forces and fluid pore pressure in a debris flow, Geophys. Res. Lett.,34, L07406, doi:10.1029/2006GL029183.
Momber, A. W. (2004), Wear of rocks by water flow, Int. J. Rock Mech.Min. Sci., 41, 51–68.
Montgomery, D. R., and E. Foufoula-Georgiou (1993), Channel networksource representation using digital elevation models, Water Resour. Res.,29(12), 3925–3934.
O’Brien, J. S., and P. Y. Julien (1988), Laboratory analysis of mudflowproperties, J. Hydraul. Eng., 144(8), 877–887.
Papa, M., S. Egashira, and T. Itoh (2004), Critical conditions of bed sedi-ment entrainment due to debris flow, Nat. Hazards Earth Syst. Sci., 4,469–474.
Parsons, J. D., K. X. Whipple, and A. Simoni (2001), Experimental studyof the grain-flow, fluid-mud transition in debris flows, J. Geol., 109,427–447.
Perez, F. L. (2001), Matrix granulometry of catastrophic debris flows(December 1991) in central coastal Venezuela, Catena, 45, 163–183.
Perng, A. T. H., H. Capart, and H. T. Chou (2006), Granular configurations,motions, and correlations in slow uniform flows driven by an inclinedconveyor belt, Granular Matter, 8, 5–17.
Pierson, T. C. (1980), Erosion and deposition by debris flows at Mt. Thomas,North Canterbury, New Zealand, Earth Surf. Processes, 5, 227–247.
Pitman, E. B., C. C. Nichita, A. K. Patra, A. C. Bauer, M. Bursik, andA. Weber (2003), A model of granular flows over an erodible surface,Discrete Continuous Dyn. Syst., Ser. B, 3(4), 589–599.
Popovics, S. (1998), Strength and Related Properties of Concrete: A Quan-titative Approach, 240 pp., John Wiley, New York.
Pudasaini, S. P., Y. Wang, and K. Hutter (2005), Modelling debris flowsdown general channels, Nat. Hazards Earth Syst. Sci., 5, 799–819.
Radziszewski, P. (1997), Predictive model for ball mill wear, Can. Metal-lurg. Q., 36(2), 87–93.
Radziszewski, P., and S. Tarasiewicz (1993a), Simulation of ball charge andliner wear, Wear, 169, 77–85.
Radziszewski, P., and S. Tarasiewicz (1993b), Modelling and simulation ofball mill wear, Wear, 160, 309–316.
Remaitre, A., J. P. Malet, and O. Maquaire (2005), Morphology and sedi-mentology of a complex debris flow in a clay-shale basin, Earth Surf.Processes Landforms, 30, 339–348.
Rickenmann, D., D. Weber, and B. Stepanov (2003), Erosion by debris flowsin the field and laboratory experiments, in Debris-Flow Hazards Mitiga-tion: Mechanics, Prediction, and Assessment, edited by D. Rickenmannand C. L. Chen, pp. 883–894, Millpress, Rotterdam, Netherlands.
Ristow, G. H. (1996), Dynamics of granular materials in a rotating drum,Europhys. Lett., 34(4), 263–268.
Savage, S. B. (1984), The mechanics of rapid granular flows, Adv. Appl.Mech., 24, 290–365.
Savage, S. B., and K. Hutter (1989), The motion of a finite mass of granularmaterial down a rough incline, J. Fluid Mech., 199, 177–215.
Seidl, M. A., and W. E. Dietrich (1992), The problem of channel erosioninto bedrock, Catena Suppl., 23, 101–124.
Shreve, R. L. (1968), The Blackhawk Landslide, Spec. Pap. Geol. Soc. Am.,108, 47 pp.
Silbert, L. E., D. Ertas, G. S. Grest, T. C. Halsey, D. Lovine, and S. J.Plimpton (2001), Granular flow down an inclined plane: Bagnold scalingand rheology, Phys. Rev. E, 64, 051302.
Sklar, L. S., and W. E. Dietrich (2001), Sediment and rock strength controlson river incision into bedrock, Geology, 29(12), 1087–1090.
Sklar, L. S., and W. E. Dietrich (2004), A mechanistic model for riverincision into bedrock by saltating bed load, Water Resour. Res., 40,W06301, doi:10.1029/2003WR002496.
Sparks, R. S. J., M. C. Gardeweg, E. S. Calder, and S. J. Matthews (1997),Erosion by pyroclastic flows on Lascar Volcano, Chile, Bull. Volcanol.,58, 557–565.
Stock, J. D., and W. E. Dietrich (2003), Valley incision by debris flows:Evidence of a topographic signature, Water Resour. Res., 39(4), 1089,doi:10.1029/2001WR001057.
Stock, J. D., and W. E. Dietrich (2006), Erosion of steepland valleys bydebris flows, Geol. Soc. Am. Bull., 118(9/10), 1125–1148, doi:10.1130/B25902.1.
Stock, J. D., D. R. Montgomery, B. D. Collins, W. E. Dietrich, and L. Sklar(2005), Field measurements of incision rates following bedrock exposure:Implications for process controls on the long profiles of valleys cut byrivers and debris flows, Geol. Soc. Am. Bull., 117(11/12), 174–194,doi:10.1130/B25560.1.
Suwa, H., and S. Okuda (1980), Dissection of valleys by debris flows,Z. Geomorphol., Suppl., 35, 164–182.
Swartz, M., and B. W. McArdell (2005), Motion of large particles in debrisflows, Geophys. Res. Abstr., 7, 05943.
Tai, Y. C., K. Hutter, and J. M. N. T. Gray (2000), Steady motion of a finitegranular mass in a rotating drum, Chin. J. Mech., 16(2), 67–72.
Takahashi, T. (1991), Debris Flow, 165 pp., Int. Assoc. for Hydraul. Res.,Brookfield, Vt.
Tegzes, P., T. Vicsek, and P. Schiffer (2002), Avalanche dynamics in wetgranular materials, Phys. Rev. Lett., 89(9), 094301.
Tognacca, C., and C. E. Minor (2000), Role of surface tension, fluid densityand fluid viscosity on debris-flow dynamics, Debris-Flow HazardsMitigation: Mechanics, Prediction, and Assessment, edited by G. F.Wiezorek and N. D. Naeser, pp. 229–235, A.A. Balkema, Rotterdam,Netherlands.
Van Gassen, W., and D. M. Cruden (1989), Momentum transfer and frictionin the debris of rock avalanches, Can. Geotech. J., 26, 623–628.
Wang, G., K. Sassa, and H. Fukuoka (2003), Downslope volume enlarge-ment of a debris slide-debris flow in the 1999 Hiroshima, Japan, rain-storm, Eng. Geol., 69, 309–330.
Whipple, K. X. (1997), Open-channel flow of Bingham fluids: Applicationsin debris-flow research, J. Geol., 105(2), 243–257.
Whipple, K. X., and G. W. Tucker (1999), Dynamics of the stream-powerriver incision model: Implications for height limits of mountain ranges,landscape response timescales, and research needs, J. Geophys. Res.,104(B8), 17,661–17,674.
�����������������������W. E. Dietrich and L. Hsu, Department of Earth and Planetary
Science, University of California, Berkeley, CA 94720, USA.([email protected])L. S. Sklar, Department of Geosciences, San Francisco State University,
San Francisco, CA 94132, USA.
F02001 HSU ET AL.: BEDROCK EROSION BY GRANULAR FLOWS
21 of 21
F02001
Copyright © 2022 FDOKUMEN