Structural, Electrical and Magnetic Properties of Sb-Doped Pr2/3Ba1/3MnO3 Perovskite Manganites
7
This article appeared in a journal published by Elsevier. The attached copy is furnished to the author for internal non-commercial research and education use, including for instruction at the authors institution and sharing with colleagues. Other uses, including reproduction and distribution, or selling or licensing copies, or posting to personal, institutional or third party websites are prohibited. In most cases authors are permitted to post their version of the article (e.g. in Word or Tex form) to their personal website or institutional repository. Authors requiring further information regarding Elsevier’s archiving and manuscript policies are encouraged to visit: http://www.elsevier.com/copyright
-
Upload
independent -
Category
Documents
-
view
3 -
download
0
Transcript of Structural, Electrical and Magnetic Properties of Sb-Doped Pr2/3Ba1/3MnO3 Perovskite Manganites

This article appeared in a journal published by Elsevier. The attachedcopy is furnished to the author for internal non-commercial researchand education use, including for instruction at the authors institution
and sharing with colleagues.
Other uses, including reproduction and distribution, or selling orlicensing copies, or posting to personal, institutional or third party
websites are prohibited.
In most cases authors are permitted to post their version of thearticle (e.g. in Word or Tex form) to their personal website orinstitutional repository. Authors requiring further information
regarding Elsevier’s archiving and manuscript policies areencouraged to visit:
http://www.elsevier.com/copyright

Author's personal copy
Journal of Alloys and Compounds 475 (2009) 440–445
Contents lists available at ScienceDirect
Journal of Alloys and Compounds
journa l homepage: www.e lsev ier .com/ locate / ja l l com
Structural, electrical and magnetic properties of Fe–Co–Crand Fe–Co–Cr–N nanocrystalline alloy films
W. Wanga, G.H. Yuea, Y. Chena, W.B. Mib, H.L. Baib, D.L. Penga,∗
a Department of Materials Science and Engineering, College of Materials, Xiamen University, Xiamen 361005, PR Chinab Tianjin Key Laboratory of Low Dimensional Materials Physics and Preparing Technology, Institute of Advanced Materials Physics,Faculty of Science, Tianjin University, Tianjin 300072, PR China
a r t i c l e i n f o
Article history:Received 29 May 2008Received in revised form 6 July 2008Accepted 10 July 2008Available online 22 August 2008
Keywords:Alloy filmsCo-sputteringSurface morphologyMagnetic properties
a b s t r a c t
Fe–Co–Cr and Fe–Co–Cr–N thin films were fabricated by magnetron co-sputtering at room temperature,and their structural, electrical and magnetic properties were examined by various analytic techniques. Itwas observed that with the increase of Cr-target power, for Fe–Co–Cr thin films the resistivity increasedand surface morphology was changed. As the nitrogen gas flow ratio increased, for Fe–Co–Cr–N thin filmsthe grain size decreased and the resistivity monotonically increased. Fe–Co–Cr thin films exhibited thebest soft-magnetic properties with a relatively large saturation magnetization (Ms) of 1.77 Wb/m2 and asmall coercivity (Hc) of 748 A/m at a Cr-target power of 80 W, whereas Fe–Co–Cr–N thin films had thebest soft-magnetic properties with a high saturation magnetization (Ms) of 1.64 Wb/m2 and a minimumcoercivity (Hc) of 279 Wb/m2 at a nitrogen gas flow ratio of 20%. The grain refinement mechanism ofchromium and nitrogen in the FeCo-based films was also discussed.
© 2008 Elsevier B.V. All rights reserved.
1. Introduction
FeCo-based magnetic thin films are attracting wide attentions[1–9] because of their exceptional magnetic properties. Some FeCo-based alloy thin films including a metal element (Ti, Ta, Zr, Hf,etc.) are excellent soft-magnetic materials that exhibit very highsaturation magnetization, low coercivity, high permeability, highresistivity, and reconcilable anisotropy, which are requirements formany modern high-frequency applications such as planner induc-tors, transformers and microwave absorbers [10]. Other FeCo-basedthin films containing one heavy element (Sm, Ag and Pt) can havehigh magnetic anisotropies and increased block temperatures, andcan be the excellent candidates for materials used in high-densitymagnetic recording disks [11].
Ever since the development of iron-based nanocrystalline soft-magnetic material by Yoshizawa et al. [12–13], various attemptshave been made to produce soft-magnetic materials by making thegrain size in the nanometer range. The soft-magnetic propertiesowing to the grain size refinement can be explained by the randomanisotropy theory [14–16]. Recently, the nanocrystalline FeCo(Fe,Co)–X–N(O) thin film system, with X = Al, Ti, Ta, Zr, Si, for example,has been a subject of great interest as candidates for high-frequencyapplications. It has been reported that FeCo–Zr–O nano-granular
∗ Corresponding author. Tel.: +86 592 2180155; fax: +86 592 2180155.E-mail address: [email protected] (D.L. Peng).
soft-magnetic thin films deposited by reactive sputtering have ahigh magnetic flux densities (Bs) up to 2.3 Wb/m2 [17]. FeCoSiNthin films, which consisted of order arrays of FeCo nanoparticlesembedded in a Si-rich matrix, have also been reported to havea high Ms value and a high resistivity up to 1000 �� cm [18].Berkowitz et al. reported that CoxFe100−x multilayer, consisting ofdiscontinuous metal layers with native oxide surfaces, exhibiteda high resistivity and a high Ms value of 1.7 Wb/m2 [19]. However,there is little work on the effect of the doped element on the surfacemorphology, microstructure, electrical and magnetic properties ofFeCo-based films. In this work, we focused on the electrical andmagnetic properties of Fe–Co–Cr and Fe–Co–Cr–N thin films whichwere synthesized by the magnetron co-sputtering technique. Theeffects of the doped elements (Cr and N) on the film microstructureand morphology were also investigated.
2. Experimental
Nanocrystalline Fe–Co–Cr and Fe–Co–Cr–N thin films were deposited on glassslides and single-crystal silicon wafers with (1 1 0) surface orientation by magnetronco-sputtering in nitrogen and argon gas atmosphere at room temperature, using apure Cr (99.99%) plate of 2 in. and a Fe65Co35 alloy plate of 3 in. in diameter. Thealloy composition of thin films was adjusted by changing the Cr-target power (PCr)while maintaining the Fe65Co35 alloy target power unchanged. The nitrogen con-tent of thin films was altered by changing the nitrogen gas flow ratio, R(N2), definedas R(N2) = [N2 flow rate]/[Ar flow rate + N2 flow rate], controlled by mass flow con-trollers in the same total gas flow rate. Cr and Fe65Co35 alloy targets were connectedto rf source and dc source, respectively. The Fe65Co35 alloy target power was kept to90 W, and Cr-target power ranged between 0 and 100 W. The nitrogen gas flow ratiowas varied from 0 to 25%. The sputtering chamber was evacuated to a base pressure
0925-8388/$ – see front matter © 2008 Elsevier B.V. All rights reserved.doi:10.1016/j.jallcom.2008.07.047

Author's personal copy
W. Wang et al. / Journal of Alloys and Compounds 475 (2009) 440–445 441
Fig. 1. XRD patterns of Fe–Co–Cr thin films deposited at different PCr.
of 6.5 × 10⁻⁴ Pa. During sputtering, the ambient gas pressure, the total gas flow rateand the substrate rotation speed were maintained at 0.7 Pa, 5.5 sccm and 30 r/min,respectively.
All the films were grown to a thickness of about 250 nm. The film thicknesseswere measured by a surface profiler (Dektak-III). The structures were analyzedby X-ray diffraction (XRD) (Panalytical X’pert-PRO). The surface morphology andcomposition were investigated by a scanning electron microscope (LEO-1530FE)equipped with an Energy Dispersive X-ray (EDX) Detector. The electrical resistiv-ity at room temperature was measured from standard four-point-probe method
Fig. 2. (a) Lattice constant and (b) averaged grain size of Fe–Co–Cr thin films as afunction of PCr.
(D41-11A/ZM). The static magnetic properties were evaluated by a vibrating-samplemagnetometer (VSM).
3. Results and discussion
3.1. Effects of Cr contents
XRD analyses of Fe–Co–Cr thin films indicate that all the filmsshow the bcc (1 1 0) diffraction peak, which strengthens and shifts
Fig. 3. SEM images of Fe–Co–Cr thin films deposited at (a) PCr = 0 W, (b) 40 W, (c) 60 W, (d) 80 W, and (e) 100 W.

Author's personal copy
442 W. Wang et al. / Journal of Alloys and Compounds 475 (2009) 440–445
Fig. 4. Metal atom fractions and atomic ratio of Fe to Co (Fe:Co) in Fe–Co–Cr thinfilms as a function of PCr.
gradually to the low angle as the Cr-target power (PCr) increasesfrom 0 to 100 W (Fig. 1). This suggests that the addition of Cr makes(1 1 0) become preferred orientation and also leads to an expandedlattice. Since the atomic radius of Cr is larger than that of Fe and Co,such an expanded lattice is likely due to Cr atoms replacing Co orFe atom sites in bcc FeCo nanocrystallites.
In order to quantitatively characterize Fe–Co–Cr thin films, thedependence of averaged lattice constant on PCr is investigated(Fig. 2a). With the increase of PCr, the lattice constant increasesfrom 2.85 to 2.87 Å. The averaged grain size is also estimated basedon the Scherrer’s formula [20], and the values of averaged grainsize are given in Fig. 2b. It can be found that the addition of a smallamount of Cr leads to an increased grain size. However, a furtheraddition leads to a decreased grain size. At a Cr-target power of80 W, the thin films have the smallest averaged grain size of about18 nm. The grain size starts to increase again at a higher Cr-targetpower.
To investigate the effect of Cr content on the microstruc-ture of Fe–Co–Cr films, we observed the surface morphologies byscanning electron microscopy (SEM) (Fig. 3) and measured thechemical compositions of thin films by EDX. As can be seen fromFig. 3, with the increase of PCr, the grain shape changes fromsheet-like (PCr = 0 W) to block-like (PCr = 40 W), then to sphere-like(PCr > 40 W), and finally to column-like (PCr = 100 W). This change in
Fig. 5. Resistivity of Fe–Co–Cr thin films as a function of PCr.
Fig. 6. (a) Ms and Hc of Fe–Co–Cr thin films as a function of PCr and (b) hysteresisloop for Fe–Co–Cr thin film at Cr-target power of 80 W.
the grain size is consistent with the result calculated by the Scher-rer’s formula (Fig. 2b). The variation of the surface morphologyand the grain size is correlative to chemical composition of thinfilms. Fig. 4 shows the atom fractions and the atomic ratio of Feto Co (Fe:Co) at various Cr-target powers. The atomic ratio of Feto Co is 65.1:34.9 from EDS of FeCo films, which is closely consis-tent with the composition of Fe65Co35 alloy target. However, withan increase in PCr, Cr atom fraction increases from 0 to 23.4% andCo atom fraction decreases from 34.9 to 14% but Fe atom fractionis nearly unchanged. The atomic ratio of Fe to Co also increaseshigh up to 63.6:14, which deviates markedly from the composi-tion of Fe65Co35 alloy target. From the experimental data above wecan infer that Co atoms are partially replaced by Cr atoms. Thereare two reasonable explanations for the concentration shift of Co.One seems to be a technical problem. However, during magnetronco-sputtering the Fe65Co35 alloy target was used and the atomicratio (Fe:Co = 65.1:34.9) of Fe to Co in the as-deposited Fe–Co alloythin films without Cr is indeed consistent with the composition(Fe:Co = 65:35) of the Fe65Co35 alloy target. When adding Cr intoFe–Co alloy thin film, the thin films should basically keep the sameatomic ratio of Fe to Co as that of Fe65Co35 alloy target. But ourexperimental data cannot prove it and the deviation of atomic ratioof Fe to Co becomes larger and larger with increasing Cr content.Therefore, we think the technical problem is not dominant for thisphenomenon. The other is that Cr preferentially combines with Feto form a more stable Fe–Co–Cr alloy thin film system. It is ascribedto that the cohesive energy between Fe and Cr is larger than thatbetween Co and Cr, since the electronegativity (1.83) of Fe is largerthan that (1.70) of Co and the electronegativity of Cr is 1.66.

Author's personal copy
W. Wang et al. / Journal of Alloys and Compounds 475 (2009) 440–445 443
The study on electrical properties of Fe–Co–Cr thin films indi-cates that the resistivity increases monotonically from 120 to156 �� cm as the Cr-target power increases from 0 to 100 W (Fig. 5).Such an increase is likely due to the formation of alloy phase andthe lattice distortion caused by Cr replacing Co.
The magnetic properties of Fe–Co–Cr thin films are closelyrelated to their microstructures. The dependence of saturationmagnetization (Ms) and coercivity (Hc) on PCr is shown in Fig. 6a. Asthe Cr-target power increases, Ms firstly keeps a constant and thengradually drops, while Hc shows a similar trend to the averagedgrain size (Fig. 2b) and has a minimum value of 748 A/m (Fig. 6b)with a relatively large saturation magnetization of 1.77 Wb/m2 at aCr-target power of 80 W.
3.2. Effects of nitrogen flow rate ratio
We have also examined the effects of nitrogen gas introduc-tion on the microstructure, electrical and magnetic properties ofFe–Co–Cr–N thin films. Here, Cr-target power PCr was fixed to 40 W.Fig. 7 shows the diffraction patterns for Fe–Co–Cr–N thin filmsof various nitrogen contents. The (1 1 0) diffraction peak becomessmaller and broader with the increase of R(N2). It is suggestedthat the thin films exhibit a gradually fined grains and becomeamorphous-like when R(N2) > 10%. Like the Fe–Co–Cr film systemdiscussed above, the (1 1 0) diffraction peak of Fe–Co–Cr–N thinfilms also shifts to the low angle due to the lattice expansion. How-ever, the origin of the expansion is different from that of Fe–Co–Crthin films. The former is ascribed to N atoms residing in the inter-
Fig. 7. XRD patterns of Fe–Co–Cr–N thin films deposited at different R(N2).
stitial sites of the lattice, while the latter to Cr atoms replacement[21].
In order to investigate the effect of nitrogen content on the sur-face morphology of Fe–Co–Cr–N thin films, we performed SEMobservations (Fig. 8). We can see that with the increase of R(N2),the thin films exhibit a gradually fined grains before the nitrogenflow ratio is less than 20%. The major reason for the grain refine-
Fig. 8. SEM images of Fe–Co–Cr–N thin films deposited at (a) R(N2) = 0, (b) 5%, (c) 10%, (d) 15%, (e) 20%, and (f) 25%.
Author's personal copy
444 W. Wang et al. / Journal of Alloys and Compounds 475 (2009) 440–445
Fig. 9. Atom fractions of Fe–Co–Cr–N thin films as a function of R(N2).
ment is a gradual destruction of the periodic lattice symmetry dueto the nitrogen incorporation, which inhibits the grain growth. Fur-ther Increasing R(N2) leads to a rough surface morphology (Fig. 8f),which probably comes from the occurrence of other amorphousphases. The dependence of metal atom fraction on R(N2) is alsoinvestigated (Fig. 9). With the increase of R(N2), the Cr atom frac-tion shows no relationship with R(N2), while the Co atom fractionslightly decreases and Fe atom fraction slightly increases. This resultis likely from the change of Fe and Co sputtering yield from thesame Fe–Co alloy target due to the introduction of N2 gas duringsputtering.
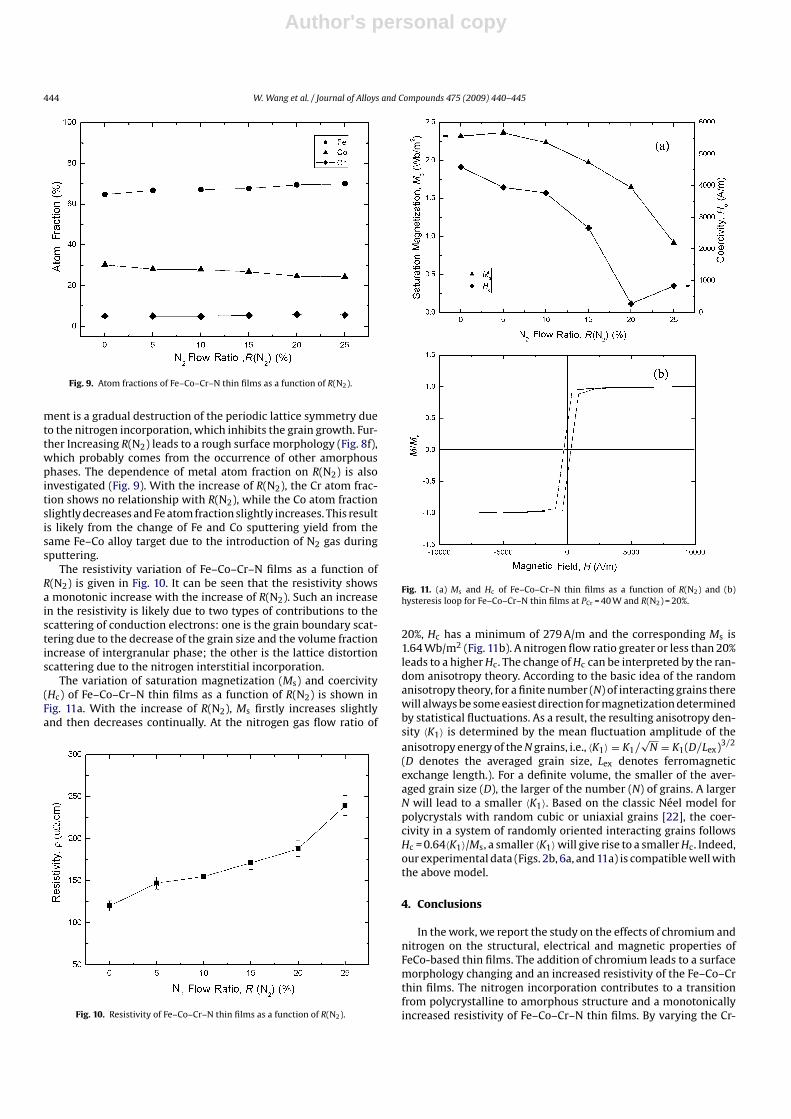
The resistivity variation of Fe–Co–Cr–N films as a function ofR(N2) is given in Fig. 10. It can be seen that the resistivity showsa monotonic increase with the increase of R(N2). Such an increasein the resistivity is likely due to two types of contributions to thescattering of conduction electrons: one is the grain boundary scat-tering due to the decrease of the grain size and the volume fractionincrease of intergranular phase; the other is the lattice distortionscattering due to the nitrogen interstitial incorporation.
The variation of saturation magnetization (Ms) and coercivity(Hc) of Fe–Co–Cr–N thin films as a function of R(N2) is shown inFig. 11a. With the increase of R(N2), Ms firstly increases slightlyand then decreases continually. At the nitrogen gas flow ratio of
Fig. 10. Resistivity of Fe–Co–Cr–N thin films as a function of R(N2).
Fig. 11. (a) Ms and Hc of Fe–Co–Cr–N thin films as a function of R(N2) and (b)hysteresis loop for Fe–Co–Cr–N thin films at PCr = 40 W and R(N2) = 20%.
20%, Hc has a minimum of 279 A/m and the corresponding Ms is1.64 Wb/m2 (Fig. 11b). A nitrogen flow ratio greater or less than 20%leads to a higher Hc. The change of Hc can be interpreted by the ran-dom anisotropy theory. According to the basic idea of the randomanisotropy theory, for a finite number (N) of interacting grains therewill always be some easiest direction for magnetization determinedby statistical fluctuations. As a result, the resulting anisotropy den-sity 〈K1〉 is determined by the mean fluctuation amplitude of theanisotropy energy of the N grains, i.e., 〈K1〉 = K1/
√N = K1(D/Lex)3/2
(D denotes the averaged grain size, Lex denotes ferromagneticexchange length.). For a definite volume, the smaller of the aver-aged grain size (D), the larger of the number (N) of grains. A largerN will lead to a smaller 〈K1〉. Based on the classic Néel model forpolycrystals with random cubic or uniaxial grains [22], the coer-civity in a system of randomly oriented interacting grains followsHc = 0.64〈K1〉/Ms, a smaller 〈K1〉 will give rise to a smaller Hc. Indeed,our experimental data (Figs. 2b, 6a, and 11a) is compatible well withthe above model.
4. Conclusions
In the work, we report the study on the effects of chromium andnitrogen on the structural, electrical and magnetic properties ofFeCo-based thin films. The addition of chromium leads to a surfacemorphology changing and an increased resistivity of the Fe–Co–Crthin films. The nitrogen incorporation contributes to a transitionfrom polycrystalline to amorphous structure and a monotonicallyincreased resistivity of Fe–Co–Cr–N thin films. By varying the Cr-

Author's personal copy
W. Wang et al. / Journal of Alloys and Compounds 475 (2009) 440–445 445
target power and the nitrogen gas flow ratio, we have successfullyprepared Fe–Co–Cr thin films with a relatively large Ms value of1.77 Wb/m2 and a minimum Hc value of 748 A/m, and Fe–Co–Cr–Nthin films with a rather high Ms value of 1.64 Wb/m2 and a mini-mum Hc value of 279 A/m. The as-synthesized films are expectedto be used in some high-frequency applications as soft-magneticmaterials.
Acknowledgements
This work was partially supported by the National Natural Sci-ence Foundation of China (Grant No. 50671087), and the NationalKey Technology R&D Program of China (2007BAE05B04).
References
[1] N.X. Sun, S.X. Wang, J. Appl. Phys. 92 (2002) 1477.[2] H. Jiang, Y.J. Chen, G.D. Lian, IEEE Trans. Magn. 39 (2003) 3559.
[3] S. Ohnuma, N. Kobayashi, T. Masumoto, J. Appl. Phys. 85 (1999) 8.[4] S. Ohnuma, N. Kobayashi, H. Fujimori, et al., Scripta Mater. 48 (2002) 903–
905.[5] S. Ohnuma, H. Fujimori, S. Mitani, T. Masumoto, J. Appl. Phys. 79 (1996) 8.[6] F. van Belle, T.J. Hayward, J.A.C. Bland, J. Appl. Phys. 102 (2007) 103908.[7] P.C. Kuo, S.S. Chang, C.M. Kuo, Y.D. Yao, H.L. Huang, J. Appl. Phys. 83 (1998)
6643.[8] S.X. Wang, N.X. Sun, M. Yamaguchi, S. Yabukami, Nature 407 (2000) 150.[9] I. Kim, J. Kim, K.H. Kim, M. Yamaguchi, IEEE Trans. Magn. 40 (2004) 2706.
[10] Y. Liu, Z.W. Liu, C.Y. Tan, K. Ong, J. Appl. Phys. 100 (2006) 093912.[11] J. Bansmann, S.H. Baker, C. Binnsb, et al., Surf. Sci. Reports 56 (2005) 189–275.[12] Y. Yoshizawa, S. Oguma, K. Yamauchi, J. Appl. Phys. 64 (1988) 6044.[13] Y. Yoshizawa, K. Yamauchi, Mater. Trans, JIM 31 (1990) 307.[14] G. Herzer, IEEE Trans. Magn. 25 (1989) 3327.[15] G. Herzer, IEEE Trans. Magn. 26 (1990) 1397.[16] G. Herzer, Mater. Sci. Eng. A 133 (1991) 1.[17] S. Ohnuma, H. Fujimori, T. Masumoto, Appl. Phys. Lett. 82 (2002) 6.[18] Y. Liu, C.Y. Tan, Z.W. Liu, K. Ong, Appl. Phys. Lett. 90 (2007) 112506.[19] G.S.D. Beach, A.E. Berkowitz, F.T. Parker David, J. Smith, Appl. Phys. Lett. 79
(2001) 2.[20] G.H. Yue, P.X. Yan, J.Z. Liu, et al., J. Appl. Phys. 98 (2005) 103506.[21] J. Das, S.S. Kalarickal, K.S. Kim, C.E. Patton, Phys. Rev. B 75 (2007) 094435.[22] L. Néel, C. R. Acad. Sci. URSS 224 (1947) 1488.