Magnetic, structural, and transport properties at very high temperature in manganites
8
Magnetic, structural, and transport properties at very high temperature in manganites Fabian Enrique Nima Ramirez, Fabio Furlan Ferreira, Wendel Andrade Alves, Jose ´ Fernando Queiruga Rey, Jose ´ Antonio Souza n Centro de Ciˆ encias Naturais e Humanas, Universidade Federal do ABC, Santo Andre ´, CEP 09090-400, SP, Brazil article info Article history: Received 21 December 2011 Available online 10 February 2012 Keywords: Manganite Phase transition Polaron mechanism Spin-lattice-charge coupling abstract Magnetic, structural, and electric transport measurements at high temperatures were carried out on La 1x Ca x MnO 3 ; x ¼0.20, 0.25, 0.30, 0.34, 0.40, and 0.45. All samples show a first-order structural phase transition from orthorhombic Pnma to rhombohedral R 3c space group at T R2O . Magnetic susceptibility measurements show that the Curie–Weiss law is strictly obeyed in the rhombohedral phase as opposed to the orthorhombic phase where the effective magnetic moment has a temperature dependence. The electrical resistivity is well described by the small polaron hopping mechanism in the samples up to x ¼0.34. As the charge carriers are introduced into the system (x ¼0.40 and 0.45), this mechanism of hopping ceases to be valid. The value of Gr ¨ uneisen parameter obtained through analysis of high- resolution X-ray powder diffraction as a function of temperature increases abruptly for the sample with x ¼0.40. This is consistent with an increase in bending and stretchinglike frequency modes observed by Raman spectroscopy. & 2012 Elsevier B.V. All rights reserved. 1. Introduction The microscopic mechanism underlying electronic, structural, and magnetic properties in strong spin–lattice–charge coupled systems is a subject of great interest in condensed matter physics [1]. The prototypal spin–charge–lattice coupled manga- nese perovskite LaMnO 3 is an antiferromagnetic and insulating system [2,3]. The introduction of holes (Mn 4 þ ) into the Mn 3 þ e g orbitals creates ferromagnetic double exchange interactions which couples the magnetic system with electrical conductivity [4], while Jahn–Teller distorted ions Mn 3 þ couple the magnetic and lattice degrees of freedom. This unusually strong coupling between the electronic, magnetic, and structural properties is suggested to bring about the colossal magnetoresistance effect [5,6]. Once the correlation among degrees of freedom is achieved a better understanding of the thermodynamic quantities of these systems will emerge. However, structural, magnetic, and electri- cal conductivity studies at very high temperatures in those systems are scarce in the literature. This has led to difficulties in understanding the order parameters and the coupled physical properties of the system. In general, it is well accepted that the electrical transport mechanism of manganites is well described by the small polaron hopping [7–9]. The localized carriers distort the surrounding lattice exchanging energy and thus forming a bounded polaron. In a simplified approach for manganites, a small lattice polaron can be formed when an e g electron localizes on a Mn 3 þ ion, and the surrounding oxygen octahedron is distorted due to the Jahn– Teller (JT) effect. On the other hand, it is not known if there exists a limit at which this model ceases to be valid when charge carriers are varied. Several works have shown that this model fails for some manganite systems, but there is no systematic study revealing the driven physical parameter responsible for deviations from small polaron mechanism [9–14]. Nevertheless, in general those fittings are made at intermediate temperature, close to the ferromagnetic transition, where fluctuations of the clustered magneticlike envir- onment surrounding small polarons influence strongly the elec- trical transport mechanism [11–14]. In addition, most of the literature is focused on the interplay between magnetic and transport properties, and no systematic study has been made to understand the correlations between the electrical resistivity and crystal structure in the paramagnetic semiconducting state. In this work, we show that the small polaron hopping mech- anism ceases to be valid as charge carriers are introduced into the system. The magnetic results indicate no significantly evidence of direct correlation between the breakdown of transport mechan- ism and the increase of the effective magnetic moment. Measure- ments of high-resolution X-ray power diffraction and Raman spectroscopy were put forward to obtain insight on nature of Contents lists available at SciVerse ScienceDirect journal homepage: www.elsevier.com/locate/jmmm Journal of Magnetism and Magnetic Materials 0304-8853/$ - see front matter & 2012 Elsevier B.V. All rights reserved. doi:10.1016/j.jmmm.2012.01.036 n Corresponding author. E-mail address: [email protected] (J.A. Souza). Journal of Magnetism and Magnetic Materials 324 (2012) 2011–2018
Transcript of Magnetic, structural, and transport properties at very high temperature in manganites
Journal of Magnetism and Magnetic Materials 324 (2012) 2011–2018
Contents lists available at SciVerse ScienceDirect
Journal of Magnetism and Magnetic Materials
0304-88
doi:10.1
n Corr
E-m
journal homepage: www.elsevier.com/locate/jmmm
Magnetic, structural, and transport properties at very high temperaturein manganites
Fabian Enrique Nima Ramirez, Fabio Furlan Ferreira, Wendel Andrade Alves, Jose FernandoQueiruga Rey, Jose Antonio Souza n
Centro de Ciencias Naturais e Humanas, Universidade Federal do ABC, Santo Andre, CEP 09090-400, SP, Brazil
a r t i c l e i n f o
Article history:
Received 21 December 2011Available online 10 February 2012
Keywords:
Manganite
Phase transition
Polaron mechanism
Spin-lattice-charge coupling
53/$ - see front matter & 2012 Elsevier B.V. A
016/j.jmmm.2012.01.036
esponding author.
ail address: [email protected] (
a b s t r a c t
Magnetic, structural, and electric transport measurements at high temperatures were carried out on
La1�xCaxMnO3; x¼0.20, 0.25, 0.30, 0.34, 0.40, and 0.45. All samples show a first-order structural phase
transition from orthorhombic Pnma to rhombohedral R3c space group at TR2O. Magnetic susceptibility
measurements show that the Curie–Weiss law is strictly obeyed in the rhombohedral phase as opposed
to the orthorhombic phase where the effective magnetic moment has a temperature dependence. The
electrical resistivity is well described by the small polaron hopping mechanism in the samples up to
x¼0.34. As the charge carriers are introduced into the system (x¼0.40 and 0.45), this mechanism of
hopping ceases to be valid. The value of Gruneisen parameter obtained through analysis of high-
resolution X-ray powder diffraction as a function of temperature increases abruptly for the sample with
x¼0.40. This is consistent with an increase in bending and stretchinglike frequency modes observed by
Raman spectroscopy.
& 2012 Elsevier B.V. All rights reserved.
1. Introduction
The microscopic mechanism underlying electronic, structural,and magnetic properties in strong spin–lattice–charge coupledsystems is a subject of great interest in condensed matterphysics [1]. The prototypal spin–charge–lattice coupled manga-nese perovskite LaMnO3 is an antiferromagnetic and insulatingsystem [2,3]. The introduction of holes (Mn4þ) into the Mn3þ eg
orbitals creates ferromagnetic double exchange interactionswhich couples the magnetic system with electrical conductivity[4], while Jahn–Teller distorted ions Mn3þ couple the magneticand lattice degrees of freedom. This unusually strong couplingbetween the electronic, magnetic, and structural properties issuggested to bring about the colossal magnetoresistance effect[5,6]. Once the correlation among degrees of freedom is achieveda better understanding of the thermodynamic quantities of thesesystems will emerge. However, structural, magnetic, and electri-cal conductivity studies at very high temperatures in thosesystems are scarce in the literature. This has led to difficultiesin understanding the order parameters and the coupled physicalproperties of the system.
In general, it is well accepted that the electrical transportmechanism of manganites is well described by the small polaron
ll rights reserved.
J.A. Souza).
hopping [7–9]. The localized carriers distort the surroundinglattice exchanging energy and thus forming a bounded polaron.In a simplified approach for manganites, a small lattice polaroncan be formed when an eg electron localizes on a Mn3þ ion, andthe surrounding oxygen octahedron is distorted due to the Jahn–Teller (JT) effect.
On the other hand, it is not known if there exists a limit atwhich this model ceases to be valid when charge carriers arevaried. Several works have shown that this model fails for somemanganite systems, but there is no systematic study revealing thedriven physical parameter responsible for deviations from smallpolaron mechanism [9–14]. Nevertheless, in general those fittingsare made at intermediate temperature, close to the ferromagnetictransition, where fluctuations of the clustered magneticlike envir-onment surrounding small polarons influence strongly the elec-trical transport mechanism [11–14]. In addition, most of theliterature is focused on the interplay between magnetic andtransport properties, and no systematic study has been made tounderstand the correlations between the electrical resistivity andcrystal structure in the paramagnetic semiconducting state.
In this work, we show that the small polaron hopping mech-anism ceases to be valid as charge carriers are introduced into thesystem. The magnetic results indicate no significantly evidence ofdirect correlation between the breakdown of transport mechan-ism and the increase of the effective magnetic moment. Measure-ments of high-resolution X-ray power diffraction and Ramanspectroscopy were put forward to obtain insight on nature of

F.E.N. Ramirez et al. / Journal of Magnetism and Magnetic Materials 324 (2012) 2011–20182012
charge and lattice correlation. We have observed that such adeviation from small polaron hopping mechanism is consistentwith an increase in the Gruneisen parameter. The electricalresistivity value at room temperature is suggested to be relatedto the abrupt change in the bending and stretching modes ascharge carriers are introduced into the system.
Fig. 1. Electrical resistivity as a function of temperature for La1�xCaxMnO3,
x¼0.20, 0.25, 0.30, 0.34, 0.40, and 0.45. The inset shows a thermal hysteresis in
the samples with x¼0.20, 0.25, 0.30, and 0.34 due to a structural phase transition
from orthorhombic (O) to rhombohedral (R) space group.
2. Experimental
Polycrystalline samples of La1�xCaxMnO3 were prepared bysol–gel method. Samples prepared through this chemical routehave better chemical homogeneity than when using the standardsolid-state reaction method. Stoichiometric amounts of hydratedmanganese acetate (C4H6MnO4 � 4H2O) and nitrates of theremaining cations were dissolved in distilled water containing a50 mol% excess of citric acid and ethylene glycol. The polymericprecursor was formed by heating and stirring the solution at120 1C. After a few hours a gel is formed, and then dried. Theorganic material was oxidized 24 h at 600 1C. The powder wasground with an agate mortar for 30 min, heat treated 15 h at1000 1C. This last step was repeated three times with reactiontemperatures of 1050 1C, 1100 1C and 1300 1C. Finally, the powderwas ground for 30 min, pressed into pellets and reacted 40 h at1350 1C. The density of our samples is very high approximately97% of theoretical density. The X-ray powder diffraction indicatesthat all samples are single phase belonging to orthorhombic spacegroup Pnma. The average Mn oxidation state was determined byiodometric titration. The titration procedure was repeated at leastthree times for each sample. The titration experiment determinesthe average Mn valence under the assumption that the valencesof La, Ca, and O are þ3, þ2, and �2. It is well known that theseMn oxides possess La and Mn defects rather than an oxygenexcess. The obtained average Mn valence was 3.23(1), 3.27(1),3.32(1), 3.35(1), 3.42(1), 3.46(1) for x¼0.20, 0.25, 0.30, 0.34, 0.40,and 0.45, respectively. Magnetization measurements (from 10 Kto 900 K) were performed using a standard vibrating samplemagnetometer (VSM) oven option from Quantum Design. Elec-trical resistivity was measured using a four-probe method using ahome-made apparatus with a platinum thermometer mountedclose to the sample. Silver epoxy was used to make contacts to thesample. Data were collected in air on warming to the highesttemperature followed by cooling. We have performed boththermogravimetric analysis (TGA) and differential scanningcalorimetry (DSC) up to 950 K (not shown). DSC shows a robustpeak indicating a phase transition for the samples and TGArevealed no changes in the studied temperature range, indicatingnegligible oxygen loss. High-resolution X-ray powder-diffraction(HRXPD) measurements were conducted on the XPD beamline atthe Laboratorio Nacional de Luz Sıncrotron [15]. The sinteredpellet was ground and sieved to reject grains larger than � 5 mm.Wavelength of 1.240 and 2y steps of 0.0051 were chosen for ourmeasurements. A furnace with Ar flow was employed for thehigh-temperature measurements. Raman spectra were recordedin a Renishaw Raman System 3000 spectrometer, with a CCDdetector, coupled to an Olympus BTH2 microscope (80-foldenhancement). A He–Ne laser (Spectra Physic, model 127) withexcitation radiation at 632.8 nm, was used.
3. Results and discussion
In Fig. 1 the electrical resistivity as a function of temperatureis presented for all samples studied herein, x¼0.20, 0.25, 0.30,0.34, 0.40, and 0.45. A thermally activated electrical transportmechanism—semiconductinglike behavior is clearly observed for
all samples. It is known that this family La1�xCaxMnO3 shows anorthorhombic to rhombohedral structural phase transition TR2O athigh temperatures [16]. In samples with x¼0.20, 0.25, 0.30, and0.34, this structural phase transition brings about a hystereticbehavior at TR2O revealing the first order nature of the transition.Interestingly, neither a hysteretic behavior nor any feature isdetected in samples with x¼0.40 and 0.45 by the electrical resis-tivity measurements. As we shall see in the unit-cell parametersobtained by high-resolution X-ray diffraction data the samplewith x¼0.45 also undergoes a structural phase transition, eventhough not visible by the electrical resistivity data. Furthermore,it is observed that as charge carriers are introduced into thesystem, the electrical resistivity decreases and abruptly increasesabove x¼0.40. The value measured in the samples with x¼0.20,0.25, 0.30, and 0.34 is in the range of 0:0120:04 O cm, while inthe samples with x¼0.40 and 0.45 it is in the range of 1220 O cm.The magnitude of the electrical resistivity close to TR2O in samplesx¼0.20, 0.25, 0.30 and 0.34 has the same order (5 mO cm) as thatfound in manganites with bad metal behavior [17], suggesting amore delocalized character of the charge carriers.
The electrical resistivity in the small polaron model may beexpressed as [7,18]
rðTÞ ¼ ATs expðEp=kBTÞ ð1Þ
where A is a pre-factor, Ep is the polaron activation energy, and kB
is the Boltzmann constant. In the adiabatic regime s¼1 (non-adiabatic regime s¼3/2), the hopping of electrons is faster(slower) than the vibration of the optical phonon mode [7,8,19].
In Fig. 2, we plot the data assuming both adiabatic andnonadiabatic regimes for samples with x¼0.20, 0.25, 0.30, and0.34. As can be observed, all samples may be fitted using thoseregimes in both rhombohedral and orthorhombic phases. In aprevious work, Souza et al. [19] showed that a temperaturedependence of electrical resistivity in high temperatures forx¼0.30 can be explained by the small polaron hopping mechanism.They observed a subtle change from adiabatic to nonadiabatic
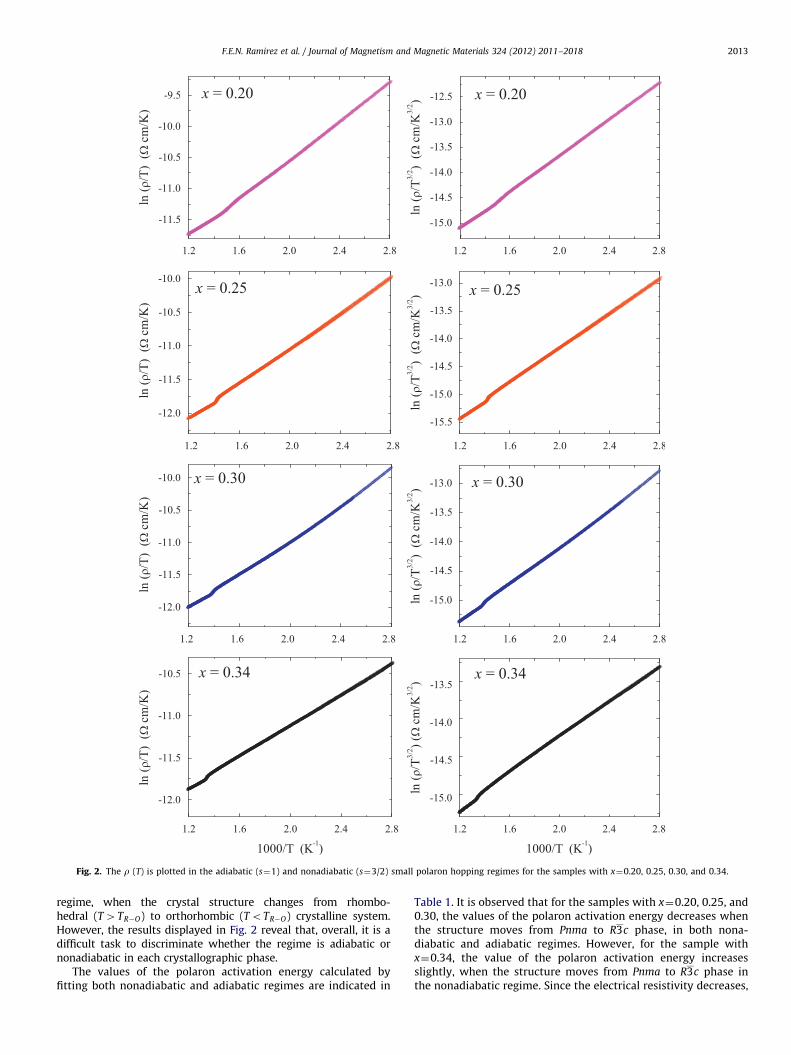
Fig. 2. The r (T) is plotted in the adiabatic (s¼1) and nonadiabatic (s¼3/2) small polaron hopping regimes for the samples with x¼0.20, 0.25, 0.30, and 0.34.
F.E.N. Ramirez et al. / Journal of Magnetism and Magnetic Materials 324 (2012) 2011–2018 2013
regime, when the crystal structure changes from rhombo-hedral (T4TR2O) to orthorhombic (ToTR2O) crystalline system.However, the results displayed in Fig. 2 reveal that, overall, it is adifficult task to discriminate whether the regime is adiabatic ornonadiabatic in each crystallographic phase.
The values of the polaron activation energy calculated byfitting both nonadiabatic and adiabatic regimes are indicated in
Table 1. It is observed that for the samples with x¼0.20, 0.25, and0.30, the values of the polaron activation energy decreases whenthe structure moves from Pnma to R3c phase, in both nona-diabatic and adiabatic regimes. However, for the sample withx¼0.34, the value of the polaron activation energy increasesslightly, when the structure moves from Pnma to R3c phase inthe nonadiabatic regime. Since the electrical resistivity decreases,

F.E.N. Ramirez et al. / Journal of Magnetism and Magnetic Materials 324 (2012) 2011–20182014
it may not be physically acceptable. Probably in this sample, thestructural phase transition is accompanied by a change fromnonadiabatic to adiabatic regime as it is the case for the samplewith x¼0.30. Therefore, the abrupt decreasing in the electricalresistivity observed close to the TR2O due to the structural phasetransition is more likely to be associated with a decreasing in thepolaron activation energy (Ep) for the samples with low chargecarriers. On the other hand, the data suggest a change fromnonadiabatic to adiabatic regime in the samples with x¼0.30 and0.34 as the system goes to rhombohedral phase.
In Fig. 3, the adiabatic and nonadiabatic regimes are evaluatedfor the high-resistivity samples, x¼0.40 and 0.45. As the chargecarriers are further introduced into the structure, the smallpolaron hopping mechanism fails to describe the electrical trans-port in this system. It is found a pronounced curvature instead oflinearity over the entire studied temperature range in bothsamples indicating complete deviations from small polaron hop-ping model. Both Arrhenius and variable-range-hopping (VRH)models were also checked to describe the temperature depen-dence of the electrical resistivity. These models also do not fit thetransport mechanism in these samples. It is important to empha-size that the studied temperature interval here is much higherthan YD=2 (YD stands for the Debye temperature). On the otherhand, the high T interval is also required as long as fluctuation of
Table 1Values of the Ep calculated from fitting the nonadiabatic and adiabatic regimes for
the samples with x¼0.20, 0.25, 0.30, and 0.34.
Sample Nonadiabatic Adiabatic
Epa (meV) Ep
b (meV) Epa (meV) Ep
b (meV)
x¼ 0:20 155.4(4) 137.5(3) 135.4(1) 103.9(5)
x¼ 0:25 133.1(2) 125.8(3) 112.0(8) 91.2(7)
x¼ 0:30 132.7(1) 127.5(1) 110.4(2) 92.9(3)
x¼ 0:34 100.2(1) 103.1(2) 78.6(3) 67.8(2)
a Pnma.b R3c.
Fig. 3. The r (T) is plotted in the adiabatic (s¼1) and nonadiabatic (s¼3/2)
magnetic short range order close to the ferromagnetic phasetransition may strongly influence the electrical transport [20].Therefore, we suggest that the electrical resistivity in thesesamples deserves further attention in order to understand howcharge carriers involve themselves as temperature and crystalstructure are changed. To accomplish this task, we have measuredmagnetic susceptibility and high resolution X-ray powder diffrac-tion in the same temperature interval for two samples: one thatthe transport mechanism is described by the small polaronhopping; and another one that this mechanism fails.
In Fig. 4, we show the inverse of w as a function of thetemperature for x¼0.25 and 0.45 which reveals clearly thestructural phase transition at TR2O. The T-independent atomiccore diamagnetic and Van Vlack susceptibility contributions weresubtracted [21]. The values of the TR2O obtained for all samples(not shown) through magnetic data are in agreement with thephase diagram [16]. A linear behavior of w�1 vs. T is observed only
above TR2O indicating that the Curie–Weiss law is obeyed,suggesting that the Mn4þ and Mn3þ ions are totally free in therhombohedral phase.
The expected value of the effective magnetic moment, assum-
ing orbital quenching, is peff ¼ gffiffiffiffiffiffiffiffiffiffiffiffiffiffiffiffiffiffiffiffiffiffiffiffiffiffiffiffiffiffiffiffiffiffiffiffiffiffiffiffiffiffiffiffiffiffiffiffiffiffiffiffiffiffiffiffiffiffiffixS1ðS1þ1Þþð1�xÞS2ðS2þ1Þ
p,
where g¼2, S1¼3/2 and S2¼2 for Mn4þ and Mn3þ , respectively
[22]. Furthermore, the slope (A) of w�1 vs. T is proportional to the
effective magnetic moment. Thus, peff ðmBÞ ¼ 2:82ffiffiffiffiffiffiffiffiffi1=A
pwhen
w�1(mole Oe/emu). We estimate the effective magnetic momentin T4TO�R and the obtained values are in very good agreementwith expected for spin-only ions Mn4þ/Mn3þ in the rhombohe-dral phase. On the other hand, below TR2O a large curvature in
w�1 vs. T is observed indicating deviation from Curie–Weiss law.The nonlinear behavior of w (T) can be confirmed by the derivative
dw=dT shown in the insets of the Fig. 3.In order to carefully compare the magnetic evolution of
samples with different transport mechanisms, we have estimatedthe effective magnetic moment of the selected samples by takinginto account the slope of a linear fit in every 10 K interval.Fig. 5 shows the effective magnetic moment of the samples with
small polaron hopping regimes for the samples with x¼0.40 and 0.45.

Fig. 4. Temperature dependence of the inverse of magnetic susceptibility as a
function of temperature for the samples with x¼0.25 and 0.45. The inset indicates
the nonlinear and linear behavior below and above of the TR2O , respectively.
Fig. 5. The effective magnetic moment as a function of the temperature for
selected samples.
Fig. 6. Temperature dependence of lattice parameters and unit-cell volume for
x¼0.30 (upper panel) and x¼0.45 (lower panel). Solid symbols and open symbols
represent parameters for Pnma phase and R3c phase, respectively. Shaded area
indicates the coexistence of orthorhombic and rhombohedral phases.
F.E.N. Ramirez et al. / Journal of Magnetism and Magnetic Materials 324 (2012) 2011–2018 2015
x¼0.25, 0.34, and 0.45 as function of the temperature. It isobserved that (i) the effective magnetic moment decreases withincreasing Mn4þ concentration and more importantly (ii) thetemperature dependence of the peff is charge carrier independent.Indeed, the curve peff vs. T for different values of x exhibits thesame behavior. Interestingly, while the transport mechanismchanges with the increasing of number of charge carriers, thetemperature dependence of the effective magnetic moment is notsignificantly influenced by these changes in the orthorhombic
phase. These results suggest that the magnetic properties are notdirectly correlated to the change in the transport mechanism.
We have done Rietveld refinements of the high resolution X-raypowder diffraction data for La0:70Ca0:30MnO3 and La0:55Ca0:45MnO3
(not shown). Fig. 6 shows the temperature dependence of theunit-cell parameters a, b=
ffiffiffi2p
, c, and unit-cell volume (V) ofboth samples. A monoclinic unit-cell setting was adopted forthe rhombohedral phase allowing a direct comparison with theorthorhombic lattice parameters [24].
In the sample with x¼0.30, an orthorhombic structure withspace group Pnma is observed up to TR2O � 690 K, while arhombohedral structure with space group R3c is observed aboveTR2O � 720 K. In between, both phases coexist. This structuralphase transition was also detected in both electrical resistivityand magnetic susceptibility results. The sample with x¼0.45exhibits a partial structural phase transition at TR2O � 767 K,above this temperature (767 KoTo891 K) both phases coexistin the whole studied temperature range. At 891 K, we stillobserved a volume fraction of 10% of orthorhombic Pnma spacegroup (90% rhombohedral R3c). This structural transition was notdetected by the electrical resistivity measurements. The absenceof thermal hysteresis in the electrical resistivity may be likelyassociated with the partial structural phase transition nature.
We believe that the difference found in the electronic trans-port mechanism between both samples as charge carriers areintroduced is closely related to the thermal expansion coefficient.Thus, we fit the unit-cell volume of the two samples using asecond order polynomial, as shown in Fig. 7. The results indicatethat for the sample with x¼0.45, the volumetric thermal expan-sion coefficient is temperature independent whereas in thesample with x¼0.30 shows a linear temperature dependence.

Fig. 7. Left panel shows the unit-cell volume as a function of the temperature for the sample with x¼0.30 and 0.45. Solid lines represent the fit with a second order
polynomial. Right panel shows the volumetric thermal expansion coefficient as a function of the temperature for the sample with x¼0.30 and 0.45.
Fig. 8. Volume of the unit cell as a function of the temperature for the sample
with x¼0.30 and 0.45. Solid lines represent the fit using anharmonic theory.
Table 2Values of the parameters obtained from the volume fitting using the anharmonic
theory.
Sample VðT ¼ 0Þ ðA3Þ
YD 9gNkB=B ðA3=KÞ
x¼ 0:30 230.25 405.5 0.0202
x¼ 0:45 224.91 410.5 0.0252
F.E.N. Ramirez et al. / Journal of Magnetism and Magnetic Materials 324 (2012) 2011–20182016
As discussed above, the electrical resistivity of the sample x¼0.30is much smaller than in the sample x¼0.45. The electricalresistivity of this sample close to TR2O, was found to be consistentwith that of bad metals. The more delocalized character of thecharge carriers in the sample with x¼0.30 increases significantlythe electronic contribution to the internal energy of the system, assuggested by the results shown in the Fig. 7. Overall, the dc/dT
is � 1:4 times higher than da/dT and db/dT for the sample withx¼0.30 and � 2:5 times higher than da/dT and db/dT for thesample with x¼0.45. Therefore, the parameter c has more in-fluence on the thermal expansion of the unit cell on both samples.For the phase R3c, we have observed a more isotropic character ofthe unit-cell thermal expansion. A carefully inspection of Fig. 6shows that the crystal strain s¼(a �b)/2(a þ b) due to orthor-hombic distortion remains roughly constant for the sample withx¼0.45 whereas it decreases quickly and goes to zero for thesample with x¼0.30.
In order to further understand the thermal expansion behaviorwhich may be coupled to the electronic transport mechanism,we have fitted the data using the anharmonic theory [23]. Inthis theory, the volume and the thermal expansion coefficient,taking into account only the anharmonic vibrations of atoms andusing the Debye model for the lattice internal energy, are given,respectively, by [25,26]
VðTÞffiVðT ¼ 0Þþ9gNkB
BðTÞ1
T
YD
� �3 Z YD=T
0
x3
ex�1dx ð2Þ
dV
dTffi
9gNkB
BðTÞ0
T
YD
� �3 Z YD=T
0
exx4
ex�1dx ð3Þ
where VðT ¼ 0Þ, YD, B, and g stand for the volume at 0 K, theDebye temperature, the bulk modulus, and the Gruneisen para-meter, respectively. This latter parameter is related to the varia-tion, with respect to volume, of the frequency of the phononmode ½dðln nÞ=dðln VÞ� ¼ �g. In order to accomplish this task, welet VðT ¼ 0Þ, YD, and 9gNkB=B be free fitting parameters. Thetemperature dependence of the volume along with the fittingusing Eq. (2) is shown in Fig. 8. At high temperatures, Eq. (2) hasan almost linear behavior with respect to temperature and Eq. (3)shows a temperature independent behavior [23]. This predictionis in line with the behavior observed for x¼0.45 sample, see Fig. 7.This result suggests that the phonon contribution is dominant forthis sample and more in line with Debye lattice model.
The obtained parameters from the fitting are shown in Table 2.It is observed an increase in the Debye temperature of the sampleLa0:55Ca0:45MnO3, indicating a decrease in the shortest phononwavelength. This is brought about by the decreasing of the unit-cell volume of the sample with x¼0.45, since the shortest wave-length phonons that propagate in the crystal depend on the
interatomic distances. Besides the variation of the Debye tem-perature, it is observed that the ratio g=B is 25% larger for thesample with x¼0.45. This may be caused by a decrease of the B
(B0:45oB0:30). However, evaluation of the bulk modulus takinginto account the change in the volume and specific heat atconstant pression indicates that if B had influenced on g=B, itwould have been in an opposite way, namely, B0:454B0:30 [23].This analysis reveals that the increasing in g=B in the sample withx¼0.45 has a significantly contribution from an increasing of theGruneisen parameter ½dðln nÞ=dðln VÞ� ¼�g. It means an increasein the phonon frequency mode with respect to the volume.
In order to check the evolution of the phonon frequency with thecalcium concentration, we have measured Raman spectra at roomtemperature for all samples. The spectra for the samples with x¼0.20and 0.40 are shown in Fig. 9 which is in agreement with that foundfor La0:70Ca0:30MnO3 [27]. The spectra consist of a rotational n1 modeand two JT activated distortions, bending n2 and stretching n3
vibration modes associated to the Mn–O–Mn octahedra [27,28]. Inorder to find the frequency value for each peak, a deconvolutionprocess was done for all spectra. The deconvolution spectra for thesamples with x¼0.20 and 0.40, which are representative samples, areshown in the Fig. 9. The rotational n1 frequency is 229 cm�1 forx¼0.20 and decreases slightly as the charge carriers are introduced

Fig. 9. (right panel) The raman spectra for the samples with x¼0.20 and 0.40 along with the deconvoluted curves. (left panel) Rotational n1 and bending n2 modes as a
function of Ca concentration.
Fig. 10. The electrical resistivity (right panel) and stretching JT activated distortion mode (left panel) measured at T¼300 K as a function of Ca doping.
F.E.N. Ramirez et al. / Journal of Magnetism and Magnetic Materials 324 (2012) 2011–2018 2017
assuming 218 cm�1 for x¼0.45 (see Fig. 9). This evolution is differentfor the bending n2 and stretching n3 vibration modes, as shown inFigs. 9 and 10. The frequency decreases slightly for the samples up tox¼0.34 and increases abruptly for the sample with x¼0.40 and 0.45.This result is most pronounced for the stretching JT activated moden3. The electrical resistivity value obtained also at room temperatureis shown in Fig. 10 in logarithm scale. Interestedly, the resistivityvalue also increases abruptly for the sample with x¼0.40 as discussedabove. In the small polaron model, the probability that an electronjump to a neighboring site depends on the lattice frequency [7]. Thehigher value of ½dðln nÞ=dðln VÞ� found in the sample La0.55Ca0.45MnO3
seems to have significantly influence for which the small polaronhopping mechanism breaks down in explaining the electronic trans-port mechanism. In the non-adiabatic regime of small polaron model,which is defined when the relevant lattice frequency is much largerthan the hopping frequency, the probability of electron hopping toneighboring sites is considered small [8]. A high value of½dðln nÞ=dðln VÞ� further reduces this probability, resulting in analteration of the electrical transport mechanism and in an abruptincrease of electrical resistivity.
4. Conclusions
In summary, we have conducted Raman spectroscopy andhigh-resolution X-ray diffraction, magnetization, and electricalresistivity in the high-temperature PMI state of the series
La1�xCaxMnO3, with x¼0.20, 0.25, 0.30, 0.34, 0.40 and 0.45. Allsamples show a structural transition close to TR2O. The abruptdecreasing in the electrical resistivity observed close to the TR2O
due to the structural phase transition is more likely to beassociated with a decreasing in the polaron activation energy(Ep) for the samples with low charge carriers. On the other hand,the data suggest a change from nonadiabatic to adiabatic regimein the samples with x¼0.30 and 0.34 as the system goes torhombohedral phase. The small polaron hopping mechanism isobeyed in the low doping (0:20oxo0:34), and breaks down forthe high doping (0:40oxo0:45) samples where the electricalresistivity deviates from such a model. It is suggested that themore delocalized character of charge carriers observed in thesamples with x¼0.20, 0.25, 0.30 and 0.34, increases the electroniccontribution to the internal energy, revealed by the temperaturedependence of the thermal expansion coefficient. The deviationfrom small polaron hopping mechanism is consistent with anincrease in the Gruneisen parameter, which is proportional to thefrequency variation with respect to the volume, dn=dV . The mag-netic results indicate no significantly evidence of direct correla-tion between the breakdown of transport mechanism and theincrease of the effective magnetic moment. The change in bothsmall polaron hopping mechanism and the electrical resistivityvalue is suggested to be related to the abrupt change in thebending and stretching modes as charge carriers are introducedinto the system. We believe that the electronic conductivityin strong coupling spin–charge–lattice systems may be more

F.E.N. Ramirez et al. / Journal of Magnetism and Magnetic Materials 324 (2012) 2011–20182018
complex than the picture embedded in Eq. (1). However, so far, anenvisaged analytical expression for the transport mechanisminvolving this coupling is not available. We hope the discussionpresented here will attract attention to this very interesting openproblem.
Acknowledgments
We are indebt with R.F. Jardim for providing conditions forthe sample preparation and J.J. Neumeier for the magneticmeasurements and fruitfully discussions. Raman spectroscopymeasurements were carried out at Laboratorio de EspectroscopiaMolecular from IQ-USP, in collaboration with Dr. Romulo AugustoAndo, to whom authors are very grateful. This material is basedupon work supported by the Brazilian Agencies CNPq Grant nos.471863/2008-4, 309811/2009-0 and 307436/2008-0 and Fapespunder Grant nos. 2010/18364-0 and 2009/18618-5.
References
[1] E. Dagotto, T. Hotta, A. Moreo, Physics Reports 344 (2001) 1.[2] E.P.-G. DeGennes, Physical Review 118 (1960) 141;
J.B. Good-enough, Physical Review 171 (1968) 466.[3] E.O. Wollan, W.C. Koehler, Physical Review 100 (1995) 545.[4] C. Zener, Physical Review 82 (1951) 403.[5] P. Schiffer, A.P. Ramirez, W. Bao, S.-W. Cheong, Physical Review Letters
75 (1995) 3336.[6] A.J. Millis, P.B. Littlewood, B.I. Shraiman, Physical Review Letters 74 (1995)
5144.[7] R. Raffaelle, H.U. Anderson, D.M. Sparlin, P.E. Parris, Physical Review B
43 (1991) 7991.[8] M. Jaime, H.T. Hardner, M.B. Salamon, M. Rubinstein, P. Dorsey, D. Emin,
Physical Review Letters 78 (1997) 951;M. Jaime, M.B. Salamon, M. Rubinstein, R.E. Treece, J.S. Horwitz, D.B. Chrisey,Physical Review B 54 (1996) 11914.
[9] J.H. Zhao, H.P. Kunkel, X.Z. Zhou, G. Williams, Journal of Physics: CondensedMatter 13 (2001) 5785;A. Banerjee, S. Pal, E. Rozenberg, B.K. Chaudhuri, Journal of Physics: Con-
densed Matter 13 (2001) 9489.[10] J.L. Cohn, C. Chiorescu, J.J. Neumeier, Physical Review B 72 (2005) 024422;
R. Ang, W.J. Lu, R.L. Zhang, B.C. Zhao, X.B. Zhu, W.H. Song, Y.P. Sun, PhysicalReview B 72 (2005) 184417;A. Karmakar, S. Majumdar, S. Giri, Physical Review B 79 (2009) 094406.
[11] B. Munirathinam, M. Krishnaiah, S. Arumugam, M. Manivel Raja, Journal ofPhysics and Chemistry of Solids 71 (2010) 1763.
[12] S.K. Srivastava, S. Ravi, Journal of Superconductivity and Novel Magnetism22 (2009) 651.
[13] R.R. Zhang, G.L. Kuang, X. Luo, Y.P. Sun, Journal of Alloys and Compounds484 (2009) 36.
[14] Y. Kalyana Lakshmi, G. Venkataiah, M. Vithal, P. Venugopal Reddy, Physica B403 (2008) 3059.
[15] F.F. Ferreira, E. Granado, W. Carvalho Jr., S.W. Kycia, D. Bruno, R. DroppaJr., Journal of Synchrotron Radiation 413 (2006) 46.
[16] V. Kiryukhin, New Journal of Physics 6 (2004) 155.[17] N.E. Hussey, K. Takenaka, H. Takagi, Philos. Mag. 84 (2004) 2847.[18] N.F. Mott, E.A. Davies, Electron Processes in Non-crystalline Materials,
Clarendon, Oxford, 1979.[19] J.A. Souza, H. Terashita, E. Granado, R.F. Jardim, N.F. Oliveira Jr., R. Muccillo,
Physical Review B 78 (2008) 054411.[20] J.A. Souza, R.F. Jardim, Physical Review B 71 (2005) 054404.[21] J.A. Souza, J.J. Neumeier, R.K. Bollinger, B. McGuire, C.A.M. dos Santos,
H. Terashita, Physical Review B 76 (2007) 024407.[22] S. Blundell, Magnetism in Condensed Matter, Oxford University Press, New
York, 1971.[23] L.A. Girifalco, Statical Mechanics of Solids, Oxford University Press, New York,
2000.[24] P.G. Radaelli, M. Marezio, H.Y. Hwang, S.W. Cheong, Journal of Solid State
Chemistry 122 (1996) 444.[25] G. Wu, J.J. Neumeier, C.D. Ling, D.N. Argyriou, Physical Review B 65 (2002)
174113.[26] T. Kiyama, K. Yoshimura, K. Kosuge, Y. Ikeda, Y. Bando, Physical Review B
54 (1996) R756.[27] M.N. Iliev, M.V. Abrashev, Journal of Raman Spectroscopy 32 (2001) 805.[28] E. Granado, J.A. Sanjurjo, C. Rettori, J.J. Neumeier, S.B. Oseroff, Physical Review
B 62 (2000) 11304.