Liquid Water: A Very Complex Fluid
31
Liquid water: A very complex fluid H EUGENE STANLEY Center for Polymer Studies and Department of Physics, Boston University, Boston, MA 02215 USA Abstract. Although H 2 O has been the topic of considerable research since the beginning of the century, the peculiar physical properties are still not well understood. First we discuss some of the anomalies of this ‘complex fluid’. Then we describe a qualitative interpretation in terms of perco- lation concepts. Finally, we discuss recent experiments and simulations relating to the hypothesis that, in addition to the known critical point in water, there exists a ‘second’ critical point at low temperatures. In particular, we discuss very recent measurements of the compression-induced melting and decompression-induced melting lines of high-pressure forms of ice. We show how knowledge of these lines enables one to obtain an approximation for the Gibbs potential GP; T and the equation of state V P; T for water, both of which are consistent with the possible continuity of liquid water and the amorphous forms of solid water. Keywords. Water; second critical point; equation of state. PACS Nos 05.70.Jk; 64.30.-t; 64.70.Ja 1. Introduction Liquid water is at first sight not a ‘complex fluid’ and hence has no place at this conference. However, understanding the highly anomalous equilibrium and dynamical properties are generally connected to the view that water, even above its melting temperature, is a transient gel with structural heterogeneities of very short length scales. Moreover, understanding the properties of water is important for understanding phenomena in ‘aqueous solutions’, such as understanding the structure of micelles and microemulsions. For these and other reasons, water is generally included under the rubric of complex fluids. We will organize the lecture around three questions. Question 1: What is the puzzle of liquid water? Question 2: Why do we care about this puzzle? Question 3: What do we actually do? The ‘we’ in this case is a rather large number of individuals. I will focus mostly on very recent work that has been published, or at least submitted, this year. This work was done in collaboration with M-C Bellissent-Funel, S V Buldyrev, M Canpolat, M Meyer, O Mishima, R Sadr-Lahijany, A Scala and F W Starr. It is also based on earlier research a few years back with C A Angell, P Debenedetti, A Geiger, P H Poole, S Sastry, F Sciortino, and J Teixeira. Any of these 15 valued collaborators could probably give this lecture as well as, if not better than, I will. PRAMANA # Indian Academy of Sciences Vol. 53, No. 1, —journal of July 1999 physics pp. 53–83 53
Transcript of Liquid Water: A Very Complex Fluid

Liquid water: A very complex fluid
H EUGENE STANLEYCenter for Polymer Studies and Department of Physics, Boston University, Boston, MA 02215 USA
Abstract. Although H2O has been the topic of considerable research since the beginning of thecentury, the peculiar physical properties are still not well understood. First we discuss some of theanomalies of this `complex fluid'. Then we describe a qualitative interpretation in terms of perco-lation concepts. Finally, we discuss recent experiments and simulations relating to the hypothesisthat, in addition to the known critical point in water, there exists a `second' critical point at lowtemperatures. In particular, we discuss very recent measurements of the compression-inducedmelting and decompression-induced melting lines of high-pressure forms of ice. We show howknowledge of these lines enables one to obtain an approximation for the Gibbs potential G�P; T�and the equation of state V�P; T� for water, both of which are consistent with the possible continuityof liquid water and the amorphous forms of solid water.
Keywords. Water; second critical point; equation of state.
PACS Nos 05.70.Jk; 64.30.-t; 64.70.Ja
1. Introduction
Liquid water is at first sight not a `complex fluid' and hence has no place at this
conference. However, understanding the highly anomalous equilibrium and dynamical
properties are generally connected to the view that water, even above its melting
temperature, is a transient gel with structural heterogeneities of very short length scales.
Moreover, understanding the properties of water is important for understanding
phenomena in `aqueous solutions', such as understanding the structure of micelles and
microemulsions. For these and other reasons, water is generally included under the rubric
of complex fluids.
We will organize the lecture around three questions.
Question 1: What is the puzzle of liquid water?
Question 2: Why do we care about this puzzle?
Question 3: What do we actually do?
The `we' in this case is a rather large number of individuals. I will focus mostly on very
recent work that has been published, or at least submitted, this year. This work was done
in collaboration with M-C Bellissent-Funel, S V Buldyrev, M Canpolat, M Meyer, O
Mishima, R Sadr-Lahijany, A Scala and F W Starr. It is also based on earlier research a
few years back with C A Angell, P Debenedetti, A Geiger, P H Poole, S Sastry, F
Sciortino, and J Teixeira. Any of these 15 valued collaborators could probably give this
lecture as well as, if not better than, I will.
PRAMANA # Indian Academy of Sciences Vol. 53, No. 1,Ðjournal of July 1999
physics pp. 53±83
53
We will organize the answer to this third and principal question in the following way:
First, we will attempt to identify, in the spirit of Sherlock Holmes, some interesting clues.
Then, we will formulate a working hypothesis, and then we will test the hypothesis, both
by experiments on real water, and by simulations of what sometimes is called `computer
water'. These simulations are useful because some of the problems associated with doing
experiments on real water can be obviated using computer simulations.
Before beginning, let us note that there are some very good general references on liquid
and glassy water. A recent book entitled Metastable Liquids [1] is a kind of sequel to
Skripov's classic on this subject. There is an even more recent book called Supercooled
Liquids published by the American Chemical Society [2]. And there are many recent
reviews [3±5], including a very recent seven-page mini-review [6]. Finally, and perhaps
most interestingly, the accomplished science writer Philip Ball has just prepared a book
that surveys the entire story of water, from the earliest times to the present [7]Ð
responding perhaps to the fact that water is one of the most appealing of the open puzzles
in all of science.
2. What is the puzzle of liquid water?
We start with the first question, `What is the puzzle?' There are many puzzles associated
with water. Firstly, water exists in many forms. All of us are familiar with one important
control parameter that distinguishes these forms, namely temperature (figure 1). Stable
water is the water that one is familiar with when one discusses biology (in reality, much
of biology takes place when water is in a supercooled regime). Why is that? Because in
Boston nothing would survive the winter, were it not for the fact that living systems are
able to survive even when the water inside them is metastable, namely supercooled. But
below about ÿ38�C, we hit a kind of Berlin Wall, beyond which there is a `no-man's
land' where water exists only in the solid, crystalline phase. That temperature is called the
temperature of homogeneous nucleation and denoted TH . At very low temperature, there
is a region in which water exists in the glassy phase. If one heats glassy water gently
above its glass transition temperature, Tg � 135 K, one finds a narrow window of 10±15
degrees in which water is liquid, although very, very viscous [8]. If one heats further, one
reaches a temperature TX � 150 K where the mobility of the ultraviscous water reaches a
sufficiently large value that the molecules can readily find out that the crystalline phase
indeed has the lowest free energyÐand it freezes. Between TX and TH , an interval of
roughly 80 degrees, there's a kind of no-man's land in the sense that water is stable only
in its solid crystalline phases. In short, only ice cubes exist in no-man's land!
2.1 Volume fluctuations
So let us begin by asking about the nature of the puzzle of liquid water. What are
the features on which we would like to focus? In any short presentation, our choices
are necessarily subjective, so we start by considering a simple response function, the
isothermal compressibility KT, which is a thermodynamic response functionÐthe response
��V of the volume per particle to an infinitesimal pressure change �P. As one lowers the
temperature of a typical liquid, KT decreases (figure 2). We understand this feature
H Eugene Stanley
54 Pramana ± J. Phys., Vol. 53, No. 1, July 1999

because in statistical mechanics courses we learn that KT is also related to something
statistical, namely the expectation value of the fluctuations in �V . As the temperature is
lowered, we expect the fluctuations to decrease. Water is an anomaly in three respects:
(i) First, the compressibility, when normalized by mass and other material parameters,
is rather larger than one would expect.
(ii) Second, and very dramatically, although at high temperatures the compressibility
decreases on lowering the temperature, below about 46�C, it actually starts to
increase, and this is not a small effect. By the time one reaches the Berlin Wall
temperature of ÿ38�C, the compressibility is actually increased by a factor of 2. It's
a hundred per cent larger than its value at 46�C.
(iii) The third remarkable feature is that if one plots one's data, not linearly as sketched in
figure 2, but rather on double-logarithmic paperÐwhere the x-axis is the logarithm of
jT ÿ 228jK and the y-axis the logarithm of the compressibilityÐone finds a region
of straight-line behavior, hinting at some sort of critical behavior. In mentioning these
experiments, I should emphasize the name of Austen Angell who, together with
numerous students, pioneered in the identification of this apparent power-law
singularity [9].
Figure 1. Schematic illustration indicating the various phases of liquid water (color-coded) that are found at atmospheric pressure. This figure is courtesy of Dr OMishima.
Liquid water: A very complex fluid
Pramana ± J. Phys., Vol. 53, No. 1, July 1999 55

2.2 Entropy fluctuations
These anomalies associated with the compressibility response function is also shared by
other response functions. Consider for example the specific heat at constant pressure CP,
which is the thermodynamic response ��S of the entropy per particle to an infinitesimal
temperature change �T (apart from proportionality factors). Once again, for a typical
liquid, this quantity is gently decreasing as one lowers the temperature, which we under-
stand because this quantity is also related to a fluctuationÐthe entropy fluctuations. And
one imagines that entropy fluctuations also decrease when one cools. Water is again
anomalous in the same three respects. The specific heat for water is, as every engineer
knows, rather large. Secondly, below about 35�C the specific heat actually starts to
increase. And lastly, that increase can be approximated by a power law (figure 2).
2.3 Volume±entropy cross-correlations
The last of the three response functions is the one that is exemplified by the experiment
of figure 3 measuring the temperature at the bottom of the glass of ice water. That is
Figure 2. Schematic dependence on temperature of (a) the isothermal compressi-bility KT, (b) the constant-pressure specific heat CP, and (c) the thermal expansivity�P. The behavior of a typical liquid is indicated by the dashed line, which veryroughly is an extrapolation of the high-temperature behavior of liquid water. Note thatwhile the anomalies displayed by liquid water are apparent above the meltingtemperature Tm, they become more striking as one supercools below Tm. This figure iscourtesy of F W Starr.
H Eugene Stanley
56 Pramana ± J. Phys., Vol. 53, No. 1, July 1999

the coefficient of thermal expansion �P, the response ��V of the volume to an infinitesimal
temperature change �T . For a typical liquid �P is positive. And again, one can understand
that positivity, in a statistical mechanics sense, because this coefficient of thermal expan-
sion is proportional to the cross-fluctuations of entropy and specific volume h��V��Si.Normally, if one has a region of the system in which the specific volume is a little
larger than the average, then the local entropy in that same region of the system is
also larger. (For example, I often complain that the reason my office is so messy is that
it is too small, and if I could only get a bigger one it would be less messy. But in
reality, I think we all know what would happen if I had a larger officeÐit would be
Figure 3. A glass of unstirred ice water with a thermometer. What is the temperatureat the bottom of the glass? This photograph is courtesy of K Mishima.
Liquid water: A very complex fluid
Pramana ± J. Phys., Vol. 53, No. 1, July 1999 57

even messier because there would be even more ways to arrange my huge quantity of
material.)
So h��V��Si is positive because in local regions of the liquid in which the volume is
larger than the average (��V is positive), then the entropy is also larger (so ��S is positive).
The product of two positive numbers is positive. Water is unusual in the same three
respects. First of all, its coefficient of thermal expansion is about 3 times smaller than that
of the typical liquid. Secondly, as one lowers the temperature, the anomaly gets stronger
and stronger and at the magic number of 4�C (which has been known for over three
centuries [10]), �P actually becomes negative, and once again this apparent divergence
exists in the sense that there appears to be an imminent apparent singularity that's
occurring. From a simple kitchen experiment (figure 3), we can understand that the 0�Cwater in a glass of ice water (or a pond in Boston winter) `floats' on top of heavier layers
of 4�C waterÐallowing the fish to survive the long winter.
3. Why do we care about liquid water?
Let us turn now to question 2, `Why care?' There are always lots of reasons to care.
Almost all of them are, in some sense, personal. For me, certainly, scientific curiosity is
always one reason to care. Why on earth could the behavior of figures 2 and 3 exist? Why
could water have such a difference compared to that of a typical liquid no matter what
kind of fluctuating quantity we look at? It does not make sense.
A second reason, which I alluded to in the beginning, is that water is a kind of model
tetrahedral liquid. It is a model in the sense that it is relatively easy to study. Most of
the temperature regions in which one studies water are reasonably accessible. There
are other tetrahedral liquids. In fact, the second most common material on our planet is
SiO2, and SiO2 has many features that are remarkably parallel to those of water. Water
and SiO2 both share that fact that they are tetrahedral liquids; that is to say, they are
liquids whose local structure approximates that of a four-coordinated, open, loose-packed
lattice.
There are also numerous practical reasons to care about water. I already alluded to the
fact that engineering depends very much on the remarkable properties of water, and so
also does life itself. Glassy water is relevant to drug preservation: if we make a glass, the
dynamics are slowed down by a factor of � 1013. Hence the time scales of biological
processes are similarly slowed down.
4. Clues for understanding water
With this brief introduction behind us, let us consider what we actually do. First
we seek for clues. The fundamental clue, perhaps, for the mystery of liquid water
dates back more than 50 years to Linus Pauling, who recognized that the distinguishing
feature of H2O, when compared to other materials that otherwise look chemically
similar, is the preponderance of hydrogen bonds. A useful cartoon illustrates the
implications of a high degree of hydrogen bonding. Each molecule has two arms,
corresponding to the two protons, and two attractive spots, corresponding to the lone
H Eugene Stanley
58 Pramana ± J. Phys., Vol. 53, No. 1, July 1999
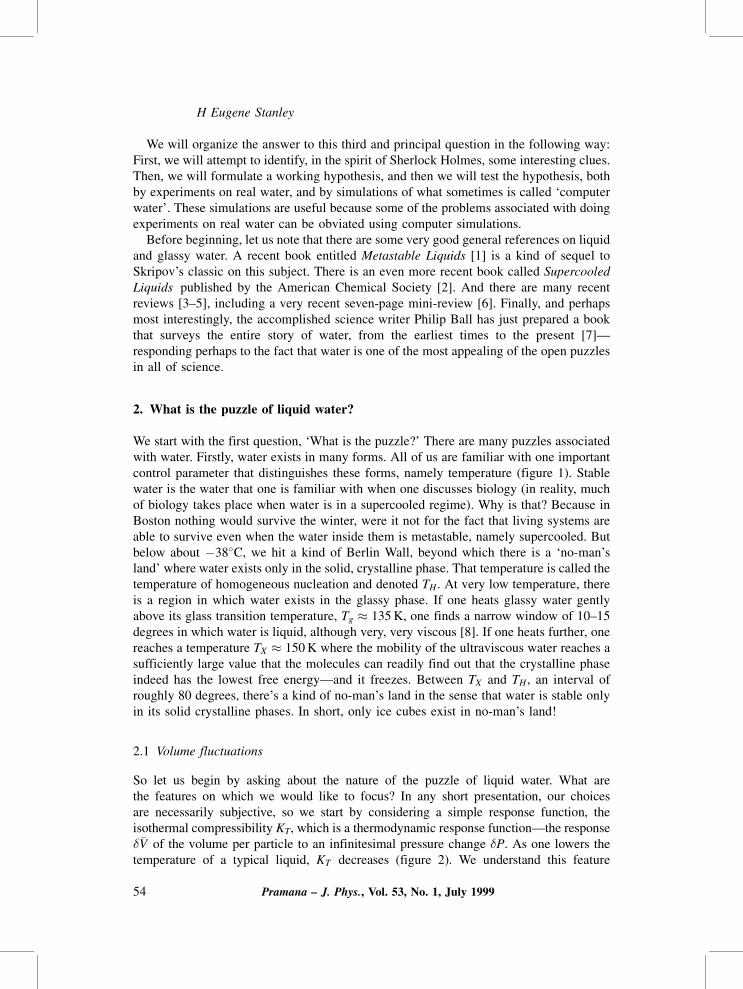
pairs. The arms reach out to the attractive spots. Since the fraction of intact bonds
exceeds the percolation threshold, the basic structure of water is a hydrogen-bonded gel.
Because these hydrogen bonds have very, very short lifetimesÐtypically a picosecondÐ
water does not behave like jello. We can pour water and it flows just like any other
liquid.
Computer simulations also support the idea that water is a network. In traditional
simulations, we have 216 water molecules in a little box, 18 AÊ on each edge, and we can
visualize the hydrogen bonds that are intact at room temperature. For any reasonable
definition of bonds, we still come back to the fact that it is made up of a strongly
hydrogen-bonded network, not isolated molecules.
There is one sense in which water is, locally, very much like ice. The distance between
nearest-neighbor molecules in liquid water is very similar to what we find in ice, and if we
calculate the positions of second-neighbors in liquid water, assuming the orientation of
these two molecules and the distance between them to be exactly the same as in ice, we
get 4.5 AÊ . If we measure a histogram experimentally, counting the number of molecules a
distance R from a central molecule, we find peaks of both the nearest- and second-
neighbors, and, if we push our luck and the temperature is not too high, we even see a
peak at the third neighbors. Thus the hydrogen-bond network has a remarkable feature: it
constrains the positions of the water molecules sufficiently that within `small neigh-
borhoods' (seeing a locale in terms of only a few neighbors) the situation is not that
different from what we find in ice.
5. Qualitative picture: Locally-structured transient gel
Although there have been many different detailed models used by researchers to describe
the structure of liquid water, many would agree that, on a qualitative level, water is a
locally-structured transient gel [11].
5.1 `Locally-structured'
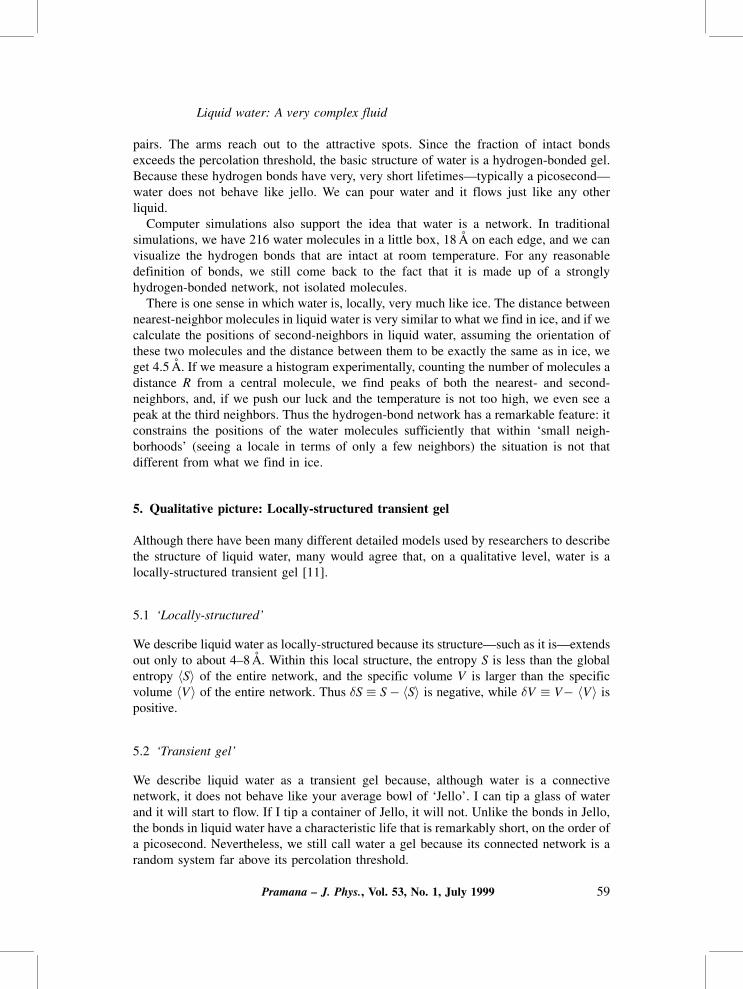
We describe liquid water as locally-structured because its structureÐsuch as it isÐextends
out only to about 4±8 AÊ . Within this local structure, the entropy S is less than the global
entropy hSi of the entire network, and the specific volume V is larger than the specific
volume hVi of the entire network. Thus �S � Sÿ hSi is negative, while �V � Vÿ hVi is
positive.
5.2 `Transient gel'
We describe liquid water as a transient gel because, although water is a connective
network, it does not behave like your average bowl of `Jello'. I can tip a glass of water
and it will start to flow. If I tip a container of Jello, it will not. Unlike the bonds in Jello,
the bonds in liquid water have a characteristic life that is remarkably short, on the order of
a picosecond. Nevertheless, we still call water a gel because its connected network is a
random system far above its percolation threshold.
Liquid water: A very complex fluid
Pramana ± J. Phys., Vol. 53, No. 1, July 1999 59
6. Microscopic structure: Local heterogeneities
To represent this structure dynamically and in three dimensions we need computer
simulation resources and a good ability to visualize 3D. To represent it as an instan-
taneous picture in two dimensions, we can use a square lattice, even a chess boardÐwith
the edges of the chess board's squares representing `bonds,' and the corners of the squares
representing `sites' (molecules).
If we take our chessboard and randomly break 20% of its bonds, leaving the other 80%
intact, we get a snapshot of the structure of liquid water. The sites with all four bonds still
intact we designate `black' sites. These have nearest-neighbor distances almost identical
to those of solid water. The areas on the grid exhibiting contiguous black sites we call
`patches.' The patches have properties that differ from the global properties of the
heterogeneous gel: a lower entropy and a larger specific volume. To calculate the number
of black moleculesÐif we neglect the possibility of correlations in this bond-breakingÐ
is fairly simple. The probability that four bonds of a given site are intact is simply the
bond probability to the power four ( f4 � p4B). If the bond probability is � 0:8, as we saw
earlier, the probability that four bonds of a given site are intact is � 0:84 or � 0:4. So
about 40% of these black sites are a part of these patches.
This picture of water is sufficient to qualitatively rationalize experimental data. For
example, this picture can explain the anomalous compressibility behavior of waterÐ
water's compressibility minimum at 46�C (typical liquids have no minimum), and the
unusually large size of water's compressibility (twice that of typical liquids). The patches
in water's hydrogen-bonded network influence the behavior of its compressibilityÐthe
fluctuations in its specific volumeÐthese black sites are present with a probability of p4B.
As temperature decreases, the bond probability increases. For each 1% rise in bond
probability there is a 4% rise in f4 and thus an amplification in the number of black sites.
As we know from percolation theory, when the number of black sites increases, the
characteristic size of a cluster or patch increases still more dramatically, providing a second
amplification mechanism. The greater increase in compressibility is a result of these two
amplification mechanisms. Were there no patches, the increase would not be as great. The
amount of this increase goes up as we lower the temperature. If I take a function with
constant slope and add this increase I end up with a function that exhibits a minimum.
We can use this picture of water to rationalize other anomalies, e.g., an anomaly in
water's specific heat (an anomaly we did not mention earlier). The specific heat is
proportional to the fluctuations in entropy. Entropy is often imagined to be a constant
quantity, one without fluctuation. But if we treat entropy as a fluctuating quantity, we have
a measure of the specific heat at constant pressureÐand that also increases dramatically
as one lowers the temperature below 35�C, and for approximately the same reasons. As
we lower the temperature, the build-up of these little patches is more and more dramatic,
causing an additional contribution to the entropy fluctuation due their increasing presence.
The anomalous behavior of its specific heat is not just the increase at low temperatures,
but also the fact that the average value of its specific heat is larger than one would expect
if these patches were not present (water is industrially important because of its high
specific heat).
But perhaps the most dramatic of these anomaliesÐthe one students first learn aboutÐ
is the 4�C anomaly in the coefficient of thermal expansion, the response of the volume to
H Eugene Stanley
60 Pramana ± J. Phys., Vol. 53, No. 1, July 1999

infinitesimal changes in temperature. This coefficient of thermal expansion is anomalous
not only because it becomes negative below 4�C, but because it is 2±3 times smallerÐ
even at high temperaturesÐthan it would be in a typical fluid. How can this be
understood in terms of these patches?
When we lower the temperature, the number and size of the structured patches increase.
These structured little regions have as a property that their entropy is smaller than the
average (a negative quantity) and their specific volume is larger than the average (a
positive quantity). Multiplying the negative quantity by the positive, we get a negative
contribution from this macroscopic thermodynamic response function. As we lower the
temperature, and the patches become more numerous, the magnitude of this negative
response function gets bigger and bigger, and it just happens to pass through zero at a
temperature of 4�C.
This is qualitative, but we can test for the existence of these patches in various ways.
Simulations provide unambiguous evidence [12], but in simulations the results always
could be wrong if the potential is wrong. Experimentally, we can not actually see them,
but by beaming X-rays into supercooled water �ÿ25�C), Bosio and Teixeira [13] observe
a characteristic Ornstein±Zernike behavior, indicating a build-up in correlated regions
with a characteristic size proportional to the inverse of the width of that Lorenztian. The
characteristic size measured using this experimental technique turns out to be a diameter
of � 8 AÊ , i.e., 2±3 atomic spacings; recent data [14] suggests this number may be even
smaller (at least at atmospheric pressure).
Another approach to testing this picture is to dilute our water sample with some other
liquid. To do that, we go into that wonderfully ordered hydrogen-bonded network with its
little patches and replace 10% of the water molecules with something that does not form
four hydrogen bonds at tetrahedral angles. If that 10% replacement is hydrogen peroxide,
the anomalies almost disappear [15]! Evidently the patches are broken up by the impurity.
Another simple but striking example is the dependence of the adiabatic sound velocity
vs / Kÿ1=2S upon the mole fraction x of ethanol. Although vs for pure ethanol �x � 1� is
much smaller than vs for pure water �x � 0�, one finds a substantial increase in vs as
ethanol is added to pure water. We would interpret this finding as follows: ethanol is
`breaking up' the patches, and thereby reducing the compressibility. When vs is plotted
against x for a range of temperatures from 5�C to 45�C, one finds that all the isotherms
intersect at a single `isosbestic point' with x � 0:17 and vs � 1:6 km=s [16, 17]. Thus at
17% ethanol, increasing T from 5�C to 45�C serves to decrease the fluctuations due to the
patches, but this is precisely compensated for by an increase in the fluctuations of the
normal regions of the network. It would be desirable to extend these observations to a
wider range of temperature and pressure, to other impurities, and to properties other than
vs. Careful study of judiciously-chosen two-component systems may serve to provide
useful clues relevant to the `puzzle of liquid water'.
To summarize thus far: When looking at the bond connectivity problem, water appears
as a large macroscopic space-filling hydrogen bond network, as expected from continuum
models of water. However when we focus on the four-bonded molecules (`sites'), we find
that water can be regarded as having certain clustering featuresÐthe clusters being not
isolated `icebergs' in a sea of dissociated liquid (as postulated in mixture models dating
back to R�ontgen) but rather patches of four-bonded molecules embedded in a highly
connected network or `gel.' Similar physical reasoning applies if we generalize the
Liquid water: A very complex fluid
Pramana ± J. Phys., Vol. 53, No. 1, July 1999 61

concept of four-bonded molecules to molecules with a smaller than average energy [18]
or to molecules with a larger than average `local structure' [19].
7. Liquid±liquid phase transition hypothesis
This qualitative picture is sufficient to explain the vertical arrows in figure 2 and the fact
that the vertical arrows get longer and hence there is a minimum but they are not sufficient
to relate at all to the presence of the apparent power-law singularity. This power-law
singularity is reminiscent of critical phenomena. It suggests there might be some sort of
critical pointÐbut how could there be a critical point? Water does have a critical point,
but water's critical point is a very ordinary critical point. The critical point of water is up
around 374�C at a pressure of approximately 227 atmospheres. Above the critical point,
water is a homogeneous fluid, while below the critical point, water can exist in either of
two distinct phases. That critical point is known and well-studied by individuals such as
Anneke Levelt-Sengers at the National Institutes of Standards and Technology in
Gaithersburg, Maryland. Water is not unusual in connection with this critical point.
What could this apparent power-law singularity have to do with a critical point? Notice
that the temperature here is about ÿ50�C, nowhere near 374�C. So there is a kind of
puzzle here. Why would one find critical point phenomena in experimental data?
A possible resolution to this paradox was proposed a couple of years ago. A gifted
Boston University graduate student, Peter Poole, working with postdocs Francesco
Sciortino and Uli Essmann, made computer simulations in this low-temperature region
with the goal of exploring in detail with a computer what might happen [20]. Why a
computer? Because `computer water' does not suffer from this Berlin Wall catastrophe at
ÿ38�C. Computer water has a wonderful virtue: in simulations of sufficiently small
systems with sufficiently small time scales, the nucleation phenomenon that plagues real
experiments simply doesn't occur. One can go as low in temperature as one has computer
time to simulate. What Poole and collaborators discovered in computer water was the
apparent existence of a second critical point. That second critical point was indeed in the
range of ÿ50�C. Exactly where is difficult to say because in computer simulations you get
out what you put in to some degree. And it's very difficult to put in an accurate tempera-
ture scale, because the actual model that's used to simulate water is itself not terribly
accurate. So when I say � ÿ50�C, I mean ÿ50�C� 10�C, or even ÿ50�C� 20�C. But
what was discovered is that, below this second critical point, the liquid phase separates into
two distinct phasesÐa low-density liquid (LDL) and a high-density liquid (HDL).
8. Plausibility arguments
A non-interacting gas has no critical point, but a gas with arbitrarily weak attractive
interactions does since at sufficiently small temperature, the ratio of the interaction to kT
will become sufficiently significant to condense the liquid out of the gas. That all
interacting gases display a critical point below which a distinct liquid phase appears was
not always appreciated. Indeed, in the early years of this century one spoke of `permanent
gases'Ðto describe gases that had never been liquefied. Helium is an example of what
was once thought to be a permanent gas [21].
H Eugene Stanley
62 Pramana ± J. Phys., Vol. 53, No. 1, July 1999

Nowadays, we understand that permanent gases cannot exist since all molecules exert
some attractive interaction, and at sufficiently low temperature this attractive interaction
will make a significant contribution. To make the argument more concrete, one can
picture droplets of lower specific volume �V forming in a single-component fluid. Once
the interaction between molecules is fixed (and P is fixed at some value above PC),
then the only remaining control parameter is T ; as T decreases the high-density droplets
increase in number and size and eventually below TC they coalesce as a distinct liquid
phase.
Water differs from most liquids due to the presence of a line of maximum density
(TMD line) in the PT phase diagram. This TMD is physically very significant, as it
divides the entire PT phase diagram into two regions with remarkably different properties:
the coefficient of thermal expansionÐwhich is proportional to the thermal average
(`correlation function') h��V��SiÐis negative on the low-temperature side of the TMD
line, while it is positive on the high-temperature side. Here �V is the volume per molecule,�S the entropy per molecule, and the �X notation indicates the departure of a quantity X
from its mean value.
That h��V��Si is negative is a thermodynamic necessity given the presence of a TMD
line. What microscopic phenomenon causes it? One not implausible explanation [11] is
related to the presence of local regions of the hydrogen bond network that are charac-
terized by four `good' hydrogen bondsÐand these local regions can be considered as
droplets just as the high-density droplets in a gas above C. Stated more formally: the
sensitivity of hydrogen bonds to the orientation of the molecules forming it encourages
local regions to form that are partially ordered in the sense that if there is a region of the
water network where each molecule has four `good' (strong) hydrogen bonds, then the
local entropy is lower (so ��S < 0) and the local specific volume is larger (so ��V > 0), so
the contribution to h��V��Si is negative for such regions.
As the temperature is lowered, there is no a priori reason why the `droplets' charac-
terized by negative values of ��V��S should not increase in number and size, just as
the droplets associated with a normal phase transition increase in number, since all
water molecules exert mutual interactions on one another, and these interactionsÐ
because of their sensitivity to orientation and well as distanceÐfavor the open clusters
characterized by ��S��V < 0. It is thus plausible that at sufficiently low temperature these
orientation-sensitive interactions will make a larger and larger contribution, and at
sufficiently low temperature (and for sufficiently low pressure), a new phaseÐhaving
roughly the density of the fully hydrogen bonded networkÐwill `condense' out of the
one-fluid region.
This intuitive picture has received striking support from a recent generalization of the
van der Waals theory. Specifically, Poole et al [22] allow each water molecule to be in
many bonding states, only one of which corresponds to a `good' quality hydrogen bond
(with a larger number of states corresponding to `poor' quality bonds). To build in this
feature, Poole et al adopt the approach of Sastry and co-workers [23, 24] and assume that
there are � 1 configurations of a weak bond, all having � � 0, and only a single
configuration in which the HB is strong with � � �HB. Thus the thermal behavior of the
HBs is represented by independent �� 1�±state systems, each described by a partition
function Z � � exp�ÿ�HB=kT�. Poole et al found that for small values of the parameter
�HB, there is no critical point (but rather a re-entrant spinodal of the form first conjectured
Liquid water: A very complex fluid
Pramana ± J. Phys., Vol. 53, No. 1, July 1999 63
by Speedy [25]). However for �HB above a threshold (about 16 kJ=mol), a critical point
appears.
The possibility of a second critical point has received recent support by phenomeno-
logical analysis of Ponyatovskii and colleagues [26] and by lattice gas models [24, 27].
Also, Roberts and co-workers [28] have shown that simulation results for a microscopic
`water-like' Hamiltonian confirms the presence of a second phase transition, previously
deduced from approximate calculations [27].
9. Tests of the hypothesis: Computer water
Simulation studies of liquid water have a rich history and have contributed greatly to our
understanding of the subject. In fact, over a quarter century ago, the ST2 (`Stillinger-2')
potential was introduced. Water is represented by a central point from which emanate
4 armsÐtwo carrying positive charges to represent the two protons associated with each
water molecule, and two carrying negative charges to represent the two lone electron pairs
[29]. The central points interact via a Lennard±Jones potential, while the point charges
and the arms interact via a Coulomb potential. Thus every pair of waterlike particles
has 42 � 1 � 17 interaction terms. Corresponding to the rather `cumbersome' nature of
such a potential is the fact that most studies are limited to extremely small systemsÐa
typical number being N � 63 � 216 waterlike particles. Recently some studies have
considered larger systems, but the typical size rarely exceeds N � 123 � 1728. It is
hoped that by using fast multipole methods one can begin to simulate much larger
systems [30].
One way to obtain less cumbersome simulations is to simplify the intermolecular
potential. To this end, the simpler TIP4P potential [31] and the much simpler SPC=E
potential [32] have enjoyed considerable popularity. However the opposite direction is
also under active investigation: simulating more realistic potentials, such as polarizable
potentials [33]. The researcher is left with the perplexing problem of which model
potential to adopt!
With these caveats, let us very briefly summarize some recent work that might be
interpreted as being consistent with (or at least not contradicting) the hypothesis that a
HDL±LDL critical point C0 exists. We emphasize that most of this work has not reached
the stage that it can be interpreted as `evidence' favoring the hypothesis, so we also
outline appropriate avenues where future work may strengthen the argumentation.
9.1 Does 1=KmaxT extrapolate to zero at (TC0 , PC0 )?
The compressibility KT diverges at a second order critical point. Thus, we expect 1=K maxT
to extrapolate to zero at the `new' HDL±LDL critical point C0, exactly as it does for the
`old' liquid±gas critical point C. Recent ST2 calculations [34] are consistent with a
plausible extrapolation to a single point in the phase diagram at which K maxT � 1. The
caveat is that one can never know that a given quantity is approaching infinityÐit could
as well just be approaching a very large number. Indeed, the possibility has been raised,
and seriously discussed, that there is no genuine singularity [35]; this possibility will be
discussed briefly at the end of this lecture.
H Eugene Stanley
64 Pramana ± J. Phys., Vol. 53, No. 1, July 1999

9.2 Is there a `kink' in the P� isotherms?
If there is a critical point, then we expect to find a kink in the P� isotherms when T is
below TC0. Indeed, such a kink appears to exist for the ST2 potential, at a temperature of
235K but not at a temperature of 280 K, consistent with TC0 somewhere between 235 K
and 280 K. This finding, originally made for simulations of 216 ST2 particles [36, 37],
has very recently been strikingly confirmed for a system 8 times larger [38]. An
analogous kink has not been found for the TIP4P potential, but a prominent inflection
occurs at the lowest temperature studiedÐsuggesting that such a kink may be developing.
Work is underway testing for inflections and possible kinks for other water potentials in
three, and also in two, dimensions.
9.3 Is there a unique structure of the liquid near the kink point?
If there exists a critical point C0, then we would expect a two±phase coexistence region
below C0. To investigate the possible structural difference between these two phases,
Sciortino et al [34] have studied the structure of the liquid at a temperature just below the
estimated value of TC0 at two values of � on the two sides of �C0 . They find that the
structure of the liquid state of ST2 at � � 1:05 g=cm3 is similar to the experimental data
on high-density amorphous (HDA) solid water, while the structure at � � 0:92 g=cm3
resembles the data on low-density amorphous (LDA) solid water. The correspondence
between the HDA ice phase and ST2 water just above �C0 , and between the LDA phase
and ST2 water just below �C0 suggests that the two phases that become critical at C0 in
ST2 water are related to the known HDA and LDA phases of amorphous ice [39, 40].
9.4 Does the coordination number approach four as C0 is approached?
Sciortino et al [34] have studied the coordination number Nnn of the ST2 liquid as a
function of T and V , where Nnn is the average number of nearest±neighbors found in the
first coordination shell of an O atom. For the high-T isotherms, their results show that a 4-
coordinated `LDL'-like configuration is approached at negative P, in agreement with
previous simulations of Geiger and co-workers [41]. For T � 273 K, Nnn also approaches 4
at positive P. That is, if T is low enough, it appears that a 4-coordinated network can form
in liquid water even for P > 0. This result is consistent with an experimental study of the
evolution of the structure function S�Q� as water is supercooled at atmospheric pressure, in
which it was found that the structure tends toward that of the LDA ice [39].
9.5 Is it possible that two apparent `phases' coexist below C0?
Convincing evidence for a HDL±LDL critical point C0 would be the presence of two
coexisting phases below C0. This search is the focus of ongoing work. One can, e.g.,
partition the water molecules into two groups (`red' and `blue' molecules), those with
fewer than the average number of nearest neighbors and those with more than the average
(figure 4). We find that the red molecules and the blue molecules segregate to different
regions of the 18 AÊ box in which they are residing. These preliminary investigations at a
Liquid water: A very complex fluid
Pramana ± J. Phys., Vol. 53, No. 1, July 1999 65

Figure 4. The results of partitioning the molecules in a computer simulation into two categories, the left picture being the `low-density'molecules (with coordination number 4) and right picture being the `high-density' molecules (with coordination number above 4). Courtesy of S THarrington.
66
Pra
ma
na
±J
.P
hys.,
Vo
l.5
3,
No
.1
,J
uly
19
99

temperature somewhat below TC0 do not prove phase coexistence [38, 42], but work is
underway to establish this possibility. In particular, one must first rule out the likelihood
that the two `phases' are merely large fluctuations due to a large correlation length
(because near a critical point there should be fluctuations of all sizes and shapes, while
the sample separating into two distinct regions is rather different). Also, one must seek to
find the phase separation occurring in much larger systems. To be conclusive, firstly one
must demonstrate that phase separation occurs in a much larger system, and secondly one
must study systematically the time dependence of S�Q� as one quenches into the two-
phase region from a large value of temperature.
Separate calculations of the weighted correlation function h�r� for the two tentatively
identified HDL and LDL phases suggest similarities with experimental results on the two
amorphous solid phases HDA and LDA [42]. Additional work remains to be done to
establish this point.
9.6 Do fluctuations appear on all time scales?
For the ST2 potential, a histogram of hydrogen bond lifetimes reveals power law behavior
over as much as two decades, with the region of `scale free behavior' extending over a
larger time domain as T is decreased [43]. For the TIP4P potential, no calculations have
yet been carried out, but for the SPC=E potential, non-Arrhenius behavior has also been
found at high temperatures [44]. At low temperatures, it is possible that power law
behavior is found [30, 38]. An important caveat in interpreting these results is that this
scale free behavior is exactly what one would expect if the hydrogen bonded network
were regarded as possessing defects (corresponding to molecules with fewer than four
good bonds), and these defects were allowed to diffuse randomly [45, 46]. Possibly some
of these ambiguities will be resolved by applying to this problem Sasai's `local structure
index' that permits one to study in some detail the local dynamics [47].
9.7 Is there `critical slowing down' of a characteristic time scale?
For the ST2 potential, the characteristic value of hydrogen bond lifetime, defined as the
value of time at which the power law distribution of bond lifetimes is cut off by an
exponential, depends sensitively on temperature and in fact is consistent with a power law
divergence as T approaches TC0 [43]. The temperature dependence of the cutoff has not
been studied for other potentials.
Appearing to diverge at roughly the same temperature is a less ambiguous measure of
the characteristic timeÐthe inverse of the self-diffusion coefficient D [48]. This slowing
down of the dynamics is consistent with what one expects near a critical point. Speci-
fically, 1=D strongly increases as Nnn ! 4. Consistent with this picture, it was found
[49, 50] that additional nearest neighbors beyond 4 have a `catalytic' effect on the mobi-
lity of the central molecule, in that they lower the local energy barrier of the molecular
exchanges that are the microscopic basis of diffusion, demonstrating the importance for
molecular mobility of molecular environments having more than four nearest neighbors.
Because of the relation between 1=D and �Nnn ÿ 4�, the manner in which Nnn ! 4 is
also significant. At high T the decrease of Nnn with P is relatively uniform. However, as T
Liquid water: A very complex fluid
Pramana ± J. Phys., Vol. 53, No. 1, July 1999 67

decreases, Nnn is observed to vary more and more abruptly from a high-coordinated
structure (Nnn > 6) to Nnn ' 4. It should be possible to collapse this family of curves onto
a single `scaling function' if the two axes are divided by appropriate powers of T ÿ TC0 ;
these tests are underway.
9.8 Is the characteristic dynamics of each `phase' different?
We can identify molecules as red/blue if they are in a region of locally high/low density
for a specified amount of time (say 100 ps). Looking at the mean square displacement of
the red and blue `phases,' we see that the red molecules (corresponding to high densities)
move much further than blue molecules (corresponding to low densities) [38, 42]. The
nature of transport in each phase is under active investigation, particularly in light of
recent proposals for the nature of the anomalous dynamics taking place in low-
temperature water [51].
9.9 Is there evidence for a HDL±LDL critical point from independent simulations?
Recently, Tanaka independently found supporting evidence of a critical point by simula-
tions for the TIP4P potential [52]. Tanaka's value of the critical temperature TC0 agrees
with the earlier estimates, but his critical pressure PC0 occurs at roughly atmospheric
pressure, or perhaps at negative pressures [52]. The resolution between the two different
values of PC0 is an open question that will hopefully be resolved shortly.
It was actually possible to identify these two phases in the computer (figure 4). I
emphasize in the computer because what you find in the computer can be suggestive and
frequently can confirm experiments. In this case it actually motivated some experimentsÐ
the search in real water for evidence for such a critical point deep in the no-man's land
between TH and TX .
The pressure of the second critical point is around one kilobar. That is easy to
remember because that happens to be the pressure at the bottom of the Marianas Trench!
Because it is at a high pressure, I am going to gradually ramp up the complexity of this
phase diagram from our first picture (figure 1), keeping the same color codes in the
second picture (figure 5). I warned you that this was a slice at one atmosphere and that
sooner or later we would have to look at pressures other than one atmosphere, and that is
what this diagram does. In fact, it shows pressures all the way up to about 0.3 gigapascals,
or approximately 3000 atmospheres.
As you can see, at approximately 1000 atmospheres a little gray dot represents where
the second critical point might lie. This awkward location presents us with perplexities.
First of all, on which side of the Berlin Wall does this mythical beast lie? It is lying on the
side that we can not reach experimentally! I will spend the rest of this talk discussing
experiments, but I am talking about experimental attempts to identify a mythical beast that
we can not get close to at all, no closer than 5, or 10, or perhaps even 15 degrees from this
actual critical point.
If we can not get close to it, why does it matter? It matters for the same reason that
Mount Everest matters. Mount Everest, approximately 10,000 meters high, is not a delta
function somewhere in Nepal and Tibet. Rather, Mount Everest is a peak that exerts an
H Eugene Stanley
68 Pramana ± J. Phys., Vol. 53, No. 1, July 1999
influence on its neighboring altitudes, both high above the timberline and well below the
timberline (figure 6). In other words, if we have a singularity in our phase diagram at a
well-defined critical point, it is going to have an effect on an entire region around the
critical pointÐa so-called critical region. It is not required that the system is exactly at its
critical point in order that the system exhibits remarkable behavior, such as the pheno-
menon of critical opalescence discovered and correctly explained in 1869 by Andrews
[53] in terms of increased fluctuations away from (but close to) the critical point (figure 7).
It is for this reason that critical phenomena are particularly interesting.
10. Tests of the hypothesis: Real water
10.1 A cautionary remark
The first statement we must make concerns the presence of an impenetrable `Berlin wall':
the line TH�P� of homogeneous nucleation temperatures [54]. By careful analysis of
experimental data above TH�P�, Speedy and Angell [25, 55, 56] pioneered the view that
some sort of singular behavior is occurring in water at a temperature Ts�P� some 5±10
Figure 5. Generalization of figure 2 to incorporate a second control parameter, thepressure. The colors are the same as used in figure 2. This figure is courtesy of Dr OMishima.
Liquid water: A very complex fluid
Pramana ± J. Phys., Vol. 53, No. 1, July 1999 69

Figure 6. Photograph of Mt. Everest and the `critical region' nearby. This photograph is, relevant to understanding why a critical point is important,since the `singular' behavior of the altitude function at Everest itself (the peak being almost 104 m) has an effect on the altitude for a huge `critical region'surrounding the peak.
HE
ugen
eS
tanley
70
Pra
ma
na
±J
.P
hys.,
Vo
l.5
3,
No
.1
,J
uly
19
99

degrees below TH�P�. Our belief is that, even though the region below TH is experi-
mentally inaccessible, we want to learn about the liquid equation of state in this region
since anything that might occur in this region (such as a line of spinodal singularities
[56, 57] or a critical point) will influence the equation of state in a large neighborhood.
10.2 Previous work
Bellissent-Funel and Bosio have recently undertaken a detailed structural study of D2O
using neutron scattering to study the effect of decreasing the temperature on the pair
correlation function and structure factor S�Q� [39, 40]. For experimental paths, they
choose a family of isobars ranging from 0.1 MPa up to 600 MPa (well above the critical
point pressure of about 100 MPa). They plot the temperature dependence of the first peak
position Q0 of S�Q� for each isobar. They find that for the 0.1 MPa isobar, Q0 approaches
1.7 AÊ ÿ1Ðthe value for LDA, low-density amorphous ice. In contrast, for the 465 MPa and
Figure 7. Critical opalescence of the critical binary mixture cyclohexane-aniline.This figure is courtesy of R A Ferrell.
Liquid water: A very complex fluid
Pramana ± J. Phys., Vol. 53, No. 1, July 1999 71

600 MPa isobars, Q0 approaches a 30% larger value, 2.2 AÊ ÿ1Ðthe value for HDA, high-
density amorphous ice. For the 260 MPa isobar, Q0 ! 2:0 Aÿ1, as if the sample were a
two-phase mixture of HDA and LDA.
Since the critical point occurs below TH�P�, it is not possible to probe the two phases
experimentally. However two analogous solid amorphous phases of H2O have been
studied extensively by Mishima and co-workers [58]. In particular, Mishima has recently
succeeded in converting the LDA phase to the HDA phase by increasing the pressure, and
then reversing this conversion by lowering the pressure. The jump in density was
measured for a range of temperatures from 77 K to 140 K. Moreover, the magnitude of the
density jump decreases as the temperature is raised, just as would occur if, instead of
making measurements on the HDA and LDA amorphous solid phases, one were instead
considering the HDL and LDL liquid phases. These results are independently corrobo-
rated by computer simulations performed using both the ST2 and TIP4P intermolecular
potentials [36].
If we assume that HDA and LDA ice are the glasses formed from the two liquid phases
discussed above, then the HDA±LDA transition can be interpreted in terms of an abrupt
change from one microstate in the phase space of the high-density liquid, to a microstate
in the phase space of the low-density liquid. The experimentally detected HDA±LDA
transition line would then be the extension into the glassy regime of the line of first-order
phase transitions separating the HDL and LDL phases (figure 8).
10.3 Recent work
We discuss now the very recent measurements of the compression-induced melting
(CIM) and decompression-induced melting (DIM) lines of high-pressure forms of ice.
We show how knowledge of these lines enables one to obtain an approximation for the
Gibbs potential G�P; T� and the equation of state V�P; T� for water, both of which are
consistent with the possible continuity of liquid water and the amorphous forms of solid
water.
When liquid water is supercooled below the homogeneous nucleation temperature,
TH , crystal phases nucleate homogeneously, and the liquid freezes spontaneously to the
crystalline phase. When amorphous solid ice is heated, it crystallizes above the crystal-
lization temperature, TX . Therefore, amorphous forms of H2O do not exist in the `no-
man's land'' between TH and TX (figure 5).
When we compress the crystalline ice Ih at low temperatures, it transforms to super-
cooled liquid on its metastable melting line above TH . Between TH and TX , to a high-
pressure crystalline ice at the smoothly extrapolated melting line [59]. Below TX, ice Ih
amorphizes to HDA at a pressure higher than the smoothly extrapolated melting line [1].
To avoid the complication of the usual crystal±crystal transformations interrupting the
melting process, we use an ice emulsion (1±10 mm ice particles in oil [60]).
Mishima creates 1 cm3 emulsified high-pressure ices in a piston-cylinder apparatus,
decompresses the sample at a constant rate of 0.2 GPa=min, andÐbecause melting is
endothermicÐobserves their transitions by detecting a change in the sample temperature
by an attached clomel±alumel thermocouple during the decompression. Then, he deter-
mines melting pressures at different temperatures (figure 9). The melting curves he
H Eugene Stanley
72 Pramana ± J. Phys., Vol. 53, No. 1, July 1999

obtains agree with previously-reported data [61, 62], which confirms the accuracy of this
method. Moreover, he can determine the location of metastable melting lines to much
lower temperatures. Unexpectedly, he finds what appear to be two possible new phases
(PNP) of solid H2O, denoted PNP±XIII and PNP±XIV.
Using the measured melting lines of ice phases at low temperatures (figure 9),
we calculate the Gibbs energy (figure 10), and the equation of state [63] (figure 11). The
P±V±T relation is consistent with (but of course does not prove) the existence of a line of
first-order liquid±liquid transitions which continues from the line of LDA±HDA transi-
tions and terminates at an apparent critical point C0. The P±V±T relation is also consistent
Figure 8. HDA is readily made at pressures higher than about 200 MPa, and LDA atpressures lower than that amount. There is pressure hysteresis, which becomes largerat lower temperatures. In fact, when the pressure of HDA is decreased at 77 K, HDAdoes not transform to LDA and can exist at 1 bar, but when subsequently heated toabout 120 K at 1 bar, HDA transforms abruptly to LDA. Shown is a photo of this`explosively-quick' transition from HDA to LDA about 125 K during warming-up at1 bar. Top panel: just before the HDA!LDA transition. Bottom panel: just after thetransition. This figure is courtesy of Dr O Mishima.
Liquid water: A very complex fluid
Pramana ± J. Phys., Vol. 53, No. 1, July 1999 73

Figure 9. The left panel shows the measured DIM temperature response of the ice emulsion during each decompression, while the center panelshows the measured CIM temperature response during each compression. The highlights correspond to the characteristic sudden changes in thesample temperature. Note also that this kink appears well below the homogeneous nucleation line TH�P�, so the possibility that the kink is due toTH�P� seems unlikely. The right panel shows the melting lines that are extracted from the data shown. Note that the DIM line of ice IV shows akink at P � 0:1 GPa and T � 215 K, and is followed by the line of broad exothermic transitions (the vertical hatched region). The right panel alsodisplays the melting lines of the other ices and the LDA/HDA and Ih=HDA transition lines (the long-dashed lines). The horizontal bar indicates therange of metastability found for the LDA/HDA transition. This figure is courtesy of Dr O Mishima.
74
Pra
ma
na
±J
.P
hys.,
Vo
l.5
3,
No
.1
,J
uly
19
99

Figure 10. (a) Schematic Gibbs potential of liquid water relative to that of ice Ih,�GL � GL ÿ GIh
. The intersection line of �GL and the basal plane defines themelting line of ice Ih. (b) Gibbs potential of a typical high-pressure ice relative to thatof ice Ih, �GHP � GHP ÿ GIh
. (c) The melting line for the high pressure ice, definedby the intersection between the Gibbs potential surface of the liquid and that of thehigh-pressure ice. We obtain numerically the �GHP along the melting line which mustequal �GL along the melting line. (d) Schematic construction of the �GL surface (thedark region) by smooth graphical interpolation between the �GL potentials along themelting lines for different ices (the thick solid lines). Each of the nearly vertical thicksolid lines is a melting line. The horizontal line is the melting line of Ice Ih where the�GL is zero (figure 3a). These lines locate on a surface (the �GL surface). Once weknow the �GL surface, we calculate the �GHP plane for PNP±XIII and PNP±XIV,following the reverse procedure using the melting lines of PNP ice. We also estimate,and show by the thick dashed lines, the �GL potentials along the melting lines of PNPices on these �GHP planes. This figure is courtesy of Dr O Mishima.
Pramana ± J. Phys., Vol. 53, No. 1, July 1999 75

with other known experimental data and also with simulation results [58, 63, 64, 20, 22,
24, 52, 28, 35, 47, 65]
One somewhat speculative argument arises from a recent interpretation of the work of
Lang and LuÈdemann, who made a series of careful NMR measurements of the spin-lattice
relaxation time T1 [66±69]. Figure 12 shows the pressure dependence of T1 for a family of
isotherms. Shown as solid lines are the Lang-LuÈdemann data and as dashed lines one
possible extrapolation of their data into the experimentally-inaccessible region (below
the homogeneous nucleation boundary) which is consistent with, but of course by
no means proves, the hypothesized second critical point. This extrapolation is made by
eye, not by formula. The extrapolated inflection corresponds to occurrence of a
singularity or critical point. This occurs at roughly the same coordinates as found in the
experiments reported in ref. [63]Ðpossibly a coincidence, but the estimated coordinates
of C0, 220 K and 100 MPa, are the same as those obtained by analysis of the metastable
melting lines.
In summary, we know the free energy surface to some level of approximation.
Since we know the Gibbs potential as a function of pressure and temperature, by
differentiation, we know the volume as a function of pressure and temperature (figure 11).
Having the volume as a function of temperature is just where we want to end this
talk, because volume as a function of pressure and temperature is the equation of
state of the liquid. So what ultimately comes out then from these experiments is the
Figure 11. Experimentally-derived [63] thermodynamics equation of stateV � V�P; T�, using the same color coding as in figures 1 and 5. The specificvolumes of the amorphous phases are known for the region below TX [6]. Solid linesare the specific volume along the melting lines of ice IV and XIV. The high-temperature liquid appears to separate into two low-temperature liquid phases justbelow the critical point located at around 0.1 GPa and 220 K. These two liquid phasesare continuous with the two amorphous phases that are known to exist below about150 K. This figure is courtesy of Dr O Mishima.
H Eugene Stanley
76 Pramana ± J. Phys., Vol. 53, No. 1, July 1999

complete equation of state. This may look a little bit complicated, so let us take it in
stages.
At high temperature, we have a familiar ideal gas behaviorÐthe volume is approxi-
mately inversely proportional to the pressure. If we look at very low temperatures, we see
the two known glassy phases of water: low-density amorphous and high density
amorphous. We have two phases here, and even the color-coding is the same. The low
density is gray; the high density is pink. They are separated by a first-order transition.
`First order' means the discontinuity in the first derivative. Volume is the first derivative
so there is a discontinuityÐwe have already mentioned about 25 per cent. So this part is
known experimentally without a shadow of a doubt. The other part has been known
experimentally for perhaps one hundred years. There is only one little thing missing,
which is the connection between them. The connection between them is what's provided
by the experiments that traverse the no-man's land, and some of those experiments are
Figure 12. Pressure dependence of T1 for a family of isotherms ranging from 473 Kdown to 195 K. These data are read off of figure 1 and Table 1 of ref. [66]. Lang andLuÈdemann noted that for the low-temperature isotherms, T1 increases with pressure,unlike the behavior in ammonia and hydrogen sulfide. Shown as solid lines are theLang-LuÈdemann data and as dashed lines a possible extrapolation of their data into theexperimentally-inaccessible region (below the homogeneous nucleation boundary)which is consistent with, but of course by no means proves, the existence of thehypothesized second critical point. This figure is courtesy of Dr O Mishima.
Liquid water: A very complex fluid
Pramana ± J. Phys., Vol. 53, No. 1, July 1999 77
indicated by these little lines that shoot across from one phase, the known part of the
phase diagram, to the other part of the phase diagram.
To summarize, we started with a one-dimensional phase diagram (figure 1), went to
a two-dimensional one (figure 5), and then to a three-dimensional one (figure 11).
Qualitative features of liquid water appear to be connected to the behavior of a locally-
structured transient gel. This locally-structured transient gel has the feature that little
clusters are formed inside the hydrogen-bonded network. Locally, these clusters have
distances and bond angles similar to that of ice and therefore have smaller density, larger
specific volume, lower entropy, and contribute to explaining qualitatively the anomalies
of water.
11. Discussion
The most natural response to the concept of a second critical point in a liquid is
bafflementÐsuch a thing just does not make sense. To make the concept more plausible,
we offer the following remarks. Consider a typical member of the class of intermolecular
potentials that go by the name of core-softened potentials [70]. These are potentials with
two wells, an outer well that is deeper and an inner well that is more shallow. Recently
Sadr±Lahijany and collaborators have re-visited such potentials with a view toward
applications to water [71]. These simple potentials might capture the essential physics of
water±water interactions in that because, in the case of water, a hydrogen-bonded
interaction leads to a larger intermolecular spacing (say 2.8 AÊ ) compared to a `non-
hydrogen-bonding' interaction (figure 13). Since at low temperatures, hydrogen bonds
predominateÐincreasing the volumeÐit follows that the outer well of a core-softened
potential must be deeper. Then as temperature is lowered, the system finds itself more
likely in the outer `deep' well than in the inner `shallow' well. Further, pressure has the
same effect as raising the temperature, since for a fixed temperature, applying pressure
favors the inner shallow well.
An advantage of such double-well potentials is that they can be solved analytically
in one-dimension and are tractable to study using approximation procedures (and
simulations) in higher dimensions [71].
To complete the intuitive picture, let us imagine two (or more) local structures, one
favored at low pressure (the outer deeper well) and the other favored at high pressure (the
inner well). If a system is cooled at a fixed low value of pressure, then the system will
settle into a phase whose properties are related to the parameters of the outer well. If, on
the other hand, the system is cooled at a fixed high value of pressure, it will settle into a
phase whose properties are related to the parameters of the inner well. Thus it becomes
plausible that depending on the pressure, the liquid could approach different phases as the
temperature is lowered. Moreover, if the outer well is deep and narrow, then we anticipate
that when ��V > 0, �S < 0Ði.e., volume and entropy fluctuations will be anticorrelated,
leading to �P < 0.
A clear physical picture has by no means emerged. However recent work has addressed
the question if we can characterize (or at least `caricature') the local structural hetero-
geneities that appear in liquid water. Specifically, Canpolat and collaborators [72] consi-
dered state points of liquid water at different pressuresÐand especially near its phase
H Eugene Stanley
78 Pramana ± J. Phys., Vol. 53, No. 1, July 1999

boundaries with ice Ih and with ice VI (a high-pressure polymorph of solid H2O). To
this end, in the spirit of the `Walrafen pentamer', they develop a model of interacting
water pentamers, and find two distinct local energy minima which they identify with two
well-defined configurations of neighboring pentamers. The `Walrafen pentamer' is
defined by four water molecules located at the corners of a tetrahedron that are hydrogen-
bonded to a central moleculeÐsee, e.g., [73]; the corner molecules are separated from the
central molecule by 2.8 AÊ , corresponding to the first peak in the oxygen-oxygen radial
distribution function. They advance the hypothesis that these configurations may be
related to the local `high-density' and `low-density' structural heterogeneities occurring
in liquid water. These results are consistent with recent experimental data on the effect of
Figure 13. Physical arguments relating to the plausibility of the existence of theknown liquid±gas critical point C and the hypothesized LDL±HDL critical point C0.(a) Idealized system characterized by a pair interaction potential with a singleattractive well. At low enough T (T < Tc) and high enough P (P > Pc), the systemcondenses into the `liquid' well shown. (b) Idealized system characterized by a pairinteraction potential whose attractive well has two sub-wells, the outer of which isdeeper and narrower. For low enough T (T < Tc0 ) and low enough P (P < Pc0 ), theone-phase liquid can `condense' into the narrow outer `low-density liquid' sub-well,thereby giving rise to a low-density liquid phase, and leaving behind the high-densityliquid phase occupying predominantly the inner subwell. (c) Two idealized interactionclusters of water molecules (`Walrafen pentamers') in configurations that maycorrespond to the two sub-wells of (b). This figure is courtesy of Dr. O. Mishima.
Liquid water: A very complex fluid
Pramana ± J. Phys., Vol. 53, No. 1, July 1999 79

high pressure on the radial distribution function, and are further tested by molecular
dynamics simulations.
Although such a picture may seem to be oversimplified, very recent work of Bellissent-
Funel [74] successfully shows that detailed neutron structure data agree with it. Also, the
simulation results are in good accord with neutron results (see, e.g., [40]), so one can be
optimistic that some day a unified coherent picture may emerge.
12. Outlook
Many open questions remain, and many experimental results are of potential relevance to
the task of answering these questions. For example, the dynamics of water is only beginn-
ing to receive some possible clarificationÐsee, e.g., [30, 51, 75] (and references therein).
In particular, it is unclear what is the effect on the hypothesized second critical point of
modifying water in ways that are interesting. For example, trees survive arctic tempera-
tures because the water in the cell does not freeze, even though the temperature is below
the homogeneous nucleation temperature of ÿ38�C. The effect of confinement on the
second critical point is just now beginning to be studied [76]. Similarly, the effect on
the second critical point of adding a second component is of interest, especially because
the interior of the cell is anything but pure water!
Before concluding, we ask `What is the requirement for a liquid to have such a second
critical point?' In fact, by the arguments above, some other liquids should display second
critical points, namely systems which at low temperature and low pressure have anti-
correlated entropy and specific volume fluctuations. Thus a natural extension to our work
is to consider other tetrahedrally-coordinated liquids. Examples of such systems are SiO2
and GeO2, known for their geological and technological importance. Both of these
systems display features in their equations of state similar to those found in simulations of
water and that can be traced to their tetrahedral configurations. This tetrahedrality of local
structure has the implication that locally-ordered regions of the liquid will have a larger
specific volume rather than a smaller specific volume than the global specific volume (as
in most liquids, for which the local structure, also resembling the global structure of the
solid, has a smaller specific volume than the global specific volume. Whenever we are at
a state point in the P±T phase diagram to the left of the locus of points where the
coefficient of thermal expansion is zero (the `TMD line'), then of necessity the volume
fluctuations are most unusual in that they are anticorrelated with the entropy fluctuations.
These unusual fluctuations grow as one moves further into the `anomalous' region to the
left of the TMD line, and ultimately a new phase condenses out of the fluid which has the
property that although the entropy of the new phase is low, the specific volume is largeÐ
this is what is called the `low-density liquid.' Since other tetrahedral liquids have similar
features, we might anticipate similar critical points occur on the liquid free energy surface
of these liquids. Simulation evidence in favor of this possibility has been reported
recently for SiO2 [77] and a two-level model has been developed for amorphous GaSb
[78]. Understanding one such material, water, may help in understanding othersÐ
whether they be other materials with tetrahedral local structures (and corresponding TMD
lines) such as SiO2 or whether they be more complex local structures like amorphous
GaSb which appears to display strikingly ordered local heterogeneities.
H Eugene Stanley
80 Pramana ± J. Phys., Vol. 53, No. 1, July 1999

Acknowledgements
In addition to my 15 valued collaborators named at the outset, I thank S H Chen,
T Grande, H-D LuÈdemann, P F McMillan, J K Nielsen, C J Roberts, R L B Selinger,
F H Stillinger, Y Suzuki, H Tanaka, P Tartaglia, G E Walrafen, B Widom and R Zhang for
guidance throughout the course of this work. This work was supported by the National
Science Foundation grant CH9728854.
References
[1] P G Debenedetti, Metastable Liquids (Princeton University Press, Princeton, 1996)[2] J T Fourkas, D Kivelson, U Mohanty and K A Nelson (eds), Supercooled Liquids: Advances
and Novel Applications (ACS Books, Washington DC, 1997)[3] J C Dore and J Teixeira, Hydrogen-Bonded Liquids (Kluwer Academic Publishers, Dordrecht,
1991)[4] S H Chen and J Teixeira, Adv. Chem. Phys. 64, 1 (1985)[5] M C Bellissent-Funel and J C Dore, Hydrogen Bond Networks (Kluwer Academic Publishers,
Dordrecht, 1994)[6] O Mishima and H E Stanley, Nature, 396, 329 (1998)[7] P Ball, Water: A Biography (Farrah Strauss, New York, 1999)[8] R S Smith and B D Kay, Nature 398, 788 (1999)
K P Stevenson, G A Kimmel, Z Dohnalek, R S Smith, and B D Kay, Science, 283, 1505(1999)
[9] C A Angell, in Water: A Comprehensive Treatise, edited by F. Franks (Plenum Press, NY,1980) Vol. 7, p. 1
[10] R Waller, trans., Essays of Natural Experiments [original in Italian by the Secretary of theAcademie del Cimento]. Facsimile of 1684 English translation (Johnson Reprint Corporation,New York, 1964)
[11] H E Stanley, J. Phys. A12, L329 (1979)H E Stanley and J Teixeira, J. Chem. Phys. 73, 3404 (1980)H E Stanley, J Teixeira, A Geiger and R L Blumberg, Physica A106, 260 (1981)
[12] A Geiger and H E Stanley, Phys. Rev. Lett. 49, 1749 (1982)H E Stanley, R L Blumberg and A Geiger, Phys. Rev. B28, 1626 (1983)H E Stanley, R L Blumberg, A Geiger, P Mausbach and J Teixeira, J. de Physique 45, C7[3](1984)
[13] L Bosio, J Teixeira and H E Stanley, Phys. Rev. Lett. 46, 597 (1981)[14] Y Xie, K F Ludwig, Jr., G Morales, D E Hare and C M Sorensen, Phys. Rev. Lett. 71, 2050
(1993)[15] C A Angell, M Oguni, and W J Sichina, J. Phys. Chem. 86, 998 (1982)[16] A Giacomini, J. Acoustical Soc. Am. 19, 701 (1947)[17] G W Willard, J. Acoustical Soc. Am. 19, 235 (1947)[18] R L Blumberg, H E Stanley, A Geiger and P Mausbach, J. Chem. Phys. 80, 5230 (1984)[19] E Shiratani and M Sasai, J. Chem. Phys. 104, 7671 (1996).[20] P H Poole, F Sciortino, U Essmann and H E Stanley, Nature 360, 324 (1992)[21] K Mendelssohn, The Quest for Absolute Zero: The Meaning of Low-Temperature Physics
(McGraw, New York, 1966), p. 42ff.[22] P H Poole, F Sciortino, T Grande, H E Stanley and C A Angell, Phys. Rev. Lett. 73, 1632
(1994)C F Tejero and M Baus, Phys. Rev. E57, 4821 (1998)
[23] S Sastry, F Sciortino and H E Stanley, J. Chem. Phys. 98, 9863 (1993)[24] S S Borick, P G Debenedetti and S Sastry, J. Phys. Chem. 99, 3781 (1995)
S S Borick and P G Debenedetti, J. Phys. Chem. 97, 6292 (1993)
Liquid water: A very complex fluid
Pramana ± J. Phys., Vol. 53, No. 1, July 1999 81

[25] R J Speedy, J. Phys. Chem. 86, 3002 (1982)[26] E G Ponyatovskii, V V Sinitsyn and T A Pozdnyakova, JETP Lett. 60, 360 (1994)[27] C J Roberts and P G Debenedetti, J. Chem. Phys. 105, 658 (1996)[28] C J Roberts, A Z Panagiotopoulos and P G Debenedetti, Phys. Rev. Lett. 77, 4386 (1996)[29] F H Stillinger and A Rahman, J. Chem. Phys. 57, 1281 (1972)[30] F W Starr, J K Nielsen and H E Stanley, Phys. Rev. Lett. 82, 2294 (1999)[31] W L Jorgensen, J Chandrasekhar, J Madura, R W Impey and M Klein, J. Chem. Phys. 79, 926
(1983)[32] H J C Berendsen, J R Grigera and T P Straatsma, J. Phys. Chem. 91, 6269 (1987)[33] U Niesar, G Corongiu, E Clementi, G R Kneller and D Bhattacharya, J. Phys. Chem. 94, 7949
(1990)[34] F Sciortino, P H Poole, U Essmann and H E Stanley, Phys. Rev. E55, 727 (1997)[35] S Sastry, P G Debenedetti, F Sciortino and H E Stanley, Phys. Rev. E53, 6144 (1996)
L P N Rebelo, P G Debenedetti and S Sastry, J. Chem. Phys. 109, 626 (1998)[36] P H Poole, U Essmann, F Sciortino and H E Stanley, Phys. Rev. E48, 4605 (1993)[37] P H Poole, F Sciortino, U Essmann and H E Stanley, Phys. Rev. E48, 3799 (1993)[38] S T Harrington, R Zhang, P H Poole, F Sciortino and H E Stanley, Phys. Rev. Lett. 78, 2409
(1997)[39] M C Bellissent-Funel and L Bosio, J. Chem. Phys. 102, 3727 (1995)[40] F W Starr, M C Bellissent-Funel and H E Stanley, Phys. Rev. E60, 1084 (1999). Cond-mat 98-
11118.[41] A Geiger, P Mausbach and J Schnitker, in Water and Aqueous Solutions edited by G W
Neilson and J E Enderby (Adam Hilger, Bristol, 1986) p. 15[42] S T Harrington, P H Poole, F Sciortino, and H E Stanley, J. Chem. Phys. 107, 7443 (1997)[43] F Sciortino, P H Poole, H E Stanley and S Havlin, Phys. Rev. Lett. 64, 1686 (1990)[44] A Luzar and D Chandler, Phys. Rev. Lett. 76, 928 (1996)
A Luzar and D Chandler, Nature 379, 55 (1996)[45] H Larralde, F Sciortino and H E Stanley, Restructuring the Hydrogen Bond Network of Water
(preprint)H Larralde, Properties of systems with many random walkers, Ph.D. Thesis (Boston University,1993)
[46] F Sciortino, A Geiger and H E Stanley, Phys. Rev. Lett. 65, 3452 (1990)[47] E Shiratani and M Sasai, J. Chem. Phys. 108, 3264 (1998)[48] F W Starr, C A Angell, R J Speedy, and H E Stanley, Entropy, Specific Heat, and Relaxation of
Water at 1 atm between 136 K and 236 K (preprint)[49] F Sciortino, A Geiger and H E Stanley, Nature 354, 218 (1991)[50] F Sciortino, A Geiger and H E Stanley, J. Chem. Phys. 96, 3857 (1992)[51] P Gallo, F Sciortino, P Tartaglia, and S H Chen, Phys. Rev. Lett. 76, 2730 (1996)
F Sciortino, P Gallo, P Tartaglia and S H Chen, Phys. Rev. E54, 6331 (1996)[52] H Tanaka, Nature 380, 328 (1996)
H Tanaka, J. Chem. Phys. 105, 5099 (1996)R J Speedy, Nature 380, 289 (1996)
[53] T Andrews, Phil. Trans. 159, 575 (1869)[54] F Franks (ed.), Water: A Comprehensive Treatise (Plenum Press, NY, 1972) Vol. 1±7; F Franks
(ed.), Water Science Reviews (Cambridge University Press, Cambridge, 1985) Vol. 1±4[55] R J Speedy, J. Phys. Chem. 91, 3354 (1987)[56] C A Angell, Supercooled water, in Water: A Comprehensive Treatise, edited by F Franks
(Plenum Press, New York, 1982)[57] P H Poole, T Grande, F Sciortino, H E Stanley and C A Angell, J. Comp. Mat. Sci. 4, 373
(1995)[58] O Mishima, J. Chem. Phys. 100, 5910 (1994)[59] O Mishima, Nature 384, 546 (1996)[60] H Kanno, R Speedy, and C A Angell, Science 189, 880 (1975)[61] P W Bridgman, Proc. Amer. Acad. Arts Sci. 47, 441 (1912)[62] L F Evans, J. Appl. Phys. 38, 4930 (1967)
H Eugene Stanley
82 Pramana ± J. Phys., Vol. 53, No. 1, July 1999

[63] O Mishima and H E Stanley, Nature 392, 164 (1998)[64] O Mishima and H E Stanley, Discontinuity in Decompression-Induced Melting of Ice IV
[Proc. Symposium on Water and Ice, Int'l Conf. on High Pressure Science and TechnologyAIRAPT-16 & HPCJ-38] Rev. High Press. Sci. Tech. 6, 1103 (1998)
[65] H E Stanley, S T Harrington, O Mishima, P H Poole, and F Sciortino, Cooperative MolecularMotions in Water: The Second Critical Point Hypothesis [Proc. 1997 Symposium on Waterand Ice, Intl. Conf. on High Pressure Science and Technology AIRAPT-16 & HPCJ-38], Rev.High Press. Sci. Tech. 7, 1090 (1998)
[66] E Lang and H D LuÈdemann, Ber. Bunsenges. Phys. Chem. 84, 462 (1980)[67] E Lang and H D LuÈdemann, Ber. Bunsenges. Phys. Chem. 85, 1016 (1981)[68] E Lang and H D LuÈdemann, J. Chem. Phys. 67, 718 (1977)[69] E Lang and H D LuÈdemann, in NMR Basic Principles and Progress (Springer-Verlag, Berlin,
1990) vol. 24, pp. 131.[70] P C Hemmer and G Stell, Phys. Rev. Lett. 24, 1284 (1970)
G Stell and P C Hemmer, J. Chem. Phys. 56, 4274 (1972)C K Hall and G Stell, Phys. Rev. A7, 1679 (1973)
[71] M R Sadr-Lahijany, A Scala, S V Buldyrev and H E Stanley, Phys. Rev. Lett. 81, 4895 (1998)M R Sadr-Lahijany, A Scala, S V Buldyrev and H E Stanley, Water-Like Anomalies for Core-Softened Models of Fluids: One Dimension (preprint)A Scala, M R Sadr-Lahijany, S V Buldyrev and H E Stanley, Water-Like Anomalies for Core-Softened Models of Fluids: Two Dimensions (preprint)
[72] M Canpolat, F W Starr, M R Sadr-Lahijany, A Scala, O Mishima, S Havlin and H E Stanley,Chem. Phys. Lett. 294, 9 (1998)M Canpolat, F W Starr, M R Sadr-Lahijany, A Scala, O Mishima, S Havlin and H E Stanley,Structural Heterogeneities and Density Maximum of Liquid Water (preprint)
[73] G E Walrafen, J. Chem. Phys. 40, 3249 (1964); 47, 114 (1967)W B Monosmith and G E Walrafen, J. Chem. Phys. 81, 669 (1984)
[74] M C Bellissent-Funel, Europhys. Lett. 42, 161 (1998)[75] F W Starr, S Harrington, F Sciortino and H E Stanley, Phys. Rev. Lett. 82, 3629 (1999)
F W Starr, F Sciortino and H E Stanley, preprint[76] M Meyer and H E Stanley, J. Phys. Chem. 103 (1999)[77] P H Poole, M Hemmati and C A Angell, Phys. Rev. Lett. 79, 2281 (1997)
H E Stanley, C A Angell, U Essmann, M Hemmati, P H Poole and F Sciortino, Physica A 205,122 (1994)
[78] E G Ponyatovskii, JETP Lett. 66, 281 (1997)
Liquid water: A very complex fluid
Pramana ± J. Phys., Vol. 53, No. 1, July 1999 83