Evaluierung von Geräten zur Müdigkeitsüberwachung
12
M. Golz 1, 2 · D. Sommer 1 · U. Trutschel 2, 3 · B. Sirois 3 · D. Edwards 4 1 Faculty of Computer Science, University of Applied Sciences, Schmalkalden 2 Institute for System Analysis and Applied Numerics, Tabarz 3 Circadian Technologies Inc., Stoneham, MA 4 Caterpillar Machine Research Inc., Peoria, IL Evaluation of fatigue monitoring technologies Schwerpunkt Driver fatigue has been a major concern of the scientific community, the transpor- tation safety organizations and the gener- al public for decades. Many authors have investigated the importance of fatigue as a cause of road crashes [15, 28]. Within the public sector, driver fatigue and loss of attention are significant factors con- tributing to commercial truck crashes ac- counting for 1200 deaths and 76,000 inju- ries annually at an estimated cost of $12.4 billion to the commercial trucking in- dustry [15]. In the surface mining indus- try the risk of fatigue is also an important issue, since the consequences of person- al injuries are comparable and the expect- ed material damage is higher. A study of truck accidents in Australian surface coal mines indicate that 93% are due to human error, and 60%–70% of human error acci- dents have been found to be fatigue-relat- ed [19]. The main causes of driver fatigue are generally comparable regardless of whether within the general driving pub- lic or within the commercial transport in- dustry. However, the monotony associated with the driving task may be greater with- in commercial transportation and mining industry due to the repetitiveness and ex- tended driving hours required. Moreover, the mining industry is faced with uniquely difficult conditions that increase incident risks, such as extremes in environmen- tal conditions like temperature, humidi- ty, and dust. Thus, one very important as- pect of transport within the mining indus- try, as well as in other areas of transporta- tion is fatigue risk management (FRM). In fact, FRM has been cited as one of three revolutions in fatigue research during the 21st century [16]. FRM is ensuring that employees recognize and take responsi- bility for their own fitness for work, and that companies utilize science-based pol- icies and practices that support human performance, rather than detract from it. Furthermore, FRM takes into consid- eration that frontline supervisors are re- sponsible for recognizing adverse working conditions, for constantly evaluating their workgroups, for any behavioral manifes- tations of fatigue, and for then taking ap- propriate measures. Automatic reporting, as a part of FRM, ensures that employees at risk are mon- itored objectively. Monitoring devices should at least be able to detect episodes of strong fatigue robustly and reliably. Un- der this presumption intervention strate- gies should be established. Such strategies require agreement by employees. In ad- dition, appropriate communications and support are established in FRM prior to, during, and following the implementa- tion of fatigue monitoring technologies (FMTs) [16]. Different FMTs have been proposed to detect driver fatigue automatically, using a variety of fatigue related measures (for a review see [28]). In this article, video-based warning systems [8, 27], as well as electrophysio- logical signals [17, 5, 12]), were investigat- ed in detail. This paper is aimed to pro- pose how the latter approach may be uti- lized as a laboratory reference to validate the first approach. To demonstrate this, two different pro- cedures were applied. First, the outcome of the video-based systems was compared to two fatigue measures which are inde- pendent of both approaches. The self-re- port of fatigue on the Karolinska sleepi- ness scale (KSS) [1] acted as a subjective fatigue measure, while the driving per- formance in terms of standard deviations of lateral position in lane (SDL) [10] act- ed as an objective fatigue measure. Sev- eral authors differentiate between fatigue and sleepiness. The term fatigue is linked to having low motivation and being in a psychophysiological state of low energy, whereas sleepiness and drowsiness are ex- pressions of the need to sleep. Crashes due to human errors are very likely caused by a combination of fatigue, sleepiness, inat- tention, and distraction. FMT devices are intended to detect all four causes. Further- more, basic theory as well as measuring methodology is lacking to discriminate between fatigue and sleepiness for normal subjects and under working conditions. Working conditions, like overnight driv- ing as in our study, mostly lead to a com- bination of lacking sleep due to long-time- since-sleep and of being in a state of low energy due to monotony and long-time- on-task. Therefore, ‘fatigue’ is used as a synonym for drowsiness, sleepiness, and tiredness throughout this text, as done by Åkerstedt et al. [2]. Secondly, video-based and electrophys- iology-based approaches were compared directly using discriminant analysis. This was achieved by recording both types of signals simultaneously during overnight driving simulations, and by performing the same kind of signal processing. The independent fatigue measures (KSS, SDL) were used to divide the data set into two Somnologie 2010 DOI 10.1007/s11818-010-0482-9 Received: 22. März 2010 Accepted: 5. Juli 2010 © Springer-Verlag 2010 1 Somnologie - Schlafforschung und Schlafmedizin 2010 |
Transcript of Evaluierung von Geräten zur Müdigkeitsüberwachung

M. Golz1, 2 · D. Sommer1 · U. Trutschel2, 3 · B. Sirois3 · D. Edwards4
1 Faculty of Computer Science, University of Applied Sciences, Schmalkalden2 Institute for System Analysis and Applied Numerics, Tabarz3 Circadian Technologies Inc., Stoneham, MA4 Caterpillar Machine Research Inc., Peoria, IL
Evaluation of fatigue monitoring technologies
Schwerpunkt
Driver fatigue has been a major concern of the scientific community, the transpor-tation safety organizations and the gener-al public for decades. Many authors have investigated the importance of fatigue as a cause of road crashes [15, 28]. Within the public sector, driver fatigue and loss of attention are significant factors con-tributing to commercial truck crashes ac-counting for 1200 deaths and 76,000 inju-ries annually at an estimated cost of $12.4 billion to the commercial trucking in-dustry [15]. In the surface mining indus-try the risk of fatigue is also an important issue, since the consequences of person-al injuries are comparable and the expect-ed material damage is higher. A study of truck accidents in Australian surface coal mines indicate that 93% are due to human error, and 60%–70% of human error acci-dents have been found to be fatigue-relat-ed [19]. The main causes of driver fatigue are generally comparable regardless of whether within the general driving pub-lic or within the commercial transport in-dustry. However, the monotony associated with the driving task may be greater with-in commercial transportation and mining industry due to the repetitiveness and ex-tended driving hours required. Moreover, the mining industry is faced with uniquely difficult conditions that increase incident risks, such as extremes in environmen-tal conditions like temperature, humidi-ty, and dust. Thus, one very important as-pect of transport within the mining indus-try, as well as in other areas of transporta-tion is fatigue risk management (FRM). In fact, FRM has been cited as one of three revolutions in fatigue research during the
21st century [16]. FRM is ensuring that employees recognize and take responsi-bility for their own fitness for work, and that companies utilize science-based pol-icies and practices that support human performance, rather than detract from it. Furthermore, FRM takes into consid-eration that frontline supervisors are re-sponsible for recognizing adverse working conditions, for constantly evaluating their workgroups, for any behavioral manifes-tations of fatigue, and for then taking ap-propriate measures.
Automatic reporting, as a part of FRM, ensures that employees at risk are mon-itored objectively. Monitoring devices should at least be able to detect episodes of strong fatigue robustly and reliably. Un-der this presumption intervention strate-gies should be established. Such strategies require agreement by employees. In ad-dition, appropriate communications and support are established in FRM prior to, during, and following the implementa-tion of fatigue monitoring technologies (FMTs) [16].
Different FMTs have been proposed to detect driver fatigue automatically, using a variety of fatigue related measures (for a review see [28]).
In this article, video-based warning systems [8, 27], as well as electrophysio-logical signals [17, 5, 12]), were investigat-ed in detail. This paper is aimed to pro-pose how the latter approach may be uti-lized as a laboratory reference to validate the first approach.
To demonstrate this, two different pro-cedures were applied. First, the outcome of the video-based systems was compared
to two fatigue measures which are inde-pendent of both approaches. The self-re-port of fatigue on the Karolinska sleepi-ness scale (KSS) [1] acted as a subjective fatigue measure, while the driving per-formance in terms of standard deviations of lateral position in lane (SDL) [10] act-ed as an objective fatigue measure. Sev-eral authors differentiate between fatigue and sleepiness. The term fatigue is linked to having low motivation and being in a psychophysiological state of low energy, whereas sleepiness and drowsiness are ex-pressions of the need to sleep. Crashes due to human errors are very likely caused by a combination of fatigue, sleepiness, inat-tention, and distraction. FMT devices are intended to detect all four causes. Further-more, basic theory as well as measuring methodology is lacking to discriminate between fatigue and sleepiness for normal subjects and under working conditions. Working conditions, like overnight driv-ing as in our study, mostly lead to a com-bination of lacking sleep due to long-time-since-sleep and of being in a state of low energy due to monotony and long-time-on-task. Therefore, ‘fatigue’ is used as a synonym for drowsiness, sleepiness, and tiredness throughout this text, as done by Åkerstedt et al. [2].
Secondly, video-based and electrophys-iology-based approaches were compared directly using discriminant analysis. This was achieved by recording both types of signals simultaneously during overnight driving simulations, and by performing the same kind of signal processing. The independent fatigue measures (KSS, SDL) were used to divide the data set into two
Somnologie 2010 DOI 10.1007/s11818-010-0482-9Received: 22. März 2010Accepted: 5. Juli 2010© Springer-Verlag 2010
1Somnologie - Schlafforschung und Schlafmedizin 2010 |

classes: mild and strong fatigue. As a last step, discriminant analysis was performed and the mean error rates for both the vid-eo-based and electrophysiology-based ap-proaches were compared.
Several authors who have investigat-ed driving variables and/or driver behav-ior variables, under different levels of fa-tigue, utilized descriptive statistics or lin-ear discriminant analysis of time-domain features. Because drivers perceive a lot of heterogeneous information and experi-ence changing road scenes, their driving behavior is extremely situation specific. Moreover, the internal state of the driver is influenced by complex regulatory pro-cesses. This leads to non-unimodal dis-tribution densities of the measured vari-ables in the feature space. Modern compu-tational intelligence methods are known to deal with this. They make it possible to adapt nonlinear discriminant functions and regularize them over a wide range, from strong locality to complete globali-ty [3]. Another advantage is that they are non-parametric methods. Therefore, they overcome limitations of parametric statis-tics. This is important if effects are expect-ed to vary from individual to individual.
Large inter-individual differences were reported for fatigue-related parameters of EOG and for driving performance vari-ables [10]. Galley et al. (2006) investigat-ed rank correlation coefficients between subjectively rated alertness and seven oc-ulomotoric parameters. They also report-ed on correlations largely differing across subjects. Positive as well as negative cor-relations occurred in all parameters de-pending on the individual.
The investigated FMT devices were all video-based. The data file stored on the host computer included results from the application of several variables such as time series of lid gap, blink duration, and pupil diameter. However, only the PER-CLOS variable was utilized to measure driver fatigue. PERCLOS is defined as the percentage of time during which the pu-pils are covered by the eye lid by more than 80% of their area [27]. Thus it is an inte-gral measure of prolonged eye closures. Typical integration intervals to calculate PERCLOS are between 1 and 5 min.
The paper is organized as follows: Firstly, it will be shown how to select FMT devices from the market for the special needs of heavy mining trucks. Then, ex-
perimental testing of the selected devic-es under the same night-time restrictions as in real night-shifts of the mining indus-try will be reported. Thirdly, the perfor-mance of modern, nonlinear methods of discriminant analysis will be demonstrat-ed on both video and electrophysiology measures. Conclusions follow in order to rate the current status of the leading FMT devices.
Material and methods
FMT devices
Market analysis and product ratingMarket analysis, in conjunction with con-sultations and experts in human factors research, revealed that at least 35 different solutions were available in the year 2006. Vendors of every product were asked to supply detailed information on different aspects of the FMT devices (see below). In the final analysis, only 22 devices were identified to be commercially available. They were considered at least to be emerg-ing technologies with potential for near-term commercialization (. Tab. 1). The basic principle of the devices varied large-ly from indirect measures of performance, (e.g., lateral lane deviation), to behavioral measures, such as oculomotor variables.
As a second step, a list of evaluation criteria was established and reviewed ex-tensively with 15 human factors experts, seven being employees of Caterpillar Inc. and Circadian Technologies, Inc. (internal experts), and the other five longstanding experts of the international research and development community in the fields of transportation, mining, biomedical tech-nology, human factors, and ergonomics (external experts). In addition, three ex-perts from the mining industry were in-cluded in order to represent their indus-try specific needs. Representatives of the FMT manufacturers were involved to pro-vide technological facts on their various products. Over a period of several weeks, the criteria were improved for clarity and described in more detail. This resulted in a list of criteria consisting of 16 cate-gories and 93 criteria in total. Next, as a third step, all experts were asked to assign relative weighting factors (range from 0 to 1) to each category and each criteria.
Tab. 1 The 22 various FMT devices commercially available in 2006
Company Product
AcuMine HaulCheck
Advanced Safety Concepts PASS
ARRB Transport Research Fatigue Management System
AssistWare Technologies SafeTrac
Atlas Research Ltd NOV Alert
Attention Technologies Driver Fatigue Monitor
Delphi Corporation Driver State Monitor
International Mining Technologies Voice Commander System
Iteris Inc Lane Departure
MCJ EyeCheck
Mobileye NV Vision/Radar Sensor
Neurocom EDVTCS
Ospat Pty OSPAT
Pemix ASTID™
Precision Control Design Inc SleepWatch
Muirhead/Remote Control Tech. Fatigue Warning System
Security Electronic Systems Sleep Control Helmet System
Seeing Machines Facelab
Sleep Diagnostics Optalert™
Smart Eye AntiSleep
SMI InSight
Welkin Nap Zapper
2 | Somnologie - Schlafforschung und Schlafmedizin 2010
Schwerpunkt
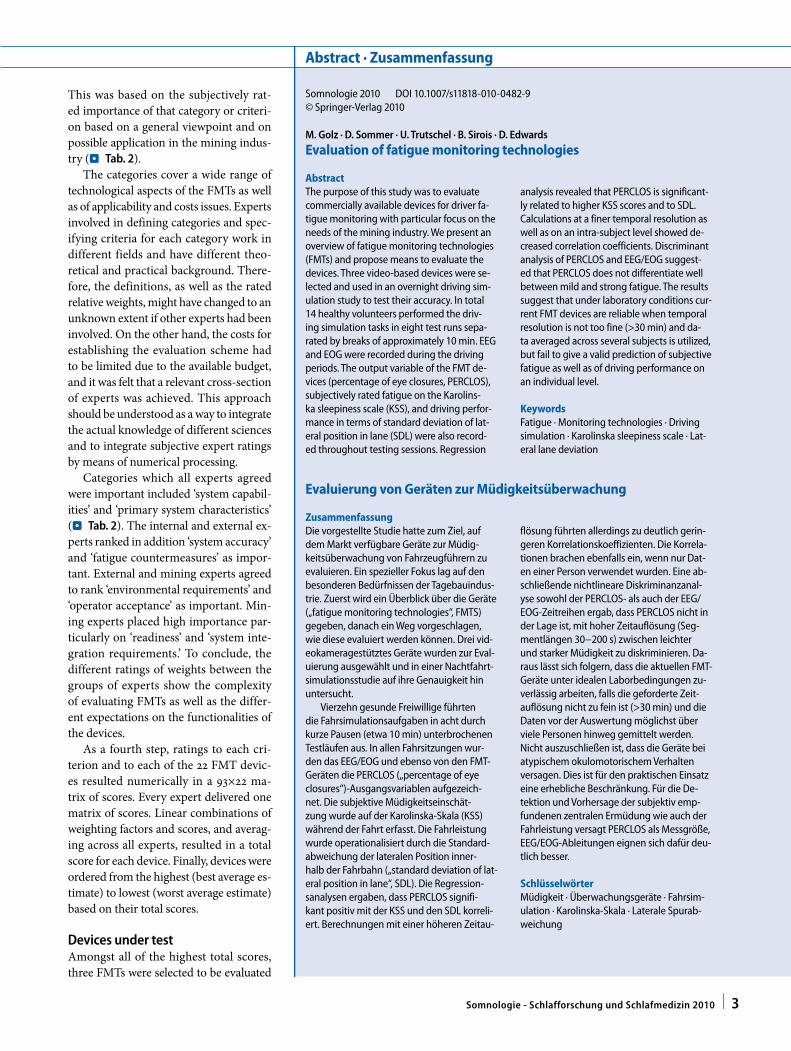
This was based on the subjectively rat-ed importance of that category or criteri-on based on a general viewpoint and on possible application in the mining indus-try (. Tab. 2).
The categories cover a wide range of technological aspects of the FMTs as well as of applicability and costs issues. Experts involved in defining categories and spec-ifying criteria for each category work in different fields and have different theo-retical and practical background. There-fore, the definitions, as well as the rated relative weights, might have changed to an unknown extent if other experts had been involved. On the other hand, the costs for establishing the evaluation scheme had to be limited due to the available budget, and it was felt that a relevant cross-section of experts was achieved. This approach should be understood as a way to integrate the actual knowledge of different sciences and to integrate subjective expert ratings by means of numerical processing.
Categories which all experts agreed were important included ‘system capabil-ities’ and ‘primary system characteristics’ (. Tab. 2). The internal and external ex-perts ranked in addition ‘system accuracy’ and ‘fatigue countermeasures’ as impor-tant. External and mining experts agreed to rank ‘environmental requirements’ and ‘operator acceptance’ as important. Min-ing experts placed high importance par-ticularly on ‘readiness’ and ‘system inte-gration requirements.’ To conclude, the different ratings of weights between the groups of experts show the complexity of evaluating FMTs as well as the differ-ent expectations on the functionalities of the devices.
As a fourth step, ratings to each cri-terion and to each of the 22 FMT devic-es resulted numerically in a 93×22 ma-trix of scores. Every expert delivered one matrix of scores. Linear combinations of weighting factors and scores, and averag-ing across all experts, resulted in a total score for each device. Finally, devices were ordered from the highest (best average es-timate) to lowest (worst average estimate) based on their total scores.
Devices under testAmongst all of the highest total scores, three FMTs were selected to be evaluated
Abstract · Zusammenfassung
Evaluation of fatigue monitoring technologies
AbstractThe purpose of this study was to evaluate commercially available devices for driver fa-tigue monitoring with particular focus on the needs of the mining industry. We present an overview of fatigue monitoring technologies (FMTs) and propose means to evaluate the devices. Three video-based devices were se-lected and used in an overnight driving sim-ulation study to test their accuracy. In total 14 healthy volunteers performed the driv-ing simulation tasks in eight test runs sepa-rated by breaks of approximately 10 min. EEG and EOG were recorded during the driving periods. The output variable of the FMT de-vices (percentage of eye closures, PERCLOS), subjectively rated fatigue on the Karolins-ka sleepiness scale (KSS), and driving perfor-mance in terms of standard deviation of lat-eral position in lane (SDL) were also record-ed throughout testing sessions. Regression
analysis revealed that PERCLOS is significant-ly related to higher KSS scores and to SDL. Calculations at a finer temporal resolution as well as on an intra-subject level showed de-creased correlation coefficients. Discriminant analysis of PERCLOS and EEG/EOG suggest-ed that PERCLOS does not differentiate well between mild and strong fatigue. The results suggest that under laboratory conditions cur-rent FMT devices are reliable when temporal resolution is not too fine (>30 min) and da-ta averaged across several subjects is utilized, but fail to give a valid prediction of subjective fatigue as well as of driving performance on an individual level.
KeywordsFatigue · Monitoring technologies · Driving simulation · Karolinska sleepiness scale · Lat-eral lane deviation
Evaluierung von Geräten zur Müdigkeitsüberwachung
ZusammenfassungDie vorgestellte Studie hatte zum Ziel, auf dem Markt verfügbare Geräte zur Müdig-keitsüberwachung von Fahrzeugführern zu evaluieren. Ein spezieller Fokus lag auf den besonderen Bedürfnissen der Tagebauindus-trie. Zuerst wird ein Überblick über die Geräte („fatigue monitoring technologies“, FMTS) gegeben, danach ein Weg vorgeschlagen, wie diese evaluiert werden können. Drei vid-eokameragestütztes Geräte wurden zur Eval-uierung ausgewählt und in einer Nachtfahrt-simulationsstudie auf ihre Genauigkeit hin untersucht.
Vierzehn gesunde Freiwillige führten die Fahrsimulationsaufgaben in acht durch kurze Pausen (etwa 10 min) unterbrochenen Testläufen aus. In allen Fahrsitzungen wur-den das EEG/EOG und ebenso von den FMT-Geräten die PERCLOS („percentage of eye closures“)-Ausgangsvariablen aufgezeich-net. Die subjektive Müdigkeitseinschät-zung wurde auf der Karolinska-Skala (KSS) während der Fahrt erfasst. Die Fahrleistung wurde operationalisiert durch die Standard-abweichung der lateralen Position inner-halb der Fahrbahn („standard deviation of lat-eral position in lane“, SDL). Die Regression-sanalysen ergaben, dass PERCLOS signifi-kant positiv mit der KSS und den SDL korreli-ert. Berechnungen mit einer höheren Zeitau-
flösung führten allerdings zu deutlich gerin-geren Korrelationskoeffizienten. Die Korrela-tionen brachen ebenfalls ein, wenn nur Dat-en einer Person verwendet wurden. Eine ab-schließende nichtlineare Diskriminanzanal-yse sowohl der PERCLOS- als auch der EEG/EOG-Zeitreihen ergab, dass PERCLOS nicht in der Lage ist, mit hoher Zeitauflösung (Seg-mentlängen 30−200 s) zwischen leichter und starker Müdigkeit zu diskriminieren. Da-raus lässt sich folgern, dass die aktuellen FMT-Geräte unter idealen Laborbedingungen zu-verlässig arbeiten, falls die geforderte Zeit-auflösung nicht zu fein ist (>30 min) und die Daten vor der Auswertung möglichst über viele Personen hinweg gemittelt werden. Nicht auszuschließen ist, dass die Geräte bei atypischem okulomotorischem Verhalten versagen. Dies ist für den praktischen Einsatz eine erhebliche Beschränkung. Für die De-tektion und Vorhersage der subjektiv emp-fundenen zentralen Ermüdung wie auch der Fahrleistung versagt PERCLOS als Messgröße, EEG/EOG-Ableitungen eignen sich dafür deu-tlich besser.
SchlüsselwörterMüdigkeit · Überwachungsgeräte · Fahrsim-ulation · Karolinska-Skala · Laterale Spurab-weichung
Somnologie 2010 DOI 10.1007/s11818-010-0482-9© Springer-Verlag 2010
M. Golz · D. Sommer · U. Trutschel · B. Sirois · D. Edwards
3Somnologie - Schlafforschung und Schlafmedizin 2010 |
in the laboratory. Vendors agreed to our testing protocol and provided integration assistance.
To publish the results we agreed not to specify the rating score and not to identify the product directly for the three devices which were selected for experiments. As it turned out, there were no large differenc-es in their technical principles. Without exception, all were based on video analy-sis, utilized modulated infra-red light (in-visible), and slightly different data rates (range: 30–120 s). They all output several variables of eyelid and head movements, but utilized only PERCLOS as a measure of fatigue. Despite the necessity of calcu-lating the pupil diameter for the analysis of PERCLOS [27], and of eye movements, no device utilized this variable as an addi-tional measure.
All three FMT devices were built into or onto the dashboard of our real car sim-ulator. Several pre-tests were performed
to determine whether there were signif-icant interferences between the devices being used simultaneously. At the end of many procedures where devices were run alone or together with other devices, and under different environmental conditions and with different subjects, we could not identify any sign of interferences.
Subjects
The experiment was performed in the driving simulation laboratory of the Fac-ulty of Computer Sciences at the Univer-sity of Applied Sciences, Schmalkalden, Germany, and was approved by the lo-cal ethics committee of the client. Vol-unteers were recruited via internet an-nouncement on the university web pag-es. Web questionnaires were utilized to ac-quire initial personal data, e.g., informa-tion on general sleep-wake rhythm, health status, and driving experience. In addi-
tion, the Pittsburgh Sleep Quality Index [4] was administered. Finally, 80 healthy volunteers were genuinely interested and fulfilled the requirements to partici-pate in the study. A total of 16 subjects (12 male, 4 female; mean age 24.4±3.1 years, range 19–29 years) were selected random-ly. They had to give their written consent to take part in the study. All subjects were right-handed. Mean score on the Pitts-burgh sleep quality index was 3.8±1.6. No subject reported chronic or current ma-jor medical illness or injury, medication or drug consumption, shift work, or trans-meridian travel within the 3 months prior to the study.
During the week preceding the study, participants had to complete a sleep di-ary to assess sleep habits. They were in-structed not to take daytime naps during that time (i.e., to go to sleep only once a day) and to refrain from excessive physi-cal activity, as well as caffeine and alcohol consumption. Finally, subjects were in-structed to consume alcoholic or caffein-ated beverages for 24 h prior to the exper-iment.
All subjects were trained in the driv-ing simulator in order to manage their performance of the lane tracking task and to minimize daytime SDL. Further-more, training was also necessary to check whether subjects suffered from “simulator sickness.”
Before starting the experiments, the wrist actigrams of each subject over the previous 3 days were checked to confirm that the subjects had fulfilled our tempo-ral specifications (i.e., time to bed after 11:00 PM and before 1:00 AM, total sleep duration between 6 and 8 h, wake-up time before 8:00 AM, and no daytime naps).
Experimental procedure
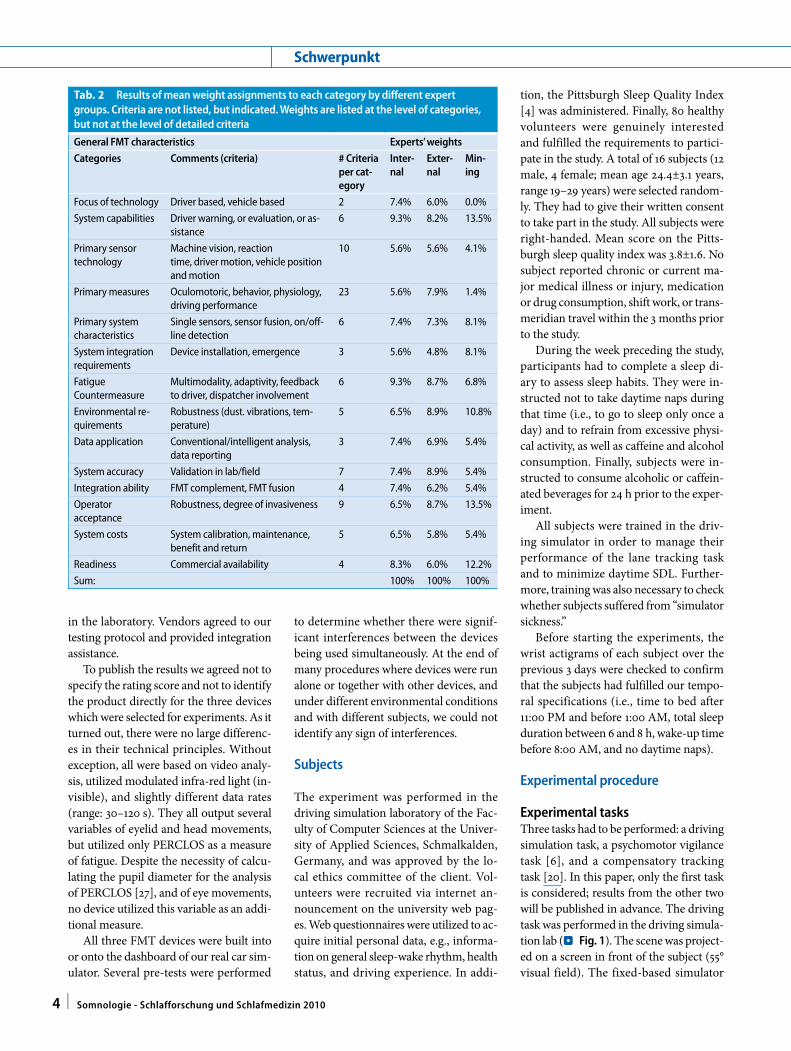
Experimental tasksThree tasks had to be performed: a driving simulation task, a psychomotor vigilance task [6], and a compensatory tracking task [20]. In this paper, only the first task is considered; results from the other two will be published in advance. The driving task was performed in the driving simula-tion lab (. Fig. 1). The scene was project-ed on a screen in front of the subject (55° visual field). The fixed-based simulator
Tab. 2 Results of mean weight assignments to each category by different expert groups. Criteria are not listed, but indicated. Weights are listed at the level of categories, but not at the level of detailed criteria
General FMT characteristics Experts’ weights
Categories Comments (criteria) # Criteria per cat-egory
Inter-nal
Exter-nal
Min-ing
Focus of technology Driver based, vehicle based 2 7.4% 6.0% 0.0%
System capabilities Driver warning, or evaluation, or as-sistance
6 9.3% 8.2% 13.5%
Primary sensor technology
Machine vision, reactiontime, driver motion, vehicle position and motion
10 5.6% 5.6% 4.1%
Primary measures Oculomotoric, behavior, physiology, driving performance
23 5.6% 7.9% 1.4%
Primary system characteristics
Single sensors, sensor fusion, on/off-line detection
6 7.4% 7.3% 8.1%
System integration requirements
Device installation, emergence 3 5.6% 4.8% 8.1%
FatigueCountermeasure
Multimodality, adaptivity, feedback to driver, dispatcher involvement
6 9.3% 8.7% 6.8%
Environmental re-quirements
Robustness (dust. vibrations, tem-perature)
5 6.5% 8.9% 10.8%
Data application Conventional/intelligent analysis, data reporting
3 7.4% 6.9% 5.4%
System accuracy Validation in lab/field 7 7.4% 8.9% 5.4%
Integration ability FMT complement, FMT fusion 4 7.4% 6.2% 5.4%
Operatoracceptance
Robustness, degree of invasiveness 9 6.5% 8.7% 13.5%
System costs System calibration, maintenance, benefit and return
5 6.5% 5.8% 5.4%
Readiness Commercial availability 4 8.3% 6.0% 12.2%
Sum: 100% 100% 100%
4 | Somnologie - Schlafforschung und Schlafmedizin 2010
Schwerpunkt
consists of a compact car body (GM Opel Corsa) with original controls. All control actions taken by the driver were record-ed on a Pentium 4 computer running un-der Windows XP SP2. The 40-min driving tasks were on a monotonous two-lane mo-torway course in darkness with simulated effects of headlights of the test vehicle (i.e., involving a restricted range of sight). One round on the course with a speed of about 60 km/h took approximately 35 min. The course was mainly straight, with sus-tained curves. There were no obstacles or oncoming traffic. The simulator software acquires data on several variables such as velocity, steering angle, position of brak-ing and gas pedal, and lateral position in lane by a rate of ten samples per sec-ond. In this article, however, only the lat-ter variable was further analyzed. That is, the lateral position of the centre of the car relative to the midline of the lane. Driv-ers with high performance should be dis-tinguished by low deviations around zero. Large lane deviations were detected on-line and a crash was assigned if all four wheels were detected out of lane. In this case, an intensive sound effect combined with a dark screen was presented and, af-ter a short interruption, driving was auto-matically re-started.
Three video cameras recorded the driving scene, drivers’ head and shoul-ders, and drivers’ right eye. Video record-ings were used to look for behavioral signs of strong fatigue, such as long eyelid clo-sure, small eyelid gap, slow roving eye movements, and head nodding.
Further variables assessed includ-ed EEG (Fp1, Fp2, C3, C4, Cz, O1, O2, A1, A2, common average reference) and EOG (vertical, horizontal; electrodes were placed at the outer canthus) which were acquired using the Polygraphy system “Sigma PLpro” (Sigma Medizintechnik GmbH, Gelenau, Germany) with a sam-pling rate of 256 s−1. The quality of the re-cordings was checked visually during the experiments. Before beginning the driving task, electrode impedances were checked and electrodes were re-mounted whenev-er necessary.
Experimental designWe conducted a within-subject, par-tial sleep deprivation design. Experi-
ments started at 11:30 PM and finished at 8:30 AM, which led to relatively long time-since-sleep (16–24 h) and passage through the circadian trough (time-of-day effect). Both are major contributing factors to fatigue.
There were eight experimental test runs, each lasting 60 min. Test runs were organized consecutively despite one large break from 3:30 AM to 4:30 AM. In this manner, the real situation for surface min-ing companies (one night shift, two 6-h blocks of driving separated by a 1-h break) was approximated.
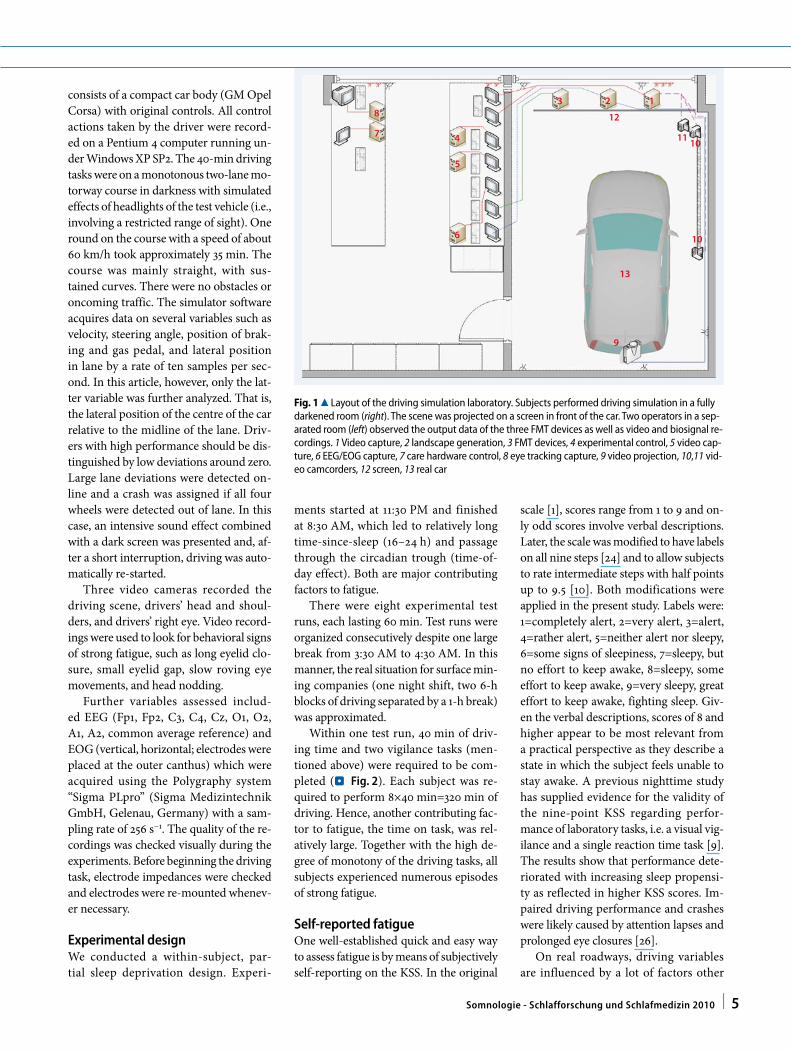
Within one test run, 40 min of driv-ing time and two vigilance tasks (men-tioned above) were required to be com-pleted (. Fig. 2). Each subject was re-quired to perform 8×40 min=320 min of driving. Hence, another contributing fac-tor to fatigue, the time on task, was rel-atively large. Together with the high de-gree of monotony of the driving tasks, all subjects experienced numerous episodes of strong fatigue.
Self-reported fatigueOne well-established quick and easy way to assess fatigue is by means of subjectively self-reporting on the KSS. In the original
scale [1], scores range from 1 to 9 and on-ly odd scores involve verbal descriptions. Later, the scale was modified to have labels on all nine steps [24] and to allow subjects to rate intermediate steps with half points up to 9.5 [10]. Both modifications were applied in the present study. Labels were: 1=completely alert, 2=very alert, 3=alert, 4=rather alert, 5=neither alert nor sleepy, 6=some signs of sleepiness, 7=sleepy, but no effort to keep awake, 8=sleepy, some effort to keep awake, 9=very sleepy, great effort to keep awake, fighting sleep. Giv-en the verbal descriptions, scores of 8 and higher appear to be most relevant from a practical perspective as they describe a state in which the subject feels unable to stay awake. A previous nighttime study has supplied evidence for the validity of the nine-point KSS regarding perfor-mance of laboratory tasks, i.e. a visual vig-ilance and a single reaction time task [9]. The results show that performance dete-riorated with increasing sleep propensi-ty as reflected in higher KSS scores. Im-paired driving performance and crashes were likely caused by attention lapses and prolonged eye closures [26].
On real roadways, driving variables are influenced by a lot of factors other
8
7 4
5
6
3
12
2 1
11 10
10
13
9
Fig. 1 8 Layout of the driving simulation laboratory. Subjects performed driving simulation in a fully darkened room (right). The scene was projected on a screen in front of the car. Two operators in a sep-arated room (left) observed the output data of the three FMT devices as well as video and biosignal re-cordings. 1 Video capture, 2 landscape generation, 3 FMT devices, 4 experimental control, 5 video cap-ture, 6 EEG/EOG capture, 7 care hardware control, 8 eye tracking capture, 9 video projection, 10,11 vid-eo camcorders, 12 screen, 13 real car
�Somnologie - Schlafforschung und Schlafmedizin 2010 |
than driver performance, e.g., road qual-ity, roadway characteristics, lighting, and crosswind. Advantageously, such influ-ences can be neglected in driving simula-tion where controlled experimental condi-tions and low traffic complexity are guar-anteed. The driver performance is the sol-itary factor of deviations in driving vari-ables. In the literature, the two most fre-quently used driving performance vari-ables are lateral lane position of the vehicle and steering angle. Further variables are speed of the vehicle, headway distance, as well as angle of throttle and brake pedals (for a review see [23]).
A variety of derived variables were pro-posed. For example, Lin & Ulsoy [18] pro-posed parameters of lane departure such as time to line crossing. Knipling & Wi-erwille [14] aimed to quantify “drift-and-jerk” steering and fluctuations in lateral lane position. Therefore, they proposed operational measures such as high-pass lateral velocity of the vehicle, standard deviation of the lateral position relative to the lane, time span that steering velocity exceeds 150” per second, number of peri-ods and time span during which the steer-ing wheel velocity is zero for at least 0.4 s were recommended. Ingre et al. [10] in-vestigated only the standard deviation of the lateral position in lane as a driving performance measure.
Data analysis
For this study we analyzed the recorded data in two different ways. Firstly, correla-tion analysis was performed between mea-sured PERCLOS data of the three devices and the two independent measures (KSS, SDL). The Pearson product-moment cor-relation coefficient, which is mainly sen-sitive to a linear relationship between two variables, was estimated utilizing the SAS software package.
Secondly, for the assessment of PER-CLOS data as a fatigue measure in com-parison with EEG/EOG, we performed nonlinear discriminant analysis. For this purpose, all signals under consideration (PA, PB, PC, EEG/EOG) were transformed to the spectral domain, and the logarith-mic power spectral densities (log PSD) were estimated by the modified peri-odogram method [22]. Other estimation techniques, such as Welch’s method, the Multi-Taper method, and parametric au-toregressive estimation utilizing the Burg method resulted in reduced variance of PSD estimation, but at the expense of bi-as. In contradiction to explorative analy-sis, computational intelligence algorithms are not, as such, sensitive to higher vari-ances but profit by having a lower estima-tion bias [12]. Log PSD values of all signals were averaged in spectral bands. In case of EEG/EOG signals, 1.0-Hz wide bands and a range of 1–23 Hz proved to be opti-mal, whereas in case of PERCLOS signals
0.2-Hz wide bands and a range of 0–4 Hz were optimal.
The independent fatigue measures (KSS, SDL) were both used to divide the whole data set into the two classes, ‘mild fatigue’ (class 1) and ‘strong fatigue’ (class 2). This was necessary to obtain labels for discriminant analysis (classification). For this, histograms of all measures were com-puted and divided in two subsets of equal size. This was accomplished based on 3-min data segments.
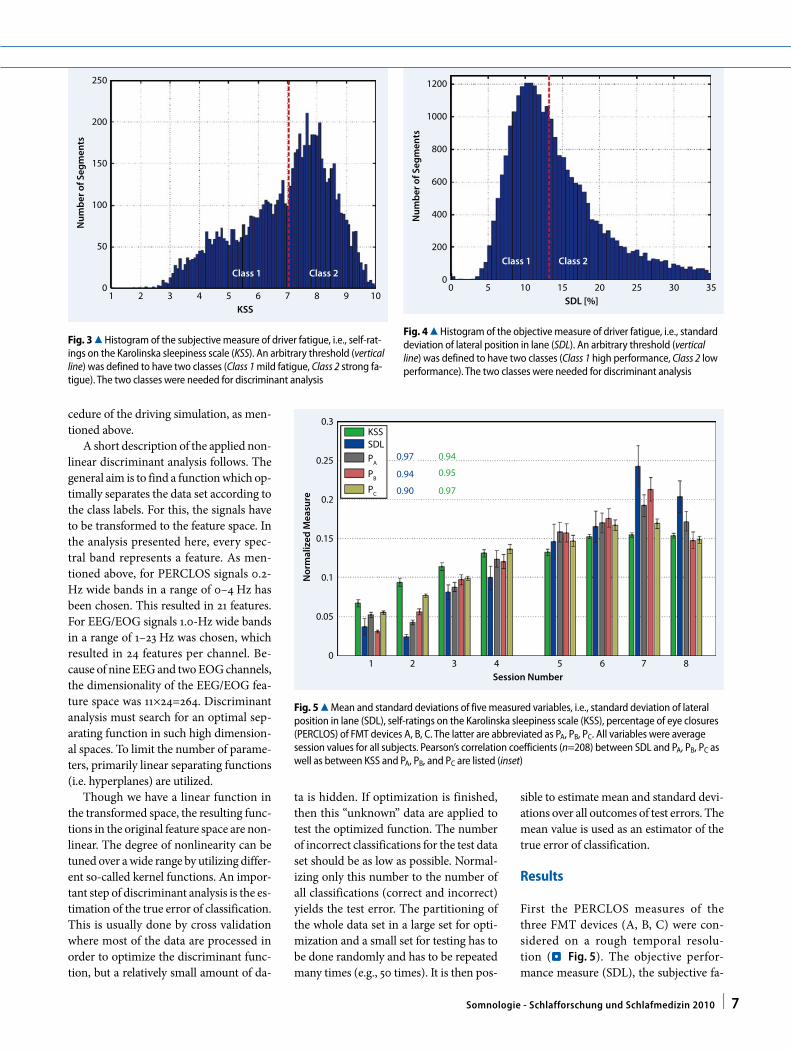
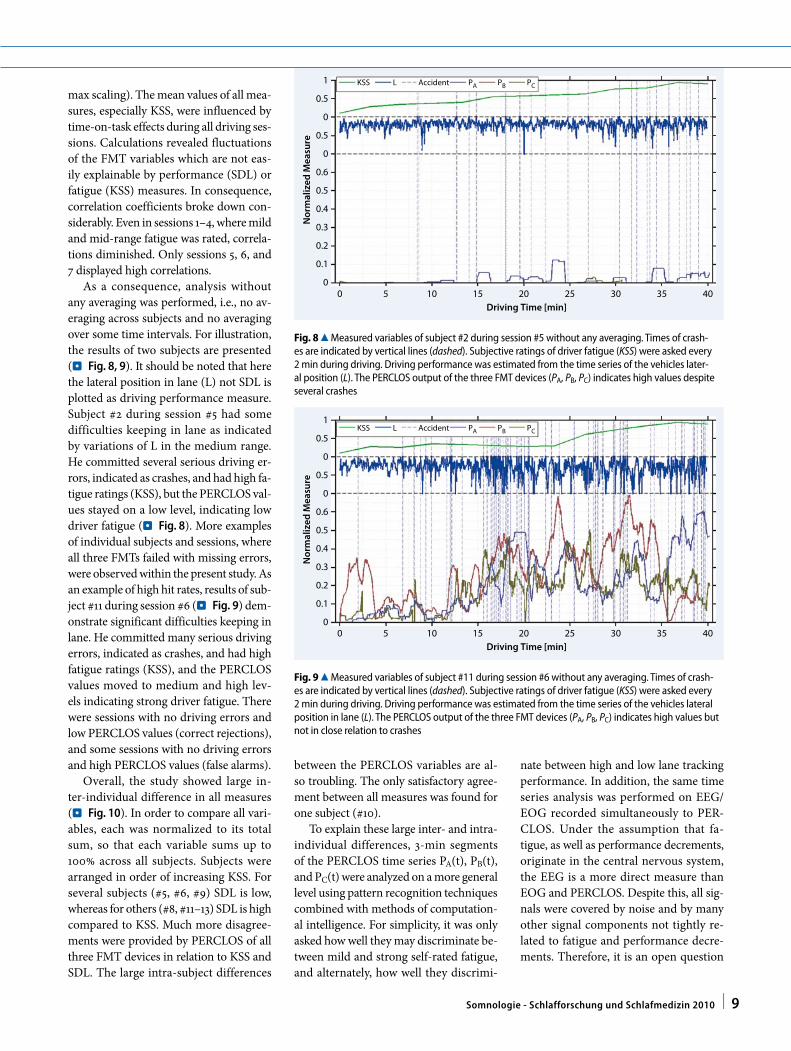
The threshold parameter for the sub-jective measure was selected at KSS=7.0 (. Fig. 3). The histogram indicates a slightly right-skewed distribution which confirms the success of the experimen-tal design in inducing strong fatigue. The same procedure was applied to the objec-tive fatigue measure SDL (. Fig. 4). Sub-jects who performed lane tracking with standard deviations lower than 13.0% with respect to the lane width were defined to be in the state of mild fatigue. In our driv-ing simulation system, the lane width was set to 5.0 m. This means that subjects in the mild fatigue state performed with standard deviations lower than 0.60 m. Lane tracking with standard deviations greater than 0.60 m was referred to as be-ing in the state of strong fatigue. Lateral positions in lane greater than 100% with respect to the lane width were also exhib-ited, but were handled by the simulation system as a crash and led to a re-start pro-
1:40am 1:50am1:30am 2:00am 2:10am 2:20am 2:30am
Calibration KSS: Karolinska Sleepiness ScaleCTT: Compensatory Tracking TaskPVT: Psychomotoric Vigilance Test
CTT PVT BreakDriving in the Simulator
10:00pm 11:30pm 0:30am 1:30am 2:30am 3:30am 4:30am 5:30am 6:30am 7:30am 8:30am
Preparation 1st Session 2nd Session 3rd Session 4th Session Break 5th Session 6th Session 7th Session 8th Session
Fig. 2 8 Experimental procedure. Experiments started at 10:00 PM with preparations (wire up etc.). Sessions started at 11:30 PM and were continued hourly (upper time line). Each session started by calibration of EEG, EOG, and FMT Devices A, B, C (lower time line). During 40-min long driving in the simulator the subjects were asked every 2 min to speak a number between one and ten in order to rate their fatigue (KSS). Driving was followed by two vigilance tasks (CTT, PVT) and a short break
6 | Somnologie - Schlafforschung und Schlafmedizin 2010
Schwerpunkt
cedure of the driving simulation, as men-tioned above.
A short description of the applied non-linear discriminant analysis follows. The general aim is to find a function which op-timally separates the data set according to the class labels. For this, the signals have to be transformed to the feature space. In the analysis presented here, every spec-tral band represents a feature. As men-tioned above, for PERCLOS signals 0.2-Hz wide bands in a range of 0–4 Hz has been chosen. This resulted in 21 features. For EEG/EOG signals 1.0-Hz wide bands in a range of 1–23 Hz was chosen, which resulted in 24 features per channel. Be-cause of nine EEG and two EOG channels, the dimensionality of the EEG/EOG fea-ture space was 11×24=264. Discriminant analysis must search for an optimal sep-arating function in such high dimension-al spaces. To limit the number of parame-ters, primarily linear separating functions (i.e. hyperplanes) are utilized.
Though we have a linear function in the transformed space, the resulting func-tions in the original feature space are non-linear. The degree of nonlinearity can be tuned over a wide range by utilizing differ-ent so-called kernel functions. An impor-tant step of discriminant analysis is the es-timation of the true error of classification. This is usually done by cross validation where most of the data are processed in order to optimize the discriminant func-tion, but a relatively small amount of da-
ta is hidden. If optimization is finished, then this “unknown” data are applied to test the optimized function. The number of incorrect classifications for the test data set should be as low as possible. Normal-izing only this number to the number of all classifications (correct and incorrect) yields the test error. The partitioning of the whole data set in a large set for opti-mization and a small set for testing has to be done randomly and has to be repeated many times (e.g., 50 times). It is then pos-
sible to estimate mean and standard devi-ations over all outcomes of test errors. The mean value is used as an estimator of the true error of classification.
Results
First the PERCLOS measures of the three FMT devices (A, B, C) were con-sidered on a rough temporal resolu-tion (. Fig. �). The objective perfor-mance measure (SDL), the subjective fa-
Num
ber o
f Seg
men
ts250
200
150
100
50
01 2 3 4 5 6 7 8 9 10
KSS
Class 1 Class 2
Fig. 3 8 Histogram of the subjective measure of driver fatigue, i.e., self-rat-ings on the Karolinska sleepiness scale (KSS). An arbitrary threshold (vertical line) was defined to have two classes (Class 1 mild fatigue, Class 2 strong fa-tigue). The two classes were needed for discriminant analysis
1200
1000
800
600
400
200
00 5 10 15 20 25 30 35
SDL [%]
Class 1 Class 2
Num
ber o
f Seg
men
ts
Fig. 4 8 Histogram of the objective measure of driver fatigue, i.e., standard deviation of lateral position in lane (SDL). An arbitrary threshold (vertical line) was defined to have two classes (Class 1 high performance, Class 2 low performance). The two classes were needed for discriminant analysis
0.3
0.25
0.2
0.15
0.1Nor
mal
ized
Mea
sure
0.05
01 2 3 4 5 6 7 8
Session Number
KSSSDLPA
PB
PC
0.97
0.94
0.90
0.94
0.95
0.97
Fig. 5 8 Mean and standard deviations of five measured variables, i.e., standard deviation of lateral position in lane (SDL), self-ratings on the Karolinska sleepiness scale (KSS), percentage of eye closures (PERCLOS) of FMT devices A, B, C. The latter are abbreviated as PA, PB, PC. All variables were average session values for all subjects. Pearson’s correlation coefficients (n=208) between SDL and PA, PB, PC as well as between KSS and PA, PB, and PC are listed (inset)
�Somnologie - Schlafforschung und Schlafmedizin 2010 |

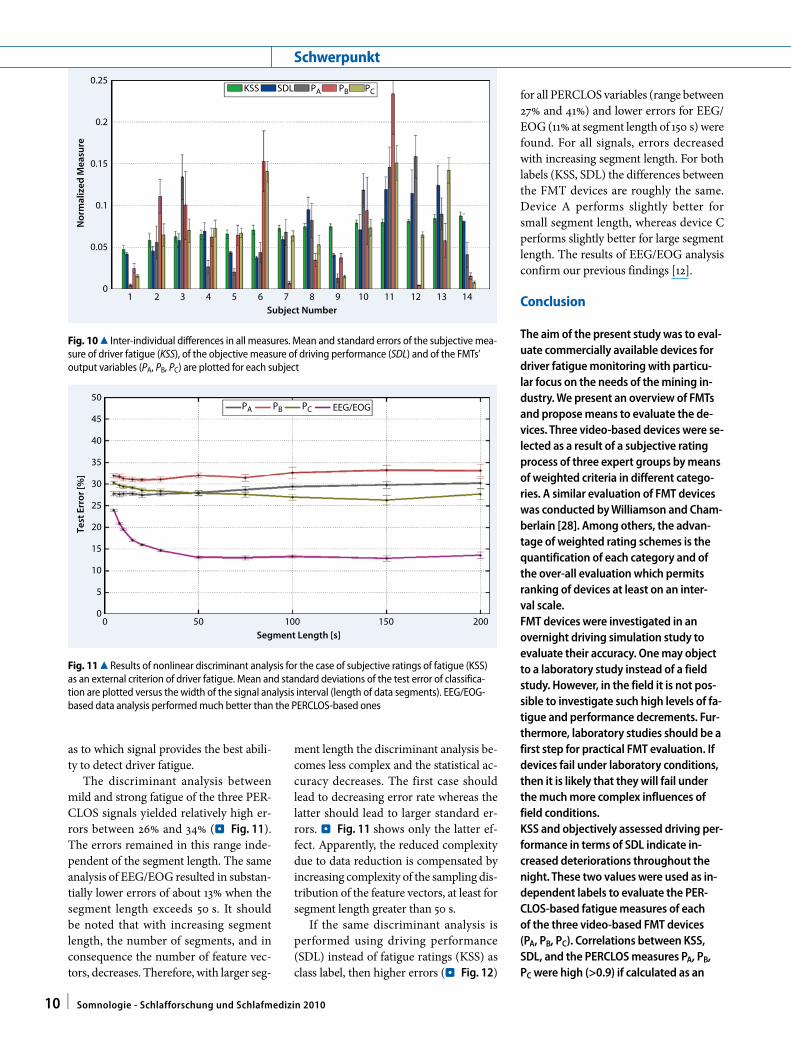
tigue measure (KSS), and the FMT out-put variables (PA, PB, PC) were averaged over the whole driving time (40 min) and across all subjects. In order to compare all variables, each was normalized to its total sum, so that each variable sums up to 100% over the whole time. As expect-ed, KSS values increased on average with time since sleep (i.e., sustained wakeful-ness) and had maximal values between 5:00 AM and 7:00 AM due to the time of day effect, i.e., circadian variation. Rough-ly the same was observed for the SDL val-ues. Deteriorations in lane tracking, as a measure of driving performance, are re-flected by SDL. In the mean, they progres-
sively increased throughout the night and peaked at 6:00 AM. There are some indi-cations of increased driving performance in the last session, possibly caused by the circadian rhythm. The course of the mean KSS values and the mean SDL are mir-rored by the mean PERCLOS measures of all three devices (PA, PB, PC). Compar-ing these measures with each other yield-ed large differences in session 1, 2, 6, and 7. On average, subjects over- and underesti-mated their subjective fatigue levels com-pared to their driving performance before and after the break, respectively. Over-all, high correlation coefficients between KSS and each of the PERCLOS variables,
as well as between SDL and each of the PERCLOS variables were obtained. These results indicate that PERCLOS is a strong indicator of driver fatigue for highly av-eraged data.
At higher temporal resolution, all da-ta were analyzed within each session (. Fig. 6, �). In non-overlapping 3-min intervals, mean and standard deviations of all five variables were calculated. Av-eraging across subjects was maintained. This resulted in 13 mean values for each variable in each session. For comparison, all measures were scaled equally by setting the minimum to zero and the maximum to one for each measured time series (min-
1
PA
PB
PC
PAPBPC
Session 1 Session 2 Session 3 Session 4 Break Session 5 Session 6 Session 7 Session 8
0.5
0
0.5
Nor
mal
ized
Mea
sure
0
0.5
0
0.5
012pm 1am 2am 3am
Time of Day4am 5am 6am 7am
0.650.33
0.72
0.81 0.790.890.95
0.370.48
0.680.92
0.750.890.89
0.82
0.710.410.78
0.600.83
0.120.34
0.43
0.12
SDL
Fig. 6 9 Mean and stan-dard deviations of the driv-ing performance mea-sure (SDL) and the FMTs output variables (PA, PB, PC). All variables were av-eraged over 3-min inter-vals and across all subjects. Pearson’s correlation coef-ficients (n=208) between SDL and PA, PB, and PC for each session are listed (up-per part)
1
0.390.830.95
KSS
PA
PB
PC
PAPBPC
0.760.290.96
0.770.650.96
0.890.550.97
0.950.820.92
0.930.790.79
0.890.720.63
0.910.250.39
Session 1 Session 2 Session 3 Session 4 Break Session 5 Session 6 Session 7 Session 8
0.5
0
0.5
Nor
mal
ized
Mea
sure
0
0.5
0
0.5
012pm 1am 2am 3am
Time of Day4am 5am 6am 7am
Fig. 7 9 Mean and stan-dard deviations of the sub-jective measure of driver fa-tigue (KSS) and the FMTs output variables (PA, PB, PC). All variables were av-eraged over 3-min inter-vals and across all subjects. Pearson’s correlation coef-ficients (n=208) between KSS and PA, PB, and PC for each session are listed (up-per part)
� | Somnologie - Schlafforschung und Schlafmedizin 2010
Schwerpunkt
max scaling). The mean values of all mea-sures, especially KSS, were influenced by time-on-task effects during all driving ses-sions. Calculations revealed fluctuations of the FMT variables which are not eas-ily explainable by performance (SDL) or fatigue (KSS) measures. In consequence, correlation coefficients broke down con-siderably. Even in sessions 1–4, where mild and mid-range fatigue was rated, correla-tions diminished. Only sessions 5, 6, and 7 displayed high correlations.
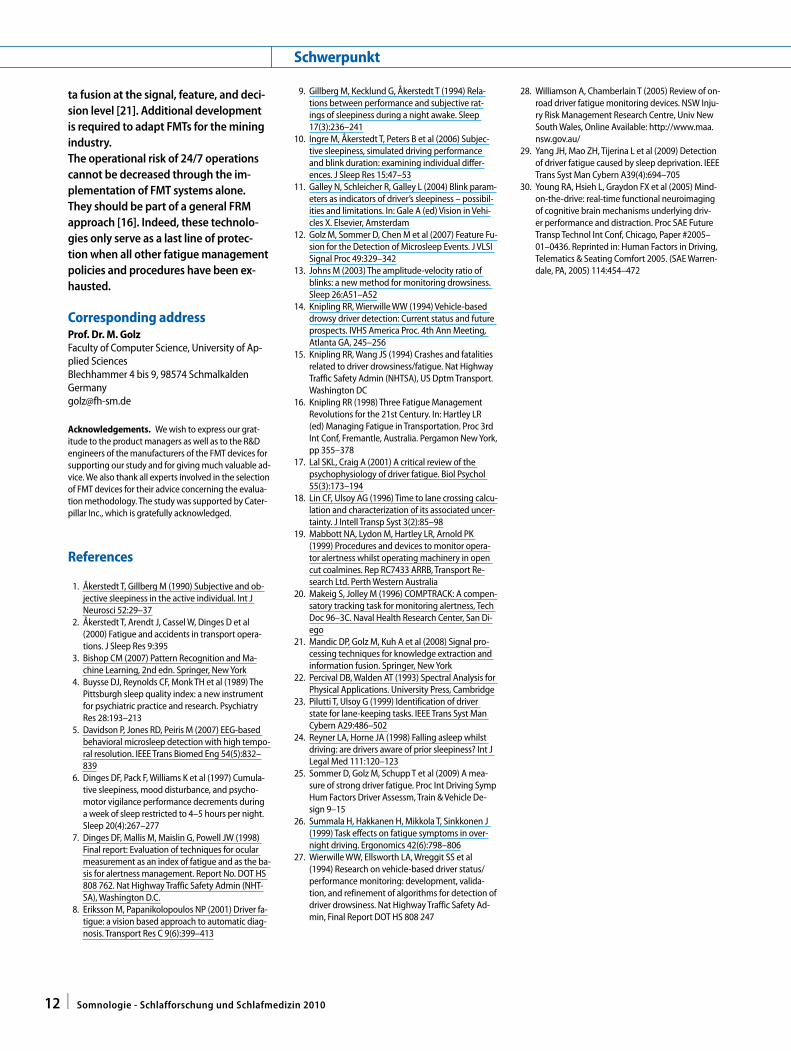
As a consequence, analysis without any averaging was performed, i.e., no av-eraging across subjects and no averaging over some time intervals. For illustration, the results of two subjects are presented (. Fig. �, 9). It should be noted that here the lateral position in lane (L) not SDL is plotted as driving performance measure. Subject #2 during session #5 had some difficulties keeping in lane as indicated by variations of L in the medium range. He committed several serious driving er-rors, indicated as crashes, and had high fa-tigue ratings (KSS), but the PERCLOS val-ues stayed on a low level, indicating low driver fatigue (. Fig. �). More examples of individual subjects and sessions, where all three FMTs failed with missing errors, were observed within the present study. As an example of high hit rates, results of sub-ject #11 during session #6 (. Fig. 9) dem-onstrate significant difficulties keeping in lane. He committed many serious driving errors, indicated as crashes, and had high fatigue ratings (KSS), and the PERCLOS values moved to medium and high lev-els indicating strong driver fatigue. There were sessions with no driving errors and low PERCLOS values (correct rejections), and some sessions with no driving errors and high PERCLOS values (false alarms).
Overall, the study showed large in-ter-individual difference in all measures (. Fig. 10). In order to compare all vari-ables, each was normalized to its total sum, so that each variable sums up to 100% across all subjects. Subjects were arranged in order of increasing KSS. For several subjects (#5, #6, #9) SDL is low, whereas for others (#8, #11–13) SDL is high compared to KSS. Much more disagree-ments were provided by PERCLOS of all three FMT devices in relation to KSS and SDL. The large intra-subject differences
between the PERCLOS variables are al-so troubling. The only satisfactory agree-ment between all measures was found for one subject (#10).
To explain these large inter- and intra-individual differences, 3-min segments of the PERCLOS time series PA(t), PB(t), and PC(t) were analyzed on a more general level using pattern recognition techniques combined with methods of computation-al intelligence. For simplicity, it was only asked how well they may discriminate be-tween mild and strong self-rated fatigue, and alternately, how well they discrimi-
nate between high and low lane tracking performance. In addition, the same time series analysis was performed on EEG/EOG recorded simultaneously to PER-CLOS. Under the assumption that fa-tigue, as well as performance decrements, originate in the central nervous system, the EEG is a more direct measure than EOG and PERCLOS. Despite this, all sig-nals were covered by noise and by many other signal components not tightly re-lated to fatigue and performance decre-ments. Therefore, it is an open question
KSS L Accident PA PB PC
Nor
mal
ized
Mea
sure
1
0.5
0
0.5
0
0.6
0.5
0.4
0.3
0.2
0.1
0
Driving Time [min]0 5 10 15 20 25 30 35 40
Fig. 8 8 Measured variables of subject #2 during session #5 without any averaging. Times of crash-es are indicated by vertical lines (dashed). Subjective ratings of driver fatigue (KSS) were asked every 2 min during driving. Driving performance was estimated from the time series of the vehicles later-al position (L). The PERCLOS output of the three FMT devices (PA, PB, PC) indicates high values despite several crashes
KSS L Accident PA PB PC
Nor
mal
ized
Mea
sure
1
0.5
0
0.5
0
0.6
0.5
0.4
0.3
0.2
0.1
0
Driving Time [min]0 5 10 15 20 25 30 35 40
Fig. 9 8 Measured variables of subject #11 during session #6 without any averaging. Times of crash-es are indicated by vertical lines (dashed). Subjective ratings of driver fatigue (KSS) were asked every 2 min during driving. Driving performance was estimated from the time series of the vehicles lateral position in lane (L). The PERCLOS output of the three FMT devices (PA, PB, PC) indicates high values but not in close relation to crashes
9Somnologie - Schlafforschung und Schlafmedizin 2010 |
as to which signal provides the best abili-ty to detect driver fatigue.
The discriminant analysis between mild and strong fatigue of the three PER-CLOS signals yielded relatively high er-rors between 26% and 34% (. Fig. 11). The errors remained in this range inde-pendent of the segment length. The same analysis of EEG/EOG resulted in substan-tially lower errors of about 13% when the segment length exceeds 50 s. It should be noted that with increasing segment length, the number of segments, and in consequence the number of feature vec-tors, decreases. Therefore, with larger seg-
ment length the discriminant analysis be-comes less complex and the statistical ac-curacy decreases. The first case should lead to decreasing error rate whereas the latter should lead to larger standard er-rors. . Fig. 11 shows only the latter ef-fect. Apparently, the reduced complexity due to data reduction is compensated by increasing complexity of the sampling dis-tribution of the feature vectors, at least for segment length greater than 50 s.
If the same discriminant analysis is performed using driving performance (SDL) instead of fatigue ratings (KSS) as class label, then higher errors (. Fig. 12)
for all PERCLOS variables (range between 27% and 41%) and lower errors for EEG/EOG (11% at segment length of 150 s) were found. For all signals, errors decreased with increasing segment length. For both labels (KSS, SDL) the differences between the FMT devices are roughly the same. Device A performs slightly better for small segment length, whereas device C performs slightly better for large segment length. The results of EEG/EOG analysis confirm our previous findings [12].
Conclusion
The aim of the present study was to eval-uate commercially available devices for driver fatigue monitoring with particu-lar focus on the needs of the mining in-dustry. We present an overview of FMTs and propose means to evaluate the de-vices. Three video-based devices were se-lected as a result of a subjective rating process of three expert groups by means of weighted criteria in different catego-ries. A similar evaluation of FMT devices was conducted by Williamson and Cham-berlain [2�]. Among others, the advan-tage of weighted rating schemes is the quantification of each category and of the over-all evaluation which permits ranking of devices at least on an inter-val scale.FMT devices were investigated in an overnight driving simulation study to evaluate their accuracy. One may object to a laboratory study instead of a field study. However, in the field it is not pos-sible to investigate such high levels of fa-tigue and performance decrements. Fur-thermore, laboratory studies should be a first step for practical FMT evaluation. If devices fail under laboratory conditions, then it is likely that they will fail under the much more complex influences of field conditions.KSS and objectively assessed driving per-formance in terms of SDL indicate in-creased deteriorations throughout the night. These two values were used as in-dependent labels to evaluate the PER-CLOS-based fatigue measures of each of the three video-based FMT devices (PA, PB, PC). Correlations between KSS, SDL, and the PERCLOS measures PA, PB, PC were high (>0.9) if calculated as an
KSS SDL PA PB PC
0.2
0.25
0.15
0.1
Nor
mal
ized
Mea
sure
0.05
01 2 3 4 5 6 7
Subject Number8 9 10 11 12 13 14
Fig. 10 8 Inter-individual differences in all measures. Mean and standard errors of the subjective mea-sure of driver fatigue (KSS), of the objective measure of driving performance (SDL) and of the FMTs’ output variables (PA, PB, PC) are plotted for each subject
50PA PB PC EEG/EOG
45
40
35
30
25
Test
Err
or [%
]
20
15
10
5
00 50 100
Segment Length [s]150 200
Fig. 11 8 Results of nonlinear discriminant analysis for the case of subjective ratings of fatigue (KSS) as an external criterion of driver fatigue. Mean and standard deviations of the test error of classifica-tion are plotted versus the width of the signal analysis interval (length of data segments). EEG/EOG-based data analysis performed much better than the PERCLOS-based ones
10 | Somnologie - Schlafforschung und Schlafmedizin 2010
Schwerpunkt

overall mean value across all subjects and over the whole time of driving with-in each driving session. Increasing the time resolution of the data analysis from 40 min to 3 min decreased the correla-tion coefficients substantially. They var-ied largely between different sessions (0.12–0.92) as well as between the three FMT devices. Moreover, with more detail, the correlation coefficients of single sub-jects and sessions on a second-by-second scale show a contradicting picture. First-ly, the PERCLOS time courses of all three FMT devices (PA, PB, PC) differ substan-tially. Secondly, frequent driving perfor-mance decrements, in terms of crashes or subjectively rated strong fatigue, were detected by the FMT devices, but some-times not. Clearly, this is not sufficient for FMTs as a tool to prevent crashes in the field. In addition, if correlation anal-ysis was performed on a subject-by-sub-ject basis, then substantial individual dif-ferences arose. For example, there were single subjects without driving error and crashes, but with substantially high PER-CLOS values. In contrast, there were sin-gle subjects with several crashes, but no indications of danger were provided by the FMTs outputs. Across all subjects and all sessions of this laboratory study we found a large variety of different correla-tion coefficients between KSS, SDL, and the FMTs’ output variables PA, PB, PC. This raises questions about the concept of the FMT devices based on the PERCLOS mea-sure. Why should they rely solely on a single fatigue measure such as PERCLOS? Intra-system video analysis provides ad-ditional information about oculomo-toric movements which have been hith-erto ignored by the calculation of a fa-tigue measure. And why is PERCLOS anal-ysis limited to threshold comparison? It is well known that threshold approach-es have general weaknesses if applied for detection tasks.Therefore, the general ability of the PER-CLOS measure of all three FMT devices to distinguish between mild and strong fatigue was of peculiar interest. As a benchmark, a combination of EEG/EOG instead of PERCLOS as input signals were used in the same framework of data anal-ysis. It has been shown recently that the combination of EEG and EOG is a proper
measure of strong fatigue when modern computational intelligence methods are utilized [2�]. The resulting mean error of discrimination between mild and strong fatigue was 13% and 10% for KSS and SDL labels, respectively, when EEG/EOG were analyzed. On the other hand, dis-criminant analysis of all three PERCLOS signals provided mean errors between 26% and 32% for KSS and between 26% and 42% for SDL labels, respectively. In contradiction to the results of Dinges et al. [�], this shows that PERCLOS seems to carry less information on drivers’ fatigue than EEG combined with EOG.Similar conclusions were reached by Johns [13]. He pointed out that under demands of sustained attention, some sleep-deprived subjects fall asleep while their eyes remain open. Unfortunate-ly, PERCLOS does not include any assess-ment of eye and eye lid movements. Im-portant dynamic characteristics which are widely accepted, such as slow rolling eye movements, reductions in maximal saccadic speed, or in velocity of eye lid reopening [11] are ignored. Their spec-tral characteristics were picked up in our study through EOG and may account for the far better results of EEG/EOG data fu-sion presented here. It should be not-ed that highly dynamical alterations are better reflected by EOG and by eye track-ing signals than by integral measures like PERCLOS. Nevertheless, adaptive sig-
nal analysis of EEG without EOG in com-bination with artificial neural networks resulted in high detection performance [�]. Alternatively, Young et al. [30] dem-onstrated how to utilize functional mag-netic resonance imaging and magne-toencephalography to measure driving performance decrements. These meth-ods make it possible to locate essential brain activated structures and their cor-responding temporal dynamics. This may help in the future to explain the large in-ter-individual differences of performance under fatigue.Even if video-based FMTs which track fa-tigue on the subject level well were avail-able, there is still the question of how the driver state is correlated to driving per-formance and vehicle status. There are situations in which the vehicle velocity is zero or close to zero where the driver-based FMTs would trigger an annoying alarm. Future FMTs have to be based on data fusion concepts [21, 29] which take inputs about driver and vehicle state in-to account.The issues discussed above will be criti-cally important for technology develop-ers to understand individual differenc-es and to ensure that the FMTs are equal-ly effective for all individuals operating in nearly the same environments. Fur-thermore, these data suggest that more work should be done to increase the ro-bustness of FMTs using concepts of da-
50PA PB PC EEG/EOG
45
40
35
30
25
Test
Err
or [%
]
20
15
10
5
00 50 100
Segment Length [s]150 200
Fig. 12 8 Results of nonlinear discriminant analysis for the case of driving performance (SDL) as an external criterion of driver fatigue. Mean and standard deviations of the test error of classification are plotted versus the width of the signal analysis interval (length of data segments). EEG/EOG-based data analysis performed much better than the PERCLOS-based ones
11Somnologie - Schlafforschung und Schlafmedizin 2010 |
ta fusion at the signal, feature, and deci-sion level [21]. Additional development is required to adapt FMTs for the mining industry.The operational risk of 24/� operations cannot be decreased through the im-plementation of FMT systems alone. They should be part of a general FRM approach [16]. Indeed, these technolo-gies only serve as a last line of protec-tion when all other fatigue management policies and procedures have been ex-hausted.
Corresponding addressProf. Dr. M. GolzFaculty of Computer Science, University of Ap-plied SciencesBlechhammer 4 bis 9, 98574 [email protected]
Acknowledgements. We wish to express our grat-itude to the product managers as well as to the R&D engineers of the manufacturers of the FMT devices for supporting our study and for giving much valuable ad-vice. We also thank all experts involved in the selection of FMT devices for their advice concerning the evalua-tion methodology. The study was supported by Cater-pillar Inc., which is gratefully acknowledged.
References
1. Åkerstedt T, Gillberg M (1990) Subjective and ob-jective sleepiness in the active individual. Int J Neurosci 52:29–37
2. Åkerstedt T, Arendt J, Cassel W, Dinges D et al (2000) Fatigue and accidents in transport opera-tions. J Sleep Res 9:395
3. Bishop CM (2007) Pattern Recognition and Ma-chine Learning, 2nd edn. Springer, New York
4. Buysse DJ, Reynolds CF, Monk TH et al (1989) The Pittsburgh sleep quality index: a new instrument for psychiatric practice and research. Psychiatry Res 28:193–213
5. Davidson P, Jones RD, Peiris M (2007) EEG-based behavioral microsleep detection with high tempo-ral resolution. IEEE Trans Biomed Eng 54(5):832–839
6. Dinges DF, Pack F, Williams K et al (1997) Cumula-tive sleepiness, mood disturbance, and psycho-motor vigilance performance decrements during a week of sleep restricted to 4–5 hours per night. Sleep 20(4):267–277
7. Dinges DF, Mallis M, Maislin G, Powell JW (1998) Final report: Evaluation of techniques for ocular measurement as an index of fatigue and as the ba-sis for alertness management. Report No. DOT HS 808 762. Nat Highway Traffic Safety Admin (NHT-SA), Washington D.C.
8. Eriksson M, Papanikolopoulos NP (2001) Driver fa-tigue: a vision based approach to automatic diag-nosis. Transport Res C 9(6):399–413
9. Gillberg M, Kecklund G, Åkerstedt T (1994) Rela-tions between performance and subjective rat-ings of sleepiness during a night awake. Sleep 17(3):236–241
10. Ingre M, Åkerstedt T, Peters B et al (2006) Subjec-tive sleepiness, simulated driving performance and blink duration: examining individual differ-ences. J Sleep Res 15:47–53
11. Galley N, Schleicher R, Galley L (2004) Blink param-eters as indicators of driver’s sleepiness – possibil-ities and limitations. In: Gale A (ed) Vision in Vehi-cles X. Elsevier, Amsterdam
12. Golz M, Sommer D, Chen M et al (2007) Feature Fu-sion for the Detection of Microsleep Events. J VLSI Signal Proc 49:329–342
13. Johns M (2003) The amplitude-velocity ratio of blinks: a new method for monitoring drowsiness. Sleep 26:A51–A52
14. Knipling RR, Wierwille WW (1994) Vehicle-based drowsy driver detection: Current status and future prospects. IVHS America Proc. 4th Ann Meeting, Atlanta GA, 245–256
15. Knipling RR, Wang JS (1994) Crashes and fatalities related to driver drowsiness/fatigue. Nat Highway Traffic Safety Admin (NHTSA), US Dptm Transport. Washington DC
16. Knipling RR (1998) Three Fatigue Management Revolutions for the 21st Century. In: Hartley LR (ed) Managing Fatigue in Transportation. Proc 3rd Int Conf, Fremantle, Australia. Pergamon New York, pp 355–378
17. Lal SKL, Craig A (2001) A critical review of the psychophysiology of driver fatigue. Biol Psychol 55(3):173–194
18. Lin CF, Ulsoy AG (1996) Time to lane crossing calcu-lation and characterization of its associated uncer-tainty. J Intell Transp Syst 3(2):85–98
19. Mabbott NA, Lydon M, Hartley LR, Arnold PK (1999) Procedures and devices to monitor opera-tor alertness whilst operating machinery in open cut coalmines. Rep RC7433 ARRB, Transport Re-search Ltd. Perth Western Australia
20. Makeig S, Jolley M (1996) COMPTRACK: A compen-satory tracking task for monitoring alertness, Tech Doc 96–3C. Naval Health Research Center, San Di-ego
21. Mandic DP, Golz M, Kuh A et al (2008) Signal pro-cessing techniques for knowledge extraction and information fusion. Springer, New York
22. Percival DB, Walden AT (1993) Spectral Analysis for Physical Applications. University Press, Cambridge
23. Pilutti T, Ulsoy G (1999) Identification of driver state for lane-keeping tasks. IEEE Trans Syst Man Cybern A29:486–502
24. Reyner LA, Horne JA (1998) Falling asleep whilst driving: are drivers aware of prior sleepiness? Int J Legal Med 111:120–123
25. Sommer D, Golz M, Schupp T et al (2009) A mea-sure of strong driver fatigue. Proc Int Driving Symp Hum Factors Driver Assessm, Train & Vehicle De-sign 9–15
26. Summala H, Hakkanen H, Mikkola T, Sinkkonen J (1999) Task effects on fatigue symptoms in over-night driving. Ergonomics 42(6):798–806
27. Wierwille WW, Ellsworth LA, Wreggit SS et al (1994) Research on vehicle-based driver status/performance monitoring: development, valida-tion, and refinement of algorithms for detection of driver drowsiness. Nat Highway Traffic Safety Ad-min, Final Report DOT HS 808 247
28. Williamson A, Chamberlain T (2005) Review of on-road driver fatigue monitoring devices. NSW Inju-ry Risk Management Research Centre, Univ New South Wales, Online Available: http://www.maa.nsw.gov.au/
29. Yang JH, Mao ZH, Tijerina L et al (2009) Detection of driver fatigue caused by sleep deprivation. IEEE Trans Syst Man Cybern A39(4):694–705
30. Young RA, Hsieh L, Graydon FX et al (2005) Mind-on-the-drive: real-time functional neuroimaging of cognitive brain mechanisms underlying driv-er performance and distraction. Proc SAE Future Transp Technol Int Conf, Chicago, Paper #2005–01–0436. Reprinted in: Human Factors in Driving, Telematics & Seating Comfort 2005. (SAE Warren-dale, PA, 2005) 114:454–472
12 | Somnologie - Schlafforschung und Schlafmedizin 2010
Schwerpunkt