Bilirubin From Heme Oxygenase1 Attenuates Vascular Endothelial Activation and Dysfunction
Upload
khangminh22Category
view
0download
0
Journal of
Clinical Medicine
Article
Evaluation of Vascular Endothelial Function in Childrenwith Type 1 Diabetes Mellitus
Karolina Nocun-Wasilewska 1, Danuta Zwolinska 1, Agnieszka Zubkiewicz-Kucharska 2
and Dorota Polak-Jonkisz 1,*
�����������������
Citation: Nocun-Wasilewska, K.;
Zwolinska, D.; Zubkiewicz-
Kucharska, A.; Polak-Jonkisz, D.
Evaluation of Vascular Endothelial
Function in Children with Type 1
Diabetes Mellitus. J. Clin. Med. 2021,
10, 5065. https://doi.org/10.3390/
jcm10215065
Academic Editor: Katarzyna
Taranta-Janusz
Received: 26 August 2021
Accepted: 26 October 2021
Published: 29 October 2021
Publisher’s Note: MDPI stays neutral
with regard to jurisdictional claims in
published maps and institutional affil-
iations.
Copyright: © 2021 by the authors.
Licensee MDPI, Basel, Switzerland.
This article is an open access article
distributed under the terms and
conditions of the Creative Commons
Attribution (CC BY) license (https://
creativecommons.org/licenses/by/
4.0/).
1 Department of Pediatric Nephrology, Wroclaw Medical Univeristy, 50-367 Wrocław, Poland;[email protected] (K.N.-W.); [email protected] (D.Z.)
2 Department of Pediatric Endocrinology and Diabetology, Wroclaw Medical University,50-367 Wrocław, Poland; [email protected]
* Correspondence: [email protected]; Tel.: +48-717364400; Fax: +48-717364409
Abstract: Diabetic kidney disease belongs to the major complications of diabetes mellitus. Here,hyperglycaemia is a key metabolic factor that causes endothelial dysfunction and vascular changeswithin the renal glomerulus. The aim of the present study was to assess the function of the vascularendothelium in children with type 1 diabetes mellitus (type 1 diabetes) by measuring selectedendothelial lesion markers in blood serum. The selected markers of endothelial lesions (sVCAM-1,sICAM-1, sE-SELECTIN, PAI-1, ADMA and RAGE) were assayed by the immunoenzymatic ELISAmethod. The study involved 66 patients (age: 5–18 years) with type 1 diabetes and 21 healthy controls(age: 5–16 years). In the type 1 diabetes patients, significantly higher concentrations of all of theassayed markers were observed compared to the healthy controls (p < 0.001). All of the evaluatedmarkers positively correlated with the disease duration, the age, and BMI of the patients, while onlyPAI-1 and sE-SELECTIN were characteristic of linear correlations with the estimated glomerularfiltration rate (eGFR). It can be concluded that endothelial inflammatory disease occurs in the earlystages of type 1 diabetes mellitus in children. The correlations between PAI-1, sE-SELECTIN, andeGFR suggest an advantage of these markers over other markers of endothelial dysfunction asprognostic factors for kidney dysfunction in children with type 1 diabetes.
Keywords: diabetic kidney disease; vascular endothelial markers; children; eGFR
1. Introduction
Diabetes is a significant health problem in children, including children who arevery young. Since the year 2006, it diabetes has been considered to be one of the mainhealth conditions with the potential of endangering public health around the world [1].Chronic hyperglycaemia results in the enhanced production of toxic oxygen derivativesthat, together with their impaired elimination by the antioxidative systems of the body,cause a specific status to emerge called “oxidative stress” [2–4]. This entails modifications inthe structures of proteins, lipids, carbohydrates, or nucleic acids, resulting in degenerativechanges to tissues, mainly those in the vascular area. Diabetic nephropathy, one of the mostserious complications of diabetes mellitus, as a clinical picture of renal microangiopathy,results from metabolic disturbances (the “glucotoxicity” effect) and coexisting inflammation.Pathomorphologic changes in the renal structure may be present at the time of diabetesdiagnosis, resulting in initial hypertrophy and hyperfunction at the early stages andthroughout albuminuria, eventually leading to end-stage renal failure.
An enhanced, non-enzymatic glycation of the basal lamina has been observed fromboth the glomeruli and the mesangial matrix and shows the formation of advanced glyca-tion products that contribute to the loss of the negative charge of the filtration membrane,increased intraglomerular pressure, and glomerular hyperfiltration [5]. At present, albumin-uria is considered the marker of generalised vascular endothelium damage [6]. However,
J. Clin. Med. 2021, 10, 5065. https://doi.org/10.3390/jcm10215065 https://www.mdpi.com/journal/jcm
J. Clin. Med. 2021, 10, 5065 2 of 15
the increased concentrations of inflammation indices can already be found during the earlyperiod where changes occur in the kidneys, which occur long before glomerulosclerosis andwhich may disappear after the metabolic balance of the disease is regained. The risk of theoccurrence and progression of chronic complications principally depend on the effectivemetabolic control of diabetes mellitus; therefore, people with well-controlled disease aremuch less likely to be endangered by chronic complications. In addition, extraglycaemicrisk factors of sclerosis, such as hypertension, hyperlipidemia, and obesity, also influencethe progression of vascular changes [7–9].
The vascular endothelium is the largest endothelial structure in the body and pro-duces numerous substances that maintain vascular homeostasis. Endothelial products,depending on their functions, are divided into three categories. These include vasomotorsubstances (e.g., asymmetric dimethylarginine-ADMA), substances affecting coagulationand fibrinolysis (e.g., plasminogen activator inhibitor-PAI-1), and substances regulatingvascular permeability and inflammatory processes (e.g., E-selectin, vascular adhesionmolecule-VCAM-1, intercellular adhesion molecule-ICAM-1). These markers, togetherwith circulating serum receptors for advanced glycation end-products-RAGE, are consid-ered as new biomarkers for endothelial damage and atherosclerosis development. Thisis because their high concentrations have been observed in cardiovascular diseases andbecause they have been shown to correlate with the presence of cardiovascular risk factors.What is more, their baseline value decreases after statin therapy [10]. The very fact thattheir expression is increased by inflammatory mediators such as IL-1, TNF, and LPS iscertainly not without significance [11,12].
Taking into account the finding that chronic hyperglycemia is the most significant,unfavourable factor and that it affects the endothelial cells in particular, the identification ofreliable markers of progressive endothelium dysfunction seems to be a primary objective.The existing knowledge gap as to whether biomarkers of inflammation and endothelialdysfunction are associated with prognosis in type 1 diabetes needs to be filled. [9].
The Aim of the Study
The aim of this study was to assess the vascular endothelium function in children withtype 1 diabetes mellitus (type 1 diabetes, DM1) based on selected markers of endotheliallesions such as sVCAM-1, sICAM-1, sE-SELECTIN, PAI-1, ADMA, and RAGE. The testsperformed in the present research were supplemented with an analysis of the effects oftype 1 diabetes duration, the degree of its metabolic balance, as well as of the effects of thepatient’s age, sex, and BMI on the extent of endothelial damage.
2. Materials and Methods
The prospective observational study involved sixty-six (66) children (36 boys and30 girls) with diagnosed type 1 diabetes who were being treated at the Department ofPediatric Endocrinology and Diabetology at the University Hospital. The presence of otherchronic diseases that could have been either inflammatory or influential for the selectedparameters were excluded.
The control group included twenty-one (21) healthy children (10 boys and 11 girls).The control children were hospitalized at the Department of Pediatric Nephrology atthe University Hospital due to suspected urinary tract abnormalities or bedwetting. Onthe basis of the diagnostic examinations performed at that time, the above-mentionedabnormalities were excluded.
Anthropometric measurements were conducted in both the group of children withtype 1 diabetes (the study group) and the control group and included body height andweight with body mass index (BMI) estimation measurements as per the BMI centile chartsdeveloped by the WHO (see the WHO Child Growth Standards). The study patients werequalified to four (4) groups depending on their nutrition status: UN—undernourishedchildren (BMI < 15 centiles), N-properly nourished children (BMI < 15–85 centiles), OV—children with overweight (BMI 85–90 centiles), and O—obese children (BMI ≥ 90 centiles).
J. Clin. Med. 2021, 10, 5065 3 of 15
Blood and urine from the patients were used as the research material. Blood wascollected in the morning from the veins of the elbow fossa into tubes without anticoagulant(the so-called “clot”) a minimum of 12 h after the patient had last ingested food or fluids.Then, the blood samples were centrifuged for 15 min at +4 ◦C at 1000× g. The obtainedserum, which was necessary for the determination of the vascular endothelial damagemarkers (sVCAM-1, sICAM-1, sE-SELECTIN, ADMA, PAI-1, RAGE), was stored in Eppen-dorf tubes in the amount of approx. 400 µL and at a temperature −70 ◦C until the planneddeterminations were made.
Albuminuria was assessed by the immunoturbidimetric method, having collected a24 h urine sample.
All of the studied endothelial inflammation markers were assayed by means of theimmunoenzymatic ELISA test and by its variant, i.e., the so-called “sandwich” ELISA(a double-binding test) in particular, where the antigen is bound between two layers ofantibodies [13,14]. The assays were conducted using the following sets: R&D Systems(sICAM-1, sVCAM-1, sE-SELECTIN, PAI-1) and Wuhan EIAab Science (RAGE, ADMA),according to the manufacturer’s instructions. The degree of metabolic DM control wasevaluated using the HbA1c concentration measured with high-performance liquid chro-matography (HPLC). The eGFR value was assessed on the basis of serum creatinineconcentration and was assayed by the Jaffe method and the Schwartz formula.
k-factor: 0.33—low birth weight infants; 0.45—normal birth weight infants; 0.55—children 2–12 years; 0.55—girls 13 years and older; 0.70—boys 13 years and older [15,16].The results were related to age- and sex-specific norms for children.
Ethical Issues
A statistical analysis was conducted by means of the Statistica software (TIBCOSoftware Inc. (2017). Statistica (data analysis software system), version 13. http://statistica.io (accessed on 25 August 2021)). A single-factor analysis of variance (ANOVA) was appliedfor the statistical material analysis using Tukey’s post hoc test or the Mann–Whitneynonparametric test. The correlation among continuous features was also determined usingthe Spearman correlation coefficient. The studied continuous features were characterisedby their distribution parameters, i.e., the mean value, the standard deviation (SD), and thesample size (N).
Two-sided p-values less than 0.05 were considered significant. Calculated p-valueswere not adjusted for multiple testing. Standard boxplots with bold lines indicating medianvalue were made, with the upper and lower edges of the box showing the first quantileand third quantile results. Black dots are individual data points.
3. Results
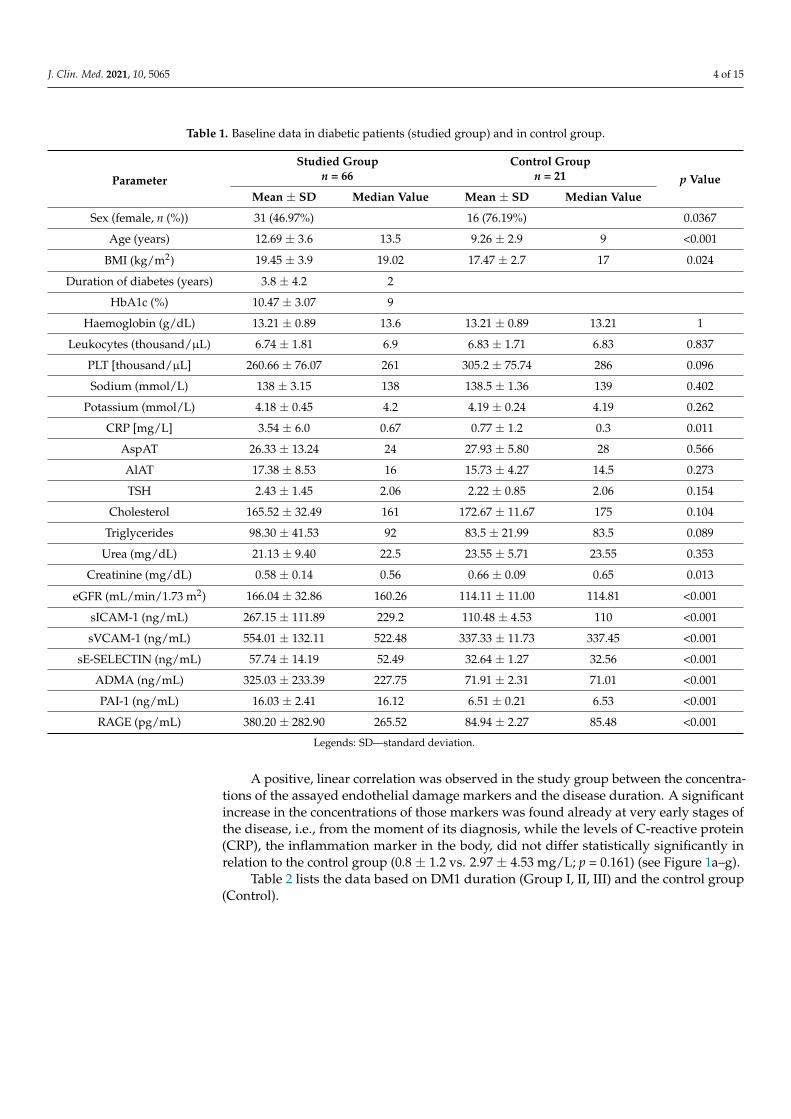
The clinical characteristics of the study groups are present Table 1. Compared to thecontrol group, the DM1 group had significantly higher age, BMI, CRP, and percentage ofmales (see Table 1).
The children with type 1 diabetes demonstrated significantly higher concentrationsof all of the studied markers of vascular endothelial damage, i.e., sICAM-1, sVCAM-1,sE-SELECTIN, ADMA, PAI-1 and RAGE, when compared to the corresponding values inthe control group (see Table 1).
For all of the studied biomarkers, the minimal values in the DM1 group were higherthan the maximal values in the control group: the sICAM-1 ranged from 102.55 to 117.8in control group vs. from 162.41 to 425.35; sVCAM-1 ranged from 313.86 to 357.27 in thecontrol group vs. from 400.20 to 762.65; sE-SELECTIN ranged from 29.12 to 35.38 in thecontrol group vs. from 41.94 to 79.95; ADMA ranged from 68.49 to 75.81 in the controlgroup vs. from 104.71 to 693.67; PAI-1 ranged from 6.02 to 6.82 in the control group vs. from12.82 to 19.38; and RAGE ranged from 80.10 to 88.12 in the control group vs. from 114.47 to796.66. Thus, it was possible to predict DM1 based on each biomarker with 100% accuracy.
J. Clin. Med. 2021, 10, 5065 4 of 15
Table 1. Baseline data in diabetic patients (studied group) and in control group.
Parameter
Studied Groupn = 66
Control Groupn = 21 p Value
Mean ± SD Median Value Mean ± SD Median Value
Sex (female, n (%)) 31 (46.97%) 16 (76.19%) 0.0367
Age (years) 12.69 ± 3.6 13.5 9.26 ± 2.9 9 <0.001
BMI (kg/m2) 19.45 ± 3.9 19.02 17.47 ± 2.7 17 0.024
Duration of diabetes (years) 3.8 ± 4.2 2
HbA1c (%) 10.47 ± 3.07 9
Haemoglobin (g/dL) 13.21 ± 0.89 13.6 13.21 ± 0.89 13.21 1
Leukocytes (thousand/µL) 6.74 ± 1.81 6.9 6.83 ± 1.71 6.83 0.837
PLT [thousand/µL] 260.66 ± 76.07 261 305.2 ± 75.74 286 0.096
Sodium (mmol/L) 138 ± 3.15 138 138.5 ± 1.36 139 0.402
Potassium (mmol/L) 4.18 ± 0.45 4.2 4.19 ± 0.24 4.19 0.262
CRP [mg/L] 3.54 ± 6.0 0.67 0.77 ± 1.2 0.3 0.011
AspAT 26.33 ± 13.24 24 27.93 ± 5.80 28 0.566
AlAT 17.38 ± 8.53 16 15.73 ± 4.27 14.5 0.273
TSH 2.43 ± 1.45 2.06 2.22 ± 0.85 2.06 0.154
Cholesterol 165.52 ± 32.49 161 172.67 ± 11.67 175 0.104
Triglycerides 98.30 ± 41.53 92 83.5 ± 21.99 83.5 0.089
Urea (mg/dL) 21.13 ± 9.40 22.5 23.55 ± 5.71 23.55 0.353
Creatinine (mg/dL) 0.58 ± 0.14 0.56 0.66 ± 0.09 0.65 0.013
eGFR (mL/min/1.73 m2) 166.04 ± 32.86 160.26 114.11 ± 11.00 114.81 <0.001
sICAM-1 (ng/mL) 267.15 ± 111.89 229.2 110.48 ± 4.53 110 <0.001
sVCAM-1 (ng/mL) 554.01 ± 132.11 522.48 337.33 ± 11.73 337.45 <0.001
sE-SELECTIN (ng/mL) 57.74 ± 14.19 52.49 32.64 ± 1.27 32.56 <0.001
ADMA (ng/mL) 325.03 ± 233.39 227.75 71.91 ± 2.31 71.01 <0.001
PAI-1 (ng/mL) 16.03 ± 2.41 16.12 6.51 ± 0.21 6.53 <0.001
RAGE (pg/mL) 380.20 ± 282.90 265.52 84.94 ± 2.27 85.48 <0.001
Legends: SD—standard deviation.
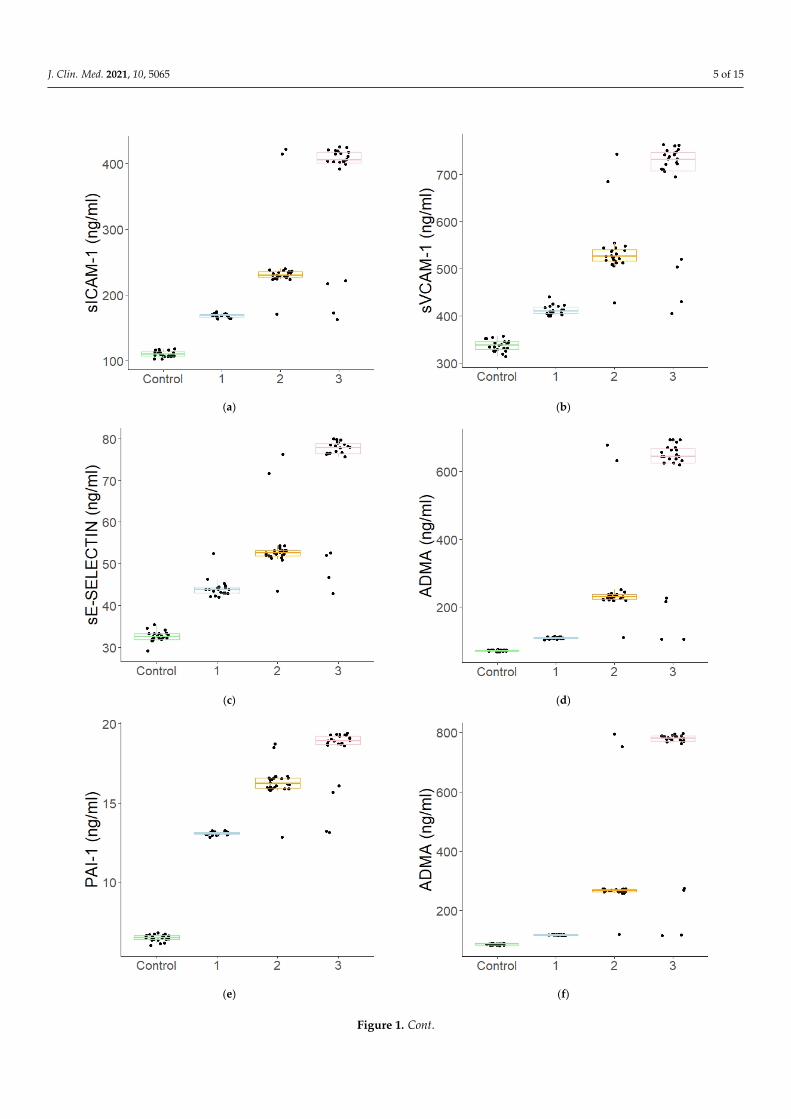
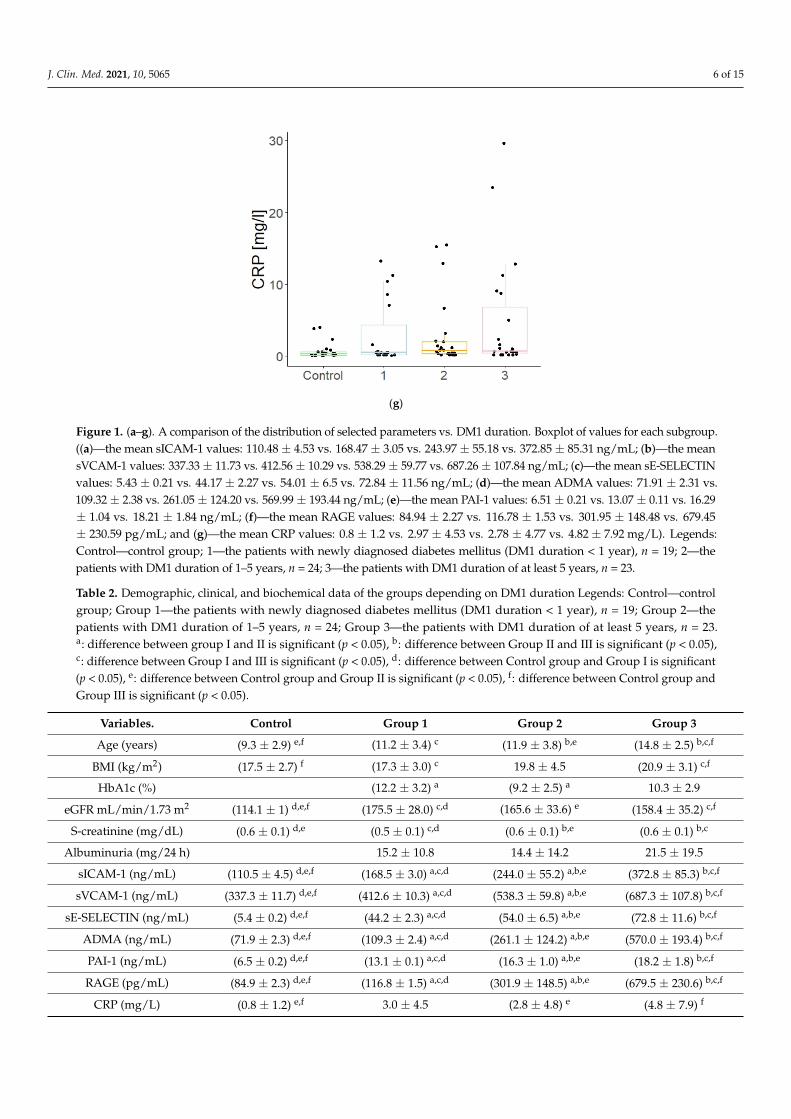
A positive, linear correlation was observed in the study group between the concentra-tions of the assayed endothelial damage markers and the disease duration. A significantincrease in the concentrations of those markers was found already at very early stages ofthe disease, i.e., from the moment of its diagnosis, while the levels of C-reactive protein(CRP), the inflammation marker in the body, did not differ statistically significantly inrelation to the control group (0.8 ± 1.2 vs. 2.97 ± 4.53 mg/L; p = 0.161) (see Figure 1a–g).
Table 2 lists the data based on DM1 duration (Group I, II, III) and the control group(Control).
J. Clin. Med. 2021, 10, 5065 5 of 15J. Clin. Med. 2021, 10, x FOR PEER REVIEW 5 of 15
(a) (b)
(c) (d)
(e) (f)
Figure 1. Cont.
J. Clin. Med. 2021, 10, 5065 6 of 15J. Clin. Med. 2021, 10, x FOR PEER REVIEW 6 of 15
(g)
Figure 1. (a–g). A comparison of the distribution of selected parameters vs. DM1 duration. Boxplot of values for each subgroup. ((a)—the mean sICAM-1 values: 110.48 ± 4.53 vs. 168.47 ± 3.05 vs. 243.97 ± 55.18 vs. 372.85 ± 85.31 ng/mL; (b)—the mean sVCAM-1 values: 337.33 ± 11.73 vs. 412.56 ± 10.29 vs. 538.29 ± 59.77 vs. 687.26 ± 107.84 ng/mL; (c)—the mean sE-SELECTIN values: 5.43 ± 0.21 vs. 44.17 ± 2.27 vs. 54.01 ± 6.5 vs. 72.84 ± 11.56 ng/mL; (d)—the mean ADMA values: 71.91 ± 2.31 vs. 109.32 ± 2.38 vs. 261.05 ± 124.20 vs. 569.99 ± 193.44 ng/mL; (e)—the mean PAI-1 values: 6.51 ± 0.21 vs. 13.07 ± 0.11 vs. 16.29 ± 1.04 vs. 18.21 ± 1.84 ng/mL; (f)—the mean RAGE values: 84.94 ± 2.27 vs. 116.78 ± 1.53 vs. 301.95 ± 148.48 vs. 679.45 ± 230.59 pg/mL; and (g)—the mean CRP values: 0.8 ± 1.2 vs. 2.97 ± 4.53 vs. 2.78 ± 4.77 vs. 4.82 ± 7.92 mg/L). Legends: Control—control group; 1—the patients with newly diagnosed diabetes mellitus (DM1 duration < 1 year), n = 19; 2—the patients with DM1 duration of 1–5 years, n = 24; 3—the patients with DM1 duration of at least 5 years, n = 23.
Table 2 lists the data based on DM1 duration (Group I, II, III) and the control group (Control).
Table 2. Demographic, clinical, and biochemical data of the groups depending on DM1 duration Legends: Control—con-trol group; Group 1—the patients with newly diagnosed diabetes mellitus (DM1 duration < 1 year), n = 19; Group 2—the patients with DM1 duration of 1–5 years, n = 24; Group 3—the patients with DM1 duration of at least 5 years, n = 23. a: difference between group I and II is significant (p < 0.05), b: difference between Group II and III is significant (p < 0.05), c: difference between Group I and III is significant (p < 0.05), d: difference between Control group and Group I is significant (p < 0.05), e: difference between Control group and Group II is significant (p < 0.05), f: difference between Control group and Group III is significant (p < 0.05).
Variables. Control Group 1 Group 2 Group 3 Age (years) (9.3 ± 2.9) e,f (11.2 ± 3.4) c (11.9 ± 3.8) b,e (14.8 ± 2.5) b,c,f BMI (kg/m2) (17.5 ± 2.7) f (17.3 ± 3.0) c 19.8 ± 4.5 (20.9 ± 3.1) c,f HbA1c (%) (12.2 ± 3.2) a (9.2 ± 2.5) a 10.3 ± 2.9
eGFR mL/min/1.73 m2 (114.1 ± 1) d,e,f (175.5 ± 28.0) c,d (165.6 ± 33.6) e (158.4 ± 35.2) c,f S-creatinine (mg/dL) (0.6 ± 0.1) d,e (0.5 ± 0.1) c,d (0.6 ± 0.1) b,e (0.6 ± 0.1) b,c
Albuminuria (mg/24 h) 15.2 ± 10.8 14.4 ± 14.2 21.5 ± 19.5 sICAM-1 (ng/mL) (110.5 ± 4.5) d,e,f (168.5 ± 3.0) a,c,d (244.0 ± 55.2) a,b,e (372.8 ± 85.3) b,c,f sVCAM-1 (ng/mL) (337.3 ± 11.7) d,e,f (412.6 ± 10.3) a,c,d (538.3 ± 59.8) a,b,e (687.3 ± 107.8) b,c,f
sE-SELECTIN (ng/mL) (5.4 ± 0.2) d,e,f (44.2 ± 2.3) a,c,d (54.0 ± 6.5) a,b,e (72.8 ± 11.6) b,c,f ADMA (ng/mL) (71.9 ± 2.3) d,e,f (109.3 ± 2.4) a,c,d (261.1 ± 124.2) a,b,e (570.0 ± 193.4) b,c,f PAI-1 (ng/mL) (6.5 ± 0.2) d,e,f (13.1 ± 0.1) a,c,d (16.3 ± 1.0) a,b,e (18.2 ± 1.8) b,c,f RAGE (pg/mL) (84.9 ± 2.3) d,e,f (116.8 ± 1.5) a,c,d (301.9 ± 148.5) a,b,e (679.5 ± 230.6) b,c,f
CRP (mg/L) (0.8 ± 1.2) e,f 3.0 ± 4.5 (2.8 ± 4.8) e (4.8 ± 7.9) f
Figure 1. (a–g). A comparison of the distribution of selected parameters vs. DM1 duration. Boxplot of values for each subgroup.((a)—the mean sICAM-1 values: 110.48 ± 4.53 vs. 168.47 ± 3.05 vs. 243.97 ± 55.18 vs. 372.85 ± 85.31 ng/mL; (b)—the meansVCAM-1 values: 337.33 ± 11.73 vs. 412.56 ± 10.29 vs. 538.29 ± 59.77 vs. 687.26 ± 107.84 ng/mL; (c)—the mean sE-SELECTINvalues: 5.43 ± 0.21 vs. 44.17 ± 2.27 vs. 54.01 ± 6.5 vs. 72.84 ± 11.56 ng/mL; (d)—the mean ADMA values: 71.91 ± 2.31 vs.109.32 ± 2.38 vs. 261.05 ± 124.20 vs. 569.99 ± 193.44 ng/mL; (e)—the mean PAI-1 values: 6.51 ± 0.21 vs. 13.07 ± 0.11 vs. 16.29± 1.04 vs. 18.21 ± 1.84 ng/mL; (f)—the mean RAGE values: 84.94 ± 2.27 vs. 116.78 ± 1.53 vs. 301.95 ± 148.48 vs. 679.45± 230.59 pg/mL; and (g)—the mean CRP values: 0.8 ± 1.2 vs. 2.97 ± 4.53 vs. 2.78 ± 4.77 vs. 4.82 ± 7.92 mg/L). Legends:Control—control group; 1—the patients with newly diagnosed diabetes mellitus (DM1 duration < 1 year), n = 19; 2—thepatients with DM1 duration of 1–5 years, n = 24; 3—the patients with DM1 duration of at least 5 years, n = 23.
Table 2. Demographic, clinical, and biochemical data of the groups depending on DM1 duration Legends: Control—controlgroup; Group 1—the patients with newly diagnosed diabetes mellitus (DM1 duration < 1 year), n = 19; Group 2—thepatients with DM1 duration of 1–5 years, n = 24; Group 3—the patients with DM1 duration of at least 5 years, n = 23.a: difference between group I and II is significant (p < 0.05), b: difference between Group II and III is significant (p < 0.05),c: difference between Group I and III is significant (p < 0.05), d: difference between Control group and Group I is significant(p < 0.05), e: difference between Control group and Group II is significant (p < 0.05), f: difference between Control group andGroup III is significant (p < 0.05).
Variables. Control Group 1 Group 2 Group 3
Age (years) (9.3 ± 2.9) e,f (11.2 ± 3.4) c (11.9 ± 3.8) b,e (14.8 ± 2.5) b,c,f
BMI (kg/m2) (17.5 ± 2.7) f (17.3 ± 3.0) c 19.8 ± 4.5 (20.9 ± 3.1) c,f
HbA1c (%) (12.2 ± 3.2) a (9.2 ± 2.5) a 10.3 ± 2.9
eGFR mL/min/1.73 m2 (114.1 ± 1) d,e,f (175.5 ± 28.0) c,d (165.6 ± 33.6) e (158.4 ± 35.2) c,f
S-creatinine (mg/dL) (0.6 ± 0.1) d,e (0.5 ± 0.1) c,d (0.6 ± 0.1) b,e (0.6 ± 0.1) b,c
Albuminuria (mg/24 h) 15.2 ± 10.8 14.4 ± 14.2 21.5 ± 19.5
sICAM-1 (ng/mL) (110.5 ± 4.5) d,e,f (168.5 ± 3.0) a,c,d (244.0 ± 55.2) a,b,e (372.8 ± 85.3) b,c,f
sVCAM-1 (ng/mL) (337.3 ± 11.7) d,e,f (412.6 ± 10.3) a,c,d (538.3 ± 59.8) a,b,e (687.3 ± 107.8) b,c,f
sE-SELECTIN (ng/mL) (5.4 ± 0.2) d,e,f (44.2 ± 2.3) a,c,d (54.0 ± 6.5) a,b,e (72.8 ± 11.6) b,c,f
ADMA (ng/mL) (71.9 ± 2.3) d,e,f (109.3 ± 2.4) a,c,d (261.1 ± 124.2) a,b,e (570.0 ± 193.4) b,c,f
PAI-1 (ng/mL) (6.5 ± 0.2) d,e,f (13.1 ± 0.1) a,c,d (16.3 ± 1.0) a,b,e (18.2 ± 1.8) b,c,f
RAGE (pg/mL) (84.9 ± 2.3) d,e,f (116.8 ± 1.5) a,c,d (301.9 ± 148.5) a,b,e (679.5 ± 230.6) b,c,f
CRP (mg/L) (0.8 ± 1.2) e,f 3.0 ± 4.5 (2.8 ± 4.8) e (4.8 ± 7.9) f
J. Clin. Med. 2021, 10, 5065 7 of 15
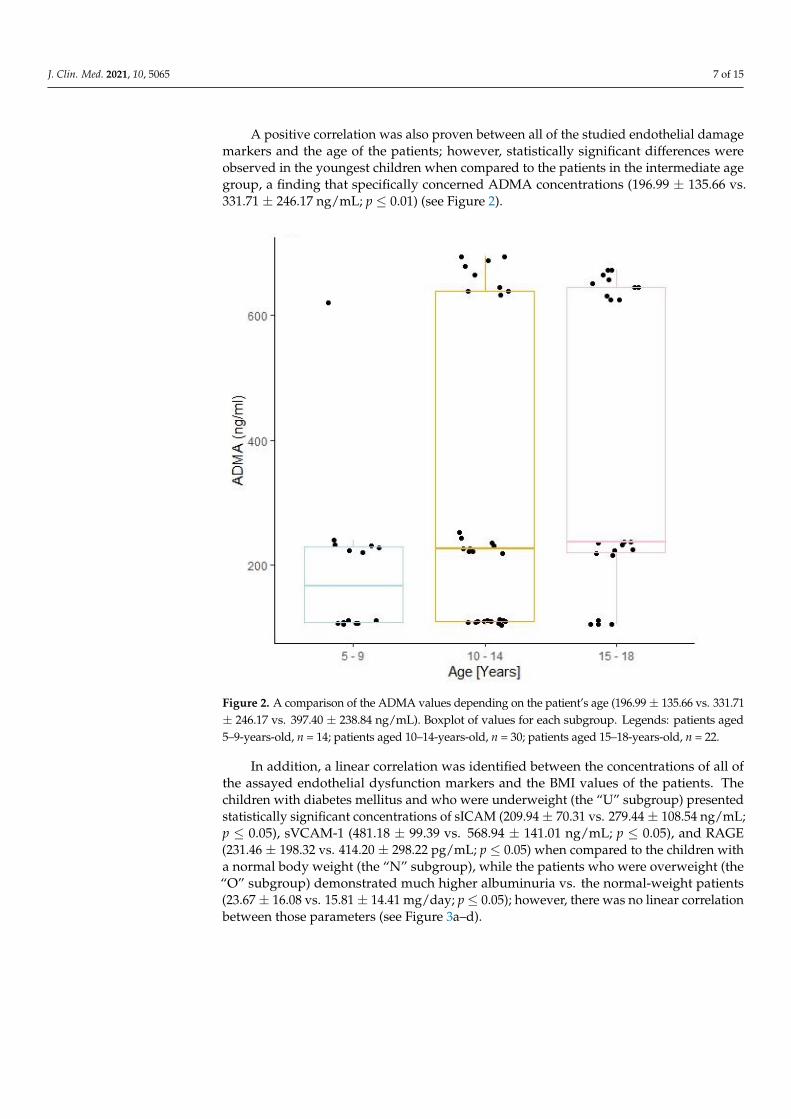
A positive correlation was also proven between all of the studied endothelial damagemarkers and the age of the patients; however, statistically significant differences wereobserved in the youngest children when compared to the patients in the intermediate agegroup, a finding that specifically concerned ADMA concentrations (196.99 ± 135.66 vs.331.71 ± 246.17 ng/mL; p ≤ 0.01) (see Figure 2).
J. Clin. Med. 2021, 10, x FOR PEER REVIEW 7 of 15
A positive correlation was also proven between all of the studied endothelial damage markers and the age of the patients; however, statistically significant differences were ob-served in the youngest children when compared to the patients in the intermediate age group, a finding that specifically concerned ADMA concentrations (196.99 ± 135.66 vs. 331.71 ± 246.17 ng/mL; p ≤ 0.01) (see Figure 2).
Figure 2. A comparison of the ADMA values depending on the patient’s age (196.99 ± 135.66 vs. 331.71 ± 246.17 vs. 397.40 ± 238.84 ng/mL). Boxplot of values for each subgroup. Legends: patients aged 5–9-years-old, n = 14; patients aged 10–14-years-old, n = 30; patients aged 15–18-years-old, n = 22.
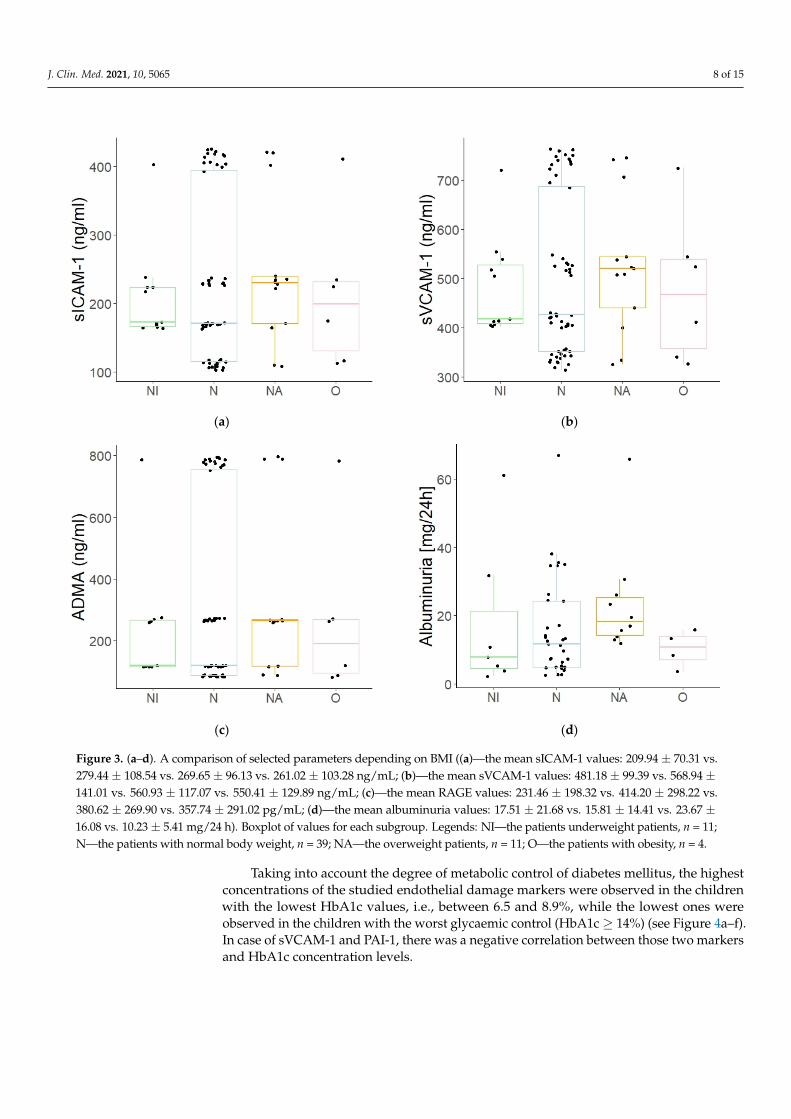
In addition, a linear correlation was identified between the concentrations of all of the assayed endothelial dysfunction markers and the BMI values of the patients. The chil-dren with diabetes mellitus and who were underweight (the “U” subgroup) presented statistically significant concentrations of sICAM (209.94 ± 70.31 vs. 279.44 ± 108.54 ng/mL; p ≤ 0.05), sVCAM-1 (481.18 ± 99.39 vs. 568.94 ± 141.01 ng/mL; p ≤ 0.05), and RAGE (231.46 ± 198.32 vs. 414.20 ± 298.22 pg/mL; p ≤ 0.05) when compared to the children with a normal body weight (the “N” subgroup), while the patients who were overweight (the “O” sub-group) demonstrated much higher albuminuria vs. the normal-weight patients (23.67 ± 16.08 vs. 15.81 ± 14.41 mg/day; p ≤ 0.05); however, there was no linear correlation between those parameters (see Figure 3a–d).
Figure 2. A comparison of the ADMA values depending on the patient’s age (196.99 ± 135.66 vs. 331.71± 246.17 vs. 397.40 ± 238.84 ng/mL). Boxplot of values for each subgroup. Legends: patients aged5–9-years-old, n = 14; patients aged 10–14-years-old, n = 30; patients aged 15–18-years-old, n = 22.
In addition, a linear correlation was identified between the concentrations of all ofthe assayed endothelial dysfunction markers and the BMI values of the patients. Thechildren with diabetes mellitus and who were underweight (the “U” subgroup) presentedstatistically significant concentrations of sICAM (209.94 ± 70.31 vs. 279.44 ± 108.54 ng/mL;p ≤ 0.05), sVCAM-1 (481.18 ± 99.39 vs. 568.94 ± 141.01 ng/mL; p ≤ 0.05), and RAGE(231.46 ± 198.32 vs. 414.20 ± 298.22 pg/mL; p ≤ 0.05) when compared to the children witha normal body weight (the “N” subgroup), while the patients who were overweight (the“O” subgroup) demonstrated much higher albuminuria vs. the normal-weight patients(23.67 ± 16.08 vs. 15.81 ± 14.41 mg/day; p ≤ 0.05); however, there was no linear correlationbetween those parameters (see Figure 3a–d).
J. Clin. Med. 2021, 10, 5065 8 of 15J. Clin. Med. 2021, 10, x FOR PEER REVIEW 8 of 15
(a) (b)
(c) (d)
Figure 3. (a–d). A comparison of selected parameters depending on BMI ((a)—the mean sICAM-1 values: 209.94 ± 70.31 vs. 279.44 ± 108.54 vs. 269.65 ± 96.13 vs. 261.02 ± 103.28 ng/mL; (b)—the mean sVCAM-1 values: 481.18 ± 99.39 vs. 568.94 ± 141.01 vs. 560.93 ± 117.07 vs. 550.41 ± 129.89 ng/mL; (c)—the mean RAGE values: 231.46 ± 198.32 vs. 414.20 ± 298.22 vs. 380.62 ± 269.90 vs. 357.74 ± 291.02 pg/mL; (d)—the mean albuminuria values: 17.51 ± 21.68 vs. 15.81 ± 14.41 vs. 23.67 ± 16.08 vs. 10.23 ± 5.41 mg/24 h). Boxplot of values for each subgroup. Legends: NI—the patients underweight patients, n = 11; N—the patients with normal body weight, n = 39; NA—the overweight patients, n = 11; O—the patients with obesity, n = 4.
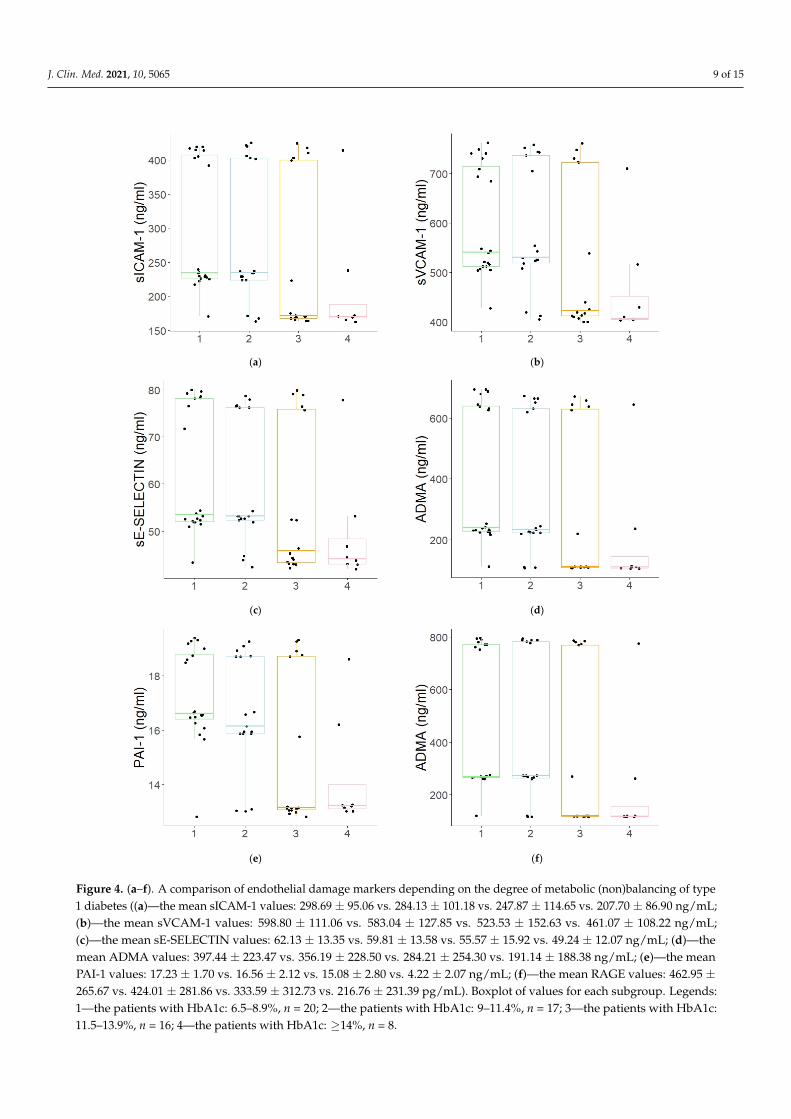
Taking into account the degree of metabolic control of diabetes mellitus, the highest concentrations of the studied endothelial damage markers were observed in the children with the lowest HbA1c values, i.e., between 6.5 and 8.9%, while the lowest ones were ob-served in the children with the worst glycaemic control (HbA1c ≥ 14%) (see Figure 4a–f). In case of sVCAM-1 and PAI-1, there was a negative correlation between those two mark-ers and HbA1c concentration levels.
Figure 3. (a–d). A comparison of selected parameters depending on BMI ((a)—the mean sICAM-1 values: 209.94 ± 70.31 vs.279.44 ± 108.54 vs. 269.65 ± 96.13 vs. 261.02 ± 103.28 ng/mL; (b)—the mean sVCAM-1 values: 481.18 ± 99.39 vs. 568.94 ±141.01 vs. 560.93 ± 117.07 vs. 550.41 ± 129.89 ng/mL; (c)—the mean RAGE values: 231.46 ± 198.32 vs. 414.20 ± 298.22 vs.380.62 ± 269.90 vs. 357.74 ± 291.02 pg/mL; (d)—the mean albuminuria values: 17.51 ± 21.68 vs. 15.81 ± 14.41 vs. 23.67 ±16.08 vs. 10.23 ± 5.41 mg/24 h). Boxplot of values for each subgroup. Legends: NI—the patients underweight patients, n = 11;N—the patients with normal body weight, n = 39; NA—the overweight patients, n = 11; O—the patients with obesity, n = 4.
Taking into account the degree of metabolic control of diabetes mellitus, the highestconcentrations of the studied endothelial damage markers were observed in the childrenwith the lowest HbA1c values, i.e., between 6.5 and 8.9%, while the lowest ones wereobserved in the children with the worst glycaemic control (HbA1c ≥ 14%) (see Figure 4a–f).In case of sVCAM-1 and PAI-1, there was a negative correlation between those two markersand HbA1c concentration levels.
J. Clin. Med. 2021, 10, 5065 9 of 15J. Clin. Med. 2021, 10, x FOR PEER REVIEW 9 of 15
(a) (b)
(c) (d)
(e) (f)
Figure 4. (a–f). A comparison of endothelial damage markers depending on the degree of metabolic (non)balancing of type1 diabetes ((a)—the mean sICAM-1 values: 298.69 ± 95.06 vs. 284.13 ± 101.18 vs. 247.87 ± 114.65 vs. 207.70 ± 86.90 ng/mL;(b)—the mean sVCAM-1 values: 598.80 ± 111.06 vs. 583.04 ± 127.85 vs. 523.53 ± 152.63 vs. 461.07 ± 108.22 ng/mL;(c)—the mean sE-SELECTIN values: 62.13 ± 13.35 vs. 59.81 ± 13.58 vs. 55.57 ± 15.92 vs. 49.24 ± 12.07 ng/mL; (d)—themean ADMA values: 397.44 ± 223.47 vs. 356.19 ± 228.50 vs. 284.21 ± 254.30 vs. 191.14 ± 188.38 ng/mL; (e)—the meanPAI-1 values: 17.23 ± 1.70 vs. 16.56 ± 2.12 vs. 15.08 ± 2.80 vs. 4.22 ± 2.07 ng/mL; (f)—the mean RAGE values: 462.95 ±265.67 vs. 424.01 ± 281.86 vs. 333.59 ± 312.73 vs. 216.76 ± 231.39 pg/mL). Boxplot of values for each subgroup. Legends:1—the patients with HbA1c: 6.5–8.9%, n = 20; 2—the patients with HbA1c: 9–11.4%, n = 17; 3—the patients with HbA1c:11.5–13.9%, n = 16; 4—the patients with HbA1c: ≥14%, n = 8.
J. Clin. Med. 2021, 10, 5065 10 of 15
Urine albumin concentration measurements were available for 55 DM1 patients. Themedian concentration of urine albumin was 12.9 mg/24 h, with an interquartile range5.25 mg/24 h–23.85 mg/24 h. In 10 patients (18.18%), the urine albumin concentrationexceeded 30 mg/24 h. There were not any statistically significant differences in the levelsof the biomarkers between the groups with and without albuminuria.
In turn, while comparing the results of the patients with reference to their sex, it wasfound that the boys were characterised by statistically significantly higher glomerularfiltration rates vs. the studied girls. Otherwise, no statistically significant differences weredemonstrated between the boys and the girls regarding the endothelial damage markers.
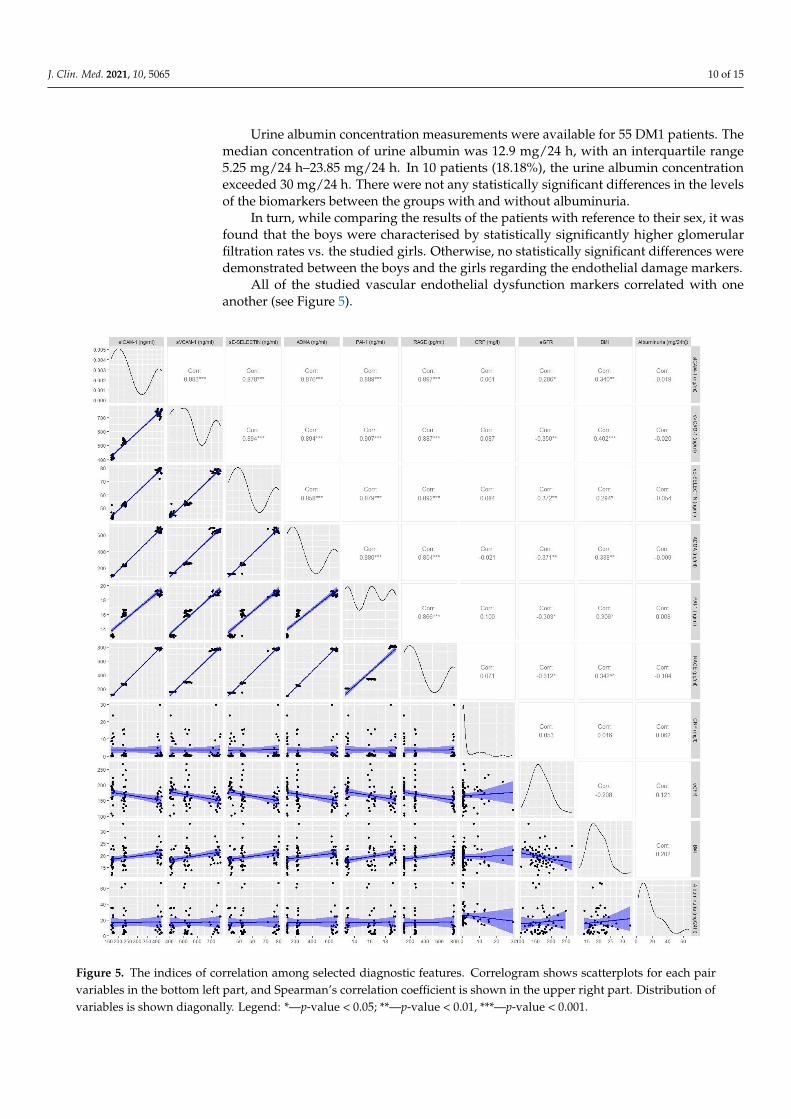
All of the studied vascular endothelial dysfunction markers correlated with oneanother (see Figure 5).
J. Clin. Med. 2021, 10, x FOR PEER REVIEW 10 of 15
Figure 4. (a–f). A comparison of endothelial damage markers depending on the degree of metabolic (non)balancing of type 1 diabetes ((a)—the mean sICAM-1 values: 298.69 ± 95.06 vs. 284.13 ± 101.18 vs. 247.87 ± 114.65 vs. 207.70 ± 86.90 ng/mL; (b)—the mean sVCAM-1 values: 598.80 ± 111.06 vs. 583.04 ± 127.85 vs. 523.53 ± 152.63 vs. 461.07 ± 108.22 ng/mL; (c)—the mean sE-SELECTIN values: 62.13 ± 13.35 vs. 59.81 ± 13.58 vs. 55.57 ± 15.92 vs. 49.24 ± 12.07 ng/mL; (d)—the mean ADMA values: 397.44 ± 223.47 vs. 356.19 ± 228.50 vs. 284.21 ± 254.30 vs. 191.14 ± 188.38 ng/mL; (e)—the mean PAI-1 values: 17.23 ± 1.70 vs. 16.56 ± 2.12 vs. 15.08 ± 2.80 vs. 4.22 ± 2.07 ng/mL; (f)—the mean RAGE values: 462.95 ± 265.67 vs. 424.01 ± 281.86 vs. 333.59 ± 312.73 vs. 216.76 ± 231.39 pg/mL). Boxplot of values for each subgroup. Legends: 1—the patients with HbA1c: 6.5–8.9%, n = 20; 2—the patients with HbA1c: 9–11.4%, n = 17; 3—the patients with HbA1c: 11.5–13.9 %, n = 16; 4—the patients with HbA1c: ≥14%, n = 8.
Urine albumin concentration measurements were available for 55 DM1 patients. The median concentration of urine albumin was 12.9 mg/24 h, with an interquartile range 5.25 mg/24 h–23.85 mg/24 h. In 10 patients (18.18%), the urine albumin concentration exceeded 30 mg/24 h. There were not any statistically significant differences in the levels of the bi-omarkers between the groups with and without albuminuria.
In turn, while comparing the results of the patients with reference to their sex, it was found that the boys were characterised by statistically significantly higher glomerular fil-tration rates vs. the studied girls. Otherwise, no statistically significant differences were demonstrated between the boys and the girls regarding the endothelial damage markers.
All of the studied vascular endothelial dysfunction markers correlated with one an-other (see Figure 5).
Figure 5. The indices of correlation among selected diagnostic features. Correlogram shows scatter-plots for each pair variables in the bottom left part, and Spearman’s correlation coefficient is shown in the upper right part. Distribution of variables is shown diagonally. Legend: *—p-value < 0.05; **—p-value < 0.01, ***—p-value < 0.001.
Figure 5. The indices of correlation among selected diagnostic features. Correlogram shows scatterplots for each pairvariables in the bottom left part, and Spearman’s correlation coefficient is shown in the upper right part. Distribution ofvariables is shown diagonally. Legend: *—p-value < 0.05; **—p-value < 0.01, ***—p-value < 0.001.

J. Clin. Med. 2021, 10, 5065 11 of 15
Simple linear regression was performed to predict eGFR based on each one of studiedbiomarkers. Among them, sE-SELECTIN had the highest R2 = 0.09 and had a regressioncoefficient = −0.75, SE = 0.28, and intercept = 209.28, p = 0.0088. In the multiple linearregression analysis, sE-SELECTIN was proven to be an independent predictor (p = 0.033)of eGFR. The model was adjusted for age, gender, and duration of DM1.
4. Discussion
Although many insights and knowledge about diabetes mellitus have been devel-oped over the last 5000 years, there are many still unanswered questions [17,18]. It isnot known what underlies the destruction of pancreatic β-cells. It has, however, beendemonstrated that persistent hyperglycaemia leads to progressive vascular endothelialdysfunction which, in turn, underpins the development of diabetic micro- and macroan-giopathy [19,20]. Since the early diagnosis of the disease is so important for the preventionof these dangerous complications, the identification of reliable endothelial dysfunctionmarkers should become our priority. In this study, we used the serum from patients todetermine the biochemical substances produced by the endothelium, such as vascular celladhesion molecules (VCAM-1), intercellular adhesion molecules (sICAM-1), selectin E (sE-Selektin), asymmetric dimethylarginine (ADMA), plasminogen activator inhibitor 1 (PAI-1),and receptors for advanced glycation end products (AGEs), because their concentrationsincrease rapidly in states of cellular stress.
In the analysed material, the children with type 1 diabetes demonstrated significantlyhigher concentrations of all six studied endothelial damage markers (sICAM-1, sVCAM-1,sE-SELECTIN, PAI-1, ADMA, RAGE) when compared to the healthy controls. A significantincrease in the concentrations of the markers was already found in the patients with newlydiagnosed diabetes mellitus, i.e., at a very early stage of the disease, while the systemicinflammation index (CRP) was normal. The longer the disease duration was, the moredistinctive the increase in the concentrations of the above-mentioned inflammation markerswas. This was confirmed by the high positive correlation values between the concentrationsof the studied markers and the disease duration. Moreover, the markers grew linearlyagainst one another. This observation confirms earlier reports that diabetes duration is animportant risk factor for the development of chronic diabetes complications, which arecharacterized by chronic subclinical endothelial inflammation [21,22].
Taking into account the degree of metabolic balance in diabetes mellitus, the highestconcentrations of the studied endothelial damage markers were observed in the childrenwith the lowest HbA1c values, while the lowest ones were observed in the children withthe worst glycaemic control. In addition, in the case of sVCAM-1 and PAI-1, there was anegative correlation between those two markers and HbA1c concentration levels. Sincepoor glycaemic control is a significant risk factor for complications in diabetes mellitus, aninverse relation could have been expected. However, it should be noted that the diabeticpatients with the best glycaemic control were also characterised by the lowest glomerularfiltration rates and had been suffering from diabetes mellitus longer than those with thestatistically significantly lower concentrations of endothelial damage markers. In fact, therewas a strong positive correlation between the studied endothelial damage markers and theduration of diabetes mellitus, while the marker levels decreased linearly with the growingglomerular filtration rate. Observations from other authors regarding the issues have beendivided: the same researchers, while evaluating the concentrations of various endothelialinflammation markers, simultaneously obtained positive and negative correlations withglomerular filtration rates [20,23]. Moreover, the correlation between the levels of themarkers and diabetes mellitus duration was often not indicated at all, even showing otherfactors, such as the metabolic control of DM or the patient’s age [24,25]. Moreover, itshould be underlined that it is not only hyperglycemia that has a damaging effect on theendothelium; hypoglycemia also induces inflammation [26–28]. Therefore, increased riskof chronic complications resulting from endothelial inflammation is a consequence of allglycemic fluctuations (so called glycemic variability) should be considered in diabetes,
J. Clin. Med. 2021, 10, 5065 12 of 15
as these fluctuations undoubtedly have a negative impact on the endothelium [29–31].This may explain the inverse relationship between HbA1c and the concentration of theinvestigated markers of inflammation. Frequent episodes of hypoglycaemia lower thelevel of HbA1c, but at the same time, hypoglycaemia also negatively affects endothelialcondition. Furthermore, in our cohort, the majority of children with the highest HbA1clevel were the newly diagnosed patients. Such disproportion might have biased the result,as in those patients, the levels of studied parameters were the lowest, indicating the inversecorrelation of who had had the disease for longer.
In our study, we also examined the impact of the patient’s age on the status of thevascular endothelium. Similar to other studies, that correlation proved to be an importantfactor for the progress of vascular changes, indicating a positive, linear correlation with allof the studied markers of endothelial damage as well as a positive correlation with the Yvariable, which corresponds to the endothelial inflammation intensity [24,32]. Althoughthe concentrations of all of those indices demonstrated the lowest values in the subgroupwith the youngest patients, statistically significant differences were only found for ADMA.This result proves the suitability and usability of the asymmetric dimethylarginine concen-tration assay for the prognosis of early changes in the endothelium, especially in youngerpatients. Other significant differences that were analysed with regard to the patient’s ageconcerned disease duration, the metabolic degree to which the patient’s diabetes mellituswas balanced, and albuminuria. This implies that the oldest children would have beensuffering from the disease for the longest period of time, and they were characterised bythe worst glycaemic control and the highest albuminuria. Such results should certainly notcome as a surprise. They once again confirm the mutual correlation of the above-mentionedparameters, as both poor glycaemic control and DM duration are the risk factors of diabetickidney disease and consequently contribute to enhanced albuminuria [32,33].
In turn, while comparing the results of the patients with reference to their sex, itwas only found that the boys had been characterised by statistically significantly higherglomerular filtration rates vs. those of the studied girls. That result was in line with theexpectations since eGFR, when taking into account the parameters of the maturing body(the patient’s height, age and sex) as calculated by the Schwartz method, requires highervalues [15]. On the other hand, no statistically significant differences were demonstratedbetween the boys and the girls regarding either the endothelial damage markers or theother evaluated parameters.
In addition, the in-house research results have allowed us to determine that childrenwith diabetes mellitus and who are underweight present statistically significantly lowerconcentrations of sICAM, sVCAM-1, and RAGE when compared to children with a normalbody weight. What is more, a linear correlation has been confirmed between the BMIvalues of the patients and the concentrations of these and other markers of endothelialdysfunction. Many publications also confirm such correlations [34–39]. On the other hand,the children who are overweight demonstrated significantly higher albuminuria vs. normalweight children, who had no linear correlation between the parameters. Moreover, positivecorrelations with BMI were found, both in terms of the patient’s age and the durationof the patient’s diabetes mellitus. Increased concentrations of endothelial dysfunctionmarkers accompanied by increased BMI values may indicate the inflammatory state ofthe endothelium in the course of the developing metabolic syndrome (obesity as the riskfactor of sclerosis). It could also be the case that the concomitance of these two conditionsincreases the risk of angiopathic complications, including diabetic kidney disease.
In contrast, while analysing the correlations between those markers and the otherparameters, based on the assays in all of the patients (i.e., both in the study group andthe control group), our attention was driven by the positive correlations between bothPAI-1 and eGFR and between sE-SELECTIN and eGFR. While all of the studied markersrevealed positive correlations with the risk factors for vascular complications (BMI, thepatient’s age, disease duration), only the two above-mentioned factors demonstrated linear
J. Clin. Med. 2021, 10, 5065 13 of 15
correlations with the kidney damage factor (eGFR), and they thus seem to be more suitablein the prognoses and detection of early unfavourable changes in the kidneys.
Musial and Zwolinska reported that the concentrations of matrix metalloproteinases(MMPs) and their tissue inhibitors (TIMPs) correlate not only with the markers of inflam-mation, e.g., e selectin, but also with eGFR, thus indicating increased inflammation andendothelial dysfunction in patients with renal failure [40]. Similar findings were reportedby Gheissari et al. and Meamar et al. [41,42]. As such, it may be assumed that mark-ers of inflammation, i.e., e-selectin, may act not only as the predictors of cardiovascularcomplications in chronic kidney disease but also to predict late diabetes complications,including nephropathy.
To sum up, the assayed endothelial dysfunction markers proved the presence ofinflammatory condition in the endothelium, which was already at the very early stagesof the disease, i.e., from the time of its diagnosis, when the inflammation marker (CRP)was not yet elevated. The enhanced inflammation of the endothelium depended on thealready well-known risk factors for vascular complications, namely disease duration, thepatient’s age, or his/her BMI. What is more, all of the studied markers demonstratedpositive linear correlations between one another, while their increasing concentrationsreflected progressive endothelial inflammation. Therefore, the essential issue is whetherthe evaluated markers are sensitive and specific enough to be used for the assessment ofvascular endothelial inflammation and thereby for the estimation of the risk of vascularcomplications in diabetes mellitus. Such studies should be conducted in children infuture to fully determine this. When looking at this issue in the context of nephrologicalcomplications, attention should be given to the linear correlations between PAI-1 and eGFRas well as to those between sE-SELECTIN and eGFR, as such results may suggest a certainadvantage of PAI-1 and sE-SELECTIN over the other endothelial dysfunction markers,especially regarding the identification of early changes in the kidneys.
5. Conclusions
1. In the patients with type 1 diabetes, statistically significantly higher concentrationswere demonstrated for all the assayed markers when compared to the correspondingvalues in the control group.
2. A significant increase in the concentrations of those markers was already observed atthe early stages of the disease.
3. All of the evaluated endothelial dysfunction markers were positively correlated withthe disease duration, the age of the patients, and their BMI, while only PAI-1 andsE-SELECTIN were characteristic of linear correlations with the estimated glomerularfiltration rate (eGFR).
Author Contributions: Conceptualization, K.N.-W., D.Z.; Data curation, D.P.-J.; Formal analysis,D.Z.; Investigation, A.Z.-K.; Methodology, K.N.-W., D.Z., A.Z.-K. and D.P.-J.; Project administration,D.Z.; Resources, K.N.-W.; Supervision, D.Z., A.Z.-K.; Validation, A.Z.-K.; Writing—original draft,K.N.-W.; Writing—review & editing, D.P.-J. All authors have read and agreed to the published versionof the manuscript.
Funding: This work was supported by the Wrocław Medical University grant ST. 942.
Institutional Review Board Statement: The study was conducted according to the guidelines ofthe Declaration of Helsinki, and approved by the Bioethical Commission at the Wroclaw PiastówSlaskich Medical University in Wroclaw (ethical approval no. 184/2017).
Informed Consent Statement: Both the children in all of the participating groups (≥16 years) andtheir parents were informed about the aims, principles, and benefits of the current research, andinformed consent was obtained from all of the participants and their legal guardians.
Data Availability Statement: The datasets generated and/or analyzed during the current studyavailable from the corresponding author on reasonable request.
Conflicts of Interest: The authors declare that they have no competing interest.
J. Clin. Med. 2021, 10, 5065 14 of 15
References1. Guariguata, L.; Whiting, D.; Hambleton, I.; Beagley, J.; Linnenkamp, U.; Shaw, J. Global estimates of diabetes prevalence for 2013
and projections for 2035. Diabetes Res. Clin. Pract. 2014, 103, 137–149. [CrossRef] [PubMed]2. Knapik-Kordecka, M.; Piwowar, A.; Warwas, M. Oxidative-antioxidant imbalances and risk factors for atherosclerosis and
vascular complications in patients with type 2 diabetes. Med. News 2007, 40, 7–8.3. Giugliano, D.; Ceriello, A.; Paolisso, G. Oxidative stress and diabetic vascular complications. Diabetes Care 1996, 19, 257–267.
[CrossRef]4. Lipinski, B. Pathophysiology of oxidative stress in diabetes mellitus. J. Diabetes Its Complicat. 2001, 15, 203–210. [CrossRef]5. Mogensen, C.E.; Christensen, C.K.; Vittinghus, E. The stages in diabetic renal disease: With emphasis on the stage of incipient
diabetic nephropathy. Diabetes 1983, 32, 64–78. [CrossRef]6. Deckert, T.; Feldt-Rasmussen, B.; Borch-Johnsen, K.; Jensen, T.; Kofoed-Enevoldsen, A. Albuminuria reflects widespread vascular
damage. Diabetologia 1989, 32, 219–226. [CrossRef]7. Krol, G.L.; Kunisaki, M.; Nishio, T.; Inoguchi, T.; Shiba, P. Biochemical and molecular mechanisms in the development of diabetic
vascular complications. Diabetes 1996, 45, S105–S108.8. Taton, J.; Czech, A.; Łaz, R. Angiotoxic Effects of Increased Oxidative Stress in Diabetes. Diabetic Heart Disease; Wydawnictwo
Medyczne via Medica: Gdansk, Poland, 2005; pp. 93–99.9. Astrup, A.S.; Tarnow, L.; Pietraszek, L.; Schalkwijk, C.G.; Stehouwer, C.D.; Parving, H.H.; Rossing, P. Markers of endothelial
dysfunction and inflammation in type 1 diabetic patients with or without diabetic nephropathy followed for 10 years: Associationwith mortality and decline of glomerular filtration rate. Diabetes Care 2008, 31, 1170–1176. [CrossRef]
10. Polek, A.; Sobiczewski, W.; Matowicka-Karna, J. P-selektyna i jej rola w niektórych chorobach P-selectin and its role in somediseases. Postepy Hig. Med. Dosw. 2009, 63, 465–470.
11. Chase, S.D.; Magnani, J.L.; Simon, S.I. E-selectin ligands as mechanosensitive receptors on neutrophils in health and disease. Ann.Biomed. Eng. 2012, 40, 849–859. [CrossRef]
12. Abbassi, O.M.I.D.; Kishimoto, T.K.; McIntire, L.V.; Anderson, D.C.; Smith, C.W. E-selectin supports neutrophil rolling in vitrounder conditions of flow. J. Clin. Investig. 1993, 92, 2719. [CrossRef]
13. Lequin, R.M. Enzyme immunoassay (EIA)/enzyme-linked immunosorbent assay (ELISA). Clin. Chem. 2005, 51, 2415–2418.[CrossRef]
14. Fossceco, S.L. Exploring Enzyme-Linked Immunosorbent Assay (ELISA) Data with the SAS®. Anal. Appl. 1999. Available online:https://stats.idre.ucla.edu/wpcontent/uploads/2016/02/analystelisa.pdf (accessed on 11 June 2018).
15. Schwartz, G.J.; Haycock, G.B.; Edelmann, C.M.; Spitzer, A. A simple estimate of glomerular filtration rate in children derivedfrom body length and plasma creatinine. Pediatrics 1976, 582, 259–263.
16. Miklaszewska, M. Laboratory Indicators of Renal Function-Determination Method and Clinical Value. Available online: https://www.mp.pl/pediatria/praktyka-kliniczna/badania-laboratoryjne/176082,laboratoryjne-wskazniki-czynnosci-nerek (accessedon 11 June 2018).
17. Korzeniowska, K.; Jabłecka, A. Diabetes (Part I). Farm. Współ. 2008, 1, 231–235. Available online: http://www.akademiamedycyny.pl/wp-content/uploads/2016/05/200804_Farmacja_003.pdf (accessed on 25 August 2021).
18. Schalkwijk, C.G.; Stehouwer, C.D. Vascular complications in diabetes mellitus: The role of endothelial dysfunction. Clin. Sci.2005, 109, 143–159. [CrossRef] [PubMed]
19. Wierusz-Wysocka, B. Pathogenetic relationships between diabetic micro- and macroangiopathy Part I. Diabetic microangiopathy-what’s new. Clin. Diabetol. 2009, 10, 151–156.
20. Araszkiewicz, A.; Mackiewicz-Wysocka, M.; Wierusz-Wysocka, B. Skin dysfunction in diabetes. Part 2—Microcirculation andperipheral nerve function. Clin. Diabetol. 2014, 3, 117–124.
21. Romero, P.; Salvat, M.; Fernandez, J.; Baget, M.; Martinez, I. Renal and retinal microangiopathy after 15 years of follow-up studyin a sample of type 1 diabetes mellitus patients. J. Diabetes Its Complicat. 2007, 21, 93–100. [CrossRef]
22. Karamanos, B.; Porta, M.; Songini, M.; Metelko, Z.; Kerenyi, Z.; Tamas, G.; Fuller, J.H. Different risk factors of microangiopathy inpatients with type I diabetes mellitus of short versus long duration. The EURODIAB IDDM Complications Study. Diabetologia2000, 43, 348–355. [CrossRef] [PubMed]
23. Karimi, Z.; Kahe, F.; Jamil, A.; Marszalek, J.; Ghanbari, A.; Afarideh, M.; Chi, G. Intercellular adhesion molecule-1 in diabeticpatients with and without microalbuminuria. Diabetes Metab. Syndrome 2018, 12, 365–368. [CrossRef]
24. Liu, J.J.; Yeoh, L.Y.; Sum, C.F.; Tavintharan, S.; Ng, X.W.; Liu, S.; Lim, S.C. Vascular cell adhesion molecule-1, but not intercellularadhesion molecule-1, is associated with diabetic kidney disease in Asians with type 2 diabetes. J. Diabetes Its Complicat. 2015, 29,707–712. [CrossRef] [PubMed]
25. Lee, S.W.; Song, K.E.; Shin, D.S.; Ahn, S.M.; Ha, E.S.; Kim, D.J.; Lee, K.W. Alterations in peripheral blood levels of TIMP-1, MMP-2,and MMP-9 in patients with type-2 diabetes. Diabetes Res. Clin. Pract. 2005, 69, 175–179. [CrossRef] [PubMed]
26. Marfella, R.; Esposito, K.; Giunta, R.; Coppola, G.; De Angelis, L.; Farzati, B.; Giugliano, D. Circulating adhesion molecules inhumans: Role of hyperglycemia and hyperinsulinemia. Circulation 2000, 101, 2247–2251. [CrossRef]
27. El Amine, M.; Sohawon, S.; Lagneau, L.; Gaham, N.; Noordally, S. Plasma levels of icam-1 and circulating endothelial cells areelevated in unstable types 1 and 2 diabetes. Endocr. Regul. 2010, 44, 17–24. [CrossRef]
J. Clin. Med. 2021, 10, 5065 15 of 15
28. Joy, N.G.; Hedrington, M.S.; Briscoe, V.J.; Tate, D.B.; Ertl, A.C.; Davis, S.N. Effects of acute hypoglycemia on inflammatory andpro-atherothrombotic biomarkers in individuals with type 1 diabetes and healthy individuals. Diabetes Care 2010, 33, 1529–1535.
29. Kilpatrick, E.S.; Rigby, A.S.; Atkin, S.L. For debate. Glucose variability and diabetes complication risk: We need to know theanswer. Diabet. Med. 2010, 27, 868–871. [CrossRef]
30. Ceriello, A.; Ihnat, M.A. ‘Glycaemic variability’: A new therapeutic challenge in diabetes and the critical care setting. Diabet. Med.2010, 27, 862–867. [CrossRef] [PubMed]
31. Lachin, J.M.; Bebu, I.; Bergenstal, R.M.; Pop-Busui, R.; Service, F.J.; Zinman, B.; Nathan, D.M. DCCT/EDIC Research Group.Association of Glycemic Variability in Type 1 Diabetes with Progression of Microvascular Outcomes in the Diabetes Control andComplications Trial. Diabetes Care 2017, 40, 777–783. [CrossRef]
32. Auwerx, J.; Bouillon, R.; Collen, D.; Geboers, J. Tissue-type plasminogen activator antigen and plasminogen activator inhibitor indiabetes mellitus. Arterioscler. Thromb. Vasc. Biol. 1988, 8, 68–72. [CrossRef]
33. Yarmolinsky, J.; Bordin Barbieri, N.; Weinmann, T. Plasminogen activator inhibitor-1 and type 2 diabetes: A systematic reviewand meta-analysis of observational studies. Sci. Rep. 2016, 6, 17714. [CrossRef]
34. Xiong, Y.; Lei, M.; Fu, S.; Fu, Y. Effect of diabetic duration on serum concentrations of endogenous inhibitor of nitric oxidesynthase in patients and rats with diabetes. Life Sci. 2005, 77, 149–159. [CrossRef]
35. Bogdanovic, R. Diabetic nephropathy in children and adolescents. Pediatric Nephrol. 2008, 23, 507–525. [CrossRef]36. Głowinska, B.; Urban, M.; Peczynska, J.; Florys, B. Soluble adhesion molecules (sICAM-1, sVCAM-1) and selectins (sE selectin, sP
selectin, sL selectin) levels in children and adolescents with obesity, hypertension, and diabetes. Metabolism 2005, 54, 1020–1026.[CrossRef] [PubMed]
37. Juhan-Vague, I.; Roul, C.; Alessi, M.C.; Ardissone, J.P.; Heim, M. Increased plasminogen activator inhibitor activity in non insulindependent diabetic patients-relationship with plasma insulin. Thromb. Haemost. 1989, 61, 370–373. [CrossRef]
38. Juhan-Vague, I.; Alessi, M.C.; Vague, P. Increased plasma plasminogen activator inhibitor 1 levels. A possible link between insulinresistance and atherothrombosis. Diabetologia 1991, 34, 457–462. [CrossRef]
39. Henry, M.; Tregouet, D.A.; Alessi, M.C.; Aillaud, M.F.; Visvikis, S.; Siest, G.; Tiret, L.; Juhan-Vague, I. Metabolic determinantsare much more important than genetic polymorphisms in determining the PAI-1 activity and antigen plasma concentrations: Afamily study with part of the Stanislas Cohort. Arterioscler. Thromb. Vasc. Biol. 1988, 18, 84–91. [CrossRef]
40. Musiał, K.; Zwolinska, D. Matrix metalloproteinases (MMP-2, 9) and their tissue inhibitors (TIMP-1, 2) as novel markers of stressresponse and atherogenesis in children with chronic kidney disease (CKD) on conservative treatment. Cell Stress Chaperones 2011,16, 97–103. [CrossRef]
41. Gheissari, A.; Meamar, R.; Abedini, A.; Roomizadeh, P.; Shafiei, M.; Samaninobandegani, Z.; Najafi, T.E. Association of matrixmetalloproteinase-2 and matrix metalloproteinase-9 with endothelial dysfunction, cardiovascular disease risk factors andthrombotic events in children with end-stage renal disease. Iran. J. Kidney Dis. 2018, 12, 169–177. [PubMed]
42. Meamar, R.; Shafiei, M.; Abedini, A.; Ghazvini MR, A.; Roomizadeh, P.; Taheri, S.; Gheissari, A. Association of E-selectin withhematological, hormonal levels and plasma proteins in children with end stage renal disease. Adv. Biomed. Res. 2016, 5, 118.[PubMed]
Copyright © 2022 FDOKUMEN