Bridge System Reliability and Reliability-Based Redundancy ...
Upload
khangminh22Category
view
1download
0
University of Windsor University of Windsor
Scholarship at UWindsor Scholarship at UWindsor
Electronic Theses and Dissertations Theses, Dissertations, and Major Papers
2006
Evaluation of the reliability of an ergonomic decision system. Evaluation of the reliability of an ergonomic decision system.
Derek Ian Dawson University of Windsor
Follow this and additional works at: https://scholar.uwindsor.ca/etd
Recommended Citation Recommended Citation Dawson, Derek Ian, "Evaluation of the reliability of an ergonomic decision system." (2006). Electronic Theses and Dissertations. 1991. https://scholar.uwindsor.ca/etd/1991
This online database contains the full-text of PhD dissertations and Masters’ theses of University of Windsor students from 1954 forward. These documents are made available for personal study and research purposes only, in accordance with the Canadian Copyright Act and the Creative Commons license—CC BY-NC-ND (Attribution, Non-Commercial, No Derivative Works). Under this license, works must always be attributed to the copyright holder (original author), cannot be used for any commercial purposes, and may not be altered. Any other use would require the permission of the copyright holder. Students may inquire about withdrawing their dissertation and/or thesis from this database. For additional inquiries, please contact the repository administrator via email ([email protected]) or by telephone at 519-253-3000ext. 3208.
Evaluation of the Reliability of an Ergonomic Decision System
byDerek Ian Dawson
A ThesisSubmitted to the Faculty of Graduate Studies and Research through Industrial and Manufacturing Systems Engineering
in Partial Fulfillment of the Requirements of the Degree of Master of Applied Science at the
University of Windsor
Windsor, Ontario, Canada
2006
© 2006 Derek Dawson
Reproduced with permission of the copyright owner. Further reproduction prohibited without permission.

Library and Archives Canada
Bibliotheque et Archives Canada
Published Heritage Branch
395 Wellington Street Ottawa ON K1A 0N4 Canada
Your file Votre reference ISBN: 978-0-494-17091-5 Our file Notre reference ISBN: 978-0-494-17091-5
Direction du Patrimoine de I'edition
395, rue Wellington Ottawa ON K1A 0N4 Canada
NOTICE:The author has granted a nonexclusive license allowing Library and Archives Canada to reproduce, publish, archive, preserve, conserve, communicate to the public by telecommunication or on the Internet, loan, distribute and sell theses worldwide, for commercial or noncommercial purposes, in microform, paper, electronic and/or any other formats.
AVIS:L'auteur a accorde une licence non exclusive permettant a la Bibliotheque et Archives Canada de reproduire, publier, archiver, sauvegarder, conserver, transmettre au public par telecommunication ou par I'lnternet, preter, distribuer et vendre des theses partout dans le monde, a des fins commerciales ou autres, sur support microforme, papier, electronique et/ou autres formats.
The author retains copyright ownership and moral rights in this thesis. Neither the thesis nor substantial extracts from it may be printed or otherwise reproduced without the author's permission.
L'auteur conserve la propriete du droit d'auteur et des droits moraux qui protege cette these.Ni la these ni des extraits substantiels de celle-ci ne doivent etre imprimes ou autrement reproduits sans son autorisation.
In compliance with the Canadian Privacy Act some supporting forms may have been removed from this thesis.
While these forms may be included in the document page count, their removal does not represent any loss of content from the thesis.
Conformement a la loi canadienne sur la protection de la vie privee, quelques formulaires secondaires ont ete enleves de cette these.
Bien que ces formulaires aient inclus dans la pagination, il n'y aura aucun contenu manquant.
i * i
CanadaReproduced with permission of the copyright owner. Further reproduction prohibited without permission.
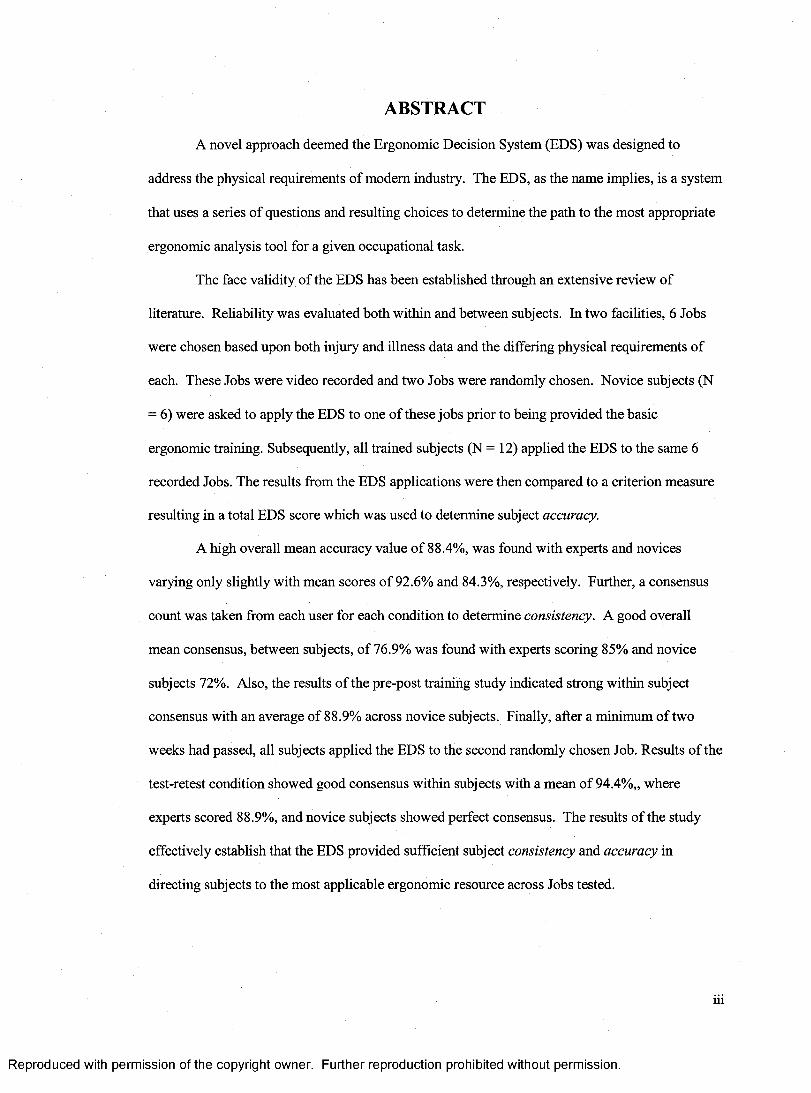
ABSTRACT
A novel approach deemed the Ergonomic Decision System (EDS) was designed to
address the physical requirements of modem industry. The EDS, as the name implies, is a system
that uses a series of questions and resulting choices to determine the path to the most appropriate
ergonomic analysis tool for a given occupational task.
The face validity of the EDS has been established through an extensive review of
literature. Reliability was evaluated both within and between subjects. In two facilities, 6 Jobs
were chosen based upon both injury and illness data and the differing physical requirements of
each. These Jobs were video recorded and two Jobs were randomly chosen. Novice subjects (N
= 6) were asked to apply the EDS to one of these jobs prior to being provided the basic
ergonomic training. Subsequently, all trained subjects (N = 12) applied the EDS to the same 6
recorded Jobs. The results from the EDS applications were then compared to a criterion measure
resulting in a total EDS score which was used to determine subject accuracy.
A high overall mean accuracy value of 88.4%, was found with experts and novices
varying only slightly with mean scores of 92.6% and 84.3%, respectively. Further, a consensus
count was taken from each user for each condition to determine consistency. A good overall
mean consensus, between subjects, of 76.9% was found with experts scoring 85% and novice
subjects 72%. Also, the results of the pre-post training study indicated strong within subject
consensus with an average of 88.9% across novice subjects. Finally, after a minimum of two
weeks had passed, all subjects applied the EDS to the second randomly chosen Job. Results of the
test-retest condition showed good consensus within subjects with a mean of 94.4%,, where
experts scored 88.9%, and novice subjects showed perfect consensus. The results of the study
effectively establish that the EDS provided sufficient subject consistency and accuracy in
directing subjects to the most applicable ergonomic resource across Jobs tested.
Reproduced with permission of the copyright owner. Further reproduction prohibited without permission.

ACKNOWLEDGEMENTS
... this is what you know ... this is what I know ... this is where we both know nothing ~ Anonymous
I would like to thank my family for their support and reassurance. Dad, your methods aren't always conventional, yet who can argue with results. Tracy, you are an angel. Aunt Bonnie, Uncle Dan, Uncle George, Aunt Faith, throughout my life you helped me to see the bigger picture.
Paul Lagroix & Roland deVerteuil... delinquents! Thanks for the support.
I would like to pay my respects to my original Advisor, the late Dr. Dutta. His outlook on life was unique, it was great to be able to share the ride for a while.
To Dr. Jim Potvin. Thank-you for ALL of your patience and support. Also, thanks for taking me on when no-one else would.
To Allison Stephens, you are a good-friend and mentor.
I would also like to thank all of my wonderful, and willing subjects.
To my future wife, Dr. Tamara Bond. T. thank-you for your love, support and for threatening to knee-cap me if I stopped-working.
This Thesis is dedicated to my mother, the late Sandra L. Dawson. She is missed constantly.
Reproduced with permission of the copyright owner. Further reproduction prohibited without permission.
iv
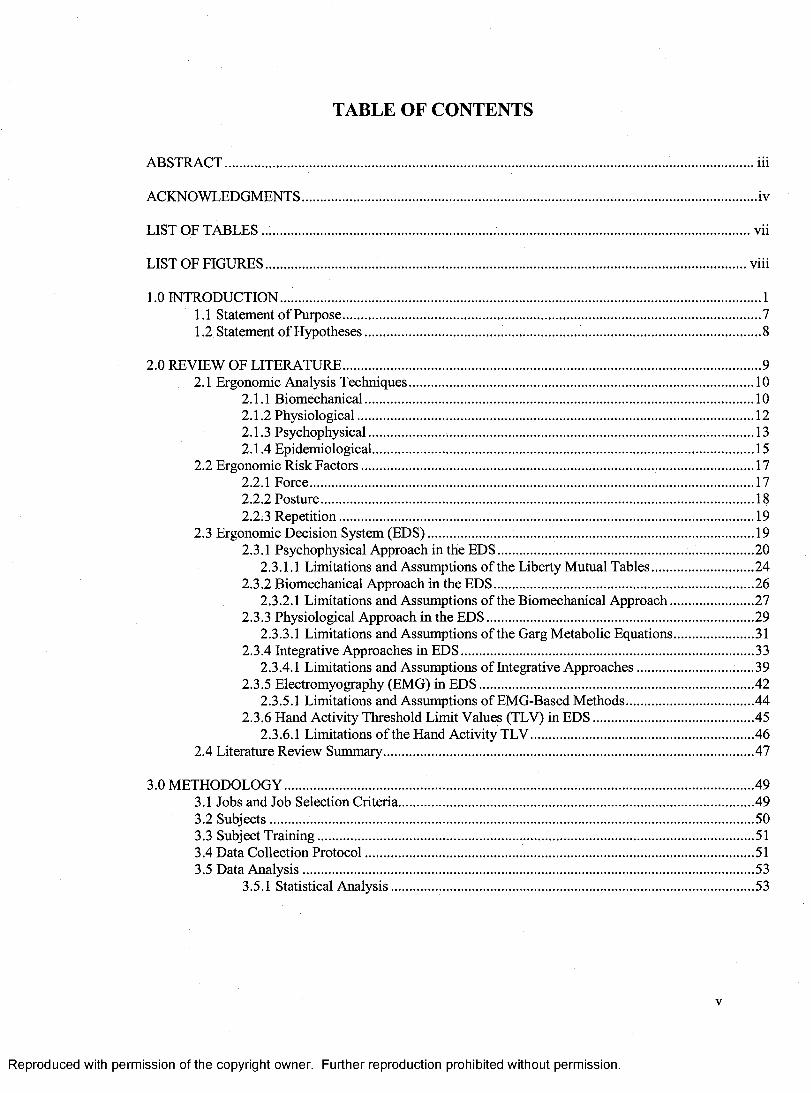
TABLE OF CONTENTS
ABSTRACT................................................................................................................................ iii
ACKNOWLEDGMENTS................................................................................................................................... iv
LIST OF TABLES..............................................................................................................................................vii
LIST OF FIGURES........................................................................................................................................... viii
1.0 INTRODUCTION...........................................................................................................................................11.1 Statement of Purpose.........................................................................................................................71.2 Statement of Hypotheses...................................................................................................................8
2.0 REVIEW OF LITERATURE.........................................................................................................................92.1 Ergonomic Analysis Techniques....................................................................................................10
2.1.1 Biomechanical.................................................................................................................102.1.2 Physiological...................................................................................................................122.1.3 Psychophysical...................... 132.1.4 Epidemiological...............................................................................................................15
2.2 Ergonomic Risk Factors..................................................................................................................172.2.1 Force.................................................................................................................................172.2.2 Posture............................................................................................................................. 182.2.3 Repetition........................................................................................................................ 19
2.3 Ergonomic Decision System (EDS).............................................................................................. 192.3.1 Psychophysical Approach in the EDS....................................................... 20
2.3.1.1 Limitations and Assumptions of the Liberty Mutual Tables............................. 242.3.2 Biomechanical Approach in the EDS...........................................................................26
2.3.2.1 Limitations and Assumptions of the Biomechanical Approach........................ 272.3.3 Physiological Approach in the EDS............................................................................. 29
2.3.3.1 Limitations and Assumptions of the Garg Metabolic Equations....................... 312.3.4 Integrative Approaches in EDS.....................................................................................33
2.3.4.1 Limitations and Assumptions of Integrative Approaches..................................392.3.5 Electromyography (EMG) in EDS............................................................................... 42
2.3.5.1 Limitations and Assumptions of EMG-Based Methods.....................................442.3.6 Hand Activity Threshold Limit Values (TLV) in EDS.............................................. 45
2.3.6.1 l im itations of the Hand Activity TLV................................................................ 462.4 Literature Review Summary........................................................................................................... 47
3.0 METHODOLOGY........................................................................................................................................493.1 Jobs and Job Selection Criteria.......................................................................................................493.2 Subjects............................................................................................................................................ 503.3 Subject Training.............................................................................................................................. 513.4 Data Collection Protocol................................................................................................................ 513.5 Data Analysis.................................................................................................................................. 53
3.5.1 Statistical Analysis.......................................................................................................53
v
Reproduced with permission of the copyright owner. Further reproduction prohibited without permission.
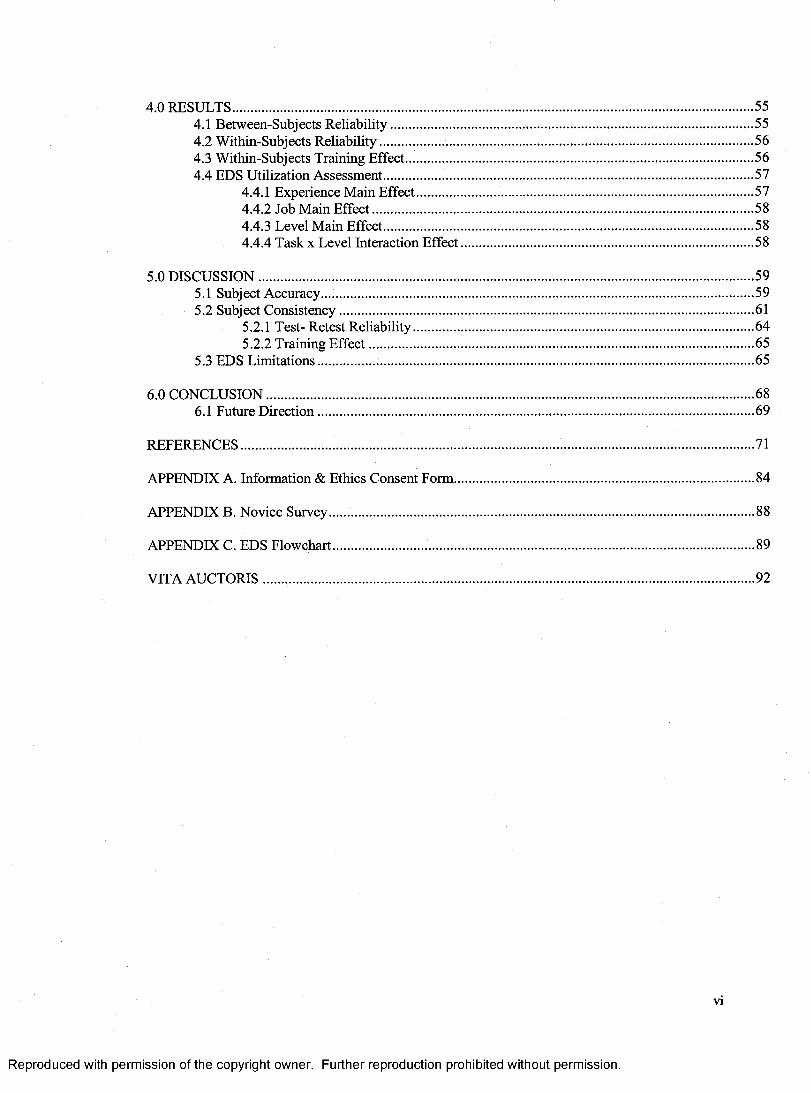
4.0 RESULTS.......................................................................................................................................................554.1 Between-Subjects Reliability.........................................................................................................554.2 Within-Subjects Reliability............................................................................................................ 564.3 Within-Subjects Training Effect.....................................................................................................564.4 EDS Utilization Assessment...........................................................................................................57
4.4.1 Experience Main Effect................................................................................................. 574.4.2 Job Main Effect............................................................. 584.4.3 Level Main Effect...........................................................................................................584.4.4 Task x Level Interaction Effect.....................................................................................58
5.0 DISCUSSION............................................................................................................................................... 595.1 Subject Accuracy............................................................................................................................. 595.2 Subject Consistency........................................................................................................................61
5.2.1 Test-Retest Reliability.................................................................................................. 645.2.2 Training Effect............................................................................................................... 65
5.3 EDS Limitations.............................................................................................................................. 65
6.0 CONCLUSION............................................................................................................................................. 686.1 Future Direction............................................................................................................................69
REFERENCES.................................................................................................................................................... 71
APPENDIX A. Information & Ethics Consent Form.......................................................................................84
APPENDIX B. Novice Survey........................................................................................................................... 88
APPENDIX C. EDS Flowchart.......................................................................................................................... 89
VITA AUCTORIS.............................................................................................................................................. 92
vi
Reproduced with permission of the copyright owner. Further reproduction prohibited without permission.
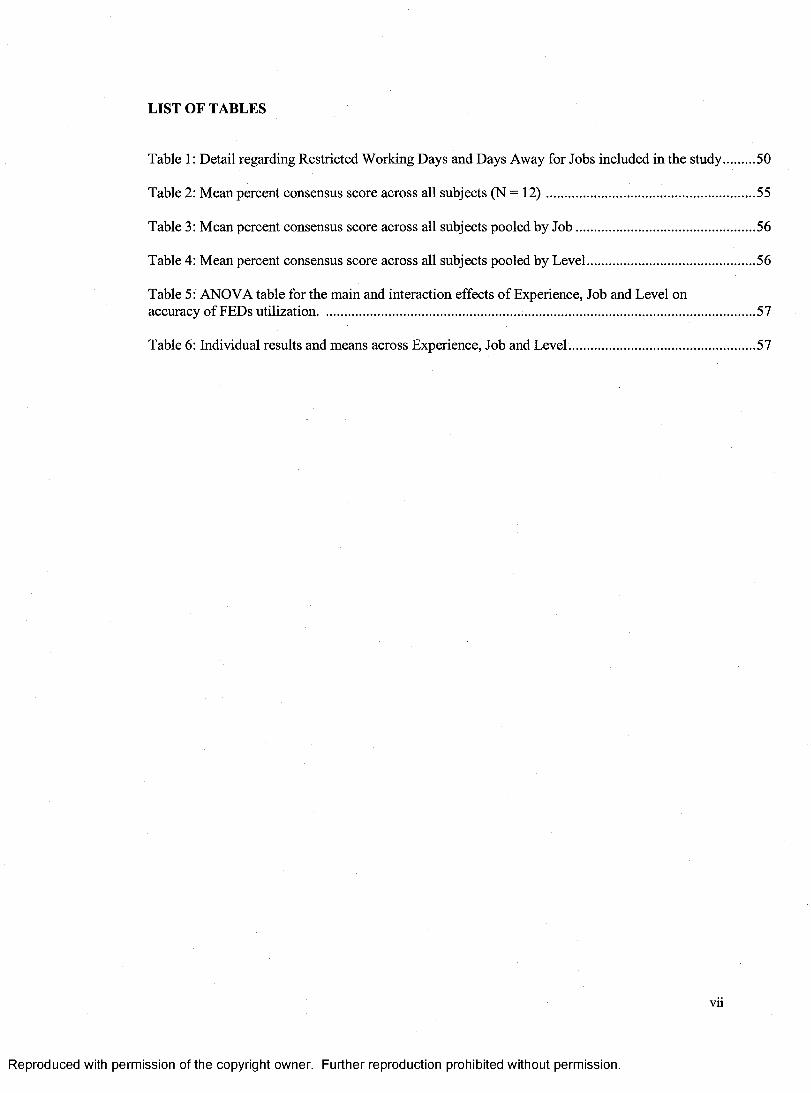
LIST OF TABLES
Table 1: Detail regarding Restricted Working Days and Days Away for Jobs included in the study......... 50
Table 2: Mean percent consensus score across all subjects (N = 12 )............................................................ 55
Table 3: Mean percent consensus score across all subjects pooled by Job ....................................................56
Table 4: Mean percent consensus score across all subjects pooled by Level.................................................56
Table 5: ANOVA table for the main and interaction effects of Experience, Job and Level onaccuracy of FEDs utilization...............................................................................................................................57
Table 6: Individual results and means across Experience, Job and Level......................................................57
Reproduced with permission of the copyright owner. Further reproduction prohibited without permission.
vii
LIST OF FIGURES
Figure 1: Statistical model for independent variables 1) Jobs, 2) Experience and 3) Level .......................54
Figure 2: Total mean score for all subjects (n = 12) by Job x Level interaction ......................................... 58
Figure 3: Total mean consensus score for all subjects (n = 12) by Job x Level interaction......................... 61
viii
Reproduced with permission of the copyright owner. Further reproduction prohibited without permission.
Chapter I INTRODUCTION
Despite advances in work mechanization and the implementation of positioners and handling
devices, manual materials handling (MMH) is still very common within the contemporary
industrial environment (Aghazadeh, 1998). Rationales favouring direct human interaction with
the component or media are many. Some of the most prevalent include: space limitations, the
varied nature of the activity which necessitates human cognition and three-dimensional
perception, and the reluctance to make substantial investment in manual manipulation devices,
automation or hybrid semi-automation (Mital, Nicholson & Ayoub, 1993; Akella & Peacock,
1999).
Physical work entails the application of some physical energy (effort) against opposing
forces within the immediate physical environment. The application of force is generally not o f
concern but rather it is the resistance, both internal and external, that elicit a response from the
body (Zetterberg &Ofverholm, 1999). This may be better defined by Newton's second law,
which stipulates that, for every applied force, there is necessarily an equal and opposing force
(Elliott & Wood, 1995). Physical work required in modem industry places many and varied
physical demands on the worker. It is the sum of the applied efforts that challenge the worker’s
musculoskeletal system. The response of these systems to the demands of a task are bounded by
the biological laws of the body, that is to say that there is an inverse relationship between tissue
tolerance and physical demands (Mital et al., 1993).
Historically, the main focus, of preventative measures to avoid physical overexposure,
had been on manual lifting (NIOSH, 1981). There are, however, a greater variety of MMH
conditions to which employees within automotive manufacturing facilities may be repeatedly
exposed including: pushing, pulling, lifting, lowering, carrying, and hand-intensive work
(Sanders & McCormick, 1993). Further, while performing these tasks, work requirements may
necessitate the use of one or two hands or body parts, statically or dynamically over a number of
1
Reproduced with permission of the copyright owner. Further reproduction prohibited without permission.
frequencies in anatomically neutral, deviated or awkward postures. Predictably, with each novel
combination of posture, action and frequency, a unique set of physical challenges is imposed
upon the worker. In order to preempt physical strain, each novel situation then requires a unique
analysis process.
The United States reports annually on the occurrence of injuries and illness and provides
a categorical breakdown of these within private industry. The data is compiled through an annual
survey conducted by the United States Department of Labor, Bureau of Labor Statistics (BLS).
This data can be used an indicator of injury and illness trends through industry, body component,
traumatogens and a host of other metrics (NIOSH, 1997; Rosecrance & Cook, 1998). Recent data
shows that although total incidence of injuries and illnesses are declining, work related
musculoskeletal disorders (MSDs) attributable to MMH are on the rise (BLS, 2003). Within
private industry, more than a third of occupational injuries and illness' are attributable to
overexertion and repetitive motion (Sanders & McCormick, 1993; Konz, 1995; GAO/HEHS,
1997; NIOSH, 1997; OSHA, Federal Register, 1999; IE, 2003). Of particular interest, recent data
indicates that the category of overexertion, defined as injuries resulting from excessive lifting,
pushing, pulling, carrying, or throwing objects, grew significantly (IE, 2003). This category now
alone constitutes more than twenty five percent of all injuries (IE, 2003).
Costs associated with MMH represent approximately 60% of all monies spent on
industrial injuries (Konz, 1995; GAO/HEHS, 1997)). Direct costs of manual handling injuries
and illnesses are estimated to be between 13 billion and 20 billion dollars annually (Mital et al.,
1993; NIOSH, 1997; IE, 2003). While direct costs are significant, it is only a portion of the total
costs. Indirect costs, including overtime, training, lost productivity and other contributors are
estimated to amount to between three and five times direct costs (Mital et al., 1993; IE, 2003).
Within the private sector, the automotive manufacturing industry has consistently been
implicated as being among the top contributors for incidence rates and sheer numbers of injury
and illness cases (NIOSH, 1997; BLS, 2003). The enormous volume of workers annually
2
Reproduced with permission of the copyright owner. Further reproduction prohibited without permission.
employed by the auto industry tends to amplify the necessity for intervention. For example, in
2001 the BLS category of motor vehicles and car bodies (SIC 3711) was second on the list of
private sector industries with the highest incidence rates for injuries and illnesses attributed to
repetitive motion (BLS, 2003). The enormity of its population, however, produced an exorbitant
number of cases (22,900) that were approximately twice the case rate of the industry topping the
list.
As with any materials, the elements that make up the musculoskeletal system have tissue
tolerance thresholds beyond which failure (in the case of humans, injury or illness) occurs
(Snook, 1978). There are a number of variables which contribute to the potential for tissue
failure, some of these include; the magnitude of stresses placed upon the body segment, the
frequency with which stresses occur and the interval between stressors (Winkel & Westgaard,
1992; Kilbom, 1994). Tissue failure may be either acute or chronic. Acute traumas are a result of
a single load exceeding the tolerance of the tissue. In the case of chronic injuries or illnesses,
failure occurs from repeated loading over a long period of time (Putz-Anderson, 1988b).
In an industrial setting, injuries or illnesses are known by a number of terms. Some of
these are defined by the body segment or joint within which they occur, such as occupational
cervicalbrachial disorders (OCD) for the shoulder region, upper extremity cumulative trauma
disorders (UECTD) and low back pain (LBP). Other terms are more generic such as, repetitive
strain injuries (RSI), cumulative trauma disorders (CTD), musculoskeletal disorders (MSD)
(Rosecrance & Cook, 1998). The repetitive and forceful movements, and postures characteristic
of manual materials handling within the automotive industry, have been implicated as
individually causal and multiplicative risk factors associated with many of the disorders
previously mentioned (Kvamstrom, 1983; World Health Organization [WHO], 1989; Marras &
Schoenmarklin, 1993; Baron, 1996;). Within the automotive manufacturing sector there are
many operations which require one or more physical stressors including; high levels of force,
high rates of repetition and awkward or sustained postures. These physical stressors have been
3
Reproduced with permission of the copyright owner. Further reproduction prohibited without permission.

shown to be risk factors for the development of acute or cumulative injury or illness (NIOSH,
1977; Putz-Anderson, 1988a; Putz-Anderson, 1988b; Kroemer, 1989; Moore et al., 1991).
Further, these stressors may concur and interact serving to amplify the risk of injury or illness
(Silverstein et al. 1987; Kilbom, 1994b).
There are a variety of approaches which may be used in order to assess MMH capabilities
over a number of working conditions. These intervention techniques include epidemiological
studies, the identification of biomechanical and physiological limitations and psychophysics
(Mital, 1993; Sanders & McCormick, 1993; Konz, 1995;). Each approach has functional
constraints. These constraints are limitations bounding the assessment methodology which, if
acknowledged, will ensure that the most appropriate approach will be used for each occupational
analysis.
Epidemiological studies examine the relationship between work and morbidity patterns in
human populations (Friedman, 1974). This approach requires a lot of time and resources to
collect this type of data (Hennekens & Buring, 1987). It further assumes that historical health
data exists, is accessible and is accurate.
Biomechanical methodologies view the human body as a system of segments
interconnected at joints. Knowledge of the properties of each segment need to be attained as well
as corresponding joint type. From this a model may be developed with each segment and link
representing the same properties as the corresponding human segments. Biomechanical criteria
are frequency independent, meaning that a tissue safety threshold, as established through
research, is applicable only to very low frequency manual materials handling. As frequency
increases efforts should decrease, therefore as frequency increases a more appropriate evaluation
tool is required. Biomechanical models are not designed to address repetitive work and fatigue
issues (Mital et al., 1993).
Physiological research provides detailed physical responses to a variety of occupational
conditions to which a worker may be commonly subjected. This type of research measures heart
4
Reproduced with permission of the copyright owner. Further reproduction prohibited without permission.
rate, oxygen consumption and energy expenditure. The data has been used to develop
physiological thresholds at which the risk of injury or illness increases. Studies of fatiguing
conditions have been used to propose work-rest ratios for a variety of work parameters (Rohmert,
1973; Rose et al., 1992). Physiological methodologies have been found to be most applicable to
high frequency work and work over extended durations (Andrews, 1967; Garg & Saxena, 1982).
The psychophysical approach to analyzing MMH conditions records the worker’s perception of
physical stress, exertion and fatigue or discomfort while completing a task (Snook, 1978; Legg &
Myles, 1981; Foreman et al., 1984; Ljunggren, 1986; Fernandez et al. 1991;). The premise is
that a worker will combine both biomechanical and physiological stresses in their subjective
evaluation of perceived stress (Gamberale et al., 1987; Sanders & McCormick, 1993; Gescheider,
1997). Further, symptoms associated with working conditions as mentioned previously, are
thought to be early indicators of work-related injuries or illness' (Yoshitake, 1971; Karwowski &
Yates, 1986; Baidya & Stevenson, 1988).
There are many ergonomic tools, aids and guidelines in existence, each of which makes
use of one or all of the analytical methodologies discussed above in order to assess working
conditions. Some are body segment specific, such as those designed to evaluate work of the
upper extremity (McAtamney & Corlett, 1993; Keyserling et al.,1993; Fisher et al., 1993;
Kilbom, 1994; Rosecrance & Cook, 1998; Bergamasco et al., 1998; Muggleton et al., 1999),
shoulder (Dul, 1988; Winkel & Westgaard, 1992) and back (Frymoyer et al., 1980; Marras et al.,
1995). Other assessment methods analyze the entire body through a variety of postures, forces
and frequencies (Rodgers, S.H., 1992; OSHA, 1995) and yet, others tend to focus on specific job
elements (which imply physical actions) such as pushing, pulling, carrying, lifting, lowering and
hand intensive work (Snook and Ciriello, 1991; Mital et al., 1993; Waters et al., 1993; Snook et
al., 1995; Snook et al., 1997; ACGIH, 2000). There exist alternative analytical devices that may
be used to supplement some of the aforementioned ergonomic prevention strategies. These
consist of intricate equipment and techniques in order to quantify the effort requirements of a task
5
Reproduced with permission of the copyright owner. Further reproduction prohibited without permission.
or series of task elements. Some methods include electromyography, often in conjunction with
cinematography, the use of accelerometers, electrogoniometers and force dynamometers. Each of
these analytical methods varies in: 1) the level of complexity required to use it, 2) the required
invasiveness during collection and 3) the tool’s ultimate sensitivity and specificity. Each has its
application limitations and many are redundant. Modem industry requires an ergonomic analysis
process containing a tool set that closely correlates with some form of outcomes measures
(symptoms data or injury, illness data). Further, the process must be: 1) able to be used by the
majority of individuals with the proper training, 2) timely and relatively non-invasive, 3) reliable
across and between users, and 4) the risk assessment tools included must show a good balance
between sensitivity and specificity.
If the analysis process exhibits poor sensitivity, an unacceptable level of false positives
will result. This, in turn, becomes very costly to the company in a number of ways. Firstly, the
ergonomics system will become overburdened by requiring the in-depth analysis of operations
that do not require intervention (Joseph et al., 2000). Second, the result would be an unnecessary,
large financial impact to companies that can employ as many as hundreds of thousands of
workers. It is, therefore, necessary that the analytical methodology adopted by an ergonomics
program be critically reviewed and evaluated for both its validity and reliability.
The Ergonomic Decision System (EDS) was designed to address the variety of
occupational conditions, to which employees within automotive manufacturing facilities may be
repeatedly exposed with the direction to preempt ergonomically unsound conditions. In order to
do this, the developers of the EDS needed to identify common physical actions required for
MMH within the workplace. Further, it needed to be established whether there were means to
review these actions for ergonomic suitability. What was essentially required was a gaps
analysis, making use of the constraints and limitations of adopted ergonomic intervention tools
and seeking-out methods to resolve these. The Ergonomic Decision System as the name implies,
is a system that uses a series of questions and resulting choices to determine the path to the most
6
Reproduced with permission of the copyright owner. Further reproduction prohibited without permission.
appropriate ergonomic analysis tool for a given occupational task. It is hypothesized that the
EDS will be useable by virtually any trained individual. Further, the system is intended to ensure
consistent and reproducible analyses.
The structure and content of the EDS were developed over an exhaustive series of
technical meetings with experts in the field of automotive ergonomics. The ergonomic tools
embedded within the EDS feature the most recent, critically reviewed and agreed-upon
scientifically based ergonomic knowledge to date. The development of the EDS represents an
attempt at formalizing efforts to evaluate ergonomic risk proactively and consistently within an
automotive manufacturing Company. Though other studies have attempted to preempt
ergonomic risk by way of checklists and various techniques (Rodgers, 1992; Keyserling et al.,
1992; McAtamney and Corlett, 1993; OSHA, 1995), many were proven to exhibit poor sensitivity
and lack consistency in results (Keyserling et al., 1992; Joseph et al., 2000).
Prior to the advent of the Ergonomic Decision System (EDS) there did not exist a
formalized ergonomic decision process which met automotive manufacturing industry
requirements. In order to meet sensitivity and specificity criteria, it was necessary that each
ergonomic tool, used within the EDS, be adopted based on consensus scientific evidence, expert
opinion and operational application. It is essential that the EDS content validity be proven, in
order to ensure sufficient sensitivity and specificity (Joseph et al., 2000). This will be
accomplished via an in depth literature review. In order for the EDS to be useful, it must be able
to be repeatedly and accurately applied by multiple analysts. Reliability of the EDS will be
established by having trained experts and novices independently use the EDS on the same
operations under the same time constraints.
1.1 Statement of Purpose
The purpose of this thesis is to establish the reliability and face validity of a unique ergonomic
process, deemed the Ergonomic Decision System. Though based on universally applicable
research, the EDS was designed to be used within the automotive manufacturing sector.
7
Reproduced with permission of the copyright owner. Further reproduction prohibited without permission.
Face validity will be established via an in-depth literature review, from which the content
of the decision system was developed. The between and within-rater reliability of the decision
system will be established from controlled testing with a number of trained ergonomic engineers
and novices working in isolation, under time restrictions and using the process in an attempt to
analyze several jobs. Particularly this study seeks to determine if the EDS is reliable across
individuals (both expert and novice) and meets established time requirements such that it can be
shown to be a relatively non-invasive and comprehensive tool.
1.2 Statement of Hypothesis
It is hypothesized that both expert and novice subjects, trained on the ergonomic decision system,
will reliably arrive at the same decision with regard to the appropriate ergonomic tool while
observing the same operation under the same constraints.
Reproduced with permission of the copyright owner. Further reproduction prohibited without permission.
8
Chapter II REVIEW OF LITERATURE
A substantial body of evidence exists to support the implementation of an ergonomics process
within the industrial manufacturing sector (OSHA, 1999). The evidence is based on two
premises; first, that there is a positive relationship between work-related musculoskeletal
disorders and workplace risk factors and second that an effective ergonomics process can reduce
the potential for these injuries and illnesses (NIOSH, 1997; NAS, 1998).
One may ask why a company would expend resources on such an endeavor? It is
expected that within society today a corporation has an obligation to its employees, their families
and the community at-large to act in a manner which does no harm (Department of Labor &
Industries, 1988; WCB, 1994). In many unionized environments this is contractually enforced.
An ergonomic convention is typically found within these contracts (UAW-Ford Motor Company,
1999). Further, within the United States, an attempt to legislate ergonomics as a component of
industrial processes was recently brought forth (OSHA, 1995; OSHA, 1999). Finally, there are
financial benefits inherent to the institutionalization of an ergonomics program. Some of these
include the provision of a larger pool of workers capable of completing work tasks, the prospect
of reduced workers compensation claims, decreased absenteeism, increased productivity and
increased quality (Eastman Kodak Company, 1986). The astute corporation adopts ergonomics,
for a number of the above reasons. It seems implicit that the benefits of the implementation of a
sound ergonomics process far outweigh the costs (Oxenburgh, 1991; Barsky & Dutta, 1997;
Busse & Bridger, 1997; GAO, 1997; Burrows et al., 1998).
The Ergonomic Decision System (EDS) serves as an integral component of the
ergonomic process within a large automotive manufacturer. It is designed to preempt
musculoskeletal disorders by having the user break an entire job into its component elements.
Subsequently, approved ergonomic analysis tool offerings are used to scrutinize each element as
the user is asked a series of prompting questions. Each question serves to progressively filter the
9
Reproduced with permission of the copyright owner. Further reproduction prohibited without permission.

input data until only the pertinent information remains. The remaining data is then run-through
the most applicable ergonomic tool. The output is a passing or failing condition for each work
element. The EDS is intended to be used proactively, in the early stages of the design process but
may be used reactively as necessary. It is postulated that a review of the research composing the
EDS will serve to provide evidence of content validity.
Human capacities are determined by work elements such as force, posture and repetition.
Each of these elements has been individually and collectively studied in an attempt to quantify
the relationships between imposed physical stress and the resulting strain. The research
approaches used include biomechanics, physiology, psychophysics and epidemiologogy. Each
approach is unique and will be discussed individually. The culmination of approaches will serve
as the research basis of the EDS.
2.1 Ergonomic Analysis Techniques
2.1.1 Biomechanical
As the name implies, biomechanics is the study of energy and forces and their effect on biological
systems (Merriam-Webster's, 1993). Research in occupational biomechanics utilizes the laws of
physics to estimate the stresses imposed upon the musculoskeletal system under working
conditions such as the actions required during the manual handling of materials. The
biomechanical approach treats the human body as an intricate system of soft and osseous tissues
acting as pulleys and levers. The levers (body segments such as lower leg or forearm) are
empowered to move because of a strategically balanced mass-spring-damper composite. Osseous
tissue or bone and joints act as rigid bodies and are essentially the systems foundation. Soft
tissues, particularly muscles and tendons serve all three roles within this system; as a component
of the levers mass to be moved, as pulleys or springs with potential energy waiting to be
converted to kinetic energy by way of concentric contraction and as dampers, ensuring stability
with eccentric contractions (Eastman Kodak Co., 1986; Tracy, 1990; Sanders & McCormick,
1993).
10
Reproduced with permission of the copyright owner. Further reproduction prohibited without permission.
Forces acting on the system either externally (mechanical force on external surface)
deemed exposure, or internally (pressure and mechanical force of soft tissues on bones or
ligaments) deemed dose, elicit a response. The bodily response depends on a number of potential
traumatogens which serve to amplify the effects of the initially applied force (Kilbom, 1994b).
The fundamental contributor is the amplitude of force required and the conditions under which
the force is applied (Eastman Kodak Co., 1986). Potentially harmful occupational conditions
include time alterations in both the application of force and segment postures. These two time-
weighted factors are collectively known as repetition (Kroemer, 1989). Further, the severity of
the posture itself tends to lengthen or shorten the active muscle. The length of a muscle is
important to its ability to produce tension. When a muscle changes in length from its resting state,
contraction efficiency decreases. The overall resulting force of a contracting muscle (total
tension) therefore also decreases (Chaffin et al., 1999). As with any materials, the elements
which make up the human kinetic segments have tissue tolerance thresholds beyond which failure
(in the case of humans, injury or illness) occurs (Snook, 1978).
Various biomechanical models have been produced in an attempt to predict and provide
guidelines to control for physical overexertion. Most of these exist within published literature
and some are available as proprietary devices and software (Park, 1973; Armstrong et al., 1979;
Greene & Wolf, 1989; Radwin et al., 1991; Loslever & Ranaivosoa, 1993;). Researchers at the
University of Michigan, Center for Ergonomics, developed a model designed to analyse
population or individual physical capabilities given various operational inputs (Keyserling &
Chaffin, 1986). These two and three-dimensional models were then developed into proprietary
software for distribution. The output of the models include percentage of the population capable
of exerting the required effort by joint, and an estimation of the compressive forces on the lower
back. Biomechanical modeling can aid the analyst in the evaluation of many aspects of manual
materials handling, whether completed by the individual and compared against physical
11
Reproduced with permission of the copyright owner. Further reproduction prohibited without permission.
thresholds established through experimental research or by entering values as required into a pre
existing analytical model.
2.1.2 Physiological
The physiological analysis technique addresses the biological limitations of the human during
long duration, repeated physical exertions where the load applied is within the physical strength
of the worker. It is unlike the biomechanical approach, which is generally used to analyze low
frequency physical efforts (Mital et al., 1993). The manual handling of materials within an
industrial manufacturing environment often requires the rapid and repeated application of effort.
During this type of work the force requirements are not usually the limiting factor, but rather it is
muscular fatigue that limits the workers endurance (Snook & Irvine, 1969; Hagberg, 1981).
During high intensity work, the muscles of the body must work more efficiently. To do so, they
require a higher volume of blood flow, carrying oxygen and nutrients to the working tissue and
sweeping away waste byproducts such as lactic acid. If the demand for these essential system
elements exceeds the supply, the activity will not be able to be continued (Andrews, 1967;
Astrand & Rodahl, 1986; Eastman Kodak, 1986).
With knowledge of the physical responses to tasks requiring some level of endurance,
physiological methodologies can focus on the measurement of heart rate, measures of oxygen
consumption, and further energy expenditure criteria in order to describe and establish physical
thresholds (Garg & Saxena, 1982; Garg, 1983). Metabolic energy expenditure is among the most
widely measured and accepted physiological response to repetitive materials handling as it is
directly proportional to the workload at steady-state conditions (Mital et al., 1993). As such, the
proportion of metabolic expenditure required may be compared to a criterion measurement for
work under a given set of physically taxing conditions (Garg et al., 1978). Several equations
have been developed for predicting energy costs for a number of manual handling scenarios
(Rohmert, 1973; Genaidy & Asfour, 1987; Rose et al. 1992). Each of these account for certain
variables as body weight, weight of load, gender, vertical start and end height of lift, dimensions
12
Reproduced with permission of the copyright owner. Further reproduction prohibited without permission.

of the load, frequency and duration of work (Sanders & McCormick, 1993). The ergonomic
threshold for working is impacted by these qualifiers.
2.1.3 Psychophysical
When biomechanical or physiological data are unknown, difficult to apply or impractical
techniques to be used, psychophysics serves as a method of evaluating a variety of working tasks.
This alternative approach entails subjects adjusting either effort (load) requirements or exertion
frequency (load held constant) while performing a task to the maximum amount that could
perceptually be sustained for some prescribed period of time (Snook & Ciriello, 1991; Mital et
al., 1993). Periodically ratings of perceived exertion, physical stress or fatigue are measured
(Borg, 1973). The theory is that since fatigue has been identified as an early symptom of use-
related musculoskeletal disorders (MSD), the psychophysical method may serve as a sensitive
indicator of MSD risk (Hagberg, 1981; Borg, 1982; Habes et al., 1985; Basmajian & Deluca,
1985; Baidya & Stevenson, 1988; Potvin & Bent, 1997).
One of the benefits of psychophysics is that it allows the interacting effects of differing
physical stressors be evaluated at the same time. The ratings obtained through this method are
the result of the central nervous system attempting to understand peripheral sensations and
physiological state. All of the inputs are integrated, referenced against experience and memory
and output as psychophysical ratings (Gescheider, 1997). Psychophysical methodologies have
been used extensively in the design and evaluation of a variety of manual materials handling tasks
(Snook & Irvine, 1968; Legg & Myles, 1981; Garg & Saxena, 1982; Ciriello et al., 1990; Snook
et al., 1995; Snook et al., 1997). The 1991 NIOSH committee used the psychophysical criterion
in the development of its equation designed to protect workers throughout a variety of lifting
durations and frequencies. The committee decided to establish a lifting effort threshold which
would be acceptable to 75 percent of the female working population. Further, this value was
proposed to ensure acceptability to veritably all male workers. The rationale for the use of the
25th percentile female population strength value, was based on the findings of Snook (1978). He
13
Reproduced with permission of the copyright owner. Further reproduction prohibited without permission.
based his findings on insurance data and stipulated that a worker is three times more susceptible
to low back injury if performing a manual task that is acceptable to less than 75% of the working
population. The psychophysical methodology has been proven to be a quick, consistent and
reproducible means of assessing physical limitations during typical manual material handling
tasks (Wardle & Gloss, 1978; Krawczyk et al., 1993). Several studies have reported that
psychophysical studies need not take place over a representative 8-hour work day, or even a
typical 5-day work week (Legg & Myles, 1981; Legg & Myles, 1985; Ciriello et al., 1990). In
fact, several studies indicate that a subject is able to accurately determine an acceptable load or
frequency, for a variety of manual handling tasks, within two hours of testing (Snook & Irvine,
1968; Snook, 1978; Ljungberg et al., 1982; Fernandez et al., 1991; Snook et al., 1997; Snook et
al., 1997). Karwowski and Yates (1986) found that at lifting frequencies of six per minute or
less, subjects could choose acceptable weights within 30 minutes that did not differ significantly
from those chosen after four hours work.
Mital (1983) however, did not find that subjects could estimate an acceptable, perceived
load while working for 20 - 30 minutes. It was stated that individuals taking part in a
psychophysical lifting study would tend to overestimate their respective maximum acceptable
weight of lift. These findings may be due in part to experimental design. It was found that
individuals would tend to choose higher workloads while adjusting the frequency with a constant
load rather than load with a constant frequency (Nicholson & Legg, 1986). Further, at higher
working frequencies the psychophysical method may overestimate physiological capabilities
(Ciriello & Snook, 1983; Karwowski & Yates; 1986). In a study conducted by Mital (1985),
psychophysical and physiological data were collected simultaneously. Findings indicated that for
manual lifting at a frequency at or below 4 actions per minute the psychophysical criteria should
be considered more reliable (Mital et al., 1993). Karwowski and Yates (1986) stipulate that the
psychophysical methodology should not be used to assess lifting capacity at a frequency above 6
14
Reproduced with permission of the copyright owner. Further reproduction prohibited without permission.
lifts per minute. From this we may establish that the upper frequency threshold for the use of the
psychophysical methodology is between 4 and 6 actions per minute.
2.1.4 Epidemiological
Epidemiology is the study of how often diseases occur in different groups of people and why
these occur.(Coggon, Rose & Barker, 1997). Translated into an occupational sense, the emphasis
of epidemiological research is on the measurement of injury or illness outcomes within a working
environment, as they relate to a population at risk (Sommerich et al., 1993). Essentially,
epidemiological studies seek to establish a relationship between workplace exposure and physical
effects. Measurements of risk include; counts (number of people within a group suffering from
some prescribed injury or illness), prevalence rate (number of people in a group suffering from
some injury or illness/total number of people within the group) and incidence rate (number of
people developing a disorder/total number at risk)/unit time). These measurements can then be
used to compare occurrence of the prescribed disorder among different groups (Mital et al.,
1993). From these comparisons, occupational risk factors of manual materials handling (i.e. load
characteristics, posture, repetition rate, duration) may be identified (Andersson, 1981). Once
identified, an attempt may be made to establish the strength of the relationships between risk
factors (Chaffin & Park, 1973; Silverstein et al., 1987).
The relative contribution of each risk factor (force, posture, repetition etc.) has been the
focus of many studies (Kadefors et al., 1976, Silverstein et al., 1987, Keyserling et al., 1993,
Hagg et al., 1995, Engstrom et al., 1998). It is generally assumed that force is the key contributor
to disorders, and deviated posture tends to amplify these forces, whereas, repetition alone depicts
the temporal relationship between deviations in posture and also the application of force, as
required by the cyclical work (Silverstein, 1985; ACGIH, 2001). Several studies have sought to
establish an exposure-response relationship between different body areas, forceful and repetitive
work (Herrin et al., 1986; Schoenmarklin & Marras, 1993; Loslever & Ranaivosoa, 1993;
15
Reproduced with permission of the copyright owner. Further reproduction prohibited without permission.
Schoenmarklin et al., 1994). The results of these may be used to identify workplace risk factors
and can provide 'benchmarks' to identify and preempt occupational risk factors (Lee et al. 1997).
Based on epidemiological studies, Armstrong et al. (1982, 1996) and Silverstein, Fine,
and Armstrong (1987) established repetition as a risk factor for CTDs. In two cross-sectional
studies, Silverstein et al. (1986-87) reviewed 4 groupings; low force-low repetition, high force-
high repetition, low force-high repetition, high force-low repetition. From these studies it was
found that the risk of a CTD injury in low force-high repetition jobs was 3.3 and 2.7 times
respectively greater than low repetition jobs. Stock (1991) reviewed 54 studies, and concluded
that specific disorders of tendons and tendon sheaths are causally related to repetitive and forceful
work. Armstrong et al. (1993) reviewed 22 studies of occupational groups, which met the criteria
of intensive hand-work and/or repetitive use of the hands and wrists. Carpal tunnel syndrome and
tendonitis of the hand-wrist were among the most frequently occurring musculoskeletal disorders
identified. Kilbom (1994b) sought to evaluate work of the upper extremity by reviewing
scientific literature with specific regard to the exposure-effect relationship. This extensive review
of epidemiological studies, cited 17 that had established an dose-response relationship between
repetitive and forceful work and musculoskeletal disorders. Latko et al. (1997) reviewed 13
selected epidemiological studies that show a relationship between repetitive work and upper
extremity disorders. This study established that the dynamic nature of modem industrial tasks
must be considered, in addition to the number of motions and the amount of idle time. The
National Institute for Occupational Safety and Health (NIOSH) performed extensive research on
musculoskeletal disorders in the workplace (1997). This was founded on the concept that, when
occupational demands repeatedly exceed the biomechanical capacity of the worker, the activities
become trauma-inducing. The study featured a critical review of epidemiologic evidence by
occupational CTD and affected body part. Results indicate that there is strong evidence of a
positive association between exposure to a combination of risk factors and injury or illness
(NIOSH 1997).
16
Reproduced with permission of the copyright owner. Further reproduction prohibited without permission.

The Occupational Safety and Health Administration (OSHA) of the U.S. Department of
Labor, performed an extensive review of epidemiological, laboratory and psychophysical
evidence (OSHA, 1999). The epidemiological evidence, concurs with previous findings that the
risk factors of force, posture and repetition are individually implicated as risk factors for CTDs.
It is noted however that the cumulative and multiplicative effect of these is of greater concern.
The epidemiological approach may produce useful insight into ergonomic risk factors
and their relative contribution. These results may be adopted in the design of operations within
manufacturing assembly facilities. It should be noted however that methodology used for these
studies should be heavily scrutinized for experimental design and statistical significance (Mital et
al., 1993). Further, the results from these studies are often qualitative due to the lack-of or
difficulty obtaining, quantitative outcomes (injury/illness) data.
2.2 Ergonomic Risk Factors
Job analysis, by way of the EDS is useful for identifying sources of injury and illness before these
are manifested in claims. Moreover, the EDS can be used to evaluate up-front design or
improvements in job and tool redesign without having to wait until claims are actually produced
or reduced. The EDS includes a method for measuring the workers exposure to each of the
primary risk factors: force, posture and repetition. The exposure is then compared to known
human capabilities to compute an injury probability. A risk factor is defined as an attribute or
exposure that increases the probability of the disease or disorder (Putz-Anderson, 1988b).
Occupational risk factors include repetitive and sustained exertions, awkward postures, and high
mechanical forces (Selan, 1994). These primary risk factors will be defined and discussed below.
2.2.1 Force
Mathematically forces represent the efforts necessary to produce or resist movement. This does
not mean that every force produces a movement, in many instances acting forces are balanced so
that no movement is produced. In fact, an occupational task may require the combination of
static and dynamic work (Frankel & Burstein, 1970). The external effect of a force tends to
17
Reproduced with permission of the copyright owner. Further reproduction prohibited without permission.
change the velocity of the body. A general principle is that a body moving at a constant velocity
requires a force to change this velocity. A stationary body has zero velocity and thus requires a
force to change its state. A body moving at a constant velocity however, is said to be in a state of
dynamic equilibrium (Chaffin & Andersson, 1991; Elliott & Wood, 1995).
Forces developed by the muscle-tendon complex act on bones at their points of insertion
and cause a rotational moment, or torque, around a joint. The muscles and bones act as a series of
levers. For example, when a worker lifts a box with both arms, the box acts as a load or
resistance on a lever, in this case the forearm (Rodgers, 1986). When the force requirements of a
job exceed worker capacity repeatedly or with a single occurrence, overexertion injuries or
illnesses can occur. The threshold limit values (effectively worker capacities) for use within the
EDS have been extrapolated from epidemiological and experimental studies. The force constraint
varies by both muscle group utilized, and combined risk factors. For example, as frequency
increases, force application capabilities decrease (Hagberg, 1981; Garg & Saxena, 1982; Habes et
al., 1985; Krom et al., 1990; Rempel et al., 1992). The acceptable force value adopted by the EDS
varies according to action reviewed, direction and frequency of application, number of hands
utilized, and postures assumed.
2.2.2 Posture
It is generally assumed that force is the key contributor to MSDs, and deviated posture tends to
amplify these forces. That is to say, as a joint is moved out of its natural or anatomically neutral
posture, there is a corresponding reduction in strength capability (Karhu et al., 1977; Snook &
Ciriello, 1991). These reductions are not necessarily linear and are unique by body part
(McAtamney & Corlett, 1993; Mital et al., 1993). The EDS employs the logic obtained from
several research papers and existing software programs and applies these as a portion of the
whole analysis for each work element reviewed.
18
Reproduced with permission of the copyright owner. Further reproduction prohibited without permission.
2.2.3 Repetition
Repetition, though difficult to isolate, is implicated as an ergonomic risk factor. Although there
are not yet any universally accepted guidelines, several studies, both epidemiologic and
experimental have adopted definitions to suit the particular situation (Armstrong et al., 1982;
Silverstein, 1985; Kilbom, 1994b; Marras et al., 1995). Repetitive movements in industrial tasks
have been shown to be an important risk factor associated with cumulative trauma disorders
(CTDs) (Silverstein et al., 1987; Marras & Schoenmarklin, 1993). For example, operational
activities involving repetitive movements that produce muscular tension are indicated often to be
associated with various occupational upper extremity disorders (Kvamstrom 1983; Habes,
Carlson & Badger, 1985; Feuerstein and Fitzgerald, 1992; Mital et al. 1993).
The EDS utilises a variety of different repetition values as a determination of which
particular ergonomic tool would be most applicable in a given situation. The value used is
determined by the particular action reviewed. For example, where repetition is reviewed in
isolation, studies indicate that an individual is able to repeat movements much more for smaller
muscle groups than larger (Kilbom, 1994b). With this understanding, lifting tasks, which tend to
require large muscle groups may be deemed frequent (repetitive) at work rates of 1 or 2 lifts per
minute. Conversely, hand intensive tasks, which tend to utilize several small muscle groups, may
be considered repetitive at 10 or more wrist movements per minute (Kilbom, 1994b). Further,
fine-finger work, such as typing, may not be viewed as highly repetitive until 200 motions a
minute (Kilbom, 1994a).
2.3 Ergonomic Decision System (EDS)
The EDS methodology consists of dismantling an operation (proposed or existing) into its
constituent elements. Each of these elements may then be scrutinized for specific physical
requirements. Once the particular physical requirements have been established, these may be
compared to the most appropriate and consensus-driven ergonomic thresholds for the given
19
Reproduced with permission of the copyright owner. Further reproduction prohibited without permission.
analysis. The source of information for each of the elements and decision variables will be
reviewed, highlighting the research methodology and the logic behind the choice.
The elements included within the EDS include both actions and required postures. These
have been established via consensus and are deemed to constitute the most common physical
manifestations within the automotive assembly environment. It was decided that rather than
reviewing the thousands of individual components which make-up an automobile a holistic
approach would be taken which should encompass the majority of actions and postures required
during the assembly process. Initially, the user of the EDS is prompted to identify particular
work tasks and subtasks required in order to complete the working task. Once these are
determined, the user is prompted to choose from among four actions and three postures, each
describing one work element. The four action choices are; pushing or pulling, carrying, lifting or
lowering, and hand intensive tasks. The three posture variables include; static work, awkward
postures and overhead work.
It was felt that by including these elements, the EDS would sufficiently address much of
occupational conditions promoting injury and illness. These actions and postures are identified
within United States Department of Labor, Bureau of Labor Statistics. The categories within
which these elements are contained include overexertion and repetitive motion. As mentioned
previously, these categories alone represent more than one third of all occupational injury and
illnesses within private industry (Sanders & McCormick, 1993; Konz, 1995; NIOSH, 1997;
OSHA, Federal Register, 1999; IE, 2003). It was the desire of the developers of the EDS to
incorporate the most applicable and consensus driven tools, aids and guidelines into the process.
These will be reviewed looking at the research methodology and a discussion of the assumptions
and limitations of each.
2.3.1 Psychophysical Approach in EDS
Psychophysical studies of various manual handling tasks have been conducted by Liberty Mutual
over the past three decades (Snook & Irvine, 1968; Snook & Irvine, 1969; Snook, 1978; Snook,
20
Reproduced with permission of the copyright owner. Further reproduction prohibited without permission.

1985; Snook & Ciriello, 1991; Snook, Vaillancourt, Cirello, Webster, 1995; Snook, Vaillancourt,
Cirello, Webster, 1997). A variety of tables constituting physically perceived thresholds were
developed over this time. The work tasks performed within the Liberty Mutual studies were
unique, in that they attempted to mirror industry as closely as possible. For example, the manual
handling of materials was dynamic, not isometric. The tasks took place over a series of distances
and frequencies, closely emulating those found in industry (Snook, 1985). Further, the studies
occurred over several sessions lasting between 4.5 to 8 hours and took place over several weeks
(Snook, 1978; Snook & Ciriello, 1991; Snook, 1995; Snook, 1997). It is through these carefully
controlled experiments that the Liberty Mutual studies have attempted to develop guidelines for
the evaluation and design of manual handling tasks that are consistent with worker capabilities
and limitations (Snook & Ciriello, 1991).
The original studies published in 1978, reviewed and compiled the findings of several
experiments that depicted the maximum acceptable weights and forces for the actions of lifting,
lowering, pushing, pulling and carrying tasks (Snook, 1978). The methods employed with each
novel action varied out of necessity. However, the primary analyses technique, psychophysics
remained constant throughout. Essentially, the worker was given control of the force variable
(usually the weight of the object being manipulated). All other variables such as frequency, size,
height, distance etc. were controlled (Snook, 1985).
In order to overcome adaptation effects, each manual handling task was broken up into
two segments; the first with a heavy initial weight, the second light. The subjects were then
instructed to make adjustments to the weight until a comfortable level had been achieved. If the
results of the first segment were within 15% of the second, the average of the two results was
recorded, if not results were discarded (Snook, 1978). The results of all experiments were
integrated into a series of tables containing maximal acceptable weight limits for these manual
handling tasks. It was however noted that not all of the values contained within the table were
experimentally derived. Assumptions were used to fill-in the gaps (Snook, 1985).
21
Reproduced with permission of the copyright owner. Further reproduction prohibited without permission.
Four additional psychophysical studies took place designed to fill-in some of the missing
components within the Liberty Mutual tables. The first experiment used 10 male and 12 female
subjects to investigate the effect of frequency on maximum acceptable weights and forces
(Snook, 1985). Fifty-one variations of seven tasks were reviewed (Snook & Ciriello, 1991).
Tasks included, four lifting or lowering, two pushing and a carrying task. These are the same
values used by Snook in previous experiments (Snook, 1978; Snook, 1985; Snook & Ciriello,
1991). The second experiment investigated the effects of object size, lifting distance and pushing
or pulling height (Snook, 1985). Experimental methodologies were identical to previous
experiments save the aforementioned variations and the subjects. Subjects were 12 female
industrial workers. The subjects performed 61 variations of these work elements (Snook, 1985).
The third experiment investigated the effects of task duration on maximum acceptable
weights and forces (Ciriello et al., 1990; Snook & Ciriello, 1991). Previous experiments used a
4-hour duration consisting of five different 40 minute tasks, with 10 minute breaks between each
task. In this experiment, the same task was performed continuously for four horns (with one 20
minute break) (Snook & Ciriello, 1991). Subjects were 10 male and 12 female industrial workers
performing 18 various lifting, lowering, pushing, pulling and carrying tasks at frequencies of 4.3
per minute or less. The third experiment also reviewed a combination task consisting of a lift,
carry and lower. It was noted that previous Liberty Mutual experiments have investigated work
elements, such as lifting, in isolation. This addendum to the third experiment followed the same
methodology as that prescribed for the work tasks reviewed in isolation (Snook & Ciriello, 1991).
The fourth experiment investigated tote boxes without handles, and lifting with extended reaches.
Subjects were six males. Forty-two variations of lifting, lowering, pushing, pulling and carrying
tasks were performed. Methodology followed that of previous three experiments.
Results of the four additional experiments which were designed to fill-in previously
assumed tabular values indicated general accuracy in assumptions save for forces and weights at
lower frequencies (Snook, 1978; Snook, 1985; Snook & Ciriello, 1991). It was found that the
22
Reproduced with permission of the copyright owner. Further reproduction prohibited without permission.
weights and forces for the 5 minute and 30 minute task frequencies were overestimated in the
original table by 10 to 15% (Snook, 1978; Snook, 1985; Snook & Ciriello, 1991). Further and
importantly, the average values of maximum acceptable weights and forces for the very high
frequency tasks (tasks faster than 4.3 per minute) were associated with oxygen consumption
values that exceeded the physiological criteria for an 8 hour work-day (33% V 0 2max) (NIOSH,
1981; Snook & Ciriello, 1991).
The addendum to the third and fourth experiments indicated that a combined task of lift,
carry and lower resulted in significantly lower maximum weights and forces than that of a carry
task in isolation. This was not the case for lifting or lowering where they were not significantly
different. Results from experiment two and four indicate that horizontal grip distance from the
body and task distance and height are significant variables to consider while establishing manual
handling guidelines (Snook, 1985; Snook & Ciriello, 1991). Specifically, the fourth experiment
found that when horizontal reach is extended (480mm) as compared to close to the body
(170mm), results indicate a median decrease in acceptable weights and forces of 48% (Snook &
Ciriello, 1991). It is noted that the biomechanical modeling of NIOSH (1981) and Chaffin &
Andersson (1984) confirm these findings (Snook & Ciriello, 1991).
The fourth experiment discovered that boxes without handles (poor coupling) resulted in
a consistent and significant decrease in acceptable weights and forces. These values varied with
frequency of action and box size. The median decrease was 16% (Snook & Ciriello, 1991). The
fourth experiment also found significant differences in maximum acceptable weights and forces
between pushing and pulling tasks over longer distances (15.2m). The maximum acceptable
initial force for the pulling task was 13% lower than for the pushing task. Further, the respective
maximum sustained force was 20% lower (Snook & Ciriello, 1991).
The results of the original seven studies were integrated with the results of the
supplementary four to establish a master eleven (Snook, 1978; Snook 1985; Snook & Ciriello,
1991). Each of these eleven experiments included two types of tasks: criterion and variation tasks
23
Reproduced with permission of the copyright owner. Further reproduction prohibited without permission.
(Snook & Ciriello, 1991). Each experiment investigated different variations in task frequency,
height, distance and box size. With the vast number of possible combinations and permutations,
the researchers stipulated that it was impractical to run every subject through all variations
(Snook & Ciriello, 1991). They decided to utilize the percentage difference from the criterion
task to develop an adjusted mean for each variation task. The standard deviation for each
variation task was then determined from the adjusted mean and the criterion task coefficient of
variation. With these values (mean and standard deviation for criterion and variation tasks) and
statistical normal distribution data, the maximum weights and forces acceptable to 10, 25, 50, 75
and 100% of the industrial population were derived (Snook & Ciriello, 1991).
2.3.1.1 Limitations & Assumptions of the Liberty Mutual Tables
Many of the limitations and assumptions involved with the Liberty Mutual tables are artifacts of
the experimental and statistical methods used. The psychophysical analysis technique relies on
the subject(s) to monitor and provide feelings and perceptions with regard to exertion and fatigue.
There may be number of psychological factors which will have an effect on the psychophysical
response during the manual materials handling activities involved in these experiments. Many of
these may be found in tabular format in Mital et al. (1993).
Since all variables (other than the one being freely adjusted by the subject(s)) must be
controlled for, the psychophysical methodology is typically restricted to laboratory investigations
(Mital et al., 1993). The results of these experiments are specific to a tightly controlled situation,
thus transference to the industrial workplace requires some flexibility with assumptions. For
example, the Liberty Mutual tables are designed to provide safe effort levels for work up to 8
hours, five days a week with a standard break schedule (Snook et al., 1970; Snook and Ciriello,
1991). Many of today's modem manufacturing firms require employees to work for 10 or more
hours per day, 6 (or more) days per week. The Liberty Mutual tables do not have a decreased
value for extended working periods. Thus, individuals who wish to apply the data from the tables
24
Reproduced with permission of the copyright owner. Further reproduction prohibited without permission.

in these environments must apply some rule-of-thumb techniques to compensate for extraneous
factors.
Naturally there will be broad variations in population strength as is implicit to normative
statistics. This must be countered with sufficient sample size. The Liberty Mutual research
tended to use relatively large sample sizes (15 to 59 subjects) for its criterion tasks (Snook, 1978;
Snook & Ciriello, 1991), however the number of subjects used in the variation tasks were well
short of the criterion (<12 female subjects for each supplementary experiment)(Snook, 1985). It
should be noted that the percentage difference between criterion and variation task was used to
develop the adjusted mean for each variation task. Further, the standard deviation for each
variation task was derived from the aforementioned adjusted mean value and the criterion task
coefficient of variation. Since the variation tasks had relatively small sample sizes, there may
have been a significant impact on the prescribed values. A basic tenant in statistics is that the
larger the sample the better (Leedy & Ellis, 2001). It has been stipulated that sampling error is
likely to occur while using parametric statistical techniques, where the sample size is less than
thirty (as was the case with the Liberty Mutual variation experiments) (Gravetter & Wallnau,
1988). Further, it is stipulated that assumptions had to be made to fill-in specific variations that
had not been studied. The values were developed based on 'adjustments' developed from the
closest applicable studied value. For example, Variations in frequency and distance for pulling
tasks are based upon adjustments developed for pushing tasks (Snook & Ciriello, 1991).
It is assumed that an individual who is to apply the values from the tables has read and
understands that certain reductions in weights or forces should accompany deviations from an
ideal state. For example, Snook and Ciriello (1991) stipulate values for handling tote boxes
without handles should be reduced by approximately 15% from the tabular value. Further, when
handling smaller boxes with extended horizontal reaching between knee and shoulder heights the
tabular values should be reduced by 50% (Snook & Ciriello, 1991).As evidenced by the large
25
Reproduced with permission of the copyright owner. Further reproduction prohibited without permission.
multiplier values, these subtleties may contribute significantly to the outcome from an industrial
task design perspective.
The practitioner should be knowledgeable enough to apply the tabular values in
circumstances where the prescribed weights and forces are most applicable. For instance, at low
frequencies (one lift every 5 & 30 minutes) of manual materials handling, the psychophysical
method may overestimate physical capabilitiesMital et al., 1993). It should be noted that this bias
was thought corrected-for in later publications (Snook, 1985; Snook & Ciriello, 1991).
Comparative results derived from a biomechanical modeling tool versus the Liberty Mutual tables
(1991) for the same elements of several operations indicate that the most recent psychophysical
tables still overestimate physical capabilities at very low frequencies. Also, at high frequencies it
was observed that the psychophysical technique produces overestimates of maximum acceptable
weights and forces (Ciriello & Snook, 1983; Fernandez et al., 1991). In fact, the average values
for the very high frequency tasks (tasks faster than 4.3 per minute) were associated with oxygen
consumption values that were greater than the accepted criteria for an 8 hour day (Snook &
Ciriello, 1991; NIOSH, 1981). These results are supported by similar experimental findings
where high frequency lifting (above 6 per minute) may cause the subjects to misjudge acceptable
values because they are cuing on muscle tension instead of metabolic demands (Karwowski &
Yates, 1986). The findings indicate that the use of the table values for manual material handling
should be restricted to relatively low to moderate frequencies (Snook & Irvine, 1969; Karwowski
& Yates, 1986).
2.3.2 Biomechanical Approach in EDS
The science of biomechanics provides the basis for certain strength prediction models. The
biomechanical model breaks the body into segments, each having a mass as determined through
anthropometric studies (Eastman Kodak Company, 1986). These models may be (and are often)
designed to assess the forces acting on particular articulations and identifying potentially
hazardous working conditions (Chaffin and Andersson, 1991).
26
Reproduced with permission of the copyright owner. Further reproduction prohibited without permission.
A strength prediction model that is commonly used is the University of Michigan's Three
Dimensional Static Strength Prediction Program (3DSSPP™). This model may be used to
simulate a wide variety of working postures and allows for a variety of anthropometric
populations to be reviewed. The model is useful for the analysis of forces acting upon the body
under 'slow' moving conditions with 'heavy' materials handling tasks (University of Michigan,
2000). The tool may be used to analyze symmetric and asymmetric postures. Further differing
magnitudes of hand forces for the left and right hands can be entered and may act in common or
differing directions. The model requires certain inputs including worker anthropometric
characteristics, worker posture while exerting force, and the load in the hands and the direction of
application. With these inputs the model is able to provide the compression force realized by the
back (comparative with NIOSH limits), the strength requirements for each joint, the percentage of
the given population capable of completing the task and the required coefficient of friction at the
shoe - floor interface. These values are based upon a large database of isometric strength data
collected over a 25 year period.
2.3.2.1 Limitations and Assumptions of the Biomechanical Approach
As mentioned in an earlier section of this document, the biomechanical approach (generally used
as a low-frequency component of the integrative approach) is used to estimate the mechanical
stresses on the body while performing some task. Within these models the human body is
divided into a series of linked segments, each possessing a similar length, center of gravity and
mass to those of the population being studied (Loslever & Ranavoisa, 1993). Limitations
inherent to the biomechanical approach include, the complexity of the human body and the
translation of complex joint interactions to mathematical modeling (Park, 1973). Researchers
attempt to counter these limitations with model scope and sophistication designed to increase the
accuracy of results. The unfortunate outcome of this increased specification is that the models
become only applicable to very narrow situations and do not translate well to other tasks
(Armstrong et al., 1979; Jagger and Luttman, 1989).
27
Reproduced with permission of the copyright owner. Further reproduction prohibited without permission.
Biomechanical models vary in the number of articulations and vascular and non-vascular
tissue interactions. Cadaver, biopsy and animal studies are used to identify the complex physical
interactions and properties of a particular segment of the human body (Goldstein et al., 1987;
Dennett & Fry, 1988; Topp & Byl, 1999). Further, complex electronic equipment, such as
electrogoniometers, accelerometers and electromyography are commonly utilized to identify joint
dynamics and tendon travel (Kadefors et al., 1976; Silverstein, 1985; Silverstein et al., 1987;
Schoenmarklin & Marras, 1993; Deal, 1995; Marras et al., 1995; Sommerich, 1996; Potvin,
1997). Obviously with each physical study and with the use of these varied and often
complicated devices, the possibility for bias and technical error increases. The combination and
application of the knowledge obtained from these studies assumes that the studies were well
performed and that all care was taken to control for potential sources of informational noise
(Fisher et al., 1993).
Biomechanical models are generally designed to take into account various amounts of
information, compute the forces acting on a joint and then compare those against some ultimate
tensile or compression value. The validity and reliability of the comparator is then essential to
accurate outcomes. For example, in reviewing several studies, Mital et al. (1993) found a range
in ultimate compressive force from 3000N to 12,000N. It was further found that several
demographic and physical characteristics play a significant role in the compressive forces. These
too must be accounted (or acknowledged). Even with all of this available information, in order to
effectively estimate the mechanical stress imposed upon the body while performing dynamic or
static work, a number of simplifications and assumptions concerning segment and tissue
interaction are necessary. The nature and extent of these assumptions and simplifications
determine the sophistication of the biomechanical model (Mital et al., 1993).
The 3DSSPP™ model (as discussed previously) is designed to assess a variety of manual
handling tasks and represents a culmination of decades worth of research. The model was
scrutinized by Chaffin and Erig (1991) during a study which collected data from 29 male subjects
28
Reproduced with permission of the copyright owner. Further reproduction prohibited without permission.

during a lift and three push and pull tasks. Results indicate that the model is highly sensitive to
slight alterations in posture. The user must be aware of the potential for significant differences in
outcomes with minor data input changes. The 3DSSPP™ model was developed from isometric
data collected over several years. As such the model is intended to be used for slow, gross
movements which are not common in the contemporary industrial environment. As such the user
must be able to scale the model output by balancing inputs between applicable population gender,
anthropometry and percent strength capable. Further multiplier values should be used to adjust
outputs for frequency.
2.3.3 Physiological Approach in the EDS
Careful manipulation of metabolic equations can allow individuals to determine energy
expenditure as the result of lifting, lowering, pushing, pulling and/or carrying a specified load.
This then may be compared to an individuals maximum aerobic power (MAP) in order to provide
a relative ratio of energy used to energy available. Garg (1976) and Garg et al. (1978) used this
reasoning toward the development of the metabolic equations.
The metabolic equations as proposed by Garg (1976) were founded upon the findings of
Snook (1969). These studies indicated that a design criteria of 33 percent MAP would be
protective for most workers. Within these studies, 16 kcal/min was taken as MAP for healthy,
young males during a dynamic job. Chaffin (1967) stipulated that 5.2 kcal/min should be
sufficiently protective for young males averaged over an 8-hour working day. This value is based
on 33% of 16 kcal/minute. However, Garg et al. (1978) stipulate that women and older workers
require a much-smaller physical work capacity limit. Garg (1976) surmised that from a review of
the available methods, a better and more applicable predictive model was required. Further, it
was stated that any physiological fatigue criteria (i.e. 5.2 kcal/minute) cannot be used by the work
analyst unless converted into useful design parameters such as frequencies, weights, distances and
more (Garg et al., 1978).
29
Reproduced with permission of the copyright owner. Further reproduction prohibited without permission.
The purpose of this study was to develop a method for estimating the metabolic energy
expenditure rate based on physical descriptions of a job and the worker completing the job tasks.
This method was to be designed to maximize usefulness within the industrial environment (Garg
et al., 1978). The model itself was based on the assumption that a job can be divided into simple
task elements and that the mean metabolic energy expenditure rate of the job can be predicted by
knowledge of the energy expenditure of the tasks and duration of the job. The model uses the
calculation that the mean metabolic energy expenditure equals the sum of the energy used for
each task plus the energy used to maintain a particular body posture averaged over the time of
exposure (Garg, 1976). In order to establish baseline net metabolic cost for various elements of
the equation a systematic collection of metabolic energy expenditure rate data for 28 separate
tasks was undertaken in a laboratory setting. Over 540 oxygen uptake measurements were made.
Differing levels of weight of load (force) and frequency of loading the body (pace) were
employed for each task. The experiments were designed so that the main effects and some
interactions accounting for the majority of the variation in the energy expenditure rate could be
analyzed.
Prediction equations of net metabolic cost for each task as a function of personal and task
variables were developed. It is stated to be of importance to note that gender effects appear for
certain tasks (lifting, lowering, pushing at bench-height, lateral movement of arms of 90 degrees)
but not for others (holding, walking, carrying, forward movement of arms, lateral movement of
arms 180 degrees) (Garg et al., 1978). Further it is said to be worth mentioning that the
prediction equations are presented as net metabolic cost per performance. Therefore, these
equations can also be used to estimate the net metabolic cost of infrequently occurring tasks or
elements that appear in special cycles of a repetitive job. However the metabolic equations do
not cover small hand or arm movements (i.e. cutting or cranking) (Garg et al., 1978).
Chaffin (1967) developed a prediction model for the metabolic energy expended during
arm activities. The model was primarily limited to weight holding activities in the sagittal plane.
30
Reproduced with permission of the copyright owner. Further reproduction prohibited without permission.
The net metabolic rates for holding 4.5, 13.6 and 22.7kg loads against the waist by a 75kg seated
subject were reported as 0.22, 0.71 and 1.66 Kcal/minute respectively. The corresponding values
as derived by Garg (1976) were 0.28, 0.84 and 1.40 Kcal/minute. The differences between the
two studies results were attributed to inter-subject variability in net metabolic costs (Garg et al.,
1978).
A comparison between the values derived by the Garg (1976) equations and those
proposed by Snook (1971) for lifting tote boxes was reported. Results of the lifting comparison
indicate that the total metabolic rates as predicted by Garg (1976) are comparable to the means of
the measured metabolic rates (Garg et al., 1978). The average absolute difference was 6.8
percent. It was noted that the predicted metabolic rates for lifting were consistently lower than
the means of the measured metabolic rates. This was explained to be attributable to the fact that
the body weight used by Snook (1971) was not representative of the industrial working
population, and that if 91kg (rather than 77kg) was used, the predicted rates would be consistently
higher than those measured (Garg et al., 1978).
In conclusion, the research indicates that the metabolic rate prediction model can be used
to estimate metabolic rates for a wide variety of manual materials handling jobs. The partitioning
of a job into its component elements allows for the identification of those tasks that are
particularly taxing to the worker. This model was said to be useful in the design of industrial
operations (Garg et al., 1978).
2.3.3.1 Limitations & Assumptions of the Garg Metabolic Equations
Physiological studies are subject to their own limitations and assumptions. These studies review
an individuals (or groups) physical endurance and limitations, considering the physical demand
for oxygen and nutrients and the disposal of waste by-products. There are several measures
which may be used to assess the efficiency of the system, some of these include, metabolic
energy cost, heart rate, blood pressure, blood lactate and ventilation volume (Mital et al., 1993).
31
Reproduced with permission of the copyright owner. Further reproduction prohibited without permission.
Each of these techniques differs in their respective invasiveness, and each require careful and
considerate analytical methods.
Typically, metabolic energy expenditure has been the most widely used technique to
assess repetitive materials handling as it is directly proportional to the workload at steady-state
conditions (Mital, 1984a; Astrand & Rodahl, 1986). There are several contributory factors
which effect metabolic energy expenditure rate. Each of these positively or negatively impact
muscle recruitment which in-tum directly impacts energy cost. Metabolic energy expenditure is
dependant upon the amount of muscle groups active during task performance (Mital et al., 1993;
Kilbom, 1994b). All of these factors must be acknowledged within research methodology or
addressed within the assumptions or limitations of the work.
With regard to Garg's equations (1976), the first and obvious limitation study was the use
of only six subjects. Such a small sample size makes statistical significance difficult to establish
and allows data anomalies or spurious elements to have a large effect on data analysis. Further,
the subsets of subjects (gender, weight) which were used to establish multiplicative effects for
energy expenditure are suspect due to the small sample size of each (i.e. 3 male; 3 female). The
experiments were performed within a laboratory setting which findings, it may be argued, are
difficult to transfer reliably into the industrial environment. The strict controls required of the
experiment each serve to call into question the application to another less-controlled setting. For
example, the tote box was controlled for size and coupling where industrial manufacturing often
requires the manual manipulation of multiple items with varying dimensions, frictional properties
and load stability. Unless controlled-for, each assumption decreases the validity of the tools
results in an industrial setting. An additional limitation of the study was that the subjects
performed tasks for far less time than would be required of a typical manufacturing assembly job.
In fact, it is stated that experiments were performed for only ten minutes. It is explained that the
first five minutes were used to establish a steady heart rate, where the subsequent five were
recorded for ventilatory minute volume and the oxygen content of expired air.
32
Reproduced with permission of the copyright owner. Further reproduction prohibited without permission.
2.3.4 Integrative Approaches in EDS
Mital Tables: Recognizing that none of the individual research approaches can provide 'safe' load
recommendations across the entire range of frequencies (Mital, 1985; Mital et al., 1987; Mital,
1992), Mital et al. (1993) developed an integrative method to determine what would be deemed
as a physically 'safe' load for a worker to lift, lower, push, pull or carry over a variety of postures,
frequencies and durations. As integration implies, the tables make use of a combination of
biomechanical, epidemiological, psychophysical, and physiological disciplines. The ultimate
goal of this composite approach is to use the 'most significant task factor', namely frequency, to
determine which prescribed value would be most applicable in a given materials handling
situation (Mital et al., 1993). As with the Liberty Mutual tables, gender, population percentiles,
box size or handle height and physical ranges further refine choice variables to the most
appropriate value. The design criteria, effectively a scalable safety threshold value 'which must
not be violated' was established for each of the four approaches and each of the physical actions
(Mital et al., 1993). This criterion value was based on the premise that injury severity and
incidence rate increase almost three-fold as job requirements approach the strength limits of
workers (Chaffin et al., 1978).
For the lifting element, previously established psychophysical data (Snook, 1978; Snook
& Ciriello, 1991) were used as the base. The rationale is that this data provides design criteria
across almost the entire lifting frequency range. This database was modified in regions where the
biomechanical or physiological design criterion were the limiting factors (Mital et al., 1993). The
design criteria for lifting based on the epidemiological approach utilized the research of Ayoub et
al. (1983) and Ayoub and Mital (1989). The studies established a 'Job Stress Index' (JSI) which is
a working duration, lifting frequency, load and lifting capacity based index (Ayoub & Mital,
1989). A 'critical JSI value' of 1.5 was set. That is to say that the occurrence of injuries, illnesses
and the severity of these increased substantially when this index was exceeded (Ayoub et al.,
1983). The study included mostly male participants and the weight equitable to a JSI value of 1.5
33
Reproduced with permission of the copyright owner. Further reproduction prohibited without permission.
was 27.24kg. The compressive value associated with the JSI value of 1.5 is based on the three
dimensional biomechanical model of Kromodihardjo and Mital (1986, 1987) and is
approximately 3930N. This represents 69% of the mean ultimate compression strength
established by Jager and Luttmann (1991). Mital et al. (1993) equate this percentage to the
female population to establish a spinal compression limit of 2689N. This would correspond to a
weight of 20kg, and a JSI held at 1.5. Therefore the biomechanical limits for use within Mital et
al. (1993) composite approach would be approximately 27kg for males and 20kg for females,
such that any table values higher than this would be replaced by these load magnitudes.
As discussed previously, the physiological approach is not limiting due to load but rather
the endurance of the individual. As one may assume, the combination workplace risk factors will
significantly increase the rate of expenditure. Further, it should be noted that the primary reason
for the sensitivity of metabolic energy expenditure rate to workplace risk-factors is the fact that
energy cost is dependant on the number and size of muscle groups recruited to perform a task
(Mital et al., 1993; Kilbom, 1994b).
It has been determined that occupational tasks requiring a metabolic energy expenditure
of more than 5 kcal/minute (approximately 33-35% of treadmill aerobic capacity) will lead to
overexertion and undue fatigue (Michael et al., 1961; Bink, 1962; Mital et al., 1993; Sanders &
McCormick, 1993). Some studies have indicated that a limit of 33% maximum aerobic power
(MAP) will be protective of workers for an 8-hour workday. Knowing that the MAP for healthy
young adult males is about 15 kcal/minute, one third of this is 5 kcal/min (Sanders &
McCormick, 1993). Others have stipulated that this value is too high and that a more
conservative approach is required. Frederick (1959) suggests that energy expenditure for an 8-
hour workday should not exceed 3.33 kcal/minute.
Further studies indicate that when frequencies are above 4 lifts per minute, the
psychophysical and physiological approaches provide very similar weight recommendations.
When frequencies are at, or below, 4 per minute, psychophysical recommendations should be
34
Reproduced with permission of the copyright owner. Further reproduction prohibited without permission.
considered more valid (Mital, 1985). It should be noted that while comparing load
recommendations for lifting activities, Garg and Ayoub (1980) found that the psychophysical
design criteria leads to greater work loads at higher frequencies when compared with the
physiological approach. Further, while lifting from floor to 0.51 meters in height, the frequency
threshold of 6 per minute was the point at which the physiological criterion limit was exceeded,
indicating that the physiological analysis technique is more appropriate at higher activity rates
The ultimate result of the integrative approach used by Mital et al. (1993) are a series of
look-up tables (as Snook & Ciriello, 1993) which provide ergonomically safe values for both
genders over many manual materials handling tasks seen in industry today. In order to use these
tables effectively, one reviews the action options (Lift/Lower, Push/Pull, Carry) and locates a
safety value based on work constraints from the appropriate table. One key feature to this
compilation is the availability of correction factors which are designed to address certain
information gaps which would likely have an impact on the safety margin for that task. These
correction factors consist of multipliers which may be applied to the tabular values. All
correction factors were designed to be used for lifting and carrying conditions. The work
duration correction may effectively be applied to all manual materials handling actions. These
correction factors may be found in Mital et al. (1993).
NIOSH Lifting Equations: The integrative approach was also used by the National Institute for
Occupational Safety and Health (NIOSH) (1981) while establishing a work practices guide for
manual lifting. An equation was developed based on the design criterion for biomechanical,
psychophysical and physiological methodologies. The formula was comprised of the critical
elements required for ergonomic analysis within which manual lifting tasks are characterized by
variables including frequency, part weight, spatial factors and duration (Reed et al., 1999). In
1991, this equation was modified to address some of the original limitations and now included a
lowered initially acceptable weight (23kg rather than 40kg as 1981) and multipliers for
asymmetrical lifting, twisting and object coupling (Waters et al., 1993). The alteration in the load
35
Reproduced with permission of the copyright owner. Further reproduction prohibited without permission.
constant represents both a desire to decrease the load constant but also a perceived need to
increase the horizontal displacement component of the equation from 15 to 25cm. With the
horizontal correction, the seemingly large change in the load constant represents only a 1kg
reduction from the 1981 equation (Reed et al., 1999). These alterations were prompted by new
research and reflect changes in psychophysically determined findings as established by Snook
and Ciriello (1991).
The biomechanical aspect of the equation required prescribed inputs to provide a value
which could estimate compressive forces on the low back, the value attained could then be
compared to established thresholds for safe lifting based on maximum disc compression (Chaffin
& Park, 1973; Jager & Luttman, 1989). The result was a cut-off value of 350 kg of disc
compressive force centered on the articulation between the fifth lumbar and first sacral vertebrae
(Waters et al., 1993). This location was chosen as the site of greatest lumbar stress during lifting
(Ayoub and Mital, 1989; Waters et al., 1993).
In order to address repetitive lifting the NIOSH 1991 committee selected metabolic
energy expenditure as the criterion measure. The committee attempted to prevent muscular
fatigue, which is likely to accompany high-frequency repeated lifting, by establishing a baseline
maximum aerobic capacity (Waters et al., 1993). It was decided that the capacity of 9.5 kcal/min
or 4000 kcal per standard working day (420 minutes) would serve as the threshold value. The
baseline energy expenditure was 10.5 kcal/min which was discounted to 9.5 kcal/min due to
concerns that treadmill tests overestimate maximal aerobic capacity for repetitive lifting (Reed at
al., 1999). This criterion is supported by many studies (Astrand & Rodahl, 1977; Mital, 1984a ;
Karwowski & Yates, 1986), however the main contributor is the research of Rodgers et al.
(1991). It should be noted that the NIOSH 1991 committee stipulates that more research is
required to validate the physiological aspect of the equation for paced lifting, such as that
required of assembly line operations.
36
Reproduced with permission of the copyright owner. Further reproduction prohibited without permission.
The NIOSH 1991 committee made adjustments to the physiological capacity value in
order to address initial vertical lifting location (surrogate measure of body parts involved) and
durations for repetitive lifting. A threshold was established for initial vertical height of lift of 75
centimetres . The committee reasoned that any initial vertical position below 75 centimetres
required the use of the muscles of the whole body. Lifts initiating above 75 centimetres required
primarily the shoulder and arm muscles. It was further stipulated that primarily arm lifts require
and expend less energy than whole body lifts. However, the capacity of those muscles was also
significantly less. In order to adjust for lifts above the 75 centimetre mark, the 1991 committee
implemented a 30 percent reduction in the energy expenditure limit of 9.5 kcal/min.
Three durations were utilized to adjust for muscular aerobic energy expenditure within
the NIOSH (1991) equation. For durations one hour or less, the figure of 9.5 kcal/min should be
reduced by 50 percent. Durations greater than one hour up to two hours the value should be
reduced to 40% of the original. For repetitive lifting tasks requiring more than 2 hours up to and
including 8 hours the value of 9.5 should be reduced by 66 percent. Using baseline criteria
derived from biomechanical, physiological and psychophysical research, the individual
components of the 1991 NIOSH lifting equation were developed. It is stated that each component
of the revised lifting equation was designed to satisfy these criteria. Where conflicting results
arise, the most conservative approach was taken (Waters et al., 1993). Each individual element
and the resulting input into the 1991 equation are discussed below.
The horizontal multiplier (HM) is dependant on the vertical height at the start of the lift
(< or > than 25 cm) and the box width. This logic was supported as Potvin and Bent (1997) found
a significant relationship between horizontal hand location, box width, and initial vertical height
of the lifting task. The vertical multiplier is defined by the vertical distance of the hands to the
floor (Vi, 1998). The multiplier values were determined by reviewing psychophysical,
epidemiological and biomechanical data over a variety of heights. The determination of the
vertical multiplier was more complicated because it varies over all vertical heights, not just for
37
Reproduced with permission of the copyright owner. Further reproduction prohibited without permission.
two ranges (Reed et al., 1999). The results set by the 1991 committee was a reduction of at least
22.5% in allowable weight for lifts originating near the floor (Waters et al., 1993). Empirical data
derived from the research of Snook (1978), Ayoub (1978) also Snook and Ciriello (1991) were
used to establish the discounting value of 22.5% for lifts above 150cm. The distance multiplier
(DM) is defined as the vertical travel distance between the origin and the destination of the
lifting/lowering task (Vi, 1998). The NIOSH 1991 committee reviewed several research papers
which indicated that lifting at or near spatial limits (reach zone, floor to above shoulder) results in
a 15% decrease in the maximal acceptable weight of lift (Waters et al., 1993). Asymmetrical
angle is defined as the angular measure of how far the object is displaced from the front (mid-
sagittal plane) of the workers body at the beginning and end of lift (Vi, 1998). Reviewing
biomechanical and psychophysical data on asymmetrical lifting revealed a decrease in maximum
acceptable weight by 8 to 22 percent as asymmetry increases (Waters et al., 1993). Further, there
in evidence of a decrease in isometric lifting ability by 39% with lifting tasks at 90 degrees as
compared to symmetric lifting (Waters et al., 1993). Coupling describes the quality of the grip
between the hand and the object (Vi, 1998). Loads equipped with appropriate couplings or
handles facilitate lifting and reduce the possibility of dropping the load (Waters et al., 1993).
In reviewing several psychophysical studies it was established that the reduction in lifting
capacity due to poor coupling should be in the order of 7% to 11%. Frequency of lift is defined
as the average number of lifts or lowers made per minute (Vi, 1998). For use within the 1991
equation, the frequency multiplier (FM) was expressed as a value within a table rather than a
formula. The Liberty Mutual values as derived from the research of Snook and Ciriello (1991)
were used for lifts at 4.3 lifts (effectively 4) per minute and below. As discussed, the 1991
equation consists of an initial load constant (23kg), multipliers for each task variable are then
applied. The result is the recommended weight limit (RWL). The data of Snook and Ciriello
(1991) (MAWL) were substituted for the RWL at < 4 lifts per minute. The 1991 committee
selected a psychophysical criterion designed to ensure that job demands would not exceed the
38
Reproduced with permission of the copyright owner. Further reproduction prohibited without permission.
acceptable lifting capacity of 75% female workers or approximately 99% of male workers
(Waters et al., 1993). For frequencies exceeding 4 lifts per minute, the equations developed by
Garg (1976) were used. The resulting weights were used to determine frequency multipliers by
dividing each into the load constant. Finally, the 1991 committee adjusted the original multiplier
values to provide a close approximation of observed and predicted effects of lifting frequency on
acceptable workloads for lifting (Rogers et al., 1991; Waters et al., 1993). It should be noted that
tabular values are provided by NIOSH (Waters et al., 1993) at durations of < 1 hour and < 2
hours, but for use within the EDS, the values of 2-8 hours are used as representative of typical
working conditions within the automotive assembly facilities.
2.3.4.1 Limitations & Assumptions of Integrated Approaches
As the name implies, integrated approaches make use of several research techniques and are
therefore inherently subject to the limitations and assumptions of each. The limitations of the
psychophysical, biomechanical and physiological approaches were well documented in their
respective reviews, therefore will not be repeated here. With regard to manual materials
handling, the epidemiological research approach attempts to identify symptomological patterns
which may then be used to preempt future occurrences of similar movement or effort patterns.
This approach relies heavily upon accurate and comprehensive recordkeeping, tracking
incidences, injuries and illnesses and/or honest feedback of fatigue and discomfort from test
subjects (Yoshitake, 1971; Mital et al., 1993). A review of epidemiological studies indicates that
much of the information linking workplace risk-factors and injury or illness is lacking or only a
qualitative link (Frymoyer et al., 1980; Troup et al., 1981; Damkot et al., 1984; Stock, 1991;
NIOSH, 1997). Also, many of the studies suffer from small sample size, lack of adequate
control, are conducted for short periods and are retrospective (Mital et al., 1993). Dealing with
subjective information, such as complaints of low back pain, which frequently may be unreliable
is another major shortcoming of epidemiological studies (Glover, 1970). Very few risk factors
have been definitively linked to injuries using epidemiological research (Mital et al., 1993).
39
Reproduced with permission of the copyright owner. Further reproduction prohibited without permission.
There are several limitations and assumptions with regard specifically to the utilization of
the NIOSH lifting equation. These have been set forth by the 1991 NIOSH committee
themselves and are to be used as guides for both the proper and intended use of the equation and
to emphasize the requirements for future research. Waters et al. (1993) stipulate that the design
criteria based on biomechanical, physiological and psychophysical design criteria should be
reviewed and adhered to. Further as mentioned previously, limitations inherent to each apply.
The 1991 committee acknowledges the need for the equation and its components to be validated.
Several studies have recently attempted to do just that. We will review these and their respective
conclusions as they apply to the limitations and assumptions of the 1991 NIOSH lifting equation
(NLE).
The frequency distribution and validity of the 1991 NIOSH recommended weight limit
(RWL) were studied by Vi (1998). It was indicated that little is known about the practical
implications of the RWL under real-world situations and that few studies have attempted to
validate this. The purpose of the study was to compare the internal validity of the RWL with
established psychophysical data under a variety of scenarios using a Monte Carlo uncertainty
analysis. Simulations of 64,000 lift/lower conditions were run within the boundaries of each
element range specified in the paper (Vi, 1998). The NLE (1991) was deemed to be a
conservative tool where 99.9% of the 64,000 scenarios were protective for 99% of the male
population (Vi, 1998). This leads one to enquire about the sensitivity of the tool at it's proposed
threshold limit value. If the tool exhibits poor sensitivity an unacceptable level of false positives
will result (Joseph et al., 2000).
Citing the fact that little information exists about the NLE ability to predict incidence and
severity of lower back disorders due to the lack of epidemiological data, Dempsey et al. (2000)
proposed a field evaluation of the revised NIOSH lifting equation. The goal of this study was to
investigate the relationship between the 1991 NLE and the incidence and the filing of workers
40
Reproduced with permission of the copyright owner. Further reproduction prohibited without permission.
compensation claims. Second, they sought to evaluate the usefulness of the tool in a variety of
work settings (Dempsey et al., 2000).
Due to the extreme difficulty finding jobs which met all of the criteria for the 1991 NLE,
the methods employed in this study required the relaxation of the NLE protocol on extraneous
manual materials handling elements (push, pull, carry), with these tasks then to be assessed with
psychophysical data. Jobs for inclusion within the study were required to be primarily lifting and
lowering intensive, however not exclusive (Dempsey et al., 2000). Outcomes measures were
derived from OSHA 200 logs and workers compensation claims during follow-up periods.
Results were obtained from the baseline assessments of 362 subjects of more than 60 facilities
that took part in the validation study. Of the initial 362 subjects, there were 180 follow-up
respondents. Dempsey et al. (2000) stipulate that a history of low back pain was the most
consistent risk factor found. Summary statistics indicated a mean weight of 11.7 kg for the 1123
lift or lower tasks observed. The conclusions drawn from this study were that there was not
enough epidemiological data to conclusively determine the validity of the NIOSH lifting
equation. It was also noted that since the NIOSH equation is designed solely to analyze lifting
and lowering, it is restrictive in an industrial setting that requires many manual handling activities
(Dempsey et al., 2000).
Reed at al. (1999) decided to review the frequency factor in manual lifting by analyzing
that component of the 1991 NLE. The stated purpose for doing this was due to the fact that many
individuals of varying credentials are charged with the ergonomics responsibilities within a
business. Many of these ergonomists have limited knowledge with regard to the background,
limits and assumptions of the resources (as the NLE) that they use. Through this research It was
concluded that by first deciding on spatial multipliers, estimates for frequency result in values
that are more conservative than research can support. Further, data show that the new version is
far more conservative than the previous (1981) equation with the frequency and horizontal
multipliers playing key roles (Karwowski & Brokaw, 1992; Vi, 1998; Reed et al., 1999). The
41
Reproduced with permission of the copyright owner. Further reproduction prohibited without permission.

threshold limit value as proposed should be scrutinized to adjust for the inherent conservative
nature of the tool.
2.3.5 Electromyography (EMG) in EDS
Electromyography (EMG) has been used extensively to evaluate muscle activity (Kadefors,
Peterson. & Herberts, 1976; Armstrong, Chaffin & Foulke, 1979; Herberts, Kadefors & Broman,
1980; Hagberg, 1981; Habes, Carlson & Badger, 1985; Suurkula & Hagg, 1987; Giroux &
Lamontagne, 1992; Wells et al., 1994; Hagg, Oster & Bystrom, 1996; Potvin & Bent, 1997;
Potvin, 1997). EMG is a technique used to indicate when muscles are active and the relationship
between a level of activity and the worker’s capacity.
Worker capacity is difficult to establish as one may imagine. Controlled experiments
where subjects work until injury or illness occurs is obviously not acceptable. Another means to
predict a potentially injurious condition was required. It has been a widely accepted assumption
that musculoskeletal injuries are preceded by localized muscle fatigue (Yoshitake, 1971;
Herberts, Kadefors & Broman, 1980; Hagberg, 1981; Borg, 1982; Habes, Carlson & Badger,
1985; Waly, Kahlil & Asfour, 1986). While the exact relationship between fatigue and injury has
not been clearly established, there is consensus among researchers that fatigue plays an important
role (Baidya & Stevenson, 1988; Baron, 1996; Yamada, Kiryu & Okada, 2001). Muscular fatigue
therefore is viewed as an ethically-driven surrogate measure of risk and task design to avoid
fatigue is seen as a rational method to minimize this risk (Yoshitake, 1971; Merletti et al., 1991).
Fatigue may be defined simply as the inability of an individual to continue with a
particular physical activity at a steady intensity (DHHS, 1992). Though difficult to analyze in the
field, subjective and objective methods have been proposed. Psychophysical rating scales, such
as the Borg (1982) scale may be used to document the workers perception of fatigue.
Alternatively physiological methods such as electromyography (EMG) may be used to quantify
fatiguing conditions. The most common measure of fatigue is the use of EMG to measure the
42
Reproduced with permission of the copyright owner. Further reproduction prohibited without permission.
subjects capability versus the subjects maximal voluntary contraction (MVC). This technique has
been dubbed the "gold standard" for the identification of fatigue occurrence (Vollestad, 1997).
Muscle fatigue may be identified through the use of EMG by observing alterations in the
spectral characteristics of the myoelectric signal. It is well-documented that the power spectrum
of surface EMG shifts toward lower frequencies and its magnitude increases as muscle fatigue
progresses (Christensen, 1986; U.S. Department of Health & Human Services, 1992; Yamada,
Kiryu & Okada, 2001). The changes have been attributed to increased muscle motor unit
recruitment in response to high level contractions compressing blood flow in the muscle, aerobic
metabolism changes to anaerobic due to resulting acidosis, muscle fiber conduction velocity
decreases due to decreased pH in the muscle and changes in the shape of the action potential
shifts the power spectrum (DHHS, 1992; Yamada, Kiryu & Okada, 2001).
In using electromyography to evaluate risk, three levels of muscle loading have been of
concern for ergonomists, those being peak, dynamic and static. Bengt Jonsson (1982) defines
these three levels based on the amplitude probability distribution function (APDF). The APDF is
the distribution of the levels of muscle contraction during an observation period (Ankrum, 2000).
Jonsson goes on to specify a quantity of time that may be ‘safely’ spent at a given contraction
level (% MVC). Peak load level, effectively the highest level of muscle activity during the EMG
recording, is defined by Jonsson (1982) as the 90th percentile value of the APDF. The dynamic
load level is deemed the 50th percentile and the static load level for muscle activity is defined as
10% or below. Jonsson (1982) established physical threshold values based on these work
durations. He stipulated that a worker should not expend more than 2-5%, 10-14% and 50-70%
of maximum voluntary contraction (MVC) during static, dynamic and peak work durations
respectively (Wells et al., 1994; Ankrum, 2000). For example, to remain within Jonsson's (1982)
threshold limits, a workers static level of muscle activity would have to remain at or below 2-5%
of EMG recorded MVC for 10% of the time or less (Wells et al., 1994).
43
Reproduced with permission of the copyright owner. Further reproduction prohibited without permission.
2.3.5.1 Limitations & Assumptions of EMG-Based Methods
The quantitative threshold values as established by Bengt Jonsson (1982) which are used to
analyze EMG signals and interpret physical stress levels have been cited frequently in the
analysis of occupational risk factors (Aaras & Westgaard, 1987; Aaras, 1994; Wells et al., 1994;
Ankrum, 2000). Jonsson (1982) suggests that the 90th percentile maximal voluntary contraction
(MVC) of the amplitude probability distribution function (APDF) (which he calls 'peak') should
not exceed 50-70%. The 50th percentile (which Jonsson calls 'dynamic') should not exceed 10-
14% and the 10th percentile (called 'static') should not exceed 2-5%.
Wells et al. (1994) stipulate that guidelines for the 'static' condition as established by
Jonsson (1982) may be too high to prevent chronic injury in the shoulder musculature. Ankrum
(2000) suggests rather that there is simply confusion in the terminology. He stipulates that the
confusion arises due to the similarity between the terms 'static task' and 'static load level'.
Ankrum (2000) states that a 'static task' is a loosely defined reference to work in which muscles
are active without much outward movement. Further, 'static load level' referring to the 10th
percentile of the APDF, is not task-specific. A misapplication of Jonsson's (1982)
recommendations can occur when static and dynamic are thought to be descriptions of work
types, rather than components of the APDF (Ankrum, 2000). The miscomprehension of the
nomenclature can then lead to job elements being diagnosed as exceeding proposed physical
threshold limits when they are actually below them. Although Ankrum (2000) cites several
research papers as having misused the static load level proposed by Jonsson (1982), it should be
noted that others recognized and accounted for this aspect (Wells et al., 1994).
The guidelines proposed by Jonsson (1982) were established for the shoulder
musculature. Similar guidelines are yet to be established for other musculature. This is of some
significance as differing muscles and muscle groups have varying numbers of muscle fibers, fiber
types, length and relative innervation. The various physical properties of each muscle may
44
Reproduced with permission of the copyright owner. Further reproduction prohibited without permission.
ultimately result in differing times to fatigue. This may negate or require some change in the
application of Jonsson's (1982) quantitative threshold values to other muscles.
2.3.6 Hand Activity Threshold Limit Value (TLV) in EDS
Repetitious movements of the hand and wrist during industrial tasks is known to be an important
risk factor associated with cumulative trauma disorders (CTDs) (Kvamstrom 1983; Habes,
Carlson & Badger, 1985; Armstrong 1986; Silverstein et al. 1987; Marras 1993). Further, when
repetition is combined with forceful work and continued for extended periods, the abilities of
individuals to perform these activities are frequently exceeded resulting in severe and chronic
injuries (Mital et al. 1993). The ACGIH proposed threshold limit value (TLV) for occupational
hand activity levels was developed with expert consensus on the most comprehensive research,
guidelines, standards and regulations worldwide. Further, comparative analysis were completed,
pitting the TLV against other applicable tools (Moore & Garg, 1995; Snook et al., 1995, 1997).
Results purport that use of the TLV will result in less type 1 and type 2 errors. This indicates that
in relation to other ergonomic assessment strategies, this tool may be used with greater
confidence of worker protection without sacrificing resources to resolve false positive or false
negative issues.
In the development of the TLV for hand activity (2001), the ACGIH has plotted
normalized peak hand force (NPF), on a scale of 0 to 10, which corresponds to 0 to 100% of the
applicable population reference strength. NPF represents the 90th percentile force value so that
force would not be driven by random or 'spurious' work elements. The ACGIH (2001) stipulate
that for the protection of the worker, the average normalized force should not be greater than 14%
of the individuals maximal voluntary contraction (MVC). The normalized force once determined
is to be plotted against hand activity level (frequency of hand movements per unit time). The
NPF/HAL value would then be compared to the TLV. This ratio is said to provide a threshold
limit value that would be applicable to the majority of the working population when applied to
cyclical tasks occurring for a duration of no less than 4 hours. The result of this integration is an
45
Reproduced with permission of the copyright owner. Further reproduction prohibited without permission.
inverse linear relationship where force increases and frequency decreases and vice-versa. Force
normalization occurs as the analyst adjusts the value obtained to the given population norms (i.e.
male mean power grasp value). Further, it is up to the analyst to determine all scaling factors
which may alter the strength capability of the individual (i.e. glove use, awkward postures, weak
grip, viscosity of object etc.). By using this structure the tool becomes more flexible and may be
used across many occupational applications.
2.3.6.1 Limitations of the Hand Activity TLV
The first and most striking limitation of this tool is its lack of field-testing. It is assumed by the
developers that the normalized peak force and hand activity aspects of the TLV can be repeatedly
obtained between observers through a variety of means. Potvin et al. (2002a) identified the need
for comprehensive field-testing and sought to determine the between-rater reliability and the
validity of the tool. The validity of the TLV for predicting injuries and discomfort was evaluated
using injury data collected from 40 jobs at one plant and from pain and discomfort data across all
280 jobs. Results indicate good between-rater reliability with correlations of more than r = 0.8.
It was concluded that the TLV guideline can be used by observers for quantifying risk, but
decisions regarding the acceptability of a task can only be made with confidence if the TLV risk
scores are above +1 or -1.
Ljuggren (1986) and later the ACGIH (2001) reported that it is not necessary to have the
individual rate their own perceived exertion, rather this exertion can be estimated by an observer.
According to the research of Potvin et al. (2002a), this would in fact be preferable as findings
indicate that observers more accurately predict effort values than subjects. In an alternative study
by Potvin et al. (2002b), elements of the ACGIH TLV were derived from live observations and
from video footage of the same. These were then compared in order to determine the differences
if any. The ACGIH (2001) deemed video footage a valid source to obtain values for input into
the TLV tool. This study was also designed to quantify the possible differences in scores from
external observers and those completing the tasks. Finally, ratings of perceived exertions were
46
Reproduced with permission of the copyright owner. Further reproduction prohibited without permission.
collected to determine which part of the forearm/wrist/hand was most closely correlated with the
ultimate peak effort scores obtained from the subjects (Potvin et al., 2002). It was concluded
from this study that video recordings were not the best means of obtaining NPF scores and that
live observations are preferable. There was however good agreement for HAL between live and
video recordings (Potvin et al., 2002).
In summary, the two studies of Potvin et al. (2002a&b) indicate that between-rater
reliability is strong, meaning several trained observers are likely to obtain a similar score while
observing the same job. Further, observers of a job seem to be better predictors for both HAL
and NPF as subjects tended to overestimate by an average of one unit for each (0-10 scale).
Validity of the TLV is indicated but using EMG to obtain the NPF and observer ratings for HAL
has been suggested as a best practice. Also, if the results fall within a TLV risk score of +/-1
further investigation is warranted. Finally, it is suggested that the TLV elements be collected
from live observations rather than video recordings.
The ACGIH (2001) does not provide any form of weighting or indicated preference in the
methods it proposes to collect the NPF aspect of the TLV. Evidently, EMG and observer ratings
should be proposed as the primary methods to be used to collect this data. Further, video
recordings were used in the beta trials of the tool. This has been shown to be an ineffective
means of rating the NPF aspect of the TLV. The ACGIH (2001) may wish to consider retesting
with live observations and correlating results to identify anomalies if any.
2.4 Literature Review Summary
This thesis is based on two premises, firstly that there is a positive relationship between
work-related musculoskeletal disorders and workplace risk factors. Secondly, that an effective
ergonomic process can reduce the potential for the resulting injuries and illnesses by preempting
these risk factors. An integral component of this process is a definitive threshold for ergonomic
acceptability. As discussed above, several ergonomic tools, aids and guidelines have been refined
47
Reproduced with permission of the copyright owner. Further reproduction prohibited without permission.
and accepted as having thresholds of sufficient sensitivity and specificity to be included within
the required tool-set.
The intent of this literature review was to provide evidence of the face validity of the
aforementioned ergonomic tools, aids and guidelines. In doing so a summary of the rationale for
tool selection, including the development background, assumptions and limitations was
necessary. The data gleaned from this was then used as the impetus for the progressive structure
of the EDS. This essentially comprises the various levels of questions which are designed to lead
the user toward the most appropriate resource during the analysis of a given task. It is the
hypothesis of this thesis that both expert and novice subjects, trained in the use of the ergonomic
decision system, will reliably arrive at the same decision with regard to the appropriate
ergonomic tool while observing the same operation under the same constraints. With that said,
the next step requires that the reliability of the decision system be established. This will be
accomplished through the review of 6 operations derived from two different facilities by 12
evaluators (6 novice and 6 expert). Details of the strategy are discussed in detail within the
following methodology section.
Reproduced with permission of the copyright owner. Further reproduction prohibited without permission.
48
Chapter III METHODOLOGY
3.1 Jobs and Job Selection Criteria
Several Jobs were chosen from two local assembly facilities (Wayne (2), Michigan, USA). One
of these facilities manufactures small cars, the other manufactures large sport-utility-vehicles.
Facility selection rationale was based on the differing component size, weights and vehicle body
spatial elements. These differences may prompt varying selection choices by the subjects and
will provide some variety to the sample Jobs.
The Jobs chosen for analysis at each of these facilities were not randomly selected. A
large sample of injury and illness data was collected via Incident Investigation Reports of the year
2004. These data were reviewed and filtered for ergonomic implications. These implications, as
input by a registered nurse or physician, must have included the terms, "repetitive motion, injury
or illness" entered within the “Injury/Illness Type” category of the Incident Investigation Report.
Further, in the aforementioned report, under the field of “Incident Analysis, Type of Contact”, the
category of “Overexertion - Repetitive” must have been entered in order to be included in the
study data compilation.
Once refined, the sample list, which resulted in at least one report of occupational injury
or illness, included 63 Jobs from the small car assembly plant and 52 Jobs from the large vehicle
assembler. These data were then sorted by plant and by severity of incident. Severity was
determined by the resulting number of “Restricted Working Days” and number of “Days Away”.
The number of “Restricted Working Days” indicates that the operator should not be assigned to a
task that taxes the body part for which the operator went to Medical. The length of time that an
operator is on restricted duty is established by the plant physician. The number of “Days Away”
refers to the amount of time that an operator is not available for work due to the medical
condition. This decision is also made by the plant physician. Finally, the refined data was
reviewed for repeat visits to Medical. This was sorted by “Process Code”, which is a systematic
49
Reproduced with permission of the copyright owner. Further reproduction prohibited without permission.
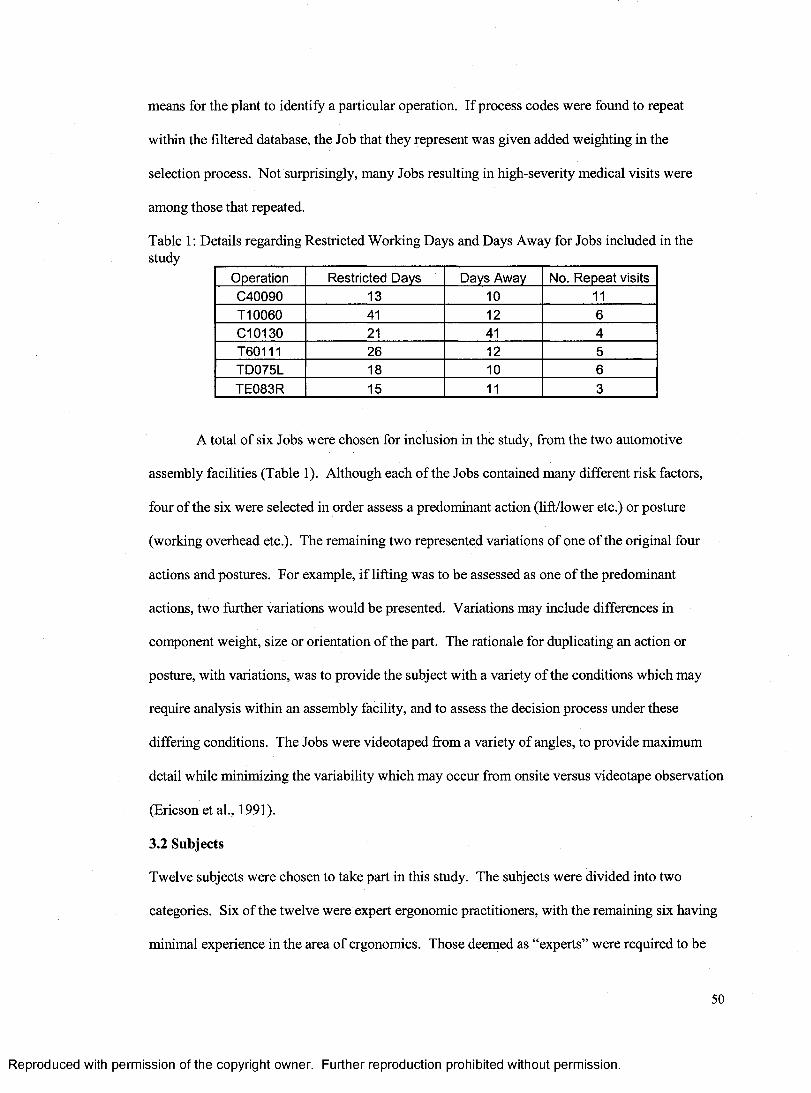
means for the plant to identify a particular operation. If process codes were found to repeat
within the filtered database, the Job that they represent was given added weighting in the
selection process. Not surprisingly, many Jobs resulting in high-severity medical visits were
among those that repeated.
Table 1: Details regarding Restricted Working Days and Days Away for Jobs included in the study _______________________________________________________________
Operation Restricted Days Days Away No. Repeat visitsC40090 13 10 11T10060 41 12 6C10130 21 41 4T60111 26 12 5TD075L 18 10 6TE083R 15 11 3
A total of six Jobs were chosen for inclusion in the study, from the two automotive
assembly facilities (Table 1). Although each of the Jobs contained many different risk factors,
four of the six were selected in order assess a predominant action (lift/lower etc.) or posture
(working overhead etc.). The remaining two represented variations of one of the original four
actions and postures. For example, if lifting was to be assessed as one of the predominant
actions, two further variations would be presented. Variations may include differences in
component weight, size or orientation of the part. The rationale for duplicating an action or
posture, with variations, was to provide the subject with a variety of the conditions which may
require analysis within an assembly facility, and to assess the decision process under these
differing conditions. The Jobs were videotaped from a variety of angles, to provide maximum
detail while minimizing the variability which may occur from onsite versus videotape observation
(Ericson et al., 1991).
3.2 Subjects
Twelve subjects were chosen to take part in this study. The subjects were divided into two
categories. Six of the twelve were expert ergonomic practitioners, with the remaining six having
minimal experience in the area of ergonomics. Those deemed as “experts” were required to be
50
Reproduced with permission of the copyright owner. Further reproduction prohibited without permission.
eligible for certification by the Board of Certification in Professional Ergonomics (BCPE). The
certification process of the BCPE is a structured approach which evaluates an individual’s
compliance to technical standards and professional competence in the field of ergonomics
(BCPE, 1999). The “novice” subjects were required to have minimal, if any,
exposure/experience in the field of ergonomics. This was tested through the application of a 10
question survey. The survey was used relatively simple questions with regard to the basics of
ergonomics and task assessment (Appendix B). The individual needed to score less than 5 of 10
correct in order to be rated a Novice.
3.3 Subject Training
Both groups received training in the use of the EDS software. This training of the experts lasted
approximately 20 minutes. The training of the novice group lasted approximately 90 minutes.
As the training time indicates, the training content differed between the expert and novice groups.
The training of the novice group consisted of many topics including; commonly used
term definition, the rationale for an ergonomics process and an introduction to seven ergonomic
risk factors with specific examples. Also, novices were provided a detailed review of the
systematic ergonomic analysis process and the application, assumptions and limitations of the
ergonomic tools that may be used during the process. Finally, the novice group was provided
with the same EDS strategy and software training as the experts.
3.4 Data Collection Protocol
Videotaped Jobs were presented to the analysts on a 21" monitor. The EDS software was
available on a separate laptop placed adjacent to the viewing monitor. The Jobs were watched in
isolation from the other subjects. The 6 Jobs were presented in a random order. The analysts
were allowed to take up to 20 minutes to review and enter information for each Job. A 15 minute
break was provided at the end of each hour. Analysts had the ability to pause, stop, rewind and
play again any Job or Job segment as often as they wished. Each were provided with a pen, blank
paper, the user manual for the software and a data sheet containing all pertinent weight, force,
51
Reproduced with permission of the copyright owner. Further reproduction prohibited without permission.
dimensional, and time-related information. Other information requests could be made of the test
administrator, who was in the room at all times.
Each Job required decisions at three different levels in the EDS software. The analysts
were instructed to inform the test administrator at the time of completion of each of the three
Levels. At that time, the analysts were provided with the correct answers for the level, requested
to revise their decisions where necessary and instructed to continue to the next Level. As
previously mentioned, the EDS was designed on the “minimum spanning tree” concept, in which
all relevant information is requested, avoiding erroneous information or duplication. The term
“Levels” refers to the gradual refinement of information requests (decisions), until the most
applicable ergonomic tool or threshold value is obtained. For example, the initial Level consisted
of the decision regarding which actions to include within the Job analysis (push/pull, lift/lower,
carry, hand-intensive work). Subsequent levels included decisions regarding the number of hands
required to complete the action, the frequency of application, spatial characteristics (grip width
etc.), among others (Appendix C). Each decision establishes (effectively eliminates) subsequent
choices, until the final and most appropriate tool or final analysis result is realized.
All computer data entry was continuously recorded using HyperCam® software and saved
to the hard drive. In addition, the results from each subject’s EDS data analysis was saved to the
hard drive of the computer upon completion.
Prior to administering the training, novice subjects were presented, and asked to analyze,
a randomly chosen Job (Job 1). The training was then provided. Following this, all six Jobs were
analyzed by all subjects.
After a two week time period had elapsed after the original analysis, each Expert and
Novice subject reanalyzed a Job, randomly chosen from the original six (Job 2). This was
designed to assess intra-rater reliability.
Reproduced with permission of the copyright owner. Further reproduction prohibited without permission.
3.5 Data Analysis
A criterion measure was necessary in order to determine the accuracy of decision making for each
Job/Level combination. The comparative measure or 'gold-standard' was provided through group
consensus of three experienced ergonomists, who were identified as having a more intimate
knowledge of the EDS process, content and software. Subject responses were considered to be
accurate if they matched the consensus of the three experienced ergonomists.
3.5.1 Statistical Analysis
For each Job/Level combination, the decisions made by each subject, were compared
with the aforementioned criterion measure. A value of one was assigned to results that matched
this criterion measure, while a value of zero was assigned where the subject’s selection did not
agree with the criterion measure. The results were totaled and averaged across all Jobs and
Levels and this value was the total mean consensus for the study. Between subject reliability was
calculated by establishing the total average consensus across subjects, using the methods below.
A consensus count, and total mean consensus between the 12 subjects, was reviewed for
each of the 6 Jobs. The total count was divided by the maximum count (12 for between subjects)
to get a percentage of subjects who did or did not concur. The total count was then subtracted
from 12 and divided by 12, to determine the percentage of subjects not concurring with the
criterion. The higher of the two percentages, was then taken as the percent consensus for each
job and level across the twelve subjects. The percentage were then be reduced by 50 and
multiplied by 2 in order to get a percent consensus of 0, 33.3, 66.6 or 100 for each level and job.
A total mean percent consensus by novice, expert and overall was taken by averaging the total
counts (6 jobs by 3 levels). For example, if 4 of 6 expert subjects agreed with the criterion for a
Job, the steps would be;
1 . 6 - 4 = 22. 2/ 6 = 0.33 and 4/6 = 0.673. Choose 0.67 (larger of 0.33 vs 0.67)4. (0.67 - 0.5) * 2 = 0.335. Sum and Average across all Jobs
53
Reproduced with permission of the copyright owner. Further reproduction prohibited without permission.
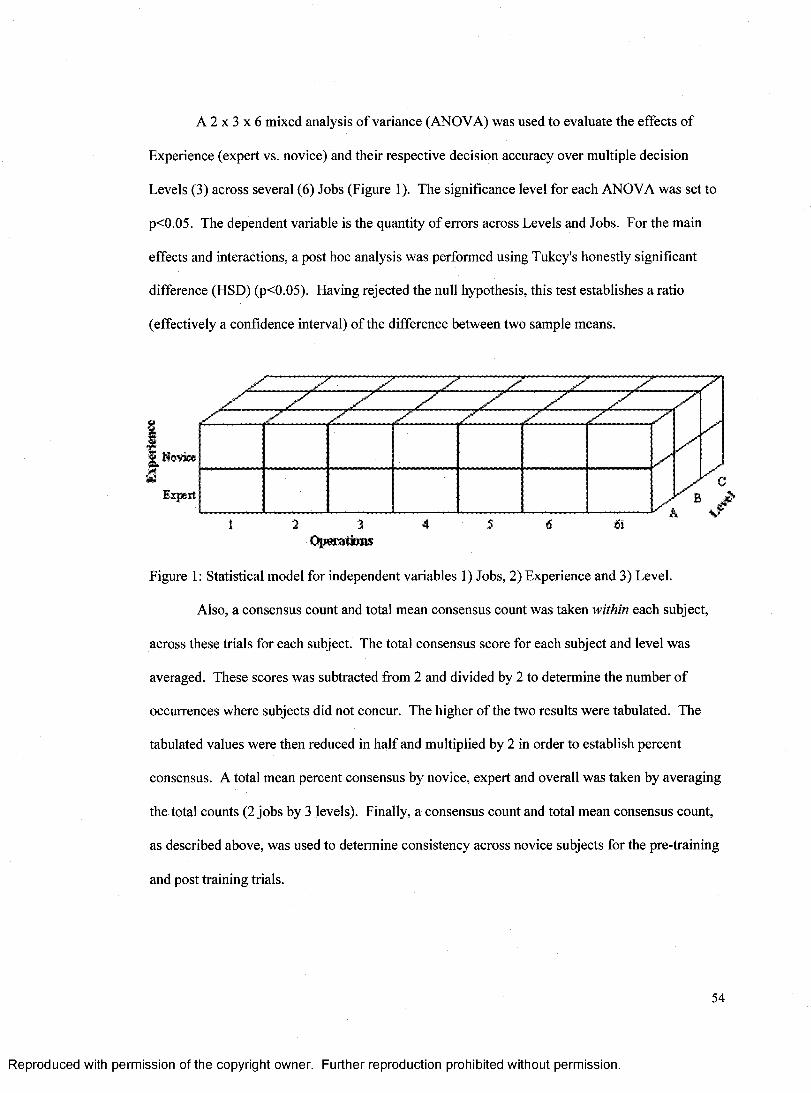
A 2 x 3 x 6 mixed analysis of variance (ANOVA) was used to evaluate the effects of
Experience (expert vs. novice) and their respective decision accuracy over multiple decision
Levels (3) across several (6) Jobs (Figure 1). The significance level for each ANOVA was set to
p<0.05. The dependent variable is the quantity of errors across Levels and Jobs. For the main
effects and interactions, a post hoc analysis was performed using Tukey's honestly significant
difference (HSD) (p<0.05). Having rejected the null hypothesis, this test establishes a ratio
(effectively a confidence interval) of the difference between two sample means.
,*1Qjy
Novice
Expert
z z: z z:
zzzz
z
Ofttittiww
Figure 1: Statistical model for independent variables 1) Jobs, 2) Experience and 3) Level.
Also, a consensus count and total mean consensus count was taken within each subject,
across these trials for each subject. The total consensus score for each subject and level was
averaged. These scores was subtracted from 2 and divided by 2 to determine the number of
occurrences where subjects did not concur. The higher of the two results were tabulated. The
tabulated values were then reduced in half and multiplied by 2 in order to establish percent
consensus. A total mean percent consensus by novice, expert and overall was taken by averaging
the total counts (2 jobs by 3 levels). Finally, a consensus count and total mean consensus count,
as described above, was used to determine consistency across novice subjects for the pre-training
and post training trials.
54
Reproduced with permission of the copyright owner. Further reproduction prohibited without permission.
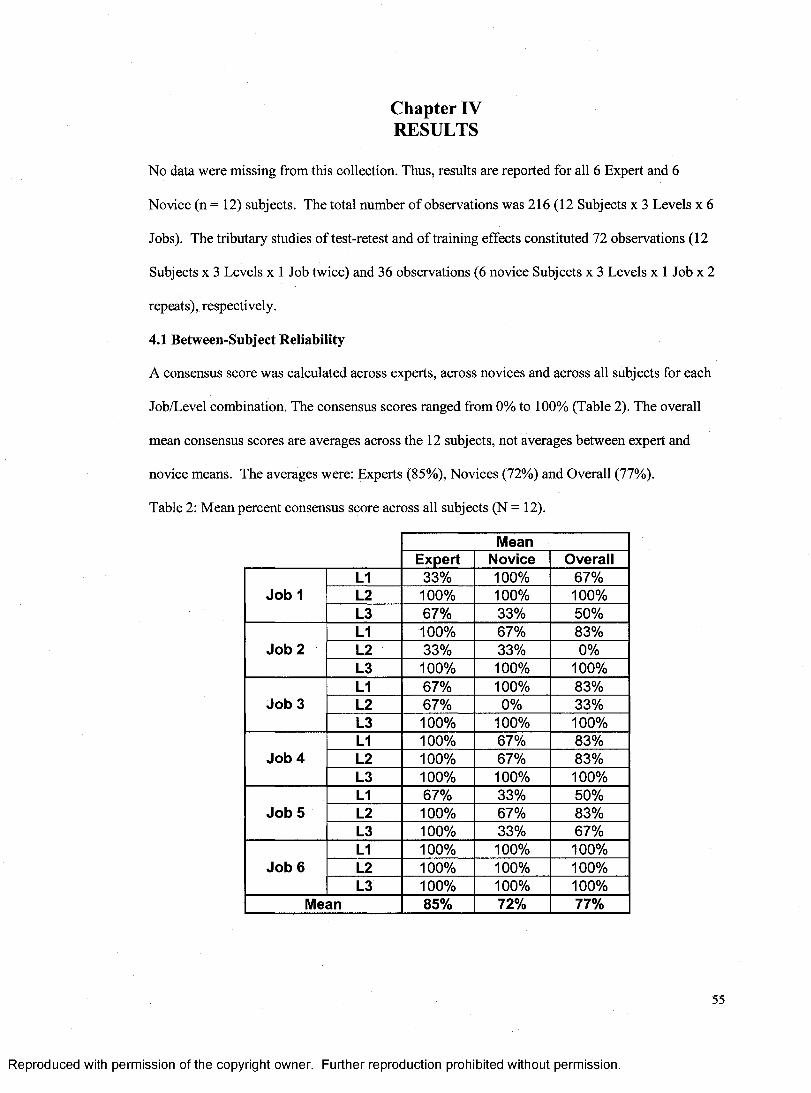
Chapter IV RESULTS
No data were missing from this collection. Thus, results are reported for all 6 Expert and 6
Novice (n = 12) subjects. The total number of observations was 216(12 Subjects x 3 Levels x 6
Jobs). The tributary studies of test-retest and of training effects constituted 72 observations (12
Subjects x 3 Levels x 1 Job twice) and 36 observations (6 novice Subjects x 3 Levels x 1 Job x 2
repeats), respectively.
4.1 Between-Subject Reliability
A consensus score was calculated across experts, across novices and across all subjects for each
Job/Level combination. The consensus scores ranged from 0% to 100% (Table 2). The overall
mean consensus scores are averages across the 12 subjects, not averages between expert and
novice means. The averages were: Experts (85%), Novices (72%) and Overall (77%).
Table 2: Mean percent consensus score across all subjects (N = 12).
MeanExpert Novice Overall
Job 1L1 33% 100% 67%L2 100% 100% 100%L3 67% 33% 50%
Job 2L1 100% 67% 83%L2 33% 33% 0%L3 100% 100% 100%
Job 3L1 67% 100% 83%L2 67% 0% 33%L3 100% 100% 100%
Job 4L1 100% 67% 83%L2 100% 67% 83%L3 100% 100% 100%
Job 5L1 67% 33% 50%L2 100% 67% 83%L3 100% 33% 67%
Job 6L1 100% 100% 100%L2 100% 100% 100%L3 100% 100% 100%
Mean 85% 72% 77%
Reproduced with permission of the copyright owner. Further reproduction prohibited without permission.
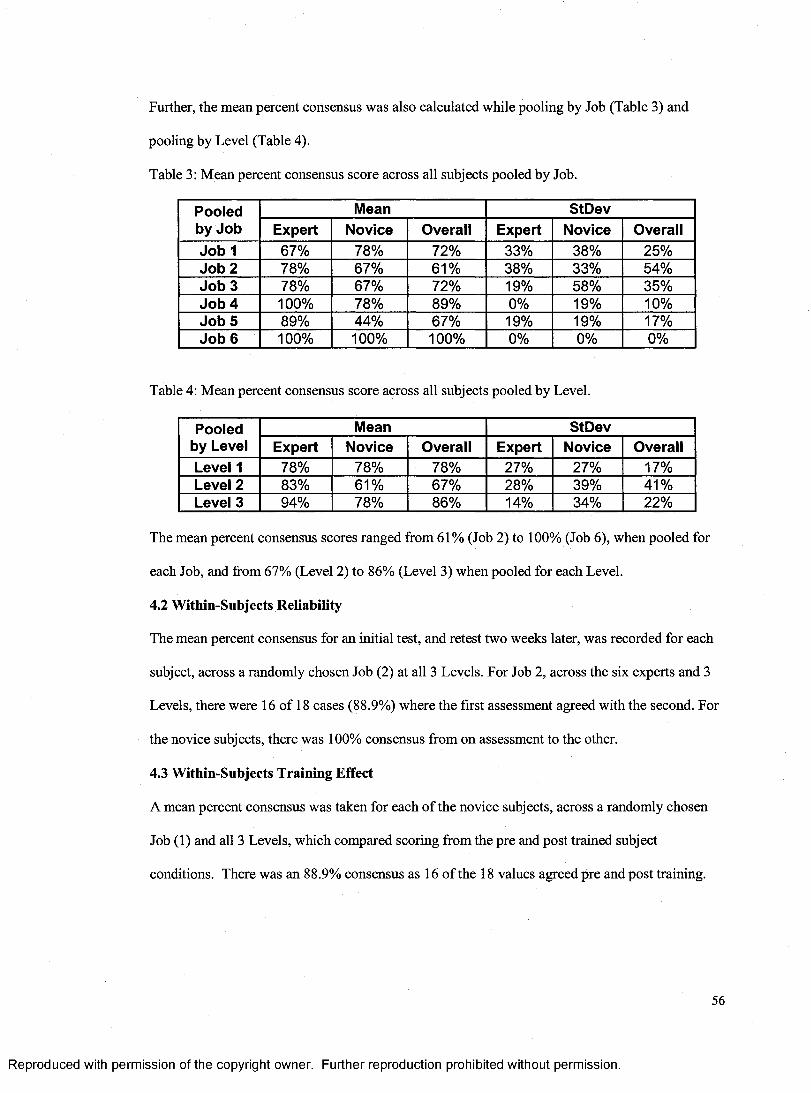
Further, the mean percent consensus was also calculated while pooling by Job (Table 3) and
pooling by Level (Table 4).
Table 3: Mean percent consensus score across all subjects pooled by Job.
Pooled by Job
Mean StDevExpert Novice Overall Expert Novice Overall
Job 1 67% 78% 72% 33% 38% 25%Job 2 78% 67% 61% 38% 33% 54%Job 3 78% 67% 72% 19% 58% 35%Job 4 100% 78% 89% 0% 19% 10%Job 5 89% 44% 67% 19% 19% 17%Job 6 100% 100% 100% 0% 0% 0%
Table 4: Mean percent consensus score across all subjects pooled by Level.
Pooled by Level
Mean StDevExpert Novice Overall Expert Novice Overall
Level 1 78% 78% 78% 27% 27% 17%Level 2 83% 61% 67% 28% 39% 41%Level 3 94% 78% 86% 14% 34% 22%
The mean percent consensus scores ranged from 61% (Job 2) to 100% (Job 6), when pooled for
each Job, and from 67% (Level 2) to 86% (Level 3) when pooled for each Level.
4.2 Within-Subjects Reliability
The mean percent consensus for an initial test, and retest two weeks later, was recorded for each
subject, across a randomly chosen Job (2) at all 3 Levels. For Job 2, across the six experts and 3
Levels, there were 16 of 18 cases (88.9%) where the first assessment agreed with the second. For
the novice subjects, there was 100% consensus from on assessment to the other.
4.3 Within-Subjects Training Effect
A mean percent consensus was taken for each of the novice subjects, across a randomly chosen
Job (1) and all 3 Levels, which compared scoring from the pre and post trained subject
conditions. There was an 88.9% consensus as 16 of the 18 values agreed pre and post training.
Reproduced with permission of the copyright owner. Further reproduction prohibited without permission.
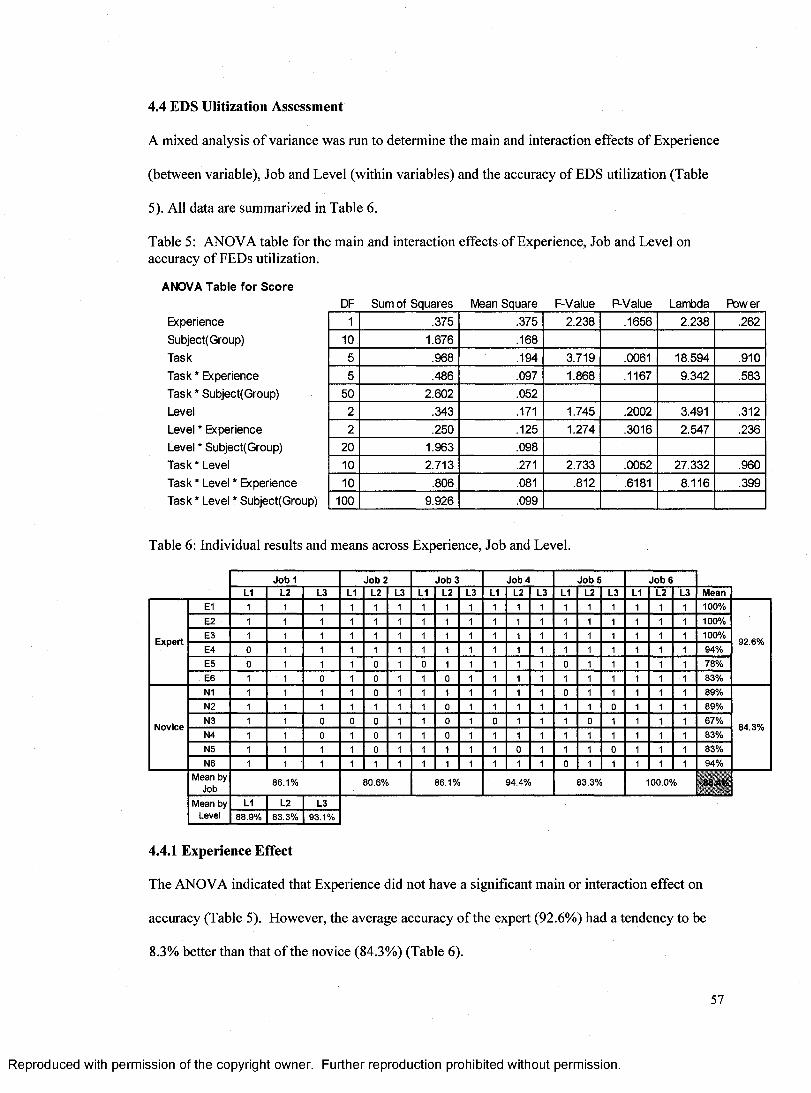
4.4 EDS Ulitization Assessment
A mixed analysis of variance was run to determine the main and interaction effects of Experience
(between variable), Job and Level (within variables) and the accuracy of EDS utilization (Table
5). All data are summarized in Table 6.
Table 5: ANOVA table for the main and interaction effects of Experience, Job and Level on accuracy of FEDs utilization.
ANOVA Table for ScoreDF Sum of Squares Mean Square F-Value P-Value Lambda Power
Experience 1 .375 .375 2.238 .1656 2.238 .262Subject(Group) 10 1.676 .168Task 5 .968 .194 3.719 .0061 18.594 .910Task * Experience 5 .486 .097 1.868 .1167 9.342 .583Task * Subject(Group) 50 2.602 .052Level 2 .343 .171 1.745 .2002 3.491 .312Level * Experience 2 .250 .125 1.274 .3016 2.547 .236Level * Subject(Group) 20 1.963 .098Task * Level 10 2.713 .271 2.733 .0052 27.332 .960Task * Level * Experience 10 .806 .081 .812 .6181 8.116 .399Task * Level * Subject(Group) 100 9.926 .099
Table 6: Individual results and means across Experience, Job and Level.
Jo b 1 Jo b 2 Jo b 3 Job 4 Jo b 5 Jo b 6L1 L2 L3 L1 L2 L3 L1 L2 L3 L1 L2 L3 L1 L2 L3 L1 L2 L3 Mean
E1 1 1 1 1 1 1 1 1 1 1 1 1 1 1 1 1 1 100%E2 1 1 1 1 1 1 1 1 1 1 1 1 1 1 1 1 1 1 100%
ExpertE3 1 1 1 1 1 1 1 1 1 1 1 1 1 1 1 1 1 1 100%
92.6%E4 0 1 1 1 1 1 1 1 1 1 1 1 1 1 1 1 1 1 94%E5 0 1 1 1 0 1 1 1 1 1 1 0 1 1 1 1 1 78%E6 1 1 0 1 0 1 1 0 1 1 1 1 1 1 1 1 1 83%N1 1 1 1 1 0 1 1 1 1 1 1 1 0 1 1 1 1 1 89%N2 1 1 1 1 1 1 1 0 1 1 1 1 1 1 1 1 1 89%
NoviceN3 1 1 0 0 1 1 0 1 1 1 1 1 1 1 1 67%
84.3%N4 1 1 0 1 0 1 1 0 1 1 1 1 1 1 1 1 1 1 83%N5 1 1 1 1 0 1 1 1 1 1 0 1 1 1 0 1 1 1 83%N6 1 1 1 1 1 1 1 1 1 1 1 1 0 1 1 1 1 1 94%
Mean by Job
86.1% 80.6% 86.1% 94.4% 83.3% 100.0%
Mean by L1 L2 L3Level 88.9% 83.3% 93.1%
4.4.1 Experience Effect
The ANOVA indicated that Experience did not have a significant main or interaction effect on
accuracy (Table 5). However, the average accuracy of the expert (92.6%) had a tendency to be
8.3% better than that of the novice (84.3%) (Table 6).
57
Reproduced with permission of the copyright owner. Further reproduction prohibited without permission.
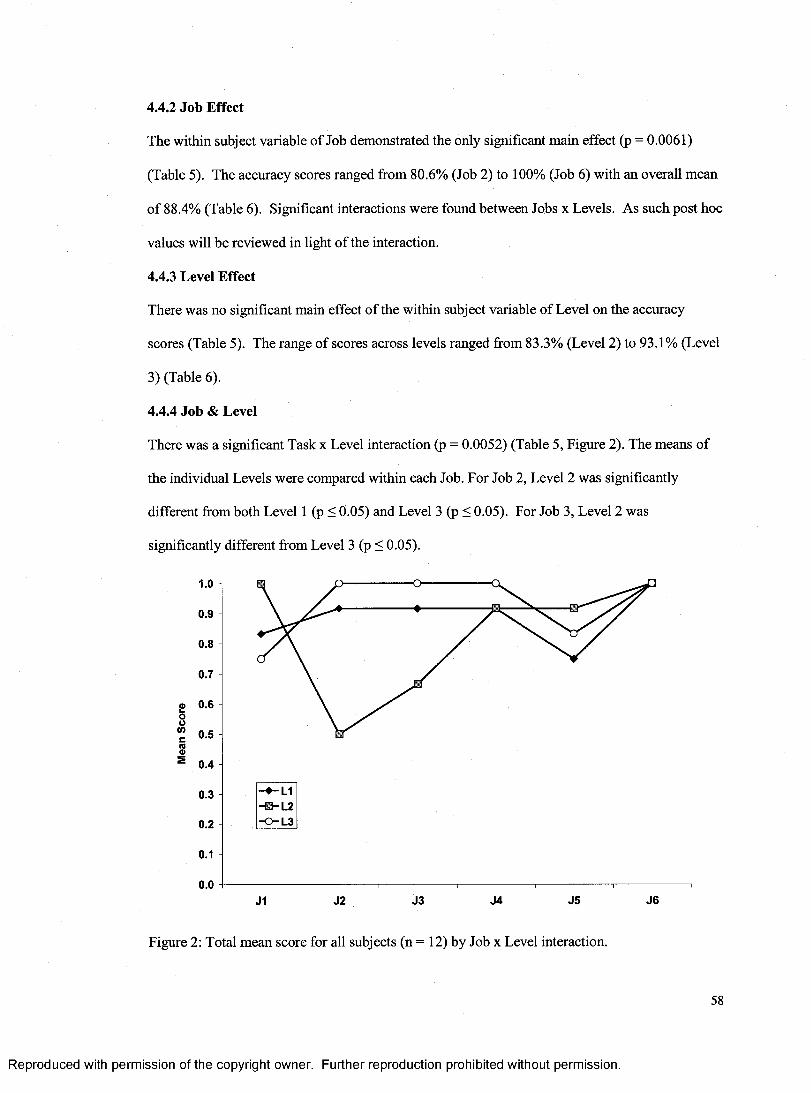
4.4.2 Job Effect
The within subject variable of Job demonstrated the only significant main effect (p = 0.0061)
(Table 5). The accuracy scores ranged from 80.6% (Job 2) to 100% (Job 6) with an overall mean
of 88.4% (Table 6). Significant interactions were found between Jobs x Levels. As such post hoc
values will be reviewed in light of the interaction.
4.4.3 Level Effect
There was no significant main effect of the within subject variable of Level on the accuracy
scores (Table 5). The range of scores across levels ranged from 83.3% (Level 2) to 93.1% (Level
3) (Table 6).
4.4.4 Job & Level
There was a significant Task x Level interaction (p = 0.0052) (Table 5, Figure 2). The means of
the individual Levels were compared within each Job. For Job 2, Level 2 was significantly
different from both Level 1 (p < 0.05) and Level 3 (p < 0.05). For Job 3, Level 2 was
significantly different from Level 3 (p < 0.05).
S 0.4
0.3-B-L2
0.2 -0 -L3
0.1
0.0J1 J2 J3 J4 J5 J6
Figure 2: Total mean score for all subjects (n = 12) by Job x Level interaction.
58
Reproduced with permission of the copyright owner. Further reproduction prohibited without permission.
Chapter V DISCUSSION
The purpose of this thesis was to establish the reliability and face validity of a unique ergonomic
process, deemed the Ergonomic Decision System. The rationale for the development of the EDS
was due to a clear lack of existing reliable, accurate and timely analysis strategies (Brodie &
Wells, 1997). Face validity was established via an in-depth literature review, from which the
content of the decision system was developed. The between and within-rater reliability of the
decision system were established from controlled testing with a number of trained ergonomic
engineers and novices working in isolation, under time constraints and using the process in an
attempt to analyze several jobs. Particularly, this study was designed to determine if the EDS is
reliable across individuals (both expert and novice) and meets established time requirements such
that it can be shown to be a relatively non-invasive and comprehensive tool.
For an ergonomic system to be useful, the elements within must provide a reliable,
accurate measure of the desired variable. Accurate and consistent values provide confidence for
the predictive ability of the system (Brodie & Wells, 1997). For the purpose of this study,
accuracy was defined as concurrence with the criterion measure. Consensus scores were used to
gage reliability between and within subjects, while raw scores were used to provide accuracy
values.
5.1 Subject Accuracy
The overall mean concurrence with the criterion measure was an impressive 88.4%, with
experts scoring 92.6% and novices 84.3%. When scrutinized more closely, it can be seen that
experts tended to score better than novices on 4 out of 6 Jobs. When individual scores were
reviewed, the range for all 6 novice subjects was 67% (subject 3) to 94% (subject 6) and for
experts was 78% (subject 5) to 100% (subjects 1,2,3).
The congruency of the results was particularly impressive, given the limited ergonomic
skill level of the novice subjects, as evidenced by their ergonomic survey scores (mean 17%) and
59
Reproduced with permission of the copyright owner. Further reproduction prohibited without permission.
the minimal training provided. The data indicate that experience should only minimally impact
accuracy, with results of the study providing statistical confirmation that experts and novices
achieved high accuracy and differ insignificantly in their concurrence with the criterion metric for
correct responses.
Mean accuracy scores for individual Jobs ranged from 81% (Job 2) to 100% (Job 6).
Though the data indicates that both novice and expert subjects had the lowest accuracy on Job 2,
the largest discrepancy was shown between the two groups on Job 5, with an average score of
72.2% for novices and 94.4% for experts. Job 5 (wire route and secure) required significant
identification of many fine motor movements, as it contained wire manipulation and six electrical
connections. Fine motor movements are difficult to assess, as they are generally difficult to see
from video and are often poorly identified (Brodie & Wells, 1997). It would seem that the
inaccuracy in novice scoring on Job 5 may be attributable jointly to inexperience in the field
(Tolmie, 2002) and to inherent difficulties with observing operations through the medium of
video recordings (Grieve et al., 1975). Some of these difficulties include the identification of
joint angles, temporal aspects and force estimations which, due to their lack of experience, novice
subjects may not be as able to identify from video footage.
The average accuracy was 88.9%, 83.3% and 93.1% for Levels 1, 2 and 3 respectively.
Task x Level demonstrated the only significant interaction for accuracy. Post hoc analysis of this
interaction indicated that that Level 2 was significantly different than: 1) both Levels 1 and 3 for
Job 2 and 2) Level 3 for Job 3. Specifically, certain elements contained within Level 2 of both
Jobs 2 and 3 tended to result in inaccurate results. For Job 2 (alternator build-up/ install), the
Level 1 gross motor element of lifting was identified well with 92% accuracy (100% expert, 83%
novice) however, the modification of this element required at Level 2 presented difficulty with
50% accuracy (67% expert, 33% novice). Specifically, the differentiation of 1 hand versus 2 for
the lift posed a problem for all subjects. For Job 3 (12A581 wire harness install), the Level 1
element of'awkward posture' was again identified well with 92% accuracy (83% expert, 100%
60
Reproduced with permission of the copyright owner. Further reproduction prohibited without permission.
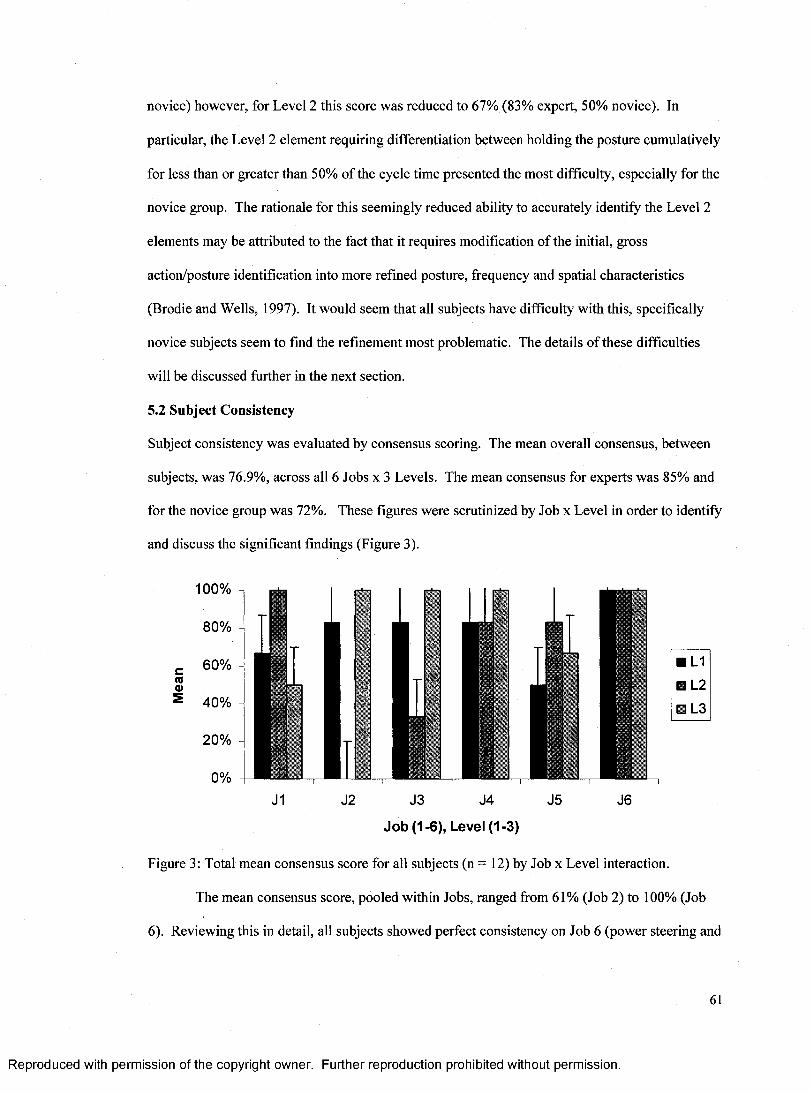
novice) however, for Level 2 this score was reduced to 67% (83% expert, 50% novice). In
particular, the Level 2 element requiring differentiation between holding the posture cumulatively
for less than or greater than 50% of the cycle time presented the most difficulty, especially for the
novice group. The rationale for this seemingly reduced ability to accurately identify the Level 2
elements may be attributed to the fact that it requires modification of the initial, gross
action/posture identification into more refined posture, frequency and spatial characteristics
(Brodie and Wells, 1997). It would seem that all subjects have difficulty with this, specifically
novice subjects seem to find the refinement most problematic. The details of these difficulties
will be discussed further in the next section.
5.2 Subject Consistency
Subject consistency was evaluated by consensus scoring. The mean overall consensus, between
subjects, was 76.9%, across all 6 Jobs x 3 Levels. The mean consensus for experts was 85% and
for the novice group was 72%. These figures were scrutinized by Job x Level in order to identify
and discuss the significant findings (Figure 3).
100%
J1 J2 J3 J4 J5 J6
Job (1-6), Level (1-3)
Figure 3: Total mean consensus score for all subjects (n = 12) by Job x Level interaction.
The mean consensus score, pooled within Jobs, ranged from 61% (Job 2) to 100% (Job
6). Reviewing this in detail, all subjects showed perfect consistency on Job 6 (power steering and
61
Reproduced with permission of the copyright owner. Further reproduction prohibited without permission.
transmission line secure) across all Levels. This Job was unique in that, unlike the other five Jobs
which focused mainly on rapid and repeated movements, the main element of this Job was a
posture, specifically, conducting work with the hands overhead. From the video, it was very
evident that this was the case. Consequently, none of the subjects missed this gross movement
and posture (Brodie & Wells, 1997). Further, since all of the work in Job 6 was overhead,
identifying the time overhead was not difficult. Also, subjects were more vocal in questioning
the test administrator for this operation, which may have led to correct answers. Finally, this was
the final Job that the subjects were presented, as such learning may have occurred. It should be
noted that subjects achieved perfect consensus on Level 3 across four of the six Jobs. This may
have been a result of Level 3’s content. Typical requirements of Level 3 are the identification of
direction or time elements. The direction of vertical, lateral or horizontal movements are
reasonably apparent for gross motor movements (Eastman Kodak, 1986). Time may have been
obtained from the video footage itself or by requesting the specific answer from the test
administrator.
The overall consensus averages for Levels 1,2, 3 were 77.8%, 66.7% and 86.1%,
respectively. When the interactions are reviewed, the consensus scoring on Level 2, versus that
of 1 or 3, was substantially lower less than the overall average (76.9%) for both Jobs 2 (0.0%)
and 3 (33.3%). The rationale for this seemingly reduced ability to consistently identify the Level
2 elements may be attributed to the fact that it requires modification of the initial Level elements
by posture, frequency and spatial characteristics. For example, if the subject identified the Level 1
element of lifting, the Level 2 would require the subject to identify the number of hands used,
whether the horizontal distance from the body to the coupling point (hands) is less than 19",
whether the vertical span of the hands are less than 26" and the number of objects lifted per cycle.
Thus, as supported by the findings of Brodie and Wells (1997), the Level 1 choice of the initial
gross action tended to be identified very effectively. Whereas, movements that were hard to
62
Reproduced with permission of the copyright owner. Further reproduction prohibited without permission.
define (temporal elements, rapid movements), postures of smaller joints (elbow, wrist) and items
that were hard to see from video (mass, force), were more difficult to identify.
Though the observer had the ability to rewind and review the operation freely, and to ask
pertinent questions of the independent observer, certain aspects may not have been easily
identifiable from the video footage, or a visual cue may have been missed. In fact, when the data
associated with Job 2/Level 2 is scrutinized, 80% of the total error can be attributed to a missed
identification of a one-handed lift. This miss may have been caused by some confusion related to
whether the operator needed to lift the object with one-hand, or whether the operator choose to
lift the object with one-hand. If the latter was the case, a subject may have ignored the one-
handed aspect, in favor of selecting of a two-handed lift.
Job 3/Level 2 was also observed to have a low consensus score (33%). When the errors
were reviewed, it was identified that, in all cases, the differences were due to the
misinterpretation of the amount of time that an individual sustained a posture. The error code
was documented as, “awkward posture held greater than 50% o f the cycle time ” where the
correct answer was less than 50%. According to the studies of both Brodie and Wells (1997) and
Grieve et al. (1975), the temporal aspect o f the operations would be classified as an element that
was hard to quantify from video. It should, however, again be noted that the observer was free to
review the operation until comfortable with their response and could ask pertinent questions at
any time. With this said, technological error, or error with the measurement system, should not
be implicated in the failure of the observer to attune themselves to this element. Further, human
elements such as subject motivation or attention, may have contributed to these errors (Spatz &
Johnston, 1989).
Clearly there were certain Levels within Jobs that had lower consensus than others, with
a range from 0.0% to 100%. However, Fleiss' kappa coefficient for agreement (1986) stipulates
the overlay of mean agreement scores to particular categories ranging from excellent agreement
(> 0.75), to fair/good agreement (0.4 - 0.75) to poor agreement (< 0.4). Adapting the current
63
Reproduced with permission of the copyright owner. Further reproduction prohibited without permission.
study results to these scales, with the overall between rater consensus levels at 76.9%, and a
minimal span between expert and novice (85.2% vs. 72.2% respectively), it may be stated that all
subjects were capable of consistently cuing to and identifying the required elements of the
decision system.
5.2.1 Test-Retest Reliability
Overall, subjects demonstrated good consensus for the test-retest condition (94.4%). The
average consensus for experts was 88.9%, where novice subjects showed perfect consensus. This
would indicate that the experimental design was reliable and consistent, such that limited
differences in responses would be expected regardless of time of testing.
While reviewing the consensus data, it is evident that, although a minimum of two weeks
had passed since the primary testing, the two experts, who did not concur with the criterion
measure for the first trial, corrected themselves for the second. The four novice subjects, who did
not concur with the criterion value for the first trial, did not do so again for the second. It appears
that experience is an important factor in variation and that, although the novice subjects did have
substantial training, they were attending to (or missing) the same cues trial after trial where the
experts learned from the previous mistake and attended to novel cues on the next opportunity.
The statistical analysis indicated that there was limited change between the means in the
test and retest trials. As mentioned previously, the same four novice subjects consistently failed
to concur with the criterion measure on the same Level (2) throughout the test and retest. This
would indicate that the study protocol was effectively designed to provide consistent results over
time. The testing made use of controlled verbiage and presented the same information to each
individual in the same manner each and every time. The operations were presented to each
subject in the same manner, as they were recorded and reviewed on a video monitor in a
controlled environment. With all input elements fixed, the results would lead to the conclusion
that the study protocol and the EDS allowed subjects to perform consistent analyses.
64
Reproduced with permission of the copyright owner. Further reproduction prohibited without permission.
5.2.2 Training Effect
A study was conducted to determine the effect of training on novice subjects. As with
the above test-retest condition, a strong consensus was found in the responses before and after
training, with an average of 88.9%. The novice subjects all had to take a screening test prior to
taking part in the study. The results of the test (Appendix B) indicated that the initial ergonomic
skill set was minimal with an average score of 17%. The results would seemingly indicate that
the ergonomic decision system is intuitive and reasonably easy to use and understand across skill
levels, even in the absence of significant training.
5.3 EDS Limitations
The choice of Job 1 for the training effect study was done randomly. Pre training-post training
data indicate that scores within and between operators for Job 1 had good consensus (72%) and
accuracy scores approaching the mean value (86.1%). By chance, another Job could have been
chosen for this scenario. Based on the post-trained data, one may anticipate that if the randomly
chosen job were, for example Job 2 or 5, the scores on the initial, pre-trained condition may have
resulted in a substantially worse outcome. Assuming that the training had some effect, the post
trained accuracy may have increased, and consensus may have changed to some extent. One
must therefore question whether the effectiveness of the training was truly tested or whether the
randomly chosen Job and its Levels were intuitive.
The choice of operation for the within-subject reliability study was also done randomly.
The selected Job (2) had very high consensus scores across the two trials, with novice subjects
scoring with low accuracy (33%), but perfect consensus. The test-retest took place after the
subjects were trained, therefore one would have to question whether some element in the training
lead to the repeated and consistent errors in novice subjects.
The subjects themselves may have induced some randomness into the study. For
instance, each novice subject received the same ergonomics training, and each expert and novice
received the same training in the use of the EDS. It is not possible, however, to determine the
65
Reproduced with permission of the copyright owner. Further reproduction prohibited without permission.

retention of information that had occurred or whether the subjects could truly apply it. Further,
the motivation of the subject may have positively or negatively impacted the subjects score on
each task. One may use time-to-complete as a surrogate measure of motivation but this is suspect
information and should be used cautiously (Eastman Kodak Company, 1986).
The six Jobs in this study were not chosen at random but, rather, were selected based on
their having a high incidence of injury, illness and medical data. However, they were chosen
from a large pool of jobs with very similar data, and were chosen to represent a number of
working conditions representing two facilities with varying dynamics. One of the facilities
produced very large vehicles and, consequently, has many very large parts. The other facility
produces a very small vehicle and has many small parts. It should be noted, however, that the six
Jobs did not cover all elements of Level 1, 2 or 3 of the EDS. Therefore, the current study is
limited to the elements included within the Jobs reviewed. Like most research, one would have to
make certain assumptions about the applicability of the tool to each unique particular
circumstance prior to use.
Video recordings have many desirable features, such as allowing an analyst to review the
operation multiple times and being sure that each time the footage is reviewed, it will be exactly
the same. However, there are also limitations associated with using video footage. For instance,
the ability to assess quantitative values is limited (Tolmie, 2002). For example, all subjects
would have difficulty accurately determining a force value while observing an experienced
worker horizontally push one component into another (i.e. Job 1, Halfshaft install). These values
would have to be quantified and provided to the observer. Further, certain elements have been
found to be particularly difficult to determine from video, such as twisting, rapid rotation, contact
stress, vibration, and fine movements (Brodie & Wells, 1997). Through this study, it was
determined that it is difficult to view certain tasks performed in tight spaces. Also, the ability to
communicate with the operator may provide insight into unobserved but difficult elements of the
Job, such as retrieving stock or flooring conditions. Video footage should be collected from
66
Reproduced with permission of the copyright owner. Further reproduction prohibited without permission.
multiple positions, angles and distances, with the intent to provide as much detail as possible.
This reduces the variability caused by on-site versus videotape analysis (Douwes & Dul, 1991).
The video recordings used within this study were taken with one camera, through a variety of
angles, in an attempt to adhere to the aforementioned protocol. It should be noted that on-site
viewing would present opportunities that this video footage did not. However, if this study had
used on-site viewing it would likely have come at a cost of controlled observation. Due to shift
scheduling, formal and informal breaks and other factors on site, field observation often results in
the viewing of different workers completing the job, often in different ways. This variability
would make it difficult to properly assess the decision system.
The Jobs were filmed and digitally recorded. It should be noted however that these Jobs
were then presented to each subject in the same order, meaning Job 1 through 6 were common
across subjects. Though all subjects achieved perfect consensus and accuracy on Job 6, no linear
or curvilinear pattern is evidenced across Jobs or Levels. The results indicate that there is
minimal indication of an order effect (Figure 2).
The EDS has been developed, and designed for use, within the automotive industry. Its
applications are therefore primarily intended for use within this sector. However, the human
body is bound by the balance between tissue demand and tolerance, not by the particular
commodity which they assemble. In addition, the Ergonomic tools incorporated into the EDS are
not specific to the automotive assembly industry. Therefore, the EDS tool should, theoretically,
be applicable to any working environment where the initial actions or postures may take place.
Reproduced with permission of the copyright owner. Further reproduction prohibited without permission.
Chapter VI CONCLUSION
This study sought to evaluate the accuracy and reliability of a novel ergonomic decision system.
The results indicate that accuracy was very high, with an overall mean of 88%, and consistency
data was also very strong with an overall between-user consensus of 77%. With this, the data
indicates that users of the EDS produced accurate and reliable results across subjects. The
original hypothesis was that both expert and novice subjects, trained on the ergonomic decision
system, would consistently arrive at the correct decision with regard to the appropriate ergonomic
tool while observing the same operation under the same constraints. When the results of the
study were run through an analysis of variance, there were no significant main or interaction
effects of experience. However, experts tended to be more accurate at 93% than novices at 84%.
The data indicate that the EDS accurately leads novice and expert subjects to arrive at an analysis
that agreed with the criterion measure. With this, the purpose was achieved and the hypothesis
should be accepted.
It was noted at the onset of this thesis that the EDS would need to be proven capable of
meeting the automotive manufacturing industry’s requirements. These requirements stipulated
that the face validity be established for the ergonomic tools, which are essentially the foundation
of the EDS. This was accomplished with a detailed review of literature that outlined the research
behind each tool, their individual criteria and their limitations. It was further stipulated that, in
order for the EDS to be useful, it must be able to be consistently applied by multiple analysts.
Otherwise, the direction of certain costly ergonomic decisions may depend on the EDS user. With
the high consistency and accuracy data provided, it can be stated that the EDS has been proven to
be reliable between and within individuals, able to be administered within reasonable time
constraints, relatively non-invasive and comprehensive.
The EDS is a system intended to allow both experts and novices to systematically break a
Job into component elements and progressively arrive at the same and most appropriate
68
Reproduced with permission of the copyright owner. Further reproduction prohibited without permission.
ergonomic tool for analysis. It is not, however, intended to completely analyze an operation. If
such an analysis was needed, it would require an individual who is sufficiently trained in the use
of the individual tools, and understands the limitations and assumptions of each. This system
does not sufficiently arm the user with this knowledge.
6.1 Future Direction
The intent of designing and testing this ergonomic decision system was to disseminate it
throughout a major original equipment manufacturer (OEM). This system provides a means to
empower many more employees, and to focus limited resources on the most appropriate
ergonomic targets, in the hope of abating future injury or illness.
With the implementation of the EDS, a concentrated focus should be given to gathering
feedback on its usability, impact on injury statistics. In addition, a comparison should be made
with data which would have been used if the tool was not provided. The EDS should also be
considered a 'living entity', such-that new and pertinent research should continuously be reviewed
and, if deemed to be of sufficient sensitivity and specificity, incorporated into the system.
Further attention should be given to the novice subject training. The results of the data
analysis were inconclusive, in that there was little apparent effect of the training. With the
current results, it is difficult to determine whether the training had an impact, whether the tool is
naturally intuitive or whether it was the job itself that provided evident elements that could easily
be attended to. It may be necessary to improve the novice training in order to further reduce
errors.
Equal weighting was given to the training of subjects for each of the action and posture
categories included within the EDS. Some of these elements require gross movements of large
body segments (lifting or working overhead). It would seem that, based on the findings of this
study and those previously cited, more focus should be given to the identification and analysis of
fine motor tasks versus that of gross. In particular, dedicated training on the video analysis of
69
Reproduced with permission of the copyright owner. Further reproduction prohibited without permission.

hand activity tasks should be added. This finding is an unexpected but important aspect of this
study and should be considered for future research.
Reproduced with permission of the copyright owner. Further reproduction prohibited without permission.
REFERENCES
Aaras, A. and Westgaard, R.H. (1987). Further studies of postural load and musculoskeletal injuries of workers at an electro-mechanical assembly plant. Applied Ergonomics, 18, 211-219.
Aaras, A. (1994). Relationship between trapezius load and the incidence of musculoskeletalillness in the neck and shoulder. International Journal of Industrial Ergonomics, 14, 341- 348.
Aghazadeh, F. (1998). Models for lifting load capacity of Indonesian population. Occupational Ergonomics, 1 (1), 67-74.
Akella, P. and Peacock, B. (1999). Intelligent Assists: A new generation of ergonomic tool. Applied Ergonomics, Case Studies, 2, 91-101.
American Conference of Governmental Industrial Hygienists (ACGIH)(2001). Threshold Limit Value: Hand Activity Level. Cincinnati, OH: American Conference of Governmental Industrial Hygienists.
Andersson, G.BJ. (1981). Epidemiologic aspects of low-back pain in industry. Spine, 5, 245-253.
Andrews, R.B. (1967). Estimation of values of energy expenditure rate from observed values of heart rate. Human Factors, 9 (6), 581-586.
Ankrum, D. (2000). On the confusion between static load level and static task. Applied Ergonomics, 31, 545-546.
Armstrong, T., Chaffin, D.B. and Foulke, J.A. (1979). A methodology for documenting hand positions and forces during manual work. Biomechanics, 12, 131-133.
Armstrong, T., Foulke, J., Joseph, B. (1982). Investigation of cumulative trauma disorders in a poultry processing plant. American Industrial Hygiene Association Journal, 43, 103-115
Armstrong, T. (1986). Ergonomics and cumulative trauma disorders. Hand Clinics, 2 (3), 553- 565.
Armstrong, T., Buckle, P., Fine, L., Hagberg, M., Jonsson, B., Kilbom, A., Kourinka, I.,Silverstein, B., Sjogaard, G. and Viikari-Juntjura, E. (1993). A conceptual model for work-related neck and upper-limb musculoskeletal disorders. Scandinavian Journal of Work. Environment and Health. 19, 73-84.
Armstrong, T., Foulke, J., Latko, W., Rayboum, R., Ulin, S. (1996). Work relatedmusculoskeletal disorders of the upper limb: Exposure evaluation. Advances in Occupational Ergonomics and Safety, 1, 405-410.
Armstrong, T. (2002). Analysis of the human-machine system: Identification of anthropometric requirements. Retrieved July 13, 2003, from http://ioe.engin.umich.edu
Reproduced with permission of the copyright owner. Further reproduction prohibited without permission.
Astrand, P.O. and Rodahl, K. (1977). Textbook of Work Physiology, second edition. New York, NY. McGraw-Hill Inc.
Astrand, P.O. and Rodahl, K. (1986). Textbook of Work Physiology, third edition. New York, NY. McGraw-Hill Inc.
Ayoub, M.M., Gidcumb, C.F., Hafez, H., Intaranont, K., Jiang, B.C. and Selan, J.L. (1983). A Design Guide for Manual Lifting Tasks. Prepared for OSHA. In A Guide to Manual Materials Handling, Mital, A., Nicholson, A.S. and Ayoub, M.M. (1993). Washington, DC. Taylor & Francis Inc.
Ayoub, M.M. and Mital, A. (1989). Manual Materials Handling. London, UK. Taylor & Francis.
Board of Certification in Professional Ergonomics (BCPE) (1999). Board of Certification in Professional Ergonomics Candidate Handbook: Certification Policies, Practices and Procedures. Bellingham, WA: Board of Certification in Professional Ergonomics.
Bink, B. (1962). The physical working capacity in relation to working time and age. Ergonomics, 5, 25-28.
Baidya, K.N. and Stevenson, M.G. (1988). Local muscle fatigue in repetitive work. Ergonomics, 31 (2), 227-239.
Baron, S. (1996). Evaluation of symptom surveys for occupational musculoskeletal disorders. American Journal of Industrial Medicine, 29 (6), 609-617.
Barsky, I. And Dutta, S.P. (1997). Cost assessment for ergonomic risk (CAFER). International Journal of Industrial Ergonomics, 20, 307-315.
Basmajian, J.V. and Deluca, C.J. (1985). Muscles Alive - Their functions revealed by electromyography, fifth edition. Baltimore, MD. Williams & Wilkins.
Bergmasco, R., Girola, C. and Colombini, D. (1998). Guidelines for designing jobs featuring repetitive tasks. Ergonomics, 41 (9), 1364-1383.
Borg, G.A.V. (1973). Perceived Exertion: A note on history and methods. Medicine and Science in Sports, 5 (2), 90-93.
Borg, G.A.V. (1982). Psychophysical bases of perceived exertion. Medicine and Science in Sports and Exercise, 14 (5), 377-381.
Brodie, D. and Wells, R. (1997). An evaluation of the utility of three ergonomic checklists forpredicting health outcomes in a car manufacturing environment. Proceedings of the 29th Annual Conference of the Human Factors Association of Canada, 45-52.
Bureau of Labor Statistics (BLS). (2003). Industry Injury and Illness Data. Summary tables. Retrieved June 28, 2003, from http://www.stats.bls.gov/iiftoshsum.htm.
Burrows, E., Jenkins, S., Thomas, G. and Rickards, J. (1998). A pre-intervention benefit/cost methodology - Refining the cost audit process. Proceedings of the 30th Annual Conference of the Human Factors Association of Canada, 131-135.
72
Reproduced with permission of the copyright owner. Further reproduction prohibited without permission.
Chaffin, D.B. (1967). The development of a prediction model for the metabolic energy expended during arm activities. In Garg, A., Chaffin, D.B. and Herrin, G. (1978). Prediction of metabolic rates for manual materials handling jobs. American Industrial Hygiene Association Journal, 39 (8), 661-674.
Chaffin, D.B. and Park, K.S. (1973). A longitudinal study of low-back pain as associated withoccupational weight lifting factors. American Industrial Hygiene Association Journal. 32, 513-525.
Chaffin, D.B., Herrin, G.D. and Keyserling, W.M. (1978). Preemployment strength testing: An updated position. Journal of occupational medicine, 20,403-408.
Chaffin, D.B. and Andersson, G.BJ. (1991). Occupational Biomechanics (2 ed.). New York, NY: John Wiley & Sons, Inc.
Chaffin D.B. and Erig, M. (1991). Three-dimensional biomechanical static strength prediction model sensitivity to postural and anthropometric inaccuracies. IIE Transactions, 23 (2), 215-227.
Chaffin, D. B., Andersson, G. B. J. & Martin, B. J. (1999). Occupational Biomechanics (3 ed.). New York, NY: John Wiley & Sons, Inc.
Chen, J., Jianwen, C. and Zhou, H. (2004). Two-step estimation for a generalized linear mixed modelwith auxiliary covariates. Statistica Sinica, 14, 361-376.
Christensen, H. (1986). Muscle activity and fatigue in the shoulder muscles during repetitive work. European Journal of Applied Physiology, 54, 596-601.
Ciriello, V.M. and Snook, S.H. (1983). A study of size, distance, height, and frequency effects on manual handling tasks. Human Factors, 25, 541-550.
Ciriello, V.M., Snook, S.H., Blick, A.C. and Wilkinson, P.L. (1990). The effects of task duration on psychophysically-determined maximum acceptable weights and forces. Ergonomics, 33 (2), 187-200.
Coggon, D., Rose, G. and Barker, D.J.P. (1997). Epidemiology for the Uninitiated, Fourth edition. BMJ Publishing Group. On: http://bmj.bmjjoumals.com/epidem/epid.html.
Damkot, D.K., Pope, M.H., Lord, J. and Frymoyer, J.W. (1984). The relationship between work history, work environment and low back pain in men. Spine, 9, 395-399.
Deal, G. (1995). Factors Affecting Acceptable Rate of Manual Mating of Connectors. PhD. [Dissertation], University of South Florida, Tampa, Florida.
Dempsey, P.G., Sorock, G.S., Cotnam, J.P., Ayoub, M.M., Westfall, P.H., Maynard, W., Fathallah, F. and O'Brien, N. (2000). Field evaluation of the revised NIOSH lifting equation. Proceedings of the IEA 2000/HFES 2000 Congress.
Dennett, X., Fry, H. (1988). Overuse syndrome: A muscle biopsy study. Lancet, April, 905-908.
73
Reproduced with permission of the copyright owner. Further reproduction prohibited without permission.
Department of Labor and Industries (1988). Regulations and Code of Practice: Manual Handling. Victoria: Department of Labor.
Dolan, P., Adams, M.A. and Hutton, W.C. (1988). Commonly adopted postures and their effect on the lumbar spine. Spine, 13 (2), 197-201.
Douwes, M. and Dul, J. (1991). Validity and reliability of estimating body angles by direct and indirect observations. In Designing for Everyone. Queinnec and Daniellou (Eds.). London, Taylor & Francis.
Dul, J. (1988). A biomechanical model to quantify shoulder load at the work place. Clinical Biomechanics, 3, 124-128.
Eastman Kodak Company (1986). Ergonomic Design for People at Work, Volume 2. New York, N.Y.: International Thomson Publishing, Inc.
Elliott, B. C. and Wood, G. A. (1995). Science and Sport in Medicine: Biomechanical Principles. Victoria, Australia: Blackwell Science Pty Ltd.
Engstrom, T., Hanse, J., Kadefors, R. (1998). Musculoskeletal symptoms due to technical preconditions in long cycle time work in an automobile assembly plant: a study of prevalence and relation to psychosocial factors and physical exposure. Applied Ergonomics, 30, 443-453.
Ericson, M., Kilbom, A., Wiktorin, C. and Winkel, J. (1991). Validity and reliability in the estimation of trunk, arm and neck inclination by observation. In Y.Queinnec and F.Daniellou (Eds.). Designing for Everyone. New York, NY: Taylor & Francis.
Fernandez, J.E., Ayoub, M.M. and Smith, J.L. (1991). Psychophysical lifting capacity over extended periods. Ergonomics, 34 (1), 23-32.
Feuerstein, M. and Fitzgerald, T. (1992). Biomechanical factors affecting upper extremity cumulative trauma disorders in sign language interpreters. Journal of Occupational Medicine, 34 (3), 257-264.
Fisher, D.L., Andres, R.O., Airth, D. and Smith S.S. (1993). Repetitive Motion Disorders: The Design of Optimal Rate-Rest Profiles. Human Factors, 35 (2), 283-304
Fleiss, J.L. (1986). The Design and Analysis of Clinical Experiments. John Wiley & Sons, Toronto.
Foreman, T.K., Baxter, C.E. and Troup, J.D.G. (1984). Ratings of acceptable load and maximal isometric lifting strengths: the effects of repetition. Ergonomics, 27 (12), 1283-1288.
Frankel, V. H. and Burstein, A. H. (1970). Orthopaedic Biomechanics. Philadelphia, PA: Lea and Febiger.
Frederick, W. (1959). Human energy in manual lifting. Modem Materials Handling, 14 (3), 74- 76.
Friedman, G.D. (1974). Primer in epidemiology. New York, NY: McGraw-Hill.
74
Reproduced with permission of the copyright owner. Further reproduction prohibited without permission.

Frymoyer, J.W., Pope, M.H., Costanza, M.C., Rosen, J.C., Goggin, J.E. and Wilder, D.G. (1980). Epidemiologic studies of low-back pain. Spine, 5 (5), 419-423. Gamberale, F., Ljungberg, A.S., Annwall, G. and Kilbom, A. (1987). An experimental evaluation of psychophysical criteria for repetitive lifting work. Applied Ergonomics, 18 (4), 311-321.
Garg, A. (1976). A metabolic rate prediction model for manual materials handling jobs. Ph.D Dissertation, University of Michigan.
Garg, A., Chaffin, D.B. and Herrin, G. (1978). Prediction of metabolic rates for manual materials handling jobs. American Industrial Hygiene Association Journal, 39 (8), 661-674.
Garg, A. and Saxena, U. (1982). Maximum frequency acceptable to female workers for one- handed lifts in the horizontal plane. Ergonomics, 25 (9), 839-853.
Garg, A. (1983). Physiological responses to one-handed lift in the horizontal plane by female workers. American Industrial Hygiene Association Journal, 44 (3), 190-200.
General Accounting Office/ Health Education and Human Services Division(GAO/HEHS)(1997). United States General Accounting Office Report to Congressional Requestors: Worker Protection, Private Sector Ergonomics Programs Yield Positive Results. Washington, DC.
Giroux, B. & Lamontagne, M. (1992). Net shoulder joint moment and muscular activity during light weight handling at different displacements and frequencies. Ergonomics, 35 (4), 385-403.
Gescheider, G.A. (1997). Psychophysics, the fundamentals. Third edition. Mahwah, NJ. Lawrence Erlbaum Associates, Inc.
Glover, J.R. (1970). Occupational health research and the problem of back pain. Transactions of the Society of Occupational Medicine, 21, 2-12.
Goldstein, S., Armstrong, T., Chaffin, D., Matthews, L. (1987). Analysis of cumulative strain in tendons and tendon sheaths. Journal of Biomechanics, 20 (1), 1-6.
Gravetter, F. and Wallnau, L. (1988). Statistics for the behavioral sciences, third edition. New York, NY. West Publishing Co.
Greene, B.L. and Wolf, S.L. (1989). Upper extremity joint movement: Comparison of two measurement devices. Arch Phys Med Rehabil, 70, 288-290.
Grieve, D.W., Miller, D.I., Mitchelson, D. Paul, J.P., and Smith, A.J. (1975). Techniques for the analysis of human movement. Princeton, N.J.: Princeton Book Co. 177.
Habes, D., Carlson, W. & Badger, D. (1985). Muscle Fatigue Associated with Repetitive Arm Lifts: effects of height, weight and reach. Ergonomics, 28 (2), 471-488.
Hagg, G., Oster, J., Bystrom, S. (1996). Forearm muscular load and wrist angle amongautomobile assembly line workers in relation to symptoms. Applied Ergonomics, 28, 41- 47.
75
Reproduced with permission of the copyright owner. Further reproduction prohibited without permission.
Hagberg, M. (1981). Work load and fatigue in repetitive arm elevations. Ergonomics, 24 (7), 543- 555.
Hennekens, C.H. and Buring, J.E. (1987). Epidemiology in medicine. Boston, Mass. Little,Brown and Co. 258-271.
Herberts, P., Kadefors, R. and Broman, H. (1980). Arm positioning in manual tasks: Anelectromyographic study of localized muscle fatigue. Ergonomics 23 (7), 655-665.
Herrin, G.D., Jariedi, M. and Anderson, C.K. (1986). Prediction of overexertion injuries using biomechanical and psychophysical models. American Industrial Hygiene Association Journal, 47, 322-330.
Honsa, K., Vennettilli, M., Mott, N., Silvera, D., Neichwiej, E., Wagar, S., Howard, M., Zettel, J. and McGill, S. (1998). The efficacy of the NIOSH (1991) hand-to-container coupling factor. In, Proceedings of the 30th Annual Conference of the Human Factors Association of Canada.
Industrial Engineer (2003). Cost of workplace injuries grows. IE Engineering and Management solutions at work, 35 (6), 9.
Jager, M. and Luttman, A. (1989). Biomechanical analysis and assessment of lumbar stressduring load lifting using a dynamic 19-segment human model. Ergonomics, 32, 93-112.
Jager, M. and Luttman, A. (1991). Compressive strength of lumbar spine elements related to age, gender, and other influencing factors. In A Guide to Manual Materials Handling. Mital, A., Nicholson, A.S., and Ayoub, M.M. (1993). Washington, DC. Taylor & Francis, Inc.
Jonsson, B. (1982). Measurement and evaluation of local muscular strain in the shoulder during constrained work. Journal of Human Ergology, 11, 73-88.
Joseph, B., Reeve, G., Kilduff, H.A., Hall-Counts, J. and Long, M. (2000). Key elements of an ergonomics process: Developing surveillance tools to evaluate risk factors. Proceedings of the IEA 2000/HFES 2000 Congress.
Kadefors, R., Peterson, I. & Herberts, P. (1976). Muscular reaction to welding work: An electromyographic investigation. Ergonomics, 19 (5), 543-558.
Karhu, P, Kansi, P. and Kuorinka, I. (1977). Correcting working postures in industry: A practical method for analysis. Applied Ergonomics, 8 (4), 199-201.
Karwowski, W. and Yates, J.W. (1986). Reliability of the psychophysical approach to manual lifting of liquids by females. Ergonomics, 29 (2), 237-248.
Karwowski, W. and Brokaw, N. (1992). Implications of the proposed revisions in the draft of the revised NIOSH lifting guide (1991) for job redesign: a field study. Proceedings of the Human Factors and Ergonomics Society 36th Annual Meeting, 659-663.
Keyserling, W., Stetson, D., Silverstein, B., and Brouwer, M. (1993). A checklist for evaluating ergonomic risk factors associated with upper extremity cumulative trauma disorders. Ergonomics, 36 (7), 807-831.
76
Reproduced with permission of the copyright owner. Further reproduction prohibited without permission.
Keyserling, W.M. and Chaffin, D.B. (1986). Occupational ergonomics- Methods to evaluate physical stress on the job. Annual Review of Public Health, 7, 77-104.
Keyserling, W., Stetson, D., Silverstein, B., and Brouwer, M. (1993). A checklist for evaluating ergonomic risk factors associated with upper extremity cumulative trauma disorders. Ergonomics, 36 (7), 807-831.
Kilbom, A. (1994)a. Repetitive work of the upper extremity: Part I - Guidelines for the practitioner. International Journal of Industrial Ergonomics, 14, 51-57.
Kilbom, A. (1994)b. Repetitive work of the upper extremity: Part II - The scientific basis(knowledge base) for the guide. International Journal of Industrial Ergonomics, 14, SOSO.
Kleinman, K, Lazarus, R. and Platt, R. (2004). A generalized linear mixed models approach for detecting incident clusters of disease in small areas, with an application to biological terrorism. American Journal of Epidemiology, 159 (3), 217-224.
Konz, S. (1995). Work design: Industrial ergonomics. Scottsdale, AZ: Publishing Horizons, Inc.
Krawczyk, S. (1993). Psychophysical determination of work design guidelines for repetitiveupper extremity transfer tasks over an eight hour day. [Dissertation]. Ann Arbour, Mi: The University of Michigan.
Krawczyk, S., Armstrong, T.J. and Snook, S.H. (1993). Psychophysical assessment of simulated assembly line work: Combinations of transferring and screw driving tasks. In proceedings of the Human Factors and Ergonomics Society, 37th annual meeting, Seattle, WA.
Kroemer, K.H.E. (1989). Cumulative trauma disorders: Their recognition and ergonomic measures to avoid them. Applied Ergonomics, 20 (4), 274-280.
Krom, M., Kester, A., Knipschild, P., Spaans, F. (1990). Risk Factors for Carpal Tunnel Syndrome. American Journal of Epidemiology, 132 (6), 1102-1110.
Kromodihardjo, S. and Mital, A. (1986). Kinetic analysis of manual lifting activities: Part I -Development of a three-dimensional computer model. International Journal of Industrial Ergonomics, 1, 77-90. In A Guide to Manual Materials Handling, Mital, A., Nicholson, A.S. and Ayoub, M.M. (1993). Washington, DC. Taylor & Francis Inc.
Kromodihardjo, S. and Mital, A. (1987). Biomechanical analysis of manual lifting tasks. Journal of Biomechanical Engineering, 109, 132-138. In A Guide to Manual Materials Handling, Mital, A., Nicholson, A.S. and Ayoub, M.M. (1993). Washington, DC. Taylor & Francis Inc.
Kvamstrom, S. (1983). Occurance of musculoskeletal disorders in the manufacturing industry with special attention to occupational shoulder disorders. Scandinavian Journal of Rehabilitation Medicine, 8, 111-114.
Latko, W., Armstrong, T., Foulke, J., Herrin, G., Rayboum, R., Ulin, S. (1997). Development and evaluation of an observational method for assessing repetition in hand tasks. American Industrial Hygiene Association Journal, 58, 278-285.
77
Reproduced with permission of the copyright owner. Further reproduction prohibited without permission.
Lee, C-C., Nelson, E., Davis, K., and Marras, W. (1997). An ergonomic comparison of industrial spray paint guns. International Journal of Industrial Ergonomics, 19, 425-435.
Leedy, P. and Ormrod, J. (2001). Practical research, seventh edition. Columbus, OH. Merrill Prentice Hall.
Legg, S.J. and Myles, W.S. (1981). Maximum acceptable repetitive lifting workloads for an 8-hour workday using psychophysical and subjective rating methods. Ergonomics, 24 (12), 907-916.
Legg, SJ. and Myles, W.S. (1985). Metabolic and cardiovascular cost, and perceived effort over an 8-hour day when lifting loads selected by the psychophysical method. Ergonomics, 28(1), 337-343.
Ljungberg, A.S., Gamberale, F. and Kilbom, A. (1982). Horizontal lifting- Physiological and psychological responses. Ergonomics, 25 (8), 741-757.
Ljunggren, G. (1986). Observer ratings of perceived exertion in relation to self ratings and heart rate. Applied Ergonomics, 17 (2), 117-125.
Loslever, P. and Ranaivosoa, A. (1993). Biomechanical and epidemiological investigation of carpal tunnel syndrome at workplaces with high risk factors. Ergonomics, 36 (5), 537- 554.
Marras, W. & Schoenmarklin, R. (1993). Wrist motions in industry. Ergonomics, 36 (4), 341- 351.
Marras, W., Marklin, R., and Greenspan, G. (1995). Quantification of wrist motions during scanning. Human Factors, 37 (2), 412-423.
Marras, W.S., Lavender, S.A., Leurgans, S.E., Fetahallah, F.A. and Allread, W.G. (1995).Biomechanical risk factors for occupationally-related low back disorders. Ergonomics, 38(2), 377-410.
McAtamney, L., and Corlett, N. (1993). RULA: a survey method for the investigation of work- related upper limb disorders. Applied Ergonomics, 24, (2), 91-99.
Merletti, R., LoConter, L.R. and Orizio, C. (1991). Indices of muscle fatigue. Journal of Electromyography and Kinesiology, 1 (1), 20-33.
Merriam-Webster's (1993). Merriam Webster's collegiate dictionary, tenth edition. Springfield, MA. Merriam-Webster Inc.
Michael, E.D., Hutton, K.E., and Horvath, S.M. (1961). Cardiorespiratory responses during prolonged exercise. Journal of Applied Physiology, 16, 997-999.
Mital, A. (1983). Maximum frequencies acceptable to males for one handed horizontal lifting in the sagittal plane. Human Factors, 25 (5), 563-571.
Reproduced with permission of the copyright owner. Further reproduction prohibited without permission.

Mital, A. (1984a). Comprehensive maximal acceptable weight of lift database for regular 8-hour workshifts. Ergonomics, 27, 1127-1138. In, Mital, A. Nicholson, A. S., and Ayoub, M.M. (1993). A guide to manual materials handling. Washington, DC. Taylor and Francis, Inc.
Mital, A. (1985). A comparison between psychophysical and physiological approaches across low and high frequency ranges. Journal of Human Ergology, 14, 59-64.
Mital, A., Fard, H., Khaldei, H. and Channaveeraiah, C. (1987). Are manual lifting weight limits based on the physiological approach realistic and practical? In Trends in Ergonomics/Human Factors IV, edited by S.S. Asfour, pp 973-977. Amsterdam: North- Holland.
Mital, A. (1992). Psychophysical capacity of industrial workers for lifting symmetrical and asymmetrical loads symmetrically and asymmetrically for 8-hour work shifts. Ergonomics, 35, 745-754.
Mital, A. Nicholson, A. S., and Ayoub, M. M. (1993). A guide to manual materials handling. Washington, DC. Taylor and Francis, Inc.
Moore, A., Wells, R. and Ranney, D. (1991). Quantifying exposure in occupational manual tasks with cumulative trauma disorder potential. Ergonomics, 34 (12), 1433-1453.
Moore, S. and Garg, A. (1995). The Strain Index: A proposed method to analyse jobs for risk of distal upper extremity disorders. American Industrial Hygiene Association, 56, 443-458.
Muggleton, J.M., Allen, R. and Chappell, P.H. (1999). Hand and arm injuries associated with repetitive manual work in industry: a review of disorders, risk factors and preventive measures. Ergonomics, 42 (5), 714-739.
National Academy of Sciences (NAS) (1998). Work related musculoskeletal disorders: A review of the evidence. Washington, DC. National Academy Press.
National Institute for Occupational Safety and Health (NIOSH) (1981). Technical report: Work practices guide for manual lifting. DHHS (NIOSH) publication No. 81-122.
National Institute for Occupational Safety and Health (NIOSH) (1986). Proposed national strategies for the prevention of leading work-related diseases and injuries: part 1. Washington, DC: Association of Schools of Public Health.
National Institute for Occupational Safety and Health (NIOSH) (1997). Hazard evaluation and technical assistance report # TA 76-93 by Wisseman, C.L. and Badger, D. Cincinnati, Ohio: US Department of Health, Education and Welfare, Center for Disease Control.
National Institute for Occupational Safety and Health (NIOSH) (1997). Musculoskeletal disorders and workplace factors. DHHS (NIOSH) publication No. 97-141.
Occupational Safety and Health Administration (OSFLA) (1995). Ergonomic protection standard. Washington, DC.
Reproduced with permission of the copyright owner. Further reproduction prohibited without permission.
Occupational Safety and Health Administration (OSHA) (1999). Proposed rules, Department of Labor, Occupational Safety and Health Administration. Federal Register, 64 (225), 65768-66078.
Oxenburgh, M. (1991). Increasing productivity and profit through health and safety. CCH International, North Ryde, N.S.W.
Park, K. (1973). A computerized simulation model of postures during manual materials handling. PhD dissertation, University of Michigan, Ann Arbor, MI.
Potvin, J.R. (1997). Effects of muscle kinematics on surface EMG amplitude and frequencyduring fatiguing dynamic contractions. The American Physiological Society, 0161-7567, 144-151.
Potvin, J.R. & Bent, L.R. (1997). A validation of techniques using surface EMG signals from dynamic contractions to quantify muscle fatigue during repetitive tasks. Journal of Electromyography and Kinesiology, 7 (2), 131-139.
Potvin, J.R. & Bent, L.R. (1997). NIOSH equation horizontal distances associated with the Liberty Mutual (Snook) lifting table box widths. Ergonomics, 40 (6), 650-655.
Potvin, J.R., Dawson, D., MacPherson, M. and Joseph, B. (2002a). Evaluating the ACGIH TLV guideline for low force/high frequency work. The Proceeding of the XVI Annual International Occupational Ergonomics and Safety Conference.
Potvin, J.R., Dawson, D., Jones, J., MacPherson, M. and Joseph, B. (2002b). Comparing risk- scores from the ACGIH TLV guideline when obtained from live observation and video records. The Proceeding of the XVI Annual International Occupational Ergonomics and Safety Conference.
Putz-Anderson, V. (1988)a. Prevention strategies adopted by select countries for work-related musculoskeletal disorders from repetitive trauma. In Trends in Ergonomics/Human Factors V, edited by F.Aghazadeh. North-Holland: Elsevier Science Publishers, 601-611.
Putz-Anderson, V. (1988)b. Cumulative Trauma Disorders: Manual for musculoskeletal diseases of the upper limbs. Bristol, PA: Taylor & Francis.
Radwin, R.G., Masters, G.P. and Lupton, F.W. (1991). A linear force-summing handdynamometer independent of point of application. Applied Ergonomics, 22 (5), 339-345.
Reed H., Peacock, B. and Mohr, E. (1999). The frequency factor in manual lifting. Applied Ergonomics Case Studies, Volume 2. 66-79.
Rempel, D., Harrison, R., & Barnhart, S. (1992). Work-related cumulative trauma disorders of the upper extremity. Journal of the American Medical Association, 267, 838-842.
Rodgers, S.H., Yates, J.W. and Garg, A. (1991). The physiological basis for manual lifting guidelines. National Technical Information Service, Report No. 91, 227-330.
Rodgers, S.H. (1992). A functional job analysis technique. Occupational Medicine: State of the art reviews. April-June, 3 (2).
80
Reproduced with permission of the copyright owner. Further reproduction prohibited without permission.
Rohmert, W. (1973). Problems in determining rest allowances. Part 2 - Determining rest allowances in different human tasks. Applied Ergonomics, 4 (2), 158-162.
Rose, L., Ericson, M., Glimskar, B., Nordgren, B. & Ortengren, R. (1992). Ergo-Index. Amodel to determine pause needs after fatigue and pain reactions during work. Advances in Industrial Ergonomics and Safety IV, 303-310.
Rosecrance, J.C. and Cook, T.M. (1998). Upper extremity musculoskeletal disorders:Occupational association and a model for prevention. Central European Journal of Occupational and Environmental Medicine, 4 (1), 214-231.
Sanders, M.S. and McCormick, E.J. (1993). Human factors in engineering and design. New York, NY: McGraw Hill.
Schoenmarklin, R., Marras, W. (1993). Dynamic capabilities of the wrist joint in industrial workers. International Journal of Industrial Ergonomics, 11, 207-224.
Schoenmarklin, R., Marras, W., Leugans, S. (1994). Industrial wrist motions and incidence of hand/wrist cumulative trauma disorders. Ergonomics, 37 (9), 1449-1459.
Selan, J. (1994). The Advanced Ergonomic Manual. Dallas, TX: Advanced Ergonomics Inc.
Silverstein, B. (1985). The prevalence of upper extremity cumulative trauma disorders in industry [Dissertation]. Ann Arbour, Mi: The University of Michigan.
Silverstein, B.A., Fine, L.J. and Armstrong, T.J. (1987). Occupational factors and carpal tunnel syndrome. American Journal of Industrial Medicine, 11, 343-358.
Skrondal, A. and Rabe-Hesketh, S. (2003). Some applications of generalized linear latent and mixed models in epidemiology: Repeated measures, measurement error and multilevel modeling. Norsk Epidemiologi, 13 (2), 265-278.
Snook, S.H. and Irvine, C.H. (1968). Maximum frequency of lift acceptable to male industrial workers. American Industrial Hygiene Association Journal, 29, 531-536.
Snook, S.H. and Irvine, C.H. (1969). Psychophysical studies of physiological fatigue criteria. Human Factors, 11 (3), 291-300.
Snook, S., Irvine, C., and Bass, S. (1970). Maximum weights and work loads acceptable to male industrial workers: A study of lifting, lowering, pushing, pulling, carrying, and walking tasks. American Industrial Hygiene Association Journal, 31, 579-586.
Snook, S. H. (1978). The design of manual handling tasks. Ergonomics, 21 (12), 963-985.
Snook, S.H. (1985). Psychophysical acceptability as a constraint in manual working capacity. Ergonomics, 28 (1), 331-335.
Snook S.H. and Ciriello, V.M., (1991) The design of manual handling tasks: Revised tables of maximum acceptable weight and forces. Ergonomics, 34 (9), 1197-1213.
81
Reproduced with permission of the copyright owner. Further reproduction prohibited without permission.
Snook, S., Vaillancourt, D., Cirello, V., Webster, B. (1995). Psychophysical studies of repetitive wrist flexion and extension. Ergonomics, 38 (7), 1488-1507.
Snook, S., Vaillancourt, D., Cirello, V., Webster, B. (1997). Maximum acceptable forces forrepetitive ulnar deviation of the wrist. American Industrial Hygiene Association Journal, 58, 509-517.
Sommerich, C., McGlothlin, J., and Marras, W. (1993). Occupational risk factorsassociated with soft tissue disorders of the shoulder: a review of recent investigations in literature
Sommerich, C., Marras, W., and Pamianpour, M. (1996). A method for developingbiomechanical profiles of hand-intensive tasks. Clinical Biomechanics, 13, 261-271.
Spatz, C. and Johnston, J. (1989). Basic Statistics, tales of distributions, 4th edn. Cole Publishing Co. Pacific Grove, C.A. 395.
Stock, S. (1991). Workplace ergonomic factors and development of musculoskeletal disorders of the neck and upper limbs: a meta-analysis. American Journal of Industrial Hygiene, 19, 87-107.
Suurkula, J. and Hagg, G. (1987). Relations between shoulder/neck disorders and EMG zero crossing shifts in female assembly workers using the test contraction method. Ergonomics, 30 (11), 1553-1564.
Tolmie, S.W. (2002). An evaluation of the validity and reliability of an ergonomic risk factor checklist. Thesis. University of Windsor. Windsor, Ontario, Canada.
Topp, K. and Byl, N. (1999). Movement dysfunction following repetitive hand opening and closing: Anatomical analysis in owl monkeys. Movement Disorders, 14 (2), 295-306.
Tracy, M.F. (1990). Biomechanical methods in posture analysis. In Evaluation of Human Work, edited by John R. Wilson and E. Nigel Corlett. New York, NY: Taylor & Francis, Inc. 571-604.
Troup, J.D., Martin, J.W. and Lloyd, C.E.F. (1981). Back pain in industry: A prospective survey. Spine, 6, 61-69.
UAW-Ford Motor Company (1999). Contractual working agreement. Appendix S. Bulletin number 1.0. Standard methods and guidelines for UAW-Ford Local Ergonomic Committees.
University of Michigan (2000). University of Michigan 3DSSPP 4.21.
U.S. Department of Health and Human Services (DHHS). (1992). Selected topics in surface electromyography for use in the occupational setting: Experts perspectives. DHHS (NIOSH) Publication No. 91-100.
U.S. General Accounting Office (GAO) Health Education and Human Services (HEHS). (1997). Worker protection - Private sector ergonomics programs yield positive results. GAO/HEHS Publication No. 97-163.
82
with permission of the copyright owner. Further reproduction prohibited without permission.
Vi, P. (1998). Evaluation of the frequency distribution and validity of the NIOSH recommended weight limit. Proceedings of the 30th Annual Conference of the Human Factors Association of Canada.
Vollestad, N.K. (1997). Measurement of human muscle fatigue. Journal of Neuroscience Methods, 74, 219-227.
Waly, S.M., Kahlil, T.M. and Asfour, S.S. (1986). Physiological basis of muscular fatigue: An electromyographic study. Trends in Ergonomics/Human Factors III, 751-758.
Waters, T.R., Putz-Anderson, V., Garg, A. and Fine, L J. (1993). Revised NIOSH equation for the design and evaluation of manual lifting tasks. Ergonomics, 36 (7), 749-776.
Wardle, M.G. and Gloss, D.S. (1978). A psychophysical approach to estimating endurance in performing physically demanding work. Human Factors, 29 (6), 745-747.
Weir, J.B. (1949). New methods for calculating metabolic rate with special reference to protein metabolism. In Garg, A., Chaffin, D.B. and Herrin, G. (1978). Prediction of metabolic rates for manual materials handling jobs. American Industrial Hygiene Association Journal, 39 (8), 661-674.
Wells, R., Moore, A., Potvin, J. and Norman, R. (1994). Assessment of risk factors fordevelopment of work-related musculoskeletal disorders (RSI). Applied Ergonomics, 25(3), 157-164.
Winkel, J. & Westgaard, R. (1992)a. Occupational and individual risk factors for shoulder-neck complaints: Part I - Guidelines for the practitioner. International Journal of Industrial Ergonomics, 10, 79-84.
Winkel, J. & Westgaard, R. (1992)b. Occupational and individual factors for shoulder-neckcomplaints: Part II - The scientific basis (literature review) for this guide. International Journal of Industrial Ergonomics,
Worker’s Compensation Board (WCB) (1994). Issued by : The Secretariat for Regulation Review Board of Governors, Draft Ergonomics Regulations. Vancouver, BC: WCB.
World Health Organization (1989). Identification and control of work-related diseases. WHO Technical Report Series
Yamada, H., Kiryu, T. and Okada, M. (2001). Development of muscle fatigue assessed by using superposition of eveoked and volitional myoelectrical potentials. Perceptual and Motor Skills, 93, 3-10.
Yoshitake, H. (1971). Relations between the symptoms and the feeling of fatigue. Ergonomics, 14 (1), 175-186.
Zetterberg, C. and Ofverholm, T. (1999). Carpal tunnel syndrome and other wrist/hand symptoms and signs in male and female car assembly workers. International Journal of Industrial Ergonomics, 23, 193-204.
83
Reproduced with permission of the copyright owner. Further reproduction prohibited without permission.

APPENDIX A
f tU N I V E R S I T Y O F
WINDSOR
LETTER OF INFORMATION
Evaluation o f the reliability o f an ergonomic decision system
You are asked to participate in a research study conducted by: Dr. Jim Potvin and Derek Dawson
If you have any questions or concerns about the research, please feel to contact either:1. Dr. Jim Potvin, Associate Professor, Faculty of Human Kinetics, University of Windsor (519- 253-3000 x2461; Room 117 HK Building; [email protected]) or home: 967-0233.
2. Derek Dawson, Ergonomic Engineer, Ford Motor Company (313-248-7209; Room E l280 Ford Motor Company, VOGO, Dearborn, MI, 48121;
PURPOSE OF STUDY
The purpose of this research is to establish the reliability and validity of a unique ergonomic process, deemed the Ergonomic Decision System. Though based on universally applicable research, the EDS was designed to be used within the automotive manufacturing sector.
Validity will be established via an in-depth literature review, from which the content of decision system was developed. Between and within-rater reliability of the decision system will be established from controlled lab testing with a number of trained and untrained engineers working in isolation, under time restrictions and using the process in an attempt to analyze several jobs
Reliability studies produce two results. The first is that the trained individuals, using the EDS will repeatedly choose the same and most applicable ergonomic tool for analysis. Second, that the results of the use of the tool indicate true positive and true negative conditions. That is to say, it is desirable to avoid conditions where an element of an operation is labeled as ergonomically unsuitable when in reality it is sound (false positive). Or conversely and perhaps more importantly, the labeling of an element of an operation as ergonomically suitable when it is in fact not (false negative).
PROCEDURES
Each of twelve subjects (6 expert and 6 novice) will each receive like verbal instructions on the test procedure. Subjects will be provided a work-station containing a computer, ergonomic decision system and HyperCam® software. Subjects will then be shown a video segment from an industrial work setting containing several full cycles of the assembly operations being evaluated.
84
Reproduced with permission of the copyright owner. Further reproduction prohibited without permission.

The subject will be able to request repeated viewing of the work tasks. Further, upon request the subjects will be provided any pertinent, additional information regarding to the operation.
In order to assess between-rater reliability, subjects will be presented with six full assembly operations, three operations were chosen from each of the two automotive assembly facilities. Although each of the operations contain many different risk-factors, four of the total six were selected in order assess a predominant action or posture. The remaining two represent variations of one of the original four actions and postures. The rationale for the action or posture duplication with variations are to provide the subject with a variety of conditions which may require analysis within an assembly facility and to assess the decision process under these conditions.
After a minimum of two weeks post-test each of the twelve subjects will repeat the analysis of one randomly chosen operation. Results between the original analysis and second will provide information for within-subject reliability comparisons.
All ergonomic decision system software use will be simultaneously recorded using HyperCam® software. These recordings will provide information on time required to complete tasks and decision paths chosen. This will then be compared to the most accurate and succinct analysis method as established by select and non-participatory expert consensus agreement.
POTENTIAL RISKS AND DISCOMFORTS
Results of the subjects analysis of the six operations will be kept confidential, however the chance exists that participants may discuss the operations. This may lead to some level of disagreement and perhaps emotional issues at some level. Please contact Dr. Potvin (519-253-3000 ext 2461) if you have any questions or concerns.
POTENTIAL BENEFITS TO SUBJECTS AND/OR TO SOCIETY
The results of the study will benefit industrial workers within the automotive community. Ford Motor Company will use the results to determine applicability of the decision system for use by a variety of audiences both proactively and reactively within its assembly facilities. The goal is to ensure that the use of the ergonomic decision system reduce the potential for injury or illness in automotive manufacturing.
PAYMENT FOR PARTICIPATION
Participants will be recruited on a volunteer basis.
CONFIDENTIALITY
Any information that is obtained in connection with this study and that can be identified with you will remain confidential and will be disclosed only with your permission. Only the researchers mentioned above will know your identity and personal information. This information will be stored in a secure computer in the ergonomics simulation laboratory (VOGO) and will not be discussed or displayed in any form that would provide an indication of your identity.
85
Reproduced with permission of the copyright owner. Further reproduction prohibited without permission.

Note that subjects should not converse with other participants about the software, analysis and/or results as this may offend some and may further bias future collections.
PARTICIPATION AND WITHDRAWAL
You can choose whether to be in this study or not. If you volunteer to be in this study, you may withdraw at any time without consequences of any kind. You may exercise the option of removing your data from the study. You may also refuse to answer any questions you don't want to answer and still remain in the study. The investigator may withdraw you from this research if circumstances arise which warrant doing so.
RIGHTS OF RESEARCH SUBJECTS
You may withdraw your consent at any time and discontinue participation without penalty. This study has been reviewed and received ethics clearance through the University of Windsor Research Ethics Board. If you have questions regarding your rights as a research subject, contact:
Research Ethics Co-ordinator Telephone: 519-253-3000, # 3916University of Windsor E-mail:
Windsor, Ontario N9B 3P4
Reproduced with permission of the copyright owner. Further reproduction prohibited without permission.
86

f iU N I V E R S I T Y O F
WINDSOR
CONSENT TO PARTICIPATE IN RESEARCH
SIGNATURE OF RESEARCH SUBJECT/LEGAL REPRESENTATIVE
I understand the information provided for the study “Evaluation of the reliability of an ergonomic
decision system” as described herein. My questions have been answered to my satisfaction, and I
agree to participate in this study. I have been given a copy of the 'Letter of information' and
'Consent to participate in research' forms.
Subjects will receive feedback on the results of the experiment by way of a feedback form. This
form will be filled out by the investigators, including the major findings and implementations of
the study.
Name of Subject
Signature of Subject Date
SIGNATURE OF INVESTIGATOR
These are the terms under which I will conduct my research.
Signature of Investigator DateDerek I. Dawson
Advisor, Dr. J. Potvin
87
Reproduced with permission of the copyright owner. Further reproduction prohibited without permission.
APPENDIX B
Novice Survey
Q1 - W hat does the word Ergonomics mean?A1 - The study o f work
Q2 - W hat are two approaches to addressing workplace conditions?A2 - Proactive & Reactive
Q3 - W hat is m eant by a workplace risk factor (with regard to Ergonomics)?A3 - A work element &/or action that increases the workers risk o f injury/illness
Q4 - W hat are the three main risk factors from an Ergonomic perspective?A4 - Force, posture, repetition
Q5 - W hat does the term CTD stand for?A5 - Cumulative trauma disorder
Q6 - W hen designing for reach, what population percentile would you minimally design for?A6 - 5 percentile female
Q7 - W hat population percentile is used to set force design standards?A7 - 25th percentile female (90th percentile population)
Q8 - W hat does OSHA stand for?A8 - Occupational Safety & Health Administration
Q9 - W ork rotation is an example o f what type o f control?A9 - Administrative
Q10 - True or False - As frequency o f movement increases, force requirements should decrease?A lO -T ru e
Reproduced with permission of the copyright owner. Further reproduction prohibited without permission.
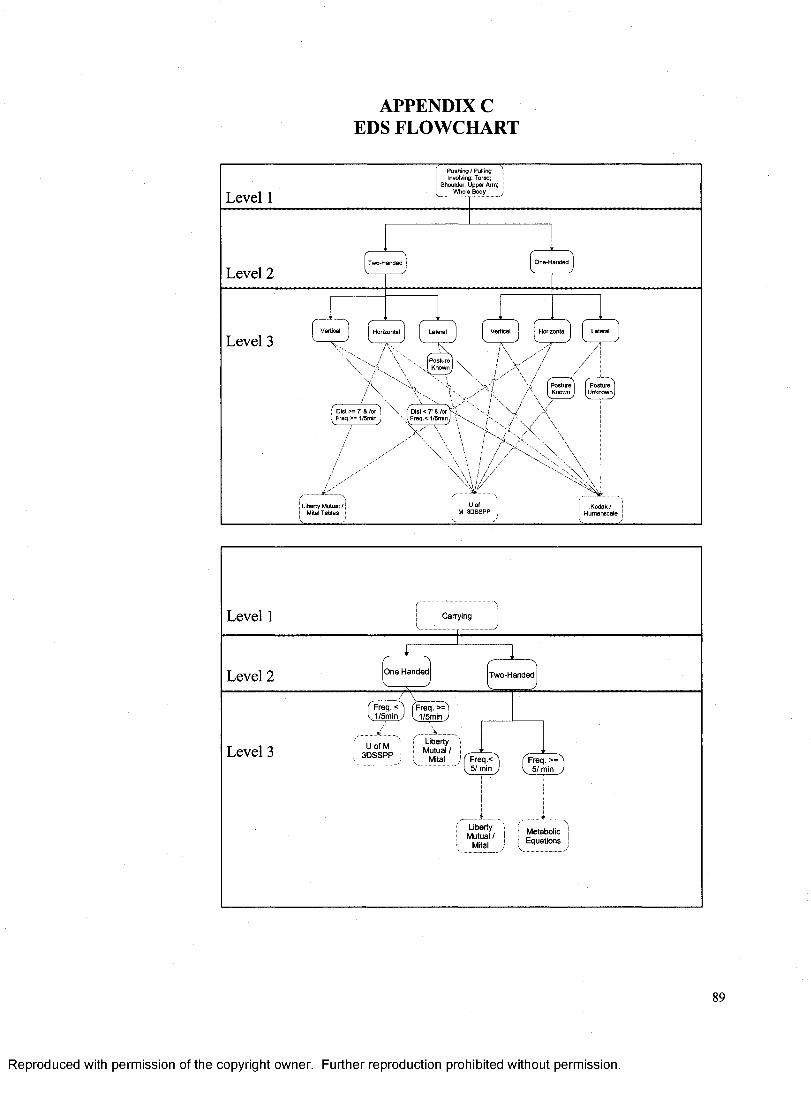
APPENDIX C EDS FLOWCHART
P ush in g / Pulling Involving: Torso;
Shoulder; U pper Arm; W hole BodyLevel 1
Level 2
Level 3
' . I F re q .< 1/5min
/ /
Liberty M utual /
Level 1 Carrying
O n e H anded!Level 2 T w o-H anded
( FreqTc ̂V 1 /5 m in y
Freq. >= . 1/5m in y
Liberty Mutual /
Mital
j U o f M j 3 D S S P PLevel 3
Freq.<5 / min
Freq. >= 5 / min
Liberty Mutual /
Mital
M etabolic | E quations j
Reproduced with permission of the copyright owner. Further reproduction prohibited without permission.
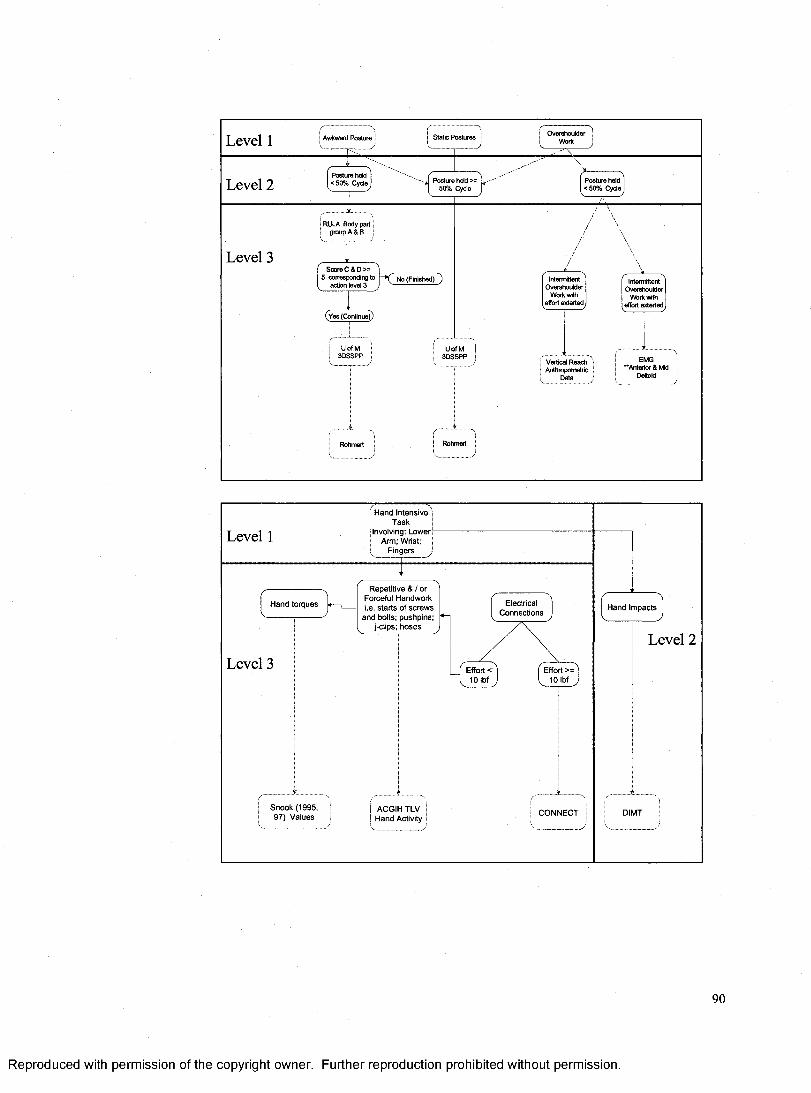
Level 1 Awkward Posture
Posture held < 5 0 % Cycle Posture held >=
50% CycleLevel 2
RULA Body part group A & B
Level 3
UofM3D SSPP
U ofM3D SSPP
Vertical Reach Anthropometric
Data
Rohmert
Posture held < 5 0 % Cycle
Static Postures
Rohmert
Intermittent O vershoulder
Work with effort ex terted i
Intermittent Overehoulder
V\fork with effort exterted
Score C & D >=5 corresponding to
action level 3No (Finished) )
EMG ‘Anterior & Mid
Deltoid
Level 1
H and In ten sive ' T ask
Involving: Low er Arm; Wrist;
F ingers ■
Level 3 Effort < 10 Ibf
Effort >= 10 Ibf
S n o o k (1 9 9 5 , 9 7 ) V a lu es
ACGIH TLV H and Activity
C O N N E C T
ElectricalC on n ection s
H and torqu es
R epetitive & / or Forceful H andwork i .e . s tarts o f s c r e w s
and bolts; pushpins; j-ciips; h o s e s
H and Im pacts JLevel 2
D M T
Reproduced with permission of the copyright owner. Further reproduction prohibited without permission.
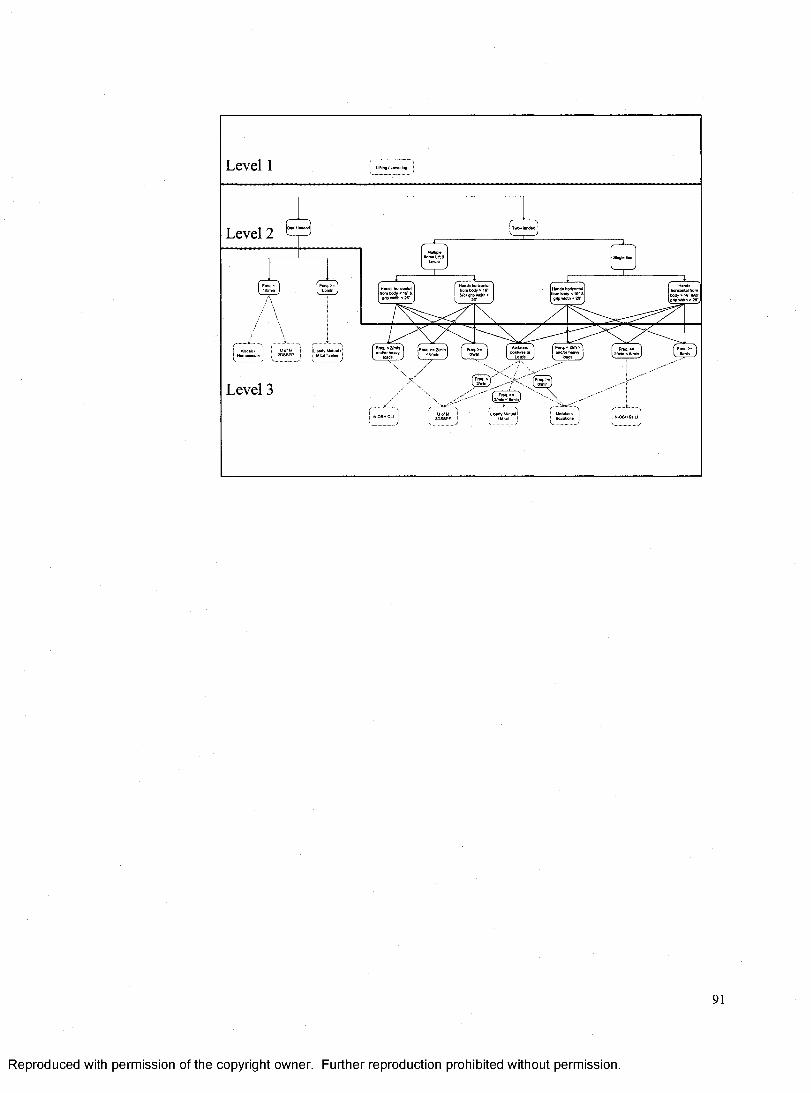
Level 1
Level 2
H»nde horizontal from body < 19 gflp width <26*
body <17 width < 26
Level 3 Wn J f i. e/mlr )
( Freg. x ^, ,
NIOSH CU
Reproduced with permission of the copyright owner. Further reproduction prohibited without permission.

VITA AUCTORIS
NAME:
PLACE OF BIRTH:
YEAR OF BIRTH:
EDUCATION:
Derek Ian Dawson
Lachine, Quebec, Canada
1971
Grimsby Secondary School, Grimsby, Ontario, Canada 1985-1990 O.S.S.G.D.
University of Windsor, Windsor, Ontario, Canada 1995-2000 B.H.K.
Reproduced with permission of the copyright owner. Further reproduction prohibited without permission.
Copyright © 2022 FDOKUMEN