Ergonomic considerations for the design of women's ... - CORE
Imtiaz Ali Khan Int. Journal of Engineering Research and Applications www.ijera.com
ISSN : 2248-9622, Vol. 4, Issue 8( Version 7), August 2014, pp.01-21
www.ijera.com 1 | P a g e
Multi-Response Ergonomic Evaluation of Higher Age Group
CNC Machine Operators
Imtiaz Ali Khan*
Department of Mechanical Engineering, Aligarh Muslim University, Aligarh (U.P.)202002, India.
Abstract This work contributes to research on improving performance in a human-CNC machine interface (HCMI)
environment. A salient contribution of this study is the use of a load cell to measure human performance. The
developed novel system can measure cognitive and motor action responses simultaneously. The performance
measurement system designed for this work may be used in other fields where systems are operated using
control panels and for observing and evaluating the responses of mentally retarded persons (or persons with
symptoms of Alzheimer‟s disease). The search time, motor action time and applied force were selected as
response variables to accurately evaluate a computer numerically controlled (CNC) machine operator‟s
performance. Based on a Taguchi experimental design, a full factorial design consisting of 27 (33) experiments
was used to collect data on human performance. The collected data were analyzed using grey relational analysis,
analysis of variance (ANOVA) and the F-test. ANOVA was performed using Design-Expert software. The
designed research was shown to have a reasonable degree of validity via a confirmation test. This study
represents an effective approach for the optimization of a higher age group operator-CNC machine interface
environment with multi-performance characteristics based on a combination of the Taguchi method and grey
relational analysis.
Relevance to industry: The findings of this work are directly applicable to the practical field to improve the
design of a CNC-machines system. This work suggests that those responsible for the functioning and operation
of CNC-machines workstations would have to redesign the system to reduce musculoskeletal injuries and other
related problems. The present results can be quite useful for future system designers. It is emphasized that
applying ergonomic principles to the design of CNC machines and interfaces can not only help to enhance
machine performance and productivity but can also enable the human operator to feel comfortable and secure.
As most companies have acquired automated manufacturing technology in recent years to be competitive,
ergonomic and safety considerations are of the utmost importance.
Keywords: Multi-performance; Search time; Motor action time; Applied force; Load cell; CNC-Environment.
I. Introduction This study determines the effect of
anthropometric factors on performance in a human-
CNC machine interface environment (HCMI).
Historical evidence suggests that many
manufacturing injuries are musculoskeletal disorders
caused by cumulative trauma. Such injuries from
cumulative wear and tear are called cumulative
trauma disorders (CTDs). Back injuries, tendinitis
and carpal tunnel syndrome are examples of common
CTDs. Work place risk factors for CTDs include
repetitive motion, high forces, awkward postures and
vibration exposure. Work-related musculoskeletal
disorders (WMSDs) remain a widespread and
growing concern in automated industries. It is
estimated that over five million workers sustain
overextension injuries per year. Ergonomic
intervention can be used to design workplaces to
prevent overextension in workers, resulting in a
savings of billions in workers‟ compensation for the
manufacturing industry.
The ergonomic design of a workstation depends
on the nature of tasks to be completed, the preferred
posture of the operator and the dynamics of the
surrounding environment (King and Fries, 2009). The
workstation design should account for the
adjustability of the working platform, clearances
under the work surface, the computer numerically
controlled (CNC) machine panel and the display
support surfaces. The effectiveness with which
operators perform their tasks at consoles or
instrument panels depends in part on how well the
equipment is designed to minimize parallax in the
viewing displays, to enable ready manipulation of the
controls and to provide adequate space and support
for the operator. In the past, studies were conducted
on the operators‟ physical impairments that were
caused by various factors related to machining
operations. Discomfort was used to measure postural
stresses(Kee and Lee, 2012).
Working posture has been considered by many
researchers as a focus on human performance. Khan
(2012), Khan and Asghar (2011) and Khan and
RESEARCH ARTICLE OPEN ACCESS
Imtiaz Ali Khan Int. Journal of Engineering Research and Applications www.ijera.com
ISSN : 2248-9622, Vol. 4, Issue 8( Version 7), August 2014, pp.01-21
www.ijera.com 2 | P a g e
Asghar (2010) researches evaluated the effect of
working postures on human performance in a
computer numerically controlled-electro discharge
machine (CNC-EDM) environment. Assessments of
the performance indicated a significant effect of
levels of angle of abduction and viewing angle. To
eliminate discomfort and reduce injuries as far as
musculoskeletal and other related problems are
concerned, findings of these researches suggested
that CNC-EDM system should be re-designed so as
to achieve, a 45 degree angle of abduction and a 21
degree viewing angle.
Slowing of motor performance in human aging is
a well demonstrated clinical observation, both studied
with simple and complex motor tasks (Jimenez-
Jimenez et al., 2011; Ruff and Parker, 1993 and
Shimoyama et al., 1990). Finger tapping (FT)
frequency lowers with advancing age (Cousins et al.,
1998; Elias et al., 1993 and Hermsdorfer et al., 1999).
Aging seems to influence the performance of simple
or complex reaction time tasks, including visual
reaction time, being the response times longer in
elderly people (Chen et al., 1994; Nissen and Corkin,
1985 and Pelosi and Blumhardt, 1999).
Research on age-related cognitive change
traditionally focuses on either development or aging,
where development ends with adulthood and aging
begins around 55 years (Germine et al., 2011). The
said approach ignores age-related changes during the
35 years in between, implying that this period is
uninformative. Germine et al. (2011) investigated
face recognition as an ability that may mature late
relative to other abilities. The study using data from
over sixty thousand participants, traced the ability to
learn new faces from pre-adolescence through middle
age. In three separate experiments, the finding show
that faces learning ability improves until just after
age 30- even though other putatively related abilities
(inverted face recognition and name recognition) stop
showing age-related improvements years earlier. The
study data provide the behavioral evidence for late
maturation of face processing and dissociation of face
recognition from other abilities over time
demonstrates that studies on adult age development
can provide insight into the organization and
development of cognitive systems.
Multiple causes contribute to the prolonged
reaction-times (RT) observed in elderly persons
(Bautmans et al., 2011). The involvement of
antagonist muscle co-activation remains unclear.
Bautmans et al. (2011) studied Mm. Biceps and
Triceps Brachii activation in 64 apparently healthy
elderly (80 ± 6 years) and 60 young (26 ± 3 years)
subjects, during a simple RT-test (moving a finger
using standardized elbow-extension from one push
button to another following a visual stimulus). RT
was divided in pre-movement-time (PMT, time for
stimulus processing) and movement-time (MT, time
for motor response completion). The study indicates
that RT performance was significantly worse in
elderly compared to young; the slowing was more
pronounced for movement time than pre-movement
time. Elderly subjects showed significantly higher
antagonist muscle co-activation during the pre-
movement time phase, which was significantly
related to worse movement and reaction times
(p˂0.01). Also, during movement time phase,
antagonist muscle co-activation was similar for both
age groups. The study concluded that increased
antagonist muscle co-activation in elderly persons
occur in an early phase, already before the start of the
movement. The findings provide further
understanding of the underlying mechanisms of age-
related slowing of human motor performance.
Chung et al. (2010) investigated the effect of age
and two keypad types (physical keypad and touch
screen) on the usability of numeric entry tasks.
Twenty four subjects (12 young adults 23-33 years
old and 12 older adults 65-76 years old) performed
three types of entry tasks. Chung et al. (2010) noticed
that the mean entry time per unit stroke of the young
adults was significantly smaller than that of the older
adults. The older adults had significantly different
mean entry times per unit stroke on the two keypad
types. Also, the error rates between young and old
adults were significantly different for the touch
screen keypad. The subjective ratings showed that the
participants preferred the touch-screen keypad to the
physical keypad. The results of the study showed that
the older adults preferred the touch-screen keypad
and could operate more quickly, and that tactile
feedback is needed for the touch-screen keypad to
increase input accuracy. The study suggests that the
results can be applied when designing different
information technology products to input numbers
using one hand.
The use of computer controlled devices is
constantly increasing. At the same time the
population of the industrialized world is aging.
Lindberg et al. (2006) investigated the speed with
which users of different ages can find a specific
computer icon from a group of others. The results
show that search performance slows with age.
However, individual variability in search
performance was very high within all age groups.
The study suggests that icon used in graphical user
interfaces should be at least about 0.7 cm at a
viewing distance of 40 cm, for the majority of users
to be able to perform their computerized tasks with
relative ease. Also, the study concluded that the inter-
icon spacing should be moderate, preferably about
the same as the icon size and ideally user interfaces
should be adaptable to individual user needs and
preferences.
Although connections between cognitive deficits
and age-associated brain differences have been
Imtiaz Ali Khan Int. Journal of Engineering Research and Applications www.ijera.com
ISSN : 2248-9622, Vol. 4, Issue 8( Version 7), August 2014, pp.01-21
www.ijera.com 3 | P a g e
elucidated, relationships with motor performance are
less understood. Seidler et al. (2010) review age-
related brain differences and motor deficits in older
adults in addition to cognition-action theories. Age
related atrophy of the motor cortical regions and
corpus callosum may precipitate or coincide with
motor declines such as balance and gait deficits,
coordination deficits and movement slowing. The
study concluded that in general, older adults exhibit
involvement of more widespread brain regions for
motor control than young adults.
The population of the developed countries is
becoming older while computer use is affecting
increasingly wide aspect of life (Hawthorn, 2000). It
is increasingly important that interface designs make
software accessible to older adults. The study noticed
that there is almost no research on what makes an
interface usable for older adults. Hawthorn (2000)
reviews the findings on the effects of age on relevant
abilities and uses this information to provide
suggestions to consider when designing interfaces for
older users. The study concludes with indications of
the needed research in the area of interface design
for older users. Kang and Yoon (2008) observed the
behavior of younger adults (20-29 years old) and
middle-aged adults (46-59 years old) interacting with
complicated electronic devices. The study examined
various aspects of interaction behaviors in terms of
performance, strategies, error consequences, physical
operation methods and workload. The analysis of
age-related differences included differences in
background knowledge. The results revealed that
differences in age meaningfully affected the observed
error frequency, the number of interaction steps, the
rigidity of exploration, the success of physical
operation methods and subjective perception of
temporal demand and performance. In contrast, trial-
and-error behavior and frustration levels were
influenced by background knowledge rather than age.
Designing human-machine interfaces that respect
the ergonomic norms and following rigorous
approaches constitute a major concern for automated
systems designers. The increased need on easily
accessible and usable interfaces leads researchers in
this domain to create methods and models that make
it possible to evaluate these interfaces in terms of
utility and usability. Two different approaches are
currently used to evaluate human-machine interfaces
(Chikhaoui and Pigot, 2010), empirical approaches
that require user involvement in the interface
development process and analytical approaches that
do not associate the user during the interface
development process. This work presents studies of
user performance on three principal tasks (cognitive,
motor action and applied force) of the machine panel
interface, developed in the context of CNC machine
system. Chikhaoui and Pigot (2010) investigated that
cognitive models show better accuracy of the user
performance. In order to provide a comfortable
environment, attention should be brought to ensure
that people should easily access and manage the
information in the environment. This can be reached
by providing the user an interface that is accessible,
usable and efficient (Joon et al., 2007). Each human-
machine interface must be clear enough, to reduce the
cognitive effort and allowing a good interaction with
the environment. Therefore, the evaluation of human-
machine interfaces appears a significant contribution
in the design of applications and systems dedicated
for automated machines.
The literature review indicates the need of
separate interface designs for higher age group
individuals. It is also observed that the cognitive and
motor performances of peoples vary with the age.
Hence there is a need to take up more studies in
order to dig deeply into the insight of the phenomena
of human aging. However, further research is
needed in manufacturing environment, to draw
guidelines for the HCMI designers as to what level of
anthropometric parameters will be really required to
enhance the higher age group operator performance.
It is noticed that almost all researchers have strongly
stressed on musculoskeletal disorders as the major
source for human performance decrement. The
present study considers the impact on performance in
a human-CNC machine interface (HCMI)
environment. Three response variables are selected
for this work. First the search time, second the motor
action time and third the applied force.
Anthropometric factors in the present study are
incorporated in terms of variability considered in
CNC machine working environment. Keeping in view
the above research work with respect to
musculoskeletal disorders and anthropometric
factors, three factors are selected for this work. First
the CNC machine panel height, second the panel
angle and third the working distance. The domain
needs to enrich more for the benefit of the
researchers and practitioners.
II. Methods 2.1. Problem statement
The preceding discussion shows that the effects
of anthropometric considerations, such as machine
panel height, panel angle and working distance, on
higher age group operator performance, particularly
in the context of HCMI, are still not fully understood;
thus, a wide scope exists for investigating these
effects. The research problem for the present work
was formulated accordingly.
There has been a rapid growth in the use of CNC
machines. These machines have entered virtually
every area of our life and work environments. As
CNC machine applications have become more
widespread globally, the musculoskeletal problems
associated with these machines have also generated
Imtiaz Ali Khan Int. Journal of Engineering Research and Applications www.ijera.com
ISSN : 2248-9622, Vol. 4, Issue 8( Version 7), August 2014, pp.01-21
www.ijera.com 4 | P a g e
more concern. Automated technologies are becoming
increasingly popular. However, the pace of research
in the field of HCMI environment has been rather
slow in comparison to the growth rate of CNC
machines, not only in developed nations but also in
developing countries, such as India. The human
problems associated with the HCMI environment are
a major research area, in which the extent and rate of
success are determined within a framework of
effective and fruitful use of current automated
technologies. There is a dire need for making
automated machine systems more useful, easier-to-
use, faster, more efficient and more compatible with
operation from an ergonomics point of view, thereby
catering to the demands of designers, manufacturers,
purchasers and users. The literature survey indicated
that most previous researchers have mainly
emphasized the need to design and develop varieties
of automated machine systems.
The present work was designed against this
background to resolve various basic issues in the use
of CNC machine tools. The experiments investigated
higher age group male performance for CNC
machine tools as a function of the machine panel
height, the panel angle and the working distance. The
present study investigated the effects of an older
group, aged 42-46 years, for male operator
performance on a CNC machine tool.
2.2. Experimental design
In this study, human performance was measured
in terms of the search time, the motor action time and
the applied force on the CNC machine panel keys.
The search time, motor action time and applied force
features were selected based on previous research
(Bedny and Karwowski, 2006; Bergmann et al.,
2011; Bothell, 2004; Chen and Chiang, 2011 and
Layer et al., 2009). Before the actual experimental
work, a pilot study was conducted to determine the
discrete levels of three HCMI parameters that could
enable the efficient and comfortable operation of a
CNC machine tool. The factors and their levels that
were selected for experimental investigation are
described as follows. Three variables were
considered in the study, i.e., the CNC machine panel
height (Parameter A) at three levels, “90 cm”, “110
cm”, and “130 cm” (Sanders and McCormick, 1992);
the CNC machine panel angle (Parameter B) at three
levels, “30 degrees”, “60 degrees” and “90 degrees”;
and the working distance (Parameter C) at three
levels, “10 cm”, “20 cm” and “30 cm” (Chikhaoui
and Pigot, 2010). The HCMI parameters/ design
factors and their values at different levels are listed in
Table 1.
Table 1 : Levels of variables used in the experiments
Factor
ident-
ifier
Factor
Unit Level
1
Level
2
Level
3
A CNC
machin
e panel
height
cm 90 110 130
B CNC
machin
e panel
angle
deg-
rees
30 60 90
C Workin
g
distance
cm 10 20 30
The experiments were conducted using a
Taguchi experimental design for which an
appropriate orthogonal array (OA) was selected. An
OA was selected for the experiments by first
computing the total number of degrees of freedom
(df). For example, a three-level design parameter
corresponds to two degrees of freedom. The degrees
of freedom associated with the interaction between
two design parameters are given by the product of the
degrees of freedom of the two respective design
parameters. In the present study, there were eighteen
(2+2+2+4+4+4) degrees of freedom because there
were three HCMI design parameters (A, B and C)
with three levels each and three two-way interactions,
AxB, AxC and BxC. Once the required degrees of
freedom were known, the next step was to select an
appropriate OA for the specific task. The degrees of
freedom for the OA needed to be greater than or at
least equal to those for the design parameters (Goel
et al., 2011). A L27 OA with 27 rows (corresponding
to the number of experiments) was chosen for the
investigations. The L27 (313
) array was an OA of 27
distinct rows, which provided 26 degrees of freedom
for studying different effects. This design matrix can
be used to examine a maximum of 26/2 = 13 two-df
effects. Thus, the L27 can be used to accommodate a
full 33 factorial design. The three parameters (A, B
and C) and the three two-way interactions (AxB,
AxC and BxC) needed 18 degrees of freedom and
occupied 18/2 = 9 of the 13 columns of an L27 OA.
The remaining four columns of the L27 OA were
treated as dummy parameters.
The search time, the motor action time and the
applied force were selected as response variables for
evaluating a CNC machine operator‟s performance.
A full factorial design (based on a L27 OA) consisting
of 27 (33) experiments was used to collect human
performance data in terms of the search time, the
motor action time and the applied force. The
collected data were analyzed using grey relational
analysis, analysis of variance (ANOVA) and the F-
test. These methods are described below.
Imtiaz Ali Khan Int. Journal of Engineering Research and Applications www.ijera.com
ISSN : 2248-9622, Vol. 4, Issue 8( Version 7), August 2014, pp.01-21
www.ijera.com 5 | P a g e
2.2.1. Grey relational analysis
The grey relational grade is an index that
represents multiple performance characteristics. The
index describes the relationships among a series of
experimental results. The grey relational grade is
determined by pre-processing the experimental data
to transfer the original sequence to a comparable
sequence. In grey relational analysis, the grey
relational grade indicates the relationship among the
sequences. If two sequences are identical, then the
grey relational grade equals „1‟. The grey relational
grade also indicates the degree of influence that the
comparability sequence can exert over the reference
sequence. Therefore, if a particular comparability
sequence is more important than another
comparability sequence relative to the reference
sequence, the grey relational grade for that
comparability sequence and reference sequence will
be higher than the other grey relational grade (Khan
et al., 2010, Ross, 1988, Siddiquee et al., 2010 and
Yang et al., 2006). In this work, the comparability
sequence and the reference sequence are treated as
being equally important.
2.2.2. Analysis of variance (ANOVA) and F-test
ANOVA and the F-test determine the individual
factors and the interaction between these factors that
significantly affects multi-performance
characteristics. This statistical analysis is based on
the variance, the degrees of freedom, and the sum of
squares, the mean square, the F-ratio, the P-value and
the % age contribution to the total variation (Ma et
al., 2007). The detailed procedure for calculating
parameters pertaining to ANOVA is described in
(Samant et al., 2008). In this work, ANOVA,
interaction effect analysis and various model
adequacy tests were carried out using Design Expert
Software (2012).
2.3. Subjects
A pool of 27 potential subjects was selected for
the present work. This pool included older males
ranging from 42 years to 46 years in age. The
selected subjects were employees of the AMU,
Aligarh, India. A self-designed questionnaire was
used to select the subjects. Out of the 130
questionnaires distributed among employees, 101
responded, out of which 27 older males were selected
on the basis of well-defined anthropometric
characteristics. The selected subjects also expressed
their willingness to participate in the present study.
No subject participated in more than one experiment.
2.4. Stimuli and the experimental task
Stimuli were presented to the subjects as colored
light emitting diodes (LEDs) that were fixed on an
adjustable height display board. The colors used for
the visual stimuli were red, blue, yellow, white and
green. The visual stimuli were provided during the
respective tasks by the experimenter controlling the
„on‟ and „off‟ positions of the LEDs. The LEDs were
connected to one of the channels (Channel-2) of the
oscilloscope through a switchboard. An indigenously
designed CNC machine panel and working platform
were used for all the studies. The panel was fitted
with ‘load cells’ (piezo-electric sensors), and the
assembly was fixed onto an adjustable „height‟ and
„angle‟ platform (Sanders and McCormick, 1992).
Variable working distances (Chikhaoui and Pigot,
2010) were realized by pasting colored strips on the
ground in front of the assembled platform. The
machine panel had two lead connections. The first
connection was with one of the channels (Channel-1)
of the oscilloscope and the second connection was
with the visual display unit (VDU) monitor through
the central processing unit (CPU). During the
experiments, the subjects stood, according to the
combination of selected HCMI parameters, in front
of the working platform (Maldonado-Macias et al.,
2009) with the index finger of the right hand (which
was used to record the search time) placed on the
CNC machine panel 15 cm away (Chikhaoui and
Pigot, 2010) from the panel keys (which were used to
record the motor action time and the applied force).
The subject‟s left hand remained free along the
subject‟s side. The subjects were required to respond
to a visual signal (a LED of a particular color that
was switched on for a short period) that was provided
by the experimenter through the switchboard. The
signal at the moment of „LED-ON‟ was recorded by
the oscilloscope. The subjects were asked to search
the CNC machine panel for the key, which was
similar to the first alphabet of the activated color
stimuli (i.e., for the color Green, the first alphabet
was „G‟), without lifting their right-hand index
finger. As soon as the required „key’ was „searched’,
the subject lifted her index finger and depressed the
key. The signal at the moment of the ‘finger-lift’ was
recorded by the oscilloscope. The time difference, in
milliseconds, between the visual-stimuli and the
finger-lift was saved as the ‘search time’ (the
cognitive time). To ensure correct task execution
(matching „key search and press‟ with the supplied
visual signal), software in the C++ language was
developed, which also helped to achieve ‘zero error’
experimental results. The software was loaded onto a
computer system that was connected to a self-
designed CNC machine panel assembly. As a
particular alphabet key (out of only five possible
alphabet keys R, B, Y, W and G) was depressed on
the machine panel (in response to a visual signal), the
loaded software displayed a full VDU screen image
(of a square shape) of the color whose first alphabet
was pressed (i.e., if the subject depressed „R‟, the
software displayed a full VDU screen square „RED‟
shaded image). This ultimately ensured correct task
Imtiaz Ali Khan Int. Journal of Engineering Research and Applications www.ijera.com
ISSN : 2248-9622, Vol. 4, Issue 8( Version 7), August 2014, pp.01-21
www.ijera.com 6 | P a g e
execution. When the task was incorrectly executed,
the task was repeated in a random order. The
software did not display an image if a key other than
one of the five previously mentioned alphabets was
depressed. Two more signals at the moment of
‘searched key pressing’ were recorded, the first on
the x-axis of the oscilloscope and the second on the
y-axis. On the x-axis, the time difference, in
milliseconds, between the „finger-lift‟ and the
„searched key press‟ moments was saved as the
‘motor action time’. When the searched key was
depressed, the ‘applied force’ on the panel key was
recorded in millivolts on the y-axis of the
oscilloscope. Each subject executed the same task for
five randomly-supplied visual stimuli (Red, Blue,
Yellow, White and Green). The same experiment was
conducted for all the participants. Finally, the average
of five human performances, for the „search time’,
the ‘motor action time’ and the ‘applied force’, was
recorded for analysis. For experimental validation, a
movie of each subject was also recorded by a video
camera (SONY Digital Handycam; HDR-XR500: 12
mega pixels). The video camera was used to record
and photograph the subject to identify stress in full-
body postures during CNC machine operation
(Maldonado-Macias et al., 2009).
2.5. Experimental set-up
In this research, a working platform was
designed using a load cell (piezo-electric sensor)
combination, which was fixed to a conventional
computer keyboard. This structure was then
assembled with a self-fabricated adjustable (in terms
of the height and angle) panel to resemble the shape
of a CNC machine panel.
Human performance was measured in terms of
search time, motor action time and applied force on
the machine panel keys. All experiments were
performed in a simulated environment chamber of
5.2 m x 4.4 m x 2.9 m size, specifically developed
within the premises of the Department of Mechanical
Engineering, AMU, Aligarh, India. The temperature
of the experiment chamber (Sanders and McCormick,
1992) was approximately 23 ± 2 degree Celsius
measured through wall temperature indicator (model:
me DTI 4001). Reflection of the light from windows
and door was eliminated through proper covering.
When the chamber was closed, the cubicle got
acoustically sealed from the outside environment.
The illumination level throughout all the
experimental sessions (OSHA, 2011 and Sanders and
McCormic, 1992) was maintained at 590 ± 10 lux.
This level of luminance was monitored through a
digital lux meter (model: LT Lutron LX-101). The
relative humidity level of the experiment chamber
(Sanders and McCormic, 1992) was approximately
77 ± 3 percent measured through „hair hygrometer‟
(model: Ekbote HAIR Hygrometer). Sound level
throughout all the experimental sessions (OSHA,
2011 and Sanders and McCormic, 1992) was
approximately 52 ± 3 dBA measured through sound
level meter (model: LT Lutron SL-4001). Measuring
tape, digital vernier caliper and weighing machine
were used to measure various anthropometric
characteristics of the subjects. The search time, motor
action time and applied force was measured through
2-Channel Oscilloscope (model: DS 1062 C; make:
Rigol Digital Oscilloscope Ultrazoom; specification:
60 MHz 400 MSa/s).
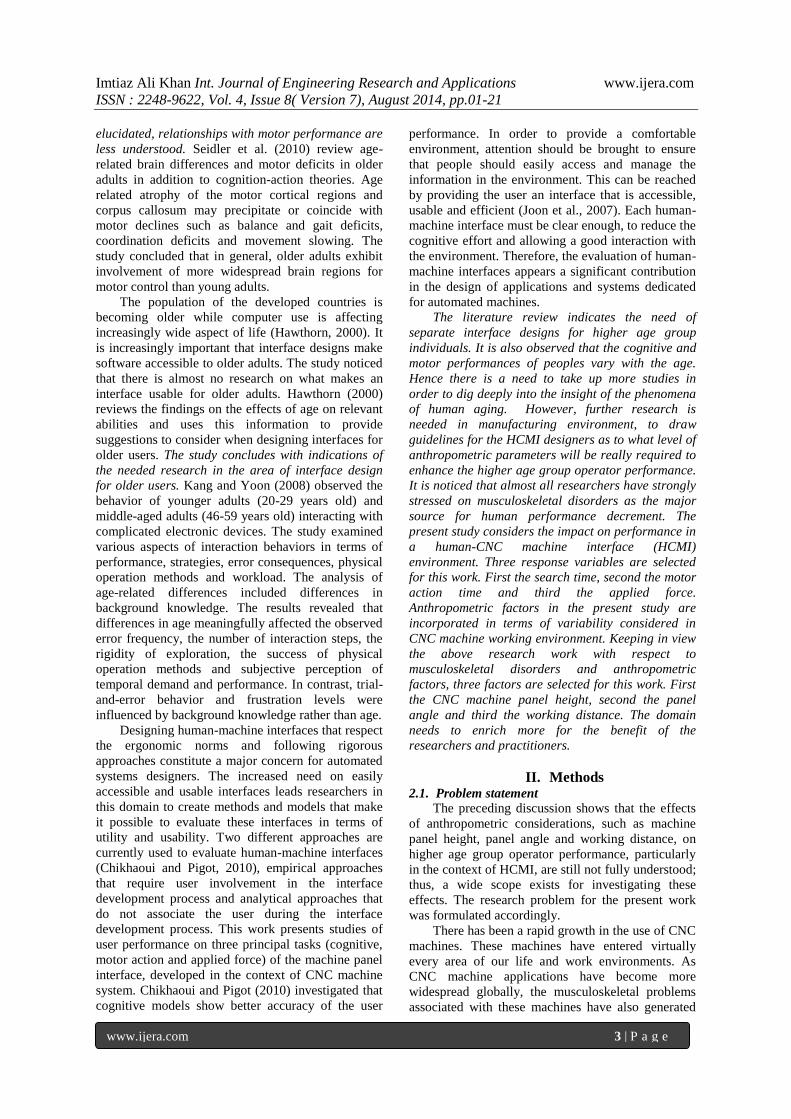
The positions of the indigenously designed CNC
machine panel, the subject and other peripheral
devices were maintained as portrayed in the
schematic (Figure 1).
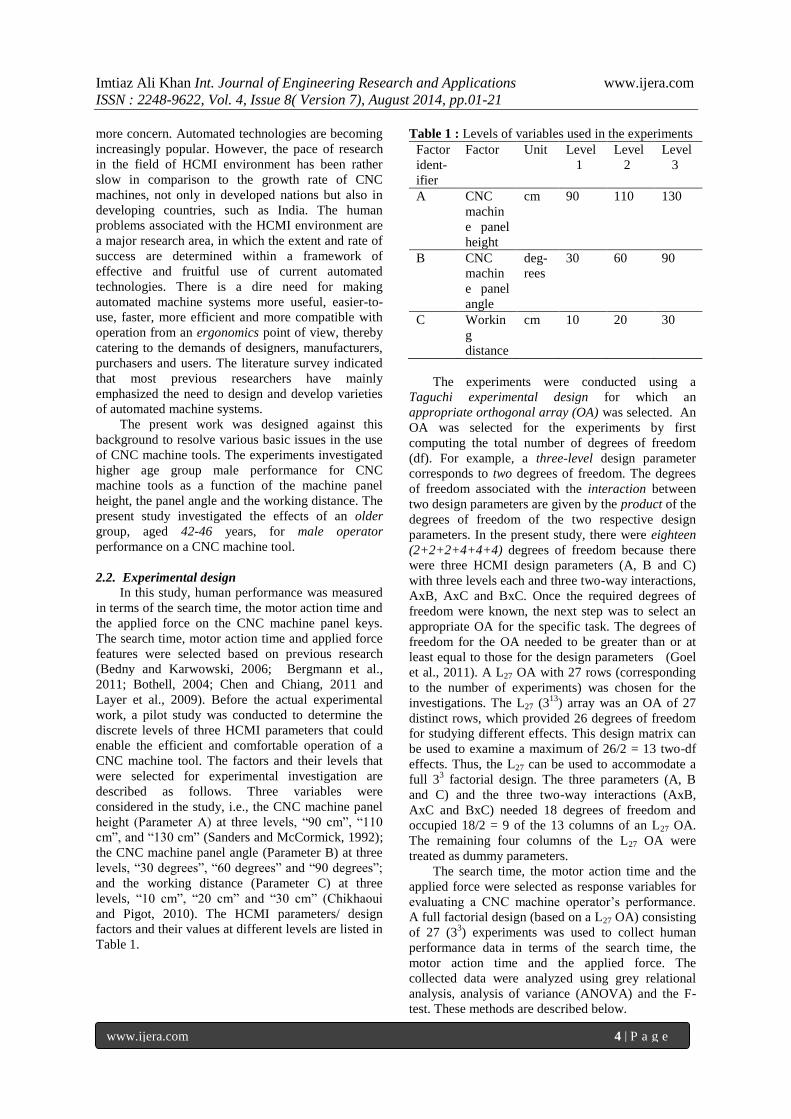
Figures 1 and 2 show that the standing subject
(item 1 of Figure 1) in front of CNC machine panel
could maintain three working distances (10/20/30
cm), as set by the colored strips.
The working platform (item 2 of Figure 1) could
be adjusted to any height (90/110/130 cm or other
heights) by using an adjustable screw, as depicted in
Figure 3.
The CNC machine panel (item 2 of Figure 1)
could also be adjusted to any angle (30/60/90 degrees
or other angles) via the adjustable mechanism shown
in Figure 4.
Figure 1: Schematic of the experimental set-up used
in the present work
Figure 2: Working distances shown with colored
strips

Imtiaz Ali Khan Int. Journal of Engineering Research and Applications www.ijera.com
ISSN : 2248-9622, Vol. 4, Issue 8( Version 7), August 2014, pp.01-21
www.ijera.com 7 | P a g e
Figure 3: CNC machine panel height adjustment
system
Figure 4: CNC machine panel angle adjustment
mechanism
The colored visual stimuli were provided by item
3 in Figure 1. Figure 5 shows how the colored LED
board was used to provide a variable height visual
signal.
Figure 5: Variable height colored LED board
Item 4 in Figure 1 indicates where the CPU and a
VDU monitor were stationed to ensure that the
experimental task was correctly executed. Figure 6
shows the CPU and the VDU monitor displaying a
green square image when a subject depressed
alphabet „G‟ on the CNC machine panel in response
to an activated green LED visual signal.
Figure 6: Full VDU green-colored screen square in
response to an applied green visual stimulus
Items 5 and 6 of Figure 1 show the experimenter
environment with a 2-Channel oscilloscope for
recording human performance and a switch board for
providing visual stimuli, respectively. Figure 7
depicts the positions of the oscilloscope and the
switch board.
Figure 7: Oscilloscope and switch board positions
Item 7 in Figure 1 shows the location where the
subjects were filmed while they performed the task.
Figure 8 indicates the position of a SONY Digital
Handycam video camera.
Figure 8: Photograph of the stand used to hold the
camera fixed
Figure 9 shows a subject with his index finger
placed at a position on the panel. As the subject lifted
his finger, a search time signal was recorded by the
oscilloscope.

Imtiaz Ali Khan Int. Journal of Engineering Research and Applications www.ijera.com
ISSN : 2248-9622, Vol. 4, Issue 8( Version 7), August 2014, pp.01-21
www.ijera.com 8 | P a g e
Figure 9 : Subject waiting for visual stimuli
Figure 10 depicts the same subject performing a
motor action in response to a supplied visual
stimulus. The corresponding motor action time and
applied force signals were recorded by the
oscilloscope.
Figure 10 : Subject performing motor action
Figure 11 shows the arrangement of the load
cells (piezo-electric sensors) that were fixed to a
keyboard. This structure was assembled with a self-
fabricated adjustable panel to resemble the shape of a
CNC machine panel.
Figure 11: Load cells (piezo-electric sensors) fixed
on a mica-sheet
2.6. General experimental procedure
A pilot study was performed in advance of the
actual experiments. This study helped to pre-plan the
details of the experimental sessions and check the
suitability of the observation sheet for collecting
experimental data. In the study, a sample of 27 older
male subjects, who all fulfilled the pre-specified
anthropometric characteristics, was selected from the
pool of potential subjects. The following preparatory
steps were undertaken before conducting the
experiments:
(i) each subject that was selected for the task was
briefed on the experimental objective and
(ii) a training session familiarized each subject with
the designed CNC machine panel; trial
experimental runs were conducted for training
purposes.
The subject stood in front of the machine panel,
according to the selected HCMI parameters, and was
given instructions; the subject then performed the
steps given below, in the prescribed order, for both
the training and the actual experimental sessions.
(a) The subject was required to keep his right-hand
index finger on a pre-defined position on the
machine panel.
(b) Colored visual stimuli were randomly presented
to the subject by the experimenter, through the
switchboard, during different sessions.
(c) The subject responded by lifting the same index
finger and depressing the requisite key on the
CNC machine panel; the task was repeated five
(for red, blue, yellow, white and green visual
signals) times for each subject.
(d) The human performance, in terms of the search
time, the motor action time and the applied force
on the key of the machine panel, was recorded
by the oscilloscope for each visual signal (Figure
12).
(e) The average of five performances was analyzed.
Figure 12: Recording of the search time, the motor
action time and the applied force by a 2-channel
oscilloscope
The parameters that most affected performance
in the human-CNC machine interface environment
were identified. These parameters were the CNC
machine panel height, the panel angle and the
working distance. A realistic human performance
measure system was then developed. The older male
performance was measured in terms of the search
time, the motor action time and the applied force on
the panel keys. Grey relational analysis and analysis
of variance techniques were found to be suitable for a
study of this nature, which involved many variables
that possessed multi-performance characteristics and
interacted with each other in a complex manner.

Imtiaz Ali Khan Int. Journal of Engineering Research and Applications www.ijera.com
ISSN : 2248-9622, Vol. 4, Issue 8( Version 7), August 2014, pp.01-21
www.ijera.com 9 | P a g e
III. Results 3.1. Comprehension
A literature review on human performance in an
HCMI environment indicated that little or no research
has been performed in the area, particularly on older
male operators. In contrast, CNC machines are
increasingly used all over the world. Today, a very
large workforce uses CNC machine tools. Keeping
these considerations in mind, the present study
explored how the performance of older age group
male operators was affected by changing the machine
panel height, the panel angle and the working
distance, while working on the CNC machine tools in
an HCMI environment. The study also determined
the optimum machine panel height, panel angle and
working distance to obtain optimal multi-
performance characteristics.
To state these objectives in statistical terms, the
following null hypothesis was constructed: “Varying
levels of CNC machine panel height, panel angle
and working distance impose equal magnitude of
operational loading on higher age group operators
resulting in no difference in human performance”.
3.2. The Experiment
Twenty-seven males, in the age group of 42-46
years, were selected from a pool of subjects to
participate in the study. All the subjects had normal
vision without corrective lenses. The chosen subjects
were right-motor sided (right-handed). None of the
subjects had a prior history of a neuromuscular
disorder.
The procedure detailed in section 2.6 was
followed for conducting the experiment and
measuring the response variables of the search time,
the motor action time and the applied force. All the
experimental sessions were conducted between 10.00
hours and 14.00 hours to exclude temporal effects
from the outcomes.
3.3. Data analysis of experimental results
The subjects committed no errors in performing
the experimental task. This was ensured by a program
that was developed in the C++ language. The human
performance in terms of the search time, the motor
action time and the applied force for different
combinations of the panel height, the panel angle and
the working distance for 27 experimental runs are
listed in Table 2.
The following sequential steps were used to
determine the optimal combination of the human-
CNC machine interface parameters for multi-
performance characteristics based on a grey relational
analysis:
i) the S/N ratios for the experimental data were
calculated,
ii) the S/N ratios were normalized,
iii) the corresponding grey relational coefficients
were determined,
iv) the grey relational grades were calculated,
v) ANOVA was carried out to determine the
significant contribution of the factors and
vi) a confirmation test was performed to check the
validity of the results.
3.3.1 Optimal parameter combination
In the HCMI environment, lower values of the
search time, the motor action time and the applied
force indicate better performance. The S/N ratios of
the search time, the motor action time and the applied
force for the 27 experimental runs were calculated
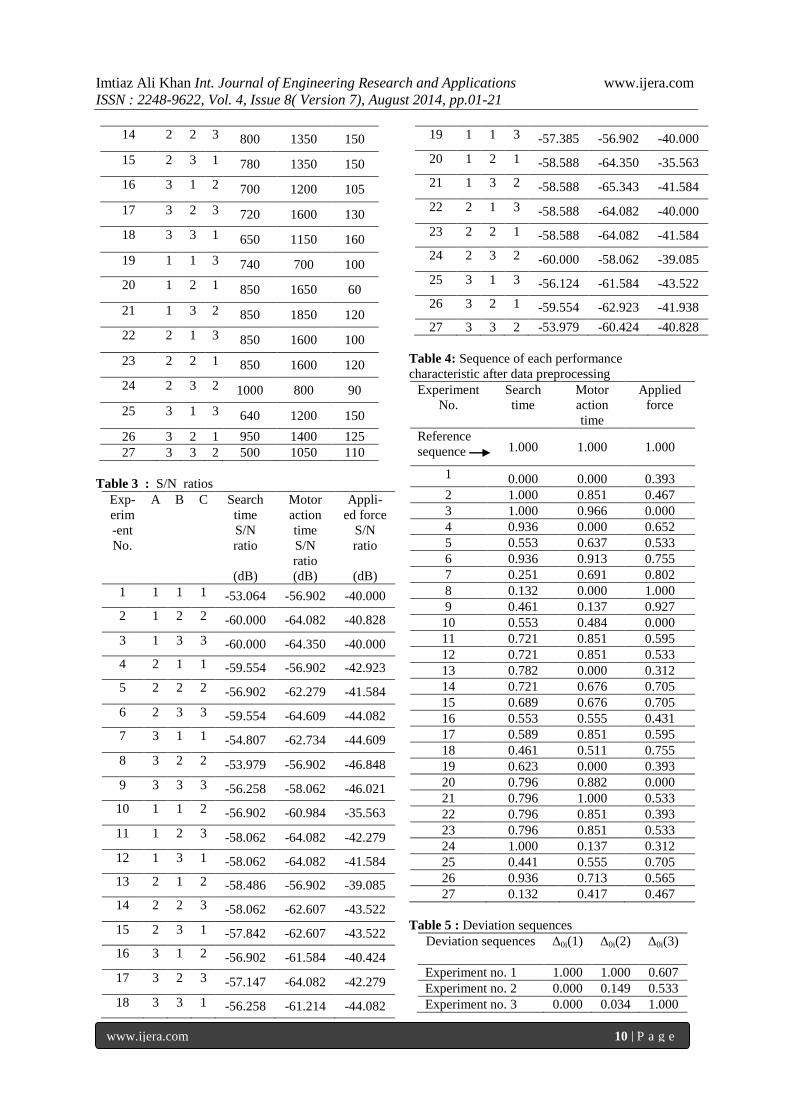
and are listed in Table 3.
Table 4 lists all the sequences following data
pre-processing of the search time, the motor action
time and the applied force. The deviation sequences
Δ0i, Δmax(k) and Δmin(k) for i=1-27 and k=1-3 were
calculated.
The results for all the Δ0i for i=1-27 are given in
Table 5.
Using Table 5, Δmax and Δmin were determined to have
the following values:
Δmax = Δ01(1) = Δ01(2) = Δ03(3) = 1.000
Δmin = Δ02(1) = Δ21(2) = Δ08(3) = 0.000
Table 6 lists the grey relational coefficient and grade
for each experiment of the L27 OA.
Table 2 : Experimental design using the L27
orthogonal array
Exper-
iment
No.
A B C Search
Time
in
millise
-conds
Motor
action
time in
millise
-conds
Appli
ed
force
in
milliv
o-lts
1 1 1 1 450 700 100
2 1 2 2 1000 1600 110
3 1 3 3 1000 1650 100
4 2 1 1 950 700 140
5 2 2 2 700 1300 120
6 2 3 3 950 1700 160
7 3 1 1 550 1370 170
8 3 2 2 500 700 220
9 3 3 3 650 800 200
10 1 1 2 700 1120 60
11 1 2 3 800 1600 130
12 1 3 1 800 1600 120
13 2 1 2 840 700 90
Imtiaz Ali Khan Int. Journal of Engineering Research and Applications www.ijera.com
ISSN : 2248-9622, Vol. 4, Issue 8( Version 7), August 2014, pp.01-21
www.ijera.com 10 | P a g e
14 2 2 3 800 1350 150
15 2 3 1 780 1350 150
16 3 1 2 700 1200 105
17 3 2 3 720 1600 130
18 3 3 1 650 1150 160
19 1 1 3 740 700 100
20 1 2 1 850 1650 60
21 1 3 2 850 1850 120
22 2 1 3 850 1600 100
23 2 2 1 850 1600 120
24 2 3 2 1000 800 90
25 3 1 3 640 1200 150
26 3 2 1 950 1400 125
27 3 3 2 500 1050 110
Table 3 : S/N ratios
Exp-
erim
-ent
No.
A B C Search
time
S/N
ratio
(dB)
Motor
action
time
S/N
ratio
(dB)
Appli-
ed force
S/N
ratio
(dB)
1 1 1 1 -53.064 -56.902 -40.000
2 1 2 2 -60.000 -64.082 -40.828
3 1 3 3 -60.000 -64.350 -40.000
4 2 1 1 -59.554 -56.902 -42.923
5 2 2 2 -56.902 -62.279 -41.584
6 2 3 3 -59.554 -64.609 -44.082
7 3 1 1 -54.807 -62.734 -44.609
8 3 2 2 -53.979 -56.902 -46.848
9 3 3 3 -56.258 -58.062 -46.021
10 1 1 2 -56.902 -60.984 -35.563
11 1 2 3 -58.062 -64.082 -42.279
12 1 3 1 -58.062 -64.082 -41.584
13 2 1 2 -58.486 -56.902 -39.085
14 2 2 3 -58.062 -62.607 -43.522
15 2 3 1 -57.842 -62.607 -43.522
16 3 1 2 -56.902 -61.584 -40.424
17 3 2 3 -57.147 -64.082 -42.279
18 3 3 1 -56.258 -61.214 -44.082
19 1 1 3 -57.385 -56.902 -40.000
20 1 2 1 -58.588 -64.350 -35.563
21 1 3 2 -58.588 -65.343 -41.584
22 2 1 3 -58.588 -64.082 -40.000
23 2 2 1 -58.588 -64.082 -41.584
24 2 3 2 -60.000 -58.062 -39.085
25 3 1 3 -56.124 -61.584 -43.522
26 3 2 1 -59.554 -62.923 -41.938
27 3 3 2 -53.979 -60.424 -40.828
Table 4: Sequence of each performance
characteristic after data preprocessing
Experiment
No.
Search
time
Motor
action
time
Applied
force
Reference
sequence 1.000 1.000 1.000
1 0.000 0.000 0.393
2 1.000 0.851 0.467
3 1.000 0.966 0.000
4 0.936 0.000 0.652
5 0.553 0.637 0.533
6 0.936 0.913 0.755
7 0.251 0.691 0.802
8 0.132 0.000 1.000
9 0.461 0.137 0.927
10 0.553 0.484 0.000
11 0.721 0.851 0.595
12 0.721 0.851 0.533
13 0.782 0.000 0.312
14 0.721 0.676 0.705
15 0.689 0.676 0.705
16 0.553 0.555 0.431
17 0.589 0.851 0.595
18 0.461 0.511 0.755
19 0.623 0.000 0.393
20 0.796 0.882 0.000
21 0.796 1.000 0.533
22 0.796 0.851 0.393
23 0.796 0.851 0.533
24 1.000 0.137 0.312
25 0.441 0.555 0.705
26 0.936 0.713 0.565
27 0.132 0.417 0.467
Table 5 : Deviation sequences
Deviation sequences
Δ0i(1) Δ0i(2) Δ0i(3)
Experiment no. 1 1.000 1.000 0.607
Experiment no. 2 0.000 0.149 0.533
Experiment no. 3 0.000 0.034 1.000
Imtiaz Ali Khan Int. Journal of Engineering Research and Applications www.ijera.com
ISSN : 2248-9622, Vol. 4, Issue 8( Version 7), August 2014, pp.01-21
www.ijera.com 11 | P a g e
Experiment no. 4 0.064 1.000 0.348
Experiment no. 5 0.447 0.363 0.467
Experiment no. 6 0.064 0.087 0.245
Experiment no. 7 0.749 0.309 0.198
Experiment no. 8 0.868 1.000 0.000
Experiment no. 9 0.539 0.863 0.073
Experiment no. 10 0.447 0.516 1.000
Experiment no. 11 0.279 0.149 0.405
Experiment no. 12 0.279 0.149 0.467
Experiment no. 13 0.218 1.000 0.688
Experiment no. 14 0.279 0.324 0.295
Experiment no. 15 0.311 0.324 0.295
Experiment no. 16 0.447 0.445 0.569
Experiment no. 17 0.411 0.149 0.405
Experiment no. 18 0.539 0.489 0.245
Experiment no. 19 0.377 1.000 0.607
Experiment no. 20 0.204 0.118 1.000
Experiment no. 21 0.204 0.000 0.467
Experiment no. 22 0.204 0.149 0.607
Experiment no. 23 0.204 0.149 0.467
Experiment no. 24 0.000 0.863 0.688
Experiment no. 25 0.559 0.445 0.295
Experiment no. 26 0.064 0.287 0.435
Experiment no. 27 0.868 0.583 0.533
Table 6 : Calculated grey relational coefficient and
grey relational grade and its orders for 27
comparability sequences
Exper-
iment
No.
Grey relational
coefficient
Grey
relati-
onal
grade
Ord
-ers
Sea-
rch
time
Motor
action
time
Appl-
ied
force
1 0.333 0.333 0.452 0.373 27
2 1.000 0.770 0.484 0.751 3
3 1.000 0.937 0.333 0.757 2
4 0.886 0.333 0.590 0.603 14
5 0.528 0.579 0.517 0.542 21
6 0.886 0.852 0.671 0.803 1
7 0.400 0.618 0.716 0.578 16
8 0.365 0.333 1.000 0.566 18
9 0.481 0.367 0.872 0.573 17
10 0.528 0.492 0.333 0.451 25
11 0.641 0.770 0.553 0.655 7
12 0.641 0.770 0.517 0.643 9
13 0.696 0.333 0.421 0.483 23
14 0.641 0.607 0.629 0.626 10
15 0.616 0.607 0.629 0.617 13
16 0.528 0.529 0.468 0.508 22
17 0.549 0.770 0.553 0.624 11
18 0.481 0.505 0.671 0.553 19
19 0.570 0.333 0.452 0.452 24
20 0.711 0.809 0.333 0.618 12
21 0.711 1.000 0.517 0.743 4
22 0.711 0.770 0.452 0.644 8
23 0.711 0.770 0.517 0.666 6
24 1.000 0.367 0.421 0.596 15
25 0.472 0.529 0.629 0.543 20
26 0.886 0.635 0.535 0.685 5
27 0.365 0.462 0.484 0.437 26
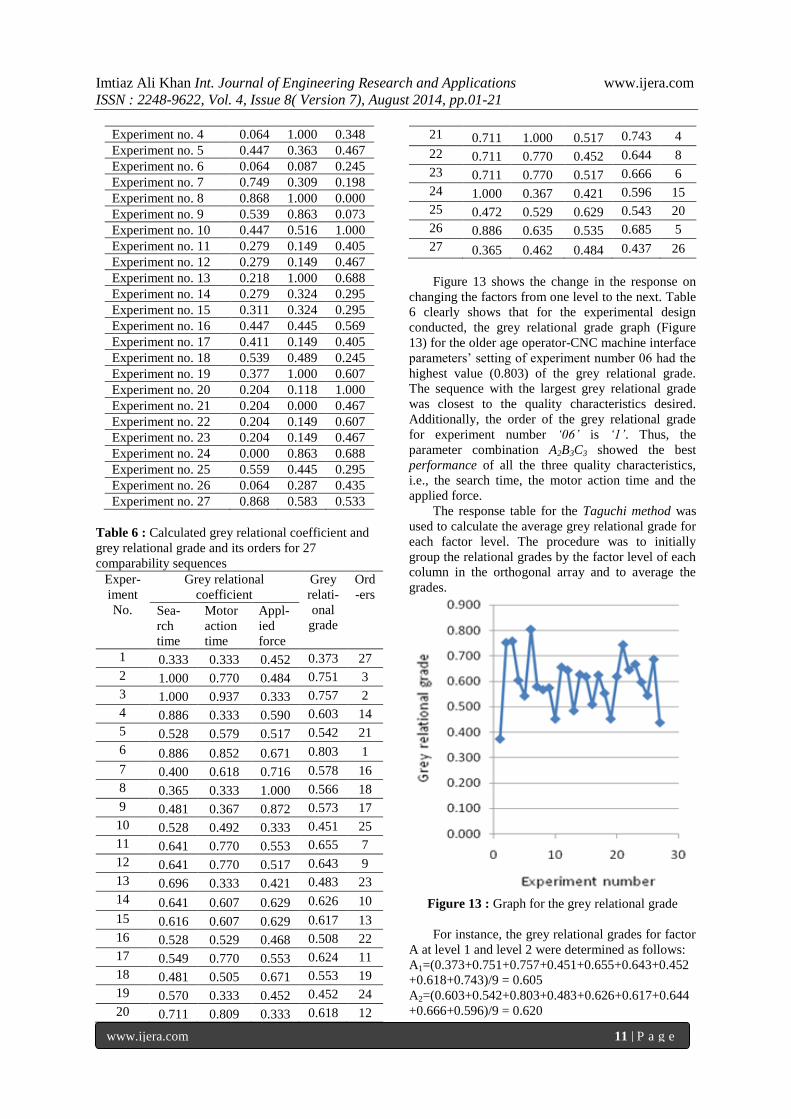
Figure 13 shows the change in the response on
changing the factors from one level to the next. Table
6 clearly shows that for the experimental design
conducted, the grey relational grade graph (Figure
13) for the older age operator-CNC machine interface
parameters‟ setting of experiment number 06 had the
highest value (0.803) of the grey relational grade.
The sequence with the largest grey relational grade
was closest to the quality characteristics desired.
Additionally, the order of the grey relational grade
for experiment number ‘06’ is ‘1’. Thus, the
parameter combination A2B3C3 showed the best
performance of all the three quality characteristics,
i.e., the search time, the motor action time and the
applied force.
The response table for the Taguchi method was
used to calculate the average grey relational grade for
each factor level. The procedure was to initially
group the relational grades by the factor level of each
column in the orthogonal array and to average the
grades.
Figure 13 : Graph for the grey relational grade
For instance, the grey relational grades for factor
A at level 1 and level 2 were determined as follows:
A1=(0.373+0.751+0.757+0.451+0.655+0.643+0.452
+0.618+0.743)/9 = 0.605
A2=(0.603+0.542+0.803+0.483+0.626+0.617+0.644
+0.666+0.596)/9 = 0.620

Imtiaz Ali Khan Int. Journal of Engineering Research and Applications www.ijera.com
ISSN : 2248-9622, Vol. 4, Issue 8( Version 7), August 2014, pp.01-21
www.ijera.com 12 | P a g e
Using the same method, calculations were
performed for each HCMI parameter level, and the
response table was constructed as shown in Table 7.
The grey relational grades represented the level of
correlation between the reference and comparability
sequences; a larger grey relational grade meant that
the comparability sequence was more strongly
correlated with the reference sequence.
Table 7 : Response table for grey relational grade
Sym-
bol
Human-
CNC
Machine
Interface
(HCMI)
Parame-
ter
Lev
el
1
Lev
el
2
Leve
l
3
Max -
Min
A CNC
machine
panel
height
0.6
05
0.6
20
0.56
3
0.057
B CNC
machine
panel
angle
0.5
15
0.6
37
0.63
6
0.122
C Working
distance
0.5
93
0.5
64
0.63
1
0.067
Therefore, the comparability sequence had a
larger value of the grey relational grade for the
search time, the motor action time and the applied
force. Based on this hypothesis, the level that
provided the largest average response was selected in
this study. The influence of each parameter level can
be more clearly presented by means of a mean grey
relational grade graph (a response graph). Figure 14
shows the response graph for the HCMI parameters
and the mean value of the grey relational grade for
different levels of each HCMI parameter.
The larger the grey relational grade, the better
are the multi-performance characteristics. Higher
values of the grey relational grade in Figure 14
indicate low search times, motor action times and
applied forces. Table 7 and Figure 14 show that A2,
B2 and C3 corresponded to the largest value of the
grey relational grade for the factors A, B and C,
respectively. Therefore, A2B2C3 was the optimal
parameter combination condition for the multi-
performance characteristics in an HCMI
environment. In other words, a panel height of 110
cm, a panel angle of 60 degrees and a working
distance of 30 cm was the optimal parameter
combination condition for older age male operators
working in the CNC machine environment. The
parameter combination A2B2C3 performed best in
terms of all the three quality characteristics, i.e., the
search time, the motor action time and the applied
force. Comparing the entries in the last column of
Table 7 shows that the largest difference between the
maximum and minimum values of the grey relational
grade were found for factor B, i.e., the CNC machine
panel angle, followed by factor C, i.e., the working
distance and then factor A, i.e. the CNC machine
panel height. This observation indicates that the CNC
machine panel angle had a stronger effect on the
multi-performance characteristics than the CNC
machine panel height and the working distance. The
optimum working condition, which yielded the
smallest search time, smallest motor action time and
smallest applied force in the present study, was quite
reasonable. For operators in the age group of 42-46
years, the optimum HCMI parameters combination
emerged as A2B2C3. At a 30-cm working distance
the shoulder abduction was high. However, 110 cm
CNC machine panel height and 60 degrees panel
angle have resulted low elbow and wrist abductions.
This parameter combination ultimately provides an
overall less musculoskeletal strain standing posture
for higher age group males. The A2B2C3 combination
resulted in the optimum performance of a CNC
machine older age male operator because of a
comfortable environment for search, motor action
and force application.
Figure 14 : Effect of HCMI parameter levels on
multi-performance
Two-way interaction plots were obtained using
Design-Expert software(2012) to estimate the
parameter interaction effects. These plots were used
to determine whether the interactions between the
HCMI parameters significantly affected the multi-
response characteristics, i.e., the grey relational
grade. The graph for the interaction between factor A
(the CNC machine panel height) and factor B (the
CNC machine panel angle) is shown in Figure 15.

Imtiaz Ali Khan Int. Journal of Engineering Research and Applications www.ijera.com
ISSN : 2248-9622, Vol. 4, Issue 8( Version 7), August 2014, pp.01-21
www.ijera.com 13 | P a g e
Design-Expert® SoftwareGrey relational grade
X1 = A: CNC machine panel heightX2 = B: CNC machine panel angle
Actual FactorC: Working distance = Level 1 of C
B1 Level 1 of BB2 Level 2 of BB3 Level 3 of B
B: CNC machine panel angle
Level 1 of A Level 2 of A Level 3 of A
Interaction
A: CNC machine panel height
Gre
y r
ela
tio
na
l g
rad
e
0.3
0.4
0.5
0.6
0.7
0.8
0.9
Figure 15 : Interaction plot for factor A and factor B
Figure 15 shows a strong interaction effect of the
CNC machine panel height and the panel angle on the
grey relational grade. Figure 15 indicates that when
the CNC machine panel was operated at a 90-cm
panel height, the multi-performance characteristic,
i.e., the grey relational grade, was maximized at a 60-
degree panel angle; the next highest grey relational
grade values were for panel angles of 90 and 30
degrees, in that order. For a 110-cm panel height, the
grade was maximized for a 90-degree panel angle,
while the next highest grade value corresponded to a
panel angle of 60 degrees, and the lowest grade value
was found for a panel angle of 30 degrees. It is
noteworthy that for a panel angle of 30 degrees, the
grade increased when the machine operation shifted
from a 90-cm to a 110-cm panel height, while a
significant effect on the multi-performance
characteristics was observed for changing operation
from a 110- to a 130-cm panel height. Furthermore,
for a 90 degree-panel angle, the grade continued to
decrease as the machine operation was shifted from
90 to 110 cm and the machine panel height was
shifted from 110 to 130 cm. The multi-performance
characteristics of the HCMI environment were
significantly affected by the panel height when the
CNC machine was operated at a 60-degree panel
angle.
The overall minimum musculoskeletal strain
posture for higher age group male operators
corresponded to a 130-cm CNC machine panel
height, with the next lowest values corresponding to
the 110-cm and 90-cm panel heights, in that order.
A graph showing the interaction between factor B
(the CNC machine panel angle) and factor C (the
working distance) is shown in Figure 16.
Design-Expert® SoftwareGrey relational grade
X1 = B: CNC machine panel angleX2 = C: Working distance
Actual FactorA: CNC machine panel height = Level 1 of A
C1 Level 1 of CC2 Level 2 of CC3 Level 3 of C
C: Working distance
Level 1 of B Level 2 of B Level 3 of B
Interaction
B: CNC machine panel angle
Gre
y r
ela
tio
na
l g
rad
e
0.3
0.4
0.5
0.6
0.7
0.8
0.9
Figure 16 : Interaction plot for factor B and factor C
Figure 16 shows that the interaction between the
CNC machine panel angle and the working distance
had a strong effect on the grey relational grade.
Figure 16 indicates that when the CNC machine was
operated at a 30-degree panel angle, the multi-
performance characteristic, i.e., grey relational grade,
was maximized at a 20-cm working distance,
followed by the 30-cm and 10-cm working distances.
However, at the 90-degree panel angle, the grade was
highest at a 30-cm working distance, followed by the
20-cm and 10-cm working distances. It is noteworthy
that at working distances of 10,20 and 30 cm, the
grade increased as the machine operation was
transferred from a 30-degree to a 60-degree CNC
machine panel angle. At a 30-cm working distance, a
significant increase in grade was recorded. It should
also be noted that the multi-performance
characteristics of an HCMI environment at 10 and
20-cm working distances were marginally affected
for higher age group male machine operators.
The minimum musculoskeletal strain posture for
older males was concluded to correspond to a 60-
degree CNC machine panel angle for 10 and 20-cm
working distances and to a 90-degree panel angle for
30-cm working distance.
The graph for the interaction between factor A (the
CNC machine panel height) and factor C (the
working distance) is shown in Figure 17.
Design-Expert® SoftwareGrey relational grade
X1 = A: CNC machine panel heightX2 = C: Working distance
Actual FactorB: CNC machine panel angle = Level 1 of B
C1 Level 1 of CC2 Level 2 of CC3 Level 3 of C
C: Working distance
Level 1 of A Level 2 of A Level 3 of A
Interaction
A: CNC machine panel height
Gre
y r
ela
tio
na
l g
rad
e
0.3
0.4
0.5
0.6
0.7
0.8
0.9
Figure 17 : Interaction plot for factor A and factor C
Imtiaz Ali Khan Int. Journal of Engineering Research and Applications www.ijera.com
ISSN : 2248-9622, Vol. 4, Issue 8( Version 7), August 2014, pp.01-21
www.ijera.com 14 | P a g e
Figure 17 reveals that the interaction between
CNC machine panel height and working distance has
a strong effect on the grey relational grade. Figure 17
indicates when CNC machine is operated at 90 cm
panel height, the multi-performance i.e. grey
relational grade is the maximum at 20 cm working
distance followed by 30 and 10 cm, respectively.
The status of grade at 110 cm panel heights is that, it
is highest at 30 cm working distance followed by 10
and 20 cm, respectively. However, at 130 cm panel
height, the grey relational grade is the maximum at
10 cm working distance followed by 30 and 20 cm,
respectively. It is significant to note that, at working
distances 10 and 30 cm, the grade increases when
CNC machine operation is shifted from 90 to 110 cm
panel height. Furthermore, significant decrease in
grade is observed at 30 cm working distances when
CNC machine operation is shifted from 110 to 130
cm panel height. It is noteworthy that the multi-
performance characteristics of HCMI are marginally
affected by the panel heights when CNC machine is
operated from a distance of 20 cm.The minimum
musculoskeletal strain posture for higher age group
males corresponded to a 110-cm CNC machine panel
height for working distances 20 and 30 cm and to a
130-cm panel height for 10- cm working distance.
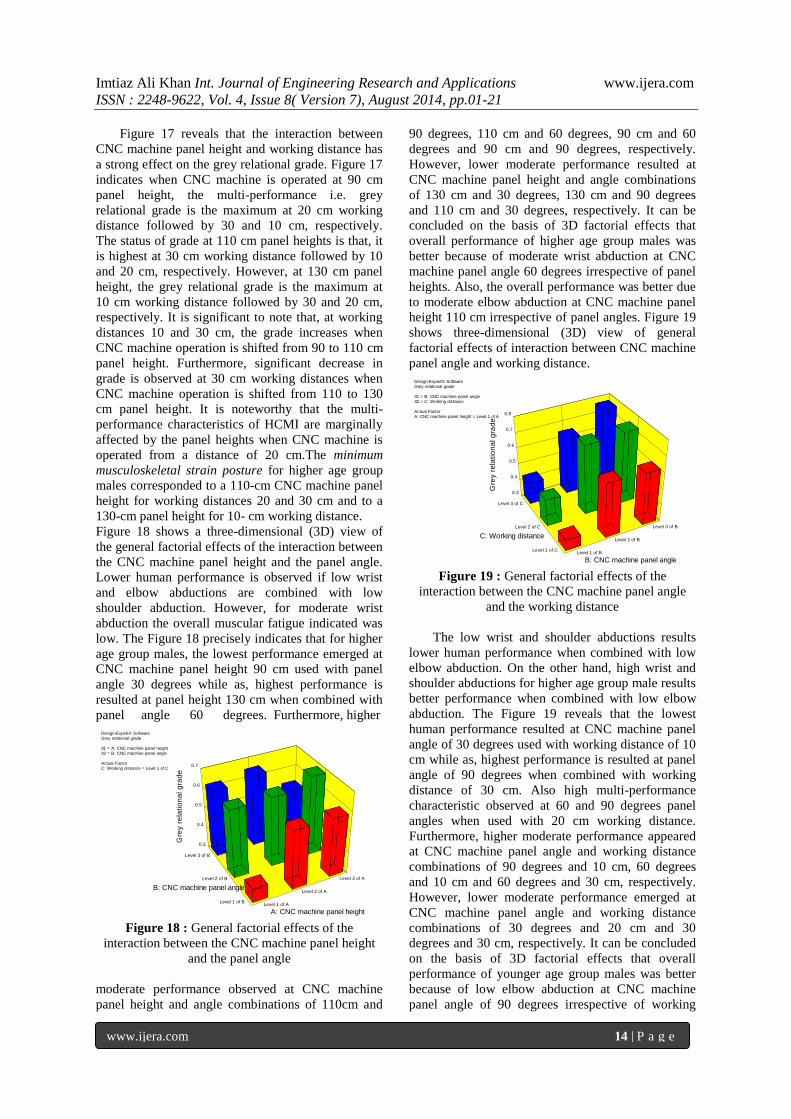
Figure 18 shows a three-dimensional (3D) view of
the general factorial effects of the interaction between
the CNC machine panel height and the panel angle.
Lower human performance is observed if low wrist
and elbow abductions are combined with low
shoulder abduction. However, for moderate wrist
abduction the overall muscular fatigue indicated was
low. The Figure 18 precisely indicates that for higher
age group males, the lowest performance emerged at
CNC machine panel height 90 cm used with panel
angle 30 degrees while as, highest performance is
resulted at panel height 130 cm when combined with
panel angle 60 degrees. Furthermore, higher
Design-Expert® SoftwareGrey relational grade
X1 = A: CNC machine panel heightX2 = B: CNC machine panel angle
Actual FactorC: Working distance = Level 1 of C
Level 1 of A
Level 2 of A
Level 3 of A
Level 1 of B
Level 2 of B
Level 3 of B
0.3
0.4
0.5
0.6
0.7
G
rey r
ela
tio
na
l g
rad
e
A: CNC machine panel height
B: CNC machine panel angle
Figure 18 : General factorial effects of the
interaction between the CNC machine panel height
and the panel angle
moderate performance observed at CNC machine
panel height and angle combinations of 110cm and
90 degrees, 110 cm and 60 degrees, 90 cm and 60
degrees and 90 cm and 90 degrees, respectively.
However, lower moderate performance resulted at
CNC machine panel height and angle combinations
of 130 cm and 30 degrees, 130 cm and 90 degrees
and 110 cm and 30 degrees, respectively. It can be
concluded on the basis of 3D factorial effects that
overall performance of higher age group males was
better because of moderate wrist abduction at CNC
machine panel angle 60 degrees irrespective of panel
heights. Also, the overall performance was better due
to moderate elbow abduction at CNC machine panel
height 110 cm irrespective of panel angles. Figure 19
shows three-dimensional (3D) view of general
factorial effects of interaction between CNC machine
panel angle and working distance.
Design-Expert® SoftwareGrey relational grade
X1 = B: CNC machine panel angleX2 = C: Working distance
Actual FactorA: CNC machine panel height = Level 1 of A
Level 1 of B
Level 2 of B
Level 3 of B
Level 1 of C
Level 2 of C
Level 3 of C
0.3
0.4
0.5
0.6
0.7
0.8
G
rey r
ela
tio
na
l g
rad
e
B: CNC machine panel angle
C: Working distance
Figure 19 : General factorial effects of the
interaction between the CNC machine panel angle
and the working distance
The low wrist and shoulder abductions results
lower human performance when combined with low
elbow abduction. On the other hand, high wrist and
shoulder abductions for higher age group male results
better performance when combined with low elbow
abduction. The Figure 19 reveals that the lowest
human performance resulted at CNC machine panel
angle of 30 degrees used with working distance of 10
cm while as, highest performance is resulted at panel
angle of 90 degrees when combined with working
distance of 30 cm. Also high multi-performance
characteristic observed at 60 and 90 degrees panel
angles when used with 20 cm working distance.
Furthermore, higher moderate performance appeared
at CNC machine panel angle and working distance
combinations of 90 degrees and 10 cm, 60 degrees
and 10 cm and 60 degrees and 30 cm, respectively.
However, lower moderate performance emerged at
CNC machine panel angle and working distance
combinations of 30 degrees and 20 cm and 30
degrees and 30 cm, respectively. It can be concluded
on the basis of 3D factorial effects that overall
performance of younger age group males was better
because of low elbow abduction at CNC machine
panel angle of 90 degrees irrespective of working

Imtiaz Ali Khan Int. Journal of Engineering Research and Applications www.ijera.com
ISSN : 2248-9622, Vol. 4, Issue 8( Version 7), August 2014, pp.01-21
www.ijera.com 15 | P a g e
distances. Also, the overall performance was better
due to moderate shoulder abduction at working
distance of 20 cm irrespective of machine panel
angles. Figure 20 shows three-dimensional (3D) view
of general factorial effects of interaction between
CNC machine panel height and working distance.
Low elbow and shoulder abductions results
lower human performance when combined with low
wrist abduction. On the other hand, moderate elbow
and high shoulder abductions for higher age group
male results better performance when combined with
low wrist abduction. The Figure 20 reveals that the
lowest
Design-Expert® SoftwareGrey relational grade
X1 = A: CNC machine panel heightX2 = C: Working distance
Actual FactorB: CNC machine panel angle = Level 1 of B
Level 1 of A
Level 2 of A
Level 3 of A
Level 1 of C
Level 2 of C
Level 3 of C
0.35
0.4
0.45
0.5
0.55
0.6
0.65
G
rey r
ela
tio
na
l g
rad
e
A: CNC machine panel height
C: Working distance
Figure 20 : General factorial effects of the
interaction between the CNC machine panel height
and the working distance
Human performance resulted at CNC machine
panel height 90 cm used with working distance 10 cm
while as, highest human performance is resulted at
panel height 110 cm when combined with working
distance 30 cm. Moreover, higher moderate
performance exhibited at CNC machine panel height
and working distance combinations of 130 cm and 10
cm, 110 cm and 10 cm and 130 cm and 30 cm,
respectively. However, lower moderate performance
emerged at CNC machine panel height and working
distance combinations of 110 cm and 20 cm, 130 cm
and 20 cm, 90 cm and 20 cm and 90 cm and 20 cm,
respectively. It can be concluded on the basis of 3D
factorial effects that overall performance of higher
age group males was better due low wrist abduction
at working distance 30 cm irrespective of CNC
machine panel heights. Also, the overall performance
was better due to moderate elbow abduction at110
cm panel height irrespective of working distances.
The residuals of the multi-performance characteristic
(the grey relational grade) were checked to ensure
that various assumptions were satisfied. To perform
model adequacy or diagnostic tests, checks were
made using Design Expert software. Figure 21 shows
the normal probability graph of the studentized
residuals.
Design-Expert® SoftwareGrey relational grade
Color points by value ofGrey relational grade:
0.824913
0.395218
Internally Studentized Residuals
No
rma
l %
Pro
ba
bility
Normal Plot of Residuals
-3.00 -2.00 -1.00 0.00 1.00 2.00
1
5
10
20
30
50
70
80
90
95
99
Figure 21: Normal probability plot of studentized
residuals
Figure 21 shows that the normal plot of residuals
fall more-or-less in line with the ideal plot. The
observed pattern was also not overly abnormal, and
the residuals followed a normal distribution. On
observing the normal probability graph, the
assumption of normality was easily concluded to be
satisfactory.
Table 8 : Results of the analysis of variance
Sy-
mb-
ol
HC
MI
para
-
met
e-rs
De
g.
of
fr
ee
d.
Su
m
of
squ
a-re
Me
-an
sq-
uar
e
F-
rat
-io
P-
va
lu
e
Contr
i-
butio
n
(%)
A
CN
C
mac
h-
ine
pan
el
heig
ht
2
0.0
16
7.8
03E
-
003
9.
13
0.
00
9
5.71
B
CN
C
mac
h-
ine
pan
el
angl
e
2
0.0
88
0.0
44
51
.6
˂
0.
01
31.42
C
Wor
k-
ing
dist
a-
nce
2
0.0
20
0.0
10
11
.7
0.
00
4
7.14
AxB
Inte
r-
4
0.0
0.0
26
0.
32.50

Imtiaz Ali Khan Int. Journal of Engineering Research and Applications www.ijera.com
ISSN : 2248-9622, Vol. 4, Issue 8( Version 7), August 2014, pp.01-21
www.ijera.com 16 | P a g e
acti
on
bet
w-
een
pan
el
heig
ht
and
angl
e
91 23 .6 00
1
BxC
Inte
r-
acti
on
bet
w-
een
pan
el
angl
e
and
wor
k-
ing
dist
a-
nce
4
0.0
14
3.5
53E
-
003
4.
16
0.
04
1
5.00
AxC
Inte
r-
acti
on
bet
w-
een
pan
el
heig
ht
and
wor
k-
ing
dist.
4
0.0
48
0.0
12
14
.2
0.
00
1
17.14
Erro
r
8
6.8
35E
-
003
8.5
44E
-
004
2.14
Tota
l
26
0.2
8
101.0
5
3.3.2. Analysis of variance
ANOVA and the F-test were used to determine
the significant HCMI parameters. The ANOVA
results from Design-Expert software are presented in
Table 8.
The purpose of ANOVA was to investigate
which human-CNC machine interface parameter/s
significantly affected the multi-performance
characteristics. This investigation was accomplished
by separating the total variability of the grey
relational grades, which was determined by the sum
of the square deviations from the total mean of the
grey relational grade in terms of the contributions by
each HCMI parameter and the error. The %age
contribution of each parameter to the total sum of the
squared deviations was used to evaluate the effect of
changing the HCMI parameter on the performance
characteristic. In addition, the F-test was used to
determine which HCMI parameter had a significant
effect on the performance characteristic. Usually, a
change in an HCMI parameter has a significant effect
on the performance characteristic when the F-value is
large. Table 8 indicates that the F-value was highest
for the working distance. The ANOVA results for the
grey relational grade are listed in Table 8.
The ANOVA results show that all the three
HCMI parameters, i.e., the CNC machine panel
height, panel angle and working distance and the
three interactions, i.e., between the CNC machine
panel height and the panel angle, between the CNC
machine panel height and the working distance and
the CNC machine panel angle and the working
distance significantly affected the multi-performance
characteristics of the older male-CNC machine
interaction environment. The results also showed that
the CNC machine panel angle was the most
significant HCMI parameter affecting the multi-
performance characteristic because it had the highest
%age contribution (31.42%) amongst the selected
individual parameters. Table 8 shows that the %age
contributions of the other parameters, in decreasing
order of magnitude, were as follows: the interaction
between the CNC machine panel height and the panel
angle (32.5%), the interaction between the CNC
machine panel height and the working distance
(17.14%), the working distance (7.14%), the CNC
machine panel height (5.71%), and the interaction
between the CNC machine panel angle and the
working distance (5.00%).
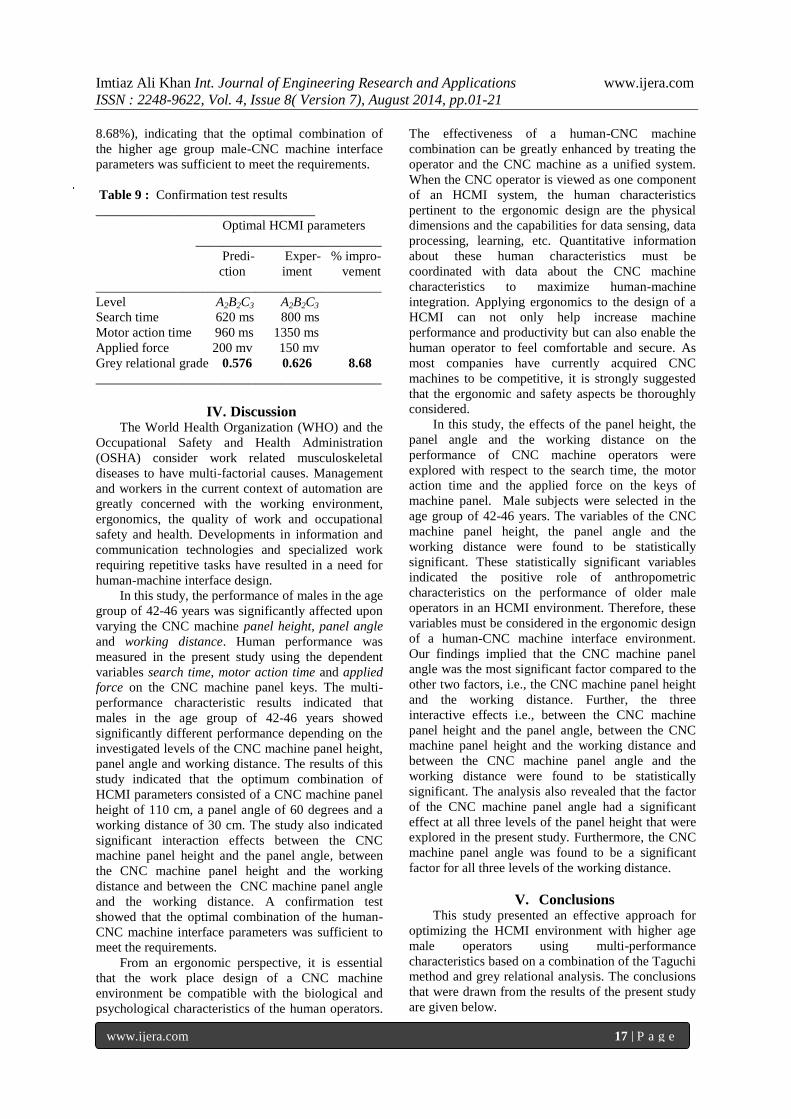
3.3.3. Confirmation test
After determining the optimal levels of the
HCMI parameters, the next step was to verify the
%age change of the grey relational grade between the
predicted and the experimental values for the optimal
combination. Table 9 compares the results of the
confirmation experiment using the optimal HCMI
parameters (A2B2C3) obtained using the proposed
method.
Table 9 shows that the grey relational grade
improved from 0.576 to 0.626 (an improvement of
Imtiaz Ali Khan Int. Journal of Engineering Research and Applications www.ijera.com
ISSN : 2248-9622, Vol. 4, Issue 8( Version 7), August 2014, pp.01-21
www.ijera.com 17 | P a g e
8.68%), indicating that the optimal combination of
the higher age group male-CNC machine interface
parameters was sufficient to meet the requirements.
Table 9 : Confirmation test results
_________________________________
Optimal HCMI parameters
____________________________
Predi- Exper- % impro-
ction iment vement
___________________________________________
Level A2B2C3 A2B2C3
Search time 620 ms 800 ms
Motor action time 960 ms 1350 ms
Applied force 200 mv 150 mv
Grey relational grade 0.576 0.626 8.68
___________________________________________
IV. Discussion The World Health Organization (WHO) and the
Occupational Safety and Health Administration
(OSHA) consider work related musculoskeletal
diseases to have multi-factorial causes. Management
and workers in the current context of automation are
greatly concerned with the working environment,
ergonomics, the quality of work and occupational
safety and health. Developments in information and
communication technologies and specialized work
requiring repetitive tasks have resulted in a need for
human-machine interface design.
In this study, the performance of males in the age
group of 42-46 years was significantly affected upon
varying the CNC machine panel height, panel angle
and working distance. Human performance was
measured in the present study using the dependent
variables search time, motor action time and applied
force on the CNC machine panel keys. The multi-
performance characteristic results indicated that
males in the age group of 42-46 years showed
significantly different performance depending on the
investigated levels of the CNC machine panel height,
panel angle and working distance. The results of this
study indicated that the optimum combination of
HCMI parameters consisted of a CNC machine panel
height of 110 cm, a panel angle of 60 degrees and a
working distance of 30 cm. The study also indicated
significant interaction effects between the CNC
machine panel height and the panel angle, between
the CNC machine panel height and the working
distance and between the CNC machine panel angle
and the working distance. A confirmation test
showed that the optimal combination of the human-
CNC machine interface parameters was sufficient to
meet the requirements.
From an ergonomic perspective, it is essential
that the work place design of a CNC machine
environment be compatible with the biological and
psychological characteristics of the human operators.
The effectiveness of a human-CNC machine
combination can be greatly enhanced by treating the
operator and the CNC machine as a unified system.
When the CNC operator is viewed as one component
of an HCMI system, the human characteristics
pertinent to the ergonomic design are the physical
dimensions and the capabilities for data sensing, data
processing, learning, etc. Quantitative information
about these human characteristics must be
coordinated with data about the CNC machine
characteristics to maximize human-machine
integration. Applying ergonomics to the design of a
HCMI can not only help increase machine
performance and productivity but can also enable the
human operator to feel comfortable and secure. As
most companies have currently acquired CNC
machines to be competitive, it is strongly suggested
that the ergonomic and safety aspects be thoroughly
considered.
In this study, the effects of the panel height, the
panel angle and the working distance on the
performance of CNC machine operators were
explored with respect to the search time, the motor
action time and the applied force on the keys of
machine panel. Male subjects were selected in the
age group of 42-46 years. The variables of the CNC
machine panel height, the panel angle and the
working distance were found to be statistically
significant. These statistically significant variables
indicated the positive role of anthropometric
characteristics on the performance of older male
operators in an HCMI environment. Therefore, these
variables must be considered in the ergonomic design
of a human-CNC machine interface environment.
Our findings implied that the CNC machine panel
angle was the most significant factor compared to the
other two factors, i.e., the CNC machine panel height
and the working distance. Further, the three
interactive effects i.e., between the CNC machine
panel height and the panel angle, between the CNC
machine panel height and the working distance and
between the CNC machine panel angle and the
working distance were found to be statistically
significant. The analysis also revealed that the factor
of the CNC machine panel angle had a significant
effect at all three levels of the panel height that were
explored in the present study. Furthermore, the CNC
machine panel angle was found to be a significant
factor for all three levels of the working distance.
V. Conclusions This study presented an effective approach for
optimizing the HCMI environment with higher age
male operators using multi-performance
characteristics based on a combination of the Taguchi
method and grey relational analysis. The conclusions
that were drawn from the results of the present study
are given below.
Imtiaz Ali Khan Int. Journal of Engineering Research and Applications www.ijera.com
ISSN : 2248-9622, Vol. 4, Issue 8( Version 7), August 2014, pp.01-21
www.ijera.com 18 | P a g e
i) The combination of the parameters and their
levels for the optimum multi-performance
characteristics of a HCMI environment using
higher age group male operators was A2B2C3
(i.e., a CNC machine panel height of 110 cm, a
panel angle of 60 degrees and a working distance
of 30 cm).
ii) The panel height significantly affected the
performance of a male operator working on a
CNC machine. Thus, the multi-performance
characteristic showed that the CNC machine
panel height was an important factor to consider
in the ergonomic design of an HCMI
environment.
iii) The levels of the CNC machine panel angle
significantly affected operator performance in a
HCMI environment. The panel angle should
therefore be given due consideration in the
ergonomic design of a CNC machine interface
environment.
iv) The working distance appeared to be a
significant factor in the HCMI environment of
the present study, and it is therefore suggested
that the impact of working distance should not be
neglected when designing an HCMI
environment.
v) The %age contributions of the CNC machine
panel angle, the working distance and the panel
height were 31.42, 7.14 and 5.71, respectively.
vi) An improvement of 8.68% in the multi-
performance characteristics, i.e., the grey
relational grade, was achieved using the
approach presented here.
vii) The minimum musculoskeletal strain posture for
a male group that was 42-46 years of age was
found to correspond to a 130-cm CNC machine
panel height for panel angles of 30, 60 and 90
degrees, with the next lowest strain posture
values at the 110-cm and 90-cm panel heights, in
that order.
viii) The anthropometrically comfortable posture for
operators corresponded to a 60-degree CNC
machine panel angle for working distances of 10,
20 cm and to a 90-degree for 30 cm working
distance.
ix) A significant interaction effect between the CNC
machine panel height and the panel angle (32.5%
contribution) led to the conclusion that an
ergonomic database exists in the form of an
optimal CNC machine panel height for a
particular panel angle and vice-versa.
x) The significant interaction effect between the
CNC machine panel angle and the working
distance (5.00% contribution) also indicated an
important ergonomic database in the form of an
optimal CNC machine panel angle for a
particular working distance and vice-versa.
xi) A significant interaction effect between the CNC
machine panel height and the working distance
(17.14% contribution) led to the conclusion that
an ergonomic database exists in the form of an
optimal CNC machine panel height for a
particular working distance and vice-versa.
References [1] Antony, N.T. and Keir, P.J. (2010). Effects
of posture, movement and hand load on
shoulder muscle activity. Electromyography
and Kinesiology, 20(2), 191-198.
[2] Ayako, T., Hiroshi J., Maria, B.,Villanueva,
G., Midori, S. and Susumu, S. (2002).
Effects of the liquid crystal display tilt angle
of a notebook computer on posture, muscle
activities and somatic complaints. Industrial
Ergonomics, 29(4), 219-229.
[3] Balasubramanian, V., Adalarasu, K. and
Regulapati, R. (2009). Comparing dynamic
and stationary standing postures in an
assembly task. Industrial Ergonomics, 39
(5), 649-654.
[4] Batten, D.M., Schultz, K.L. and Sluchak,
T.J. (1998). Optimal viewing angle for touch
screen displays: Is there such a thing?
Industrial Ergonomics, 22(4-5), 343-350.
[5] Bautmans, I., Vantieghem, S., Gorus, E.,
Grazzini, Yuri-Reva, Fierens, Y., Pool-
Goudzwaard, A. and Mets, T. (2011). Age-
related differences in pre-movement
antagonist muscle co-activation and
reaction-time performance. Journal of
Experimental Gerontology, 46(8), 637-642.
[6] Bedny, G. and Karwowski, W. (2006). A
systematic-structural theory of activity:
Applications to human performance and
work design, CRC Press, Boca Raton.
[7] Bergmann, G., Graichen, F., Bender, A.
Rohlmann, A., Halder, A. Beier, A. and
Westerhoff, P. (2011). In vivo gleno-
humeral joint loads during forward flexion
and abduction. Journal of Biomechanics,
44(8), 1543-1552.
[8] Bothell, D. (2004). Act-r 6.0 Reference
Manual. Working Draft, Carnegie Mellon
University.
[9] Burgess-Limerick, Robin, M.W., Mark, C.
and Vanessa, L. (2000). Visual display
height. Journal of Human Factors and
Ergonomics Society, 42, 140-150.
[10] Chen, Chien-Hsiung and Chiang, Shu-Ying
(2011). The effects of Panel arrangement on
search performance. Journal of Displays,
32(5), 254-260.
[11] Chen, H.C., Ashton-Miller, J.A. , Alexander,
N.B. and Schultz, A.B. (1994). Effects of
age and available response time on ability

Imtiaz Ali Khan Int. Journal of Engineering Research and Applications www.ijera.com
ISSN : 2248-9622, Vol. 4, Issue 8( Version 7), August 2014, pp.01-21
www.ijera.com 19 | P a g e
to step over an obstacle. Journal of
Gerontol, 49, pp. M227-M233.
[12] Chikhaoui, B. and Pigot, H. (2010).
Towards analytical evaluation of human
machine interfaces developed in the context
of smart homes. Journal of Interacting with
Computers, 22(6), 449-464.
[13] Chung, M.K., Lee, I. and Kee, D. (2003).
Assessment of postural load for lower limb
postures based on perceived discomfort.
Industrial Ergonomics, 31, 17-32.
[14] Chung, M.K., Kim, D., Na, S. and Lee, D.
(2010). Usability evaluation of numeric
entry tasks on keypad type and age.
Industrial Ergonomics, 40(1), 97-105.
[15] Cousins, M.S., Corrow, C., Finn, M. and
Salamone, J.D. (1998). Temporal measures
of human finger tapping: effects of age.
Journal of Pharmacology Biochemistry and
Behavior, 59, 445-449.
[16] Design Expert Software (2012), Version
8.0.7.1 , http://www.statease.com as
browsed on 25.11.2011.
[17] Elias, M.F., Robbins, M.A., Walter, L.J. and
Schultz Jr., N.R. (1993). The influence of
gender and age on Halstead-Reitan
neuropsychological test performance.
Journal of Gerontol, 48, 278-281.
[18] Fraser, K., Burgess-Limerick, R., Plooy, A.
and Ankrum, D.R. (1999). The influence of
computer monitor height on head and neck
posture. Industrial ergonomics, 23(3), 171-
179.
[19] Germine, L.T., Duchaine, B. and
Nakayama, K. (2011). Where cognitive
development and aging meet: Face learning
ability peaks after age 30. Journal of
Cognition, 118(2), 201-210.
[20] Goel, P., Khan, Z.A., Siddiquee, A.N.,
Kamaruddin, S. and Gupta, R.K. (2011).
Influence of slab milling process parameters
on surface integrity of HSLA: a multi-
performance characteristic optimization.
Journal of Advanced Manufacturing
Technology, DOI 10.1007/s00170-011-
3763-y, Published online 22.11.2011.
[21] Hawthorn, D. (2000). Possible implications
of aging for interface designers. Journal of
Interacting with Computers, 12(5), 507-528.
[22] Hermsdorfer, J., Marquardt, C., Wack, S.
and Mai, N. (1999). Comparative analysis of
diadochokinetic movements.
Electromyography and Kinesiology, 9, 283-
295.
[23] Hongwei, H., Daniel, L. and Karl, S. (2002).
Anthropometric differences among
occupational groups. Ergonomics, 45(2),
136-152.
[24] Jan, S., Arnaud, J. and Arthur, S. (2003).
Posture, muscle activity and muscle fatigue
in prolonged VDT work at different screen
height settings. Ergonomics, 46, 714-730.
[25] Jimenez-Jimenez, F.J., Calleja, M., Alonso-
Navarro, H., Rubio, L., Navacerrada, F.,
Pilo-de-Fuente, B., Plaza-Nieto, J.F.,
Arroyo-Solera, M., Garcia-Ruiz, P.J.,
Garcia-Martin, E. and Agundez, J.A.G.
(2011). Influence of age and gender in
motor performance in healthy subjects.
Journal of Neurological Sciences, 302(1-2),
72-80.
[26] John, B.E. and Kieras, D.E. (1996). Using
GOMS for user interface design and
evaluation: which technique? ACM
Transactions on Computer-Human
Interaction. 3(4), 287-319.
[27] Joon, L.S., Llseok, L.K. and Wook, K.M.
(2007). A user interface for controlling
information appliances in smart homes, N.T.
Nguyen et al., Editors, Agent and Multi-
Agent Systems: Technologies and
Applications, 4496, 875-883.
[28] Jung-Yong, K., Min-Keun, C. and Ji-Soo,
P. (2003). Measurement of physical work
capacity during arm and shoulder lifting at
various shoulder flexion and ad/abduction
angles. Journal of Human Factors and
Ergonomics in Manufacturing, 13, 153-163.
[29] Kang, N.E. and Yoon, W.C. (2008). Age-
and experience-related user behavior
differences in the use of complicated
electronic devices. Journal of Human-
Computer Studies, 66(6), 425-437.
[30] Kee, D. and Lee, I. (2012). Relationships
between subjective and objective measures
in assessing postural stresses. Applied
Ergonomics, 43(2), 277-282.
[31] Khan, I.A. (2012). Ergonomic design of
human-CNC machine interface, Inaki
Maurtua, Editor, Human Machine
Interaction-Getting Closer, InTech Open
Access Publisher, Croatia, pp. 115-136.
[32] Khan, I.A. and Asghar, M. (2010).
Ergonomic evaluation of the angle of
abduction in a computer numerically
controlled electro discharge machine
environment. Journal of Cognition
Technology & Work, 12(4), 263-269.
[33] Khan, I.A. and Asghar, M. (2011).
Ergonomic design of the viewing angle in a
computer numerically controlled electro
discharge machine environment, Waldemar
Karwowski, Gavriel Salvendy, Editors,
Advances in Human Factors, Ergonomics
and Safety in Manufacturing and Service
Imtiaz Ali Khan Int. Journal of Engineering Research and Applications www.ijera.com
ISSN : 2248-9622, Vol. 4, Issue 8( Version 7), August 2014, pp.01-21
www.ijera.com 20 | P a g e
Industries, CRC Press, Taylor & Francis
Group, New York, pp. 169-179.
[34] Khan, Z.A., Kamaruddin, S. and Siddiquee,
A.N. (2010). Feasibility study of use of
recycled high density polyethylene and multi
response optimization of injection moulding
parameters using combined Grey relational
and principal component analysis. Journal
of Materials & Design, 31(6), 2925-2931.
[35] King, P.H. and Fries, R.C. (2009). Design of
biomedical devices and systems, CRC Press,
Taylor & Francis Group, New York, pp.
146.
[36] Layer, J.K., Karwowski, W. and Furr, A.
(2009). The effect of cognitive demands and
perceived quality of work life on human
performance in manufacturing
environments. Industrial Ergonomics, 39(2),
413-421.
[37] Lindberg, T., Nasanen, R. and Muller,
K. (2006). How age affects the speed of
perception of computer icons. Journal of
Displays, 27(4-5), 170-177.
[38] Ma, Y., Hu, H., Northwood, D. and Nie, X.
(2007). Optimization of the electrolytic
plasma oxidation processes for corrosion
protection of magnesium alloy AM50 using
the Taguchi method. Journal of Materials
Processing Technology, 182, 58-64.
[39] Maldonado-Macias, A., Ramirez, M.G.,
Garcia, J.L., Diaz, J.J. and Noriega, S.
(2009). Ergonomic evaluation of work
stations related with the operation of
advanced manufacturing technology
equipment: Two cases of study. XV
Congreso Internacional de ergonomia
SEMAC.
[40] Messing, K., Tissot, F. and Stock,S.R.
(2006). Lower limb pain, standing, sitting,
walking: The Importance of Freedom to
Adjust One’s Posture, The International
Ergonomics Association, Maastricht,
Netherlands.
[41] Ngomo, S., Messing, K., Perrault, H. and
Comtois, A. (2008). Orthostatic symptoms,
blood pressure and working postures of
factory and service workers over an
observed workday. Applied Ergonomics,
39(6), 729-736.
[42] Nissen, M.J. and Corkin, S. (1985).
Effectiveness of attentional cueing in older
and younger adults. Journal of Gerontol, 40,
185-191.
[43] OSHA (2011). Occupational Safety and
Health Administration, website
http://www.dazor.com/OSHA.pdf as
browsed on 18.11.2011.
[44] Pelosi, L. and Blumhardt, L.D. (1999).
Effects of age on working memory: an event-
related potential study . Journal of Cognitive
Brain Research, 7(3), 321-334.
[45] Peter, W.J. and Jack, T.D. (2006). Different
computer tasks affect the exposure of the
upper extremity to biomechanical risk
factors. Ergonomics, 49, 45-61.
[46] Phillips, C.A., Repperger, D.W., Kinsler, R.,
Bharwani, G. and Kender, D. (2007). A
quantitative model of the human-machine
interaction and multi-task performance: A
strategy function and the unity model
paradigm. Journal of Computers in Biology
and Medicine, 37(9), 1259-1271.
[47] Pope, D.P., Hunt, M., Birrell, F.N., Silman,
A.J. and Macfarlane, G.J. (2003). Hip pain
onset in relation to cumulative workplace
and leisure time mechanical load: a
population based case-control study. Annals
of the Rheumatic Diseases, 62, 322-326.
[48] Reid, C.R., Bush, P.M., Karwowski, W. and
Durrani, S.K. (2010). Occupational postural
activity and lower extremity discomfort: A
review. Industrial Ergonomics, 40(3), 247-
256.
[49] Ross, P.J. (1988). Taguchi techniques for
quality engineering, NY: McGraw-Hill.
[50] Ruff, R.M. and Parker, S.B. (1993).
Gender- and age-specific changes in motor
speed and eye-hand coordination in adults:
normative values for the finger tapping and
grooved pegboard tests. Percept Motor
Skills, 76, 1219-1230.
[51] Samant, A.N., Paital, S.R. and Dahotre,
N.B. (2008). Process optimization in laser
surface structuring of alumina. Journal of
Materials Processing Technology, 203, 498-
504.
[52] Sanders, M.S. and McCormick, E.J.
(1992). Human factors in engineering and
design, 7th
ed., NY: McGraw-Hill.
[53] Seidler, R.D., Bernard, J.A., Burutolu, T.B.,
Fling, B.W., Gordon, M.T., Gwin, J.T.,
Kwak, Y. and Lipps, D.B. (2010). Motor
control and aging: Links to age-related
brain structural, functional and biochemical
effects. Neuroscience & Behavioral
Reviews, 34(5), 721-733.
[54] Shimoyama, I., Ninchoji, T. and Uemura, K.
(1990). The finger-tapping test: A
quantitative analysis. Arch Neurol, 47, 681-
684.
[55] Siddiquee, A.N., Khan, Z.A. and Mallick, Z.
(2010). Grey relational analysis coupled
with principal component analysis for
optimization design of the process
parameters in in-feed centreless cylindrical
Imtiaz Ali Khan Int. Journal of Engineering Research and Applications www.ijera.com
ISSN : 2248-9622, Vol. 4, Issue 8( Version 7), August 2014, pp.01-21
www.ijera.com 21 | P a g e
grinding. Journal of Advanced
Manufacturing Technology, 46, 983-992.
[56] Smith, W.D., Berquer, R. and Davis, S.
(2002). An ergonomic study of the optimum
operating table height for laparoscopic
surgery. Surgical Endoscopy, 16, 416-421.
[57] Susan, L.M. and Andy, M. (2006). Surface
EMG evaluation of sonographer scanning
postures. Journal of Diagnostic Medical
Sonography, 22, 298-305.
[58] Westgaard, R.H., Aaras, A. and Stranden, E.
(1998). Postural angles as an indicator of
postural load and muscular injury in
occupational work situations. Ergonomics,
31(6), 915-933.
[59] Wu, C. and Liu, Y. (2009). Development
and evaluation of an ergonomic software
package for predicting multiple-task human
performance and mental workload in
human-machine interface design and
evaluation. Computers & Industrial
Engineering, 56(1), 323-333.
[60] Yang, Y.Y., Shie, J.R. and Huang, C.H.
(2006). Optimization of dry machining
parameters for high purity graphite in end-
milling process. Journal of Materials and
Manufacturing Processes, 21, 832-837.
Copyright © 2022 FDOKUMEN