Effects of metformin on retinoblastoma growth in vitro and in vivo
Upload
khangminh22Category
view
2download
0
HAL Id: tel-01677239https://tel.archives-ouvertes.fr/tel-01677239
Submitted on 8 Jan 2018
HAL is a multi-disciplinary open accessarchive for the deposit and dissemination of sci-entific research documents, whether they are pub-lished or not. The documents may come fromteaching and research institutions in France orabroad, or from public or private research centers.
L’archive ouverte pluridisciplinaire HAL, estdestinée au dépôt et à la diffusion de documentsscientifiques de niveau recherche, publiés ou non,émanant des établissements d’enseignement et derecherche français ou étrangers, des laboratoirespublics ou privés.
Évaluation in vitro et in vivo des perturbateursendocriniens chez le poisson zèbre : cas de substances
seules et en mélangesHélène Serra
To cite this version:Hélène Serra. Évaluation in vitro et in vivo des perturbateurs endocriniens chez le poisson zèbre : casde substances seules et en mélanges. Chimie analytique. Université de Bordeaux, 2017. Français.�NNT : 2017BORD0744�. �tel-01677239�
THÈSE
PRÉSENTÉE POUR OBTENIR LE GRADE DE
DOCTEUR DE
L’UNIVERSITÉ DE BORDEAUX
ÉCOLE DOCTORALE DES SCIENCES CHIMIQUES SPÉCIALITÉ : CHIMIE ANALYTIQUE ET ENVIRONNEMENTALE
Par Hélène SERRA
Soutenue le 21 novembre 2017
ÉVALUATION IN VITRO ET IN VIVO DES PERTURBATEURS ENDOCRINIENS CHEZ
LE POISSON ZÈBRE : CAS DE SUBSTANCES SEULES ET EN MÉLANGES
Membres du jury :
Mme BAUDRIMONT, Magalie Professeur, Université de Bordeaux Présidente du jury
M. NAVAS, José-Maria Directeur de recherche, INIA, Madrid Rapporteur
M. LEVI, Yves Professeur, Université Paris Sud Rapporteur
Mme BERNARD, Cécile Professeur, MNHN Examinateur
M. PERCEVAL, Olivier Chargé de mission écotoxicologie, AFB Examinateur
Mme BUDZINSKI, Hélène Directrice de recherche CNRS, Université de Bordeaux Directrice de thèse
M. AÏT-AÏSSA, Selim Chargé de recherche, INERIS Encadrant de thèse
Titre : Evaluation in vitro et in vivo des perturbateurs endocriniens chez le
poisson zèbre : cas des substances seules et en mélanges
Résumé
L’objectif de ce travail de thèse est d’évaluer le potentiel de nouveaux bio-essais in vitro
et in vivo basés sur le poisson zèbre pour la biosurveillance de la contamination chimique de l’eau
par les xeno-estrogènes. Pour cela, les bio-essais ont été appliqués pour évaluer les effets de
polluants aquatiques environnementaux seuls, mais aussi en mélanges simples (reconstitués) et
complexes (échantillons environnementaux). L’évaluation d’échantillons d’eau à travers les bio-
essais in vitro humain (MELN) et poisson zèbre (ZELH-zfERβ2) a montré des différences qualitatives
et quantitatives de réponse, non expliquées par les molécules estrogéniques détectées. Afin de
mieux comprendre ces différences, l’activité de polluants aquatiques a été caractérisée sur les
différents modèles, individuellement et au sein de mélanges de 2 à 12 polluants, combinant
molécules estrogéniques et non estrogéniques pour simuler des situations environnementales.
Les résultats obtenus montrent que les bio-essais basés sur le poisson zèbre répondent
différemment, et parfois de manière opposée, au modèle humain MELN aux mélanges
reconstitués. Ces différences s’expliquent par des sensibilités différentes à certaines molécules
entrainant des interactions avec la réponse aux xeno-œstrogènes spécifiques à chaque modèle
biologique. Dans son ensemble, ce travail montre que les particularités biologiques de chaque bio-
essai peuvent influencer la réponse des xeno-estrogènes quand présents au sein de mélange avec
d’autres polluants. Ces résultats sont discutés au regard de l’utilisation de bio-essais dans
l’évaluation de la contamination chimique des masses d’eau.
Mots clés : xeno-estrogènes, poisson zèbre, mélanges, bio-surveillance, activité estrogénique,
échantillons environnementaux
Title: In vitro and in vivo assessment of endocrine disrupting chemicals in
zebrafish: the case of aquatic contaminants alone and in mixtures
Abstract
This PhD thesis aims at assessing the potential of innovative in vitro and in vivo zebrafish-
based bioassays for biomonitoring of surface water contamination by xeno-estrogens. For this
purpose, the bioassays were applied to assess the effect of environmentally relevant surface water
pollutants, alone and in simple (artificial) and complex (environmental samples) mixtures. The
screening of surface water samples in zebrafish- (ZELH-zfERβ2 cells) and human-based (MELN
cells) bioassays revealed qualitative and quantitative differences which could not be entirely
explained by the xeno-estrogens identified. To better understand the response of bioassays to
complex environmental mixtures, the activity of environmentally relevant surface water
pollutants was characterized across the bioassays, alone and in 2 to 12-component mixtures
combining estrogenic and non-estrogenic chemicals to simulate an environmental contamination.
The results indicate that zebrafish-based bioassays have a different and even in some cases an
opposite response to the simple mixtures compared with the human-based bioassay MELN. These
differences are explained by different sensitivity to some pollutants leading to bioassay-specific
interactions with estrogen receptor activation. Altogether, this work shows that the biological
particularities of each bioassay can influence the response to estrogenic chemicals when mixed
with other environmental pollutants, opening the discussion regarding their implementation in
chemical water biomonitoring.
Key words: xeno-estrogens, zebrafish, mixtures, bio-monitoring, estrogenic activity, environnemental samples
Unités de recherche/Resarch Units
INERIS- Unité d’écotoxicologie in vitro et in vivo (DRC/VIVA/ECOT)
Rue Jacques Taffanel, 60550 Verneuil-en-Halatte
Université de Bordeaux - EPOC, UMR 5805 CNRS, LPTC
351, Cours de la Libération, 33405 Talence, Franc
REMERCIEMENTS
Tout d’abord, je tiens à remercier tous les membres du jury d’avoir accepté d’évaluer ces
trois années de travail : M. Levi et M. Navas, en tant que rapporteur, ainsi que Mme Baudrimont,
Mme Bernard, et M. Perceval. Merci à Hélène Budzinski d’avoir accepté de superviser la thèse.
Malgré la distance, les échanges ont toujours été enrichissants et ont significativement contribués
à faire aboutir ce travail. Merci à Selim et François, de m’avoir encadré au quotidien, de m’avoir
supporté (dans les deux sens du terme), et de ne pas avoir baissé les bras dans les moments
difficiles. Merci de m’avoir initié et formé dans vos domaines respectifs de compétence - so
zebrafish ! - et de m’avoir permi de vous accompagner aux réunions du projet européen, c’était
une expérience super intéressante ! Un grand merci en particulier à Selim pour ton temps et ta
patience pour me former à la culture cellulaire. Merci pour tes conseils au cours de ces trois
années, j’espère en avoir fait et en faire bon usage…
Je tiens aussi à remercier M. Thybaud et M. Porcher de m’avoir accueilli au sein de l’unité
ECOT, ainsi que M. Geffard, M. Perceval, M. Gonzalez et M. Beaudouin d’avoir participé aux
comités de pilotage. Un grand merci à Patrice Gonzalez pour m’avoir accueilli dans son équipe et
pour m’avoir fait découvrir, avec Cerise, la PCR. Je garderai un très bon souvenir de ces 4 semaines
à la station marine d’Arcachon.
Trois années et beaucoup de rencontres ! Tout d’abord, merci à Manu pour ton dynamisme
et ta bonne humeur au quotidien, c’était un plaisir de travailler avec toi et regardes, il fait beau
aujourd’hui. A toutes les idées cuisines, les recettes, Wilson et les petites histoires qui ont rendu
les heures passées au labo toujours très chaleureuses. A Daniel et tes blagues, tes citations
(« Leonco, 2017 »), tes ancêtres les esclaves, le foot le mercredi midi (en collants !), Manchester,
Fécamp, le stade de France, et j’en oublie surement. A Younes, le papa’pinoche des cyclopinoches,
roi de la FIV qui fait pousser des pièces de deux euros dans ma voiture. A ces séances Freelytics,
ces petits gâteaux délicieux et ce couscous qu’on attend toujours. A Adrien et tes origamis, ta
passion pour ce doux breuvage à base de houblon, ton talent de pâtissier, les vides grenier, ta
voiture qui s’entend à dix km, et ta gentillesse (à part pour les gerbilles !). Deep, à ces années
terminées et commencées ensemble à Paris et à Bruxelles, et tous ces petits moments à papoter,
ces journées à Bordeaux et ton soutien pendant la thèse. A Vincent, super dynamique co-
fondateur du club des doctorants, si si ! Quelle idée folle on a eu de lancer ce club !! On aura réussi

des petites choses, et c’était une belle aventure, en espérant que le flambeau passera aux
générations futures. A Nihal, merci d’avoir cru autant au club des doctorants et d’avoir si souvent
contribué à le faire vivre. A Clémentine, et tous ses petits dessins et jeux de mots. A Grazia, pour
ta bonne humeur et ton bon esprit combatif, pour ces soirées passées ensemble. A Audrey, pour
ton dynamisme, ton envie, et ces discussions enjouées sur la bière, Jack, Daniels, Tequila et
Margarita (nos rongeurs préférés) sans oublier les soirées piscine. A Elodie, ton enthousiasme au
labo restera un exemple. A Betty, pour ta bonne humeur et ton rire. A Morgane, pour ton
dynamisme, ta clairvoyance et gentillesse, pour les séances de sport vernoliennes, ce château
qu’on a jamais trouvé et cette mythique soirée à Beauvais. A Valentin pour ton humour acide (de
« ta génération » je suppose) et ton accent belge. Et à tous ceux que je n’oublie pas : Nico, Hakim,
Louis, Manoj, Fanny, Clémence, Maxime, Marie, Thomas, Soafara, Anitha, Francesco,
Youngchang…
A toute l’équipe ECOT pour sa bonne humeur et convivialité : Edith, Nathalie, Benjamin,
Sandrine (« intéressant, c’est très intéressant ! »), Cyril, Olivier, Anne et Patrick (et les garçons). A
tous les gars du foot (et à Alexandra) pour les mercredi midi sur le terrain et pour ces trois tournois
vaillamment défendus, et à René, sportif inépuisable. Merci à Juste pour toutes ces discussions,
ton enthousiasme et ton aide à faire sortir de terre ce projet de jeux. Merci à John, pour son
indéfectible soutien et ses conseils précieux depuis toutes ces années qui aboutissent enfin. Et un
grand merci à ma famille, d’avoir vécu (et survécu) trois années rythmées par le poisson zèbre et
les hormones sans en être perturbé, et de m’avoir soutenu et accompagné jusqu’à aujourd’hui.
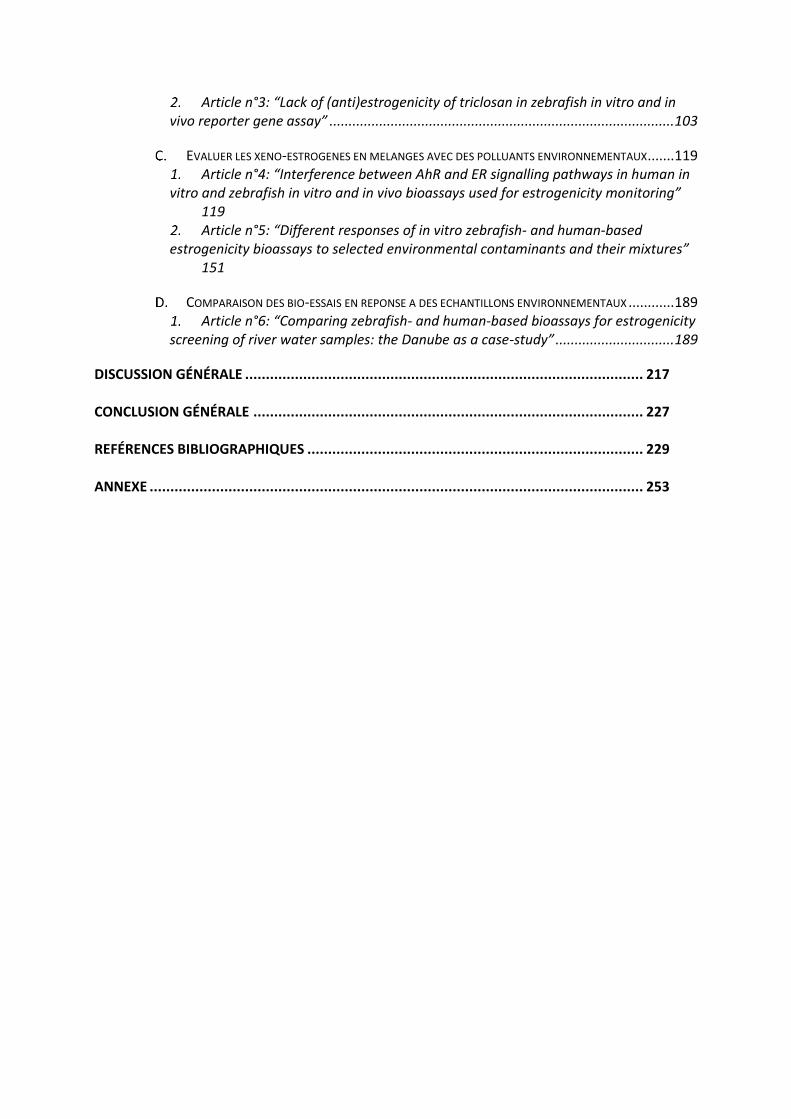
Table des matières
LISTE DES TABLEAUX ......................................................................................................... I
LISTE DES FIGURES ........................................................................................................... II
LISTE DES ABBRÉVIATIONS .............................................................................................. III
PUBLICATIONS & COMMUNICATIONS .............................................................................. IV
INTRODUCTION GÉNÉRALE ............................................................................................... 1
SYNTHÈSE BIBLIOGRAPHIQUE ........................................................................................... 7
SYSTEME ENDOCRINIEN ET VOIE DES ESTROGENES .................................................................. 8 Le système endocrinien ......................................................................................... 8 Les récepteurs des estrogènes ............................................................................. 11 Exemples de gènes ER-régulés............................................................................. 21
EVALUATION DES XENO-ESTROGENES ................................................................................ 25 Xeno-estrogènes environnementaux ................................................................... 25 Bio-essais et activité estrogénique ...................................................................... 26 Evaluation des xeno-estrogènes en mélange ...................................................... 36
BIO-SURVEILLANCE DES XENO-ESTROGENES DANS L’ENVIRONNEMENT ...................................... 42 Surveillance de l’eau en France ........................................................................... 42 Stratégie de bio-analyse pour évaluer les xeno-estrogènes ................................ 46 Conclusions et défis ............................................................................................. 53
DEMARCHE EXPERIMENTALE .......................................................................................... 55
OBJECTIF ..................................................................................................................... 56
LE PROJET SOLUTIONS ................................................................................................ 57 Présentation ........................................................................................................ 57 Implications dans le cadre de la thèse ................................................................. 58
METHODOLOGIE ........................................................................................................... 61 Modèles cellulaires in vitro .................................................................................. 61 Modèle in vivo : le test EASZY .............................................................................. 63 Sensibilité des bio-essais ...................................................................................... 64 Analyse des données ........................................................................................... 65
RESULTATS ..................................................................................................................... 67
LES BIO-ESSAIS DANS LA BIO-SURVEILLANCE : APPORTS ET BESOINS .......................................... 68 Article n°1: “Linking in vitro effects and detected organic micropollutants in
surface water using mixture toxicity modelling” ......................................................... 68
RENSEIGNER L’ACTIVITE DE POLLUANTS ENVIRONNEMENTAUX ................................................. 81 Article n°2: “Development of a bioanalytical test battery for water quality
monitoring: fingerprinting identified micropollutants and their contribution to effects in surface water” ......................................................................................................... 81
Article n°3: “Lack of (anti)estrogenicity of triclosan in zebrafish in vitro and in vivo reporter gene assay” .......................................................................................... 103
EVALUER LES XENO-ESTROGENES EN MELANGES AVEC DES POLLUANTS ENVIRONNEMENTAUX ....... 119 Article n°4: “Interference between AhR and ER signalling pathways in human in
vitro and zebrafish in vitro and in vivo bioassays used for estrogenicity monitoring” 119
Article n°5: “Different responses of in vitro zebrafish- and human-based estrogenicity bioassays to selected environmental contaminants and their mixtures” 151
COMPARAISON DES BIO-ESSAIS EN REPONSE A DES ECHANTILLONS ENVIRONNEMENTAUX ............ 189 Article n°6: “Comparing zebrafish- and human-based bioassays for estrogenicity
screening of river water samples: the Danube as a case-study” ............................... 189
DISCUSSION GÉNÉRALE ................................................................................................ 217
CONCLUSION GÉNÉRALE .............................................................................................. 227
REFÉRENCES BIBLIOGRAPHIQUES ................................................................................. 229
ANNEXE ....................................................................................................................... 253
I
LISTE DES TABLEAUX
Tableau I: Exemples de ligands environnementaux de ER et de leur occurrence dans les eaux de surface. .......................................................................................................................................... 25
Tableau II: Exemples et principales caractéristiques de lignées cellulaires à gènes rapporteurs développées pour évaluer l'activation de ER chez l’Homme et les poissons .................................. 29
Tableau III: Exemples et caractéristiques principales de lignées de poissons transgéniques développées pour évaluer les xeno-estrogènes.. ........................................................................... 34
Tableau IV: Sensibilité des principales lignées de poissons transgéniques aux composés estrogéniques ................................................................................................................................ 35
Tableau V: Avantages et inconvénients des bio-essais et de l'analyse chimique ciblée .................. 46
Tableau VI: Exemples d'études évaluant l'activité oestrogénique d'effluents de stations d'épuration urbaine. ...................................................................................................................... 49
Tableau VII: Exemples d'études évaluant l'activité estrogénique d'échantillons ponctuels d'eau de surface à travers le monde............................................................................................................. 50
Tableau VIII: Caractéristiques principales des cas d'étude du Danube et de Novi Sad .................... 59
Tableau IX: Caractéristiques des lignées cellulaires utilisées dans le cadre de la thèse .................. 61
Tableau X: Sensibilité des bio-essais à l'estradiol (E2) et à l'ethinyl estradiol (EE2).. ...................... 64
Tableau XI: Résultats du criblage de 34 molécules sur les bio-essais MELN, ZELHα, ZELHβ2, ZELH, PXR et dans le test EASZY.. ............................................................................................................ 84
Tableau XII: Méthodes utilisées pour dériver des valeurs seuils d'activité oestrogénique pour les échantillons environnementaux. ..................................................................................................225
Tableau XIII : Bio-essais in vitro et in vivo utilisés dans l’étude sur les mélanges reconstitués. .....254
Tableau XIV: 12 composés choisis pour les mélanges reconsitués. ...............................................255
Tableau XV : Ratios utilisés pour la réalisation des mélanges M1 et M2, et bio-essais susceptibles de capturer les effets de chaque composé. ...................................................................................255
II
LISTE DES FIGURES
Figure 1: Steroidogénèse chez le poisson ......................................................................................... 9
Figure 2: Régulation hormonale de la gamétogenèse chez les poissons femelles ........................... 10
Figure 3: Structure générale des récepteurs nucléaires .................................................................. 12
Figure 4: Signalisation des estrogènes : voie d'activation génomique et non génomique.. ............ 13
Figure 5: Arbre phylogénétique du récepteur ERα chez les poissons téléostéens .......................... 15
Figure 6: Analyse des identités de séquence entre les domaines des récepteurs ER du poisson zèbre et de l'Homme pour les régions codantes ...................................................................................... 16
Figure 7: Exemples type de profils de réponse de ligands de ER..................................................... 17
Figure 8: Possibles mécanismes d'interaction entre les voies de signalisation de ER et AhR. ......... 20
Figure 9: Exemples d’essais in vitro et in vivo pour évaluer les molécules estrogéniques chez les mammifères et les poissons. .......................................................................................................... 26
Figure 10: Principe d’un test de transactivation avec gène rapporteur basé sur l'utilisation de la luciférase pour évaluer l’activité d’une molécule. .......................................................................... 28
Figure 11: exemples de réponse des sous-types de zfER à des xeno-estrogènes dans différentes lignées cellulaires........................................................................................................................... 31
Figure 12: Principe de l'évaluation de l'état des masses d'eau de surface dans le cadre de la DCE en France. ........................................................................................................................................... 43
Figure 13: Principe général de la bio-analyse. ................................................................................ 47
Figure 14: Démarche expérimentale de la thèse ............................................................................ 56
Figure 15: Représentation schématique de la structuration du projet européen SOLUTIONS. ....... 57
Figure 16: Démarche du work package de SOLUTIONS dédiés aux bio-essais................................. 58
Figure 17 : Sites échantillonnés (points rouges) dans le cadre de la JDS3 ....................................... 60
Figure 18: Représentation schématique de l’évaluation de l’activité d’une molécule dans les tests in vitro. .......................................................................................................................................... 61
Figure 19: représentation schématique du test EASZY pour évaluer l'estrogenicité de molécules. 64
Figure 20: Principe du calcul d’équivalents biologique (Bio-TEQ) et chimique (Chem-TEQ) pour évaluer l’activité estrogénique d’un échantillon environnemental. ............................................... 66
Figure 21: Comparaison de l'activité estrogénique d'extraits d'eaux de surface sur les cellules ZELHβ2 et MELN. ..........................................................................................................................222

III
LISTE DES ABBRÉVIATIONS
AhR Aryl Hydrocarbon Receptor GFP Green fluorescent proteine
ARNT Aryl hydrocarbon Receptor Nuclear Translocator
GPER Récepteur des estrogènes couplé à une proteine G
4-n-NP 4-n-nonylphenol HAP Hydrocarbure aromatique polycyclique
17β-HSD 17β-hydroxystéroïde deshydrogénase
hpf Heures post fécondation
AroB Aromatase B IA Independent Action
BaP Benzo(a)pyrene jpf Jours post fécondation
BbF Benzo(b)fluoranthène Kd Constante de dissociation
Bio-TEQ Equivalent Toxique Biologique
LBD Ligand Binding Domain
BPA Bisphénol A LUC Luciferase
CA Concentration Addition LVSPE Large Volume Solid Phase Extraction
Chem-TEQ Equivalent Toxique Chimique
MAPK Mitogen Activated Protein Kinase
ChgH/L Choriogenine H/L MCF-7 Lignée cellulaire de cancer du sein (Michigan Cancer Foundation-7)
CYP450 Cytochrome P450 MELN MCF7- ERE-Luc-Neomycin
DBD DNA Binding Domain OCDE Organisation pour la Coopération Economique et pour le Développement
DCE Directive Cadre sur l'Eau PE Pertrubateur endocrinien
DHP Dihydroprogesterone PG Prostaglandine
DSMO Dimethylsulfoxide PI3K Phosphoinositide 3-kinase
E1 Estrone REP Relative potency
E2 17β-Estradiol TA Transactivation Assay
E2-Eq Estradiol Equivalent TCDD 2,3,7,8-tetrachlorodibenzodioxin
ECHA European Chemicals Agency TCS Triclosan
ECx Concentration efficace induisant X% de réponse
TEQ Equivalent Toxique
EDC Endocrine Disrupting chemicals
TF Transcription Factor
EE2 17α-Ethinyl Estradiol TPP Triphenylphosphate
ER Récepteur des estrogènes VTG Vitellogenine
ERE Estrogen Response Element YES Yeast Estrogen Screen
EROD Ethoxyresorufin-O-deethylase
ZELH ZFL-ERE-Luc-Hygromycin
ES Effect Summation
ZFL Lignée de cellules de foie de poisson zèbre (zebrafish liver)
FDA Food and Drug Organisation
IV
PUBLICATIONS &
COMMUNICATIONS
➢ Articles publiés
P. Neale, S. Ait-Aissa, W. Brack, N. Creusot, M. Denison, B. Deutschmann, K.
Hilscherová, H. Hollert, M. Krauss, J. Novák, T. Schulze, T-B. Seiler, H. Serra, Y. Shao, B.
Escher (2015). Linking in vitro effects and detected organic micropollutants in surface
water using mixture toxicity modeling. Environ. Sci. Technol., 49 (24), pp 14614–14624
(article n°1)
P. Neale, R. Altenburger, S. Aїt-Aїssa, F. Brion, W. Busch, G. Umbuzeiro, M.
Denison, D. Du Pasquier, K. Hilscherová, H. Hollert, D. A. Morales, J. Novák, R. Schlichting,
T-B. Seiler, H. Serra, Y. Shao, A. Tindall, KE Tollefsen, T. Williams, B. Escher. (2017)
Development of a bioanalytical test battery for water quality monitoring: fingerprinting
identified micropollutants and their contribution to effects in surface water. Water Res.
123, 734–750. doi:10.1016/j.watres.2017.07.016 (article n°2)
➢ Articles en preparation
H. Serra, F. Brion, H. Budzinski, S. Aït-Aïssa. Lack of (anti)estrogenicity of triclosan
in zebrafish ER reporter gene bioassays in vitro and in vivo. (en préparation) (article n°3)
H. Serra, F. Brion, H. Budzinski, G. Daffe, P. Gonzalez, S. Aït-Aïssa. Interference
between AhR and ER signalling pathways in human in vitro and zebrafish in vitro and in
vivo bioassays used for estrogenicity monitoring. (en préparation) (article n°4)
H. Serra, M. Scholze, R. Altenburger, W. Busch, H. Budzinski, F. Brion, S. Aït-Aïssa.
Different responses of in vitro zebrafish- and human-based estrogenicity bioassays to
selected environmental contaminants and their mixtures. (en préparation) (article n°5)
H. Serra, F. Brion, H. Budzinski, T. Schulze, W. Brack, S. Aït-Aïssa. Comparing
zebrafish- and human-based bioassays for estrogenicity screening of river water samples:
the Danube as a case-study. (en préparation) (article n°6)
R. Altenburger et al. Mixture response in complex contaminated samples: an
inerlaboratory comparative study using effect based methods (en préparation)

V
➢ Conférences nationales & internationales
H. Serra, F. Brion, H. Budzinski, M. Scholze, R. Altenburger, S. Aït-Aïssa.
Comparaison de la réponse de lignées cellulaires humaine et de poisson zèbre utilisées
pour évaluer l'estrogénicité de polluants émergents seuls et en mélanges reconstitués.
Colloque de la SEFA 2017, 29-30 juin, Lille, France (communication orale)
H. Serra, F. Brion, M. Scholze, W. Busch, R. Altenburger, S. Aït-Aïssa. Different
responses of zebrafish and human-based estrogenicity bioassays to selected
environmental contaminants and their mixtures. Europe SETAC 2017, 7-11 mai, Bruxelles,
Belgique (communication orale)
H. Serra, H. Budzinski, F. Brion, S. Aït-Aïssa. Investigation of (anti)estrogenicity of
triclosan using in vitro and in vivo zebrafish bioassays. Europe SETAC 2016, 22-26 mai,
Nantes, France (poster)
H. Serra, M. Sonavane, H. Budzinski, F. Brion, S. Aït-Aïssa. Evidence of crosstalk
between AhR and ER pathways in human and zebrafish reporter cell lines used for
estrogenicity screening. 2nd Workshop PNRPE, 21-22 janvier 2016, Paris, France (Poster)
H. Serra, F. Brion, N. Creusot, J.M. Porcher, N. Munz, J. Hollender, T. Schulze, M.
Krauss, W. Brack and S. Aït-Aïssa. An integrated assessment of estrogenicity of complex
environmental samples using in vivo and in vitro effect-based tools. Europe SETAC 2015,
3-7 mai 2015, Barcelone, Espagne (Poster)
P. Neale, R. Altenburger, S. Aїt-Aїssa, F. Brion, W. Busch, G. Umbuzeiro, M.
Denison, D. Du Pasquier, K. Hilscherová, H. Hollert, D. A. Morales, J. Novák, R. Schlichting,
T-B. Seiler, H. Serra, Y. Shao, A. Tindall, KE Tollefsen, T. Williams, B. Escher. (2017)
Fingerprinting the effects of individual micropollutants in a bioanalytical test battery
developed for water quality monitoring. SETAC Australasia 2017, 4-6 September 2017,
Gold Coast, Australie (communication orale)
P. Neale, S. Ait-Aissa, W. Brack, N. Creusot, M. Denison, B. Deutschmann, K.
Hilscherová, H. Hollert, M. Krauss, J. Novák, T. Schulze, T-B. Seiler, H. Serra, Y. Shao, B.
Escher. Applying mixture toxicity modelling to assess the contribution of detected
chemicals to in vitro effects: An example from the Danube River. Europe SETAC 2016, 22-
26 mai 2016, Nantes, France (poster).

INTRODUCTION GÉNÉRALE

Introduction générale
2
Les eaux continentales constituent le réceptacle de quantité de composés chimiques
provenant de diverses sources, rejets industriels, hospitaliers, d’effluents de station d’épuration
ou encore de l’agriculture. Les progrès des dernières décennies en matière d´analyses chimiques,
tant dans l’échantillonnage de matrices complexes que dans la détection et quantification de
molécules en mélange à l’état de traces, ont permis de mettre en évidence l´étendue de la
contamination chimique des eaux à travers le monde (Kolpin et al., 2002; Loos et al., 2009). La
grande diversité des familles de composés retrouvés dans le milieu aquatique (ex : pesticides,
médicaments, produits d´hygiène) soulève la question du devenir et des effets de ces molécules
une fois dans le compartiment aquatique et, en conséquence, du risque auquel sont exposées les
espèces aquatiques.
La présence de perturbateurs endocriniens (PE) dans l’environnement aquatique, tels que
les alkylphénols, bisphénols, pesticides ou les dérivés hormonaux, a fait l’objet de nombreuses
études au cours des dernières décennies (Sumpter and Jobling, 2013). Les PE peuvent être définis
comme « des substances exogènes qui provoquent des effets néfastes sur la santé d’un organisme
ou de sa descendance, secondairement à des changements dans la fonction endocrine » (WHO
2002). Dans le compartiment aquatique, les poissons sont parmi les organismes les plus sensibles
aux PE (Sumpter et Johnson, 2008). Des cas d’intersexes (apparition d’oocytes dans les gonades
mâles, ou inversement) ont été reportés sur des poissons sauvages, comme des goujons péchés
en aval d’un l’effluent d’une industrie pharmaceutique (Sanchez et al., 2011), ou des gardons
vivants à proximité de rejets de stations d’épuration (Jobling et al., 1998). Dans le cas des gardons,
la présence d’intersexe était associée à une diminution de la fertilité des mâles (Jobling et al.,
2002).
Les PE agissent sur le système endocrinien via de multiples mécanismes d’action, parmi
lesquels l’interaction avec la voie de signalisation des estrogènes est particulièrement bien
documentée chez les poissons (Mills and Chichester, 2005). Les estrogènes jouent un rôle essentiel
dans les processus physiologiques fondamentaux tels que la croissance, le développement et la
reproduction (Segner et al., 2013). De nombreuses études en laboratoire ont montré que
l’exposition chronique à de très faibles concentrations d’estradiol (E2) ou d’ethinyl estradiol (EE2)
pouvait impacter négativement les fonctions gonadiques et altérer la fécondité, fertilité et succès
reproducteur des poissons (review dans Caldwell et al., 2012). Dans un lac expérimental canadien,
Introduction générale
3
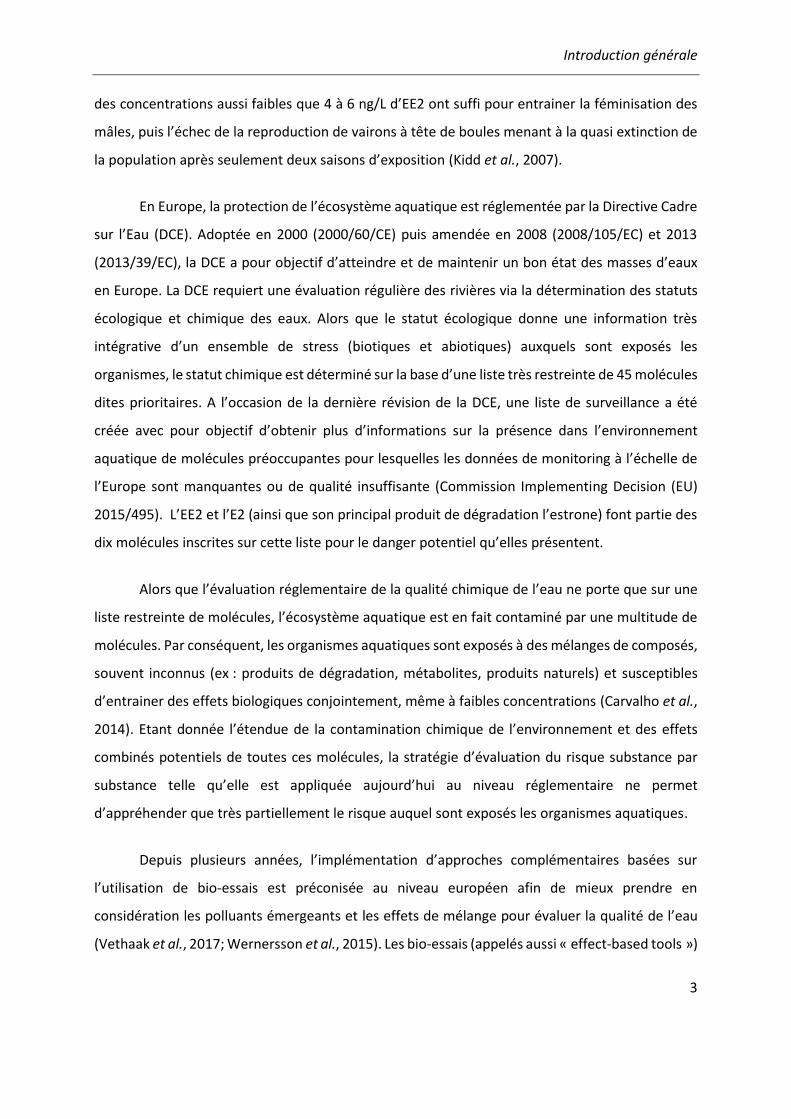
des concentrations aussi faibles que 4 à 6 ng/L d’EE2 ont suffi pour entrainer la féminisation des
mâles, puis l’échec de la reproduction de vairons à tête de boules menant à la quasi extinction de
la population après seulement deux saisons d’exposition (Kidd et al., 2007).
En Europe, la protection de l’écosystème aquatique est réglementée par la Directive Cadre
sur l’Eau (DCE). Adoptée en 2000 (2000/60/CE) puis amendée en 2008 (2008/105/EC) et 2013
(2013/39/EC), la DCE a pour objectif d’atteindre et de maintenir un bon état des masses d’eaux
en Europe. La DCE requiert une évaluation régulière des rivières via la détermination des statuts
écologique et chimique des eaux. Alors que le statut écologique donne une information très
intégrative d’un ensemble de stress (biotiques et abiotiques) auxquels sont exposés les
organismes, le statut chimique est déterminé sur la base d’une liste très restreinte de 45 molécules
dites prioritaires. A l’occasion de la dernière révision de la DCE, une liste de surveillance a été
créée avec pour objectif d’obtenir plus d’informations sur la présence dans l’environnement
aquatique de molécules préoccupantes pour lesquelles les données de monitoring à l’échelle de
l’Europe sont manquantes ou de qualité insuffisante (Commission Implementing Decision (EU)
2015/495). L’EE2 et l’E2 (ainsi que son principal produit de dégradation l’estrone) font partie des
dix molécules inscrites sur cette liste pour le danger potentiel qu’elles présentent.
Alors que l’évaluation réglementaire de la qualité chimique de l’eau ne porte que sur une
liste restreinte de molécules, l’écosystème aquatique est en fait contaminé par une multitude de
molécules. Par conséquent, les organismes aquatiques sont exposés à des mélanges de composés,
souvent inconnus (ex : produits de dégradation, métabolites, produits naturels) et susceptibles
d’entrainer des effets biologiques conjointement, même à faibles concentrations (Carvalho et al.,
2014). Etant donnée l’étendue de la contamination chimique de l’environnement et des effets
combinés potentiels de toutes ces molécules, la stratégie d’évaluation du risque substance par
substance telle qu’elle est appliquée aujourd’hui au niveau réglementaire ne permet
d’appréhender que très partiellement le risque auquel sont exposés les organismes aquatiques.
Depuis plusieurs années, l’implémentation d’approches complémentaires basées sur
l’utilisation de bio-essais est préconisée au niveau européen afin de mieux prendre en
considération les polluants émergeants et les effets de mélange pour évaluer la qualité de l’eau
(Vethaak et al., 2017; Wernersson et al., 2015). Les bio-essais (appelés aussi « effect-based tools »)
Introduction générale
4
sont des tests biologiques permettant d’évaluer une réponse spécifique à différents niveaux
d’organisation : cellule, l’organe, tissu ou organisme. Les paramètres mesurés peuvent être très
spécifiques (ex : activation d’un récepteur) ou apicaux (ex : mortalité). Les bio-essais présentent
l’avantage de prendre en compte les effets biologiques d’un mélange de polluants
environnementaux, connus et inconnus. L’utilisation d’approches bio-analytiques combinant bio-
essais et analyses chimiques s’est beaucoup développée au cours des dernières années, montrant
la complémentarité des méthodes pour améliorer l’évaluation de la qualité des milieux (Brack et
al., 2016; Dévier et al., 2011).
Aujourd’hui, les principaux bio-essais utilisés pour évaluer la présence de composés
estrogéniques dans l’environnement sont des tests de transactivation in vitro basés sur l’utilisation
de lignées cellulaires exprimant le récepteur des estrogènes humain (ER). Ces bio-essais sont
sensibles, fiables, et robustes pour évaluer les composés estrogéniques en mélange et au sein
d’échantillons environnementaux (Kunz et al., 2017; Leusch et al., 2017). Cependant, les
récepteurs des estrogènes (ER) des poissons ont une sensiblité différente des ER de l’Homme pour
certains composés estrogéniques environnementaux (Matthews et al., 2000; Molina-Molina et al.,
2008; Pinto et al., 2014). De plus, chaque modèle biologique utilisé pour les bio-essais conserve
des spécificités du tissu et de l’espèce d’origine (ex : cofacteurs de ER, métabolisme), susceptibles
d’influencer la réponse aux composés estrogéniques (Routledge et al., 2000).
De récentes études ont montré que des bio-essais in vitro basés sur le ER du poisson zèbre
(Sonavane et al., 2016) et du médaka (Ihara et al., 2014) pouvaient répondre différemment que
des bio-essais basés sur le récepteur ERα humain à des échantillons environnementaux, aussi bien
quantitativement que qualitativement. Dans certaines situations, les réponses in vitro des
récepteurs ER de poisson se corrélaient mieux avec les mesures in vivo chez le poisson que la
réponse du bio-essai in vitro basé sur ER de l’Homme (Ihara et al., 2015; Sonavane et al., 2016a).
Au regard des différences inter-espèces et des spécificités de réponse des bio-essais basés sur les
ER de poisson, ces études soulèvent la question de l’adéquation des bio-essais in vitro basés sur
l’Homme pour rendre compte de l’exposition aux molécules estrogéniques chez le poisson, taxon
le plus sensible de l’écosystème aquatique à ces molécules.
Introduction générale
5
La thèse s’inscrit dans une démarche d’évaluation de l’estrogénicité des eaux de surface à
l’aide d’une approche bio-analytique basée sur des bio-essais in vitro et in vivo chez le modèle
poisson zèbre. L’objectif général de ce travail de thèse vise à caractériser les réponses des bio-
essais basés sur le poisson zèbre vis-à-vis de polluants aquatiques environnementaux soit seuls,
soit en mélanges simples (reconstitués) et au sein d’échantillons environnementaux.
Cette thèse a été menée à l’INERIS, en collaboration avec l’UMR-EPOC (Université de
Bordeaux), et en grande partie dans le cadre du projet européen FP7-SOLUTIONS. L’application
des bio-essais au cas d’étude du projet (molécules priorisées, mélanges reconstitués, études
terrain) a permis de les inscrire dans une approche intégrée combinant de nombreux outils
analytiques et bio-analytiques.
Le manuscrit s’organise en quatre grandes parties :
(1) une synthèse bibliographique présentant les principales caractéristiques du système
endocrinien des vertébrés, en particulier les spécificités des poissons par rapport à l’Homme, ainsi
que les bio-essais existant pour évaluer les composés estrogéniques et leurs applications dans une
démarche de bio-surveillance ;
(2) une présentation des principaux objectifs du travail de thèse incluant une brève
description du projet SOLUTIONS et de la démarche expérimentale mise en œuvre ;
(3) les résultats présentés sous forme d’articles et répartis dans 4 chapitres qui concernent
(1) les acquis et limites actuelles de la bio-analyse d’échantillons complexes, (2) l’évaluation de
l’estrogénicité de polluants environnementaux testées seuls et (3) en mélanges reconstitués, et
enfin (4) une application à des échantillons environnementaux ;
(4) une discussion générale visant à replacer les résultats dans le contexte de la surveillance
des milieux aquatiques.

Introduction générale
6

SYNTHÈSE BIBLIOGRAPHIQUE
Synthèse bibliographique : système endocrinien et voie des estrogènes
8
Système endocrinien et voie des estrogènes
Cette partie aborde la fonction endocrinienne dans son ensemble et la voie des estrogènes
chez le poisson en particulier. Par la suite, le mode d’action des estrogènes via les récepteurs des
estrogènes est décrit, avec en focalisant particulièrement sur les différences entre Homme et
poissons. Enfin, deux exemples de gènes estrogéno-régulés codant pour protéines d’intérêt (la
vitellogénine et l’aromatase B) sont présentés.
Le système endocrinien
Le système endocrinien est formé par un réseau d’organes (glandes) et d’hormones qui
agissent de manière coordonnée pour maintenir l’homéostasie et contrôler de nombreuses
fonctions comme le développement, la croissance ou la reproduction, en relation avec le système
nerveux (Norris and Carr, 2013). Les glandes sécrètent des hormones qui peuvent soit agir
localement (glandes autocrine et paracrine), soit à distance au niveau des organes effecteurs en
étant véhiculées dans le sang par des protéines (glandes neurocrines et endocrines). Les hormones
ont des précurseurs variés, comme les dérivés d’acides aminés (ex : mélatonine), des polypeptides
(ex : insuline) et glycoprotéines (ex : hormone folliculo-stimulante), des dérivés du cholestérol (ex :
hormones stéroïdiennes) ou des dérivés d’acides gras (ex : prostaglandines). Les niveaux circulant
d’hormones sont contrôlés par un système complexe de rétrocontrôles, garantissant une action
rapide, contrôlée et adaptée. La suite la synthèse porte sur la voie des estrogènes qui font partie
des hormones stéroïdes.
1.1 Stéroïdogénèse
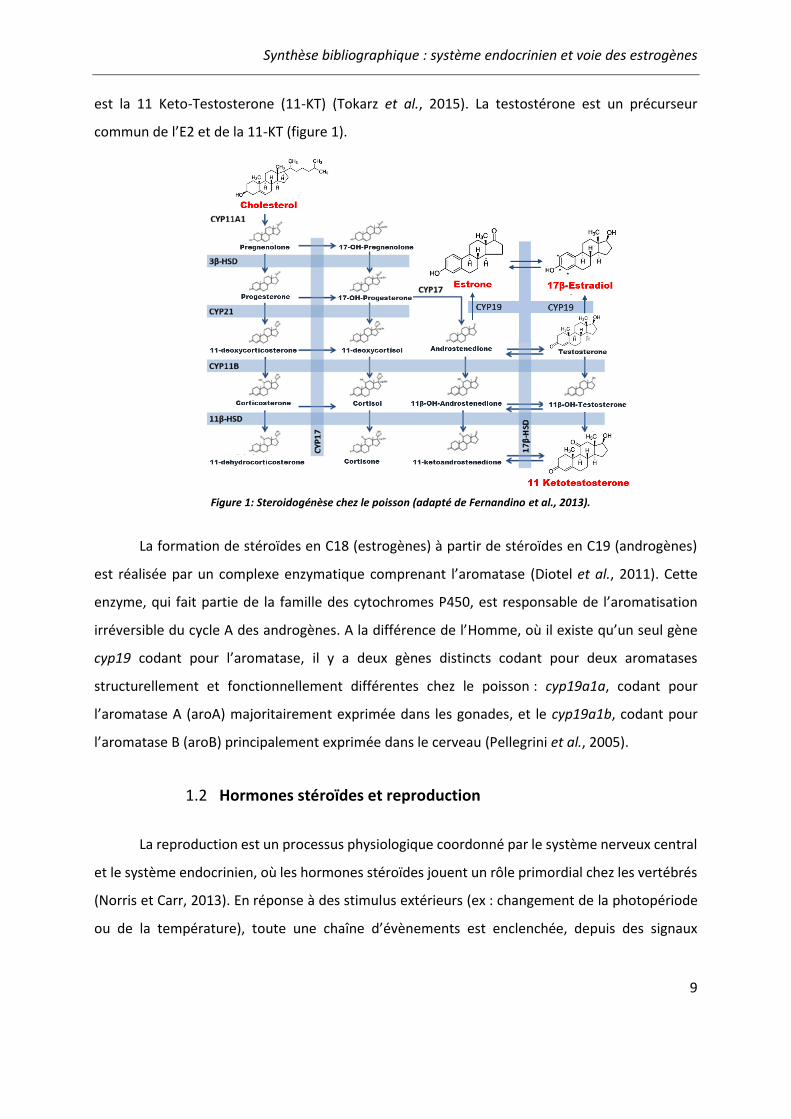
La stéroidogénèse chez les poissons est présentée dans la figure 1 (adapté de Fernandino
et al., 2013). Les hormones stéroïdiennes sont synthétisées à partir du cholestérol, converti
progressivement par de nombreuses enzymes en androgènes, progestagènes, corticoïdes et
estrogènes. L’androstenedione et la testostérone (T), inter-convertibles par l’action de la 17β-
hydroxystéroïde déshydrogénase (17β-HSD), sont les précurseurs de l’estrone (E1) et du 17β-
estradiol (E2), respectivement. A la différence de l’Homme, le principal androgène chez le poisson
Synthèse bibliographique : système endocrinien et voie des estrogènes
9
est la 11 Keto-Testosterone (11-KT) (Tokarz et al., 2015). La testostérone est un précurseur
commun de l’E2 et de la 11-KT (figure 1).
La formation de stéroïdes en C18 (estrogènes) à partir de stéroïdes en C19 (androgènes)
est réalisée par un complexe enzymatique comprenant l’aromatase (Diotel et al., 2011). Cette
enzyme, qui fait partie de la famille des cytochromes P450, est responsable de l’aromatisation
irréversible du cycle A des androgènes. A la différence de l’Homme, où il existe qu’un seul gène
cyp19 codant pour l’aromatase, il y a deux gènes distincts codant pour deux aromatases
structurellement et fonctionnellement différentes chez le poisson : cyp19a1a, codant pour
l’aromatase A (aroA) majoritairement exprimée dans les gonades, et le cyp19a1b, codant pour
l’aromatase B (aroB) principalement exprimée dans le cerveau (Pellegrini et al., 2005).
1.2 Hormones stéroïdes et reproduction
La reproduction est un processus physiologique coordonné par le système nerveux central
et le système endocrinien, où les hormones stéroïdes jouent un rôle primordial chez les vertébrés
(Norris et Carr, 2013). En réponse à des stimulus extérieurs (ex : changement de la photopériode
ou de la température), toute une chaîne d’évènements est enclenchée, depuis des signaux
Figure 1: Steroidogénèse chez le poisson (adapté de Fernandino et al., 2013).
Synthèse bibliographique : système endocrinien et voie des estrogènes
10
neuronaux jusqu’aux stimuli hormonaux, menant à la maturation, libération, et fécondation des
gamètes.
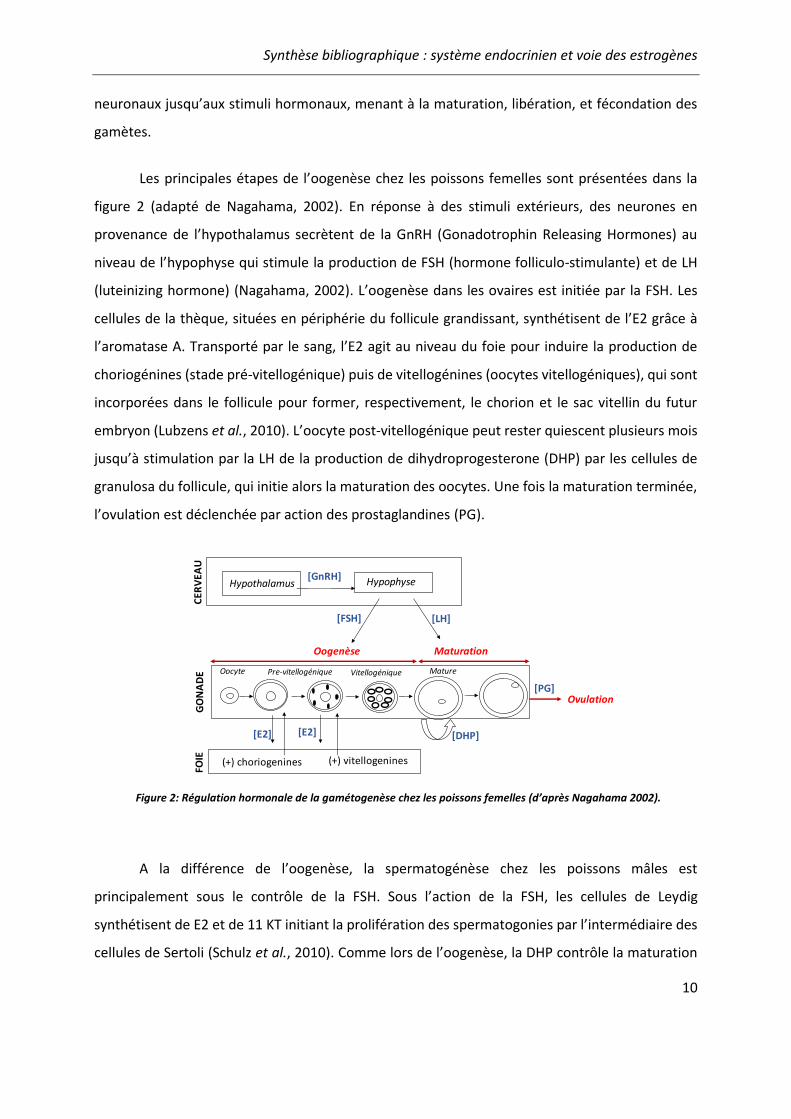
Les principales étapes de l’oogenèse chez les poissons femelles sont présentées dans la
figure 2 (adapté de Nagahama, 2002). En réponse à des stimuli extérieurs, des neurones en
provenance de l’hypothalamus secrètent de la GnRH (Gonadotrophin Releasing Hormones) au
niveau de l’hypophyse qui stimule la production de FSH (hormone folliculo-stimulante) et de LH
(luteinizing hormone) (Nagahama, 2002). L’oogenèse dans les ovaires est initiée par la FSH. Les
cellules de la thèque, situées en périphérie du follicule grandissant, synthétisent de l’E2 grâce à
l’aromatase A. Transporté par le sang, l’E2 agit au niveau du foie pour induire la production de
choriogénines (stade pré-vitellogénique) puis de vitellogénines (oocytes vitellogéniques), qui sont
incorporées dans le follicule pour former, respectivement, le chorion et le sac vitellin du futur
embryon (Lubzens et al., 2010). L’oocyte post-vitellogénique peut rester quiescent plusieurs mois
jusqu’à stimulation par la LH de la production de dihydroprogesterone (DHP) par les cellules de
granulosa du follicule, qui initie alors la maturation des oocytes. Une fois la maturation terminée,
l’ovulation est déclenchée par action des prostaglandines (PG).
A la différence de l’oogenèse, la spermatogénèse chez les poissons mâles est
principalement sous le contrôle de la FSH. Sous l’action de la FSH, les cellules de Leydig
synthétisent de E2 et de 11 KT initiant la prolifération des spermatogonies par l’intermédiaire des
cellules de Sertoli (Schulz et al., 2010). Comme lors de l’oogenèse, la DHP contrôle la maturation
Hypothalamus Hypophyse
Oogenèse Maturation
GO
NA
DE
FOIE (+) choriogenines
[E2] [E2]
Pre-vitellogénique Vitellogénique
[DHP]
Oocyte Mature
Ovulation[PG]
[FSH] [LH]
[GnRH]
(+) vitellogenines
CER
VEA
U
Figure 2: Régulation hormonale de la gamétogenèse chez les poissons femelles (d’après Nagahama 2002).

Synthèse bibliographique : système endocrinien et voie des estrogènes
11
des spermatogonies, et serait secrétée par les cellules souches et les cellules matures (Chen et al.,
2010).
1.3 Métabolisme et élimination
Après avoir agi, les hormones stéroïdes sont métabolisées par l’action conjointe des
enzymes de phase I et de phase II qui augmentent leur polarité et facilitent leur élimination (Xu et
al., 2005). Les enzymes de phase I, dites de fonctionnalisation, catalysent des réactions simples
comme des oxydations, des réductions, ou des hydrolyses. Elles regroupent essentiellement des
enzymes de la famille des cytochromes P450 responsables d’oxydation et d’oxydo-réduction (Xu
et al., 2005). Les cytochromes P450 sont majoritairement régulés de manière transcriptionnelle
par des récepteurs nucléaires, à l’instar du CYP1A et CYP3A inductibles, respectivement, par le
récepteur AhR (« Aryl hydrocarbon receptor »), et par le récepteur PXR (« Pregnane X receptor »)
(Denison and Nagy, 2003). Les enzymes de phase II, dites de conjugaison, transfèrent des
groupements polaires, comme un groupement glucuronide (par des glucuronyl transferases,
UGT), glutathion (glutathione-S-transferase, GST), ou sulfate (sulfo-transferase, SULT), pour
faciliter leur élimination (James, 2011)
Il existe beaucoup de similitudes dans le métabolisme des hormones stéroïdes au sein des
vertébrés (James, 2011; Sanderson and van, 2009). La métabolisation des stéroïdes s’effectue
principalement dans le foie. L’estradiol, par exemple, est pris en charge par les CYP1A et CYP3A,
ainsi que par les hydroxy-stéroïde déshydrogénases (Sanderson and van, 2009). Les métabolites
glucuro- et sulfo-conjugués formés sont ensuite éliminés par des transporteurs tels que la P-gp
(« P-glycoprotein ») et la MRP (« Multidrug-resistance Associated Protein »).
Les récepteurs des estrogènes
2.1 Structure et mode d’action
2.1.1 Généralités
Les récepteurs des estrogènes (ER) sont des récepteurs nucléaires qui font partie de la
sous-famille III des récepteurs stéroïdiens, incluant les récepteurs des progestagènes, des
Synthèse bibliographique : système endocrinien et voie des estrogènes
12
androgènes, des glucocorticoïdes, des minéralocorticoïdes et des estrogen-related receptors
(Laudet, 1997). Il existe plusieurs sous-types de ER (α et ß), qui peuvent différer en fonction des
espèces (Matthews et al., 2000; Tohyama et al., 2016). Les récepteurs nucléaires sont des facteurs
de transcription qui régulent l’expression de gènes cibles impliqués dans de grandes fonctions
physiologiques comme la croissance, le développement ou la reproduction (Heldring et al., 2007;
Segner et al., 2013).
2.1.2 Structure
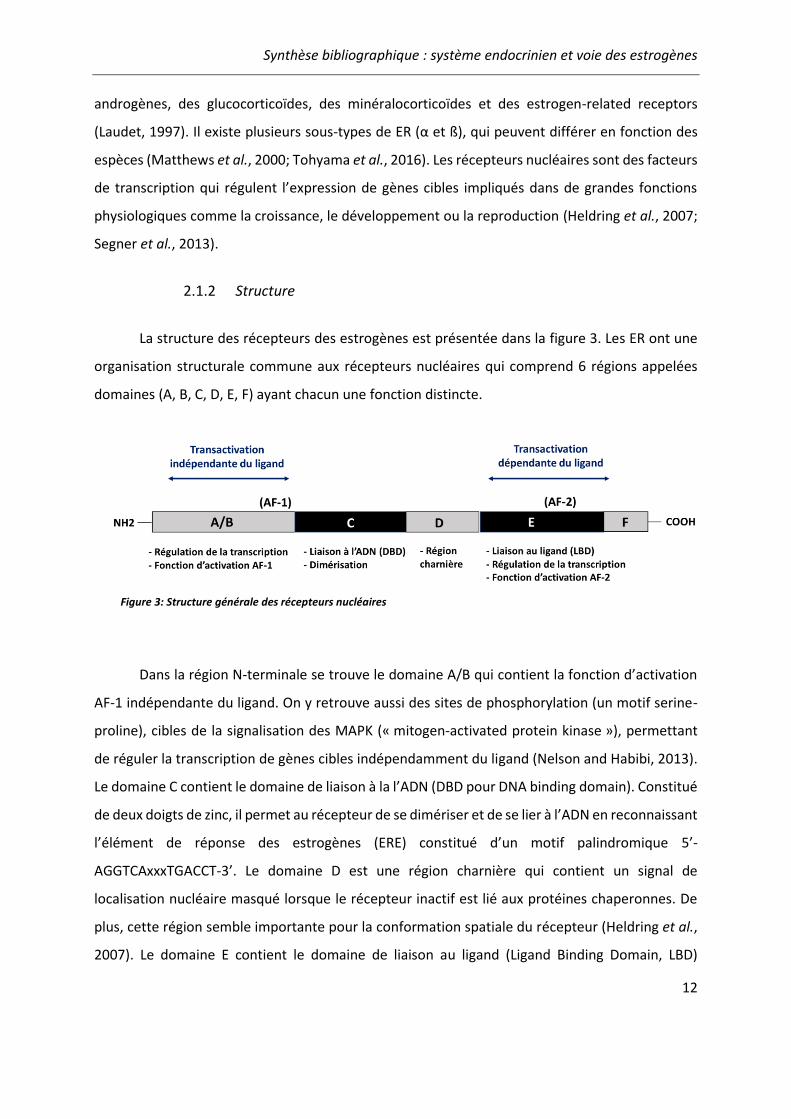
La structure des récepteurs des estrogènes est présentée dans la figure 3. Les ER ont une
organisation structurale commune aux récepteurs nucléaires qui comprend 6 régions appelées
domaines (A, B, C, D, E, F) ayant chacun une fonction distincte.
Dans la région N-terminale se trouve le domaine A/B qui contient la fonction d’activation
AF-1 indépendante du ligand. On y retrouve aussi des sites de phosphorylation (un motif serine-
proline), cibles de la signalisation des MAPK (« mitogen-activated protein kinase »), permettant
de réguler la transcription de gènes cibles indépendamment du ligand (Nelson and Habibi, 2013).
Le domaine C contient le domaine de liaison à la l’ADN (DBD pour DNA binding domain). Constitué
de deux doigts de zinc, il permet au récepteur de se dimériser et de se lier à l’ADN en reconnaissant
l’élément de réponse des estrogènes (ERE) constitué d’un motif palindromique 5’-
AGGTCAxxxTGACCT-3’. Le domaine D est une région charnière qui contient un signal de
localisation nucléaire masqué lorsque le récepteur inactif est lié aux protéines chaperonnes. De
plus, cette région semble importante pour la conformation spatiale du récepteur (Heldring et al.,
2007). Le domaine E contient le domaine de liaison au ligand (Ligand Binding Domain, LBD)
Figure 3: Structure générale des récepteurs nucléaires
Synthèse bibliographique : système endocrinien et voie des estrogènes
13
composé de 12 hélices α formant une poche hydrophobe. Le domaine E contient aussi la fonction
d’activation AF-2 dépendante du ligand capable d’interagir avec des cofacteurs et avec la fonction
AF-1 pour réguler la transcription. Le région C-terminale, de petite taille et très variable, constitue
le domaine F et jouerait un rôle dans l’action des anti-estrogènes (Nelson and Habibi, 2013).
2.1.3 Mode d’action
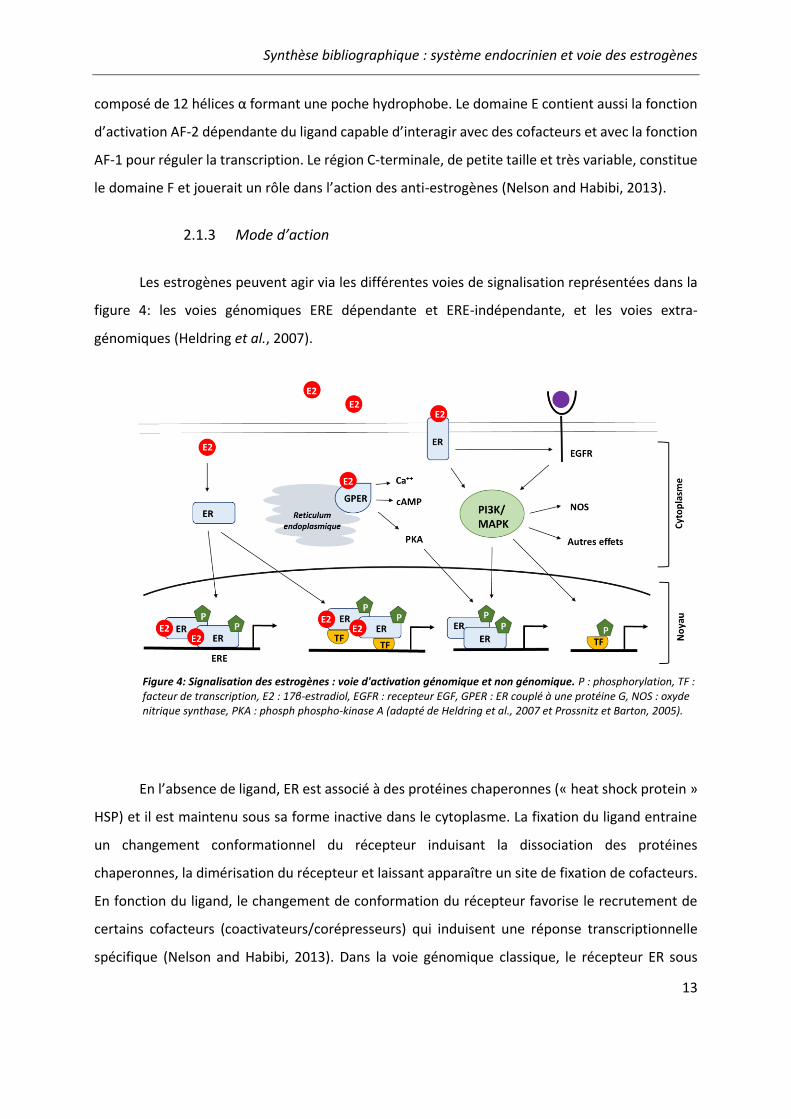
Les estrogènes peuvent agir via les différentes voies de signalisation représentées dans la
figure 4: les voies génomiques ERE dépendante et ERE-indépendante, et les voies extra-
génomiques (Heldring et al., 2007).
En l’absence de ligand, ER est associé à des protéines chaperonnes (« heat shock protein »
HSP) et il est maintenu sous sa forme inactive dans le cytoplasme. La fixation du ligand entraine
un changement conformationnel du récepteur induisant la dissociation des protéines
chaperonnes, la dimérisation du récepteur et laissant apparaître un site de fixation de cofacteurs.
En fonction du ligand, le changement de conformation du récepteur favorise le recrutement de
certains cofacteurs (coactivateurs/corépresseurs) qui induisent une réponse transcriptionnelle
spécifique (Nelson and Habibi, 2013). Dans la voie génomique classique, le récepteur ER sous
Figure 4: Signalisation des estrogènes : voie d'activation génomique et non génomique. P : phosphorylation, TF : facteur de transcription, E2 : 17β-estradiol, EGFR : recepteur EGF, GPER : ER couplé à une protéine G, NOS : oxyde nitrique synthase, PKA : phosph phospho-kinase A (adapté de Heldring et al., 2007 et Prossnitz et Barton, 2005).

Synthèse bibliographique : système endocrinien et voie des estrogènes
14
forme d’homodimère activé se lie à l’ADN au niveau des séquences ERE situées dans les
promoteurs de gènes cibles hormono-régulés. Cependant, chez l’Homme, un tiers des gènes
régulés par ER ne contient pas de séquence ERE complète (Björnström and Sjöberg, 2005).
Dans la voie génomique non-ERE dépendante, les ER peuvent moduler la transcription de
gènes en interagissant avec d’autres facteurs de transcription tels que Sp-1 (specific protein 1), ou
le complexe AP-1 (activating protein 1) contenant un dimère c-jun et/ou c-fos (Heldring et al.,
2007). Les estrogènes peuvent aussi induire des actions rapides via les récepteurs ER
membranaires en interagissant avec des récepteurs tyrosines kinases tels que les récepteurs de
facteurs de croissance (EGF et IGF). D’autre part, il a été mis en évidence l’existence d’un récepteur
membranaire couplé à un protéine G, le GPR30 (« G-protein-coupled estrogen receptor »),
capable de lier l’E2 et d’induire des réponses cellulaires rapides (Prossnitz and Barton, 2011;
Thomas et al., 2005). L’activation des récepteurs membranaires induit des réponses rapides, telles
que l’activation de la voie des MAPK et PI3K (phosphoinositide 3-kinase) et d’une cascade de
réponses cytoplasmiques (Heldring et al., 2007).
2.2 Spécificités des récepteurs des estrogènes chez le poisson
Cette partie traite des différences entre récepteurs des estrogènes ichtyens et humains en
termes d’homologie de séquence, d’affinité et de réponse à l’E2.
2.2.1 Séquences des ER
L’existence des ER a été mise en évidence initialement par l’identification de ERα chez
l’Homme, puis d’un deuxième sous-type, ERβ, chez le rat (Kuiper et al., 1996) et de nombreuses
autres espèces (Matthews et al., 2000). Chez l’Homme, les deux sous-types de ER, hERα et hERβ,
sont codés par deux gènes distincts, esr1 et esr2. Chez les poissons téléostéens, un évènement de
duplication du génome il y a environ 350 millions d’années serait responsable de l’apparition d’un
autre sous-type de ER, orthologue de esr2 (Tohyama et al., 2016). Chez les salmoniformes, une
autre duplication du génome plus récente est suggérée pour expliquer la présence de deux esr1
identifiés chez la truite (Nagler et al., 2007; Tohyama et al., 2016). D’après la nomenclature
internationale (Gray et al., 2015), esr1 code pour ERα, esr2a pour ERβ2 et esr2b pour ERβ1, sauf

Synthèse bibliographique : système endocrinien et voie des estrogènes
15
pour le médaka (O. latipes), où la séquence esr2a correspond au sous-type initialement appelé
ERβ1 et esr2b au sous-type initialement appelé ERβ2 (Tohyama et al., 2015).
Les ER de nombreux vertébrés, incluant mammifères, amphibiens et poissons, ont été
isolés et séquencés au cours des deux dernières décennies (Hawkins et al., 2000). Un exemple
récent d’arbre phylogénétique illustrant l’évolution de ERα chez les poissons téléostéens est
présenté en figure 5 (issu de Tohyama et al., 2016). Si les structures de ER pour chaque sous-type
sont relativement bien conservées au sein des cyprinidés (gardon, carpe, vairon tête de boule et
poisson zèbre), on observe que ces espèces forment un groupe distinct par rapport aux autres
poissons téléostéens, comme le médaka, l’épinoche ou la truite arc-en-ciel (figure 5).
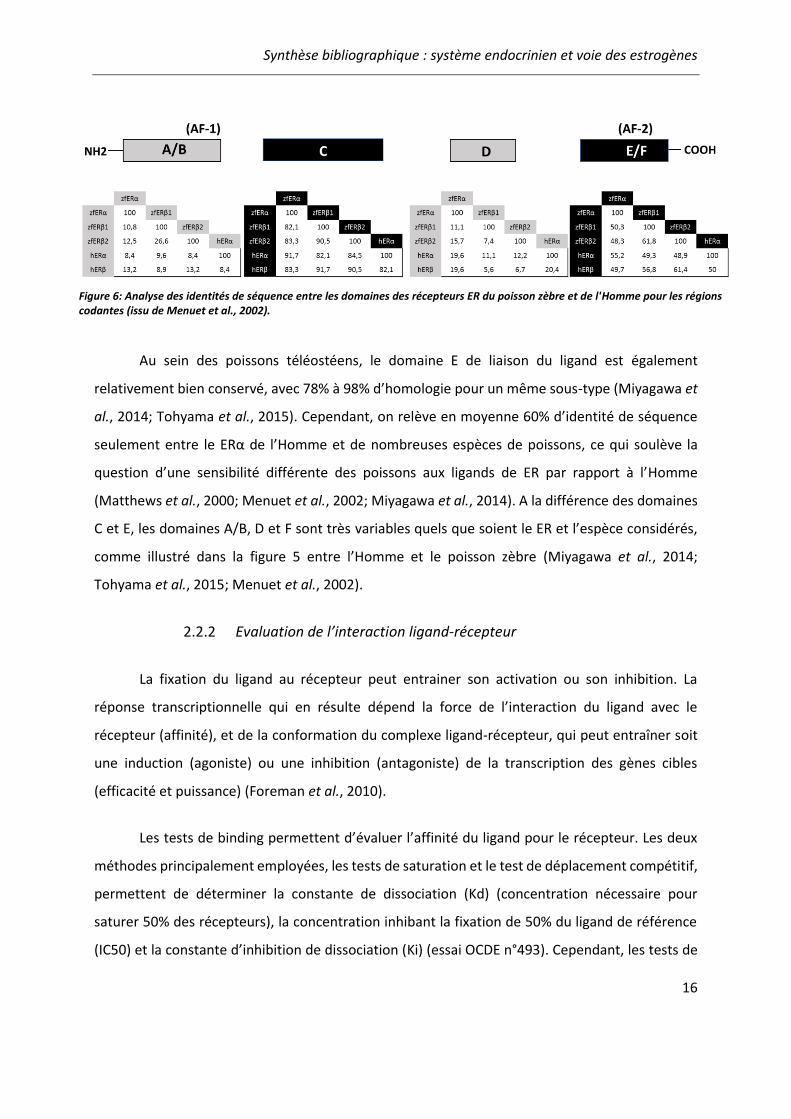
Les sous-types de ER partagent un certain degré d’homologie entre poissons et
mammifères. Le domaine C de liaison à l’ADN est très bien conservé entre vertébrés et au sein
des poissons téléostéens (Miyagawa et al., 2014; Tohyama et al., 2015), indiquant le maintien de
la cible génomique des ER au cours de l’évolution. A titre d’exemple, la figure 6 présente les
homologies de séquences pour les récepteurs ER humain (hERα et hERβ) et les récepteurs ERα,
ERß1 et ERß2 du poisson zèbre (zfERα, zfERβ1, zfERβ2). Menuet et al. (2002) montrent qu’il y a
plus de 90% d’homologie de séquence entre zfERα et hERα, et entre zfERβ et hERβ.
Figure 5: Arbre phylogénétique du récepteur ERα chez les poissons téléostéens (issu de Tohyama et al., 2016). L’échelle represente 0.05 substitutions par sites.
Synthèse bibliographique : système endocrinien et voie des estrogènes
16
Au sein des poissons téléostéens, le domaine E de liaison du ligand est également
relativement bien conservé, avec 78% à 98% d’homologie pour un même sous-type (Miyagawa et
al., 2014; Tohyama et al., 2015). Cependant, on relève en moyenne 60% d’identité de séquence
seulement entre le ERα de l’Homme et de nombreuses espèces de poissons, ce qui soulève la
question d’une sensibilité différente des poissons aux ligands de ER par rapport à l’Homme
(Matthews et al., 2000; Menuet et al., 2002; Miyagawa et al., 2014). A la différence des domaines
C et E, les domaines A/B, D et F sont très variables quels que soient le ER et l’espèce considérés,
comme illustré dans la figure 5 entre l’Homme et le poisson zèbre (Miyagawa et al., 2014;
Tohyama et al., 2015; Menuet et al., 2002).
2.2.2 Evaluation de l’interaction ligand-récepteur
La fixation du ligand au récepteur peut entrainer son activation ou son inhibition. La
réponse transcriptionnelle qui en résulte dépend la force de l’interaction du ligand avec le
récepteur (affinité), et de la conformation du complexe ligand-récepteur, qui peut entraîner soit
une induction (agoniste) ou une inhibition (antagoniste) de la transcription des gènes cibles
(efficacité et puissance) (Foreman et al., 2010).
Les tests de binding permettent d’évaluer l’affinité du ligand pour le récepteur. Les deux
méthodes principalement employées, les tests de saturation et le test de déplacement compétitif,
permettent de déterminer la constante de dissociation (Kd) (concentration nécessaire pour
saturer 50% des récepteurs), la concentration inhibant la fixation de 50% du ligand de référence
(IC50) et la constante d’inhibition de dissociation (Ki) (essai OCDE n°493). Cependant, les tests de
Figure 6: Analyse des identités de séquence entre les domaines des récepteurs ER du poisson zèbre et de l'Homme pour les régions codantes (issu de Menuet et al., 2002).
Synthèse bibliographique : système endocrinien et voie des estrogènes
17
binding ne donnent pas d’information sur la réponse induite et ne permettent pas de différencier
les agonistes des antagonistes.
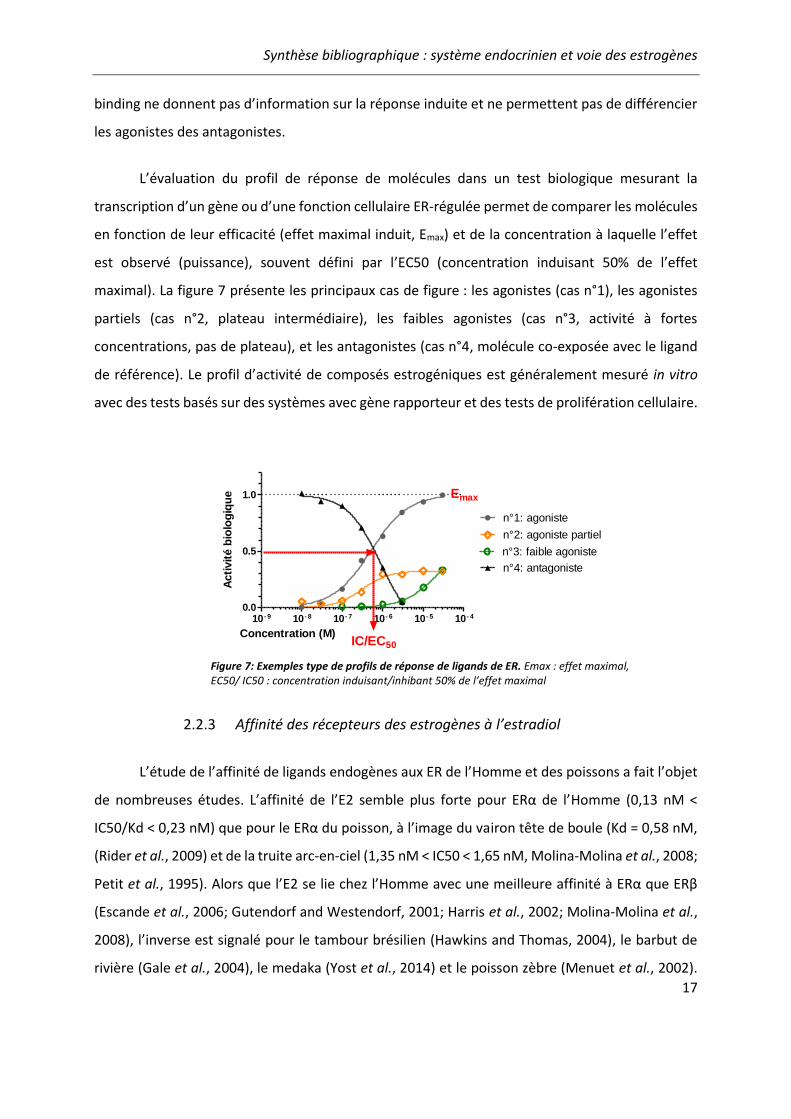
L’évaluation du profil de réponse de molécules dans un test biologique mesurant la
transcription d’un gène ou d’une fonction cellulaire ER-régulée permet de comparer les molécules
en fonction de leur efficacité (effet maximal induit, Emax) et de la concentration à laquelle l’effet
est observé (puissance), souvent défini par l’EC50 (concentration induisant 50% de l’effet
maximal). La figure 7 présente les principaux cas de figure : les agonistes (cas n°1), les agonistes
partiels (cas n°2, plateau intermédiaire), les faibles agonistes (cas n°3, activité à fortes
concentrations, pas de plateau), et les antagonistes (cas n°4, molécule co-exposée avec le ligand
de référence). Le profil d’activité de composés estrogéniques est généralement mesuré in vitro
avec des tests basés sur des systèmes avec gène rapporteur et des tests de prolifération cellulaire.
2.2.3 Affinité des récepteurs des estrogènes à l’estradiol
L’étude de l’affinité de ligands endogènes aux ER de l’Homme et des poissons a fait l’objet
de nombreuses études. L’affinité de l’E2 semble plus forte pour ERα de l’Homme (0,13 nM <
IC50/Kd < 0,23 nM) que pour le ERα du poisson, à l’image du vairon tête de boule (Kd = 0,58 nM,
(Rider et al., 2009) et de la truite arc-en-ciel (1,35 nM < IC50 < 1,65 nM, Molina-Molina et al., 2008;
Petit et al., 1995). Alors que l’E2 se lie chez l’Homme avec une meilleure affinité à ERα que ERβ
(Escande et al., 2006; Gutendorf and Westendorf, 2001; Harris et al., 2002; Molina-Molina et al.,
2008), l’inverse est signalé pour le tambour brésilien (Hawkins and Thomas, 2004), le barbut de
rivière (Gale et al., 2004), le medaka (Yost et al., 2014) et le poisson zèbre (Menuet et al., 2002).
10- 9 10- 8 10- 7 10- 6 10- 5 10- 4
0.0
0.5
1.0
n°1: agoniste
n°3: faible agoniste
n°2: agoniste partiel
n°4: antagoniste
IC/EC50
Emax
Concentration (M)
Acti
vit
é b
iolo
giq
ue
Figure 7: Exemples type de profils de réponse de ligands de ER. Emax : effet maximal, EC50/ IC50 : concentration induisant/inhibant 50% de l’effet maximal
Synthèse bibliographique : système endocrinien et voie des estrogènes
18
Les différences d’affinité entre hERα et hERβ ont été attribuées à des changements clé d’acides
aminés dans le LBD (Matthews et al., 2000). Une raison similaire a été suggérée pour les
différences de sensibilité entre sous-type de ER du tambour brésilien (Hawkins et al., 2004) et
entre ER l’Homme et le poisson zèbre (Pinto et al., 2014).
De plus, à la différence de l’Homme, l’augmentation de la température réduit l’affinité de
l’E2 chez certaines espèces piscicoles, comme la truite (Hornung et al., 2003), le tilapia (Tan et al.,
1999) et le vairon à tête-de-boule (Rider et al., 2009). La thermolabilité du récepteur ERα ichthyen
pourrait être due à des différences d’acides aminés clé dans des sous-parties du domaine E (Tan
et al., 1999).
L’activation des ER en réponse à la fixation de l’estradiol a été évaluée chez de nombreuses
espèces de poisson et chez l’Homme in vitro. Chez les poissons, les ERβs sont en moyenne plus
sensibles à l’E2 (0,01 nM < EC50 < 0,5 nM) que ERα (0,1 nM < EC50 < 1 nM), comme dans le cas du
poisson zèbre (Cosnefroy et al., 2012; Le Page et al., 2006; Tohyama et al., 2015), de l’épinoche
(Tohyama et al., 2015), du médaka (Tohyama et al., 2015), du gardon (Katsu et al., 2007), de la
carpe (Katsu et al., 2013; Tohyama et al., 2015), et du tilapia (Davis et al., 2010). A l’inverse des
poissons, ERβ chez l’Homme est 2 à 6 fois moins sensible à l’E2 (0,0065 nM <EC50< 0,2 nM) que
ERα (0,001 nM <EC50< 0,05 nM) (Balaguer et al., 1999; Molina-Molina et al., 2008; Shanle and Xu,
2011).
Les différences de réponse à l’E2 entre sous-types de ER pour l’Homme et les poissons sont
en accord avec les différences d’affinité présentées précédemment. De la même manière que
pour l’affinité, une augmentation de la température peut diminuer la sensibilité de ER à l’E2 chez
la truite et le poisson zèbre (Pinto et al., 2014, Hornung et al., 2003, Matthews et al. 2002).
2.3 Interactions entre ER et AhR
La voie de signalisation du récepteur des estrogènes peut interferer avec d’autres voies de
signalisation comme celle du récepteur de la progestérone (Katzenellenbogen, 2000), des
androgènes (Karamouzis et al., 2016), ou de la dioxine AhR (Ohtake et al., 2003). L’interaction des
voies de signalisation de ER et AhR, la plus documentée à ce jour, sera prise comme exemple pour
la suite.
Synthèse bibliographique : système endocrinien et voie des estrogènes
19
2.3.1 Généralités
Le récepteur AhR (« aryl hydrocarbon receptor ») est un facteur de transcription de la
famille des facteurs de transcription bHLH-PAS (« basic Helix-Loop-Helix/PER-ARNT-Sim »),
impliqués dans la réponse aux signaux extérieurs (ex : polluants) et aux signaux physiologiques
(ex : hypoxie et rythmes circadiens) (Bersten et al., 2013; Tian et al., 2015). Le récepteur AhR a été
initialement décrit comme le récepteur de la dioxine et des composés dioxin-like (ex : dioxines,
polychlorobiphényls plans (PCB), furanes, HAP). S’il est principalement décrit comme un récepteur
de xénobiotiques, il possède aussi certains ligands endogènes, comme les dérivés du tryptophane
(Denison and Nagy, 2003). Il a été montré que AhR avait une fonction clé dans de nombreux
processus physiologiques comme le développement, l´immunité, la différenciation cellulaire et la
reproduction (review dans Barouki et al., 2007; Hahn, 2002).
2.3.2 Mode d’action de AhR
Sous forme inactivé, AhR est présent dans le cytoplasme au sein d’un complexe protéique
contenant des protéines chaperonnes HSP90. Apres fixation du ligand, le changement de
conformation entraine la dimérisation avec le facteur de translocation ARNT (« aryl hydrocarbon
receptor nuclear translocator ») et la migration de l’hétérodimère dans le noyau. Le complexe
formé recrute des facteurs de co-activation pour se lier aux séquences XRE (« xenobiotic response
element », aussi appelées DRE pour « dioxin response element ») et induire la transcription de
gènes cibles. AhR induit principalement des enzymes du métabolisme des xénobiotiques de phase
I (ex : Cyp1a) et de phase II (Hahn, 2001). D’autre part, AhR induit la transcription de AhRR (« AhR
repressor »), capable d’entrer en compétition avec AhR pour se dimériser avec ARNT et se fixer
aux DRE (Evans et al., 2008; Karchner et al., 2002).
A la différence de l’Homme qui n’exprime qu’un AhR, un ARNT et un AhRR, plusieurs
isoformes sont décrites chez plusieurs espèces de poissons : AhR1a, AhR1b, AhR2, ARNT1, ARNT2,
AhRR1 et AhRR2 (Evans et al., 2008; Hahn et al., 2009; Karchner et al., 2002). Les isoformes de
AhR ont des rôles distincts chez le poisson, et répondent différemment à la TCDD, qui est plus
active sur l’induction de AhR2 que AhR1 (Bugel et al., 2013).
Synthèse bibliographique : système endocrinien et voie des estrogènes
20
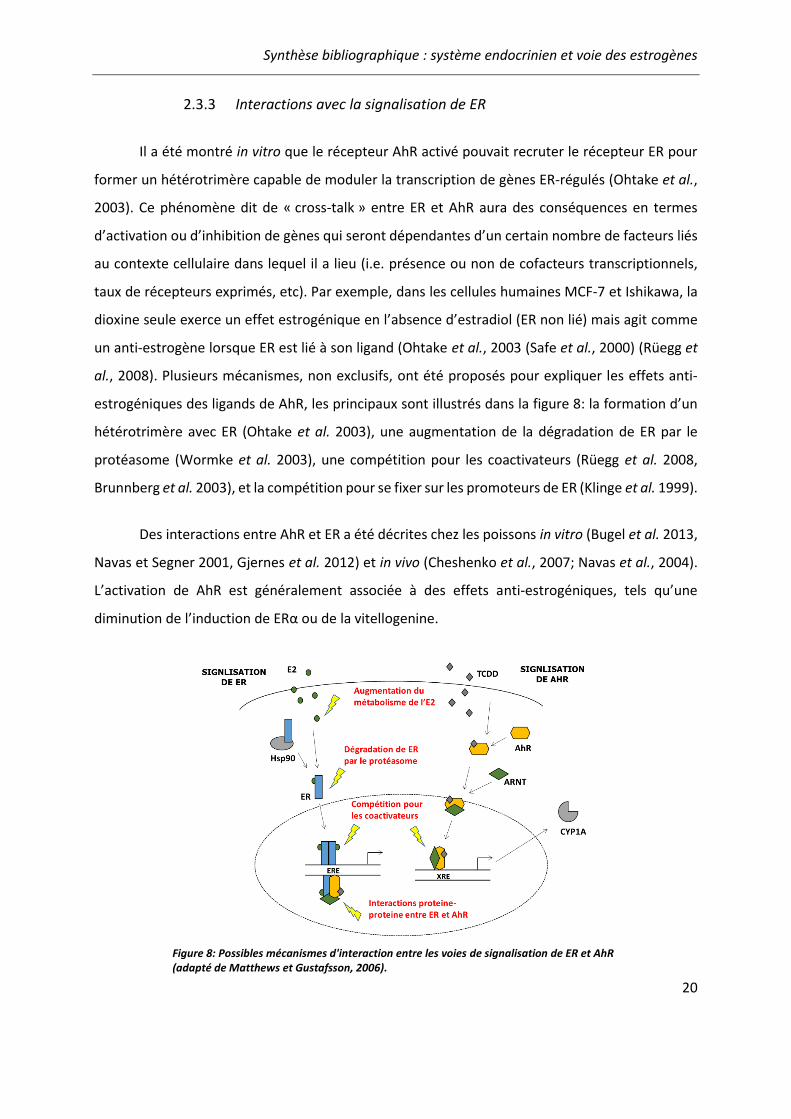
2.3.3 Interactions avec la signalisation de ER
Il a été montré in vitro que le récepteur AhR activé pouvait recruter le récepteur ER pour
former un hétérotrimère capable de moduler la transcription de gènes ER-régulés (Ohtake et al.,
2003). Ce phénomène dit de « cross-talk » entre ER et AhR aura des conséquences en termes
d’activation ou d’inhibition de gènes qui seront dépendantes d’un certain nombre de facteurs liés
au contexte cellulaire dans lequel il a lieu (i.e. présence ou non de cofacteurs transcriptionnels,
taux de récepteurs exprimés, etc). Par exemple, dans les cellules humaines MCF-7 et Ishikawa, la
dioxine seule exerce un effet estrogénique en l’absence d’estradiol (ER non lié) mais agit comme
un anti-estrogène lorsque ER est lié à son ligand (Ohtake et al., 2003 (Safe et al., 2000) (Rüegg et
al., 2008). Plusieurs mécanismes, non exclusifs, ont été proposés pour expliquer les effets anti-
estrogéniques des ligands de AhR, les principaux sont illustrés dans la figure 8: la formation d’un
hétérotrimère avec ER (Ohtake et al. 2003), une augmentation de la dégradation de ER par le
protéasome (Wormke et al. 2003), une compétition pour les coactivateurs (Rüegg et al. 2008,
Brunnberg et al. 2003), et la compétition pour se fixer sur les promoteurs de ER (Klinge et al. 1999).
Des interactions entre AhR et ER a été décrites chez les poissons in vitro (Bugel et al. 2013,
Navas et Segner 2001, Gjernes et al. 2012) et in vivo (Cheshenko et al., 2007; Navas et al., 2004).
L’activation de AhR est généralement associée à des effets anti-estrogéniques, tels qu’une
diminution de l’induction de ERα ou de la vitellogenine.
Figure 8: Possibles mécanismes d'interaction entre les voies de signalisation de ER et AhR (adapté de Matthews et Gustafsson, 2006).
Synthèse bibliographique : système endocrinien et voie des estrogènes
21
De plus, l’interaction entre ER et AhR peut aussi affecter la signalisation de AhR. Dans des
lignées cellulaires de mammifères, où l’activation de ER par E2 entraine une diminution de la
transcription du cyp1a et une diminution de l’activité enzymatique EROD dans les cellules
humaines MCF-7 (Coumoul et al., 2001) et de souris HC11 (Wihlen et al., 2009). Chez les poissons,
une interaction réciproque négative a été reportée dans des hépatocytes de truite arc-en ciel
entre E2 et la ß-naphtoflavone (Navas and Segner, 2000a), et dans des hépatocytes de saumon
entre nonylphenol et PCB77 (Mortensen and Arukwe, 2007), ainsi qu’in vivo dans des larves de
poisson zèbre entre E2 et dioxine (Cheshenko et al., 2007).
Exemples de gènes ER-régulés
3.1 La vitellogénine
3.1.1 Fonction et structure
Chez les poissons téléostéens ovipares, les récepteurs des estrogènes sont impliqués dans
la régulation de la production de la vitellogénine (vtg). La vitellogénine est une
glycolipophosphoprotéine précurseur du sac vitellin du futur embryon. Elle est synthétisée
principalement par le foie sous le contrôle de l’E2 produit par les follicules ovariens au cours de la
gamétogénèse chez les femelles. Transportées par le sang, la vtg est incorporée dans l’oocyte puis
subit des protéolyses successives pour donner les acides aminés qui serviront à la croissance de
l’embryon (Matsubara et al., 2003).
La vitellogénine est codée par de multiples gènes constituant une grande famille très
diverse au sein de poisson téléostéens (Reading et al., 2009). Chez le poisson zèbre, 7 gènes ont
été identifiés sur 2 chromosomes distincts qui diffèrent par le type de vtg produite. Les type vtgA
(codés par les vtg 1et 4 à 7) et vtgB (codé par vtg2) contiennent les domaines lipovitelline I (Lv I)
et phosvitin (Pv) et ont environ 60% d’homologie, alors que le type vtgC (codé par vtg3) ne
contient pas le domaine Pv (Wang et al., 2005). Le profil d’expression des vtg diffère en fonction
du sexe, du stade de développement et du statut reproducteur (Eide et al., 2014; Jin et al., 2009;
Nelson and Habibi, 2013). Dans le foie de femelle de poisson zèbre mature, les ARNm des vtg 1, 2,
4 ,5, 7 semblent être les plus induits et la vtg3 n’est que très faiblement exprimée, alors que chez

Synthèse bibliographique : système endocrinien et voie des estrogènes
22
les mâles de poisson zèbre mature, l’expression hépatique indiquée pour les vitellogenines semble
très faible (vtg1, 2, 5, 7) voire non détectable pour la vtg3 (Eide et al., 2014; Meng et al., 2010).
3.1.2 Régulation
In vitro, tous les sous-types de ER du poisson zèbre (Chen and Chan, 2016) et du médaka
(Lee Pow et al., 2016) sont capables d’induire la vtg, même si des différences de sensibilité entre
sous-types sont notées. Dans des cultures primaires d’hépatocytes de poisson rouge, la répression
des ERβ a abolit l’induction de la vtg par l’E2 chez les mâles, mais n’a eu que peu, voire pas d’effets
chez les femelles par rapport à ERα (Nelson and Habibi, 2010). Chez des embryons de poisson
zèbre, où les 3 sous-types de ER étaient successivement réprimés, Griffin et al. (2013) ont montré
que zfERα et zfERβ1 étaient nécessaires pour l’induction de la vtg1 par l’E2 (Griffin et al., 2013).
Yost et al. (2014) suggèrent que les ERβ sont nécessaires à l’initiation et au maintien de la
transcription de ERα, responsable de la production de vtg (Yost et al., 2014). De fait, il a été montré
in vitro que les ERß du poisson zèbre et de l’achigan à grande bouche pouvaient réguler l’activité
transcriptionnelle de ERα positivement (Menuet et al., 2004) ou négativement (Sabo-Attwood et
al., 2007).
Même si l’activation séquentielle de la vtg est discutée par Griffin et al., 2013, ces études
indiquent que tous les sous-types sont susceptibles de réguler la transcription de vtg, et qu’au-
delà du rôle connu de ERα, les ERβ semblent nécessaires pour la production de vtg en réponse à
l’E2 chez les poissons mâles (Griffin et al., 2013; Nelson and Habibi, 2010). L’induction de la vtg
par les ER, en particulier chez les poissons mâles, est utilisé comme marqueur d’exposition à des
composés estrogéniques dans de nombreux tests (ex : OCDE n°234, 229) et chez les poissons
sauvages (ex: Henneberg et al., 2014; Vethaak et al., 2005).
3.2 L’aromatase B
L’aromatase B est une enzyme clé de la stéroïdogenèse responsable de la conversion
irréversible des androgènes en estrogènes (aromatisation du cycle A, voir introduction A.1.1).
Synthèse bibliographique : système endocrinien et voie des estrogènes
23
3.2.1 Expression et activité
Au stade embryo-larvaire, l’expression de l’aroB est basse chez le poisson zèbre (Menuet
et al., 2005), mais corrèle temporellement avec l’expression de ER dès 24-48 hpf (K. Mouriec et
al., 2009). Chez les poissons, l’aroB est principalement exprimée dans les cellules gliales radiaires,
cellules progeniteurs des neurones, ce qui suggère un rôle essentiel de l’estradiol dans la
neurogénèse (Diotel et al., 2010). Chez les mammifères, il a été montré que l’estradiol a de
nombreux rôles dans le système nerveux central, parmi lesquels des fonctions neuro-protectrices,
de neurogénèse, de plasticité synaptique (Azcoitia et al., 2017; Garcia-Segura, 2009).
Chez le poisson, l’activité et l’expression de l’aroB sont particulièrement importantes au
niveau des zones périventriculaires des bulbes olfactifs, du télencéphale, de l’aire pré-optique et
dans les noyaux de l’hypothalamus (Pellegrini et al., 2016). Ces zones sont impliquées dans la
réception (bulbes olfactifs, noyaux de l’hypothalamus) et dans le traitement (télencéphale) des
informations sensorielles (ex : visuelles, mécano-sensorielles, gustatives) pour les traduire en
réponses comportementale, endocrine et somatique (Kotrschal et al., 1998), suggerant les
multiples fonctions des estrogènes. De plus, le poisson au stade adulte conserve une grande
quantité de cellules radiales gliales (Pellegrini et al., 2007). Dans la zone hypothalamus/aire pre-
optique, l’activité de l’aroB est 100 à 1000 fois plus forte chez le poisson que chez l’Homme,
indiquant un rôle important de cette enzyme dans le cerveau du poisson à l’age adulte (Pasmanik
and Callard, 1985).
3.2.2 Régulation
Chez les poissons ayant une reproduction saisonnière, comme le poisson chat, l’activité de
l’aroB fluctue au cours du cycle reproducteur et reste positivement corrélée avec la gamétogénèse
et à l’activité de l’aromatase A chez les femelles (González and Piferrer, 2003; Pasmanik and
Callard, 1988). Le promoteur du gène cyp19a1b contient une séquence ERE et une ½ séquence
ERE (Kazeto et al., 2001). Le role des ER dans le contrôle transcriptionel du cyp19a1b a été
confirmée (Le Page et al., 2006; Menuet et al., 2005). Son expression est très inductible au stade
embryo-larvaire par de nombreux xeno-estrogènes grâce à une boucle d’auto-régulation positive
du récepteur des estrogènes (Diotel et al., 2010; Hinfray et al., 2006; Menuet et al., 2005). De plus,
l’expression de l’aroB est induite par des androgènes aromatisables (ex : testostérone) et certains
Synthèse bibliographique : système endocrinien et voie des estrogènes
24
androgènes non aromatisable (ex : 5-α dihydrotestosterone) métabolisé en derivés estrogéniques
capables d’activer ER (Brion et al., 2012; Cheshenko et al., 2008; Karen Mouriec et al., 2009).
Cependant, l’expression du gène nécessite la présence du facteur glial X, un facteur neuro-glial
spécifique qui se fixe sur une séquence régulatrice à proximité du ERE, ce qui confère une
spécificité tissulaire de l’expression de l’aroB (Le Page et al., 2008). De part sa forte sensibilité et
inductibilité par l’estradiol et les xeno-estrogènes, ces résultats montrent l’interet d’étudier
l’expression de l’aroB au stade embryo-larvaire chez le poisson pour évaluer une perturbation de
la signalisation des estrogènes. En comparaison, l’expression et l’activité de l’aroB ne semblent
pas être modulées par l’estradiol chez le poisson zèbre à l’âge adulte (Hinfray et al., 2006).

Introduction bibliographique : évaluation des xeno-estrogènes
25
Evaluation des xeno-estrogènes
Cette partie a pour but de présenter les outils biologiques disponibles pour évaluer les
composés estrogéniques seuls et en mélanges, en mettant l’accent sur les bio-essais in vitro et in
vivo chez les poissons.
Xeno-estrogènes environnementaux
Les nombreuses études menées au cours des deux dernières décennies ont permis de
mettre en évidence la vaste contamination de l’environnement aquatique par les contaminants
organiques et d’identifier de nombreux composés estrogéniques de diverses origines (Petrovic et
al., 2004; Sharma et al., 2009). Des exemples de ligands environnementaux de ER et de leur
occurrence dans les eaux de surface sont présentés dans le tableau I.
Tableau I: Exemples de ligands environnementaux de ER et de leur occurrence dans les eaux de surface.
Famille Exemples de xeno-estrogènes
Exemple de structure et de niveau détecté dans les eaux de surface
Médicaments et produits d’hygiène
Ethinylestradiol (EE2), Equilin, diethylstilbestrol (DES), mestranol, benzophenones, parabens
Ex : Ethinylestradiol (CAS 57-63-6)
Angleterre, UK : 0,06 – 0,18 ng/L (LOQ=0,05 ng/) (Johnson et al., 2012)
Pesticides organochlorés
DDT, o,p’-DDT, p,p’-DDE, metoxychlor, endosufans
Ex: α-endosulfan (CAS 959-98-8)
Floride, USA : 0,21 – 54 ng/L (LOQ : 0,2 ng/L) Fréquence de détection : 81% (n= 88) (Harman-Fetcho et al., 2005)
Phyto-estrogènes daidzeine, genisteine, coumestrol
Ex : genisteine (CAS 446-72-0) Review (monde): nd – 2650 ng/L (Jarosova et al., 2015)
Myco-estrogènes Zearalenone, α/β-zearalanol
Ex : Zearalenone (CAS 17924-92-4) Review (monde) : nd – 80,6 ng/L (Jarosova et al., 2015)
Composés industriels
alkylphenol, bisphenols
Ex : Bisphenol A (CAS 80-05-7) Europe : nd - 223 ng/L (LOQ=5 ng/L) Moyenne : 25 ng/L Fréquence de détection : 34% (n=122) (Loos et al., 2009)

Introduction bibliographique : évaluation des xeno-estrogènes
26
Les xeno-estrogènes retrouvés dans l’environnement aquatique ont de multiples sources
et appartiennent à des familles distinctes. Par exemple, on retrouve parmi les xeno-estrogènes
des médicaments (ex : EE2, diéthylstilbestrol) et des produits d’hygiène (ex : benzophénone)
provenant principalement des rejets de STEP, mais aussi des composés naturels d’origines animale
(ex : E2 et E1) et végétale (ex : génisteine et daidzéine), et des composés industriels (ex :
bisphénols) et des pesticides (ex : endosulfan). Malgré les diversités de structures chimiques
couvertes par ces molécules, les ligands de ER partagent un motif phénolique commun (Kinani et
al., 2008). La diversité des molécules estrogéniques potentiellement présentes dans
l’environnement aquatique illustre la difficulté de les rechercher de manière exhaustive avec des
méthodes analytiques chimiques ciblant chaque molécule de manière individuelle.
Bio-essais et activité estrogénique
De nombreuses méthodes in vitro et in vivo ont été décrites pour évaluer l’activité
estrogénique de molécules, quelques exemples sont présentés dans la figure 9. Ces bio-essais
s’appuient sur le mode d’action des estrogènes, de la liaison du ligand au récepteur (test de
binding), l’activation du récepteur (tests de transactivation), à l’induction de gènes ER-régulés (ex :
vitellogénine, aromatase B) jusqu’aux effets qui peuvent en résulter, tels que la prolifération
cellulaire, l’augmentation du poids de l’utérus chez les rongeurs, ou l’altération du développement
sexuel et de la reproduction des poissons.
Figure 9: Exemples d’essais in vitro et in vivo pour évaluer les molécules estrogéniques chez les mammifères et les poissons. Les lignes OCDE sont mentionnées lorsqu’elles existent.

Introduction bibliographique : évaluation des xeno-estrogènes
27
2.1 Bio-essais in vitro
Les principales méthodes développées pour évaluer les composés estrogéniques in vitro
sont les tests de binding, de prolifération cellulaire et de transactivation (« transactivation
assays », TA) basés sur des systèmes avec gène rapporteur. Les tests de TA seront plus approfondis
dans cette partie.
2.1.1 Tests de binding
Les tests de binding permettent d’évaluer la liaison et l’affinité du ligand pour le récepteur
(voir introduction A-2.2.2). Ils peuvent être réalisés à partir de préparations cellulaires (cellules
vivantes ou extraits cellulaires) exprimant le récepteur (entier ou recombinant), ou encore
d’homogénat de tissu contenant le(s) récepteur(s) natif(s). Ils permettent de déterminer la
constante de dissociation (Kd) (concentration nécessaire pour saturer 50% des récepteurs), la
concentration inhibant la fixation de 50% du ligand de référence (IC50) et la constante d’inhibition
de dissociation (Ki) (OECD, 2015a). Cependant, ils ne donnent pas d’informations sur la réponse
induite et ne permettent pas de différencier les agonistes des antagonistes.
2.1.2 Tests de prolifération cellulaire
Les tests de prolifération cellulaire sont réalisés dans des lignées de cellules cancéreuses,
telles que les cellules MCF-7 ou T47D, où la croissance des cellules est estrogéno-dépendante (ex :
E-SCREEN, Soto et al., 1995). Le test E-SCREEN est sensible mais il peut manquer de spécificité car
de nombreux facteurs peuvent interférer (positivement ou négativement) avec la prolifération
cellulaire indépendamment du ER (Leusch et al., 2017; Silva et al., 2011).
2.1.3 Tests de transactivation
Les TA in vitro sont des systèmes cellulaires transfectés avec un gène rapporteur sous le
contrôle d’un promoteur répondant à l’activation de ER. La mesure de l’expression du gène
rapporteur (ou de l’activité de la protéine synthétisée) permet de quantifier spécifiquement
l’activation de ER sur la base d’une courbe concentration-réponse, comme présenté dans la figure
10. Il est ainsi possible de déterminer le potentiel estrogénique relatif d’une molécule donnée
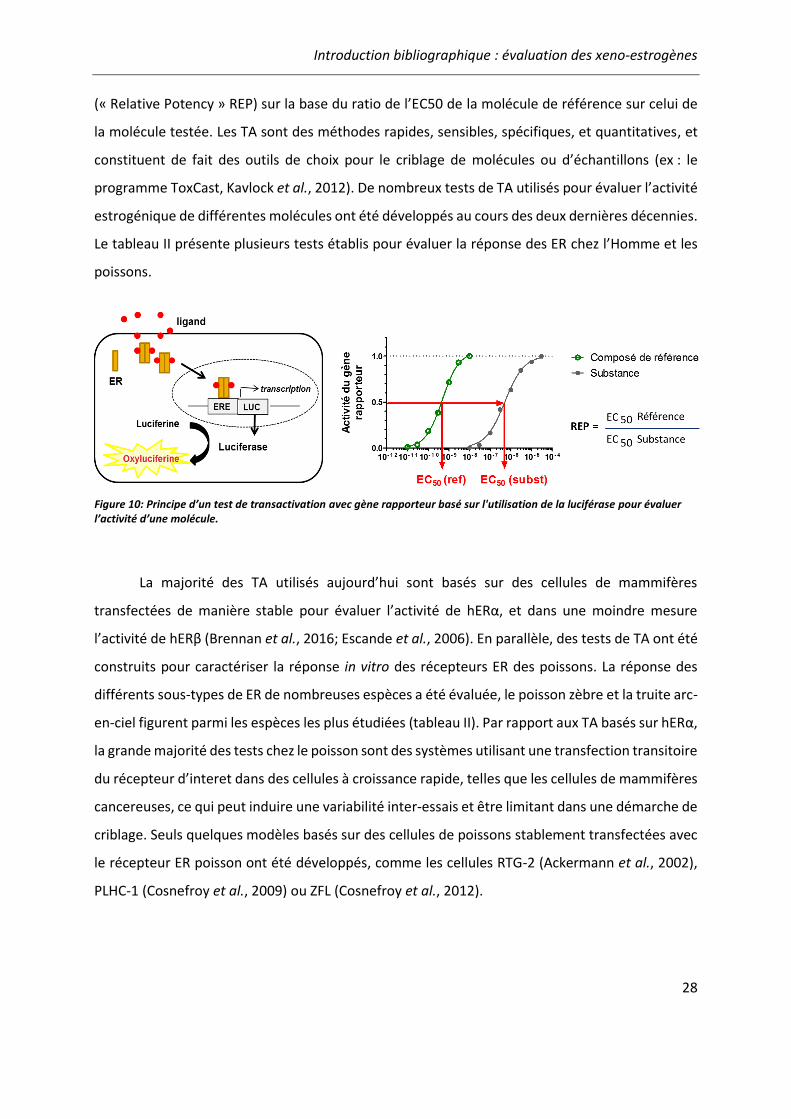
Introduction bibliographique : évaluation des xeno-estrogènes
28
(« Relative Potency » REP) sur la base du ratio de l’EC50 de la molécule de référence sur celui de
la molécule testée. Les TA sont des méthodes rapides, sensibles, spécifiques, et quantitatives, et
constituent de fait des outils de choix pour le criblage de molécules ou d’échantillons (ex : le
programme ToxCast, Kavlock et al., 2012). De nombreux tests de TA utilisés pour évaluer l’activité
estrogénique de différentes molécules ont été développés au cours des deux dernières décennies.
Le tableau II présente plusieurs tests établis pour évaluer la réponse des ER chez l’Homme et les
poissons.
La majorité des TA utilisés aujourd’hui sont basés sur des cellules de mammifères
transfectées de manière stable pour évaluer l’activité de hERα, et dans une moindre mesure
l’activité de hERβ (Brennan et al., 2016; Escande et al., 2006). En parallèle, des tests de TA ont été
construits pour caractériser la réponse in vitro des récepteurs ER des poissons. La réponse des
différents sous-types de ER de nombreuses espèces a été évaluée, le poisson zèbre et la truite arc-
en-ciel figurent parmi les espèces les plus étudiées (tableau II). Par rapport aux TA basés sur hERα,
la grande majorité des tests chez le poisson sont des systèmes utilisant une transfection transitoire
du récepteur d’interet dans des cellules à croissance rapide, telles que les cellules de mammifères
cancereuses, ce qui peut induire une variabilité inter-essais et être limitant dans une démarche de
criblage. Seuls quelques modèles basés sur des cellules de poissons stablement transfectées avec
le récepteur ER poisson ont été développés, comme les cellules RTG-2 (Ackermann et al., 2002),
PLHC-1 (Cosnefroy et al., 2009) ou ZFL (Cosnefroy et al., 2012).
Figure 10: Principe d’un test de transactivation avec gène rapporteur basé sur l'utilisation de la luciférase pour évaluer l’activité d’une molécule.
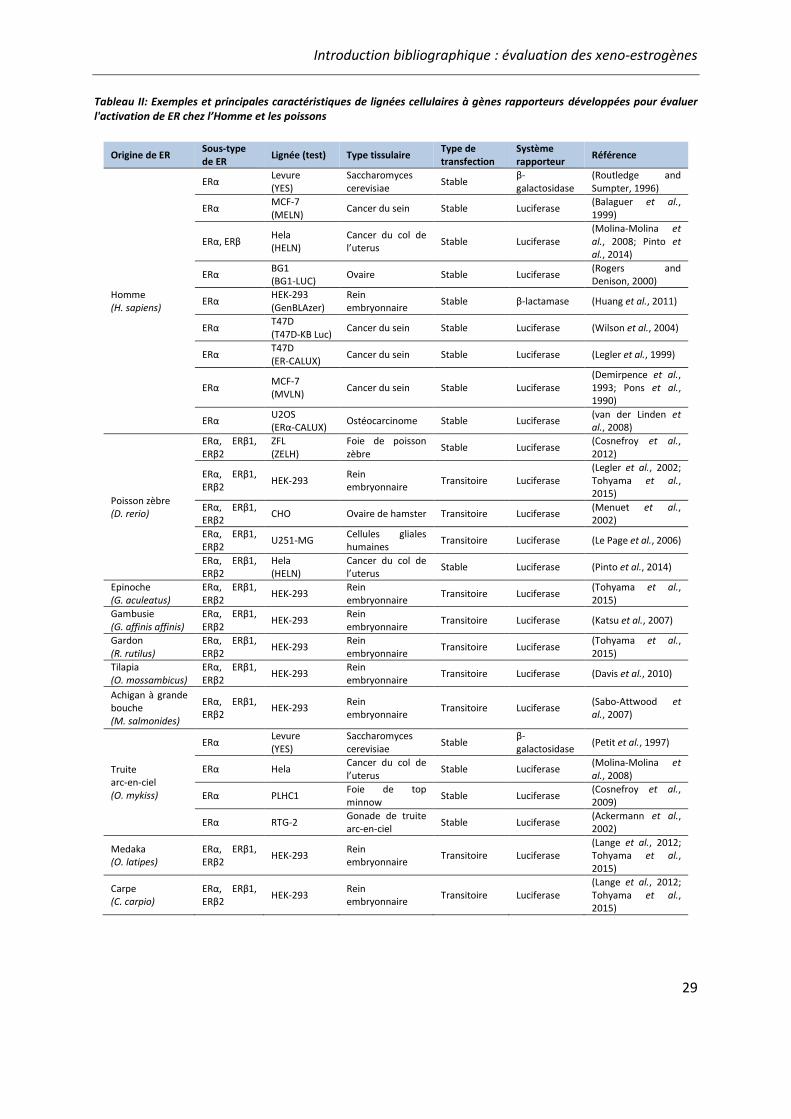
Introduction bibliographique : évaluation des xeno-estrogènes
29
Tableau II: Exemples et principales caractéristiques de lignées cellulaires à gènes rapporteurs développées pour évaluer l'activation de ER chez l’Homme et les poissons
Origine de ER Sous-type de ER
Lignée (test) Type tissulaire Type de transfection
Système rapporteur
Référence
Homme (H. sapiens)
ERα Levure (YES)
Saccharomyces cerevisiae
Stable β-galactosidase
(Routledge and Sumpter, 1996)
ERα MCF-7 (MELN)
Cancer du sein Stable Luciferase (Balaguer et al., 1999)
ERα, ERβ Hela (HELN)
Cancer du col de l’uterus
Stable Luciferase (Molina-Molina et al., 2008; Pinto et al., 2014)
ERα BG1 (BG1-LUC)
Ovaire Stable Luciferase (Rogers and Denison, 2000)
ERα HEK-293 (GenBLAzer)
Rein embryonnaire
Stable β-lactamase (Huang et al., 2011)
ERα T47D (T47D-KB Luc)
Cancer du sein Stable Luciferase (Wilson et al., 2004)
ERα T47D (ER-CALUX)
Cancer du sein Stable Luciferase (Legler et al., 1999)
ERα MCF-7 (MVLN)
Cancer du sein Stable Luciferase (Demirpence et al., 1993; Pons et al., 1990)
ERα U2OS (ERα-CALUX)
Ostéocarcinome Stable Luciferase (van der Linden et al., 2008)
Poisson zèbre (D. rerio)
ERα, ERβ1, ERβ2
ZFL (ZELH)
Foie de poisson zèbre
Stable Luciferase (Cosnefroy et al., 2012)
ERα, ERβ1, ERβ2
HEK-293 Rein embryonnaire
Transitoire Luciferase (Legler et al., 2002; Tohyama et al., 2015)
ERα, ERβ1, ERβ2
CHO Ovaire de hamster Transitoire Luciferase (Menuet et al., 2002)
ERα, ERβ1, ERβ2
U251-MG Cellules gliales humaines
Transitoire Luciferase (Le Page et al., 2006)
ERα, ERβ1, ERβ2
Hela (HELN)
Cancer du col de l’uterus
Stable Luciferase (Pinto et al., 2014)
Epinoche (G. aculeatus)
ERα, ERβ1, ERβ2
HEK-293 Rein embryonnaire
Transitoire Luciferase (Tohyama et al., 2015)
Gambusie (G. affinis affinis)
ERα, ERβ1, ERβ2
HEK-293 Rein embryonnaire
Transitoire Luciferase (Katsu et al., 2007)
Gardon (R. rutilus)
ERα, ERβ1, ERβ2
HEK-293 Rein embryonnaire
Transitoire Luciferase (Tohyama et al., 2015)
Tilapia (O. mossambicus)
ERα, ERβ1, ERβ2
HEK-293 Rein embryonnaire
Transitoire Luciferase (Davis et al., 2010)
Achigan à grande bouche (M. salmonides)
ERα, ERβ1, ERβ2
HEK-293 Rein embryonnaire
Transitoire Luciferase (Sabo-Attwood et al., 2007)
Truite arc-en-ciel (O. mykiss)
ERα Levure (YES)
Saccharomyces cerevisiae
Stable β-galactosidase
(Petit et al., 1997)
ERα Hela Cancer du col de l’uterus
Stable Luciferase (Molina-Molina et al., 2008)
ERα PLHC1 Foie de top minnow
Stable Luciferase (Cosnefroy et al., 2009)
ERα RTG-2 Gonade de truite arc-en-ciel
Stable Luciferase (Ackermann et al., 2002)
Medaka (O. latipes)
ERα, ERβ1, ERβ2
HEK-293 Rein embryonnaire
Transitoire Luciferase (Lange et al., 2012; Tohyama et al., 2015)
Carpe (C. carpio)
ERα, ERβ1, ERβ2
HEK-293 Rein embryonnaire
Transitoire Luciferase (Lange et al., 2012; Tohyama et al., 2015)

Introduction bibliographique : évaluation des xeno-estrogènes
30
Parmi les premiers TA établis, figurent ceux basés sur l’utilisation de levures recombinantes
exprimant le récepteur ERα humain, comme dans le test YES (Routledge and Sumpter, 1996) ou le
récepteur ERα de la truite arc-en-ciel (Petit et al., 1997). Organismes stables et faciles à cultiver,
les levures ont l’inconvénient d’avoir une membrane peu perméable et un contexte cellulaire
différent de ceux des vertébrés, ce qui entraine un risque de faux négatifs (Leusch et al., 2010).
La majorité des TA utilisés dans le criblage de molécules sont des systèmes in vitro basés
sur des cellules de mammifères exprimant hERα. Ces lignées cellulaires ont une sensibilité pour
l’E2 de l’ordre du pM (EC50 ~ 10 pM), 100 fois meilleure que pour le test YES (review dans Leusch
et al., 2010). La puissance relative (REP) des xeno-estrogènes par rapport à l’E2 in vitro varie d’un
facteur 10 000 à 100 000 en fonction des composés. Par exemple, l’EE2 et le DES, des estrogènes
de synthèse, ont des EC50 de l’ordre du pM, tandis que la genisteine et l’α-zearalenone ont des
EC50 de l’ordre du nM et les alkylphenols et le bisphenol A ont des EC50 de l’ordre du µM (ex:
Gutendorf and Westendorf, 2001; Pinto et al., 2014).
Il existe une bonne corrélation entre TA basés sur hERα pour les principaux xeno-
estrogènes, à l’image du test de prolifération cellulaire E-SCREEN et test BG1-LUC (Dreier et al.,
2015), entre différents tests YES (Fang et al., 2000), entre lignées HEK-293-hERα et BG1-LUC (R.
Huang et al., 2014), ou entre plusieurs tests (Kunz et al., 2017). Cependant, le REP d’une molécule
peut varier d’un modèle à l’autre, et parfois même au sein d’un même test en fonction du
laboratoire (Jarosova et al., 2014, Leusch et al., 2010), montrant que l’extrapolation de l’activité
d’une molécule entre deux TA peut entrainer une variabilité parfois importante. Le REP de l’E3,
par exemple, est 15 à 143 fois plus faible dans le YES que dans les cellules de mammifères
(Jarosova et al., 2014).
Chez les poissons, la réponse des ER a été la plus étudiée pour le poisson zèbre et la truite
arc-en-ciel. La figure 11 illustre le cas du poisson zèbre avec les réponses des différents sous-types
de zfER à certains xeno-estrogènes pour 4 lignées cellulaires : les lignées U251-MG, HEK-293 et
HELN issues de cellules mammifères, et la lignée ZELH issue de foie de poisson zèbre. Comme
observé avec hERα, les différences de puissance relative entre xeno-estrogènes sont retrouvées
pour les zfER avec un facteur 10 000 entre l’EC50 de l’EE2 et l’EC50 du BPA, quelle que soit la lignée

Introduction bibliographique : évaluation des xeno-estrogènes
31
(figure 11). Les sous-types de zfERs n’ont pas tous les mêmes sensibilités aux xeno-estrogènes,
comme par exemple pour l’EE2 plus actif sur les zfERß que sur zfERα.
Si le mécanisme de liaison des xeno-estrogènes aux ER est conservé au sein des poissons,
des différences de réponse entre sous-types de ER d’une même espèce et entre espèces de
poisson sont parfois observées (Lange et al., 2012, Toyahama et al., 2015). Le BPA, par exemple,
n’entraine qu’une très faible activation des ER du gardon, alors qu’il entraine l’activation des ER
du médaka, du poisson zèbre et de l’épinoche (Tohyama et al., 2015). D’autre part, les récepteurs
ER ichtyens et humains répondent parfois avec des sélectivités inversées à certains composés. La
génisteine et la benzophenone-2 (BP-2), par exemple, ont une meilleure affinité pour hERβ que
hERα (Pinto et al., 2014, Westendorf et Gutendorf, 2001), mais chez le poisson zèbre, ces
molécules sont 3 à 5 fois plus actives sur zfERα et zfERβ2 que sur zfERβ1 (Pinto et al., 2014). Une
observation similaire a été faite pour ERα de la truite arc-en-ciel qui a une sensibilité à la BP-2
similaire à hERβ, et supérieure à hERα (Molina-Molina et al., 2008).
Comme illustré dans la figure 11, la réponse de zfER peut changer en fonction de la lignée
cellulaire où il est exprimé. Cela est particulièrement marquant pour l’α-zearalenol qui est 100 fois
moins active dans les ZELH (cellules de foie de poisson zèbre, Cosnefroy et al., 2012) que dans les
cellules HELN (cellules Hela, Pinto et al., 2014) ou U251-MG (cellules gliales, Le Page et al., 2006).
De la même manière, la réponse du ERα de la truite arc-en-ciel à l’α-zearalenol est 100 fois plus
faible dans les cellules PLHC-1 (cellules de foie de vairon) que dans les cellules HELN (Cosnefroy et
al., 2009), suggérant un rôle du contexte cellulaire spécifique aux cellules de foie dans la réponse
observée.
E2
EE2
a-Zea
rale
nol
Gen
iste
ine
BPA
BP2
10- 3
10- 2
10- 1
100
101
102
103
104
105
zfER zfER1 zfER2
HELN (Pinto et al., 2014)
U251-MG (Le Page et al., 2006)
ZELH (Cosnefroy et al., 2012)
HEK-293 (Tohyama et al., 2015)
EC
50 (
nM
)
Figure 11: exemples de réponse des sous-types de zfER à des xeno-estrogènes dans différentes lignées cellulaires.
Introduction bibliographique : évaluation des xeno-estrogènes
32
Chaque lignée cellulaire a conservé des caractéristiques biologiques (ex : cofacteurs,
métabolisme) qui lui sont propres. Les cofacteurs (corépresseurs/coactivateurs) de ER varient en
fonction du tissu, et sont susceptibles d’influencer la réponse du ER (McDonnell and Norris, 2002;
Routledge et al., 2000). De plus, le devenir de la molécule dans le système biologique est important
à considérer. Dans les cellules T47D-KBluc, la 17-ßHSD est fonctionnelle et peut convertir l’E1 en
E2, ce qui explique que cette lignée soit particulièrement sensible à l’E1 (Bermudez et al., 2012).
La caractérisation du métabolisme de la benzophenone 2 et du bisphenol S dans les cellules ZELH-
zfERs, MELN et T47D-KBluc a permis de montrer que les cellules de foie de poisson zèbre (ZELH)
ont un profil métabolique distinct des MELN et T47D-KBluc, qualitativement proche du profil
observé dans les cultures primaires d’hépatocytes de poisson zèbre (Le Fol et al., 2015). De plus,
la voie de signalisation AhR est inductible dans les cellules MCF-7, d’où sont issues les cellules
MELN, pouvant entrainer des interactions avec la voie ER (Ohtake et al., 2003).
2.1.4 Conclusion
Les tests in vitro représentent un niveau d’organisation biologique simple. Les systèmes
cellulaires avec gène rapporteur permettent d’avoir une réponse sensible, spécifique et rapide.
Néanmoins, le choix du système cellulaire et du sous-type de récepteur étudié peut avoir une
influence sur l’activité d’une molécule donnée et donc, in fine, sur le diagnostic in vitro. De plus, à
la différence de l’organisme entier, l’influence de la pharmacocinétique (absorption, distribution,
métabolisme, élimination) est peu prise en compte in vitro, et les interactions entre organes sur
la réponse aux xeno-estrogènes est inexistante. S’ils permettent de donner une information à la
fois spécifique et sensible sur l’activité d’une molécule, des essais complémentaires in vivo sont
donc nécessaires pour déterminer les effets à l’échelle de l’organisme.
2.2 Bio-essais in vivo chez le poisson
2.2.1 Tests règlementaires
Au niveau réglementaire, 4 essais pour évaluer les perturbateurs endocriniens chez le
poisson in vivo bénéficient de lignes directrices OCDE : l’essai n°229 « essai à court terme de
reproduction des poissons » (OCDE, 2009a), l’essai n°230 « essai de 21 jours sur les poissons »
(OCDE, 2009b), l’essai n°234 « essai de développement sexuel des poissons » (OCDE, 2011) et
Introduction bibliographique : évaluation des xeno-estrogènes
33
l’essai n°240 « étude étendue de toxicité pour la reproduction sur une génération chez le
médaka » (OCDE, 2015b). Le plus court de ces essais durent 21 jours (essais n°229 et 230). Les
paramètres mesurés sont principalement la vtg plasmatique, le ratio phénotypique (essai n°234),
la fécondité (essai n°229) et les caractères sexuels secondaires chez le médaka et le vairon à tête
de boule (essai n°229, 230 et 240). Ces essais permettent de mettre en évidence le potentiel
perturbateur endocrinien d’une molécule, et la mesure de la vtg plasmatique donne une indication
sur l’estrogénicité. Bien qu’essentiels pour évaluer les effets estrogéniques, les tests in vivo
disponibles sont éxigeants en temps, organismes et moyens, et sont préférentiellement utilisés
lors d’une deuxième phase d’évaluation, après des approches de screening.
2.2.2 Tests embryo-larvaires sur poissons transgéniques
Depuis plusieurs années, des tests embryo-larvaires sur lignées de poisson zèbre et de
médaka transgéniques ont été développés pour évaluer spécifiquement l’action et les effets des
xéno-estrogènes in vivo (Gong et al., 2001; Lee et al., 2015). La spécificité de réponse au niveau
individuel combinée à un test de courte durée rend l’utilisation des poissons transgéniques au
stade embryo-larvaire particulièrement intéressante pour évaluer les composés estrogéniques.
Différents modèles de poissons transgéniques ont été développés, dont certains sont
présentés dans le tableau III. Construits par modification stable du génome, les poissons
transgéniques expriment un gène rapporteur sous le contrôle d’un promoteur répondant à
l’activation de ER. Le poisson zèbre et le médaka sont les deux espèces modèles utilisées pour
établir des lignées transgéniques. Le poisson zèbre présente des caractéristiques très attrayantes
qui en ont fait un vertébré modèle très utilisé en toxicologie, biologie et génétique (Segner et al.,
2013). Son génome est totalement séquencé, il est facile à élever, a un temps de génération court
(3 à 6 mois), se reproduit tout au long de l’année au laboratoire et chaque femelle peut pondre
jusqu’à 200 œufs par semaine. Les embryons sont de petite taille et translucides permettant le
suivi visuel du développement des organes dans les premiers jours de vie (Stegeman et al., 2010).
Le médaka présente des caractéristiques similaires, mais à la différence du poisson zèbre, cette
espèce a un déterminisme sexuel génétique qui rend possible l’évaluation des molécules en
fonction du genre (Scholz et al., 2005).

Introduction bibliographique : évaluation des xeno-estrogènes
34
Tableau III: Exemples et caractéristiques principales de lignées de poissons transgéniques développées pour évaluer les xeno-estrogènes. ERE : estrogen response element, hpf : heure post fertilisation, hph : heure post éclosion, GFP/RFP : green/red fluorescent protein.
Espèce Tissu cible quantification
Promoteur Système rapporteur
Période d’exposition
E2 (nM) (paramètre)
Référence
Poisson zèbre
Poisson entier ERE-Gal4 GFP 0 - 96 hpf 0,0091 (LOEC) (Lee et al., 2012)
Poisson entier ERE GFP 4 – 120 hpf - (Green et al., 2016)
Foie ERE-zvtg1 GFP 7 - 13 dpf 0,36 (LOEC) (H. Chen et al., 2010)
Foie ERE GFP 1 - 3/5 dpf 1,8 (LOEC) (Gorelick et al., 2014; Gorelick and Halpern, 2011)
Cerveau (Cellules gliales)
cyp19a1b GFP 0 – 96 hpf 0,5 (EC50) (Brion et al., 2012; Tong et al., 2009)
Medaka
Foie Chg-L GFP+RFP 4 – 10 dph 0,091 (LOEC) (Salam et al., 2008)
Foie Chg-H GFP 0 -1 dph 0,63 (LOEC) (Kurauchi et al., 2005)
Foie Chg-H GFP+RFP 0 -16 dph 0,18 (EC50) (Scholz et al., 2005)
Les lignées de poisson transgénique basées sur l’utilisation d’un promoteur synthétique
(ERE) permettent d’évaluer l’activation de ER dans un grand nombre de tissus (ex : foie, muscles,
cœur, Gorelick et al., 2014). Toutefois, l’activation de ER dans ces modèles ne donnent pas
d’information sur la réponse du tissu biologique en question, à la différence des lignées de
poissons transgéniques construits avec un promoteur naturel (ex : cyp19a1b, Chg-H et vtg1) où
une activation du gène peut être corrélée à une réponse spécifique. Dans le cas du poisson zèbre
transgénique cyp19a1b-GFP, il a été montré que l’expression de la GFP corrélait parfaitement avec
l’expression de la protéine AroB endogène mise en évidence par immuno-coloration (Tong et al.,
2009).
Si le premier modèle de poisson transgénique pour évaluer l’estrogénicité se basait sur
l’utilisation de la luciférase comme gène rapporteur (Legler et al., 2000), l’utilisation de protéines
fluorescentes (Green ou Red Fluoresence Protein GFP, RFP) a été préférée par la suite car elles
sont plus stables (8h contre 1h à 3h pour la luciférase), ne nécessitent pas le sacrifice de l’animal,
ni l’addition de substrat pour faire la mesure (Lee et al., 2015). L’activation de ER dans les modèles
basés sur la GFP et RFP est déterminée en mesurant la fluorescence par microscopie de manière
non invasive (photographie).
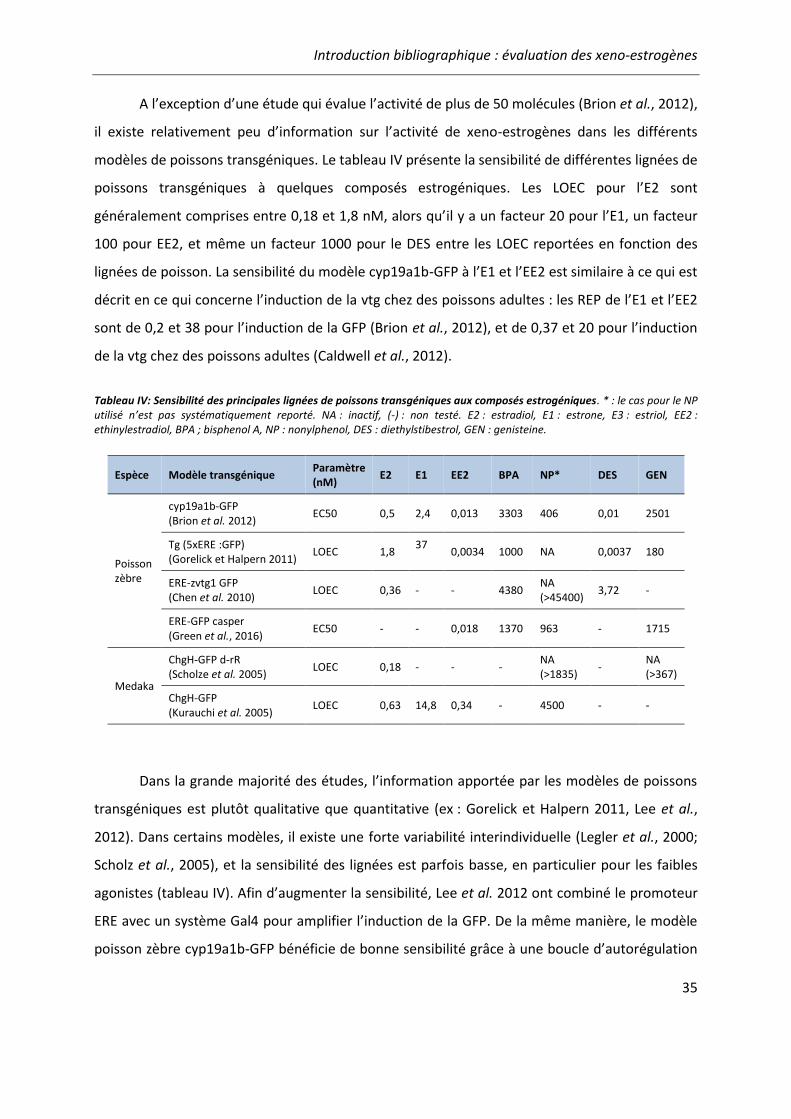
Introduction bibliographique : évaluation des xeno-estrogènes
35
A l’exception d’une étude qui évalue l’activité de plus de 50 molécules (Brion et al., 2012),
il existe relativement peu d’information sur l’activité de xeno-estrogènes dans les différents
modèles de poissons transgéniques. Le tableau IV présente la sensibilité de différentes lignées de
poissons transgéniques à quelques composés estrogéniques. Les LOEC pour l’E2 sont
généralement comprises entre 0,18 et 1,8 nM, alors qu’il y a un facteur 20 pour l’E1, un facteur
100 pour EE2, et même un facteur 1000 pour le DES entre les LOEC reportées en fonction des
lignées de poisson. La sensibilité du modèle cyp19a1b-GFP à l’E1 et l’EE2 est similaire à ce qui est
décrit en ce qui concerne l’induction de la vtg chez des poissons adultes : les REP de l’E1 et l’EE2
sont de 0,2 et 38 pour l’induction de la GFP (Brion et al., 2012), et de 0,37 et 20 pour l’induction
de la vtg chez des poissons adultes (Caldwell et al., 2012).
Tableau IV: Sensibilité des principales lignées de poissons transgéniques aux composés estrogéniques. * : le cas pour le NP utilisé n’est pas systématiquement reporté. NA : inactif, (-) : non testé. E2 : estradiol, E1 : estrone, E3 : estriol, EE2 : ethinylestradiol, BPA ; bisphenol A, NP : nonylphenol, DES : diethylstibestrol, GEN : genisteine.
Espèce Modèle transgénique Paramètre (nM)
E2 E1 EE2 BPA NP* DES GEN
Poisson zèbre
cyp19a1b-GFP (Brion et al. 2012)
EC50 0,5 2,4 0,013 3303 406 0,01 2501
Tg (5xERE :GFP) (Gorelick et Halpern 2011)
LOEC 1,8 37
0,0034 1000 NA 0,0037 180
ERE-zvtg1 GFP (Chen et al. 2010)
LOEC 0,36 - - 4380 NA (>45400)
3,72 -
ERE-GFP casper (Green et al., 2016)
EC50 - - 0,018 1370 963 - 1715
Medaka
ChgH-GFP d-rR (Scholze et al. 2005)
LOEC 0,18 - - - NA (>1835)
- NA (>367)
ChgH-GFP (Kurauchi et al. 2005)
LOEC 0,63 14,8 0,34 - 4500 - -
Dans la grande majorité des études, l’information apportée par les modèles de poissons
transgéniques est plutôt qualitative que quantitative (ex : Gorelick et Halpern 2011, Lee et al.,
2012). Dans certains modèles, il existe une forte variabilité interindividuelle (Legler et al., 2000;
Scholz et al., 2005), et la sensibilité des lignées est parfois basse, en particulier pour les faibles
agonistes (tableau IV). Afin d’augmenter la sensibilité, Lee et al. 2012 ont combiné le promoteur
ERE avec un système Gal4 pour amplifier l’induction de la GFP. De la même manière, le modèle
poisson zèbre cyp19a1b-GFP bénéficie de bonne sensibilité grâce à une boucle d’autorégulation
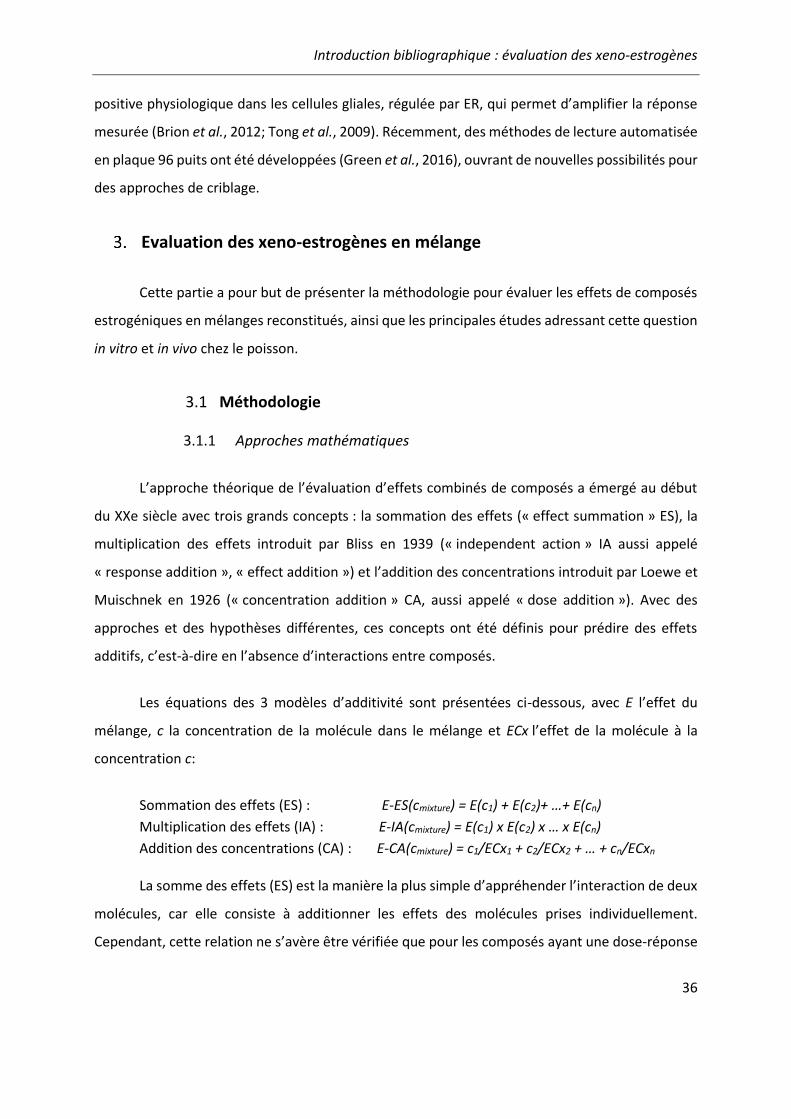
Introduction bibliographique : évaluation des xeno-estrogènes
36
positive physiologique dans les cellules gliales, régulée par ER, qui permet d’amplifier la réponse
mesurée (Brion et al., 2012; Tong et al., 2009). Récemment, des méthodes de lecture automatisée
en plaque 96 puits ont été développées (Green et al., 2016), ouvrant de nouvelles possibilités pour
des approches de criblage.
Evaluation des xeno-estrogènes en mélange
Cette partie a pour but de présenter la méthodologie pour évaluer les effets de composés
estrogéniques en mélanges reconstitués, ainsi que les principales études adressant cette question
in vitro et in vivo chez le poisson.
3.1 Méthodologie
3.1.1 Approches mathématiques
L’approche théorique de l’évaluation d’effets combinés de composés a émergé au début
du XXe siècle avec trois grands concepts : la sommation des effets (« effect summation » ES), la
multiplication des effets introduit par Bliss en 1939 (« independent action » IA aussi appelé
« response addition », « effect addition ») et l’addition des concentrations introduit par Loewe et
Muischnek en 1926 (« concentration addition » CA, aussi appelé « dose addition »). Avec des
approches et des hypothèses différentes, ces concepts ont été définis pour prédire des effets
additifs, c’est-à-dire en l’absence d’interactions entre composés.
Les équations des 3 modèles d’additivité sont présentées ci-dessous, avec E l’effet du
mélange, c la concentration de la molécule dans le mélange et ECx l’effet de la molécule à la
concentration c:
Sommation des effets (ES) : E-ES(cmixture) = E(c1) + E(c2)+ …+ E(cn)
Multiplication des effets (IA) : E-IA(cmixture) = E(c1) x E(c2) x … x E(cn)
Addition des concentrations (CA) : E-CA(cmixture) = c1/ECx1 + c2/ECx2 + … + cn/ECxn
La somme des effets (ES) est la manière la plus simple d’appréhender l’interaction de deux
molécules, car elle consiste à additionner les effets des molécules prises individuellement.
Cependant, cette relation ne s’avère être vérifiée que pour les composés ayant une dose-réponse

Introduction bibliographique : évaluation des xeno-estrogènes
37
linéaire passant par l’origine (Berenbaum, 1989). L’absence de considération pour le profil
d’activité des composés, souvent testés en mono-dose, a mené de nombreux auteurs à parler
erronément d’antagonisme ou de synergisme (Kortenkamp and Altenburger, 1998). Dans le cas
de réponses non linéaires, les modèles CA et IA sont préférentiellement utilisés. Le modèle IA
assume que les molécules en mélange induisent des effets similaires de manière indépendante les
unes des autres. L’effet du mélange se traduit de manière probabiliste par la multiplication des
effets. A la différence du modèle IA, le modèle CA est basé sur l’hypothèse que les composés en
mélange ont un mode d’action similaire. Chaque composé peut être alors considéré comme une
dilution du composé le plus actif, et exprimé en termes de puissance relative (REP) par rapport à
celui-ci. Ainsi, l’effet d’un mélange est prédit en additionnant les concentrations des composés
pondérés par leur puissance relative.
Combinés, les composés chimiques peuvent agir de manière additive mais peuvent aussi
interagir entrainant un effet plus important (potentialisation, supra-additivité, synergisme) ou
moins important (inhibition, infra-additivité, antagonisme) qu’attendu. Cependant, il n’existe pas
aujourd’hui de modèle mathématique généraliste permettant de prédire la présence
d’interactions. La mise en évidence d’une interaction passe donc nécessairement par la
caractérisation de la déviation par rapport à l’hypothèse d’additivité initiale, évaluée avec des
méthodes graphiques (ex : comparaison des intervalles de confiance, Scholze et al., 2014) ou
numériques (ex: Chou and Talalay, 1984; Jonker et al., 2005).
3.1.2 Plan expérimental
Afin d’évaluer la validité des modèles d’additivité, différentes approches peuvent être
utilisées. La technique la plus exhaustive consiste à tester toutes les combinaisons possibles de
molécules en suivant un plan factoriel. Très couteux en ressources (temps et matériels), le plan
factoriel est surtout utilisé pour les mélanges binaires ou ternaires évalués in vitro (ex: Bermudez
et al., 2010). Aujourd’hui, l’approche préconisée et la plus communément utilisée consiste à
réaliser des mélanges avec des ratios fixes entre les composés (Kortenkamp and Altenburger,
1998). Une fois le mélange constitué, il est testé en dilutions croissantes pour obtenir un profil de
réponse comparable aux prédictions. Les ratios entre molécules peuvent être déterminés sur la
base de leur activité (mélanges équipotents en ECx), de leur concentration (mélanges

Introduction bibliographique : évaluation des xeno-estrogènes
38
équimolaires), ou de leur occurrence environnementale (mélanges représentatifs d’une
exposition donnée). On retrouve aussi des plans d’expérience en rayon qui consiste à tester
seulement certaines combinaisons de molécules avec un ratio fixe interchangeable (ex: Hinfray et
al., 2016).
3.2 Evaluation des xeno-estrogènes en mélange
3.2.1 Mélanges de xeno-estrogènes in vitro
Les études évaluant des mélanges de molécules estrogéniques in vitro ont généralement
testé moins de 10 composés, parmi lesquels les hormones naturelles et de synthèses (E1, E2, EE2),
les alkylphenols, le bisphénol A et la génisteine sont les plus souvent retrouvés (Rajapakse et al.,
2002; Silva et al., 2011). Les principaux tests utilisés sont le YES (Payne et al., 2000; Rajapakse et
al., 2002) et le E-SCREEN (Rajapakse et al., 2004; Scholze et al., 2014), et dans une moindre
mesure, les lignées cellulaires humaines avec gène rapporteur (Bermudez et al., 2012; Ghisari and
Bonefeld-Jorgensen, 2009). Une seule étude a évalué l’activité d’un mélange spécifiquement sur
hERβ (ERβ-CALUX, Seeger et al., 2016). Peu d’informations sont disponibles pour les effets de
mélange sur la réponse des ER de poissons in vitro, à l’exception de deux études utilisant des
cellules gliales humaines transfectées transitoirement avec les récepteurs de poisson zèbre (zfERα,
zfERβ1, zfERβ2) et la luciférase sous le contrôle du promoteur du gène cyp19a1b (Hinfray et al.,
2016; Le Page et al., 2006).
Dans la très grande majorité des études, les effets des mélanges de composés
estrogéniques sont correctement prédits par le modèle de CA, que ce soit des mélanges
équipotents (Frische et al., 2009; Ghisari and Bonefeld-Jorgensen, 2009; Heneweer et al., 2005),
équimolaires (Demaegdt et al., 2016; Payne et al., 2000), ou réalisés sur la base de données
d’exposition dit « mélanges environnementaux » (Evans et al., 2012). Afin d’évaluer les effets des
molécules estrogéniques à faibles concentrations, telles que retrouvées dans l’environnement,
Silva et al. 2002 ont reconstitué un mélange équipotent de 8 molécules (comprenant une
benzophénone, des PCB, le BPA, la génisteine, et le résorcinol) présentes à des concentrations
inférieures à leur NOEC et EC01 (Silva et al., 2002). Alors que chaque composé pris
individuellement était inactif, combinés ensemble, le mélange entrainait un effet significatif sur la
réponse du test YES.
Introduction bibliographique : évaluation des xeno-estrogènes
39
Le concept de « something from nothing » introduit par cette étude, et confirmé par la
suite (Rajapakse et al., 2002; Scholze et al., 2014; Seeger et al., 2016), montre que, même à des
concentrations très faibles, des molécules ciblant ER peuvent agir conjointement pour éliciter une
réponse significative. De plus, les composés estrogéniques en mélanges peuvent influencer
significativement la réponse de l’E2, que ce soit des mélanges binaires (Rajapakse et al., 2001) ou
de 11 faibles agonistes présents à leurs NOEC (Rajapakse et al., 2002). Les effets aux faibles
concentrations et les interactions avec les hormones endogènes montrent que les effets additifs
des xéno-estrogènes sont importants à considérer dans l’évaluation du risque, et que l’absence
de synergisme n’est pas synonyme d’absence d’effets.
Des déviations par rapport aux prédictions du modèle CA sont parfois reportées, ces effets
étant généralement plus faibles qu’attendus et justifiés par l’activation d’enzymes du
métabolisme (Silva et al., 2011), par la présence de « modulateurs » ayant une estrogénicité
minimale (Evans et al., 2012) ou par l’addition de molécules interférentes (Frische et al., 2009). A
ce jour, un seul cas de synergisme majeur a été observé pour des mélanges de 2, 4 et 8
benzophénones testées à leurs NOEC et EC10 sur le test YES (Kunz and Fent, 2006). A l’exception
de cette dernière étude, les déviations reportées ne dépassent généralement pas un facteur 5 par
rapport à l’effet attendu, indiquant la robustesse du modèle de CA au regard de la variabilité
biologique et expérimentale.
3.2.2 Mélanges de xeno-estrogènes in vitro et in vivo chez le poisson
Les études portant sur les effets combinés des xeno-estrogènes chez les poissons ont
principalement évalué l’induction de la vitellogénine (mRNA ou VTG plasmatique) in vitro dans des
cultures primaires d’hépatocytes (Petersen et al., 2013; Petersen and Tollefsen, 2011) après 7 ou
14 jours d’exposition de poissons juvéniles (Correia et al., 2007; Kunz and Fent, 2009; Thorpe et
al., 2003) ou adultes (Brian et al., 2005; Sun et al., 2009; Zhang et al., 2009). Peu d’études ont
évalué l’induction de l’aromatase B in vitro (Hinfray et al., 2016;) ou in vivo dans des lignées de
poissons zèbres transgéniques au stade embryo-larvaire (Brion et al., 2012; Hinfray et al., 2016;
Petersen et al., 2013). La majorité des mélanges testés ne contenait pas plus de 5 molécules, avec
généralement les hormones naturelles et de synthèse (E1, E2, E3, EE2), les alkylphenols (OP, NP)
et le BPA présents en mélange équipotents. L’absence d’études évaluant l’additivité pour des
Introduction bibliographique : évaluation des xeno-estrogènes
40
mélanges plus complexes (ex : 14 molécules, Scott et al., 2017; ou 6 molécules, Crago et al., 2015)
se justifie par la nécessité d’avoir le profil d’activité de chaque molécule, ce qui exige du temps et
des organismes plus le nombre de composés augmente, ce qui pose problème au regard de
l’éthique et du bien-être animal.
Lorsque l’additivité a été évaluée avec le modèle CA, une bonne corrélation entre l’effet
prédit et l’effet observé est généralement observée, indiquant l’absence d’interactions majeures
entre molécules estrogéniques in vivo pour induire la vtg (Zhang et al., 2009,2010, Sun et al., 2009,
Brian et al., 2005, Thorpe et al., 2001) ou l’aromatase B (Brion et al., 2012; Petersen et al., 2013).
Brian et al. (2005) ont été les premiers à évaluer l’additivité d’un mélange de 5 composés in vivo.
Ils ont montré que l’E2, EE2, NP, OP et le BPA en mélange équipotent à leur EC50, et en mélange
à de très faibles concentrations (1/5 de l’EC50) avaient un effet additif sur l’induction de la VTG
après 14 jours d’exposition de vairons à tête de boules adultes mâles. Une étude ultérieure a
montré que ces mêmes 5 composés en mélange pouvaient affecter la fécondité des vairons à têtes
de boules, même à des concentrations peu ou pas actives quand administrées isolément, illustrant
les conséquences possibles sur la performance de la reproduction de poissons mâles de faibles
concentrations de xeno-estrogènes (Brian et al., 2007).
De légères déviations du modèle de CA sont parfois reportées in vivo, soit à fortes
(Petersen et al., 2013; Thorpe et al., 2003) ou à faibles concentrations (Kunz and Fent, 2009). Les
raisons proposées pour les déviations observées sont une métabolisation (Thorpe et al., 2001) et
une cytotoxicité plus importante (Petersen et al., 2013; Thorpe et al., 2003), ainsi qu’un possible
antagonisme à faibles concentrations entre 3 filtres UV (Kunz and Fent, 2009).
3.2.3 Conclusion
Les composés estrogéniques en mélanges agissent majoritairement de manière additive
sur l’activation des ER in vitro et sur l’induction de la vtg et de l’aromatase B in vivo chez le poisson.
A la différence des molécules seules, l’effet d’un mélange dépend non seulement des
concentrations de molécules présentes mais aussi du nombre de composés, de leur ratio et de
leur puissance (Kortenkamp, 2007). Un même mélange peut induire des réponses différentes en
fonction du modèle biologique, car chaque molécule n’y a pas nécessairement le même profil
d’activité (ex: Evans et al., 2012; Seeger et al., 2016). Les xeno-estrogènes puissants (ex : E1, EE2)

Introduction bibliographique : évaluation des xeno-estrogènes
41
étant généralement moins concentrés que les ligands faibles (ex : alkylphenols) dans l’écosystème
aquatiques, la caractérisation des niveaux d’exposition est donc une étape essentielle pour
évaluer le danger, et en conséquent le risque associé aux mélanges de xeno-estrogènes.

Introduction bibliographique : bio-surveillance des xeno-estrogènes
42
Bio-surveillance des xeno-estrogènes dans
l’environnement
Cette partie présente tout d’abord le cadre législatif de la surveillance des ressources en
eau en France avec l’implémentation de la Directive Cadre sur l’Eau (DCE, Directive 2000/60/CE),
et ses limites concernant l’évaluation de la contamination chimique des masses d’eau. Puis, les
grands principes de la bio-analyse sont présentés et illustrés avec des exemples d’application dans
l’évaluation la contamination de l’eau par les xeno-estrogènes.
Surveillance de l’eau en France
1.1 Introduction à la Directive Cadre sur l’Eau
Avec l’adoption de la DCE en 2000, transposée en loi nationale en 2004 (Loi n° 2004-338
du 21 avril 2004), et avec la loi sur l’eau et les milieux aquatiques (Loi n° 2006-1772 du 30
décembre 2006), la politique de la gestion de l’eau au niveau européen et national a sensiblement
évoluée. A la différence des précédentes directives et lois, la DCE impose un cadre stratégique
d’évaluation de l’état des masses d’eau à travers l’Europe avec une obligation de résultat :
atteindre et maintenir le bon état des masses d’eau d’ici 2015. L’objectif initial de 2015 a été
réévalué par la suite face aux difficultés d’implémentation au niveau national, prévu par le
législateur dès le début (Directive 2000/60/CE, 2000). La DCE évolue par cycle de 6 ans, dont le
premier s’est conclu en 2015 et le deuxième est en cours (2015 – 2021). En 2019 débutera la
prochaine révision de la DCE pour préparer le 3ème cycle de 2021-2027.
La DCE est une législation ambitieuse responsable d’un changement de paradigme
important dans l’évaluation des ressources en eau (Voulvoulis et al., 2017). Il n’est plus question
de se restreindre au contrôle de la pollution, mais de considérer l’intégrité des écosystèmes
aquatiques dans leur ensemble. Pour cela, la DCE reprend la notion d’évaluation de l’état de
l’écosystème à l’échelle du bassin hydrographique, tel qu’appliqué en France depuis 1964, mais
introduit de nouveaux objectifs de réduction de la pollution chimique et surtout de surveillance
biologique.
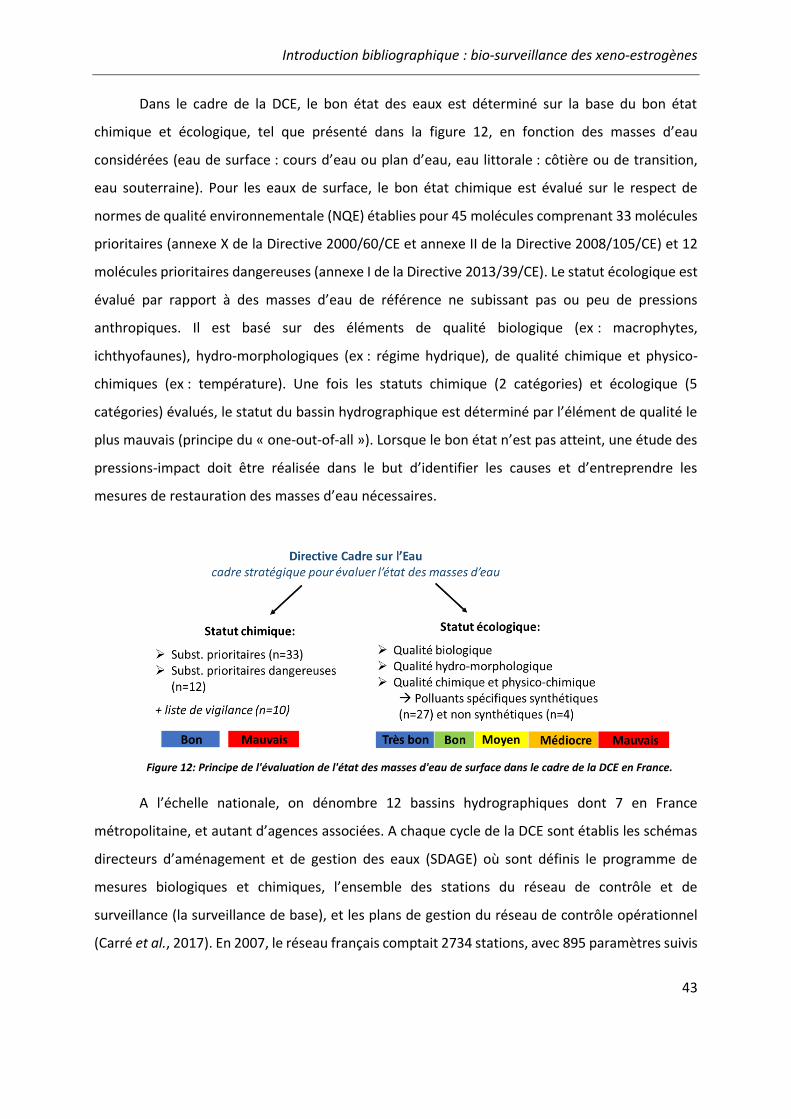
Introduction bibliographique : bio-surveillance des xeno-estrogènes
43
Dans le cadre de la DCE, le bon état des eaux est déterminé sur la base du bon état
chimique et écologique, tel que présenté dans la figure 12, en fonction des masses d’eau
considérées (eau de surface : cours d’eau ou plan d’eau, eau littorale : côtière ou de transition,
eau souterraine). Pour les eaux de surface, le bon état chimique est évalué sur le respect de
normes de qualité environnementale (NQE) établies pour 45 molécules comprenant 33 molécules
prioritaires (annexe X de la Directive 2000/60/CE et annexe II de la Directive 2008/105/CE) et 12
molécules prioritaires dangereuses (annexe I de la Directive 2013/39/CE). Le statut écologique est
évalué par rapport à des masses d’eau de référence ne subissant pas ou peu de pressions
anthropiques. Il est basé sur des éléments de qualité biologique (ex : macrophytes,
ichthyofaunes), hydro-morphologiques (ex : régime hydrique), de qualité chimique et physico-
chimiques (ex : température). Une fois les statuts chimique (2 catégories) et écologique (5
catégories) évalués, le statut du bassin hydrographique est déterminé par l’élément de qualité le
plus mauvais (principe du « one-out-of-all »). Lorsque le bon état n’est pas atteint, une étude des
pressions-impact doit être réalisée dans le but d’identifier les causes et d’entreprendre les
mesures de restauration des masses d’eau nécessaires.
A l’échelle nationale, on dénombre 12 bassins hydrographiques dont 7 en France
métropolitaine, et autant d’agences associées. A chaque cycle de la DCE sont établis les schémas
directeurs d’aménagement et de gestion des eaux (SDAGE) où sont définis le programme de
mesures biologiques et chimiques, l’ensemble des stations du réseau de contrôle et de
surveillance (la surveillance de base), et les plans de gestion du réseau de contrôle opérationnel
(Carré et al., 2017). En 2007, le réseau français comptait 2734 stations, avec 895 paramètres suivis
Figure 12: Principe de l'évaluation de l'état des masses d'eau de surface dans le cadre de la DCE en France.

Introduction bibliographique : bio-surveillance des xeno-estrogènes
44
et plus de 4 million d’analyses faites par an, laissant entrevoir le coût et l’effort de gestion
nécessaires pour répondre aux exigences de la DCE (Laronde and Petit, 2010).
1.2 Evaluation de la contamination chimique
1.2.1 Etat des lieux
La DCE impose un suivi régulier de 45 molécules à tous les états membres pour évaluer le
statut chimique des masses d’eau avec comme critère de qualité le respect des NQE. Parmi ces 45
molécules régulées se trouvent les nonylphenols et octylphenols, régulées à cause de leurs
activités PE (Sumpter and Jobling, 2013). En plus des molécules dangereuses, des polluants
spécifiques de l’état écologique, définis comme « molécules pertinentes rejetées en quantité
significative », ont été identifiés au niveau national pour chaque bassin hydrographique (Arrêté
du 27 juillet 2015). La liste établie en 2015 pour la France contient 27 molécules (« polluants
synthétiques ») et 4 métaux (« polluants non synthétiques ») surveillés spécifiquement dans
certains bassins hydrographiques dans le cadre de l’évaluation de l’état écologique. Dans le cadre
d’une surveillance prospective de la contamination de l’eau, la France a lancé un plan national de
lutte contre les micropolluants dans la continuité de précedentes actions (Plan micropolluants
2016-2021 pour préserver la qualité des eaux et de la biodiversité, 2016). De plus, au niveau
réglementaire, la France s’est dotée d’une liste de vigilance nationale comprenant 98 composés à
quantifier dans les eaux de surface de métropole, parmi lesquelles certains PE comme les
phtalates, les bisphenols A et S, l’estrone et la norethindrone (Arrêté du 7 août 2015).
1.2.2 Limites
L’inclusion d’une nouvelle molécule à surveiller dans le cadre de la DCE est un processus
lent qui nécessite que le danger et l’exposition à la molécule en question soient bien caractérisés.
Lors de la révision de la DCE en 2013 a été mis en place un système de liste de vigilance (« watch
list ») avec l’objectif d’obtenir suffisamment de données de qualité sur la présence de certains
polluants dans les eaux de surface européennes pour statuer sur leur inclusion future dans la DCE.
La liste de vigilance est limitée à 10 molécules et est réévaluée tous les deux ans, une molécule ne
pouvant y rester plus de 4 ans. Les informations d’occurrence obtenues doivent permettre au
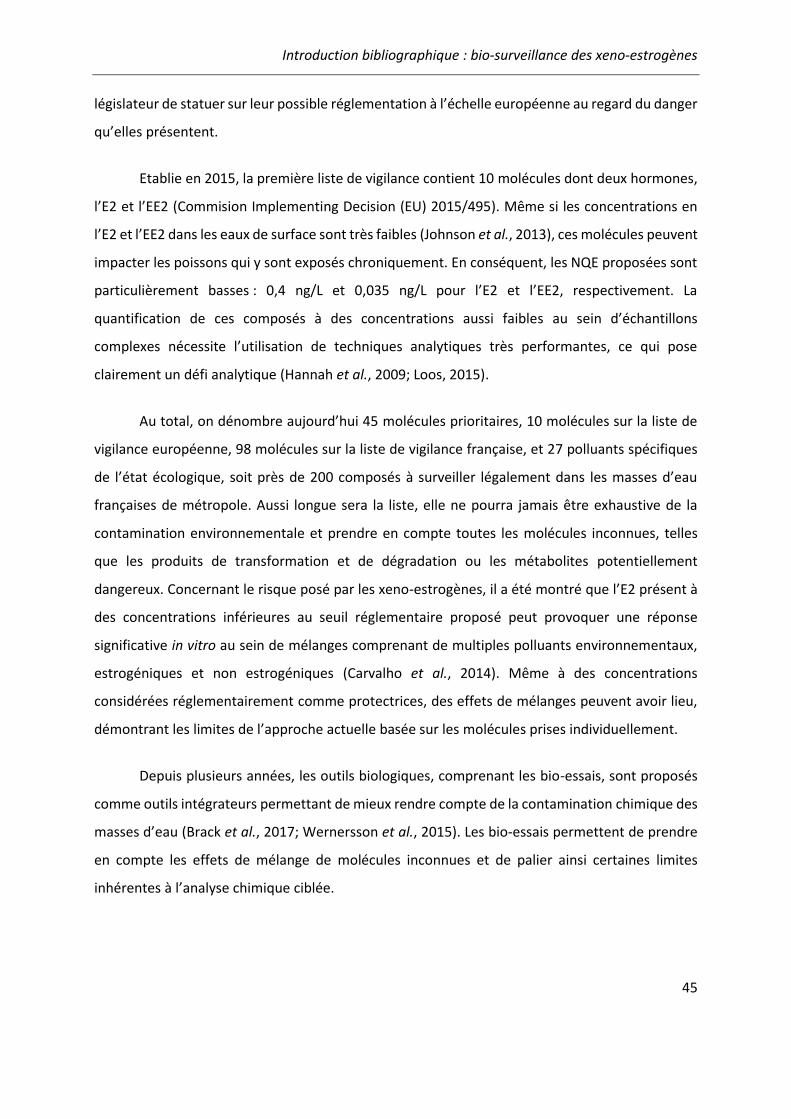
Introduction bibliographique : bio-surveillance des xeno-estrogènes
45
législateur de statuer sur leur possible réglementation à l’échelle européenne au regard du danger
qu’elles présentent.
Etablie en 2015, la première liste de vigilance contient 10 molécules dont deux hormones,
l’E2 et l’EE2 (Commision Implementing Decision (EU) 2015/495). Même si les concentrations en
l’E2 et l’EE2 dans les eaux de surface sont très faibles (Johnson et al., 2013), ces molécules peuvent
impacter les poissons qui y sont exposés chroniquement. En conséquent, les NQE proposées sont
particulièrement basses : 0,4 ng/L et 0,035 ng/L pour l’E2 et l’EE2, respectivement. La
quantification de ces composés à des concentrations aussi faibles au sein d’échantillons
complexes nécessite l’utilisation de techniques analytiques très performantes, ce qui pose
clairement un défi analytique (Hannah et al., 2009; Loos, 2015).
Au total, on dénombre aujourd’hui 45 molécules prioritaires, 10 molécules sur la liste de
vigilance européenne, 98 molécules sur la liste de vigilance française, et 27 polluants spécifiques
de l’état écologique, soit près de 200 composés à surveiller légalement dans les masses d’eau
françaises de métropole. Aussi longue sera la liste, elle ne pourra jamais être exhaustive de la
contamination environnementale et prendre en compte toutes les molécules inconnues, telles
que les produits de transformation et de dégradation ou les métabolites potentiellement
dangereux. Concernant le risque posé par les xeno-estrogènes, il a été montré que l’E2 présent à
des concentrations inférieures au seuil réglementaire proposé peut provoquer une réponse
significative in vitro au sein de mélanges comprenant de multiples polluants environnementaux,
estrogéniques et non estrogéniques (Carvalho et al., 2014). Même à des concentrations
considérées réglementairement comme protectrices, des effets de mélanges peuvent avoir lieu,
démontrant les limites de l’approche actuelle basée sur les molécules prises individuellement.
Depuis plusieurs années, les outils biologiques, comprenant les bio-essais, sont proposés
comme outils intégrateurs permettant de mieux rendre compte de la contamination chimique des
masses d’eau (Brack et al., 2017; Wernersson et al., 2015). Les bio-essais permettent de prendre
en compte les effets de mélange de molécules inconnues et de palier ainsi certaines limites
inhérentes à l’analyse chimique ciblée.
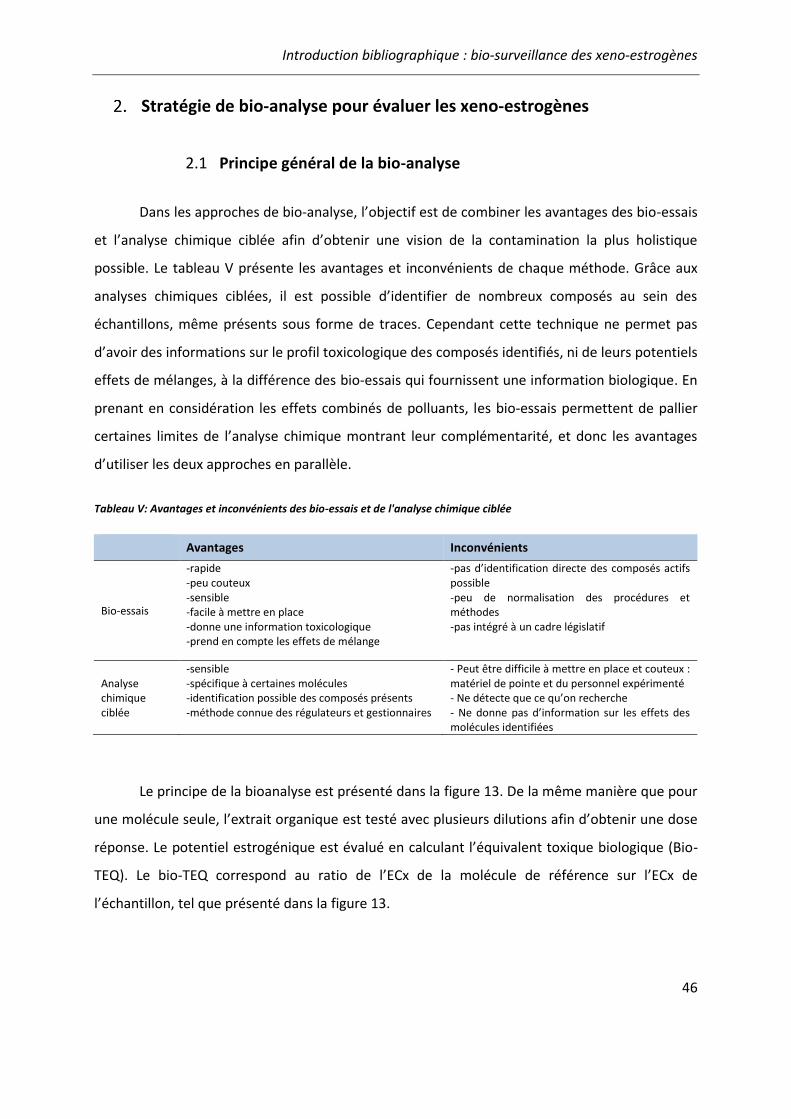
Introduction bibliographique : bio-surveillance des xeno-estrogènes
46
Stratégie de bio-analyse pour évaluer les xeno-estrogènes
2.1 Principe général de la bio-analyse
Dans les approches de bio-analyse, l’objectif est de combiner les avantages des bio-essais
et l’analyse chimique ciblée afin d’obtenir une vision de la contamination la plus holistique
possible. Le tableau V présente les avantages et inconvénients de chaque méthode. Grâce aux
analyses chimiques ciblées, il est possible d’identifier de nombreux composés au sein des
échantillons, même présents sous forme de traces. Cependant cette technique ne permet pas
d’avoir des informations sur le profil toxicologique des composés identifiés, ni de leurs potentiels
effets de mélanges, à la différence des bio-essais qui fournissent une information biologique. En
prenant en considération les effets combinés de polluants, les bio-essais permettent de pallier
certaines limites de l’analyse chimique montrant leur complémentarité, et donc les avantages
d’utiliser les deux approches en parallèle.
Tableau V: Avantages et inconvénients des bio-essais et de l'analyse chimique ciblée
Avantages Inconvénients
Bio-essais
-rapide -peu couteux -sensible -facile à mettre en place -donne une information toxicologique -prend en compte les effets de mélange
-pas d’identification directe des composés actifs possible -peu de normalisation des procédures et méthodes -pas intégré à un cadre législatif
Analyse chimique ciblée
-sensible -spécifique à certaines molécules -identification possible des composés présents -méthode connue des régulateurs et gestionnaires
- Peut être difficile à mettre en place et couteux : matériel de pointe et du personnel expérimenté - Ne détecte que ce qu’on recherche - Ne donne pas d’information sur les effets des molécules identifiées
Le principe de la bioanalyse est présenté dans la figure 13. De la même manière que pour
une molécule seule, l’extrait organique est testé avec plusieurs dilutions afin d’obtenir une dose
réponse. Le potentiel estrogénique est évalué en calculant l’équivalent toxique biologique (Bio-
TEQ). Le bio-TEQ correspond au ratio de l’ECx de la molécule de référence sur l’ECx de
l’échantillon, tel que présenté dans la figure 13.
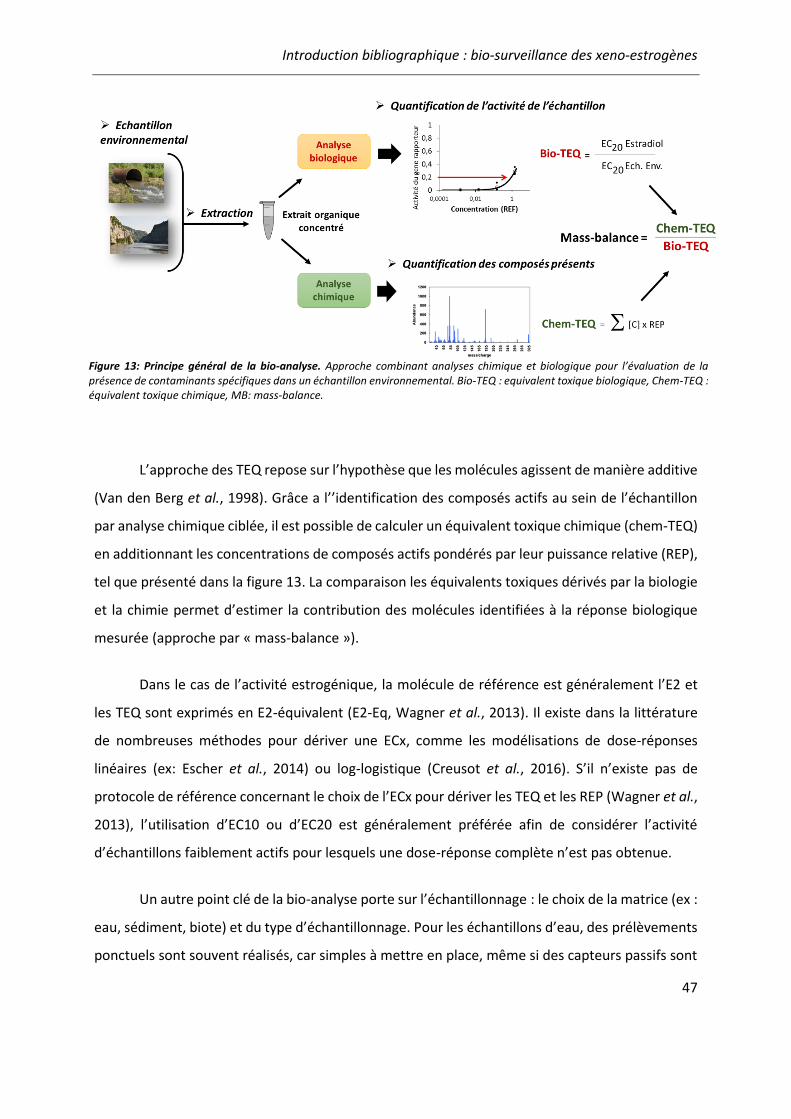
Introduction bibliographique : bio-surveillance des xeno-estrogènes
47
L’approche des TEQ repose sur l’hypothèse que les molécules agissent de manière additive
(Van den Berg et al., 1998). Grâce a l’’identification des composés actifs au sein de l’échantillon
par analyse chimique ciblée, il est possible de calculer un équivalent toxique chimique (chem-TEQ)
en additionnant les concentrations de composés actifs pondérés par leur puissance relative (REP),
tel que présenté dans la figure 13. La comparaison les équivalents toxiques dérivés par la biologie
et la chimie permet d’estimer la contribution des molécules identifiées à la réponse biologique
mesurée (approche par « mass-balance »).
Dans le cas de l’activité estrogénique, la molécule de référence est généralement l’E2 et
les TEQ sont exprimés en E2-équivalent (E2-Eq, Wagner et al., 2013). Il existe dans la littérature
de nombreuses méthodes pour dériver une ECx, comme les modélisations de dose-réponses
linéaires (ex: Escher et al., 2014) ou log-logistique (Creusot et al., 2016). S’il n’existe pas de
protocole de référence concernant le choix de l’ECx pour dériver les TEQ et les REP (Wagner et al.,
2013), l’utilisation d’EC10 ou d’EC20 est généralement préférée afin de considérer l’activité
d’échantillons faiblement actifs pour lesquels une dose-réponse complète n’est pas obtenue.
Un autre point clé de la bio-analyse porte sur l’échantillonnage : le choix de la matrice (ex :
eau, sédiment, biote) et du type d’échantillonnage. Pour les échantillons d’eau, des prélèvements
ponctuels sont souvent réalisés, car simples à mettre en place, même si des capteurs passifs sont
Figure 13: Principe général de la bio-analyse. Approche combinant analyses chimique et biologique pour l’évaluation de la présence de contaminants spécifiques dans un échantillon environnemental. Bio-TEQ : equivalent toxique biologique, Chem-TEQ : équivalent toxique chimique, MB: mass-balance.
Introduction bibliographique : bio-surveillance des xeno-estrogènes
48
aussi utilisés afin d’intégrer les flux de polluants au cours du temps. Pour les échantillons d’eau de
surface ponctuels, une étape de concentration est souvent réalisée pour faciliter l’analyse.
L’extraction en phase solide (« solid phase extraction » SPE) permet de capturer une large gamme
de polluants organiques (ex : phase HLB), et elle est le plus souvent utilisée dans des démarches
de bio-analyses. Récemment, un nouvel appareil permettant de combiner échantillonnage et
extraction SPE in situ a été développé (Schulze et al., 2017). Apportés sur site, cet appareil permet
d’extraire de grands volumes (50L à 1000L, « large volume SPE » LVSPE), de concentrer des
matrices très diluées comme les eaux de surface, et de palier certains problèmes liés à
l’échantillonnage et au stockage d’échantillons ponctuels (Schulze et al., 2017).
2.2 Applications environnementales
De nombreux outils biologiques sont utilisés pour évaluer l’état de contamination des
masses d’eau. Cette partie se focalise sur l’utilisation des tests de transactivation pour évaluer
l’activité estrogénique des échantillons d’effluents de stations d’épuration et d’eau de surface, et
de leur intégration dans une démarche de bio-monitoring incluant des approches spécifiques au
poisson.
2.2.1 Estrogenicité des effluents de stations d’épuration
Des exemples d’études évaluant l’activité estrogénique d’effluents de stations d’épuration
urbarines sont présentées dans le tableau VI. Dans la très grande majorité des échantillons
d’effluents de STEP testés, une activité estrogénique a été mesurée avec des niveaux variant de
0,03 à 98 ng/L E2-Eq, et en moyenne quelques ng/L E2-Eq (tableau VI).
La variabilité entre les niveaux mesurés peut s’expliquer par différents facteurs liés à la
période d’échantillonnage (ex : Aerni et al., 2004) et à l’effluent, comme le type de STEP, le
nombre d’habitants desservis par la STEP, l’existence ou non d’un traitement secondaire/tertiaire,
etc. Le type de bio-essai peut, dans une moindre mesure, influencer la mesure finale. Par exemple,
les E2-Eq quantifiés avec le test YES étaient en moyenne plus élevés que dans le test HEK-hERα
(Pawlowski et al., 2003). De récentes études inter-laboratoires comparant l’activité de plusieurs
bio-essais in vitro montrent que la variabilité inter-tests est faible et que les niveaux d’activité
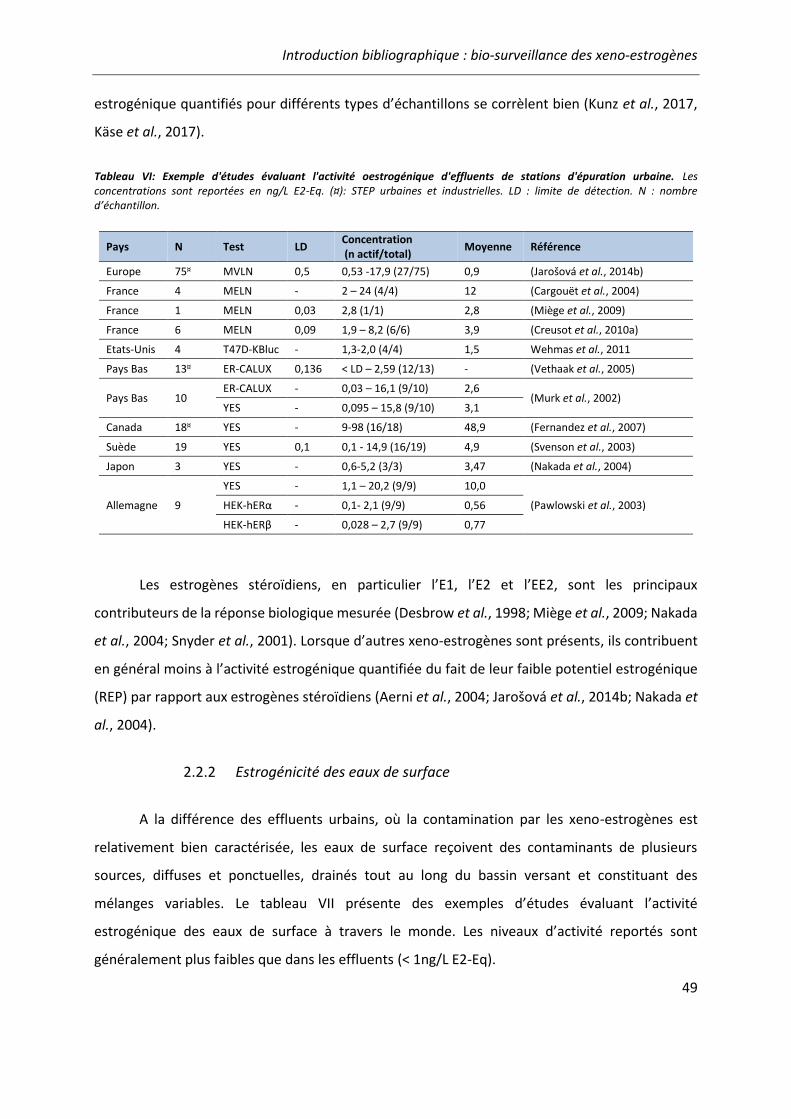
Introduction bibliographique : bio-surveillance des xeno-estrogènes
49
estrogénique quantifiés pour différents types d’échantillons se corrèlent bien (Kunz et al., 2017,
Käse et al., 2017).
Tableau VI: Exemple d'études évaluant l'activité oestrogénique d'effluents de stations d'épuration urbaine. Les concentrations sont reportées en ng/L E2-Eq. (¤): STEP urbaines et industrielles. LD : limite de détection. N : nombre d’échantillon.
Pays N Test LD Concentration (n actif/total)
Moyenne Référence
Europe 75¤ MVLN 0,5 0,53 -17,9 (27/75) 0,9 (Jarošová et al., 2014b)
France 4 MELN - 2 – 24 (4/4) 12 (Cargouët et al., 2004)
France 1 MELN 0,03 2,8 (1/1) 2,8 (Miège et al., 2009)
France 6 MELN 0,09 1,9 – 8,2 (6/6) 3,9 (Creusot et al., 2010a)
Etats-Unis 4 T47D-KBluc - 1,3-2,0 (4/4) 1,5 Wehmas et al., 2011
Pays Bas 13¤ ER-CALUX 0,136 < LD – 2,59 (12/13) - (Vethaak et al., 2005)
Pays Bas 10 ER-CALUX - 0,03 – 16,1 (9/10) 2,6
(Murk et al., 2002) YES - 0,095 – 15,8 (9/10) 3,1
Canada 18¤ YES - 9-98 (16/18) 48,9 (Fernandez et al., 2007)
Suède 19 YES 0,1 0,1 - 14,9 (16/19) 4,9 (Svenson et al., 2003)
Japon 3 YES - 0,6-5,2 (3/3) 3,47 (Nakada et al., 2004)
Allemagne 9
YES - 1,1 – 20,2 (9/9) 10,0
(Pawlowski et al., 2003) HEK-hERα - 0,1- 2,1 (9/9) 0,56
HEK-hERβ - 0,028 – 2,7 (9/9) 0,77
Les estrogènes stéroïdiens, en particulier l’E1, l’E2 et l’EE2, sont les principaux
contributeurs de la réponse biologique mesurée (Desbrow et al., 1998; Miège et al., 2009; Nakada
et al., 2004; Snyder et al., 2001). Lorsque d’autres xeno-estrogènes sont présents, ils contribuent
en général moins à l’activité estrogénique quantifiée du fait de leur faible potentiel estrogénique
(REP) par rapport aux estrogènes stéroïdiens (Aerni et al., 2004; Jarošová et al., 2014b; Nakada et
al., 2004).
2.2.2 Estrogénicité des eaux de surface
A la différence des effluents urbains, où la contamination par les xeno-estrogènes est
relativement bien caractérisée, les eaux de surface reçoivent des contaminants de plusieurs
sources, diffuses et ponctuelles, drainés tout au long du bassin versant et constituant des
mélanges variables. Le tableau VII présente des exemples d’études évaluant l’activité
estrogénique des eaux de surface à travers le monde. Les niveaux d’activité reportés sont
généralement plus faibles que dans les effluents (< 1ng/L E2-Eq).

Introduction bibliographique : bio-surveillance des xeno-estrogènes
50
Tableau VII: Exemples d'études évaluant l'activité estrogénique d'échantillons ponctuels d'eau de surface à travers le monde. Les activités estrogéniques sont exprimées en ng/L E2-Eq. LOQ : limite de quantification, n : nombre d’échantillons.
Pays n Test utilisé LOQ Activité estrogénique (Échantillons actifs)
Moyenne Référence
USA 6 T47D-KBluc 0,1 0,13 – 4,72 (6/6) 1,17 (Cavallin et al., 2014)
USA 32 T47D-KBluc 0,032 0,095 – 116 (32/32) 5,9
(Conley et al., 2017) BL-YES 0,2 0,24 – 4,1 (24/32) 1,2
USA 38 T47D-KBluc - 0,02 – 295 (35/38) -
(Alvarez et al., 2013) YES - 0,05-4610 (9/38) -
Chine 12 YES - 0,67-136 (10/12) 34,7 (Chen et al., 2016)
Europe 18 MELN 0,024 0,04 – 1,85 (14/18) 0,43 (Tousova et al., 2017)
France 7 MELN - 0,30-4,52 (7/7) 1,07 (Cargouët et al., 2004)
France 8 MELN 0,03 ~ 1 (3/8) ~1 (Miège et al., 2009)
USA 6 MCF-7 +ERE-LUC 1,4 6,8 (1/6) 6,8 (Kassotis et al., 2015)
Australie 8 ERα-CALUX 0,016 0,03-0,15 (8/8) ~0,1 (Roberts et al., 2015)
Pays-Bas 90 ER-CALUX 0,136 LD – 0,166 (85/90) - (Vethaak et al., 2005)
République tchèque
10 hERα-Hela-9903 - 0,02-2,07 (9/10) - (Prochazkova et al., 2017)
Aux Etats-Unis, Conley et al. (2017) constatent que les échantillons les plus actifs (3/23)
provenaient de sites où les rejets de STEP constituaient 50 à 100% de la rivière. De nombreuses
études ont de fait étudié l’impact des rejets de STEP sur les niveaux d’estrogénicité des eaux de
surface. Par exemple, dans de petits cours d’eau suisses, Neale et al. (2017) montrent qu’il y a une
activité estrogénique 2 à 5 fois plus forte en aval qu’en amont du rejet de l’effluent de STEP
urbaine qui constitue 20% du débit de la rivière. Une observation similaire est faite pour la Seine
en aval de la STEP d’Achères qui draine 8 millions d’équivalent habitants, avec une activité
mesurée 6 fois plus élevée en aval qu’en amont (Cargouet et al., 2004). Ces études confirment que
les effluents de STEP peuvent contribuer de manière significative à l’estrogénicité des cours d’eau.
En plus de la quantité de molécules déversées par les rejets de STEP, ou provenant d’autres
sources, le débit de la rivière est un facteur qui peut fortement influencer la concentration en
polluants dans les eaux, et donc l’activité estrogénique mesurée (Johnson, 2010). Les niveaux
d’activité estrogénique détectés varient d’un facteur 4 à 100 entre été/hiver (Afrique du Sud,
Truter et al., 2016) et entre période sèche/humide (Chine, Chen et al., 2016). De la même manière,

Introduction bibliographique : bio-surveillance des xeno-estrogènes
51
Alvarez et al. (2013) observent une activité estrogénique plus forte dans les rivières proches de
zones d’épandage d’engrais animal après des épisodes de pluies.
Dans les échantillons d’eau de surface, l’estrone est le composé le plus souvent retrouvé
comme contributeur principal de l’activité estrogénique des eaux de rivières. L’E2 et l’EE2 sont en
revanche beaucoup moins fréquemment détectés dans les rivières, à la différence des échantillons
provenant d’effluents de STEP urbaines (ex : Conley et al., 2017, Kassotis et al., 2015, Chen et al.,
2016). Cependant, malgré une bonne sensibilité analytique, les composés identifiés ne suffisent
pas toujours à expliquer la réponse biologique observée. Dans l’étude d’Alvarez et al. (2013), 69%
des 38 échantillons étaient inférieurs à la limite de détection en analyse chimique ciblée pour les
estrogènes stéroïdiens (LD=0,8 ng/L), alors que seulement 5% était négatif en in vitro avec le test
T47D-KBLuc. D’autres xeno-estrogènes, tels que le bisphénol A (ex : Chen et al., 2016) ou des
phyto-estrogènes (ex : Prochazkova et al., 2017), sont aussi retrouvés mais ils contribuent
généralement très peu à l’activité mesurée. Dans l’étude de Chen et al. (2016), 10% à 65% de
l’estrogénicité des 10 échantillons reste inexpliquée, alors que le BPA, E2, EE2, E1, DES, OP, et NP
ont été recherchés et parfois quantifiés. De la même manière, les 10 molécules actives
recherchées et parfois quantifiées dans l’étude de Tousova et al. (2017) n’ont permis d’expliquer
de 1% à 77% de l’activité mesurée.
L’inadéquation entre molécules quantifiées et réponse mesurée in vitro peut être due à
plusieurs facteurs comme la présence de molécules actives non identifiées par les analyses
chimiques ciblées (Chen et al., 2016), non recherchées (Prochazkova et al., 2017) ou présentes à
des concentrations inférieures à la LOQ (Alvarez et al., 2013). De plus, l’approche par mass balance
est basée sur l’hypothèse que les molécules ont des effets additifs, or la co-occurrence d’activités
estrogénique et anti-oestrogénique dans certaines études (ex : Kassotis et al., 2015; Tousova et
al., 2017) soulèvent la question d’interactions entre polluants environnementaux au sein de
l’échantillon pour un bio-essai donné.
2.2.3 Utilisation de bio-essais poisson pour évaluer l’estrogénicité
La majorité des études réalisées jusqu’à présent ont été faites avec des bio-essais basés
sur le récepteur ERα humain. Malgré des différences de sensibilité aux xéno-estrogènes entre ER
humain et ichthyens (Aerni et al., 2004; Cosnefroy et al., 2009; Pinto et al., 2014), peu d’études

Introduction bibliographique : bio-surveillance des xeno-estrogènes
52
ont utilisés des bio-essais basés sur ER de poisson dans des démarches de bio-monitoring.
Cependant, lorsque les réponses des bio-essais basé sur ER humain et sur ER poisson ont été
comparées, des différences sont parfois constatées (Ihara et al., 2014; Rutishauser et al., 2004;
Sonavane et al., 2016). Dans le cas de Ihara et al. (2014), les échantillons de STEP étaient actifs sur
les bio-essais basés sur ERα humain et ERα du medaka, mais les niveaux d’activité étaient parfois
très différents. Les estrogènes stéroïdiens quantifiés ne permettaient pas d’expliquer ces
différences, mais la présence d’une activté anti-estrogénique bien distincte entre les deux
modèles semble contribuer aux differences observées. De plus, l’activité estrogénique mesurée in
vitro sur le récepteur ERα du médaka corrélait mieux avec l’induction de la vtg1 et de la ChgH in
vivo chez le médaka mâle, que l’activité mesurée sur le modèle in vitro exprimant le récepteur
hERα.
D’autre part, des bio-essais in vitro et in vivo basés sur le modèle du poisson zèbre ont été
comparés avec un test MELN pour évaluer l’activité estrogénique d’échantillons d’eau de surface
(Sonavane et al., 2016). Alors que 12 des 20 échantillons étaient détectés par les tests in vitro
humain (MELN) et poisson zèbre (ZELH-zfERß2), 8 étaient sélectivement actifs sur le modèle ZELH-
zfERß2, qui expriment le sous-type zfERß2, spécifique au poisson. De plus, l’activité de 3
échantillons parmi les plus estrogéniques a été confirmée in vivo sur des embryons de poisson
zèbre transgénique cyp19a1b-GFP (Brion et al., 2012), parmi lesquels un site était sélectivement
actif sur les modèles poisson zèbre in vitro et in vivo (Sonavane et al. 2016). Jusqu’à présent, les
tests embryo-larvaires avec des poissons transgéniques n’avaient été utilisés que sporadiquement
et de manière qualitative pour évaluer l’activité estrogénique d’échantillons d’effluents de STEP
(Kurauchi et al., 2005) ou d’eau de surface (Gorelick et al., 2014). Pour la première fois, l’activité
estrogénique d’un échantillon environnemental a pu être quantifiée in vivo chez le poisson (Neale
et al., 2017b; Sonavane et al., 2016).
2.2.4 Intégration des bio-essais dans un cadre législatif
La mesure de l’activité estrogénique n’est pas une finalité en soi, mais une étape pour
évaluer la qualité chimique de l’eau. Pour intégrer les bio-essais dans une démarche de bio-
surveillance, un cadre d’utilisation doit être établi. Différentes approches ont été récemment
proposées pour combiner analyses chimiques ciblées et bio-analyse dans l’évaluation de la qualité
Introduction bibliographique : bio-surveillance des xeno-estrogènes
53
des milieux, à l’instar de Vethaak et al. (2017) pour l’évaluation du milieu marin et Van der Oost
et al. (2017) pour l’évaluation des eaux de surface. Dans le cas de l’activité estrogénique,
l’intégration des bio-essais passe par la définition d’une valeur seuil d’activité estrogénique. Les
valeurs récemment proposées ont été établies pour des TA basés sur hERα à partir des données
de toxicité chronique chez organismes aquatiques (Van der Oost et al., 2017), et en particulier
chez le poisson (Jarošová et al., 2014a; Kunz et al., 2015). Cependant, leur intégration dans un
cadre legislatif nécessite qu’un cadre applicatif soit clairement définit (ex : action déclenchée en
cas de dépassement).
Conclusions et défis
Ces dernières années, de très nombreuses études environnementales ont montré l’utilité
des bio-essais in vitro pour l’évaluation de l’estrogénicité des milieux. Si leur intérêt pour la
surveillance de la qualité chimique des milieux, en complément des analyses chimiques ciblées,
n’est plus contestée, il n’en demeure pas moins que certaines questions de recherche doivent être
encore adressées pour améliorer le diagnostic fourni par ces outils et permettre leur utilisation
future en bio-surveillance environnementale. Des études récentes comparant modèles humains
et poissons suggèrent que les bio-essais ne donnent pas nécessairement le même diagnostic de la
contamination par les xeno-estrogènes. La différence de réponse pourrait être liée aux spécificités
de chaque modèle biologique : ER poisson ou humain, cellules mammifères ou cellules de poisson,
et in vitro vs in vivo. Comprendre ces différences et leurs conséquences sur le diagnostic
environnemental est nécessaire pour permettre une utilisation optimale des bio-essais dans
l’évaluation de la qualité de l’eau.

Introduction bibliographique : bio-surveillance des xeno-estrogènes
54

DEMARCHE EXPERIMENTALE
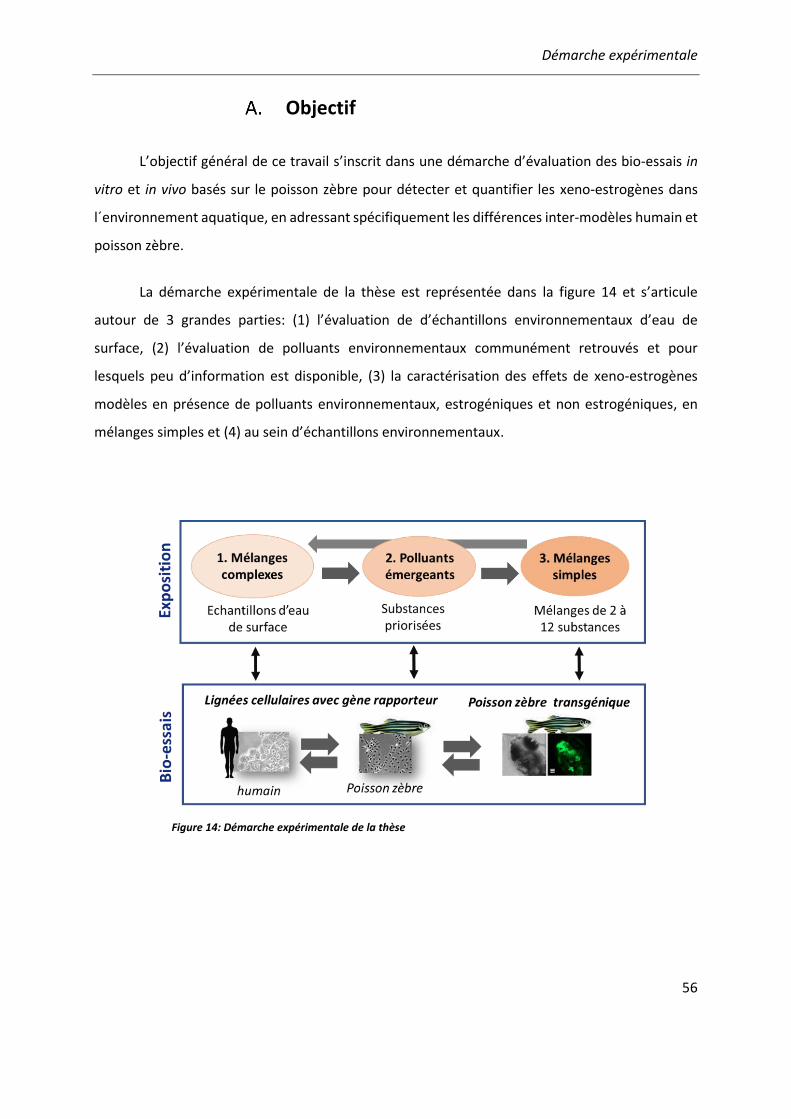
Démarche expérimentale
56
Objectif
L’objectif général de ce travail s’inscrit dans une démarche d’évaluation des bio-essais in
vitro et in vivo basés sur le poisson zèbre pour détecter et quantifier les xeno-estrogènes dans
l´environnement aquatique, en adressant spécifiquement les différences inter-modèles humain et
poisson zèbre.
La démarche expérimentale de la thèse est représentée dans la figure 14 et s’articule
autour de 3 grandes parties: (1) l’évaluation de d’échantillons environnementaux d’eau de
surface, (2) l’évaluation de polluants environnementaux communément retrouvés et pour
lesquels peu d’information est disponible, (3) la caractérisation des effets de xeno-estrogènes
modèles en présence de polluants environnementaux, estrogéniques et non estrogéniques, en
mélanges simples et (4) au sein d’échantillons environnementaux.
Figure 14: Démarche expérimentale de la thèse
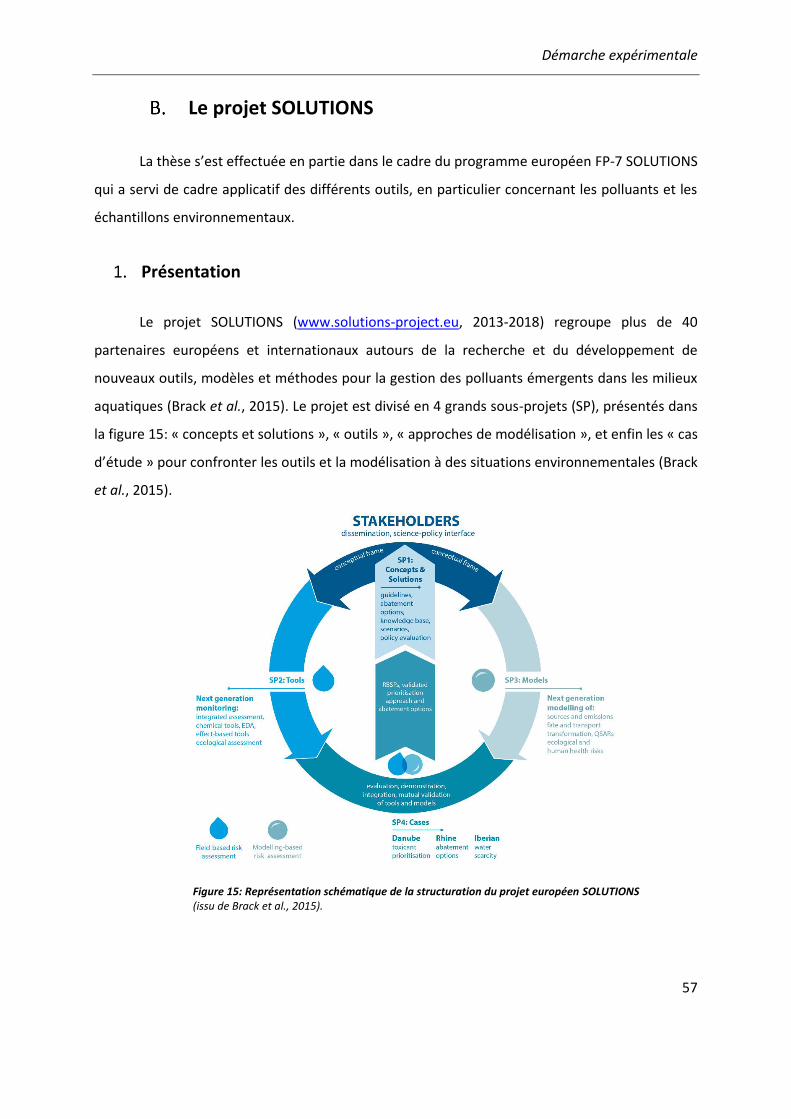
Démarche expérimentale
57
Le projet SOLUTIONS
La thèse s’est effectuée en partie dans le cadre du programme européen FP-7 SOLUTIONS
qui a servi de cadre applicatif des différents outils, en particulier concernant les polluants et les
échantillons environnementaux.
Présentation
Le projet SOLUTIONS (www.solutions-project.eu, 2013-2018) regroupe plus de 40
partenaires européens et internationaux autours de la recherche et du développement de
nouveaux outils, modèles et méthodes pour la gestion des polluants émergents dans les milieux
aquatiques (Brack et al., 2015). Le projet est divisé en 4 grands sous-projets (SP), présentés dans
la figure 15: « concepts et solutions », « outils », « approches de modélisation », et enfin les « cas
d’étude » pour confronter les outils et la modélisation à des situations environnementales (Brack
et al., 2015).
Figure 15: Représentation schématique de la structuration du projet européen SOLUTIONS (issu de Brack et al., 2015).
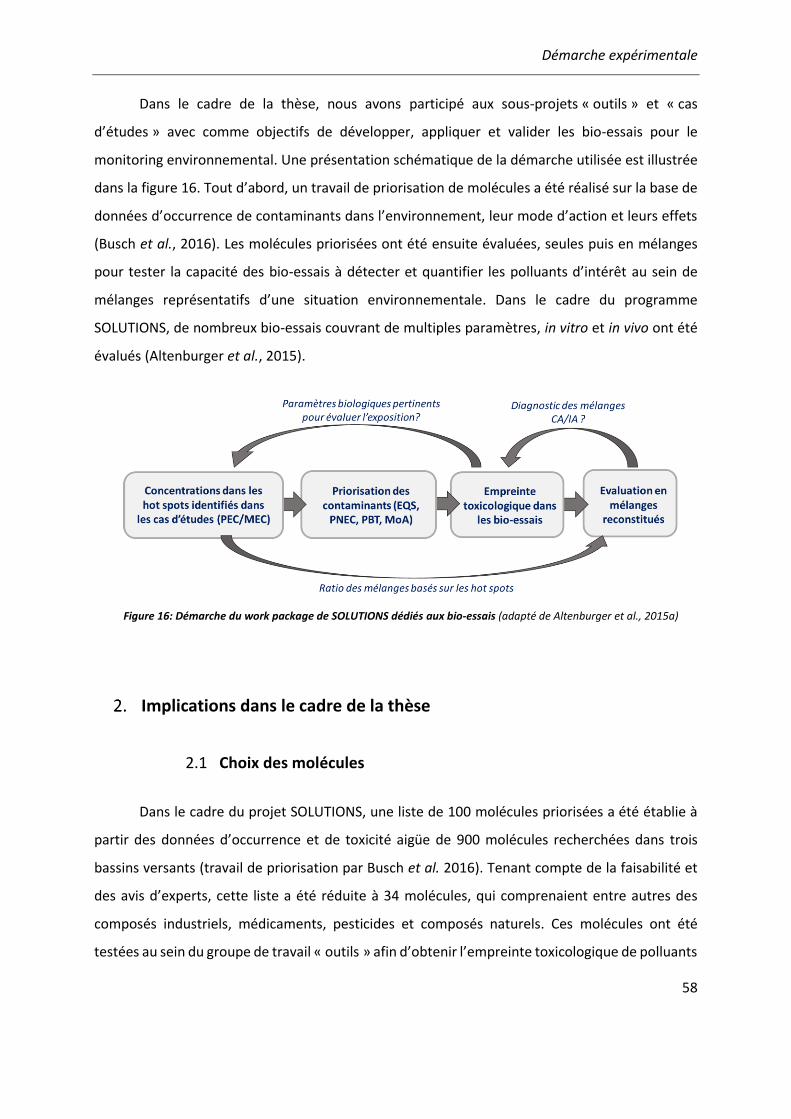
Démarche expérimentale
58
Dans le cadre de la thèse, nous avons participé aux sous-projets « outils » et « cas
d’études » avec comme objectifs de développer, appliquer et valider les bio-essais pour le
monitoring environnemental. Une présentation schématique de la démarche utilisée est illustrée
dans la figure 16. Tout d’abord, un travail de priorisation de molécules a été réalisé sur la base de
données d’occurrence de contaminants dans l’environnement, leur mode d’action et leurs effets
(Busch et al., 2016). Les molécules priorisées ont été ensuite évaluées, seules puis en mélanges
pour tester la capacité des bio-essais à détecter et quantifier les polluants d’intérêt au sein de
mélanges représentatifs d’une situation environnementale. Dans le cadre du programme
SOLUTIONS, de nombreux bio-essais couvrant de multiples paramètres, in vitro et in vivo ont été
évalués (Altenburger et al., 2015).
Implications dans le cadre de la thèse
2.1 Choix des molécules
Dans le cadre du projet SOLUTIONS, une liste de 100 molécules priorisées a été établie à
partir des données d’occurrence et de toxicité aigüe de 900 molécules recherchées dans trois
bassins versants (travail de priorisation par Busch et al. 2016). Tenant compte de la faisabilité et
des avis d’experts, cette liste a été réduite à 34 molécules, qui comprenaient entre autres des
composés industriels, médicaments, pesticides et composés naturels. Ces molécules ont été
testées au sein du groupe de travail « outils » afin d’obtenir l’empreinte toxicologique de polluants
Figure 16: Démarche du work package de SOLUTIONS dédiés aux bio-essais (adapté de Altenburger et al., 2015a)
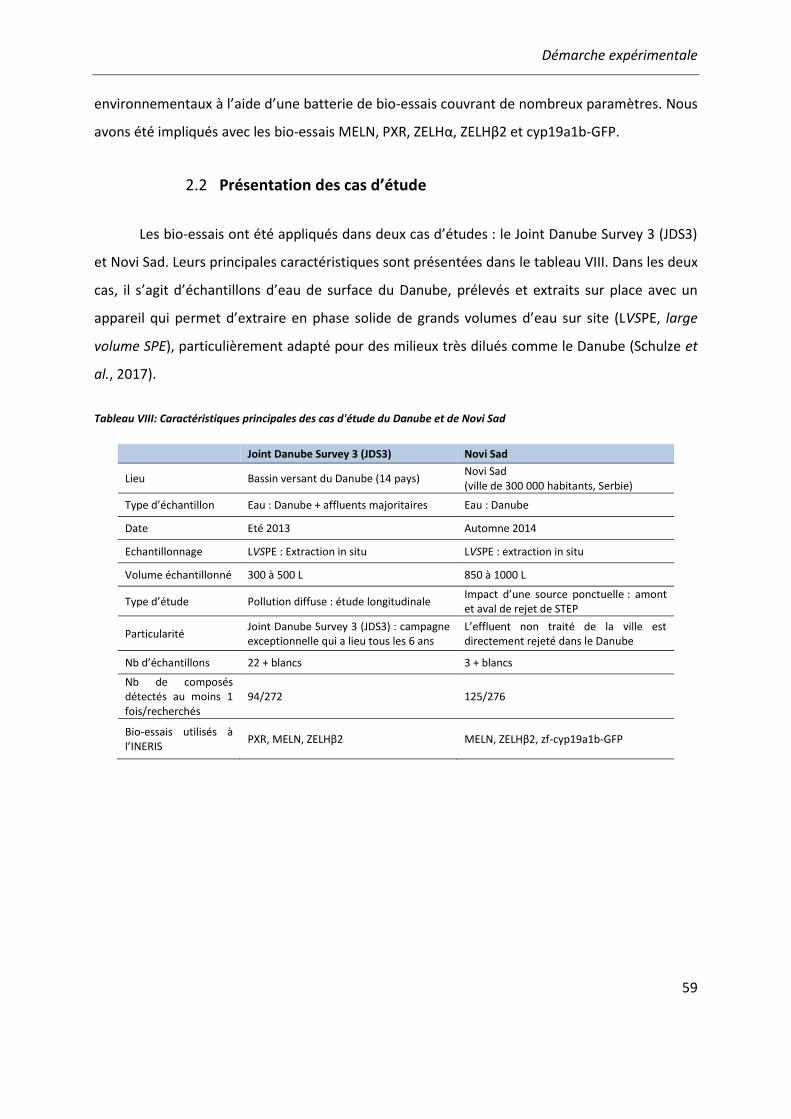
Démarche expérimentale
59
environnementaux à l’aide d’une batterie de bio-essais couvrant de nombreux paramètres. Nous
avons été impliqués avec les bio-essais MELN, PXR, ZELHα, ZELHβ2 et cyp19a1b-GFP.
2.2 Présentation des cas d’étude
Les bio-essais ont été appliqués dans deux cas d’études : le Joint Danube Survey 3 (JDS3)
et Novi Sad. Leurs principales caractéristiques sont présentées dans le tableau VIII. Dans les deux
cas, il s’agit d’échantillons d’eau de surface du Danube, prélevés et extraits sur place avec un
appareil qui permet d’extraire en phase solide de grands volumes d’eau sur site (LVSPE, large
volume SPE), particulièrement adapté pour des milieux très dilués comme le Danube (Schulze et
al., 2017).
Tableau VIII: Caractéristiques principales des cas d'étude du Danube et de Novi Sad
Joint Danube Survey 3 (JDS3) Novi Sad
Lieu Bassin versant du Danube (14 pays) Novi Sad (ville de 300 000 habitants, Serbie)
Type d’échantillon Eau : Danube + affluents majoritaires Eau : Danube
Date Eté 2013 Automne 2014
Echantillonnage LVSPE : Extraction in situ LVSPE : extraction in situ
Volume échantillonné 300 à 500 L 850 à 1000 L
Type d’étude Pollution diffuse : étude longitudinale Impact d’une source ponctuelle : amont et aval de rejet de STEP
Particularité Joint Danube Survey 3 (JDS3) : campagne exceptionnelle qui a lieu tous les 6 ans
L’effluent non traité de la ville est directement rejeté dans le Danube
Nb d’échantillons 22 + blancs 3 + blancs
Nb de composés détectés au moins 1 fois/recherchés
94/272 125/276
Bio-essais utilisés à l’INERIS
PXR, MELN, ZELHβ2 MELN, ZELHβ2, zf-cyp19a1b-GFP
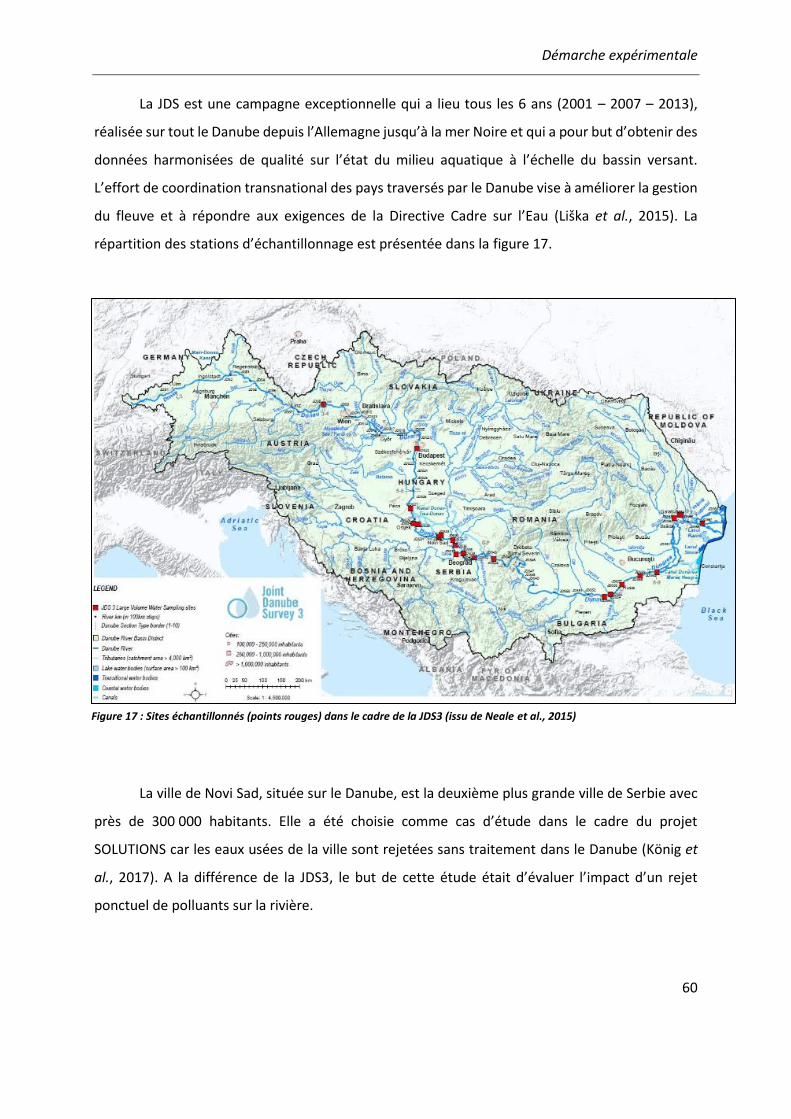
Démarche expérimentale
60
La JDS est une campagne exceptionnelle qui a lieu tous les 6 ans (2001 – 2007 – 2013),
réalisée sur tout le Danube depuis l’Allemagne jusqu’à la mer Noire et qui a pour but d’obtenir des
données harmonisées de qualité sur l’état du milieu aquatique à l’échelle du bassin versant.
L’effort de coordination transnational des pays traversés par le Danube vise à améliorer la gestion
du fleuve et à répondre aux exigences de la Directive Cadre sur l’Eau (Liška et al., 2015). La
répartition des stations d’échantillonnage est présentée dans la figure 17.
La ville de Novi Sad, située sur le Danube, est la deuxième plus grande ville de Serbie avec
près de 300 000 habitants. Elle a été choisie comme cas d’étude dans le cadre du projet
SOLUTIONS car les eaux usées de la ville sont rejetées sans traitement dans le Danube (König et
al., 2017). A la différence de la JDS3, le but de cette étude était d’évaluer l’impact d’un rejet
ponctuel de polluants sur la rivière.
Figure 17 : Sites échantillonnés (points rouges) dans le cadre de la JDS3 (issu de Neale et al., 2015)
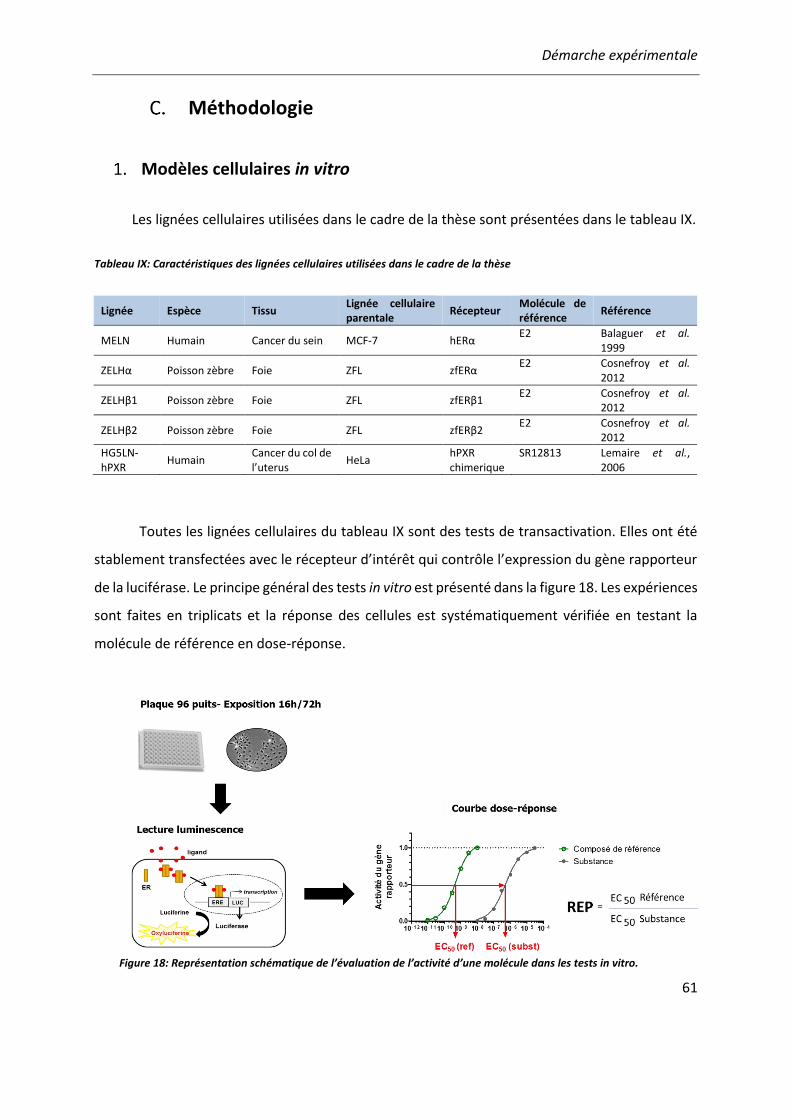
Démarche expérimentale
61
Méthodologie
Modèles cellulaires in vitro
Les lignées cellulaires utilisées dans le cadre de la thèse sont présentées dans le tableau IX.
Tableau IX: Caractéristiques des lignées cellulaires utilisées dans le cadre de la thèse
Toutes les lignées cellulaires du tableau IX sont des tests de transactivation. Elles ont été
stablement transfectées avec le récepteur d’intérêt qui contrôle l’expression du gène rapporteur
de la luciférase. Le principe général des tests in vitro est présenté dans la figure 18. Les expériences
sont faites en triplicats et la réponse des cellules est systématiquement vérifiée en testant la
molécule de référence en dose-réponse.
Lignée Espèce Tissu Lignée cellulaire parentale
Récepteur Molécule de référence
Référence
MELN Humain Cancer du sein MCF-7 hERα E2 Balaguer et al.
1999
ZELHα Poisson zèbre Foie ZFL zfERα E2 Cosnefroy et al.
2012
ZELHβ1 Poisson zèbre Foie ZFL zfERβ1 E2 Cosnefroy et al.
2012
ZELHβ2 Poisson zèbre Foie ZFL zfERβ2 E2 Cosnefroy et al.
2012
HG5LN-hPXR
Humain Cancer du col de l’uterus
HeLa hPXR chimerique
SR12813 Lemaire et al., 2006
Figure 18: Représentation schématique de l’évaluation de l’activité d’une molécule dans les tests in vitro.

Démarche expérimentale
62
1.1 Lignée cellulaire ZELH-zfER
Les cellules ZELHα, ZELHβ1 et ZELHβ2 sont des cellules ZFL (issues d’une culture primaire
d’hépatocytes de poisson zèbre) qui ont été d’abord stablement transfectées avec le gène
rapporteur de la luciférase sous le contrôle d’un promoteur synthétique ERE (produisant la lignée
stable ZELH, sans récepteur), puis avec chaque sous-type de zfER (Cosnefroy et al., 2012). Ces
lignées ont été établies à l’INERIS (Cosnefroy, 2011) et caractérisées avec divers xeno-estrogènes
connus (Cosnefroy et al., 2012, thèse M. Sonavane, 2015).
Dans les cellules ZFL, aucune expression de zfER n’est détectée (Cosnefroy, 2011).
Cependant, elles ont conservé une voie AhR inductible (Creusot et al., 2015; Eide et al., 2014;
Wentworth et al., 2004). De plus, le profil métabolique (enzymes de phase II) des ZFL est similaire
à celui de cultures primaires d’hépatocytes de poisson zèbre, bien que quantitativement moins
important (Le Fol et al., 2015).
1.2 Lignée cellulaire MELN
La lignée MELN (Balaguer et al., 1999) a été utilisée comme modèle humain d’évaluation
de l’estrogénicité. Les cellules MELN sont dérivées de la lignée de cellules de cancer du sein MCF-
7 qui expriment de manière endogène importante le récepteur hERα, mais pas de hERβ
fonctionnel (Balaguer, communication personnelle). La lignée MELN a été établie par transfection
stable du gène rapporteur de la luciférase sous contrôle d’un promoteur synthétique ERE
répondant à l’activation de hERα. La lignée MELN est bien caractérisée et est utilisée depuis
longtemps pour évaluer des molécules seules (Balaguer et al., 1999; Pillon et al., 2005) et des
échantillons environnementaux (Creusot et al., 2013; Kinani et al., 2010).
1.3 Lignée cellulaire PXR
La lignée HG5LN-hPXR a également été évaluée comme méthode biologique de détection
de la présence de xénobiotiques dans le cadre du projet SOLUTIONS car cette lignée est sensible
à de nombreuses familles de polluants environnementaux (Creusot et al., 2010a; Lemaire et al.,
2006; Mnif et al., 2007). Le récepteur pregnane-X (PXR) est un récepteur nucléaire qui, une fois
activé, induit la transcription d’enzymes du métabolisme et particulièrement le CYP3A4,
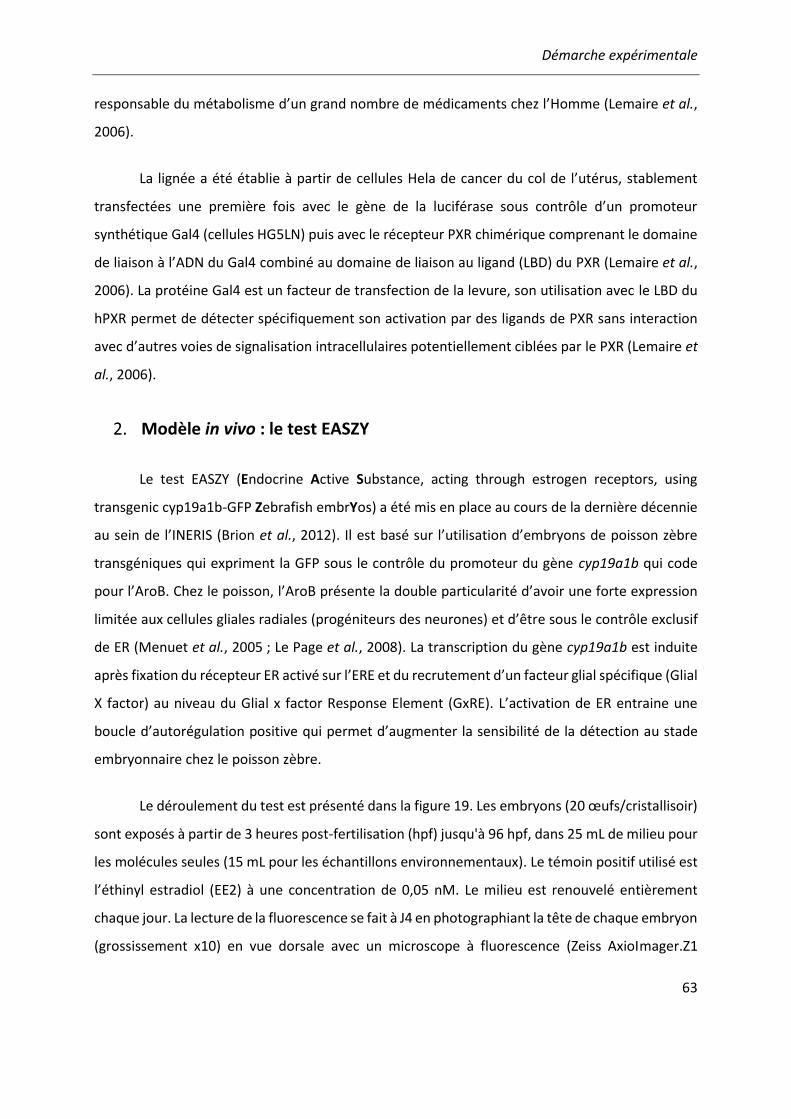
Démarche expérimentale
63
responsable du métabolisme d’un grand nombre de médicaments chez l’Homme (Lemaire et al.,
2006).
La lignée a été établie à partir de cellules Hela de cancer du col de l’utérus, stablement
transfectées une première fois avec le gène de la luciférase sous contrôle d’un promoteur
synthétique Gal4 (cellules HG5LN) puis avec le récepteur PXR chimérique comprenant le domaine
de liaison à l’ADN du Gal4 combiné au domaine de liaison au ligand (LBD) du PXR (Lemaire et al.,
2006). La protéine Gal4 est un facteur de transfection de la levure, son utilisation avec le LBD du
hPXR permet de détecter spécifiquement son activation par des ligands de PXR sans interaction
avec d’autres voies de signalisation intracellulaires potentiellement ciblées par le PXR (Lemaire et
al., 2006).
Modèle in vivo : le test EASZY
Le test EASZY (Endocrine Active Substance, acting through estrogen receptors, using
transgenic cyp19a1b-GFP Zebrafish embrYos) a été mis en place au cours de la dernière décennie
au sein de l’INERIS (Brion et al., 2012). Il est basé sur l’utilisation d’embryons de poisson zèbre
transgéniques qui expriment la GFP sous le contrôle du promoteur du gène cyp19a1b qui code
pour l’AroB. Chez le poisson, l’AroB présente la double particularité d’avoir une forte expression
limitée aux cellules gliales radiales (progéniteurs des neurones) et d’être sous le contrôle exclusif
de ER (Menuet et al., 2005 ; Le Page et al., 2008). La transcription du gène cyp19a1b est induite
après fixation du récepteur ER activé sur l’ERE et du recrutement d’un facteur glial spécifique (Glial
X factor) au niveau du Glial x factor Response Element (GxRE). L’activation de ER entraine une
boucle d’autorégulation positive qui permet d’augmenter la sensibilité de la détection au stade
embryonnaire chez le poisson zèbre.
Le déroulement du test est présenté dans la figure 19. Les embryons (20 œufs/cristallisoir)
sont exposés à partir de 3 heures post-fertilisation (hpf) jusqu'à 96 hpf, dans 25 mL de milieu pour
les molécules seules (15 mL pour les échantillons environnementaux). Le témoin positif utilisé est
l’éthinyl estradiol (EE2) à une concentration de 0,05 nM. Le milieu est renouvelé entièrement
chaque jour. La lecture de la fluorescence se fait à J4 en photographiant la tête de chaque embryon
(grossissement x10) en vue dorsale avec un microscope à fluorescence (Zeiss AxioImager.Z1
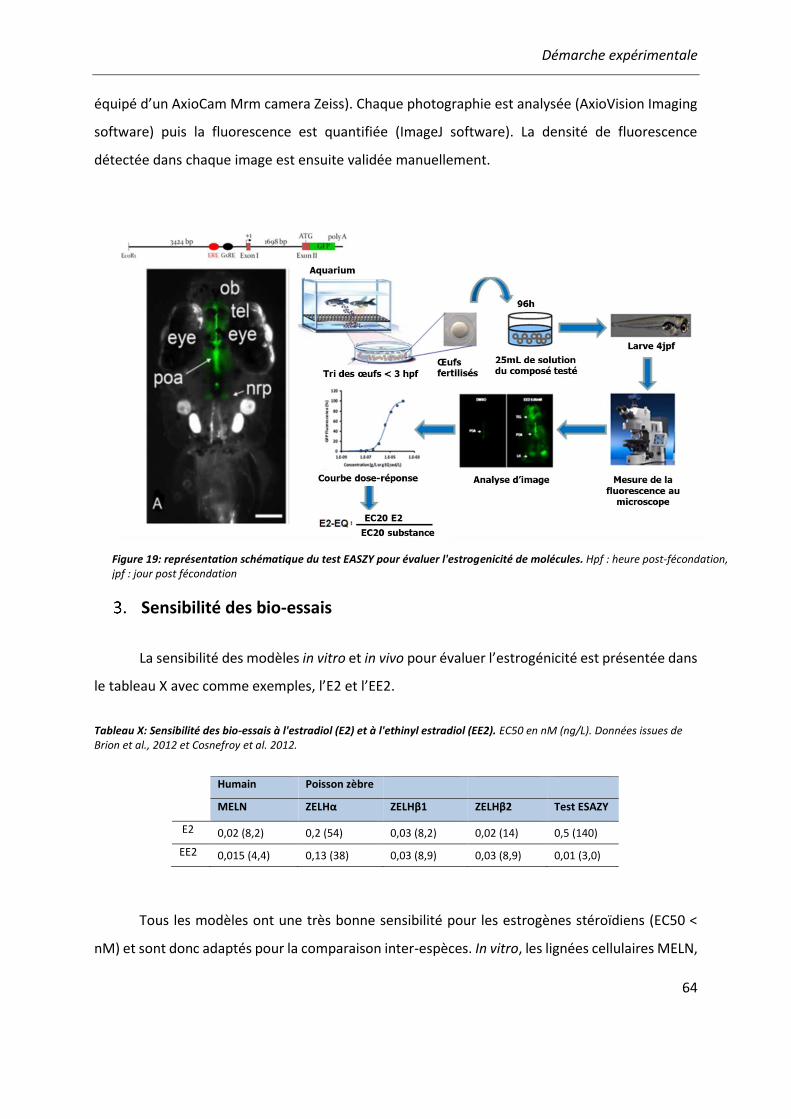
Démarche expérimentale
64
équipé d’un AxioCam Mrm camera Zeiss). Chaque photographie est analysée (AxioVision Imaging
software) puis la fluorescence est quantifiée (ImageJ software). La densité de fluorescence
détectée dans chaque image est ensuite validée manuellement.
Sensibilité des bio-essais
La sensibilité des modèles in vitro et in vivo pour évaluer l’estrogénicité est présentée dans
le tableau X avec comme exemples, l’E2 et l’EE2.
Tableau X: Sensibilité des bio-essais à l'estradiol (E2) et à l'ethinyl estradiol (EE2). EC50 en nM (ng/L). Données issues de Brion et al., 2012 et Cosnefroy et al. 2012.
Tous les modèles ont une très bonne sensibilité pour les estrogènes stéroïdiens (EC50 <
nM) et sont donc adaptés pour la comparaison inter-espèces. In vitro, les lignées cellulaires MELN,
Humain Poisson zèbre
MELN ZELHα ZELHβ1 ZELHβ2 Test ESAZY
E2 0,02 (8,2) 0,2 (54) 0,03 (8,2) 0,02 (14) 0,5 (140)
EE2 0,015 (4,4) 0,13 (38) 0,03 (8,9) 0,03 (8,9) 0,01 (3,0)
Figure 19: représentation schématique du test EASZY pour évaluer l'estrogenicité de molécules. Hpf : heure post-fécondation, jpf : jour post fécondation

Démarche expérimentale
65
ZELHβ1, ZELHβ2 sont les plus sensibles. L’activité de l’EE2 est beaucoup plus importante in vivo
dans le modèle de poisson zèbre transgénique cyp19a1b-GFP qu’in vitro, quelle que soit la lignée
cellulaire considérée.
Analyse des données
4.1 Molécules seules
Les données expérimentales ont été normalisées entre 0 et 1 en soustrayant le niveau
basal d’activité (control solvant) rapporté au niveau du témoin positif, tel que présenté dans la
l’équation (1). Les données expérimentales ont été ensuite analysées en utilisant l’équation de Hill
dans la Macro Excel Regtox 7.0.7®, téléchargeable gratuitement
à www.normalesup.org/~vindimian/fr_download.html. Dans le cas des molécules seules, les ECX
(EC pour « Effective Concentration » = concentration induisant X % de l’effet maximum induit par
la molécule) ont été dérivées en modélisant les données avec le minimum fixé à 0. Dans le cas où
aucun plateau d’activité n’était atteint (i.e. courbes incomplètes), le maximum de la modélisation
a été fixé à 1 pour dériver des PCX (PC pour « Positive Control » = concentration induisant x % de
l’effet maximal induit par la molécule de référence).
Effet =signalmolécule/echantillon − signalcontrole solvant
signlatemoin positif − signalcontrole solvant
(1)
4.2 Echantillons environnementaux
Dans les cas des échantillons environnementaux, les données ont été systématiquement
normalisées entre 0 et 1, comme pour les molécules seules, puis modélisées en fixant le minimum
à 0, le maximum à 1 et utilisant la pente de la molécule de référence. Les valeurs dérivées sont
des PC20, utilisées pour calculer les Bio-TEQ, d’après la formule de la fig. 20. Afin d’évaluer la
contribution des composés identifiés dans les échantillons à la réponse biologique mesurée
(approche par « mass-balance », voir introduction C-2.2.1) des équivalents biologiques (Chem-
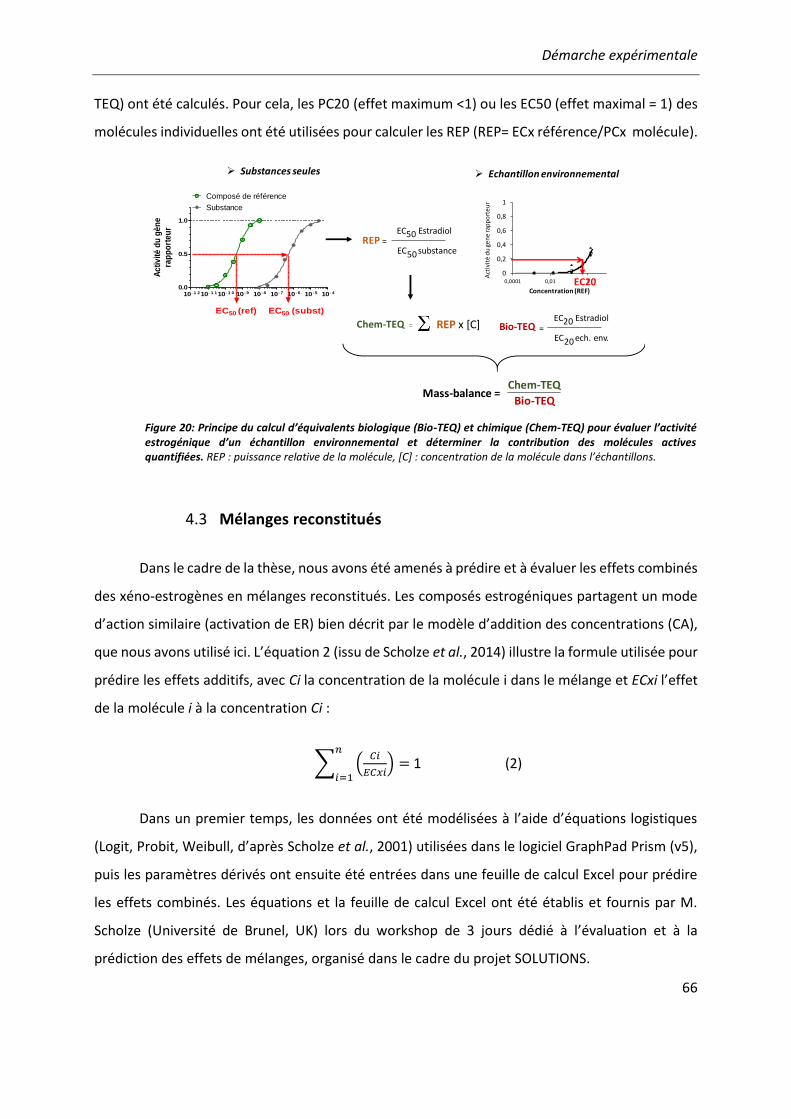
Démarche expérimentale
66
TEQ) ont été calculés. Pour cela, les PC20 (effet maximum <1) ou les EC50 (effet maximal = 1) des
molécules individuelles ont été utilisées pour calculer les REP (REP= ECx référence/PCx molécule).
4.3 Mélanges reconstitués
Dans le cadre de la thèse, nous avons été amenés à prédire et à évaluer les effets combinés
des xéno-estrogènes en mélanges reconstitués. Les composés estrogéniques partagent un mode
d’action similaire (activation de ER) bien décrit par le modèle d’addition des concentrations (CA),
que nous avons utilisé ici. L’équation 2 (issu de Scholze et al., 2014) illustre la formule utilisée pour
prédire les effets additifs, avec Ci la concentration de la molécule i dans le mélange et ECxi l’effet
de la molécule i à la concentration Ci :
∑ (𝐶𝑖
𝐸𝐶𝑥𝑖)
𝑛
𝑖=1= 1 (2)
Dans un premier temps, les données ont été modélisées à l’aide d’équations logistiques
(Logit, Probit, Weibull, d’après Scholze et al., 2001) utilisées dans le logiciel GraphPad Prism (v5),
puis les paramètres dérivés ont ensuite été entrées dans une feuille de calcul Excel pour prédire
les effets combinés. Les équations et la feuille de calcul Excel ont été établis et fournis par M.
Scholze (Université de Brunel, UK) lors du workshop de 3 jours dédié à l’évaluation et à la
prédiction des effets de mélanges, organisé dans le cadre du projet SOLUTIONS.
Chem-TEQ = REP x [C] Bio-TEQ = EC20 Estradiol
EC20 ech. env.
➢ Echantillon environnemental➢ Substances seules
Bio-TEQ
Chem-TEQMass-balance =
10- 1 2 10- 1 1 10- 1 0 10- 9 10- 8 10- 7 10- 6 10- 5 10- 4
0.0
0.5
1.0
Substance
Composé de référence
EC50 (subst)EC50 (ref)
Ac
tiv
ité
du
gè
ne
rap
po
rte
ur
10- 1 2 10- 1 1 10- 1 0 10- 9 10- 8 10- 7 10- 6 10- 5 10- 4
0.0
0.5
1.0
Substance
Composé de référence
EC50 (subst)EC50 (ref)
Ac
tiv
ité
du
gè
ne
rap
po
rte
ur
REP = EC50 Estradiol
EC50 substance
0
0,2
0,4
0,6
0,8
1
0,0001 0,01 1
Act
ivit
éd
u g
en
e ra
pp
ort
eu
r
Concentration (REF)EC20
Figure 20: Principe du calcul d’équivalents biologique (Bio-TEQ) et chimique (Chem-TEQ) pour évaluer l’activité estrogénique d’un échantillon environnemental et déterminer la contribution des molécules actives quantifiées. REP : puissance relative de la molécule, [C] : concentration de la molécule dans l’échantillons.

RESULTATS
Résultats : chapitre A – article n°1
68
Les bio-essais dans la bio-surveillance : apports et
besoins
Un nombre important d’études a montré la faisabilité et la pertinence de l’utilisation bio-
essais in vitro basés sur le récepteur hER pour évaluer l’œstrogénicité de matrices
environnementales. Pour les matrices les plus concentrées, telles que les rejets d’eaux usées,
l’intégration des bio-essais au sein d’approches bio-analytiques en combinaison avec des analyses
chimiques ciblées a permis d’identifier les principaux contributeurs, i.e. les hormones
stéroïdiennes. En revanche, il existe beaucoup moins d’information sur les niveaux d’activité
estrogénique et l’identité des molécules responsables de la réponse mesurée dans un contexte de
multi-contamination plus diffus, tel que les rivières et fleuves.
Dans le cadre du projet SOLUTIONS, nous avons appliqué le bio-essai MELN pour évaluer
l’estrogénicité d’échantillons d’eau du Danube, fleuve représentatif d’un contexte de multi-
contaminations avec une forte capacité de dilution. La comparaison des réponses mesurées avec
l’analyse de plus de 250 polluants a permis d’identifier certains contributeurs chimiques mais a
également permi de mettre en avant le manque d’information sur de nombreuses molécules,
informations nécessaires pour mieux caractériser ce type de matrice.
Article n°1: “Linking in vitro effects and detected organic
micropollutants in surface water using mixture toxicity modelling”
1.1 Contexte et objectif
De nombreux bio-essais sont aujourd’hui disponibles pour évaluer la qualité chimique de
l’eau. Dans le cadre du projet SOLUTIONS, un panel de bio-essais reflétant différents modes
d’action a été utilisé pour évaluer l’activité biologique de 25 échantillons d’eau de surface du
Danube prélevés dans le cadre de la troisième campagne du programme international de
surveillance du Danube (« Joint Danube Survey 3 », JDS3, Liška et al., 2015). Dans cette campagne,
les prélèvements ont été réalisés depuis l’Autriche jusqu’à la mer Noire. Entre 300 et 500 L d’eau
ont été prélevés et extraits in situ par LVSPE, puis analysés dans les bio-essais et par analyses
Résultats : chapitre A – article n°1
69
chimiques (voir démarche expérimentale, B.2.2). Un des objectifs spécifiques de l’étude était
d’évaluer la proportion de l’activité biologique mesurée expliquée par les molécules retrouvées.
Pour cela, les résultats des bio-essais ont été comparés aux analyses de plus de 250 polluants
recherchés dans les échantillons d’eau et dont 94 ont été quantifiés. Dans cette étude
collaborative, nous avons contribué avec les bio-essais MELN et HG5LN-hPXR.
1.2 Principaux résultats
Les résultats du criblage d’échantillons montrent que les niveaux d’estrogénicité détectés
par les MELN dans le Danube sont relativement faibles (< 0,1 ng/L E2-Eq), à l’exception du site
JDS41 où il atteint 1,24 ng/L E2-Eq. Ce site est situé à la confluence de la Velika Morava et du
Danube et a été identifié comme un site particulièrement pollué lors la JDS3 (Liška et al., 2015).
L’estrone et dans une moindre mesure la génistéine sont les principaux contributeurs de l’activité
estrogénique mesurée. Cependant, dans la majorité des échantillons actifs (11/15), ils permettent
d’expliquer moins de 20% de la réponse biologique mesurée, et particulièrement pour le site
JDS41.
Dans la lignée PXR, une activité biologique est mesurée à 20 des 22 sites, comprise entre
0,125 et 4,61 ng/L SR-Eq. Les 13 molécules actives quantifiées expliquent moins de 0.1% de la
réponse mesurée. De la même manière, les composés retrouvés n’expliquent que très peu la
réponse des bio-essais sur le stress oxydant (test ARE-bla), l’activation de p53 (test p53RE-bla) et
sur la mortalité embryonnaire (« fish embryo toxicity test »).
De manière générale, cette première évaluation montre que les bio-essais apportent une
information complémentaire à l’analyse chimique en mesurant des mélanges de molécules actives
non identifiées par la chimie analytique ciblée. Cependant, ces résultats mettent aussi en avant
l’absence d’information sur l’activité de la grande majorité des molécules retrouvées dans les
échantillons, suggérant la présence de molécules actives non identifiées jusqu’à présent.

Résultats : chapitre A – article n°1
70
1.3 Conclusion
➢ Les MELN peuvent détecter de faibles niveaux d’activité estrogénique
➢ Si l’estrone semble un contributeur majeur de l’activité estrogénique des eaux de surface
à de nombreux sites, l’activité estrogénique reste parfois mal expliquée par les analyses
ciblées
➢ Il existe un manque important d’informations sur l’activité estrogénique de nombreuses
molécules retrouvées dans les échantillons environnementaux
Linking in Vitro Effects and Detected Organic Micropollutants inSurface Water Using Mixture-Toxicity ModelingPeta A. Neale,*,†,‡ Selim Ait-Aissa,§ Werner Brack,∥,# Nicolas Creusot,§ Michael S. Denison,⊥
Bjorn Deutschmann,# Klara Hilscherova,∇ Henner Hollert,# Martin Krauss,∥ Jirí Novak,∇ Tobias Schulze,∥
Thomas-Benjamin Seiler,# Helene Serra,§ Ying Shao,# and Beate I. Escher‡,∥,○
†Smart Water Research Centre, School of Environment, Griffith University, Southport QLD 4222, Australia‡National Research Centre for Environmental Toxicology (Entox), The University of Queensland, Brisbane QLD 4108, Australia§Institut National de l’Environnement Industriel et des Risques INERIS, Unite d’Ecotoxicologie, 60550 Verneuil-en-Halatte, France∥UFZ − Helmholtz Centre for Environmental Research, 04318 Leipzig, Germany⊥Department of Environmental Toxicology, University of California, Davis, California 95616, United States#Department of Ecosystem Analysis, Institute for Environmental Research, RWTH Aachen University, 52074 Aachen, Germany∇Research Centre for Toxic Compounds in the Environment (RECETOX), Masaryk University, Kamenice 753/5, 62500 Brno,Czech Republic
○Environmental Toxicology, Center for Applied Geosciences, Eberhard Karls University Tubingen, 72074 Tubingen, Germany
*S Supporting Information
ABSTRACT: Surface water can contain countless organicmicropollutants, and targeted chemical analysis alone mayonly detect a small fraction of the chemicals present. Con-sequently, bioanalytical tools can be applied complementary tochemical analysis to detect the effects of complex chemicalmixtures. In this study, bioassays indicative of activation of thearyl hydrocarbon receptor (AhR), activation of the pregnaneX receptor (PXR), activation of the estrogen receptor (ER),adaptive stress responses to oxidative stress (Nrf2), genotoxicity(p53) and inflammation (NF-κB) and the fish embryo toxicitytest were applied along with chemical analysis to water extractsfrom the Danube River. Mixture-toxicity modeling was appliedto determine the contribution of detected chemicals to thebiological effect. Effect concentrations for between 0 to 13 detected chemicals could be found in the literature for the differentbioassays. Detected chemicals explained less than 0.2% of the biological effect in the PXR activation, adaptive stress response, andfish embryo toxicity assays, while five chemicals explained up to 80% of ER activation, and three chemicals explained up to 71%of AhR activation. This study highlights the importance of fingerprinting the effects of detected chemicals.
■ INTRODUCTION
Human-impacted rivers can contain a complex mixture ofmicropollutants, such as pharmaceuticals, pesticides, and indus-trial compounds, as well as their transformation products.1,2
The sources of these contaminants can include both pointsources, such as wastewater effluent discharge, and diffusesources, such as runoff from urban and agricultural areas.3
Given the diversity of micropollutants in water, targetedchemical analysis alone is insufficient to detect all chemicalspresent in the aquatic environment. Bioanalytical tools comple-ment chemical analysis because they can provide informationabout the biological effects of chemicals present in a sampleand reveal the presence of active compounds not detected bytargeted analysis.In vitro bioassays based on various cellular response
pathways, including induction of xenobiotic metabolism,
receptor-mediated effects, adaptive stress responses, andcytotoxicity, have been applied to detect the presence ofmicropollutants in water samples.4−6 Although the activation ofthese endpoints does not necessarily translate into higher-level effects, biological response at the cellular level is a keystep in the adverse outcome pathway.7 Furthermore, bioassaysindicative of xenobiotic metabolism and repair and defensemechanisms can be applied as sensitive tools to detect thepresence of micropollutants because effects in these endpointsoften occur at lower concentrations than those causing celldeath or damage.
Received: August 22, 2015Revised: October 29, 2015Accepted: October 30, 2015Published: October 30, 2015
Article
pubs.acs.org/est
© 2015 American Chemical Society 14614 DOI: 10.1021/acs.est.5b04083Environ. Sci. Technol. 2015, 49, 14614−14624
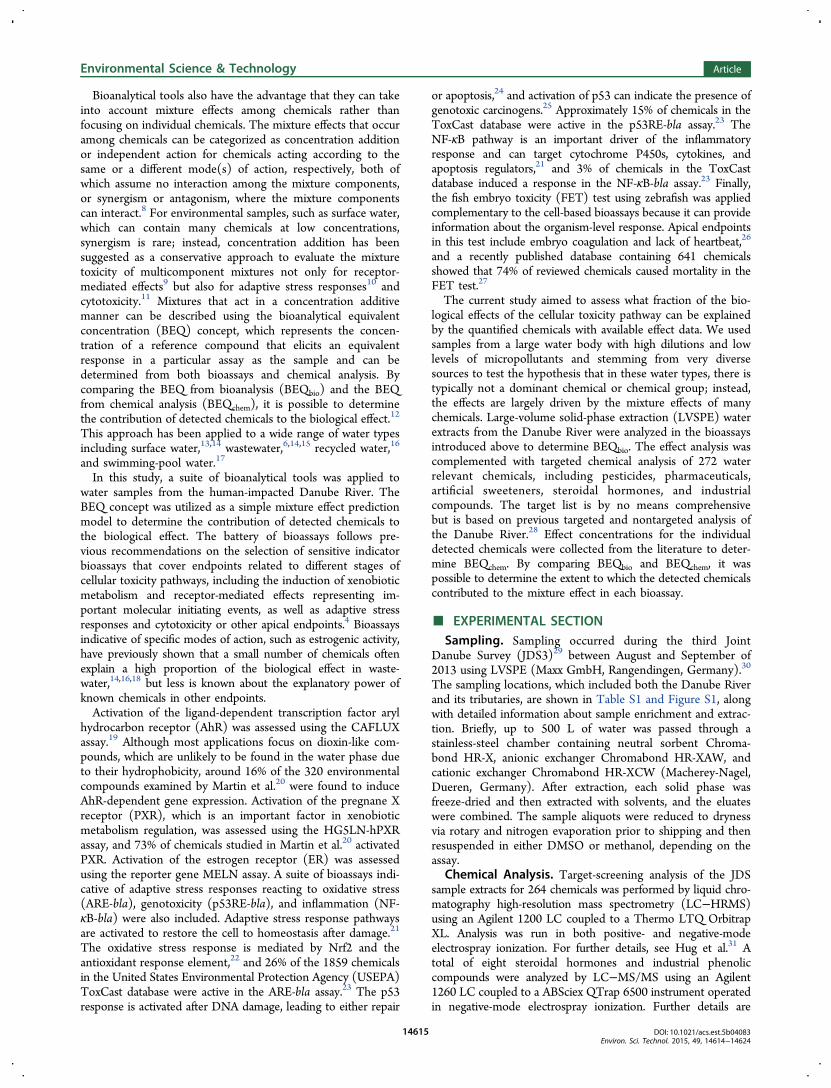
Bioanalytical tools also have the advantage that they can takeinto account mixture effects among chemicals rather thanfocusing on individual chemicals. The mixture effects that occuramong chemicals can be categorized as concentration additionor independent action for chemicals acting according to thesame or a different mode(s) of action, respectively, both ofwhich assume no interaction among the mixture components,or synergism or antagonism, where the mixture componentscan interact.8 For environmental samples, such as surface water,which can contain many chemicals at low concentrations,synergism is rare; instead, concentration addition has beensuggested as a conservative approach to evaluate the mixturetoxicity of multicomponent mixtures not only for receptor-mediated effects9 but also for adaptive stress responses10 andcytotoxicity.11 Mixtures that act in a concentration additivemanner can be described using the bioanalytical equivalentconcentration (BEQ) concept, which represents the concen-tration of a reference compound that elicits an equivalentresponse in a particular assay as the sample and can bedetermined from both bioassays and chemical analysis. Bycomparing the BEQ from bioanalysis (BEQbio) and the BEQfrom chemical analysis (BEQchem), it is possible to determinethe contribution of detected chemicals to the biological effect.12
This approach has been applied to a wide range of water typesincluding surface water,13,14 wastewater,6,14,15 recycled water,16
and swimming-pool water.17
In this study, a suite of bioanalytical tools was applied towater samples from the human-impacted Danube River. TheBEQ concept was utilized as a simple mixture effect predictionmodel to determine the contribution of detected chemicals tothe biological effect. The battery of bioassays follows pre-vious recommendations on the selection of sensitive indicatorbioassays that cover endpoints related to different stages ofcellular toxicity pathways, including the induction of xenobioticmetabolism and receptor-mediated effects representing im-portant molecular initiating events, as well as adaptive stressresponses and cytotoxicity or other apical endpoints.4 Bioassaysindicative of specific modes of action, such as estrogenic activity,have previously shown that a small number of chemicals oftenexplain a high proportion of the biological effect in waste-water,14,16,18 but less is known about the explanatory power ofknown chemicals in other endpoints.Activation of the ligand-dependent transcription factor aryl
hydrocarbon receptor (AhR) was assessed using the CAFLUXassay.19 Although most applications focus on dioxin-like com-pounds, which are unlikely to be found in the water phase dueto their hydrophobicity, around 16% of the 320 environmentalcompounds examined by Martin et al.20 were found to induceAhR-dependent gene expression. Activation of the pregnane Xreceptor (PXR), which is an important factor in xenobioticmetabolism regulation, was assessed using the HG5LN-hPXRassay, and 73% of chemicals studied in Martin et al.20 activatedPXR. Activation of the estrogen receptor (ER) was assessedusing the reporter gene MELN assay. A suite of bioassays indi-cative of adaptive stress responses reacting to oxidative stress(ARE-bla), genotoxicity (p53RE-bla), and inflammation (NF-κB-bla) were also included. Adaptive stress response pathwaysare activated to restore the cell to homeostasis after damage.21
The oxidative stress response is mediated by Nrf2 and theantioxidant response element,22 and 26% of the 1859 chemicalsin the United States Environmental Protection Agency (USEPA)ToxCast database were active in the ARE-bla assay.23 The p53response is activated after DNA damage, leading to either repair
or apoptosis,24 and activation of p53 can indicate the presence ofgenotoxic carcinogens.25 Approximately 15% of chemicals in theToxCast database were active in the p53RE-bla assay.23 TheNF-κB pathway is an important driver of the inflammatoryresponse and can target cytochrome P450s, cytokines, andapoptosis regulators,21 and 3% of chemicals in the ToxCastdatabase induced a response in the NF-κB-bla assay.23 Finally,the fish embryo toxicity (FET) test using zebrafish was appliedcomplementary to the cell-based bioassays because it can provideinformation about the organism-level response. Apical endpointsin this test include embryo coagulation and lack of heartbeat,26
and a recently published database containing 641 chemicalsshowed that 74% of reviewed chemicals caused mortality in theFET test.27
The current study aimed to assess what fraction of the bio-logical effects of the cellular toxicity pathway can be explainedby the quantified chemicals with available effect data. We usedsamples from a large water body with high dilutions and lowlevels of micropollutants and stemming from very diversesources to test the hypothesis that in these water types, there istypically not a dominant chemical or chemical group; instead,the effects are largely driven by the mixture effects of manychemicals. Large-volume solid-phase extraction (LVSPE) waterextracts from the Danube River were analyzed in the bioassaysintroduced above to determine BEQbio. The effect analysis wascomplemented with targeted chemical analysis of 272 waterrelevant chemicals, including pesticides, pharmaceuticals,artificial sweeteners, steroidal hormones, and industrialcompounds. The target list is by no means comprehensivebut is based on previous targeted and nontargeted analysis ofthe Danube River.28 Effect concentrations for the individualdetected chemicals were collected from the literature to deter-mine BEQchem. By comparing BEQbio and BEQchem, it waspossible to determine the extent to which the detected chemicalscontributed to the mixture effect in each bioassay.
■ EXPERIMENTAL SECTIONSampling. Sampling occurred during the third Joint
Danube Survey (JDS3)29 between August and September of2013 using LVSPE (Maxx GmbH, Rangendingen, Germany).30
The sampling locations, which included both the Danube Riverand its tributaries, are shown in Table S1 and Figure S1, alongwith detailed information about sample enrichment and extrac-tion. Briefly, up to 500 L of water was passed through astainless-steel chamber containing neutral sorbent Chroma-bond HR-X, anionic exchanger Chromabond HR-XAW, andcationic exchanger Chromabond HR-XCW (Macherey-Nagel,Dueren, Germany). After extraction, each solid phase wasfreeze-dried and then extracted with solvents, and the eluateswere combined. The sample aliquots were reduced to drynessvia rotary and nitrogen evaporation prior to shipping and thenresuspended in either DMSO or methanol, depending on theassay.
Chemical Analysis. Target-screening analysis of the JDSsample extracts for 264 chemicals was performed by liquid chro-matography high-resolution mass spectrometry (LC−HRMS)using an Agilent 1200 LC coupled to a Thermo LTQ OrbitrapXL. Analysis was run in both positive- and negative-modeelectrospray ionization. For further details, see Hug et al.31 Atotal of eight steroidal hormones and industrial phenoliccompounds were analyzed by LC−MS/MS using an Agilent1260 LC coupled to a ABSciex QTrap 6500 instrument operatedin negative-mode electrospray ionization. Further details are
Environmental Science & Technology Article
DOI: 10.1021/acs.est.5b04083Environ. Sci. Technol. 2015, 49, 14614−14624
14615
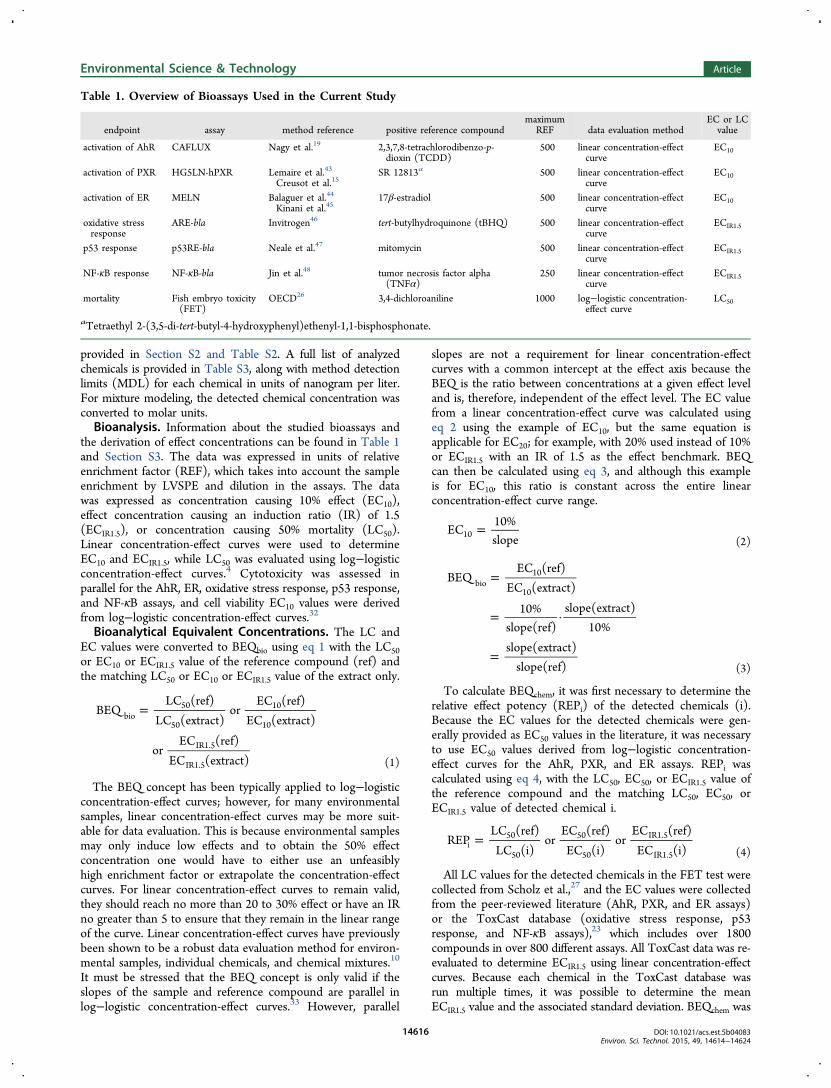
provided in Section S2 and Table S2. A full list of analyzedchemicals is provided in Table S3, along with method detectionlimits (MDL) for each chemical in units of nanogram per liter.For mixture modeling, the detected chemical concentration wasconverted to molar units.Bioanalysis. Information about the studied bioassays and
the derivation of effect concentrations can be found in Table 1and Section S3. The data was expressed in units of relativeenrichment factor (REF), which takes into account the sampleenrichment by LVSPE and dilution in the assays. The datawas expressed as concentration causing 10% effect (EC10),effect concentration causing an induction ratio (IR) of 1.5(ECIR1.5), or concentration causing 50% mortality (LC50).Linear concentration-effect curves were used to determineEC10 and ECIR1.5, while LC50 was evaluated using log−logisticconcentration-effect curves.4 Cytotoxicity was assessed inparallel for the AhR, ER, oxidative stress response, p53 response,and NF-κB assays, and cell viability EC10 values were derivedfrom log−logistic concentration-effect curves.32Bioanalytical Equivalent Concentrations. The LC and
EC values were converted to BEQbio using eq 1 with the LC50or EC10 or ECIR1.5 value of the reference compound (ref) andthe matching LC50 or EC10 or ECIR1.5 value of the extract only.
=BEQLC (ref)
LC (extract)or
EC (ref)EC (extract)
orEC (ref)
EC (extract)
bio50
50
10
10
IR1.5
IR1.5 (1)
The BEQ concept has been typically applied to log−logisticconcentration-effect curves; however, for many environmentalsamples, linear concentration-effect curves may be more suit-able for data evaluation. This is because environmental samplesmay only induce low effects and to obtain the 50% effectconcentration one would have to either use an unfeasiblyhigh enrichment factor or extrapolate the concentration-effectcurves. For linear concentration-effect curves to remain valid,they should reach no more than 20 to 30% effect or have an IRno greater than 5 to ensure that they remain in the linear rangeof the curve. Linear concentration-effect curves have previouslybeen shown to be a robust data evaluation method for environ-mental samples, individual chemicals, and chemical mixtures.10
It must be stressed that the BEQ concept is only valid if theslopes of the sample and reference compound are parallel inlog−logistic concentration-effect curves.33 However, parallel
slopes are not a requirement for linear concentration-effectcurves with a common intercept at the effect axis because theBEQ is the ratio between concentrations at a given effect leveland is, therefore, independent of the effect level. The EC valuefrom a linear concentration-effect curve was calculated usingeq 2 using the example of EC10, but the same equation isapplicable for EC20; for example, with 20% used instead of 10%or ECIR1.5 with an IR of 1.5 as the effect benchmark. BEQcan then be calculated using eq 3, and although this exampleis for EC10, this ratio is constant across the entire linearconcentration-effect curve range.
=EC10%slope10
(2)
=
= ·
=
BEQEC (ref)
EC (extract)
10%slope(ref)
slope(extract)10%
slope(extract)slope(ref)
bio10
10
(3)
To calculate BEQchem, it was first necessary to determine therelative effect potency (REPi) of the detected chemicals (i).Because the EC values for the detected chemicals were gen-erally provided as EC50 values in the literature, it was necessaryto use EC50 values derived from log−logistic concentration-effect curves for the AhR, PXR, and ER assays. REPi wascalculated using eq 4, with the LC50, EC50, or ECIR1.5 value ofthe reference compound and the matching LC50, EC50, orECIR1.5 value of detected chemical i.
=REPLC (ref)
LC (i)or
EC (ref)EC (i)
orEC (ref)
EC (i)i50
50
50
50
IR1.5
IR1.5 (4)
All LC values for the detected chemicals in the FET test werecollected from Scholz et al.,27 and the EC values were collectedfrom the peer-reviewed literature (AhR, PXR, and ER assays)or the ToxCast database (oxidative stress response, p53response, and NF-κB assays),23 which includes over 1800compounds in over 800 different assays. All ToxCast data was re-evaluated to determine ECIR1.5 using linear concentration-effectcurves. Because each chemical in the ToxCast database wasrun multiple times, it was possible to determine the meanECIR1.5 value and the associated standard deviation. BEQchem was
Table 1. Overview of Bioassays Used in the Current Study
endpoint assay method reference positive reference compoundmaximum
REF data evaluation methodEC or LCvalue
activation of AhR CAFLUX Nagy et al.19 2,3,7,8-tetrachlorodibenzo-p-dioxin (TCDD)
500 linear concentration-effectcurve
EC10
activation of PXR HG5LN-hPXR Lemaire et al.43
Creusot et al.15SR 12813a 500 linear concentration-effect
curveEC10
activation of ER MELN Balaguer et al.44
Kinani et al.4517β-estradiol 500 linear concentration-effect
curveEC10
oxidative stressresponse
ARE-bla Invitrogen46 tert-butylhydroquinone (tBHQ) 500 linear concentration-effectcurve
ECIR1.5
p53 response p53RE-bla Neale et al.47 mitomycin 500 linear concentration-effectcurve
ECIR1.5
NF-κB response NF-κB-bla Jin et al.48 tumor necrosis factor alpha(TNFα)
250 linear concentration-effectcurve
ECIR1.5
mortality Fish embryo toxicity(FET)
OECD26 3,4-dichloroaniline 1000 log−logistic concentration-effect curve
LC50
aTetraethyl 2-(3,5-di-tert-butyl-4-hydroxyphenyl)ethenyl-1,1-bisphosphonate.
Environmental Science & Technology Article
DOI: 10.1021/acs.est.5b04083Environ. Sci. Technol. 2015, 49, 14614−14624
14616

calculated for each JDS sample using REPi and the detected con-centration (M) (eq 5). The variability associated with BEQchemfor the chemicals present in the ToxCast database was assessedusing error propagation. EC and LC values collected from theliterature generally did not include standard deviation, so it wasnot possible to determine the variability associated with BEQchemfor the AhR, PXR, ER, and FET assays.
∑= ·=
CBEQ REPi
ichem1
n
i(5)
■ RESULTS AND DISCUSSIONChemical Analysis. Of the 272 analyzed chemicals, 94 were
detected at least once in the 22 JDS samples. The number ofchemicals detected at each site ranged from 20 to 64. The sumof the molar concentration and number of detected chemicalsat each site are shown in Figure 1A, with the concentrations in
pM for each of the detected chemicals at the different sampl-ing sites shown in Table S4. The most frequently detectedchemicals were the artificial sweetener acesulfame, the industrialcompounds triphenylphosphine oxide and 2-benzothiazolesul-fonic acid, and the antimicrobial sulfamethoxazole, which werepresent at detectable levels at all studied sites. In all but onetributary, other common wastewater micropollutants, includingcarbamazepine and its transformation products, the corrosion
inhibitors benzotriazole and methylbenzotriazole, the artificialsweeteners cyclamate and sucralose, and several herbicides andtransformation products (metolachlor, isoproturon, atrazine,and terbuthylazine-2-hydroxy) were detected. The antidiabeticpharmaceutical metformin was found at the highest concen-trations, with concentrations up to 7.6 nM. Overall, chemicalcontamination was relatively low, with none of the detectedchemicals exceeding the Water Framework Directive environ-mental-quality standards.34
Bioanalysis. The EC and LC values for the different JDSwater samples are shown in Figure 1B and Table S5, with theconcentration-effect curves for all assays shown in Figure S2.The assays indicative of activation of ER, activation of PXR,activation of AhR, and the NF-κB response tended to be the mostresponsive, followed by the oxidative stress response. The p53response occurred at higher effect concentrations. The leastresponsive assay was the FET test, which required a REF of 100to 500 for 50% mortality or a REF of 50 to 300 for 10% mortality.Although most samples did have a response in the assays, the
effects were relatively low, with the EC values for the oxidativestress and AhR assays similar to previously benchmarked ECvalues for surface water.35 Kittinger et al.36 also only detectedminimal effects in Danube River samples when assessing geno-toxicity. Furthermore, ER activation, when expressed as BEQbio(0.02−1.1 pM), was lower than generally observed in wastewatereffluent37 due to dilution in the river, although one contaminatedsite, JDS 41 (BEQbio 4.7 pM), was identified by this assay.JDS 64 had the lowest sum chemical concentration, and
this corresponded to no effect at the maximum REF for theoxidative stress response, p53 response, and NF-κB assays, andonly minimal effects at high concentrations in the other assays.Cell viability was assessed in parallel for most cell-based assays,and in most cases, there was negligible cytotoxicity in thestudied concentration range. However, cytotoxicity did maskother endpoint manifestations at high REFs in some samplesfor the AhR (JDS 41 and 63), ER (JDS 35, 55, 57, 59, 63 and67), oxidative stress response (JDS 55 and 67), p53 response(JDS 41, 55, 57 and 63), and NF-κB (JDS 36 and 41) assays.Hence, it was not possible to derive EC values for induction forthese particular samples, but EC10 values for cytotoxicity werecalculated and are included in Table S5. JDS 41, which had thehighest effect in the ER activation and oxidative stress responseassays and was cytotoxic in several other assays, was the mostpolluted site with the highest amount of total detected chemicalconcentration. Overall, there was no significant relationshipbetween effect and sum detected chemicals at each site for thedifferent assays.For mixture modeling, the EC and LC values were converted
to BEQbio using the respective reference compounds for eachassay (Table 2, Table S5). Although the EC or LC values givean indication of the sensitivity of the assay, BEQbio converts theeffect into the concentration of reference compound that wouldelicit the same response as the sample mixture. Furthermore,the BEQ concept simplifies mixture-toxicity modeling.10,11
Bioanalytical Equivalent Concentration from Chem-ical Analysis. Prior to calculating BEQchem, the publishedliterature and ToxCast database were searched for EC or LCvalues for the detected chemicals. For each assay, between0 and 13 literature EC or LC values could be found for the94 detected chemicals (Table S6). Using the literature EC orLC values for each chemical and the EC or LC value of theassay reference compound, the REPi was calculated using eq 4(Table 3).
Figure 1. (A) The sum molar concentration of chemicals detected ateach JDS site (black bars), along with the number of chemicalsdetected at each site (red circles), and (B) LC or EC values for allsamples in units of relative enrichment factor (REF).
Environmental Science & Technology Article
DOI: 10.1021/acs.est.5b04083Environ. Sci. Technol. 2015, 49, 14614−14624
14617
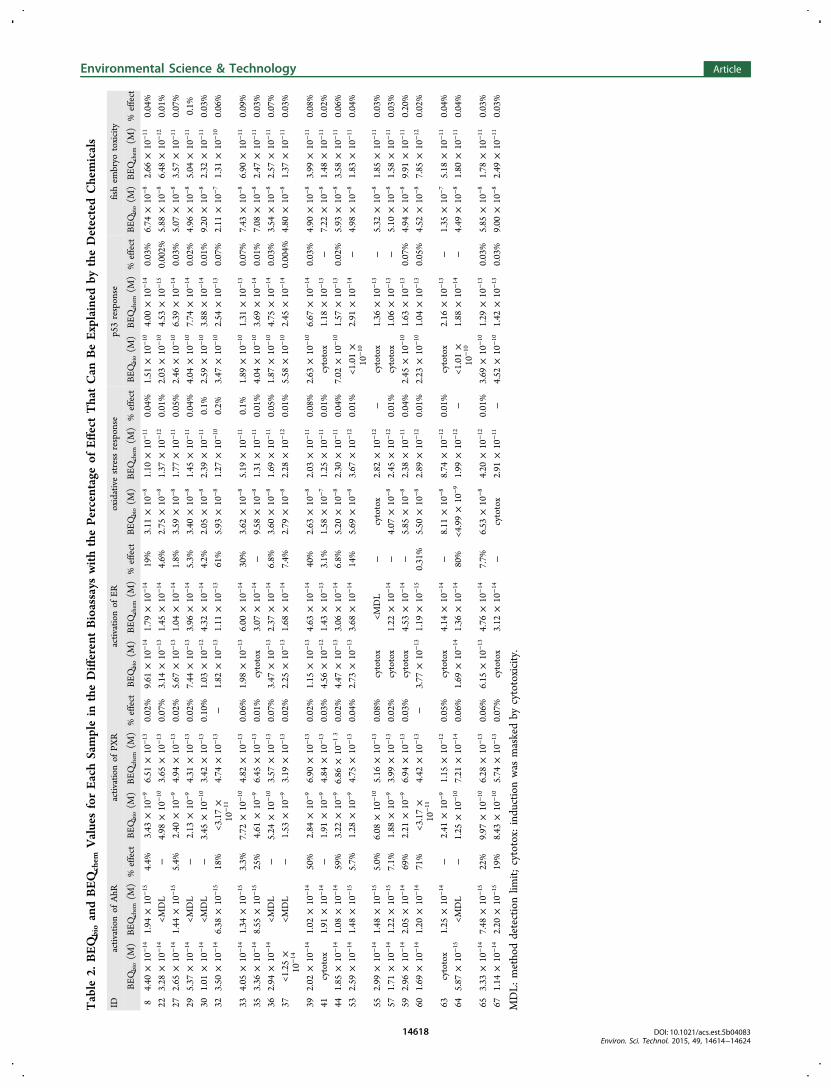
Table
2.BEQ
bioandBEQ
chem
ValuesforEachSamplein
theDifferentBioassays
withthePercentageof
EffectThatCan
BeExplained
bytheDetectedChemicals
IDactivationof
AhR
activationof
PXR
activationof
ERoxidativestress
response
p53response
fishem
bryo
toxicity
BEQ
bio(M
)BEQ
chem
(M)
%effect
BEQ
bio(M
)BEQ
chem
(M)
%effect
BEQ
bio(M
)BEQ
chem
(M)
%effect
BEQ
bio(M
)BEQ
chem
(M)
%effect
BEQ
bio(M
)BEQ
chem
(M)
%effect
BEQ
bio(M
)BEQ
chem
(M)
%effect
84.40
×10
−14
1.94
×10
−15
4.4%
3.43
×10
−9
6.51
×10
−13
0.02%
9.61
×10
−14
1.79
×10
−14
19%
3.11
×10
−8
1.10
×10
−11
0.04%
1.51
×10
−10
4.00
×10
−14
0.03%
6.74
×10
−8
2.66
×10
−11
0.04%
223.28
×10
−14
<MDL
−4.98
×10
−10
3.65
×10
−13
0.07%
3.14
×10
−13
1.45
×10
−14
4.6%
2.75
×10
−8
1.37
×10
−12
0.01%
2.03
×10
−10
4.53
×10
−15
0.002%
5.88
×10
−8
6.48
×10
−12
0.01%
272.65
×10
−14
1.44
×10
−15
5.4%
2.40
×10
−9
4.94
×10
−13
0.02%
5.67
×10
−13
1.04
×10
−14
1.8%
3.59
×10
−8
1.77
×10
−11
0.05%
2.46
×10
−10
6.39
×10
−14
0.03%
5.07
×10
−8
3.57
×10
−11
0.07%
295.37
×10
−14
<MDL
−2.13
×10
−9
4.31
×10
−13
0.02%
7.44
×10
−13
3.96
×10
−14
5.3%
3.40
×10
−8
1.45
×10
−11
0.04%
4.04
×10
−10
7.74
×10
−14
0.02%
4.96
×10
−8
5.04
×10
−11
0.1%
301.01
×10
−14
<MDL
−3.45
×10
−10
3.42
×10
−13
0.10%
1.03
×10
−12
4.32
×10
−14
4.2%
2.05
×10
−8
2.39
×10
−11
0.1%
2.59
×10
−10
3.88
×10
−14
0.01%
9.20
×10
−8
2.32
×10
−11
0.03%
323.50
×10
−14
6.38
×10
−15
18%
<3.17×
10−11
4.74
×10
−13
−1.82
×10
−13
1.11
×10
−13
61%
5.93
×10
−8
1.27
×10
−10
0.2%
3.47
×10
−10
2.54
×10
−13
0.07%
2.11
×10
−7
1.31
×10
−10
0.06%
334.05
×10
−14
1.34
×10
−15
3.3%
7.72
×10
−10
4.82
×10
−13
0.06%
1.98
×10
−13
6.00
×10
−14
30%
3.62
×10
−8
5.19
×10
−11
0.1%
1.89
×10
−10
1.31
×10
−13
0.07%
7.43
×10
−8
6.90
×10
−11
0.09%
353.36
×10
−14
8.55
×10
−15
25%
4.61
×10
−9
6.45
×10
−13
0.01%
cytotox
3.07
×10
−14
−9.58
×10
−8
1.31
×10
−11
0.01%
4.04
×10
−10
3.69
×10
−14
0.01%
7.08
×10
−8
2.47
×10
−11
0.03%
362.94
×10
−14
<MDL
−5.24
×10
−10
3.57
×10
−13
0.07%
3.47
×10
−13
2.37
×10
−14
6.8%
3.60
×10
−8
1.69
×10
−11
0.05%
1.87
×10
−10
4.75
×10
−14
0.03%
3.54
×10
−8
2.57
×10
−11
0.07%
37<1
.25×
10−14
<MDL
−1.53
×10
−9
3.19
×10
−13
0.02%
2.25
×10
−13
1.68
×10
−14
7.4%
2.79
×10
−8
2.28
×10
−12
0.01%
5.58
×10
−10
2.45
×10
−14
0.004%
4.80
×10
−8
1.37
×10
−11
0.03%
392.02
×10
−14
1.02
×10
−14
50%
2.84
×10
−9
6.90
×10
−13
0.02%
1.15
×10
−13
4.63
×10
−14
40%
2.63
×10
−8
2.03
×10
−11
0.08%
2.63
×10
−10
6.67
×10
−14
0.03%
4.90
×10
−8
3.99
×10
−11
0.08%
41cytotox
1.91
×10
−14
−1.91
×10
−9
4.84
×10
−13
0.03%
4.56
×10
−12
1.43
×10
−13
3.1%
1.58
×10
−7
1.25
×10
−11
0.01%
cytotox
1.18
×10
−13
−7.22
×10
−8
1.48
×10
−11
0.02%
441.85
×10
−14
1.08
×10
−14
59%
3.22
×10
−9
6.86
×10
−13
0.02%
4.47
×10
−13
3.06
×10
−14
6.8%
5.20
×10
−8
2.30
×10
−11
0.04%
7.02
×10
−10
1.57
×10
−13
0.02%
5.93
×10
−8
3.58
×10
−11
0.06%
532.59
×10
−14
1.48
×10
−15
5.7%
1.28
×10
−9
4.75
×10
−13
0.04%
2.73
×10
−13
3.68
×10
−14
14%
5.69
×10
−8
3.67
×10
−12
0.01%
<1.01×
10−10
2.91
×10
−14
−4.98
×10
−8
1.83
×10
−11
0.04%
552.99
×10
−14
1.48
×10
−15
5.0%
6.08
×10
−10
5.16
×10
−13
0.08%
cytotox
<MDL
−cytotox
2.82
×10
−12
−cytotox
1.36
×10
−13
−5.32
×10
−8
1.85
×10
−11
0.03%
571.71
×10
−14
1.22
×10
−15
7.1%
1.88
×10
−9
3.99
×10
−13
0.02%
cytotox
1.22
×10
−14
−4.07
×10
−8
2.45
×10
−12
0.01%
cytotox
1.06
×10
−13
−5.10
×10
−8
1.58
×10
−11
0.03%
592.96
×10
−14
2.05
×10
−14
69%
2.21
×10
−9
6.94
×10
−13
0.03%
cytotox
4.53
×10
−14
−5.85
×10
−8
2.38
×10
−11
0.04%
2.45
×10
−10
1.63
×10
−13
0.07%
4.94
×10
−8
9.91
×10
−11
0.20%
601.69
×10
−14
1.20
×10
−14
71%
<3.17×
10−11
4.42
×10
−13
−3.77
×10
−13
1.19
×10
−15
0.31%
5.50
×10
−8
2.89
×10
−12
0.01%
2.23
×10
−10
1.04
×10
−13
0.05%
4.52
×10
−8
7.85
×10
−12
0.02%
63cytotox
1.25
×10
−14
−2.41
×10
−9
1.15
×10
−12
0.05%
cytotox
4.14
×10
−14
−8.11
×10
−8
8.74
×10
−12
0.01%
cytotox
2.16
×10
−13
−1.35
×10
−7
5.18
×10
−11
0.04%
645.87
×10
−15
<MDL
−1.25
×10
−10
7.21
×10
−14
0.06%
1.69
×10
−14
1.36
×10
−14
80%
<4.99×10
−9
1.99
×10
−12
−<1
.01×
10−10
1.88
×10
−14
−4.49
×10
−8
1.80
×10
−11
0.04%
653.33
×10
−14
7.48
×10
−15
22%
9.97
×10
−10
6.28
×10
−13
0.06%
6.15
×10
−13
4.76
×10
−14
7.7%
6.53
×10
−8
4.20
×10
−12
0.01%
3.69
×10
−10
1.29
×10
−13
0.03%
5.85
×10
−8
1.78
×10
−11
0.03%
671.14
×10
−14
2.20
×10
−15
19%
8.43
×10
−10
5.74
×10
−13
0.07%
cytotox
3.12
×10
−14
−cytotox
2.91
×10
−11
−4.52
×10
−10
1.42
×10
−13
0.03%
9.00
×10
−8
2.49
×10
−11
0.03%
MDL:
methoddetectionlim
it;cytotox:inductionwas
maskedby
cytotoxicity.
Environmental Science & Technology Article
DOI: 10.1021/acs.est.5b04083Environ. Sci. Technol. 2015, 49, 14614−14624
14618
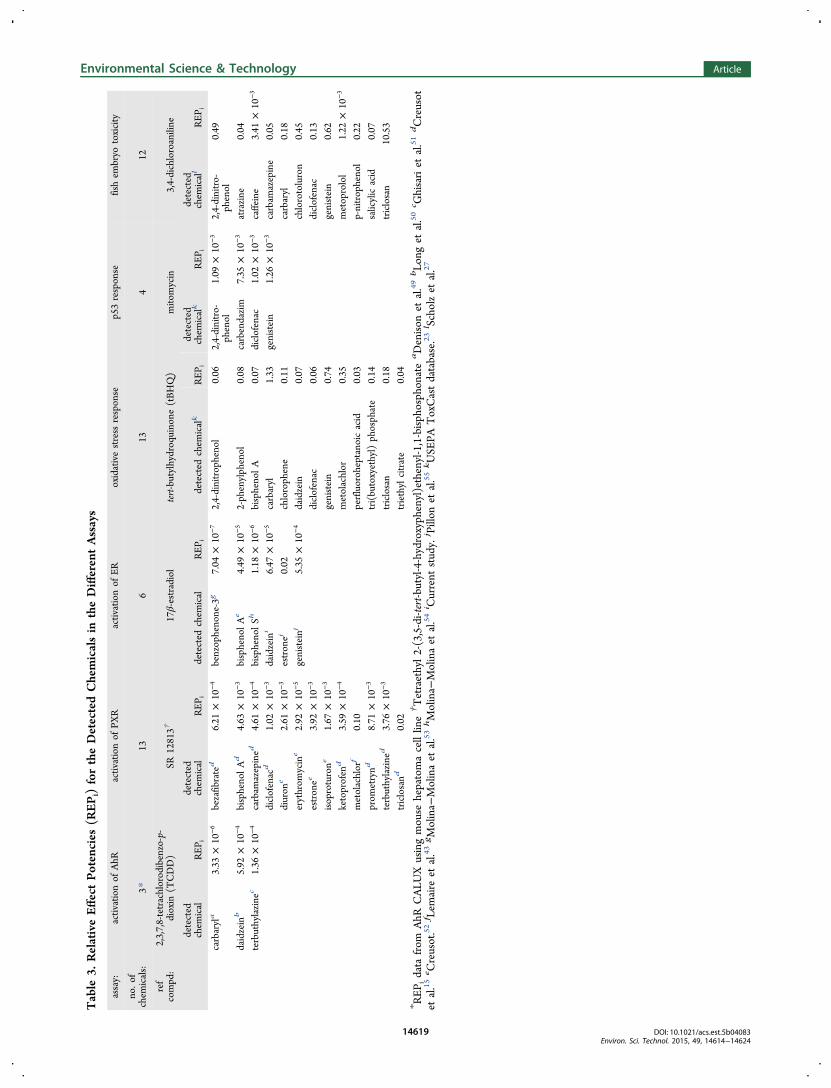
Table
3.RelativeEffectPotencies
(REPi)fortheDetectedChemicalsin
theDifferentAssays
assay:
activationof
AhR
activationof
PXR
activationof
ERoxidativestress
response
p53response
fishem
bryo
toxicity
no.o
fchem
icals:
3*13
613
412
ref
compd:
2,3,7,8-tetrachlorodibenzo-p-
dioxin
(TCDD)
SR12813†
17β-estradiol
tert-butylhydroquinone
(tBHQ)
mito
mycin
3,4-dichloroaniline
detected
chem
ical
REP
i
detected
chem
ical
REP
idetected
chem
ical
REP
idetected
chem
icalk
REP
i
detected
chem
icalk
REP i
detected
chem
icall
REP i
carbaryla
3.33
×10
−6
bezafibrated
6.21
×10
−4
benzophenone-3g
7.04
×10
−7
2,4-dinitrophenol
0.06
2,4-dinitro-
phenol
1.09
×10
−3
2,4-dinitro-
phenol
0.49
daidzeinb
5.92
×10
−4
bisphenolAd
4.63
×10
−3
bisphenolAe
4.49
×10
−5
2-phenylphenol
0.08
carbendazim
7.35
×10
−3
atrazine
0.04
terbuthylazinec
1.36
×10
−4
carbam
azepined
4.61
×10
−4
bisphenolSh
1.18
×10
−6
bisphenolA
0.07
diclofenac
1.02
×10
−3
caffeine
3.41
×10
−3
diclofenacd
1.02
×10
−3
daidzeini
6.47
×10
−5
carbaryl
1.33
genistein
1.26
×10
−3
carbam
azepine
0.05
diurone
2.61
×10
−3
estronej
0.02
chlorophene
0.11
carbaryl
0.18
erythrom
ycine
2.92
×10
−5
genisteinj
5.35
×10
−4
daidzein
0.07
chlorotoluron
0.45
estronee
3.92
×10
−3
diclofenac
0.06
diclofenac
0.13
isoproturone
1.67
×10
−3
genistein
0.74
genistein
0.62
ketoprofend
3.59
×10
−4
metolachlor
0.35
metoprolol
1.22
×10
−3
metolachlorf
0.10
perfluoroheptanoicacid
0.03
p-nitrophenol
0.22
prom
etrynd
8.71
×10
−3
tri(butoxyethyl)phosphate
0.14
salicylicacid
0.07
terbuthylazined
3.76
×10
−3
triclosan
0.18
triclosan
10.53
triclosand
0.02
triethylcitrate
0.04
*REP
idata
from
AhR
CALU
Xusingmouse
hepatomacellline†Tetraethyl2-(3,5-di-tert-butyl-4-hydroxyphenyl)ethenyl-1,1-bisphosphonateaDenison
etal.49bLo
nget
al.50
c Ghisariet
al.51
dCreusot
etal.15e C
reusot.52
f Lem
aire
etal.43
gMolina−
Molinaet
al.53hMolina−
Molinaet
al.54
i Current
study.j Pillon
etal.55
kUSE
PAToxCastdatabase.23l Scholzet
al.27
Environmental Science & Technology Article
DOI: 10.1021/acs.est.5b04083Environ. Sci. Technol. 2015, 49, 14614−14624
14619

LC50 values at 48 h exposure for the FET test were collectedfor 12 chemicals from Scholtz et al.,27 with REPi calculated usingthe mean 3,4-dichloroaniline LC50 value from the same study.A total of 13 EC values were collected from the literature for thePXR assay, while six EC values were available for the ER assay.Although no EC values were available for the detectedchemicals in the AhR CAFLUX assay, EC values were availablefor three of the detected chemicals (terbuthylazine, carbaryl,and daidzein) in the mouse AhR CALUX assay. Although theseassays focus on the same endpoint (reporter gene expression),they utilize different animal cell lines (rat hepatoma versusmouse hepatoma), and previous work has shown species-specific differences in responsiveness to some AhR ligands.38
To account for differences in sensitivity between the mouse andrat AhR models, we also collected TCDD EC values from eachstudy to calculate REPi rather than using the TCDD EC valuefrom the current study.EC values for the oxidative stress response, p53 response,
and NF-κB assays were collected from the ToxCast database.23
A total of 486, 278, and 62 chemicals in the ToxCast databasewere active in the oxidative stress response, p53 response, andNF-κB assays, respectively (Figure 2). Of the 94 chemicals
detected in the JDS samples, 49 of these were also included inthe ToxCast database. However, many of the detectedcompounds were not active in the assays, with 13 compoundsactive in the oxidative stress response assay, four compoundsactive in the p53 response assay, and none active in the NF-κBassay. ECIR1.5 values for the detected chemicals in the oxidativestress response and p53 response assays were calculated fromraw emission data available in the ToxCast MySQL database. Toderive REPi for the detected chemicals, we used experimentalECIR1.5 values for reference compounds tBHQ and mitomycin.Using REPi and the detected chemical concentration,
BEQchem was calculated using eq 5 for each water sample(Table 2). BEQchem could not be calculated for some samplesfor the AhR and ER bioassays because none of the chemicalswith literature EC values were detected in the samples.Furthermore, it was not possible to derive BEQchem values forthe NF-κB assay because none of the detected chemicals wereactive, despite the NF-κB assay being one of the moreresponsive for the JDS samples (Figure 1B). Only 3% of the1859 chemicals in the ToxCast database were active in theNF-κB assay, compared to 26 and 15% of chemicals in oxidativestress response and p53 response assays, respectively (Figure 2).The NF-κB assay has been used for water quality monitoring inonly one study,4 and it is still unclear what types of water-basedpollutants induce a response in this assay.
Percent of Biological Effect That Can Be Explained byChemical Analysis. The comparison between BEQbio andBEQchem for each assay is shown in Table 2, although thecontribution of the individual detected chemicals to thebiological effect is shown in Figure 3. For some JDS samples,it was not possible to determine the contribution of detectedchemicals to the biological effect, and this was attributed toeither cytotoxicity masking the manifestation of otherendpoints, no effect at the maximum REF, or the activechemicals being below the MDL.The BEQchem for AhR activation was calculated using only
three chemicals, but they explained between 3 and 71% of thebiological effect (Figure 3A). The effect was mostly driven bythe phytoestrogen daidzein, which has previously been shownto be a weak AhR activator in mouse cells but not in humancells,39 and the herbicide terbuthylazine. The insecticidecarbaryl only explained 0.5% of the effect in JDS 67. Similarly,the BEQchem for activation of ER could explain up to 80% ofthe effect, with the hormone estrone and the phytoestrogengenistein contributing significantly. Estrogenic effects in waste-water are often explained by the presence of potent naturaland synthetic estrogenic hormones, such as 17β-estradiol and17α-ethinylestradiol,14,18 but these compounds were below thedetection limit in the current study. Previous studies have alsoattributed ER activation in river water to genistein.40
In contrast, the detected chemicals could explain less than0.2% of the biological effect in the adaptive stress responseassays, PXR assay, and the FET test (Figure 3). A number ofstudies have also shown similarly low contributions of detectedchemicals to the oxidative stress response in a range of watertypes, including wastewater and pool water.10,17,41 Genisteindominated the contribution of quantified chemicals to thebiological effect for the oxidative stress response. Althoughcarbaryl and the disinfectant chlorophene were detected in theJDS samples and are active in the oxidative stress response assay,they occurred only in samples in which cytotoxicity maskedinduction and could not be used to explain the biological effect.It has also been demonstrated that detected chemicals in surfacewater and wastewater can only explain a small fraction of PXRactivity.15 However, for this receptor, the use of the concentra-tion addition model may be limited because it has been recentlydemonstrated that, due to a large ligand-binding pocket, PXR canstably bind binary mixtures of certain weakly active chemicals,which leads to synergistic activation of target genes.42 Theherbicide metolachlor mostly contributed to the effect in thePXR assay. The BEQchem versus BEQbio comparison for watersamples has not been conducted previously for the p53 responseor FET assays; thus, it was not possible to compare our resultswith the literature. Genistein and the industrial compound2,4-dinitrophenol mostly contributed to the p53 response insamples collected from Austria to Serbia (JDS 8 to 39), while thefungicide carbendazim dominated the effect further downstream.Finally, 2,4-dinitrophenol and genistein together contributed upto 0.08% of the effect explained by quantified chemicals in theFET assay, though antimicrobial triclosan alone could explain upto 0.15% of the biological effect in JDS 59 (Figure 3).The small contribution of detected chemicals to the bio-
logical response in the adaptive stress response and PXR assaysis not surprising because many compounds can activate theseendpoints, as discussed earlier. Furthermore, 471 out of 641 or74%, of reviewed compounds in Scholz et al.27 had a responsein the FET test. Consequently, many compounds are active inthese assays, and, although comparability may have been
Figure 2. Overview of the active and inactive detected chemicalspresent in the ToxCast database in the oxidative stress response (ARE,red), p53 response (blue), and NF-κB response (green) assays.
Environmental Science & Technology Article
DOI: 10.1021/acs.est.5b04083Environ. Sci. Technol. 2015, 49, 14614−14624
14620
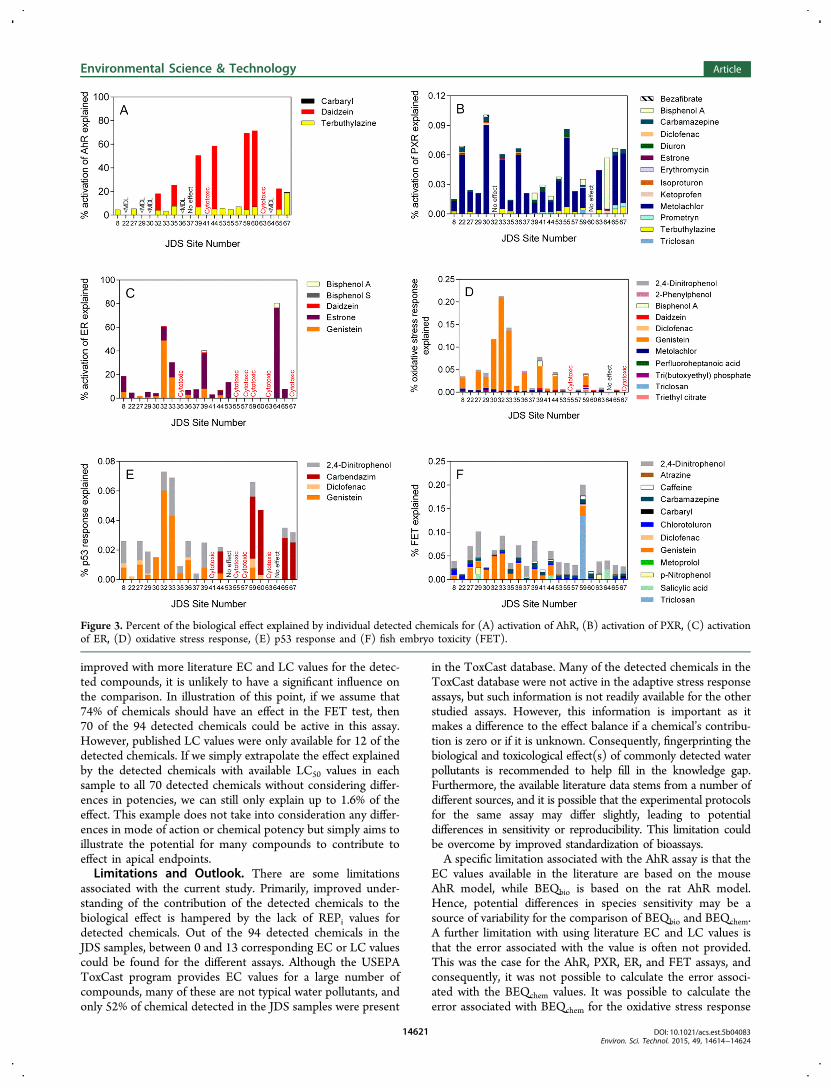
improved with more literature EC and LC values for the detec-ted compounds, it is unlikely to have a significant influence onthe comparison. In illustration of this point, if we assume that74% of chemicals should have an effect in the FET test, then70 of the 94 detected chemicals could be active in this assay.However, published LC values were only available for 12 of thedetected chemicals. If we simply extrapolate the effect explainedby the detected chemicals with available LC50 values in eachsample to all 70 detected chemicals without considering differ-ences in potencies, we can still only explain up to 1.6% of theeffect. This example does not take into consideration any differ-ences in mode of action or chemical potency but simply aims toillustrate the potential for many compounds to contribute toeffect in apical endpoints.Limitations and Outlook. There are some limitations
associated with the current study. Primarily, improved under-standing of the contribution of the detected chemicals to thebiological effect is hampered by the lack of REPi values fordetected chemicals. Out of the 94 detected chemicals in theJDS samples, between 0 and 13 corresponding EC or LC valuescould be found for the different assays. Although the USEPAToxCast program provides EC values for a large number ofcompounds, many of these are not typical water pollutants, andonly 52% of chemical detected in the JDS samples were present
in the ToxCast database. Many of the detected chemicals in theToxCast database were not active in the adaptive stress responseassays, but such information is not readily available for the otherstudied assays. However, this information is important as itmakes a difference to the effect balance if a chemical’s contribu-tion is zero or if it is unknown. Consequently, fingerprinting thebiological and toxicological effect(s) of commonly detected waterpollutants is recommended to help fill in the knowledge gap.Furthermore, the available literature data stems from a number ofdifferent sources, and it is possible that the experimental protocolsfor the same assay may differ slightly, leading to potentialdifferences in sensitivity or reproducibility. This limitation couldbe overcome by improved standardization of bioassays.A specific limitation associated with the AhR assay is that the
EC values available in the literature are based on the mouseAhR model, while BEQbio is based on the rat AhR model.Hence, potential differences in species sensitivity may be asource of variability for the comparison of BEQbio and BEQchem.A further limitation with using literature EC and LC values isthat the error associated with the value is often not provided.This was the case for the AhR, PXR, ER, and FET assays, andconsequently, it was not possible to calculate the error associ-ated with the BEQchem values. It was possible to calculate theerror associated with BEQchem for the oxidative stress response
Figure 3. Percent of the biological effect explained by individual detected chemicals for (A) activation of AhR, (B) activation of PXR, (C) activationof ER, (D) oxidative stress response, (E) p53 response and (F) fish embryo toxicity (FET).
Environmental Science & Technology Article
DOI: 10.1021/acs.est.5b04083Environ. Sci. Technol. 2015, 49, 14614−14624
14621
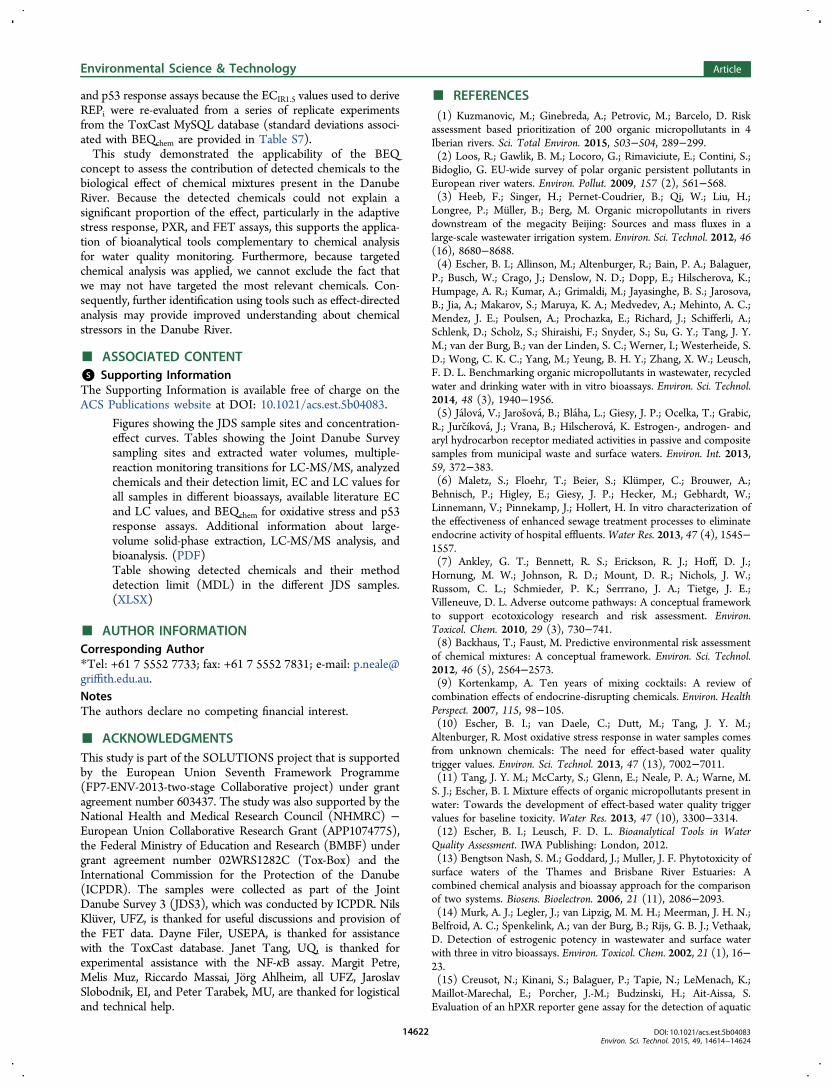
and p53 response assays because the ECIR1.5 values used to deriveREPi were re-evaluated from a series of replicate experimentsfrom the ToxCast MySQL database (standard deviations associ-ated with BEQchem are provided in Table S7).This study demonstrated the applicability of the BEQ
concept to assess the contribution of detected chemicals to thebiological effect of chemical mixtures present in the DanubeRiver. Because the detected chemicals could not explain asignificant proportion of the effect, particularly in the adaptivestress response, PXR, and FET assays, this supports the applica-tion of bioanalytical tools complementary to chemical analysisfor water quality monitoring. Furthermore, because targetedchemical analysis was applied, we cannot exclude the fact thatwe may not have targeted the most relevant chemicals. Con-sequently, further identification using tools such as effect-directedanalysis may provide improved understanding about chemicalstressors in the Danube River.
■ ASSOCIATED CONTENT*S Supporting InformationThe Supporting Information is available free of charge on theACS Publications website at DOI: 10.1021/acs.est.5b04083.
Figures showing the JDS sample sites and concentration-effect curves. Tables showing the Joint Danube Surveysampling sites and extracted water volumes, multiple-reaction monitoring transitions for LC-MS/MS, analyzedchemicals and their detection limit, EC and LC values forall samples in different bioassays, available literature ECand LC values, and BEQchem for oxidative stress and p53response assays. Additional information about large-volume solid-phase extraction, LC-MS/MS analysis, andbioanalysis. (PDF)Table showing detected chemicals and their methoddetection limit (MDL) in the different JDS samples.(XLSX)
■ AUTHOR INFORMATIONCorresponding Author*Tel: +61 7 5552 7733; fax: +61 7 5552 7831; e-mail: [email protected] authors declare no competing financial interest.
■ ACKNOWLEDGMENTSThis study is part of the SOLUTIONS project that is supportedby the European Union Seventh Framework Programme(FP7-ENV-2013-two-stage Collaborative project) under grantagreement number 603437. The study was also supported by theNational Health and Medical Research Council (NHMRC) −European Union Collaborative Research Grant (APP1074775),the Federal Ministry of Education and Research (BMBF) undergrant agreement number 02WRS1282C (Tox-Box) and theInternational Commission for the Protection of the Danube(ICPDR). The samples were collected as part of the JointDanube Survey 3 (JDS3), which was conducted by ICPDR. NilsKluver, UFZ, is thanked for useful discussions and provision ofthe FET data. Dayne Filer, USEPA, is thanked for assistancewith the ToxCast database. Janet Tang, UQ, is thanked forexperimental assistance with the NF-κB assay. Margit Petre,Melis Muz, Riccardo Massai, Jorg Ahlheim, all UFZ, JaroslavSlobodnik, EI, and Peter Tarabek, MU, are thanked for logisticaland technical help.
■ REFERENCES(1) Kuzmanovic, M.; Ginebreda, A.; Petrovic, M.; Barcelo, D. Riskassessment based prioritization of 200 organic micropollutants in 4Iberian rivers. Sci. Total Environ. 2015, 503−504, 289−299.(2) Loos, R.; Gawlik, B. M.; Locoro, G.; Rimaviciute, E.; Contini, S.;Bidoglio, G. EU-wide survey of polar organic persistent pollutants inEuropean river waters. Environ. Pollut. 2009, 157 (2), 561−568.(3) Heeb, F.; Singer, H.; Pernet-Coudrier, B.; Qi, W.; Liu, H.;Longree, P.; Muller, B.; Berg, M. Organic micropollutants in riversdownstream of the megacity Beijing: Sources and mass fluxes in alarge-scale wastewater irrigation system. Environ. Sci. Technol. 2012, 46(16), 8680−8688.(4) Escher, B. I.; Allinson, M.; Altenburger, R.; Bain, P. A.; Balaguer,P.; Busch, W.; Crago, J.; Denslow, N. D.; Dopp, E.; Hilscherova, K.;Humpage, A. R.; Kumar, A.; Grimaldi, M.; Jayasinghe, B. S.; Jarosova,B.; Jia, A.; Makarov, S.; Maruya, K. A.; Medvedev, A.; Mehinto, A. C.;Mendez, J. E.; Poulsen, A.; Prochazka, E.; Richard, J.; Schifferli, A.;Schlenk, D.; Scholz, S.; Shiraishi, F.; Snyder, S.; Su, G. Y.; Tang, J. Y.M.; van der Burg, B.; van der Linden, S. C.; Werner, I.; Westerheide, S.D.; Wong, C. K. C.; Yang, M.; Yeung, B. H. Y.; Zhang, X. W.; Leusch,F. D. L. Benchmarking organic micropollutants in wastewater, recycledwater and drinking water with in vitro bioassays. Environ. Sci. Technol.2014, 48 (3), 1940−1956.(5) Jalova, V.; Jarosova, B.; Blaha, L.; Giesy, J. P.; Ocelka, T.; Grabic,R.; Jurcíkova, J.; Vrana, B.; Hilscherova, K. Estrogen-, androgen- andaryl hydrocarbon receptor mediated activities in passive and compositesamples from municipal waste and surface waters. Environ. Int. 2013,59, 372−383.(6) Maletz, S.; Floehr, T.; Beier, S.; Klumper, C.; Brouwer, A.;Behnisch, P.; Higley, E.; Giesy, J. P.; Hecker, M.; Gebhardt, W.;Linnemann, V.; Pinnekamp, J.; Hollert, H. In vitro characterization ofthe effectiveness of enhanced sewage treatment processes to eliminateendocrine activity of hospital effluents.Water Res. 2013, 47 (4), 1545−1557.(7) Ankley, G. T.; Bennett, R. S.; Erickson, R. J.; Hoff, D. J.;Hornung, M. W.; Johnson, R. D.; Mount, D. R.; Nichols, J. W.;Russom, C. L.; Schmieder, P. K.; Serrrano, J. A.; Tietge, J. E.;Villeneuve, D. L. Adverse outcome pathways: A conceptual frameworkto support ecotoxicology research and risk assessment. Environ.Toxicol. Chem. 2010, 29 (3), 730−741.(8) Backhaus, T.; Faust, M. Predictive environmental risk assessmentof chemical mixtures: A conceptual framework. Environ. Sci. Technol.2012, 46 (5), 2564−2573.(9) Kortenkamp, A. Ten years of mixing cocktails: A review ofcombination effects of endocrine-disrupting chemicals. Environ. HealthPerspect. 2007, 115, 98−105.(10) Escher, B. I.; van Daele, C.; Dutt, M.; Tang, J. Y. M.;Altenburger, R. Most oxidative stress response in water samples comesfrom unknown chemicals: The need for effect-based water qualitytrigger values. Environ. Sci. Technol. 2013, 47 (13), 7002−7011.(11) Tang, J. Y. M.; McCarty, S.; Glenn, E.; Neale, P. A.; Warne, M.S. J.; Escher, B. I. Mixture effects of organic micropollutants present inwater: Towards the development of effect-based water quality triggervalues for baseline toxicity. Water Res. 2013, 47 (10), 3300−3314.(12) Escher, B. I.; Leusch, F. D. L. Bioanalytical Tools in WaterQuality Assessment. IWA Publishing: London, 2012.(13) Bengtson Nash, S. M.; Goddard, J.; Muller, J. F. Phytotoxicity ofsurface waters of the Thames and Brisbane River Estuaries: Acombined chemical analysis and bioassay approach for the comparisonof two systems. Biosens. Bioelectron. 2006, 21 (11), 2086−2093.(14) Murk, A. J.; Legler, J.; van Lipzig, M. M. H.; Meerman, J. H. N.;Belfroid, A. C.; Spenkelink, A.; van der Burg, B.; Rijs, G. B. J.; Vethaak,D. Detection of estrogenic potency in wastewater and surface waterwith three in vitro bioassays. Environ. Toxicol. Chem. 2002, 21 (1), 16−23.(15) Creusot, N.; Kinani, S.; Balaguer, P.; Tapie, N.; LeMenach, K.;Maillot-Marechal, E.; Porcher, J.-M.; Budzinski, H.; Ait-Aissa, S.Evaluation of an hPXR reporter gene assay for the detection of aquatic
Environmental Science & Technology Article
DOI: 10.1021/acs.est.5b04083Environ. Sci. Technol. 2015, 49, 14614−14624
14622

emerging pollutants: screening of chemicals and application to watersamples. Anal. Bioanal. Chem. 2010, 396 (2), 569−583.(16) Escher, B. I.; Lawrence, M.; Macova, M.; Mueller, J. F.;Poussade, Y.; Robillot, C.; Roux, A.; Gernjak, W. Evaluation ofcontaminant removal of reverse osmosis and advanced oxidation infull-scale operation by combining passive sampling with chemicalanalysis and bioanalytical tools. Environ. Sci. Technol. 2011, 45 (12),5387−5394.(17) Yeh, R. Y. L.; Farre, M. J.; Stalter, D.; Tang, J. Y. M.; Molendijk,J.; Escher, B. I. Bioanalytical and chemical evaluation of disinfectionby-products in swimming pool water. Water Res. 2014, 59, 172−184.(18) Rutishauser, B. V.; Pesonen, M.; Escher, B. I.; Ackermann, G. E.;Aerni, H. R.; Suter, M. J. F.; Eggen, R. I. L. Comparative analysis ofestrogenic activity in sewage treatment plant effluents involving threein vitro assays and chemical analysis of steroids. Environ. Toxicol. Chem.2004, 23 (4), 857−864.(19) Nagy, S. R.; Sanborn, J. R.; Hammock, B. D.; Denison, M. S.Development of a green fluorescent protein-based cell bioassay for therapid and inexpensive detection and characterization of Ah receptoragonists. Toxicol. Sci. 2002, 65 (2), 200−210.(20) Martin, M. T.; Dix, D. J.; Judson, R. S.; Kavlock, R. J.; Reif, D.M.; Richard, A. M.; Rotroff, D. M.; Romanov, S.; Medvedev, A.;Poltoratskaya, N.; Gambarian, M.; Moeser, M.; Makarov, S. S.; Houck,K. A. Impact of environmental chemicals on key transcriptionregulators and correlation to toxicity end points within EPA’s ToxCastprogram. Chem. Res. Toxicol. 2010, 23 (3), 578−590.(21) Simmons, S. O.; Fan, C.-Y.; Ramabhadran, R. Cellular stressresponse pathway system as a sentinel ensemble in toxicologicalscreening. Toxicol. Sci. 2009, 111 (2), 202−225.(22) Zhang, D. D. Mechanistic studies of the Nrf2-Keap1 signalingpathway. Drug Metab. Rev. 2006, 38 (4), 769−789.(23) US EPA. Interactive Chemical Safety for Sustainability (iCSS)Dashboard. http://actor.epa.gov/dashboard/ (accessed 23rd March2015).(24) Knight, A. W.; Little, S.; Houck, K.; Dix, D.; Judson, R.; Richard,A.; McCarroll, N.; Akerman, G.; Yang, C.; Birrell, L.; Walmsley, R. M.Evaluation of high-throughput genotoxicity assays used in profiling theUS EPA ToxCastTM chemicals. Regul. Toxicol. Pharmacol. 2009, 55 (2),188−199.(25) Duerksen-Hughes, P. J.; Yang, J.; Ozcan, O. p53 induction as agenotoxic test for twenty-five chemicals undergoing in vivocarcinogenicity testing. Environ. Health Perspect. 1999, 107 (10),805−812.(26) OECD. Test No. 236: Fish Embryo Acute Toxicity (FET) Test,OECD Guidelines for the Testing of Chemicals, Section 2. OECDPublishing: Paris, 2013.(27) Scholz, S.; Ortmann, J.; Kluver, N.; Leonard, M. Extensivereview of fish embryo acute toxicities for the prediction of GHS acutesystemic toxicity categories. Regul. Toxicol. Pharmacol. 2014, 69 (3),572−579.(28) Schymanski, E. L.; Singer, H. P.; Slobodnik, J.; Ipolyi, I. M.;Oswald, P.; Krauss, M.; Schulze, T.; Haglund, P.; Letzel, T.; Grosse, S.;Thomaidis, N. S.; Bletsou, A.; Zwiener, C.; Ibanez, M.; Portoles, T.; deBoer, R.; Reid, M. J.; Onghena, M.; Kunkel, U.; Schulz, W.; Guillon,A.; Noyon, N.; Leroy, G.; Bados, P.; Bogialli, S.; Stipanicev, D.;Rostkowski, P.; Hollender, J. Non-target screening with high-resolution mass spectrometry: Critical review using a collaborativetrial on water analysis. Anal. Bioanal. Chem. 2015, 407 (21), 6237−6255.(29) Liska, I.; Wagner, F.; Sengl, M.; Deutsch, K.; Slobodník, J. JointDanube Survey 3 - A Comprehensive Analysis of Danube Water Quality.International Commission for the Protection of the Danube River:Vienna, Austria, 2015.(30) Schulze, T.; Krauss, M.; Novak, J.; Hilscherova, K.; Ait-Aissa, S.;Creusot, N.; Macova, M.; Neale, P. A.; Escher, B. I.; Gomes, T.;Tollefsen, K. E.; Tarcai, Z.; Shao, Y.; Deutschmann, B.; Seiler, T.-B.;Hollert, H.; Tarabek, P.; Tousova, Z.; Slobodnik, J.; Walz, K.-H.;Brack, W. Large Volume Sampling and Effect-Based Screening. In JointDanube Survey 3 - A Comprehensive Analysis of Danube Water Quality;
Liska, I., Wagner, F., Sengl, M., Deutsch, K., Slobodník, J., Eds;International Commission for the Protection of the Danube River:Vienna, Austria, 2015; pp 284−295.(31) Hug, C.; Ulrich, N.; Schulze, T.; Brack, W.; Krauss, M.Identification of novel micropollutants in wastewater by a combinationof suspect and nontarget screening. Environ. Pollut. 2014, 184, 25−32.(32) Escher, B. I.; Dutt, M.; Maylin, E.; Tang, J. Y. M.; Toze, S.; Wolf,C. R.; Lang, M. Water quality assessment using the AREc32 reportergene assay indicative of the oxidative stress response pathway. J.Environ. Monit. 2012, 14 (11), 2877−2885.(33) Villeneuve, D. L.; Blankenship, A. L.; Giesy, J. P. Derivation andapplication of relative potency estimates based on in vitro bioassayresults. Environ. Toxicol. Chem. 2000, 19 (11), 2835−2843.(34) European Commission. Directive 2013/39/EU of the EuropeanParliament and the Council of 12 August 2013 amending Directives2000/60/EC and 2008/105/EC as regards priority substances in thefield of water policy. Off. J. Eur. Union, 2013, L226/1−L226/17.(35) Tang, J. Y. M.; Taulis, M.; Edebeli, J.; Leusch, F. D. L.; Jagals, P.;Jackson, G. P.; Escher, B. I. Chemical and bioanalytical assessment ofcoal seam gas associated water. Envir. Chem. 2015, 12 (3), 267−285.(36) Kittinger, C.; Baumert, R.; Folli, B.; Lipp, M.; Liebmann, A.;Kirschner, A.; Farnleitner, A. H.; Grisold, A. J.; Zarfel, G. E.Preliminary toxicological evaluation of the river Danube using invitro bioassays. Water 2015, 7 (5), 1959−1968.(37) Jarosova, B.; Ersekova, A.; Hilscherova, K.; Loos, R.; Gawlik, B.M.; Giesy, J. P.; Blaha, L. Europe-wide survey of estrogenicity inwastewater treatment plant effluents: the need for the effect-basedmonitoring. Environ. Sci. Pollut. Res. 2014, 21 (18), 10970−10982.(38) DeGroot, D.; He, G.; Fraccalvieri, D.; Bonati, L.; Pandini, A.;Denison, M. S. AhR ligands: Promiscuity in binding and diversity inresponse. In The Ah Receptor in Biology and Toxicology’ Pohjanvirta, R.,Ed.; John Wiley & Sons, Inc.: Hoboken, NJ, 2011; pp 63−79.(39) Zhang, S.; Qin, C. H.; Safe, S. H. Flavonoids as aryl hydrocarbonreceptor agonists/antagonists: Effects of structure and cell context.Environ. Health Perspect. 2003, 111 (16), 1877−1882.(40) Kawanishi, M.; Takamura-Enya, T.; Ermawati, R.; Shimohara,C.; Sakamoto, M.; Matsukawa, K.; Matsuda, T.; Murahashi, T.; Matsui,S.; Wakabayashi, K.; Watanabe, T.; Tashiro, Y.; Yagi, T. Detection ofgenistein as an estrogenic contaminant of river water in Osaka.Environ. Sci. Technol. 2004, 38 (23), 6424−6429.(41) Tang, J. Y. M.; Busetti, F.; Charrois, J. W. A.; Escher, B. I. Whichchemicals drive biological effects in wastewater and recycled water?Water Res. 2014, 60, 289−299.(42) Delfosse, V.; Dendele, B.; Huet, T.; Grimaldi, M.; Boulahtouf,A.; Gerbal-Chaloin, S.; Beucher, B.; Roecklin, D.; Muller, C.; Rahmani,R.; Cavailles, V.; Daujat-Chavanieu, M.; Vivat, V.; Pascussi, J. M.;Balaguer, P.; Bourguet, W. Synergistic activation of human pregnane Xreceptor by binary cocktails of pharmaceutical and environmentalcompounds. Nat. Commun. 2015, 6, 8089.(43) Lemaire, G.; Mnif, W.; Pascussi, J. M.; Pillon, A.; Rabenoelina,F.; Fenet, H.; Gomez, E.; Casellas, C.; Nicolas, J. C.; Cavailles, V.;Duchesne, M. J.; Balaguer, P. Identification of new human pregnane Xreceptor ligands among pesticides using a stable reporter cell system.Toxicol. Sci. 2006, 91 (2), 501−509.(44) Balaguer, P.; Francois, F.; Comunale, F.; Fenet, H.; Boussioux,A. M.; Pons, M.; Nicolas, J. C.; Casellas, C. Reporter cell lines to studythe estrogenic effects of xenoestrogens. Sci. Total Environ. 1999, 233(1−3), 47−56.(45) Kinani, S.; Bouchonnet, S.; Creusot, N.; Bourcier, S.; Balaguer,P.; Porcher, J.-M.; Ait-Aissa, S. Bioanalytical characterisation ofmultiple endocrine- and dioxin-like activities in sediments fromreference and impacted small rivers. Environ. Pollut. 2010, 158 (1),74−83.(46) Invitrogen. CellSensor ARE-bla Hep G2 cell-based assayprotocol. http://tools.lifetechnologies.com/content/sfs/manuals/cellsensor_AREblaHepG2_man.pdf.(47) Neale, P. A.; Stalter, D.; Tang, J. Y. M.; Escher, B. I.Bioanalytical evidence that chemicals in tattoo ink can induce adaptivestress responses. J. Hazard. Mater. 2015, 296, 192−200.
Environmental Science & Technology Article
DOI: 10.1021/acs.est.5b04083Environ. Sci. Technol. 2015, 49, 14614−14624
14623
(48) Jin, L.; Gaus, C.; Escher, B. I. Adaptive stress response pathwaysinduced by environmental mixtures of bioaccumulative chemicals indugongs. Environ. Sci. Technol. 2015, 49 (11), 6963−6973.(49) Denison, M. S.; Phelan, D.; Winter, G. M.; Ziccardi, M. H.Carbaryl, a carbamate insecticide, is a ligand for the hepatic Ah(dioxin) receptor. Toxicol. Appl. Pharmacol. 1998, 152 (2), 406−414.(50) Long, M. H.; Kruger, T.; Ghisari, M.; Bonefeld-Jørgensen, E. C.Effects of selected phytoestrogens and their mixtures on the functionof the thyroid hormone and the aryl hydrocarbon receptor. Nutr.Cancer 2012, 64 (7), 1008−1019.(51) Ghisari, M.; Long, M.; Tabbo, A.; Bonefeld-Jørgensen, E. C.Effects of currently used pesticides and their mixtures on the functionof thyroid hormone and aryl hydrocarbon receptor in cell culture.Toxicol. Appl. Pharmacol. 2015, 284 (3), 292−303.(52) Creusot, N. Contribution de l’approche effect directed analysis a l’identification de perturbateurs endocriniens dans les milieuxaquatiques. Ph.D. Dissertation, University of Bordeaux, Bordeaux,France, 2011.(53) Molina-Molina, J.-M.; Escande, A.; Pillon, A.; Gomez, E.;Pakdel, F.; Cavailles, V.; Olea, N.; Ait-Aissa, S.; Balaguer, P. Profilingof benzophenone derivatives using fish and human estrogen receptor-specific in vitro bioassays. Toxicol. Appl. Pharmacol. 2008, 232 (3),384−395.(54) Molina-Molina, J.-M.; Amaya, E.; Grimaldi, M.; Saenz, J.-M.;Real, M.; Fernandez, M. F.; Balaguer, P.; Olea, N. In vitro study on theagonistic and antagonistic activities of bisphenol-S and otherbisphenol-A congeners and derivatives via nuclear receptors. Toxicol.Appl. Pharmacol. 2013, 272 (1), 127−136.(55) Pillon, A.; Boussioux, A. M.; Escande, A.; Ait-Aissa, S.; Gomez,E.; Fenet, H.; Ruff, M.; Moras, D.; Vignon, F.; Duchesne, M. J.;Casellas, C.; Nicolas, J. C.; Balaguer, P. Binding of estrogeniccompounds to recombinant estrogen receptor-alpha: Application toenvironmental analysis. Environ. Health Perspect. 2005, 113 (3), 278−284.
Environmental Science & Technology Article
DOI: 10.1021/acs.est.5b04083Environ. Sci. Technol. 2015, 49, 14614−14624
14624

Résultats : chapitre B – article n°2
80
Résultats : chapitre B – article n°2
81
Renseigner l’activité de polluants environnementaux
Le nombre croissant de contaminants chimiques retrouvés dans les eaux de surface
soulève le besoin de mieux caractériser leur réponse potentielle. Dans le cas d’étude du Danube,
ce manque de connaissance représentait clairement une limite à l’interprétation des résultats des
bio-essais. Dans ce chapitre, nous adressons l’évaluation de l’activité estrogénique de polluants
environnementaux à l’aide de modèles in vitro (humains et poisson zèbre) et in vivo chez le poisson
zèbre. Ces modèles ont été appliqués dans une démarche de criblage à un ensemble de 34
molécules priorisées dans le cadre du projet SOLUTIONS (article n°2). Puis, un travail plus
spécifique a été mené sur le triclosan, un contaminant émergent très présent dans
l’environnement aquatique et qui est suspecté d’être un perturbateur endocrinien (article n°3).
Article n°2: “Development of a bioanalytical test battery for water
quality monitoring: fingerprinting identified micropollutants and their
contribution to effects in surface water”
1.1 Contexte et objectif
Dans le chapitre 1, nous avons constaté qu’il y avait un manque d’information sur l’activité
des polluants détectés dans les échantillons environnementaux pour la plupart des bio-essais
utilisés (article n°1). Réalisée dans le cadre du projet SOLUTIONS, cette étude a pour but d’évaluer
l’activité de polluants environnementaux communément retrouvés dans les eaux de surface
européennes à travers une batterie de bio-essais comprenant des tests in vitro et in vivo. Les 20
bio-essais de cette étude ont été choisis de manière à couvrir de multiples modes de toxicité,
spécifiques (ex : activation d’un récepteur) et apicaux (ex : toxicité aigüe sur l’embryon de
poisson).
Le choix des polluants évalués s’est effectué principalement sur trois critères : (1) le
quotient de risque basé sur les concentrations mesurées dans les eaux de surface européennes et
les données de toxicité aigüe sur algue, poisson, et daphnie (issu de Busch et al., 2016), (2)
l’existence d’une norme de qualité environnementale et (3) le mode d’action des composés. Au
final, 34 molécules ont été sélectionnées, dont 32 figurent parmi les 214 polluants priorisés par
Résultats : chapitre B – article n°2
82
Busch et al., (2016). Les informations obtenues ont ensuite été utilisées pour mettre à jour la mass-
balance des échantillons du Danube sur les bio-essais MELN et PXR (article n°1) et évaluer la
contribution des nouvelles molécules identifiées dans l’activité biologique mesurée.
1.2 Principaux résultats
Les résultats du criblage sur nos différents bio-essais sont résumés dans le tableau XI. En
complément, l’activité anti-estrogénique de certaines molécules a été évaluée dans les modèles
in vitro, ainsi que dans les cellules ZELH, utilisées comme contrôle d’une inhibition non ER-
spécifique de la luciférase (anti-estrogénicité et effets non spécifiques présentés et discutés dans
le chapitre 3, article n°5).
Le criblage des 34 molécules sur la lignée hPXR a mis en évidence l’activité des deux tiers
des molécules testées, confirmant la capacité de la lignée à répondre à de nombreux polluants
environnementaux. Cependant, les 6 nouvelles molécules actives identifiées dans les échantillons
de la JDS3 n’ont permis d’améliorer la mass-balance que de 0.1% dans le meilleur des cas. En
moyenne, l’effet biologique expliqué par les 18 molécules actives restait inférieur à 0.2%. Ce
résultat est en accord avec des études précédentes faites sur le même modèle (Creusot et al. ,
2010, 2014 ; Kinani et al. , 2010). Le récepteur PXR présente la spécificité de pouvoir lier plusieurs
molécules simultanément et entrainer un effet synergique sur l’activité transcriptionnelle
(Delfosse et al., 2015). En conséquent, il est possible que le concept d’additivité assumé dans le
calcul de la mass-balance ne soit pas approprié pour rendre compte de l’activité des ligands de
hPXR au sein d’échantillons environnementaux.
Dans les bio-essais d’estrogénicité in vitro MELN, ZELHα et ZELHβ2 et dans le test in vivo
EASZY, la majorité des molécules testées sont inactives. Tous les modèles in vitro et in vivo basés
sur le poisson zèbre détectent les mêmes xeno-estrogènes (le bisphénol A et la génisteine), mais
certaines molécules sont différemment actives en fonction des modèles cellulaires. En particulier,
le triphenyl phosphate (TPP), le benzo(a)pyrene (BaP), le 4-n-nonylphenol (4-n-NP) sont
estrogéniques dans les MELN mais anti-estrogéniques dans les ZELHα et ZELHβ2 (tableau XI).
Parmi les bio-essais pour évaluer l’estrogenicité dans l’article n°3 figure aussi la lignée de médaka
transgénique ChgH-GFP (Kurauchi et al., 2005). A la différence du test EASZY, le TPP et le

Résultats : chapitre B – article n°2
83
chlorophene sont actifs sur le modèle médaka mais la génisteine ne l’est pas. Dans son ensemble,
le criblage illustre l’importance d’utiliser des données d’activité propres à chaque bio-essai dans
un contexte de bio-analyse, car il peut y avoir des réponses différentes liées à chaque bio-essai
(ex : espèce, stade de développement, durée d’exposition).
La mass-balance des échantillons de la JDS3 testés sur les cellules MELN a été réévaluée au
regard des nouvelles données obtenues sur les molécules individuelles. Cette analyse conforte la
forte contribution de l’estrone dont le REP a été réévalué à 0.11 (REP initial de 0.02 publié par
Pillon et al., 2005). En revanche, les autres molécules nouvellement identifiées comme actives
contribuent très peu à l’activité mesurée. Pour certains échantillons, les molécules retrouvées
expliquent toujours moins de 20% de l’activité mesurée, en particulier pour le site JDS41 qui est
le plus actif (1,24 ng/L E2-Eq).
1.3 Conclusion
➢ On apporte de nouvelles informations sur l’activité PXR de polluants émergents
➢ Tous les bio-essais détectent correctement les ligands estrogéniques connus, le bisphénol
A et la génistéine
➢ La grande majorité des polluants environnementaux testés n’est pas estrogénique dans
les bio-essais in vitro et in vivo
➢ Le BaP, TPP et 4-n-NP ont des réponses opposées entre bio-essais in vitro humain et de
poisson zèbre : estrogéniques en MELN mais anti-estrogéniques dans les ZELH-zfERs
Les differences inter-modèles obervées pour certaines molécules soulèvent la question de
facteurs modèle-spécifiques capables d’influencer la réponse estrogénique (ex : interaction entre
ER et AhR dans le cas du BaP ?), et de leurs conséquences sur l’activité des xeno-estrogènes en
mélange.
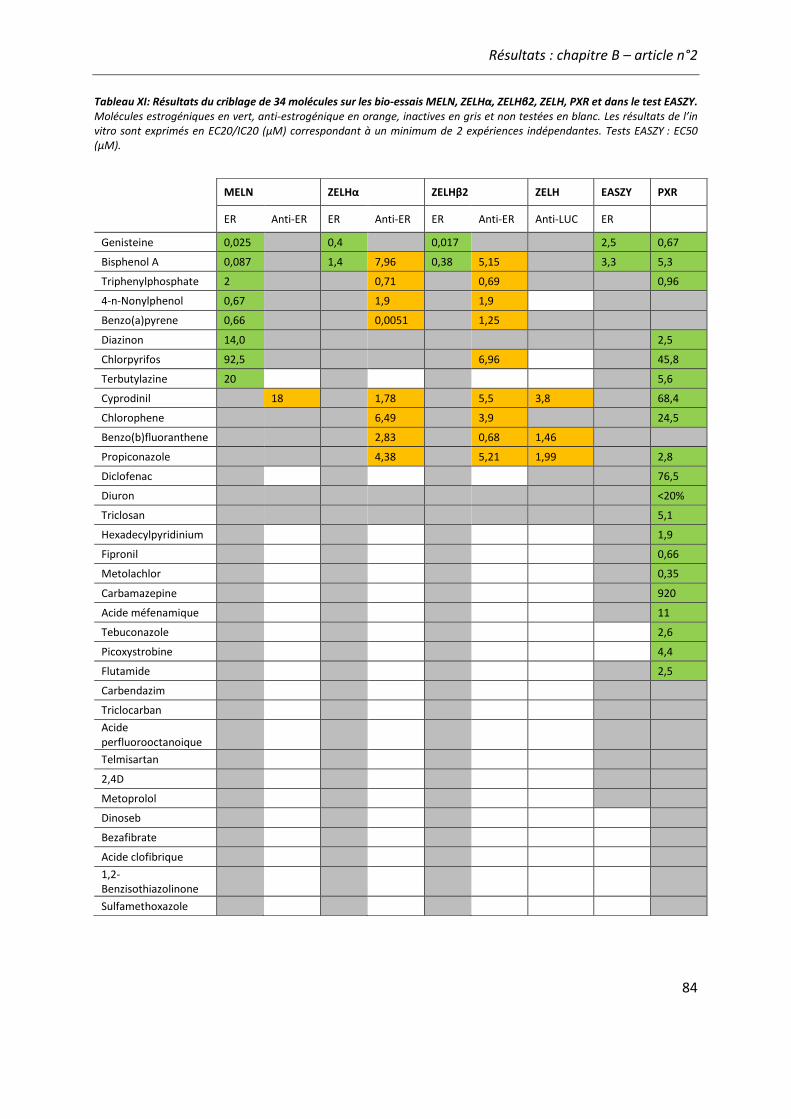
Résultats : chapitre B – article n°2
84
Tableau XI: Résultats du criblage de 34 molécules sur les bio-essais MELN, ZELHα, ZELHβ2, ZELH, PXR et dans le test EASZY. Molécules estrogéniques en vert, anti-estrogénique en orange, inactives en gris et non testées en blanc. Les résultats de l’in vitro sont exprimés en EC20/IC20 (µM) correspondant à un minimum de 2 expériences indépendantes. Tests EASZY : EC50 (µM).
MELN ZELHα ZELHβ2 ZELH EASZY PXR
ER Anti-ER ER Anti-ER ER Anti-ER Anti-LUC ER
Genisteine 0,025 0,4 0,017 2,5 0,67
Bisphenol A 0,087 1,4 7,96 0,38 5,15 3,3 5,3
Triphenylphosphate 2 0,71 0,69 0,96
4-n-Nonylphenol 0,67 1,9 1,9
Benzo(a)pyrene 0,66 0,0051 1,25
Diazinon 14,0 2,5
Chlorpyrifos 92,5 6,96 45,8
Terbutylazine 20 5,6
Cyprodinil 18 1,78 5,5 3,8 68,4
Chlorophene 6,49 3,9 24,5
Benzo(b)fluoranthene 2,83 0,68 1,46
Propiconazole 4,38 5,21 1,99 2,8
Diclofenac 76,5
Diuron <20%
Triclosan 5,1
Hexadecylpyridinium 1,9
Fipronil 0,66
Metolachlor 0,35
Carbamazepine 920
Acide méfenamique 11
Tebuconazole 2,6
Picoxystrobine 4,4
Flutamide 2,5
Carbendazim
Triclocarban
Acide perfluorooctanoique
Telmisartan
2,4D
Metoprolol
Dinoseb
Bezafibrate
Acide clofibrique
1,2-Benzisothiazolinone
Sulfamethoxazole
Development of a bioanalytical test battery for water qualitymonitoring: Fingerprinting identified micropollutants and theircontribution to effects in surface water
Peta A. Neale a, b, Rolf Altenburger c, Selim Aït-Aïssa d, François Brion d, Wibke Busch c,Gisela de Arag~ao Umbuzeiro e, Michael S. Denison f, David Du Pasquier g,Kl�ara Hilscherov�a h, Henner Hollert i, Daniel A. Morales e, Ji�rí Nov�ak h, Rita Schlichting c,Thomas-Benjamin Seiler i, Helene Serra d, Ying Shao i, Andrew J. Tindall g,Knut Erik Tollefsen j, Timothy D. Williams k, Beate I. Escher b, c, l, *
a Australian Rivers Institute, Griffith School of Environment, Griffith University, Southport, QLD, 4222, Australiab The University of Queensland, National Research Centre for Environmental Toxicology (Entox), Brisbane, QLD, 4108, Australiac UFZ e Helmholtz Centre for Environmental Research, 04318 Leipzig, Germanyd Institut National de l'Environnement Industriel et des Risques INERIS, Unit�e d’Ecotoxicologie, 60550, Verneuil-en-Halatte, Francee School of Technology, University of Campinas, Limeira, SP, 13484-332, Brazilf Department of Environmental Toxicology, University of California, Davis, CA, 95616, United Statesg WatchFrog, Batiment Genavenir 3, 1 rue Pierre Fontaine, 91000 Evry, Franceh Masaryk University, Research Centre for Toxic Compounds in the Environment (RECETOX), Kamenice 753/5, 62500 Brno, Czech Republici Department of Ecosystem Analysis, Institute for Environmental Research, RWTH Aachen University, 52074 Aachen, Germanyj Norwegian Institute for Water Research NIVA, Gaustadall�een 21, 0349 Oslo, Norwayk School of Biosciences, The University of Birmingham, Birmingham, B15 2TT, UKl Eberhard Karls University Tübingen, Environmental Toxicology, Center for Applied Geosciences, 72074 Tübingen, Germany
a r t i c l e i n f o
Article history:Received 2 March 2017Received in revised form4 June 2017Accepted 7 July 2017Available online 9 July 2017
Keywords:In vitroCell-based bioassayIn vivoFish embryo toxicity testToxCastMixture toxicity
a b s t r a c t
Surface waters can contain a diverse range of organic pollutants, including pesticides, pharmaceuticalsand industrial compounds. While bioassays have been used for water quality monitoring, there is limitedknowledge regarding the effects of individual micropollutants and their relationship to the overallmixture effect in water samples. In this study, a battery of in vitro bioassays based on human and fish celllines and whole organism assays using bacteria, algae, daphnids and fish embryos was assembled for usein water quality monitoring. The selection of bioassays was guided by the principles of adverse outcomepathways in order to cover relevant steps in toxicity pathways known to be triggered by environmentalwater samples. The effects of 34 water pollutants, which were selected based on hazard quotients,available environmental quality standards and mode of action information, were fingerprinted in thebioassay test battery. There was a relatively good agreement between the experimental results andavailable literature effect data. The majority of the chemicals were active in the assays indicative of apicaleffects, while fewer chemicals had a response in the specific reporter gene assays, but these effects weretypically triggered at lower concentrations. The single chemical effect data were used to improve pub-lished mixture toxicity modeling of water samples from the Danube River. While there was a slightincrease in the fraction of the bioanalytical equivalents explained for the Danube River samples, for someendpoints less than 1% of the observed effect could be explained by the studied chemicals. The newmixture models essentially confirmed previous findings from many studies monitoring water qualityusing both chemical analysis and bioanalytical tools. In short, our results indicate that many morechemicals contribute to the biological effect than those that are typically quantified by chemical
* Corresponding author. UFZ e Helmholtz Centre for Environmental Research,Permoserstr. 15, 04318 Leipzig, Germany.
E-mail address: [email protected] (B.I. Escher).
Contents lists available at ScienceDirect
Water Research
journal homepage: www.elsevier .com/locate/watres
http://dx.doi.org/10.1016/j.watres.2017.07.0160043-1354/© 2017 Elsevier Ltd. All rights reserved.
Water Research 123 (2017) 734e750

monitoring programs or those regulated by environmental quality standards. This study not onlydemonstrates the utility of fingerprinting single chemicals for an improved understanding of the bio-logical effect of pollutants, but also highlights the need to apply bioassays for water quality monitoring inorder to prevent underestimation of the overall biological effect.
© 2017 Elsevier Ltd. All rights reserved.
1. Introduction
Chemical pollution in rivers has been identified as a majorthreat to ecosystem and public health (V€or€osmarty et al., 2010;Malaj et al., 2014). Busch et al. (2016) identified 426 differentchemicals present in European rivers, including the Danube andRhine. While the huge number of chemicals present in surfacewaters indicates that targeted chemical analysis alone is unsuitablefor understanding the overall chemical burden, it is still the mainapproach used for water quality monitoring, e.g., in the EuropeanUnion Water Framework Directive (WFD) (European Commission,2011, 2012).
A diverse set of in vivo, in vitro and ecological indicators wereproposed as monitoring tools within the WFD (Wernersson et al.,2015). In vivo bioassays have a long tradition of application ineffluent assessment and water quality monitoring studies (Escherand Leusch, 2012). In contrast, in vitro cellular bioassays havemainly been applied to assess technical water treatment processes,such as sewage treatment (Prasse et al., 2015), advanced watertreatment (Leusch and Snyder, 2015) and drinking water treatment(Neale et al., 2012). In most applications, in vitro bioassays are notbeing used as a direct link to the ecological health of aquatic or-ganisms, but rather as a complementary analytical tool to detectand quantify chemicals via their response to environmental mix-tures. The EU Project SOLUTIONS proposes to connect both ap-proaches and employ bioassays for water quality monitoring whilstlinking them to chemical assessment (Altenburger et al., 2015).Cell-based bioassays have also been proposed as part of the first tierscreening step of a new conceptual framework for monitoringwater contaminants in California (Maruya et al., 2016).
Programs such as the United States Environmental ProtectionAgency (US EPA) Toxicity Forecaster (ToxCast) and Toxicity Testingin the 21st Century (Tox21) have screened a large number ofchemicals in more than a thousand in vitro assays (US EPA, 2015).These programs focus on human health assessment (Tice et al.,2013), with less attention on effects relevant to environmentalrisk assessment. More recently, Schroeder et al. (2016) proposedthe application of the high-throughput screening tools used inToxCast and Tox21 for environmental surveillance and waterquality monitoring initiatives.
Consequently, the goal of the current study was to assemble abattery of bioassays that covers both the expected effects andsafeguards against overlooking others with unidentified modes ofaction. Cellularassays based on different steps of cellular toxicitypathways were applied, as well as whole organism assays indica-tive of both apical and specific effects. Cellular effects are key partsof adverse outcome pathways (Ankley et al., 2010), with the studiedbioassays covering induction of xenobiotic metabolism, receptor-mediated effects, reactive modes of action, induction of adaptivestress response pathways and cell viability. Assays using bacteria(Aliivibrio fischeri and Salmonella enterica serovar typhimurium),algae (Chlamydomonas reinhardtii), crustaceans (Daphnia magna),fish (embryonic Danio rerio and Oryzias latipes) and amphibians(embryonic Xenopus laevis) were applied, while cellular responseswere evaluated using cultured fish cells (Danio rerio), as well asmammalian cells (human and rat cell lines), allowing comparison
with the existing US EPA ToxCast database (US EPA, 2015). Effectdata from peer-reviewed literature and the US EPA ToxCast data-base were collected and compared with our experimental effectdata. In vitro and whole organism specific effects were compared todetermine if the studied pollutants acted as baseline toxicants,meaning they would result in non-specific effects, or would pro-duce specific effects in the whole organism assays. The generatedeffects data were finally applied to improve mixture toxicitymodeling for environmental water samples.
2. Assembling a bioanalytical test battery for surface waterquality monitoring
Ideally, a bioanalytical test battery for water quality monitoringshould be motivated by effects found typically in water and includeassays covering a wide range of environmentally relevant modes ofaction and different stages of cellular toxicity pathways, as well aslow-complexity whole-organism effects (Fig. 1). To narrow downthe large number of available bioassays to a smaller list of indicatorbioassays, a balance must be struck between the desire to cover allpossible effects and practicability issues. Broad coverage of modesof action, inclusion of the contributions from all chemicals andrelevance for ecological health through the alignment of the bio-assays to relevant steps of adverse outcome pathways are desirable(Schroeder et al., 2016), as well as a focus on effects that have beenpreviously observed in water samples (Escher et al., 2014). Practi-cability, assay robustness, applicability for less specialized labora-tories and the possibility to run the assays in a high-throughputmode for low-volume tests were further considered (Escher andLeusch, 2012). Reducing the sample volume requirements foreach test is also important as it facilitates routine monitoring bydecreasing the total volume required at each sampling location.
A large screening study using more than a hundred individualin vitro bioassays as well as a multifactorial assay that quantifies theactivation of 25 nuclear receptors and 45 transcription factorsdemonstrated that the estrogen receptor (ER), and to a lesser de-gree the glucocorticoid receptor (GR), were amongst the mostresponsive hormonal nuclear receptors in wastewater and surfacewater testing (Escher et al., 2014). Therefore, ER reporter gene as-says were a prominent component of the test battery in this studyand we included assays using human and fish cell lines (Table 1).Furthermore, surface water samples have also been shown toinhibit the androgen receptor (AR) (Escher et al., 2014; J�alov�a et al.,2013). Given the high relevance of hormone receptors, we addedthree transgenic assays that have been developed in recent years toassess hormone-mediated effects in early life-stage organisms(Brion et al., 2012; Fini et al., 2007; Spirhanzlova et al., 2016). Nu-clear receptors triggering the activation of metabolism and otherbiological effects such as the aryl hydrocarbon receptor (AhR), thepregnane X receptor (PXR) and the peroxisome-proliferator-activated receptor (PPARg) were even more prominently acti-vated by water sample extracts (Escher et al., 2014) and play aprominent role in the proposed test battery.
We also included reporter gene assays for activation of adaptivestress responses in the present study (Table 1, Fig. 1). Adaptivestress responses are key events (Simmons et al., 2009) and very
P.A. Neale et al. / Water Research 123 (2017) 734e750 735
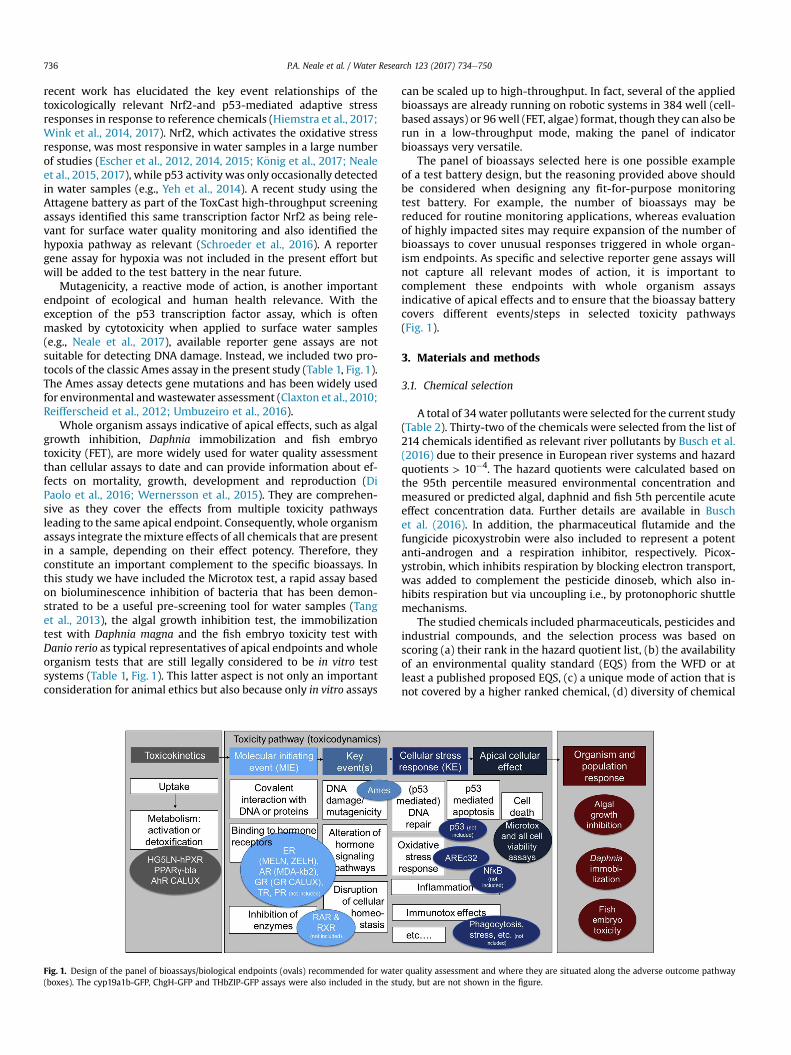
recent work has elucidated the key event relationships of thetoxicologically relevant Nrf2-and p53-mediated adaptive stressresponses in response to reference chemicals (Hiemstra et al., 2017;Wink et al., 2014, 2017). Nrf2, which activates the oxidative stressresponse, was most responsive in water samples in a large numberof studies (Escher et al., 2012, 2014, 2015; K€onig et al., 2017; Nealeet al., 2015, 2017), while p53 activity was only occasionally detectedin water samples (e.g., Yeh et al., 2014). A recent study using theAttagene battery as part of the ToxCast high-throughput screeningassays identified this same transcription factor Nrf2 as being rele-vant for surface water quality monitoring and also identified thehypoxia pathway as relevant (Schroeder et al., 2016). A reportergene assay for hypoxia was not included in the present effort butwill be added to the test battery in the near future.
Mutagenicity, a reactive mode of action, is another importantendpoint of ecological and human health relevance. With theexception of the p53 transcription factor assay, which is oftenmasked by cytotoxicity when applied to surface water samples(e.g., Neale et al., 2017), available reporter gene assays are notsuitable for detecting DNA damage. Instead, we included two pro-tocols of the classic Ames assay in the present study (Table 1, Fig. 1).The Ames assay detects gene mutations and has been widely usedfor environmental andwastewater assessment (Claxton et al., 2010;Reifferscheid et al., 2012; Umbuzeiro et al., 2016).
Whole organism assays indicative of apical effects, such as algalgrowth inhibition, Daphnia immobilization and fish embryotoxicity (FET), are more widely used for water quality assessmentthan cellular assays to date and can provide information about ef-fects on mortality, growth, development and reproduction (DiPaolo et al., 2016; Wernersson et al., 2015). They are comprehen-sive as they cover the effects from multiple toxicity pathwaysleading to the same apical endpoint. Consequently, whole organismassays integrate themixture effects of all chemicals that are presentin a sample, depending on their effect potency. Therefore, theyconstitute an important complement to the specific bioassays. Inthis study we have included the Microtox test, a rapid assay basedon bioluminescence inhibition of bacteria that has been demon-strated to be a useful pre-screening tool for water samples (Tanget al., 2013), the algal growth inhibition test, the immobilizationtest with Daphnia magna and the fish embryo toxicity test withDanio rerio as typical representatives of apical endpoints and wholeorganism tests that are still legally considered to be in vitro testsystems (Table 1, Fig. 1). This latter aspect is not only an importantconsideration for animal ethics but also because only in vitro assays
can be scaled up to high-throughput. In fact, several of the appliedbioassays are already running on robotic systems in 384 well (cell-based assays) or 96well (FET, algae) format, though they can also berun in a low-throughput mode, making the panel of indicatorbioassays very versatile.
The panel of bioassays selected here is one possible exampleof a test battery design, but the reasoning provided above shouldbe considered when designing any fit-for-purpose monitoringtest battery. For example, the number of bioassays may bereduced for routine monitoring applications, whereas evaluationof highly impacted sites may require expansion of the number ofbioassays to cover unusual responses triggered in whole organ-ism endpoints. As specific and selective reporter gene assays willnot capture all relevant modes of action, it is important tocomplement these endpoints with whole organism assaysindicative of apical effects and to ensure that the bioassay batterycovers different events/steps in selected toxicity pathways(Fig. 1).
3. Materials and methods
3.1. Chemical selection
A total of 34water pollutants were selected for the current study(Table 2). Thirty-two of the chemicals were selected from the list of214 chemicals identified as relevant river pollutants by Busch et al.(2016) due to their presence in European river systems and hazardquotients > 10�4. The hazard quotients were calculated based onthe 95th percentile measured environmental concentration andmeasured or predicted algal, daphnid and fish 5th percentile acuteeffect concentration data. Further details are available in Buschet al. (2016). In addition, the pharmaceutical flutamide and thefungicide picoxystrobin were also included to represent a potentanti-androgen and a respiration inhibitor, respectively. Picox-ystrobin, which inhibits respiration by blocking electron transport,was added to complement the pesticide dinoseb, which also in-hibits respiration but via uncoupling i.e., by protonophoric shuttlemechanisms.
The studied chemicals included pharmaceuticals, pesticides andindustrial compounds, and the selection process was based onscoring (a) their rank in the hazard quotient list, (b) the availabilityof an environmental quality standard (EQS) from the WFD or atleast a published proposed EQS, (c) a unique mode of action that isnot covered by a higher ranked chemical, (d) diversity of chemical
Fig. 1. Design of the panel of bioassays/biological endpoints (ovals) recommended for water quality assessment and where they are situated along the adverse outcome pathway(boxes). The cyp19a1b-GFP, ChgH-GFP and THbZIP-GFP assays were also included in the study, but are not shown in the figure.
P.A. Neale et al. / Water Research 123 (2017) 734e750736

use groups, (e) a specific mode of action that is covered by the testbattery, (f) a specific mode of action expected to lead to enhancedtoxicity in the whole organism bioassays and (g) lack of rapidbiodegradation based on BIOWIN™ (US EPA, 2008). The final scoresfor prioritization are given in Table S1 of the SupplementaryInformation.
A minimum score of three points was required to qualify achemical for experimental analysis and preference was given tochemicals ranked in the top 100 of Busch et al. (2016). An exceptionwas hexadecylpyridinium, which had a score of two, but was stillincluded as it was the only surface active antiseptic compound andwas ranked 2nd in Busch et al. (2016) based on its hazard quotient.The non-steroidal anti-androgenic compound flutamide only had ascore of 2 because no information about its degradability wasavailable in BIOWIN™. All other compounds, with the exception ofhexadecylpyridinium, were not readily biodegradable according toBIOWIN™, which meets the expectation that more recalcitrantchemicals will be found in surface water. The antibiotic sulfa-methoxazole was the only antibiotic selected despite its low rank inBusch et al. (2016) because no other sulfonamides were rankedhigher and they are an important antibiotic group. Apart from theseexceptions, all other chemicals were selected based on their highscore. If chemicals with a similar structure and function had anequal score, the chemical ranked higher in Busch et al. (2016) wasincluded.
3.2. Data mining
Effect data for the 34 selected chemicals were collected fromeither the peer reviewed literature or the US EPA ToxCast database(US EPA, 2015) for the studied bioassays. The effect data werecategorized based on data availability and quality (Fig. S1). Achemical was considered active if it had a response in the studiedassay, while a chemical was considered inactive if it was tested in astudied assay and had no effect (or was inactive up to cytotoxicconcentrations). When experimental data were unavailable for thestudied assay, but available in another assay covering the samemode of action, chemicals were assigned the class of likely active or
likely inactive, based on whether they produced an effect or not. Ifno experimental data were available, but the mode of action of thestudied chemical and bioassays theoretically matched, the chem-icals were assigned as potentially active or potentially inactive.Chemicals were considered as ‘inactive’ if they were only active inthe whole organism assays indicative of apical effects at effectconcentrations (EC) greater than 1 mM. The 1 mM cut-off wasbased on the highest tested chemical concentration in many assaysin the ToxCast database. In some cases, no information could befound and the chemical was designated as ‘no informationavailable’.
3.3. Bioanalysis
Bioassays applied in this study are listed in Table 1. A summaryof experimental conditions, test media and quality controls areprovided in Table S2. Detailed standard operating procedures (SOP)of the bioassays, also detailing whether cytotoxicity controls wereperformed, are presented in the SI. All chemicals were run with atleast two independent replicates in each assay, with each chemicalassessed over a range of concentrations. Concentration-effectcurves for each assay's positive reference compound are shown inFig. S2. The assays were run by eight different laboratories and itshould be noted that not all 34 selected chemicals were run in allassays, but the average coverage was 71% with the exact numberstested given in Table 1 and the percentage tested given in Table S2.The coverage depended on the capacity of each laboratory and priorknowledge of the mechanism of action. For example, the algaegrowth inhibition assay focused on chemicals with known effectson photosynthesis or other modes of action likely to lead to sub-stantial toxicity, with only 50% of the chemicals tested, while theMicrotox assay was applied to all 34 chemicals. The chemicalconcentration ranges studied in the different assays are provided inTable S3, with the maximum tested concentrations selected basedon the physicochemical properties of the studied chemicalsincluding solubility.
Table 1The applied assays with the number of chemicals tested per assay and the number of chemicals active in each assay.
Assay ID Assay name Measured endpoint or molecular target Method reference No. of testedchemicals
No. of activechemicals
1 AhR CALUX Activation of aryl hydrocarbon receptor (AhR) Brennan et al. (2015) 18 72 HG5LN-hPXR Activation of pregnane x receptor (PXR) Lemaire et al. (2006) 34 203 PPARg-bla Binding of chemicals to peroxisome
proliferator-activated receptor gamma (PPARg)Invitrogen (2010) 18 4
4 MDA-kb2 Activation of androgen receptor (AR) Wilson et al. (2002) 24 35 Anti-MDA-kb2 Inhibition of androgen receptor (AR) Wilson et al. (2002) 25 126 MELN Activation of estrogen receptor (ER) Balaguer et al. (1999) 34 97 ZELH-zfERalpha Activation of estrogen receptor (ER) Cosnefroy et al. (2012) 34 28 ZELH-zfERbeta2 Activation of estrogen receptor (ER) Cosnefroy et al. (2012) 34 29 GR CALUX Activation of glucocorticoid receptor (GR) Van der Linden et al. (2008) 20 010 cyp19a1b-GFP cyp19a1b gene expression Brion et al. (2012) 26 211 ChgH-GFP Estrogen receptor (ER) modulation,
modulation of steroidogenesisSpirhanzlova et al. (2016) 24 17
12 THbZIP-GFP (XETA) Modulation of thyroid hormone signaling Fini et al. (2007) 20 913 Ames fluctuation test Mutagenicity (þ/-S9) Reifferscheid et al. (2012) 22 114 Ames microplate agar Mutagenicity (þ/-S9) DeMarini et al. (1989),
Mortelmans andZeiger (2000)
12 1
15 AREc32 Induction of oxidative stress response Escher et al. (2012) 18 916 Microtox Inhibition of bioluminescence (Escher et al., 2017) 34 1617 Algal growth inhibition Growth inhibition OECD (2011) 17 1218 Daphnia
immobilization testImmobilization OECD (2004) 17 15
19 FET (96 well plate) Mortality OECD (2013) 20 1320 FET (glass vial) Mortality OECD (2013) 29 17
P.A. Neale et al. / Water Research 123 (2017) 734e750 737
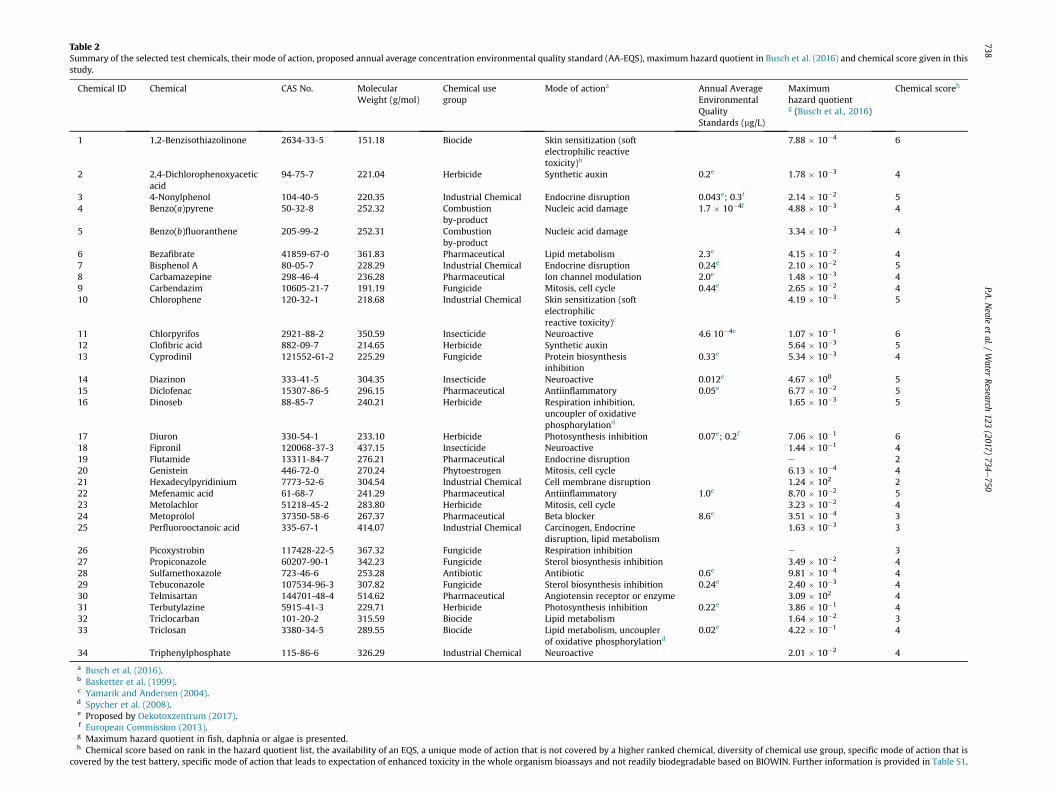
Table 2Summary of the selected test chemicals, their mode of action, proposed annual average concentration environmental quality standard (AA-EQS), maximum hazard quotient in Busch et al. (2016) and chemical score given in thisstudy.
Chemical ID Chemical CAS No. MolecularWeight (g/mol)
Chemical usegroup
Mode of actiona Annual AverageEnvironmentalQualityStandards (mg/L)
Maximumhazard quotientg (Busch et al., 2016)
Chemical scoreh
1 1,2-Benzisothiazolinone 2634-33-5 151.18 Biocide Skin sensitization (softelectrophilic reactivetoxicity)b
7.88 � 10�4 6
2 2,4-Dichlorophenoxyaceticacid
94-75-7 221.04 Herbicide Synthetic auxin 0.2e 1.78 � 10�3 4
3 4-Nonylphenol 104-40-5 220.35 Industrial Chemical Endocrine disruption 0.043e; 0.3f 2.14 � 10�2 54 Benzo(a)pyrene 50-32-8 252.32 Combustion
by-productNucleic acid damage 1.7 � 10�4f 4.88 � 10�3 4
5 Benzo(b)fluoranthene 205-99-2 252.31 Combustionby-product
Nucleic acid damage 3.34 � 10�3 4
6 Bezafibrate 41859-67-0 361.83 Pharmaceutical Lipid metabolism 2.3e 4.15 � 10�2 47 Bisphenol A 80-05-7 228.29 Industrial Chemical Endocrine disruption 0.24e 2.10 � 10�2 58 Carbamazepine 298-46-4 236.28 Pharmaceutical Ion channel modulation 2.0e 1.48 � 10�3 49 Carbendazim 10605-21-7 191.19 Fungicide Mitosis, cell cycle 0.44e 2.65 � 10�2 410 Chlorophene 120-32-1 218.68 Industrial Chemical Skin sensitization (soft
electrophilicreactive toxicity)c
4.19 � 10�3 5
11 Chlorpyrifos 2921-88-2 350.59 Insecticide Neuroactive 4.6 10�4e 1.07 � 10�1 612 Clofibric acid 882-09-7 214.65 Herbicide Synthetic auxin 5.64 � 10�3 513 Cyprodinil 121552-61-2 225.29 Fungicide Protein biosynthesis
inhibition0.33e 5.34 � 10�3 4
14 Diazinon 333-41-5 304.35 Insecticide Neuroactive 0.012e 4.67 � 100 515 Diclofenac 15307-86-5 296.15 Pharmaceutical Antiinflammatory 0.05e 6.77 � 10�2 516 Dinoseb 88-85-7 240.21 Herbicide Respiration inhibition,
uncoupler of oxidativephosphorylationd
1.65 � 10�3 5
17 Diuron 330-54-1 233.10 Herbicide Photosynthesis inhibition 0.07e; 0.2f 7.06 � 10�1 618 Fipronil 120068-37-3 437.15 Insecticide Neuroactive 1.44 � 10�1 419 Flutamide 13311-84-7 276.21 Pharmaceutical Endocrine disruption e 220 Genistein 446-72-0 270.24 Phytoestrogen Mitosis, cell cycle 6.13 � 10�4 421 Hexadecylpyridinium 7773-52-6 304.54 Industrial Chemical Cell membrane disruption 1.24 � 102 222 Mefenamic acid 61-68-7 241.29 Pharmaceutical Antiinflammatory 1.0e 8.70 � 10�2 523 Metolachlor 51218-45-2 283.80 Herbicide Mitosis, cell cycle 3.23 � 10�2 424 Metoprolol 37350-58-6 267.37 Pharmaceutical Beta blocker 8.6e 3.51 � 10�4 325 Perfluorooctanoic acid 335-67-1 414.07 Industrial Chemical Carcinogen, Endocrine
disruption, lipid metabolism1.63 � 10�3 3
26 Picoxystrobin 117428-22-5 367.32 Fungicide Respiration inhibition e 327 Propiconazole 60207-90-1 342.23 Fungicide Sterol biosynthesis inhibition 3.49 � 10�2 428 Sulfamethoxazole 723-46-6 253.28 Antibiotic Antibiotic 0.6e 9.81 � 10�4 429 Tebuconazole 107534-96-3 307.82 Fungicide Sterol biosynthesis inhibition 0.24e 2.40 � 10�3 430 Telmisartan 144701-48-4 514.62 Pharmaceutical Angiotensin receptor or enzyme 3.09 � 102 431 Terbutylazine 5915-41-3 229.71 Herbicide Photosynthesis inhibition 0.22e 3.86 � 10�1 432 Triclocarban 101-20-2 315.59 Biocide Lipid metabolism 1.64 � 10�2 333 Triclosan 3380-34-5 289.55 Biocide Lipid metabolism, uncoupler
of oxidative phosphorylationd0.02e 4.22 � 10�1 4
34 Triphenylphosphate 115-86-6 326.29 Industrial Chemical Neuroactive 2.01 � 10�2 4
a Busch et al. (2016).b Basketter et al. (1999).c Yamarik and Andersen (2004).d Spycher et al. (2008).e Proposed by Oekotoxzentrum (2017).f European Commission (2013).g Maximum hazard quotient in fish, daphnia or algae is presented.h Chemical score based on rank in the hazard quotient list, the availability of an EQS, a unique mode of action that is not covered by a higher ranked chemical, diversity of chemical use group, specific mode of action that is
covered by the test battery, specific mode of action that leads to expectation of enhanced toxicity in the whole organism bioassays and not readily biodegradable based on BIOWIN. Further information is provided in Table S1.
P.A.N
ealeet
al./Water
Research123
(2017)734
e750
738
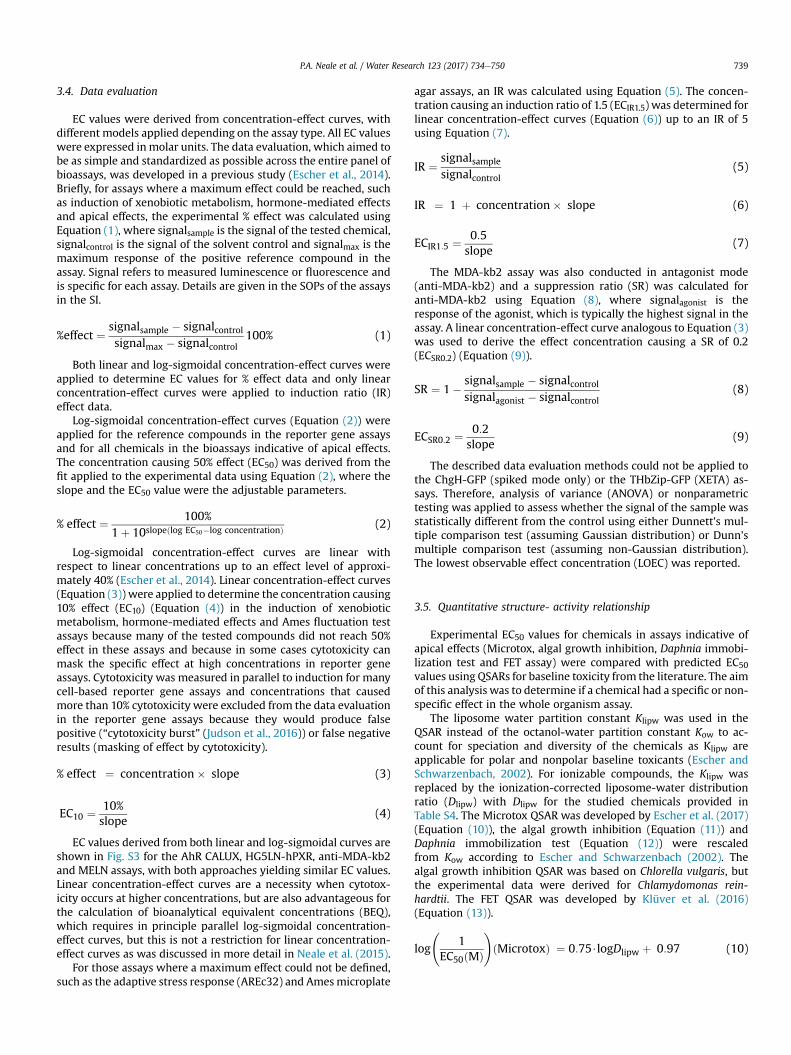
3.4. Data evaluation
EC values were derived from concentration-effect curves, withdifferent models applied depending on the assay type. All EC valueswere expressed inmolar units. The data evaluation, which aimed tobe as simple and standardized as possible across the entire panel ofbioassays, was developed in a previous study (Escher et al., 2014).Briefly, for assays where a maximum effect could be reached, suchas induction of xenobiotic metabolism, hormone-mediated effectsand apical effects, the experimental % effect was calculated usingEquation (1), where signalsample is the signal of the tested chemical,signalcontrol is the signal of the solvent control and signalmax is themaximum response of the positive reference compound in theassay. Signal refers to measured luminescence or fluorescence andis specific for each assay. Details are given in the SOPs of the assaysin the SI.
%effect ¼ signalsample � signalcontrolsignalmax � signalcontrol
100% (1)
Both linear and log-sigmoidal concentration-effect curves wereapplied to determine EC values for % effect data and only linearconcentration-effect curves were applied to induction ratio (IR)effect data.
Log-sigmoidal concentration-effect curves (Equation (2)) wereapplied for the reference compounds in the reporter gene assaysand for all chemicals in the bioassays indicative of apical effects.The concentration causing 50% effect (EC50) was derived from thefit applied to the experimental data using Equation (2), where theslope and the EC50 value were the adjustable parameters.
% effect ¼ 100%1þ 10slopeðlog EC50�log concentrationÞ (2)
Log-sigmoidal concentration-effect curves are linear withrespect to linear concentrations up to an effect level of approxi-mately 40% (Escher et al., 2014). Linear concentration-effect curves(Equation (3)) were applied to determine the concentration causing10% effect (EC10) (Equation (4)) in the induction of xenobioticmetabolism, hormone-mediated effects and Ames fluctuation testassays because many of the tested compounds did not reach 50%effect in these assays and because in some cases cytotoxicity canmask the specific effect at high concentrations in reporter geneassays. Cytotoxicity was measured in parallel to induction for manycell-based reporter gene assays and concentrations that causedmore than 10% cytotoxicity were excluded from the data evaluationin the reporter gene assays because they would produce falsepositive (“cytotoxicity burst” (Judson et al., 2016)) or false negativeresults (masking of effect by cytotoxicity).
% effect ¼ concentration� slope (3)
EC10 ¼ 10%slope
(4)
EC values derived from both linear and log-sigmoidal curves areshown in Fig. S3 for the AhR CALUX, HG5LN-hPXR, anti-MDA-kb2and MELN assays, with both approaches yielding similar EC values.Linear concentration-effect curves are a necessity when cytotox-icity occurs at higher concentrations, but are also advantageous forthe calculation of bioanalytical equivalent concentrations (BEQ),which requires in principle parallel log-sigmoidal concentration-effect curves, but this is not a restriction for linear concentration-effect curves as was discussed in more detail in Neale et al. (2015).
For those assays where a maximum effect could not be defined,such as the adaptive stress response (AREc32) and Amesmicroplate
agar assays, an IR was calculated using Equation (5). The concen-tration causing an induction ratio of 1.5 (ECIR1.5) was determined forlinear concentration-effect curves (Equation (6)) up to an IR of 5using Equation (7).
IR ¼ signalsample
signalcontrol(5)
IR ¼ 1 þ concentration� slope (6)
ECIR1:5 ¼ 0:5slope
(7)
The MDA-kb2 assay was also conducted in antagonist mode(anti-MDA-kb2) and a suppression ratio (SR) was calculated foranti-MDA-kb2 using Equation (8), where signalagonist is theresponse of the agonist, which is typically the highest signal in theassay. A linear concentration-effect curve analogous to Equation (3)was used to derive the effect concentration causing a SR of 0.2(ECSR0.2) (Equation (9)).
SR ¼ 1� signalsample � signalcontrolsignalagonist � signalcontrol
(8)
ECSR0:2 ¼ 0:2slope
(9)
The described data evaluation methods could not be applied tothe ChgH-GFP (spiked mode only) or the THbZip-GFP (XETA) as-says. Therefore, analysis of variance (ANOVA) or nonparametrictesting was applied to assess whether the signal of the sample wasstatistically different from the control using either Dunnett's mul-tiple comparison test (assuming Gaussian distribution) or Dunn'smultiple comparison test (assuming non-Gaussian distribution).The lowest observable effect concentration (LOEC) was reported.
3.5. Quantitative structure- activity relationship
Experimental EC50 values for chemicals in assays indicative ofapical effects (Microtox, algal growth inhibition, Daphnia immobi-lization test and FET assay) were compared with predicted EC50values using QSARs for baseline toxicity from the literature. The aimof this analysis was to determine if a chemical had a specific or non-specific effect in the whole organism assay.
The liposome water partition constant Klipw was used in theQSAR instead of the octanol-water partition constant Kow to ac-count for speciation and diversity of the chemicals as Klipw areapplicable for polar and nonpolar baseline toxicants (Escher andSchwarzenbach, 2002). For ionizable compounds, the Klipw wasreplaced by the ionization-corrected liposome-water distributionratio (Dlipw) with Dlipw for the studied chemicals provided inTable S4. The Microtox QSAR was developed by Escher et al. (2017)(Equation (10)), the algal growth inhibition (Equation (11)) andDaphnia immobilization test (Equation (12)) were rescaledfrom Kow according to Escher and Schwarzenbach (2002). Thealgal growth inhibition QSAR was based on Chlorella vulgaris, butthe experimental data were derived for Chlamydomonas rein-hardtii. The FET QSAR was developed by Klüver et al. (2016)(Equation (13)).
log
1
EC50 Mð Þ
!Microtoxð Þ ¼ 0:75$logDlipw þ 0:97 (10)
P.A. Neale et al. / Water Research 123 (2017) 734e750 739
log
1
EC50 Mð Þ
!ðalgal growth inhibitionÞ
¼ 0:91$logDlipw þ 0:63 (11)
log
1
EC50 Mð Þ
!ðDaphnia immobilization testÞ
¼ 0:77$logDlipw þ 1:89 (12)
log
1
EC50 Mð Þ
!FETð Þ ¼ 0:99$logDlipw þ 0:78 (13)
The toxic ratio (TRi) was derived using Equation (14) fromVerhaar et al. (1992), with a chemical with a TR of > 0.1 to < 10considered a baseline toxicant, while a chemical with a TR > 10 wasconsidered to have a specific effect in the assay.
TRi ¼EC50�baseline toxicity QSAR;i
EC50�experimental;i(14)
3.6. Mixture toxicity modeling
To compare different chemicals in one bioassay and as a basis formixture toxicity modeling (Neale et al., 2015), the relative effectpotency (REPi) was calculated from the effect concentration of thereference compound divided by the effect concentration of com-pound i (Equation (15)). The REPi can be defined for any effectconcentration ECx for any matching effect level x but it is only in-dependent of effect level for linear concentration-effect curves(Neale et al., 2015) or if the slopes of the sigmoidal log-concentration-effect curves are similar for the reference com-pound and the compound of interest, i (Villeneuve et al., 2000).
REPi ¼ECx refð ÞECx ið Þ (15)
In mixture toxicity modeling we compare the bioanalyticalequivalent concentrations from bioassays (BEQbio, Equation (16))with the bioanalytical equivalent concentrations from chemicalanalysis (BEQchem, Equation (17)) for environmental samples usingthe detected concentration of an individual chemical (Ci) and itsREPi (Neale et al., 2015).
BEQbio ¼ ECx refð ÞECx sampleð Þ (16)
BEQchem ¼Xni¼1
REPi$Ci (17)
4. Results
4.1. Availability of effect data in literature
A variable picture of available effect data emerged for the 34selected chemicals in the 20 studied assays (Fig. S4, Table S5).Several of the studied compounds, including fipronil, carbendazim,bisphenol A, propiconazole, triclocarban, chlorophene, benzo(a)pyrene, benzo(b)fluoranthene and genistein, were expected to beactive, likely active or potentially active in more than 50% of the
studied assays. In contrast, no information was available regardingthe effect of telmisartan, hexadecylpyridinium, clofibric acid andmefenamic acid in 50% or more of the selected assays. Data avail-ability tended to be more comprehensive for the conventionalecotoxicology tests, such as the Daphnia immobilization test andthe FET assay, while there was no information available regardingthe effect for 50% or more of these relevant water contaminants forthe HG5LN-hPXR, ZELH-zfERalpha, ZELH-zfERbeta2 and Cyp19a1b-GFP assays. The US EPA ToxCast database proved to be a valuabletool, with effect or likely effect data available for 33 of the 34studied chemicals for the AhR CALUX, PPARg-bla, MDA-kb2 andAREc32 assays. Overall, the data mining exercise highlights the lackof effect data for many of the detected water pollutants, empha-sizing the importance of fingerprinting their biological effects.
4.2. Experimental effect data
The experimental EC values for the studied chemicals are re-ported in Table 3, with a summary of the active and inactivechemicals shown in Fig. 2A and all concentration-effect curvesprovided in Figs. S5eS27. Twenty-four of the representativechemicals were run in 10 or more assays, with bisphenol A (70%),diazinon (55%), cyprodinil (50%) and triphenylphosphate (50%)active in 50% or more of the applied assays. In contrast, hex-adecylpyridinium (20%), 2,4-dichlorophenoxyacetic acid (18%),telmisartan (15%) and triclocarban (17%) were active in 20% or lessof the studied assays, while carbendazimwas only active in the FETassay, despite being predicted to be active, likely active or poten-tially active in 50% of the assays and ranked at 16th in the list ofpotentially bioactive chemicals by Busch et al. (2016). The com-parison between the experimental data and expected activity basedon the data mining exercise is shown in Fig. 2B. While only aqualitative assessment was possible, between 39% and 100% of theexperimental effect data matched the expected activity, with over60% similarity observed for most assays (Table S6). The observedeffects of the chemicals for each assay class are described below.
4.2.1. Induction of xenobiotic metabolismAssays indicative of activation of AhR (AhR CALUX (ID 1)), acti-
vation of PXR (HG5LN-hPXR (ID 2)) and binding to PPARg (PPARg-bla (ID 3)) were applied in the current study. Seven of the 18 testedchemicals were active in the AhR CALUX assay, while 20 of the 34chemicals were active in the HG5LN-hPXR assay, which fits withprevious findings by Martin et al. (2010) that many environmentalchemicals can activate AhR and PXR. In contrast, only 4 out of the 18tested chemicals were active in the PPARg-bla assay, with thepharmaceutical telmisartan the only active compound thatmatched with the available effect data from the US EPA ToxCastdatabase (US EPA, 2015).
4.2.2. Hormone receptor-mediated effectsIn vitro assays indicative of activation and inhibition of AR
(MDA-kb2 (ID 4), anti-MDA-kb2 (ID 5)), activation of ER (MELN (ID6), ZELH-zfERalpha (ID 7), ZELH-zfERbeta2 (ID 8)) and activation ofGR (GR CALUX (ID 9)) were included in the test battery. Twenty-four compounds were run in the MDA-kb2 assay, with only threechemicals, benzo(a)pyrene, benzo(b)fluoranthene and genistein,inducing more than 10% effect in the assay. The MDA-kb2 assaycontains both AR and GR (Wilson et al., 2002), and the activesamples were also analyzed in the presence of the AR antagonistflutamide, which suppressed the response, confirming that thethree chemicals were indeed AR agonists (Fig. S9). In contrast, 12 ofthe 25 tested chemicals were active in the anti-MDA-kb2 assay,with seven of these active chemicals also reported to be active inthe US EPA ToxCast database (US EPA, 2015). Between 2 and 9 of the
P.A. Neale et al. / Water Research 123 (2017) 734e750740

Table 3Effect concentrations EC (M) for the selected water pollutants in the studied assays. Lowest observable effect concentration (LOEC) reported for the ChgH-GFP (spiked) and THbZIP-GFP (XETA) assays. SE¼ standard error, CI¼ 95%confidence intervals.
Chemical AhR CALUX (1) HG5LN-hPXR (2) PPARg-bla (3) MDA-kb2 (4) Anti-MDA-kb2 (5) MELN (6) ZELH-zfERalpha (7)
ZELH-zfERbeta2 (8)
EC10 ± SE EC10 ± SE EC10 ± SE EC10 ± SE ECSR0.2 ± SE EC10 ± SE EC10 ± SE EC10 ± SE
1,2-Benzisothiazolinone e >3.00 � 10�5 e e e >3.00 � 10�5 >3.00 � 10�5 >3.00 � 10�5
2,4-Dichlorophenoxyaceticacid
e >3.00 � 10�5 e >2.00 � 10�4 >2.00 � 10�4 >3.00 � 10�5 >3.00 � 10�5 >3.00 � 10�5
4-Nonylphenol (1.36 ± 0.06) � 10�5 >3.00 � 10�5 >1.07 � 10�5 >2.00 � 10�4 >6.67 � 10�5 (9.69 ± 0.61) � 10�7 >1.00 � 10�5 >1.00 � 10�5
Benzo(a)pyrene (8.38 ± 0.55) � 10�10 >1.00 � 10�5 >4.61 � 10�6 (5.20 ± 0.40) � 10�6 (1.29 ± 0.14) � 10�6 (5.30 ± 0.69) � 10�7 >1.00 � 10�5 >1.00 � 10�5
Benzo(b)fluoranthene (8.23 ± 0.94) � 10�10 >3.00 � 10�5 >3.96 � 10�6 (5.08 ± 0.69) � 10�6 >2.00 � 10�4 (7.26 ± 1.35) � 10�7 >1.00 � 10�5 >1.00 � 10�5
Bezafibrate e >3.00 � 10�5 e e e >3.00 � 10�5 >3.00 � 10�5 >3.00 � 10�5
Bisphenol A >4.47 � 10�5 (4.75 ± 0.48) � 10�6 >2.51 � 10�5 >6.67 � 10�5 (1.72 ± 0.24) � 10�7 (6.91 ± 0.21) � 10�8 (1.41 ± 0.19)� 10�6
(2.86 ± 0.27)� 10�6
Carbamazepine e (3.63 ± 0.32) � 10�5 e >2.00 � 10�4 (5.37 ± 1.48) � 10�5 >3.00 � 10�5 >3.00 � 10�5 >3.00 � 10�5
Carbendazim >2.00 � 10�5 >3.00 � 10�6 >5.44 � 10�6 >2.00 � 10�4 >2.00 � 10�4 >3.00 � 10�6 >3.00 � 10�6 >3.00 � 10�6
Chlorophene >9.67 � 10�5 (1.02 ± 0.06) � 10�5 >1.01 � 10�5 >2.00 � 10�4 (2.10 ± 0.24) � 10�7 >3.00 � 10�5 >3.00 � 10�5 >3.00 � 10�5
Chlorpyrifos (1.25 ± 0.10) � 10�6 (5.11 ± 0.34) � 10�6 >5.84 � 10�5 >2.00 � 10�4 (1.42 ± 0.16) � 10�5 (8.91 ± 0.41) � 10�6 >3.00 � 10�5 >3.00 � 10�5
Clofibric acid e >3.00 � 10�5 e e e >3.00 � 10�5 >3.00 � 10�5 >3.00 � 10�5
Cyprodinil (6.36 ± 0.88) � 10�6 (5.26 ± 0.23) � 10�6 >4.21 � 10�5 >2.00 � 10�4 (1.34 ± 0.36) � 10�5 >3.00 � 10�5 >3.00 � 10�5 >3.00 � 10�5
Diazinon (1.35 ± 0.06) � 10�5 (1.44 ± 0.11) � 10�6 (5.30 ± 0.46) � 10�5 >2.00 � 10�4 (8.77 ± 0.58) � 10�6 (8.53 ± 0.34) � 10�6 >3.00 � 10�5 >3.00 � 10�5
Diclofenac >1.37 � 10�4 (3.78 ± 0.32) � 10�5 (1.21 ± 0.09) � 10�6 >2.00 � 10�4 >6.67 � 10�5 >3.00 � 10�5 >3.00 � 10�5 >3.00 � 10�5
Dinoseb e >3.00 � 10�5 e e e >3.00 � 10�5 >3.00 � 10�5 >3.00 � 10�5
Diuron e (3.64 ± 0.34) � 10�5 e >2.00 � 10�4 >5.00 � 10�5 >3.00 � 10�5 >3.00 � 10�5 >3.00 � 10�5
Fipronil >3.32 � 10�6 (6.35 ± 0.78) � 10�6 >1.64 � 10�6 >2.22 � 10�5 (1.83 ± 0.24) � 10�6 >3.00 � 10�5 >3.00 � 10�5 >3.00 � 10�5
Flutamide e (2.17 ± 0.10) � 10�6 e e (2.07 ± 0.08) � 10�7 >3.00 � 10�5 >3.00 � 10�5 >3.00 � 10�5
Genistein >1.30 � 10�5 (1.24 ± 0.13) � 10�6 >1.41 � 10�5 (4.14 ± 0.42) � 10�5 >3.33 � 10�5 (1.22 ± 0.23) � 10�8 (9.71 ± 0.71)� 10�7
(2.54 ± 0.37)� 10�8
Hexadecylpyridinium e (1.00 ± 0.11) � 10�6 e >1.00 � 10�5 >5.56 � 10�7 >1.00 � 10�5 >1.00 � 10�5 >1.00 � 10�5
Mefenamic acid e (1.08 ± 0.06) � 10�5 e >2.00 � 10�4 >6.67 � 10�5 >3.00 � 10�5 >3.00 � 10�5 >3.00 � 10�5
Metolachlor e (2.68 ± 0.11) � 10�7 e e e >3.00 � 10�5 >3.00 � 10�5 >3.00 � 10�5
Metoprolol e >3.00 � 10�5 e >2.00 � 10�4 >2.00 � 10�4 >3.00 � 10�5 >3.00 � 10�5 >3.00 � 10�5
Perfluorooctanoic acid >1.18 � 10�4 >3.00 � 10�5 >2.19 � 10�5 >2.00 � 10�4 >6.67 � 10�5 >3.00 � 10�5 >3.00 � 10�5 >3.00 � 10�5
Picoxystrobin e (1.73 ± 0.21) � 10�5 e e e >3.00 � 10�5 >3.00 � 10�5 >3.00 � 10�5
Propiconazole >2.20 � 10�5 (2.94 ± 0.18) � 10�6 >2.23 � 10�5 >2.00 � 10�4 (2.87 ± 0.39) � 10�6 >3.00 � 10�5 >3.00 � 10�5 >3.00 � 10�5
Sulfamethoxazole e >3.00 � 10�5 e e e >3.00 � 10�5 >3.00 � 10�5 >3.00 � 10�5
Tebuconazole e (1.88 ± 0.27) � 10�6 e e e >3.00 � 10�5 >3.00 � 10�5 >3.00 � 10�5
Telmisartan (1.57 ± 0.08) � 10�5 >5.00 � 10�6 (1.43 ± 0.10) � 10�7 >2.00 � 10�4 >5.00 � 10�5 >5.00 � 10�6 >5.00 � 10�6 >5.00 � 10�6
Terbutylazine e (1.03 ± 0.06) � 10�5 e e e (1.52 ± 0.06) � 10�5 >3.00 � 10�5 >3.00 � 10�5
Triclocarban >4.80 � 10�6 >3.00 � 10�5 >3.31 � 10�7 >3.33 � 10�6 >2.22 � 10�6 >1.00 � 10�5 >1.00 � 10�5 >1.00 � 10�5
Triclosan >8.50 � 10�5 (1.77 ± 0.16) � 10�6 >2.05 � 10�6 >7.41 � 10�6 (6.52 ± 0.68) � 10�7 >3.00 � 10�5 >1.00 � 10�5 >1.00 � 10�5
Triphenylphosphate >1.00 � 10�6 (9.10 ± 0.26) � 10�7 (4.24 ± 0.34) � 10�6 >2.00 � 10�4 (6.25 ± 1.13) � 10�6 (1.71 ± 0.09) � 10�6 >3.00 � 10�5 >3.00 � 10�5
Chemical GR CALUX (9) cyp19a1b-GFP (10) ChgH-GFP (11) THbZIP-GFP (XETA) (12) Ames fluctuationtest (13)
Ames microplateagar (14)
EC10 ± SE EC10 ± SE (M) EC10 (unspiked) (M) LOEC (spiked) (M) LOEC (unspiked) (M) LOEC (spiked) (M) EC10 ± SE ECIR1.5 ± SE (M)
1,2-Benzisothiazolinone e e e e e e e e
2,4-Dichlorophenoxyaceticacid
>4.52 � 10�4 >3.00 � 10�5 >4.52 � 10�4 3.39 � 10�4b >4.52 � 10�4 >4.52 � 10�4 e e
4-Nonylphenol >2.84 � 10�5 >2.50 � 10�6 >2.27 � 10�6 2.27 � 10�6b e e e e
Benzo(a)pyrene >9.91 � 10�5 >3.00 � 10�6 e e e e (1.70 ± 0.11) � 10�7c (6.90 ± 0.79) � 10�6c
Benzo(b)fluoranthene e >3.00 � 10�6 >3.96 � 10�8 >3.96 � 10�8 >3.96 � 10�8 >3.96 � 10�8 >9.91 � 10�8 >3.96 � 10�3
Bezafibrate >2.76 � 10�4 e e e e e e e
Bisphenol A >1.10 � 10�4 (1.58 ± 0.09) � 10�6 (1.24 ± 0.21) � 10�5 2.19 � 10�6a 1.64 � 10�5a 1.64 � 10�5a >1.10 � 10�5 >1.31 � 10�2
Carbamazepine e >3.00 � 10�5 >1.27 � 10�4 1.27 � 10�4a 8.56 � 10�5a >1.27 � 10�4 >4.23 � 10�4 e
Carbendazim >2.64 � 10�4 >3.00 � 10�5 >2.62 � 10�6 >2.62 � 10�6 >2.62 � 10�6 >2.62 � 10�6 e e
(continued on next page)
P.A.N
ealeet
al./Water
Research123
(2017)734
e750
741
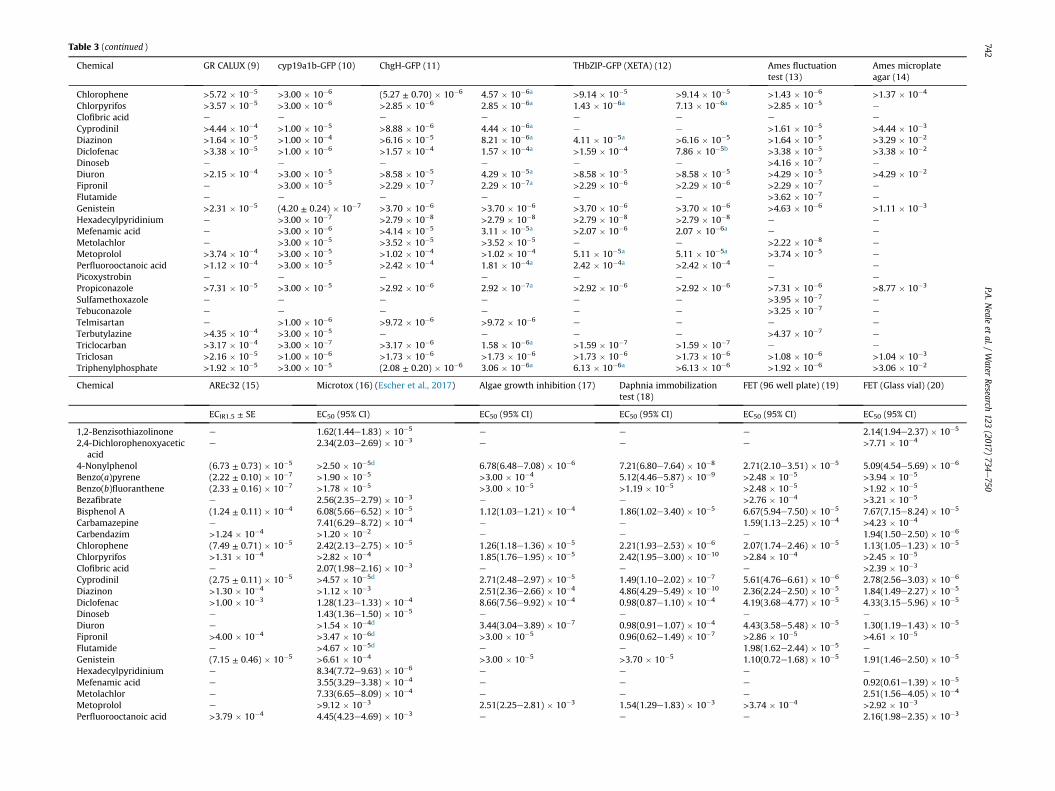
Table 3 (continued )
Chemical GR CALUX (9) cyp19a1b-GFP (10) ChgH-GFP (11) THbZIP-GFP (XETA) (12) Ames fluctuationtest (13)
Ames microplateagar (14)
Chlorophene >5.72 � 10�5 >3.00 � 10�6 (5.27 ± 0.70) � 10�6 4.57 � 10�6a >9.14 � 10�5 >9.14 � 10�5 >1.43 � 10�6 >1.37 � 10�4
Chlorpyrifos >3.57 � 10�5 >3.00 � 10�6 >2.85 � 10�6 2.85 � 10�6a 1.43 � 10�6a 7.13 � 10�6a >2.85 � 10�5 e
Clofibric acid e e e e e e e e
Cyprodinil >4.44 � 10�4 >1.00 � 10�5 >8.88 � 10�6 4.44 � 10�6a e e >1.61 � 10�5 >4.44 � 10�3
Diazinon >1.64 � 10�5 >1.00 � 10�4 >6.16 � 10�5 8.21 � 10�6a 4.11 � 10�5a >6.16 � 10�5 >1.64 � 10�5 >3.29 � 10�2
Diclofenac >3.38 � 10�5 >1.00 � 10�6 >1.57 � 10�4 1.57 � 10�4a >1.59 � 10�4 7.86 � 10�5b >3.38 � 10�5 >3.38 � 10�2
Dinoseb e e e e e e >4.16 � 10�7 e
Diuron >2.15 � 10�4 >3.00 � 10�5 >8.58 � 10�5 4.29 � 10�5a >8.58 � 10�5 >8.58 � 10�5 >4.29 � 10�5 >4.29 � 10�2
Fipronil e >3.00 � 10�5 >2.29 � 10�7 2.29 � 10�7a >2.29 � 10�6 >2.29 � 10�6 >2.29 � 10�7 e
Flutamide e e e e e e >3.62 � 10�7 e
Genistein >2.31 � 10�5 (4.20 ± 0.24) � 10�7 >3.70 � 10�6 >3.70 � 10�6 >3.70 � 10�6 >3.70 � 10�6 >4.63 � 10�6 >1.11 � 10�3
Hexadecylpyridinium e >3.00 � 10�7 >2.79 � 10�8 >2.79 � 10�8 >2.79 � 10�8 >2.79 � 10�8 e e
Mefenamic acid e >3.00 � 10�6 >4.14 � 10�5 3.11 � 10�5a >2.07 � 10�6 2.07 � 10�6a e e
Metolachlor e >3.00 � 10�5 >3.52 � 10�5 >3.52 � 10�5 e e >2.22 � 10�8 e
Metoprolol >3.74 � 10�4 >3.00 � 10�5 >1.02 � 10�4 >1.02 � 10�4 5.11 � 10�5a 5.11 � 10�5a >3.74 � 10�5 e
Perfluorooctanoic acid >1.12 � 10�4 >3.00 � 10�5 >2.42 � 10�4 1.81 � 10�4a 2.42 � 10�4a >2.42 � 10�4 e e
Picoxystrobin e e e e e e e e
Propiconazole >7.31 � 10�5 >3.00 � 10�5 >2.92 � 10�6 2.92 � 10�7a >2.92 � 10�6 >2.92 � 10�6 >7.31 � 10�6 >8.77 � 10�3
Sulfamethoxazole e e e e e e >3.95 � 10�7 e
Tebuconazole e e e e e e >3.25 � 10�7 e
Telmisartan e >1.00 � 10�6 >9.72 � 10�6 >9.72 � 10�6 e e e e
Terbutylazine >4.35 � 10�4 >3.00 � 10�5 e e e e >4.37 � 10�7 e
Triclocarban >3.17 � 10�4 >3.00 � 10�7 >3.17 � 10�6 1.58 � 10�6a >1.59 � 10�7 >1.59 � 10�7 e e
Triclosan >2.16 � 10�5 >1.00 � 10�6 >1.73 � 10�6 >1.73 � 10�6 >1.73 � 10�6 >1.73 � 10�6 >1.08 � 10�6 >1.04 � 10�3
Triphenylphosphate >1.92 � 10�5 >3.00 � 10�5 (2.08 ± 0.20) � 10�6 3.06 � 10�6a 6.13 � 10�6a >6.13 � 10�6 >1.92 � 10�6 >3.06 � 10�2
Chemical AREc32 (15) Microtox (16) (Escher et al., 2017) Algae growth inhibition (17) Daphnia immobilizationtest (18)
FET (96 well plate) (19) FET (Glass vial) (20)
ECIR1.5 ± SE EC50 (95% CI) EC50 (95% CI) EC50 (95% CI) EC50 (95% CI) EC50 (95% CI)
1,2-Benzisothiazolinone e 1.62(1.44e1.83) � 10�5 e e e 2.14(1.94e2.37) � 10�5
2,4-Dichlorophenoxyaceticacid
e 2.34(2.03e2.69) � 10�3 e e e >7.71 � 10�4
4-Nonylphenol (6.73 ± 0.73) � 10�5 >2.50 � 10�5d 6.78(6.48e7.08) � 10�6 7.21(6.80e7.64) � 10�8 2.71(2.10e3.51) � 10�5 5.09(4.54e5.69) � 10�6
Benzo(a)pyrene (2.22 ± 0.10) � 10�7 >1.90 � 10�5 >3.00 � 10�4 5.12(4.46e5.87) � 10�9 >2.48 � 10�5 >3.94 � 10�5
Benzo(b)fluoranthene (2.33 ± 0.16) � 10�7 >1.78 � 10�5 >3.00 � 10�5 >1.19 � 10�5 >2.48 � 10�5 >1.92 � 10�5
Bezafibrate e 2.56(2.35e2.79) � 10�3 e e >2.76 � 10�4 >3.21 � 10�5
Bisphenol A (1.24 ± 0.11) � 10�4 6.08(5.66e6.52) � 10�5 1.12(1.03e1.21) � 10�4 1.86(1.02e3.40) � 10�5 6.67(5.94e7.50) � 10�5 7.67(7.15e8.24) � 10�5
Carbamazepine e 7.41(6.29e8.72) � 10�4 e e 1.59(1.13e2.25) � 10�4 >4.23 � 10�4
Carbendazim >1.24 � 10�4 >1.20 � 10�2 e e e 1.94(1.50e2.50) � 10�6
Chlorophene (7.49 ± 0.71) � 10�5 2.42(2.13e2.75) � 10�5 1.26(1.18e1.36) � 10�5 2.21(1.93e2.53) � 10�6 2.07(1.74e2.46) � 10�5 1.13(1.05e1.23) � 10�5
Chlorpyrifos >1.31 � 10�4 >2.82 � 10�4 1.85(1.76e1.95) � 10�5 2.42(1.95e3.00) � 10�10 >2.84 � 10�4 >2.45 � 10�5
Clofibric acid e 2.07(1.98e2.16) � 10�3 e e e >2.39 � 10�3
Cyprodinil (2.75 ± 0.11) � 10�5 >4.57 � 10�5d 2.71(2.48e2.97) � 10�5 1.49(1.10e2.02) � 10�7 5.61(4.76e6.61) � 10�6 2.78(2.56e3.03) � 10�6
Diazinon >1.30 � 10�4 >1.12 � 10�3 2.51(2.36e2.66) � 10�4 4.86(4.29e5.49) � 10�10 2.36(2.24e2.50) � 10�5 1.84(1.49e2.27) � 10�5
Diclofenac >1.00 � 10�3 1.28(1.23e1.33) � 10�4 8.66(7.56e9.92) � 10�4 0.98(0.87e1.10) � 10�4 4.19(3.68e4.77) � 10�5 4.33(3.15e5.96) � 10�5
Dinoseb e 1.43(1.36e1.50) � 10�5 e e e e
Diuron e >1.54 � 10�4d 3.44(3.04e3.89) � 10�7 0.98(0.91e1.07) � 10�4 4.43(3.58e5.48) � 10�5 1.30(1.19e1.43) � 10�5
Fipronil >4.00 � 10�4 >3.47 � 10�6d >3.00 � 10�5 0.96(0.62e1.49) � 10�7 >2.86 � 10�5 >4.61 � 10�5
Flutamide e >4.67 � 10�5d e e 1.98(1.62e2.44) � 10�5 e
Genistein (7.15 ± 0.46) � 10�5 >6.61 � 10�4 >3.00 � 10�5 >3.70 � 10�5 1.10(0.72e1.68) � 10�5 1.91(1.46e2.50) � 10�5
Hexadecylpyridinium e 8.34(7.72e9.63) � 10�6 e e e e
Mefenamic acid e 3.55(3.29e3.38) � 10�4 e e e 0.92(0.61e1.39) � 10�5
Metolachlor e 7.33(6.65e8.09) � 10�4 e e e 2.51(1.56e4.05) � 10�4
Metoprolol e >9.12 � 10�3 2.51(2.25e2.81) � 10�3 1.54(1.29e1.83) � 10�3 >3.74 � 10�4 >2.92 � 10�3
Perfluorooctanoic acid >3.79 � 10�4 4.45(4.23e4.69) � 10�3 e e e 2.16(1.98e2.35) � 10�3
P.A.N
ealeet
al./Water
Research123
(2017)734
e750
742
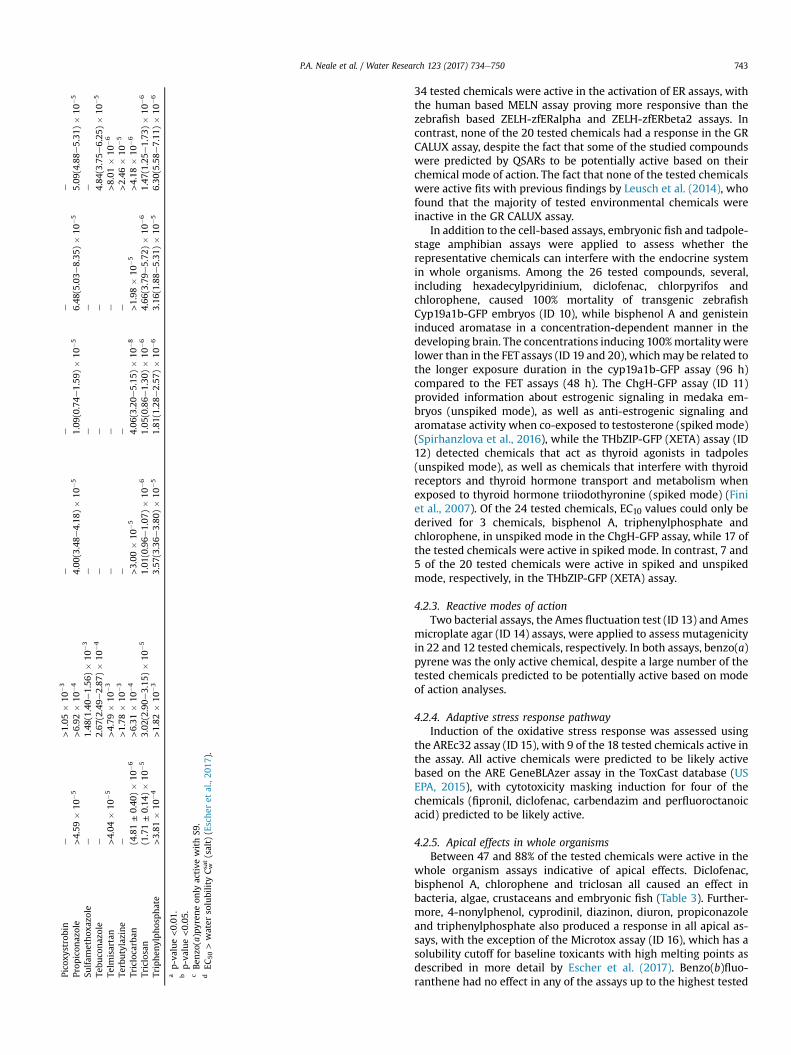
34 tested chemicals were active in the activation of ER assays, withthe human based MELN assay proving more responsive than thezebrafish based ZELH-zfERalpha and ZELH-zfERbeta2 assays. Incontrast, none of the 20 tested chemicals had a response in the GRCALUX assay, despite the fact that some of the studied compoundswere predicted by QSARs to be potentially active based on theirchemical mode of action. The fact that none of the tested chemicalswere active fits with previous findings by Leusch et al. (2014), whofound that the majority of tested environmental chemicals wereinactive in the GR CALUX assay.
In addition to the cell-based assays, embryonic fish and tadpole-stage amphibian assays were applied to assess whether therepresentative chemicals can interfere with the endocrine systemin whole organisms. Among the 26 tested compounds, several,including hexadecylpyridinium, diclofenac, chlorpyrifos andchlorophene, caused 100% mortality of transgenic zebrafishCyp19a1b-GFP embryos (ID 10), while bisphenol A and genisteininduced aromatase in a concentration-dependent manner in thedeveloping brain. The concentrations inducing 100%mortality werelower than in the FETassays (ID 19 and 20), whichmay be related tothe longer exposure duration in the cyp19a1b-GFP assay (96 h)compared to the FET assays (48 h). The ChgH-GFP assay (ID 11)provided information about estrogenic signaling in medaka em-bryos (unspiked mode), as well as anti-estrogenic signaling andaromatase activity when co-exposed to testosterone (spiked mode)(Spirhanzlova et al., 2016), while the THbZIP-GFP (XETA) assay (ID12) detected chemicals that act as thyroid agonists in tadpoles(unspiked mode), as well as chemicals that interfere with thyroidreceptors and thyroid hormone transport and metabolism whenexposed to thyroid hormone triiodothyronine (spiked mode) (Finiet al., 2007). Of the 24 tested chemicals, EC10 values could only bederived for 3 chemicals, bisphenol A, triphenylphosphate andchlorophene, in unspiked mode in the ChgH-GFP assay, while 17 ofthe tested chemicals were active in spiked mode. In contrast, 7 and5 of the 20 tested chemicals were active in spiked and unspikedmode, respectively, in the THbZIP-GFP (XETA) assay.
4.2.3. Reactive modes of actionTwo bacterial assays, the Ames fluctuation test (ID 13) and Ames
microplate agar (ID 14) assays, were applied to assess mutagenicityin 22 and 12 tested chemicals, respectively. In both assays, benzo(a)pyrene was the only active chemical, despite a large number of thetested chemicals predicted to be potentially active based on modeof action analyses.
4.2.4. Adaptive stress response pathwayInduction of the oxidative stress response was assessed using
the AREc32 assay (ID 15), with 9 of the 18 tested chemicals active inthe assay. All active chemicals were predicted to be likely activebased on the ARE GeneBLAzer assay in the ToxCast database (USEPA, 2015), with cytotoxicity masking induction for four of thechemicals (fipronil, diclofenac, carbendazim and perfluoroctanoicacid) predicted to be likely active.
4.2.5. Apical effects in whole organismsBetween 47 and 88% of the tested chemicals were active in the
whole organism assays indicative of apical effects. Diclofenac,bisphenol A, chlorophene and triclosan all caused an effect inbacteria, algae, crustaceans and embryonic fish (Table 3). Further-more, 4-nonylphenol, cyprodinil, diazinon, diuron, propiconazoleand triphenylphosphate also produced a response in all apical as-says, with the exception of the Microtox assay (ID 16), which has asolubility cutoff for baseline toxicants with high melting points asdescribed in more detail by Escher et al. (2017). Benzo(b)fluo-ranthene had no effect in any of the assays up to the highest tested
Pico
xystrobin
e>1.05
�10
�3
ee
ee
Prop
icon
azole
>4.59
�10
�5
>6.92
�10
�4
4.00
(3.48e
4.18
)�
10�5
1.09
(0.74e
1.59
)�
10�5
6.48
(5.03e
8.35
)�
10�5
5.09
(4.88e
5.31
)�
10�5
Sulfam
ethox
azole
e1.48
(1.40e
1.56
)�
10�3
ee
ee
Tebu
conazole
e2.67
(2.49e
2.87
)�
10�4
ee
e4.84
(3.75e
6.25
)�
10�5
Telm
isartan
>4.04
�10
�5
>4.79
�10
�3
ee
e>8.01
�10
�6
Terbutylazine
e>1.78
�10
�3
ee
e>2.46
�10
�5
Triclocarban
(4.81±0.40
)�
10�6
>6.31
�10
�4
>3.00
�10
�5
4.06
(3.20e
5.15
)�
10�8
>1.98
�10
�5>4.18
�10
�6
Triclosan
(1.71±0.14
)�
10�5
3.02
(2.90e
3.15
)�
10�5
1.01
(0.96e
1.07
)�
10�6
1.05
(0.86e
1.30
)�
10�6
4.66
(3.79e
5.72
)�
10�6
1.47
(1.25e
1.73
)�
10�6
Triphen
ylphosphate
>3.81
�10
�4
>1.82
�10
�3
3.57
(3.36e
3.80
)�
10�5
1.81
(1.28e
2.57
)�
10�6
3.16
(1.88e
5.31
)�
10�5
6.30
(5.58e
7.11
)�
10�6
ap-value<0.01
.bp-value<0.05
.cBen
zo(a)pyren
eon
lyactive
withS9
.dEC
50>water
solubilityC wsa
t(salt)
(Escher
etal.,20
17).
P.A. Neale et al. / Water Research 123 (2017) 734e750 743
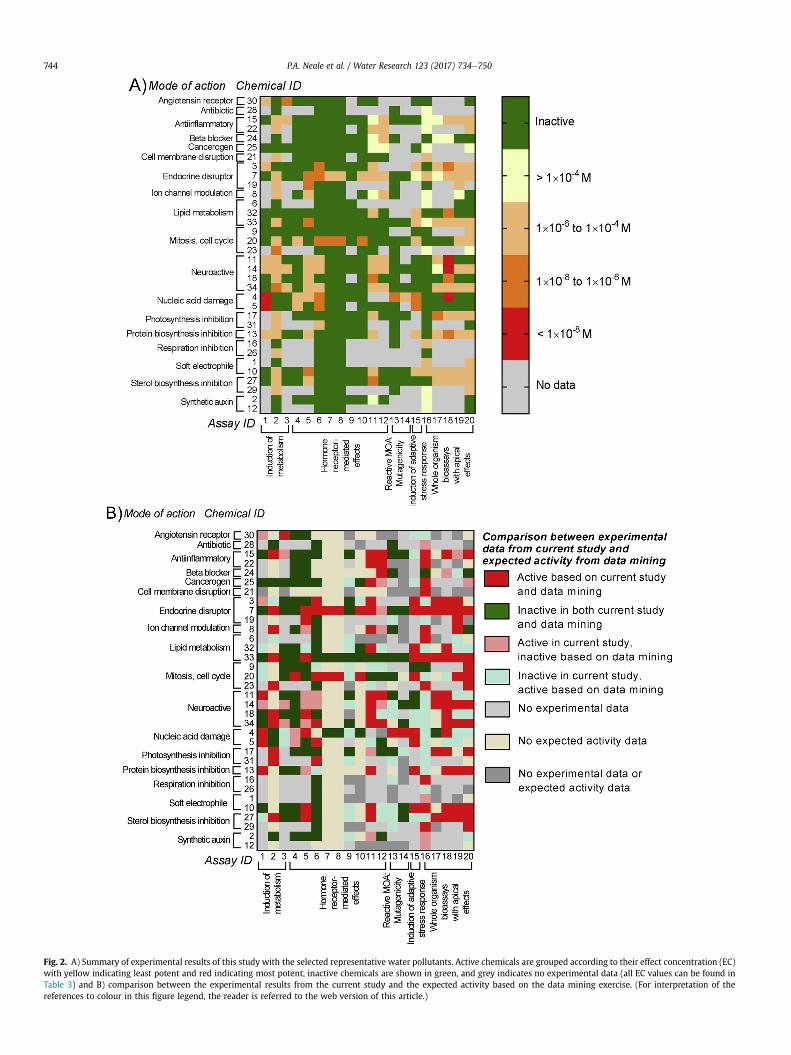
Fig. 2. A) Summary of experimental results of this study with the selected representative water pollutants. Active chemicals are grouped according to their effect concentration (EC)with yellow indicating least potent and red indicating most potent, inactive chemicals are shown in green, and grey indicates no experimental data (all EC values can be found inTable 3) and B) comparison between the experimental results from the current study and the expected activity based on the data mining exercise. (For interpretation of thereferences to colour in this figure legend, the reader is referred to the web version of this article.)
P.A. Neale et al. / Water Research 123 (2017) 734e750744

concentration, while effects were only observed for metoprolol atconcentrations above 1 � 10�3 M in the algae growth inhibition (ID17) and Daphnia immobilization (ID 18) assays. Fipronil, triclo-carban and benzo(a)pyrene only produced a positive response inthe Daphnia immobilization assay, with no observed effect at thehighest concentrations tested in the other apical assays.
5. Discussion
5.1. Suitability of the bioassay test battery to detect representativepollutants
The majority of assays indicative of induction of xenobioticmetabolism, adaptive stress responses and apical effects in wholeorganisms were able to detect a large number of studied chemicalscompared to assays indicative of hormone receptor-mediated effectsor reactive modes of action. In many cases, the same chemical wasactive in a number of assays, but at different concentrations (Fig. 2A).For example, consistent with mechanistic considerations, theendocrine-active chemical bisphenol A induced an effect at lowerconcentrations in the MELN, anti-MDA-kb2 and Cyp19a1b-GFP as-says compared to the AREc32 assay and apical endpoints. Whilesome modes of action, such as endocrine disruption, were wellcovered by assays indicative of specific effects, other modes of actionwere covered indirectly by the whole organism assays indicative ofapical effects. This suggests that a single bioassay cannot be repre-sentative for all effects but the applied bioassay battery was gener-ally suitable to detect the effect of the selected pollutants.
The discrepancy between expected and observed activity in thesame bioassay (Fig. 2B) could be attributed to several factorsincluding the quality of the expected activity data and solubilityissues. For example, the experimental results from the GR CALUXassay had the lowest correspondence with the expected activity,but many of the chemicals expected to be potentially active werebased on a theoretical match with mode of action from QSARpredictions, rather than being based on experimental data.Furthermore, many of the studied pollutants showed less effectthan predicted in the Microtox assay due to the solubility cutoff forchemicals with high melting points, which is discussed in moredetail in Escher et al. (2017) and which might also apply for otherbioassays.
Bioassays are typically applied to enriched water samples, withsolid-phase extraction commonly used. In order to assess whetherthe studied assays were suitable for detecting the individual com-pounds from the list of studied water contaminants at environ-mentally relevant concentrations, occurrence data were comparedwith the EC values. Busch et al. (2016) reported the 95th percentileof all measured environmental concentrations (MEC95) from sixstudies on European rivers, with the maximumMEC95 reprinted inTable S7. Based on the MEC95 values the MELN assay couldpotentially detect bisphenol A and genistein in water samples after17 and 15-fold enrichment, respectively, while the Daphniaimmobilization assay could detect chlorpyrifos and diazinon inwater samples after 17 and 3-fold enrichment, respectively(Table S7). A larger number of assays, including AhR CALUX,HG5LN-hPXR, PPARg-bla, Anti-MDA-kb2, ZELH-zfERalpha andZELH-zfERbeta2, are potentially able to detect more of the studiedchemicals with up to 500-fold enrichment. However, it is importantto note that in environmental samples, bioassays will not detectsingle compounds, but rather mixtures of compounds. Therefore, itdoes not mean that a particular bioassay is unsuitable for waterquality monitoring if a single chemical is not detected. It is ratherlikely that none of the known pollutants cause an effect alone, butinstead it is the mixture effect that will be detected by the assay.This is termed a “something from nothing” effect (Silva et al., 2002),
which has been demonstrated numerous times in defined mixtureexperiments where chemicals mixed at concentrations below theirobservable effect level show an effect in combination.
5.2. Comparing cellular effects with whole organism specific effects
Three in vitro assays indicative of activation of ER in a human cellline (MELN) and zebrafish cell lines (ZELH-zfERalpha and ZELH-zfERbeta2) and two whole organism assays indicative of ER-regulated effects in early life-stage fish. Cyp19a1b-GFP (zebrafish)and ChgH-GFP (medaka) were applied in the current study,allowing a comparison of estrogenic effects between different celllines and different organisms. While 9 of the tested chemicals(diazinon, bisphenol A, triphenylphosphate, 4-nonylphenol, chlor-pyrifos, benzo(a)pyrene, benzo(b)fluoranthene, terbutylazine andgenistein) were active in theMELN assay, only two, bisphenol A andgenistein, had a response in the ZELH-zfERalpha and ZELH-zfERbeta2 assays. This could be due to either species-specific dif-ferences in sensitivity or selectivity, as has previously beenobserved in environmental samples for the studied assays(Sonavane et al., 2016), and/or due to the higher metabolic capacityof the hepatic zebrafish cell line, which may potentially lead tomore biotransformation of the test compounds than the MELNassay, which is based on a breast cancer cell line (Le Fol et al., 2015).At the organism level, the Cyp19a1b-GFP assay results were veryconsistent with the ZELH-zfERalpha and ZELH-zfERbeta2 assays,with bisphenol A and genistein able to induce the expression of ER-regulated aromatase in the developing brain. Other bisphenolcompounds have also been shown to induce estrogenic responsesin the studied zebrafish in vitro and whole organism assays (Le Folet al., 2017). This emphasizes the relevance of applying fish-specificin vitro assays, as well as early life-stage organism assays, forenvironmental risk assessment.
The ChgH-GFP assay using medaka embryos also responded tobisphenol A, but genistein, which was active in all other estrogenicassays, did not induce a response in the ChgH-GFP assay. This hasalso been observed in a previous study and was attributed to thelower sensitivity of medaka to genistein, with reversetranscriptase-polymerase chain reaction (RT-PCR) indicating nochange in choriogenin H or vitellogenin transcription in the pres-ence of genistein (Scholz et al., 2005). In addition to bisphenol A,EC10 values could be determined for triphenylphosphate andchlorophene in unspiked mode, with triphenylphosphate alsoactive in the MELN assay. The observed differences between thezebrafish and medaka assays may be due to differences in speciessensitivity to (xeno)-estrogens. It is noteworthy that both trans-genic models presented differences in sensitivity to the referencecompound 17a-ethinylestradiol (Fig. S2) and to some xenoes-trogens (e.g. bisphenol A and genistein) (Figs. S14 and S15), thushighlighting the different intrinsic sensitivities in the estrogenicresponse. The exposure duration (96 h for the Cyp19a1b-GFP assayand 24 h for the ChgH-GFP assay), the tissue context (brain versusliver) and the metabolic capacity of the models may account forthese differences. The variability in responsiveness and sensitivityof the many different estrogenicity assays is well known (Kunzet al., 2017) and can be used to investigate the exact toxic mecha-nisms and to differentiate true effects from assay interferences(Browne et al., 2015; Judson et al., 2015). In turn this does not meanthat for water quality monitoring that many different assaysindicative of the one endpoint should be used or that one assayshould be favored over others. However, when undertakingmixture toxicity modeling or when deriving effect-based triggervalues, one should use data from the same bioassay as the BEQvalue will be specific for each assay (Escher et al., 2015).
P.A. Neale et al. / Water Research 123 (2017) 734e750 745
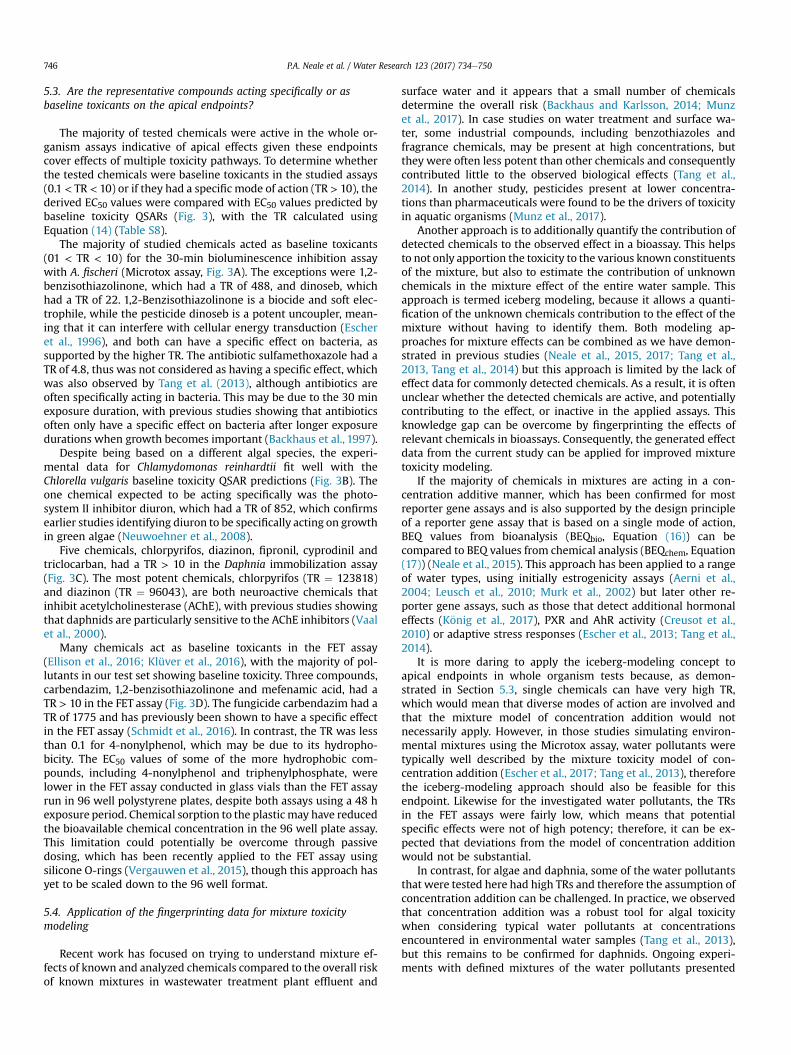
5.3. Are the representative compounds acting specifically or asbaseline toxicants on the apical endpoints?
The majority of tested chemicals were active in the whole or-ganism assays indicative of apical effects given these endpointscover effects of multiple toxicity pathways. To determine whetherthe tested chemicals were baseline toxicants in the studied assays(0.1 < TR < 10) or if they had a specific mode of action (TR > 10), thederived EC50 values were compared with EC50 values predicted bybaseline toxicity QSARs (Fig. 3), with the TR calculated usingEquation (14) (Table S8).
The majority of studied chemicals acted as baseline toxicants(01 < TR < 10) for the 30-min bioluminescence inhibition assaywith A. fischeri (Microtox assay, Fig. 3A). The exceptions were 1,2-benzisothiazolinone, which had a TR of 488, and dinoseb, whichhad a TR of 22. 1,2-Benzisothiazolinone is a biocide and soft elec-trophile, while the pesticide dinoseb is a potent uncoupler, mean-ing that it can interfere with cellular energy transduction (Escheret al., 1996), and both can have a specific effect on bacteria, assupported by the higher TR. The antibiotic sulfamethoxazole had aTR of 4.8, thus was not considered as having a specific effect, whichwas also observed by Tang et al. (2013), although antibiotics areoften specifically acting in bacteria. This may be due to the 30 minexposure duration, with previous studies showing that antibioticsoften only have a specific effect on bacteria after longer exposuredurations when growth becomes important (Backhaus et al., 1997).
Despite being based on a different algal species, the experi-mental data for Chlamydomonas reinhardtii fit well with theChlorella vulgaris baseline toxicity QSAR predictions (Fig. 3B). Theone chemical expected to be acting specifically was the photo-system II inhibitor diuron, which had a TR of 852, which confirmsearlier studies identifying diuron to be specifically acting on growthin green algae (Neuwoehner et al., 2008).
Five chemicals, chlorpyrifos, diazinon, fipronil, cyprodinil andtriclocarban, had a TR > 10 in the Daphnia immobilization assay(Fig. 3C). The most potent chemicals, chlorpyrifos (TR ¼ 123818)and diazinon (TR ¼ 96043), are both neuroactive chemicals thatinhibit acetylcholinesterase (AChE), with previous studies showingthat daphnids are particularly sensitive to the AChE inhibitors (Vaalet al., 2000).
Many chemicals act as baseline toxicants in the FET assay(Ellison et al., 2016; Klüver et al., 2016), with the majority of pol-lutants in our test set showing baseline toxicity. Three compounds,carbendazim, 1,2-benzisothiazolinone and mefenamic acid, had aTR > 10 in the FET assay (Fig. 3D). The fungicide carbendazim had aTR of 1775 and has previously been shown to have a specific effectin the FET assay (Schmidt et al., 2016). In contrast, the TR was lessthan 0.1 for 4-nonylphenol, which may be due to its hydropho-bicity. The EC50 values of some of the more hydrophobic com-pounds, including 4-nonylphenol and triphenylphosphate, werelower in the FET assay conducted in glass vials than the FET assayrun in 96 well polystyrene plates, despite both assays using a 48 hexposure period. Chemical sorption to the plastic may have reducedthe bioavailable chemical concentration in the 96 well plate assay.This limitation could potentially be overcome through passivedosing, which has been recently applied to the FET assay usingsilicone O-rings (Vergauwen et al., 2015), though this approach hasyet to be scaled down to the 96 well format.
5.4. Application of the fingerprinting data for mixture toxicitymodeling
Recent work has focused on trying to understand mixture ef-fects of known and analyzed chemicals compared to the overall riskof known mixtures in wastewater treatment plant effluent and
surface water and it appears that a small number of chemicalsdetermine the overall risk (Backhaus and Karlsson, 2014; Munzet al., 2017). In case studies on water treatment and surface wa-ter, some industrial compounds, including benzothiazoles andfragrance chemicals, may be present at high concentrations, butthey were often less potent than other chemicals and consequentlycontributed little to the observed biological effects (Tang et al.,2014). In another study, pesticides present at lower concentra-tions than pharmaceuticals were found to be the drivers of toxicityin aquatic organisms (Munz et al., 2017).
Another approach is to additionally quantify the contribution ofdetected chemicals to the observed effect in a bioassay. This helpsto not only apportion the toxicity to the various known constituentsof the mixture, but also to estimate the contribution of unknownchemicals in the mixture effect of the entire water sample. Thisapproach is termed iceberg modeling, because it allows a quanti-fication of the unknown chemicals contribution to the effect of themixture without having to identify them. Both modeling ap-proaches for mixture effects can be combined as we have demon-strated in previous studies (Neale et al., 2015, 2017; Tang et al.,2013, Tang et al., 2014) but this approach is limited by the lack ofeffect data for commonly detected chemicals. As a result, it is oftenunclear whether the detected chemicals are active, and potentiallycontributing to the effect, or inactive in the applied assays. Thisknowledge gap can be overcome by fingerprinting the effects ofrelevant chemicals in bioassays. Consequently, the generated effectdata from the current study can be applied for improved mixturetoxicity modeling.
If the majority of chemicals in mixtures are acting in a con-centration additive manner, which has been confirmed for mostreporter gene assays and is also supported by the design principleof a reporter gene assay that is based on a single mode of action,BEQ values from bioanalysis (BEQbio, Equation (16)) can becompared to BEQ values from chemical analysis (BEQchem, Equation(17)) (Neale et al., 2015). This approach has been applied to a rangeof water types, using initially estrogenicity assays (Aerni et al.,2004; Leusch et al., 2010; Murk et al., 2002) but later other re-porter gene assays, such as those that detect additional hormonaleffects (K€onig et al., 2017), PXR and AhR activity (Creusot et al.,2010) or adaptive stress responses (Escher et al., 2013; Tang et al.,2014).
It is more daring to apply the iceberg-modeling concept toapical endpoints in whole organism tests because, as demon-strated in Section 5.3, single chemicals can have very high TR,which would mean that diverse modes of action are involved andthat the mixture model of concentration addition would notnecessarily apply. However, in those studies simulating environ-mental mixtures using the Microtox assay, water pollutants weretypically well described by the mixture toxicity model of con-centration addition (Escher et al., 2017; Tang et al., 2013), thereforethe iceberg-modeling approach should also be feasible for thisendpoint. Likewise for the investigated water pollutants, the TRsin the FET assays were fairly low, which means that potentialspecific effects were not of high potency; therefore, it can be ex-pected that deviations from the model of concentration additionwould not be substantial.
In contrast, for algae and daphnia, some of the water pollutantsthat were tested here had high TRs and therefore the assumption ofconcentration addition can be challenged. In practice, we observedthat concentration addition was a robust tool for algal toxicitywhen considering typical water pollutants at concentrationsencountered in environmental water samples (Tang et al., 2013),but this remains to be confirmed for daphnids. Ongoing experi-ments with defined mixtures of the water pollutants presented
P.A. Neale et al. / Water Research 123 (2017) 734e750746
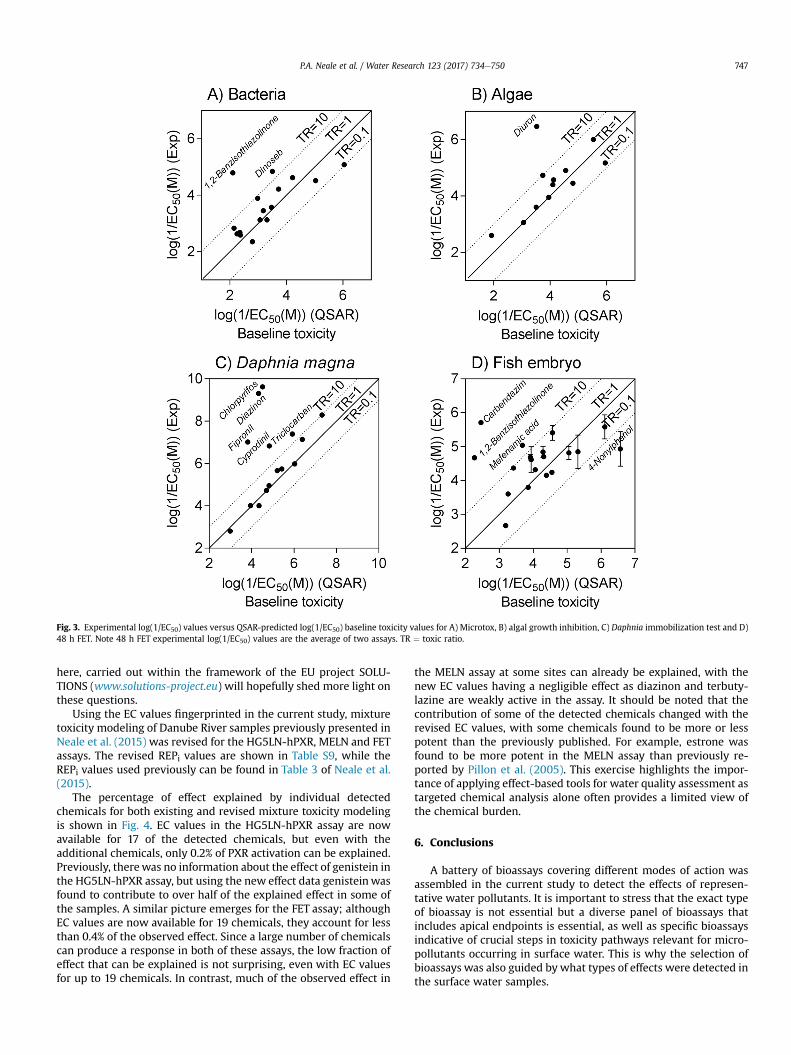
here, carried out within the framework of the EU project SOLU-TIONS (www.solutions-project.eu) will hopefully shed more light onthese questions.
Using the EC values fingerprinted in the current study, mixturetoxicity modeling of Danube River samples previously presented inNeale et al. (2015) was revised for the HG5LN-hPXR, MELN and FETassays. The revised REPi values are shown in Table S9, while theREPi values used previously can be found in Table 3 of Neale et al.(2015).
The percentage of effect explained by individual detectedchemicals for both existing and revised mixture toxicity modelingis shown in Fig. 4. EC values in the HG5LN-hPXR assay are nowavailable for 17 of the detected chemicals, but even with theadditional chemicals, only 0.2% of PXR activation can be explained.Previously, therewas no information about the effect of genistein inthe HG5LN-hPXR assay, but using the new effect data genisteinwasfound to contribute to over half of the explained effect in some ofthe samples. A similar picture emerges for the FET assay; althoughEC values are now available for 19 chemicals, they account for lessthan 0.4% of the observed effect. Since a large number of chemicalscan produce a response in both of these assays, the low fraction ofeffect that can be explained is not surprising, even with EC valuesfor up to 19 chemicals. In contrast, much of the observed effect in
the MELN assay at some sites can already be explained, with thenew EC values having a negligible effect as diazinon and terbuty-lazine are weakly active in the assay. It should be noted that thecontribution of some of the detected chemicals changed with therevised EC values, with some chemicals found to be more or lesspotent than the previously published. For example, estrone wasfound to be more potent in the MELN assay than previously re-ported by Pillon et al. (2005). This exercise highlights the impor-tance of applying effect-based tools for water quality assessment astargeted chemical analysis alone often provides a limited view ofthe chemical burden.
6. Conclusions
A battery of bioassays covering different modes of action wasassembled in the current study to detect the effects of represen-tative water pollutants. It is important to stress that the exact typeof bioassay is not essential but a diverse panel of bioassays thatincludes apical endpoints is essential, as well as specific bioassaysindicative of crucial steps in toxicity pathways relevant for micro-pollutants occurring in surface water. This is why the selection ofbioassays was also guided by what types of effects were detected inthe surface water samples.
Fig. 3. Experimental log(1/EC50) values versus QSAR-predicted log(1/EC50) baseline toxicity values for A) Microtox, B) algal growth inhibition, C) Daphnia immobilization test and D)48 h FET. Note 48 h FET experimental log(1/EC50) values are the average of two assays. TR ¼ toxic ratio.
P.A. Neale et al. / Water Research 123 (2017) 734e750 747

All studied chemicals were active in at least one of the appliedassays, with the industrial compound bisphenol A active in 70% ofthe studied assays. As expected, more chemicals were active in theassays indicative of apical effects, but the concentrations at whichsome chemicals induced an effect were much lower in assays thatwere based on a specific pathway/mechanism. For example, gen-istein and bisphenol A were more responsive in the ER mediatedassays compared to the whole organism assays. These patternsillustrate how important it is to combine bioassays with apicalendpoints and specific pathway endpoints to comprehensivelycapture the hazard potential of micropollutants in surface water.
There was reasonable agreement between the experimentalresults and the expected activity, though the data mining exercisehighlighted the lack of available data, particularly for some recentlydeveloped mechanism-based assays, which is a common limitationof such investigations. Effect data for individual chemicals arerequired as input parameters for mixture toxicity modeling and thedata generated in the current study will be applied in ongoing andfuture studies to assess the mixture effects of representative pol-lutants in river and other water samples.
Acknowledgements
The project SOLUTIONS is supported by the European Union
Seventh Framework Programme (FP7-ENV-2013-two-stageCollaborative project) under grant agreement number 603437.Neale was supported by the National Health and Medical ResearchCouncil (NHMRC) e European Union Collaborative Research Grant(APP1074775). Umbuzeiro and Morales acknowledge Fapesp forresearch funding (2015/24758-5 and 2013/16956-6); Moralesthanks CAPES for PhD fellowship and Shao thanks CSC for a PhDfellowship. Hollert, Seiler and Shao would like to kindly thankNikon Deutschland GmbH, Promega Corporation and ibs tecnomaraGmbH for their contribution to this study as a partner of the Stu-dents Lab "Fascinating Environment" at Aachen Biology andBiotechnology (ABBt). We thank Maria K€onig (UFZ), Christin Küh-nert (UFZ), Janet Krüger (UFZ), Ana Catarina Almeida (NIVA), Jos�eZwarg (FT/UNICAMP), Letícia Ferreira (FT/UNICAMP) and ElodiePaillard (WatchFrog) for experimental assistance and Nils Klüver(UFZ) for helpful discussions.
Appendix A. Supplementary data
Supplementary data related to this article can be found at http://dx.doi.org/10.1016/j.watres.2017.07.016.
References
Aerni, H.R., Kobler, B., Rutishauser, B.V., Wettstein, F.E., Fischer, R., Giger, W.,
Fig. 4. Percent effect elucidated by enriched water samples from different sites of the Danube River explained by detected chemicals for HG5LN-hPXR based on A) literature ECvalues and B) EC values measured in the present study, MELN based on C) literature EC values and D) EC values measured in the present study and FET based on E) literature ECvalues and F) EC values measured in the present study (Fig. 4A, C and E are reprinted with permission from Neale et al. (2015). Linking in vitro effects and detected organicmicropollutants in surface water using mixture-toxicity modeling. Environmental Science & Technology, 49(24): 14614e14624. Copyright 2015 American Chemical Society).
P.A. Neale et al. / Water Research 123 (2017) 734e750748

Hungerbuhler, A., Marazuela, M.D., Peter, A., Schonenberger, R., Vogeli, A.C.,Suter, M.J.F., Eggen, R.I.L., 2004. Combined biological and chemical assessmentof estrogenic activities in wastewater treatment plant effluents. Anal. Bioanal.Chem. 378 (3), 688e696.
Altenburger, R., Aït-Aïssa, S., Antczak, P., Backhaus, T., Barcelo, D., Seiler, T.-B.,Brion, F., Busch, W., Chipman, K., de Alda, M.L., de Aragao Umbuzeiro, G.,Escher, B.I., Falciani, F., Faust, M., Focks, A., Hilscherov�a, K., Hollender, J.,Hollert, H., Jager, F., Jahnke, A., Kortenkamp, A., Krauss, M., Lemkine, G.F.,Munthe, J., Neumann, S., Schymanski, E.L., Scrimshaw, M., Segner, H.,Slobodnik, J., Smedes, F., Kughathas, S., Teodorovic, I., Tindall, A.J., Tollefsen, K.E.,Walz, K.-H., Williams, T.D., Van den Brink, P.J., van Gils, J., Vrana, B., Zhang, X.,Brack, W., 2015. Future water quality monitoring - adapting tools to deal withmixtures of pollutants in water resource management. Sci. Total Environ.512e513, 540e551.
Ankley, G.T., Bennett, R.S., Erickson, R.J., Hoff, D.J., Hornung, M.W., Johnson, R.D.,Mount, D.R., Nichols, J.W., Russom, C.L., Schmieder, P.K., Serrrano, J.A.,Tietge, J.E., Villeneuve, D.L., 2010. Adverse outcome pathways: a conceptualframework to support ecotoxicology research and risk assessment. Environ.Toxicol. Chem. 29 (3), 730e741.
Backhaus, T., Froehner, K., Altenburger, R., Grimme, L.H., 1997. Toxicity testing withVibrio fischeri: a comparison between the long term (24 h) and the short term(30 min) bioassay. Chemosphere 35 (12), 2925e2938.
Backhaus, T., Karlsson, M., 2014. Screening level mixture risk assessment of phar-maceuticals in STP effluents. Water Res. 49, 157e165.
Balaguer, P., Francois, F., Comunale, F., Fenet, H., Boussioux, A.M., Pons, M.,Nicolas, J.C., Casellas, C., 1999. Reporter cell lines to study the estrogenic effectsof xenoestrogens. Sci. Total Environ. 233 (1e3), 47e56.
Basketter, D.A., Rodford, R., Kimber, I., Smith, I., Wahlberg, J.E., 1999. Skin sensiti-zation risk assessment: a comparative evaluation of 3 isothiazolinone biocides.Contact Derm. 40 (3), 150e154.
Brennan, J.C., He, G.C., Tsutsumi, T., Zhao, J., Wirth, E., Fulton, M.H., Denison, M.S.,2015. Development of species-specific Ah receptor-responsive third generationCALUX cell lines with enhanced responsiveness and improved detection limits.Environ. Sci. Technol. 49 (19), 11903e11912.
Brion, F., Le Page, Y., Piccini, B., Cardoso, O., Tong, S.K., Chung, B.C., Kah, O., 2012.Screening estrogenic activities of chemicals or mixtures in vivo using transgenic(cyp19a1b-GFP) zebrafish embryos. Plos One 7 (5), e36069.
Browne, P., Judson, R.S., Casey, W.M., Kleinstreuer, N.C., Thomas, R.S., 2015.Screening chemicals for estrogen receptor bioactivity using a computationalmodel. Environ. Sci. Technol. 49 (14), 8804e8814.
Busch, W., Schmidt, S., Kuhne, R., Schulze, T., Krauss, M., Altenburger, R., 2016.Micropollutants in European rivers: a mode of action survey to support thedevelopment of effect-based tools for water monitoring. Environ. Toxicol.Chem. 35 (8), 1887e1899.
Claxton, L.D., Umbuzeiro, G.D.A., DeMarini, D.M., 2010. The Salmonella mutagenicityassay: the stethoscope of genetic toxicology for the 21st century. Environ.Health Perspect. 118, 1515e1522.
Cosnefroy, A., Brion, F., Maillot-Marechal, E., Porcher, J.M., Pakdel, F., Balaguer, P.,Aït-Aïssa, S., 2012. Selective activation of zebrafish estrogen receptor subtypesby chemicals by using stable reporter gene assay developed in a zebrafish livercell line. Toxicol. Sci. 125 (2), 439e449.
Creusot, N., Kinani, S., Balaguer, P., Tapie, N., LeMenach, K., Maillot-Mar�echal, E.,Porcher, J.M., Budzinski, H., Aït-Aïssa, S., 2010. Evaluation of an hPXR reportergene assay for the detection of aquatic emerging pollutants: screening ofchemicals and application to water samples. Anal. Bioanal. Chem. 396 (2),569e583.
DeMarini, D.M., Dallas, M.M., Lewtas, J., 1989. Cytotoxicity and effect on mutage-nicity of buffers in a microsuspension assay. Teratog. Carcin. Mut. 9 (5),287e295.
Di Paolo, C., Ottermanns, R., Keiter, S., Aït-Aïssa, S., Bluhm, K., Brack, W.,Breitholtz, M., Buchinger, S., Carere, M., Chalon, C., Cousin, X., Dulio, V.,Escher, B.I., Hamers, T., Hilscherov�a, K., Jarque, S., Jonas, A., Maillot-Marechal, E.,Marneffe, Y., Nguyen, M.T., Pandard, P., Schifferli, A., Schulze, T., Seidensticker, S.,Seiler, T.B., Tang, J., van der Oost, R., Vermeirssen, E., Zounkova, R., Zwart, N.,Hollert, H., 2016. Bioassay battery interlaboratory investigation of emergingcontaminants in spiked water extracts - towards the implementation of bio-analytical monitoring tools in water quality assessment and monitoring. WaterRes. 104, 473e484.
Ellison, C.M., Piechota, P., Madden, J.C., Enoch, S.J., Cronin, M.T.D., 2016. Adverseoutcome pathway (AOP) informed modeling of aquatic toxicology: QSARs, read-across, and interspecies verification of modes of action. Environ. Sci. Technol. 50(7), 3995e4007.
Escher, B.I., Snozzi, M., Schwarzenbach, R.P., 1996. Uptake, speciation, and uncou-pling activity of substituted phenols in energy transducing membranes. Envi-ron. Sci. Technol. 30 (10), 3071e3079.
Escher, B.I., Schwarzenbach, R.P., 2002. Mechanistic studies on baseline toxicity anduncoupling of organic compounds as a basis for modeling effective membraneconcentrations in aquatic organisms. Aquat. Sci. 64 (1), 20e35.
Escher, B.I., Dutt, M., Maylin, E., Tang, J.Y.M., Toze, S., Wolf, C.R., Lang, M., 2012.Water quality assessment using the AREc32 reporter gene assay indicative ofthe oxidative stress response pathway. J. Environ. Monit. 14 (11), 2877e2885.
Escher, B.I., Leusch, F.D.L., 2012. Bioanalytical Tools in Water Quality Assessment.IWA Publishing, London.
Escher, B.I., van Daele, C., Dutt, M., Tang, J.Y.M., Altenburger, R., 2013. Most oxidativestress response in water samples comes from unknown chemicals: the need for
effect-based water quality trigger values. Environ. Sci. Technol. 47 (13),7002e7011.
Escher, B.I., Allinson, M., Altenburger, R., Bain, P.A., Balaguer, P., Busch, W., Crago, J.,Denslow, N.D., Dopp, E., Hilscherov�a, K., Humpage, A.R., Kumar, A., Grimaldi, M.,Jayasinghe, B.S., Jarosova, B., Jia, A., Makarov, S., Maruya, K.A., Medvedev, A.,Mehinto, A.C., Mendez, J.E., Poulsen, A., Prochazka, E., Richard, J., Schifferli, A.,Schlenk, D., Scholz, S., Shiraish, F., Snyder, S., Su, G.Y., Tang, J.Y.M., van derBurg, B., van der Linden, S.C., Werner, I., Westerheide, S.D., Wong, C.K.C.,Yang, M., Yeung, B.H.Y., Zhang, X.W., Leusch, F.D.L., 2014. Benchmarking organicmicropollutants in wastewater, recycled water and drinking water with in vitrobioassays. Environ. Sci. Technol. 48 (3), 1940e1956.
Escher, B.I., Neale, P.A., Leusch, F.D.L., 2015. Effect-based trigger values for in vitrobioassays: reading across from existing water quality guideline values. WaterRes. 81 (0), 137e148.
Escher, B.I., Baumer, A., K€onig, M., Kühnert, C., Mayer, P., Klüver, N., 2017. Generalbaseline toxicity QSAR for nonpolar, polar and ionisable chemicals in thebioluminescence inhibition assay with Aliivibrio fischeri. Env. Sci. Process.Impact 19 (3), 414e428.
European Commission, 2011. Common Implementation Strategy for the WaterFramework Directive (2000/60/EC). Guidance Document No. 27. Technicalguidance for deriving environmental quality standards, Brussels.
European Commission, 2012. Proposal for a Directive of the European Parliamentand the Council Amending Directives 2000/60/EC and 2008/105/EC as RegardsPriority Substances in the Field of Water Policy. COM/2011/0876 final - 2011/0429 (COD), Brussels.
European Commission, 2013. Directive 2013/39/EU of the European Parliament andthe Council of 12. August 2013 amending Directives 2000/60/EC and 2008/105/EC as regards priority substances in the field of water policy. Off. J. Eur. Union.L226/221 L226/217.
Fini, J.B., Le Mevel, S., Turque, N., Palmier, K., Zalko, D., Cravedi, J.P., Demeneix, B.A.,2007. An in vivo multiwell-based fluorescent screen for monitoring vertebratethyroid hormone disruption. Environ. Sci. Technol. 41 (16), 5908e5914.
Hiemstra, S., Niemeijer, M., Koedoot, E., Wink, S., Pip, J.E., Vlasveld, M., de Zeeuw, E.,van Os, B., White, A., van de Water, B., 2017. Comprehensive landscape of Nrf2and p53 pathway activation dynamics by oxidative stress and DNA damage.Chem. Res. Toxicol. 30 (4), 923e933.
Invitrogen, 2010. GeneBLAzer® PPAR Gamma 293H DA and PPAR Gamma-UAS-bla293H Cell-based Assay Protocol. Invitrogen Corporation, Carlsbad, CA, USA.
J�alov�a, V., Jaro�sov�a, B., Bl�aha, L., Giesy, J.P., Ocelka, T., Grabic, R., Jur�cíkov�a, J.,Vrana, B., Hilscherov�a, K., 2013. Estrogen-, androgen- and aryl hydrocarbonreceptor mediated activities in passive and composite samples from municipalwaste and surface waters. Environ. Int. 59, 372e383.
Judson, R., Houck, K., Martin, M., Richard, A.M., Knudsen, T.B., Shah, I., Little, S.,Wambaugh, J., Setzer, R.W., Kothya, P., Phuong, J., Filer, D., Smith, D., Reif, D.,Rotroff, D., Kleinstreuer, N., Sipes, N., Xia, M.H., Huang, R.L., Crofton, K.,Thomas, R.S., 2016. Analysis of the effects of cell stress and cytotoxicity onin vitro assay activity across a diverse chemical and assay space. Toxicol. Sci. 152(2), 323e339.
Judson, R.S., Magpantay, F.M., Chickarmane, V., Haskell, C., Tania, N., Taylor, J.,Xia, M.H., Huang, R.L., Rotroff, D.M., Filer, D.L., Houck, K.A., Martin, M.T.,Sipes, N., Richard, A.M., Mansouri, K., Setzer, R.W., Knudsen, T.B., Crofton, K.M.,Thomas, R.S., 2015. Integrated model of chemical perturbations of a biologicalpathway using 18 in vitro high-throughput screening assays for the estrogenreceptor. Toxicol. Sci. 148 (1), 137e154.
Klüver, N., Vogs, C., Altenburger, R., Escher, B.I., Scholz, S., 2016. Development of ageneral baseline toxicity QSAR model for the fish embryo acute toxicity test.Chemosphere 164, 164e173.
K€onig, M., Escher, B.I., Neale, P.A., Krauss, M., Hilscherov�a, K., Nov�ak, J., Teodorovi�c, I.,Schulze, T., Seidensticker, S., Kamal Hashmi, M.A., Ahlheim, J., Brack, W., 2017.Impact of untreated wastewater on a major European river evaluated with acombination of in vitro bioassays and chemical analysis. Environ. Pollut. 220,1220e1230.
Kunz, P.Y., Simon, E., Creusot, N., Jayasinghe, B.S., Kienle, C., Maletz, S., Schifferli, A.,Sch€onlau, C., Aït-Aïssa, S., Denslow, N.D., Hollert, H., Werner, I.,Vermeirssen, E.L.M., 2017. Effect-based tools for monitoring estrogenic mix-tures: evaluation of five in vitro bioassays. Water Res. 110, 378e388.
Le Fol, V., Aït-Aïssa, S., Cabaton, N., Dolo, L., Grimaldi, M., Balaguer, P., Perdu, E.,Debrauwer, L., Brion, F., Zalko, D., 2015. Cell-specific biotransformation ofbenzophenone-2 and bisphenol-S in zebrafish and human in vitro models usedfor toxicity and estrogenicity screening. Environ. Sci. Technol. 49 (6),3860e3868.
Le Fol, V., Aït-Aïssa, S., Sonavane, M., Porcher, J.-M., Balaguer, P., Cravedi, J.-P.,Zalko, D., Brion, F., 2017. In vitro and in vivo estrogenic activity of BPA, BPF andBPS in zebrafish-specific assays. Ecotoxicol. Environ. Saf. 142, 150e156.
Lemaire, G., Mnif, W., Pascussi, J.M., Pillon, A., Rabenoelina, F., Fenet, H., Gomez, E.,Casellas, C., Nicolas, J.C., Cavailles, V., Duchesne, M.J., Balaguer, P., 2006. Iden-tification of new human pregnane X receptor ligands among pesticides using astable reporter cell system. Toxicol. Sci. 91 (2), 501e509.
Leusch, F.D.L., De Jager, C., Levi, Y., Lim, R., Puijker, L., Sacher, F., Tremblay, L.A.,Wilson, V.S., Chapman, H.F., 2010. Comparison of five in vitro bioassays tomeasure estrogenic activity in environmental waters. Environ. Sci. Technol. 44(10), 3853e3860.
Leusch, F.D.L., Khan, S.J., Laingam, S., Prochazka, E., Froscio, S., Trang, T.,Chapman, H.F., Humpage, A., 2014. Assessment of the application of bio-analytical tools as surrogate measure of chemical contaminants in recycled
P.A. Neale et al. / Water Research 123 (2017) 734e750 749
water. Water Res. 49, 300e315.Leusch, F.D.L., Snyder, S.A., 2015. Bioanalytical tools: half a century of application for
potable reuse. Environ. Sci. Water Res. Technol. 1, 606e621.Malaj, E., von der Ohe, P.C., Grote, M., Kuhne, R., Mondy, C.P., Usseglio-Polatera, P.,
Brack, W., Schafer, R.B., 2014. Organic chemicals jeopardize the health offreshwater ecosystems on the continental scale. Proc. Natl. Acad. Sci. U.S.A. 111(26), 9549e9554.
Martin, M.T., Dix, D.J., Judson, R.S., Kavlock, R.J., Reif, D.M., Richard, A.M.,Rotroff, D.M., Romanov, S., Medvedev, A., Poltoratskaya, N., Gambarian, M.,Moeser, M., Makarov, S.S., Houck, K.A., 2010. Impact of environmental chemicalson key transcription regulators and correlation to toxicity end points withinEPA's ToxCast program. Chem. Res. Toxicol. 23 (3), 578e590.
Maruya, K.A., Dodder, N.G., Mehinto, A.C., Denslow, N.D., Schlenk, D., Snyder, S.A.,Weisberg, S.B., 2016. A tiered, integrated biological and chemical monitoringframework for contaminants of emerging concern in aquatic ecosystems. Integr.Environ. Assess. Manag 12 (3), 540e547.
Mortelmans, K., Zeiger, E., 2000. The Ames Salmonella/microsome mutagenicityassay. Mutat. Res. Fund. Mol. Mech. Mut. 455 (1e2), 29e60.
Munz, N.A., Burdon, F.J., de Zwart, D., Junghans, M., Melo, L., Reyes, M.,Schonenberger, U., Singer, H.P., Spycher, B., Hollender, J., Stamm, C., 2017. Pes-ticides drive risk of micropollutants in wastewater-impacted streams duringlow flow conditions. Water Res. 110, 366e377.
Murk, A.J., Legler, J., van Lipzig, M.M.H., Meerman, J.H.N., Belfroid, A.C.,Spenkelink, A., van der Burg, B., Rijs, G.B.J., Vethaak, D., 2002. Detection of es-trogenic potency in wastewater and surface water with three in vitro bioassays.Environ. Toxicol. Chem. 21 (1), 16e23.
Neale, P.A., Antony, A., Bartkow, M., Farre, M., Heitz, A., Kristiana, I., Tang, J.Y.M.,Escher, B.I., 2012. Bioanalytical assessment of the formation of disinfection by-products in a drinking water treatment plant. Environ. Sci. Technol. 46 (18),10317e10325.
Neale, P.A., Aït-Aïssa, S., Brack, W., Creusot, N., Denison, M.S., Deutschmann, B.,Hilscherov�a, K., Hollert, H., Krauss, M., Novak, J., Schulze, T., Seiler, T.-B.,Serra, H., Shao, Y., Escher, B.I., 2015. Linking in vitro effects and detected organicmicropollutants in surface water using mixture-toxicity modeling. Environ. Sci.Technol. 49 (24), 14614e14624.
Neale, P.A., Munz, N.A., Aït-Aïssa, S., Altenburger, R., Brion, F., Busch, W., Escher, B.I.,Hilscherov�a, K., Kienle, C., Novak, J., Seiler, T.B., Shao, Y., Stamm, C., Hollender, J.,2017. Integrating chemical analysis and bioanalysis to evaluate the contributionof wastewater effluent on the micropollutant burden in small streams. Sci. TotalEnviron. 576, 785e795.
Neuwoehner, J., Junghans, M., Koller, M., Escher, B.I., 2008. QSAR analysis andspecific endpoints for classifying the physiological modes of action of biocidesin synchronous green algae. Aquat. Toxicol. 90 (1), 8e18.
OECD, 2004. Test No. 202: Daphnia Sp. Acute Immobilisation Test. OECD Publishing,Paris.
OECD, 2011. Test No. 201: Freshwater Alga and Cyanobacteria, Growth InhibitionTest. OECD Publishing, Paris.
OECD, 2013. Test No. 236: Fish Embryo Acute Toxicity (FET) Test, OECD Guidelinesfor the Testing of Chemicals, Section 2. OECD Publishing, Paris.
Oekotoxzentrum, 2017. Proposals for Acute and Chronic Quality Standards. http://www.ecotoxcentre.ch/expert-service/quality-standards/proposals-for-acute-and-chronic-quality-standards/ (Accessed 26 February 2017).
Pillon, A., Boussioux, A.M., Escande, A., Aït-Aïssa, S., Gomez, E., Fenet, H., Ruff, M.,Moras, D., Vignon, F., Duchesne, M.J., Casellas, C., Nicolas, J.C., Balaguer, P., 2005.Binding of estrogenic compounds to recombinant estrogen receptor alpha:application to environmental analysis. Environ. Health Perspect. 113 (3),278e284.
Prasse, C., Stalter, D., Schulte-Oehlmann, U., Oehlmann, J., 2015. Spoilt for choice: acritical review on the chemical and biological assessment of current wastewatertreatment technologies. Water Res. 87, 237e270.
Reifferscheid, G., Maes, H.M., Allner, B., Badurova, J., Belkin, S., Bluhm, K., Brauer, F.,Bressling, J., Domeneghetti, S., Elad, T., Fluckiger-Isler, S., Grummt, H.J.,Guertler, R., Hecht, A., Heringa, M.B., Hollert, H., Huber, S., Kramer, M.,Magdeburg, A., Ratte, H.T., Sauerborn-Klobucar, R., Sokolowski, A., Soldan, P.,Smital, T., Stalter, D., Venier, P., Ziemann, C., Zipperle, J., Buchinger, S., 2012.International round-robin study on the Ames fluctuation test. Environ. Mol.Mutagen 53 (3), 185e197.
Schmidt, S., Busch, W., Altenburger, R., Küster, E., 2016. Mixture toxicity of watercontaminants-effect analysis using the zebrafish embryo assay (Danio rerio).Chemosphere 152, 503e512.
Scholz, S., Kurauchi, K., Kinoshita, M., Oshima, Y., Ozato, K., Schirmer, K.,Wakamatsu, Y., 2005. Analysis of estrogenic effects by quantification of greenfluorescent protein in juvenile fish of a transgenic medaka. Environ. Toxicol.Chem. 24 (10), 2553e2561.
Schroeder, A.L., Ankley, G.T., Houck, K.A., Villeneuve, D.L., 2016. Environmentalsurveillance and monitoringdthe next frontiers for high-throughput toxi-cology. Environ. Toxicol. Chem. 35 (3), 513e525.
Silva, E., Rajapakse, N., Kortenkamp, A., 2002. Something from "nothing" - eight
weak estrogenic chemicals combined at concentrations below NOECs producesignificant mixture effects. Environ. Sci. Technol. 36 (8), 1751e1756.
Simmons, S.O., Fan, C.-Y., Ramabhadran, R., 2009. Cellular stress response pathwaysystem as a sentinel ensemble in toxicological screening. Toxicol. Sci. 111 (2),202e225.
Sonavane, M., Creusot, N., Maillot-Mar�echal, E., P�ery, A., Brion, F., Aït-Aïssa, S., 2016.Zebrafish-based reporter gene assays reveal different estrogenic activities inriver waters compared to a conventional human-derived assay. Sci. Total En-viron. 550, 934e939.
Spirhanzlova, P., Leleu, M., Sebillot, A., Lemkine, G.F., Iguchi, T., Demeneix, B.A.,Tindall, A.J., 2016. Oestrogen reporter transgenic medaka for non-invasiveevaluation of aromatase activity. Comp. Biochem. Physiol. C Toxicol. Pharma-col. 179, 64e71.
Spycher, S., Smejtek, P., Netzeva, T.I., Escher, B.I., 2008. Toward a class-independentquantitative structure - activity relationship model for uncouplers of oxidativephosphorylation. Chem. Res. Toxicol. 21 (4), 911e927.
Tang, J.Y.M., McCarty, S., Glenn, E., Neale, P.A., Warne, M.S.J., Escher, B.I., 2013.Mixture effects of organic micropollutants present in water: towards thedevelopment of effect-based water quality trigger values for baseline toxicity.Water Res. 47 (10), 3300e3314.
Tang, J.Y.M., Busetti, F., Charrois, J.W.A., Escher, B.I., 2014. Which chemicals drivebiological effects in wastewater and recycled water? Water Res. 60, 289e299.
Tice, R.R., Austin, C.P., Kavlock, R.J., Bucher, J.R., 2013. Improving the human hazardcharacterization of chemicals: a Tox21 update. Environ. Health Perspect. 121 (7),756e765.
Umbuzeiro, G.D.A., Heringa, M., Zeiger, E., 2016. In vitro genotoxicity testing: sig-nificance and use in environmental monitoring. Adv. Biochem. Eng. Biotechnol.1e22.
US EPA, 2008. Estimation Programs Interface Suite for Windows, v4.1. United StatesEnvironmental Protection Agency, Washington, DC, USA.
US EPA, 2015. Interactive Chemical Safety for Sustainability (ICSS) Dashboard V2.http://actor.epa.gov/dashboard/ (Accessed 5 January 2016).
Vaal, M.A., Van Leeuwen, C.J., Hoekstra, J.A., Hermens, J.L.M., 2000. Variation insensitivity of aquatic species to toxicants: practical consequences for effectassessment of chemical substances. Environ. Manag. 25 (4), 415e423.
Van der Linden, S.C., Heringa, M.B., Man, H.Y., Sonneveld, E., Puijker, L.M.,Brouwer, A., Van der Burg, B., 2008. Detection of multiple hormonal activities inwastewater effluents and surface water, using a panel of steroid receptor CALUXbioassays. Environ. Sci. Technol. 42 (15), 5814e5820.
Vergauwen, L., Schmidt, S.N., Stinckens, E., Maho, W., Blust, R., Mayer, P., Covaci, A.,Knapen, D., 2015. A high throughput passive dosing format for the Fish EmbryoAcute Toxicity test. Chemosphere 139, 9e17.
Verhaar, H.J.M., Vanleeuwen, C.J., Hermens, J.L.M., 1992. Classifying environmentalpollutants 1. Structure-activity-relationships for prediction of aquatic toxicity.Chemosphere 25 (4), 471e491.
Villeneuve, D.L., Blankenship, A.L., Giesy, J.P., 2000. Derivation and application ofrelative potency estimates based on in vitro bioassay results. Environ. Toxicol.Chem. 19 (11), 2835e2843.
V€or€osmarty, C.J., McIntyre, P.B., Gessner, M.O., Dudgeon, D., Prusevich, A., Green, P.,Glidden, S., Bunn, S.E., Sullivan, C.A., Liermann, C.R., Davies, P.M., 2010. Globalthreats to human water security and river biodiversity. Nature 467 (7315),555e561.
Wernersson, A.-S., Carere, M., Maggi, C., Tusil, P., Soldan, P., James, A., Sanchez, W.,Dulio, V., Broeg, K., Reifferscheid, G., Buchinger, S., Maas, H., Van Der Grinten, E.,O'Toole, S., Ausili, A., Manfra, L., Marziali, L., Polesello, S., Lacchetti, I., Mancini, L.,Lilja, K., Linderoth, M., Lundeberg, T., Fj€allborg, B., Porsbring, T., Larsson, D.J.,Bengtsson-Palme, J., F€orlin, L., Kienle, C., Kunz, P., Vermeirssen, E., Werner, I.,Robinson, C.D., Lyons, B., Katsiadaki, I., Whalley, C., den Haan, K., Messiaen, M.,Clayton, H., Lettieri, T., Carvalho, R.N., Gawlik, B.M., Hollert, H., Di Paolo, C.,Brack, W., Kammann, U., Kase, R., 2015. The European technical report onaquatic effect-based monitoring tools under the water framework directive.Env. Sci. Eur. 27 (7), 1e11.
Wilson, V.S., Bobseine, K., Lambright, C.R., Gray, L.E., 2002. A novel cell line, MDA-kb2, that stably expresses an androgen- and glucocorticoid-responsive re-porter for the detection of hormone receptor agonists and antagonists. Toxicol.Sci. 66 (1), 69e81.
Wink, S., Hiemstra, S., Huppelschoten, S., Danen, E., Niemeijer, M., Hendriks, G.,Vrieling, H., Herpers, B., van de Water, B., 2014. Quantitative high content im-aging of cellular adaptive stress response pathways in toxicity for chemicalsafety assessment. Chem. Res. Toxicol. 27 (3), 338e355.
Wink, S., Hiemstra, S., Herpers, B., van de Water, B., 2017. High-content imaging-based BAC-GFP toxicity pathway reporters to assess chemical adversity liabil-ities. Archives Toxicol. 91 (3), 1367e1383.
Yamarik, T.A., Andersen, F.A., Cosmetic Ingredient Review E., 2004. Safety assess-ment of dichlorophene and chlorophene. Int. J. Toxicol. 23, 1e27.
Yeh, R.Y.L., Farre, M.J., Stalter, D., Tang, J.Y.M., Molendijk, J., Escher, B.I., 2014. Bio-analytical and chemical evaluation of disinfection by-products in swimmingpool water. Water Res. 59, 172e184.
P.A. Neale et al. / Water Research 123 (2017) 734e750750

Résultats : chapitre B – article n°3
102
Résultats : chapitre B – article n°3
103
Article n°3: “Lack of (anti)estrogenicity of triclosan in zebrafish in vitro
and in vivo reporter gene assay”
2.1 Contexte et objectifs
Le triclosan (TCS) est un agent antibactérien utilisé dans de nombreux produits d’hygiène
personnelle. Rejeté en continu par les stations d’épuration, il est communément retrouvé dans
l’environnement aquatique. De nombreuses études ont mis évidence que le cette molécule avait
des effets, entre autres, sur la voie de signalisation des estrogènes, des androgènes et sur l’axe
thyroïdien (Dann et Hontela, 2011; Yueh et Tukey, 2016). Face à son potentiel PE, le risque posé
par le triclosan est actuellement réévalué par de nombreuses agences réglementaires. Par
exemple, depuis 2016, l’agence américaine FDA (« Food and Drug Administration ») et l’Union
Européenne ont interdit à la vente certains produits d’hygiène en contenant (Commission
Implementing Decision (EU) 2016/110; US Food and Drug Organisation, 2016).
De manière générale, les mécanismes responsables des effets estrogéniques du triclosan
sont mal compris, et les informations concernant sa capacité à activer ou antagoniser ER sont
parfois contradictoires (Yueh et Tukey, 2016). Dans les tests in vitro basé sur des cellules
mammifères exprimant hERα, il est à la fois décrit comme estrogénique (Henry et Fair, 2013), anti-
estrogénique (Ahn et al., 2008), avec des effets prolifératifs (Henry et Fair, 2013) et anti-
proliferatifs (Gee et al., 2008). Chez le poisson, le TCS induit la VTG chez les poissons mâles dans
certaines études uniquement, et plus spécifiquement à faibles concentrations sans effet sur le
succes de la reproduction (Raut and Angus, 2010 ; Ishibashi et al., 2004). Le triclosan étant
communément retrouvé dans l’environnement, le but de cette étude est d’évaluer la capacité
estrogénique et anti-estrogénique du triclosan dans les bio-essais in vitro MELN et ZELH-zfERs et
dans le test in vivo EASZY et d’apporter des informations mécanistiques sur l’activité de cette
molécule spécifiquement sur les ER du poisson zèbre.
2.2 Principaux résultats
Résultats : chapitre B – article n°3
104
Nous observons que le triclosan n’active pas ni antagonise la réponse ER, quel que soit le
bio-essai. Cependant, à 1 µM, le triclosan interfere avec la réponse à l’E2 chez les larves de poisson
zèbre, et spécifiquement à faibles concentrations d’E2. De plus, lors du test EASZY, nous avons
observé qu’une majorité des larves exposées à la plus forte concentration de TCS (1 µM) présentait
des défauts de nages. Bien que qualitative, cette information est en accord avec les effets du
triclosan sur le développement musculosquelettique des poissons (Cherednichenko et al., 2012).
2.3 Conclusions
➢ Le triclosan n’interfère pas avec les récepteurs des œstrogènes humains et de poisson
zèbre in vitro
➢ In vivo, le triclosan n’a pas d’effet (anti)estrogénique dans le bio-essai cyp19a1b-GFP mais
peut interferer avec la réponse à l’estradiol.

Résultats : chapitre B – article n°3
105
ARTICLE n°3
Lack of (anti)estrogenicity of triclosan in zebrafish in vitro and in vivo reporter
gene assays
H. Serra1,2, F. Brion1, H. Budzinski2, S. Aït-Aïssa1
1 Institut National de l’environnement Industriel et des Risques (INERIS), Unité d’Ecotoxicologie
in vitro et in vivo, BP 2, 60550 Verneuil-en-Halatte, France
2 Université de Bordeaux, EPOC-UMR 5805, 33405 Talence, France
* Corresponding author
INTRODUCTION
Triclosan (TCS) is chlorinated phenolic chemical used as a wide spectrum antimicrobial
agent in many personal care products, such as in cosmetics. Around 400 tons of TCS were used in
Europe in 2007, reflecting its extensive application over the last decades (Scientific committee on
consumer safety (SCCS), 2010). As a household chemical, TCS enters into the aquatic environment
mainly through waste water treatment plant effluent releases after incomplete removal by
adsorption to sewage sludge (Dann and Hontela, 2011). TCS is commonly detected in WWTP
effluents (Loos et al., 2013) and in river water where it was reported to occur at concentrations
ranging from the ng/L range up to 2.3 µg/L (Brausch and Rand, 2011; Kolpin et al., 2002; Schultz
et al., 2012).
TCS toxicity in vivo has been well studied, particularly regarding its endocrine disrupting
capacity. TCS was shown to interfere with the thyroid, estrogen and androgen signaling pathways
in several organisms, including frogs, rat and fish, raising concern among scientists and regulators
about its effects in human and wild life (Dann and Hontela, 2011; Triclosan - Substance evaluation
- CoRAP - ECHA). In fish, TCS was first suggested to be an androgenic chemical, as Foran et al.
(2000) observed a tendency of TCS to induce a biased sex ratio toward males after exposure of
medaka fry to 100 µg/L. TCS endocrine disrupting effects were further investigated, with regard
to its estrogenicity. Raut and Angus (2010) and Ishibashi et al. (2004) reported the induction

Résultats : chapitre B – article n°3
106
vitellogenin (VTG) in male mosquito fish and medaka, respectively, after exposure to 100 µg/L TCS.
The VTG induction was however observed at the low concentrations tested. Furthermore, the
reproductive success of medaka exposed for 21 days up to 200 µg/L was not impacted (Ishibashi
et al., 2004) and TCS did not induce VTG in male fathead minnow exposed for 21 days up to 450
ng/L (Schultz et al. 2012). A recent in vitro study comparing ERα ligand binding domain affinity of
several fish species to estrogenic chemicals showed that TCS activated selectively some fish ERα,
suggesting possible fish-species specific sensitivity toward TCS (Miyagawa et al., 2014).
Numerous studies addressed the in vitro estrogenic effects of TCS in transactivation (TA)
and proliferative assays with, however, contrasting outcomes. For instance, TCS was found to
transactivate hERα in transitory transfected monkey cells (H. Huang et al., 2014) and to promote
MCF-7 cell growth up to 80% of positive control effect at 75 µM (Henry and Fair, 2013). The
proliferative effect of TCS in MCF-7 cells was associated with changes in expression of endogenous
target genes pS2 and hERα similar to E2 response (Henry and Fair, 2013) and was blocked by
addition of ICI (Kim et al., 2016). While TCS was reported to compete with E2 to bind recombinant
hERα/hERβ (Gee et al., 2008), suggesting the involvement of ER in TCS response, other studies
suggested the lack of agonist activity of TCS toward hERα in similar TA and described TCS as anti-
estrogenic (Ahn et al., 2008; Gee et al., 2008).
To date, most in vitro studies on TCS anti(estrogenic) effects originate from mammalian
test systems. Despite much information obtained so far suggesting the involvement of ER signaling
in TCS response, the underlying mechanism of its estrogen-related effects remains unclear. In
addition, TCS is widely and worldwide detected in the aquatic environment, but only few
mechanistic studies focused on ER signaling pathway in fish. Therefore, our study aims at
investigating TCS interaction with ER signaling using in vivo and in vivo zebrafish ER reporter gene
assays, addressing both TCS estrogenic and anti-estrogenic effects, and comparing the response
with a well-studied human reporter cell line. For this purpose, we exposed (1) zebrafish liver cell
lines stably transfected to express selectively zfERα (ZELHα), zfERβ1 (ZELHβ1) or zfERβ2 (ZELHβ2),
(2) human breast cancer MCF-7 cells expressing endogenous hERα (MELN) and (3) in vivo
transgenic cyp19a1b-GFP zebrafish embryos, which express cyp19a1b gene under the strict
regulation of ER in radial glial cells, to TCS in presence and absence of estradiol (E2).

Résultats : chapitre B – article n°3
107
MATERIAL AND METHODS
Chemicals and reagents
17β-estradiol (E2, CAS n°50-28-2), ethinylestradiol (EE2, CAS n°57-63-6) and triclosan (TCS,
CAS n°3380-34-5) were purchased from Sigma-Aldrich (France). Dimethylsulfoxide (DMSO),
Leibovitz 15 culture medium (L-15), fetal calf serum (FCS), 4-(2-hydroxy-ethyl)-1-
piperazineethanesulfonic acid (HEPES), epidermal growth factor (EGF), G418, 3-[4,5-
dimethylthiazol-2-yl]-2,5-diphenyl-tetrazoliumbromide (MTT) and D-luciferin were purchased
from Sigma Aldrich (St-Quentin Fallavier, France); Dulbecco's Modified Eagle Medium High
Glucose (DMEM HG) powder, F-12 nutrient mixture (Ham's F12) powder, penicillin and
streptomycin were from Gibco (France); insulin, hygromycin B and sodium bicarbonate were from
Dominique Dutscher (France).
In vitro assays: cell culture, luciferase and cell viability assays
The zebrafish in vitro assays were derived from the zebrafish liver (ZFL) cell line that was
stably transfected first by an ERE-driven luciferase gene, yielding the ZELH cell line, and then by
zfERα subtype, yielding the ZELH-zfERα, by zfERβ1 subtype yielding the ZELH-zfERβ1 cell lines or
by zfERβ2 subtype yielding the ZELHβ2 cell lines (Cosnefroy et al., 2012). Establishment of these
cell models and their response to different classes of well-known xeno-estrogens have been
previously described (Cosnefroy et al., 2012, Sonavane et al., 2016). In addition, the ZFL and ZELH
cell lines were used as ER-negative controls. In addition to the zebrafish cell models, we used the
human-derived MELN cell line (Balaguer et al., 1999) kindly provided by Dr. Patrick Balaguer
(INSERM Montpellier, France). The MELN cells are derived from the MCF-7 cells, which
endogenously express the hERα, but no functional hERβ (P. Balaguer, personal communication).
Conditions for routine cell culture and exposure to chemicals have been detailed previously
(Balaguer et al., 1999, Cosnefroy et al., 2012, Sonavane et al. 2016). Briefly, ZELH-zfERs cells were
seeded in 96-well white opaque culture plates (Greiner CellStar™, Dutscher, France) at 25,000 cells
per well in phenol red free LDF-DCC medium (containing 50% of L-15, 35% of DMEM HG, 15% of
Ham's F12, 15 mM of HEPES, 0.15 g/l of sodium bicarbonate, 0.01 mg/ml of insulin, 50 ng/ml of
EGF and 50 U/ml of penicillin and streptomycin antibiotics, 5% v/v stripped FCS). MELN were
seeded at 80,000 cells per well cell line in steroid-free DMEM medium. Cells were left to adhere
Résultats : chapitre B – article n°3
108
for 24 h. Then, they were exposed in triplicates to serial dilutions of test compound for either 72 h
at 28 °C for zebrafish cells or 16h at 37°C for MELN cells. After exposure, luciferase activity was
measured. The medium was removed and replaced by 50 μl per well of medium containing
0.3 mM luciferin. The luminescence signal was measured in living cells using a microtiter plate
luminometer (Synergy H4, BioTek). The effect of test chemicals on cell viability was assessed by
using the 3-(4,5-dimethyl-thiazol-2-yl)-2,5diphenyl tetrazolium bromide (MTT) assay (Mosmann
1983). After cell exposure, culture medium was removed and replaced by 100 μL of medium
containing 0.5 mg/mL MTT. Cells were incubated for 3 h. In metabolically active cells, MTT is
reduced onto a blue formazan precipitate, which was dissolved by adding 100 μL of DMSO after
removal of MTT containing medium. Plates were then read at 570 nm against a 640 nm reference
wavelength on a microplate reader (KC-4, BioTek Instruments, France) and results were expressed
as absorbance relative to control cells.
In vivo zebrafish bioassays
In vivo (anti)estrogenicity of TCS was assessed using the transgenic cyp19a1b-GFP zebrafish
line previously developed (Tong et al., 2009) and well characterized with different classes of
estrogens and xeno-estrogen compounds (Brion et al., 2012). The assay procedure for individual
chemical testing has been described in detail by Brion et al. (2012). In brief, 20 fertilized transgenic
eggs were selected for each experimental group and exposed for 96 h in 25 ml of acclimated water
in glass crystallizers. Serial dilutions were tested with a final volume of solvent (DMSO) of 0.01%
v/v, a concentration without any effects on embryo development or GFP expression. In each
experimental series, positive (EE2 0.05 nM) and DMSO controls were included as separate
experimental groups. Exposed embryos were incubated at 28 °C, under semi-static conditions with
daily complete renewal of medium. After the exposure period, each zebrafish larva was
photographed using a Zeiss AxioImager.Z1 microscope equipped with an AxioCam Mrm camera
(Zeiss GmbH, Gottingen, Germany) to measure GFP expression in the brain. Image analysis was
performed using the ImageJ software, and fluorescence data was treated exactly as previously
described (Brion et al., 2012).
Data analysis
Dose-response curves were fitted to the experimental data using the Hill equation as
provided in the RegTox 7.5 Microsoft Excel™ macro, freely available at
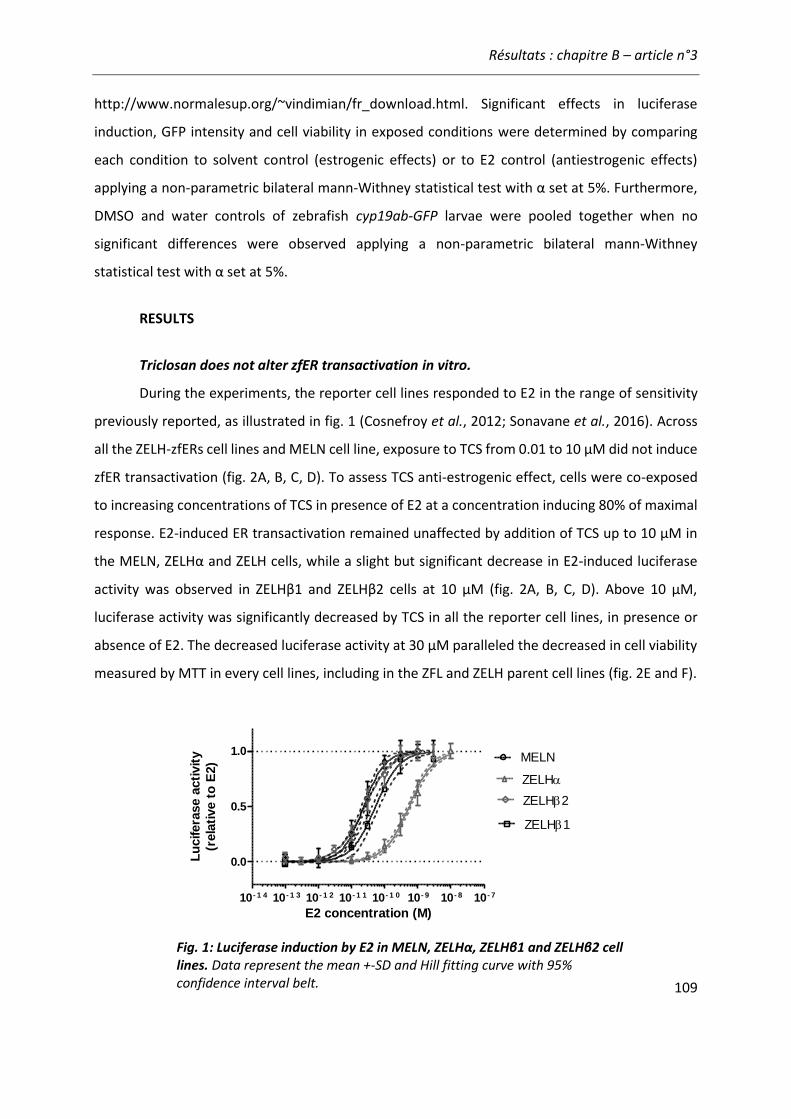
Résultats : chapitre B – article n°3
109
http://www.normalesup.org/~vindimian/fr_download.html. Significant effects in luciferase
induction, GFP intensity and cell viability in exposed conditions were determined by comparing
each condition to solvent control (estrogenic effects) or to E2 control (antiestrogenic effects)
applying a non-parametric bilateral mann-Withney statistical test with α set at 5%. Furthermore,
DMSO and water controls of zebrafish cyp19ab-GFP larvae were pooled together when no
significant differences were observed applying a non-parametric bilateral mann-Withney
statistical test with α set at 5%.
RESULTS
Triclosan does not alter zfER transactivation in vitro.
During the experiments, the reporter cell lines responded to E2 in the range of sensitivity
previously reported, as illustrated in fig. 1 (Cosnefroy et al., 2012; Sonavane et al., 2016). Across
all the ZELH-zfERs cell lines and MELN cell line, exposure to TCS from 0.01 to 10 µM did not induce
zfER transactivation (fig. 2A, B, C, D). To assess TCS anti-estrogenic effect, cells were co-exposed
to increasing concentrations of TCS in presence of E2 at a concentration inducing 80% of maximal
response. E2-induced ER transactivation remained unaffected by addition of TCS up to 10 µM in
the MELN, ZELHα and ZELH cells, while a slight but significant decrease in E2-induced luciferase
activity was observed in ZELHβ1 and ZELHβ2 cells at 10 µM (fig. 2A, B, C, D). Above 10 µM,
luciferase activity was significantly decreased by TCS in all the reporter cell lines, in presence or
absence of E2. The decreased luciferase activity at 30 µM paralleled the decreased in cell viability
measured by MTT in every cell lines, including in the ZFL and ZELH parent cell lines (fig. 2E and F).
10- 1 4 10- 1 3 10- 1 2 10- 1 1 10- 1 0 10- 9 10- 8 10- 7
0.0
0.5
1.0MELN
ZELH
ZELH2
ZELH1
E2 concentration (M)
Lu
cifera
se a
cti
vit
y
(rela
tive t
o E
2)
Fig. 1: Luciferase induction by E2 in MELN, ZELHα, ZELHβ1 and ZELHβ2 cell lines. Data represent the mean +-SD and Hill fitting curve with 95% confidence interval belt.
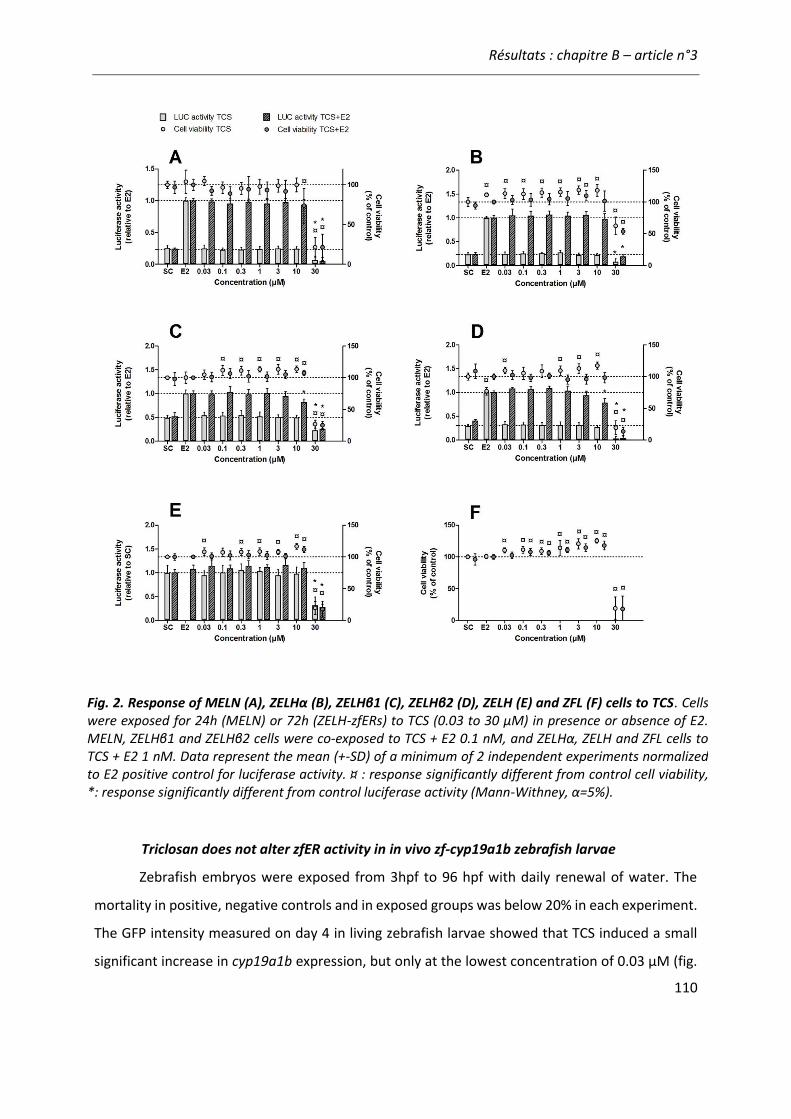
Résultats : chapitre B – article n°3
110
Triclosan does not alter zfER activity in in vivo zf-cyp19a1b zebrafish larvae
Zebrafish embryos were exposed from 3hpf to 96 hpf with daily renewal of water. The
mortality in positive, negative controls and in exposed groups was below 20% in each experiment.
The GFP intensity measured on day 4 in living zebrafish larvae showed that TCS induced a small
significant increase in cyp19a1b expression, but only at the lowest concentration of 0.03 µM (fig.
Fig. 2. Response of MELN (A), ZELHα (B), ZELHβ1 (C), ZELHβ2 (D), ZELH (E) and ZFL (F) cells to TCS. Cells were exposed for 24h (MELN) or 72h (ZELH-zfERs) to TCS (0.03 to 30 µM) in presence or absence of E2. MELN, ZELHβ1 and ZELHβ2 cells were co-exposed to TCS + E2 0.1 nM, and ZELHα, ZELH and ZFL cells to TCS + E2 1 nM. Data represent the mean (+-SD) of a minimum of 2 independent experiments normalized to E2 positive control for luciferase activity. ¤ : response significantly different from control cell viability, *: response significantly different from control luciferase activity (Mann-Withney, α=5%).
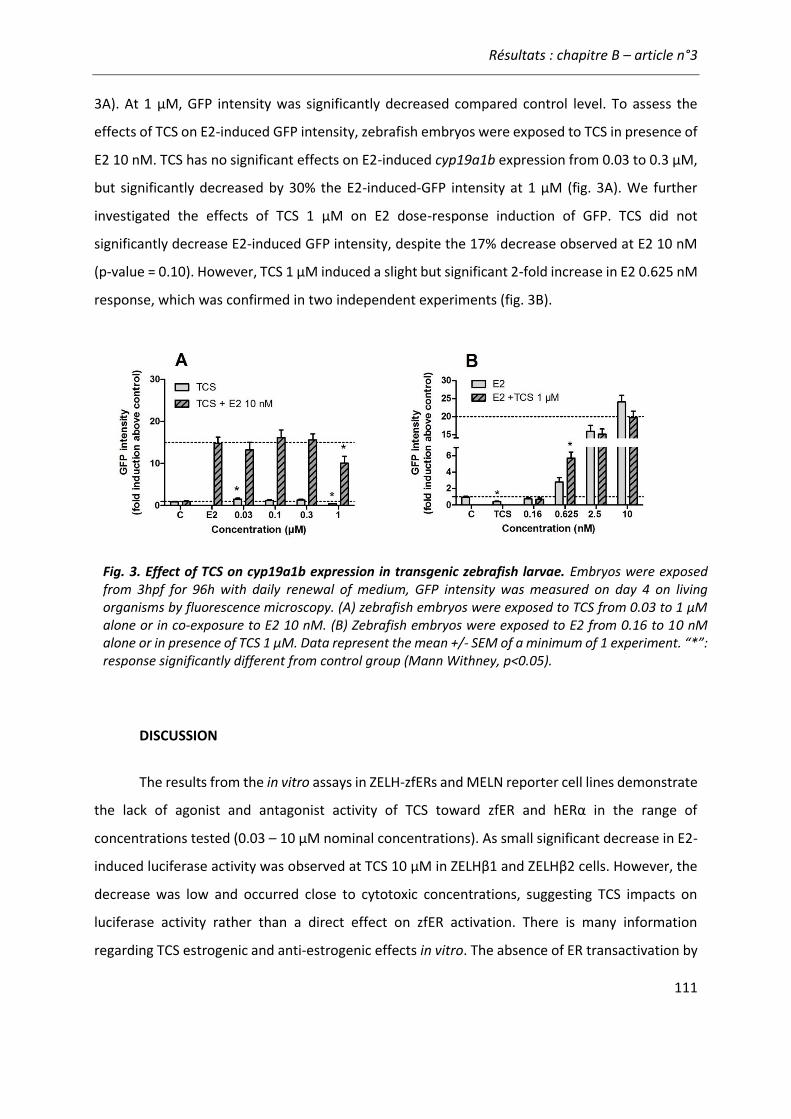
Résultats : chapitre B – article n°3
111
3A). At 1 µM, GFP intensity was significantly decreased compared control level. To assess the
effects of TCS on E2-induced GFP intensity, zebrafish embryos were exposed to TCS in presence of
E2 10 nM. TCS has no significant effects on E2-induced cyp19a1b expression from 0.03 to 0.3 µM,
but significantly decreased by 30% the E2-induced-GFP intensity at 1 µM (fig. 3A). We further
investigated the effects of TCS 1 µM on E2 dose-response induction of GFP. TCS did not
significantly decrease E2-induced GFP intensity, despite the 17% decrease observed at E2 10 nM
(p-value = 0.10). However, TCS 1 µM induced a slight but significant 2-fold increase in E2 0.625 nM
response, which was confirmed in two independent experiments (fig. 3B).
DISCUSSION
The results from the in vitro assays in ZELH-zfERs and MELN reporter cell lines demonstrate
the lack of agonist and antagonist activity of TCS toward zfER and hERα in the range of
concentrations tested (0.03 – 10 µM nominal concentrations). As small significant decrease in E2-
induced luciferase activity was observed at TCS 10 µM in ZELHβ1 and ZELHβ2 cells. However, the
decrease was low and occurred close to cytotoxic concentrations, suggesting TCS impacts on
luciferase activity rather than a direct effect on zfER activation. There is many information
regarding TCS estrogenic and anti-estrogenic effects in vitro. The absence of ER transactivation by
Fig. 3. Effect of TCS on cyp19a1b expression in transgenic zebrafish larvae. Embryos were exposed from 3hpf for 96h with daily renewal of medium, GFP intensity was measured on day 4 on living organisms by fluorescence microscopy. (A) zebrafish embryos were exposed to TCS from 0.03 to 1 µM alone or in co-exposure to E2 10 nM. (B) Zebrafish embryos were exposed to E2 from 0.16 to 10 nM alone or in presence of TCS 1 µM. Data represent the mean +/- SEM of a minimum of 1 experiment. “*”: response significantly different from control group (Mann Withney, p<0.05).
Résultats : chapitre B – article n°3
112
TCS alone in the zebrafish reporter cell lines is in agreement with previous studies based on human
cells transfected with recombinant fish or human ERα (Ahn et al., 2008; Gee et al., 2008; Miyagawa
et al., 2014). To our knowledge, no information on zfERβ1 and zfERβ2 subtypes implication in TCS
response are available so far, impeding any comparison. Contrasting with the lack of estrogenic
effects, the absence of anti-estrogenic activity observed in the zebrafish and human reporter cell
lines differs from previous reports. Except one study showing no effect of TCS on EE2-induced
hERα activation in cancer cells (Louis et al. 2013), several in vitro studies described TCS as anti-
estrogenic in TA and proliferative assays (Ahn et al. 2008, Gee et al. 2008, Henry et al. 2011). To
our knowledge no information on anti-estrogenic effect of TCS on fish ER has been previous
reported, thus, differences between test systems, i.e. organism (fish vs human), tissue (cancer
cells vs hepatocytes) and ER subtype (ERα vs ERβ1/β2), may contribute to the differences
observed.
In the present study, we noticed a decrease in reporter gene activity at 30 µM TCS,
irrespectively of E2 in all the cell lines, which paralleled a marked decrease in cell viability. TCS was
shown to induce a caspase-dependent apoptosis in neuronal cells (Park et al., 2016; Szychowski
et al., 2015) and to reduce cell viability by targeting cell proliferation in mouse embryonic stem
cells (Chen et al., 2015) and in MCF-7 cells (Liu et al., 2002). Thus, the decreased cell viability
observed in ZFL-derived cells and in MELN cells at 30 µM is in agreement with the broad cellular
toxicity of TCS reported in the high µM range.
TCS (anti)estrogenic effects were further investigated in vivo using transgenic zebrafish
embryos that express GFP under the control of cyp19a1b promoter in radial glial cells (Brion et al.
2012). Cyp19a1b codes for the brain aromatase (aromatase B) responsible of the conversion of
androgens into estrogens and which expression is highly inducible by ER agonists at the embryonic
stage through an auto-regulatory loop (Le Page et al., 2008; Menuet et al., 2005). In the present
study, we showed that TCS did not induce cyp19a1b expression and did not significantly reduced
10 nM E2-induced cyp19a1b expression from 0.03 to 1 µM. These results are in line with the in
vitro data obtained in this study in the same model species.
At 1 µM, TCS significantly decreased GFP intensity as compared to other tested
concentrations. To our knowledge, no chemical has been reported to decrease basal cyp19a1b
Résultats : chapitre B – article n°3
113
expression in zebrafish embryos. Interestingly, TCS is known to target the thyroid axis in many
organisms, including in fish at the larval and adult stages (Pinto et al., 2013; Schnitzler et al., 2016).
Thyroid hormones are essential to central nervous system development and function (Di Liegro,
2008). For instance, triiodothyronine (T3) is necessary for oligodendrocytes and astrocytes
differentiation from glial cells (Noda, 2015). TCS was shown to alter the thyroid system of
Cyprinodon variegates larvae, including T3 levels (Schnitzler et al., 2016). Thus, we may
hypothesize that the decrease in GFP intensity observed at 1 µM TCS may result from neuro-
developmental toxicity, including toxic effects toward radial glial cells supporting GFP intensity. In
addition, we noticed the predominance of lethargy and swimming alterations in zebrafish larvae
exposed to 1 µM TCS, irrespectively from E2 10 nM addition. Albeit qualitative, these observations
are in agreement with fathead minnow and rainbow trout embryo-larval developmental toxicity
reported in the same range of concentrations (Cherednichenko et al., 2012; Orvos et al., 2002).
Alteration of swimming behavior in larvae was shown to be specific mode of action of TCS in fish,
as TCS targets the ryanodine receptor channels involve in calcium release from the endoplasmic,
impairing excitation-contraction coupling in skeletal muscles of fish (Ahn et al., 2008; Brennan et
al., 2005; Cherednichenko et al., 2012; Fritsch et al., 2013).
As TCS at 1 µM induced specific effects and decreased GFP expression compared to other
test concentrations, we further tested the effect of TCS 1 µM on cyp19a1b induction at lower E2
concentrations. Our results indicate that TCS 1 µM did not decrease E2-induced GFP intensity from
0.16 to 10 nM E2. However, a slight significant 2-fold increase in GFP intensity was measured when
TCS 1 µM was co-exposed to E2 0.625 nM. Similar low dose effects and non-monotonic responses
were previously described in fish regarding VTG induction by TCS in male medaka and mosquito
fish (Ishibashi et al. 2004, Raut et Agnus 2010). In mammals, several authors suggested that TCS
may interact with circulating hormones and thus increase the action of estrogens (Feng et al.,
2016; Zorrilla et al., 2009). For instance, TCS was shown to potentiate the EE2 response in the rat
uterotrophic assay (Louis et al., 2013; Stoker et al., 2010).
Among all possible TCS toxicity pathways, our study addressed the very specific effect of
TCS on zfER transactivation in zebrafish reporter gene assays. Our results demonstrated that TCS
lacks agonist and antagonist activities toward zfER in in vitro and in vivo, and toward hERα in vitro
in reporter gene assays. At 1 µM, TCS interfered with low E2 concentration in transgenic zebrafish

Résultats : chapitre B – article n°3
114
larvae, suggesting that modulation of E2 response may occur in zebrafish, but irrespectively of
direct binding and transactivation of zfERs.
ACKNOWLEDGEMENTS
This study is supported by INERIS and by SOLUTIONS Project from the European Union Seventh
Framework Program (FP7-ENV-2013-two-stage Collaborative project) under grant agreement
603437. We would like to thank Emmanuelle Maillot-Marechal and Benjamin Piccini for technical
support.
Résultats : chapitre B – article n°3
115
REFERENCES
Ahn, K.C., Zhao, B., Chen, J., Cherednichenko, G., Sanmarti, E., Denison, M.S., Lasley, B., Pessah, I.N., Kultz, D., Chang, D.P.Y., Gee, S.J., Hammock, B.D., 2008. In vitro biologic activities of the antimicrobials triclocarban, its analogs, and triclosan in bioassay screens: Receptor-based bioassay screens. Environ. Health Perspect. 116, 1203–1210. doi:10.1289/ehp.11200
Balaguer, P., Francois, F., Comunale, F., Fenet, H., Boussioux, A.M., Pons, M., Nicolas, J.C., Casellas, C., 1999. Reporter cell lines to study the estrogenic effects of xenoestrogens. Sci. Total Environ. 233, 47–56. doi:10.1016/S0048-9697(99)00178-3
Brausch, J.M., Rand, G.M., 2011. A review of personal care products in the aquatic environment: environmental concentrations and toxicity. Chemosphere 82, 1518–1532. doi:10.1016/j.chemosphere.2010.11.018
Brennan, C., Mangoli, M., Dyer, C.E.F., Ashworth, R., 2005. Acetylcholine and calcium signalling regulates muscle fibre formation in the zebrafish embryo. J. Cell Sci. 118, 5181–5190. doi:10.1242/jcs.02625
Brion, F., Le Page, Y., Piccini, B., Cardoso, O., Tong, S.-K., Chung, B., Kah, O., 2012. Screening Estrogenic Activities of Chemicals or Mixtures In vivo Using Transgenic (cyp19a1b-GFP) Zebrafish Embryos. Plos One 7, e36069. doi:10.1371/journal.pone.0036069
Chen, X., Xu, B., Han, X., Mao, Z., Chen, M., Du, G., Talbot, P., Wang, X., Xia, Y., 2015. The effects of triclosan on pluripotency factors and development of mouse embryonic stem cells and zebrafish. Arch. Toxicol. 89, 635–646. doi:10.1007/s00204-014-1270-2
Cherednichenko, G., Zhang, R., Bannister, R.A., Timofeyev, V., Li, N., Fritsch, E.B., Feng, W., Barrientos, G.C., Schebb, N.H., Hammock, B.D., Beam, K.G., Chiamvimonvat, N., Pessah, I.N., 2012. Triclosan impairs excitation-contraction coupling and Ca2+ dynamics in striated muscle. Proc. Natl. Acad. Sci. U. S. A. 109, 14158–14163. doi:10.1073/pnas.1211314109
Cosnefroy, A., Brion, F., Maillot-Maréchal, E., Porcher, J.-M., Pakdel, F., Balaguer, P., Aït-Aïssa, S., 2012. Selective activation of zebrafish estrogen receptor subtypes by chemicals by using stable reporter gene assay developed in a zebrafish liver cell line. Toxicol. Sci. Off. J. Soc. Toxicol. 125, 439–449. doi:10.1093/toxsci/kfr297
Dann, A.B., Hontela, A., 2011. Triclosan: environmental exposure, toxicity and mechanisms of action. J. Appl. Toxicol. 31, 285–311. doi:10.1002/jat.1660
Di Liegro, I., 2008. Thyroid hormones and the central nervous system of mammals (Review). Mol. Med. Rep. 1, 279–295.
Feng, Y., Zhang, P., Zhang, Z., Shi, J., Jiao, Z., Shao, B., 2016. Endocrine Disrupting Effects of Triclosan on the Placenta in Pregnant Rats. Plos One 11, e0154758. doi:10.1371/journal.pone.0154758
Foran, C.M., Bennett, E.R., Benson, W.H., 2000. Developmental evaluation of a potential non-steroidal estrogen: triclosan. Mar. Environ. Res. 50, 153–156. doi:10.1016/S0141-1136(00)00080-5
Fritsch, E.B., Connon, R.E., Werner, I., Davies, R.E., Beggel, S., Feng, W., Pessah, I.N., 2013. Triclosan Impairs Swimming Behavior and Alters Expression of Excitation-Contraction Coupling Proteins in Fathead Minnow (Pimephales promelas). Environ. Sci. Technol. 47, 2008–2017. doi:10.1021/es303790b
Résultats : chapitre B – article n°3
116
Gee, R.H., Charles, A., Taylor, N., Darbre, P.D., 2008. Oestrogenic and androgenic activity of triclosan in breast cancer cells. J. Appl. Toxicol. 28, 78–91. doi:10.1002/jat.1316
Huang, H., Du, G., Zhang, W., Hu, J., Wu, D., Song, L., Xia, Y., Wang, X., 2014. The in vitro estrogenic activities of triclosan and triclocarban. J. Appl. Toxicol. 34, 1060–1067. doi:10.1002/jat.3012
Ishibashi, H., Matsumura, N., Hirano, M., Matsuoka, M., Shiratsuchi, H., Ishibashi, Y., Takao, Y., Arizono, K., 2004. Effects of triclosan on the early life stages and reproduction of medaka Oryzias latipes and induction of hepatic vitellogenin. Aquat. Toxicol. 67, 167–179. doi:10.1016/j.aquatox.2003.12.005
Kim, S.-H., Hwang, K.-A., Choi, K.-C., 2016. Treatment with kaempferol suppresses breast cancer cell growth caused by estrogen and triclosan in cellular and xenograft breast cancer models. J. Nutr. Biochem. 28, 70–82. doi:10.1016/j.jnutbio.2015.09.027
Kolpin, D.W., Furlong, E.T., Meyer, M.T., Thurman, E.M., Zaugg, S.D., Barber, L.B., Buxton, H.T., 2002. Pharmaceuticals, hormones, and other organic wastewater contaminants in. Environ. Sci. Technol. 36, 1202–1211. doi:10.1021/es011055j
Le Page, Y., Menuet, A., Kah, O., Pakdel, F., 2008. Characterization of a cis-acting element involved in cell-specific expression of the zebrafish brain aromatase gene. Mol. Reprod. Dev. 75, 1549–1557. doi:10.1002/mrd.20892
Liu, B.Q., Wang, Y.Q., Fillgrove, K.L., Anderson, V.E., 2002. Triclosan inhibits enoyl-reductase of type I fatty acid synthase in vitro and is cytotoxic to MCF-7 and SKBr-3 breast cancer cells. Cancer Chemother. Pharmacol. 49, 187–193. doi:10.1007/s00280-001-0399-x
Loos, R., Carvalho, R., Antonio, D.C., Cornero, S., Locoro, G., Tavazzi, S., Paracchini, B., Ghiani, M., Lettieri, T., Blaha, L., Jarosova, B., Voorspoels, S., Servaes, K., Haglund, P., Fick, J., Lindberg, R.H., Schwesig, D., Gawlik, B.M., 2013. EU-wide monitoring survey on emerging polar organic contaminants in wastewater treatment plant effluents. Water Res. 47, 6475–6487. doi:10.1016/j.watres.2013.08.024
Louis, G.W., Hallinger, D.R., Stoker, T.E., 2013. The effect of triclosan on the uterotrophic response to extended doses of ethinyl estradiol in the weanling rat. Reprod. Toxicol. 36, 71–77. doi:10.1016/j.reprotox.2012.12.001
Menuet, A., Pellegrini, E., Brion, F., Gueguen, M.M., Anglade, I., Pakdel, F., Kah, O., 2005. Expression and estrogen-dependent regulation of the zebrafish brain aromatase gene. J. Comp. Neurol. 485, 304–320. doi:10.1002/cne.20497
Miyagawa, S., Lange, A., Hirakawa, I., Tohyama, S., Ogino, Y., Mizutani, T., Kagami, Y., Kusano, T., Ihara, M., Tanaka, H., Tatarazako, N., Ohta, Y., Katsu, Y., Tyler, C.R., Iguchi, T., 2014. Differing species responsiveness of estrogenic contaminants in fish is conferred by the ligand binding domain of the estrogen receptor. Environ. Sci. Technol. 48, 5254–5263. doi:10.1021/es5002659
Noda, M., 2015. Possible role of glial cells in the relationship between thyroid dysfunction and mental disorders. Front. Cell. Neurosci. 9, 194. doi:10.3339/fncel.2015.00194
Orvos, D.R., Versteeg, D.J., Inauen, J., Capdevielle, M., Rothenstein, A., Cunningham, V., 2002. Aquatic toxicity of triclosan. Environ. Toxicol. Chem. 21, 1338–1349. doi:10.1897/1551-5028(2002)021<1338:ATOT>2.0.CO;2
Park, B.K., Gonzales, E.L.T., Yang, S.M., Bang, M., Choi, C.S., Shin, C.Y., 2016. Effects of Triclosan on Neural Stem Cell Viability and Survival. Biomol. Ther. 24, 99–107. doi:10.4062/biomolther.2015.164
Résultats : chapitre B – article n°3
117
Pinto, P.I.S., Guerreiro, E.M., Power, D.M., 2013. Triclosan interferes with the thyroid axis in the zebrafish (Danio rerio). Toxicol. Res. 2, 60–69. doi:10.1039/c2tx20005h
Raut, S.A., Angus, R.A., 2010. Triclosan Has Endocrine-Disrupting Effects in Male Western Mosquitofish, Gambusia Affinis. Environ. Toxicol. Chem. 29, 1287–1291. doi:10.1002/etc.150
Schnitzler, J.G., Frédérich, B., Dussenne, M., Klaren, P.H.M., Silvestre, F., Das, K., 2016. Triclosan exposure results in alterations of thyroid hormone status and retarded early development and metamorphosis in Cyprinodon variegatus. Aquat. Toxicol. 181, 1–10. doi:10.1016/j.aquatox.2016.10.019
Schultz, M.M., Bartell, S.E., Schoenfuss, H.L., 2012. Effects of triclosan and triclocarban, two ubiquitous environmental contaminants, on anatomy, physiology, and behavior of the fathead minnow (Pimephales promelas). Arch. Environ. Contam. Toxicol. 63, 114–124. doi:10.1007/s00244-011-9748-x
Scientific committee on consumer safety (SCCS), 2010. Opinion on triclosan - Antimicrobial resistance (No. SCCP/1251/09).
Sonavane, M., Creusot, N., Maillot-Maréchal, E., Péry, A., Brion, F., Aїt-Aïssa, S., 2016. Zebrafish-based reporter gene assays reveal different estrogenic activities in river waters compared to a conventional human-derived assay. Sci. Total Environ. 550, 934–939. doi:10.1016/j.scitotenv.2016.01.187
Stoker, T.E., Gibson, E.K., Zorrilla, L.M., 2010. Triclosan exposure modulates estrogen-dependent responses in the female wistar rat. Toxicol. Sci. Off. J. Soc. Toxicol. 117, 45–53. doi:10.1093/toxsci/kfq180
Szychowski, K.A., Sitarz, A.M., Wojtowicz, A.K., 2015. Triclosan induces Fas receptor-dependent apoptosis in mouse neocortical neurons in vitro. Neuroscience 284, 192–201. doi:10.1016/j.neuroscience.2014.10.001
Tong, S.-K., Mouriec, K., Kuo, M.-W., Pellegrini, E., Gueguen, M.-M., Brion, F., Kah, O., Chung, B., 2009. A cyp19a1b-GFP (Aromatase B) Transgenic Zebrafish Line That Expresses GFP in Radial Glial Cells. Genesis 47, 67–73. doi:10.1002/dvg.20459
Triclosan - Substance evaluation - CoRAP - ECHA [WWW Document], n.d. URL https://echa.europa.eu/information-on-chemicals/evaluation/community-rolling-action-plan/corap-table/-/dislist/details/0b0236e1807e4774 (accessed 3.28.17).
Zorrilla, L.M., Gibson, E.K., Jeffay, S.C., Crofton, K.M., Setzer, W.R., Cooper, R.L., Stoker, T.E., 2009. The Effects of Triclosan on Puberty and Thyroid Hormones in Male Wistar Rats. Toxicol. Sci. 107, 56–64. doi:10.1093/toxsci/kfn225

Résultats : chapitre B – article n°3
118
Résultats : chapitre C – article n°4
119
Evaluer les xeno-estrogènes en mélanges avec des
polluants environnementaux
L’objectif de ce chapitre est d’évaluer dans nos bio-essais l’activité estrogénique de xéno-
estrogènes lorsqu’ils sont présents au sein de mélanges. Nous avons adressé deux cas de figures :
(1) l’influence de ligands de AhR sur la réponse estrogénique (article n°4), et (2) la détection de
xéno-estrogènes au sein d’un mélange de 12 molécules comprenant des molécules non actives et
inhibitrices par une approche incluant une modélisation des effets additifs des xeno-estrogènes
(article n°5).
Article n°4: “Interference between AhR and ER signalling pathways in
human in vitro and zebrafish in vitro and in vivo bioassays used for
estrogenicity monitoring”
1.1 Contexte et objectifs
Les contaminants environnementaux peuvent affecter le système endocrinien par de
nombreux mécanismes, à l’image les dioxines et composés dioxine-like qui sont capables
d’interférer avec la signalisation de ER. Comme nous l’avons vu dans l’article n°3, le ligand de AhR
BaP était estrogénique dans les MELN mais anti-estrogénique dans les ZELH-zfERs, soulevant la
question de l’implication de AhR dans la réponse des ZELH-zfERs, d’autant que les ZELH-zfERs
proviennent de cellules de foie de poisson zèbre où les genes ahr2 et cyp1a sont inductibles (Eide
et al., 2014).
L’objectif de cette étude est d’évaluer une possible interaction entre ER et AhR dans les
modèles utilisés pour évaluer l’estrogénicité environnementale in vitro et in vivo. Pour cela, les
bio-essais ont été exposé à la TCDD et à l’E2, seul, en combinaison et en présence d’antagoniste
de ER (ICI) ou de AhR (CH223191). L’interaction réciproque entre les deux voies de signalisation a
été évaluée en mesurant l’activité de la luciférase (in vitro), EROD (in vitro) et l’intensité de la GFP
(test ESAZY), ainsi que l’expression de gènes endogènes ER- (pS2, vtg1-5 et vtg7, cyp19a1b) et
AhR-régulés (ahr, ahr2, cyp1a). Ce travail est le fruit d’une collaboration avec Patrice Gonzalez et
Résultats : chapitre C – article n°4
120
son équipe (laboratoire EPOC/OASU, Université de Bordeaux) concernant l’approche moléculaire
(PCR) de l’étude.
1.2 Principaux résultats
D’une marnière générale, nous observons qu’il y a une interaction réciproque entre les
voies AhR et ER dans tous les modèles étudiés avec des différences marquées entre bio-essais in
vitro humain et poisson zèbre et une bonne concordance entre modèles in vitro et in vivo de
poisson zèbre.
Sur la voie ER, la TCDD, seule et en présence d’E2, induit une augmentation de l’activité
luciférase sur les MELN qui est abolie par l’antagoniste de AhR, le CH223191, confirmant le rôle
de AhR. A l’inverse, la TCDD diminue l’activité de la luciférase induite par l’E2 dans les ZELH-zfERs
et dans les larves cyp19a1b-GFP. In vitro, l’anti-estrogénicité est beaucoup plus marquée sur
l’activité de la luciférase dans les ZELHα que dans les ZELHβ2. A 72h d’exposition, le CH223191 ne
permet pas de lever significativement l’effet anti-estrogénique in vitro, mais restaure
partiellement l’activité de la GFP dans les larves de poisson zèbre.
Ces interactions croisées sont également retrouvées, dans une certaine mesure, sur
l’expression de gènes endogènes cibles de ces récepteurs. Dans les cellules MELN, l’expression de
pS2 est différemment affectée par la TCDD : seule, la TCDD diminue l’expression de pS2 et n’a
aucun effet en présence d’E2. Dans les ZELHα, seule l’expression induite par l’E2 de la vtg3 est
diminuée par la TCDD à 72h d’exposition, et son expression est restaurée en présence de
CH223191. Dans les ZELHβ2, seule l’expression induite par l’E2 de la vtg5 est diminuée en présence
de TCDD, et son niveau d’expression n’est pas modifié en présence de CH223191. Comparée aux
résultats obtenus à 24h d’exposition, l’anti-estrogénicité de la TCDD sur l’expression de vtg5 s’est
amplifiée à 72h et n’est plus antagonisée par le CH223191. Dans les larves de poisson zèbre, le
profil d’expression de cyp19a1b est totalement similaire au profil d’expression de la GFP, et en
présence de CH223191, l’effet anti-estrogénique de la TCDD est totalement levé.
Sur la voie AhR, l’activité EROD est inhibée par l’E2 dans les MELN et l’addition de
l’antagoniste de ER, l’ICI, permet de lever cette inhibition et même de potentialiser l’activité EROD.
Ce résultat est confirmé au niveau transcriptionnel avec l’expression du cyp1a, montrant
Résultats : chapitre C – article n°4
121
l’implication de ER dans la régulation transcriptionnelle du cyp1a. Dans les cellules ZELHα, l’activité
EROD est aussi inhibée par l’E2, mais l’addition d’ICI ne permet de restaurer que partiellement
l’activité EROD. Contrairement aux cellules MELN, l’expression de cyp1a n’est pas modulée par
l’E2 ni par l’ICI dans les ZELH-zfERs. Cependant, une interaction négative entre E2 et TCDD est
observée sur l’expression de ahr2 à 72h d’exposition, non modifiée par l’antagoniste de ER, l’ICI.
Dans les ZELHβ2, aucune activité EROD n’est détectée, alors que la TCDD induit l’expression du
cyp1a. Comme dans les ZELHα, l’expression induite par la TCDD du cyp1a est peu affectée par l’E2,
mais une interaction négative est observée au niveau transcriptionnel pour ahr2 à 72h
d’exposition. L’addition d’ICI bloque partiellement l’effet de l’E2 sur l’expression de ahr2. De la
même manière, l’expression du cyp1a induite par la TCDD n’est pas affectée par l’E2 ou l’ICI dans
les larves transgéniques. Cependant, l’E2 et plus fortement la TCDD induisent une diminution de
l’expression de ahr2 dans les larves. En co-exposition avec la TCDD, l’E2 diminue l’inhibition de
l’expression de ahr2, qui est partiellement restaurée en bloquant ER avec l’ICI.
Dans son ensemble, ces résultats indiquent que l’interaction entre la TCDD et l’E2 est
variable en fonction du temps d’exposition et du gène ciblé (luciférase vs gènes endogènes),
montrant une dynamique complexe d’interaction entre les deux voies de signalisation dans les
bio-essais.
1.3 Conclusion
➢ Il y a une interaction réciproque entre les signalisations de AhR et ER dans tous les bio-
essais
➢ La TCDD induit des effets opposés sur la réponse à l’E2 entre bio-essais : inhibition dans
les modèles poisson zèbre mais activation sur les MELN
➢ Les effets mesurés in vitro en cellules ZELH-zfERs sont retrouvés in vivo chez l’embryon,
attestant de la pertinence des bio-essais in vitro pour révéler des effets chez cette espèce
modèle.

Résultats : chapitre C – article n°4
122
Résultats : chapitre C – article n°4
123
ARTICLE n°4
Interference between AhR and ER signalling pathways in human in vitro
and zebrafish in vitro and in vivo bioassays used for estrogenicity monitoring
Hélène Serra1,2, François Brion1, Hélène Budzinski2, Guillemine Daffe3, Patrice Gonzalez3, Selim Aït-
Aïssa1*
1Institut National de l’Environnement Industriel et des risques (INERIS), unité Ecotoxicologie in
vitro et in vivo, Verneuil-en-Halatte, France
2 UMR-CNRS EPOC/LPTC, Université de Bordeaux, Talence, France
3 UMR-CNRS EPOC/OASU, Université de Bordeaux, Arcachon, France
* Corresponding author. E-mail: [email protected]
INTRODUCTION
Endocrine-disrupting chemicals (EDCs) represent a wide range of environmental
contaminants that interfere with the endocrine system through multiple modes of action (Kabir
et al., 2015). Among them, direct binding of chemicals with the estrogen receptor (ER) is a well-
identified key molecular event that mediates transcriptional activation of target genes involved in
cell and tissue endocrine responses in vertebrates (Nelson and Habibi, 2013). While a number of
environmental compounds are direct (ant)agonist ligands of the estrogen receptors (ERs) (e.g.
reviewed in Kiyama and Wada-Kiyama, 2015), other contaminant-activated mechanisms, such as
activation of other nuclear receptors or transcription factors, such as the aryl hydrocarbon
receptor (AhR), can interfere with and modulate the ER-signaling pathway (Matthews and
Gustafsson, 2006; Ohtake et al., 2003).
Polycyclic aromatic hydrocarbons (PAHs) and polyhalogenated aromatic hydrocarbons
(PHAHs) are typical environmental AhR ligands. They exert their primary effects through binding
to AhR which heterodimerizes with AhR nuclear translocator (ARNT) and activates the
transcription of several genes of biotransformation enzymes including the cytochrome P4501A
(CYP1A) (Denison and Nagy, 2003). Ligand activated-AhR can also interact with (un)liganded ER to
Résultats : chapitre C – article n°4
124
form an heterotrimer that binds to estrogen response elements (ERE), and thereby modulates the
transcription of ER-regulated genes. Such mechanism has been demonstrated in vitro in human
breast cancer cells and in vivo to induce proliferation of endometrial cells and uterine growth in
ovariectomized mouse (Ohtake et al., 2003; Rüegg et al., 2008; Safe et al., 2000; Wormke et al.,
2003).
Given the ubiquitous nature of ER and AhR ligands in the aquatic environment, it is
important to consider their interactions and their effects on the endocrine system in fish for
hazard and risk assessment of these compounds. However, cross-talk between ER and AhR
pathways has been less studied in fish than in mammals, although there are some evidences that
activated AhR inhibits ER-regulated gene expression both in vitro and in vivo (Bugel et al., 2013;
Cheshenko et al., 2007; Navas and Segner, 2000b; Smeets et al., 1999). Conversely, some PCB
congeners were described to induce in vitro the transcription of ER-dependent genes in salmon
hepatocytes (Mortensen and Arukwe, 2008, 2007) and to potentiate in vivo estrogenic responses
in salmon co-exposed with PCB and the xeno-oestrogen nonylphenol (Arukwe et al., 2001).
Moreover, the inhibitory effect of (xeno)-estrogens on AhR mediated responses has been
described in rainbow trout suggesting that ER/AhR cross-talk could be bi-directional (Mortensen
and Arukwe, 2008; Navas and Segner, 2000a). Thus, there is a need to further investigate the
interactions between ER and AhR and their consequences on the regulation of ER- and AhR-
regulated genes in fish.
This study aimed at characterising the ER-AhR interference in a set of human- and fish-
based bioassays that are routinely used for estrogenicity monitoring. For this purpose, we
assessed the effect of typical ER and AhR ligands (E2 and TCDD, respectively), on ER- and AhR-
mediated response in different in vitro and in vivo zebrafish ER-reporter gene bioassays. The study
was conducted using established zebrafish liver (ZFL) cells stably transfected with luciferase (Luc)
reporter gene and zebrafish ERα (ZELHα cells) or zebrafish ERβ2 (ZELHβ2 cells) (Cosnefroy et al.,
2012; Sonavane et al., 2016). ZFL cells express functional AhR2 (Wentworth et al., 2004) and
inducible cyp1a mRNA expression (Eide et al., 2014). To determine whether the cross-talk could
be observed at the organism level, in vivo experiments were conducted in transgenic zebrafish
embryos expressing GFP under control of cyp19a1b promoter (Brion et al., 2012; Tong et al.,
2009). For comparison purpose, experiments were also conducted in vitro in MCF-7 cells stably
Résultats : chapitre C – article n°4
125
transfected with estrogen-regulated luciferase gene (MELN cells, Balaguer et al., 1999), in which
ER/AhR interactions have been evidenced (Ohtake et al., 2003). Effects on ER pathway were
investigated by assessing both reporter gene activity in the different models and endogenous gene
expression, i.e. pS2 in MELN cells, vtg1-5 and vtg7 in ZELHα and ZELHβ2 cells, and cyp19a1b in
zebrafish embryos. AhR signaling pathway was investigated by measuring EROD activity, and ahr
(MELN cells), ahr2 (zebrafish bioassays) and cyp1a expression.
MATERIAL AND METHODS
Chemicals and bioreagents
17β-estradiol (E2), 2,3,7,8-tetrachlorodibenzo-p-dioxin (TCDD), α-naphtoflavone (αNF), 7-
ethoxyresorufin (7-ERF), dimethylsulfoxide (DMSO), Leibovitz 15 culture medium (L-15), fetal calf
serum (FCS), 4-(2-hydroxy-ethyl)-1-piperazineethanesulfonic acid (HEPES), epidermal growth
factor (EGF), G418, 3-[4,5-dimethylthiazol-2-yl]-2,5-diphenyl-tetrazoliumbromide (MTT) and D-
luciferin were purchased from Sigma Aldrich (St-Quentin Fallavier, France); Dulbecco's Modified
Eagle Medium High Glucose (DMEM HG) powder, F-12 nutrient mixture (Ham's F12) powder,
penicillin and streptomycin were purchased from Gibco (France); insulin, hygromycin B and
sodium bicarbonate were purchased from Dominique Dutscher (France), RNAlater was purchased
from Thermo Fisher Scientific (France) and ICI 182,780 was purchased from TOCRIS (France).
In vitro assays and cell culture
The zebrafish in vitro assays were derived from the zebrafish liver cell (ZFL) line that was
stably transfected by first an ERE-driven luciferase reporter gene, yielding the ZELH cell line, and
then by zfERα or zfERβ2 subtype, yielding the ZELHα and ZELHβ2 cell lines, respectively (Cosnefroy
et al., 2012). Establishment of these cell models and their response to different classes of well-
known xeno-estrogens have been previously described (Cosnefroy et al., 2012, Sonavane et al.,
2016). In addition, the ZFL and ZELH cell lines were used as control cell lines with no functional ER.
The human-derived MELN cell line (Balaguer et al., 1999) was kindly provided by Dr. Patrick
Balaguer (INSERM Montpellier, France). The MELN cells are MCF-7 cells stably transfected by an
ERE-driven luciferase reporter gene and express endogenous hERα, but no functional hERβ (P.
Balaguer, personal communication).
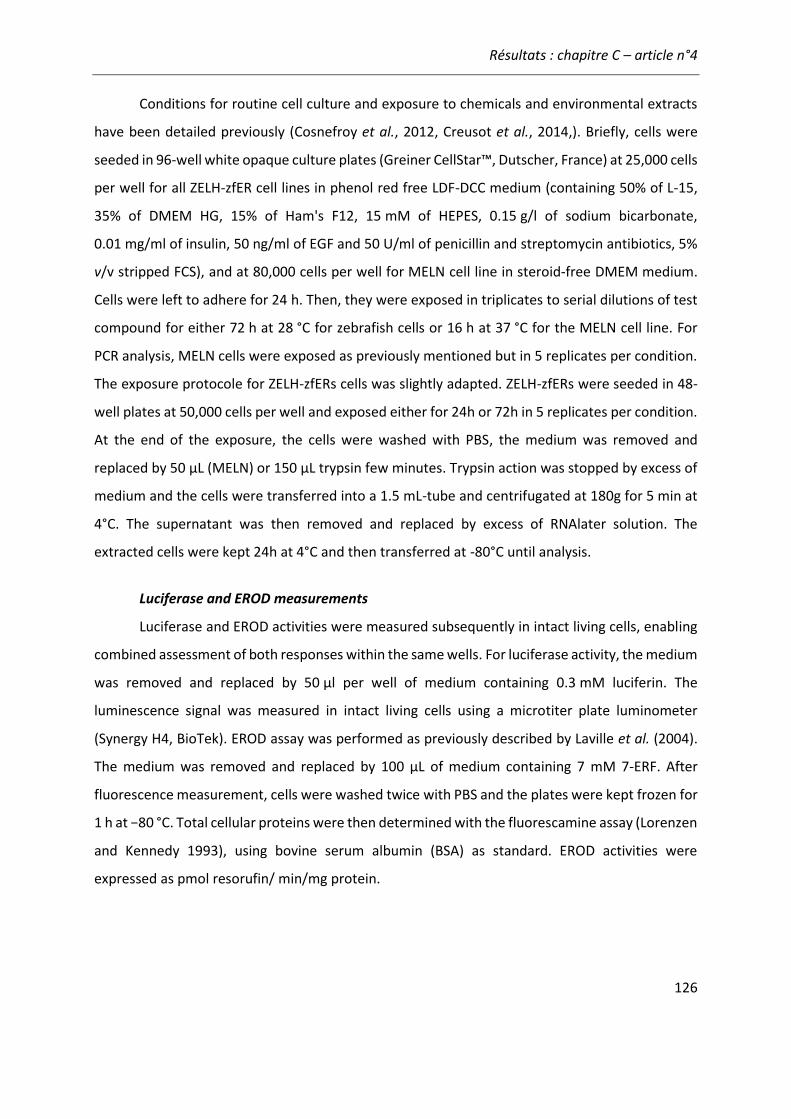
Résultats : chapitre C – article n°4
126
Conditions for routine cell culture and exposure to chemicals and environmental extracts
have been detailed previously (Cosnefroy et al., 2012, Creusot et al., 2014,). Briefly, cells were
seeded in 96-well white opaque culture plates (Greiner CellStar™, Dutscher, France) at 25,000 cells
per well for all ZELH-zfER cell lines in phenol red free LDF-DCC medium (containing 50% of L-15,
35% of DMEM HG, 15% of Ham's F12, 15 mM of HEPES, 0.15 g/l of sodium bicarbonate,
0.01 mg/ml of insulin, 50 ng/ml of EGF and 50 U/ml of penicillin and streptomycin antibiotics, 5%
v/v stripped FCS), and at 80,000 cells per well for MELN cell line in steroid-free DMEM medium.
Cells were left to adhere for 24 h. Then, they were exposed in triplicates to serial dilutions of test
compound for either 72 h at 28 °C for zebrafish cells or 16 h at 37 °C for the MELN cell line. For
PCR analysis, MELN cells were exposed as previously mentioned but in 5 replicates per condition.
The exposure protocole for ZELH-zfERs cells was slightly adapted. ZELH-zfERs were seeded in 48-
well plates at 50,000 cells per well and exposed either for 24h or 72h in 5 replicates per condition.
At the end of the exposure, the cells were washed with PBS, the medium was removed and
replaced by 50 µL (MELN) or 150 µL trypsin few minutes. Trypsin action was stopped by excess of
medium and the cells were transferred into a 1.5 mL-tube and centrifugated at 180g for 5 min at
4°C. The supernatant was then removed and replaced by excess of RNAlater solution. The
extracted cells were kept 24h at 4°C and then transferred at -80°C until analysis.
Luciferase and EROD measurements
Luciferase and EROD activities were measured subsequently in intact living cells, enabling
combined assessment of both responses within the same wells. For luciferase activity, the medium
was removed and replaced by 50 μl per well of medium containing 0.3 mM luciferin. The
luminescence signal was measured in intact living cells using a microtiter plate luminometer
(Synergy H4, BioTek). EROD assay was performed as previously described by Laville et al. (2004).
The medium was removed and replaced by 100 µL of medium containing 7 mM 7-ERF. After
fluorescence measurement, cells were washed twice with PBS and the plates were kept frozen for
1 h at −80 °C. Total cellular proteins were then determined with the fluorescamine assay (Lorenzen
and Kennedy 1993), using bovine serum albumin (BSA) as standard. EROD activities were
expressed as pmol resorufin/ min/mg protein.
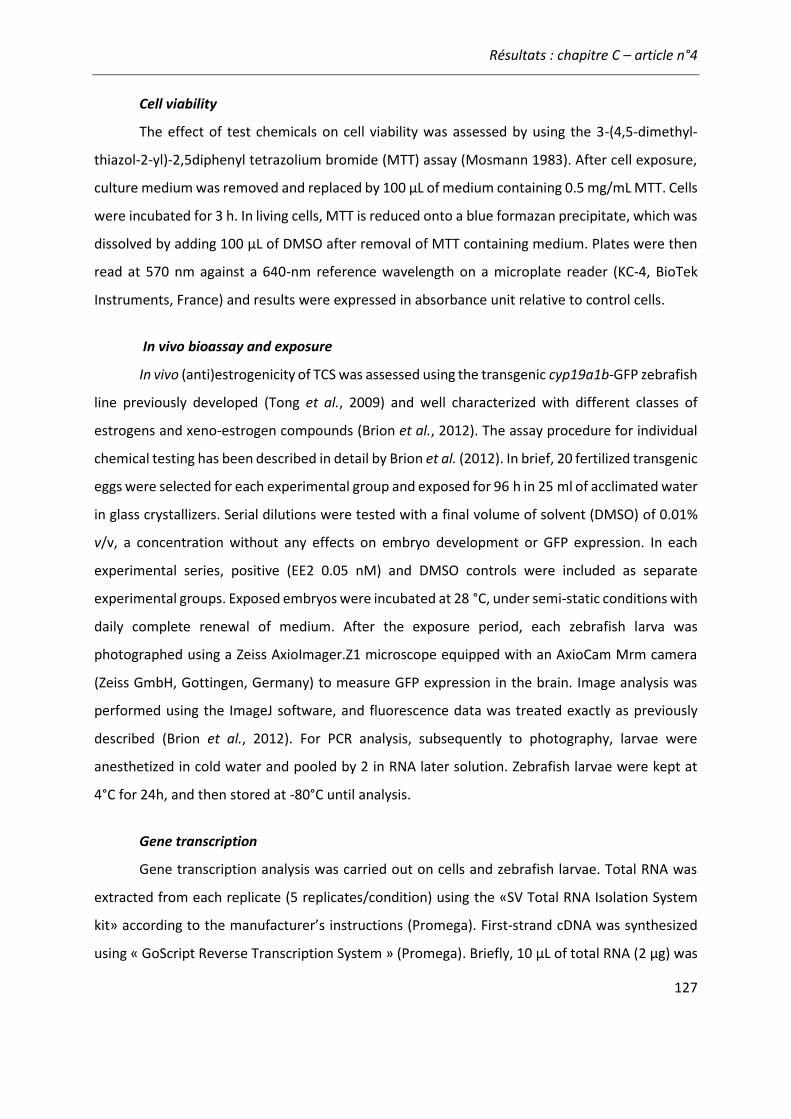
Résultats : chapitre C – article n°4
127
Cell viability
The effect of test chemicals on cell viability was assessed by using the 3-(4,5-dimethyl-
thiazol-2-yl)-2,5diphenyl tetrazolium bromide (MTT) assay (Mosmann 1983). After cell exposure,
culture medium was removed and replaced by 100 μL of medium containing 0.5 mg/mL MTT. Cells
were incubated for 3 h. In living cells, MTT is reduced onto a blue formazan precipitate, which was
dissolved by adding 100 μL of DMSO after removal of MTT containing medium. Plates were then
read at 570 nm against a 640-nm reference wavelength on a microplate reader (KC-4, BioTek
Instruments, France) and results were expressed in absorbance unit relative to control cells.
In vivo bioassay and exposure
In vivo (anti)estrogenicity of TCS was assessed using the transgenic cyp19a1b-GFP zebrafish
line previously developed (Tong et al., 2009) and well characterized with different classes of
estrogens and xeno-estrogen compounds (Brion et al., 2012). The assay procedure for individual
chemical testing has been described in detail by Brion et al. (2012). In brief, 20 fertilized transgenic
eggs were selected for each experimental group and exposed for 96 h in 25 ml of acclimated water
in glass crystallizers. Serial dilutions were tested with a final volume of solvent (DMSO) of 0.01%
v/v, a concentration without any effects on embryo development or GFP expression. In each
experimental series, positive (EE2 0.05 nM) and DMSO controls were included as separate
experimental groups. Exposed embryos were incubated at 28 °C, under semi-static conditions with
daily complete renewal of medium. After the exposure period, each zebrafish larva was
photographed using a Zeiss AxioImager.Z1 microscope equipped with an AxioCam Mrm camera
(Zeiss GmbH, Gottingen, Germany) to measure GFP expression in the brain. Image analysis was
performed using the ImageJ software, and fluorescence data was treated exactly as previously
described (Brion et al., 2012). For PCR analysis, subsequently to photography, larvae were
anesthetized in cold water and pooled by 2 in RNA later solution. Zebrafish larvae were kept at
4°C for 24h, and then stored at -80°C until analysis.
Gene transcription
Gene transcription analysis was carried out on cells and zebrafish larvae. Total RNA was
extracted from each replicate (5 replicates/condition) using the «SV Total RNA Isolation System
kit» according to the manufacturer’s instructions (Promega). First-strand cDNA was synthesized
using « GoScript Reverse Transcription System » (Promega). Briefly, 10 µL of total RNA (2 µg) was
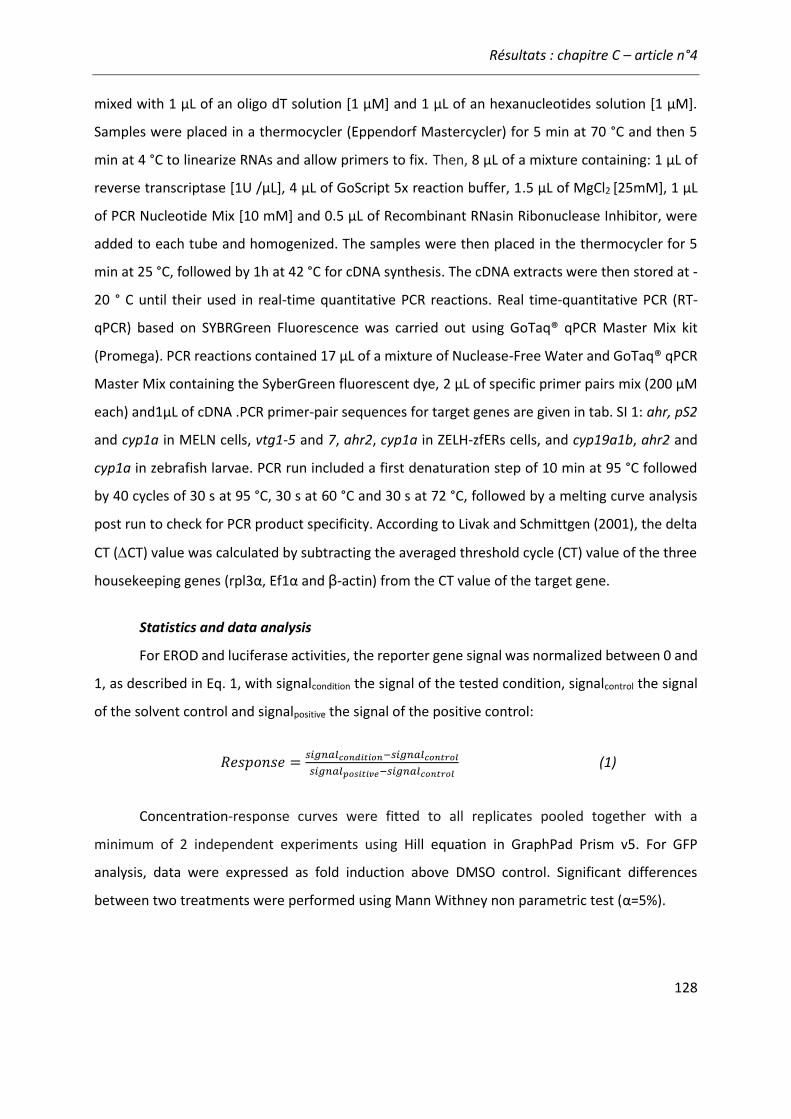
Résultats : chapitre C – article n°4
128
mixed with 1 µL of an oligo dT solution [1 µM] and 1 µL of an hexanucleotides solution [1 µM].
Samples were placed in a thermocycler (Eppendorf Mastercycler) for 5 min at 70 °C and then 5
min at 4 °C to linearize RNAs and allow primers to fix. Then, 8 µL of a mixture containing: 1 µL of
reverse transcriptase [1U /µL], 4 µL of GoScript 5x reaction buffer, 1.5 µL of MgCl2 [25mM], 1 µL
of PCR Nucleotide Mix [10 mM] and 0.5 µL of Recombinant RNasin Ribonuclease Inhibitor, were
added to each tube and homogenized. The samples were then placed in the thermocycler for 5
min at 25 °C, followed by 1h at 42 °C for cDNA synthesis. The cDNA extracts were then stored at -
20 ° C until their used in real-time quantitative PCR reactions. Real time-quantitative PCR (RT-
qPCR) based on SYBRGreen Fluorescence was carried out using GoTaq® qPCR Master Mix kit
(Promega). PCR reactions contained 17 µL of a mixture of Nuclease-Free Water and GoTaq® qPCR
Master Mix containing the SyberGreen fluorescent dye, 2 µL of specific primer pairs mix (200 µM
each) and1µL of cDNA .PCR primer-pair sequences for target genes are given in tab. SI 1: ahr, pS2
and cyp1a in MELN cells, vtg1-5 and 7, ahr2, cyp1a in ZELH-zfERs cells, and cyp19a1b, ahr2 and
cyp1a in zebrafish larvae. PCR run included a first denaturation step of 10 min at 95 °C followed
by 40 cycles of 30 s at 95 °C, 30 s at 60 °C and 30 s at 72 °C, followed by a melting curve analysis
post run to check for PCR product specificity. According to Livak and Schmittgen (2001), the delta
CT (CT) value was calculated by subtracting the averaged threshold cycle (CT) value of the three
housekeeping genes (rpl3α, Ef1α and β-actin) from the CT value of the target gene.
Statistics and data analysis
For EROD and luciferase activities, the reporter gene signal was normalized between 0 and
1, as described in Eq. 1, with signalcondition the signal of the tested condition, signalcontrol the signal
of the solvent control and signalpositive the signal of the positive control:
𝑅𝑒𝑠𝑝𝑜𝑛𝑠𝑒 =𝑠𝑖𝑔𝑛𝑎𝑙𝑐𝑜𝑛𝑑𝑖𝑡𝑖𝑜𝑛−𝑠𝑖𝑔𝑛𝑎𝑙𝑐𝑜𝑛𝑡𝑟𝑜𝑙
𝑠𝑖𝑔𝑛𝑎𝑙𝑝𝑜𝑠𝑖𝑡𝑖𝑣𝑒−𝑠𝑖𝑔𝑛𝑎𝑙𝑐𝑜𝑛𝑡𝑟𝑜𝑙 (1)
Concentration-response curves were fitted to all replicates pooled together with a
minimum of 2 independent experiments using Hill equation in GraphPad Prism v5. For GFP
analysis, data were expressed as fold induction above DMSO control. Significant differences
between two treatments were performed using Mann Withney non parametric test (α=5%).
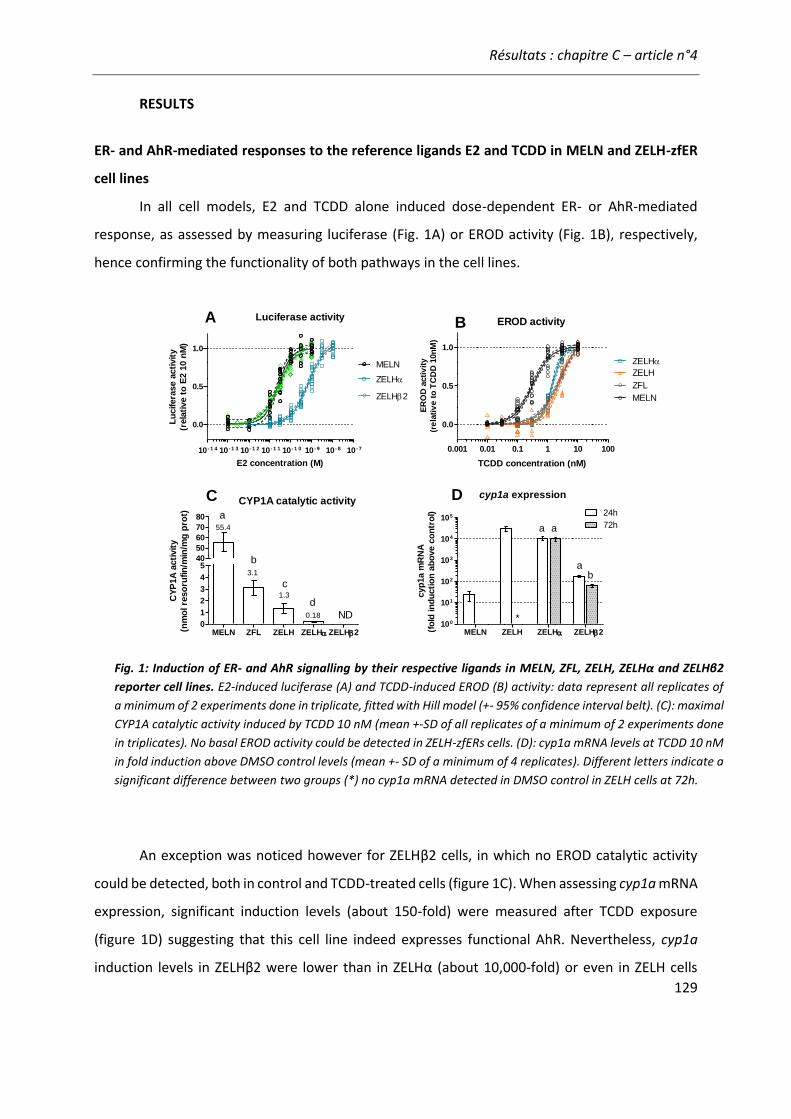
Résultats : chapitre C – article n°4
129
RESULTS
ER- and AhR-mediated responses to the reference ligands E2 and TCDD in MELN and ZELH-zfER
cell lines
In all cell models, E2 and TCDD alone induced dose-dependent ER- or AhR-mediated
response, as assessed by measuring luciferase (Fig. 1A) or EROD activity (Fig. 1B), respectively,
hence confirming the functionality of both pathways in the cell lines.
An exception was noticed however for ZELHβ2 cells, in which no EROD catalytic activity
could be detected, both in control and TCDD-treated cells (figure 1C). When assessing cyp1a mRNA
expression, significant induction levels (about 150-fold) were measured after TCDD exposure
(figure 1D) suggesting that this cell line indeed expresses functional AhR. Nevertheless, cyp1a
induction levels in ZELHβ2 were lower than in ZELHα (about 10,000-fold) or even in ZELH cells
0.001 0.01 0.1 1 10 100
0.0
0.5
1.0
MELN
ZELH
ZELH
ZFL
EROD activity
TCDD concentration (nM)
ER
OD
acti
vit
y
(re
lati
ve
to
TC
DD
10n
M)
MELN ZFL ZELH ZELH ZELH20
1
2
3
4
540
50
60
70
80
CYP1A catalytic activity
ND
55.4
3.1
1.3
0.18
a
b
c
dCY
P1A
acti
vit
y
(nm
ol re
so
rufin
/min
/mg
pro
t)
MELN ZELH ZELH ZELH2 100
101
102
103
104
105 24h
72h
cyp1a expression
*
a a
ab
cyp
1a m
RN
A
(fo
ld in
du
cti
on
ab
ove c
on
tro
l)
B
C D
10 - 1 4 10 - 1 3 10 - 1 2 10 - 1 1 10 - 1 0 10 - 9 10 - 8 10 - 7
0.0
0.5
1.0
MELN
ZELH
ZELH2
Luciferase activity
E2 concentration (M)
Lu
cifera
se a
cti
vit
y
(rela
tive t
o E
2 1
0 n
M)
A
Fig. 1: Induction of ER- and AhR signalling by their respective ligands in MELN, ZFL, ZELH, ZELHα and ZELHβ2
reporter cell lines. E2-induced luciferase (A) and TCDD-induced EROD (B) activity: data represent all replicates of
a minimum of 2 experiments done in triplicate, fitted with Hill model (+- 95% confidence interval belt). (C): maximal
CYP1A catalytic activity induced by TCDD 10 nM (mean +-SD of all replicates of a minimum of 2 experiments done
in triplicates). No basal EROD activity could be detected in ZELH-zfERs cells. (D): cyp1a mRNA levels at TCDD 10 nM
in fold induction above DMSO control levels (mean +- SD of a minimum of 4 replicates). Different letters indicate a
significant difference between two groups (*) no cyp1a mRNA detected in DMSO control in ZELH cells at 72h.
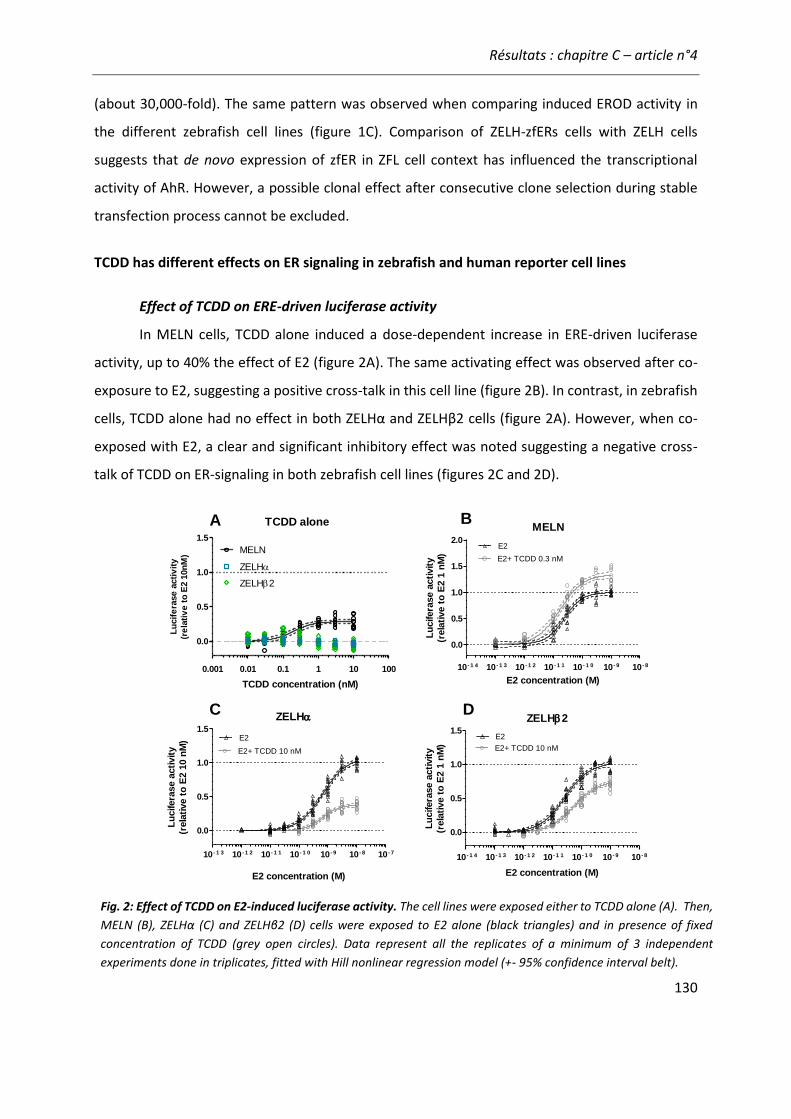
Résultats : chapitre C – article n°4
130
(about 30,000-fold). The same pattern was observed when comparing induced EROD activity in
the different zebrafish cell lines (figure 1C). Comparison of ZELH-zfERs cells with ZELH cells
suggests that de novo expression of zfER in ZFL cell context has influenced the transcriptional
activity of AhR. However, a possible clonal effect after consecutive clone selection during stable
transfection process cannot be excluded.
TCDD has different effects on ER signaling in zebrafish and human reporter cell lines
Effect of TCDD on ERE-driven luciferase activity
In MELN cells, TCDD alone induced a dose-dependent increase in ERE-driven luciferase
activity, up to 40% the effect of E2 (figure 2A). The same activating effect was observed after co-
exposure to E2, suggesting a positive cross-talk in this cell line (figure 2B). In contrast, in zebrafish
cells, TCDD alone had no effect in both ZELHα and ZELHβ2 cells (figure 2A). However, when co-
exposed with E2, a clear and significant inhibitory effect was noted suggesting a negative cross-
talk of TCDD on ER-signaling in both zebrafish cell lines (figures 2C and 2D).
10 - 1 3 10 - 1 2 10 - 1 1 10 - 1 0 10 - 9 10 - 8 10 - 7
0.0
0.5
1.0
1.5
E2+ TCDD 10 nM
E2
ZELH
E2 concentration (M)
Lu
cifera
se a
cti
vit
y
(rela
tive t
o E
2 1
0 n
M)
10 - 1 4 10 - 1 3 10 - 1 2 10 - 1 1 10 - 1 0 10 - 9 10 - 8
0.0
0.5
1.0
1.5
E2+ TCDD 10 nM
E2
ZELH2
E2 concentration (M)
Lu
cifera
se a
cti
vit
y
(rela
tive t
o E
2 1
nM
)
B
10 - 1 4 10 - 1 3 10 - 1 2 10 - 1 1 10 - 1 0 10 - 9 10 - 8
0.0
0.5
1.0
1.5
2.0E2
E2+ TCDD 0.3 nM
MELN
E2 concentration (M)
Lu
cifera
se a
cti
vit
y
(rela
tive t
o E
2 1
nM
)
C
0.001 0.01 0.1 1 10 100
0.0
0.5
1.0
1.5
MELN
ZELH
ZELH2
TCDD alone
TCDD concentration (nM)
Lu
cif
era
se
acti
vit
y
(re
lati
ve
to
E2 1
0n
M)
A
D
Fig. 2: Effect of TCDD on E2-induced luciferase activity. The cell lines were exposed either to TCDD alone (A). Then,
MELN (B), ZELHα (C) and ZELHβ2 (D) cells were exposed to E2 alone (black triangles) and in presence of fixed
concentration of TCDD (grey open circles). Data represent all the replicates of a minimum of 3 independent
experiments done in triplicates, fitted with Hill nonlinear regression model (+- 95% confidence interval belt).
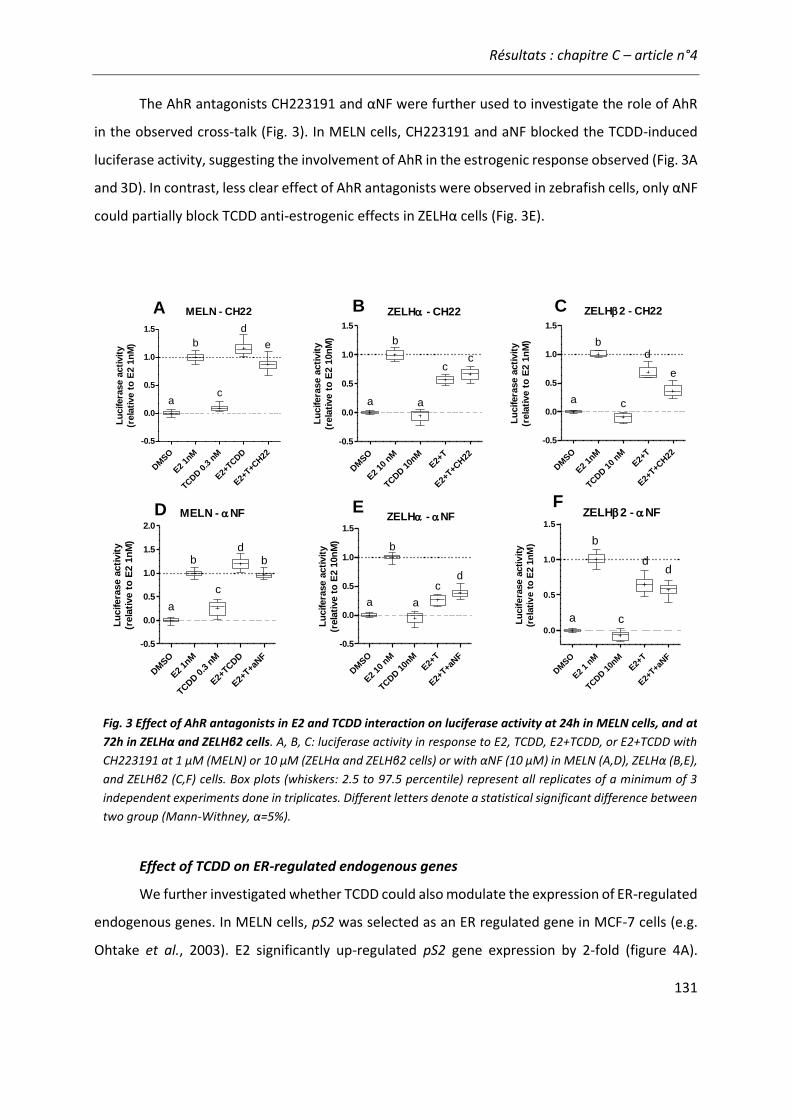
Résultats : chapitre C – article n°4
131
The AhR antagonists CH223191 and αNF were further used to investigate the role of AhR
in the observed cross-talk (Fig. 3). In MELN cells, CH223191 and aNF blocked the TCDD-induced
luciferase activity, suggesting the involvement of AhR in the estrogenic response observed (Fig. 3A
and 3D). In contrast, less clear effect of AhR antagonists were observed in zebrafish cells, only αNF
could partially block TCDD anti-estrogenic effects in ZELHα cells (Fig. 3E).
Effect of TCDD on ER-regulated endogenous genes
We further investigated whether TCDD could also modulate the expression of ER-regulated
endogenous genes. In MELN cells, pS2 was selected as an ER regulated gene in MCF-7 cells (e.g.
Ohtake et al., 2003). E2 significantly up-regulated pS2 gene expression by 2-fold (figure 4A).
DM
SO
E2 1n
M
TCDD 1
0 nM
E2+T
E2+T+C
H22
-0.5
0.0
0.5
1.0
1.5
a
b
e
ZELH2 - CH22
c
d
Lu
cifera
se a
cti
vit
y
(rela
tive t
o E
2 1
nM
)
DM
SO
E2
10 n
M
TCDD 1
0nM
E2+
T
E2+
T+CH22
-0.5
0.0
0.5
1.0
1.5
a
cc
ZELH - CH22
a
b
Lu
cifera
se a
cti
vit
y
(rela
tive t
o E
2 1
0n
M)
DM
SO
E2
1nM
TCDD 0
.3 n
M
E2+
TCDD
E2+
T+CH22
-0.5
0.0
0.5
1.0
1.5
a
b
c
d
e
MELN - CH22
Lu
cifera
se a
cti
vit
y
(rela
tive t
o E
2 1
nM
)
A B
D
C
E F
DM
SO
E2 1n
M
TCDD 0
.3 n
M
E2+TC
DD
E2+T+a
NF
-0.5
0.0
0.5
1.0
1.5
2.0
a
bd
MELN - NF
c
b
Lu
cifera
se a
cti
vit
y
(rela
tive t
o E
2 1
nM
)
DM
SO
E2
10 n
M
TCDD 1
0nM
E2+
T
E2+
T+aNF
-0.5
0.0
0.5
1.0
1.5
a
b
c
ZELH - NF
a
d
Lu
cifera
se a
cti
vit
y
(rela
tive t
o E
2 1
0n
M)
DM
SO
E2
1 nM
TCDD 1
0nM
E2+
T
E2+
T+aNF
0.0
0.5
1.0
1.5
a
b
d
ZELH2 - NF
c
d
Lu
cif
era
se
acti
vit
y
(re
lati
ve
to
E2 1
nM
)
Fig. 3 Effect of AhR antagonists in E2 and TCDD interaction on luciferase activity at 24h in MELN cells, and at
72h in ZELHα and ZELHβ2 cells. A, B, C: luciferase activity in response to E2, TCDD, E2+TCDD, or E2+TCDD with
CH223191 at 1 µM (MELN) or 10 µM (ZELHα and ZELHβ2 cells) or with αNF (10 µM) in MELN (A,D), ZELHα (B,E),
and ZELHβ2 (C,F) cells. Box plots (whiskers: 2.5 to 97.5 percentile) represent all replicates of a minimum of 3
independent experiments done in triplicates. Different letters denote a statistical significant difference between
two group (Mann-Withney, α=5%).

Résultats : chapitre C – article n°4
132
Contrasting with luciferase activity, TCDD alone slightly decreased pS2 basal expression compared
to solvent control, but had no significant effects when co-exposed with E2, or with E2 and
CH223191 (figure 4A).
In ZELH-zfER cells, we selected several vtg genes (vtg1- 5 and vtg7) that were previously
described to be expressed in zebrafish hepatic cell context (Eide et al., 2014). Basic mRNA levels
in control ZELH, ZELHα and ZELHβ2 cells were overall very low or even undetectable, which
confirmed the previous observations on ZFL (Eide et al., 2014). Interestingly, except vtg2, all
examined vtg genes were significantly induced by E2 after 24 h and/or 72 h in ZELHα and ZELHβ2
(Fig SI 1) but not in ZELH cells that express no functional ER (data not shown). This result confirms
the functionality of the newly expressed zfERs on endogenous ZFL cell response. Furthermore,
TCDD significantly decreased E2-induced vtg3 in ZELHα and vtg5 in ZELHβ2 cells after 72h of
exposure. In ZELHα cells, the effect of TCDD was rescued by addition of CH223191, suggesting the
involvement of AhR in the negative crosstalk (figure 4B). In ZELHβ2 cells, CH223191 rescued the
anti-estrogenic effect of TCDD on vtg5 expression at 24h of exposure (figure SI 2), but enhanced
its anti-estrogenic effect at 72h of exposure. A similar trend as observed for luciferase activity in
ZELHβ2 at 72h of exposure (figure 4D).
DM
SO
E2
10nM
TCDD 1
0nM
E2+
T
E2+
T+CH22
0.001
0.01
0.1
1
10
*
a a
b
ND
ZELH - 72h
vtg
3 m
RN
A
(fo
ld i
nd
ucti
on
ab
ove E
2)
DM
SO
E2
1nM
TCDD 1
0nM
E2+
T
E2+
T+CH22
0.0001
0.001
0.01
0.1
1
10
a
b
d*
ZELH2 - 72h
c
vtg
5 m
RN
A
(fo
ld in
du
cti
on
ab
ove E
2)
DM
SO
E2 1n
M
TCDD 1
0 nM
E2+T
E2+T+C
H22
0.1
1
10
2
a
b
c
b b
MELN - 24h
pS
2 m
RN
A
(fo
ld i
nd
ucti
on
ab
ove E
2)
A B C
Fig. 4: Effect of AhR antagonist in E2 and TCDD interaction on endogenous gene expression at 24h in MELN
cells, and at 72h in ZELHα and ZELHβ2 cells. mRNA levels of pS2 in MELN cells (A), vtg3 in ZELHα (B), and vtg5
in ZELHβ2 cells (C) in response to E2, TCDD, E2+TCDD, or E2+TCDD with CH223191 at 1 µM (MELN) or 10 µM
(ZELHα and ZELHβ2 cells) (n= 4 to 5 replicates). Different letters denote a statistical significant difference
between two group (Mann-Withney, α=5%).
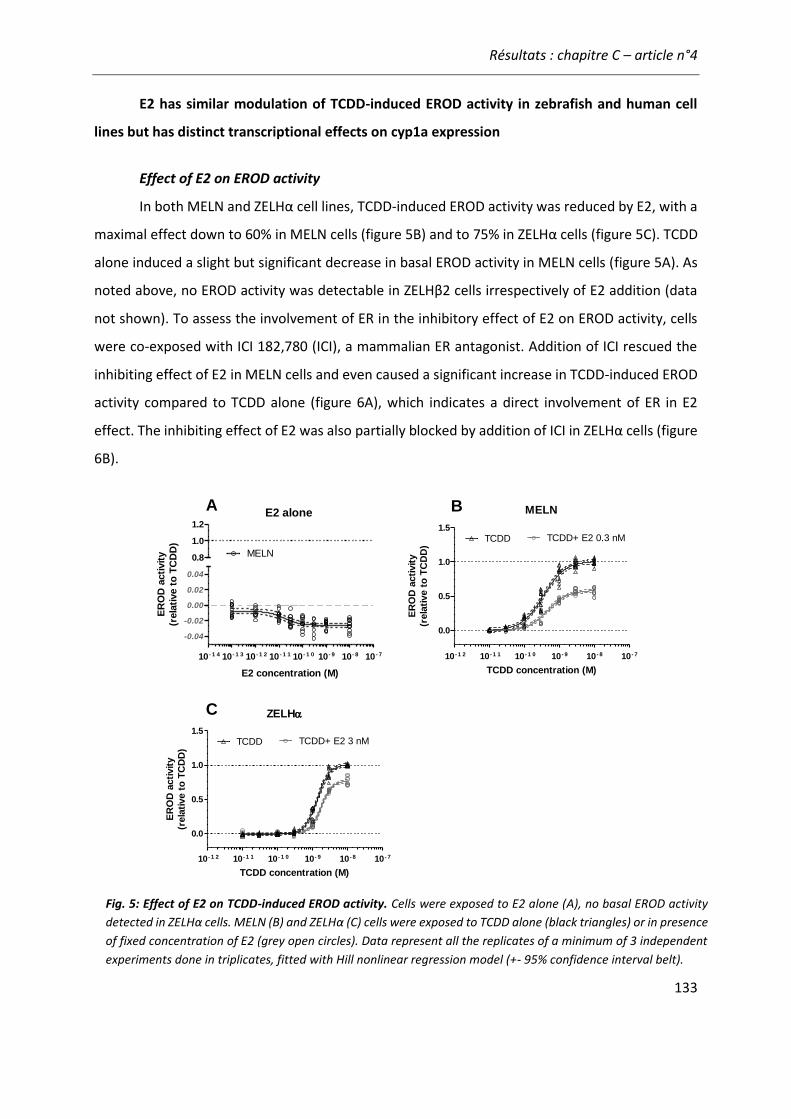
Résultats : chapitre C – article n°4
133
E2 has similar modulation of TCDD-induced EROD activity in zebrafish and human cell
lines but has distinct transcriptional effects on cyp1a expression
Effect of E2 on EROD activity
In both MELN and ZELHα cell lines, TCDD-induced EROD activity was reduced by E2, with a
maximal effect down to 60% in MELN cells (figure 5B) and to 75% in ZELHα cells (figure 5C). TCDD
alone induced a slight but significant decrease in basal EROD activity in MELN cells (figure 5A). As
noted above, no EROD activity was detectable in ZELHβ2 cells irrespectively of E2 addition (data
not shown). To assess the involvement of ER in the inhibitory effect of E2 on EROD activity, cells
were co-exposed with ICI 182,780 (ICI), a mammalian ER antagonist. Addition of ICI rescued the
inhibiting effect of E2 in MELN cells and even caused a significant increase in TCDD-induced EROD
activity compared to TCDD alone (figure 6A), which indicates a direct involvement of ER in E2
effect. The inhibiting effect of E2 was also partially blocked by addition of ICI in ZELHα cells (figure
6B).
10- 1 2 10- 1 1 10- 1 0 10 - 9 10 - 8 10 - 7
0.0
0.5
1.0
1.5
TCDD+ E2 0.3 nMTCDD
MELN
TCDD concentration (M)
ER
OD
acti
vit
y
(rela
tive t
o T
CD
D)
10- 1 2 10- 1 1 10- 1 0 10- 9 10- 8 10 - 7
0.0
0.5
1.0
1.5
TCDD+ E2 3 nMTCDD
ZELH
TCDD concentration (M)
ER
OD
acti
vit
y
(rela
tive t
o T
CD
D)
A B
10 - 1 4 10 - 1 3 10 - 1 2 10 - 1 1 10 - 1 0 10 - 9 10 - 8 10 - 7
-0.04
-0.02
0.00
0.02
0.04
0.8
1.0
1.2
E2 alone
MELN
E2 concentration (M)
ER
OD
acti
vit
y
(rela
tive t
o T
CD
D)
C
Fig. 5: Effect of E2 on TCDD-induced EROD activity. Cells were exposed to E2 alone (A), no basal EROD activity
detected in ZELHα cells. MELN (B) and ZELHα (C) cells were exposed to TCDD alone (black triangles) or in presence
of fixed concentration of E2 (grey open circles). Data represent all the replicates of a minimum of 3 independent
experiments done in triplicates, fitted with Hill nonlinear regression model (+- 95% confidence interval belt).

Résultats : chapitre C – article n°4
134
Effect of E2 on AhR-regulated endogenous genes
When assessing AhR target genes in MELN cells, E2 tended to reduce TCDD-induced cyp1a
expression, but the effect did not reach statistical significance. However, ICI significantly up-
regulated by 4-fold cyp1a expression compared to TCDD (Fig. 6D), as seen for EROD activity (figure
DM
SO T E
2
T+E2
E2+
T+ICI
0.0
0.5
1.0
1.5
a
d
e
b
c
MELNE
RO
D a
cti
vit
y
(rela
tive t
o T
CD
D 0
.3 n
M)
DM
SO T E
2
E2+
T
E2+
T+ICI
0.01
0.1
1
10
bb
c
aa
MELN - 24h
cyp
1a m
RN
A
(fo
ld in
du
cti
on
ab
ove T
CD
D)
DM
SO T E
2
T+E2
E2+
T+ICI
-0.5
0.0
0.5
1.0
1.5
a
b
a
cd
ZELH
ER
OD
acti
vit
y
(rela
tive t
o T
CD
D 1
0n
M)
DM
SO T E
2
E2+
T
E2+
T+ICI
10- 610- 510- 410- 30.1
1
10
aa a
ND
ZELH - 72hcyp
1a m
RN
A
(fo
ld in
du
cti
on
ab
ove T
CD
D)
A B
D E
-0.5
0.0
0.5
1.0
1.5
ZELH2
Not EROD activity
detected
ER
OD
acti
vit
y
(rela
tive t
o T
CD
D 1
0n
M)
C
DM
SO T E
2
E2+
T
E2+
T+ICI
0.001
0.01
0.1
1
10
a,b ab
ZELH2 - 72h
cyp
1a m
RN
A
(fo
ld in
du
cti
on
ab
ove T
CD
D)
F
DM
SO T E
2
E2+
T
E2+
T+ICI
0.1
1
10
MELN - 24h
a a,b b,cc c
ah
r m
RN
A
(fo
ld in
du
cti
on
ab
ove T
CD
D)
DM
SO T E
2
E2+
T
E2+
T+ICI
0.1
1
10
ZELH2 - 72h
ab
ac d
ah
r2 m
RN
A
(fo
ld in
du
cti
on
ab
ove T
CD
D)
DM
SO T E
2
E2+
T
E2+
T+ICI
0.1
1
10
ZELH - 72h
a a
bc c
ah
r2 m
RN
A
(fo
ld in
du
cti
on
ab
ove T
CD
D)
G H I
Fig. 6: Effect of the ER antagonist ICI 182,178 (ICI) on EROD activity and cyp1a and ahr/ahr2 gene expression at 24h in MELN cells, and at 72h in ZELHα and ZELHβ2 cells. A, B, C: effect of ER antagonist ICI on EROD activity in MELN (A), ZELHα (B), and ZELHβ2 (C) cells. Box plots (whiskers: 2.5 to 97.5 percentile) represent all replicates of a minimum of 3 independent experiments done in triplicates. D, E, F: cyp1a mRNA levels in MELN cells (D), ZELHα (E), and ZELHβ2 cells (F) in response to E2, TCDD, E2+TCDD, or E2+TCDD with ICI (n= 4 to 5 replicates). G, H, I: mRNA levels of ahr in MELN cells (D), and ahr2 in ZELHα (E) and ZELHβ2 cells (F) in response to E2, TCDD, E2+TCDD, or E2+TCDD with ICI (n= 4 to 5 replicates). Different letters denote a statistical significant difference between two groups (Mann-Withney, α=5%).

Résultats : chapitre C – article n°4
135
6A), hence suggesting the involvement of ER in the transcriptional regulation of CYP1A in MELN
cells. ahr mRNA levels were not enhanced by TCDD in MELN cells, but co-exposure with E2 and
then with E2 and ICI very slightly but significantly increased its expression (Fig. 6G).
In contrast to human cells, cyp1a mRNA levels in zebrafish cells were similar among all
treatment containing TCDD, including after co-exposure with ICI, suggesting no or little
interference of zfERα or zfERβ2 on transcriptional regulation of CYP1A (figures 6E and 6F,
respectively). In comparison, TCDD-induced ahr2 expression was significantly reduced by E2 in
both ZELHα and ZELHβ2 cells at 72h of exposure (figure 6H and 6I). Addition of ICI partially restored
TCDD response in ZELHβ2 cells (figure 6I).
In vivo effects of TCDD on cyp19a1b and cyp1a expression in transgenic zebrabrafish larvae
Our in vitro data suggest important cross-species differences on the effect of AhR on ER-
regulated genes. To further investigate this effect at the organism level, we used an in vivo
reporter gene assay based on transgenic zebrafish embryos expressing GFP under control of
cyp19a1b constitutive promoter in radial glial cells (Tong et al., 2009, Brion et al. 2012). Cyp19a1b-
driven GFP intensity and cyp19a1b mRNA expression were used to investigate ER signaling, and
cyp1a and ahr2 mRNA expression as indicator of AhR signaling. The figure 7 shows that co-
exposure to TCDD 0.05 nM and E2 10 nM lead to a significant decrease in both GFP intensity (figure
7A) and cyp19a1b mRNA (figure 7B) compared to E2 levels. Thus, the anti-estrogenic effect of
TCDD observed in zebrafish cell lines was confirmed in vivo at the transcriptional level using both
the reporter and endogenous gene response. Addition of CH223191 significantly rescued the anti-
estrogenic effect of TCDD on cyp19a1b mRNA levels (Fig 7B), with a similar effect observed in the
GFP expression (fig. 7A), thus indicating the involvement of AhR in TCDD anti-estrogenic effect.
Furthermore, we observed that embryos treated with CH223191 had a reduced occurrence of
TCDD-related phenotypical toxicity (e.g. oedema). In comparison, addition of αNF, a partial AhR
agonist, did not reduced significantly TCDD anti-estrogenic effect on cyp19a1b expression.
To investigate the reciprocity of cross-interaction, cyp1a and ahr2 expression was also
measured in zebrafish embryos, as illustrated in Fig. 7C and 7D. As observed in ZELH-zfERs cells,
cyp1a expression was significantly induced by TCDD in zebrafish embryos, and this induction was
not modulated by E2, or any AhR or ER antagonists. In contrast, ahr2 expression was highly
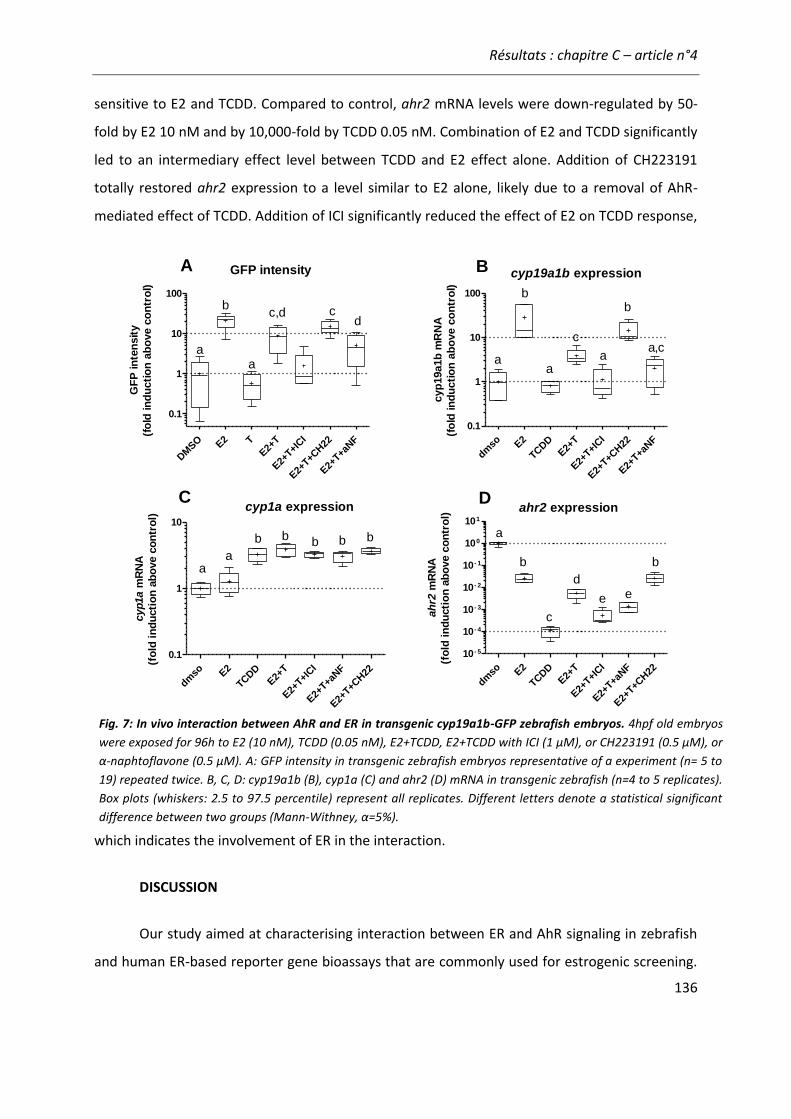
Résultats : chapitre C – article n°4
136
sensitive to E2 and TCDD. Compared to control, ahr2 mRNA levels were down-regulated by 50-
fold by E2 10 nM and by 10,000-fold by TCDD 0.05 nM. Combination of E2 and TCDD significantly
led to an intermediary effect level between TCDD and E2 effect alone. Addition of CH223191
totally restored ahr2 expression to a level similar to E2 alone, likely due to a removal of AhR-
mediated effect of TCDD. Addition of ICI significantly reduced the effect of E2 on TCDD response,
which indicates the involvement of ER in the interaction.
DISCUSSION
Our study aimed at characterising interaction between ER and AhR signaling in zebrafish
and human ER-based reporter gene bioassays that are commonly used for estrogenic screening.
dmso E
2
TCDD
E2+
T
E2+
T+ICI
E2+
T+CH22
E2+
T+aNF
0.1
1
10
100
a
b
a
c
b
a,c
cyp19a1b expression
a
cyp
19a1b
mR
NA
(fo
ld in
du
cti
on
ab
ove c
on
tro
l)DM
SO E
2 T
E2+
T
E2+
T+ICI
E2+
T+CH22
E2+
T+aNF
0.1
10
100
1
a
b
a
c,d cd
GFP intensity
GF
P in
ten
sit
y
(fo
ld in
du
cti
on
ab
ove c
on
tro
l)
A B
dmso E
2
TCDD
E2+
T
E2+
T+ICI
E2+
T+aNF
E2+
T+CH22
0.1
1
10
cyp1a expression
aa
b b b b b
cyp1a
mR
NA
(fo
ld i
nd
ucti
on
ab
ove c
on
tro
l)
ahr2 expression
dmso E
2
TCDD
E2+
T
E2+
T+ICI
E2+
T+aNF
E2+
T+CH22
10 - 5
10 - 4
10 - 3
10 - 2
10 - 1
100
101
a
b b
c
d
e e
ah
r2 m
RN
A
(fo
ld i
nd
ucti
on
ab
ove c
on
tro
l)
C D
Fig. 7: In vivo interaction between AhR and ER in transgenic cyp19a1b-GFP zebrafish embryos. 4hpf old embryos
were exposed for 96h to E2 (10 nM), TCDD (0.05 nM), E2+TCDD, E2+TCDD with ICI (1 µM), or CH223191 (0.5 µM), or
α-naphtoflavone (0.5 µM). A: GFP intensity in transgenic zebrafish embryos representative of a experiment (n= 5 to
19) repeated twice. B, C, D: cyp19a1b (B), cyp1a (C) and ahr2 (D) mRNA in transgenic zebrafish (n=4 to 5 replicates).
Box plots (whiskers: 2.5 to 97.5 percentile) represent all replicates. Different letters denote a statistical significant
difference between two groups (Mann-Withney, α=5%).
Résultats : chapitre C – article n°4
137
By monitoring both gene activity (ER-driven luciferase or GFP and TCDD-induced EROD activities)
and ER- and AhR-regulated gene expression, we show that such interactions occurred in all ER-
reporter gene systems, with marked differences between in vitro human and zebrafish-based
bioassays, and very good agreement between in vitro and in vivo zebrafish assays. Some specific
variations were also noted depending on the assessed endpoint (i.e. reporter vs endogenous
gene).
Opposite effect of TCDD on reporter gene activity in zebrafish and human based
bioassays
In MELN cells, TCDD exhibited estrogenic effects on luciferase activity, alone and in
presence of E2, in agreement with previous reports (Balaguer 1999, Ohtake et al., 2003). Liganded
AhR was shown to recruit unliganded hERα to ER-regulated promoter leading to induction of
estrogenic response (Ohtake et al., 2003). Involvement of AhR in the estrogenic response in MELN
cells was evidenced by addition of AhR antagonist CH223191 or AhR partial agonist α-NF (figure
3), which blocked the induced luciferase activity. In contrast with reporter gene activity, TCDD
alone induced a down-regulation of pS2 expression in MELN cells, and did not modulate E2-
induced pS2 expression. In MCF-7 cells, 3-methychloranthene (3MC) up-regulated pS2 expression
alone, but had anti-estrogenic effect in presence of E2 (Ohtake et al., 2003). Differences between
AhR ligands (TCDD vs 3MC) and cell culture/exposure systems may account for the differences
observed with MELN cells.
Contrasting with human cells, TCDD had a marked anti-estrogenic effect on E2-induced
luciferase activity in ZELHα and, to a lesser extent, in ZELHβ2 cells. Anti-estrogenic effects of AhR
ligands on ER response have been previously reported in fish hepatocytes, such as inhibition of
vtg induction in primary cultures of fish hepatocytes by β-naphtoflavone (Grans et al., 2010; Navas
and Segner, 2000a) or by PCB-77 (Chang et al., 2014; Mortensen et al., 2006). To assess the
relevance of luciferase inhibition in zebrafish hepatocytes, vtg1-5 and 7 gene expression was
assessed in presence of E2 and E2+TCDD. Our results indicate that most vtg genes were detected
in response to E2 in both cell lines, except for vtg2. The effect of E2 was indeed mediated by zfER
since no vtg induction by E2 was noted in ZELH cells, in line with previous reports in parental ZFL
cells (Eide et al., 2014).

Résultats : chapitre C – article n°4
138
Interestingly, TCDD anti-estrogenic effect was only observed for vtg3 expression in ZELHα
cells, while in ZELHβ2 cells, vtg4, 5 and 7 at 24h of exposure and vtg5 at 72h of exposure were
down-regulated by TCDD. Lee Pow et al. (2016) showed that medaka ERβ2 was the most potent
ER subtype on inducing luciferase activity driven by VTG type I or VTG type II promoter.
Interestingly, vtg4,5 and 7 belong to VTG type II, while vtg3 belong to VTG type III in zebrafish
(Wang et al. 2005). In ZELH cells, which is representative of zebrafish liver cell context, it is likely
that promoter-specific context may have influenced the transcriptional activity of AhR/zfER
complex leading to differential action of TCDD on ER-regulated genes. Furthermore, it has been
shown that zfERs subtypes are differently regulated in zebrafish liver, with zfERα, but not zfEReta2,
being upregulated by E2 and zfERbeta1 being downregulated by E2 (Menuet et al. 2002). Further
experiments assessing the expression of the different receptor subtypes, at both mRNA and
protein levels, would be warranted to better understand the differences between zebrafish cell
models.
We further investigated the in vivo effect of TCDD on ER response using transgenic
zebrafish expressing GFP under control of ER-regulated cyp19a1b promoter in radial glial cells
(Tong et al., 2009, Brion et al., 2012). In zebrafish larvae, TCDD exhibited an anti-estrogenic effect
on E2-induced evidenced by both cyp19a1b mRNA levels and cyp19a1b-driven GFP; this effect was
rescued by CH223191 showing the involvement of AhR (figure 7). Similar anti-estrogenic effect of
TCDD on brain aromatase expression has been previously reported in wild type zebrafish
(Cheshenko et al., 2007). Interestingly, GFP expression and cyp19a1b expression had similar
response profile, illustrating the suitability of the transgenic zebrafish line to study modulation of
ER response in vivo. Moreover, this in vivo observation was in perfect agreement with in vitro
results on zebrafish cell lines, which strengthens the relevance of using in vitro fish-derived models
to fish-specific effect.
Evidence for a bi-directional crosstalk between AhR and ER signalling in reporter gene
assays
The comparison of human and zebrafish bioassays showed differences in CYP1A response.
MELN cells were the most sensitivity to TCDD-induced EROD activity, and had the highest CYP1A
catalytic activity. In comparison, all ZFL-derived cells, except ZELHβ2 cells, had similar sensitivity
to EROD induction but with low CYP1A catalytic activity compared to MELN. The high induction of
Résultats : chapitre C – article n°4
139
cyp1a expression in ZFL-derived cells might compensate the low catalytic capacity of the zebrafish
CYP1A enzyme. Compared to other fish cell lines, no basal EROD activity was detected in ZFL
(Creusot et al., 2015; Miranda et al., 1993).
Furthermore, it is remarkable that de novo expression of zfER in ZFL cells led to a reduced
EROD activity and cyp1a inducibility, especially in ZELHbeta2 cells. It is likely that zfER compete
with AhR for transcriptional cofactors leading to lower responsiveness of AhR pathway. Lack of
EROD activity, despite a functional AhR signaling might be the consequence of post-transcriptional
regulation or reduced catalytic activity reaching levels below the EROD detection limits.
Furthermore, an indirect effect of zfERβ2 transfection in ZELH cells cannot be excluded (e.g.
insertion in key cyp1a regulatory sequence). Further experiments using transient transfection
would be helpful to test this hypothesis.
In mammalian models, ERα was shown to have an important role in AhR dependent
transcription, such as in regulating cyp1a expression and related EROD activity (Beischlag and
Perdew, 2005; Wihlen et al., 2009). In the present study, a direct involvement of hERα in cyp1a
transcriptional regulation was observed in MELN cells, in which ICI enhanced both basal and TCDD-
induced cyp1a mRNA and EROD levels. Our data confirm the role of hERα in induced AhR signaling
in MELN cells, illustrating the bi-directionnal crosstalk between both signaling pathways. In
zebrafish cells, E2 decreased the TCDD-induced EROD activity but without impacting significantly
TCDD-induced cyp1a expression. Addition of ICI partially restored the EROD activity, but did not
impact cyp1a expression. The lack of cyp1a transcriptional modulation by E2 and/or zfERα would
argue in favor of an interaction of E2 with CYP1A catalytic activity, as E2 is known to be a substrate
of CYP1A family. Compared to cyp1a, TCDD-induced ahr2 expression was reduced by addition of
E2 at 72h of exposure in both zebrafish cell lines, and was not (ZELHα cells) or only partially rescued
(ZELHβ2 cells) by addition of ICI. Thus, we observed a bidirectional crosstalk in zebrafish reporter
gene assays, but with different effects on AhR-signaling depending on the cell line and the AhR-
regulated gene selected.
The same pattern was again observed in zebrafish embryos, where TCDD-induced cyp1a
expression was not impacted by E2, nor by ICI, as observed in vitro. A previous internal study
showed no effect of E2 10 nM on TCDD induced EROD activity in wild type zebrafish larvae, nor

Résultats : chapitre C – article n°4
140
modulation by ICI (data not shown), comforting the idea of cyp1a gene expression and EROD
activity in zebrafish larvae is not very sensitive to E2. However, our study shows that TCDD and
E2 interacted on ahr2 induction in zebafish larvae. TCDD drastically decreased ahr2 mRNA, which
was significantly reduced by addition of E2. Blocking ER with ICI partially restored ahr2 to levels
close to TCDD levels, indicating that a crosstalk of ER on AhR response was also observed in
zebrafish embryos.
Implications for estrogenicity assessment
Altogether, this study illustrated that constitutive AhR signaling pathway can be induced in
ER-based reporter gene bioassays and interfere with ER response, leading to cell type-, species-
and promoter-specific interactions. The cell type and promoter-specific interaction between E2
and TCDD illustrates the need to properly characterize the response of each model, as marked
differences can be observed depending on the endpoint selected (Wihlen et al., 2009). Anti-
estrogenic effects of TCDD were well detected in all zebrafish-based bioassays showing the
relevance of the test systems to study modulation of ER response by AhR ligands in this model
species.
Numerous in vitro bioassays are routinely applied to assess the estrogenic activity of
environmental samples, in which AhR ligands are ubiquist pollutants. Our results suggest that co-
occurrence of AhR and ER ligands may interfere with ER response in all ER-reporter gene assays,
which may eventually lead to different outcomes depending on the cell lines used. Thus, a good
knowledge of ER-reporter systems is needed to properly characterize the response of chemicals,
especially in complex mixtures, such as in environmental samples.
ACKNOWLEDGEMENTS
This study is supported by INERIS and by SOLUTIONS Project from the European Union
Seventh Framework Program (FP7-ENV-2013-two-stage Collaborative project) under grant
agreement 603437. We would like to thank Emmanuelle Maillot-Marechal and Benjamin Piccini
for technical support.

Résultats : chapitre C – article n°4
141
REFERENCES
Arukwe, A., Yadetie, F., Male, R., Goksøyr, A., 2001. In vivo modulation of nonylphenol-induced zonagenesis and vitellogenesis by the antiestrogen, 3,3′4,4′-tetrachlorobiphenyl (PCB-77) in juvenile fish. Environ. Toxicol. Pharmacol. 10, 5–15. doi:10.1016/S1382-6689(01)00063-1
Balaguer, P., Francois, F., Comunale, F., Fenet, H., Boussioux, A.M., Pons, M., Nicolas, J.C., Casellas, C., 1999. Reporter cell lines to study the estrogenic effects of xenoestrogens. Sci. Total Environ. 233, 47–56. doi:10.1016/S0048-9697(99)00178-3
Beischlag, T.V., Perdew, G.H., 2005. ER α-AHR-ARNT protein-protein interactions mediate estradiol-dependent transrepression of dioxin-inducible gene transcription. J. Biol. Chem. 280, 21607–21611. doi:10.1074/jbc.C500090200
Brion, F., Le Page, Y., Piccini, B., Cardoso, O., Tong, S.-K., Chung, B., Kah, O., 2012. Screening Estrogenic Activities of Chemicals or Mixtures In vivo Using Transgenic (cyp19a1b-GFP) Zebrafish Embryos. Plos One 7, e36069. doi:10.1371/journal.pone.0036069
Brunnberg, S., Pettersson, K., Rydin, E., Matthews, J., Hanberg, A., Pongratz, I., 2003. The basic helix–loop–helix–PAS protein ARNT functions as a potent coactivator of estrogen receptor-dependent transcription. Proc. Natl. Acad. Sci. 100, 6517–6522. doi:10.1073/pnas.1136688100
Bugel, S.M., White, L.A., Cooper, K.R., 2013. Inhibition of vitellogenin gene induction by 2,3,7,8-tetrachlorodibenzo-p-dioxin is mediated by aryl hydrocarbon receptor 2 (AHR2) in zebrafish (Danio rerio). Aquat. Toxicol. 126, 1–8. doi:10.1016/j.aquatox.2012.09.019
Chang, Z., Lu, M., Kim, S.-S., Park, J.-S., 2014. Potential role of HSP90 in mediating the interactions between estrogen receptor (ER) and aryl hydrocarbon receptor (AhR) signaling pathways. Toxicol. Lett. 226, 6–13. doi:10.1016/j.toxlet.2014.01.032
Cheshenko, K., Brion, F., Le Page, Y., Hinfray, N., Pakdel, F., Kah, O., Segner, H., Eggen, R.I.L., 2007. Expression of zebra fish aromatase cyp19a and cyp19b genes in response to the ligands of estrogen receptor and aryl hydrocarbon receptor. Toxicol. Sci. 96, 255–267. doi:10.1093/toxsci/kfm003
Cosnefroy, A., Brion, F., Maillot-Maréchal, E., Porcher, J.-M., Pakdel, F., Balaguer, P., Aït-Aïssa, S., 2012. Selective activation of zebrafish estrogen receptor subtypes by chemicals by using stable reporter gene assay developed in a zebrafish liver cell line. Toxicol. Sci. Off. J. Soc. Toxicol. 125, 439–449. doi:10.1093/toxsci/kfr297
Creusot, N., Brion, F., Piccini, B., Budzinski, H., Porcher, J.M., Aït-Aïssa, S., 2015. BFCOD activity in fish cell lines and zebrafish embryos and its modulation by chemical ligands of human aryl hydrocarbon and nuclear receptors. Environ. Sci. Pollut. Res. Int. 22, 16393–16404. doi:10.1007/s11356-014-3882-8
Denison, M.S., Nagy, S.R., 2003. Activation of the Aryl Hydrocarbon Receptor by Structurally Diverse Exogenous and Endogenous Chemicals. Annu. Rev. Pharmacol. Toxicol. 43, 309–334. doi:10.1146/annurev.pharmtox.43.100901.135828
Résultats : chapitre C – article n°4
142
Eide, M., Rusten, M., Male, R., Jensen, K.H.M., Goksoyr, A., 2014. A characterization of the ZFL cell line and primary hepatocytes as in vitro liver cell models for the zebrafish (Danio rerio). Aquat. Toxicol. 147, 7–17. doi:10.1016/j.aquatox.2013.11.023
Grans, J., Wassmur, B., Celander, M.C., 2010. One-way inhibiting cross-talk between arylhydrocarbon receptor (AhR) and estrogen receptor (ER) signaling in primary cultures of rainbow trout hepatocytes. Aquat. Toxicol. 100, 263–270. doi:10.1016/j.aquatox.2010.07.024
Grimaldi, M., Boulahtouf, A., Delfosse, V., Thouennon, E., Bourguet, W., Balaguer, P., 2015. Reporter Cell Lines for the Characterization of the Interactions between Human Nuclear Receptors and Endocrine Disruptors. Front. Endocrinol. 6, 62. doi:10.3389/fendo.2015.00062
Hahn, M.E., 2001. Dioxin toxicology and the aryl hydrocarbon receptor: Insights from fish and other non-traditional models. Mar. Biotechnol. 3, S224–S238. doi:10.1007/s10126-001-0045-Y
Iwanari, M., Nakajima, M., Kizu, R., Hayakawa, K., Yokoi, T., 2002. Induction of CYP1A1, CYP1A2, and CYP1B1 mRNAs by nitropolycyclic aromatic hydrocarbons in various human tissue-derived cells: chemical-, cytochrome P450 isoform-, and cell-specific differences. Arch. Toxicol. 76, 287–298. doi:10.1007/s00204-002-0340-z
Kabir, E.R., Rahman, M.S., Rahman, I., 2015. A review on endocrine disruptors and their possible impacts on human health. Environ. Toxicol. Pharmacol. 40, 241–258. doi:10.1016/j.etap.2015.06.009
Kiyama, R., Wada-Kiyama, Y., 2015. Estrogenic endocrine disruptors: Molecular mechanisms of action. Environ. Int. 83, 11–40. doi:10.1016/j.envint.2015.05.012
Klinge, C.M., Bowers, J.L., Kulakosky, P.C., Kamboj, K.K., Swanson, H.I., 1999. The aryl hydrocarbon receptor (AHR)/AHR nuclear translocator (ARNT) heterodimer interacts with naturally occurring estrogen response elements. Mol. Cell. Endocrinol. 157, 105–119.
Lee Pow, C.S.D., Yost, E.E., Aday, D., Kullman, S.W., 2016. Sharing the Roles: An Assessment of Japanese Medaka Estrogen Receptors in Vitellogenin Induction. Environ. Sci. Technol. doi:10.1021/acs.est.6b01968
Lee, Y., Jin, Y., Lim, W., Ji, S., Choi, S., Jang, S., Lee, S., 2003. A ginsenoside-Rh1, a component of ginseng saponin, activates estrogen receptor in human breast carcinoma MCF-7 cells. J. Steroid Biochem. Mol. Biol. 84, 463–468.
Matthews, J., Celius, T., Halgren, R., Zacharewski, T., 2000. Differential estrogen receptor binding of estrogenic substances: a species comparison. J. Steroid Biochem. Mol. Biol. 74, 223–234. doi:10.1016/S0960-0760(00)00126-6
Matthews, J., Gustafsson, J.-Å., 2006. Estrogen receptor and aryl hydrocarbon receptor signaling pathways. Nucl. Recept. Signal. 4. doi:10.1621/nrs.04016
Miranda, C.L., Collodi, P., Zhao, X., Barnes, D.W., Buhler, D.R., 1993. Regulation of Cytochrome P450 Expression in a Novel Liver Cell Line from Zebrafish (Brachydanio rerio). Arch. Biochem. Biophys. 305, 320–327. doi:10.1006/abbi.1993.1429
Résultats : chapitre C – article n°4
143
Mortensen, A.S., Arukwe, A., 2008. Estrogenic effect of dioxin-like aryl hydrocarbon receptor (AhR) agonist (PCB congener 126) in salmon hepatocytes. Mar. Environ. Res. 66, 119–120. doi:10.1016/j.marenvres.2008.02.041
Mortensen, A.S., Arukwe, A., 2007. Interactions Between Estrogen- and Ah-Receptor Signalling Pathways in Primary Culture of Salmon Hepatocytes Exposed to Nonylphenol and 3,3’,4,4’-Tetrachlorobiphenyl (Congener 77). Comp. Hepatol. 6, 2. doi:10.1186/1476-5926-6-2
Mortensen, A.S., Tolfsen, C.C., Arukwe, A., 2006. Gene Expression Patterns in Estrogen (Nonylphenol) and Aryl Hydrocarbon Receptor Agonists (PCB-77) Interaction Using Rainbow Trout (Oncorhynchus Mykiss) Primary Hepatocyte Culture. J. Toxicol. Environ. Health A 69, 1–19. doi:10.1080/15287390500257792
Navas, J.M., Segner, H., 2000a. Antiestrogenicity of beta-naphthoflavone and PAHs in cultured rainbow trout hepatocytes: evidence for a role of the arylhydrocarbon receptor. Aquat. Toxicol. 51, 79–92. doi:10.1016/S0166-445X(00)00100-4
Navas, J.M., Segner, H., 2000b. Modulation of trout 7-ethoxyresorufin-O-deethylase (EROD) activity by estradiol and octylphenol. Mar. Environ. Res. 50, 157–162.
Nelson, E.R., Habibi, H.R., 2013. Estrogen receptor function and regulation in fish and other vertebrates. Gen. Comp. Endocrinol. 192, 15–24. doi:10.1016/j.ygcen.2013.03.032
Ohtake, F., Takeyama, K., Matsumoto, T., Kitagawa, H., Yamamoto, Y., Nohara, K., Tohyama, C., Krust, A., Mimura, J., Chambon, P., Yanagisawa, J., Fujii-Kuriyama, Y., Kato, S., 2003. Modulation of oestrogen receptor signalling by association with the activated dioxin receptor. Nature 423, 545–550. doi:10.1038/nature01606
Rüegg, J., Swedenborg, E., Wahlström, D., Escande, A., Balaguer, P., Pettersson, K., Pongratz, I., 2008. The transcription factor aryl hydrocarbon receptor nuclear translocator functions as an estrogen receptor beta-selective coactivator, and its recruitment to alternative pathways mediates antiestrogenic effects of dioxin. Mol. Endocrinol. Baltim. Md 22, 304–316. doi:10.1210/me.2007-0128
Safe, S., Wormke, M., Samudio, I., 2000. Mechanisms of inhibitory aryl hydrocarbon receptor-estrogen receptor crosstalk in human breast cancer cells. J. Mammary Gland Biol. Neoplasia 5, 295–306.
Smeets, J.M.W., Rankouhi, T.R., Nichols, K.M., Komen, H., Kaminski, N.E., Giesy, J.P., van den Berg, M., 1999. In vitroVitellogenin Production by Carp (Cyprinus carpio) Hepatocytes as a Screening Method for Determining (Anti)Estrogenic Activity of Xenobiotics. Toxicol. Appl. Pharmacol. 157, 68–76. doi:10.1006/taap.1999.8663
Sonavane, M., Creusot, N., Maillot-Maréchal, E., Péry, A., Brion, F., Aїt-Aïssa, S., 2016. Zebrafish-based reporter gene assays reveal different estrogenic activities in river waters compared to a conventional human-derived assay. Sci. Total Environ. 550, 934–939. doi:10.1016/j.scitotenv.2016.01.187
Tong, S.-K., Mouriec, K., Kuo, M.-W., Pellegrini, E., Gueguen, M.-M., Brion, F., Kah, O., Chung, B., 2009. A cyp19a1b-GFP (Aromatase B) Transgenic Zebrafish Line That Expresses GFP in Radial Glial Cells. Genesis 47, 67–73. doi:10.1002/dvg.20459

Résultats : chapitre C – article n°4
144
Wentworth, J.N., Buzzeo, R., Pollenz, R.S., 2004. Functional characterization of aryl hydrocarbon receptor (zfAHR2) localization and degradation in zebrafish (Danio rerio). Biochem. Pharmacol. 67, 1363–1372. doi:10.1016/j.bcp.2003.12.002
Wihlen, B., Ahmed, S., Inzunza, J., Matthews, J., 2009. Estrogen Receptor Subtype- and Promoter-Specific Modulation of Aryl Hydrocarbon Receptor-Dependent Transcription. Mol. Cancer Res. 7, 977–986. doi:10.1158/1541-7786.MCR-08-0396
Wormke, M., Stoner, M., Saville, B., Walker, K., Abdelrahim, M., Burghardt, R., Safe, S., 2003. The aryl hydrocarbon receptor mediates degradation of estrogen receptor α through activation of proteasomes. Mol. Cell. Biol. 23, 1843–1855. doi:10.1128/MCB.23.6.1843-1855.2003
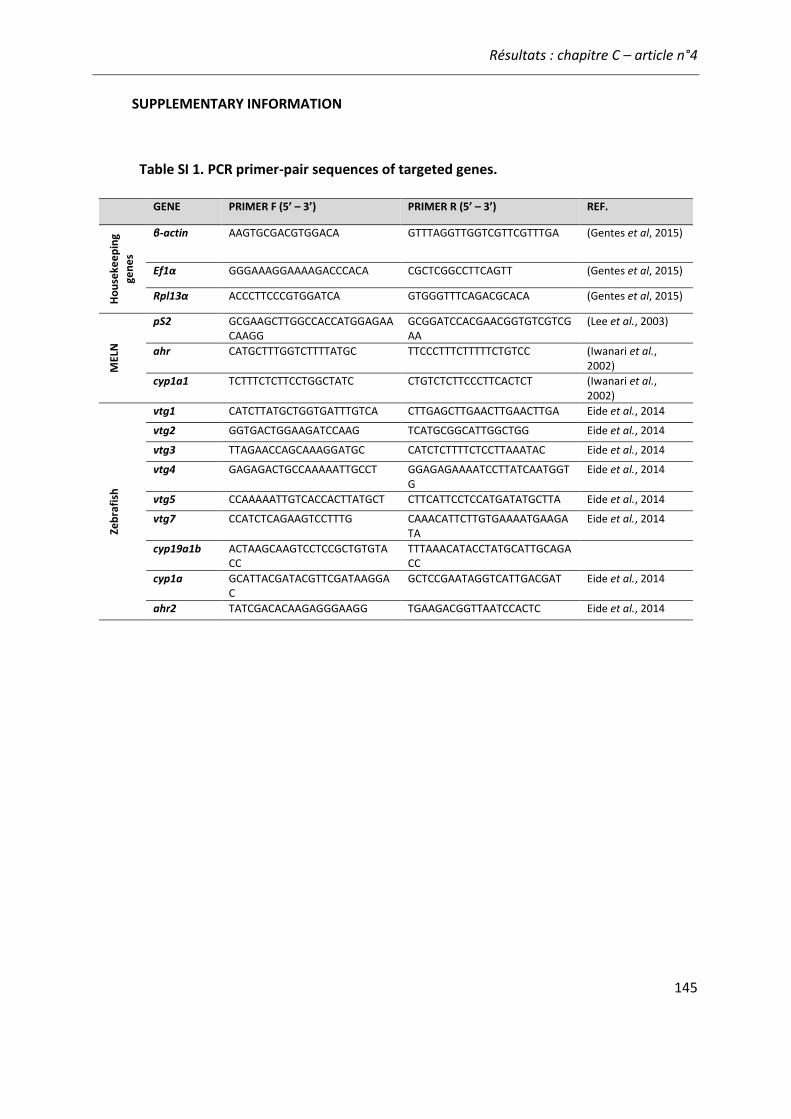
Résultats : chapitre C – article n°4
145
SUPPLEMENTARY INFORMATION
Table SI 1. PCR primer-pair sequences of targeted genes.
GENE PRIMER F (5’ – 3’) PRIMER R (5’ – 3’) REF.
Ho
use
kee
pin
g
gen
es
β-actin AAGTGCGACGTGGACA GTTTAGGTTGGTCGTTCGTTTGA (Gentes et al, 2015)
Ef1α GGGAAAGGAAAAGACCCACA CGCTCGGCCTTCAGTT (Gentes et al, 2015)
Rpl13α ACCCTTCCCGTGGATCA GTGGGTTTCAGACGCACA (Gentes et al, 2015)
MEL
N
pS2 GCGAAGCTTGGCCACCATGGAGAACAAGG
GCGGATCCACGAACGGTGTCGTCGAA
(Lee et al., 2003)
ahr CATGCTTTGGTCTTTTATGC TTCCCTTTCTTTTTCTGTCC (Iwanari et al., 2002)
cyp1a1 TCTTTCTCTTCCTGGCTATC CTGTCTCTTCCCTTCACTCT (Iwanari et al., 2002)
Zeb
rafi
sh
vtg1 CATCTTATGCTGGTGATTTGTCA CTTGAGCTTGAACTTGAACTTGA Eide et al., 2014
vtg2 GGTGACTGGAAGATCCAAG TCATGCGGCATTGGCTGG Eide et al., 2014
vtg3 TTAGAACCAGCAAAGGATGC CATCTCTTTTCTCCTTAAATAC Eide et al., 2014
vtg4 GAGAGACTGCCAAAAATTGCCT GGAGAGAAAATCCTTATCAATGGTG
Eide et al., 2014
vtg5 CCAAAAATTGTCACCACTTATGCT CTTCATTCCTCCATGATATGCTTA Eide et al., 2014
vtg7 CCATCTCAGAAGTCCTTTG CAAACATTCTTGTGAAAATGAAGATA
Eide et al., 2014
cyp19a1b ACTAAGCAAGTCCTCCGCTGTGTACC
TTTAAACATACCTATGCATTGCAGACC
cyp1a GCATTACGATACGTTCGATAAGGAC
GCTCCGAATAGGTCATTGACGAT Eide et al., 2014
ahr2 TATCGACACAAGAGGGAAGG TGAAGACGGTTAATCCACTC Eide et al., 2014
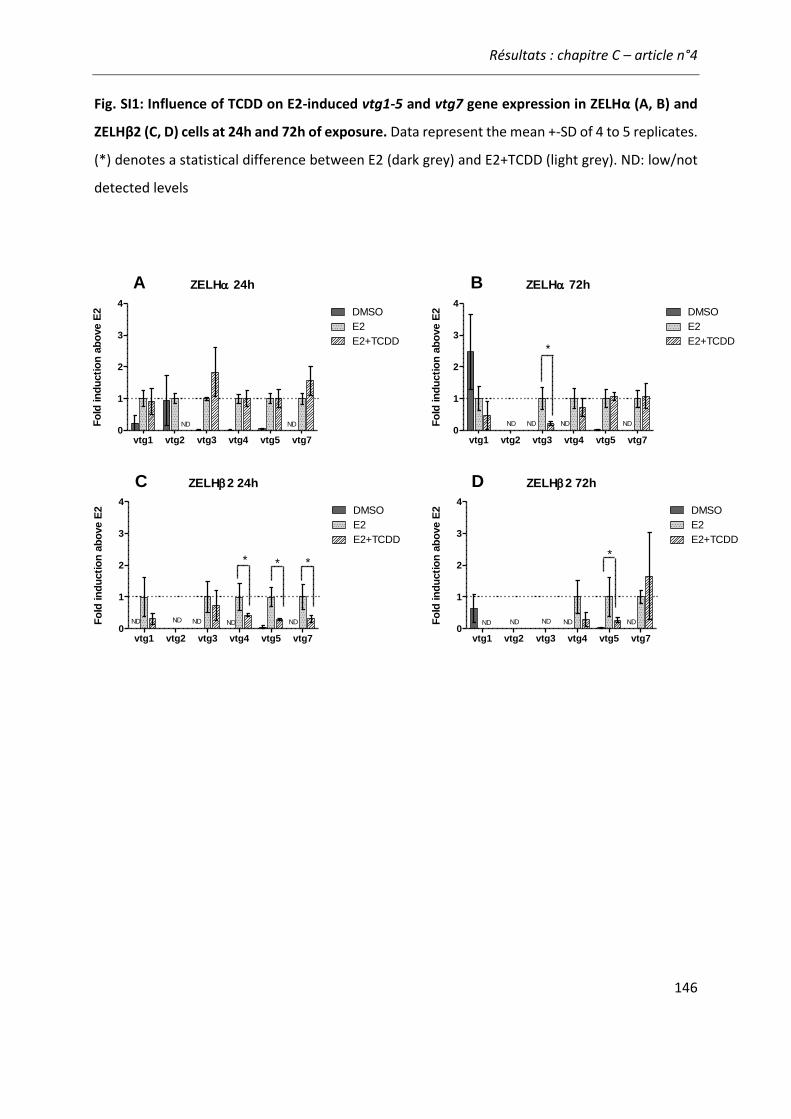
Résultats : chapitre C – article n°4
146
Fig. SI1: Influence of TCDD on E2-induced vtg1-5 and vtg7 gene expression in ZELHα (A, B) and
ZELHβ2 (C, D) cells at 24h and 72h of exposure. Data represent the mean +-SD of 4 to 5 replicates.
(*) denotes a statistical difference between E2 (dark grey) and E2+TCDD (light grey). ND: low/not
detected levels
ZELH 24h
vtg1 vtg2 vtg3 vtg4 vtg5 vtg70
1
2
3
4DMSO
E2
E2+TCDD
NDNDFo
ld in
du
cti
on
ab
ove E
2
ZELH 72h
vtg1 vtg2 vtg3 vtg4 vtg5 vtg70
1
2
3
4DMSO
E2
ND
*E2+TCDD
ND ND NDFo
ld in
du
cti
on
ab
ove E
2
ZELH2 24h
vtg1 vtg2 vtg3 vtg4 vtg5 vtg70
1
2
3
4DMSO
E2
ND
* * *
E2+TCDD
ND ND ND NDFo
ld in
du
cti
on
ab
ove E
2
ZELH2 72h
vtg1 vtg2 vtg3 vtg4 vtg5 vtg70
1
2
3
4DMSO
E2
ND
*
E2+TCDD
ND ND ND NDFo
ld in
du
cti
on
ab
ove E
2
A B
C D
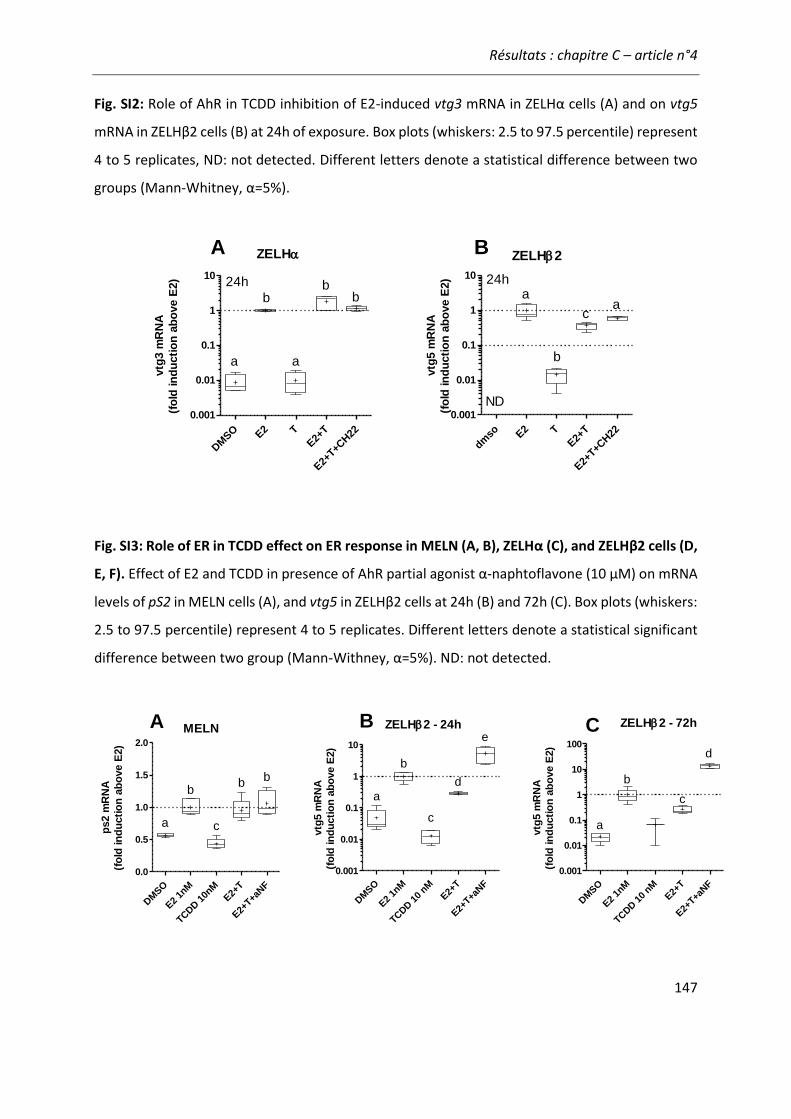
Résultats : chapitre C – article n°4
147
Fig. SI2: Role of AhR in TCDD inhibition of E2-induced vtg3 mRNA in ZELHα cells (A) and on vtg5
mRNA in ZELHβ2 cells (B) at 24h of exposure. Box plots (whiskers: 2.5 to 97.5 percentile) represent
4 to 5 replicates, ND: not detected. Different letters denote a statistical difference between two
groups (Mann-Whitney, α=5%).
Fig. SI3: Role of ER in TCDD effect on ER response in MELN (A, B), ZELHα (C), and ZELHβ2 cells (D,
E, F). Effect of E2 and TCDD in presence of AhR partial agonist α-naphtoflavone (10 µM) on mRNA
levels of pS2 in MELN cells (A), and vtg5 in ZELHβ2 cells at 24h (B) and 72h (C). Box plots (whiskers:
2.5 to 97.5 percentile) represent 4 to 5 replicates. Different letters denote a statistical significant
difference between two group (Mann-Withney, α=5%). ND: not detected.
DM
SO E
2 T
E2+
T
E2+
T+CH22
0.001
0.01
0.1
1
1024h
ZELH
a
bb
b
a
vtg
3 m
RN
A
(fo
ld in
du
cti
on
ab
ove E
2)
dmso E
2 T
E2+
T
E2+
T+CH22
0.001
0.01
0.1
1
10 24h
ZELH2
ND
a
b
ac
vtg
5 m
RN
A
(fo
ld in
du
cti
on
ab
ove E
2)
A B
DM
SO
E2 1n
M
TCDD 1
0 nM
E2+T
E2+T+a
NF
0.001
0.01
0.1
1
10
ZELH2 - 24h
a
b
c
e
d
vtg
5 m
RN
A
(fo
ld in
du
cti
on
ab
ove E
2)
DM
SO
E2 1n
M
TCDD 1
0 nM
E2+T
E2+T+a
NF
0.001
0.01
0.1
1
10
100
ZELH2 - 72h
a
b
c
d
vtg
5 m
RN
A
(fo
ld in
du
cti
on
ab
ove E
2)
DM
SO
E2
1nM
TCDD 1
0nM
E2+
T
E2+
T+aNF
0.0
0.5
1.0
1.5
2.0
a
bb
b
MELN
cps2 m
RN
A
(fo
ld in
du
cti
on
ab
ove E
2)
B CA

Résultats : chapitre C – article n°4
148
Fig. SI4: Role of ER in E2 and TCDD interaction on cyp1a and ahr2 gene expression at 24h in
ZELHα (A, C) and ZELHβ2 cells (B, D). Cells were exposed to E2, TCDD, E2+TCDD, and E2+TCDD
with ICI. Box plots (whiskers: 2.5 to 97.5 percentile) represent 4 to 5 replicates, different letters
denote a statistical significant difference between two groups (Mann-Withney, α=5%). (*)
indicates n<4, no statistical analysis was performed.
DM
SO T E2
E2+T
E2+T+I
CI
10 - 6
10 - 5
10 - 4
10 - 30.1
1
10
ZELH - 24h
a
b b b
a
cyp
1a m
RN
A
(fo
ld in
du
cti
on
ab
ove T
CD
D)
DM
SO T E2
E2+T
E2+T+I
CI
0.1
1
10
ZELH - 24h
a
b
a
b b
ah
r2 m
RN
A
(fo
ld in
du
cti
on
ab
ove T
CD
D)
DM
SO T E2
E2+T
E2+T+I
CI
10 - 3
10 - 2
1
10
ZELH2 - 24h
*
a
b
a
a
cyp
1a m
RN
A
(fo
ld in
du
cti
on
ab
ove T
CD
D)
DM
SO T E2
E2+T
E2+T+I
CI
0.1
1
10
ZELH2 - 24h
a,bb
aa,b
c
ah
r2 m
RN
A
(fo
ld in
du
cti
on
ab
ove T
CD
D)
A B
C D
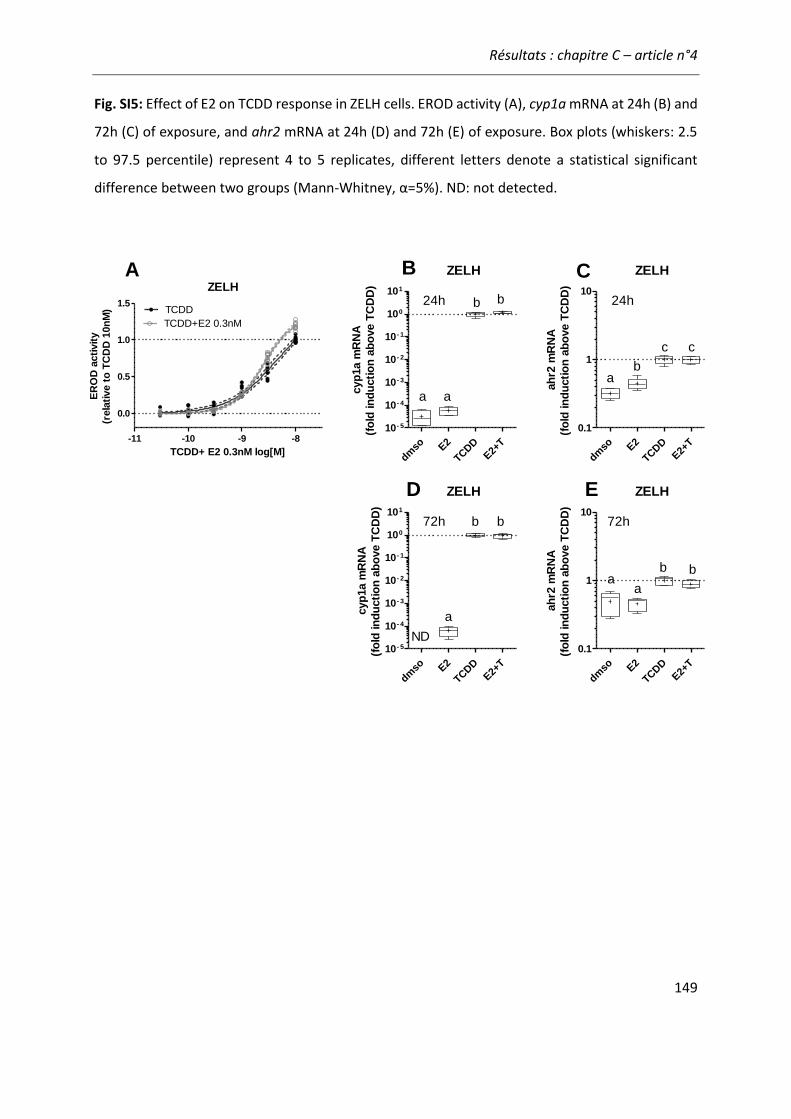
Résultats : chapitre C – article n°4
149
Fig. SI5: Effect of E2 on TCDD response in ZELH cells. EROD activity (A), cyp1a mRNA at 24h (B) and
72h (C) of exposure, and ahr2 mRNA at 24h (D) and 72h (E) of exposure. Box plots (whiskers: 2.5
to 97.5 percentile) represent 4 to 5 replicates, different letters denote a statistical significant
difference between two groups (Mann-Whitney, α=5%). ND: not detected.
-11 -10 -9 -8
0.0
0.5
1.0
1.5
TCDD+E2 0.3nM
TCDD
ZELH
TCDD+ E2 0.3nM log[M]
ER
OD
acti
vit
y
(rela
tive t
o T
CD
D 1
0n
M)
dmso E
2
TCDD
E2+
T
10 - 5
10 - 4
10 - 3
10 - 2
10 - 1
100
101
24h
ZELH
a a
b b
cyp
1a m
RN
A
(fo
ld in
du
cti
on
ab
ove T
CD
D)
dmso E
2
TCDD
E2+
T
10 - 5
10 - 4
10 - 3
10 - 2
10 - 1
100
101
72h
ZELH
ND
a
b b
cyp
1a m
RN
A
(fo
ld in
du
cti
on
ab
ove T
CD
D)
dmso E
2
TCDD
E2+
T
0.1
1
1024h
ZELH
ab
c c
ah
r2 m
RN
A
(fo
ld in
du
cti
on
ab
ove T
CD
D)
dmso E
2
TCDD
E2+
T
0.1
1
1072h
ZELH
aa
b b
ah
r2 m
RN
A
(fo
ld in
du
cti
on
ab
ove T
CD
D)
A B C
D E
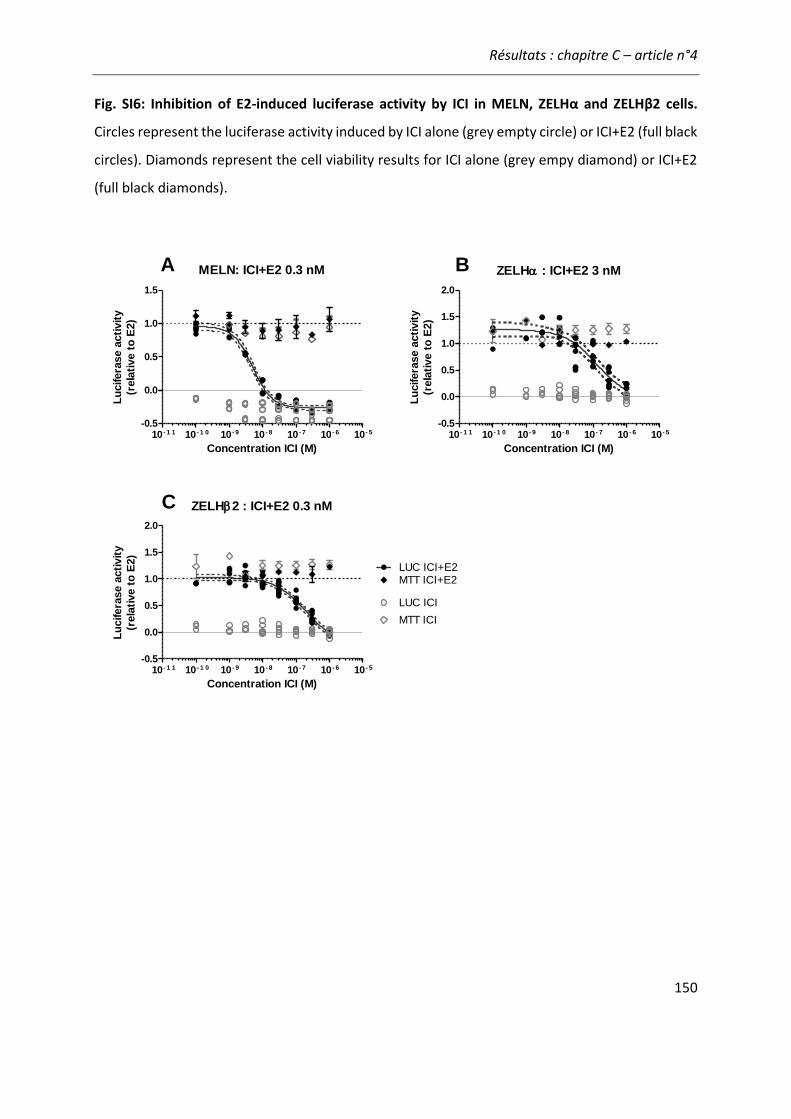
Résultats : chapitre C – article n°4
150
Fig. SI6: Inhibition of E2-induced luciferase activity by ICI in MELN, ZELHα and ZELHβ2 cells.
Circles represent the luciferase activity induced by ICI alone (grey empty circle) or ICI+E2 (full black
circles). Diamonds represent the cell viability results for ICI alone (grey empy diamond) or ICI+E2
(full black diamonds).
MELN: ICI+E2 0.3 nM
10 - 1 1 10 - 1 0 10- 9 10 - 8 10 - 7 10 - 6 10- 5
-0.5
0.0
0.5
1.0
1.5
Concentration ICI (M)
Lu
cifera
se a
cti
vit
y
(rela
tive t
o E
2)
ZELH : ICI+E2 3 nM
10 - 1 1 10 - 1 0 10- 9 10 - 8 10 - 7 10 - 6 10- 5
-0.5
0.0
0.5
1.0
1.5
2.0
Concentration ICI (M)
Lu
cifera
se a
cti
vit
y
(rela
tive t
o E
2)
ZELH2 : ICI+E2 0.3 nM
10 - 1 1 10 - 1 0 10 - 9 10 - 8 10- 7 10 - 6 10 - 5
-0.5
0.0
0.5
1.0
1.5
2.0
LUC ICI+E2
MTT ICI
LUC ICI
MTT ICI+E2
Concentration ICI (M)
Lu
cifera
se a
cti
vit
y
(rela
tive t
o E
2)
A B
C
Résultats : chapitre C – article n°5
151
Article n°5: “Different responses of in vitro zebrafish- and human-based
estrogenicity bioassays to selected environmental contaminants and their
mixtures”
2.1 Contexte et objectifs
Dans l’environnement, les xeno-estrogènes sont présent sous forme de mélanges avec de
nombreux autres composés. Alors que les effets additifs des estrogènes ont été principalement
étudiés dans des situations peu représentatives d’une situation environnementale (ex : mélanges
équipotents), une autre approche a été appliquée dans le cadre du projet européen SOLUTIONS.
Dans le cadre de l’évaluation des bio-essais, deux mélanges de 12 polluants environnementaux
ont été définit dans le but de montrer la capacité des bio-essais à détecter les effets additifs des
molécules actives au sein de mélanges de molécules inactives (Altenburger et al., in prep). Chaque
mélange comportait les mêmes 12 molécules mais avec des ratios fixes differents. Une
introduction à la démarche de l’étude est présentée en annexe I.
Dans le cas de l’activité estrogénique, l’objectif de cette étude était de comparer la
capacité des bio-essais in vitro MELN et ZELH-zfERs à détecter les effets combinés du bisphenol A
et de la génisteine au sein d’un mélange de polluants environnementaux. L’activité estrogénique
et anti-estrogénique a été évaluée pour chaque mélange afin de tenir compte d’une interaction
possible sur la réponse oestrogénique. Le modèle de concentration addition (CA) a été utilisé afin
de prédire et d’évaluer les effets additifs des molécules actives ensemble et au sein des mélanges
de 12 composés.
2.2 Principaux résultats
En combinaison binaire avec les mêmes ratios que dans les deux mélanges, le bisphénol A
et la génisteine ont des effets additifs dans tous les modèles. Au sein des mélanges de 12 polluants,
les effets combinés des xeno-estrogènes sont bien détecté dans les MELN. Dans les ZELHβ2,
aucune activité estrogénique n’est détectée pour le mélange 1, bien qu’attendue, et une activité
plus faible qu’attendue est mesurée pour le mélange 2. Dans les deux cas, une forte inhibition de
Résultats : chapitre C – article n°5
152
l’activité induite par la luciférase était observée, bien prédites par les molécules inhibitrices
identifiées (TPP, chlorophene, propiconazole).
Afin de mettre en évidence l’effet des molécules inhibitrices, les cellules ZELHα et ZELHβ2
ont été exposées aux bisphenol A et à la génisteine en présence des inhibiteurs identifiés (mélange
de 4 à 5 composés). Le résultat de cette évaluation montre que les molécules inhibitrices sont bien
responsables de la déviation de l’activité estrogénique attendue dans les ZELHβ2, et dans une
moindre mesure dans les ZELHα.
2.3 Conclusion
➢ Le bisphenol A et la génisteine ont des effets additifs dans les ZELH-zfERs
➢ Les MELN détectent bien les effets additifs des xeno-estrogènes au sein des mélanges
reconsitués
➢ En mélanges, les molécules inhibant spécifiquement l’activité induite de la luciferase
peuvent moduler négativement la réponse estrogénique aux xeno-estrogènes dans les
ZELH-zfERs
Résultats : chapitre C – article n°5
153
ARTICLE n°5
Different responses of in vitro zebrafish- and human-based
estrogenicity bioassays to selected environmental contaminants and their
mixtures
Hélène Serra1,2, Martin Scholze3, Rolf Altenburger4, Wibke Busch4, Hélène Budzinski2, François
Brion1, Selim Aït-Aïssa1,*
1Institut National de l’Environnement Industriel et des risques (INERIS), unité Ecotoxicologie in
vitro et in vivo, 60550 Verneuil-en-Halatte, France
2 UMR-CNRS EPOC/LPTC, Université de Bordeaux, Talence, France
3Brunel University London, Uxbridge, United Kingdom
4UFZ– Helmholtz Centre for Environmental Research, Leipzig, Germany
*Corresponding author
ABSTRACT
This study aimed to compare the ability of in vitro zebrafish ZELHα and ZELHβ2 and human
MELN ER reporter gene assays to detect combined effect of xeno-estrogens in mixtures. For that
purpose, two fixed-ratio mixtures were designed with 12 environmentally relevant surface water
pollutants covering diverse modes of action, including bisphenol A and genistein as ER agonist.
Bisphenol A and genistein had additive effects in all cell models, well predicted by CA model. When
replaced in a context of multiple contaminants within the 12-component mixtures, we observed
a higher influence of non-estrogenic chemicals in ZELH-zfERs cells, which interacted negatively
with zfER activation and decreased the expected response. This study shows that the same set of
xeno-estrogens within an environmental relevant mixture can results in different mixture effects,
highlighting the need to consider bioassay specificities (e.g. fish vs human ER, cell context) in
environmental bio-monitoring.
KEY WORDS: Estrogenicity, mixtures, in vitro, human, zebrafish

Résultats : chapitre C – article n°5
154
INTRODUCTION
The contamination of the aquatic environment by endocrine disrupting chemicals (EDC), in
particular by xeno-estrogens (XE), has become a major concern because of their capacity to
adversely affect wild organisms, such as fish (Sumpter, 2005). Estrogenic chemicals mediate their
effects by the estrogen receptor (ER) through a well conserved mode of action among vertebrates
(Nelson and Habibi, 2013). Activated ER binds specific DNA sequence and regulates the
transcription of target genes involved in physiological processes such as growth, development and
reproduction (Segner et al., 2013). A wide range of estrogenic chemicals such as alkylphenols,
bisphenols, phytoestrogens or natural and synthetic hormones were identified in river waters
(Jarošová et al., 2015; Kolpin et al., 2002; Loos et al., 2009). In order to complement target
chemical analysis, in vitro bioassays, such as reporter gene assays, are suggested as valuable tools
for xeno-estrogens monitoring in environmental matrices as they were shown to be rapid and
sensitive to quantify estrogenic activity of (unknown) active chemicals within complex mixtures
such as urban effluents and surface water (Conley et al., 2017; Neale et al., 2015).
To date, most of in vitro bioassays used in bio-monitoring are reporter gene assays based
on human ERα (hERα) activation expressed in mammalian or yeast cells (Kunz et al., 2015, Leusch
et al., 2017). Compared to human that have 2 ER subtypes (ERα and ERβ), most teleost fish express
ERα and 2 ERβ subtypes, i.e. ERβ1 and ERβ2, originating from an ancient whole genome
duplication event (Hoegg et al., 2004; Tohyama et al., 2016). Studies comparing fish and human
ERs transactivation in vitro showed differences in sensitivity and selectivity between ER-subtype
and species to known xeno-estrogens (Cosnefroy et al., 2012; Molina-Molina et al., 2008; Pinto et
al., 2014). Changes in key amino acids in ER ligand binding domain are believe to be responsible
for the different affinity of fish and human ER (Hawkins and Thomas, 2004; Matthews et al., 2000).
Furthermore, ER response can be influenced by the cell context, such as ER- and cell-specific
transcription co-factors recruitment (McDonnell and Norris, 2002) or metabolism (Le Fol et al.,
2015). The few studies using fish-based in vitro reporter gene assays in bio-monitoring showed
that, in some cases, they can respond differently qualitatively and quantitatively than human-
based bioassays to water and effluent samples (Sonavane et al., 2016, Ihara et al., 2014,
Rutischauer et al., 2004). For instance, using the recently developed ZELHβ2 in vitro bioassay, we
reported that some surface water extracts were active on ZELHβ2 cells but lacked estrogenic
Résultats : chapitre C – article n°5
155
activity in human-based cells (Sonavane et al., 2016). These results suggest that cross-species
differences and bioassays specific factors (e.g. cell context) may affect the quantification of xeno-
estrogens in complex mixtures.
The model of concentration addition (CA, Loewe et Muischnek, 1926), which assumes that
chemicals sharing similar mode of action have additive effect, has been shown to predict well the
combined action of xeno-estrogens mixtures in in vitro mammalian (Ghisari and Bonefeld-
Jorgensen, 2009; Rajapakse et al., 2004; Scholze et al., 2014; Seeger et al., 2016) and fish systems
(Petersen and Tollefsen, 2011; Hinfray et al., 2016; Le Page et al., 2006). However, in certain
scenarios, deviations from CA prediction are observed (Evans et al., 2012; Frische et al., 2009; Silva
et al., 2011). Different hypotheses have been formulated such as an increased metabolism of
xeno-estrogens (Silva et al., 2011, Petersen and Tollefsen, 2011), modulating effects by chemicals
having minimal to no estrogenic activity (Evans et al., 2012) or interactions with toxic chemicals
(Frische et al., 2009). In the case of environmental contamination, xeno-estrogens co-occur with
many other chemicals with diverse mode of action (Busch et al., 2016; Loos et al., 2009; Neale et
al., 2015), which might interfere with ER response in a given bioassay though multiple ways such
as cytotoxicity or activation of other intracellular signaling pathways. Given the complexity of
environmental contamination, there is a need to better understand the response of fish and
human-based bioassays to xeno-estrogens within mixtures of chemicals representative of aquatic
contamination.
In this context, our study aimed to assess the ability of zebrafish and human-based in vitro
reporter gene assays to detect combined activity of xeno-estrogens within a mixture of
environmentally relevant surface water pollutants. As part of a bioassay benchmarking exercise
(Altenburger et al., in prep), two fixed-ratio mixtures of 12 chemicals with dissimilar mode of
actions were designed (Tab. 1), in which genistein, a phytoestrogen, and bisphenol A were
selected as environmental xeno-estrogens. For each chemical and mixture, both estrogenic and
anti-estrogenic activities were assessed in parallel in zebrafish (ZELHα and ZELHβ2 cells) and
human-based (MELN cells) bioassays to account for possible negative modulation on ER response.
Concentration Addition (CA) model (Loewe et Muischnek, 1926) and extended CA model (Scholze
et al., 2014) were applied to predict and assess the combined effects of xeno-estrogens.

Résultats : chapitre C – article n°5
156
MATERIAL AND METHODS
Chemicals and reagents
17β-estradiol (E2), triclosan (TCS) were purchased from Sigma-Aldrich (France). Bisphenol
A (BPA), Genistein, propiconazole, diclofenac, diazinon, diuron, cyprodinil, triphenylphosphate
(TPP), benzo(a)pyrene (BaP), benzo(b)fluoranthene (BbF), chlorophene, hydroxy-tamoxifen (OH-
TAM). Dimethylsulfoxide (DMSO), Leibovitz 15 culture medium (L-15), fetal calf serum (FCS), 4-(2-
hydroxy-ethyl)-1-piperazineethanesulfonic acid (HEPES), epidermal growth factor (EGF), G418, 3-
[4,5-dimethylthiazol-2-yl]-2,5-diphenyl-tetrazoliumbromide (MTT) and D-luciferin were
purchased from Sigma Aldrich (St-Quentin Fallavier, France); Dulbecco's Modified Eagle Medium
High Glucose (DMEM HG) powder, F-12 nutrient mixture (Ham's F12) powder, penicillin and
streptomycin were from Gibco (France); insulin, hygromycin B and sodium bicarbonate were from
Dominique Dutscher (France).
In vitro bioassays
Cell culture, luciferase and cell viability assays
The zebrafish in vitro assays were derived from the zebrafish liver (ZFL) cell line. ZFL were
stably transfected, first, with an ERE-driven firefly luciferase gene, yielding the ZELH cell line, and
then with zfERα subtype, yielding the ZELH-zfERα, or with zfERβ2 subtype yielding the ZELHβ2 cell
lines (Cosnefroy et al., 2012). Establishment of these cell models and their response to different
classes of well-known xeno-estrogens have been previously described (Cosnefroy et al., 2012,
Sonavane et al., 2016). In addition, the ZELH cell line was used as ER-negative control for non-
specific luciferase modulation. The human-derived MELN cell line (Balaguer et al., 1999) kindly
provided by Dr. Patrick Balaguer (INSERM Montpellier, France) was used to compare the fish cells
with an established mammalian cell model. The MELN cells are derived from the breast cancer
MCF-7 cells, which endogenously express the hERα, but no functional hERβ (P. Balaguer, personal
communication), and were stably transfected with an ERE-driven firefly luciferase reporter gene.
Conditions for routine cell culture have been detailed previously (Balaguer et al., 1999,
Cosnefroy et al., 2012). For exposure experiments, ZELH-derived cells were seeded in 96-well
white opaque culture plates (Greiner CellStar™, Dutscher, France) at 25,000 cells per well in
phenol red free LDF-DCC medium (containing L-15 50%, DMEM HG 35%, Ham's F12 15%, HEPES
Résultats : chapitre C – article n°5
157
15 mM, 0.15 g/L sodium bicarbonate, 0.01 mg/mL insulin, 50 ng/mL EGF, 50 U/mL penicillin and
streptomycin antibiotics, 5% v/v stripped FCS). MELN were seeded at 80,000 cells per well in
steroid-free DMEM medium. Cells were left to adhere for 24 h. Then, they were exposed in
triplicates to serial dilutions of test compound for either 72 h at 28 °C for zebrafish cells or 16h at
37°C for MELN cells. Each plate included both solvent and positive controls. After exposure, culture
medium was removed and replaced by 50 μl per well of medium containing 0.3 mM luciferin. The
luminescence signal was measured in living cells using a microtiter plate luminometer (Synergy
H4, BioTek). The effect of test chemicals on cell viability was assessed by using the 3-(4,5-dimethyl-
thiazol-2-yl)-2,5diphenyl tetrazolium bromide (MTT) assay (Mosmann 1983). After cell exposure,
culture medium was removed and replaced by 100 μL of medium containing 0.5 mg/mL MTT. Cells
were incubated for 1 h to 3 h. In metabolically active cells, MTT is reduced onto a blue formazan
precipitate, which is dissolved by adding 100 μL of DMSO after removal of MTT containing
medium. Plates were read at 570 nm against a 640nm reference wavelength on a microplate
reader (KC-4, BioTek Instruments, France) and results are expressed as absorbance relative to
control cells.
In vitro testing of single chemicals and mixtures
The mixture compositions are given in Tab. 1. Single chemical and 2-,3- and 5-component
mixtures testing were done in DMSO and respecting a maximal solvent concentration of 0,1% v/v
or 0,15% v/v (in case of co-exposure with E2). The 12-component mixtures were received already
prepared in methanol (as part of a round robin test on bioassays, Altenburger et al., in prep). M1
and M2 were tested with a maximal solvent concentration of 0,1% or 0,15% (in co-exposure with
E2) which correspond to a maximal concentration of 124 µM of M1, and 15.1 µM of M2. The
response of MELN cells to TPP and BPA in DMSO and in methanol were similar (data not shown),
thus, no significant effect of the solvent is expected. Stock solutions in DMSO and methanol were
stable at 4°C for up to 3 months.
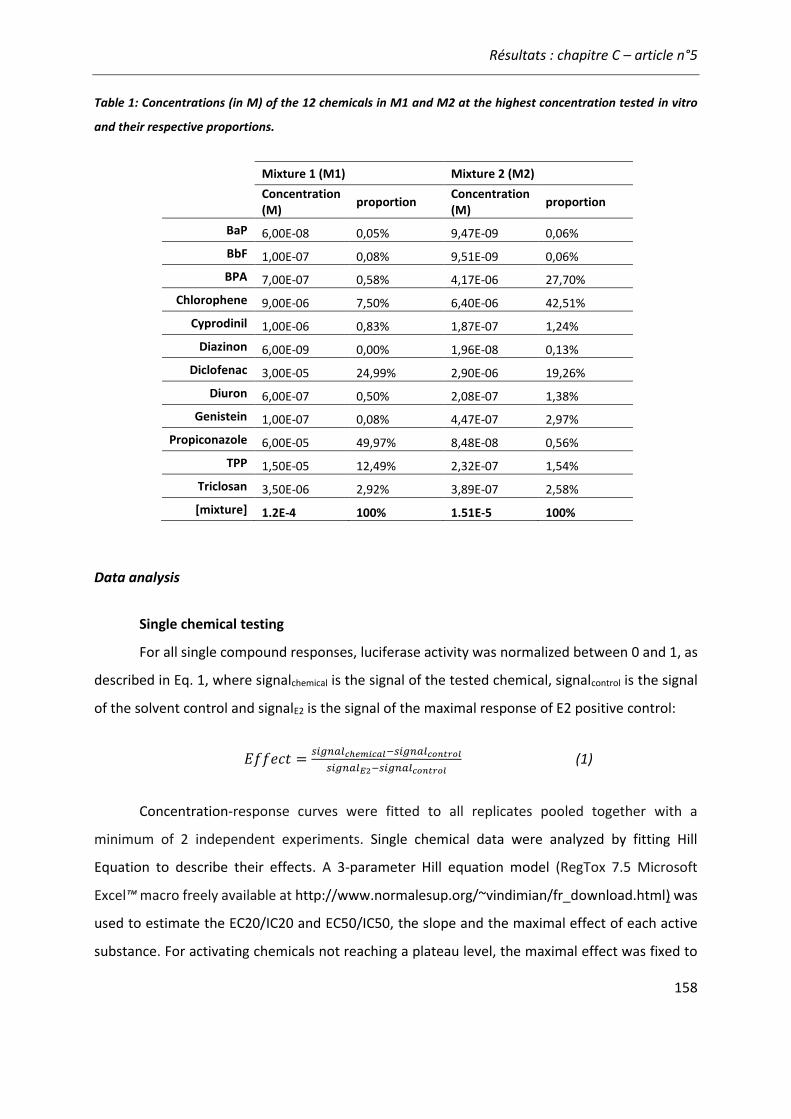
Résultats : chapitre C – article n°5
158
Table 1: Concentrations (in M) of the 12 chemicals in M1 and M2 at the highest concentration tested in vitro
and their respective proportions.
Mixture 1 (M1) Mixture 2 (M2)
Concentration (M)
proportion Concentration (M)
proportion
BaP 6,00E-08 0,05% 9,47E-09 0,06%
BbF 1,00E-07 0,08% 9,51E-09 0,06%
BPA 7,00E-07 0,58% 4,17E-06 27,70%
Chlorophene 9,00E-06 7,50% 6,40E-06 42,51%
Cyprodinil 1,00E-06 0,83% 1,87E-07 1,24%
Diazinon 6,00E-09 0,00% 1,96E-08 0,13%
Diclofenac 3,00E-05 24,99% 2,90E-06 19,26%
Diuron 6,00E-07 0,50% 2,08E-07 1,38%
Genistein 1,00E-07 0,08% 4,47E-07 2,97%
Propiconazole 6,00E-05 49,97% 8,48E-08 0,56%
TPP 1,50E-05 12,49% 2,32E-07 1,54%
Triclosan 3,50E-06 2,92% 3,89E-07 2,58%
[mixture] 1.2E-4 100% 1.51E-5 100%
Data analysis
Single chemical testing
For all single compound responses, luciferase activity was normalized between 0 and 1, as
described in Eq. 1, where signalchemical is the signal of the tested chemical, signalcontrol is the signal
of the solvent control and signalE2 is the signal of the maximal response of E2 positive control:
𝐸𝑓𝑓𝑒𝑐𝑡 =𝑠𝑖𝑔𝑛𝑎𝑙𝑐ℎ𝑒𝑚𝑖𝑐𝑎𝑙−𝑠𝑖𝑔𝑛𝑎𝑙𝑐𝑜𝑛𝑡𝑟𝑜𝑙
𝑠𝑖𝑔𝑛𝑎𝑙𝐸2−𝑠𝑖𝑔𝑛𝑎𝑙𝑐𝑜𝑛𝑡𝑟𝑜𝑙 (1)
Concentration-response curves were fitted to all replicates pooled together with a
minimum of 2 independent experiments. Single chemical data were analyzed by fitting Hill
Equation to describe their effects. A 3-parameter Hill equation model (RegTox 7.5 Microsoft
Excel™ macro freely available at http://www.normalesup.org/~vindimian/fr_download.html) was
used to estimate the EC20/IC20 and EC50/IC50, the slope and the maximal effect of each active
substance. For activating chemicals not reaching a plateau level, the maximal effect was fixed to
Résultats : chapitre C – article n°5
159
1, and a positive control value (PC20 and PC50) was derived instead of an EC value. For inhibiting
chemicals, hydroxy-tamoxifen (OH-TAM) was used as a control. For inhibiting chemicals not
reaching a plateau level, the maximal effect was fixed to 0.
Mixture prediction based on CA model
For mixture prediction, single data were fitted with log-logistic function (logit). CA model
was used to predict the additive effects of activating and inhibiting chemicals separately, as
described in Scholze et al. (2014) using eq. (2), with Ci chemical concentration i in the mixture, and
ECxi the response of the substance i at Ci:
∑ (𝐶𝑖
𝐸𝐶𝑥𝑖)
𝑛
𝑖=1= 1 (2)
Estradiol-equivalent (E2-Eq) derivation
E2-Eq of the 12-component mixtures were calculated based on chemical information (E2-
Eq predicted) and measured effects (E2-Eq observed). Hill equation was used to derive the EC20
of the mixture by fixing the minimum and the maximum of the response to 0 and 1, respectively,
and fixing the slope to the one of E2. The E2-Eq observed was calculated as the ratio of EC20 of E2
to the EC20 of the mixture, and expressed in mol/L. The E2-Eq predicted was calculated as the
ratio of EC20 of E2 to the predicted EC20 of the mixture based on CA prediction, and expressed in
mol/L.
RESULTS
Activation and inhibition of ER response by single chemicals
The experimental parameters of ER activation by single chemicals on MELN, ZELHα and
ZELHβ2 cells are presented in Tab. 2. All individual concentration-response data, including E2, are
provided in supp. materials (Fig. SI 1). The phytoestrogen genistein and BPA were the most potent
XE, but with different sensitivity and efficacy depending on the cell lines. MELN cells were the most
responsive cells to BPA (EC50=0.32 µM, maximal effect of 86% of E2 response), while ZELHα and
ZELHβ2 cells showed similar sensitivity with an EC50 of 2.8 µM and 1 µM, respectively, and a
maximum induction around 30 % of E2 response (Tab. 2). In case of genistein, MELN cells were
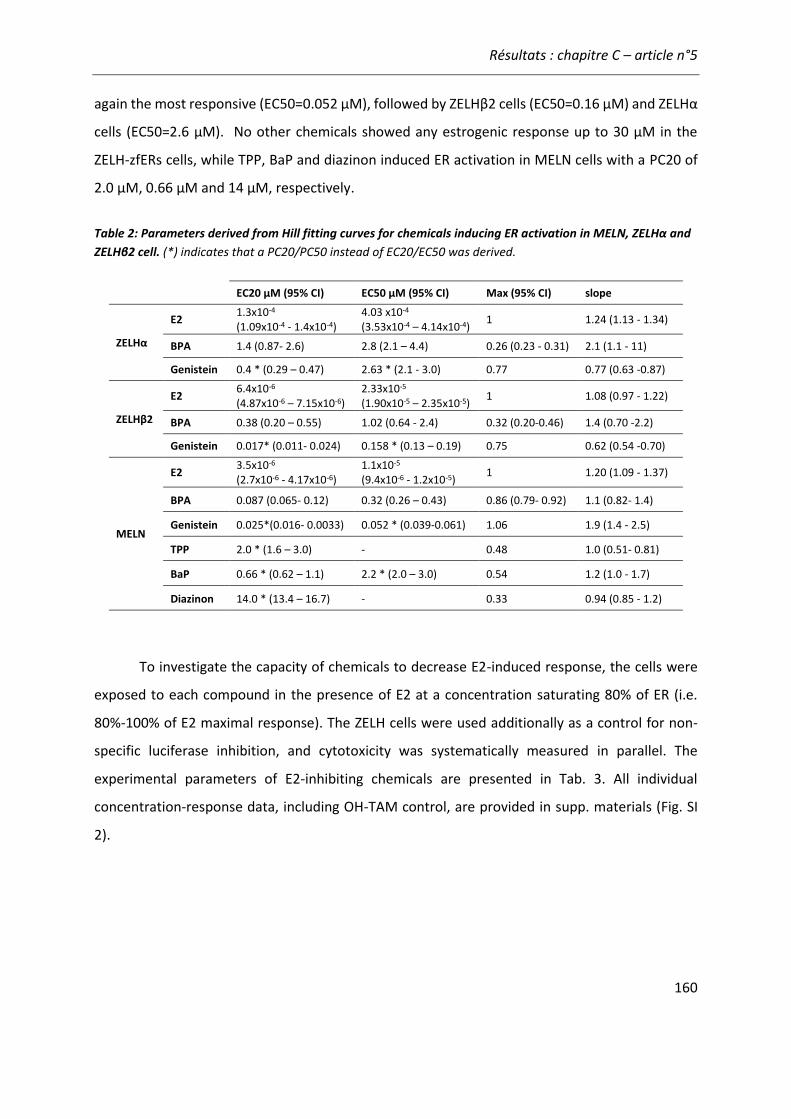
Résultats : chapitre C – article n°5
160
again the most responsive (EC50=0.052 µM), followed by ZELHβ2 cells (EC50=0.16 µM) and ZELHα
cells (EC50=2.6 µM). No other chemicals showed any estrogenic response up to 30 µM in the
ZELH-zfERs cells, while TPP, BaP and diazinon induced ER activation in MELN cells with a PC20 of
2.0 µM, 0.66 µM and 14 µM, respectively.
Table 2: Parameters derived from Hill fitting curves for chemicals inducing ER activation in MELN, ZELHα and
ZELHβ2 cell. (*) indicates that a PC20/PC50 instead of EC20/EC50 was derived.
EC20 µM (95% CI) EC50 µM (95% CI) Max (95% CI) slope
ZELHα
E2 1.3x10⁻⁴ (1.09x10⁻⁴ - 1.4x10⁻⁴)
4.03 x10⁻⁴ (3.53x10⁻⁴ – 4.14x10⁻⁴)
1 1.24 (1.13 - 1.34)
BPA 1.4 (0.87- 2.6) 2.8 (2.1 – 4.4) 0.26 (0.23 - 0.31) 2.1 (1.1 - 11)
Genistein 0.4 * (0.29 – 0.47) 2.63 * (2.1 - 3.0) 0.77 0.77 (0.63 -0.87)
ZELHβ2
E2 6.4x10⁻⁶ (4.87x10⁻⁶ – 7.15x10⁻⁶)
2.33x10⁻⁵ (1.90x10⁻⁵ – 2.35x10⁻⁵)
1 1.08 (0.97 - 1.22)
BPA 0.38 (0.20 – 0.55) 1.02 (0.64 - 2.4) 0.32 (0.20-0.46) 1.4 (0.70 -2.2)
Genistein 0.017* (0.011- 0.024) 0.158 * (0.13 – 0.19) 0.75 0.62 (0.54 -0.70)
MELN
E2 3.5x10⁻⁶ (2.7x10⁻⁶ - 4.17x10⁻⁶)
1.1x10⁻⁵
(9.4x10⁻⁶ - 1.2x10⁻⁵) 1 1.20 (1.09 - 1.37)
BPA 0.087 (0.065- 0.12) 0.32 (0.26 – 0.43) 0.86 (0.79- 0.92) 1.1 (0.82- 1.4)
Genistein 0.025*(0.016- 0.0033) 0.052 * (0.039-0.061) 1.06 1.9 (1.4 - 2.5)
TPP 2.0 * (1.6 – 3.0) - 0.48 1.0 (0.51- 0.81)
BaP 0.66 * (0.62 – 1.1) 2.2 * (2.0 – 3.0) 0.54 1.2 (1.0 - 1.7)
Diazinon 14.0 * (13.4 – 16.7) - 0.33 0.94 (0.85 - 1.2)
To investigate the capacity of chemicals to decrease E2-induced response, the cells were
exposed to each compound in the presence of E2 at a concentration saturating 80% of ER (i.e.
80%-100% of E2 maximal response). The ZELH cells were used additionally as a control for non-
specific luciferase inhibition, and cytotoxicity was systematically measured in parallel. The
experimental parameters of E2-inhibiting chemicals are presented in Tab. 3. All individual
concentration-response data, including OH-TAM control, are provided in supp. materials (Fig. SI
2).
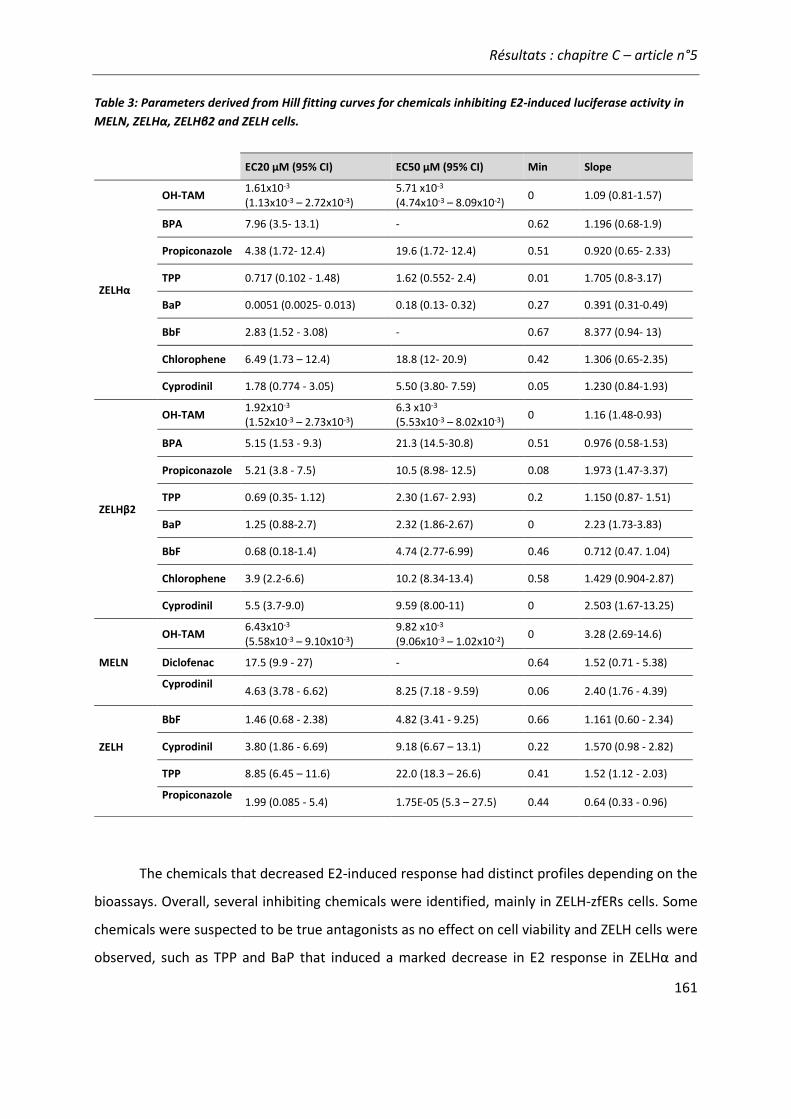
Résultats : chapitre C – article n°5
161
Table 3: Parameters derived from Hill fitting curves for chemicals inhibiting E2-induced luciferase activity in
MELN, ZELHα, ZELHβ2 and ZELH cells.
The chemicals that decreased E2-induced response had distinct profiles depending on the
bioassays. Overall, several inhibiting chemicals were identified, mainly in ZELH-zfERs cells. Some
chemicals were suspected to be true antagonists as no effect on cell viability and ZELH cells were
observed, such as TPP and BaP that induced a marked decrease in E2 response in ZELHα and
EC20 µM (95% CI) EC50 µM (95% CI) Min Slope
ZELHα
OH-TAM 1.61x10⁻³ (1.13x10⁻³ – 2.72x10⁻³)
5.71 x10⁻³ (4.74x10⁻³ – 8.09x10⁻²)
0 1.09 (0.81-1.57)
BPA 7.96 (3.5- 13.1) - 0.62 1.196 (0.68-1.9)
Propiconazole 4.38 (1.72- 12.4) 19.6 (1.72- 12.4) 0.51 0.920 (0.65- 2.33)
TPP 0.717 (0.102 - 1.48) 1.62 (0.552- 2.4) 0.01 1.705 (0.8-3.17)
BaP 0.0051 (0.0025- 0.013) 0.18 (0.13- 0.32) 0.27 0.391 (0.31-0.49)
BbF 2.83 (1.52 - 3.08) - 0.67 8.377 (0.94- 13)
Chlorophene 6.49 (1.73 – 12.4) 18.8 (12- 20.9) 0.42 1.306 (0.65-2.35)
Cyprodinil 1.78 (0.774 - 3.05) 5.50 (3.80- 7.59) 0.05 1.230 (0.84-1.93)
ZELHβ2
OH-TAM 1.92x10⁻³ (1.52x10⁻³ – 2.73x10⁻³)
6.3 x10⁻³ (5.53x10⁻³ – 8.02x10⁻³)
0 1.16 (1.48-0.93)
BPA 5.15 (1.53 - 9.3) 21.3 (14.5-30.8) 0.51 0.976 (0.58-1.53)
Propiconazole 5.21 (3.8 - 7.5) 10.5 (8.98- 12.5) 0.08 1.973 (1.47-3.37)
TPP 0.69 (0.35- 1.12) 2.30 (1.67- 2.93) 0.2 1.150 (0.87- 1.51)
BaP 1.25 (0.88-2.7) 2.32 (1.86-2.67) 0 2.23 (1.73-3.83)
BbF 0.68 (0.18-1.4) 4.74 (2.77-6.99) 0.46 0.712 (0.47. 1.04)
Chlorophene 3.9 (2.2-6.6) 10.2 (8.34-13.4) 0.58 1.429 (0.904-2.87)
Cyprodinil 5.5 (3.7-9.0) 9.59 (8.00-11) 0 2.503 (1.67-13.25)
MELN
OH-TAM 6.43x10⁻³ (5.58x10⁻³ – 9.10x10⁻³)
9.82 x10⁻³ (9.06x10⁻³ – 1.02x10⁻²)
0 3.28 (2.69-14.6)
Diclofenac 17.5 (9.9 - 27) - 0.64 1.52 (0.71 - 5.38)
Cyprodinil
4.63 (3.78 - 6.62) 8.25 (7.18 - 9.59) 0.06 2.40 (1.76 - 4.39)
ZELH
BbF 1.46 (0.68 - 2.38) 4.82 (3.41 - 9.25) 0.66 1.161 (0.60 - 2.34)
Cyprodinil 3.80 (1.86 - 6.69) 9.18 (6.67 – 13.1) 0.22 1.570 (0.98 - 2.82)
TPP 8.85 (6.45 – 11.6) 22.0 (18.3 – 26.6) 0.41 1.52 (1.12 - 2.03)
Propiconazole
1.99 (0.085 - 5.4) 1.75E-05 (5.3 – 27.5) 0.44 0.64 (0.33 - 0.96)
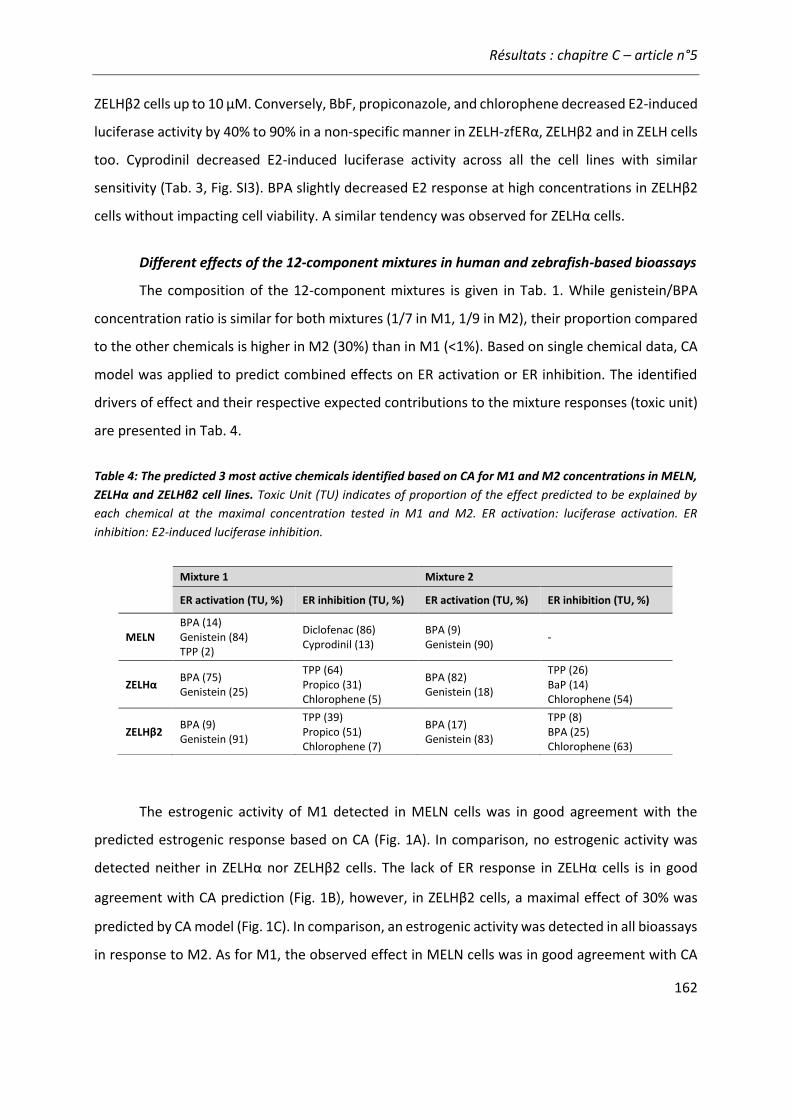
Résultats : chapitre C – article n°5
162
ZELHβ2 cells up to 10 µM. Conversely, BbF, propiconazole, and chlorophene decreased E2-induced
luciferase activity by 40% to 90% in a non-specific manner in ZELH-zfERα, ZELHβ2 and in ZELH cells
too. Cyprodinil decreased E2-induced luciferase activity across all the cell lines with similar
sensitivity (Tab. 3, Fig. SI3). BPA slightly decreased E2 response at high concentrations in ZELHβ2
cells without impacting cell viability. A similar tendency was observed for ZELHα cells.
Different effects of the 12-component mixtures in human and zebrafish-based bioassays
The composition of the 12-component mixtures is given in Tab. 1. While genistein/BPA
concentration ratio is similar for both mixtures (1/7 in M1, 1/9 in M2), their proportion compared
to the other chemicals is higher in M2 (30%) than in M1 (<1%). Based on single chemical data, CA
model was applied to predict combined effects on ER activation or ER inhibition. The identified
drivers of effect and their respective expected contributions to the mixture responses (toxic unit)
are presented in Tab. 4.
Table 4: The predicted 3 most active chemicals identified based on CA for M1 and M2 concentrations in MELN,
ZELHα and ZELHβ2 cell lines. Toxic Unit (TU) indicates of proportion of the effect predicted to be explained by
each chemical at the maximal concentration tested in M1 and M2. ER activation: luciferase activation. ER
inhibition: E2-induced luciferase inhibition.
The estrogenic activity of M1 detected in MELN cells was in good agreement with the
predicted estrogenic response based on CA (Fig. 1A). In comparison, no estrogenic activity was
detected neither in ZELHα nor ZELHβ2 cells. The lack of ER response in ZELHα cells is in good
agreement with CA prediction (Fig. 1B), however, in ZELHβ2 cells, a maximal effect of 30% was
predicted by CA model (Fig. 1C). In comparison, an estrogenic activity was detected in all bioassays
in response to M2. As for M1, the observed effect in MELN cells was in good agreement with CA
Mixture 1 Mixture 2
ER activation (TU, %) ER inhibition (TU, %) ER activation (TU, %) ER inhibition (TU, %)
MELN BPA (14) Genistein (84) TPP (2)
Diclofenac (86) Cyprodinil (13)
BPA (9) Genistein (90)
-
ZELHα BPA (75) Genistein (25)
TPP (64) Propico (31) Chlorophene (5)
BPA (82) Genistein (18)
TPP (26) BaP (14) Chlorophene (54)
ZELHβ2 BPA (9) Genistein (91)
TPP (39) Propico (51) Chlorophene (7)
BPA (17) Genistein (83)
TPP (8) BPA (25) Chlorophene (63)
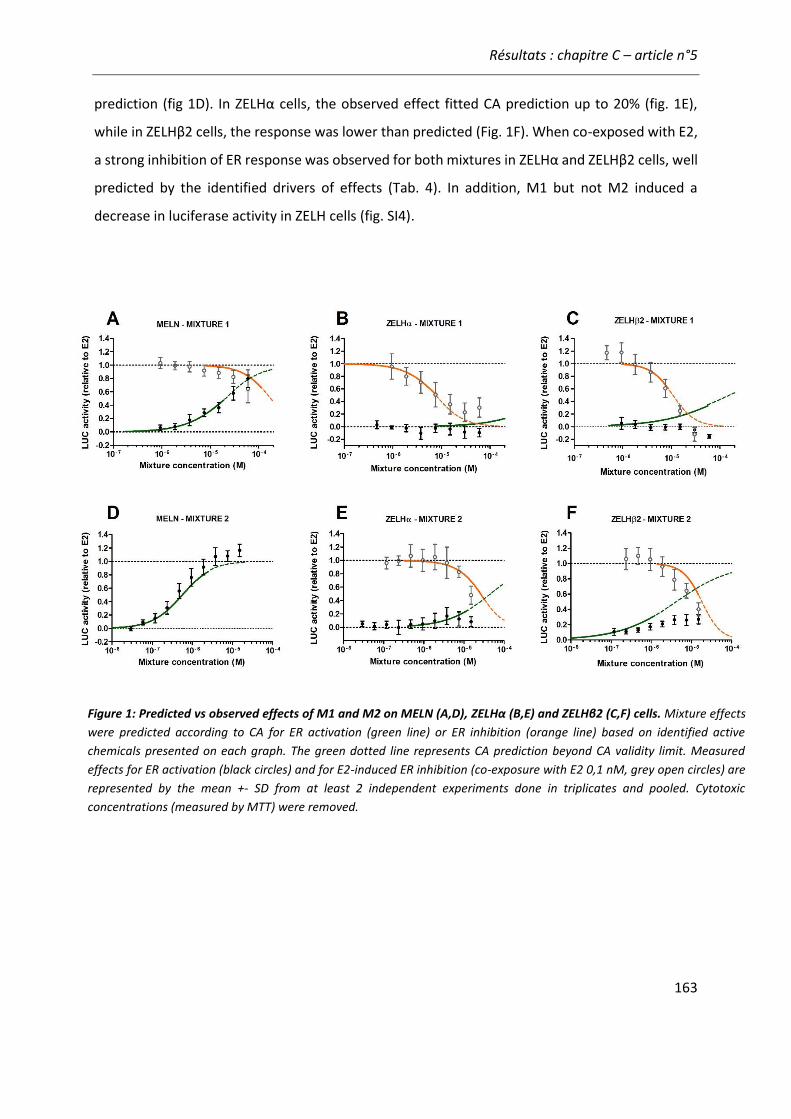
Résultats : chapitre C – article n°5
163
prediction (fig 1D). In ZELHα cells, the observed effect fitted CA prediction up to 20% (fig. 1E),
while in ZELHβ2 cells, the response was lower than predicted (Fig. 1F). When co-exposed with E2,
a strong inhibition of ER response was observed for both mixtures in ZELHα and ZELHβ2 cells, well
predicted by the identified drivers of effects (Tab. 4). In addition, M1 but not M2 induced a
decrease in luciferase activity in ZELH cells (fig. SI4).
Figure 1: Predicted vs observed effects of M1 and M2 on MELN (A,D), ZELHα (B,E) and ZELHβ2 (C,F) cells. Mixture effects
were predicted according to CA for ER activation (green line) or ER inhibition (orange line) based on identified active
chemicals presented on each graph. The green dotted line represents CA prediction beyond CA validity limit. Measured
effects for ER activation (black circles) and for E2-induced ER inhibition (co-exposure with E2 0,1 nM, grey open circles) are
represented by the mean +- SD from at least 2 independent experiments done in triplicates and pooled. Cytotoxic
concentrations (measured by MTT) were removed.
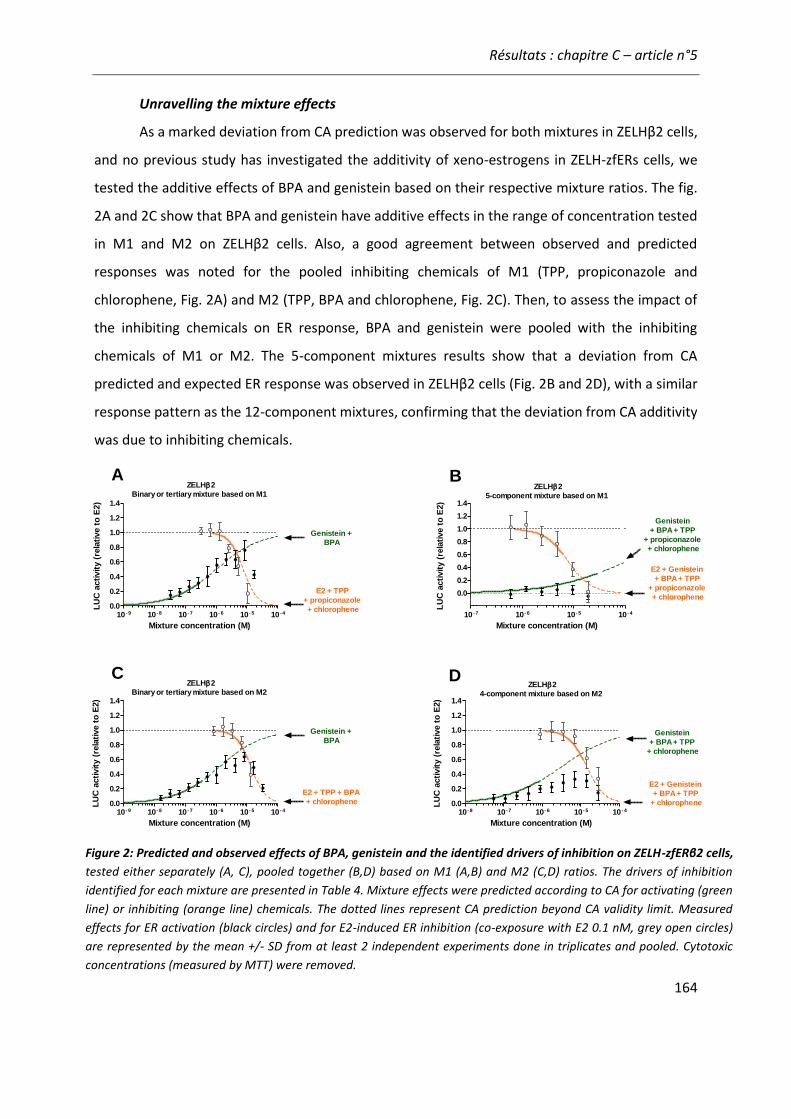
Résultats : chapitre C – article n°5
164
Unravelling the mixture effects
As a marked deviation from CA prediction was observed for both mixtures in ZELHβ2 cells,
and no previous study has investigated the additivity of xeno-estrogens in ZELH-zfERs cells, we
tested the additive effects of BPA and genistein based on their respective mixture ratios. The fig.
2A and 2C show that BPA and genistein have additive effects in the range of concentration tested
in M1 and M2 on ZELHβ2 cells. Also, a good agreement between observed and predicted
responses was noted for the pooled inhibiting chemicals of M1 (TPP, propiconazole and
chlorophene, Fig. 2A) and M2 (TPP, BPA and chlorophene, Fig. 2C). Then, to assess the impact of
the inhibiting chemicals on ER response, BPA and genistein were pooled with the inhibiting
chemicals of M1 or M2. The 5-component mixtures results show that a deviation from CA
predicted and expected ER response was observed in ZELHβ2 cells (Fig. 2B and 2D), with a similar
response pattern as the 12-component mixtures, confirming that the deviation from CA additivity
was due to inhibiting chemicals.
ZELH2
Binary or tertiary mixture based on M1
10 - 9 10 - 8 10 - 7 10 - 6 10 - 5 10 - 4
0.0
0.2
0.4
0.6
0.8
1.0
1.2
1.4
Genistein +
BPA
E2 + TPP
+ propiconazole
+ chlorophene
Mixture concentration (M)
LU
C a
cti
vit
y (
rela
tive t
o E
2)
ZELH2
5-component mixture based on M1
10 - 7 10 - 6 10 - 5 10 - 4
0.0
0.2
0.4
0.6
0.8
1.0
1.2
1.4
E2 + Genistein
+ BPA + TPP
+ propiconazole
+ chlorophene
Genistein
+ BPA + TPP
+ propiconazole
+ chlorophene
Mixture concentration (M)
LU
C a
cti
vit
y (
rela
tive t
o E
2)
ZELH2
Binary or tertiary mixture based on M2
10 - 9 10 - 8 10 - 7 10 - 6 10 - 5 10 - 4
0.0
0.2
0.4
0.6
0.8
1.0
1.2
1.4
E2 + TPP + BPA
+ chlorophene
Genistein +
BPA
Mixture concentration (M)
LU
C a
cti
vit
y (
rela
tive t
o E
2)
ZELH2
4-component mixture based on M2
10 - 8 10 - 7 10 - 6 10 - 5 10 - 4
0.0
0.2
0.4
0.6
0.8
1.0
1.2
1.4
E2 + Genistein
+ BPA + TPP
+ chlorophene
Genistein
+ BPA + TPP
+ chlorophene
Mixture concentration (M)
LU
C a
cti
vit
y (
rela
tive t
o E
2)
A B
C D
Figure 2: Predicted and observed effects of BPA, genistein and the identified drivers of inhibition on ZELH-zfERβ2 cells,
tested either separately (A, C), pooled together (B,D) based on M1 (A,B) and M2 (C,D) ratios. The drivers of inhibition
identified for each mixture are presented in Table 4. Mixture effects were predicted according to CA for activating (green
line) or inhibiting (orange line) chemicals. The dotted lines represent CA prediction beyond CA validity limit. Measured
effects for ER activation (black circles) and for E2-induced ER inhibition (co-exposure with E2 0.1 nM, grey open circles)
are represented by the mean +/- SD from at least 2 independent experiments done in triplicates and pooled. Cytotoxic
concentrations (measured by MTT) were removed.
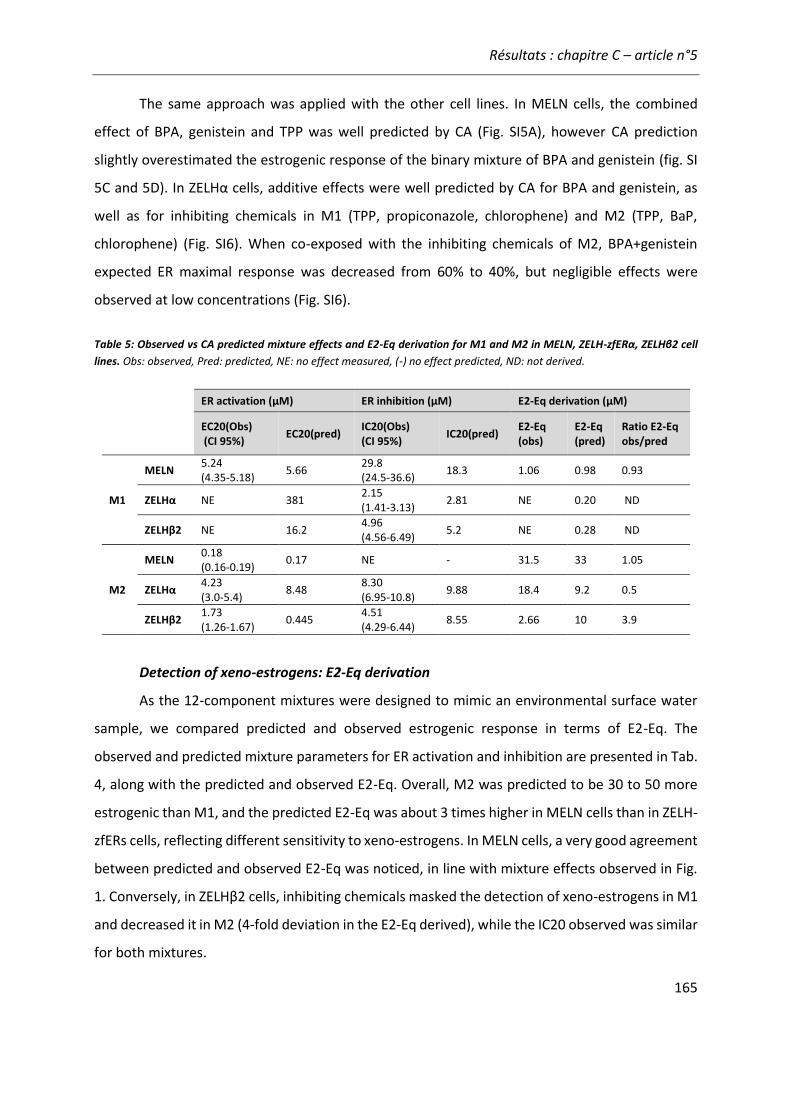
Résultats : chapitre C – article n°5
165
The same approach was applied with the other cell lines. In MELN cells, the combined
effect of BPA, genistein and TPP was well predicted by CA (Fig. SI5A), however CA prediction
slightly overestimated the estrogenic response of the binary mixture of BPA and genistein (fig. SI
5C and 5D). In ZELHα cells, additive effects were well predicted by CA for BPA and genistein, as
well as for inhibiting chemicals in M1 (TPP, propiconazole, chlorophene) and M2 (TPP, BaP,
chlorophene) (Fig. SI6). When co-exposed with the inhibiting chemicals of M2, BPA+genistein
expected ER maximal response was decreased from 60% to 40%, but negligible effects were
observed at low concentrations (Fig. SI6).
Table 5: Observed vs CA predicted mixture effects and E2-Eq derivation for M1 and M2 in MELN, ZELH-zfERα, ZELHβ2 cell
lines. Obs: observed, Pred: predicted, NE: no effect measured, (-) no effect predicted, ND: not derived.
ER activation (µM) ER inhibition (µM) E2-Eq derivation (µM)
EC20(Obs) (CI 95%)
EC20(pred) IC20(Obs) (CI 95%)
IC20(pred) E2-Eq (obs)
E2-Eq (pred)
Ratio E2-Eq obs/pred
M1
MELN 5.24 (4.35-5.18)
5.66 29.8 (24.5-36.6)
18.3 1.06 0.98 0.93
ZELHα NE 381 2.15 (1.41-3.13)
2.81 NE 0.20 ND
ZELHβ2 NE 16.2 4.96 (4.56-6.49)
5.2 NE 0.28 ND
M2
MELN 0.18 (0.16-0.19)
0.17 NE - 31.5 33 1.05
ZELHα 4.23 (3.0-5.4)
8.48 8.30 (6.95-10.8)
9.88 18.4 9.2 0.5
ZELHβ2 1.73 (1.26-1.67)
0.445 4.51 (4.29-6.44)
8.55 2.66 10 3.9
Detection of xeno-estrogens: E2-Eq derivation
As the 12-component mixtures were designed to mimic an environmental surface water
sample, we compared predicted and observed estrogenic response in terms of E2-Eq. The
observed and predicted mixture parameters for ER activation and inhibition are presented in Tab.
4, along with the predicted and observed E2-Eq. Overall, M2 was predicted to be 30 to 50 more
estrogenic than M1, and the predicted E2-Eq was about 3 times higher in MELN cells than in ZELH-
zfERs cells, reflecting different sensitivity to xeno-estrogens. In MELN cells, a very good agreement
between predicted and observed E2-Eq was noticed, in line with mixture effects observed in Fig.
1. Conversely, in ZELHβ2 cells, inhibiting chemicals masked the detection of xeno-estrogens in M1
and decreased it in M2 (4-fold deviation in the E2-Eq derived), while the IC20 observed was similar
for both mixtures.

Résultats : chapitre C – article n°5
166
DISCUSSION
Different estrogenic response of fish and mammalian-based bioassays have been observed
for effluent (Ihara et al., 2014; Rutishauser et al., 2004) and surface water samples (Sonavane et
al., 2016), questioning the underlying reasons for such fish-specific response to complex
environmental mixtures. In this study, the differences between zebrafish ZELH-zfERs and human
MELN cells responses were investigated from a theoretical point of view using two mixtures of
known chemicals. As part a of bioassay benchmarking exercise (Altenburger et al., in prep), two
fixed-ratio mixtures were designed with 12 prioritized environmentally relevant surface water
pollutants previously characterized in MELN and ZELH-zfERs cells (Busch et al., 2016; Neale et al.,
2017), which included the ER environmental ligands BPA and genistein. Using the same mixtures,
marked differences were observed in the estrogenic response that was well quantified in MELN
cells, but not in ZELHβ2 cells. By unravelling the mixture effect, we demonstrated that chemicals
lacking estrogenic activity but negatively interfering with zfERs response influenced the detection
and quantification of estrogenic chemicals in ZELHβ2 cells, leading to an underestimation of the
mixture estrogenic activity.
Combined effects of xeno-estrogens in MELN and ZELH-zfERs cells
Combined effects of xeno-estrogens have been extensively investigated in in vitro human-
based bioassays and were shown to be well predicted by CA model (Ghisari and Bonefeld-
Jorgensen, 2009; Rajapakse et al., 2004; Seeger et al., 2016; Silva et al., 2011, Scholze et al., 2014).
In MELN cells, the additive effects of xeno-estrogens were well predicted for both 12-component
mixtures with CA and extended CA models, confirming previous results obtained on the same cell
line (Creusot et al., 2016).
Additivity of xeno-estrogens was reported in different fish in vitro and in vivo test systems
for ER-regulated genes, ie. vitellogenin (Brian et al., 2005; Petersen and Tollefsen, 2011; Thorpe
et al., 2003; Zhang et al., 2010) and brain aromatase cyp19a1b (Brion et al., 2012; Petersen et al.,
2013, Le Page et al., 2006, Hinfray et al., 2016,). In ZELHα and ZELHβ2 cells, we report for the first
time the additive effect of the genistein and BPA binary mixture, showing the suitability of ZELH-
zfERs cells to study combined effects of xeno-estrogens. BPA acts as a partial agonist in ZELH-zfERs
cells, inducing a maximal response around 30% of E2 maximal response, as previously observed
and discussed (Le Fol et al., 2017a), while genistein induced up to 75% of E2 maximal response. As
Résultats : chapitre C – article n°5
167
partial agonism of BPA was suspected in ZELHβ2 cells, we additionally compared the CA and
extended CA predictions with the full logistic model (FLM, Ezechias and Cajthaml, 2016) and the
generalized concentration addition (GCA, Howard and Webster, 2009) predictions as they were
specifically developed to take into account partial agonists. FLM and GCA better predicted the
maximal response reached by the binary mixture of BPA and genistein, in particular for M2, while
CA and extended CA models provided more accurate predictions at low concentrations (Fig. SI7),
as previously reported (Schlotz et al., 2017).
While BPA and genistein had additive effects in ZELHβ2 cells, their estrogenic activity in
presence of 10 other non-estrogenic chemicals in the 12-component mixtures was lower than
expected. Influence of negative modulators on estrogenic response have been shown in vitro
when xeno-estrogens were combined with chemicals at cytotoxic concentrations (so called “toxic
masking effect”, Frische et al., 2009), with anti-estrogenic chemicals (Yang et al., 2015) and with
chemicals having minimal to no estrogenic response (Evans et al., 2012). By unravelling the
mixture response, we evidenced that chemicals negatively interfering with zfER response were
responsible for the deviation from expected additive response in ZELHβ2 cells.
Different responses of MELN and ZELH-zfERs bioassays: influence of inhibiting chemicals
Among inhibiting chemicals, TPP and BaP were identified as specific ER-luciferase inhibitors
in ZELHα and ZELHβ2 cells (i.e. no effect on cytotoxicity and no luciferase inhibition in ZELH cells
in parallel). Interestingly, both chemicals had opposite response profiles in MELN and ZELH-zfERs
cells, activating ER response in MELN cells, but decreasing it in zebrafish-based bioassays. BaP is a
well-known AhR ligand (Denison and Nagy, 2003). Direct physical interaction between liganded
AhR and ER has been demonstrated in different cell types expressing both receptors, leading to
the formation of an ER-AhR-ARNT heterotrimer and to the subsequent modulation of ER-regulated
gene expression (Ohtake et al., 2003). In fish, AhR ligands such as β-naphtoflavone, dioxin or BaP
were shown to exert anti-estrogenic effects through this cross-talk mechanism (Cheshenko et al.,
2007; Navas and Segner, 2000b). In previous experiments, we observed that TCDD, the
prototypical AhR ligand, decreased E2-induced response in ZELH-zfERs cells, while it increased it
in MELN cells (unpublished data). The occurrence of such ER-AhR crosstalk in our in vitro bioassays
indicates that differential modulation of ER-luciferase could, at least partially, explained the
opposite observed effects of BaP in ZELH-zfERs and MELN cells.
Résultats : chapitre C – article n°5
168
TPP was shown to induce hERα activation in vitro in CHO-K1 cells in the low µM range
(Kojima et al., 2013), as observed in the MELN cells (this study and Creusot et al., 2016). In ZELH-
zfERs cells, TPP lacked ER agonist activity, as observed in transgenic zebrafish embryos (Neale et
al., 2017a), but decreased E2-induced response by 90% at 10 µM (current study). Influence of
tissue-specific responses (e.g. metabolism, Kojima et al., 2016), and cross-species differences may
account for the differences observed between MELN and ZELH-zfERs cells. Further studies using
receptor binding assay would be warranted to better characterize zfER interaction with TPP.
In such reporter cell-based models, an inhibition of reporter gene activity can be either an
ER-dependent mechanism due to binding with antagonists or partial agonists (ex: Yang et al.,
2015) or non-ER-dependent mechanism due to cytotoxicity (e.g. Frische et al., 2009) or luciferase
inhibition (e.g. Auld and Inglese, 2004). In the zebrafish-based bioassays, such non-ER specific
interactions with luciferase activity were suggested for chlorophene, BbF, propiconazole and
cyprodinil. Few information on (anti)estrogenicity of chlorophene and cyprodinil are available.
Lack of ER agonist activity was reported in the YES assay for cyprodinil (Medjakovic et al., 2014)
and in ER-CALUX assay for chlorophene (Houtman et al., 2004), as observed in the current study.
Interestingly, cyprodinil decreased luciferase activity in a dose-dependent manner across all
bioassays irrespectively of E2 induction (Fig. SI 3). The anilinopyrimidinic pesticide shares
structural similarities with known luciferase inhibitors (Auld and Inglese, 2004) and was reported
to impact firefly luciferase activity via ATP production in vitro (Coleman et al., 2012), which
suggests a direct interaction with luciferase leading to its inhibition. In case of propiconazole, a
weak estrogenic activity was reported at 10 µM and above in MVLN cells (Kjeldsen et al., 2013),
while both proliferative and anti-proliferative effects were reported in MCF-7 proliferative assay
(Kjærstad et al., 2010). It is noteworthy that diazinon induced a weak ER response in MELN cells,
as previously observed in BG1 cells (Kojima et al., 2005), and that triclosan, a chemical suspected
to be a xeno-estrogens (Dann et Hontela, 2011), showed no (anti)estrogenic activity across the
bioassays (further discussed in Serra et al., in prep).
MELN cells originate from MCF-7 breast cancer cells, while ZELH-zfERs cells were
established from zebrafish liver cells. Both MELN and ZELH-zfERs cells remain metabolically active
but with distinct metabolic capacities and profiles (Creusot et al., 2015; Le Fol et al., 2015). Some
chemicals among the 12 selected for the mixtures were shown to activate AhR (e.g. BaP, BbF,
Résultats : chapitre C – article n°5
169
cyprodinil) and hPXR (e.g. cyprodinil, TPP, propiconazole) which mediate the transcription of
phase I metabolic enzymes, such as CYP1A and CYP3A, respectively (Neale et al., 2017). Activated
metabolic pathways are likely to have differently influenced the intracellular fate of xeno-
estrogens in the bioassays, resulting in different mixture responses. For instance, an increased
metabolism was hypothesized to cause the negative deviation from CA prediction in the E-SCREEN
(Silva et al., 2011) and in primary rainbow trout hepatocytes (Petersen and Tollefsen, 2011).
Internal concentrations of the 12 chemicals in ZELH-zfERs cells at the end of the exposure period
would be needed to assess whether an increased metabolism of BPA and genistein contributed to
the deviation from CA prediction.
Zebrafish- vs human-based bioassays: potential implications for environmental bio-
monitoring
Aquatic organisms, such as fish, are continuously exposed to a wide diversity of chemicals
covering different modes of action, including xeno-estrogens (Loos et al., 2009, Busch et al., 2016).
In vitro ER-reporter gene assays have been used to screen for surface water estrogenic activity,
providing information on the occurrence of xeno-estrogens within environmental mixtures (e.g.
Neale et al., 2015, Conley et al., 2017). Given the complex chemical contamination of the aquatic
system, the response of in vitro bioassay to environmental samples is a result of the combined
effects of xeno-estrogens potentially balanced by interactions with non-estrogenic chemicals,
raising the question of the relevance of such interactions and the consequences in terms of
environmental monitoring.
Comparing in vitro and in vivo medaka-based bioassays response to effluent samples, Ihara
et al. (2015) showed that the estrogenic activity measured in the medaka-based in vitro bioassay
was a better predictor of the in vivo VTG induction in adult male medaka than the estrogenic
activity measured in the human-based bioassay (Ihara et al., 2015). Similar concordance between
in vitro and in vivo estrogenic activity of surface water extracts was observed with zebrafish-based
models (Sonavane et al., 2016). These studies suggest that in vitro fish-specific response could
better reflect an in vivo fish response. To further investigate the biological relevance of the in vitro
ZELH-zfERs response to the mixtures, both 12-chemical mixtures were also tested in vivo in
transgenic zebrafish embryos expressing GFP under control of cyp19a1b promoter in radial glial
cells (Altenburger et al., in prep, Brion et al., 2012). However, no estrogenic response could be
Résultats : chapitre C – article n°5
170
detected for both mixtures because of a high mortality, especially for M1, suggesting that the 12-
component mixtures might be as much or more hazardous to zebrafish embryos than expected
combined effect of estrogenic chemicals.
To conclude, we showed that in vitro zebrafish and human-based bioassays are both
suitable to assess additivity of xeno-estrogens. However, when xeno-estrogens were within the
12-chemical mixtures, the estrogenic activity quantified was the result of a mixture effect that
tooked into account inhibiting chemicals. Because of distinct sensitivity to environmental
pollutants, MELN and ZELH-zfERs cells provided complementary information on the chemicals in
the 12-component mixtures. ZELH-zfERs cells have kept metabolic capacity qualitatively similar to
those observed in primary culture of zebrafish hepatocytes, suggesting the good
representativeness of ZELH-derived cells to a fish liver metabolism (Le Fol et al., 2015). When
replaced in a context of environmental contamination and surface water monitoring, this study
shows that a mindful consideration of the ER-based bioassay specificities (e.g. fish vs human ER,
influence of the cell context) is needed to ensure a proper interpretation of results, as
environmental chemicals may interfere with ER response in a cell-specific manner.
ACKNOWLEDGMENT
This work was supported by the EU Seventh Framework Programme as a part of
SOLUTIONS project (FP7-ENV-2013-two-stage) under grant agreement number 603437, and by
the French Ministry of Ecology (P190-Ecotoxicologie).
Résultats : chapitre C – article n°5
171
REFERENCES
Auld, D.S., Inglese, J., 2004. Interferences with Luciferase Reporter Enzymes, in: Sittampalam, G.S., Coussens, N.P., Nelson, H., Arkin, M., Auld, D., Austin, C., Bejcek, B., Glicksman, M., Inglese, J., Iversen, P.W., Li, Z., McGee, J., McManus, O., Minor, L., Napper, A., Peltier, J.M., Riss, T., Trask, O.J., Weidner, J. (Eds.), Assay Guidance Manual. Eli Lilly & Company and the National Center for Advancing Translational Sciences, Bethesda (MD).
Brian, J.V., Harris, C.A., Scholze, M., Backhaus, T., Booy, P., Lamoree, M., Pojana, G., Jonkers, N., Runnalls, T., Bonfà, A., Marcomini, A., Sumpter, J.P., 2005. Accurate Prediction of the Response of Freshwater Fish to a Mixture of Estrogenic Chemicals. Environ. Health Perspect. 113, 721–728. doi:10.1289/ehp.7598
Brion, F., Le Page, Y., Piccini, B., Cardoso, O., Tong, S.-K., Chung, B., Kah, O., 2012. Screening Estrogenic Activities of Chemicals or Mixtures In vivo Using Transgenic (cyp19a1b-GFP) Zebrafish Embryos. Plos One 7, e36069. doi:10.1371/journal.pone.0036069
Busch, W., Schmidt, S., Kuehne, R., Schulze, T., Krauss, M., Altenburger, R., 2016. Micropollutants in European rivers: A mode of action survey to support the development of effect-based tools for water monitoring. Environ. Toxicol. Chem. 35, 1887–1899. doi:10.1002/etc.3460
Cheshenko, K., Brion, F., Le Page, Y., Hinfray, N., Pakdel, F., Kah, O., Segner, H., Eggen, R.I.L., 2007. Expression of zebra fish aromatase cyp19a and cyp19b genes in response to the ligands of estrogen receptor and aryl hydrocarbon receptor. Toxicol. Sci. 96, 255–267. doi:10.1093/toxsci/kfm003
Coleman, M.D., O’Neil, J.D., Woehrling, E.K., Ndunge, O.B.A., Hill, E.J., Menache, A., Reiss, C.J., 2012. A Preliminary Investigation into the Impact of a Pesticide Combination on Human Neuronal and Glial Cell Lines In vitro. PLoS ONE 7. doi:10.1371/journal.pone.0042768
Conley, J.M., Evans, N., Cardon, M.C., Rosenblum, L., Iwanowicz, L.R., Hartig, P.C., Schenck, K.M., Bradley, P.M., Wilson, V.S., 2017. Occurrence and In vitro Bioactivity of Estrogen, Androgen, and Glucocorticoid Compounds in a Nationwide Screen of United States Stream Waters. Environ. Sci. Technol. 51, 4781–4791. doi:10.1021/acs.est.6b06515
Cosnefroy, A., Brion, F., Maillot-Marechal, E., Porcher, J.-M., Pakdel, F., Balaguer, P., Ait-Aissa, S., 2012. Selective Activation of Zebrafish Estrogen Receptor Subtypes by Chemicals by Using Stable Reporter Gene Assay Developed in a Zebrafish Liver Cell Line. Toxicol. Sci. 125, 439–449. doi:10.1093/toxsci/kfr297
Creusot, N., Brion, F., Piccini, B., Budzinski, H., Porcher, J.M., Ait-Aissa, S., 2015. BFCOD activity in fish cell lines and zebrafish embryos and its modulation by chemical ligands of human aryl hydrocarbon and nuclear receptors. Environ. Sci. Pollut. Res. 22, 16393–16404. doi:10.1007/s11356-014-3882-8
Creusot, N., Dévier, M.-H., Budzinski, H., Aït-Aïssa, S., 2016. Evaluation of an extraction method for a mixture of endocrine disrupters in sediment using chemical and in vitro biological analyses. Environ. Sci. Pollut. Res. 23, 10349–10360. doi:10.1007/s11356-016-6062-1
Dann, A.B., Hontela, A., 2011. Triclosan: environmental exposure, toxicity and mechanisms of action. J. Appl. Toxicol. 31, 285–311. doi:10.1002/jat.1660
Résultats : chapitre C – article n°5
172
Denison, M.S., Nagy, S.R., 2003. Activation of the Aryl Hydrocarbon Receptor by Structurally Diverse Exogenous and Endogenous Chemicals. Annu. Rev. Pharmacol. Toxicol. 43, 309–334. doi:10.1146/annurev.pharmtox.43.100901.135828
Escher, B.I., Allinson, M., Altenburger, R., Bain, P.A., Balaguer, P., Busch, W., Crago, J., Denslow, N.D., Dopp, E., Hilscherova, K., Humpage, A.R., Kumar, A., Grimaldi, M., Jayasinghe, B.S., Jarosova, B., Jia, A., Makarov, S., Maruya, K.A., Medvedev, A., Mehinto, A.C., Mendez, J.E., Poulsen, A., Prochazka, E., Richard, J., Schifferli, A., Schlenk, D., Scholz, S., Shiraish, F., Snyder, S., Su, G., Tang, J.Y.M., van der Burg, B., van der Linden, S.C., Werner, I., Westerheide, S.D., Wong, C.K.C., Yang, M., Yeung, B.H.Y., Zhang, X., Leusch, F.D.L., 2014. Benchmarking Organic Micropollutants in Wastewater, Recycled Water and Drinking Water with In vitro Bioassays. Environ. Sci. Technol. 48, 1940–1956. doi:10.1021/es403899t
Evans, R.M., Scholze, M., Kortenkamp, A., 2012. Additive Mixture Effects of Estrogenic Chemicals in Human Cell-Based Assays Can Be Influenced by Inclusion of Chemicals with Differing Effect Profiles. PLOS ONE 7, e43606. doi:10.1371/journal.pone.0043606
Ezechias, M., Cajthaml, T., 2016. Novel full logistic model for estimation of the estrogenic activity of chemical mixtures. Toxicology 359, 58–70. doi:10.1016/j.tox.2016.06.017
Frische, T., Faust, M., Meyer, W., Backhaus, T., 2009. Toxic masking and synergistic modulation of the estrogenic activity of chemical mixtures in a yeast estrogen screen (YES). Environ. Sci. Pollut. Res. 16, 593–603. doi:10.1007/s11356-009-0184-7
Ghisari, M., Bonefeld-Jorgensen, E.C., 2009. Effects of plasticizers and their mixtures on estrogen receptor and thyroid hormone functions. Toxicol. Lett. 189, 67–77. doi:10.1016/j.toxlet.2009.05.004
Hawkins, M.B., Thomas, P., 2004. The unusual binding properties of the third distinct teleost estrogen receptor subtype ER β a are accompanied by highly conserved amino acid changes in the ligand binding domain. Endocrinology 145, 2968–2977. doi:10.1210/en.2003.0806
Hinfray, N., Tebby, C., Garoche, C., Piccini, B., Bourgine, G., Aït-Aïssa, S., Kah, O., Pakdel, F., Brion, F., 2016. Additive effects of levonorgestrel and ethinylestradiol on brain aromatase (cyp19a1b) in zebrafish specific in vitro and in vivo bioassays. Toxicol. Appl. Pharmacol. 307, 108–114. doi:10.1016/j.taap.2016.07.023
Hoegg, S., Brinkmann, H., Taylor, J.S., Meyer, A., 2004. Phylogenetic Timing of the Fish-Specific Genome Duplication Correlates with the Diversification of Teleost Fish. J. Mol. Evol. 59, 190–203. doi:10.1007/s00239-004-2613-z
Houtman, C.J., Van Oostveen, A.M., Brouwer, A., Lamoree, M.H., Legler, J., 2004. Identification of estrogenic compounds in fish bile using bioassay-directed fractionation. Environ. Sci. Technol. 38, 6415–6423. doi:10.1021/es049750p
Howard, G.J., Webster, T.F., 2009. Generalized concentration addition: A method for examining mixtures containing partial agonists. J. Theor. Biol. 259, 469–477. doi:10.1016/j.jtbi.2009.03.030
Jarošová, B., Javůrek, J., Adamovský, O., Hilscherová, K., 2015. Phytoestrogens and mycoestrogens in surface waters--Their sources, occurrence, and potential contribution to estrogenic activity. Environ. Int. 81, 26–44. doi:10.1016/j.envint.2015.03.019
Kjærstad, M.B., Taxvig, C., Nellemann, C., Vinggaard, A.M., Andersen, H.R., 2010. Endocrine disrupting effects in vitro of conazole antifungals used as pesticides and pharmaceuticals. Reprod. Toxicol. 30, 573–582. doi:10.1016/j.reprotox.2010.07.009
Résultats : chapitre C – article n°5
173
Kjeldsen, L.S., Ghisari, M., Bonefeld-Jørgensen, E.C., 2013. Currently used pesticides and their mixtures affect the function of sex hormone receptors and aromatase enzyme activity. Toxicol. Appl. Pharmacol. 272, 453–464. doi:10.1016/j.taap.2013.06.028
Kojima, H., Takeuchi, S., Itoh, T., Iida, M., Kobayashi, S., Yoshida, T., 2013. In vitro endocrine disruption potential of organophosphate flame retardants via human nuclear receptors. Toxicology 314, 76–83. doi:10.1016/j.cox.2013.09.004
Kojima, H., Takeuchi, S., Van den Eede, N., Coyaci, A., 2016. Effects of primary metabolites of organophosphate flame retardants on transcriptional activity via human nuclear receptors. Toxicol. Lett. 245, 31–39. doi:10.1016/j.toxlet.2016.01.004
Kojima, M., * K.F., Sasaki, M., Nakamura, M., Tsuji, M., Nishiyama, T., 2005. Evaluation of estrogenic activities of pesticides using an in vitro reporter gene assay. Int. J. Environ. Health Res. 15, 271–280. doi:10.1080/09603120500155765
Kolpin, D.W., Furlong, E.T., Meyer, M.T., Thurman, E.M., Zaugg, S.D., Barber, L.B., Buxton, H.T., 2002. Pharmaceuticals, hormones, and other organic wastewater contaminants in. Environ. Sci. Technol. 36, 1202–1211. doi:10.1021/es011055j
Le Fol, V., Aït-Aïssa, S., Cabaton, N., Dolo, L., Grimaldi, M., Balaguer, P., Perdu, E., Debrauwer, L., Brion, F., Zalko, D., 2015. Cell-specific biotransformation of benzophenone-2 and bisphenol-s in zebrafish and human in vitro models used for toxicity and estrogenicity screening. Environ. Sci. Technol. 49, 3860–3868. doi:10.1021/es505302c
Le Fol, V., Aït-Aïssa, S., Sonavane, M., Porcher, J.-M., Balaguer, P., Cravedi, J.-P., Zalko, D., Brion, F., 2017. In vitro and in vivo estrogenic activity of BPA, BPF and BPS in zebrafish-specific assays. Ecotoxicol. Environ. Saf. 142, 150–156. doi:10.1016/j.ecoenv.2017.04.009
Le Page, Y., Scholze, M., Kah, O., Pakdel, F., 2006. Assessment of Xenoestrogens Using Three Distinct Estrogen Receptors and the Zebrafish Brain Aromatase Gene in a Highly Responsive Glial Cell System. Environ. Health Perspect. 114, 752–758. doi:10.1289/ehp.8141
Loewe S, Muischnek H (1926) Über Kombinationswirkungen I. Mitteilung: Hilfsmittel der Fragestellung. Naunyn-Schmiedebergs Arch Exp Pathol Pharmakol 114: 313–326
Loos, R., Gawlik, B.M., Locoro, G., Rimaviciute, E., Contini, S., Bidoglio, G., 2009. EU-wide survey of polar organic persistent pollutants in European river waters. Environ. Pollut. 157, 561–568. doi:10.1016/j.envpol.2008.09.020
Matthews, J., Celius, T., Halgren, R., Zacharewski, T., 2000. Differential estrogen receptor binding of estrogenic substances: a species comparison. J. Steroid Biochem. Mol. Biol. 74, 223–234. doi:10.1016/S0960-0760(00)00126-6
McDonnell, D.P., Norris, J.D., 2002. Connections and regulation of the human estrogen receptor. Science 296, 1642–1644. doi:10.1126/science.1071884
Medjakovic, S., Zoechling, A., Gerster, P., Ivanova, M.M., Teng, Y., Klinge, C.M., Schildberger, B., Gartner, M., Jungbauer, A., 2014. Effect of nonpersistent pesticides on estrogen receptor, androgen receptor, and aryl hydrocarbon receptor. Environ. Toxicol. 29, 1201–1216. doi:10.1002/tox.21852
Molina-Molina, J.-M., Escande, A., Pillon, A., Gomez, E., Pakdel, F., Cavaillès, V., Olea, N., Aït-Aïssa, S., Balaguer, P., 2008. Profiling of benzophenone derivatives using fish and human estrogen receptor-specific in vitro bioassays. Toxicol. Appl. Pharmacol. 232, 384–395. doi:10.1016/j.taap.2008.07.017
Résultats : chapitre C – article n°5
174
Navas, J.M., Segner, H., 2000. Antiestrogenicity of β-naphthoflavone and PAHs in cultured rainbow trout hepatocytes: evidence for a role of the arylhydrocarbon receptor. Aquat. Toxicol. 51, 79–92. doi:10.1016/S0166-445X(00)00100-4
Neale, P.A., Ait-Aissa, S., Brack, W., Creusot, N., Denison, M.S., Deutschmann, B., Hilscherova, K., Hollert, H., Krauss, M., Novak, J., Schulze, T., Seiler, T.-B., Serra, H., Shao, Y., Escher, B.I., 2015. Linking in vitro Effects and Detected Organic Micropollutants in Surface Water Using Mixture-Toxicity Modeling. Environ. Sci. Technol. 49, 14614–14624. doi:10.1021/acs.est.5b04083
Neale, P.A., Altenburger, R., Aït-Aïssa, S., Brion, F., Busch, W., de Aragão Umbuzeiro, G., Denison, M.S., Du Pasquier, D., Hilscherová, K., Hollert, H., Morales, D.A., Novák, J., Schlichting, R., Seiler, T.-B., Serra, H., Shao, Y., Tindall, A.J., Tollefsen, K.E., Williams, T.D., Escher, B.I., 2017. Development of a bioanalytical test battery for water quality monitoring: Fingerprinting identified micropollutants and their contribution to effects in surface water. Water Res. 123, 734–750. doi:10.1016/j.watres.2017.07.016
Nelson, E.R., Habibi, H.R., 2013. Estrogen receptor function and regulation in fish and other vertebrates. Gen. Comp. Endocrinol. 192, 15–24. doi:10.1016/j.ygcen.2013.03.032
Ohtake, F., Takeyama, K., Matsumoto, T., Kitagawa, H., Yamamoto, Y., Nohara, K., Tohyama, C., Krust, A., Mimura, J., Chambon, P., Yanagisawa, J., Fujii-Kuriyama, Y., Kato, S., 2003. Modulation of oestrogen receptor signalling by association with the activated dioxin receptor. Nature 423, 545–550. doi:10.1038/nature01606
Petersen, K., Fetter, E., Kah, O., Brion, F., Scholz, S., Tollefsen, K.E., 2013. Transgenic (cyp19a1b-GFP) zebrafish embryos as a tool for assessing combined effects of oestrogenic chemicals. Aquat. Toxicol. 138, 88–97. doi:10.1016/j.aquatox.2013.05.001
Petersen, K., Tollefsen, K.E., 2011. Assessing combined toxicity of estrogen receptor agonists in a primary culture of rainbow trout (Oncorhynchus mykiss) hepatocytes. Aquat. Toxicol. Amst. Neth. 101, 186–195. doi:10.1016/j.aquatox.2010.09.018
Pinto, C., Grimaldi, M., Boulahtouf, A., Pakdel, F., Brion, F., Aït-Aïssa, S., Cavaillès, V., Bourguet, W., Gustafsson, J.-A., Bondesson, M., Balaguer, P., 2014. Selectivity of natural, synthetic and environmental estrogens for zebrafish estrogen receptors. Toxicol. Appl. Pharmacol. 280, 60–69. doi:10.1016/j.taap.2014.07.020
Rajapakse, N., Silva, E., Scholze, M., Kortenkamp, A., 2004. Deviation from additivity with estrogenic mixtures containing 4-nonylphenol and 4-tert-octylphenol detected in the E-SCREEN assay. Environ. Sci. Technol. 38, 6343–6352.
Routledge, E.J., Sumpter, J.P., 1996. Estrogenic activity of surfactants and some of their degradation products assessed using a recombinant yeast screen. Environ. Toxicol. Chem. 15, 241–248. doi:10.1002/etc.5620150303
Rutishauser, B.V., Pesonen, M., Escher, B.I., Ackermann, G.E., Aerni, H.-R., Suter, M.J.-F., Eggen, R.I.L., 2004. Comparative analysis of estrogenic activity in sewage treatment plant effluents involving three in vitro assays and chemical analysis of steroids. Environ. Toxicol. Chem. 23, 857–864. doi:10.1897/03-286
Schlotz, N., Kim, G.-J., Jäger, S., Günther, S., Lamy, E., 2017. In vitro observations and in silico predictions of xenoestrogen mixture effects in T47D-based receptor transactivation and proliferation assays. Toxicol. In vitro. doi:10.1016/j.tiv.2017.08.017
Résultats : chapitre C – article n°5
175
Scholze, M., Silva, E., Kortenkamp, A., 2014. Extending the Applicability of the Dose Addition Model to the Assessment of Chemical Mixtures of Partial Agonists by Using a Novel Toxic Unit Extrapolation Method. PLOS ONE 9, e88808. doi:10.1371/journal.pone.0088808
Seeger, B., Klawonn, F., Bekale, B.N., Steinberg, P., 2016. Mixture Effects of Estrogenic Pesticides at the Human Estrogen Receptor α and β. PLOS ONE 11, e0147490. doi:10.1371/journal.pone.0147490
Segner, H., Casanova-Nakayama, A., Kase, R., Tyler, C.R., 2013. Impact of environmental estrogens on fish considering the diversity of estrogen signaling. Gen. Comp. Endocrinol. 191, 190–201. doi:10.1016/j.ygcen.2013.05.015
Silva, E., Rajapakse, N., Scholze, M., Backhaus, T., Ermler, S., Kortenkamp, A., 2011. Joint Effects of Heterogeneous Estrogenic Chemicals in the E-Screen—Exploring the Applicability of Concentration Addition. Toxicol. Sci. 122, 383–394. doi:10.1093/toxsci/kfr103
Sonavane, M., Creusot, N., Maillot-Marechal, E., Pery, A., Brion, F., Ait-Aissa, S., 2016. Zebrafish-based reporter gene assays reveal different estrogenic activities in river waters compared to a conventional human-derived assay. Sci. Total Environ. 550, 934–939. doi:10.1016/j.scitotenv.2016.01.187
Sumpter, J.P., 2005. Endocrine disrupters in the aquatic environment: An overview. Acta Hydrochim. Hydrobiol. 33, 9–16. doi:10.1002/aheh.200400555
Thorpe, K.L., Cummings, R.I., Hutchinson, T.H., Scholze, M., Brighty, G., Sumpter, J.P., Tyler, C.R., 2003. Relative potencies and combination effects of steroidal estrogens in fish. Environ. Sci. Technol. 37, 1142–1149.
Tohyama, S., Miyagawa, S., Lange, A., Ogino, Y., Mizutani, T., Ihara, M., Tanaka, H., Tatarazako, N., Kobayashi, T., Tyler, C.R., Iguchi, T., 2016. Evolution of estrogen receptors in ray-finned fish and their comparative responses to estrogenic substances. J. Steroid Biochem. Mol. Biol. 158, 189–197. doi:10.1016/j.jsbmb.2015.12.009
Yang, R., Li, N., Rao, K., Ma, M., Wang, Z., 2015. Combined action of estrogen receptor agonists and antagonists in two-hybrid recombinant yeast in vitro. Ecotoxicol. Environ. Saf. 111, 228–235. doi:10.1016/j.ecoenv.2014.09.025
Zhang, H., Kong, F.-X., Yu, Y., Shi, X.-L., Zhang, M., Tian, H.-E., 2010. Assessing the combination effects of environmental estrogens in fish. Ecotoxicol. Lond. Engl. 19, 1476–1486. doi:10.1007/s10646-010-0533-9
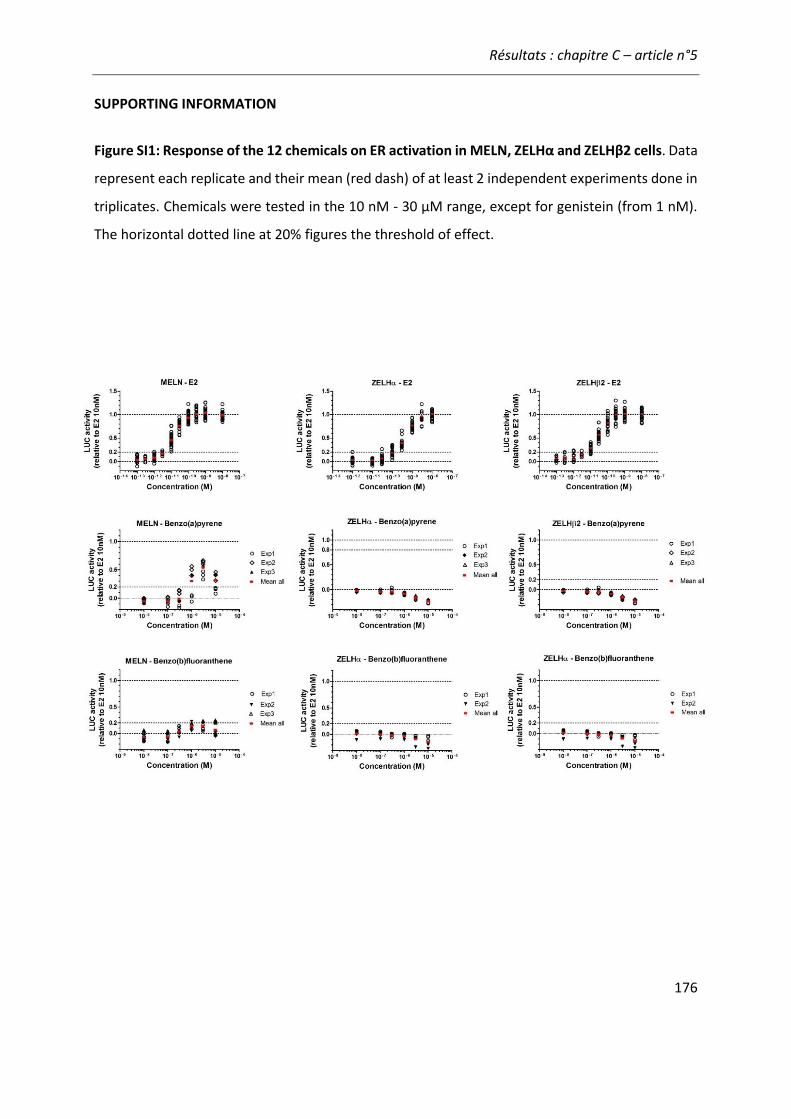
Résultats : chapitre C – article n°5
176
SUPPORTING INFORMATION
Figure SI1: Response of the 12 chemicals on ER activation in MELN, ZELHα and ZELHβ2 cells. Data
represent each replicate and their mean (red dash) of at least 2 independent experiments done in
triplicates. Chemicals were tested in the 10 nM - 30 µM range, except for genistein (from 1 nM).
The horizontal dotted line at 20% figures the threshold of effect.

Résultats : chapitre C – article n°5
177

Résultats : chapitre C – article n°5
178
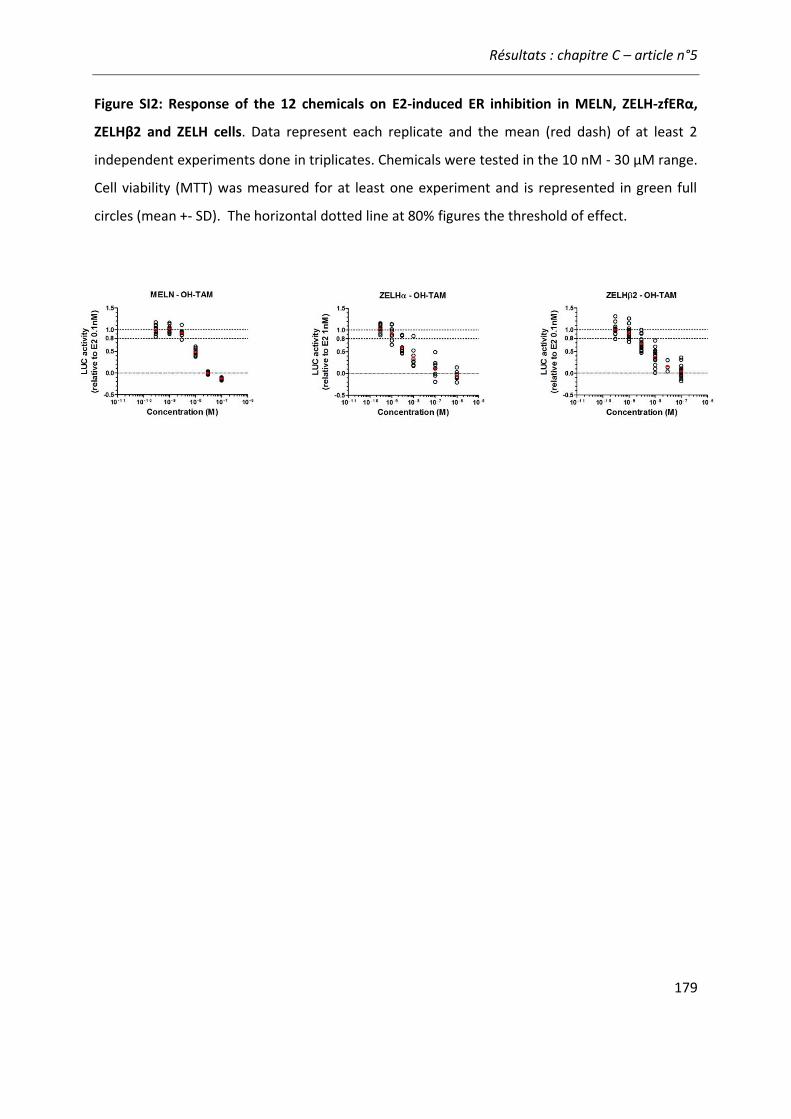
Résultats : chapitre C – article n°5
179
Figure SI2: Response of the 12 chemicals on E2-induced ER inhibition in MELN, ZELH-zfERα,
ZELHβ2 and ZELH cells. Data represent each replicate and the mean (red dash) of at least 2
independent experiments done in triplicates. Chemicals were tested in the 10 nM - 30 µM range.
Cell viability (MTT) was measured for at least one experiment and is represented in green full
circles (mean +- SD). The horizontal dotted line at 80% figures the threshold of effect.
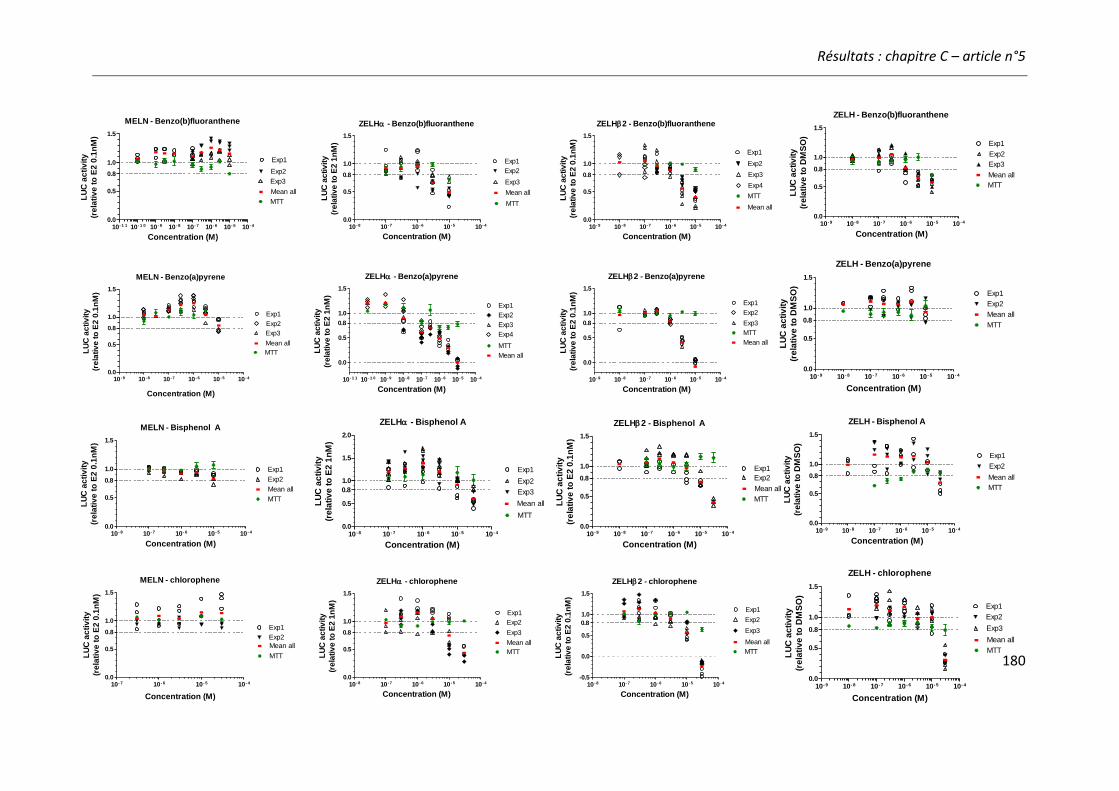
Résultats : chapitre C – article n°5
180
ZELH - Benzo(b)fluoranthene
10- 9 10- 8 10- 7 10- 6 10- 5 10 - 4
0.0
0.5
1.0
1.5
Exp3
Mean allMTT
Exp2
Exp1
0.8
Concentration (M)
LU
C a
ctiv
ity
(re
lativ
e to
DM
SO
)
ZELH - Benzo(a)pyrene
10 - 9 10 - 8 10 - 7 10 - 6 10 - 5 10 - 4
0.0
0.5
1.0
1.5
Exp1
Exp2
Mean allMTT
0.8
Concentration (M)
LU
C a
cti
vit
y
(re
lati
ve
to
DM
SO
)
ZELH - Bisphenol A
10- 9 10- 8 10- 7 10- 6 10 - 5 10- 4
0.0
0.5
1.0
1.5
Mean all
Exp1
MTT
Exp2
0.8
Concentration (M)
LU
C a
ctiv
ity
(re
lativ
e to
DM
SO
)
ZELH - chlorophene
10- 9 10- 8 10- 7 10 - 6 10- 5 10- 4
0.0
0.5
1.0
1.5
Exp2
Exp1
Mean allMTT
Exp30.8
Concentration (M)
LU
C a
cti
vit
y
(re
lati
ve
to
DM
SO
)
MELN - Benzo(b)fluoranthene
10- 1 1 10- 1 0 10 - 9 10 - 8 10 - 7 10- 6 10- 5 10 - 4
0.0
0.5
1.0
1.5
Exp2
Mean all
Exp1
Exp3
MTT
0.8
Concentration (M)
LU
C a
cti
vit
y
(re
lati
ve
to
E2
0.1
nM
)
MELN - Benzo(a)pyrene
10 - 9 10 - 8 10 - 7 10 - 6 10 - 5 10 - 4
0.0
0.5
1.0
1.5
Exp1
Exp2
Mean all
Exp3
MTT
0.8
Concentration (M)
LU
C a
ctiv
ity
(re
lativ
e to
E2
0.1
nM
)
MELN - Bisphenol A
10 - 8 10 - 7 10 - 6 10 - 5 10 - 40.0
0.5
1.0
1.5
Exp1
Exp2
Mean allMTT
0.8
Concentration (M)
LU
C a
cti
vit
y
(re
lati
ve
to
E2
0.1
nM
)
MELN - chlorophene
10 - 7 10 - 6 10 - 5 10 - 4
0.0
0.5
1.0
1.5
Exp2
Mean all
Exp1
MTT
0.8
Concentration (M)
LU
C a
cti
vit
y
(re
lati
ve
to
E2
0.1
nM
)
ZELH - Benzo(b)fluoranthene
10 - 8 10 - 7 10 - 6 10 - 5 10 - 4
0.0
0.5
1.0
1.5
Exp2
Mean all
Exp1
Exp3
MTT
0.8
Concentration (M)
LU
C a
ctiv
ity
(re
lativ
e to
E2
1n
M)
ZELH - Benzo(a)pyrene
10 - 1 1 10 - 1 0 10 - 9 10 - 8 10 - 7 10 - 6 10 - 5 10 - 4
0.0
0.5
1.0
1.5
Exp1
Exp2
Mean all
MTT
Exp3
Exp4
0.8
Concentration (M)
LU
C a
ctiv
ity
(re
lativ
e to
E2
1n
M)
ZELH - Bisphenol A
10 - 8 10 - 7 10 - 6 10 - 5 10 - 4
0.0
0.5
1.0
1.5
2.0
Mean all
Exp1
Exp2
MTT
0.8 Exp3
Concentration (M)
LU
C a
cti
vit
y
(re
lati
ve
to
E2
1n
M)
ZELH - chlorophene
10 - 8 10 - 7 10 - 6 10 - 5 10 - 4
0.0
0.5
1.0
1.5
Exp3
Exp1
Exp2
Mean allMTT
0.8
Concentration (M)
LU
C a
ctiv
ity
(re
lativ
e to
E2
1n
M)
ZELH2 - Benzo(b)fluoranthene
10 - 9 10 - 8 10 - 7 10 - 6 10 - 5 10 - 4
0.0
0.5
1.0
1.5
Exp2
Mean all
Exp1
Exp3
MTT
Exp4
0.8
Concentration (M)
LU
C a
ctiv
ity
(re
lativ
e to
E2
0.1
nM
)
ZELH2 - Benzo(a)pyrene
10 - 9 10 - 8 10 - 7 10 - 6 10 - 5 10 - 4
0.0
0.5
1.0
1.5
Exp1
Exp2
Mean all
Exp3
MTT
0.8
Concentration (M)
LU
C a
ctiv
ity
(re
lativ
e to
E2
0.1
nM
)
ZELH2 - Bisphenol A
10 - 9 10 - 8 10 - 7 10 - 6 10 - 5 10 - 4
0.0
0.5
1.0
1.5
Mean all
Exp1
Exp2
MTT
0.8
Concentration (M)
LU
C a
cti
vit
y
(re
lati
ve
to
E2
0.1
nM
)
ZELH2 - chlorophene
10 - 8 10 - 7 10 - 6 10 - 5 10 - 4
-0.5
0.0
0.5
1.0
1.5
Exp3
Exp1
Exp2
Mean allMTT
0.8
Concentration (M)
LU
C a
ctiv
ity
(re
lativ
e to
E2
0.1
nM
)
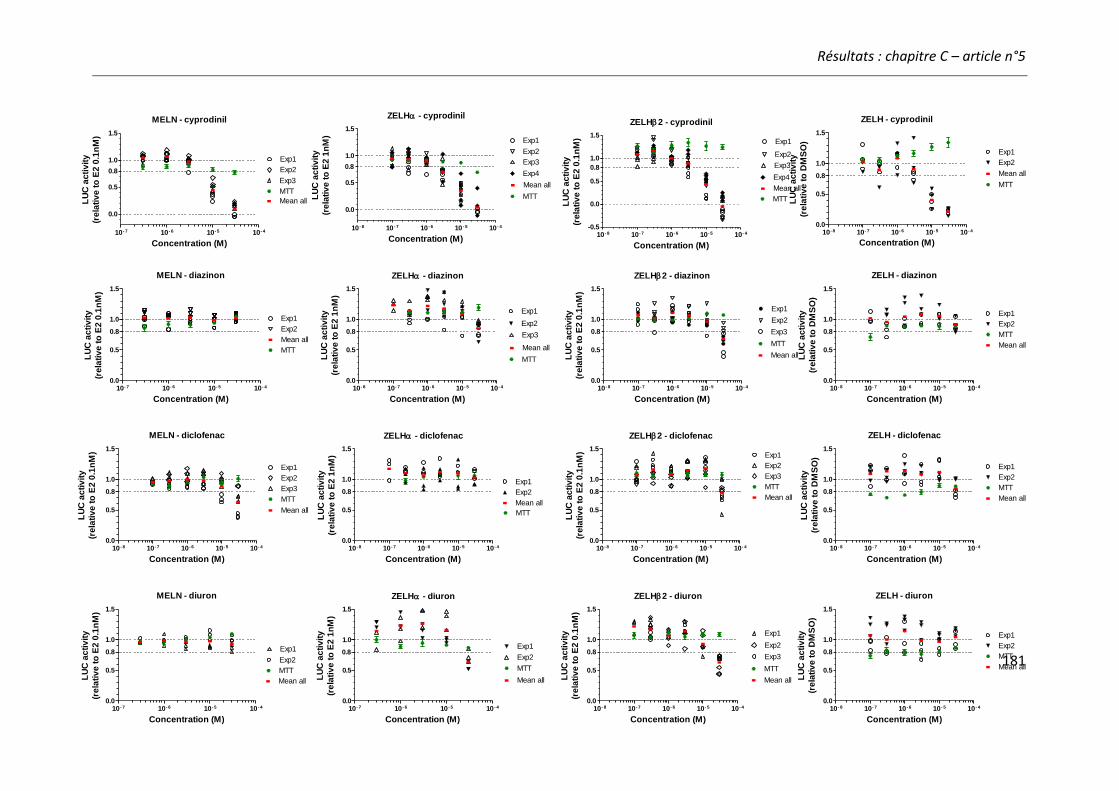
Résultats : chapitre C – article n°5
181
ZELH - cyprodinil
10- 8 10- 7 10- 6 10- 5 10- 4
0.0
0.5
1.0
1.5
Exp2
Mean all
Exp1
MTT
0.8
Concentration (M)
LU
C a
cti
vit
y
(re
lati
ve
to
DM
SO
)
ZELH - diazinon
10- 8 10- 7 10- 6 10- 5 10- 4
0.0
0.5
1.0
1.5
Exp1
Mean all
MTT
Exp20.8
Concentration (M)
LU
C a
cti
vit
y
(re
lati
ve
to
DM
SO
)
ZELH - diclofenac
10 - 8 10 - 7 10- 6 10- 5 10- 4
0.0
0.5
1.0
1.5
Exp1
Mean all
MTT
Exp2
0.8
Concentration (M)
LU
C a
cti
vit
y
(re
lati
ve
to
DM
SO
)
ZELH - diuron
10 - 8 10- 7 10 - 6 10 - 5 10 - 4
0.0
0.5
1.0
1.5
Exp1
Mean all
MTT
Exp20.8
Concentration (M)
LU
C a
cti
vit
y
(re
lati
ve
to
DM
SO
)
MELN - cyprodinil
10- 7 10 - 6 10- 5 10- 4
0.0
0.5
1.0
1.5
Exp1
Exp2
Mean all
Exp3
MTT
0.8
Concentration (M)
LU
C a
cti
vit
y
(re
lati
ve
to
E2
0.1
nM
)
MELN - diazinon
10- 7 10- 6 10- 5 10 - 4
0.0
0.5
1.0
1.5
Exp1
Exp2
Mean allMTT
0.8
Concentration (M)
LU
C a
cti
vit
y
(re
lati
ve
to
E2
0.1
nM
)
MELN - diclofenac
10 - 8 10- 7 10- 6 10- 5 10- 4
0.0
0.5
1.0
1.5
Exp1
Mean all
MTT
Exp3
Exp2
0.8
Concentration (M)
LU
C a
cti
vit
y
(re
lati
ve
to
E2
0.1
nM
)
MELN - diuron
10 - 7 10- 6 10- 5 10 - 4
0.0
0.5
1.0
1.5
Exp1
Mean all
Exp2
MTT
0.8
Concentration (M)
LU
C a
cti
vit
y
(re
lati
ve
to
E2
0.1
nM
)
ZELH - cyprodinil
10 - 8 10 - 7 10 - 6 10 - 5 10 - 4
0.0
0.5
1.0
1.5
Exp2
Exp4
Exp1
Exp3
Mean all
MTT
0.8
Concentration (M)
LU
C a
cti
vit
y
(re
lati
ve
to
E2
1n
M)
ZELH - diazinon
10- 8 10- 7 10- 6 10 - 5 10- 4
0.0
0.5
1.0
1.5
Exp2
Mean all
Exp1
Exp3
MTT
0.8
Concentration (M)
LU
C a
cti
vit
y
(re
lati
ve
to
E2
1n
M)
ZELH - diclofenac
10 - 8 10 - 7 10- 6 10- 5 10- 4
0.0
0.5
1.0
1.5
Exp1
Mean all
Exp2
MTT
0.8
Concentration (M)
LU
C a
cti
vit
y
(re
lati
ve
to
E2
1n
M)
ZELH - diuron
10 - 7 10 - 6 10 - 5 10 - 4
0.0
0.5
1.0
1.5
Exp1
Mean all
Exp2
MTT
0.8
Concentration (M)
LU
C a
cti
vit
y
(re
lati
ve
to
E2
1n
M)
ZELH2 - cyprodinil
10 - 8 10- 7 10- 6 10- 5 10- 4
-0.5
0.0
0.5
1.0
1.5
Exp2
Exp4
Exp1
Exp3
Mean allMTT
0.8
Concentration (M)
LU
C a
cti
vit
y
(re
lati
ve
to
E2
0.1
nM
)
ZELH2 - diazinon
10 - 8 10- 7 10- 6 10 - 5 10 - 4
0.0
0.5
1.0
1.5
Exp2
Mean all
MTT
Exp1
Exp30.8
Concentration (M)
LU
C a
cti
vit
y
(re
lati
ve
to
E2
0.1
nM
)
ZELH2 - diclofenac
10 - 8 10- 7 10- 6 10- 5 10- 4
0.0
0.5
1.0
1.5
Exp1
Mean all
Exp2
MTT
Exp3
0.8
Concentration (M)L
UC
ac
tiv
ity
(re
lati
ve
to
E2
0.1
nM
)
ZELH2 - diuron
10 - 8 10- 7 10- 6 10- 5 10- 4
0.0
0.5
1.0
1.5
Exp2
Mean all
Exp3
MTT
Exp1
0.8
Concentration (M)
LU
C a
cti
vit
y
(re
lati
ve
to
E2
0.1
nM
)
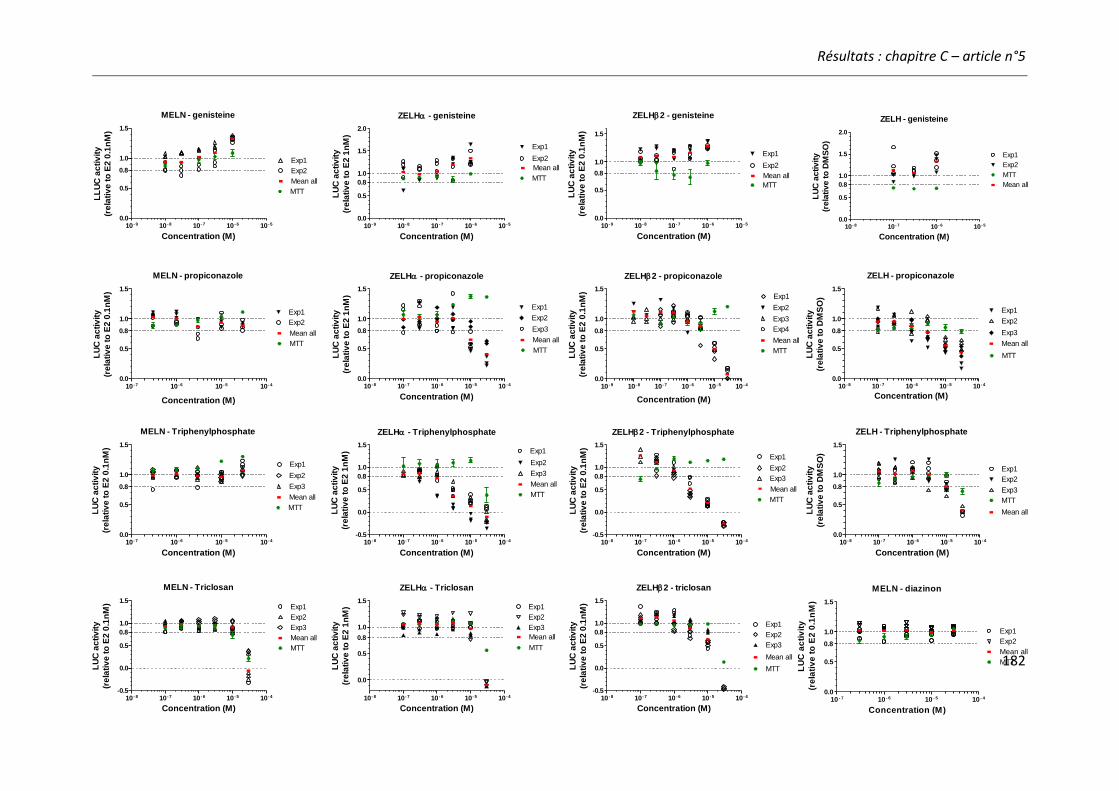
Résultats : chapitre C – article n°5
182
ZELH - genisteine
10 - 8 10 - 7 10 - 6 10 - 5
0.0
0.5
1.0
1.5
2.0
Exp1
Mean all
MTT
Exp2
0.8
Concentration (M)
LU
C a
cti
vit
y
(re
lati
ve
to
DM
SO
)
ZELH - propiconazole
10 - 8 10 - 7 10 - 6 10 - 5 10 - 4
0.0
0.5
1.0
1.5
Mean all
Exp1
MTT
Exp2
Exp30.8
Concentration (M)
LU
C a
cti
vit
y
(re
lati
ve
to
DM
SO
)
ZELH - Triphenylphosphate
10 - 8 10 - 7 10 - 6 10 - 5 10 - 4
0.0
0.5
1.0
1.5
Exp1
Exp2
Mean all
MTT
Exp30.8
Concentration (M)
LU
C a
cti
vit
y
(re
lati
ve
to
DM
SO
)
MELN - diazinon
10 - 7 10 - 6 10 - 5 10 - 4
0.0
0.5
1.0
1.5
Exp1
Exp2
Mean allMTT
0.8
Concentration (M)
LU
C a
cti
vit
y
(re
lati
ve
to
E2
0.1
nM
)
ZELH - genisteine
10 - 9 10 - 8 10 - 7 10 - 6 10 - 5
0.0
0.5
1.0
1.5
2.0
Exp1
Mean all
Exp2
MTT0.8
Concentration (M)
LU
C a
cti
vit
y
(re
lati
ve
to
E2
1n
M)
ZELH - propiconazole
10 - 8 10 - 7 10 - 6 10 - 5 10 - 4
0.0
0.5
1.0
1.5
Exp1
Mean all
Exp3
Exp2
0.8
MTT
Concentration (M)
LU
C a
cti
vit
y
(re
lati
ve
to
E2
1n
M)
ZELH - Triphenylphosphate
10 - 8 10 - 7 10 - 6 10 - 5 10 - 4
-0.5
0.0
0.5
1.0
1.5
Exp2
Mean all
Exp1
Exp3
MTT
0.8
Concentration (M)
LU
C a
cti
vit
y
(re
lati
ve
to
E2
1n
M)
ZELH - Triclosan
10 - 8 10 - 7 10 - 6 10 - 5 10 - 4
0.0
0.5
1.0
1.5
Exp1
Exp2
Exp3
Mean all0.8
MTT
Concentration (M)
LU
C a
cti
vit
y
(re
lati
ve
to
E2
1n
M)
MELN - genisteine
10 - 9 10 - 8 10 - 7 10 - 6 10 - 5
0.0
0.5
1.0
1.5
Exp1
Mean all
Exp2
MTT
0.8
Concentration (M)
LL
UC
ac
tiv
ity
(re
lati
ve
to
E2
0.1
nM
)
MELN - propiconazole
10 - 7 10 - 6 10 - 5 10 - 4
0.0
0.5
1.0
1.5
Exp1
Mean all
Exp2
MTT
0.8
Concentration (M)
LU
C a
cti
vit
y
(re
lati
ve
to
E2
0.1
nM
)
MELN - Triphenylphosphate
10 - 7 10 - 6 10 - 5 10 - 4
0.0
0.5
1.0
1.5
Exp2
Mean all
Exp1
Exp3
MTT
0.8
Concentration (M)
LU
C a
cti
vit
y
(re
lati
ve
to
E2
0.1
nM
)
MELN - Triclosan
10 - 8 10 - 7 10 - 6 10 - 5 10 - 4
-0.5
0.0
0.5
1.0
1.5
Exp1
Exp2
Exp3
Mean all0.8
MTT
Concentration (M)
LU
C a
cti
vit
y
(re
lati
ve
to
E2
0.1
nM
)
ZELH2 - genisteine
10 - 9 10 - 8 10 - 7 10 - 6 10 - 5
0.0
0.5
1.0
1.5
Exp1
Mean all
Exp2
MTT
0.8
Concentration (M)
LU
C a
cti
vit
y
(re
lati
ve
to
E2
0.1
nM
)
ZELH2 - propiconazole
10 - 9 10 - 8 10 - 7 10 - 6 10 - 5 10 - 4
0.0
0.5
1.0
1.5
Exp1
Exp2
Exp3
Exp4
Mean allMTT
0.8
Concentration (M)
LU
C a
cti
vit
y
(re
lati
ve
to
E2
0.1
nM
)
ZELH2 - Triphenylphosphate
10 - 8 10 - 7 10 - 6 10 - 5 10 - 4
-0.5
0.0
0.5
1.0
1.5
Exp2
Mean all
Exp1
Exp3
MTT
0.8
Concentration (M)
LU
C a
cti
vit
y
(re
lati
ve
to
E2
0.1
nM
)ZELH2 - triclosan
10 - 8 10 - 7 10 - 6 10 - 5 10 - 4
-0.5
0.0
0.5
1.0
1.5
Exp1
Exp2
Exp3
Mean all
0.8
MTT
Concentration (M)
LU
C a
cti
vit
y
(re
lati
ve
to
E2
0.1
nM
)
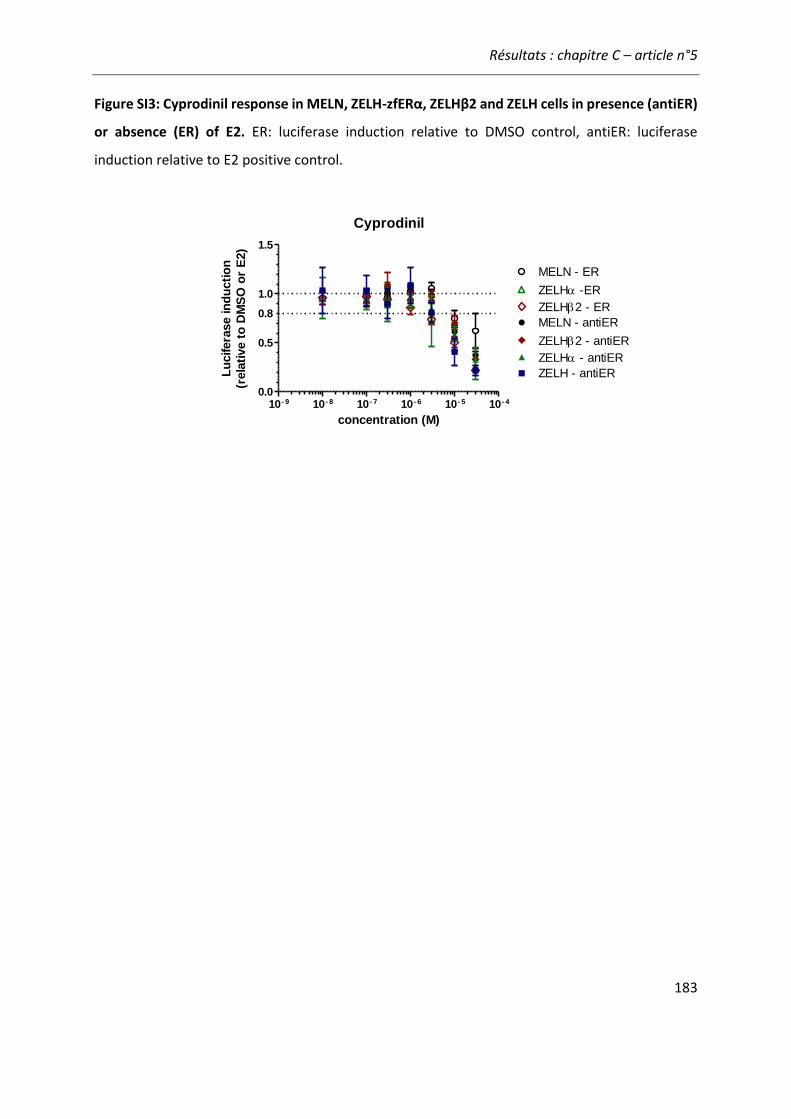
Résultats : chapitre C – article n°5
183
Figure SI3: Cyprodinil response in MELN, ZELH-zfERα, ZELHβ2 and ZELH cells in presence (antiER)
or absence (ER) of E2. ER: luciferase induction relative to DMSO control, antiER: luciferase
induction relative to E2 positive control.
Cyprodinil
10- 9 10- 8 10- 7 10- 6 10- 5 10- 4
0.0
0.5
1.0
1.5
ZELH -ER
ZELH2 - ER
ZELH - antiER
MELN - antiER
ZELH2 - antiER
ZELH - antiER
MELN - ER
0.8
concentration (M)
Lu
cifera
se in
du
cti
on
(rela
tive t
o D
MS
O o
r E
2)
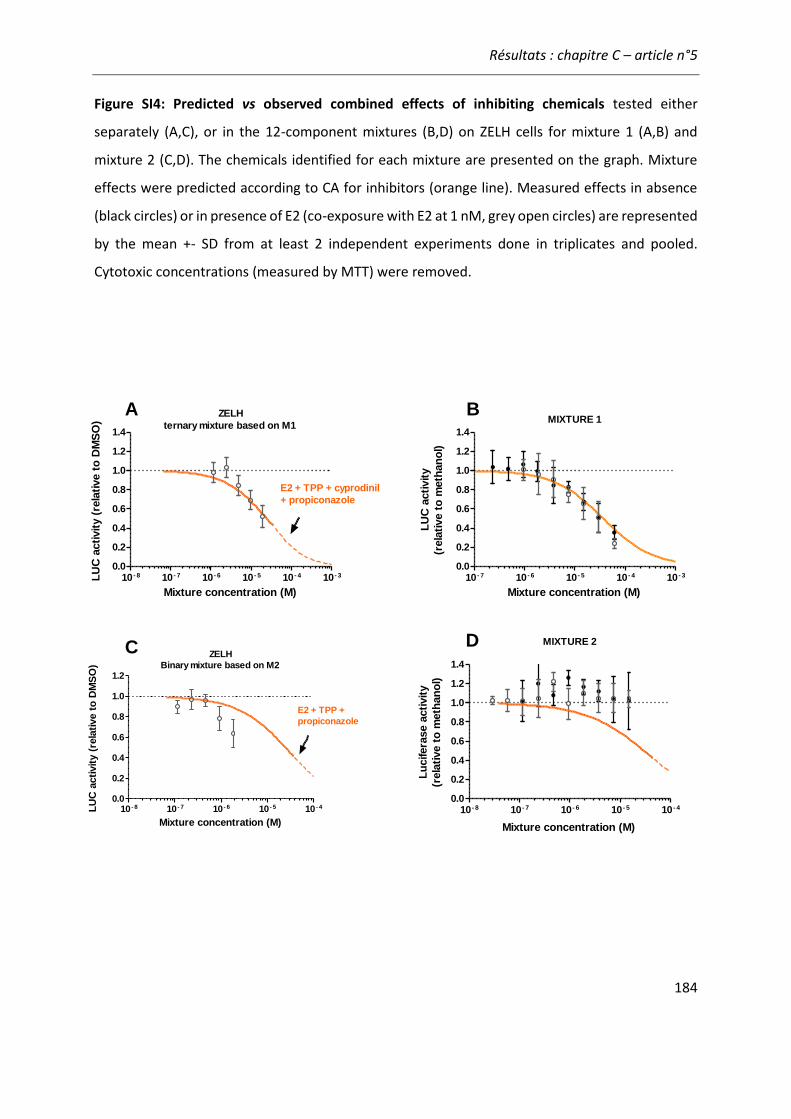
Résultats : chapitre C – article n°5
184
Figure SI4: Predicted vs observed combined effects of inhibiting chemicals tested either
separately (A,C), or in the 12-component mixtures (B,D) on ZELH cells for mixture 1 (A,B) and
mixture 2 (C,D). The chemicals identified for each mixture are presented on the graph. Mixture
effects were predicted according to CA for inhibitors (orange line). Measured effects in absence
(black circles) or in presence of E2 (co-exposure with E2 at 1 nM, grey open circles) are represented
by the mean +- SD from at least 2 independent experiments done in triplicates and pooled.
Cytotoxic concentrations (measured by MTT) were removed.
ZELH
ternary mixture based on M1
10 - 8 10 - 7 10 - 6 10 - 5 10 - 4 10 - 3
0.0
0.2
0.4
0.6
0.8
1.0
1.2
1.4
E2 + TPP + cyprodinil
+ propiconazole
Mixture concentration (M)
LU
C a
cti
vit
y (
rela
tive t
o D
MS
O) MIXTURE 1
10 - 7 10 - 6 10 - 5 10 - 4 10 - 3
0.0
0.2
0.4
0.6
0.8
1.0
1.2
1.4
Mixture concentration (M)
LU
C a
cti
vit
y
(rela
tive t
o m
eth
an
ol)
ZELH
Binary mixture based on M2
10 - 8 10 - 7 10 - 6 10 - 5 10 - 4
0.0
0.2
0.4
0.6
0.8
1.0
1.2
E2 + TPP +
propiconazole
Mixture concentration (M)
LU
C a
cti
vit
y (
rela
tive t
o D
MS
O)
MIXTURE 2
10 - 8 10 - 7 10 - 6 10 - 5 10 - 4
0.0
0.2
0.4
0.6
0.8
1.0
1.2
1.4
Mixture concentration (M)
Lu
cifera
se a
cti
vit
y
(rela
tive t
o m
eth
an
ol)
A B
C D
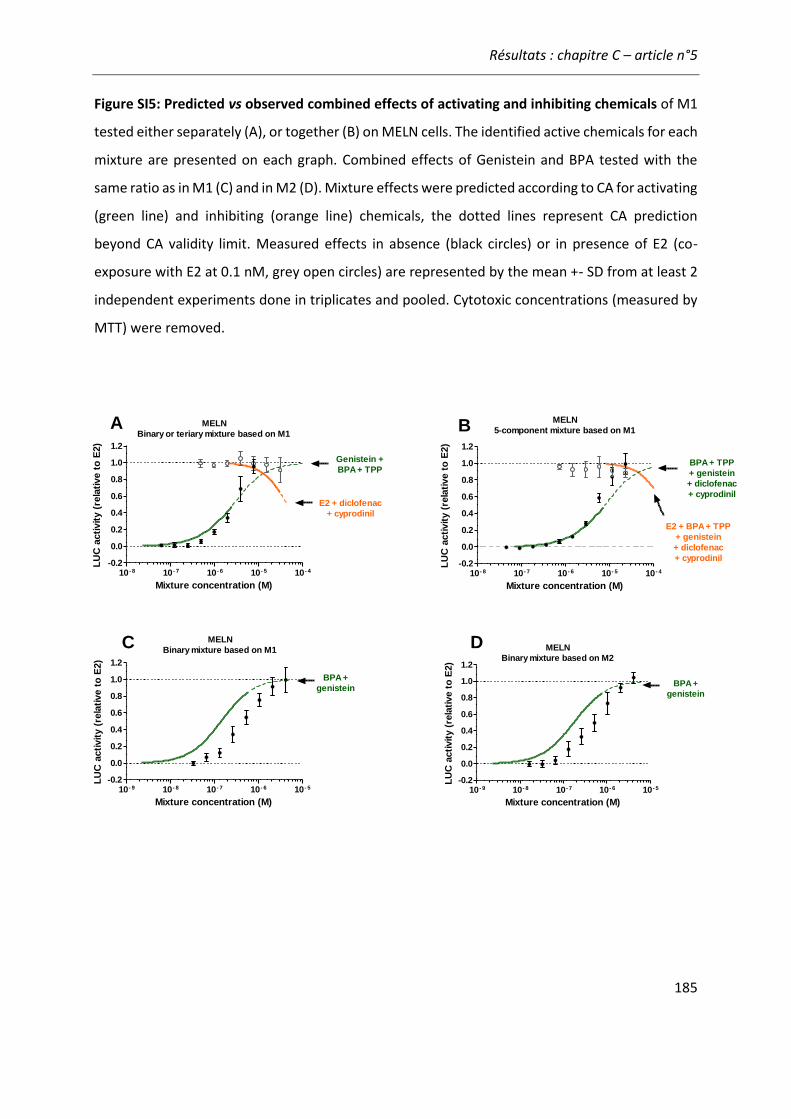
Résultats : chapitre C – article n°5
185
Figure SI5: Predicted vs observed combined effects of activating and inhibiting chemicals of M1
tested either separately (A), or together (B) on MELN cells. The identified active chemicals for each
mixture are presented on each graph. Combined effects of Genistein and BPA tested with the
same ratio as in M1 (C) and in M2 (D). Mixture effects were predicted according to CA for activating
(green line) and inhibiting (orange line) chemicals, the dotted lines represent CA prediction
beyond CA validity limit. Measured effects in absence (black circles) or in presence of E2 (co-
exposure with E2 at 0.1 nM, grey open circles) are represented by the mean +- SD from at least 2
independent experiments done in triplicates and pooled. Cytotoxic concentrations (measured by
MTT) were removed.
MELN
Binary or teriary mixture based on M1
10 - 8 10 - 7 10 - 6 10 - 5 10 - 4
-0.2
0.0
0.2
0.4
0.6
0.8
1.0
1.2
Genistein +
BPA + TPP
E2 + diclofenac
+ cyprodinil
Mixture concentration (M)
LU
C a
cti
vit
y (
rela
tive t
o E
2)
MELN
5-component mixture based on M1
10 - 8 10 - 7 10 - 6 10 - 5 10 - 4
-0.2
0.0
0.2
0.4
0.6
0.8
1.0
1.2
BPA + TPP
+ genistein
+ diclofenac
+ cyprodinil
E2 + BPA + TPP
+ genistein
+ diclofenac
+ cyprodinil
Mixture concentration (M)
LU
C a
cti
vit
y (
rela
tive t
o E
2)
10 - 9 10 - 8 10 - 7 10 - 6 10 - 5
-0.2
0.0
0.2
0.4
0.6
0.8
1.0
1.2
MELN
Binary mixture based on M1
BPA +
genistein
Mixture concentration (M)
LU
C a
cti
vit
y (
rela
tive t
o E
2)
10 - 9 10- 8 10- 7 10- 6 10- 5
-0.2
0.0
0.2
0.4
0.6
0.8
1.0
1.2
MELN
Binary mixture based on M2
BPA +
genistein
Mixture concentration (M)
LU
C a
cti
vit
y (
rela
tive t
o E
2)
A B
C D

Résultats : chapitre C – article n°5
186
Figure SI6: Predicted and observed effects of BPA, genistein and the identified drivers of
inhibition on ZELHα cells, tested either separately (A, C), pooled together (B,D) based on M1 (A,B)
and M2 (C,D) ratios. The drivers of inhibition identified for each mixture are presented in Table 4.
Mixture effects were predicted according to CA for activating (green line) or inhibiting (orange
line) chemicals, the dotted lines represent CA prediction beyond CA validity limit. Measured
effects for ER activation (black circles) and for E2-induced ER inhibition (co-exposure with E2 1 nM,
grey open circles) are represented by the mean +- SD from at least 2 independent experiments
done in triplicates and pooled. Cytotoxic concentrations (measured by MTT) were removed.
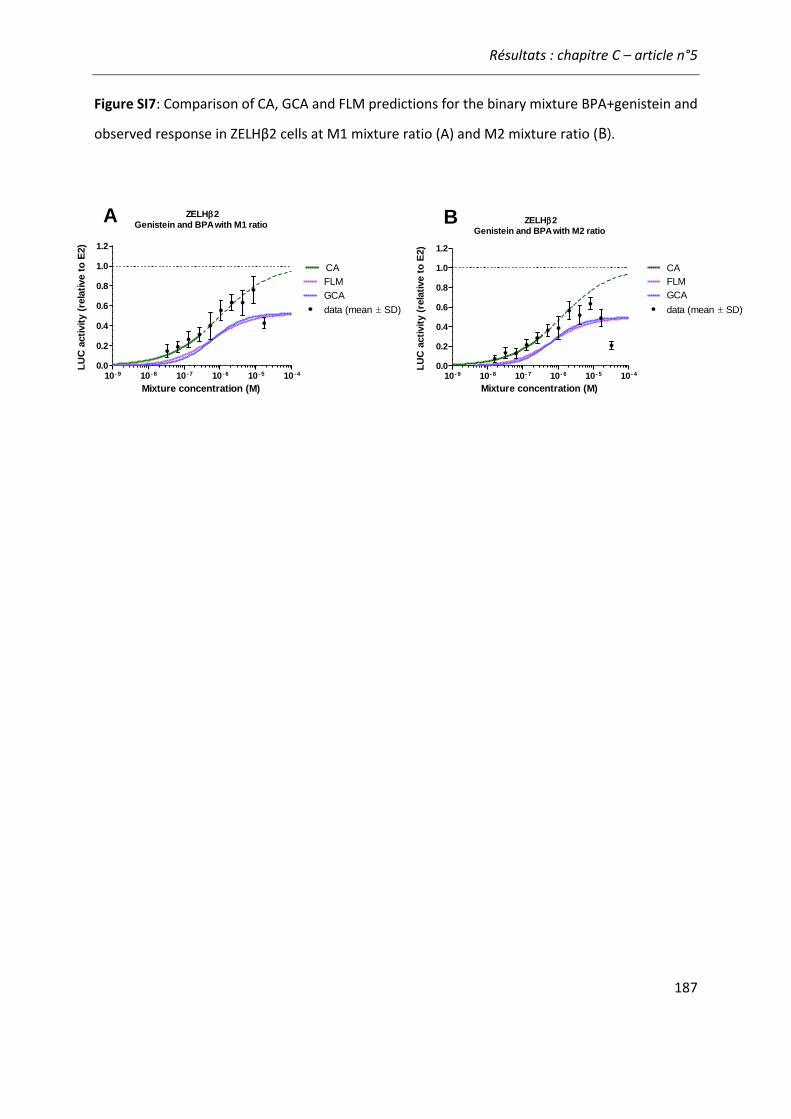
Résultats : chapitre C – article n°5
187
Figure SI7: Comparison of CA, GCA and FLM predictions for the binary mixture BPA+genistein and
observed response in ZELHβ2 cells at M1 mixture ratio (A) and M2 mixture ratio (B).
ZELH2
Genistein and BPA with M1 ratio
10 - 9 10 - 8 10 - 7 10 - 6 10 - 5 10 - 4
0.0
0.2
0.4
0.6
0.8
1.0
1.2
FLM
GCA
CA
data (mean SD)
Mixture concentration (M)
LU
C a
cti
vit
y (
rela
tive t
o E
2)
ZELH2
Genistein and BPA with M2 ratio
10 - 9 10 - 8 10 - 7 10 - 6 10 - 5 10 - 4
0.0
0.2
0.4
0.6
0.8
1.0
1.2
FLM
GCA
CA
data (mean SD)
Mixture concentration (M)
LU
C a
cti
vit
y (
rela
tive t
o E
2)
A B

Résultats : chapitre C – article n°5
188
Résultats : chapitre D – article n°6
189
Comparaison des bio-essais en réponse à des
échantillons environnementaux
Article n°6: “Comparing zebrafish- and human-based bioassays for
estrogenicity screening of river water samples: the Danube as a case-study”
1.1 Contexte et objectifs
Au départ du travail de thèse, il avait été constaté que les cellules ZELHβ2 répondaient
quantitativement et parfois qualitativement différemment des cellules MELN aux échantillons
environnementaux (Sonanave et al., 2016). Au regard des différences inter-modèles observées
pour les molécules seules et les mélanges simples, le but de cette étude était de comparer la
réponse des bio-essais MELN et ZELHβ2 à des échantillons d’eau de surface. Dans un premier
temps, les échantillons de la JDS3 évalués dans l’article n°1 ont été testés sur les cellules ZELHβ2.
Afin d’aller plus loin, le cas d’étude de Novi Sad a été choisi pour évaluer l’influence de l’anti-
estrogénicité et comparer la réponse des modèles in vitro à l’activité oestrogénique in vivo avec
le test EASZY. Novi Sad est la deuxième ville de Serbie (300 000 habitants) et les eaux usées de la
ville sont rejetées sans traitement dans le Danube (voir démarche experimentale, B.2.2). Les deux
cas d’études du projet SOLUTIONS ont été caractérisés biologiquement et chimiquement, ce qui a
permis une comparaison approfondie des différences inter-modèles.
1.2 Résultats et discussion
Le criblage des échantillons de la JDS3 sur ZELHβ2 a montré que le bio-essai pouvait
détecter de faibles niveaux d’activité estrogénique (<0,1 ng/L E2-Eq). Le site le plus actif sur les
MELN était également bien détecté par les ZELHβ2 (JDS41). Cependant, la comparaison des deux
modèles in vitro montre que les cellules ZELHβ2 (8/22) ont détecté moins d’échantillons actifs que
les cellules MELN (15/22). De plus, si certains sites sont détectés de la même manière par les deux
bio-essais (n=10), d’autres sont sélectivement actifs sur MELN (n=10) ou sur ZELHβ2 (n=2).
L’estrone est le principal contributeur de l’activité estrogénique mesurée dans les deux bio-essais
(comme observé dans l’article n°1 et n°3). Cependant, les xeno-estrogènes détectés ne

Résultats : chapitre D – article n°6
190
permettent pas d’expliquer les différences de réponse pour les échantillons sélectivement actif
sur un modèle biologique. Ces résultats suggèrent que d’autres facteurs spécifiques à chaque bio-
essai ont influencé la réponse aux xéno-estrogènes présents dans les échantillons.
Dans le cas d’étude de Novi Sad, l’échantillon prélevé à proximité du rejet de l’effluent
d’eau usée de la ville était le plus actif in vitro et le seul actif in vivo. Les estrogènes stéroïdiens
(E2, l’E1 et l’E3) étaient les principaux contributeurs identifiés. Une bonne corrélation entre
l’activité estrogénique mesurée et prédite a été observée pour les MELN et pour le test EASZY,
cependant, l’activité mesurée dans les cellules ZELHβ2 est 7 fois plus faible qu’attendue.
Cependant, la faible activité anti-estrogénique mesurée ne permet pas d’expliquer la déviation de
la réponse observée.
1.3 Conclusion
➢ Les sites les plus contaminés sont bien détectés par tous les modèles, y compris par le test
ESAZY, mais les échantillons faiblement actifs sont mieux détectées avec les MELN
➢ Les différences de sensibilité entre les cellules MELN et ZELHβ2 ne sont pas expliquées par
les xeno-estrogènes identifiés

Résultats : chapitre D – article n°6
191
ARTICLE n°6
Comparing zebrafish- and human-based bioassays for estrogenicity
screening of river water samples: the Danube as a case-study
Helene Serra1,2, François Brion1, Hélène Budzinski2, Tobias Schulze3, Werner Brack3, Selim Aït-
Aïssa1*
1Institut National de I’Environnement Industriel et des risques (INERIS), Verneuil-en-Halatte,
France
2 Université de Bordeaux, Talence, France
3UFZ– Helmholtz Centre for Environmental Research, Leipzig, Germany
* corresponding author
INTRODUCTION
Over the last decades, the occurrence of endocrine disrupting chemicals (EDC) in the
aquatic environment has raised concern because of their adverse effects in aquatic organisms
(Sumpter, 2005). EDC mediate their effects through multiple mechanisms, among which
interaction with the estrogen receptor (ER) is well documented in vertebrates, such as fish
(Sumpter and Jobling, 2013). ER is a nuclear receptor acting as a ligand-dependent transcription
factor that modulates the expression of target genes involved in physiological processes, such as
growth and reproduction (Segner et al., 2013). Given the many environmental pollutants
identified as xeno-estrogens (e.g. reviewed in Kiyama and Wada-Kiyama, 2015), chemical analysis
targeting a define list of analytes is often not sufficient to characterize xeno-estrogenic
contamination in an environmental mixture. Bioassays are therefore often applied to provide a
more holistic view of xeno-estrogen contamination. Bioassays capture the activity of both known
and unknown xeno-estrogens present in a given sample and thus complement the information
provided by chemical analysis of selected key compounds (Altenburger et al., 2015). They have
been successfully applied to monitor estrogenic activity in many matrices such as waste waters
Résultats : chapitre D – article n°6
192
(Jarošová et al., 2014b), drinking water (Escher et al., 2014), and surface water (Vethaak et al.,
2005).
Most of currently used bioassays are in vitro reporter gene assays based on human ERα
activation in mammalian or yeast cells (Kunz et al., 2015; Leusch et al., 2017). Compared to human
that express two ER subtypes, ERα and ERβ, most teleost fish express at least 3 ER subtypes, ERα,
ERβ1 and ERβ2 (Tohyama et al., 2016). ER mode of action is well conserved among vertebrates,
however fish and human ER subtypes may have different sensitivity and selectively towards xeno-
estrogens (Cosnefroy et al., 2009; Matthews et al., 2000; Molina-Molina et al., 2008; Pinto et al.,
2014). Furthermore, transactivation of ER can be modulated by the cellular context, such as the
presence of cell-specific transcriptional cofactors (Routledge et al., 2000) or cell-specific
metabolism (Le Fol et al., 2015). Despite different response to xeno-estrogens, very few studies
so far compared fish and human-based bioassays in bio-monitoring studies. For instance, when
waste water effluent samples were screened on human or medaka ERα expressing cells, most
samples were active on both cell lines, but some were significantly more potent on medaka ERα
(Ihara et al., 2014). These differences could not be fully explained by the steroidal estrogens
identified, and the authors further suggested the influence of species-specific sensitivity to anti-
estrogenic chemicals (Ihara et al., 2015). Recently, we reported that some surface water extracts
were active on zebrafish in vitro ZELHβ2 cells but lacked estrogenic activity in human-based cells
(Sonavane et al., 2016). These results suggest that cross-species differences and bioassays specific
cellular factors may influence the activity of xeno-estrogens and thus their detection within
complex mixtures. However more data issued from different environmental contexts are still
needed to further document such hypothesis which may have implication in the refinement of
bioanalytical tools in environmental monitoring.(Sonavane et al., 2016)
In that context, our study aimed at investigating and comparing the response of fish- and
human-based reporter gene bioassays to assess estrogenicity of surface water samples from the
Danube river, which is representative of a large water body context with high dilutions and low
micropollutants concentrations originating from diverse sources (Liška et al., 2015). The water
sample extracts originating from two case-studies, namely the Joint Danube Survey (JDS, Neale et
al., 2015) and Novi Sad city (König et al., 2017), were analyzed by two in vitro bioassays, namely,
zebrafish liver cells (ZFL) stably transfected with the estrogen receptor zfERβ2 (ZELHβ2 cells) and
Résultats : chapitre D – article n°6
193
the human-based MELN cells constitutively expressing hERα (Balaguer et al., 1999). In addition,
an in vivo assay using transgenic zebrafish embryos expressing GFP under the control of ER-
regulated cyp19a1b promoter was further used to assess an impact at the organism level at
selected sites (Brion et al. 2012). Information provided by the different bioassays is discussed in
regard to 1) the frequency of detection and the quantification of estrogenic activity and 2) the
relative contribution of selected xeno-estrogens identified in the samples, by using both mass-
balance analysis and concentration-addition prediction (Loewe et Muischnek, 1926).
MATERIAL AND METHODS
Chemicals and reagents
17β-estradiol (E2), ethinylestradiol (EE2) and hydroxy-tamoxifen (OH-TAM) were
purchased from Sigma-Aldrich (France). Dimethylsulfoxide (DMSO), Leibovitz 15 culture medium
(L-15), fetal calf serum (FCS), 4-(2-hydroxy-ethyl)-1-piperazineethanesulfonic acid (HEPES),
epidermal growth factor (EGF), G418, 3-[4,5-dimethylthiazol-2-yl]-2,5-diphenyl-
tetrazoliumbromide (MTT) and D-luciferin were purchased from Sigma Aldrich (St-Quentin
Fallavier, France); Dulbecco's Modified Eagle Medium High Glucose (DMEM HG) powder, F-12
nutrient mixture (Ham's F12) powder, penicillin and streptomycin were from Gibco (France);
insulin, hygromycin B and sodium bicarbonate were from Dominique Dutscher (France).
Study sites, sampling and extraction procedure
Two sets of Danube River water samples collected and prepared during the Joint Danube
Survey 3 (JDS, 22 samples) and Novi Sad (NS, 3 samples) campaigns were used in this study. Site
description and collection and preparation of water samples were described in detail previously
(Neale et al 2015, König et al 2017). In brief, sampling of the JDS was carried out between August
and September 2013 in Danube River and some tributaries from Austria to Romania (Liška et al.,
2015, Neale et al., 2015). The city of Novi Sad city (300 000 inhabitants, Serbia), located on the
Danube River, was selected to investigate the impact of untreated municipal effluent release on
the Danube river (König et al., 2017). The Novi Sad sites investigated were selected as follow: NS1
2 km upstream the effluent release, NS2 200 m downstream the effluent release, and NS3 7 km
downstream the effluent release. In both case-studies, the samples were collected using a on-site
solid phase extraction (SPE) device designed to sample and extract large volume (LV) of water on
Résultats : chapitre D – article n°6
194
site (LVSPE device, Schulze et al., 2017). About 500 L of water were extracted and concentrated at
each site in JDS (Neale et al., 2015), and 850 L to 1000 L at NS sites (König et al. 2017). The organic
extracts were reduced to dryness before shipping, then resuspended in DMSO and stored at -20°C
before bio-analysis. Further information on study sites, sampling procedures and extraction
methods are provided in Neale et al. (2015) and König et al. (2017).
In vitro bioassays
The zebrafish in vitro assays were derived from the zebrafish liver (ZFL) cell line. ZFL cells
were stably transfected first by an ERE-driven luciferase gene, yielding the ZELH cell line, and then
by zfERβ2 subtype yielding the ZELHβ2 cell lines (Cosnefroy et al., 2012). Establishment of this cell
model and its response to different classes of well-known xeno-estrogens have been previously
described. In addition, we used the human-derived MELN cell line (Balaguer et al., 1999) kindly
provided by Dr. Patrick Balaguer (INSERM Montpellier, France). The MELN cells are derived from
the breast cancer MCF-7 cells, which endogenously express the hERα, but no functional hERβ (P.
Balaguer, personal communication), and were stably transfected with an ERE-driven firefly
luciferase reporter gene.
Conditions for routine cell culture and exposure to chemicals have been detailed previously
(Sonavane et al., 2016). Briefly, ZELH-zfERs cells were seeded in 96-well white opaque culture
plates (Greiner CellStar™, Dutscher, France) at 25,000 cells per well in phenol red free LDF-DCC
medium (containing L-15 50%, DMEM HG 35%, Ham's F12 15%, HEPES 15 mM, 0.15 g/L sodium
bicarbonate, 0.01 mg/mL insulin, 50 ng/mL EGF, 50 U/mL penicillin and streptomycin antibiotics,
5% v/v stripped FCS). MELN were seeded at 80,000 cells per well in steroid- and phenol red-free
DMEM medium. Cells were left to adhere for 24 h, and then exposed for either 72 h at 28 °C for
zebrafish cells or 16h at 37°C for MELN cells. Cell were exposed in triplicates to serial dilutions of
sample extracts to obtain a final DMSO concentration in the well plate of 0.5% (v/v). To assess
anti-estrogenic activity at selected sites, ZELHβ2 and MELN cells were co-exposed to the sample
in presence of 0.1 nM E2, i.e. a concentration saturating 80% to 100% of ER. Each plate included
both solvent and positive controls. After exposure, culture medium was removed and replaced by
50 μl per well of medium containing 0.3 mM D-luciferin. The luminescence signal was measured
in living cells using a microtiter plate luminometer (Synergy H4, BioTek). The effect of samples on
cell viability was assessed by using the 3-(4,5-dimethyl-thiazol-2-yl)-2,5diphenyl tetrazolium
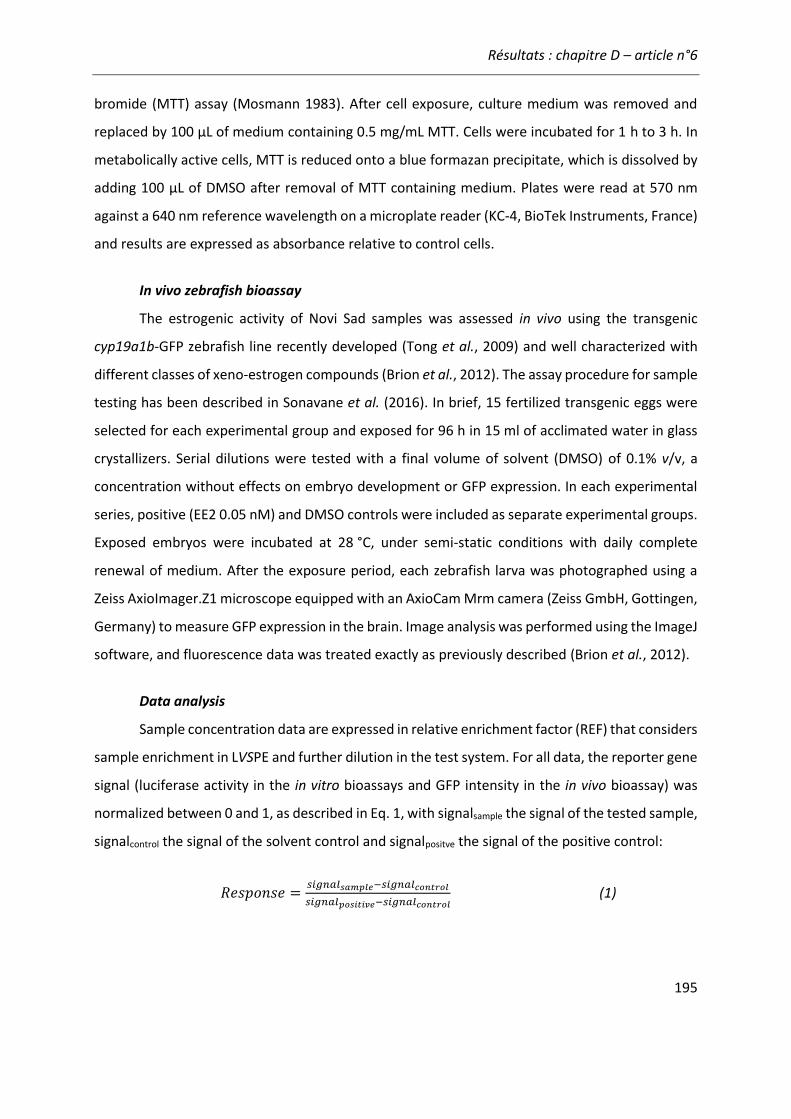
Résultats : chapitre D – article n°6
195
bromide (MTT) assay (Mosmann 1983). After cell exposure, culture medium was removed and
replaced by 100 μL of medium containing 0.5 mg/mL MTT. Cells were incubated for 1 h to 3 h. In
metabolically active cells, MTT is reduced onto a blue formazan precipitate, which is dissolved by
adding 100 μL of DMSO after removal of MTT containing medium. Plates were read at 570 nm
against a 640 nm reference wavelength on a microplate reader (KC-4, BioTek Instruments, France)
and results are expressed as absorbance relative to control cells.
In vivo zebrafish bioassay
The estrogenic activity of Novi Sad samples was assessed in vivo using the transgenic
cyp19a1b-GFP zebrafish line recently developed (Tong et al., 2009) and well characterized with
different classes of xeno-estrogen compounds (Brion et al., 2012). The assay procedure for sample
testing has been described in Sonavane et al. (2016). In brief, 15 fertilized transgenic eggs were
selected for each experimental group and exposed for 96 h in 15 ml of acclimated water in glass
crystallizers. Serial dilutions were tested with a final volume of solvent (DMSO) of 0.1% v/v, a
concentration without effects on embryo development or GFP expression. In each experimental
series, positive (EE2 0.05 nM) and DMSO controls were included as separate experimental groups.
Exposed embryos were incubated at 28 °C, under semi-static conditions with daily complete
renewal of medium. After the exposure period, each zebrafish larva was photographed using a
Zeiss AxioImager.Z1 microscope equipped with an AxioCam Mrm camera (Zeiss GmbH, Gottingen,
Germany) to measure GFP expression in the brain. Image analysis was performed using the ImageJ
software, and fluorescence data was treated exactly as previously described (Brion et al., 2012).
Data analysis
Sample concentration data are expressed in relative enrichment factor (REF) that considers
sample enrichment in LVSPE and further dilution in the test system. For all data, the reporter gene
signal (luciferase activity in the in vitro bioassays and GFP intensity in the in vivo bioassay) was
normalized between 0 and 1, as described in Eq. 1, with signalsample the signal of the tested sample,
signalcontrol the signal of the solvent control and signalpositve the signal of the positive control:
𝑅𝑒𝑠𝑝𝑜𝑛𝑠𝑒 =𝑠𝑖𝑔𝑛𝑎𝑙𝑠𝑎𝑚𝑝𝑙𝑒−𝑠𝑖𝑔𝑛𝑎𝑙𝑐𝑜𝑛𝑡𝑟𝑜𝑙
𝑠𝑖𝑔𝑛𝑎𝑙𝑝𝑜𝑠𝑖𝑡𝑖𝑣𝑒−𝑠𝑖𝑔𝑛𝑎𝑙𝑐𝑜𝑛𝑡𝑟𝑜𝑙 (1)

Résultats : chapitre D – article n°6
196
Concentration-response curves were fitted to all replicates pooled together with a
minimum of 2 independent experiments using Hill equation in RegTox 7.5 Microsoft Excel™ macro
(freely available at http://www.normalesup.org/~vindimian/fr_download.html). Positive control
20 (PC20, concentration corresponding to 20% response of that of positive control) were
estimated for samples reaching 20% effect by fixing the minimum and the maximum of the sample
response to 0 and 1, respectively, and fixing the slope to the one of E2. The biological estradiol-
equivalent (Bio-EEQ) was calculated as the ratio of EC20/IC20 of positive control (E2 for estrogenic
activity, OH-TAM for anti-estrogenic activity) to the PC20 of the sample, expressed in EEQ ng/L, as
presented in equation. 2:
𝐵𝑖𝑜 − 𝐸𝐸𝑄 =𝐸𝐶20/𝐼𝐶20𝑝𝑜𝑠𝑖𝑡𝑖𝑣𝑒 𝑐𝑜𝑛𝑡𝑟𝑜𝑙
𝑃𝐶20𝑠𝑎𝑚𝑝𝑙𝑒 (2)
To assess the contribution of detected chemicals to the biological response observed,
chemical equivalents (Chem-EEQ) were calculated for estrogenic chemicals. The Chem-EEQ was
calculated as the sum of the concentration of each active chemical weighted by its relative
estrogenic potency (REP), as presented in equation (3):
𝐶ℎ𝑒𝑚 − 𝐸𝐸𝑄 = ∑ 𝑅𝐸𝑃𝑖 𝑥 𝐶𝑖𝑛𝑖 (3)
The REP defined as the ratio of PC20 of E2 to the PC20 of the chemical, or EC50 when no
PC20 was available (indicated in Tab. SI4). The contribution of the active chemicals to the biological
response was assessed by dividing the Chem-EEQ by the Bio-EEQ, expressed in %. As an alternative
method for comparing chemical and bioassay data, the concentration addition (CA) model (Loewe
et Muischnek, 1926) was used to predict the combined effects of identified estrogenic chemicals
and compared with observed activity. For that purpose, single chemical data were fitted with logit
non-linear regression model in GraphPad Prism v.5. The logit parameters derived were then used
in an Excel template to predict the combined estrogenic response based on the concentration and
mixture ratios of the active chemicals identified in each sample. For simplification purpose, only
the active chemicals contributing to more than 5% of the predicted response at REF=1 were used
in CA prediction. Logit equation and the Excel template were kindly provided by Martin Scholze
(Brunel University, UK).
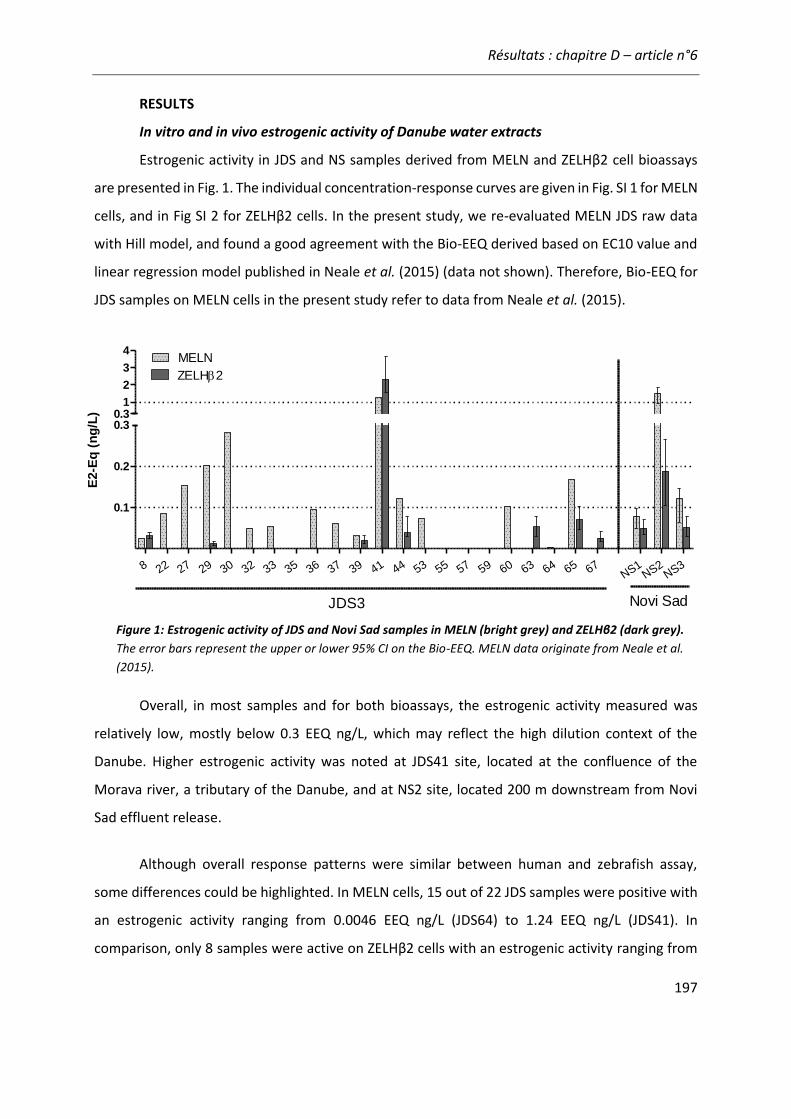
Résultats : chapitre D – article n°6
197
RESULTS
In vitro and in vivo estrogenic activity of Danube water extracts
Estrogenic activity in JDS and NS samples derived from MELN and ZELHβ2 cell bioassays
are presented in Fig. 1. The individual concentration-response curves are given in Fig. SI 1 for MELN
cells, and in Fig SI 2 for ZELHβ2 cells. In the present study, we re-evaluated MELN JDS raw data
with Hill model, and found a good agreement with the Bio-EEQ derived based on EC10 value and
linear regression model published in Neale et al. (2015) (data not shown). Therefore, Bio-EEQ for
JDS samples on MELN cells in the present study refer to data from Neale et al. (2015).
Overall, in most samples and for both bioassays, the estrogenic activity measured was
relatively low, mostly below 0.3 EEQ ng/L, which may reflect the high dilution context of the
Danube. Higher estrogenic activity was noted at JDS41 site, located at the confluence of the
Morava river, a tributary of the Danube, and at NS2 site, located 200 m downstream from Novi
Sad effluent release.
Although overall response patterns were similar between human and zebrafish assay,
some differences could be highlighted. In MELN cells, 15 out of 22 JDS samples were positive with
an estrogenic activity ranging from 0.0046 EEQ ng/L (JDS64) to 1.24 EEQ ng/L (JDS41). In
comparison, only 8 samples were active on ZELHβ2 cells with an estrogenic activity ranging from
8 22 27 29 30 32 33 35 36 37 39 41 44 53 55 57 59 60 63 64 65 67NS1
NS2NS3
1
2
3
4
ZELH2
MELN
0.30.3
0.1
0.2
JDS3 Novi Sad
E2-E
q (
ng
/L)
Figure 1: Estrogenic activity of JDS and Novi Sad samples in MELN (bright grey) and ZELHβ2 (dark grey).
The error bars represent the upper or lower 95% CI on the Bio-EEQ. MELN data originate from Neale et al.
(2015).
Résultats : chapitre D – article n°6
198
0.012 (JDS29) to 2.3 EEQ ng/L (JDS41). Interestingly, 10 samples had similar response pattern on
both bioassays (6 active and 4 inactive), whereas 2 samples (i.e. JDS63, 67) were selectively active
in ZELHβ2 cells and 10 (e.g. JDS22, 27, 30) were only active in MELN cells.
In Novi Sad samples, the estrogenic activity pattern was similar between MELN and ZELHβ2
assays, with a peak of activity detected just after the effluent release (NS2 site) and then a dilution
of the signal at the downstream NS3 site. However, it is noticeable that NS2 sample showed higher
estrogenic activity in MELN cells (1.52 EEQ ng/L) than in ZELHβ2 cells (0.19 EEQ ng/L, Fig. 1). NS
samples were also tested in vivo in transgenic cyp19a1b-GFP zebrafish embryos. NS2 estrogenic
activity was confirmed and reached 3.3 EEQ ng/L (Fig. 2C) while NS1 and NS3 were inactive in this
assay (data not shown). This result confirms the high estrogenic potency of NS2 sample and its
ability to impact fish embryo.
To evaluate the possible presence of antiestrogenic compounds in NS extracts that could
have differentially influenced the response in in vitro bioassays, we further assessed the anti-
estrogenic activity of NS samples in MELN and ZELHβ2 cells. In both assays, an inhibiting effect in
NS2 was noted but at much higher REF concentrations (i.e. > 30 REF) than those required to exert
an agonistic response, i.e. > 3 REF (Fig 2A and 2B). Similar patterns were noted for NS2 and NS3
(Fig.2 and SI 3). Therefore, although interferences of ER-specific inhibiting substances cannot be
excluded in ZELH cells, they had likely minor impact on the response.
0.01 0.1 1 10 100-0.2
0.0
0.2
0.4
0.6
0.8
1.0
1.2
Exp1
Exp2
Exp3
Exp1
Exp2
CA
REF
Lu
cifera
se a
cti
vit
y
(rela
tive t
o E
2)
0.01 0.1 1 10 100-0.2
0.0
0.4
0.6
0.8
1.0
1.2
1.4
Exp1
Exp2
Exp1
Exp2
0.2
CA
REF
Lu
cifera
se a
cti
vit
y
(rela
tive t
o E
2)
1 10 100
0.0
0.4
0.6
0.8
1.0
1.2
Exp1
0.2
CA
REF
GF
P in
ten
sit
y
(rela
tive t
o E
E2 0
.5n
M)
A B CMELN ZELH2
cyp19a1b-GFP
Figure 2: Estrogenic (filled symbols) and antiestrogenic (empty symbols) activities of Novi Sad NS2 sample on MELN
cells (A), ZELHβ2 cells (B) and in transgenic zebrafish embryos (C). The green line represents concentration addition
(CA) prediction based on main active xeno-estrogens identified in the sample (contribution >5% of the response at
REF=1)
Résultats : chapitre D – article n°6
199
The active chemicals identified only partially explained the fish-specific responses
Among the more than 100 chemicals detected in both case-studies (König et al., 2017;
Neale et al., 2015), information on in vitro and in vivo estrogenic activity was available for up to
36 chemicals, among which 6 to 9 were estrogenic in at least one bioassay (Neale et al., 2017).
The concentrations of 9 active chemicals at the 25 sampling sites are presented in Tab. SI 3. The
REP values of these xeno-estrogens (provided in Tab. SI 4) were used to calculate chemical
estrogen-equivalents (Chem-EEQ) and the ratio of Chem-EEQ to Bio-EEQ was used to determine
the contribution of the xeno-estrogens to the biological response measured.
In MELN cells, estrone was the main potent xeno-estrogen identified in JDS samples, along
with genistein (Neale et al., 2017). They explained 14% to 163% of biological response observed
in most samples, except at JDS27 and JDS60 (<1%, no estrone detected), and at JDS64 (409%, very
weak estrogenic response) (Tab. SI 1). Based on chemical information, 5 samples were predicted
to have an estrogenic activity ranging from 0.18 to 0.58 ng EEQ ng/L in MELN cells, but were not
detected due to cytotoxic masking effect. Conversely, JDS27 and JDS60 were active in MELN cells
albeit no significant contributors could be identified.
In addition to the classical mass-balance approach, the CA model was used to predict the
combined effects of individual xeno-estrogens at the mixture ratio of each sample. The predicted
estrogenic response was plotted against observed data for JDS samples (Fig. SI 1 and SI 2) and for
Novi Sad samples (Fig. 2 and Fig. SI 3). The estrogenic activity of 2 samples were in good agreement
with CA up to 20% (JDS8, 33), in line with the mass-balance analysis results (73% to 74%). CA clearly
underestimated the estrogenic response of 5 samples (JDS29, 30, 41, 44, 65), again in line with the
mass-balance analysis (<50% of response explained). However, there is more uncertainty on the
correlation between and observed response for JDS22, 32, 36, 39 likely because of the very weak
response measured.
In ZELHβ2 cells, estrone and genistein explained 11% to 136% of the observed biological
response, except for JDS29 (503%), JDS39 (306%) and JDS67 (214%) for which the biological
activity was lower than predicted by chemical data. 11 samples were predicted to be active in
ZELHβ2 cells with levels ranging from 0.22 to 0.65 EEQ ng/L, but were not detected (Tab. SI 1). The
active samples were further compared with the CA prediction curve. As in MELN cells, the maximal
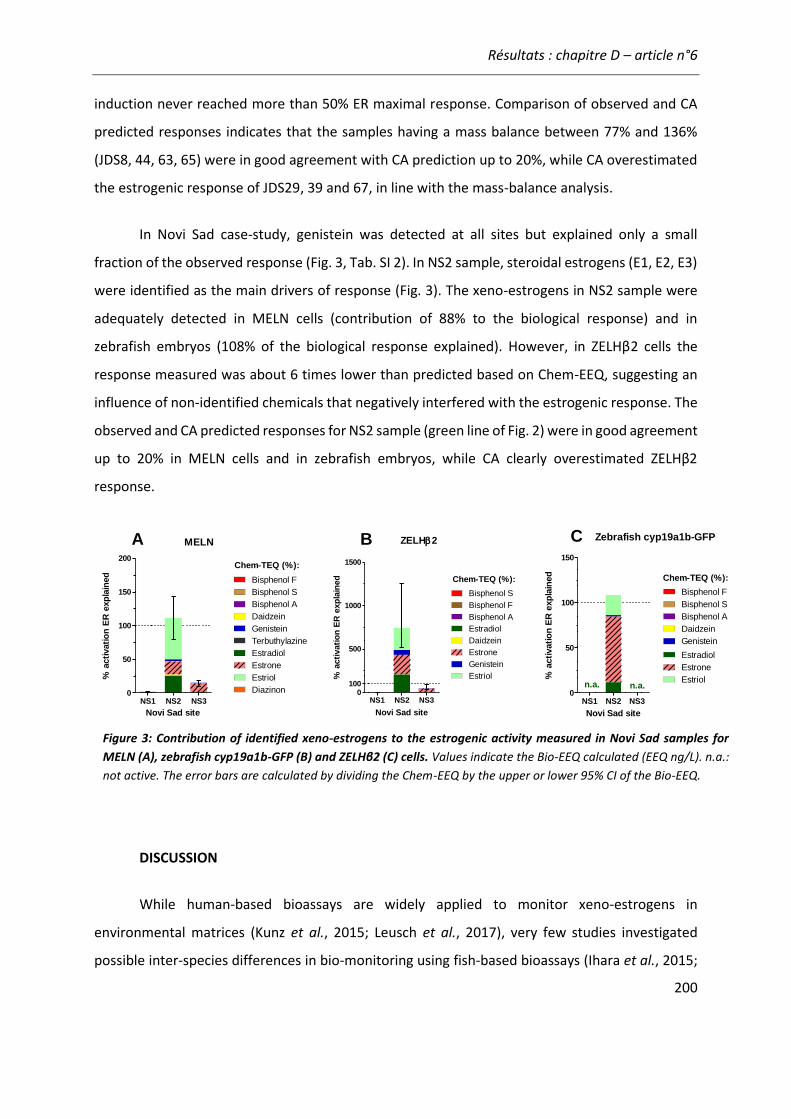
Résultats : chapitre D – article n°6
200
induction never reached more than 50% ER maximal response. Comparison of observed and CA
predicted responses indicates that the samples having a mass balance between 77% and 136%
(JDS8, 44, 63, 65) were in good agreement with CA prediction up to 20%, while CA overestimated
the estrogenic response of JDS29, 39 and 67, in line with the mass-balance analysis.
In Novi Sad case-study, genistein was detected at all sites but explained only a small
fraction of the observed response (Fig. 3, Tab. SI 2). In NS2 sample, steroidal estrogens (E1, E2, E3)
were identified as the main drivers of response (Fig. 3). The xeno-estrogens in NS2 sample were
adequately detected in MELN cells (contribution of 88% to the biological response) and in
zebrafish embryos (108% of the biological response explained). However, in ZELHβ2 cells the
response measured was about 6 times lower than predicted based on Chem-EEQ, suggesting an
influence of non-identified chemicals that negatively interfered with the estrogenic response. The
observed and CA predicted responses for NS2 sample (green line of Fig. 2) were in good agreement
up to 20% in MELN cells and in zebrafish embryos, while CA clearly overestimated ZELHβ2
response.
DISCUSSION
While human-based bioassays are widely applied to monitor xeno-estrogens in
environmental matrices (Kunz et al., 2015; Leusch et al., 2017), very few studies investigated
possible inter-species differences in bio-monitoring using fish-based bioassays (Ihara et al., 2015;
NS1 NS2 NS30
50
100
150
200
Bisphenol F
Bisphenol S
Bisphenol A
Daidzein
Genistein
Terbuthylazine
Estradiol
Estrone
Estriol
Diazinon
Chem-TEQ (%):
MELN
Novi Sad site
% a
cti
vati
on
ER
exp
lain
ed
NS1 NS2 NS30
500
1000
1500
100
Chem-TEQ (%):
Bisphenol S
Bisphenol F
Bisphenol A
Estradiol
Daidzein
Estrone
Genistein
Estriol
ZELH2
Novi Sad site
% a
cti
vati
on
ER
exp
lain
ed
NS1 NS2 NS30
50
100
150
Bisphenol F
Bisphenol S
Bisphenol A
Daidzein
Genistein
Estradiol
Estrone
Estriol
Chem-TEQ (%):
n.a. n.a.
Zebrafish cyp19a1b-GFP
Novi Sad site
% a
cti
vati
on
ER
exp
lain
ed
A B C
Figure 3: Contribution of identified xeno-estrogens to the estrogenic activity measured in Novi Sad samples for
MELN (A), zebrafish cyp19a1b-GFP (B) and ZELHβ2 (C) cells. Values indicate the Bio-EEQ calculated (EEQ ng/L). n.a.:
not active. The error bars are calculated by dividing the Chem-EEQ by the upper or lower 95% CI of the Bio-EEQ.
Résultats : chapitre D – article n°6
201
Rutishauser et al., 2004; Sonavane et al., 2016). Therefore, the aim of the study was to compare
the capacity of human and zebrafish-based in vitro bioassays to quantify estrogenic activity in river
water samples.
Taking the Danube as case-study representative a of large river with high dilution, our
results show that most water samples screened had a very low estrogenic activity (mostly below
<0,2 EEQ ng/L) and that MELN cells performed better to detect the low levels of estrogenic activity
than ZELHβ2 cells. 19 out of 25 samples were active in MELN cells against 10 out of 25 in ZELHβ2
cells. Interestingly, 10 samples were only active in MELN cells, while 2 were only detected in
ZELHβ2 cells. We previously reported different response of MELN and ZELHβ2 cells for POCIS
extracts deployed in French rivers (Sonavane et al., 2016). 8 out 20 samples were only estrogenic
in ZELHβ2 cells, which suggested the presence of xeno-estrogens specifically active in the
zebrafish-based bioassay. In the current study, information on active chemicals were available.
Estrone and/or genistein were the most frequently detected xeno-estrogens and the main
contributors to the response measured, in agreement with previous studies investigating surface
water estrogenic activity using in vitro bioassays (Alvarez et al., 2013; Conley et al., 2017). In JDS
samples, since estrone and/or genistein were detected in most of the samples that were
selectively active in MELN or ZELHβ2 cells, it is likely that other non-identified compounds present
in the extracts interfered with ER response within the cells.
We recently compared MELN and ZELHβ2 cells response to bisphenol A and genistein in
mixture with 10 non-estrogenic environmentally relevant chemicals (Serra et al., in prep). Among
the 10 non-estrogenic chemicals, some pollutants specifically inhibited the E2-induced luciferase
activity in ZELHβ2 cells but not in MELN cells (e.g. triphenyl phosphate, propiconazole). As a result,
these inhibiting chemicals decreased the expected ZELHβ2 response when mixed with the xeno-
estrogens, showing interactions of chemicals having opposite effects on the bioassay response
(Serra et al., in prep). Interestingly, differences between fish ER and human ERα estrogenic activity
have been previously observed for effluent samples (Ihara et al., 2014), and the anti-estrogenic
activity, more pronounced either in the fish or human assay, was suggested to contribute to the
differences observed (Ihara et al., 2015). In the current study, 1/3 (3/8) of the active JDS samples
on ZELHβ2 cells had a decreased estrogenic response compared to CA prediction curve (mass-

Résultats : chapitre D – article n°6
202
balance > 200%), whenever an activity was detected, suggesting a possible negative interaction
on ER response.
Despite distinct capacities to detect low levels of estrogenic activity, both cell lines
quantified a high estrogenic activity at JDS41 and NS2 sites. JDS41 site is located at the confluence
of the Danube and the Velika Morava, in Serbia, and was identified as a highly contaminated site
in the JDS survey (Liška et al., 2015; Neale et al., 2015). The estrogenic activity measured in MELN
cells (0.74 EEQ ng/L) and in ZELHβ2 cells (2.3 EEQ ng/L) was higher than predicted based on the
identified xeno-estrogens (Chem-EEQ < 0.3 EEQ ng/L), showing the complementarity of both
chemical and biological approaches to assess contamination by xeno-estrogens at that site. NS2
site was situated 200m downstream the untreated effluent release of Novi Sad city (300 000
inhabitants, König et al., 2017). Compared with NS1 and NS3, a higher estrogenic activity was
quantified for NS2 site in MELN cells (1.52 EEQ ng/L) and in ZELHβ2 cells (0.19 EEQ ng/L), in
agreement with previous reported results in in vitro bioassays hERα-based GenBLAzer (0.26 EEQ
ng/L) and BG1Luc4E(2) (0.67 EEQ ng/L) (König et al., 2017). E2, E1, and E3 were identified as the
main driver of response. While MELN cells quantified well the steroid estrogens additive effects,
however, the estrogenic activity measured in ZELHβ2 cells was much lower than predicted (mass-
balance > 700%). In this sample, the anti-estrogenic activity was assessed and revealed a low
inhibition of E2-induced response occurring at high REF. Thus, the deviation of predicted response
does not seem to be the consequence of co-occurrence of estrogenic and anti-estrogenic activity.
To further investigate the zebrafish-based bioassay response, transgenic cyp19a1b-GFP
zebrafish embryos were used to assess the in vivo effect of NS samples (Brion et al., 2012). This
transgenic zebrafish model has been previously successfully used to quantify estrogenic activity of
surface waters (Sonavane et al., 2016) and effluents samples (Neale et al., 2017b). In this
transgenic fish, GFP is under the control of cyp19a1b promoter which is an ER-regulated gene that
encodes for the brain aromatase responsible for the conversion of steroidal androgens into
estrogens (Pellegrini et al., 2005). The use of the zebrafish in vivo bioassay confirmed the
estrogenic activity of NS2 sample, which was in good agreement with the expected response
based on CA. Thus, the different performance of ZELHβ2 cells compared to MELN cells for NS2
sample might be a bioassay-specific pattern. ZELHβ2 cells originate from zebrafish liver (ZFL) cells
and remain metabolically inducible with similar response profile as zebrafish primary hepatocytes,

Résultats : chapitre D – article n°6
203
but with different response profile compared to MELN cells (Creusot et al., 2015; Le Fol et al.,
2015). It is likely that bioassay-specific factors, such as metabolic capacity and sensitivity to co-
occurring chemicals in the samples may have contributed to the different response observed in
ZELHβ2 and MELN cells.
By comparing human and zebrafish-based in vitro bioassays, we observed that both cell
lines performed qualitatively differently to quantify estrogenic activity in samples issues from a
large river with high dilution with both detected well the highest contaminated sites. This
observation confirmed previous results obtained on the same models assessing passive sampling
water extracts (Sonavane et al., 2016), and with other fish cell lines applied to effluents (Ihara et
al., 2014; Rutishauser et al., 2004). The different performances of in vitro bioassays could not be
explained by the xeno-estrogens identified, suggesting that other factors such as bioassay-specific
interactions and/or presence of unidentified active substances influenced the ER response to the
complex mixtures. Further research would be warranted to better characterized the underlying
reasons for fish-specific bioassay response.
Résultats : chapitre D – article n°6
204
REFERENCES
Altenburger, R., Ait-Aissa, S., Antczak, P., Backhaus, T., Barceló, D., Seiler, T.-B., Brion, F., Busch, W., Chipman, K., López de Alda, M., Umbuzeiro, G. de A., Escher, B.I., Falciani, F., Faust, M., Focks, A., Hilscherova, K., Hollender, J., Hollert, H., Jäger, F., Jahnke, A., Kortenkamp, A., Krauss, M., Lemkine, G.F., Munthe, J., Neumann, S., Schymanski, E.L., Scrimshaw, M., Segner, H., Slobodnik, J., Smedes, F., Kughathas, S., Teodorovic, I., Tindall, A.J., Tollefsen, K.E., Walz, K.-H., Williams, T.D., Van den Brink, P.J., van Gils, J., Vrana, B., Zhang, X., Brack, W., 2015. Future water quality monitoring--adapting tools to deal with mixtures of pollutants in water resource management. Sci. Total Environ. 512–513, 540–551. doi:10.1016/j.scitotenv.2014.12.057
Alvarez, D.A., Shappell, N.W., Billey, L.O., Bermudez, D.S., Wilson, V.S., Kolpin, D.W., Perkins, S.D., Evans, N., Foreman, W.T., Gray, J.L., Shipitalo, M.J., Meyer, M.T., 2013. Bioassay of estrogenicity and chemical analyses of estrogens in streams across the United States associated with livestock operations. Water Res. 47, 3347–3363. doi:10.1016/j.watres.2013.03.028
Balaguer, P., Francois, F., Comunale, F., Fenet, H., Boussioux, A.M., Pons, M., Nicolas, J.C., Casellas, C., 1999. Reporter cell lines to study the estrogenic effects of xenoestrogens. Sci. Total Environ. 233, 47–56. doi:10.1016/S0048-9697(99)00178-3
Brion, F., Le Page, Y., Piccini, B., Cardoso, O., Tong, S.-K., Chung, B., Kah, O., 2012. Screening Estrogenic Activities of Chemicals or Mixtures In vivo Using Transgenic (cyp19a1b-GFP) Zebrafish Embryos. Plos One 7, e36069. doi:10.1371/journal.pone.0036069
Conley, J.M., Evans, N., Cardon, M.C., Rosenblum, L., Iwanowicz, L.R., Hartig, P.C., Schenck, K.M., Bradley, P.M., Wilson, V.S., 2017. Occurrence and In vitro Bioactivity of Estrogen, Androgen, and Glucocorticoid Compounds in a Nationwide Screen of United States Stream Waters. Environ. Sci. Technol. 51, 4781–4791. doi:10.1021/acs.est.6b06515
Cosnefroy, A., Brion, F., Guillet, B., Laville, N., Porcher, J.M., Balaguer, P., Aït-Aïssa, S., 2009. A stable fish reporter cell line to study estrogen receptor transactivation by environmental (xeno)estrogens. Toxicol. Vitro Int. J. Publ. Assoc. BIBRA 23, 1450–1454. doi:10.1016/j.tiv.2009.07.003
Cosnefroy, A., Brion, F., Maillot-Maréchal, E., Porcher, J.-M., Pakdel, F., Balaguer, P., Aït-Aïssa, S., 2012. Selective activation of zebrafish estrogen receptor subtypes by chemicals by using stable reporter gene assay developed in a zebrafish liver cell line. Toxicol. Sci. Off. J. Soc. Toxicol. 125, 439–449. doi:10.1093/toxsci/kfr297
Creusot, N., Brion, F., Piccini, B., Budzinski, H., Porcher, J.M., Aït-Aïssa, S., 2015. BFCOD activity in fish cell lines and zebrafish embryos and its modulation by chemical ligands of human aryl hydrocarbon and nuclear receptors. Environ. Sci. Pollut. Res. Int. 22, 16393–16404. doi:10.1007/s11356-014-3882-8
Escher, B.I., Allinson, M., Altenburger, R., Bain, P.A., Balaguer, P., Busch, W., Crago, J., Denslow, N.D., Dopp, E., Hilscherova, K., Humpage, A.R., Kumar, A., Grimaldi, M., Jayasinghe, B.S., Jarosova, B., Jia, A., Makarov, S., Maruya, K.A., Medvedev, A., Mehinto, A.C., Mendez, J.E., Poulsen, A., Prochazka, E., Richard, J., Schifferli, A., Schlenk, D., Scholz, S., Shiraish, F., Snyder, S., Su, G., Tang, J.Y.M., van der Burg, B., van der Linden, S.C., Werner, I., Westerheide, S.D., Wong, C.K.C., Yang, M., Yeung, B.H.Y., Zhang, X., Leusch, F.D.L., 2014.
Résultats : chapitre D – article n°6
205
Benchmarking Organic Micropollutants in Wastewater, Recycled Water and Drinking Water with In vitro Bioassays. Environ. Sci. Technol. 48, 1940–1956. doi:10.1021/es403899t
Ihara, M., Ihara, M.O., Kumar, V., Narumiya, M., Hanamoto, S., Nakada, N., Yamashita, N., Miyagawa, S., Iguchi, T., Tanaka, H., 2014. Co-occurrence of Estrogenic and Antiestrogenic Activities in Wastewater: Quantitative Evaluation of Balance by in vitro ERα Reporter Gene Assay and Chemical Analysis. Environ. Sci. Technol. 48, 6366–6373. doi:10.1021/es5014938
Ihara, M., Kitamura, T., Kumar, V., Park, C.-B., Ihara, M.O., Lee, S.-J., Yamashita, N., Miyagawa, S., Iguchi, T., Okamoto, S., Suzuki, Y., Tanaka, H., 2015. Evaluation of Estrogenic Activity of Wastewater: Comparison Among In vitro ERα Reporter Gene Assay, In vivo Vitellogenin Induction, and Chemical Analysis. Environ. Sci. Technol. 49, 6319–6326. doi:10.1021/acs.est.5b01027
Jarošová, B., Erseková, A., Hilscherová, K., Loos, R., Gawlik, B.M., Giesy, J.P., Bláha, L., 2014. Europe-wide survey of estrogenicity in wastewater treatment plant effluents: the need for the effect-based monitoring. Environ. Sci. Pollut. Res. 21, 10970–10982. doi:10.1007/s11356-014-3056-8
Kiyama, R., Wada-Kiyama, Y., 2015. Estrogenic endocrine disruptors: Molecular mechanisms of action. Environ. Int. 83, 11–40. doi:10.1016/j.envint.2015.05.012
König, M., Escher, B.I., Neale, P.A., Krauss, M., Hilscherová, K., Novák, J., Teodorović, I., Schulze, T., Seidensticker, S., Kamal Hashmi, M.A., Ahlheim, J., Brack, W., 2017. Impact of untreated wastewater on a major European river evaluated with a combination of in vitro bioassays and chemical analysis. Environ. Pollut. Barking Essex 1987 220, 1220–1230. doi:10.1016/j.envpol.2016.11.011
Kunz, P.Y., Kienle, C., Carere, M., Homazava, N., Kase, R., 2015. In vitro bioassays to screen for endocrine active pharmaceuticals in surface and waste waters. J. Pharm. Biomed. Anal. 106, 107–115. doi:10.1016/j.jpba.2014.11.018
Le Fol, V., Aït-Aïssa, S., Cabaton, N., Dolo, L., Grimaldi, M., Balaguer, P., Perdu, E., Debrauwer, L., Brion, F., Zalko, D., 2015. Cell-specific biotransformation of benzophenone-2 and bisphenol-s in zebrafish and human in vitro models used for toxicity and estrogenicity screening. Environ. Sci. Technol. 49, 3860–3868. doi:10.1021/es505302c
Leusch, F.D.L., Neale, P.A., Hebert, A., Scheurer, M., Schriks, M.C.M., 2017. Analysis of the sensitivity of in vitro bioassays for androgenic, progestagenic, glucocorticoid, thyroid and estrogenic activity: Suitability for drinking and environmental waters. Environ. Int. 99, 120–130. doi:10.1016/j.envint.2016.12.014
Liška, I., Wagner, F., Sengl, M., Deutsch, K., Slobodník, J., 2015. Joint Danube Survey 3. A Comprehensive Analysis of Danube Water Quality. International Commission for the Protection of the Danube River (ICPDR).
Matthews, J., Celius, T., Halgren, R., Zacharewski, T., 2000. Differential estrogen receptor binding of estrogenic substances: a species comparison. J. Steroid Biochem. Mol. Biol. 74, 223–234. doi:10.1016/S0960-0760(00)00126-6
Résultats : chapitre D – article n°6
206
Molina-Molina, J.-M., Escande, A., Pillon, A., Gomez, E., Pakdel, F., Cavaillès, V., Olea, N., Aït-Aïssa, S., Balaguer, P., 2008. Profiling of benzophenone derivatives using fish and human estrogen receptor-specific in vitro bioassays. Toxicol. Appl. Pharmacol. 232, 384–395. doi:10.1016/j.taap.2008.07.017
Neale, P.A., Ait-Aissa, S., Brack, W., Creusot, N., Denison, M.S., Deutschmann, B., Hilscherova, K., Hollert, H., Krauss, M., Novak, J., Schulze, T., Seiler, T.-B., Serra, H., Shao, Y., Escher, B.I., 2015. Linking in vitro Effects and Detected Organic Micropollutants in Surface Water Using Mixture-Toxicity Modeling. Environ. Sci. Technol. 49, 14614–14624. doi:10.1021/acs.est.5b04083
Neale, P.A., Munz, N.A., Aїt-Aїssa, S., Altenburger, R., Brion, F., Busch, W., Escher, B.I., Hilscherová, K., Kienle, C., Novák, J., Seiler, T.-B., Shao, Y., Stamm, C., Hollender, J., 2017. Integrating chemical analysis and bioanalysis to evaluate the contribution of wastewater effluent on the micropollutant burden in small streams. Sci. Total Environ. 576, 785–795. doi:10.1016/j.scitotenv.2016.10.141
Pellegrini, E., Menuet, A., Lethimonier, C., Adrio, F., Gueguen, M.-M., Tascon, C., Anglade, I., Pakdel, F., Kah, O., 2005. Relationships between aromatase and estrogen receptors in the brain of teleost fish. Gen. Comp. Endocrinol., 5th International Symposium on Fish Endocrynology 142, 60–66. doi:10.1016/j.ygcen.2004.12.003
Pinto, C., Grimaldi, M., Boulahtouf, A., Pakdel, F., Brion, F., Aït-Aïssa, S., Cavaillès, V., Bourguet, W., Gustafsson, J.-A., Bondesson, M., Balaguer, P., 2014. Selectivity of natural, synthetic and environmental estrogens for zebrafish estrogen receptors. Toxicol. Appl. Pharmacol. 280, 60–69. doi:10.1016/j.taap.2014.07.020
Routledge, E.J., White, R., Parker, M.G., Sumpter, J.P., 2000. Differential Effects of Xenoestrogens on Coactivator Recruitment by Estrogen Receptor (ER) α and ERβ. J. Biol. Chem. 275, 35986–35993. doi:10.1074/jbc.M006777200
Rutishauser, B.V., Pesonen, M., Escher, B.I., Ackermann, G.E., Aerni, H.-R., Suter, M.J.-F., Eggen, R.I.L., 2004. Comparative analysis of estrogenic activity in sewage treatment plant effluents involving three in vitro assays and chemical analysis of steroids. Environ. Toxicol. Chem. 23, 857–864. doi:10.1897/03-286
Schulze, T., Ahel, M., Ahlheim, J., Aït-Aïssa, S., Brion, F., Di Paolo, C., Froment, J., Hidasi, A.O., Hollender, J., Hollert, H., Hu, M., Kloß, A., Koprivica, S., Krauss, M., Muz, M., Oswald, P., Pêtre, M., Schollée, J.E., Seiler, T.-B., Shao, Y., Slobodnik, J., Sonavane, M., Suter, M.J.-F., Tollefsen, K.E., Tousova, Z., Walz, K.-H., Brack, W., 2017. Assessment of a novel device for onsite integrative large-volume solid phase extraction of water samples to enable a comprehensive chemical and effect-based analysis. Sci. Total Environ. 581, 350–358. doi:10.1016/j.scitotenv.2016.12.140
Segner, H., Casanova-Nakayama, A., Kase, R., Tyler, C.R., 2013. Impact of environmental estrogens on fish considering the diversity of estrogen signaling. Gen. Comp. Endocrinol. 191, 190–201. doi:10.1016/j.ygcen.2013.05.015
Sonavane, M., Creusot, N., Maillot-Maréchal, E., Péry, A., Brion, F., Aїt-Aïssa, S., 2016. Zebrafish-based reporter gene assays reveal different estrogenic activities in river waters compared to a conventional human-derived assay. Sci. Total Environ. 550, 934–939. doi:10.1016/j.scitotenv.2016.01.187

Résultats : chapitre D – article n°6
207
Sumpter, J.P., 2005. Endocrine disrupters in the aquatic environment: An overview. Acta Hydrochim. Hydrobiol. 33, 9–16. doi:10.1002/aheh.200400555
Sumpter, J.P., Jobling, S., 2013. The occurrence, causes, and consequences of estrogens in the aquatic environment. Environ. Toxicol. Chem. 32, 249–251. doi:10.1002/etc.2084
Tohyama, S., Miyagawa, S., Lange, A., Ogino, Y., Mizutani, T., Ihara, M., Tanaka, H., Tatarazako, N., Kobayashi, T., Tyler, C.R., Iguchi, T., 2016. Evolution of estrogen receptors in ray-finned fish and their comparative responses to estrogenic substances. J. Steroid Biochem. Mol. Biol. 158, 189–197. doi:10.1016/j.jsbmb.2015.12.009
Tong, S.-K., Mouriec, K., Kuo, M.-W., Pellegrini, E., Gueguen, M.-M., Brion, F., Kah, O., Chung, B., 2009. A cyp19a1b-GFP (Aromatase B) Transgenic Zebrafish Line That Expresses GFP in Radial Glial Cells. Genesis 47, 67–73. doi:10.1002/dvg.20459
Vethaak, A.D., Lahr, J., Schrap, S.M., Belfroid, A.C., Rijs, G.B.J., Gerritsen, A., de Boer, J., Bulder, A.S., Grinwis, G.C.M., Kuiper, R.V., Legler, J., Murk, T.A.J., Peijnenburg, W., Verhaar, H.J.M., de Voogt, P., 2005. An integrated assessment of estrogenic contamination and biological effects in the aquatic environment of The Netherlands. Chemosphere 59, 511–524. doi:10.1016/j.chemosphere.2004.12.053
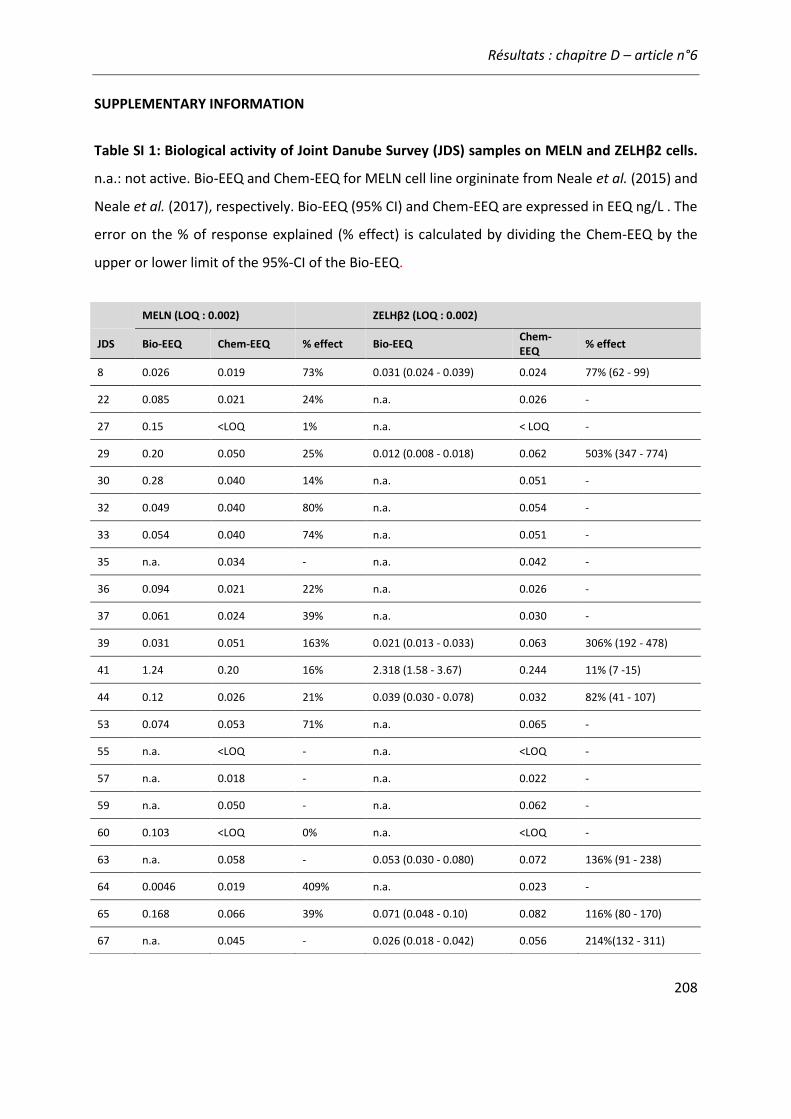
Résultats : chapitre D – article n°6
208
SUPPLEMENTARY INFORMATION
Table SI 1: Biological activity of Joint Danube Survey (JDS) samples on MELN and ZELHβ2 cells.
n.a.: not active. Bio-EEQ and Chem-EEQ for MELN cell line orgininate from Neale et al. (2015) and
Neale et al. (2017), respectively. Bio-EEQ (95% CI) and Chem-EEQ are expressed in EEQ ng/L . The
error on the % of response explained (% effect) is calculated by dividing the Chem-EEQ by the
upper or lower limit of the 95%-CI of the Bio-EEQ.
MELN (LOQ : 0.002) ZELHβ2 (LOQ : 0.002)
JDS Bio-EEQ Chem-EEQ % effect Bio-EEQ Chem-EEQ
% effect
8 0.026 0.019 73% 0.031 (0.024 - 0.039) 0.024 77% (62 - 99)
22 0.085 0.021 24% n.a. 0.026 -
27 0.15 <LOQ 1% n.a. < LOQ -
29 0.20 0.050 25% 0.012 (0.008 - 0.018) 0.062 503% (347 - 774)
30 0.28 0.040 14% n.a. 0.051 -
32 0.049 0.040 80% n.a. 0.054 -
33 0.054 0.040 74% n.a. 0.051 -
35 n.a. 0.034 - n.a. 0.042 -
36 0.094 0.021 22% n.a. 0.026 -
37 0.061 0.024 39% n.a. 0.030 -
39 0.031 0.051 163% 0.021 (0.013 - 0.033) 0.063 306% (192 - 478)
41 1.24 0.20 16% 2.318 (1.58 - 3.67) 0.244 11% (7 -15)
44 0.12 0.026 21% 0.039 (0.030 - 0.078) 0.032 82% (41 - 107)
53 0.074 0.053 71% n.a. 0.065 -
55 n.a. <LOQ - n.a. <LOQ -
57 n.a. 0.018 - n.a. 0.022 -
59 n.a. 0.050 - n.a. 0.062 -
60 0.103 <LOQ 0% n.a. <LOQ -
63 n.a. 0.058 - 0.053 (0.030 - 0.080) 0.072 136% (91 - 238)
64 0.0046 0.019 409% n.a. 0.023 -
65 0.168 0.066 39% 0.071 (0.048 - 0.10) 0.082 116% (80 - 170)
67 n.a. 0.045 - 0.026 (0.018 - 0.042) 0.056 214%(132 - 311)
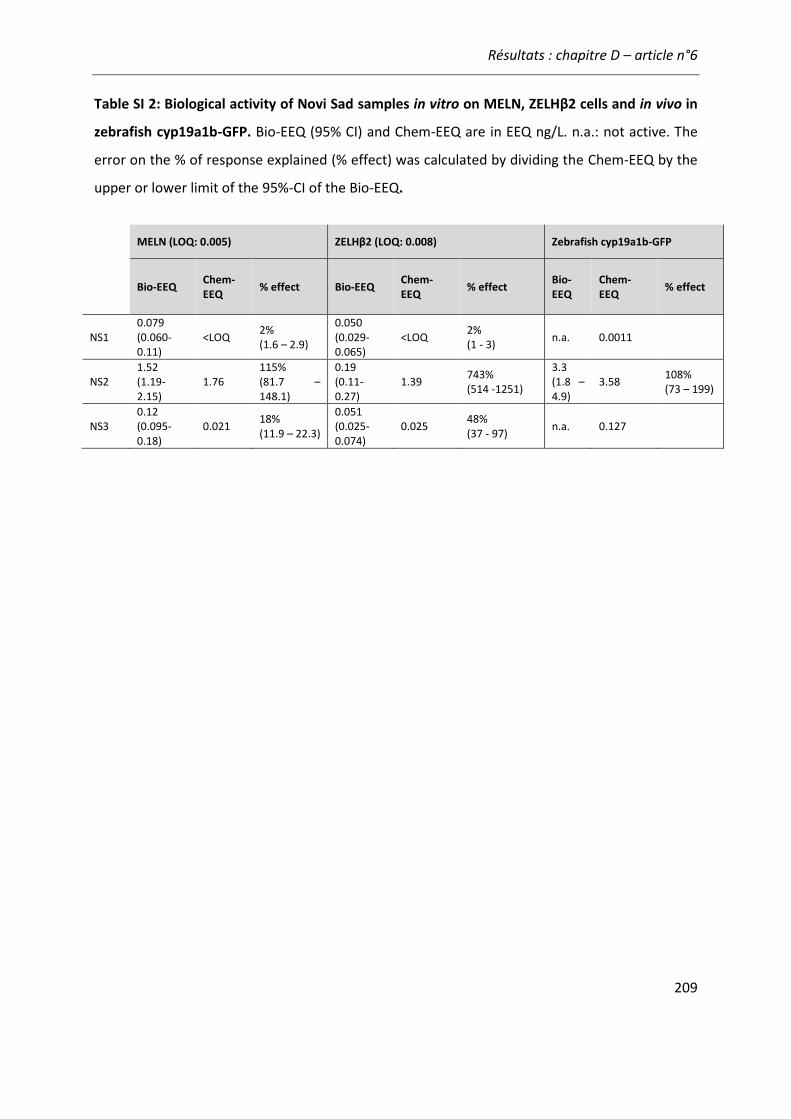
Résultats : chapitre D – article n°6
209
Table SI 2: Biological activity of Novi Sad samples in vitro on MELN, ZELHβ2 cells and in vivo in
zebrafish cyp19a1b-GFP. Bio-EEQ (95% CI) and Chem-EEQ are in EEQ ng/L. n.a.: not active. The
error on the % of response explained (% effect) was calculated by dividing the Chem-EEQ by the
upper or lower limit of the 95%-CI of the Bio-EEQ.
MELN (LOQ: 0.005) ZELHβ2 (LOQ: 0.008) Zebrafish cyp19a1b-GFP
Bio-EEQ Chem-EEQ
% effect Bio-EEQ Chem-EEQ
% effect Bio-EEQ
Chem-EEQ
% effect
NS1 0.079 (0.060-0.11)
<LOQ 2% (1.6 – 2.9)
0.050 (0.029- 0.065)
<LOQ 2% (1 - 3)
n.a. 0.0011
NS2 1.52 (1.19-2.15)
1.76 115% (81.7 – 148.1)
0.19 (0.11-0.27)
1.39 743% (514 -1251)
3.3 (1.8 – 4.9)
3.58 108% (73 – 199)
NS3 0.12 (0.095-0.18)
0.021 18% (11.9 – 22.3)
0.051 (0.025-0.074)
0.025 48% (37 - 97)
n.a. 0.127
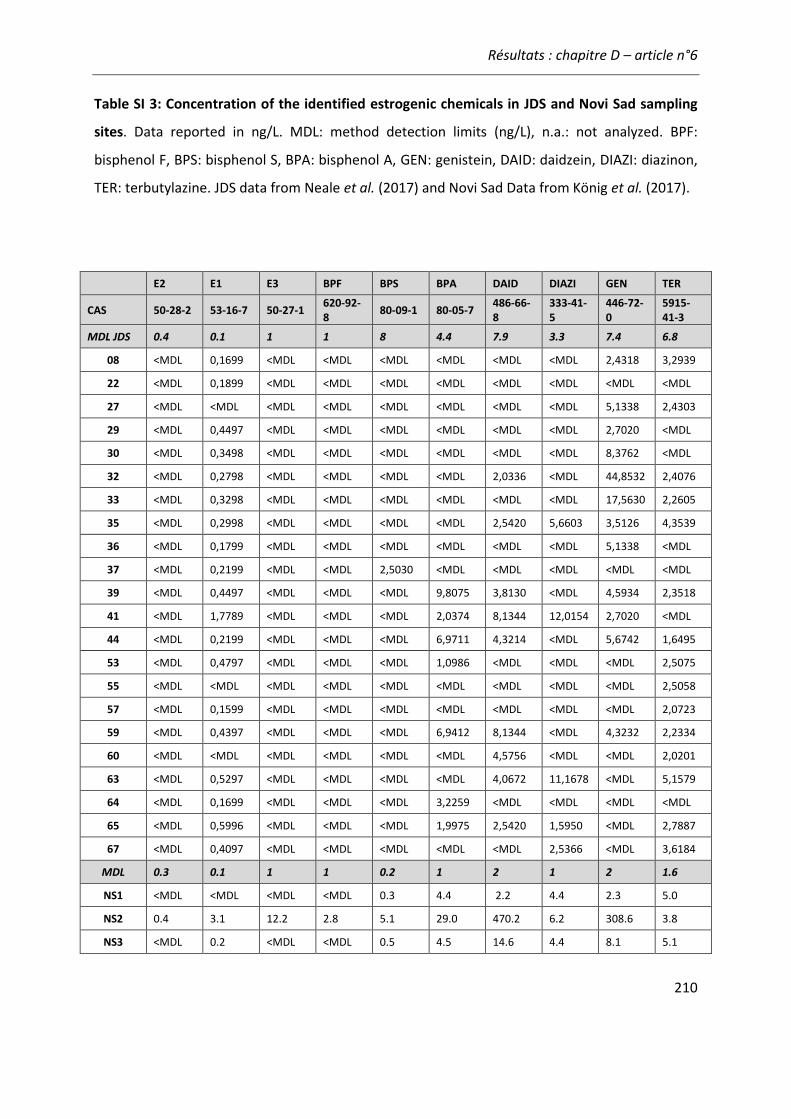
Résultats : chapitre D – article n°6
210
Table SI 3: Concentration of the identified estrogenic chemicals in JDS and Novi Sad sampling
sites. Data reported in ng/L. MDL: method detection limits (ng/L), n.a.: not analyzed. BPF:
bisphenol F, BPS: bisphenol S, BPA: bisphenol A, GEN: genistein, DAID: daidzein, DIAZI: diazinon,
TER: terbutylazine. JDS data from Neale et al. (2017) and Novi Sad Data from König et al. (2017).
E2 E1 E3 BPF BPS BPA DAID DIAZI GEN TER
CAS 50-28-2 53-16-7 50-27-1 620-92-8
80-09-1 80-05-7 486-66-8
333-41-5
446-72-0
5915-41-3
MDL JDS 0.4 0.1 1 1 8 4.4 7.9 3.3 7.4 6.8
08 <MDL 0,1699 <MDL <MDL <MDL <MDL <MDL <MDL 2,4318 3,2939
22 <MDL 0,1899 <MDL <MDL <MDL <MDL <MDL <MDL <MDL <MDL
27 <MDL <MDL <MDL <MDL <MDL <MDL <MDL <MDL 5,1338 2,4303
29 <MDL 0,4497 <MDL <MDL <MDL <MDL <MDL <MDL 2,7020 <MDL
30 <MDL 0,3498 <MDL <MDL <MDL <MDL <MDL <MDL 8,3762 <MDL
32 <MDL 0,2798 <MDL <MDL <MDL <MDL 2,0336 <MDL 44,8532 2,4076
33 <MDL 0,3298 <MDL <MDL <MDL <MDL <MDL <MDL 17,5630 2,2605
35 <MDL 0,2998 <MDL <MDL <MDL <MDL 2,5420 5,6603 3,5126 4,3539
36 <MDL 0,1799 <MDL <MDL <MDL <MDL <MDL <MDL 5,1338 <MDL
37 <MDL 0,2199 <MDL <MDL 2,5030 <MDL <MDL <MDL <MDL <MDL
39 <MDL 0,4497 <MDL <MDL <MDL 9,8075 3,8130 <MDL 4,5934 2,3518
41 <MDL 1,7789 <MDL <MDL <MDL 2,0374 8,1344 12,0154 2,7020 <MDL
44 <MDL 0,2199 <MDL <MDL <MDL 6,9711 4,3214 <MDL 5,6742 1,6495
53 <MDL 0,4797 <MDL <MDL <MDL 1,0986 <MDL <MDL <MDL 2,5075
55 <MDL <MDL <MDL <MDL <MDL <MDL <MDL <MDL <MDL 2,5058
57 <MDL 0,1599 <MDL <MDL <MDL <MDL <MDL <MDL <MDL 2,0723
59 <MDL 0,4397 <MDL <MDL <MDL 6,9412 8,1344 <MDL 4,3232 2,2334
60 <MDL <MDL <MDL <MDL <MDL <MDL 4,5756 <MDL <MDL 2,0201
63 <MDL 0,5297 <MDL <MDL <MDL <MDL 4,0672 11,1678 <MDL 5,1579
64 <MDL 0,1699 <MDL <MDL <MDL 3,2259 <MDL <MDL <MDL <MDL
65 <MDL 0,5996 <MDL <MDL <MDL 1,9975 2,5420 1,5950 <MDL 2,7887
67 <MDL 0,4097 <MDL <MDL <MDL <MDL <MDL 2,5366 <MDL 3,6184
MDL 0.3 0.1 1 1 0.2 1 2 1 2 1.6
NS1 <MDL <MDL <MDL <MDL 0.3 4.4 2.2 4.4 2.3 5.0
NS2 0.4 3.1 12.2 2.8 5.1 29.0 470.2 6.2 308.6 3.8
NS3 <MDL 0.2 <MDL <MDL 0.5 4.5 14.6 4.4 8.1 5.1
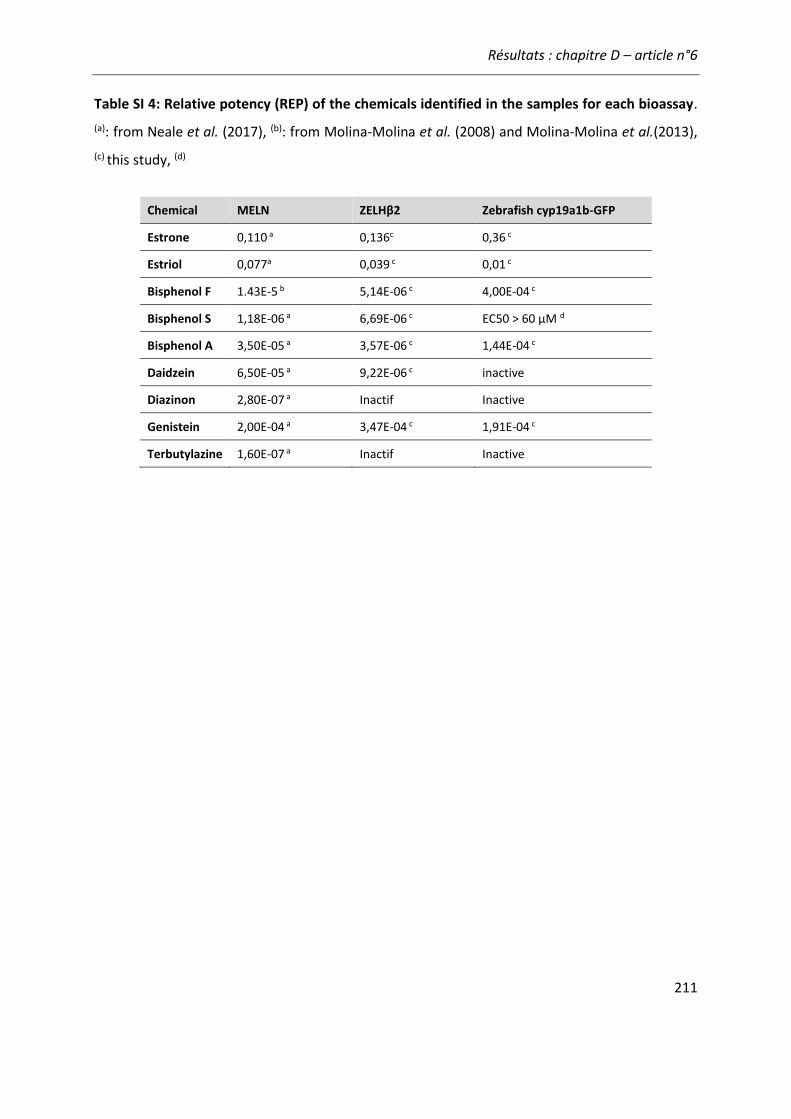
Résultats : chapitre D – article n°6
211
Table SI 4: Relative potency (REP) of the chemicals identified in the samples for each bioassay.
(a): from Neale et al. (2017), (b): from Molina-Molina et al. (2008) and Molina-Molina et al.(2013),
(c) this study, (d)
Chemical MELN ZELHβ2 Zebrafish cyp19a1b-GFP
Estrone 0,110 a 0,136c 0,36 c
Estriol 0,077a 0,039 c 0,01 c
Bisphenol F 1.43E-5 b 5,14E-06 c 4,00E-04 c
Bisphenol S 1,18E-06 a 6,69E-06 c EC50 > 60 µM d
Bisphenol A 3,50E-05 a 3,57E-06 c 1,44E-04 c
Daidzein 6,50E-05 a 9,22E-06 c inactive
Diazinon 2,80E-07 a Inactif Inactive
Genistein 2,00E-04 a 3,47E-04 c 1,91E-04 c
Terbutylazine 1,60E-07 a Inactif Inactive
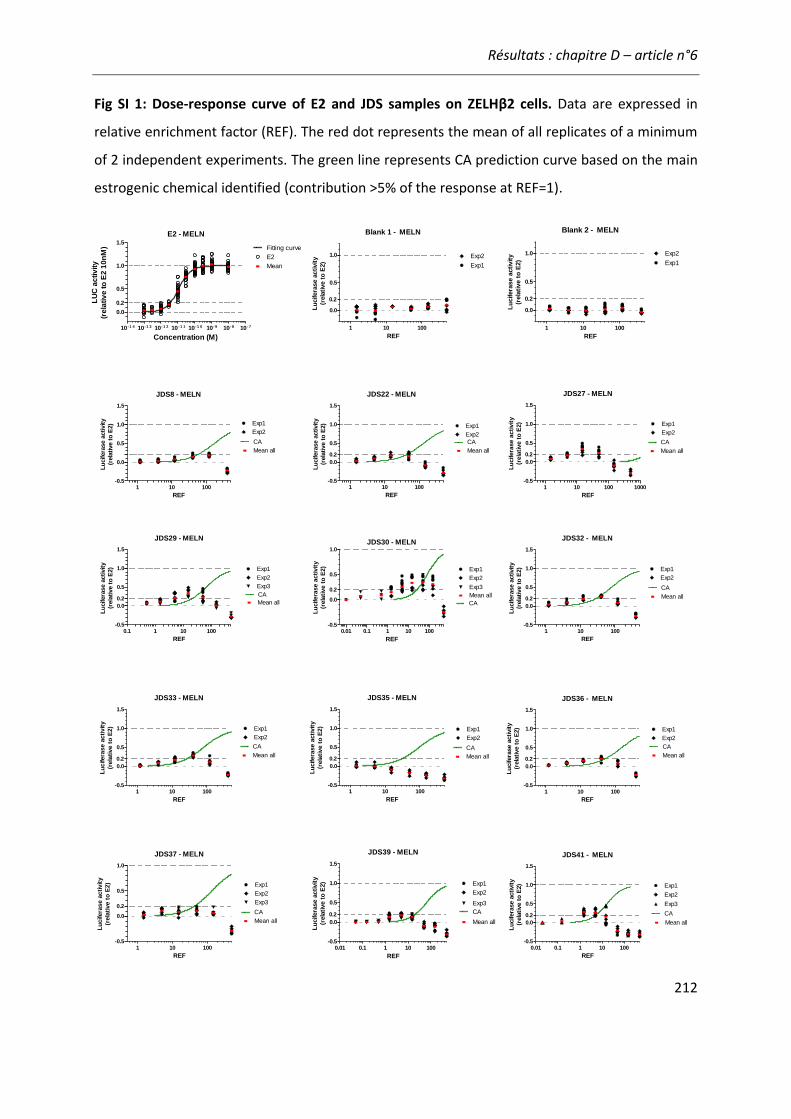
Résultats : chapitre D – article n°6
212
Fig SI 1: Dose-response curve of E2 and JDS samples on ZELHβ2 cells. Data are expressed in
relative enrichment factor (REF). The red dot represents the mean of all replicates of a minimum
of 2 independent experiments. The green line represents CA prediction curve based on the main
estrogenic chemical identified (contribution >5% of the response at REF=1).
E2 - MELN
10 - 1 4 10 - 1 3 10 - 1 2 10 - 1 1 10 - 1 0 10 - 9 10 - 8 10 - 7
0.0
0.5
1.0
1.5
0.2
E2
Mean
Fitting curve
Concentration (M)
LU
C a
ctiv
ity
(re
lativ
e to
E2
10
nM
)
Blank 1 - MELN
1 10 100
0.0
0.5
1.0
Exp1
Exp2
0.2
REF
Lu
cifera
se a
cti
vit
y
(rela
tive t
o E
2)
Blank 2 - MELN
1 10 100
0.0
0.5
1.0
Exp1
Exp2
0.2
REF
Lu
cifera
se a
cti
vit
y
(rela
tive t
o E
2)
JDS8 - MELN
1 10 100-0.5
0.0
0.5
1.0
1.5
Exp1
Exp2
CA
Mean all
REF
Lu
cifera
se a
cti
vit
y
(rela
tive t
o E
2)
JDS22 - MELN
1 10 100-0.5
0.0
0.5
1.0
1.5
Exp1
Exp2
CA
0.2Mean all
REF
Lu
cifera
se a
cti
vit
y
(rela
tive t
o E
2)
JDS27 - MELN
1 10 100 1000-0.5
0.0
0.5
1.0
1.5
Exp1
Exp2
CA
0.2Mean all
REF
Lu
cifera
se a
cti
vit
y
(rela
tive t
o E
2)
JDS29 - MELN
0.1 1 10 100-0.5
0.0
0.5
1.0
1.5
Exp2
Exp3
Mean all
Exp1
CA0.2
REF
Lu
cifera
se a
cti
vit
y
(rela
tive t
o E
2)
JDS30 - MELN
0.01 0.1 1 10 100-0.5
0.0
0.5
1.0
Exp1
Exp2
Mean all
Exp3
CA
0.2
REF
Lu
cifera
se a
cti
vit
y
(rela
tive t
o E
2)
JDS32 - MELN
1 10 100-0.5
0.0
0.5
1.0
1.5
Exp1
Exp2
CA
0.2 Mean all
REF
Lu
cifera
se a
cti
vit
y
(rela
tive t
o E
2)
JDS33 - MELN
1 10 100-0.5
0.0
0.5
1.0
1.5
Exp1
Exp2
CA
0.2Mean all
REF
Lu
cifera
se a
cti
vit
y
(rela
tive t
o E
2)
JDS35 - MELN
1 10 100-0.5
0.0
0.5
1.0
1.5
Exp1
Exp2
CA
0.2 Mean all
REF
Lu
cifera
se a
cti
vit
y
(rela
tive t
o E
2)
JDS36 - MELN
1 10 100-0.5
0.0
0.5
1.0
1.5
Exp1
Exp2
CA
0.2Mean all
REF
Lu
cifera
se a
cti
vit
y
(rela
tive t
o E
2)
JDS37 - MELN
1 10 100-0.5
0.0
0.5
1.0
Exp1
Exp2
Exp3
CA0.2
Mean all
REF
Lu
cifera
se a
cti
vit
y
(rela
tive t
o E
2)
JDS39 - MELN
0.01 0.1 1 10 100-0.5
0.0
0.5
1.0
1.5
Exp1
Exp2
Mean all
Exp3
CA0.2
REF
Lu
cifera
se a
cti
vit
y
(rela
tive t
o E
2)
JDS41 - MELN
0.01 0.1 1 10 100-0.5
0.0
0.5
1.0
1.5
Exp1
Exp2
Mean all
Exp3
CA0.2
REF
Lu
cifera
se a
cti
vit
y
(rela
tive t
o E
2)
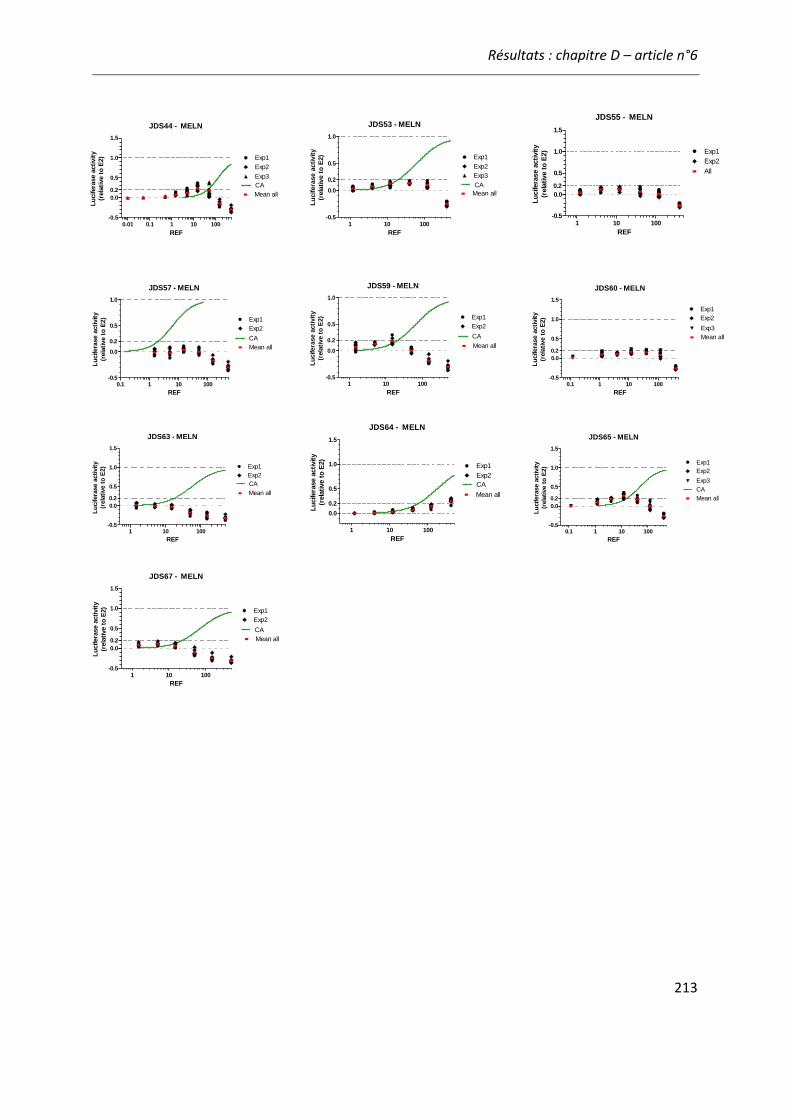
Résultats : chapitre D – article n°6
213
JDS44 - MELN
0.01 0.1 1 10 100-0.5
0.0
0.5
1.0
1.5
Exp1
Exp2
Mean all
Exp3
CA0.2
REF
Lu
cifera
se a
cti
vit
y
(rela
tive t
o E
2)
JDS53 - MELN
1 10 100-0.5
0.0
0.5
1.0
Exp1
Exp2
Mean all
Exp3
CA0.2
REF
Lu
cifera
se a
cti
vit
y
(rela
tive t
o E
2)
JDS55 - MELN
1 10 100-0.5
0.0
0.5
1.0
1.5
Exp1
Exp2
0.2
All
REF
Lu
cifera
se a
cti
vit
y
(rela
tive t
o E
2)
JDS57 - MELN
0.1 1 10 100-0.5
0.0
0.5
1.0
Exp1
Exp2
CA0.2
Mean all
REF
Lu
cifera
se a
cti
vit
y
(rela
tive t
o E
2)
JDS59 - MELN
1 10 100-0.5
0.0
0.5
1.0
Exp1
Exp2
Mean all
CA0.2
REF
Lu
cifera
se a
cti
vit
y
(rela
tive t
o E
2)
JDS60 - MELN
0.1 1 10 100-0.5
0.0
0.5
1.0
1.5
Exp1
Exp2
0.2
Exp3
Mean all
REF
Lu
cifera
se a
cti
vit
y
(rela
tive t
o E
2)
JDS63 - MELN
1 10 100-0.5
0.0
0.5
1.0
1.5
Exp1
Exp2
Mean all
CA
0.2
REF
Lu
cifera
se a
cti
vit
y
(rela
tive t
o E
2)
JDS64 - MELN
1 10 100
0.0
0.5
1.0
1.5
Exp1
Exp2
Mean all
CA
0.2
REF
Lu
cifera
se a
cti
vit
y
(rela
tive t
o E
2)
JDS65 - MELN
0.1 1 10 100-0.5
0.0
0.5
1.0
1.5
Exp1
Exp2
Mean all
Exp3
CA
0.2
REFL
ucifera
se a
cti
vit
y
(rela
tive t
o E
2)
JDS67 - MELN
1 10 100-0.5
0.0
0.5
1.0
1.5
Exp1
Exp2
CA
0.2 Mean all
REF
Lu
cifera
se a
cti
vit
y
(rela
tive t
o E
2)

Résultats : chapitre D – article n°6
214
Fig SI 2: Dose-response curve of E2 and JDS samples on ZELHβ2 cells. Data are expressed in
relative enrichment factor (REF). The red dot represents the mean of all replicates of a minimum
of 2 independent experiments. The green line represents CA prediction curve based on the
estrogenic chemical identified. (contribution >5% of the response at REF=1)
ZELH2 - E2
10 - 1 4 10 - 1 3 10 - 1 2 10 - 1 1 10 - 1 0 10 - 9 10 - 8 10 - 7
0.0
0.5
1.0
1.5
0.2
Fitting curve
E2
Mean all
Concentration (M)
LU
C a
cti
vit
y
(re
lati
ve
to
E2
10
nM
)
JDS8 - ZELH2
1 10 100 1000-0.5
0.0
0.5
1.0
Exp1
Exp2
CA
Mean all
0.2
REF
Lu
cifera
se a
cti
vit
y
(rela
tive t
o E
2)
JDS22 - ZELH2
1 10 100 1000-0.5
0.0
0.5
1.0
Exp1
Exp2
CA0.2
Exp3
Mean all
REF
Lu
cifera
se a
cti
vit
y
(rela
tive t
o E
2)
JDS27 - ZELH2
1 10 100 1000-0.5
0.0
0.5
1.0
Exp1
Exp2
CA
0.2
Mean all
REFL
ucifera
se a
cti
vit
y
(rela
tive t
o E
2)
JDS29 - ZELH2
1 10 100 1000-0.5
0.0
0.5
1.0
Exp2
Exp3
Mean all
Exp1
CA0.2
REF
Lu
cifera
se a
cti
vit
y
(rela
tive t
o E
2)
JDS30 - ZELH2
1 10 100 1000-0.5
0.0
0.5
1.0
Exp1
Exp2
Mean allCA
0.2
REF
Lu
cifera
se a
cti
vit
y
(rela
tive t
o E
2)
JDS32 - ZELH2
1 10 100 1000-0.5
0.0
0.5
1.0
Exp1
Exp2
CA0.2
Exp3
Mean all
REF
Lu
cifera
se a
cti
vit
y
(rela
tive t
o E
2)
JDS33 - ZELH2
1 10 100 1000-0.5
0.0
0.5
1.0
Exp1
Exp2
CA0.2
Exp3
Mean all
REF
Lu
cifera
se a
cti
vit
y
(rela
tive t
o E
2)
JDS35 - ZELH2
1 10 100 1000-0.5
0.0
0.5
1.0
0.2
5/02/16
12/02/16
CA
Mean all
REF
Lu
cifera
se a
cti
vit
y
(rela
tive t
o E
2)
JDS36 - ZELH2
1 10 100 1000-0.5
0.0
0.5
1.0
0.2
Exp1
Exp2
Mean allCA
REF
Lu
cifera
se a
cti
vit
y
(rela
tive t
o E
2)
JDS37 - ZELH2
1 10 100 1000-0.5
0.0
0.5
1.0
Exp1
Exp2
CA
0.2
Mean all
REF
Lu
cifera
se a
cti
vit
y
(rela
tive t
o E
2)
JDS39 - ZELH2
1 10 100 1000-0.5
0.0
0.5
1.0
Exp1
Exp2
Mean allCA
0.2
REF
Lu
cifera
se a
cti
vit
y
(rela
tive t
o E
2)
JDS41 - ZELH2
0.1 1 10 100 1000-0.5
0.0
0.5
1.0
Exp1
Exp2
Mean all
CA0.2
REF
Lu
cifera
se a
cti
vit
y
(rela
tive t
o E
2)
Blank 1 - ZELH2
1 10 100 1000-0.5
0.0
0.5
1.0
0.2
Exp1
Exp2
REF
Lu
cifera
se a
cti
vit
y
(rela
tive t
o E
2)
Blank 2 - ZELH2
1 10 100 1000-0.5
0.0
0.5
1.0
0.2
Exp1
Exp2
REF
Lu
cifera
se a
cti
vit
y
(rela
tive t
o E
2)
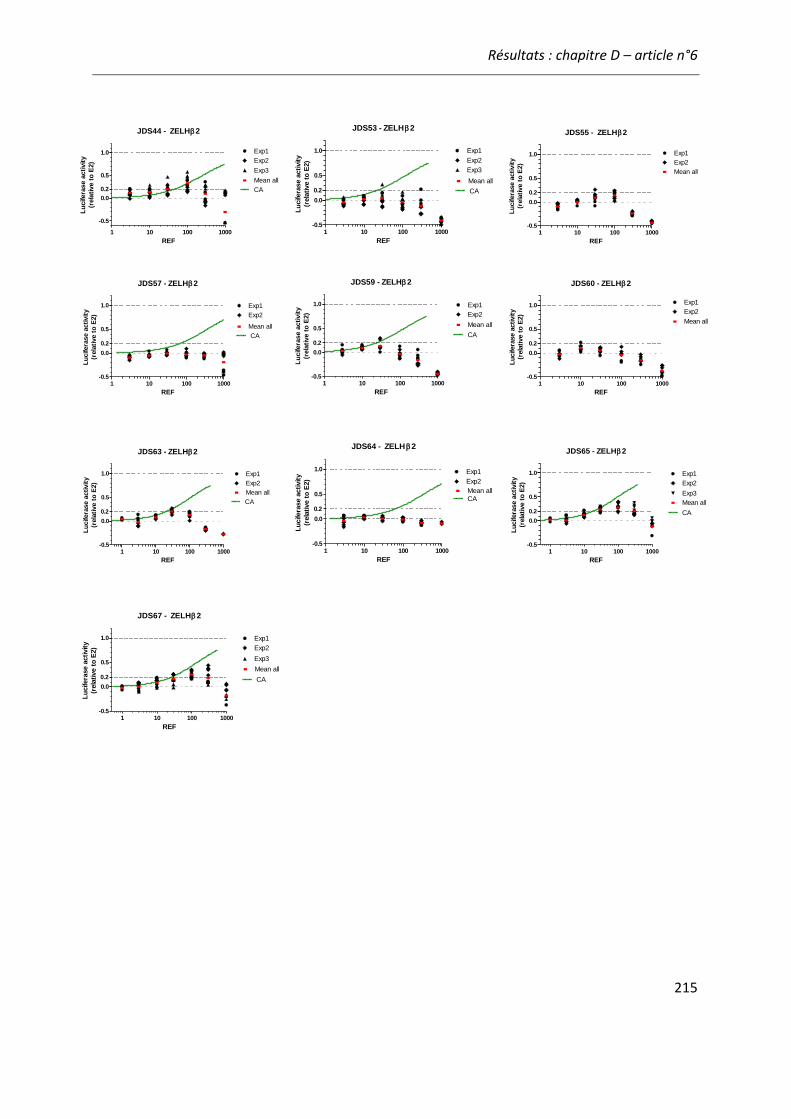
Résultats : chapitre D – article n°6
215
JDS44 - ZELH2
1 10 100 1000
-0.5
0.0
0.5
1.0
Exp1
Exp2
Mean all
Exp3
CA0.2
REF
Lu
cifera
se a
cti
vit
y
(rela
tive t
o E
2)
JDS53 - ZELH2
1 10 100 1000-0.5
0.0
0.5
1.0
Exp1
Exp2
Mean all
Exp3
CA0.2
REF
Lu
cifera
se a
cti
vit
y
(rela
tive t
o E
2)
JDS55 - ZELH2
1 10 100 1000-0.5
0.0
0.5
1.0
0.2
Exp1
Exp2
Mean all
REF
Lu
cifera
se a
cti
vit
y
(rela
tive t
o E
2)
JDS57 - ZELH2
1 10 100 1000-0.5
0.0
0.5
1.0
Exp1
Exp2
CA0.2
Mean all
REF
Lu
cifera
se a
cti
vit
y
(rela
tive t
o E
2)
JDS59 - ZELH2
1 10 100 1000-0.5
0.0
0.5
1.0
Exp1
Exp2
Mean all
CA0.2
REF
Lu
cifera
se a
cti
vit
y
(rela
tive t
o E
2)
JDS60 - ZELH2
1 10 100 1000-0.5
0.0
0.5
1.0
0.2
Exp1
Exp2
Mean all
REF
Lu
cifera
se a
cti
vit
y
(rela
tive t
o E
2)
JDS63 - ZELH2
1 10 100 1000-0.5
0.0
0.5
1.0
0.2
Exp1
Exp2
Mean allCA
REF
Lu
cifera
se a
cti
vit
y
(rela
tive t
o E
2)
JDS64 - ZELH 2
1 10 100 1000-0.5
0.0
0.5
1.0
Exp1
Exp2
Mean allCA
0.2
REF
Lu
cifera
se a
cti
vit
y
(rela
tive t
o E
2)
JDS65 - ZELH2
1 10 100 1000-0.5
0.0
0.5
1.0
Exp1
Exp2
Mean all
Exp3
CA0.2
REF
Lu
cifera
se a
cti
vit
y
(rela
tive t
o E
2)
JDS67 - ZELH2
1 10 100 1000-0.5
0.0
0.5
1.0
Exp1
Exp2
CA0.2
Exp3
Mean all
REF
Lu
cifera
se a
cti
vit
y
(rela
tive t
o E
2)
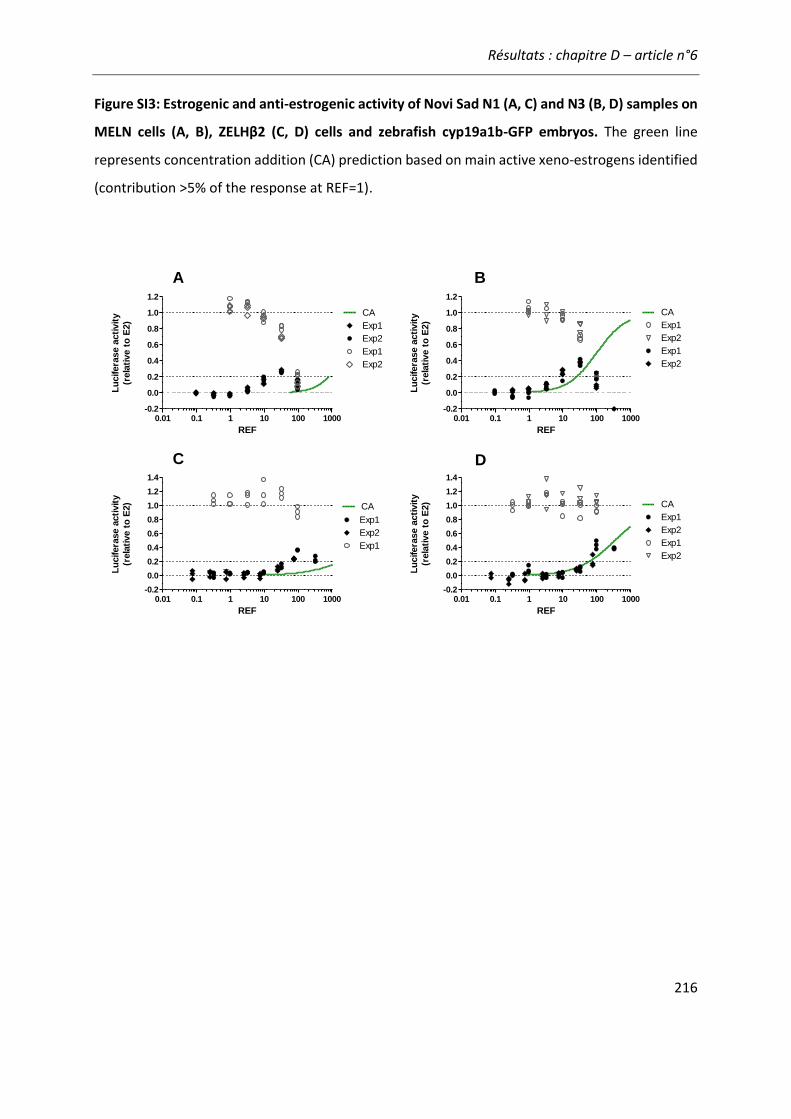
Résultats : chapitre D – article n°6
216
Figure SI3: Estrogenic and anti-estrogenic activity of Novi Sad N1 (A, C) and N3 (B, D) samples on
MELN cells (A, B), ZELHβ2 (C, D) cells and zebrafish cyp19a1b-GFP embryos. The green line
represents concentration addition (CA) prediction based on main active xeno-estrogens identified
(contribution >5% of the response at REF=1).
0.01 0.1 1 10 100 1000-0.2
0.0
0.2
0.4
0.6
0.8
1.0
1.2
CA
Exp1
Exp2
Exp1
Exp2
REF
Lu
cifera
se a
cti
vit
y
(rela
tive t
o E
2)
0.01 0.1 1 10 100 1000-0.2
0.0
0.2
0.4
0.6
0.8
1.0
1.2
CA
Exp1
Exp2
Exp1
Exp2
REF
Lu
cifera
se a
cti
vit
y
(rela
tive t
o E
2)
0.01 0.1 1 10 100 1000-0.2
0.0
0.2
0.4
0.6
0.8
1.0
1.2
1.4
Exp1
Exp2
Exp1
CA
REF
Lu
cifera
se a
cti
vit
y
(rela
tive t
o E
2)
0.01 0.1 1 10 100 1000-0.2
0.0
0.2
0.4
0.6
0.8
1.0
1.2
1.4
CA
Exp1
Exp2
Exp1
Exp2
REF
Lu
cifera
se a
cti
vit
y
(rela
tive t
o E
2)
A B
C D

DISCUSSION GÉNÉRALE
Discussion générale
218
Au cours des dernières années, les bio-essais basés sur l’activation de ER se sont avérés
être des outils pertinents pour pallier certaines limites de l’analyse chimique ciblée et apporter
une meilleure compréhension de la contamination environnementale par les molécules
oestrogéniques. La majorité des bio-essais aujourd’hui utilisés dans le bio-monitoring sont des
tests de transactivation in vitro basés sur des cellules de mammifères exprimant le récepteur des
oestrogènes humain ERα. Cependant, des différences de sensibilité entre bio-essais basés sur le
ER de l’Homme et des poissons ont été observées pour des xeno-estrogènes seuls (Cosnefroy et
al., 2012; Pinto et al., 2014), mais aussi pour des échantillons environnementaux (Ihara et al.,
2015, Sonavane et al., 2016), montrant le besoin d’améliorer notre comprehension du diagnotic
environnemental fourni par ces outils.
Le travail de thèse s’inscrit dans la continuité des travaux de l’INERIS portant sur
l’évaluation les bio-essais in vitro et in vivo basés sur le poisson zèbre pour quantifier les composés
estrogéniques dans l’environnement aquatique. Dans le cadre de la thèse, nous avons évalué les
différences inter-modèles avec une attention particulière pour les polluants présents dans les
eaux de surface pour lesquels il existait un manque d’information dans les bio-essais. Afin de
mieux représenter une situation environnementale, ces polluants ont été testés seuls mais aussi
en mélange avec des molécules estrogéniques modèles dans le but d’évaluer leur capacité à
moduler la réponse de ER. Ces informations ont ensuite été confrontées aux données des
échantillons environnementaux afin de discuter leur apport dans un contexte de bio-surveillance.
EVALUATION DES DIFFERENCES INTER-MODELES : BIO-ESSAIS HUMAIN VS POISSON ZEBRE
Au départ de ce travail de thèse, les bio-essais poisson zèbre avaient été bien caractérisés
pour les xéno-estrogènes connus mais relativement peu pour d’autres familles de composés
(Brion et al., 2012, Cosnefroy et al., 2012). Sur la base d’un travail de priorisation de polluants
environnementaux mené dans le cadre du projet SOLUTIONS (Busch et al., 2016), nous avons
évalué l’activité de 34 polluants couvrant diverses familles chimiques (articles n°2 et 3).
Une majorité des 34 molécules testées ne présentait aucune activité oestrogénique, quel
que soit le bio-essai utilisé. Cependant, dans ce travail, nous observons aussi des différences inter-
modèles cellulaires notables en ce qui concerne l’activité ER et anti-ER de certaines molécules
seules. Par exemple, le BaP, le TPP et le 4-n-NP étaient sélectivement oestrogéniques dans les
Discussion générale
219
MELN mais anti-estrogéniques dans les ZELHα et ZELHβ2. Si les différences de sensibilité inter-
espèces constituent un facteur important (Hotchkiss et al 2008), d’autres facteurs plus spécifiques
du contexte cellulaire ont également certainement influencé le devenir des molécules testées et
in fine leurs activités biologiques. Le BaP, et dans une moindre mesure le TPP étant des activateurs
de AhR (Neale et al., 2015), nous avons testé l’hypothèse de l’implication d’une interférence entre
voies ER et AhR dans nos modèles.
L’interaction entre AhR et ER a été évaluée dans les bio-essais in vitro et in vivo avec la
dioxine et l’E2 comme ligands modèles (article n°4). Les résultats obtenus ont permis de confirmer
que la dioxine entrainait, d’une part, des effets anti-estrogéniques dans les bio-essais poissons
zèbre, et d’autre part, pro-oestrogéniques dans les cellules MELN. L’induction de la luciférase par
la dioxine dans les MELN avait déjà décrite précédemment (Balaguer et al., 1999, These Escande
2007). Dans les ZELH-zfERs, les effets anti-estrogéniques de la dioxine étaient particulièrement
marqués dans les ZELHα. De manière intéressante, ce cross-talk négatif a été également retrouvé
in vivo dans le modèle embryonnaire cyp19a1b-GFP, montrant la bonne cohérence des modèles
poisson-zèbre entre eux.
La présence d’une voie AhR inductible dans les cellules ZELH-zfER démontre que la réponse
de ER peut être modulée négativement par la présence de ligands de AhR. De manière indirecte,
ces résultats pourraient expliquer l’observation d’une activité anti-estrogénique de certaines
molécules comme le BaP ou le TPP dans les modèles ZELH-zfERs. Il pourrait être interessant de
suivre leur activité AhR au sein des cellules MELN et ZELH-zfERs pour appuyer cette hypothèse.
D’autre part, la voie AhR peut aussi conduire à la production de dérivés hydroxylés du BaP et du
TPP, dont certains sont décrit comme interagissant avec ER (Hayakawa et al., 2007; Kojima et al.,
2016). Evaluer l’activité des dérivés hydroxylés du TPP apporterait des informations intéressantes
sur le rôle du métabolisme de phase I dans l’activité de ces molécules dans les différents systèmes
cellulaires.
Le métabolisme des xénobiotiques peut jouer un rôle important dans le devenir des xeno-
estrogènes au niveau intra-cellulaire et moduler ainsi leur disponibilité pour lier et activer ER. Des
travaux récents portant sur le bisphenol S et la benzophenone 2 ont ainsi montré des capacités de
biotransformation différentes entre les cellules ZELH-zfER et MELN, les cellules de poisson zèbre
Discussion générale
220
ayant conservées des capacités métaboliques qualitativement proches de celles de cellules
hépatiques primaires de poisson zèbre (Le Fol et al., 2015) et de larves de poisson zèbre (Le Fol et
al., 2017b). Si ces résultats vont dans le sens de nos conclusions en termes de proximité des bio-
essais poisson zèbre, une meilleure caractérisation du devenir des xeno-estrogènes au sein des
modèles cellulaire permettrait d’approfondir nos connaissances, en particulier pour les molécules
anti-estrogéniques.
Dans une démarche de criblage, l’utilisation du modèle cellulaire ZELH exprimant la
luciferase mais pas de récepteur ER fonctionnel s’est avérée être utile pour identifier les molécules
capables d’induire une réponse non spécifique du récepteur des estrogènes. C’est le cas du BbF
et du propiconazole qui inhibent l’activité de la luciférase dans les ZELHα, ZELHβ2 et dans les
cellules ZELH (article n°5). D’autre part, nous avons observé que le cyprodinil inhibait l’activité de
la luciférase dans les modèles MELN, ZELHα, ZELHβ2 et ZELH indépendamment de l’addition d’E2,
et sans affecter la viabilité cellulaire. La luciférase de luciole (« firefly lucicerase ») utilisée dans
tous les bio-essais in vitro de ce travail est une enzyme ATP-dépendante dont l’activité peut être
sélectivement inhibée par certaines molécules (ex : le resveratrol, Auld and Inglese, 2004;
Bakhtiarova et al., 2006). Dans des approches de criblage haut débit, 1% à 5% des molécules serait
des inhibiteurs de la luciférase de luciole, indiquant que ce mécanisme d’interférence bien
caractérisé n’est si pas rare (ex : 3% parmi 70 000 molécules testées, Auld et al., 2008). Tenir
compte d’un effet non-spécifique sur le système rapporteur est essentiel pour éviter une
interprétation erronée de l’activité d’une molécule, particulièrement dans le cas de test
d’antagonisme. Dans notre étude, il serait pertinent d’évaluer l’activité anti-estrogénique des
molécules identifiées comme inhibiteur de la luciferase dans le modèle embryonnaire cyp19a1b-
GFP pour conclure sur la validité toxicologique des résultats observés in vitro.
EVALUATION DES DIFFERENCES INTER-MODELES A DES MELANGES ENVIRONNEMENTAUX
Dans l’environnement aquatique les xéno-estrogènes sont présents au milieu d’une
multitude de composés ayant divers modes d’action et effets potentiels. Afin de simuler une
contamination environnementale, deux mélanges de 12 molécules ont été définis pour
déterminer la capacité des bio-essais à quantifier l’activité combinée de xeno-estrogènes au sein
des mélanges incluant des molécules non-estrogéniques (article n°5). Si l’additivité entre

Discussion générale
221
molécules oestrogéniques a pu être confirmée dans tous les modèles cellulaires (et pour la
première fois dans le cas des cellules ZELH-zfER), des différences sont observées dans le cas de
mélanges reconstitués. Dans les MELN, l’activité estrogénique des xeno-estrogènes était bien
détectée au sein des mélanges, tandis que dans les cellules ZELH-zfERs, elle était masquée par une
forte activité anti-estrogénique due à la présence de composés comme le TPP et le propiconazole.
Dans cette approche théorique d’un mélange complexe, les résultats obtenus indiquent que les
différences de réponse entre les cellules MELN et ZELHβ2 peuvent s’expliquer par l’activité des
molécules ayant un profil de réponse bio-essai spécifique. Cette hypothèse avait été suggérée
pour expliquer la sélectivité de l’activité estrogénique sur les modèles poisson zèbre pour certains
extraits de POCIS (Sonavane et al., 2016) ou d’échantillons d’eau de rivières (Projet EDA-EMERGE,
Thèse M. Sonavane, 2015).
Dans ce travail de thèse, nous avons testé 25 extraits d’échantillons d’eau du Danube. Ces
échantillons représentent un contexte environnemental unique par la quantité de pays traversés
(de l’Autriche à la Roumanie), par la variabilité de la pollution (ponctuelle et diffuse, urbaine,
industrielle et agricole), et par la forte capacité de dilution du fleuve. La figure 21Figure 21 résume
l’activité des échantillons d’eau de surface du projet EDA-EMERGE (15 échantillons, rivières
moyennes, thèse de M. Sovanave 2015) et de ce travail de thèse (25 échantillons, contexte fluvial)
arbitrairement classée en 5 catégories : inactifs, très faiblement actifs (<0,1 ng/L E2-Eq), peu actifs
(0,1 à 0,3 ng/L E2-Eq), actifs (0,3 à 1 ng/L E2-Eq) et très actifs (> 1 ng/L E2-Eq). Les échantillons des
deux campagnes ont été prélevés et extraits avec la même technique de LVSPE, avec 50 L
échantillonnés dans la campagne EDA-EMERGE, 300 L à 500 L pour la JDS3 et 850 L à 1000L pour
Novi Sad. La figure 21 montre que la majorité des échantillons actifs d’EDA-EMERGE a une activité
estrogénique supérieure à 0,1 ng/L d’E2-Eq, alors que l’activité des échantillons du Danube (JDS3
et Novi Sad) est principalement inférieure à 0,3 voire 0,1 ng/L E2-Eq, ce qui reflète la faible
estrogénicité du Danube dans son ensemble. La plus forte prévalence d’échantillons actifs dans
les cellules ZELHβ2 (i.e. > 0.3 ng/L E2-Eq) pour les échantillons d’EDA-EMERGE n’est pas retrouvée
dans les échantillons de JDS3 et de Novi Sad, mais les sites les plus contaminés sont relativement
bien identifiés par les deux bio-essais.
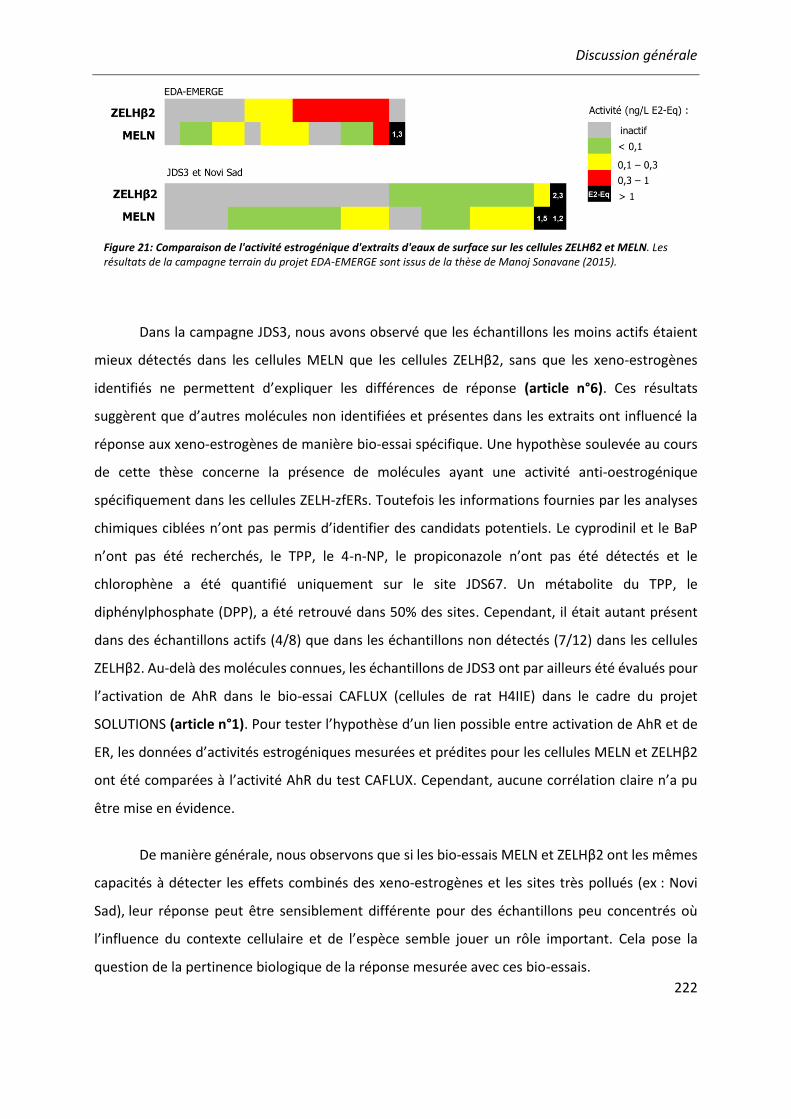
Discussion générale
222
Dans la campagne JDS3, nous avons observé que les échantillons les moins actifs étaient
mieux détectés dans les cellules MELN que les cellules ZELHβ2, sans que les xeno-estrogènes
identifiés ne permettent d’expliquer les différences de réponse (article n°6). Ces résultats
suggèrent que d’autres molécules non identifiées et présentes dans les extraits ont influencé la
réponse aux xeno-estrogènes de manière bio-essai spécifique. Une hypothèse soulevée au cours
de cette thèse concerne la présence de molécules ayant une activité anti-oestrogénique
spécifiquement dans les cellules ZELH-zfERs. Toutefois les informations fournies par les analyses
chimiques ciblées n’ont pas permis d’identifier des candidats potentiels. Le cyprodinil et le BaP
n’ont pas été recherchés, le TPP, le 4-n-NP, le propiconazole n’ont pas été détectés et le
chlorophène a été quantifié uniquement sur le site JDS67. Un métabolite du TPP, le
diphénylphosphate (DPP), a été retrouvé dans 50% des sites. Cependant, il était autant présent
dans des échantillons actifs (4/8) que dans les échantillons non détectés (7/12) dans les cellules
ZELHβ2. Au-delà des molécules connues, les échantillons de JDS3 ont par ailleurs été évalués pour
l’activation de AhR dans le bio-essai CAFLUX (cellules de rat H4IIE) dans le cadre du projet
SOLUTIONS (article n°1). Pour tester l’hypothèse d’un lien possible entre activation de AhR et de
ER, les données d’activités estrogéniques mesurées et prédites pour les cellules MELN et ZELHβ2
ont été comparées à l’activité AhR du test CAFLUX. Cependant, aucune corrélation claire n’a pu
être mise en évidence.
De manière générale, nous observons que si les bio-essais MELN et ZELHβ2 ont les mêmes
capacités à détecter les effets combinés des xeno-estrogènes et les sites très pollués (ex : Novi
Sad), leur réponse peut être sensiblement différente pour des échantillons peu concentrés où
l’influence du contexte cellulaire et de l’espèce semble jouer un rôle important. Cela pose la
question de la pertinence biologique de la réponse mesurée avec ces bio-essais.
Figure 21: Comparaison de l'activité estrogénique d'extraits d'eaux de surface sur les cellules ZELHβ2 et MELN. Les résultats de la campagne terrain du projet EDA-EMERGE sont issus de la thèse de Manoj Sonavane (2015).
Discussion générale
223
PERTINENCE ECOTOXICOLOGIQUE DES BIO-ESSAIS BASES SUR LE POISON ZEBRE
Les bio-essais basés sur le poisson zèbre utilisés dans ce travail de thèse permettent
d’évaluer l’activité des molécules oestrogéniques dans un contexte physiologique propre au
poisson zèbre : des cellules de foie (ZFL) et le contexte neuro-glial chez l’embryon (test ESAZY). Le
foie, principal organe de détoxification, est impliqué chez les femelles dans la production de
choriogénine et vitellogénine sous le contrôle des estrogènes. La régulation de la production de
vtg par ER est d’ailleurs utilisée comme biomarqueur d’exposition des poissons mâles à des
composés estrogéniques. D’autre part, l’aromatase B est une enzyme clée de la stéroïdogénèse
qui permet la production d’estradiol sous le contrôle des ER. Son expression tissulaire spécifique
dans les cellules gliales radiales, progéniteurs des neurones, montre l’importance de cette enzyme
dans la neurogénèse et les processus neuro-endocrines. L’induction de l’aromatase B au stade
embryo-larvaire où elle est peu exprimée en fait donc un marqueur interessant de la perturbation
estrogénique.
Bien que provenant de contextes tissulaires distincts, les informations obtenues dans le
cadre de la thèse montrent une bonne correspondance de la réponse estrogénique des bio-essais
in vitro ZELH-zfERs et in vivo cyp19a1b-GFP. Ils ont détecté les mêmes molécules actives (et
inactives) dans le criblage de polluants (article n°2 et 3), et la dioxine a induit un cross-talk négatif
dans tous les bio-essais poisson zèbre. Dans le cas des échantillons environnementaux, l’activité
estrogénique a été confirmée pour l’échantillon le plus actif de Novi Sad (article n°6), confirmant
la tendance observée dans les travaux précédents où le test in vivo détectait plus spécifiquement
les échantillons les plus actifs (Thèse M. Sonavane, 2015). La capacité des bio-essais poisson zèbre
à détecter et quantifier des molécules oestrogéniques spécifiquement actives chez le poisson a
également été suggérée, en particulier pour un site situé en aval d’un rejet industriel impacté par
des progestatifs de synthèse (Creusot et al., 2014), où une activité significative était détectée sur
les modèles ZELHβ2 et cyp19a1b-GFP mais pas sur le modèle humain MELN (Sonavane et al.,
2016).
A la différence des bio-essais in vitro, le modèle in vivo présente l’avantage de pouvoir
prendre en compte les processus d’absorption, distribution, métabolisme et élimination, et de
rendre compte d’autres voies de toxicité à l’échelle de l’organisme. Par exemple, nous avons
Discussion générale
224
observé que le triclosan a modifié les capacités de nage des larves (article n°3), ce qui concorde
avec la toxicité musculaire connue de la molécule capable d’interagir avec les récepteurs de la
ryanodine impliqué dans la contraction musculaire (Cherednichenko et al., 2012; Fritsch et al.,
2013). De plus, lorsque les larves ont été exposées aux mélanges reconstitués de 12 molécules,
une forte mortalité a été observée, indiquant qu’au dela des xeno-estrogènes, les mélanges
étaient avant tout extrêment toxiques chez les embryons de poisson (Altenburger et al., in prep,
annexe I). Dans une démarche intégrée d’évaluation du danger, le modèle embryonnaire de
poisson zèbre cyp19a1b-GFP est un outil de choix qui apporte des informations mécanistiques sur
les xeno-estrogènes mais aussi des informations de toxicité développementale et aigüe. Ces
résultats montrent l’avantage de combiner tests in vitro et in vivo, car ils apportent des
informations complémentaires sur la contamination de l’échantillon.
INTEGRATION DES BIO-ESSAIS BASES SUR LE POISSON ZEBRE EN BIOSURVEILLANCE
Dans le cadre de la bio-surveillance de la qualité de l’eau, les bio-essais apportent une
information à l’interface entre réponse biologique et évaluation de l’exposition. Pour la
surveillance de la contamination chimique, telle qu’envisagée dans la DCE, l’objectif est d’évaluer
la présence de molécules prioritaires de la manière la plus sensible et spécifique possible. Les
informations obtenues au cours de la thèse suggèrent que les cellules MELN sont les plus
appropriées pour rendre compte de la présence des xeno-estrogènes connus. De fait, les MELN
permettent de détecter et quantifier l’activité estrogénique des principaux xeno-estrogènes qui
sont actifs à la fois sur hERα et sur zfERs (ex : estrogènes stéroïdiens, phytoestrogènes) au sein de
mélange contenant des polluants non-estrogéniques (articles n°5 et 6).
Si on sort du cadre de la détection des xéno-estrogènes connus, les bio-essais offrent aussi
la possibilité de détecter des molécules dont l’activité est non documentée jusqu’à ce jour et
susceptibles d’entrainer des effets en mélanges avec d’autres molécules (ex : anti-estrogènes).
Ainsi, l’utilisation de bio-essais poisson zèbre permet de commencer à comprendre les effets des
polluants environnementaux en mélange (ex : interaction AhR/ER) de part leur contexte
biologique proche de celui des organismes à protéger : les poissons. Dans ce sens, ces outils
semblent particulièrement pertinents et adaptés dans une démarche de diagnotic
environnemental.

Discussion générale
225
Afin de permettre l’utilisation des bio-essais dans un cadre réglementaire, il est nécessaire
de définir un cadre d’application avec des règles d’interprétation, à l’instar des NQE pour les
molécules prioritaires. Différentes valeurs seuils d’activité estrogénique comprises entre 0,3 et 0,5
ng/ E2-EQ ont été récemment proposées ; le tableau XII synthétise les différentes approches
utilisées.
Tableau XII: Méthodes utilisées pour dériver des valeurs seuils d'activité oestrogénique pour les échantillons environnementaux. SSD : species sensitivity distribution. HC5% concentration dangereuse pour 5% des organismes, PNEC : predicted no effect concentration.
EXPOSITION
DANGER Valeur proposée
(E2-Eq ng/L) Référence Provenance des
données de toxicité Méthode de détermination
Tous les xeno-estrogènes convertis en E2-Eq
Tous les organismes aquatiques
HC5% dérivé par SSD avec toutes les données
0,52 (van der Oost et al., 2017)
E2 (basé sur la liste de vigilance européenne)
Poisson
NQE de l’E2 dérivée par SSD pour la toxicité chronique de l’E2 chez le poisson
0,4 (Kunz et al., 2015)
Stéroïde le plus sensible (EE2) + proportion d’occurrence dans les effluents de STEP
Poisson PNEC dérivé par SSD de toxicité chronique de l’EE2 chez le poisson
0,3 (Jarošová et al., 2014a)
Activité estrogénique in vitro d’échantillons environnementaux
Poisson Activité estrogénique d’échantillons in vivo dans le test EASZY
0,2 à 0,5 Brion, 2017 dans (Käse et Carere, 2017)
La majorité des valeurs seuils proposées ont été dérivées à partir des données d’efffets de
xéno-estrogènes connus, soit chez tous les organismes aquatiques (Van der Oost, 2017) ou plus
spécifiquement chez le poisson en prenant en compte les effets sur la reproduction (Jarošová et
al., 2014a; Kunz et al., 2015). Ces données ont été ensuite utilisées pour effectuer une distribution
cumulée de la sensibilité des espèces (« SSD » : species sensitivity distribution) ce qui a permi de
dériver une NQE (Kunz et al., 2015), une concentration prédite sans effets (PNEC « predicted no-
effect concentration », Cadwell et al., 2012) ou une concentration dangeureuse (HC5%
« hazardous concentration », van der Oost et al., 2017), convertie en estradiol équivalents sur les
modèles in vitro exprimant hERα. Alors que ces valeurs seuils sont dérivées à partir de données
sur les molécules seules, une autre approche, récemment proposée par notre laboratoire, consiste
à comparer de manière empirique l’activité estrogénique d’échantillons environnementaux in
vitro et in vivo avec le test EASZY. De cette façon, le danger est évalué de manière plus holistique,
Discussion générale
226
en tenant compte des effets de mélanges et des molécules inconnues sur un organisme
représentatif du taxon particulièrement sensible aux xéno-estrogènes. Appliquée à 35
échantillons d’eau de surface et d’eau usée dans le cadre du projet européen « Effect-based and
chemical analytical monitoring for the steroidal estrogens » (Käse and Carere, 2017), cette
approche a permi de dériver des valeurs seuils comprises entre 0,2 et 0,5 ng/L E2-Eq. La bonne
concordance entre réponse in vitro et in vivo observée jusqu’à présent pour les échantillons les
plus actifs conforte la démarche proposée (ex : article n°6).
L’avantage majeur des bio-essais, à la différence de l’analyse chimique ciblée, est de
pouvoir prendre en compte l’action combinée de polluants sur l’activation de ER sans connaitre
leur identité. Cependant, chaque modèle biologique conserve des spécificités propres en termes
de détection des molécules estrogéniques. Il est donc important de combiner bio-essais in vitro et
in vivo pour obtenir une information intégrée de la contamination environnementale. Des
schémas d’utilisation des bio-essais dans des démarches d’évaluation de la qualité chimique de
l’eau ont été récemment proposés (Maruya et al., 2016; van der Oost et al., 2017; Vethaak et al.,
2017). Ils se structurent autour d’une batterie de bio-essais couvrant différents modes
d’action/effets couplés à des analyses chimiques ciblées et non ciblées. Ces stratégies de bio-
analyses montrent les possibilites offertes part les outils biologiques pour améliorer la
compréhension de la contamination chimique. Cependant, si l’utilisation des bio-essais pour
évaluer l’estrogénicité dans un cadre législatif est envisagée, leur intégration dans un cadre
réglementaire induira un changement de paradigme important dans l’évaluation de la qualité
chimique des milieux, en passant d’une évaluation de l’exposition substance par substance à une
évaluation de l’effet d’un mélange de substances.

227
CONCLUSION GÉNÉRALE

Conclusion générale
228
Un des objectifs de ce travail de thèse était d’améliorer notre compréhension des
différences de réponse entre bio-essais humain et poisson zèbre pour évaluer la contamination
par les xeno-estrogènes dans l’environnement. Dans ce cadre, les bio-essais humain MELN et
poisson zèbre in vitro (ZELHα, ZELHβ2) et in vivo (test EASZY) ont été choisis pour évaluer la
l’activité estrogénique de polluants environnementaux retrouvés dans l’environnement. Ces
polluants ont été testés seuls mais aussi en présence de xeno-estrogènes modèles pour évaluer
leur capacité à interférer avec la réponse estrogénique. En combinant analyses moléculaires,
cellulaires et approches prédictives, ce travail montre que des interactions entre molécules
estrogéniques et non-estrogéniques peuvent avoir lieu de manière bio-essai spécifique. En
conséquent, les spécificités biologiques des bio-essais sont importantes à prendre en compte car
elles sont susceptibles d’influencer la réponse aux xeno-estrogènes au sein de mélanges
contenant de multiples polluants.
A travers les différences approches (molécules seules, mélanges simples, échantillons
environnemenaux), une bonne cohérence de réponse a été observée entre les différents modèles
poisson zèbre, conformant leur utilisation combinée dans une démarche d’évaluation de la
contamination du compartiment aquatique. De fait, à la différence des tests in vitro, le test EASZY
fournit une information à l’échelle de l’organisme, susceptible d’être impactée par d’autres voies
de toxicité et fournit ainsi des informations conmplémentaires sur la toxicitié aigue de
l’échantillon.
Appliqués dans une approche de bio-monitoring, les bio-essais poissons peuvent répondre
différemment à la présence de xeno-estrogènes que des cellules humaines exprimant hERα. Bien
que les informations apportées au cours de cette thèse montrent que ces différences ont
potentiellement un fondement toxicologique ou physiologique, il n’en reste pas moins que la
réponse d’un bio-essai à des échantillons environnementaux peut être parfois complexe à
interpréter. Par conséquent, une démarche intégrée combinant bio-essais in vitro et in vivo
semble pertinente pour combiner des informations complémentaires sur le risque chimique lié à
ces matrices.

Références
229
REFÉRENCES BIBLIOGRAPHIQUES
Ackermann, G.E., Brombacher, E., Fent, K., 2002. Development of a fish reporter gene system for the assessment of estrogenic compounds and sewage treatment plant effluents. Environ. Toxicol. Chem. 21, 1864–1875. doi:10.1002/etc.5620210914
Aerni, H.-R., Kobler, B., Rutishauser, B.V., Wettstein, F.E., Fischer, R., Giger, W., Hungerbühler, A., Marazuela, M.D., Peter, A., Schönenberger, R., Vögeli, A.C., Suter, M.J.-F., Eggen, R.I.L., 2004. Combined biological and chemical assessment of estrogenic activities in wastewater treatment plant effluents. Anal. Bioanal. Chem. 378, 688–696. doi:10.1007/s00216-003-2276-4
Ahn, K.C., Zhao, B., Chen, J., Cherednichenko, G., Sanmarti, E., Denison, M.S., Lasley, B., Pessah, I.N., Kultz, D., Chang, D.P.Y., Gee, S.J., Hammock, B.D., 2008. In vitro biologic activities of the antimicrobials triclocarban, its analogs, and triclosan in bioassay screens: Receptor-based bioassay screens. Environ. Health Perspect. 116, 1203–1210. doi:10.1289/ehp.11200
Altenburger, R., Ait-Aissa, S., Antczak, P., Backhaus, T., Barceló, D., Seiler, T.-B., Brion, F., Busch, W., Chipman, K., de Alda, M.L., de Aragão Umbuzeiro, G., Escher, B.I., Falciani, F., Faust, M., Focks, A., Hilscherova, K., Hollender, J., Hollert, H., Jäger, F., Jahnke, A., Kortenkamp, A., Krauss, M., Lemkine, G.F., Munthe, J., Neumann, S., Schymanski, E.L., Scrimshaw, M., Segner, H., Slobodnik, J., Smedes, F., Kughathas, S., Teodorovic, I., Tindall, A.J., Tollefsen, K.E., Walz, K.-H., Williams, T.D., Van den Brink, P.J., van Gils, J., Vrana, B., Zhang, X., Brack, W., 2015. Future water quality monitoring--adapting tools to deal with mixtures of pollutants in water resource management. Sci. Total Environ. 512–513, 540–551. doi:10.1016/j.scitotenv.2014.12.057
Alvarez, D.A., Shappell, N.W., Billey, L.O., Bermudez, D.S., Wilson, V.S., Kolpin, D.W., Perkins, S.D., Evans, N., Foreman, W.T., Gray, J.L., Shipitalo, M.J., Meyer, M.T., 2013. Bioassay of estrogenicity and chemical analyses of estrogens in streams across the United States associated with livestock operations. Water Res. 47, 3347–3363. doi:10.1016/j.watres.2013.03.028
Arrêté du 7 août 2015 modifiant l’arrêté du 25 janvier 2010 établissant le programme de surveillance de l’état des eaux en application de l’article R. 212-22 du code de l’environnement, n.d.
Arrêté du 27 juillet 2015 modifiant l’arrêté du 25 janvier 2010 relatif aux méthodes et critères d’évaluation de l’état écologique, de l’état chimique et du potentiel écologique des eaux de surface pris en application des articles R. 212-10, R. 212-11 et R. 212-18 du code de l’environnement, n.d.
Arukwe, A., Yadetie, F., Male, R., Goksøyr, A., 2001. In vivo modulation of nonylphenol-induced zonagenesis and vitellogenesis by the antiestrogen, 3,3′4,4′-tetrachlorobiphenyl (PCB-77) in juvenile fish. Environ. Toxicol. Pharmacol. 10, 5–15. doi:10.1016/S1382-6689(01)00063-1
Auld, D.S., Inglese, J., 2004. Interferences with Luciferase Reporter Enzymes, in: Sittampalam, G.S., Coussens, N.P., Nelson, H., Arkin, M., Auld, D., Austin, C., Bejcek, B., Glicksman, M., Inglese, J., Iversen, P.W., Li, Z., McGee, J., McManus, O., Minor, L., Napper, A., Peltier, J.M., Riss, T., Trask, O.J., Weidner, J. (Eds.), Assay Guidance Manual. Eli Lilly & Company and the National Center for Advancing Translational Sciences, Bethesda (MD).
Auld, D.S., Southall, N.T., Jadhav, A., Johnson, R.L., Diller, D.J., Simeonov, A., Austin, C.P., Inglese, J., 2008. Characterization of Chemical Libraries for Luciferase Inhibitory Activity. J. Med. Chem. 51, 2372–2386. doi:10.1021/jm701302v
Azcoitia, I., Arevalo, M.A., Garcia-Segura, L.M., 2017. Neural-derived estradiol regulates brain plasticity. J. Chem. Neuroanat. doi:10.1016/j.jchemneu.2017.04.004
Bakhtiarova, A., Taslimi, P., Elliman, S.J., Kosinski, P.A., Hubbard, B., Kavana, M., Kemp, D.M., 2006. Resveratrol inhibits firefly luciferase. Biochem. Biophys. Res. Commun. 351, 481–484. doi:10.1016/j.bbrc.2006.10.057
Références
230
Balaguer, P., Francois, F., Comunale, F., Fenet, H., Boussioux, A.M., Pons, M., Nicolas, J.C., Casellas, C., 1999. Reporter cell lines to study the estrogenic effects of xenoestrogens. Sci. Total Environ. 233, 47–56. doi:10.1016/S0048-9697(99)00178-3
Barouki, R., Coumoul, X., Fernandez-Salguero, P.M., 2007. The aryl hydrocarbon receptor, more than a xenobiotic-interacting protein. FEBS Lett. 581, 3608–3615. doi:10.1016/j.febslet.2007.03.046
Beischlag, T.V., Perdew, G.H., 2005. ER α-AHR-ARNT protein-protein interactions mediate estradiol-dependent transrepression of dioxin-inducible gene transcription. J. Biol. Chem. 280, 21607–21611. doi:10.1074/jbc.C500090200
Berenbaum, M.C., 1989. What is synergy? Pharmacol. Rev. 41, 93–141.
Bermudez, D.S., Gray, L.E., Wilson, V.S., 2012. Modelling defined mixtures of environmental oestrogens found in domestic animal and sewage treatment effluents using an in vitro oestrogen-mediated transcriptional activation assay (T47D-KBluc). Int. J. Androl. 35, 397–406. doi:10.1111/j.1365-2605.2012.01278.x
Bermudez, D.S., Gray, L.E., Wilson, V.S., 2010. Modeling the Interaction of Binary and Ternary Mixtures of Estradiol with Bisphenol A and Bisphenol AF in an In vitro Estrogen-Mediated Transcriptional Activation Assay (T47D-KBluc). Toxicol. Sci. 116, 477–487. doi:10.1093/toxsci/kfq156
Bersten, D.C., Sullivan, A.E., Peet, D.J., Whitelaw, M.L., 2013. bHLH-PAS proteins in cancer. Nat. Rev. Cancer 13, 827–841. doi:10.1038/nrc3621
Björnström, L., Sjöberg, M., 2005. Mechanisms of Estrogen Receptor Signaling: Convergence of Genomic and Nongenomic Actions on Target Genes. Mol. Endocrinol. 19, 833–842. doi:10.1210/me.2004-0486
Bliss, C.I., 1939. The Toxicity of Poisons Applied Jointly1. Ann. Appl. Biol. 26, 585–615. doi:10.1111/j.1744-7348.1939.tb06990.x
Brack, W., Ait-Aissa, S., Burgess, R.M., Busch, W., Creusot, N., Di Paolo, C., Escher, B.I., Mark Hewitt, L., Hilscherova, K., Hollender, J., Hollert, H., Jonker, W., Kool, J., Lamoree, M., Muschket, M., Neumann, S., Rostkowski, P., Ruttkies, C., Schollee, J., Schymanski, E.L., Schulze, T., Seiler, T.-B., Tindall, A.J., De Aragão Umbuzeiro, G., Vrana, B., Krauss, M., 2016. Effect-directed analysis supporting monitoring of aquatic environments — An in-depth overview. Sci. Total Environ. 544, 1073–1118. doi:10.1016/j.scitotenv.2015.11.102
Brack, W., Altenburger, R., Schüürmann, G., Krauss, M., López Herráez, D., van Gils, J., Slobodnik, J., Munthe, J., Gawlik, B.M., van Wezel, A., Schriks, M., Hollender, J., Tollefsen, K.E., Mekenyan, O., Dimitrov, S., Bunke, D., Cousins, I., Posthuma, L., van den Brink, P.J., López de Alda, M., Barceló, D., Faust, M., Kortenkamp, A., Scrimshaw, M., Ignatova, S., Engelen, G., Massmann, G., Lemkine, G., Teodorovic, I., Walz, K.-H., Dulio, V., Jonker, M.T.O., Jäger, F., Chipman, K., Falciani, F., Liska, I., Rooke, D., Zhang, X., Hollert, H., Vrana, B., Hilscherova, K., Kramer, K., Neumann, S., Hammerbacher, R., Backhaus, T., Mack, J., Segner, H., Escher, B., de Aragão Umbuzeiro, G., 2015. The SOLUTIONS project: challenges and responses for present and future emerging pollutants in land and water resources management. Sci. Total Environ. 503–504, 22–31. doi:10.1016/j.scitotenv.2014.05.143
Brack, W., Dulio, V., Agerstrand, M., Allan, I., Altenburger, R., Brinkmann, M., Bunke, D., Burgess, R.M., Cousins, I., Escher, B.I., Hernandez, F.J., Hewitt, L.M., Hilscherova, K., Hollender, J., Hollert, H., Kase, R., Klauer, B., Lindim, C., Herraez, D.L., Miege, C., Munthe, J., O’Toole, S., Posthuma, L., Ruedel, H., Schaefer, R.B., Sengl, M., Smedes, F., van de Meent, D., van den Brink, P.J., van Gils, J., van Wezel, A.P., Vethaak, A.D., Vermeirssen, E., von der Ohe, P.C., Vrana, B., 2017. Towards the review of the European Union Water Framework Directive: Recommendations for more efficient assessment and management of chemical contamination in European surface water resources. Sci. Total Environ. 576, 720–737. doi:10.1016/j.scitotenv.2016.10.104
Brausch, J.M., Rand, G.M., 2011. A review of personal care products in the aquatic environment: environmental concentrations and toxicity. Chemosphere 82, 1518–1532. doi:10.1016/j.chemosphere.2010.11.018
Brennan, C., Mangoli, M., Dyer, C.E.F., Ashworth, R., 2005. Acetylcholine and calcium signalling regulates muscle fibre formation in the zebrafish embryo. J. Cell Sci. 118, 5181–5190. doi:10.1242/jcs.02625

Références
231
Brennan, J.C., Bassal, A., He, G., Denison, M.S., 2016. Development of a recombinant human ovarian (BG1) cell line containing estrogen receptor α and β for improved detection of estrogenic/antiestrogenic chemicals., Development of a recombinant human ovarian (BG1) cell line containing estrogen receptor α and β for improved detection of estrogenic/antiestrogenic chemicals. Environ. Toxicol. Chem. Environ. Toxicol. Chem. SETAC 35, 35, 91, 91–100. doi:10.1002/etc.3146, 10.1002/etc.3146
Brian, J.V., Harris, C.A., Scholze, M., Backhaus, T., Booy, P., Lamoree, M., Pojana, G., Jonkers, N., Runnalls, T., Bonfà, A., Marcomini, A., Sumpter, J.P., 2005. Accurate Prediction of the Response of Freshwater Fish to a Mixture of Estrogenic Chemicals. Environ. Health Perspect. 113, 721–728. doi:10.1289/ehp.7598
Brian, J.V., Harris, C.A., Scholze, M., Kortenkamp, A., Booy, P., Lamoree, M., Pojana, G., Jonkers, N., Marcomini, A., Sumpter, J.P., 2007. Evidence of estrogenic mixture effects on the reproductive performance of fish. Environ. Sci. Technol. 41, 337–344.
Brion, F., Le Page, Y., Piccini, B., Cardoso, O., Tong, S.-K., Chung, B., Kah, O., 2012a. Screening Estrogenic Activities of Chemicals or Mixtures In vivo Using Transgenic (cyp19a1b-GFP) Zebrafish Embryos. Plos One 7, e36069. doi:10.1371/journal.pone.0036069
Brion, F., Le Page, Y., Piccini, B., Cardoso, O., Tong, S.-K., Chung, B., Kah, O., 2012b. Screening Estrogenic Activities of Chemicals or Mixtures In vivo Using Transgenic (cyp19a1b-GFP) Zebrafish Embryos. Plos One 7, e36069. doi:10.1371/journal.pone.0036069
Brunnberg, S., Pettersson, K., Rydin, E., Matthews, J., Hanberg, A., Pongratz, I., 2003. The basic helix–loop–helix–PAS protein ARNT functions as a potent coactivator of estrogen receptor-dependent transcription. Proc. Natl. Acad. Sci. 100, 6517–6522. doi:10.1073/pnas.1136688100
Bugel, S.M., White, L.A., Cooper, K.R., 2013. Inhibition of vitellogenin gene induction by 2,3,7,8-tetrachlorodibenzo-p-dioxin is mediated by aryl hydrocarbon receptor 2 (AHR2) in zebrafish (Danio rerio). Aquat. Toxicol. 126, 1–8. doi:10.1016/j.aquatox.2012.09.019
Busch, W., Schmidt, S., Kuehne, R., Schulze, T., Krauss, M., Altenburger, R., 2016. Micropollutants in European rivers: A mode of action survey to support the development of effect-based tools for water monitoring. Environ. Toxicol. Chem. 35, 1887–1899. doi:10.1002/etc.3460
Caldwell, D.J., Mastrocco, F., Anderson, P.D., Länge, R., Sumpter, J.P., 2012. Predicted-no-effect concentrations for the steroid estrogens estrone, 17β-estradiol, estriol, and 17α-ethinylestradiol. Environ. Toxicol. Chem. 31, 1396–1406. doi:10.1002/etc.1825
Cargouët, M., Perdiz, D., Mouatassim-Souali, A., Tamisier-Karolak, S., Levi, Y., 2004. Assessment of river contamination by estrogenic compounds in Paris area (France). Sci. Total Environ. 324, 55–66. doi:10.1016/j.scitotenv.2003.10.035
Carré, C., Meybeck, M., Esculier, F., 2017. The Water Framework Directive’s “percentage of surface water bodies at good status”: unveiling the hidden side of a “hyperindicator.” Ecol. Indic. 78, 371–380. doi:10.1016/j.ecolind.2017.03.021
Carvalho, R.N., Arukwe, A., Ait-Aissa, S., Bado-Nilles, A., Balzamo, S., Baun, A., Belkin, S., Blaha, L., Brion, F., Conti, D., Creusot, N., Essig, Y., Ferrero, V.E.V., Flander-Putrle, V., Fürhacker, M., Grillari-Voglauer, R., Hogstrand, C., Jonáš, A., Kharlyngdoh, J.B., Loos, R., Lundebye, A.-K., Modig, C., Olsson, P.-E., Pillai, S., Polak, N., Potalivo, M., Sanchez, W., Schifferli, A., Schirmer, K., Sforzini, S., Stürzenbaum, S.R., Søfteland, L., Turk, V., Viarengo, A., Werner, I., Yagur-Kroll, S., Zounková, R., Lettieri, T., 2014. Mixtures of Chemical Pollutants at European Legislation Safety Concentrations: How Safe Are They? Toxicol. Sci. 141, 218–233. doi:10.1093/toxsci/kfu118
Cavallin, J.E., Durhan, E.J., Evans, N., Jensen, K.M., Kahl, M.D., Kolpin, D.W., Kolodziej, E.P., Foreman, W.T., LaLone, C.A., Makynen, E.A., Seidl, S.M., Thomas, L.M., Villeneuve, D.L., Weberg, M.A., Wilson, V.S., Ankley, G.T., 2014. Integrated assessment of runoff from livestock farming operations: Analytical chemistry, in vitro bioassays, and in vivo fish exposures. Environ. Toxicol. Chem. 33, 1849–1857. doi:10.1002/etc.2627
Références
232
CE, 2000. Directive 2000/60/CE [WWW Document]. URL http://eur-lex.europa.eu/legal-content/fr/ALL/?uri=CELEX%3A32000L0060 (accessed 10.8.17).
CE, n.d. Directive 2008/105/CE du Parlement européen et du Conseil du 16 décembre 2008 établissant des normes de qualité environnementale dans le domaine de l’eau [WWW Document]. URL http://eur-lex.europa.eu/legal-content/FR/TXT/?uri=celex%3A32008L0105 (accessed 10.8.17).
Chang, Z., Lu, M., Kim, S.-S., Park, J.-S., 2014. Potential role of HSP90 in mediating the interactions between estrogen receptor (ER) and aryl hydrocarbon receptor (AhR) signaling pathways. Toxicol. Lett. 226, 6–13. doi:10.1016/j.toxlet.2014.01.032
Chen, H., Hu, J., Yang, J., Wang, Y., Xu, H., Jiang, Q., Gong, Y., Gu, Y., Song, H., 2010. Generation of a fluorescent transgenic zebrafish for detection of environmental estrogens. Aquat. Toxicol. Amst. Neth. 96, 53–61. doi:10.1016/j.aquatox.2009.09.015
Chen, S.X., Bogerd, J., García-López, Á., de Jonge, H., Waal, D., P, P., Hong, W.S., Schulz, R.W., 2010. Molecular Cloning and Functional Characterization of a Zebrafish Nuclear Progesterone Receptor. Biol. Reprod. 82, 171–181. doi:10.1095/biolreprod.109.077644
Chen, X., Xu, B., Han, X., Mao, Z., Chen, M., Du, G., Talbot, P., Wang, X., Xia, Y., 2015. The effects of triclosan on pluripotency factors and development of mouse embryonic stem cells and zebrafish. Arch. Toxicol. 89, 635–646. doi:10.1007/s00204-014-1270-2
Chen, X.-W., Zhao, J.-L., Liu, Y.-S., Hu, L.-X., Liu, S.-S., Ying, G.-G., 2016. Evaluation of estrogenic activity in the Pearl River by using effect-directed analysis. Environ. Sci. Pollut. Res. 23, 21692–21702. doi:10.1007/s11356-016-7377-7
Chen, Y.Y., Chan, K.M., 2016. Regulation of vitellogenin (vtg1) and estrogen receptor (er) gene expression in zebrafish (Danio rerio) following the administration of Cd2+ and 2,3,7,8-tetrachlorodibenzo-p-dioxin (TCDD). Chemosphere 147, 467–476. doi:10.1016/j.chemosphere.2015.12.083
Cherednichenko, G., Zhang, R., Bannister, R.A., Timofeyev, V., Li, N., Fritsch, E.B., Feng, W., Barrientos, G.C., Schebb, N.H., Hammock, B.D., Beam, K.G., Chiamvimonvat, N., Pessah, I.N., 2012. Triclosan impairs excitation-contraction coupling and Ca2+ dynamics in striated muscle. Proc. Natl. Acad. Sci. U. S. A. 109, 14158–14163. doi:10.1073/pnas.1211314109
Cheshenko, K., Brion, F., Le Page, Y., Hinfray, N., Pakdel, F., Kah, O., Segner, H., Eggen, R.I.L., 2007. Expression of zebra fish aromatase cyp19a and cyp19b genes in response to the ligands of estrogen receptor and aryl hydrocarbon receptor. Toxicol. Sci. 96, 255–267. doi:10.1093/toxsci/kfm003
Cheshenko, K., Pakdel, F., Segner, H., Kah, O., Eggen, R.I.L., 2008. Interference of endocrine disrupting chemicals with aromatase CYP19 expression or activity, and consequences for reproduction of teleost fish. Gen. Comp. Endocrinol. 155, 31–62. doi:10.1016/j.ygcen.2007.03.005
Chou, T.C., Talalay, P., 1984. Quantitative analysis of dose-effect relationships: the combined effects of multiple drugs or enzyme inhibitors. Adv. Enzyme Regul. 22, 27–55.
Coleman, M.D., O’Neil, J.D., Woehrling, E.K., Ndunge, O.B.A., Hill, E.J., Menache, A., Reiss, C.J., 2012. A Preliminary Investigation into the Impact of a Pesticide Combination on Human Neuronal and Glial Cell Lines In vitro. PLoS ONE 7. doi:10.1371/journal.pone.0042768
Conley, J.M., Evans, N., Cardon, M.C., Rosenblum, L., Iwanowicz, L.R., Hartig, P.C., Schenck, K.M., Bradley, P.M., Wilson, V.S., 2017. Occurrence and In vitro Bioactivity of Estrogen, Androgen, and Glucocorticoid Compounds in a Nationwide Screen of United States Stream Waters. Environ. Sci. Technol. 51, 4781–4791. doi:10.1021/acs.est.6b06515
Correia, A.D., Freitas, S., Scholze, M., Goncalves, J.F., Booij, P., Lamoree, M.H., Mañanós, E., Reis-Henriques, M.A., 2007. Mixtures of Estrogenic Chemicals Enhance Vitellogenic Response in Sea Bass. Environ. Health Perspect. 115, 115–121. doi:10.1289/ehp.9359
Références
233
Cosnefroy, A., Brion, F., Guillet, B., Laville, N., Porcher, J.M., Balaguer, P., Aït-Aïssa, S., 2009. A stable fish reporter cell line to study estrogen receptor transactivation by environmental (xeno)estrogens. Toxicol. Vitro Int. J. Publ. Assoc. BIBRA 23, 1450–1454. doi:10.1016/j.tiv.2009.07.003
Cosnefroy, A., Brion, F., Maillot-Maréchal, E., Porcher, J.-M., Pakdel, F., Balaguer, P., Aït-Aïssa, S., 2012. Selective activation of zebrafish estrogen receptor subtypes by chemicals by using stable reporter gene assay developed in a zebrafish liver cell line. Toxicol. Sci. Off. J. Soc. Toxicol. 125, 439–449. doi:10.1093/toxsci/kfr297
Coumoul, X., Diry, M., Robillot, C., Barouki, R., 2001. Differential Regulation of Cytochrome P450 1A1 and 1B1 by a Combination of Dioxin and Pesticides in the Breast Tumor Cell Line MCF-7. Cancer Res. 61, 3942–3948.
Crago, J., Tran, K., Budicin, A., Schreiber, B., Lavado, R., Schlenk, D., 2015. Exploring the Impacts of Two Separate Mixtures of Pesticide and Surfactants on Estrogenic Activity in Male Fathead Minnows and Rainbow Trout. Arch. Environ. Contam. Toxicol. 68, 362–370. doi:10.1007/s00244-014-0098-3
Creusot, N., Ait-Aissa, S., Tapie, N., Pardon, P., Brion, F., Sanchez, W., Thybaud, E., Porcher, J.-M., Budzinski, H., 2014. Identification of Synthetic Steroids in River Water Downstream from Pharmaceutical Manufacture Discharges Based on a Bioanalytical Approach and Passive Sampling. Environ. Sci. Technol. 48, 3649–3657. doi:10.1021/es405313r
Creusot, N., Brion, F., Piccini, B., Budzinski, H., Porcher, J.M., Aït-Aïssa, S., 2015. BFCOD activity in fish cell lines and zebrafish embryos and its modulation by chemical ligands of human aryl hydrocarbon and nuclear receptors. Environ. Sci. Pollut. Res. Int. 22, 16393–16404. doi:10.1007/s11356-014-3882-8
Creusot, N., Budzinski, H., Balaguer, P., Kinani, S., Porcher, J.-M., Aït-Aïssa, S., 2013. Effect-directed analysis of endocrine-disrupting compounds in multi-contaminated sediment: identification of novel ligands of estrogen and pregnane X receptors. Anal. Bioanal. Chem. 405, 2553–2566. doi:10.1007/s00216-013-6708-5
Creusot, N., Dévier, M.-H., Budzinski, H., Aït-Aïssa, S., 2016. Evaluation of an extraction method for a mixture of endocrine disrupters in sediment using chemical and in vitro biological analyses. Environ. Sci. Pollut. Res. 23, 10349–10360. doi:10.1007/s11356-016-6062-1
Creusot, N., Kinani, S., Balaguer, P., Tapie, N., LeMenach, K., Maillot-Marechal, E., Porcher, J.-M., Budzinski, H., Ait-Aissa, S., 2010a. Evaluation of an hPXR reporter gene assay for the detection of aquatic emerging pollutants: screening of chemicals and application to water samples. Anal. Bioanal. Chem. 396, 569–583. doi:10.1007/s00216-009-3310-y
Creusot, N., Kinani, S., Balaguer, P., Tapie, N., LeMenach, K., Maillot-Maréchal, E., Porcher, J.-M., Budzinski, H., Aït-Aïssa, S., 2010b. Evaluation of an hPXR reporter gene assay for the detection of aquatic emerging pollutants: screening of chemicals and application to water samples. Anal. Bioanal. Chem. 396, 569–583. doi:10.1007/s00216-009-3310-y
Dann, A.B., Hontela, A., 2011. Triclosan: environmental exposure, toxicity and mechanisms of action. J. Appl. Toxicol. 31, 285–311. doi:10.1002/jat.1660
Davis, L.K., Katsu, Y., Iguchi, T., Lerner, D.T., Hirano, T., Grau, E.G., 2010. Transcriptional activity and biological effects of mammalian estrogen receptor ligands on three hepatic estrogen receptors in Mozambique tilapia. J. Steroid Biochem. Mol. Biol. 122, 272–278. doi:10.1016/j.jsbmb.2010.05.009
Delfosse, V., Dendele, B., Huet, T., Grimaldi, M., Boulahtouf, A., Gerbal-Chaloin, S., Beucher, B., Roecklin, D., Muller, C., Rahmani, R., Cavailles, V., Daujat-Chavanieu, M., Vivat, V., Pascussi, J.-M., Balaguer, P., Bourguet, W., 2015. Synergistic activation of human pregnane X receptor by binary cocktails of pharmaceutical and environmental compounds. Nat. Commun. 6, 8089. doi:10.1038/ncomms9089
Demaegdt, H., Daminet, B., Evrard, A., Scippo, M.-L., Muller, M., Pussemier, L., Callebaut, A., Vandermeiren, K., 2016. Endocrine activity of mycotoxins and mycotoxin mixtures. Food Chem. Toxicol. Int. J. Publ. Br. Ind. Biol. Res. Assoc. 96, 107–116. doi:10.1016/j.fct.2016.07.033
Références
234
Demirpence, E., Duchesne, M.J., Badia, E., Gagne, D., Pons, M., 1993. MVLN cells: a bioluminescent MCE-7-derived cell line to study the modulation of estrogenic activity. J. Steroid Biochem. Mol. Biol. 46, 355–364.
Denison, M.S., Nagy, S.R., 2003. Activation of the aryl hydrocarbon receptor by structurally diverse exogenous and endogenous chemicals. Annu. Rev. Pharmacol. Toxicol. 43, 309–334. doi:10.1146/annurev.pharmtox.43.100901.135828
Desbrow, C., Routledge, E.J., Brighty, G.C., Sumpter, J.P., Waldock, M., 1998. Identification of Estrogenic Chemicals in STW Effluent. 1. Chemical Fractionation and in vitro Biological Screening. Environ. Sci. Technol. 32, 1549–1558. doi:10.1021/es9707973
Dévier, M.-H., Mazellier, P., Aït-Aïssa, S., Budzinski, H., 2011. New challenges in environmental analytical chemistry: Identification of toxic compounds in complex mixtures. Comptes Rendus Chim., Green and sustainable chemistry 14, 766–779. doi:10.1016/j.crci.2011.04.006
Di Liegro, I., 2008. Thyroid hormones and the central nervous system of mammals (Review). Mol. Med. Rep. 1, 279–295.
Diotel, N., Do Rego, J.-L., Anglade, I., Vaillant, C., Pellegrini, E., Gueguen, M.-M., Mironov, S., Vaudry, H., Kah, O., 2011. Activity and expression of steroidogenic enzymes in the brain of adult zebrafish. Eur. J. Neurosci. 34, 45–56. doi:10.1111/j.1460-9568.2011.07731.x
Diotel, N., Le Page, Y., Mouriec, K., Tong, S.-K., Pellegrini, E., Vaillant, C., Anglade, I., Brion, F., Pakdel, F., Chung, B., Kah, O., 2010. Aromatase in the brain of teleost fish: expression, regulation and putative functions. Front. Neuroendocrinol. 31, 172–192. doi:10.1016/j.yfrne.2010.01.003
Directive 2013/39/UE du Parlement européen et du Conseil du 12 août 2013 modifiant les directives 2000/60/CE et 2008/105/CE en ce qui concerne les substances prioritaires pour la politique dans le domaine de l’eau [WWW Document], n.d. URL http://eur-lex.europa.eu/legal-content/FR/ALL/?uri=celex%3A32013L0039 (accessed 10.8.17).
Dreier, D.A., Connors, K.A., Brooks, B.W., 2015. Comparative endpoint sensitivity of in vitro estrogen agonist assays. Regul. Toxicol. Pharmacol. RTP 72, 185–193. doi:10.1016/j.yrtph.2015.04.009
Eide, M., Rusten, M., Male, R., Jensen, K.H.M., Goksoyr, A., 2014. A characterization of the ZFL cell line and primary hepatocytes as in vitro liver cell models for the zebrafish (Danio rerio). Aquat. Toxicol. 147, 7–17. doi:10.1016/j.aquatox.2013.11.023
Escande, A., Pillon, A., Servant, N., Cravedi, J.P., Larrea, F., Muhn, P., Nicolas, J.C., Cavailles, V., Balaguer, P., 2006. Evaluation of ligand selectivity using reporter cell lines stably expressing estrogen receptor α or beta. Biochem. Pharmacol. 71, 1459–1469. doi:10.1016/j.bcp.2006.02.002
Escher, B.I., Allinson, M., Altenburger, R., Bain, P.A., Balaguer, P., Busch, W., Crago, J., Denslow, N.D., Dopp, E., Hilscherova, K., Humpage, A.R., Kumar, A., Grimaldi, M., Jayasinghe, B.S., Jarosova, B., Jia, A., Makarov, S., Maruya, K.A., Medvedev, A., Mehinto, A.C., Mendez, J.E., Poulsen, A., Prochazka, E., Richard, J., Schifferli, A., Schlenk, D., Scholz, S., Shiraish, F., Snyder, S., Su, G., Tang, J.Y.M., van der Burg, B., van der Linden, S.C., Werner, I., Westerheide, S.D., Wong, C.K.C., Yang, M., Yeung, B.H.Y., Zhang, X., Leusch, F.D.L., 2014. Benchmarking Organic Micropollutants in Wastewater, Recycled Water and Drinking Water with In vitro Bioassays. Environ. Sci. Technol. 48, 1940–1956. doi:10.1021/es403899t
EU, 2016. Commission Implementing Decision (EU) 2016/110 of 27 January 2016 not approving triclosan as an existing active substance for use in biocidal products for product-type 1 [WWW Document]. URL http://eur-lex.europa.eu/legal-content/EN/TXT/?uri=uriserv%3AOJ.L_.2016.021.01.0086.01.ENG (accessed 10.8.17).
Evans, B.R., Karchner, S.I., Allan, L.L., Pollenz, R.S., Tanguay, R.L., Jenny, M.J., Sherr, D.H., Hahn, M.E., 2008. Repression of Aryl Hydrocarbon Receptor (AHR) Signaling by AHR Repressor: Role of DNA Binding and Competition for AHR Nuclear Translocator. Mol. Pharmacol. 73, 387–398. doi:10.1124/mol.107.040204

Références
235
Evans, R.M., Scholze, M., Kortenkamp, A., 2012. Additive Mixture Effects of Estrogenic Chemicals in Human Cell-Based Assays Can Be Influenced by Inclusion of Chemicals with Differing Effect Profiles. PLOS ONE 7, e43606. doi:10.1371/journal.pone.0043606
Ezechias, M., Cajthaml, T., 2016. Novel full logistic model for estimation of the estrogenic activity of chemical mixtures. Toxicology 359, 58–70. doi:10.1016/j.tox.2016.06.017
Fang, H., Tong, W., Perkins, R., Soto, A.M., Prechtl, N.V., Sheehan, D.M., 2000. Quantitative comparisons of in vitro assays for estrogenic activities. Environ. Health Perspect. 108, 723–729.
Feng, Y., Zhang, P., Zhang, Z., Shi, J., Jiao, Z., Shao, B., 2016. Endocrine Disrupting Effects of Triclosan on the Placenta in Pregnant Rats. Plos One 11, e0154758. doi:10.1371/journal.pone.0154758
Fernandez, M.P., Ikonomou, M.G., Buchanan, I., 2007. An assessment of estrogenic organic contaminants in Canadian wastewaters. Sci. Total Environ. 373, 250–269. doi:10.1016/j.scitotenv.2006.11.018
Fernandino, J.I., Hattori, R.S., Moreno Acosta, O.D., Strüssmann, C.A., Somoza, G.M., 2013. Environmental stress-induced testis differentiation: androgen as a by-product of cortisol inactivation. Gen. Comp. Endocrinol. 192, 36–44. doi:10.1016/j.ygcen.2013.05.024
Foran, C.M., Bennett, E.R., Benson, W.H., 2000. Developmental evaluation of a potential non-steroidal estrogen: triclosan. Mar. Environ. Res. 50, 153–156. doi:10.1016/S0141-1136(00)00080-5
Foreman, J.C., Johansen, T., Gibb, A.J., 2010. Textbook of Receptor Pharmacology, Third Edition. CRC Press.
Frische, T., Faust, M., Meyer, W., Backhaus, T., 2009. Toxic masking and synergistic modulation of the estrogenic activity of chemical mixtures in a yeast estrogen screen (YES). Environ. Sci. Pollut. Res. Int. 16, 593–603. doi:10.1007/s11356-009-0184-7
Fritsch, E.B., Connon, R.E., Werner, I., Davies, R.E., Beggel, S., Feng, W., Pessah, I.N., 2013. Triclosan Impairs Swimming Behavior and Alters Expression of Excitation-Contraction Coupling Proteins in Fathead Minnow (Pimephales promelas). Environ. Sci. Technol. 47, 2008–2017. doi:10.1021/es303790b
Gale, W.L., Patiño, R., Maule, A.G., 2004. Interaction of xenobiotics with estrogen receptors α and beta and a putative plasma sex hormone-binding globulin from channel catfish (Ictalurus punctatus). Gen. Comp. Endocrinol. 136, 338–345. doi:10.1016/j.ygcen.2004.01.009
Garcia-Segura, L.M., 2009. Hormones and Brain Plasticity. Oxford University Press.
Gee, R.H., Charles, A., Taylor, N., Darbre, P.D., 2008. Oestrogenic and androgenic activity of triclosan in breast cancer cells. J. Appl. Toxicol. 28, 78–91. doi:10.1002/jat.1316
Ghisari, M., Bonefeld-Jorgensen, E.C., 2009. Effects of plasticizers and their mixtures on estrogen receptor and thyroid hormone functions. Toxicol. Lett. 189, 67–77. doi:10.1016/j.toxlet.2009.05.004
Gong, Z., Ju, B., Wan, H., 2001. Green fluorescent protein (GFP) transgenic fish and their applications. Genetica 111, 213–225. doi:10.1023/A:1013796810782
González, A., Piferrer, F., 2003. Aromatase activity in the European sea bass (Dicentrarchus labrax L.) brain. Distribution and changes in relation to age, sex, and the annual reproductive cycle. Gen. Comp. Endocrinol. 132, 223–230. doi:10.1016/S0016-6480(03)00086-8
Gorelick, D.A., Halpern, M.E., 2011. Visualization of estrogen receptor transcriptional activation in zebrafish. Endocrinology 152, 2690–2703. doi:10.1210/en.2010-1257
Gorelick, D.A., Iwanowicz, L.R., Hung, A.L., Blazer, V.S., Halpern, M.E., 2014. Transgenic Zebrafish Reveal Tissue-Specific Differences in Estrogen Signaling in Response to Environmental Water Samples. Environ. Health Perspect. 122, 356–362. doi:10.1289/ehp.1307329
Grans, J., Wassmur, B., Celander, M.C., 2010. One-way inhibiting cross-talk between arylhydrocarbon receptor (AhR) and estrogen receptor (ER) signaling in primary cultures of rainbow trout hepatocytes. Aquat. Toxicol. 100, 263–270. doi:10.1016/j.aquatox.2010.07.024
Références
236
Gray, K.A., Yates, B., Seal, R.L., Wright, M.W., Bruford, E.A., 2015. Genenames.org: the HGNC resources in 2015. Nucleic Acids Res. 43, D1079–D1085. doi:10.1093/nar/gku1071
Green, J.M., Metz, J., Lee, O., Trznadel, M., Takesono, A., Brown, A.R., Owen, S.F., Kudoh, T., Tyler, C.R., 2016. High-Content and Semi-Automated Quantification of Responses to Estrogenic Chemicals Using a Novel Translucent Transgenic Zebrafish. Environ. Sci. Technol. 50, 6536–6545. doi:10.1021/acs.est.6b01243
Griffin, L.B., January, K.E., Ho, K.W., Cotter, K.A., Callard, G.V., 2013. Morpholino-mediated knockdown of ERα, ERβa, and ERβb mRNAs in zebrafish (Danio rerio) embryos reveals differential regulation of estrogen-inducible genes. Endocrinology 154, 4158–4169. doi:10.1210/en.2013-1446
Grimaldi, M., Boulahtouf, A., Delfosse, V., Thouennon, E., Bourguet, W., Balaguer, P., 2015. Reporter Cell Lines for the Characterization of the Interactions between Human Nuclear Receptors and Endocrine Disruptors. Front. Endocrinol. 6, 62. doi:10.3389/fendo.2015.00062
Gutendorf, B., Westendorf, J., 2001. Comparison of an array of in vitro assays for the assessment of the estrogenic potential of natural and synthetic estrogens, phytoestrogens and xenoestrogens. Toxicology 166, 79–89.
Hahn, M.E., 2002. Aryl hydrocarbon receptors: diversity and evolution. Chem. Biol. Interact. 141, 131–160. doi:10.1016/S0009-2797(02)00070-4
Hahn, M.E., 2001. Dioxin toxicology and the aryl hydrocarbon receptor: Insights from fish and other non-traditional models. Mar. Biotechnol. 3, S224–S238. doi:10.1007/s10126-001-0045-Y
Hahn, M.E., Allan, L.L., Sherr, D.H., 2009. Regulation of constitutive and inducible AHR signaling: complex interactions involving the AHR repressor. Biochem. Pharmacol. 77, 485–497. doi:10.1016/j.bcp.2008.09.016
Hannah, R., D’Aco, V.J., Anderson, P.D., Buzby, M.E., Caldwell, D.J., Cunningham, V.L., Ericson, J.F., Johnson, A.C., Parke, N.J., Samuelian, J.H., Sumpter, J.P., 2009. EXPOSURE ASSESSMENT OF 17 α-ETHINYLESTRADIOL IN SURFACE WATERS OF THE UNITED STATES AND EUROPE. Environ. Toxicol. Chem. 28, 2725–2732. doi:10.1897/08-622.1
Harman-Fetcho, J.A., Hapeman, C.J., McConnell, L.L., Potter, T.L., Rice, C.P., Sadeghi, A.M., Smith, R.D., Bialek, K., Sefton, K.A., Schaffer, B.A., Curry, R., 2005. Pesticide occurrence in selected South Florida canals and biscayne bay during high agricultural activity. J. Agric. Food Chem. 53, 6040–6048. doi:10.1021/jf047803g
Harris, H.A., Bapat, A.R., Gonder, D.S., Frail, D.E., 2002. The ligand binding profiles of estrogen receptors α and beta are species dependent. Steroids 67, 379–384.
Hawkins, M.B., Thomas, P., 2004. The unusual binding properties of the third distinct teleost estrogen receptor subtype ER beta a are accompanied by highly conserved amino acid changes in the ligand binding domain. Endocrinology 145, 2968–2977. doi:10.1210/en.2003.0806
Hawkins, M.B., Thornton, J.W., Crews, D., Skipper, J.K., Dotte, A., Thomas, P., 2000. Identification of a third distinct estrogen receptor and reclassification of estrogen receptors in teleosts. Proc. Natl. Acad. Sci. U. S. A. 97, 10751–10756. doi:10.1073/pnas.97.20.10751
Hayakawa, K., Onoda, Y., Tachikawa, C., Hosoi, S., Yoshita, M., Chung, S.W., Kizu, R., Toriba, A., Kameda, T., Tang, N., 2007. Estrogenic/Antiestrogenic Activities of Polycyclic Aromatic Hydrocarbons and Their Monohydroxylated Derivatives by Yeast Two-Hybrid Assay. J. Health Sci. 53, 562–570. doi:10.1248/jhs.53.562
Heldring, N., Pike, A., Andersson, S., Matthews, J., Cheng, G., Hartman, J., Tujague, M., Ström, A., Treuter, E., Warner, M., Gustafsson, J.-Å., 2007. Estrogen Receptors: How Do They Signal and What Are Their Targets. Physiol. Rev. 87, 905–931. doi:10.1152/physrev.00026.2006
Heneweer, M., Muusse, M., van den Berg, M., Sanderson, J.T., 2005. Additive estrogenic effects of mixtures of frequently used UV filters on pS2-gene transcription in MCF-7 cells. Toxicol. Appl. Pharmacol. 208, 170–177. doi:10.1016/j.taap.2005.02.006
Références
237
Henneberg, A., Bender, K., Blaha, L., Giebner, S., Kuch, B., Köhler, H.-R., Maier, D., Oehlmann, J., Richter, D., Scheurer, M., Schulte-Oehlmann, U., Sieratowicz, A., Ziebart, S., Triebskorn, R., 2014. Are In vitro Methods for the Detection of Endocrine Potentials in the Aquatic Environment Predictive for In vivo Effects? Outcomes of the Projects SchussenAktiv and SchussenAktivplus in the Lake Constance Area, Germany. PLOS ONE 9, e98307. doi:10.1371/journal.pone.0098307
Hinfray, N., Palluel, O., Turies, C., Cousin, C., Porcher, J.M., Brion, F., 2006. Brain and gonadal aromatase as potential targets of endocrine disrupting chemicals in a model species, the zebrafish (Danio rerio). Environ. Toxicol. 21, 332–337. doi:10.1002/tox.20203
Hinfray, N., Tebby, C., Garoche, C., Piccini, B., Bourgine, G., Aït-Aïssa, S., Kah, O., Pakdel, F., Brion, F., 2016. Additive effects of levonorgestrel and ethinylestradiol on brain aromatase (cyp19a1b) in zebrafish specific in vitro and in vivo bioassays. Toxicol. Appl. Pharmacol. 307, 108–114. doi:10.1016/j.taap.2016.07.023
Hoegg, S., Brinkmann, H., Taylor, J.S., Meyer, A., 2004. Phylogenetic Timing of the Fish-Specific Genome Duplication Correlates with the Diversification of Teleost Fish. J. Mol. Evol. 59, 190–203. doi:10.1007/s00239-004-2613-z
Hornung, M.W., Ankley, G.T., Schmieder, P.K., 2003. Induction of an estrogen-responsive reporter gene in rainbow trout hepatoma cells (RTH 149) at 11 or 18°C. Environ. Toxicol. Chem. 22, 866–871. doi:10.1002/etc.5620220426
Houtman, C.J., Van Oostveen, A.M., Brouwer, A., Lamoree, M.H., Legler, J., 2004. Identification of estrogenic compounds in fish bile using bioassay-directed fractionation. Environ. Sci. Technol. 38, 6415–6423. doi:10.1021/es049750p
Howard, G.J., Webster, T.F., 2009. Generalized concentration addition: A method for examining mixtures containing partial agonists. J. Theor. Biol. 259, 469–477. doi:10.1016/j.jtbi.2009.03.030
Huang, H., Du, G., Zhang, W., Hu, J., Wu, D., Song, L., Xia, Y., Wang, X., 2014. The in vitro estrogenic activities of triclosan and triclocarban. J. Appl. Toxicol. 34, 1060–1067. doi:10.1002/jat.3012
Huang, R., Sakamuru, S., Martin, M.T., Reif, D.M., Judson, R.S., Houck, K.A., Casey, W., Hsieh, J.-H., Shockley, K.R., Ceger, P., Fostel, J., Witt, K.L., Tong, W., Rotroff, D.M., Zhao, T., Shinn, P., Simeonov, A., Dix, D.J., Austin, C.P., Kavlock, R.J., Tice, R.R., Xia, M., 2014. Profiling of the Tox21 10K compound library for agonists and antagonists of the estrogen receptor α signaling pathway. Sci. Rep. 4, srep05664. doi:10.1038/srep05664
Huang, R., Xia, M., Cho, M.-H., Sakamuru, S., Shinn, P., Houck, K.A., Dix, D.J., Judson, R.S., Witt, K.L., Kavlock, R.J., Tice, R.R., Austin, C.P., 2011. Chemical Genomics Profiling of Environmental Chemical Modulation of Human Nuclear Receptors. Environ. Health Perspect. 119, 1142–1148. doi:10.1289/ehp.1002952
Ihara, M., Ihara, M.O., Kumar, V., Narumiya, M., Hanamoto, S., Nakada, N., Yamashita, N., Miyagawa, S., Iguchi, T., Tanaka, H., 2014. Co-occurrence of Estrogenic and Antiestrogenic Activities in Wastewater: Quantitative Evaluation of Balance by in vitro ERα Reporter Gene Assay and Chemical Analysis. Environ. Sci. Technol. 48, 6366–6373. doi:10.1021/es5014938
Ihara, M., Kitamura, T., Kumar, V., Park, C.-B., Ihara, M.O., Lee, S.-J., Yamashita, N., Miyagawa, S., Iguchi, T., Okamoto, S., Suzuki, Y., Tanaka, H., 2015. Evaluation of Estrogenic Activity of Wastewater: Comparison Among In vitro ERα Reporter Gene Assay, In vivo Vitellogenin Induction, and Chemical Analysis. Environ. Sci. Technol. 49, 6319–6326. doi:10.1021/acs.est.5b01027
Ishibashi, H., Matsumura, N., Hirano, M., Matsuoka, M., Shiratsuchi, H., Ishibashi, Y., Takao, Y., Arizono, K., 2004. Effects of triclosan on the early life stages and reproduction of medaka Oryzias latipes and induction of hepatic vitellogenin. Aquat. Toxicol. 67, 167–179. doi:10.1016/j.aquatox.2003.12.005
Iwanari, M., Nakajima, M., Kizu, R., Hayakawa, K., Yokoi, T., 2002. Induction of CYP1A1, CYP1A2, and CYP1B1 mRNAs by nitropolycyclic aromatic hydrocarbons in various human tissue-derived cells: chemical-, cytochrome P450 isoform-, and cell-specific differences. Arch. Toxicol. 76, 287–298. doi:10.1007/s00204-002-0340-z

Références
238
James, M.O., 2011. Steroid catabolism in marine and freshwater fish. J. Steroid Biochem. Mol. Biol., Special Issue on Steroid Metabolism in Marine Organisms 127, 167–175. doi:10.1016/j.jsbmb.2010.10.003
Jarošová, B., Bláha, L., Giesy, J.P., Hilscherová, K., 2014a. What level of estrogenic activity determined by in vitro assays in municipal waste waters can be considered as safe? Environ. Int. 64, 98–109. doi:10.1016/j.envint.2013.12.009
Jarošová, B., Erseková, A., Hilscherová, K., Loos, R., Gawlik, B.M., Giesy, J.P., Bláha, L., 2014b. Europe-wide survey of estrogenicity in wastewater treatment plant effluents: the need for the effect-based monitoring. Environ. Sci. Pollut. Res. 21, 10970–10982. doi:10.1007/s11356-014-3056-8
Jarošová, B., Javůrek, J., Adamovský, O., Hilscherová, K., 2015. Phytoestrogens and mycoestrogens in surface waters--Their sources, occurrence, and potential contribution to estrogenic activity. Environ. Int. 81, 26–44. doi:10.1016/j.envint.2015.03.019
Jin, Y., Chen, R., Sun, L., Qian, H., Liu, W., Fu, Z., 2009. Induction of estrogen-responsive gene transcription in the embryo, larval, juvenile and adult life stages of zebrafish as biomarkers of short-term exposure to endocrine disrupting chemicals. Comp. Biochem. Physiol. Part C Toxicol. Pharmacol. 150, 414–420. doi:10.1016/j.cbpc.2009.06.006
Jobling, S., Beresford, N., Nolan, M., Rodgers-Gray, T., Brighty, G.C., Sumpter, J.P., Tyler, C.R., 2002. Altered sexual maturation and gamete production in wild roach (Rutilus rutilus) living in rivers that receive treated sewage effluents. Biol. Reprod. 66, 272–281. doi:10.1095/biolreprod66.2.272
Jobling, S., Nolan, M., Tyler, C.R., Brighty, G., Sumpter, J.P., 1998. Widespread sexual disruption in wild fish. Environ. Sci. Technol. 32, 2498–2506. doi:10.1021/es9710870
Johnson, A.C., 2010. Natural Variations in Flow Are Critical in Determining Concentrations of Point Source Contaminants in Rivers: An Estrogen Example. Environ. Sci. Technol. 44, 7865–7870. doi:10.1021/es101799j
Johnson, A.C., Dumont, E., Williams, R.J., Oldenkamp, R., Cisowska, I., Sumpter, J.P., 2013. Do concentrations of ethinylestradiol, estradiol, and diclofenac in European rivers exceed proposed EU environmental quality standards? Environ. Sci. Technol. 47, 12297–12304. doi:10.1021/es4030035
Jonker, M.J., Svendsen, C., Bedaux, J.J.M., Bongers, M., Kammenga, J.E., 2005. Significance testing of synergistic/antagonistic, dose level-dependent, or dose ratio-dependent effects in mixture dose-response analysis. Environ. Toxicol. Chem. 24, 2701–2713. doi:10.1897/04-431R.1
Kabir, E.R., Rahman, M.S., Rahman, I., 2015. A review on endocrine disruptors and their possible impacts on human health. Environ. Toxicol. Pharmacol. 40, 241–258. doi:10.1016/j.etap.2015.06.009
Karamouzis, M.V., Papavassiliou, K.A., Adamopoulos, C., Papavassiliou, A.G., 2016. Targeting Androgen/Estrogen Receptors Crosstalk in Cancer. Trends Cancer 2, 35–48. doi:10.1016/j.trecan.2015.12.001
Karchner, S.I., Franks, D.G., Powell, W.H., Hahn, M.E., 2002. Regulatory interactions among three members of the vertebrate aryl hydrocarbon receptor family: AHR repressor, AHR1, and AHR2. J. Biol. Chem. 277, 6949–6959. doi:10.1074/jbc.M110779200
Käse, R., Carere, M., n.d. Effect-based and chemical analytical monitoring for the steroidal estrogens [WWW Document]. Oekotoxzentrum. URL http://www.ecotoxcentre.ch/ (accessed 10.10.17).
Kassotis, C.D., Alvarez, D.A., Taylor, J.A., vom Saal, F.S., Nagel, S.C., Tillitt, D.E., 2015. Characterization of Missouri surface waters near point sources of pollution reveals potential novel atmospheric route of exposure for bisphenol A and wastewater hormonal activity pattern. Sci. Total Environ. 524–525, 384–393. doi:10.1016/j.scitotenv.2015.04.013
Katsu, Y., Hinago, M., Sone, K., Urushitani, H., Guillette, L.J., Iguchi, T., 2007. In vitro assessment of transcriptional activation of the estrogen and androgen receptors of mosquitofish, Gambusia affinis affinis. Mol. Cell. Endocrinol. 276, 10–17. doi:10.1016/j.mce.2007.06.004
Références
239
Katsu, Y., Lange, A., Miyagawa, S., Urushitani, H., Tatarazako, N., Kawashima, Y., Tyler, C.R., Iguchi, T., 2013. Cloning, expression and functional characterization of carp, Cyprinus carpio, estrogen receptors and their differential activations by estrogens. J. Appl. Toxicol. 33, 41–49. doi:10.1002/jat.1707
Katzenellenbogen, B.S., 2000. Mechanisms of action and cross-talk between estrogen receptor and progesterone receptor pathways. J. Soc. Gynecol. Investig. 7, S33-37.
Kavlock, R., Chandler, K., Houck, K., Hunter, S., Judson, R., Kleinstreuer, N., Knudsen, T., Martin, M., Padilla, S., Reif, D., Richard, A., Rotroff, D., Sipes, N., Dix, D., 2012. Update on EPA’s ToxCast Program: Providing High Throughput Decision Support Tools for Chemical Risk Management. Chem. Res. Toxicol. 25, 1287–1302. doi:10.1021/tx3000939
Kazeto, Y., Ijiri, S., Place, A.R., Zohar, Y., Trant, J.M., 2001. The 5’-flanking regions of CYP19A1 and CYP19A2 in zebrafish. Biochem. Biophys. Res. Commun. 288, 503–508. doi:10.1006/bbrc.2001.5796
Kidd, K.A., Blanchfield, P.J., Mills, K.H., Palace, V.P., Evans, R.E., Lazorchak, J.M., Flick, R.W., 2007. Collapse of a fish population after exposure to a synthetic estrogen. Proc. Natl. Acad. Sci. U. S. A. 104, 8897–8901. doi:10.1073/pnas.0609568104
Kim, S.-H., Hwang, K.-A., Choi, K.-C., 2016. Treatment with kaempferol suppresses breast cancer cell growth caused by estrogen and triclosan in cellular and xenograft breast cancer models. J. Nutr. Biochem. 28, 70–82. doi:10.1016/j.jnutbio.2015.09.027
Kinani, S., Bouchonnet, S., Bourcier, S., Creusot, N., Porcher, J.-M., Aït-Aïssa, S., 2008. Extraction and purification procedures for simultaneous quantification of phenolic xenoestrogens and steroid estrogens in river sediment by gas chromatography/ion trap mass spectrometry. Rapid Commun. Mass Spectrom. RCM 22, 3651–3661. doi:10.1002/rcm.3771
Kinani, S., Bouchonnet, S., Creusot, N., Bourcier, S., Balaguer, P., Porcher, J.-M., Aït-Aïssa, S., 2010. Bioanalytical characterisation of multiple endocrine- and dioxin-like activities in sediments from reference and impacted small rivers. Environ. Pollut. Barking Essex 1987 158, 74–83. doi:10.1016/j.envpol.2009.07.041
Kiyama, R., Wada-Kiyama, Y., 2015. Estrogenic endocrine disruptors: Molecular mechanisms of action. Environ. Int. 83, 11–40. doi:10.1016/j.envint.2015.05.012
Kjærstad, M.B., Taxvig, C., Nellemann, C., Vinggaard, A.M., Andersen, H.R., 2010. Endocrine disrupting effects in vitro of conazole antifungals used as pesticides and pharmaceuticals. Reprod. Toxicol. 30, 573–582. doi:10.1016/j.reprotox.2010.07.009
Kjeldsen, L.S., Ghisari, M., Bonefeld-Jørgensen, E.C., 2013. Currently used pesticides and their mixtures affect the function of sex hormone receptors and aromatase enzyme activity. Toxicol. Appl. Pharmacol. 272, 453–464. doi:10.1016/j.taap.2013.06.028
Klinge, C.M., Bowers, J.L., Kulakosky, P.C., Kamboj, K.K., Swanson, H.I., 1999. The aryl hydrocarbon receptor (AHR)/AHR nuclear translocator (ARNT) heterodimer interacts with naturally occurring estrogen response elements. Mol. Cell. Endocrinol. 157, 105–119.
Kojima, H., Takeuchi, S., Itoh, T., Iida, M., Kobayashi, S., Yoshida, T., 2013. In vitro endocrine disruption potential of organophosphate flame retardants via human nuclear receptors. Toxicology 314, 76–83. doi:10.1016/j.cox.2013.09.004
Kojima, H., Takeuchi, S., Van den Eede, N., Coyaci, A., 2016. Effects of primary metabolites of organophosphate flame retardants on transcriptional activity via human nuclear receptors. Toxicol. Lett. 245, 31–39. doi:10.1016/j.toxlet.2016.01.004
Kojima, M., * K.F., Sasaki, M., Nakamura, M., Tsuji, M., Nishiyama, T., 2005. Evaluation of estrogenic activities of pesticides using an in vitro reporter gene assay. Int. J. Environ. Health Res. 15, 271–280. doi:10.1080/09603120500155765
Kolpin, D.W., Furlong, E.T., Meyer, M.T., Thurman, E.M., Zaugg, S.D., Barber, L.B., Buxton, H.T., 2002. Pharmaceuticals, hormones, and other organic wastewater contaminants in. Environ. Sci. Technol. 36, 1202–1211. doi:10.1021/es011055j

Références
240
König, M., Escher, B.I., Neale, P.A., Krauss, M., Hilscherová, K., Novák, J., Teodorović, I., Schulze, T., Seidensticker, S., Kamal Hashmi, M.A., Ahlheim, J., Brack, W., 2017. Impact of untreated wastewater on a major European river evaluated with a combination of in vitro bioassays and chemical analysis. Environ. Pollut. Barking Essex 1987 220, 1220–1230. doi:10.1016/j.envpol.2016.11.011
Kortenkamp, A., 2007. Ten Years of Mixing Cocktails: A Review of Combination Effects of Endocrine-Disrupting Chemicals. Environ. Health Perspect. 115, 98–105. doi:10.1289/ehp.9357
Kortenkamp, A., Altenburger, R., 1998. Synergisms with mixtures of xenoestrogens: a reevaluation using the method of isoboles. Sci. Total Environ. 221, 59–73.
Kotrschal, K., Staaden, M.J.V., Huber, R., 1998. Fish Brains: Evolution and Anvironmental Relationships. Rev. Fish Biol. Fish. 8, 373–408. doi:10.1023/A:1008839605380
Kuiper, G.G., Enmark, E., Pelto-Huikko, M., Nilsson, S., Gustafsson, J.A., 1996. Cloning of a novel receptor expressed in rat prostate and ovary. Proc. Natl. Acad. Sci. U. S. A. 93, 5925–5930.
Kunz, P.Y., Fent, K., 2009. Estrogenic activity of ternary UV filter mixtures in fish (Pimephales promelas) — An analysis with nonlinear isobolograms. Toxicol. Appl. Pharmacol. 234, 77–88. doi:10.1016/j.taap.2008.09.032
Kunz, P.Y., Fent, K., 2006. Estrogenic activity of UV filter mixtures. Toxicol. Appl. Pharmacol. 217, 86–99. doi:10.1016/j.taap.2006.07.014
Kunz, P.Y., Kienle, C., Carere, M., Homazava, N., Kase, R., 2015. In vitro bioassays to screen for endocrine active pharmaceuticals in surface and waste waters. J. Pharm. Biomed. Anal. 106, 107–115. doi:10.1016/j.jpba.2014.11.018
Kunz, P.Y., Simon, E., Creusot, N., Jayasinghe, B.S., Kienle, C., Maletz, S., Schifferli, A., Schönlau, C., Aït-Aïssa, S., Denslow, N.D., Hollert, H., Werner, I., Vermeirssen, E.L.M., 2017. Effect-based tools for monitoring estrogenic mixtures: Evaluation of five in vitro bioassays. Water Res. 110, 378–388. doi:10.1016/j.watres.2016.10.062
Kurauchi, K., Nakaguchi, Y., Tsutsumi, M., Hori, H., Kurihara, R., Hashimoto, S., Ohnuma, R., Yamamoto, Y., Matsuoka, S., Kawai, S., Hirata, T., Kinoshita, M., 2005. In vivo Visual Reporter System for Detection of Estrogen-Like Substances by Transgenic Medaka. Environ. Sci. Technol. 39, 2762–2768. doi:10.1021/es0486465
Lange, A., Katsu, Y., Miyagawa, S., Ogino, Y., Urushitani, H., Kobayashi, T., Hirai, T., Shears, J.A., Nagae, M., Yamamoto, J., Ohnishi, Y., Oka, T., Tatarazako, N., Ohta, Y., Tyler, C.R., Iguchi, T., 2012. Comparative responsiveness to natural and synthetic estrogens of fish species commonly used in the laboratory and field monitoring. Aquat. Toxicol. 109, 250–258. doi:10.1016/j.aquatox.2011.09.004
Laronde, S., Petit, K., 2010. Bilan national des efforts de surveillance de la qualité des cours d’eau. ONEMA.
Laudet, V., 1997. Evolution of the nuclear receptor superfamily: early diversification from an ancestral orphan receptor. J. Mol. Endocrinol. 19, 207–226.
Le Fol, V., Aït-Aïssa, S., Cabaton, N., Dolo, L., Grimaldi, M., Balaguer, P., Perdu, E., Debrauwer, L., Brion, F., Zalko, D., 2015. Cell-specific biotransformation of benzophenone-2 and bisphenol-s in zebrafish and human in vitro models used for toxicity and estrogenicity screening. Environ. Sci. Technol. 49, 3860–3868. doi:10.1021/es505302c
Le Fol, V., Aït-Aïssa, S., Sonavane, M., Porcher, J.-M., Balaguer, P., Cravedi, J.-P., Zalko, D., Brion, F., 2017a. In vitro and in vivo estrogenic activity of BPA, BPF and BPS in zebrafish-specific assays. Ecotoxicol. Environ. Saf. 142, 150–156. doi:10.1016/j.ecoenv.2017.04.009
Le Fol, V., Brion, F., Hillenweck, A., Perdu, E., Bruel, S., Aït-Aïssa, S., Cravedi, J.-P., Zalko, D., 2017b. Comparison of the In vivo Biotransformation of Two Emerging Estrogenic Contaminants, BP2 and BPS, in Zebrafish Embryos and Adults. Int. J. Mol. Sci. 18. doi:10.3390/ijms18040704
Références
241
Le Page, Y., Menuet, A., Kah, O., Pakdel, F., 2008. Characterization of a cis-acting element involved in cell-specific expression of the zebrafish brain aromatase gene. Mol. Reprod. Dev. 75, 1549–1557. doi:10.1002/mrd.20892
Le Page, Y., Scholze, M., Kah, O., Pakdel, F., 2006. Assessment of Xenoestrogens Using Three Distinct Estrogen Receptors and the Zebrafish Brain Aromatase Gene in a Highly Responsive Glial Cell System. Environ. Health Perspect. 114, 752–758. doi:10.1289/ehp.8141
Lee, O., Green, J.M., Tyler, C.R., 2015. Transgenic fish systems and their application in ecotoxicology. Crit. Rev. Toxicol. 45, 124–141. doi:10.3109/10408444.2014.965805
Lee, O., Takesono, A., Tada, M., Tyler, C.R., Kudoh, T., 2012. Biosensor Zebrafish Provide New Insights into Potential Health Effects of Environmental Estrogens. Environ. Health Perspect. 120, 990–996. doi:10.1289/ehp.1104433
Lee Pow, C.S.D., Yost, E.E., Aday, D., Kullman, S.W., 2016. Sharing the Roles: An Assessment of Japanese Medaka Estrogen Receptors in Vitellogenin Induction. Environ. Sci. Technol. doi:10.1021/acs.est.6b01968
Lee, Y., Jin, Y., Lim, W., Ji, S., Choi, S., Jang, S., Lee, S., 2003. A ginsenoside-Rh1, a component of ginseng saponin, activates estrogen receptor in human breast carcinoma MCF-7 cells. J. Steroid Biochem. Mol. Biol. 84, 463–468.
Legler, J., Broekhof, J.L.M., Brouwer, A., Lanser, P.H., Murk, A.J., van der Saag, P.T., Vethaak, A.D., Wester, P., Zivkovic, D., van der Burg, B., 2000. A Novel in vivo Bioassay for (Xeno-)estrogens Using Transgenic Zebrafish. Environ. Sci. Technol. 34, 4439–4444. doi:10.1021/es0000605
Legler, J., van den Brink, C.E., Brouwer, A., Murk, A.J., van der Saag, P.T., Vethaak, A.D., van der Burg, B., 1999. Development of a stably transfected estrogen receptor-mediated luciferase reporter gene assay in the human T47D breast cancer cell line. Toxicol. Sci. Off. J. Soc. Toxicol. 48, 55–66.
Legler, J., Zeinstra, L.M., Schuitemaker, F., Lanser, P.H., Bogerd, J., Brouwer, A., Vethaak, A.D., De Voogt, P., Murk, A.J., Van der Burg, B., 2002. Comparison of in vivo and in vitro reporter gene assays for short-term screening of estrogenic activity. Environ. Sci. Technol. 36, 4410–4415. doi:10.1021/es010323a
Lemaire, G., Mnif, W., Pascussi, J.M., Pillon, A., Rabenoelina, F., Fenet, H., Gomez, E., Casellas, C., Nicolas, J.C., Cavailles, V., Duchesne, M.J., Balaguer, P., 2006. Identification of new human pregnane X receptor ligands among pesticides using a stable reporter cell system. Toxicol. Sci. 91, 501–509. doi:10.1093/toxsci/kfj173
Leusch, F.D.L., De Jager, C., Levi, Y., Lim, R., Puijker, L., Sacher, F., Tremblay, L.A., Wilson, V.S., Chapman, H.F., 2010. Comparison of Five in vitro Bioassays to Measure Estrogenic Activity in Environmental Waters. Environ. Sci. Technol. 44, 3853–3860. doi:10.1021/es903899d
Leusch, F.D.L., Neale, P.A., Hebert, A., Scheurer, M., Schriks, M.C.M., 2017. Analysis of the sensitivity of in vitro bioassays for androgenic, progestagenic, glucocorticoid, thyroid and estrogenic activity: Suitability for drinking and environmental waters. Environ. Int. 99, 120–130. doi:10.1016/j.envint.2016.12.014
Liška, I., Wagner, F., Sengl, M., Deutsch, K., Slobodník, J., 2015. Joint Danube Survey 3. A Comprehensive Analysis of Danube Water Quality. International Commission for the Protection of the Danube River (ICPDR).
Liu, B.Q., Wang, Y.Q., Fillgrove, K.L., Anderson, V.E., 2002. Triclosan inhibits enoyl-reductase of type I fatty acid synthase in vitro and is cytotoxic to MCF-7 and SKBr-3 breast cancer cells. Cancer Chemother. Pharmacol. 49, 187–193. doi:10.1007/s00280-001-0399-x
Loi n° 2004-338 du 21 avril 2004 portant transposition de la directive 2000/60/ CE du Parlement européen et du Conseil du 23 octobre 2000 établissant un cadre pour une politique communautaire dans le domaine de l’eau, n.d.
Loi n° 2006-1772 du 30 décembre 2006 sur l’eau et les milieux aquatiques, n.d.
Loos, R., 2015. Analytical methods for possible WFD 1st watch list substances. Publications Office of the European Union. doi:10.2788/723416
Références
242
Loos, R., Carvalho, R., Antonio, D.C., Cornero, S., Locoro, G., Tavazzi, S., Paracchini, B., Ghiani, M., Lettieri, T., Blaha, L., Jarosova, B., Voorspoels, S., Servaes, K., Haglund, P., Fick, J., Lindberg, R.H., Schwesig, D., Gawlik, B.M., 2013. EU-wide monitoring survey on emerging polar organic contaminants in wastewater treatment plant effluents. Water Res. 47, 6475–6487. doi:10.1016/j.watres.2013.08.024
Loos, R., Gawlik, B.M., Locoro, G., Rimaviciute, E., Contini, S., Bidoglio, G., 2009. EU-wide survey of polar organic persistent pollutants in European river waters. Environ. Pollut. 157, 561–568. doi:10.1016/j.envpol.2008.09.020
Louis, G.W., Hallinger, D.R., Stoker, T.E., 2013. The effect of triclosan on the uterotrophic response to extended doses of ethinyl estradiol in the weanling rat. Reprod. Toxicol. 36, 71–77. doi:10.1016/j.reprotox.2012.12.001
Lubzens, E., Young, G., Bobe, J., Cerdà, J., 2010. Oogenesis in teleosts: How fish eggs are formed. Gen. Comp. Endocrinol., Fish Reproduction 165, 367–389. doi:10.1016/j.ygcen.2009.05.022
Maruya, K.A., Dodder, N.G., Mehinto, A.C., Denslow, N.D., Schlenk, D., Snyder, S.A., Weisberg, S.B., 2016. A tiered, integrated biological and chemical monitoring framework for contaminants of emerging concern in aquatic ecosystems. Integr. Environ. Assess. Manag. 12, 540–547. doi:10.1002/ieam.1702
Matsubara, T., Nagae, M., Ohkubo, N., Andoh, T., Sawaguchi, S., Hiramatsu, N., Sullivan, C.V., Hara, A., 2003. Multiple vitellogenins and their unique roles in marine teleosts. Fish Physiol. Biochem. 28, 295–299. doi:10.1023/B:FISH.0000030559.71954.37
Matthews, J., Celius, T., Halgren, R., Zacharewski, T., 2000. Differential estrogen receptor binding of estrogenic substances: a species comparison. J. Steroid Biochem. Mol. Biol. 74, 223–234. doi:10.1016/S0960-0760(00)00126-6
Matthews, J., Gustafsson, J.-Å., 2006. Estrogen receptor and aryl hydrocarbon receptor signaling pathways. Nucl. Recept. Signal. 4. doi:10.1621/nrs.04016
McDonnell, D.P., Norris, J.D., 2002. Connections and regulation of the human estrogen receptor. Science 296, 1642–1644. doi:10.1126/science.1071884
Medjakovic, S., Zoechling, A., Gerster, P., Ivanova, M.M., Teng, Y., Klinge, C.M., Schildberger, B., Gartner, M., Jungbauer, A., 2014. Effect of nonpersistent pesticides on estrogen receptor, androgen receptor, and aryl hydrocarbon receptor. Environ. Toxicol. 29, 1201–1216. doi:10.1002/tox.21852
Meng, X., Bartholomew, C., Craft, J.A., 2010. Differential expression of vitellogenin and oestrogen receptor genes in the liver of zebrafish, Danio rerio. Anal. Bioanal. Chem. 396, 625–630. doi:10.1007/s00216-009-3112-2
Menuet, A., Le Page, Y., Torres, O., Kern, L., Kah, O., Pakdel, F., 2004. Analysis of the estrogen regulation of the zebrafish estrogen receptor (ER) reveals distinct effects of ERα, ERbeta1 and ERbeta2. J. Mol. Endocrinol. 32, 975–986.
Menuet, A., Pellegrini, E., Anglade, I., Blaise, O., Laudet, V., Kah, O., Pakdel, F., 2002. Molecular characterization of three estrogen receptor forms in zebrafish: Binding characteristics, transactivation properties, and tissue distributions. Biol. Reprod. 66, 1881–1892. doi:10.1095/biolreprod66.6.1881
Menuet, A., Pellegrini, E., Brion, F., Gueguen, M.M., Anglade, I., Pakdel, F., Kah, O., 2005. Expression and estrogen-dependent regulation of the zebrafish brain aromatase gene. J. Comp. Neurol. 485, 304–320. doi:10.1002/cne.20497
Miège, C., Gabet, V., Coquery, M., Karolak, S., Jugan, M.-L., Oziol, L., Levi, Y., Chevreuil, M., 2009. Evaluation of estrogenic disrupting potency in aquatic environments and urban wastewaters by combining chemical and biological analysis. TrAC Trends Anal. Chem., In-situ trialing and validation of ecological and chemical water measurements 28, 186–195. doi:10.1016/j.trac.2008.11.007
Mills, L.J., Chichester, C., 2005. Review of evidence: Are endocrine-disrupting chemicals in the aquatic environment impacting fish populations? Sci. Total Environ. 343, 1–34. doi:10.1016/j.scitotenv.2004.12.070

Références
243
Miranda, C.L., Collodi, P., Zhao, X., Barnes, D.W., Buhler, D.R., 1993. Regulation of Cytochrome P450 Expression in a Novel Liver Cell Line from Zebrafish (Brachydanio rerio). Arch. Biochem. Biophys. 305, 320–327. doi:10.1006/abbi.1993.1429
Miyagawa, S., Lange, A., Hirakawa, I., Tohyama, S., Ogino, Y., Mizutani, T., Kagami, Y., Kusano, T., Ihara, M., Tanaka, H., Tatarazako, N., Ohta, Y., Katsu, Y., Tyler, C.R., Iguchi, T., 2014. Differing species responsiveness of estrogenic contaminants in fish is conferred by the ligand binding domain of the estrogen receptor. Environ. Sci. Technol. 48, 5254–5263. doi:10.1021/es5002659
Mnif, W., Pascussi, J.-M., Pillon, A., Escande, A., Bartegi, A., Nicolas, J.-C., Cavaillès, V., Duchesne, M.-J., Balaguer, P., 2007. Estrogens and antiestrogens activate hPXR. Toxicol. Lett. 170, 19–29. doi:10.1016/j.toxlet.2006.11.016
Molina-Molina, J.-M., Escande, A., Pillon, A., Gomez, E., Pakdel, F., Cavaillès, V., Olea, N., Aït-Aïssa, S., Balaguer, P., 2008. Profiling of benzophenone derivatives using fish and human estrogen receptor-specific in vitro bioassays. Toxicol. Appl. Pharmacol. 232, 384–395. doi:10.1016/j.taap.2008.07.017
Mortensen, A.S., Arukwe, A., 2008. Estrogenic effect of dioxin-like aryl hydrocarbon receptor (AhR) agonist (PCB congener 126) in salmon hepatocytes. Mar. Environ. Res. 66, 119–120. doi:10.1016/j.marenvres.2008.02.041
Mortensen, A.S., Arukwe, A., 2007. Interactions Between Estrogen- and Ah-Receptor Signalling Pathways in Primary Culture of Salmon Hepatocytes Exposed to Nonylphenol and 3,3’,4,4’-Tetrachlorobiphenyl (Congener 77). Comp. Hepatol. 6, 2. doi:10.1186/1476-5926-6-2
Mortensen, A.S., Tolfsen, C.C., Arukwe, A., 2006. Gene Expression Patterns in Estrogen (Nonylphenol) and Aryl Hydrocarbon Receptor Agonists (PCB-77) Interaction Using Rainbow Trout (Oncorhynchus Mykiss) Primary Hepatocyte Culture. J. Toxicol. Environ. Health A 69, 1–19. doi:10.1080/15287390500257792
Mouriec, K., Gueguen, M.-M., Manuel, C., Percevault, F., Thieulant, M.-L., Pakdel, F., Kah, O., 2009. Androgens Upregulate cyp19a1b (Aromatase B) Gene Expression in the Brain of Zebrafish (Danio rerio) Through Estrogen Receptors. Biol. Reprod. 80, 889–896. doi:10.1095/biolreprod.108.073643
Mouriec, K., Lareyre, J.J., Tong, S.K., Le Page, Y., Vaillant, C., Pellegrini, E., Pakdel, F., Chung, B.C., Kah, O., Anglade, I., 2009. Early regulation of brain aromatase (cyp19a1b) by estrogen receptors during zebrafish development. Dev. Dyn. Off. Publ. Am. Assoc. Anat. 238, 2641–2651. doi:10.1002/dvdy.22069
Murk, A.J., Legler, J., van Lipzig, M.M.H., Meerman, J.H.N., Belfroid, A.C., Spenkelink, A., van der Burg, B., Rijs, G.B.J., Vethaak, D., 2002. Detection of estrogenic potency in wastewater and surface water with three in vitro bioassays. Environ. Toxicol. Chem. 21, 16–23. doi:10.1002/etc.5620210103
Nagahama, Y., 2002. Endocrine regulation of gametogenesis in fish. Int. J. Dev. Biol. 38, 217–229. doi:10.1387/ijdb.7981031
Nagler, J.J., Cavileer, T., Sullivan, J., Cyr, D.G., Rexroad, C., 2007. The complete nuclear estrogen receptor family in the rainbow trout: Discovery of the novel ERα2 and both ERβ isoforms. Gene 392, 164–173. doi:10.1016/j.gene.2006.12.030
Nakada, N., Nyunoya, H., Nakamura, M., Hara, A., Iguchi, T., Takada, H., 2004. Identification of estrogenic compounds in wastewater effluent. Environ. Toxicol. Chem. 23, 2807–2815. doi:10.1897/03-699.1
Navas, J.M., Segner, H., 2000a. Modulation of trout 7-ethoxyresorufin-O-deethylase (EROD) activity by estradiol and octylphenol. Mar. Environ. Res. 50, 157–162.
Navas, J.M., Segner, H., 2000b. Antiestrogenicity of beta-naphthoflavone and PAHs in cultured rainbow trout hepatocytes: evidence for a role of the arylhydrocarbon receptor. Aquat. Toxicol. 51, 79–92. doi:10.1016/S0166-445X(00)00100-4
Navas, J.M., Zanuy, S., Segner, H., Carrillo, M., 2004. beta-Naphthoflavone alters normal plasma levels of vitellogenin, 17 beta-estradiol and luteinizing hormone in sea bass broodstock. Aquat. Toxicol. 67, 337–345. doi:10.1016/j.aquatox.2004.01.016
Références
244
Neale, P.A., Ait-Aissa, S., Brack, W., Creusot, N., Denison, M.S., Deutschmann, B., Hilscherova, K., Hollert, H., Krauss, M., Novak, J., Schulze, T., Seiler, T.-B., Serra, H., Shao, Y., Escher, B.I., 2015. Linking in vitro Effects and Detected Organic Micropollutants in Surface Water Using Mixture-Toxicity Modeling. Environ. Sci. Technol. 49, 14614–14624. doi:10.1021/acs.est.5b04083
Neale, P.A., Altenburger, R., Aït-Aïssa, S., Brion, F., Busch, W., de Aragão Umbuzeiro, G., Denison, M.S., Du Pasquier, D., Hilscherová, K., Hollert, H., Morales, D.A., Novák, J., Schlichting, R., Seiler, T.-B., Serra, H., Shao, Y., Tindall, A.J., Tollefsen, K.E., Williams, T.D., Escher, B.I., 2017a. Development of a bioanalytical test battery for water quality monitoring: Fingerprinting identified micropollutants and their contribution to effects in surface water. Water Res. 123, 734–750. doi:10.1016/j.watres.2017.07.016
Neale, P.A., Munz, N.A., Aїt-Aїssa, S., Altenburger, R., Brion, F., Busch, W., Escher, B.I., Hilscherová, K., Kienle, C., Novák, J., Seiler, T.-B., Shao, Y., Stamm, C., Hollender, J., 2017b. Integrating chemical analysis and bioanalysis to evaluate the contribution of wastewater effluent on the micropollutant burden in small streams. Sci. Total Environ. 576, 785–795. doi:10.1016/j.scitotenv.2016.10.141
Nelson, E.R., Habibi, H.R., 2013. Estrogen receptor function and regulation in fish and other vertebrates. Gen. Comp. Endocrinol. 192, 15–24. doi:10.1016/j.ygcen.2013.03.032
Nelson, E.R., Habibi, H.R., 2010. Functional significance of nuclear estrogen receptor subtypes in the liver of goldfish. Endocrinology 151, 1668–1676. doi:10.1210/en.2009-1447
Noda, M., 2015. Possible role of glial cells in the relationship between thyroid dysfunction and mental disorders. Front. Cell. Neurosci. 9, 194. doi:10.3339/fncel.2015.00194
Norris, D.O., Carr, J.A., 2013. Vertebrate Endocrinology. Academic Press.
OECD, 2015a. Essai n° 493 : Ligne directrice axée sur la performance pour les essais in vitro faisant appel au récepteur d’oestrogène recombinant humain (hrER) pour la détection des substances ayant une affinité de liaison avec les récepteurs des oestrogènes. Organisation for Economic Co-operation and Development, Paris.
OECD, 2015b. Test No. 240: Étude étendue de toxicité pour la reproduction sur une génération chez médaka (MEOGRT). Organisation for Economic Co-operation and Development, Paris.
OECD, 2011. Test No. 234: Fish Sexual Development Test. Organisation for Economic Co-operation and Development, Paris.
OECD, 2009a. Essai n° 229 : Essai à court terme de reproduction des poissons. Organisation for Economic Co-operation and Development, Paris.
OECD, 2009b. Test No. 230: 21-day Fish Assay. Organisation for Economic Co-operation and Development, Paris.
Ohtake, F., Takeyama, K., Matsumoto, T., Kitagawa, H., Yamamoto, Y., Nohara, K., Tohyama, C., Krust, A., Mimura, J., Chambon, P., Yanagisawa, J., Fujii-Kuriyama, Y., Kato, S., 2003. Modulation of oestrogen receptor signalling by association with the activated dioxin receptor. Nature 423, 545–550. doi:10.1038/nature01606
Orvos, D.R., Versteeg, D.J., Inauen, J., Capdevielle, M., Rothenstein, A., Cunningham, V., 2002. Aquatic toxicity of triclosan. Environ. Toxicol. Chem. 21, 1338–1349. doi:10.1897/1551-5028(2002)021<1338:ATOT>2.0.CO;2
Park, B.K., Gonzales, E.L.T., Yang, S.M., Bang, M., Choi, C.S., Shin, C.Y., 2016. Effects of Triclosan on Neural Stem Cell Viability and Survival. Biomol. Ther. 24, 99–107. doi:10.4062/biomolther.2015.164
Pasmanik, M., Callard, G.V., 1988. Changes in Brain Aromatase and 5α-Reductase Activities Correlate Significantly with Seasonal Reproductive Cycles in Goldfish (Carassius auratus). Endocrinology 122, 1349–1356. doi:10.1210/endo-122-4-1349
Pasmanik, M., Callard, G.V., 1985. Aromatase and 5 α-reductase in the teleost brain, spinal cord, and pituitary gland. Gen. Comp. Endocrinol. 60, 244–251.

Références
245
Pawlowski, S., Ternes, T., Bonerz, M., Kluczka, T., van der Burg, B., Nau, H., Erdinger, L., Braunbeck, T., 2003. Combined in situ and in vitro assessment of the estrogenic activity of sewage and surface water samples. Toxicol. Sci. 75, 57–65. doi:10.1093/toxsci/kfg162
Payne, J., Rajapakse, N., Wilkins, M., Kortenkamp, A., 2000. Prediction and assessment of the effects of mixtures of four xenoestrogens. Environ. Health Perspect. 108, 983–987.
Pellegrini, E., Diotel, N., Vaillant-Capitaine, C., Pérez Maria, R., Gueguen, M.-M., Nasri, A., Cano Nicolau, J., Kah, O., 2016. Steroid modulation of neurogenesis: Focus on radial glial cells in zebrafish. J. Steroid Biochem. Mol. Biol., SI:Steroids & Nervous System 160, 27–36. doi:10.1016/j.jsbmb.2015.06.011
Pellegrini, E., Menuet, A., Lethimonier, C., Adrio, F., Gueguen, M.-M., Tascon, C., Anglade, I., Pakdel, F., Kah, O., 2005. Relationships between aromatase and estrogen receptors in the brain of teleost fish. Gen. Comp. Endocrinol., 5th International Symposium on Fish Endocrynology 142, 60–66. doi:10.1016/j.ygcen.2004.12.003
Pellegrini, E., Mouriec, K., Anglade, I., Menuet, A., Le Page, Y., Gueguen, M.-M., Marmignon, M.-H., Brion, F., Pakdel, F., Kah, O., 2007. Identification of aromatase-positive radial glial cells as progenitor cells in the ventricular layer of the forebrain in zebrafish. J. Comp. Neurol. 501, 150–167. doi:10.1002/cne.21222
Petersen, K., Fetter, E., Kah, O., Brion, F., Scholz, S., Tollefsen, K.E., 2013. Transgenic (cyp19a1b-GFP) zebrafish embryos as a tool for assessing combined effects of oestrogenic chemicals. Aquat. Toxicol. 138, 88–97. doi:10.1016/j.aquatox.2013.05.001
Petersen, K., Tollefsen, K.E., 2011. Assessing combined toxicity of estrogen receptor agonists in a primary culture of rainbow trout (Oncorhynchus mykiss) hepatocytes. Aquat. Toxicol. Amst. Neth. 101, 186–195. doi:10.1016/j.aquatox.2010.09.018
Petit, F., Le Goff, P., Cravedi, J.P., Valotaire, Y., Pakdel, F., 1997. Two complementary bioassays for screening the estrogenic potency of xenobiotics: recombinant yeast for trout estrogen receptor and trout hepatocyte cultures. J. Mol. Endocrinol. 19, 321–335. doi:10.1677/jme.0.0190321
Petit, F., Valotaire, Y., Pakdel, F., 1995. Differential functional activities of rainbow trout and human estrogen receptors expressed in the yeast Saccharomyces cerevisiae. Eur. J. Biochem. 233, 584–592.
Petrovic, M., Eljarrat, E., Alda, M.J.L. de, Barceló, D., 2004. Endocrine disrupting compounds and other emerging contaminants in the environment: A survey on new monitoring strategies and occurrence data. Anal. Bioanal. Chem. 378, 549–562. doi:10.1007/s00216-003-2184-7
Pillon, A., Boussioux, A.-M., Escande, A., Aït-Aïssa, S., Gomez, E., Fenet, H., Ruff, M., Moras, D., Vignon, F., Duchesne, M.-J., Casellas, C., Nicolas, J.-C., Balaguer, P., 2005. Binding of Estrogenic Compounds to Recombinant Estrogen Receptor-α: Application to Environmental Analysis. Environ. Health Perspect. 113, 278–284. doi:10.1289/ehp.7522
Pinto, C., Grimaldi, M., Boulahtouf, A., Pakdel, F., Brion, F., Aït-Aïssa, S., Cavaillès, V., Bourguet, W., Gustafsson, J.-A., Bondesson, M., Balaguer, P., 2014. Selectivity of natural, synthetic and environmental estrogens for zebrafish estrogen receptors. Toxicol. Appl. Pharmacol. 280, 60–69. doi:10.1016/j.taap.2014.07.020
Pinto, P.I.S., Guerreiro, E.M., Power, D.M., 2013. Triclosan interferes with the thyroid axis in the zebrafish (Danio rerio). Toxicol. Res. 2, 60–69. doi:10.1039/c2tx20005h
Plan micropolluants 2016-2021 pour préserver la qualité des eaux et de la biodiversité, 2016.
Pons, M., Gagne, D., Nicolas, J.C., Mehtali, M., 1990. A new cellular model of response to estrogens: a bioluminescent test to characterize (anti) estrogen molecules. BioTechniques 9, 450–459.
Prochazkova, T., Sychrova, E., Javurkova, B., Vecerkova, J., Kohoutek, J., Lepsova-Skacelova, O., Blaha, L., Hilscherova, K., 2017. Phytoestrogens and sterols in waters with cyanobacterial blooms - Analytical methods and estrogenic potencies. Chemosphere 170, 104–112. doi:10.1016/j.chemosphere.2016.12.006

Références
246
Prossnitz, E.R., Barton, M., 2011. The G protein-coupled estrogen receptor GPER in health and disease. Nat. Rev. Endocrinol. 7, 715–726. doi:10.1038/nrendo.2011.122
Rajapakse, N., Ong, D., Kortenkamp, A., 2001. Defining the Impact of Weakly Estrogenic Chemicals on the Action of Steroidal Estrogens. Toxicol. Sci. 60, 296–304. doi:10.1093/toxsci/60.2.296
Rajapakse, N., Silva, E., Kortenkamp, A., 2002. Combining xenoestrogens at levels below individual no-observed-effect concentrations dramatically enhances steroid hormone action. Environ. Health Perspect. 110, 917–921.
Rajapakse, N., Silva, E., Scholze, M., Kortenkamp, A., 2004. Deviation from additivity with estrogenic mixtures containing 4-nonylphenol and 4-tert-octylphenol detected in the E-SCREEN assay. Environ. Sci. Technol. 38, 6343–6352.
Raut, S.A., Angus, R.A., 2010. Triclosan Has Endocrine-Disrupting Effects in Male Western Mosquitofish, Gambusia Affinis. Environ. Toxicol. Chem. 29, 1287–1291. doi:10.1002/etc.150
Reading, B.J., Hiramatsu, N., Sawaguchi, S., Matsubara, T., Hara, A., Lively, M.O., Sullivan, C.V., 2009. Conserved and Variant Molecular and Functional Features of Multiple Egg Yolk Precursor Proteins (Vitellogenins) in White Perch (Morone americana) and other Teleosts. Mar. Biotechnol. 11, 169. doi:10.1007/s10126-008-9133-6
Rider, C.V., Hartig, P.C., Cardon, M.C., Wilson, V.S., 2009. Comparison of chemical binding to recombinant fathead minnow and human estrogen receptors α in whole cell and cell-free binding assays. Environ. Toxicol. Chem. 28, 2175–2181. doi:10.1897/09-018.1
Roberts, J., Bain, P.A., Kumar, A., Hepplewhite, C., Ellis, D.J., Christy, A.G., Beavis, S.G., 2015. Tracking multiple modes of endocrine activity in Australia’s largest inland sewage treatment plant and effluent- receiving environment using a panel of in vitro bioassays. Environ. Toxicol. Chem. 34, 2271–2281. doi:10.1002/etc.3051
Rogers, J.M., Denison, M.S., 2000. Recombinant cell bioassays for endocrine disruptors: development of a stably transfected human ovarian cell line for the detection of estrogenic and anti-estrogenic chemicals. In Vitr. Mol. Toxicol. 13, 67–82.
Routledge, E.J., Sumpter, J.P., 1996a. Estrogenic activity of surfactants and some of their degradation products assessed using a recombinant yeast screen. Environ. Toxicol. Chem. 15, 241–248. doi:10.1002/etc.5620150303
Routledge, E.J., Sumpter, J.P., 1996b. Estrogenic activity of surfactants and some of their degradation products assessed using a recombinant yeast screen. Environ. Toxicol. Chem. 15, 241–248. doi:10.1002/etc.5620150303
Routledge, E.J., White, R., Parker, M.G., Sumpter, J.P., 2000. Differential Effects of Xenoestrogens on Coactivator Recruitment by Estrogen Receptor (ER) α and ERβ. J. Biol. Chem. 275, 35986–35993. doi:10.1074/jbc.M006777200
Rüegg, J., Swedenborg, E., Wahlström, D., Escande, A., Balaguer, P., Pettersson, K., Pongratz, I., 2008. The transcription factor aryl hydrocarbon receptor nuclear translocator functions as an estrogen receptor beta-selective coactivator, and its recruitment to alternative pathways mediates antiestrogenic effects of dioxin. Mol. Endocrinol. Baltim. Md 22, 304–316. doi:10.1210/me.2007-0128
Rutishauser, B.V., Pesonen, M., Escher, B.I., Ackermann, G.E., Aerni, H.-R., Suter, M.J.-F., Eggen, R.I.L., 2004. Comparative analysis of estrogenic activity in sewage treatment plant effluents involving three in vitro assays and chemical analysis of steroids. Environ. Toxicol. Chem. 23, 857–864. doi:10.1897/03-286
Sabo-Attwood, T., Blum, J.L., Kroll, K.J., Patel, V., Birkholz, D., Szabo, N.J., Fisher, S.Z., McKenna, R., Campbell-Thompson, M., Denslow, N.D., 2007. Distinct expression and activity profiles of largemouth bass (Micropterus salmoides) estrogen receptors in response to estradiol and nonylphenol. J. Mol. Endocrinol. 39, 223–237. doi:10.1677/JME-07-0038

Références
247
Safe, S., Wormke, M., Samudio, I., 2000. Mechanisms of inhibitory aryl hydrocarbon receptor-estrogen receptor crosstalk in human breast cancer cells. J. Mammary Gland Biol. Neoplasia 5, 295–306.
Salam, M.A., Sawada, T., Ohya, T., Ninomiya, K., Hayashi, S., 2008. Detection of environmental estrogenicity using transgenic medaka hatchlings (Oryzias latipes) expressing the GFP-tagged choriogenin L Gene. J. Environ. Sci. Health Part A 43, 272–277. doi:10.1080/10934520701792761
Sanchez, W., Sremski, W., Piccini, B., Palluel, O., Maillot-Maréchal, E., Betoulle, S., Jaffal, A., Aït-Aïssa, S., Brion, F., Thybaud, E., Hinfray, N., Porcher, J.-M., 2011. Adverse effects in wild fish living downstream from pharmaceutical manufacture discharges. Environ. Int. 37, 1342–1348. doi:10.1016/j.envint.2011.06.002
Sanderson, T., van, den B.M., 2009. Interactions of xenobiotics with the steroid hormone biosynthesis pathway. Pure Appl. Chem. 75, 1957–1971. doi:10.1351/pac200375111957
Schlotz, N., Kim, G.-J., Jäger, S., Günther, S., Lamy, E., 2017. In vitro observations and in silico predictions of xenoestrogen mixture effects in T47D-based receptor transactivation and proliferation assays. Toxicol. In vitro. doi:10.1016/j.tiv.2017.08.017
Schnitzler, J.G., Frédérich, B., Dussenne, M., Klaren, P.H.M., Silvestre, F., Das, K., 2016. Triclosan exposure results in alterations of thyroid hormone status and retarded early development and metamorphosis in Cyprinodon variegatus. Aquat. Toxicol. 181, 1–10. doi:10.1016/j.aquatox.2016.10.019
Scholz, S., Kurauchi, K., Kinoshita, M., Oshima, Y., Ozato, K., Schirmer, K., Wakamatsu, Y., 2005. Analysis of estrogenic effects by quantification of green fluorescent protein in juvenile fish of a transgenic medaka. Environ. Toxicol. Chem. 24, 2553–2561. doi:10.1897/04-525R.1
Scholze, M., Boedeker, W., Faust, M., Backhaus, T., Altenburger, R., Grimme, L.H., 2001. A general best-fit method for concentration-response curves and the estimation of low-effect concentrations. Environ. Toxicol. Chem. 20, 448–457.
Scholze, M., Silva, E., Kortenkamp, A., 2014. Extending the Applicability of the Dose Addition Model to the Assessment of Chemical Mixtures of Partial Agonists by Using a Novel Toxic Unit Extrapolation Method. PLOS ONE 9, e88808. doi:10.1371/journal.pone.0088808
Schultz, M.M., Bartell, S.E., Schoenfuss, H.L., 2012. Effects of triclosan and triclocarban, two ubiquitous environmental contaminants, on anatomy, physiology, and behavior of the fathead minnow (Pimephales promelas). Arch. Environ. Contam. Toxicol. 63, 114–124. doi:10.1007/s00244-011-9748-x
Schulz, R.W., de França, L.R., Lareyre, J.-J., LeGac, F., Chiarini-Garcia, H., Nobrega, R.H., Miura, T., 2010. Spermatogenesis in fish. Gen. Comp. Endocrinol., Fish Reproduction 165, 390–411. doi:10.1016/j.ygcen.2009.02.013
Schulze, T., Ahel, M., Ahlheim, J., Aït-Aïssa, S., Brion, F., Di Paolo, C., Froment, J., Hidasi, A.O., Hollender, J., Hollert, H., Hu, M., Kloß, A., Koprivica, S., Krauss, M., Muz, M., Oswald, P., Pêtre, M., Schollée, J.E., Seiler, T.-B., Shao, Y., Slobodnik, J., Sonavane, M., Suter, M.J.-F., Tollefsen, K.E., Tousova, Z., Walz, K.-H., Brack, W., 2017. Assessment of a novel device for onsite integrative large-volume solid phase extraction of water samples to enable a comprehensive chemical and effect-based analysis. Sci. Total Environ. 581, 350–358. doi:10.1016/j.scitotenv.2016.12.140
Scientific committee on consumer safety (SCCS), 2010. Opinion on triclosan - Antimicrobial resistance (No. SCCP/1251/09).
Scott, P.D., Coleman, H.M., Colville, A., Lim, R., Matthews, B., McDonald, J.A., Miranda, A., Neale, P.A., Nugegoda, D., Tremblay, L.A., Leusch, F.D.L., 2017. Assessing the potential for trace organic contaminants commonly found in Australian rivers to induce vitellogenin in the native rainbowfish (Melanotaenia fluviatilis) and the introduced mosquitofish (Gambusia holbrooki). Aquat. Toxicol. Amst. Neth. 185, 105–120. doi:10.1016/j.aquatox.2017.02.008
Seeger, B., Klawonn, F., Bekale, B.N., Steinberg, P., 2016. Mixture Effects of Estrogenic Pesticides at the Human Estrogen Receptor α and β. PLOS ONE 11, e0147490. doi:10.1371/journal.pone.0147490

Références
248
Segner, H., Casanova-Nakayama, A., Kase, R., Tyler, C.R., 2013. Impact of environmental estrogens on fish considering the diversity of estrogen signaling. Gen. Comp. Endocrinol. 191, 190–201. doi:10.1016/j.ygcen.2013.05.015
Shanle, E.K., Xu, W., 2011. Endocrine disrupting chemicals targeting estrogen receptor signaling: Identification and mechanisms of action. Chem. Res. Toxicol. 24, 6–19. doi:10.1021/tx100231n
Sharma, V.K., Anquandah, G.A.K., Yngard, R.A., Kim, H., Fekete, J., Bouzek, K., Ray, A.K., Golovko, D., 2009. Nonylphenol, octylphenol, and bisphenol-A in the aquatic environment: A review on occurrence, fate, and treatment. J. Environ. Sci. Health Part A 44, 423–442. doi:10.1080/10934520902719704
Silva, E., Rajapakse, N., Kortenkamp, A., 2002. Something from “nothing”--eight weak estrogenic chemicals combined at concentrations below NOECs produce significant mixture effects. Environ. Sci. Technol. 36, 1751–1756.
Silva, E., Rajapakse, N., Scholze, M., Backhaus, T., Ermler, S., Kortenkamp, A., 2011. Joint Effects of Heterogeneous Estrogenic Chemicals in the E-Screen—Exploring the Applicability of Concentration Addition. Toxicol. Sci. 122, 383–394. doi:10.1093/toxsci/kfr103
Smeets, J.M.W., Rankouhi, T.R., Nichols, K.M., Komen, H., Kaminski, N.E., Giesy, J.P., van den Berg, M., 1999. In vitroVitellogenin Production by Carp (Cyprinus carpio) Hepatocytes as a Screening Method for Determining (Anti)Estrogenic Activity of Xenobiotics. Toxicol. Appl. Pharmacol. 157, 68–76. doi:10.1006/taap.1999.8663
Snyder, S.A., Villeneuve, D.L., Snyder, E.M., Giesy, J.P., 2001. Identification and Quantification of Estrogen Receptor Agonists in Wastewater Effluents. Environ. Sci. Technol. 35, 3620–3625. doi:10.1021/es001254n
Sonavane, M. 2015.Intérêt d'une approche combinant bioessais in vitro et in vivo chez le poisson zèbre pour l'identification de perturbateurs endocriniens dans l'environnement aquatiques. Thèse
Sonavane, M., Creusot, N., Maillot-Marechal, E., Pery, A., Brion, F., Ait-Aissa, S., 2016. Zebrafish-based reporter gene assays reveal different estrogenic activities in river waters compared to a conventional human-derived assay. Sci. Total Environ. 550, 934–939. doi:10.1016/j.scitotenv.2016.01.187
Soto, A.M., Sonnenschein, C., Chung, K.L., Fernandez, M.F., Olea, N., Serrano, F.O., 1995. The E-SCREEN assay as a tool to identify estrogens: an update on estrogenic environmental pollutants. Environ. Health Perspect. 103 Suppl 7, 113–122.
Stegeman, J.J., Goldstone, J.V., Hahn, M.E., 2010. 10 - Perspectives on zebrafish as a model in environmental toxicology, in: Perry, S.F., Ekker, M., Farrell, A.P., Brauner, C.J. (Eds.), Fish Physiology, Zebrafish. Academic Press, pp. 367–439. doi:10.1016/S1546-5098(10)02910-9
Stoker, T.E., Gibson, E.K., Zorrilla, L.M., 2010. Triclosan exposure modulates estrogen-dependent responses in the female wistar rat. Toxicol. Sci. Off. J. Soc. Toxicol. 117, 45–53. doi:10.1093/toxsci/kfq180
Sumpter, J.P., 2005. Endocrine disrupters in the aquatic environment: An overview. Acta Hydrochim. Hydrobiol. 33, 9–16. doi:10.1002/aheh.200400555
Sumpter, J.P., Jobling, S., 2013. The occurrence, causes, and consequences of estrogens in the aquatic environment. Environ. Toxicol. Chem. 32, 249–251. doi:10.1002/etc.2084
Sun, L., Zha, J., Wang, Z., 2009. Effects of binary mixtures of estrogen and antiestrogens on Japanese medaka (Oryzias latipes). Aquat. Toxicol. 93, 83–89. doi:10.1016/j.aquatox.2009.03.010
Svenson, A., Allard, A.S., Ek, M., 2003. Removal of estrogenicity in Swedish municipal sewage treatment plants. Water Res. 37, 4433–4443. doi:10.1016/S0043-1354(03)00395-6
Szychowski, K.A., Sitarz, A.M., Wojtowicz, A.K., 2015. Triclosan induces Fas receptor-dependent apoptosis in mouse neocortical neurons in vitro. Neuroscience 284, 192–201. doi:10.1016/j.neuroscience.2014.10.001
Références
249
Tan, N.S., Frecer, V., Lam, T.J., Ding, J.L., 1999. Temperature dependence of estrogen binding: importance of a subzone in the ligand binding domain of a novel piscine estrogen receptor. Biochim. Biophys. Acta 1452, 103–120.
Thomas, P., Pang, Y., Filardo, E.J., Dong, J., 2005. Identity of an estrogen membrane receptor coupled to a G protein in human breast cancer cells. Endocrinology 146, 624–632. doi:10.1210/en.2004-1064
Thorpe, K.L., Cummings, R.I., Hutchinson, T.H., Scholze, M., Brighty, G., Sumpter, J.P., Tyler, C.R., 2003. Relative potencies and combination effects of steroidal estrogens in fish. Environ. Sci. Technol. 37, 1142–1149.
Thorpe, K.L., Hutchinson, T.H., Hetheridge, M.J., Scholze, M., Sumpter, J.P., Tyler, C.R., 2001. Assessing the biological potency of binary mixtures of environmental estrogens using vitellogenin induction in juvenile rainbow trout (Oncorhynchus mykiss). Environ. Sci. Technol. 35, 2476–2481.
Tian, J., Feng, Y., Fu, H., Xie, H.Q., Jiang, J.X., Zhao, B., 2015. The Aryl Hydrocarbon Receptor: A Key Bridging Molecule of External and Internal Chemical Signals. Environ. Sci. Technol. 49, 9518–9531. doi:10.1021/acs.est.5b00385
Tohyama, S., Miyagawa, S., Lange, A., Ogino, Y., Mizutani, T., Ihara, M., Tanaka, H., Tatarazako, N., Kobayashi, T., Tyler, C.R., Iguchi, T., 2016. Evolution of estrogen receptors in ray-finned fish and their comparative responses to estrogenic substances. J. Steroid Biochem. Mol. Biol. 158, 189–197. doi:10.1016/j.jsbmb.2015.12.009
Tohyama, S., Miyagawa, S., Lange, A., Ogino, Y., Mizutani, T., Tatarazako, N., Katsu, Y., Ihara, M., Tanaka, H., Ishibashi, H., Kobayashi, T., Tyler, C.R., Iguchi, T., 2015. Understanding the molecular basis for differences in responses of fish estrogen receptor subtypes to environmental estrogens. Environ. Sci. Technol. 49, 7439–7447. doi:10.1021/acs.est.5b00704
Tokarz, J., Möller, G., Hrabě de Angelis, M., Adamski, J., 2015. Steroids in teleost fishes: A functional point of view. Steroids, Steroidogenesis: The Classics and Beyond 103, 123–144. doi:10.1016/j.steroids.2015.06.011
Tong, S.-K., Mouriec, K., Kuo, M.-W., Pellegrini, E., Gueguen, M.-M., Brion, F., Kah, O., Chung, B., 2009. A cyp19a1b-GFP (Aromatase B) Transgenic Zebrafish Line That Expresses GFP in Radial Glial Cells. Genesis 47, 67–73. doi:10.1002/dvg.20459
Tousova, Z., Oswald, P., Slobodnik, J., Blaha, L., Muz, M., Hu, M., Brack, W., Krauss, M., Di Paolo, C., Tarcai, Z., Seiler, T.-B., Hollert, H., Koprivica, S., Ahel, M., Schollée, J.E., Hollender, J., Suter, M.J.-F., Hidasi, A.O., Schirmer, K., Sonavane, M., Ait-Aissa, S., Creusot, N., Brion, F., Froment, J., Almeida, A.C., Thomas, K., Tollefsen, K.E., Tufi, S., Ouyang, X., Leonards, P., Lamoree, M., Torrens, V.O., Kolkman, A., Schriks, M., Spirhanzlova, P., Tindall, A., Schulze, T., 2017. European demonstration program on the effect-based and chemical identification and monitoring of organic pollutants in European surface waters. Sci. Total Environ. 601, 1849–1868. doi:10.1016/j.scitotenv.2017.06.032
Triclosan - Substance evaluation - CoRAP - ECHA [WWW Document], n.d. URL https://echa.europa.eu/information-on-chemicals/evaluation/community-rolling-action-plan/corap-table/-/dislist/details/0b0236e1807e4774 (accessed 3.28.17).
Truter, J.C., Wyk, J.H. van, Oberholster, P.J., Botha, A.-M., Klerk, A.R. de, 2016. An In vitro and In vivo Assessment of Endocrine Disruptive Activity in a Major South African River. Water. Air. Soil Pollut. 227, 54. doi:10.1007/s11270-016-2748-8
UE, 2015. Commission Implementing Decision (EU) 2015/495 of 20 March 2015 establishing a watch list of substances for Union-wide monitoring in the field of water policy [WWW Document]. URL http://eur-lex.europa.eu/legal-content/EN/TXT/?uri=uriserv%3AOJ.L_.2015.078.01.0040.01.ENG (accessed 10.8.17).
US Food and Drug Organisation, 2016. Safety and Effectiveness of Consumer Antiseptics; Topical Antimicrobial Drug Products for Over-the-Counter Human Use [WWW Document]. Fed. Regist. URL https://www.federalregister.gov/documents/2016/09/06/2016-21337/safety-and-effectiveness-of-consumer-antiseptics-topical-antimicrobial-drug-products-for (accessed 10.7.17).
Références
250
Van den Berg, M., Birnbaum, L., Bosveld, A.T., Brunström, B., Cook, P., Feeley, M., Giesy, J.P., Hanberg, A., Hasegawa, R., Kennedy, S.W., Kubiak, T., Larsen, J.C., van Leeuwen, F.X., Liem, A.K., Nolt, C., Peterson, R.E., Poellinger, L., Safe, S., Schrenk, D., Tillitt, D., Tysklind, M., Younes, M., Waern, F., Zacharewski, T., 1998. Toxic equivalency factors (TEFs) for PCBs, PCDDs, PCDFs for humans and wildlife. Environ. Health Perspect. 106, 775–792.
van der Linden, S.C., Heringa, M.B., Man, H.-Y., Sonneveld, E., Puijker, L.M., Brouwer, A., van der Burg, B., 2008. Detection of Multiple Hormonal Activities in Wastewater Effluents and Surface Water, Using a Panel of Steroid Receptor CALUX Bioassays. Environ. Sci. Technol. 42, 5814–5820. doi:10.1021/es702897y
van der Oost, R., Sileno, G., Suárez-Muñoz, M., Nguyen, M.T., Besselink, H., Brouwer, A., 2017. SIMONI (smart integrated monitoring) as a novel bioanalytical strategy for water quality assessment: Part i-model design and effect-based trigger values. Environ. Toxicol. Chem. 36, 2385–2399. doi:10.1002/etc.3836
Vethaak, A.D., Davies, I.M., Thain, J.E., Gubbins, M.J., Martinez-Gomez, C., Robinson, C.D., Moffat, C.F., Burgeot, T., Maes, T., Wosniok, W., Giltrap, M., Lang, T., Hylland, K., 2017. Integrated indicator framework and methodology for monitoring and assessment of hazardous substances and their effects in the marine environment. Mar. Environ. Res. 124, 11–20. doi:10.1016/j.marenvres.2015.09.010
Vethaak, A.D., Lahr, J., Schrap, S.M., Belfroid, A.C., Rijs, G.B.J., Gerritsen, A., de Boer, J., Bulder, A.S., Grinwis, G.C.M., Kuiper, R.V., Legler, J., Murk, T.A.J., Peijnenburg, W., Verhaar, H.J.M., de Voogt, P., 2005. An integrated assessment of estrogenic contamination and biological effects in the aquatic environment of The Netherlands. Chemosphere 59, 511–524. doi:10.1016/j.chemosphere.2004.12.053
Voulvoulis, N., Arpon, K.D., Giakoumis, T., 2017. The EU Water Framework Directive: From great expectations to problems with implementation. Sci. Total Environ. 575, 358–366. doi:10.1016/j.scitotenv.2016.09.228
Wagner, M., Vermeirssen, E.L.M., Buchinger, S., Behr, M., Magdeburg, A., Oehlmann, J., 2013. Deriving bio-equivalents from in vitro bioassays: Assessment of existing uncertainties and strategies to improve accuracy and reporting. Environ. Toxicol. Chem. 32, 1906–1917. doi:10.1002/etc.2256
Wang, H., Tan, J.T.T., Emelyanov, A., Korzh, V., Gong, Z., 2005. Hepatic and extrahepatic expression of vitellogenin genes in the zebrafish, Danio rerio. Gene 356, 91–100. doi:10.1016/j.gene.2005.03.041
Wehmas, L.C., Cavallin, J.E., Durhan, E.J., Kahl, M.D., Martinovic, D., Mayasich, J., Tuominen, T., Villeneuve, D.L., Ankley, G.T., 2011. Screening complex effluents for estrogenic activity with the T47D-KBluc cell bioassay: Assay optimization and comparison with in vivo responses in fish. Environ. Toxicol. Chem. 30, 439–445. doi:10.1002/etc.388
Wentworth, J.N., Buzzeo, R., Pollenz, R.S., 2004. Functional characterization of aryl hydrocarbon receptor (zfAHR2) localization and degradation in zebrafish (Danio rerio). Biochem. Pharmacol. 67, 1363–1372. doi:10.1016/j.bcp.2003.12.002
Wernersson, A.-S., Carere, M., Maggi, C., Tusil, P., Soldan, P., James, A., Sanchez, W., Dulio, V., Broeg, K., Reifferscheid, G., Buchinger, S., Maas, H., Grinten, E.V.D., O’Toole, S., Ausili, A., Manfra, L., Marziali, L., Polesello, S., Lacchetti, I., Mancini, L., Lilja, K., Linderoth, M., Lundeberg, T., Fjällborg, B., Porsbring, T., Larsson, D.J., Bengtsson-Palme, J., Förlin, L., Kienle, C., Kunz, P., Vermeirssen, E., Werner, I., Robinson, C.D., Lyons, B., Katsiadaki, I., Whalley, C., Haan, K. den, Messiaen, M., Clayton, H., Lettieri, T., Carvalho, R.N., Gawlik, B.M., Hollert, H., Paolo, C.D., Brack, W., Kammann, U., Kase, R., 2015. The European technical report on aquatic effect-based monitoring tools under the water framework directive. Environ. Sci. Eur. 27, 7. doi:10.1186/s12302-015-0039-4
WHO/IPCS 2002. Global assessment of the state-of-the-science of endocrine disruptors WHO/PCS/EDC/02.2, http://www.who.int/ipcs/publications/en/ch1.pdf
Wihlen, B., Ahmed, S., Inzunza, J., Matthews, J., 2009. Estrogen Receptor Subtype- and Promoter-Specific Modulation of Aryl Hydrocarbon Receptor-Dependent Transcription. Mol. Cancer Res. 7, 977–986. doi:10.1158/1541-7786.MCR-08-0396
Références
251
Wilson, V.S., Bobseine, K., Gray, L.E., 2004. Development and characterization of a cell line that stably expresses an estrogen-responsive luciferase reporter for the detection of estrogen receptor agonist and antagonists. Toxicol. Sci. Off. J. Soc. Toxicol. 81, 69–77. doi:10.1093/toxsci/kfh180
Wormke, M., Stoner, M., Saville, B., Walker, K., Abdelrahim, M., Burghardt, R., Safe, S., 2003. The aryl hydrocarbon receptor mediates degradation of estrogen receptor α through activation of proteasomes. Mol. Cell. Biol. 23, 1843–1855. doi:10.1128/MCB.23.6.1843-1855.2003
Xu, C., Li, C.Y.-T., Kong, A.-N.T., 2005. Induction of phase I, II and III drug metabolism/transport by xenobiotics. Arch. Pharm. Res. 28, 249. doi:10.1007/BF02977789
Yang, R., Li, N., Rao, K., Ma, M., Wang, Z., 2015. Combined action of estrogen receptor agonists and antagonists in two-hybrid recombinant yeast in vitro. Ecotoxicol. Environ. Saf. 111, 228–235. doi:10.1016/j.ecoenv.2014.09.025
Yost, E.E., Lee Pow, C., Hawkins, M.B., Kullman, S.W., 2014. Bridging the gap from screening assays to estrogenic effects in fish: potential roles of multiple estrogen receptor subtypes. Environ. Sci. Technol. 48, 5211–5219. doi:10.1021/es404093n
Yueh, M.-F., Tukey, R.H., 2016. Triclosan: A Widespread Environmental Toxicant with Many Biological Effects. Annu. Rev. Pharmacol. Toxicol. 56, 251–272. doi:10.1146/annurev-pharmtox-010715-103417
Zhang, H., Kong, F.-X., Wang, S.-H., Yu, Y., Zhang, M., 2009. Vitellogenin induction by a mixture of steroidal estrogens in freshwater fishes and relevant risk assessment. Environ. Toxicol. 24, 484–491. doi:10.1002/tox.20453
Zhang, H., Kong, F.-X., Yu, Y., Shi, X.-L., Zhang, M., Tian, H.-E., 2010. Assessing the combination effects of environmental estrogens in fish. Ecotoxicol. Lond. Engl. 19, 1476–1486. doi:10.1007/s10646-010-0533-9
Zorrilla, L.M., Gibson, E.K., Jeffay, S.C., Crofton, K.M., Setzer, W.R., Cooper, R.L., Stoker, T.E., 2009. The Effects of Triclosan on Puberty and Thyroid Hormones in Male Wistar Rats. Toxicol. Sci. 107, 56–64. doi:10.1093/toxsci/kfn225

Références
252

ANNEXE

Annexe
254
Introduction au plan expérimental des mélanges reconstitués
L’étude présentée dans l’article n°5 a été réalisée dans la continuité d’une étude propre
au programme SOLUTIONS visant à démontrer la capacité de multiples bio-essais à detecter les
effets combinés de plusieurs contaminants au sein d’un échantillon synthétique répresentatif
d’une contamination multiple (Altenburger et al., in prep). Le tableau XIII présente les 17 bio-
essais utilisés dans cette étude.
Tableau XIII : Bio-essais in vitro et in vivo utilisés dans l’étude sur les mélanges reconstitués.
Niveau biologique
Système biologique
Effet observé Référence
Récepteur cellulaire
Cellules mammifères et de poisson
Activation/inhibition de récepteur nucléaire
Biotransformation (HG5LN-hPXR) Lemaire et al. 2006
Activité estrogenique (MELN) Activité estrogénique (ZELH-zfERα, ZELH-zfERβ2)
Balaguer et al. 1999 Cosnefroy et al. 2012
Activité (anti)androgénique Jalova et al. 2013 (MDA-kB2)
Activité glucocorticoïde
Réponse cellulaire
Salmonella typhimurium
Test de Ames Mutagenicité Umbuzeiro et al., 2011, Reiferscheid et al., 2012
Cellules mammifères
Nrf2 protein (activation AREc32)
Stress oxydatif Wang et al. 2006 Escher et al. 2012
Organisme (activation de récepteur)
Embryons de poisson zèbre
Estrogenicié cyp19a1b-GFP
Activité estrogenique Brion at al. 2012
Embryons de médaka
Estrogenicité chgh-GFP
Activité (anti)estrogénique Spirhanzlova et al. 2016
Organisme (effets apicaux)
Algues Growth Effets apicaux Almeida et al. (in press)
Daphnies Mobilité Effets apicaux Williams et al. 2011
Embryons de poisson zèbre
Development Effets apicaux Klüver et al. 2011
Microtox Energie, metabolisme Effets apicaux
Les molécules des deux mélanges synthétiques ont été choisies sur la base du criblage de
34 molécules (article n°2) afin de permettre à chaque bio-essai présenté dans le tableau XIII de
pouvoir détecter au moins deux molécules actives parmi les 12. Le tableau XIV présente les 12
molécules du mélange avec leur mode d’action associé.
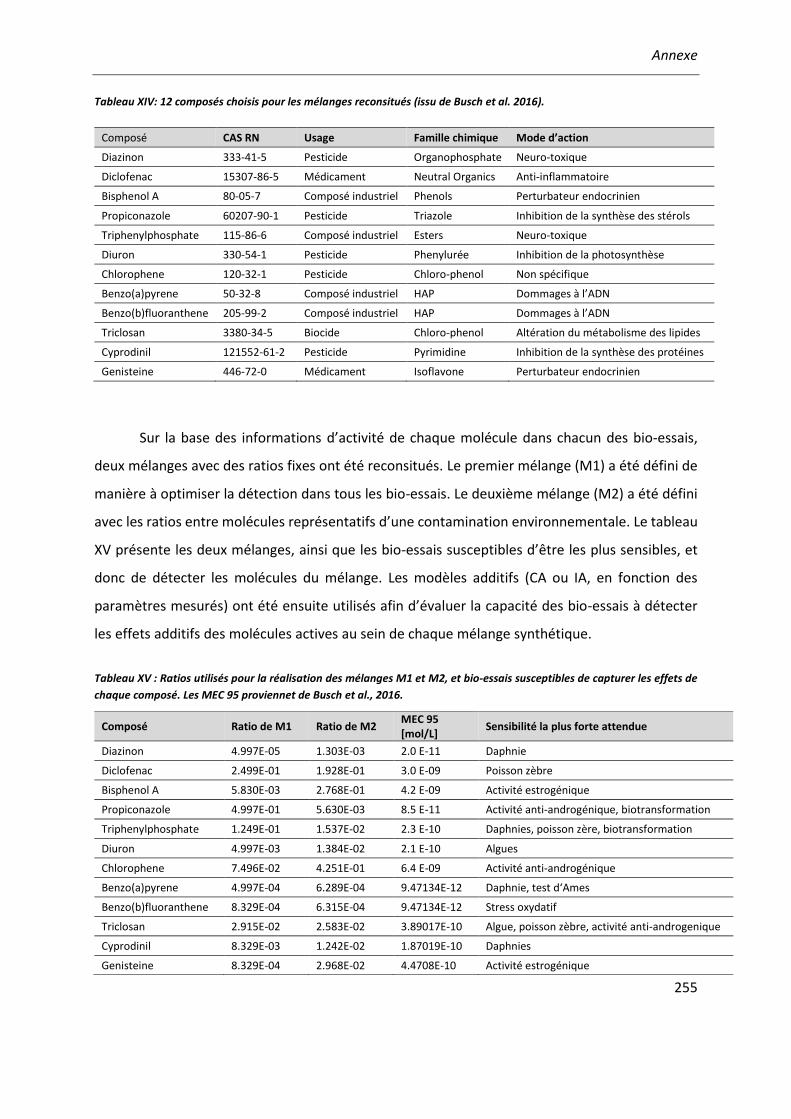
Annexe
255
Tableau XIV: 12 composés choisis pour les mélanges reconsitués (issu de Busch et al. 2016).
Composé CAS RN Usage Famille chimique Mode d’action
Diazinon 333-41-5 Pesticide Organophosphate Neuro-toxique
Diclofenac 15307-86-5 Médicament Neutral Organics Anti-inflammatoire
Bisphenol A 80-05-7 Composé industriel Phenols Perturbateur endocrinien
Propiconazole 60207-90-1 Pesticide Triazole Inhibition de la synthèse des stérols
Triphenylphosphate 115-86-6 Composé industriel Esters Neuro-toxique
Diuron 330-54-1 Pesticide Phenylurée Inhibition de la photosynthèse
Chlorophene 120-32-1 Pesticide Chloro-phenol Non spécifique
Benzo(a)pyrene 50-32-8 Composé industriel HAP Dommages à l’ADN
Benzo(b)fluoranthene 205-99-2 Composé industriel HAP Dommages à l’ADN
Triclosan 3380-34-5 Biocide Chloro-phenol Altération du métabolisme des lipides
Cyprodinil 121552-61-2 Pesticide Pyrimidine Inhibition de la synthèse des protéines
Genisteine 446-72-0 Médicament Isoflavone Perturbateur endocrinien
Sur la base des informations d’activité de chaque molécule dans chacun des bio-essais,
deux mélanges avec des ratios fixes ont été reconsitués. Le premier mélange (M1) a été défini de
manière à optimiser la détection dans tous les bio-essais. Le deuxième mélange (M2) a été défini
avec les ratios entre molécules représentatifs d’une contamination environnementale. Le tableau
XV présente les deux mélanges, ainsi que les bio-essais susceptibles d’être les plus sensibles, et
donc de détecter les molécules du mélange. Les modèles additifs (CA ou IA, en fonction des
paramètres mesurés) ont été ensuite utilisés afin d’évaluer la capacité des bio-essais à détecter
les effets additifs des molécules actives au sein de chaque mélange synthétique.
Tableau XV : Ratios utilisés pour la réalisation des mélanges M1 et M2, et bio-essais susceptibles de capturer les effets de
chaque composé. Les MEC 95 proviennet de Busch et al., 2016.
Composé Ratio de M1 Ratio de M2 MEC 95 [mol/L]
Sensibilité la plus forte attendue
Diazinon 4.997E-05 1.303E-03 2.0 E-11 Daphnie
Diclofenac 2.499E-01 1.928E-01 3.0 E-09 Poisson zèbre
Bisphenol A 5.830E-03 2.768E-01 4.2 E-09 Activité estrogénique
Propiconazole 4.997E-01 5.630E-03 8.5 E-11 Activité anti-androgénique, biotransformation
Triphenylphosphate 1.249E-01 1.537E-02 2.3 E-10 Daphnies, poisson zère, biotransformation
Diuron 4.997E-03 1.384E-02 2.1 E-10 Algues
Chlorophene 7.496E-02 4.251E-01 6.4 E-09 Activité anti-androgénique
Benzo(a)pyrene 4.997E-04 6.289E-04 9.47134E-12 Daphnie, test d‘Ames
Benzo(b)fluoranthene 8.329E-04 6.315E-04 9.47134E-12 Stress oxydatif
Triclosan 2.915E-02 2.583E-02 3.89017E-10 Algue, poisson zèbre, activité anti-androgenique
Cyprodinil 8.329E-03 1.242E-02 1.87019E-10 Daphnies
Genisteine 8.329E-04 2.968E-02 4.4708E-10 Activité estrogénique
Résumé
L’objectif de ce travail de thèse est d’évaluer le potentiel de nouveaux bio-essais in vitro et
in vivo basés sur le poisson zèbre pour la biosurveillance de la contamination chimique de l’eau
par les xeno-estrogènes. Pour cela, les bio-essais ont été appliqués pour évaluer les effets de
polluants aquatiques environnementaux seuls, mais aussi en mélanges simples (reconstitués) et
complexes (échantillons environnementaux). L’évaluation d’échantillons d’eau à travers les bio-
essais in vitro humain (MELN) et poisson zèbre (ZELH-zfERβ2) a montré des différences qualitatives
et quantitatives de réponse, non expliquées par les molécules estrogéniques détectées. Afin de
mieux comprendre ces différences, l’activité de polluants aquatiques a été caractérisée sur les
différents modèles, individuellement et au sein de mélanges de 2 à 12 polluants, combinant
molécules estrogéniques et non estrogéniques pour simuler des situations environnementales.
Les résultats obtenus montrent que les bio-essais basés sur le poisson zèbre répondent
différemment, et parfois de manière opposée, au modèle humain MELN aux mélanges
reconstitués. Ces différences s’expliquent par des sensibilités différentes à certaines molécules
entrainant des interactions avec la réponse aux xeno-œstrogènes spécifiques à chaque modèle
biologique. Dans son ensemble, ce travail montre que les particularités biologiques de chaque bio-
essai peuvent influencer la réponse des xeno-estrogènes quand présents au sein de mélange avec
d’autres polluants. Ces résultats sont discutés au regard de l’utilisation de bio-essais dans
l’évaluation de la contamination chimique des masses d’eau.
Abstract
This PhD thesis aims at assessing the potential of innovative in vitro and in vivo zebrafish-
based bioassays for biomonitoring of surface water contamination by xeno-estrogens. For this
purpose, the bioassays were applied to assess the effect of environmentally relevant surface water
pollutants, alone and in simple (artificial) and complex (environmental samples) mixtures. The
screening of surface water samples in zebrafish- (ZELH-zfERβ2 cells) and human-based (MELN
cells) bioassays revealed qualitative and quantitative differences which could not be entirely
explained by the xeno-estrogens identified. To better understand the response of bioassays to
complex environmental mixtures, the activity of environmentally relevant surface water
pollutants was characterized across the bioassays, alone and in 2 to 12-component mixtures
combining estrogenic and non-estrogenic chemicals to simulate an environmental contamination.
The results indicate that zebrafish-based bioassays have a different and even in some cases an
opposite response to the simple mixtures compared with the human-based bioassay MELN. These
differences are explained by different sensitivity to some pollutants leading to bioassay-specific
interactions with estrogen receptor activation. Altogether, this work shows that the biological
particularities of each bioassay can influence the response to estrogenic chemicals when mixed
with other environmental pollutants, opening the discussion regarding their implementation in
chemical water biomonitoring.
Copyright © 2022 FDOKUMEN