In vitro tests to predict in vivo performance of liposomal dosage forms
19
Chemistry and Physics of Lipids, 64 (1993) 219-237 219 Elsevier Scientific Publishers Ireland Ltd. In vitro tests to predict in vivo performance of liposomal dosage forms Shimon Amselem*, Rivka Cohen and Yechezkel Barenholz Department of Biochemistry, Hebrew University - Hadassah Medical School, P.O. Box 1172, 91010 Jerusalem (Israel) (Received March 30th, 1993; revision received May 6th, 1993; accepted July 12th, 1993) Design of liposome-based formulations for clinical use can be assisted by employing in vitro assays to predict pharmacokinetics and bioavailability of the drug before employing costly and time-consumingin vivo studies. For such formulations of the anti-cancer drug doxorubicin (DXR) we developed two assays. (A) An assay which determines the dilution-induced DXR release in buffers and plasma. This assay was employed to evaluate two liposomal DXR formulations: (i) membrane-associated liposomal doxorubicin (L- DXR), and (ii) sterically-stabilized liposomes which encapsulate DXR in the aqueous phase of the liposomes (S-DXR). The agreement between the dilution-induced release assay in vitro and the pharmacokinetics of DXR administrated either as L-DXR or as S-DXR in humans suggests that the dilution release assay can be used as a predictor for the pharmacokinetic performance of liposomal for- mulations. (B) An assay which determines intracellular drug release induced by liposome degradation in the presence of mouse liver lysosome lysate. This assay was used to assess bioavailability of DXR when delivered via L-DXR, which are taken up by the reticuloendothelial system (RES). (C) An assay which complements conventional chromatographic analyses (HPLC or TLC) of the drug, in which a DXR adduct or aggregate was determined by using Sephadex LH-20 gel exclusion chromatography. Key words: liposomes; sterically stabilized liposomes; doxorubicin delivery; dilution release assay; liposome pharmacokinetics; lipo- some quality control Introduction For the past decade our laboratory has been involved in a systematic program to develop opti- mal liposome delivery systems for doxorubicin (DXR). We developed two kinds of liposomal DXR preparations: (i) oligolamellar liposomes (L- DXR), in which DXR is membrane associated, and (ii) sterically-stabilized small unilamellar lipo- somes, S-DXR, in which DXR is encapsulated in the intraliposomal aqueous phase [1-26]. The physical and chemical characterization of these two formulations is shown in Table I. Our general approach is described by the concept map in Correspondence to: Yechezkel Barenholz, Department of Biochemistry, The Hebrew University - Hadassah Medical School, P.O. Box t172, 91010 Jerusalem, Israel. *Present address: Pharmos Ltd., Weizmann Industrial Park, 76326 Rehovot, Israel. Fig. 1. The successive steps involved in this ap- proach were aimed at selecting a liposome com- position with high efficiency of drug capture, preservation of the full biological activity of the drug after liposome encapsulation, chemical and physical stability, a favorable tissue distribution pattern, decreased toxicity, increased efficacy, and therefore an improved therapeutic index. Clinical trials with these two liposomal-DXR formulations were performed [6-11,23], which required upscal- ing to liter batches of stable formulations and developing suitable quality control protocols [12-17]. The left side of the concept map in Fig. 1 describes the various aspects of the engineering of the liposomal formulation; the right side demon- strates our current approach to assess performance of the liposomal formulations in vivo. These stud- ies include pharmacokinetics, biodistribution, tox- icity, and efficacy of the formulation. Such in vivo 0009-3084/93/$06.00 © 1993 Elsevier Scientific Publishers Ireland Ltd. Printed and Published in Ireland
-
Upload
independent -
Category
Documents
-
view
7 -
download
0
Transcript of In vitro tests to predict in vivo performance of liposomal dosage forms

Chemistry and Physics of Lipids, 64 (1993) 219-237 219 Elsevier Scientific Publishers Ireland Ltd.
In vitro tests to predict in vivo performance of liposomal dosage forms
S h i m o n A m s e l e m * , R i v k a C o h e n a n d Y e c h e z k e l B a r e n h o l z
Department of Biochemistry, Hebrew University - Hadassah Medical School, P.O. Box 1172, 91010 Jerusalem (Israel)
(Received March 30th, 1993; revision received May 6th, 1993; accepted July 12th, 1993)
Design of liposome-based formulations for clinical use can be assisted by employing in vitro assays to predict pharmacokinetics and bioavailability of the drug before employing costly and time-consuming in vivo studies. For such formulations of the anti-cancer drug doxorubicin (DXR) we developed two assays. (A) An assay which determines the dilution-induced DXR release in buffers and plasma. This assay was employed to evaluate two liposomal DXR formulations: (i) membrane-associated liposomal doxorubicin (L- DXR), and (ii) sterically-stabilized liposomes which encapsulate DXR in the aqueous phase of the liposomes (S-DXR). The agreement between the dilution-induced release assay in vitro and the pharmacokinetics of DXR administrated either as L-DXR or as S-DXR in humans suggests that the dilution release assay can be used as a predictor for the pharmacokinetic performance of liposomal for- mulations. (B) An assay which determines intracellular drug release induced by liposome degradation in the presence of mouse liver lysosome lysate. This assay was used to assess bioavailability of DXR when delivered via L-DXR, which are taken up by the reticuloendothelial system (RES). (C) An assay which complements conventional chromatographic analyses (HPLC or TLC) of the drug, in which a DXR adduct or aggregate was determined by using Sephadex LH-20 gel exclusion chromatography.
Key words: liposomes; sterically stabilized liposomes; doxorubicin delivery; dilution release assay; liposome pharmacokinetics; lipo- some quality control
Introduction
For the past decade our laboratory has been involved in a systematic program to develop opti- mal liposome delivery systems for doxorubicin (DXR). We developed two kinds o f liposomal D X R preparations: (i) oligolamellar liposomes (L- DXR), in which D X R is membrane associated, and (ii) sterically-stabilized small unilamellar lipo- somes, S-DXR, in which D X R is encapsulated in the intraliposomal aqueous phase [1-26]. The physical and chemical characterization o f these two formulations is shown in Table I. Our general approach is described by the concept map in
Correspondence to: Yechezkel Barenholz, Department of Biochemistry, The Hebrew University - Hadassah Medical School, P.O. Box t172, 91010 Jerusalem, Israel. *Present address: Pharmos Ltd., Weizmann Industrial Park, 76326 Rehovot, Israel.
Fig. 1. The successive steps involved in this ap- proach were aimed at selecting a liposome com- position with high efficiency of drug capture, preservation of the full biological activity o f the drug after liposome encapsulation, chemical and physical stability, a favorable tissue distribution pattern, decreased toxicity, increased efficacy, and therefore an improved therapeutic index. Clinical trials with these two l iposomal-DXR formulations were performed [6-11,23], which required upscal- ing to liter batches o f stable formulations and developing suitable quality control protocols [12-17].
The left side o f the concept map in Fig. 1 describes the various aspects o f the engineering o f the liposomal formulation; the right side demon- strates our current approach to assess performance o f the liposomal formulations in vivo. These stud- ies include pharmacokinetics, biodistribution, tox- icity, and efficacy o f the formulation. Such in vivo
0009-3084/93/$06.00 © 1993 Elsevier Scientific Publishers Ireland Ltd. Printed and Published in Ireland
220
TABLE 1
Comparison between L-DXR and S-DXR
L-DXR a SDXR b
Liposome type Lipid composition
T,z of matrix lipid (PC) Charge in low ionic strength
Charge in high ionic strength
Size
Number of lamellae
Location of drug
RES-directed egg PC:egg PG:chol, 7.0:3.0:4.0 < O°C strongly negative
negative
200-500 nm
oligolamellar
membrane associated
Drug/phospholipid ratio 0.05-0.07 Release of drug upon dilution fast and Kp dependent Plasma pharmacokinetics:
tl/2 in small rodents <0.2 h (1) ---10 h; (2) ~20 h tl/2 in humans <0.5 h (2) >24 h
Sterically-stabilized, having long RES uptake (1) HPC:HPI:chol., 92.5:7.5:40.0 (2) HPC:PEG-DSPE:choI., 55:5:40 52°C (I) strongly negative (2) negative ( 1 ) negative (2) almost no charge (1) < 100 nm (2) < 100 nm (1) mostly unilamellar (2) mostly unilamellar (1) liposome aqueous phase (2) liposome aqueous phase 0.1-0.25 none
aFor general characterization of RES-directed liposomes (L-DXR) see Refs. 1-16. bFor general characterization of sterically-stabilized liposomes (S-DXR) see Refs. 13, 43, 55, and 56. Abreviations: HPC, hydrogenated soy phosphatidylcholine; HPI, hydrogenated soy phosphatidylinositol; PEG-DSPC, polyethylene- glycol-distearoylphosphatidylcholine; PG, phosphatidylglycerol; chol, cholesterol.
studies are labor-intense, very costly, and require a long time before complete evaluation can be per- formed. Also, animal studies do not necessarily correspond to the performance in humans. For example, after intravenous injection of L-DXR in mice, the pharmacokinetics of the formulation components suggests that the drug reaches the liver associated with liposomes. This is based on the fact that the ratio of drug to lipid reaching the liver is similar to that in the intact formulation; the level of drug reaching the liver is higher when delivered as L-DXR than as free drug; and most of the drug in plasma is liposome-associated [11,19]. However, when L-DXR was administered in- travenously to patients the liposomes did reach the reticuloendothelial system [9], but during the infu- sion there was a fast (almost immediate) release of DXR in the plasma, which was not found in mice. In all patients evaluated, the level of release was
significant, representing up to 50% of the total drug infused [91. Since we used the same formula- tion in mice and humans it is obvious that the dif- ference in pharmacokinetic behavior is related to some differences between organisms. The most striking of these differences between mice and hu- mans is the degree ofliposome dilution upon intra- venous injection. In mice, dilution of the liposomes is minimal (< 10-fold), while in humans, especially under infusion, the dilution is very large (100-10000-fold). This suggests that the large dilution induces release of drug from the lipo- somes and led us to develop an in vitro test which imitates in vivo dilution and therefore may predict the performance of L-DXR and other liposomal formulations in vivo. Two additional in vitro assays which relate to intracellular processing of the liposomal formulation and drug bioavailability are also described.

ENGINEERING OF FORMULAT I ON
J STABILITY I OPTIMIZATION
iLl DRUG DELl VERY POSOMAL
will be developed only if
ADVANTAGEOUS TO SOLVE CLINICAL PROBLEM ]
J f
LI POSOME
dependent upon
IOU'L'T [ I CONTROL OF LIPID ASSAYS ~ COMPOS TION ~'~
. . . . "i'77T -A'~ 1 CHEMICAL I alk ~" ~" ~ . . . . . . I * - ' * - MEMBRANE ELECTR,CAL
FLUID(S) ] ~ STABILITY ~ I RAT[° ~ FLUIDITY ~ CHARGE
I SUITABLE ANIMAL MODEL SYSTEM(S)
l BIODISTRIBUTION AND
PHARMACOKI NET I CS
J .terin / I I THERAPEUTIC
I NDEX
221
Fig. 1. Concept map describing the development of liposomes as drug carriers.
Experimental Procedures
Dilution-induced drug release assay for liposomal formulations
In principle, the dilution release assay is simple. The liposomal formulation is diluted in the desired medium and then incubated for the desired time at the desired temperature. The extent of dilution is limited by the sensitivity of the assays used to determine liposome and drug (agent) concentra- tions. The assay requires that liposomes (i.e., lipo- some phospholipid, L), liposome-associated drug (DL), and free drug (liposome-non-associated drug) (DF) can be determined. The total drug in the liposomal formulation is given by:
DT = DL + DF (l)
The release can be determined either by: (a) collecting all liposome-non-associated drug
(DF) and liposomes (L), from which D E can be
determined (thus one has to ensure the complete (100%) recovery of liposomes and drug) or (b) determining the % drug release from the DL/L ratio at all ranges of dilution, using Eqn. (2):
% Release-- [ [(DL/L)o- (DL/L)]/(DL/L)0 } x 100,
(2)
where (DE/L)0 is the ratio of liposome-associated drug to the liposome in the original liposome dis- persion (no dilution); (DE/L) is the same ratio at any given dilution. If all the drug in the non- diluted formulation is liposome-associated, then DT = (DE)0 and Eqn. (2) can be modified to:
% Release = {[(DT/L ) - (DL/L)]/(DT/L)} x 100
(3)
The methods used to separate liposome- associated and liposome-non-associated drug are described and reviewed in detail elsewhere [16].

222
Principally, two approaches are available: (i) sepa- ration according to differences in size using gel exclusion chromatography (GEC), and (ii) separ- ation according to differences in electrical charge, for example, separation between liposomes bearing either negatively charged or neutral phospholipid and a drug which is positively charged, either by ion exchange chromatography or liposome precipitation using positively charged polyelectrolytes [16]. Each of these two approaches has its limitations. The main limitations of the GEC approach are that it imposes undesired and uncontrolled dilution and that the level of recovery of the liposomes is not reproducible. For the 'separation by charge' ap- proach, no sample dilution occurs; however, the complete stoichiometry may be problematic. For ex- ample, the elution of free anthracycline from Dowex 50 WX-4 resin is very poor [24]. Recently, however, this problem has been resolved by using elution me- dium containing quaternary amphipathic amines such as benzalkonium chloride at pH 9-10 (Bar and Barenholz, unpublished results).
The 'separation by charge' approach is better when the percent release is determined from the DL/L ratio. The 'GEC approach', if the recovery of liposomes is not complete, may be misleading since it also separates liposomes based on their size, ag- gregation, etc. Therefore the DL/L ratio may be re- lated to only a part of the liposome population. Also, the final dilution has to be corrected for the dilution imposed by the method itself.
Doxorubicin determination Either absorbance or fluorescence intensity
measurements were used to determine DXR con- centration. The sensitivity limit of the spectrophoto- metric measurement is determined by the molar extinction of DXR (e480 = 12 500); therefore, 5 nmol/ml should the lowest concentration that can be determined. Starting with about 4 mM DXR in the original liposomal formulation permits a max- imal dilution of 800-fold. The sensitivity limit of the fluorescence intensity measurements is at least 50 times higher, which enables reaching at least a 40 000-fold dilution of the above formulation.
For both determinations, one volume of the analyte is diluted by nine volumes of acidic isopropanol (isopropanol:0.75 N HCI, 9:1 v/v). This
dilution dissolves the liposomes so the samples have no turbidity and ensures that the measurements are done under identical conditions at all times. The latter is important since both absorbance and flu- orescence intensities are pH dependent and the flu- orescence intensity is also strongly affected by the medium dielectric constant [16,17]. Each sample was further diluted in acidic isopropanol to bring it to the range of 0.05-1.00.D. for the absorbance measurements. For fluorimetric determination, it is important to bring all the samples to the same fluorescence intensity range so that measurements are comparable.
Absorbance measurements were performed using dual-beam spectrophotometers (Perkin-Elmer Lambda B, USA, or Kontron Uvikon 860, Switzerland), using acidic isopropanol as a refer- ence. Absorbance at 480 nm was used to determine DXR concentration.
Fluorescence intensity was determined using a Perkin-Elmer LS-5 spectrofluorimeter. Samples were excited at 480 nm and the emission spectrum was recorded. The fluorescence intensity at 590 nm was used to determine DXR concentration. The complete spectra and TLC and HPLC analyses [16] indicate that the DXR remains intact during sam- ple preparation and dilutions.
Phospholipid determination The phospholipid concentration was determined
by a modified [16] Bartlett method [27], fitting the sensitivity scale to the calculated amount of phos- pholipid in the liposome batch ( - 65 mM [14,16]). The sensitivity limit of this assay is 4 nmol; therefore, for the formulations used in our study (50 mM phospholipids [14]), a 10 000-fold dilution is the maximal one.
Determination of Dr, DL, DF, and L D x was determined as described above after
liposome dissolution by acidic isopropanol. DL and D v were determined using GEC minicolumns [16] and the 'separation by charge approach', using the cation exchange resin Dowex 50 WX-4 [12,16,24]. This method is especially recommended for negatively charged liposomes [28] since their ad- sorption to the resin is negligible and liposome re- covery is complete, while the free DXR is

completely adsorbed due to its positive charge. We found that for liposomes which are not, or are only weakly, negatively charged, especially under high ionic strength, the recovery of liposomes is < 100%. However, for such liposomes the DL/L ratio can still be used to determine the drug release, as described above. We recommend using 50 mg wet Dowex per 1 mg DXR [12, 16]. Either batch or minicolumns can be used for the separation [16].
The validation of the Dowex separation method is described in the 'Results and Discussion' section. The GEC and Dowex separation methods gave comparable results. We prefer the Dowex method because it is much less labor-intense.
Dilution-induced drug release assay in plasma The release assay using dilution in plasma is
similar to that using dilution in buffer. However, liposomes cannot be determined by their phospho- lipid content due to the presence of 4-7.5 mM plas- ma phospholipids (originating mostly from plasma lipoproteins). For clinical batches, radioactive lipo- some markers cannot be utilized routinely. Therefore the determination of liposome concentra- tion should be based on quantification of a liposome lipid which is not present in plasma.
For L-DXR we used phosphatidylglycerol (PG) as a marker due to its very low concentration in human plasma (3-5 gM) [8,9]. For S-DXR, a semisynthetic lipid not present in plasma, poly- ethyleneglycol distearoylphosphatidylethanol- amine (PEG-DSPE), was used.
Here we will describe only the L-DXR, in which we determined the changes in plasma PG as a quantitative measure of plasma liposome concen- tration. Once the concentration of the liposome marker is available, the percent of release can be determined using Eqn. 2 or 3.
Quantification of liposomal-PG & human plasma Calculation of total PG concentration in plasma
at each time point, [PG]T, requires measuring the level of total phosphatidylethanolamine (PE) in the plasma, [PE]T. [PE]T is then used as internal stan- dard. We found that [PE]T remains constant in the patient's plasma during the experiment and therefore there is no need for its determination for each time point. [PE]T is time-independent.
223
Multiplying the ratio of [PG]/[PE] in each sample by the [PE]T, the [PG]T of the sample is obtained. [PE]T is obtained by complete trinitrophenylation of the PE using trinitrobenzenesulfonic acid (TNBS) to give TNP-PE and careful application of all the plasma lipid extract under conditions that almost 100% of the phospholipids applied to the TLC are recovered (see below). Thus, using this procedure enables us to correct each sample for complete re- covery of PG according to:
[PGIT = [PELT X [PG]/ITNP-PE], (4)
where [PG] is the measured PG concentration in each sample and [TNP-PE] is the measured TNP- PE concentration after complete trinitrophenylation of the plasma PE. [PG] and ITNP-PE] are measured in the same sample of plasma (or diluted plasma). All concentrations are expressed in nmol/ml (gM). The trinitrophenylation of the aminophospholipids also improves the separation between the aminophospholipids (due to their modification) and PG (see R F values in Table II).
Liposomes were diluted in human plasma in the range of 0-10 000 dilution. The diluted samples
TABLE II
R F values of plasma lipids after trinitrophenylation and TLC analysis
Compound R F
Neutral lipid 1 TNP-DXR 0.93 TNP-PE 0.87 TNP-PSI 0.78 TNP-PS2 0.7 PG 0.53 PC 0.13 SPM 0.07
*No free PE or PS was present after TNBS labelling as deter- mined by ninhydrin spray. The R e of free PE is 0.47, over- lapping with PG. TNP-DXR is a phosphorus-free spot. Abbreviations: TNP, trinitrophenylated; PC, phosphatidylcho- line; PE, phosphatidylethanolamine; PS, phosphatidylserine; PG, phosphatidylglycerol; SPM, sphingomyelin.

224
were incubated for the desired time at the desired temperature (usually 37°C). Plasma was then extracted by adding 2 volumes of methanol to 1 volume of plasma followed by 1 volume of chloroform. The one-phase system obtained was centrifuged at 4°C to remove precipitating proteins and other non-lipid materials [29]. The next stage was trinitrophenylation of the plasma aminolipids using freshly prepared TNBS solution from powder (although the 5% solution from Sigma Chemical Co. can also be used). The TNBS solution was added to the one-phase system to a final concentration of 6 mM, together with sodium bicarbonate to a final concentration of 50 mM. The reaction mixture was incubated for 1 h at room temperature in the dark. After complete trinitrophenylation was achieved (usually 1 h incubation), as was determined from the lack of ninhydrin-positive aminophospholipids on TLC [16], the reaction was terminated by ad- ding 1 volume of chloroform and i volume of water. Two phases were formed after vortexing and centrifugation [29]. The upper phase was discarded and the lower, chloroformic, phase was washed using a synthetic upper phase composed of chloroform:methanol:water (6:94:96, v/v). The washed lower phase was transferred to conical tubes and the solvents were evaporated by a stream of nitrogen.
For TLC analysis, the resulting yellow dry sam- ples were dissolved in 50 t~l chloroform:methanol (2:1, v/v), the test tubes were vortexed and centrifug- ed in a desk centrifuge to remove lipids from test tube walls, and the supernatant applied to TLC glass plates (Analtech, Newark, DE, USA, silica gel G 250 tzm, 20 x 20 cm, catalogue no. 01911), which have a low phosphorus level (around 0.5 nmol/2 cm 2 spot). The test tubes were then washed with chloroform:methanol (2:1, v/v) and the supernatant applied to the TLC plate; this was repeated until no yellow color (TNP derivatives) remained in the test tubes. The plate was developed in two different solvent systems: first in diethyl ether:glacial acetic acid (190:10, v/v) to remove neutral lipids (which run in the solvent front), and then the plate was dried and developed in a second solvent mixture of chloroform:acetone:methanol:glacial acetic acid: water (6:8:2:2:1, v/v), to separate plasma phospho- lipids. Spots were detected by their fluorescence after Primuline spray (sensitivity limit, 0.5 #g
phospholipids per spot [16]). TNP derivatives (quenched spots in the Primuline detection) were detected by their yellow color. Spots were iden- tified using authentic markers. PG and TNP-PE spots were scraped and analyzed directly for their phosphorus content by a modified (higher sensitiv- ity) Bartlett procedure (sensitivity limit 5 nmol phosphorus per spot [16]). The separation on TLC is described by the RF values of the various spots (see Table II). Using this procedure, recovery of phospholipids was always better than 88%.
In vitro test for lysosome degradation of L-DXR Lysosome preparation. Lysosomes were obtained
from rat liver homogenates. One gram of rat liver was homogenized in 9 volumes of 0.25 M sucrose solution containing 1 mM EDTA, pH 7.0, using a Potter-Elvehjem homogenizer with a Teflon pes- tle. The crude homogenate was centrifuged for 10 min at 800 x g at 4°C and the pellet (nuclei and cell debris) discarded. The supernatant was cen- trifuged again for 20 min at 25 000 x g at 4°C in a Sorval centrifuge. The pellet containing the lyso- somes was resuspended in 4 volumes of the sucrose solution by gentle homogenization in the hand homogenizer, followed by ultrasonic irradiation using a bath sonifier (Transsonic 460/H Elma Lab-line Inst., Germany) for 8 min; then 10 freeze-thaw cycles were carried out to facilitate re- lease of lysosomal enzymes [30,31]. This crude lysosomal extract was either used immediately or was stored at -20°C without loss of activity for at least 6 months.
Liposome degradation by lysosomes. Estimation of liposome degradation by lysosomes was carried out by determination of the formation of lyso- phosphatidylcholine (LPC), the phospholipid product of phosphatidylcholine (PC) hydrolysis by phospholipase A. LPC was quantitated using TLC, which separates LPC from its parent phos- pholipid PC. One hundred microliters of L-DXR clinical-batch samples containing 6.8 /~mol of phospholipids (of which 4.8 /~mol was PC) was incubated with rat liver lysosomes (100/~1) in aci- dic buffer (acetate, pH 4.4) (in a final incubation volume of 0.6 ml) for different periods of time at 37°C with gentle shaking. At the desired time, the incubation was terminated by Bligh and Dyer ex- traction [29] using a solvent mixture having a final

ratio of chloroform:methanol:0.1 N HCI of 1:1:1 v/v (acidic conditions are required to transfer all the DXR to the aqueous methanolic upper phase [16]). After phase separation, aliquots of the lower chloroformic phase were loaded onto TLC silica gel-coated glass plates and eluted with a solvent mixture composed of chloroform:methanol:water (70:30:4, v/v). The spots stained by Primuline spray [16] were then scraped off and their phos- phorus content was determined by the modified Bartlett assay [16]. Percent hydrolysis was calculated using Eqn. 5:
% PC hydrolysis = [LPC]/[PC]T X 100, (5)
where [PC]T is the total PC level at time zero. A known amount of liposomes composed of sphingomyelin was added to the system before the
Kav
1.0
0.8
0.6
0.4
0.2
0 . 0 . . . . . . . . . . . . . . . . . . . . . . . . . . . . . 1 0 1 0 0 1 0 0 0 1 0 0 0 0 1 0 0 0 0 0
MOLECULAR MASS (Da)
Fig. 2. Relationship between elution behavior and molecular properties: Kay versus molecular mass for polyethylene glycols in ethanol on Sephadex LH-20 column. The elution volumes were determined by chromatography of polyethylene glycol preparations with very narrow molecular mass distributions (ethylene glycol, triethylene glycol, polyethylene glycols with molecular mass = 400, 1000, 4000, and 10 000). The data used to compile the diagram were taken from 'Sephadex LH-20' by Pharmacia Fine Chemicals, Sweden, and they were adapted from the graph in Ref. 57.
225
extraction to serve as internal standard to correct for various losses of phospholipids during the pro- cess. The release of DXR was determined using Dowex 50WX-4, as described above.
Complementary analysis of physical and chemical changes in doxorubicin
Characterization of irreversible physical aggre- gation and chemical (oligomerization) changes of DXR in liposomal formulations is another impor- tant in vitro test to predict performance. Routine- ly, we used HPLC and TLC procedures to follow such changes (for review see Refs. 16 and 17). Cur- rently both methods are not sufficient to quantify these changes. Therefore we added a complemen- tary approach to analyze DXR using gel exclusion chromatography based on the hydrophobic Sephadex LH-20 column and elution by ethanol. Sephadex LH-20 has a resolution in the range of 50-5000 molecular mass units, enabling us to resolve and quantify products in this range. The molecular mass was calculated from the calibra- tion curve in ethanol (Fig. 2). Kay of each sample was determined using Eqn. 6:
Kay = l ie- Vo/Vx, (6)
where lie is the elution volume of the analyte; V0 is the void volume; and V x is the total gel volume. In the .column used by us, V0 = 7 ml, Ve -- 11.78 ml, and V x = 15.4 ml. Column dimensions were 20 × 1 cm.
Samples from several clinical batches of L-DXR and preclinical batches of S-DXR were solubilized in ethanol by diluting 1 ml of the liposomes into 3 ml of ethanol. Aliquots of 0.2 ml were loaded into the Sephadex LH-20 column, the column was eluted with ethanol, and DXR and phospholipid were determined in the alcoholic eluates by the methods described in the previous section.
Results and Discussion
Validation of the use of the 'Dowex approach' to determine DXR encapsulation (or release) from liposomes
Effect of DXR/Dowex ratio. Storm et al. [28], using negatively charged liposomes, were the first to separate free and liposome-associated DXR by

226
adsorption of the free DXR to Dowex 50WX-4. We found that this approach can also be used in the presence of plasma and that protein-associated DXR adsorbs to Dowex in a manner similar to free DXR [24]. Previously we found that a ratio of 50 mg Dowex to 1 mg DXR is optimal to obtain complete removal of non-liposome-associated DXR from liposomes [12,16]. In this study we found that the ratio of Dowex to liposomal DXR does not affect the DXR/PL ratio determination over a large range of Dowex to liposomal DXR (from 50:1 to 500:1). This was tested for both L- DXR and S-DXR. When the elution was done in glucose or sucrose solutions or plasma, complete recovery of liposomes (based on phospholipid determination) was obtained for 50-500 mg Dowex for 1 mg of DXR, in both L-DXR and S- DXR. This indicates that the liposomes are not adsorbed by the Dowex and the Dowex does not induce release of DXR from the liposomes. Therefore the ratio of DXR levels before and after Dowex treatment (DL/DT) is sufficient to give per- centage encapsulation or release of DXR. How- ever, under conditions in which the liposomes are not negatively charged or that the charge is hid- den, such as for S-DXR containing PEG-DSPE in 0.9% NaC1 [55] (see Table I), the recovery of phospholipids is not complete and therefore calcu- lation of level of free DXR or its release needs to be based on the DXR/PL ratio (Eqn. 2 or 3). This was confirmed using the GEC approach [16] under conditions in which the liposome recovery was complete. Based on these and previous studies [12,14,16] we can conclude that the use of Dowex does not introduce artifacts and can be used as a safe method to assess level of free DXR in liposo- mal preparations containing DXR, as well as DXR release from liposomes, as demonstrated below.
Dilution-induced release of DXR from liposomes The first hint of release of membrane-associated
DXR from L-DXR upon dilution was obtained from studies comparing the cytotoxic effects of L- DXR and free DXR on various cells in culture, in which almost identical curves were obtained for L- DXR and free-DXR [32]. We continued these studies and found that the uptake of DXR by cells
in culture and the cytotoxic effects were dependent on the extent to which the liposomes were diluted in the cell medium (Haran and Barenholz, un- published data). Even cells which did not have measurable liposome phagocytosis, such as J6456 lymphoma [32], showed accumulation of DXR which had the expected cytotoxic effect. In phagocytic cells, such as peritoneal macrophages derived from mice, no correlation between DXR and liposome uptake was obtained. Furthermore, agents such as cytochalasin B which inhibit lipo- some uptake did not affect DXR uptake, while the presence of Dowex-50 WX-4 (which adsorbs free DXR with high affinity, Refs. 12, 24 and 28) com- pletely inhibits DXR uptake and its cytotoxic effect but not liposome uptake (Haran and Barenholz, unpublished data).
Cells incubated with S-DXR, which does not release DXR upon dilution but shows time- dependent slow DXR release, have much lower uptake of DXR and were also much less sensitive to DXR, unless the DXR was released from the liposomes by an ionophore [25]. The presence of Dowex 50 WX-4 resin in the cell medium com- pletely inhibited the cytotoxic effect of S-DXR, suggesting that the cytotoxic effect is related to drug release from the liposomes [25].
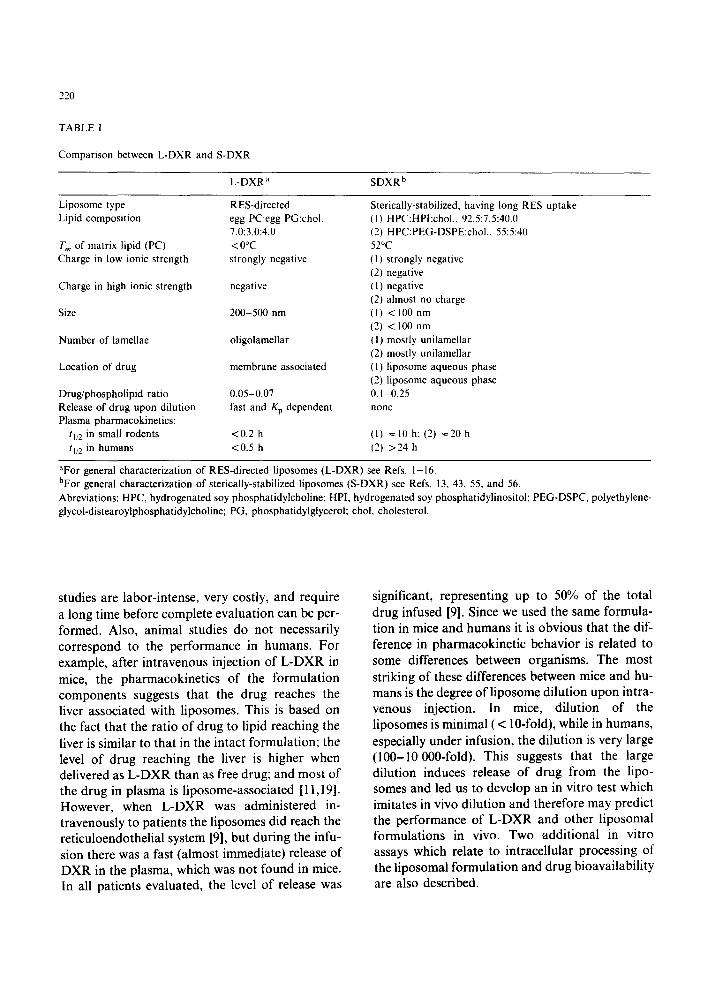
To analyze the kinetics of release in completely controllable conditions, an L-DXR batch was prepared containing about 65 mM phospholipid, 0.1 mol % of [3H]cholesterol oleate (as a non- transferable liposome marker [33] and about 4 mM DXR. The liposomes were diluted 1:10 000 in 0.9% NaC1 at 37°C. At the desired time, aliquots were loaded on Sephadex G-50 and the void volume and free DXR were collected [16]. More than 90% of the liposomes were recovered in the void volume, DXR was determined from the flu- orescence intensity at 590 nm (excitation at 480 nm) as described in 'Experimental Procedures'. Recovery of DXR was higher than 90%. Figure 3 shows a biphasic release starting with a very rapid process and followed by a slower one. Simulation using iterative nonlinear least-square analysis soft- ware [34] gave the rate constants from which tv2 values of < 1 min and 10 min (related to 50°/,, and 30% of the DXR, respectively) were calculated. The analysis also indicates the presence of a third

component of very long tl/2 (ca. 20% of the liposo- mal DXR). The three tl/2 values suggest the presence of three pools which differ in their DXR interaction with liposomes. Almost no release (<5%) was obtained for 10-fold dilution of these liposomes.
Table III demonstrates the results of an experi- ment in which a dilution release assay in 0.9% NaC1 was performed on one of the clinical batches of L-DXR [14] prepared for our Phase I clinical trials [6,7]. In this experiment the effect of time on the extent of release at various dilutions (0-3000- fold) was determined. Comparing the release after 10 min and 60 min at 37°C in Table III reveals that most of the release process was obtained during the first 10 min of incubation, in agreement with Fig. 3, although additional release of DXR was
c /1
E o tn o
.m
c o
e~ eY X
"100
, - ' • ' • ' • ' • 0
0 20 40 60 80
80
60
4 0
2 0
Time (rain)
Fig. 3. Doxorubicin release after 10 000-fold dilution of L- DXR in 0.9% NaCI. The lipid mixture used for liposome preparation (see Table I) included 0.1 tool % [3Hlcholesterol oleate. All other details of preparation were identical to our routine protocol for batch preparation [14]. The dilution release assay of DXR was performed after separation of liposome-associated DXR from free DXR by gel exclusion chromatography using a Sephadex G-50 column [12,16]. All values were corrected for the amount of liposomes as deter- mined from the cholesterol ester radioactivity.
227
obtained during the 10-60 min incubation. The ki- netics of release described in Fig. 3 indicates that there are at least 3 pools of DXR molecules, the first and largest one being responsible for the very rapid release occurring upon dilution. Table III also demonstrates that the incubation per se without dilution does not induce drug release. We further analyzed the data of the dilution release assay by calculating apparent partition coeffi- cients. This was done using Eqns. 7 to 9 [35]:
ML/MA = ID]L × VL/IDIA × VA = Kp(VL/VA),
(7)
K p = M L × VA/M A × V L, (8)
where Kp is the apparent partition coefficient of DXR between the liposome and the aqueous phase; [D]L is the concentration of DXR in the liposome lipid phase; [D]A is the concentration of DXR in the aqueous phase; VL is the volume of the lipid phase; VA is the volume of the aqueous phase (which approximates the total volume of the system (VT); ML is the amount of DXR in the lipid phase, which was obtained by subtracting the content of DXR present in the liposomes (derived from 1 ml sample) from the total amount of DXR in 1 ml sample; MR is the amount of DXR in the total aqueous phase (1 ml). VL was calculated from the following equation:
V e (/~1) = PL(#mol) × MW (mg) x V (ml/g),
(9)
where PL (gmol) is the phospholipid content expressed in gmol; MW is the average molecular weight of the phospholipids (in the case of L-DXR with 70 mol % PC and 30 mol % PG this value is equal to (7 PC + 3 PG)/10 in mg = 0.787 mg); V (ml/g) is the partial specific volume of the lipo- somes. This was determined to be 0.98 ml/g at 20°C [36]. For the determination of Kp, the analy- sis was performed only on the dilutions in which drug release was large enough so that free DXR determination was meaningful. The results obtain- ed after 60 min incubation are summarized in Table IV; this shows that Kp is dilution-

228
TABLE II1
Dilution-induced release of DXR from clinical batch 33 of L-DXR*
Sample Theoretical Phospholipid Actual L-DXR DXR/L-DXR % DXR No. dilution phosphorus dilution released
(fold) 0zmol • ml -I) (fold) (/~mol • ml t) (mol/mol)
A: After 10 min incubation at 37°C 0 0 68.1 0 3.752 0.0551 0 1 10 6.81 10.0 0.3671 0.0539 2.2 2 100 0.65 104.8 0.0297 0.0457 17.1 3 1000 0.08 851.3 0.00342 0.0428 22.3 4 2000 0.045 1513.0 0.00165 0.0366 33.6 5 4000 0.025 2724.0 0.00070 0,0281 49.0
B: After 60 min incubation at 37°C 0 0 68.1 0 3.752 0.0551 0 1 10 6.7 10.2 0.3672 0.0548 0.5 2 100 0.7 97.3 0.0274 0.0391 29.0 3 1000 0.08 851.3 0.00278 0.0348 36.9 4 2000 0.038 1792.0 0.00119 0.0314 43.0 5 4000 0.021 3243.0 0.00057 0.0270 50.9
*The dilution-induced release of D X R from L-DXR was determined from the change in drug-to-phospholipid ratio. Phospholipid concentration of batch 33 was 69 mM. L-DXR batch characterization is described in Amselem et al. [12] and in Table I. For more details see text.
dependent. The best curve fitting of the data is described by a complex logarithmic relation between Kp and the dilution. The meaning of this relationship is not yet clear. One of the possible explanations is that more than one type of DXR-phospholipid association exists. The presence of various pools of DXR in the liposomes may be related to several factors such as: (i) the differences in the interaction of negative versus neutral phospholipids with DXR [37,38, reviewed
in Ref. 17]; (ii) the distribution of DXR between the lamellae forming the oligolamellar L-DXR [11,19]; and (iii) the effect of vesicle curvature, together with the fact that the vesicle size distribu- tion is broad [11,19]. Therefore, at high dilution, mainly the stronger interaction exists and conse- quently Kp is higher. Possibly this complex behav- ior reflects the 3 pools of DXR observed kinetically in Fig. 3. It is worth noting that even the pool which dissociates very fast from the lipo-
TABLE IV
Effect of liposome dilution on DXR Kp
Sample Dilution V L VA/VL No. (fold) (/~1) x l03
2 97 0.54 1.85 3 851 0.062 16.1 4 1792 0.029 34.5 5 3243 0.016 62.5
ML/M A Kp
2.448 4.5 x 10³ 1.714 27.6 x l03 1.326 45.8 x l03 0.965 60.4 X 10³
For more details see Table IIIB.

somes (lower Kp) requires dilution and is not released in the presence of Dowex without dilution.
It can be concluded that the release assay described here, in which a drug dilution up to 1:10 000 is used, is feasible and can be standardiz- ed. No phospholipid loss occurs due to the assay (Table III and validation of Dowex assay above). The affinity of DXR to the liposomes (expressed as Kp) is in the range 4.5 × 10³ to 60 × 103 for a dilution range of 100-3000-fold. Loss of DXR from L-DXR due to liposome dilution does occur. The higher the dilution the larger is the loss. For a dilution of 3000-fold, about 50% of the liposo- mal drug is released. The release is somewhat time- dependent, but the differences between 10 min in- cubation at 37°C and 60 min incubation at 37°C are small, which suggests that most of the release is occurring over a very short period of time, as also suggested by Fig. 3. Even for the DXR pool of the lowest affinity, the liposome Kp is high (4,500) and therefore at least 100-fold dilution in saline is required to detect a real loss of drug. There is good agreement between two different assays which determine the drug-to-lipid ratio: the Dowex approach and GEC (compare Fig. 3 and Table III).
The phenomenon of dilution-induced release was also confirmed using the 'Split Flow Thin Cell technique' (SPLITT) [39]. This approach is capable of small-scale rapid separation of lipo- somes and molecules released from the liposomes
229
[39,40]. Comparison was made between our opti- mal L-DXR, which was used in clinical trials [14], and other liposomal formulations containing suboptimal levels of PG and cholesterol. Upon 100-fold fast dilution, minimal DXR release oc- curred for the clinical batch, in agreement with the dilution-induced release assay (Table III), while almost complete release of DXR was obtained for the suboptimal preparations. The 'SPLITT' meth- od needs some modification in order to follow the effects of dilution higher than 250-fold.
The dilution release assay was also used by us as a quality control test to follow-up the stability of liposomal batches for clinical use upon storage [17]. Table V describes and summarizes analysis of three clinical batches of L-DXR by the dilution re- lease assay in saline. The data were plotted on a graph in which the DXR/PL ratio is described as a function of the dilution (in logarithmic scale). The data of each of the three curves fit well to the logarithmic equation y = a x b, where y is the DXR/PL ratio, x is the dilution factor (in the range of dilution 1:10 ° to 1:104), a is the intercept for x = 10 °, namely no dilution, and b is the expo- nent. Table V presents the parameters of the best- fitted equations.
As shown in Table V, batch LT4C (a lyophilized L-DXR batch stored at 4°C) had the lowest release upon dilution. Batch HU36 (a liquid form of L- DXR) had slightly higher drug release upon dilu- tion. Storage of the lyophilized L-DXR at 60°C (batch LT60C) increased the dilution-related re-
TABLE V
Sample analysis by the dilution release assay
Batch No. DXR/PL* = a DXR/PL** = a Dilution effect**
Exponent = b % DXR remaining at 10 000-fold dulution
HU36 0.052 0.058 -0.106 43 LT4C 0.073 0.071 -0.081 51 LT60C 0.046 0.047 -0.169 2
*Measurements were made immediately after hydration o f lyophilized batch samples (LT4C, LT60C) or on a freshly prepared batch (HU36).
**Measurements were made 5 days after the first measurements. a is the measured DXR/PL ratio in the liposomes of the undiluted analyte and b is the exponent in the equation y = a x b (see text).

230
lease to the extent that upon a l0 000-fold dilu- tion, 98% of the DXR was released from the liposomes, compared with only about 50% release for the same sample stored at 4°C (batch LT4C). The profiles of the dilution-dependent release of lyophilized L-DXR immediately after hydration and after 5 days storage at 4°C post-hydration were identical, suggesting that the equilibrium was achieved shortly after hydration. The dilution re- lease assay also demonstrates that small unilamellar vesicles (SUV) have much lower Kp than oligolamellar vesicles (OLV) [11]. The differ- ence is related to differences between SUV and OLV in curvature and number of lamellae [11], thus the dilution release assay is a sensitive tool to predict changes in liposomal-DXR character- ization.
The stability of liposome-associated drug/agent in vivo in body fluids such as plasma is a major factor in determining drug pharmacokinetics and biodistribution [20,22,41-43]. Our recent work demonstrates that one of the major factors which determine this stability, at least for liposome- membrane-bound amphipathic drugs such as DXR [9], is the very large dilution (1000-10 000- fold) which occurs upon the slow infusion of a li- posomal dispersion into the relatively very large volume of plasma in humans. For DXR this dilution-dependent release is controlled to a large extent by the partition coefficient of the drug be- tween the liposomes and the plasma [9,10]. The Kp was almost identical when the dilution release assay was performed in 0.9% NaCI or in human plasma. That is, for L-DXR, the dilution factor overrides the effect of plasma components on lipo- some integrity. Our data demonstrate that for this system, it is feasible to measure the release of drug from liposomes as a function of liposome dilution over a broad range of 0-3000-fold dilution. A similar percent leakage which occurred in vitro was also found in vivo in humans. Therefore, experiments in mice cannot replace the above- described in vitro dilution assay, since due to the very small dilution which occurs upon intravenous injection into mice and the relatively fast uptake by the RES, no major leakage was observed [11].
A similar prediction can be made using intra- venous administration of DXR encapsulated in
small unilamellar liposomes having extended circulation time (S-DXR) [20,22,42,43]. In these small liposomes, the DXR was loaded into the aqueous phase by an ammonium sulfate gradient [21], and the DXR, which is mostly in a 'gel' state of DXR-sulfate salt, reaches an apparent concen- tration > 100 mM [21,26]. The DXR leakage from these liposomes was of first-order kinetics and very slow and dilution-independent; however, it was dependent on liposome composition and tempera- ture. For liposomes composed of fluid phospho- lipid matrix at 37°C, the initial release rate was slow but measurable: about 0.3% of trapped drug per minute, while for liposomes composed of solid matrix phospholipid, such as dipalmitoylphospha- tidylcholine (DPPC) or hydrogenated soy phos- phatidylcholine (HPC) (Tm of 41°C and 52.5°C, respectively [44]), initial release rate was even much slower (0.1% and <0.02% of trapped drug per minute, respectively), and indeed no drug was released in the circulation of large animals (dogs, [20]), or of humans [23]. For such formulations, the release assay measures the integrity of the lipo- somal membrane as a barrier.
The comparison between L-DXR and S-DXR (Table I) suggests that the dilution-dependent re- lease is determined mainly by two parameters, (1) a kinetic one, i.e. the release rate of DXR from the liposomes, described by a rate constant (kor0 and (2) a thermodynamic one, i.e., the liposome-to- medium partition coefficient (Kp). For L-DXR where kon- is very fast and not a rate-limiting fac- tor, the release is mainly Kp-dependent. For S- DXR, kon~ is the rate-limiting factor. Therefore, in S-DXR, in spite of the relatively low Kp of DXR, only a very low level of drug is released in a linear relationship with time and in first-order kinetics. When the liposomes are injected parenterally, a third factor, the rate of liposome clearance (kL), also has to be considered. The interplay between kon- and ke determines the significance of Kp for the pharmacokinetic behavior of liposomal for- mulations.
General comments on the dilution release assay A dilution-related release is dependent on the
drug/agent liposome-to-medium partition coeffic- ient (Kp), which is a thermodynamic parameter. In

some cases the release is time dependent, and therefore it also involves the kinetic parameter, korf. The effect of medium composition on the re- lease may be very important, especially for agents that have low water solubility. In the latter case, the presence of a 'sink' in the medium is very important. The sink can be other liposomes [19] which can be separated from the liposomal for- mulation due to differences in size or electrical charge [16,33], or albumin [45]. Lipoproteins can also be used as a sink. For drugs like membrane- associated DXR, which have high water solubility and a very fast release-rate from liposomes (koff, see Fig. 3), Kp will be the dominant factor in determining the release upon dilution.
For drugs like amphothericin B which have very low water solubility, without the presence of a sink such as albumin the assay is meaningless [45]. A similar need for a sink is required for testing lipo- somal formulations of interleukin-2 [46]. The ki- netic factor koff, a complex rate constant, is related either to the desorption rate constant or to the diffusion across the liposomal membrane(s). The kof r for liposomal phospholipids is very slow (tl/2 = 10-1000 h [47]) and it is faster for choles- terol (tl/2 in the range of 0.5-1 h [33,47]). All these kof f values are dependent on liposome lipid composition and liposome curvature [33,47]. However, for membrane-associated DXR, the kof r is very short (< 1 s).
Complete pharmacokinetic evaluation of L-DXR formulations: relationship with dilution release assay
The relevance of dilution release assay to the in vivo performance of L-DXR was demonstrated using a complete pharmacokinetic evaluation of L- DXR formulation in patients.
For the complete evaluation we analyze the level of total plasma doxorubicin [DXR]T, the plasma liposome-associated doxorubicin [DXR]L, and the level of plasma PG. The non-liposome- associated DXR (defined as [DXR]F is calculated as~
[DXR]F = [DXR]T - [DXR]L (10)
The determination of [DXR]L, [DXR]T and [PG] are described above.
231
The L-DXR clinical trial included 19 evaluable patients, who can be divided into two groups. In one group, represented by patient ll (fig. 3a in Ref. 9), who had minimal or no liver involvement (<grade I), most of the DXR in the plasma (> 90%) was liposome associated. The treatment- related toxicity in these patients was low. The sec- ond group of patients is represented by patient l0 (Fig. 3b in Ref. 9). This group was characterized by liver involvement of > grade II. A relatively large fraction of the DXR in group II patients' plasma is free and not liposome associated (see Table VI). The L-DXR-related toxicity (myelosup- pression and/or mucositis) in these patients was of grade III or IV [6,9]. These data indicate that the high fraction of free DXR in the plasma ([DXR]F/[DXR]T) is related to the liver status of the patients. The larger is the liver involvement, the lower is the ratio of ([DXR]F/[DXR]T). This was observed either at peak level or the area under the curve (AUC, see table III in Ref. 9). However, in both groups, the ratio of [DXR]L/[PG ] was reduced with time, with the largest reduction oc- curring very quickly after L-DXR reached the patient's blood (fig. 4 in Ref. 9 and Table VI). Table VI demonstrates that for patient l0 (group II), the [DXR]L/[PG ] was reduced from 0.18 in the original batch to 0.078 twenty minutes (and probably much faster) after the begining of infu- sion; the level of free drug [DXR]F was relatively high. The accumulation of non-liposome- associated DXR in plasma is mainly a result of the lower capacity of the liver (the main organ for DXR removal and biotransformation) to take up and/or metabolize DXR. The major route of excretion of DXR and its metabolites is biliary. In many patients with severe liver involvement, the DXR processing is severely impaired and clearance of DXR and its metabolites was delayed (reviewed in Ref. 48). This led to the recommenda- tion for dose reduction for patients with extensive liver abnormalities. Therefore the ratio of AUCL/AUCF may be a measure of the extent of liver involvement. In the case of patient 10, liver lobectomy was the main cause for the accumula- tion of free DXR in plasma.
The reduction in the [DXR]L/[PG ] ratio is explained by dilution-related release. The complex

TA
BL
E V
I
Com
plet
e pl
asm
a ph
arm
acok
inet
ics
of l
ipos
omal
DX
R a
nd l
ipos
omes
*
Tim
e D
ose
of P
G
Pla
sma
% i
njec
ted
Lip
osom
e (m
in)
adm
inis
tere
d (P
G)
dose
of
PG
cl
eara
nce
rate
(n
mol
/ml)
(n
mol
/ml)
in
pla
sma
(nm
ol p
hos-
ph
olip
ids
lipi
ds
ml-
I .
min
-1)
Dos
e of
DX
R
adm
inis
tere
d (/
~g/m
l)
Pla
sma
lipo
som
al
DX
R
(/~g
/ml)
Pla
sma
free
D
XR
(#
g/m
l)
% i
njec
ted
dose
of
lipo
som
al
DX
R
in p
lasm
a
Lip
osom
al D
XR
cl
eara
nce
rate
(n
mol
•
ml -
I •
min
-j)
[DX
R]L
[PG
]T
mol
ar r
atio
Infu
sion
20
20
0 32
.2
16.1
0 27
.96
40
404
46.6
11
.50
29.7
8 78
78
9 10
1.3
12.8
2 29
.39
Pos
t in
fusi
on
15
789
45.3
5.
73
35
789
30.2
3.
80
0.76
48
78
9 22
.6
2.86
0.
58
62
789
18.6
2.
35
0.29
18
0 78
9 10
.9
1.38
0.
07
390
789
3.1
0.39
0.
04
18.5
37
.4
72.8
72.8
72
.8
72.8
72
.8
72.8
72
.8
1.45
1.
22
4.00
1.10
0.
44
0.13
6 0.
10
0.04
3 0.
05
0.20
2.
18
2.37
0.40
0.
15
0.15
0.
105
0.10
5
7.27
3.
06
5.14
1.41
0.
56
0.17
0.
13
0.05
0.
05
1.58
1.
66
1.63
0.04
3 0.
030
0.00
2 <
0.00
1
0.07
8 0.
045
0.06
8
0.04
1 0.
024
0.01
3 0.
008
0.00
7
*In
pati
ent
No.
10
, se
e te
xt a
nd R
ef.
9.
[DX
R]L
/[PG
IT i
n th
e ba
tch
was
0.1
8; [
DX
R]
L =
lip
osom
e-as
soci
ated
DX
R.
pharmacokinetic profile of this patient demon- strates the power of the analysis proposed in this paper. Patient 10 weighed 70 kg and had a body surface area of 1.75 m 2. The patient received 120 mg/m 2 DXR (total, 210 mg) and 9.94 mmol of phospholipids, of which 2.13 mmol was egg phos- phatidylglycerol. A plasma volume of 2700 ml was estimated from blood volume (7.5% of body weight) and the hematocrit. The ratio [DXR]L/ [PG]a- in the liposome formulation was 0.18. Li- posome clearance is described in this paper as [phospholipids] • time -l (nmol • min-l). Clear- ance of liposomal doxorubicin is described as [DXR]L • time -t (nmol • min-l).
Liposome clearance rate during infusion was constant, about 29 nmol phospholipid • m1-1 min -I (or a total of about 78 #mol • min-I). The clearance rate of DXR was also constant, about 1.6 nmol • m1-1 • min -1 (or a total of about 4.3 /zmol • min-1). The tl/2 of the liposomes was about 12 min and ofliposomal-DXR, about 6 min, compared with 2 min for free DXR released from the liposomes. Based on L-DXR phospholipid batch concentration of 65 mM, the liposome dilu- tion in plasma varied from > 1000-fold during the first 20 min of infusion to 200-fold at the end of in- fusion. Dilution increased from about 500-fold 15 min after the infusion to about 2000-fold 3 h after the end of the infusion.
The reduction in the ratio [DXR]L/[PG]T from 0.18 (L-DXR before infusion) to 0.078 twenty minutes after infusion suggests that the liposomes quickly released about 60% of their DXR, a value which resembles the results of the in vitro dilution- dependent release. The slower phase of reduction in [DXR]L/[PGIT ratio in the patient's plasma is also related to size-dependent clearance of lipo- somes [41], with the larger liposomes which have higher [DXR]L/PL ratio [111 cleared faster.
In contrast to the pharmacokinetics of L-DXR, the pharmacokinetics of DXR encapsulated in the aqueous phase of long-circulating small unilamel- lar liposomes (S-DXR, see Table I) in humans was very different. No free drug was observed in plas- ma of any of 15 patients, and the circulation time of S-DXR was much lower (hi2 of approx. 40 h) in spite of the large dilution [23] and was similar to that in dogs and rodents [20]. This was again in
233
agreement with the dilution release assay, as no dilution-dependent release was obtained with S-DXR.
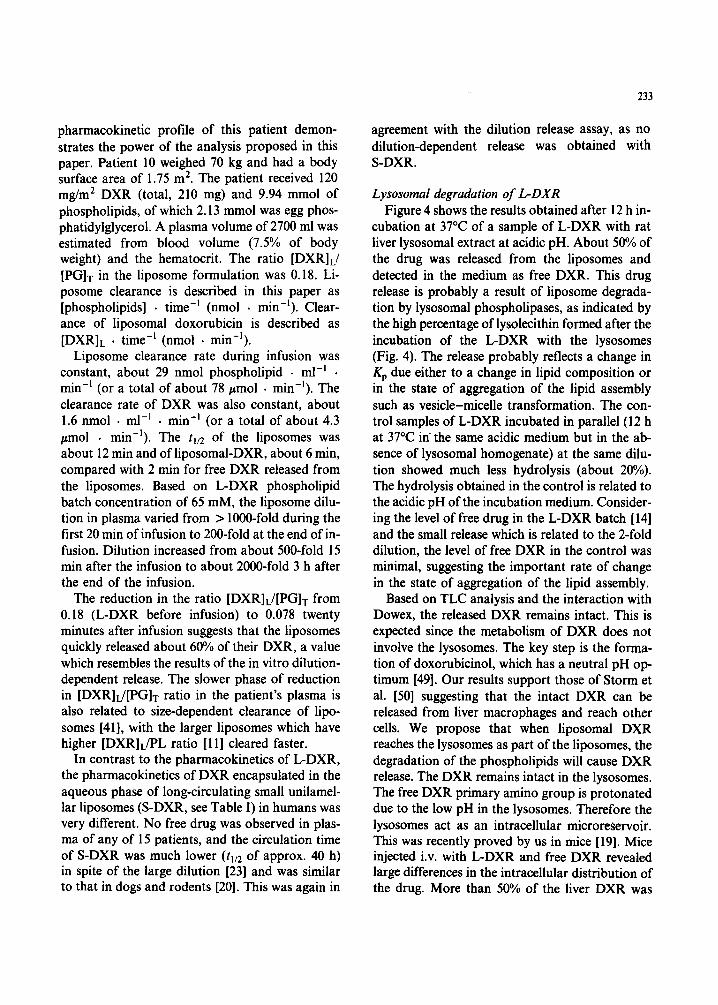
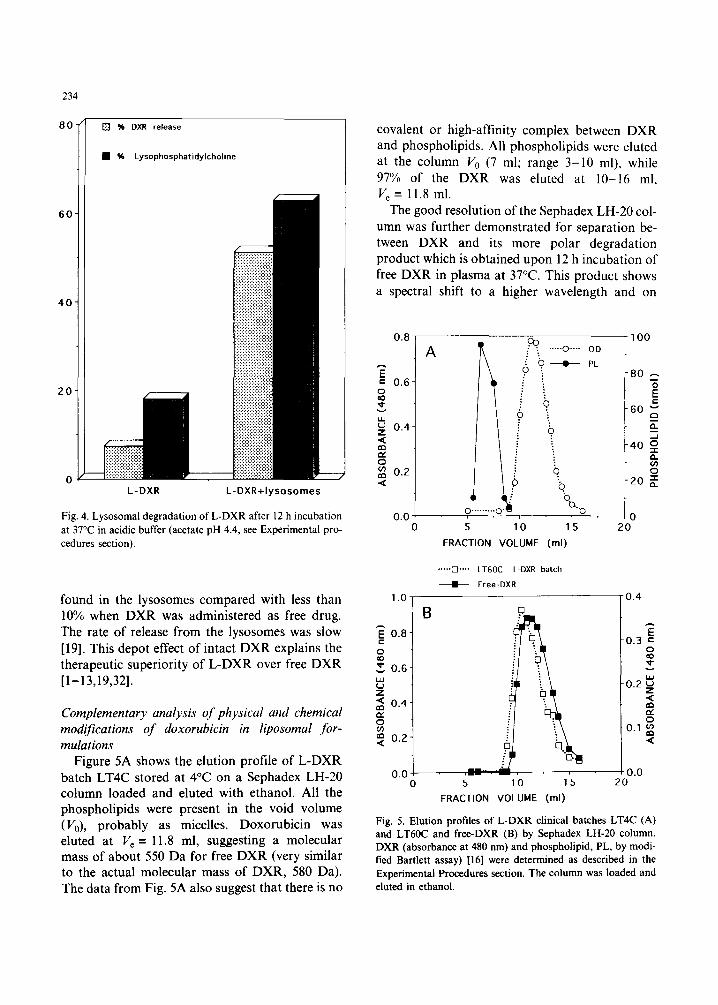
Lysosomal degradation of L-DXR Figure 4 shows the results obtained after 12 h in-
cubation at 37°C of a sample of L-DXR with rat liver lysosomal extract at acidic pH. About 50% of the drug was released from the liposomes and detected in the medium as free DXR. This drug release is probably a result of liposome degrada- tion by lysosomal phospholipases, as indicated by the high percentage of lysolecithin formed after the incubation of the L-DXR with the lysosomes (Fig. 4). The release probably reflects a change in Kp due either to a change in lipid composition or in the state of aggregation of the lipid assembly such as vesicle-micelle transformation. The con- trol samples of L-DXR incubated in parallel (12 h at 37°C in the same acidic medium but in the ab- sence of lysosomal homogenate) at the same dilu- tion showed much less hydrolysis (about 20%). The hydrolysis obtained in the control is related to the acidic pH of the incubation medium. Consider- ing the level of free drug in the L-DXR batch [14] and the small release which is related to the 2-fold dilution, the level of free DXR in the control was minimal, suggesting the important rate of change in the state of aggregation of the lipid assembly.
Based on TLC analysis and the interaction with Dowex, the released DXR remains intact. This is expected since the metabolism of DXR does not involve the lysosomes. The key step is the forma- tion of doxorubicinol, which has a neutral pH op- timum [49]. Our results support those of Storm et al. [50] suggesting that the intact DXR can be released from liver macrophages and reach other cells. We propose that when liposomal DXR reaches the lysosomes as part of the liposomes, the degradation of the phospholipids will cause DXR release. The DXR remains intact in the lysosomes. The free DXR primary amino group is protonated due to the low pH in the lysosomes. Therefore the lysosomes act as an intracellular microreServoir. This was recently proved by us in mice [19]. Mice injected i.v. with L-DXR and free DXR revealed large differences in the intracellular distribution of the drug. More than 50% of the liver DXR was
234
80
60
40
20
0
q % DXR release
q % Lysophosphatidylcholine
L-DXR L-DXR+lysosomes
Fig. 4. Lysosomal degradation of L-DXR after 12 h incubation at 37°C in acidic buffer (acetate pH 4.4, see Experimental pro- cedures section).
found in the lysosomes compared with less than 10% when DXR was administered as free drug. The rate of release from the lysosomes was slow [ 191. This depot effect of intact DXR explains the therapeutic superiority of L-DXR over free DXR [l-13,19,32].
Complementary analysis of physical and chemical modifications of doxorubicin in liposomal for- mulations
Figure 5A shows the elution profile of L-DXR batch LT4C stored at 4°C on a Sephadex LH-20 column loaded and eluted with ethanol. All the phospholipids were present in the void volume (V,,), probably as micelles. Doxorubicin was eluted at V, = 11.8 ml, suggesting a molecular mass of about 550 Da for free DXR (very similar to the actual molecular mass of DXR, 580 Da). The data from Fig. 5A also suggest that there is no
covalent or high-affinity complex between DXR and phospholipids. All phospholipids were eluted at the column V0 (7 ml; range 3-10 ml), while 97% of the DXR was eluted at lo- 16 ml, V, = 11.8 ml.
The good resolution of the Sephadex LH-20 col- umn was further demonstrated for separation be- tween DXR and its more polar degradation product which is obtained upon 12 h incubation of free DXR in plasma at 37°C. This product shows a spectral shift to a higher wavelength and on
I
i‘ T
100
i ., 0 . . . OD
PL A
4 b
0.01 %
0 5 10 15
FRACTION VOLUME (ml)
0.8
z = 0.6
8 v
.....iZi.... LT6OC L-DXR batch
& Free-DXR
1.0, 10.4
! B i 0.8-
8 z 0.6-
ti
5 : 0.4-
f$ 0.2-
I
o.o- 8 $0.0 0 5 10 15 20
FRACTION VOLUME (ml)
Fig. 5. Elution profiles of L-DXR clinical batches LT4C (A) and LT6OC and free-DXR (B) by Sephadex LH-20 column. DXR (absorbance at 480 nm) and phospholipid, PL, by modi- tied Bartlett assay) [16] were determined as described in the Experimental Procedures section. The column was loaded and eluted in ethanol.

Sephadex LH-20 columns it has a larger Kav (Fig. 2), corresponding to a molecular mass of 400-450 Da, suggesting that it resembles 7-deoxy- demethyl doxorubicinol or its aglycone. This is also supported by the spectral shift [49].
Figure 5B shows a comparison between the elu- tion profiles of free DXR and L-DXR stored in lyophilized form at 60°C (clinical batch LT60C). Both samples were dissolved under identical con- ditions in ethanol. This comparison suggests that DXR in batch LT60C (V e = 11 ml) has a larger molecular mass (1000-1100 Da) than free DXR (lie= 11.8 ml). We have not yet succeeded in analyzing this adduct by TLC or HPLC, and it is not yet clear if it is a new chemical entity. DXR in batches LT4C and HU36 resemble free DXR. Storage at higher temperature (75°C) induces the appearance of peaks of larger molecular mass (V¢ < 11.0 ml).
The appearance of a DXR-related entity of higher molecular mass may be a result of either physical irreversible aggregation or chemical oligomerization (dimerization). It is expected that the change in molecular mass of DXR makes it biologically unavailable; therefore this assay may be very useful to assess the therapeutic efficacy of liposomal DXR by in vitro testing.
The mechanism of the appearance of the higher DXR-related molecular mass, although not yet known, may possibly be related to the reversible self-aggregation of the drug. A reversible self- aggregation of DXR molecules has previously been demonstrated to be an important physical factor which may affect the chemical stability of DXR [17]. This phenomenon results from the stacking of the planar aromatic rings of anthra- cyclines due to the interaction between the r elec- trons of the rings [17,51,52]. The aggregation is facilitated by increasing ionic strength and by the presence of metal ions such as iron and copper [17]. There are various models to describe the self- aggregation process; these are discussed elsewhere [53,54]. It is worth noting that the DXR self- association in aqueous media can be demonstrated at a concentration as low as 1/xM, at which dimers are formed [54], and that larger aggregates occur at higher concentration. The aggregation process can be followed by various physical methods,
235
including proton NMR, circular dichroism, sedi- mentation equilibrium, and absorbance and flu- orescence spectra [171.
It is not clear yet if the appearance of high molecular mass entities is facilitated by the interac- tion of the DXR with the liposomal membrane. Also, the contribution of DXR reversible self- aggregation to the appearance of high molecular mass adducts is unknown. Finally, the energy of activation of formation of the adduct has to be studied in order to assess its relevancy to the L- DXR performance.
Concluding Remarks
(a) The pharmacokinetic performance of liposomal formulations is dependent on two kinet- ic rate constants: (i) the rate constant which describes the release of the agent from the lipo- somes (kofr) and (ii) the rate of liposome clearance (kL), as well as on a thermodynamic parameter: the liposome-to-body fluid partition coefficient (Kp). In most cases, kL can be predicted based on liposome size and lipid composition. Kp and koff can be determined by an in vitro dilution-induced release assay. This was demonstrated by the corre- lation between the in vitro dilution-induced release and the pharmacokinetic profile of the DXR ad- ministrated intravenously in two different liposo- mal formulations (L-DXR and S-DXR).
(b) For RES-directed liposomal formulations, the bioavailability of the drug is related to the lipo- some lipids' degradation and the fate of the re- leased drug in the lysosomes of the RES cells.
(c) The appearance of DXR-related products, as yet unidentified by HPLC, was described. These products are of higher molecular mass than DXR, suggesting oligomerization of DXR.
Acknowledgement
This work was supported in part by Liposome Technology Inc., Menlo Park, CA.
References
1 A. Gabizon, A. Dagan, D. Goren, Y. Barenholz and Z. Fuks (1982) Cancer Res. 42, 4734-4739.

236
2
3
4
5
A. Gabizon, D. Goren, Z. Fuks, Y. Barenholz, A. Dagan and A. Meshorer (1983) Cancer Res. 43, 4730-4735. A. Gabizon, D. Goren, Z. Fuks, A. Meshorer and Y. Barenholz (1985) Br. J. Cancer 51, 681-689. A. Gabizon, A. Meshorer and Y. Barenholz (1986) J. Natl. Cancer Inst. 77, 459-469. A. Gabizon, A. Sulkes, T. Peretz, D. Goren, S. Druckman, S. Amselem, R. Ben-Yosef, N. Ben-Baruch and Y. Barenholz (1989) in: l.J. Fidler and G. Lopez- Berestein (Eds.), Liposomes in the Therapy of Infectious Diseases and Cancer, UCLA Symposia on Molecular and Cellular Biology, Vol. 89, Alan R. Liss, New York, pp. 391-402.
6 A. Gabizon, T. Peretz, A. Sulkes, S. Amselem, R. Ben- Yosef, N. Ben Baruch, R. Catane, S. Biran and Y. Barenholz (1989) Eur. J. Cancer Clin. Oncol. 25, 1795-1803.
7 A. Gabizon, S. Amselem, D. Goren, R. Cohen, S. Druckmann, I. Fromer, R. Chisin, T. Peretz, A. Sulkes and Y. Barenholz (1990) J. Liposome Res. 1,491-502.
8 Y. Barenholz, S. Druckmann, R. Cohen, S. Amselem, A. Sulkes and A. Gabizon (1990) in: E. Rubinstein (Ed.), Proc. 16th int. Congress Chemotherapy., Jerusalem, pp. 303.1 to 303.3.
9 A. Gabizon, R. Chisin, S. Amselem, D. Goren, R. Cohen, S. Druckmann, I. Fromer, T, Peretz, A. Sulkes and Y. Barenholz (1991) Br. J. Cancer 64, 1125-1132.
10 R. Cohen and Y. Barenholz (1990) in: G. Gregoriadis, H. Patel and A.T. Florence (Eds.), Liposomes in Drug Deli- very: 21 Years On, London University, School of Pharmacy.
11 D. Goren, A. Gabizon and Y. Barenholz (1990) Biochim. Biophys. Acta 1029, 285-294.
12 S. Amselem, A. Gabizon and Y. Barenholz (1990) J. Pharm. Sci. 79, 1045-1052.
13 S. Amselem, A. Gabizon and Y. Barenholz (1990) J. Lipo- some Res. 1, 299-313.
14 S. Amselem, R. Cohen, S. Druckmann, A. Gabizon, D. Goren, R.M. Abra, A. Huang, R. New and Y. Barenholz (1992) J. Liposome Res. 2, 93-123.
15 S. Amselem, A. Gabizon and Y. Barenholz (1993) in: G. Gregoriadis (Ed.), Liposome Technology, 2nd edition, vol. 1, Chapter 28, CRC Press, Boca Raton, FL, pp. 501-525.
16 Y. Barenholz and S. Amselem (1993) in: G. Gregoriadis (Ed.), Liposome Technology, 2nd edition, Vol. 1, Chapter 29, CRC Press, Boca Raton, FL, pp. 527-616.
17 Y. Barenholz, S. Amselem, D. Goren, R. Cohen, D. Gelvan, A. Samuni, E.B. Golden and A. Gabizon (1993) Med. Res. Rev. 13, 449-491.
18 Y. Barenholz and D. Crommelin (1993) in: J. Swarbrick and J.C. Boyalon (Eds.), Encyclopedia of Pharmaceutical Technology, Marcel Dekker, New York, in press.
19 D. Goren (1990), Ph.D. Thesis, Hebrew University, Jerusalem, Israel.
20 A. Gabizon, M. Biater and Y. Barenholz (1993) Phar- macol. Res. 10, 703-708.
21 G. Haran, R. Cohen, L.K. Bar and Y. Barenholz (1993) Biochim. Biophys. Acta, in press.
22 Y. Barenholz and A. Gabizon, in: A. Agranat and R. Meshoulam (Eds.), (1992) Trends in Medicinal Chemistry, Blackwell Scientific Publications. Oxford, pp. 393-395.
23 A. Gabizon, R. Catane, B. Uziely, B. Kaufman, T. Safra, R. Cohen, F. Martin, Y. Barenholz and A. Huang (1992) Proc. Am. Soc. Clin. Oncol. 11, 124 (Abstract).
24 S. Druckmann, A. Gabizon and Y. Barenholz (1989) Biochim. Biophys. Acta 980, 381-384.
25 A.T. Horwitz, Y. Barenholz and A. Gabizon (1992) Biochim. Biophys. Acta, 1109, 203-209.
26 D.D. Lasic, P.M. Frederick, M.C. Stuart, Y. Barenholz and J.I. Mclntosh (1992) FEBS Lett. 312, 255-258.
27 G.R. Bartlett (1959) J. Biol. Chem. 234, 466-468. 28 G. Storm, L. Van Bloois, M. Brouwer and D.J. Crom-
melin (1985) Biochim. Biophys. Acta 818, 343-351. 29 E.J. Bligh and W.J. Dyer (19591 Can. J. Biochem. Physiol.
37, 85-124. 30 Y. Barenholz, A. Roitman and S. Gatt (19661 J. Biol.
Chem. 241, 3731-3737 31 S. Gatt and Y. Barenholz (1969) Methods Enzymol. 14,
167-170. 32 A. Gabizon, D. Goren, A. Ramu and Y. Barenholz (1986)
in: G. Gregoriadis (Ed.), Targeting of Drugs with Synthet- ic Systems, NATO ASI Series, pp. 229-238.
33 L. Bar, Y. Barenholz and T.E. Thompson (1986) Biochemistry 26, 5460-5465.
34 M.L. Johnson and S.G. Fraiser (1985) Method Enzymol. 117, 301-342.
35 K.A. Sikaris, K.R. Thulborn and W.H. Sawyer (1981) Chem. Phys. Lipids 29, 23-26.
36 Y. Barenholz, D. Gibbs, B. Litman, J. Gall and T.E. Thompson (1977) Biochemistry 16, 2806-2810.
37 P.P. Constantinidis, N. inouchi, T.R. Tritton, A.C. Sar- torelli and J.M. Sturtevant (1986) J. Biol. Chem. 261, 10196-10203.
38 M. Duarte-Karim, J.M. Ruyschaert and Hildebrand (1976) Biochim. Biphys. Res. Commun. 71,658-663.
39 S. Levin and T. Bar-Shua (1993) in: G. Gregoriadis (Ed.), Liposome Technology, 2nd edition, Vol. ll, CRC Press, Boca Raton, FL, pp. 293-306.
40 S. Levin and G. Tawil (1993) Anal. Chem., in press 41 J.H. Senior (1987) Crit. Rev. Therap. Drug Carrier Syst.
3, 123-193. 42 A. Gabizon, R. Shiota and D. Papahadjopoulos (1989) J.
Natl. Cancer Inst. 81, 1484-1488. 43 A. Gabizon (1992) Cancer Res. 52, 891-896. 44 D. Lichtenberg and Y. Barenholz (1988) in: D. Glick (Ed.)
Methods of Biochemical Analysis, vol. 33, John Wiley, New York, pp. 337-462.
45 M. Levy (1992) Ph.D. Thesis, Hebrew University, Jerusalem, Israel.

46 Y. Barenholz, O. Palgi, G. Goiod, N. Emanuel, Y. Rotkosky, E. Braun and E. Kedar (1993) in: G. Gregoriadis, A.C. Allison and G. Poste (Eds.), New Generation Vaccines: The Role of Basic Immunology, Plenum Press, New York, in press.
47 M.C. Phillips, W.J. Johnson and G.H. Rothblat 0987) Biochim. Biophys. Acta 906, 223-276.
48 S.B. Kaye, J. Cummings and D.J. Kerr 0985) Eur. J. Cancer Clin. Oncol. 21,893-895.
49 C.E. Riggs and N.R. Bachur 0983) in: M.N. Ames, G. Powis and J.S. Kovach (Eds.), Pharmacokinetics of Anti- cancer Agents in Humans, Chapter 10, Elsevier, Amster- dam, pp. 229-278.
50 G. Storm, J. Regts, J.H. Beijnen and F.H. Rodnick (1989) J. Liposome Res. l, 195-210.
237
51 N.S. Angerman, T.A. Victor, C.L. Bell and S.S. Danyluk 0972) Biochemistry I l, 2402-2411.
52 S.R. Martin 0980) Biopolymers 19, 713-721. 53 M. Menozzi, L. Valentini, E. Vannini and F. Arcamone
0984) J. Pharm. Sci. 73, 766-770. 54 J.B. Chaires, N. Dattagupta and D.M. Crothers (1982)
Biochemistry 21, 3927-3932. 55 M.C. Woodle, L.R. Collins, E. Sponster, N. Kossovsky,
D. Papahadjopoulos and F. Martin (1992) Biophys. J. 61, 902-910.
56 M.C. Woodle and D. Lasic (1992) Biochim. Biophys. Acta 113, 171-199.
57 L. Fisher (1974) in: An Introduction to Gel Chroma- tography, North Holland, American Elsevier, New York.