Back massage: Long term effects and dosage determination ...
178
University of South Florida Scholar Commons Graduate eses and Dissertations Graduate School 2007 Back massage: Long term effects and dosage determination for persons with pre-hypertension and hypertension Christine M. Olney University of South Florida Follow this and additional works at: hp://scholarcommons.usf.edu/etd Part of the American Studies Commons is Dissertation is brought to you for free and open access by the Graduate School at Scholar Commons. It has been accepted for inclusion in Graduate eses and Dissertations by an authorized administrator of Scholar Commons. For more information, please contact [email protected]. Scholar Commons Citation Olney, Christine M., "Back massage: Long term effects and dosage determination for persons with pre-hypertension and hypertension" (2007). Graduate eses and Dissertations. hp://scholarcommons.usf.edu/etd/2307
-
Upload
khangminh22 -
Category
Documents
-
view
0 -
download
0
Transcript of Back massage: Long term effects and dosage determination ...

University of South FloridaScholar Commons
Graduate Theses and Dissertations Graduate School
2007
Back massage: Long term effects and dosagedetermination for persons with pre-hypertensionand hypertensionChristine M. OlneyUniversity of South Florida
Follow this and additional works at: http://scholarcommons.usf.edu/etd
Part of the American Studies Commons
This Dissertation is brought to you for free and open access by the Graduate School at Scholar Commons. It has been accepted for inclusion inGraduate Theses and Dissertations by an authorized administrator of Scholar Commons. For more information, please [email protected].
Scholar Commons CitationOlney, Christine M., "Back massage: Long term effects and dosage determination for persons with pre-hypertension and hypertension"(2007). Graduate Theses and Dissertations.http://scholarcommons.usf.edu/etd/2307
Back Massage: Long Term Effects and Dosage Determination
for Persons With Pre-Hypertension and Hypertension
By
Christine M. Olney
A dissertation submitted in partial fulfillment of the requirements for the degree of
Doctor of Philosophy College fo Nursing
University of South Florida
Major Professor: Mary Webb, Ph. D. Jason Beckstead, Ph.D. Theresa Beckie, Ph.D. Doug Schocken, M.D. Maureen Groer, Ph.D.
Date of Approval:
March 26, 2007
Keywords: blood pressure, body mass index, effleurage, randomized, relaxation response
Copyright: 2007, Christine M. Olney
Dedication
This dissertation is dedicated to my husband, Ronald Olney, who has been my
best friend and a constant source of encouragement for more than 28 years. It is
also dedicated to our children, Hannah and Elizabeth; they are the world’s best
cheering squad a mom could ever desire. It is my wish to always be an
inspiration to them. Lastly, this dissertation is dedicated to my parents, Paul and
Alice Neppel. Two statements (among their many sage words of wisdom) were
of significant inspiration for me as a child. I believe these often repeated words
laid the foundation for me to become a researcher: “because” and “you can do
anything you choose to do”, the former statement being the most unsatisfactory
answer to my question of “why” and the latter statement instilling in me the
confidence to go forth.

Acknowledgements
I would like to express my gratitude to my dissertation committee for their
guidance and support throughout the dissertation process. I would also like to
acknowledge Dean Patricia Burns for providing a research space at the College
of Nursing.
i
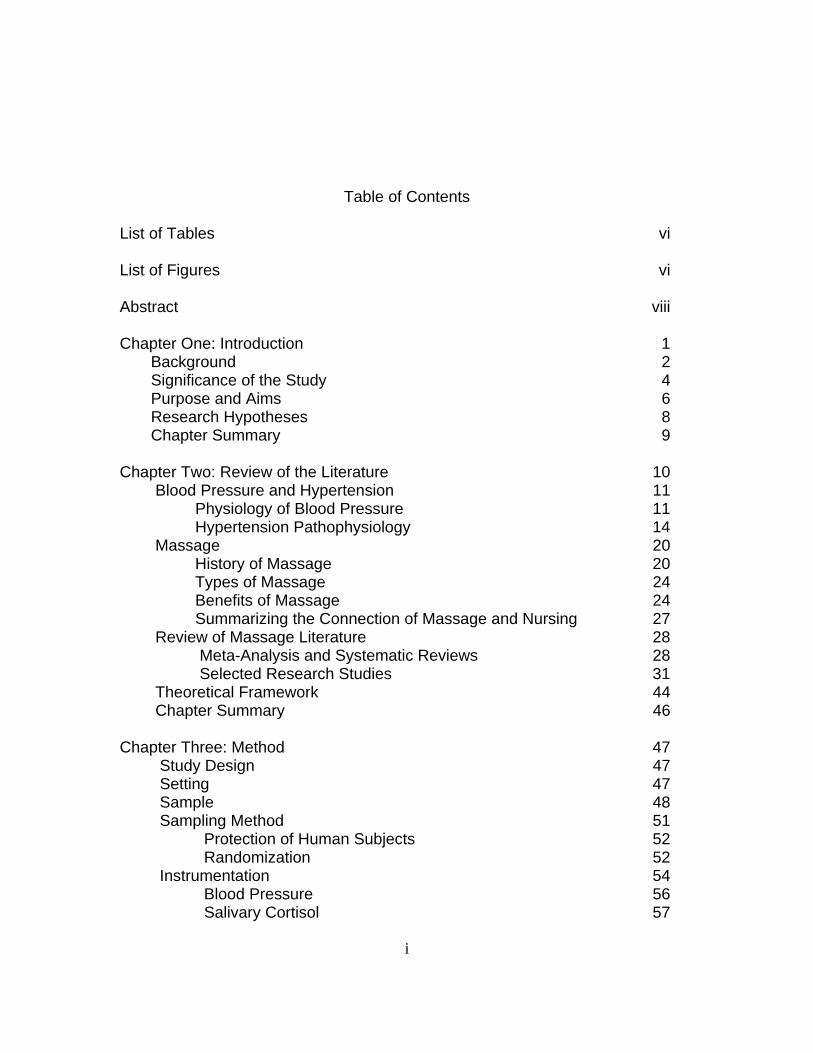
Table of Contents
List of Tables vi List of Figures vi Abstract viii Chapter One: Introduction 1 Background 2 Significance of the Study 4 Purpose and Aims 6 Research Hypotheses 8 Chapter Summary 9 Chapter Two: Review of the Literature 10 Blood Pressure and Hypertension 11 Physiology of Blood Pressure 11 Hypertension Pathophysiology 14 Massage 20 History of Massage 20 Types of Massage 24 Benefits of Massage 24 Summarizing the Connection of Massage and Nursing 27 Review of Massage Literature 28 Meta-Analysis and Systematic Reviews 28 Selected Research Studies 31 Theoretical Framework 44 Chapter Summary 46 Chapter Three: Method 47 Study Design 47 Setting 47 Sample 48 Sampling Method 51 Protection of Human Subjects 52 Randomization 52 Instrumentation 54 Blood Pressure 56 Salivary Cortisol 57
ii
State Trait Personality Inventory 58 Expectations Rating Scale 59 Touch Perception Rating Scale 59 Perceived Rapport Scale 59 Subject Information form 60 Procedure 60 The Massage Therapist 61 Massage Routine 61 10-Massage Group and 5-Massage Group Procedure 62 Control Group Procedure 63 Post Intervention Procedures 63 Data Management 63 Security 63 Data Analysis Plan 64 Chapter Summary 64 Chapter Four: Overview of Findings 66 Analytical Strategy 66 Preliminary Analyses 67 Sample 67 Assumptions 75 Missing data 75 Normality and Outliers 77 Homogeneity of Variance 81 Sphericity 81 Homogeneity of Regression Slopes 81 Correlations 82 Hypotheses Testing 92 Hypothesis 1 92 Hypothesis 2 95 Hypothesis 3 99 Hypothesis 4 100 Hypothesis 5 101 Systolic lying & sitting blood pressure changes 102
over time Diastolic lying & sitting blood pressure changes 103
over time Additional Analysis of Interest 107 Expectations 107 Chapter Five: Discussion 108 Additional Discussion 113 Study Limitations 116 Implications for Practice 117 Future Research Recommendations 118
iii
References 120 Appendices 130 Appendix 1: CD list 131 Appendix 2: Recruitment Flyer 132 Appendix 3: Letter from Institution Review Board 133 Appendix 4: Approved Consent form 134 Appendix 5: Approved HIPAA form 136 Appendix 6: Subject Information form 140 Appendix 7: Mini Mental Exam 142 Appendix 8: State Trait Personality Inventory 144 Appendix 9: Permission from Dr Spielberger 148 Appendix 10: Subject Touch Perception Scale 149 Appendix 11: Subject Perceived Rapport Scale 150 Appendix 12: Schedule for Participants 151 Appendix 13: Medications Used by Study Participants 152 Appendix 14: Means and Standard Deviation Bars for 153 Trait Anxiety, Anger and Depression Appendix 15: Correlations of pertinent variables 155 Appendix 16: Scatter Plots Correlations of pertinent variables 159 Appendix 17: Correlations of Antihypertensive Medication, 161
BMI and Baroreceptor Response About the Author End Page
iv
List of Tables Table 1 JNC VII Classification of Blood Pressure 16 Table 2 Types of Massage 24 Table 3 Benefits of Massage 25 Table 4 Summary of Massage Studies in which Blood Pressure Measured 32 Table 5 Reasons Interested Persons did not Join Study 50 Table 6 Reasons Consented Participants Dropped out of Study 54 Table 7 Variables Measured and Instruments used to Measure each Variable 55 Table 8 Characteristics of Groups 68 Table 9 Antihypertensive Medications Used by Study 70 Participants Table 10 Means (Standard Deviations) and Significance of 71 State Anxiety, Anger and Depression Table 11 Means (Standard Deviations) and Significance of 72 Trait Anxiety, Anger and Depression Table 12 Cortisol Means (Standard Deviations) and 73 Significance Table 13 The Subject Touch Perception Scale Means 74 (Standard Deviation) Table 14 Subject Perceived Rapport Scale Means 75 (Standard Deviation) Table 15 Demographics of Dependent Variable Means 76 (Standard Deviations)

v
Table 16 Heterogeneity of Variance of BMI and Systolic 82 Blood Pressure Table 17 Correlations of Antihypertensive Medication, BMI and 87 Blood Pressure Difference Scores: 10-Massage Group Table 18 Correlations of Antihypertensive Medication, BMI and 88 Blood Pressure Difference Scores: 5-Massage Group. Table 19 Correlations of Antihypertensive Medication, BMI and 89 Blood Pressure Difference Scores: Control Group. Table 20 Analysis of Covariance of Massage Effects on Systolic 93 Blood Pressure: A Report of Simple Main Effects after Controlling for BMI Table 21 Analysis of Covariance of Massage Effects on Diastolic 96 Blood Pressure: A Report of Simple Main Effects after Controlling for BMI
Table 22 Laying and Sitting Blood Pressure Group Means 101 (Standard Deviations) Table 23 Lying to Sitting Change in Systolic Blood Pressure: 106 Simple Main Effects of Position by Time within Group Table 24 Lying to Sitting Change in Diastolic Blood Pressure: 107
Simple Main Effects of Position within Group
vi
List of Figures
Figure 1 Psychophysiology and Blood Pressure Model 4 Figure 2 Baroreceptor Pathway 13 Figure 3 Model of Massage Influence on Blood Pressure 45 within the Psychophysiology Framework Figure 4 Participant Eligibility and Attrition 53 Figure 5 State Anxiety Means and Standard Deviation Bars 78 Figure 6 State Anger Means and Standard Deviation Bars 78 Figure 7 State Depression Means and Standard Deviation 79 Bars Figure 8 Group Means of Cortisol Levels over Time 79 Figure 9 Group Means of Systolic Blood Pressures over Time 80 Figure 10 Group Means of Diastolic Blood Pressures over Time 80 Figure 11 Systolic Blood Pressure Difference and BMI for 90 10-Massage Group Figure 12 Systolic Blood Pressure Difference and BMI for 90 5-Massage Group Figure 13 Systolic Blood Pressure Difference and BMI for 91 Control Group Figure 14 Systolic Blood Pressures over Time, Total Group 94
and Split by BMI: 10-Massage Group Figure 15 Systolic Blood Pressures over Time, Total Group 95 and Split by BMI with Trend lines:10-Massage group
vii
Figure 16 Diastolic Blood Pressures over Time, Total Group 98 and Split by BMI: 10-Massage group Figure 17 Diastolic Blood Pressures over Time, Total Group 98 and Split by BMI with Trend lines:10-Massage group Figure 18 10-Massage Group Lying & Sitting Systolic Blood 102
Pressure Relationship Figure 19: 5-Massage Group Lying & Sitting Systolic Blood 102 Pressure Relationship Figure 20: Control Group Lying & Sitting Systolic Blood 103 Pressure Relationship Figure 21: 10-Massage Group Lying & Sitting Diastolic Blood 103
Pressure Relationship Figure 22: 5-Massage Group Lying & Sitting Diastolic Blood 104 Pressure Relationship Figure 23: Control Group Lying & Sitting Diastolic Blood 104 Pressure Relationship
viii
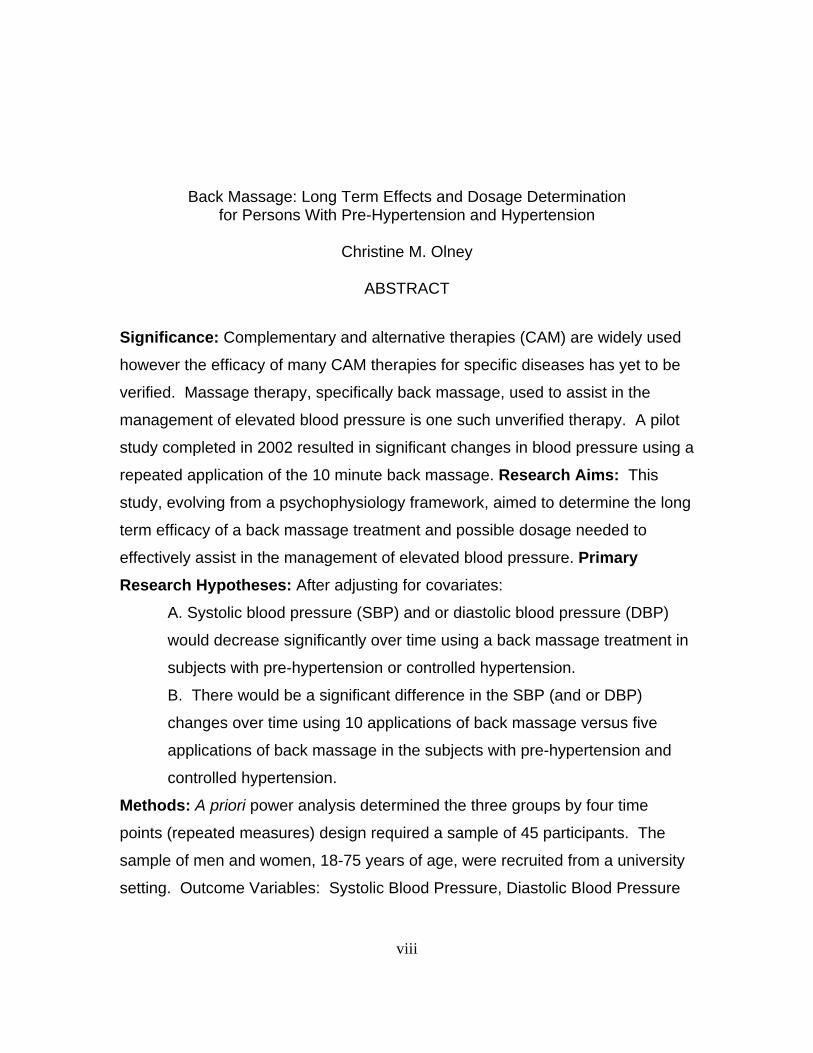
Back Massage: Long Term Effects and Dosage Determination for Persons With Pre-Hypertension and Hypertension
Christine M. Olney
ABSTRACT
Significance: Complementary and alternative therapies (CAM) are widely used
however the efficacy of many CAM therapies for specific diseases has yet to be
verified. Massage therapy, specifically back massage, used to assist in the
management of elevated blood pressure is one such unverified therapy. A pilot
study completed in 2002 resulted in significant changes in blood pressure using a
repeated application of the 10 minute back massage. Research Aims: This
study, evolving from a psychophysiology framework, aimed to determine the long
term efficacy of a back massage treatment and possible dosage needed to
effectively assist in the management of elevated blood pressure. Primary
Research Hypotheses: After adjusting for covariates:
A. Systolic blood pressure (SBP) and or diastolic blood pressure (DBP)
would decrease significantly over time using a back massage treatment in
subjects with pre-hypertension or controlled hypertension.
B. There would be a significant difference in the SBP (and or DBP)
changes over time using 10 applications of back massage versus five
applications of back massage in the subjects with pre-hypertension and
controlled hypertension.
Methods: A priori power analysis determined the three groups by four time
points (repeated measures) design required a sample of 45 participants. The
sample of men and women, 18-75 years of age, were recruited from a university
setting. Outcome Variables: Systolic Blood Pressure, Diastolic Blood Pressure
ix
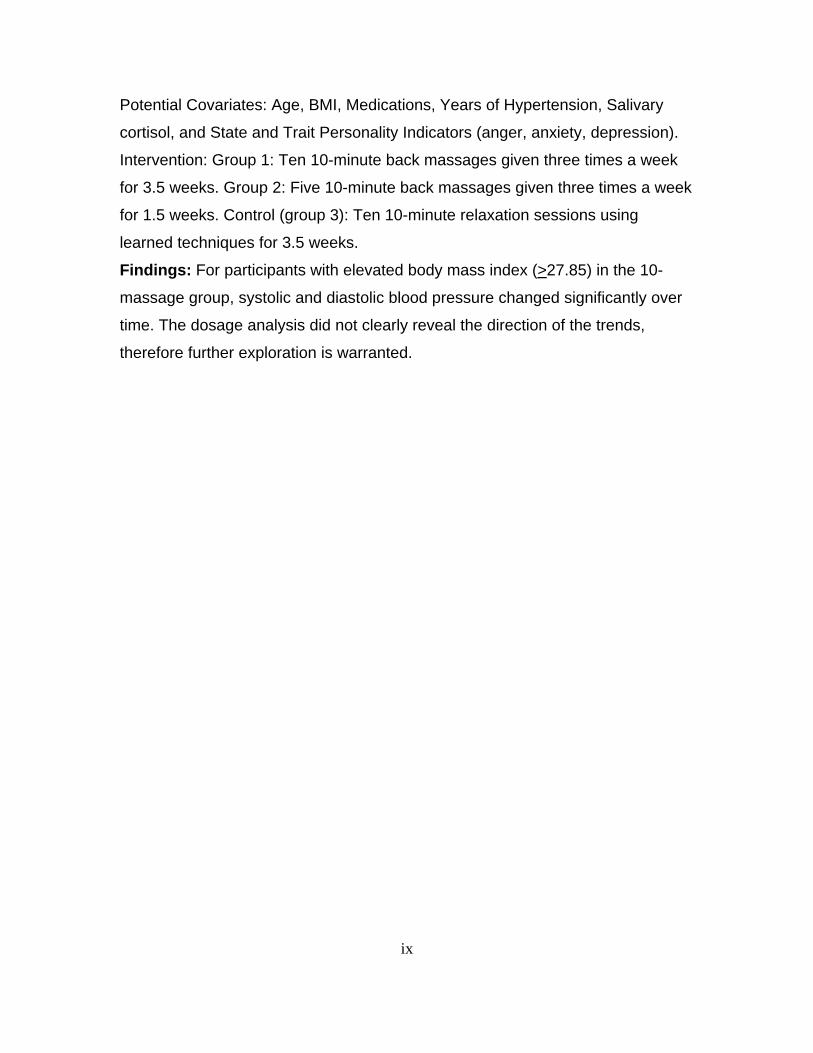
Potential Covariates: Age, BMI, Medications, Years of Hypertension, Salivary
cortisol, and State and Trait Personality Indicators (anger, anxiety, depression).
Intervention: Group 1: Ten 10-minute back massages given three times a week
for 3.5 weeks. Group 2: Five 10-minute back massages given three times a week
for 1.5 weeks. Control (group 3): Ten 10-minute relaxation sessions using
learned techniques for 3.5 weeks.
Findings: For participants with elevated body mass index (>27.85) in the 10-
massage group, systolic and diastolic blood pressure changed significantly over
time. The dosage analysis did not clearly reveal the direction of the trends,
therefore further exploration is warranted.
1
Chapter One
Introduction
Massage has long been thought to have an effect on blood pressure
levels (e. g. Longworth, 1982; Hernandez-Rief, Field, Krasnegor et al., 2000;
Moyer, Rounds & Hannum, 2004). However, specific effects of massage on
blood pressure levels remain controversial due to the scarcity of rigorous
randomized clinical trials (Moyer et al., 2004). Recently an organized effort by
the scientific community has emerged to understand the efficacy of massage. In
2004, Moyer et al. published a meta-analysis of 37 experimental clinical trials of
massage therapy. This work calculated the effect sizes for nine dependent
variables; five studies measured systolic and diastolic blood pressures as
dependent variables. The meta-analysis results provided scientific evidence and
a better understanding of the efficacy of massage in the management of blood
pressure. Further the meta-analysis identified specific questions in need of
exploration regarding the effects of massage.
The intent of this study was to explore specifically identified areas in
question regarding the efficacy of massage effects on blood pressure. An in-
depth review of literature about massage and blood pressure, along with the
findings from the PI’s pilot study (Olney, 2005), guided the proposal for this
study. This study sought to determine the long-term effects of back massage
2
and to compare two dosages of back massage on persons with elevated blood
pressure. Further, this study examined a specific physiological mechanism,
baroreceptor response, which could possibly assist in the understanding of the
effects of back massage on blood pressure.
Background
Massage therapy, in particular, therapeutic back massage, has long been
of interest to nursing. Historically, back massage has been an integral part of
nursing care, usually administered when preparing the patient for nighttime
sleep. As the American health care system has changed, the workload of the
hospital staff nurse intensified and back massage fell from the working
vernacular of nursing care (Meintz, 1995). By the 1990’s, complementary and
alternative medicine became embedded in healthcare, reinvigorating interest in
massage therapy and back massage. Currently, back massage, along with other
forms of massage are now considered complementary therapies. Under the
auspices of complementary therapy, back massage is commonly referred to as
therapeutic back massage.
Elevated blood pressure is a serious health problem throughout the world.
Unmitigated elevated blood pressure, be it pre-hypertension or hypertension
often results in dire health consequences. Hypertension is a major contributor to
cardiovascular disease, the primary cause of death in the United States
(American Heart Association, 2006). Researchers, internationally, have
historically identified multiple causes of hypertension, yet with more than 90% of
cases of hypertension, causation remains elusive (Kaplan, 2002). Scientists
3
have studied and verified many phenomena that add to the understanding of the
development of hypertension. One often addressed phenomenon for elevation of
blood pressure is unrelenting stress.
Psychophysiology, the study of how psychological factors influence
physiology, resulting in health or illness, provided a conceptual framework for this
study. Psychophysiology considers the influence of stress on homeostasis,
adaptation and allostasis to help explain the relationships between man and his
internal and external environment.
Stress has long been recognized as a contributing factor to the
development of elevated blood pressure (Benson, 2000). Movement from a
Cartesian approach toward a holistic model of psychophysiology has allowed
scientists to begin to explain the integrative interactivity of the human element
within one’s endogenous environment. Specifically, environmental chronic
physical (external) stressors such as obesity, nicotine, and caffeine are known to
contribute to the genesis of hypertension. Perceived stress (internal) is also
recognized a as contributory factor in transitory and chronic hypertension. These
external and internal stressors influence the autonomic nervous system,
hormonal-endocrine system and the immune system (Segerstrom & Miller,
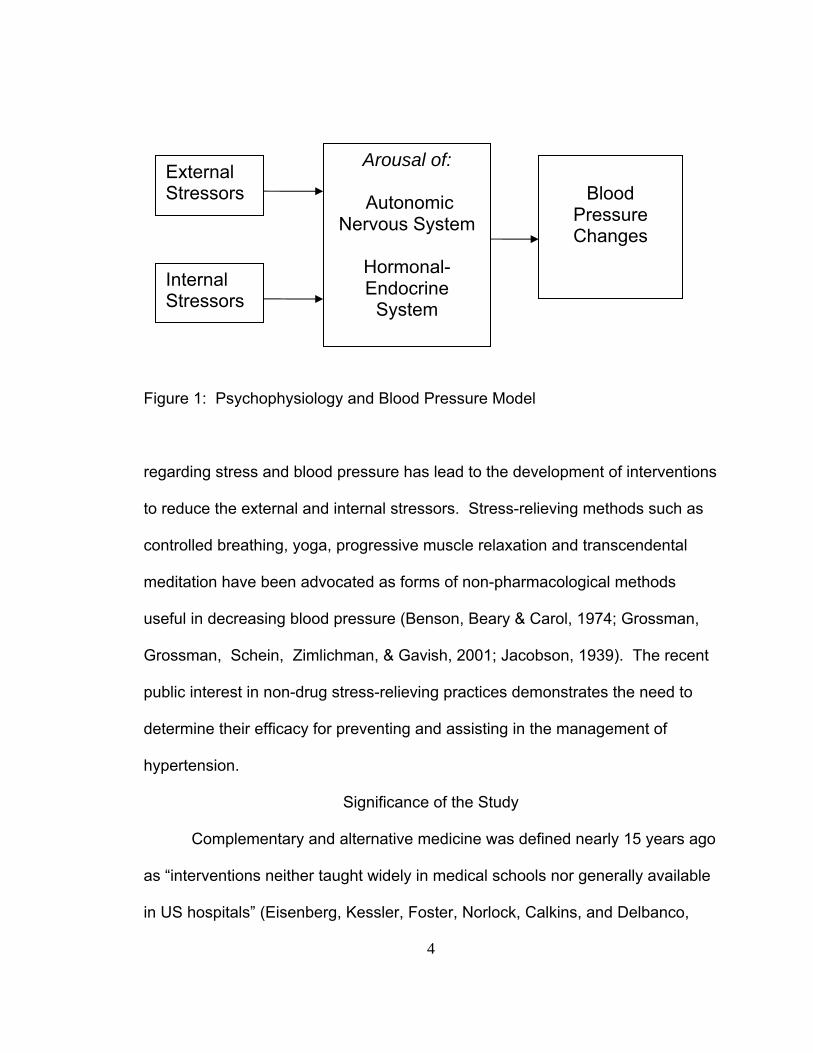
2004). The result is that blood pressure changes in response to the arousal or
lack of arousal (Figure 1). The psychophysiology theory is developed further in
Chapter two.
The relationship between stressors and their effects on blood pressure
has been well studied by the scientific community. The knowledge gained
4
Figure 1: Psychophysiology and Blood Pressure Model
regarding stress and blood pressure has lead to the development of interventions
to reduce the external and internal stressors. Stress-relieving methods such as
controlled breathing, yoga, progressive muscle relaxation and transcendental
meditation have been advocated as forms of non-pharmacological methods
useful in decreasing blood pressure (Benson, Beary & Carol, 1974; Grossman,
Grossman, Schein, Zimlichman, & Gavish, 2001; Jacobson, 1939). The recent
public interest in non-drug stress-relieving practices demonstrates the need to
determine their efficacy for preventing and assisting in the management of
hypertension.
Significance of the Study
Complementary and alternative medicine was defined nearly 15 years ago
as “interventions neither taught widely in medical schools nor generally available
in US hospitals” (Eisenberg, Kessler, Foster, Norlock, Calkins, and Delbanco,
External Stressors
Arousal of:
Autonomic Nervous System
Hormonal-Endocrine
System
Blood
Pressure Changes
Internal Stressors
5
1993, page 246). The interest in complementary and alternative therapies,
including massage therapy, has evolved rapidly. Reports of the usage of
complementary and alternative therapies among Americans has varied from
28.9% (Ni, Simile, and Hardy, 2002) to 62% (Barnes, Powell-Griner, McFann, &
Nahin, 2004) of the population. In a recent study measuring trends of
complementary and alternative therapy use over the past 50 years by adults in
the United States, researchers found the use of massage therapy experienced
rapid growth in the 1980’s and 1990’s (Kessler, Davis, Foster et al., 2001).
Tindle, Davis, Phillips, and Eisenberg (2005) further evaluated the trends of
complementary and alternative therapies between 1997 and 2002 and found the
trend in massage has stayed approximately the same as previous years.
Barnes, Powell-Griner, McFann, and Nahin (2004), in a search for types of
complementary and alternative therapies usage among American adults, agreed
with Kessler et al. (2001) that massage therapy was used by approximately five
percent of the population for many purposes. Yeh, Davis and Phillips (2006)
reported that 36% of patients with cardiovascular disease use complementary
and alternative therapies. Further, 5% specifically use complementary and
alternative therapies to treat their hypertension.
Massage is used for a multitude of purposes including muscle relaxation,
circulatory stimulation, myofascial release, and lymphatic drainage. Back
massage is one type of massage used by nurses even though the efficacy of
back massage is not well established. Therefore, research on back massage is
important.
6
The media has led the general population to believe that massage can
indeed influence their blood pressure trajectories (Prevention Magazine, 2006;
Kurashova-Wine, 1999). Though there are some findings in the literature
towards this end, the research is not rigorous enough to state that there are
indeed any long-term effects. Therefore, long-term effects of therapeutic back
massage are of relevant interest and rigorous studies are urgently needed to
protect the public from possible harm. Further, the literature does not address
the dosage needed to effect change. Is one back massage as effective as are
several? There is little information available to advise a clinician for patient
teaching. Another reason for further therapeutic back massage research is to
clarify the underlying mechanism(s) influencing the changes in blood pressure
with back massage. If indeed, there is a long-term effect of back massage on
blood pressure, what mechanism(s) are involved?
Finally, offsetting the onset of hypertension has potential health care cost
savings, including a delay in drug treatment intervention, a possible decrease in
dosage needed, and the delay in overall health de-conditioning sequela that
occurs with the onset of uncontrolled elevated blood pressure. This study
evaluated a therapy that could easily be taught to family members for utilization,
thus alleviating the need for costly massage therapy clinicians.
Purposes and Aims
The primary purpose of this study was to determine if therapeutic back
massage could provide long-term effects to a person with elevated blood
pressure. This study tested the findings of a pilot study in which an experimental
7
design compared back massage to relaxation (Olney, 2005). A second purpose
of this study was to compare two dosages of therapeutic back massage on
persons with elevated blood pressure. Finally, this study tested for changes in
baroreceptor activity as a possible explanation of effects of therapeutic back
massage.
The specific aims of this study were to:
1. Determine the difference in systolic blood pressure over time in a
treatment versus control group of prehypertensive and hypertensive
subjects.
2. Determine the difference in diastolic blood pressure over time in a
treatment versus the control group of pre-hypertensive and
hypertensive subjects.
3. Compare the systolic blood pressure changes over time of two
dosages of back massage in pre-hypertensive and hypertensive
subjects.
4. Compare the diastolic blood pressure changes over time of two
dosages of back massage in pre-hypertensive and hypertensive
subjects.
5. Determine the difference in lying versus sitting blood pressure change
over time in the treatment versus control groups of pre-hypertensive
and hypertensive subjects.
8
Research Hypotheses
The study tested the long-term effects and dosage of therapeutic back
massage on persons with elevated blood pressure. Furthermore, the study
aimed to examine a possible physiological mechanism, baroreceptor response,
explaining part of the change which may occur with TBM. The following research
hypotheses were tested:
1. After adjusting for covariates, systolic blood pressure will decrease
significantly over time using back massage treatment in subjects with
prehypertension and controlled hypertension.
2. After adjusting for covariates, diastolic blood pressure will decrease
significantly over time using back massage treatment in subjects with
prehypertension and controlled hypertension.
3. After adjusting for covariates, there will be a significant difference in
systolic blood pressure changes using 10 applications of back massage
versus five applications of back massage in subjects with prehypertension
and controlled hypertension.
4. After adjusting for covariates, there will be a significant difference in
diastolic blood pressure changes using 10 applications of back massage
versus five applications of back massage in subjects with prehypertension
and controlled hypertension.
5. There will be a significant change over time in reclining blood pressures
compared to sitting blood pressures in the subjects with prehypertension

9
and controlled hypertension in the back massage treatment group of 10
applications when compared to the control group.
Chapter Summary
Chapter One presented a brief overview of what is known about the
effects of massage on blood pressure and a statement of the purpose of this
study to further understand that relationship. A short discussion about how
the practice of the back rub with bedtime preparation has been lost only to
have back rubs re-emerge under the auspices of complementary therapies.
The seriousness of elevated blood pressure was briefly discussed. The
psychoneuroimmunology theory provides a framework within which
understanding of how elevated blood pressure develops and how a stress
reduction method such as massage may assist in managing a healthy blood
pressure level. The primary purpose of this study was presented: to test for
long term effects of back massage. Further a second purpose was to test two
dosages of massage for effects. Finally, the study tested for a mechanism,
change baroreceptor function. The significance of the study discussed the
increase in complementary therapy usage by the general population and the
need to ensure that using massage for blood pressure management is indeed
a safe practice. The financial impact of offsetting the onset of hypertension
through the use of a complementary therapy such as massage was
discussed. Finally the five study hypotheses were clearly stated.
10
Chapter Two
Review of the Literature
Chapter Two presents a review of the relevant literature regarding the
state of the science on hypertension and massage therapy. A brief overview of
blood pressure physiology is presented as well as the pathophysiology of
hypertension. A full review of massage literature as it relates to this study
follows. The framework for the study is discussed, clarifying the theoretical
underpinnings for the study.
Initial computerized searches on Medline, Cochrane Database of
Systematic Reviews, CINAHL and OVID-Full Text, using the headings of blood
pressure, elevated blood pressure, hypertension, baro-receptors, or high blood
pressure yielded more than 280,000 articles. Searches for massage literature
under headings of massage, massage therapy, back massage, back rub,
therapeutic massage, yielded more than 8,000 articles. In Pub Med alone,
combining search terms using the Boolean “AND”, for example, massage AND
blood pressure, yielded a much-reduced result of 413 hits. Limiting the articles to
the English language, adults and human studies further reduced the number of
articles to 120. Perusal of the reference lists from recovered articles led to
additional relevant research discovery. In addition, computer searches and
11
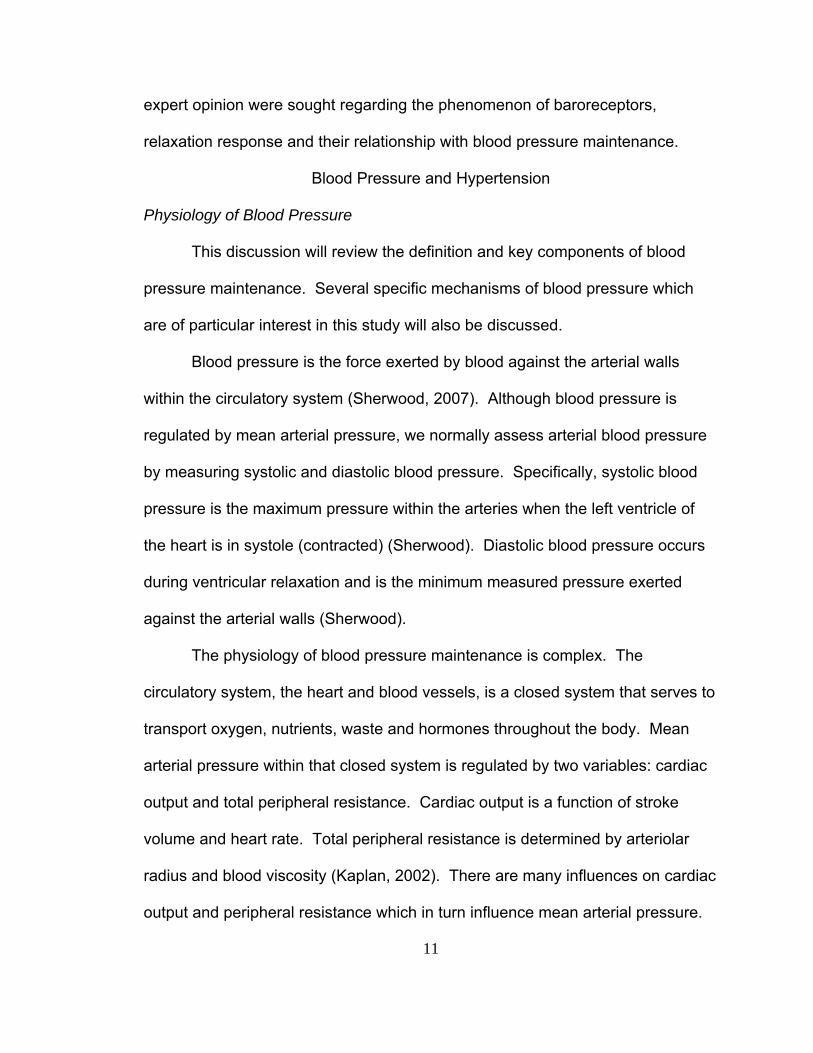
expert opinion were sought regarding the phenomenon of baroreceptors,
relaxation response and their relationship with blood pressure maintenance.
Blood Pressure and Hypertension
Physiology of Blood Pressure
This discussion will review the definition and key components of blood
pressure maintenance. Several specific mechanisms of blood pressure which
are of particular interest in this study will also be discussed.
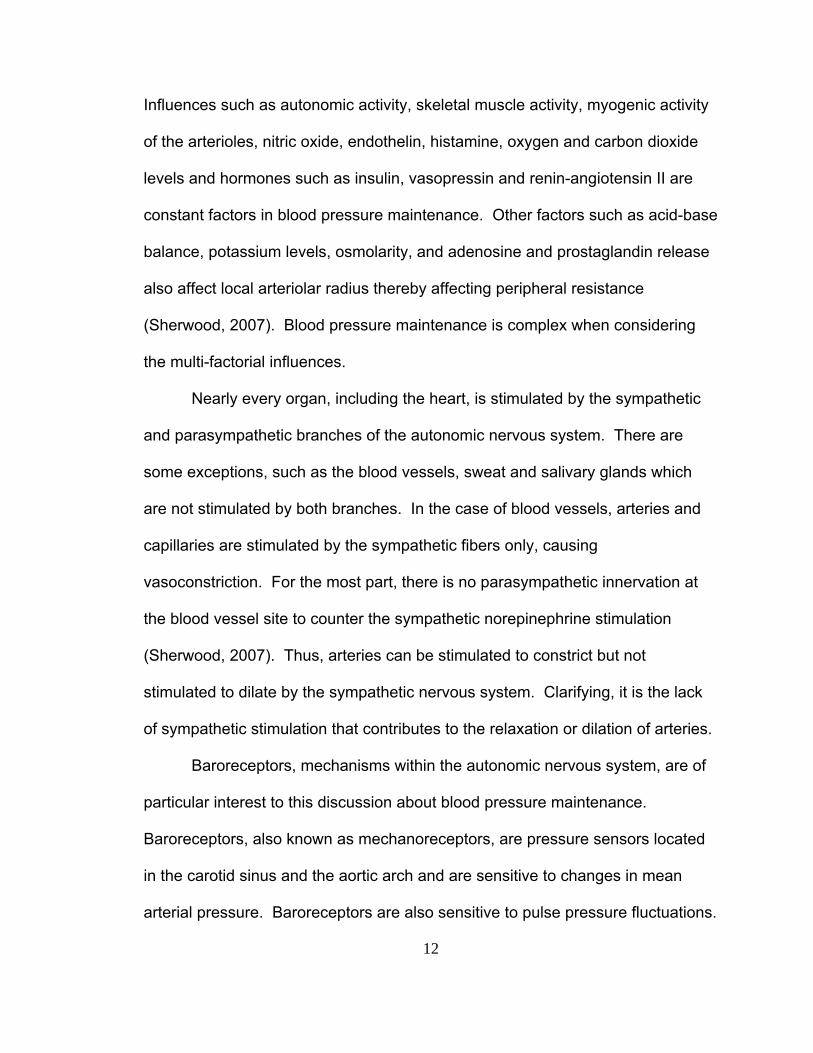
Blood pressure is the force exerted by blood against the arterial walls
within the circulatory system (Sherwood, 2007). Although blood pressure is
regulated by mean arterial pressure, we normally assess arterial blood pressure
by measuring systolic and diastolic blood pressure. Specifically, systolic blood
pressure is the maximum pressure within the arteries when the left ventricle of
the heart is in systole (contracted) (Sherwood). Diastolic blood pressure occurs
during ventricular relaxation and is the minimum measured pressure exerted
against the arterial walls (Sherwood).
The physiology of blood pressure maintenance is complex. The
circulatory system, the heart and blood vessels, is a closed system that serves to
transport oxygen, nutrients, waste and hormones throughout the body. Mean
arterial pressure within that closed system is regulated by two variables: cardiac
output and total peripheral resistance. Cardiac output is a function of stroke
volume and heart rate. Total peripheral resistance is determined by arteriolar
radius and blood viscosity (Kaplan, 2002). There are many influences on cardiac
output and peripheral resistance which in turn influence mean arterial pressure.
12
Influences such as autonomic activity, skeletal muscle activity, myogenic activity
of the arterioles, nitric oxide, endothelin, histamine, oxygen and carbon dioxide
levels and hormones such as insulin, vasopressin and renin-angiotensin II are
constant factors in blood pressure maintenance. Other factors such as acid-base
balance, potassium levels, osmolarity, and adenosine and prostaglandin release
also affect local arteriolar radius thereby affecting peripheral resistance
(Sherwood, 2007). Blood pressure maintenance is complex when considering
the multi-factorial influences.
Nearly every organ, including the heart, is stimulated by the sympathetic
and parasympathetic branches of the autonomic nervous system. There are
some exceptions, such as the blood vessels, sweat and salivary glands which
are not stimulated by both branches. In the case of blood vessels, arteries and
capillaries are stimulated by the sympathetic fibers only, causing
vasoconstriction. For the most part, there is no parasympathetic innervation at
the blood vessel site to counter the sympathetic norepinephrine stimulation
(Sherwood, 2007). Thus, arteries can be stimulated to constrict but not
stimulated to dilate by the sympathetic nervous system. Clarifying, it is the lack
of sympathetic stimulation that contributes to the relaxation or dilation of arteries.
Baroreceptors, mechanisms within the autonomic nervous system, are of
particular interest to this discussion about blood pressure maintenance.
Baroreceptors, also known as mechanoreceptors, are pressure sensors located
in the carotid sinus and the aortic arch and are sensitive to changes in mean
arterial pressure. Baroreceptors are also sensitive to pulse pressure fluctuations.

13
Pulse pressure, the difference between systolic and diastolic pressures, can be
altered by slight changes in systolic and diastolic pressures without changing the
mean arterial pressure (Sherwood, 2007). When mean arterial pressure or pulse
pressure changes, the baroreceptors sense the change. An example would be
when a healthy supine person sits up. The action of sitting up initially lowers
blood pressure (through gravity) thereby decreasing stroke volume and cardiac
output. The sensed lower blood pressure causes the baroreceptors to fire at a
slower rate, sending a message via the ninth and tenth afferent cranial nerves to
the autonomic center in the brain (nucleus of the solitary tract) (Sherwood).
Figure 2: Baroreceptor Pathway
Baroreceptors in Aortic Arch and Carotids
Nucleus of Solitary Tract
Cardiac Vagal
Motorneurons
Spinal cord: Sympathetic Preganglionic Motorneurons
Heart Rate Blood Pressure
Medulla
14
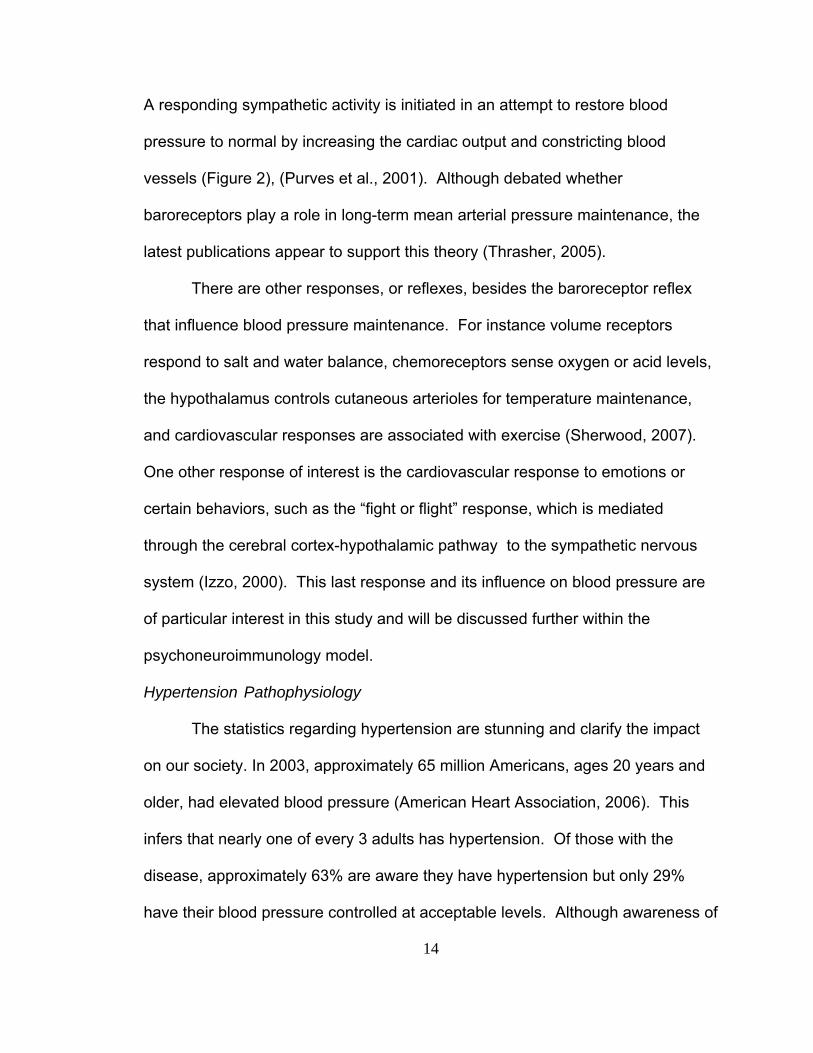
A responding sympathetic activity is initiated in an attempt to restore blood
pressure to normal by increasing the cardiac output and constricting blood
vessels (Figure 2), (Purves et al., 2001). Although debated whether
baroreceptors play a role in long-term mean arterial pressure maintenance, the
latest publications appear to support this theory (Thrasher, 2005).
There are other responses, or reflexes, besides the baroreceptor reflex
that influence blood pressure maintenance. For instance volume receptors
respond to salt and water balance, chemoreceptors sense oxygen or acid levels,
the hypothalamus controls cutaneous arterioles for temperature maintenance,
and cardiovascular responses are associated with exercise (Sherwood, 2007).
One other response of interest is the cardiovascular response to emotions or
certain behaviors, such as the “fight or flight” response, which is mediated
through the cerebral cortex-hypothalamic pathway to the sympathetic nervous
system (Izzo, 2000). This last response and its influence on blood pressure are
of particular interest in this study and will be discussed further within the
psychoneuroimmunology model.
Hypertension Pathophysiology
The statistics regarding hypertension are stunning and clarify the impact
on our society. In 2003, approximately 65 million Americans, ages 20 years and
older, had elevated blood pressure (American Heart Association, 2006). This
infers that nearly one of every 3 adults has hypertension. Of those with the
disease, approximately 63% are aware they have hypertension but only 29%
have their blood pressure controlled at acceptable levels. Although awareness of
15
hypertension has improved over the past 10 years, the death rate due to
elevated blood pressure has increased by almost 30%. In 2003, of those with
hypertension, the overall death rate was 18%. Of all deaths in 2003,
hypertension was either the primary cause or contributed to 12% of the deaths.
Almost $64 billion is spent annually on direct and indirect cost due to
hypertension (American Heart Association, 2006). Clearly the financial impact on
our society is extreme.
Nearly 90% of hypertension cases are categorized as primary
hypertension (American heart Association, 2006). Secondary hypertension,
which has known renal, endocrine and neurogenic causes, comprises the
remaining 10% of hypertension cases and will not be discussed.
Primary hypertension is of concern to health care providers because it
alters normal function of the heart and blood vessels. With hypertension
development, there is an abnormal increase in peripheral resistance and/or
cardiac output thus increasing the heart workload and exposing blood vessels to
excessive internal pressure (Kaplan, 2002). Unmitigated, chronic elevated blood
pressure leads to target organ damage resulting in congestive heart failure,
stroke, renal failure, and retinal damage. The majority of persons who
experience their first heart attack, first stroke or have congestive heart failure
have elevated blood pressure (American Heart Association, 2006).
The World Health Organization and the International Society of
Hypertension have defined hypertension as a blood pressure measuring above
140/90 mmHg (World Health Organization, International Society of Hypertension

16
Writing Group, 2003; Chalmers, 1999.) The Seventh Report from the Joint
National Committee on Prevention, detection, Evaluation and Treatment of High
Blood Pressure (JNC7) amended the definition by adding an additional blood
pressure classification called prehypertension for adults age 18 and older
(Chobanian et. al., 2003). Prehypertension is defined as a systolic blood
pressure of 120 -139 mmHg or higher and/or a diastolic blood pressure of 80 - 89
mmHg or higher (Table 1).
Table 1
JNC VII Classification of Blood Pressure
____________________________________________________________ B/P Classification Systolic (mmHg) Diastolic (mmHg)
____________________________________________________________
Normal < 120 and < 80
Prehypertensive 120-139 or 80-89
Stage 1 Hypertension 140-159 or 90-99
Stage 2 Hypertension >160 or > 100
_____________________________________________________________
A person whose blood pressure is in the prehypertensive category is at
greater risk for developing hypertension than one whose blood pressure is
normal (Vasan et al., 2001). Lifestyle modification is the treatment of choice for
this classification (Chobanian et al., 2003) and includes recommendations of
dietary changes such as a reduction in sodium and increase in calcium intake
(Oparil, 2000), reduction in weight (Kaplan, 2002; McCowen, Chan, & Blackburn,

17
2000), cessation and avoidance of tobacco (Onken, White, Cooney et al., 2001),
decrease in alcohol consumption (Cushman, 2000), increase in exercise (Herrera
& Lowenthal, 2000), and stress reduction (Light, 2000). Results from stress
reduction studies (Patel, 1997) have shown significant changes in blood pressure
and support a strong argument for further research (Webb, 2002; Webb &
Beckstead, 2002, Yucha, et. al., 2001). Massage therapy is one such stress
reduction method researched for its impact on cardiovascular, immunological,
and psychological outcomes (Groer, 1994; Ironson & Field, 1996; Moyer et al.,
2004).
Any one or all of the highly interactive neural, hormonal, chemical, and
mechanical systems may contribute to the development of high blood pressure
(Kaplan, 2002). Further, these interactions are uniquely expressed and where
the exact maladaptation occurs leading to the development of chronically
elevated blood pressure is unique. Therefore using a reductionist approach to
explain hypertension pathophysiology has historically proven difficult (Delgado &
Weder, 2000).
Research has also identified contributory factors in the development of
hypertension such as genetics, age, race/ethnicity, obesity, smoking, diet, lack of
exercise, inflammation, salt sensitivity as well as psychological factors of anxiety,
anger, hostility and depression (Charmandari, Kino, Souvatzoglou, & Chrousos,
2003; Chobanian et al., 2003; He & MacGregor, 2003; Li & Chen, 2005; Li, 2006;
Rutledge & Hogan, 2002; & Yan et al., 2003).
18
Baroreceptors appear to have a role in hypertension. These
mechanoreceptors “reset” their firing threshold to a higher level in the presence
of chronically elevated blood pressure. When resetting occurs, a higher
threshold is required to fire an action potential, allowing for a higher level of
pressure against the vessel walls before the impulse signal is generated and
responded to through the autonomic nervous system. Presently, there is great
debate in the literature regarding the resetting of baroreceptors and hypertension
(DiBona, 2004; Dickerson, 2004; Sleight, 2004; Thrasher, 2004). This
dissertation study will not be resolving the debate, but does examine baroreflex
sensitivity.
The association of psychological factors with hypertension has been
studied for many years, although methodological issues have provided
inconsistent findings (Rutledge & Hogan, 2002). For example, in their review of
the literature relating anger and anxiety to essential hypertension, Spielberg and
colleagues concluded that the evidence was controversial. It was clear that
suppressed anger and hypertension had an association, but causation was not
verified (Spielberger et al., 1991). A later review by Rutledge and Hogan (2002)
assessed the associations between hypertension and psychological factors such
as anger, anxiety and depression, arguing that the effect sizes of the 15 studies
were not attributable to methodological characteristics. They concluded the
effect sizes for the psychological variables of anger, anxiety and depression were
significant. Scalco, Scalco, Azul and Lotufo (2005) reviewed the relationship
between hypertension and depression. The evidence demonstrated a complex
19
relationship between depression and hypertension with suggestions that
depression increases the risk of developing hypertension. Additionally, studies
reviewed by Light (2001) clearly demonstrate the relationship between perceived
stress and hypertension. This dissertation study measured psychological factors
of anger, anxiety, and depression as covariates to the blood pressure outcome
variables.
Persons initially diagnosed with pre-hypertension and hypertension should
be advised to strictly adhere to lifestyle modifications such as weight reduction,
following the Dietary Approaches to Stop Hypertension (DASH) diet and
decreasing in dietary sodium consumption (Chobanian et al., 2003).
Recommended modifications also included are increase in exercise, moderation
of alcohol consumption, and cessation of smoking. Usual pharmacological
treatments of hypertension include thiazide-type diuretics as an initial therapy
alone, or in combination with one of the following classes of drugs: angiotensin
converting enzyme inhibitors, angiotensin-receptor blockers, calcium channel
blockers, or beta-blockers (Chobanian et al., 2003). Other medications are
available to assist in gaining a desirable blood pressure level. The right
combination of medication is often influenced by other disease processes the
person may be experiencing (Chobanian et al., 2003).
Beyond the lifestyle modifications recommended by the Seventh Report of
the Joint National Committee (Chobanian et al., 2003), some practitioners
recommend non-pharmacological interventions to assist in the management of
hypertension. Some of these interventions include biofeedback, relaxation
20
training, massage therapy, transcendental meditation, breathing exercises,
cognitive therapy and herbal supplements (Light, 2001; Weil, 2007).
Massage
History of Massage
Massage has a long and rich history. Nearly every early culture in the
world has recorded some form of manual manipulation of soft tissue. From the
first known civilization, clay tablet writings dated 2100 BC, described rubbing and
friction for a remedy of a diseased part (Benjamin, 2005). Ancient recordings of
massage from China, Japan, India, Greece, Rome, and Turkey have provided
the underlying foundation for modern massage practice (Salvo, 1999; Benjamin,
2005). The knowledge and use of massage, just as many other health practices,
traveled with mankind as they traded and warred.
Hippocrates of Cos, (460-375 BC) the father of modern western medicine,
and Galen, a Roman physician, promoted the use of rubbing and friction. The
Greek’s had gymnasiums, where their men exercised, and received massages
regularly. The Roman’s borrowed the Greek ideas to develop Roman baths,
where massage, along with the bath, was utilized by both men and women
(Benjamin, 2005).
During the Middle Ages, after the Roman Empire deteriorated, massage
was mostly lost as a health practice, although there is some evidence that folk
healers and mid-wives used massage. From that same period, the Arabic
Empire offers writings from a physician/philosopher, Avicenna (980-1037 BC)
who promoted the use of massage, exercise and bathing (Beck, 1999).
21
The modern western massage evolved in the 19th and 20th centuries.
Pehr Henrik Ling (1776-1839) and Johann Mezger (1838-1909) are given credit
for giving a scientific basis to massage. Ling, a Swedish fencing master and
educator, believed that movement of the body was the key to good health. His
writings on educational gymnastics influenced physical education in the western
world. Ling’s system of passive and active movements was used to treat medical
conditions. The passive movements included shaking, pressing, stroking
pinching, squeezing, kneading, clapping, vibrations and rolling (Benjamin, 2005).
It was Mezger, a physician from Amsterdam who categorized the soft tissue
movements (massage) into four categories, as we know them today: effleurage
(stroking), petrissage (kneading), friction (rubbing), and tapotement (tapping).
The United States was introduced to Swedish massage techniques in the
mid to late 19th century. It was through the practice and writings of people such
as Drs. George and Charles Taylor, orthopedic practitioners, and Hartvig Nissen
who published Swedish Movement and Massage in several medical journals, that
medical practitioners in the United States became interested in the benefits of
massage (Salvo, 1999). These renowned medical practitioners offered legitimate
credence to massage health benefits. Massage was even more popularized in
the late 19th century by John Kellogg (of Battle Creek, Michigan) who opened a
natural healing resort which advocated healthy living through vegetarianism,
sunshine, exercise, colonics, and massage.
Swedish massage held importance in health and healing early in the 20th
century. Schools of massage taught students how to apply Swedish movement,
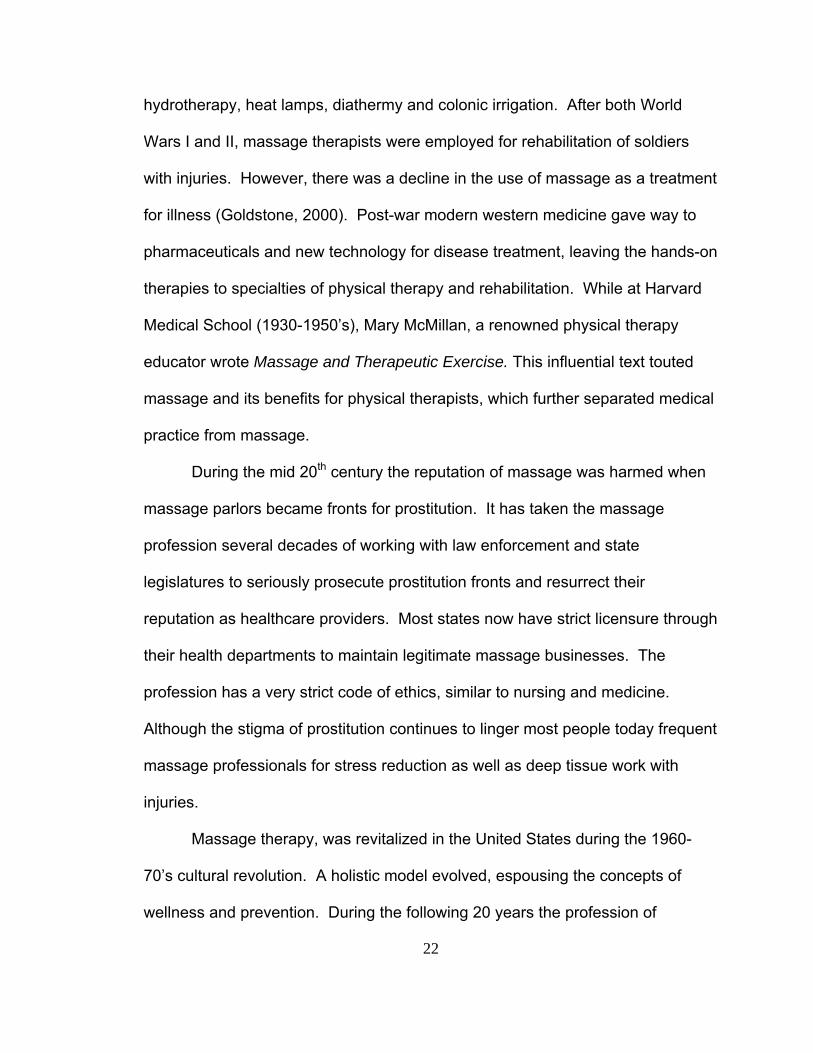
22
hydrotherapy, heat lamps, diathermy and colonic irrigation. After both World
Wars I and II, massage therapists were employed for rehabilitation of soldiers
with injuries. However, there was a decline in the use of massage as a treatment
for illness (Goldstone, 2000). Post-war modern western medicine gave way to
pharmaceuticals and new technology for disease treatment, leaving the hands-on
therapies to specialties of physical therapy and rehabilitation. While at Harvard
Medical School (1930-1950’s), Mary McMillan, a renowned physical therapy
educator wrote Massage and Therapeutic Exercise. This influential text touted
massage and its benefits for physical therapists, which further separated medical
practice from massage.
During the mid 20th century the reputation of massage was harmed when
massage parlors became fronts for prostitution. It has taken the massage
profession several decades of working with law enforcement and state
legislatures to seriously prosecute prostitution fronts and resurrect their
reputation as healthcare providers. Most states now have strict licensure through
their health departments to maintain legitimate massage businesses. The
profession has a very strict code of ethics, similar to nursing and medicine.
Although the stigma of prostitution continues to linger most people today frequent
massage professionals for stress reduction as well as deep tissue work with
injuries.
Massage therapy, was revitalized in the United States during the 1960-
70’s cultural revolution. A holistic model evolved, espousing the concepts of
wellness and prevention. During the following 20 years the profession of

23
massage therapy gained acceptance. The American Massage Therapy
Association Foundation was established in the early 1990’s. A major mission of
the American Massage Therapy Foundation has been to fund research and
establish a data base for massage’s efficacy. The University of Miami, College of
Medicine, created the Touch Research Institute in the early 1990’s with a goal to
understand the role of touch in human health and development. The International
Symposium on the Science of Touch will hold its third conference in 2008 with an
effort to share the latest research and knowledge gained. The National Institutes
of Health established an Office of Alternative Medicine in the early 1990’s which
in 1998 became the National Center for Complementary and Alternative
Medicine. Millions of research dollars have been granted to the study of
massage therapy‘s effectiveness through National Center for Complementary
and Alternative Medicine.
The American Nurses Association acknowledges massage therapy as a
sub-specialty for nursing. An active National Association of Nurse Massage
Therapists organization has evolved from this recognition. The National
Association of Nurse Massage Therapists promotes the use of touch with
patients, the intention to heal and the use of current research findings (National
Association of Nurse Massage Therapists, 2006). With this national support,
entrepreneurial nurses have been able to own and manage private businesses
with touch and massage being the holistic intervention used for healing (Mitzel-
Wilkinson, 2000).
24
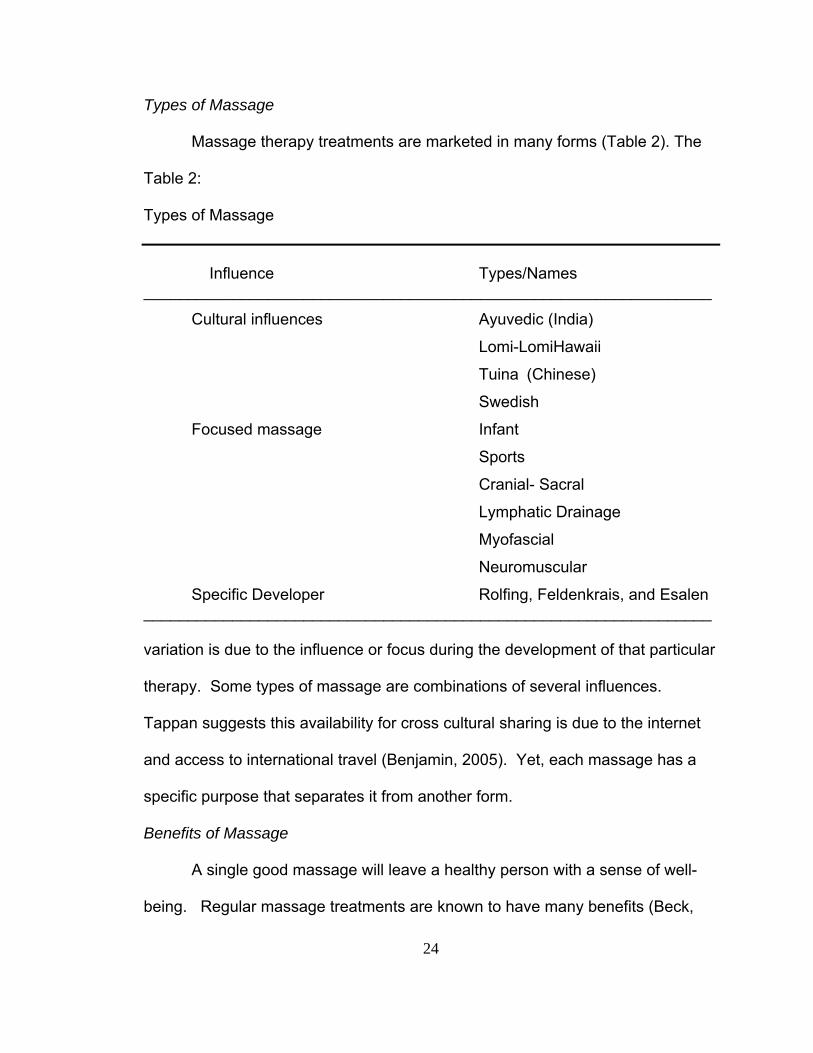
Types of Massage
Massage therapy treatments are marketed in many forms (Table 2). The
Table 2:
Types of Massage
Influence Types/Names
________________________________________________________________
Cultural influences Ayuvedic (India)
Lomi-LomiHawaii
Tuina (Chinese)
Swedish
Focused massage Infant
Sports
Cranial- Sacral
Lymphatic Drainage
Myofascial
Neuromuscular
Specific Developer Rolfing, Feldenkrais, and Esalen ________________________________________________________________ variation is due to the influence or focus during the development of that particular
therapy. Some types of massage are combinations of several influences.
Tappan suggests this availability for cross cultural sharing is due to the internet
and access to international travel (Benjamin, 2005). Yet, each massage has a
specific purpose that separates it from another form.
Benefits of Massage
A single good massage will leave a healthy person with a sense of well-
being. Regular massage treatments are known to have many benefits (Beck,
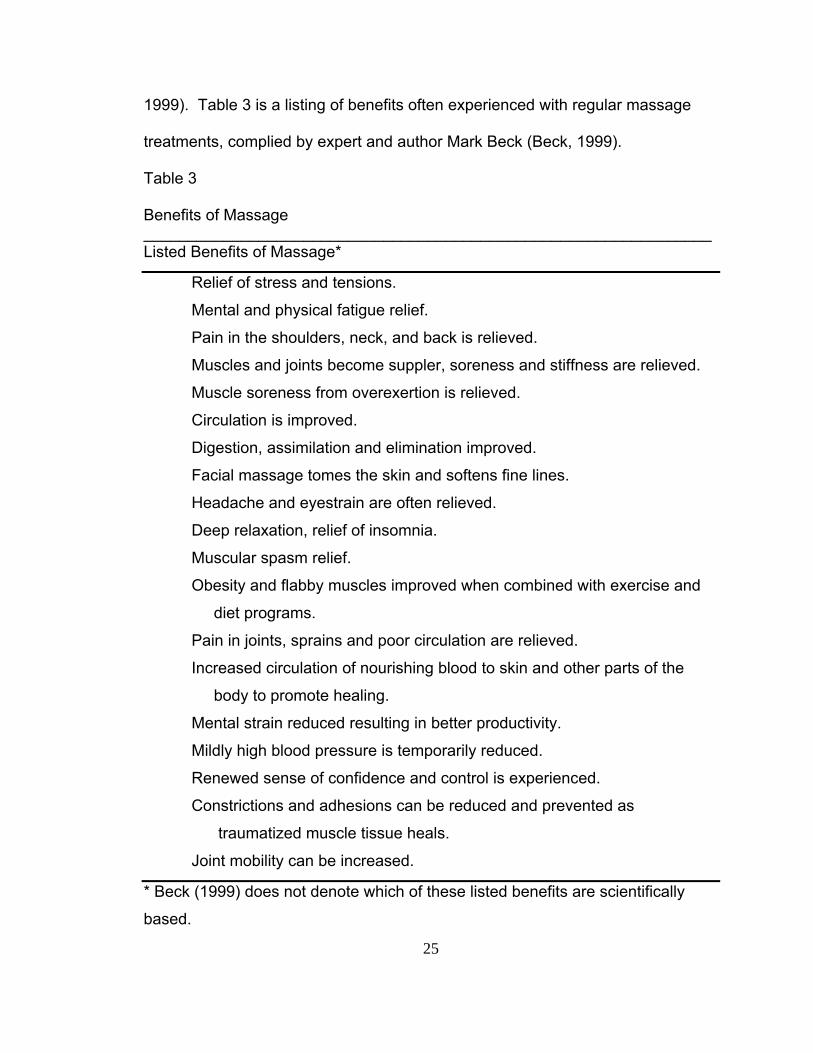
25
1999). Table 3 is a listing of benefits often experienced with regular massage
treatments, complied by expert and author Mark Beck (Beck, 1999).
Table 3
Benefits of Massage ________________________________________________________________ Listed Benefits of Massage*
Relief of stress and tensions.
Mental and physical fatigue relief.
Pain in the shoulders, neck, and back is relieved.
Muscles and joints become suppler, soreness and stiffness are relieved.
Muscle soreness from overexertion is relieved.
Circulation is improved.
Digestion, assimilation and elimination improved.
Facial massage tomes the skin and softens fine lines.
Headache and eyestrain are often relieved.
Deep relaxation, relief of insomnia.
Muscular spasm relief.
Obesity and flabby muscles improved when combined with exercise and
diet programs.
Pain in joints, sprains and poor circulation are relieved.
Increased circulation of nourishing blood to skin and other parts of the
body to promote healing.
Mental strain reduced resulting in better productivity.
Mildly high blood pressure is temporarily reduced.
Renewed sense of confidence and control is experienced.
Constrictions and adhesions can be reduced and prevented as
traumatized muscle tissue heals.
Joint mobility can be increased.
* Beck (1999) does not denote which of these listed benefits are scientifically
based.

26
For critically ill persons there are some benefits with gentle massage such
as improved mobility, help in controlling pain and discomfort, reduction in
disorientation and confusion, reduction in isolation and fear, ease of emotional
distress, and the development of a more positive attitude about condition. With
all of these benefits listed, few are actually based upon scientific research. Most
of these benefits are based upon observation of massage performed over the
millenniums of massage practice.
The benefit of temporary reduction of mild high blood pressure along with
several other listed benefits to include relief of stress, tension, mental strain, and
increase in circulation and gain in a sense of relaxation are being addressed by a
growing body of literature. This growing literature is building the
psychophysiology framework for understanding the relationship between
massage and blood pressure.
The purpose of the massage used in this study was to invoke relaxation
by the use of a regularly applied back massage. Swedish massage uses five
classic strokes of effleurage, petrissage, tapotement, friction and vibration. The
effleurage stroke, when applied with moderate pressure, slowly and smoothly on
the back, may stimulate the parasympathetic nervous system and evoke the
relaxation response (Benjamin, 2005). Nurses are taught to use rhythmic
effleurage strokes to provide comfort, relaxation, induce sleep, and reduce
anxiety in the ill patient (Potter & Perry, 2001). Cambron, Dexheimer and Coe
(2006) examined the six different types of massage. Interestingly, the
researchers found that some baseline characteristics, i.e. younger age and taller

27
stature, were associated significantly with greater changes in systolic blood
pressure. Although no significant relationships were found with gender, race,
medication, or weight, there were trends of decreased pressure in males, heavier
persons and Hispanics (Cambron, Dexheimer & Coe, 2006). Duration and
pressure of the six different massage types were associated with change in blood
pressure. Cambron and colleagues found that although not significant, Swedish
massage had the greatest effect on blood pressure reduction (Cambron,
Dexheimer & Coe, 2006). The authors noted that several therapy types
increased blood pressure; therefore they encouraged the use of Swedish
massage on persons with hypertension. In view of the review of literature, the
specific technique used in this research project was Swedish massage which
utilizes the effleurage stroke on the back.
Summarizing the Connection of Massage and Nursing
Massage has been used in nursing practice for years, particularly the back
massage. Massage is recognized as part of nursing practice. A professional
organization of nurses, active National Association of Nurse Massage Therapists
promotes the use of massage. Holistic nursing, which embraces the practice of
nursing through a bio-psycho-social-spiritual model, has energized and promoted
the use of touch to heal (Dossey, Keegan & Guzzetta, 2000). Many of the
research studies establishing the validity of massage have come from nursing, a
number of them evolving from the holistic framework.
28
Review of Massage Literature
Massage literature is rich in many ways. There are hundreds of studies
that have been completed. Some valuable information gleaned from these
studies has help to validate the practice of massage. For example, research has
validated that depression and anxiety are influenced by multiple doses of
massage (Moyer, Rounds, & Hannum, 2004).
Outcomes from massage studies have influenced nursing practice. For
example, research about massaging over boney prominences resulted in a
change in nursing practice for prevention of pressure ulcers (Dyson, 1978; Buss,
Halfens, & Abu-Saad, 1997). Prior to this research, nurses were encouraged to
massage vigorously the boney prominences of a bedridden patient. Nursing
presently espouses not to massage bony prominences, particularly if they are
inflamed. The story is not finished, though, with yet another review of the
literature recently published arguing there is not strong evidence either way
regarding the massaging of bony prominences (Duimel-Peeters, Halfens, Berger,
& Snoeckx, 2005). This is a good example demonstrating that even though there
have been studies completed and the findings have changed practice, the
findings may not necessarily be strong enough to confirm the practice.
Meta-Analysis and Systematic Reviews
Strength of evidence is very important when practice is being challenged.
Meta-analysis and systematic reviews of experimental studies offer the strongest
evidence in research (Burns & Grove, 2005). The literature search on massage
yielded one meta-analysis of the effects of massage on nine dependent variables
29
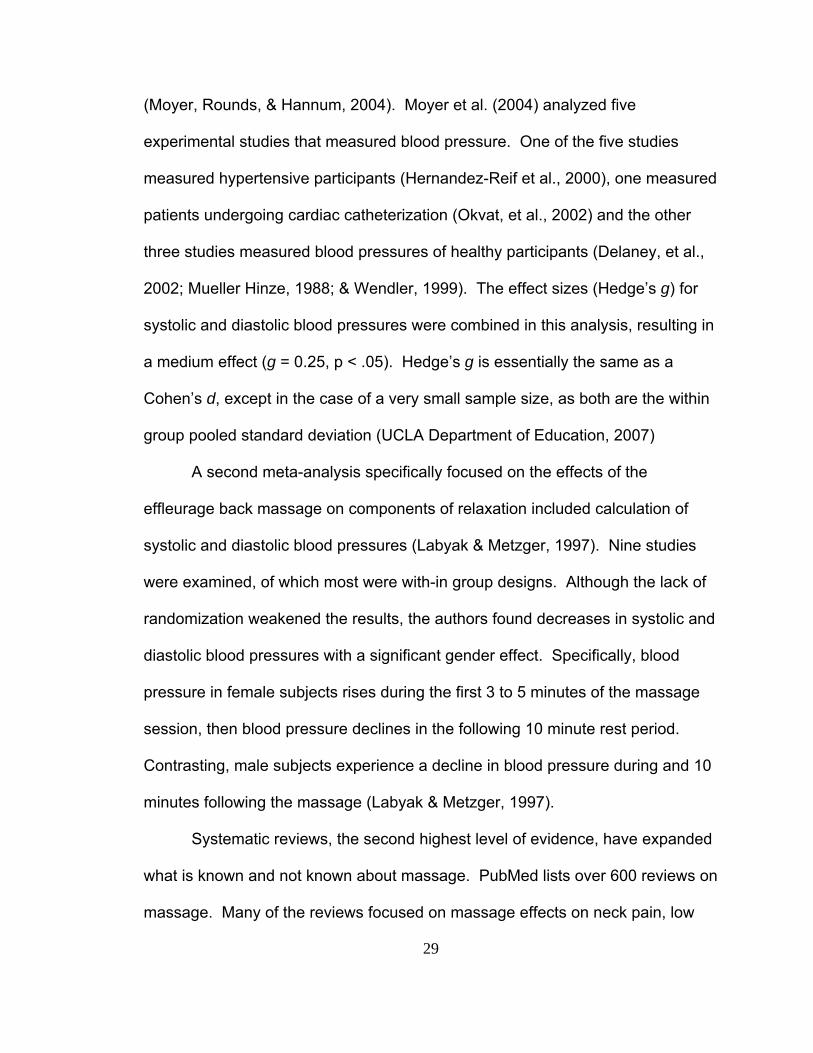
(Moyer, Rounds, & Hannum, 2004). Moyer et al. (2004) analyzed five
experimental studies that measured blood pressure. One of the five studies
measured hypertensive participants (Hernandez-Reif et al., 2000), one measured
patients undergoing cardiac catheterization (Okvat, et al., 2002) and the other
three studies measured blood pressures of healthy participants (Delaney, et al.,
2002; Mueller Hinze, 1988; & Wendler, 1999). The effect sizes (Hedge’s g) for
systolic and diastolic blood pressures were combined in this analysis, resulting in
a medium effect (g = 0.25, p < .05). Hedge’s g is essentially the same as a
Cohen’s d, except in the case of a very small sample size, as both are the within
group pooled standard deviation (UCLA Department of Education, 2007)
A second meta-analysis specifically focused on the effects of the
effleurage back massage on components of relaxation included calculation of
systolic and diastolic blood pressures (Labyak & Metzger, 1997). Nine studies
were examined, of which most were with-in group designs. Although the lack of
randomization weakened the results, the authors found decreases in systolic and
diastolic blood pressures with a significant gender effect. Specifically, blood
pressure in female subjects rises during the first 3 to 5 minutes of the massage
session, then blood pressure declines in the following 10 minute rest period.
Contrasting, male subjects experience a decline in blood pressure during and 10
minutes following the massage (Labyak & Metzger, 1997).
Systematic reviews, the second highest level of evidence, have expanded
what is known and not known about massage. PubMed lists over 600 reviews on
massage. Many of the reviews focused on massage effects on neck pain, low
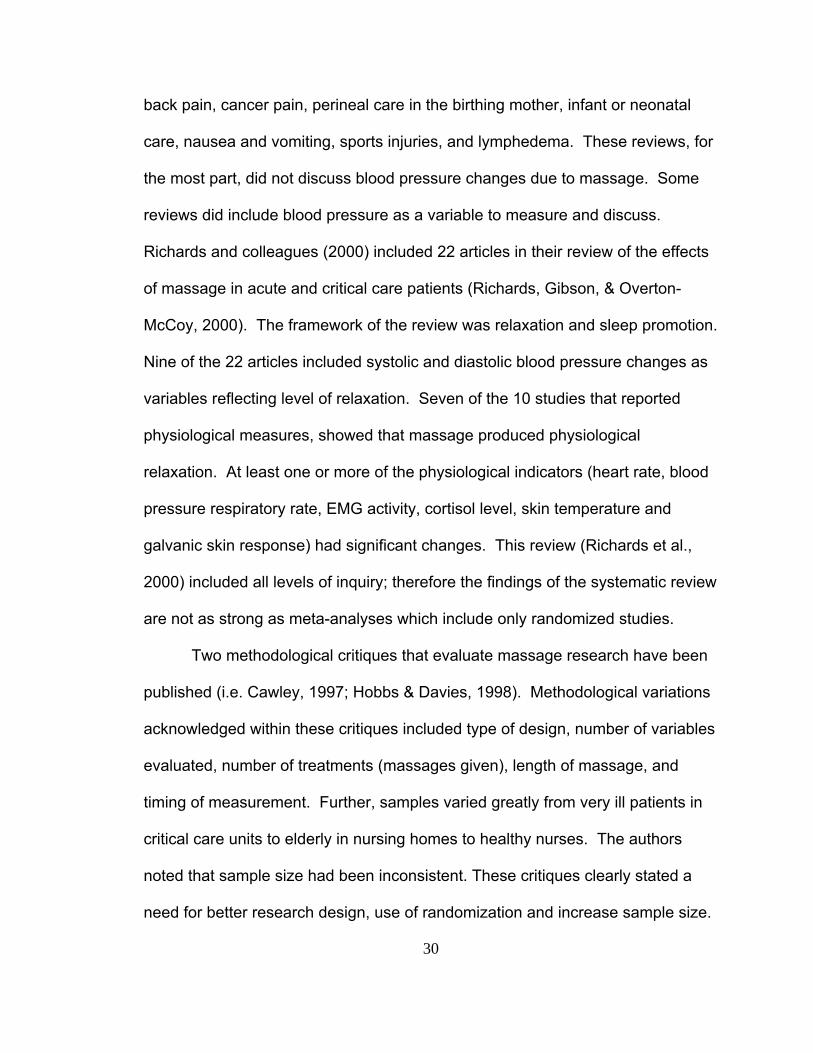
30
back pain, cancer pain, perineal care in the birthing mother, infant or neonatal
care, nausea and vomiting, sports injuries, and lymphedema. These reviews, for
the most part, did not discuss blood pressure changes due to massage. Some
reviews did include blood pressure as a variable to measure and discuss.
Richards and colleagues (2000) included 22 articles in their review of the effects
of massage in acute and critical care patients (Richards, Gibson, & Overton-
McCoy, 2000). The framework of the review was relaxation and sleep promotion.
Nine of the 22 articles included systolic and diastolic blood pressure changes as
variables reflecting level of relaxation. Seven of the 10 studies that reported
physiological measures, showed that massage produced physiological
relaxation. At least one or more of the physiological indicators (heart rate, blood
pressure respiratory rate, EMG activity, cortisol level, skin temperature and
galvanic skin response) had significant changes. This review (Richards et al.,
2000) included all levels of inquiry; therefore the findings of the systematic review
are not as strong as meta-analyses which include only randomized studies.
Two methodological critiques that evaluate massage research have been
published (i.e. Cawley, 1997; Hobbs & Davies, 1998). Methodological variations
acknowledged within these critiques included type of design, number of variables
evaluated, number of treatments (massages given), length of massage, and
timing of measurement. Further, samples varied greatly from very ill patients in
critical care units to elderly in nursing homes to healthy nurses. The authors
noted that sample size had been inconsistent. These critiques clearly stated a
need for better research design, use of randomization and increase sample size.
31
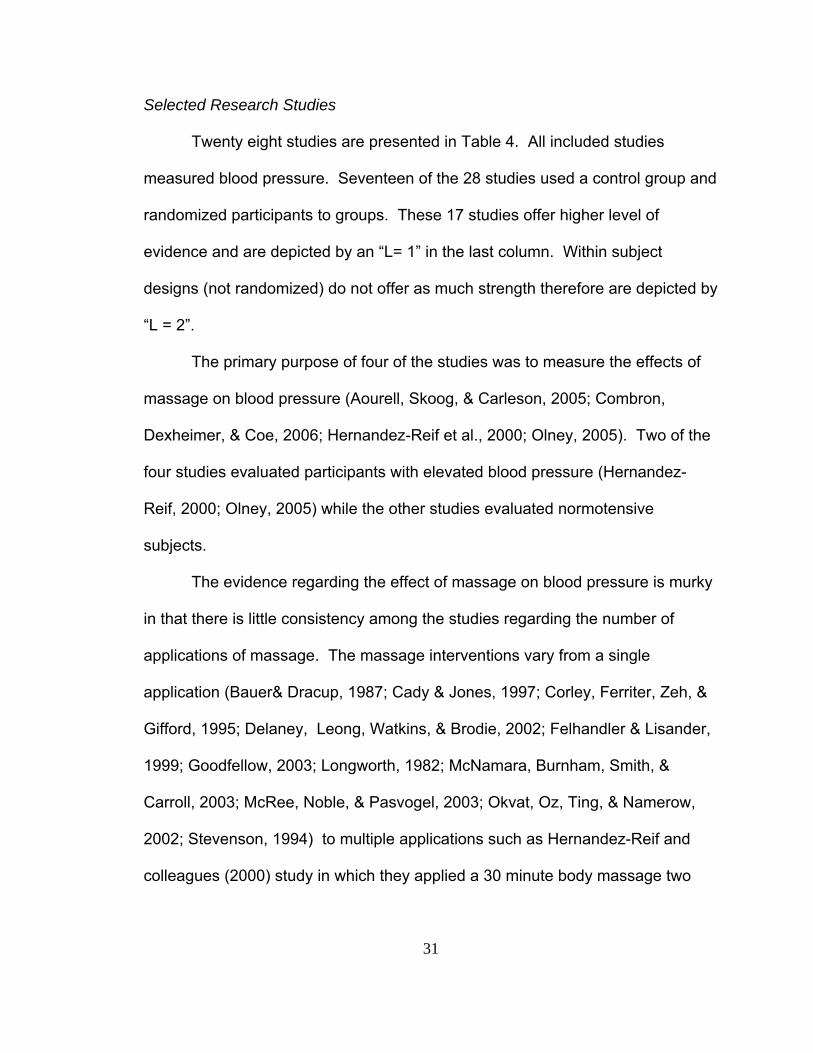
Selected Research Studies
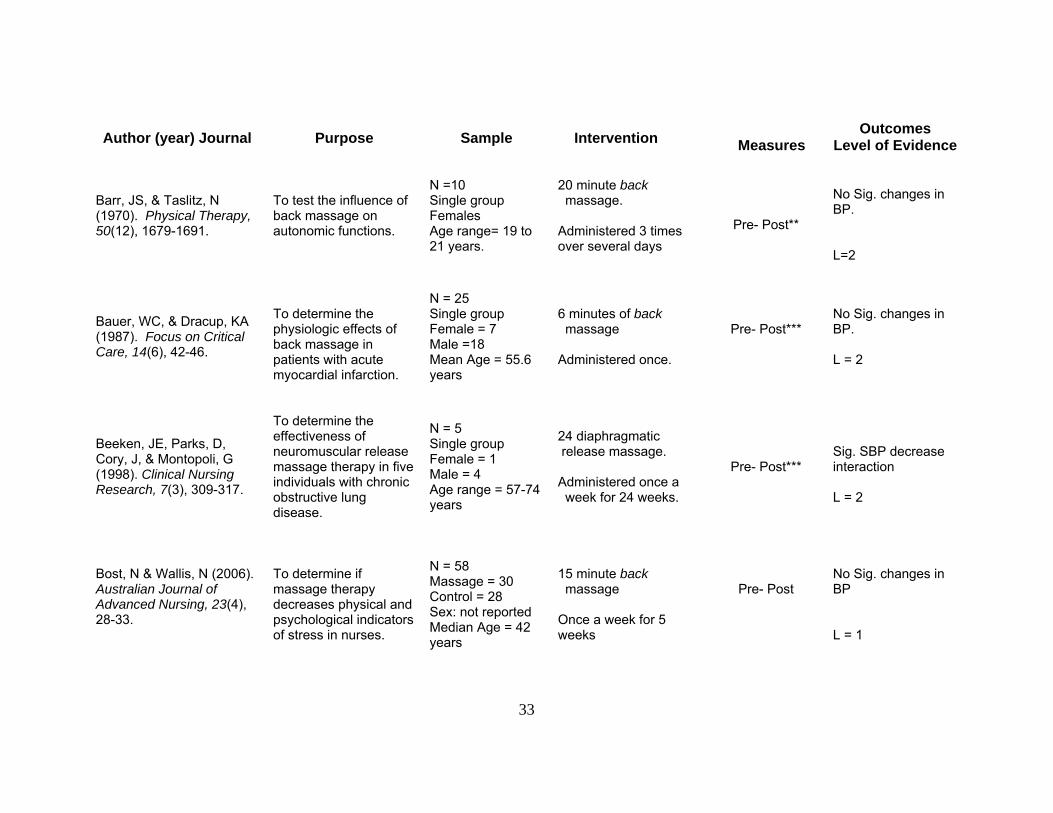
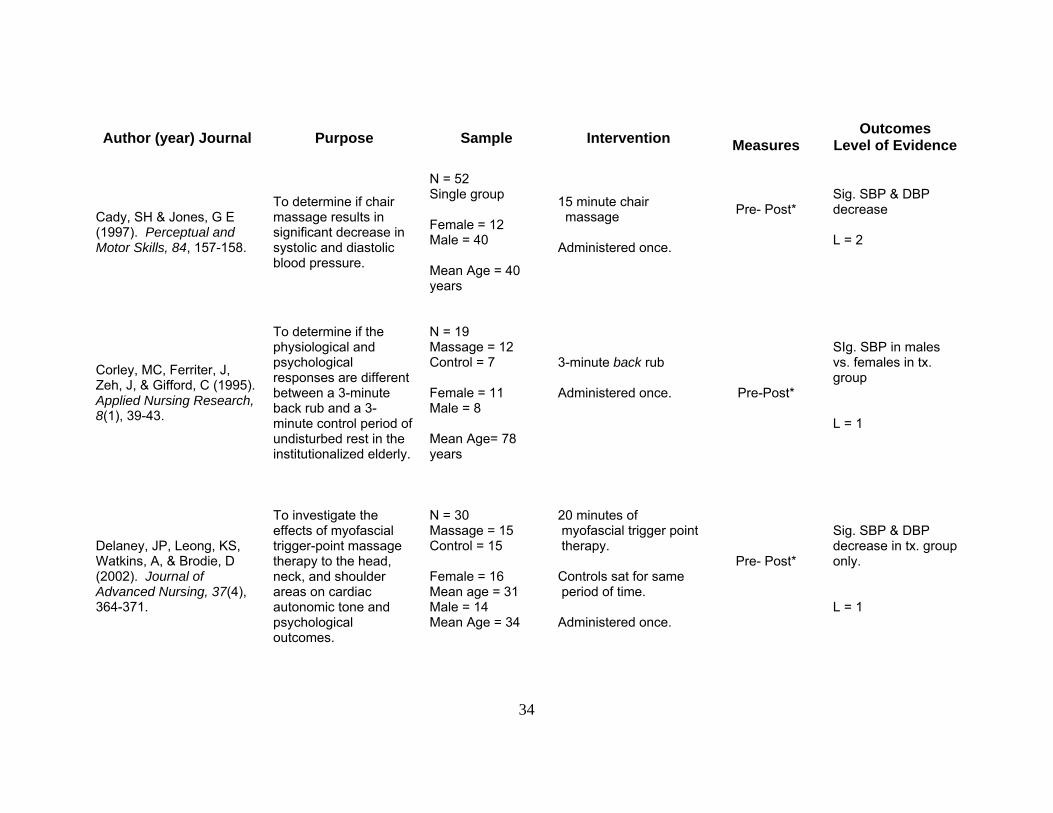
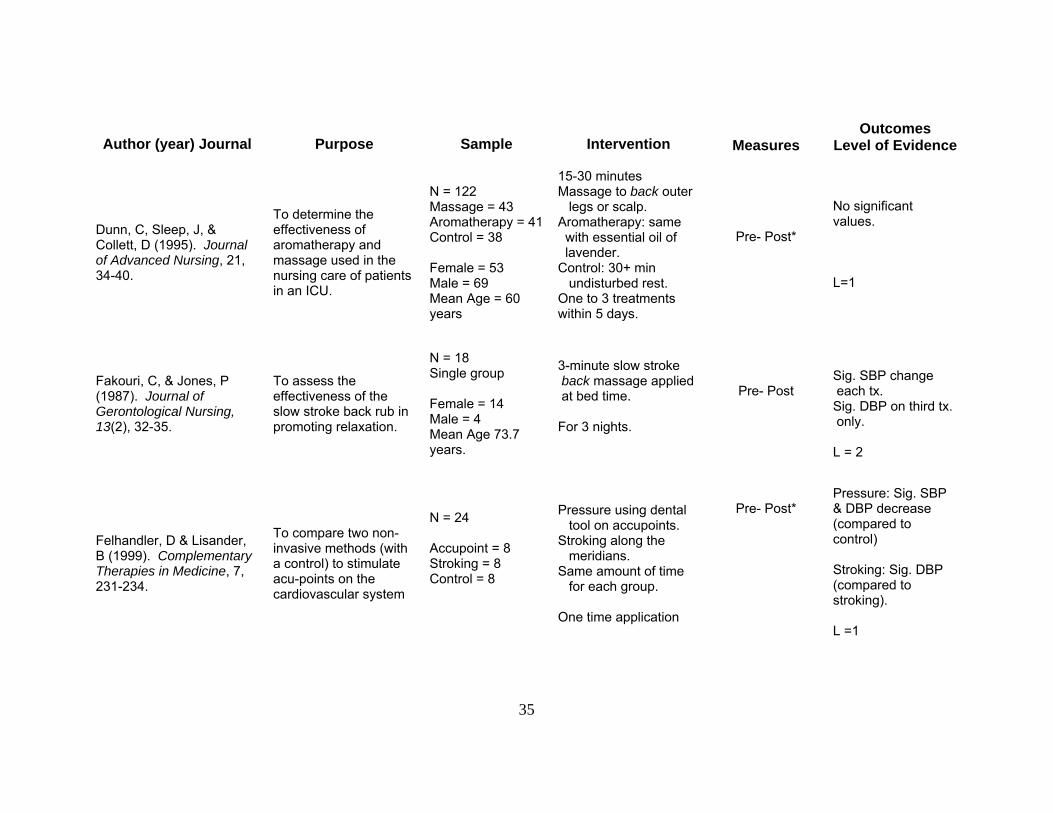
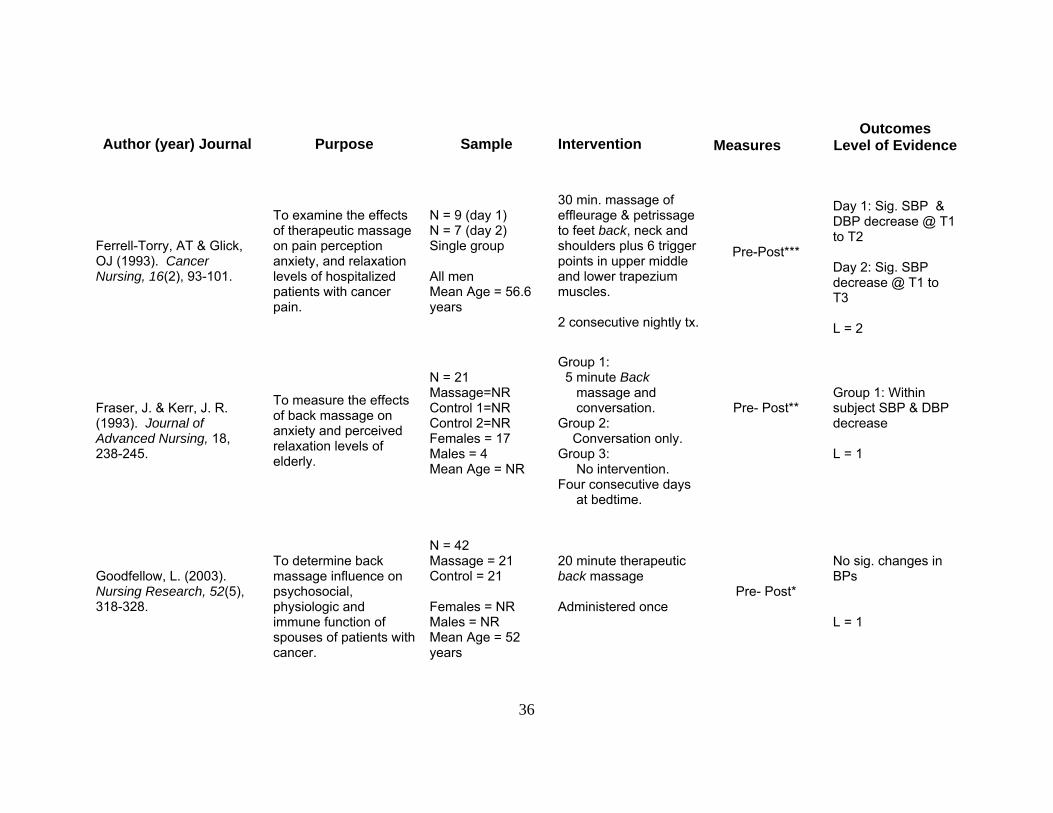
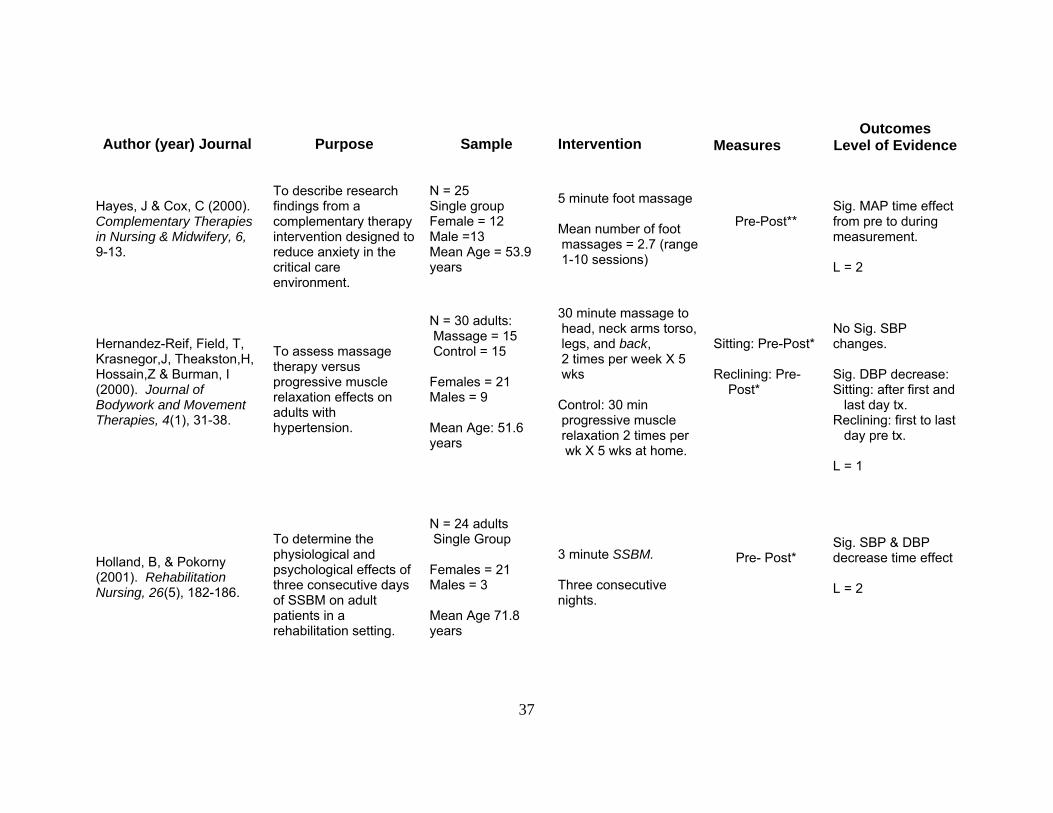
Twenty eight studies are presented in Table 4. All included studies
measured blood pressure. Seventeen of the 28 studies used a control group and
randomized participants to groups. These 17 studies offer higher level of
evidence and are depicted by an “L= 1” in the last column. Within subject
designs (not randomized) do not offer as much strength therefore are depicted by
“L = 2”.
The primary purpose of four of the studies was to measure the effects of
massage on blood pressure (Aourell, Skoog, & Carleson, 2005; Combron,
Dexheimer, & Coe, 2006; Hernandez-Reif et al., 2000; Olney, 2005). Two of the
four studies evaluated participants with elevated blood pressure (Hernandez-
Reif, 2000; Olney, 2005) while the other studies evaluated normotensive
subjects.
The evidence regarding the effect of massage on blood pressure is murky
in that there is little consistency among the studies regarding the number of
applications of massage. The massage interventions vary from a single
application (Bauer& Dracup, 1987; Cady & Jones, 1997; Corley, Ferriter, Zeh, &
Gifford, 1995; Delaney, Leong, Watkins, & Brodie, 2002; Felhandler & Lisander,
1999; Goodfellow, 2003; Longworth, 1982; McNamara, Burnham, Smith, &
Carroll, 2003; McRee, Noble, & Pasvogel, 2003; Okvat, Oz, Ting, & Namerow,
2002; Stevenson, 1994) to multiple applications such as Hernandez-Reif and
colleagues (2000) study in which they applied a 30 minute body massage two
32
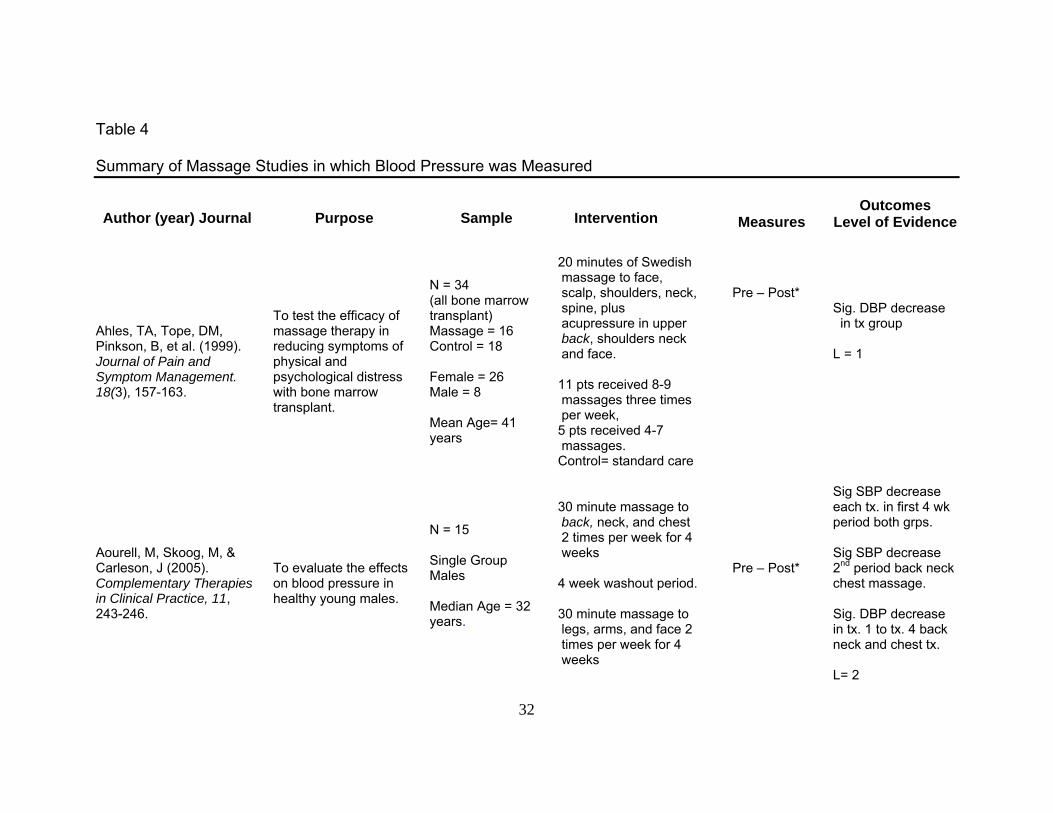
Table 4
Summary of Massage Studies in which Blood Pressure was Measured
Author (year) Journal Purpose Sample Intervention
Measures Outcomes
Level of Evidence
Ahles, TA, Tope, DM, Pinkson, B, et al. (1999). Journal of Pain and Symptom Management. 18(3), 157-163.
To test the efficacy of massage therapy in reducing symptoms of physical and psychological distress with bone marrow transplant.
N = 34 (all bone marrow transplant) Massage = 16 Control = 18 Female = 26 Male = 8 Mean Age= 41 years
20 minutes of Swedish massage to face, scalp, shoulders, neck, spine, plus acupressure in upper back, shoulders neck and face. 11 pts received 8-9 massages three times per week, 5 pts received 4-7 massages. Control= standard care
Pre – Post*
Sig. DBP decrease in tx group L = 1
Aourell, M, Skoog, M, & Carleson, J (2005). Complementary Therapies in Clinical Practice, 11, 243-246.
To evaluate the effects on blood pressure in healthy young males.
N = 15 Single Group Males Median Age = 32 years.
30 minute massage to back, neck, and chest 2 times per week for 4 weeks 4 week washout period. 30 minute massage to legs, arms, and face 2 times per week for 4 weeks
Pre – Post*
Sig SBP decrease each tx. in first 4 wk period both grps. Sig SBP decrease 2nd period back neck chest massage. Sig. DBP decrease in tx. 1 to tx. 4 back neck and chest tx. L= 2
33
Author (year) Journal Purpose Sample Intervention Measures
Outcomes Level of Evidence
Barr, JS, & Taslitz, N (1970). Physical Therapy, 50(12), 1679-1691.
To test the influence of back massage on autonomic functions.
N =10 Single group Females Age range= 19 to 21 years.
20 minute back massage. Administered 3 times over several days
Pre- Post**
No Sig. changes in BP. L=2
Bauer, WC, & Dracup, KA (1987). Focus on Critical Care, 14(6), 42-46.
To determine the physiologic effects of back massage in patients with acute myocardial infarction.
N = 25 Single group Female = 7 Male =18 Mean Age = 55.6 years
6 minutes of back massage Administered once.
Pre- Post***
No Sig. changes in BP. L = 2
Beeken, JE, Parks, D, Cory, J, & Montopoli, G (1998). Clinical Nursing Research, 7(3), 309-317.
To determine the effectiveness of neuromuscular release massage therapy in five individuals with chronic obstructive lung disease.
N = 5 Single group Female = 1 Male = 4 Age range = 57-74 years
24 diaphragmatic release massage. Administered once a week for 24 weeks.
Pre- Post***
Sig. SBP decrease interaction L = 2
Bost, N & Wallis, N (2006). Australian Journal of Advanced Nursing, 23(4), 28-33.
To determine if massage therapy decreases physical and psychological indicators of stress in nurses.
N = 58 Massage = 30 Control = 28 Sex: not reported Median Age = 42 years
15 minute back massage Once a week for 5 weeks
Pre- Post
No Sig. changes in BP L = 1
34
Author (year) Journal Purpose Sample Intervention Measures
Outcomes Level of Evidence
Cady, SH & Jones, G E (1997). Perceptual and Motor Skills, 84, 157-158.
To determine if chair massage results in significant decrease in systolic and diastolic blood pressure.
N = 52 Single group Female = 12 Male = 40 Mean Age = 40 years
15 minute chair massage Administered once.
Pre- Post*
Sig. SBP & DBP decrease L = 2
Corley, MC, Ferriter, J, Zeh, J, & Gifford, C (1995). Applied Nursing Research, 8(1), 39-43.
To determine if the physiological and psychological responses are different between a 3-minute back rub and a 3- minute control period of undisturbed rest in the institutionalized elderly.
N = 19 Massage = 12 Control = 7 Female = 11 Male = 8 Mean Age= 78 years
3-minute back rub Administered once.
Pre-Post*
SIg. SBP in males vs. females in tx. group L = 1
Delaney, JP, Leong, KS, Watkins, A, & Brodie, D (2002). Journal of Advanced Nursing, 37(4), 364-371.
To investigate the effects of myofascial trigger-point massage therapy to the head, neck, and shoulder areas on cardiac autonomic tone and psychological outcomes.
N = 30 Massage = 15 Control = 15 Female = 16 Mean age = 31 Male = 14 Mean Age = 34
20 minutes of myofascial trigger point therapy. Controls sat for same period of time. Administered once.
Pre- Post*
Sig. SBP & DBP decrease in tx. group only. L = 1
35
Author (year) Journal Purpose Sample Intervention
Measures Outcomes
Level of Evidence
Dunn, C, Sleep, J, & Collett, D (1995). Journal of Advanced Nursing, 21, 34-40.
To determine the effectiveness of aromatherapy and massage used in the nursing care of patients in an ICU.
N = 122 Massage = 43 Aromatherapy = 41 Control = 38 Female = 53 Male = 69 Mean Age = 60 years
15-30 minutes Massage to back outer legs or scalp. Aromatherapy: same with essential oil of lavender. Control: 30+ min undisturbed rest. One to 3 treatments within 5 days.
Pre- Post*
No significant values. L=1
Fakouri, C, & Jones, P (1987). Journal of Gerontological Nursing, 13(2), 32-35.
To assess the effectiveness of the slow stroke back rub in promoting relaxation.
N = 18 Single group Female = 14 Male = 4 Mean Age 73.7 years.
3-minute slow stroke back massage applied at bed time. For 3 nights.
Pre- Post
Sig. SBP change each tx. Sig. DBP on third tx. only. L = 2
Felhandler, D & Lisander, B (1999). Complementary Therapies in Medicine, 7, 231-234.
To compare two non-invasive methods (with a control) to stimulate acu-points on the cardiovascular system
N = 24 Accupoint = 8 Stroking = 8 Control = 8
Pressure using dental tool on accupoints. Stroking along the meridians. Same amount of time for each group. One time application
Pre- Post*
Pressure: Sig. SBP & DBP decrease (compared to control) Stroking: Sig. DBP (compared to stroking). L =1
36
Author (year) Journal Purpose Sample Intervention
Measures Outcomes
Level of Evidence
Ferrell-Torry, AT & Glick, OJ (1993). Cancer Nursing, 16(2), 93-101.
To examine the effects of therapeutic massage on pain perception anxiety, and relaxation levels of hospitalized patients with cancer pain.
N = 9 (day 1) N = 7 (day 2) Single group All men Mean Age = 56.6 years
30 min. massage of effleurage & petrissage to feet back, neck and shoulders plus 6 trigger points in upper middle and lower trapezium muscles. 2 consecutive nightly tx.
Pre-Post***
Day 1: Sig. SBP & DBP decrease @ T1 to T2 Day 2: Sig. SBP decrease @ T1 to T3 L = 2
Fraser, J. & Kerr, J. R. (1993). Journal of Advanced Nursing, 18, 238-245.
To measure the effects of back massage on anxiety and perceived relaxation levels of elderly.
N = 21 Massage=NR Control 1=NR Control 2=NR Females = 17 Males = 4 Mean Age = NR
Group 1: 5 minute Back massage and conversation. Group 2: Conversation only. Group 3: No intervention. Four consecutive days at bedtime.
Pre- Post**
Group 1: Within subject SBP & DBP decrease L = 1
Goodfellow, L. (2003). Nursing Research, 52(5), 318-328.
To determine back massage influence on psychosocial, physiologic and immune function of spouses of patients with cancer.
N = 42 Massage = 21 Control = 21 Females = NR Males = NR Mean Age = 52 years
20 minute therapeutic back massage Administered once
Pre- Post*
No sig. changes in BPs L = 1
37
Author (year) Journal Purpose Sample Intervention
Measures Outcomes
Level of Evidence
Hayes, J & Cox, C (2000). Complementary Therapies in Nursing & Midwifery, 6, 9-13.
To describe research findings from a complementary therapy intervention designed to reduce anxiety in the critical care environment.
N = 25 Single group Female = 12 Male =13 Mean Age = 53.9 years
5 minute foot massage Mean number of foot massages = 2.7 (range 1-10 sessions)
Pre-Post**
Sig. MAP time effect from pre to during measurement. L = 2
Hernandez-Reif, Field, T, Krasnegor,J, Theakston,H, Hossain,Z & Burman, I (2000). Journal of Bodywork and Movement Therapies, 4(1), 31-38.
To assess massage therapy versus progressive muscle relaxation effects on adults with hypertension.
N = 30 adults: Massage = 15 Control = 15 Females = 21 Males = 9 Mean Age: 51.6 years
30 minute massage to head, neck arms torso, legs, and back, 2 times per week X 5 wks Control: 30 min progressive muscle relaxation 2 times per wk X 5 wks at home.
Sitting: Pre-Post*
Reclining: Pre- Post*
No Sig. SBP changes. Sig. DBP decrease: Sitting: after first and last day tx. Reclining: first to last day pre tx. L = 1
Holland, B, & Pokorny (2001). Rehabilitation Nursing, 26(5), 182-186.
To determine the physiological and psychological effects of three consecutive days of SSBM on adult patients in a rehabilitation setting.
N = 24 adults Single Group Females = 21 Males = 3 Mean Age 71.8 years
3 minute SSBM. Three consecutive nights.
Pre- Post*
Sig. SBP & DBP decrease time effect L = 2

38
Author (year) Journal Purpose Sample Intervention
Measures Outcomes
Level of Evidence
Longworth, JCD (1982). Advances in Nursing Science, 4(4), 44-61.
To examine the psycho-physiological effects of the slow-stroke back massage (SSBM) on normal individuals who were free of disease conditions that might influence the results.
N = 32 Single group All female Mean Age = 31.5 years
3 and 6 minutes of SSBM. Administered once.
Pre- Post**
Sig. SBP decrease in mean scores over time. No Sig. DBP changes. L = 2
McNamara, ME, Burnham, DC, Smith, C, & Carroll, DL (2003). Alternative Therapies in Health and Medicine, 9(1), 50-57.
To measure the effects of a 20 minute back massage on the physiological and psychological human responses in patients admitted for diagnostic cardiac catheterization
N = 46; Massage = 23 Control = 23 Female=12 Male=34 Mean Age = 64.9 years
20 minutes back massage. Administered once.
Pre- Post***
Sig. SBP & DBP decrease for within subjects main effect of time. Sig. SBP decrease between group. Sig. SBP decrease for time by group L= 1
Meek, SS (1993). IMAGE: Journal of Nursing Scholarship, 25(1), 17-21.
To examine the effects of SSBM on SBP, DBP HR and Skin temperature in hospice patients.
N = 30 Single Group Female =14 Male =16 Mean Age = 70.8 years.
3 minute SSBM 2 consecutive days
Pre- Post***
Sig. SBP & DBP decrease main effect due to time. Tx effect persisted for five min. L = 2
39
Author (year) Journal Purpose Sample Intervention
Measures Outcomes
Level of Evidence
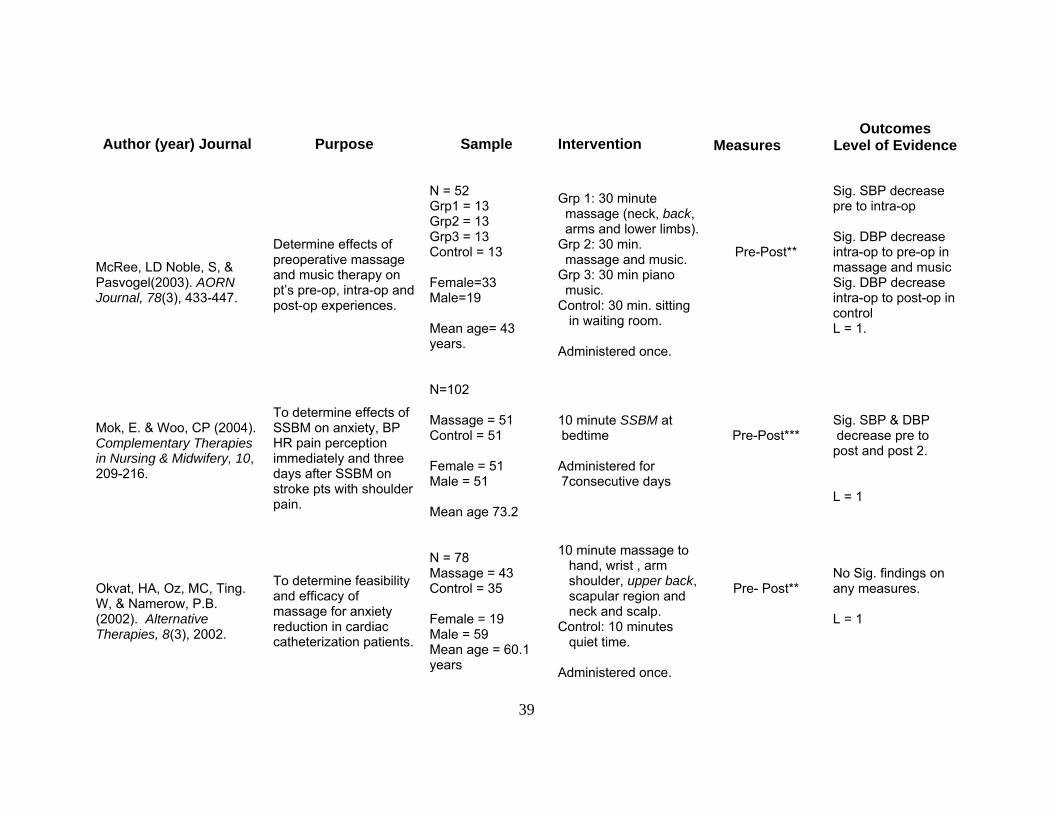
McRee, LD Noble, S, & Pasvogel(2003). AORN Journal, 78(3), 433-447.
Determine effects of preoperative massage and music therapy on pt’s pre-op, intra-op and post-op experiences.
N = 52 Grp1 = 13 Grp2 = 13 Grp3 = 13 Control = 13 Female=33 Male=19 Mean age= 43 years.
Grp 1: 30 minute massage (neck, back, arms and lower limbs). Grp 2: 30 min. massage and music. Grp 3: 30 min piano music. Control: 30 min. sitting in waiting room. Administered once.
Pre-Post**
Sig. SBP decrease pre to intra-op Sig. DBP decrease intra-op to pre-op in massage and music Sig. DBP decrease intra-op to post-op in control L = 1.
Mok, E. & Woo, CP (2004). Complementary Therapies in Nursing & Midwifery, 10, 209-216.
To determine effects of SSBM on anxiety, BP HR pain perception immediately and three days after SSBM on stroke pts with shoulder pain.
N=102 Massage = 51 Control = 51 Female = 51 Male = 51 Mean age 73.2
10 minute SSBM at bedtime Administered for 7consecutive days
Pre-Post***
Sig. SBP & DBP decrease pre to post and post 2. L = 1
Okvat, HA, Oz, MC, Ting. W, & Namerow, P.B. (2002). Alternative Therapies, 8(3), 2002.
To determine feasibility and efficacy of massage for anxiety reduction in cardiac catheterization patients.
N = 78 Massage = 43 Control = 35 Female = 19 Male = 59 Mean age = 60.1 years
10 minute massage to hand, wrist , arm shoulder, upper back, scapular region and neck and scalp. Control: 10 minutes quiet time. Administered once.
Pre- Post**
No Sig. findings on any measures. L = 1
40
Author (year) Journal Purpose Sample Intervention Measures
Outcomes Level of Evidence
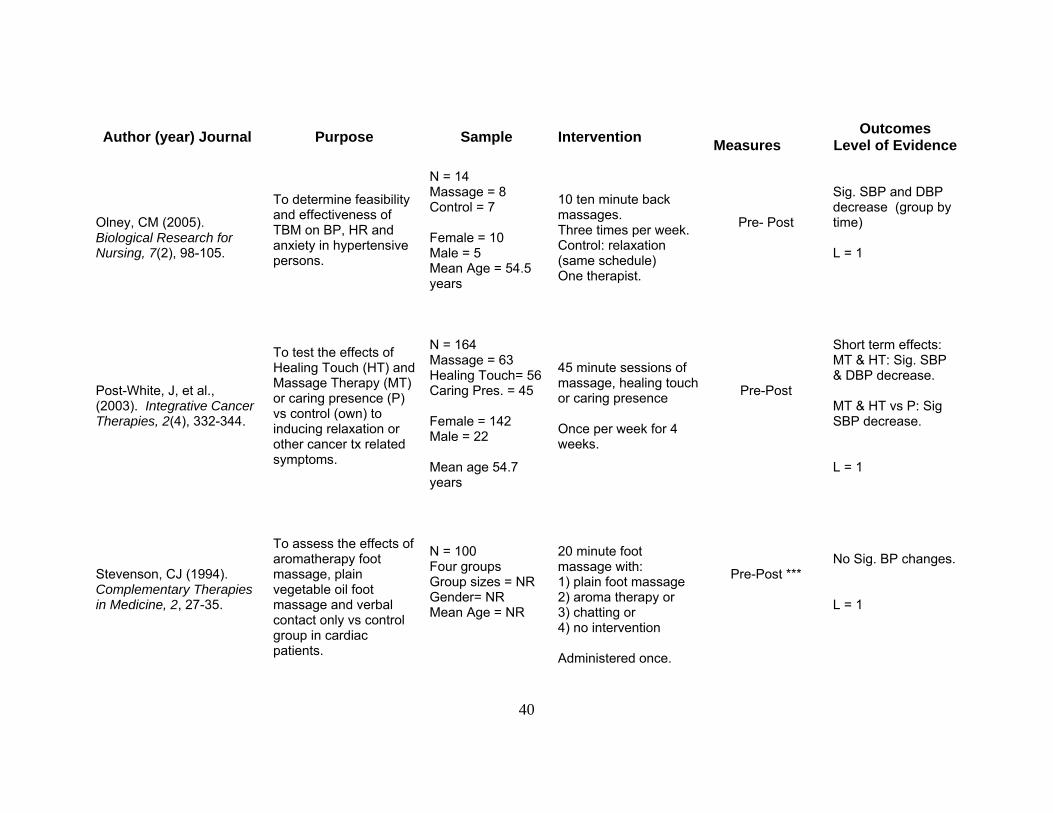
Olney, CM (2005). Biological Research for Nursing, 7(2), 98-105.
To determine feasibility and effectiveness of TBM on BP, HR and anxiety in hypertensive persons.
N = 14 Massage = 8 Control = 7 Female = 10 Male = 5 Mean Age = 54.5 years
10 ten minute back massages. Three times per week. Control: relaxation (same schedule) One therapist.
Pre- Post
Sig. SBP and DBP decrease (group by time) L = 1
Post-White, J, et al., (2003). Integrative Cancer Therapies, 2(4), 332-344.
To test the effects of Healing Touch (HT) and Massage Therapy (MT) or caring presence (P) vs control (own) to inducing relaxation or other cancer tx related symptoms.
N = 164 Massage = 63 Healing Touch= 56 Caring Pres. = 45 Female = 142 Male = 22 Mean age 54.7 years
45 minute sessions of massage, healing touch or caring presence Once per week for 4 weeks.
Pre-Post
Short term effects: MT & HT: Sig. SBP & DBP decrease. MT & HT vs P: Sig SBP decrease. L = 1
Stevenson, CJ (1994). Complementary Therapies in Medicine, 2, 27-35.
To assess the effects of aromatherapy foot massage, plain vegetable oil foot massage and verbal contact only vs control group in cardiac patients.
N = 100 Four groups Group sizes = NR Gender= NR Mean Age = NR
20 minute foot massage with: 1) plain foot massage 2) aroma therapy or 3) chatting or 4) no intervention Administered once.
Pre-Post ***
No Sig. BP changes. L = 1
41
Author (year) Journal Purpose Sample Intervention Measures
Outcomes Level of Evidence
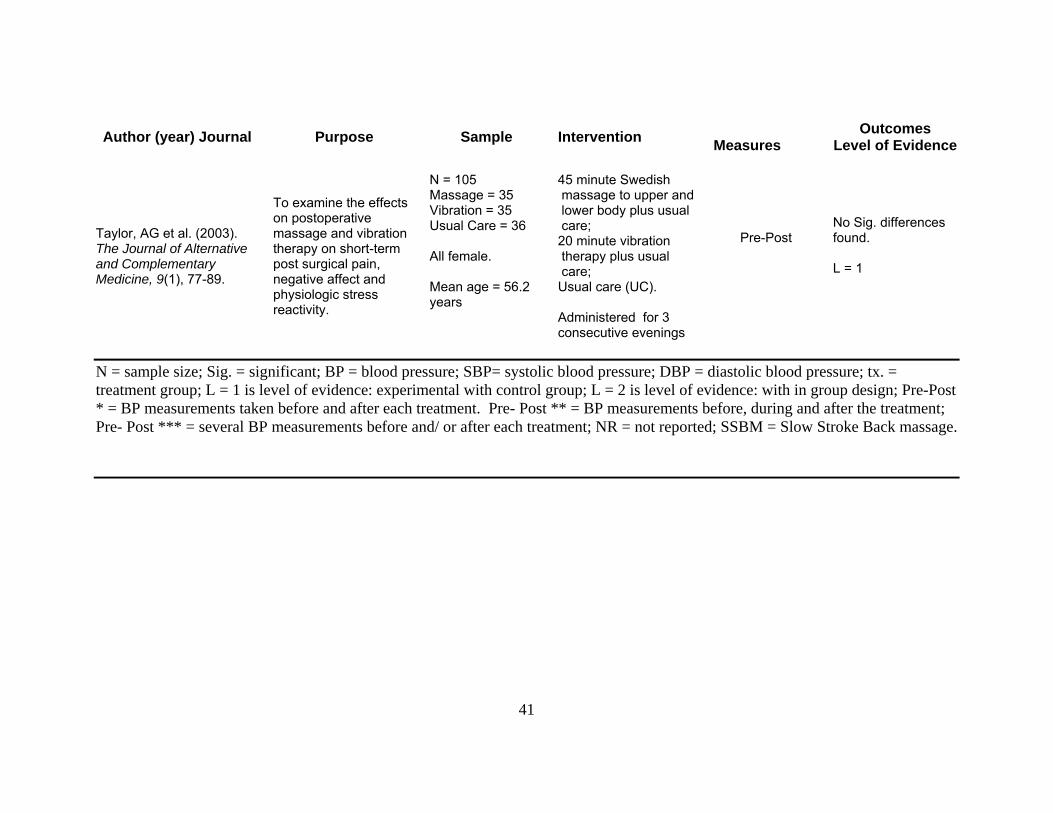
Taylor, AG et al. (2003). The Journal of Alternative and Complementary Medicine, 9(1), 77-89.
To examine the effects on postoperative massage and vibration therapy on short-term post surgical pain, negative affect and physiologic stress reactivity.
N = 105 Massage = 35 Vibration = 35 Usual Care = 36 All female. Mean age = 56.2 years
45 minute Swedish massage to upper and lower body plus usual care; 20 minute vibration therapy plus usual care; Usual care (UC). Administered for 3 consecutive evenings
Pre-Post
No Sig. differences found. L = 1
N = sample size; Sig. = significant; BP = blood pressure; SBP= systolic blood pressure; DBP = diastolic blood pressure; tx. = treatment group; L = 1 is level of evidence: experimental with control group; L = 2 is level of evidence: with in group design; Pre-Post * = BP measurements taken before and after each treatment. Pre- Post ** = BP measurements before, during and after the treatment; Pre- Post *** = several BP measurements before and/ or after each treatment; NR = not reported; SSBM = Slow Stroke Back massage.

42
times a week for five weeks (Hernandez-Reif et al., 2000; see also Ahles, Tope,
Pinkson et al., 1999; Aourell, Skoog & Carleson, 2005; Barr & Taslitz, 1970;
Beeken, Parks, Cory, & Montopoli, 1998; Bost & Wallis, 2006; Dunn, Sleep &
Collett, 1995; Fakouri & Jones, 1987; Ferrell-Torry & Glick, 1993; Fraser & Kerr,
1993; Hayes & Cox, 2000; Holland & Pokorny, 2001; Meek1993; Mok & Woo,
2004; Olney, 2005; Post-White, Kinney, Savik, Gau, Wilcox, & Lerner, 2003;
Taylor, Galper, Taylor, Rice, Andersen, Irvin, Wang, & Harrell, 2003). Moyer
and colleagues (2004) determined that single dose massage did elicit a
moderate effect size for blood pressure (Moyer, Rounds & Hannum, 2004). They
did not analyze multi dose effect on blood pressure.
Further, the variation in the length of massage application time, such as a
3-minute back massage (Holland & Pokorny, 2001) versus a 20-minute back
massage (Goodfellow, 2003) has made it difficult to determine the most effective
dosage. Moyer and colleagues (2004) reported in their meta-analysis that length
of massage session did not reach statistical significance, but felt a higher
powered study may prove differently. They encouraged further studies to include
two levels of application time (Moyer, Rounds & Hannum, 2004).
Another issue of differentiation among the research is the type of massage
applied. Some researchers utilized the slow stroke back massage which is a
systematic effleurage applied to the back. The predominant massage utilized
effleurage to the back and sometimes other parts of the body. When the
effleurage is combined with other therapies, for instance acupressure point,

43
vibration, foot massage and or aromatherapy, determination of which stroke is
effective becomes problematic.
The relationship of massage and psychological factors has been studied,
particularly depression, anxiety, and anger which are known to also be
associated with hypertension (Bost & Wallis, 2006; Field et al., 1996; Field,
Quintino, Henteleff, Wells-Keife, & Delvecchio-Feinberg,1997; Groer et al., 1994;
Hernadez-Reif, Dieter, Field, Swedlow, & Diego, 1998; Hernandez-Reif, Field ,
Ironson, Beutler, & Vera, 2005; Ironson et al., 1996; McRee, Noble & Pasvogel,
2003; Mok & Woo, 2004; Olney, 2005; Post-White et al., 2003; Rexilius, Mundt,
Megel, & Agrawal, 2002; Shulman & Jones, 1996; Smith, Kemp, Hemphill &
Vojir, 2002) . Depression, anxiety and anger have been shown to change
significantly with application of massage. A meta-analysis (Moyer, Rounds &
Hannum, 2004) found significant effects of massage on factors state anxiety, trait
anxiety and depression (Hedge’s) g = .37, g = .75 and g = .62, p< .01,
respectively.
Neuroendocrine measures of the physiological stress response have been
shown to be affected by massage therapy. Specifically, cortisol, a common
measure of the hypothalamic pituitary adrenal axis, is often measured in
massage studies. Cortisol is known to increase with perceived stress. Massage
therapy research has mixed results regarding its effect on cortisol levels. In the
Moyer, Rounds, and Hannum (2004) meta-analysis, massage did not produce a
significant mean effect size in cortisol. Field and colleagues argue that cortisol

44
decreases on average 31% in reviewed studies using massage therapy (Field,
Hernandez-Reif, Diego, Schanberg a & Kuhn, 2005).
Theoretical Framework
Psychophysiology provides the framework for this research. In this study,
the goal was to determine characteristics (long-term effects and dosage) of the
relationship between a known stress reduction therapy (massage) and a state of
health (hypertension). In the review of literature, evidence was presented
demonstrating the associations between psychological factors (anxiety,
depression and anger), neuroendocrine function (cortisol), and health (levels of
blood pressure) (Light, 2001; Lovello, 2005; Rutledge & Hogan, 2002 ). Figure 3
depicts this relationship.
The intervention of massage has a relationship with blood pressure, as
discussed in the review of literature. Because of the integrated relationship
between the environmental, psychological and physiological factors within
hypertension, each must be measured when blood pressure is measured. Blood
pressure is, in essence, evaluated in the presence of the psychophysiologic
status. In other words, the internal and external factors are covariates to the
blood pressure at the moment it is measured. It is only in this context, evaluating
blood pressure in the presence of the covariates, that the influence of back
massage can be understood. No one piece exists in isolation of the other.
Further, this very simplified model, Figure 3, does not intend to exemplify the
intricately complex full model of massage, blood pressure and psychophysiology.
Lovallo (2005) has built numerous elaborate models to depict the psychological

45
Figure 3: Model of Massage Influence on Blood Pressure within the Psychophysiology Framework
Massage Intervention
Systolic Blood Pressure Diastolic Blood Pressure Baroreceptor Response
Systolic Blood Pressure Diastolic Blood Pressure Baroreceptor Response
Psychological Factors
Physiological Factors
Environmental Factors Age
Alcohol BMI Ethnicity/Race Exercise Gender Medications Smoking S-T Anger S-T Anxiety S-T Depression Salivary Cortisol
Potential Covariates:

46
and neuroendocrine relationship with health status. Figure 3 is intended to
demonstrate that massage is known to have an influence on blood pressure as it
exists within the model of psychophysiology. The environmental, psychological,
and physiological factors shown in this model are operationalized by the potential
covariates: age, alcohol, body mass index (BMI), ethnicity/ race, exercise,
gender, medications, smoking, anxiety, anger, depression, and salivary cortisol
and are not exclusive of other influences that may be included in a full
psychophysiology model.
Chapter Summary
Chapter Two has reviewed the physiology of blood pressure and the
pathophysiology of hypertension conveying the complexity and the seriousness
of the disease process. The history of massage was discussed developing a
background of why effleurage stroke is the type of massage recommended for
eliciting the relaxation response. The review of massage literature clarified the
troubling lack of consistency in massage research thus far, specifically the lack of
systematic approach to type of massage, length of massage, and number of
dosages needed to elicit particular responses. The psychophysiology framework
has provided a solid theoretical basis upon which to explore the effects of
massage on persons with hypertension. This framework is a holistic model in
which the relationship of the covariates in the model can be explored.
47
Chapter Three
Method
Chapter three presents the methodology used in this study. Included are:
the study design, setting, sample, sampling method, instrumentation, procedure
and data analysis plan.
Study design
The study was a 3 x 4 experimental design. Participants were randomized
to one of three groups. Treatment 1 received 10 back massages, treatment 2
received 5 back massages and the control group received ten sessions using
self-selected relaxation. Four measurement time points included pre-
intervention, 48-72 hours post-intervention, at week eight of the study (2 weeks
post intervention for the 10-Massage group and Control group / 4 weeks post
intervention for the 5-Massage group) and at week ten of the study. The study
design attempted to blind the researcher to the data by having a research
assistant do data collection.
Setting
The research study took place at a large metropolitan university. A suite
provided by the College of Nursing had two rooms, the first being a sitting area
where participants were able to sit in comfortable chairs with a water fountain
providing a continuous, relaxing soft sound and magazines to page through while
48
waiting. The second room contained a table at which the participant sat to
complete written instruments, a comfortable adjustable chair in which the
participant sat to have blood pressures taken, and the massage table upon which
the participant lie to receive the massage or to do relaxation. The room was
divided by a folding screen behind which the massage table was positioned,
offering participants a sense of privacy while gaining the horizontal position onto
the massage table. The rooms, painted in a soft butter color, were approximately
12 x 20 feet, providing adequate space. The air temperature in the rooms
averaged 72 degrees Fahrenheit. Soft relaxing music played continuously
throughout the day from a stereo in the second room. See Appendix 1 for a list
of the musical CDs used in this study.
Participants were granted permission by the university parking and
transportation department to park in the parking lot adjacent to the College of
Nursing during the period of data gathering. The entire data collection took 235
days beginning April 7, 2006 and ending November 28, 2006.
Sample
An a priori power analysis, based on the researcher’s pilot study, (Olney,
2005) suggested that a sample size of seven per group for diastolic pressure
(α= .05, β= .80, effect size 1.56) or sample size of three per group for systolic
pressure (α= .05, β= .80, effect size 2.25) was needed to detect a difference.
With no other literature suggesting significant findings using such a small sample,
the researcher consulted experienced researchers to gain a better estimate for
sample size needed in this study. In a phone conversation with expert massage
49
researcher, Dr. Maria Hernandez-Reif of the Touch Research Institute, University
of Miami, Miami, FL, advised that smaller samples are appropriate with massage
because the effect sizes on outcome variables tend to be large. Therefore, it
was determined that 15 subjects per group would be adequate to detect a
significant change in systolic or diastolic blood pressure. The researcher
proposed to recruit 18 subjects per group to allow for attrition due to dismissals
and drop out. Therefore, the goal was to recruit and enroll 54 participants.
Recruitment
Given that nearly one in three adults has hypertension (American Heart
Association, 2006), the researcher determined the local university population
would be adequate from which to pull a sample of hypertensive participants.
Therefore a convenience sample was recruited from the University of South
Florida faculty, staff, students and associates, which has a total population of
approximately 50,000 with >43,000 students (University of South Florida, 2005),
and >7,000 faculty and staff, (University of South Florida, 2004). Therefore, an
estimated 16,000 hypertensive persons, not considering age variance, were
available to be recruited from the university campus. Recruitment began with a
mass mailing of an approved recruitment flyer via the University of South Florida
Health Sciences Center’s e-mail system (Appendix 2). A hard copy of the flyer
was also posted on approved bulletin boards through out the Health Science
Center’s campus. Due to the nature of the study, a rolling enrollment had to
occur; therefore the internet flyer was posted on average every 3 weeks to recruit
more participants. After several months of posting throughout the Health
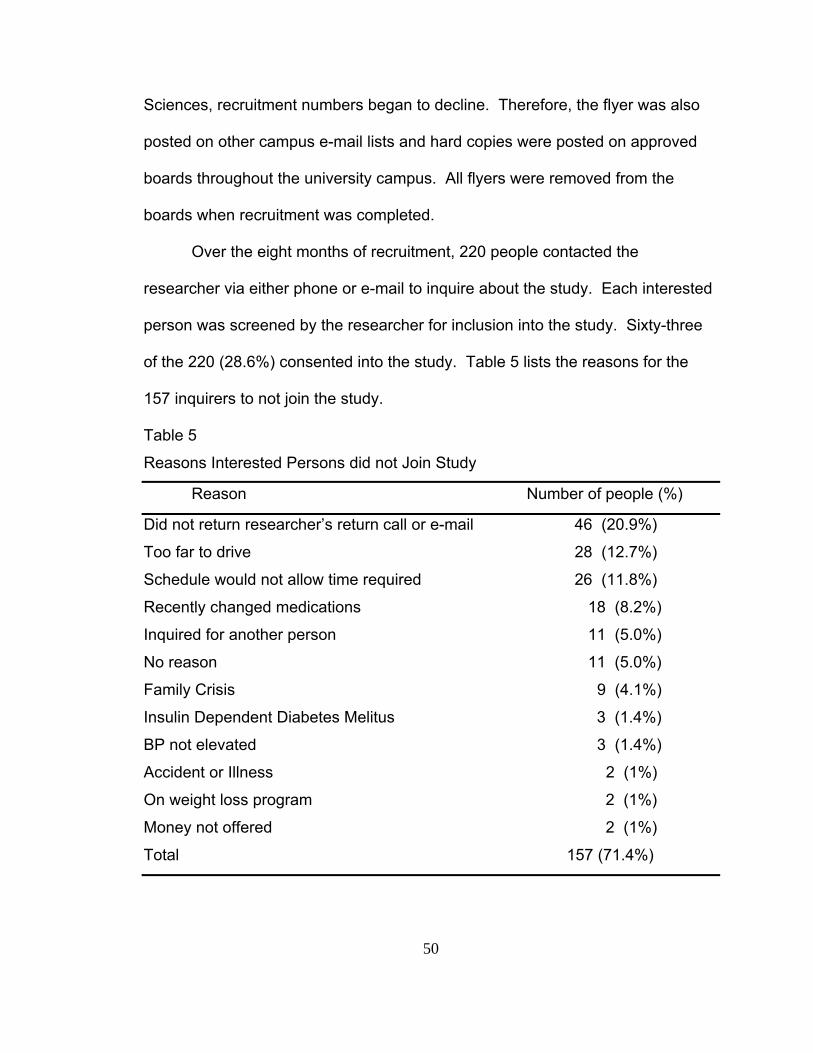
50
Sciences, recruitment numbers began to decline. Therefore, the flyer was also
posted on other campus e-mail lists and hard copies were posted on approved
boards throughout the university campus. All flyers were removed from the
boards when recruitment was completed.
Over the eight months of recruitment, 220 people contacted the
researcher via either phone or e-mail to inquire about the study. Each interested
person was screened by the researcher for inclusion into the study. Sixty-three
of the 220 (28.6%) consented into the study. Table 5 lists the reasons for the
157 inquirers to not join the study.
Table 5
Reasons Interested Persons did not Join Study
Reason Number of people (%)
Did not return researcher’s return call or e-mail 46 (20.9%)
Too far to drive 28 (12.7%)
Schedule would not allow time required 26 (11.8%)
Recently changed medications 18 (8.2%)
Inquired for another person 11 (5.0%)
No reason 11 (5.0%)
Family Crisis 9 (4.1%)
Insulin Dependent Diabetes Melitus 3 (1.4%)
BP not elevated 3 (1.4%)
Accident or Illness 2 (1%)
On weight loss program 2 (1%)
Money not offered 2 (1%)
Total 157 (71.4%)
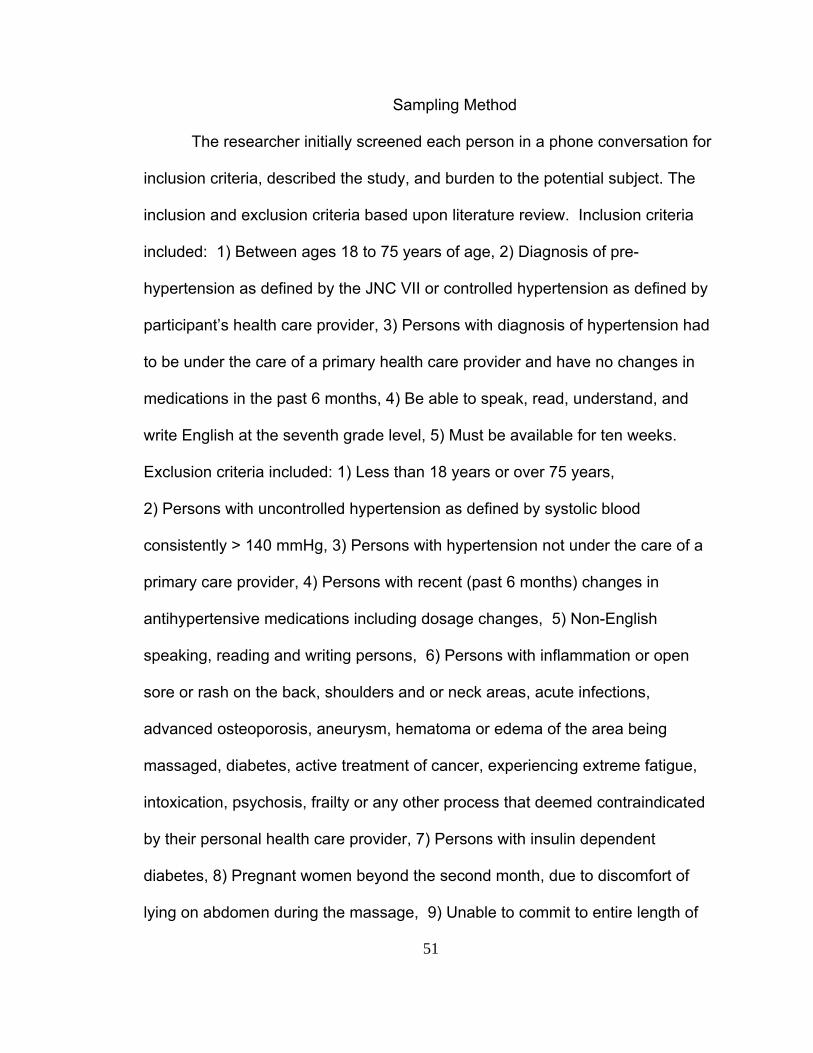
51
Sampling Method
The researcher initially screened each person in a phone conversation for
inclusion criteria, described the study, and burden to the potential subject. The
inclusion and exclusion criteria based upon literature review. Inclusion criteria
included: 1) Between ages 18 to 75 years of age, 2) Diagnosis of pre-
hypertension as defined by the JNC VII or controlled hypertension as defined by
participant’s health care provider, 3) Persons with diagnosis of hypertension had
to be under the care of a primary health care provider and have no changes in
medications in the past 6 months, 4) Be able to speak, read, understand, and
write English at the seventh grade level, 5) Must be available for ten weeks.
Exclusion criteria included: 1) Less than 18 years or over 75 years,
2) Persons with uncontrolled hypertension as defined by systolic blood
consistently > 140 mmHg, 3) Persons with hypertension not under the care of a
primary care provider, 4) Persons with recent (past 6 months) changes in
antihypertensive medications including dosage changes, 5) Non-English
speaking, reading and writing persons, 6) Persons with inflammation or open
sore or rash on the back, shoulders and or neck areas, acute infections,
advanced osteoporosis, aneurysm, hematoma or edema of the area being
massaged, diabetes, active treatment of cancer, experiencing extreme fatigue,
intoxication, psychosis, frailty or any other process that deemed contraindicated
by their personal health care provider, 7) Persons with insulin dependent
diabetes, 8) Pregnant women beyond the second month, due to discomfort of
lying on abdomen during the massage, 9) Unable to commit to entire length of

52
study, and 10) Persons with history of thoracotomy. This last criteria was added
after an adverse event (See Appendix 3 for letter from Institution Review Board).
Of the 220 inquiries, 63 interested persons met the study criteria. A 30
minute appointment was arranged for the participant to complete the initial paper
work, meet the researcher, and have the study explained again to ensure the
participant understood the commitment.
Protection of Human Subjects
The initial paper work included the approved University of South Florida
Human Subjects Institutional Review Board consent form (Appendix 4), the
approved University of South Florida Research Authorization for Use and
Disclosure of Protected Health Information form (Appendix 5), and a Subject
Information form (Appendix 6) . If the participant was older than 65 years of age,
a Mini-Mental State Exam was administered (Appendix 7). Once the researcher
was assured the participant was committed to the study, that they understood the
commitment and the consent and health information protection form was signed,
a schedule was arranged with the participant for the entire study.
Randomization
Fourteen of the consented 63 participants dropped from the study prior to
randomization. The reasons for leaving the study are listed in Table 6.
Randomization to group occurred on the fifth visit to the research lab (see
procedure). At the study’s completion, there were 42 participants who had
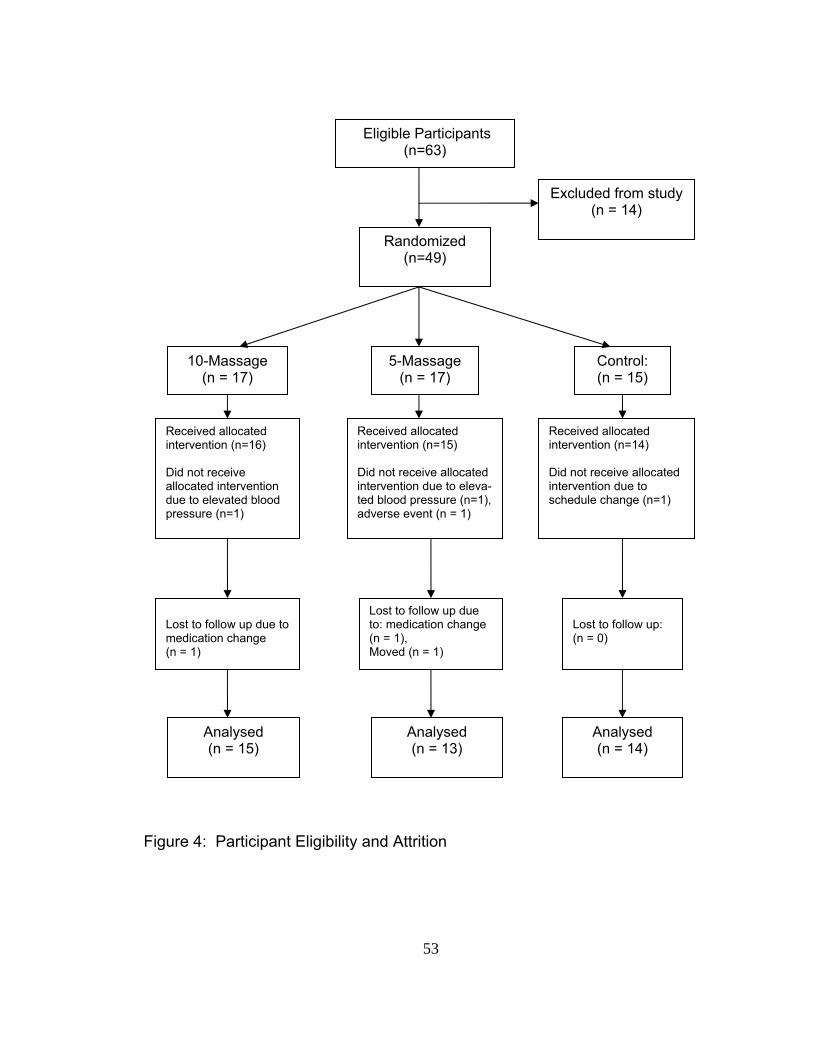
53
Figure 4: Participant Eligibility and Attrition
Eligible Participants (n=63)
Randomized (n=49)
Excluded from study (n = 14)
10-Massage (n = 17)
5-Massage (n = 17)
Control: (n = 15)
Received allocated intervention (n=16) Did not receive allocated intervention due to elevated blood pressure (n=1)
Received allocated intervention (n=15) Did not receive allocated intervention due to eleva- ted blood pressure (n=1), adverse event (n = 1)
Received allocated intervention (n=14) Did not receive allocated intervention due to schedule change (n=1)
Lost to follow up due to: medication change (n = 1), Moved (n = 1)
Lost to follow up due to medication change (n = 1)
Analysed (n = 15)
Analysed (n = 13)
Analysed (n = 14)
Lost to follow up: (n = 0)
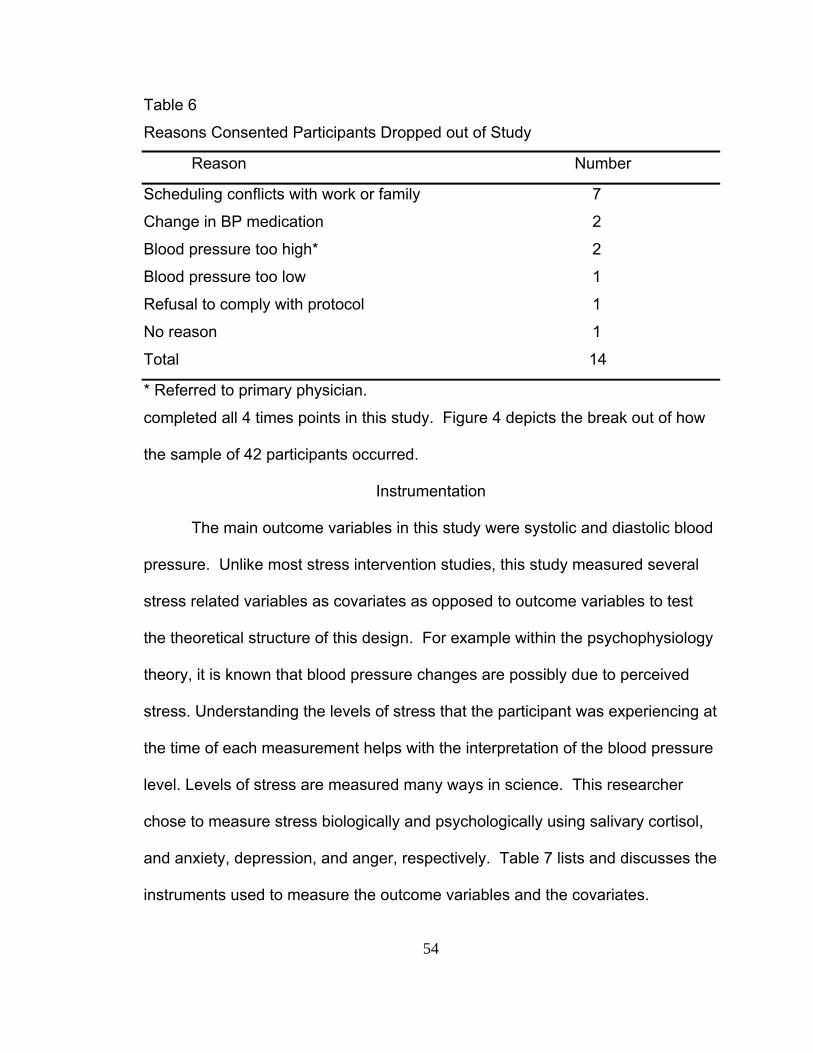
54
Table 6
Reasons Consented Participants Dropped out of Study
Reason Number
Scheduling conflicts with work or family 7
Change in BP medication 2
Blood pressure too high* 2
Blood pressure too low 1
Refusal to comply with protocol 1
No reason 1
Total 14
* Referred to primary physician.
completed all 4 times points in this study. Figure 4 depicts the break out of how
the sample of 42 participants occurred.
Instrumentation
The main outcome variables in this study were systolic and diastolic blood
pressure. Unlike most stress intervention studies, this study measured several
stress related variables as covariates as opposed to outcome variables to test
the theoretical structure of this design. For example within the psychophysiology
theory, it is known that blood pressure changes are possibly due to perceived
stress. Understanding the levels of stress that the participant was experiencing at
the time of each measurement helps with the interpretation of the blood pressure
level. Levels of stress are measured many ways in science. This researcher
chose to measure stress biologically and psychologically using salivary cortisol,
and anxiety, depression, and anger, respectively. Table 7 lists and discusses the
instruments used to measure the outcome variables and the covariates.
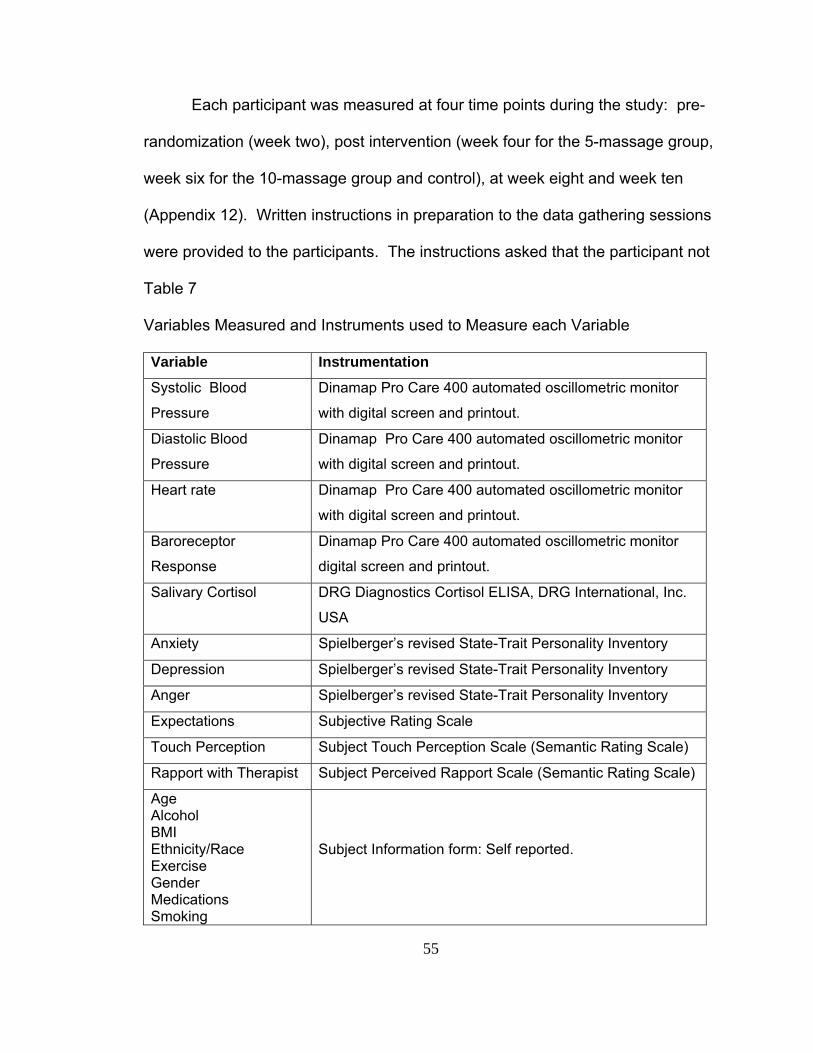
55
Each participant was measured at four time points during the study: pre-
randomization (week two), post intervention (week four for the 5-massage group,
week six for the 10-massage group and control), at week eight and week ten
(Appendix 12). Written instructions in preparation to the data gathering sessions
were provided to the participants. The instructions asked that the participant not
Table 7
Variables Measured and Instruments used to Measure each Variable
Variable Instrumentation
Systolic Blood
Pressure
Dinamap Pro Care 400 automated oscillometric monitor
with digital screen and printout.
Diastolic Blood
Pressure Dinamap Pro Care 400 automated oscillometric monitor
with digital screen and printout. Heart rate Dinamap Pro Care 400 automated oscillometric monitor
with digital screen and printout.
Baroreceptor
Response
Dinamap Pro Care 400 automated oscillometric monitor
digital screen and printout.
Salivary Cortisol
DRG Diagnostics Cortisol ELISA, DRG International, Inc.
USA
Anxiety Spielberger’s revised State-Trait Personality Inventory
Depression Spielberger’s revised State-Trait Personality Inventory
Anger Spielberger’s revised State-Trait Personality Inventory
Expectations Subjective Rating Scale
Touch Perception Subject Touch Perception Scale (Semantic Rating Scale)
Rapport with Therapist Subject Perceived Rapport Scale (Semantic Rating Scale)
Age Alcohol BMI Ethnicity/Race Exercise Gender Medications Smoking
Subject Information form: Self reported.
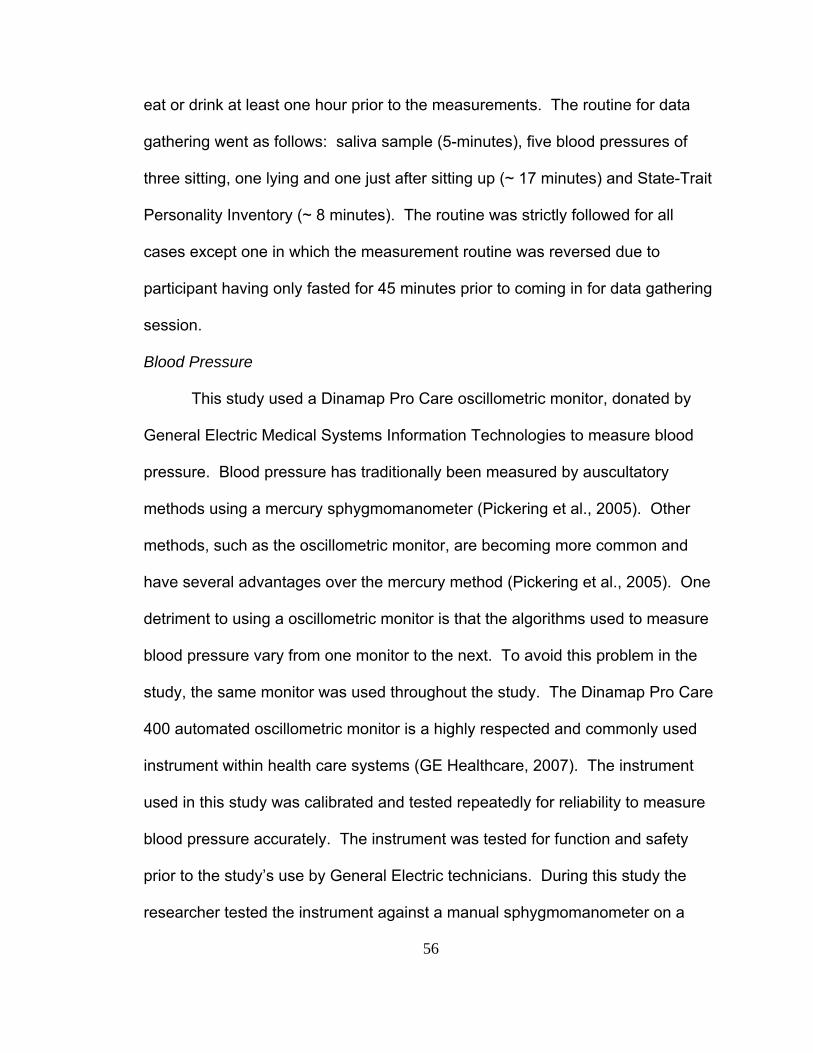
56
eat or drink at least one hour prior to the measurements. The routine for data
gathering went as follows: saliva sample (5-minutes), five blood pressures of
three sitting, one lying and one just after sitting up (~ 17 minutes) and State-Trait
Personality Inventory (~ 8 minutes). The routine was strictly followed for all
cases except one in which the measurement routine was reversed due to
participant having only fasted for 45 minutes prior to coming in for data gathering
session.
Blood Pressure
This study used a Dinamap Pro Care oscillometric monitor, donated by
General Electric Medical Systems Information Technologies to measure blood
pressure. Blood pressure has traditionally been measured by auscultatory
methods using a mercury sphygmomanometer (Pickering et al., 2005). Other
methods, such as the oscillometric monitor, are becoming more common and
have several advantages over the mercury method (Pickering et al., 2005). One
detriment to using a oscillometric monitor is that the algorithms used to measure
blood pressure vary from one monitor to the next. To avoid this problem in the
study, the same monitor was used throughout the study. The Dinamap Pro Care
400 automated oscillometric monitor is a highly respected and commonly used
instrument within health care systems (GE Healthcare, 2007). The instrument
used in this study was calibrated and tested repeatedly for reliability to measure
blood pressure accurately. The instrument was tested for function and safety
prior to the study’s use by General Electric technicians. During this study the
researcher tested the instrument against a manual sphygmomanometer on a

57
regular basis to ensure the Dinamap Pro Care 400 continued to measure
accurately.
Correct blood pressure cuff size is very important for accurate blood
pressure measurement (Pickering et al., 2005). Each participant had their non-
dominant arm measured by the researcher to determine correct cuff size prior to
the first blood pressure measurement according to the American Heart
Association Guidelines for cuff sizes. Three systolic and diastolic blood
pressures were measured and averaged at each of the four time points.
The Dinamap Pro Care 400 monitor was also used to record the heart rate
during each blood pressure measurement. The monitor stored the recordings
and provided a paper print out of those blood pressure and heart rate recordings
at the end of each participant’s visits.
To determine baroreceptor response, blood pressures sitting and lying are
compared. Therefore the appropriate instrument to measure this variable was
the Dinamap Pro Care 400.
Salivary Cortisol
Salivary cortisol was used as a physiological marker of perceived stress
(Smyth et. al., 1998). Salivary cortisol kits obtained from DRG Diagnostics
Cortisol ELISA, DRG International, Inc. USA were used by the researcher. Dr.
Maureen Groer, University of South Florida, College of Nursing, provided the lab,
freezer space, and guidance in correct laboratory methodology.
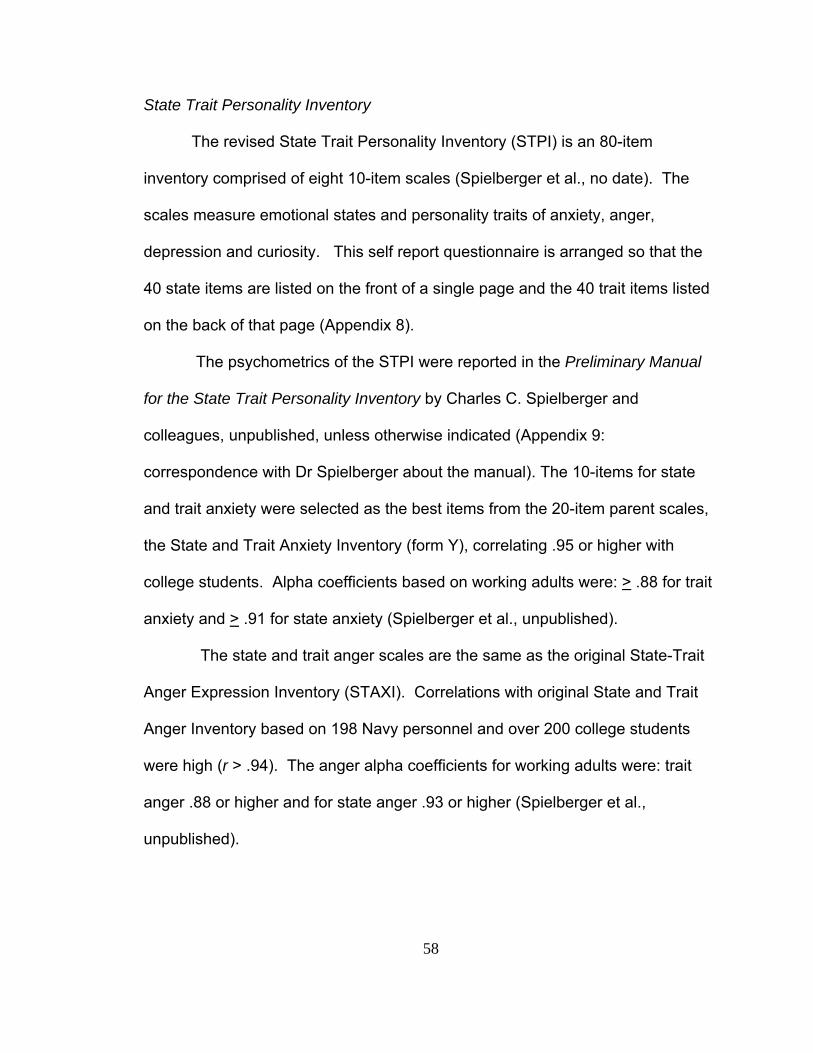
58
State Trait Personality Inventory
The revised State Trait Personality Inventory (STPI) is an 80-item
inventory comprised of eight 10-item scales (Spielberger et al., no date). The
scales measure emotional states and personality traits of anxiety, anger,
depression and curiosity. This self report questionnaire is arranged so that the
40 state items are listed on the front of a single page and the 40 trait items listed
on the back of that page (Appendix 8).
The psychometrics of the STPI were reported in the Preliminary Manual
for the State Trait Personality Inventory by Charles C. Spielberger and
colleagues, unpublished, unless otherwise indicated (Appendix 9:
correspondence with Dr Spielberger about the manual). The 10-items for state
and trait anxiety were selected as the best items from the 20-item parent scales,
the State and Trait Anxiety Inventory (form Y), correlating .95 or higher with
college students. Alpha coefficients based on working adults were: > .88 for trait
anxiety and > .91 for state anxiety (Spielberger et al., unpublished).
The state and trait anger scales are the same as the original State-Trait
Anger Expression Inventory (STAXI). Correlations with original State and Trait
Anger Inventory based on 198 Navy personnel and over 200 college students
were high (r > .94). The anger alpha coefficients for working adults were: trait
anger .88 or higher and for state anger .93 or higher (Spielberger et al.,
unpublished).
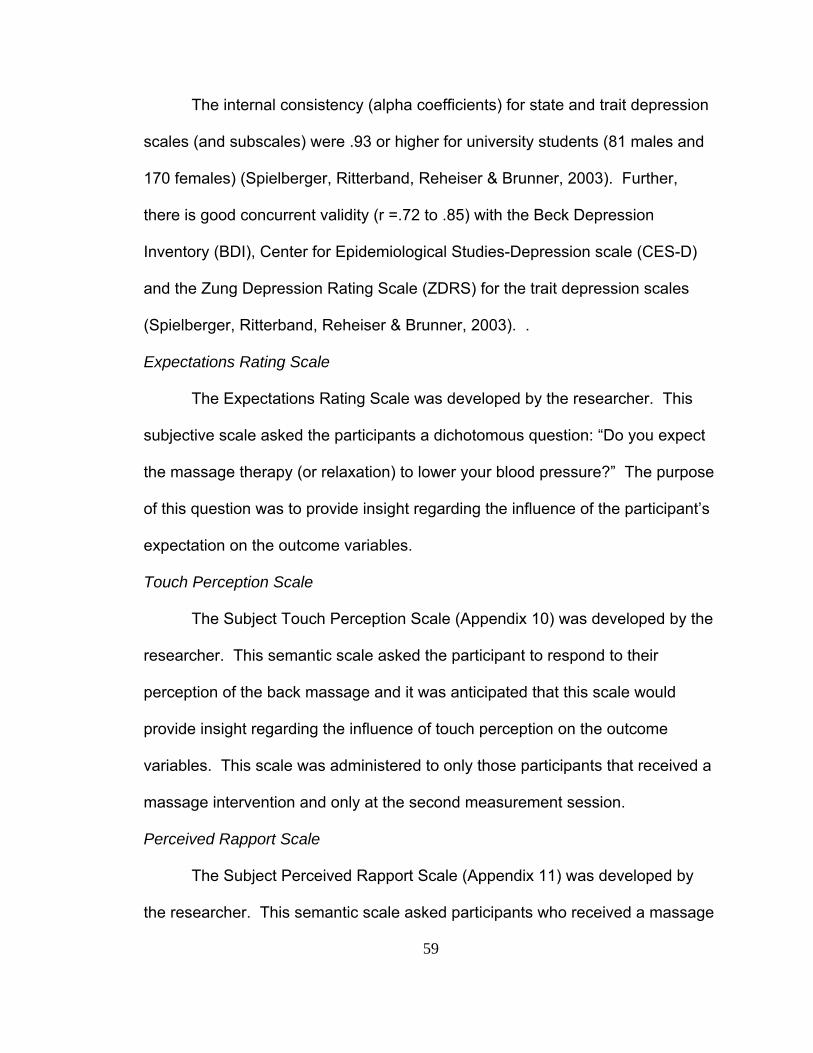
59
The internal consistency (alpha coefficients) for state and trait depression
scales (and subscales) were .93 or higher for university students (81 males and
170 females) (Spielberger, Ritterband, Reheiser & Brunner, 2003). Further,
there is good concurrent validity (r =.72 to .85) with the Beck Depression
Inventory (BDI), Center for Epidemiological Studies-Depression scale (CES-D)
and the Zung Depression Rating Scale (ZDRS) for the trait depression scales
(Spielberger, Ritterband, Reheiser & Brunner, 2003). .
Expectations Rating Scale
The Expectations Rating Scale was developed by the researcher. This
subjective scale asked the participants a dichotomous question: “Do you expect
the massage therapy (or relaxation) to lower your blood pressure?” The purpose
of this question was to provide insight regarding the influence of the participant’s
expectation on the outcome variables.
Touch Perception Scale
The Subject Touch Perception Scale (Appendix 10) was developed by the
researcher. This semantic scale asked the participant to respond to their
perception of the back massage and it was anticipated that this scale would
provide insight regarding the influence of touch perception on the outcome
variables. This scale was administered to only those participants that received a
massage intervention and only at the second measurement session.
Perceived Rapport Scale
The Subject Perceived Rapport Scale (Appendix 11) was developed by
the researcher. This semantic scale asked participants who received a massage
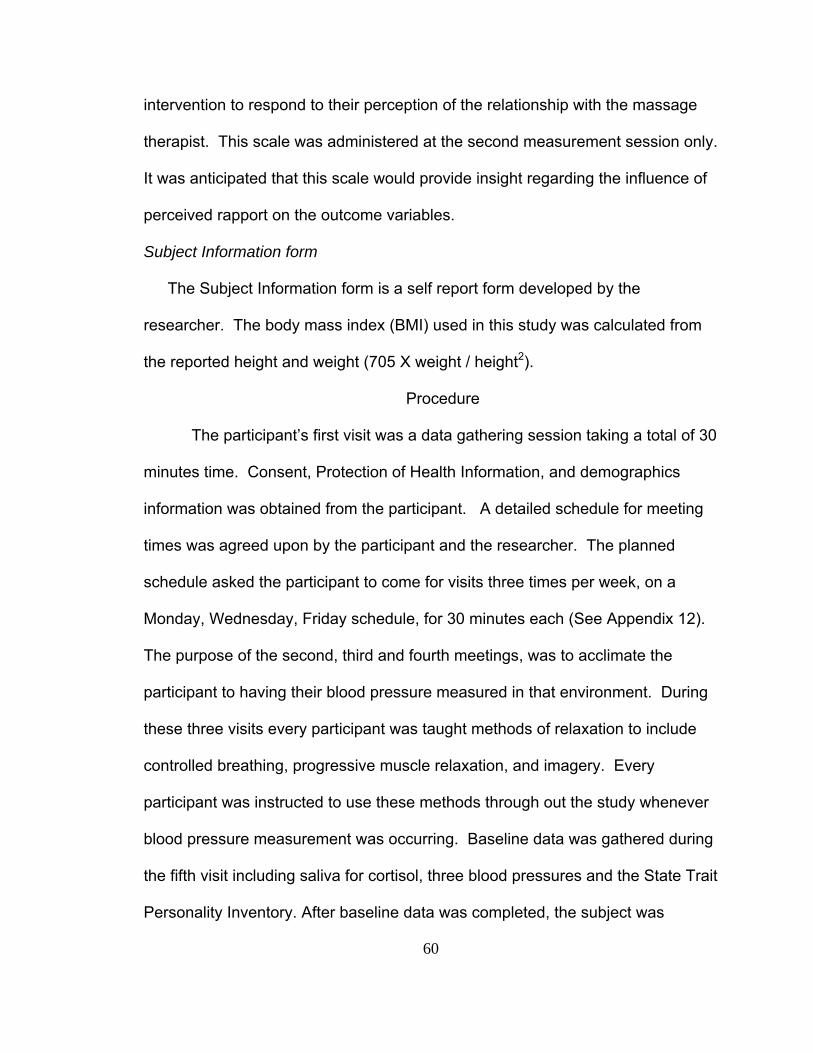
60
intervention to respond to their perception of the relationship with the massage
therapist. This scale was administered at the second measurement session only.
It was anticipated that this scale would provide insight regarding the influence of
perceived rapport on the outcome variables.
Subject Information form
The Subject Information form is a self report form developed by the
researcher. The body mass index (BMI) used in this study was calculated from
the reported height and weight (705 X weight / height2).
Procedure
The participant’s first visit was a data gathering session taking a total of 30
minutes time. Consent, Protection of Health Information, and demographics
information was obtained from the participant. A detailed schedule for meeting
times was agreed upon by the participant and the researcher. The planned
schedule asked the participant to come for visits three times per week, on a
Monday, Wednesday, Friday schedule, for 30 minutes each (See Appendix 12).
The purpose of the second, third and fourth meetings, was to acclimate the
participant to having their blood pressure measured in that environment. During
these three visits every participant was taught methods of relaxation to include
controlled breathing, progressive muscle relaxation, and imagery. Every
participant was instructed to use these methods through out the study whenever
blood pressure measurement was occurring. Baseline data was gathered during
the fifth visit including saliva for cortisol, three blood pressures and the State Trait
Personality Inventory. After baseline data was completed, the subject was
61
randomized to one of three groups by drawing an assignment from a canister.
The canister had equal numbers of folded slips of paper with a designated group
assignment to: Treatment 1 (10-Massage group), Treatment 2 (5-Massage
group) or Control. The specified group procedure was then explained to the
participant. The sixth through fifteenth visits for the 10-Massage and Control
groups and the sixth through tenth visits for the 5-Massage group was the
intervention period. During the 30-minute intervention visit the participant first sat
quietly for 3-5 minutes, utilizing the learned methods of relaxation. Once the
participant indicated he or she felt relaxed, one measurement of blood pressure
was obtained. Then the individual treatment procedure was instituted.
The Massage Therapist
For fidelity purposes, this study utilized one massage therapist. The
researcher is a nationally certified, state licensed massage therapist. The
researcher developed the back massage based on professional experience, the
empirical evidence and advice from a former massage instructor, Maggie Kelly,
Licensed Massage Therapist. Former clients offered feedback during the
development phase of the back massage, allowing refinement to the pressure
used and the speed of the strokes.
Massage Routine
The massage routine used a sequence of three types of strokes for the
duration of the 10-minute back massage. Using both hands the therapist applied
long effleurage strokes that started from the base of the neck, along both sides of
the spine, to the base of the sacrum, then returning to the neck base by a smooth
62
pulling stroke to the lateral sides of the back. The hands of the therapist never
lost contact with the subject’s back. This effleurage stroke was rhythmic and
repeated three times. The second stroke, also repeated three times, was a
circular stroke starting at the base of the occipital bone, at ear level. The stroke
was moved along the lateral neck and over the upper shoulders (deltoids) and
returned to the ear area. The third stroke, repeated three times, again started at
the base of the neck, circling the perimeter of the scapula. Each set of three
strokes took approximately five seconds to complete. The sequence was
repeated for the full 10-minute application.
10-Massage Group and 5-Massage Group Procedure
The therapist stepped out of the room while the subject disrobed (behind
a screen) from the waist up and then lay prone on a cleanly draped massage
table with her/his face resting on the face support extension. The researcher re-
entered the room only after the participant indicated she/he was prepared. A
towel was tucked into the participant’s waist band to protect the clothing and a
pillow placed under the lower leg and ankle to support the feet. A rhythmic 10-
minute back massage was administered using a non-allergenic massage lotion.
The back was dried with a clean towel. Before leaving the room, the therapist
reminded the participant to sit at the edge of the table and breathe for several
breaths prior to getting off the massage table to redress. The therapist left the
room and returned once the participant indicated she/he was dressed and sitting
in the chair. The participant sat quietly for 2-5 minutes allowing the researcher to
63
assess any adverse effects of the massage such as dizziness, and then a
second blood pressure and heart rate was measured.
Control Group Procedure
The control group participants experienced the same procedure as the
treatment group participants except they did not receive a massage. The control
participants were directed to use the learned relaxation techniques for the 10
minutes as they lie supine on the massage table. They were offered pillows for
support under the head and knees and a blanket for warmth.
Post Intervention Procedures
Three post-intervention visits took place in this study. For the 10-Massage
and Control group participants the first post measurement was the sixteenth visit
(~week 6). For the 5-Massage group participants, the first post measurement
was eleventh visit (~week 4). The third and fourth post measurements occurred
during the eighth and tenth week after their enrollment (Appendix 12).
Data Management
Security
All data was gathered on paper and filed in the respective participant’s file.
The files were maintained in a locked cabinet at the study site throughout the
duration of the study. During the analysis phase the files were maintained in a
locked cabinet in the researcher’s office. The data were loaded into an EXCEL
file using only coded identification numbers. A password was needed to access
the data file.
64
Data Analysis Plan
The data were analyzed using the SPSS Graduate Pack 11.5. Alpha was
set at .05, protecting against a Type I error. Prior to analysis, all data were
examined for accuracy in data entry, missing values, and whether assumptions
of each analysis were met. Basic analysis of variance was used to determine
differences in the mean group demographic characteristics.
Hypotheses 1 through 4 required adjustment of covariates prior to the
analysis comparing changes in group means over time. The MANOVA
procedure provided insight and adjustments needed to meet the assumptions of
analysis of covariance (ANCOVA). An analysis of covariance tested for mean
group changes over time in systolic and diastolic blood pressure. Follow up
orthogonal analysis was planned for the expected interactions.
Hypothesis 5 was concerned with the change in baro-receptor function.
This hypothesis stated that the change in the lying blood pressure group mean
compared to the sitting blood pressure group mean would be significantly
different for the participants who received 10 massages than the control group.
This hypothesis was analyzed using an ANOVA procedure.
Chapter Summary
Chapter 3 described the method used in this study. The process of
sample selection was described, including protection of their human rights and
their personal information. A figure (Figure 4) of participant eligibility depicted the
number of interested individuals and how, once completely randomized into the
study, the attrition rate prolonged the recruitment time period. The instruments to

65
measure each variable were fully described. The procedure for each group was
different therefore full discloser was included in this report. Data security
throughout the study was ensured. The analysis plan for each hypothesis was
discussed and the results will be fully disclosed in Chapter four.
66
Chapter Four
Overview of Findings
The purpose of this study was to evaluate the long term effects and
dosage of back massage for persons with hypertension or pre-hypertension.
This randomized clinical trial tested five hypotheses addressing the effectiveness
of back massage. The first two hypotheses were related to the long term effects
of back massage. The third and fourth hypotheses compared dosage of back
massage. The fifthl hypothesis addressed a possible causal physiological
mechanism for change in blood pressure using back massage. Each participant
was measured for all variables at four time points during the study: pre-
randomization (week two), post intervention (week four for the 5-massage group,
week six for the 10-massage group), at week eight, and week ten (Appendix 12).
The probability of making a Type I error was set at p<.05 for all the analyses.
Analytical Strategy
Unlike many stress intervention studies that measure biological and
psychological variables as outcome variables, this study was designed to
evaluate blood pressure changes within the context of the psychological and
biological status of the participant at each measurement session. Therefore, this
study used analysis of variance (ANOVA) and analysis of covariance (ANCOVA)
to determine the effects of massage on blood pressure. The assumptions of
ANOVA and ANCOVA were assessed for violations. If violations to the
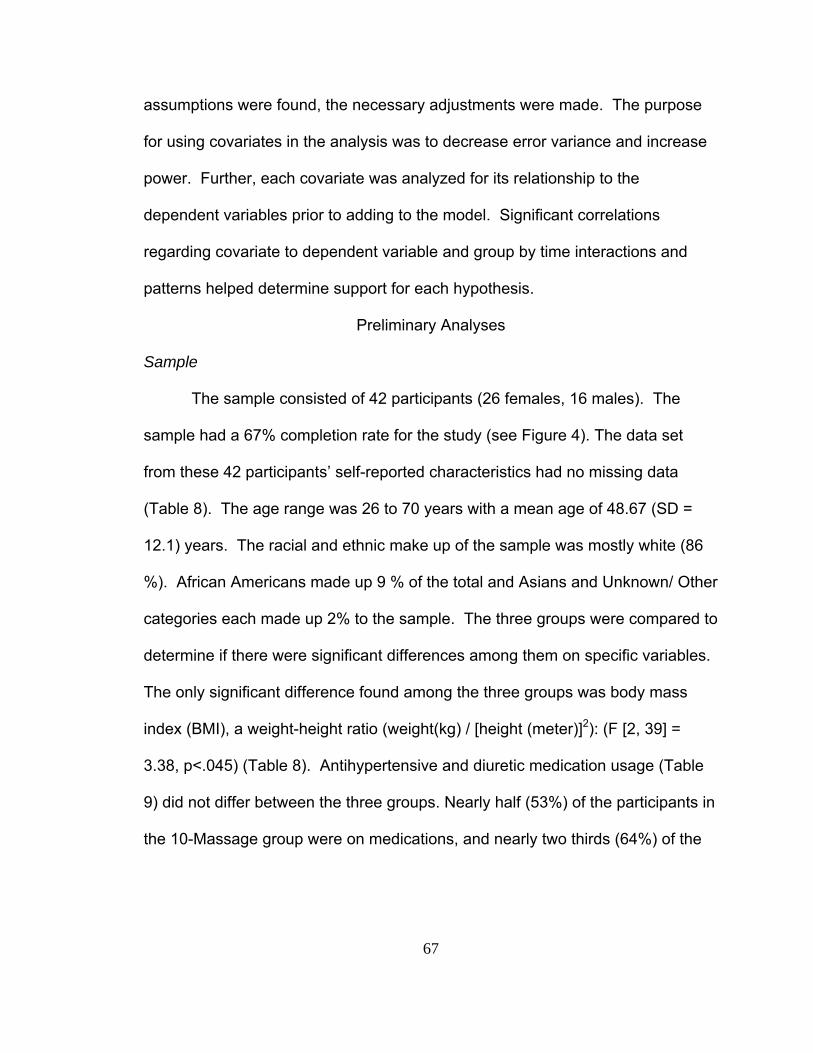
67
assumptions were found, the necessary adjustments were made. The purpose
for using covariates in the analysis was to decrease error variance and increase
power. Further, each covariate was analyzed for its relationship to the
dependent variables prior to adding to the model. Significant correlations
regarding covariate to dependent variable and group by time interactions and
patterns helped determine support for each hypothesis.
Preliminary Analyses
Sample
The sample consisted of 42 participants (26 females, 16 males). The
sample had a 67% completion rate for the study (see Figure 4). The data set
from these 42 participants’ self-reported characteristics had no missing data
(Table 8). The age range was 26 to 70 years with a mean age of 48.67 (SD =
12.1) years. The racial and ethnic make up of the sample was mostly white (86
%). African Americans made up 9 % of the total and Asians and Unknown/ Other
categories each made up 2% to the sample. The three groups were compared to
determine if there were significant differences among them on specific variables.
The only significant difference found among the three groups was body mass
index (BMI), a weight-height ratio (weight(kg) / [height (meter)]2): (F [2, 39] =
3.38, p<.045) (Table 8). Antihypertensive and diuretic medication usage (Table
9) did not differ between the three groups. Nearly half (53%) of the participants in
the 10-Massage group were on medications, and nearly two thirds (64%) of the
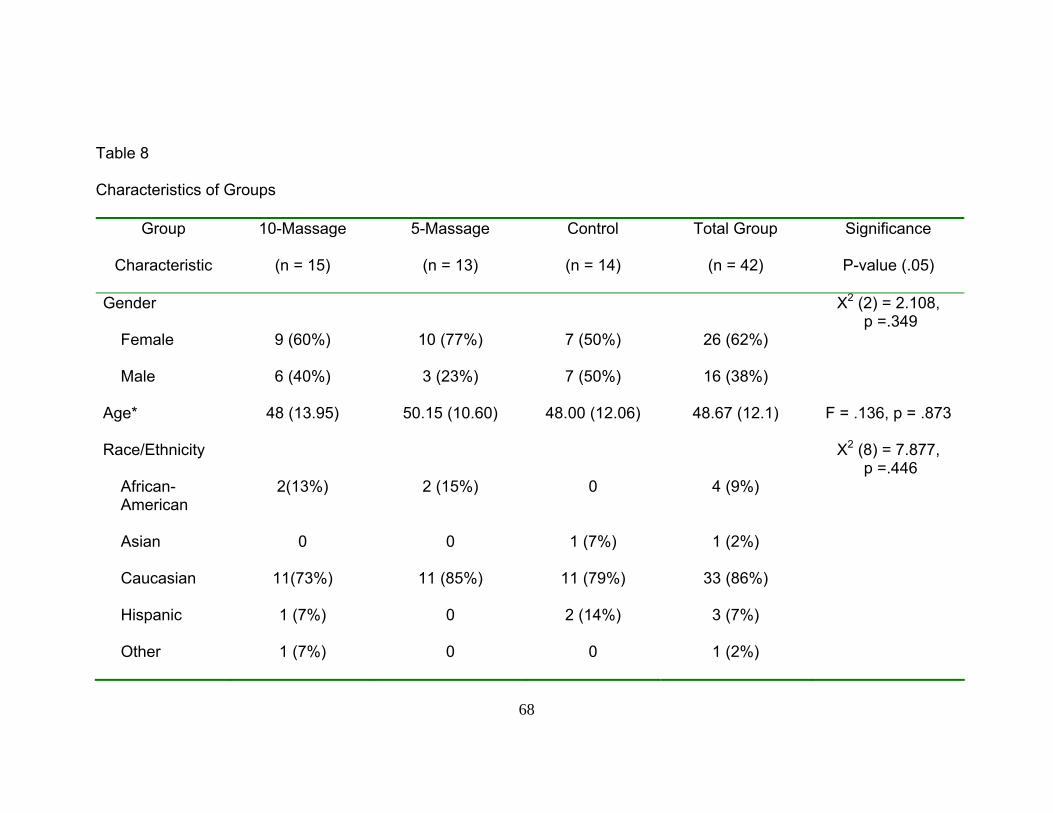
68
Table 8
Characteristics of Groups
Group
10-Massage 5-Massage Control Total Group Significance
Characteristic
(n = 15) (n = 13) (n = 14) (n = 42) P-value (.05)
Gender
Χ2 (2) = 2.108, p =.349
Female
9 (60%) 10 (77%) 7 (50%) 26 (62%)
Male
6 (40%) 3 (23%) 7 (50%) 16 (38%)
Age*
48 (13.95) 50.15 (10.60) 48.00 (12.06) 48.67 (12.1) F = .136, p = .873
Race/Ethnicity
Χ2 (8) = 7.877, p =.446
African- American
2(13%) 2 (15%) 0 4 (9%)
Asian
0 0 1 (7%) 1 (2%)
Caucasian
11(73%) 11 (85%) 11 (79%) 33 (86%)
Hispanic
1 (7%) 0 2 (14%) 3 (7%)
Other
1 (7%) 0 0 1 (2%)
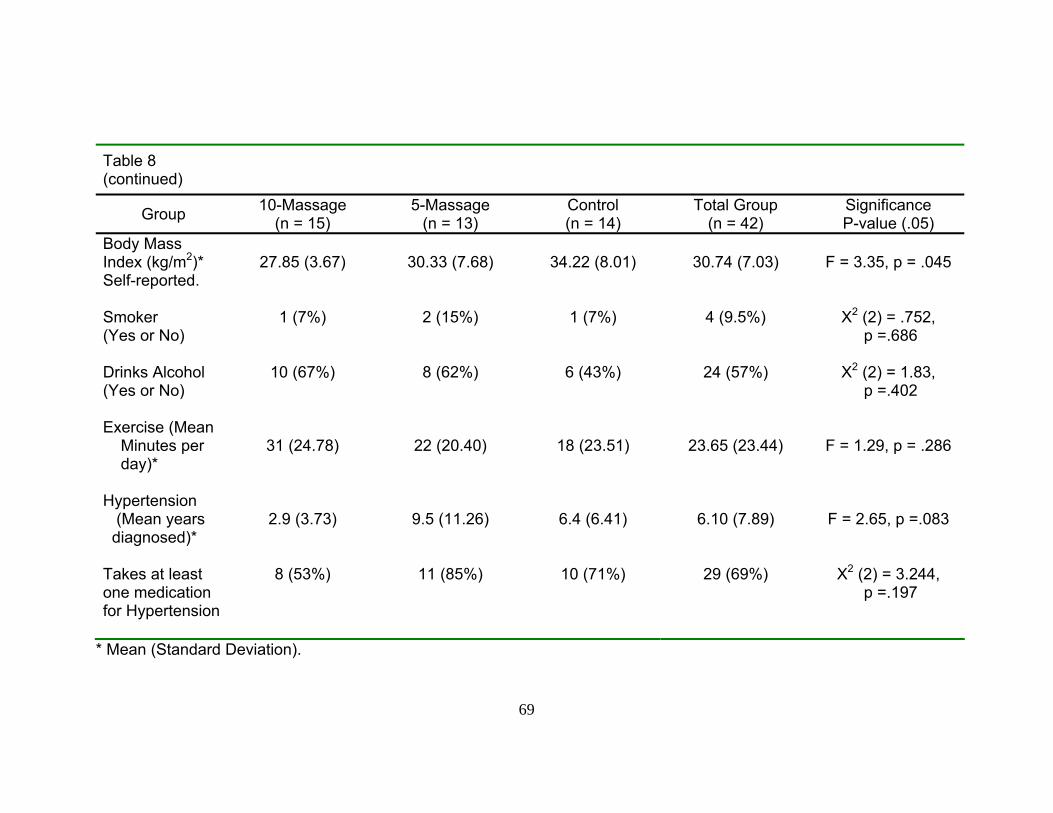
69
Table 8 (continued)
Group 10-Massage (n = 15)
5-Massage (n = 13)
Control (n = 14)
Total Group (n = 42)
Significance P-value (.05)
Body Mass Index (kg/m2)* Self-reported.
27.85 (3.67)
30.33 (7.68)
34.22 (8.01)
30.74 (7.03)
F = 3.35, p = .045
Smoker (Yes or No)
1 (7%) 2 (15%) 1 (7%) 4 (9.5%) Χ2 (2) = .752, p =.686
Drinks Alcohol (Yes or No)
10 (67%) 8 (62%) 6 (43%) 24 (57%) Χ2 (2) = 1.83, p =.402
Exercise (Mean Minutes per day)*
31 (24.78)
22 (20.40)
18 (23.51)
23.65 (23.44)
F = 1.29, p = .286
Hypertension (Mean years diagnosed)*
2.9 (3.73)
9.5 (11.26)
6.4 (6.41)
6.10 (7.89)
F = 2.65, p =.083
Takes at least one medication for Hypertension
8 (53%) 11 (85%) 10 (71%) 29 (69%) Χ2 (2) = 3.244, p =.197
* Mean (Standard Deviation).
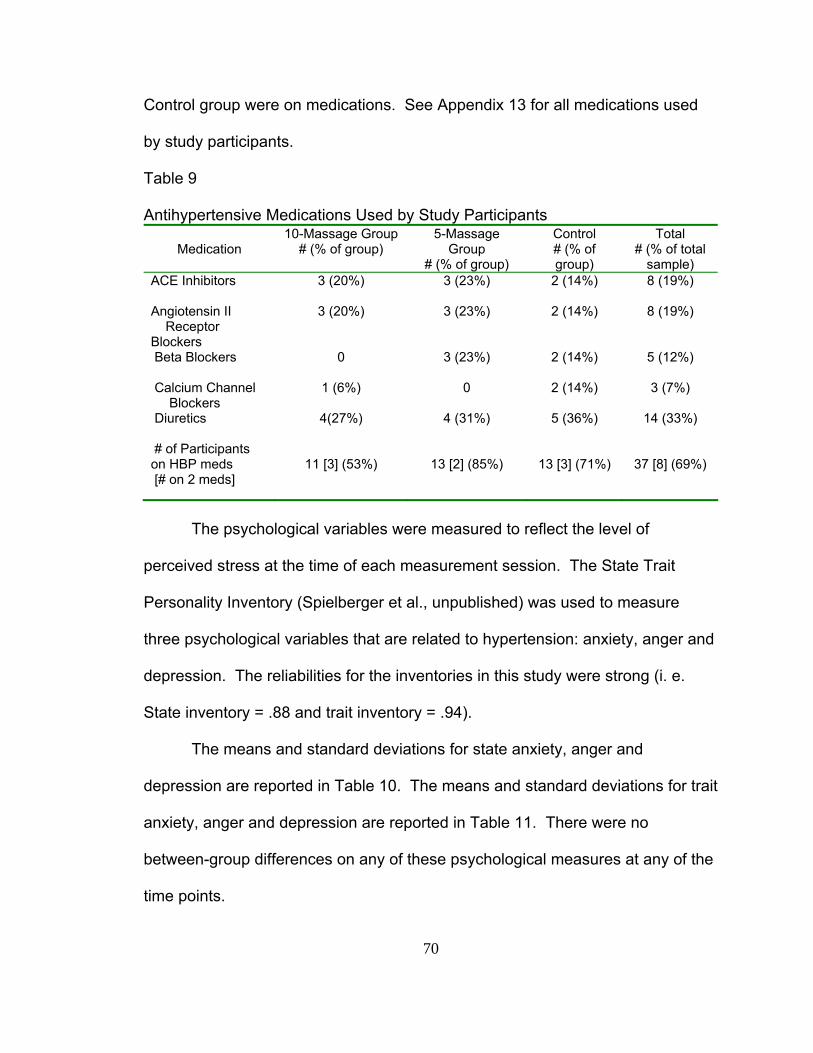
70
Control group were on medications. See Appendix 13 for all medications used
by study participants.
Table 9 Antihypertensive Medications Used by Study Participants
Medication
10-Massage Group # (% of group)
5-Massage Group
# (% of group)
Control # (% of group)
Total # (% of total
sample) ACE Inhibitors
3 (20%) 3 (23%) 2 (14%) 8 (19%)
Angiotensin II Receptor Blockers
3 (20%) 3 (23%) 2 (14%) 8 (19%)
Beta Blockers
0 3 (23%) 2 (14%) 5 (12%)
Calcium Channel Blockers
1 (6%) 0 2 (14%) 3 (7%)
Diuretics
4(27%) 4 (31%) 5 (36%) 14 (33%)
# of Participants on HBP meds [# on 2 meds]
11 [3] (53%)
13 [2] (85%)
13 [3] (71%)
37 [8] (69%)
The psychological variables were measured to reflect the level of
perceived stress at the time of each measurement session. The State Trait
Personality Inventory (Spielberger et al., unpublished) was used to measure
three psychological variables that are related to hypertension: anxiety, anger and
depression. The reliabilities for the inventories in this study were strong (i. e.
State inventory = .88 and trait inventory = .94).
The means and standard deviations for state anxiety, anger and
depression are reported in Table 10. The means and standard deviations for trait
anxiety, anger and depression are reported in Table 11. There were no
between-group differences on any of these psychological measures at any of the
time points.

71
Table 10 Means (Standard Deviations) and Significance of State Anxiety, Anger and Depression
Variable*
10-Massage Group
5-Massage Group Control TOTAL Significance
Pre State Anxiety 15.53 (5.69) 13.23 (2.89) 15.36 (4.88) 14.76 (4.71) F(2,39) = 1.002, p = .376
Post State Anxiety 15.80 (6.96) 14.85 (7.05) 14.07 (6.44) 14.93 (6.69) F(2,39) = 0.234, p = .793
Post 1 State Anxiety 15.27 (4.45) 17.38 (8.17) 15.43 (8.12) 15.98 (6.94) F(2,39) = 0.378, p = .688
Post 2 State Anxiety 16.40 (6.67) 14.00 (6.10) 14.64 (5.58) 15.07 (6.09) F(2,39) = 0.581, p = .564
Pre State Anger 12.40 (5.29) 10.38 (0.96) 11.29 (2.20) 11.40 (3.47) F(2,39) = 1.197, p = .313
Post State Anger 11.47 (3.91) 12.92 (8.04) 11.00 (2.72) 11.76 (2.72) F(2,39) = 0.485, p = .620
Post 1 State Anger 10.73 (1.28) 13.08 (5.65) 11.93 (5.36) 11.86 (4.46) F(2,39) = 0.960, p = .392
Post 2 State Anger 11.60 (4.36) 10.31 (0.86) 11.00 (1.84) 11.00 (2.84) F(2,39) = 0.712, p = .497
Pre State Depression 13.20 (2.91) 12.31 (1.70) 15.64 (5.49) 13.74 (3.91) F(2,39) = 2.928, p = .065
Post State Depression 16.47 (5.58) 15.08 (4.72) 15.86 (7.89) 15.83 (6.10) F(2,39) = 0.174, p = .841
Post 1 State Depression 14.67 (3.50) 16.31 (6.26) 16.50 (7.50) 15.79 (5.85) F(2,39) = 0.418, p = .661
Post 2 State Depression 15.67 (5.12) 16.38 (6.46) 16.29 (7.45) 16.10 (6.23) F(2,39) = 0.053 p = .948
*Pre = measurement at week 2 Post = measurement at week 4 if in 5-Massage group or at week 6 if in 10-Massage group or Control Post 1= measurement at week 8 Post 2 = measurement at week 10

72
Table 11 Means (Standard Deviations) and Significance of Trait Anxiety, Anger and Depression
Variable* 10-Massage Group
5-Massage Group Control TOTAL Significance
Pre Trait Anxiety 18.53 (5.42) 16.85 (5.51) 18.50 (5.13) 18.00 (5.28) F(2,39) = 0.438, p = .649
Post Trait Anxiety 17.80 (4.90) 15.69 (5.20) 17.43 (6.16) 17.02 (5.39) F(2,39) = 0.581, p = .564
Post 1 Trait Anxiety 17.67 (4.97) 16.54 (4.98) 17.64 (6.34) 17.31 (5.36) F(2,39) = 0.187, p = .830
Post 2 Trait Anxiety 17.87 (5.28) 17.23 (5.97) 17.64 (6.33) 17.60 (5.72) F(2,39) = 0.042, p = .959
Pre Trait Anger 18.40 (5.54) 18.31 (5.09) 16.57 (3.78) 17.76 (4.83) F(2,39) = 0.628, p = .539
Post Trait Anger 17.27 (4.42) 16.31 (3.33) 16.21 (3.47) 16.62 (3.74) F(2,39) = 0.342, p = .713
Post 1 Trait Anger 17.27 (4.18) 16.77 (4.83) 15.64 (4.11) 16.57 (4.32) F(2,39) = 0.519, p = .599
Post 2 Trait Anger 16.93 (4.33) 16.23 (5.09) 15.57 (4.24) 16.26 (4.47) F(2,39) = 0.325, p = .724
Pre Trait Depression 16.73 (5.09) 15.62 (4.79) 17.64 (5.42) 16.69 (5.05) F(2,39) = 0.531, p = .592
Post Trait Depression 17.07 (5.43) 15.23 (5.05) 17.93 (7.11) 16.79 (5.90) F(2,39) = 0.721, p = .493
Post 1 Trait Depression 16.60 (5.12) 15.62 (5.30) 16.57 (6.70) 16.29 (5.62) F(2,39) = 0.128, p = .880
Post 2 Trait Depression 17.87 (5.72) 16.54 (7.13) 17.43 (8.00) 17.31 (6.83) F(2,39) = 0.129, p = .879
*Pre = measurement at week 2 Post = measurement at week 4 if in 5-Massage group or at week 6 if in 10-Massage group or Control Post 1= measurement at week 8 Post 2 = measurement at week 10

73
The cortisol means and standards deviations and ANOVA results are
reported in Table 12. There were no group differences at any of the four time
points.
Table 12 Cortisol Means (Standard Deviations) and Significance Variable* 10-Massage
Group 5-Massage Group
Control TOTAL Significance
Pre Cortisol
12.54 (8.38) 14.14 (7.18)
10.65 (4.79)
12.45 (6.99)
F(2,38) = 0.804, p = .455
Post Cortisol
15.37 (5.92) 16.33 (7.11)
14.64 (6.46)
15.44 (6.36)
F(2,38) = 0.223, p = .801
Post1 Cortisol
14.35 (6.81) 15.47 (7.42)
12.83 (7.09)
14.22 (7.00)
F(2,38) = 0.455, p = .638
Post2 Cortisol
13.44 (7.70) 14.73 (6.60)
11.28 (6.38)
13.16 (6.93)
F(2,38) = 0.817, p = .450
*Pre = measurement at week 2 Post = measurement at week 4 if in 5-Massage group or at week 6 if in 10-Massage group or Control Post 1= measurement at week 8 Post 2 = measurement at week 10
The expectation question, a dichotomous variable, asked if the participant
believed if the massage (or relaxation, if in the control group) would help lower
their blood pressure. Over 86% of the participants in the 10-Massage group and
93% of participants in the 5-Massage group responded to the expectation
question in the affirmative. Approximately 76% of the Control group believed the
relaxation would decrease their blood pressure. The groups did not differ
Χ2 (4) = 4.616, p = .329.
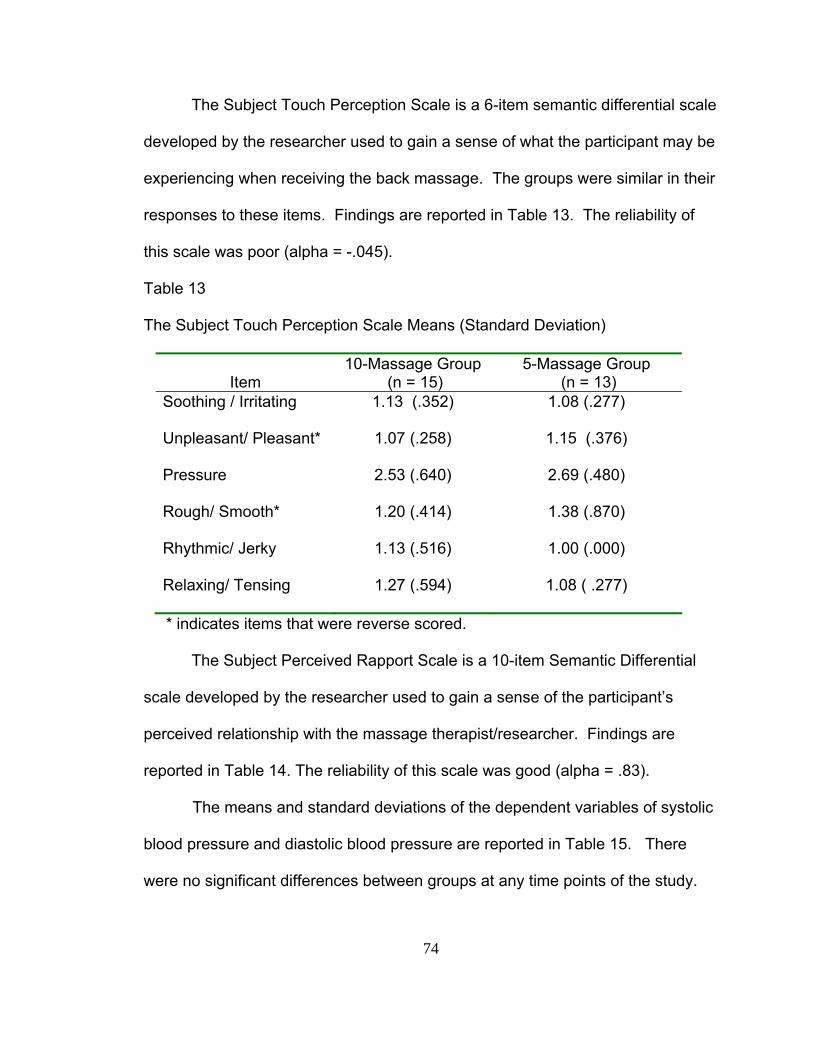
74
The Subject Touch Perception Scale is a 6-item semantic differential scale
developed by the researcher used to gain a sense of what the participant may be
experiencing when receiving the back massage. The groups were similar in their
responses to these items. Findings are reported in Table 13. The reliability of
this scale was poor (alpha = -.045).
Table 13
The Subject Touch Perception Scale Means (Standard Deviation)
Item
10-Massage Group (n = 15)
5-Massage Group (n = 13)
Soothing / Irritating 1.13 (.352) 1.08 (.277)
Unpleasant/ Pleasant* 1.07 (.258) 1.15 (.376)
Pressure 2.53 (.640) 2.69 (.480)
Rough/ Smooth* 1.20 (.414) 1.38 (.870)
Rhythmic/ Jerky 1.13 (.516) 1.00 (.000)
Relaxing/ Tensing 1.27 (.594) 1.08 ( .277)
* indicates items that were reverse scored.
The Subject Perceived Rapport Scale is a 10-item Semantic Differential
scale developed by the researcher used to gain a sense of the participant’s
perceived relationship with the massage therapist/researcher. Findings are
reported in Table 14. The reliability of this scale was good (alpha = .83).
The means and standard deviations of the dependent variables of systolic
blood pressure and diastolic blood pressure are reported in Table 15. There
were no significant differences between groups at any time points of the study.
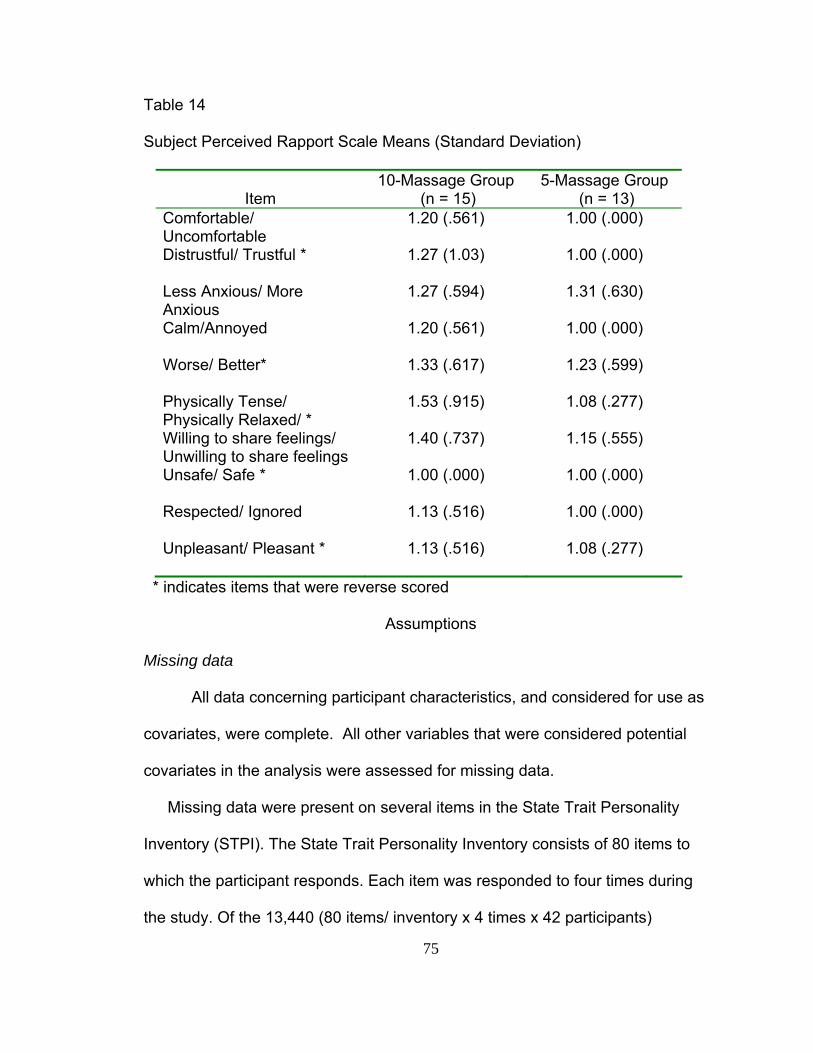
75
Table 14
Subject Perceived Rapport Scale Means (Standard Deviation)
Item
10-Massage Group (n = 15)
5-Massage Group (n = 13)
Comfortable/ Uncomfortable
1.20 (.561) 1.00 (.000)
Distrustful/ Trustful * 1.27 (1.03) 1.00 (.000)
Less Anxious/ More Anxious
1.27 (.594) 1.31 (.630)
Calm/Annoyed 1.20 (.561) 1.00 (.000)
Worse/ Better* 1.33 (.617) 1.23 (.599)
Physically Tense/ Physically Relaxed/ *
1.53 (.915) 1.08 (.277)
Willing to share feelings/ Unwilling to share feelings
1.40 (.737) 1.15 (.555)
Unsafe/ Safe * 1.00 (.000) 1.00 (.000)
Respected/ Ignored 1.13 (.516) 1.00 (.000)
Unpleasant/ Pleasant * 1.13 (.516) 1.08 (.277)
* indicates items that were reverse scored
Assumptions
Missing data
All data concerning participant characteristics, and considered for use as
covariates, were complete. All other variables that were considered potential
covariates in the analysis were assessed for missing data.
Missing data were present on several items in the State Trait Personality
Inventory (STPI). The State Trait Personality Inventory consists of 80 items to
which the participant responds. Each item was responded to four times during
the study. Of the 13,440 (80 items/ inventory x 4 times x 42 participants)

76
Table 15
Demographics of Dependent Variable Means (Standard Deviations)
Variable 10-MassageGroup 5-Massage Group Control
(n = 15) (n = 13) (n = 14)
Pre Systolic 121.04 (11.32) 118.95 (12.49) 124.19 (10.53)
Post Systolic 119.38 (17.97) 120.79 (13.91) 119.83 (9.35)
Post Systolic1 119.76 (13.09) 122.38 (14.80) 119.43 (8.12)
Post Systolic2 120.73 (15.06) 115.82 (12.80) 118.31 (11.22)
Pre Diastolic 76.91 (7.18) 75.87 (5.59) 75.69 (10.86)
Post Diastolic 76.73 (10.81) 76.51 (6.27) 72.64 (9.41)
Post Diastolic1 77.58 (8.97) 76.82 (8.46) 76.14 (7.18)
Post Diastolic2 76.69 (10.60) 75.31 (7.34) 76.62 (9.07)
*Pre = measurement at week 2 Post = measurement at week 4 if in 5-Massage group or at week 6 if in 10-Massage group or Control Post 1= measurement at week 8 Post 2 = measurement at week 10
Note: The groups did not differ; all p values were > .05
77
possible responses in the State Trait Personality Inventory, 10 participants failed
to respond to 17 items. The provided instructions for managing missing data
were followed for all missing data (Spielberger, unpublished). Briefly, a prorated
score was computed by determining a mean score for the subscale from which
the item was missing. The value was then multiplied by 10 and rounded to the
next highest whole number.
Heart rate data were missing on two participants in the control group at
pre-measurement. Three heart rate post-measurements were missing on one
participant. These cases were dropped in any analyses that involved heart rates.
Salivary cortisol was measured at the four established time points. One case in
the control group had missing data at each of the four time points. The case was
dropped from any analyses that involved cortisol as a covariate.
There were no missing data from the Subject Touch Perception Scale and
the Subject Perceived Rapport Scale data set. The Expectations question, which
asked for a “yes” or “no” response, had one missing case in each of the massage
groups. These cases were left out of any subsequent analyses. There were no
missing data on the dependent variables, systolic and diastolic blood pressures.
Normality and Outliers
There was significant positive skewness in the potential covariates of
anxiety, anger, and depression. Figures 5, 6 and 7 depict the means with
standard deviations of state anxiety, anger and depression, respectively.

78
6
11
16
21
26
2 4 6 8 10
WEEK
STA
TE A
NXI
ETY
SCO
RE
10M5MCNT
Figure 5: State Anxiety Means and Standard Deviation Bars
Figure 6: State Anger Means and Standard Deviation Bars
Appendix 14 shows a similar depiction of the means with standard
deviation bars for trait anxiety, anger and depression. Of particular interest,
preliminary analysis resulted in no difference (effect sizes did not change, error
did not decrease) using both the skewed data and the transformed data.
Therefore for ease of interpretation, the un-transformed data of anxiety, anger
and depression were used in the analysis.
4 6 8
10 12 14 16 18 20
2 4 6 8 10 WEEK
STA
TE A
NG
ER S
CO
RE
10M5MCNT
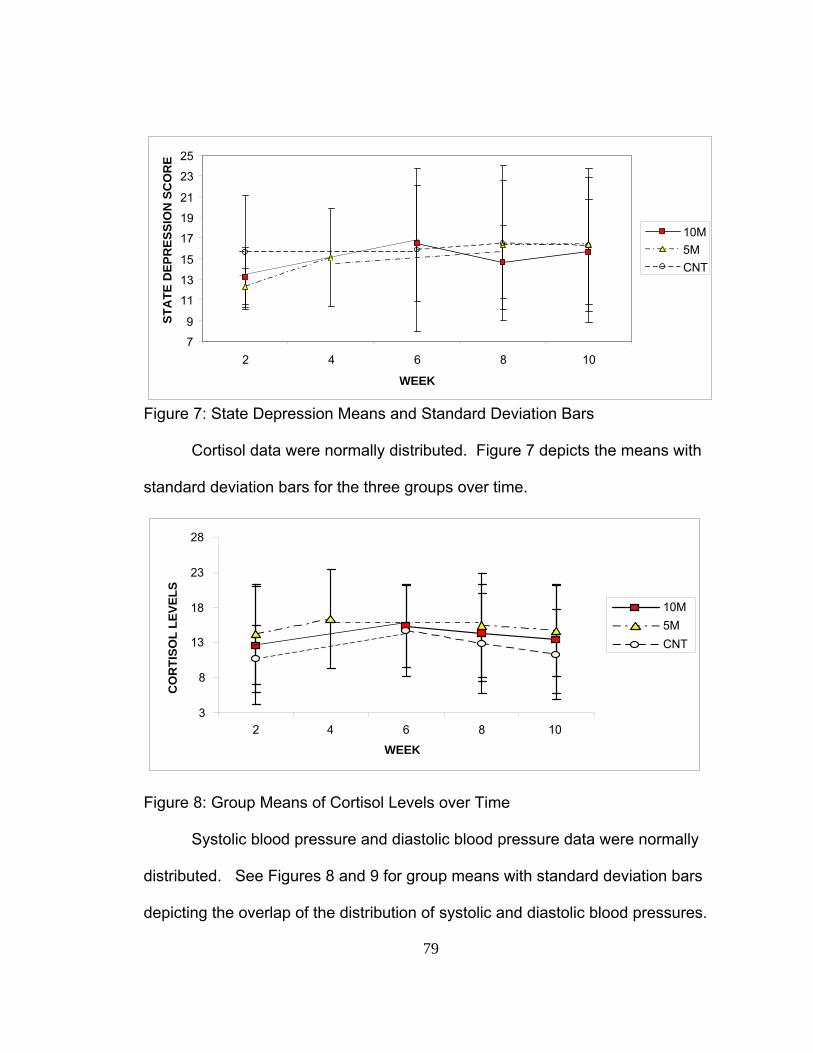
79
Figure 7: State Depression Means and Standard Deviation Bars
Cortisol data were normally distributed. Figure 7 depicts the means with
standard deviation bars for the three groups over time.
Figure 8: Group Means of Cortisol Levels over Time
Systolic blood pressure and diastolic blood pressure data were normally
distributed. See Figures 8 and 9 for group means with standard deviation bars
depicting the overlap of the distribution of systolic and diastolic blood pressures.
7 9
11 13 15 17 19 21 23 25
2 4 6 8 10 WEEK
STA
TE D
EPR
ESSI
ON
SC
OR
E
10M5MCNT
3
8
13
18
23
28
2 4 6 8 10
WEEK
CO
RTI
SOL
LEVE
LS
10M5MCNT
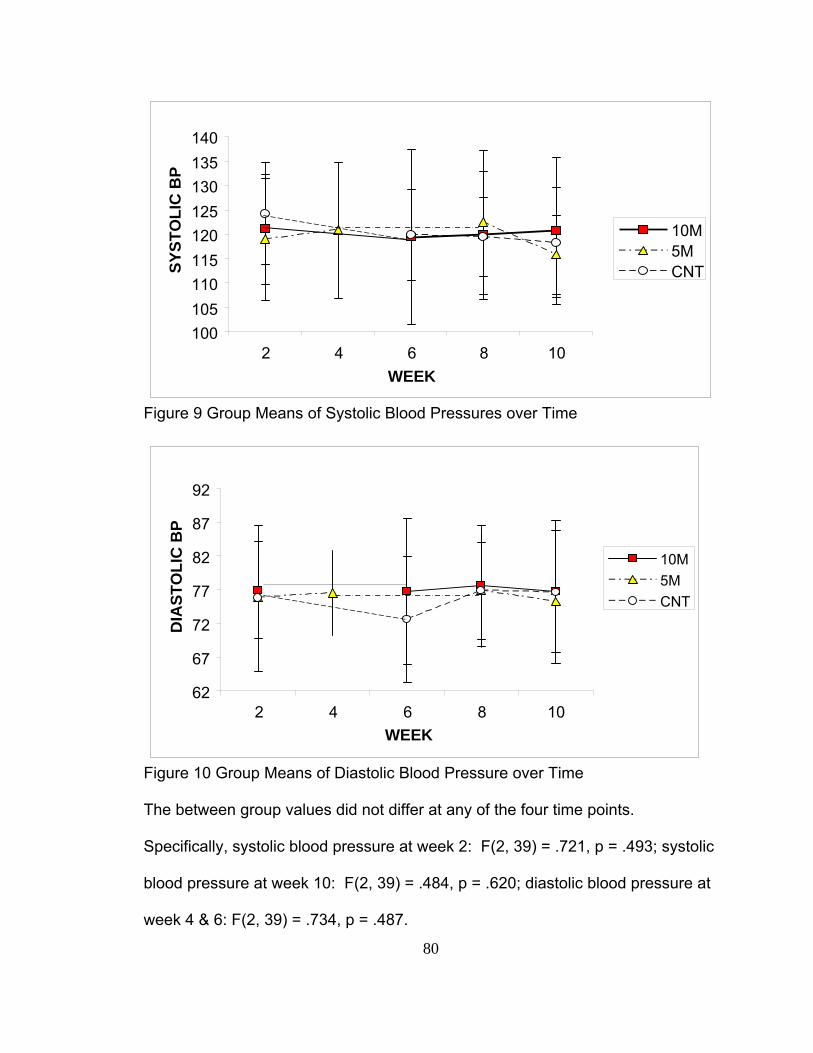
80
Figure 9 Group Means of Systolic Blood Pressures over Time
Figure 10 Group Means of Diastolic Blood Pressure over Time
The between group values did not differ at any of the four time points.
Specifically, systolic blood pressure at week 2: F(2, 39) = .721, p = .493; systolic
blood pressure at week 10: F(2, 39) = .484, p = .620; diastolic blood pressure at
week 4 & 6: F(2, 39) = .734, p = .487.
100 105 110 115 120 125 130 135 140
2 4 6 8 10WEEK
SYST
OLI
C B
P
10M5MCNT
62
67
72
77
82
87
92
2 4 6 8 10WEEK
DIA
STO
LIC
BP
10M5MCNT
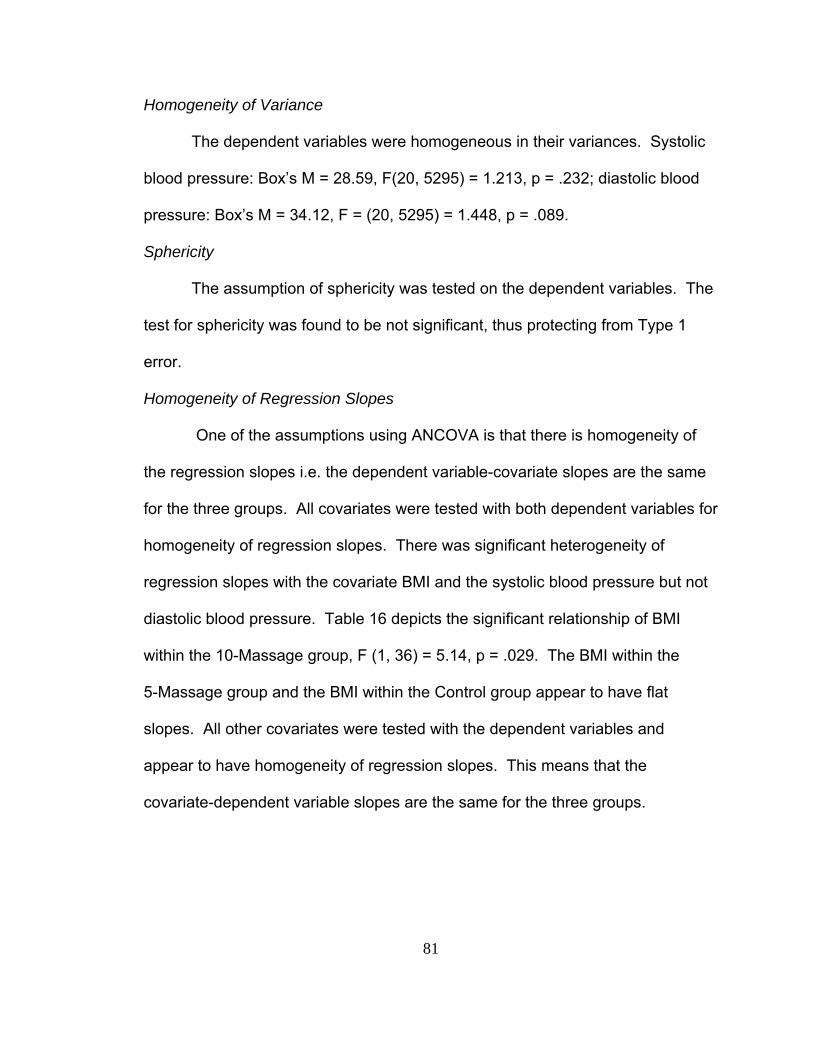
81
Homogeneity of Variance
The dependent variables were homogeneous in their variances. Systolic
blood pressure: Box’s M = 28.59, F(20, 5295) = 1.213, p = .232; diastolic blood
pressure: Box’s M = 34.12, F = (20, 5295) = 1.448, p = .089.
Sphericity
The assumption of sphericity was tested on the dependent variables. The
test for sphericity was found to be not significant, thus protecting from Type 1
error.
Homogeneity of Regression Slopes
One of the assumptions using ANCOVA is that there is homogeneity of
the regression slopes i.e. the dependent variable-covariate slopes are the same
for the three groups. All covariates were tested with both dependent variables for
homogeneity of regression slopes. There was significant heterogeneity of
regression slopes with the covariate BMI and the systolic blood pressure but not
diastolic blood pressure. Table 16 depicts the significant relationship of BMI
within the 10-Massage group, F (1, 36) = 5.14, p = .029. The BMI within the
5-Massage group and the BMI within the Control group appear to have flat
slopes. All other covariates were tested with the dependent variables and
appear to have homogeneity of regression slopes. This means that the
covariate-dependent variable slopes are the same for the three groups.
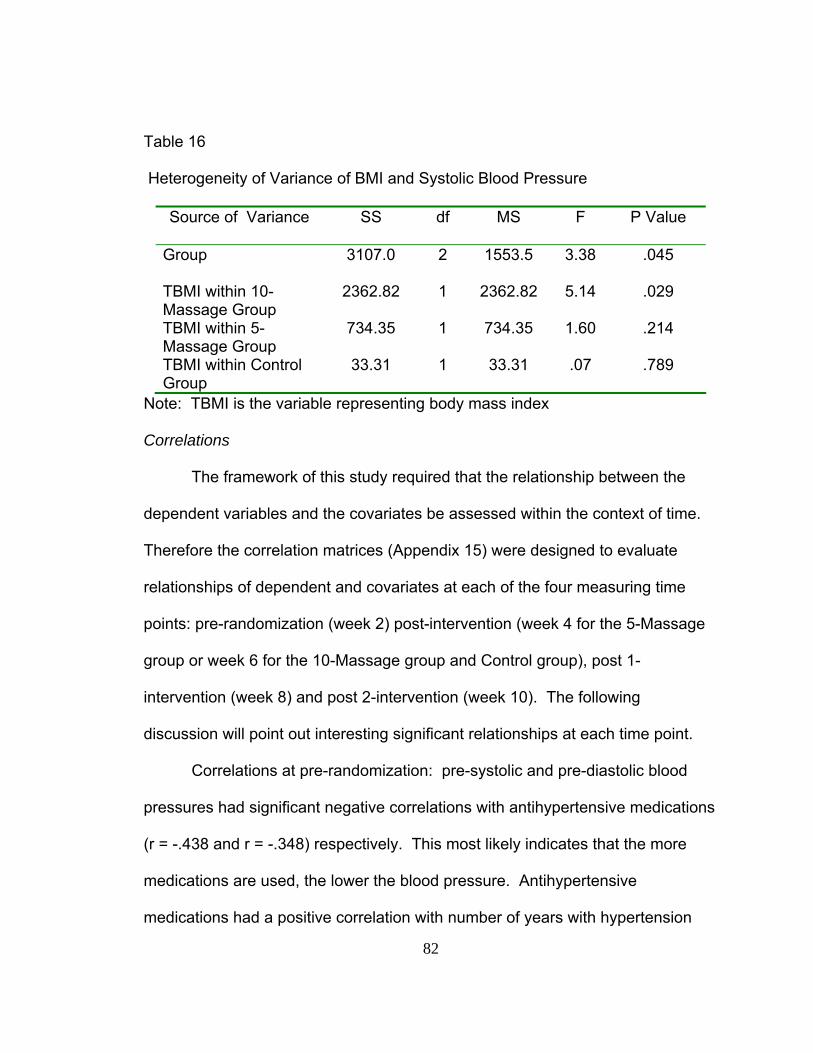
82
Table 16
Heterogeneity of Variance of BMI and Systolic Blood Pressure
Source of Variance SS df MS F P Value
Group 3107.0 2 1553.5 3.38 .045
TBMI within 10-Massage Group
2362.82 1 2362.82 5.14 .029
TBMI within 5-Massage Group
734.35 1 734.35 1.60 .214
TBMI within Control Group
33.31 1 33.31 .07 .789
Note: TBMI is the variable representing body mass index
Correlations
The framework of this study required that the relationship between the
dependent variables and the covariates be assessed within the context of time.
Therefore the correlation matrices (Appendix 15) were designed to evaluate
relationships of dependent and covariates at each of the four measuring time
points: pre-randomization (week 2) post-intervention (week 4 for the 5-Massage
group or week 6 for the 10-Massage group and Control group), post 1-
intervention (week 8) and post 2-intervention (week 10). The following
discussion will point out interesting significant relationships at each time point.
Correlations at pre-randomization: pre-systolic and pre-diastolic blood
pressures had significant negative correlations with antihypertensive medications
(r = -.438 and r = -.348) respectively. This most likely indicates that the more
medications are used, the lower the blood pressure. Antihypertensive
medications had a positive correlation with number of years with hypertension
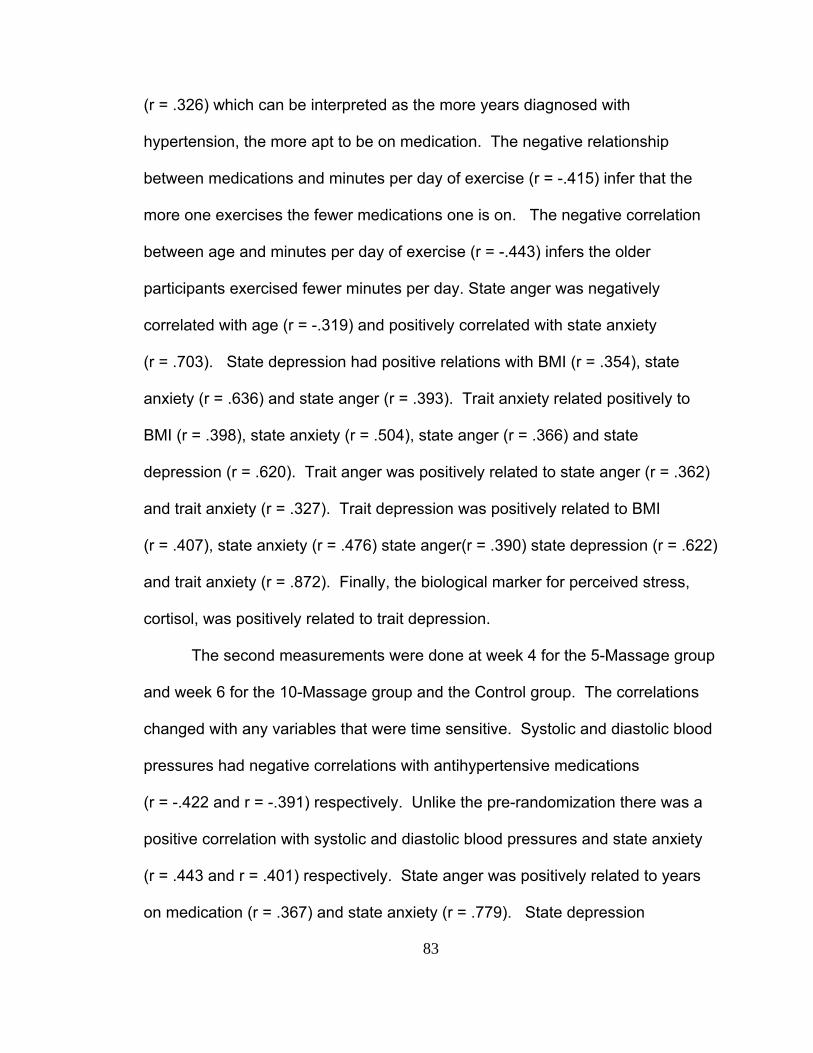
83
(r = .326) which can be interpreted as the more years diagnosed with
hypertension, the more apt to be on medication. The negative relationship
between medications and minutes per day of exercise (r = -.415) infer that the
more one exercises the fewer medications one is on. The negative correlation
between age and minutes per day of exercise (r = -.443) infers the older
participants exercised fewer minutes per day. State anger was negatively
correlated with age (r = -.319) and positively correlated with state anxiety
(r = .703). State depression had positive relations with BMI (r = .354), state
anxiety (r = .636) and state anger (r = .393). Trait anxiety related positively to
BMI (r = .398), state anxiety (r = .504), state anger (r = .366) and state
depression (r = .620). Trait anger was positively related to state anger (r = .362)
and trait anxiety (r = .327). Trait depression was positively related to BMI
(r = .407), state anxiety (r = .476) state anger(r = .390) state depression (r = .622)
and trait anxiety (r = .872). Finally, the biological marker for perceived stress,
cortisol, was positively related to trait depression.
The second measurements were done at week 4 for the 5-Massage group
and week 6 for the 10-Massage group and the Control group. The correlations
changed with any variables that were time sensitive. Systolic and diastolic blood
pressures had negative correlations with antihypertensive medications
(r = -.422 and r = -.391) respectively. Unlike the pre-randomization there was a
positive correlation with systolic and diastolic blood pressures and state anxiety
(r = .443 and r = .401) respectively. State anger was positively related to years
on medication (r = .367) and state anxiety (r = .779). State depression
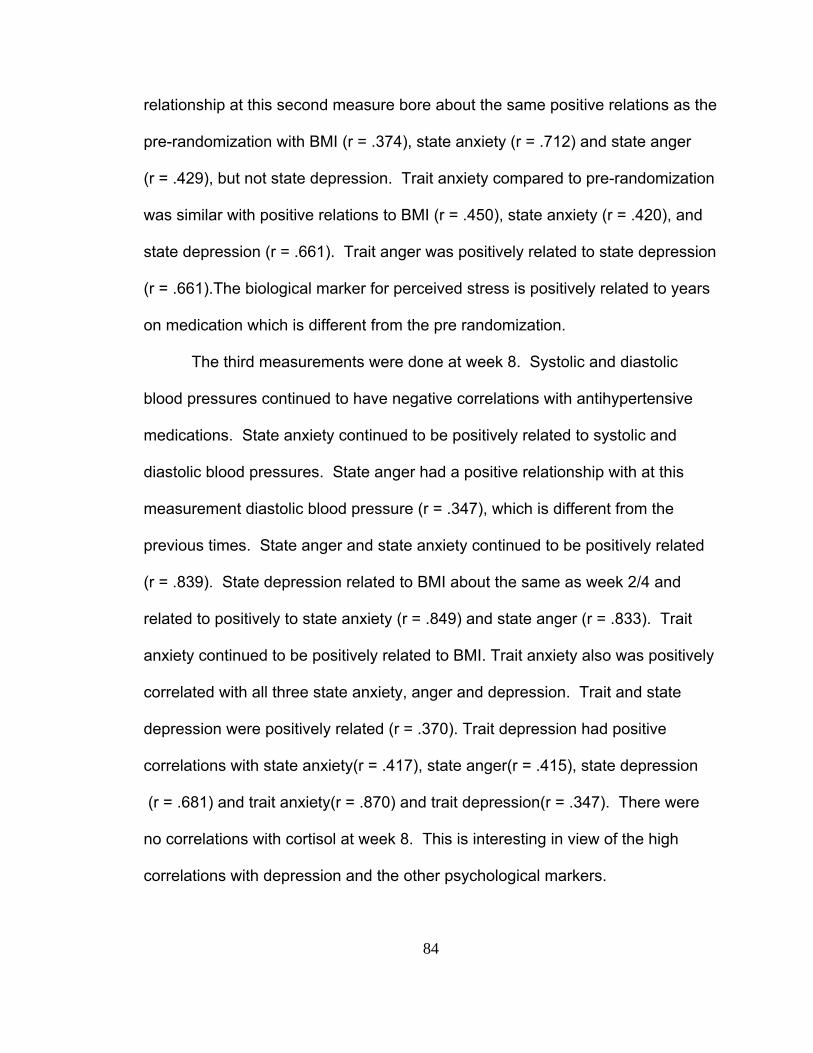
84
relationship at this second measure bore about the same positive relations as the
pre-randomization with BMI (r = .374), state anxiety (r = .712) and state anger
(r = .429), but not state depression. Trait anxiety compared to pre-randomization
was similar with positive relations to BMI (r = .450), state anxiety (r = .420), and
state depression (r = .661). Trait anger was positively related to state depression
(r = .661).The biological marker for perceived stress is positively related to years
on medication which is different from the pre randomization.
The third measurements were done at week 8. Systolic and diastolic
blood pressures continued to have negative correlations with antihypertensive
medications. State anxiety continued to be positively related to systolic and
diastolic blood pressures. State anger had a positive relationship with at this
measurement diastolic blood pressure (r = .347), which is different from the
previous times. State anger and state anxiety continued to be positively related
(r = .839). State depression related to BMI about the same as week 2/4 and
related to positively to state anxiety (r = .849) and state anger (r = .833). Trait
anxiety continued to be positively related to BMI. Trait anxiety also was positively
correlated with all three state anxiety, anger and depression. Trait and state
depression were positively related (r = .370). Trait depression had positive
correlations with state anxiety(r = .417), state anger(r = .415), state depression
(r = .681) and trait anxiety(r = .870) and trait depression(r = .347). There were
no correlations with cortisol at week 8. This is interesting in view of the high
correlations with depression and the other psychological markers.
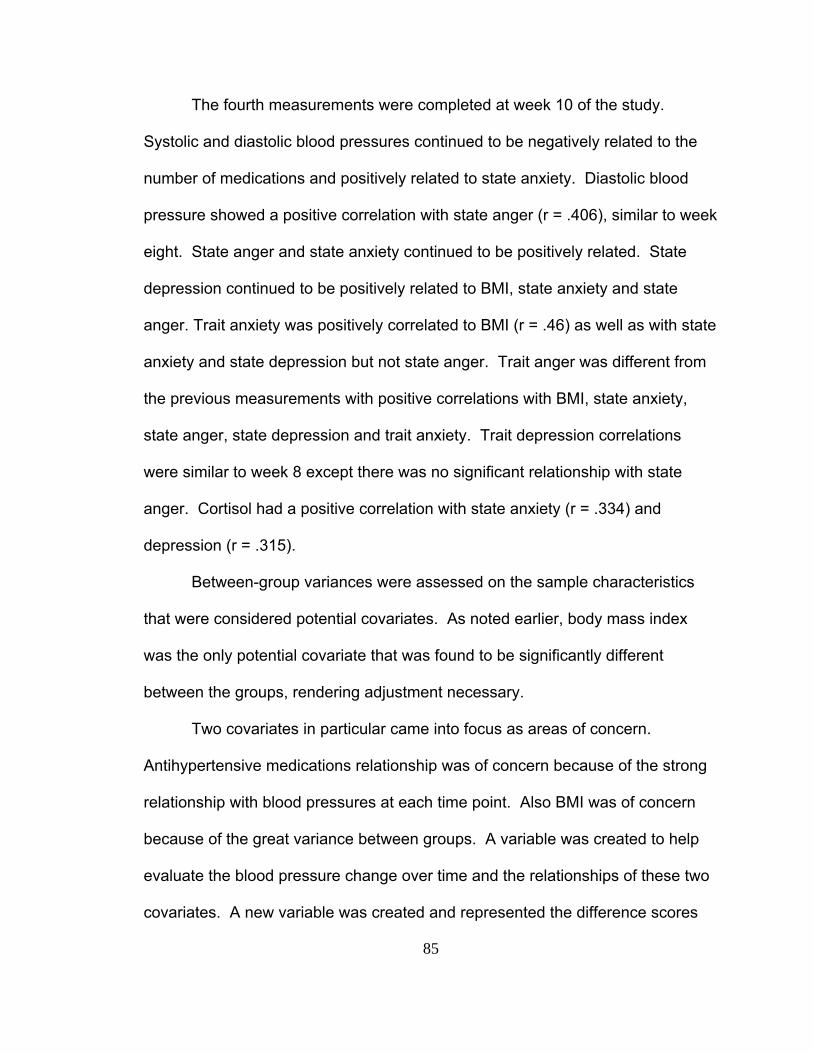
85
The fourth measurements were completed at week 10 of the study.
Systolic and diastolic blood pressures continued to be negatively related to the
number of medications and positively related to state anxiety. Diastolic blood
pressure showed a positive correlation with state anger (r = .406), similar to week
eight. State anger and state anxiety continued to be positively related. State
depression continued to be positively related to BMI, state anxiety and state
anger. Trait anxiety was positively correlated to BMI (r = .46) as well as with state
anxiety and state depression but not state anger. Trait anger was different from
the previous measurements with positive correlations with BMI, state anxiety,
state anger, state depression and trait anxiety. Trait depression correlations
were similar to week 8 except there was no significant relationship with state
anger. Cortisol had a positive correlation with state anxiety (r = .334) and
depression (r = .315).
Between-group variances were assessed on the sample characteristics
that were considered potential covariates. As noted earlier, body mass index
was the only potential covariate that was found to be significantly different
between the groups, rendering adjustment necessary.
Two covariates in particular came into focus as areas of concern.
Antihypertensive medications relationship was of concern because of the strong
relationship with blood pressures at each time point. Also BMI was of concern
because of the great variance between groups. A variable was created to help
evaluate the blood pressure change over time and the relationships of these two
covariates. A new variable was created and represented the difference scores
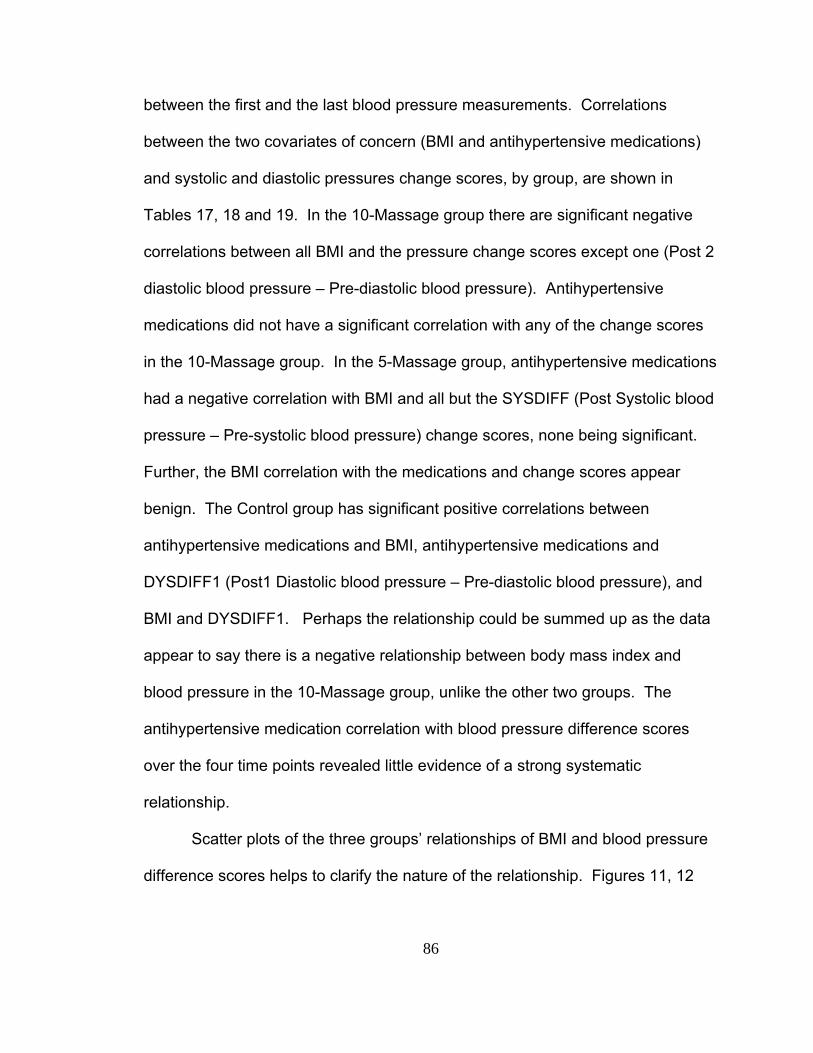
86
between the first and the last blood pressure measurements. Correlations
between the two covariates of concern (BMI and antihypertensive medications)
and systolic and diastolic pressures change scores, by group, are shown in
Tables 17, 18 and 19. In the 10-Massage group there are significant negative
correlations between all BMI and the pressure change scores except one (Post 2
diastolic blood pressure – Pre-diastolic blood pressure). Antihypertensive
medications did not have a significant correlation with any of the change scores
in the 10-Massage group. In the 5-Massage group, antihypertensive medications
had a negative correlation with BMI and all but the SYSDIFF (Post Systolic blood
pressure – Pre-systolic blood pressure) change scores, none being significant.
Further, the BMI correlation with the medications and change scores appear
benign. The Control group has significant positive correlations between
antihypertensive medications and BMI, antihypertensive medications and
DYSDIFF1 (Post1 Diastolic blood pressure – Pre-diastolic blood pressure), and
BMI and DYSDIFF1. Perhaps the relationship could be summed up as the data
appear to say there is a negative relationship between body mass index and
blood pressure in the 10-Massage group, unlike the other two groups. The
antihypertensive medication correlation with blood pressure difference scores
over the four time points revealed little evidence of a strong systematic
relationship.
Scatter plots of the three groups’ relationships of BMI and blood pressure
difference scores helps to clarify the nature of the relationship. Figures 11, 12
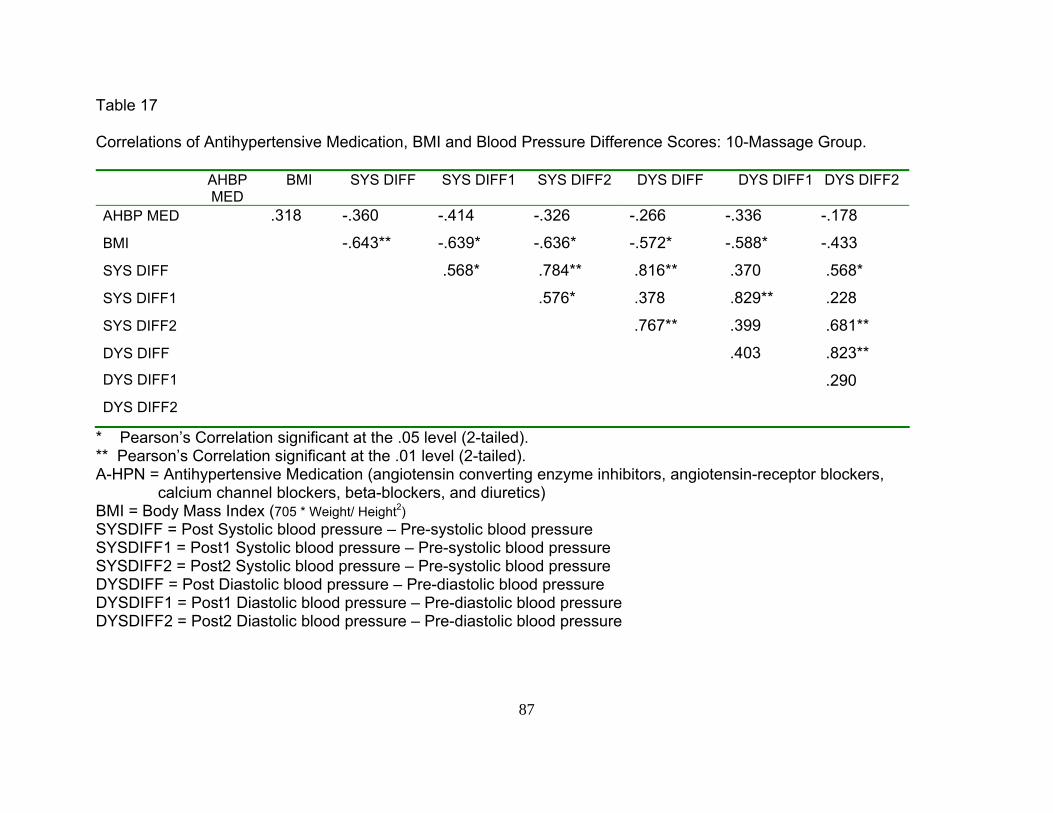
87
Table 17 Correlations of Antihypertensive Medication, BMI and Blood Pressure Difference Scores: 10-Massage Group.
AHBP MED
BMI SYS DIFF SYS DIFF1 SYS DIFF2 DYS DIFF DYS DIFF1 DYS DIFF2
AHBP MED .318 -.360 -.414 -.326 -.266 -.336 -.178
BMI -.643** -.639* -.636* -.572* -.588* -.433
SYS DIFF .568* .784** .816** .370 .568*
SYS DIFF1 .576* .378 .829** .228
SYS DIFF2 .767** .399 .681**
DYS DIFF .403 .823** DYS DIFF1 .290 DYS DIFF2
* Pearson’s Correlation significant at the .05 level (2-tailed). ** Pearson’s Correlation significant at the .01 level (2-tailed). A-HPN = Antihypertensive Medication (angiotensin converting enzyme inhibitors, angiotensin-receptor blockers, calcium channel blockers, beta-blockers, and diuretics) BMI = Body Mass Index (705 * Weight/ Height2) SYSDIFF = Post Systolic blood pressure – Pre-systolic blood pressure SYSDIFF1 = Post1 Systolic blood pressure – Pre-systolic blood pressure SYSDIFF2 = Post2 Systolic blood pressure – Pre-systolic blood pressure DYSDIFF = Post Diastolic blood pressure – Pre-diastolic blood pressure DYSDIFF1 = Post1 Diastolic blood pressure – Pre-diastolic blood pressure DYSDIFF2 = Post2 Diastolic blood pressure – Pre-diastolic blood pressure

88
Table 18 Correlations of Antihypertensive Medication, BMI and Blood Pressure Difference Scores: 5-Massage Group.
AHBP MED
BMI SYS DIFF SYS DIFF1 SYS DIFF2 DYS DIFF DYS DIFF1 DYS DIFF2
AHBP MED -.444 .138 -.094 -.181 -.196 -.333 -.451
BMI .004 .163 -.037 .309 .190 .065
SYS DIFF .080 .489 .634* .309 .373
SYS DIFF1 .057 .051 .711** .367
SYS DIFF2 .205 .018 .609*
DYS DIFF .502 .644* DYS DIFF1 .626* DYS DIFF2
* Pearson’s Correlation significant at the .05 level (2-tailed). ** Pearson’s Correlation significant at the .01 level (2-tailed). A-HPN = Antihypertensive Medication (angiotensin converting enzyme inhibitors, angiotensin-receptor blockers, calcium channel blockers, beta-blockers, and diuretics) BMI = Body Mass Index (705 * Weight/ Height2) SYSDIFF = Post Systolic blood pressure – Pre-systolic blood pressure SYSDIFF1 = Post1 Systolic blood pressure – Pre-systolic blood pressure SYSDIFF2 = Post2 Systolic blood pressure – Pre-systolic blood pressure DYSDIFF = Post Diastolic blood pressure – Pre-diastolic blood pressure DYSDIFF1 = Post1 Diastolic blood pressure – Pre-diastolic blood pressure DYSDIFF2 = Post2 Diastolic blood pressure – Pre-diastolic blood pressure

89
Table 19 Correlations of Antihypertensive Medication, BMI and Blood Pressure Difference Scores: Control Group.
AHBP MED
BMI SYS DIFF SYS DIFF1 SYS DIFF2 DYS DIFF DYS DIFF1 DYS DIFF2
AHBP MED .689** .074 .400 -.067 .278 .603* .259
BMI .299 .463 .136 .225 .583* .477
SYS DIFF .660* .676** .568* .394 .418
SYS DIFF1 .579* .641* .703** .735**
SYS DIFF2 .320 .109 .319
DYS DIFF .763** .753** DYS DIFF1 .755** DYS DIFF2
* Pearson’s Correlation significant at the .05 level (2-tailed). ** Pearson’s Correlation significant at the .01 level (2-tailed). A-HPN = Antihypertensive Medication (angiotensin converting enzyme inhibitors, angiotensin-receptor blockers, calcium channel blockers, beta-blockers, and diuretics) BMI = Body Mass Index (705 * Weight/ Height2) SYSDIFF = Post Systolic blood pressure – Pre-systolic blood pressure SYSDIFF1 = Post1 Systolic blood pressure – Pre-systolic blood pressure SYSDIFF2 = Post2 Systolic blood pressure – Pre-systolic blood pressure DYSDIFF = Post Diastolic blood pressure – Pre-diastolic blood pressure DYSDIFF1 = Post1 Diastolic blood pressure – Pre-diastolic blood pressure DYSDIFF2 = Post2 Diastolic blood pressure – Pre-diastolic blood pressure
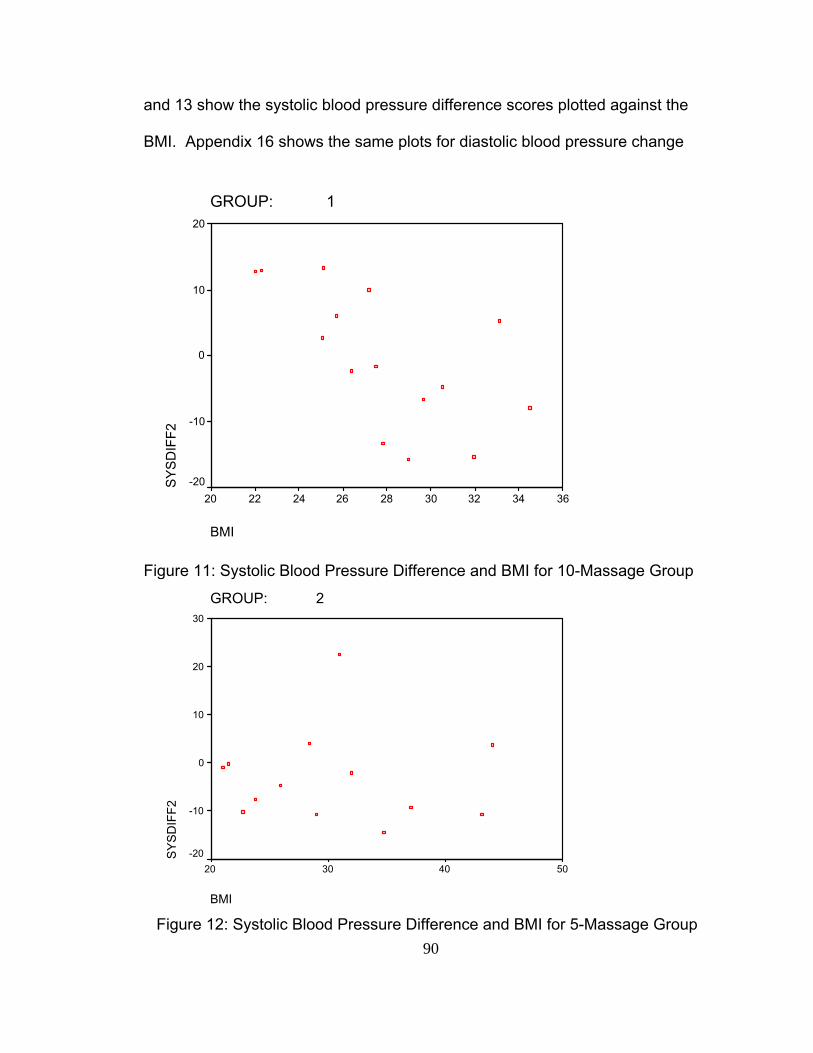
90
and 13 show the systolic blood pressure difference scores plotted against the
BMI. Appendix 16 shows the same plots for diastolic blood pressure change
GROUP: 1
BMI
363432302826242220
SY
SD
IFF2
20
10
0
-10
-20
Figure 11: Systolic Blood Pressure Difference and BMI for 10-Massage Group
GROUP: 2
BMI
50403020
SY
SD
IFF2
30
20
10
0
-10
-20
Figure 12: Systolic Blood Pressure Difference and BMI for 5-Massage Group
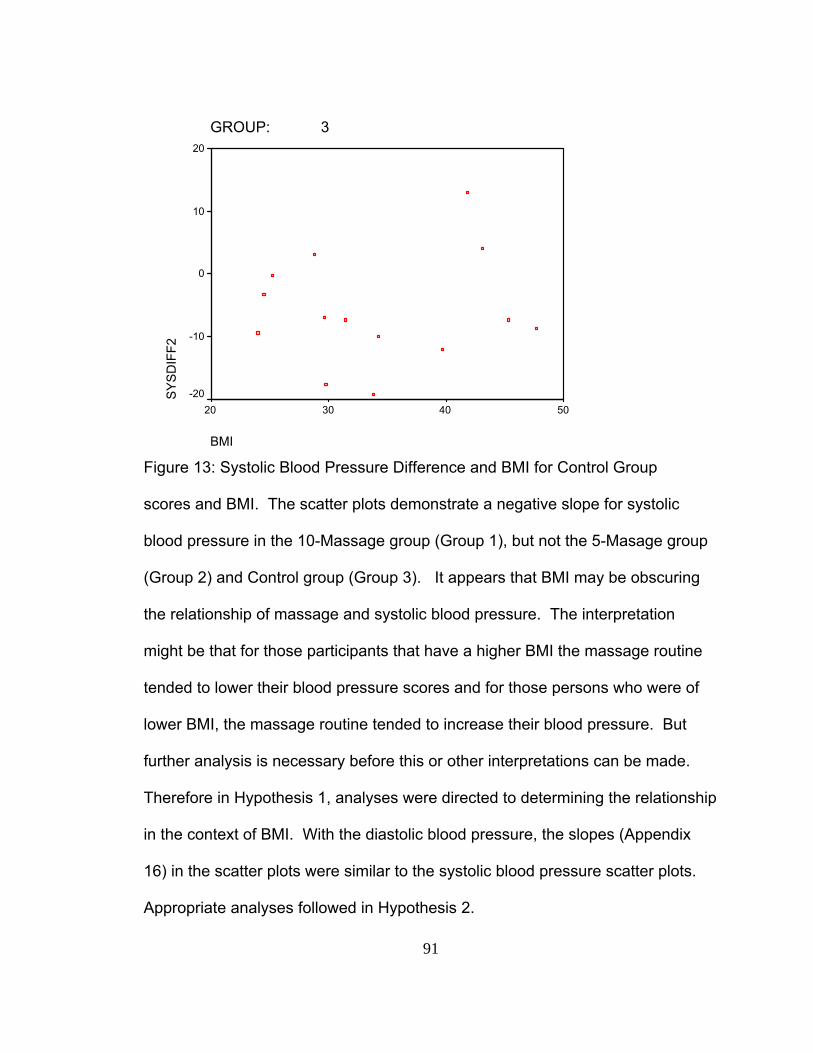
91
GROUP: 3
BMI
50403020
SYSD
IFF2
20
10
0
-10
-20
Figure 13: Systolic Blood Pressure Difference and BMI for Control Group scores and BMI. The scatter plots demonstrate a negative slope for systolic
blood pressure in the 10-Massage group (Group 1), but not the 5-Masage group
(Group 2) and Control group (Group 3). It appears that BMI may be obscuring
the relationship of massage and systolic blood pressure. The interpretation
might be that for those participants that have a higher BMI the massage routine
tended to lower their blood pressure scores and for those persons who were of
lower BMI, the massage routine tended to increase their blood pressure. But
further analysis is necessary before this or other interpretations can be made.
Therefore in Hypothesis 1, analyses were directed to determining the relationship
in the context of BMI. With the diastolic blood pressure, the slopes (Appendix
16) in the scatter plots were similar to the systolic blood pressure scatter plots.
Appropriate analyses followed in Hypothesis 2.
92
Hypothesis Testing
Hypothesis 1
The first hypothesis stated that after adjusting for covariates, systolic
blood pressure would decrease significantly over time using back massage
treatment in subjects with prehypertension and controlled hypertension. When
the data were analyzed using an ANOVA without considering any of the
covariates, the group x time interactions were not significant F(6, 117) = 1.38,
p = .248. Each covariate with a significant correlation, (p = .05), was placed into
the analysis, hypothesizing that the covariates would decrease error variance
and increase power of the analysis.
The ANCOVA analysis with BMI as a covariate, assuming homogeneity of
regression slopes, yielded the same non-significant F-test. Error variance was
the same for both ANOVA and ANCOVA tests (MS within + residual = 51.88).
The heterogeneity of regression slopes method was then used to determine if
adjusting for BMI would decrease the error variance. The test yielded a non-
significant group x time interaction, F(6,108) = 2.08, p = .062.
In the context of the hypothesis in which the study design is expecting to
find change over time within the 10-Massage group and 5-Massage group and
not the Control group and considering that the interaction was nearly significant,
a test for simple main effects was employed. The simple main effect of time for
10-Massage group was significant F(3, 108) = 3.50, p = .018. Error variance did
decrease (MS within + residual = 49.85). No other significant simple main effects

93
for time were detected (Table 20). The effect size and power of the simple main
effects analysis increased from a basic ANOVA with a partial η2 = .005,
power = .083 to partial η2 = .089, power = .77 when using the heterogeneity
slopes method in ANCOVA.
Table 20
Analysis of Covariance of Massage Effects on Systolic Blood Pressure: A Report
of Simple Main Effects after Controlling for BMI
Source of Variance SS (adjusted)*
df MS F P Value
Time within 10- Massage Group
532.70 3 174.57 3.50 .018
Time within 5- Massage Group
12.04 3 4.01 .08 .970
Time with Control Group
145.73 3 48.58 .97 .408
Error
Within Groups 5383.39 108 49.85
Note: SME = simple main effects of time. * These tests were based on ANCOVA using heterogeneous slopes adjustment of the covariate BMI.
Further analysis was needed to understand the significant finding in the
10-Massage group, particularly in view of the group means plotted in Figure 9.
The scatter plots, Figures 11, 12, and 13, help to conceptualize the significant
finding in the 10-Massage group, as the negative slope of the 10-Massage group
is visually obvious. The results appear to be obscured by BMI. Therefore a
graph was constructed depicting the 10-masssage group data when split at the
median of BMI (Figure 14). The heavy line depicts the entire group (n = 15), and
appears to have little, if any, slope over time. But when the group is split by the
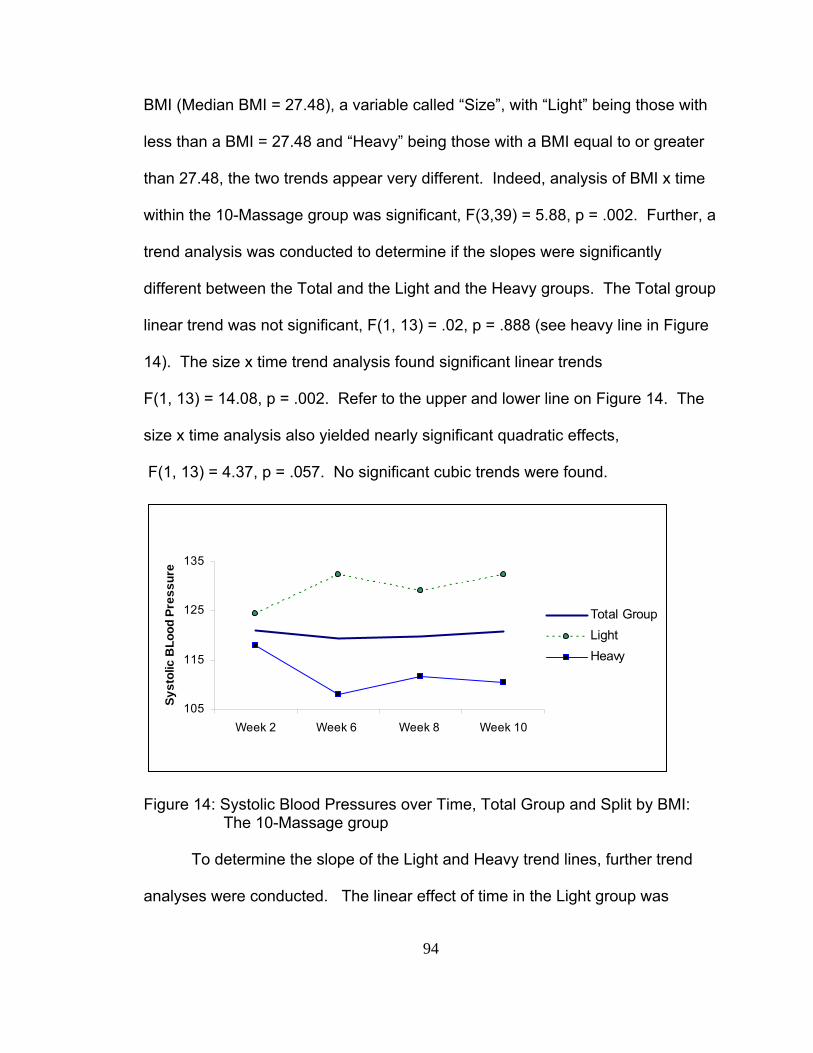
94
BMI (Median BMI = 27.48), a variable called “Size”, with “Light” being those with
less than a BMI = 27.48 and “Heavy” being those with a BMI equal to or greater
than 27.48, the two trends appear very different. Indeed, analysis of BMI x time
within the 10-Massage group was significant, F(3,39) = 5.88, p = .002. Further, a
trend analysis was conducted to determine if the slopes were significantly
different between the Total and the Light and the Heavy groups. The Total group
linear trend was not significant, F(1, 13) = .02, p = .888 (see heavy line in Figure
14). The size x time trend analysis found significant linear trends
F(1, 13) = 14.08, p = .002. Refer to the upper and lower line on Figure 14. The
size x time analysis also yielded nearly significant quadratic effects,
F(1, 13) = 4.37, p = .057. No significant cubic trends were found.
105
115
125
135
Week 2 Week 6 Week 8 Week 10
Syst
olic
BLo
od P
ress
ure
Total GroupLightHeavy
Figure 14: Systolic Blood Pressures over Time, Total Group and Split by BMI: The 10-Massage group To determine the slope of the Light and Heavy trend lines, further trend
analyses were conducted. The linear effect of time in the Light group was
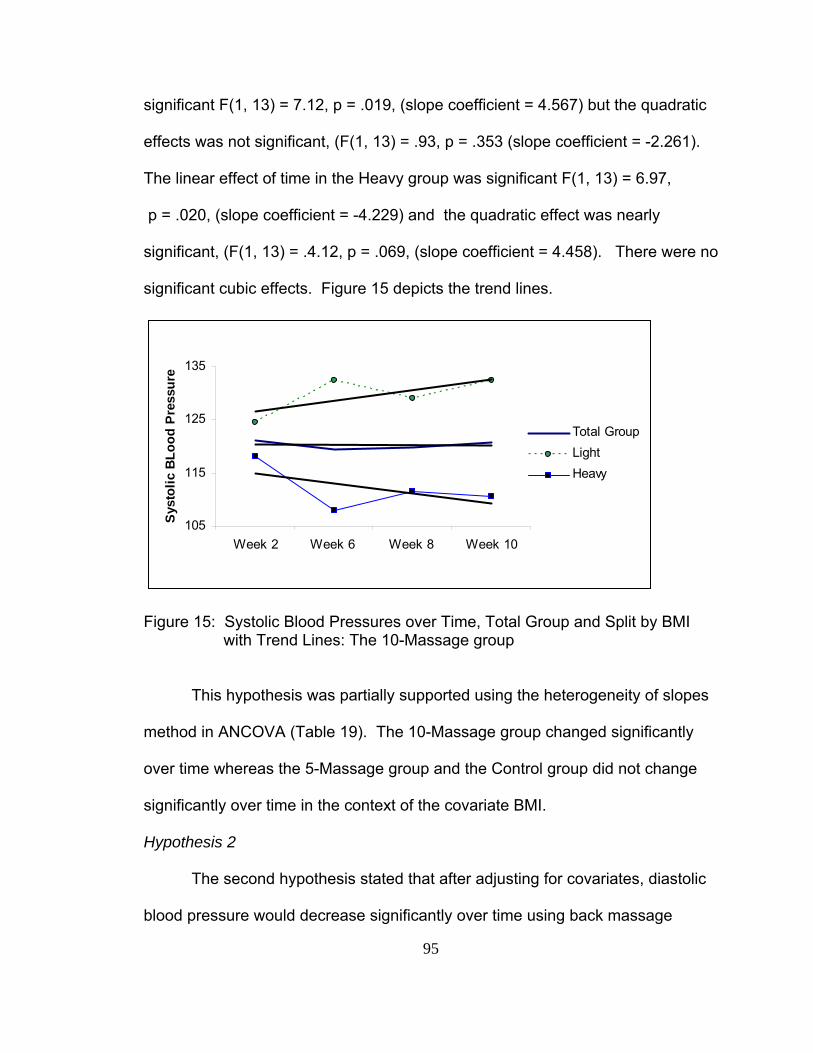
95
significant F(1, 13) = 7.12, p = .019, (slope coefficient = 4.567) but the quadratic
effects was not significant, (F(1, 13) = .93, p = .353 (slope coefficient = -2.261).
The linear effect of time in the Heavy group was significant F(1, 13) = 6.97,
p = .020, (slope coefficient = -4.229) and the quadratic effect was nearly
significant, (F(1, 13) = .4.12, p = .069, (slope coefficient = 4.458). There were no
significant cubic effects. Figure 15 depicts the trend lines.
105
115
125
135
Week 2 Week 6 Week 8 Week 10
Sys
tolic
BLo
od P
ress
ure
Total GroupLightHeavy
Figure 15: Systolic Blood Pressures over Time, Total Group and Split by BMI with Trend Lines: The 10-Massage group
This hypothesis was partially supported using the heterogeneity of slopes
method in ANCOVA (Table 19). The 10-Massage group changed significantly
over time whereas the 5-Massage group and the Control group did not change
significantly over time in the context of the covariate BMI.
Hypothesis 2
The second hypothesis stated that after adjusting for covariates, diastolic
blood pressure would decrease significantly over time using back massage
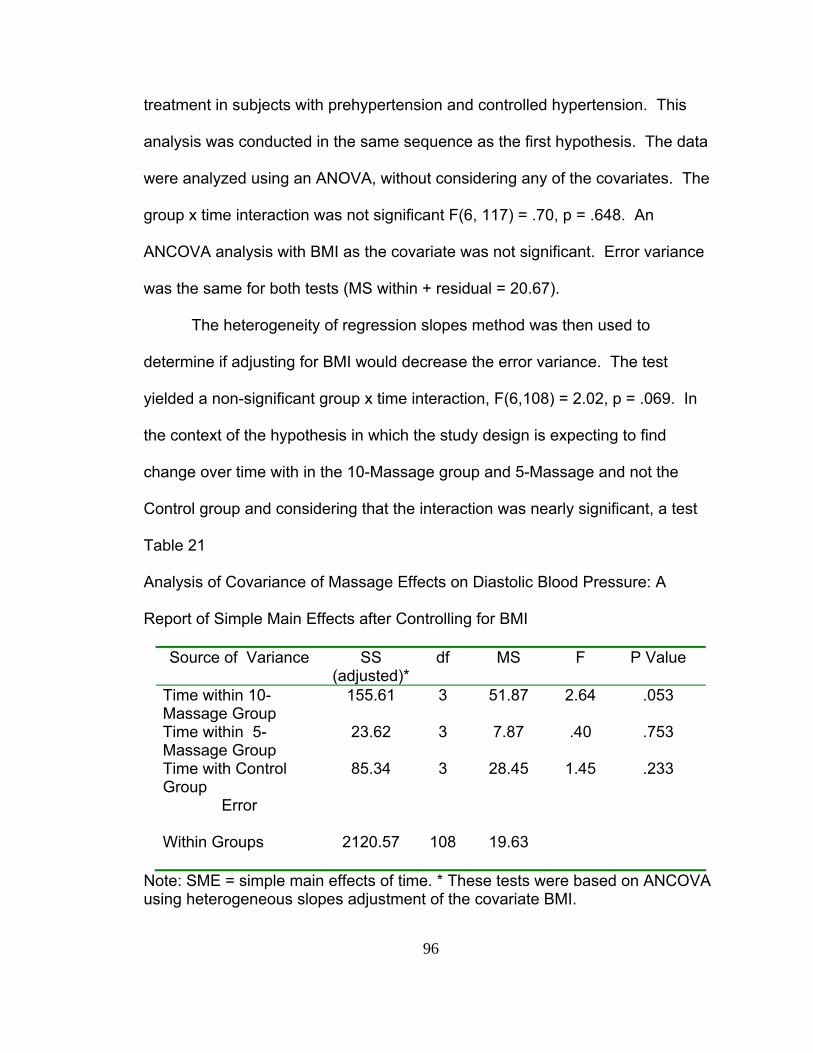
96
treatment in subjects with prehypertension and controlled hypertension. This
analysis was conducted in the same sequence as the first hypothesis. The data
were analyzed using an ANOVA, without considering any of the covariates. The
group x time interaction was not significant F(6, 117) = .70, p = .648. An
ANCOVA analysis with BMI as the covariate was not significant. Error variance
was the same for both tests (MS within + residual = 20.67).
The heterogeneity of regression slopes method was then used to
determine if adjusting for BMI would decrease the error variance. The test
yielded a non-significant group x time interaction, F(6,108) = 2.02, p = .069. In
the context of the hypothesis in which the study design is expecting to find
change over time with in the 10-Massage group and 5-Massage and not the
Control group and considering that the interaction was nearly significant, a test
Table 21
Analysis of Covariance of Massage Effects on Diastolic Blood Pressure: A
Report of Simple Main Effects after Controlling for BMI
Source of Variance SS (adjusted)*
df MS F P Value
Time within 10- Massage Group
155.61 3 51.87 2.64 .053
Time within 5- Massage Group
23.62 3 7.87 .40 .753
Time with Control Group
85.34 3 28.45 1.45 .233
Error
Within Groups 2120.57 108 19.63
Note: SME = simple main effects of time. * These tests were based on ANCOVA using heterogeneous slopes adjustment of the covariate BMI.
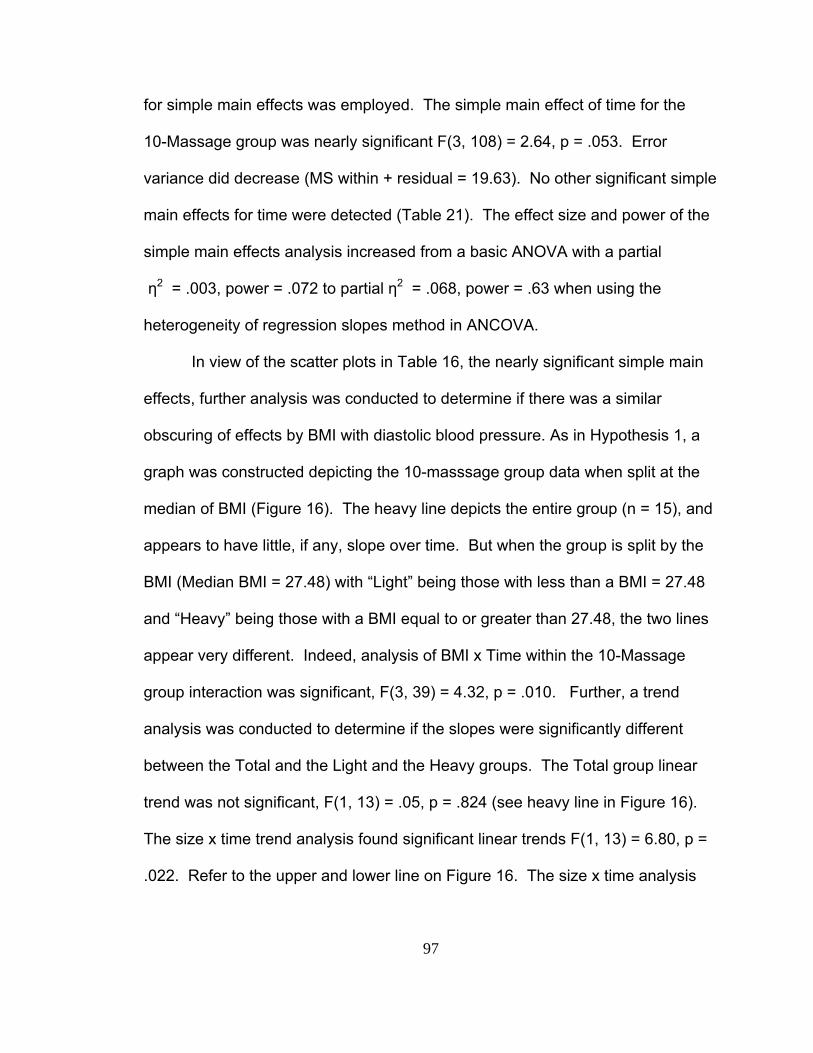
97
for simple main effects was employed. The simple main effect of time for the
10-Massage group was nearly significant F(3, 108) = 2.64, p = .053. Error
variance did decrease (MS within + residual = 19.63). No other significant simple
main effects for time were detected (Table 21). The effect size and power of the
simple main effects analysis increased from a basic ANOVA with a partial
η2 = .003, power = .072 to partial η2 = .068, power = .63 when using the
heterogeneity of regression slopes method in ANCOVA.
In view of the scatter plots in Table 16, the nearly significant simple main
effects, further analysis was conducted to determine if there was a similar
obscuring of effects by BMI with diastolic blood pressure. As in Hypothesis 1, a
graph was constructed depicting the 10-masssage group data when split at the
median of BMI (Figure 16). The heavy line depicts the entire group (n = 15), and
appears to have little, if any, slope over time. But when the group is split by the
BMI (Median BMI = 27.48) with “Light” being those with less than a BMI = 27.48
and “Heavy” being those with a BMI equal to or greater than 27.48, the two lines
appear very different. Indeed, analysis of BMI x Time within the 10-Massage
group interaction was significant, F(3, 39) = 4.32, p = .010. Further, a trend
analysis was conducted to determine if the slopes were significantly different
between the Total and the Light and the Heavy groups. The Total group linear
trend was not significant, F(1, 13) = .05, p = .824 (see heavy line in Figure 16).
The size x time trend analysis found significant linear trends F(1, 13) = 6.80, p =
.022. Refer to the upper and lower line on Figure 16. The size x time analysis
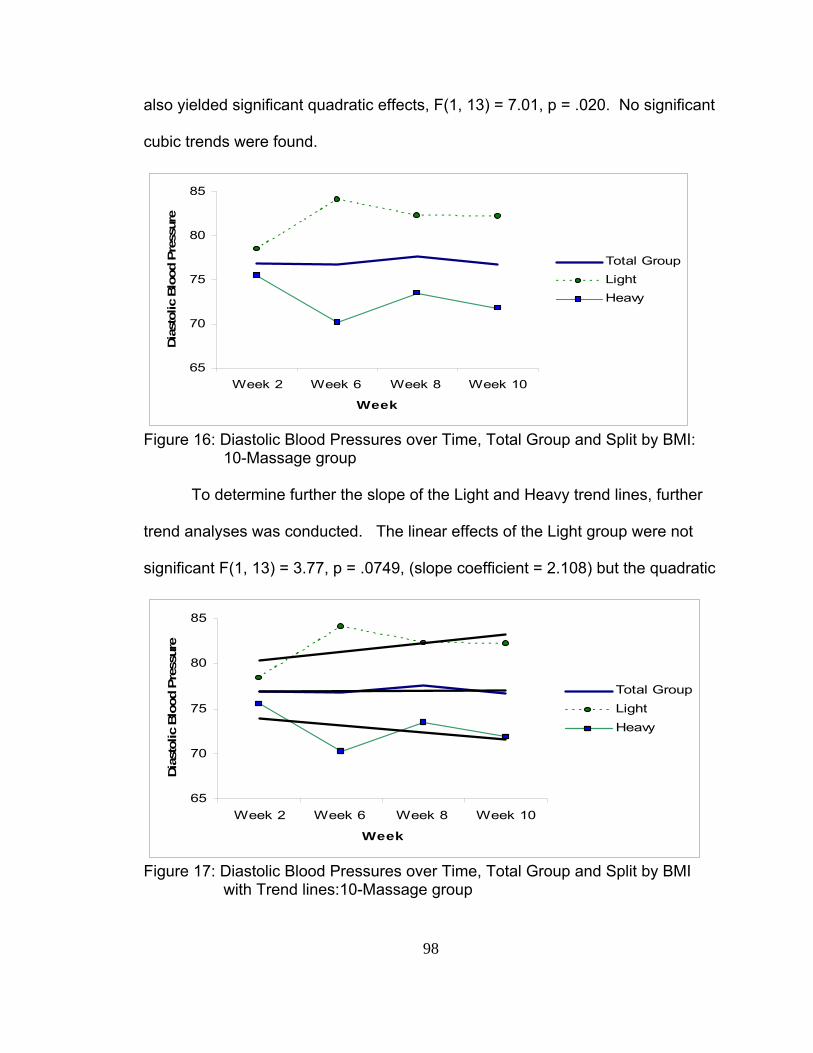
98
also yielded significant quadratic effects, F(1, 13) = 7.01, p = .020. No significant
cubic trends were found.
65
70
75
80
85
Week 2 Week 6 Week 8 Week 10
Week
Dias
tolic
Blo
od P
ress
ure
Total GroupLightHeavy
Figure 16: Diastolic Blood Pressures over Time, Total Group and Split by BMI: 10-Massage group
To determine further the slope of the Light and Heavy trend lines, further
trend analyses was conducted. The linear effects of the Light group were not
significant F(1, 13) = 3.77, p = .0749, (slope coefficient = 2.108) but the quadratic
65
70
75
80
85
Week 2 Week 6 Week 8 Week 10
Week
Dias
tolic
Blo
od P
ress
ure
Total GroupLightHeavy
Figure 17: Diastolic Blood Pressures over Time, Total Group and Split by BMI with Trend lines:10-Massage group
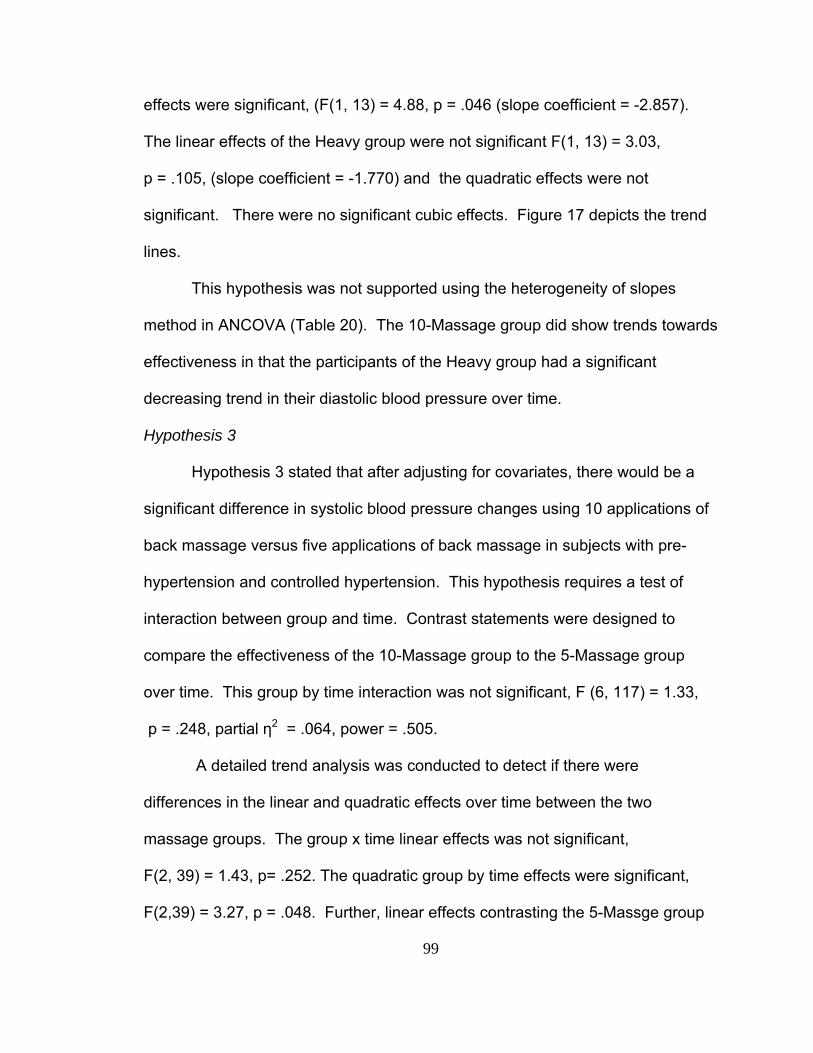
99
effects were significant, (F(1, 13) = 4.88, p = .046 (slope coefficient = -2.857).
The linear effects of the Heavy group were not significant F(1, 13) = 3.03,
p = .105, (slope coefficient = -1.770) and the quadratic effects were not
significant. There were no significant cubic effects. Figure 17 depicts the trend
lines.
This hypothesis was not supported using the heterogeneity of slopes
method in ANCOVA (Table 20). The 10-Massage group did show trends towards
effectiveness in that the participants of the Heavy group had a significant
decreasing trend in their diastolic blood pressure over time.
Hypothesis 3
Hypothesis 3 stated that after adjusting for covariates, there would be a
significant difference in systolic blood pressure changes using 10 applications of
back massage versus five applications of back massage in subjects with pre-
hypertension and controlled hypertension. This hypothesis requires a test of
interaction between group and time. Contrast statements were designed to
compare the effectiveness of the 10-Massage group to the 5-Massage group
over time. This group by time interaction was not significant, F (6, 117) = 1.33,
p = .248, partial η2 = .064, power = .505.
A detailed trend analysis was conducted to detect if there were
differences in the linear and quadratic effects over time between the two
massage groups. The group x time linear effects was not significant,
F(2, 39) = 1.43, p= .252. The quadratic group by time effects were significant,
F(2,39) = 3.27, p = .048. Further, linear effects contrasting the 5-Massge group

100
to the 10-Massage group were not significant F(1, 39) = .47, p = .498, but the
quadratic effect for this contrast was significant F(1, 39) = 4.82, p = .034. This
indicates that the shape of the trend lines for the 10-Massage group and the
5-Massage group are not the same.
Hypothesis 4
Hypothesis 4 stated that after adjusting for covariates, there would be a
significant difference in diastolic blood pressure changes using 10 applications of
back massage versus five applications of back massage in subjects with pre-
hypertension and controlled hypertension. This hypothesis requires a test of
interaction between group and time. Contrast statements were designed to
compare the effectiveness of the 10-Massage group to the 5-Massage group
over time. The group x time interaction was not significant, F (6, 117) = .70,
p = .648, partial η2 = .0354, power = .270.
A detailed trend analysis was performed to detect if there were
differences in the linear and quadratic effects over time between the two
massage groups. The group by time linear effect was not significant,
F(2, 39) = .51, p = .603. The quadratic group by time effect was not significant,
F(2,39) = 1.45, p = .246.
Hypothesis 5
Hypothesis 5 stated that there would be a significant change over time in
reclining blood pressures compared to sitting blood pressures in the subjects with
prehypertension and controlled hypertension in the back massage treatment
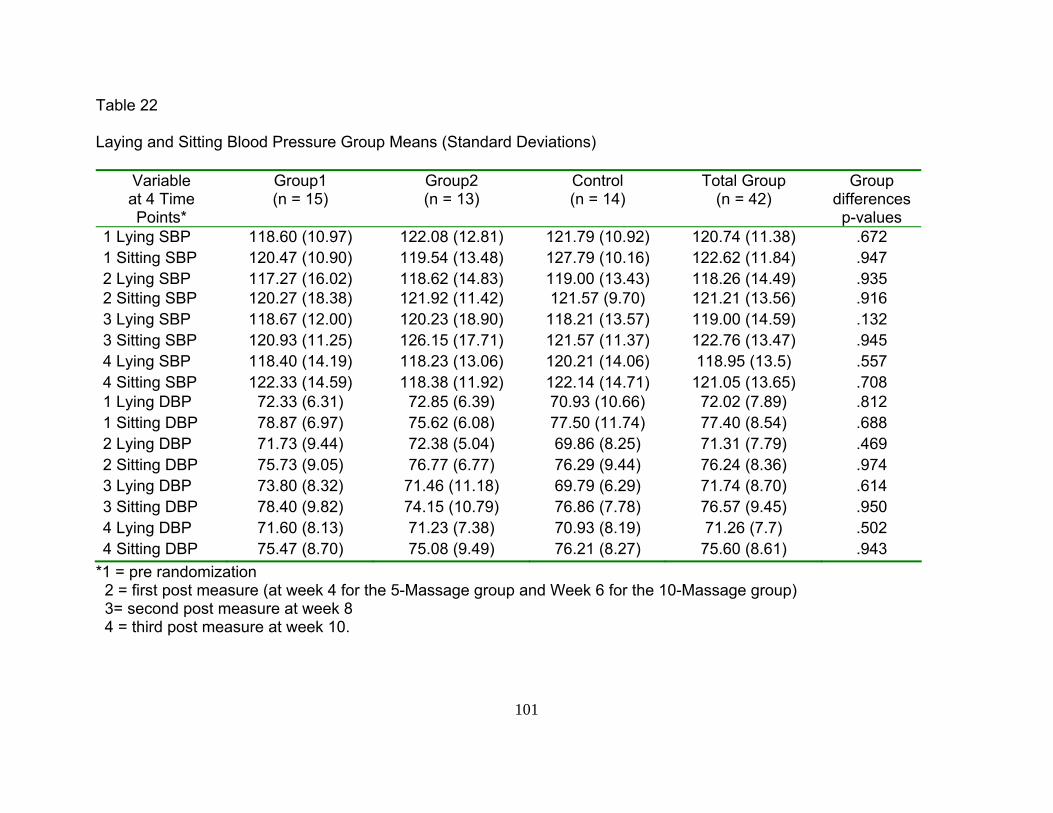
101
Table 22
Laying and Sitting Blood Pressure Group Means (Standard Deviations)
Variable at 4 Time Points*
Group1 (n = 15)
Group2 (n = 13)
Control (n = 14)
Total Group (n = 42)
Group differences p-values
1 Lying SBP 118.60 (10.97) 122.08 (12.81) 121.79 (10.92) 120.74 (11.38) .672 1 Sitting SBP 120.47 (10.90) 119.54 (13.48) 127.79 (10.16) 122.62 (11.84) .947 2 Lying SBP 117.27 (16.02) 118.62 (14.83) 119.00 (13.43) 118.26 (14.49) .935 2 Sitting SBP 120.27 (18.38) 121.92 (11.42) 121.57 (9.70) 121.21 (13.56) .916 3 Lying SBP 118.67 (12.00) 120.23 (18.90) 118.21 (13.57) 119.00 (14.59) .132 3 Sitting SBP 120.93 (11.25) 126.15 (17.71) 121.57 (11.37) 122.76 (13.47) .945 4 Lying SBP 118.40 (14.19) 118.23 (13.06) 120.21 (14.06) 118.95 (13.5) .557 4 Sitting SBP 122.33 (14.59) 118.38 (11.92) 122.14 (14.71) 121.05 (13.65) .708 1 Lying DBP 72.33 (6.31) 72.85 (6.39) 70.93 (10.66) 72.02 (7.89) .812 1 Sitting DBP 78.87 (6.97) 75.62 (6.08) 77.50 (11.74) 77.40 (8.54) .688 2 Lying DBP 71.73 (9.44) 72.38 (5.04) 69.86 (8.25) 71.31 (7.79) .469 2 Sitting DBP 75.73 (9.05) 76.77 (6.77) 76.29 (9.44) 76.24 (8.36) .974 3 Lying DBP 73.80 (8.32) 71.46 (11.18) 69.79 (6.29) 71.74 (8.70) .614 3 Sitting DBP 78.40 (9.82) 74.15 (10.79) 76.86 (7.78) 76.57 (9.45) .950 4 Lying DBP 71.60 (8.13) 71.23 (7.38) 70.93 (8.19) 71.26 (7.7) .502 4 Sitting DBP 75.47 (8.70) 75.08 (9.49) 76.21 (8.27) 75.60 (8.61) .943
*1 = pre randomization 2 = first post measure (at week 4 for the 5-Massage group and Week 6 for the 10-Massage group) 3= second post measure at week 8 4 = third post measure at week 10.
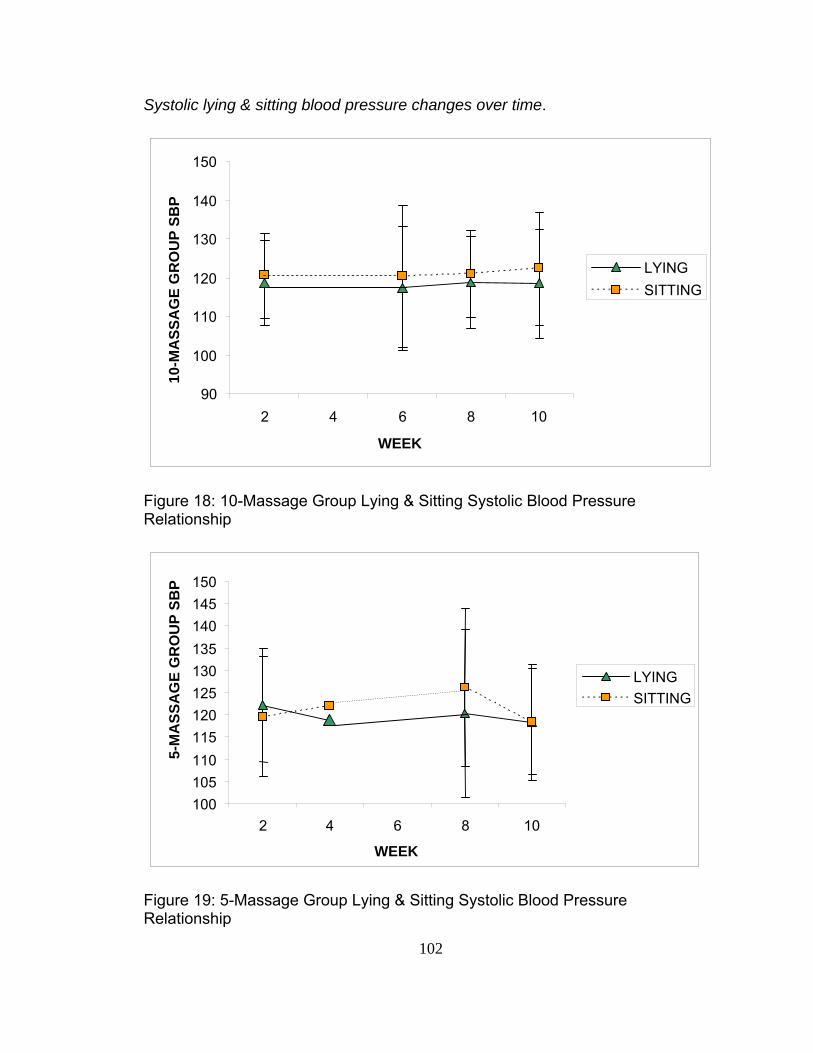
102
Systolic lying & sitting blood pressure changes over time.
Figure 18: 10-Massage Group Lying & Sitting Systolic Blood Pressure Relationship
Figure 19: 5-Massage Group Lying & Sitting Systolic Blood Pressure Relationship
90
100
110
120
130
140
150
2 4 6 8 10
WEEK
10-M
ASS
AG
E G
RO
UP
SBP
LYINGSITTING
100 105 110 115 120 125 130 135 140 145 150
2 4 6 8 10
WEEK
5-M
ASS
AG
E G
RO
UP
SBP
LYINGSITTING
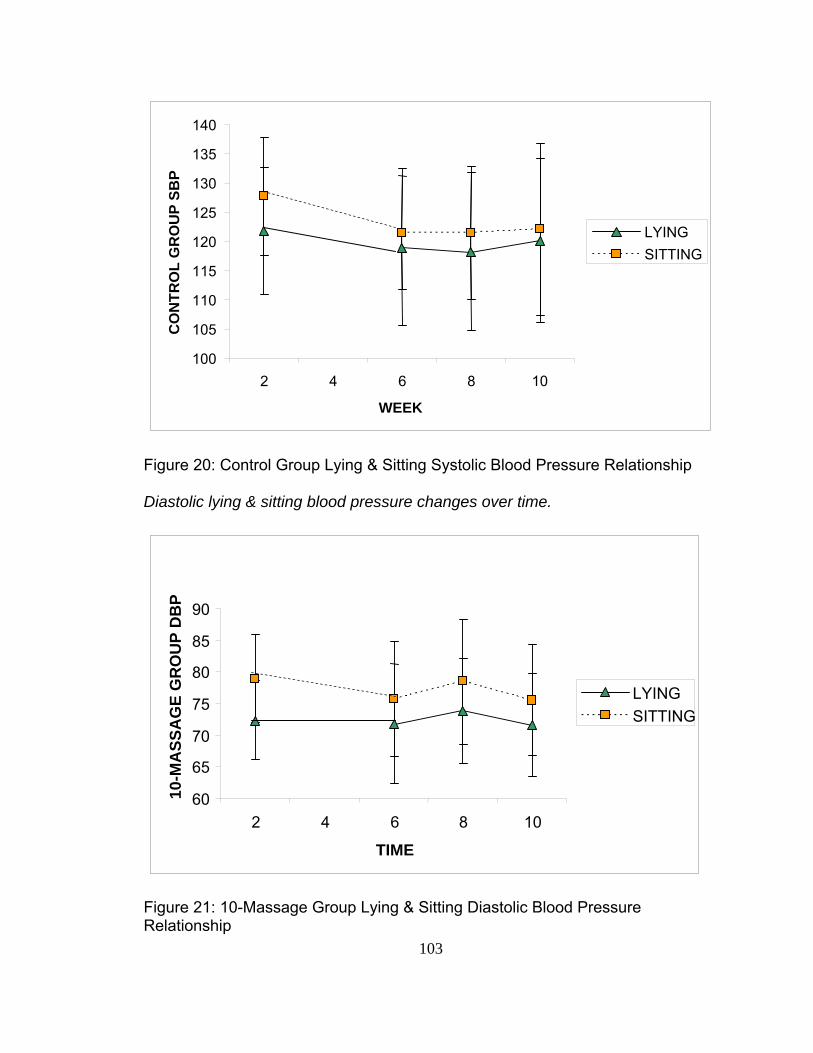
103
Figure 20: Control Group Lying & Sitting Systolic Blood Pressure Relationship Diastolic lying & sitting blood pressure changes over time.
Figure 21: 10-Massage Group Lying & Sitting Diastolic Blood Pressure Relationship
100
105
110
115
120
125
130
135
140
2 4 6 8 10
WEEK
CO
NTR
OL
GR
OU
P SB
P
LYINGSITTING
60
65
70
75
80
85
90
2 4 6 8 10
TIME
10-M
ASS
AG
E G
RO
UP
DB
P
LYINGSITTING
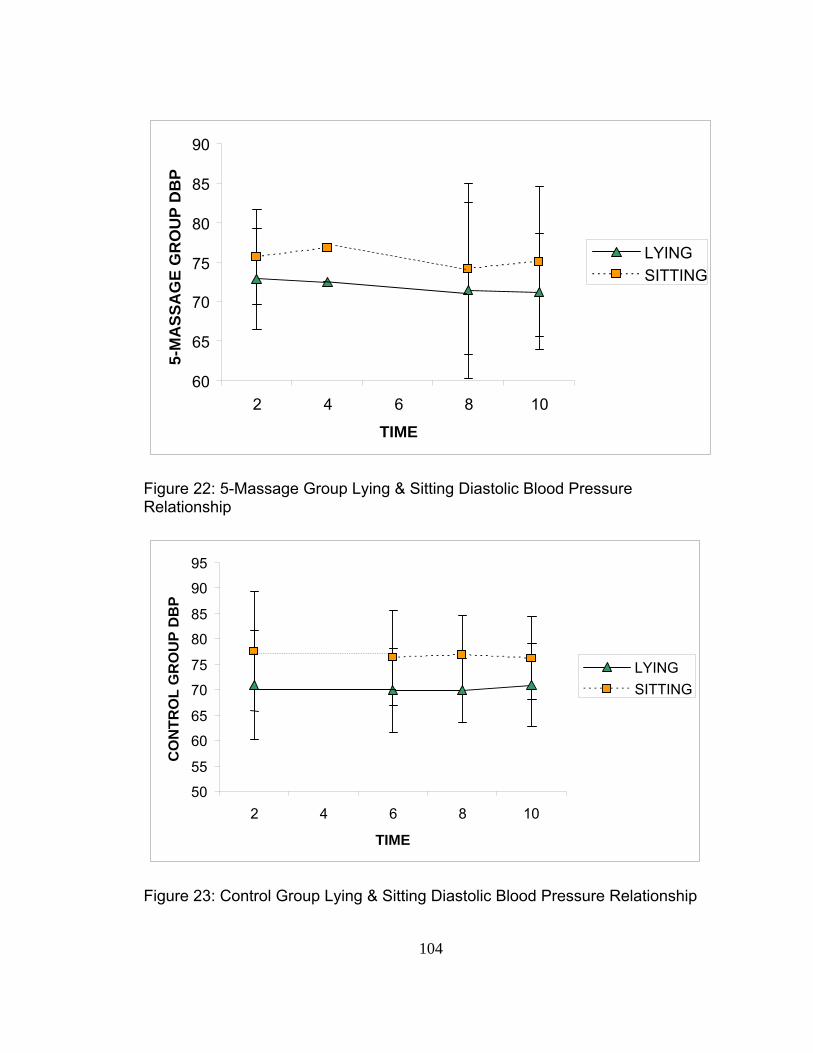
104
Figure 22: 5-Massage Group Lying & Sitting Diastolic Blood Pressure Relationship
Figure 23: Control Group Lying & Sitting Diastolic Blood Pressure Relationship
60
65
70
75
80
85
90
2 4 6 8 10
TIME
5-M
ASS
AG
E G
RO
UP
DB
P
LYINGSITTING
50
55
60
65
70
75
80
85
90
95
2 4 6 8 10
TIME
CO
NTR
OL
GR
OU
P D
BP
LYINGSITTING
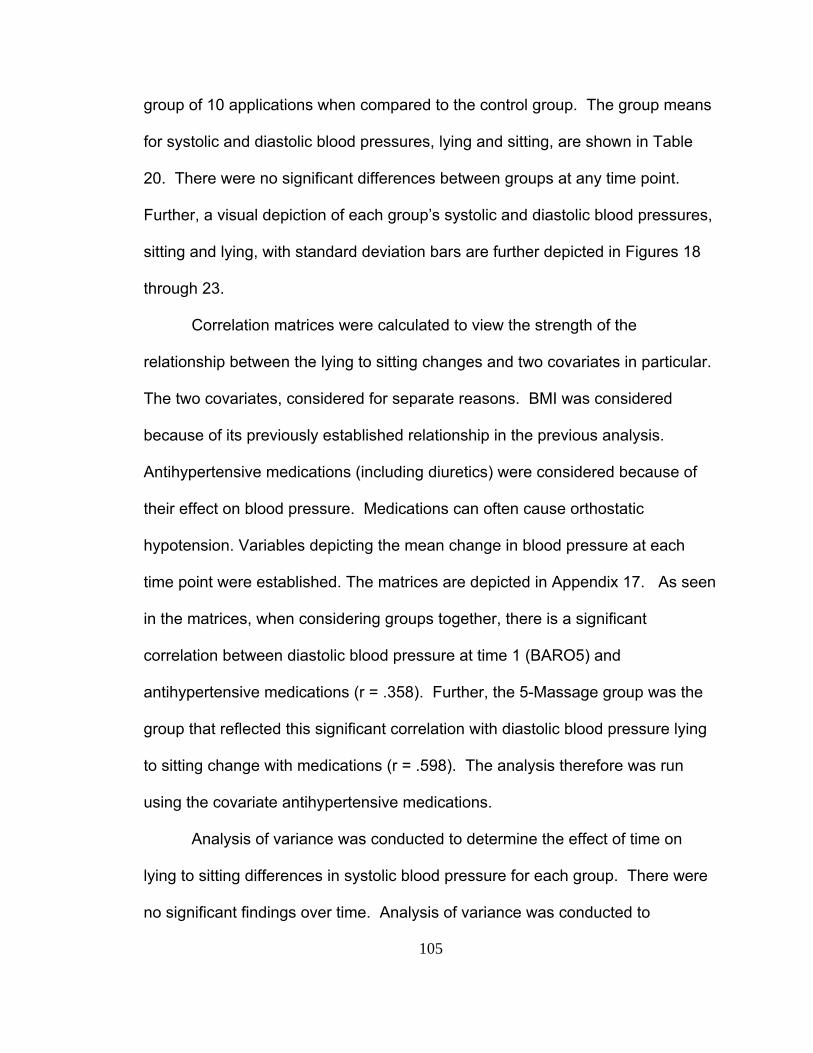
105
group of 10 applications when compared to the control group. The group means
for systolic and diastolic blood pressures, lying and sitting, are shown in Table
20. There were no significant differences between groups at any time point.
Further, a visual depiction of each group’s systolic and diastolic blood pressures,
sitting and lying, with standard deviation bars are further depicted in Figures 18
through 23.
Correlation matrices were calculated to view the strength of the
relationship between the lying to sitting changes and two covariates in particular.
The two covariates, considered for separate reasons. BMI was considered
because of its previously established relationship in the previous analysis.
Antihypertensive medications (including diuretics) were considered because of
their effect on blood pressure. Medications can often cause orthostatic
hypotension. Variables depicting the mean change in blood pressure at each
time point were established. The matrices are depicted in Appendix 17. As seen
in the matrices, when considering groups together, there is a significant
correlation between diastolic blood pressure at time 1 (BARO5) and
antihypertensive medications (r = .358). Further, the 5-Massage group was the
group that reflected this significant correlation with diastolic blood pressure lying
to sitting change with medications (r = .598). The analysis therefore was run
using the covariate antihypertensive medications.
Analysis of variance was conducted to determine the effect of time on
lying to sitting differences in systolic blood pressure for each group. There were
no significant findings over time. Analysis of variance was conducted to

106
determine the effect of position by time on lying to sitting differences in systolic
blood pressure for each group. Position X time appears to make a difference
with a significant interaction in the 5-Massage group, F (3,117) = 2.77, p = .045,
partial η2 = .066, power = .657 (Table 23). Figure 19 depicts the interaction,
thus the significant change, in lying to sitting blood pressure over time for the
5-Massage group. No other significant effects were found in systolic blood
pressure lying to sitting differences. Analyses of covariance using BMI and
antihypertensive medications as covariates were conducted. Neither medications
nor BMI changed the error variance of the analysis.
Table 23
Lying to Sitting Change in Systolic Blood Pressure: Simple Main Effects of
Position by Time within Group
Source of Variance SS df MS F P Value
Position X Time within 10-Massage Group
18.57 3 6.19 .19 .900
Position X Time within 5-Massage Group
265.03 3 88.34 2.77 .045
Position X Time within 10-Massage Group
67.18 3 22.39 .70 .552
Error
Within Group 3727.35 117 31.86
Analysis of variance was conducted to determine the lying to sitting
differences in diastolic blood pressure for each group. A significant effect for
position was found in all three groups (Table 24). Figures 21, 22, and 23 depict
that significant gap between the lying and sitting positions at each time point,
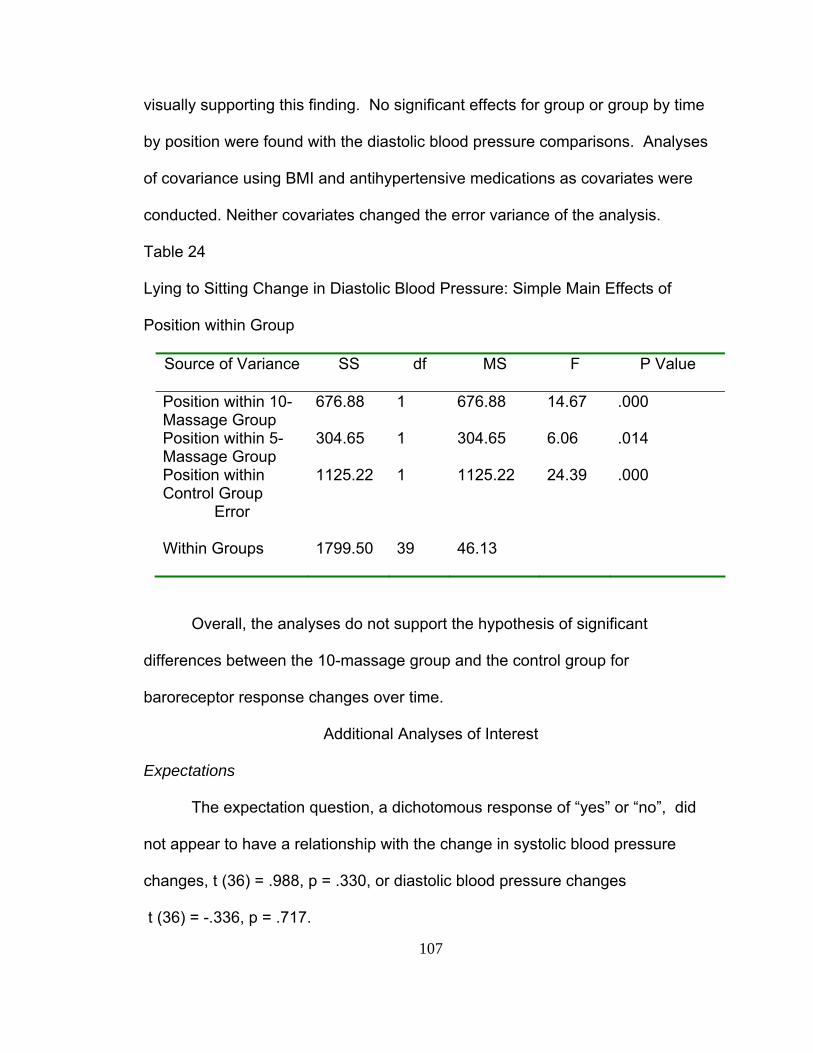
107
visually supporting this finding. No significant effects for group or group by time
by position were found with the diastolic blood pressure comparisons. Analyses
of covariance using BMI and antihypertensive medications as covariates were
conducted. Neither covariates changed the error variance of the analysis.
Table 24
Lying to Sitting Change in Diastolic Blood Pressure: Simple Main Effects of
Position within Group
Source of Variance SS df MS F P Value
Position within 10-Massage Group
676.88 1 676.88 14.67 .000
Position within 5-Massage Group
304.65 1 304.65 6.06 .014
Position within Control Group
1125.22 1 1125.22 24.39 .000
Error
Within Groups 1799.50 39 46.13
Overall, the analyses do not support the hypothesis of significant
differences between the 10-massage group and the control group for
baroreceptor response changes over time.
Additional Analyses of Interest
Expectations
The expectation question, a dichotomous response of “yes” or “no”, did
not appear to have a relationship with the change in systolic blood pressure
changes, t (36) = .988, p = .330, or diastolic blood pressure changes
t (36) = -.336, p = .717.
108
Chapter Five
Discussion
Nursing has a long history using massage, particularly back massage, as
a comfort measure for their patients. The knowledge generated regarding the
efficacy of massage comes mostly from the nursing literature. However, today
massage is usually considered an alternative or complementary therapy rather
than a conventional nursing therapy. The general population has embraced it as
one of the many alternative non-pharmaceutical treatments for a number of
disease processes, including heart disease and hypertension. The efficacy of
massage for treatment of persons with pre-hypertension and hypertension is not
yet established. Therefore, with the safety of the public in mind, the current
study proposed to determine if there are long term effects of massage. The
study also compared two dosages of massage for their impact on systolic and
diastolic blood pressure and tested for change in baroreceptor response in
persons receiving massage treatments.
The study used a 3-group randomized clinical trial design. The sample
consisted of 42 adults, (62% female, 86% Caucasian) predominantly from a
southwest central United States university setting. The mean age for the total
sample was 48.7 years (range 26 to 70 years) and the mean length of time
reported to be living with hypertension was 6.1years. The participants in this
study exercised, on average, 24 minutes per day. Exercise included walking,
109
jogging, weight lifting, and aerobic sports. The study sample was obese with a
BMI greater than 30, on average. More than half (57%) of the study sample
drank alcohol at least occasionally. Most (90.5%) did not smoke cigarettes at the
time of the study. Two subjects, older than 70 years of age, were screened for
mental capacity (MMSE), each scoring the maximum (30) on the exam.
A majority of the participants believed that participating in this study would
impact their blood pressure. Considering the positive expectation, the voluntary
nature and willingness of participation, adherence to the study protocol remained
tasking for the participants. The study protocol requested participants to visit the
research office for 30 minutes, three times per week, totaling 13 or 18 visits,
depending on the group to which the participant was randomized. Although only
twelve of the 355 treatment (massage and relaxation) sessions were missed and
not rescheduled, compliance to the schedule was a challenge for most
participants. The average time between visits was greater than the planned 2.3
days. Even though it was difficult for participants to adhere to the regularity of
three times per week visits, most were able to stick to the daily allotted 30 minute
time slot for their treatments. For example if participant #1 was scheduled for 3
pm, she came on time at 3 pm each visit. Rarely did the treatment times deviate
from the schedule.
To achieve a sense of long-term effects of changes in blood pressure due
to the back massage, the study was set up so that blood pressures were
measured four times during the study: prior to randomization to group (week 2),
at the completion of the treatment sessions (week 4 for the 5-Massage group and
110
week 6 for the 10-Massage group and the Control group), again at week 8 of the
study and again at week 10 of the study. The second measurement was planned
to take place 48 hours after the last treatment. In reality, this appointment in
which the initial effects of massage on blood pressure were to be measured was
more than 48 hours but less than 72 hours on average after the last treatment.
In respect to timeliness, however, all participants were able to be present
within 30 minutes of the scheduled time for the four data gathering appointments.
This was important for the fidelity of the study in that the variables with circadian
cycles could be comparable over time.
Although a power analysis was done a priori based on effect sizes of a
previous study, (Olney, 2005) the analysis showed no significant main effects.
However, after adjusting for the BMI heterogeneity of regression slope, the
analysis yielded significant simple main effects in the 10-massage group over
time. This analysis suggested that giving regular ten-minute back massages over
approximately 3.5 weeks, is related to a significant decrease in systolic blood
pressure, but is limited to persons with a BMI greater than 27.48 kg/m2. The long
term effect of the back massages routine was four weeks after the back
massages were discontinued.
The diastolic blood pressure analysis indicated no significant main effects.
Because of the influence of body mass index on systolic blood pressure in the
10-Massage group, a follow up trend analysis was conducted and did reveal
significant diastolic blood pressure slope differences between the heavier (BMI
111
equal to or greater than 27.48 kg/m2) and the lighter (BMI less than 27.48 kg/m2)
participants within the 10-Massage group.
This is the first study known to the principle investigator designed to
analyze long term effects of back massage. The literature has suggested that
one back massage can elicit short term (usually measured within 15 minutes
after end of massage) decreases in both systolic and diastolic blood pressure
(e. g. Cady, & Jones, 1997; McNamara, Burnham, Smith & Carroll 2003). In the
majority of massage studies, the blood pressure is measured just prior to the
massage and just after the massage. In other reported studies, when the
massage is repeated for several days the significant effects were calculated with
each massage session (Aourell, Skoog, & Carleson, 2005; Ferrell-Torry & Glick,
1993; Holland & Pokorny, 2001). Hernandez-Reif and colleagues (2000) have
applied massage for 30 minutes, three times a week and this resulted in diastolic
blood pressure changes over time. Mok and Woo (2004) found significant
systolic and diastolic changes, applying a 10-minute back massage for seven
evenings and measuring pre and post intervention at day 1, day 7 and three days
after stopping the application. Although it is unclear which blood pressure
measures (pre-intervention or post intervention or all) they used in their repeated
measures analysis, this is the best comparison for the current study, supporting
changes over time. Unfortunately, Mok and Woo’s study did not discuss BMI.
Mok and Woo did measure for effects of age and gender, finding none. The
Moyer, Rounds and Hannum (2004) meta-analysis suggested that testing of the
long term effects as one of the necessary questions to further the science.
112
Summarizing, the results of the current study imply that there may be beneficial
effects on systolic and diastolic blood pressure in persons of higher BMI (greater
than or equal to 27.48 kg/m2).
The randomization process appears to have equalized all of the potential
covariates other than BMI. This study sample was small (n=42). Perhaps a
larger, randomized sample would equalize the BMI thus allowing for a better
sense of the weight issue. A larger sample would also decrease the possibility of
a Type I error.
Dosage of massage is another recommended area of research suggested
by numerous studies including the Moyer and colleague meta-analysis (Moyer,
Rounds, & Hannum, 2004). The current study evaluated if giving 5 back
massages could be as effective as 10 back massages for lowering systolic and
diastolic blood pressure. However, in the current study main effect of group by
time interaction for dosage was not significant thus recommendations for an
appropriate prescription can not be made at this time.
Baroreceptor response can be measured by comparing the lying blood
pressure to the sitting upright blood pressure. In this study, systolic and diastolic
blood pressure were measured in the lying position and then again immediately
upon sitting upright. The current study attempted to establish baroreceptor
response as the mechanism that could explain why back massage may have
influenced the long term blood pressure.
It was hypothesized that by inducing a therapeutic level of relaxation
(repeated experiences of lowered blood pressure) the baroreceptor firing
113
threshold would be re-set to a healthier level. This resetting to a healthier level
would be manifested by a narrower gap between lying and sitting blood
pressures. When viewing the position dependent systolic pressure changes over
time for each group in Figures 18, 19 and 20, the group that most closely
resembles the expectation is the control group (Figure 20). When viewing the
position dependent diastolic pressure changes over time for each group in
Figures 21, 22, and 23, the group that most closely resembles the expectation is
the 10-massage group (Figure 21). The analysis determined the changes were
not significant.
Additional Discussion
The intimacy of massage demands that researchers begin to measure the
relationship between the massage therapist and the one receiving the massage.
This study did measure two concepts to further the understanding of touch
perception and perceived rapport for those experiencing the massage. However,
the therapist was constant across all participants in this study therefore the
findings are not generalizable to other therapists-patient relationships.
To gain a sense of what the participant may be experiencing when
receiving the back massage, a Subject Touch Perception Scale was developed.
This semantic differential-like scale listed opposing pairs of each characteristic of
the massage. The reliability test on the six items used to describe the perception
of touch was very poor. Removal of all items but the ‘smooth’ and ‘relaxing’
items from the reliabilities test yielded a higher alpha = .5722. Thus it appears
that this instrument needs further development. Keeping the reliabilities issue in
114
mind, for the purposes of beginning the discussion on perception of touch the
following summary of the data is presented. Overall, the massage was perceived
as soothing, pleasant, smooth, rhythmic and relaxing. All but the pressure items
were scaled such that a score of 1 was perceived as a more positive experience.
Mean group scores ranged from 1.00 (example: rhythmic) to 1.27 (example:
relaxing) indicating that the perception of the massage touch on these five items
was a positive experience for the participants. The pressure-item on this scale
interpreted differently from the other five items. Pressure was scaled from too
soft (1.00) to too hard (5.00). Thus the resulting score of 3.00 may be interpreted
by the participant as “just right”. Both groups felt the pressure of the massage
was a bit on the soft side with the mean scores for the 10-massage group (2.53)
and 5-massage group (2.69).
These data are supported by the verbal requests by several participants to
use more pressure. Due to the nature of the study, the researcher explained to
the participant the same pressure must be used on all subjects. The implication
here may be that response is determined by pressure. For instance, maybe
some participants needed a deeper pressure to achieve a “relaxation response”.
This is clearly an area for future research.
Beyond the touch perception results, anecdotally, there were several
comments made by participants about the sound of the massage. Usually there
was little sound elicited by the massage strokes using oil. However, on several
participants, the massage strokes elicited a loud friction sound when the back
was covered by body hair or a suction sound when the back was hair free. In
115
these particular cases the participants stated that the sound prevented them from
truly relaxing.
Touch perception is a phenomenon which has been measured and
reported in populations of abused persons. However, measuring the perception
of touch in massage research is relatively new. This researcher did not find a
developed instrument that measured touch perception from a non-abusive
framework. Therefore, the development of an instrument would be helpful to
massage researchers when attempting to determine the effects of massage.
The experienced relationship with the massage therapist is of interest to
researchers who evaluate the effects of massage (Moyer, Hanum, & Rounds,
2004). To gain a sense of the participant’s perceived relationship with the
massage therapist a perceived rapport scale was developed. This semantic
differential-like scale listed 10 opposing characteristics of what the participant
may have been experiencing. A score of 1 related to a more positive experience
whereas a score of 5 related to a more negative experience. Scores for the two
groups ranged from 1.00 (example: safe) to 1.53 (example: physically relaxed).
The two groups were not different in their perception and the participants felt
positive about their relationship with the massage therapist.
This information is not as useful as the researcher had hypothesized. The
variance was insignificant to determine if there is any influence on the variables
being measured in this study. A larger scale, with 10 rather than 5 levels of
response may have generated a greater contrast among responses. Content
and concurrent validity would add to its interpretability. Also measuring the

116
control group for their interpretation of the relationship may have added to this
analysis. Theoretically, development a valid instrument would be beneficial in
future massage research, as it would help explain more of the variance found in
the research analysis.
Study Limitations
This study was underpowered for the analyses of diastolic pressure and
baroreceptor. The original power analysis was based upon the researcher’s pilot
work (Olney, 2005). A larger sample would increase the power and better reflect
dosage comparison.
This study was conducted on a university campus which is not necessarily
reflective of the general hypertensive population. Therefore caution is advised to
not generalize these findings beyond like populations.
The participants’ characteristics were self-reported. Items such as weight
and height, minutes per day of exercise, years on diagnosed with hypertension
and years on medications were subject to the participants ability to recall
correctly and report accurately the requested data. Therefore it is possible that
the self-reported data lack full and accurate disclosure. Inaccurate reporting of
the characteristics such as height and weight, which formulate the BMI covariate,
could lead to analysis that does not reflect reality.
Another important limitation in this study is that the research assistant left
the study during the second month. This created several issues for study fidelity.
First, when the researcher took over the measurement sessions, she became
unblinded to the data. It is possible that exposure to the data caused bias in the
117
interactions of the researcher towards the participants. Another possible issue
with the research assistant leaving the study was that 14 participants had their
pre-randomization data gathered by the research assistant. Only 9 of those
participants had their first post measure and none had third and forth measures
conducted by the research assistant. This inconsistency of data gatherer across
time may have impacted the expectation of some participants, thus outcomes.
Implications for Practice
There are implications for practice resulting from this study. The
significant findings of 10-back massage treatment imply that there may be lasting
treatment effects for up to 4 weeks for systolic and diastolic blood pressure for
persons with elevated body mass index. The linear and quadratic appearance of
the analysis indicates there maybe an immediate treatment effect and a
sustained effect out to a 4 week period of time. This study did not indicate the
duration of effects beyond 4 weeks post application. It is most likely that the
effectiveness weakens the further away from the last treatment, based upon the
psychophysiology theory. The data are not clear enough to make implications
regarding dosage. Further research is needed before definitive
recommendations can be made as to exact dosage and length of effects. This
study does indicate that systolic and diastolic blood pressure levels did decrease
with a regularly applied 10-minute back massage for persons who had a higher
body mass index. Back massage is a safe treatment for most persons.
Recommending back massage as an adjunct therapy to drug therapy for persons
with pre-hypertension or hypertension would certainly cause no harm in those

118
with body mass index above 27.43 kg/m2 provided the person is otherwise
healthy. But recommending the 10- minute back massage for those with lower
body mass index should be done with caution.
It would not be safe to recommend back massage as a sole treatment for
persons with pre-hypertension or hypertension. Treatment of elevated blood
pressure needs to be multifaceted, to include lifestyle modifications including
weight maintenance at a healthy level, exercise, diet management, and stress
reduction. Once the diagnosis of hypertension is established, anti-hypertension
medications are necessary to help lower and maintain a healthy blood pressure
level. At this point, the evidence only supports back massage to be used as an
adjunct therapy.
Future Research Recommendations
This study was based on psychophysiology theory and the design built
upon previously published research and recommendations. The aim of this
study, to determine long-term effects and dosage for person with pre-
hypertension or hypertension, was clearly the next step in knowledge building.
This study design needs to be expanded to a larger more heterogeneous
population. This study did not analyze gender effects. However comparing
gender effects would be interesting particularly because there are studies
reporting differences among gender. Also, race effects must be tested, in view of
the disparate onset of hypertension and heart disease in minority populations. It
is possible due to cultural differences, that massage would have a different
effect.
119
Regarding methodological recommendations, first, blinding the researcher
to the data to prevent possible bias is necessary. Biological responses to
massage need to be measured in future studies. Biological data in particular can
add to the knowledge about the physiological response to such interventions.
Psychological measurement should continue to be a part of future studies both
as in this study as covariates, or as outcome variables. The relationship with the
therapist needs to be further explored. Establishment of validity for a touch
perception instrument and rapport perception instrument would enhance
measurement of these variables.
120
References
Ahles, T. A., Tope, D. M., Pinkson, B., Walch, S., Hann, D., Whedon, M., et al. (1999). Massage therapy for patients undergoing autologous bone marrow transplantation. Journal of Pain and Symptom Management. 18(3), 157-163.
Altshul, S. (2006, August). Massage your mood: a friendly touch eases depression and anxiety. Prevention Magazine,100.
American Heart Association (2006). High Blood Pressure Statistics. Retrieved November 26, 2006, from http://www.americanheart.org/presenter.jhtml?identifier=4621
Aourell, M., Skoog, M., & Carleson, J. (2005). Effects of Swedish massage on blood pressure. Complementary Therapies in Clinical Practice, 11, 243-246.
Barnes, P. M., Powell-Griner, E., MeFann, K., & Nahin, R. L. (May, 2004). Complementary and alternative medicine use among adults: United States, 2002. Advance Data from Vital & Health Statistics, 343, 1-19. Retrieved January 3, 2007 from http://www.cdc.gov/nchs/products/pubs/pubd/ad/ad.htm
Barr, J. S., & Taslitz, N. (1970). The influence of back massage on autonomic functions. Physical Therapy, 50(12), 1679-1691.
Bauer, W. C., & Dracup, K. A. (1987). Physiological effects of back massage in patients with acute myocardial infarction. Focus on Critical Care, 14(6), 42-46.
Beck, M. (1999). Milady’s Theory and practice of therapeutic massage. Albany, NY: Milady.
Beeken, J. E., Parks, D., Cory, J., & Montopoli, G. (1998). The effectiveness of neuromuscular release massage therapy in five individuals with chronic obstructive lung disease. Clinical Nursing Research, 7(3), 309-317.
Benjamin, P. J., and Tappan, F. M. (2005). Tappan’s handbook of healing massage techniques (4th ed.). Upper Saddle River, NJ: Pearson Prentice Hall.
Benson, (2000). The Relaxation Response. New York: First WholeCare.

121
Benson, H., Beary, J. F., & Carol, M. (1974). The relaxation response. Psychiatry, 37, 37-46.
Bost, N. & Wallis, N. (2006). The effectiveness of a 15 minute weekly massage in reducing physical and psychological stress in nurses. Australian Journal of Advanced Nursing, 23(4), 28-33.
Burns, N., & Groves, S. K. (2005). The practice of nursing research: Conduct, critique, and utilization (5th ed.). St. Louis, MO: Elsevier Saunders.
Buss, I. C., Halfens, R. J., & Abu-Saad, H. H. (1997). The effectiveness of massage in preventing pressure sores: A literature review. Rehabilitative Nursing, 22(5), 229-234.
Cady, S. H., & Jones G. E. (1997). Massage therapy as a workplace intervention for reduction of stress. Perceptual and Motor Skills, 84, 157-158.
Cawley, N. (1997). A critique of the methodology of research studies evaluating massage. European Journal of Cancer Care, 6, 23-31.
Cambron, J. A., Dexheimer, J., & Coe, P. (2006). Changes in blood pressure after various forms of therapeutic massage: A preliminary study. The Journal of Alternative and Complementary Medicine, 12(1), 65-70.
Chalmers, (1999). WHO-ISH Guidelines for the Management of Hypertension. Medical Journal of Australia, 171 (9), 458-459.
Charmandari, E., Kino, T., Souvatzoglou, E., & Chrousos, G. P. (2003). Pediatric stress: Hormonal mediators and human development. Hormone Research 59(4), 161-79.
Chobanian, A. V., Bakris, G. L., Black, H. R., Cushman, W. C., Green, L. A., Izzo, J. L., et al. (2003). The seventh report of the joint national committee on prevention, detection evaluation, and treatment of high blood pressure: The JNC 7 report. Journal of the American Medical Association, 289(19), 2560-2572.
Corley, M. C., Ferriter, J., Zeh, J., & Gifford, C. (1995). Physiological and psychological effects of back rubs. Applied Nursing Research, 8(1), 39-43.
Cushman, W. C. (2000). Alcohol consumption and the management of hypertension. In S. Oparil & M. Weber (Eds.), Hypertension: A companion to Brenner and Rector's the kidney (pp. 466-470). New York: W. B. Saunders Company.
122
Delaney, J. P., Leong, K.S., Watkins, A., & Brodie, D. (2002). The short-term effects of myofascial trigger point massage therapy on cardiac autonomic tone in healthy subjects. Journal of Advanced Nursing, 37(4), 364-371.
Delgado, C., & Weder, A. (2000). Pathophysiology of hypertension. In S. Oparil & M. A. Weber (Eds.), Hypertension: A companion to Brenner and Rector’s the kidney (pp. 21-28). New York: W. B. Saunders Company.
DiBona, G. F. (2004). The sympathetic nervous system and hypertension: Recent developments. Hypertension, 43, 147-150.
Dickerson, C. J. (2004). Commentary on Hot Topic Review: Baroreceptors and the long-term control of blood pressure. Experimental Physiology, 89 (4), 335-337.
Dossey, B. M., Keegan, G., Guzzetta, C. E. (1999). Holistic Nursing: A handbook for practice (3rd ed.). Gaithersburg, MD: Aspen Publishers.
Duimel-Peeters, I. G., Halfens, R. J., Berger, M. P., Snoeckx, L. H. (2005). The effects of massage as a method to prevent pressure ulcers: A review of the literature. Ostomy Wound Management, 51(4), 70-80.
Dunn, C., Sleep, J., & Collett, D. (1995). Sensing an improvement: An experimental study to evaluate the use of aromatherapy, massage and periods of rest in an intensive care unit. Journal of Advanced Nursing, 21, 34-40.
Dyson, R. (1978). Bed sores - the injuries hospital staff inflict on patients. Nursing Mirror 146(42), 30-32.
Eisenberg, D. M., Kessler, R. C., Foster, C., Norlack, F. E., Calkins, D. R., & Delbanco, T. L. (1993). Unconventional medicine in the United States. Prevelance, costs and patterns of use. The New England Journal of Medicine, 326, 246-252.
Fakouri, C., & Jones, P. (1987). Relaxation Rx: Slow stroke back rub. Journal of Gerontological Nursing, 13(2), 32-35.
Felhandler, D., & Lisander, B. (1999). Effects of non-invasive stimulation of acupoints on the cardiovascular system. Complementary Therapies in Medicine, 7, 231-234.
Ferrell-Torry, A. T. & Glick, O. J. (1993). The use of therapeutic massage as a nursing intervention to modify anxiety and the perception of cancer pain. Cancer Nursing, 16(2), 93-101.
123
Field, T. Grizzle, N., Scafidi, & Schanberg, S. (1996). Massage and relaxation therapies’ effects on depressed adolescent mothers. Adolescence, 31(124), 903-911.
Field, T., Quintino, O., Henteleff, T., Wells-Keife, L., Delvecchio-Feinberg, G. (1997). Job stress reduction therapies. Alternative Therapies in Health and Medicine, 3(4), 54-56.
Field, T., Hernandez-Reif, M., Diego, M., Schanberg, S., & Kuhn, C. (2005). Cortisol deceases and serotonin and dopamine increase following massage therapy. International Journal of Neuroscience, 115(10), 1397-1413.
Fraser, J. & Kerr, J. R. (1993). Psycho physiological effects of back massage on elderly institutionalized patients. Journal of Advanced Nursing, 18, 238-245.
GE Healthcare (2007). Pro 400: Gold standard BP, Temp, SpO2 and Pulse. Retrieved January 5, 2007 from http://www.gehealthcare.com/euen/patient_monitoring/products/imm-monitoring/dinamapp/pro400.html
Goldstone, L. A. (2000). Massage as an orthodox medical treatment past and future. Complementary Therapies in Nursing & Midwifery, 6, 169-175.
Goodfellow, L. (2003). The effects of therapeutic back massage on psychophysiologic variables and immune function in spouses of patients with cancer. Nursing Research, 52(5), 318-328.
Groer, M., Mozingo, J., Droppleman, P., Davis, M., Jolly, M. L., Boynton, M., et al. (1994). Measures of salivary secretory immunoglobulin A and state anxiety after a nursing back rub. Applied Nursing Research, 7(1), 2-6.
Grossman, E., Grossman , A., Schein, M.H., Zimlichman, R., & Gavish, B. (2001). Breathing-control lowers blood pressure. Journal of Human Hypertension, 15, 263-269
Hayes, J. & Cox, C. (2000). Immediate effects of a five-minute foot massage on patients in critical care. Complementary Therapies in Nursing & Midwifery, 6, 9-13.
He, F. J., & MacGregor, G. A. (2003). Potassium: More beneficial effects. Climacteric, 6(Supplement 3), 36-48.
Hernandez-Reif, M., Dieter, J., Field, T., Swerdlow, B., & Diego, M. (1998). Migraine headaches are reduced by massage therapy. International Journal of Neuroscience, 96, 1-11.

124
Hernandez-Reif, M., Field, T., Krasnegor, J., Theakston, H., Hossain, Z., Burman, I. (2000). High blood pressure and associated symptoms were reduced by massage therapy. Journal of Bodywork and Movement Therapies, 4(1), 31-38.
Hernandez-Reif, M., Ironson, G., Field, T., Hurley, J., Katz, G., Diego, M., et al. (2004). Breast cancer patients have improved immune and neuroendocrine functions following massage therapy. Journal of Psychosomatic Research, 57(1), 45-52.
Herrera, A. H., & Lowenthal, D. L. (2000). Exercise and hypertension. In S. Oparil & M. Weber (Eds.), Hypertension: A companion to Brenner and Rector's the kidney, (pp. 470-478). New York: W. B. Saunders Company.
Hobbs, S., and Davies P. D. (1998). Critical review of how nurses research massage therapy: Are they using the best methods? Complementary Therapies in Nursing & Midwifery, 4, 35-40.
Holland, B., & Pokorny, M. E. (2001). Slow stroke back massage: Its effect on patients in a rehabilitation setting. Rehabilitation Nursing, 26(5), 182-186.
Ironson, G., Field, T., Scafidi, F., Hashimoto, M., Kumar, A., Price, A., et al. (1996). Massage therapy is associated with enhancement of the immune system’s cytotoxic capacity. International Journal of Neuroscience, 84(1-4), 205-217.
Izzo, J. L. (2000). Sympathetic nervous system in acute and chronic blood pressure elevation. In S. Oparil & M. A. Weber (Eds.), Hypertension: A companion to Brenner and Rector’s the kidney, (pp. 42-58). New York: W. B. Saunders Company.
Jacobson (1938). Progressive relaxation. Chicago: Chicago University Press.
Kaplan, N. M. (2002). Kaplan’s clinical hypertension (8th ed.). Philadelphia: Lippincott Williams & Wilkins.
Kessler, R. C., Davis, R. B., Foster, D. F., Van Rompay, M. I., Walters, E. E., Wilkey, et al. (2001). Long-term trends in the use of complementary and alternative medical therapies in the United States. Annuls of Internal Medicine, 135(4), 262-268.
Kurashova-Wine, Z. (1999). Massage for hypertension. Massage Magazine, 67, 67-68.
Labyak, S. E., & Metzger, B. L. (1997). The effects of effleurage back rub on the physiological components of relaxation: a meta-analysis. Nursing Research, 46(1), 59-62.
125
Li, J. J., & Chen, J. L. (2005). Inflammation may be a bridge connecting hypertension and atherosclerosis. Medical Hypotheses, 64(5), 925-929.
Light, K. C. (2000). Environmental and psychosocial stress in hypertension onset and progression. In S. Oparil & M. A. Weber (Eds.), Hypertension: A companion to Brenner and Rector’s the kidney, (pp. 59–70). New York: W. B. Saunders Company.
Longworth, J. C. D. (1982). Psychophysiological effects of slow stroke back massage in normotensive females. Advances in Nursing Science, 4(4), 44-61.
Lovello, W. R. (2005). Stress & health: Biological and psychological interactions (2nd ed.). London: Sage Publications.
McCowen, K. C., Chan, S., & Blackburn, G. L. (2000). Diet-calories. In S. Oparil & M. Weber (Eds.), Hypertension: A companion to Brenner and Rector's the kidney, (pp. 460-465). New York: W. B. Saunders Company.
McNamara, M. E., Burnham, D. C., Smith, C., & Carroll, D. L. (2003). The effects of back massage before diagnostic cardiac catheterization. Alternative Therapies in Health and Medicine, 9(1), 50-57.
McRee, L. D., Noble, S., & Pasvogel, A. (2003). Using massage and music therapy to improve postoperative outcomes. AORN Journal, 78(3), 433-447.
Meek, S. S. (1993). Effects of slow stroke back massage on relaxation in hospice clients. IMAGE: Journal of Nursing Scholarship, 25(1), 17-21.
Meintz, S. L. (1995). Whatever became of the backrub? RN, (April, 1995), 49-56.
Mitzel-Wilkinson, A. (2000). Massage therapy as a nursing practice. Journal of Holistic Nursing 14(2), 48-56.
Mok, E. & Woo, C. P. (2004). The effects of slow-stroke back massage on anxiety and shoulder pain in elderly stroke patients. Complementary Therapies in Nursing & Midwifery, 10, 209-216.
Moyer, C. A., Rounds, J., & Hannum, J. W. (2004). A meta-analysis of massage therapy research. Psychological Bulletin, 130(1), 3-18.
Mueller Hinze, M. L. (1988). The effects of therapeutic touch and acupressure on experimentally-induced pain (Doctoral dissertation, University of Texas at Austin, 1988). Dissertation Abstracts International, 49, 4755.
126
Munro, B. H. (2001). Statistical methods for health care research (4th ed.). New York: Lippincott.
National Association of Nurse Massage Therapists (2007). NANMT philosophy. Retrieved December 2, 2007, from http://www.nanmt.org/philosophy.html
Ni, H., Simile, C., & Hardy, A. M. (2002). Utilization of complementary and alternative medicine by United States adults: results form the 1999 national health interview survey. Medical Care, 40(4), 353-358.
Okvat, H. A., Oz, M. C., Ting. W., & Namerow, P. B. (2002). Massage therapy for patients undergoing cardiac catheterization. Alternative Therapies, 8(3), 68-75.
Olney, C. M. (2005). The effect of therapeutic back massage in hypertensive persons: A preliminary study. Biological Research for Nursing, 7(2), 98-105.
Onken, D. A., White, W. B., Cooney, J. L., et al. (2001). Impact of Smoking cessation on ambulatory blood pressure and heart rate in postmenopausal women. American Journal of Hypertension, 14, 942-949.
Pickering, T. G., Hall, J. E., Appel, L. J., Falkner, B. E., Graves, J., Hill, M. N., et al., (2005). Recommendations for blood pressure measurement in humans and experimental animals. Part 1: blood pressure measurement in humans. A statement for professionals from the subcommittee of professional and public education of the American Heart Association Council on High Blood Pressure Research. Circulation, 111, 697-716.
Post-White, J., Kinney, M. E., Savik, K., Gau, J. B., Wilcox, C., & Lerner, I. (2003). Therapeutic massage and healing touch improve symptoms in cancer. Integrative Cancer Therapies, 2(4), 332-344.
Potter, P. A., & Perry, A. G. (2001). Fundamentals of Nursing (5th ed.). ST. Louis: Mosby.
Purves, D., Augustine, G. J., Fitzpatrick, D., Katz, L. C., LaMantia, A., McNamara, J. O., et al. (Eds.). (2001). Neuroscience (2nd ed.). Sunderland, Massachusetts: Sinauer Associates, Inc.
Rexilius, S. J., Mundt, C., Erickson Megel, M. & Agrawal, S. (2002). Therapeutic effects of massage etherapy and handling touch on caregivers of patients undergoing autologous hematopoietic stem cell transplant. Oncology Nursing Forum, 29(3), E35-44.
Richards, K. C., Gibson, R., & Overton-McCoy, A. L. (2000). Effects of massage in acute and critical care. AACN Clinical Issues, 11(1), 77-96.
127
Rutledge, T. R., & Hogan, B. E. (2002). A quantitative review of prospective evidence linking psychological factors with hypertension development. Psychosomatic Medicine, 64, 758-766.
Salvo, S.G. (1999). Massage therapy: Principles and practice. Philadelphia: Saunders.
Segerstrom, S. C., & Miller, G. E. (2004). Psychological stress and the human immune system: A meta-analytic study of 30 years of inquiry. Psychological Bulliten, 130(4), 601-630 .
Scalco, A. Z., Scalco, M. Z., Azul, J. B. S., and Lotufo, N. F. (2005). Hypertension and Depression. Clinics, 60(3), 241-250.
Shulman, K. R., & Jones, G. E. (1996). The effectiveness of massage therapy intervention on reducing anxiety in the workplace. The Journal of Applied Behavioral Science, 32(2), 160-173.
Sherwood, L. (2007). Human physiology: From cells to systems (6th ed.). Belmont, CA: Thomson.
Sleight, P. (2004). Commentary on Hot Topic Review: Arterial baroreflexes can determine long-term blood pressure. Experimental Physiology, 89 (4), 337-341.
Smith, M. C., Kemp, J., Hemphill, L., & Vojir, C. P. (2002). Outcomes of therapeutic massage for hospitalized cancer patients. Journal of Nursing Scholarship, 34(3), 257-262.
Smyth, J., Ockenfels, M. C., Porter, L., Kirschbaum, C., Hellhammer, D. H., & Stone, A. A. (1998). Stressors and mood measured on a momentary basis are associated with salivary cortisol secretion. Psychoneuroendocrinology, 23(4), 353-370.
Spielberger, C. D., Crane, R. S., Kearns, W. D., Pellegrin, K. L., Rickman, R. L., & Johnson, E. H. (1991). Anger and anxiety in essential hypertension. In C. D. Spielberger, I. G. Sarason, Z. Kulcs, & G. L. Van Heck (Eds.), Stress and emotion (Vol. 14, pp. 265-283). New York: Hemisphere/Taylor & Francis.
Speilberger, C. D., Ritterband, L. M., Reheiser, E. C., & Brunner, T. M. (2003). The nature and measurement of depression. Revista Internacional de Psicologia Clinica de la Salud/ International Journal of Clinical and Health Psychology 3(2), 209-234.

128
Speilberger, C. D., Jacobs, C., Crane, R., Russell, S., Westberry, L., Barker, L., et al. (n.d.). Preliminary manual for the State-Trait Personality Inventory (STPI). University of South Florida: unpublished.
Stevenson, C. J. (1994). The psychophysiological effects of aromatherapy massage following cardiac surgery. Complementary Therapies in Medicine, 2, 27-35.
Tabachnick, B. G., & Fidell, L. S. (2001). Using multivariate statistics (4th ed.). Boston: Allyn and Bacon.
Taylor, A. G. Galper, D. I., Taylor, P., Rice, L. W., Andersen, W., Irvin, W., et al. (2003). Effects of adjunctive Swedish massage and vibration therapy on short-term postoperative outcomes: A randomized, controlled trial. The Journal of Alternative and Complementary Medicine, 9(1), 77-89.
Tindal, H. A., Davis, R. B., Phillips, R. S.,& Eisenberg, D. M. (2005). Trends in use of complementary and alternative medicine by US adults: 1997-2002. Alternative Therapies in Health Medicine, 11(1), 42-49.
Thrasher, T. N. (2005). Baroreceptors, baroreceptor unloading, and the long-term control of blood pressure. American Journal of Physiology: Regulatory, Interrogative and Comparative Physiology, 288(4), R8 19-27.
UCLA Department of Education (2007). Introduction to research design and statistics: Effect size. Retrieved February 2, 2007, from http://www.gseis.ucla.edu/courses/ed230a2/notes/effect.html
University of South Florida (2004). Gender and ethnicity distribution and employee headcount: Fall 2003. Retrieved March 10, 2004, from http://isis.fastmail.usf.edu/bpa/factbook/fb2004/default.htm
University of South Florida (2006). 2005 – 2006 academic year, Tampa physical campus, intended and declared majors in all colleges, all departments, all majors: Annual unduplicated student headcount. Retrieved December 29, 2006, from http://usfweb2.usf.edu/infomart/infomartapps/Major10.aspx
Vasan, R. S., Larson, M. G., Leip, E. P., Evans, J. C.. O'Donnell, C. J., Kannel, W. B., et al. (2001). Impact of High-Normal Blood Pressure on the Risk of
Cardiovascular Disease. New England Journal of Medicine, 345(18), 1291-1297.
Webb, M. S. (2002). Stress management strategies in hypertension control. Ethnicity & Disease, 12 (Supplemental 3), S3-95-S3-100.
129
Webb, M. S., & Beckstead. J. W. (2002). Stress-related influences on blood pressure in African American women. Research in Nursing & Health, 25, 383-393.
Wendler, M. C. (1999). An investigation of selected outcomes of Tellington touch in healthy soldiers (Doctoral dissertation, University of Colorado, 1999). Dissertation Abstracts International, 60, 5439.
Wendler, M. C., (2003). Effects of Tellington touch in healthy adults awaiting venipuncture. Research in Nursing & Health, 26, 40-52.
Weil, A. (2007). Hypertension. Retrieved January 27, 2007, from http://www.alternativemedicine.com/common/adam/DisplayMonograph.aspstoreID=02AD61F001A74B5887D3BD11F6C28169&name=ConsConditions_Hypertensioncc#MassagePT
World Health Organization, International Society of Hypertension Writing Group (2003). 2003 World Health Organization (WHO)/ International Society of Hypertension (ISH) statement on management of hypertension. Journal of Hypertension, 21(11), 1983-1992.
Yan, L. L., Liu. K., Matthews, K. A., Daviglus, M. L., Ferguson, F., & Kiefe, C. I. (2003). Psychosocial factors and risk of hypertension: The coronary artery risk development in young adults (CARDIA) study. Journal of American Medical Association, 290(16), 2138-2148.
Yeh, G. Y., Davis, R. B., & Phillips, R.S. (2006). Use of complementary therapies in patients with cardiovascular disease. American Journal of Cardiology, 98(5), 673-680.
Yucha, C. B., Clark, L., Smith, M., Uris, P., LaFleur, B., & Duval, S. (2001). The effect of biofeedback in hypertension. Applied Nursing Research, 14(1), 29-35.

130
Appendices

131
Appendix 1
List of Music CDs
Benghiat, M. (2002). At Peace: Flow [CD]. Riverside, CT: At Peace Media.
Benghiat, M. (2003). At Peace: Spirit [CD]. Riverside, CT: At Peace Media.
Frantzich, P. (2005). Lifescapes: The Best of Massage & Meditation [ 2 CD set].
Montreal:Compass Productions.
Gibson, D. (1989). Solitudes: Harmony [CD]. Toronto: Solitudes, Ltd.
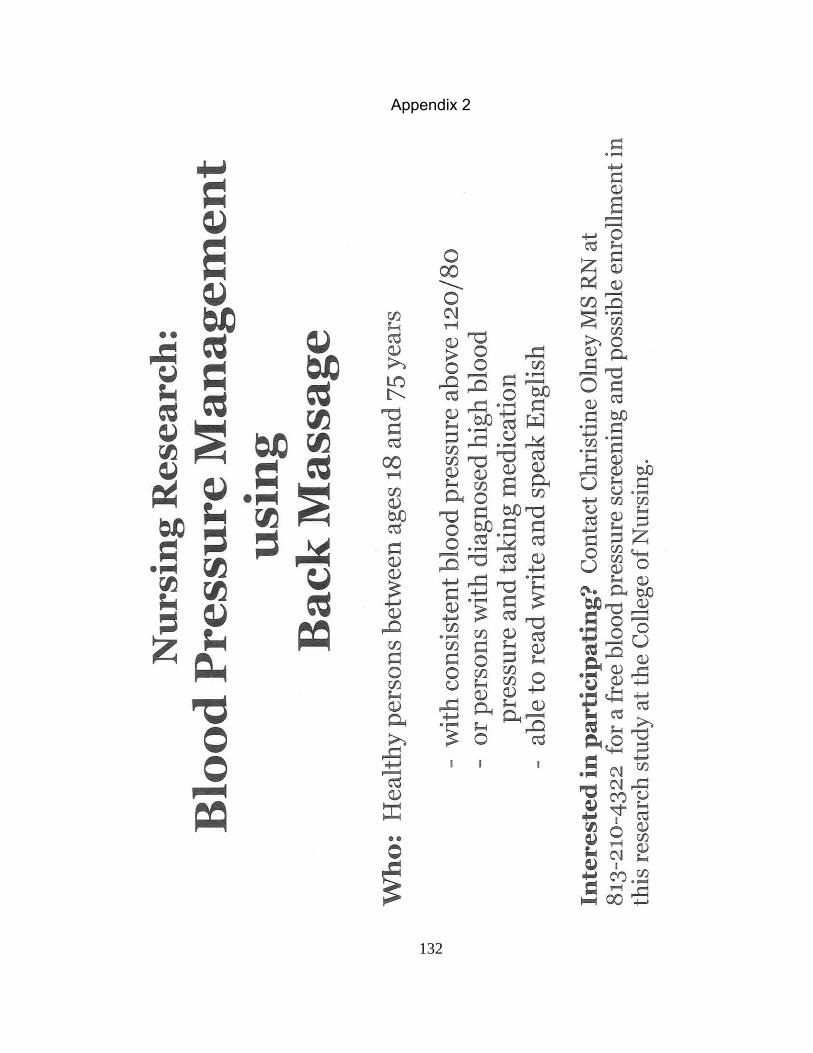
132
Appendix 2
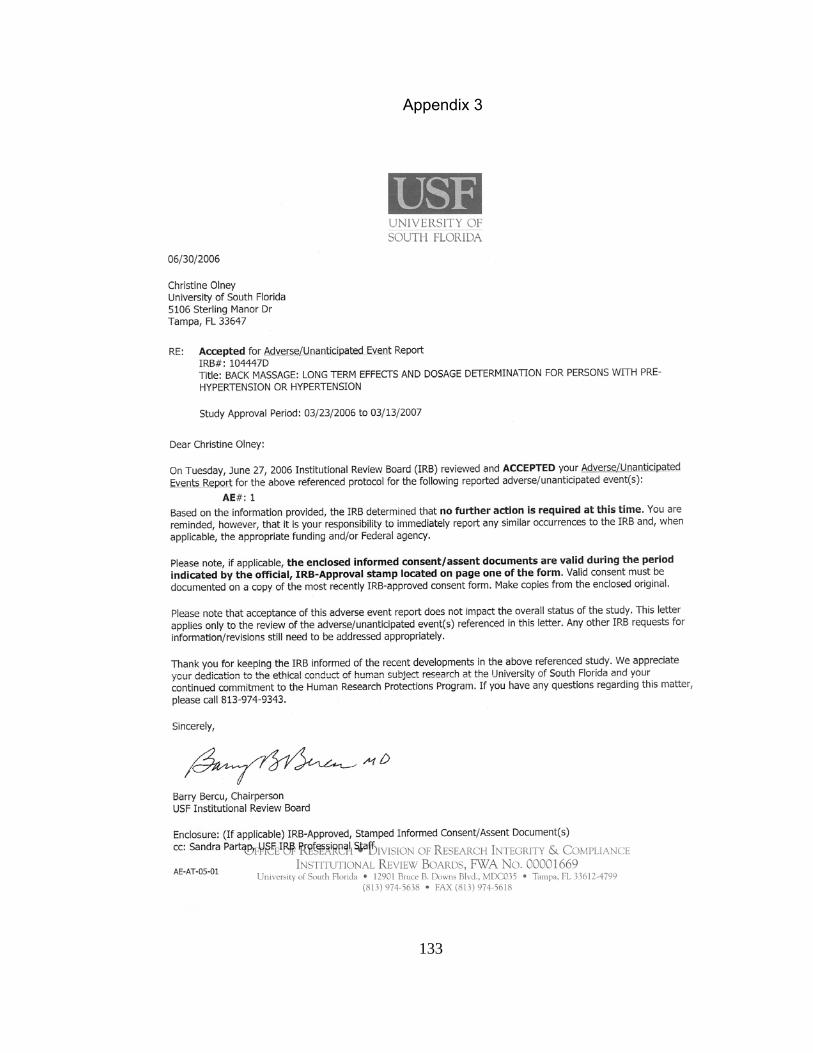
133
Appendix 3
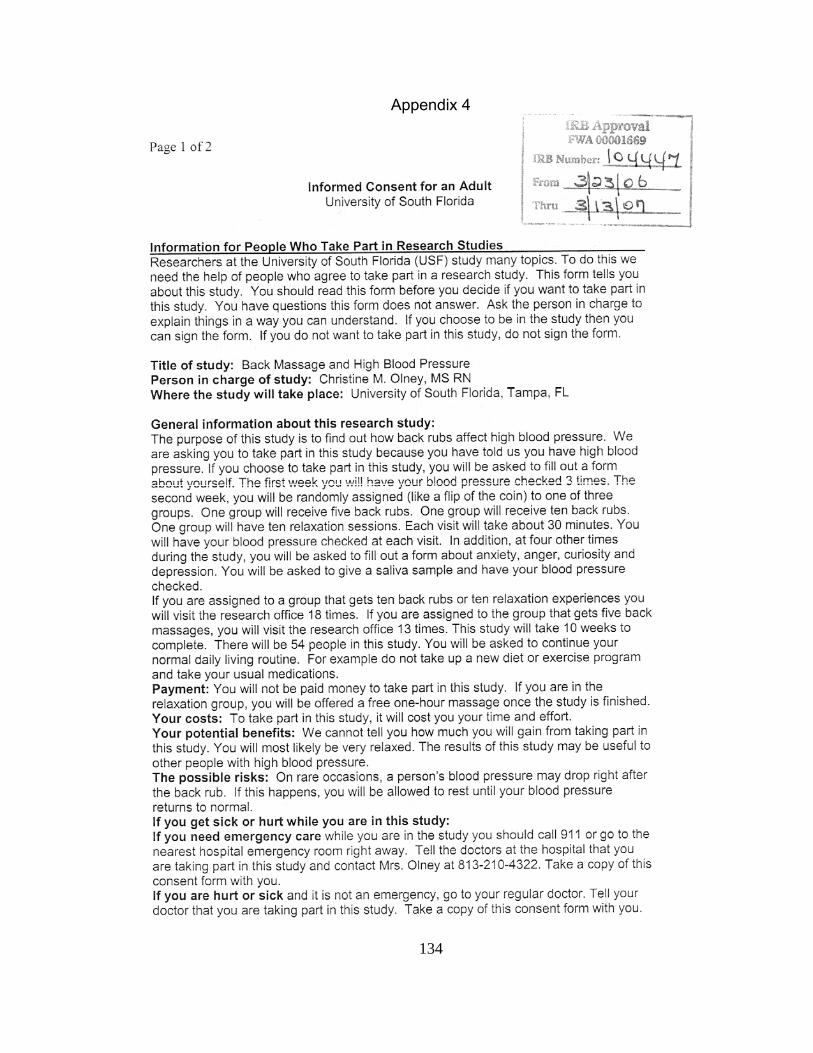
134
Appendix 4
135
Appendix 4 (continued)
136
Appendix 5
137
Appendix 5 (continued)
138
Appendix 5 (continued)

139
Appendix 5 (continued)
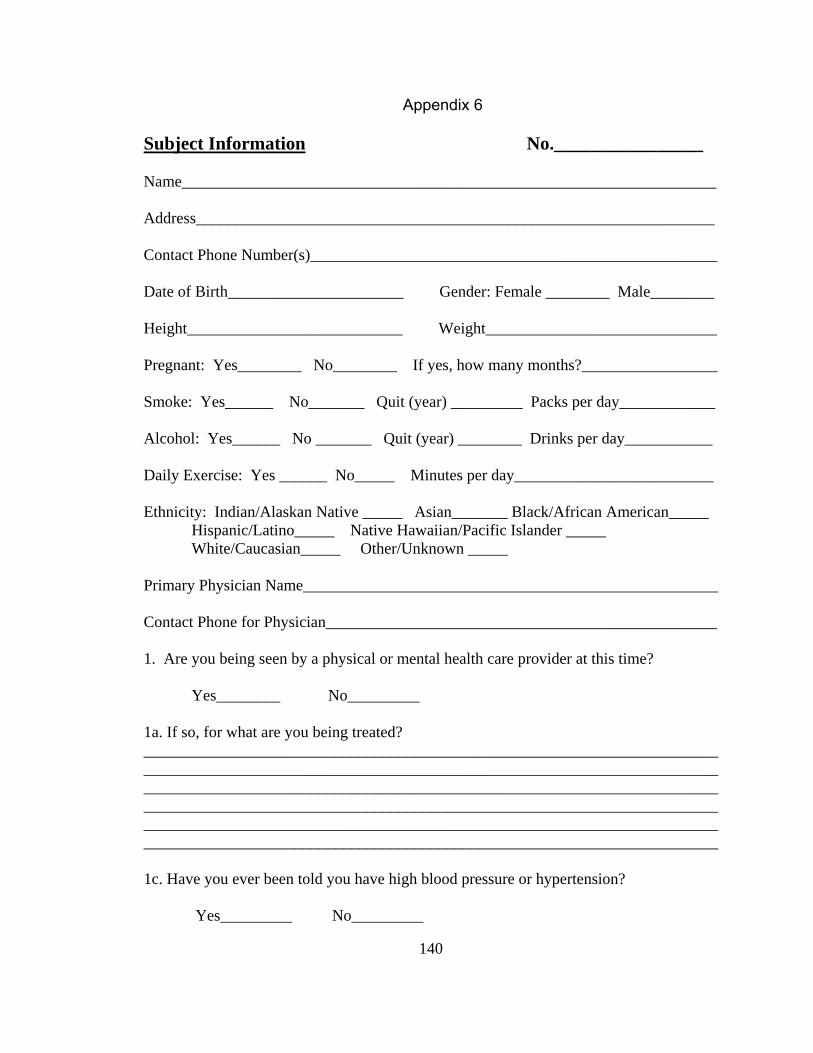
140
Appendix 6
Subject Information No.________________ Name___________________________________________________________________ Address_________________________________________________________________ Contact Phone Number(s)___________________________________________________ Date of Birth______________________ Gender: Female ________ Male________ Height___________________________ Weight_____________________________ Pregnant: Yes________ No________ If yes, how many months?_________________ Smoke: Yes______ No_______ Quit (year) _________ Packs per day____________ Alcohol: Yes______ No _______ Quit (year) ________ Drinks per day___________ Daily Exercise: Yes ______ No_____ Minutes per day_________________________ Ethnicity: Indian/Alaskan Native _____ Asian_______ Black/African American_____ Hispanic/Latino_____ Native Hawaiian/Pacific Islander _____ White/Caucasian_____ Other/Unknown _____ Primary Physician Name____________________________________________________ Contact Phone for Physician_________________________________________________ 1. Are you being seen by a physical or mental health care provider at this time? Yes________ No_________ 1a. If so, for what are you being treated? ________________________________________________________________________________________________________________________________________________________________________________________________________________________________________________________________________________________________________________________________________________________________________________________________________________________________________________ 1c. Have you ever been told you have high blood pressure or hypertension? Yes_________ No_________

141
Appendix 6 (continued)
1d. If you answered “yes”, for how many years? _______________________________ 1e. Do you take medication for high blood pressure or hypertension? Yes_________ No_________ 1f. If you answered “yes”, what is/are the name(s) of the medication(s) and how long have you been taking the medication(s)? ________________________________________________________________________________________________________________________________________________________________________________________________________________________ 2. What other medications are you taking at this time? Include prescriptions, over the counter and illegal medications, herbals, vitamins or any other treatments that you either take orally, rectally, inject or put on your skin. Also include dosage and how often you take the medication. ________________________________________________________________________________________________________________________________________________________________________________________________________________________________________________________________________________________________________________________________________________________________________________________________________________________________________________ 3. List any allergies you have to medications, food, animals or household items (or other). ________________________________________________________________________________________________________________________________________________________________________________________________________________________ 4. Check any therapies you are receiving: _________ Massage therapy _________ Physical Therapy _________ Acupuncture _________ Occupational Therapy _________ Herbal therapy _________ Other 3a. If you check any of the above, for what are you being treated? ________________________________________________________________________________________________________________________________________________________________________________________________________________________
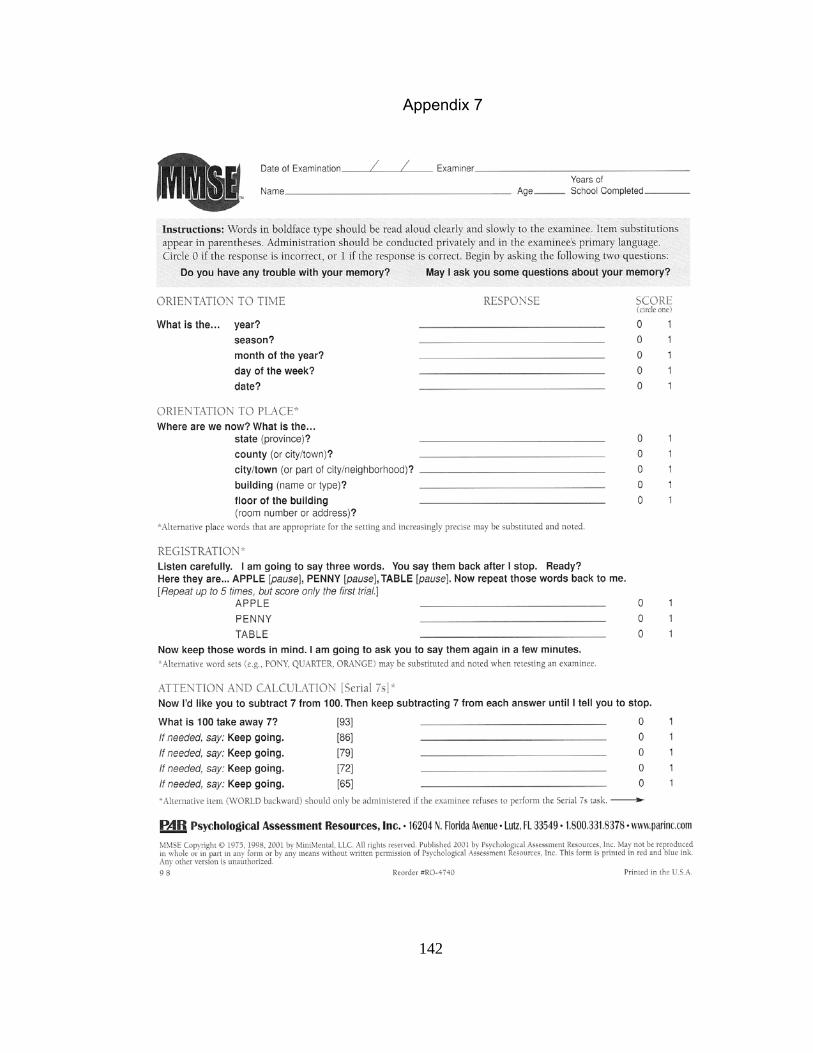
142
Appendix 7

143
Appendix 7 (continued)
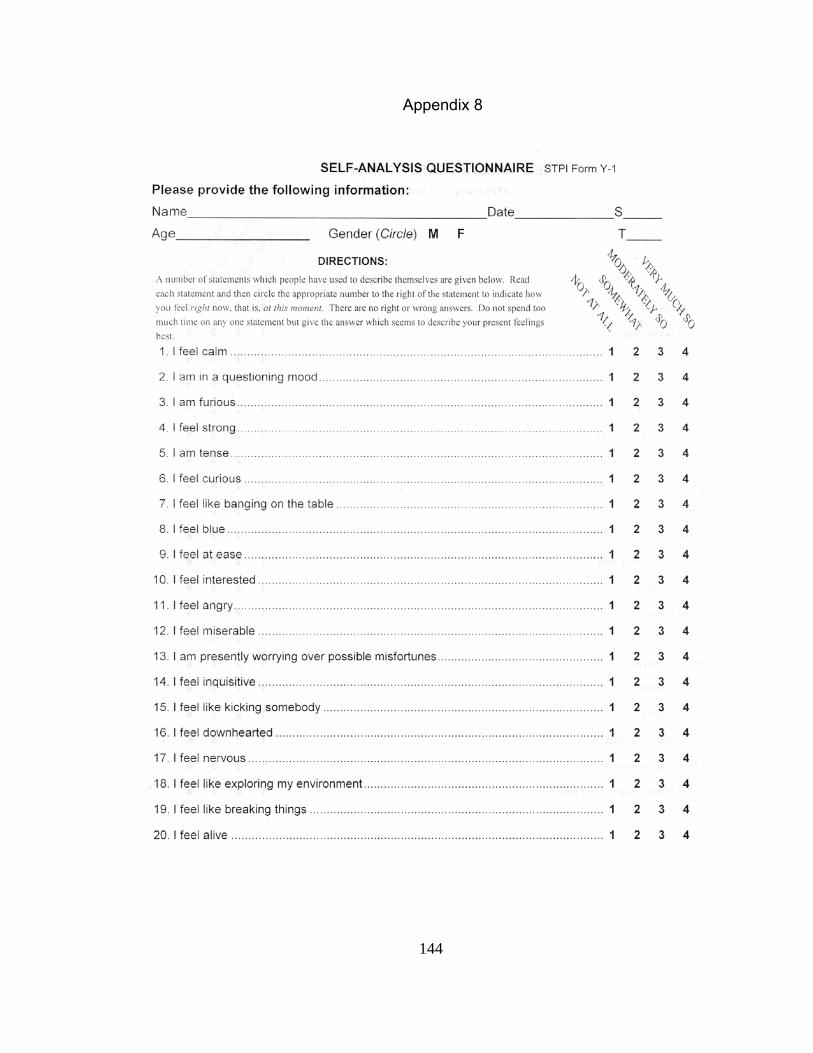
144
Appendix 8
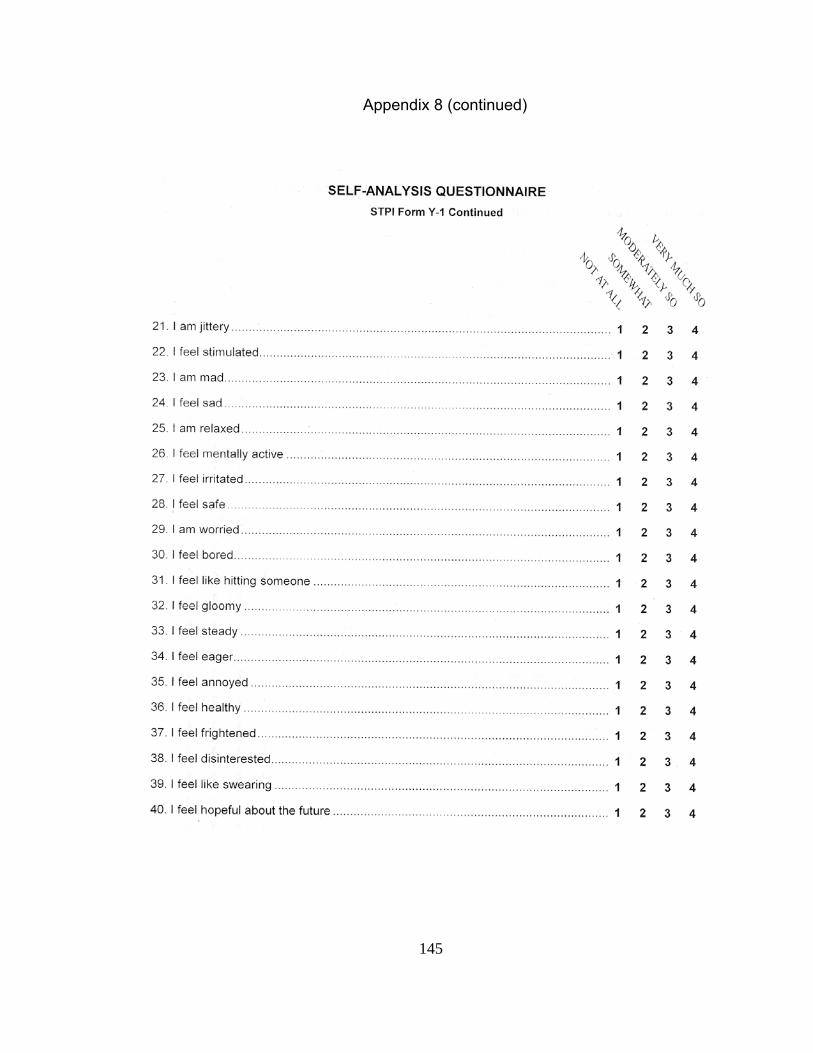
145
Appendix 8 (continued)
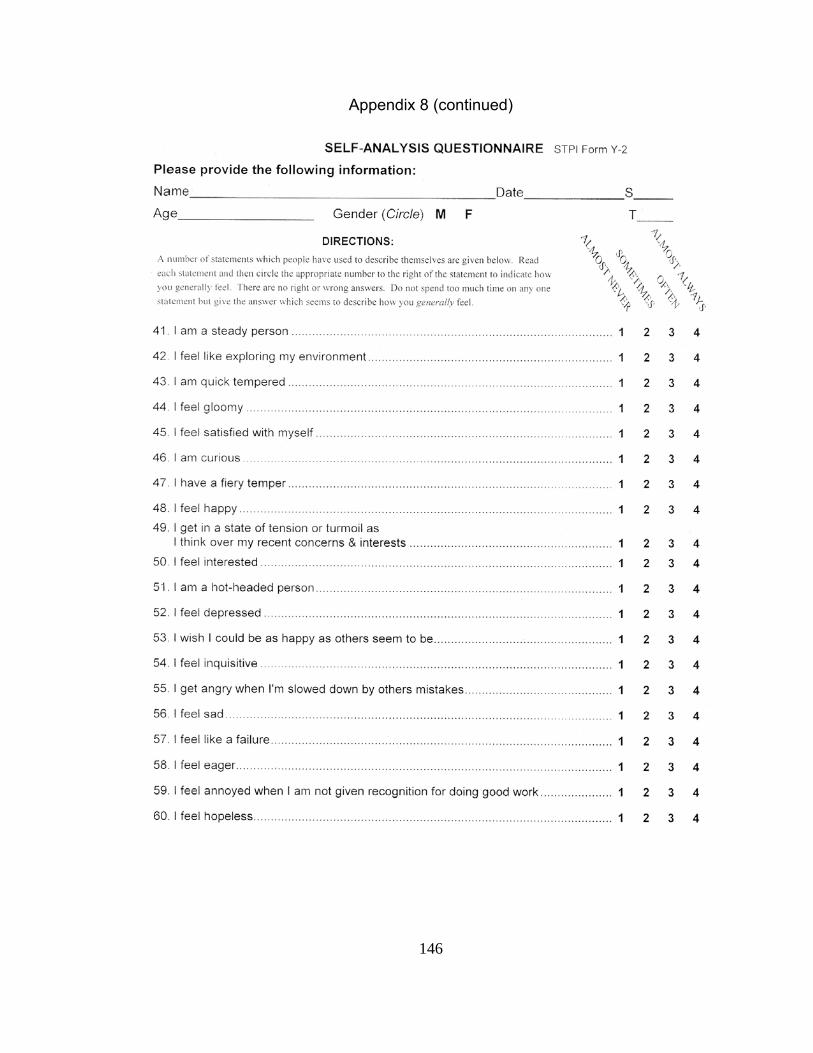
146
Appendix 8 (continued)

147
Appendix 8 (continued)
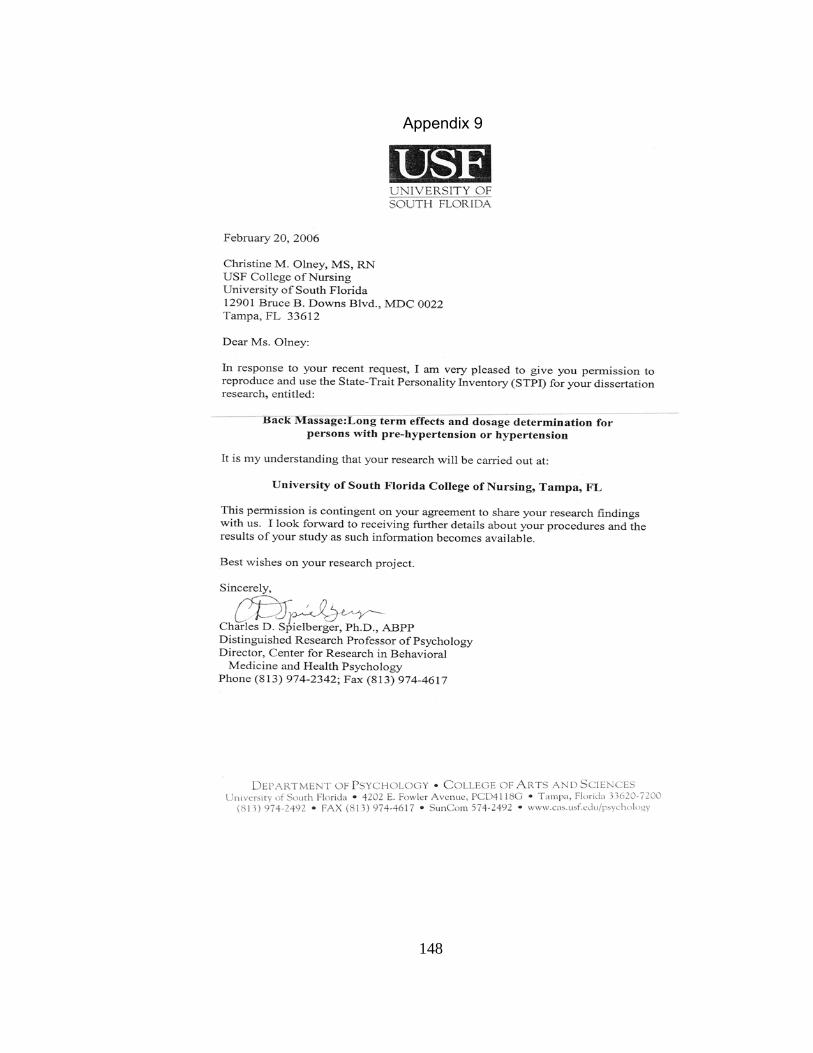
148
Appendix 9

149
Appendix 10
Subject Touch Perception Scale: A back massage feels different to every person that gets one. The researcher would like to understand how the back massages felt to you. Below is a list of words that will help you tell the researcher what the back massages felt like to you. Directions: Please circle the “X” that most correctly describes the feeling that you experienced when you got your back massages. Example: On the soothing/irritating word pair, if you felt the back massages were soothing, you would circle the “X” closer to the word “soothing” but if the back massages were irritating to you, you would circle the last “X”. The “X” that you circle is the right response for you. To me the back massages felt: ---------------------very------less----neutral----less---very------------------------ 1. Soothing X X X X X Irritating 2. Unpleasant X X X X X Pleasant 3. Too soft X X X X X Too hard 4. Rough X X X X X Smooth 5. Rhythmic X X X X X Jerky 6. Relaxing X X X X X Tensing
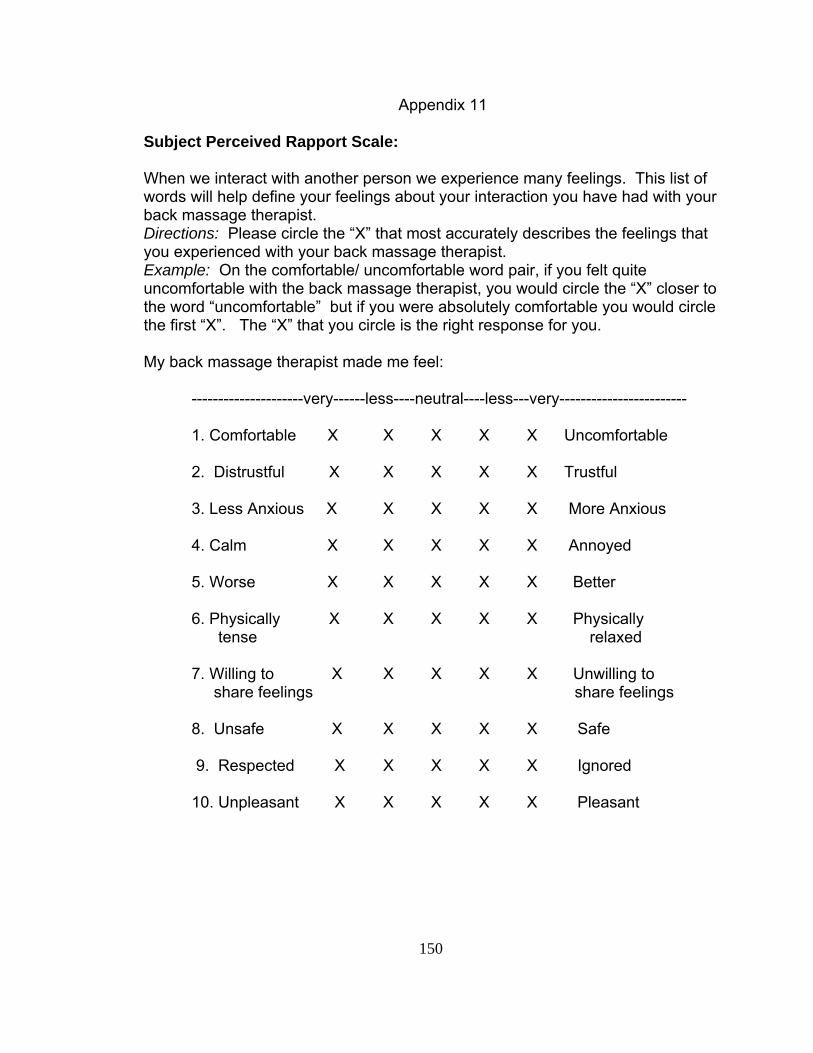
150
Appendix 11
Subject Perceived Rapport Scale: When we interact with another person we experience many feelings. This list of words will help define your feelings about your interaction you have had with your back massage therapist. Directions: Please circle the “X” that most accurately describes the feelings that you experienced with your back massage therapist. Example: On the comfortable/ uncomfortable word pair, if you felt quite uncomfortable with the back massage therapist, you would circle the “X” closer to the word “uncomfortable” but if you were absolutely comfortable you would circle the first “X”. The “X” that you circle is the right response for you. My back massage therapist made me feel: ---------------------very------less----neutral----less---very------------------------ 1. Comfortable X X X X X Uncomfortable 2. Distrustful X X X X X Trustful 3. Less Anxious X X X X X More Anxious 4. Calm X X X X X Annoyed 5. Worse X X X X X Better 6. Physically X X X X X Physically tense relaxed 7. Willing to X X X X X Unwilling to share feelings share feelings 8. Unsafe X X X X X Safe 9. Respected X X X X X Ignored 10. Unpleasant X X X X X Pleasant

151
Appendix 12: Schedule for Participants
If you are in the group that receives 10 back massages OR 10 relaxation sessions:
Week 1 1 1 2 2 2 3 3 3 4 4 4 5 5 5 6 8 10 Visit: 1 2 3 4 5 6 7 8 9 10 11 12 13 14 15 16 17 18 Consent Habituation T1* Treatments: Visits 6-15 T2 T3 T4
If you are in the group that receives 5 back massages:
Week 1 1 1 2 2 2 3 3 3 4 4 8 10 Visit: 1 2 3 4 5 6 7 8 9 10 11 12 13 Consent Habituation T1* Treatments: Visits 6-10 T2 T3 T4 Legend Consent: the first visit you will read and sign consent and HIPAA forms and fill out a demographics form. Habituation: At these three visit you will have your blood pressure taken 3 times and you will be adjusting to the
research environment. T1, T2, T3, & T4: These are the days the investigator will take your blood pressure for the actual data base,
collect your saliva and have you fill out a personality inventory. *At the end of the first visit (T1) you will be randomized, in other words, you will draw the group you will be in, for the study.
Treatments: You will either be receiving 10 ten-minute back massages, 5 ten-minute back massages or 10 ten-minute relaxation sessions.
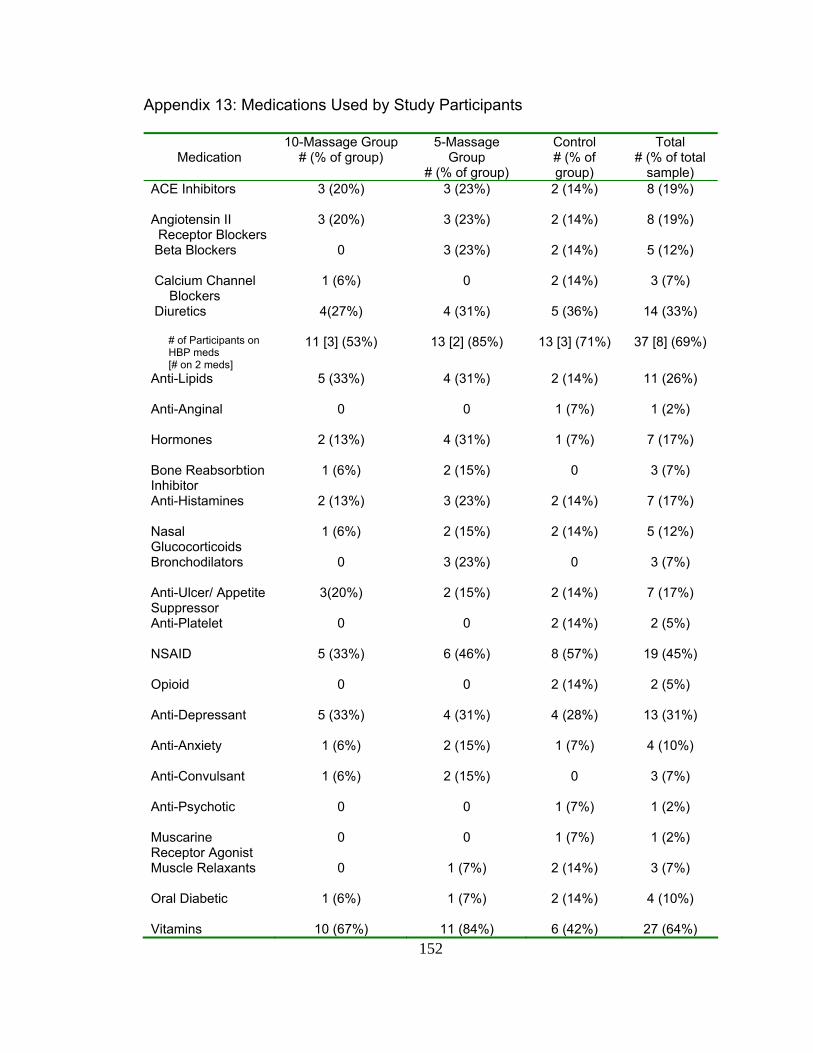
152
Appendix 13: Medications Used by Study Participants
Medication
10-Massage Group # (% of group)
5-Massage Group
# (% of group)
Control # (% of group)
Total # (% of total
sample) ACE Inhibitors
3 (20%) 3 (23%) 2 (14%) 8 (19%)
Angiotensin II Receptor Blockers
3 (20%) 3 (23%) 2 (14%) 8 (19%)
Beta Blockers
0 3 (23%) 2 (14%) 5 (12%)
Calcium Channel Blockers
1 (6%) 0 2 (14%) 3 (7%)
Diuretics
4(27%) 4 (31%) 5 (36%) 14 (33%)
# of Participants on HBP meds [# on 2 meds]
11 [3] (53%) 13 [2] (85%) 13 [3] (71%) 37 [8] (69%)
Anti-Lipids
5 (33%) 4 (31%) 2 (14%) 11 (26%)
Anti-Anginal
0 0 1 (7%) 1 (2%)
Hormones
2 (13%) 4 (31%) 1 (7%) 7 (17%)
Bone Reabsorbtion Inhibitor
1 (6%) 2 (15%) 0 3 (7%)
Anti-Histamines
2 (13%) 3 (23%) 2 (14%) 7 (17%)
Nasal Glucocorticoids
1 (6%) 2 (15%) 2 (14%) 5 (12%)
Bronchodilators
0 3 (23%) 0 3 (7%)
Anti-Ulcer/ Appetite Suppressor
3(20%) 2 (15%) 2 (14%) 7 (17%)
Anti-Platelet
0 0 2 (14%) 2 (5%)
NSAID
5 (33%) 6 (46%) 8 (57%) 19 (45%)
Opioid
0 0 2 (14%) 2 (5%)
Anti-Depressant
5 (33%) 4 (31%) 4 (28%) 13 (31%)
Anti-Anxiety
1 (6%) 2 (15%) 1 (7%) 4 (10%)
Anti-Convulsant
1 (6%) 2 (15%) 0 3 (7%)
Anti-Psychotic
0 0 1 (7%) 1 (2%)
Muscarine Receptor Agonist
0 0 1 (7%) 1 (2%)
Muscle Relaxants
0 1 (7%) 2 (14%) 3 (7%)
Oral Diabetic
1 (6%) 1 (7%) 2 (14%) 4 (10%)
Vitamins 10 (67%) 11 (84%) 6 (42%) 27 (64%)
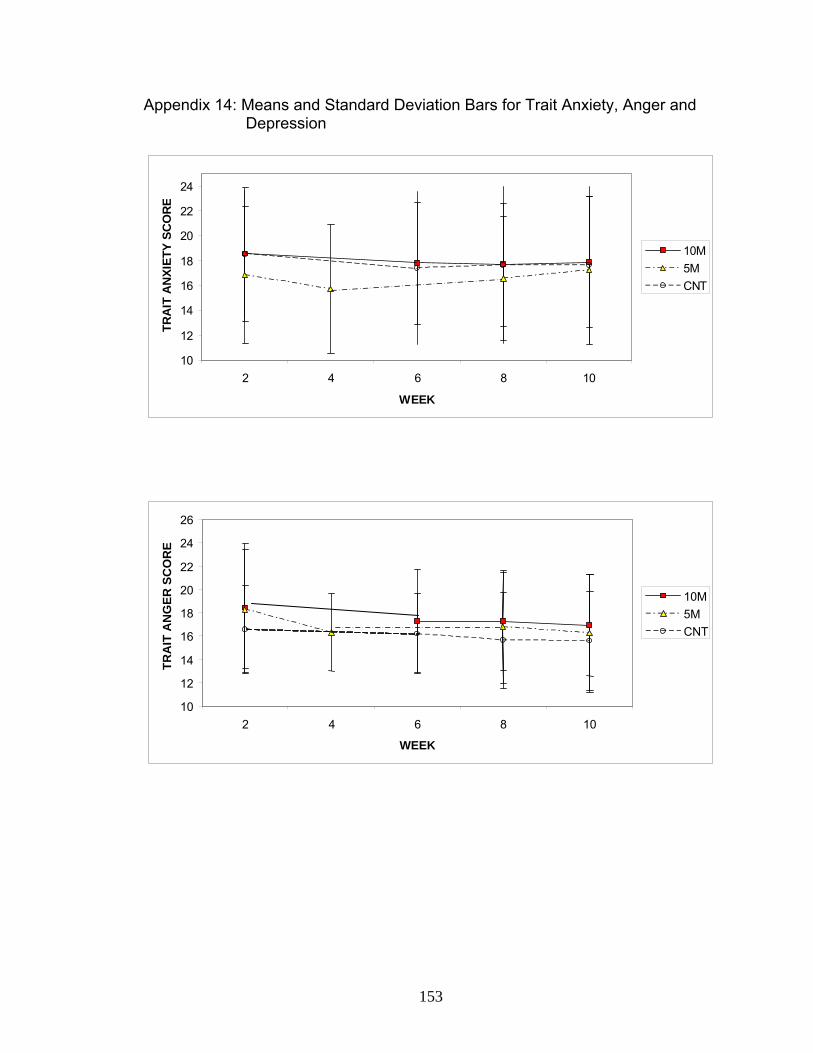
153
Appendix 14: Means and Standard Deviation Bars for Trait Anxiety, Anger and Depression
10
12
14
16
18
20
22
24
2 4 6 8 10
WEEK
TRA
IT A
NXI
ETY
SCO
RE
10M5MCNT
10 12 14 16 18 20 22 24 26
2 4 6 8 10 WEEK
TRA
IT A
NG
ER S
CO
RE
10M5MCNT

154
Appendix 14: Means and Standard Deviation Bars for Trait Anxiety, Anger and Depression (Continued)
79
111315171921232527
2 4 6 8 10
WEEK
TRA
IT D
EPR
ESSI
ON
SC
OR
E
10M5MCNT

155
Appendix 15: Correlations of pertinent variables Correlation of pertinent variables at pre-randomization measurement (Week 2)
PRE SYS
PRE DIAS
AGE BMI YRS HBP
MPD EXC
A-HPN S- ANX1
S-ANG1
S-DEP1
T-ANX1
T-ANG1
T- DEP1
CORT1
PRESYS .490 -.131 .053 -.053 .116 -.438** .165 .039 .072 .048 .027 .005 .079 PRE DIAS -.220 -.232 -.033 .187 -.348* .235 .117 .208 .081 .130 -.051 .040 AGE -.068 .236 -.443* .304 -.260 -.319* -.091 -.075 -.216 -.093 .033 BMI .140 -.268 .251 .207 .133 .354* .398* .087 .407* -.255 YRSHBP -.126 .326* -.168 -.037 -.037 -.197 .034 -.048 .193 MPDEXC -.415** -.158 .013 -.216 -.160 .158 -.211 -.015 A-HPN -.023 .184 .021 -.049 .150 -.042 -.108 S-ANX1 .703* .636* .504* .102 .476* .028 S-ANG1 .393* .366* .362* .390* -.121 S-DEP1 .620* -.015 .622* -.008 T-ANX1 .327* .872* .047 T-ANG1 .258 .019 T-DEP1 .322* CORT1
* Pearson’s Correlation significant at the .05 level (2-tailed). ** Pearson’s Correlation significant at the .01 level (2-tailed). A-HPN = Antihypertensive Meds (angiotensin converting enzyme inhibitors, angiotensin-receptor blockers, calcium channel blockers, beta-blockers, and diuretics) PRESYS = Systolic blood pressure measured prior to randomization PRE DIAS = Diastolic blood pressure measured prior to randomization BMI = Body mass index YRSHBP = Years the participant has been diagnosed with hypertension MPDEXC = Average number of minutes the participant exercises every day S-ANX1 = State anxiety measured prior to randomization S-ANG1 = State anger measured prior to randomization T-ANX1 = Trait anxiety measured prior to randomization T-ANG1 = Trait anger measured prior to randomization T-DEP1 = Trait depression measured prior to randomization CORT1 = Salivary cortisol measured prior to randomization
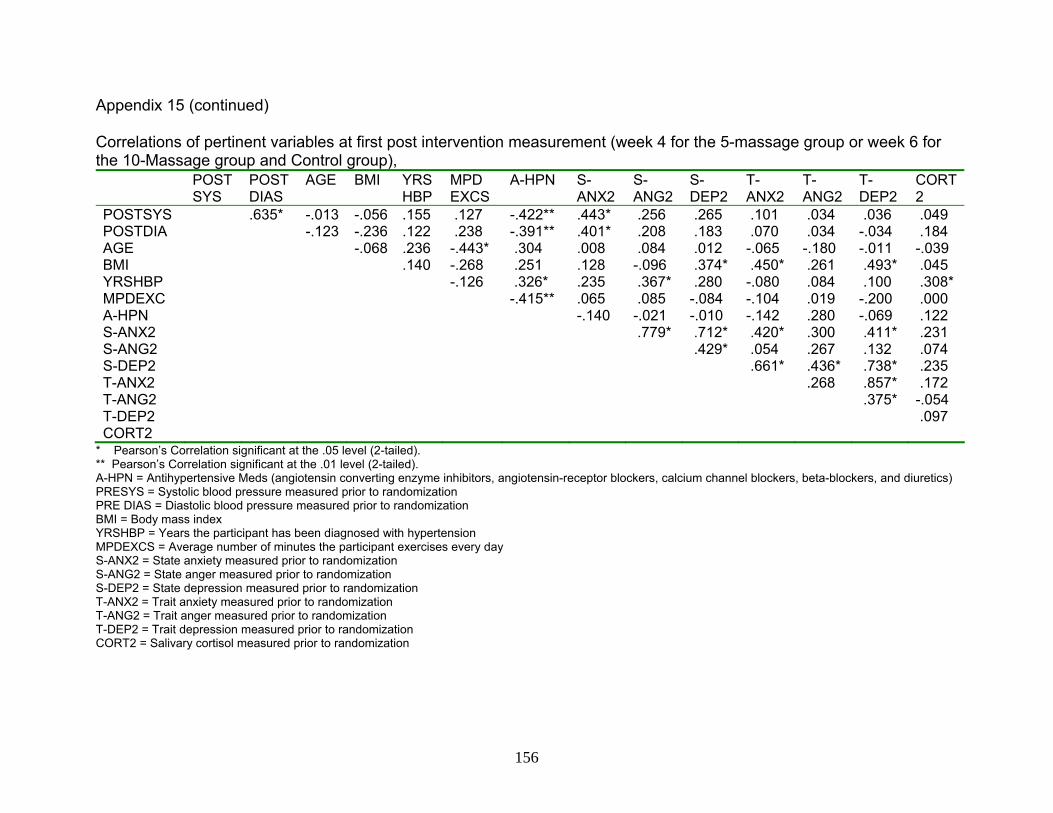
156
Appendix 15 (continued) Correlations of pertinent variables at first post intervention measurement (week 4 for the 5-massage group or week 6 for the 10-Massage group and Control group),
POST SYS
POST DIAS
AGE BMI YRS HBP
MPD EXCS
A-HPN S- ANX2
S-ANG2
S-DEP2
T-ANX2
T-ANG2
T- DEP2
CORT2
POSTSYS .635* -.013 -.056 .155 .127 -.422** .443* .256 .265 .101 .034 .036 .049 POSTDIA -.123 -.236 .122 .238 -.391** .401* .208 .183 .070 .034 -.034 .184 AGE -.068 .236 -.443* .304 .008 .084 .012 -.065 -.180 -.011 -.039 BMI .140 -.268 .251 .128 -.096 .374* .450* .261 .493* .045 YRSHBP -.126 .326* .235 .367* .280 -.080 .084 .100 .308* MPDEXC -.415** .065 .085 -.084 -.104 .019 -.200 .000 A-HPN -.140 -.021 -.010 -.142 .280 -.069 .122 S-ANX2 .779* .712* .420* .300 .411* .231 S-ANG2 .429* .054 .267 .132 .074 S-DEP2 .661* .436* .738* .235 T-ANX2 .268 .857* .172 T-ANG2 .375* -.054 T-DEP2 .097 CORT2
* Pearson’s Correlation significant at the .05 level (2-tailed). ** Pearson’s Correlation significant at the .01 level (2-tailed). A-HPN = Antihypertensive Meds (angiotensin converting enzyme inhibitors, angiotensin-receptor blockers, calcium channel blockers, beta-blockers, and diuretics) PRESYS = Systolic blood pressure measured prior to randomization PRE DIAS = Diastolic blood pressure measured prior to randomization BMI = Body mass index YRSHBP = Years the participant has been diagnosed with hypertension MPDEXCS = Average number of minutes the participant exercises every day S-ANX2 = State anxiety measured prior to randomization S-ANG2 = State anger measured prior to randomization S-DEP2 = State depression measured prior to randomization T-ANX2 = Trait anxiety measured prior to randomization T-ANG2 = Trait anger measured prior to randomization T-DEP2 = Trait depression measured prior to randomization CORT2 = Salivary cortisol measured prior to randomization
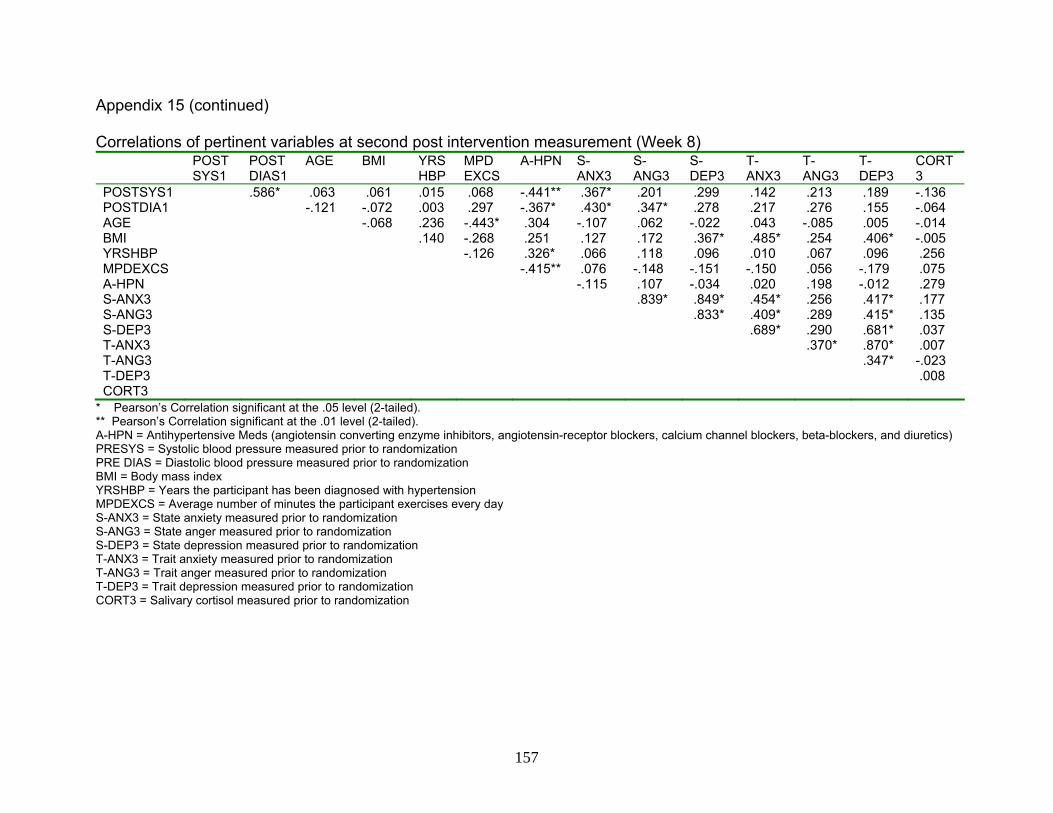
157
Appendix 15 (continued) Correlations of pertinent variables at second post intervention measurement (Week 8) POST
SYS1 POST DIAS1
AGE BMI YRS HBP
MPD EXCS
A-HPN S- ANX3
S-ANG3
S-DEP3
T-ANX3
T-ANG3
T-DEP3
CORT3
POSTSYS1 .586* .063 .061 .015 .068 -.441** .367* .201 .299 .142 .213 .189 -.136 POSTDIA1 -.121 -.072 .003 .297 -.367* .430* .347* .278 .217 .276 .155 -.064 AGE -.068 .236 -.443* .304 -.107 .062 -.022 .043 -.085 .005 -.014 BMI .140 -.268 .251 .127 .172 .367* .485* .254 .406* -.005 YRSHBP -.126 .326* .066 .118 .096 .010 .067 .096 .256 MPDEXCS -.415** .076 -.148 -.151 -.150 .056 -.179 .075 A-HPN -.115 .107 -.034 .020 .198 -.012 .279 S-ANX3 .839* .849* .454* .256 .417* .177 S-ANG3 .833* .409* .289 .415* .135 S-DEP3 .689* .290 .681* .037 T-ANX3 .370* .870* .007 T-ANG3 .347* -.023 T-DEP3 .008 CORT3
* Pearson’s Correlation significant at the .05 level (2-tailed). ** Pearson’s Correlation significant at the .01 level (2-tailed). A-HPN = Antihypertensive Meds (angiotensin converting enzyme inhibitors, angiotensin-receptor blockers, calcium channel blockers, beta-blockers, and diuretics) PRESYS = Systolic blood pressure measured prior to randomization PRE DIAS = Diastolic blood pressure measured prior to randomization BMI = Body mass index YRSHBP = Years the participant has been diagnosed with hypertension MPDEXCS = Average number of minutes the participant exercises every day S-ANX3 = State anxiety measured prior to randomization S-ANG3 = State anger measured prior to randomization S-DEP3 = State depression measured prior to randomization T-ANX3 = Trait anxiety measured prior to randomization T-ANG3 = Trait anger measured prior to randomization T-DEP3 = Trait depression measured prior to randomization CORT3 = Salivary cortisol measured prior to randomization

158
Appendix 15 (continued) Correlations of pertinent variables at second post intervention measurement (Week 10)
POST SYS2
POST DIAS2
AGE BMI YRS HBP
MPD EXCS
A-HPN S- ANX4
S-ANG4
S-DEP4
T-ANX4
T-ANG4
T-DEP4
CORT4
POSTSYS2 .604* -.061 -.088 -.009 .059 -.556** .361* .166 .080 -.015 -.036 .060 .186 POSTDIA2 -.130 -.115 .195 .127 -.397** .386* .406* .283 .191 .097 .208 .139 AGE -.068 .236 -.443* .304 -.057 -.026 .022 -.005 -.080 .011 -.042 BMI .140 -.268 .251 .147 .072 .365* .460* .313* .338* .047 YRSHBP -.126 .326* .096 .181 .165 -.016 .155 .067 .205 MPDEXCS -.415** .089 -.014 -.150 -.221 -.013 -.124 .004 A-HPN .008 .165 .052 .043 .296 -.084 .064 S-ANX4 .740* .725* .460* .545* .419* .334* S-ANG4 .477* .248 .504* .189 .085 S-DEP4 .826* .552* .816* .315* T-ANX4 .441* .874* .166 T-ANG4 .419* .101 T-DEP4 .127 CORT4
* Pearson’s Correlation significant at the .05 level (2-tailed). ** Pearson’s Correlation significant at the .01 level (2-tailed). A-HPN = Antihypertensive Meds (angiotensin converting enzyme inhibitors, angiotensin-receptor blockers, calcium channel blockers, beta-blockers, and diuretics) PRESYS = Systolic blood pressure measured prior to randomization PRE DIAS = Diastolic blood pressure measured prior to randomization BMI = Body mass index YRSHBP = Years the participant has been diagnosed with hypertension MPDEXCS = Average number of minutes the participant exercises every day S-ANX4 = State anxiety measured prior to randomization S-ANG4 = State anger measured prior to randomization S-DEP4 = State depression measured prior to randomization T-ANX4 = Trait anxiety measured prior to randomization T-ANG4 = Trait anger measured prior to randomization T-DEP4 = Trait depression measured prior to randomization CORT4 = Salivary cortisol measured prior to randomization
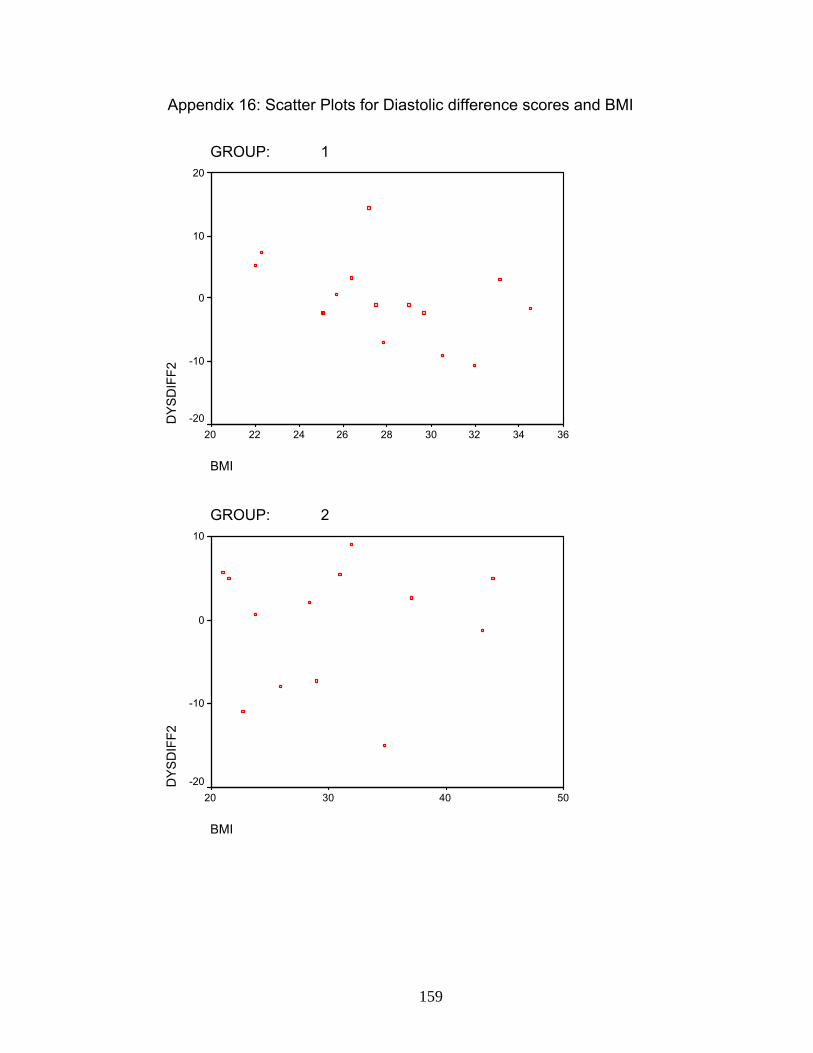
159
Appendix 16: Scatter Plots for Diastolic difference scores and BMI
GROUP: 1
BMI
363432302826242220
DYS
DIF
F220
10
0
-10
-20
GROUP: 2
BMI
50403020
DYS
DIF
F2
10
0
-10
-20
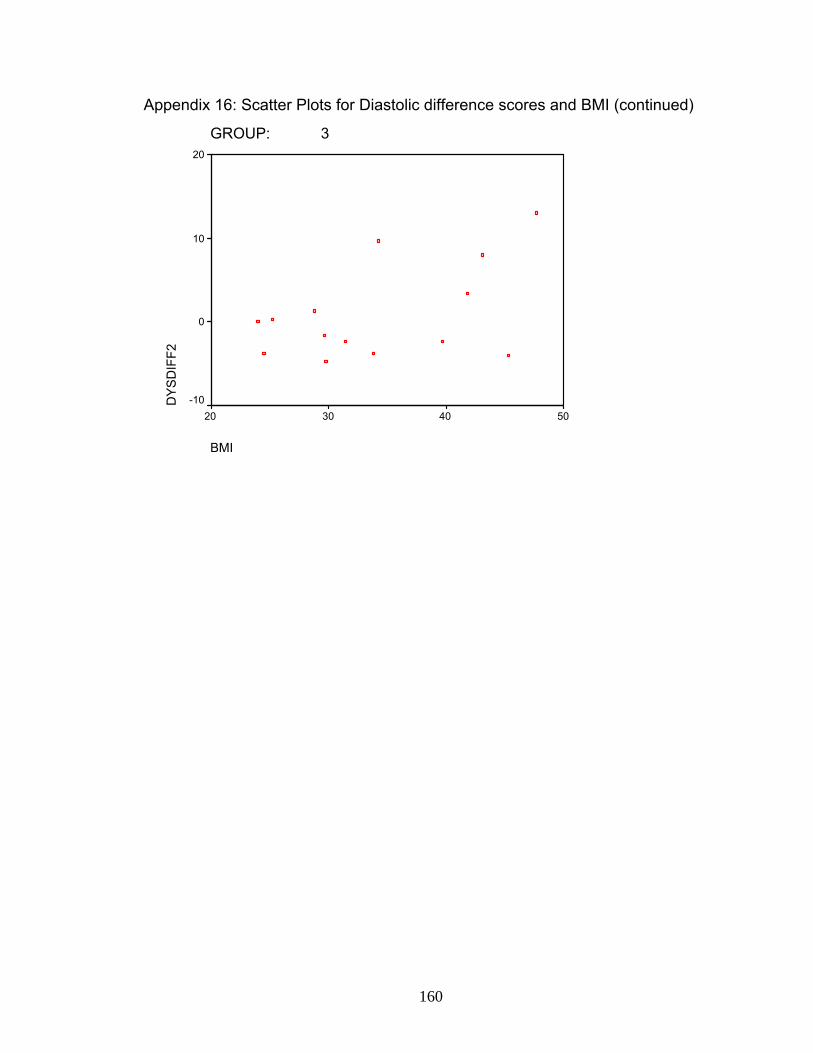
160
Appendix 16: Scatter Plots for Diastolic difference scores and BMI (continued)
GROUP: 3
BMI
50403020
DYS
DIF
F220
10
0
-10
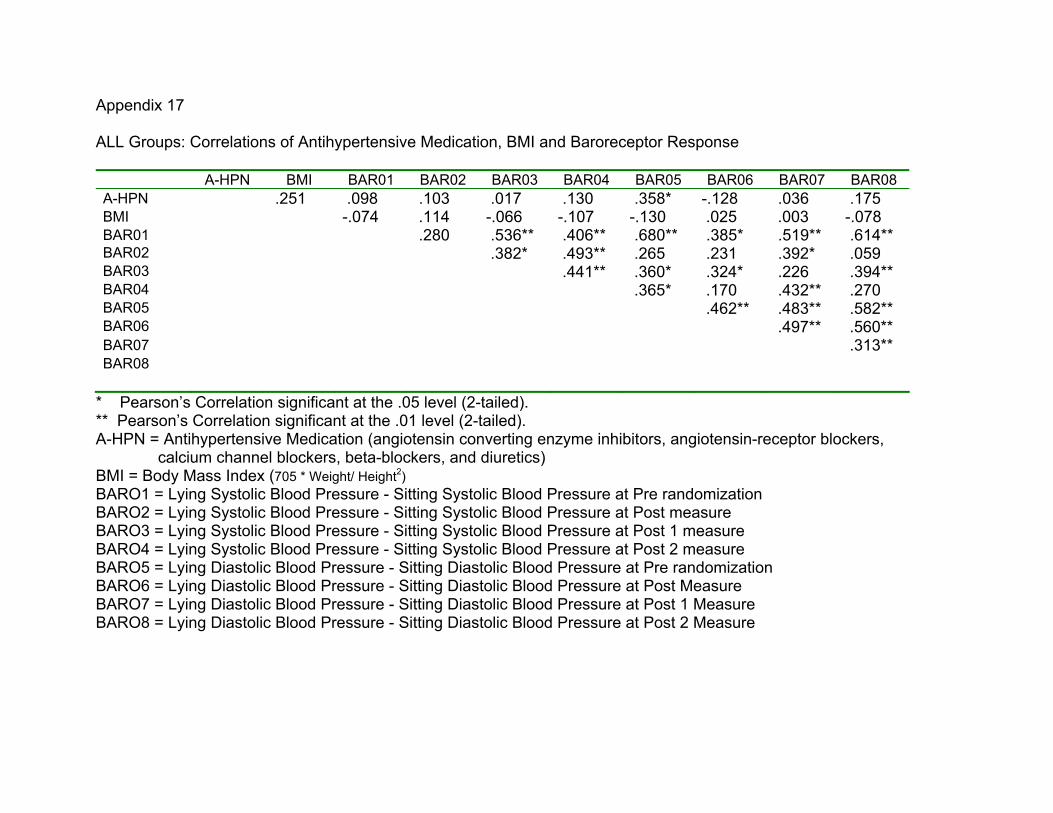
Appendix 17 ALL Groups: Correlations of Antihypertensive Medication, BMI and Baroreceptor Response
A-HPN BMI BAR01 BAR02 BAR03 BAR04 BAR05 BAR06 BAR07 BAR08 A-HPN .251 .098 .103 .017 .130 .358* -.128 .036 .175 BMI -.074 .114 -.066 -.107 -.130 .025 .003 -.078 BAR01 .280 .536** .406** .680** .385* .519** .614** BAR02 .382* .493** .265 .231 .392* .059 BAR03 .441** .360* .324* .226 .394** BAR04 .365* .170 .432** .270 BAR05 .462** .483** .582** BAR06 .497** .560** BAR07 .313** BAR08
* Pearson’s Correlation significant at the .05 level (2-tailed). ** Pearson’s Correlation significant at the .01 level (2-tailed). A-HPN = Antihypertensive Medication (angiotensin converting enzyme inhibitors, angiotensin-receptor blockers, calcium channel blockers, beta-blockers, and diuretics) BMI = Body Mass Index (705 * Weight/ Height2) BARO1 = Lying Systolic Blood Pressure - Sitting Systolic Blood Pressure at Pre randomization BARO2 = Lying Systolic Blood Pressure - Sitting Systolic Blood Pressure at Post measure BARO3 = Lying Systolic Blood Pressure - Sitting Systolic Blood Pressure at Post 1 measure BARO4 = Lying Systolic Blood Pressure - Sitting Systolic Blood Pressure at Post 2 measure BARO5 = Lying Diastolic Blood Pressure - Sitting Diastolic Blood Pressure at Pre randomization BARO6 = Lying Diastolic Blood Pressure - Sitting Diastolic Blood Pressure at Post Measure BARO7 = Lying Diastolic Blood Pressure - Sitting Diastolic Blood Pressure at Post 1 Measure BARO8 = Lying Diastolic Blood Pressure - Sitting Diastolic Blood Pressure at Post 2 Measure

162
Appendix 17 (continued) 10-Massage Group: Correlations of Antihypertensive Medication, BMI and Baroreceptor Response
A-HPN BMI BAR01 BAR02 BAR03 BAR04 BAR05 BAR06 BAR07 BAR08 A-HPN .318 .051 .235 .122 .086 .165 -.477 -.168 .238 BMI -.350 .351 -.162 .109 -.146 -.007 .115 -.294 BAR01 .170 .435 .248 .815** .420 .492 .824** BAR02 .156 .219 .208 .047 .220 .045 BAR03 .040 .367 .307 -.077 .339 BAR04 .103 .467 .270 .532* BAR05 .316 .653** .597* BAR06 .523* .423 BAR07 .308 BAR08
* Pearson’s Correlation significant at the .05 level (2-tailed). ** Pearson’s Correlation significant at the .01 level (2-tailed). A-HPN = Antihypertensive Medication (angiotensin converting enzyme inhibitors, angiotensin-receptor blockers, calcium channel blockers, beta-blockers, and diuretics) BMI = Body Mass Index (705 * Weight/ Height2) BARO1 = Lying Systolic Blood Pressure - Sitting Systolic Blood Pressure at Pre randomization BARO2 = Lying Systolic Blood Pressure - Sitting Systolic Blood Pressure at Post measure BARO3 = Lying Systolic Blood Pressure - Sitting Systolic Blood Pressure at Post 1 measure BARO4 = Lying Systolic Blood Pressure - Sitting Systolic Blood Pressure at Post 2 measure BARO5 = Lying Diastolic Blood Pressure - Sitting Diastolic Blood Pressure at Pre randomization BARO6 = Lying Diastolic Blood Pressure - Sitting Diastolic Blood Pressure at Post Measure BARO7 = Lying Diastolic Blood Pressure - Sitting Diastolic Blood Pressure at Post 1 Measure BARO8 = Lying Diastolic Blood Pressure - Sitting Diastolic Blood Pressure at Post 2 Measure

163
Appendix 17 (continued) 5-Massage Group: Correlations of Antihypertensive Medication, BMI and Baroreceptor Response
A-HPN BMI BAR01 BAR02 BAR03 BAR04 BAR05 BAR06 BAR07 BAR08 A-HPN -.444 -.109 .093 .057 .397 .596* -.153 .104 .192 BMI .201 .111 .245 -.116 -.437 .029 -.001 .205 BAR01 .477 .605* .535 .433 .189 .559* .257 BAR02 .556* .495 .353 .492 .677* .014 BAR03 .619* .360 .350 .417 .349 BAR04 .703** .227 .667* .103 BAR05 .342 .415 .384 BAR06 .415 .499 BAR07 .150 BAR08
* Pearson’s Correlation significant at the .05 level (2-tailed). ** Pearson’s Correlation significant at the .01 level (2-tailed). A-HPN = Antihypertensive Medication (angiotensin converting enzyme inhibitors, angiotensin-receptor blockers, calcium channel blockers, beta-blockers, and diuretics) BMI = Body Mass Index (705 * Weight/ Height2) BARO1 = Lying Systolic Blood Pressure - Sitting Systolic Blood Pressure at Pre randomization BARO2 = Lying Systolic Blood Pressure - Sitting Systolic Blood Pressure at Post measure BARO3 = Lying Systolic Blood Pressure - Sitting Systolic Blood Pressure at Post 1 measure BARO4 = Lying Systolic Blood Pressure - Sitting Systolic Blood Pressure at Post 2 measure BARO5 = Lying Diastolic Blood Pressure - Sitting Diastolic Blood Pressure at Pre randomization BARO6 = Lying Diastolic Blood Pressure - Sitting Diastolic Blood Pressure at Post Measure BARO7 = Lying Diastolic Blood Pressure - Sitting Diastolic Blood Pressure at Post 1 Measure BARO8 = Lying Diastolic Blood Pressure - Sitting Diastolic Blood Pressure at Post 2 Measure
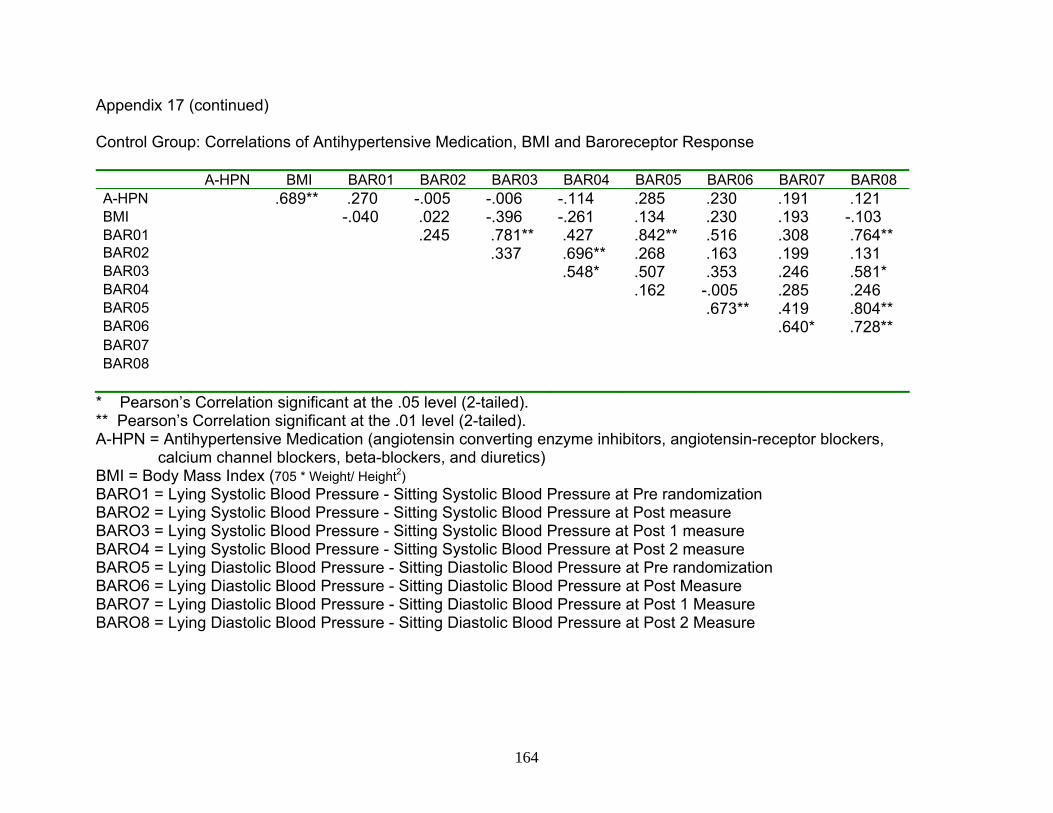
164
Appendix 17 (continued) Control Group: Correlations of Antihypertensive Medication, BMI and Baroreceptor Response
A-HPN BMI BAR01 BAR02 BAR03 BAR04 BAR05 BAR06 BAR07 BAR08 A-HPN .689** .270 -.005 -.006 -.114 .285 .230 .191 .121 BMI -.040 .022 -.396 -.261 .134 .230 .193 -.103 BAR01 .245 .781** .427 .842** .516 .308 .764** BAR02 .337 .696** .268 .163 .199 .131 BAR03 .548* .507 .353 .246 .581* BAR04 .162 -.005 .285 .246 BAR05 .673** .419 .804** BAR06 .640* .728** BAR07 BAR08
* Pearson’s Correlation significant at the .05 level (2-tailed). ** Pearson’s Correlation significant at the .01 level (2-tailed). A-HPN = Antihypertensive Medication (angiotensin converting enzyme inhibitors, angiotensin-receptor blockers, calcium channel blockers, beta-blockers, and diuretics) BMI = Body Mass Index (705 * Weight/ Height2) BARO1 = Lying Systolic Blood Pressure - Sitting Systolic Blood Pressure at Pre randomization BARO2 = Lying Systolic Blood Pressure - Sitting Systolic Blood Pressure at Post measure BARO3 = Lying Systolic Blood Pressure - Sitting Systolic Blood Pressure at Post 1 measure BARO4 = Lying Systolic Blood Pressure - Sitting Systolic Blood Pressure at Post 2 measure BARO5 = Lying Diastolic Blood Pressure - Sitting Diastolic Blood Pressure at Pre randomization BARO6 = Lying Diastolic Blood Pressure - Sitting Diastolic Blood Pressure at Post Measure BARO7 = Lying Diastolic Blood Pressure - Sitting Diastolic Blood Pressure at Post 1 Measure BARO8 = Lying Diastolic Blood Pressure - Sitting Diastolic Blood Pressure at Post 2 Measure

About the Author
Christine M. Olney received her Bachelor’s Degree in Nursing from
Montana State University, in 1978. Mrs. Olney’s Master’s Degree in Nursing
was received in May of 2002 from South Dakota State University.
During her doctoral education program at the University of South Florida,
Tampa, Mrs. Olney developed a role as a nursing research resident in a local
hospital. In the role as a research resident she initiated and maintained a
nursing research program. The role led to several nursing research projects
and publications.
Mrs. Olney has accepted a fellowship at the James A. Haley Veteran’s
Administration Patient Safety Center. She plans to continue pursuing the
impact of complementary therapies.