Ethnic differences in parathyroid hormone secretion and mineral metabolism in response to oral...
16
Ethnic differences in parathyroid hormone secretion and mineral metabolism in response to oral phosphate administration Liya Yan a , Inez Schoenmakers a , Bo Zhou b , Landing M. Jarjou c , Emily Smith a , Shailja Nigdikar a , Gail R. Goldberg a,c , and Ann Prentice a,c,⁎ a MRC Human Nutrition Research, Elsie Widdowson Laboratory, Fulbourn Road, Cambridge CB1 9NL, UK. b Department of Preventive Medicine, Shenyang Medical College, 146 Huanghe North Street, Shenyang 110034, PR China. c MRC Keneba, Gambia. Abstract Ethnic differences in bone metabolism have been reported and it has been suggested that these may be partly due to prolonged exposure to an elevated plasma parathyroid hormone (PTH) concentration or a decreased sensitivity to PTH. We explored ethnic differences in bone and mineral metabolism by 5 days of oral phosphate (P) loading to stimulate PTH secretion. Healthy older people from UK (B), The Gambia (G) and China (C), 15 individuals from each sex and ethnic group, were studied. Blood and urine samples were collected before and 2 h after P dose on days 1, 4 and 5 and on a control day. The induced changes (%) in PTH and markers of mineral and bone metabolism after 2 h and over 5 days were examined. At baseline, PTH, 1,25(OH) 2 D and bone turnover markers were higher in Gambian subjects than in British and Chinese subjects (P ≤ 0.01). 2 h after P loading, ionized calcium (iCa) decreased and PTH and plasma P (P) increased in all groups (P ≤ 0.01, n.s. between groups). Urinary P to creatinine ratio (uP/Cr) increased, the increase being greater in Chinese subjects than in British and Gambian subjects on days 4 and 5 (P ≤ 0.01). By day 5, fasting iCa was decreased and P increased in British and Gambian (P ≤ 0.01) but not in Chinese subjects. Fasting PTH and uP/Cr increased in all groups. There were ethnic differences in changes in bone markers, but the relationship with changes in PTH was comparable between groups. In conclusion, ethnic differences in mineral metabolism in response to 5-day P loading were found. Chinese subjects showed a more rapid renal clearance of P than British and Gambian counterparts and there were differences between the groups in the skeletal response to P loading, but no evidence was found for resistance to the resorbing effects of PTH. © 2009 Elsevier Inc. This document may be redistributed and reused, subject to certain conditions. ⁎Corresponding author. MRC Human Nutrition Research, Elsie Widdowson Laboratory, Fulbourn Road, Cambridge CB1 9NL, UK. Fax: +44 1223 437515. [email protected]. This document was posted here by permission of the publisher. At the time of deposit, it included all changes made during peer review, copyediting, and publishing. The U.S. National Library of Medicine is responsible for all links within the document and for incorporating any publisher-supplied amendments or retractions issued subsequently. The published journal article, guaranteed to be such by Elsevier, is available for free, on ScienceDirect. Sponsored document from Bone Published as: Bone. 2009 August ; 45(2): 238–245. Sponsored Document Sponsored Document Sponsored Document
-
Upload
independent -
Category
Documents
-
view
0 -
download
0
Transcript of Ethnic differences in parathyroid hormone secretion and mineral metabolism in response to oral...

Ethnic differences in parathyroid hormone secretion and mineralmetabolism in response to oral phosphate administration
Liya Yana, Inez Schoenmakersa, Bo Zhoub, Landing M. Jarjouc, Emily Smitha, ShailjaNigdikara, Gail R. Goldberga,c, and Ann Prenticea,c,⁎aMRC Human Nutrition Research, Elsie Widdowson Laboratory, Fulbourn Road, Cambridge CB19NL, UK.bDepartment of Preventive Medicine, Shenyang Medical College, 146 Huanghe North Street,Shenyang 110034, PR China.cMRC Keneba, Gambia.
AbstractEthnic differences in bone metabolism have been reported and it has been suggested that these maybe partly due to prolonged exposure to an elevated plasma parathyroid hormone (PTH) concentrationor a decreased sensitivity to PTH. We explored ethnic differences in bone and mineral metabolismby 5 days of oral phosphate (P) loading to stimulate PTH secretion. Healthy older people from UK(B), The Gambia (G) and China (C), 15 individuals from each sex and ethnic group, were studied.Blood and urine samples were collected before and 2 h after P dose on days 1, 4 and 5 and on acontrol day. The induced changes (%) in PTH and markers of mineral and bone metabolism after 2 hand over 5 days were examined.
At baseline, PTH, 1,25(OH)2D and bone turnover markers were higher in Gambian subjects than inBritish and Chinese subjects (P ≤ 0.01).
2 h after P loading, ionized calcium (iCa) decreased and PTH and plasma P (P) increased in all groups(P ≤ 0.01, n.s. between groups). Urinary P to creatinine ratio (uP/Cr) increased, the increase beinggreater in Chinese subjects than in British and Gambian subjects on days 4 and 5 (P ≤ 0.01). By day5, fasting iCa was decreased and P increased in British and Gambian (P ≤ 0.01) but not in Chinesesubjects. Fasting PTH and uP/Cr increased in all groups. There were ethnic differences in changesin bone markers, but the relationship with changes in PTH was comparable between groups.
In conclusion, ethnic differences in mineral metabolism in response to 5-day P loading were found.Chinese subjects showed a more rapid renal clearance of P than British and Gambian counterpartsand there were differences between the groups in the skeletal response to P loading, but no evidencewas found for resistance to the resorbing effects of PTH.
© 2009 Elsevier Inc.This document may be redistributed and reused, subject to certain conditions.
⁎Corresponding author. MRC Human Nutrition Research, Elsie Widdowson Laboratory, Fulbourn Road, Cambridge CB1 9NL, UK.Fax: +44 1223 437515. [email protected] document was posted here by permission of the publisher. At the time of deposit, it included all changes made during peer review,copyediting, and publishing. The U.S. National Library of Medicine is responsible for all links within the document and for incorporatingany publisher-supplied amendments or retractions issued subsequently. The published journal article, guaranteed to be such by Elsevier,is available for free, on ScienceDirect.
Sponsored document fromBone
Published as: Bone. 2009 August ; 45(2): 238–245.
Sponsored Docum
ent Sponsored D
ocument
Sponsored Docum
ent

KeywordsPhosphate; Parathyroid hormone; Bone markers; Bone and mineral metabolism; Ethnic differences
IntroductionPopulations differ in fragility fracture risk. Differences in the extent of loss of bone quantityand material properties during ageing result from complex interactions between hormonestatus, genetic traits, diet and physical activity over the lifespan. Increased parathyroid hormone(PTH) secretion and bone turnover induced by poor vitamin D status and/or low calcium (Ca)intake is considered to increase the risk of osteoporosis in older people [1].
However, we have shown that older Gambian and Chinese populations with a low incidenceof osteoporotic fractures have elevated plasma PTH associated with low Ca intake and/or poorvitamin D status [2–5]. In the UK Ca intake is close to recommendations, there is a winter nadirin vitamin D status but no corresponding increase in PTH concentration [5,6]. In The Gambia,vitamin D status is good because there is ample opportunity for cutaneous vitamin D synthesisthroughout the year, but Ca intake is exceptionally low (∼ 300 mg/day) and PTH concentrationsare elevated compared to British adults throughout the year [3,7]. In northern China, vitaminD status is poor in winter, Ca intake is low, and PTH concentrations are higher than those ofBritish counterparts [5]. Furthermore, in older Chinese adults, there is no significant inverseassociation between PTH concentration and bone mineral status (BMC and BMD), in contrastto Caucasian adults in Britain and elsewhere [5,8]. Resistance to the bone resorbing effects ofPTH and racial differences in PTH dynamics have been reported in Black American women[9–11]. All these findings have led us to hypothesise that prolonged exposure to elevated PTHin plasma, either chronically or seasonally, may alter skeletal responsiveness to its effects[12].
Oral phosphate (P) has been used by others to stimulate PTH secretion and investigate theeffect of PTH on bone turnover [13], to test if skeletal responsiveness to PTH differs betweenethnic groups. We conducted a study in healthy older adults in the UK, The Gambia and Chinausing a similar protocol.
Subjects and methodsSubjects
The study was conducted at MRC Human Nutrition Research (HNR), Cambridge, UK, MRCKeneba, The Gambia, and Shenyang Medical College, Shenyang, PR China. Cambridge(latitude 52°N) is a university town in the southeast of England with a temperate climate.Keneba (latitude 13°N) is a rural village in The Gambia and the climate is tropical, hot andsunny all year with a wet season from June to November. Shenyang (latitude 42°N) is anindustrial city in the northeast of China where winter (November–March) is cold and dark butsummer (June–September) is hot and sunny.
Thirty healthy adults (15 men, 15 women) aged 60–75 years were recruited in each centre.Exclusion criteria were any pathological disorder or medication known to affect mineral orbone metabolism. All subjects were ambulatory with normal renal function (fasting plasmacreatinine < 115 μmol/l). Subjects in Cambridge (all were of Caucasian origin) with a hip bonemineral density (BMD) < − 2.5 T-score were excluded. This criterion was not used in Kenebaand Shenyang because there are no appropriate Chinese and Gambian reference data.
BMD was measured using dual-energy X-ray absorptiometry (DXA) (GE Lunar, WI, USA,software 4.7e in all centres). Height and weight were measured, from which the body mass
Yan et al. Page 2
Published as: Bone. 2009 August ; 45(2): 238–245.
Sponsored Docum
ent Sponsored D
ocument
Sponsored Docum
ent

index (BMI) was calculated. To allow for possible effects of season, subjects were studied oncein February–April and once in July–September. Five British (2 males, 3 females), 2 Chinese(1 male, 1 female) and 1 Gambian (female) subjects were not available for the second phase.
Ethical approval was given by the Cambridge Local Research Ethics Committee, the GambianGovernment/MRC Laboratories Joint Ethics Committee and the Academic Committee ofShenyang Medical College. Informed written consent was obtained from all subjects.
PTH stimulation testIn each phase of the study, subjects took a 1 g dose of elemental P dissolved in 200 ml water,twice daily (0700–0900 h and 1900–2100 h) for 5 consecutive days (Phosphate-Sandoz, HKPharma, UK) (Fig. 1). Each P dose also contained 246 mg potassium and 938 mg sodium. Thestimulation test was preceded within 5 days by a control day in which 200 ml water only wasgiven (day 0). On days 0, 1, 4, and 5, subjects attended the research centre between 0700–0900 h after an overnight fast. Individual subjects attended at the same time for each of theirvisits. Blood and urine samples were collected on arrival (timepoint A) and 2 hours (2 h) afterconsuming the water or morning P dose (timepoint B). Subjects remained sedentary during the2 h and drank 500 ml water to standardise fluid intake but no other food or liquid was consumed.
Dietary Ca and P intakes were assessed in each phase of the study [7,14,15]. Subjects wererequested to keep to their usual diet the week before and during each stimulation test.
Sample collections and laboratory analysesBlood samples were collected into tubes containing EDTA or lithium-heparin. Blood ionizedCa (iCa) was measured in the lithium-heparin sample (ABL77, Radiometer Medical, USA)within 10 min and pH 7.4 corrected values were used. The remainder of the sample was placedon ice, the plasma was separated from cells within 30 min in a refrigerated centrifuge, andstored at − 80 °C. Urine samples were collected immediately after blood collection. Acidified(HCl, 10 ml/l, laboratory reagent grade, SG 1.18, Fisher Scientific) and non-acidified aliquotswere stored at − 20 °C. All samples from The Gambia and samples for analysis of vitamin Dmetabolites from China were transported on dry ice to Cambridge.
EDTA-plasma was used for analyses of PTH, total N-terminal propeptide of type 1 procollagen(P1NP), N-mid osteocalcin (OC) and β-form of cross-linked C-telopeptide of type 1 collagen(CTXβ). Lithium-heparin plasma was used for all other analyses. Singleton measurements weremade for blood iCa and for those markers analyzed by Elecsys (see below). All other analyseswere conducted in duplicate. For each analyte, all samples from a single subject were analyzedin the same run. Plasma total Ca, P and creatinine (Ca, P and Cr), and urinary Ca, P and Cr(uCa, uP and uCr) was measured by colorimetric methods (Cambridge: Konelab, Finland;Shenyang: 7170A Hitachi automatic analyzer, Japan). Within and between-assay coefficientsof variation (CV) were < 2.0% and < 4.0% respectively. PTH, P1NP, OC and CTXβ weremeasured on an automatic analyzer (Elecsys 2010, Roche Diagnostics, USA). Between-assayCV were 4.7%, 3.2%, 3.1% and 4.3% respectively. The OC assay detects both the intactmolecule and N-terminal fragment. Plasma bone alkaline phosphatase (BALP) and urinarydeoxypyridinoline (uDPD) was measured by ELISA (Metra BAP and DPD EIA kits, QuidelCorporation, USA). Within and between-assay CV were 2.1% and 7.9% for BALP and 6.3%and 10.0% for DPD. Plasma 25- (25-OHD) and 1,25-dihydroxyvitamin D (1,25(OH)2D) weremeasured by radioimmunoassay (DiaSorin, Stillwater, MN, USA and IDS, Tyne and Wear,UK respectively). Within and between-assay CV were 4.1% and 6.1% for 25-OHD, and 7.5%and 9.0% for 1,25(OH)2D. Concentrations of uCa, uP and uDPD were expressed as a ratiorelative to urinary creatinine (uCr) to adjust for urine volume (uCa/Cr, uP/Cr and uDPD/Cr).
Yan et al. Page 3
Published as: Bone. 2009 August ; 45(2): 238–245.
Sponsored Docum
ent Sponsored D
ocument
Sponsored Docum
ent

Assay performance was monitored using kit and in-house controls. The quality of 25-OHD,1,25(OH)2D and PTH assays was monitored by participation in the Vitamin D External QualityAssessment Scheme (www.deqas.org), and the National External Quality Assessment Scheme(www.ukneqas.org.uk). Cross-calibrations were conducted for those assays that wereperformed in different centres by measuring in-house control materials, ten aliquots for eachanalyte. The difference between the laboratories ranged from 1% to 9%. Gambian and Chinesevalues were adjusted to Cambridge values using the appropriate multiplication factor.
Data-handling and analysisStatistical analysis was performed using the Linear Model facility in Data Desk 6.1.1 (DataDescription, Ithaca, NY, USA). To permit the exploration of proportion relationships, variableswere converted to natural logarithms whereby group differences × 100 correspond closely topercentage differences [(difference / mean) × 100] [16]. All percent differences (± SE)presented were obtained this way. Baseline values are presented as mean (± SD) for normally-distributed data, and as geometric means (95% CI) for skewed data.
The absolute and relative (percentage) changes in each analyte were examined to investigatethe response to P administration. Because the patterns of change were similar, only percentage(%) changes are presented for simplicity. The change by 2 h was defined as the change in avariable from timepoint A (before P dose) to timepoint B (2 h after) on the same day. Theresponse on day 0 was used to control for any change that was independent of the effect ofadministered P. Thus, change by 2 h(%) = (lnBday (1, 4 or 5) − lnAday (1,4 or 5)) − (lnBday 0 − lnAday 0). Change by day 5 (%) wasdefined as the difference in fasting values between baseline (mean of timepoint A on days 0and 1) and day 5 (timepoint A), calculated as lnA5 − lnAbaseline. The estimated glomerularfiltration rate (eGFR) was calculated according to the Cockroft and Gault equation (Traynoret al., 2006) [39] and the ratio of the maximum tubular reabsorption rate of phosphate toglomerular filtration rate (TmP/GFR) was calculated using the formula described by Payne[18] and Barth et al. [17].
Within groups, the significance of change from baseline by 2 h and day 5, and the differencein 2 h change between days 1 and 5 was examined by Student's paired t-test. Differencesbetween groups were examined using ANOVA or ANCOVA. Subject, sex, season and agewere independent variables and subject was nested by sex and group. Scheffé post-hoc testswere used to test significance of differences between groups in pairs and to minimise the effectsof multiple testing. Multiple linear regression was used to examine the relationship betweenchange in PTH and change in markers of mineral and bone metabolism. Group differences inCa concentration were examined after adjusting for albumin concentration by including it asan independent variable. All statistical models were set up in a standardised way by generatinga full model, which included all potential confounders. Any variable of P > 0.05 was removedby backward elimination to provide a parsimonious model. P values ≤ 0.05 were consideredsignificant.
ResultsNo significant seasonal effects were detected in the British or Gambian groups. A significantdifference between the two seasons was found in some of the biochemical markers in theChinese group. However, this did not affect the interpretation of the data presented in this paperand is not described further. There were significant differences between men and women inmany baseline characteristics. However, there were no significant group–season or group–sexinteractions identified for intra-individual changes by 2 h and day 5 in any biochemical marker.Therefore, except for subject characteristics and summary information at baseline, the data foreach group are presented with season and gender combined.
Yan et al. Page 4
Published as: Bone. 2009 August ; 45(2): 238–245.
Sponsored Docum
ent Sponsored D
ocument
Sponsored Docum
ent

Subject characteristics and baseline dataAge, height, weight, BMI, dietary Ca and P intake and hip BMD are indicated in Table 1. Therewere significant differences in dietary intakes of Ca and P within sex and between groups.Dietary Ca and P intakes and Ca:P ratio were higher in British than Chinese and Gambiansubjects (ANOVA P ≤ 0.01). Ca and P intakes were lower in Gambian than Chinese subjects(P ≤ 0.05). BMI was higher in British than in Gambian subjects (ANOVA P ≤ 0.001) andhigher in Chinese males than Gambian males (ANOVA P ≤ 0.05).
Compliance as estimated by pill count was 100%. No side effects were reported, except formild to moderate diarrhoea in 3 subjects.
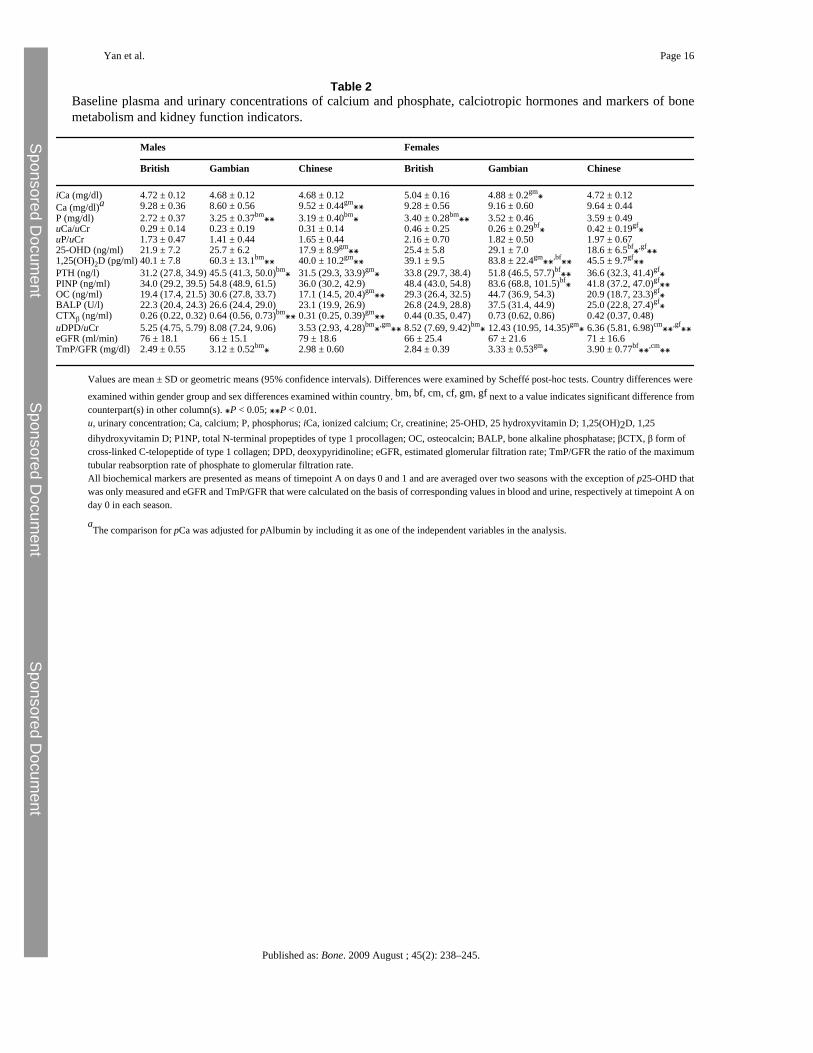
There were significant differences in baseline P, Cr, TmP/GFR and uCa/Cr and in theconcentrations of other biochemical markers, most notably, 25-OHD, 1,25(OH)2D and PTH(Table 2). 25-OHD was higher in British than Chinese females, and in Gambian than Chinesemales and females. 1,25(OH)2D, PTH and bone turnover markers were higher in Gambianmen and women than both British and Chinese men and women (ANOVA P ≤ 0.01).
Change by 2 hOn day 1, oral P loading resulted in significant increases in P, PTH and uP/Cr of comparablemagnitude, and concurrent decreases in iCa and uCa/Cr in all three groups, except for uCa/Crin the British group which was not significantly altered (Fig. 2). On days 4 and 5, the patternof response was similar to that on day 1, although the magnitude of some changes was smaller(Fig. 2). The exception was uCa/Cr which was increased on day 5 in the Gambian group butdecreased in the Chinese group. Significant between-group differences were found in the 2 hchange in uP/Cr and uCa/Cr (Fig. 2). The increase in uP/Cr was higher in the Chinese than inBritish and Gambian subjects on days 4 and 5 (ANOVA P ≤ 0.001) with a trend in that directionon day 1 (ANOVA P = 0.1).
The 2 h change in 1,25(OH)2D differed between the groups (Fig. 2). In British subjects, 1,25(OH)2D was significantly and consistently increased after the P dose on all days. However, itwas slightly increased or remained unchanged in the Gambian, whereas in the Chinese subjects,there was a trend for a decrease on all days (ANOVA P ≤ 0.001).
Significant changes by 2 h in bone remodelling markers were observed. OC and CTXβincreased in the British (2–4% and 8–12% respectively, P ≤ 0.05 on all days) and Gambian(2–5% and 2–8% respectively, P ≤ 0.05 on day 1) groups and non-significant increases in theChinese group (3–5% and 6–10% respectively). There were no significant between-groupdifferences. No significant changes were found in any other bone remodelling markers (P1NP,BALP, uDPD/Cr, not shown).
Change by day 5There was a significant increase in fasting values of P, PTH and uP/Cr and a concurrent decreasein iCa and uCa/Cr in the British and Gambian subjects on day 5 in response to P loading (Fig.3). In the Chinese subjects, the changes in PTH, uP/Cr and uCa/Cr paralleled those in the othertwo groups, whereas P and iCa on day 5 were not significantly different from baseline(significant between-group difference ANOVA P ≤ 0.001). The changes in iCa and PTH weresignificantly greater in the Gambian group (ANOVA P ≤ 0.001). The decrease in uCa/Cr wassmaller in the Chinese group (ANOVA P ≤ 0.001). Fasting 1,25(OH)2D decreased by day 5in all three groups, the decrease was smaller in Gambian than in British and Chinese subjects(ANOVA P ≤ 0.01).
Yan et al. Page 5
Published as: Bone. 2009 August ; 45(2): 238–245.
Sponsored Docum
ent Sponsored D
ocument
Sponsored Docum
ent

Fasting values of BALP decreased significantly by day 5 in the British and Gambian but notthe Chinese subjects (ANOVA P = 0.02). P1NP did not change significantly in any group. Thechange in OC was greater in the Gambian than both the British and Chinese subjects (ANOVAP ≤ 0.01). There were no significant changes in any of the markers of bone resorption, exceptfor CTXβ, which decreased in the Chinese subjects (Fig. 4, ANOVA P ≤ 0.001).
Regression analyses revealed that the 5-day change in PTH was significantly and positivelyrelated to the changes in CTXβ and OC with no significant group interaction (P ≤ 0.001 andP = 0.002 respectively). No significant association with PTH was found for any of the othermarkers.
DiscussionAs expected, oral P stimulated PTH secretion in all British, Gambian and Chinese subjects.However, the induced perturbations in Ca and P homeostasis produced different responses bythe kidney and skeleton. In particular, the increase in PTH was more pronounced in theGambian group, and the Chinese subjects had more rapid renal P clearance and a greater renalCa conservation. In addition, the Chinese subjects showed very little change in bone turnovermarkers, as evidenced by fasting values on day 5, in contrast to the changes in bone formationand/or resorption markers observed in the other groups.
We assume that the differences in P metabolism were not due to differences in intestinalabsorption efficiency because dietary P is usually well absorbed (55–80%) and plasma Pincreases within hours after ingestion [19]. Indeed a significant increase in P was observed 2 hafter the P dose in all groups. Plasma P is predominantly regulated by changes in urinary Pexcretion [20] and consistent with this, uP/Cr was increased in all three groups. However, inthe Chinese subjects the increase by 2 h was significantly greater than in the British andGambian group. This higher uP/Cr may explain why fasting P on day 5 was not increased inthe Chinese group compared to baseline, in contrast to the increase observed in British andGambian subjects. We speculate that the more rapid P clearance in Chinese subjects may bedue to differences in renal regulation of P metabolism through a mechanism that is independentof PTH, for example fibroblast growth factor 23 (FGF23) or gastro-intestinal factors[21,22].Plasma FGF 23 is reported not to respond to changes in P absorption within a few hours[23]. The observed changes 2 h after P administration might rather arise from modulation ofthe renal sodium-phosphate co-transporter by the plasma P concentration and/or through atpresent unrecognized signals involved in the phosphate intestinal-renal axis and emanatingfrom the gastro-intestinal tract in response to an increase in P ingestion or absorption[22,24].
Our results may reflect an adaptation of the kidney and/or skeleton to a low Ca but sufficientP intake in older Chinese adults, and suggests a mechanistic explanation for our previousfindings that a higher endogenous PTH is not associated with lower bone mineral status orhigher bone resorption [5]. The data suggest that the roles of the kidney and skeleton in theregulation of Ca and P metabolism may have shifted towards a greater role for the kidney, moreefficiently clearing P and reducing urinary Ca losses. It is impossible to tell from these datawhether this was caused by skeletal resistance to the action of PTH or increased renal sensitivityto PTH, or to P loading. Furthermore, the combined changes in PTH (increase) and 1,25(OH)2D (decrease) may have resulted in preventing bone resorption or reducing bone formation[25] in the Chinese group. A different pattern was seen in the Gambian group. The extremelylow dietary Ca intake (Table 1) is close to factorial calculations of obligatory Ca losses in theliterature [26] and may have prevented the ‘adaptation’ seen in the Chinese group, becausemaintenance of plasma Ca concentration needs fractional Ca absorption and renal Caconservation to be at their physiological maximum, which requires 1,25(OH)2D to be high all
Yan et al. Page 6
Published as: Bone. 2009 August ; 45(2): 238–245.
Sponsored Docum
ent Sponsored D
ocument
Sponsored Docum
ent

the time. These different responses may explain the differences in bone turnover markers.These remained unchanged in the Chinese group, with the exception of CTXβ, which showeda significant decrease by day 5.
The 5-day increase in fasting PTH also differed between groups. The greater decrease in iCa,and correspondingly greater increase in PTH in the Gambian subjects may be due to theirhabitual exceptionally low Ca intake and the low Ca:P ratio in the intestine after P loading.This would have led to relatively less Ca and more P being absorbed. The significant decreasein BALP by day 5 in the British and Gambian subjects may be due to inhibition of boneformation by PTH and/or a reduction in 1,25(OH)2D, as reported in other P and 1,25(OH)2Dloading studies [27,28]. This contrasts with the current concept of endogenous or exogenousPTH stimulating bone formation [29] and the observed tendency of an increase in P1NP.Potentially, this might be attributed to the different phases of osteoblast differentiation andactivation, reflected by these markers [30]. The significant increase in OC (a marker of boneformation and potentially resorption [31]) and a tendency towards an increase in CTXβ anduDPD/Cr in the Gambian subjects may be attributed to their more pronounced increase in PTH.
Despite the decrease in CTXβ in the Chinese group multiple linear regression analysisdemonstrated that the changes in CTXβ and OC were positively related to the change in PTHand that the relationships did not differ significantly between the groups. These findingstherefore provide no evidence in support of differences in skeletal resistance to PTH betweenthe groups. Our results in The Gambia are therefore different to those in African-Americansin which skeletal resistance to PTH was found; a smaller increase in bone resorption comparedwith White counterparts in response to PTH infusion [9,10]. The differences between thestudies may be due to subjects' genotype, body composition, diet, life-style and/or differentmethods used to stimulate PTH secretion (PTH or citrate/Ca infusion over 24 h vs. oral P over5 days) [9,10]. In particular, the habitual low calcium intakes of Gambian subjects, leading tosecondary hyperparathyroidism [3,7] and potential enlargement of the PTH reserve [32], therelatively high Vitamin D status throughout the year and the high levels of physical activityand low BMI in Gambians compared to African-Americans [9,10] may have influenced theseresults. This was reflected in baseline characteristics; Gambian subjects had elevated PTH,1,25(OH)2D and bone turnover markers compared to the British and Chinese subjects. Wehave previously reported elevated PTH, 1,25(OH)2D and markers of bone formation, but notresorption, in a study of Gambian women [3], in which DPD output measured in 24 h urinesamples was lower compared to British counterparts. In the present study early morning fastingurine samples were collected and DPD was expressed as uDPD/Cr. This might, to some extent,explain the discrepancy between our studies.
The 2 h change in 1,25(OH)2D in response to P loading was a decrease in the Chinese, and anincrease in the British and Gambian subjects. This may have been due to differences in plasmaP and renal P filtration rate which suppresses 1,25(OH)2D production [33]. In contrast, the 5-day change in 1,25(OH)2D was a decrease in all groups. The magnitude of the decrease wassignificantly smaller in the Gambian compared to the British and Chinese subjects. This maybe due to the greater 5-day increase in PTH in the Gambian subjects which would have had agreater stimulatory effect on renal 1-α hydroxylase activity [12], and therefore counteractedthe effect of the increased absorbed P load.
There are some limitations to this study. Firstly, it was conducted in subjects consuming theirhabitual diet. The mean Ca and P intakes in the three groups were very different, which mayhave confounded the changes in PTH and mineral metabolism in response to the same absoluteamount of P given. However, standardisation of diets across groups would have led todeviations from habitual intake and induced changes in ‘usual’ calcium and bone metabolism.Secondly, the range of changes in PTH and bone markers induced may have been too small or
Yan et al. Page 7
Published as: Bone. 2009 August ; 45(2): 238–245.
Sponsored Docum
ent Sponsored D
ocument
Sponsored Docum
ent

too short to fully evaluate skeletal responsiveness to PTH. However, the changes in plasma Pand PTH were close to circadian variations [34,35] and therefore probably correspond withvariations in plasma P, iCa and PTH induced by diet, physical activity or circadian cycle. Theurinary excretion of Ca, P and DPD were expressed as a ratio relative to uCr to adjust for urinevolume. Therefore, they may depend on kidney function, lean body mass (LBM) or BMI andpotentially on diet, fluid intake and sweat losses [36,37]. No significant differences in kidneyfunction, as assessed by eGFR between groups were found (Table 2). BMI was lower inGambian subjects compared to British but not in Chinese subjects. However, proportional LBMand sweat losses may be relatively high in Gambian subjects and expected to increase ratherthan decrease the uCr concentration [38]. Many statistical comparisons were reported in thisstudy. Although Scheffé post-hoc tests were used to minimise the effects of multiple testing,case findings may have occurred. The main finding of this study, i.e. a difference in renalexcretion between groups, was however highly significant (P < 0.001).
In conclusion, we have demonstrated differences in PTH secretion and in bone and mineralmetabolism in response to oral P loading between British, Chinese and Gambian subjects, butno evidence in support of resistance to the resorbing effects of PTH in any group. Furtherinvestigations are in progress to explore the underlying mechanisms for the different renal andskeletal response when Ca-P homeostasis is perturbed and the differences in renal P clearanceas influenced by FGF23 and kidney function.
AcknowledgmentsThe work in China was supported in part by a grant from the Nestlé Foundation. We thank Mr Mark Chatfield (HNR)for his statistical advice, Ms Janet Bennett, Dr Ann Laskey, Ms Ann Laidlaw (HNR), Mr Mustapha Ceesay, MrYankuba Sawo (MRC, Keneba), Mr Lianying Guo, Ms Xiaohong Wang and Mr Zhuo Zhang (Shenyang MedicalCollege) for their valuable assistance, and all the subjects for their participation.
References[1]. Riggs B.L. Melton L.J. III Involutional osteoporosis. N. Engl. J. Med. 1986;314:1676–1686.
[PubMed: 3520321][2]. Adebajo A.O. Cooper C. Evans J.G. Fractures of the hip and distal forearm in West Africa and the
United Kingdom. Age Ageing 1991;20:435–438. [PubMed: 1776593][3]. Aspray T.J. Yan L. Prentice A. Parathyroid hormone and rates of bone formation are raised in
perimenopausal rural Gambian women. Bone 2005;36:710–720. [PubMed: 15780975][4]. Yan L. Zhou B. Prentice A. Wang X. Golden M.H. Epidemiological study of hip fracture in Shenyang,
People's Republic of China. Bone 1999;24:151–155. [PubMed: 9951786][5]. Yan L. Zhou B. Wang X. D'Ath S. Laidlaw A. Laskey M.A. Older people in China and the United
Kingdom differ in the relationships among parathyroid hormone, vitamin D, and bone mineralstatus. Bone 2003;33:620–627. [PubMed: 14555267]
[6]. Bates C.J. Carter G.D. Mishra G.D. O'Shea D. Jones J. Prentice A. In a population study, canparathyroid hormone aid the definition of adequate vitamin D status? A study of people aged65 years and over from the British National Diet and Nutrition Survey. Osteoporos. Int.2003;14:152–159. [PubMed: 12730772]
[7]. Jarjou L.M. Prentice A. Sawo Y. Laskey M.A. Bennett J. Goldberg G.R. Randomized, placebo-controlled, calcium supplementation study in pregnant Gambian women: effects on breast-milkcalcium concentrations and infant birth weight, growth, and bone mineral accretion in the first yearof life. Am. J. Clin. Nutr. 2006;83:657–666. [PubMed: 16522914]
[8]. Khaw K.T. Sneyd M.J. Compston J. Bone density parathyroid hormone and 25-hydroxyvitamin Dconcentrations in middle aged women. BMJ 1992;305:273–277. [PubMed: 1392857]
[9]. Cosman F. Morgan D.C. Nieves J.W. Shen V. Luckey M.M. Dempster D.W. Resistance to boneresorbing effects of PTH in black women. J. Bone. Miner. Res. 1997;12:958–966. [PubMed:9169356]
Yan et al. Page 8
Published as: Bone. 2009 August ; 45(2): 238–245.
Sponsored Docum
ent Sponsored D
ocument
Sponsored Docum
ent

[10]. Fuleihan G.E. Gundberg C.M. Gleason R. Brown E.M. Stromski M.E. Grant F.D. Racial differencesin parathyroid hormone dynamics. J. Clin. Endocrinol. Metab. 1994;79:1642–1647. [PubMed:7989469]
[11]. Cosman F. Shen V. Morgan D. Gordon S. Parisien M. Nieves J. Biochemical responses of bonemetabolism to 1,25-dihydroxyvitamin D administration in black and white women. Osteoporos. Int.2000;11:271–277. [PubMed: 10824245]
[12]. Silverberg, S.J.; Fitzpatrick, L.A.; Bilezikian, J.P. The role of parathyroid hormone and vitamin Din the pathogenesis of osteoporosis. In: Marcus, R.; Feldman, D.; Kelsey, J., editors. Osteoporosis.Academic Press; 1996. p. 715-726.
[13]. Silverberg S.J. Shane E. de la Cruz L. Segre G.V. Clemens T.L. Bilezikian J.P. Abnormalities inparathyroid hormone secretion and 1,25-dihydroxyvitamin D3 formation in women withosteoporosis. N. Engl. J. Med. 1989;320:277–281. [PubMed: 2911322]
[14]. Bodner C.H. Soutar A. New S.A. Validation of a food frequency questionnaire for use in a Scottishpopulation: correlation of antioxidant vitamin intakes with biochemical measures. J. Hum. Nutr.Dietet. 1998;11:373–380.
[15]. Yan L. Zhou B. Greenberg D. Wang L. Nigdikar S. Prynne C. Vitamin K status of older individualsin northern China is superior to that of older individuals in the UK. Br. J. Nutr. 2004;92:939–945.[PubMed: 15613256]
[16]. Cole T.J. Sympercents: symmetric percentage differences on the 100 log(e) scale simplify thepresentation of log transformed data. Stat. Med. 2000;19:3109–3125. [PubMed: 11113946]
[17]. Barth J.H. Jones R.G. Payne R.B. Calculation of renal tubular reabsorption of phosphate: thealgorithm performs better than the nomogram. Ann. Clin. Biochem. 2000;37(Pt 1):79–81. [PubMed:10672378]
[18]. Payne R.B. Renal tubular reabsorption of phosphate (TmP/GFR): indications and interpretation.Ann. Clin. Biochem. 1998;35(Pt 2):201–206. [PubMed: 9547891]
[19]. Heaney R.P. Phosphorus nutrition and the treatment of osteoporosis. Mayo. Clin. Proc. 2004;79:91–97. [PubMed: 14708952]
[20]. Bijvoet, O.L.M. Indices for the measurement of the renal handling of phosphate. In: Massry, S.;Fleisch, H., editors. Renal handling of phosphate. Plenum Medical Book Company; New York,London: 1980. p. 1-37.
[21]. Mirams M. Robinson B.G. Mason R.S. Nelson A.E. Bone as a source of FGF23: regulation byphosphate? Bone 2004;35:1192–1199. [PubMed: 15542045]
[22]. Berndt T. Kumar R. Phosphatonins and the regulation of phosphate homeostasis. Annu. Rev.Physiol. 2007;69:341–359. [PubMed: 17002592]
[23]. Nishida Y. Taketani Y. Yamanaka-Okumura H. Imamura F. Taniguchi A. Sato T. Acute effect oforal phosphate loading on serum fibroblast growth factor 23 levels in healthy men. Kidney. Int.2006;70:2141–2147. [PubMed: 17063170]
[24]. Martin D.R. Ritter C.S. Slatopolsky E. Brown A.J. Acute regulation of parathyroid hormone bydietary phosphate. Am. J. Physiol. Endocrinol. Metab. 2005;289:E729–E734. [PubMed: 15914507]
[25]. DeLuca H.F. Overview of general physiologic features and functions of vitamin D. Am. J. Clin.Nutr. 2004;80:1689S–1696S. [PubMed: 15585789]
[26]. Charles P. Eriksen E.F. Hasling C. Sondergard K. Mosekilde L. Dermal, intestinal and renalobligatory losses of calcium: relation to skeletal calcium loss. Am. J. Clin. Nutr. 1991;54:266S–273S. [PubMed: 2053572]
[27]. Karkkainen M. Lamberg-Allardt C. An acute intake of phosphate increases parathyroid hormonesecretion and inhibits bone formation in young women. J. Bone Miner. Res. 1996;11:1905–1912.[PubMed: 8970892]
[28]. Kemi V.E. Karkkainen M.U. Lamberg-Allardt C.J. High phosphorus intakes acutely and negativelyaffect Ca and bone metabolism in a dose-dependent manner in healthy young females. Br. J. Nutr.2006;96:545–552. [PubMed: 16925861]
[29]. Jilka R.L. Molecular and cellular mechanisms of the anabolic effect of intermittent PTH. Bone2007;40:1434–1446. [PubMed: 17517365]
Yan et al. Page 9
Published as: Bone. 2009 August ; 45(2): 238–245.
Sponsored Docum
ent Sponsored D
ocument
Sponsored Docum
ent

[30]. Lian, J.B.; Stein, G.S.; Aubin, J.E. Bone formation: maturation and functional activity of osteoblastlineage cells. In: Favus, MJ., editor. Primer on the metabolic bone diseases and disorders of mineralmetabolism. American Society for Bone and Mineral Research; Washington: 2003. p. 13-27.
[31]. Kurahara N. Hosoda K. Tatsumi J. The N-terminal fragment of osteocalcin is released duringosteoclastic bone resorption in vitro. J. Bone Miner. Res. 1998;16:11–16.
[32]. de Francisco A.M. Riancho J.A. Amado J.A. del Arco C. Macias J.G. Cotorruelo J.G. Calcium,hyperparathyroidism, and vitamin D metabolism after kidney transplantation. Transplant. Proc.1987;19:3721–3723. [PubMed: 3313899]
[33]. Portale A.A. Halloran B.P. Murphy M.M. Morris R.C. Oral intake of phosphorus can determine theserum concentration of 1,25-dihydroxyvitamin D by determining its production rate in humans. J.Clin. Invest. 1986;77:7–12. [PubMed: 3753709]
[34]. Kemp G.J. Blumsohn A. Morris B.W. Circadian changes in plasma phosphate concentration, urinaryphosphate excretion, and cellular phosphate shifts. Clin. Chem. 1992;38:400–402. [PubMed:1547558]
[35]. Schlemmer A. Hassager C. Acute fasting diminishes the circadian rhythm of biochemical markersof bone resorption. Eur. J. Endocrinol. 1999;140:332–337. [PubMed: 10097253]
[36]. Welle S. Thornton C. Totterman S. Forbes G. Utility of creatinine excretion in body-compositionstudies of healthy men and women older than 60 y. Am. J. Clin. Nutr. 1996;63:151–156. [PubMed:8561053]
[37]. Walser M. Creatinine excretion as a measure of protein nutrition in adults of varying age. J. Parenter.Enteral. Nutr. 1987;11:73S–78S.
[38]. Singh J. Prentice A.M. Diaz E. Coward W.A. Ashford J. Sawyer M. Energy expenditure of Gambianwomen during peak agricultural activity measured by the doubly-labelled water method. Br. J. Nutr.1989;62:315–329. [PubMed: 2819016]
[39]. Traynor J. Mactier R. Geddes C.C. Fox J.G. How to measure renal function in clinical practice.BMJ 2006;5333(7571):733–737. [PubMed: 17023465]
Yan et al. Page 10
Published as: Bone. 2009 August ; 45(2): 238–245.
Sponsored Docum
ent Sponsored D
ocument
Sponsored Docum
ent

Fig. 1.Study design. (■) Water on control day or 1 g elemental phosphate dose during the 5-day test.(↑) Blood and urine samples obtained before (A) and 2 h after (B) water or the morningphosphate dose.
Yan et al. Page 11
Published as: Bone. 2009 August ; 45(2): 238–245.
Sponsored Docum
ent Sponsored D
ocument
Sponsored Docum
ent

Fig. 2.Change by 2 h (lnBday (1, 4 or 5) − lnAday (1,4 or 5)) − (lnBday 0 − lnAday 0)] on days 1, 4 and 5[% (SE)]. Black, striped and clear bars indicate British, Gambian and Chinese subjectsrespectively. ⁎ = significant change compared to baseline within country P ≤ 0.05. b⁎ andb⁎⁎ = vs. British subjects P ≤ 0.05 and P ≤ 0.01 respectively; g⁎⁎ = vs. Gambian subjectsP ≤ 0.01 by Scheffé post-hoc tests in ANOVA.
Yan et al. Page 12
Published as: Bone. 2009 August ; 45(2): 238–245.
Sponsored Docum
ent Sponsored D
ocument
Sponsored Docum
ent

Fig. 3.5-day change (lnA5 − lnAbaseline) in fasting samples [% (SE)]. ⁎ = significant change comparedto baseline within country P < 0.05. b⁎ and b⁎⁎ = vs. British subjects P ≤ 0.05 and P ≤ 0.01;g⁎⁎ = vs. Gambian subjects P ≤ 0.01 by Scheffé post-hoc tests in ANOVA.
Yan et al. Page 13
Published as: Bone. 2009 August ; 45(2): 238–245.
Sponsored Docum
ent Sponsored D
ocument
Sponsored Docum
ent

Fig. 4.5-day change (lnA5 − lnAbaseline) in bone turnover markers [% (SE)]. ⁎ = significant changecompared to baseline within country P ≤ 0.05. b⁎ = vs. British subjects P ≤ 0.05; g⁎⁎ = vs.Gambian subjects P ≤ 0.01 by Scheffé post-hoc tests in ANOVA.
Yan et al. Page 14
Published as: Bone. 2009 August ; 45(2): 238–245.
Sponsored Docum
ent Sponsored D
ocument
Sponsored Docum
ent

Sponsored Docum
ent Sponsored D
ocument
Sponsored Docum
ent
Yan et al. Page 15
Table 1Characteristics of subjects.
Males Females
British Gambian Chinese British Gambian Chinese
Age (years) 67.4 ± 3.3 66.5 ± 3.3 64.4 ± 4.3 65.7 ± 3.9 67.5 ± 4.1 62.5 ± 3.3gf⁎Height (cm) 174.3 ± 5.4 166.0 ± 8.6bm⁎⁎ 167.2 ± 5.5bm⁎⁎ 160.7 ± 6.3 157.9 ± 6.4 154.4 ± 4.7bf⁎Weight (kg) 80.7 ± 12.4 58.5 ± 7.8bm⁎⁎ 71.2 ± 9.1bm⁎,gm⁎⁎ 71.6 ± 13.0 55.9 ± 9.8bf⁎⁎ 62.1 ± 8.0bf⁎BMI (kg/m2) 26.5 ± 3.81 21.2 ± 1.57bm⁎⁎ 25.5 ± 3.17gm⁎ 27.6 ± 4.02 22.3 ± 1.57bf⁎⁎ 26.0 ± 2.53Ca intake (mg/day) 1185 ± 196 367 ± 129bm⁎⁎ 588 ± 196bm⁎⁎,gm⁎⁎ 1151 ± 242 296 ± 140bf⁎⁎ 509 ± 266bf⁎⁎,gf⁎⁎P intake (mg/day) 1692 ± 271 803 ± 264bm⁎⁎ 1303 ± 263bm⁎⁎,gm⁎⁎ 1517 ± 224 665 ± 269bf⁎⁎ 1029 ± 262cm⁎,bf⁎⁎,gf⁎⁎Ca:P 0.70 ± 0.08 0.46 ± 0.08bm⁎⁎ 0.45 ± 0.11bm⁎⁎ 0.76 ± 0.13 0.45 ± 0.12bf⁎⁎ 0.48 ± 0.15bf⁎⁎Femoral neck BMD (g/cm2)
0.947 ± 0.121 0.916 ± 0.138 0.898 ± 0.114 0.833 ± 0.069 0.749 ± 0.094 0.774 ± 0.118
Femoral trochanter BMD(g/cm2)
0.889 ± 0.113 0.804 ± 0.117 0.824 ± 0.116 0.685 ± 0.082 0.647 ± 0.078 0.671 ± 0.084
Means (± SD). Differences were examined by Scheffé post-hoc tests. Country differences were examined within gender group and sex differences examined
within country. bm, bf, cm, cf, gm, gf next to a value indicates significant difference from counterpart(s) in other column(s). ⁎P < 0.05; ⁎⁎P < 0.01.Ca and P intakes were assessed on day 0 for each season and were presented as means of two seasons.BMI, body mass index; Ca, calcium; P, phosphorus, BMD, bone mineral density.
Published as: Bone. 2009 August ; 45(2): 238–245.
Sponsored Docum
ent Sponsored D
ocument
Sponsored Docum
ent
Yan et al. Page 16
Table 2Baseline plasma and urinary concentrations of calcium and phosphate, calciotropic hormones and markers of bonemetabolism and kidney function indicators.
Males Females
British Gambian Chinese British Gambian Chinese
iCa (mg/dl) 4.72 ± 0.12 4.68 ± 0.12 4.68 ± 0.12 5.04 ± 0.16 4.88 ± 0.2gm⁎ 4.72 ± 0.12Ca (mg/dl)a 9.28 ± 0.36 8.60 ± 0.56 9.52 ± 0.44gm⁎⁎ 9.28 ± 0.56 9.16 ± 0.60 9.64 ± 0.44P (mg/dl) 2.72 ± 0.37 3.25 ± 0.37bm⁎⁎ 3.19 ± 0.40bm⁎ 3.40 ± 0.28bm⁎⁎ 3.52 ± 0.46 3.59 ± 0.49uCa/uCr 0.29 ± 0.14 0.23 ± 0.19 0.31 ± 0.14 0.46 ± 0.25 0.26 ± 0.29bf⁎ 0.42 ± 0.19gf⁎uP/uCr 1.73 ± 0.47 1.41 ± 0.44 1.65 ± 0.44 2.16 ± 0.70 1.82 ± 0.50 1.97 ± 0.6725-OHD (ng/ml) 21.9 ± 7.2 25.7 ± 6.2 17.9 ± 8.9gm⁎⁎ 25.4 ± 5.8 29.1 ± 7.0 18.6 ± 6.5bf⁎,gf⁎⁎1,25(OH)2D (pg/ml) 40.1 ± 7.8 60.3 ± 13.1bm⁎⁎ 40.0 ± 10.2gm⁎⁎ 39.1 ± 9.5 83.8 ± 22.4gm⁎⁎,bf⁎⁎ 45.5 ± 9.7gf⁎⁎PTH (ng/l) 31.2 (27.8, 34.9) 45.5 (41.3, 50.0)bm⁎ 31.5 (29.3, 33.9)gm⁎ 33.8 (29.7, 38.4) 51.8 (46.5, 57.7)bf⁎⁎ 36.6 (32.3, 41.4)gf⁎PINP (ng/ml) 34.0 (29.2, 39.5) 54.8 (48.9, 61.5) 36.0 (30.2, 42.9) 48.4 (43.0, 54.8) 83.6 (68.8, 101.5)bf⁎ 41.8 (37.2, 47.0)gf⁎⁎OC (ng/ml) 19.4 (17.4, 21.5) 30.6 (27.8, 33.7) 17.1 (14.5, 20.4)gm⁎⁎ 29.3 (26.4, 32.5) 44.7 (36.9, 54.3) 20.9 (18.7, 23.3)gf⁎BALP (U/l) 22.3 (20.4, 24.3) 26.6 (24.4, 29.0) 23.1 (19.9, 26.9) 26.8 (24.9, 28.8) 37.5 (31.4, 44.9) 25.0 (22.8, 27.4)gf⁎CTXβ (ng/ml) 0.26 (0.22, 0.32) 0.64 (0.56, 0.73)bm⁎⁎ 0.31 (0.25, 0.39)gm⁎⁎ 0.44 (0.35, 0.47) 0.73 (0.62, 0.86) 0.42 (0.37, 0.48)uDPD/uCr 5.25 (4.75, 5.79) 8.08 (7.24, 9.06) 3.53 (2.93, 4.28)bm⁎,gm⁎⁎ 8.52 (7.69, 9.42)bm⁎ 12.43 (10.95, 14.35)gm⁎ 6.36 (5.81, 6.98)cm⁎⁎,gf⁎⁎eGFR (ml/min) 76 ± 18.1 66 ± 15.1 79 ± 18.6 66 ± 25.4 67 ± 21.6 71 ± 16.6TmP/GFR (mg/dl) 2.49 ± 0.55 3.12 ± 0.52bm⁎ 2.98 ± 0.60 2.84 ± 0.39 3.33 ± 0.53gm⁎ 3.90 ± 0.77bf⁎⁎,cm⁎⁎
Values are mean ± SD or geometric means (95% confidence intervals). Differences were examined by Scheffé post-hoc tests. Country differences were
examined within gender group and sex differences examined within country. bm, bf, cm, cf, gm, gf next to a value indicates significant difference fromcounterpart(s) in other column(s). ⁎P < 0.05; ⁎⁎P < 0.01.u, urinary concentration; Ca, calcium; P, phosphorus; iCa, ionized calcium; Cr, creatinine; 25-OHD, 25 hydroxyvitamin D; 1,25(OH)2D, 1,25dihydroxyvitamin D; P1NP, total N-terminal propeptides of type 1 procollagen; OC, osteocalcin; BALP, bone alkaline phosphatase; βCTX, β form ofcross-linked C-telopeptide of type 1 collagen; DPD, deoxypyridinoline; eGFR, estimated glomerular filtration rate; TmP/GFR the ratio of the maximumtubular reabsorption rate of phosphate to glomerular filtration rate.All biochemical markers are presented as means of timepoint A on days 0 and 1 and are averaged over two seasons with the exception of p25-OHD thatwas only measured and eGFR and TmP/GFR that were calculated on the basis of corresponding values in blood and urine, respectively at timepoint A onday 0 in each season.
aThe comparison for pCa was adjusted for pAlbumin by including it as one of the independent variables in the analysis.
Published as: Bone. 2009 August ; 45(2): 238–245.