
Towards the Structures of the Parathyroid Hormone Receptors ...
211
Towards the Structures of the Parathyroid Hormone Receptors By James George Henderson Submitted in accordance with the requirements for the degree of Doctor of Philosophy The University of Leeds School of Biomedical Sciences & Astbury Centre for Structural Molecular Biology March 2021
-
Upload
khangminh22 -
Category
Documents
-
view
1 -
download
0
Transcript of Towards the Structures of the Parathyroid Hormone Receptors ...

Towards the Structures of the Parathyroid
Hormone Receptors
By
James George Henderson
Submitted in accordance with the
requirements for the degree of
Doctor of Philosophy
The University of Leeds
School of Biomedical Sciences
&
Astbury Centre for Structural Molecular
Biology
March 2021

i

ii

iii
Intellectual Property and Publication
Statement
The candidate confirms that the work submitted is his own, except where work which
has formed part of jointly authored publications has been included. The contribution
of the candidate and the other authors of this work has been explicitly indicated below.
The candidate confirms that appropriate credit had been given within the thesis where
reference has been made to the work of others.
Chapter 5 contains work from the following jointly-authored paper:
(1) Harborne, S. P. D., Strauss, J., Boakes, J. C., Wright, D. L., Henderson, J.
G., Boivineau, J., Jaakola, V.P., and Goldman, A. (2020). IMPROvER: the
Integral Membrane Protein Stability Selector. Scientific Reports, 10, 15165
(2020)
Dr Harborne created the IMPROvER program for predicting potentially stabilisng
mutations in unrelated proteins. Three proteins were examined in this paper: CIPPase,
hENT1, and PTH1R. Dr Harborne and Mr Srauss provided data for CIPPase, while
hENT1 data was given by Ms Boakes and Ms Wright. I obtained all data pertaining to
PTH1R.
This copy has been supplied on the understanding that it is copyright material and that
no quotation from the thesis may be published without proper acknowledgement. The
right of James Henderson to be identified as Author of this work has been asserted by
James Henderson in accordance with the Copyright, Designs and Patents act 1988.
© 2021 The University of Leeds and James George Henderson.

iv
Acknowledgments
Firstly, I would like to thank my supervisors Adrian Goldman and Dan Donnelly, for
their continued support throughout this incredibly difficult PhD. They have both
guided and helped me through the many challenges that I faced, for which I am
incredibly grateful. I would also like to thank the BBSRC for their funding and for
giving me the opportunity to advance my career path in the sciences.
I also want to additionally thank the BBSRC for allowing me to fulfil one of my
lifetime ambitions of living in Japan. Through the PIPS program I was able to obtain
teaching experience, which improved my confidence and public speaking skills. This
was all thanks to the staff at the Green Room: Hiroshi Saito, Matt Lounton, and Darian
Godfrey. I hope they are all doing well, along with all my former students. Thanks to
Dennis as well for taking me out for yakiniku! Overall, it was truly an unforgettable
experience.
I would never have made it this far without the help of my colleagues in the lab.
Particular thanks must go to Dr Steven Harborne, who greatly helped me during my
first year and for helping me get my name on a paper! The other postdocs throughout
my time at Leeds were also invaluable, including Nita Shah, Maren Tomson, Francis
Totanes, Julie Heggelund (lab bully), and James Hillier.
The many friends I made over the past four years have truly helped me get through
some tough times. Whenever I was feeling low, I could always count on Jannik to lose
to me in whatever activity we tried, be it tennis or rock climbing. It was always a good
ego boost to be the best in the climbing group we formed (sorry Claudia and Jack),

v
though I don’t think I will miss being someone’s personal chauffer too badly (still the
best lab partner one could have though <3). I can honestly say when I started this, I
never imagined I would share a Japanese hot spring with a lab friend in our boxers,
but we did it Brendan (sugoi best buddies always). Of course, it was a pleasure to do
anything but actually work with you Alex. I also want to thank everyone else in the
lab: Ana, Anchal, Andreas, Craig, Emily, Jess, Maria, and all other lab members, past
and present (mainly for not getting annoyed whenever I would try to procrastinate
and annoy them).
A big thanks to my gaming friends: Aaran, Andrew, Liam, Matthew, and Rory who
would always be able to help me destress by playing videogames (mainly Liam, let’s
face it). They were also of major help when dealing with any Microsoft Excel issues,
for which I am extremely grateful.
I would like to thank my parents for everything they have done for me (buying a flat
comes to mind) and to my brother Jeremy for taking the time to read over this thesis,
even though he probably didn’t understand most of it. Last, but not least, a huge thanks
to my partner Joanna who has had to endure four years of me stressing over things not
working properly! As hard as this PhD has been, it would have been much harder
without her.

vi
Abstract
G protein-coupled receptors (GPCRs) are a superfamily of membrane proteins that
transduce extracellular signals to invoke physiological responses. Class B GPCRs are
regulated by peptide hormones and are characterised by a seven transmembrane
domain, a 120-150 residue extracellular domain (ECD), and an intracellular C-
terminus. The parathyroid hormone 1/2 receptors (PTH1R/PTH2R) belong to this
family and, despite being closely related, have different physiological roles: PTH1R is
crucial in bone metabolism, whereas PTH2R function is significantly less well defined.
The original aims of this research were to solve the structures of these two receptors.
This involved creating various receptor constructs that would be suitable candidates
for downstream structural trials. Insect cell expressed receptors were quantified
through fluorescent intensity densitometry analysis and a potential candidate for
further structural studies was found in the form of a mini Gs protein bound to an
apocytochrome, b562RIL (BRIL) fusion protein following a FLAG purification.
However, a constitutively active receptor, created by tethering PTH(1-14) to BRIL-
PTH1R and verified through LANCE® cAMP assays, was unable to form this
complex.
PTH2R proved a major challenge, so attempts to solve the isolated ECD were made
instead. This was pursued using Escherichia coli expressed protein in various
oxidising environments, though due to low protein yields and poor stability it was
impossible to obtain a candidate for further trials.

vii
Finally, the novel integral membrane protein stability selector (IMPROvER) program
was used to create a thermostable PTH1R. Through fluorescent based thermostability
assays, 40% of 20 mutations were stabilising with a maximum increase of 3.4 ± 1.1 °C.
Combinations of these mutations resulted in a construct with an improved stability of
10 ± 0.76 °C. This research gives a strong foundation for future structural work
regarding PTH1R and has highlighted that IMPROvER is a valid alternative to more
laborious methods such as alanine scanning.

viii
Table of Contents
Intellectual Property and Publication Statement .............................................. iii
Acknowledgments ................................................................................................. iv
Abstract .................................................................................................................. vi
Table of Contents ............................................................................................... viii
List of Figures ...................................................................................................... xii
List of Tables ........................................................................................................ xv
List of Abbreviations .......................................................................................... xvi
Chapter 1 Introduction .............................................................................................. 1
1.1 G Protein-Coupled Receptors .................................................................... 1
1.1.1 Overview ............................................................................................... 1
1.2 Techniques to Solve GPCR Structures ...................................................... 4
1.2.1 Crystallisation ............................................................................................ 4
1.2.2 Nanobodies ................................................................................................. 6
1.2.3 Cryogenic Electron Microscopy ............................................................ 10
1.2.4 Mini G Protein ......................................................................................... 13
1.3 Improving and Optimising Workflow ..................................................... 15
1.3.1 IMPROvER ........................................................................................ 15
1.4 GPCR signalling ........................................................................................ 17
1.4.1 G Protein Signalling ................................................................................ 17
1.5 PTH Receptors ........................................................................................... 20
1.5.1 PTH1R ...................................................................................................... 20
1.5.2 PTH and PTHrP ...................................................................................... 23
1.5.3 TIP39 and the PTH2R ............................................................................. 24
1.6 Solved Family B GPCR Structures .......................................................... 27
1.6.1 Conserved ECD Structure ...................................................................... 27
1.6.2 Non-PTH Receptor Structures............................................................... 29
1.7 PTHR Structures ............................................................................................ 40
1.7.1 Inactive PTH1R Structure ...................................................................... 40
1.7.2 The Active PTH1R Structure ................................................................. 43
1.8 Summary ......................................................................................................... 47
1.9 Aims ................................................................................................................. 49
Chapter 2 Methods ................................................................................................... 50
2.1 Standard Protocols ......................................................................................... 50
2.1.1 Buffers and Chemicals ............................................................................ 50

ix
2.1.2 Primers ..................................................................................................... 50
2.1.3 Media and Agar Plates............................................................................ 50
2.1.4 Preparation of Competent Cells ............................................................ 51
2.1.5 Heat shock transformation ..................................................................... 52
2.1.6 Polymerase Chain Reaction ................................................................... 52
2.1.7 Agarose gel electrophoresis .................................................................... 53
2.1.8 In-Fusion cloning ..................................................................................... 53
2.1.9 Mutagenesis ............................................................................................. 55
2.1.10 DNA Purification ................................................................................... 56
2.1.11 SDS-PAGE ............................................................................................. 56
2.1.12 Western Blotting ................................................................................... 57
2.1.13 Native-Page ............................................................................................ 58
2.1.14 Dialysis ................................................................................................... 58
2.2 Sf9 Work ......................................................................................................... 59
2.2.1 Bacmid Preparation and Sf9 Cell Transfection ................................... 59
2.2.2 Virus amplification ................................................................................. 60
2.2.3 Determining Optimal Time to Harvest ................................................. 61
2.2.4 Large-Scale Sf9 Expression .................................................................... 61
2.3 PTH1R and PTH2R Profile Determination .................................................. 61
2.3.1 Cloning of Wild-type Constructs ........................................................... 61
2.3.2 Protein Quantification ............................................................................ 62
2.3.3 Solubilisation Screening.......................................................................... 63
2.3.4 Determining optimal solubilisation time ............................................... 63
2.4 HEK-293 Cell work ........................................................................................ 64
2.4.1 DNA MaxiPrep ........................................................................................ 64
2.4.2 HEK-293 Cell Maintenance ................................................................... 64
2.4.3 HEK-293 Transfection ............................................................................ 65
2.5 PTH Receptor Modification .......................................................................... 66
2.6 Constitutively Active PTH1R ........................................................................ 66
2.6.1 Creating a PTH-tethered Receptor Construct ..................................... 66
2.6.2 LANCE cAMP Assay Protocol .............................................................. 67
2.6.3 Optimisation of LANCE® Assay Conditions ....................................... 67
2.7 Expression and Purification of the G Protein Heterotrimer ...................... 68
2.8 Nanobody Work ............................................................................................. 69
2.8.1 nb37 Expression and Purification ......................................................... 69
2.8.2 nb35 Expression ...................................................................................... 70
2.8.3 Osmotic shock .......................................................................................... 71

x
2.8.4 nb35 Purification ..................................................................................... 71
2.9 Purification of PTH1R-G protein Complex ................................................. 72
2.9.1 Co-expression of PTH1R and a G Protein ............................................ 72
2.9.2 Complex purification .............................................................................. 72
2.9.3 Mini G protein ......................................................................................... 73
2.9.4 PTH1R-Mini G protein Complex Purification ..................................... 73
2.10 PTH2R Characterisation ............................................................................. 73
2.11 PTH2RECD Work ........................................................................................... 74
2.11.1 Expression and Purification of DsbC .................................................. 74
2.11.2 Optimisation of PTH2RECD Expression ............................................... 75
2.11.3 PTH2RECD Protein Expression and Purification ................................ 75
2.11.4 Mass Spectrometry................................................................................ 76
2.12 IMPROvER .................................................................................................. 76
2.12.1 Acquiring Ordered IMPROvER Mutants .......................................... 76
2.12.2 Cloning of mutants ................................................................................ 76
2.12.3 High Throughput Transfection of Sf9 Cells ....................................... 77
2.12.4 Functional Analysis of IMPROvER Mutants ..................................... 77
2.12.5 Thermostability assay for BRIL-PTH1R Control .............................. 77
2.12.6 Thermostability Assay for IMPROvER Mutants .............................. 78
2.12.7 CompoMug ............................................................................................ 78
2.12.8 Fractional Factorial Design .................................................................. 79
Chapter 3 Towards the Structure of PTH1R ......................................................... 80
3.1 Aims ................................................................................................................. 80
3.2 Cloning of Constructs .................................................................................... 80
3.3 Expression of PTH1R ..................................................................................... 82
3.4 HEK-293 Expression ...................................................................................... 85
3.5 Truncation of PTH1R ECD ........................................................................... 87
3.6 Constitutively Active Receptor ..................................................................... 90
3.7 GPCR-G Protein Complex Formation ......................................................... 95
3.7.1 G Protein Expression .............................................................................. 95
3.7.2 Multiple Protein Expression in Sf9 Cells .............................................. 98
3.7.3 Nanobody Expression and Purification ................................................ 99
3.7.4 Optimisation of Nanobody Purification .............................................. 102
3.8 Formation of the GPCR-G Protein Complex ............................................ 103
3.8.1 GPCR-G Protein-nb35 Complex ......................................................... 103
3.8.2 GPCR-Mini G Protein Complex .......................................................... 104
3.9 Conclusions ................................................................................................... 106

xi
Chapter 4 Towards the PTH2R Structure ........................................................... 108
4.1 Aims ............................................................................................................... 108
4.2 Expression and Quantification of PTH2R in Sf9 Cells ............................. 108
4.3 Solubilisation of PTH2R ............................................................................... 111
4.4 A General Method for Solving Family B GPCR ECD Structures .......... 112
4.5 Purification of DsbC .................................................................................... 114
4.6 PTH2RECD Purification ................................................................................ 116
4.7 Optimisation of PTH2RECD Expression ...................................................... 119
4.8 Conclusions ................................................................................................... 130
Chapter 5 IMPROvER .......................................................................................... 131
5.1 Aims of the Chapter ..................................................................................... 131
5.2 Identification of Stabilising Mutants .......................................................... 133
5.2.1 Predicted Stabilising Mutants .............................................................. 133
5.2.2 Melting Temperatures of IMPROvER Mutants ................................ 134
5.2.3 Functional Analysis of Stabilising Mutants ........................................ 140
5.3 Comparison with CompoMug ..................................................................... 144
5.4 Fractional Factorial ..................................................................................... 146
5.4.1 Theory of Fractional Factorial Design ................................................ 146
5.4.2 Fractional Factorial Design on IMPROvER Mutants ........................... 148
Chapter 6 Conclusions and Discussion ................................................................ 157
6.1 Overall Conclusions ..................................................................................... 157
6.1.1 PTH1R .................................................................................................... 157
6.1.2 PTH2R .................................................................................................... 159
6.1.3 IMPROvER ........................................................................................... 161
6.2 Comparing PTH1R efforts to the solved PTH1R structures .................... 163
6.3 Future Work ................................................................................................. 165
6.4 Final Remarks .............................................................................................. 167
Chapter 7 References ............................................................................................. 168
Appendix ................................................................................................................. 185
Primers ................................................................................................................ 185
Putting PTH1R and PTH2R into pFastBac CTH/CGVH ........................... 185
Receptor modifications .................................................................................. 185
G Protein ......................................................................................................... 187
Tethered Receptors ........................................................................................ 187
PTH2RECD ........................................................................................................ 189
IMPROvER Mutations .................................................................................. 190

xii
List of Figures
Figure 1.1: A timeline showing the year-on-year rise of solved family B
structures .................................................................................................................... 3
Figure 1.2: A simplified schematic highlighting the differences between
conventional antibodies, camelid antibodies and nanobodies ................................ 7
Figure 1.3: The comparison of different nanobodies on the structure of the
2AR ............................................................................................................................ 8
Figure 1.4: Alignment of inactive and active 2AR structures .............................. 9
Figure 1.5: Comparison between a full heterotrimeric G protein structure and
the mini Gs protein ................................................................................................... 15
Figure 1.6: Schematic describing the process of GPCR signalling ...................... 19
Figure 1.7: The role of PTH in maintaining physiological calcium levels .......... 21
Figure 1.8: A simplified schematic showing PTH receptor binding specificity
and receptor functionality ....................................................................................... 26
Figure 1.9: Conserved family B ECD structures................................................... 29
Figure 1.10: Cartoon representations of family B GPCR structures .................. 31
Figure 1.11: The differences between GLP1R structures and the glucagon
receptor ..................................................................................................................... 34
Figure 1.12: An overview of the current structural knowledge of active family B
GPCRs ....................................................................................................................... 35
Figure 1.13: Structural alignment of the active GLP1R (green) and the inactive
glucagon receptor (orange)...................................................................................... 37
Figure 1.14: GLP1R structure and activation process .......................................... 39
Figure 1.15: Overall structure of the inactive PTH1R bound to ePTH ............... 41
Figure 1.16: Structural alignment of inactive and active PTH1R ........................ 45
Figure 1.17: The alterations in PTH1R that promote the unwinding and kink of
helix VI. ..................................................................................................................... 47
Figure 1.18: Structural alignment of all current active family B receptors ....... 48
Figure 2.1: A simplified schematic, explaining In-Fusion cloning...................... 55
Figure 2.2: Basic design of PTH1R-pFastBac constructs ..................................... 62
Figure 3.1: A representative In-Fusion cloning reaction ...................................... 81
Figure 3.2: Expression and Optimisation of PTH1R in Sf9 cells ......................... 82
Figure 3.3: Quantification of PTH1R-CGVH. ....................................................... 84

xiii
Figure 3.4: Solubilisation of PTH1R-CTH ............................................................. 85
Figure 3.5: Expression and quantification of PTH1R in HEK-293 cells. ............ 86
Figure 3.6: Quantification of truncated receptors ................................................ 88
Figure 3.7: Solubilisation profile of BRIL-PTH1R ............................................... 89
Figure 3.8: Schematic of the principle behind a tethered receptor. .................... 91
Figure 3.9: Expression of PTH(1-14) tethered PTH1R constructs ...................... 92
Figure 3.10: Principles of the LANCE® cAMP assay .......................................... 93
Figure 3.11: LANCE cAMP functional assay on tethered PTH1R constructs ... 94
Figure 3.12: Expression of G protein subunits ...................................................... 96
Figure 3.13: Purification of full G protein complex .............................................. 97
Figure 3.14: Co-expression of 4 viruses in Sf9 cells .............................................. 98
Figure 3.15: Purification and quantification of nb37 ........................................... 99
Figure 3.16: Expression and purification of nb35 ............................................... 101
Figure 3.17: Optimisation of nb35 purification ................................................... 102
Figure 3.18: Attempted GPCR-G protein complex formation .......................... 104
Figure 3.19: Purification of GPCR-mini G protein complex ............................. 105
Figure 4.1: Quantification of PTH2R ................................................................... 109
Figure 4.2: Expression of PTH2R Mutants .......................................................... 110
Figure 4.3: Solubilisation of PTH2R ..................................................................... 111
Figure 4.4: A schematic for obtaining correctly folded family B ECD structures
.................................................................................................................................. 114
Figure 4.5: Ammonium sulphate precipitation of DsbC .................................... 115
Figure 4.6: Purification of DsbC ........................................................................... 116
Figure 4.7: Purification of MBP-PTH2RECD ........................................................ 117
Figure 4.8: Attempted amylose purification of MBP-PTH2RECD ...................... 118
Figure 4.9: Expression of MBP-PTH2RECD in E. coli strains ............................. 120
Figure 4.10: Native gel of MBP-PTH2RECD in different E. coli strains ............. 121
Figure 4.11: Expression of PTH2RECD with and without DsbC ......................... 122
Figure 4.12: Degradation of expressed PTH2RECD protein ................................ 123
Figure 4.13: PTH2RECD quantification though western blot densitometry
analysis .................................................................................................................... 124
Figure 4.14: Expression trials using different medias and temperatures ......... 125
Figure 4.15: The effects that different volumes of E. coli have on expression. . 127
Figure 4.16: GFP versus MBP tagged PTH2RECD ............................................... 128

xiv
Figure 4.17: An His and amylose purification of PTH2RECD ............................. 129
Figure 5.1: Schematic of IMPROvER workflow to obtain a ranked list of most
stabilising mutations .............................................................................................. 132
Figure 5.2: Expression and Tm of BRIL-PTH1R ................................................. 135
Figure 5.3: Single point temperature assay on IMPROvER mutants ............... 136
Figure 5.4: Melting curves of PTH1R mutants and Tm analysis ........................ 138
Figure 5.5: Location of IMPROvER predicted mutations in PTH1R ............... 139
Figure 5.6: Functional assays of wild-type PTH1R and mutant constructs ...... 141
Figure 5.7: Presence of double banding in G323A .............................................. 149
Figure 5.8: Tm of fractional factorial constructs .................................................. 151
Figure 5.9: The effects of mutations on the magnitude of main and two-way
effects. ...................................................................................................................... 155

xv
List of Tables
Table 2.1: Composition of buffers for making competent cells ........................... 51
Table 2.2: Antibodies and dilutions used for western blots ................................. 58
Table 2.3: Volume of DMEM to be added one hour before transfection ........... 65
Table 2.4: DNA:PEI ratios for HEK-293 transfection ......................................... 65
Table 4.1: The conditions investigated for expression of PTH2RECD ................ 125
Table 5.1: The top 10% of IMRPOvER’s predicted stabilising mutations ...... 134
Table 5.2: Overview of IMPROvER mutant thermostability ............................ 137
Table 5.3: IMPROvER functional assay results ................................................. 142
Table 5.4: A list of mutations obtained from CompoMug. ............................... 145
Table 5.5: An example of results to highlight the concept of fractional factorial
experimental designs .............................................................................................. 147
Table 5.6: Fractional factorial design................................................................... 149
Table 5.7: Fractional factorial construct thermostability data .......................... 150
Table 5.8: The confounding aliases of the fractional factorial design ............... 154

xvi
List of Abbreviations
2D: Two Dimensional
3D: Three Dimensional
5-HT1BR: serotonin 5-hydroxytryptamine1B receptor
A1R: Adenosine A1 Receptor
A2AR: Adenosine A2AR
BRIL: apocytochrome b562RIL
2AR: 2-adrenergic receptor
BSA: Bovine serum albumin
cAMP: Cyclic adenosine monophosphate
CGRP: Calcitonin gene-related peptide
CHS: cholesteryl hemisuccinate
CHO: Chinese hamster ovary
CLR: Calcitonin-like receptor
CompoMug: Computational predictions of mutations in GPCRs
CRF: Corticotropin-releasing factor
CRF1R: Corticotropin-releasing factor 1 receptor
Cryo-EM: Cryo-Electron microscopy
DAG: Diacylglycerol
DDM: Dodecyl maltoside
DM: Decyl maltoside
DMEM: Dulbeco’s modified eagle medium
DNA: Deoxyribonucleic acid
DPA: Day after proliferation arrest
DsbC: Disulphide bond C
DTT: Dithiothreitol
EDTA: Ethylenediaminetetraacetic acid
ECD: Extracellular domain
ECL: Extracellular loop
E. coli: Escherichia coli
FBS: Foetal bovine serum
FRET: Fluorescent Resonance Energy Transfer

xvii
GFP: Green Fluorescent Protein
GDP: Guanosine diphosphate
GIPR: Gastric inhibitory polypeptide receptor
GLP: Glucagon-like-peptide
GLP1R: Glucagon-like-peptide 1 receptor
GNAS: G protein αs
GNG1: G protein subunit γ 2
GOI: Gene of interest
GPCR: G-Protein coupled receptors
GTP: Guanosine triphosphate
HEK-293: Human embryonic kidney-293
HEPES: 4-(2-hydroxyethyl)-1-piperazineethanesulfonic acid
His: Histidine
IBMX: 3-isobutyl-1-methylxanthine
ICL: Intracellular loop
IMPROvER: Integral membrane protein stability selector
IP3: Inositol trisphosphate
IPTG: β-D-1-thiogalactopyranoside
LCP: Lipid cubic phase
LB: Luria broth
LMNG: Lauryl maltose neopentyl glycol
MBP: Maltose binding protein
nb35: Nanobody 35
nb80: Nanobody 80
NEB: New England Biolabs
Ni-NTA: Nickel-Nitrolotriacetic acid
NMR: Nuclear magnetic resonance
OD600: Optical density measured at 600 nm
OG: Octyl glucoside
OGNG: Octyl glucose neopentyl glycol
-OR: -Opioid receptor
PAC1R: Pituitary adenylate cyclase-activating polypeptide receptor
PAGE: Polyacrylamide gel electrophoresis

xviii
PBS: Phosphate buffered saline
PCR: Polymerase chain reaction
PIP2: Phosphatidylinositol 4,5-bisphosphate
PDB: Protein database
PTH: Parathyroid hormone
PTHrP: Parathyroid hormone related peptide
PTH1R: Parathyroid hormone 1 receptor
PTH2R: Parathyroid hormone 2 receptor
RhoGEF: RhoGTPase nucleotide exchange factors
R.M.S.D: Root-mean-square deviation
SB: super broth
SDS: sodium dodecyl sulphate
SEM: Standard error of the mean
Sf9: Spodoptera frugiperda 9
TAE buffer: Tris-acetate, EDTA buffer
TB: terrific broth
TBST: Tris-buffered saline with Tween-20
TIP39: Tuberoinfundibular peptide of 39 residues
Tm: Melting Temperature
TMD: Transmembrane domain
TR-FRET: Time-resolved Fluorescence Energy Transfer
TrpV1: Transient receptor potential cation channel subfamily V member 1
X-Gal: 5-Bromo-4-chloro-3-inodyl β-D-galactopyranoside
YFP: Yellow fluorescent protein

1
Chapter 1 Introduction
1.1 G Protein-Coupled Receptors
1.1.1 Overview
G-protein coupled receptors (GPCRs) are a superfamily of integral membrane
receptors, the primary function of which is to transduce an extracellular signal into the
cell to promote a large range of physiological effects. Typically, they contain a seven
transmembrane region with an extracellular N-terminus and an intracellular C-
terminus. To date, over 800 human GPCR genes have been identified (Chung et al.,
2012), which are activated by a diverse range of stimuli including: organic small
molecules, proteins, peptide hormones, lipids, photons, and ions. This allows GPCRs
to play a role in practically all elements of human life, including cardiovascular,
endocrine, immune and nervous systems, as well as cell growth, embryonic
development and even emotion (Dobolyi, et al., 2012; Wettschureck & Offermanns,
2005). This also means that GPCR misfunction is involved in a number of diseases
such as diabetes, cardiovascular failure, bone disorders, and cancer. As such, between
30-40% of all current drugs target GPCRs (Ghosh et al., 2015). Therefore, by
understanding GPCR structures and functions, it may be possible to design novel
drugs to overcome diseases that have long eluded current treatments.
There are several subfamilies of GPCRs, the most abundant of which is the family A,
or Rhodopsin like-receptors, which account for a minimum of 70%, of all GPCRs
(Fredriksson, 2003). A significantly smaller subfamily is the Family B, or secretin-
like receptors, which are encoded by only 15 genes in humans. The parathyroid
hormone (PTH) receptors 1 and 2 (PTH1R/PTH2R) are one of these 15 family B

2
GPCR members, all of which bind to hormone peptides. Other members include the
glucagon, glucagon-like-peptide 1 and 2 (GLP1R, GLP2R), corticotropin-releasing
factor (CRF), calcitonin, glucose dependant insulinotropic hormone receptor (GIPR),
growth hormone releasing hormone, pituitary adenylate cyclase activating polypeptide
(PACAP), and the secretin receptors. These receptors are characterised by a 120-150
residue extracellular domain (ECD) that contains six conserved cysteine residues to
form 3 disulphide bonds, the typical 7 -helical transmembrane domain, and an
intracellular C-terminus. At the start of this project, it was hypothesised that solving
the full-length PTH receptor structures could form the foundations for structurally
based drug design and ultimately lead to the creation of new drugs.
Before the onset of the work described in this thesis, only the ECD of PTH1R had been
solved (Pioszak & Xu, 2008), but now there are two full-length structures, an inactive
and an active structure (Ehrenmann et al., 2018; Zhao et al., 2019). In recent years
techniques have been developed in aiding protein structure determination as typically,
GPCRs have very low levels of expression and are highly flexible proteins; both of
these features make crystallisation challenging. Thermostabilising mutations,
truncated receptors, fusion proteins, and improved expression systems have all been
utilised in solving GPCR structures. This has led to practically all family B GPCR
structures being solved as shown in Figure 1.1.

3
At the time of writing, only three family B receptors have yet to be solved: PTH2R,
GIPR, and the vasoactive intestinal polypeptide (VIP) receptor 2; however, a GIPR
structure is now available on BioRxiv (Zhao et al., 2021). A significant factor in this
rise of solved structures was the optimisation of cryogenic-electron microscopy (cryo-
EM), which accounts for 70% of all solved family B structures. At the start of this
project (2016) only four structures were solved, CRF receptor 1 (CRF1R) and the
glucagon receptor, all of which were x-ray crystal structures. The initial aims of this
work were to solve the structures of the PTH receptors by utilising similar
methodologies as these previously solved structures; however, with the ever
increasing knowledge in GPCR structural studies, there were many alternative routes
and techniques that could be utilised.
Figure 1.1: A timeline showing the year-on-year rise of solved family B structures. At
the beginning of the project (2016) only four structures were solved, but by the end of
2020 this had increased to 49 individual structures, with approximately 70% solved
using cryo-EM.
0
10
20
30
40
50
60
2013 2014 2015 2016 2017 2018 2019 2020
Tota
l nu
mb
er o
f St
ruct
ure
s
Year
cryo-EM Crystal

4
1.2 Techniques to Solve GPCR Structures
1.2.1 Crystallisation
Crystallisation of GPCRs has been a major obstacle that has only recently been
overcome. Natively, GPCRs have low expression levels and are highly flexible
proteins with multiple conformations. It is also challenging to both solubilise and
purify the receptors whilst maintaining their functionality. The 2-adrenergic receptor
(2AR), a family A GPCR, bound to a partial inverse agonist, carazolol, was the first
non-rhodopsin GPCR to be solved and required a baculovirus-mediated expression in
insect cells (Rasmussen et al., 2007). Insect cells allow post-translational
modifications and can produce proteins with a high expression level. The majority of
solved GPCRs have since used insect cell lines as their primary expression model.
GPCRs typically have highly flexible N and C-termini in addition to a heterogeneous
third intracellular loop, and thus the two termini are often truncated (Hollenstein et
al., 2013; Manglik et al., 2012; Rasmussen et al., 2007; Siu et al., 2013). To stabilise
the third intracellular loop, a fusion approach is commonly performed i.e. replacing
the loop with a crystallisable protein that efficiently diffracts such as T4 lysozyme or
apocytochrome b562RIL (BRIL). These fusion proteins have been used to solve the
glucagon and CRF1R structures respectively (Hollenstein et al., 2013; Siu et al., 2013),
as well as many family A GPCR structures. Fusion proteins can extend the complexes’
polar surface area to increase the number of crystal contacts formed throughout
crystallisation. Maltose binding protein (MBP) has been fused to the ECD of PTH1R
to solve its structure (Pioszak & Xu, 2008). Another means of increasing receptor
stability is thermostabilisation, whereby a number of mutants are created and tested
on their ability to bind ligands at increasing temperatures. Improved thermostability

5
reduces receptor flexibility and stabilises the protein in a single conformation. This
method, in conjunction with the fusion of BRIL, was used to solve the CRF1R structure
(Hollenstein et al., 2013). Often various combinations of these techniques are used to
produce stable GPCRs that must then be isolated and purified.
Detergents are critical for GPCR solubilisation and removal from the host cell
membrane. A commonly used detergent is dodecyl maltoside (DDM), which was used
for the crystallisation of 2AR (Rasmussen et al., 2007). However, the choice of
detergent must be determined through screening as membrane proteins can lose their
functionality in the detergent-solubilised state. As GPCRs are embedded membrane
proteins they are in close proximity to cholesterol. Interactions between GPCRs and
cholesterol maintain receptor structure and promote stability (Yao & Kobilka, 2005);
therefore, cholesteryl hemisuccinate (CHS), a cholesterol derivative, is often added to
detergents during GPCR purification. This creates a more native-like environment and
can maintain functional receptors for longer periods. The receptors can then be
purified using affinity tags, such as an amino FLAG and carboxy poly-histidine tag
(His). These tags can then be targeted in an antibody affinity column or immobilised
metal affinity chromatography respectively (Manglik et al., 2012). Another form of
purification is ligand affinity purification, which has the additional benefit of only
purifying correctly folded and functional receptors (Novick & Rubinstein, 2012).
After the receptors have been purified, they need to maintain their functionality to
produce meaningful structures. To achieve this, a highly selective ligand that can
promote the receptor into a certain conformation can be used. Covalent agonists that
irreversibly bind their receptor can potentially create extremely stable receptors that

6
remain in single conformations. By utilising this technique, a covalent agonist
facilitated the crystallisation of the 2AR so that the structure could be determined
(Rosenbaum et al., 2011); however, the final structure was in an inactive state.
Contrastingly, virtually all active structures have been solved using non-covalent
ligands. After the purified GPCR is both stable and retains functionality it often
becomes crystallised through lipid cubic phase (LCP) crystallisation. In LCP the
protein becomes embedded in a lipid bilayer to mimic the native environment. The
most commonly used lipids in LCP are monoolein and cholesterol, though for the
2AR-Gs complex MAG7.7 replaced monoolein to accommodate for the large
hydrophilic region of the G protein (Rasmussen et al., 2011b). LCP produces
microcrystals that are highly fragile and sensitive to radiation damage. As such,
synchrotron sources have to use microfocus beam lines, as the crystals are often
invisible to regular beams (Ghosh et al., 2015).
1.2.2 Nanobodies
A major breakthrough was the use of nanobodies; antibodies originating from llamas
that do not have light chains. Camelids (e.g., camels and llamas) can produce heavy-
chain only antibodies i.e. they do not contain any light chains, and are composed of
one variable and two constant domains (Hamer-Casterman et al., 1998) (Figure 1.2).
Nanobodies are single domain antibodies; they are made up of a single monomeric
variable domain This means they are significantly smaller (~15 kDa) than a standard
antibody (~150 kDa), but they still retain the equal binding capabilities of fully sized
antibodies. Obtaining a specific nanobody requires immunisation of a camelid,
harvesting their lymphocytes, and isolation of the mRNA. Functional nanobodies are
then selected using either phage or yeast displays.

7
The first example of a nanobody being used to solve an active GPCR was nanobody
80 (nb80), which mimicked G protein behaviour by increasing receptor affinity for its
agonist upon binding to the β2AR (Figure 1.3B) (Rasmussen et al., 2011a). Shortly
after this, nanobody 35 (nb35) was utilised to solve the active 2AR-Gs complex by
stabilising G protein interactions (Figure 1.3A) (Rasmussen et al., 2011b), as nb35
stabilises the G protein at the / subunit interface and prevents dissociation.
Nanobodies have since been used to solve various active GPCRs such as GLP1R, the
calcitonin gene related peptide receptor (CGRP), and the Calcitonin receptor (Liang
et al., 2018; Liang et al., 2017; Zhang et al., 2018).
Conventional antibodies do not usually bind to clefts on protein surfaces as they
contain six variable antigen binding loops as opposed to only three from heavy-chain
only antibodies. The higher number of variable loops in conventional antibodies
typically form planar surfaces for antigen binding, whereas camelid antibodies have
Figure 1.2: A simplified schematic highlighting the differences between conventional
antibodies, camelid antibodies and nanobodies. A conventional antibody contains two
heavy chains (HC) and two light chains (LC), both of which have constant (C) and
variable fragments (V), which provides the antibody with different binding
specificities. Camelid antibodies do not have light chain and are approximately 90
kDa. The nanobody is a single gene fragment derived from the variable region of the
camelid heavy chain antibody that retains specificity for its target.

8
convex antigen binding sites, primarily formed by the third variable loop (De Genst et
al., 2006). This allows heavy-chain only antibodies to access regions in proteins that
are usually not accessible by conventional antibodies. This, along with the added
benefit of being able to bind conformational epitopes, establishes nanobodies as highly
advantageous tools for stabilising proteins and improving crystallisation.
A combination of the previously discussed techniques were used to solve the 2AR-
Gs structure (Figure 1.4), the first active GPCR complex structure (Rasmussen et al.,
2011b). To accomplish this, T4 lysozyme was N-terminally tagged to a C-terminally
truncated 2AR and FLAG purified. All three subunits of the G-protein (, , and )
A B C
Figure 1.3: The comparison of different nanobodies on the structure of the 2AR. A.
The 2AR-G protein-nb35 complex (PDB entry 3SN6). The nb35 (magenta) protein
occupies and stabilises the interface between the (yellow) and (cyan) subunits,
there is no interaction with the subunit (blue). The 2AR (green) is stabilised in an
active state bound almost exclusively to the subunit. B. The 2AR (green) bound to
nb80 (magenta) (PDB entry 3P0G). The nb80 was specifically designed to stabilise
the receptor in an active state and mimics the subunit interaction. C. Alignment of
the two 2AR’s solved using different nanobodies. The receptors align extremely well,
but there are some differences on the cytoplasmic end, such as a 3 A movement in
helix VI of the 2AR-G protein-nb35 complex. 2AR-G protein-nb35 is in green and
2AR-nb80 complex is in magenta.

9
were expressed in HighFive insect cells, with a 6 x His tag attached to the subunit.
Following a His purification they were able to pull down all G protein subunits. The
heterotrimer was then mixed with an agonist bound-2AR, forming the GPCR-G-
protein complex. After a further FLAG/size exclusion purification they were left with
a purified 2AR-Gs complex. The nb35 protein, specific for the interface between
the and subunits, was also added to maintain stability of the complex and inhibit
dissociation. Variations on this protocol have been used to solve active GPCRs
(García-Nafría et al., 2018a; Liang et al., 2017; Zhao et al., 2020), but the principles
have remained the same.
Figure 1.4: Alignment of inactive and active 2AR structures. Alignment of the two
receptor states give a R.M.S.D value of 1.417, the most critical differences being a
roughly 14 A bend in helix VI and a cytoplasmic end extension of helix V. The PDB
entries for the active 2AR (green) and inactive 2AR (orange) are 3SN6 and 3NY8
respectively.

10
Currently, the techniques available for GPCR crystallisation have made determining
GPCR crystal structures far more feasible, with over 400 solved structures in the
protein data base (PDB). With these advances it is now possible to solve GPCR
structures that were previously unobtainable, such as the PTH receptors. Indeed, using
several techniques as described here, Ehrenmann et al. (2018) were able to solve the
inactive PTH1R structure at a 2.5 A resolution. Furthermore, Zhao et al. (2019) were
even able to solve the active structure of PTH1R using cryo-EM.
1.2.3 Cryogenic Electron Microscopy
Crystallography relies on the use of X-rays to determine protein structure, through the
use of x-ray diffraction experiments. Cryo-EM uses electrons to determine atomic
level details. The use of electrons requires the use of a vacuum, as electrons are
scattered in air, and have a high chance of causing radiation damage to the protein. To
minimalize radiation damage the proteins must be held at cryogenic levels (roughly
-150 C or lower), which also accomplishes protein preservation. Typically only
around 3 L of sample at a concentration of 0.05-5 M is required for cryo-EM
(Passmore & Russo, 2016). The sample is applied to a grid, which has a thin ‘holey’
carbon film, and any excess liquid is removed using filter paper. The grid is then
immediately plunged into liquid ethane to cryogenically freeze it. This, ideally, should
create a very fine layer of ice which contains the protein of interest in several
confirmations. Two-dimensional (2D) images, or particles, of the protein can then be
captured and combined to produce a three-dimensional (3D) reconstruction.
At the time the first active GPCR was solved (Rasmussen et al., 2011b) the resolutions
obtained from cryo-EM were generally poor, ranging from 7-9 A; these were typically

11
large and stable protein complexes. In 2013, the transient receptor potential cation
channel subfamily V member 1 (TrpV1), a membrane protein, was solved at 3.4 A
(Liao et al., 2013). Now many active family B GPCRs have been solved using cryo-
EM. There are multiple reasons why there has been such an advancement in cryo-EM.
One critical point is the development of direct electron detectors. These detectors have
a remarkable efficiency and since cryo-EM can produce images with high levels of
background noise these detectors have been crucial in improving cryo-EM efficiency
and resolution. Briefly, instead of creating a single image the detectors can collect 10’s
of frames per second, essentially capturing a movie of the molecules. Every frame can
then be corrected for radiation damage. Electrons are significantly more damaging to
biological samples than x-rays and can very rapidly destroy the sample. The multiple
frames allow the user to remove particularly blurry images and through averaging
make the pictures clearer. The development of voltage potential phase plates has also
allowed users to further increase the contrast between particles and background noise,
making it easier to isolate the protein (Danev et al., 2019).
Recently, many GPCRs have been solved using cryo-EM including the GLP1R,
calcitonin, adenosine A1 and A2A receptors (A1R/A2AR), the serotonin 5-
hydroxytryptamine 1B receptor (5-HT1BR), -opioid receptor (-OR), CGRP, the
human rhodopsin receptor, PTH1R, and many more. (Draper-Joyce et al., 2018;
García-Nafría et al., 2018a; García-Nafría et al., 2018b; Koehl et al., 2018; Kossiakoff
& Subramaniam, 2018; Liang et al., 2017; Zhang et al., 2017; Zhao et al., 2019). The
global resolution of these receptors varies from 3.5 (-OR) up to 4.5 Å (rhodopsin).
These cryo-EM studies consistently produced similar findings to previously solved
GPCR and GPCR-G-protein complex crystal structures. The active structure of A2AR

12
was the first instance of directly comparing the same GPCR between cryo-EM and x-
ray crystallography (Carpenter & Tate, 2017; García-Nafría et al., 2018a). The overall
architecture of these two structures was highly similar, however there were instances
of disagreement. In the cryo-EM structure, extracellular loop (ECL) II was far more
disordered and flexible, whereas in the crystal structure it was a helical loop that
capped the receptor. The reasoning for this alteration was that the cryo-EM structure
was solved at a more physiological pH (pH 7.5) than the crystal structure. This caused
the loss of a salt bridge, leading to a more disordered structure. The similarities
between the two structures highlights how cryo-EM can be used as an alternative to
x-ray crystallography.
Cryo-EM also has the advantage of speed over x-ray crystallography, as the formation
of crystals is not required. Typically, to acquire a crystal structure extensive protein
engineering is a necessity. This can include thermostable mutagenesis, identifying
optimal protein truncations, and locating the ideal target for a fusion protein insertion.
This is not necessarily required for cryo-EM, as shown by the full-length calcitonin
receptor, which only had a N-terminal FLAG and C-terminal His tag modifications
(Liang et al., 2017). Protein engineering is still utilised to help solve GPCR structures,
as the rhodopsin receptor was solved with the addition of a C-terminal BRIL insertion
to facilitate expression (Kossiakoff & Subramaniam, 2018). An additional advantage
of cryo-EM is that milder detergents such as LMNG can be used for solubilisation and
purification (Hauer et al., 2015).
A major limitation of cryo-EM is the size of protein that can be solved. Smaller
proteins (<100 kDa) produce very poor signal to noise ratios, making it extremely
13
difficult to accurately determine particles from background. In 2016 the smallest
protein to be solved was the 93 kDa isocitrate dehydrogenase (Merk et al., 2016), yet
just one year later a cryo-EM structure for human haemoglobin (64 kDa) was solved
to 3.2 Å (Khoshouei et al., 2017). To date, the smallest protein structure solved
through cryo-EM is 43 kDa, the catalytic domain of protein kinase A (Herzik et al.,
2019). Natively GPCRs are approximately 30-50 kDa, raising issues regarding the use
of cryo-EM to deduce their structure. All cryo-EM GPCR structures are solved as
complexes that typically include a G-protein and a nanobody. For example, the final
product of the A2AR-G-protein complex was approximately 135 kDa (García-Nafría,
et al., 2018a). Smaller sizes such as a GPCR-mini G protein complexes (~60-70 kDa)
and inactive GPCRs are unlikely to be easily solved using cryo-EM due to these size
limitations.
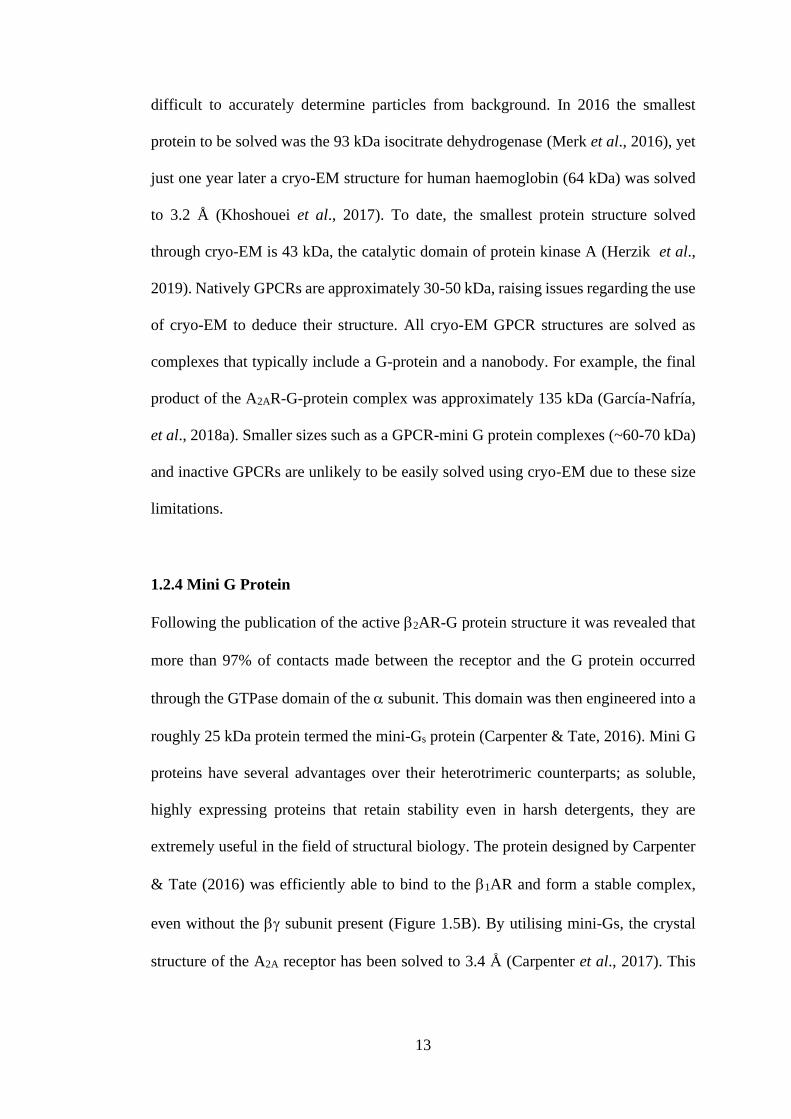
1.2.4 Mini G Protein
Following the publication of the active 2AR-G protein structure it was revealed that
more than 97% of contacts made between the receptor and the G protein occurred
through the GTPase domain of the subunit. This domain was then engineered into a
roughly 25 kDa protein termed the mini-Gs protein (Carpenter & Tate, 2016). Mini G
proteins have several advantages over their heterotrimeric counterparts; as soluble,
highly expressing proteins that retain stability even in harsh detergents, they are
extremely useful in the field of structural biology. The protein designed by Carpenter
& Tate (2016) was efficiently able to bind to the 1AR and form a stable complex,
even without the subunit present (Figure 1.5B). By utilising mini-Gs, the crystal
structure of the A2A receptor has been solved to 3.4 A (Carpenter et al., 2017). This

14
was the first instance of the A2A in its active form and highlighted the suitability of
mini G proteins in structural studies.
However, this does not mean a perfect alternative to native G proteins has been
discovered. Mini G proteins have several limitations; as previously noted they are only
approximately 25 kDa as opposed to the roughly 90 kDa full-length G protein,
meaning GPCR-mini Gs complexes would be extremely difficult to solve using cryo-
EM. Furthermore, despite the majority of binding occurring in the GTPase domain of
the subunit, a mini G protein removes any potential interactions that may also be
occurring. Despite this, there is a cryo-EM structure of A2A that utilised a mini G
protein (García-Nafría, et al., 2018a); however, in this instance the full structure
contained a receptor, mini G protein, the -subunit and nb35, allowing the size
limitation to be overcome. This structure was able to reveal that there are interactions
between the first intracellular loop and the subunit, an interaction that would be
impossible to show in a GPCR-mini G protein structure alone. In family B GPCRs,
helix 8 is angled approximately 30 more towards the G protein, promoting further
interactions with the subunit, which are not seen in family A receptors. Solving the
structures of G protein bound GPCRs is an integral step in unravelling their structural-
functional relationship and is highly desirable in the development of any future drugs.

15
1.3 Improving and Optimising Workflow
1.3.1 IMPROvER
Currently, two-thirds of all solved GPCR structures have at least one stabilising
mutation, highlighting the importance of protein engineering. However, the
techniques decribed above are not exclusive to solving GPCR structures and can be
applied to any type of protein structural work i.e. Shi et al. (2019), through protein
engineering, created a 8 x His-tagged thermostable uricase, expressed in Escherichia
coli (E. coli) and obtained the crystal structure at a 2.0 Å resolution. Unfortunately,
creating a thermostable protein is a labour intensive process that continues to hold
back structural studies. Using an alanine scanning mutagenesis approach, whereby all
A B C
Figure 1.5: Comparison between a full heterotrimeric G protein structure and the mini
Gs protein. A. A cartoon representation of the active 2AR (green) bound to the
heterotrimeric G protein, stabilised by nanobody 35 (yellow). The subunits are
represented by cyan and blue respectively (PDB entry 3SN6). B. The active A2A
receptor (blue), stabilised by a mini G protein. The engineered GTPase domain of the
subunit (purple) is able to stabilise the receptor in its active state, allowing
crystallisation to be performed (PDB entry 5G53). C. Alignment of mini Gs (yellow)
and the full subunit (magenta). Over 97% of the receptor-G protein binding
interactions occur in the GTPase domain, which is the foundation for the mini Gs
protein.

16
residues are individually mutated into alanines, only 5% of mutations (16/315) for the
A2AR increased the thermostability by > 1.5 °C (Lebon et al., 2011). Therefore,
improving these procedures will be a major asset in the field of structural biology. A
novel approach to this problem is the integral membrane protein stability selector
(IMPROvER) system.
IMPROvER is a computational pipeline that can identify potentially stabilising
mutations (Harborne et al., 2020) by using three separate approaches: deep-
sequencing, model-based, and data-driven models. In the deep-sequencing approach,
IMPROvER sequence aligns over 8,000 sequences to assess natural variation in the
protein sequences. It uses EVmutation (Hopf et al., 2017) as a basis for this search,
whereby it compares the current amino acid position against the sequence consensus.
Residues that have a low occurrence at a set position are candidates for substitution
and the program nominates amino acids with a higher frequency. EVcoupling module
plmc creates a matrix with a scoring system based on how similar each position is
compared to the overall consensus.
In the structure-based module, in-silico mutagenesis is performed on homology
models using FoldX (Schymkowitz et al., 2005). The ΔΔG, a measure for predicting
how a single point mutation effects protein stability, is calculated for every residue by
mutating it to an alanine. From this initial round of mutagenesis, if a position has a
normalised score above 70% (suggested to be stabilising) it is then mutated to every
other residue. The energy of unfolding for the final model is then compared to the
wild-type sequence and calculates the ΔΔG. Each amino acid is then ranked on the
best substitution.

17
Finally, the data-driven module is based on a single mutation GPCR dataset for most
positions in the human A2AR, rat neurotensin receptor 1, and the turkey -1 adrenergic
receptor (1AR), resulting in approximately 2,000 mutational results. Each of these
were then run through various bioinformatics tools to predict secondary structure,
disorder, membrane topology, lipid and helix contact, and sequence
alignment/conservation. By applying a weighted score system to these parameters
IMPROvER provided a final scoring system, by multiplying the individual values,
which ranks the mutations from most stabilising to least. One aim of this research is
to verify the validity of this novel program, potentially easing the workflow of
structural studies.
1.4 GPCR signalling
1.4.1 G Protein Signalling
In the classical view of GPCR signalling, to begin the process of signal transduction
an agonist, or ligand, must bind to a receptor, which then elicits associated downstream
effects. However, an agonist is not always required to activate a receptor as many
GPCRs display constitutive activation (Seifert & Wenzel-Seifert, 2002) and it is now
known that GPCRs have various conformations that can increase basal G protein
activity. Once the conformation of the GPCR is in a favourable state, the G protein
can bind the receptor allowing guanine nucleotide exchange to occur. Guanine
nucleotide exchange is the process by which guanosine triphosphate (GTP) replaces
the previously bound guanosine diphosphate (GDP) (Sullivan et al., 1987). This
process ultimately activates the G protein and stimulates its decoupling from the
GPCR and the dissociation of subunits, thus permitting the associated downstream
effects. The G protein is composed of three subunits, an α and a βγ complex (Ueda et

18
al., 1994), with the α subunit being responsible for the GDP/GTP binding. Both the α
and βγ subunits can dissociate from the receptor and bind other molecules to stimulate
distinct effects. The β and γ subunit are always associated with each other and do not
exist as individual proteins. The α subunit has its own intrinsic GTPase activity which
is responsible for hydrolysing the GTP back into GDP and restabilising the G protein
(Markby et al., 1993). This process is summarised in Figure 1.6.
When the G protein dissociates the individual subunits proceed to activate further
downstream proteins. There are only 16 genes that encode the α subunits, which are
classified into 4 main families, Gs, Gi/o, Gq, and G12/13. The C-terminus of the α subunit
is critical in defining coupling specificity. Mutations in this region can inhibit G
protein activation and only a 3 amino acid substitution is needed to change from Gq to
Gs (Conklin et al., 1993; Semack et al., 2016). These α subunits all have different
signalling pathways. Gs works by activating the protein adenylyl cyclase, which is
responsible for the production of the second messenger cyclic adenosine
monophosphate (cAMP). cAMP can directly activate a number of proteins including,
but not limited to, Protein kinase A, exchange proteins activated by cAMP and ion
channels. These proteins then stimulate a range of different downstream effects.
cAMP dependant pathways are very common amongst GPCRs, such as the β2AR and
the PTH receptors. As such, when experimenting on Gs, a readout of the cAMP
response is often used as a direct measurement of activity.

19
Gi has the opposite effect on cAMP production as it is able to inhibit adenylyl cyclase
activity. This results in a decrease in cAMP. Gq signalling pathways are able to
increase calcium ion release from the endoplasmic reticulum and can increase protein
kinase C activity. This is achieved through phospholipase C activation, which
hydrolyses phosphatidylinositol 4,5-bisphosphate (PIP2) into inositol trisphosphate
Ligand binding promotes a
conformational change and
facilitates G protein binding,
which facilitates guanine
nucleotide exchange
The G protein reforms,
creating a heterotrimer
which then binds to a
new GPCR. The ligand
is also dissociated.
RGS activates
GTPases, which
converts GTP to
GDP.
GTP binding causes
dissociation of the α
subunit from the
GPCR and the βγ
subunits. These are
then free to promote
downstream
signalling.
Figure 1.6: Schematic describing the process of GPCR signalling. When the receptor
is activated by a ligand there is a conformational change, allowing G protein binding.
The α subunit then facilitates guanine nucleotide exchange, from GDP to GTP. The
presence of GTP causes the dissociation of the α subunit from the receptor and the βγ
subunits. These are then able to activate downstream proteins such as adenylyl cyclase.
Regulators of G protein signalling (RGS) are then able to activate the GTPase function
of α subunits which catalyses GTP back into GDP. This allows the G protein to reform
and bind to another receptor.

20
(IP3) and diacylglycerol (DAG). IP3 binds to IP3 receptors on the endoplasmic
reticulum, promoting the release of calcium ions, facilitating DAG activation of
protein kinase C.
G12/13 signalling pathways activate RhoGTPase nucleotide exchange factors
(RhoGEFs), which are GTPase activating proteins (GAPs). G12/13 promotes the
translocation of RhoGEFs to the membrane, where they can activate RhoA. RhoA can
activate downstream effectors such as Rho-associated protein kinases, which often
regulate cellular cytoskeletons. RhoGEFs also contain regulators of G protein
signalling (RGS) domains which can interact with activated α subunits to promote the
conversion of GTP to GDP, thus promoting the inactivation of GPCR signalling (Chen
et al., 2012). GPCRs are not limited to binding only one type of α subunit, for example
when expressed in Chinese hamster ovary (CHO) cells the A1R can couple to both Gi
and Gs (Cordeaux et al., 2004). GPCRs may therefore be able to take agonist specific
conformations based on small differences in ligand structures. These different
conformations may then be able to lead to G protein specificity. One receptor that has
demonstrated these multiple conformations is PTH1R, which has two main
endogenous peptides: PTH and parathyroid hormone related peptide (PTHrP).
1.5 PTH Receptors
1.5.1 PTH1R
PTH1R is expressed in the bone and kidneys where, upon activation by PTH, it
regulates calcium and phosphate homeostasis. A decrease in calcium concentration is
detected by the parathyroid hormone glands, which then promotes an increase in PTH
production. Binding of PTH to PTH1R promotes mobilisation of calcium and

21
phosphate from the bones, renal tubular reabsorption of calcium, and an increased
production of vitamin D (Potts, 2005). PTH promotes the production of active vitamin
D, which facilitates the absorption of calcium in the small intestine (Figure 1.7).
PTHrP is also capable of stimulating PTH1R and induces similar effects on bone and
kidney cells as PTH. PTH1R is primarily coupled to Gs, which, upon PTH binding,
activates adenylyl cyclase to increase cAMP concentrations and increase protein
kinase A activity. PTH is a polypeptide of 84 amino acids, PTH(1-84), though in 1971
it was found that PTH(1-34) was just as effective regarding efficacy and affinity as
PTH(1-84) (Potts et al., 1971). Accordingly, it is now commonly used as a treatment
for osteoporosis, though it can induce hypercalcemia.
Figure 1.7: The role of PTH in maintaining physiological calcium levels. When the
parathyroid glands detect a decrease in calcium concentration, they react by producing
PTH. This is released into the bloodstream and acts in several key regions by binding
to PTH1R. It increases renal absorbance of calcium, resulting in a decrease of calcium
lost in the urine, promotes calcium absorption in the intestines, and cause the release
of calcium from bones. All of these actions increase calcium levels, which is then
detected by the parathyroid glands. This causes an inhibition and PTH production is
decreased, helping to maintain normal calcium ion homeostasis.

22
Interestingly, PTH and PTHrP can have both catabolic and anabolic effects on bones,
which comes from the receptor’s ability to adopt two active conformations termed RG
and RO (Dean et al., 2008). The RG state is coupled to the G protein, whereas RO is
independent of G protein activity. These states also have different binding capabilities
as agonistic ligands were found to bind with a higher affinity to the RG state than to
RO; however, antagonists did not appear to have any conformational bias (Hoare, et
al., 2001). The increased agonist affinity may arise from structural variations between
the two conformations as it is believed the RG state is in a more closed position. This
hypothesis stems from the pseudo-irreversible binding of agonistic ligands in the RG
state and the simultaneous binding of two ligands, PTH(1-34) and PTH(3-34) in the
RO state, suggesting a more open conformation. A chimeric PTH/PTHrP peptide was
created, which had a high affinity for the RO state and was capable of producing
prolonged endosomal cAMP signalling, and increasing serum Ca2+ concentrations in
monkeys (Shimizu et al., 2016).
Ligands that target the two distinct states have different cAMP signalling mechanisms.
RG state ligands produce cAMP that is localised at the cell surface; this is enabled by
cAMP phosphodiesterases and receptor internalisation. RO specific ligands can also
produce cAMP at the cell membrane, but they are capable of prolonged cAMP
production, which originates from the endosome; these features of conformational
specific agonists has led to the different responses for clinical PTH(1-34) and
abaloparatide (Hattersley et al., 2016). Abaloparatide is a synthetic analogue of PTHrP
that is capable of stimulating bone formation without inducing hypercalcemia, an
effect that is often observed with PTH(1-34) (Vilardaga et al., 2011). Abaloparatide
has a higher selectivity for the RG state, thus only producing cell surface cAMP.

23
1.5.2 PTH and PTHrP
Using nuclear magnetic resonance (NMR) spectroscopy, it was initially discovered
that both PTH and PTHrP shared several structural similarities, including an -helix
in the N-terminus that extends to residues 13 and 14 for PTHrP and PTH respectively,
followed by a highly flexible region (Barden & Cuthbertson, 1993). However
following crystallisation of the peptides, the structure was found, at a 0.9Å resolution,
to be a single continuous helix (Jin et al., 2000). The reason behind these differences
is that the helical content of the peptide would increase under conditions that
mimicked the native environment. This is possibly associated with PTH being a
hydrophobic peptide and requiring hydrophobic conditions to adapt to its natural
conformation. The complete structure of PTH(1-34) is a slightly bent amphipathic
helix, with a 15 bend between the N and C-termini. Glycine at position 12 is a
conserved residue between both PTH and PTHrP but substitution of this residue with
proline, a helix breaker, dramatically decreases both the binding affinity and the
adenylate cyclase activity by 840 and 3500 fold respectively (Chorev et al., 1990).
This shows that the helical conformation of the peptide is essential for its binding and
agonistic properties.
Residues 1-14 of PTH and PTHrP have considerable sequence identity (~60%) and
are essential for hormone function and receptor activation (Luck et al., 1999). Beyond
these residues, the amino acid sequence is significantly different despite residues 15-
34 being crucial for receptor binding (Jüppner et al., 1994). The way PTH (1-34) binds
to PTH1R is known as the ‘two-site’ model. In this model, the C-terminus of PTH(1-
34), residues 15-34, interacts with the ECD of the receptor (Bergwitz et al., 1996).
The N-terminus of the agonist then interacts with the transmembrane domain (TMD)

24
of PTH1R. This promotes a conformational change in the GPCR leading to signal
transduction. This model appears to be true for all family B GPCRs (Pal et al., 2012).
A commonly used PTH1R antagonist, PTH (7-34), works on the principle that it still
has the potential to bind the receptor but, due to the truncated N-terminus, is unable to
activate it.
1.5.3 TIP39 and the PTH2R
Far less is known about PTH2R, both in terms of structure and function. Discovered
in 1995, PTH2R is ligand selective for PTH and is not stimulated by PTHrP. It also
has a highly different distribution than PTH1R as it does not occur in the bones or
kidneys. Instead, it is primarily found in the brain, pancreas, testis, and placenta (Usdin
et al., 1995). Additionally, it was discovered that PTH is not the endogenous ligand
for PTH2R but that it is primarily stimulated by a tuberoinfundibular peptide of 39
residues (TIP39) (Usdin et al., 1999). TIP39 is unable to activate PTH1R and has a
limited homology with PTH, however it is capable of binding to PTH1R. There are
only seven identical residues, the majority of these being at the C-terminus.
TIP39s structure was solved through a combination of NMR and circular dichroism.
(Piserchio et al., 2000). Based on the circular dichroic results it was estimated that
TIP39 has a helical content of approximately 85% and the NMR results suggested
there were in fact two helical components from Ala-5 to Arg-22 and Leu-26 to Leu-
36. Despite almost no conservation of residues in the N terminus between TIP39 and
PTH, when comparing the structures of TIP39 with PTH(1-34) many similarities are
observed. Superposition of the peptides showed a highly conserved distribution of
polar and hydrophobic amino acids within the N-terminus. The only significant

25
difference was Asp-7 and Arg-13 of TIP39 are charged residues as opposed to the
hydrophobic Ile-5 and Leu-11 residues seen in PTH(1-34). Therefore, the N-terminus
of both ligands is likely to have very similar functions regarding signalling. The C-
terminus helix of TIP39 has a lower percentage identity, compared to the N-terminus,
and a reduced amphipathic nature compared to PTH(1-34). TIP(7-39), a PTH2R
antagonist, has a 32 fold lower binding affinity to PTH2R than TIP39 (Hoare et al.,
2000).
PTH2R and TIP39 also have strikingly different physiological functions than PTH and
PTH1R (Figure 1.8). TIP39 increases corticotropin-releasing hormone (a hormone
associated with the stress response) by over 300% when injected at 100 nM into medial
basal hypothalamic explants (Ward et al., 2001). In addition, TIP39 administration is
also capable of increasing luteinising hormone-releasing hormone and as a result also
increases luteinising hormone concentrations. This directly implicates TIP39 and
PTH2R as having direct effects on the hypothalamo-pituitary-gonadal axis. Indeed,
further studies demonstrated that knockout mice for Tifp39, the gene that encodes
TIP39, are sterile as they lacked any spermatids (Usdin et al., 2008). Furthermore,
spermatid production could be salvaged if TIP39 was transgenically expressed and
therefore TIP39 appears to be a requirement for maturation of sperm. There is also an
association between TIP39 and the pain response as PTH2R is highly expressed in
neurones that are linked with nociception. A 500 pM intracerebroventricular injection
of an antagonist of PTH2R known as HYWH-TIP39 (TIP39 with an altered residue
sequence of His-4, Tyr-5, Trp-6 and His-7) significantly delayed the response to both
tail-flick and hot-plate tests (Dimitrov et al., 2010). Evidently, it is clear that the

26
physiological roles of PTH and TIP39 vary dramatically, despite activating related
receptors.
Currently, there are no structures of PTH2R, so knowledge in this area is extremely
limited. PTH2R shares a 52% identity with PTH1R, though some regions such as the
C-terminus are as low as 14% (Bisello et al., 2004). These differences lead to different
functionalities of the receptor i.e. the residues responsible for PTH2R interactions
with -arrestin are residues 426-457, at the C-terminus, whereas PTH1R--arrestin
binding occurs at intracellular loop (ICL) III (Ferrari & Bisello,
2001). Furthermore, PTH(1-34) stimulation of the receptors in human embryonic
kidney 293 (HEK-293) cells, produces vastly different outcomes. While PTH(1-34)
promotes -arrestin binding and internalisation of PTH1R, it does not activate this
Figure 1.8: A simplified schematic showing PTH receptor binding specificity and
receptor functionality. While PTH (red) is able to activate both receptors, it is unlikely
to induce PTH2R specific responses due to receptor localisation (brain and testes).
PTHrP (green) can only activate PTH1R and TIP39 (blue) is similarly restricted to
PTH2R activation. PTH1R activation results in calcium ion homeostasis and PTH2R
stimulation leads to multiple physiological effects, such as spermatogenesis, pain, and
stress.

27
chain of effects in PTH2R, despite producing similar cAMP levels (Bisello et al.,
2004). This suggests that there must be variations within these receptors’ structures,
which ultimately lead to these various outcomes.
1.6 Solved Family B GPCR Structures
1.6.1 Conserved ECD Structure
Before the solution of full family B structures was possible, several ECD structures
had been solved, such as PTH1R, CGRP, CRF1R, GIPR, GLP1R, PAC receptor
(PAC1R), and the calcitonin-like receptor (CLR) (Booe et al., 2015; Killion et al.,
2018; Kumar et al., 2011; Pioszak & Xu, 2008; Pioszak et al., 2008; ter Haar et al.,
2010; Underwood et al., 2010). Interestingly, it was discovered that all family B ECDs
contained two -helices and four -sheets that are arranged into a three layer --
fold (Figure 1.9) that is held together through three disulphide bonds. The sequence
conservation of family B ECDs is limited to only 11 residues, of which six are
cysteines. This conserved -- fold has since been termed the “secretin family
recognition fold” (Pal et al., 2012).
Prior to commencing this research, the ECD of PTH1R, bound to both PTH and
PTHrP, had already been solved (Pioszak et al., 2009; Pioszak, et al., 2008). The
amphipathic helix of the agonists binds to a hydrophobic groove within the ECD of
the receptor, antiparallel to the C-terminal helix, resembling a “hot dog in a bun”
conformation. This orientates the peptides so that the N-terminus is towards the TMD
of PTH1R. The connection between these two surfaces is primarily through
hydrophobic interactions originating from Phe-23, Leu-24, Leu-27, and Ile-28 of
PTHrP and Val-21, Trp-23, Leu-24, Leu-28, Val-31, and Phe-34 of PTH. This

28
suggests that, despite sharing similar structures, PTH and PTHrP must have different
binding mechanisms. PTH remains as a helix and forms critical hydrogen bonds
between the C-terminus and the ECD. PTHrP contrastingly unwinds after Ile-31 to
form additional hydrogen bonds. The ECD accommodates these differences in binding
through only minor alterations in conformation, including a shift in the Ile-115 side
chain for PTHrP and a rotamer change at Leu-41, as predicted by Mann et al. (2008).
Despite sharing this highly conserved structure the requirements for it and receptor
activation vary between family B members. They can be divided into two distinct
groups, one in which the ECD acts as an affinity trap and is not essential for activation,
and one in which it is an absolute requirement for activation. PTH1R, CRF1R and
PAC1R belong to the former group; however, GLP1R and the glucagon receptor cannot
be activated when the ECD is not present (Zhao et al., 2016). This is one of many
differences between family B GPCRs, but accurately determining the structures of
these receptors will aid us in unravelling their mechanisms.

29
1.6.2 Non-PTH Receptor Structures
1.6.2.1 Inactive Receptor Structures
With the advancements in structural studies, almost all family B GPCRs have now
been solved. The first family B GPCR to be solved was the crystal structure of the
glucagon receptor (Siu et al., 2013) at a 3.4 Å resolution. To solve this, the ECD was
A B
C
Figure 1.9: Conserved family B ECD structures. A. The ECD of PTH1R (yellow)
bound to the C terminus of PTH (cyan). The red line resembles disordered residues
that were unsolved in the crystal structure. B. The molecular surface binding of PTH
to the ECD, stabilised by hydrophobic interactions. C. Alignment of isolated family
B ECD structures. Despite having almost no sequence homology between the
structures all take on the conserved family B fold characterised by a -- fold.

30
replaced with BRIL, the C-terminus was truncated, and it was stabilised by an
antagonist. Structurally, the helices of the glucagon receptor are in very similar
orientations and positions as the helices in family A GPCRs. Where the two classes
have major differences is within their ligand binding pockets; the heights of
extracellular loops II and VII have the largest distance between them compared to all
of the currently solved family A GPCR structures. This creates a wider and deeper
area for the ligand to bind to than is seen in family A GPCRs.
A unique contrast to family A GPCRs was that the N-terminus end of helix I is far
longer and exists as three -helical turns above the membrane (Figure 1.10A). This
12-residue region is known as the stalk and is critical for glucagon binding and
receptor activation, though it is not currently found in other family B GPCRs, such as
CRF1R (Hollenstein et al., 2013). Additionally, the full-length inactive glucagon
receptor was solved by using an inhibitory antibody (Zhang et al., 2018), which
showed the stalk region taking on a β-strand confirmation as opposed to the -helices
previously described (Figure 1.10B). In this structure it was found that ECL I and the
stalk region interact with each other in order to form a β-sheet, which regulate peptide
binding by inhibiting the peptide N-terminus from binding in the TMD (Figure 1.10B).
For the two-site model to remain true, ECL I/stalk interactions must be disrupted
following the binding of the peptide C-terminus to the receptor ECD. The molecular
interactions between the glucagon receptor and a glucagon analogue were revealed
through a 3.0 Å crystal structure (Zhang et al., 2018), which revealed an
approximately 90 angle shift of the ECD compared with the previously solved
inactive structure (Zhang et al., 2018). ECL I dissociates from the stalk region and

31
forms -helical turns near helix III, while the N-terminal region (towards helix II)
remains disordered. Following dissociation and conformational rearrangement, both
regions form multiple interactions with the peptide. ECL I of the glucagon receptor is
16 residues long, making it much longer than family A ECL I and some family B
members such as CRF1R (10 residues). However, PTH1R has an even longer ECL I
(30 residues), which may mean that this region has even more involvement in peptide
binding and receptor activation.
The inactive CRF1R structure was also solved in the same year as the glucagon
receptor (Hollenstein et al., 2013). The most notable difference between these two
receptors (excluding the elongated glucagon receptor stalk) are the tips of helices VI
and VII, with an approximately 14 Å distance between the peaks of helix VII. The
cytoplasmic half of the receptors adopt similar conformations, which gives both
proteins a V-shape arrangement, creating a larger peptide binding cavity. Of particular
A B
C
Figure 1.10: Cartoon representations of family B GPCR structures. A. Structural
alignment of the inactive glucagon receptor (orange) and CRF1R (lime) (PDB entries
4L6R and 4K5Y respectively) . The glucagon receptor has a highly elongated helix I,
termed the stalk, which is absent in CRF1R, and there is a 14 Å distance between the
tips of helix VII. Intracellularly the two structures closely align. B. Alignment of two
separately solved glucagon receptor structures (PDB entries 5XEZ and 5XF1). The
stalk and ECL I form a β-sheet (green), capping the TMD and regulating ligand
binding. Upon binding, the stalk and ECL I dissociate, allowing the stalk to take on
the additional 3 -helical turns seen previously.

32
interest was the discovery of the antagonist allosteric binding site, which was found
deep in the cytoplasmic half of the receptor, 18 Å away from the cavity centre, and 4
Å away from the intracellular boundary of the receptor. CRF2R and CRF1R have a
very high sequence homology in this hydrophobic binding pocket; however, the
antagonist (CP-376395) will only bind to CRF1R. Only two major differences between
receptor sequences exist in this binding site, H199 and M276, and V195 and I272, for
CRF1R and CRF2R respectively. Mutating the CRF1R residues to CRF2R inhibits
antagonist binding but has no effect on peptide agonist binding (Hoare et al., 2006).
Findings such as these highlight the medicinal benefits that structural biology can
have, as it has identified a novel binding site, which may lead to the discovery of new
structural based small molecule drugs.
More recently, Wu et al. (2020) solved the full-length GLP1R structure at a 3.2 Å
resolution. This was an exciting insight into a peptide-free GPCR, which revealed a
closed conformation of the ECD. To achieve this, Wu et al. (2020) added several
thermostabilising mutations, an ECD-binding antibody, and a negative allosteric
modulator to trap the inactive conformation. This new structure aligned well (R.M.S.D
of 0.6 Å) with the previously solved inactive TMD of GLP1R (Song et al., 2017);
however, there were differences in ECLs I and III. Previously, these loops were highly
disordered regions, but when the ECD is present, they take on -helical
conformations. The ECD is able to form interactions with ECLs I and III, creating a
closed conformation. Unexpectedly, this conformation does not match the two-site
binding model that is prevalent in family B GPCRs. It is hypothesised that in the
peptide-free receptor the ECD has subtle dynamics, but that it favours the closed

33
conformation. These small movements are enough to allow GLP to reach its binding
site, promoting large conformational changes and peptide binding in the TMD core.
Comparing this full-length structure to the previously solved glucagon structure
(Zhang et al., 2018), also bound to an inhibitory antibody, revealed strong similarities
in the cytoplasmic halves of the receptors (Figure 1.11). This was expected as both
receptors are Gs coupled and so should have similar binding mechanisms.
Contrastingly, there are major structural differences on the extracellular half of the
receptor, especially in ECLs I, III and the ECD. As previously discussed, ECL I and
the stalk region of the glucagon receptor interact with each other in order to form a β-
sheet to help regulate peptide binding, whereas GLP1R-ECL I has an -helical
arrangement. The most significant difference regarding orientation is the ECD; the
glucagon receptor’s ECD has a far more open arrangement, while, as previously
mentioned, the GLP1R-ECD is closed. It should be noted that the inhibitory antibody
interacts with ECL I, limiting the flexibility of the ECD in the glucagon receptor
structure. Measuring from the C-terminal tips of the α-1 helix of the -- ECD fold,
there is an approximately 50 Å distance between the two structures. A noteworthy
observation is that individual mutations of the ECD, ECL I, or ECL III were all able
to increase the basal activity of the glucagon receptor; thereby suggesting that the ECD
may be a negative regulator of activity (Koth et al., 2012). The closed conformation
of the ECD in the GLP1R ECD (Wu et al., 2020) conforms to this hypothesis; however,
there have been no identifiable mutations in the ECD/ECL interface that increase basal
activity levels for GLP1R.

34
1.6.2.2 Active Receptor Structures
As of 2020, we now have a representative active structure from every family B GPCR
subfamily (Figure 1.12), which were all solved by cryo-EM. To discuss each one in
detail would be impractical for the purposes of this introduction, so only some of these
receptors shall be touched upon. The first active family B GPCR to be solved was the
GLP1R (Zhang et al., 2017). To facilitate the expression and purification of these
receptors, a FLAG-tag was inserted after a hemagglutinin signal peptide and then
expressed in insect cells. To increase complex stability nb35 was also co-expressed.
A
B
Figure 1.11: The differences between GLP1R structures and the glucagon receptor. A.
Comparing the major differences between two inactive state GLP1R structures. The
major conformational differences lie in ECLs I and III. PDB entries 6LN2 and 5VEX
B. Alignment of full-length GLP1R and glucagon receptor structures. The ECD are in
vastly different orientations, with approximately 50 Å between the tips of the 1 helix
of the secretin family recognition fold. PDB entries 6LN2 and 5XEZ.
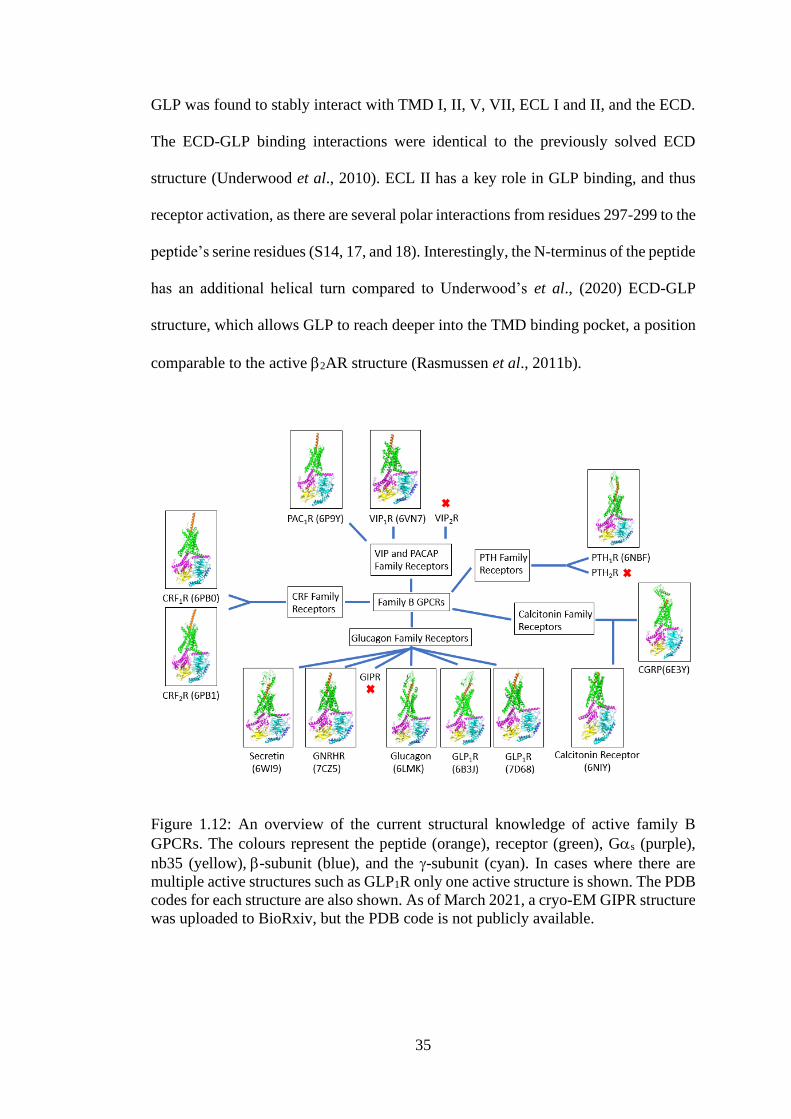
35
GLP was found to stably interact with TMD I, II, V, VII, ECL I and II, and the ECD.
The ECD-GLP binding interactions were identical to the previously solved ECD
structure (Underwood et al., 2010). ECL II has a key role in GLP binding, and thus
receptor activation, as there are several polar interactions from residues 297-299 to the
peptide’s serine residues (S14, 17, and 18). Interestingly, the N-terminus of the peptide
has an additional helical turn compared to Underwood’s et al., (2020) ECD-GLP
structure, which allows GLP to reach deeper into the TMD binding pocket, a position
comparable to the active 2AR structure (Rasmussen et al., 2011b).
Figure 1.12: An overview of the current structural knowledge of active family B
GPCRs. The colours represent the peptide (orange), receptor (green), Gs (purple),
nb35 (yellow), -subunit (blue), and the -subunit (cyan). In cases where there are
multiple active structures such as GLP1R only one active structure is shown. The PDB
codes for each structure are also shown. As of March 2021, a cryo-EM GIPR structure
was uploaded to BioRxiv, but the PDB code is not publicly available.

36
At the time of publication there was no inactive GLP1R structure, so the glucagon
receptor was used to identify key structural changes. The most significant difference
between these receptors is a kink found within helix VI (Figure 1.13), which occurs at
the conserved PXXG motif of family B GPCRs. Proline and glycine residues make
this motif more flexible and likely to unwind and appear to be essential for signal
transduction. This kink has since been found in all other family B GPCR active
structures (Liang et al., 2020). Ligand binding promotes the unwinding of helix VI,
which then allows interactions with the 5 helix of Gs, facilitating G protein-receptor
binding. When superimposed onto the active 2AR an almost identical GPCR-G-
protein conformation is seen; however, there are additional interactions between the
subunit and ICL III and helix VIII. The extracellular half of helix VI is also affected
though an outward movement compared to the inactive glucagon receptor. This allows
the peptide agonist to bind deeper into the TMD binding cavity by creating a wider
opening. The other major difference is a bend in helix VII at G359, which ultimately
creates an approximately 4.5 Å movement of the helix VII tip from the corresponding
position in the glucagon receptor.

37
More recently, GLP1R has been solved bound to a non-peptide agonist (TT-OAD2) at
a 3.0 Å resolution (Zhao et al., 2020). TT-OAD2 binds to the extracellular half of the
receptor, as opposed to deep within the TMD pocket as seen by the allosteric
antagonistic binding site in CRF1R (Hollenstein et al., 2013). The primary interactions
are hydrophobic bonds to residues in TMD I, II, III, and ECL I and II. There is little
overlap between the TT-OAD2 and GLP binding site (Zhang et al., 2017); of the total
29 residues that interact with the two agonists, only 10 interact with both agonists.
GLP also has interactions with TMD V-VII and penetrates much deeper into the TMD
core. Despite the different binding sites, the two active structures have a high
alignment (R.M.S.D of 0.68) and are almost identical towards the cytoplasmic half of
the receptor. This means that despite different binding properties the two agonists are
able to promote similar conformational changes, such as the kink in helix VI, to allow
the binding of the G protein. Using molecular dynamic simulations Zhao et al., (2020)
demonstrated that upon GLP binding, there were persistent interactions with Y152,
Figure 1.13: Structural alignment of the active GLP1R (green) and the inactive
glucagon receptor (orange). PDB entries 5VAI and 4L6R respectively. The most
noteworthy conformational change is the sharp kink in helix VI (now confirmed to be
highly conserved in all active family B GPCRs) which facilitates G protein binding
through the 5 helix of Gs.

38
R190, Y241, and E364; however, TT-OAD2 allosterically alters the highly conserved
central polar network of family B GPCRs, a water network where stable water
molecules are able to facilitate receptor stability, through K197, Y145, and Y148.
(Zhang et al., 2017).
With the recent full-length inactive GLP1R structure being solved (Wu et al., 2020) it
has granted us a new insight into the activation process of family GPCRs (Figure 1.14).
The activation of GLP1R requires a dramatic 28 Å change to the position of the ECD,
from a closed to an open conformation. There is a large reorientation of ECL I
(approximately 180⁰), and an outward movement of 5 A, which grants the peptide a
wider opening into the TMD core. Without this movement the sidechain of residue
D215 would inhibit GLP access to the TMD. There is a large outward movement of
ECL III of approximately 12 Å. Despite these large openings of the TMD the binding
pocket surface area remains relatively similar to the inactive state due to an inward
movement of helix II following peptide binding. With this information we can begin
to create a step-by-step understanding of GLP peptide binding promoting
conformational changes, which facilitates G protein binding.

39
A recent breakthrough was achieved by Qiao et al. (2020), who were able to solve the
active glucagon receptor structure bound to both Gs and Gi. Both proteins bound
into the cavity created by the kink in helix VI, accompanied by 8 and 2 Å outward
A
B
Figure 1.14: GLP1R structure and activation process A. Alignment of inactive GLP1R
(green) and active GLP1R (blue), PDB entries 6LN2 and 5VAI respectively. The
conserved active helix VI kink is observable, accompanied by large shifts in ECL I
and III. B. Proposed activation process of GLP1R. In the inactive state the ECD
preferentially takes a closed conformation but can bind the peptide through minor
movements. This reorientates the ECD, promoting TMD changes and G protein
binding.

40
movements of the intracellular half of helices V and VII. These movements were
conserved in both instances, meaning that there is a common binding pocket for Gs
and Gi. This does not seem to hold true for family A GPCRs, such as the -OR and
the 2AR, where the active helix VI position is not conserved (Koehl et al., 2018;
Rasmussen et al., 2011b). Despite binding in the same cavity, there is a difference in
the total binding area between the 5 helix of the G protein and the receptor: 802 Å2
and 551 Å2 for Gs and Gi respectively. The 5 helix of the two G proteins differ at
residues 23 and 24 (Y23, E24, and C23, G24 for Gs and Gi respectively). Y23 and
E24 are bulkier residues than C23 and G24, meaning that Gs needs a larger binding
pocket than Gi. The large outward movement of helix VI creates a cavity that can
accommodate these larger residues, and preferentially favours the binding of Gs, but
can still allow Gi binding. Additionally, ICL II has extensive interactions with Gs,
but is very limited with Gi.
1.7 PTHR Structures
1.7.1 Inactive PTH1R Structure
At the onset of this research project very little was known about the PTH receptor
structures. High-resolution crystal structures of PTH1R ECD had been solved bound
to both PTH(1-34) and PTHrP (Pioszak & Xu, 2008; Pioszak et al., 2009), but there
was no structural data on PTH2R. In late 2018 the inactive structure of PTH1R was
solved at a 2.5 A resolution (Figure 1.15) through the use of x-ray crystallography
(Ehrenmann et al., 2018). To create a thermostable receptor, ten point mutations were
introduced, which were identified through the use of alanine scanning mutagenesis,
directed yeast evolution, and the addition of a fusion protein, Pyrococcus abyssi
glycogen synthase (PGS), at ICL III. Disordered residues of the ECD, residues 61-

41
104, were also removed. However, they were unable to obtain a structure using
endogenous PTH, so they designed a PTH mimetic agonist (ePTH) that was able to
stabilise the receptor and displayed almost identical interactions as previously solved
between wild-type PTH and the ECD, excluding two residues (Pioszak & Xu 2008).
As expected the PTH1R structure closely resembled other solved family B GPCRs and
maintained the predicted ECD structure (Pioszak & Xu, 2008).
The particularly long ECL I of PTH1R, approximately 30 residues, was not resolved
in this structure. The C-terminus of ePTH binds to the ECD and displays extensive
interactions with the juxtamembrane region; R20 of the peptide forms ionic
interactions with D137, suggesting that the orientation of the ECD, relative to the
TMD, is defined by the agonist. When the negative charge of residue 137 is not present
i.e. through mutagenesis, then the affinity for PTH binding is greatly reduced (Weaver
et al., 2014). Before this structure was solved, the orientation of the ECD was believed
A B
Figure 1.15: Overall structure of the inactive PTH1R bound to ePTH. A. Cartoon
representation of ePTH (yellow) bound to the inactive PTH1R (cyan) structure (PDB
entry 6FJ3). B. Structural alignment of PTH1R and the inactive glucagon receptor
(orange, PDB entry 5XEZ), with a R.M.S.D value of 1.522.

42
to be determined through ECL I and III interactions. There are also interactions
between the two helices and the loop connecting β3 and β4 of the secretin family
fold with ePTH.
The N-terminus of ePTH lies against helices II, III and ECL II, a position that is locked
by a homoarginine at residue position 11, which is positioned between helices I and
II. Further down the peptide, Q6 packs against Y429 of ECL III. At the end of the
peptide residues 1 and 2 take on non-helical conformations and are positioned next to
helices V and VI. As previously discussed, a common PTH antagonist, PTH(7-34),
has antagonistic properties as it can bind the ECD but cannot promote receptor
activation. From this structure, the N-terminus is positioned to interact with various
residues such as extracellular helix VII residues E444, M441, M445, which, when
mutated, significantly decrease peptide affinity (Ehrenmann et al., 2018). ePTH
residue E4 is also pointed towards highly conserved residues Y195 and R233 of
helices I and II.
A crucial domain within GPCRs is the conserved central polar network, previously
identified in the active GLP1R structure (Zhang et al., 2017), which lies one helical
turn below the binding pocket. In PTH1R the key residues are R233, N295, H420, and
Q451. The structure of PTH1R revealed a water molecule that establishes connections
between helices II, III, and VII through interactions with residues R233, Y296, and
Q451. Previous research on PTH1R revealed that mutations of either R233 or Q451
significantly reduced binding affinity of PTH (Gardella et al., 1996) and the
importance of these residues is further highlighted as residue 4 of ePTH directly
interacts with R233, which, in this inactive confirmation, has hydrogen bonds to Q451,
43
stabilising its orientation. Furthermore, interactions between N295 and S229 help
maintain PTH1R structure.
The publication of the inactive PTH1R was a major steppingstone in improving our
understanding of family B GPCRs and their functions. For example, it provided a
structural explanation of the condition known as Jansen’s metaphyseal
chondrodysplasia, which leads to dwarfism and hypercalcemia. It is caused by a
sporadic mutation of I458R that, structurally, could destabilise helix VI, pushing it
into the kink that is associated with activated receptors. The reason Ehrenmann et al.
(2018) were unable to solve the active structure was due to the many modifications
they added to the receptor, such as the stabilising mutants and the inclusion of PGS
fusion protein. Q440R formed an addition hydrogen bond between helices VI and VII,
inhibiting helix VI outward movement. Furthermore, Y191C and K240M mutations
pushed the N-terminus of e-PTH away from helices V and VI, preventing the initial
movement of helix VI. The primary aim of this research project was to solve the active
structure of either PTH1R or PTH2R, so the publication of inactive PTH1R was a useful
tool in attempting to improve experimental methodologies; however, in 2019 the
active structure of PTH1R was solved using cryo-EM (Zhao et al., 2019)(Figure 1.16).
1.7.2 The Active PTH1R Structure
To overcome the low expression levels associated with GPCRs, Zhao et al. (2019)
added a double MBP tag to the C-terminus. They also utilised a negative form of the
G protein, which they stabilised using nb35. Similar to Ehrenmann et al., (2018), a
modified peptide was required (LA-PTH); a PTH/PTHrP chimera that had a 10-100
fold higher potency than either of its individual native peptides. LA-PTH also had a
significantly slower dissociation time than PTH, resulting in prolonged cAMP

44
production, a result of endosomal signalling. LA-PTH is a chimeric PTH/PTHrP
peptide, where the C-terminus is PTHrP derived. Therefore it was found that the LA-
PTH/ECD binding aligned well with the previous PTHrP/ECD structure (Pioszak et
al., 2009). The increased affinity for binding is due to additional hydrophobic and
hydrogen bonds that arise from amino acid changes at residues 10, 11, 12 and 14
(N10Q, L11R, G12A, and H14W). These additional bonds are also responsible for the
prolonged signalling response.
Three distinct states were solved at global resolutions ranging from 3 to 4 A, where,
in each case, the ECD was in a different conformational state; however, the TMD was
constant in all instances. The most striking of these states was one in which LA-PTH
was no longer interacting with the ECD and was bound solely at its N-terminus. It is
hypothesised that this is the beginning of the dissociation of the ligand from the
receptor, which would match the kinetics of receptor activation. Castro et al. (2005)
discovered that, through the use of fluorescence resonance energy transfer (FRET),
PTH (1-34) rapidly associates its C-terminus with the ECD in approximately 140 ms,
whereas the N-terminus can take an entire second to finish binding to the TMD. This
means that due to the prolonged interaction of the N-terminal LA-PTH with the
PTH1R TMD, the C-terminal may bind and unbind repeatedly during receptor
activation, potentially explaining the prolonged signalling that is seen in PTH1R.
As demonstrated multiple times, the intracellular half of active family B receptors are
very similar due to their Gs binding (Liang et al., 2017; Qiao et al., 2020; Zhang et
al., 2017). In all of the solved active structures, only between 32 to 63 % of the
potential binding pocket space is occupied by the ligand. Furthermore, despite the
structures taking on a conserved TMD conformation the individual binding pockets

45
are exclusive to the associated receptor due to their unique residue side chains. The
orientation between the ECD and the TMD is also different for each active receptor,
which also helps the peptide bind in a unique location. Comparing active PTH1R to
active GLP1R (Zhang et al., 2017), there is no interaction between PTH1R ECD/TMD
whereas GLP1R ECL I is able to form van der Waals interactions with the ECD. This
may explain why the ECD of PTH1R appears to have a higher degree of mobility.
As both the inactive and active structures have now been solved, it has allowed us to
analyse the conformational changes; of particular note is that the inactive crystal
structure was the first agonist-bound family B receptor that did not include the G
protein. Upon structural alignment, the extracellular half of the receptors align almost
identically, while the intracellular halves are vastly different due to the near 80 kink
Figure 1.16: Structural alignment of inactive and active PTH1R. The inactive receptor
(cyan) is bound to ePTH (yellow), and the active receptor (magenta) is bound to LA-
PTH (orange, PDB entries 6FJ3 and 6NBF respectively). The extracellular halves of
the receptor align well, whereas the cytoplasmic halves have considerable differences,
primarily due to the kink in helix VI.

46
in helix VI of the active conformation. This aligns with Ehrenmann et al.’s, (2018)
hypothesis that they captured the receptor in an intermediate state, between active and
inactive, with the extracellular half of the receptor being in an active state
conformation. The outward shift of helix VI is a hallmark of activated GPCRs and
leads to a large cytoplasmic opening, which promotes G protein coupling through the
α5 helix of Gαs, while the subunits can form contacts with helix VIII. Crucially,
the agonist-receptor interactions are nearly identical between the two structures,
suggesting that the agonist binds the receptor in a similar manner both with and
without the G protein being present.
A crucial residue in PTH1R activation is Q451. As mentioned earlier residues R233
and Q451 are key components of the central polar network (Ehrenmann et al., 2018).
In the inactive state R233 has hydrogen bonds to Q451 stabilising its orientation;
however, following activation, peptide residue E4 interacts with R233 causing a
rearrangement of the R233-Q451 bond (Figure 1.17). This allows Q451 to re-orientate
itself and form new bonds with H420 and P415. P415 is part of the highly conserved
family B motif PXXG, which, as previously discussed, is the origin of the helix VI
kink. The kink is stabilised by H420, Q451, and N374 through interactions with
residues 415-417 of helix VI. Many of these residues are highly conserved among
family B GPCRs in a NPGHQ motif, suggesting that the activation process of these
receptors is conserved through key residues that stabilise the helix VI kink.

47
1.8 Summary
Our knowledge of family B structures has expanded rapidly in the past four years,
revealing several key characteristics in their active conformations. All the receptor
peptide agonists have -helical conformations that interact deep in the TMD core, in
close proximity to a central polar network, and with the ECD. The ECD is a highly
flexible domain that has variable metastable states, which are influenced by peptide
binding. Another region with a high degree of variability is ECL III and the tips of
helix VI and VII. This region was not a requirement for TT-OAD2 binding and GLP1R
activation (Zhao et al., 2020), meaning that, unlike highly conserved regions such as
the helix VI kink, this area of the receptor is able to take on more conformations while
still being involved in receptor activation. Contrastingly, TMDs III, IV and V are
highly conserved, as is ECL II (Figure 1.18).
A B
Figure 1.17: The alterations in PTH1R that promote the unwinding and kink of helix
VI. In the inactive state (PDB entry 6FJ3), PTH1R (cyan) residue R233 interacts with
and stabilises the orientation of Q451 through hydrogen bonds. In the active state
(magenta, PDB entry 6NBF) the R233/Q451 interaction is broken, allowing Q451 to
orientate downwards and interact with P415, a conserved residue at the kink of helix
VI. Some residues were removed to better visualise the area of interest.

48
When inactive structures are available for comparison, there appears to be a
reconfiguration of ECL II partially facilitated by movements of helices IV and V,
which additionally reorganises ICL II, ultimately assisting G protein binding.
Interestingly, the changes in ECL II are not seen in agonist-bound, G protein free
receptors, such as PTH1R (Ehrenmann et al., 2018), implying G protein binding
further alters receptor conformation. Towards the intracellular half of the receptors the
most notable misalignments occur at ICL II, which has interactions with the Gs Ras
domain, the GTPase domain of G proteins. All receptors also displayed interactions to
the βγ subunit through helix VIII, which has been shown to be important in receptor
functionality, as truncating this helix decreased cAMP production for the calcitonin
and CRF receptors (Liang et al., 2017; Ma et al., 2020).
Figure 1.18: Structural alignment of all current active family B receptors. The basic
TMD shape is highly conserved, with the helix VI kink always occurring at the PXXG
motif. Another conserved region is ECL II, which commonly has interactions with the
ECD.

49
1.9 Aims
The primary aims of this research were to unravel the active structures of PTH1R
and/or PTH2R. If successful it would reveal key structural features that would expand
our understanding of GPCR activation and signalling. With the huge influx of family
B GPCR structural data in the past few years we now have a solid comprehension of
the key conformational changes that occur during GPCR activation. However,
acquiring these structures is still a laborious undertaking that requires extensive
amounts of work before any structural studies can be performed. Easing the
preliminary workload i.e. creating thermostable functional proteins that are good
candidates for crystallisation or cryo-EM, would be a tremendous benefit in the field
of structural biology, not only saving time but also easing costs of such experiments.
Therefore, a further aim of this research was to evaluate the effectiveness of the novel
IMPROvER program to optimise the selection of candidates for structural trials.

50
Chapter 2 Methods
2.1 Standard Protocols
2.1.1 Buffers and Chemicals
All buffers were prepared with Milli-Q® water and filtered using a 0.22 µm membrane
filter (GE Healthcare Life Sciences) or sterilised using an autoclave. Unless otherwise
stated, all chemicals were purchased from Sigma-Aldrich, Melford Laboratories, or
Thermo Fisher Scientific.
2.1.2 Primers
All primers were purchased via Eurofins Genomics and were produced as standard
desalted primers.
2.1.3 Media and Agar Plates
E. coli media was prepared using pre-made Luria broth (LB), terrific broth (TB), or
super broth (SB) granules (Sigma-Aldrich), diluted in Milli-Q® water. Solutions were
autoclaved and stored at room temperature. Antibiotics were added as required and
diluted to appropriate working levels. Agar plates were prepared using LB granules
(Sigma-Aldrich) and agar powder (Melford Laboratories) diluted in Milli-Q® water.
These were autoclaved, and upon cooling, were poured into plastic petri dishes under
a fume hood with an appropriate antibiotic. Following solidification, plates were
stored at 4 °C.

51
2.1.4 Preparation of Competent Cells
Frozen E. coli glycerol stock cells were streaked onto a LB-agar plate, with an
appropriate antibiotic if required. Plates were typically grown overnight at 37 °C or
until colonies could be easily identified. A single colony was picked and grown in LB
medium in a shaking incubator at 200 rpm and 37 ⁰C overnight. A 1/500 dilution of
the starter culture was added to pre-warmed LB medium and incubated at 37 °C until
an optical density, measured at 600 nm (OD600), of 0.4 – 0.6 was reached. All
subsequent steps were performed on ice. Cells were chilled and centrifuged at 3,000
x g for 10 minutes. The resulting pellet was gently resuspended in 20 mL of Tbf1
buffer (Table 2.1) and chilled on ice for 5 minutes. Cells were centrifuged at 3,000 x
g for 10 minutes and the supernatant discarded. Cells were then resuspended in 1 mL
of Tbf2 buffer per 50 mL of culture and incubated on ice for 15 minutes. 50 µL aliquots
were then flash frozen and stored at -80 ⁰C.
Table 2.1: Composition of buffers for making competent cells
Buffer Compound Final Concentration
KAc 30 mM
RbCl2 100 mM
Tbf I Buffer CaCl2.2H20 10 mM
MnCl2.4H20 50 mM
Glycerol 15%
Tbf II Buffer
MOPS 10 mM
CaCl2.2H20 75 mM
RbCl2 10 mM
Glycerol 15%

52
2.1.5 Heat shock transformation
Transformation of plasmids/DNA into E. coli strains was achieved using a typical heat
shock protocol. Following the addition of a plasmid to an aliquot of competent E. coli
cells, they were incubated on ice for 15-20 minutes. Samples were heat shocked by a
~45 second incubation at 42 °C, then returned to ice for 2 minutes. Approximately one
mL of sterile LB media was added to aid cell recovery and incubated at 37 °C for one
hour. For simple transformations, between 50 and 100 µL of cells were plated onto a
LB-agar plate with the appropriate antibiotic. For more challenging transformations,
such as following a cloning reaction, cells were centrifuged for one minute at 3,000 x
g and fully resuspended using 50-100 µL, all of which was spread onto an appropriate
agar plate.
2.1.6 Polymerase Chain Reaction
All cloning was performed with Q5 High-Fidelity 2X Master Mix (New England
BioLabs (NEB)) and a standard polymerase chain reaction (PCR) protocol. For a
typical 50 µL reaction, 0.5 µM forward and reverse primers, 1 ng/µL vector, and 25
µL of Q5® High-Fidelity Master Mix were used. The annealing temperatures of
primers were estimated using the NEB calculator (tm.calculator.neb.com). If reactions
did not produce the desired band on a gel electrophoresis, optimisation of annealing
temperature was determined through a gradient PCR. A standard PCR protocol was
as follows: an initial 95 °C treatment for one minute, 95 °C for 30 seconds, 50-70 °C
for 30 seconds, 72 °C (1 minute per kb DNA), repeat ~30 times, and lastly 72 °C for
5 minutes.

53
For determining if insertion and deletion reactions were successful, colony PCR was
utilised. A master mix containing Q5® High-Fidelity Master Mix and 0.5 µM forward
and reverse primers was created. 10 µL aliquots were then prepared in PCR tubes.
Following colony formation, multiple colonies were picked with individual pipette
tips and mixed into the master mix aliquots. The tip could then either be added to LB
media to grow overnight cultures or streaked onto a LB-agar plate. PCR thermocycling
was performed as described above, except the initial 95 °C denaturation step was
performed for 6 minutes.
2.1.7 Agarose gel electrophoresis
To visualise DNA samples, such as for cloning and screening, a ~1% w/v agarose gel
was made using 1 x TAE buffer (40 mM tris-acetate, 1 mM ethylenediaminetetraacetic
acid (EDTA), pH 8.5) and 0.5 x SYBR safe DNA Gel Stain (Invitrogen). A 6 x Purple
Gel Loading Dye (NEB) was added to samples, which were loaded alongside a
GeneRuler DNA Ladder Mix (Thermo Fisher Scientific). Gels were run in 1 x TAE
buffer at either 100 or 75 V and visualised using a G:BOX (Syngene).
2.1.8 In-Fusion cloning
When attempting to insert genes into plasmids, In-Fusion HD Cloning Plus (Takara-
Bio) was used. The genes of interest were amplified, using appropriate forward and
reverse primers, with a minimum 15 base pair homologous overlap at their termini
that were complementary to the ends of a linearised vector. Plasmid linearization was
achieved using inverse PCR, as this allowed flexibility when choosing annealing sites.
The amplified vector/inserts were loaded onto a 1% agarose gel to determine
successful amplification, and to identify any contaminating bands.

54
Using a Safe ImagerTM 2.0 Blue-Light Transilluminator (Invitrogen) DNA bands were
visualised and excised from agarose gels. DNA extraction from gels was achieved
using a Nucelospin® Gel and PCR Clean Up Kit (Macherey-Nagel). Briefly, the gels
were melted in 2 volumes of a guanidinium thiocyanate binding buffer at 50 C before
loaded onto a silica membrane column. The column was washed twice with an
ethanolic wash buffer and dried via centrifugation. The DNA was then eluted and
quantified by using the dsDNA application on a DS-11 Spectrophotometer (DeNovix).
If gel electrophoresis revealed a clean band with no contaminants, gel purification was
not required. Instead the PCR end-product could be mixed directly with NTI buffer
and loaded onto a column.
In-Fusion cloning allowed a linearised vector and the genes of interest termini to
anneal together forming a circular plasmid that could be used to transform E. coli. This
was performed by incubating the vector and insert at a molar ratio of 1:2 for 15 minutes
at 50 C; however, the molar ratios were increased up to 1:10 when working with
smaller inserts. A 5X In-Fusion enzyme premix and MilliQ® water were also included
in the mixture. A simplified schematic of In-Fusion cloning is shown in Figure 2.1.

55
2.1.9 Mutagenesis
A Q5 site-directed mutagenesis technique was also employed to introduce
mutations/delete residues through inverse PCR, where the mutations were present on
the primers being used. Following a PCR, 1 µL of DpnI (NEB) was added per 50 µL
reaction and incubated at 37 °C for one hour. The sample was then heat treated at
80 °C for 20 minutes. For a 20 µL reaction, 2 µL of a 10 x T4 DNA Ligase Reaction
Buffer, 1 µL T4 DNA Ligase, 1 µL T4 Polynucleotide Kinase (NEB), 8 µL MilliQ®
water, and 8 µL of sample were mixed and incubated at room temperature for ~2-3
hours. 2.5 µL were then used to transform OmniMAXTM competent E. coli cells
following the previously stated transformation protocol. Successful mutagenesis was
verified by sequencing the region of interest (Eurofins Genomics).
Figure 2.1: A simplified schematic, explaining In-Fusion cloning. A plasmid of
choice is linearised, either though restriction enzyme digestion or inverse PCR. The
desired DNA is then amplified using PCR and includes 15 bases that correspond to
the final 15 bases at either end of the vector. The two segments are then incubated
with the In-Fusion enzyme at 50 C for 15 minutes, resulting in a complete plasmid
with the desired gene of interest (GOI).

56
2.1.10 DNA Purification
All small scale DNA purifications were performed using a Nucleospin® Plasmid
Miniprep Kit (Macherey-Nagel). For high-copy plasmids such as pFastBac, a two mL
overnight E. coli culture was adequate for acquiring usable DNA concentrations. For
low-copy plasmids up to 10 mL of overnight culture was used. Cultures were
centrifuged at 11,000 x g for one minute and resuspended in A1 resuspension buffer.
Cell lysis was achieved with A2 lysis buffer and neutralised with A3 neutralisation
buffer. Following a 10 minute centrifugation at 11,000 x g the supernatant was
transferred to the kit supplied columns. Following a one minute 11,000 x g
centrifugation, the membrane was washed twice with a wash buffer (AW buffer),
centrifuged as before and washed once with buffer A4, supplemented with ethanol.
The membrane was dried through centrifugation and DNA was eluted in elution buffer.
DNA was quantified in the same manner as stated above. All buffers were supplied in
the Miniprep kit.
2.1.11 SDS-PAGE
Samples were prepared in a 5 x sodium dodecyl sulphate (SDS) sample buffer (250
mM Tris-HCl pH 6.8, 10% SDS, 0.25% bromophenol blue, 500 mM Dithiothreitol
(DTT), and 50% glycerol) and incubated at room temperature for approximately 10
minutes. Samples were then loaded onto Mini-Protean® TGX (4-20%) or CriterionTM
TGC (4-20%) precast gels (Bio-Rad). To visualise the molecular weight of the protein,
protein ladders were loaded alongside samples, such as the Color Prestained Protein
Standard (NEB). A 10 x SDS running buffer (25mM Tris, 192 mM glycine, 0.1% SDS)
was prepared and diluted 10-fold for applications. A constant voltage of 150 V in a 1
x SDS polyacrylamide gel electrophoresis (PAGE) running buffer was applied for

57
approximately one hour. If the protein of interest was fluorescently tagged, it was
visualised using in-gel fluorescence. Alternatively, if protein expression was high
enough, visualisation was achieved with Coomassie staining using Quick Coomassie
Stain (Generon). If protein concentration was insufficient then further analysis would
require a western blot. All three approaches were visualised with a G:BOX (Syngene).
2.1.12 Western Blotting
Following an SDS or native-PAGE, proteins were transferred onto Polyvinylidene
difluoride or nitrocellulose membranes using the Trans-blot® turboTM blotting system
(Bio-rad). Membranes were blocked in Tris-buffered saline with Tween-20 (TBST)
(Sigma-Aldrich) and 2% bovine serum albumin (BSA) (Sigma-Aldrich) or dried
skimmed milk powder (Marvel), either at room temperature for one hour or overnight
at 4 C on a rotating mixer. Membranes were probed with an appropriate antibody,
which included anti-His (Thermo Fisher Scientific), anti-PTH1R (Atlas Antibodies),
anti-FLAG (Sigma-Aldrich), anti-MBP (NEB), anti-G protein alpha S (GNAS)
(Abcam), or anti-G protein subunit gamma 2 (GNG2) (Thermo Fisher Scientific) for
one hour at room temperature. Membranes were washed three times with TBST and,
if required, probed with secondary antibodies such as anti-mouse (Invitrogen) or anti-
rabbit (Jackson ImmunoResearch Europe). After washing, membranes were
developed using ClarityTM Western ECL Substrate (Bio-Rad) and imaged on a G:BOX
(Syngene). If required, re-probing with additional antibodies was achieved with the
addition of a mild stripping buffer solution (200 mM glycine pH 8.0, 5mM SDS, 1%
Tween-20) for 30 minutes, before three washes with TBST. A new antibody could
then be applied to the membrane. A list of antibodies and their dilutions is shown in
Table 2.2

58
Table 2.2: Antibodies and dilutions used for western blots. Anti-His antibodies were
tagged with horseradish peroxidase, so secondary antibodies were not required. All
other antibodies required secondary, horseradish peroxidase conjugated, antibodies.
Primary Antibody Dilution Secondary Antibody Dilution
Anti-His 1:10,000 Not required X
Anti-PTH1R 1:5,000 Anti-Rabbit 1:5,000
Anti-GNAS 1:3,000 Anti-Rabbit 1:5,000
Anti-GNG2 1:8,000 Anti-Rabbit 1:5,000
Anti-MBP 1:10,000 Anti-Mouse 1:10,000
Anti-FLAG 1:1,000 Anti-Mouse 1:10,000
2.1.13 Native-Page
Samples were diluted in 4 x native sample buffer (62.5 mM Tris-HCl pH 6.8, 0.01%
bromophenol blue, and 40% glycerol), and loaded onto a Mini-Protean® TGX (4-20%)
precast gel (Bio-Rad). Protein migration was initiated in Native-PAGE running buffer
(25mM Tris, 192 mM glycine, pH 8) subjugated at a constant voltage of 150 V.
Visualisation of gels was achieved as described above.
2.1.14 Dialysis
Following procedures such as a nickel column purification, dialysis was used to
remove components, such as high concentrations of imidazole. The solutions were
dialysed overnight in an appropriate dialysis buffer in Snakeskin Dialysis Membranes
with various molecular weight cut offs. Following the overnight incubation, the
dialysis buffer was typically replaced every two hours for a total of at least three buffer
replacements.

59
2.2 Sf9 Work
Sf9 cells were grown in either Sf9-000 II serum-free media (GibcoTM) or Insect-
XPRESSTM medium with L-glutamine (Lonza). Cells were maintained between ~ 0.5
to 5 million cells/mL at 27 °C and shaking at 120 rpm. Cell density was counted
manually with a haemocytometer or automatically with a CountessTM II Automated
Cell Counter (Invitrogen) and stained with a trypan blue stain (Invitrogen).
2.2.1 Bacmid Preparation and Sf9 Cell Transfection
Two variations of MAX Efficiency DH10Bac cells (Thermo Fisher Scientific) were
used for isolating recombinant bacmids, one with yellow fluorescent protein (YFP)
and one without. The presence of YFP made monitoring transfection efficiency viable
and the YFP-free variant made quantification through GFP-tagged proteins possible.
Bacmid isolation required multiple antibiotics, and so, following a heat shock protocol,
cells were incubated at 37 °C for 16 hours. Cells were spread on agar plates containing
kanamycin, tetracycline, gentamycin, 5-Bromo-4-Chloro-3-Indolyl β-D-
Galactopyranoside (X-Gal), and β-D-1-thiogalactopyranoside (IPTG) at 50, 10, 7
and 100 µg/mL respectively and 0.16 mM IPTG. Plates were left to incubate at 37 C
for approximately 48 hours, or until there was a clear distinction between blue and
white colonies. White colonies were picked and incubated in 2 mL of LB media for
16 hours at 37 C. Cultures were harvested, resuspended, lysed and neutralised using
Macherey-Nagel Nucleospin® Plasmid Miniprep Kit buffers. The supernatant was
then mixed with isopropanol at approximately a 3:2 ratio and gently mixed before a
centrifugation at 15,000 x g for 10 minutes. The resulting transparent pellet was
washed in 200 µL of 70% ethanol and after a final 15,000 x g centrifugation the pellet
was topped with 50 µL of fresh 70% ethanol.

60
On a 6-well plate, 1x10⁶ Sf9 cells were plated per well in 3 mL total volume of Insect
X-PRESS media (Lonza). The DNA pellet was air dried for approximately ten minutes
and then resuspended in 30 µL of sterile Milli-Q® water. X-tremeGENE HP DNA
Transfection Reagent (Sigma-Aldrich) was individually mixed with the Insect-
XPRESS media and the bacmid DNA in a 1:10 ratio. These were then gently mixed
at a 1:2 ratio respectively and incubated at room temperature for up to 30 minutes. 150
L of mixture was added per well and was left to incubate at 27 C for approximately
six days, sealed with parafilm. If transfected cells had YFP/GFP then it was possible
to determine successful transfection through imaging the cells under an EVOS
microscope (Thermo Fisher Scientific). If no fluorescent marker was present,
transfection was assumed to be successful if cells appeared larger and darker under a
normal microscope. 60 hours after transfection, the media from the plates was
harvested as this contained the initial baculovirus (V0) and was stored at 4 °C in a
LightSafe tube. The media was replaced with fresh Insect X-PRESS media and
incubated at 27 C for a further 60 hours. Protein expression was the verified using a
western blot.
2.2.2 Virus amplification
To amplify the baculovirus, 25 mL of Sf9 cells, at a density of 1x10⁶ cells/mL, were
infected with 1.5 mL of V0. Cell growth was monitored every 24 hours to maintain
density between 1-1.5 x 10⁶ cells/mL. 1 mL of cells were also harvested by
centrifugation at 500 x g for ten minutes every 24 hours, and frozen at -20 C, to
determine the optimal incubation duration. 24 hours after the day cells stop dividing,
or the day after proliferation arrest (DPA), the V1 baculovirus was harvested by
centrifugation at 500 x g for 10 minutes and storing the supernatant at 4 °C.

61
2.2.3 Determining Optimal Time to Harvest
When creating the V1 virus, the optimal day of harvesting protein was simultaneously
determined. Cells were infected with a baculovirus and allowed to grow to DPA + 96
hours, or until cell viability fell below 60%. Every 24 hours approximately one mL of
cells at 1x10⁶ cells/mL were collected. Samples were centrifuged and isolated pellets
were frozen at -20 °C until required. Once all samples were ready for analysis, cells
were lysed by sonication. Whole cell lysates were used to prepare SDS-PAGE samples.
If too viscous cells could be centrifuged and the supernatant could be analysed.
2.2.4 Large-Scale Sf9 Expression
In one L Erlenmeyer flasks, 300 mL of Sf9 cells at a density between 1-2 x 10⁶
cells/mL were infected with a predetermined optimal volume of V1 or V2 baculovirus.
Cells were maintained at 27 °C with shaking at 120 rpm. Ideally, cells should have
doubled in density a single time and then be harvested based on the day of best
expression. Cells were centrifuged at 700 x g for 30 minutes at 4 °C. The supernatant
was discarded, and cell pellets were resuspended in 1 x phosphate buffered saline (PBS)
buffer, pre-chilled to 4 °C. Following another centrifugation, as above, cell pellets
were aliquoted and flash frozen and stored at -80 °C.
2.3 PTH1R and PTH2R Profile Determination
2.3.1 Cloning of Wild-type Constructs
All cloning of PTH1/2R was performed on a human wild-type variant, supplied in a
pcDNA plasmid (Mann et al., 2008). PTH1/2R were amplified using PCR and
pFastBac plasmids were linearised using inverse PCR. The two were joined together
using In-Fusion (Figure 2.2) cloning as described in 2.1.8.

62
2.3.2 Protein Quantification
Multiple ways to determine protein quantification were performed throughout this
research. Samples were plated onto a 96-well plate and had either their absorbance or
fluorescence recorded using a FLUOstar Optima microplate reader (BMG LabTech).
Protein concentrations were calculated following a standard bicinchoninic acid (BCA)
assay protocol (Thermo Fisher Scientific). Fluorescently labelled protein
concentrations were calculated by comparing the densities of the fluorescent protein
against known GFP concentrations. Western blot densitometry analysis of a protein
Figure 2.2: Basic design of PTH1R-pFastBac constructs. Using In-Fusion cloning it is
possible to insert PTH receptors into pFastBac CTH and CGVH, resulting in a C-
terminally tagged protein. CTH is a C-terminal His tag, separated by a tobacco etch
virus cleavage site. CGVH is a C-terminal GFP and His tag separated from the protein
of interest by a human rhinovirus protease site.

63
against known standards was also performed when fluorescence was not available.
FIJI image software was used for densitometry analysis of proteins.
2.3.3 Solubilisation Screening
Sf9 cells were infected with the appropriate baculovirus and grown until the day of
best expression. Following centrifugation, pellets were resuspended in 20 mM 4-(2-
hydroxyethyl)-1-piperazineethanesulfonic acid (HEPES), 200 mM NaCl, and 20%
glycerol buffer solution with a cOmpleteTM Protease Inhibitor Cocktail (Sigma-
Aldrich). Cells were then mixed with a detergent at a 1% w/v concentration, with or
without cholesterol hemisuccinate (CHS), at 0.2% w/v of the final solution. Samples
were incubated overnight at 4 °C on a rolling mixer and then ultracentrifuged at 55,000
rpm for one hour. The supernatant was saved, and the pellet was resuspended in
HEPES buffer. Samples were then prepared for western blotting as described above.
Proteins were visualised using anti-His antibodies to determine soluble and insoluble
receptor density. The detergents used in the detergent screen were n-dodecyl-β-D-
maltopyranoside (DDM) and lauryl maltose neopentyl Glycol (LMNG) with or
without CHS, and fos-choline-12.
2.3.4 Determining optimal solubilisation time
Determining the optimal solubilisation period was performed as above, changing only
the period of solubilisation. An overnight incubation was assumed to achieve
maximum solubilisation; thus, the shorter durations were compared to this to
determine the optimum solubilisation time. The solubilisation durations ranged from
one to four hours.

64
2.4 HEK-293 Cell work
2.4.1 DNA MaxiPrep
To ensure viable concentrations of DNA for HEK-293 cell transfection were obtained,
a Maxiprep kit (Macherey-Nagel) was utilised. 500 mL of cultures, with the
appropriate plasmid, were grown overnight at 37 C, pelleted, and resuspend in 25
mM Tris-HCl, 10 mM EDTA, and 50 mg of lysozyme. DNA was denatured by the
addition of 0.2 M NaOH, 1% SDS, which was neutralised by 3M potassium acetate
pH 4.8. Samples were centrifuged at 11,000 x g and the supernatant was filtered
through QIAfilter Maxi Cartridges (Qiagen). 0.6 volume worth of isopropanol was
added before another centrifugation, after which the supernatant was discarded. Pellets
were resuspended in 10 mM Tris-HCl, 10 mM EDTA, followed by the addition of an
equal volume of 5 M LiCl. Following centrifugation to harvest the supernatant, 0.6
volume of isopropanol was added and centrifuged. Pellets were resuspended in a Tris-
EDTA solution and incubated with heat treated RNase A solution for 15 minutes.
DNA precipitation was achieved by the addition of 0.25 volume 30% polyethylene
glycol (PEG) 6000, 2.5 M NaCl, and incubated on ice for 30 minutes. Samples were
pelleted and resuspended in Tris-EDTA, and an equal volume of chloroform. After
centrifugation, the top aqueous layer was saved and mixed with 0.1 volume of 5 M
NaCl and three volumes of ethanol. After centrifugation the pellet was washed with
70% ethanol and centrifuged one final time. DNA was resuspended in Tris-EDTA.
2.4.2 HEK-293 Cell Maintenance
Human embryonic kidney-293 (HEK-293) cells were maintained in Dulbecco’s
Modified Eagle Medium (DMEM), supplemented with 10% foetal bovine serum (FBS)
and incubated at 37 °C at 5% CO2. Cells were maintained at a 20-90% confluency and
were dislodged by a short 37 °C incubation in 1 X trypsin. Trypsin was neutralised by

65
the addition of fresh DMEM and cells were split into new flasks through gentle
agitation.
2.4.3 HEK-293 Transfection
HEK-293 cells were seeded at a confluence of 25% in DMEM + 10% FBS and 1%
penicillin-streptomycin and were left to incubate at 37 C with 5% CO2 for 24 hours.
An hour before transfection, the medium was replaced with DMEM Table 2.3,
supplemented with 5% FBS and penicillin/streptomycin. DNA:polyethylenimine (PEI)
complexes were mixed as described in Table 2.4 and diluted in DMEM/5%
FBS/penicillin/streptomycin. The resulting solution was added to the cells and left to
incubate until protein harvesting. Transfection efficiency was determined through
EVOS imaging of GFP-tagged proteins. Protein expression was determined through
western blots.
Table 2.3: Volume of DMEM to be added one hour before transfection
96 Well 24 Well 6 Well 35 mm T25 T75
DMEM to be added (µL) 100 400 2000 2000 2000 6000
Table 2.4: DNA:PEI ratios for HEK-293 transfection
96 Well 24 Well 6 Well 35 mm T25 T75
DNA, 400 µg/mL (µL) 0.83 5.20 25 20.8 65 195
PEI, 1 mg/mL (µL) 0.33 2.08 10 8.33 26 77.5
DMEM + 5% FBS (µL) 3.33 20.79 100 83.3 260 777.5
Total volume (µL) 4.49 28.07 135 112.5 351 1050

66
2.5 PTH Receptor Modification
Point mutations, deletions, and insertions were achieved using Q5 site-directed
mutagenesis. Various fusion constructs were created throughout this research
including BRIL-PTH1R, PTH1RECD-PTH2R
TMD, MBP-PTH2RECD and GFP-
PTH2RECD. To achieve this, the required DNA sequences were amplified using a
standard PCR reaction with overlapping 15 base pair overhangs. Infusion HD Cloning
Plus was then used to join two proteins together and place them in the desired vector,
such as pFastBac. To create truncated constructs, or single residue mutants, standard
inverse PCR protocols were performed. Agarose gels were used to determine
successful amplification of DNA.
2.6 Constitutively Active PTH1R
2.6.1 Creating a PTH-tethered Receptor Construct
To create the constitutively active receptor constructs, PTH residues 1-14 were
attached to the N-terminus of BRIL-PTH1R, by one of three flexible linkers:
(GGGGS)1, (GGGGS)3, and GSAGSAAGSGEF (GSAGSA). This was performed
through two PCR reactions. Firstly, the linkers were attached to PTH1R through an
inverse PCR reaction, with the sequence of the linker split evenly over the forward
and reverse primers. Upon sequence verification (Eurofins Genomics), a similar
procedure was performed using forward and reverse primers with the sequences of
PTH(1-14) split over the two primers. Tethered receptors were expressed in Sf9 cells
as described previously.

67
2.6.2 LANCE cAMP Assay Protocol
To determine if the modified receptors retained functionality, a LANCE cAMP assay
was used (PerkinElmer). Cells transfected with appropriate receptors were grown and
harvested based on previously established optimisation expression protocols. Cells
were washed in a stimulation buffer (1 x PBS with 0.1% BSA, and when using cell-
based assays 500 µM 3-isobutyl-1-methylxanthine (IBMX)). To create a cAMP
standard curve, concentrations ranging from 1 x 10⁻⁶ to 1 x 10-11 M of cAMP were
prepared using stimulation buffer. A 1/100 Alexa fluor® 64-anti cAMP antibody was
also prepared in stimulation buffer. Solutions containing a 1/18 Eu-W8044 dilution in
cAMP detection buffer and a 1/6 dilution of Biotin-cAMP in cAMP detection buffer
were separately prepared. 1/125 dilutions of these two solutions were then each added
to the same cAMP detection buffer and incubated at room temperature for at least 15
minutes. To an Optiplate-384 microplate (PerkinElmer), 6 µL of a cAMP standard
solution or cell suspension and 6 µL of the Alexa fluor® antibody solution were co-
incubated for approximately one hour at room temperature. Following this, 12 µL of
the detection mixture was added and a further hour incubation was performed.
Measurements were recorded using a Victor x5 multilabel plate reader (PerkinElmer),
with an excitation filter of 340 nm and 615/665 nm emission filters.
2.6.3 Optimisation of LANCE® Assay Conditions
To optimise the conditions for the LANCE® cAMP assay, the appropriate cell count
was determined. To achieve this, forskolin dose response curves were created.
Forskolin is a GPCR independent means of increasing cAMP production through
adenylyl cyclase activation. The cAMP assay was prepared with varying numbers of
cells in each well and a range of forskolin concentrations (10-9 – 10-4 M). The optimal

68
cell count was one in which the Forskolin dose-response curve covers most of the
linear region in the cAMP standard curve.
2.7 Expression and Purification of the G Protein Heterotrimer
A rat subunit and human and subunits were all ordered in individual plasmids
from Addgene (catalogue numbers 24499, 67018, and 67018 respectively). The and
subunits both contained a Halo tag, which was removed by inverse PCR. The
subunit had the C-terminal residues of Gq (EYNLV), so was mutated to Gs
(QYELL). Once the desired sequences were confirmed, they were cloned into
pFastBac vectors for Sf9 cell transfection and a His tag was put onto the C-terminus
of the subunit. Protein expression was verified by western blotting with anti-GNAS,
anti-GNG2 and anti-His. All three subunits were co-expressed in Sf9 cells by infecting
at a 1:1:1 ratio. Cells were harvested approximately 72 hours after infection and
resuspended in 50 mM HEPES, pH 8.0, 65 mM NaCl, 1.1 mM MgCl2, 1 mM EDTA,
5 mM -mercaptoethanol and 10 M guanosine diphosphate (GDP) with protease
inhibitor tablets. Cells were lysed by 40 strokes with a Dounce homogeniser, followed
by a slow speed centrifugation. The supernatant was retrieved, and membranes were
isolated by a high-speed spin. The membranes were resuspended in 50 mM HEPES,
pH 8.0, 50 mM NaCl, 100 M MgCl2, 5 mM -Mercaptoethanol, 10 M GDP, and
protease inhibitors. Membranes were flash frozen at -80 C.
To solubilise the G protein, sodium cholate detergent was added to a final
concentration of 1%, and MgCl2 was added up to a final concentration of 5 mM. The
samples were gently mixed at 4 C for 40 minutes and then centrifuged. The
solubilised supernatant was then diluted 5-fold with a nickel-nitrilotriaceteic acid (Ni-

69
NTA) loading buffer (20 mM HEPES, pH 8.0, 363 mM NaCl, 1.25 mM MgCl2, 6.25
mM imidazole, 5 mM -mercaptoethanol, 10 M GDP). Ni Sepharose 6 Fast Flow
Resin (Sigma Aldrich) was washed several times with water and a loading buffer
containing the sample of interest, which were then mixed at 4 C for one hour. The
resin was then collected in a purification column and washed with wash buffer 1 (20
mM HEPES, pH 8.0, 300 mM NaCl, 2 mM MgCl2, 5 mM imidazole, 0.2% cholate, 5
mM β-mercaptoethanol, 10 μM GDP), wash buffer 2 (20 mM HEPES, pH 8.0, 50 mM
NaCl, 1 mM MgCl2, 10 mM imidazole, 0.1% DDM 5 mM β-mercaptoethanol, 10 μM
GDP), and wash buffer 3 (20 mM HEPES, pH 8.0, 50 mM NaCl, 1 mM MgCl2, 5 mM
imidazole, 0.1% DDM, 5 mM β-mercaptoethanol, 10 μM GDP). The G protein could
then be eluted using a Ni-NTA elution buffer (20 mM HEPES, pH 8.0, 40 mM NaCl,
1 mM MgCl2, 200 mM imidazole, 0.1% DDM, 5 mM -mercaptoethanol, 10 M
GDP). Complex formation was confirmed by western blotting the elutions with the
individual subunit antibody.
2.8 Nanobody Work
2.8.1 nb37 Expression and Purification
A nb37 baculovirus was expressed in Sf9 cells using a standard expression protocol.
The nb37 strain had a membrane signal peptide and a C-terminal His tag for
purification. Protein expression was achieved following a standard Sf9 transfection
protocol as described previously. Following expression, cells were lysed in 50 mM
Tris (pH 8.0), 200 mM NaCl, 1 mM MgCl2, and EDTA-free Protease Inhibitor
Cocktail (Roche), by approximately 40 strokes using a Dounce homogeniser.
Membrane proteins were isolated by a high speed centrifugation at 55,000 x g for one
hour. Membranes were then resuspended in 50 mM Tris (pH 8.0), 100 mM NaCl, 100

70
M MgCl2, 10 mM imidazole and protease inhibitors. Ni Sepharose 6 Fast Flow
Resin (Sigma Aldrich) was washed with water, followed by resuspension buffer, and
added to the resuspended membrane proteins. Mixing at 4 °C for one hour was
performed before the solution was passed through a gravity-flow column. The column
was repeatedly washed with the resuspension buffer and proteins were eluted in 50
mM Tris (pH 7.5), 50 mM NaCl, and 300 mM imidazole, which was subsequently
dialysed against a 50mM Tris (pH7.5), 100mM NaCl buffer.
2.8.2 nb35 Expression
WK6 and BL21 strains of E. coli were used for expression of nb35. The sequence of
nb35 was obtained from PDB entry 3SN6 and ordered from GeneArt Gene Synthesis
(Thermo Fisher Scientific). The sequence was cloned into pET28 plasmid for E. coli
expression with a C-terminal His tag. E. coli were transformed using a standard
transformation protocol and plated onto agar plates. A single colony was inoculated
in LB media and incubated at 37 °C overnight. The following day, the E. coli were
diluted in a larger volume of LB media (typically 400-500 mL) to an OD600 0.05 and
incubated at 37 °C, with shaking, until an OD of approximately 0.6 was reached. The
OD was regularly checked using a Biochrom WPA Biowave II spectrophotometer
(Thermo Fisher Scientific). Expression of nb35 was induced by the addition of 1 mM
IPTG and grown overnight at 28 °C with shaking. Other conditions were tested for
optimal expression such as changing the IPTG concentration and changing the
incubation temperature and duration. Expression was confirmed through a Coomassie
stain and a western blot probed with an anti-His antibody.

71
2.8.3 Osmotic shock
Osmotic shock was used to lyse nanobody expressing E. coli cells. Cell samples were
centrifuged at 14,000 x g for five minutes and the resulting supernatant was discarded.
Cells were then resuspended in a 0.2 M Tris-HCl (pH 8.0), 171 g/L sucrose, and 0.1
M EDTA buffer solution, approximately ¼ of the initial suspension volume. For
control samples, cells were resuspended in ice-cold water. The resuspended samples
were incubated on ice for 20 minutes with regular inversions to prevent sedimentation.
A 14,000 x g centrifugation for 15 minutes was then performed, and the pellet was
saved. Cells were then resuspended in either a fractionation buffer (50 mM Tris-HCl,
0.005 M MgSO4, 0.2% SDS), or ice-cold water, in approximately ¼ of the former
suspension volume. Cells were then incubated on ice for 20 minutes. A final 15 minute
centrifugation at 14,000 x g was performed and the protein-containing supernatant was
saved. To determine the degree of lysis achieved, Coomassie staining was performed.
2.8.4 nb35 Purification
Following osmotic shock lysis, nb35 was purified using standard nickel affinity
chromatography. The supernatant obtained from the osmotic shock lysis was
supplemented with 10 mM imidazole and bound to Ni Sepharose® 6 Fast Flow Resin
(Sigma-Aldrich), pre-equilibrated with 50mM Tris-HCl (pH 8.0), 100 mM NaCl, and
10 mM imidazole. This was mixed at 4 C with shaking for one hour before it was
applied to a gravity-flow column. The resin was washed with 50 mM Tris (pH 8.0),
300 mM NaCl and 10 mM imidazole, and nb35 was eluted with lysis buffer
supplemented with 300 mM imidazole. The elutions were then pooled and dialysed
against a 50 mM Tris (pH 7.5), 100 mM NaCl buffer.

72
2.9 Purification of PTH1R-G protein Complex
2.9.1 Co-expression of PTH1R and a G Protein
To achieve co-expression, a range of PTH1R::: baculovirus ratios were tested in
Sf9 cells, 1:1:1:1, 1:2:2:2, 1:1:2:1, and 1:2:1:1. Each individual baculovirus dilution
was optimised for expression and used as the basis for the co-expression ratios.
Proteins were visualised using anti-His, GNAS, and GNG2 antibodies on a western
blot. Densitometry analysis revealed which ratio was the most appropriate to use.
2.9.2 Complex purification
Sf9 cells were infected with 4 baculoviruses and maintained in either Sf9-000 II serum-
free media (GibcoTM) or Insect-XPRESSTM medium with L-glutamine (Lonza). Cells
were transfected at a density between 1.5 to 2 x 10⁶ cells/mL, cultured at 27 °C and
harvested at DPA + 48 hours. Cell pellets were flash frozen and stored at -80 °C until
required.
Cell pellets were thawed and lysed in 30 mM HEPES (pH 7.4), 150 mM NaCl, 10 mM
MgCl2, 1 mM MnCl2, and 10% glycerol, supplemented with EDTA-free Protease
Inhibitor Cocktail (Roche), by approximately 50 strokes with a Dounce homogeniser.
10 µM PTH was added to promote complex formation with one unit of Apyrase (NEB)
and two mg of purified nb35. Lysates were incubated for one hour at room temperature
to promote PTH binding. PTH-tethered receptors and BRIL-PTH controls did not
require the addition of PTH. Cell lysates were solubilised with 1% DDM (w/v) and
0.2% CHS (w/v) at 4 °C for one hour on a mixing roller. Solubilised material was
isolated by a high speed ultracentrifugation at 55, 000 x g for 1 hour at 4 °C. The
supernatant was diluted two-fold by adding the same buffer as above, excluding DDM

73
and CHS, and was incubated with an ANTI-FLAG M2 Affinity gel (Sigma-Aldrich)
resin, and CaCl2 at a final concentration of 2.5 mM, for one hour at 4 °C with mixing.
The resin was loaded onto a pre-equilibrated column and was washed with 20 column
volumes of 30 mM HEPES (pH 7.4), 150 mM NaCl, 2.5 mM CaCl2, 10 mM MgCl2,
1 mM MnCl2, 0.05% DDM (w/v), 0.0012% CHS (w/v), 10 % glycerol, 1 µM PTH,
and 25 µM TCEP. The complex was eluted from the FLAG column using a FLAG
elution buffer, 30 mM HEPES (pH 7.5), 150 mM NaCl, 1 mM MgCl2, 5mM EDTA,
200 µM FLAG peptide, 1 µM PTH, 25 µM TCEP, 0.05% DDM (w/v), and 0.0012%
CHS (w/v).
2.9.3 Mini G protein
A baculovirus encoding a C-terminal His-tagged mini G protein was optimised for
expression in Sf9 as previously described. Co-expression of the mini G protein and a
PTH1R construct was achieved by infection with a 1:1 ratio of baculoviruses. Co-
expression was determined through an anti-His western blot.
2.9.4 PTH1R-Mini G protein Complex Purification
The purification of the PTH1R-Mini G protein complex was achieved in the same
manner described in section 2.8.2. The main difference between the two purifications
was that the addition of nb35 was not required in this instance.
2.10 PTH2R Characterisation
PTH2R characterisation was performed in the same manner as PTH1R. Expression and
quantification was performed in Sf9 cells with a C-terminal GFP/His tag and standard
solubilisation protocol performed. Additional detergents used to solubilise PTH2R

74
included decyl maltoside (DM), octyl glucoside (OG), octyl glucose neopentyl glycol
(OGNG), and cymal 5. Densitometry analysis was performed with FIJI image
software.
2.11 PTH2RECD Work
2.11.1 Expression and Purification of DsbC
The plasmid used for Disulphide bond C (DsbC) expression was the pCDFDuet-1
plasmid, however, it only contained DsbC in the second cloning site, the primary
cloning site did not encode any protein. This was used to transform BL21 (DE3) cells.
Single colonies were grown in suspension to an OD600 between 0.5-0.6 before they
were induced with 0.4 mM IPTG. Cells were harvested and resuspended in 50 mM
Tris-HCl (pH 7.5), 10% glycerol, 150 mM NaCl, 0.5 mM EDTA, and 1 mM DTT.
Two passes through a cell disruptor at 30 kpsi was efficient to lyse the cells. To isolate
the protein of interest, ammonium sulphate precipitation was utilised. Following lysis,
1.5% streptomycin sulphate was added and mixed for 20 minutes to precipitate the
nucleic acids. This was centrifuged at 3,000 x g and ammonium sulphate was added
to 45% saturation and stirred for one hour. Precipitated material was removed by
centrifugation and the resulting supernatant was brought to 75% saturation. At this
level DsbC precipitated and could be harvested by centrifugation. The precipitated
fragment was dialysed to 25 mM Tris-HCl (pH 7.5), 0.5 mM EDTA, and 1mM DTT.
This was then loaded onto a HiTrapTM Q FF anion exchange column that was
prewashed in Tris-HCl (pH 7.5), 10% glycerol, 0.5 mM EDTA, and 1 mM DTT. A
linear gradient from 0 to 0.5 M NaCl was used to elute the protein. Fractions were
visualised using a Coomassie gel, pooled, and loaded onto a Sephacryl S200 HR gel
filtration column (GE Healthcare), prewashed in Tris-HCl (pH 7.5), 10% glycerol, 150

75
mM NaCl, 0.5 mM EDTA, and 1 mM DTT. DsbC containing fragments were
determined using Coomassie staining, pooled and frozen at -80C.
2.11.2 Optimisation of PTH2RECD Expression
PTH2RECD (residues 29-144), with an N-terminal MBP/C-terminal His tag, was cloned
into the first multiple cloning site of a pCDFDuet-1 plasmid. The signal leader of MBP
was omitted for cytoplasmic expression. DsbC isomerase was cloned into the second
multiple cloning site of pCDFDuet-1, lacking a signal peptide. Various expression
trials were then performed to optimise expression of PTH2RECD. Firstly, three different
E. coli strains were tested: Origami (DE3), Rosetta-Gami B (DE3) and BL21 (DE3).
A standard E. coli IPTG expression protocol was used, as described in 2.9.2. Various
other conditions were then altered such as IPTG concentration, incubation temperature
and duration, and media type (LB, TB, SB).
2.11.3 PTH2RECD Protein Expression and Purification
Rosetta-Gami B (DE3) cells were transformed with the pCDFDuet-1 plasmid,
containing both PTH2RECD and DsbC, and colonies were then incubated in LB media
at 37 C overnight. Cultures were inoculated at an OD600 of 0.05 and grew to midlog
phase before induction with 0.5 mM IPTG. After a four hour incubation at 37 C, cells
were harvested and resuspended in 50 mM Tris HCl, pH 7.5, 150 mM NaCl, 25 mM
imidazole, and 10% glycerol. Cell lysis was achieved by two passes through a cell
disrupter at 30 kpsi. A slow and fast speed centrifugation removed any unnecessary
components and left only cytoplasmic proteins. Ni Sepharose 6 Fast Flow Resin
(Sigma Aldrich) was washed with water, followed by resuspension buffer, and added
to the cytoplasmic extract. This was gently mixed at 4 C for one hour before it was

76
applied to a gravity-flow column. The column was washed with the resuspension
buffer and proteins were eluted in 50 mM Tris HCl, pH 7.5, 150 mM NaCl, 250 mM
imidazole, and 10% glycerol.
2.11.4 Mass Spectrometry
Mass spectrometry was performed at the University of Leeds, Faculty of Biological
Sciences Mass Spectrometry Facility. SDS-PAGE was performed on the appropriate
samples and the gels were stained with a Bio-SafeTM Coomassie Stain (Bio-Rad).
Keratin contamination was minimised by using sterile plastic containers. Protein
identification was performed with an in-house Synapt HDMS system (Waters) and
analysed using an UltiMate 3000 HPLC system (Dionex).
2.12 IMPROvER
2.12.1 Acquiring Ordered IMPROvER Mutants
Wild-type PTH1R sequence was inputted into the IMPROvER program (Harborne et
al., 2020) by Dr Steven Harborne, which produced a ranked list of mutations based on
three modules: data-drive, deep-sequence, and model based. An exclusion list of
residues, containing Y191, Y195, H223, M231-D241, L244, Y245, L289, N295, K359,
K360, T410, M414, P415, H420, Y421, F424, M425, W437, Q440, M441, M445, and
Q451, was provided and fed to the IMPROvER program to prevent mutagenesis of
key functional residues.
2.12.2 Cloning of mutants
Forward and reverse primers were designed by the IMPRoVER program but were
manually altered if the predicted Tm was deemed too high (as predicted by

77
tm.calculator.neb.com). All primers designed had high Tms, therefore, a bulk inverse
PCR was performed at 69 °C. All samples were visualised through gel electrophoresis
and, following identification of a positive band, were sequence verified using Eurofins
Genomics Sanger Sequencing.
2.12.3 High Throughput Transfection of Sf9 Cells
Due to the high number of transfections required to express all IMPROvER predicted
proteins, a more efficient transfection protocol was utilised: specifically, a scaled
protocol for 24-well plate transfections. 2 mL of Sf9 cells, at a density of 0.5 x 10⁶
cells/mL, were added to each well of a poly-D-lysine 24-well cell culture plate
(Sarsstedt) and allowed to adhere for approximately 20 minutes. XtremeGENE HP
Transfection Reagent (Roche) was diluted 1:10 in Insect-XPRESS Protein-free media
(Lonza) and bacmid DNA was added to 10 ng µL-1. This was incubated for up to 30
minutes at room temperature before being added to the Sf9 cells. Following this, the
protocol remained identical to the previously described method in 2.2.1
2.12.4 Functional Analysis of IMPROvER Mutants
Functional analysis was performed with the LANCE cAMP assay (PerkinElmer) as
described in 2.6.2.
2.12.5 Thermostability assay for BRIL-PTH1R Control
A rapid throughput fluorescence based assay was used to determine thermostability of
the various PTH1R constructs. Sf9 cells were infected with the appropriate baculovirus
and harvested at DPA + 48 hours, based on previous expression optimisation
experiments. Cell pellets were then resuspended to 1 mL of 1 X PBS with protease

78
inhibitors. DDM was then added to a concentration of 1 % and the final solution was
solubilised at 4 °C for one hour. Solubilised proteins were isolated by a one hour
centrifugation at 21,000 x g at 4 °C. The supernatant was then divided into 50 µL
aliquots and heat treated at a range of temperatures (34-60 °C) for 10 minutes with a
4 °C treated control. Samples were incubated for 10 minutes at 4 °C before a 35 minute,
21,000 x g centrifugation. The supernatants were collected, and an SDS-PAGE was
performed. The in-gel fluorescence was visualised with a G:BOX (Syngene), and
densitometry analysis of the heat-treated samples compared to the 4 °C control was
performed. The survival percentage against the 4 °C control was then plotted onto a
graph vs temperature to determine the Tm of the BRIL-PTH1R control.
2.12.6 Thermostability Assay for IMPROvER Mutants
To determine potentially stabilising mutations, the mutants were initially only heat
treated to the Tm of the BRIL-PTH1R control (39 °C). Following densitometry analysis,
if there was > 50% survival at 39 °C they were deemed potentially stabilising. Full Tm
curves were then obtained for each of the potentially stabilising mutations using the
protocol described above in 2.3.4.
2.12.7 CompoMug
As an alternative to IMPROvER, Computational Predictions of Mutations in GPCRs
(CompoMug) was also utilised (Popov et al., 2018). The knowledge and sequence-
based modules were applied to PTH1R. For the knowledge-based module, the generic
numbering layout of PTH1R (obtained from www.gpcrdb.org) and the fasta sequence
were fed to CompoMug, which produced a list of mutations. For the sequence-based
module, five sequence alignment files were required: ortholog sequences, sub-family

79
sequences, all secretin-based GPCRs, all adhesion-based GPCRs, and sequences
corresponding to solved family B receptor structures.
2.12.8 Fractional Factorial Design
The fractional factorial design was performed by Dr Steven Harborne using a python
library (PyDOE), which provided 16 runs in a fractional factorial design vs 256 runs
in a full two-factor factorial design. A 2IV8-4 design was chosen whereby 8 factors were
investigated. The eight factors investigated were confirmed thermostabilising
mutations through the methodology described in 2.3.5. Please see 5.4.1 for a more in
depth description on fractional factorial designs. ANOVA test analysis was performed
with R programming language using a linear regression model.

80
Chapter 3 Towards the Structure of
PTH1R
3.1 Aims
The aim of this chapter was to express and purify a functional construct of PTH1R that
could be used as a candidate for downstream structural work. As there were only four
solved crystal structures at the beginning of this research, much work was needed to
optimise and create a suitable PTH construct for structural trials. To accomplish this,
a range of PTH1R constructs were cloned and tested for their total yields and
functionality. The ideal construct would be one that highly expressed to ensure that
there was enough protein for efficient purifications. To further aid in solving an active
structure, a constitutively active receptor construct was pursued through protein
modifications, specifically by adding PTH(1-14) to the N-terminus, attached via a
flexible linker. After establishing and optimising protein expression, purification of
constructs would be required, necessitating further optimisation. Acquiring a G
protein bound receptor structure also requires the expression of, and complex
formation between, PTH1R and the G protein. Multiple approaches to create a GPCR-
G protein complex were pursued including the use of a nanobody and the use of a mini
G protein. Based on these results, either crystallography or cryo-EM could be pursued
as viable methods to solve the structure of PTH1R.
3.2 Cloning of Constructs
A wild-type PTH1R sequence in a pcDNA3.1 vector was available (Mann et al., 2008);
however, this plasmid was not suitable for Sf9 transfection. An insect expression
system was initially chosen, as they account for over 80% of recombinant GPCR

81
expression hosts, with Sf9 cells being the most commonly used (Munk et al., 2019).
Using the In-Fusion cloning kit, full-length PTH1R was cloned into a pFastBac
expression vector, containing either a C-terminal GFP-6 x His tag, separated by a
human rhinovirus protease site, henceforth referred to as PTH1R-CGVH, or a 6 x His
tag alone, separated by a tobacco etch virus protease site, referred to as PTH1R-CTH.
This was achieved through In-Fusion cloning, which allows an amplified PCR
fragment to be inserted into a linearised vector. The following is a representative In-
Fusion cloning reaction. Further cloning results will not be presented in this thesis.
The DNA bands shown in Figure 3.1 were all pure fragments without any
contamination. In these instances, cloning was made easier; however, some
experiments did have contaminating DNA bands present on gels. When this occurred,
the desired DNA bands were excised, and gel purified. Regardless, both PTH1R-CTH
and PTH1R-CGVH were successfully cloned and sequence verified using Eurofins
Genomics Sanger Sequencing.
Figure 3.1: A representative In-Fusion cloning reaction. A PTH1R fragment (1782 bp)
was amplified by a traditional PCR protocol and pFastBac-CGVH (5630 bp) was
linearised through inverse PCR. The two were joined together through an In-Fusion
cloning reaction creating PTH1R-CGVH (7412 bp).

82
3.3 Expression of PTH1R
To quantify expression, the PTH constructs were transformed into the E. coli strain
DH10BacTM, which contained a baculovirus shuttle vector, facilitating the creation of
a bacmid. Following bacmid DNA isolation, Sf9 cells were individually transfected
with both PTH1R-CTH and PTH1R-CGVH. PTH1R-CTH/CGVH have molecular
masses of approximately 70 and 95 kDa respectively, and expression was verified
through western blots. The use of western blots allowed for the optimisation of
expression conditions to be obtained, i.e. by collecting 24 hourly samples, the best day
to harvest cells post transfection can be deduced. Furthermore, visualising the GFP
fluorescence from the PTH1R-CGVH allowed for the localisation of the receptor to be
determined.
A C
B
Figure 3.2: Expression and Optimisation of PTH1R in Sf9 cells. A. An anti-PTH1R
western blot confirmed receptor expression in Sf9 cells. B. Optimisation of PTH1R
baculovirus dilution and hours post DPA. C. PTH1R-CGVH fluorescence captured
with an EVOS microscope. There was a high abundance of fluorescence on the
circumference of the cells, showing membrane localisation of the receptor. CC = Cell
control

83
Transfection of PTH1R-CGVH and PTH1R-CTH was verified through an anti-PTH1R
western blot, as demonstrated by Figure 3.2A, showing approximately 70 and 90 kDa
proteins. Despite having a similarity of > 50%, anti-PTH1R did not bind to PTH2R
(expression discussed in Chapter 4), which further verified both the antibody and the
expression of PTH1R-CTH and PTH1R-CGVH. Densitometry analysis of the bands in
Figure 3.2A, revealed that both PTH1R constructs had approximately the same density,
suggesting that the addition of the C-terminal GFP tag did not have a significant effect
on protein expression. With this knowledge, a GFP tag was assumed not to effect
PTH1R construct expression. Furthermore, the addition of the GFP tag did not seem
to affect receptor localisation. Figure 3.2C shows a clear ring of fluorescence on the
circumference of the cells, which corresponds to receptor localisation within the
membrane. GFP tagged receptors are thus a reliable and easy method to determine
receptor localisation.
To accurately quantify how much protein could be obtained from Sf9 cells, it was
essential to determine the optimal time to harvest cells. To produce proteins in Sf9
cells, a baculovirus is required. Adding a virus at too high a concentration would result
in the death of the cells, while too low a concentration would fail to prompt infection,
and henceforth expression of the protein of interest. Thus, it was crucial to also
determine baculovirus concentration. Figure 3.2B shows that a 1:1000 baculovirus
dilution and harvesting at DPA + 48 hours was the optimal day for harvesting. As
many proteins were expressed in Sf9 cells throughout the duration of this project,
further expression optimisations will not be presented.

84
Using the optimised conditions of PTH1R expression, quantification was achieved
through in-gel fluorescence of PTH1R-CGVH compared with known standards of
GFP. By comparing the densities of the fluorescent bands, it is possible to back
calculate how much protein is expressed per litre of insect cells. Following cell
harvesting, whole cells were used to accurately determine total cell yields.
Figure 3.3 revealed that PTH1R-CGVH expression was approximately 50 µg/L, and if
the GFP tag does not affect expression, then this would also be wild-type PTH1R
expression levels. However, the total protein yields were not a workable amount of
protein for structural studies. This was expected as GPCRs are often expressed at low
yields, and so receptor modifications would be required to increase expression. To
better characterise the wild-type construct, protein solubility was investigated. A
common detergent for GPCR solubilisation, DDM (Ehrenmann et al., 2018;
Rasmussen et al., 2011b; Wu et al., 2020), was used in an initial solubilisation
screening. To ensure maximum solubility, PTH1R was solubilised overnight at 4 °C.
Fos-choline 12 was used as a positive control, as it is an extremely potent detergent
Figure 3.3: Quantification of PTH1R-CGVH. In-gel fluorescence of PTH1R was
compared to fluorescence of known GFP standards using densitometry. Total PTH1R
quantification was calculated to be 50 ± 12 µg/L.

85
that will likely solubilise 100% of the protein but is not usable for further downstream
experiments, as it can destabilise proteins.
Figure 3.4 showed that approximately 50% (44.7 ± 3.7) of total PTH1R was solubilised
in DDM and DDM with CHS (51.7 ± 2.9), which is an adequate level of solubilisation.
Unfortunately, this meant that only 25 µg/L of wild-type PTH1R was available to work
with, assuming a total expression of 50 µg/L. Even further protein losses would occur
during purification, meaning that this was a completely unviable amount of protein to
work with for structural studies, as often milligrams of protein are required for
crystallisation (McPherson & Gavira, 2014).
3.4 HEK-293 Expression
PTH1R was expressed in HEK-293 cells to see if there was any improvement on
expression. This also had the added benefit of establishing an expression protocol for
Figure 3.4: Solubilisation of PTH1R-CTH. A. The solubilisation of PTH1R in fos-
choline 12 (Fos), DDM, and DDM with CHS (+ CHS). There was 100% solubilisation
in the Fos treated lanes and approximately 50% solubilisation in the DDM and DDM
with CHS treated lanes. S = soluble, In = insoluble. Membrane was probed using an
anti-His antibody. B. Bar chart showing solubilisation percentages, obtained through
densitometry analysis using FIJI software. Error bars are standard error of the means,
obtained from three independent experiments.
A B

86
future functional assays. For HEK-293 expression, PTH1R was cloned into pOPIN
plasmids (Berrow et al., 2007) through In-Fusion cloning and included a C-terminal
GFP tag. Following sequence verification, HEK-293 transfection was achieved using
the PEI based protocol described in Chapter 2. As before, optimisation of expression
had to be solved, which was performed by comparing the fluorescence of HEK-293
cells.
A
B
Figure 3.5: Expression and quantification of PTH1R in HEK-293 cells. A. Optimisation
of incubation with PEI present. B. Optimal day of expression post transfection.
Expression was measured through cell fluorescence. Cells were incubated with PEI for
20 hours. C. Quantification of PTH1R though in-gel fluorescence. PTH1R fluorescence
could not be visualised on the gel, making quantification impossible. D. Verification
of PTH1R expression through an anti-PTH1R antibody.
C D

87
Transfection of HEK-293 cells was performed using PEI, which is toxic to cells;
therefore, optimal exposure time to PEI was determined to be 20 hours before being
replaced with fresh media (Figure 3.5A). Simultaneously, it was found that 48 hours
was the optimal time to harvest cells, as 72 hours post transfection cell death began to
occur (Figure 3.5B). Despite these optimisations, quantification of PTH1R in HEK-
293 cells was not possible due to low expression levels. PTH expression was verified
using an anti-PTH1R antibody (Figure 3.5D); however, it was at such a low level that
the fluorescence was not able to be visualised in the gel. Therefore, the Sf9 expression
system was chosen for further experiments. The optimisations performed, while not
useful for solving PTH1R’s structure, were still of use for functional assays further
downstream.
3.5 Truncation of PTH1R ECD
One of the most common methods to increase GPCR stability and expression is to
attach a fusion protein to the protein, such as T4 lysozyme or BRIL. To avoid
inhibiting any intracellular interactions, such as G protein binding, BRIL was fused to
the N-terminus of the receptor. Four random points, close to the start of helix I, were
chosen for truncation to determine if it was capable of increasing protein expression
before BRIL was added. An important factor that must be considered is that removing
the entire ECD will also remove the signal peptide, which is responsible for localising
the receptor in the membrane. Therefore, a hemagglutinin signal peptide was cloned
onto the N-terminus of the truncated and the BRIL-attached receptor. All proteins had
a C-terminal GFP tag to allow quantification of the receptor. Following sequence
confirmation, the proteins of interest were expressed in Sf9 cells and harvested at the
appropriate time.

88
By comparing the in-gel fluorescence of the truncated receptors to known standards
(as seen in Figure 3.3), it was possible to determine if the truncations had increased
receptor expression. Truncation at residue 179 appeared to have the largest increase
in expression as it was double wild-type levels at ~100 µg/L of Sf9 cells. All other
truncations, while producing small increases in expression, did not achieve the levels
of 179. Therefore, it was decided that BRIL would be added to this truncated receptor.
Following the addition of BRIL, quantification was performed by densitometry
analysis and it was calculated that BRIL-PTH1R expressed at approximately 300 µg/L
of Sf9 cells. This was six times higher than wild-type expression and is a much more
realistic expression level for further structural studies. The captured GFP image from
the cell verified that the modifications to PTH1R did not affect membrane localisation.
Various other GPCR structures have used a hemagglutinin signal peptide to increase
A B
C D
Figure 3.6: Quantification of truncated receptors. A. The ECD was truncated at four
sites to determine the optimal location to attach the fusion protein, BRIL. The addition
of BRIL significantly increased protein expression. B. Membrane localisation of
BRIL-PTH1R determined through GFP fluorescence. Error bars are standard error of
the mean, obtained from three individual experiments.

89
receptor expression and promote membrane localisation (Milic & Veprintsev, 2015);
therefore, it was used in all future PTH1R constructs.
One final factor that had to be determined was whether this new BRIL-PTH1R
construct could still be solubilised. Previously PTH1R had shown solubilisation in
DDM, so this was used again to test BRIL-PTH1R solubilisation. In addition to DDM,
LMNG was also tested, as this has been used to solve approximately 30% of GPCR
structures (Munk et al., 2019), though DDM with CHS remains the most commonly
used detergent. Another compound known as CHAPS, a zwitterionic detergent, was
also tested, as it has been shown to create a more stable environment for protein
purification (Milic & Veprintsev, 2015).
Figure 3.7: Solubilisation profile of BRIL-PTH1R. A. In-gel solubilisation profiles of
DDM and LMNG, with additives, were tested on their ability to solubilise BRIL-
PTH1R. Membrane was probed with an anti-His antibody. B. Bar chart showing that
all detergents achieved approximately 50% solubilisation compared with Fos-choline
12. Error bars are standard error of the mean, obtained from three individual
experiments.
A B
C

90
The addition of BRIL did not seem to affect the solubilisation profile of PTH1R.
Approximately 50% of the protein was solubilised in DDM with CHS compared to
the Fos-choline 12 solubilisation response, as previously seen in Figure 3.4.
Additionally, the presence of CHAPS did not seem to have any additive effects on
solubilisation, thus it was not added on subsequent solubilisations. LMNG also did not
seem to have any major improvements on total solubilisation compared with DDM.
Therefore, DDM with CHS was chosen as the detergent for further experiments.
3.6 Constitutively Active Receptor
In order to solve an active receptor structure, the protein must be pushed towards an
active conformation, which is commonly done through the use of an agonist, allowing
a G protein to bind. However, purchasing peptides can be expensive and does not
guarantee a stable active conformation, due to the inherently instable nature of GPCRs.
For these reasons, a constitutively active receptor, created by tethering PTH(1-14)
onto the N-terminus was pursued. As previously discussed, residues 1-14 are essential
for receptor activation and are even able to activate PTH1R when the ECD is not
present (Luck et al., 1999). By attaching a flexible linker between the receptor and
PTH(1-14) it may be possible for the residues to reach into the receptor core,
ultimately activating it. This would mean that the receptor to agonist concentration
ratio would be 1:1 and should always activate the receptor. The principle behind this
is shown in Figure 3.8.

91
The optimal length of flexible linker had to be determined, so several constructs were
created using pre-established linkers (GGGGS)1, (GGGGS)3, and GSAGSAAGSGEF
(GSAGSA) (Chen et al., 2013). These were expressed using the same protocol as wild-
type PTH1R. To efficiently purify the protein two purification tags were added, an N-
terminal FLAG tag (DYKDDDDK) and an 8 x His tag. The full sequence plan for
these constructs can be seen in Figure 3.9.
Figure 3.8: Schematic of the principle behind a tethered receptor. In the absence of
PTH(1-14) the receptor will remain in an inactive state. However, when attached to a
flexible linker it may be possible for it to reach into the receptor core, leading to
activation.

92
Using two antibodies confirmed both purification tags were present, and that the full-
length protein was being expressed, as the two tags were at opposite termini. After
expression had been confirmed, it was crucial to determine if the receptors were
constitutively active; to achieve this the LANCE® cAMP assay was used; a time-
resolved fluorescence energy transfer (TR-FRET) based assay (Figure 3.10). A
Europium-labelled, biotin-cAMP tagged streptavidin molecule is excited at a 340 nm
wavelength and, in the absence of free cAMP, fluorescence energy transfer (FRET)
can occur, due to an Alexa Fluor 647 tagged cAMP antibody binding to the biotin-
cAMP. When excited, the Alexa Fluor molecule emits at a 665 nm wavelength;
however, in the presence of free cAMP, the measured 665 nm emission will decrease
as the Alexa Fluor will no longer be in a close enough proximity to the europium label
for FRET to occur. This is a result of the competitive binding between the cAMP
antibody and the free cAMP/biotin-cAMP. Therefore, there is an inversely
A
C
B
C
Figure 3.9: Expression of PTH(1-14) tethered PTH1R constructs. A. The design of
protein constructs. A hemagglutinin signal peptide (HemaG) on the N-terminus, to
direct the receptor to the membrane, was followed by PTH(1-14) and one of three
flexible linkers, (GGGGS)1, (GGGGS)3, and GSAGSA. B. Expression of tethered
constructs verified with anti-His and anti-FLAG antibodies.

93
proportional relationship between cAMP concentration and the 665 nm signal,
allowing a standard curve to be created.
Forskolin is an activator of adenylyl cyclase and can increase cAMP levels
independent of GPCR involvement. Therefore, Forskolin was ideal for a GPCR-
independent positive control. The various constructs were expressed in HEK-293 cells
using the established protocol from Figure 3.5.
A
B
Figure 3.10: Principles of the LANCE® cAMP assay. A. Excitation in the absence of
free cAMP. Excitation of Europium at 340 nm allows FRET to occur to the Alexa
Fluor 647 molecule, which emits at 665 nm. B. Excitation in the presence of free
cAMP. The Alexa Fluor molecule no longer binds the cAMP labelled streptavidin,
inhibiting FRET. There is then a decrease in 665 nm emission.

94
From Figure 3.11, it appeared that the constructs were constitutively active. The
unstimulated, untethered receptor response (control cells) produced only a fraction of
cAMP compared to all other conditions, while the tethered receptors were capable of
producing ~50% of the forskolin treated control response (46.3 ± 12.2, 46.4 ± 12.7,
and 35.1 ± 4.9% for (GGGGS)1, (GGGGS)3, and GSAGSA respectively). When
Figure 3.11: LANCE cAMP functional assay on tethered PTH1R constructs. A. A
standard curve created using known concentrations of cAMP. The linear range of the
curve is highlighted by the red-dashed lines. B. Optimisation of cell count per well
using known forskolin concentrations. The optimal count was the one which would
best fit into the linear region of the standard curve responses. Both 5000 and 10000
cells fit well into the linear range C. cAMP readouts of the various constructs with and
without 10 µM of Forskolin. Constitutive activity was determined by comparing non-
stimulated untethered receptor responses. All tethered receptors produced significantly
higher levels of cAMP (p < 0.05) than the untreated control sample and produced
approximately 50% of the forskolin treated cell responses. Error bars are standard error
of the mean, obtained from three individual experiments performed in triplicates.
A
C
B
C
C
C

95
Forskolin was added to the tethered receptor wells, cAMP was produced up to control
stimulated levels, showing that the addition of the linkers and PTH do not appear to
have any adverse effects on the maximal signalling response.
3.7 GPCR-G Protein Complex Formation
Having created a constitutively active receptor, the next step in solving the active
structure was to express the G protein and form the full GPCR-G protein complex. As
discussed in Chapter 1, to prevent dissociation of the G protein, a nanobody, nb35, is
commonly used; therefore, optimisation of a nanobody expression was pursued.
Alternatively, a mini G protein that binds the active receptor is another route that can
be pursued.
3.7.1 G Protein Expression
To solve the active PTH1R structure, it must be bound to a G protein. However, as the
G protein is composed of three subunits, forming the full protein is not as easy as
simply expressing a single protein. Therefore, a complex must be formed. The first
instance of an active GPCR-G protein was solved by Rasmussen et al., (2011b) who
individually purified a G protein and the β2AR and then formed the complex by mixing
the two purified proteins. Since this breakthrough in GPCR structural studies, the
majority of active GPCR structures follow a similar protocol. The sequences for rat α
subunit and human βγ subunits were ordered from Addgene and required minor
cloning alterations, such as removing a halo tag, and all were cloned into pFastBac
plasmids. Expression was achieved by following a standard Sf9 cell transfection
protocol. The approximate sizes of the individual subunits are 46, 35 and 10 kDa for
the α, β, and γ subunits respectively.
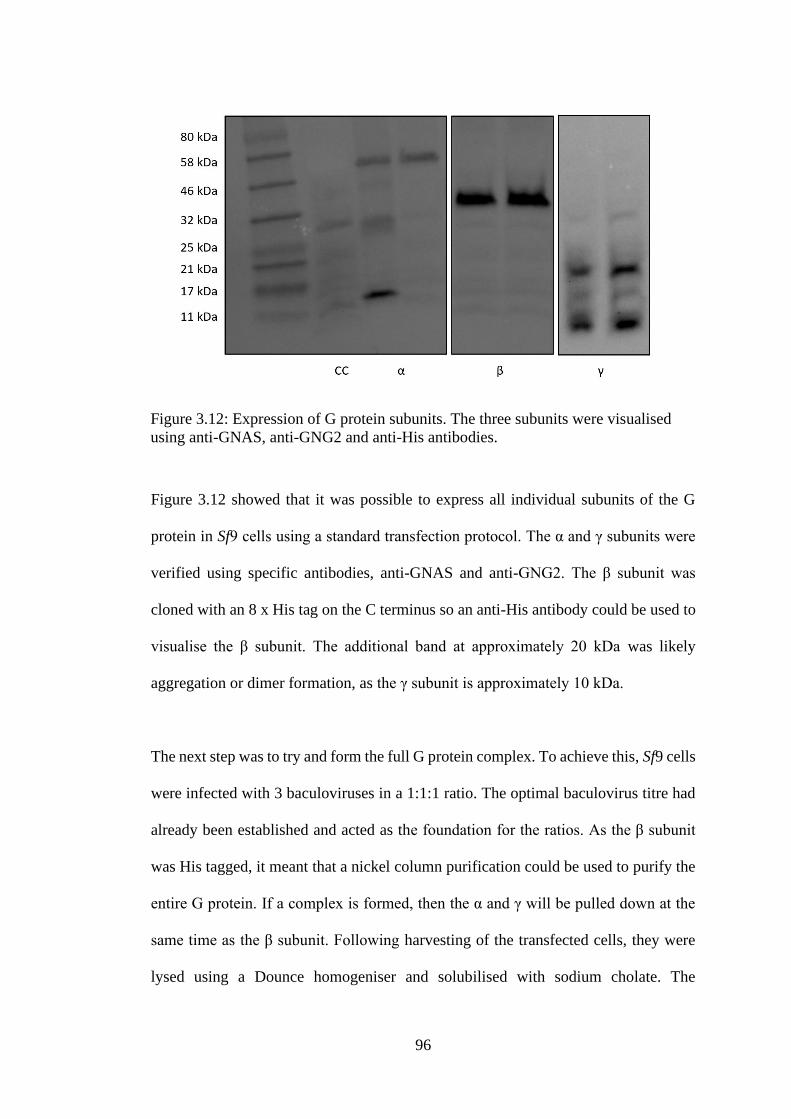
96
Figure 3.12 showed that it was possible to express all individual subunits of the G
protein in Sf9 cells using a standard transfection protocol. The α and γ subunits were
verified using specific antibodies, anti-GNAS and anti-GNG2. The β subunit was
cloned with an 8 x His tag on the C terminus so an anti-His antibody could be used to
visualise the β subunit. The additional band at approximately 20 kDa was likely
aggregation or dimer formation, as the γ subunit is approximately 10 kDa.
The next step was to try and form the full G protein complex. To achieve this, Sf9 cells
were infected with 3 baculoviruses in a 1:1:1 ratio. The optimal baculovirus titre had
already been established and acted as the foundation for the ratios. As the β subunit
was His tagged, it meant that a nickel column purification could be used to purify the
entire G protein. If a complex is formed, then the α and γ will be pulled down at the
same time as the β subunit. Following harvesting of the transfected cells, they were
lysed using a Dounce homogeniser and solubilised with sodium cholate. The
Figure 3.12: Expression of G protein subunits. The three subunits were visualised
using anti-GNAS, anti-GNG2 and anti-His antibodies.

97
solubilised samples were then applied to a nickel column purification. Washes and
purifications were saved to visualise on a western blot to determine any protein losses.
From a single purification, all three subunits could be pulled down, suggesting the
formation of a G protein complex. While some α subunit was lost in the washes, the
clear majority could be seen eluting with the β subunit. Contrastingly, there appeared
to be no loss of γ subunit in the washes. Following the success of this experiment, the
simultaneous expression of four proteins using baculoviruses was pursued: the three
G protein viruses and a virus for PTH1R. If it were possible to form a GPCR-G protein
complex from one purification it could eliminate potential protein losses from multiple
purifications and could eliminate several steps that Rasmussen et al. (2011b) had taken
to solve the β2AR.
Figure 3.13: Purification of full G protein complex. Three western blots probing for
individual G protein subunits after a His purification of the β subunit. Following the
elution of the His tagged β subunit, the α and γ subunits were eluted simultaneously,
suggesting a complex was formed.
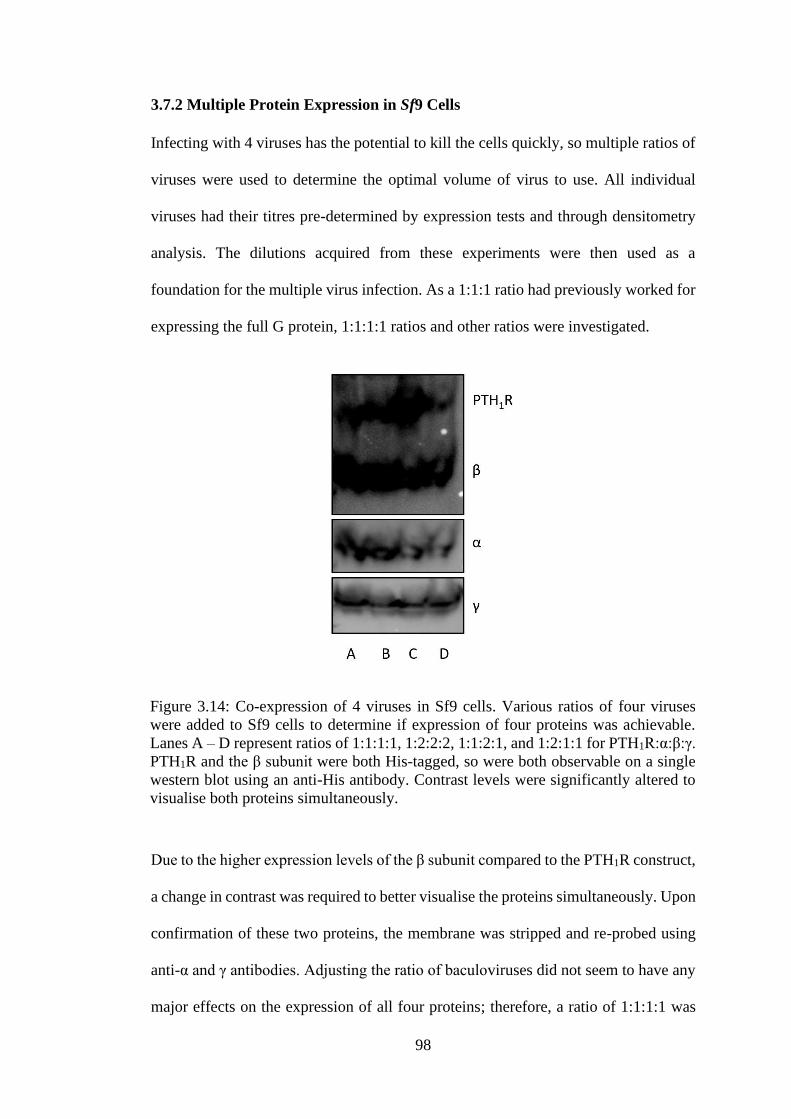
98
3.7.2 Multiple Protein Expression in Sf9 Cells
Infecting with 4 viruses has the potential to kill the cells quickly, so multiple ratios of
viruses were used to determine the optimal volume of virus to use. All individual
viruses had their titres pre-determined by expression tests and through densitometry
analysis. The dilutions acquired from these experiments were then used as a
foundation for the multiple virus infection. As a 1:1:1 ratio had previously worked for
expressing the full G protein, 1:1:1:1 ratios and other ratios were investigated.
Due to the higher expression levels of the β subunit compared to the PTH1R construct,
a change in contrast was required to better visualise the proteins simultaneously. Upon
confirmation of these two proteins, the membrane was stripped and re-probed using
anti-α and γ antibodies. Adjusting the ratio of baculoviruses did not seem to have any
major effects on the expression of all four proteins; therefore, a ratio of 1:1:1:1 was
Figure 3.14: Co-expression of 4 viruses in Sf9 cells. Various ratios of four viruses
were added to Sf9 cells to determine if expression of four proteins was achievable.
Lanes A – D represent ratios of 1:1:1:1, 1:2:2:2, 1:1:2:1, and 1:2:1:1 for PTH1R:α:β:γ.
PTH1R and the β subunit were both His-tagged, so were both observable on a single
western blot using an anti-His antibody. Contrast levels were significantly altered to
visualise both proteins simultaneously.

99
chosen for future expression. Having successfully expressed all proteins, it was
essential to obtain a nanobody that could stabilise the full protein complex.
3.7.3 Nanobody Expression and Purification
Traditionally, nanobodies are expressed in E. coli cells and purified in high
concentrations. The purified product is then added to a GPCR-G protein mixture to
form a stable complex. The most used nanobody for stabilising GPCR-G protein
complexes is nb35 (Manglik et al., 2017) which stabilises the G protein and inhibits
dissociation; however, nb37 is also a potential candidate for complex stability
(Westfield et al., 2011). Coincidentally, a nb37 baculovirus was available in the lab.
Following optimisation of expression, a small scale His purification was performed to
determine if the Sf9 expression system was a viable alternative to the more traditional
E. coli expression.
A B
C
Figure 3.15: Purification and quantification of nb37. A. His purification of nb37. The
most prevalent protein was nb37, but other contaminating bands were present. B.
Quantification of nb37 using known His protein standards.

100
Purification of nb37 was achieved using a His purification protocol and quantified
through a western blot with known standards of His-tagged proteins. However, to find
the range where undiluted nb37 could be accurately quantified, the known standards
had to be lowered to 0.005 to 0.1 mg/mL. As E. coli expressed nanobodies often
produces milligrams of purified protein (Pardon et al., 2014), it was not efficient to
further pursue this line of work; therefore, nb35 was produced in E. coli.
Periplasmic expression of nb35 and a nickel affinity chromatography purification can
result in high yields of the protein (Pardon et al., 2014). In order to perform the His
purification, the cells must be lysed; however, this procedure is different than Sf9 cell
lysis. One technique that can be utilised is osmotic shock. Osmotic shock lyses cells
through changes in salt concentrations and inward movements of water into the cell.
The increased pressure of water in the cells causes the cells to lyse. The WK6 E. coli
strain is often used for expression of nb35 due to the high levels of protein that can be
obtained (Pardon et al., 2014). Following protein expression, cells were resuspended
in ice-cold TES (0.2 M Tris-HCl, 0.1 M EDTA, and 200 g L-1 sucrose) and incubated
on ice. Following this, cells were centrifuged and resuspended in ice-cold water. After
a further ice incubation and centrifugation, nb35 was obtained from the supernatant.

101
Expression of nb35 in WK6 cells was not achieved but was feasible in BL21 cells.
This was unexpected, as nb35 has previously been expressed in WK6 cells (Pardon et
al., 2014). Various methods of expressing nb35 in WK6 cells were attempted (longer
incubation times, different IPTG concentrations) but with no success (data not shown).
Regardless, protein expression was achieved in BL21 cells. Following an osmotic
shock protocol (performed on nb35 expressing BL21 cells), it was revealed that it was
not completely effective as most of the protein remained in the pellet. Only a small
amount of protein was present in the supernatant, which explains the faint bands seen
in the purification Coomassie stain. Due to the unsuccessful lysis, quantification of
the elution was not performed as it could be vastly improved by improving the osmotic
Figure 3.16: Expression and purification of nb35. A. Expression trials of nb35 in WK6
and BL21 cells. Expression was unsuccessful in WK6 cells but did express in BL21.
B. Centrifugation of cells post osmotic shock. Most of the protein was still in the pellet
suggesting lysis was not efficient. C. Coomassie stain showing the results of a His
purification.
A
C
B

102
shock protocol. The conditions for purifying nb35 therefore had to be heavily
optimised before they could be used for structural studies.
3.7.4 Optimisation of Nanobody Purification
As the ice-cold water approach was not efficient, different solutions to promote cell
lysis were investigated, namely a 0.01 M Tris-HCl, 0.005 MgSO4, and 0.2% SDS
buffer. To determine if lysis was improved, final densities of pellet-bound and
supernatant containing nb35 were compared. Improvement was deemed successful
when there was more nb35 present in the supernatant, as this would suggest increased
cell lysis.
Figure 3.17 showed that the new fractionation buffer (containing MgSO4) caused the
highest cell lysis, as following a centrifugation there was proportionally more protein
in the supernatant than in the pellet compared with TES and water treated samples.
Figure 3.17: Optimisation of nb35 purification: A. Osmotic shock using different
solutions. The presence of 5 mM MgSO4 appeared to have the greatest effect on cell
lysis. The control (treatment with only ice-cold water) showed almost no proteins in
the final supernatant. Error bars are standard error of the mean, obtained from three
individual experiments. B. Coomassie staining of nb35, purified using nickel affinity
chromatography.
A B
C

103
This then allowed more protein to be available for purification. The total yield of
purified nb35 was determined to be 3.8 mg/L of E. coli cells. With these yields, nb35
could then be used for complex formation experiments. Due to the significant
improvement of protein yields compared with nb37 and the relative ease of using E.
coli cells over Sf9 cells, it was decided to use nb35 exclusively in future experiments.
3.8 Formation of the GPCR-G Protein Complex
3.8.1 GPCR-G Protein-nb35 Complex
Having obtained a viable PTH1R construct, demonstrated purification of a G protein
and nb35, formation of a full GPCR-G protein complex was pursued. Sf9 cells,
simultaneously co-expressing PTH1R, the α, and βγ subunits were lysed and complex
formation was initiated with the addition of 10 µM PTH, 2 mg nb35, and Apyrase.
Apyrase is added to GPCR-G protein solutions to hydrolyse any GDP released from
the α subunit as it can inhibit receptor-G protein binding if present. The complex can
then be solubilised and purified. As the receptor and β subunit are both His-tagged, a
FLAG purification of the receptor was required to avoid co-purification of the β
subunit.

104
Figure 3.18 shows an attempt at forming the GPCR-G protein complex, using nb35.
The (GGGGS)1 construct appeared to be able to form a complex with the α subunit,
but the βγ subunits were lost in the flow-through. This suggests that nb35 was unable
to stabilise the interaction between the βγ and α subunit. Had a complex formed, then
the βγ subunits would be visible in the elution and not in the flow-through. As the
GPCR was able to bind the α subunit, this was a promising sign that an alternative
approach to forming an active complex could work: a GPCR-mini G protein complex.
3.8.2 GPCR-Mini G Protein Complex
Simultaneously, work was being performed on creating a PTH1R-mini G protein
complex. As this complex lacks the βγ subunits its overall size is significantly smaller
than a full GPCR-G protein complex. Therefore, cryo-EM would be more challenging.
Due to the previous success of the G protein complex formation (Figure 3.13), a
Figure 3.18: Attempted GPCR-G protein complex formation. A. Elutions from a
FLAG purification showing a GGGGS1 and α subunit complex formation. Control
samples were treated with PTH and apyrase but nb35 was not present. B.
Representative western blots showing the loss of the β and γ subunits in the flow-
through, suggesting the desired complex did not form. Anti-GNAS, GNG2 and anti-
His antibodies were used to visualise the three subunits.
A B
C

105
PTH1R-mini G complex by co-expression of the two proteins in Sf9 cells was pursued.
The mini G protein was His tagged (as well as PTH1R). This meant that following a
purification it would be possible to see both the receptor and the mini G protein in one
western blot. Expression of the mini G protein was optimised and co-expression using
a 1:1 ratio was achieved. Purification was achieved in a similar manner to the
previously attempted GPCR-G protein-nb35 complex formation, in that Apyrase and
10 µM of PTH were added post cell lysis. The approximate weight of the mini G
protein is 27 kDa.
Interestingly, when using a control BRIL-PTH1R construct (without any tethered
ligand) and co-expressing the mini G protein, it appeared that a complex was formed
(Figure 3.19A). Following a Flag purification, a western blot was probed using an
Figure 3.19: Purification of GPCR-mini G protein complex. A. Flag purification of an
untethered BRIL-PTH1R, showing the co-purification of the mini G protein, suggesting
complex formation. B. Attempted complex formation with PTH(1-14)-(GGGGS)1-
PTH1R (GGGGS1). There was no sign of the mini G protein in the elutions suggesting
that the protein was lost in the flow-through. C. Presence of the mini G protein in the
flow-through, showing that GGGGS1 was unable to form the GPCR-G protein complex.
All membranes were probed with an anti-His antibody
A B
C
C
C

106
anti-His antibody. In the presence of 10 µM PTH there was a band at approximately
25 kDa which corresponds well with the 27 kDa mini G protein. However, when using
a PTH-tethered construct, GGGGS1, there was no sign of the mini G protein in the
elutions. Instead it appeared that the protein was lost in the flow-through (Figure
3.19C). This means that the complex was not formed. One potential reason for this
was that since the (GGGGS)1 receptor is constitutively active they will be going
through the process of desensitisation. This means that the intracellular half of the
receptor may be phosphorylated, from G protein receptor kinases, and bound to
proteins such as arrestins, ultimately desensitising the receptor from the mini G protein.
If this was occurring, then there would be no access for the mini G protein to bind and
thus the complex would not be formed. If this reasoning is accurate, then constitutively
active receptors are not a viable choice for determining active receptor structures.
3.9 Conclusions
It quickly became apparent that PTH1R was a difficult protein to work on, primarily
due to its extremely low expression levels of 50 µg/L. Low expression levels are
common when working with GPCRs, which is why extensive alterations are often
required. Through truncations and the addition of BRIL, the expression levels were
increased up to 300 µg/L, a far more realistic level for structural studies. PTH1R also
had a highly standard GPCR solubilisation profile, in that it had approximately 50 %
solubilisation in DDM, a detergent that has been used to solve over 50 % of all GPCR
structures (Munk et al., 2019). In a unique take on solving active structures, a
constitutively active tethered receptor was created and verified through cAMP
functional assays. Towards the active structure, purification of the G protein complex
was pursued and achieved following previously established protocols (Rasmussen et

107
al., 2011b); however, to improve upon the efficiency of this protocol, it was
demonstrated that both receptor and G protein could be co-expressed simultaneously.
To capture the GPCR-G protein complex in an active state a stabilising nanobody is
required. The expression and purification of nb35 was successful, though the insect-
expressed nb37 yields were too low to be a viable alternative.
Despite these successes, the formation of the GPCR-G protein-nb35 complex was not
obtained, as the βγ subunits were lost in the purification flow-through. However, the
α subunit was co-purified with the receptor, which indicated that a mini G protein
could be a viable alternative. Following co-expression of the receptor and a mini G
protein, complex formation was still not achieved using a PTH-tethered receptor.
Constitutive activation may have led to desensitisation of GPCR-G protein binding,
which may explain the failure to form a complex. Contrastingly, when using BRIL-
PTH1R there was co-purification of the mini G protein and the GPCR. This may have
been an ideal target to start running crystallisation trials on had the research proceeded;
however, both an inactive and active full PTH1R-G protein structure were solved
during the duration of this research (Ehrenmann et al., 2018; Zhao et al., 2019).
Comparisons between the protocols used to solve these structures and the research
presented here will be discussed in Chapter 6. Regardless, this work has demonstrated
the expression and purification of a PTH1R construct and the complex formation
between it and a mini G protein, which had not been demonstrated at the start of this
research.

108
Chapter 4 Towards the PTH2R Structure
4.1 Aims
The aims of this chapter were to improve our knowledge and understanding of PTH2R
by solving its structure. Far less information is known about PTH2R than PTH1R, and
even at this present day, there is still no structural knowledge regarding PTH2R.
Therefore, any structural determination would be highly desirable, even solving the
ECD. It became readily apparent that solving the full-length PTH2R structure would
be incredibly difficult and so efforts were placed into solving the ECD. To this end,
the ECD was expressed in E. coli cells and purified to attempt to solve the structure.
As disulphide bonds are essential for maintaining the correctly folded ECD shape, a
number of methods to ensure the correct formation of these bonds was pursued such
as using E. coli strains with oxidised environments (Origami and Rosetta-Gami), co-
expression with a disulphide bond isomerase and incubation with a purified isomerase.
This, in tangent with the work on PTH1R, could hopefully increase our knowledge of
the PTH receptors.
4.2 Expression and Quantification of PTH2R in Sf9 Cells
As previously established with PTH1R, the addition of GFP did not have any
significant effects on protein expression levels. Therefore, the same technique was
used to try and solve PTH2R expression. As with PTH1R, a wild-type PTH2R sequence
(Mann et al., 2008) was cloned into pFastBac-CTH and CGVH, creating PTH2R-CTH
and PTH2R-CGVH. These plasmids were transformed into MAX Efficiency
DH10Bac cells in order to obtain a bacmid. Sf9 cells were transfected with a
baculovirus and following confirmation of protein expression the baculovirus was

109
amplified to V1. After determining optimal time of harvesting and baculovirus dilution
(data not shown), quantification of PTH2R was achieved by comparing in-gel
fluorescence to known GFP standards.
Unfortunately, PTH2R levels were even lower than wild-type PTH1R and were only
approximately 25 µg/L, as determined through densitometry analysis of the bands.
This was a completely unusable level of protein, and as such, significant protein
modifications were required to increase this value. The ECD of PTH1R and PTH2R
have almost no conservation between them, but the TMDs do share approximately 50%
sequence identity. Therefore, a chimeric PTH1RECD-PTH2R
TMD construct was
designed. Using In-Fusion, the ECD of PTH1R was cloned onto the TMD of PTH2R
and expressed in Sf9 cells. Alternatively, the ECD was truncated as this was
previously established to increase expression in the case of PTH1R. If expression
levels improved by adequate amounts, then the truncated sites would be ideal spots to
Figure 4.1: Quantification of PTH2R. The quantification of PTH2R using in-gel
fluorescence compared to known standards of GFP. PTH1R was also quantified to
show a comparison between the two receptors. The PTH2R bands were very faint and
so are highlighted by the red square. Through densitometry PTH1R had almost double
the expression of PTH2R.

110
add the fusion protein BRIL, as this was able to increase expression six-fold over
native PTH1R levels. Furthermore, a random site on the C-terminus of the receptor
was picked for truncation as another means of increasing expression. All constructs’
expression trials were optimised before quantification through in-gel fluorescence and
densitometry analysis.
PTH2R modifications showed a similar pattern as PTH1R regarding expression. When
the ECD was truncated at various points it was able to double expression up to
approximately 50 µg/L, which is comparable with wild-type PTH1R yields. However,
this was still an unusable level or protein for structural studies. If the addition of BRIL
had a similar result as shown for PTH1R, then it should be approximately three times
higher than the ECD truncated construct. This would only boost expression to around
150 µg/L, which is still not an ideal level to work with. The addition of PTH1R ECD
A B
Figure 4.2: Expression of PTH2R Mutants. A. In-gel fluorescence of various PTH2R
mutations compared to 5 ng of GFP. Although C-439 did not appear to be expressing,
it was verified using an anti-His western blot (not shown). B. Bar chart showing the
expression levels of wild-type PTH2R and its mutants. Truncating the N-terminus or
replacing the ECD with PTH1R ECD doubled wild-type expression. Truncating the C-
terminus appears to have no effect on protein expression. Error bars are standard error
of the mean, obtained from three individual experiments.

111
to PTH2R TMD had a similar effect as truncating the ECD, by effectively doubling
wild-type expression. Truncating the C-terminus caused no significant change to
protein expression levels, though it did likely create a more stable receptor by
removing the highly mobile disordered C terminus.
4.3 Solubilisation of PTH2R
Simultaneously, a solubilisation profile of PTH2R was investigated by performing a
solubilisation screen with various detergents. Following cell transfection, cells were
harvested and allowed to solubilise overnight at 4 °C in the appropriate detergent to
allow maximum solubilisation to occur. Cell samples were put through a high-speed
centrifugation to separate insoluble and soluble matter and visualised using an Anti-
His western blot. Detergent efficiency was determined by comparison with a Fos-
choline 12 response.
Figure 4.3: Solubilisation of PTH2R. A. Solubilisation of PTH2R in 1% (w/v) dodecyl
maltoside (DDM) with and without 0.2% cholesteryl hemisuccinate (CHS) (w/v)
compared to fos-choline 12 (Fos). Fos-choline 12 solubilised the majority of PTH2R
but DDM showed almost no signs of solubilisation. B. Solubilisation screen of PTH2R
using decyl maltoside (DM), lauryl maltose neopentyl glycol (LMNG), octyl
glucoside (OG), octyl glucose neopentyl glycol (OGNG), and cymal 5. There was no
sign of successful solubilisation in any of the detergents. Representative image of
failed solubilisation attempts. All samples were visualised using anti-His antibodies.
S = soluble, In = Insoluble.
A B

112
Initially, PTH2R was solubilised only in DDM (+/- CHS), as this was used to solubilise
approximately 50% of PTH1R constructs; however, there appeared to be no
solubilisation of PTH2R in this detergent. Fos-choline 12 was the only detergent
capable of causing solubilisation. Following these results, a solubilisation screen was
performed using a wider range of detergents (DM, LMNG, OG, OGNG, and Cymal
5) however, all detergents failed to solubilise PTH2R. At this point it was determined
that attempts to solve the full PTH2R structure would be fraught with difficulties. The
protein had very poor levels of expression and was difficult to solubilise. For these
reasons, it was concluded to move away from solving the full structure and instead
focus on a potentially less problematic aspect of family B GPCR structures, the ECD.
4.4 A General Method for Solving Family B GPCR ECD Structures
As previously discussed in Chapter 1, family B GPCRs have a conserved ECD
structure, the secretin family recognition fold, characterised by a -- fold. This
was determined long before full family B GPCR structures were being solved, as the
ECD is a soluble region of the receptor. Different techniques can be utilised to solve
the ECD structure, such as expressing in inclusion bodies and refolding the protein
into its native state (Underwood et al., 2010), but a more common and reproducible
method was developed by Pioszak et al., (2008) where an N-terminal MBP fusion
protein was fused to the ECD along with a His tag on the C-terminus. As the ECD is
a heavily folded structure maintained by disulphide bonds it is essential that these
bonds are present in the structure to ensure a native conformation is achieved.
To this end, the protein can be expressed in an E. coli strain that has been specifically
modified to promote disulphide bond formation, such as Origami (DE3) cells. Origami

113
cells have mutations in gor and trxB genes; this creates an oxidised cytoplasm, which
can facilitate disulphide bond formation. However, there is a chance that non-native
disulphide bonds will form. To prevent this, the protein can be co-expressed with
another protein known as DsbC. DsbC, and other disulphide bond isomerases, can
break non-native disulphide bonds, helping ensure the formation of native protein
structures. Even with all these measures, incorrectly folded proteins were still obtained
by Pioszak & Xu (2008) during their PTH1R ECD research. A final incubation step
was required to remove the misfolded protein, leaving only a homogenous, correctly
folded ECD. Purified DsbC could be incubated with the purified MBP-ECD protein
in addition with reduced and oxidised glutathione to promote disulphide bond
shuffling. Pioszak & Xu (2008) determined that by performing this additional
incubation they obtained far less misfolded protein. The general workflow for
obtaining the ECD can be seen in Figure 4.4.

114
4.5 Purification of DsbC
DsbC is a highly expressing and stable 25 kDa protein and was expressed in E. coli
BL21 (DE3) cells. Cells were grown and induced with 0.4 mM IPTG for four hours
to express DsbC. Following cell harvesting, cells were lysed via a French pressure cell
press. Protein precipitation using ammonium sulphate was used to isolate the protein
of interest. At low ion concentrations, the solubility of proteins tends to increase, a
phenomenon referred to as ‘salting-in’. As ion concentration is increased protein
solubility decreases and will eventually lead to the precipitation of the protein. As
individual proteins have different solubilities in higher ionic conditions, it is possible
Figure 4.4: A schematic for obtaining correctly folded family B ECD structures. The
ECD of interest (PTH2R) is N-terminally tagged with an MBP fusion protein and C-
terminally His tagged. It is then co expressed in an appropriate E. coli strain with
DsbC, which is also individually purified. Following an amylose and His purification,
the resulting product is incubated with purified DsbC and reduced/oxidised
glutathione to promote correct folding of the ECD.

115
to isolate proteins based on their solubility. DsbC can be partially purified by bringing
ammonium sulphate levels up to 75% saturation, as at this level it will precipitate.
Many other proteins can be precipitated at only 45% saturation, thus facilitating the
purification of DsbC.
Following the ammonium sulphate precipitation, DsbC was dialysed and loaded onto
a HiTrap™ Q FF Anion exchange column, which is used to separate proteins based
on their charge. The column contains a positively charged resin, which can trap
negatively charged proteins. Elutions were then performed by using an increasing
anion gradient; in the case of DsbC, 0-0.5 M NaCl was used. The increase in Cl- ions
competes with the protein for resin binding and promotes elution. The elutions were
then pooled and loaded onto a gel-filtration, or size-exclusion, column. Proteins move
through highly porous beads, with smaller proteins travelling further into the pores
Figure 4.5: Ammonium sulphate precipitation of DsbC. A precipitation purification of
DsbC in BL21 cells. Cells were lysed and centrifuged, creating the lysis precipitate
and supernatant. Ammonium sulphate was added at various saturations and
precipitates were collected via centrifugation.

116
than larger proteins, resulting in a slower movement of smaller proteins. The proteins
are then eluted from the column in a decreasing order of size. By using these three
purification protocols it was possible to purify DsbC.
Following the protocol used by Pioszak & Xu (2008), a highly purified form of DsbC
was obtained and concentrated to 3 mg/mL. This would facilitate native disulphide
bond formation following PTH2RECD purification, which was required by Pioszak &
Xu (2008) to create homogenous, correctly folded PTH1R ECD.
4.6 PTH2RECD Purification
PTH2RECD residues 25-144 were cloned into the first cloning site of a pCDFDuet-1
plasmid using In-Fusion cloning, with a C-terminal His-tag. An MBP tag was then
also cloned onto the N-terminus, to allow for an amylose purification downstream. In
the second cloning site of pCDFDuet-1, DsbC was cloned without any tags. Once the
A B
Figure 4.6: Purification of DsbC. A. Anion exchange purification elution fractions.
DsbC was very apparent in at least three of the elution fractions. Six of the fractions
were pooled for further purification. B. Size exclusion purification of DsbC. Elution
fractions provided purified DsbC. Other bands at approximately 50 kDa were also
present but were most likely aggregates of DsbC or dimers.

117
MBP-PTH2R-DsbC pCDFDuet-1 plasmid was complete it was expressed in the E. coli
Origami (DE3) strain.
MBP-PTH2RECD is approximately 58 kDa in size and DsbC is 25 kDa. The pCDFDuet-
1 plasmid was transformed into E. coli cells, induced with IPTG, and expressed at
37 °C for 4 hours. Cells were harvested and lysed using a French pressure cell press.
A nickel-based His purification was then performed to purify the protein of interest.
There appeared to be a prominent band at 25 kDa which likely corresponded to DsbC,
though it was significantly less than what was seen previously when individually
purifying DsbC. This may have been because the location of expression had been
changed, or perhaps when co-expressing two proteins using the pCDFDuet-1 plasmid
expression levels were not as high. The purified DsbC from above was expressed using
the pCDFDuet-1 plasmid, but it was the only protein being expressed. A His
Figure 4.7: Purification of MBP-PTH2RECD. A Coomassie gel showing a His
purification of MBP-PTH2RECD through all stages of the purification. The protein of
interest was released in the two elution lanes but was also partially retained in the
resin. The prominent band at 25 kDa was likely DsbC.

118
purification was performed to try and purify MBP-PTH2RECD. The protein at 25 kDa,
assumed to be DsbC, was lost in the flow-through and subsequent washes. This was
expected as it was untagged so should not bind to the nickel resin. A prominent band
was present in the elutions, though was also still bound to the resin, at approximately
58 kDa, the predicted mass of MBP-PTH2RECD. The next stage of purification was to
perform an amylose purification.
Following an amylose purification, it appeared that most of the protein was lost in the
flow-through. Upon close inspection there was a very faint band that appeared to be
present in the elutions lane. However, due to the failure of the purification protocol,
in Figure 4.8, mass spectrometry analysis was used to verify the expression of MBP-
PTH2RECD. The 58 kDa band was excised and sent to the University of Leeds Mass
Spectrometry facility to determine the protein identity. Unfortunately, upon receiving
the results, it appeared that the protein that was believed to be MBP-PTH2RECD was in
Figure 4.8: Attempted amylose purification of MBP-PTH2RECD. A coomassie gel
showing the attempted amylose purification of MBP-PTH2RECD. Almost all protein
from the previous His purification was lost in the flow-through. There was only a very
faint band in the elution lane.

119
fact something entirely different. The closest protein identified, with a 54 % sequence
identity, was an alkyl hydroperoxide reductase subunit. This is an E. coli protein which
is a scavenger for hydrogen peroxide and provides protection to the cells. As this
protein does not have an MBP tag it was lost in the flow-through of the amylose
purification. His purifications, while useful for primary purifications, often co-purify
native E. coli proteins which have multiple histidine residues in their sequences and
thus bind to nickel resin. In order to proceed with solving the ECD structure, several
optimisations had to be performed.
4.7 Optimisation of PTH2RECD Expression
As mentioned previously, solving family B ECDs using an E. coli strain that is capable
of promoting disulphide bond formation is a useful tool. As the Origami strain failed
in expressing PTH2RECD, Rosetta-Gami cells, which combine the features of Origami
and BL21 strains, were investigated as an alternative expression host. Rosetta-Gami
cells combine the characteristics of Origami and BL21 strains to potentially express
correctly folded proteins at a high level.

120
Figure 4.9 displayed that BL21 cells could successfully express the protein of interest,
which the Origami strain was not able to achieve. The second lower band present in
the western blots likely corresponded with endogenous MBP (a molecular weight of
approximately 42 kDa), as an anti-MBP antibody was used for probing. Rosetta-Gami
cells were able to express the desired protein, however the expression was
significantly lower than BL21 cells. Regardless, as E. coli cells are reasonably easy to
express in large volumes, it was decided that this would be the cell line to proceed
with. Furthermore, due to the characteristics of Rosetta-Gami cells increasing
disulphide bond formation, expression in this host was more desirable than BL21 cells.
Native-PAGE was used to determine if Rosetta-Gami cells produced a noticeable
effect on disulphide bond formation.
A B
Figure 4.9: Expression of MBP-PTH2RECD in two E. coli strains A. Anti-His western
blot of PTH2RECD expression in Origami and BL21 strains. Expression was achieved
in the BL21 strain but was not present in the Origami cells. B. Expression in Rosetta-
Gami (RG) and BL21 strains. Both strains showed expression of PTH2RECD.

121
The native gel showed that there was a clear difference between BL21 expressed
MBP-PTH2RECD and Rosetta-Gami expressed protein. In BL21 cells there is one clear
band that was relatively high up the gel; however, for the Rosetta-Gami cells there
were multiple bands present at various location on the gel. The more disulphide bonds
present the lower it would move through the native gel. This likely meant that the
Rosetta-Gami strain was creating multiple proteins with varying numbers of
disulphide bonds, resulting in misfolding of the protein. This aligns with Pioszak and
Xu’s (2008) findings, which required an additional overnight incubation with purified
DsbC to create conformational homogeneity.
The expression of MBP-PTH2RECD was considerably lower than expected, as Pioszak
and Xu (2008) were ultimately able to purify the PTH1R ECD at 50 mg/L. Conversely,
MBP-PTH2RECD failed to show expression on a Coomassie gel. As It was
simultaneously co-expressed with DsbC, expression trials with just one protein were
investigated, to determine if co-expression hampered total yields.
Figure 4.10: Native gel of MBP-PTH2RECD in different E. coli strains. Comparing the
Rosetta-Gami (RG) and BL21 strains, there were two additional lower bands in the
Rosetta-Gami cells, likely representing PTH2RECD with additional disulphide bonds.

122
Interestingly, it appeared that MBP-PTH2RECD expression was not possible when it
was not co-expressed with DsbC. Despite being designed to provide ideal conditions
for disulphide bonds to form, the Rosetta-Gami strain was unable to express the
protein unless DsbC was co-expressed. The same was true of the BL21 strain,
suggesting that the presence of DsbC was more important for expression than the
environment provided by the Rosetta-Gami cells. However, the Rosetta-Gami strain
was still clearly affecting the protein as demonstrated in Figure 4.10.
A major issue that frequently occurred was the degradation of the protein. As already
shown, expression of the protein seemed to be ‘hit or miss’, with some occurrences of
the protein failing to express even when using identical protocols as previously
successful expressions. To further increase the difficulties of working with this protein,
in some instances the protein would almost completely degrade as highlighted below.
A B
Figure 4.11: Expression of PTH2RECD with and without DsbC. A. Expression in
Rosetta-Gami cells. B. Expression in BL21 Cells. In both cell types expression of
PTH2RECD was not achieved when DsbC was not co-expressed. All data obtained
through anti-His western blots

123
As shown in Figure 4.12, most of the protein was degraded and only a very faint band
at the original 58 kDa size of the protein remained. In cases such as this, further
purification was impossible due to the low levels of protein. This occurred frequently,
despite protocols being performed at 4 °C and having protease inhibitors present.
Another major issue that was ever present was the incredibly low yields of protein that
were obtained. Using a standard E. coli expression protocol, quantification of total
protein was determined through densitometry analysis, following an anti-His western
blot using known His-tagged protein standards.
Figure 4.12: Degradation of expressed PTH2RECD protein. Following successful
expression of the ECD the protein showed extreme degradation after cell harvesting.
Membrane was probed using anti-His antibodies.

124
Unfortunately, when using a standard E. coli expression protocol on the PTH2RECD
construct, an exceedingly low level of expression was obtained. To overcome this
issue, and potentially protein degradation, optimisation of the expression conditions
was performed. To optimise protein expression, many variables were evaluated such
as inducing with different IPTG concentrations, temperatures, incubation times, and
different media. The conditions for expression shown in Figure 4.14 were as follows:
37 °C treated cells were grown for four hours post-IPTG induction, 30 °C for 6 hours,
25 °C and 20 °C were incubated overnight. Cell expression was determined using an
anti-His western blot.
A B
Figure 4.13: PTH2RECD quantification though western blot densitometry analysis. A.
An anti-His western blot with known concentrations of His-tagged human rhinovirus
protease (HRV). Concentrations included 10, 25, 50, 100, 150 and 200 µg/L. MBP-
PTH2RECD (2R) could not be visualised due to low expression levels. B. An anti-His
western blot of 10 µg/L HRV and MBP-PTH2RECD, to facilitate visualisation of the
protein of interest (highlighted in red); however, expression levels were still lower
than 10 µg/L.

125
Table 4.1: The conditions investigated for expression of PTH2RECD. Media,
temperature, incubation period, and IPTG concentration were all investigated as a
means of creating a more reproducible expression system in Rosetta-Gami cells.
Inconsistent expression was characterised by protein detection only achievable in
some instances.
Media Temperature (°C) Incubation Period
(Hours)
IPTG Conc.
(mM)
Expression
LB 37 4 0.2 Inconsistent
LB 37 6 0.2 Inconsistent
LB 37 4 0.5 Inconsistent
LB 37 4 1 Inconsistent
LB 30 8 0.2 No
LB 25 16 0.2 No
LB 20 16 0.2 No
TB 37 4 0.2 No
TB 37 4 0.5 No
TB 30 8 0.2 No
TB 30 8 0.5 No
TB 25 16 0.2 No
TB 25 16 0.5 No
Figure 4.14: Expression trials using different medias and temperatures. Only a single
trial was successful in expressing PTH2RECD, as shown by the presence of a band at
58 kDa in the Luria broth (LB), 37 °C lane. There was no expression in any terrific
broth (TB) or super broth (SB) trials.

126
Media Temperature (°C) Incubation Period
(Hours)
IPTG Conc.
(mM)
Expression
TB 20 16 0.2 No
TB 20 16 0.5 No
SB 37 4 0.2 No
SB 37 4 0.5 No
SB 30 8 0.2 No
SB 30 8 0.5 No
SB 25 16 0.2 No
SB 25 16 0.5 No
SB 20 16 0.2 No
SB 20 16 0.5 No
Surprisingly, of all 12 variables examined in Figure 4.14, expression was only
successful in one instance, a 4 hour incubation at 37 °C using LB media. Table 4.1
shows various other conditions that were investigated to improve expression; however,
infrequent expression was only obtained in LB grown cells at 37 °C. When LB was
replaced with TB or SB, expression was not successful. Unfortunately, even in
conditions where expression was achieved, the reliability of expression was low.
Newly ordered and freshy prepared Rosetta-Gami cells were unable to reliably express
the protein in conditions proven to work. This meant that creating a large-scale
expression was incredibly difficult. In a further attempt to optimise expression, the
effects that aeration had on E. coli suspensions were investigated. To achieve this,
different volumes of E. coli cultures were grown in 2 L flasks and expression was
determined through a western blot.

127
Growing cells in 400 mL cultures produced the lowest intensity PTH2RECD band as
shown in Figure 4.15, highlighting that a lower level of expression was obtained than
from growing in 200 or 300 mL cultures. Densitometry analysis revealed that 300 mL
was the optimal volume for growing large-scale cultures, despite the large degradation
product. Despite the many optimisation attempts this construct was proving incredibly
difficult to work with, especially as confirming expression required a western blot. To
alleviate this issue, the MBP tag was replaced with a GFP tag. This could have
potentially increased protein expression and made visualisation of protein expression
considerably easier, as it could be performed by shining a blue light and seeing if the
cells appeared green, assuming that the protein expression was high enough that it
would be visible.
Figure 4.15: The effects that different growth volumes of E. coli have on expression.
At 400 mL per 2 L flask there was the lowest level of expression for the 58 kDa
PTH2RECD. The highest level of expression was obtained at 300 mL per 2 L flask,
though there is also the highest level of degradation.

128
Figure 4.16 showed that the addition of GFP failed to express PTH2R in the Rosetta-
Gami cells but was successful in BL21 cells. The expression levels of BL21 versus
Rosetta-Gami were hugely significant; however, using this system would likely limit
the degree of natively folded proteins as shown in Figure 4.10. Therefore, the MBP-
PTH2RECD construct was expressed in Rosetta-Gami cells and purified.
Figure 4.16: GFP versus MBP tagged PTH2RECD. The MBP tag was replaced with a
GFP tag to determine if this increased expression of the ECD. Rosetta-Gami and BL21
cells were tested for expression using anti-His antibodies.

129
As Figure 4.17B showed, it was actually possible to determine if protein expression
was achieved by performing a Coomassie stain. In all instances, if DsbC was
expressed (as shown by a very large band at 25 kDa) then PTH2RECD was also
expressed, despite not being visible on the same gel. Following successful expression
of PTH2RECD, it was possible to attempt small scale purifications. A standard His
protocol was performed, which when evaluated through a western blot, showed that
the majority of the protein could be purified. Similarly, there were no apparent issues
in the amylose purification. A range of elution buffers were used to determine what
Figure 4.17: A His and amylose purification of PTH2RECD. A. His purification of
PTH2RECD verified with an anti-MBP antibody. B. A Coomassie stained gel of the His
purified PTH2RECD. The large bands at 25 kDa are the co-expressed DsbC proteins. C.
An anti-MBP western blot of an amylose purification using a range of maltose elution
concentrations ranging from 2-10 mM.
A B
C

130
concentration of maltose the protein would be eluted with. All of the available protein
was eluted by using up to 4 mM of elution buffer.
Unfortunately, this was only a small scale purification that, though it was successful
in purifying PTH2RECD, would be incredibly difficult to replicate in large scale. Since
the protein is so unreliable in expression it would be impossible to reliably transform
over 3 L worth of E. coli cells. Meaning that, for some unknown reasons, the
techniques that have been used to solve various other family B GPCR ECDs were not
applicable to PTH2RECD in Rosetta-Gami cells. The success rate for expression was
higher in BL21 cells so another approach may be more applicable to PTH2RECD
structure determination, such as producing the protein in inclusion bodies and
refolding the protein, as was performed for the GLP1R ECD (Underwood et al., 2010),
see Chapter 6 for more details.
4.8 Conclusions
Unfortunately, no major findings were discovered during the research into PTH2R. To
date it remains one of three family B GPCRs that has yet to be solved (PTH2R, GIPR,
VIP2R). Whether this is happenstance or is a result of PTH2R being a particularly
challenging protein to do structural work with is open for debate. The full-length
receptor had levels even lower than that of PTH1R, at only approximately 25 µg/L,
and proved difficult to even solubilise. As the project moved to solving the ECD
structure, countless problems were encountered such as the protein failing to express,
protein degradation, and low expression levels, all of which made solving the structure
of PTH2RECD impossible with the methods utilised.

131
Chapter 5 IMPROvER
5.1 Aims of the Chapter
The aim of this chapter was to verify the novel program, IMPROvER, and
simultaneously create a thermostable variant of PTH1R. If successful, this would prove
the validity of IMPROvER and could be used on other proteins, including PTH2R. The
usual approach for identifying thermostabilising mutations is via alanine scanning
mutagenesis (Magnani et al., 2008; Serrano-Vega et al., 2008; Shibata et al., 2013);
whereby amino acids are mutated to alanine and alanines are mutated into leucines.
Through in-silico tests, based on previously established stability data, IMPROvER
predicts potentially stabilising mutations, (see Chapter 1 and Figure 5.1). Since
IMPROvER can predict hundreds of results so a high throughput system is required
to efficiently determine whether the mutations are stabilising. To overcome this, GFP
was cloned onto the C-terminus of BRIL-PTH1R and expressed in Sf9 cells. Following
solubilisation in DDM and membrane isolation, stability testing was performed by
heating the protein to a desired temperature, removing precipitated protein, and
comparing the resulting supernatant to a 4 ⁰C treated sample. From a ten-temperature
challenge, a melting curve was created, and thus, the apparent melting temperature
(Tm) could be obtained. By comparing the Tm to a non-mutated PTH1R, it would be
possible to determine if the mutant construct affected stability.

132
Improving stability is not the only trait that has to be investigated, as to have
physiological relevancy, the mutant constructs must maintain functionality. Therefore,
thermostabilised mutants were also assessed on their functionality through a
LANCE® cAMP assay.
The final aim of this chapter was to use a fractional factorial design to create a highly
thermostable receptor. In a two-level full factorial design with seven factors (27), 128
individual experiments would be required; however, this can be significantly
decreased using a fractional factorial design. Fractional factorial designs involve a
determined subset of combinations from a full factorial design, which are likely to
Figure 5.1: Schematic of IMPROvER workflow to obtain a ranked list of most
stabilising mutations. Three modules are used to create the predicted mutations: deep-
sequence (red), data-driven (blue), and model-based (green). This produces a list of
mutations which are compared to a list of residues to be excluded due to critical
functional characteristics. Image adapted from Harborne et al. (2020).

133
reveal significant information about the system being studied. Through this technique
it should be possible to significantly reduce the workload in obtaining a highly stable
construct and determine which mutations are having the most significant effects on
stability.
5.2 Identification of Stabilising Mutants
5.2.1 Predicted Stabilising Mutants
IMPROvER was fed with a wild-type PTH1R sequence and was told to exclude
various residues that were previously shown to be important in receptor functionality:
Y191, Y195, H223, M231-D241, L244, Y245, L289, N295, K359, K360, T410, M414,
P415, H420, Y421, F424, M425, W437, Q440, M441, M445, and Q451 (Bisello et al.,
1998; Clark, 1998; Gensure et al., 2003; Gensure et al., 2001; Hollenstein et al., 2014;
Liang et al., 2018; Schipani et al., 1997). Only the top 10% of mutants suggested by
IMPROvER were considered for in vitro experiments. From these, 30 potentially
stabilising mutations were identified, of which three were excluded for being at
functionally important sites (identified above). Nine mutations for each approach,
deep-sequence, model-based, and data-driven analysis, were ultimately identified.
These were ranked from most likely to be stabilising to least likely (Table 5.1). Once
the mutation list had been acquired, the next step was to individually clone all the
mutants, through Q5 mutagenesis. The IMPROvER program provided a list of forward
and reverse primers that can be used to create the mutations (Appendix) and the
appropriate Tm to use in a PCR reaction. As the provided Tms were all high (> 66 °C)
a single Tm of 69 °C was used for all reactions. The conditions for the inverse PCR
protocol are described in Chapter 2. Of the 27 mutations, 20 were successfully cloned
and sequence verified using Eurofins Genomics Sanger Sequencing.

134
Table 5.1: The top 10% of IMRPOvER’s predicted stabilising mutations. The
program’s ranking of most likely to be stabilising is shown in descending order for
each approach. Highlighted in green are mutations that were successfully cloned and
expressed in Sf9 cells, cells in grey either failed during cloning or Sf9 expression.
Model-based Data-driven Deep-sequence
S198M T203A T427M
S229S A337L A275K
S201F A369L G188Y
F291T A333L M189L
T249N Q401A L228V
D251R F288A S356A
S370A E391A G188K
E259P T294A A274D
E260R G323A T427L
5.2.2 Melting Temperatures of IMPROvER Mutants
To better visualise the fluorescence of the receptor, the ECD of PTH1R was replaced
with BRIL to increase expression, and a GFP was joined to the C-terminus (see
Chapter 3). Mutations were introduced through inverse site-directed PCR mutagenesis
and sequence verified before they were expressed in Sf9 cells. Optimisation of
expression is also described in Chapter 3. Before any mutant constructs could be tested
for stability, it was essential to determine the wild-type Tm. To this end, following
BRIL-PTH1R expression, cells were diluted to 20 x 106 cells/mL and solubilised in 1%
DDM. Following centrifugation, aliquots of the supernatant were heat treated for 10
minutes at a range of temperatures, before a final centrifugation to remove precipitated
proteins. The supernatants were transferred onto a gel and the density of the
fluorescent bands, relative to a 4 ⁰C treated sample, was recorded using FIJI software.
The Tm of the BRIL-PTH1R control was ultimately determined to be 38.7 ± 0.8 ⁰C.

135
Having obtained the Tm of the control construct, it was possible to determine the Tms
of the mutant constructs. To identify stabilising mutations, the constructs of interest
were heated to the Tm of BRIL-PTH1R (39 °C) and compared to a 4 °C treated sample
(Figure 5.3). If they had a survival greater than 50%, they were potentially stabilising
as they had a higher survivability than the “wild-type” BRIL-PTH1R construct.
Potentially stabilising constructs had their full melting curves determined to verify
improved stability.
A B
Figure 5.2: Expression and Tm of BRIL-PTH1R. A. GFP fluorescence of BRIL-PTH1R
in Sf9 cells. B. BRIL-PTH1R stability assessed through in gel fluorescence. Protein
survival was calculated as a percentage of the 4 °C sample. Tm was calculated to be
38.7 ± 0.8 °C. Error bars are standard error of the mean, obtained from five individual
experiments performed in triplicates.

136
Figure 5.3 identified several mutations that may have induce stabilising effects; ten of
the 20 mutants selected had over 63% survival at 39 °C (Table 5.2). Three further
mutants also had borderline improved thermostability, resulting in 13 potentially
stabilising mutations out of 20, a 70% success rate. The mutations of interest were:
G188K, G188Y, M189L, S198M, D251R, D260R, A274D, F288A, F291T, G323A,
A333L, E391A, and Q401A. To determine their Tm, full melting curves were obtained
for every mutation of interest.
A B
Figure 5.3: Single point temperature assay on IMPROvER mutants. A. Representative
GFP fluorescence in Sf9 cells of mutant T203A. B. Identifying potentially stabilising
mutants. PTH1R mutants were heat treated at 4 and 39 °C to determine survival. A
survival > 50% (0.5 scaled GFP) suggested potential thermostabilisation. In gel
fluorescence image was mutant T203A. Error bars are standard error of the mean,
obtained from three individual experiments performed in triplicates.

137
Table 5.2: Overview of IMPROvER mutant thermostability. Mutations are listed in
ascending residue order, sorted by IMPROvER deep-sequence, model-based, and
data-driven approaches. Remaining GFP signal was calculated by in-gel fluorescence
after a 39 °C heat treatment. Full Tm curves were only obtained if initial survival was
> 60%. Average Tm was calculated from three individual Tms estimated from three
repeats. *Standard error of the mean (SEM). – Represents constructs that did not have
full melting curves determined.
Module Construct Remaining
GFP (%)
Error
(± %)*
Tm
(°C)
Error
(± °C)*
ΔTm
(°C)
Control 54.0 2.2 38.7 0.8 0.0
Deep-sequence G188K 64.0 2.1 40.3 1.2 1.6
Deep-sequence G188Y 64.6 1.0 41.2 0.7 2.5
Deep-sequence M189L 62.3 1.4 39.1 0.9 0.4
Deep-sequence L228V 41.7 1.9 - - -
Deep-sequence A274D 64.6 6.3 39.1 0.1 0.4
Deep-sequence A275K 47.5 12.2 - - -
Deep-sequence S356A 55.4 5.7 - - -
Deep-sequence T427L 51.3 5.4 - - -
Deep-sequence T427M 54.0 1.2 - - -
Model-based S198M 67.0 0.8 42.1 0.8 3.4
Model-based D251R 67.2 1.5 41.7 1.5 3.0
Model-based E259P 51.4 4.0 - - -
Model-based E260R 62.1 1.6 39.7 1.5 1.0
Model-based F291T 65.8 2.2 40.9 0.9 2.2
Data-driven T203A 56.2 1.6 - - -
Data-driven F288A 72.0 3.5 41.5 0.7 2.8
Data-driven G323A 74.6 1.8 41.5 0.6 2.8
Data-driven A333L 66.5 0.5 - - -
Data-driven E391A 63.6 6.0 39.4 0.2 0.5
Data-driven Q401A 68.1 2.7 40.7 0.2 2.0

138
Table 5.2 and Figure 5.4 revealed that eight of the 13 tested mutations had an increased
Tm of >1.1 °C, which was larger than the average SEM of ∆Tm: G188K, G188Y,
S198M, D251R, F288A, F291T, G323A, and Q401A. Two mutations also had
borderline stabilising effects, E260R and E391A, meaning that there were potentially
10 stabilising mutations identified through IMPROvER, a 50% success rate from the
20 constructs successfully expressed in Sf9 cells. A333L thermostability results were
inconclusive and thus are not shown. The most stabilising mutation was S198M with
a Tm of 42.1 ± 0.8 °C.
A B
C D
Figure 5.4: Melting curves of PTH1R mutants and Tm analysis. A. A 10 temperature
thermostability assay at 4, 34, 36, 38, 40, 42, 45, 48, 54, and 60 °C to determine the
Tm for model-based IMPROvER mutants. Data was collected as an average of three
repeats. B. Data-driven Tm analysis. C. Deep-sequence Tm analysis. D. Bar chart of
determined Tm values for control and mutant constructs. S198M fluorescence is shown
as a representative in-gel GFP fluorescence for melting curve analysis. Error bars are
standard error of the mean, obtained from three individual experiments performed in
triplicates.

139
Using the inactive PTH1R structure as a model (Ehrenmann et al., 2018) allowed the
mapping of IMPROvER predicted mutants (Figure 5.5). However, the missing regions
such as ECL I had to be filled in using SWISS-MODEL, a protein homology
modelling server. Mapping the mutations onto this model made it possible to speculate
the rationale behind the cause of stabilisation. The most stabilising mutation, S198M,
lies in helix I and faces into the helical bundle between helices II and VII. Helix VII
of family B GPCRs has shown to be a dynamic region of the TMD and has large
structural changes following activation (Hollenstein et al., 2013; Zhang et al., 2017;
Zhao et al., 2019). By mutating S198M it may be that this construct increased the
rigidity of helix I, ultimately increasing stability.
A rationale behind E260R and D251R as stabilising mutations is more challenging as
they are in the disordered ECL I region. In contrast to wild-type PTH1R, the constructs
used throughout this chapter had a truncated ECD, which was replaced with a BRIL
fusion protein. It may be possible that E260R and D251R interact with BRIL, which
Figure 5.5: Location of IMPROvER predicted mutations in PTH1R. The mutations are
colour coded, based on the IMPROvER module used to identify them, model-based
(green), data-driven (blue), and deep-sequencing (red). Inactive PTH1R (PDB ID
6FJ3) was used as a template model in SWISS-MODEL to fill in gaps such as ECL I,
so that mutations could be more easily identified.

140
would increase protein stability for this construct, but would not be present in a fully
wild-type PTH1R construct; however, for the purposes of solving an active PTH1R
structure the BRIL-PTH1R constructs would still be viable mutations, assuming
functionality was retained.
Further work into IMPROvER was performed by Harborne et al., (2020), which
demonstrated the capabilities of the program in a more general capacity than just
GPCR thermostability. The success rate for non-GPCRs using IMPROvER was 27%
for a Clostridium leptum pyrophosphatase (CIPPase) and 12% for human equilibrative
nucleoside transporter isoform 1 (hENT1). For CIPPase, the biggest increase in Tm
was 13 ± 1.4 °C with only 4% of constructs being deemed as destabilising. hENT1
was more in line with PTH1R Tm changes, as the most stabilising mutation was 2.6 ±
1.3 ° C; however, 15 destabilising mutations were found (a 36% rate), which while
high, is still lower than random mutations in GPCRs (48.5%).
5.2.3 Functional Analysis of Stabilising Mutants
An important aspect of stabilising mutations is that they must maintain protein
functionality, so that they better represent the native protein conformation. To this end,
the LANCE® cAMP assay was performed on the top eight most stabilising mutations
that would also be used in further downstream experiments: G188Y, S198M, D251R,
E260R, F288A, F291T, E391A, and Q401A. For continuity, the constructs used for
the functional assays were ΔECD, BRIL-PTH1R proteins (not including GFP).
Compared to wild-type PTH1R, the truncated form requires higher concentrations (up
to 1 µM) of PTH before activation occurs (Luck et al., 1999). Therefore, by comparing

141
the BRIL-PTH1R mutant constructs to a BRIL-PTH1R control, it would still be
possible to determine if the mutation of interest would influence functionality.
A
B
Figure 5.6: Functional assays of wild-type PTH1R and mutant constructs. A.
Comparison of wild-type PTH1R and BRIL-PTH1R. The replacement of the ECD with
BRIL caused a significant decrease in the efficacy of PTH(1-34) to stimulate cAMP
production. B. Comparison of IMPROvER mutations with the BRIL-PTH1R control.
The majority of mutations did not appear to effect receptor functionality, excluding
F288A and S198M which showed considerable decreases in cAMP production. Error
bars are standard error of the mean, obtained from three individual experiments
performed in triplicates.

142
Table 5.3: IMPROvER functional assay results. The percentage of the maximal forskolin results were obtained from three separate LANCE cAMP
functional assays. All errors are standard error of the mean. – Indicates that the construct was not measured at the respective concentration.
Wild-type Control G188Y S198M D251R
Concentration
(M)
% of Maximal
Forskolin
Response
Error
(± %)
% of Maximal
Forskolin
Response
Error
(± %)
% of Maximal
Forskolin
Response
Error
(± %)
% of Maximal
Forskolin
Response
Error
(± %)
% of Maximal
Forskolin
Response
Error
(± %)
1.00 x 10⁻⁴ 107.21 4.04 106.88 8.93 110.11 4.45 47.90 3.41 113.91 5.09
5.00 x 10⁻⁵ - - 101.93 6.14 100.62 4.44 44.79 3.55 105.12 3.79
2.50 x 10⁻⁵ - - 85.76 5.06 78.28 2.28 29.75 2.13 88.07 1.79
1.25 x 10⁻⁵ 105.1 3.89 62.46 1.72 59.91 1.68 26.01 1.29 70.27 0.82
6.25 x 10⁻⁶ - - 38.93 2.13 43.56 2.49 24.24 1.96 41.43 2.98
1.00 x 10⁻⁶ 101.01 3.11 12.41 1.96 18.29 3.47 17.93 2.31 17.61 1.14
1.00 x 10⁻⁷ 97.67 2.72 8.14 2.64 14.21 5.49 13.71 6.36 11.98 2.50
1.00 x 10⁻⁸ 100.13 2.92 7.35 2.74 9.39 1.89 14.13 3.31 7.52 1.34
1.00 x 10⁻⁹ 88.69 1.76 - - - - - - - -
1.00 x 10⁻¹⁰ 35.36 3.52 - - - - - - - -
1.00 x 10⁻¹¹ 8.1 0.52 - - - - - - - -
1.00 x 10⁻¹² 4.47 1.54 - - - - - - - -
E260R F288A F291T E391A Q401A
Concentration
(M)
% of Maximal
Forskolin
Response
Error
(± %)
% of Maximal
Forskolin
Response
Error
(± %)
% of Maximal
Forskolin
Response
Error
(± %)
% of Maximal
Forskolin
Response
Error
(± %)
% of Maximal
Forskolin
Response
Error
(± %)
1.00 x 10⁻⁴ 120.70 5.92 37.02 2.29 107.60 6.51 123.31 5.04 105.70 4.16
5.00 x 10⁻⁵ 108.21 6.03 31.97 2.51 81.17 5.35 91.33 4.41 102.29 4.91
2.50 x 10⁻⁵ 96.91 7.12 20.96 1.55 46.99 3.06 66.64 3.18 76.65 3.18
1.25 x 10⁻⁵ 70.83 2.52 21.07 1.73 19.01 1.16 58.69 2.72 62.35 1.86
6.25 x 10⁻⁶ 39.06 2.37 11.83 1.92 17.75 2.88 32.48 2.73 35.42 3.53
1.00 x 10⁻⁶ 18.92 1.11 13.27 3.30 13.51 3.91 15.02 4.36 17.98 1.53
1.00 x 10⁻⁷ 15.67 2.73 11.99 2.88 12.86 2.91 10.42 3.38 12.35 1.76
1.00 x 10⁻⁸ 10.75 3.13 12.09 0.96 13.76 2.47 10.09 2.52 9.28 1.45

143
Figure 5.6A and Table 5.3 verified previous studies (Luck et al., 1999; Zhao et al.,
2016) in that the removal of the ECD significantly decreases the ability of PTH(1-34)
to stimulate PTH1R; however, the constructs described in this research required 100
fold higher PTH(1-34) concentrations for maximal cAMP production than previous
research. Instead, these response curves closely resembled PTH(1-14) ΔECD-PTH1R
response curves (Luck et al., 1999), where concentrations ranging from 1 to 100 µM
were required for activation. This may be due to the presence of BRIL, which could
partially inhibit ligand binding, by blocking the binding pocket.
By comparing the maximum cAMP levels produced by the constructs it became very
apparent which mutants affected functionality. F288A has previously been
demonstrated to inhibit functionality (Ehrenmann et al., 2018) as it has key binding
interactions with residue 5 of PTH. From Figure 5.6B, F288A failed to reach the
cAMP levels of other mutations and the control, reinforcing the findings by
Ehrenmann et al., (2018). S198M, a fully conserved residue in all secretin related
GPCRs, and the most stabilising point mutation identified, also showed reduced
functionality. As discussed previously, S198 appears to be involved in helix-helix
interactions between helix I and VII. By replacing S198M with a large hydrophilic
residue it may increase the rigidity of helix I, ultimately inhibiting key helix
movements required for receptor activation. Finally, there also appeared to be a small
shift to the right in the dose response curve of F291T. F291 is only one helical turn
away from F288 and, following mutagenesis, may increase helix II and III packing
interactions. For activation of PTH1R, the peptide forms interactions with every helix,
excluding helix IV (Zhao et al., 2019); therefore, any mutations that increase helix
rigidity/packing have the potential to reduce functionality by inhibiting native peptide-

144
receptor interactions. However, these are not true representations of the mutations in
wild-type PTH1R due to the absence of the ECD and so functional assays on wild-type
receptors with the mutations would be desirable data.
Due to heavy time restraints, a result of the coronavirus outbreak, it was not possible
to perform these functional tests on full-length PTH1R constructs. However, as the
functional assay could still identify previously established inhibiting mutations such
as F288A (Ehrenmann et al., 2018), it is likely that these results would translate to
full-length PTH1R constructs.
5.3 Comparison with CompoMug
IMPROvER is by no means the first program to attempt to identify stabilising
mutations. One such program that was released recently is CompoMug
(COMputational Predictions Of MUtations in GPCRs) (Popov et al., 2018), which is
similar to IMPROvER in that it decides which mutations to mutate based on previous
family A GPCR mutant data. In a knowledge-based module, known stabilising
mutations, such as a mutation to tryptophan at position 3.41 (family A GPCR
numbering) (Ballesteros & Weinstein, 1995) are applied to the protein of interest to
help identify potentially stabilising mutations. Another module utilised by
CompoMug is the sequence-based module. Through this, CompoMug searches for
residues that deviate from the conserved sequence of related GPCRs. For PTH1R, it
was compared against PTH1R orthologs, the entire family B GPCR branch, and solved
family B structure sequences. The assumption that CompoMug makes is that mutating
outliers to the more conserved residue is likely to increase stability. These two
modules have many similarities with the data-driven and deep-sequence modules of

145
IMPROvER, which is why they were used to provide a list of mutations to be
compared with the mutations provided by IMPROvER.
Table 5.4: A list of mutations obtained from CompoMug. Two modules were utilised,
knowledge-based and sequence-based to obtain a list of mutations. The knowledge-
based module was incompatible with PTH1R, but mutations were obtained from the
sequence based module. Highlighted in green are identical mutations suggested by
IMPROvER, blue are mutations at the same location but mutated to different residues,
and yellow are mutations within one residue of an IMPROvER suggested mutation.
Immediately, a major drawback of CompoMug was revealed, as it was unable to create
mutations for PTH1R, a family B GPCR. CompoMug was designed solely to identify
mutations in family A GPCRs. Specifically, the knowledge-based module searches for
crucial conserved regions of family A GPCRs, such as the Na+ binding pocket.
Mutations in this region, such as D2.50N, S3.39A, and D7.49N, can often promote stability
by decoupling ligand binding and intracellular conformational changes (Fenalti et al.,
2014; Katritch et al., 2014; Kruse et al., 2012). As family B and A GPCRs have
different binding mechanisms and conserved sites the knowledge-based module was
unable to work efficiently and ultimately could not provide a single mutation.
The sequence-based module was able to give a list of 29 mutations it deemed as
potentially stabilising. Interestingly, five of these residue locations were also
identified by IMPROvER of which two were identical, reinforcing the validity of the
two programs. The five mutations were not solely from IMPROvER’s deep-
Knowledge-based No Viable Mutations
R186Q G188Y M189I V197L T203L V206L
A210L H225N A272V T286V S308T M312V
Sequence-based G323L V326L F327I V340A S341V V365G
S370A V372L L373V L406A M414V M425A
A426F Q440E Y443F M445L L446F

146
sequencing module and were obtained from all three modules: G188Y and M189L
were obtained from deep-sequencing, T203A and S370A from model-based, and
G323A from the data-driven module. Furthermore, two mutations were within one
residue of those identified by IMPROvER, including V197L, which is adjacent to
S198, the most stabilising mutation. The success rate of CompoMug for mutations
with greater than 1.5 °C thermostability for 5-HT2C was 25% (Popov et al., 2018).
Under this criterion, IMPROvER had an approximately 20% success rate for
mutations with a substantial stability increase. By combining their mutants, Popov et
al., (2018) were able to create a triple mutant that had a melting temperature
approximately 13 °C above wild-type. As several stabilising mutations were identified,
finding the optimal combination of mutations would be challenging. Therefore, a
fractional factorial experimental design was utilised.
5.4 Fractional Factorial
5.4.1 Theory of Fractional Factorial Design
A fractional factorial experiment is one in which only a subset of total combinations
is required to identify the most important features of a full factorial run. For example,
if there are six factors in an experiment, then in a full, two-level, factorial experiment
there would be 26 or 64 potential runs, which is a large volume of work. A fractional
factorial design exploits what is known as the sparsity-of-effects principle, which
states that results are usually determined by main effects (single factor) and two-factor
interactions. The higher the order of interaction then the less likely it is to influence
the result. In Layman’s terms, only a few effects are statistically significant. Fractional
factorial designs have been used to improve protein expression by examining factors
such as growth media, E. coli strains, and fusion tags (Papaneophytou & Kontopidis,

147
2014). To better explain a fractional factorial design, a three factor experiment (23)
will be demonstrated:
Table 5.5: An example of results to highlight the concept of fractional factorial
experimental designs. This is a two-level full factorial design with three factors X1,
X2, and X3. The observations (Y) for each run are also recorded.
The Y column represents the recorded response for an experimental run and the X
columns are factors being investigated. The two-levels being investigated are -1,
which is a ‘low’ setting and +1 is a ‘high’ setting. By performing all possible
combinations, we can calculate the effects each factor has i.e. the average of all ‘high’
settings minus the average of all ‘low’ settings:
Run X1 X2 X3 Y
1 -1 -1 -1 Y1 = 13
2 +1 -1 -1 Y2 = 43
3 -1 +1 -1 Y3 = 21
4 +1 +1 -1 Y4 = 37
5 -1 -1 +1 Y5 = 37
6 +1 -1 +1 Y6 = 31
7 -1 +1 +1 Y7 = 39
8 +1 +1 +1 Y8 = 33

148
X1: (43+37+31+33)/4 - (13+21+37+39)/4 = 36-27.5 = 8.5
However, it is possible to get similar data using a smaller number of runs. By using
runs 1, 4, 6, and 7 the equation is as follows:
X1: (37+31)/2 – (13+39)/2 = 34-26 = 8
In this instance, the value obtained from the fractional factorial experiment is very
close to the value obtained by performing all possible experimental runs.
Specifically, the design that was chosen for this research was a 2IV8-4 design. Fractional
designs are expressed using Ik-p. I is the number of levels of each factor to be
investigated. For the IMPROvER mutant design, I was equal two, as the two factors
were mutated and non-mutated. K was the number of factors being investigated (eight
stabilising mutations) and p was the size of the fraction of the full factorial design (2k-
1 will be half as many experiments, 2k-2 will be a quarter and so on). IV represents the
resolution, which means that no main effects are confounded with any two-factor
interactions and that they are only confounded with three-factor interactions and
higher. Two-factor interactions may be confounded with other two-factor interactions;
therefore, it cannot be determined which of the 2-way interactions are important and
so further research would be needed to confirm any findings.
5.4.2 Fractional Factorial Design on IMPROvER Mutants
IMPROvER accurately predicted up to 10 stabilising mutations, which created up to
a 3.4 °C increase in Tm (S198M). Due to the low stability of GPCRs, an even higher
increase was desirable. Towards this goal, various combinations of the identified
mutations were tested to determine if they had additive effects on stability. As both
mutations at G188 were determined to be stabilising, only G188Y was investigated as

149
it had a higher degree of thermostability. Furthermore, G323A was excluded due to
the presence of double banding as shown in Figure 5.7.
The remaining eight mutations (G188Y, S198M, D251R, E260R, F288A, F291T,
E391A, and Q401A) were studied for any additive effects on stability (eight factors
for the fractional factorial design). Testing all possible combinations (256) would
create an extensive workload, thus a fractional factorial design was used to identify
the best possible combinations (Table 5.6).
Figure 5.7: Presence of double banding in G323A. In-gel fluorescence of temperature
challenged mutations G323A and G188Y. G188Y showed a single band in all lanes,
whereas G323A showed two bands.
Table 5.6: Fractional factorial design. The mutations required to create the 16
constructs needed for a fractional factorial experiment.

150
Following mutagenesis and sequence verification, the constructs were all expressed in
Sf9 cells, excluding construct 2, which did not express. Regardless, it was still possible
to obtain results using the available 15 constructs.
Table 5.7: Fractional factorial construct thermostability data. The Tm for each
construct was obtained through triplicate in-gel fluorescent intensities using
temperatures ranging from 4 to 60 °C. The error is shown as a SEM.
Construct Tm (°C) ΔTm (°C) Error (±°C)
1 39.10 0.00 0.68
3 47.16 8.05 0.98
4 47.58 8.48 0.64
5 46.55 7.44 1.41
6 44.78 5.68 0.21
7 43.92 4.82 1.57
8 48.15 9.05 1.05
9 47.83 8.73 1.25
10 46.16 7.05 0.51
11 49.16 10.05 0.76
12 47.71 8.60 1.39
13 44.45 5.35 0.49
14 47.42 8.32 2.04
15 42.15 3.05 0.33
16 44.87 5.76 1.68

151
Figure 5.8: Tm of fractional factorial constructs. A. A representative melting curve of
all constructs demonstrated by construct 10. B. Tm bar chart of all constructs including
the control. C. ΔTm of the fractional factorial constructs, calculated by subtracting the
Tm of the control construct. All error bars are standard error of the mean obtained from
three individual experiments performed in triplicate. D. Location of all eight mutations
using inactive PTH1R (PDB 6FJ3) as a model. Gaps such as ECL I were modelled
using SWISS-MODEL.
A B
C
D

152
It was immediately apparent that having all eight mutations (construct 16) was less
stable than some of the other constructs, such as construct 11 (44.87 and 49.16 °C
respectively). This highlights that the stabilising effects of the mutations are not
additive, likely because there are negative two-way interactions. Essentially, when two
mutations are combined, they produce a Tm which is lower than the individual effects
combined. This may mean that the mutations are stabilising PTH1R in similar manners,
such as stabilising the same helix, so the combined effects are not as prominent as the
individual mutations. The most stable construct was construct 11, which included
S198M (the most stabilising individual mutant identified), E260R, F291T, and E391A.
The least stabilising construct, construct 15, only had a ΔTm of 3.05 °C and contained
S198M, D251R, E260R, and F288A; therefore, certain combinations of mutations are
detrimental to protein stability.
Unfortunately, due to the resolution of the design and that only 15/16 constructs were
fully evaluated, the results of F288A and F291T were confounded with each other.
This means that it is not known which one of these mutations was having the primary
stabilising effect on the receptor. Looking at the individual stabilising mutation data
(Figure 5.4 and Table 5.2), F288A did have a higher melting point than F291T, which
may imply that F288A was having the main stabilising effects at that region of the
receptor. A linear regression model of ΔTm and the magnitude of main effects,
determined by Dr Steven Harborne with R programming, was able to show a
correlation between the fractional factorial main effects and ΔTm.

153
Figure 5.9: The effects of mutations on the magnitude of main and two-way effects.
A. The order of main and two-way effects. S198M, the most stabilising individual
mutation, had the greatest effect on protein stability, while a combination of G188Y
and E391A appeared to be the most detrimental. F291T and F288A are shown together
as their results were confounded with each other. Refer to table 5.7 for all confounding
two-way interactions B. Correlation between the ΔTm and the fractional factorial main
effects. The equation of the line was determined by excluding E260R and E391A. P <
0.05 for S198M, E260R, F288A (or F291T), and Q401A. Error bars are standard error
of the mean, obtained from three individual experiments performed in triplicates.
A
B

154
Table 5.8: The confounding aliases of the fractional factorial design
When the main effects were paired with the individual mutation ΔTm values, all but
two correlated well. If the two outliers, E260R and E391A, are omitted then the R2
value is 0.85. Upon re-evaluation of E260R, three measurements were taken to deduce
the average ΔTm, 41.65, 41.20, and 39.63 °C. It may be that the 39.63 °C was an outlier
which, if ignored, significantly raises the ΔTm and would better fit with the results
shown above. Furthermore, from Figure 5.9, E391A has very little effect in the
fractional factorial constructs. E391A was a highly borderline stabilising mutation and
was not expected to cause significant improvements to receptor stability. The
mutations with the highest magnitude of effect were S198M, E260R, and F288A (or
F291T). Taking this into consideration, construct 11 was able to have a ΔTm of 10 °C,
through the stabilising effects of just three mutations.
The most beneficial combination of mutations appeared to be S198M and G188Y.
Indeed, when this combination was present in constructs 4, 8, and 12, the ΔTms of
these constructs were all above 8 °C. While both residues are positioned on helix I,
they face different directions. S198 faces the pocket between helices II and VII, while
G188 faces away from the binding core, towards the lipid bilayer. These two methods
Confounding aliases
G188Y:S198M = D251R:E391A = E260R:Q401A
G188Y:D251R = S198M:E391A = F288A:Q401A = F291T:Q401A
G188Y:E260R = S198M:Q401A = F288A:E391A = F291T:E391A
G188Y:F288A = G188Y:F291T = D251R:Q401A
G188Y:E391A = S198M:D251R = E260R:F288A = E260R:F291T
G188Y:Q401A = S198M:E260R = D251R:F288A = D251R:F291T
S198M:F288A = S198M:F291T = D251R:E260R = E391A:Q401A

155
of stabilisation may be independent enough from each other that they both have
positive effects on stability. Surprisingly, one of the most negative combinations
appears to be G188Y and E391A. This combination is harder to explain, as E391 is
located in ICL III. It may be that this mutation affects the cytoplasmic position of the
receptor helices, which alters the conformation of the receptor and prevents G188Y
from interacting with its stabilisation target. A similar effect may be occurring with
F288A and Q401A mutations, which also showed negative effects on stability.
From Figure 5.9A, G188Y, S198M, E260R, and F288A (or F291T) appeared to be the
most likely combination to create a highly thermostable construct. Individually,
G188Y did not have any significant main effects on stability; however, when in
combination with S198M there did appear to be a positive change. Furthermore,
G188Y, S198M and E260R were all present in construct 12, which had a ΔTm of 8.60,
while construct 11 (the most stabilising construct) contained S198M, E260R, F291T,
and E391A. By replacing E391A with G188Y, it may create a construct with an even
higher melting temperature. Had the Tm of construct 2 also been solved then it would
have made it easier to identify the optimal combination of mutations as F288A and
F291T would not have been confounded.
A caveat of this design was that the two-way interactions were confounded with each
other. To create a fractional factorial design, aliases are required to reduce the number
of experiments required. For example, G188Y:S198M = D251R:E391A =
E260R:Q401A, making it difficult to accurately determine which of these
combinations was responsible for the effect (see Table 5.7). As E391A and Q401A
were present in the other aliases, and did not appear to have positive effects on stability,

156
it appeared that G188Y and S198M were the most effective of these aliases; however,
further studies would be required to verify this.
Ultimately, by using a fractional factorial design, the optimal combination of
mutations was discovered: G188Y, S198M, E260R, and F288A (or F291A).
Furthermore, when combining the stabilising mutations, it appeared to be most
effective to avoid including Q401A and E391A.

157
Chapter 6 Conclusions and Discussion
6.1 Overall Conclusions
Unfortunately, many aspects of this project were fraught with difficulties. Initially,
quantification of wild-type PTH1R and PTH2R revealed very low yields of 50 and 25
µg/L respectively. Low expression yields of GPCRs are a commonly known
characteristic of this family of receptors (McCusker et al., 2007), but with PTH2R even
solubilisation was a major hurdle. This resulted in a shift towards solving the ECD of
PTH2R with limited success. Work on PTH1R proved more successful but was halted
following the release of the active structure (Zhao et al., 2019). In an attempt to
optimise the structural biology work pipeline (designing stabilised constructs),
IMPROvER was used to create thermostabilising mutations of PTH1R, the success
rate of which was well above the more conventional alanine scanning mutagenesis
approach.
6.1.1 PTH1R
As demonstrated in Chapter 3, low expression of PTH1R was overcome by truncating
the ECD, inserting a hemagglutinin signal peptide, and inserting a BRIL fusion protein
at the N-terminus, a method that was utilised to solve the structure of the glucagon
receptor (Siu et al., 2013). This increased the yields of PTH1R in Sf9 cells up to
approximately 300 µg/L, a far more feasible level for structural studies. In a novel
approach to solving an active GPCR structure, a constitutively active PTH1R was
created by tethering PTH(1-14) to the N-terminus using linkers of varying lengths:
(GGGGS)1, (GGGGS)3, and GSAGSA. All tethered constructs that were created
showed constitutive activation through LANCE® cAMP functional assays as all three

158
constructs reached ~50% of the forskolin-treated control cell response, while untreated
control cells were only at approximately 1%. With this knowledge in hand, attempts
were made to co-purify a PTH1R-G protein complex using a tethered receptor. To this
end, co-expression of BRIL-PTH1R, the α, and the βγ subunit in Sf9 cells was
performed. This is now a commonly used protocol for solving GPCR structures (Duan
et al., 2020; Liang et al., 2018; Wang et al., 2020).
Attempts were made to purify Sf9 cell expressed nb37; however, the final yields were
too low for further downstream experiments. Ultimately, it was decided that the more
conventional E. coli produced nb35 would be utilised. Despite being unable to produce
nb35 in WK6 cells, high yields were obtained using BL21 cells (3.8 mg/L). A sound
rationale behind the lack of expression in WK6 cells cannot currently be provided,
excluding some type of issue that was present with the strain that was available in the
lab, as even creating new competent cells was not enough to solve the issue.
Unfortunately, co-purification of a tethered receptor with the complete G protein
heterotrimer was not achieved; however, the α subunit could be co-purified by using
a FLAG purification. The reasons for this dissociation are provided below in 6.2. The
pull-down of the α subunit redirected the research towards co-purification with a mini
G protein, as it is primarily based on the α-subunit and does not require the βγ subunit
(Carpenter & Tate, 2016). In this instance co-purification was achieved using an
untethered BRIL-PTH1R construct but was not possible when using a tethered receptor.
This may be due to receptor modifications in a constitutively active environment,
which prevents the mini G protein from binding. The data shown in this thesis is the
first example of a PTH1R-mini G protein complex and may be suitable for further

159
structural studies. Interestingly, a PAC1R structure was solved using an engineered G
protein (Kobayashi et al., 2020). PAC1R is similar to PTH1R in that it does not require
the ECD for receptor activation. To solve the structure of PAC1R, a mini Gs protein, a
βγ subunit, and nb35 were used. They expressed and purified the mini Gs from E. coli
cells, while the βγ subunits were from insect cells. After purifying the engineered G
protein, it was mixed with nb35, purified and concentrated. This allowed them to
obtain a structure at a 3.9 Å resolution, highlighting that a mini G protein can be used
to solve family B GPCRs.
6.1.2 PTH2R
Research on full-length PTH2R was far more challenging than initially expected due
to the limitations described above in 6.1. Therefore, efforts were made to try and solve
the structure of the PTH2RECD, a soluble domain that theoretically should have been
easier to solve than a full-length structure. To this end, the methodology described by
Pioszak & Xu (2008) was used, as they created general workflow that was used to
solve the ECD structures of PTH1R, PAC1R, and CRF1R (Kumar et al., 2011; Pioszak
& Xu, 2008; Pioszak et al., 2008). To help facilitate the formation of native disulphide
bonds that are required for the structure of the ECD, DsbC was successfully purified
following Pioszak and Xu’s (2008) methods. Once obtained, attempts were made to
purify the ECD; however, difficulties with expression quickly became apparent as
traditional techniques, such as expressing in Origami cells, were not working.
Expression was reliably achieved in BL21 cells, though this did not provide the
environment required for disulphide bond formation, as shown through native gels
(Figure 4.10). Expression was achieved in Rosetta-Gami cells; however, after multiple
rounds of optimisation, it was still too difficult to reliably express the protein of

160
interest. Difficulties with this protein were further exacerbated by degradation of the
protein and low expression. Using small-scale purifications, purification of the ECD
was achieved with little loss in the flow-through; however, as reliable expression was
unobtainable, the work on PTH2R was halted. As stated earlier, PTH2R is one of the
few family B receptors remaining that has yet to be solved. A potential explanation
for this could be due to issues with expression of the receptor, as this has been the
most recurrent problem faced throughout this research.
As briefly alluded to in Chapter 5, an alternative approach to solving PTH2RECD
structure may be pursued in the form of refolding experiments. The biggest issue that
was faced throughout this chapter was the reliability of expression in the Rosetta-Gami
cell line; however, BL21 cells were able to express the ECD. Underwood et al., (2010)
successfully solved the GLP1R ECD structure through expression in BL21 cell
inclusion bodies. Inclusion bodies are a collection of highly aggregated proteins often
observed when expressing recombinant proteins. Following expression, the ECD-
containing inclusion bodies can be solubilised in guanidine-HCl and DTT, which
denatures the protein. Removal of the DTT is achieved by dialysis. To refold the
protein, L-arginine and various ratios of reduced and oxidised glutathione can be
added to the samples. L-arginine can aid in protein refolding by inhibiting protein
aggregation, whereas the glutathione promotes disulphide exchange. Initially this
route was not pursued for PTH2RECD, as there are often complications in the refolding
stage (Thomson et al., 2012); however, given more time, this may have been a viable
route to pursue.

161
6.1.3 IMPROvER
Despite the issues concerning PTH2R and the slow progress on PTH1R, the final aspect
of this research, IMPROvER, proved to be highly successful. By providing
IMPROvER with the wild-type PTH1R sequence and a list of functional residues to
avoid mutating, it produced a ranked list of potentially stabilising mutations. Only the
top 10% of mutations (30 in total) were investigated for their effects on stability. Of
these, three were excluded for functional roles and seven failed to make it to successful
Sf9 expression. Through a high-throughput, in-gel fluorescence-based thermostability
assay it was discovered that the Tm of BRIL-PTH1R was 38.7 ± 0.8 ⁰C, and that eight
single point mutations had an increased thermostability of > 1.1 °C, a success rate of
40% for the constructs that were successfully expressed in Sf9 cells.
Many of these mutations also retained functionality relative to the control BRIL-
PTH1R construct, but there were still some which reduced function such as F288A.
Unfortunately, the most stabilising mutation, S198M, also inhibited receptor
functionality; however, it could be that this mutation stabilises an inactive state. This
was shown in the human A2A receptor, where certain thermostabilising mutations
(A208L) decreased constitutive activity and simultaneously abolished agonist induced
signalling (Bertheleme et al., 2013). Interestingly, this was not due to reduced G
protein coupling. The LANCE cAMP assay cannot determine the cause of receptor
function loss; therefore, further studies would be required. One such experiment would
be to determine ligand binding affinity in both the absence and presence of a G protein.
G protein binding increases the receptor’s binding affinity through alterations to the
receptor’s structure; therefore, comparisons between a +/- G protein strain could
reveal if loss of function is due to the inhibition of G protein binding.

162
IMPROvER also produced seven closely related mutations that were obtained from a
different program, CompoMug. The major advantage of IMPROvER over
CompoMug is that it can be applied to any protein, whereas CompoMug is specifically
for GPCRs. As stated by the authors, the machine-learning-based module (not used
for PTH1R) would require retraining on other target families before it could be used.
The success rate of CompoMug for mutant construct Tms > 1.5 °C was 25%. Under
the same criterion, there were four constructs with Tms of 41.5 °C or higher, a success
rate of 20% for IMPROvER, which is comparable with CompoMug. IMPROvER also
had success with non-GPCR proteins, with a 27% success for CIPPase and 12% for
hENT1 (Harborne et al., 2020). Traditional alanine scanning mutagenesis approaches
have significantly lower levels of success; approximately 5% for the A2AR (16/315)
and 1.5% (5/297) for the endothelin receptor for Tms of > 1.5 and 1.7 °C respectively
(Lebon et al., 2011; Okuta et al., 2016).
To reduce the workload associated with creating stabilised membrane receptors, an
experimental design known as a fractional factorial design was utilised. By using a
two-factor experimental design the total amount of experiments required was
decreased from 256 constructs to just 16. Due to time constraints, not all experiments
could be completed; however, only one construct failed to have it ΔTm solved, which
was still enough to analyse the effects of combining different mutations. When
combining all eight mutations, the ΔTm was only 5.76 °C, which was lower than many
other constructs investigated, highlighting that the stability of each mutant was not
additive and when combined could be detrimental to stability. The most stabilising
construct consisted of S198M, E260R, F291T, and E391A. E391A was only a
borderline stabilising mutation and did not appear to have much effect on the fractional

163
factorial constructs, meaning that, potentially, the 10 °C ΔTm came from just three
mutations. Popov et al., (2018), through CompoMug, were able to create a triple
mutant construct with a ΔTm of approximately 13 °C, which is only slightly higher
than the most stabilising fractional factorial construct.
Following analysis of the constructs, the most likely combination to improve stability
looked to be G188Y, S198M, E260R, and F288A (or F291T). Furthermore, it
appeared that E391A and Q401A could have negative effects when combined with
other mutations. This may be due to their location at ICL III, which may cause a
reorganisation of the cytoplasmic halves of the helices. If this occurs, then other
mutations may no longer be able to interact with the region that is required for
stabilisation. Natively, GPCRs are highly mobile proteins; therefore, any stabilising
mutation is likely to affect other regions of the receptor, even if the two regions are
not in close proximity. This is one reason why finding stabilising mutations can be
challenging, as it is often difficult to reason where certain stabilising mutations may
be placed in a proteins structure. Having a program such as IMPROvER will therefore
facilitate the discovery of new stabilising mutations in proteins, which will ultimately
make solving new protein structures an easier task.
6.2 Comparing PTH1R efforts to the solved PTH1R structures
As noted by Zhao et al., (2019), they also had to overcome the issues of low receptor
expression and instability of the PTH1R-G protein complex (see 1.7.1 and 1.7.2 for
further detail concerning the PTH1R structures). To achieve this, they fused a double
MBP tag to the C-terminus of the receptor and used a dominant negative form of the
G protein, stabilised by nb35. This dominant negative G protein was first engineered

164
by Liang et al., (2017) to help solve the GLP1R structure, and was created with 9
stabilising mutations that stabilise interactions with the βγ subunit and inhibit protein
dissociation. Even with this more stable G protein, nb35 was still required for the
structure to be solved. The data acquired in this research only had nb35 to stabilise the
G protein, likely resulting in the loss of the βγ subunit. Had the dominant-negative
form of the G protein been used, it may have helped inhibit subunit dissociation.
Additionally, Zhao et al., (2019) used a modified PTH agonist termed long acting PTH
(LA-PTH), which was 10-100 fold more potent than endogenous PTH and maintained
the GPCR-G protein complex for longer due to its longer lasting nature. The degree
of stabilisation they were able to achieve was far higher than this research was able to
accomplish and explains how they were able to succeed. Another difference between
our purification protocols was the detergent used for solubilisation. In this research
DDM with CHS was used, whereas LMNG with CHS was used to solve the active
structure; however, there appeared to be no significant difference in solubilisation
between these detergents (Figure 3.7), so likely not a major contributing factor as the
inactive PTH1R structure was solved using DDM (Ehrenmann et al., 2018).
Even so, there were also several methodological similarities between this research and
that of Zhao et al., (2019). For one, at the outset of this PhD there were very few active
GPCR structures available, the most cited being the active β2AR, which individually
purified the GPCR and G protein (Rasmussen et al., 2011b). As shown in Figure 3.14,
co-expression of the GPCR and the G protein was achieved, which resulted in the
avoidance of having to perform extra purification steps and potential protein losses.
This has now become a standard protocol to purify an active GPCR-G protein complex
(Duan et al., 2020; Liang et al., 2018; Wang et al., 2020). As with most GPCR

165
structures, a hemagglutinin signal peptide was used to further increase receptor
expression and almost identical conditions were used for Sf9 expression of the G
protein and receptor. Additionally, Zhao et al., (2019) expressed nb35 in BL21 cells.
Initially, there was issues expressing nb35 in the conventional WK6 cell line, as was
performed by Rasmussen et al., (2011b), and so expression was attempted in BL21
cells. There are now multiple structures solved using BL21 expressed nb35. (Duan et
al., 2020; Zhao et al., 2019). Despite these similarities, the complex still dissociated,
highlighting the importance of LA-PTH and the negative G protein.
6.3 Future Work
To further the work relating to the BRIL-PTH1R-mini Gs complex, it has become
apparent that using a wild-type peptide sequence for PTH would be inefficient, due to
the issues of stability found by Ehrenmann et al., (2018) and Zhao et al., (2019).
Therefore, a modified peptide such as ePTH or LA-PTH would be beneficial. These
should be tested on the IMPROvER constructs with improved thermostability to
determine if they are still capable of binding the mini Gs protein. If so, then this would
be a highly viable candidate for further structural trials. As the βγ subunits would not
be present the size of the complex would be significantly smaller than full GPCR-G
protein complexes, potentially making cryo-EM studies more challenging; however,
the cryo-EM structure of the catalytic domain of protein kinase A, a 43 kDa protein,
was solved at a ~ 6 Å resolution (Herzik et al., 2019), which means that solving the
PTH1R-mini Gs complex is well within the realms of possibility.
Having verified IMPROvER, it would be useful to determine stabilising mutations for
PTH2R, as it remains one of the few family B GPCRs yet to be solved. With just how

166
rapidly full family B structures are being solved, it is logical to focus on the full
structure over the ECD for PTH2R. Due to the difficulties associated with PTH2R, it
would be valuable to find an optimal fusion protein, and location, that could both
increase expression and solubility. Due to the similarities between PTH1R and PTH2R
(~60% sequence identity) it may be beneficial to follow the methods that Zhao et al.,
(2019) used i.e. having a double MBP tag at the C-terminus.
Assuming a stable complex can be created, it would be of great interest to try and
solve the active structure with two ligands, TIP39 and PTH. TIP39 activation of
PTH2R promotes sustained cAMP production, whereas PTH activation only briefly
induces cAMP. This is due to different downstream effects that occur following ligand
activation; TIP39 promotes β-arrestin mobilisation and internalisation, while PTH
does not (Bisello et al., 2004), likely due to subtle structural changes. It would be
interesting to compare the structures of a TIP39 bound PTH2R and a PTH bound
structure, as this could reveal key residues that promote receptor internalisation. It is
likely that a modified PTH would be required, such as LA-PTH or ePTH, to improve
the stability of the active complex, but it is also likely that a long acting TIP39 would
need to be designed. Regardless, a significant amount of work is required before an
active PTH2R structure can be solved.

167
6.4 Final Remarks
Despite the set-backs, a potentially viable construct was found in the form of a BRIL-
PTH1R-mini Gs. PTH2R proved to be extremely difficult to work with and failed to
reproduce results using established methodologies for solving family B ECD
structures. However, the full-length PTH2R structure could be solved in the future by
utilising IMPROvER, which proved to be a highly valuable tool by effectively
reducing the workload associated with finding stabilising mutations. At the time of
writing, only two family B GPCR structures remain unsolved. In just four years, over
two thirds of all family B GPCRs were solved, leading to the conclusion that it is only
a matter of time until we have structures for every single member.

168
Chapter 7 References
Ballesteros, J. A., & Weinstein, H. (1995). Integrated methods for the construction of
three-dimensional models and computational probing of structure-function
relations in G protein-coupled receptors. Methods in Neurosciences, 25, 366–428.
https://doi.org/10.1016/S1043-9471(05)80049-7
Barden, J. A., & Cuthbertson, R. M. (1993). Stabilized NMR structure of human
parathyroid hormone(1-34). European Journal of Biochemistry, 215, 315–321.
Bergwitz, C., Gardella, T. J., Flannery, M. R., Potts, J. T., Kronenberg, H. M.,
Goldring, S. R., & Jüppner, H. (1996). Full activation of chimeric receptors by
hybrids between parathyroid hormone and calcitonin. Evidence for a common
pattern of ligand-receptor interaction. Journal of Biological Chemistry, 271(43),
26469–26472. https://doi.org/10.1074/jbc.271.43.26469
Berrow, N. S., Alderton, D., Sainsbury, S., Nettleship, J., Assenberg, R., Rahman, N.,
Stuart, D. I., & Owens, R. J. (2007). A versatile ligation-independent cloning
method suitable for high-throughput expression screening applications. Nucleic
Acids Research, 35(6), e45. https://doi.org/10.1093/nar/gkm047
Bertheleme, N., Singh, S., Dowell, S. J., Hubbard, J., & Byrne, B. (2013). Loss of
constitutive activity is correlated with increased thermostability of the human
adenosine A2A receptor. British Journal of Pharmacology, 169(5), 988–998.
https://doi.org/10.1111/bph.12165
Bisello, A., Adams, A. E., Mierke, D. F., Pellegrini, M., Rosenblatt, M., Suva, L. J.,
& Chorev, M. (1998). Parathyroid hormone-receptor interactions identified
directly by photocross-linking and molecular modeling studies. Journal of
Biological Chemistry, 273(35), 22498–22505.
https://doi.org/10.1074/jbc.273.35.22498
Bisello, A., Manen, D., Pierroz, D. D., Usdin, T. B., Rizzoli, R., & Ferrari, S. L. (2004).
Agonist-specific regulation of parathyroid hormone (PTH) receptor type 2
activity: structural and functional analysis of PTH- and tuberoinfundibular
peptide (TIP) 39-stimulated desensitization and internalization. Mol Endocrinol,
18(6), 1486–1498. https://doi.org/10.1210/me.2003-0487

169
Booe, J. M., Walker, C. S., Barwell, J., Kuteyi, G., Simms, J., Jamaluddin, M. A.,
Warner, M. L., Bill, R. M., Harris, P. W., Brimble, M. A., Poyner, D. R., Hay, D.
L., & Pioszak, A. A. (2015). Structural Basis for Receptor Activity-Modifying
Protein-Dependent Selective Peptide Recognition by a G Protein-Coupled
Receptor. Molecular Cell, 58(6), 1040–1052.
https://doi.org/10.1016/j.molcel.2015.04.018
Carpenter, B., Nehmé, R., Warne, T., Leslie, A. G. W., & Tate, C. G. (2017). Structure
of the adenosine A2A receptor bound to an engineered G protein. Nature,
536(7614), 104–107. https://doi.org/10.1038/nature18966.Structure
Carpenter, B., & Tate, C. G. (2017). Expression, Purification and Crystallisation of
the Adenosine A2A Receptor Bound to an Engineered Mini G Protein. BIO-
PROTOCOL, 7(8), e2234. https://doi.org/10.21769/BioProtoc.2234
Carpenter, B., & Tate, C. G. (2016). Engineering a minimal G protein to facilitate
crystallisation of G protein-coupled receptors in their active conformation.
Protein Engineering, Design and Selection, 29(12), 583–593.
https://doi.org/10.1093/protein/gzw049
Castro, M., Nikolaev, V. O., Palm, D., Lohse, M. J., & Vilardaga, J. P. (2005). Turn-
on switch in parathyroid hormone receptor by a two-step parathyroid hormone
binding mechanism. Proceedings of the National Academy of Sciences of the
United States of America, 102(44), 16084–16089.
https://doi.org/10.1073/pnas.0503942102
Chen, X., Zaro, J. L., & Shen, W. C. (2013). Fusion protein linkers: Property, design
and functionality. In Advanced Drug Delivery Reviews (pp. 1357–1369).
https://doi.org/10.1016/j.addr.2012.09.039
Chen, Z., Guo, L., Hadas, J., Gutowski, S., Sprang, S. R., & Sternweis, P. C. (2012).
Activation of p115-RhoGEF requires direct association of Gα 13 and the Dbl
homology domain. Journal of Biological Chemistry, 287(30), 25490–25500.
https://doi.org/10.1074/jbc.M111.333716
Chorev, M., Goldman, M. E., McKee, R. L., Roubini, E., Levy, J. J., Gay, C. T.,
Reagan, J. E., Fisher, J. E., Caporale, L. H., Golub, E. E., Caulfield, M. P., Nutt,
R. F., & Rosenblatt, M. (1990). Modifications of position 12 in parathyroid
hormone and parathyroid hormone related protein: Toward the design of highly
potent antagonists. Biochemistry, 29, 1580–1586.

170
Chung, Y., Kobilka, T. S., Thian, F. S., Chae, P. S., Pardon, E., Mathiesen, J. M., Shah,
S. T. a, Lyons, J. a, Caffrey, M., Gellman, S. H., Steyaert, J., Skiniotis, G., Weis,
W. I., Roger, K., & Kobilka, B. K. (2012). Crystal Structure of the B2 Adrenergic
Receptor-Gs protein complex. Nature, 477(7366), 549–555.
https://doi.org/10.1038/nature10361.Crystal
Clark, J. A. (1998). Multiple Regions of Ligand Discrimination Revealed by Analysis
of Chimeric Parathyroid Hormone 2 (PTH2) and PTH/PTH-Related Peptide
(PTHrP) Receptors. Molecular Endocrinology, 12(2), 193–206.
https://doi.org/10.1210/me.12.2.193
Conklin, B. R., Farfel, Z., Lustig, K. D., Julius, D., & Bourne, H. R. (1993).
Substitution of three amino acids switches receptor specificity of G qα to that of
Giα. Nature, 363(6426), 274–276. https://doi.org/10.1038/363274a0
Cordeaux, Y., Ijzerman, A. P., & Hill, S. J. (2004). Coupling of the human A 1
adenosine receptor to different heterotrimeric G proteins: Evidence for agonist-
specific G protein activation. British Journal of Pharmacology, 143(6), 705–714.
https://doi.org/10.1038/sj.bjp.0705925
Danev, R., Yanagisawa, H., & Kikkawa, M. (2019). Cryo-Electron Microscopy
Methodology: Current Aspects and Future Directions. In Trends in Biochemical
Sciences (pp. 837–848). https://doi.org/10.1016/j.tibs.2019.04.008
De Genst, E., Silence, K., Decanniere, K., Conrath, K., Loris, R., Kinne, J.,
Muyldermans, S., & Wyns, L. (2006). Molecular basis for the preferential cleft
recognition by dromedary heavy-chain antibodies. Proceedings of the National
Academy of Sciences, 103(12), 4586–4591.
https://doi.org/10.1073/pnas.0505379103
Dean, T., Vilardaga, J. P., Potts, J. T., & Gardella, T. J. (2008). Altered selectivity of
parathyroid hormone (PTH) and PTH-related protein (PTHrP) for distinct
conformations of the PTH/PTHrP receptor. Molecular Endocrinology, 22(1),
156–166. https://doi.org/10.1210/me.2007-0274
Dimitrov, E. L., Petrus, E., & Usdin, T. B. (2010). Tuberoinfundibular peptide of 39
residues (TIP39) signaling modulates acute and tonic nociception. Experimental
Neurology, 226(1), 68–83. https://doi.org/10.1016/j.expneurol.2010.08.004
Dobolyi, A., Dimitrov, E., Palkovits, M., & Usdin, T. B. (2012). The neuroendocrine
functions of the parathyroid hormone 2 receptor. Frontiers in Endocrinology, 1–
10. https://doi.org/10.3389/fendo.2012.00121

171
Draper-Joyce, C. J., Khoshouei, M., Thal, D. M., Liang, Y.-L., Nguyen, A. T. N.,
Furness, S. G. B., Venugopal, H., Baltos, J.-A., Plitzko, J. M., Danev, R.,
Baumeister, W., May, L. T., Wootten, D., Sexton, P. M., Glukhova, A., &
Christopoulos, A. (2018). Structure of the adenosine-bound human adenosine A1
receptor–Gi complex. Nature, 558(7711), 559–563.
https://doi.org/10.1038/s41586-018-0236-6
Duan, J., Shen, D., Zhou, X. E., Bi, P., Liu, Q. feng, Tan, Y. xia, Zhuang, Y. wen,
Zhang, H. bing, Xu, P. yu, Huang, S. J., Ma, S. shan, He, X. heng, Melcher, K.,
Zhang, Y., Xu, H. E., & Jiang, Y. (2020). Cryo-EM structure of an activated VIP1
receptor-G protein complex revealed by a NanoBiT tethering strategy. Nature
Communications, 11(1), 4121. https://doi.org/10.1038/s41467-020-17933-8
Ehrenmann, J., Schöppe, J., Klenk, C., Rappas, M., Kummer, L., Doré, A. S., &
Plückthun, A. (2018). High-resolution crystal structure of parathyroid hormone
1 receptor in complex with a peptide agonist. Nature Structural and Molecular
Biology, 25, 1086–1092. https://doi.org/10.1038/s41594-018-0151-4
Fenalti, G., Giguere, P. M., Katritch, V., Huang, X. P., Thompson, A. A., Cherezov,
V., Roth, B. L., & Stevens, R. C. (2014). Molecular control of δ-opioid receptor
signalling. Nature, 506(7487), 191–196. https://doi.org/10.1038/nature12944
Ferrari, S. L., & Bisello, A. (2001). Cellular distribution of constitutively active
mutant parathyroid hormone (PTH)/PTH-related protein receptors and regulation
of cyclic adenosine 3’,5’-monophosphate signaling by beta-arrestin2. Molecular
Endocrinology (Baltimore, Md.), 15(1), 149–163.
https://doi.org/10.1210/mend.15.1.0587
Fredriksson, R. (2003). The G-Protein-Coupled Receptors in the Human Genome
Form Five Main Families. Phylogenetic Analysis, Paralogon Groups, and
Fingerprints. Molecular Pharmacology, 63(6), 1256–1272.
https://doi.org/10.1124/mol.63.6.1256
García-Nafría, J., Lee, Y., Bai, X., Carpenter, B., & Tate, C. G. (2018a). Cryo-EM
structure of the adenosine A2A receptor coupled to an engineered heterotrimeric
G protein. ELife, 7, e35946. https://doi.org/10.7554/eLife.35946
García-Nafría, J., Nehmé, R., Edwards, P. C., & Tate, C. G. (2018b). Cryo-EM
structure of the serotonin 5-HT1B receptor coupled to heterotrimeric Go. Nature,
558.

172
Gardella, T. J., Luck, M. D., Fan, M. H., & Lee, C. (1996). Transmembrane residues
of the parathyroid hormone (PTH)/PTH-related peptide receptor that specifically
affect binding and signaling by agonist ligands. Journal of Biological Chemistry,
271(22), 12820–12825. https://doi.org/10.1074/jbc.271.22.12820
Gensure, R. C., Shimizu, N., Tsang, J., & Gardella, T. J. (2003). Identification of a
Contact Site for Residue 19 of Parathyroid Hormone (PTH) and PTH-Related
Protein Analogs in Transmembrane Domain Two of the Type 1 PTH Receptor.
Molecular Endocrinology, 17(12), 2647–2658. https://doi.org/10.1210/me.2003-
0275
Gensure, R. C., Petroni, B., Jüppner, H., & Gardella, T. J. (2001). Identification of
determinants of inverse agonism in a constitutively active PTH/PTHrP receptor
by photoaffinity crosslinking and mutational analysis. Journal of Biological
Chemistry, 276(46), 42692–42699.
Ghosh, E., Kumari, P., Jaiman, D., & Shukla, A. K. (2015). Methodological advances:
the unsung heroes of the GPCR structural revolution. Nat Rev Mol Cell Biol,
16(2), 69–81. https://doi.org/10.1038/nrm3933
Hamer-Casterman,T, C., Muyldermans, S., Robinson, G., Hamers, C., Bajyana, E.,
Bendahman, N., & Hamilton, R. (1998). Naturally occurring antibodies devoid
of light chains. Nature, 363(June), 446–448.
Harborne, S. P. D., Strauss, J., Boakes, J. C., Wright, D. L., Henderson, J. G.,
Boivineau, J., Jaakola, V. P., & Goldman, A. (2020). IMPROvER: the Integral
Membrane Protein Stability Selector. Scientific Reports, 10(1), 15165.
https://doi.org/10.1038/s41598-020-71744-x
Hattersley, G., Dean, T., Corbin, B. A., Bahar, H., & Gardella, T. J. (2016). Binding
selectivity of abaloparatide for PTH-type-1-receptor conformations and effects
on downstream signaling. Endocrinology, 157(1), 141–149.
https://doi.org/10.1210/en.2015-1726
Hauer, F., Gerle, C., Fischer, N., Oshima, A., Shinzawa-Itoh, K., Shimada, S.,
Yokoyama, K., Fujiyoshi, Y., & Stark, H. (2015). GraDeR: Membrane Protein
Complex Preparation for Single-Particle Cryo-EM. Structure, 23(9), 1769–1775.
https://doi.org/10.1016/j.str.2015.06.029
Herzik, M. A., Wu, M., & Lander, G. C. (2019). High-resolution structure
determination of sub-100 kDa complexes using conventional cryo-EM. Nature
Communications. https://doi.org/10.1038/s41467-019-08991-8
173
Hoare, S. R. J., Brown, B. T., Santos, M. A., Malany, S., Betz, S. F., & Grigoriadis,
D. E. (2006). Single amino acid residue determinants of non-peptide antagonist
binding to the corticotropin-releasing factor1 (CRF1) receptor. Biochemical
Pharmacology, 72(2), 244–255. https://doi.org/10.1016/j.bcp.2006.04.007
Hoare, S. R. J., Clark, J. A., & Usdin, T. B. (2000). Molecular determinants of
tuberoinfundibular peptide of 39 residues (TIP39) selectivity for the parathyroid
hormone-2 (PTH2) receptor: N-terminal truncation of TIP39 reverses PTH2
receptor/PTH1 receptor binding selectivity. Journal of Biological Chemistry,
275(35), 27274–27283. https://doi.org/10.1074/jbc.M003910200
Hoare, S. R. J., Gardella, T. J., & Usdin, T. B. (2001). Evaluating the signal
transduction mechanism of the parathyroid hormone 1 receptor. Effect of
receptor-G-protein interaction on the ligand binding mechanism and receptor
conformation. Journal of Biological Chemistry, 276(11), 7741–7753.
https://doi.org/10.1074/jbc.M009395200
Hollenstein, K., Kean, J., Bortolato, A., Cheng, R. K. Y., Doré, A. S., Jazayeri, A.,
Cooke, R. M., Weir, M., & Marshall, F. H. (2013). Structure of class B GPCR
corticotropin-releasing factor receptor 1. Nature, 499(7459), 438–443.
https://doi.org/10.1038/nature12357
Hollenstein, K., De Graaf, C., Bortolato, A., Wang, M., Marshall, F & Stevens, R. C.,
(2014). Insights into the structure of class B GPCRs. Trends Pharmacol Sci,
35(1), 12–22. https://www.ncbi.nlm.nih.gov/pmc/articles/PMC3931419/
Hopf, T. A., Ingraham, J. B., Poelwijk, F. J., Schärfe, C. P. I., Springer, M., Sander,
C., & Marks, D. S. (2017). Mutation effects predicted from sequence co-variation.
Nature Biotechnology, 35, 128–135. https://doi.org/10.1038/nbt.3769
Jin, L., Briggs, S. L., Chandrasekhar, S., Chirgadze, N. Y., Clawson, D. K., Schevitz,
R. W., Smiley, D. L., Tashjian, A. H., & Zhang, F. (2000). Crystal structure of
human parathyroid hormone 1-34 at 0.9-Å resolution. Journal of Biological
Chemistry, 275(35), 27238–27244. https://doi.org/10.1074/jbc.M001134200
Jüppner, H., Schipani, E., Bringhurst, F. R., McClure, I., Keutmann, H. T., Potts, J. T.,
Kronenberg, H. M., Abou-Samra, A. B., Segre, G. V., & Gardella, T. J. (1994).
The extracellular amino-terminal region of the parathyroid hormone (PTH)/PTH-
related peptide receptor determines the binding affinity for carboxyl-terminal
fragments of PTH-(1-34). Endocrinology, 134(2), 879–884.
https://doi.org/10.1210/en.134.2.879

174
Katritch, V., Fenalti, G., Abola, E. E., Roth, B. L., Cherezov, V., & Stevens, R. C.
(2014). Allosteric sodium in class A GPCR signaling. In Trends in Biochemical
Sciences (pp. 233–244). https://doi.org/10.1016/j.tibs.2014.03.002
Khoshouei, M., Radjainia, M., Baumeister, W., & Danev, R. (2017). Cryo-EM
structure of haemoglobin at 3.2 Å determined with the Volta phase plate. Nature
Communications, 8. https://doi.org/10.1038/ncomms16099
Killion, E. A., Wang, J., Yie, J., Shi, S. D.-H., Bates, D., Min, X., Komorowski, R.,
Hager, T., Deng, L., Atangan, L., Lu, S.-C., Kurzeja, R. J. M., Sivits, G., Lin, J.,
Chen, Q., Wang, Z., Thibault, S. A., Abbott, C., Meng, T., Clavette, B.,
Murawsky, C. M., Foltz, I., Rottman, J., Hale, C., Veniant, M., & Lloyd, D. J.
(2018). Anti-obesity effects of GIPR antagonists alone and in combination with
GLP-1R agonists in preclinical models. Science Translational Medicine, 10(472).
https://doi.org/10.1126/scitranslmed.aat3392
Kobayashi, K., Shihoya, W., Nishizawa, T., Kadji, F. M. N., Aoki, J., Inoue, A., &
Nureki, O. (2020). Cryo-EM structure of the human PAC1 receptor coupled to
an engineered heterotrimeric G protein. Nature Structural and Molecular Biology,
27, 274–280. https://doi.org/10.1038/s41594-020-0386-8
Koehl, A., Hu, H., Maeda, S., Zhang, Y., Qu, Q., Paggi, J. M., Latorraca, N. R., Hilger,
D., Dawson, R., Matile, H., Schertler, G. F. X., Granier, S., Weis, W. I., Dror, R.
O., Manglik, A., Skiniotis, G., & Kobilka, B. K. (2018). Structure of the µ-opioid
receptor–Gi protein complex. Nature, 558(7711), 547–552.
https://doi.org/10.1038/s41586-018-0219-7
Kossiakoff, A. A., & Subramaniam, S. (2018). Cryo-EM structure of human rhodopsin
bound to an inhibitory G protein. Nature, 558(7711), 553–558.
https://doi.org/10.1038/s41586-018-0215-y
Koth, C. M., Murray, J. M., Mukund, S., Madjidi, A., Minn, A., Clarke, H. J., Wong,
T., Chiang, V., Luis, E., Estevez, A., Rondon, J., Zhang, Y., Hötzel, I., & Allan,
B. B. (2012). Molecular basis for negative regulation of the glucagon receptor.
Proceedings of the National Academy of Sciences of the United States of America,
109(36), 14393–14398. https://doi.org/10.1073/pnas.1206734109

175
Kruse, A. C., Hu, J., Pan, A. C., Arlow, D. H., Rosenbaum, D. M., Rosemond, E.,
Green, H. F., Liu, T., Chae, P. S., Dror, R. O., Shaw, D. E., Weis, W. I., Wess,
J., & Kobilka, B. K. (2012). Structure and dynamics of the M3 muscarinic
acetylcholine receptor. Nature, 482, 552–556.
https://doi.org/10.1038/nature10867
Kumar, S., Pioszak, A. A., Zhang, C., Swaminathan, K., & Xu, H. E. (2011). Crystal
structure of the PAC1R extracellular domain unifies a consensus fold for
hormone recognition by class B G-protein coupled receptors. PLoS ONE, 6(5),
e19682. https://doi.org/10.1371/journal.pone.0019682
Lebon, G., Bennett, K., Jazayeri, A., & Tate, C. G. (2011). Thermostabilisation of an
agonist-bound conformation of the human adenosine A2A receptor. Journal of
Molecular Biology, 409(3), 298–310. https://doi.org/10.1016/j.jmb.2011.03.075
Liang, Y. L., Khoshouei, M., Deganutti, G., Glukhova, A., Koole, C., Peat, T. S.,
Radjainia, M., Plitzko, J. M., Baumeister, W., Miller, L. J., Hay, D. L.,
Christopoulos, A., Reynolds, C. A., Wootten, D., & Sexton, P. M. (2018). Cryo-
EM structure of the active, Gs-protein complexed, human CGRP receptor. Nature.
https://doi.org/10.1038/s41586-018-0535-y
Liang, Y. L., Belousoff, M. J., Zhao, P., Danev, R., Sexton, P. M., Wootten, D., Liang,
Y., Belousoff, M. J., Zhao, P., Koole, C., Fletcher, M. M., & Truong, T. T. (2020).
Toward a Structural Understanding of Class B GPCR Peptide Binding and
Activation Article Toward a Structural Understanding of Class B GPCR Peptide
Binding and Activation. Molecular Cell, 77(3), 656–668.
https://doi.org/10.1016/j.molcel.2020.01.012
Liang, Y. L., Khoshouei, M., Deganutti, G., Glukhova, A., Koole, C., Peat, T. S.,
Radjainia, M., Plitzko, J. M., Baumeister, W., Miller, L. J., Hay, D. L.,
Christopoulos, A., Reynolds, C. A., Wootten, D., & Sexton, P. M. (2018). Cryo-
EM structure of the active, G s -protein complexed, human CGRP receptor.
Nature, 561(7724), 492–497. https://doi.org/10.1038/s41586-018-0535-y
Liang, Y. L., Khoshouei, M., Radjainia, M., Zhang, Y., Glukhova, A., Tarrasch, J.,
Thal, D. M., Furness, S. G. B., Christopoulos, G., Coudrat, T., Danev, R.,
Baumeister, W., Miller, L. J., Christopoulos, A., Kobilka, B. K., Wootten, D.,
Skiniotis, G., & Sexton, P. M. (2017). Phase-plate cryo-EM structure of a class
B GPCR-G-protein complex. Nature, 546(7656), 118–123.
https://doi.org/10.1038/nature22327

176
Liao, M., Cao, E., Julius, D., & Cheng, Y. (2013). Structure of the TRPV1 ion channel
determined by electron cryo-microscopy. Nature, 504, 107–112.
https://doi.org/10.1038/nature12822
Luck, M. D., Carter, P. H., & Gardella, T. J. (1999). The (1-14) fragment of
parathyroid hormone (PTH) activates intact and amino-terminally truncated
PTH-1 receptors. Molecular Endocrinology.
https://doi.org/10.1210/mend.13.5.0277
Ma, S., Shen, Q., Zhao, L. H., Mao, C., Zhou, X. E., Shen, D. D., de Waal, P. W., Bi,
P., Li, C., Jiang, Y., Wang, M. W., Sexton, P. M., Wootten, D., Melcher, K.,
Zhang, Y., & Xu, H. E. (2020). Molecular Basis for Hormone Recognition and
Activation of Corticotropin-Releasing Factor Receptors. Molecular Cell, 77(3),
669–680. https://doi.org/10.1016/j.molcel.2020.01.013
Magnani, F., Shibata, Y., Serrano-Vega, M. J., & Tate, C. G. (2008). Co-evolving
stability and conformational homogeneity of the human adenosine A2a receptor.
Proceedings of the National Academy of Sciences of the United States of America,
105(31), 10744–10749. https://doi.org/10.1073/pnas.0804396105
Manglik, A., Kobilka, B. K., & Steyaert, J. (2017). Nanobodies to Study G Protein–
Coupled Receptor Structure and Function. Annual Review of Pharmacology and
Toxicology, 57, 19–37. https://doi.org/10.1146/annurev-pharmtox-010716-
104710
Manglik, A., Kruse, A. C., Kobilka, T. S., Thian, F. S., Jesper, M., Sunahara, R. K.,
Pardo, L., Weis, W. I., & Kobilka, B. K. (2012). Crystal structure of the µ-opioid
receptor bound to a morphinan antagonist. Nature, 485(7398), 321–326.
https://doi.org/10.1038/nature10954.Crystal
Mann, R., Wigglesworth, M. J., & Donnelly, D. (2008). Ligand-receptor interactions
at the parathyroid hormone receptors: subtype binding selectivity is mediated via
an interaction between residue 23 on the ligand and residue 41 on the receptor.
Molecular Pharmacology, 74(3), 605–613.
https://doi.org/10.1124/mol.108.048017
Markby, D. W., Onrust, R., & Bourne, H. R. (1993). Separate GTP binding and
GTPase activating domains of a Gα subunit. Science, 262(5141), 1895–1901.
https://doi.org/10.1126/science.8266082

177
McCusker, E. C., Bane, S. E., O’Malley, M. A., & Robinson, A. S. (2007).
Heterologous GPCR expression: A bottleneck to obtaining crystal structures. In
Biotechnology Progress (pp. 540–547). https://doi.org/10.1021/bp060349b
McPherson, A., & Gavira, J. A. (2014). Introduction to protein crystallization. In Acta
Crystallographica Section F:Structural Biology Communications (pp. 2–20).
https://doi.org/10.1107/S2053230X13033141
Merk, A., Bartesaghi, A., Banerjee, S., Falconieri, V., Rao, P., Davis, M. I., Pragani,
R., Boxer, M. B., Earl, L. A., Milne, J. L. S., & Subramaniam, S. (2016).
Breaking Cryo-EM Resolution Barriers to Facilitate Drug Discovery. Cell,
165(7), 1698–1707. https://doi.org/10.1016/j.cell.2016.05.040
Milic, D., & Veprintsev, D. B. (2015). Large-scale production and protein engineering
of G protein-coupled receptors for structural studies. In Frontiers in
Pharmacology (pp. 1–24). https://doi.org/10.3389/fphar.2015.00066
Munk, C., Mutt, E., Isberg, V., Nikolajsen, L. F., Bibbe, J. M., Flock, T., Hanson, M.
A., Stevens, R. C., Deupi, X., & Gloriam, D. E. (2019). An online resource for
GPCR structure determination and analysis. Nature Methods, 16(2), 151–162.
https://doi.org/10.1038/s41592-018-0302-x
Novick, D., & Rubinstein, M. (2012). Ligand affinity chromatography, an
indispensable method for the purification of soluble cytokine receptors and
binding proteins. Methods in Molecular Biology, 820, 195–214.
https://doi.org/10.1007/978-1-61779-439-1_12
Okuta, A., Tani, K., Nishimura, S., Fujiyoshi, Y., & Doi, T. (2016).
Thermostabilization of the Human Endothelin Type B Receptor. Journal of
Molecular Biology, 428(11), 2265–2274.
https://doi.org/10.1016/j.jmb.2016.03.024
Pal, K., Melcher, K., & Xu, H. E. (2012). Structure and mechanism for recognition of
peptide hormones by Class B G-protein-coupled receptors. Acta Pharmacologica
Sinica, 33(3), 300–311. https://doi.org/10.1038/aps.2011.170
Papaneophytou, C. P., & Kontopidis, G. (2014). Statistical approaches to maximize
recombinant protein expression in Escherichia coli: A general review. In Protein
Expression and Purification (pp. 22–32).
https://doi.org/10.1016/j.pep.2013.10.016

178
Pardon, E., Laeremans, T., Triest, S., Rasmussen, S. G. F., Wohlkönig, A., Ruf, A.,
Muyldermans, S., Hol, W. G. J., Kobilka, B. K., & Steyaert, J. (2014). A general
protocol for the generation of Nanobodies for structural biology. Nature
Protocols, 9(3), 674–693. https://doi.org/10.1038/nprot.2014.039
Passmore, L. A., & Russo, C. J. (2016). Specimen Preparation for High-Resolution
Cryo-EM. In Methods in Enzymology (Vol. 579, pp. 51–86).
https://doi.org/10.1016/bs.mie.2016.04.011
Perrin, M. H., Grace, C. R. R., Riek, R., & Vale, W. W. (2006). The three-dimensional
structure of the n-terminal domain of corticotropin-releasing factor receptors
sushi domains and the B1 family of G protein-coupled receptors. Annals of the
New York Academy of Sciences, 1070, 105–119.
https://doi.org/10.1196/annals.1317.065
Pioszak, A. A., Parker, N. R., Suino-Powell, K., & Xu, H. E. (2008). Molecular
recognition of corticotropin-releasing factor by its G-protein-coupled receptor
CRFR1. Journal of Biological Chemistry, 283(47), 32900–32912.
https://doi.org/10.1074/jbc.M805749200
Pioszak, A. A., & Xu, H. E. (2008). Molecular recognition of parathyroid hormone by
its G protein-coupled receptor. Proceedings of the National Academy of Sciences,
105(13), 5034–5039. https://doi.org/10.1073/pnas.0801027105
Pioszak, A. A, Parker, N. R., Gardella, T. J., & Xu, H. E. (2009). Structural basis for
parathyroid hormone-related protein binding to the parathyroid hormone receptor
and design of conformation-selective peptides. The Journal of Biological
Chemistry, 284(41), 28382–28391. https://doi.org/10.1074/jbc.M109.022905
Piserchio, A., Usdin, T., & Mierke, D. F. (2000). Structure of tuberoinfundibular
peptide (TIP39). J Biol Chem, 275(401), 27284–27290.
Popov, P., Peng, Y., Shen, L., Stevens, R. C., Cherezov, V., Liu, Z. J., & Katritch, V.
(2018). Computational design of thermostabilizing point mutations for G protein-
coupled receptors. ELife, 7, e34729. https://doi.org/10.7554/eLife.34729
Potts, J. T. (2005). Parathyroid hormone: Past and present. Journal of Endocrinology,
187(3), 311–325. https://doi.org/10.1677/joe.1.06057

179
Potts, J. T., Tregear, G. W., Keutmann, H. T., Niall, H. D., Sauer, R., Deftos, L. J.,
Dawson, B. F., Hogan, M. L., & Aurbach, G. D. (1971). Synthesis of a
biologically active N-terminal tetratriacontapeptide of parathyroid hormone.
Proceedings of the National Academy of Sciences of the United States of America,
68(1), 63–67. https://doi.org/10.1073/pnas.68.1.63
Qiao, A., Han, S., Li, X., Li, Z., Zhao, P., Dai, A., Chang, R., Tai, L., Tan, Q., Chu,
X., Ma, L., Thorsen, T. S., Reedtz-Runge, S., Yang, D., Wang, M.-W., Sexton,
P. M., Wootten, D., & Wu, B. (2020). Structural basis of Gs and Gi recognition
by the human glucagon receptor. Science, 367(6484), 1346–1352.
https://doi.org/10.1126/science.aaz5346
Rasmussen, S. G. F., Choi, H.-J., Rosenbaum, D. M., Kobilka, T. S., Thian, F. S.,
Edwards, P. C., Burghammer, M., Ratnala, V. R. P., Sanishvili, R., Fischetti, R.
F., Schertler, G. F. X., Weis, W. I., & Kobilka, B. K. (2007). Crystal structure of
the human β2 adrenergic G-protein-coupled receptor. Nature, 450(7168), 383–
388. https://doi.org/10.1038/nature06325
Rasmussen, S. G. F., Choi, H. J., Fung, J. J., Pardon, E., Casarosa, P., Chae, P. S.,
Devree, B. T., Rosenbaum, D. M., Thian, F. S., Kobilka, T. S., Schnapp, A.,
Konetzki, I., Sunahara, R. K., Gellman, S. H., Pautsch, A., Steyaert, J., Weis, W.
I., & Kobilka, B. K. (2011a). Structure of a nanobody-stabilized active state of
the β(2) adrenoceptor. Nature, 469(7329), 175–180.
https://doi.org/10.1038/nature09648
Rasmussen, S. G. F., DeVree, B. T., Zou, Y., Kruse, A. C., Chung, K. Y., Kobilka, T.
S., Thian, F. S., Chae, P. S., Pardon, E., Calinski, D., Mathiesen, J. M., Shah, S.
T. A., Lyons, J. A., Caffrey, M., Gellman, S. H., Steyaert, J., Skiniotis, G., Weis,
W., Sunahara, K., & Kobilka, B. K. (2011b). Crystal structure of the β2
adrenergic receptor-Gs protein complex. Nature, 477(7366), 549–555.
https://doi.org/10.1038/nature10361
Rosenbaum, D. M., Zhang, C., Lyons, J. a, Holl, R., Aragao, D., Arlow, D. H.,
Rasmussen, S. G. F., Choi, H.-J., Devree, B. T., Sunahara, R. K., Chae, P. S.,
Gellman, S. H., Dror, R. O., Shaw, D. E., Weis, W. I., Caffrey, M., Gmeiner, P.,
& Kobilka, B. K. (2011). Structure and function of an irreversible agonist-β(2)
adrenoceptor complex. Nature, 469(7329), 236–240.
https://doi.org/10.1038/nature09665
180
Schipani, E., Jensen, G. S., Pincus, J., Nissenson, R. A., Gardella, T. J., & Jüppner, H.
(1997). Constitutive activation of the cyclic adenosine 3’,5’-monophosphate
signaling pathway by parathyroid hormone (PTH)/PTH-related peptide receptors
mutated at the two loci for Jansen’s metaphyseal chondrodysplasia. Molecular
Endocrinology, 11(7), 851–858. https://doi.org/10.1210/me.11.7.851
Schymkowitz, J., Borg, J., Stricher, F., Nys, R., Rousseau, F., & Serrano, L. (2005).
The FoldX web server: An online force field. Nucleic Acids Research.
https://doi.org/10.1093/nar/gki387
Seifert, R., & Wenzel-Seifert, K. (2002). Constitutive activity of G-proteins-coupled
receptors: Cause of disease and common property of wild-type receptors. In
Naunyn-Schmiedeberg’s Archives of Pharmacology (pp. 381–416).
https://doi.org/10.1007/s00210-002-0588-0
Semack, A., Sandhu, M., Malik, R. U., Vaidehi, N., & Sivaramakrishnan, S. (2016).
Structural elements in the Gαs and Gβq C termini that mediate selective G
Protein-coupled Receptor (GPCR) signaling. Journal of Biological Chemistry,
291(34), 17929–17940. https://doi.org/10.1074/jbc.M116.735720
Serrano-Vega, M. J., Magnani, F., Shibata, Y., & Tate, C. G. (2008). Conformational
thermostabilization of the β1-adrenergic receptor in a detergent-resistant form.
Proceedings of the National Academy of Sciences of the United States of America,
105(3), 877–882. https://doi.org/10.1073/pnas.0711253105
Shi, Y., Wang, T., Zhou, X. E., Liu, Q. feng, Jiang, Y., & Xu, H. E. (2019). Structure-
based design of a hyperthermostable AgUricase for hyperuricemia and gout
therapy. Acta Pharmacologica Sinica, 40(10), 1364–1372.
https://doi.org/10.1038/s41401-019-0269-x
Shibata, Y., Gvozdenovic-Jeremic, J., Love, J., Kloss, B., White, J. F., Grisshammer,
R., & Tate, C. G. (2013). Optimising the combination of thermostabilising
mutations in the neurotensin receptor for structure determination. Biochimica et
Biophysica Acta - Biomembranes, 1828(4), 1293–1301.
https://doi.org/10.1016/j.bbamem.2013.01.008
Shimizu, M., Joyashiki, E., Noda, H., Watanabe, T., Okazaki, M., Nagayasu, M.,
Adachi, K., Tamura, T., Potts, J. T., Gardella, T. J., & Kawabe, Y. (2016).
Pharmacodynamic Actions of a Long-Acting PTH Analog (LA-PTH) in
Thyroparathyroidectomized (TPTX) Rats and Normal Monkeys. Journal of Bone
and Mineral Research, 31(7), 1405–1412. https://doi.org/10.1002/jbmr.2811

181
Siu, F. Y., He, M., de Graaf, C., Han, G. W., Yang, D., Zhang, Z., Zhou, C., Xu, Q.,
Wacker, D., Joseph, J. S., Liu, W., Lau, J., Cherezov, V., Katritch, V., Wang, M.-
W., & Stevens, R. C. (2013). Structure of the human glucagon class B G-protein-
coupled receptor. Nature, 499(7459), 444–449.
https://doi.org/10.1038/nature12393
Song, G., Yang, D., Wang, Y., De Graaf, C., Zhou, Q., Jiang, S., Liu, K., Cai, X., Dai,
A., Lin, G., Liu, D., Wu, F., Wu, Y., Zhao, S., Ye, L., Han, G. W., Lau, J. Wu,
B., Hanson, M., Liu, Z., Wang, M., & Stevens, R. C. (2017). Human GLP-1
receptor transmembrane domain structure in complex with allosteric modulators.
Nature, 546(7657), 312–315. https://doi.org/10.1038/nature22378
Sullivan, K. A., Miller, R. T., Masters, S. B., Beiderman, B., Heideman, W., & Bourne,
H. R. (1987). Identification of receptor contact site involved in receptor-G protein
coupling. Nature, 330(6150), 758–760. https://doi.org/10.1038/330758a0
ter Haar, E., Koth, C. M., Abdul-Manan, N., Swenson, L., Coll, J. T., Lippke, J. A.,
Lepre, C. A., Garcia-Guzman, M., & Moore, J. M. (2010). Crystal structure of
the ectodomain complex of the CGRP receptor, a class-B GPCR, reveals the site
of drug antagonism. Structure, 18(9), 1083–1093.
https://doi.org/10.1016/j.str.2010.05.014
Thomson, C. A., Olson, M., Jackson, L. M., & Schrader, J. W. (2012). A Simplified
Method for the Efficient Refolding and Purification of Recombinant Human GM-
CSF. PLoS ONE, 7(11), e49891. https://doi.org/10.1371/journal.pone.0049891
Ueda, N., Iniguez-Lluhi, J. A., Lee, E., Smrcka, A. V., Robishaw, J. D., & Gilman, A.
G. (1994). G protein βγ subunits. Simplified purification and properties of novel
isoforms. Journal of Biological Chemistry, 269(6), 4388–4395.
Underwood, C. R., Garibay, P., Knudsen, L. B., Hastrup, S., Peters, G. H., Rudolph,
R., & Reedtz-Runge, S. (2010). Crystal structure of glucagon-like peptide-1 in
complex with the extracellular domain of the glucagon-like peptide-1 receptor.
Journal of Biological Chemistry, 285(1), 723–730.
https://doi.org/10.1074/jbc.M109.033829
Usdin, T. B., Gruber, C., & Bonner, T. I. (1995). Identification and functional
expression of a receptor selectively recognizing parathyroid hormone, the PTH2
receptor. In Journal of Biological Chemistry (Vol. 270, Issue 26, pp. 15455–
15458). https://doi.org/10.1074/jbc.270.26.15455

182
Usdin, T. B., Hoare, S. R., Wang, T., Mezey, E., & Kowalak, J. a. (1999). TIP39: a
new neuropeptide and PTH2-receptor agonist from hypothalamus. Nature
Neuroscience, 2(11), 941–943. https://doi.org/10.1038/14724
Usdin, T. B., Paciga, M., Riordan, T., Kuo, J., Parmelee, A., Petukova, G., Daniel
Camerini-Otero, R., & Mezey, É. (2008). Tuberoinfundibular peptide of 39
residues is required for germ cell development. Endocrinology, 149(9), 4292–
4300. https://doi.org/10.1210/en.2008-0419
Vilardaga, J. P., Romero, G., Friedman, P. A., & Gardella, T. J. (2011). Molecular
basis of parathyroid hormone receptor signaling and trafficking: A family B
GPCR paradigm. In Cellular and Molecular Life Sciences (Vol. 68, Issue 1, pp.
1–13). https://doi.org/10.1007/s00018-010-0465-9
Wang, J., Song, X., Zhang, D., Chen, X., Li, X., Sun, Y., Li, C., Song, Y., Ding, Y.,
Ren, R., Harrington, E. H., Hu, L. A., Zhong, W., Xu, C., Huang, X., Wang, H.
W., & Ma, Y. (2020). Cryo-EM structures of PAC1 receptor reveal ligand
binding mechanism. Cell Research, 30, 436–445.
https://doi.org/10.1038/s41422-020-0280-2
Ward, H. L., Small, C. J., Murphy, K. G., Kennedy, A. R., Ghatei, M. A., & Bloom,
S. R. (2001). The actions of tuberoinfundibular peptide on the hypothalamo-
pituitary axes. Endocrinology, 142(8), 3451–3456.
https://doi.org/10.1210/en.142.8.3451
Weaver, R. E., Wigglesworth, M. J., & Donnelly, D. (2014). A salt bridge between
Arg-20 on parathyroid hormone (PTH) and Asp-137 on the PTH1receptor is
essential for full affinity. Peptides, 61, 83–87.
https://doi.org/10.1016/j.peptides.2014.09.004
Westfield, G. H., Rasmussen, S. G. F., Su, M., Dutta, S., DeVree, B. T., Chung, K. Y.,
Calinski, D., Velez-Ruiz, G., Oleskie, A. N., Pardon, E., Chae, P. S., Liu, T., Li,
S., Woods, V. L., Steyaert, J., Kobilka, B. K., Sunahara, R. K., & Skiniotis, G.
(2011). Structural flexibility of the Gαs α-helical domain in the β 2-adrenoceptor
Gs complex. Proceedings of the National Academy of Sciences of the United
States of America, 108(38), 16086–16091.
https://doi.org/10.1073/pnas.1113645108
Wettschureck, N., & Offermanns, S. (2005). Mammalian G Proteins and Their Cell
Type Specific Functions. Physilological Review, 85(4), 1159–1204.
https://doi.org/10.1152/physrev.00003.2005.

183
Wu, F., Yang, L., Hang, K., Laursen, M., Wu, L., Han, G. W., Ren, Q., Roed, N. K.,
Lin, G., Hanson, M. A., Jiang, H., Wang, M.-W., Reedtz-Runge, S., Song, G., &
Stevens, R. C. (2020). Full-length human GLP-1 receptor structure without
orthosteric ligands. Nature Communications, 11. https://doi.org/10.1038/s41467-
020-14934-5
Yao, Z., & Kobilka, B. K. (2005). Using synthetic lipids to stabilize purified ??2
adrenoceptor in detergent micelles. Analytical Biochemistry, 343(2), 344–346.
https://doi.org/10.1016/j.ab.2005.05.002
Zhang, H., Qiao, A., Yang, L., Van Eps, N., Frederiksen, K. S., Yang, D., Dai, A., Cai,
X., Zhang, H., Yi, C., Cao, C., He, L., Yang, H., Lau, J., Ernst, O. P., Hanson, M.
A., Stevens, R. C., Wang, M., Reedtz-Runge, S., Jiang, H., Zhao, Q., & Wu, B.
(2018). Structure of the glucagon receptor in complex with a glucagon analogue.
Nature, 553(7686), 106–110. https://doi.org/10.1038/nature25153
Zhang, Y., Sun, B., Feng, D., Hu, H., Chu, M., Qu, Q., Tarrasch, J. T., Li, S., Sun
Kobilka, T., Kobilka, B. K., & Skiniotis, G. (2017). Cryo-EM structure of the
activated GLP-1 receptor in complex with a G protein. Nature, 546(7657), 248–
253. https://doi.org/10.1038/nature22394
Zhao, F., Zhang, C., Zhou, Q., Hang, K., Zou, X., Chen, Y., Wu, F., Rao, Q., Dai, A.,
Yin, W., Shen, D., Zhang, Y., Xia, T., Stevens, R., Xu, E., Yang, D., Zhao, L., &
Wang, M.-W (2021). Structural insights into hormone recognition by the human
glucose-dependent insulinotropic polypeptide receptor.
https://doi.org/10.1101/2021.03.18.436101
Zhao, L. H., Ma, S., Sutkeviciute, I., Shen, D.-D., Zhou, X. E., de Waal, P. W., Li, C.-
Y., Kang, Y., Clark, L. J., Jean-Alphonse, F. G., White, A. D., Yang, D., Dai, A.,
Cai, X., Chen, J., Li, C., Jiang, Y., Watanabe, T., Gardella, T., Melcher, K., Wang,
M., Vilardaga, J. & Zhang, Y. (2019). Structure and dynamics of the active
human parathyroid hormone receptor-1. Science, 364(6436), 148–153.
https://doi.org/10.1126/science.aav7942
Zhao, L. H., Yin, Y., Yang, D., Liu, B., Hou, L., Wang, X., Pal, K., Jiang, Y., Feng,
Y., Cai, X., Dai, A., Liu, M., Wang, M. W., Melcher, K., & Xu, H. E. (2016).
Differential requirement of the extracellular domain in activation of class B G
protein-coupled receptors. Journal of Biological Chemistry, 291(29), 15119–
15130. https://doi.org/10.1074/jbc.M116.726620

184
Zhao, P., Liang, Y. L., Belousoff, M. J., Deganutti, G., Fletcher, M. M., Willard, F. S.,
Bell, M. G., Christe, M. E., Sloop, K. W., Inoue, A., Truong, T. T., Clydesdale,
L., Furness, S. G. B., Christopoulos, A., Wang, M. W., Miller, L. J., Reynolds,
C. A., Danev, R., Sexton, P., & Wootten, D. (2020). Activation of the GLP-1
receptor by a non-peptidic agonist. Nature, 577, 432–436.
https://doi.org/10.1038/s41586-019-1902-z

185
Appendix
Primers
Putting PTH1R and PTH2R into pFastBac CTH/CGVH
Primer name Sequence Tm (°C)
PTH1R-CTH Forward ACAGCGATGCCTAGGATGGGGACC
GCCCGGATC
PTH1R-CTH Reverse GTTTTCCGTACCGCCTGCAGGCATG
ACTGTCTCCCACTC
62
PTH2R-CTH Forward ACAGCGATGCCTAGGATGGCCGGG
CTGG
PTH2R-CTH Reverse GTTTTCCGTACCGCCTGCAGGGAGA
ACATCCTCAGTTTCTCC
62
PTH1R-CGVH
Forward
GAAACAGCGATGCCTAGGATGGGG
ACCGCCCG
PTH1R-CGVH Reverse TAGTACTTCTAGTCCTGCAGGCATG
ACTGTCTCCCACTCT
64
PTH2R-CGVH
Forward
GAAACAGCGATGCCTAGGATGGCC
GGGCTGG
PTH2R-CGVH Reverse TAGTACTTCTAGTCCTGCAGGGAGA
ACATCCTCAGTTTCTCC
62
pFastBac-CTH
Linear Forward
CCTGCAGGCGGTACG
pFastBac-CTH
Linear Reverse
CCTAGGCATCGCTGTTTC 63
pFastBac-CGVH
Linear Forward
CCTGCAGGACTAGAAGTA
pFastBac-CGVH
Linear Reverse
AAGGAAACAGCGATGCC 60
Receptor modifications
Primer
name
Sequence Tm (°C) Description
PTH1R -
Hema
Forward
AGCTACATCTTCTGCCTGGTATTC
GATGCAGATGACGTCATG
Inserting N-
PTH1R-
Hema
Reverse
CAGGGCGATGATCGTCTTCATCCT
AGGCATCGCTGTTTC
61 terminal
signal peptide

186
Primer
name
Sequence Tm (°C) Description
PTH2R-
Hema
Forward
AGCTACATCTTCTGCCTGGTATTC
CAGCTGGATTCTGATGGC
Inserting N-
PTH2R-
Hema
Reverse
CAGGGCGATGATCGTCTTCATCCT
AGGCATCGCTGTTTC
63 terminal
signal peptide
PTH1R-
ECD
Forward
GAAACAGCGATGCCTAGGATGGG
GACCGCCCGG
Creating PTH
PTH1R-
ECD
Reverse
GTAGTTGGCCCACGTCCT 68 chimera
construct
PTH2R-
TMD
Forward
ACGTGGGCCAACTACTCAGACT
Creating PTH
PTH2R-
TMD
Reverse
TAGTACTTCTAGTCCTGCAGGGA
GAACATCCTCAGTTTCTCCTTGG
67 Chimera
construct
PTH1R-169
Forward
GAGTGTGTCAAATTTCTCAC
Truncating
PTH1R-169
Reverse
GAATACCAGGCAGAAGATGTA 59 receptor
PTH1R-179
Forward
GAACGGGAGGTGTTTGA
Truncating
PTH1R-179
Reverse
GAATACCAGGCAGAAGATGTA 61 receptor
PTH2R-124
Forward
GACTGCCTTCGCTTTCTGCAG
Truncating
PTH2R-124
Reverse
GAATACCAGGCAGAAGATGTA 61 receptor
PTH2R-128
Forward
TTTCTGCAGCCAGATATCAG
Truncating
PTH2R-128
Reverse
GAATACCAGGCAGAAGATGTA 61 receptor
BRIL-
PTH1R
Forward
TGCCTGGTATTCGCTGCGGATCT
GGAAGATAA
Adding BRIL
BRIL-
PTH1R
Reverse
AAACACCTCCCGTTCCAGATATT
TCTGAATATACGC
56 To PTH1R

187
G Protein
Primer name Sequence Tm (°C) Description
pFastBac-
CTH Forward
GGATCCGAATTCAAGCTTG
Removing the
pFastBac-
CTH Reverse
CCTAGGCATCGCTGTTTC 62 His tag
γ-Forward ACAGCGATGCCTAGGATG
GCCAGCAACA
Insert γ into
γ-Reverse CTTGAATTCGGATCCTTAA
AGGATAGCACAGAAAAAC
57 pFastBac
α-Forward ACAGCGATGCCTAGGATG
GGCTGCCTCGG
Insert α into
α-Reverse CTTGAATTCGGATCCTTAG
ACCAGATTGTACTCGCG
65 pFastBac
β-Forward ACAGCGATGCCTAGGATGG
GATCCGAAATCG
Insert β into
β-Reverse CGTACCGCCTGCAGGTTAG
TTCCAAATCTTGAGAAG
57 pFastBac
Tethered Receptors
Primer
name
Sequence Tm (°C) Description
FLAG
Forward
CTACTAAAAGCGGATCTGG
AAGATAAC
Adding a
FLAG
Reverse
ATCGTCTTTGTAATCAGCGA
ATACCAGGCAGAA
60 FLAG tag
GGGGS1
Forward
GGAGGGTCAGCGGATCTGGA
AGATAAC
Adding
GGGGS1
Reverse
ACCGCCTTTGTCATCATCGTC
TTTG
58 GGGGS(1)
GGGGS3
Froward
GGAGGTGCAGGAGGTGGTGG
TGCTGCGGATCTGGAAGATAAC
Adding
GGGGS3
Reverse
TCCACCTGACCCTCCACCGC
CTTTGTCATCATCGTCTTTG
58 GGGGS(3)
GSA
Forward
GCCGGATCGGGGGAATTTAG
CGGATCTGGAAGATAAC
Adding
GSA
Reverse
TGCAGATCCAGCTGAACCTTT
GTCATCATCGTCTTTG
58 GSAGSA-
AGSGEF

188
Primer
name
Sequence Tm (°C) Description
PTH-GS1
Forward
CGAAAGTGATGATTGTGATGG
GCGGTGGAGGTG
59
Adding
PTH(1-14) to
PTH-GS1
Reverse
CCATATCTTTCGCCGGAATCAT
TTTGTCATCATCGTCTTTGTA
GGGGS(1)
PTH-GS3
Forward
CGAAAGTGATGATTGTGATGGG
CGGTGGAGGGT
61
Adding
PTH(1-14) to
PTH-GS3
Reverse
CCATATCTTTCGCCGGAATCATT
TTGTCATCATCGTCTTTGTAATC
GGGGS(3)
PTH-GSA
Forward
CGAAAGTGATGATTGTGATGGG
TTCAGCTGGATCTGCA
61
Adding
PTH(1-14) to
PTH-GSA
Reverse
CCATATCTTTCGCCGGAATCATT
TTGTCATCATCGTCTTTGTAATC
GSAGSA-
AGSGEF
pOPINE
Linear
Forward
GTGATTAACCTCAGGTGC
59
Tethered
receptors into
pOPINE
Linear
Reverse
TCCGTAATCATGGTCATAG mammalian
vector
PTH-
pOPINE
Forward
GACCATGATTACGGAATGA
AGACGATCATCGCC
61
Tethered
receptors into
PTH-
pOPINE
Reverse
CCTGAGGTTAATCACTCACA
TGACTGTCTCCC
mammalian
vector

189
PTH2RECD
Primer
name
Sequence Tm (°C) Description
pCDFDuet
Linear-1
Forward
AATTCGAGCTCGGC
56
Linearise
cloning
pCDFDuet
Linear-1
Reverse
CCATGGTATATCTCCTTATTA Site 1
pCDFDuet
Linear-2
Forward
TTCGAGTCTGGTAAAG
55
Linearise
cloning
pCDFDuet
Linear-2
Reverse
TATCTCCTTCTTATACTTAACTA
AT
site 2
PTH2R ECD
Forward
GGAGATATACCATGGCAGCT
GGATTCTGATGGCA
Place ECD
into pCDF-
PTH2R ECD
Reverse
GCGCCGAGCTCGAATGAGGCGTT
CAAAGAATTCTTG
63 Duet plasmid
DsbC
Forward
TATAAGAAGGAGATAATGAAA
AAAGGCTTTATGCTG
60
Place DsbC
into pCDF-
DsbC
Reverse
TTTACCAGACTCGAATTTGCC
GCTGGTCATTT
Duet
MBP-2R
Forward
GGAGATATACCATGGAAAATC
GAAGAAGGTAAACTGG
61
Adding MBP
to PTH2R
MBP-2R
Reverse
ATCAGAATCCAGCTGCGGACC
CTGGAACAGA
ECD
GFP-2R
Forward
GGAGATATACCATGGATGAGT
AAAGGAGAAGAAC
56
Replacing
MBP with
GFP-2R
Reverse
GCTCGCATTACCATGGCTAG
CAGAACCAGC
GFP

190
Primer
name
Sequence Tm (°C) Description
MBP-2R
Linear
Forward
CATGGTAATGCGAGCTC
56
Replacing
MBP with
MBP-2R
Linear
Reverse
CCATGGTATATCTCCTTATTA
GFP
IMPROvER Mutations
*Mutation is highlighted in red
Primer Name Sequence Tm (°C)
G188K Forward TGACCGCCTGAAGATGATTTACACCGT 72
G188K Reverse AACACCTCCCGTTCCAGATATTTC 67
G188Y Forward TGACCGCCTGTACATGATTTACACCGTG 72
G188Y Reverse AACACCTCCCGTTCCAGATATTTCTG 68
M189L Forward CCGCCTGGGCCTGATTTACACCG 75
M189L Reverse TCAAACACCTCCCGTTCCAGATATTTCT 69
S198M Forward CCGTGATGCTGGCGTCCCT 74
S198M Reverse AGTAGCCCACGGTGTAAATCATGC 69
S201F Forward GTCCCTGGCGTTCCTCACCGTAG 74
S201F Reverse ACGGAGTAGCCCACGGTG 70
T203A Forward GTCCCTCGCCGTAGCTGTGCTCATC 76
T203A Reverse GCCAGGGACACGGAGTAGC 71
L228V Forward GCACCTGTTCGTGTCCTTCATGCTG 73
L228V Reverse ATGTGGATGTAGTTGCGCGTG 68

191
Primer name Sequence Tm (°C)
S229S Forward TTCCTGAGCTTCATGCTGCGC 71
S229S Reverse CAGGTGCATGTGGATGTAGTTGC 69
T249N Forward GCGCCAACCTTGATGAGGCTGAG 73
T249N Reverse CAGAGTAGAGCACAGCGTCCT 69
D251R Forward CACGCTTCGTGAGGCTGAGCG 74
D251R Reverse GCGCCAGAGTAGAGCACAG 68
E259P Forward CCTGAGCTGCGCGCCATC 73
E259P Reverse CTCGGTGAGGCGCTCAG 69
E260R Forward CACCGAGGAGAGGCTGCGCGCCA 81
E260R Reverse AGGCGCTCAGCCTCATCAAGCG 75
A274D Forward GCCTGCCACCGACGCTGCCGGCT 85
A274D Reverse GGCGGGGGCGCCTGGG 81
A275K Forward TGCCACCGCCAAGGCCGGCTACG 82
A275K Reverse GGCGGCGGGGGC 73
F288A Forward ACCTTCGCCCTTTACTTCCTGGC 72
F288A Reverse CACAGCCACCCTGCAGC 70
F291T Forward CTTCCTTTACACCCTGGCCACCAACTAC 73
F291T Reverse AAGGTCACAGCCACCCTG 68
T294A Forward CTTCCTGGCCGCCAACTACTACTGG 74
T294A Reverse TAAAGGAAGAAGGTCACAGCCACC 69
G323A Forward GTACCTGTGGGCCTTCACAGTCTTC 71
G323A Reverse TTCTTCTCTGAGAAGAAGGCCATGAAG 68

192
Primer name Sequence Tm (°C)
A333L Forward TGCCCCTGGTCTTCGTGGCTG 75
A333L Reverse GACCCCAGCCGAAGACTGTGAA 72
A337L Forward TTCGTGCTGGTGTGGGTCAGTGT 74
A337L Reverse GACAGCGGGCAGACCC 70
S356A Forward GGACTTGAGCGCCGGGAACAAAAAGT 74
S356A Reverse CAGCACCCGGTGTTGGC 71
A369L Forward CATCCTGCTCTCCATTGTGCTCAAC 70
A369L Reverse GGCACCTGGATGATCCACTTTTT 68
E391A Forward CAAGCTGCGGGCGACCAACGCCG 81
E391A Reverse GTGGCGAGCACCCGGACGATATTGATGA 76
Q401A Forward ACGGGCTCAGTACCGGAAGCTG 74
Q401A Reverse GTGTCACACCGGCCGG 70
T427L Forward CTTCATGGCCCTGCCATACACCGA 74
T427L Reverse ACAATGTAGTGGACGCCAAAGAGG 69
T427M Forward CTTCATGGCCATGCCATACACCGAGGT 75
T427M Reverse ACAATGTAGTGGACGCCAAAGAGG 69