Estimating Evapotranspiration in Three Contrasting Forest Ecosystems Using Eddy Covariance, Sapflow,...
12
Energy and water balance of two contrasting loblolly pine plantations on the lower coastal plain of North Carolina, USA G. Sun a, *, A. Noormets b , M.J. Gavazzi a , S.G. McNulty a , J. Chen c , J.-C. Domec b , J.S. King b , D.M. Amatya d , R.W. Skaggs e a Southern Global Change Program, Southern Research Station, USDA Forest Service, 920 Main Campus Dr., Suite 300, Venture II, Raleigh, NC 27606, United States b Department of Forestry and Environmental Resources, North Carolina State University, Raleigh, NC, United States c Department of Earth, Ecological, and Environmental Sciences, University of Toledo, Toledo, OH 43606, United States d Center for Forested Wetlands Research, USDA Forest Service, 3734 Highway 402, Cordesville, SC 29434, United States e Department of Biological and Agricultural Engineering, North Carolina State University, Raleigh, NC, United States 1. Introduction Loblolly pine (Pinus taeda L.) is a common species in the southern United States and pine plantations are a major economic component in the region (Schultz, 1997; Fox et al., 2004). The productivity of loblolly pine plantations increased greatly during the past decades due to advances in tree genetic improvement and intensive silviculture practices that often involve water manage- ment such as drainage (Amatya et al., 1996), bedding, and applications of fertilization and herbicides (Albaugh et al., 2004). The impacts of intensive forest managements and land conversions on ecosystem services including energy partitioning (Gholz and Clark, 2002; Powell et al., 2005), water quantity and quality (Sun et al., 2004), forest productivity, and carbon sequestration (McNulty et al., 1996; Johnsen et al., 2001; Clark et al., 2004; Powell et al., 2008; Noormets et al., 2009) are of great interest to both scientists and policy makers. Energy, water, and carbon cycles in forest ecosystems are tightly coupled through the evapotranspiration (ET) processes (Wilson and Baldocchi, 2000; Law et al., 2002; Noormets et al., 2006)(Fig. 1). Although land managers are more interested in water and carbon balances, quantifying forest energy balance offers insights to how management affects the forest microclimate and the feedbacks of land use change to climate change at a regional scale (Gholz and Clark, 2002; Powell et al., 2005; Restrepo and Arain, 2005; Jackson et al., 2005; Pielke et al., 2007; Liu et al., 2008). Uncertainty about the combined consequences of affor- estation or deforestation on regional climate and greenhouse gas Forest Ecology and Management 259 (2010) 1299–1310 ARTICLE INFO Article history: Received 21 March 2009 Received in revised form 4 September 2009 Accepted 9 September 2009 Keywords: Energy balance Evapotranspiration Forest albedo Forest hydrology Loblolly pine Water balance ABSTRACT During 2005–2007, we used the eddy covariance and associated hydrometric methods to construct energy and water budgets along a chronosequence of loblolly pine (Pinus taeda) plantations that included a mid-rotation stand (LP) (i.e., 13–15 years old) and a recently established stand on a clearcut site (CC) (i.e., 4–6 years old) in Eastern North Carolina. Our central objective was to quantify the differences in both energy and water balances between the two contrasting stands and understand the underlining mechanisms of environmental controls. We found that the LP site received about 20% more net radiation (R n ) due to its lower averaged albedo (a) of 0.25, compared with that at the CC (a = 0.34). The mean monthly averaged Bowen ratios (b) at the LP site were 0.89 0.7, significantly (p = 0.02) lower than at the CC site (1.45 1.2). Higher net radiation resulted in a 28% higher (p = 0.02) latent heat flux (LE) for ecosystem evapotranspiration at the LP site, but there was no difference in sensible heat flux (H) between the two contrasting sites. The annual total evapotranspiration (ET) at the LP site and CC site was estimated as 1011–1226 and 755–855 mm year 1 , respectively. The differences in ET rates between the two contrasting sites occurred mostly during the non-growing seasons and/or dry periods, and they were small during peak growing seasons or wet periods. Higher net radiation and biomass in LP were believed to be responsible to the higher ET. The monthly ET/Grass Reference ET ratios differed significantly across site and season. The annual ET/P ratio for the LP and CC were estimated as 0.70–1.13 and 0.60–0.88, respectively, indicating higher runoff production from the CC site than the LP site. This study implied that reforestation practices reduced surface albedos and thus increased available energy, but they did not necessarily increase energy for warming the atmosphere in the coastal plain region where soil water was generally not limited. This study showed the highly variable response of energy and water balances to forest management due to climatic variability. Published by Elsevier B.V. * Corresponding author. Tel.: +1 919 515 9498; fax: +1 919 5132978. E-mail addresses: [email protected], [email protected] (G. Sun). Contents lists available at ScienceDirect Forest Ecology and Management journal homepage: www.elsevier.com/locate/foreco 0378-1127/$ – see front matter . Published by Elsevier B.V. doi:10.1016/j.foreco.2009.09.016
-
Upload
independent -
Category
Documents
-
view
4 -
download
0
Transcript of Estimating Evapotranspiration in Three Contrasting Forest Ecosystems Using Eddy Covariance, Sapflow,...
Forest Ecology and Management 259 (2010) 1299–1310
Energy and water balance of two contrasting loblolly pine plantations on thelower coastal plain of North Carolina, USA
G. Sun a,*, A. Noormets b, M.J. Gavazzi a, S.G. McNulty a, J. Chen c, J.-C. Domec b, J.S. King b,D.M. Amatya d, R.W. Skaggs e
a Southern Global Change Program, Southern Research Station, USDA Forest Service, 920 Main Campus Dr., Suite 300, Venture II, Raleigh, NC 27606, United Statesb Department of Forestry and Environmental Resources, North Carolina State University, Raleigh, NC, United Statesc Department of Earth, Ecological, and Environmental Sciences, University of Toledo, Toledo, OH 43606, United Statesd Center for Forested Wetlands Research, USDA Forest Service, 3734 Highway 402, Cordesville, SC 29434, United Statese Department of Biological and Agricultural Engineering, North Carolina State University, Raleigh, NC, United States
A R T I C L E I N F O
Article history:
Received 21 March 2009
Received in revised form 4 September 2009
Accepted 9 September 2009
Keywords:
Energy balance
Evapotranspiration
Forest albedo
Forest hydrology
Loblolly pine
Water balance
A B S T R A C T
During 2005–2007, we used the eddy covariance and associated hydrometric methods to construct
energy and water budgets along a chronosequence of loblolly pine (Pinus taeda) plantations that
included a mid-rotation stand (LP) (i.e., 13–15 years old) and a recently established stand on a clearcut
site (CC) (i.e., 4–6 years old) in Eastern North Carolina. Our central objective was to quantify the
differences in both energy and water balances between the two contrasting stands and understand the
underlining mechanisms of environmental controls. We found that the LP site received about 20% more
net radiation (Rn) due to its lower averaged albedo (a) of 0.25, compared with that at the CC (a = 0.34).
The mean monthly averaged Bowen ratios (b) at the LP site were 0.89 � 0.7, significantly (p = 0.02) lower
than at the CC site (1.45 � 1.2). Higher net radiation resulted in a 28% higher (p = 0.02) latent heat flux (LE) for
ecosystem evapotranspiration at the LP site, but there was no difference in sensible heat flux (H) between the
two contrasting sites. The annual total evapotranspiration (ET) at the LP site and CC site was estimated as
1011–1226 and 755–855 mm year�1, respectively. The differences in ET rates between the two contrasting
sites occurred mostly during the non-growing seasons and/or dry periods, and they were small during peak
growing seasons or wet periods. Higher net radiation and biomass in LP were believed to be responsible to the
higher ET. The monthly ET/Grass Reference ET ratios differed significantly across site and season. The annual
ET/P ratio for the LP and CC were estimated as 0.70–1.13 and 0.60–0.88, respectively, indicating higher runoff
production from the CC site than the LP site. This study implied that reforestation practices reduced surface
albedos and thus increased available energy, but they did not necessarily increase energy for warming the
atmosphere in the coastal plain region where soil water was generally not limited. This study showed the
highly variable response of energy and water balances to forest management due to climatic variability.
Published by Elsevier B.V.
Contents lists available at ScienceDirect
Forest Ecology and Management
journa l homepage: www.e lsevier .com/ locate / foreco
1. Introduction
Loblolly pine (Pinus taeda L.) is a common species in thesouthern United States and pine plantations are a major economiccomponent in the region (Schultz, 1997; Fox et al., 2004). Theproductivity of loblolly pine plantations increased greatly duringthe past decades due to advances in tree genetic improvement andintensive silviculture practices that often involve water manage-ment such as drainage (Amatya et al., 1996), bedding, andapplications of fertilization and herbicides (Albaugh et al.,2004). The impacts of intensive forest managements and landconversions on ecosystem services including energy partitioning
* Corresponding author. Tel.: +1 919 515 9498; fax: +1 919 5132978.
E-mail addresses: [email protected], [email protected] (G. Sun).
0378-1127/$ – see front matter . Published by Elsevier B.V.
doi:10.1016/j.foreco.2009.09.016
(Gholz and Clark, 2002; Powell et al., 2005), water quantity andquality (Sun et al., 2004), forest productivity, and carbonsequestration (McNulty et al., 1996; Johnsen et al., 2001; Clarket al., 2004; Powell et al., 2008; Noormets et al., 2009) are of greatinterest to both scientists and policy makers.
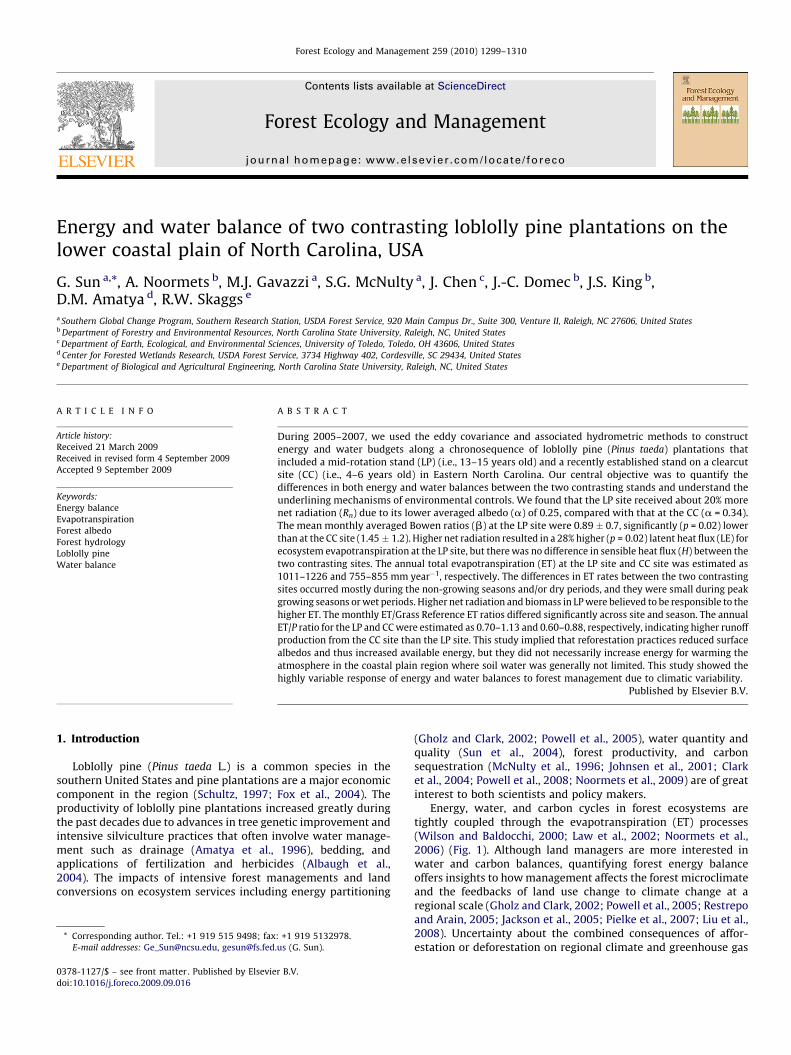
Energy, water, and carbon cycles in forest ecosystems aretightly coupled through the evapotranspiration (ET) processes(Wilson and Baldocchi, 2000; Law et al., 2002; Noormets et al.,2006) (Fig. 1). Although land managers are more interested inwater and carbon balances, quantifying forest energy balanceoffers insights to how management affects the forest microclimateand the feedbacks of land use change to climate change at aregional scale (Gholz and Clark, 2002; Powell et al., 2005; Restrepoand Arain, 2005; Jackson et al., 2005; Pielke et al., 2007; Liu et al.,2008). Uncertainty about the combined consequences of affor-estation or deforestation on regional climate and greenhouse gas
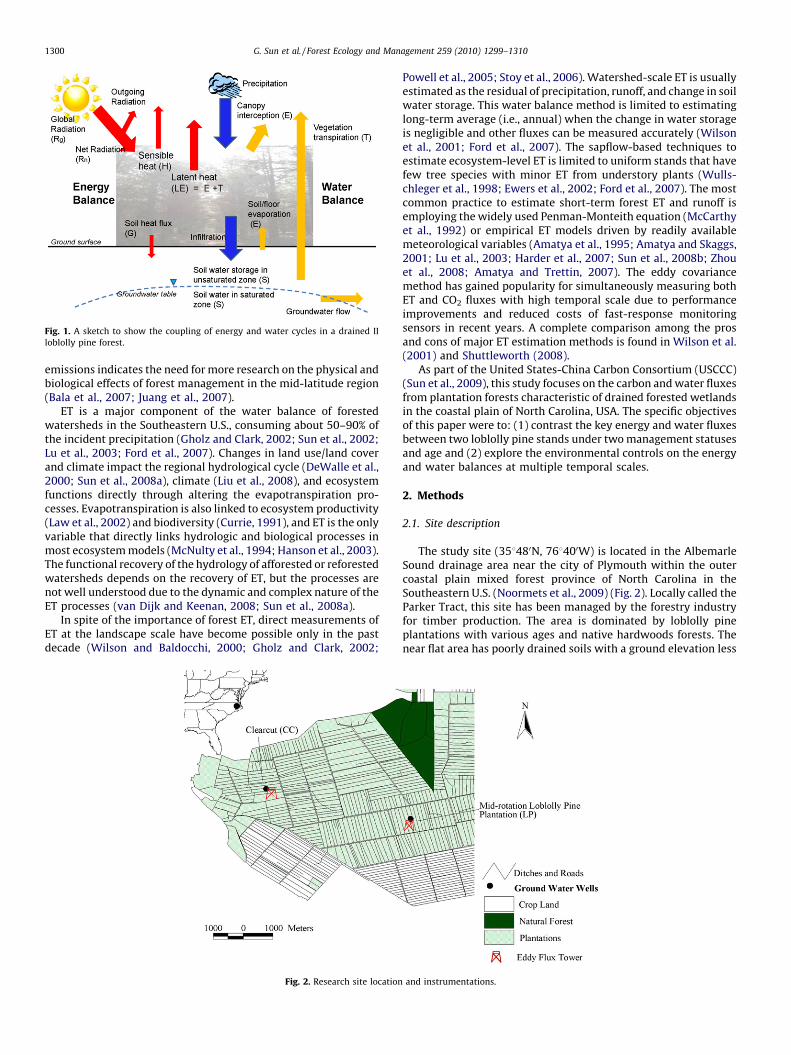
Fig. 1. A sketch to show the coupling of energy and water cycles in a drained II
loblolly pine forest.
G. Sun et al. / Forest Ecology and Management 259 (2010) 1299–13101300
emissions indicates the need for more research on the physical andbiological effects of forest management in the mid-latitude region(Bala et al., 2007; Juang et al., 2007).
ET is a major component of the water balance of forestedwatersheds in the Southeastern U.S., consuming about 50–90% ofthe incident precipitation (Gholz and Clark, 2002; Sun et al., 2002;Lu et al., 2003; Ford et al., 2007). Changes in land use/land coverand climate impact the regional hydrological cycle (DeWalle et al.,2000; Sun et al., 2008a), climate (Liu et al., 2008), and ecosystemfunctions directly through altering the evapotranspiration pro-cesses. Evapotranspiration is also linked to ecosystem productivity(Law et al., 2002) and biodiversity (Currie, 1991), and ET is the onlyvariable that directly links hydrologic and biological processes inmost ecosystem models (McNulty et al., 1994; Hanson et al., 2003).The functional recovery of the hydrology of afforested or reforestedwatersheds depends on the recovery of ET, but the processes arenot well understood due to the dynamic and complex nature of theET processes (van Dijk and Keenan, 2008; Sun et al., 2008a).
In spite of the importance of forest ET, direct measurements ofET at the landscape scale have become possible only in the pastdecade (Wilson and Baldocchi, 2000; Gholz and Clark, 2002;
Fig. 2. Research site location
Powell et al., 2005; Stoy et al., 2006). Watershed-scale ET is usuallyestimated as the residual of precipitation, runoff, and change in soilwater storage. This water balance method is limited to estimatinglong-term average (i.e., annual) when the change in water storageis negligible and other fluxes can be measured accurately (Wilsonet al., 2001; Ford et al., 2007). The sapflow-based techniques toestimate ecosystem-level ET is limited to uniform stands that havefew tree species with minor ET from understory plants (Wulls-chleger et al., 1998; Ewers et al., 2002; Ford et al., 2007). The mostcommon practice to estimate short-term forest ET and runoff isemploying the widely used Penman-Monteith equation (McCarthyet al., 1992) or empirical ET models driven by readily availablemeteorological variables (Amatya et al., 1995; Amatya and Skaggs,2001; Lu et al., 2003; Harder et al., 2007; Sun et al., 2008b; Zhouet al., 2008; Amatya and Trettin, 2007). The eddy covariancemethod has gained popularity for simultaneously measuring bothET and CO2 fluxes with high temporal scale due to performanceimprovements and reduced costs of fast-response monitoringsensors in recent years. A complete comparison among the prosand cons of major ET estimation methods is found in Wilson et al.(2001) and Shuttleworth (2008).
As part of the United States-China Carbon Consortium (USCCC)(Sun et al., 2009), this study focuses on the carbon and water fluxesfrom plantation forests characteristic of drained forested wetlandsin the coastal plain of North Carolina, USA. The specific objectivesof this paper were to: (1) contrast the key energy and water fluxesbetween two loblolly pine stands under two management statusesand age and (2) explore the environmental controls on the energyand water balances at multiple temporal scales.
2. Methods
2.1. Site description
The study site (358480N, 768400W) is located in the AlbemarleSound drainage area near the city of Plymouth within the outercoastal plain mixed forest province of North Carolina in theSoutheastern U.S. (Noormets et al., 2009) (Fig. 2). Locally called theParker Tract, this site has been managed by the forestry industryfor timber production. The area is dominated by loblolly pineplantations with various ages and native hardwoods forests. Thenear flat area has poorly drained soils with a ground elevation less
and instrumentations.
G. Sun et al. / Forest Ecology and Management 259 (2010) 1299–1310 1301
than 8 m above the sea level. The area has been drained with anetwork of field ditches (90–100 cm deep; 80–100 m spacing) andcanals that divide the watershed into a mosaic of regularly shapedfields and blocks of fields. The long-term (1945–2008) averageannual precipitation was 1320 � 211 mm and was evenly distrib-uted. The annual mean temperature was 15.5 8C, with a high averagemonthly temperature occurring in July (26.6 8C), and an averagemonthly low occurring in January (6.4 8C). The growing seasonaveraged about 195 days.
Within the Parker Track, two blocks were selected to representan age chronosequence of loblolly plantations (Fig. 2). The firstblock (CC) has an area of 70 ha. It was originally a nativehardwoods forest, but was harvested using a clearcut method in2002. Two-year-old loblolly pine seedlings were planted in 2004 ata 1.5 m � 6 m spacing and had a density of 1040 � 127 trees ha�1.This block was covered with annual plants and shrubs that reached aheight of 2.5 m in 2006. The dense weedy groundcover was primarilycomposed of Eupatorium capillofolium (dog fennel) and Smilax
rotundifolia (greenbrier). The soil is classified as the Cape Fear Series(i.e., fine, mixed, semiactive Typic Umbraquult). Diggs (2004)described the soil as being dark sandy loam in the top 25 cm with5–15% organic matter, sandy clay loam from a depth of 25–60 cm,sandy loam at 60–75 cm depth, and gray sandy clay from a depth of75–155 cm. Soil porosity was estimated to be 0.68, 0.5, 0.4 for soillayer 0–25, 25–75, and 75–100 cm, respectively. The maximumhydraulic conductivity of the top layer was 700 cm h�1, but decreasedto 40 cm h�1 at the 70 cm depth. Leaf area was not measured at thissite, but we observed a dense weedy cover during the study period(2005–2007). According to Gholz and Clark (2002) leaf area couldincrease dramatically up to 3.0 m2 m�2 within the first few years at aclearcut pine flatwoods, similar to this study site.
The second loblolly pine plantation site (LP) was located about3 km from CC (Fig. 2). The LP block was a 90 ha, mid-rotation loblollypine stand established in 1992 after clearcutting the previousmature pine plantation. Planting spacing was 1.5 m � 4.5 m. In2005, the measured basal area was approximately 25 m2 ha�1, andthe tree density was about 1660 trees ha�1. The averaged canopyheight was 11.9 m (2005), 12.8 m (2006) and 14.1 m (2007). Themaximum projected leaf area index (LAI) in early fall was3.9 m2 m�2 (2005), 4.0 m2 m�2 (2006) and 4.4 m2 m�2 (2007). Inwinter season (January–March), LAI decreased to 2.4–2.8 m2 m�2,mostly due to leaf fall of subdominant and understory Acer rubrum
(red maple) and S. rotundifolia (greenbrier). The organic soil at thissite was classified as the Belhaven Series histosol (i.e., loamy mixeddysic thermic Terric Haplosaprists). The soil is a very dark brown toblack, with a high organic matter content in the top 50 cm, and darkgrayish brown sandy loam at 50–85 cm depth. A sandy clay loamlayer exists from 85 to 200 cm, and a gray loamy sand was commonbelow the 200 cm depth. The maximum hydraulic conductivity ofthe top layer was 700 cm h�1, but decreased to about 10 cm h�1 atthe 70 cm depth. Soil porosity values were estimated as 0.72, 0.40,0.36, 0.45 for the layers of 0–45 cm, 45–75, 85–150, and 150–250 cm, respectively (Diggs, 2004; Grace et al., 2006a,b). Drainableporosity varied from 0.05 in the deep soil layers (>100 cm) to 0.2 inthe shallow layers (<40 cm).
In the fall of 2004, a walk-up scaffold and a radio towers wereerected at the center of LP and CC blocks, respectively, and bothtowers were instrumented to measure water and carbon fluxes andmicrometeorology. The LP and CC towers had a fetch of about 1000and 300 m, respectively.
2.2. Flux measurements for H, LE, and G
Following the AmeriFlux protocols, latent heat (LE), andsensible heat (H) flux measurements were made 23 and 10 mabove the forest floor at LP and CC, respectively (Noormets et al.,
2009). The open-path eddy covariance system consists of aninfrared gas analyzer (IRGA, Model LI-7500, LI-COR, Lincoln, NE,USA), a CSAT3 three-dimensional sonic anemometer (CampbellScientific Instrument-CSI, Logan, UT, USA), and a CR5000 datalogger (CSI). Air temperature was derived from sound speedmeasured by the sonic anemometer and was also obtained using athermocouple, that was used for estimating H. A relative humidityand air temperature sensor (model HMP-45C; Vaisala Oyj,Helsinki, Finland) was also installed at the same height as theIRGA to check vapor density. The 30-min mean fluxes for H and LEwere computed as the covariance of vertical wind speed, airtemperature, and the concentration of water using the EC_Pro-cessor software package (http://research.eeescience.utoledo.edu/lees/ECP/ECP.html). The algorithm uses the formulation of Leuning(2004) in the planar fit coordinate system (Wilczak et al., 2001),which was calculated from the entire year’s mean wind data. Theturbulent fluxes were adjusted for fluctuations in air density(Webb et al., 1980). Sonic air temperatures were corrected forchanges in humidity and pressure (Schotanus et al., 1983). Wecorrected the 30-min fluxes for the warming of IRGA using themethod developed by Burba et al. (2008).
For each site, soil heat flux (G) was measured at three locationsusing heat flux plates (model HFT3, CSI, Logan, UT, USA) buried5 cm below the ground surface. Data were recorded at a 30-mininterval along with other micrometeorological variables describedlater. The average of the three plate measured values were used forenergy balance calculations.
2.3. Micrometeorological measurements
Micrometeorological variables measured on each towerincluded air temperature, photosynthetically active radiation(PAR) (model LI-190, Licor), downward and upward shortwaveand longwave radiation (model CNR-1, Kipp and Zonen, Delft,Netherlands). Net radiation (Rn) was derived by summing up thenet shortwave and long wave radiation measurements using allfour measured radiation components. Precipitation was measuredcontinuously by two tipping bucket type of rain gages (TE-525, CSI;Onset1 Data Logging Rain Gauge, Onset Computer Corporation,USA), and one backup using manual rain gages (Forestry SuppliersInc., USA).
Soil temperature (Ts) was measured at 5 and 20 cm with CS107(CSI) temperature probes. The top 30-cm averaged volumetric soilmoisture content was measured continuously using a verticallyinserted CS616 (CSI) time domain reflectometer (TDR). Beginningon 10th May of 2007, the soil moisture profile at 10, 20, 30, 40, 50,60, 80, 120 cm depths was measured using Sentek EnviroSCANsensors (Sentek Sensor Technologies, Stepney, Australia) at aseparate location at the LP site. Next to the flux each tower, ashallow groundwater well was installed to monitor the water tablefluctuations at an hourly basis. The ground water table loggerswere based on ultrasonic and water pressure mechanisms(Infinities USA, Port Orange, FL, USA). Soil moisture content profileand water table level data were used to estimate the annual andmonthly change in soil water storage at the LP site.
2.4. Energy balance equation
We adopted the following simplified equation to examineenergy balances of a loblolly pine plantation forest (Gholz andClark, 2002). We neglect changes in energy storage and in energyused by photosynthesis at the monthly time scale:
Rn ¼ H þ LEþ G (1)
where Rn is net radiation flux at the interface between forestcanopy and the atmosphere. Rn represents the absorbed total
G. Sun et al. / Forest Ecology and Management 259 (2010) 1299–13101302
energy by the ecosystem this is redistributed into of H, LE, and G.The ratio of H and Rn is called Bowen ratio, b = H/LE. Albedo isdefined as the ratio of outgoing and incident shortwave radiation.
2.5. The water balance equation
The water balance for the study site is expressed as
P ¼ ETþ Q þDS (2)
where P is precipitation (mm), ET is ecosystem evapotranspiration(mm) that includes canopy interception or wet canopy evaporationand plant transpiration (i.e., dry canopy transpiration); Q isdrainage (i.e., shallow groundwater flowing out the watershed)(mm); and DS represents the change in water storage (mm) in boththe unsaturated and saturated soil zones (Fig. 1).
The total 30-min ET (mm 30-min�1) was converted from latentheat flux, LE (Wm�2) in Eq. (1), by the formula: ET = LE � (0.01800/44000) � 3600 � 0.5. The measured eddy fluxes are interpreted asrepresenting the total ecosystem evapotranspiration (ET) thatincludes both plant transpiration and evaporation from soil andplant surfaces.
We used the following equation to calculate monthly or annualDS when only soil moisture (u30) for the top 30 cm was measuredbefore 20 May 2007.
DS ¼ Du30 � 300þDWT� ud (3)
where DWT is the change in water table depth (mm) and ud is thesoil drainable porosity (ud). After 20 May 2007, soil moisturecontent at multiple layers was measured, so the following formulawas used to estimate DS:
DS ¼Xn
i¼1
uiDiðt þ 1Þ þ Dsðt þ 1Þ � us
!
�Xmi¼1
uiDiðtÞ þ DsðtÞ � us
!(4)
where ui is the soil moisture content at layer i that varies from m ton depending on the water table level from 1 month (year) t to nextmonth (year) t + 1. Di is the soil thickness interval (mm)corresponding to layer i. Ds is the saturated soil thickness (mm)above an arbitrary reference level and us is the saturated soilmoisture content or soil porosity.
2.5.1. Throughfall and stemflow measurements
A total of ten manual rain gages used as throughfall collectorswere randomly installed between the trees on the planting bedsand in the middle of two adjacent beds in the vicinity of the fluxtower at the LP site. Data were collected at a biweekly timeinterval. The interception rates were calculated as the differencebetween gross rainfall recorded by the rain gage on the tower andthat measured as throughfall divided by the gross rainfall.Stemflow measurements were made on two trees for a few stormevents in 2005 to estimate the proportion of rainfall and notcaptured by the throughfall collectors.
2.5.2. Grass reference evapotranspiration (ETo)
The FAO Penman-Monteith equation or often called the FAO-56grass reference ET method (Allen et al., 1994) estimates the actualET of a hypothetical well-watered grass that has a 0.12 m canopyheight, a leaf area of 4.8, a bulk surface resistance of 70 s m�1, andalbedo of 0.23. Since actual ET generally correlates closely with ETo,we used ETo to gapfill missing ET data at the half-hour scale. Usinghalf-hour meteorological data, half-hour ETo (mm) was estimatedand summed to derive daily and monthly ET. The albedo at the CCsite was very close to the ‘reference grass’ (see Section 3).
Therefore, we assumed that the CC site represented the ‘referencegrass’ condition defined by the FAO-56 method.
2.5.3. Data quality control and gapfilling of missing 30-min ET
Data quality was judged by atmospheric stability and fluxstationarity during periods of well-developed turbulence asreported previously (Noormets et al., 2008). Following the qualityscreening, the remaining data coverage was 42% (2005), 47%(2006) and 49% (2007), with gaps caused primarily by periods ofdew and precipitation, and poorly developed turbulence (u* = 0.20at LP, u* = 0.1 at CC, determined for each site, data not shown). Thelatter often co-occurred with very stable or very unstableatmospheric conditions. Obvious outliers were removed on a yearand site basis. For example, data points with LE > 800 W m�2 orLE < �200 W m�2 and H > 500 W m�2 or H < �200 W m�2 wereremoved. The 30-min ET data sets were gap-filled using theestablished monthly ET � ETo regression models developed fromexisting data. If ETo is not available, gaps were filled withregression relationships between ET and Rn by month. When allmeteorological variables are missing, linear interpolation methodwas used. When large gaps occurred such as half of the 48 datapoints were missing, that date was considered to produce ‘‘nodata’’. Similarly, if a third of the data points in a month weremissing or invalid, then this month was considered as having ‘‘nodata’’. Potential estimation errors in LE during rainfall events whensensors are wet were also addressed in the EC Processor(Meiresonne et al., 2003).
We recognize the energy imbalance problem for all eddycovariance measurements. The available energy (Rn + G) is gen-erally higher than turbulence fluxes (LE + H). Several reasons havebeen identified: (1) missing data due to either equipment failure,or a lack of air turbulence needed to meet the designed accuracy ofIRGA (Wilson et al., 2002). Wilson et al. (2002) documented that alack of closure, with 20% the energy is missing was not uncommonin the FLUXNET. (2) Heterogeneity of landscape (Foken, 2008). (3)Measurement errors in net radiation and soil heat flux (Restrepoand Arain, 2005).
Data quality control on the half-hour eddy flux data wereperformed in the EC processor that was implemented using the SASsoftware. The SAS procedure, ‘Proc Mixed’, that considers theinfluence of time on the variances of a variable examined, was usedto test the differences of the means of key observed energy andmicrometeorological variables between the LP and CC sites.
3. Results
3.1. Micrometeorology
The year 2006 had an annual total precipitation of 1272 mm,slightly lower than the long-term average (1320 mm) measured 8-km North at the Plymouth Weather Station in Washington Countyby NOAA (http://www.nc-climate.ncsu.edu/). However, 2005 wasmuch wetter (P = 1467 mm) than the average due to higher thannormal rainfall in the fall, and 2007 was an extremely dry year(P = 892 mm or 68% of long-term average). The severe dry summer,fall, and winter resulted in extremely dry hydrologic conditions asindicated by the low soil moisture (Fig. 3) and low groundwatertable (Fig. 4).
The 3-year averaged daily Rn at LP was significantly (p < 0.01)higher than CC by about 20% (Fig. 5). Rn was linearly correlatedwith incoming global radiation input at the half-hour time interval(Table 1). The mean albedos (a) were 0.25 and 0.16 for CC and LP,respectively. The mean albedos at both sites had little inter-annualvariations (Table 1), but they had large intra-annual variability,reflecting the changes of plant phonology and surface character-istics of vegetation covers (e.g., LAI). Site albedos reached the
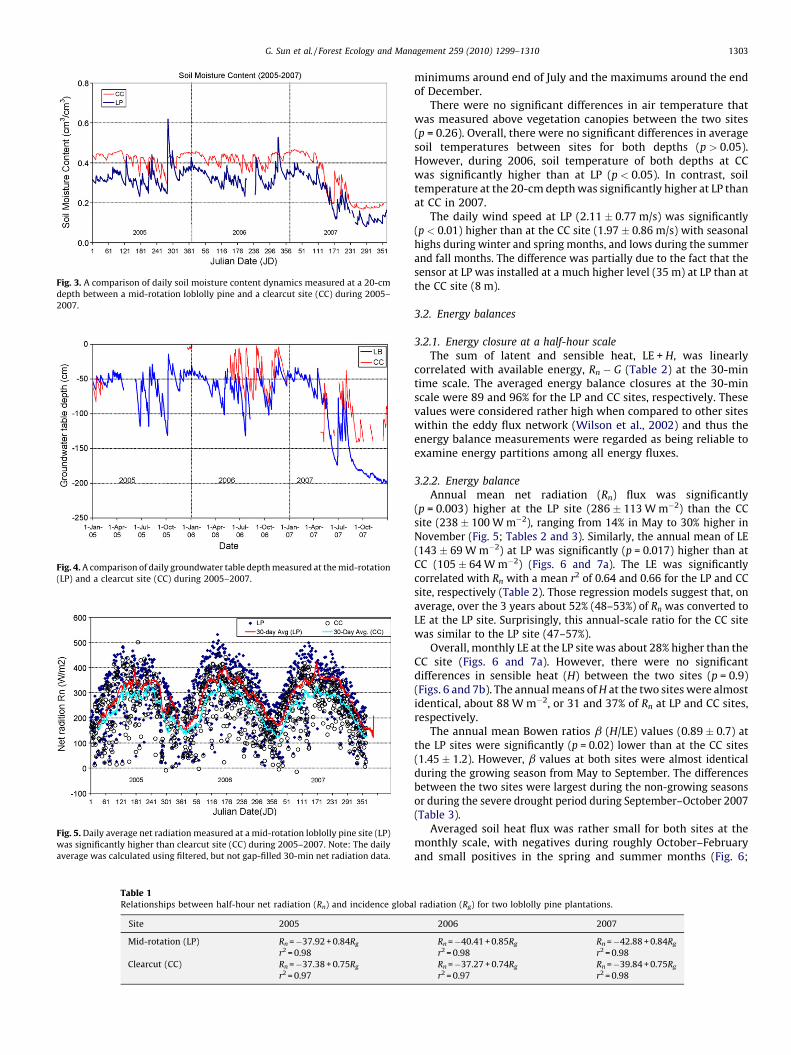
Fig. 3. A comparison of daily soil moisture content dynamics measured at a 20-cm
depth between a mid-rotation loblolly pine and a clearcut site (CC) during 2005–
2007.
Fig. 4. A comparison of daily groundwater table depth measured at the mid-rotation
(LP) and a clearcut site (CC) during 2005–2007.
Fig. 5. Daily average net radiation measured at a mid-rotation loblolly pine site (LP)
was significantly higher than clearcut site (CC) during 2005–2007. Note: The daily
average was calculated using filtered, but not gap-filled 30-min net radiation data.
Table 1Relationships between half-hour net radiation (Rn) and incidence globa
Site 2005
Mid-rotation (LP) Rn =�37.92 + 0.84Rg
r2 = 0.98
Clearcut (CC) Rn =�37.38 + 0.75Rg
r2 = 0.97
G. Sun et al. / Forest Ecology and Management 259 (2010) 1299–1310 1303
minimums around end of July and the maximums around the endof December.
There were no significant differences in air temperature thatwas measured above vegetation canopies between the two sites(p = 0.26). Overall, there were no significant differences in averagesoil temperatures between sites for both depths (p > 0.05).However, during 2006, soil temperature of both depths at CCwas significantly higher than at LP (p < 0.05). In contrast, soiltemperature at the 20-cm depth was significantly higher at LP thanat CC in 2007.
The daily wind speed at LP (2.11 � 0.77 m/s) was significantly(p < 0.01) higher than at the CC site (1.97 � 0.86 m/s) with seasonalhighs during winter and spring months, and lows during the summerand fall months. The difference was partially due to the fact that thesensor at LP was installed at a much higher level (35 m) at LP than atthe CC site (8 m).
3.2. Energy balances
3.2.1. Energy closure at a half-hour scale
The sum of latent and sensible heat, LE + H, was linearlycorrelated with available energy, Rn � G (Table 2) at the 30-mintime scale. The averaged energy balance closures at the 30-minscale were 89 and 96% for the LP and CC sites, respectively. Thesevalues were considered rather high when compared to other siteswithin the eddy flux network (Wilson et al., 2002) and thus theenergy balance measurements were regarded as being reliable toexamine energy partitions among all energy fluxes.
3.2.2. Energy balance
Annual mean net radiation (Rn) flux was significantly(p = 0.003) higher at the LP site (286 � 113 W m�2) than the CCsite (238 � 100 W m�2), ranging from 14% in May to 30% higher inNovember (Fig. 5; Tables 2 and 3). Similarly, the annual mean of LE(143 � 69 W m�2) at LP was significantly (p = 0.017) higher than atCC (105 � 64 W m�2) (Figs. 6 and 7a). The LE was significantlycorrelated with Rn with a mean r2 of 0.64 and 0.66 for the LP and CCsite, respectively (Table 2). Those regression models suggest that, onaverage, over the 3 years about 52% (48–53%) of Rn was converted toLE at the LP site. Surprisingly, this annual-scale ratio for the CC sitewas similar to the LP site (47–57%).
Overall, monthly LE at the LP site was about 28% higher than theCC site (Figs. 6 and 7a). However, there were no significantdifferences in sensible heat (H) between the two sites (p = 0.9)(Figs. 6 and 7b). The annual means of H at the two sites were almostidentical, about 88 W m�2, or 31 and 37% of Rn at LP and CC sites,respectively.
The annual mean Bowen ratios b (H/LE) values (0.89 � 0.7) atthe LP sites were significantly (p = 0.02) lower than at the CC sites(1.45 � 1.2). However, b values at both sites were almost identicalduring the growing season from May to September. The differencesbetween the two sites were largest during the non-growing seasonsor during the severe drought period during September–October 2007(Table 3).
Averaged soil heat flux was rather small for both sites at themonthly scale, with negatives during roughly October–Februaryand small positives in the spring and summer months (Fig. 6;
l radiation (Rg) for two loblolly pine plantations.
2006 2007
Rn =�40.41 + 0.85Rg Rn =�42.88 + 0.84Rg
r2 = 0.98 r2 = 0.98
Rn =�37.27 + 0.74Rg Rn =�39.84 + 0.75Rg
r2 = 0.97 r2 = 0.98
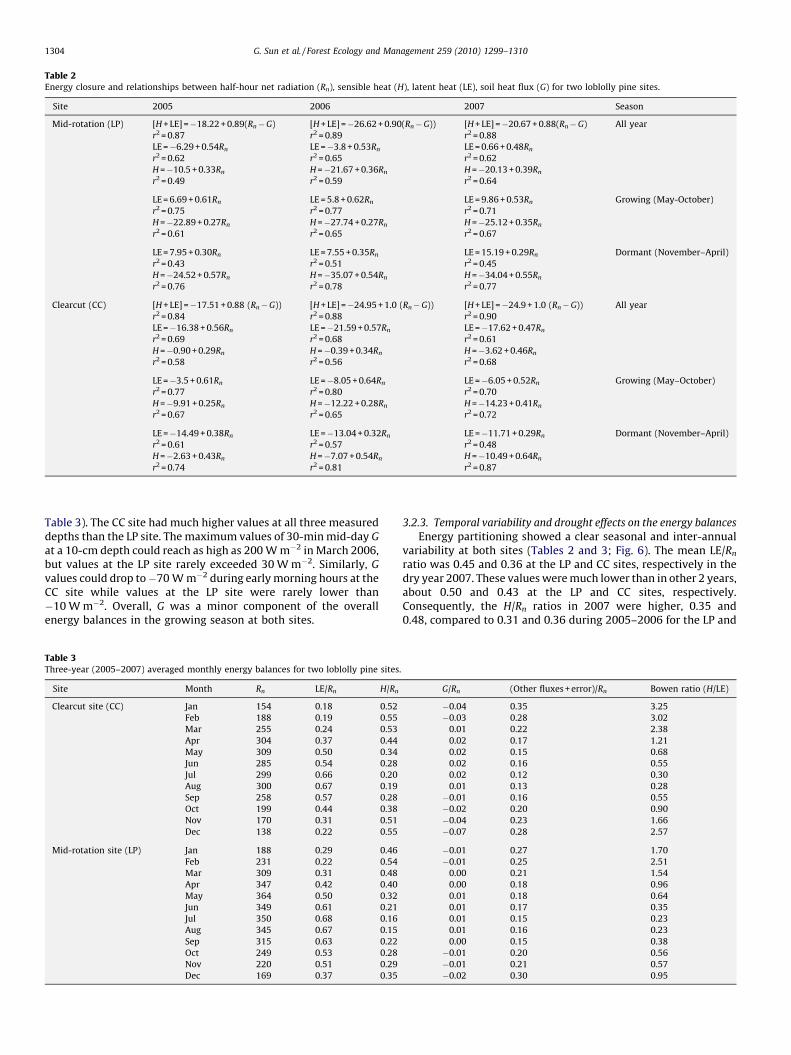
Table 2Energy closure and relationships between half-hour net radiation (Rn), sensible heat (H), latent heat (LE), soil heat flux (G) for two loblolly pine sites.
Site 2005 2006 2007 Season
Mid-rotation (LP) [H + LE] =�18.22 + 0.89(Rn�G) [H + LE] =�26.62 + 0.90(Rn�G)) [H + LE] =�20.67 + 0.88(Rn�G) All year
r2 = 0.87 r2 = 0.89 r2 = 0.88
LE =�6.29 + 0.54Rn LE =�3.8 + 0.53Rn LE = 0.66 + 0.48Rn
r2 = 0.62 r2 = 0.65 r2 = 0.62
H =�10.5 + 0.33Rn H =�21.67 + 0.36Rn H =�20.13 + 0.39Rn
r2 = 0.49 r2 = 0.59 r2 = 0.64
LE = 6.69 + 0.61Rn LE = 5.8 + 0.62Rn LE = 9.86 + 0.53Rn Growing (May-October)
r2 = 0.75 r2 = 0.77 r2 = 0.71
H =�22.89 + 0.27Rn H =�27.74 + 0.27Rn H =�25.12 + 0.35Rn
r2 = 0.61 r2 = 0.65 r2 = 0.67
LE = 7.95 + 0.30Rn LE = 7.55 + 0.35Rn LE = 15.19 + 0.29Rn Dormant (November–April)
r2 = 0.43 r2 = 0.51 r2 = 0.45
H =�24.52 + 0.57Rn H =�35.07 + 0.54Rn H =�34.04 + 0.55Rn
r2 = 0.76 r2 = 0.78 r2 = 0.77
Clearcut (CC) [H + LE] =�17.51 + 0.88 (Rn�G)) [H + LE] =�24.95 + 1.0 (Rn�G)) [H + LE] =�24.9 + 1.0 (Rn�G)) All year
r2 = 0.84 r2 = 0.88 r2 = 0.90
LE =�16.38 + 0.56Rn LE =�21.59 + 0.57Rn LE =�17.62 + 0.47Rn
r2 = 0.69 r2 = 0.68 r2 = 0.61
H =�0.90 + 0.29Rn H =�0.39 + 0.34Rn H =�3.62 + 0.46Rn
r2 = 0.58 r2 = 0.56 r2 = 0.68
LE =�3.5 + 0.61Rn LE =�8.05 + 0.64Rn LE =�6.05 + 0.52Rn Growing (May–October)
r2 = 0.77 r2 = 0.80 r2 = 0.70
H =�9.91 + 0.25Rn H =�12.22 + 0.28Rn H =�14.23 + 0.41Rn
r2 = 0.67 r2 = 0.65 r2 = 0.72
LE =�14.49 + 0.38Rn LE =�13.04 + 0.32Rn LE =�11.71 + 0.29Rn Dormant (November–April)
r2 = 0.61 r2 = 0.57 r2 = 0.48
H =�2.63 + 0.43Rn H =�7.07 + 0.54Rn H =�10.49 + 0.64Rn
r2 = 0.74 r2 = 0.81 r2 = 0.87
G. Sun et al. / Forest Ecology and Management 259 (2010) 1299–13101304
Table 3). The CC site had much higher values at all three measureddepths than the LP site. The maximum values of 30-min mid-day G
at a 10-cm depth could reach as high as 200 W m�2 in March 2006,but values at the LP site rarely exceeded 30 W m�2. Similarly, G
values could drop to�70 W m�2 during early morning hours at theCC site while values at the LP site were rarely lower than�10 W m�2. Overall, G was a minor component of the overallenergy balances in the growing season at both sites.
Table 3Three-year (2005–2007) averaged monthly energy balances for two loblolly pine sites
Site Month Rn LE/Rn H/Rn
Clearcut site (CC) Jan 154 0.18 0.52
Feb 188 0.19 0.55
Mar 255 0.24 0.53
Apr 304 0.37 0.44
May 309 0.50 0.34
Jun 285 0.54 0.28
Jul 299 0.66 0.20
Aug 300 0.67 0.19
Sep 258 0.57 0.28
Oct 199 0.44 0.38
Nov 170 0.31 0.51
Dec 138 0.22 0.55
Mid-rotation site (LP) Jan 188 0.29 0.46
Feb 231 0.22 0.54
Mar 309 0.31 0.48
Apr 347 0.42 0.40
May 364 0.50 0.32
Jun 349 0.61 0.21
Jul 350 0.68 0.16
Aug 345 0.67 0.15
Sep 315 0.63 0.22
Oct 249 0.53 0.28
Nov 220 0.51 0.29
Dec 169 0.37 0.35
3.2.3. Temporal variability and drought effects on the energy balances
Energy partitioning showed a clear seasonal and inter-annualvariability at both sites (Tables 2 and 3; Fig. 6). The mean LE/Rn
ratio was 0.45 and 0.36 at the LP and CC sites, respectively in thedry year 2007. These values were much lower than in other 2 years,about 0.50 and 0.43 at the LP and CC sites, respectively.Consequently, the H/Rn ratios in 2007 were higher, 0.35 and0.48, compared to 0.31 and 0.36 during 2005–2006 for the LP and
.
G/Rn (Other fluxes + error)/Rn Bowen ratio (H/LE)
�0.04 0.35 3.25
�0.03 0.28 3.02
0.01 0.22 2.38
0.02 0.17 1.21
0.02 0.15 0.68
0.02 0.16 0.55
0.02 0.12 0.30
0.01 0.13 0.28
�0.01 0.16 0.55
�0.02 0.20 0.90
�0.04 0.23 1.66
�0.07 0.28 2.57
�0.01 0.27 1.70
�0.01 0.25 2.51
0.00 0.21 1.54
0.00 0.18 0.96
0.01 0.18 0.64
0.01 0.17 0.35
0.01 0.15 0.23
0.01 0.16 0.23
0.00 0.15 0.38
�0.01 0.20 0.56
�0.01 0.21 0.57
�0.02 0.30 0.95
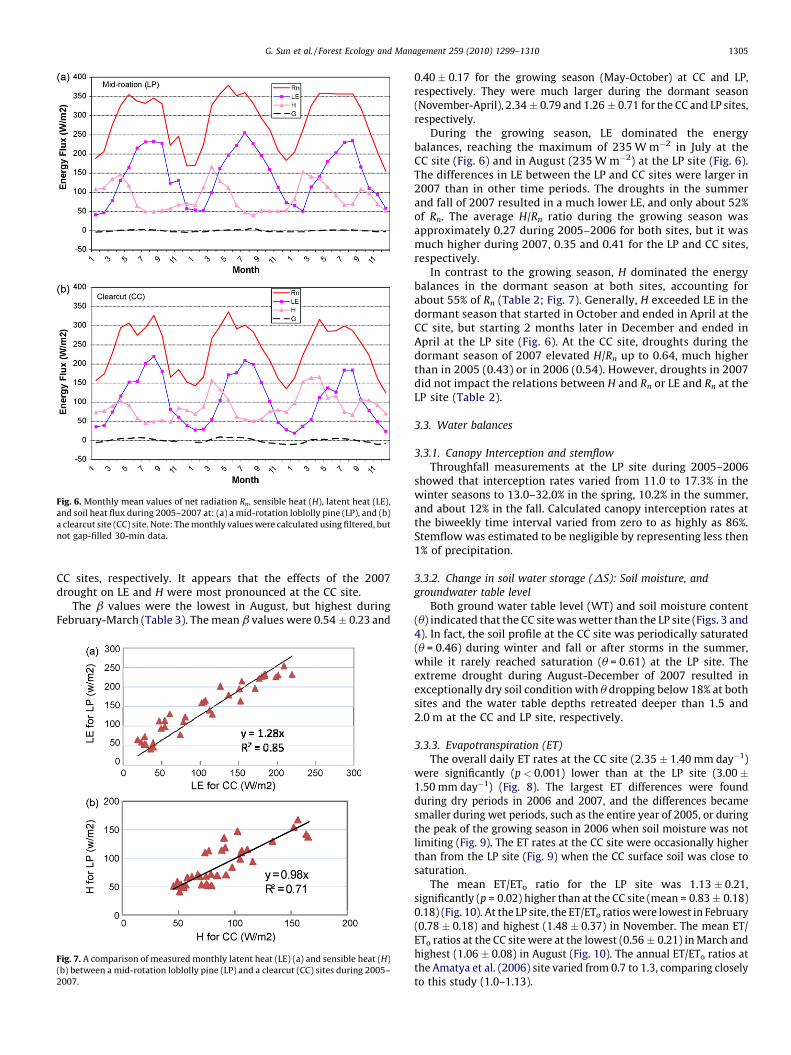
Fig. 6. Monthly mean values of net radiation Rn, sensible heat (H), latent heat (LE),
and soil heat flux during 2005–2007 at: (a) a mid-rotation loblolly pine (LP), and (b)
a clearcut site (CC) site. Note: The monthly values were calculated using filtered, but
not gap-filled 30-min data.
G. Sun et al. / Forest Ecology and Management 259 (2010) 1299–1310 1305
CC sites, respectively. It appears that the effects of the 2007drought on LE and H were most pronounced at the CC site.
The b values were the lowest in August, but highest duringFebruary-March (Table 3). The mean b values were 0.54 � 0.23 and
Fig. 7. A comparison of measured monthly latent heat (LE) (a) and sensible heat (H)
(b) between a mid-rotation loblolly pine (LP) and a clearcut (CC) sites during 2005–
2007.
0.40 � 0.17 for the growing season (May-October) at CC and LP,respectively. They were much larger during the dormant season(November-April), 2.34 � 0.79 and 1.26 � 0.71 for the CC and LP sites,respectively.
During the growing season, LE dominated the energybalances, reaching the maximum of 235 W m�2 in July at theCC site (Fig. 6) and in August (235 W m�2) at the LP site (Fig. 6).The differences in LE between the LP and CC sites were larger in2007 than in other time periods. The droughts in the summerand fall of 2007 resulted in a much lower LE, and only about 52%of Rn. The average H/Rn ratio during the growing season wasapproximately 0.27 during 2005–2006 for both sites, but it wasmuch higher during 2007, 0.35 and 0.41 for the LP and CC sites,respectively.
In contrast to the growing season, H dominated the energybalances in the dormant season at both sites, accounting forabout 55% of Rn (Table 2; Fig. 7). Generally, H exceeded LE in thedormant season that started in October and ended in April at theCC site, but starting 2 months later in December and ended inApril at the LP site (Fig. 6). At the CC site, droughts during thedormant season of 2007 elevated H/Rn up to 0.64, much higherthan in 2005 (0.43) or in 2006 (0.54). However, droughts in 2007did not impact the relations between H and Rn or LE and Rn at theLP site (Table 2).
3.3. Water balances
3.3.1. Canopy Interception and stemflow
Throughfall measurements at the LP site during 2005–2006showed that interception rates varied from 11.0 to 17.3% in thewinter seasons to 13.0–32.0% in the spring, 10.2% in the summer,and about 12% in the fall. Calculated canopy interception rates atthe biweekly time interval varied from zero to as highly as 86%.Stemflow was estimated to be negligible by representing less then1% of precipitation.
3.3.2. Change in soil water storage (DS): Soil moisture, and
groundwater table level
Both ground water table level (WT) and soil moisture content(u) indicated that the CC site was wetter than the LP site (Figs. 3 and4). In fact, the soil profile at the CC site was periodically saturated(u = 0.46) during winter and fall or after storms in the summer,while it rarely reached saturation (u = 0.61) at the LP site. Theextreme drought during August-December of 2007 resulted inexceptionally dry soil condition with u dropping below 18% at bothsites and the water table depths retreated deeper than 1.5 and2.0 m at the CC and LP site, respectively.
3.3.3. Evapotranspiration (ET)
The overall daily ET rates at the CC site (2.35 � 1.40 mm day�1)were significantly (p < 0.001) lower than at the LP site (3.00 �1.50 mm day�1) (Fig. 8). The largest ET differences were foundduring dry periods in 2006 and 2007, and the differences becamesmaller during wet periods, such as the entire year of 2005, or duringthe peak of the growing season in 2006 when soil moisture was notlimiting (Fig. 9). The ET rates at the CC site were occasionally higherthan from the LP site (Fig. 9) when the CC surface soil was close tosaturation.
The mean ET/ETo ratio for the LP site was 1.13 � 0.21,significantly (p = 0.02) higher than at the CC site (mean = 0.83 � 0.18)0.18) (Fig. 10). At the LP site, the ET/ETo ratios were lowest in February(0.78 � 0.18) and highest (1.48 � 0.37) in November. The mean ET/ETo ratios at the CC site were at the lowest (0.56 � 0.21) in March andhighest (1.06 � 0.08) in August (Fig. 10). The annual ET/ETo ratios atthe Amatya et al. (2006) site varied from 0.7 to 1.3, comparing closelyto this study (1.0–1.13).
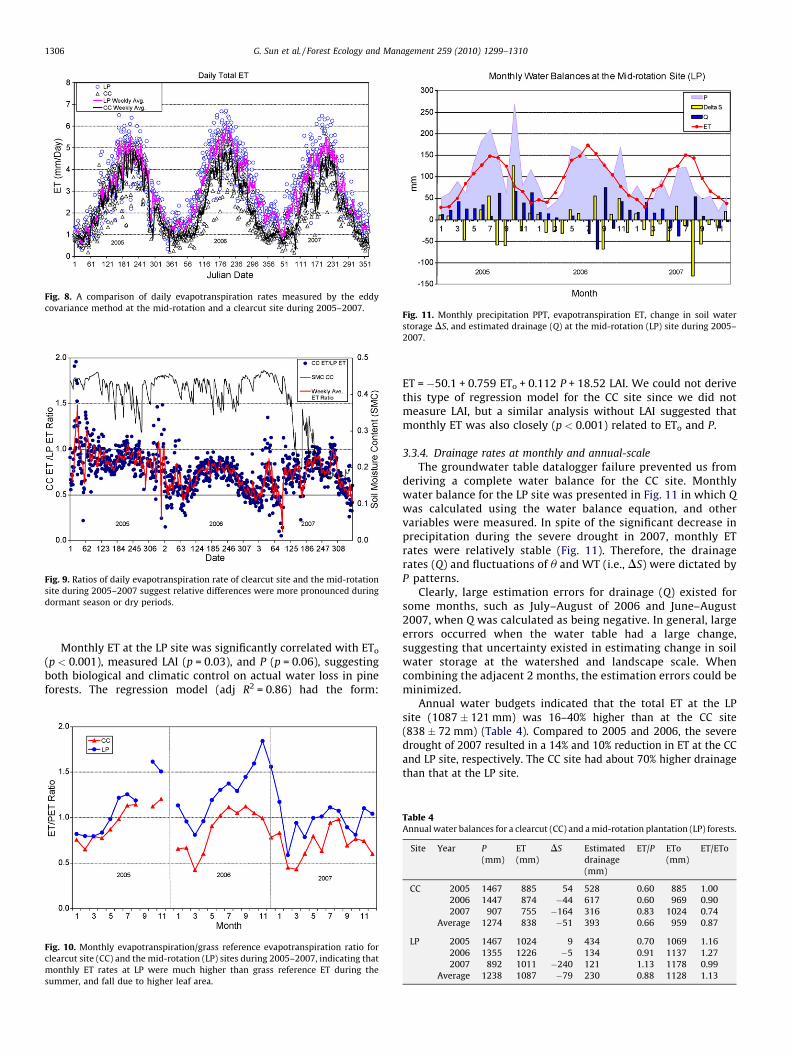
Fig. 8. A comparison of daily evapotranspiration rates measured by the eddy
covariance method at the mid-rotation and a clearcut site during 2005–2007.
Fig. 9. Ratios of daily evapotranspiration rate of clearcut site and the mid-rotation
site during 2005–2007 suggest relative differences were more pronounced during
dormant season or dry periods.
Fig. 11. Monthly precipitation PPT, evapotranspiration ET, change in soil water
storage DS, and estimated drainage (Q) at the mid-rotation (LP) site during 2005–
2007.
G. Sun et al. / Forest Ecology and Management 259 (2010) 1299–13101306
Monthly ET at the LP site was significantly correlated with ETo
(p < 0.001), measured LAI (p = 0.03), and P (p = 0.06), suggestingboth biological and climatic control on actual water loss in pineforests. The regression model (adj R2 = 0.86) had the form:
Fig. 10. Monthly evapotranspiration/grass reference evapotranspiration ratio for
clearcut site (CC) and the mid-rotation (LP) sites during 2005–2007, indicating that
monthly ET rates at LP were much higher than grass reference ET during the
summer, and fall due to higher leaf area.
ET = �50.1 + 0.759 ETo + 0.112 P + 18.52 LAI. We could not derivethis type of regression model for the CC site since we did notmeasure LAI, but a similar analysis without LAI suggested thatmonthly ET was also closely (p < 0.001) related to ETo and P.
3.3.4. Drainage rates at monthly and annual-scale
The groundwater table datalogger failure prevented us fromderiving a complete water balance for the CC site. Monthlywater balance for the LP site was presented in Fig. 11 in which Q
was calculated using the water balance equation, and othervariables were measured. In spite of the significant decrease inprecipitation during the severe drought in 2007, monthly ETrates were relatively stable (Fig. 11). Therefore, the drainagerates (Q) and fluctuations of u and WT (i.e., DS) were dictated byP patterns.
Clearly, large estimation errors for drainage (Q) existed forsome months, such as July–August of 2006 and June–August2007, when Q was calculated as being negative. In general, largeerrors occurred when the water table had a large change,suggesting that uncertainty existed in estimating change in soilwater storage at the watershed and landscape scale. Whencombining the adjacent 2 months, the estimation errors could beminimized.
Annual water budgets indicated that the total ET at the LPsite (1087 � 121 mm) was 16–40% higher than at the CC site(838 � 72 mm) (Table 4). Compared to 2005 and 2006, the severedrought of 2007 resulted in a 14% and 10% reduction in ET at the CCand LP site, respectively. The CC site had about 70% higher drainagethan that at the LP site.
Table 4Annual water balances for a clearcut (CC) and a mid-rotation plantation (LP) forests.
Site Year P
(mm)
ET
(mm)
DS Estimated
drainage
(mm)
ET/P ETo
(mm)
ET/ETo
CC 2005 1467 885 54 528 0.60 885 1.00
2006 1447 874 �44 617 0.60 969 0.90
2007 907 755 �164 316 0.83 1024 0.74
Average 1274 838 �51 393 0.66 959 0.87
LP 2005 1467 1024 9 434 0.70 1069 1.16
2006 1355 1226 �5 134 0.91 1137 1.27
2007 892 1011 �240 121 1.13 1178 0.99
Average 1238 1087 �79 230 0.88 1128 1.13
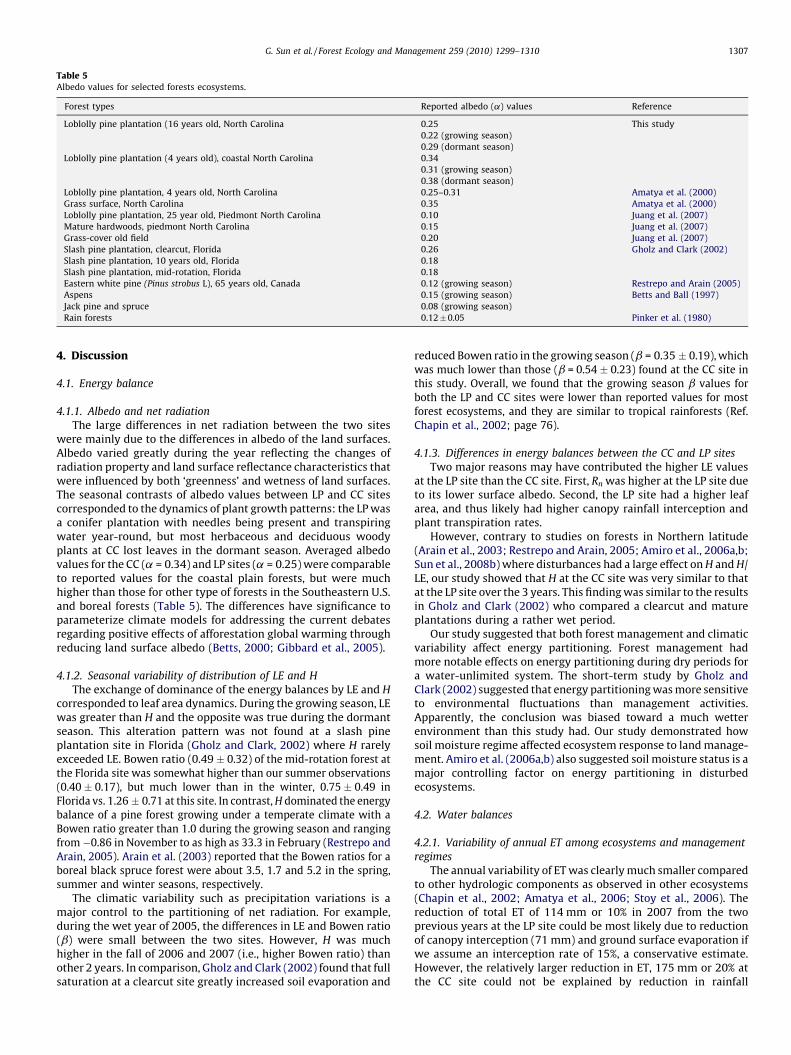
Table 5Albedo values for selected forests ecosystems.
Forest types Reported albedo (a) values Reference
Loblolly pine plantation (16 years old, North Carolina 0.25 This study
0.22 (growing season)
0.29 (dormant season)
Loblolly pine plantation (4 years old), coastal North Carolina 0.34
0.31 (growing season)
0.38 (dormant season)
Loblolly pine plantation, 4 years old, North Carolina 0.25–0.31 Amatya et al. (2000)
Grass surface, North Carolina 0.35 Amatya et al. (2000)
Loblolly pine plantation, 25 year old, Piedmont North Carolina 0.10 Juang et al. (2007)
Mature hardwoods, piedmont North Carolina 0.15 Juang et al. (2007)
Grass-cover old field 0.20 Juang et al. (2007)
Slash pine plantation, clearcut, Florida 0.26 Gholz and Clark (2002)
Slash pine plantation, 10 years old, Florida 0.18
Slash pine plantation, mid-rotation, Florida 0.18
Eastern white pine (Pinus strobus L), 65 years old, Canada 0.12 (growing season) Restrepo and Arain (2005)
Aspens 0.15 (growing season) Betts and Ball (1997)
Jack pine and spruce 0.08 (growing season)
Rain forests 0.12�0.05 Pinker et al. (1980)
G. Sun et al. / Forest Ecology and Management 259 (2010) 1299–1310 1307
4. Discussion
4.1. Energy balance
4.1.1. Albedo and net radiation
The large differences in net radiation between the two siteswere mainly due to the differences in albedo of the land surfaces.Albedo varied greatly during the year reflecting the changes ofradiation property and land surface reflectance characteristics thatwere influenced by both ‘greenness’ and wetness of land surfaces.The seasonal contrasts of albedo values between LP and CC sitescorresponded to the dynamics of plant growth patterns: the LP wasa conifer plantation with needles being present and transpiringwater year-round, but most herbaceous and deciduous woodyplants at CC lost leaves in the dormant season. Averaged albedovalues for the CC (a = 0.34) and LP sites (a = 0.25) were comparableto reported values for the coastal plain forests, but were muchhigher than those for other type of forests in the Southeastern U.S.and boreal forests (Table 5). The differences have significance toparameterize climate models for addressing the current debatesregarding positive effects of afforestation global warming throughreducing land surface albedo (Betts, 2000; Gibbard et al., 2005).
4.1.2. Seasonal variability of distribution of LE and H
The exchange of dominance of the energy balances by LE and H
corresponded to leaf area dynamics. During the growing season, LEwas greater than H and the opposite was true during the dormantseason. This alteration pattern was not found at a slash pineplantation site in Florida (Gholz and Clark, 2002) where H rarelyexceeded LE. Bowen ratio (0.49 � 0.32) of the mid-rotation forest atthe Florida site was somewhat higher than our summer observations(0.40 � 0.17), but much lower than in the winter, 0.75 � 0.49 inFlorida vs. 1.26 � 0.71 at this site. In contrast, H dominated the energybalance of a pine forest growing under a temperate climate with aBowen ratio greater than 1.0 during the growing season and rangingfrom �0.86 in November to as high as 33.3 in February (Restrepo andArain, 2005). Arain et al. (2003) reported that the Bowen ratios for aboreal black spruce forest were about 3.5, 1.7 and 5.2 in the spring,summer and winter seasons, respectively.
The climatic variability such as precipitation variations is amajor control to the partitioning of net radiation. For example,during the wet year of 2005, the differences in LE and Bowen ratio(b) were small between the two sites. However, H was muchhigher in the fall of 2006 and 2007 (i.e., higher Bowen ratio) thanother 2 years. In comparison, Gholz and Clark (2002) found that fullsaturation at a clearcut site greatly increased soil evaporation and
reduced Bowen ratio in the growing season (b = 0.35 � 0.19), whichwas much lower than those (b = 0.54 � 0.23) found at the CC site inthis study. Overall, we found that the growing season b values forboth the LP and CC sites were lower than reported values for mostforest ecosystems, and they are similar to tropical rainforests (Ref.Chapin et al., 2002; page 76).
4.1.3. Differences in energy balances between the CC and LP sites
Two major reasons may have contributed the higher LE valuesat the LP site than the CC site. First, Rn was higher at the LP site dueto its lower surface albedo. Second, the LP site had a higher leafarea, and thus likely had higher canopy rainfall interception andplant transpiration rates.
However, contrary to studies on forests in Northern latitude(Arain et al., 2003; Restrepo and Arain, 2005; Amiro et al., 2006a,b;Sun et al., 2008b) where disturbances had a large effect on H and H/LE, our study showed that H at the CC site was very similar to thatat the LP site over the 3 years. This finding was similar to the resultsin Gholz and Clark (2002) who compared a clearcut and matureplantations during a rather wet period.
Our study suggested that both forest management and climaticvariability affect energy partitioning. Forest management hadmore notable effects on energy partitioning during dry periods fora water-unlimited system. The short-term study by Gholz andClark (2002) suggested that energy partitioning was more sensitiveto environmental fluctuations than management activities.Apparently, the conclusion was biased toward a much wetterenvironment than this study had. Our study demonstrated howsoil moisture regime affected ecosystem response to land manage-ment. Amiro et al. (2006a,b) also suggested soil moisture status is amajor controlling factor on energy partitioning in disturbedecosystems.
4.2. Water balances
4.2.1. Variability of annual ET among ecosystems and management
regimes
The annual variability of ET was clearly much smaller comparedto other hydrologic components as observed in other ecosystems(Chapin et al., 2002; Amatya et al., 2006; Stoy et al., 2006). Thereduction of total ET of 114 mm or 10% in 2007 from the twoprevious years at the LP site could be most likely due to reductionof canopy interception (71 mm) and ground surface evaporation ifwe assume an interception rate of 15%, a conservative estimate.However, the relatively larger reduction in ET, 175 mm or 20% atthe CC site could not be explained by reduction in rainfall
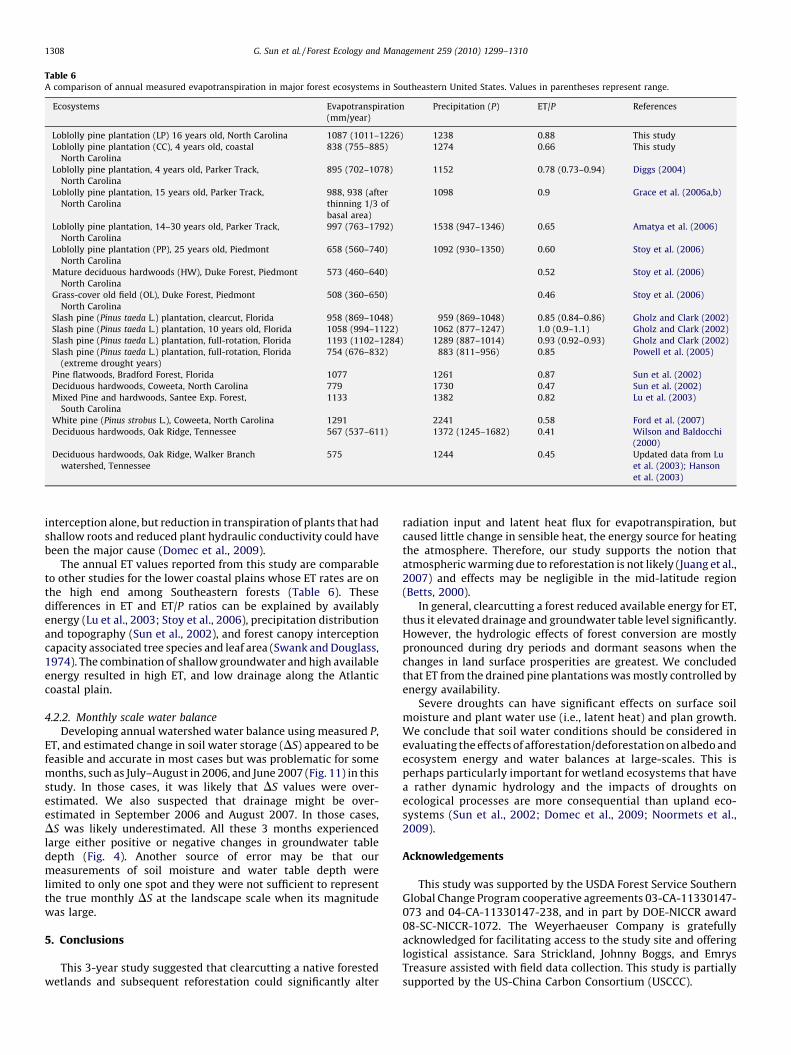
Table 6A comparison of annual measured evapotranspiration in major forest ecosystems in Southeastern United States. Values in parentheses represent range.
Ecosystems Evapotranspiration
(mm/year)
Precipitation (P) ET/P References
Loblolly pine plantation (LP) 16 years old, North Carolina 1087 (1011–1226) 1238 0.88 This study
Loblolly pine plantation (CC), 4 years old, coastal
North Carolina
838 (755–885) 1274 0.66 This study
Loblolly pine plantation, 4 years old, Parker Track,
North Carolina
895 (702–1078) 1152 0.78 (0.73–0.94) Diggs (2004)
Loblolly pine plantation, 15 years old, Parker Track,
North Carolina
988, 938 (after
thinning 1/3 of
basal area)
1098 0.9 Grace et al. (2006a,b)
Loblolly pine plantation, 14–30 years old, Parker Track,
North Carolina
997 (763–1792) 1538 (947–1346) 0.65 Amatya et al. (2006)
Loblolly pine plantation (PP), 25 years old, Piedmont
North Carolina
658 (560–740) 1092 (930–1350) 0.60 Stoy et al. (2006)
Mature deciduous hardwoods (HW), Duke Forest, Piedmont
North Carolina
573 (460–640) 0.52 Stoy et al. (2006)
Grass-cover old field (OL), Duke Forest, Piedmont
North Carolina
508 (360–650) 0.46 Stoy et al. (2006)
Slash pine (Pinus taeda L.) plantation, clearcut, Florida 958 (869–1048) 959 (869–1048) 0.85 (0.84–0.86) Gholz and Clark (2002)
Slash pine (Pinus taeda L.) plantation, 10 years old, Florida 1058 (994–1122) 1062 (877–1247) 1.0 (0.9–1.1) Gholz and Clark (2002)
Slash pine (Pinus taeda L.) plantation, full-rotation, Florida 1193 (1102–1284) 1289 (887–1014) 0.93 (0.92–0.93) Gholz and Clark (2002)
Slash pine (Pinus taeda L.) plantation, full-rotation, Florida
(extreme drought years)
754 (676–832) 883 (811–956) 0.85 Powell et al. (2005)
Pine flatwoods, Bradford Forest, Florida 1077 1261 0.87 Sun et al. (2002)
Deciduous hardwoods, Coweeta, North Carolina 779 1730 0.47 Sun et al. (2002)
Mixed Pine and hardwoods, Santee Exp. Forest,
South Carolina
1133 1382 0.82 Lu et al. (2003)
White pine (Pinus strobus L.), Coweeta, North Carolina 1291 2241 0.58 Ford et al. (2007)
Deciduous hardwoods, Oak Ridge, Tennessee 567 (537–611) 1372 (1245–1682) 0.41 Wilson and Baldocchi
(2000)
Deciduous hardwoods, Oak Ridge, Walker Branch
watershed, Tennessee
575 1244 0.45 Updated data from Lu
et al. (2003); Hanson
et al. (2003)
G. Sun et al. / Forest Ecology and Management 259 (2010) 1299–13101308
interception alone, but reduction in transpiration of plants that hadshallow roots and reduced plant hydraulic conductivity could havebeen the major cause (Domec et al., 2009).
The annual ET values reported from this study are comparableto other studies for the lower coastal plains whose ET rates are onthe high end among Southeastern forests (Table 6). Thesedifferences in ET and ET/P ratios can be explained by availablyenergy (Lu et al., 2003; Stoy et al., 2006), precipitation distributionand topography (Sun et al., 2002), and forest canopy interceptioncapacity associated tree species and leaf area (Swank and Douglass,1974). The combination of shallow groundwater and high availableenergy resulted in high ET, and low drainage along the Atlanticcoastal plain.
4.2.2. Monthly scale water balance
Developing annual watershed water balance using measured P,ET, and estimated change in soil water storage (DS) appeared to befeasible and accurate in most cases but was problematic for somemonths, such as July–August in 2006, and June 2007 (Fig. 11) in thisstudy. In those cases, it was likely that DS values were over-estimated. We also suspected that drainage might be over-estimated in September 2006 and August 2007. In those cases,DS was likely underestimated. All these 3 months experiencedlarge either positive or negative changes in groundwater tabledepth (Fig. 4). Another source of error may be that ourmeasurements of soil moisture and water table depth werelimited to only one spot and they were not sufficient to representthe true monthly DS at the landscape scale when its magnitudewas large.
5. Conclusions
This 3-year study suggested that clearcutting a native forestedwetlands and subsequent reforestation could significantly alter
radiation input and latent heat flux for evapotranspiration, butcaused little change in sensible heat, the energy source for heatingthe atmosphere. Therefore, our study supports the notion thatatmospheric warming due to reforestation is not likely (Juang et al.,2007) and effects may be negligible in the mid-latitude region(Betts, 2000).
In general, clearcutting a forest reduced available energy for ET,thus it elevated drainage and groundwater table level significantly.However, the hydrologic effects of forest conversion are mostlypronounced during dry periods and dormant seasons when thechanges in land surface prosperities are greatest. We concludedthat ET from the drained pine plantations was mostly controlled byenergy availability.
Severe droughts can have significant effects on surface soilmoisture and plant water use (i.e., latent heat) and plan growth.We conclude that soil water conditions should be considered inevaluating the effects of afforestation/deforestation on albedo andecosystem energy and water balances at large-scales. This isperhaps particularly important for wetland ecosystems that havea rather dynamic hydrology and the impacts of droughts onecological processes are more consequential than upland eco-systems (Sun et al., 2002; Domec et al., 2009; Noormets et al.,2009).
Acknowledgements
This study was supported by the USDA Forest Service SouthernGlobal Change Program cooperative agreements 03-CA-11330147-073 and 04-CA-11330147-238, and in part by DOE-NICCR award08-SC-NICCR-1072. The Weyerhaeuser Company is gratefullyacknowledged for facilitating access to the study site and offeringlogistical assistance. Sara Strickland, Johnny Boggs, and EmrysTreasure assisted with field data collection. This study is partiallysupported by the US-China Carbon Consortium (USCCC).
G. Sun et al. / Forest Ecology and Management 259 (2010) 1299–1310 1309
References
Albaugh, T.J., Allen, H.L., Dougherty, P.M., Johnsen, K.H., 2004. Long-term growthresponses of loblolly pine to optimal nutrient and water resource availability.Forest Ecology and Management 192 (3-A), 19.
Allen, R.G., Smith, M., Pereira, L.S., Perrier, A., 1994. An update for the calculation ofreference evapotranspiration. ICID Bulletin 43, 35–92.
Amatya, D.M., Skaggs, R.W., Gregory, J.D., 1995. Comparison of methods for esti-mating REF-ET. ASCE Journal of Irrigation and Drainage Engineering 121 (6),427–435.
Amatya, D.M., Skaggs, R.W., Gregory, J.D., 1996. Effects of controlled drainage on thehydrology of drained pine plantations in the North Carolina coastal plain.Journal of Hydrology 181, 211–232.
Amatya, D.M., Skaggs, R.W., Cheschier, G.W., Fernandez, G.P., 2000. Solar and netradiation for estimating potential evaporation from three vegetation canopies.Presentation at the 2000 ASAE Annual International Meeting, Paper No: 002135.
Amatya, D.M., Skaggs, R.W., 2001. Hydrologic modeling of pine plantations onpoorly drained soils. Forest Science 47, 103–114.
Amatya, D.M., Skaggs, R.W., Gilliam, J.W., 2006. Hydrology and water quality of adrained loblolly pine plantation in coastal North Carolina. In: Williams, Tho-mas, (Eds.), Hydrology and Management of Forested Wetlands: Proceedings ofthe International Conference, St. Joseph, MI: American Society of Agriculturaland Biological Engineers, pp. 218–230.
Amatya, D.M., Trettin, C.C., 2007. Annual evapotranspiration of a forested wetlandwatershed, SC. ASABE Paper No. 07222. St. Joseph, Mich.: ASABE. In: 2007 ASABEAnnual International Meeting, 17–20 June. 16 p.
Amiro, B.D., Barr, A.G., Black, T.A., Iwashita, H., Kljun, N., McCaughey, J.H., Morgen-stern, K., Murayama, S., Nesic, Z., Orchansky, A.L., Saigusa, N., 2006a. Carbon,energy and water fluxes at mature and disturbed forest sites, Saskatchewan,Canada. Agricultural and Forest Meteorology 136, 237–251.
Amiro, B.D., Orchansky, A.L., Barr, A.G., Black, T.A., Chambers, S.D., Chapin III, F.S.,Goulden, M.L., Litvak, M., Liu, H.P., McCaughey, J.H., McMillan, A., Randerson,J.T., 2006b. The effect of post-fire stand age on the boreal forest energy balance.Agricultural and Forest Meteorology 140, 41–50.
Arain, M.A., Black, T.A., Barr, A.G., Griffis, T.J., Morgenstern, K., Nesic, Z., 2003. Year-round observations of the energy and water vapour fluxes above a boreal blackspruce forest. Hydrological Processes 17, 3581–3600.
Bala, G., Caldeira, K., Wickett, M., Phillips, T.J., Lobell, D.B., Delire, C., Mirin, A., 2007.Combined climate and carbon-cycle effects of large-scale deforestation. Pro-ceedings of the National Academic Sciences United States America 104, 6550.
Betts, A.K., Ball, J.H., 1997. Albedo over the boreal forest. Journal of GeophysicalResearch 102 (D24) 28, 901–909.
Betts, R.A., 2000. Offset of the potential carbon sink from boreal forestation bydecreases in surface albedo. Nature 408 (9), 187–190.
Burba, G.G., McDermitt, D.K., Grelle, A., Anderson, D.J., Xu, L., 2008. Addressing theinfluence of instrument surface heat exchange on the measurements of CO2 fluxfrom open-path gas analyzers. Global Change Biology 14, 1854–1876.
Chapin, F.S., Maston, P.A., Mooney, H.A., 2002. Principles of Terrestrial EcosystemEcology. Springer-Verlag, New York.
Clark, K.L., Gholz, H.L., Castro, M.S., 2004. Carbon dynamics along a chronosequenceof slash pine plantations in North Florida. Ecological Applications 14 (4), 1154–1171.
Currie, D.J., 1991. Energy and large-scale patterns of animal and plant speciesrichness. The American Naturalist 137 (1), 27–49.
DeWalle, D.R., Swistock, B.R., Johnson, T.E., McGuire, K.J., 2000. Potential effects ofclimate change and urbanization on mean annual streamflow in the UnitedStates. Water Resources Research 36 (9), 2655–2664.
Diggs, J.A., 2004. Simulation of nitrogen and hydrology loading of forested fields inEastern North Carolina using DRAINMOD-N 11. M.S. Thesis, North CarolinaState University, Raleigh, NC, 155 p.
Domec, J.-C., Noormets, A., King, J.S., Sun, G., McNulty, S.G., Gavazzi, M.J., Boggs, J.L.,Treasure, E.A., 2009. Decoupling the influence of leaf and root hydraulic con-ductances on stomatal conductance and its sensitivity to vapor pressure deficitas soil dries in a drained loblolly pine plantation. Plant, Cell & Environment,doi:10.1111/j.365-3040.2009.01981.x.
Ewers, B.E., Mackay, D.S., Gower, S.T., Ahl, D.E., Burrows, S.N., Samanta, S., 2002. Treespecies effects on stand transpiration in Northern Wisconsin. Water ResourcesResearch 38 (7), doi:10.1029/2001WR000830.
Ford, C.R., Hubbard, R.M., Kloeppel, B.D., Vose, J.M., 2007. A comparison of sap flux-based evapotranspiration estimates with catchment-scale water balance. Agri-cultural and Forest Meteorology 145, 176–185.
Foken, T., 2008. The energy balance closure problem: an overview. EcologicalApplications 18 (6), 1351–1367.
Fox, T.R., Jokela, E.J., Allen, H.L., 2004. The evolution of pine plantation silviculture inthe Southern United States. In: Rauscher, H.M., Johnsen, K. (Eds.), SouthernForest Science: Past, Present, and Future. Gen. Tech. Rep. SRS-75,Asheville, NC,U.S. Department of Agriculture, Forest Service, Southern Research Station,(Chapter 8), pp. 63–82.
Gholz, H.L., Clark, K.L., 2002. Energy exchange across a chronosequence of slash pineforests in Florida. Agricultural and Forest Meteorology 112, 87–102.
Gibbard, S., Caldeira, K., Bala, G., Phillips, T.J., Wickett, M., 2005. Climate effects ofglobal land cover change. Geographical Research Letters 32, L23705,doi:10.1029/2005GL024550.
Grace III, J.M., Skaggs, R.W., Chescheir, G.M., 2006a. Hydrologic and water qualityeffects of thinning loblolly pine. Transactions of the American Society ofAgricultural and Biological Engineers 49 (3), 645–654.
Grace III, M.J., Skaggs, R.W., Cassel, D.K., 2006b. Soil physical changes associatedwith forest harvesting operations on an organic soil. Soil Science Society ofAmerica Journal 70, 503–509.
Hanson, P.J., Amthor, J.S., Wullschleger, S.D., Wilson, K.B., Grant, R.F., Hartley, A., Hui,D., Hunt Jr., E.R., Johnson, D.W., Kimball, J., King, A.W., Luo, Y., McNulty, S.G., Sun,G., Thornton, P.E., Wang, S., Williams, M., Cushman, R.M., 2003. Carbon andwater cycle simulations for an upland oak forest from 1993 to 2000 using 13stand-level models: inter-model comparisons and evaluations against inde-pendent measurements. Ecological Monographs 74, 443–489.
Harder, S.V., Amatya, D.M., Callahan, T.J., Trettin, C.C., Hakkila, J., 2007. Hydrologyand water budget for a forested Atlantic coastal plain watershed, South Car-olina. Journal of the American Water Resources Association 43, 563–575.
Jackson, R.B., Jobbagy, E.G., Avissar, R., et al., 2005. Trading water for carbon withbiological carbon sequestration. Science (1944–1947).
Johnsen, K.H., Wear, D.N., Oren, R., Teskey, R.O., Sanchez, F., Will, R.E., Butnor, J.,Markewitz, D., Richter, D., Rials, T., Allen, H.L., Seiler, J., Ellsworth, D., Maier, C.,Katul, G., Dougherty, P.M., 2001. Carbon sequestration and southern pineforests. Journal of Forestry 99 (4), 14–21.
Juang, J.-Y., Katul, G.G., Siqueira, M.B.S., Stoy, P.C., Novick, K.A., 2007. Separating theeffects of albedo from eco-physiological changes on surface temperature alonga successional chronosequence in the Southeastern US. Geophysical ResearchLetters 34 (L21408), doi:10.1029/2007GL031296.
Law, B.E., Falge, E., Gu, L., Baldocchi, D.D., Bakwin, P., Berbigier, P., Davis, K., Dolman,A.J., Falk, M., Fuentes, J.D., Goldstein, A., Granier, A., Grelle, A., Hollinger, D.,Janssens, I.A., Jarvis, P., Jensen, N.O., Katul, G., Mahli, Y., Matteucci, G., Meyers, T.,Monson, R., Munger, W., Oechel, W., Olson, R., Pilegaard, K., Paw, K.T., Thor-geirsson, H., Valentini, R., Verma, S., Vesala, T., Wilson, K., Wofsy, S., 2002.Environmental controls over carbon dioxide and water vapor exchange ofterrestrial vegetation. Agricultural and Forest Meteorology 113, 97–120.
Leuning, R., 2004. Measurements of trace gas fluxes in the atmosphere using eddycovariance: WPL corrections revisited. In: Lee, X., Massman, W.J., Law, B.E.(Eds.), Handbook of Micrometeorology. A Guide to Surface Flux Measurementand Analysis. Kluwer Academic Publishers, Boston, pp. 119–132.
Liu, Y., Stanturf, J., Lu, H., 2008. Modeling the potential of the Northern China forestshelterbelt in improving hydroclimate conditions. Journal of the AmericanWater Resources Association 44 (5), 1176–1192.
Lu, J., Sun, G., Amatya, D.M., McNulty, S.G., 2003. Modeling actual evapotranspira-tion from forested watersheds across the Southeastern United States. Journal ofAmerican Water Resources Association 39, 887–896.
McCarthy, E.J., Flewelling, J.W., Skaggs, R.W., 1992. Hydrologic Model for DrainedForested Watershed. ASCE Journal of Irrigation and Drainage Engineering 118,1242–1255.
McNulty, S.G., Vose, J.M., Swank, W.T., Aber, J.D., Federer, C.A., 1994. Regional scaleforest ecosystem modeling: database development, model predictions andvalidation using a geographic information system. Climate Research 4, 223–231.
McNulty, S.G., Vose, J.M., Swank, W.T., 1996. Loblolly pine hydrology and produc-tivity across the Southern United States. Forest Ecology and Management 86,241–251.
Meiresonne, L., Sampson, D.A., Kowalski, A.S., Janssens, I.A., Nadezhdina, N., Cermak,J., Van Slycken, J., Ceulemans, R., 2003. Water flux estimates from a Belgian Scotspine stand: a comparison of different approaches. Journal of Hydrology 270,230–252.
Noormets, A., Ewers, B., Sun, G., Mackay, S., Zheng, D., McNulty, S.G., Chen, J., 2006.Water and carbon cycles in heterogeneous landscapes: an ecosystem perspec-tive. In: Chen, J., Saunders, S.C., Brosofske, K.D., Crow, T.R. (Eds.), Linking Ecologyto Landscape Hierarchies. Nova Publishing, Carbondale, IL, USA, pp. 89–123.
Noormets, A., McNulty, S.G., DeForest, J.L., Sun, G., Li, Q., Chen, J., 2008. Droughtduring canopy development has lasting effect on annual carbon balance in adeciduous temperate forest. New Phytologist 179, 818–828.
Noormets, A., McNulty, S.G., Gavazzi, M.J., Sun, G., Domec, J.C., King, J., Chen, J., 2009.Response of carbon fluxes to drought in a coastal plain loblolly pine forest.Global Change Biology, doi:10.1111/j.365-2486.009.01928.x.
Pielke, R.A., Adegoke, J., Beltran-Przekurat, A., Hiemstra, C.A., Lin, J., Nair, U.S.,Niyogi, D., Nobis, T.E., 2007. An overview of regional land-use and land-coverimpacts on rainfall, 2007. Tellus B 59 (3), 587–601.
Pinker, R.T., Thompson, O.E., Eck, T.F., 1980. The albedo of a tropical evergreenforest. Quarterly Journal of the Royal Meteorological Society 106 (449), 551–558.
Powell, T.L., Starr, G., Clark, K.L., Martin, T.A., Gholz, H.L., 2005. Ecosystem andunderstory water and energy exchange for a mature, naturally regenerated pineflatwoods forest in North Florida. Canadian Journal of Forest Research 35 (7),1568–1580.
Powell, T.L., Gholz, H.L., Clark, K.L., Starr, G., Cropper Jr., W.P., Martin, T.A., 2008.Carbon exchange of a mature naturally regenerated pine forest in North Florida.Global Change Biology, doi:10.1111/j.1365-2486.2008.01675.x.
Restrepo, N.C., Arain, M.A., 2005. Energy and water exchanges from a temperatepine plantation forest. Hydrological Processes 19, 27–49.
Schotanus, P., Nieuwstadt, F.T.M., de Bruin, H.A.R., 1983. Temperature measure-ment with a sonic anemometer and its application to heat and moisture fluxes.Boundary-Layer Meteorology 26, 81–93.
Schultz, R.P., 1997. Loblolly Pine—The Ecology and Culture of Loblolly Pine (Pinustaeta L.) Agricultural Handbook 713. U.S. Department of Agriculture ForestService, Washington, DC.
Shuttleworth, W.J., 2008. Evapotranspiration measurement methods. SouthwestHydrology 7, 22–23.

G. Sun et al. / Forest Ecology and Management 259 (2010) 1299–13101310
Stoy, P., Katul, G.G., Siqueira, M.B.S., Juang, J.Y., Novick, K.A., McCarthy, H.R., Oishi,A.C., Uebelherr, J.M., Kim, H.-S., Oren, R., 2006. Separating the effects of climateand vegetation on evapotranspiration along a successional chronosequence inthe southeastern US. Global Change Biology 12, 2115–2135.
Sun, G., McNulty, S.G., Amatya, D.M., Skaggs, R.W., Swift, L.W., Shepard, J.P., Riekerk,H., 2002. A comparison of the hydrology of the coastal forested wetlands/pineflatwoods and the mountainous uplands in the southern US. Journal of Hydrol-ogy 263, 92–104.
Sun, G., Riedel, M., Jackson, R., Kolka, R., Amatya, D., Shepard, J., 2004. Influences ofmanagement of Southern forests on water quantity and quality. In: Rauscher,H.M., Johnsen, K. (Eds.), Southern Forest Science: Past, Present, and Future. Gen.Tech. Rep. SRS-75. U.S. Department of Agriculture, Forest Service, SouthernResearch Station, Asheville, NC, (Chapter 19), pp. 195–234.
Sun, G., McNulty, S.G., Moore Myers, J.A., Cohen, E.C., 2008a. Impacts of multiplestresses on water demand and supply across the Southeastern United States.Journal of American Water Resources Association 44 (6), 1441–1457.
Sun, G., Noormets, A., Chen, J., McNulty, S.G., 2008b. Evapotranspiration estimatesfrom eddy covariance towers and hydrologic modeling in managed forests inNorthern Wisconsin, USA. Agricultural and Forest Meteorology 148, 257–267.
Sun, G., Sun, O.J., Zhou, G., 2009. Water and carbon dynamics in selectedecosystems in China (Editorial). Agricultural and Forest Meteorology,doi:10.1016/j.agrformet.2009.06.008.
Swank, W.T., Douglass, J.E., 1974. Streamflow greatly reduced by converting hard-woods to pine. Science 185, 857–859.
van Dijk, A.I.J.M., Keenan, R.J., 2008. Planted forests and water in perspective. ForestEcology and Management 251, 1–7.
Webb, E.K., Pearman, G.I., Leuning, R., 1980. Correction of flux measurements fordensity effects due to heat and water vapor transfer. Quarterly Journal of theRoyal Meteorological Society 106, 85–106.
Wilczak, J.M., Oncley, S.P., Stage, S.A., 2001. Sonic anemometer tilt correctionalgorithms. Boundary-Layer Meteorology 99, 127–150.
Wilson, K.B., Baldocchi, D.D., 2000. Seasonal and inter-annual variability of energyfluxes over a broadleaved temperate deciduous forest in North America. Agri-cultural and Forest Meteorology 100, 1–18.
Wilson, K.B., Hanson, P.J., Mulholland, P.J., Baldocchi, D.D., Wullschleger, S.D., 2001.A comparison of methods for determining forest evapotranspiration and itscomponents: sap-flow, soil water budget, eddy covariance and catchmentwater balance. Agricultural and Forest Meteorology 106, 153–168.
Wilson, K.B., Goldstein, A., Falge, E., Aubinet, M., Baldocchi, D., Berbigier, P.,Bernhofer, C., Ceulemans, R., Dolman, H., Field, C., Grelle, A., Ibrom, A., Law,B.E., Kowalski, A., Meyers, T., Moncrieff, J., Monson, R., Oechel, W., Tenhunen, J.,Valentini, R., Verma, S., 2002. Energy balance closure at FLUXNET sites. Agri-cultural and Forest Meteorology 113, 223–243.
Wullschleger, S.D., Meinzer, F.C., Vertessy, R.A., 1998. A review of whole-plant wateruse studies in trees. Tree Physiology 18, 499–512.
Zhou, G., Sun, G., Wang, X., Zhou, C., McNulty, S.G., Vose, J.M., Amatya, D.M., 2008.Estimating forest ecosystem evapotranspiration at multiple temporal scaleswith a dimension analysis approach. Journal of American Water ResourcesAssociation 44 (1), 208–221.