Equine grazing in managed subalpine wetlands: Effects on arthropods and plant structure as a...
42
2013. Environmental Management 52: 1474-1486 The final publication is available at Springer via http://link.springer.com/article/10.1007/s00267-013-0154-1 Equine grazing in managed subalpine wetlands: Effects on arthropods and plant structure as a function of habitat Jeffrey G. Holmquist * , Jutta Schmidt-Gengenbach, Sylvia A. Haultain J.G. Holmquist, J. Schmidt-Gengenbach University of California San Diego, White Mountain Research Station, 3000 East Line Street, Bishop, California, USA 93514 Current address: University of California Los Angeles, Institute of the Environment and Sustainability, White Mountain Research Center, 3000 East Line Street, Bishop, California, USA 93514 *Corresponding author. Tel.: +1 760 387 1909; fax: +1 760 873 7830 E-mail: [email protected] S.A. Haultain Sequoia and Kings Canyon National Parks, Three Rivers, California, USA 93271
Transcript of Equine grazing in managed subalpine wetlands: Effects on arthropods and plant structure as a...

2013. Environmental Management 52: 1474-1486
The final publication is available at Springer via
http://link.springer.com/article/10.1007/s00267-013-0154-1
Equine grazing in managed subalpine wetlands:
Effects on arthropods and plant structure as a function of habitat
Jeffrey G. Holmquist*, Jutta Schmidt-Gengenbach, Sylvia A. Haultain
J.G. Holmquist, J. Schmidt-Gengenbach
University of California San Diego, White Mountain Research Station, 3000 East Line
Street, Bishop, California, USA 93514
Current address: University of California Los Angeles, Institute of the Environment and
Sustainability, White Mountain Research Center, 3000 East Line Street, Bishop, California, USA
93514
*Corresponding author. Tel.: +1 760 387 1909; fax: +1 760 873 7830
E-mail: [email protected]
S.A. Haultain
Sequoia and Kings Canyon National Parks, Three Rivers, California, USA 93271

2
Abstract Grazing management necessarily emphasizes the most spatially extensive vegetation
assemblages, but landscapes are mosaics, often with more mesic vegetation types embedded
within a matrix of drier vegetation. Our primary objective was to contrast effects of equine
grazing on both subalpine vegetation structure and associated arthropods in a drier reed grass
(Calamagrostis muiriana) dominated habitat versus a wetter, more productive sedge habitat
(Carex utriculata). A second objective was to compare reed grass and sedge as habitats for
fauna, irrespective of grazing. All work was done in Sequoia National Park (California, USA),
where detailed, long-term records of stock management were available. We sampled paired
grazed and control wet meadows that contained both habitats. There were moderate negative
effects of grazing on vegetation, and effects were greater in sedge than in reed grass.
Conversely, negative grazing effects on arthropods, albeit limited, were greater in the drier
reed grass, possibly due to microhabitat differences. The differing effects on plants and
animals as a function of habitat emphasize the importance of considering both flora and fauna,
as well as multiple habitat types, when making management decisions. Sedge supported twice
the overall arthropod abundance of reed grass as well as greater diversity; hemipteran and
dipteran taxa were particularly abundant in sedge. Given the greater grazing effects on sedge
vegetation, greater habitat provision for terrestrial arthropods, and value as aquatic arthropod
habitat, the wetter sedge assemblage is worthy of additional consideration by managers when
planning for grazing and other aspects of land usage.
Keywords: land management, pack stock grazing, subalpine wetland, terrestrial arthropod
assemblages, vegetation assemblages, disturbance

3
Introduction
Grazing disturbance effects can differ across vegetation assemblages, and the nature
and strength of such differences vary as a function of environment and the nature of grazing
pressure (Ravolainen et al. 2011; Manning et al. 2013). Productive, wetter, and less
structurally robust assemblages of plants tend to be more sensitive to grazing (Stohlgren et al.
1989; Cole and Spildie 1998; Bråthen et al. 2007; Sørensen et al. 2009; Jones et al. 2011), but
some of these plant assemblages have been shown to tolerate grazing well relative to other
vegetation and even respond positively to grazing (Kitti et al. 2009; Deléglise et al. 2011).
Differing grazing effects as a function of vegetation type may (Bestelmeyer and Wiens 2001)
or may not (Verdú et al. 2007) cascade into the arthropod assemblage, although there has been
comparatively little study of grazing effects on invertebrates as a function of vegetation
assemblage.
Landscapes are mosaics, often with patches of more mesic vegetation types embedded
within the matrix of drier vegetation (Kitti et al. 2009; Deléglise et al. 2011; Holmquist et al.
2011a). Assemblages in these wetter patches may be more easily damaged by grazing, because
trampling impacts can be facilitated by moist, less firm substrata (Jensen 1985; Marlow et al.
1987; Willat and Sulistyaningsih 1990; Allen and Marlow 1994; Cole 2004; see also Turner
1987; McClaran 1989; Eckrich and Holmquist 2000). Differing responses as a function of
vegetation type (Cole 1995a; b; Cole and Spildie 1998) may be amplified in mountain wetlands
as a result of the short growing season, high soil moisture (Nagy and Grabherr 2009) and high
level of aquatic-terrestrial connectivity, with many ecological flows passing through the
arthropod assemblage (Yi et al. 2006; Epanchin et al. 2010; Holmquist et al. 2011a).
4
Subalpine wet meadows in Sequoia National Park, in the Sierra Nevada of California,
USA, are potentially vulnerable habitats that are opened annually for two- to three-month
pulses of equine grazing that begin about one month after the start of the short growing season
(McClaran 1989; Holmquist et al. 2010; 2013; see also Kohler et al. 2004). Grazing is
primarily by mules and horses that are used to transport people and materials into the
backcountry ("pack stock," McClaran 1989; Cole et al. 2004; Newsome et al. 2004). These
subalpine grazed wetlands often have a reed grass, Calamagrostis muiriana B.L. Wilson and S.
Gray (formerly included in C. breweri Thurber) as an important component; pack stock have
been shown to have only minor to moderate effects on reed grass and the associated arthropod
assemblage during the short Park grazing seasons (Holmquist et al. 2010; 2013). Although the
reed grass assemblage in these wet meadows is saturated or briefly flooded during snowmelt,
the meadows also support patches of vegetation that remain flooded for a month or more
following snowmelt and retain higher soil moisture throughout the growing season (Benedict
1983; Stohlgren et al. 1989; Neuman 1996; Loheide et al. 2009; Roche et al. 2012). These
wetter habitats support a virtual monoculture of the rhizomatous sedge Carex utriculata L.
Bailey (Benedict 1983; Allen and Marlow 1994; Neuman 1996), which provides a structurally
distinct habitat: a taller canopy (up to 70 cm vs. ~9 cm, Holmquist et al. 2010; 2013), broader
blades (2-12 mm vs. 1 mm, Botti and Sydoriak 2001), up to twice the productivity of reed
grass (Stohlgren et al. 1989), lower shoot density, and higher soil silt content (400 vs. 2900
shoots/m2, 60 vs. 10% silt, Holmquist and Schmidt-Gengenbach unpublished). Stock graze
both sedge and reed grass habitats intensively (Ballenger et al. 2012 unpublished report). We
hypothesized that there would be more grazing effects in the wetter sedge assemblage than in
5
the drier reed grass assemblage and that there would in turn be more grazing impact on
arthropods in sedge than in reed grass.
Arthropod assemblages have been shown to vary as a function of both plant species and
structure in a variety of vegetated habitats (Lawton 1983; Stoner and Lewis 1985; Holmquist
1997; Dennis et al. 1998; Morris 2000; Reid and Hochuli 2007), and faunal movements and
assemblage structure are influenced by habitat context as well (Wiens et al. 1985; Holmquist
1998). Although the reed grass-dominated vegetation assemblage has greater plant taxonomic
and structural diversity (Benedict 1983; Neuman 1996; Holmquist et al. 2010; see also Dennis
et al. 1998), the tall canopy of the sedge monoculture creates a larger volume of habitat, and
canopy height can be a positive predictor of faunal diversity and abundance in Sierran wetlands
(Holmquist et al. 2011a).
Our primary objective was to compare effects of stock on terrestrial arthropods and
vegetation structure in reed grass versus sedge habitats. Interaction terms that would indicate
differences in control-grazed response slope as a function of habitat were of particular interest.
Inclusion of arthropods, in addition to primary producers, allowed us to examine the response
of a large portion of total assemblage complexity (Marty 2005; Cardoso et al. 2011; Pocock et
al. 2012). A second objective was to determine whether the less dense, but productive and tall,
sedge habitats support a higher diversity and abundance of arthropods than reed grass,
irrespective of grazing.

6
Methods
Design overview
We examined vegetation influence on pack stock effects with a 2x2x2 blocked factorial
design (Treatment: Control, Grazed; Vegetation: Reed grass, Sedge; Year: 2010, 2011) using
paired control and grazed subalpine wet meadows. There are meadows in Sequoia National
Park that have been closed to grazing for ~25 years, and we were able to locate six meadows
that had both reed grass and sedge habitats and that could be paired with nearby grazed
meadows that also had both vegetation types (Fig. 1). Meadows senesce by late September
(Stohlgren et al. 1989) with accompanying sharp declines in arthropod diversity and abundance
(Holmquist et al. 2013). We sampled meadows just before vegetation senescence and thus
after the majority of grazing for a given season. By making use of long-term management
manipulations of grazing pressure, this design was effectively a large-scale and long-term
experiment that allowed us to explore the grazing effects that are occurring in these meadows
under current management (see also Bestelmeyer and Wiens 2001; Bråthen et al. 2007). Any
differences in response to grazing between the two vegetation assemblages were likely to be a
function of differences in morphology, soils, and palatability between the two vegetation
assemblages, and fauna would be expected to be affected primarily via indirect effects. The
results were thus indicative of overall effects of grazing exposure when stock are released into
meadows with access to both habitat types.
Study area and meadows
The National Park Service (NPS) controls stock access to these subalpine wetlands, and
stock are generally not permitted in meadows until at least one month after snowmelt
7
(McClaran 1989). Intermittent stock use of the meadows lasts from two to three months,
depending on snow year. This study included a subset of the reed grass-dominated grazed
meadows used in previous studies of pack stock effects (Holmquist et al. 2010; 2013): Hockett,
South Fork Pasture, Penned-up, Nathan's, Rock Creek Crossing, and Lower Crabtree, each
coupled with a control meadow. Sampling at the end of the growing season incorporated both
multi-decadal and annual effects of grazing relative to the long-closed control meadows
(Holmquist et al. 2013). The grazed meadows were exposed to a mean of 16.0 (SE = 5.2)
stock nights/ha/year over the last 20 years; mean stock nights/ha were higher in 2010 (22.2, SE
= 9.1) than in 2011 (8.3, SE = 3.5). The two meadows of each pair were separated by a mean
of only 755 m (SE = 191), but meadow pairs were separated by up to 40 km (Fig. 1). Reed
grass- and sedge-dominated assemblages accounted for 42% (SE = 6.3) and 40% (SE = 5.4),
respectively, of the wetland area in the study meadows (data from Neuman 1990 unpublished
report; pers. obs.). The remainder of the area was composed of other relatively dry
assemblages that were more similar to reed grass than sedge, i.e., various drier habitat
assemblages represented 60% of the total. There were no differences in proportions of reed
grass in grazed versus ungrazed meadows (t-test: p = 0.61), and there were similarly no
differences for sedge (p = 0.40). Distances between centroids of sampled reed grass and sedge
habitats within individual meadows averaged only 31 m (SE= 4.7); distances did not differ as a
function of grazing treatment (p= 0.39). Cropping and equine manure were visible in both
vegetation types in grazed meadows. We sampled meadows approximately one week before
vegetation senescence at the end of the 2010 and 2011 growing seasons. Early season
sampling was not possible, because the sedges are completely flooded before stock arrive, and
sedge habitats are more aquatic than terrestrial at that time. There were different antecedent

8
conditions for the two years, because there was more snowfall in 2011 than 2010 (131 and 89
cm snow water equivalent, respectively, at Hockett Meadow). Each meadow opening date is
determined by the NPS after evaluation of soil saturation (sufficiently dry, McClaran 1989)
and vegetation characteristics (sufficiently well-developed), so we sampled under similar
phenological conditions in 2010 and 2011, despite the differing snow years. Sampling in 2010
concluded in early September, whereas 2011 sampling extended to the end of September. We
used two randomly-selected subsample locations at each grazed or control meadow, and there
were two additional randomly-selected subsamples nested within each of the first pair of
subsamples for some vegetation and physical measurements. Subsamples were averaged such
that there was one value for each grazed or control replicate for each year for a given metric.
There were new random locations for subsamples each year, and thus Year was incorporated as
an additional factor instead of using repeated measures. Holmquist et al. (2010; 2013) provide
additional details on grazing management, vegetation, and study meadows.
Faunal methodology
We made 50 standard sweep net sweeps (New 1998; Southwood and Henderson 2000)
at each study meadow, evenly divided between the two subsampling locations. The net had a
30.5 cm aperture and mesh size of 0.5 x 0.75 mm. We did the sweeping before collecting
vegetation data at each meadow in order to minimize disturbance (additional faunal sampling
details in Holmquist et al. 2010; 2013).
Faunal samples were identified to family (see also Fahrig and Jonsen 1998; Koricheva
et al. 2000), and then morphospecies counts were made for each sample (Kremen et al. 1993;
Oliver and Beattie 1996; Gerlach et al. in press). This study was particularly broad in that we
9
examined responses across all arthropod families (see also Fahrig and Jonsen 1998; Koricheva
et al. 2000; Pocock et al. 2012).
Vegetation and Physical Data
Vegetation structural parameters are effective tools for detection of stock effects on
vegetation assemblages, to the extent that such measures have been used as proxies for grazing
intensity or manipulated as independent variables to represent grazing (Hendricks et al. 2005;
Elliot and Henry 2011; Jones et al. 2011). We measured percent bare ground, percent green,
standing brown (senescent), and litter cover using a point-intercept transect centered and
randomly oriented in each subsample location. We measured canopy height, litter depth, and
soil strength (Ben Meadows pocket penetrometer) at two random locations within each
subsample. We used a Kestrel 3000 meter to record average wind speed and air temperature at
a point midway between the two subsamples.
Analysis
Univariate analyses of the 2x2x2 blocked factorial were done with ANCOVAs (df =
1,1,1,5; SYSTAT 12), comparing the influences of grazing, vegetation, year, and associated
interactions on arthropods and vegetation structure. Response variables included abundances by
taxon, richness, dominance, percentages of predators and herbivores, percentages of more- and
less-motile fauna, expected number of species (which compensates for differing abundance;
E(S18), Hurlbert 1971; Magurran 2004), and evenness (probability of interspecific encounter,
P.I.E., Hurlbert 1971). We calculated E(S18) and P.I.E. using the application Diversity. Some
measures were divided by canopy height to compensate for differing habitat volumes represented

10
by the two vegetation types. Proportional variables were square-root transformed ((y)0.5 + (y +
1)0.5) and others were log transformed (log (y + 1)). Control meadows were significantly higher
than grazed meadows, although the differential was small (mean difference = 59.8 m, SE = 13;
Holmquist et al. 2010), so we used elevation as a covariate (Underwood 1997; see also Wettstein
and Schmid 1999). Calculation of the general linear model included substitutions for missing
cells. We estimated power for ANCOVAs a priori (Bausell and Li 2002) using G*Power (Mayr
et al. 2007). We calculated the alpha level that would be required in order to have an equivalent
beta error (Kendall et al. 1992; Mapstone 1995; Erdfelder et al. 1996; Dayton 1998; Reynolds et
al. 2011): alpha = beta = 0.16, and the associated power (1-beta) was 0.84. We present both
alpha = 0.16 and the standard alpha (= 0.05) as significance thresholds to provide additional
perspective for our results, with the particular goal of avoiding Type II error given the potential
impact to these wetlands should we incorrectly reach a conclusion of "no effect." We also
constructed rank abundance plots, compared distributions with Kolmogorov-Smirnov two-
sample tests (Magurran 2004), and assessed trends across variables with two-tailed sign tests.
Multivariate analyses for fauna included comparisons as a function of study factors using
multi-response permutation procedures (MRPP) as well as analyses of dispersion using
PERMDISP2 software developed by MJ Anderson (see also Anderson 2001; Ratkowsky 2008).
Response and explanatory matrices contained all meadows; the response matrix included
families that were collected in three or more samples (57 families; McCune and Grace 2002;
Peck 2010; but see Poos and Jackson 2012). The response matrix was relativized by maximum
abundance for each family; the final response matrix had a coefficient of variation of 51%, and
66% of the cells contained zeros. The explanatory matrix included coding variables for
Treatment and Vegetation. We used the Sørensen distance measure for all analyses and rank-

11
transformed the distance matrix prior to the MRPP analyses. We examined differences among
groups with MRPP using the a priori coding variables from the explanatory matrix (Treatment
and Vegetation combinations). In order to assess the relative influence of non-study factors, we
then ran a second MRPP using a new group membership variable that used the four highest level
groups resulting from a hierarchical, polythetic, agglomerative cluster analysis (group average
linkage). The permutational dispersion analysis was based on 9,999 permutations.
Results
Vegetation and Physical
Grazing, vegetation type, and study year were significant influences on several
response variables; there were a number of significant interaction terms, and block effects were
present for most parameters (Table 1). Only three individual variables showed overall
significant effects of grazing (less litter depth and cover, greater soil compaction), but the
directional trend across all metrics, vegetation types, and years was strong (P < 0.0001; two-
tailed sign test). Significant differences as a function of vegetation assemblage included taller
canopy height in sedge and greater green cover and soil strength in the reed grass assemblage.
Five variables differed significantly between the two years of the study (canopy height, litter
depth, bare ground, green cover, brown cover; Table 1). There were four Treatment x
Vegetation interactions: canopy height, litter depth, bare ground, and green cover. All
interactions indicated greater grazing impact in sedge than in reed grass, although proportional
changes for canopy height were similar for the two vegetation assemblages. There were also
several significant interactions that demonstrated an influence of Year on both Treatment and
Vegetation trends (Table 1); trends for these variables were stronger in 2010 than in 2011.
12
Litter depth was greater in sedge in 2010, but was greater in reed grass in 2011, whereas soil
strength was greater in reed grass than sedge in both years, but more strongly so in 2011.
Atmospheric metrics had no significant differences across study variables, with the exception
of a block effect for temperature.
Fauna
Diptera and Hemiptera dominated control and grazed meadows in both vegetation
types. Ephydridae, Anthomyiidae, Muscidae (all Diptera), Cicadellidae, and Aphididae
(Hemiptera) were the most abundant of the 80 families collected (Online Resource 1). Family
richness was greatest for Diptera (34), Hemiptera (12), and Hymenoptera (12). Seventy-one
percent of the families were present in three or more samples.
The lack of significant Treatment differences for any faunal assemblage-level metric
stood in contrast to the vegetation results, but there were more significant faunal differences for
Vegetation and Year factors (Table 2) than were observed for vegetation structure responses
(Table 1). There was no significant Treatment trend across metrics (p = 0.15), and there was
only a single Treatment x Year interaction (% predators). There were no Treatment x
Vegetation interactions. Sedge supported twice the total abundance of reed grass as well as
greater family and morphospecies richness, but expected number of species was lower in sedge
than reed grass after compensation for differing canopy height. The weak directional trend
across all metrics (p = 0.080; two-tailed sign test) indicating higher diversity in sedge became
strongly significant if considered on a per-area basis only (p = 0.0008), i.e., if the metrics that
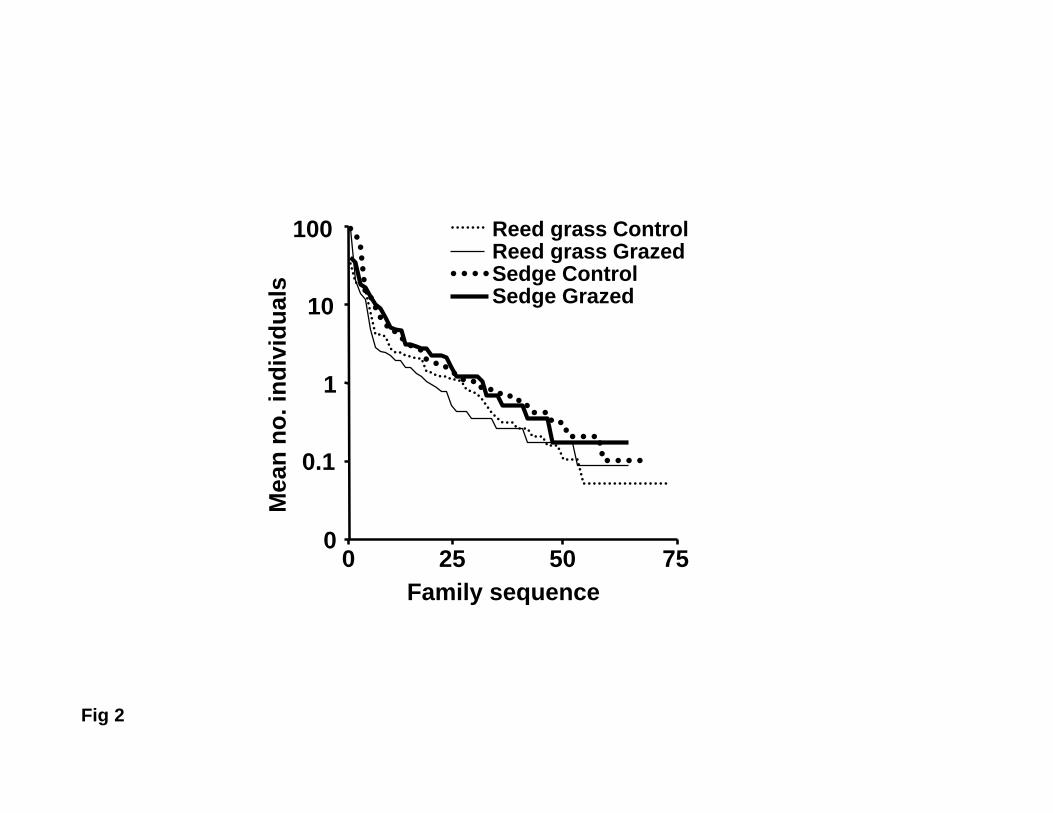
compensated for differing canopy height were not considered. All rank-abundance plots most
closely approximated a log normal distribution (Fig. 2). The grazed rank-abundance
13
distribution had less evenness than the control distribution in reed grass (p = 0.020,
Kolmogorov-Smirnov two-sample test), whereas the two distributions were not different in
sedge (p = 0.42). There was also less evenness in reed grass than in sedge, irrespective of
grazing (Fig. 2; p = 0.017). The many significant Year contrasts indicated higher diversity in
2011. Vegetation x Year interactions indicated that the differences by Vegetation were stronger
in 2010 than 2011. In contrast to the vegetation results, there was only a single block effect
(PIE; Table 2).
Individual orders and dominant taxa also showed a large number of significant
responses to Vegetation and Year, and there was a relatively greater response to Treatment
than observed for assemblage metrics (Table 3). Cicadellid leafhoppers and dolichopodid flies
were less abundant on grazed than control plots, whereas the inverse held for Orthoptera and
Coleoptera. There was a strong overall trend of lower abundance on grazed meadows across
the common taxa in Table 3 (p = 0.0020; two-tailed sign test), but not when all families were
considered (p = 0.59; Online Resource 1). A single Treatment x Vegetation interaction was
present: fewer agromyzid flies in grazed than control reed grass, but more in grazed than
control sedge. There was, however, a strong trend across abundant taxa (Table 3) of lower
abundances in grazed reed grass relative to control reed grass (p < 0.0001), whereas this trend
was absent in sedge (p = 0.31). This trend was not present in either assemblage when rare taxa
were included (reed grass, p = 0.43; sedge, p = 0.99; Online Resource 1). There were five
Treatment x Year interactions, but there was not consistent directionality. The significant
Vegetation contrasts involved a number of hemipteran and dipteran taxa and indicated greater
abundances in sedge (Table 3); chloropid flies were the single exception. There was a strong
trend of greater abundances in sedge across the taxa in both Table 3 (p = 0.0003) and across all
14
families (p = 0.0008; Online Resource 1; see also MRPP results below). Twenty families were
found only in sedge, whereas only eight families were collected exclusively in reed grass, and
most of the latter taxa were represented by a small number of individuals (Online Resource 1).
Half of the Table 3 taxa had Vegetation x Year interactions, and most were the result of higher
sedge abundances in 2010 but higher reed grass abundances in 2011. There were also many
strong Year effects; in general, hemipteran taxa had greater abundances in 2011, but most of
the other taxa with significant Year effects had greater abundances in 2010 (Table 3). Block
effects were present, but these spatial differences were not associated with particular groups.
The initial MRPP randomization test (p = 0.013) suggested that there were distinct
compositional differences among the main study factors, but the low effect size (A = 0.056) also
indicated that there was a great deal of variance within each of these factors. Two pairwise
comparisons were significant: control reed grass vs. control sedge (p = 0.0050) and grazed reed
grass vs. control sedge (p = 0.0004), and there was also a weaker contrast between grazed and
control reed grass (p = 0.13). The subsequent MRPP that used the group membership variable
from the cluster analysis had a lower p-value (< 0.0001) and higher A (= 0.25); further, all
pairwise comparisons were significant (p 0.014) indicating that factors other than vegetation
type and grazing exposure were likely important influences as well. Dispersion analyses were
not significant. Overall dispersion results were consistent, whether derived from deviations from
centroids or from spatial medians (each in turn from both ANOVA tables and permutation of
residuals); p-values ranged from 0.59 to 0.74. No pairwise dispersion comparisons were
significant among any combination of factors (0.18 < p < 0.85). The significant MRPP results in
combination with the non-significant dispersion results suggest that assemblage structure did
differ as a function of study factors rather than in variability/dispersion alone.

15
Discussion
There were negative grazing effects on vegetation, and as hypothesized these effects
were greater in sedge than in reed grass habitats. Although some tall montane sedges are
relatively unaffected by grazing (Allen and Marlow 1994; McIlroy and Allen-Diaz 2012), our
findings better align with results obtained by Clary (1995) and Sørensen et al. (2009) who
found high elevation and/or high latitude sedges to demonstrate more grazing effects than other
vegetation. Stohlgren et al. (1989), also working in Sequoia and using experimental clipping,
determined that assemblages dominated in part by sedge were more affected than assemblages
dominated in part by reed grass. Reed grass forms a dense root mat (Botti and Sydoriak 2001),
which, in combination with a shoot density six times greater than sedge, should confer some
protection from trampling via higher shear strength (Morrocco and Ballantyne 2008; Monz et
al. 2010). The greater effects of grazing on sedge relative to reed grass in our study were likely
also driven in part by soil moisture (Jensen 1985; Marlow et al. 1987; Allen and Marlow
1994), which is two to fourteen times greater in sedge than in reed grass in the Sierra (Neuman
1996; Holmquist and Schmidt-Gengenbach unpublished). Higher soil moisture and silt content
may have contributed to the observed lower soil strength in sedge, which, coupled with a
morphology that may be more easily penetrated, probably influences the observed patterns of
hoof punching: conservatively twice as deep in sedge as in reed grass (Neuman 1996).
Differential resistance per se of the plant assemblages was beyond the scope of this study and
is a candidate for future study (see also Cole 1995b; Rejmánková 1999).
We had hypothesized greater grazing impact on arthropod assemblages in sedge than in
reed grass, but the effects on arthropods in reed grass, albeit limited, were equal to or greater
than in sedge, despite the greater effects of grazing on sedge vegetation structure. Evidence for
16
greater grazing influence on reed grass fauna included a strong trend of lower abundances
across common taxa in grazed reed grass versus no trend in sedge, significantly different rank-
abundance distributions for grazed versus control reed grass, in contrast to the lack of
difference for sedge, as well as weaker trends apparent from MRPP. The unexpected
differences between the faunal responses in reed grass versus sedge may have been due to the
larger volume of habitat (per unit area) provided by the latter as a result of the taller canopy.
Minor alterations of vegetation structure in sedge would still leave the majority of habitat
intact, and levels of grazing pressure were clearly below any threshold for cascading effects on
fauna. In contrast, similar changes to reed grass structure could have a proportionally larger
effect with commensurate indirect effects on the associated arthropod assemblage. Thus the
most important "interaction" detected in the study was the greater grazing effect on vegetation
structure in sedge but greater effect on fauna in reed grass. The differing effects on plants and
animals as a function of habitat emphasize the importance of considering both flora and fauna
in management decisions (see also Kruess and Tscharntke 2002). Overall effects on fauna were
nonetheless relatively minor, thus aligning with earlier findings from studies addressing
different questions in this managed environment (Holmquist et al. 2010; 2013). Mitigating
factors may include relatively low stock use, late openings during study years, movement of
fauna among habitats, and sampling grain (Holmquist et al. 2013, submitted).
Taxon-specific grazing effects were split; some taxa, such as cicadellid leafhoppers,
were less abundant in grazed meadows, whereas others, such as acridid grasshoppers, were
more abundant. Herbivores, particularly leafhoppers, are tightly tied to the vegetation canopy
(Andresen et al. 1990; Gibson et al. 1992), and this group can in turn be susceptible to impacts
from grazing (Morris 1979; Holmquist et al. 2013; but see Kruess and Tscharntke 2002).

17
There is thus the possibility of negative feedback (Bormann & Likens 1979; Heinselman 1981;
Clark 1989) in terms of effects on vegetation, such that an increase in vertebrate grazing effects
may be somewhat mitigated by concomitant release from leafhopper herbivory. Conversely,
the positive relationship of another group of herbivores—grasshoppers—to grazing is
consistent with other grazing studies in these meadows (Holmquist et al. 2010; 2013) and
elsewhere (Bock et al. 2006; Cease et al. 2012; Fartmann et al. 2012). Although vertebrate
grazers are herbivorous competitors, many grasshoppers prefer grazed areas with a) reduced
canopy and litter, and b) increased bare ground, because access to bare ground facilitates soil
oviposition, and the warmer ground resulting from reductions in cover likely speeds
development (Huntly and Inouye 1988; Fartmann et al. 2012; but see Spalinger et al. 2011).
These mechanisms may have contributed to higher orthopteran abundances in our grazed
meadows, which had lower canopy height, litter depth and cover, and more extensive bare
ground relative to control meadows. Nutritional imperatives may also contribute to this pattern
of grasshopper abundance. Cease et al. (2012) found that grazing in a grassland lowered the
ratios of nitrogen and protein to carbohydrate and that these low ratios counterintuitively
increase growth, survival, and habitat selection by acridid grasshoppers. Orthopteran
herbivory can be substantial, particularly in high-altitude environments, where these animals
remove up to 30% of above-ground biomass (Blumer and Diemer 1996); some taxa feed at the
base of blades, which then fall to the substrate unconsumed, and ingest as little as 20% of
removed material (Bailey and Riegert 1973; Thompson et al. 1995). There is thus also the
potential for positive feedback (e.g., Rykiel et al. 1988; Cochrane et al. 1999) in that grazed
patches are more likely to attract grasshopper herbivory that may in turn remove a
disproportionate amount of canopy. Although overall grasshopper abundances were low in our
18
study, the biomass removed by grasshoppers can exceed grasshopper biomass by a factor of 33
(Blumer and Diemer 1996), so even a low density of grasshoppers can have a
disproportionately large effect.
Vegetation type and annual effects, the latter likely driven by differences in both winter
precipitation and stock activity, were both more important than grazing effects in terms of
influence on arthropods. These results are analogous to those of an earlier study that found
seasonal and annual effects to outweigh effects of grazing in these meadows (Holmquist et al.
2013). Roche et al. (2012) similarly found that differences in soil saturation and the associated
vegetation assemblage were also more important than cattle grazing in structuring Yosemite
toad (Anaxyrus [= Bufo] canorus) distributions in Sierra wetlands. There was clearly higher
faunal diversity and abundance in sedge than reed grass, but this relationship was largely
reversed when assessed after compensation for differing canopy height. Thus superior habitat
was provided by sedge on a per-area basis, but by reed grass on a per-volume basis. In this
sense, sedge provided greater habitat quantity, but reed grass provided better habitat quality if
the habitats are considered as three-dimensional "patch bodies" (Johnston 1995) after
accounting for differing canopy height. Although not a uniform result, many studies of
arthropods in other comparatively simple habitats have also determined that the higher
diversity and abundance found in taller-canopy habitats is reduced or reversed if compensation
is made for canopy height and/or leaf-area index (e.g., Stoner 1983; Holmquist et al. 1989;
Morris 2000; see also Reid and Hochuli 2007). Relationships in the current study were likely
driven by the taller canopy (Cunha et al. 2012), low soil strength, high soil moisture (Neuman
1996), and high productivity (Stohlgren et al. 1989) in sedge, versus the greater green cover,
higher plant species richness (Benedict 1983; Neuman 1996), and higher structural complexity
19
and heterogeneity (see also Denno 1977; Holmquist 1998; Cunha et al. 2012) in the reed grass
assemblage.
Management Implications
The wetter sedge habitat is less common in these wetlands than is reed grass in
combination with other drier vegetation assemblages. Differences in soil moisture (Neuman
1996) may have contributed to the significantly higher diversity and abundance of terrestrial
fauna in sedge, irrespective of grazing. A number of the taxa found predominantly or exclusively
in sedge have one or more life stages that make use of damp habitats, such as Saldidae
(Hemiptera) and Dolichopodidae, Ephydridae, Culicidae, Lonchopteridae, Micropezidae, and
Sciomyzidae (all Diptera). Further, sedge habitats are flooded for a month or more during early
and mid-season (Benedict 1983; Stohlgren et al. 1989; Loheide et al. 2009), during which time
an assemblage of aquatic arthropods is also present (Holmquist et al. 2011a). Reed grass can
also be flooded during early season, but these areas are much less extensive and persistent than
flooded sedge habitat. Sedge has an emergent canopy during the flooded phase, which
simultaneously supports a terrestrial assemblage, whereas areas of flooded reed grass have little
or no emergent canopy to accommodate terrestrial fauna. Sedge habitat thus represents a strong
terrestrial-aquatic interface (see also Haslett 1997; Wettstein and Schmid 1999; Holmquist et al.
2011a). On a per-area basis, sedge provides disproportionately more habitat for both terrestrial
and aquatic fauna than does reed grass, and the value of sedge habitat in this context is
noteworthy. Sedge patches are thus analogous to other vegetated and water-associated habitat
elements that support high aquatic and terrestrial arthropod diversity and are of conservation
importance, such as prairie or desert spring riparian habitat (Anderson and Anderson 1995; Sada
20
et al. 2005; Holmquist et al. 2011b). Although managers might overlook sedge habitats because
of low botanical diversity, the contribution to overall arthropod diversity via habitat provision is
clear.
Our Sequoia study wetlands appear to have tolerated grazing with only minor to
moderate effects, likely in part due to management use of annual, wetland-specific assessments
to determine meadow opening dates and allowable stock densities (McClaran 1989; Holmquist
et al. 2010; 2013). There may, however, be fewer restrictions in other managed areas that
contain sedge or other wetter, sensitive assemblages. A potential concern is that, if stock
access is determined on the basis of drier, more dominant vegetation assemblages, sedge
patches in opened meadows might remain in a wetter, more vulnerable state at opening. In
such a scenario, a simple stipulation that stock users release animals into meadows as far from
wetter habitats as possible might reduce effects on sedge habitats for some meadow
configurations. Use of portable electric fencing (e.g., Hall et al. 1992), although impractical
for large areas, might be useful for partial exclosure of smaller, heavily used sedge patches.
This approach would be most practical in situations in which the fencing could be used in
conjunction with natural impediments such as deeper ponds and streams or rock bands.
Exclosure of animals is sometimes preferable to enclosure, as some packers who have used
backcountry electric fencing report that enclosure is too confining and results in poor
performance by stock, although enclosing only the lead animal may mitigate this concern.
Another alternative would be the placement of a small number of logs in wetter habitat, as this
novel approach has been shown to decrease usage by mammalian grazers to the benefit of
vegetation, arthropods, and reptiles (Barton et al. 2011; Manning et al. 2013). Such approaches

21
could reduce effects on sensitive, wetter patches in heavily used areas while leaving meadows
open for stock use.
Acknowledgements Rick Dodson and Steve Case were outstanding field assistants, and Marie
French was her usual meticulous self while sorting samples. We thank Sequoia National Park for their
excellent support, especially from Corie Cann, Erik Frenzel, Erika Jostad, and Charisse Sydoriak, and
WMRC faculty and staff, especially Vikki DeVries, Frank Powell, and John Smiley. The paper was
improved through review by, or discussion with, Liz Ballenger, Beverly Collins, Dave Graber,
Rebecca Efroymson, Peggy Moore, Sarah Sheehan, Matthew Taylor, Harold Werner, and an
anonymous reviewer. This project was supported by the National Park Service (J8R07080005), and
the current study built upon earlier work funded by the NPS (J8C07100004, J8R07070006, and
J8R07030011). Angela Evenden expertly assisted with agreement development via the Californian
and Great Basin Cooperative Ecosystems Studies Units.
Ethical Standards This study complies with the laws of the USA. We obtained a Scientific
Research and Collecting permit from the US National Park Service for work in Sequoia National Park
for each year of the study. No protected species were sampled.
Conflict of Interest The authors declare that they have no conflict of interest.
22
References
Allen DR, Marlow CB (1994) Shoot population dynamics of beaked sedge following cattle
grazing. J Range Manag 47:64-69
Anderson MJ (2001) A new method for non-parametric multivariate analysis of variance. Austral
Ecol 26:32-46
Anderson TM, Anderson NH (1995) The insect fauna of spring habitats in semiarid rangelands
in central Oregon. Journal Kansas Entomol Soc 68:65-76
Andresen H, Bakker JP, Brongers M, Heydemann B, Irmler U (1990) Long-term changes of salt
marsh communities by cattle grazing. Plant Ecol 89:137-148
Bailey CG, Riegert PW (1973) Energy dynamics of Encoptolophus sordidus costalis
(Scudder)(Orthoptera: Acrididae) in a grassland ecosystem. Canadian J Zool 51:91-100
Barton PS, Manning AD, Gibb H, Wood JT, Lindenmayer DB, Cunningham SA (2011)
Experimental reduction of native vertebrate grazing and addition of logs benefit beetle
diversity at multiple scales. J Appl Ecology 48:943-951
Bausell RB, Li YF (2002) Power analysis for experimental research. Cambridge University
Press, Cambridge
Benedict NB (1983) Plant associations of subalpine meadows, Sequoia National Park,
California. Arctic Alpine Res 15:383–396
Bestelmeyer BT, Wiens JA (2001) Ant biodiversity in semiarid landscape mosaics: the
consequences of grazing vs. natural heterogeneity. Ecol Appl 11:1123-1140
Blumer P, Diemer M (1996) The occurrence and consequences of grasshopper herbivory in an
alpine grassland, Swiss Central Alps. Arctic Alpine Res 28:435-440

23
Bock CE, Jones ZF, Bock JH (2006) Grasshopper abundance in an Arizona rangeland
undergoing exurban development. Rangeland Ecol Manag 59:640–647
Bormann FH, Likens GE (1979) Pattern and process in a forested ecosystem. Springer, New
York
Botti SJ, Sydoriak W (2001) An illustrated flora of Yosemite National Park. Yosemite
Association, Yosemite National Park
Bråthen KA, Ims RA, Yoccoz NG, Fauchald P, Tveraa T, Hausner VH (2007) Induced shift in
ecosystem productivity? Extensive scale effects of abundant large herbivores. Ecosystems
10:773-789
Cardoso P, Erwin TL, Borges PAV, New TR (2011) The seven impediments in invertebrate
conservation and how to overcome them. Biol Conserv 144:2647-2655
Cease AJ, Elser JJ, Ford CF, Hao S, Kang L, Harrison JF (2012) Heavy livestock grazing
promotes locust outbreaks by lowering plant nitrogen content. Science 335:467-469
Clark JS (1989) Ecological disturbance as a renewal process: theory and application to fire
history. Oikos 56:17-30
Clary WP (1995) Vegetation and soil responses to grazing simulation on riparian meadows. J
Range Manag 48:18-25
Cochrane MA, Alencar A, Schulze MD, Souza CM Jr, Nepstad DC, Lefebvre P, Davidson EA
(1999) Positive feedbacks in the fire dynamic of closed canopy tropical forests. Science 284:
1832-1835
Cole DN (1995a) Experimental trampling of vegetation. I. Relationship between trampling
intensity and vegetation response. J Appl Ecol 32:203-214
24
Cole DN (1995b) Experimental trampling of vegetation. II. Predictors of resistance and
resilience. J Appl Ecol 32:215-224
Cole DN (2004) Impacts of hiking and camping on soils and vegetation: a review. In: Buckley R
(ed) Environmental impacts of ecotourism. CABI, Oxford, pp 41-60
Cole DN, Spildie DR (1998) Hiker, horse and llama trampling effects on native vegetation in
Montana, USA. J Environ Manag 53:61-71
Cole DN, van Wagtendonk JW, McClaran MP, Moore PE, McDougald NK (2004) Response of
mountain meadows to grazing by recreational pack stock. J Range Manage 57:153-160
Cunha ER, Thomaz SM, Mormul RP, Cafofo EG, Bonaldo AB (2012) Macrophyte structural
complexity influences spider assemblage attributes in wetlands. Wetlands 32:369-377
Dayton PK (1998) Reversal of the burden of proof in fisheries management. Science 279:821-
822
Deléglise C, Loucougaray G, Alard D (2011) Effects of grazing exclusion on the spatial
variability of subalpine plant communities: a multiscale approach. Basic Appl Ecol 12:609-
619
Dennis P, Young MR, Gordon IJ (1998) Distribution and abundance of small insects and
arachnids in relation to structural heterogeneity of grazed, indigenous grasslands. Ecol
Entomol 23:253-264
Denno RF (1977) Comparison of the assemblages of sap-feeding insects (Homoptera-Hemiptera)
inhabiting two structurally different salt marsh grasses in the genus Spartina. Environ
Entomol 6:359-372
Eckrich CE, Holmquist JG (2000) Trampling in a seagrass assemblage: direct effects, response
of associated fauna, and the role of substrate characteristics. Mar Ecol-Prog Ser 201:199-209

25
Elliot TL, Henry GHR (2011) Effects of simulated grazing in ungrazed wet sedge tundra in the
High Arctic. Arct Antarct Alp Res 43:198-206
Epanchin PN, Knapp RA, Lawler SP (2010) Nonnative trout impact an alpine-nesting bird by
altering aquatic-insect subsidies. Ecology 91:2406–2415
Erdfelder E, Faul F, Buchner A (1996) GPOWER: a general power analysis program. Behav Res
Meth Instr C 28:1-11
Fahrig L, Jonsen I (1998) Effect of habitat patch characteristics on abundance and diversity of
insects in an agricultural landscape. Ecosystems 1:197-205
Fartmann T, Krämer B, Stelzner F, Poniatowski D (2012) Orthoptera as ecological indicators for
succession in steppe grassland. Ecol Indic 20:337–344
Gerlach J, Samways M, Pryke J (In press) Terrestrial invertebrates as bioindicators: an overview
of available taxonomic groups. J Insect Conserv DOI: 10.1007/s10841-013-9565-9
Gibson CWD, Brown VK, Losito L, McGavin GC (1992) The response of invertebrate
assemblies to grazing. Ecography 15:166-176
Hall LM, George MR, McCreary DD, Adams TE (1992) Effects of cattle grazing on blue oak
seedling damage and survival. J Range Manag 45:503-506
Haslett JR (1997) Insect communities and the spatial complexity of mountain habitats. Global
Ecol Biogeogr 6:49-56
Heinselman ML (1981) Fire and succession in the conifer forests of northern North America. In:
West DC, Shugart HH, Botkin DB (eds) Forest succession: concepts and application.
Springer, Berlin, pp 374-405

26
Hendricks HH, Bond WJ, Midgley JJ, Novellie PA (2005) Plant species richness and
composition a long livestock grazing intensity gradients in a Namaqualand (South Africa)
protected area. Plant Ecol 176:19-33
Holmquist JG (1997) Disturbance and gap formation in a marine benthic mosaic: influence of
shifting macroalgal patches on seagrass structure and mobile invertebrates. Mar Ecol-Prog
Ser 158:121-130
Holmquist JG (1998) Permeability of patch boundaries to benthic invertebrates: influences of
boundary contrast, light level, and faunal density and mobility. Oikos 81:558–566
Holmquist JG, Jones JR, Schmidt-Gengenbach J, Pierotti LF, Love JP (2011a) Terrestrial and
aquatic macroinvertebrate assemblages as a function of wetland type across a mountain
landscape. Arct Antarct Alp Res 43:568–584
Holmquist JG, Powell GVN, Sogard SM (1989) Decapod and stomatopod assemblages on a
system of seagrass-covered mud banks in Florida Bay. Mar Biol 100:473-483
Holmquist JG, Schmidt-Gengenbach J, Haultain SA (2010) Does long-term grazing by pack
stock in subalpine wet meadows result in lasting effects on arthropod assemblages? Wetlands
30: 352-362
Holmquist JG, Schmidt-Gengenbach J, Haultain SA (2013) Effects of a long-term disturbance on
arthropods and vegetation in subalpine wetlands: manifestations of pack stock grazing in
early versus mid-season. PLoS ONE 8:1-10
Holmquist JG, Schmidt-Gengenbach J, Slaton MR (2011b) Influence of invasive palms on
terrestrial arthropod assemblages in desert spring habitat. Biol Conserv 144:518-525
Huntly N, Inouye R (1988) Pocket gophers in ecosystems: patterns and mechanisms. BioScience
38:786-793

27
Hurlbert SH (1971) The nonconcept of species diversity: a critique and alternative parameters.
Ecology 52:577-586
Jensen A (1985) The effect of cattle and sheep grazing on salt-marsh vegetation at Skallingen,
Denmark. Plant Ecol 60:37-48
Johnston CA (1995) Effects of animals on landscape pattern. In: Hansson L, Fahrig L, Merriam
G (eds) Mosaic landscapes and ecological processes. Chapman & Hall, London, pp 57-80
Jones WM, Fraser LH, Curtis PJ (2011) Plant community functional shifts in response to
livestock grazing in intermountain depressional wetlands in British Columbia, Canada. Biol
Conserv 144:511-517
Kendall KC, Metzgar LH, Patterson DA, Steele BM (1992) Power of sign surveys to monitor
population trends. Ecol Appl 2:422–430
Kitti H, Forbes BC, Oksanen J (2009) Long- and short-term effects of reindeer grazing on tundra
wetland vegetation. Polar Biol 32:253-261
Kohler F, Gillet F, Gobat J-M, Buttler A (2004) Seasonal vegetation changes in mountain
pastures due to simulated effects of cattle grazing. J Veg Sci 15:143-150
Koricheva J, Mulder CPH, Schmid B, Joshi J, Huss-Danell K (2000) Numerical responses of
different trophic groups of invertebrates to manipulations of plant diversity in grasslands.
Oecologia 125:271-282
Kremen C, Colwell RK, Erwin TL, Murphy DD, Noss RF, Sanjayan MA (1993) Terrestrial
arthropod assemblages: their use in conservation planning. Conserv Biol:796-808
Kruess A, Tscharntke T (2002) Contrasting responses of plant and insect diversity to variation in
grazing intensity. Biol Conserv 106:293–302
28
Lawton JH (1983) Plant architecture and the diversity of phytophagous insects. Annu Rev
Entomol 28:23-39
Loheide SP II, Deitchman RS, Cooper DJ, Wolf EC, Hammersmark CT, Lundquist JD (2009) A
framework for understanding the hydroecology of impacted wet meadows in the Sierra
Nevada and Cascade Ranges, California, USA. Hydrogeol J 17:229-246
Magurran AE (2004) Measuring biological diversity. Blackwell Science Ltd., Oxford
Manning AD, Cunningham RB, Lindenmayer DB (2013) Bringing forward the benefits of coarse
woody debris in ecosystem recovery under different levels of grazing and vegetation density.
Biol Conserv 157:204-214
Mapstone BD (1995) Scalable decision rules for environmental impact studies: effect size, Type
I, and Type II errors. Ecol Appl 5:401–410
Marlow CB, Pogacnik TM, Quinsey SD (1987) Streambank stability and cattle grazing in
southwestern Montana. J Soil Water Conserv 42:291-296
Marty JT (2005) Effects of cattle grazing on diversity in ephemeral wetlands. Conserv Biol
19:1626-1632
Mayr S, Buchner A, Erdfelder E, Faul F (2007) A short tutorial of GPower. Quant Methods
Psychol 3:51-59
McClaran MP (1989) Recreational pack stock management in Sequoia and Kings Canyon
National Parks. Rangelands 11:3–8
McCune B, Grace JB (2002) Analysis of ecological communities. MjM Software Design,
Gleneden Beach

29
McIlroy SK, Allen-Diaz BH (2012) Plant community distribution along water table and grazing
gradients in montane meadows of the Sierra Nevada Range (California, USA). Wetlands
Ecol Manage 20:287-296
Monz CA, Cole DN, Leung Y-F, Marion JL (2010) Sustaining visitor use in protected areas:
future opportunities in recreation ecology research based on the USA experience. Environ
Manag 45:551-562
Morris MG (1979) Responses of grassland invertebrates to management by cutting. II.
Heteroptera. J App Ecol 16:417–432
Morris MG (2000) The effects of structure and its dynamics on the ecology and conservation of
arthropods in British grasslands. Biol Conserv 95:129-142
Morrocco SM, Ballantyne CK (2008) Footpath morphology and terrain sensitivity on high
plateaux: the Mamore Mountains, Western Highlands of Scotland. Earth Surf Proc Land
33:40-54
Nagy L, Grabherr G (2009) The biology of alpine habitats. Oxford University Press, New York
Neuman MJ (1996) Packstock hoofprint depth and soil strength relationships in wet meadow
soils of Sequoia & Kings Canyon National Parks, California. MS Thesis, University of
Arizona
New TR (1998) Invertebrate surveys for conservation. Oxford University, New York
Newsome D, Cole DN, Marion JL (2004) Environmental impacts associated with recreational
horse-riding. In: Buckley R (ed) Environmental impacts of ecotourism. CABI, Oxford, pp
61-82
Oliver I, Beattie AJ (1996) Invertebrate morphospecies as surrogates for species: a case study.
Conserv Biol 10:99-109
30
Peck JE (2010) Multivariate analysis for community ecologists: step-by-step using PC-ORD.
MjM Software Design, Gleneden Beach
Pocock MJO, Evans DM, Memmott J (2012) The robustness and restoration of a network of
ecological networks. Science 335:973-977
Poos MS, Jackson DA (2012) Addressing the removal of rare species in multivariate
bioassessments: The impact of methodological choices. Ecol Indic 18:82-90
Ratkowsky DA (2008) Tests for dispersion among macrofungal species assemblages. Australas
Mycol 27:66-73
Ravolainen VT, Bråthen KA, Ims RA, Yoccoz NG, Henden JA, Killengreen ST (2011) Rapid,
landscape scale responses in riparian tundra vegetation to exclusion of small and large
mammalian herbivores. Basic Appl Ecol 12:643-653
Reid AM, Hochuli DF (2007) Grassland invertebrate assemblages in managed landscapes: Effect
of host plant and microhabitat architecture. Austral Ecol 32:708-718
Rejmánková E, Rejmánek M, Djohan T, Goldman CR (1999) Resistance and resilience of
subalpine wetlands with respect to prolonged drought. Folia Geobot 34:175-188
Reynolds JH, Thompson WL, Russell B (2011) Planning for success: Identifying effective and
efficient survey designs for monitoring. Biol Conserv 144:1278-1284
Roche LM, Latimer AM, Eastburn DJ, Tate KW (2012) Cattle grazing and conservation of a
meadow-dependent amphibian species in the Sierra Nevada. PLoS ONE 7:1-11
Rykiel EJ Jr, Coulson RN, Sharpe PJH, Allen TFH, Flamm RO (1988) Disturbance propagation
by bark beetles as an episodic landscape phenomenon. Landscape Ecol 1:129-139
31
Sada DW, Fleishman E, Murphy DD (2005) Associations among spring-dependent aquatic
assemblages and environmental and land use gradients in a Mojave Desert mountain range.
Diversity Distrib 11:91-99
Sørensen LI, Mikola J, Kytöviita M-M, Olofsson J (2009) Trampling and spatial heterogeneity
explain decomposer abundances in a sub-arctic grassland subjected to simulated reindeer
grazing. Ecosystems 12:830-842
Southwood TRE, Henderson PA (2000) Ecological methods. Blackwell, Malden
Spalinger LC, Haynes AG, Schütz M, Risch AC (2011) Impact of wild ungulate grazing on
Orthoptera abundance and diversity in subalpine grasslands. Insect Conserv Diver 5:444-452
Stohlgren TJ, DeBenedetti SH, Parsons DJ (1989) Effects of herbage removal on productivity of
selected high–Sierra meadow community types. Environ Manag 13:485–491
Stoner AW (1983) Distributional ecology of amphipods and tanaidaceans associated with three
seagrass species. J Crust Biol 3:505-518
Stoner AW, Lewis FG III (1985) The influence of quantitative and qualitative aspects of habitat
complexity in tropical sea-grass meadows. J Exp Mar Biol Ecol 94:19-40
Thompson DC, Torell LA, Huddleston EW, Davis JH (1995) Forage destruction by Aulocara
elliotti (Orthoptera: Acrididae) on rangeland in the southwestern United States. J Econ
Entomol 88:1455-1460
Turner MG (1987) Effects of grazing by feral horses, clipping, trampling, and burning on a
Georgia salt marsh. Estuaries 10:54-60
Underwood AJ (1997) Experiments in ecology. Cambridge University Press, Cambridge
32
Verdú JR, Moreno CE, Sánchez-Rojas G, Numa C, Galante E, Halffter G (2007) Grazing
promotes dung beetle diversity in the xeric landscape of a Mexican Biosphere Reserve. Biol
Conserv 140:308-317
Wettstein W, Schmid B (1999) Conservation of arthropod diversity in montane wetlands: effect
of altitude, habitat quality and habitat fragmentation on butterflies and grasshoppers. J Appl
Ecol 36:363-373
Wiens JA, Crawford CS, Gosz JR (1985) Boundary dynamics: a conceptual framework for
studying landscape ecosystems. Oikos 45:421-427
Willatt ST, Sulistyaningsih N (1990) Effect of plant roots on soil strength. Soil Till Res 16:329-
336
Yi X, Yang Y, Zhang X (2006) Modeling trophic positions of the alpine meadow ecosystem
combining stable carbon and nitrogen isotope ratios. Ecol Model 193:801-808

33
Figure Captions
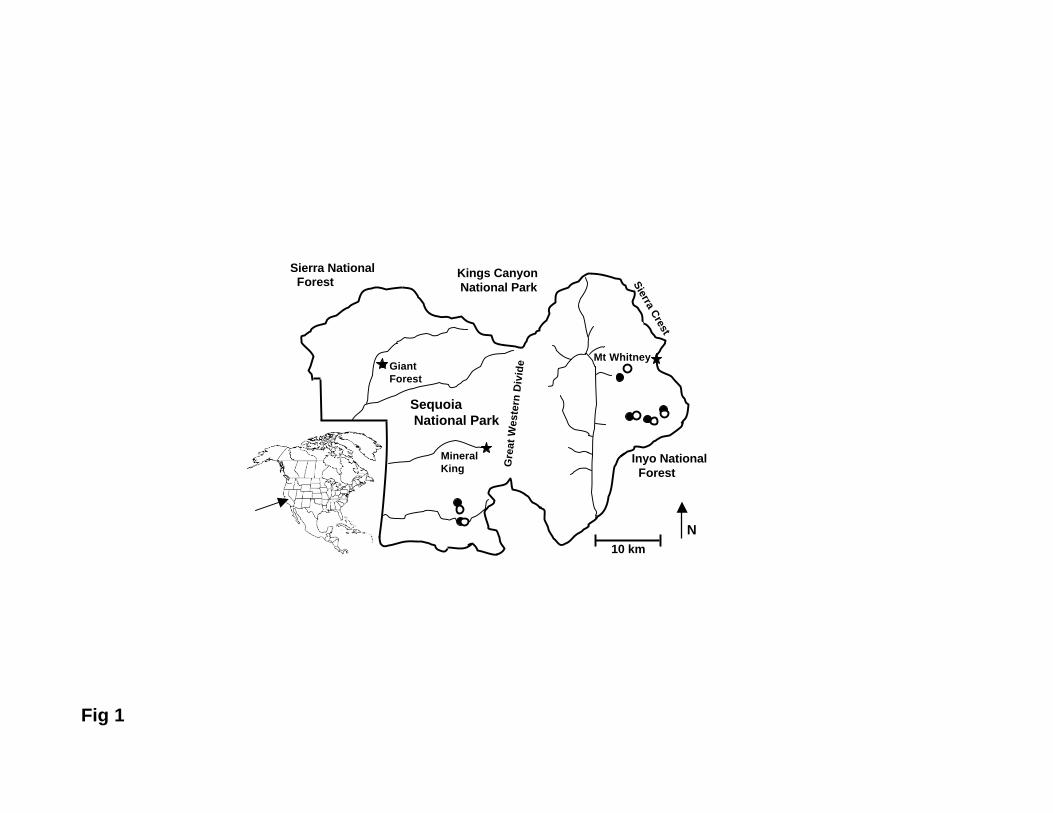
Fig. 1. Sequoia National Park in the Sierra Nevada of California, USA. Each of the six pairs of
meadows (blocks) was composed of a grazed (black circle) meadow paired with an ungrazed
(white circle) meadow. Meadows of a given pair are separated slightly on the map for clarity
where necessary. Modified from Holmquist et al. 2010 with permission from Springer
Fig. 2 Rank abundance plots for families, based on mean abundances, comparing grazed and
control meadows as a function of vegetation type
Inyo National Forest
Sierra National Forest
Kings Canyon National Park
Mt WhitneyGiantForest
MineralKing
Sequoia National Park
Sierra Crest
Gre
at W
este
rn D
ivid
e
10 km
N
Fig 1
Reed grass ControlReed grass GrazedSedge ControlSedge Grazed
100
10
1
0.1
0
Mea
n n
o. i
nd
ivid
ual
s
Family sequence0 25 50 75
Fig 2
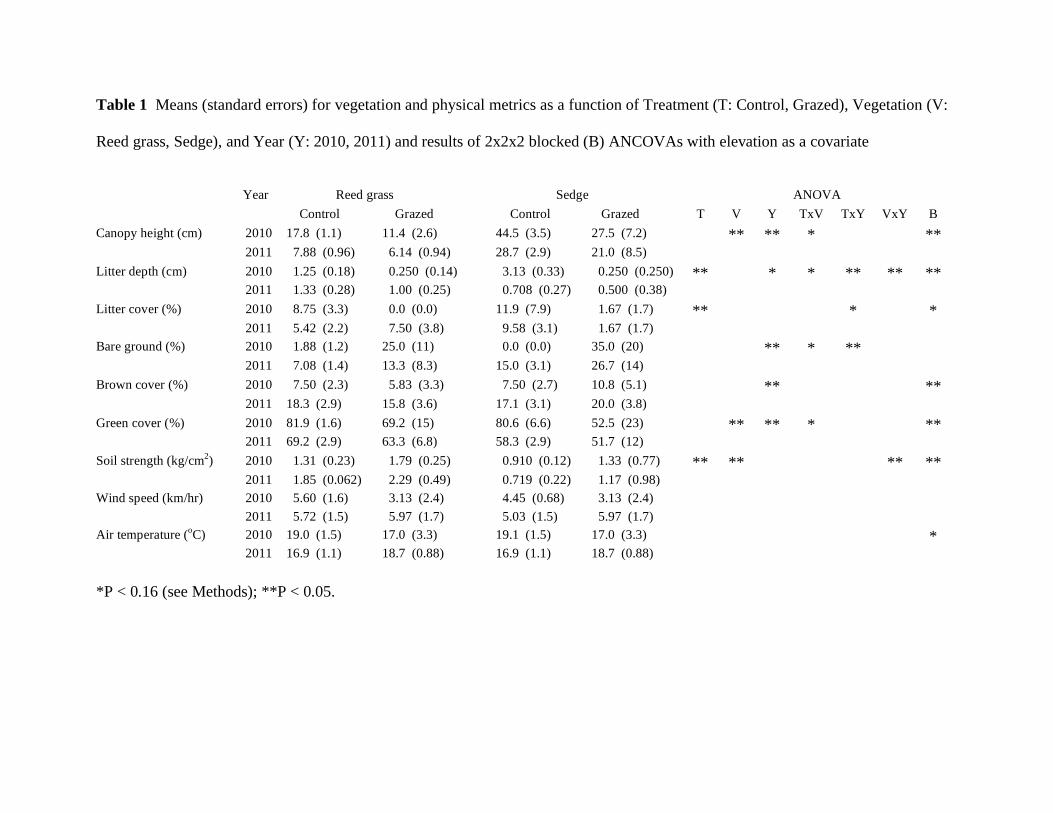
Table 1 Means (standard errors) for vegetation and physical metrics as a function of Treatment (T: Control, Grazed), Vegetation (V:
Reed grass, Sedge), and Year (Y: 2010, 2011) and results of 2x2x2 blocked (B) ANCOVAs with elevation as a covariate
Year Reed grass Sedge ANOVA
Control Grazed Control Grazed T V Y TxV TxY VxY B
Canopy height (cm) 2010 17.8 (1.1) 11.4 (2.6) 44.5 (3.5) 27.5 (7.2) ** ** * ** 2011 7.88 (0.96) 6.14 (0.94) 28.7 (2.9) 21.0 (8.5) Litter depth (cm) 2010 1.25 (0.18) 0.250 (0.14) 3.13 (0.33) 0.250 (0.250) ** * * ** ** ** 2011 1.33 (0.28) 1.00 (0.25) 0.708 (0.27) 0.500 (0.38) Litter cover (%) 2010 8.75 (3.3) 0.0 (0.0) 11.9 (7.9) 1.67 (1.7) ** * * 2011 5.42 (2.2) 7.50 (3.8) 9.58 (3.1) 1.67 (1.7) Bare ground (%) 2010 1.88 (1.2) 25.0 (11) 0.0 (0.0) 35.0 (20) ** * **
2011 7.08 (1.4) 13.3 (8.3) 15.0 (3.1) 26.7 (14) Brown cover (%) 2010 7.50 (2.3) 5.83 (3.3) 7.50 (2.7) 10.8 (5.1) ** ** 2011 18.3 (2.9) 15.8 (3.6) 17.1 (3.1) 20.0 (3.8) Green cover (%) 2010 81.9 (1.6) 69.2 (15) 80.6 (6.6) 52.5 (23) ** ** * ** 2011 69.2 (2.9) 63.3 (6.8) 58.3 (2.9) 51.7 (12) Soil strength (kg/cm2) 2010 1.31 (0.23) 1.79 (0.25) 0.910 (0.12) 1.33 (0.77) ** ** ** ** 2011 1.85 (0.062) 2.29 (0.49) 0.719 (0.22) 1.17 (0.98) Wind speed (km/hr) 2010 5.60 (1.6) 3.13 (2.4) 4.45 (0.68) 3.13 (2.4) 2011 5.72 (1.5) 5.97 (1.7) 5.03 (1.5) 5.97 (1.7) Air temperature (oC) 2010 19.0 (1.5) 17.0 (3.3) 19.1 (1.5) 17.0 (3.3) * 2011 16.9 (1.1) 18.7 (0.88) 16.9 (1.1) 18.7 (0.88) *P < 0.16 (see Methods); **P < 0.05.

Table 2 Means (standard errors) of faunal assemblage metrics as a function of Treatment (T: Control, Grazed), Vegetation (V: Reed
grass, Sedge), and Year (Y: 2010, 2011) and results of 2x2x2 blocked (B) ANCOVAs with elevation as a covariate. All measures
were based on 50-sweep samples
Year Reed grass Sedge ANOVA
Control Grazed Control Grazed T V Y TxV TxY VxY B
Total individuals 2010 157 (49) 80.3 (32) 369 (179) 208 (6.4) ** 2011 154 (35) 83.3 (40) 286 (109) 188 (70) Total individuals/cm 2010 9.28 (3.2) 9.88 (6.2) 8.54 (4.4) 8.50 (1.8) canopy height 2011 19.7 (4.0) 12.2 (4.6) 10.8 (4.5) 9.19 (0.29) Family richness 2010 19.0 (3.4) 13.3 (4.4) 28.8 (1.3) 24.0 (6.6) ** * 2011 22.3 (3.1) 18.0 (4.2) 23.3 (3.6) 21.3 (6.7) Morphospecies richness 2010 28.5 (7.0) 16.7 (6.2) 40.1 (3.5) 38.3 (13) ** * 2011 33.7 (6.0) 23.7 (7.6) 35.5 (6.3) 33.0 (12) Expected no. of 2010 8.65 (1.9) 8.15 (3.0) 10.4 (2.2) 9.35 (2.7) * *
morphospecies 2011 10.6 (0.72) 11.0 (1.0) 9.20 (1.4) 10.1 (1.9) Expected morphospecies/ 2010 0.484 (0.12) 0.652 (0.13) 0.236 (0.054) 0.356 (0.11) ** ** **
cm canopy height 2011 1.40 (0.12) 1.87 (0.33) 0.342 (0.068) 0.570 (0.12) Probability of 2010 0.705 (0.16) 0.660 (0.20) 0.804 (0.13) 0.743 (0.17) ** *
interspecific encounter 2011 0.868 (0.030) 0.888 (0.025) 0.774 (0.078) 0.868 (0.067) % Family dominance 2010 44.5 (15) 49.9 (19) 35.5 (14) 42.5 (17) * * 2011 34.0 (3.7) 26.4 (2.3) 43.1 (11) 37.1 (7.2) % Species dominance 2010 43.3 (16) 48.4 (20) 30.7 (15) 42.0 (18) ** 2011 27.5 (6.1) 23.6 (3.5) 36.9 (10) 22.3 (11) % Predators 2010 12.9 (3.6) 13.6 (7.1) 17.6 (7.2) 9.13 (5.8) ** * 2011 10.9 (2.2) 19.4 (2.2) 14.2 (3.2) 26.5 (12) % Herbivores 2010 10.5 (3.2) 8.56 (2.7) 23.6 (7.0) 15.8 (8.0) * ** 2011 33.7 (4.4) 47.2 (7.5) 45.9 (12) 45.5 (10) % More motile fauna 2010 94.3 (1.5) 92.0 (3.4) 91.6 (3.2) 91.6 (5.5) * 2011 79.9 (3.7) 87.4 (3.8) 73.4 (12) 85.8 (3.6) % Less motile fauna 2010 5.67 (1.5) 8.00 (3.4) 8.38 (3.2) 8.21 (5.6) *

2011 20.1 (3.8) 12.6 (3.8) 26.6 (12) 14.2 (3.6)
*P < 0.16 (see Methods); **P < 0.05.
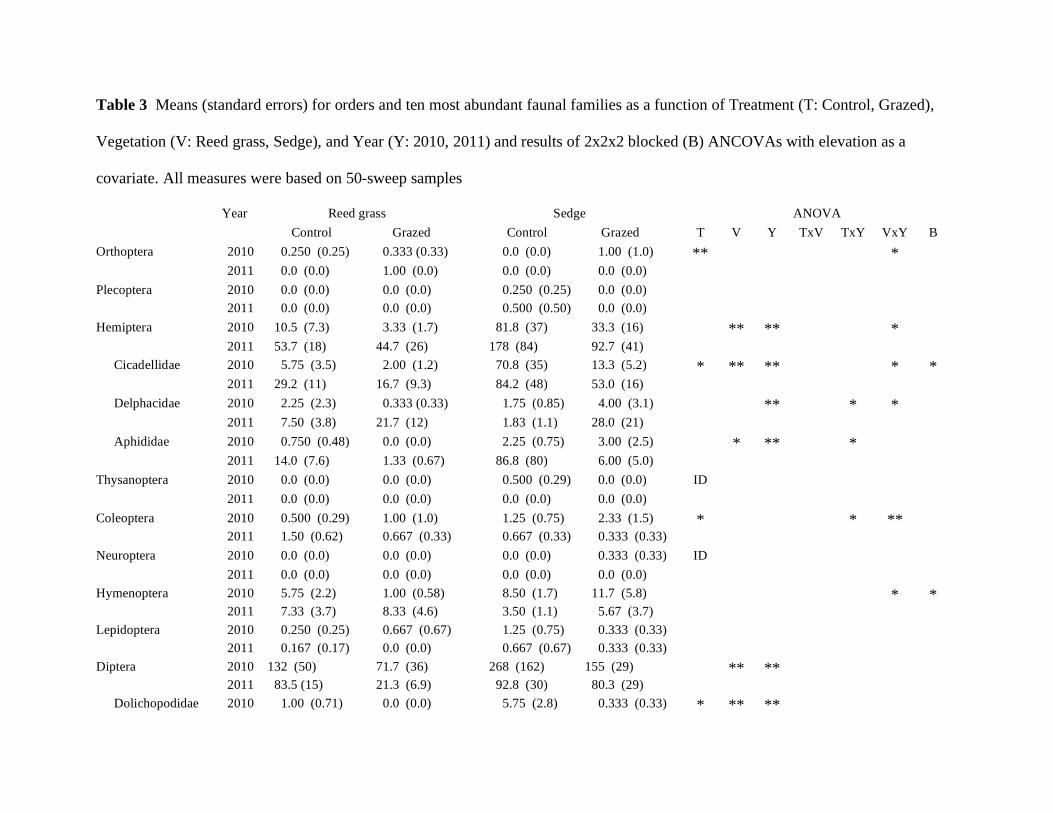
Table 3 Means (standard errors) for orders and ten most abundant faunal families as a function of Treatment (T: Control, Grazed),
Vegetation (V: Reed grass, Sedge), and Year (Y: 2010, 2011) and results of 2x2x2 blocked (B) ANCOVAs with elevation as a
covariate. All measures were based on 50-sweep samples
Year Reed grass Sedge ANOVA
Control Grazed Control Grazed T V Y TxV TxY VxY B
Orthoptera 2010 0.250 (0.25) 0.333 (0.33) 0.0 (0.0) 1.00 (1.0) ** * 2011 0.0 (0.0) 1.00 (0.0) 0.0 (0.0) 0.0 (0.0) Plecoptera 2010 0.0 (0.0) 0.0 (0.0) 0.250 (0.25) 0.0 (0.0) 2011 0.0 (0.0) 0.0 (0.0) 0.500 (0.50) 0.0 (0.0) Hemiptera 2010 10.5 (7.3) 3.33 (1.7) 81.8 (37) 33.3 (16) ** ** * 2011 53.7 (18) 44.7 (26) 178 (84) 92.7 (41)
Cicadellidae 2010 5.75 (3.5) 2.00 (1.2) 70.8 (35) 13.3 (5.2) * ** ** * * 2011 29.2 (11) 16.7 (9.3) 84.2 (48) 53.0 (16) Delphacidae 2010 2.25 (2.3) 0.333 (0.33) 1.75 (0.85) 4.00 (3.1) ** * * 2011 7.50 (3.8) 21.7 (12) 1.83 (1.1) 28.0 (21) Aphididae 2010 0.750 (0.48) 0.0 (0.0) 2.25 (0.75) 3.00 (2.5) * ** * 2011 14.0 (7.6) 1.33 (0.67) 86.8 (80) 6.00 (5.0)
Thysanoptera 2010 0.0 (0.0) 0.0 (0.0) 0.500 (0.29) 0.0 (0.0) ID 2011 0.0 (0.0) 0.0 (0.0) 0.0 (0.0) 0.0 (0.0) Coleoptera 2010 0.500 (0.29) 1.00 (1.0) 1.25 (0.75) 2.33 (1.5) * * ** 2011 1.50 (0.62) 0.667 (0.33) 0.667 (0.33) 0.333 (0.33) Neuroptera 2010 0.0 (0.0) 0.0 (0.0) 0.0 (0.0) 0.333 (0.33) ID 2011 0.0 (0.0) 0.0 (0.0) 0.0 (0.0) 0.0 (0.0) Hymenoptera 2010 5.75 (2.2) 1.00 (0.58) 8.50 (1.7) 11.7 (5.8) * * 2011 7.33 (3.7) 8.33 (4.6) 3.50 (1.1) 5.67 (3.7) Lepidoptera 2010 0.250 (0.25) 0.667 (0.67) 1.25 (0.75) 0.333 (0.33) 2011 0.167 (0.17) 0.0 (0.0) 0.667 (0.67) 0.333 (0.33) Diptera 2010 132 (50) 71.7 (36) 268 (162) 155 (29) ** ** 2011 83.5 (15) 21.3 (6.9) 92.8 (30) 80.3 (29)
Dolichopodidae 2010 1.00 (0.71) 0.0 (0.0) 5.75 (2.8) 0.333 (0.33) * ** **

2011 3.67 (2.9) 1.67 (1.7) 16.8 (11) 19.0 (13) Anthomyiidae 2010 33.0 (16) 13.0 (8.1) 19.0 (2.8) 30.3 (14) ** * 2011 10.7 (2.8) 1.00 (0.58) 2.33 (0.72) 4.00 (2.3) Muscidae 2010 3.50 (.87) 2.00 (1.5) 10.0 (4.7) 12.0 (6.1) * * * * 2011 26.5 (16) 5.67 (2.4) 14.8 (4.7) 12.3 (7.5) Agromyzidae 2010 1.75 (0.76) 0.667 (0.67) 4.75 (1.9) 7.33 (1.2) ** * ** * 2011 4.00 (1.3) 1.67 (0.88) 2.17 (0.48) 6.00 (2.6) Chloropidae 2010 5.00 (2.8) 2.33 (0.88) 2.25 (0.95) 4.33 (2.2) * * ** 2011 3.50 (1.4) 1.67 (0.88) 1.67 (0.56) 0.0 (0.0) Ephydridae 2010 70.8 (59) 41.3 (39) 190 (156) 63.3 (53) ** ** 2011 12.5 (5.4) 0.667 (0.33) 24.8 (11) 14.0 (11)
Araneae 2010 7.25 (4.0) 2.33 (1.2) 7.50 (2.3) 4.00 (1.7) 2011 8.00 (3.0) 7.33 (6.3) 10.0 (5.4) 8.33 (4.5)
Araneidae 2010 3.00 (0.82) 1.00 (0.58) 5.25 (1.9) 2.67 (1.2) ** ** 2011 3.00 (0.86) 6.00 (6.0) 0.333 (0.33) 0.0 (0.0)
*P < 0.16 (see Methods); **P < 0.05; ID = insufficient data to test.

Online Resource 1 Overview of abundance relationships by habitat and treatment. R = Reed
grass, S = Sedge, C = Control, G = Grazed. Absence of a given combination indicates zero
abundance. Inequalities do not indicate statistical differences
Orthoptera Lepidoptera
Acrididae RG = SG > RC Coleophoridae RG = SG > RC > SC
Plecoptera Pyralidae RG
Chloroperlidae SC Hesperiidae SC
Hemiptera Noctuidae SC > SG
Saldidae SG > SC Diptera
Miridae SG > SC > RG > RC Tipulidae SG > SC > RC
Nabidae SG > SC > RC > RG Ceratopogonidae SC > SG > RG
Anthocoridae SC Chironomidae SC > SG > RG > RC
Scutelleridae RG = SG Culicidae SC = SG
Rhyparochromidae RG > SC Simuliidae SG > RC > SC
Lygaeidae SG > RC > SC > RG Cecidomyiidae RG > SC
Geocoridae RG = SG > SC Mycetophilidae RG > SG
Cicadellidae SC > SG > RC > RG Sciaridae SG > RC > SC > RG
Delphacidae RG > SG > RC > SC Empididae RC > RG > SC > SG
Psyllidae SC > RC > RG Dolichopodidae SG > SG > RC = RG
Aphididae SC > SG > RC > RG Lonchopteridae SG > SC
Thysanoptera Phoridae SC > SG > RG > RC
Thripidae SC Pipunculidae SG > RC > SC > RG
Coleoptera Syrphidae SC > SG = RG > RC
Staphylinidae RC > RG > SC Anthomyiidae RC > SG > SC > RG
Melyridae SC Calliphoridae SG
Coccinellidae SG > SC > RG > RC Muscidae SC > SG > RC > RG
Mordellidae RC = RG Sarcophagidae RC
Chrysomelidae SG Scathophagidae SC > RC > SG
Neuroptera Tachinidae RC > RG > SC > SG
Hemerobiidae SG Psilidae RC
Hymenoptera Micropezidae SC
Tenthredinidae SG Lonchaeidae RC > SC
Braconidae SG > SC = RC > RG Tephritidae RC > SC > RG > SG
Ichneumonidae SC > SG = RC > RG Chamaemyiidae RG > SC
Pteromalidae SG > RC > RG > SC Sciomyzidae SC
Eucoilidae RC = SC Sepsidae SC > RG > SG > RC
Proctotrupidae SG Agromyzidae SG > SC > RG > RC
Diapriidae RG > SC > RC Opomyzidae RG
Bethylidae SG Chloropidae RC > RG = SG > SC
Dryinidae RC Heleomyzidae RG > SG > RC > SC
Pemphredonidae SG Sphaeroceridae SG > SC > RC > RG
Apidae RC Drosophilidae RG = SG > SC > RC
Formicidae SG > RG > RC > SC Ephydridae SC > SG > RC > RG

Araneae
Araneidae SC > SG > RG > RC
Tetragnathidae SC > SG > RC
Linyphiidae SC > RG > RC
Dyctinidae SC > SG
Oxyopidae SG
Lycosidae RC > SG > SC
Philodromidae SG
Thomisidae RC > RG > SC > SG
Salticidae RC