
Present-day deformation of the Dauphine Alpine and Subalpine massifs (SE France)
12
Geophys. J. lnf. (1996) 127, 189-200 Present-day deformation of the Dauphine Alpine and Subalpine massifs (SE France) Joseph Martinod,' Franqois Jouanne,2Joel Taverna,' Gilles Mhard,2 Jean-Franqois Gamond,' Xavier Darmendrail,2 Jean-Cyrille Notter3 and Christophe Bade4 'LGIT-IRlGM, Observatoire de Grenoble, UMR CNRS 5559, BP53X, F-38041 Grenoble cedex, France 2Laboratoire de Gdodynamique des Chaines Alpines, EPRS CNRS 129 Universitd de Savoie, BP1104, F-73011 Chambdry cedex, France 3Seruice de Gkodksie et Nivellement, Instituf Gdographique National, 2 Av. Pasteur, BP68, F-94160 Saint Mandk, France 4Laboratoire de Gkodynamique des Chaines Alpines, EPRS CNRS 129,15 rue Maurice Gignoux, F-38000 Grenoble, France Accepted 1996 June 1. Received 1996 April 26; in original form 1995 September 20 SUMMARY The positions of 20 geodetic points surveyed in 1946-1952 by the Institut Geographique National in the Grenoble area (western Alps) were remeasured in 1993-1994 using GPS. We evaluate the displacements of the common points of the networks between the two surveys, and calculate the strain-rate tensors for different sets of three adjacent points. The significant N70" shortening direction observed at the boundary of the Belledonne and Taillefer massifs suggests that the dextral strike-slip motion between the External Crystalline Massifs (ECM) and the Subalpine domain is still active. Geological evidence suggests that this deformation, which is compatible with the few focal mechanisms available for the area, occurred throughout the late Neogene. Our data also suggest a roughly 3-5 mm yr-' active shortening concentrated at the external front of the Subalpine chains. This thrust motion results in a principal axis of compression orientated N130", oblique to the direction of shortening observed in the ECM. This change in direction is also seen in in situ stress measurements. This motion may mark the southward continuation of the active fault observed in the Jura mountains by Jouanne, Menard & Darmendrail ( 1995). INTRODUCTION: THE GEOLOGICAL ENVIRONMENT OF THE GEODETIC NETWORKS Neogene tectonics In 1993 and 1994, the positions of 20 benchmarks established in 1946, 1950 and 1952 by the Institut Geographique National (IGN) near Grenoble (SE France) were remeashred using GPS in order to evaluate the present-day deformation of this part of the French Alps. The area studied is located on the western- most part of the Alpine arc, from the Belledonne and Taillefer Massifs (Alpine External Crystalline Massifs) to the east, through the Subalpine chains of the Chartreuse and Vercors massifs, and to the Bas-Dauphine molassic basin to the west (Fig. 1). The late Tertiary tectonics of this part of the French Alps is marked by the uplift of the External Crystalline Massifs (ECM), which began at about 20 Ma (Mugnier & Menard 1986; Menard 1988). Two successive basement thrusts accom- modated the uplift of these massifs, first a more internal one ('Accident Median de Belledonne', (QM), which was active during the Miocene, and then an external thrust, which was active from the late Miocene to the present (Fig. 1). This uplift was accompanied by dextral strike-slip motion of the Belledonne Massif relative to the foreland, interpreted as a consequence of the counter-clockwise rotation of the Adriatic plate and internal parts of the Alpine arc with respect to stable Europe (e.g. Gidon 1974; MCnard 1988; Vialon, Rochette & Menard 1989; Vialon 1990). According to Menard (1988), most of the recent strike-slip motion has been accommodated within the ECM, on the boundary (DM) between the External and the Internal Belledonne massif, while the frontal Belledonne fault mostly accommodated thrust motion. The dextral strike-slip motion of the internal Belledonne thrust is, however, poorly documented. Dextral NE-SW strike-slip faults are more clearly visible within the sedimentary cover of the Subalpine chains (e.g. Goguel 1948; Doudoux 1973; Gidon 1981; Gratier, Menard & Arpin 1989), or within the Liassic cover of the ECM (Gratier, Lejeune & Vergne 1973). In the Subalpine chains, strike-slip faults are recent, synchronous with the last period of shortening of the sedimentary cover, and their slip 0 1996 RAS 189 by guest on April 23, 2016 http://gji.oxfordjournals.org/ Downloaded from
-
Upload
independent -
Category
Documents
-
view
0 -
download
0
Transcript of Present-day deformation of the Dauphine Alpine and Subalpine massifs (SE France)

Geophys. J . l n f . (1996) 127, 189-200
Present-day deformation of the Dauphine Alpine and Subalpine massifs (SE France)
Joseph Martinod,' Franqois Jouanne,2 Joel Taverna,' Gilles Mhard,2 Jean-Franqois Gamond,' Xavier Darmendrail,2 Jean-Cyrille Notter3 and Christophe Bade4 'LGIT-IRlGM, Observatoire de Grenoble, UMR CNRS 5559, BP53X, F-38041 Grenoble cedex, France 2Laboratoire de Gdodynamique des Chaines Alpines, EPRS CNRS 129 Universitd de Savoie, BP1104, F-73011 Chambdry cedex, France 3Seruice de Gkodksie et Nivellement, Instituf Gdographique National, 2 Av. Pasteur, BP68, F-94160 Saint Mandk, France 4Laboratoire de Gkodynamique des Chaines Alpines, EPRS CNRS 129,15 rue Maurice Gignoux, F-38000 Grenoble, France
Accepted 1996 June 1. Received 1996 April 26; in original form 1995 September 20
SUMMARY The positions of 20 geodetic points surveyed in 1946-1952 by the Institut Geographique National in the Grenoble area (western Alps) were remeasured in 1993-1994 using GPS. We evaluate the displacements of the common points of the networks between the two surveys, and calculate the strain-rate tensors for different sets of three adjacent points. The significant N70" shortening direction observed at the boundary of the Belledonne and Taillefer massifs suggests that the dextral strike-slip motion between the External Crystalline Massifs (ECM) and the Subalpine domain is still active. Geological evidence suggests that this deformation, which is compatible with the few focal mechanisms available for the area, occurred throughout the late Neogene. Our data also suggest a roughly 3-5 mm yr-' active shortening concentrated at the external front of the Subalpine chains. This thrust motion results in a principal axis of compression orientated N130", oblique to the direction of shortening observed in the ECM. This change in direction is also seen in in situ stress measurements. This motion may mark the southward continuation of the active fault observed in the Jura mountains by Jouanne, Menard & Darmendrail ( 1995).
INTRODUCTION: THE GEOLOGICAL ENVIRONMENT OF THE GEODETIC NETWORKS
Neogene tectonics
In 1993 and 1994, the positions of 20 benchmarks established in 1946, 1950 and 1952 by the Institut Geographique National (IGN) near Grenoble (SE France) were remeashred using GPS in order to evaluate the present-day deformation of this part of the French Alps. The area studied is located on the western- most part of the Alpine arc, from the Belledonne and Taillefer Massifs (Alpine External Crystalline Massifs) to the east, through the Subalpine chains of the Chartreuse and Vercors massifs, and to the Bas-Dauphine molassic basin to the west (Fig. 1).
The late Tertiary tectonics of this part of the French Alps is marked by the uplift of the External Crystalline Massifs (ECM), which began at about 20 Ma (Mugnier & Menard 1986; Menard 1988). Two successive basement thrusts accom- modated the uplift of these massifs, first a more internal one
('Accident Median de Belledonne', (QM), which was active during the Miocene, and then an external thrust, which was active from the late Miocene to the present (Fig. 1). This uplift was accompanied by dextral strike-slip motion of the Belledonne Massif relative to the foreland, interpreted as a consequence of the counter-clockwise rotation of the Adriatic plate and internal parts of the Alpine arc with respect to stable Europe (e.g. Gidon 1974; MCnard 1988; Vialon, Rochette & Menard 1989; Vialon 1990). According to Menard (1988), most of the recent strike-slip motion has been accommodated within the ECM, on the boundary (DM) between the External and the Internal Belledonne massif, while the frontal Belledonne fault mostly accommodated thrust motion. The dextral strike-slip motion of the internal Belledonne thrust is, however, poorly documented. Dextral NE-SW strike-slip faults are more clearly visible within the sedimentary cover of the Subalpine chains (e.g. Goguel 1948; Doudoux 1973; Gidon 1981; Gratier, Menard & Arpin 1989), or within the Liassic cover of the ECM (Gratier, Lejeune & Vergne 1973). In the Subalpine chains, strike-slip faults are recent, synchronous with the last period of shortening of the sedimentary cover, and their slip
0 1996 RAS 189
by guest on April 23, 2016
http://gji.oxfordjournals.org/D
ownloaded from

190 J. Martinod et al.
1pB is 198 -
5: 1975 -
Figure 1. Tectonic map of the Grenoble area. Earthquakes of magnitude M,>4 that occurred during the last half-century have been plotted, with their focal mechanisms where available (after FrCchet 1978; Menard 1988; Nicolas et at. 1990 Grasso et al. 1992). Triangles mark the common points between the 1946-1952 and 1993-1994 networks.
decreases from east to west, suggesting that they resulted from the strike-slip motion of the ECM with respect to the Subalpine domain (Gidon 1981, 1990).
The uplift of the ECM also resulted in an increase of deformation of the sedimentary cover in the Subalpine chains, and in particular in the development of the most external thrusts of the Chartreuse Massif (Gidon 1981) and in the recent propagation of the deformation in the direction of the Bas Dauphine to the West (Colleau & Lenatre 1991).
ANALYSIS O F THE COMPARED NETWORKS
Geodetic data
Two sets of geodetic data have been examined in order to evaluate the deformation that occurred around Grenoble during the last half-century. Triangulation observations were made to establish the French second-order geodetic reference network of the area during three measurement campaigns, in 1946, 1950 and 1952, by the Institut Geographique National (IGN). They were performed using theodolites to measure horizontal angles between stations; a total of 86 geodetic points
was measured. There were granite benchmarks at most of the sites.
503 angular measurements constrain the 86 points of the old network. The standard deviation of a direction observation, oV, is assumed to be
where B, is expressed in degrees, D is the distance in km, n is the number of repeats of the measurements, A is the standard deviation of the centring and B is the standard deviation of the instrumental error, according to IGN studies. A is expressed inmm, B in degrees and k=0.3283 converts mm’ to ( degree)’. The choice of A (20 mm) and B (6.3 x degrees for T2 Wild theodolites) allows us to take into account the difference in precision between the old measurements, and to compare them with the GPS data.
In 1993, we looked for all the old benchmarks still existing in the area around Grenoble, on the Belledonne Massif (ECM), on the Vercors and Chartreuse Subalpine chains, and in the foreland molasse basin of the Bas-Dauphine. The new regional
degrees for T3, 9 x
0 1996 RAS, G J I 127, 189-200
by guest on April 23, 2016
http://gji.oxfordjournals.org/D
ownloaded from

Present-day deformation of the Dauphin6 mas& 191
geodetic network of 34 stations (Fig. 2) that was measured by GPS in 1993 and 1994 included most of the usable old triangulation sites. We eliminated all benchmarks whose stab- ility seemed doubtful, which is the case for many sites situated on the summits of the Chartreuse Massif. Moreover, many sites cannot be measured by GPS because of their location in wooded areas, which is the case for most of the benchmarks situated in the molasse basin. This explains why the network we measured in 1993 and 1994 only includes a few old benchmarks in the molasse basin as well as in the Chartreuse Massif. The density of old measurable sites is higher in the south of the network, in the Vercors and Taillefer massifs. Altogether, the triangulation and GPS surveys (Fig. 2, Table 1) have 20 sites in common.
Most of the GPS data were acquired in August 1993 using 12 Ashtech dual-frequency receivers. The sites measured in August 1993 were occupied for three 6 hr sessions, except a
few points of the network that could only be measured for two sessions because of bad meteorological conditions. Some points in the eastern part of the network (CCH, GGA, OUL, AHU and PMT) were reoccupied in August 1994 in three 12 hr sessions. Finally, the network presented in Fig. 2 also includes five points of a national large-scale GPS network established over the western Alps (Ferhat 1994) and measured in four 12 hr sessions in September 1993 (points VIR, FUR, CDM, CFE and MTC).
GPS data have been treated using the GPPS software developed by the Ashtech company, and the adjustment of data has been carried out with the Geolab software. The accuracy of the GPS data may be improved using software that allows more interactive processing than GPPS does. In fact, the adjustment of the GPS data calculated using GPPS shows 95 per cent error ellipses smaller than 3 cm, which is much better than the precision of classical triangulation data.
JS"30 N
45"N
Figure 2. Location of the points of the 1993-1994 GPS Network.
0 1996 RAS, GJI 127, 189-200
by guest on April 23, 2016
http://gji.oxfordjournals.org/D
ownloaded from
192 J . Martinod et al.
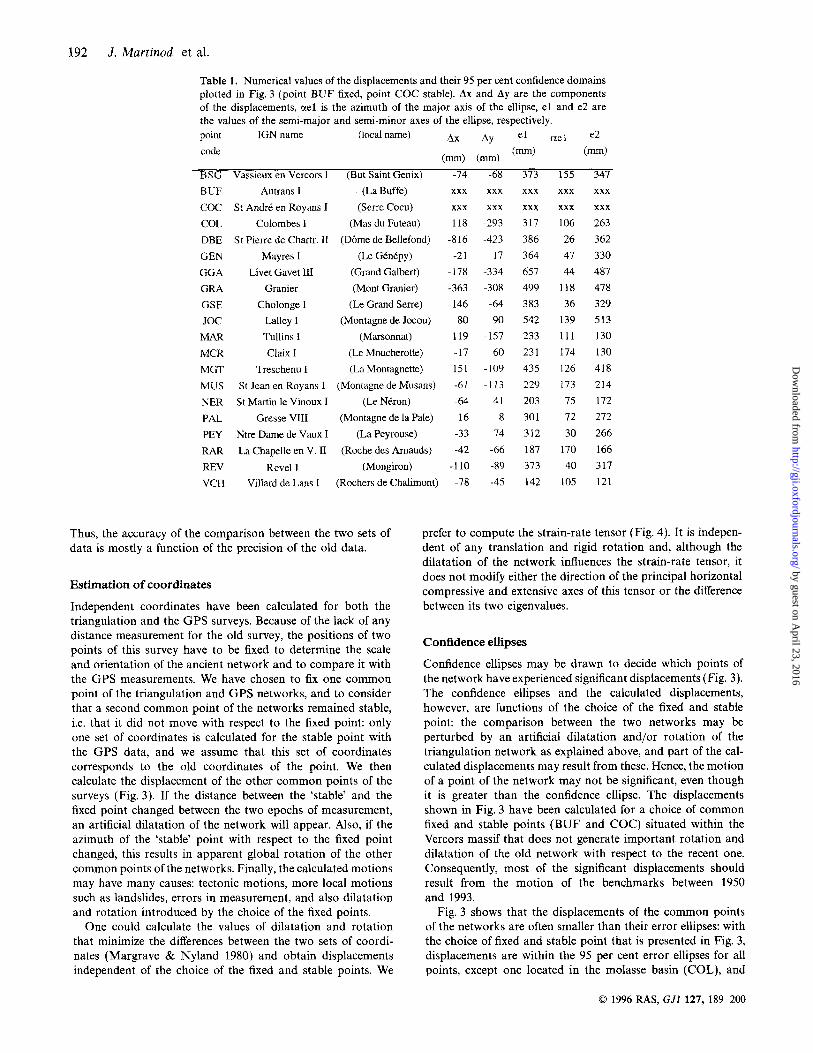
Table 1. Numerical values of the displacements and their 95 per cent confidence domains plotted in Fig. 3 (point BUF fixed, point COC stable). Ax and Ay are the components of the displacements, ctel is the azimuth of the major axis of the ellipse, e l and e2 are the values of the semi-major and semi-minor axes of the ellipse, respectively.
point IGN name (local name) AX AY el a e l e2 code (mm) (mm)
(mm) (mm)
BSG Vassieux en Vercors I (But Saint Genix) -74 -68 373 155 347 BUF Autrans I (La Buffe) COC St Andrt en Royans I (Serre Cocu) COL Colornbes I (Mas du Futeau) DBE St Pierre de Chartr. I1 (DBrne de Bellefond) GEN Mayres I (Le GBntpy) GGA Livet Gavet I11 (Grand Galbert) GRA Granier (Mont Granier) GSE Cholonge I (Le Grand Serre) JOC Lalley I (Montagne de Jocou) MAR Tullins I (Marsonnat) MCR Claix I (Le Moucherotte) MGT Treschenu I (La Montdgnette) MUS St Jean en Royans I (Montagne de Musans) NER St Martin le Vinoux I (Le NBron) PAL Gresse VIII (Montagne de la Pale) PEY Ntre Dame de Vaux I (La Peyrouse) RAR La Chapelle en V. I1 (Roche des Arnauds) REV Revel I (Mongiron)
xxx xxx xxx xxx 118 -293
-816 -423 -21 17
-178 -334 -363 -308 -146 -64 -80 90 119 -157 -17 60 151 -109
-61 -113 -64 41 16 8
-33 74 -42 -66
-110 -89
VCH Villard de Lans I (Rochers de Chalirnont) -78 -45
Thus, the accuracy of the comparison between the two sets of data is mostly a function of the precision of the old data.
Estimation of coordinates
Independent coordinates have been calculated for both the triangulation and the GPS surveys. Because of the lack of any distance measurement for the old survey, the positions of two points of this survey have to be fixed to determine the scale and orientation of the ancient network and to compare it with the GPS measurements. We have chosen to fix one common point of the triangulation and GPS networks, and to consider that a second common point of the networks remained stable, i.e. that it did not move with respect to the fixed point: only one set of coordinates is calculated for the stable point with the GPS data, and we assume that this set of coordinates corresponds to the old coordinates of the point. We then calculate the displacement of the other common points of the surveys (Fig. 3). If the distance between the ‘stable’ and the fixed point changed between the two epochs of measurement, an artificial dilatation of the network will appear. Also, if the azimuth of the ‘stable’ point with respect to the fixed point changed, this results in apparent global rotation of the other common points of the networks. Finally, the calculated motions may have many causes: tectonic motions, more local motions such as landslides, errors in measurement, and also dilatation and rotation introduced by the choice of the fixed points.
One could calculate the values of dilatation and rotation that minimize the differences between the two sets of coordi- nates (Margrave & Nyland 1980) and obtain displacements independent of the choice of the fixed and stable points. We
xxx xxx 317 386 3 64 657 499 383 542 233 23 1 435 229 203 30 1 312 187 373 142
KXX
xxx 106 26 47 44
118 36
139 111 174 126 173 75 72 30
170 40
105
xxx xxx 263 362 330 487 47 8 329 513 130 130 418 214 172 272 266 166 317 121
prefer to compute the strain-rate tensor (Fig. 4). It is indepen- dent of any translation and rigid rotation and, although the dilatation of the network influences the strain-rate tensor, it does not modify either the direction of the principal horizontal compressive and extensive axes of this tensor or the difference between its two eigenvalues.
Confidence ellipses
Confidence ellipses may be drawn to decide which points of the network have experienced significant displacements (Fig. 3). The confidence ellipses and the calculated displacements, however, are functions of the choice of the fixed and stable point: the comparison between the two networks may be perturbed by an artificial dilatation and/or rotation of the triangulation network as explained above, and part of the cal- culated displacements may result from these. Hence, the motion of a point of the network may not be significant, even though it is greater than the confidence ellipse. The displacements shown in Fig. 3 have been calculated for a choice of common fixed and stable points (BUF and COC) situated within the Vercors massif that does not generate important rotation and dilatation of the old network with respect to the recent one. Consequently, most of the significant displacements should result from the motion of the benchmarks between 1950 and 1993.
Fig. 3 shows that the displacements of the common points of the networks are often smaller than their error ellipses: with the choice of fixed and stable point that is presented in Fig. 3, displacements are within the 95 per cent error ellipses for all points, except one located in the molasse basin (COL), and
0 1996 RAS, GJI 127, 189-200
by guest on April 23, 2016
http://gji.oxfordjournals.org/D
ownloaded from

Present-day deformation of the Dauphin6 massifs 193
'30 N
"OON
Figure 3. Displacements of the common points of the 1946-1952 and 1993-1994 networks, with error ellipses calculated at a 95 per cent level of confidence. Point BUF is fixed, and the old coordinates of point COC have been chosen, assuming that COC has been 'stable' between the two measurement times, i.e. that its relative position with respect to point BUF was the same as in 1993.
two located in the Chartreuse Massif (GRA and DBE). The relative motion of some points of the network with respect to others may be significant, however, even when their calculated motion lies inside the error ellipse. For instance, we shall see that GSE has moved significantly with respect to PEY and GEN, a result that is not apparent from Fig. 3. In order to find the points of the network that have moved significantly, we applied a Fisher-Snedecor statistical test (Segall & Matthews, 1988).
Fisher-Snedecor test
The goal of this statistical test is to identify which stations have undergone significant changes of coordinates. We formally test the null hypothesis HO that the displacements are due to random noise in the data (Pelzer 1971; Niemeier 1981; Chrzanowski Yong-Qi & Secord 1982; Welsch 1983; Jouanne, Menard & Jault 1994). If this hypothesis is rejected, it is possible to interpret the motion of some of the stations. To
0 1996 RAS, GJI 127, 189-200
by guest on April 23, 2016
http://gji.oxfordjournals.org/D
ownloaded from

194 J. Martinod et al.
W 3 0 N
45"OON
I \
\ - - - /
SO30 E W O O E
Figure 4. Principal axes of the strain-rate tensors for the triangular areas shown. The clouds of points are computed by a Monte Carlo analysis of the dispersion of the data.
perform the test, we compared two solutions, one 'free' and the other 'constrained'.
To obtain the free solution, a set of coordinates is calculated independently for each survey. Since there are redundant observations, this allows us to estimate the internal consistency of the old and new observations. To get the constrained solution, we assume that no motion occurred between the two measurement times. All the observations are mixed to give a single solution valid for both sets of measurements. If motions occurred between the two measurements, the sum of the residuals is larger for the constrained solution than for the free solution. The Fisher-Snedecor test determines whether this increase is significant or not:
F=Sl2/SzZ is compared with Fo, k l , kZ, 95%, where Fo, k l , kZ, 95%
is such that
~ ' ( k l ) and ~ ' ( k 2 ) are random variables, independently x2 distributed with k l and k2 degrees of freedom, with k l = (n,-pc)-(nf-pf) and k2=nf-p, where n is the number of observations (n, = nf ), and p the number of unknowns ( p , < pf ). Subscript f refers to the free network (where the two datasets are treated as being independent) and subscript c refers to the constrained network (where the common points are con- strained to have identical coordinates).
0 1996 RAS, GJI 127, 189-200
by guest on April 23, 2016
http://gji.oxfordjournals.org/D
ownloaded from

Present-day deformation of the Dauphin6 massifs 195
Denoting the weighted sum of squares of residuals by R(Qf in the case of free network, Qc in the constrained case), the quantities S: and S2, are defined as follows:
where Q, = (v;Wvf) = (vTWvf )I + (v; WV, )I,
and
W is the matrix of observational weights, and vf and vc are the residuals of the free and constrained adjustments. The roman numerals denote the times of observation ( I and 11). The test criterion is as follows: if F = (SI2/ SZ2) 5 Fa, kl. k2, 95%,
the hypothesis that no motion occurred is accepted, based on the 95 per cent significance level.
Table2 presents one of the studies carried out on the common points of the networks. The null hypothesis is rejected, since F = 5.598 >Fa, kl, k2, 95yo = 1.42. Therefore, at least one point has undergone significant displacement between the two surveys. The Fisher-Snedecor test can the be used, in a second step, to define the points for which we have to calculate two different sets of coordinates. Table 2 shows that F is still too large after the choice of any first moving point, and that two different sets of coordinates have to be assigned to at least two points. The procedure may be repeated for two, three or more moving points, as long as the null hypothesis is rejected.
We tried to assign different sets of coordinates to all possible combinations of three points of the network and observed that at least four points must be simultaneously released to have the null hypothesis accepted. Table2 shows that the null hypothesis is accepted when the four points DBE-JOC-MGT- REV are simultaneously released. Since these points are wide-
spread through the whole network, a significant deformation of many of the points of the network is suspected.
Calculation of the strain-rate tensor, and Monte Carlo analysis of errors
To calculate the strain-rate tensor, we assume that the defor- mation is continuous within triangular elements formed by sets of three neighbouring points of the network. The principal strain-rate values and their directions are, respectively, the eigenvalues of the strain-rate tensor, and their associated eigenvectors. In Fig. 4 and Table 3, we present the strain-rate tensors calculated for 25 triangles formed by sets of points of the network. In this figure, we have not represented the strain- rate tensor for any triangle including point DBE. The motion of this point is very rapid in the regional tectonic context and we suspect that it results from local superficial motion (e.g. a landslide). The directions of the principal axes of the strain- rate tensor are independent of the choice of the fixed and stable points. The eigenvalues are a function of the apparent global dilatation of the network, but not the difference between the two eigenvalues.
In order to represent the accuracy of the calculations of the strain-rate tensors, we used a Monte Carlo analysis (Kasser et al. 1987). This method consists of perturbing each data value with a random noise normalized to its accuracy to calculate the two sets of coordinates of the common points of the networks and the associated strain-rate tensors. We per- turbed both the old angle values and the GPS data, and achieved 80 adjustments and calculations of the strain-rate tensors with different randomly perturbed initial data (Fig. 4). The dispersion of the eigenvalues and the directions of the principal axes of the strain-rate tensors results in an evaluation of the 95 per cent confidence domains of the strain-rate tensors (Kasser et al. 1987).
We observe that the directions of the principal axes of some
Table 2. Test of the null hypothesis: The null hypothesis that displacements are due to random noise in the data is tested by a Fisher-Snedecor test. At least four of the 19 common points of the networks (DBE-JOC-MGT-REV) must be simultaneously released to satisfy the null hypothesis. A significant deformation must then have been recorded between the two measurement times.
Variance factor U-P n k l k2 F FO
Free network
Constrained
One released point DBE REV NER GRA JOC
2 released points DBE-JOC DBE-MGT DBE-REV DBE-PAL
3 released points DBE-JOC-MGT
4 released points DBE-JOC-MGT-REV
7.944
9.917
7.944 9.237 9.661 9.678 9.694
7.71 1 7.711 7.845 7.865
7.667
7.5307
417
451
449 449 449 449 449
447 447 447 447
445
443
3070.913
4472.747
3566.945 4147.413 4337.968 4345.287 4352.650
3446.638 3446.906 3506.804 3515.789
3411.948
3336.100
34
32 32 32 32 32
30 30 30 30
28
26
417
417 417 417 417 41 7
417 417 417 417
417
417
5.598
2.105 4.568 5.377 5.408 5.439
1.700 1.702 1.973 2.014
1.654
1.385
1.42
1.42 1.42 1.42 1.42 1.42
1.46 1.46 1.46 1.46
1.50
1.50
0 1996 RAS, GJI 127, 189-200
by guest on April 23, 2016
http://gji.oxfordjournals.org/D
ownloaded from

196 J . Mnrtinod et al.
Table 3. Numerical values of the principal axes and rigid rotation angles of the strain-rate tensors plotted in Figs 4 and 5. Az, hl h2 and o are, respectively, the azimuth of the principal extensional axis, the values of the major and minor axis of the tensor (in ppm yr-'), and its rigid rotation (in degree yr-'); eAz, ehl, eh2, and em are the values of the uncertainty on these parameters.
triangles A ~ ( u ) e h 11 e h ~ h2 eh2 m e m
GRA-COL-NER 104.5 62.9 -0.27 0.09 -0.35 0.10 -5.6 6.0 REV-GRA-NER REV-GRA-GGA NER-BUF-COL BUF-COL-MAR COC-VCH-MAR MAR-BUF-VCH BUF-VCH-MCR BUF-MCR-NER MCR-NER-REV MCR-REV-GSE REV-GGA-GSE MCR-PEY-GSE PEY-GSE-GEN PAL-GEN-JOC PAL-PEY-GEN PAL-JOC-MGT MCR-PAL-PEY MCR-PAL-VCH PAL-MGT-BSG MUS-COC-RAR RAR-PAL-BSG COC-RAR-VCH RAR-BSG-MUS R AR-VCH-PAL
134.2 144.7 72.0 34.9 179.0 39.5 54.6 22.3 150.6 157.8 143.3 142.6 157.1 5 1.3 2.3 54.2 19.3 67.3 23.9 31.4 64.6 178.0 56.0 100.9
8.8 0.09 10.0 0.29 19.0 -0.12 67.2 -0.22 60.0 -0.11 7.4 0.12 8.8 0.17 41.5 -0.08 9.4 0.15 12.2 0.02 19.4 0.29 7.9 0.00 5.6 0.24 33.8 -0.03 11.5 0.14 4.4 0.64 28.3 0.05 16.5 0.17 7.7 0.22 17.2 0.19 15.8 0.12 9.5 0.12 19.6 0.08 39.0 0.04
tensors do not change significantly whatever the initial pertur- bation is, and we conclude that the data give significant information on the deformation of several triangles whose apices are common geodetic points of the networks. For instance, the principal shortening axis (N70") of the triangle consisting of the points GSE, GEN and PEY is significant, although the displacement of those three points was inside their 95 per cent confidence ellipses with the choice of fixed and stable point adopted in Fig. 3.
DISCUSSION: THE PRESENT-DAY TECTONICS OF THE GRENOBLE AREA
Other data to be taken into account
In situ stress measurements
The relationship between in situ stress measurements and the deformation of the continental crust is not always obvious. It is interesting to note, however, that the few in situ stress data available in the Belledonne and Mont Blanc ECM suggest a principal horizontal compressive axis orientated NE-SW (Menard 1988; Rebai, Philip & Taboada 1992; Grellet et al. 1993), very different from the N110" orientation of this axis measured in the Subalpine chains near Chambery. In fact, our geodetic data show a similar change in the orientation of the
0.10 -0.37 0.08 0.19 -0.84 0.39 0.32 -0.35 0.11 0.18 -0.35 0.12 0.07 -0.17 0.12 0.04 -0.36 0.16 0.07 -0.14 0.13 0.18 -0.16 0.09 0.15 -0.18 0.13 0.09 -0.17 0.13 0.18 -0.36 0.29 0.09 -0.17 0.13 0.12 -0.42 0.14 0.14 -0.12 0.09 0.14 -0.09 0.15 0.17 -0.22 0.1 1
0.11 -0.11 0.15 0.07 0.00 0.09 0.10 -0.09 0.09 0.10 -0.01 0.07 0.10 -0.04 0.09 0.10 -0.20 0.12 0.08 -0.06 0.08 0.12 -0.02 0.08
2.2 32.7 2.6 -7.8 9.3 -7. I -1.7 -4.8 8.8 10.1 26.9 11.0
2 1.4 2.9 -2.9 -5.7 -6.6 -4.1 2.9 -2.9 0.3 5.4 -0.2 -7.0
7.0 18.8 8.5 8.3 4.3 2.8 3.4 5.9 6.7 4.3 20.3 4.2 7.4 6.8 5.5 7.8 5.5 4.7 4.5 4.8 4.4 4.0 4.6 3.4
principal shortening axis, from N60" in the ECM, to N120" in the western part of the Subalpine chains.
Seismicity
The Northern French Alps are a region of moderate seismicity. Only a few earthquakes of magnitude higher than 4 have occurred in the Grenoble area since 1950 (Fig. 1). The strongest shock (1962 April 25) occurred near Correnqon, in the Vercors Massif; its magnitude was estimated as 5.3 (Rothe 1972). Calculated focal mechanisms (Fig. 1) generally show a hori- zontal P axis oriented roughly E-W, except for the 1963 April 25 Monteynard earthquake, which occurred very close to the surface and resulted from normal faulting (Frechet 1978; Menard 1988; Nicolas, Santoire & Delpech 1990; Grasso et at. 1992). It is worth noting that all the earthquakes that occurred near Monteynard, including the 1962 April 25 Correnqon earthquake, i.e. most of the earthquakes that occurred in the area during the last 50 yr, are thought to have been triggered by the infilling of the Monteynard reservoir lake in 1962 (Grasso et al. 1992).
The comparison of geodetic data with focal mechanisms must be made with care, since the earthquakes had magnitudes that were too small to produce significant deformation at the surface (no more than 10 earthquakes with a magnitude higher than 4 during the last half-century in the area).
0 1996 RAS, GJI 127, 189-200
by guest on April 23, 2016
http://gji.oxfordjournals.org/D
ownloaded from

Present-day deformation of the Dauphin6 massifs 197
Levelling lines
The comparison of levelling lines gives more detailed infor- mation on the active regional tectonics (Fourniguet 1977; Darmendrail 1994). Only the vertical component of displace- ments is available using this technique. It is not always possible to decide whether the observed vertical motions result from the compaction of Quaternary post-glaciation sediments underlying many levelling lines, or whether they result from tectonic motions. Moreover, the same vertical displacements can result from different tectonic regimes, e.g. normal faulting and thrusting can generate similar levelling-line differences. Nevertheless, the comparison of levelling lines measured in the beginning of the century with more recent ones shows an ECM uplift of roughly 1 to 1.5 mm yr-' with respect to the Bas- Dauphine molasse basin and the Isere valley northeast of Grenoble (Gresivaudan) (Fourniguet 1977; Darmendrail 1994; Jouanne et al. 1995). Similar uplift rates have been observed within the Swiss central Alps (Schaer & Jeanrichard 1974). The Subalpine Chartreuse and Vercors chains have also risen with respect to the molasse basin, at a rate of roughly 1 mm yr-' for the Vercors and 1 to 1.5 mm yr-' for the Chartreuse (Darmendrail 1994). Finally, the Isere valley between Grenoble and Voiron is subsiding (1 mm yr-' of vertical motion with respect to the molasse basin), although it is not clear if this vertical motion has resulted from the compaction of the recent sediments infilling the valley (several hundred metres of post- glaciation sediment infill this part of the valley), or from tectonic motions.
Neotectonics
To determine the tectonic regime responsible for the vertical motions, it is necessary to incorporate information about the horizontal displacements. Only a few neotectonic events have been observed in the Grenoble area as it was covered by ice during the last glaciation, which destroyed most of the morpho- logical evidence of recent tectonic motions (Menard 1988; Darmendrail 1994).
In St. Etienne de Crossey, near Voiron, west of the Chartreuse Massif (Fig. l ) , some N50" to N80" thrust faults, associated with N130 to N160 strike-slip faults are present within recent Quaternary sediments (Gidon 1961; Grellet et al. 1993). They probably resulted from the development of the Montagne du Ratz thrust and therefore from the further shortening of the sedimentary cover at the eastern boundary of the Bas-Dauphine basin.
Recent NE-SW faults have also been observed within the Belledonne Massif, near the boundary between the External and Internal Belledonne Chain, which may suggest that the QM Belledonne fault is still active (Bordet 1970; Menard 1988).
Finally, the uplift of the Belledonne Massif with respect to the Isere valley is marked, both in the morphology of this valley and in the topographic profiles of the rivers flowing down from Belledonne to the Isbre valley (Darmendrail 1994; Darmendrail, & Menard & Tardy 1994). According to these authors, the SE boundary of this part of the Isere valley is an active normal fault. Since the last glaciation, this fault has accommodated roughly 1.5 mm yr-' uplift of the Belledonne massif with respect to the Isere valley, as measured by repeated levelling. This uplift rate is similar to the uplift rate of Belledonne estimated from thermochronological data for the
last few million years (Menard 1988), although it is clear that the normal fault bounding the Isere valley, if it exists, has only been activated recently. Such a normal component of the fault bounding the western side of the ECM, according to Dannendrail et al. (1994) and Gamond (1993), would mark the gravity sliding of the Subalpine sedimentary cover in response to the uplift of the crystalline chain. This sliding could explain the normal-faulting focal mechanism of the Monteynard 1963 April 25 earthquake (Grasso et al. 1992; Gamond 1993).
In the next section, we show how the data presented above concerning the horizontal present-day motions help in con- straining the regional tectonic motion.
Interpretation of the comparison between the two geodetic networks: the present-day tectonic motions in the Grenoble area
Fig. 3 shows that the amplitude of the displacements that occurred in the Grenoble area between 1950 and 1993 is of the same order as the precision of the old data. It is difficult then to constrain precisely the deformation that has ocurred in the area during the last half-century.
Only one point (DBE) has really moved significantly with respect to the other points of the network. Its displacement is about one metre towards the WSW, corresponding to a displacement rate of more than 2cm yr-'. Such a rate is anomalous in the regional context, and we suspect that it results from a local landslide.
The Subalpine frontal thrust
The two points located in the molasse basin, NW of the Subalpine Chains, moved to the SSE with respect to the points located in Vercors and Chartreuse (Fig. 3). The displacement is slightly outside the 95 per cent error ellipses for point COL, and a few strain rate tensors calculated for triangles including the points of the foreland basin show a significant shortening direction orientated between N120" and N150", suggesting that the thrusting of the Subalpine chains above the molasse basin is still active. With our data it is difficult to constrain the rate of horizontal shortening, but we estimate it to be about 3 to 5mm yr-l. Such a value is similar to the E-W shortening rate observed by triangulation and levelling com- parisons by Jouanne et al. (1994, 1995) in the Southern Jura Mountains, between the internal and external Jura. The eastern boundary of the Bas-Dauphin6 molasse basin may be the southward continuation of this active regional thrust.
The Belledonne and Taillefer massifs
In the eastern part of the network, some triangles show significant deformation tensors at the boundary between the ECM and the Subalpine domain. In this part of the network, the shortening direction is orientated roughly N70", clearly different from the N130" direction of shortening at the bound- ary between the Subalpine chains and the molasse basin (Fig. 4). In the eastern part of the network, the shortening is
0 1996 RAS, G J I 127, 189-200
by guest on April 23, 2016
http://gji.oxfordjournals.org/D
ownloaded from

198 J. Martinod et al.
therefore oblique to the direction of the main geological structures, while it is perpendicular to the main folds at the western boundary of the Chartreuse and Vercors massifs. Such an oblique shortening may result from the present-day continu- ation of the strike-slip motion of the Belledonne Massif with respect to the Subalpine domain that has been suggested by geologists for the late Neogene (see above). The clockwise rotation of the triangles located at the boundary of the Belledonne chain (Fig. 5 ) supports the existence of this dextral strike-slip motion, which i s also compatible with most of the
focal mechanisms available within the Belledonne and Mont Blanc ECM.
Our data show that significant horizontal displacements have occurred during the last half-century between the ECM and the Subalpine sedimentary cover. The main component of the relative motion is a strike-slip component. Levelling data and geomorphology demonstrate that this strike-slip motion is combined with the uplift of the ECM with respect to the Iskre and Drac valleys (Fourniguet 1977; MCnard 1988; Darmendrail 1994 Darmendrail et al. 1994). Our data cannot
45"30 N
45"WN
5"30 E 6"cQ E
Figure 5. Rigid rotation of the strain-rate tensors for sets of three adjacent geodetic points. The dark angles represent the uncertainty of this parameter, estimated with the Monte Carlo analysis.
0 1996 RAS, GJI 127, 189-200
by guest on April 23, 2016
http://gji.oxfordjournals.org/D
ownloaded from
Present-day deformation of the Dauphin6 massijs 199
distinguish between the possibilities that the uplift of Belledonne results from normal faulting (gravity sliding) in front of the ECM or that it results from shortening between the Belledonne Massif and the Subalpine chains.
The Vercors Mountain
Within the Vercors Massif, there is not a large amount of deformation, and the principal axes of the strain-rate tensor are generally not significant (Fig. 4). Some significant defor- mation is observable, in particular in the southern part of the network (near MGT), but this deformation only results from the motion of one point, MGT, situated at the boundary of our network. Hence it is difficult to claim that the calculated strain-rate tensors of triangles having this point as an apex represent a tectonic regional deformation, and that it is not the consequence of a local landslide motion.
CONCLUSION
The comparison between the IGN triangulation network meas- ured in 1946-1952 and the GPS data collected in 1993-1994 gives information on the horizontal motions that have occurred in the Grenoble area during the last 45 yr. A few displacement vectors and some strain-rate tensors reveal significant present- day regional tectonic activity.
Shortening has been detected in front of the Subalpine chains. The shortening rate (3-5mm yr-') is similar to the rate calculated by Jouanne e t al. (1994, 1995) within the Jura Mountains, which may be the northern continuation of this active frontal thrust. Dextral strike-slip motion is observed at the boundary between the ECM and the Subalpine domain. The change in orientation of the shortening axis of the strain- rate tensors, turning from N70" in the ECM to N130" near the molasse basin, is consistent with the rotation of the principal horizontal stress axis revealed by in situ stress measurements. Such kinematic variations may result from the partitioning between strike-slip and thrust motion in front of the ECM, as is generally observed in areas where crustal shortening is combined with strike-slip motion (e.g. Richard & Cobbold 1989). It is also worth noting that the local moderate seismicity can only account for a tiny proportion of these displacements, which suggests that most of the tectonic motions of this part of the Alpine arc are accommodated by aseismic processes.
Fig. 3 makes it clear that the detected motions are, however, very close to the noise level. New geodetic measurements are necessary to confirm that the detected coordinate changes are significant. A large GPS network was measured on the whole western Alpine arc in 1993. Repeating the measurements within a few years would provide a test of the displacements sug- gested here.
ACKNOWLEDGMENTS
The authors wish to thank M. Lepape and the Institut Geographique National for their collaboration in the 1993 GPS campaign and for giving us the data of the 1946, 1950 and 1952 triangulation campaigns covering the Grenoble area. We also wish to thank Michel Kuntz, Michel Dietrich, Claude Deladoeuille, Jean Noel Lauzat, CCcile ThomCrC, Anne Raymond, the Fenestraz family, the rugby club of Saint Martin
&Heres, and all the other people who carried batteries and GPS receivers over most summits of this country. We are also indebted to an anonymous reviewer for helping us to improve this paper. This work has been financed by the P61e Grenoblois &Etudes et de Recherches pour la PrCvention des Risques Naturels, and by the Institut National des Sciences de 1'Univers.
REFERENCES
Bordet, P., 1970. Les failles vivantes des Grands moulins (massif cristallin externe de Belledonne), Geologie Alpine, 46, 43-47.
Chrzanowski, A., Yong-Qi, C. & Secord, J.M., 1982. On the analysis of deformation surveys, 4th Canadian symp. mining surveying & deformation movements, pp. 431-452, eds Anderson, E. & Teskey, F., Banff, Alberta, Canada.
Colleau, A. & LenBtre, N., 1991. A new digital method for analysis of neotectonics applied to the Bonnevaux-Chambaran area, France, Tectonophysics, 194, 295-305.
Darmendrail, X., 1994. DCformation recente et actuelle des Alpes occidentales. Mise en Cvidence, caractkrisation et quantification par analyse geomorphologique et comparaison de nivellements, Gdologie alpine, Mbm. H.S., 21, 174pp.
Darmendrail, X., Menard, G. & Tardy, M., 1994. Interpretation neotectonique d'anomalies geomorphologiques dans une grande vallCe des Alpes nord-occidentales: le Grksivaudan, C. R . Acad. Sci. Paris, 318, 815-821.
Doudoux, B., 1973. Nouvelles donnees tectoniques sur le massif des Bauges (Savoie), Ann. Centre uniuersitaire de Savoie, 1, 125-139.
Ferhat, G., 1994. Mise en place d'un reseau GPS dans les Alpes pour la surveillance tectonique, Revue XYZ, 57, 42-43.
Fourniguet, J., 1977. Mise en Cvidence des mouvements neotectoniques actuels verticaux dans le S.E. de la France par comparaison de nivellements successifs, Rapport BRGM, 77-SGN-081-GEO.
FrCchet, J., 1978. Sismicite du S.E. de la France et une nouvelle mbthode de zonage sismique, These 3eme cycle, Universite de Grenoble, France.
Gamond, J.F., 1993. Normal faulting and tectonic inversion driven by gravity in a thrusting regime, J. struct. Geol, 16, 1-9.
Gidon, M., 1961. Deux cas d'acidents tectoniques dans des formations quaternaires recentes des Alpes franqaises (Isere et Haute Savoie), Extrait tux. Lab. Geol. Fac. Sci. Grenoble, 37, 89-91.
Gidon, M., 1974. L'arc alpin a-t'il une origine tourbillonaire?, C. R. Acad. Sci. Paris, 278, 21-24.
Gidon, M., 1981. Les deformations de la couverture des Alpes occiden- tales externes dans la region de Grenoble; leur rapport avec celles du socle, C. R . Acad. Sci. Paris, 292, 1057-1060.
Gidon, M., 1990. Les derochements et leur place dans la structuration du Massif de la Chartreuse (Alpes occidentales franqaises), Geologie alpine, 66, 39-55.
Goguel, J., 1948. Le r6le des failles de decrochement dans le massif de la Grande Chartreuse, Bull. Soc. geol. Fr., 5, 227-235.
Grasso, J.R., Guyoton, F., Frichet, J. & Gamond, J.F., 1992. Triggered earthquakes as stress gauge: Implication for the uppercrust behavior in the Grenoble area, France, Pageoph, 139, 579-605.
Gratier, J.P., Lejeune, B. & Vergne, J.L., 1973. Etude des deformations de la couverture et des bordures sedimentaires des massifs cristallins externes de Belledonne, des Grandes Rousses et du Pelvoux, Thdse 3&"" cycle, Universitb de Grenoble, France.
Gratier, J.P., Mtnard, G. & Arpin, R., 1989. Strain-displacement compatibility and restoration of the Chaines Subalpines of the western Alps, in Alpine Tectonics, eds Coward, M.P., Dietrich, D. & Park, R.G., Geol. Soc. spec. Pub, 45, 65-81.
Grellet, B., Combes, P., Granier, T. & Philip, H., 1993. Sismotectonique de la France mttropolitaine dans son cadre geologique et geophy- sique, Mkm. Soc. GCol. Fr., 164, 76pp.
Jouanne, F., Menard, G. & Jault, D., 1994. Present-day deformation
0 1996 RAS, G J l 127, 189-200
by guest on April 23, 2016
http://gji.oxfordjournals.org/D
ownloaded from

200 J . Martinod et al.
of the French northwestern Alps/southern Jura mountains: compari- son between historical triangulations, Geophys. J . Int, 119, 151-165.
Jouanne, F., Menard, G. & Darmendrail, X., 1995. Present-day vertical displacements in the North-Western Alps and Southern Jura moun- tains: data from levellings comparisons, Tectonics, 14, 606-616.
Kasser, M., Ruegg, J.C., Lesage, P., Ortlieb, L., Pagarete, J., Duch, N., Guerrero, J. & Roldan, J., 1987. Geodetic measurement of plate motion across the central Gulf of California, Geophys. Res. Lett.,
Margrave, G.F. & Nyland, E., 1980. Strain from repeated geodetic surveys by generalized inverse methods, Can. J. Earth Sci., 17,
Mtnard, G., 1988. Structure et cinematique d’une chaine de collision: les Alpes occidentales et centrales, Thtse d’Etat, Universite de Grenoble, France.
Mugnier, J.L. & Menard, G., 1986. Le diveloppement du bassin molassique suisse et l’evolution des Alpes externes: une modele cintmatique, Bull. Centre Rech. Explor. Prod. Elf Aquitaine, 10, 123-135.
Nicolas, N., Santoire, J.P. & Delpech, P.Y., 1990. Intraplate seismicity: new seismotectonic data in western Europe, Tectonophysics, 179, 27-53.
Niemeier, W., 1981. Statistical tests for detecting movements in repeat- edly measured geodetic networks, Tecronophysics, 71, 335-351.
Pelzer, H., 1971. Zur analyse geodetischer deformationsmessungen, Dtsch. Geod. Komm. Reihe C, 164.
14, 5-8.
1020-1030.
Rebai, S., Philip, H. & Taboada, A,, 1992. Modern tectonic stress field in the Mediterranean region: evidences for stress deviations at different scale, Geophys. J. Int., 110, 106-140.
Richard, P. & Cobbold, P.R., 1989. Structures en fleur positives et decrochements crustaux: modelisation analogique et interprktation mtcanique, C. R. Acad. Sci. Paris, 308, 553-560.
Rothe, E. (1972). La stismicite de la France de 1961 a 1970, Ann l’lnstitut Phys. du Globe, IX, Universite de Strasbourg.
Schaer, J.P. & Jeanrichard, F., 1974. Mouvements actuels verticaux et anciens dans les Alpes suisses, Eclog. Geol. Helu., 67, 101-119.
Segall, P. & Matthews, P.V., 1988. Displacements calculations from geodetic data and the testing of geophysical deformation models, J. geophys. Res., 93, 14954-14966.
Vialon, P., 1990. Deep Alpine structures and geodynamic evolution : an introduction and outline of a new interpretation, in Deep structure ofthe Alps, eds Roure, F., Heitzmann, P. & Polino, R., Mkm. SOC. Geol. Fr., 156, Mbm. SOC. Gtol. Suisse, 1; Vol. Spec. Soc. Geol. It.,
Vialon, P., Rochette, P. & Menard, G., 1989. Indentation and rotation in the western alpine arc, in Alpine Tectonics, eds Coward, M.P., Dietrich, D. & Park, R.G., Geol. SOC. spec. Publ., 45, 329-338.
Welsh, W., 1983. Finite element analysis of strain patterns from geodetic observations across a plate margin, Tectonophysics, 97,
1, 7-14.
57-71.
0 1996 RAS, GJI 127, 189-200
by guest on April 23, 2016
http://gji.oxfordjournals.org/D
ownloaded from