Equine electrocardiography revisited: 12- lead recording ...
221
Equine electrocardiography revisited: 12- lead recording, vectorcardiography and the power of machine intelligence Glenn Van Steenkiste Dissertation submitted in fulfilment of the requirements for the degree of Doctor of Veterinary Science (PhD) 2020 Promotors: Prof. Dr. Gunther van Loon Prof. Dr. Guillaume Crevecoeur Prof. Dr. Tammo Delhaas Prof. Dr. Annelies Decloedt Department of Large Animal Internal Medicine Faculty of Veterinary Medicine Ghent University
-
Upload
khangminh22 -
Category
Documents
-
view
3 -
download
0
Transcript of Equine electrocardiography revisited: 12- lead recording ...

Equine electrocardiography revisited: 12-
lead recording, vectorcardiography and
the power of machine intelligence
Glenn Van Steenkiste
Dissertation submitted in fulfilment of the requirements
for the degree of Doctor of Veterinary Science (PhD)
2020
Promotors:
Prof. Dr. Gunther van Loon
Prof. Dr. Guillaume Crevecoeur
Prof. Dr. Tammo Delhaas
Prof. Dr. Annelies Decloedt
Department of Large Animal Internal Medicine
Faculty of Veterinary Medicine
Ghent University

Equine electrocardiography revisited: 12-lead recording, vectorcardiography and the power
of machine intelligence
Electrocardiografie bij het paard opnieuw bekeken: 12-afleidingen opnames,
vectorcardiografie en de kracht van kunstmatige intelligentie
Glenn Van Steenkiste
Equine Cardioteam Vakgroep Inwendige Ziekten van de Grote Huisdieren,
Faculteit Diergeneeskunde, Universiteit Gent,
Salisburylaan 133, 9820 Merelbeke, Belgium
This research was funded by a PhD Fellowship of the Research Foundation Flanders
(FWO- 1S56217N)

Members of The Jury Prof. Dr. Gunther van Loon, promotor Equine Cardioteam, Department of Large Animal Internal Medicine, Faculty of Veterinary Medicine, Merelbeke, Belgium
Prof. Dr. Annelies Decloedt, promotor Equine Cardioteam, Department of Large Animal Internal Medicine, Faculty of Veterinary Medicine, Merelbeke, Belgium
Prof. Dr. Guillaume Crevecoeur, promotor Department of Electromechanical, System and Metal Engineering, Faculty of Engineering and Architecture, Ghent, Belgium
Prof. Dr. Tammo Delhaas, promotor Department of Biomedical Engineering, CARIM School for Cardiovascular Diseases, Maastricht University Medical Centre, Maastricht, The Netherlands
Prof. Dr. Frank Pasmans, chairman Department of Pathology, Bacteriology and Avian Diseases, Faculty of Veterinary Medicine, Merelbeke, Belgium
Prof. Dr. Pascale Smets, Secretary Department of Small Animals, Faculty of Veterinary Medicine, Merelbeke, Belgium
Prof. Dr. Rikke Buhl Department of Veterinary Clinical Sciences, Faculty of Health and Medical Sciences, University of Copenhagen, Taastrup, Denmark
Dr. Stijn Schauvliege Department of Surgery an Anaesthesiology of Domestic Animals, Faculty of Veterinary Medicine, Merelbeke, Belgium
Dr. Tim Boussy Department of Cardiology, AZ Groeninge, Kortrijk, Belgium
Dr. Frederic Van Heuverswyn Department of interventional cardiology and cardiac electrophysiology, Faculty of Medicine and Health Sciences, Ghent, Belgium


The important thing is to never stop questioning
- Albert Einstein -


Table of Contents Preface .................................................................................................................................. 3
General Introduction .............................................................................................................. 5
Scientific Aims ......................................................................................................................43
Chapter 1: Transfer Learning in ECG Classification from Human to Horse Using a Novel
Parallel Neural Network Architecture ....................................................................................47
Chapter 2: Atrial fibrillatory rate in horses based on a modified base-apex surface
electrocardiogram analysis ...................................................................................................73
Chapter 3: Three dimensional ultra-high-density electro-anatomical cardiac mapping in horses:
methodology .........................................................................................................................87
Chapter 4: Endocardial electro-anatomic mapping in healthy horses: Normal sinus impulse
propagation in the left and right atrium and the ventricles ................................................... 107
Chapter 5: An exploratory study on Electrocardiographic and Vectorcardiographic
Differentiation of the Site of Origin of Focally induced Premature Depolarizations in Horses
........................................................................................................................................... 127
General discussion ............................................................................................................. 157
Summary ............................................................................................................................ 181
Samenvatting ..................................................................................................................... 187
Curriculum Vitae ................................................................................................................. 195
Bibliography ....................................................................................................................... 199
Dankwoord ......................................................................................................................... 207


L i s t o f a b b r e v i a t i o n s | 1
List of Abbreviations AI artificial intelligence
AF atrial fibrillation
AFCL atrial fibrillation cycle length
AFR atrial fibrillation rate
APD atrial premature depolarisations
ASTI atrial systolic time interval
AT atrial tachycardia
AV atrioventricular
bpm beats per minute
CaVC caudal vena cava
CNN convolutional neural network
CrVC cranial vena cava
cTnI cardiac troponin I
ECG electrocardiogram; electrocardiography
eECG equine ECG
EGM electrogram
IEA initial electrical axis
ISA index of simultaneous depolarisation for the atria
LA left atrium
LSTM long short-term memory
LV left ventricle
MEA mean electrical axis
PD propagation duration
RA right atrium

2 | L i s t o f a b b r e v i a t i o n s
RA-AFR right atrial atrial fibrillation rate
RV right ventricle
SA sinoatrial
SR sinus rhythm
TVEC transvenous electrical cardioversion
VCG Vectorcardiogram, vectorcardiography
VPD ventricular premature depolarization
WCT Wilson’s central terminal
P r e f a c e | 3
Arrhythmias are very common in horses, but the origin and clinical significance is often
unknown. The use of the ECG in horses is still limited to rhythm and rate diagnosis whereas
identification of the underlying mechanisms of arrhythmias often requires invasive
electrophysiological studies that have not fully been developed in horses. Automatic or semi-
automatic analysis of the equine ECG is currently not reliable. This makes ECG interpretation
a laborious task reserved to experienced veterinarians, limiting the use of ECG in horses. While
12-lead ECG recording has been a cornerstone in the development of human cardiology, this
technique remains poorly explored in equine cardiology and up till today, there is not even a
universally accepted lead system for use in horses. Prevalence data, incidence data and
differentiating criteria between harmful and benign arrhythmias, are incomplete in horses due
to the lack of adapted recording methods and software.
In the introduction of this thesis a brief overview is given of the genesis of the ECG and the
use of the ECG in human and equine medicine and the differences between them. Then the
analysis of the equine ECG is described together with a summary of the most common
arrhythmias in horses. Finally, a brief overview is given of the use of invasive clinical
electrophysiological studies in horses and humans.
The first part of the research section of this PhD aims at improving the detection of arrhythmias
by developing an algorithm for automated analysis of equine ECGs and by improved
characterization of AF from the surface ECG. In a second part the use of a new invasive
electrophysiological technique is explored. The third and last part of this PhD studies the use
of multiple lead recordings for the diagnosis of the origin of atrial and ventricular
depolarizations.
Preface


General Introduction


G e n e r a l i n t r o d u c t i o n | 7
Genesis of the electrocardiogram
Changes in the cardiac electric field can be registered with a galvanometer attached to the
body surface [1]. Every measuring system contains at least two electrodes. The potential
difference between these two electrodes is amplified by the ECG recording device. The
potential difference measured by a bipolar lead reflects the sum of all electrical fields which
are present at one moment in time. Unipolar leads refer to a derivation in which one of the
electrodes is placed upon a ‘zero-area’ of the body where no electrical current is present. By
doing so the second electrode, the differential electrode, measures the currents underneath it
instead of between both electrodes. Because it’s practically impossible to find a location on the
body with zero electrical potential, Wilson’s central terminal (WCT) is often used [2]. With this
technique the zero potential is reconstructed by coupling the three limb electrodes with three
equal resistors. The central point of this short circuit is called WCT.
The position of the electrodes is chosen to represent electrical changes of the heart in a
particular direction. The potential differences at the electrodes are also influenced by other
factors such as the cardiac position within the thorax, the shape of the thorax, the conductivity
of tissues between heart and electrodes [3], and the activation pattern of the heart [1,4].
Because it is impossible to account for all the effects mentioned above, every ECG theory is
based upon simplifications with the basic assumption that the electrical activity of every
individual cell can be summed into one common dipole with a permanent place, but with a
changing direction, polarity and magnitude: the cardiac vector [1,5]. The ECG recorder will
show a positive deflection if the net direction of the cardiac vector is pointed towards the
positive electrode of a bipolar lead and a negative deflection if it’s away from it.
The conduction process in the heart follows a predictable pathway, resulting in an organised
contraction of the atria followed by contraction of the ventricles. The following descriptions are
based upon the deflections in a modified base-apex ECG on a horse, with the negative
electrode on the right withers and the positive electrode on the left lower thorax [6]. The initial
depolarization of the sinus node is not visible on the surface ECG but atrial depolarization is
visible as the P wave on the surface ECG (Figure 1). In horses, the P wave is often bifid at rest
and singular during higher heart rates. The bifid P wave at rest has been attributed to a delay
in interatrial conduction [7]. The first part of the bifid P wave has been said to reflect right atrial
and the second part left atrial depolarization, although literature contains conflicting data. The
overall duration of the P wave is below 160ms and increases with the weight and age of the
horse [8]. The slow conduction of the AV node starts during the atrial depolarization and
continues during the PR segment, the iso-electric line between the P wave and the QRS
8 | G e n e r a l i n t r o d u c t i o n
complex. The depolarization of the bundle of His and bundle branches is also not visible on
the surface ECG and occurs during the PR segment. The depolarization of the ventricles is
represented by the QRS complex on the surface ECG with the J point as the end of the QRS
complex. The duration of the QRS is relatively short due to the extensive Purkinje network in
horses and should not exceed 140ms [3,8]. The nomenclature of the QRS complex is a
combination of deflections with a capital or lower-case letter depending if the amplitude of the
deflection is relatively large or small. The following nomenclature is used for the different
deflections [9]:
- Q or q wave: first negative deflection before the first positive R or r wave
- R or r wave: first positive deflection of the QRS complex
- S or s wave: first negative deflection after R or r wave
- R’ or r’ wave: second positive deflection of the QRS complex
- S’ or s’ wave: second negative deflection after R’ or r’ wave
- QS wave: completely negative QRS complex without any positive deflections
The QRS is followed by another iso-electric line: the ST segment, which is the depolarized
state of the ventricles. The repolarization of the ventricles is represented by the T wave. The
T wave morphology shows variations in polarity as well as duration depending on the
autonomic nervous tone and heart rate at rest [6]. At heart rates above 70-90 beats per minute
(bpm) the T wave is usually monophasic and the polarity is opposite to the QRS polarity.
Despite these variations at rest, the T wave can be helpful for differentiation between QRS
complexes and artefacts because the latter are not followed by a T wave. The repolarization
of the atria is often not visible on the surface ECG [6].
The correlations between the surface ECG and the intracardiac conduction in the horse are
described in more detail in Chapter 4.
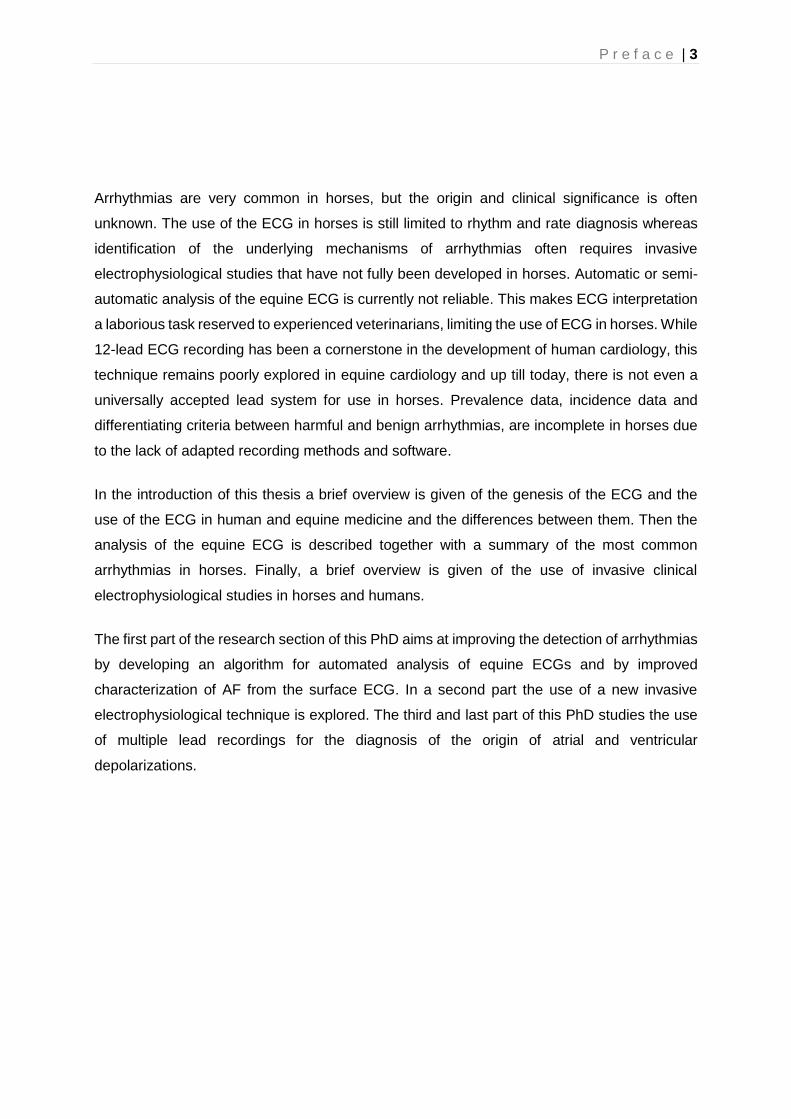
Figure 1: Nomenclature of the different deflections and intervals of the equine modified base-apex ECG
G e n e r a l i n t r o d u c t i o n | 9
Electrocardiography in human medicine
The 12-lead ECG
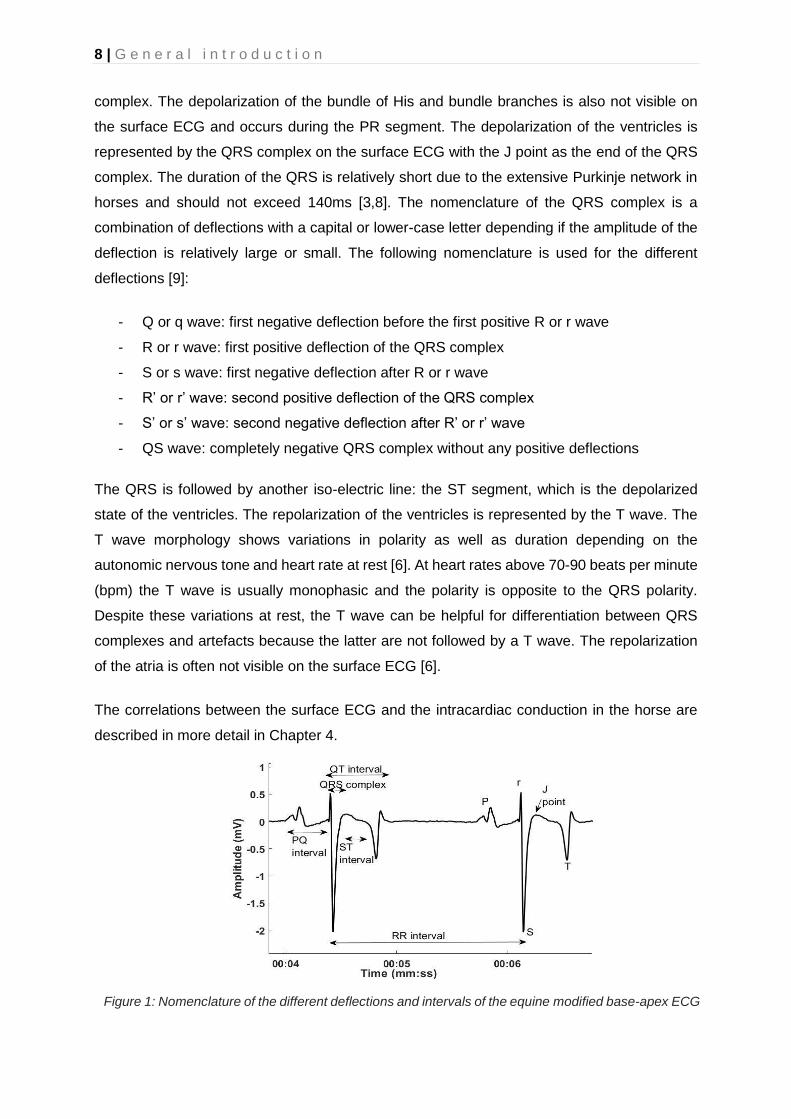
In 1906, bipolar limb leads I, II and III were first described, later followed by the description of
Einthoven’s triangle and the description of the mean electrical axis of the heart using
Einthoven’s triangle (Figure 2) [10,11]. Einthoven’s triangle is formed by lead I which is
recorded by the right arm (-) and left arm electrode (+), lead II between right arm (-) and left
foot electrode (+) and lead III between left arm (-) and left food electrode (+). The mean
electrical axis was calculated by projecting the momentary potential differences on the sides
of Einthoven’s equilateral triangle as shown in Figure 2. The clinical significance of the mean
electrical axis is the diagnosis of left or right axis deviation, which can indicate a conduction
abnormality or ventricular enlargement. Einthoven also introduced the letters PQRST for the
description of the different deflections of the ECG. He started in the middle of the alphabet to
not interfere with letters used in mathematics at the time and leaving room for future additions
to the descriptions, such as the U wave.
In 1934 Wilson et al. described the central terminal which allowed for a constant reference
voltage, so that the exploring electrode only reflected the variation at a single point, hence the
term unipolar lead [2]. These leads were later called the V leads. Wilson proposed 6 precordial
lead positions which were later standardized by the American Heart Association (Figure 3)
[12,13]. These precordial leads allowed to look at the heart from different angles and thus
provided additional information on cardiac electrical activity. In fact, the ST elevation during
Figure 2: Einthoven’s triangle with the calculation of a vector representation of the electrical activity of
the heart at a given moment: the mean electrical axis. The vector magnitude is the segment pq, here
marked in blue, and the vector angle is α. [11]

10 | G e n e r a l i n t r o d u c t i o n
myocardial infarction was first noticed using a precordial lead on the chest [14]. Einthoven’s
limb leads and Wilson’s precordial leads were later joined by the augmented unipolar limb
leads of Goldberger [15]. Goldberger improved the unipolar limb leads of Wilson by removing
one of the resistors of WCT. This increased the potential of the unipolar limb leads with 50%
compared to Wilson’s unipolar limb leads, which made them comparable in terms of amplitude
to the bipolar limb leads. The combination of the three limb leads of Einthoven, the three
augmented limb leads of Goldberger and the six precordial leads of Wilson represent the
conventional 12-lead ECG. The name 12-lead ECG can be confusing since only 9 electrodes
are used which can produce 8 independent leads. Only the bipolar leads I, II and the unipolar
leads V1 to V6 are truly independent leads while III, aVR, aVL and aVF are calculated from
the 2 independent bipolar leads. By inspecting the heart from different directions with multiple
leads instead of a single bipolar lead a more complete assessment can be made of the
electrical properties of the heart [9].
Figure 3: Precordial electrode placement in human medicine as standardized by the American Heart
Association. The left image shows the position of the electrodes on a human torso. The right image reflects
the positioning of each electrode relative to the heart in the transverse plane. [258]

G e n e r a l i n t r o d u c t i o n | 11
The development of vectorcardiography in human medicine
As mentioned above, Einthoven introduced the concept of measuring the mean electrical axis
of the heart, which was also represented by a vector (Figure 2) [16]. Later this theory evolved
to the concept of a 3-dimensional loop in space. Wilson and Johnston were the first to use the
word vectorcardiogram (VCG) and described the concept of deriving a resultant vector from
the amplitudes of the ECG in three perpendicular directions (Figure 4) [17,18]. In the following
years different papers appeared showing that Einthoven’s triangle was only approximately
equilateral relative to the anatomy, but not relative to the electrical conduction through the
thorax [19–23]. These studies showed that the human torso could not be represented by a
homogenous conducting medium. The result of Frank’s studies was the development of a
corrected orthogonal lead system with the purpose of measuring the normalized components
of the resultant cardiac vector in three perpendicular directions [24]. The electrode positions
for recording the Frank VCG are shown in Figure 5. This technique is currently still in use in
places were the VCG is not derived from the 12-lead ECG. Other VCG configurations were
proposed, but the Frank VCG remained the most popular one [18].
Figure 4: Panel A: Concept of deriving the components A, B and C of a resultant vector given the
knowledge of the amplitudes in three perpendicular directions X, Y and Z respectively. Panel B:
Projection of a spatial loop of a vectorcardiogram onto three mutually perpendicular planes as commonly
used in vectorcardiography. [19]
A B

12 | G e n e r a l i n t r o d u c t i o n
With the availability of three simultaneously recorded orthogonal leads XYZ, it is possible to
plot the magnitude and direction of the resultant cardiac vector with the coordinates XYZ as
shown in Figure 4 panel A. When followed throughout the cardiac cycle the tip will trace out a
loop in space (Figure 4 panel B). Conventionally, this path is then projected on three mutually
perpendicular planes for further study.
Sixty years ago, the use of VCG was discontinued in many clinical practices since most
experienced physicians were used to interpreting the 12-lead ECG and recording a VCG
required additional equipment and labour.[18,19]. In the 90’s, newly developed software
enabled the calculation of the VCG out of a 12-lead ECG, the so called ’12-lead VCG’, leading
to a renewed interest for the VCG since ubiquitous 12-lead ECG hardware could be used [18].
Nowadays, within computer software, it is relatively simple to add a VCG exam to the standard
12-lead ECG exam without additional hardware. For that reason it has been suggested to
implement the VCG in the current ECG clinical diagnostic algorithms [18,25]. The advantage
of using both the VCG and the 12-lead ECG lies in an improved understanding of the
underlying electrical activity of the heart [26]. Although the VCG does not provide additional
information, the phase relationship of the VCG between the different leads can be utilized to
assist with diagnosis. Figure 6 illustrates the relationships between the various leads of an
idealised 12-lead ECG and the orthogonal leads of the VCG. This shows that it is possible to
Figure 5: Frank vectorcardiogram lead system. The individual positions of the electrodes and the values
of the resistors are chosen for a corrected vectorcardiography lead system: each lead has a normalised
strength and points in the direction of one of the main perpendicular axes of the body (x, y and z).
Abbreviations: H, head; F, left foot; A, C, E, I and M are a selection of the electrodes that Frank used
for an earlier study [24]

G e n e r a l i n t r o d u c t i o n | 13
manually construct a vector loop with knowledge of the 12-lead ECG and vice versa. For
example, the estimation of the QRS axis of a 12-lead ECG in the frontal plane is implicitly done
by a physiologist from the 12-lead ECG, while it remains an approximation since the 12-lead
ECG is not orthogonal.
Figure 6: The interrelationship between the lead vectors of the 12-lead ECG and the orthogonal VCG. These are
shown in an idealized form, without taking torso inhomogeneities into account and the precordial leads are placed
in an idealised transversal plane. Lead Z is directed positively to anterior instead of posterior.

14 | G e n e r a l i n t r o d u c t i o n
Electrocardiography in equine medicine
Differences between the physiology of horses and humans
Anatomy of the heart
The heart is located in the middle of the left-right axis of the thorax between the 3th and 6th
intercostal space. It has been suggested that the long axis is orientated at approximately 45°
to vertical with its base lying dorsal and cranial to the apex (Figure 7) [27]. Due to the
positioning of the heart in the thorax of the horse the electrodes of the ECG cannot be placed
in a similar way as in human medicine.
Conduction system of the heart
The initial spontaneous generation of an action potential (automaticity) occurs under
physiological circumstances within the hoof shaped sinoatrial (SA) node, located in the RA at
the junction between the cranial vena cava and RA appendage [28]. Automaticity can also
occur in the atrioventricular (AV) node and the specialized conduction fibres of the His Purkinje
system, but these are overruled by the faster rate of spontaneous action potential generation
in the SA node [29]. Consequently, the SA node is the site of initial impulse generation in the
normal heart. The SA node is richly innervated by the parasympathetic and sympathetic
nervous systems that provide stimuli to alter heart rate. From the SA node, the impulse spreads
Figure 7: Schematic drawing of the sagittal (panel A) and dorsal (panel B) cross-sections through the
thorax of a horse. The relationship between the different parts of the ventricles and the anatomical axes
of the body is given. Abbreviations: LV, left Ventricle; RV, right ventricle. [30]

G e n e r a l i n t r o d u c t i o n | 15
over the atria from right to left atrium and to the AV node. Three different pathways between
sinus node and AV node have been described [28,30]. The cranial internodal tract consists of
2 parts: a branch through the interatrial septum to the AV node and the bundle of Bachman
that connects both atria. The caudal internodal tract, also called Thorel tract, runs over the
terminal crest and continues along the coronary sinus to the AV node. The middle internodal
tract, also called the Wenckebach tract, is situated in between the other two tracts in the
interatrial septum.
In the normal horse the AV node is the sole conduction pathway from atria to ventricles which
are electrically isolated by the annulus fibrosis cordis, a collagen structure. After reaching the
AV node, the impulse is conducted slowly over the AV node into the rapidly conducting bundle
of His. The bundle of His is 2-5 cm long and runs right cranioventrally to the septum in the
annulus fibrosis cordis [28]. The bundle of His splits into a right and left bundle branch. The
right bundle branch is located deep into the myocardium and is anatomically, and probably
electrically, isolated from the high septal myocardium with a sheath of connective tissue until
it reaches the base of the caudal septal papillary muscle [31]. After passing the caudal septal
papillary muscle the right bundle branch crosses to the RV free wall along the septomarginal
trabecula and ends in the Purkinje fibers. At the height of the caudal septal papillary muscle
three branches split from the right bundle branch: one to the RV apex, one to the high septum
and one to the cranial septal papillary muscle.
The left bundle branch leaves the bundle of His ventral to the right coronary cusp of the aortic
valve after which it reaches the left ventricular endocardium and immediately splits into 3
branches [28]. The middle branch runs to the apex through the septum and ends into the
Purkinje network between the mid septum and the LV apex with some offshoots continuing to
the apical part of the LV free wall. The other two branches cross the LV through the LV
moderator bands, also called false tendons, to the two papillary muscles of the free wall where
they end in the Purkinje network. Similar as the right bundle branch, the entire left bundle
branch is anatomically isolated from the myocardium until it branches into the Purkinje network.
Contrary to humans and small animals, the Purkinje network in ungulates spreads through the
entire thickness of the myocardium [31]. This network also continues through the entire
septum. The Purkinje network of the left and right ventricle is connected through the septum
with several “interventricular connections” and Purkinje fibers of the right ventricle extend into
the myocardium of the left ventricle and vice versa. There are no or little Purkinje fibers in a
small area underneath the valves and at the tips of the papillary muscles. This difference in
the Purkinje network has important consequences for the depolarization of the ventricles and
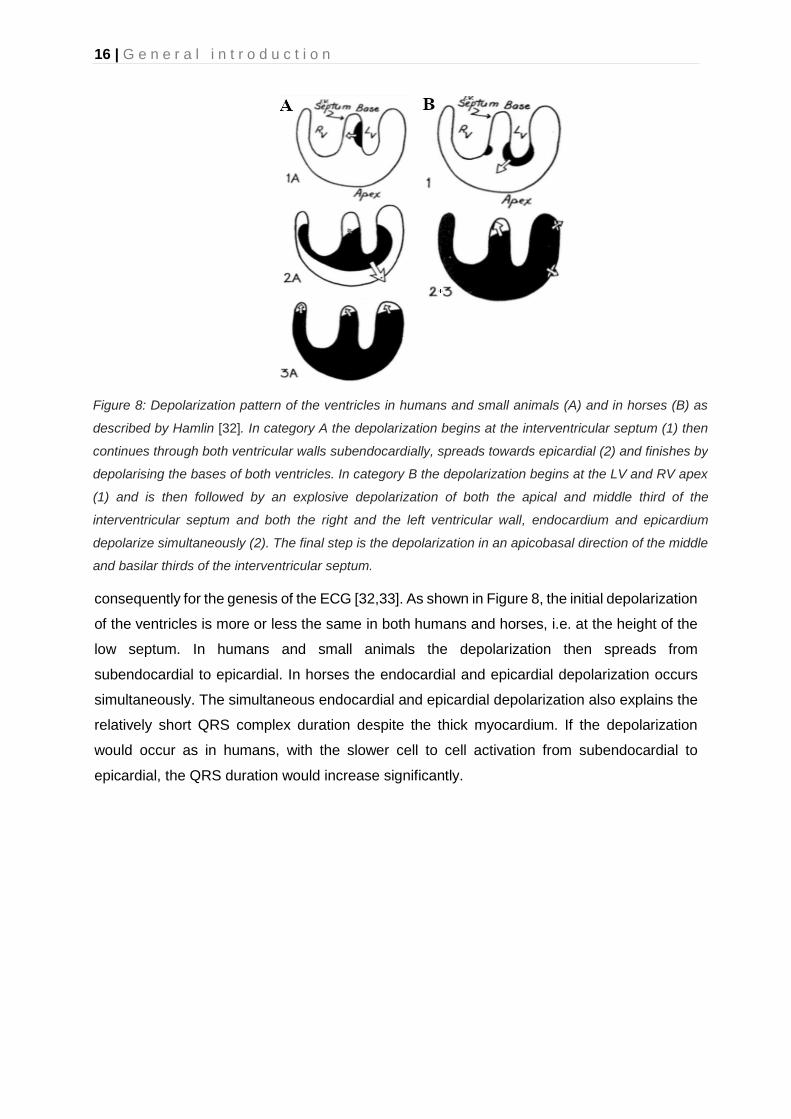
16 | G e n e r a l i n t r o d u c t i o n
consequently for the genesis of the ECG [32,33]. As shown in Figure 8, the initial depolarization
of the ventricles is more or less the same in both humans and horses, i.e. at the height of the
low septum. In humans and small animals the depolarization then spreads from
subendocardial to epicardial. In horses the endocardial and epicardial depolarization occurs
simultaneously. The simultaneous endocardial and epicardial depolarization also explains the
relatively short QRS complex duration despite the thick myocardium. If the depolarization
would occur as in humans, with the slower cell to cell activation from subendocardial to
epicardial, the QRS duration would increase significantly.
Figure 8: Depolarization pattern of the ventricles in humans and small animals (A) and in horses (B) as
described by Hamlin [32]. In category A the depolarization begins at the interventricular septum (1) then
continues through both ventricular walls subendocardially, spreads towards epicardial (2) and finishes by
depolarising the bases of both ventricles. In category B the depolarization begins at the LV and RV apex
(1) and is then followed by an explosive depolarization of both the apical and middle third of the
interventricular septum and both the right and the left ventricular wall, endocardium and epicardium
depolarize simultaneously (2). The final step is the depolarization in an apicobasal direction of the middle
and basilar thirds of the interventricular septum.

G e n e r a l i n t r o d u c t i o n | 17
ECG lead systems in the horse
The first ECG of a horse was recorded in Einthoven’s laboratory in 1910 [34]. In the first 50
years, most of the data was recorded using Einthoven’s triangle with the electrodes on the
limbs as was done in humans (Figure 9) [30,34–38]. The results of these studies varied widely
and the intrahorse repeatability was very low. Some authors noticed that the positioning of the
legs had a great impact upon the ECG morphology [4, 34,39,40]. Due to the electrode
placement on the extremities of the horse, Einthoven’s triangle was almost perpendicular to
the electrical axis of the equine heart and located ventral to the heart (Figure 9) which resulted
in an underestimation of the electrical activity [4,7]. Therefore, different authors suggested
triangles that were placed around the thorax. Currently it has generally been accepted that the
electrodes need to be positioned along the average direction of the electrical axis of the heart,
the so called ‘base-apex’ electrode configuration [6], but there is no universally accepted
electrode configuration in the horse. Up to today, the most commonly used base-apex
configurations are the Dubois configuration (Figure 10) [41,42] and a ‘modified base-apex’
configuration (Figure 11) [6].
Figure 9: Positioning of the electrode configuration of Einthoven in the horse with the different
derivations. As can be seen the plane made by Einthoven’s triangle is outside the heart. The yellow line
indicates the electrical axis of the heart. [42]

18 | G e n e r a l i n t r o d u c t i o n
The use of precordial electrodes has only sparsely been described in equine cardiology and
many publications used an electrode configuration with the Einthoven’s limb leads on the
extremities in order to obtain WCT [35, 38,43]. As described above, the 12-lead ECG is an
essential tool for human cardiology. In equine cardiology only a handful of articles have been
written about the use of the 12-lead ECG, since it was long believed that only a part of the
depolarization of the heart was visible on the surface ECG due to the different depolarization
pattern of the equine heart. Indeed, for the atria some authors described that only the RA and
the interatrial septum was represented on the surface ECG [44]. For the QRS complex it was
described that the explosive depolarization pattern of the ventricles leads to cancelling out of
many cardiac vectors [33] and that only the depolarization of the basal part of the ventricular
septum and a part of the LV free wall are visible on the surface ECG. These findings led to a
reduced interest in equine ECG. As a result, the use of the ECG in horses has mostly been
restricted to the diagnosis of rate and rhythm [45]. The development of veterinary specific ECG
recording devices and the increased awareness that cardiac rhythm disturbances occur more
frequently than previously thought caused a regained interest into equine electrocardiography.
This renewed interest led to the use of new electrode configurations. A “modified base-apex”
electrode configuration (Figure 11) was proposed for the recording of ECGs during exercise
and long-term recordings [6]. This adapted configuration was applied since the normal base-
apex ECG configuration, with the right arm electrode on the neck, is prone to creating
movement artefacts and falling off during exercise [46]. The positioning of the electrodes in the
modified base-apex ECG was chosen in order to fit under a girth around the thorax while still
being positioned along the average direction of the electrical axis of the heart and allowing the
3 leads to each highlight different aspects of the cardiac depolarization/repolarization [6,47].
Figure 10: Positioning of the Dubois electrode configuration. [42]

G e n e r a l i n t r o d u c t i o n | 19
Recently a group from Copenhagen proposed an adapted 12-lead ECG configuration (Figure
12) which addressed some of the original shortcomings by placing Einthoven’s triangle in a
plane close to the mean electrical axis of the heart, similar to the Dubois lead system, and the
precordial electrodes in a plane perpendicular to the electrical axis of the heart [41,48].
Preliminary results of this new 12 lead ECG configuration showed significant correlation
between certain ECG characteristics and LA and LV mass [48]
Figure 12: Twelve lead electrode configuration proposed by the Copenhagen research group.
Abbreviations: LA, left arm electrode; LF, left foot electrode; RA, right arm electrode; V, precordial lead.
Figure 11: Modified base-apex electrode configuration. This configuration is particularly useful during
long-term recordings and during exercise recordings. Abbreviations: LA, left arm; LL, left leg; N, neutral;
RA, right arm electrode. [6,47].

20 | G e n e r a l i n t r o d u c t i o n
Analysis of the equine ECG
Arrhythmias in the horse
Arrhythmias are quite common in horses, especially at rest, when they even have a higher
incidence than any other domestic species due to the horse’s high vagal tone [8,49].
Physiological arrhythmias at rest include sinus arrhythmia, SA block, sinus arrest, first and
second degree AV block and sinus bradycardia [50,51]. The most common physiological
arrhythmia is 2nd degree AV block. It is believed that most equine arrhythmias occur in
response to blood pressure [1]. There are two types of AV block: Mobitz type I and Mobitz type
II. Mobitz type I is characterized by a lengthening of the PQ interval before a dropped QRS
complex. In human medicine this type of arrhythmia is almost always a disease of the AV node.
Mobitz type II is not characterised by PQ interval changes related to the AV block. In human
medicine this is almost always a disease of the His-Purkinje system. In horses, Mobitz type I
is most commonly observed [52]. All physiological arrhythmias should disappear during
exercise or excitement of the horse [51,53].
The most common pathological arrhythmias in horses are atrial (APD) and ventricular (VPD)
premature depolarizations, atrial fibrillation (AF), and atrial tachycardia (AT).
Atrial premature depolarizations
APDs originate from an ectopic focus in the atrial myocardium and occur before the
depolarization of the sinus node. On the ECG they are denoted as P’. They occur occasionally
in otherwise healthy horses and only affect performance if they cause an excessively high
heart rate during exercise or predispose to paroxysmal atrial fibrillation or atrial tachycardia
[52,53]. A high number of APDs after AF cardioversion has also been associated with an
increased risk for AF recurrence [54]. Underlying systemic or cardiac disease may be present
and in rare cases atrial myocardial abnormalities may be seen on ultrasound.
On the ECG APDs can be recognised as a premature P’ wave. The P’ wave morphology
depends on the site of APD origin and some correlation between the morphology on a base-
apex lead and site of origin has been described [44]. This correlation will be discussed in more
detail in Chapter 5. Depending on the timing within the cardiac cycle the P’ wave is not followed
at all by a normal QRS complex, followed by a QRS complex with an increased amplitude if
the PP’ interval is short, and otherwise by a normal QRS complex [51,55]. The APD usually
‘resets’ the SA node which leads to an interruption of the basic rhythm of the node. This causes
the SA node to resume its normal pacemaker activity at an earlier time than would be expected

G e n e r a l i n t r o d u c t i o n | 21
from its normal RR interval. The interval between the premature complex and next normal QRS
complex is called a non-compensatory pause. Sometimes the SA node is not reset by the APD
which in case of conduction to the ventricles leads to a compensatory pause. If the APD does
not reset the SA node and is not conducted to the ventricles, the RR intervals remain normal.
Atrial tachycardia
When more than 3 APDs occur in a row, the arrhythmia is called AT. On the ECG P’ waves
occur at a high regular rate. The QRS morphology is normal, but the RR intervals may be
irregular at rest due to the intermittent AV conduction.
Classically, in human patients, the differentiation between a focal AT and atrial flutter has been
based on a cut off atrial rate (atrial flutter is faster than focal AT) and the presence of isoelectric
baselines during focal AT but not in atrial flutter. However, electrophysiological studies have
shown that these surface electrocardiography (ECG) characteristics not always match the
underlying electrophysiological mechanisms, which leads to confusion in terminology [56].
Therefore, expert groups of the European and North-American society of cardiology have
suggested to use the general term AT for rapid atrial rhythms, different from AF, irrespective
to the underlying mechanism [56]. This general term AT includes both ‘focal AT’ and ‘macro-
reentrant AT’, whereby the latter includes different types of atrial flutter [56]. Focal AT
represents AT that originates from a small area (focus). The mechanism of focal AT is
enhanced automaticity, triggered activity or micro-reentry. Macro-reentrant AT represents a
reentry wave around a large central obstacle of anatomical or functional origin and usually
depends on an area of slow conduction (Figure 13). In horses, similar ECG characteristics
regarding rate and isoelectric baselines have been applied to differentiate focal AT from atrial
flutter [57,58], but these remain speculative and unproven. Electrophysiological studies are
needed to make a valid differentiation. In human medicine AT needs to be distinguished from
another supraventricular tachycardia: AV nodal reentry tachycardia (AVNRT) which are reentry
loops involving the AV node. AVNRTs have currently not been described yet in horses. The
AV node is probably resistant to AVNRT due to the high vagal tone [59].
Atrial fibrillation
AF is characterised by its irregular irregularity and is one of the most common cardiac causes
of poor performance of the horse [53]. When the heart goes into AF various parts of the atrial
myocardium are in different stages of electrical activity, so the electrical and contractile
mechanism are uncoordinated [60]. Due to the large atria and high vagal tone, AF is quite
common in horses with an estimated prevalence up to 2.5% [1,60]. AF can be a paroxysmal

22 | G e n e r a l i n t r o d u c t i o n
dysrhythmia which spontaneously reverts to sinus rhythm within 3-5 days. This type of AF
mainly occurs in equine athletes during intense exercise. However, in most cases AF
immediately becomes permanent in horses and does not convert spontaneously to SR [53].
Different theories about the electropathogenesis of AF have been proposed [61–64]. AF needs
a trigger to start the arrhythmia and a suitable substrate to sustain it. APDs, and especially
focal AT or atrial flutter, may induce AF. In human medicine, myocardial sleeves invading the
pulmonary veins have been shown to be the most important source of ectopic activity,
triggering AF. These myocardial sleeves in the pulmonary veins have also been identified in
the horse and a recent case study suggested that they might be a source of AF [65,66]. The
second important factor is the maintenance of AF. There are several theories for maintenance
of AF, but the most important one is that of reentry (Figure 13) [1]. During reentry an impulse
repetitively travels around an abnormal circuit. Under normal circumstances the refractory
period of the myocardial cells prevents the depolarization wave from travelling backwards.
However, when the depolarization wave can travel through an alternative pathway with slow
conduction, allowing part of the depolarized myocardial cells enough time to repolarise, then
the depolarization wave can re-enter the pathway and start a loop. As long as the front of the
depolarization wave does not hit the depolarized tissue, the loop will continue. The multiple
reentry wave theory states that during AF multiple loops randomly turn around over the atria
[61]. In horses, AF is usually a self-perpetuating and progressive arrhythmia because AF itself
induces electrical remodelling of the atrium within 12h [67]. AF perpetuation is facilitated even
Figure 13: Schematic drawing of a reentry loop. After passing of the depolarization wave front (arrow
head), the myocardial tissue is brought in a refractory state (red) for a time equal to the refractory period
of that tissue. After that, tissue gradually recovers (shaded red) until it has regained full excitability
(white). The reentry loop can only propagate when a small area of excitable tissue (excitable gap)
precedes the depolarization wave front. [1]

G e n e r a l i n t r o d u c t i o n | 23
more by a large atrial size and structural lesions. Prompt treatment of the dysrhythmia is
advised because the electrical remodelling predisposes to persistent AF which is even more
difficult to treat [51,53].
On the ECG, AF is characterised by the absence of P waves and the presence of f waves and
irregularly irregular RR intervals with normal QRS morphology [68]. The morphology of the f
waves may be coarse or fine and the rate of the f waves can be as high as 500 per minute. In
the absence of underlying disease the ventricular rate at rest is normal [52]. During exercise
or stress the heart rate can go above 240 bpm with instantaneous bursts of up to 450 bpm
[68].
Ventricular premature depolarizations
VPDs originate from an ectopic focus somewhere in the ventricular myocardium and are
depolarizations that occur earlier than expected during normal SR[1]. They occur less
frequently in horses than in other species [46] but can be seen during and especially post-
exercise with a prevalence varying between 19-52% in race horses [69–71]. Underlying causes
include myocardial damage, systemic disease, hypoxia, acid-base and electrolyte
disturbances, drugs and intoxication [51]. In horses, VPDs are usually not retrogradely
conducted to the atria in contrast to human medicine [59]. A high number of VPDs, different
morphologies of VPDs, short coupling intervals or the presence of paroxysmal VT are
associated with an increased risk for collapse or even sudden cardiac death. Horses with these
risk factors should be retired from work and examined thoroughly [51, 53,71].
On the ECG, VPDs present as isolated QRS-T complexes that occur too early and are followed
by a compensatory pause because they do not interrupt the normal SA node rhythm. This
compensatory pause results in a VPD-enclosing RR interval that equals twice the normal RR
interval. Some VPDs may occur without interrupting the normal rhythm: the interlacing VPDs.
In rare occasions a VPD may fuse with a normal ventricular depolarization which is called a
fusion beat. Because the left and right ventricle are not simultaneously activated by the bundle
branches, the ectopic QRS complexes are usually wider and have a different morphology.
Similar as for APDs, the morphology of the QRS complex on the surface ECG has been
correlated to the site of origin of the VPD and especially multiple lead recording may be useful
to determine this origin [73,74]. However, these studies had to use specially constructed
hardware to record an adapted semi-orhtogonal ECG or could not differentiate an apical or
basal location of the VPD.

24 | G e n e r a l i n t r o d u c t i o n
Analysis of the equine ECG
In order to avoid overdiagnosis of arrhythmias in the ECG, one should first assess the quality
of the ECG since artefacts are easily misinterpreted as dysrhythmia [52]. On top of quality
assessment, the evaluation of the ECG should also be performed in a methodical manner. The
normal heart rate at rest is between 24 and 50 bpm with a maximum of 220 – 240 bpm during
maximal exercise [74]. Heart rates at rest below 24 bpm or over 50 bpm are called bradycardia
and tachycardia, respectively. The heart rhythm can be regular or irregular. Although small
deviations in the RR interval are physiological in horses, deviations of >20% at rest or >5%
during exercise have been suggested to be abnormal [47,77,78]. If irregularities are present,
their nature should be investigated: is the irregularity regular or irregular, do they occur in a
certain pattern and can they be induced or terminated by exciting the horse [1]? The
morphology and duration of each P wave and QRS complex should be the same. Finally, there
should be a relationship between the different waves: each P wave should be followed by a
QRS complex, each QRS complex should be proceeded by a P wave and each QRS complex
should be followed by a T wave.
Due to the large differences between the equine and human ECG, human ECG software does
not perform well for equine ECGs [47]. One of the most striking differences between human
and equine ECGs is that instead of having a large R peak in a base-to-apex lead, a large S
peak is prominent in equine ECGs in combination with a prominent T wave. In addition, the T
wave polarity and P wave morphology change with increasing heart rate [47]. Because there
is currently a lack of horse-adapted software, equine ECGs are only manually analysed by a
trained equine clinician or cardiologist [79]. At present, only the methodology for one filtering
method and two QRS detection algorithms have been described, whereas no classification
algorithms have been described for horses [71,80,81].
Semi-automated ECG analysis is usually performed based upon the RR interval. The software
detects the S waves and calculates the RR intervals, if an interval is larger or smaller than a
predefined percentage of the previous interval, the software indicates this altered complex [47].
The operator then decides if it was indeed an arrhythmia that has been detected. This speeds
up the ECG analysis but the drawback is that only arrhythmias with a different timing are
detected. For example, arrhythmias that induce a morphology change, such as a fusion beat,
do not trigger the software. The algorithm is also dependent upon the used thresholds for the
maximum RR interval deviation.
G e n e r a l i n t r o d u c t i o n | 25
Automated ECG analysis (of the human ECG)
The ECG has been used frequently for research in artificial intelligence and pattern recognition.
Not only is the ECG signal a rather simple repetitive electrical signal which can be easily
recorded and imported into a pc, there is also a lot of knowledge on how to interpret the ECG.
Last but not least, ECG signals are produced in enormous quantities which makes it interesting
to automate the process of interpretation [81]. However, when can a computer program be
considered to be intelligent and can it be called artificial or machine intelligence? The following
interpretation to intelligence was devised by Turing [82]: “Suppose that a computer and a
human being are sitting in separate closed chambers and that an outside investigator is
questioning them. If the investigator cannot decide from the answers whether they are given
by the computer or by man, then the computer has attained full human intelligence”. Thus for
ECG analysis this implies that the analysis should give the exact same results when analysed
by a computer program as if it was analysed by a human. Currently this level of ECG analysis
has been reached in human cardiology as some algorithms even outperform the accuracy of
a single cardiologist [83–86].
ECG analysis algorithms contain a fixed set of principal components [80]: First, the ECG needs
to be pre-processed. ECG signals typically contain different types of noise and artefacts, the
ECG needs to be filtered. This is usually done with bandpass and notch filters. Artefacts are
removed afterwards using wavelet transforms or neural networks since the filtering does not
remove all noise. Optionally the ECG can then be normalised in order to visually compare ECG
signals between different patients or for improved feature extraction and classificiaton.
The next step is to extract the features out of the ECG. Typically, the P-QRS-T complex
features are first extracted. The locations, durations, amplitudes and shapes of the different
deflections inside the signal are detected. The Pan-Tompkins algorithm is the most commonly
used algorithm for the detections of the R wave [87], but it is an extensively studied field and
many algorithms have been described. Once the P-QRS-T complex is detected, statistical
features can be derived from these waves. Statistical features are usually applied to time
domain analysis of the ECG signal. These features offer an effective means for analysing the
patient or disease specific variations. Optionally the morphological and wavelet features are
extracted from an ECG signal.
Since the ECG contains a lot of information, only the most relevant features are selected. The
most relevant features are the features that contribute most to the final classification result. By
selecting only the most relevant features the classification becomes more robust, faster and
the underlying decision-making process of the classification algorithm becomes more

26 | G e n e r a l i n t r o d u c t i o n
transparent [88]. A large variety of feature selection algorithms have been described, going
from different statistical analyses methods, to clustering and deep learning algorithms. Instead
of selecting the most relevant features, the feature dataset can also be transformed to a lower
dimensional dataset. This is done by creating a reduced number of new features from the
existing features. The most commonly used algorithms for feature transformation are principal
and independent component analysis and linear discriminant analysis. Feature selection and
feature transformation can be used toghether or seperately.
Once the features are extracted the actual classification of the ECG begins. Numerous
classification algorithms have been described for ECG analysis. Currently, the most active field
of research is artificial neural networks that are mathematical models losely inspired upon
biological neural networks. Different matrices are interconnected using ‘neurons’, which are
weight matrices, and by creating different connections within the model, various network
architectures can be constructed [89]. The universal approximation theorem of artificial neural
networks states that neural networks can represent a wide variety of interesting functions when
given appropriate parameters (i.e. the values of the weight matrices) [90]. These artificial
neural networks are often organised as deep neural networks. These deep neural networks
use a cascade of layers of artificial neurons for feature extraction and transformation. Each
successive layer uses the output of the previous layer as input. A hierarchical representation
is given in deep neural networks: each layer derives a different level of information from the
data. By doing so, they have the capability to recognise complex patterns in data. Deep
learning is the study of artificial neural networks and related machine learning algorithms [91].
Other frequently used machine learning algorithms are linear discriminant analysis, k nearest
neighbor, support vector machines, decision trees and bayesian classifiers. Machine learning
is the subfield of computer science that aims at giving computers the ability to learn without
being explicitly programmed [92]. In a classic computer algorithm, the processing of the input
data is completely defined by the programmer. The programmer defines the specific steps the
algorithm has to follow to get to a result in the program. In a machine learning algorithm, the
programmer defines the input, the optional output and part of the processing steps, but not all.
The machine learning algorithm will define its own criteria based upon the input to get to the
result. Whereas most machine learning algorithms are supervised (both input and output are
given), sometimes they are unsupervised (only an input is given), mostly used to explore data.
In reinforcement learning, the algorithm discovers through trial and error the most effective
actions.
Deep learning and machine learning are often used interchangeably. Deep learning is also a
machine learning algorithm, but not all machine learning algorithms are deep learning and

G e n e r a l i n t r o d u c t i o n | 27
every computer algorithm, with or without machine learning, can be called artificial intelligence
as long as they show any sign of intelligence, or in other words give the same results as a
human would do (Figure 14).
Most complete ECG classification algorithms implement the above mentioned individual steps
one by one, but recently new machine learning algorithms have been proposed that do all or
some of these steps at once [84,85,93]. These end-to-end algorithms implement the feature
extraction, feature selection and classification step at once using convolutional or recurrent
neural networks.
Figure 14: Venn diagram showing the relationship between deep learning, machine learning and
artificial intelligence.

28 | G e n e r a l i n t r o d u c t i o n
Invasive cardiac electrophysiology
Measuring intracardiac potentials
The surface ECG describes the sum of the electrical changes of the heart based upon
electrodes on the body surface, thus far away from the heart. Invasive electrophysiological
research is aimed at obtaining local information from inside the heart. Two different
approaches for measuring intracardiac potentials can be used: bipolar or unipolar
electrograms.
Bipolar electrograms are measured with two small electrodes that are located very close to
each other, preferentially less than 2mm since an electrical dipole inside the heart is less than
1mm [94]. Due to the small interelectrode distance, both electrodes are equally influenced by
electric fields that originate from more remote locations. Since both electrodes are influenced
equally, no potential difference between the two electrodes will be measured. Only electric
potentials located near the electrodes, thus less than 5 times the interelectrode distance away,
cause a measurable potential difference between both electrodes [95]. If an electric dipole
approaches the longitudinal axis of the electrodes, the potential difference between both
electrodes will show a triphasic deflection (Figure 15). The small first and last deflection of the
electrogram show the coming and going of the electric field respectively. The large middle
sharp peak indicates the moment when the electric dipole is in the middle of both electrodes.
No potential difference will be measured if an electric dipole approaches the electrodes
perpendicular to the longitudinal axis [96].
Unipolar electrograms are derived between an exploring electrode inside the heart and WCT
or a distant extracardiac intravascular electrode, in order to avoid muscle noise [97]. Unipolar
electrograms are influenced by the depolarization of the entire heart. As a consequence, the
duration of a unipolar electrogram equals the duration of the P wave or QRS complex on the
surface ECG. The polarity of the unipolar electrogram depends upon the direction of the
depolarization wave compared to the recording electrode. If the depolarization wave goes
away from the electrode, the electrogram will be negative and vice versa. However,
depolarizations that occur close to the electrode have a larger effect upon the measured
potential compared to depolarizations that occur on more remote locations. Similar to a bipolar
electrode it is possible to detect a local transient electrical dipole using the intrinsic deflection
(Figure 15). The intrinsic deflection is a very steep deflection with a high dV/dt on the
electrogram which is caused by a transient dipole just below the electrode [98]. The main

G e n e r a l i n t r o d u c t i o n | 29
disadvantage of a unipolar electrogram compared to a bipolar electrogram is that no precise
peak timing can be determined and the transient dipole may have passed at any point of the
intrinsic deflection [30]. However, unipolar electrograms are convenient for determining the
exact location of the site of origin of a depolarization. A unipolar electrogram will have a QS
morphology if it is positioned at the origin, while at all other locations it will have a RS
morphology. This differentiation is not possible with a bipolar electrogram [97].
Figure 15 Typical bipolar (A) and unipolar (B and C) intracardiac electrogram. The top of the peak (2)
on the bipolar electrogram indicates the moment of local depolarization. The first (1) and last (3) part of
the deflection mark the coming and going of the depolarization wave. The intrinsic deflection (2) on the
unipolar electrogram with RS morphology (B) indicates the moment of local depolarization while the
other deflections indicate an approaching (1) and departing (3) depolarization wave. The unipolar
electrogram with the QS morphology (C) indicates that the exploring electrode is positioned at the site
of origin of a depolarization. [30]
A B C
30 | G e n e r a l i n t r o d u c t i o n
Clinical electrophysiology in humans
Clinical cardiac electrophysiology (EP), involving intracardiac recording and electrical
stimulation, has not only led to improved interpretation of the surface ECG but has evolved to
play a major role in the therapy of arrhythmias in human medicine. The development of
catheter ablation techniques increased the interest for the use of clinical EP for the
identification of suitable targets for curative ablation [99]. First, some conventional mapping
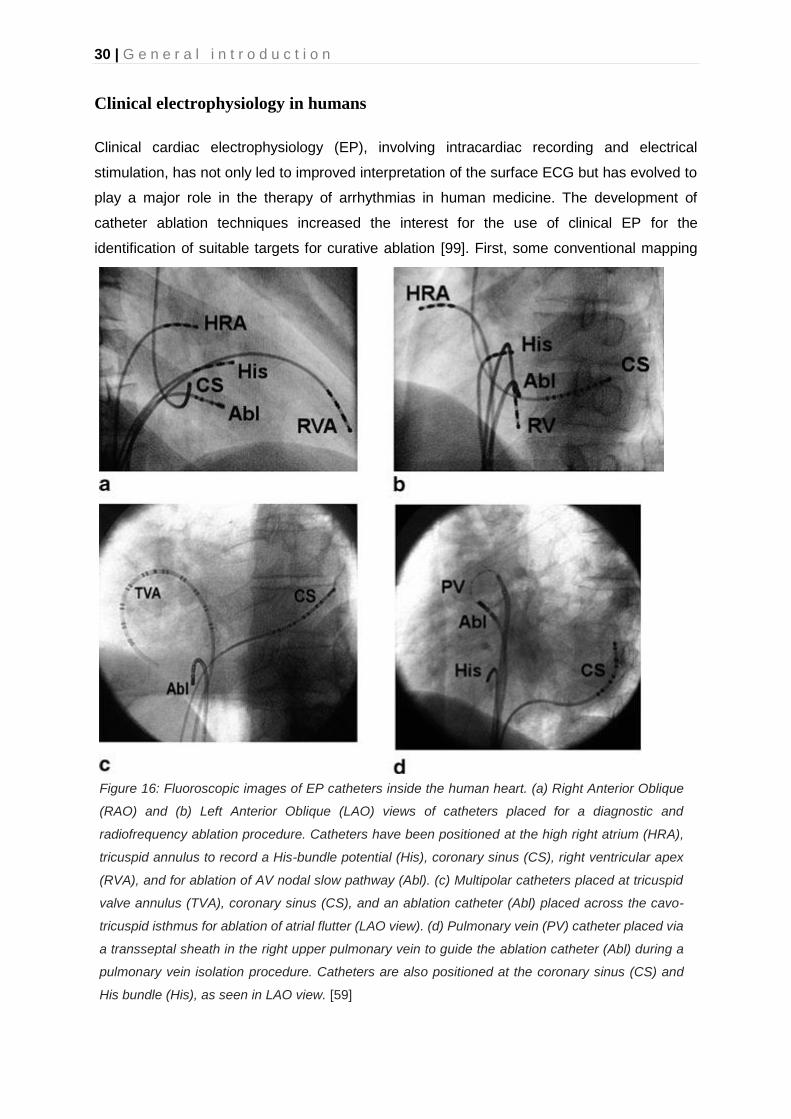
Figure 16: Fluoroscopic images of EP catheters inside the human heart. (a) Right Anterior Oblique
(RAO) and (b) Left Anterior Oblique (LAO) views of catheters placed for a diagnostic and
radiofrequency ablation procedure. Catheters have been positioned at the high right atrium (HRA),
tricuspid annulus to record a His-bundle potential (His), coronary sinus (CS), right ventricular apex
(RVA), and for ablation of AV nodal slow pathway (Abl). (c) Multipolar catheters placed at tricuspid
valve annulus (TVA), coronary sinus (CS), and an ablation catheter (Abl) placed across the cavo-
tricuspid isthmus for ablation of atrial flutter (LAO view). (d) Pulmonary vein (PV) catheter placed via
a transseptal sheath in the right upper pulmonary vein to guide the ablation catheter (Abl) during a
pulmonary vein isolation procedure. Catheters are also positioned at the coronary sinus (CS) and
His bundle (His), as seen in LAO view. [59]
G e n e r a l i n t r o d u c t i o n | 31
techniques will be described, followed by the more advanced electro-anatomical mapping
techniques.
EP procedures in human medicine are usually performed in a dedicated EP lab and guided by
fluoroscopy [59]. Patients are studied with no, or mild sedation. Electrodes are inserted
percutaneously under local anaesthesia. Depending on the procedure, two to five catheters
are usually inserted. A large variety of specialized electrode catheters have been developed
for specific purposes and anatomical variations. Most laboratories routinely place three
catheters: a high right atrial, a His bundle and an RV apex catheter are placed for the initial
study. In case of supraventricular tachycardias, a fourth catheter is placed in the coronary sinus
to provide recording from the left atrium and ventricle (Figure 16). This is the so called standard
four-wire technique [59]. However, if possible, the number of catheters is reduced as much as
possible to avoid unnecessary catheter use and to reduce complications and cost. For
example, a single catheter approach has been described for left-sided accessory pathway
ablation [100].
By using multiple catheters inside the heart, the activation timings of different sites can be
compared. By doing so, an approximate localization can be given of the first myocardial
activation. This technique is called endocardial mapping [97]. The origin of different kinds of
arrhythmias can be determined by placing the catheters in different cardiac chambers with
simultaneous recording. There are different approaches to intracardiac mapping.
Activation sequence mapping is typically used for focal tachycardias [97]. This is done by
roving a mapping catheter inside the heart and recording the timing of successive electrograms
compared with a stable reference signal. The origin of the focal tachycardia is the location with
the earliest activation timing. Usually bipolar electrograms are used to find this earliest location
while the QS morphology of a unipolar electrogram is used to confirm the location as the origin.
Reentry tachycardias do not have a site of earliest activation since there is continuous electrical
activation. Nevertheless, activation mapping can still be useful in locating the sites that are
critical for the maintenance of tachycardia as long as the physiologist has knowledge of the
possible substrates that support the tachycardia. A possible substrate, for example fibrous
tissue after an infarction, will be active during the diastolic phase of the heart while healthy
myocardial tissue will be active during the systolic phase of the heart. However, additional
pacing manoeuvres are necessary to prove that these substrates are indeed critical to sustain
the arrhythmia and not just ‘bystanders’ of the dysrhythmia.
Pacemapping is used to simulate the origin of a tachycardia and create a 12-lead ECG that is
identical to the tachycardia itself. Stimulation must be done using a similar cycle length as the

32 | G e n e r a l i n t r o d u c t i o n
tachycardia. This is mostly done in combination with activation mapping. A disadvantage of
this technique is that the pacing spike on the 12-lead ECG may hamper the interpretation of
the 12-lead ECG. Also, in case of myocardial infarction or typical atrial flutter the conduction
may be different during pacing in comparison to the naturally occurring tachycardia, producing
different 12-lead ECG morphologies [101].
Entrainment mapping is used for determining the circuit of re-entrant tachycardias [97]. Re-
entrant tachycardias typically have a fast and slow component in their circuit, so that there is
time for cardiac tissue to recover and repolarise. The activation wavefront travels around the
circuit and continuously encounters excitable cardiac myocardium ahead of it (Figure 13). The
tissue area between the advancing head of the activation wavefront and the refractory tail is
known as the excitable gap. During entrainment mapping, pacing is done in order to interact
with this excitable gap. The resulting changes of the arrhythmia due to the pacing indicate if
the pacing was done within the circuit or outside and if the tachycardia is a focal tachycardia
or a re-entrant tachycardia. The circuit is reset when the paced depolarization reaches the
excitable gap of a re-entrant tachycardia since no excitable tissue is available anymore. This
is called overdrive pacing and is typically done with a cycle length slightly shorter than the
tachycardia cycle length. Fusion between the pacing-induced depolarizations and the
tachycardia is strongly supportive for a re-entrant circuit, this is called entrainment of the
tachycardia [102]. If the pacing suppresses or accelerates the tachycardia, it is most likely a
focal tachycardia.
Successful entrainment is no proof that the pacing occurs within the reentry circuit. Therefore,
further examination of the fused ECG complexes, return cycle interval and relationship of the
intracardiac electrograms is required. One of these criteria is the return cycle. The return cycle
length is the interval between the last paced beat and the onset of the next beat of tachycardia.
The smaller the difference between the return cycle and the tachycardia cycle length, the closer
the pacing occurs to the reentry circuit.

G e n e r a l i n t r o d u c t i o n | 33
Electroanatomic mapping systems, such as CARTO, Ensite and Rhythmia, correlate the
activation timing with 3D chamber morphologies. They create a global activation map by
sequentially collecting activation timings on the 3D geometry of the chamber and thus can offer
a view upon the entire circuit of the arrhythmia (Figure 17). They are unsuitable for use during
unstable arrhythmias, but in that case they can be used to acquire data during SR. Data
obtained during SR can be used to identify a suitable ablation target, for example the
identification of scar tissue based upon the voltage map of the chamber. The 3D data of the
mapping system can optionally be merged with 3D geometry acquired from CT or MRI data in
order to offer increased anatomical accuracy. Localization of the catheters can be done by two
different techniques: impedance or magnetic tracking. Impedance tracking utilizes the principle
that when an external current is applied across a medium with predictable impedance, a
voltage drop occurs [103]. The electric field strength is proportional to the relative position
within the medium. By applying different high frequency small amplitude currents in three
dimensions using three or more pairs of skin electrodes, the catheter can be tracked in three
dimensions. The catheter positioning is calculated using the amplitude of each different
frequency at the catheter. The frequency is specific for each orthogonal axis. Magnetic tracking
uses three or more magnets with varying strength and a coil, located at the tip of the catheter,
that is positioned into the magnetic field of the magnets. The electrical current that is generated
inside the coil of the catheter depends upon the coil’s orientation towards the magnetic field
Figure 17: 3D electroanatomical in a human of a left atrial activation map of a roof-dependent
macroreentry showing a critical isthmus (in dark red color) located on the roof, between 2 areas of scar
(shown in grey), in the anterosuperior (A) and posterosuperior (B) projections. The electrodes and the
acquired points have been hidden for better visualization of the map. Atrial tachycardia was successfully
terminated by performing an ablation line to transect the critical isthmus (width 6.9 mm) on the roof.
[259]
34 | G e n e r a l i n t r o d u c t i o n
and the strength of the magnetic field. This is used to calculate the positioning and direction of
the catheter.
Clinical electrophysiology in horses
Whereas fluoroscopy and radiography can be performed in horses, they provide limited
information about exact catheter location in relation to specific anatomical structures due to
the large dimensions of the thorax. CT and MRI of the heart cannot be performed because the
available devices are not large enough for the equine thorax. Because of these restrictions in
image acquisitions, four-wire electrophysiological studies cannot be applied in horses and
therapeutic clinical electrophysiology in horses is limited to the implantation of pacemakers in
cases of bradycardia, such as 3rd degree AV block and transvenous electrical cardioversion
(TVEC) of AF and AT [104–107]. Termination of AT by overdrive pacing has been described
but is not routinely used in practice [108]. Intra-atrial electrograms during AF are commonly
recorded at our clinic for the measurement of the atrial fibrillation cycle length (AFCL), an
important parameter to estimate the degree of atrial remodelling [109].
Invasive electrophysiological techniques have been used in horses, mainly in a research
setting. Recently, the technique was described for measuring atrial and ventricular refractory
period and monophasic action potential duration of the right atrium and ventricle in the standing
horse using a contact catheter [110]. Both persistent and acute AF models using pacemaker
implantation have been described to study the pathophysiology of AF in the horse [67,111–
113].
Conclusion
Despite the importance of cardiac arrhythmias in horses, the current knowledge about the
equine electrophysiology and electrocardiography is quite limited in comparison with human
medicine. There is a need for improved screening by automating the ECG analysis but also
for the development of more advanced diagnostic techniques. These advanced techniques
include both invasive and non-invasive techniques. Electro-anatomical mapping (invasive)
may improve our knowledge of the equine cardiac electrophysiology and this knowledge may
be linked to the findings on the surface ECG of multiple lead recordings (non-invasive).

G e n e r a l i n t r o d u c t i o n | 35
References
[1] van Loon G, Patteson M. Electrophysiology and arrhythmogenesis. Cardiol. Horse. Second Edi, Elsevier Ltd; 2010, p. 59–73.
[2] Wilson FN, Johnston FD, Macleod AG, Barker PS. Electrocardiograms that represent the potential variations of a single electrode. Am Heart J 1934;9:447–58.
[3] Smith CR, Hamlin RL, Crocker HD. Comparative Electrocardiography. Ann N Y Acad Sci 1965;127:155–69.
[4] Holmes JR, Darke PGGG. Studies on the Development of a New Lead System for Equine Electrocardiography. Equine Vet J 1970;2:12–21.
[5] Wilson FN, Bayley RH. The Electric Field of an Eccentric Dipole in a Homogeneous Spherical Conducting Medium. Circulation 1950;1:84–92.
[6] Verheyen T, Decloedt A, De Clercq D, Deprez P, Sys SU, van Loon G. Electrocardiography in horses – part 1 : how to make a good recording. Vlaams Diergeneeskd Tijdschr 2010;79:331–6.
[7] Kusachi R. Fundamental studies on electrocardiograms of the horse: i. Unipolar semidirect lead. Jpn J Vet Res 1955;3:120–35.
[8] Bonagura JD, Reef VB. Chapter 8 - Disorders of the Cardiovascular System. In: Reed SM, Bayly WM, Sellon DC, editors. Equine Intern. Med. (Second Ed. Second Edi, Saint Louis: W.B. Saunders; 2004, p. 355–459.
[9] Andries E, Stroobandt R, De Pooter J, Verdonck F, Sinnaeve F. ECG-registratie en nomenclatuur. ECG uit het hoofd. Zesde gehe, Antwerpen : Garant Uitgevers; 2016, p. 107–26.
[10] Einthoven W. Die galvanometrische Registrirung des menschlichen Elektrokardiogramms, zugleich eine Beurtheilung der Anwendung des Capillar-Elektrometers in der Physiologie. Arch Für Die Gesamte Physiol Des Menschen Und Der Tiere 1903;99:472–80.
[11] Einthoven W. Weiteres über das Elektrokardiogramm. Arch Für Die Gesamte Physiol Des Menschen Und Der Tiere 1908;122:517–84.
[12] Barnes AR, Pardee HEB, White PD, Wilson FN, Wolferth CC. Standardization of precordial leads. Am Heart J 1938;15:235–9.
[13] Kossmann CE, Johnston FD. The precordial electrocardiogram: I. The potential variations of the precordium and of the extremities in normal subjects. Am Heart J 1935;10:925–41.
[14] Wolferth C, Wood F. The electrocardiographic diagnosis of coronary occulusion by the use of chest leads. Am J Med Sci 1932;183:30–4.
[15] Goldberger E. A simple, indifferent, electrocardiographic electrode of zero potential and a technique of obtaining augmented, unipolar, extremity leads. Am Heart J 1942;23:483–92.

36 | G e n e r a l i n t r o d u c t i o n
[16] Einthoven W, Fahr G, De Waart A. Über die Richtung und die manifeste Grösse der Potentialschwankungen im menschlichen Herzen und über den Einfluss der Herzlage auf die Form des Elektrokardiogramms. Pflüger’s Arch Für Die Gesamte Physiol Des Menschen Und Der Tiere 1913;150:275–315.
[17] Wilson FN, Johnston FD. The vectorcardiogram. Am Heart J 1938;16:14–28.
[18] Man S, Maan AC, Schalij MJ, Swenne CA. Vectorcardiographic diagnostic & prognostic information derived from the 12-lead electrocardiogram: Historical review and clinical perspective. J Electrocardiol 2015;48:463–75.
[19] Macfarlane PW. The coming of age of Cardiology. In: Macfarlane PW, van Oosterom A, Pahlm O, Kligfield P, Janse M, Camm J, editors. Compr. Electrocardiol., London: Springer London; 2011, p. 3–48.
[20] McFee R, Stow RM, Johnston FD. Graphic Representation of Electrocardiographic Leads by Means of Fluid Mappers. Circulation 1952;6:21–9.
[21] McFee R, Johnston FD. Electrocardiographic Leads. Circulation 1953;8:554–68.
[22] Brody DA, Erb BD, Romans WE. The approximate determination of lead vectors and the burger triangle in normal human subjects. Am Heart J 1956;51:211–20.
[23] Frank E. The image surface of a homogeneous torso. Am Heart J 1954;47:757–68.
[24] Frank E. An Accurate, Clinically Practical System For Spatial Vectorcardiography. Circulation 1956;13:737–49.
[25] Kors JA, van Herpen G, Willems JL, van Bemmel JH. Improvement off automated electrocardiographic diagnosis by combination of computer interpretations of the electrocardiogram and vectorcardiogram. Am J Cardiol 1992;70:96–9.
[26] Macfarlane PW. Lead Systems. In: Macfarlane PW, van Oosterom A, Pahlm O, Kligfield P, Janse M, Camm J, editors. Compr. Electrocardiol., London: Springer London; 2011, p. 377–415.
[27] Hamlin RL, Smith CR. Anatomical and Physiologic Basis for Intpretation of the Electrocardiogram. Am J Vet Res 1960;21:701–8.
[28] Bishop SP, Cole CR. Morphology of the specialized conducting tissue in the atria of the equine heart. Anat Rec 1967;158:401–15.
[29] Bright JM, Marr CM. Chapter 1 - Introduction to cardiac anatomy and physiology. In: Marr CM, Bowen IM, editors. Cardiol. Horse (Second Ed. Second Edi, Edinburgh: W.B. Saunders; 2010, p. 3–19.
[30] Muylle E. Experimenteel onderzoek naar het verloop van de depolarisatiegolf in het hart van het paard : de genesis van het electrocardiografisch P- en QRS-complex.., 1975.
[31] Meyling HA, Ter Borg H. The conducting system of the heart in hoofed animals. Cornell Vet 1957;47:419–55.
[32] Hamlin RL, Smith CR. Categorization of common domestic mammals based upon their
G e n e r a l i n t r o d u c t i o n | 37
ventricular activation process. Ann N Y Acad Sci 1965;127:195–203.
[33] Muylle E, Oyaert W. Equine Electrocardiography The Genesis of the Different Configurations of the “QRS” Complex. Zentralblatt Für Veterinärmedizin R A 1977;24:762–71.
[34] Brooijmans AWM. Electrocardiography in Horses and Cattle: Theoretical and Clinical Aspects. Baarn: Uitgeverij Cantecleer; 1957.
[35] Van Zijl WJJ. The electrocardiogram of the normal horse using the techniques of Einthoven and Wilson. Tijdschr Diergeneesk 1951;76:85–96.
[36] Holmes JR, Alps BJ. Studies into equine electrocardiography and vectorcardiography. II. Cardiac Vector Distributions in Apparently Healthy Horses. Can J Comp Med Vet Sci 1967;31:219–25.
[37] Dukes HH, Batt HT. Studies on the electrocardiogram of the horse. Amer J Physiol 1941;133:265–6.
[38] Buss DD, Rawlings CA, Bisgard GE. The normal electrocardiogram of the domestic pony. J Electrocardiol 1975;8:167–72.
[39] Steel JD. Studies on the Electrocardiogram of the Racehorse. Australian Medical Publ. Company; 1963.
[40] Muylle E, Oyaert W. Clinical Evaluation of Cardiac Vectors in the Horse. Equine Vet J 1971;3:129–36.
[41] Dubois M. Du choix des dérivations et d’une normalisation de l’électrocardiogramme chez quelques ongulés domestiques. Rec Méd Vét 1961;133:425–48.
[42] da Costa CF, Samesima N, Pastore CA. Cardiac Mean Electrical Axis in Thoroughbreds—Standardization by the Dubois Lead Positioning System. PLoS One 2017;12:e0169619.
[43] Fregin GF. The equine electrocardiogram with standardized body and limb positions. Cornell Vet 1982;72:304–24.
[44] Hamlin RL, Smetzer DL, Senta T, Smith CR. Atrial activation paths and P waves in horses. Am J Physiol 1970;219:306–13.
[45] Verheyen T. Equine electrocardiography: exploration of new diagnostic strategies. Ghent university, 2012.
[46] Young LE, van Loon G. Diseases of the heart and vessels. In: Hinchcliff KW, Kaneps AJ, Geor RJ, editors. Equine Sport. Med. Surg. basic Clin. Sci. equine Athl., 2014, p. 695–743.
[47] Mitchell KJ. Equine Electrocardiography. Vet Clin North Am Equine Pract 2019;35:65–83.
[48] Hesselkilde EZ, Carstensen H, Vandsø Petersen B, Jespersen T, Kanters JK, Buhl R. Is ECG in horses only for dysrhythmia diagnosis? Introducing a new method for 12-lead

38 | G e n e r a l i n t r o d u c t i o n
ECG. J Vet Intern Med 2016;30:1500–1.
[49] Hamlin RL, Klepinger WL, Gilpin KW, Smith CR. Autonomic control of heart rate in the horse. Am J Physiol 1972;222:976–8.
[50] Bowen IM. Cardiac Dysrhythmias. Curr. Ther. Equine Med. Fifth Ed. Five Editi, Elsevier Inc.; 2003, p. 602–13.
[51] van Loon G. Cardiac Arrhythmias in Horses. Vet Clin North Am - Equine Pract 2019;35:85–102.
[52] Verheyen T, Decloedt A, De Clercq D, Deprez P, Sys S, van Loon G. Electrocardiography in horses, part 2: how to read the equine ECG. Vlaams Diergeneeskd Tijdschr 2010;59:337–44.
[53] Reef VB, Bonagura J, Buhl R, Mcgurrin MKJ, Schwarzwald CC, van Loon G, Young LE. Recommendations for management of equine athletes with cardiovascular abnormalities. J Vet Intern Med 2014;28:749–61.
[54] Vernemmen I, De Clercq D, Decloedt A, Vera L, Van Steenkiste G, van Loon G. Atrial premature depolarisations five days post electrical cardioversion are related to atrial fibrillation recurrence risk in horses. Equine Vet J 2020;52:374–8.
[55] Broux B, De Clercq D, Decloedt A, Van Der Vekens N, Verheyen T, Ven S, Pardon B, van Loon G. Atrial Premature Depolarization-Induced Changes in QRS and T Wave Morphology on Resting Electrocardiograms in Horses. J Vet Intern Med 2016;30:1253–9.
[56] Saoudi N, Cosío F, Waldo A, Chen S., Iesaka Y, Lesh M, Saksena S, Salerno J, Schoels W. A classification of atrial flutter and regular atrial tachycardia according to electrophysiological mechanisms and anatomical bases. A Statement from a Joint Expert Group from the Working Group of Arrhythmias of the European Society of Cardiology. Eur Heart J 2001;22:1162–82.
[57] van Loon G. Atrial Premature Complexes and Atrial Tachycardia. In: M. Durando M, editor. Clin. Vet. Advis. horse. 6th ed., St. Louis: Elsevier; 2011, p. 54–5.
[58] van Loon G. Atrial Flutter. In: M. Durando M, editor. Clin. Vet. Advis. horse, vol. 1, Elsevier; 2011, p. 52–3.
[59] Rankin A, Quin R, Rae A. Clinical Cardiac Electrophysiology. In: Macfarlane PW, van Oosterom A, Pahlm O, Kligfield P, Janse M, Camm J, editors. Compr. Electrocardiol., London: Springer London; 2011, p. 1133–62.
[60] Decloedt A, Verheyen T, Van N, Vekens D, Sys S, De Clercq D, van Loon G. Long-term follow-up of atrial function after cardioversion of atrial fibrillation in horses. Vet J 2013;197:583–8.
[61] Waks JW, Josephson ME. Mechanisms of Atrial Fibrillation – Reentry, Rotors and Reality. Arrhythmia Electrophysiol Rev 2014;3:90.
[62] Jalife J, Berenfeld O, Mansour M. Mother rotors and fibrillatory conduction: A mechanism of atrial fibrillation. Cardiovasc Res 2002;54:204–16.

G e n e r a l i n t r o d u c t i o n | 39
[63] Jalife J. Rotors and spiral waves in atrial fibrillation. J Cardiovasc Electrophysiol 2003;14:776–80.
[64] Goya M, Ouyang F, Ernst S, Volkmer M, Antz M, Kuck KH. Electroanatomic mapping and catheter ablation of breakthroughs from the right atrium to the superior vena cava in patients with atrial fibrillation. Circulation 2002;106:1317–20.
[65] Vandecasteele T, Cornillie P, Vandevelde K, Logothetidou A, Couck L, van Loon G, Van den Broeck W. Presence of Ganglia and Telocytes in Proximity to Myocardial Sleeve Tissue in the Porcine Pulmonary Veins Wall. Anat Histol Embryol 2017;46:325–33.
[66] Linz D, Hesselkilde E, Kutieleh R, Jespersen T, Buhl R, Sanders P. Pulmonary vein firing initiating atrial fibrillation in the horse: Oversized dimensions but similar mechanisms. J Cardiovasc Electrophysiol 2020:jce.14422.
[67] De Clercq D, van Loon G, Tavernier R, Duchateau L, Deprez P. Atrial and ventricular electrical and contractile remodeling and reverse remodeling owing to short-term pacing-induced atrial fibrillation in horses. J Vet Intern Med 2008;22:1353–9.
[68] Allen KJ, Young LE, Franklin SH. Evaluation of heart rate and rhythm during exercise. Equine Vet Educ 2016;28:99–112.
[69] Buhl R, Petersen EE, Lindholm M, Bak L, Nostell K. Cardiac arrhythmias in standardbreds during and after racing-possible association between heart size, valvular regurgitations, and arrhythmias. J Equine Vet Sci 2013;33:590–6.
[70] Hiraga A, Sugano S. History of research in Japan on electrocardiography in the racehorse. J Equine Sci 2015;26:1–13.
[71] Physick-Sheard PW, McGurrin MKJ. Ventricular arrhythmias during race recovery in standardbred racehorses and associations with autonomic activity. J Vet Intern Med 2010;24:1158–66.
[72] Navas de Solis C. Exercising arrhythmias and sudden cardiac death in horses: Review of the literature and comparative aspects. Equine Vet J 2016;48:406–13.
[73] Holmes JR, Alps BJ. Studies into equine electrocardiography and vectorcardiography IV. Vector Distributions In Some Arrhythmias. Can J Comp Med Vet Sci 1967;31:150–5.
[74] Pfister R, Seifert-Alioth C, Beglinger R. Die Bestimmung des Ursprungsortes ventrikulärer Extrasystolen beim Pferd. Schweizer Arch Für Tierheilkd SAT Die Fachzeitschrift Für Tierärztinnen Und Tierärzte 1984;126:165–72.
[75] Fregin GF. Medical evaluation of the cardiovascular system. Vet Clin North Am Equine Pract 1992;8:329–46.
[76] Reef VB. Evaluation of the equine cardiovascular system. Vet Clin North Am Equine Pract 1985;1:275–88.
[77] Frick L, Schwarzwald CC, Mitchell KJ. The use of heart rate variability analysis to detect arrhythmias in horses undergoing a standard treadmill exercise test. J Vet Intern Med 2018:1–13.

40 | G e n e r a l i n t r o d u c t i o n
[78] Flethøj M, Kanters JK, Pedersen PJ, Haugaard MM, Carstensen H, Olsen LH, Buhl R. Appropriate threshold levels of cardiac beat-to-beat variation in semi-automatic analysis of equine ECG recordings. BMC Vet Res 2016;12:266.
[79] Trachsel DS, Bitschnau C, Waldern N, Weishaupt MA, Schwarzwald CC. Observer agreement for detection of cardiac arrhythmias on telemetric ECG recordings obtained at rest, during and after exercise in 10 Warmblood horses. Equine Vet J 2010;42:208–15.
[80] Lanata A, Guidi A, Baragli P, Valenza G, Scilingo EP. A Novel Algorithm for Movement Artifact Removal in ECG Signals Acquired from Wearable Systems Applied to Horses. PLoS One 2015;10:e0140783.
[81] Kaplan Berkaya S, Uysal AK, Sora Gunal E, Ergin S, Gunal S, Gulmezoglu MB. A survey on ECG analysis. Biomed Signal Process Control 2018;43:216–35.
[82] Kors JA, van Herpen G. Computer analysis of the electrocardiogram. In: Macfarlane PW, van Oosterom A, Pahlm O, Kligfield P, Janse M, Camm J, editors. Compr. Electrocardiol., London: Springer London; 2011, p. 1723–52.
[83] Turing AM. I.—Computing machinery and intelligence. Mind 1950;LIX:433–60.
[84] Rajpurkar P, Hannun AY, Haghpanahi M, Bourn C, Ng AY. Cardiologist-Level Arrhythmia Detection with Convolutional Neural Networks. Comput Vis Pattern Recognit 2017.
[85] Hannun AY, Rajpurkar P, Haghpanahi M, Tison GH, Bourn C, Turakhia MP, Ng AY. Cardiologist-level arrhythmia detection and classification in ambulatory electrocardiograms using a deep neural network. Nat Med 2019;25:65–9.
[86] Murugesan B, Ravichandran V, Shankaranarayana SM, Ram K, Preejith SP, Joseph J, Sivaprakasam M. ECGNet : Deep Network for Arrhythmia Classification. IEEE Int Symp Med Meas Appl 2018:1–6.
[87] Kiranyaz S, Ince T, Gabbouj M. Real-Time Patient-Specific ECG Classification by 1-D Convolutional Neural Networks. IEEE Trans Biomed Eng 2016;63:664–75.
[88] Pan J, Tompkins WJ. A Real-Time QRS Detection Algorithm. IEEE Trans Biomed Eng 1985;BME-32:230–6.
[89] Kantardzic M. Data mining: concepts, models, methods, and algorithms. John Wiley & Sons; 2011.
[90] Islam M, Chen G, Jin S. An Overview of Neural Network. Am J Neural Networks Appl 2019;5:7.
[91] Csáji BC. Approximation with artificial neural networks. 2001.
[92] Deng L. Deep Learning: Methods and Applications. Found Trends® Signal Process 2014;7:197–387.
[93] Ongsulee P. Artificial intelligence, machine learning and deep learning. Int Conf ICT Knowl Eng 2018:1–6.

G e n e r a l i n t r o d u c t i o n | 41
[94] Rahhal MM Al, Bazi Y, AlHichri H, Alajlan N, Melgani F, Yager RR. Deep learning approach for active classification of electrocardiogram signals. Inf Sci (Ny) 2016;345:340–54.
[95] Vander Ark CR, Reynolds EW. An experimental study of propagated electrical activity in the canine heart. Circ Res 1970;26:451–60.
[96] Schaefer H, Trautwein W. Further experiments on the nature of the excitation wave in the myocardium of the dog. Pflugers Arch Gesamte Physiol Menschen Tiere 1951;253:152—164.
[97] Schaefer H, Haas HG. Electrocardiography. vol. 1. Amer. Physiol. Ass.; 1962.
[98] Segal OR, Koa-Wing M, Jarman J, Peters N, Markides V, Davies DW. Intracardiac mapping. In: Macfarlane PW, van Oosterom A, Pahlm O, Kligfield P, Janse M, Camm J, editors. Compr. Electrocardiol., London: Springer London; 2011, p. 1165–91.
[99] Durrer D, Van Der Tweel LH. Excitation of the left ventricular wall of the dog and goat. Ann N Y Acad Sci 1957;65:779–803.
[100] Morady F. Radio-frequency ablation as treatment for cardiac arrhythmias. N Engl J Med 1999;340:534–44.
[101] Kuck KH, Schlauter M. Single-catheter approach to radiofrequency current ablation of left-sided accessory pathways in patients with Wolff-Parkinson-White syndrome. Circulation 1991;84:2366–75.
[102] Liu TY, Tai CT, Huang BH, Higa S, Lin YJ, Huang JL, Yuniadi Y, Lee PC, Ding YA, Chen SA. Functional characterization of the crista terminalis in patients with atrial flutter: Implications for radiofrequency ablation. J Am Coll Cardiol 2004;43:1639–45.
[103] Almendral JM, Gottlieb CD, Rosenthal ME, Stamato NJ, Buxton AE, Marchlinski FE, Miller JM, Josephson ME. Entrainment of ventricular tachycardia: Explanation for surface electrocardiographic phenomena by analysis of electrograms recorded within the tachycardia circuit. Circulation 1988;77:569–80.
[104] Wittkampf FHM, Wever EFD, Derksen R, Wilde AAM, Ramanna H, Hauer RNW, Robles De Medina EO. LocaLisa: New technique for real-time 3-dimensional localization of regular intracardiac electrodes. Circulation 1999;99:1312–7.
[105] Van Steenkiste G, De Clercq D, Vera L, Decloedt A, van Loon G. Sustained atrial tachycardia in horses and treatment by transvenous electrical cardioversion. Equine Vet J 2019;51:634–40.
[106] De Clercq D, van Loon G, Schauvliege S, Tavernier R, Baert K, Croubels S, De Backer P, Deprez P. Transvenous electrical cardioversion of atrial fibrillation in six horses using custom made cardioversion catheters. Vet J 2008;177:198–204.
[107] van Loon G. Dysrhythmias: Cardiac pacing and electrical cardioversion. Cardiol. Horse. Second Edi, Elsevier Ltd; 2010, p. 179–92.
[108] De Lange L, Van Steenkiste G, Vera L, De Clercq D, Decloedt A, Cromheeke KMC, van Loon G. First succesful applications of closed loop stimulation pacemakers with remote

42 | G e n e r a l i n t r o d u c t i o n
monitoring in two syncopal miniature donkeys. Proc. 12th Eur. Coll. Equine Intern. Med. Congr., 2019.
[109] van Loon G, Jordaens L, Muylle E, Nollet G, Sustronck B. Intracardiac overdrive pacing as a treatment of atrial flutter in a horse. Vet Rec 1998;142:301–3.
[110] De Clercq D, Decloedt A, Sys SU, Verheyen T, Van Der Vekens N, van Loon G. Atrial fibrillation cycle length and atrial size in horses with and without recurrence of atrial fibrillation after electrical cardioversion. J Vet Intern Med 2014;28:624–9.
[111] De Clercq D, Broux B, Vera L, Decloedt A, van Loon G. Measurement variability of right atrial and ventricular monophasic action potential and refractory period measurements in the standing non-sedated horse. BMC Vet Res 2018;14:101–18.
[112] van Loon G, Duytschaever M, Tavernier R, Fonteyne W, Jordaens L, Deprez P. An Equine Model of Chronic Atrial Fibrillation: Methodology. Vet J 2002;164:142–50.
[113] De Clercq D, Decloedt A, Tavernier R, Deprez P, van Loon G. Atrial and ventricular electrical and contractile remodelling and reverse remodelling due to chronic pacing-induced atrial fibrillation in horses: Preliminary results. Vlaams Diergeneeskd Tijdschr 2019;88:269–77.

Scientific Aims


S c i e n t i f i c a i m s | 45
The general aim of this PhD is to advance the detection, diagnosis and general understanding
of equine arrhythmias. At the moment, equine ECG analysis is still done manually since human
and small animal ECG software cannot be used for the equine ECG due to the differences in
the ECG morphology. This makes ECG interpretation a laborious task reserved to experienced
veterinarians, limiting the use of ECG in horses. In addition, the atrial fibrillation cycle length is
an important parameter for studying the degree of electrical remodelling of the atrium during
atrial fibrillation but needs to be recorded invasively or with expensive hardware. Therefore,
the first objective is to develop an algorithm specific for equine ECG analysis. The second
objective is to test the hypothesis that the atrial fibrillation cycle length can be estimated by
deriving the atrial fibrillatory rate from the surface ECG.
In human medicine, invasive electrophysiological techniques have greatly advanced the
understanding of arrhythmias due to their ability to better identify the cardiac depolarization.
These techniques have not fully been developed in horses and the current knowledge about
the normal depolarization pattern of the heart in sinus rhythm and the correlation with the
surface ECG is limited. Therefore, the third objective is to test the hypothesis that 3D electro-
anatomical mapping is feasible to perform in horses using techniques from human medicine.
The fourth objective is to test the hypothesis that the complete atrial and ventricular
depolarisation is represented on the surface ECG.
While multiple lead recordings and especially 12-lead ECG have been a cornerstone in the
development of human cardiology, this technique remains poorly explored in equine
cardiology. Therefore, the fifth objective is to evaluate the hypothesis that the characteristics
of a 12-lead ECG derived vectorcardiogram are correlated to the origin of an atrial or ventricular
premature depolarisation.
In summary, the specific aims of the present doctoral thesis are:
1. To develop an algorithm for equine specific ECG analysis. (Chapter 1)
2. To evaluate whether the atrial fibrillatory rate derived from a base-apex surface ECG
is correlated with the intracardiac measured atrial fibrillatory cycle length (Chapter 2).
3. To develop a technique for 3D electro-anatomic mapping in horses (Chapter 3).
4. To describe the sinus propagation in the atria and ventricles in healthy horses using
3D electro-anatomical mapping and correlate the cardiac depolarization pattern to the
deflections on the surface ECG (Chapter 4).
5. To evaluate if VCG characteristics can differentiate between the anatomical origin of
atrial and ventricular premature depolarizations (Chapter 5).

Chapter 1: Transfer Learning in ECG
Classification from Human to Horse
Using a Novel Parallel Neural Network
Architecture


Transfer Learning in ECG Classification from Human to Horse Using a Novel
Parallel Neural Network Architecture
Glenn Van Steenkiste1 *, Gunther van Loon1, and Guillaume Crevecoeur2,3
1 Department of large animal internal medicine, Ghent University, Ghent, 9000, Belgium
2 Department of Electromechanical, System and Metal Engineering, Ghent University, Ghent, 9000, Belgium
3 Core Lab EEDT-DC, Flanders Make, Belgium
Adapted from:
Van Steenkiste G, van Loon G, Crevecoeur G. Transfer Learning in ECG Classification from
Human to Horse Using a Novel Parallel Neural Network Architecture, Scientific Reports,
2020;10:186
50 | C h a p t e r 1
Summary
Automatic or semi-automatic analysis of the equine electrocardiogram (eECG) is currently not
possible because human or small animal ECG analysis software is unreliable due to a different
ECG morphology in horses resulting from a different cardiac innervation. Both filtering, beat
detection and classification for eECGs are currently poorly or not described in the literature.
There are also no public databases available for eECGs as is the case for human ECGs. In
this paper we propose the use of wavelet transforms for both filtering and QRS detection in
eECGs. In addition, we propose a novel robust deep neural network (DNN) using a parallel
convolutional neural network architecture for ECG beat classification. The network was trained
and tested using both the MIT-BIH arrhythmia and an own made eECG dataset with 26.440
beats on 4 classes: normal, premature ventricular depolarization, premature atrial
depolarization and noise. The network was optimized using a genetic algorithm and an
accuracy of 97.7% and 92.6% was achieved for the MIT-BIH and eECG database respectively.
Afterwards, transfer learning from the MIT-BIH dataset to the eECG database was applied
after which the average accuracy, recall, positive predictive value and F1 score of the network
increased with an accuracy of 97.1%.

C h a p t e r 1 | 51
Introduction
A cardiac arrhythmia is an abnormal impulse generation or an abnormal conduction of the
impulse from the sinoatrial node in the heart [1]. An electrocardiogram (ECG) allows to detect
these abnormalities non-invasively. Horses often present arrhythmias at rest and/or during
exercise and arrhythmias can range from being clinically irrelevant to potentially life threatening
[2–5]. At the same time, sudden death during exercise occurs at an up to 10 times higher ratio
in horses compared to human athletes [6,7]. Looking at the causes of sudden death, a
cardiovascular problem is found in 8.8% of the cases, but in 68% of the cases no pathology is
found on autopsy and a fatal arrhythmia is proposed as the most likely cause of sudden death
[6,8]. Arrhythmias in horses may not be associated with obvious clinical signs which alert the
owner, and simple auscultation is not always reliable, which requires the recording of an
electrocardiogram to make a diagnosis [9]. Also in human medicine the use of an ECG has
been proven to be the way to go for pre-participation screening [10]. However, ECG
interpretation is time-consuming and requires expertise. Furthermore, intra- and interobserver
agreement for recognition and classification of arrhythmias varies from good during rest to poor
during exercise which currently limits the usage of ECGs in horses [11]. Computer aided signal
analysis can eliminate both intra- as interobserver variability and can be done quicker and
more cost effective when compared to human interpretation.
Automated ECG interpretation is challenging since an ECG signal can vary between and within
patients under different physical circumstances [12]. In order to perform diagnosis based on
an ECG, the algorithm must be able to characterize and recognize ECG morphology and
rhythm. For human medicine numerous algorithms have been proposed both for filtering, QRS
detection and classification of ECGs, but for horses only one filtering algorithm, two QRS
detection algorithms and no classification algorithms were described by the knowledge of the
authors [3,13,14]. Hoofed animals, such as the horse, have a different nervous conduction
system of the heart which results in a different ECG morphology as can been seen in Figure 1
[15]. One of the most striking differences between human and equine ECGs (eECGs) is that
instead of having a large R peak, a large S peak is prominent in eECGs. Because there is
currently a lack of horse-adapted software, equine ECGs are currently only manually analysed
by a trained equine clinician or cardiologist [4,11].
The aim of this study is to develop algorithms for an end-to-end system for beat-to-beat eECG
analysis for horses based upon conventional ECG signal processing techniques along with
state-of-the-art deep learning techniques for feature extraction and classification. Since deep
learning approaches require massive amounts of data to be trained, which is not available for

52 | C h a p t e r 1
eECGs, transfer learning will be applied in order to improve results for eECG classification. In
most automated ECG interpretation studies, the authors concentrate on conventional machine
learning approaches: pre-processing, feature extraction, feature reduction and feature
classification [16]. The advantage of using deep learning above the conventional techniques
is that the essential steps, namely feature extraction, feature selection and classification can
be developed without explicit definition. Improvements in deep learning network architectures
and more powerful computing hardware has recently increased the usage of deep learning
networks for cardiac arrhythmia diagnosis in ECGs. Two of the most recent papers use short
segments of ECG, 1 second and 2 seconds respectively, and use a residual convolutional
neural network (CNN) [17,18]. Murugesan et al. also introduce the combined use of a long
short memory (LSTM) block with a CNN showing improved results. The improved results can
be explained because the relationship with surrounding heartbeats can yield important
information which is used by the LSTM block. Recurrent neural networks have traditionally
been used for time series processing, but they are resource intensive and recent results have
shown that convolutional neural network approaches can outperform recurrent neural networks
for tasks such as audio synthesis and machine translation [19]. Therefore, we introduce a
parallel network in this paper, with a separate pathway for feature extraction from both the
individual ECG morphology and the temporal relationship. Despite the papers above achieving
a high accuracy, sensitivity and positive predictive value (PPV), they lack the ability of providing
the cardiologist an exact number of abnormal beats which is an important prerequisite in eECG
analysis. Horses can have a heart rate up to 240 bpm (4 beats per second) and thus a segment
of 1 or 2 seconds can include both normal and abnormal heartbeats simultaneously [20].
Another study by Isin and Ozdalili [21] converts R-T segments to 256x256x3 images and uses
the convolutional layers of a pre-trained alexNet [22] as neural network architecture to extract
the features, that on their turn are fed into a hidden layer after a principal component analysis
is applied to reduce the number of features. Zihlman et al. [23] and Rubin et al. [24] both used
a similar approach by converting the ECG to a spectrogram and feeding this into a CNN.
Furthermore, Zihlman et al. also introduces a long short memory block between the
convolutional layers and the hidden layers as network architecture. Lou et al. [25] also converts
the ECG to a spectrogram using a modified frequency slice wavelet transform before feeding
the ECG to a stacked denoising auto-encoder for feature extraction, the result is then given to
deep neural network for classification. Kachuee et al. [26] and Kiranyaz et al. [27] directly apply
a CNN network using single unprocessed ECG beats as input to the network. The papers of
Kiranyaz et al., Kachuee et al., Lou et al., Rubin et al. and Isin and Ozdalili have the advantage
of providing beat per beat classification.

C h a p t e r 1 | 53
There are multiple annotated human ECG datasets available, with the Physionet MIT-BIH
arrhythmia dataset as one of the most commonly used databases in studies [28,29]. Since for
eECGs such datasets are lacking we use transfer learning from a network trained upon the
MIT-BIH dataset to an own generated dataset for horses with 20.000 beats which were
recorded in a clinical setting. Transfer learning for ECGs has already successfully been used
in different studies for human ECG classification, but has not yet been applied between
different species [17,21,27].
Methods
Procedures on animals were approved by the Ethical Committee, Faculty of Veterinary
Medicine, Ghent University (EC2016/35). All experiments were performed in accordance with
the relevant guidelines and regulations.
Dataset Description
The MIT-BIH arrhythmia database is one of the most used arrhythmia databases for research
in ECG signal processing [28,35]. It contains 48 half-hour annotated, two-channel (lead II and
modified V1, V2, V3, V4 or V5 leads) ambulatory ECG recordings, obtained from 47 patients
sampled at 360Hz per channel.
Because no datasets are available for eECGs we collected and annotated a dataset of 26.440
beats from 15 horses. Seven horses were used in a previous pacing study, in which ectopic
depolarisations were introduced in the atrium and ventricle with electrical stimulation of the
heart, resulting in an exact annotation of each beat [36]. The remaining 8 eECGs were selected
from clinical cases based upon a high frequency of ectopic beats in order to include more
clinical realistic timings of premature beats compared to the paced beats. Two veterinarians
with experience in cardiology annotated these recordings using a Python based ECG
annotation tool designed for this work. All eECGs were recorded at 500Hz using the modified
base-apex electrode configuration [37]. Because the eECGs were recorded at 500Hz, the MIT-
BIH dataset was upsampled in order to match eECGs. The ECG was subsampled to 100Hz
for the timing vector in order to reduce the memory and computational cost, the resolution
remained 500Hz for the morphology input. Lead I and II were used for the algorithm from the
eECG dataset.
The median number of samples of each class was calculated for each dataset and the samples
of each training class were randomly under- or oversampled with replacement in order to

54 | C h a p t e r 1
acquire the median number of samples for each class. This was done using the imbalanced-
learn toolkit v 4.3 [38].
eECG specific pre-processing.
Baseline wandering is the low frequency noise typically induced by movement and breathing
of the horse and can induce large differences between the amplitudes of the beats. A median
filter can be used to remove this artefact without changing or disturbing the characteristics of
the waveform. The original eECG signal was processed with a median filter of 200 ms width in
order to remove P waves and QRS complexes, followed by a median filter of 600 ms width to
remove T waves [30]. The signal resulting from the second filtering contains the baseline of
the ECG signal and is subsequently subtracted from the original ECG signal to obtain an ECG
signal without baseline wandering.
After removing the baseline wandering, the resulting ECG signal still contains other residual
noise in the higher frequency range. In this study we used Discrete Wavelet transform using a
Coiflet 2 wavelet to filter the signal [31]. The signal was first decomposed into several subbands
by applying Wavelet Transform with a Daubechies mother wavelet of order 8, since this has
been proven to be the most appropriate wavelet basis function for denoising ECGs [39]. Next,
all values below a certain threshold were set to 0, after which the signal was reconstructed.
Using these pre-processing methods high frequency components of the ECG signal decrease
as lower details are removed from the original signal. An example of an ECG trace filtered by
a subsequent median and Discrete Wavelet filter is shown in Figure 2.
Figure 1: Humane (upper) and equine (lower) ECG at rest. Both ECGs are shown at the same
paper speed and resolution. Note the difference in both morphology as basal heart rate.
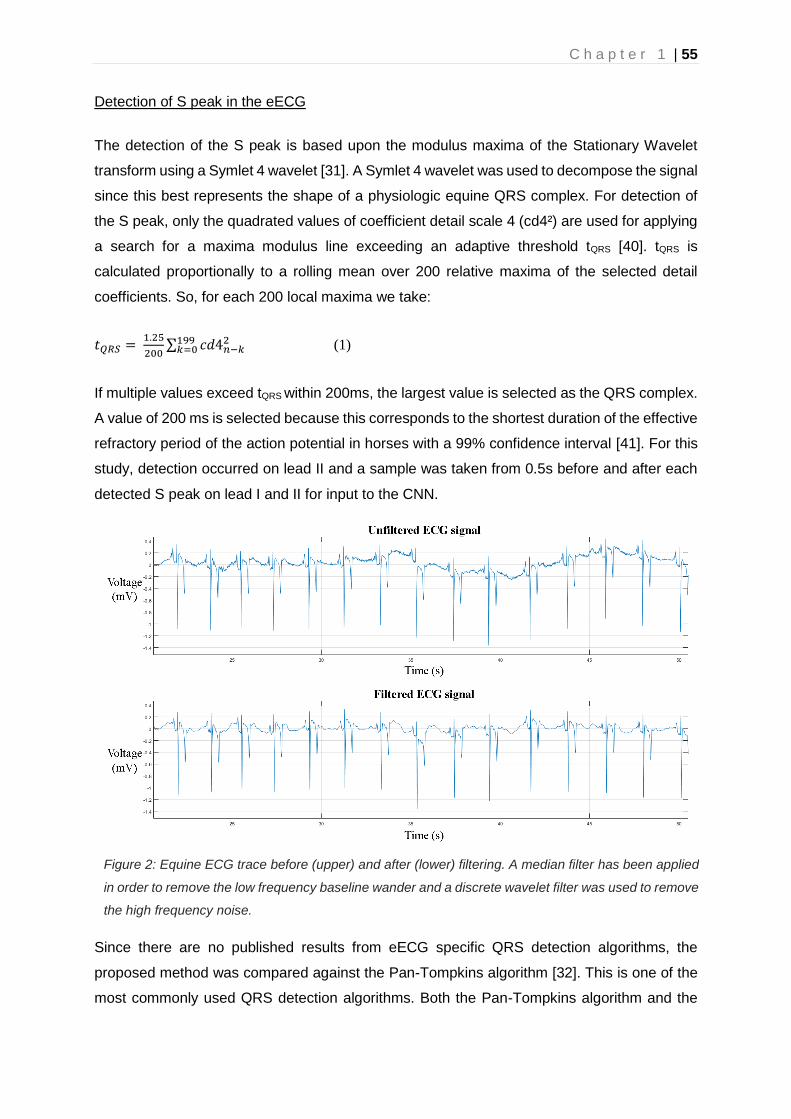
C h a p t e r 1 | 55
Detection of S peak in the eECG
The detection of the S peak is based upon the modulus maxima of the Stationary Wavelet
transform using a Symlet 4 wavelet [31]. A Symlet 4 wavelet was used to decompose the signal
since this best represents the shape of a physiologic equine QRS complex. For detection of
the S peak, only the quadrated values of coefficient detail scale 4 (cd4²) are used for applying
a search for a maxima modulus line exceeding an adaptive threshold tQRS [40]. tQRS is
calculated proportionally to a rolling mean over 200 relative maxima of the selected detail
coefficients. So, for each 200 local maxima we take:
𝑡𝑄𝑅𝑆 = 1.25
200∑ 𝑐𝑑4𝑛−𝑘
2199𝑘=0 (1)
If multiple values exceed tQRS within 200ms, the largest value is selected as the QRS complex.
A value of 200 ms is selected because this corresponds to the shortest duration of the effective
refractory period of the action potential in horses with a 99% confidence interval [41]. For this
study, detection occurred on lead II and a sample was taken from 0.5s before and after each
detected S peak on lead I and II for input to the CNN.
Since there are no published results from eECG specific QRS detection algorithms, the
proposed method was compared against the Pan-Tompkins algorithm [32]. This is one of the
most commonly used QRS detection algorithms. Both the Pan-Tompkins algorithm and the
Figure 2: Equine ECG trace before (upper) and after (lower) filtering. A median filter has been applied
in order to remove the low frequency baseline wander and a discrete wavelet filter was used to remove
the high frequency noise.

56 | C h a p t e r 1
proposed algorithm were implemented in Matlab 2018b (MathWorks). Both algorithms were
run on 30m eECGs of 5 different horses. The results were manually checked for correctness.
Parallel Convolutional Neural Network Architecture for eECG and ECG classification
Convolutional layers of different sizes have been shown to learn distinct feature
representations and thus combining these features will provide better feature representation
compared to one single filter [17,42]. Based on this, the input layers for the filtered signal are
connected to 2 parallel paths, each with identical architecture but different parameters. We
propose a CNN architecture with two parallel input layers: one layer ingests the filtered signal
of the detected beats of lead I and II in a 2x512 matrix while a second layer ingests a 1D vector
(1x2048 samples) representing the relative timing of each detected beat in a 20s segment,
using 1 for a detected beat and 0 otherwise. Sample inputs are shown in Figure 3. By doing
so, the network is forced to learn both features that represent the morphology, the filtered
signal input, and the temporal relationship of the detected beat, the 1D vector, compared to
the surrounding beats. Both of these features are essential for correct ECG interpretation. Most
approaches for individual beat classification only process the individual beat, without
information of the surrounding ECG trace. While some ECG classification strategies involve
the processing of longer traces with multiple beats, thus extracting possible temporal
relationship features, they do not offer the benefit of beat-to-beat classification. Each parallel
path consists of 2 2D convolutional layers, each followed by a batch normalization layer, a
rectified linear unit activation (ReLU) block and a dropout layer [43–45]. The CNN layer
performs convolution with a convolution width kernel size of 2*convolution width with
1*subsampling strides, so no interaction exists between both leads, the convolution width and
Figure 3: High level architecture of the complete proposed ECG processing method. Two raw ECG
leads are filtered and QRS detection is performed on lead II. After QRS detection 500 points around the
detected beat, both from lead I and lead II, are extracted in addition with a vector representation of all
detected QRS complexes 10s before and 10s after each beat. These inputs are presented to the
network that performs the classification into 4 classes.

C h a p t e r 1 | 57
subsampling stride are shown in Table II for each network. Zero-padding was used after
convolution in order to keep the temporal order of the input signal. The batch normalization
layers normalize the learned features of the previous CNN layer resulting in reduced overfitting
and improved learning speed. The ReLu layer permits to add a non-linearity to the network
which favours a deeper representation. The dropout layer improves the generalization
capabilities of the network and avoids co-adaptation by randomly setting a fraction (=1-p) of
the neurons to zero. Based upon the residual like architecture of Rajpurkar et al. [18], a
residual connection is used within each path in a similar manner to those found in the Residual
Network architecture [46]. This shortcut connection subsamples the input using a Max Pooling
operation with the same subsample factor as the combined convolutional layers of that path
[47]. The 2 parallel paths are flattened, concatenated and connected to a fully connected layer
with a ReLU layer.
A separate parallel pathway processes the 1D vector with the relative timing information of the
detected beat. The path consists of two 1D convolutional layers each followed by a dropout
layer, no improvements in overall accuracy could be achieved by adding batch normalization
blocks and residual connections as was done for the morphology paths. The last dropout is
also connected to a fully connected layer with a ReLU layer. The outputs of the fully connected
layers of the morphology and timing pathway are concatenated and connected to a final fully
connected layer with soft-max activation in order to produce a distribution over the 4 output
classes for each detected beat. The soft-max layer is used to perform closed-set
Figure 4: High level architecture of both proposed networks. Panel A shows the CNN with parallel
timing pathway, panel B shows the CNN without timing pathway. The red rectangle highlights the layers
that were retrained when only performing transfer learning on the top layers. CONV: convolutional
block; BN: batch normalization; RELU: rectified linear activation unit; Max Pool 2D: Max pooling
operation; Dense: fully connected layer; Softmax: Softmax activation block with the 4 different output
classes.

58 | C h a p t e r 1
identifications. The output of this layer is an integer label correlating to a predefined class. By
adding a dedicated fully connected layer for each parallel pathway, the extracted features can
be processed by a ‘specialized’ layer for each type of feature, timing or morphology, before
feeding it into a general fully connected classification layer. Both a CNN with and without
parallel pathway for timing were built and tested. The high-level architectures of both networks
are shown in Figure 4.
Since there are no other published equine ECG classification methods to compare against, the
deep CNN architecture of Kachuee et al. was implemented and trained on our eECG dataset
[26]. This architecture was chosen because of both the good accuracy on the MIT-BIH dataset
and the ability to perform beat per beat classification. All deep CNN network parameters were
set as described in the paper.
Training method
The softmax cross entropy was used as loss function for training. The Adam optimizer with the
default parameters described in the paper and with a learning rate of 0.0001 was used for
updating the weights [48]. Dropout and L2 regularization was set to 0.2 and 0.001 respectively.
Batch size was fixed to 500 and number of epochs to 20. The networks were built using Keras
with TensorFlow backend [49].
Figure 5: Training method for obtaining the evaluation metrics for the MIT-BIH dataset (panel A) and the
eECG dataset (panel B). The MIT-BIH dataset is directly trained on the MIT-BIH training set (80% of
total dataset) with the MIT-BIH optimized CNN parameters for the proposed CNN architectures. For the
eECG dataset, the same MIT-BIH training set was used for obtaining the initial weights with the eECG
optimized CNN parameters. Afterwards the network is retrained with the eECG training data.

C h a p t e r 1 | 59
The deep CNN was trained as described in the paper with the Adam optimizer, with the
learning rate, beta-1, and beta-2 of 0.001, 0.9 and 0.999, respectively [26]. Learning rate is
decayed exponentially with a decay factor of 0.75 every 10000 iterations. The MIT-BIH
optimised CNN parameters were used for evaluating the performance on the MIT-BIH dataset,
the eECG optimized CNN parameters were used for evaluating the performance on the eECG
dataset. The training method is visualised in Figure 5.
Transfer learning offers a useful solution for models where limited training data, a lack of
expertise for training and moderate computer resources for training are available. In transfer
learning a pre-trained network is used for a different task, with fine-tuning of some or all layers
with the data from the different task. With a CNN, the convolutional layers can be reused as a
feature extractor while the final layers (typically deep layers) can be retrained for a different
classification task. Since the eECG dataset (26,440) is significantly smaller compared to the
MIT-BIH ECG dataset (297,131 beats) transfer learning was applied from the MIT-BIH trained
model to the eECG trained model. After training the complete model on the MIT-BIH ECG
dataset, transfer learning to the eECG dataset was applied in two different ways:
- All weights of the pre-trained network are updated. After training the model on the MIT-
BIH dataset all weights are reused as initial weights for training on the eECG dataset,
so both the feature extractor (convolutional layers) and classification part (fully
connected layers) are adapted to the eECG dataset.
- Using the pre-trained MIT-BIH network as a feature extractor. In this case all layers
were frozen for training after training on the MIT-BIH dataset (i.e. the weights were not
updated during training) except the fully connected layers. By doing so the pre-trained
CNN acts as a feature extractor for the ECG and only the classification layers are
retrained.
Evaluation Metrics
Standard metrics for classification tasks were used for evaluation: accuracy (ACC), Recall;
positive predictive value (PPV) and F1-score, which are defined next:
𝐴𝐶𝐶 = (𝑇𝑃+𝑇𝑁)
(𝑇𝑃+𝑇𝑁+𝐹𝑃+𝐹𝑁)
𝑅𝑒𝑐𝑎𝑙𝑙 =𝑇𝑃
(𝑇𝑃+𝐹𝑁) (2)
𝑃𝑃𝑉 = 𝑇𝑃
(𝑇𝑃+𝐹𝑃)

60 | C h a p t e r 1
𝐹1 − 𝑠𝑐𝑜𝑟𝑒 = 2∗𝑅∗𝑃𝑃𝑉
(𝑅+ 𝑃𝑃𝑉)
TP: true positive, TN: true negative, FP: false positive, FN: false negative
- Each CNN was trained 3 times with identical initial parameters, the metrics were
averaged over the results of these 3 trainings. The following tests were conducted:
- Each CNN (deep CNN, proposed CNN with and without parallel timing pathway) was
tested with the resampled MIT-BIH and eECG dataset.
- The resampled eECG dataset was tested with both the network without transfer
learning and with both transfer learning methods.
- In order to test the effect of the resampling, both the MIT-BIH and eECG dataset without
resampling were used to train the parallel and deep CNN network with transfer learning
from MIT-BIH to eECG.
Results
Datasets
Both the MIT-BIH and eECG dataset were split at random into a 60% training, 20% validation
and 20% test dataset. The validation dataset was used as fitness value for the genetic
algorithm and the validation and training dataset were used for training the final CNN. The test
dataset was used for validation of the final trained CNN. Because both datasets are
unbalanced in number of samples for each class, a resampling was applied for the training
dataset. The MIT-BIH database has 15 different beat type classes, but since there is only
limited knowledge and data about the different equine arrhythmias they were reallocated in the
following 4 classes depending on the underlying primary mechanism: Normal (N), atrial
premature depolarization (APD), ventricular premature depolarization (VPD) or artefact (A).
The MIT-BIH dataset had 237704 beats for training the CNN, with 186874 N, 11799 APD,
37153 VPD and 1878 A and 59427 samples for testing with 46841 N, 2892 APD, 9232 VPD,
462 A. The different classes were resampled to 24476 samples for each class for training, thus
resulting in 97904 training samples in total. The eECG dataset was split in a training dataset
of 21152 samples, with 15991 N, 1087 APD, 3699 VPD and 375 A which were resampled to
2393 samples of each class and 5288 samples for testing with 3972 N, 255 APD, 971 VPD
and 90 A.

C h a p t e r 1 | 61
Signal processing of the ECG signal
The ECG signal was first pre-processed using a median filter to remove the baseline wander,
followed by Discrete Wavelet transform to remove the remaining noise [30,31]. The result of
the filtering is shown in Figure 2. Next, S peaks in eECGs were detected based upon the
modulus maxima of the Stationary Wavelet transform with a Symlet 4 wavelet and an adaptive
threshold [31]. The detected beats were used for training and testing of the proposed CNN
architectures.
The proposed QRS detection algorithm was compared to the popular Pan-Tompkins algorithm
on 5 different 30m eECG traces (10356 beats in total) [32]. The results of the comparison are
shown in Table 1.
Table 1: comparison of proposed QRS detection algorithm with Pan-Tompkins [32] on 10356 equine
QRS complexes.
algorithm False Positive (beats)
False Negative (beats)
Positive Predictive Value
(%)
Recall (%)
Proposed 94 204 99.1 98.0
Pan-Tompkins 2156 737 81.5 91.5
The ECG classification algorithm
The CNN were designed for a fixed network input of 2x500 data points for the morphological
input and 2000 data points for the timing input. The high-level architecture of the complete
proposed ECG processing method is shown in Figure 3 and the high-level architecture of the
proposed CNN’s is shown in Figure 4. Weights were set using random weight initialization for
the MIT-BIH dataset. For the eECG dataset, both randomly initialized weights and the weights
from the pretrained CNN on the MIT-BIH dataset (transfer learning) were used for comparison.
The used training method is shown in Figure 5. A genetic algorithm (GA) was used to optimize
the CNN parameters. The non-dominated sorting genetic algorithm II (NSGA-II) was used with
a population size of 20 and optimized during 10 generations with the accuracy as fitness value
and training was ended after 50 epochs or when the training accuracy stopped improving for
3 epochs [33]. The following parameters were optimized: number of filters, width of convolution
and subsampling for each individual convolutional layer, number of neurons for each fully
connected layer, L2 regularization and dropout used for training.

62 | C h a p t e r 1
The details of the best network architecture calculated by the GA are given in Table 2. This
network achieved an accuracy of 97.7% on the eECG validation dataset. The results of the
different datasets and with or without transfer learning from the MIT-BIH dataset to the eECG
dataset are given in Table 3 in addition with the results of training without resampling the
dataset. The transfer learning was done using 2 different methods: the first method updated
the weights of all the layers of the network during the training, while the second method only
updated the weights of the fully connected layers. With the second transfer learning method
the convolutional layers are used as pre-trained feature extractors while the fully connected
layers are re-trained as classification layers. Results from the non-parallel network are shown
in Table 4. It took around 13h46m for running the GA, 20m for training on the MIT-BIH dataset
and 4m30s for training on the eECG dataset for the entire network and 18s for only retraining
the top fully connected layers. In order to evaluate the performance of our proposed
architecture on the eECG dataset, both the resampled MIT-BIH and eECG dataset were
trained and evaluated with the deep CNN architecture proposed by Kachuee et al [26]. Results
of the deep CNN architecture are shown in Table 5.
Discussion and Conclusion
Optimization of neural network hyperparameters is a time intensive task that can consume
multiple weeks of computing time in order to combine all possible (realistic) parameters. Here
we used a GA for optimization of the CNN parameters, which only consumed 13h46m of
computing time in order to run once without human interaction. The GA also achieved a good
network reduction with relatively small network dimensions as can be seen in Table 2.
Since there are no published results of QRS detection algorithms on eECGs, we validated our
proposed QRS detection algorithm against the Pan-Tompkins algorithm [32]. This algorithm is
the most commonly used algorithm in literature for QRS detection on human ECG traces. As
shown in Table 1 the Pan-Tompkins algorithm has a lower positive predictive value and
sensitivity in comparison with our proposed algorithm. The high number of false positive
results, and thus low positive predictive value, of the Pan-Tompkins algorithm is mainly
explained due to the detection of the high T-wave as a QRS complex. In certain circumstances
the detection of the T-wave obstructed the detection of the actual QRS complex, especially
during higher heart rates during exercise, which explains the higher number of false negative
results. Most false positive detected beats of the proposed algorithm were high frequency and
high amplitude artefacts on the ECG trace which also induced a short blanking period due to
the adaptive threshold of the algorithm. This blanking period accounts for most of the false
negative beats of the proposed algorithm. The higher number of false positives would have

C h a p t e r 1 | 63
Table 2: Results from the genetic algorithm after optimizing both on the MIT-BIH dataset and the
eECG dataset.
CNN 1 CNN 2 CNN timing
MIT-BIH
Layer 1
Subsampling 4 2 128
Convolution width 60 20 300
Filters 16 40 4
Layer 2
Subsampling 16 16 8
Convolution Width 30 20 100
Filters 16 32 8
Neurons in fully connected layers
512 512
Neurons in final fully connected layer
32
eECG
Layer 1
Subsampling 8 2 32
Convolution width 10 30 50
Filters 16 8 64
Layer 2
Subsampling 4 16 16
Convolution Width 50 20 30
Filters 64 64 4
Neurons in fully connected layers
512 512
Neurons in final fully connected layer
32
implied a higher number of A, namely more T waves that would have been detected as QRS
complexes, in the eECG dataset and thus a better balance of the different classes since there
are currently only 465 A in the eECG dataset or 2.2% of the total number of beats. However in
combination with the lower sensitivity this would have resulted in a lower number of total true
positives and therefore have an impact on the 1D timing vector which would be less
representative for the relative timing of each QRS around the detected beat. If the 1D timing
vector would include more artefacts and/or lesser QRS complexes this could possibly affect
the usefulness of the 1D timing vector for the overall classification algorithm.
Currently there are no published equine ECG classifications methods and/or published
datasets, therefore it is difficult to benchmark the performance of the proposed method for
equine ECGs. The intra- and interobserver agreement has been suggested to be similar as for
human ECGs, but the accuracy of the individual equine physiologist has not yet been studied

64 | C h a p t e r 1
[11]. When comparing with the numerous described algorithms for human ECG classification,
our proposed method shows good classification results with an accuracy of 97.7% for the MIT-
Table 3: Scores for the parallel network for different datasets, testing methods with or without
resampling the datasets and different transfer learning techniques.
Class Recall (%) Positive Predictive Value (%)
F1-score (%) Accuracy (%)
Scores with resampling
MIT-BIH 97.7
N 99.4 97.3 98.4
APC 70.1 94.8 80.6
VPC 93.6 94.8 80.6
A 81.9 90.6 86.0
eECG without transfer learning 92.6
N 99.2 81.7 95.2
APC 43.3 95.7 59.5
VPC 97.7 96.2 96.9
A 81.7 91.5 96.2
eECG with transfer learning on the entire network 97.1
N 99.5 97.1 98.3
APC 73.2 95.7 81.6
VPC 97.1 97.8 97.4
A 87.8 87.8 87.8
eECG with transfer learning on the top layers 86.4
N 99.0 83.7 90.7
APC 41.6 85.5 55.4
VPC 75.4 97.5 84.9
A 85.4 90.9 88.1
Scores without resampling
MIT-BIH 98.2
N 98.2 99.2 99.1
APC 90.2 88.3 89.2
VPC 97.8 98.2 97.6
A 91.8 89.6 87.0
eECG with transfer learning 98.2
N 99.0 99.1 99.0
APC 90.9 92.6 91.7
VPC 97.8 97.8 97.8
A 92.2 81.5 85.1

C h a p t e r 1 | 65
Table 4: Scores for the CNN architecture without parallel timing input.
Class Recall (%) Positive Predictive Value
(%)
F1-score (%) Accuracy (%)
Scores with resampling
MIT-BIH 96.7
N 99.7 96.8 98.2
APC 69.0 94.4 79.7
VPC 95.3 96.8 96.1
A 82.0 89.4 85.5
eECG with transfer learning on the entire network 91.9
N 99.5 90.5 94.7
APC 43.5 96.7 59.1
VPC 96.9 96.5 96.7
A 81.0 90.0 85.3
BIH database, with an even a higher accuracy of 98.2% when not applying resampling to the
training dataset. However it should be noted that direct comparison between publications is
difficult due to the different metrics, classes and datasets that are used for evaluating the
classification performance [14]. In addition, accuracy alone is not the most optimal
measurement of performance for ECG classification due to the imbalanced nature of ECG data
which is illustrated here with a 99:1 ratio for the N:A classes in the MIT-BIH training dataset
and a 43:1 ratio for the N:A classes in the eECG dataset. Since neural networks are even more
vulnerable for overfitting when the dataset is imbalanced we used a resampling technique for
the training data in order to achieve better classification results for the individual classes as
has been shown before [23]. As can be seen in Table 3, the resampling had a negative effect
on both the accuracy and individual scores, which is in contradiction to previous publications.
The average recall, PPV and F1-score decreased from 94.7%, 93.8% and 93.2% to 86.3%,
94.5% and 90.5% for the MIT-BIH database and changed from 95.0%, 92.7% and 93.4% to
89.4%, 94.3% and 91.8% for the eECG dataset. A higher accuracy without resampling can be
expected due to overfitting of the neural network on the majority class, the decrease of the
individual scores however is unexpected. The effect might be explained due to our resampling
technique that noticeably decreases the total number of training samples, from 237704 to
97904 for the MIT-BIH dataset and from 21152 to 9572 for the eECG dataset. In addition to
the decrease of the total number of samples the network can be trained on, and thus loss of
information for the network, samples of the smallest class are copied multiple times and
overfitting for this class can be expected. We tested both theories by undersampling to even
lower numbers per class, which even further lowered the overall accuracy, and oversampling
to higher numbers per class which slightly increased the overall accuracy and individual

66 | C h a p t e r 1
Table 5: Scores for the deep CNN architecture proposed by Kachuee et al [26]
Class Recall (%) Positive Predictive Value (%)
F1-score (%) Accuracy (%)
Scores with resampling
MIT-BIH 95.9
N 99.3 96.3 97.8
APC 68.5 91.4 78.3
VPC 92.3 96.0 94.1
A 77.3 86.3 81.5
eECG without transfer learning 92.0
N 99.1 91.3 95.0
APC 46.5 92.2 61.8
VPC 96.0 96.1 96.0
A 78.5 88.3 84.5
eECG with transfer learning on the entire network 93.8
N 98.6 93.8 96.2
APC 56.6 85.5 68.1
VPC 94.1 96.9 95.4
A 75.8 87.6 81.7
scores, but never exceeded the scores without resampling. This indicates that no extra
information was learned by the network by copying the smallest classes, but this increased the
required learning time with 50%. Another method to decrease overfitting and exploit the entire
dataset is ensembling [23]. Multiple trained networks of the same type are used which are
trained and validated, with early stopping, on different but overlapping parts of the dataset, the
individual predictions are combined by majority voting. We applied this technique on our
datasets with the parallel network for our production model with 5 trained networks and
achieved an increased accuracy of 99.1% for the MIT-BIH dataset and 98.7% for the eECG
dataset with improved (1 - 3%) performance metrics for all classes. Further improvements
could be achieved by creating larger ensembles.
The results in Table 4 indicate that our proposed architecture with parallel timing input achieves
a higher classification performance on all metrics, this effect remains for both the MIT-BIH and
eECG dataset. These results reflect the clinical importance of the relative timing of each beat
in the ECG trace that is also used by the cardiologist for the interpretation of the ECG. Other
publications also acknowledge the importance of the temporal relationship by creating
recurrent neural networks, for example by using LSTM blocks in combination with a CNN in 2
publications which had similar improvements in results as in our study by including the

C h a p t e r 1 | 67
temporal relationship [17,23]. Larger CNN architectures with more layers or more parallel
pathways, similarly to the inception block used in ECGNet, have been studied, but no further
improvement in classification accuracy could be achieved [17].
Because there are currently no other equine ECG classification methods published, we
compared our method against the deep CNN network architecture of Kachuee et al [26]. In
order to validate our implementation of the deep CNN architecture, the deep CNN was also
trained and validated on the MIT-BIH dataset as described in the paper. Since our
implementation only use 4 classes instead of the 5 classes described in the original paper, our
accomplished accuracy was slightly higher (95.9% vs. 93.4%) in comparison with the achieved
accuracy in the paper as can be seen in Table 5. However, the accuracy on all datasets
remained lower in comparison with our proposed parallel CNN architecture.
When trained on the eECG dataset, the proposed network achieved a low accuracy of 92.6%
when using randomly initialised weights. The results remained similar for both training with and
without a resampled dataset, especially the recall and F1-score for the APD remained very
low. Because of the small and imbalanced dataset, the network is very vulnerable to overfitting
despite the use of L2 regularisation and dropout layers. By using transfer learning from the
similar but larger MIT-BIH dataset a significant improvement of accuracy and average recall,
PPV and F1-score from 92.6%, 80.4%, 93.7% and 84.5% to 97.1%, 89.4%, 94,3% and 91.8%
could be achieved due to the improved feature extraction of the CNN. However, when the CNN
layers were used as feature extractor and only the top classification layers were retrained for
classification of the eECG dataset, the achieved average accuracy was even lower in
comparison without transfer learning. This indicates that the features extracted from the MIT-
BIH dataset, however being a good initial weight, cannot be directly applied to the eECG
dataset without updating the weights of the acquired features. Transfer learning has been
applied before for ECGs, both between datasets and for patient specific holter ECG
interpretation, but by the knowledge of the authors never between species [17,25,34]. For the
future, an improved, larger and better balanced, dataset should be used with the transfer
learning for achieving even higher improvement of classification accuracy of eECGs with the
current parallel network.
We propose two novel CNN architectures for ECG specific beat-to-beat classification using the
beat morphology on 2 leads and a graphical representation of the timing of each beat. An
equine specific filtering and QRS detection algorithm is proposed and validated against the
popular Pan-Tompkins QRS detection algorithm. The classification model performance was
validated on a human and an own-made equine dataset with and without resampling of the
dataset for equally balanced classes. Transfer learning was used from the human to the equine

68 | C h a p t e r 1
dataset for improved classification performance for all classes of the equine dataset. Our
results on both datasets were compared against the deep CNN network architecture of
Kachuee et al [26]. A genetic algorithm was used for successful optimization of the CNN
parameters. By the best of the authors’ knowledge this is the first equine specific ECG
classification algorithm and this algorithm may help to improve diagnosis of possible life-
threatening arrhythmias in horses. Applying the architecture to larger (equine) ECG datasets
for improved classification performance and extending the number of classes for classification
are interesting pathways to be explored in the future.

C h a p t e r 1 | 69
References
[1] van Loon G, Patteson M. Electrophysiology and arrhythmogenesis. Cardiol. Horse. Second Edi, Elsevier Ltd; 2010, p. 59–73.
[2] Ryan N, Marr CM, Mcgladdery AJ. Survey of cardiac arrhythmias during submaximal and maximal exercise in Thoroughbred racehorses. Equine Vet J 2010;37:265–8.
[3] Physick-Sheard PW, McGurrin MKJ. Ventricular arrhythmias during race recovery in standardbred racehorses and associations with autonomic activity. J Vet Intern Med 2010;24:1158–66.
[4] Buhl R, Petersen EE, Lindholm M, Bak L, Nostell K. Cardiac arrhythmias in standardbreds during and after racing-possible association between heart size, valvular regurgitations, and arrhythmias. J Equine Vet Sci 2013;33:590–6.
[5] Barbesgaard L, Buhl R, Meldgaard C. Prevalence of exercise-associated arrhythmias in normal performing dressage horses. Equine Vet J 2010;42:202–7.
[6] Lyle CH, Blissitt KJ, Kennedy RN, McGorum BC, Newton JR, Parkin TDH, et al. Risk factors for race-associated sudden death in Thoroughbred racehorses in the UK (2000-2007). Equine Vet J 2012;44:459–65.
[7] Corrado D, Basso C, Schiavon M, Pelliccia A, Thiene G. Pre-Participation Screening of Young Competitive Athletes for Prevention of Sudden Cardiac Death. J Am Coll Cardiol 2008;52:1981–9.
[8] Lyle CH, Uzal FA, Mcgorum BC, Aida H, Blissitt KJ, Case JT, et al. Sudden death in racing Thoroughbred horses: An international multicentre study of post mortem findings. Equine Vet J 2011;43:324–31.
[9] Martinez MW, Ayub B, Barrett M. Is Auscultation the Achilles’ Heel of Sports Screening? -Evidence on the Proficiency of Primary Care Physicians. Circulation, vol. 126, 2012, p. A9502.
[10] Harmon KG, Zigman M, Drezner JA. The effectiveness of screening history, physical exam, and ECG to detect potentially lethal cardiac disorders in athletes: A systematic review/meta-analysis. J Electrocardiol 2015;48:329–38.
[11] Trachsel DS, Bitschnau C, Waldern N, Weishaupt MA, Schwarzwald CC. Observer agreement for detection of cardiac arrhythmias on telemetric ECG recordings obtained at rest, during and after exercise in 10 Warmblood horses. Equine Vet J 2010;42:208–15.
[12] Banerjee S, Mitra M. Application of cross wavelet transform for ECG pattern analysis and classification. IEEE Trans Instrum Meas 2014;63:326–33.
[13] Lanata A, Guidi A, Baragli P, Valenza G, Scilingo EP. A Novel Algorithm for Movement Artifact Removal in ECG Signals Acquired from Wearable Systems Applied to Horses. PLoS One 2015;10:e0140783.
[14] Kaplan Berkaya S, Uysal AK, Sora Gunal E, Ergin S, Gunal S, Gulmezoglu MB. A survey on ECG analysis. Biomed Signal Process Control 2018;43:216–35.
[15] Meyling HA, Ter Borg H. The conducting system of the heart in hoofed animals. Cornell Vet 1957;47:419–55.
[16] Acharya UR, Oh SL, Hagiwara Y, Tan JH, Adam M, Gertych A, et al. A deep convolutional neural network model to classify heartbeats. Comput Biol Med 2017;89:389–96.
70 | C h a p t e r 1
[17] Murugesan B, Ravichandran V, Shankaranarayana SM, Ram K, Preejith SP, Joseph J, et al. ECGNet : Deep Network for Arrhythmia Classification. IEEE Int Symp Med Meas Appl 2018:1–6.
[18] Rajpurkar P, Hannun AY, Haghpanahi M, Bourn C, Ng AY. Cardiologist-Level Arrhythmia Detection with Convolutional Neural Networks. Comput Vis Pattern Recognit 2017.
[19] Bai S, Kolter JZ, Koltun V. An Empirical Evaluation of Generic Convolutional and Recurrent Networks for Sequence Modeling 2018.
[20] Vincent TL, Newton JR, Deaton CM, Franklin SH, Biddick T, Mckeever KH, et al. Retrospective study of predictive variables for maximal heart rate (HRmax) in horses undergoing strenuous treadmill exercise. Equine Vet J 2006;38:146–52.
[21] Isin A, Ozdalili S. Cardiac arrhythmia detection using deep learning. Procedia Comput Sci 2017;120:268–75.
[22] Krizhevsky A, Sutskever I, Hinton. GE. Imagenet classification with deep convolutional neural networks. Adv Neural Inf Process Syst 2012:1097–105.
[23] Zihlmann M, Perekrestenko D, Tschannen M. Convolutional Recurrent Neural Networks for Electrocardiogram Classification. Comput Cardiol (2010) 2017;44:1–4.
[24] Rubin J, Parvaneh S, Rahman A, Conroy B, Babaeizadeh S. Densely Connected Convolutional Networks and Signal Quality Analysis to Detect Atrial Fibrillation Using Short Single-Lead ECG Recordings. Comput Cardiol (2010) 2017;44:2–5.
[25] Luo K, Li J, Wang Z, Cuschieri A. Patient-Specific Deep Architectural Model for ECG Classification. J Healthc Eng 2017;2017:1–13.
[26] Kachuee M, Fazeli S, Sarrafzadeh M. ECG heartbeat classification: A deep transferable representation. 2018 IEEE Int Conf Healthc Informatics 2018:443–4.
[27] Kiranyaz S, Ince T, Hamila R, Gabbouj M. Convolutional Neural Networks for patient-specific ECG classification. 2015 37th Annu. Int. Conf. IEEE Eng. Med. Biol. Soc., IEEE; 2015, p. 2608–11.
[28] Merone M, Soda P, Sansone M, Sansone C. ECG databases for biometric systems: A systematic review. Expert Syst Appl 2017;67:189–202.
[29] Goldberger AL, Amaral LAN, Glass L, Hausdorff JM, Ivanov PC, Mark RG, et al. PhysioBank, PhysioToolkit, and PhysioNet. Circulation 2000;101:E215-20.
[30] De Chazal P, Heneghan C, Sheridan E, Reilly R, Nolan P, O’Malley M. Automated processing of the single-lead electrocardiogram for the detection of obstructive sleep apnoea. IEEE Trans Biomed Eng 2003;50:686–96.
[31] Sasikala P, Wahidabanu R. Robust R Peak and QRS detection in Electrocardiogram using wavelet transform. Int J Adv Comput Sci Appl 2010;1:48–53.
[32] Pan J, Tompkins WJ. A Real-Time QRS Detection Algorithm. IEEE Trans Biomed Eng 1985;BME-32:230–6.
[33] Deb K, Pratap A, Agarwal S, Meyarivan T. A fast and elitist multiobjective genetic algorithm: NSGA-II. IEEE Trans Evol Comput 2002;6:182–97.
[34] Kiranyaz S, Ince T, Gabbouj M. Real-Time Patient-Specific ECG Classification by 1-D Convolutional Neural Networks. IEEE Trans Biomed Eng 2016;63:664–75.
C h a p t e r 1 | 71
[35] Moody GB, Mark RG. The impact of the MIT-BIH arrhythmia database. IEEE Eng Med Biol Mag 2001;20:45–50.
[36] Van Steenkiste G, De Clercq D, Vera L, van Loon G. Specific 12-lead electrocardiographic characteristics that help to localize the anatomical origin of ventricular ectopy in horses: preliminary data. J Vet Intern Med 2019;33:1548.
[37] Verheyen T, Decloedt A, De Clercq D, Deprez P, Sys SU, van Loon G. Electrocardiography in horses – part 1 : how to make a good recording. Vlaams Diergeneeskd Tijdschr 2010;79:331–6.
[38] Lemaître G, Nogueira F, Aridas CK. Imbalanced-learn: A Python Toolbox to Tackle the Curse of Imbalanced Datasets in Machine Learning. J Mach Learn Res 2017;18:1–5.
[39] Singh BN, Tiwari AK. Optimal selection of wavelet basis function applied to ECG signal denoising. Digit Signal Process 2006;16:275–87.
[40] Merah M, Abdelmalik TA, Larbi BH. R-peaks detection based on stationary wavelet transform. Comput Methods Programs Biomed 2015;121:149–60.
[41] De Clercq D, Broux B, Vera L, Decloedt A, van Loon G. Measurement variability of right atrial and ventricular monophasic action potential and refractory period measurements in the standing non-sedated horse. BMC Vet Res 2018;14:101–18.
[42] Szegedy C, Liu W, Jia Y, Sermanet P, Reed S, Anguelov D, et al. Going Deeper with Convolutions 2014;18:186–91.
[43] Ioffe S, Szegedy C. Batch Normalization: Accelerating Deep Network Training by Reducing Internal Covariate Shift 2015.
[44] Nair V, Hinton GE. Rectified Linear Units Improve Restricted Boltzmann Machines Vinod. Proc. 27th Int. Conf. Mach. Learn., JMLR. org; 2010, p. 807–14.
[45] Srivastava N, Hinton G, Krizhevsky A, Sutskever I, Salakhutdinov R. Dropout: A Simple Way to Prevent Neural Networks from Overfitting. J Mach Learn Res 2014;15:1929–58.
[46] He K, Zhang X, Ren S, Sun J. Deep Residual Learning for Image Recognition. IEEE Conf 2015;32:428–9.
[47] Scherer D, Müller A, Behnke S. Evaluation of Pooling Operations in Convolutional Architectures for Object Recognition. 20th Int. Conf. Artif. Neural Networks, Springer, Berlin, Heidelberg; 2010, p. 92–101.
[48] Kingma DP, Ba J. Adam: A Method for Stochastic Optimization. ICLR 2015, 2014, p. 1–15.
[49] Chollet F. Keras 2015. https://keras.io.


Chapter 2: Atrial fibrillatory rate in horses
based on a modified base-apex surface
electrocardiogram analysis


Atrial fibrillatory rate in horses based on a modified base-apex surface
electrocardiogram analysis
Glenn Van Steenkiste1*, Jonas Carlson2, Annelies Decloedt1, Lisse Vera1, Rikke Buhl3, Pyotr
G. Platonov4, Gunther van Loon1
1 Equine Cardioteam, Department of Large Animal Internal Medicine, Faculty of Veterinary Medicine, Ghent University, Salisburylaan 133, 9820 Merelbeke, Belgium
2 Department of Cardiology, Lund University, 21185 Lund, Sweden
3 Department of Veterinary Clinical Sciences, Faculty of Health and Medical Sciences, University of Copenhagen, Højbakkegaard Allé 5, 2630 Taastrup, Denmark
4 Arrhythmia Clinic, Skåne University Hospital and Department of Cardiology, Clinical Sciences, Lund University, 21185 Lund, Sweden
Adapted from:
Van Steenkiste, G., Carlson J., Decloedt, A., Vera L., Buhl R., Platonov P. G., van Loon G.
Atrial fibrillatory rate in horses based on a modified base-apex surface electrocardiogram
analysis, Journal of Veterinary Cardiology, 2020; Submitted
C h a p t e r 2 | 76
Summary
The objective of this study was to compare the atrial fibrillatory rate (AFR) derived from a
single-lead surface electrocardiogram (ECG) and from a local right atrial intracardiac recording
(RA-FR) during atrial fibrillation (AF) and to evaluate the correlation with transvenous electrical
cardioversion (TVEC) threshold (in Joules), number of shocks and cardioversion success rate
in horses. Horses were included if a simultaneous recording of the right atrial intracardiac
electrogram and a modified base-apex ECG was available. Clinical records of horses with AF
treated by TVEC were reviewed. Three minutes long episodes of simultaneous intracardiac
electrograms and surface ECG during AF were selected for analysis and compared using
Bland-Altman test. The mean RA-FR was measured from the deflections on the intracardiac
electrogram, while the AFR was extracted from the surface ECG using spatiotemporal QRS
and T-wave cancellation. Seventy-three horses satisfied the inclusion criteria. The mean
difference between RA-FR and AFR was -13 fibrillations per minute (fpm) (-3.7%) (p<0.01),
the 95% limits of agreement were between -66 and 40 fpm (-18.5 and 11.2%) and there was
a moderate (ρ=0.65) correlation between RA-FR and AFR (p<0.01). Neither RA-FR nor AFR
showed a significant correlation with transvenous electrical cardioversion threshold or number
of shocks. There was no significant difference between the RA-FR or AFR in horses that
converted to SR compared to horses that didn’t convert. In conclusion, the AFR may allow
non-invasive long-term monitoring of AF dynamics. The significantly faster AFR compared to
the RA-FR might suggest a faster left atrial fibrillatory rate. Neither RA-FR nor AFR could be
used to predict the minimal defibrillation threshold for TVEC.

C h a p t e r 2 | 77
Introduction
Atrial fibrillation (AF) is the most common pathological arrhythmia in horses with an estimated
prevalence of 2.5% [1]. Medical treatment using quinidine sulphate as well as transvenous
electrical cardioversion (TVEC) have been well established [2,3]. The recurrence rate of AF
after successful treatment is between 15 and 39% at 1 year after conversion [4,5]. The atrial
effective refractory period is an important parameter to study the degree of atrial electrical
remodelling [6]. This parameter has been studied in horses using programmed electrical
stimulation, but the technique can only be applied during sinus rhythm [7]. During AF, the atrial
fibrillation cycle length (AFCL) can be used instead as it is directly related to the atrial effective
refractory period. In human medicine, the AFCL has been used to investigate the effects of
antiarrhythmic drugs on AF [8–10] and has been identified as an independent factor for
prediction of AF treatment outcome and AF recurrence rate [9]. In horses, no independent
correlation was found between the AFCL and AF recurrence but correlations were found
between the AFCL and AF duration and also between the shortest 5% AFCL to left atrial size
ratio and AF recurrence [11]. Since horses with a longer AF duration are less likely to convert
using a medical treatment [12], the AFCL could be a useful indicator to recommend TVEC. In
experimentally pacing-induced AF, only horses with an AFR less than 350 fibrillations per
minute (fpm) showed spontaneous cardioversion to SR [13] but no data exist on horses with
naturally-occurring paroxysmal AF.
The AFCL is typically measured invasively from bipolar intra-atrial electrogram recordings as
the time between two successive atrial depolarisations. Tissue Doppler has been validated as
a non-invasive way of determining the AFCL in horses and humans, but this requires
specialized equipment, an experienced handler and cannot be used for long-term continuous
monitoring [14,15]. Another non-invasive option is deriving the atrial fibrillatory rate (AFR) from
the surface ECG, a technique that has been validated against the intracardiac AFCL
recordings in humans [16]. Although the technique could not be used to estimate the exact
local AFCL within the atrium, it was a good representation of the dynamics of the AFCL.
Measuring the AFR from the surface ECG would allow long term monitoring, for example to
investigate the effects of drugs on AF in horses. Recently, the effect of antiarrhythmic drugs
on the surface ECG-derived AFR was studied in horses [13,17]. However, so far the technique
has not been compared with the intracardiac AFCL in horses.
The first goal of this study was to compare the non-invasively determined AFR from the surface
ECG with the AFCL derived from a right atrial electrogram in horses with naturally-occurring

C h a p t e r 2 | 78
AF. The second aim was to evaluate if the TVEC energy threshold, number of shocks needed
for conversion and successful conversion were related to the AFR.
Animals, Materials and Methods:
Study population
Records of horses referred to the Department of Large Animal Internal Medicine, Ghent
University, for TVEC of AF since 2013 were reviewed in order to identify horses in which at
least three minutes of good quality, simultaneous recording of the intra-atrial electrogram and
surface ECG under sedation, prior to the TVEC procedure, were available. The following
characteristics from the TVEC procedure were collected: restoration of sinus rhythm (yes, no),
energy delivery at cardioversion (Joules), number of shocks needed for cardioversion. The AF
duration was not available in the current dataset. The TVEC procedure was performed as
previously described [3].
Intracardiac electrogram recording
The TVEC procedure started with insertion of catheters in the standing, sedated (detomidine
7.5 µg/kg IV, Domidine®a) horse. As part of our standard procedure, a temporary pacing
catheter, connected to an adapted Televet 100 deviceb, was first inserted in the right atrium
and positioned at the intervenous tubercle. Subsequently, two TVEC catheters were inserted
and positioned in the left pulmonary artery and right ventricle under ultrasound guidance.
During TVEC catheter positioning the Televet 100 device recorded the right atrial electrogram
Figure 1: Example of an intra-atrial electrogram (lower trace) from the right atrium recorded simultaneously
with a modified base-apex surface electrocardiogram (upper trace). The mean intra-atrial fibrillation rate
is calculated from the time interval between 2 successive atrial depolarisations.
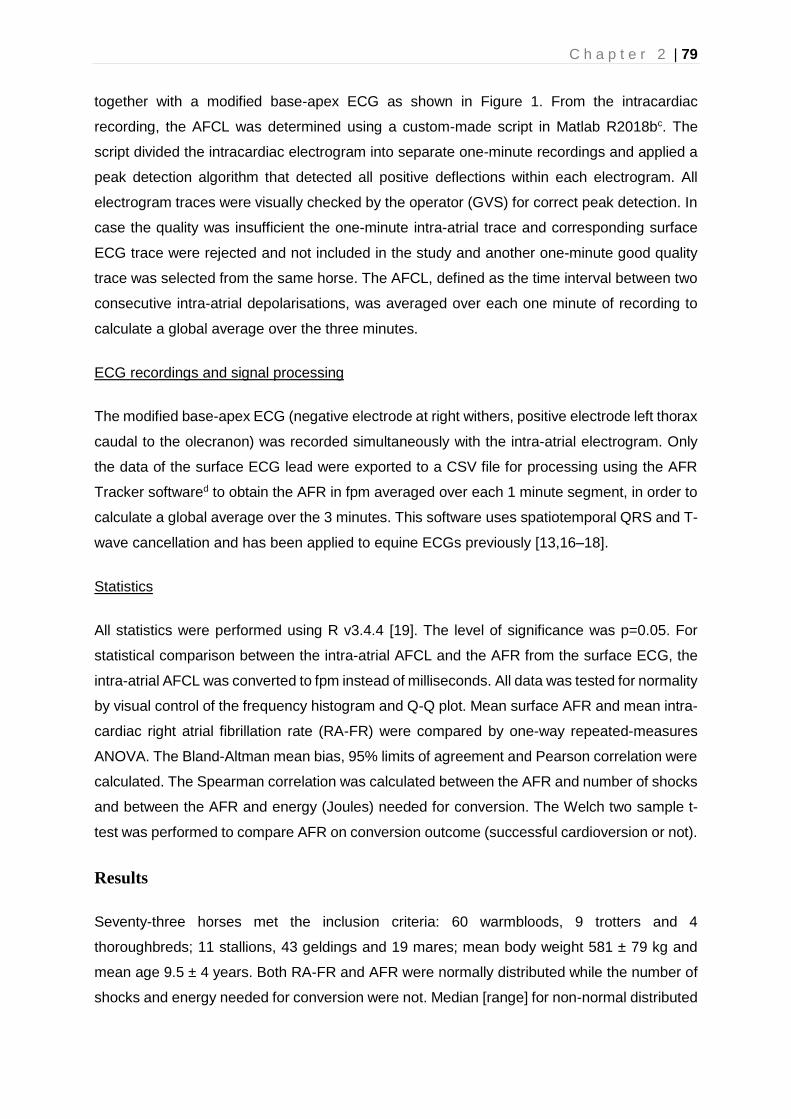
C h a p t e r 2 | 79
together with a modified base-apex ECG as shown in Figure 1. From the intracardiac
recording, the AFCL was determined using a custom-made script in Matlab R2018bc. The
script divided the intracardiac electrogram into separate one-minute recordings and applied a
peak detection algorithm that detected all positive deflections within each electrogram. All
electrogram traces were visually checked by the operator (GVS) for correct peak detection. In
case the quality was insufficient the one-minute intra-atrial trace and corresponding surface
ECG trace were rejected and not included in the study and another one-minute good quality
trace was selected from the same horse. The AFCL, defined as the time interval between two
consecutive intra-atrial depolarisations, was averaged over each one minute of recording to
calculate a global average over the three minutes.
ECG recordings and signal processing
The modified base-apex ECG (negative electrode at right withers, positive electrode left thorax
caudal to the olecranon) was recorded simultaneously with the intra-atrial electrogram. Only
the data of the surface ECG lead were exported to a CSV file for processing using the AFR
Tracker softwared to obtain the AFR in fpm averaged over each 1 minute segment, in order to
calculate a global average over the 3 minutes. This software uses spatiotemporal QRS and T-
wave cancellation and has been applied to equine ECGs previously [13,16–18].
Statistics
All statistics were performed using R v3.4.4 [19]. The level of significance was p=0.05. For
statistical comparison between the intra-atrial AFCL and the AFR from the surface ECG, the
intra-atrial AFCL was converted to fpm instead of milliseconds. All data was tested for normality
by visual control of the frequency histogram and Q-Q plot. Mean surface AFR and mean intra-
cardiac right atrial fibrillation rate (RA-FR) were compared by one-way repeated-measures
ANOVA. The Bland-Altman mean bias, 95% limits of agreement and Pearson correlation were
calculated. The Spearman correlation was calculated between the AFR and number of shocks
and between the AFR and energy (Joules) needed for conversion. The Welch two sample t-
test was performed to compare AFR on conversion outcome (successful cardioversion or not).
Results
Seventy-three horses met the inclusion criteria: 60 warmbloods, 9 trotters and 4
thoroughbreds; 11 stallions, 43 geldings and 19 mares; mean body weight 581 ± 79 kg and
mean age 9.5 ± 4 years. Both RA-FR and AFR were normally distributed while the number of
shocks and energy needed for conversion were not. Median [range] for non-normal distributed
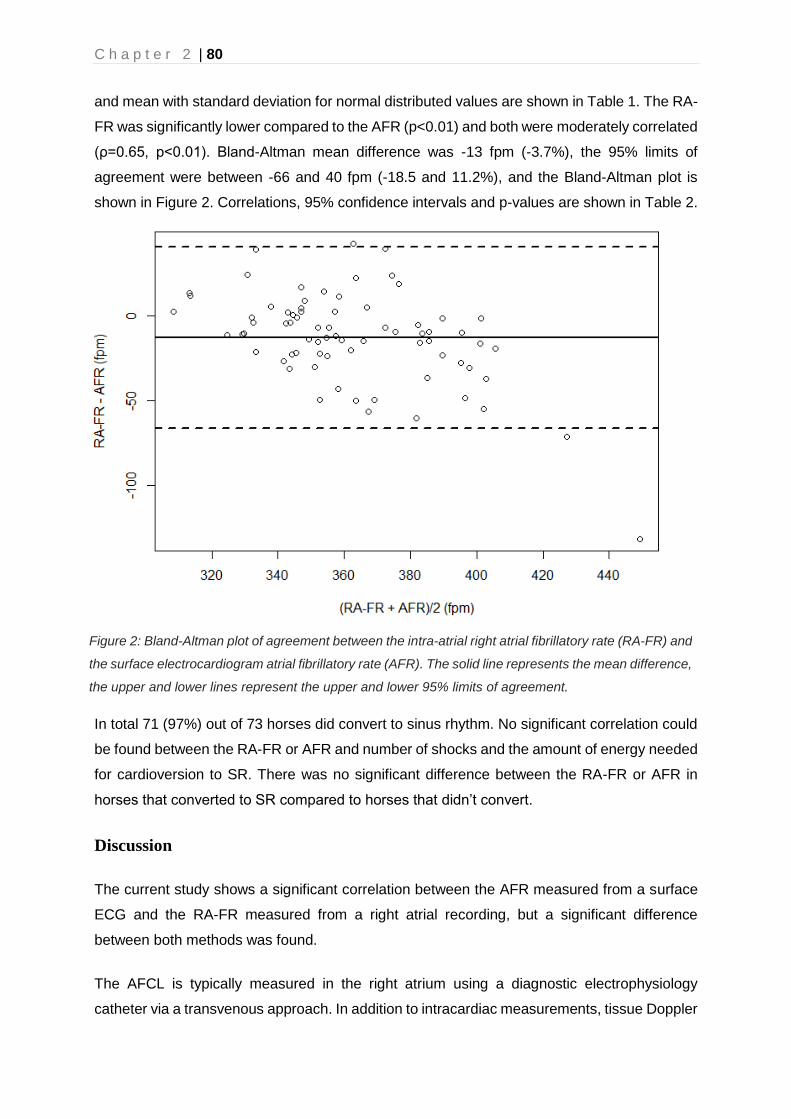
C h a p t e r 2 | 80
and mean with standard deviation for normal distributed values are shown in Table 1. The RA-
FR was significantly lower compared to the AFR (p<0.01) and both were moderately correlated
(ρ=0.65, p<0.01). Bland-Altman mean difference was -13 fpm (-3.7%), the 95% limits of
agreement were between -66 and 40 fpm (-18.5 and 11.2%), and the Bland-Altman plot is
shown in Figure 2. Correlations, 95% confidence intervals and p-values are shown in Table 2.
In total 71 (97%) out of 73 horses did convert to sinus rhythm. No significant correlation could
be found between the RA-FR or AFR and number of shocks and the amount of energy needed
for cardioversion to SR. There was no significant difference between the RA-FR or AFR in
horses that converted to SR compared to horses that didn’t convert.
Discussion
The current study shows a significant correlation between the AFR measured from a surface
ECG and the RA-FR measured from a right atrial recording, but a significant difference
between both methods was found.
The AFCL is typically measured in the right atrium using a diagnostic electrophysiology
catheter via a transvenous approach. In addition to intracardiac measurements, tissue Doppler
Figure 2: Bland-Altman plot of agreement between the intra-atrial right atrial fibrillatory rate (RA-FR) and
the surface electrocardiogram atrial fibrillatory rate (AFR). The solid line represents the mean difference,
the upper and lower lines represent the upper and lower 95% limits of agreement.

C h a p t e r 2 | 81
imaging has been shown to be a reliable method for quantification of AFCL in horses and
humans [14,15]. However, both techniques only allow for relatively short recordings and are
only applicable in a clinical setting. The use of the surface ECG for the assessment of the
AFCL has already been proposed and validated in the 90’s in human medicine, and has been
used in horses to both monitor the effect of antiarrhythmic drugs during experimentally-induced
Table 1: Mean, median, standard deviation and range for different characteristics and measurements
in 73 horses with atrial fibrillation. Abbreviations: s.d., standard deviation; RA-FR, intracardiac atrial
fibrillation rate; AFR, surface ECG atrial fibrillatory rate.
Measurement Mean Median s.d. range
RA-FR (fpm) 356 23 306 - 410
AFR (fpm) 369 38 303 - 527 Energy (Joules)
200 150 - 360
Number of shocks
1.5 1 - 15
Table 2: Correlations, 95% confidence intervals and p-values between different metrics used in the
study. Abbreviations, RA-FR: intracardiac atrial fibrillation rate; AFR, surface ECG atrial fibrillatory rate.
correlation 95% confidence
interval3 p-value
RA-FR AFR 0.651 <0.001 Number of shocks 0.142 0.138 Conversion to sinus rhythm (fpm)
-28 953 0.106
Energy 0.122 0.325 AFR Number of shocks 0.132 0.260 Energy 0.132 0.288 Conversion to sinus rhythm (fpm)
-72 1423 0.190
1 Pearson correlation, 2 Spearman correlation, 3 Difference between converted & non-converted, Welch two sample t test
AF and to assess the RA AFCL [13,16,20]. This technique allows for long term continuous
assessment of the AFR and is easily applicable. Recent studies in horses with experimentally
induced AF have shown that the AFR dynamics are similar in horses compared to humans
with paroxysmal AF and that AFR could be used to study the effect of antiarrhythmic drugs
during AF. However, the AFR was not compared to the RA-FR in these studies [13,17]. A
comparison between manual calculation of the f-f interval from the surface ECG and

C h a p t e r 2 | 82
intracardiac RA AFCL found a moderate correlation between both methods [20]. However,
these results were possibly biased towards longer f-f intervals, and thus segments with coarse
AF on the ECG, because otherwise f waves were not clearly identifiable.
The absolute mean difference between RA-FR and AFR in our study (13 fpm) is similar
compared to a study in human medicine (11 fpm) [16] Similar as in human medicine, the AFR
is not an exact measurement of the local AFCL within the atrium, but it is rather a
representation of global AF dynamics. The correlation between RA-FR and AFR supports the
potential to use AFR to monitor long term dynamics of AF [13]. In addition to tracking the effect
of antiarrhythmic compounds on AF, the technique could also be used to assess the effect of
circadian rhythm or autonomic tone on AF dynamics. Since the AFR doesn’t need long RR
intervals to be measured, in contrast to tissue Doppler, the AFR could also be used at higher
heart rates, e.g. during exercise [15]. Only global AF dynamics can be estimated with the AFR
since the technique currently does not allow for local measurements, which are possible with
tissue Doppler and intracardiac electrogram measurements.
AFCL differences between intra-atrial electrogram recording and tissue Doppler image
analyses have been documented in a previous study in horses but these were attributed to
spatiotemporal AFCL variation because both measurements were not performed
simultaneously and not at the same intra-atrial location. In our study recordings of both surface
ECG and intracardiac electrograms were done simultaneously, avoiding the temporal variable.
This leaves the spatial AFCL variation, which could not be avoided due to the electrode
configuration of a modified base-apex ECG. In horses with naturally-occurring persistent AF a
significantly faster AFR in the left atrium compared to the right atrium has been demonstrated
[15]. The AFR in the current study was significantly faster compared to the RA-FR, which might
suggest that the modified base-apex lead is more influenced by left compared to right atrial
electrical activity.
In our study the modified base-apex lead (bipolar) was used for recording the surface ECG.
For this electrode configuration, the electrodes are positioned at a large distance from the atria
and encompass a much larger portion of the atria compared to the unipolar V1 or oesophageal
lead used in human trials [16,21]. Because of the long distance between recording electrodes
and atria, this lead probably results in a more global AFR measurement compared to the more
localized AFR from V1 in human medicine. The latter has a better relationship with the
fibrillatory rate of the coronary sinus and left pulmonary veins in comparison with right atrial
fibrillatory rate [16,22]. The larger the anatomical distance between the intracardiac and
surface ECG recording location, the bigger the difference between the intracardiac atrial
fibrillation rate and AFR. These theories should be further investigated by applying different
C h a p t e r 2 | 83
electrode configurations, using unipolar electrodes close to the right atrial free wall and/or
using intra-atrial recordings from the left atrium which could be compared to both the global
AFR and a unipolar AFR. In human medicine a transseptal puncture is used to perform left
atrial electrogram recording, but this technique has not yet been described in horses. Another
option would be to record left atrial AFCL from the coronary sinus since this approach does
not require access to the left atrium.
The current study didn’t show a significant difference between a lower AFR and success of
TVEC, which has also not been described in human medicine. However, as only 2 out of 73
horses did not convert conclusions should not be drawn from this dataset. No correlation was
found between RA-FR or AFR and the number of shocks or the energy needed for
cardioversion. This is in contradiction to human studies in which a moderate to strong positive
correlation was found between the minimal threshold for external cardioversion and AFR
[23,24]. This may indicate that other mechanisms play a role in the minimal cardioversion
threshold such as atrial structural defects or atrial size.
Limitations
We only measured at one right atrial location, thus spatial intracardiac fibrillatory rate variability
and correlation with the AFR could not be assessed. Since only one surface ECG lead was
recorded, no information is available about the use of different lead configurations on the AFR.
Conclusion
The surface ECG-derived AFR was moderately correlated with the intracardiac RA-FR. The
non-invasive approach may allow long-term monitoring of the AFR in order to investigate AF
pathophysiology in horses and the effect of antiarrhythmic drugs. However, results show a
significantly faster AFR compared to the RA-FR, which might be related to a shorter left atrial
AFCL. Neither RA-FR nor AFR could be used to predict the minimal defibrillation threshold for
TVEC.

C h a p t e r 2 | 84
Footnotes
aEurovet Animal Health B.V., Bladel, The Netherlands.
bEngel Engineering Services GmbH, Heusen-stamm, Germany.
cMathworks, Natick, United States.
dCardioLund Research AB, Lund, Sweden.

C h a p t e r 2 | 85
References
[1] Else RW, Holmes JR. Pathological Changes in Atrial Fibrillation in the Horse. Equine Vet J 1971;3:56–64.
[2] Reef VB, Reirner JM, Spencer P a. Treatment of Atrial Fibrillation in Horses : New Perspectives. J Vet Intern Med 1995;9:57–67.
[3] De Clercq D, van Loon G, Schauvliege S, Tavernier R, Baert K, Croubels S, et al. Transvenous electrical cardioversion of atrial fibrillation in six horses using custom made cardioversion catheters. Vet J 2008;177:198–204.
[4] McGurrin MKJ, Physick-Sheard PW, Kenney DG. Transvenous electrical cardioversion of equine atrial fibrillation: Patient factors and clinical results in 72 treatment episodes. J Vet Intern Med 2008;22:609–15.
[5] Decloedt A, Schwarzwald CC, De Clercq D, Van Der Vekens N, Pardon B, Reef VB, et al. Risk Factors for Recurrence of Atrial Fibrillation in Horses After Cardioversion to Sinus Rhythm. J Vet Intern Med 2015;29:946–53.
[6] Wijffels MCEF, Kirchhof CJHJ, Dorland R, Allessie MA. Atrial Fibrillation Begets Atrial Fibrillation. Circulation 1995;92:1954–68.
[7] Van Loon G, Duytschaever M, Tavernier R, Fonteyne W, Jordaens L, Deprez P. An equine model of chronic atrial fibrillation: methodology. Vet J 2002;164:142–50.
[8] Drewitz I, Willems S, Salukhe T V, Steven D, Hoffmann BA, Servatius H, et al. Atrial fibrillation cycle length is a sole independent predictor of a substrate for consecutive arrhythmias in patients with persistent atrial fibrillation. Circ Arrhythm Electrophysiol 2010;3:351–60.
[9] Meurling CJ, Roijer A, Waktare JEP, Holmqvist F, Lindholm CJ, Ingemansson MP, et al. Prediction of sinus rhythm maintenance following DC-cardioversion of persistent atrial fibrillation - the role of atrial cycle length. BMC Cardiovasc Disord 2006;6:11.
[10] Haissaguerre M, Sanders P, Hocini M, Hsu L-F, Shah DC, Scavée C, et al. Changes in Atrial Fibrillation Cycle Length and Inducibility During Catheter Ablation and Their Relation to Outcome. Circulation 2004;109:3007–13.
[11] De Clercq D, Decloedt A, Sys SU, Verheyen T, Van Der Vekens N, van Loon G. Atrial fibrillation cycle length and atrial size in horses with and without recurrence of atrial fibrillation after electrical cardioversion. J Vet Intern Med 2014;28:624–9.
[12] Reef VB, Levitan CW, Spencer PA. Factors Affecting Prognosis and Conversion in Equine Atrial Fibrillation. J Vet Intern Med 1988;2:1–6.
[13] Hesselkilde EZ, Carstensen H, Haugaard MM, Carlson J, Pehrson S, Jespersen T, et al. Effect of flecainide on atrial fibrillatory rate in a large animal model with induced atrial fibrillation. BMC Cardiovasc Disord 2017;17:289.
[14] Duytschaever M, Heyse A, De Sutter J, Crijns H, Gillebert T, Tavernier R, et al. Transthoracic Tissue Doppler Imaging of the Atria: A Novel Method to Determine the Atrial Fibrillation Cycle Length. J Cardiovasc Electrophysiol 2006;17:1202–9.
[15] Decloedt A, de Clercq D, van der Vekens N, Verheyen T, van Loon G. Noninvasive determination of atrial fibrillation cycle length by atrial colour tissue Doppler imaging in horses. Equine Vet J 2014;46:174–9.

C h a p t e r 2 | 86
[16] Holm M, Pehrson S, Ingemansson M, Sörnmo L, Johansson R, Sandhall L, et al. Non-invasive assessment of the atrial cycle length during atrial fibrillation in man: introducing, validating and illustrating a new ECG method. Cardiovasc Res 1998;38:69–81.
[17] Carstensen H, Kjœr L, Haugaard MM, Flethøj M, Hesselkilde EZ, Kanters JK, et al. Antiarrhythmic effects of combining dofetilide and ranolazine in a model of acutely induced atrial fibrillation in horses. J Cardiovasc Pharmacol 2018;71:26–35.
[18] Stridh M, Sommo L. Spatiotemporal QRST cancellation techniques for analysis of atrial fibrillation. IEEE Trans Biomed Eng 2001;48:105–11.
[19] Team RC. R: A Language and Environment for Statistical Computing 2018.
[20] De Clercq D, van Loon G, Deprez P. Determination and correlation of f-f interval and right atrial fibrillation cycle length in 30 horses with atrial fibrillation. J. Vet. Intern. Med., Barcelona, Spain: 2009, p. 10–1.
[21] Bollmann A, Kanuru N, McTeague K, Walter P, DeLurgio D, Langberg J. Frequency Analysis of Human Atrial Fibrillation Using the Surface Electrocardiogram and Its Response to Ibutilide. Am J Cardiol 1998;81:1439–45.
[22] Husser D, Stridh M, Sornmo L, Olsson SB, Bollmann A. Frequency analysis of atrial fibrillation from the surface electrocardiogram. Indian Pacing Electrophysiol J 2004;4:122–36.
[23] Tai CT, Chen SA, Liu AS, Yu WC, Ding YA, Chang MS, et al. Spectral analysis of chronic atrial fibrillation and its relation to minimal defibrillation energy. PACE - Pacing Clin Electrophysiol 2002;25:1747–51.
[24] Bollmann A, Mende M, Neugebauer A, Pfeiffer D. Atrial fibrillatory frequency predicts atrial defibrillation threshold and early arrhythmia recurrence in patients undergoing internal cardioversion of persistent atrial fibrillation. PACE - Pacing Clin Electrophysiol 2002;25:1179–84.

Chapter 3: Three dimensional ultra-high-
density electro-anatomical cardiac
mapping in horses: methodology


Three dimensional ultra-high-density electro-anatomical cardiac mapping in
horses: methodology
Glenn Van Steenkiste1*, Dominique De Clercq1, Tim Boussy2, Lisse Vera1, Stijn
Schauvliege3, Annelies Decloedt1, Gunther van Loon1
1Equine Cardioteam Ghent University, Department of Large Animal Internal Medicine, Ghent
University, Belgium
2Department of Cardiology, AZ Groeninge, Kortrijk, Belgium
3Department of Surgery and Anaesthesiology of domestic animals, Ghent University,
Belgium
Adapted from:
Van Steenkiste G, De Clercq D, Boussy T, Vera L, Schauvliege S, Decloedt A, van Loon, G.
Three dimensional ultra-high-density electro-anatomical cardiac mapping in horses:
methodology, Equine Veterinary Journal, 2020; evj.13229

C h a p t e r 3 | 90
Summary
This study was aimed at describing the technique and evaluating the feasibility of magnetic
electro-anatomical mapping of the equine heart. A mapping system using an 8.5F bidirectional
deflectable catheter with a deployable mini-basket (3-22mm) containing 64 electrodes divided
over 8 splines was evaluated. Based upon predefined beat acceptance criteria, the system
automatically acquires endocardial electrograms and catheter location information. Electro-
anatomical maps were acquired in 4 horses in sinus rhythm under general anaesthesia. All
endocardial areas within each chamber could be reached. Access to the left atrium required
the use of a deflectable sheath. With exception of the left atrial map of horse 1, all 4 chambers
in all 4 horses could be mapped. Optimization of the beat acceptance criteria led to a reduction
in manual correction of the automatically accepted beats from 13.1% in the first horse to 0.4%
of the beats in the last horse. This study showed that ultra-high-density 3D electro-anatomical
mapping is feasible in adult horses and is a promising tool for electrophysiological research
and characterisation of complex arrhythmias.
C h a p t e r 3 | 91
Introduction
Arrhythmias are very common in horses, but the origin is often unknown [1,2]. Identification of
the underlying mechanisms of arrhythmias requires invasive electrophysiological studies. In
humans and dogs, under fluoroscopic guidance, a standard ‘four-wire’ electrophysiological
diagnostic exam uses four recording catheters at specific locations such as high (superior /
dorsal) right atrium, His bundle, coronary sinus and right ventricular apex [3,4]. In horses, His
bundle and coronary sinus recording have not been well described. Fluoroscopy and
radiography can be performed but provide limited information about exact catheter location in
relation to specific anatomical structures, due to the large dimensions of the thorax. 3D insight
is also difficult in horses as CT and MRI of the heart cannot be performed due to the animals’
size. Therefore, four-wire electrophysiological studies cannot be applied in horses currently.
Recently, an advanced technique, ‘electro-anatomical mapping’, has become available in
human medicine. Such an electro-anatomical mapping system tracks the 3D location of a
catheter in the heart using impedance sensing or using a magnetic sensor in the catheter in
combination with an external magnetic field generator. Using this technique, depolarisation of
the atria and ventricles can be visualised. In addition, it allows precise identification of the site
of earliest activation with focal tachycardia and macro re-entry tachycardia [3]. Recently, a new
mapping system (Rhythmiaa) has been developed, which uses both impedance sensing and a
magnetic field in combination with a magnetic sensor on the distal tip of a paired mapping
catheter (Intellamap Oriona) for a hybrid location identification and this provides a higher
tracking accuracy (± 1mm) compared to impedance sensing alone [5]. The mapping catheter
is an 8.5F bidirectional deflectable device with a deployable mini-basket (diameter ranging 3–
22mm) consisting of 8 splines. Each spline contains 8 printed, small (0.4mm²) low impedance
electrodes (64 electrodes in total) with an interelectrode spacing of 2.5mm (centre-to-centre).
This mapping system is designed to rapidly obtain high resolution electro-anatomical activation
maps with automatic annotation of endocardial electrograms (EGMs). The system has been
validated in humans, pigs and dogs and integrates 3 functionalities [5–7]. First, as the mapping
catheter is manoeuvred along the endocardial wall, the inner surface geometry of the mapped
chamber is gradually constructed by recording the outermost electrode locations of the
mapping catheter once every beat during end diastole (Beat-Gated mode). In this mode, only
beats occurring within the expiration phase of the respiratory cycle are included (Respiratory
phase filter). Second, for every heart beat all intracardiac EGMs are recorded and projected
on the surface geometry as a voltage map or an electrical activation map. Only EGMs occurring
within a predefined distance from the geometric shell are shown on screen (fill threshold). For
the electro-anatomical activation map the system uses a stable electrogram from a coronary
sinus (coronary sinus) catheter as the atrial timing reference, and the surface ECG as the
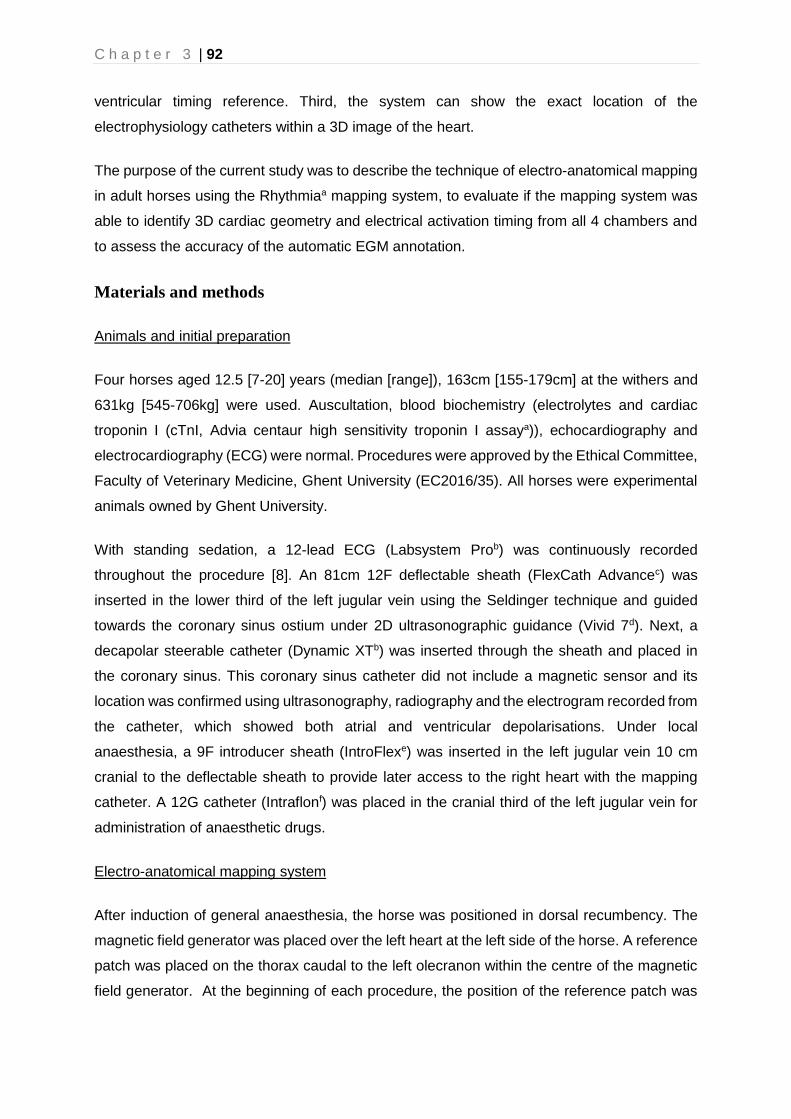
C h a p t e r 3 | 92
ventricular timing reference. Third, the system can show the exact location of the
electrophysiology catheters within a 3D image of the heart.
The purpose of the current study was to describe the technique of electro-anatomical mapping
in adult horses using the Rhythmiaa mapping system, to evaluate if the mapping system was
able to identify 3D cardiac geometry and electrical activation timing from all 4 chambers and
to assess the accuracy of the automatic EGM annotation.
Materials and methods
Animals and initial preparation
Four horses aged 12.5 [7-20] years (median [range]), 163cm [155-179cm] at the withers and
631kg [545-706kg] were used. Auscultation, blood biochemistry (electrolytes and cardiac
troponin I (cTnI, Advia centaur high sensitivity troponin I assaya)), echocardiography and
electrocardiography (ECG) were normal. Procedures were approved by the Ethical Committee,
Faculty of Veterinary Medicine, Ghent University (EC2016/35). All horses were experimental
animals owned by Ghent University.
With standing sedation, a 12-lead ECG (Labsystem Prob) was continuously recorded
throughout the procedure [8]. An 81cm 12F deflectable sheath (FlexCath Advancec) was
inserted in the lower third of the left jugular vein using the Seldinger technique and guided
towards the coronary sinus ostium under 2D ultrasonographic guidance (Vivid 7d). Next, a
decapolar steerable catheter (Dynamic XTb) was inserted through the sheath and placed in
the coronary sinus. This coronary sinus catheter did not include a magnetic sensor and its
location was confirmed using ultrasonography, radiography and the electrogram recorded from
the catheter, which showed both atrial and ventricular depolarisations. Under local
anaesthesia, a 9F introducer sheath (IntroFlexe) was inserted in the left jugular vein 10 cm
cranial to the deflectable sheath to provide later access to the right heart with the mapping
catheter. A 12G catheter (Intraflonf) was placed in the cranial third of the left jugular vein for
administration of anaesthetic drugs.
Electro-anatomical mapping system
After induction of general anaesthesia, the horse was positioned in dorsal recumbency. The
magnetic field generator was placed over the left heart at the left side of the horse. A reference
patch was placed on the thorax caudal to the left olecranon within the centre of the magnetic
field generator. At the beginning of each procedure, the position of the reference patch was

C h a p t e r 3 | 93
calibrated and the maximum allowed deviation was set at 30mm. A 12-lead ECG was
continuously recorded and was used to create an impedance field to aid the tracking of the
catheters inside the horse. The following variables can be modified as acceptance criteria for
inclusion of cardiac beats in the map in continuous mapping mode: (1) upper and lower limits
for cycle length, (2) respiration phase, (3) propagation reference (stability of the collected EGM
deflection relative to the reference EGM deflection), (4) ECG morphology reference, (5)
catheter electrogram stability, (6) catheter motion and (7) tracking quality. The acceptance
criteria for these variables were automatically set with the initialisation of each new map and
were continuously monitored and adapted by the operator if beats were incorrectly classified
during the mapping procedure. A “beat” in the automated recording software refers to each
depolarisation on the time reference lead (coronary sinus EGM deflection for the atria, QRS
complex from a surface ECG lead for the ventricles). After automatic initialisation of a map, the
operator checked whether the system had selected the surface lead with the most pronounced
morphology difference between QRS complex and T wave (e.g. a large negative S peak and
a singular positive T wave) and/or the largest deflection on the coronary sinus EGM as
reference leads. During atrial mapping, the system also performed QRS detection from the
surface ECG lead in order to avoid erroneous detection of deflections on the ventricular far
field EGM as originating in the atrial EGM deflection. The fill threshold of the electro-anatomical
maps was set at 13mm. All settings that are not mentioned below were kept at default values.
The activation timing of each EGM deflection recorded on the mapping catheter was measured
using the maximum amplitude of the bipolar signal or the maximum negative dV/dt of the
unipolar signal, depending on the selected map type (bipolar or unipolar activation map).
During and after data acquisition, individual EGMs and individual heart beats could be
reviewed for manual annotation or deletion of that selected point. All maps were acquired
during sinus rhythm. A map was considered complete when the acquired anatomical
morphology was consistent with that of the entire chamber on ultrasound.
Mapping protocol
A schematic diagram of the setup is shown in Figure 1. To map the left heart, an 8.5F bi-
directional deflectable sheath (Zurpazb) was inserted in the right common carotid artery and,
using ultrasonographic guidance, advanced through the aortic valve into the left ventricle (LV).
The mapping catheter was inserted through the sheath into the LV while the basket was closed.
Both the sheath and the mapping catheter were continuously flushed with heparinised saline
(1 IU/ml) using pressurized bags (120mmHg). Under ultrasonographic guidance, the distal part
of the deflectable sheath was directed towards the mitral valve. In diastole, when the mitral
valve was open, the mapping catheter was advanced into the left atrium (LA). The mini-basket
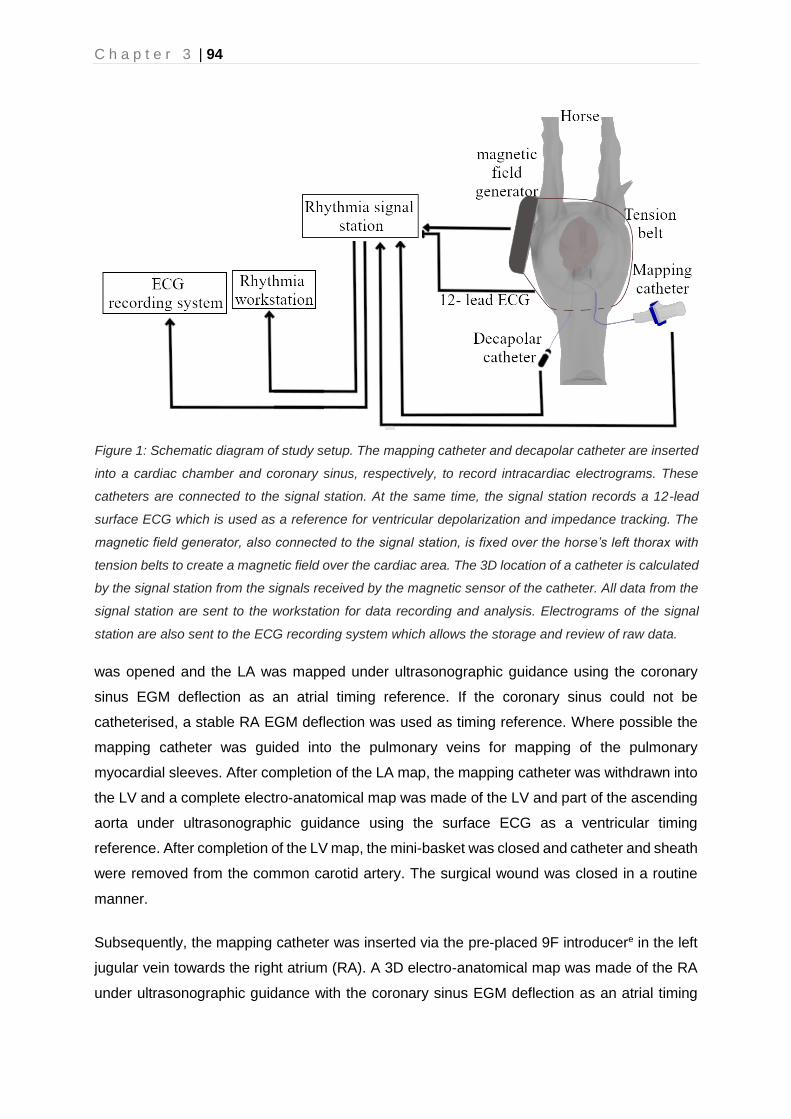
C h a p t e r 3 | 94
was opened and the LA was mapped under ultrasonographic guidance using the coronary
sinus EGM deflection as an atrial timing reference. If the coronary sinus could not be
catheterised, a stable RA EGM deflection was used as timing reference. Where possible the
mapping catheter was guided into the pulmonary veins for mapping of the pulmonary
myocardial sleeves. After completion of the LA map, the mapping catheter was withdrawn into
the LV and a complete electro-anatomical map was made of the LV and part of the ascending
aorta under ultrasonographic guidance using the surface ECG as a ventricular timing
reference. After completion of the LV map, the mini-basket was closed and catheter and sheath
were removed from the common carotid artery. The surgical wound was closed in a routine
manner.
Subsequently, the mapping catheter was inserted via the pre-placed 9F introducere in the left
jugular vein towards the right atrium (RA). A 3D electro-anatomical map was made of the RA
under ultrasonographic guidance with the coronary sinus EGM deflection as an atrial timing
Figure 1: Schematic diagram of study setup. The mapping catheter and decapolar catheter are inserted
into a cardiac chamber and coronary sinus, respectively, to record intracardiac electrograms. These
catheters are connected to the signal station. At the same time, the signal station records a 12-lead
surface ECG which is used as a reference for ventricular depolarization and impedance tracking. The
magnetic field generator, also connected to the signal station, is fixed over the horse’s left thorax with
tension belts to create a magnetic field over the cardiac area. The 3D location of a catheter is calculated
by the signal station from the signals received by the magnetic sensor of the catheter. All data from the
signal station are sent to the workstation for data recording and analysis. Electrograms of the signal
station are also sent to the ECG recording system which allows the storage and review of raw data.

C h a p t e r 3 | 95
reference. After completion of the RA map, the mapping catheter was guided towards the right
ventricle (RV). A RV map was recorded using the surface ECG as a timing reference. The map
was extended up to a few cm beyond the pulmonary valve. At the end of the procedure, all
catheters and introducers were removed and the horses were recovered using rope-assisted
recovery. After recovery, clinical status was monitored and blood for cTnI assay was withdrawn

C h a p t e r 3 | 96
Figure 2: Echocardiographic right parasternal long axis oblique view (Panel A) and the simultaneous electro-
anatomical map (Panel B) of the left ventricle (left lateral view) in horse 3. On both images, the basket of the
mapping catheter (white circle) is positioned in the left ventricular apex. The electro-anatomical map is shown
for the left ventricle (color) while for the other compartments only anatomy (grey) is shown. Panel C shows
the left lateral view of the right atrial electro-anatomical map of horse 2. The arrow shows the earliest
activation in sinus rhythm which indicates the location of the sinus node. The color bars in the right upper
corner and in panel E indicate the color code of the current map relative to the timing reference. Panel E
shows multiple electrograms recorded in the map in panel C. The recording on top is the surface ECG with
the P wave and QRS complex. The next two electrograms are recorded from the coronary sinus catheter of
which R: coronary sinus 1-2 is used as timing reference and ▲R is used to assess timing stability. The 3
traces at the bottom are recorded by the mini-basket of the mapping catheter which is, in this image, located
near the sinus node. These 3 traces consist of two unipolar signals (U1 and U2) and a bipolar signal (B) from
the 6th and 7th electrode from spline G (G6, G7). The latter shows the automatically detected atrial
depolarization (blue vertical line) which occurs, as expected, 63 ms before the coronary sinus depolarization.
Panel D shows the anatomical map of both ventricles from a left caudo-lateral view in horse 2. Abbreviations:
Ao, aorta; Av, azygos vein; CaVC: caudal vena cava; CrVC: cranial vena cava; LA: left atrium; LV: left
ventricle; RV: right ventricle; PA: pulmonary artery; TV: tricuspid valve.

C h a p t e r 3 | 97
4h after the procedure. One horse, horse 4, was euthanised and its heart was examined
grossly for endocardial damage.
Data analysis
In review mode, all accepted beats were manually checked for correctness. Incorrect beats
were defined as ectopic beats which had erroneously been classified as of sinus origin. The
following metrics were exported from the mapping system for each chamber: mapped volume,
total number of annotated EGM deflections, total number of accepted beats, total number of
beats (including non-accepted beats), active mapping time and used acceptance criteria. Data
are reported as median [range] and because of the limited number of animals, only descriptive
statistics are reported.
Results
The key challenges encountered during the procedures are summarised in Table 1 along with
the respective solutions that were implemented. The results from individual horses are given
in Table 2. The system could not create an impedance field using the 12-lead ECG, therefore
only the magnetic field was used for catheter localisation. The coronary sinus could be
catheterised in 3 out of 4 standing horses in 2h [50min–2h15min], and catheter position was
confirmed with radiography and the EGM. In the 2nd horse, the coronary sinus catheter was
left in the RA. Preparation time between induction and start of actual mapping was 1h45min
[1h – 2h30min] and included positioning of the horse and magnetic field generator, surgical
preparation of the carotid artery and positioning the mapping catheter into the left atrium. After
completion of each map, the ultrasound-based anatomical locations of the mapping catheter
corresponded with the respective anatomical locations on the mapping system (Figure 2 panel
A and B). The 3D location of the coronary sinus catheter, which was not equipped with a
magnetic sensor, could not be displayed by the mapping system. A composition of both a right
atrial activation map and the anatomy of the ventricles is shown in Figure 2 panel C and D.
The LA could be reached in all horses but a complete LA map was not achieved in the first
horse. In this horse, the mapping catheter could not be kept stable in the LA because the
deflectable sheath had been inserted too cranially in the common carotid artery and not enough
sheath was left in the LV to guide the mapping catheter into the LA. In this horse only a small
LA volume (119ml) could be mapped. The result suggesting an extremely large volume of the
LA in horse 2 can be explained by the instable magnetic field generator position at the start of
the LA mapping procedure, which resulted in large error margins. That problem was completely
resolved in horses 3 and 4 by using tension belts in order to fix the position of the magnet. In
horse 4, mapping of the LV had to be aborted due to hypotension during anaesthesia, hence
C h a p t e r 3 | 98
the smaller LV volume estimate. The horse was recovered uneventfully and the right heart was
mapped during a second procedure. The other horses recovered uneventfully.
After the procedure, the cTnI concentration at 4 hours for horses 2, 3 and 4 was 0.153 ng/ml
[0.034-0.2ng/ml] while cTnI at the end of anaesthesia was below detection range. No serum
was taken from horse 1. Horse 4 was euthanized at the end of the second mapping procedure
for unrelated reasons (chronic intermittent lameness). No visual cardiac abnormalities were
detected on macroscopic necropsy of the heart. In all horses, mild swelling was noted at the
site of puncture of the common carotid artery and a pressure bandage was placed during 3
days, after which the swelling had disappeared.
During manual correction of the accepted beats after the procedure (in review mode), 1.6%
[0.4-13.1%] of the accepted beats were rejected by the operator.

C h a p t e r 3 | 99
Table 1: Key challenges encountered during the procedures and suggested solutions.
Problem Solution
System Error: reference patch has moved Ensure a stable patch and magnetic field generator position in relation to the horse. Reposition the generator or recalibrate the reference patch. Note that a new anatomical map should be started if the reference patch is recalibrated, otherwise the recorded EGMs will be projected on the incorrect anatomy.
T wave incorrectly identified as QRS complex
Adjust the triggering threshold for the reference leads or select a different triggering method (min or max threshold instead of the absolute value). If the problem persists consider starting a new map and select a different surface ECG lead with a better polarity/amplitude difference between QRS and T wave.
Slow acquisition of EGMs Check if the QRS complex/atrial depolarization is correctly identified on the reference lead. Check the different beat acceptance criteria when too many beats are faulty rejected. In general, the initial settings for cycle length and catheter motion, which are calculated during automatic initialization, are too sensitive and the maximal allowed deviation should be raised.
Multiple beats are rejected erroneously Check the different beat acceptance criteria. The cycle length can vary during the study and may require adjustment. In general, the initial settings for cycle length and catheter motion, which are calculated during automatic initialization, are too sensitive.
A stable left atrial position cannot be maintained
A deflectable sheath in the left ventricle, aimed at the left atrium, guides the catheter to the left atrium and stabilizes its position.

C h a p t e r 3 | 100
Table 2: Mapped volume, total number of annotated EGMs, total number of accepted beats, total
number of beats (including not accepted), active mapping time for each chamber and post-procedure
cardiac troponin I for each horse. The percentage of accepted beats on the total recorded beats is
shown between brackets.
Horse 1 2 3 4
Cardiac troponin I concentration (ng/ml) 4h after mapping
NA 0.034 0.153 0.250†
Left atrium
Map completed No Yes Yes Yes
Mapped volume (ml) 119 1243 562 413
Total number of beats 280 1430 1603 2133
After automatic Criteria
Beats 232 [82%] 1270 [88%] 1020 [64%] 1209 [57%]
Electrograms 147 11884 8538 49613
After manual correction
Beats 232 [82%] 1173 [82%] 989 [62%] 1207 [57%]
Electrograms 147 10669 8363 49848
Time required for mapping (min)
7 36 47 34
Left ventricle
Map completed Yes Yes Yes Yes
Mapped volume (ml) 685 638 681 440
Total number of beats 1227 1005 2136 2402
After automatic Criteria
Beats 954 [77%] 555 [55%] 1159 [54%] 1212 [50%]
Electrograms 4083 5274 8064 41398
After manual correction
Beats 748 [61%] 555 [55%] 1158 [54%] 1212 [50%]
Electrograms 3106 5274 8045 41398
Time required for mapping (min)
30 24 60 42
Right atrium
Map completed Yes Yes Yes Yes‡
Mapped volume (ml) 743 752 550 655
Total number of beats 643 2190 2203 3340
After automatic Criteria
Beats 485 [75%] 1236 [56%] 1426 [64%] 2552 [76%]
Electrograms 4436 3236 10636 26907
After manual correction
Beats 472 (73%) 1232 (56%)
1415 (64%)
2531 (76%)
Electrograms 4409 3181 10624 26619
Time required for mapping (min)
18 45 57 69
Right ventricle
Map completed Yes Yes Yes Yes‡
Mapped volume (ml) 578 530 532 422
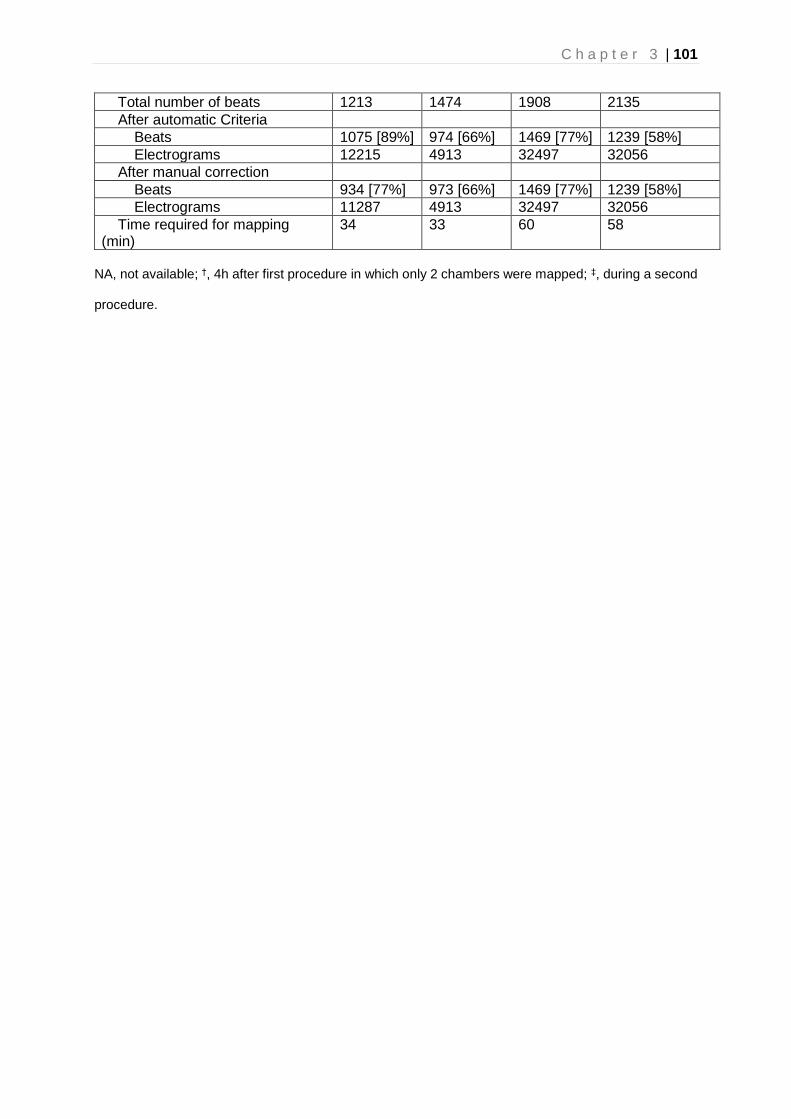
C h a p t e r 3 | 101
Total number of beats 1213 1474 1908 2135
After automatic Criteria
Beats 1075 [89%] 974 [66%] 1469 [77%] 1239 [58%]
Electrograms 12215 4913 32497 32056
After manual correction
Beats 934 [77%] 973 [66%] 1469 [77%] 1239 [58%]
Electrograms 11287 4913 32497 32056
Time required for mapping (min)
34 33 60 58
NA, not available; †, 4h after first procedure in which only 2 chambers were mapped; ‡, during a second
procedure.

C h a p t e r 3 | 102
Discussion
We report the successful application of electro-anatomical mapping in adult horses using the
Rhythmiab mapping system. This ultra-high-density electro-anatomical mapping system
identified both the 3D cardiac geometry and electrical activation patterns in all four chambers
in adult horses without the need for CT, fluoroscopy or radiography. Catheterisation of the
coronary sinus proved to be a challenging, but feasible method in order to acquire a stable
reference signal, desirable for mapping the atria. Placement of the coronary sinus catheter
was hampered by rather poor visibility of the coronary sinus ostium on ultrasound.
Fluoroscopy-guided catheter placement, as used in humans, is difficult in horses because of
their size and resultant high radiation doses. However, EGM recording and radiography was
useful to confirm the coronary sinus catheter position.
The mapping catheter was capable of reaching most of the endocardial surface of all
chambers. The LA was the most difficult location to map and a deflectable sheath was
necessary for the retrograde approach. In human medicine the LA is typically accessed
through a transseptal puncture. This technique is less invasive and allows for a better
accessibility of the pulmonary veins. Transseptal puncture has not been described in horses
previously. The second area which was difficult to reach was the right ventricular
supraventricular crest because the mapping catheter was often dragged into the right
ventricular outflow tract when approaching this area. In completed maps, mapping catheter
location corresponded to ultrasound findings well but measurements were not compared for 2
main reasons: (1) it is difficult to measure 3D geometry using a 2D measuring technique
(ultrasound); (2) the acquired maps did not cover the entire volume of the chambers, in order
to limit the duration of the anaesthesia and because mapping of the central lumen of a chamber
does not provide any extra information to the electrophysiological activation map.
Previous studies in humans and dogs have already proven the feasibility of this electro-
anatomical mapping system for the acquisition of accurate high-resolution voltage and
activation maps using the automatic annotation function [5,7]. The automatic annotation
function proved to be feasible in horses if the beat acceptance criteria were correctly updated
during the procedure, which is clearly illustrated by the decline in manually corrected beats in
the offline review mode from 13.1% in horse 1 to 0.4% in horse 4. Correct updating of beat
acceptance criteria required operator learning. In this study beats were considered normal if
both the timing was regular and the morphology was consistent on all 12 surface ECG leads.
The most common reasons for incorrect beat rejection were the cycle length and catheter
motion. Since the automatic initialisation sets the beat acceptance criteria designed for a

C h a p t e r 3 | 103
human subject, the allowed cycle length variation was too small for the normal beat-to-beat
variation seen in horses. The allowed maximum catheter motion was increased since cardiac
motion is larger in horses compared to humans. As the most optimal surface ECG reference
leads were not known in the first two horses, a higher number of faulty acquired beats did
occur. Many incorrect detections, especially misdetection of T waves as QRS complexes,
could be avoided by selecting a reference lead in which the ventricular depolarisation and
repolarisation had an opposite polarity. Further improvement was obtained by defining a
maximum or minimum triggering threshold, instead of the default ‘triggering above an absolute
value’. We found the remaining incorrect EGM timing annotations could be easily adjusted in
the review mode. These were typically induced by noise on the EGMs.
Unexpectedly, the active mapping time did not decrease with increased operator experience.
This is because due to experience, better insight of the desired morphology of a full map with
coverage of the complete endocardium was gained and more time was spent to acquire these
complete maps. The small size of the electrodes and close interelectrode spacing has the
advantage of producing very high-resolution EGMs, but also has the disadvantage of only
covering a small area of the endocardium. This resulted in relatively long acquisition times for
these horses compared to maps in human patients and in incomplete coverage of the entire
lumen. This was mainly demonstrated by the fact that the ventricular volumes were smaller
than the atrial volumes because the entire inner lumen of the ventricles was not mapped.
Long acquisition times were also caused by the slow heart rate in horses and the fact that we
aimed to map all 4 chambers in one procedure. Mapping multiple chambers and the long
anaesthesia time probably also affected cTnI concentrations. However, under clinical
circumstances, the typical indication for mapping in an equine patient is the presence of a
tachyarrhythmia requiring mapping of only 1 or 2 chambers. Thus, in clinical cases, reducing
the number of chambers mapped will significantly reduce procedure time and may reduce the
risk of increased troponin concentrations. In this study, the electro-anatomical maps were only
acquired during sinus rhythm but the technique shows high potential to characterize complex
arrhythmias in clinical patients.
Conclusion
In this pilot study we assessed the feasibility of a novel ultra-high-density electro-anatomical
mapping system in horses. The system was applicable to identify 3D cardiac geometry and
electrical activation patterns from all chambers in adult horses in SR. The mapping catheter
could reach all areas of the heart. The automatic annotation program functioned well if the

C h a p t e r 3 | 104
correct beat acceptance criteria were chosen. In the future this technique could be applied in
horses with arrhythmias.
Manufacturers’ addresses
aSiemens, Erlangen, Germany
bBoston Scientific, Diegem, Belgium
cMedtronic, Jette, Belgium
dGE Healthcare, Diegem, Belgium
eEdwards Life sciences, Groot-Bijgaarden, Belgium
fVygon, Brussels, Belgium

C h a p t e r 3 | 105
References
1. Young, L.E. and van Loon, G. (2014) Diseases of the heart and vessels. In: Equine sports medicine and surgery : basic and clinical sciences of the equine athlete, Eds: K.W. Hinchcliff, A.J. Kaneps and R.J. Geor. pp 695–743.
2. Pfister, R., Seifert-Alioth, C. and Beglinger, R. (1984) Die Bestimmung des Ursprungsortes ventrikulärer Extrasystolen beim Pferd. Schweizer Arch. für Tierheilkd. SAT die Fachzeitschrift für Tierärztinnen und Tierärzte 165–172.
3. Murgatroyd, F.D. and Krahn, A.D. (2003) Handbook of cardiac electrophysiology, Remedica, Londen.
4. Santilli, R.A., Spadacini, G., Moretti, P., Perego, M., Perini, A., Tarducci, A., Crosara, S. and Salerno-Uriarte, J.A. (2006) Radiofrequency catheter ablation of concealed accessory pathways in two dogs with symptomatic atrioventricular reciprocating tachycardia. J. Vet. Cardiol. 8, 157–165.
5. Mantziari, L., Butcher, C., Kontogeorgis, A., Panikker, S., Roy, K., Markides, V. and Wong, T. (2015) Utility of a Novel Rapid High-Resolution Mapping System in the Catheter Ablation of Arrhythmias. JACC Clin. Electrophysiol. 1, 411–420.
6. Tanaka, Y., Genet, M., Chuan Lee, L., Martin, A.J., Sievers, R. and Gerstenfeld, E.P. (2015) Utility of high-resolution electroanatomic mapping of the left ventricle using a multispline basket catheter in a swine model of chronic myocardial infarction. Hear. Rhythm 12, 144–154.
7. Nakagawa, H., Ikeda, A., Sharma, T., Lazzara, R. and Jackman, W.M. (2012) Rapid high resolution electroanatomical mapping evaluation of a new system in a canine atrial linear lesion model. Circ. Arrhythmia Electrophysiol. 5, 417–424.
8. Hesselkilde, E.Z., Carstensen, H., Vandsø Petersen, B., Jespersen, T., Kanters, J.K. and Buhl, R. (2016) Is ECG in horses only for dysrhythmia diagnosis? Introducing a new method for 12-lead ECG. J. Vet. Intern. Med. 30, 1500–1501.


Chapter 4: Endocardial electro-anatomic
mapping in healthy horses: Normal sinus
impulse propagation in the left and right
atrium and the ventricles


Endocardial electro-anatomic mapping in healthy horses: Normal sinus impulse
propagation in the left and right atrium and the ventricles
Glenn Van Steenkiste1*, Lisse Vera1, Annelies Decloedt1, Stijn Schauvliege2, Tim Boussy3,
Gunther van Loon1
1 Equine Cardioteam Ghent University, Department of Large Animal Internal Medicine, Faculty of Veterinary Medicine, Ghent University, Merelbeke, Belgium
2 Department of Surgery and Anesthesiology of Domestic Animals, Faculty of Veterinary Medicine, Ghent University, Merelbeke, Belgium
3 Department of Cardiology, AZ Groeninge, Kortrijk, Belgium
Adapted from:
Van Steenkiste G, Vera L, Decloedt A, Schauvliege S, Boussy T, van Loon, G. Endocardial
electro-anatomic mapping in healthy horses: Normal sinus impulse propagation in the left
and right atrium and the ventricles, The Veterinary Journal, 2020; j.tvjl.2020.105452
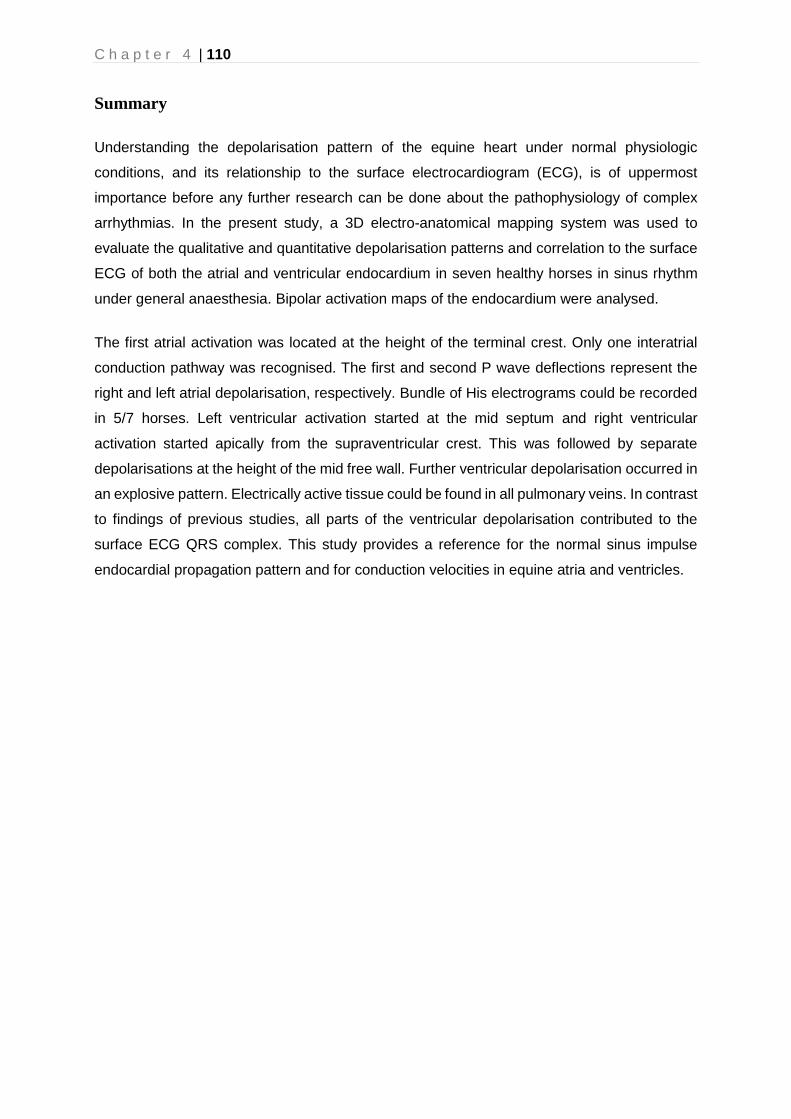
C h a p t e r 4 | 110
Summary
Understanding the depolarisation pattern of the equine heart under normal physiologic
conditions, and its relationship to the surface electrocardiogram (ECG), is of uppermost
importance before any further research can be done about the pathophysiology of complex
arrhythmias. In the present study, a 3D electro-anatomical mapping system was used to
evaluate the qualitative and quantitative depolarisation patterns and correlation to the surface
ECG of both the atrial and ventricular endocardium in seven healthy horses in sinus rhythm
under general anaesthesia. Bipolar activation maps of the endocardium were analysed.
The first atrial activation was located at the height of the terminal crest. Only one interatrial
conduction pathway was recognised. The first and second P wave deflections represent the
right and left atrial depolarisation, respectively. Bundle of His electrograms could be recorded
in 5/7 horses. Left ventricular activation started at the mid septum and right ventricular
activation started apically from the supraventricular crest. This was followed by separate
depolarisations at the height of the mid free wall. Further ventricular depolarisation occurred in
an explosive pattern. Electrically active tissue could be found in all pulmonary veins. In contrast
to findings of previous studies, all parts of the ventricular depolarisation contributed to the
surface ECG QRS complex. This study provides a reference for the normal sinus impulse
endocardial propagation pattern and for conduction velocities in equine atria and ventricles.
C h a p t e r 4 | 111
Introduction
Normal endocardial atrial and ventricular propagation has been studied in humans and dogs
[1–3]. In horses, the atrial and ventricular propagation has only been described using invasive
epicardial or transmural electrophysiology studies, but not yet under physiological conditions
[4–8]. Former studies suggested that the surface ECG QRS complex mainly represents the
apical third or the basal third of the interventricular septum, thus limiting the diagnostic value
of the ECG for ventricular pathologies such as the origin of ventricular ectopy and dilation.
[4,7,9]. However, other authors have shown that certain characteristics of the surface ECG
may indicate the origin of ventricular and atrial arrhythmias [10–13]. Some authors suggested
that the surface ECG could be used for the assessment of ventricular and atrial dilation [9,14–
16].
In order to unravel the pathophysiology of complex arrhythmias such as atrial tachycardia, the
normal depolarisation pattern of the equine heart should first be understood. Recently 3D
electro-anatomical mapping of the cardiac activation pattern has been proven to be feasible in
adult horses using the Rhythmiaa mapping system [17]. This electro-anatomical mapping
system rapidly obtains high resolution electro-anatomical activation maps with automatic
annotation of endocardial electrograms (EGMs). The system tracks the 3D location of the
catheter in the heart using impedance sensing or using a magnetic sensor in the catheter in
combination with an external magnetic field generator. Using this technique, the endocardial
depolarisation of the atria and ventricles can be visualised on a 3D anatomical map of the
heart.
In the present study this electro-anatomical mapping system was used to evaluate both the
qualitative and quantitative depolarisation patterns of both the atrial and ventricular
endocardium in 7 healthy horses in sinus rhythm under general anaesthesia. The atrial and
ventricular depolarisation patterns were also correlated to the morphology of the P wave and
QRS complex on the surface ECG, respectively.
Methods
Horses
This research was approved by the ethical committee of the Faculty of Veterinary Medicine,
Ghent University (Approval number, EC2016/35; Approval date, 1 June 2016). Seven horses,
aged 11 [5-20] years (median [range]), 162 cm [155-165 cm] at the withers and 545 kg [444-
631 kg] were used. Horses were included if no murmurs were present on auscultation,

C h a p t e r 4 | 112
biochemistry (electrolytes and cardiac troponin I (cTnI)) was within reference values, no
structural abnormalities were found on echocardiography and electrocardiography (ECG)
showed normal sinus rhythm. The presence of an occasional 2nd degree AV block on the ECG
was allowed. Horses 1 to 4 were owned by the Faculty of Veterinary Medicine. Horses 5 to 7
were donated by their owners for scientific research followed by euthanasia due to orthopaedic
problems. Informed consent was obtained from all owners. The mapping procedure of all 4
cardiac chambers was performed under general anaesthesia as described elsewhere [17].
Horses 1-4 were also used in a previous study [17].
Data Analysis
Bipolar activation maps were used for data analysis. The activation maps consisted of a colour
coded 3D representation of the endocardial conduction (Figure 1-3) in which the rainbow
colour spectrum displays timing from red (depolarised endocardium) to purple (yet to be
depolarised endocardium). Qualitative analysis was performed by describing the propagation
wave for every chamber and for the interatrial conduction. Data points were automatically
annotated using the maximum deflection of the bipolar signal as the local depolarisation time.
Activation maps were evaluated with a projection distance (=maximum interpolation distance
between data points) of 10 mm, a minimum voltage threshold of 0.03 mV and time steps of 5
ms. Multiple breakthroughs of the sinus impulse were considered if two or more distinct areas
were activated separately with a clear spatial difference [2]. The location and depolarisation
timing relative to the maximum QRS complex amplitude on the surface ECG for the Bundle of
His was recorded if the Bundle of His EGM could be identified.
For the quantitative analysis, measurements of the different time intervals during the
depolarisation wave were done using the probe tool of the mapping software which displayed
the earliest depolarisation within a radius of 5 mm of the calliper. Depolarisation timing was
calculated relative to the first endocardial atrial or ventricular depolarisation. The average
conduction velocity was calculated by measuring the distance between the different pre-
defined locations, as listed in Table 2, and dividing the distance by the difference in
depolarisation time. Relation with the surface ECG was described relative to lead II of the
mapping system, which had a modified base-apex electrode configuration with the positive
electrode left of the xyphoid and the negative electrode on the dorsal part of the right spine of
the scapula [17]. An index of simultaneous depolarisation for the atria (ISA), in order to assess
the period of the atrial systolic time interval during which both atria were activated
simultaneously, was calculated according to equation 1 [2]:

C h a p t e r 4 | 113
𝐼𝑆𝐴 =(𝑃𝐷𝑅𝐴 + 𝑃𝐷𝐿𝐴)−𝐴𝑆𝑇𝐼
𝐴𝑆𝑇𝐼 (1)
Where PDRA and PDLA are the propagation durations (in milliseconds) in the RA and LA,
respectively, and ASTI is the atrial systolic time interval (in milliseconds). Data are described
as mean ± S.D.
Figure 1: From subpanel a to i, atrial activation steps from a dorsal view are shown in steps of 10 ms. In the lower
left corner of each subpanel, the current timing in relation to lead II of the surface ECG is indicated by a white
vertical line. The colour varies following the rainbow colour spectrum from red (earliest depolarisation) to purple
(latest depolarisation). A part of the initial and final activation cannot be visualized since it is located apically. In
this horse the first atrial activation is located ventromedially. The grey areas indicate a local voltage below the
minimal voltage threshold (0.03 mV). AV, azygous vein; CaVC, caudal vena cava; CrVC, cranial vena cava; II,
pulmonary vein ostium II; III, pulmonary vein ostium III; IV, pulmonary vein ostium IV; LA, left atrium; RA, right
atrium.

C h a p t e r 4 | 114
Figure 2: Activation steps for the ventricles from subpanel a to i with 8 ms between each subpanel. The
ventricles are seen from a left view. The ECG trace in the lower right corner represents lead II of the
surface ECG. The white vertical line indicates the current time point of that subpanel. The colour varies
following the rainbow colour spectrum from red (earliest depolarisation) to purple (latest depolarisation).
Ao, aorta; IVS, interventricular septum; LV, left ventricle; MV, mitral valve; PA, pulmonary artery; RV,
right ventricle.

C h a p t e r 4 | 115
Figure 3: Areas of first activation of the sinus node area, on static activation maps of the right atrium
from three horses. The colour variates following the rainbow colour spectrum from red (earliest
depolarisation) to purple (latest depolarisation). The sinus node areas are located medial (panel a),
cranial (panel b) and lateral (panel c). AV, azygous vein; CaVC, caudal vena cava; CrVC, cranial
vena cava; IVT, intervenous tubercle; TV, tricuspid valve.

C h a p t e r 4 | 116
Results
A mean of 13593 ± 9055, 26576 ± 16920, 22517 ± 19422 and 29236 ± 16633 EGMs were
acquired for the right and left atrium (RA, LA) and right and left ventricle (RV, LV), respectively.
Stable sinus rhythm was present during mapping. Horses 1 to 4 recovered uneventfully; horses
5 to 7 were euthanized after the procedure as scheduled. A complete LA map could not be
obtained in horse 1 and therefore these LA data were not used. The relation of the endocardial
depolarisation with the surface ECG is described in Table 1. Depolarisation times of each
chamber relative to the first endocardial atrial/ventricular depolarisation are listed in Table 2.
Conduction velocities for atria and ventricles are listed in Table 3. Figure 1 shows the atrial
and Figure 2 the ventricular activation pattern.
Sinus impulse propagation in the atria
The P wave was bifid in all horses, only in horse 7 the positive bifid P wave was preceded by
a small negative deflection. The first atrial activation was located at the level of the terminal
crest in all horses and thus denoted as the sinus node (SN) area. In 4 horses the earliest SN
area activation was situated ventromedially to the cranial vena cava (CrVC), in 1 horse
ventrally to the CrVC and in horse 1 ventrolaterally to the CrVC (Figure 3). Horse 7 had 2
earliest SN activation sites: one lateral area which resulted in a biphasic P wave and one
medial area which resulted in a monophasic P wave. The medial site had a 50ms shorter PQ
interval on the surface ECG compared to the lateral site and was only active at heart rates
below 35 beats per minute. For further data-analysis only the biphasic P wave was included.
The SN area was horseshoe shaped ventrally to the CrVC, following the terminal crest.
After initial depolarisation of the sinus node area, the main wavefront propagates medially in a
caudodorsal direction towards the intervenous tubercle. In the meantime, the depolarisation
wavefront also spreads in a radial way from the main wavefront, but at a lower conduction
velocity. After the main wavefront has reached the intervenous tubercle, the wavefront
continues to activate the RA in a radial way. The RA depolarisation ends in the caudal vena
cava (CaVC). The electro-anatomic delineation, the anatomical line where the electrical activity
is below the threshold of 0.03mV, was very irregular in the CaVC in all cases and well
delineated for the CrVC in 5 cases, but also irregular in 2 horses.
At the onset of LA depolarisation, 2/3rd of the RA is already activated and the depolarisation
wavefront has reached the right sided interatrial septum. In the LA, no breakthroughs could be
seen at the height of the interatrial septum. All breakthroughs in the LA occurred at the height
of the base of ostium III and/or IV at the location of the previously described insertion of the

C h a p t e r 4 | 117
Bachmann bundle [5]. The depolarisation of the LA occurred radially away from the initial
breakthrough site in all horses. A different conduction velocity could be seen towards the
interatrial septum. Depolarisation of the LA terminated at the left lateral free wall.
Sinus impulse propagation in the ventricles
Bundle of His EGMs could be recorded in 5 out of 7 horses: 5 recordings could be made in the
left ventricle and 1 in the right ventricle. In the LV, the Bundle of His was recorded from the
interventricular septum apical to the noncoronary leaflet of the aortic valve. In the RV, the
Bundle of His could be located apically to the septal tricuspid leaflet.
Initial depolarisation of the LV occurred at the high septum in 1 horse, at the high and mid
septum in 2 horses, and at the middle of the septum in 3 horses. In all horses, separate
depolarisation of the mid free wall at the height of the insertion of the false tendons occurred
shortly after or almost simultaneously with the septal depolarisation. After the initial
depolarisation of the septum and the free wall, depolarisation continued in an explosive way
without a clear depolarisation wavefront.
Almost simultaneously with the LV, depolarisation of the RV initiated at the height of the septal
part of the supraventricular crest in 6 out of 7 horses. In 1 horse depolarisation started at the
mid free wall and a separate simultaneous depolarisation was found in the mid septum apically
to the supraventricular crest. In 3 horses a separate depolarisation also started simultaneously
in the mid free wall apically to the supraventricular crest. In the remaining horses the mid free
wall also depolarised as a separate location immediately after the initial depolarisation. Further
depolarisation of the RV inflow tract occurred in an explosive way without a clear depolarisation
wavefront in 5 horses, and with a radial spreading wavefront starting from the initial
depolarisation locations in 2 horses. Depolarisation of the RV outflow tract occurred in a radial
way starting from the depolarised areas from the inflow tract. The depolarisation of the RV
ended at the pulmonary valve.

C h a p t e r 4 | 118
Table 1 Relation between intracardiac activation and lead II of the mapping system a
Surface ECG morphology Corresponding activation
P wave Electrocardiographically silent part of initial atrial depolarisation b
24 ms: cranial terminal crest (n=2) 40 ms: lateral terminal crest (n=1) 0 ms: medial terminal crest (n=4)
Negative initial P wave polarity Lateral side terminal crest (n=1) Positive initial P wave polarity Medial and cranial side terminal crest
(n=6) Onset 2nd positive P wave deflection Onset of left atrial depolarisation QRS complex
Q wave Depolarisation LV high septum (n=1)
R wave Depolarisation apical 3rd LV septum and RV high septal part of supraventricular crest.
Between onset QRS and S wave peak
Depolarisation of complete LV with exception of LV high free wall. (n=7) Depolarisation of RV inflow tract and part of the RV outflow tract (n=7) Depolarisation of the LV high septum (n=6)
After S wave peak Depolarisation LV high free wall and RV outflow tract.
LV, left ventricle; RV, right ventricle. a Lead II of the mapping system had a modified base-apex electrode configuration with the positive electrode left of the xyphoid and the negative electrode on the dorsal part of the right spine of the scapula. b The durations during which there is atrial activation without electrocardiographic activity on the surface ECG are reported according to each sinus node location.

C h a p t e r 4 | 119
Table 2 Timings (ms) of atrial and ventricular activation.
Chamber Location Mean Standard deviation
Minimum Maximum
Right atrium (n=7) a Intervenous tubercle 55 12 38 76 Free wall at tricuspid valve level 84 22 48 120 Interatrial septum 93 24 58 137 Cranial vena cava 115 17 89 141 Caudal vena cava lateral wall 117 15 98 145 Caudal vena cava medial wall 127 19 102 163 Right atrium completely
depolarised 139 15 119 168
Left atrium (n=6) a First depolarization at insertion
Bachmann bundle 85 27 53 139
Base ostium III 92 38 34 142 Base ostium IV 103 28 73 144 Base ostium II 117 22 95 151 Dorsal interatrial septum 121 28 86 158 Lateral free wall near mitral valve
level 150 30 106 191
Time needed for complete depolarisation of left atrium
68 19 44 101
Both atria (n=6) a Both atria completely depolarised 156 24 128 191 Index of simultaneous activation 0.34 0.11 0.16 0.52 Left ventricle (n=7) b Bundle of His apical to aortic
valve (n=5) compared to left ventricular activation
-31 c 8 -21 -45 c
Mid septum 8 3 0 (n=5) d 11 Lateral mid free wall 11 9 1 26 High septum 15 8 0 (n=3) d 23 Caudal mid free wall 15 9 1 26 Lateral high free wall 26 12 12 43 Caudal high free wall 26 13 8 47 Apex 26 5 17 35 Time needed for complete
depolarization of left ventricle 55 16 21 73
Right ventricle (n=7) b Bundle of His apical to tricuspid
valve (n=1) compared to right ventricular activation
-51 c
Timing of first activation of right ventricle compared to left ventricle
-3 c 8 -16 c 7
Septal part of the supraventricular crest
13 11 0 (n=4) 29
Mid septum 13 7 0 (n=1) 27 High free wall (outflow tract at the
height of tricuspid) 19 8 9 29
Apex 21 5 13 29 Mid free wall 22 6 0 (n=2) 33

C h a p t e r 4 | 120
Free wall adjacent to the tricuspid valve
35 19 6 60
Septum adjacent to the tricuspid valve
36 17 11 67
Right ventricular outflow tract adjacent to the pulmonary valve
53 22 27 88
Time needed for complete depolarization of inflow tract
45 15 26 67
Time needed for complete depolarization of right ventricle
58 19 32 88
Both ventricles (n=7) b Complete ventricles depolarized 63 20 38 97
a Timings for the atria are relative to the first endocardial activation in the right atrium except if written otherwise. b Timings for the left and right ventricle are relative to the first left and right endocardial activation in the left and right ventricle, respectively. c Negative values indicate activations that occur earlier in time. d One horse had simultaneous initial depolarization of the mid and high left ventricular septum.
Table 3 Conduction velocities in m/s within the atria and ventricles
Chamber Activation type Mean Standard deviation
Minimum Maximum
Right atrium (n=7) Caudodorsal depolarisation
towards intervenous tubercle 1.6 0.3 1.3 2.1
Radial spreading depolarisation 1.2 0.2 0.9 1.7 Depolarisation towards cranial
vena cava 0.9 0.2 0.6 1.2
Left atrium (n=6) Radial spreading depolarisation 0.8 0.2 0.3 1.4 Interatrial septum 0.5 0.2 0.3 0.9 Left ventricle (n=7) Radial spreading depolarisation
a 5.8 1.5 1.9 11.6
Right ventricle (n=7) Radial spreading depolarisation
of inflow tract (n=2) 3.2 0.8 2.1 4.8
Radial spreading depolarisation of outflow tract
2.8 1.0 0.6 5.0
a Estimated value since no clear depolarisation wavefront could be identified

C h a p t e r 4 | 121
Discussion
In the past the myocardial activation pattern was studied using invasive epicardial or
transmural electrodes, but until now no endocardial studies were done under less invasive
circumstances [4–8]. Former studies have led to a better electrophysiological understanding
of the equine heart but the data may be biased due to the invasive character of the studies,
invading the myocardium. Our study describes the normal depolarisation in the intact horse
and correlates the depolarisation pattern with the different deflections of the surface ECG. This
knowledge is mandatory in order to use the surface ECG for arrhythmia characterisation
(origin, mechanism) and for assessing atrial or ventricular dilation [13,14].
The anatomical position of the earliest SN activation including the individual variation between
horses in this study was identical to what was described in previous electrophysiological and
anatomical studies of the SN [4,5,18]. The initial depolarization of the SN area could be seen
on the surface ECG if the SN area was located medially. This is in contradiction with previous
results where the initial atrial depolarisation was not visible, which might be due to the
difference in surface ECG lead configurations and because of epicardial mapping [4,5]. One
horse presented with 2 rate-dependent, probably vagally-mediated, SN exit sites which
resulted in a different P wave morphology and PQ interval. This implies that such vagally-
induced altered P waves may be hard or impossible to differentiate from atrial ectopy based
on a single lead of the surface ECG. The rest of the atrial endocardial conduction pattern was
similar as was described by epicardial studies, but we recorded a slightly faster endocardial
conduction velocity. This is consistent with endo-/epicardial velocity differences seen in dogs
(1.2 m/s versus 1 m/s) [1,4].
The faster conduction of 1.6 m/s from the terminal crest towards the intervenous tubercle also
corresponds to previous results in dogs [19]. Since no combined epicardial mapping was done
in our study, the conduction velocity of the interatrial band (Bachmann bundle) could not be
measured directly [1]. Based upon the distance between the intervenous tubercle and the
location of first depolarisation in the LA, the estimated continuous velocity on the interatrial
band was 1.6 m/s. No indications were found for a conduction delay between the right and left
atrium as previously described [5]. Despite the fast conduction velocity of the interatrial band,
a large part of the RA was already depolarised before the LA started to depolarise which leads
to a smaller index of simultaneous activation for the atria compared to man (± 0.3 vs 0.5 in
humans), leading to a bifid P wave on the surface ECG [2]. In 1 horse the cranial-dorsal part
of the LA along the anatomical pathway of the Bachmann bundle showed a pre-excitation like
pattern as previously described [2], because the depolarisation on the anatomical pathway

C h a p t e r 4 | 122
occurred within 5 ms of the initial depolarisation of the LA, which is also seen in humans.
During sinus rhythm, no pathways of interatrial conduction were found besides the Bachmann
bundle, contrary to what is seen in dogs and humans [1,2]. However, since no mapping was
performed during pacing from different locations within the atrium, other interatrial pathways
cannot be excluded. Contrary to human medicine, where the inferior vena cava has a sharp
delineation and the superior vena cava is irregularly delineated, the CaVC delineation was very
irregular in all horses [2]. In human medicine, myocardial sleeves are found at these areas and
these provide a possible substrate for ectopy which may initiate atrial arrhythmias such as
atrial tachycardia or atrial fibrillation [20]. The presence of myocardial sleeves in the equine
vena cavas has not been described histologically yet, but recently it has been shown that atrial
tachycardia can originate from the CaVC in horses [21]. Myocardial sleeves in the pulmonary
veins have been histologically demonstrated in horses [22] and our study shows that these
sleeves are electrophysiologically active.
For the first time Bundle of His EGMs could be recorded in the equine ventricles. Only one
Bundle of His EGM could be recorded in the RV, probably due to the difficult location
underneath the septal tricuspid valve leaflet [18]. This difficult to access location may hamper
the standard ‘four-wire’ electrophysiological diagnostic exam in horses which requires, among
other locations, a recording of the Bundle of His EGM [23]. The Bundle of His EGM in the LV
could not be recorded in 2 horses because it was difficult to keep the mapping catheter stable
underneath the aortic valve due to cardiac motion and blood flow.
Variations could be seen in the initial depolarisation site in both the left and right ventricle, mid
septum and mid free wall, but in general the first depolarisations and explosive depolarisation
are similar as seen in humans and as described in an epicardial study in horses [3,7,24]. The
3 horses that showed initial high septal depolarisation also had almost simultaneous mid septal
depolarisation. The ventricular conduction velocity represented the conduction via the Purkinje
fibres rather than the ventricular myocardial cells due to the clearly faster speeds.
Some studies have shown that certain characteristics of the surface ECG may indicate the
origin of ventricular arrhythmias [10–13] and assess dilation [9,14–16]. However, some of
these older studies were inconclusive and it was thought that only the apical or basal part of
the septum contributes to the surface ECG QRS complex [6,7,9]. However, our study shows
that the entire ventricular depolarisation process is represented in the QRS complex. We
therefore suggest that appropriate 12-lead surface ECG recordings may provide much more
information regarding the origin of ventricular ectopy and size than what is currently believed.
Limitations

C h a p t e r 4 | 123
The current study only included a limited number of animals, but despite this limitation only
minimal individual variations in the conduction pattern were encountered. However, not all
anatomical variations may be included. There was some variation in the first site of ventricular
depolarisation, but because the rapid conduction via the Purkinje system delivered the
depolarisation at different areas within a very short timeframe, this did not affect QRS
morphology or duration. This is in sharp contrast to a ventricular premature beat that depends
on slow myocardial cell-to-cell conduction, resulting in altered QRS morphology and duration.
For the quantitative analysis of the conduction velocity, only minor variations were seen in the
atria. Large variations were seen in the ventricles, but this is due to the indistinctly defined
depolarisation wavefront, which made it difficult to measure the conduction velocity and these
measurements should be interpreted as estimates. Concurrent epicardial mapping may
improve the understanding of the atrial depolarisation pattern, especially the interatrial
conduction. Future studies combining both epi- and endocardial mapping should be performed,
including experimental pacing at different locations in order to better understand the interatrial
conduction mechanisms. Finally, remapping at higher heart rates using positive chronotropic
therapy could provide a better understanding of the different conduction mechanisms.
Conclusion
This study provides a reference for the normal endocardial sinus depolarisation pattern and
conduction velocities in the equine atria and ventricles. The only interatrial conduction pathway
identified was Bachmann bundle. The depolarisation of RA and LA could be identified on the
surface ECG as the first and second part of the bifid P wave. Most of the ventricular
depolarisation occurred very fast without a clear depolarisation front. Contrary to current
knowledge, all regions of the ventricular depolarisation contributed to the QRS complex on the
surface ECG. Electrophysiologically active tissue could be found in the caudal vena cava and
pulmonary veins in all horses.

C h a p t e r 4 | 124
References
[1] Derakhchan K, Li D, Courtemanche M, Smith B, Brouillette J, Page PL. Method for Simultaneous Epicardial and Endocardial Mapping of In Vivo Canine Heart: Application to Atrial Conduction Properties and Arrhythmia Mechanisms. J Cardiovasc Electrophysiol 2001;12:548–55.
[2] De Ponti R, Ho SY, Salerno-Uriarte JA, Tritto M, Spadacini G. Electroanatomic Analysis of Sinus Impulse Propagation in Normal Human Atria. J Cardiovasc Electrophysiol 2002;13:1–10.
[3] Cassidy DM, Vassallo JA, Marchlinski FE, Buxton AE, Untereker WJ, Josephson ME. Endocardial mapping in humans in sinus rhythm with normal left ventricles: activation patterns and characteristics of electrograms. Circulation 1984;70:37–42.
[4] Muylle E, Oyaert W. Atrial Activation Pathways and the P Wave in the Horse. Zentralblatt Für Veterinärmedizin R A 1975;22:474–84.
[5] Hamlin RL, Smetzer DL, Senta T, Smith CR. Atrial activation paths and P waves in horses. Am J Physiol 1970;219:306–13.
[6] Muylle E, Oyaert W. Equine Electrocardiography The Genesis of the Different Configurations of the “QRS” Complex. Zentralblatt Für Veterinärmedizin R A 1977;24:762–71.
[7] Muylle E, Oyaert W. Excitation of the Ventricular Epicardium in the Horse. Zentralblatt Für Veterinärmedizin R A 1975;22:463–73.
[8] Muylle E. Experimenteel onderzoek naar het verloop van de depolarisatiegolf in het hart van het paard : de genesis van het electrocardiografisch P- en QRS-complex., 1975.
[9] Hamlin RL, Smith CR. Categorization of common domestic mammals based upon their ventricular activation process. Ann N Y Acad Sci 1965;127:195–203.
[10] Pfister R, Seifert-Alioth C, Beglinger R. Die Bestimmung des Ursprungsortes ventrikulärer Extrasystolen beim Pferd. Schweizer Arch Für Tierheilkd SAT Die Fachzeitschrift Für Tierärztinnen Und Tierärzte 1984;126:165–72.
[11] Hamlin RL, Smetzer DL, Smith CR. Analysis of QRS Complex Recorded Through a Semiorthogonal Lead System in the Horse. Am J Physiol 1964;207:325–33.
[12] Van Steenkiste G, De Clercq D, Decloedt A, Vera L, van Loon G. A 12‐lead electrocardiogram interpretation algorithm to determine the anatomical site of origin of atrial premature depolarizations in horses: preliminary data. Equine Vet J 2019;51:8–8.
[13] Van Steenkiste G, De Clercq D, Vera L, van Loon G. Specific 12-lead electrocardiographic characteristics that help to localize the anatomical origin of ventricular ectopy in horses: preliminary data. J Vet Intern Med 2019;33:1548.
[14] Hesselkilde EZ, Carstensen H, Vandsø Petersen B, Jespersen T, Kanters JK, Buhl R. Is ECG in horses only for dysrhythmia diagnosis? Introducing a new method for 12-lead ECG. J Vet Intern Med 2016;30:1500–1.
[15] Holmes. Spatial Vector Changes during Ventricular Depolarisation using a Semi-Orthogonal Lead System-A Study of 190 Cases. Equine Vet J 1976;8:1–16.
[16] Muylle E, Oyaert W. Clinical Evaluation of Cardiac Vectors in the Horse. Equine Vet J 1971;3:129–36.

C h a p t e r 4 | 125
[17] Van Steenkiste G, De Clercq D, Boussy T, Vera L, Schauvliege S, Decloedt A, et al. Three dimensional ultra‐high‐density electro‐anatomical cardiac mapping in horses: methodology. Equine Vet J 2020:evj.13229.
[18] Bishop SP, Cole CR. Morphology of the specialized conducting tissue in the atria of the equine heart. Anat Rec 1967;158:401–15.
[19] Goodman D, van der Steen A, van Dam R. Endocardial and epicardial activation pathways of the canine right atrium. Am J Physiol Content 1971;220:1–11.
[20] Goya M, Ouyang F, Ernst S, Volkmer M, Antz M, Kuck KH. Electroanatomic mapping and catheter ablation of breakthroughs from the right atrium to the superior vena cava in patients with atrial fibrillation. Circulation 2002;106:1317–20.
[21] Van Steenkiste G, Duytschaever M, De Clercq D, Tavernier R, Michielsen A, Decloedt A, et al. First successful radiofrequency ablation of atrial tachycardia in a horse guided by a high density 3d electro-anatomical mapping system (rhythmia). J Vet Intern Med 2019;33:1547.
[22] Vandecasteele T, Van Den Broeck W, Tay H, Couck L, van Loon G, Cornillie P. 3D reconstruction of the porcine and equine pulmonary veins, supplemented with the identification of telocytes in the horse. Anat Histol Embryol 2018;47:145–52.
[23] Murgatroyd FD, Krahn AD. Handbook of cardiac electrophysiology. Londen: Remedica; 2003.
[24] Durrer D, van Dam RT, Freud GE, Janse MJ, Meijler FL, Arzbaecher RC. Total excitation of the isolated human heart. Circulation 1970;41:899–912.


Chapter 5: An exploratory study on
Electrocardiographic and
Vectorcardiographic Differentiation of the
Site of Origin of Focally induced
Premature Depolarizations in Horses

An exploratory study on Electrocardiographic and Vectorcardiographic
Differentiation of the Site of Origin of Focally induced Premature
Depolarizations in Horses
Glenn Van Steenkiste1*, Tammo Delhaas2, Ben Hermans2, Lisse Vera1, Annelies Decloedt1,
Gunther van Loon1
1Equine Cardioteam, Department of Large Animal Internal Medicine, Faculty of Veterinary Medicine, Ghent University, Belgium
2CARIM School for Cardiovascular Diseases, Maastricht University Medical Centre, Maastricht, The Netherlands
Adapted from:
Van Steenkiste G., Delhaas T., Hermans, B., Vera L. Decloedt A., van Loon G. An exploratory
study on Electrocardiographic and Vectorcardiographic Differentiation of the Site of Origin of
Focally induced Premature Depolarizations in Horses, In preparation

130 | C h a p t e r 5
Summary
In human cardiology, the anatomical origin of both atrial (APDs) and ventricular premature
depolarizations (VPDs) are derived from P wave and QRS complex characteristics on a 12-
lead electrocardiogram (ECG) and from vectorcardiography (VCG). The objective of this study
was to differentiate between anatomical locations of premature depolarizations and to
differentiate premature depolarizations from sinus rhythm (SR) based upon VCG
characteristics. A 12-lead ECG was recorded in seven horses under general anaesthesia while
endomyocardial atrial and ventricular pacing was performed (800-1000 ms cycle length) at the
left atrial free wall and septum, right atrial free wall, intervenous tubercle, as well as the cranial
and caudal junction with the vena cava for the atrium. Left and right ventricular pacing was
performed at the at the apex, mid and high septum and mid and high free wall, and at the right
ventricular outflow tract. Catheter positioning was guided by 3D electro-anatomical mapping
and transthoracic ultrasound. The VCG was calculated from the 12-lead ECG using custom
made algorithms and was used to determine the mean electrical axis of the first and second
half of the P wave and the initial and mean electrical axis of the QRS complex. A logistic
regression model was made for each possible combination of paced locations and every paced
location was also compared with SR. The model included the azimuth, elevation and radius of
each electrical axis. The p values were calculated for the regression coefficients of the models
of each combination in order to determine significant differences. Significant (p<0.05)
differentiation could be made between every paced APD. SR showed significant differences
from all paced APDs except the cranial junction with vena cava. Left and right ventricular paced
complexes showed a significant (p<0.05) differences. Within the left ventricle, paced
complexes showed significant differences. Within the right ventricle, only paced complexes
originating from the right ventricular outflow tract were significantly different from all other
paced beats. Paced complexes originating from the right ventricular mid septum and the left
ventricular apex were not significantly different from sinus rhythm. The current results suggest
that VCG is useful to identify the anatomical origin of atrial and ventricular ectopy but
differentiation within the right ventricle is challenging.

C h a p t e r 5 | 131
Introduction
Arrhythmias are common in horses but the current knowledge about the underlying
mechanisms is very limited [1]. In human medicine and dogs, specific 12-lead
electrocardiogram (ECG) characteristics have been described to identify the origin of both
atrial (APD) and ventricular (VPD) premature depolarizations [2,3]. Different algorithms and
criteria have been established in human cardiology for the identification and differentiation of
the underlying mechanisms of ventricular arrhythmias. Former studies in horses had
contradictory results regarding the diagnostic value of 12-lead ECG and vectorcardiogram
(VCG) for localisation of premature depolarizations [4–7]. The 12-lead ECG and VCG were
therefore considered unreliable in horses although some studies indicated that the electrode
positioning was not optimal [4, 6,8]. Recent studies showed that 12-lead ECG has added value
in equine cardiology, if the lead system is properly adjusted to the anatomical position of the
equine heart [9–11]. Recently an adapted 12-lead ECG configuration applicable with widely
used hardware was proposed [9], which addressed some of the original shortcomings by
placing Einthoven’s triangle in a plane close to the mean electrical axis of the heart and the
precordial electrodes in a plane perpendicular to the electrical axis of the heart [9].
In human medicine it is important to know the anatomical origin of premature depolarizations
for several reasons. The choice for medical treatment, catheter ablation or no therapy can be
based upon the site of origin of the arrhythmia [12,13]. When catheter ablation is indicated, the
procedure is planned based upon the origin of the premature depolarization [14]. In addition,
it is known that ventricular arrhythmias pose a risk for sudden cardiac death in humans [15]
and some myocardial areas are more arrhythmogenic than others [16]. Consequently it is
important to identify the exact (anatomical) origin of the arrhythmia even if there is no visible
structural heart disease [15].
In the past, VCG required specialised equipment and physiologists were more confident
interpreting the 12-lead ECG. Nowadays, VCG has regained interest in human medicine
because of more easy-to-use equipment [17]. The VCG provides additional insight that
remains unexplored in the 12-lead ECG such as the true QRS complex direction and amplitude
in three dimensions, the spatial angle between the initial and mean electrical axis of the QRS
complex [17,18], the true P wave axes in three dimensions and vector loop inscription direction
[17,19,20]. The VCG can be used to increase the power of statistical analyses by decreasing
the number of independent variables. Indeed, calculating the VCG from the 12-lead ECG offers
a reduction in the number of leads from 12 to 3 with only a minimal information loss [21].

132 | C h a p t e r 5
The aim of this explorative study was to determine if it is possible to differentiate induced
premature depolarizations originating from anatomical areas using a 12-lead ECG derived
VCG, and second to differentiate them from sinus beats.
Methods
A cross sectional analytic study design was used. This study was approved by the ethical
committee of the faculty of veterinary medicine, Ghent University (EC 2016/35) and animal
care was according to their guidelines. Seven Warmblood geldings aged 12.5 [5-20] years
(median [range]), 163 cm [155-179 cm] height at the withers and 548 kg [420-706 kg] were
used. Four horses were owned by the Faculty of Veterinary Medicine. Three horses were
donated by their owner for scientific research followed by euthanasia due to orthopaedic
problems. Informed consent was obtained from all owners. Horses were included in the study
if auscultation, biochemistry (electrolytes and cardiac troponin I), echocardiography and ECG
were normal. These horses were also used in a previous study [22].
Electrophysiological study
The study was performed under general anaesthesia. Prior to pacing, a complete
endomyocardial 3D electro-anatomical map of the atria and ventricles (Rhythmia, Boston
Scientific, Diegem, Belgium) was created, as described elsewhere [22]. The 3D electro-
anatomical map was used as a reference to navigate the mapping/pacing catheter (Intellamap
Orion, Boston Scientific, Diegem, Belgium) inside the heart to specific anatomical locations.
Simultaneous echocardiography (Vivid 7, GE Healthcare, Diegem, Belgium) served as an
additional confirmation of the pacing location. Supra-threshold pacing was performed at 800-
1000 ms cycle length (EPS 320, MicroPace EP Inc, Santa Ana, United States) at the following
6 locations in the atria: LA free wall and septum, RA free wall, intervenous tubercle, junction
with the cranial (CrVC) and caudal (CaVC) vena cava. In the ventricles the following 11
locations were paced: right and left apex, mid and high septum and mid and high free wall,
and the right ventricular outflow tract. At least 20 pacing-induced premature depolarizations
were recorded with a 12-lead ECG (Labsystem Pro, Boston Scientific, Diegem, Belgium) with
the following electrode configuration [9]: left and right arm electrode on the left and right dorsal
spina scapulae, respectively; left foot electrode was placed at the abdominal midline caudal to
the xiphoid process. The precordial leads were placed on the manubrium sterni (V1), on the
ventral part of the left (V2) and right (V6) triceps muscle, in the left 6th intercostal space at the
level of the shoulder joint (V3) and elbow joint (V4), and in the right 6th intercostal space at the
level of the elbow joint (V5). Electrode placement is shown in Figure 1. The VCG axes were
calculated from the 12-lead ECG using the following equations:

C h a p t e r 5 | 133
𝑉𝑥 =𝑉2+𝑉4
2−
𝑉5+𝑉6
2
𝑉𝑦 =𝑉4+𝑉5
2−
𝑉2+𝑉6
2
V𝑧 = −𝑎𝑉𝐹
With Vx the right-left, Vy the cranial-caudal and Vz the ventral-dorsal axis [23].
Data analysis
Measurements were done using a custom-made program (Matlab R2018b, Mathworks,
Einthoven, The Netherlands). For the atria the onset, offset and middle of the P’ wave for the
3 most representative paced beats and of the P wave for 3 beats in SR was manually annotated
on lead II by a single observer. The middle was defined as the half of the total duration if the
P wave was singular, the zero-crossing if the P wave was biphasic and the notch if the P wave
was bifid. From these annotated P waves the spatial mean electrical axis (MEA) for both the
first (MEA1) and second (MEA2) half of the P wave (P1 and P2) were calculated. The MEA was
defined as the VCG coordinate with the largest radius distance from the origin in a spherical
coordinate system as shown in Figure 2. The electrical axis was defined by the azimuth,
elevation and radius of each point.
For the ventricles the onset and offset of the QRS complex were manually selected for 3 beats
by a single observer on lead II. From the VCG the spatial initial (IEA) and mean (MEA) electrical
axes were calculated as the VCG coordinates with the largest radius, similar as for the atria.
The MEA was selected over the entire VCG loop and the IEA was defined as the largest radius
within the first 40ms beginning from the onset of the QRS
Figure 1: Electrode placement to record the 12-lead electrocardiogram. Abbreviations: LA: left arm
electrode; LF: left foot electrode; RA: right arm electrode; V: precordial electrode.
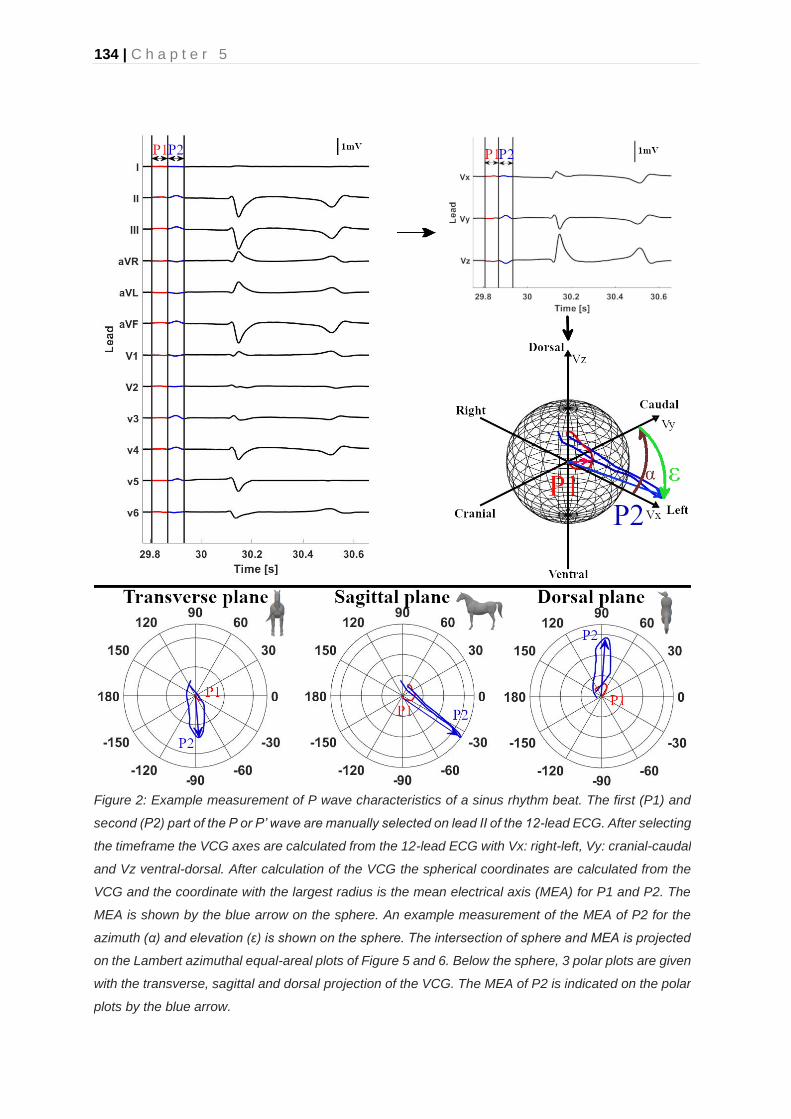
134 | C h a p t e r 5
Figure 2: Example measurement of P wave characteristics of a sinus rhythm beat. The first (P1) and
second (P2) part of the P or P’ wave are manually selected on lead II of the 12-lead ECG. After selecting
the timeframe the VCG axes are calculated from the 12-lead ECG with Vx: right-left, Vy: cranial-caudal
and Vz ventral-dorsal. After calculation of the VCG the spherical coordinates are calculated from the
VCG and the coordinate with the largest radius is the mean electrical axis (MEA) for P1 and P2. The
MEA is shown by the blue arrow on the sphere. An example measurement of the MEA of P2 for the
azimuth (α) and elevation (ε) is shown on the sphere. The intersection of sphere and MEA is projected
on the Lambert azimuthal equal-areal plots of Figure 5 and 6. Below the sphere, 3 polar plots are given
with the transverse, sagittal and dorsal projection of the VCG. The MEA of P2 is indicated on the polar
plots by the blue arrow.

C h a p t e r 5 | 135
complex. The origin of the spherical coordinate system was defined as the onset of the P wave
for the atria and the QRS complex for the ventricles.
Statistical analysis
All statistics were done in Matlab (Matlab R2018b, Mathworks, Einthoven, The Netherlands).
The Kuiper test was used to determine if the azimuth and elevation angles followed a von
Mises distribution [24]. The Shapiro-Wilk test was used to test if the radius followed a normal
distribution. Results of MEA1, MEA2 for the atria and MEA, IEA for the ventricles are described
as mean ± standard deviation and with the 95% confidence interval. Within each horse, the
radius of each P’ wave was normalized to the radius of the P wave in SR and the radius of the
QRS’ complex was normalised to the radius of the QRS complex in SR. After normalization
the spherical coordinates were converted to a Cartesian coordinate system similar to Figure 2
and 3 in order to streamline data analysis [25]. Multiple logistic regression models were fitted
upon the x, y and z coordinates. A regression model was made for each possible combination
of every paced location within the atria or ventricles and also between every paced location
and SR. For each possible combination three logistic regression models were made. For the
atria, two models were made for the MEA1 and MEA2 separately, each model containing the
azimuth, elevation and radius of the MEA1 or MEA2. A third model was made with the combined
values of MEA1 and MEA2. For the ventricles two models were made for the IEA and MEA
separately, each model containing the azimuth, elevation and radius of the IEA or MEA. A third
model was made with the combined values of IEA and MEA. The p values were calculated for
all the regression coefficients of each individual model and were considered significant if p <
0.05.
Results
Good quality ECG could be recorded during pacing at all locations and during SR. Atrial pacing
data were not available from the LA septum in 3 horses, the RA intervenous turbercle in 2
horses, and from the LA free wall and ostia in 1 horse. Example 12-lead ECGs of the paced
complexes are shown in Figure 3 and 4. The ECGs in these figures have been selected as the
most common P wave and QRS complex morphologies when pacing at these locations.

136 | C h a p t e r 5
Figure 3: Example 12-lead P wave morphologies with their respective location of pacing. The current
figure displays the most commonly noticed P wave morphology during pacing in the different horses.
Abbreviations: LA, left atrium; RA, right atrium.

C h a p t e r 5 | 137
Figure 4: Example 12-lead ECG QRS complex morphology with their respective location of pacing.
The current figure displays the most commonly noticed QRS wave morphology during pacing in the
different horses. Abbreviations: LV, left ventricle; RV, right ventricle.

138 | C h a p t e r 5
Atria
The directions of the individual depolarizations are shown in the Lambert azimuthal equal-areal
plots in Figure 5 for MEA1 and in Figure 6 for MEA2. Only the average directions of the MEA
are described below. The reader is referred to Figure 5 and 6 for the individual variations.
In horses in SR both MEA1 and MEA2 were directed left caudoventrally. Pacing at the LA free
wall induced a right MEA1 and left cranial MEA2. Induced APDs from the LA septum had a right
cranial MEA1 and MEA2.
Both MEA1 and MEA2 were directed left caudoventrally for APDs originating from the CrVC.
Four induced APDs from the RA free wall had a left cranial MEA1 and three had a caudal MEA1,
all APDs from the RA free wall had a left caudoventral MEA2. Pacing at the RA intervenous
tubercle showed a left cranial MEA1 and right caudoventral MEA2 and pacing in the RA CaVC
showed both a left cranial MEA1 and MEA2.
The contingency table of the lowest p values for each combination is given in Table 2. Adding
the P1 and P2 duration to the logistic regression models did not improve the overall number of
significant differentiations. Because P’ waves of the RA CrVC had a similar morphology as P
waves during SR they could not be differentiated from each other. Differentiation between
every location in the atria and all other paced locations and SR could be made based upon the
combination of MEA1 and MEA2 characteristics.
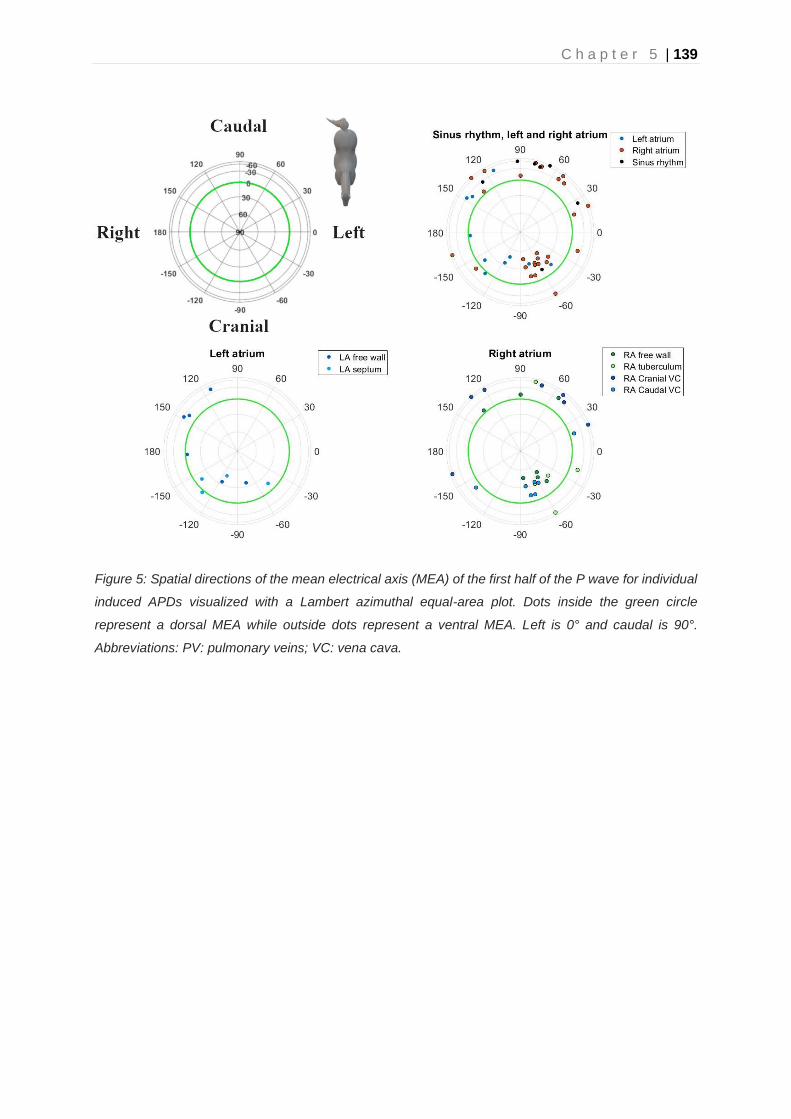
C h a p t e r 5 | 139
Figure 5: Spatial directions of the mean electrical axis (MEA) of the first half of the P wave for individual
induced APDs visualized with a Lambert azimuthal equal-area plot. Dots inside the green circle
represent a dorsal MEA while outside dots represent a ventral MEA. Left is 0° and caudal is 90°.
Abbreviations: PV: pulmonary veins; VC: vena cava.

140 | C h a p t e r 5
Figure 6: Spatial directions of the mean electrical axis (MEA) of the second half of the P wave for
individual induced APDs visualized with a Lambert azimuthal equal-area plot. Dots inside the green
circle represent a dorsal MEA while outside dots represent a ventral MEA. Left is 0° and caudal is 90°.
Abbreviations: PV: pulmonary veins; VC: vena cava.

C h a p t e r 5 | 141
Table 1: Descriptive statistics of the electrical axes distribution for the different induced atrial
premature depolarizations. The mean electrical axis is measured as the maximum radius during the
first (P1) or second (P2) half of the P wave.
Location
n Mean electrical axis P1 Mean electrical axis P2
Azimuth (°)
Elevation (°)
Radius (mV)
Duration (ms)
Azimuth (°)
Elevation (°)
Radius (mV)
Duration (ms)
Sinus rhythm
7 69±48 -39±26 0.1±0.06 70±10 67±28 -45±9 180±0.05 80±10
Left atrium
Free wall 6 178±55 -3±30 0.11±0.0
3 90±20 -159±67 3±33 120±30 80±20
Septum 4 -110±35 18±19 0.16±0.0
6 70±10 -123±14 22±19 190±50 80±10
Right atrium
Caudal vena cava
7 -70±40 15±18 0.11±0.0
6 80±30 -53±43 12±21 140±40 80±30
Cranial vena cava
7 85±52 -59±13 0.12±0.0
8 80±20 65±20 -48±12 260±0.09 100±20
Free wall 7 -24±68 16±29 0.11±0.0
5 80±20 58±17 -45±12 210±0.08 90±30
Intervenous tubercle
5 -32±47 -15±39 0.13±0.1
1 60±20 38±19 -47±21 210±0.09 80±40

142 | C h a p t e r 5
Table 2: Contingency table with the significant results for the regression coefficients of the logistic
regression for each combination of induced atrial premature depolarizations and each combination of
induced atrial premature depolarizations and sinus rhythm. Logistic regression was done based upon
the mean electrical axis calculated for both the first and second half of the P wave. A p<0.05 is
considered a significant difference. Every significant value was also significant for the combined use of
the first and second half of the P wave characteristics. The significant differences based upon the mean
and initial electrical axis are shown in the lower left and upper right area of the table respectively. A
dark grey area indicates that the electrical axis was significant on its own and in combination with the
other electrical axis, while a light grey area indicates that the electrical axis was only significant in
combination with the other electrical axis. A white area indicates no significant differences at all.
Location LA fw LA sep RA
CaVC RA CrVC RA fw RA ivt SR
LA fw
Mean electrical axis
P1
LA sep
RA CaVC
RA CrVC
RA fw
RA ivt
SR
Mean electrical axis P2
Abbreviations: LA: left atrium; RA: right atrium; CaVC: caudal vena cava; CrVC: cranial vena cava; fw :
free wall; sep: septum; ivt: intervenous tubercle; Superscripts: 1: mean electrical axis of first half P wave;
2: mean electrical axis of second half P wave.

C h a p t e r 5 | 143
Ventricles
Descriptive statistics for the induced VPDs and SR are given in Table 3. The radius followed a
normal distribution with exception for the right and left ventricular apex and RV mid free wall.
The azimuth and elevation angle had a von Mises distribution for all locations. The contingency
table of the lowest p values for each combination is given in Table 4. The individual IEA and
MEA for each beat are shown in the Lambert azimuthal equal-area plot in Figure 7 for the IEA
and in Figure 8 for the MEA. Only the average directions of the IEA and MEA are described
below. The reader is referred to Figure 7 and 8 for the individual variations.
In horses in SR IEA was very variable and directed dorsally in 4 cases, left caudally in 2 cases
and cranioventrally in 1 case. The SR beats continued into a right craniodorsal MEA.
Nearly all VPDs from the LV had a right cranially aimed IEA end MEA. Induced VPDs in the
LV mid and high free wall had a right craniodorsal IEA and MEA. Differentiation between high
and mid free wall could be made based upon the normalized radius of IEA, which was longer
for VPDs from the high free wall. Induced VPDs in the LV septum had a left cranial IEA and
MEA. A horizontally to slightly ventrally aimed IEA and MEA were noted for VPDs originating
from the high septum while the VPDs located at the mid septum had a dorsally aimed IEA and
MEA. Pacing at the LV apex induced a left craniodorsal IEA which continued into a right
craniodorsal MEA, similar as SR depolarizations.
As shown in Table 3, nearly all VPDs originating from the RV had a left caudally aimed IEA
and MEA. Induced VPDs from the RV outflow tract had a caudoventrally aimed IEA and
caudoventrally aimed MEA. Pacing at the RV free wall induced an IEA and MEA towards the
left and slightly towards ventral. Induced VPDs from the mid and high septum produced a left
caudoventral IEA and (left) caudal MEA. High septal VPDs had a slightly ventrally aimed MEA
which was useful to differentiate them from mid septal VSDs. Pacing at the RV apex induced
a left horizontal IEA and left dorsally aimed MEA.
For SR, no significant differences could be found between SR and paced complexes from the
LV apex and RV mid free wall. All other pacing locations showed significant differences with
SR. Between LV and RV, IEA was significantly different between most LV and RV pacing
locations. Induced VPDs from the LV had a right cranial IEA and VPDs from the RV had a left
caudal IEA. One exception is the LV high septum for which IEA was not significantly different
with the RV. However, for the LV high septum the MEA was significantly different compared to
the RV pacing locations. Within the LV all paced complexes showed significant differences
compared to each other. Due to the similar morphology of SR and paced complexes from the

144 | C h a p t e r 5
LV apex, no significant differences could be found between SR complexes and LV apex
complexes.
Differentiation within the RV was difficult. No significant differences could be found between
high and mid free wall VPD complexes. Due to the high variability in mid free wall VPDs, VPDs
originating from the mid free wall were not significantly different from VPDs of the high septum
and mid septum, RV apex. VPDs originating from the RV mid septum could were not
significantly different from the mid free wall. Induced VPDs originating from the RV high septum
showed a high similarity to VPDs from the RV high free wall and could only be differentiated
based upon the combined use of IEA and MEA.
Figure 7: Spatial directions of the initial electrical axis (IEA) of the QRS complex for individual induced
VPDs visualized using a Lambert azimuthal equal-area plot. The IEA is calculated during the first 40ms
of the QRS complex. Dots inside the green circle represent a dorsal IEA while outside dots represent a
ventral IEA. Left is 0°, caudal is 90° azimuth and dorsal is 90° elevation.

C h a p t e r 5 | 145
Figure 8: Spatial directions of the mean electrical axis (MEA) of the QRS complex for individual induced
VPDs visualized with a Lambert azimuthal equal-area plot. The MEA is calculated over the entire QRS
complex. Dots inside the green circle represent a dorsal MEA while outside dots represent a ventral
MEA. Left is 0°, caudal is 90° azimuth and dorsal is 90° elevation.
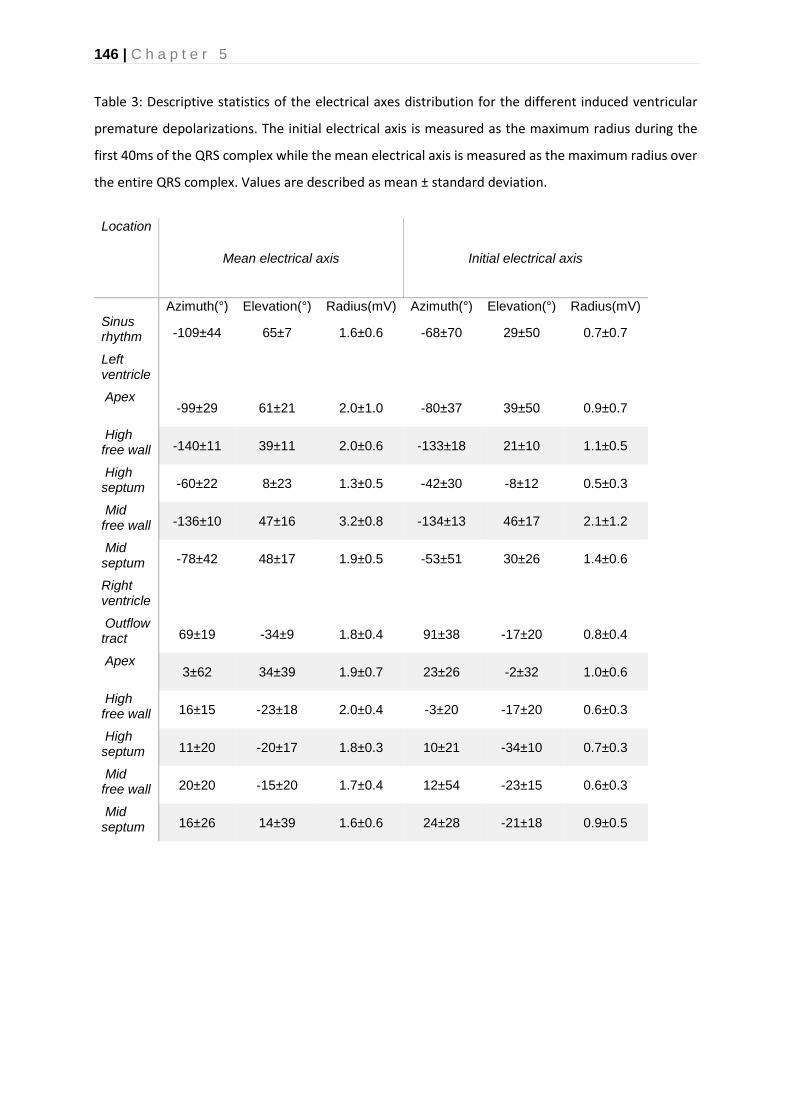
146 | C h a p t e r 5
Table 3: Descriptive statistics of the electrical axes distribution for the different induced ventricular
premature depolarizations. The initial electrical axis is measured as the maximum radius during the
first 40ms of the QRS complex while the mean electrical axis is measured as the maximum radius over
the entire QRS complex. Values are described as mean ± standard deviation.
Location
Mean electrical axis Initial electrical axis
Azimuth(°) Elevation(°) Radius(mV) Azimuth(°) Elevation(°) Radius(mV) Sinus rhythm -109±44 65±7 1.6±0.6 -68±70 29±50 0.7±0.7
Left ventricle
Apex -99±29 61±21 2.0±1.0 -80±37 39±50 0.9±0.7
High free wall -140±11 39±11 2.0±0.6 -133±18 21±10 1.1±0.5
High septum -60±22 8±23 1.3±0.5 -42±30 -8±12 0.5±0.3
Mid free wall -136±10 47±16 3.2±0.8 -134±13 46±17 2.1±1.2
Mid septum -78±42 48±17 1.9±0.5 -53±51 30±26 1.4±0.6
Right ventricle
Outflow tract 69±19 -34±9 1.8±0.4 91±38 -17±20 0.8±0.4
Apex 3±62 34±39 1.9±0.7 23±26 -2±32 1.0±0.6
High free wall 16±15 -23±18 2.0±0.4 -3±20 -17±20 0.6±0.3
High septum 11±20 -20±17 1.8±0.3 10±21 -34±10 0.7±0.3
Mid free wall 20±20 -15±20 1.7±0.4 12±54 -23±15 0.6±0.3
Mid septum 16±26 14±39 1.6±0.6 24±28 -21±18 0.9±0.5

C h a p t e r 5 | 147
Table 4:. Contingency table with the significant results for the regression coefficients of the logistic regression for each combination of induced ventricular
premature depolarizations and each combination of induced ventricular premature depolarizations and sinus rhythm. Logistic regression was done based
upon the mean electrical axis and initial electrical axis calculated from each QRS complex. A p<0.05 is considered a significant difference. Every significant
value was also significant for the combined use of the initial and mean electrical axis characteristics. The significant differences based upon the mean and
initial electrical axis are shown in the lower left and upper right area of the table respectively. A dark grey area indicates that the electrical axis was significant
on its own and in combination with the other electrical axis, while a light grey area indicates that the electrical axis was only significant in combination with
the other electrical axis. A white area indicates no significant differences at all.
Location LV apex LV hfw LV hsep LV mfw LV msep RV ot RV apex RV hfw RV hsep RV mfw RV msep SR
LV apex
IEA
LV hfw
LV hsep
LV mfw
LV msep
RV ot
RV apex
RV hfw
RV hsep
RV mfw
RV msep
SR
MEA
Abbreviations: IEA, initial electrical axis; LV: left ventricle; MEA, mean electrical axis; RV, right ventricle; mfw , mid free wall; msep, mid septum, hfw, high free
wall; hsep, high septum; ot, outflow tract.

148 | C h a p t e r 5
Discussion
The current study describes VCG characteristics of induced premature depolarizations in
horses in an experimental set-up. Analysis of VCG characteristics allowed to identify specific
anatomical origins of premature depolarizations.
The current electrode placement for the 12-lead ECG was recently described [9] and creates
an Einthoven triangle which is almost in line with the mean electrical axis of the equine heart
and places WCT close to the heart. This should provide more reliable information about atrial
and ventricular electrophysiology compared to older configurations [9,26]. Although better, the
current electrode configuration might still not be the most optimal configuration because WCT
is still dorsal to the heart instead of in the center of the heart. However, due to the current
method of calculation of the VCG from the 12-lead ECG the effect of WCT is completely
omitted from all axes since Vx, Vy and Vz are bipolar. Most of the precordial electrodes were
placed in a plane near the apex of the ventricles while in human and small animal medicine
the electrodes are placed as close as possible to the heart in order to obtain a better sensitivity
and specificity for a change in conduction pattern. The current configuration might benefit from
moving the precordial electrodes up to a plane at the height of the mid ventricles and potentially
place the remaining electrodes at the height of the left and right atrium for improved
differentiation between the atria.
Differentiation between the anatomical origin of APDs using VCG characteristics
Due to the different anatomical positioning and electrophysiology of the equine heart, human
12-lead ECG characteristics [27–30] cannot be applied in horses. No direct comparison of the
current algorithm with the previously described P wave characteristics for horses could be
made due to a different electrode configuration and different anatomical locations for the origin
of the APDs [7,31].The first study describing the P wave change due to atrial stimulation and
cauterization was performed in small animals [32]. However, no further studies could be found
that describe ECG characteristics for atrial ectopy in small animals, but it has been suggested
that ECG characteristics for atrial ectopy are similar as in human medicine [3]. During SR at
rest P1 is generated by the depolarization of the RA in a caudoventral direction. P2 is produced
by the depolarization of the LA, again in a caudoventral direction [33]. This matches the
findings on the VCG where both MEA1 and MEA2 are directed caudoventrally. However, one
horse had an MEA1 in SR that was directed left craniodorsally as seen on Figure 5. This
particular horse had 2 sinus node exit areas, one at the medial crista terminalis and a second
one at the right atrial free wall [10]. The P wave shown in Figure 5 was produced by a SR
depolarization originating from the RA free wall which explains why MEA1 is close to a cluster
C h a p t e r 5 | 149
of APDs originating from the RA free wall. Similar sinus node exit areas and P wave
morphology shifts have also been observed during mapping studies in dogs [34]. These
changes could be induced in dogs by electrically stimulating the vagus nerve.
As can be seen in Figure 5 and 6 the clusters represent the intra-atrial origin of the induced
APD. P2 rather shows clustering representing the interatrial origin of the APD. This is also
shown in Table 2 where MEA1 is more frequently significantly different within the atria and
MEA2 is more frequently significantly different between the atria. This matches previous
findings in horses [7,10]. Indeed, during P1 the depolarization wave spreads within the atrium
of origin causing MEA1 while during P2 the depolarization spreads to the adjacent atrium
causing MEA2. Only 4 out of 7 induced APDs of the RA free wall had a left craniodorsal MEA1
and 3 had a caudoventral MEA1. This could be explained by slight differences in free wall
pacing site, with APDs induced slightly more caudally resulting in a cranially directed MEA1,
and vice versa. In the current Figures 5 and 6 such differences cannot be seen without
examining the entire VCG loop of the P wave. This also applies to APDs originating from the
RA intervenous tubercle, LA free wall and LA ostia. However, the APDs originating from the
RA CrVC with a cranial MEA1 and the CaVC APD with a caudal MEA1 can’t be explained by
this theory. The left cranial MEA2 of APDs originating from the junction with the CaVC are in
contradiction with previous findings [7]. In a previous study, induced APDs at the ostium of the
coronary sinus had a similar cranially directed MEA1 but were followed by a caudally directed
MEA2. In our results MEA2 for the CaVC was directed left cranial in most cases, which implies
that the LA is also depolarized from caudal to cranial. An anterior breakthrough site from the
right to the left atrium through the oval fossa or coronary sinus has been described in humans
but has not yet been described in horses [10,35,36]. A similar mechanism might exist in horses.
Another possible explanation is that pacing near the CaVC resulted in transmural electrical
stimulation of the adjacent left atrial myocardium. Stimulation at this location would lead to a
cranially directed MEA2. Pacing at the caudal RA CaVC at the side of the free wall while
creating an electro-anatomical map of the LA could elucidate the underlying mechanisms.
Similarly, simultaneous LA pacing and RA mapping would provide better insights into the
interatrial conduction of APDs originating from the LA. The APDs originating from the LA with
a caudal MEA2 could have a left-to-right atrial breakthrough site at the Bachmann bundle while
the cranial MEA2 could have a caudal left-to-right atrial breakthrough site. In human medicine
left-to-right breakthroughs have been described at the level of the oval fossa, coronary sinus
and intervenous tubercle at the insertion point of the Bachmann bundle [37].
Differentiation between the anatomical origin of VPDs using VCG characteristics

150 | C h a p t e r 5
The VCG characteristics for the QRS during SR were similar as those previously reported for
semi-orthogonal lead systems in horses with a dorsally and cranially directed MEA in the
spatial VCG [38,39]. The large IEA spread during SR corresponds with the large individual
differences of initial ventricular activation found during electro-anatomical mapping, which is
similar as in humans [10,40]. Horses with a ventral IEA had an initial ventricular activation
located at the high septum while a dorsal IEA corresponded with an initial ventricular activation
between the LV apex and LV mid septum.
Based upon the VCG characteristics it was difficult to differentiate between the RV free wall
and septum as shown in Table 4. Previous research by our group has shown that the RV in
horses has a more explosive depolarisation pattern compared to the LV, which may be due to
conduction over the septomarginal trabecula [10]. However, it is unlikely that induced VPDs
could have a similarly rapid propagation speed as normal sinus rhythm beats, which would
imply that (some) induced VPDs activated the His-Purkinje network. In human medicine, VPDs
originating from the RV septum have lower initial amplitude in leads V1-V3 compared to other
VPDs. These characteristics are used to differentiate between RV free wall and septum
[41,42]. Other difficult to differentiate anatomical locations in the RV were mainly adjacent
areas. Pacing in the RV apical region could not be differentiated from the RV septum or free
wall, which may also reflect the limitations of the pacing catheter used in the current study.
Because of the basket shape of the pacing catheter no perfect apical stimulation could be
achieved. Similarly, the large spread of both IEA and MEA of some induced VPD origins, such
as the RV mid free wall, could be explained because the pacing site of the induced VPD was
not always exactly the same. If a VPD was induced more to the right of the ventricle, this would
depolarise a larger mass in a left direction and thus a left directed IEA/MEA. However, if a VPD
is induced more cranially this would produce a more caudal IEA/MEA while still being induced
at the RV mid free wall. Surprisingly, right and left septum could be differentiated in
contradiction to human medicine where it is challenging to differentiate between left and right
ventricular septum [42]. A possible explanation would be the up to ±4 times thicker
interventricular septum in horses, compared to humans, since only the IEA was significantly
different between the left and right ventricular septum [43,44].
Some clusters appear to be similar on the Lambert azimuthal equal area plots but are still
significantly different due to a difference in radius length, which is not visible on the Lambert
plot. As can be seen in Table 3, the radius was longer for most VPDs in comparison with SR.
Because QRS complexes in SR follow the most optimal depolarization pathway and depolarize
both the LV and RV simultaneously some cancelling out of the cardiac electric field occurs.

C h a p t e r 5 | 151
One notable exception is the LV high free wall, due to the central position in the heart this
location can also lead to some cancelling out of the cardiac electric field.
Previous research has shown that the LV depolarization often starts at the low mid septum
[10]. This region is close to the LV apex which may explain why no significant differences could
be found between induced VPDs and QRS complexes in SR since 4 out of 7 horses had an
initial LV depolarization at the low mid septum. In addition, one horse also had a SR like QRS’
complex by pacing at the RV apex. If the His-Purkinje network could be activated at the RV
apex it could also induce a craniodorsal MEA, similar as QRS complexes in SR and paced
complexes from the LV apex. This due to the proximity of the RV apex to the LV apex/mid
septum.
A previous study in horses described the changes in QRS patterns in horses using a semi-
orthogonal lead system and induced VPDs in the right and left ventricle using epicardial
mechanical stimulation [8]. The directions of the electrical axis of the QRS in left and right
ventricular induced VPDs in the horizontal plane were similar as those seen in the current
study. However, our study has the advantage that no adapted equipment is necessary to
perform the recordings. Indeed, the current VCG can be easily derived from the 12-lead ECG
which can be recorded with inexpensive commercially available 12-lead ECG recording
devices from human medicine.
Most studies in humans describe the QRS morphology of VPDs using the 12-lead ECG [42].
Due to the different anatomical position of the heart, the human electrode configuration cannot
be directly copied to the horse, thus making a direct comparison between the current study in
horses and QRS morphologies described in humans difficult.
Limitations
Only a small number of animals was used in the current study, but the power of the test was
sufficient to show that the 12-lead ECG derived VCG could have an added value for equine
electrocardiography. Larger studies should be done in order to enable the construction of a
clinically applicable algorithm for the identification of the anatomical site of origin of premature
depolarizations. The current study was done in healthy horses. It is known in humans that the
activation propagates away from the premature depolarization in a predictable manner in
individuals without structural heart disease while the propagation is less predictable in the
presence of structural heart disease [42]. The current results may thus not be representative
for horses with cardiac disease. In addition, since no capture threshold was determined this
could have affected the conduction pattern of the induced premature depolarisation. However,

152 | C h a p t e r 5
similar pacing studies in humans were useful to define diagnostic criteria applicable to clinical
patients [28]. In our study only endocardial pacing was done while in human patients QRS
morphology may be different for endocardial versus epicardial origin of VPDs [45]. These are
attributed to the Purkinje network, which is positioned subendocardial in humans, causing
endocardial VPDs to propagate faster compared to epicardial VPDs. In horses the Purkinje
network is more diffusely spread in the ventricular myocardium and it is thus unclear whether
the slower conduction for epicardial VPDs also accounts to horses since transmural conduction
from endo- to epicardium is known to be below 5ms during SR in healthy horses [46,47]. In
addition, it is unknown if naturally occurring VPDs enter the His-Purkinje system. The current
study used supra-threshold pacing for inducing VPDs which could have activated the His-
Purkinje system due to the higher currents compared to a naturally occurring VPD. As a result,
the induced VPDs may have a different morphology compared to naturally occurring VPDs. In
addition, all recordings were done during anaesthesia in dorsal recumbency, which may have
affected the position of the heart and thus the recorded complexes. Annotations of the QRS
complex were done manually by a single observer but QRS complex endings were not always
clearly defined due to the presence of a pronounced r’ wave.
Conclusion
The current study shows that the 12-lead ECG derived VCG is a useful technique to identify
the anatomical origin of atrial and ventricular ectopy. The VCG could possibly be used for the
construction of a clinically applicable algorithm for differentiation between different anatomical
origins of APDs and VPDs. Further research should be done in a larger group of horses with
experimentally induced arrhythmias but also in clinical patients in which the underlying cause
and location of APDs, atrial tachycardia, VPDs or ventricular tachycardia is identified using
endocardial mapping.

C h a p t e r 5 | 153
References
[1] Navas de Solis C. Exercising arrhythmias and sudden cardiac death in horses: Review of the literature and comparative aspects. Equine Vet J 2016;48:406–13.
[2] Lee J, Fynn S. P Wave Morphology in Guiding the Ablation Strategy of Focal Atrial Tachycardias and Atrial Flutter. Curr Cardiol Rev 2014;11:103–10.
[3] Santilli RA, Perego M, Crosara S, Gardini F, Bellino C, Moretti P, Spadacini G. Utility of 12-lead electrocardiogram for differentiating paroxysmal supraventricular tachycardias in dogs. J Vet Intern Med 2008;22:915–23.
[4] Muylle E, Oyaert W. Equine Electrocardiography The Genesis of the Different Configurations of the “QRS” Complex. Zentralblatt Für Veterinärmedizin R A 1977;24:762–71.
[5] Holmes JR, Alps BJ. Studies into equine electrocardiography and vectorcardiography IV. Vector Distributions In Some Arrhythmias. Can J Comp Med Vet Sci 1967;31:150–5.
[6] Pfister R, Seifert-Alioth C, Beglinger R. Die Bestimmung des Ursprungsortes ventrikulärer Extrasystolen beim Pferd. Schweizer Arch Für Tierheilkd SAT Die Fachzeitschrift Für Tierärztinnen Und Tierärzte 1984;126:165–72.
[7] Hamlin RL, Smetzer DL, Senta T, Smith CR. Atrial activation paths and P waves in horses. Am J Physiol 1970;219:306–13.
[8] Hamlin RL, Smetzer DL, Smith CR. Analysis of QRS Complex Recorded Through a Semiorthogonal Lead System in the Horse. Am J Physiol 1964;207:325–33.
[9] Hesselkilde EZ, Carstensen H, Vandsø Petersen B, Jespersen T, Kanters JK, Buhl R. Is ECG in horses only for dysrhythmia diagnosis? Introducing a new method for 12-lead ECG. J Vet Intern Med 2016;30:1500–1.
[10] Van Steenkiste G, L. V, A. D, S. S, T. B, van Loon G. Endocardial electro-anatomic mapping in healthy horses: Normal sinus impulse propagation in the left and right atrium and the ventricles. Vet J 2020:105452.
[11] Van Steenkiste G, De Clercq D, Vera L, van Loon G. Specific 12-lead electrocardiographic characteristics that help to localize the anatomical origin of ventricular ectopy in horses: preliminary data. J Vet Intern Med 2019;33:1548.
[12] Cronin EM, Bogun FM, Maury P, Peichl P, Chen M, Namboodiri N, Aguinaga L, Leite LR, Al-Khatib SM, Anter E, Berruezo A, Callans DJ, Chung MK, Cuculich P, d’Avila A, Deal BJ, … Zeppenfeld K. 2019 HRS/EHRA/APHRS/LAHRS expert consensus statement on catheter ablation of ventricular arrhythmias. Europace 2019;21:1143–4.
[13] Pedersen CT, Kay GN, Kalman J, Borggrefe M, Della-Bella P, Dickfeld T, Dorian P, Huikuri H, Kim YH, Knight B, Marchlinski F, Ross D, Sacher F, Sapp J, Shivkumar K, Soejima K, … Peachey H. EHRA/HRS/APHRS expert consensus on ventricular arrhythmias. Europace 2014;16:1257–83.
[14] Yamada T, Kay GN. Optimal ablation strategies for different types of ventricular tachycardias. Nat Rev Cardiol 2012;9:512–25.
[15] Zorzi A, Marra MP, Rigato I, De Lazzari M, Susana A, Niero A, Pilichou K, Migliore F, Rizzo S, Giorgi B, De Conti G, Sarto P, Serratosa L, Patrizi G, De Maria E, Pelliccia A, … Corrado D. Nonischemic left ventricular scar as a substrate of life-threatening ventricular arrhythmias and sudden cardiac death in competitive athletes. Circ Arrhythmia Electrophysiol 2016;9:1–14.

154 | C h a p t e r 5
[16] Al-Khatib SM, Stevenson WG, Ackerman MJ, Bryant WJ, Callans DJ, Curtis AB, Deal BJ, Dickfeld T, Field ME, Fonarow GC, Gillis AM, Granger CB, Hammill SC, Hlatky MA, Joglar JA, Kay GN, … Page RL. 2017 AHA/ACC/HRS Guideline for Management of Patients With Ventricular Arrhythmias and the Prevention of Sudden Cardiac Death. Circulation 2018;138:e272–391.
[17] Man S, Maan AC, Schalij MJ, Swenne CA. Vectorcardiographic diagnostic & prognostic information derived from the 12-lead electrocardiogram: Historical review and clinical perspective. J Electrocardiol 2015;48:463–75.
[18] Kors JA, van Herpen G, Willems JL, van Bemmel JH. Improvement off automated electrocardiographic diagnosis by combination of computer interpretations of the electrocardiogram and vectorcardiogram. Am J Cardiol 1992;70:96–9.
[19] Sano T, Hellerstein HK, Vayda E. P vector loop in health and disease as studied by the technique of electrical dissection of the vectorcardiogram (differential vectorcardiography). Am Heart J 1957.
[20] Rangel MO, O’Neal WT, Soliman EZ. Usefulness of the Electrocardiographic P-Wave Axis as a Predictor of Atrial Fibrillation. Am J Cardiol 2016;117:100–4.
[21] Kors JA, van Herpen G. Computer analysis of the electrocardiogram. In: Macfarlane PW, van Oosterom A, Pahlm O, Kligfield P, Janse M, Camm J, editors. Compr. Electrocardiol., London: Springer London; 2011, p. 1723–52.
[22] Van Steenkiste G, De Clercq D, Boussy T, Vera L, Schauvliege S, Decloedt A, van Loon G. Three dimensional ultra‐high‐density electro‐anatomical cardiac mapping in horses: methodology. Equine Vet J 2020:evj.13229.
[23] Holmes JR, Else RW. Further Studies on a New Lead for Equine Electrocardiography. Equine Vet J 1972;4:81–7.
[24] Edward Batschelet. Circular Statistics in Biology. New York: Taylor & Francis; 1981.
[25] Cremers J, Klugkist I. One direction? A tutorial for circular data analysis using R with examples in cognitive psychology. Front Psychol 2018;9:1–13.
[26] Van Zijl WJJ. The electrocardiogram of the normal horse using the techniques of Einthoven and Wilson. Tijdschr Diergeneesk 1951;76:85–96.
[27] Abramson DI, Fenichel NM, Shookhoff C. A study of electrical activity in the auricles. Am Heart J 1938;15:471–81.
[28] Qian ZY, Hou XF, Xu DJ, Yang B, Chen ML, Chen C, Zhang FX, Shan QJ, Cao KJ, Zou JG. An algorithm to predict the site of origin of focal atrial tachycardia. PACE - Pacing Clin Electrophysiol 2011;34:414–21.
[29] Tang CW, Scheinman MM, Van Hare GF, Epstein LM, Fitzpatrick AP, Lee RJ, Lesh MD. Use of P wave configuration during atrial tachycardia to predict site of origin. J Am Coll Cardiol 1995;26:1315–24.
[30] Tada H, Nogami A, Naito S, Suguta M, Nakatsugawa M, Horie Y, Tomita T, Hoshizaki H, Oshima S, Taniguchi K. Simple Electrocardiographic Criteria for Identifying the Site of Origin of Focal Right Atrial Tachycardia. Pacing Clin Electrophysiol 1998;21:2431–9.
[31] Kistler PM, Roberts-Thomson KC, Haqqani HM, Fynn SP, Singarayar S, Vohra JK, Morton JB, Sparks PB, Kalman JM. P-Wave Morphology in Focal Atrial Tachycardia. J Am Coll Cardiol 2006;48:1010–7.
C h a p t e r 5 | 155
[32] Muylle E, Oyaert W. Atrial Activation Pathways and the P Wave in the Horse. Zentralblatt Für Veterinärmedizin R A 1975;22:474–84.
[33] Hamlin RL, Himes JA, Guttridge H, Kirkham W. P wave in the electrocardiogram of the horse. Am J Vet Res 1970;31:1027–31.
[34] Goldberg JM, Lynn-Johnson MH. Changes in canine P wave morphology observed with shifts in intra-SA nodal pacemaker localization. J Electrocardiol 1980;13:209–17.
[35] De Ponti R, Ho SY, Salerno-Uriarte JA, Tritto M, Spadacini G. Electroanatomic Analysis of Sinus Impulse Propagation in Normal Human Atria. J Cardiovasc Electrophysiol 2002;13:1–10.
[36] Holmqvist F, Husser D, Tapanainen JM, Carlson J, Jurkko R, Xia Y, Havmöller R, Kongstad O, Toivonen L, Olsson SB, Platonov PG. Interatrial conduction can be accurately determined using standard 12-lead electrocardiography: Validation of P-wave morphology using electroanatomic mapping in man. Hear Rhythm 2008;5:413–8.
[37] Dong J, Zrenner B, Schreieck J, Deisenhofer I, Karch M, Schneider M, Von Bary C, Weyerbrock S, Yin Y, Schmitt C. Catheter ablation of left atrial focal tachycardia guided by electroanatomic mapping and new insights into interatrial electrical conduction. Hear Rhythm 2005;2:578–91.
[38] Muylle E, Oyaert W. Clinical Evaluation of Cardiac Vectors in the Horse. Equine Vet J 1971;3:129–36.
[39] Holmes. Spatial Vector Changes during Ventricular Depolarisation using a Semi-Orthogonal Lead System-A Study of 190 Cases. Equine Vet J 1976;8:1–16.
[40] Durrer D, van Dam RT, Freud GE, Janse MJ, Meijler FL, Arzbaecher RC. Total excitation of the isolated human heart. Circulation 1970;41:899–912.
[41] Tada H, Ito S, Naito S, Kurosaki K, Ueda M, Shinbo G, Hoshizaki H, Oshima S, Nogami A, Taniguchi K. Prevalence and electrocardiographic characteristics of idiopathic ventricular arrhythmia originating in the free wall of the right ventricular outflow tract. Circ J 2004;68:909–14.
[42] Yamada T. Twelve-lead electrocardiographic localization of idiopathic premature ventricular contraction origins. J Cardiovasc Electrophysiol 2019;30:2603–17.
[43] Bakos Z, Vörös K, Järvinen T, Reiczigel J. Two-dimensional and M-mode echocardiographic measurements of cardiac dimensions in healthy standardbred trotters. Acta Vet Hung 2002;50:273–82.
[44] Henry WL, Ware J, Gardin JM, Hepner SI, McKay J, Weiner M. Echocardiographic measurements in normal subjects. Growth-related changes that occur between infancy and early adulthood. Circulation 1978;57:278–85.
[45] Berruezo A, Mont L, Nava S, Chueca E, Bartholomay E, Brugada J. Electrocardiographic Recognition of the Epicardial Origin of Ventricular Tachycardias. Circulation 2004;109:1842–7.
[46] Meyling HA, Ter Borg H. The conducting system of the heart in hoofed animals. Cornell Vet 1957;47:419–55.
[47] Muylle E. Experimenteel onderzoek naar het verloop van de depolarisatiegolf in het hart van het paard : de genesis van het electrocardiografisch P- en QRS-complex., 1975.


General discussion

G e n e r a l d i s c u s s i o n | 159
This thesis explores both new and “old” diagnostic strategies for recording and interpretation
of the equine electrocardiogram (ECG) and clearly shows that the ECG can be used for more
than rate and rhythm determination. The current belief that only a limited part of the cardiac
depolarization can be extracted from the ECG in horses is proven incorrect. In addition, we
showed that multiple lead systems, such as the 12-lead ECG, do have an added value in
equine cardiology and allow localization of the origin of premature depolarizations. New
methods for both improved detection of arrhythmias and characterization of atrial fibrillation
(AF) based upon the surface ECG were studied. The current thesis also describes a new
technique, 3D electro-anatomical mapping, which adds a powerful tool for the evaluation of
equine electrophysiology by creating precise electrical activation maps on a 3D image of the
equine heart. In fact, this is the first technique that enables to create a 3D image of the heart
in a living, adult horse.
In this general discussion an overview is given of the advancements made in this doctoral
thesis. In addition, comparisons are made with the current state of the art in equine and human
medicine and future prospects are discussed.
Initial diagnosis of arrhythmias with the use of deep learning
An ECG is an effective tool for the initial diagnosis of various medical conditions such as
cardiac rhythm disturbances and electrolyte disturbances [1]. However, ECG interpretation
requires expertise and is very time consuming. Numerous automatic classification algorithms
have been described for the analysis of human ECGs [1]. As described in Chapter 1, automatic
or semi-automatic analysis of the equine ECG using human or small animal ECG analysis
software is not reliable because horses have a different cardiac conduction system, resulting
in a dissimilar, until now largely unknown, myocardial activation process. The T wave has a
very different and variable morphology and is often, erroneously, interpreted by the software
as a QRS complex. Furthermore, both intra- and interobserver agreement for recognition and
classification of equine arrhythmias is good for recordings at rest, but poor during exercise [2].
Deep learning models have the ability to consider all information in a training dataset, making
them ideal for finding patterns in complex (physiological) signals while delivering consistent
results [3]. We developed a deep learning model specifically for automatic detection of atrial
and ventricular premature depolarizations in equine ECGs (Chapter 1). Deep learning requires
large datasets (>1000 samples for each class) for training a model, which are not publicly
available for horses. For that reason we applied transfer learning from a network trained upon
the human MIT-BIH ECG dataset (>100.000 annotated beats from 47 patients) to a dataset for
horses with 26.440 beats from 15 horses which was recorded in our own clinical setting and

160 | G e n e r a l d i s c u s s i o n
annotated by experienced clinicians from the Equine Cardioteam. The proposed model yields
similar performance to state-of-the-art algorithms for human ECG analysis and may thus be a
valuable asset for an improved ECG screening for cardiac arrhythmias in horses. The use of
artificial intelligence is currently very limited in biomedical signal processing for animals. Our
study explored the value of deep learning to detect arrhythmias in horses.
Despite delivering excellent results, the model seems to be very sensitive for individual
variations due to physiological differences, such as a larger R wave or a small negative
deflection in the P wave, or slight differences in electrode placement (unpublished data). This
is due to overfitting in which the model learns features specific for a specific dataset but not
necessarily representative for the real world [4]. This has been described extensively in
machine learning models. A possible solution for this would be to learn upon (larger) datasets
with more patients. Datasets with ECG recordings from up to 53.000 different patients have
been described, but even then overfitting may occur due to the complexity of the model [5].
Another possible solution is individual optimization of the model in which transfer learning is
applied on a couple of minutes of the ECG trace of an individual horse in order to optimise the
model’s internal parameter for this specific patient [6]. Adding information to the dataset could
also be done by adding extra leads to the dataset, e.g. using a 12-lead ECG instead of a 2-
lead ECG for classification [7].
The positive effect of adjusting the model structure with the knowledge about the human
decision making process was shown in Chapter 1. By adding an extra input to the model
Figure 1: Integrated gradients applied on the deep learning model of Chapter 1 with a ventricular
premature depolarization complex as example input for the model. The attribution of a part of the signal
on the final class prediction is represented by the color code from dark blue (little attribution) to dark
red (important attribution). In this case, the prediction of the deep learning model is mostly based on
both the QRS and T wave morphology. Note that the model also has some attention for the location
where the P wave should be present in SR, especially in lead I.

G e n e r a l d i s c u s s i o n | 161
specifically for the beat-to-beat timing interval, the overall accuracy could be improved with
5%. However, the sensitivity for the individual variations in the ECG trace still indicates an
inadequate generalization ability of the model. By using explainable artificial intelligence (AI)
the cause of this inadequate generalization could be identified and addressed. Explainable AI
is the current method for improving machine learning models [8]. By exploring the underlying
decision-making mechanisms, machine learning algorithms could explain why an arrhythmia
has been detected. This is because algorithms may overly rely upon single features of the
training/testing dataset or an unwanted predictor label may have leaked into the dataset which
cannot always be identified without further inspection. Clinicians have access to information
beyond the data delivered to the model and thus can adjust parameters that are important for
an improved generalization ability of the model. Consequently, the algorithm can be optimized
by removing confounding training data, adjusting the ratios of different classes within the
training dataset or adjusting the weights of individual parameters. In Figure 1 an example is
given of explainable AI by calculating the Shapley values on a VPD using the deep learning
model of Chapter 1. The Shapley values represent the relative attribution of each feature, in
this case line segment, to the actual prediction [9]. In Figure 1 the Shapley value was calculated
using the integrated gradients method, which is better suited for signal data [10,11]. This
example shows that the model of Chapter 1 mainly focusses on the morphology of the QRS
complex and T wave for assigning the class VPD to this beat.
Studying the characteristics of atrial fibrillation
Analysis of the surface ECG can also be used to study the pathophysiology of atrial fibrillation
in horses. Our study in Chapter 2 demonstrated a significant correlation between the atrial
fibrillation rate (AFR) measured from a surface ECG and the atrial fibrillation cycle length
(AFCL) measured from a right intra-atrial recording. The correlation between the intracardiac
AFCL and the AFR supports the potential to use AFR to monitor long term dynamics of AF
[12]. However, similar as in human medicine the AFR was not an exact measurement of the
local AFCL within the right atrium, but rather is a representation of global AF dynamics [13]. In
horses with naturally-occurring persistent AF, a significantly faster AFCL in the left atrium
compared to the right atrium has been demonstrated with Tissue Doppler Imaging [14]. In our
study (Chapter 2), the AFR measured from the surface ECG was significantly faster compared
to the intracardiac right atrial AFCL, which is different compared to results in human patients.
The reason is probably that the technique of AFR determination in human medicine has been
based upon a local, unipolar recording from lead V1, for which the electrode is positioned very
close to the right atrium. The AFR in our study (Chapter 2) was based upon a bipolar lead with
a relatively long distance between recording electrodes and atria, which probably resulted in a

162 | G e n e r a l d i s c u s s i o n
more global AFR measurement. An increased distance between the intracardiac and surface
ECG recording location results in an increased difference between the intracardiac AFCL and
AFR [13]. Intracardiac recordings from the right and left atrium, using the coronary sinus, while
recording different 12-lead ECG configurations should provide an insight in the intracardiac AF
dynamics and correlation between AFR and intracardiac measured AFCL. We expect that,
similar as in human medicine, precordial electrodes close to an intracardiac recording site
show a better relation with the intracardiac AFCL. The current study only compared the AFCL
and AFR during 3 minutes. If a longer period could have been analysed, e.g. 30 minutes, the
relationship over time between the AFR and AFCL could also have been assessed.
Use of the 12-lead ECG
By using the Copenhagen electrode configuration in combination with 3D electro-anatomical
mapping we could show that both the complete atrial and ventricular activation are visible on
the surface ECG (Chapter 4). This is an advancement compared to previous publications in
which it was stated that only the depolarization of the right atrium, the interatrial septum, and
the interventricular septum are visible on the surface ECG [15–17]. The value of 12-lead ECG
and vectorcardiography (VCG) for both the localization of premature depolarizations and
diagnosis of atrial/ventricular dilatation has shown contradictory results in horses in the past
[16,18–20]. The 12-lead ECG and VCG was considered unreliable in horses due to the
particularities of the equine conduction system [21]. However, electrode positioning in those
studies was very different compared to our study. Some of those older studies mentioned the
shortcoming of the former lead systems that actually led to a discontinuation of further research
on the 12-lead ECG in horses [16,19,20]. Looking back at those studies, guidelines for 12-lead
ECG electrode placement in horses were based upon human electrode placement and thus
arm/limb leads were placed upon the horse’s limbs [22]. This led to wide variations in
morphology of the recorded ECG traces between individual horses and an extreme sensitivity
to forelimb movement [23,24]. By placing the electrodes on the limbs of the horse, Wilson’s
central terminal (WCT) is placed outside the heart and Einthoven’s triangle is almost
perpendicular to the electrical axis of the equine heart and below the heart as shown in Figure
2. Different orthogonal lead systems were proposed to fix this issue and although these were
more reliable compared to former lead configurations with electrodes on the limbs, they were
never widely used outside of experimental setups because custom made ECG recording
devices, with an adapted amplification circuit to construct the different orthogonal leads, were
needed [20,24–26]. The Copenhagen configuration used in Chapters 4-6 addresses some of
the original shortcomings by placing Einthoven’s triangle in a plane close to the mean electrical

G e n e r a l d i s c u s s i o n | 163
axis of the heart, similar to the Dubois lead system, and the precordial electrodes in a plane
perpendicular to the electrical axis of the heart [27,28].
The usefulness of the 12-lead ECG is further supported by the findings in Chapter 5 which
show that the 12-lead ECG and especially VCG do allow identification of the anatomical origin
of atrial and ventricular premature depolarizations. Currently, only the characteristics of the
VCG were described in Chapter 5. The 12-lead ECG characteristics of the paced complexes
were also studied [29,30] but P wave and QRS morphologies were only significantly different
for certain pacing locations in a limited number of leads. This is in line with previous studies in
both humans and horses suggesting that combining different electrodes, or using large single
electrodes, provides a better predictive value for predicting the site of origin of arrhythmias
compared to interpreting single bipolar leads [24,31]. Similar as in human medicine this does
not mean that for diagnostic and educational purposes the VCG is a replacement for the 12-
lead ECG, it rather complements it [32,33]. Indeed, in human medicine the VCG is frequently
used to explain the findings from the 12-lead ECG. Due to the placement of the precordial
Figure 2: Electrode locations of Einthoven’s triangle following the Van Zijl and Copenhagen
configuration. Depending on the electrode configuration, the subsequent theoretical location of Wilson’s
central terminal (WCT) and recording plane are illustrated (blue line). The mean electrical axis (MEA) is
the main direction of the depolarization of the heart. As can be derived from these figures the Van Zijl
configuration leads to a Wilson’s central terminal positioned outside the mean electrical axis and outside
the heart. In addition, Einthoven’s triangle is almost perpendicular to the electrical axis of the equine
heart. The Copenhagen configuration is a clear theoretical improvement over the Van Zijl method. The
heart is indicated by the red circle. Abbreviations: LA: left arm electrode; LF: left foot electrode; RA: right
arm electrode; WCT: Wilson’s central terminal.

164 | G e n e r a l d i s c u s s i o n
electrodes in our studies, the VCG can be easily calculated from the 12-lead ECG without the
need for matrix multiplications as used in human medicine [33]. Indeed, also in human
medicine it is possible to calculate VCG leads from the 12-lead ECG but it remains an imperfect
approximation of the VCG [32,34,35]. By placing the electrodes in a horizontal plane on the
horse, a true orthogonal VCG can be calculated for the cranio-caudal and right-left axis, similar
to the Frank VCG. Since the VCG is calculated directly from the ECG without transformation
matrices it is easier to relate the VCG findings to the 12-lead ECG recording. However, the
ventro-dorsal axis remains an estimation because in the Copenhagen electrode configuration
Einthoven’s triangle is not truly perpendicular to the plane of the precordial electrodes.
Although better than previously described electrode configurations for horses, the current
Copenhagen electrode configuration might still not be the most optimal configuration. In a
theoretical, optimal situation WCT should be in the centre of the heart and the precordial
electrodes close to the heart [36]. As can be seen in Figure 3, and also noted by Dubois [27],
lead I of the Copenhagen configuration only shows very small deflections, indicating little
information between left and right arm electrode. The deflection in Lead I is smaller compared
to the X-axis of the VCG, which is calculated from 4 electrodes at the height of the ventricle,
suggesting that the lungs might be insulators for the cardiac electric field and that more
information about the left-right axis of the heart can be acquired when placing the electrodes
in a ventral position. Furthermore, most of the precordial electrodes of the Copenhagen
configuration are placed in a plane around the cardiac apex probably recording an electrical
field that underestimates the true cardiac electrical field.
Figure 3: Lead I and the left-right axis (Vx) of the VCG calculated from the Copenhagen electrode
configuration. Lead I shows smaller deflections compared to the left-right axis calculated from the
precordial electrodes V2, V4, V5 and V6 which are located at the height of the ventricles.
G e n e r a l d i s c u s s i o n | 165
We provided insights for identification of the origin of atrial and ventricular premature
depolarizations based upon a small number of animals. ECG studies in a large number of
horses should be performed to identify the effect of breed, weight, age and sex on P wave and
QRS complex variations on the 12-lead ECG and VCG [36]. Prior to performing large reference
studies, the most optimal lead configuration should be identified, either multiple possible lead
configurations during pacing studies, or perhaps even full body surface mapping. Activation
maps of each pacing location would have been very illustrative in order to explain the observed
electrocardiographic characteristics of each paced location. However, mapping of all 4
chambers including the pacing study was already time consuming. Therefore, we chose not to
add extra mapping studies.
Improved medical imaging for electrophysiological research
Electrophysiological research has been limited in horses because of the difficulties related to
cardiac imaging. Until now, myocardial activation patterns in horses had only been studied
using open-chest surgery [15–17, 23,37]. Fluoroscopy, the most important imaging tool during
invasive cardiology procedures in humans and small animals, can only image the cardiac
silhouette in horses and is thus too inaccurate to guide invasive cardiac procedures. Contrary
to human and small animal medicine, computer tomography and magnetic resonance imaging
are not possible in horses due to the huge thorax which doesn’t fit in the gantry.
Echocardiography is therefore the most important cardiac imaging technique in horses.
Although new echocardiographic views have recently been described [38], echocardiographic
guidance of catheters still remains challenging using 2D transthoracic ultrasound. Because
precise localization of catheters and anatomical landmarks is very difficult in horses, standard
electrophysiology research techniques used in human medicine, such as the four-wire
technique and pace mapping have not yet been developed in horses [39]. This is why the
development of equine electrophysiology studies actually occurred in a reverse order
compared to human medicine and started with the more recently developed 3D electro-
anatomical mapping using the RhythmiaTM mapping system. Because this mapping system
tracks the catheter using an electro-magnetic field, generated by an external electro-magnet
placed over the horse’s thorax, precise localization of the mapping and ablation catheter within
the equine heart becomes possible almost without the need of other imaging techniques.
The applicability of 3D electro-anatomical mapping in adult horses is an enormous step forward
in the field of equine electrophysiology. During the mapping procedure, the external magnetic
field generator should not move in relation to the heart. This only appeared possible under
complete anaesthesia which adds additional risks to the procedure [40]. We made several
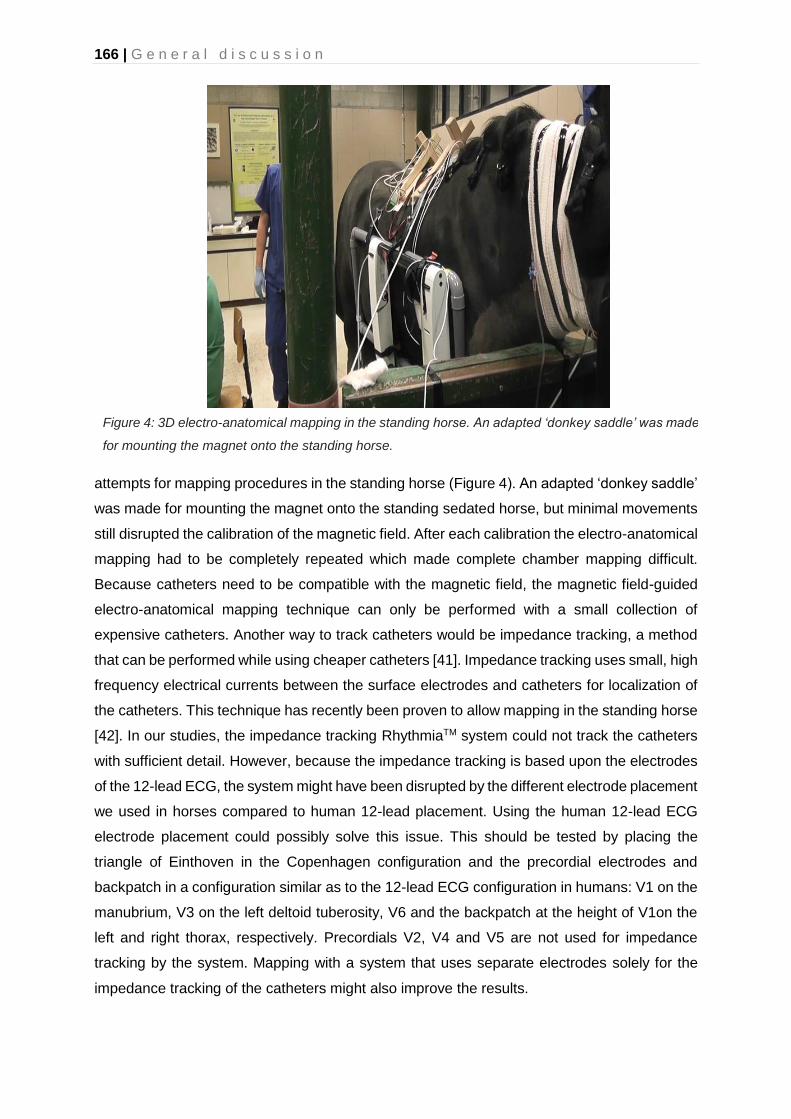
166 | G e n e r a l d i s c u s s i o n
attempts for mapping procedures in the standing horse (Figure 4). An adapted ‘donkey saddle’
was made for mounting the magnet onto the standing sedated horse, but minimal movements
still disrupted the calibration of the magnetic field. After each calibration the electro-anatomical
mapping had to be completely repeated which made complete chamber mapping difficult.
Because catheters need to be compatible with the magnetic field, the magnetic field-guided
electro-anatomical mapping technique can only be performed with a small collection of
expensive catheters. Another way to track catheters would be impedance tracking, a method
that can be performed while using cheaper catheters [41]. Impedance tracking uses small, high
frequency electrical currents between the surface electrodes and catheters for localization of
the catheters. This technique has recently been proven to allow mapping in the standing horse
[42]. In our studies, the impedance tracking RhythmiaTM system could not track the catheters
with sufficient detail. However, because the impedance tracking is based upon the electrodes
of the 12-lead ECG, the system might have been disrupted by the different electrode placement
we used in horses compared to human 12-lead placement. Using the human 12-lead ECG
electrode placement could possibly solve this issue. This should be tested by placing the
triangle of Einthoven in the Copenhagen configuration and the precordial electrodes and
backpatch in a configuration similar as to the 12-lead ECG configuration in humans: V1 on the
manubrium, V3 on the left deltoid tuberosity, V6 and the backpatch at the height of V1on the
left and right thorax, respectively. Precordials V2, V4 and V5 are not used for impedance
tracking by the system. Mapping with a system that uses separate electrodes solely for the
impedance tracking of the catheters might also improve the results.
Figure 4: 3D electro-anatomical mapping in the standing horse. An adapted ‘donkey saddle’ was made
for mounting the magnet onto the standing horse.

G e n e r a l d i s c u s s i o n | 167
Another option for a more precise identification of the intracardiac localization of catheters
could be the use of 3D ultrasound.This technique has recently become powerful enough to
enable continuous real-time 3D imaging of catheters in the large equine heart as seen in Figure
5. However, before 3D ultrasound can be used routinely in horses, more extensive knowledge
of equine cardiac anatomy is needed. Moreover, though it has been described that some
important anatomical landmarks can be identified using ultrasound [43], identification of
electrophysiologically important structures such as coronary sinus and bundle of His [39], has
not been described yet.
The location of the bundle of His is described in Chapter 4, but only in 1 out of 7 horses a His
electrogram could be recorded in the right ventricle, probably due to the difficult location
underneath the septal tricuspid valve leaflet [44]. The challenging recording of the His bundle
may hamper the standard ‘four-wire’ electrophysiological diagnostic exam in horses. The ‘four-
wire’ technique usually requires catheters positioned at the high right atrium, right ventrical
apex, coronary sinus and bundle of His. The activation timing of the His bundle is not necessary
with 3D electro-anatomical mapping since the activation timings of the complete atrium and/or
ventricle are mapped. By doing so, the origin of an arrhythmia is shown on a 3D electro-
Figure 5: Real-time 3D ultrasound image of a transvenous electrical cardioversion catheter inside the
right ventricle. The catheter is indicated by the red arrow on both 2D and 3D views. On the 2D views
only a part of the catheter can be visualised while on the 3D image the entire cather is visible.
Abbreviations: LV: left ventricle; IVS: interventricular septum; RV: right ventricle.

168 | G e n e r a l d i s c u s s i o n
anatomical map instead of based upon timing differences between electrodes positioned at
different strategical locations.
Catheterization of the coronary sinus was necessary as a timing reference for the atrial
activation maps described in Chapter 3 and 4 and has proven to be feasible under guidance
of both 2D and 3D ultrasound with radiographic confirmation. However, catheterization of the
coronary sinus in our 7 horses in Chapter 4 remained challenging due to Vieussens valve, the
first venous valve in the coronary sinus when entering from the right atrium. Vieussens valve
also hampers catheterization of the coronary sinus in human patients, and the use of over-the-
wire catheters has been suggested as a possible solution [45]. During our studies, we applied
an over-the-wire catheter with a 0.014” guiding wire, but the guiding wire was too limp and did
not facilitate access to the coronary sinus.
The use of intracardiac echocardiography (ICE) could also be an asset for improved medical
imaging and navigation inside the heart (Figure 6). The ICE catheter uses a miniaturized
ultrasound probe mounted on the tip of a steerable catheter which is introduced in the vessels
and can be manoeuvred inside the heart. Because of the close proximity to the intracardiac
structures, ICE provides high resolution images and visualises structures that are not possible
to visualise with transthoracic ultrasound. Our Equine Cardioteam has succesfully used ICE in
adult horses in a preliminary study and for the visualization of a transseptal puncture
(unpublished data) proving the feasability of the technique in adult horses. Currently, the
Figure 6: Ultrasound image acquired with intracardiac echocardiography (ICE). The ultrasound catheter
is positioned in the caudal vena cava and offers a clear view on the coronary sinus (CS) and Thebesian
valve (arrow). Total imaging depth is 8 cm and left on screen is cranial.
CS
CS
Caudal
vena cava
G e n e r a l d i s c u s s i o n | 169
completeness of the 3D electro-anatomical map was assessed using transthoracic ultrasound
and the voltage map. However, it is not possible to visualise every structure of the heart with
transthoracic ultrasound. Therefore, ICE could have been a useful tool to assess completeness
of the maps in chapters 3 and 4.
Improved understanding of arrhythmias
In this thesis 3D electro-anatomical mapping was solely used to describe the depolarization
pattern of atria and ventricles in healthy horses (Chapter 3 and 4) and as a tool to induce
premature depolarizations in atria and ventricles (Chapter 5). In humans, 3D electro-
anatomical mapping is used as a powerful diagnostic technique for localizing the earliest site
of activation in focal tachycardias and identifying the reentrant circuit in macro-reentry
tachycardias, thus guiding targeted therapy by catheter ablation [41]. Using 3D electro-
anatomical mapping, atrial tachycardia (AT) could be mapped for the first time in 5 horses and
in 4 cases sinus rhythm could be restored with ablation [46]. Remarkably, all horses with
successful arrhythmia ablation had AT from a rapidly firing focus or local reentry originating
from the caudal vena cava. In human medicine the superior vena cava has been described as
a possible location for ectopy, due to myocardial sleeves which may initiate atrial arrhythmias
such as AT or AF. However, no myocardial sleeves have been described in the inferior vena
cava [47]. Indeed, in human medicine the inferior vena cava has a sharp delineation and the
superior vena cava is irregularly delineated on electro-anatomical mapping [48]. In the horses
we found an irregular delineation of the caudal vena cava. Further research is required to
determine how myocardial tissue is distributed in the cranial and caudal vena cava in horses.
Recently, it has been shown that AT can be the underlying cause of AF in horses, similar as
in human patients [46,49]. Ablation of an underlying (focal) AT source could be a treatment
option for AF in horses, possibly yielding a lower recurrence rate compared to transvenous
electrical cardioversion (TVEC) [50]. In humans, atrial premature depolarizations (APDs)
originating from the myocardial sleeves in the pulmonary veins frequently initiate AF [51]. A
lower recurrence of AF after pulmonary vein isolation by ablation has been noted if the left
atrial fibrillation rate is faster compared to the right [52]. This indicates a possible supporting
role of the pulmonary veins for AF maintenance in some individuals. Ablation of the ectopic
focus or pulmonary veins is advised in human patients with >1000 atrial premature
depolarizations (APDs) pre- or post-ablation of paroxysmal AF [50]. In horses it has been
shown that AF recurrence is more likely if a higher number of APDs (>25 APDs/24h) is present
5 days post-cardioversion [53]. The presence of myocardial sleeves in the pulmonary veins
has been confirmed in horses, but it is currently unknown if these play a role in the initiation or

170 | G e n e r a l d i s c u s s i o n
maintenance of AF [54]. Recently the initiation of AF due to premature depolarizations
originating from the pulmonary veins has been suggested [55] On average a similar left-to-
right gradient in atrial fibrillation rate as in humans has been found in horses using tissue
Doppler [14]. The left-to-right gradient was also suggested in our results because the surface
ECG-derived global measure of atrial fibrillation rate was faster than the AF rate locally
determined in the right atrium. Intracardiac recordings from coronary sinus and right atrium
showed a faster AFCL in the coronary sinus compared to the right atrium, suggesting a
possible role for the pulmonary veins in the pathogenesis of AF in horses (unpublished results).
Future perspectives
In this thesis deep learning was only used in the first chapter for detection of atrial and/or
ventricular premature depolarizations. Datasets from the other chapters are still too small for
a deep learning approach. When more data would become available, deep learning could also
be an asset for the identification of the anatomical origin of premature depolarizations from 12-
lead data as has been demonstrated in human medicine [55]. Besides trusting on the prediction
itself, deep learning could also be used for assisted decision-making in which the model
explains the physician why it makes a certain decision. These decision support systems offer
Figure 7: Comparison of different filtering techniques applied on a horse ECG. Additional white gaussian
noise was added to the original unfiltered ECG. The bandpass filtered ECG was filtered between 0.05Hz
and 35Hz, these values equal the settings in the Televet software. The neural network filter was trained
upon 2 hours of ECG data which had been contaminated with both white gaussian noise and random
noise.

G e n e r a l d i s c u s s i o n | 171
an improved accuracy and confidence compared to the decision of a physician on its own or
the use of an unsupervised deep learning model [56].
We used deep learning for the classification of ECGs but the technique could also be used for
other diagnostic purposes. Recent research of our group showed that AF can be detected from
heart rate monitor data based upon the heart rate variability [57]. A high heart rate variability
indicates that AF is possibly present. This allows horse owners to monitor their horses with
low-risk, low-cost, easy to use equipment. However, heart rate monitor data often contain noise
due to bad electrode contact or heart rate variability may be high for other reasons, such as
2nd degree AV block, which is very common in horses. Because a heart rate monitor does not
allow visual inspection of the ECG, these artefacts cannot be identified by the owner. We
designed a custom neural network for the detection of AF in heart rate monitoring data [58].
The neural network outperformed heart rate variability based upon a validation group of 20
horses, 10 horses with AF and 10 horses in sinus rhythm with each 10 minutes of heart rate
data, with 98% versus 83% accuracy. This is a promising tool for home monitoring of horses
by their owners.
Deep learning can also be used for other tasks than just classification. An example is the
filtering of ECG signals with convolutional autoencoder neural networks [59]. In Figure 7, a
noisy ECG from a horse with additional white gaussian noise is filtered by a classic bandpass
filter and a neural network. The neural network clearly outperforms the bandpass filter.
Advanced filtering techniques offer several great opportunities in equine cardiology. For
example, oesophageal ECG recordings are possible in horses and allow for improved
recordings of the atrial electrical activity [60]. Nonetheless, the oesophageal ECG could only
be recorded in the standing horse. Recordings made at walk were uninterpretable due to
motion artefacts. Advanced filtering by a neural network may allow to filter out these artefacts
and allow oesophageal ECG recording at walk or even during exercise.
In human medicine, exercise ECG recordings are usually recorded on a cycle ergometer [61].
This produces less motion of the upper body resulting in less motion artefacts. In horses this
is not possible and horses are lunged or ridden for an exercise test which produces a lot of
artefacts due to motion of the electrodes and muscle activity [62,63]. Sometimes this precludes
proper interpretation of the ECG. The use of devices with built-in electrodes for improved
recording quality has been suggested, but these are not commercially available at the moment
[63]. In human medicine specific guidelines exist about the design of ECG amplifiers,
electrodes and ECG cables during exercise testing [64]. It is unclear whether veterinary
equipment fulfils these requirements. In addition to adapted hardware, adapted post-
processing of the signal could also be a possible solution for reduced artefacts in the ECG. In
172 | G e n e r a l d i s c u s s i o n
addition to the above mentioned neural network filter, filtering of an ECG by synthesis of a
single ECG lead out of a 12-lead ECG or VCG has been described [65,66]. This significantly
reduces the noise in the ECG, with minimal information loss.
Regarding AF it has been shown that horses with a longer AF duration are less likely to convert
using a medical treatment [67]. Due to the correlation between the intracardiac AFCL and
duration of AF [68], the intracardiac measured AFCL could be a useful indicator to assess AF
duration, electrical remodelling, electrophysiological properties and as such treatment
outcome or even risk for AF recurrence. Our studies suggest that AFR might be a valuable
non-invasive alternative. AFCL or AFR might therefore be used in the decision making process
to choose for medical treatment or the more powerful TVEC treatment. Future studies should
be done to determine the correlation between AFR and AF duration, success of medical or
electrical treatment, and AF recurrence rate.
In one out of the five ablation procedures, the horse could not be ablated, probably because
the AT originated from the left atrium. In human medicine the left atrium is typically accessed
through a transseptal puncture. Compared to the retrograde approach through the aorta used
in Chapter 3, a transseptal puncture would be less invasive and would allow for a better
accessibility of left atrial structures. Moreover, the transseptal approach might be beneficial to
obtain stable catheter position and apply some force to the catheter during ablation.
Consequently, the development of a technique for transseptal puncture in horses should be
further investigated to further develop left atrial ablation strategies. Currently ongoing research
by our Equine Cardioteam focusses on developing a transseptal puncture technique in horses.
Ultrasound guided puncture of the interatrial septum has been successfully performed, but
insertion of catheters remains challenging.
3D electro-anatomical mapping could also be used to identify the underlying cause and
mechanism of ventricular arrhythmias. In human medicine, ventricular arrhythmias attribute to
about half of sudden death cases [69]. In horses no pathology is found on necropsy in up to
68% of sudden death cases and a fatal arrhythmia may be suspected in these cases [70–72].
Ventricular arrhythmias are frequently found in horses at rest or during exercise but it remains
unclear from which (anatomical) regions they originate or what their associated risk is [70,73–
78]. Further development of intracardiac electrophysiological studies and multiple lead
recordings, including the techniques described in this thesis, will enhance our knowledge of
intracardiac conduction disorders and cardiac dysrhythmias in horses.
Additionally to the characterization of premature depolarizations or tachycardias, our group
and others could also demonstrate that the ECG can be used for the diagnosis of left
G e n e r a l d i s c u s s i o n | 173
ventricular hypertrophy [28,79]. In human medicine the 12-lead ECG is a clinically used
method for diagnosis of hypertrophy or dilation of every individual chamber based upon P wave
or QRS complex characteristics. Whether or not this applies to horses and allows similar
guidelines for the equine 12-lead ECG or VCG, is currently unknown but these techniques
could be a cheap and easily applicable method for the diagnosis of hypertrophy in clinical
practice.
Spontaneous ventricular arrhythmias found on pre-participation screenings of human athletes
may be treated with ablation. Ablation reduces the frequency of ventricular arrhythmias and
even cures some idiopathic cases [69]. However, with the currently available technology it is
unclear whether or not ventricular arrhythmias in horses can be treated with ablation.
Commercially available ablation catheters can only provide a lesion depth of up to 9.4mm [80],
while the left ventricular free wall can have a thickness of up to 32mm in healthy horses [81].
This limits the use of ablation to the right ventricle or non-transmural lesions in the left ventricle.
Another aspect is the risk for ventricular fibrillation. Ablation and some electrophysiological
studies in the ventricles, such as programmed electrical stimulation, can be a possible trigger
for ventricular fibrillation. External defibrillation of the ventricles in horses has only been
described for small horses of up to 340kg, and with an experimental monophasic defibrillator
of 5.000J [82]. Using the correlation between body weight and defibrillation energy described
by Geddes, defibrillating the ventricles in a warmblood horse of 600kg would require a
theoretical 12.000J monophasic shock. Although biphasic shocks have a lower defibrillation
threshold, the maximal energy delivery of 360J of nowadays commercial defibrillators will most
likely not be able to convert ventricular fibrillation in adult horses. Our research group has done
a successful internal electrical cardioversion of a drug-resistant ventricular tachycardia in an
adult horse [83], but it is unknown if internal electrical cardioversion would be effective for
ventricular fibrillation.
General conclusion
We show that equine ECGs, especially multiple lead recordings, have more clinical
applications than currently believed. Results and methods described in this thesis can be a
starting point for future investigations into equine electrocardiography. The algorithm for semi-
automated analysis of equine ECGs could be used to improve screening for arrythmias in the
general horse population. The atrial fibrillation rate derived from the surface ECG allows to
better understand the underlying pathophysiology of atrial fibrillation. Finally, 3D electro-
anatomical mapping and multiple lead recordings can be used to determine the underlying
origin of arrhythmias and guide their targeted treatment.

174 | G e n e r a l d i s c u s s i o n
References
[1] Kaplan Berkaya S, Uysal AK, Sora Gunal E, Ergin S, Gunal S, Gulmezoglu MB. A survey on ECG analysis. Biomed Signal Process Control 2018;43:216–35.
[2] Trachsel DS, Bitschnau C, Waldern N, Weishaupt MA, Schwarzwald CC. Observer agreement for detection of cardiac arrhythmias on telemetric ECG recordings obtained at rest, during and after exercise in 10 Warmblood horses. Equine Vet J 2010;42:208–15.
[3] Faust O, Hagiwara Y, Hong TJ, Lih OS, Acharya UR. Deep learning for healthcare applications based on physiological signals: A review. Comput Methods Programs Biomed 2018;161:1–13.
[4] Mudrakarta PK, Taly A, Sundararajan M, Dhamdhere K. Did the model understand the question? ACL 2018 - 56th Annu Meet Assoc Comput Linguist Proc Conf (Long Pap 2018;1:1896–906.
[5] Hannun AY, Rajpurkar P, Haghpanahi M, Tison GH, Bourn C, Turakhia MP, Ng AY. Cardiologist-level arrhythmia detection and classification in ambulatory electrocardiograms using a deep neural network. Nat Med 2019;25:65–9.
[6] Kiranyaz S, Ince T, Gabbouj M. Real-Time Patient-Specific ECG Classification by 1-D Convolutional Neural Networks. IEEE Trans Biomed Eng 2016;63:664–75.
[7] Yao Q, Wang R, Fan X, Liu J, Li Y. Multi-class Arrhythmia detection from 12-lead varied-length ECG using Attention-based Time-Incremental Convolutional Neural Network. Inf Fusion 2020;53:174–82.
[8] Google. AI Explainability Whitepaper. 2019.
[9] Christoph Molnar. Interpretable Machine Learning. Christoph Molnar; 2020.
[10] Google. Introduction to AI Explanations for AI Platform 2020. https://cloud.google.com/ai-platform/prediction/docs/ai-explanations/overview#compare-methods (accessed April 4, 2020).
[11] Sundararajan M, Taly A, Yan Q. Axiomatic Attribution for Deep Networks. 34th Int Conf Mach Learn ICML 2017 2017;7:5109–18.
[12] Hesselkilde EZ, Carstensen H, Haugaard MM, Carlson J, Pehrson S, Jespersen T, Buhl R, Platonov PG. Effect of flecainide on atrial fibrillatory rate in a large animal model with induced atrial fibrillation. BMC Cardiovasc Disord 2017;17:289.
[13] Holm M, Pehrson S, Ingemansson M, Sörnmo L, Johansson R, Sandhall L, Sunemark M, Smideberg B, Olsson C, Olsson SB. Non-invasive assessment of the atrial cycle length during atrial fibrillation in man: introducing, validating and illustrating a new ECG method. Cardiovasc Res 1998;38:69–81.
[14] Decloedt A, de Clercq D, van der Vekens N, Verheyen T, van Loon G. Noninvasive determination of atrial fibrillation cycle length by atrial colour tissue Doppler imaging in horses. Equine Vet J 2014;46:174–9.
G e n e r a l d i s c u s s i o n | 175
[15] Muylle E, Oyaert W. Atrial Activation Pathways and the P Wave in the Horse. Zentralblatt Für Veterinärmedizin R A 1975;22:474–84.
[16] Muylle E, Oyaert W. Equine Electrocardiography The Genesis of the Different Configurations of the “QRS” Complex. Zentralblatt Für Veterinärmedizin R A 1977;24:762–71.
[17] Hamlin RL, Smetzer DL, Senta T, Smith CR. Atrial activation paths and P waves in horses. Am J Physiol 1970;219:306–13.
[18] Holmes JR, Alps BJ. Studies into equine electrocardiography and vectorcardiography IV. Vector Distributions In Some Arrhythmias. Can J Comp Med Vet Sci 1967;31:150–5.
[19] Pfister R, Seifert-Alioth C, Beglinger R. Die Bestimmung des Ursprungsortes ventrikulärer Extrasystolen beim Pferd. Schweizer Arch Für Tierheilkd SAT Die Fachzeitschrift Für Tierärztinnen Und Tierärzte 1984;126:165–72.
[20] Hamlin RL, Smetzer DL, Smith CR. Analysis of QRS Complex Recorded Through a Semiorthogonal Lead System in the Horse. Am J Physiol 1964;207:325–33.
[21] Meyling HA, Ter Borg H. The conducting system of the heart in hoofed animals. Cornell Vet 1957;47:419–55.
[22] Van Zijl WJJ. The electrocardiogram of the normal horse using the techniques of Einthoven and Wilson. Tijdschr Diergeneesk 1951;76:85–96.
[23] Muylle E, Oyaert W. Excitation of the Ventricular Epicardium in the Horse. Zentralblatt Für Veterinärmedizin R A 1975;22:463–73.
[24] Holmes JR, Darke PGGG. Studies on the Development of a New Lead System for Equine Electrocardiography. Equine Vet J 1970;2:12–21.
[25] Holmes JR, Else RW. Further Studies on a New Lead for Equine Electrocardiography. Equine Vet J 1972;4:81–7.
[26] Muylle E, Oyaert W. Clinical Evaluation of Cardiac Vectors in the Horse. Equine Vet J 1971;3:129–36.
[27] Dubois M. Du choix des dérivations et d’une normalisation de l’électrocardiogramme chez quelques ongulés domestiques. Rec Méd Vét 1961;133:425–48.
[28] Hesselkilde EZ, Carstensen H, Vandsø Petersen B, Jespersen T, Kanters JK, Buhl R. Is ECG in horses only for dysrhythmia diagnosis? Introducing a new method for 12-lead ECG. J Vet Intern Med 2016;30:1500–1.
[29] Van Steenkiste G, De Clercq D, Vera L, van Loon G. Specific 12-lead electrocardiographic characteristics that help to localize the anatomical origin of ventricular ectopy in horses: preliminary data. J Vet Intern Med 2019;33:1548.
[30] Van Steenkiste G, De Clercq D, Decloedt A, Vera L, van Loon G. A 12‐lead electrocardiogram interpretation algorithm to determine the anatomical site of origin of atrial premature depolarizations in horses: preliminary data. Equine Vet J 2019;51:8–8.
176 | G e n e r a l d i s c u s s i o n
[31] Qian ZY, Hou XF, Xu DJ, Yang B, Chen ML, Chen C, Zhang FX, Shan QJ, Cao KJ, Zou JG. An algorithm to predict the site of origin of focal atrial tachycardia. PACE - Pacing Clin Electrophysiol 2011;34:414–21.
[32] Schreurs CA, Algra AM, Man S-C, Cannegieter SC, van der Wall EE, Schalij MJ, Kors JA, Swenne CA. The spatial QRS-T angle in the Frank vectorcardiogram: accuracy of estimates derived from the 12-lead electrocardiogram. J Electrocardiol 2010;43:294–301.
[33] Man S, Maan AC, Schalij MJ, Swenne CA. Vectorcardiographic diagnostic & prognostic information derived from the 12-lead electrocardiogram: Historical review and clinical perspective. J Electrocardiol 2015;48:463–75.
[34] Maheshwari S, Acharyya A, Schiariti M, Puddu PE. Frank vectorcardiographic system from standard 12 lead ECG: An effort to enhance cardiovascular diagnosis. J Electrocardiol 2016;49:231–42.
[35] Dawson D, Yang H, Malshe M, Bukkapatnam STS, Benjamin B, Komanduri R. Linear affine transformations between 3-lead (Frank XYZ leads) vectorcardiogram and 12-lead electrocardiogram signals. J Electrocardiol 2009;42:622–30.
[36] Macfarlane PW, Lawrie TDV. The Normal Electrocardiogram and Vectorcardiogram. In: Macfarlane PW, van Oosterom A, Pahlm O, Kligfield P, Janse M, Camm J, editors. Compr. Electrocardiol., London: Springer London; 2011, p. 483–546.
[37] Muylle E. Experimenteel onderzoek naar het verloop van de depolarisatiegolf in het hart van het paard : de genesis van het electrocardiografisch P- en QRS-complex. 1975.
[38] Vandecasteele T, van Loon G, Vandevelde K, De Pauw B, Simoens P, Cornillie P. Topography and ultrasonographic identification of the equine pulmonary vein draining pattern. Vet J 2016;210:17–23.
[39] Murgatroyd FD, Krahn AD. Handbook of cardiac electrophysiology. Londen: Remedica; 2003.
[40] Dugdale AHA, Taylor PM. Equine anaesthesia-associated mortality: Where are we now? Vet Anaesth Analg 2016.
[41] Knackstedt C, Schauerte P, Kirchhof P. Electro-anatomic mapping systems in arrhythmias. Europace 2008;10:iii28–34.
[42] Hesselkilde E, Linz D, Saljic A, Carstensen H, Rayed K, Jespersen T, Sanders P, Buhl R. First catheter-based high-density endocardial 3D electroanatomical mapping of the right atrium in standing horses. Equine Vet J 2020;13:1095–9.
[43] Vandecasteele T, Cornillie P, van Steenkiste G, Vandevelde K, Gielen I, Vanderperren K, van Loon G. Echocardiographic identification of atrial-related structures and vessels in horses validated by computed tomography of casted hearts. Equine Vet J 2019;51:90–6.
[44] Bishop SP, Cole CR. Morphology of the specialized conducting tissue in the atria of the equine heart. Anat Rec 1967;158:401–15.

G e n e r a l d i s c u s s i o n | 177
[45] Corcoran SJ, Lawrence C, McGuire MA. The valve of Vieussens: An important cause of difficulty in advancing catheters into the cardiac veins. J Cardiovasc Electrophysiol 1999;10:804–8.
[46] Van Steenkiste G, Duytschaever M, De Clercq D, Tavernier R, Michielsen A, Decloedt A, Schauvliege S, van Loon G. First successful radiofrequency ablation of atrial tachycardia in a horse guided by a high density 3d electro-anatomical mapping system (rhythmia). J Vet Intern Med 2019;33:1547.
[47] Goya M, Ouyang F, Ernst S, Volkmer M, Antz M, Kuck KH. Electroanatomic mapping and catheter ablation of breakthroughs from the right atrium to the superior vena cava in patients with atrial fibrillation. Circulation 2002;106:1317–20.
[48] De Ponti R, Ho SY, Salerno-Uriarte JA, Tritto M, Spadacini G. Electroanatomic Analysis of Sinus Impulse Propagation in Normal Human Atria. J Cardiovasc Electrophysiol 2002;13:1–10.
[49] Jaïs P, Haïssaguerre M, Shah DC, Chouairi S, Gencel L, Hocini M, Clémenty J. A Focal Source of Atrial Fibrillation Treated by Discrete Radiofrequency Ablation. Circulation 1997;95:572–6.
[50] Calkins H, Hindricks G, Cappato R, Kim Y-H, Saad EB, Aguinaga L, Akar JG, Badhwar V, Brugada J, Camm J, Chen P-S, Chen S-A, Chung MK, Cosedis Nielsen J, Curtis AB, Davies DW, … Willems S. 2017 HRS/EHRA/ECAS/APHRS/SOLAECE expert consensus statement on catheter and surgical ablation of atrial fibrillation. EP Eur 2018;20:e1–160.
[51] Haïssaguerre M, Jaïs P, Shah DC, Takahashi A, Hocini M, Quiniou G, Garrigue S, Le Mouroux A, Le Métayer P, Clémenty J. Spontaneous Initiation of Atrial Fibrillation by Ectopic Beats Originating in the Pulmonary Veins. N Engl J Med 1998;339:659–66.
[52] Lazar S, Dixit S, Callans DJ, Lin D, Marchlinski FE, Gerstenfeld EP. Effect of pulmonary vein isolation on the left-to-right atrial dominant frequency gradient in human atrial fibrillation. Hear Rhythm 2006;3:889–95.
[53] Vernemmen I, De Clercq D, Decloedt A, Vera L, Van Steenkiste G, van Loon G. Atrial premature depolarisations five days post electrical cardioversion are related to atrial fibrillation recurrence risk in horses. Equine Vet J 2020;52:374–8.
[54] Vandecasteele T, Van Den Broeck W, Tay H, Couck L, van Loon G, Cornillie P. 3D reconstruction of the porcine and equine pulmonary veins, supplemented with the identification of telocytes in the horse. Anat Histol Embryol 2018;47:145–52.
[55] Linz D, Hesselkilde E, Kutieleh R, Jespersen T, Buhl R, Sanders P. Pulmonary vein firing initiating atrial fibrillation in the horse: Oversized dimensions but similar mechanisms. J Cardiovasc Electrophysiol 2020:jce.14422.
[56] Pereira A, Dam P Van, Abacherli R. Automated Identification and Localization of Premature Ventricle Contractions in Standard 12-Lead ECGs. 2019 IEEE Can. Conf. Electr. Comput. Eng., IEEE; 2019, p. 1–4.
[57] Sayres R, Taly A, Rahimy E, Blumer K, Coz D, Hammel N, Krause J, Narayanaswamy A, Rastegar Z, Wu D, Xu S, Barb S, Joseph A, Shumski M, Smith J, Sood AB, … Webster DR. Using a Deep Learning Algorithm and Integrated Gradients Explanation to Assist Grading for Diabetic Retinopathy. Ophthalmology 2019;126:552–64.

178 | G e n e r a l d i s c u s s i o n
[58] Broux B, De Clercq D, Decloedt A, Ven S, Vera L, Van Steenkiste G, Mitchell K, Schwarzwald C, van Loon G. Heart rate variability parameters in horses distinguish atrial fibrillation from sinus rhythm before and after successful electrical cardioversion. Equine Vet J 2017;49:723–8.
[59] Van Steenkiste G, De Clercq D, Decloedt A, Vera L, van Loon G. Détection fiable de la fibrillation atriale chez des chevaux à l’aide d’apprentissage en profondeur. Ateliers journées Annu. AVEF, Tours, 2019, 2019, p. 161.
[60] Chiang H-T, Hsieh Y-Y, Fu S-W, Hung K-H, Tsao Y, Chien S-Y. Noise Reduction in ECG Signals Using Fully Convolutional Denoising Autoencoders. IEEE Access 2019;7:60806–13.
[61] Verheyen T, Decloedt A, De Clercq D, Sys S, van Loon G. Oesophageal electrocardiography in healthy horses. Equine Vet J 2012;44:640–5.
[62] Akkerhuis KM, Simoons ML. Exercise electrocardiography and exercise testing. In: Macfarlane PW, van Oosterom A, Pahlm O, Kligfield P, Janse M, Camm J, editors. Compr. Electrocardiol., London: Springer London; 2011, p. 1675–719.
[63] Verheyen T, Decloedt A, De Clercq D, Deprez P, Sys SU, van Loon G. Electrocardiography in horses – part 1 : how to make a good recording. Vlaams Diergeneeskd Tijdschr 2010;79:331–6.
[64] Mitchell KJ. Equine Electrocardiography. Vet Clin North Am Equine Pract 2019;35:65–83.
[65] Pina IL, Balady GJ, Hanson P, Labovitz AJ, Madonna DW, Myers J. Guidelines for Clinical Exercise Testing Laboratories. Circulation 1995;91:912–21.
[66] Fischer SE, Wickline SA, Lorenz CH. Novel real-time R-wave detection algorithm based on the vectorcardiogram for accurate gated magnetic resonance acquisitions. Magn Reson Med 1999;42:361–70.
[67] Huang B, Wang Y. QRS Complexes Detection by Using the Principal Component Analysis and the Combined Wavelet Entropy for 12-Lead Electrocardiogram Signals. 2009 Ninth IEEE Int. Conf. Comput. Inf. Technol., vol. 1, IEEE; 2009, p. 246–51.
[68] Reef VB, Levitan CW, Spencer PA. Factors Affecting Prognosis and Conversion in Equine Atrial Fibrillation. J Vet Intern Med 1988;2:1–6.
[69] De Clercq D, Decloedt A, Sys SU, Verheyen T, Van Der Vekens N, van Loon G. Atrial fibrillation cycle length and atrial size in horses with and without recurrence of atrial fibrillation after electrical cardioversion. J Vet Intern Med 2014;28:624–9.
[70] John RM, Tedrow UB, Koplan BA, Albert CM, Epstein LM, Sweeney MO, Miller AL, Michaud GF, Stevenson WG. Ventricular arrhythmias and sudden cardiac death. Lancet 2012;380:1520–9.
[71] Lyle CH, Blissitt KJ, Kennedy RN, McGorum BC, Newton JR, Parkin TDH, Stirk A, Boden LA. Risk factors for race-associated sudden death in Thoroughbred racehorses in the UK (2000-2007). Equine Vet J 2012;44:459–65.

G e n e r a l d i s c u s s i o n | 179
[72] Lyle CH, Turley G, Blissitt KJ, Pirie RS, Mayhew IG, McGorum BC, Keen JA. Retrospective Evaluation of Episodic Collapse in the Horse in a Referred Population: 25 Cases (1995-2009). J Vet Intern Med 2010;24:1498–502.
[73] Brown CM, Kaneene JB, Taylor RF. Sudden and unexpected death in horses and ponies: an analysis of 200 cases. Equine Vet J 1988;20:99–103.
[74] Martin BB, Reef VB, Parente EJ, Sage AD. Causes of poor performance of horses during training, racing, or showing: 348 cases (1992-1996). J Am Vet Med Assoc 1996;216:554–8.
[75] Ryan N, Marr CM, Mcgladdery AJ. Survey of cardiac arrhythmias during submaximal and maximal exercise in Thoroughbred racehorses. Equine Vet J 2010;37:265–8.
[76] Physick-Sheard PW, McGurrin MKJ. Ventricular arrhythmias during race recovery in standardbred racehorses and associations with autonomic activity. J Vet Intern Med 2010;24:1158–66.
[77] Buhl R, Petersen EE, Lindholm M, Bak L, Nostell K. Cardiac arrhythmias in standardbreds during and after racing-possible association between heart size, valvular regurgitations, and arrhythmias. J Equine Vet Sci 2013;33:590–6.
[78] Barbesgaard L, Buhl R, Meldgaard C. Prevalence of exercise-associated arrhythmias in normal performing dressage horses. Equine Vet J 2010;42:202–7.
[79] Buhl R, Meldgaard C, Barbesgaard L. Cardiac arrhythmias in clinically healthy showjumping horses. Equine Vet J 2010;42:196–201.
[80] Neuckermans Z, Van Steenkiste G, Decloedt A, van Loon G. Diagnosis of left ventricular hypertrophy diagnosis by vectorcardiography: first confirmed cases. Voorjaarsdagen, Den Haag: 2020.
[81] Koruth JS, Kuroki K, Iwasawa J, Viswanathan R, Brose R, Buck ED, Donskoy E, Dukkipati SR, Reddy VY. Endocardial ventricular pulsed field ablation: a proof-of-concept preclinical evaluation. EP Eur 2019:1–6.
[82] Zucca E, Ferrucci F, Croci C, Di Fabio V, Zaninelli M, Ferro E. Echocardiographic measurements of cardiac dimensions in normal Standardbred racehorses. J Vet Cardiol 2008;10:45–51.
[83] Geddes LA, Tacker WA, Rosborough JP, Moore AG, Cabler PS. Electrical dose for ventricular defibrillation of large and small animals using precordial electrodes. J Clin Invest 1974;53:310–9.
[84] van Loon G, De Clercq D, Schauvliege S, Verheyen T. Successful electrical cardioversion of sustained ventricular tachycardia in an adult horse. In: Verbruggen A-M, Theyse L, Werners A, editors. Eur. Vet. Conf. 42nd, Proc., 2009, p. 374.


Summary


S u m m a r y | 183
Arrhythmias are very common in horses, but the origin and clinical significance is often
unknown. The use of the electrocardiogram (ECG) in horses is still limited to rhythm and rate
diagnosis whereas identification of the underlying mechanisms of arrhythmias often requires
invasive electrophysiological studies that have not fully been developed in horses. Meanwhile,
in human medicine the 12-lead ECG has been a cornerstone in the development of human
cardiology. Next to the diagnosis of arrhythmias, it also allows recognition of structural cardiac
abnormalities, conduction disturbances, genetically mediated electrical abnormalities,
myocardial infarction and electrolyte disturbances. Additionally, advanced invasive techniques
have been developed in humans for both the identification of the underlying mechanisms of
arrhythmias and treatment of arrhythmias. Equine cardiology has not followed this evolution
largely because knowledge from human and small animal cardiology cannot be directly
extrapolated to horses due to their different conduction system. For a long time, it was believed
that only a part of the depolarization of the equine heart was visible on the surface ECG and
that, hence, the surface ECG was only of limited use.
The General introduction discusses the current knowledge about human and especially equine
ECG. First the genesis and nomenclature of the electrocardiogram in horses is briefly
discussed. Next, an overview is given of the development of ECG in humans with extra
emphasis on the 12-lead ECG and vectorcardiography (VCG). Subsequently, the anatomical
and physiological differences between the human and equine heart are discussed. These are
followed by the development of equine ECG and some common lead systems that have been
used in horses. Subsequently, equine ECG characteristics and analysis are described. This
section starts with the description of the most commonly occurring arrhythmias, their
underlying pathophysiology and their appearance on the surface ECG. Thereafter, manual
analyses of the equine ECG are described followed by a description of automated analyses of
the human ECG. Finally, a short overview is given of invasive cardiac electrophysiological
techniques in humans and horses.
The first major objective of this dissertation was to improve the screening and diagnosis of
arrhythmias in horses using the modified base-apex bipolar surface ECG recording. Therefore,
we explored the use of deep learning for the semi-automated analysis of equine ECGs in
Chapter 1 and evaluated the use of the atrial fibrillatory rate (AFR) derived from a surface
ECG in Chapter 2. The second major objective was to develop a new invasive method for
identifying the origin of cardiac arrhythmias: 3D electro-anatomical mapping. Therefore, the
development and methodology of the technique in horses is described in Chapter 3, and the
normal depolarization pattern of the heart in sinus rhythm (SR) using this 3D electro-
anatomical mapping technique is described in Chapter 4. The third major objective of this

184 | S u m m a r y
study was to evaluate if multiple lead recordings, i.e. the 12-lead ECG and vectorcardiography,
have additional value for equine cardiology if adapted to equine physiology. Therefore, we
explored the use of 12-lead ECG and VCG for the determination of the site of origin for atrial
and ventricular premature depolarizations in Chapter 5.
Chapter 1 describes the development of a complete algorithm for equine specific ECG
analysis. Both the initial filtering and QRS beat detection were done with wavelet
transformations. The QRS detection algorithm outperformed the classic Pan-Tompkins
algorithm with a sensitivity of 99.0% versus 91.5% for the Pan-Tompkins algorithm. Next, a
novel parallel convolutional neural network architecture was proposed for the feature extraction
and classification of the individual beats. The novelty of this network architecture is the parallel
processing of both the morphological data from the ECG deflections and the relative timing to
the other beats in the ECG. Because no public datasets are available for equine ECGs, a
dataset was made with 26.440 beats in 4 classes: normal, ventricular and atrial premature
depolarization and noise. The network was then trained and tested using both the human MIT-
BIH arrhythmia dataset and the own-made equine ECG dataset. The network was optimized
using a genetic algorithm and an accuracy of 97.7% and 92.6% was achieved for the MIT-BIH
and equine ECG database, respectively. Afterwards, transfer learning from the MIT-BIH
dataset to the equine ECG database was applied after which the average accuracy, sensitivity,
positive predictive value and F1 score of the network increased with an accuracy of 97.1%.
In Chapter 2 the AFR derived from a single-lead surface ECG was compared with the atrial
fibrillation rate derived from a right atrial intracardiac recording (RA-FR). Three minute long
episodes of simultaneous electrograms and surface ECG during atrial fibrillation (AF) were
selected for analysis and compared using Bland-Altman test. The mean RA-FR was measured
from the deflections on the intracardiac electrogram, while the AFR was extracted from the
surface ECG using spatiotemporal QRS and T-wave cancellation. In addition, we evaluated
the correlation of AFR with transvenous electrical cardioversion (TVEC) threshold (in Joules),
number of shocks and cardioversion success rate in horses. This was done in 73 horses
treated for atrial fibrillation by TVEC. The mean difference between RA-FR and AFR was -13
fibrillations per minute and there was a moderate (r=0.65) correlation between RA-FR and
AFR. Neither RA-FR nor AFR showed a significant correlation with transvenous electrical
cardioversion threshold, number of shocks or cardioversion success. We concluded that the
AFR may allow non-invasive long-term monitoring of AF dynamics and that neither RA-FR nor
AFR can be used to predict the minimal defibrillation threshold.
The methodology for 3D ultra-high-density electro-anatomical mapping is described in
Chapter 3. Ultra-high-density cardiac mapping allowed very accurate characterization of atrial

S u m m a r y | 185
and ventricular electrophysiology and activation timing. Electro-anatomical maps were
acquired from all 4 chambers in four horses in SR under general anaesthesia. All endocardial
areas within each chamber could be reached with the basket catheter of the mapping system,
but access to the left atrium required the use of a deflectable sheath. With the exception of the
left atrial map of 1 horse, all four chambers in all four horses could be mapped. The mapping
system uses beat acceptance criteria for the automatic acquisition of endocardial
electrograms. Optimization of the beat acceptance criteria led to a reduction in manual
correction of the automatically accepted beats from 13.1% in the first horse to 0.4% of the
beats in the last horse. The study shows that 3D electro-anatomical mapping is feasible in
adult horses and that it is a promising tool for electrophysiological research and
characterization of complex arrhythmias.
The first electrophysiological research performed with the 3D electro-anatomical mapping
system in horses is described in Chapter 4. The system was used to evaluate the qualitative
and quantitative depolarization patterns and correlation to the surface ECG of both the atrial
and ventricular endocardium in 7 healthy horses in sinus rhythm under general anaesthesia.
This was done by analysing the bipolar activation maps of the endocardium. The first atrial
activation was located at the height of the terminal crest. Only one interatrial conduction
pathway was recognized. The first and second P wave deflections represented the right and
left atrial depolarization, respectively. Bundle of His electrograms could be recorded in 5 out
of 7 horses. Left ventricular activation started at the mid septum and right ventricular activation
started apically from the supraventricular crest. This was followed by separate depolarizations
at the height of the right and left ventricular mid free wall. Further ventricular depolarization
occurred in an explosive pattern. The results of this study are a reference for the normal sinus
impulse propagation pattern and for the conduction velocities in equine atria and ventricles.
Even more importantly, these results show that all parts of the atrial and ventricular
depolarization contribute to the surface ECG’s P wave and QRS complex. Thus, the surface
ECG does contain information about the entire depolarization of the heart, in contrast to
findings of previous studies.
The next goal was to evaluate whether VCG characteristics can differentiate between
anatomical locations of atrial (APDs) and ventricular premature depolarizations (VPDs) as well
as between SR and APDs (Chapter 5). In 7 horses a 12-lead ECG was recorded under general
anaesthesia while endomyocardial pacing was performed (800-1000 ms cycle length) in the
atria at the pulmonary veins, left atrial free wall and septum, right atrial free wall, intervenous
tubercle, as well as the cranial and caudal junction with vena cava. Endomyocardial pacing
was performed in the ventricles at the apex, mid and high septum and mid and high free wall,

186 | S u m m a r y
and at the right ventricular outflow tract. Catheter positioning was guided by 3D electro-
anatomical mapping and transthoracic ultrasound. The VCG was calculated from the 12-lead
ECG using custom-made algorithms and was used to determine the mean electrical axis of
the first and second half of the P wave and the initial and mean electrical axis of the QRS
complex. A significant differentiation could be made between the site of origin of every paced
APD. SR could be differentiated from all paced APDs except those originating from the cranial
junction with vena cava. For the ventricles a significant differentiation was possible between
left and right ventricular paced complexes. Within the left ventricle, paced complexes from all
locations showed significant differences. Within the right ventricle, only paced complexes
originating from the right ventricular outflow tract were significantly different from all other
paced beats. Paced complexes originating from other locations within the right ventricle only
showed significant differences compared to locations not adjacent to the paced location. Paced
complexes originating from the right ventricular mid septum and the left ventricular apex were
not significantly different from sinus rhythm. These results suggest that VCG, and in extension
multiple lead recordings, could be useful to identify the anatomical origin of atrial and
ventricular ectopy in horses. However, differentiation of the site of origin within the right
ventricle is challenging.
As a general conclusion this work shows that equine ECGs have more clinical applications
than currently employed and especially multiple lead recordings are underused at the moment.
The results and methods described in this thesis can be a starting point for future investigations
into equine electrocardiography. The algorithm for semi-automated analysis of equine ECGs
could be used to improve screening for arrythmias in the general horse population. The atrial
fibrillation rate derived from the surface ECG allows to better understand the underlying
pathophysiology of atrial fibrillation. Finally, 3D electro-anatomical mapping and multiple lead
recordings can be used to determine the underlying origin of arrhythmias and guide their
targeted treatment.

Samenvatting


S a m e n v a t t i n g | 189
Hartritmestoornissen komen regelmatig voor bij paarden, maar de oorsprong en het klinisch
belang ervan zijn vaak niet gekend. In tegenstelling tot in de humane geneeskunde, is bij
paarden het gebruik van een elektrocardiogram (ECG) momenteel nog steeds gelimiteerd tot
het bepalen van het hartritme en de hartfrequentie. Om de onderliggende oorzaak van
hartritmestoornissen te achterhalen zijn invasieve elektrofysiologische onderzoeken
noodzakelijk, maar deze zijn tot op heden nog niet voldoende ontwikkeld in de cardiologie van
het paard. In de humane geneeskunde ligt het 12-lead ECG aan de basis van de ontwikkeling
van de humane cardiologie waarbij het niet alleen gebruikt wordt voor de diagnose van
hartritmestoornissen maar ook de basis vormt voor het diagnosticeren van structurele
hartafwijkingen, geleidingsstoornissen, genetische aandoeningen van het hart en verstoring
van de elektrolytenhuishouding. Naast het 12-lead ECG, wordt in de humane geneeskunde
eveneens gebruik gemaakt van geavanceerde invasieve technieken om de onderliggende
oorzaken van hartritmestoornissen in kaart te brengen en deze vervolgens te behandelen. In
de cardiologie van het paard zijn veel van deze technieken tot op heden nog niet ontwikkeld.
Deels komt dit doordat de grootte van de paardenthorax belemmerend werkt voor de
toepassing van beeldvormende apparatuur, deels ook omdat het cardiale geleidingssysteem
van paarden anders is dan dat van de mens. Dit laatste maakt het onmogelijk om anatomische
en elektrofysiologische kennis van het hart van de mens en kleine huisdieren rechtstreeks naar
het paard te extrapoleren. Ook werd vanwege dit geleidingssysteem voor lange tijd gedacht
dat slechts een deel van de elektrische activiteit van het paardenhart zichtbaar was op het
oppervlakte ECG en daardoor het oppervlakte ECG bij paarden slechts beperkt bruikbaar was.
De algemene inleiding bespreekt de huidige kennis van de elektrocardiografie bij de mens en
vooral bij het paard. Eerst wordt het ontstaan van het ECG bij het paard en de nomenclatuur
ervan besproken. Dit wordt gevolgd door een overzicht van de ontwikkeling van de
elektrocardiografie bij de mens met extra nadruk op de ontwikkeling van het 12-lead ECG en
de vectorcardiografie. Vervolgens worden de anatomische en fysiologische verschillen tussen
het paarden- en mensenhart besproken. Daarna wordt de ontwikkeling van de
elektrocardiografie bij het paard besproken, samen met enkele veelgebruikte
elektrodeconfiguraties. Vervolgens wordt de analyse van het ECG van het paard en de
kenmerken ervan besproken. Dit deel begint met de beschrijving van enkele vaak
voorkomende hartritmestoornissen bij paarden, samen met hun onderliggende pathofysiologie
en de specifieke kenmerken die te zien zijn op het oppervlakte ECG. Daarna wordt de manuele
analyse van het paarden ECG besproken, gevolgd door de bespreking van automatische
analysetechnieken voor humane ECGs. Op het einde wordt een kort overzicht gegeven van
de invasieve elektrofysiologische technieken die tot op heden gebruikt worden bij mensen en
paarden.

190 | S a m e n v a t t i n g
Het eerste hoofddoel van dit proefschrift was om de screening en diagnose van
hartritmestoornissen bij paarden te verbeteren, gebruik makende van het aangepaste base-
apex oppervlakte ECG. Daarom werd het gebruik van neurale netwerken voor de
semiautomatische analyse van paarden ECG’s onderzocht in Hoofdstuk 1 en het gebruik van
de atriale fibrillatie frequentie (AFF) afgeleid van een oppervlakte-ECG geëvalueerd in
Hoofdstuk 2. Het tweede hoofddoel was het ontwikkelen van een nieuwe invasieve methode
voor het identificeren van de oorsprong van hartritmestoornissen: 3D elektro-anatomische
mapping. De ontwikkeling en methodologie van deze techniek bij paarden werd beschreven in
Hoofdstuk 3. Het normale depolarisatiepatroon van het hart in sinusritme met behulp van deze
3D elektro-anatomische mapping techniek werd beschreven in Hoofdstuk 4. Het derde
hoofddoel van deze studie was om te evalueren of opnames met meerdere afleidingen, het
12-lead ECG en vectorcardiografie, een toegevoegde waarde hebben voor cardiologie bij
paarden indien deze technieken aangepast worden aan hun fysiologie. Daarom hebben we
het gebruik van het 12-lead ECG en vectorcardiografie voor de bepaling van de plaats van
herkomst van atriale en ventriculaire premature depolarisaties onderzocht in Hoofdstuk 5.
Hoofdstuk 1 beschrijft de ontwikkeling van een algoritme specifiek voor analyse van het ECG
bij het paard. Zowel de initiële filtering als de detectie van het QRS-complex werden uitgevoerd
met wavelet-transformaties. Het detectiealgoritme voor het QRS-complex presteerde beter
dan het vaak gebruikte Pan-Tompkins algoritme met een gevoeligheid van 99,0% versus
91,5%, respectievelijk. Vervolgens werd een nieuwe, parallelle convolutionele neurale
netwerkarchitectuur voorgesteld voor de extractie en classificatie van de afzonderlijke slagen.
Deze netwerkarchitectuur is vernieuwend omwille van de parallelle verwerking van zowel de
morfologische gegevens van de ECG-golven als de relatieve timing ten opzichte van de andere
hartslagen in het ECG. Omdat er geen openbare datasets beschikbaar waren voor ECG’s van
paarden, werd een dataset gemaakt met 26.440 slagen in 4 klassen: normale hartslagen,
ventriculaire en atriale premature depolarisaties en storing. Het netwerk werd vervolgens
getraind en getest met behulp van zowel de menselijke MIT-BIH-aritmiedataset als de
zelfgemaakte ECG-dataset voor paarden. Het netwerk werd geoptimaliseerd met behulp van
een genetisch algoritme en een nauwkeurigheid van 97,7% en 92,6% werd bereikt voor
respectievelijk de MIT-BIH- en paarden-ECG-database. Daarna werden de geleerde
kenmerken van de MIT-BIH-dataset toegepast op de paarden-ECG-database, met een
techniek genaamd transfer learning, waarna de gemiddelde gevoeligheid, positieve
voorspellende waarde en F1-score van het netwerk toenamen en de nauwkeurigheid steeg tot
97,1%.
S a m e n v a t t i n g | 191
In Hoofdstuk 2 wordt de AFF die is afgeleid van het aangepaste basis-apex oppervlakte ECG
vergeleken met de AFF die is afgeleid van een rechts atriale intra-cardiale opname (RA-FF).
Opnames van 3 minuten tijdens atriale fibrillatie (AF) van zowel het oppervlakte ECG als van
intra-cardiale elektrogrammen werden geselecteerd voor analyse en vergeleken met behulp
van de Bland-Altman-test. De gemiddelde RA-FF werd gemeten aan de hand van de golven
op het intra-cardiale elektrogram, terwijl de AFF werd geëxtraheerd uit het oppervlakte-ECG
met behulp van spatio-temporale QRS- en T-golf-annulering. Daarnaast werd de correlatie van
AFF met de hoeveelheid energie (in Joules) die nodig was voor transveneuze elektrische
cardioversie, het aantal benodigde schokken en het succespercentage van cardioversie bij
paarden geëvalueerd. Dit werd gedaan bij 73 paarden die waren behandeld voor AF door
middel van transveneuze elektrische cardioversie. De RA-FF was gemiddeld 13 fibrillaties per
minuut lager dan de AFF en er was een matige (r = 0,65) correlatie tussen RA-FF en AFF.
Noch RA-FF, noch AFF vertoonden een significante correlatie met de transveneuze
elektrische cardioversiedrempel, het aantal benodigde schokken of de kans op
cardioversiesucces. We concludeerden dat de AFF niet-invasieve monitoring van de AF
dynamiek op lange termijn mogelijk maakt en dat noch RA-FF noch AFF kunnen worden
gebruikt om de minimale defibrillatiedrempel te voorspellen.
De methodologie voor 3D-elektro-anatomische mapping wordt beschreven in Hoofdstuk 3.
3D-elektro-anatomische mapping maakt een zeer nauwkeurige 3D kaart van de atriale en
ventriculaire elektrofysiologie en de verschillende activeringstijdstippen binnen het hart. Bij vier
paarden werden elektro-anatomische kaarten van de vier hartkamers verkregen in sinusritme
onder algemene anesthesie. Alle endocardiale gebieden binnen elke kamer konden worden
bereikt met de katheter van het mappingsysteem, maar voor toegang tot het linker atrium was
het gebruik van een stuurbare begeleidingskatheter vereist. De atria en ventrikels van de vier
paarden konden in kaart worden gebracht met uitzondering van de linker atriale kaart van één
paard. Het mappingsysteem gebruikt bepaalde criteria voor de automatische acquisitie van de
endocardiale elektrogrammen. Optimalisatie van deze criteria voor de aanvaarding van
elektrogrammen leidde tot een vermindering van de benodigde handmatige correctie van de
automatisch geaccepteerde hartslagen van 13,1% bij het eerste paard tot 0,4% van de
hartslagen bij het laatste paard. De studie laat zien dat 3D elektro-anatomische mapping
mogelijk is bij volwassen paarden en dat het een veelbelovend instrument is voor
elektrofysiologisch onderzoek en karakterisering van complexe hartritmestoornissen bij
paarden.
Het eerste elektrofysiologische onderzoek dat met het 3D elektro-anatomische
mappingsysteem werd uitgevoerd bij paarden wordt beschreven in Hoofdstuk 4. Het systeem

192 | S a m e n v a t t i n g
werd gebruikt om de kwalitatieve en kwantitatieve depolarisatiepatronen en de relatie met het
oppervlakte-ECG van zowel het atriale als het ventriculaire endocardium te evalueren. Dit werd
gedaan door middel van analyse van bipolaire endocardiale activeringskaarten van 7 gezonde
paarden in sinusritme onder algemene anesthesie. De eerste atriale activering bevond zich ter
hoogte van de crista terminalis. Er werd slechts één interatriale geleidingsroute gevonden ter
hoogte van de bundel van Bachmann. De eerste en tweede P-golfafbuiging op het oppervlakte
ECG vertegenwoordigden respectievelijk de rechter en linker atriale depolarisatie.
Elektrogrammen van de bundel van His konden worden opgenomen bij vijf van de zeven
paarden. De activering van het linkerventrikel begon ter hoogte van het midden van het septum
en de activering van het rechterventrikel begon apicaal van de crista supraventricularis. Dit
werd gevolgd door afzonderlijke depolarisaties ter hoogte van het midden van de vrije wand
van zowel het rechter- als linkerventrikel. De verdere ventriculaire depolarisatie vond plaats in
een explosief patroon. De resultaten van deze studie zijn een referentie voor het normale
depolarisatiepatroon tijdens sinusritme en voor de geleidingssnelheden in de atria en
ventrikels van paarden. Nog belangrijker is dat deze resultaten aantonen dat alle delen van de
atriale en ventriculaire depolarisatie bijdragen aan de P-golf en het QRS-complex van het
oppervlakte ECG. Het oppervlakte ECG bevat dus wél informatie over de volledige
depolarisatie van het hart, in tegenstelling tot wat eerdere studies concludeerden.
Het volgende doel was om te evalueren of op basis van het vectorcardiogram onderscheid kan
gemaakt worden tussen de anatomische oorsprong van atriale (APD’s) en ventriculaire
premature depolarisaties (VPD’s) en tussen sinusritme en APD’s (Hoofdstuk 5). Bij zeven
paarden werd onder algemene anesthesie een 12-lead ECG geregistreerd, terwijl intracardiale
atriale stimulatie werd uitgevoerd door middel van pacing (cyclusduur 800-1000 ms) aan de
linker atriale vrije wand en het septum, de rechter atriale vrije wand, de interveneuze kam,
evenals de craniale en caudale overgang met de vena cava. In de ventrikels werd er rechter-
en linkerventrikel intracardiale stimulatie uitgevoerd ter hoogte van de apex, midden en hoog
septum, midden en hoog vrije wand, en ter hoogte van het rechterventrikel uitstroomkanaal.
Catheter positionering werd begeleid door 3D elektro-anatomische mapping en door
transthoracale echografie. Het vectorcardiogram werd berekend uit het 12-lead ECG met
behulp van op maat gemaakte algoritmes en werd gebruikt om de gemiddelde elektrische as
van de eerste en tweede helft van de P-golf te bepalen en de initiële en gemiddelde elektrische
as van het QRS-complex. Hierbij kon een significant onderscheid worden gemaakt tussen de
herkomstplaatsen van elke gestimuleerde APD. Sinusritme kon worden onderscheiden van
alle gestimuleerde APD’s behalve van degene die afkomstig waren van de craniale overgang
met de vena cava. Voor de ventrikels was een significante differentiatie mogelijk tussen
gestimuleerde complexen afkomstig van het linker- en rechterventrikel. Binnen het
S a m e n v a t t i n g | 193
linkerventrikel vertoonden de gestimuleerde complexen van alle locaties significante
onderlinge verschillen. Binnen het rechterventrikel waren alleen gestimuleerde complexen
afkomstig van het rechterventrikel uitstroomkanaal significant verschillend van alle andere
gestimuleerde complexen. Gestimuleerde complexen afkomstig van andere locaties binnen
het rechterventrikel vertoonden alleen significante verschillen vergeleken met locaties die niet
grenzen aan de gestimuleerde locatie. Er kon geen onderscheid gemaakt worden tussen
complexen tijdens sinusritme en complexen tijdens stimulering van het midden van het septum
aan de rechterventrikel zijde of de linkerventrikel apex. Deze resultaten suggereren dat
vectorcardiografie en, in het verlengde daarvan, ECG-opnamesystemen met meerdere
afleidingen nuttig kunnen zijn om de anatomische oorsprong van atriale ectopie bij paarden te
identificeren.
De algemene conclusie van dit proefschrift is dat het ECG bij paarden meer klinische
toepassingen heeft dan er momenteel worden gebruikt en dat voornamelijk ECG-
opnamesystemen met meerdere afleidingen van grote meerwaarde kunnen zijn. De resultaten
en methoden beschreven in dit proefschrift kunnen een startpunt zijn voor toekomstig
onderzoek naar elektrocardiografie bij paarden. Het algoritme voor semi-geautomatiseerde
analyse van ECG’s van paarden zou kunnen worden gebruikt om screening van
hartritmestoornissen binnen de algemene paardenpopulatie te verbeteren. De AFF afgeleid
van het oppervlakte-ECG maakt het mogelijk de onderliggende pathofysiologie van atriale
fibrillatie beter te begrijpen. Ten slotte kunnen 3D-elektro-anatomische kaarten en ECG
opnames met meerdere afleidingen worden gebruikt om de onderliggende oorzaak van
hartritmestoornissen te bepalen en deze beter en gerichter te behandelen.


Curriculum Vitae


C u r r i c u l u m V i t a e | 197
Glenn Van Steenkiste werd geboren op 7 Maart 1992 te Roeselare. Na het beëindigen van het
secundair onderwijs aan het VTI Kortrijk, richting Industriële Wetenschappen, startte hij met
de studies Diergeneeskunde aan de Universiteit Gent. In 2016 behaalde hij het diploma van
dierenarts (optie Paard) met onderscheiding.
In Oktober van datzelfde jaar trad hij in dienst bij de vakgroep Inwendige ziekten van de grote
huisdieren op de Faculteit Diergeneeskunde in Merelbeke als doctoraatsstudent, onder
begeleiding van Prof. Dr. Gunther van Loon en Prof. Dr. Annelies Decloedt en in samenwerking
met de vakgroep Elektromechanica, systeem- en metaaltechniek van de Faculteit
Ingenieurswetenschappen en architectuur onder de begeleiding van Prof. Dr. Crevecoeur. In
Januari 2017 kreeg Glenn Van Steenkiste een beurs van het Fonds voor Wetenschappelijk
onderzoek (FWO, 1S56217N). Naast het cardiologisch onderzoek stond hij ook in voor het
begeleiden van schrijfopdrachten voor master studenten en was hij betrokken bij de
dienstverlening voor cardiologie patiënten. In 2018 kwam er de samenwerking bij met de
vakgroep Biomedical Engineering van de Universiteit van Maastricht onder de begeleiding van
Prof. Dr. Tammo Delhaas.
Glenn Van Steenkiste is auteur van 4 en medeauteur van 8 internationale (Q1) publicaties en
gaf presentaties op 4 internationale congressen. In 2019 won hij niet alleen de “AVEF scientific
Poster award” voor beste wetenschappelijke poster maar ook de “Voorjaarsdagen BEVA
award” voor beste orale presentatie.


Bibliography


B i b l i o g r a p h y | 201
Papers
Broux B, De Clercq D, Decloedt A, Ven S, Vera L, Van Steenkiste G, Mitchell K, Schwarzwald
C, van Loon G. Heart rate variability parameters in horses distinguish atrial fibrillation from
sinus rhythm before and after successful electrical cardioversion. Equine Veterinary Journal.
2017;49(6):723–8.
Decloedt A, Broux B, De Clercq D, Deprez P, Van Steenkiste G, Vera L, van Loon G. Effect
of sotalol on heart rate, QT interval, and atrial fibrillation cycle length in horses with atrial
fibrillation. Journal of Veterinary Internal Medicine. 2018;32(2):815–21.
Vera L, Decloedt A, Van Steenkiste G, De Clercq D, Govaere J, van Loon G.
Electrocardiographic confirmation of a twin pregnancy in a mare at 8 months of gestation.
Journal of Veterinary Cardiology. 2018;20(4):294–9.
Vandecasteele T, Cornillie P, Van Steenkiste G, Vandevelde K, Gielen I, Vanderperren K,
van Loon G . Echocardiographic identification of atrial-related structures and vessels in horses
validated by computed tomography of casted hearts. Equine Veterinary Journal.
2019;51(1):90–6.
Van Steenkiste G, De Clercq D, Vera L, Decloedt A, van Loon G. Sustained atrial tachycardia
in horses and treatment by transvenous electrical cardioversion. Equine Veterinary Journal.
2019;51(5):634–40.
Van Steenkiste G, van Loon G, Crevecoeur G. Transfer learning in ECG classification from
human to horse using a novel parallel neural network architecture. Scientific Reports.
2020;10(1):186
Vernemmen I, De Clercq D, Decloedt A, Vera L, Van Steenkiste G, van Loon G. Atrial
premature depolarisations five days post electrical cardioversion are related to atrial fibrillation
recurrence risk in horses. Equine Veterinary Journal. 2020; evj.13186
Vera L, De Clercq D, Van Steenkiste G, Decloedt A, Chiers K, van Loon G. Differences in
ultrasound-derived arterial wall stiffness parameters and noninvasive blood pressure between
Friesian horses and Warmblood horses. Journal of Veterinary Internal Medicine.
2020;34(2):893-901
Vera L, De Clercq D, Paulussen E, Van Steenkiste G, Decloedt A, Chiers K, van Loon G.
Aortic, common carotid and external iliac artery arterial wall stiffness parameters in horses :
202 | B i b l i o g r a p h y
inter-day and inter-observer and intra-observer measurement variability. Equine Veterinary
Journal. 2020; evj.13196
Van Steenkiste G, De Clercq D, Boussy T, Vera L, Schauvliege S, Decloedt A, van Loon G
Three dimensional ultra‐high‐density electro‐anatomical cardiac mapping in horses :
methodology. Equine Veterinary Journal. 2020; evj.13229
Vera L, Van Steenkiste G, Decloedt A, Chiers K, van Loon G. Age-related differences in blood
pressure, ultrasound-derived arterial diameters and arterial wall stiffness parameters in horses
Equine Veterinary Journal. 2020; evj.13263
Van Steenkiste G, Vera L, Decloedt A, Schauvliege S, Boussy T., van Loon G. Endocardial
electro-anatomic mapping in healthy horses: normal sinus impulse propagation in the left and
right atrium and ventricle. The Veterinary Journal 2020: j.tvjl.2020.105452

B i b l i o g r a p h y | 203
Presentations
Broux B, De Clercq D, Vera L, Van Steenkiste G, Decloedt A, Watteyn A, Devreese M,
Croubels S, van Loon G. Pharmacokinetics and electrophysiological effects of different
dosages of oral sotalol in horses: preliminary results. 9th Congress of the European College
of Equine Internal Medicine, 3-5 November 2016, Helsinki, Finland, p96
Hamerlinck P, Ven S, Van Steenkiste G, De Clercq D, Decloedt A, van Loon G. Left ventricular
function in the ageing horse. 9th Congress of the European College of Equine Internal
Medicine, 3-5 November 2016, Helsinki, Finland, . p. 107
Broux B, De Clercq D, Vera L, Van Steenkiste G, Decloedt A, van Loon G. Heart rate variability
parameters to detect atrial fibrillation in horses. 9th Congress of the European College of
Equine Internal Medicine, 3-5 November 2016, Helsinki, Finland,. p. 97
van Loon G, Boussy T, Vera L, De Clercq D, Schauvliege S, Vandecasteele T, Van Steenkiste
G., Van Langenhove G. Successful high resolution 3D electroanatomical cardiac mapping in
adult horses in sinus rhythm, 2017 ACVIM Forum, 8-10 June 2017, National Harbor, MD, USA,
Journal Of Veterinary Internal Medicine(31), p. 4
Broux B, De Clercq D, Ven S, Vera L, Van Steenkiste G, Decloedt A, van Loon G. Heart rate
monitor derived heart rate variability to diagnose atrial fibrillation in horses. 2017 ACVIM
Forum, 8-10 June 2017, National Harbor, MD, USA, Journal Of Veterinary Internal
Medicine(31), p. 4
van Loon G, Vandecasteele T, Van Steenkiste G, Gielen I, Vanderperren K, Cornillie P.
Ultrasonographic identification of atrial-related structures, validated by 3D CT-segmented
imaging of equine casted hearts. 10th Annual European College of Equine Internal Medicine,
2-3 November 2017, Budapest, Hungary, Journal Of Veterinary Internal Medicine(32), p: 877
De Clercq D, Van Steenkiste G, Vera L, Schauvliege S, Decloedt A, van Loon G. QRS
morphology changes depending on site of ventricular pacing during high resolution 3D electro-
anatomical mapping in adult horses : preliminary results. 10th Annual European College of
Equine Internal Medicine congress : 2-3 November 2017, Budapest, Hungary, Journal Of
Veterinary Internal Medicine(32), p: 877

204 | B i b l i o g r a p h y
Vera L, De Clercq D, Decloedt A, Van Steenkiste G, van Loon G. Reproducibility of arterial
diameter measurements using B- and M-mode ultrasonography in standing Warmblood
horses. British Equine Veterinary Association congress, 12-15 September 2018, Birmingham,
UK,. p. 308–9
Vera L, De Clercq D, Van Steenkiste G, Decloedt A, Chiers K, van Loon G. Friesian horses
show higher arterial blood pressure compared to Warmbloods. 11th European College of
Equine Internal Medicine congress, 7-10 November 2018, Gent, Belgium, Journal Of
Veterinary Internal Medicine(33), p: 1548
Ven S, Decloedt A, Vera L, Van Steenkiste G, De Clercq D, van Loon G. Cardiac dimensions
and function in matched untrained versus endurance-trained Arabian horses. 10th
International conference on Equine Exercise Physiology, 12-16 November 2018, Lorne,
Australia, Comparative Exercise Physiology(14). p. 78
Vera L, De Clercq D, Broux B, Ven S, Van Steenkiste G, van Loon G. Inter-day, inter-observer
and intra-observer variability of arterial pulse wave velocity measurements using pulsed wave
Doppler in healthy horses. 51st European Veterinary Conference Voorjaarsdagen 11-13 April
2018, The Hague, The Netherlands.
Van Steenkiste G, Duytschaever M, De Clercq D, Tavernier R, Vera L, Michielsen A,
Decloedt, A., van Loon G. First successful radiofrequency ablation of focal atrial tachycardia
in a horse guided by a high density 3D electro-anatomical mapping system (Rhythmia®). 11th
European College of Equine Internal Medicine congress, 7-10 November 2018, Gent, Belgium,
Journal Of Veterinary Internal Medicine(33), p: 1547
Vera L, Van Steenkiste G, De Clercq D, Decloedt A, Deserranno B, van Loon G. Right atrial
related structures in horses, of interest during electrophysiological studies. 11th European
College of Equine Internal Medicine congress, 7-10 November 2018, Gent, Belgium, Journal
Of Veterinary Internal Medicine(33), p: 1557
Van Steenkiste G, De Clercq D, Decloedt A, Vera L, van Loon G. Specific 12-lead ECG
characteristics that help localize the anatomical origin of ventricular ectopy in horses :
preliminary data. 11th European College of Equine Internal Medicine congress, 7-10
November 2018, Gent, Belgium, Journal Of Veterinary Internal Medicine(33), p: 1548
Vera L, De Clercq D, Van Steenkiste G, Decloedt A, Chiers K, van Loon G. Differences in
cardiovascular physiology between Friesian horses and Warmblood horses. 51st European
Veterinary Conference Voorjaarsdagen 10-12 April 2019, The Hague, The Netherlands.

B i b l i o g r a p h y | 205
Van Steenkiste G, De Clercq D, Decloedt A, Vera L, van Loon G. A 12-lead electrocardiogram
interpretation algorithm to determine the anatomical site of origin of atrial premature
depolarizations in horses : preliminary data. 51st European Veterinary Conference
Voorjaarsdagen 10-12 April 2019, The Hague, The Netherlands.
Van Steenkiste G, Delhaas T, Hermans B, Vera L, Vernemmen I, Decloedt A, van Loon G..
Accuracy of electrocardiographic and vectorcardiographic criteria to identify the anatomical
location of ventricular ectopy in horses : preliminary data. British Equine Veterinary Association
congress, 11-14 September 2019, Equine Veterinary Jorunal (51) p: 17
Van Steenkiste G, De Clercq D, Decloedt A, Vera L, van Loon G. A 12‐lead electrocardiogram
interpretation algorithm to determine the anatomical site of origin of atrial premature
depolarizations in horses : preliminary data. British Equine Veterinary Association congress,
11-14 September 2019, Equine Veterinary Jorunal (51) p: 8
Vernemmen I, De Clercq D, Decloedt A, Vera L, Van Steenkiste G, van Loon G. Correlation
between atrial premature depolarisations after electrical cardioversion and risk for atrial
fibrillation recurrence in horses. British Equine Veterinary Association congress, 11-14
September 2019, Equine Veterinary Jorunal (51) p: 18
van Loon G, De Clercq D, Decloedt A, Vera L, Van Steenkiste G, De Bruijn M, van Loon G..
ACVIM Forum, 6-8 June 2019, Phoenix, AZ, USA,. p. 184–184.
De Lange L, De Clercq D, Vera L, Van Steenkiste G, ter Woort F, van Loon G. Rupture
partielle de la paroi de l’aorte avec dissection et formation d’un pseudo-anévrisme chez un
étalon Frison de 10 ans sans symptômes cliniques. Ateliers et journées annuelles AVEF, 13-
15 November, 2019, Tours, France. p. 159
Van Steenkiste G, Vera L, De Lange L, Decloedt A, De Clercq D, van Loon G. Développement
d’un simulateur d’échocardiographie équine basé sur des images tomographiques dérivées à
l’aide de cœurs moulés. Ateliers et journées annuelles AVEF, 13-15 November, 2019, Tours,
France. p. 78
Vera L, De Clercq D, Van Steenkiste G, De Lange L, Decloedt A, Neuckermans Z, van Loon
G. L’échographie des artères principales chez les chevaux âgés montre un diamètre supérieur,
une paroie plus épaisse et plus rigide par rapport à des jeunes chevaux. Ateliers et journées
annuelles AVEF, 13-15 November, 2019, Tours, France. p. 77

206 | B i b l i o g r a p h y
Van Steenkiste G, De Clercq D, Decloedt A, Vera L, van Loon G. Détection fiable de la
fibrillation atriale chez des chevaux à l’aide d’apprentissage en profondeur. Ateliers et journées
annuelles AVEF, 13-15 November, 2019, Tours, France. p. 161
De Lange L, Van Steenkiste G, Vera L, De Clercq D, Decloedt A, Cromheeke KM, van Loon
G. First succesful applications of closed loop stimulation pacemakers with remote monitoring
in two syncopal miniature donkeys. 12th European College of Equine Internal Medicine
congress, 20-23 November 2019, Valencia, Spain.
De Lange L, Vera L, Van Steenkiste G, Vernemmen I, De Clercq D, Decloedt A, Raes E, van
Loon G (2019). Full in silico 3D reconstruction of the equine heart and major vessels. ECEIM
congress, 21-23 November 2019, Valencia, Spain.
Neukermans Z, Van Steenkiste G, Decloedt A, van Loon G Diagnosis of left ventricular
hypertrophy by vectorcardiography: first confirmed cases, 52nd European Veterinary
Conference Voorjaarsdagen 15-17 April 2020, The Hague, The Netherlands.
De Lange L., Vera L., Van Steenkiste G., Vernemmen I., Decloedt A., van Loon G.
Prevalence and characteristics of ventricular septal defects as isolated congenital condition in
an equine internal medicine population of 23980 horses (2008 – 2019), 52nd European
Veterinary Conference Voorjaarsdagen 15-17 April 2020, The Hague, The Netherlands.
Van Steenkiste G., Carlson J., Decloedt A., Vera L., Buhl R., Plantonov P., van Loon G.
Analysis of surface electrocardiograms for the determination of atrial fibrillatory rate in horses.
52nd European Veterinary Conference Voorjaarsdagen 15-17 April 2020, The Hague, The
Netherlands.
van Loon G., Vera L., Decloedt A., Schauvliege S., Boussy T., Van Steenkiste G. Equine 3D
Electroanatomical Mapping in Sinus Rhythm elucidates the Electrocardiogram and Cardiac
Electrical Activation Pattern, ACVIM Forum, 10-13 June 2019, Maryland, MD, USA.

Dankwoord

Als er geen naastenliefde in uw hart is,
hebt u de ergste hartkwaal die er bestaat
- Bob Hope -
D a n k w o o r d | 209
Welkom bij het meest gelezen, en waarschijnlijk voor de meesten ook het enige belangrijke,
hoofdstuk van dit boekje: het dankwoord. Bij deze: aan allen die ook maar in de verste verte
iets hebben bijgedragen aan de realisatie van dit doctoraat: Dank u! Aan alle anderen: ook
bedankt voor het lezen, het geschreven woord heeft niet veel nut als niemand het leest.
Degenen die zich altijd tot de samenvatting van een artikel beperken kunnen het dus bij deze
houden.
De personen die iets meer tijd of interesse hebben mogen gerust verder lezen voor de iets
langere versie. Want laat ons eerlijk zijn, dankzij de COVID-19 maatregelen had ik een
overschot aan rust en afzondering om na te denken. Wat een mens allemaal niet moet doen
om eens op zijn gemak te zijn1… Echter, mijn dankbetuigingen gaan uit naar mijn promotoren.
Zonder hen zou dit werk nooit zijn wat het geworden is. Gunther, ik kwam 4 jaar geleden naar
jou met mijn 1e zelfgemaakte ecg-recorder om te vragen of ik bij jou een PhD mocht doen. Je
hebt er meteen je tanden in gezet en mij voluit gesteund om mijn FWO-beurs te behalen,
zonder dat u me eigenlijk kende, en het is ons dan ook gelukt om die beurs te behalen. Door
de jaren heen heeft u mijn enthousiasme voor de cardiologie alleen nog maar meer kunnen
aanwakkeren tijdens onze vele inspirerende gesprekken! Annelies, bedankt voor alle feedback
en hulp die u me door de jaren heen hebt gegeven. U slaagde er steeds toch weer in om orde
te scheppen in de soms (vaak) chaotische (geschreven) spinsels van mijn brein. Ook
statistisch bracht u me steeds terug op het rechte pad als ik weer eens te ver dreigde af te
dwalen. Buiten het professionele was u natuurlijk ook altijd een fijne gesprekspartner bij 1 van
onze vele middagwandelingen naar de Resto, een betere professor voor communicatie
konden ze niet hebben gekozen! Guillaume, dankzij jou kon ik toch weer contact leggen met
de wereld die ik 6 jaar daarvoor de rug had toegekeerd (maar nooit uit het hart had verloren)
de ingenieurswereld. Dank u om me terug wegwijs te maken in deze wereld en de mogelijkheid
te geven om een doctoraat te schrijven waar mijn 2 grote passies in verwerkt zijn: paarden en
engineering. Tammo, u kwam er maar halverwege bij, maar u heeft zeker uw stempel gedrukt
op dit doctoraat en zult dit hoogstwaarschijnlijk ook doen bij onze volgende werken. Uw
diepgaande kennis van de humane elektrofysiologie heeft ons een grotere kennis gegeven
van de paarden elektrofysiologie dan we ooit hadden durven hopen aan het begin van dit
doctoraat. Hoewel de onderlinge communicatie niet altijd even vlot verliep, al zal menig lezer
dit waarschijnlijk toeschrijven aan mijn communicatievaardigheden … , ben ik zeer blij dat u
erbij bent gekomen en de wetenschappelijke waarde van dit werk naar het huidige niveau heeft
geholpen.
1 Disclaimer: ik verklaar hierbij officieel niets te maken te hebben met de uitbraak van het SARS-CoV-2 virus. De wereldpolitiek heeft al het harde werk voor mij gedaan.

210 | D a n k w o o r d
I would also like to say many thanks to the members of the examination committee. Prof. Dr.
Buhl, Prof. Dr. Pasmans, Dr. Van Heuverswyn, Dr. Schauvliege, Dr. Smets and Dr. Boussy for
reading my work despite your sparse and precious time and sharing your detailed insights and
advice on how to improve it.
Dr. Schauvliege en Dr. Boussy, of als ik zo vrij mag zijn: Stijn en Tim: bedankt om jullie vele
uren te spenderen in de operatiezaal zodat wij onze 1e paarden konden mappen, en uiteindelijk
zelfs wereldnieuws konden worden door de 1e paarden te ableren! Stijn, je hebt een fantastisch
team van anesthesisten opgeleid! Zonder jouw en Charlotte, Lavinia, Anna en Anneleen hun
expertise was het ons nooit gelukt om de lange operaties tot een goed eind te brengen! En
Stijn, nogmaals sorry dat je door ons het nieuwjaar diner van de vakgroep hebt gemist! Tim,
bedankt om al je kennis te delen over het elektrofysiologisch onderzoek, en vooral om zo
geduldig te zijn voor onze grote paardenharten met een lage hartslag (die we niet willen
opdrijven). Eens de corona maatregelen voorbij zijn komen we zeker nog eens naar uw
zangkunsten luisteren, driemaal is scheepsrecht!
Het equine cardioteam. Het team der teams zonder wiens vele uren, nu ja eerder dagen en
weken, aan werk dit werk er nooit was gekomen. Sofie en Barbara, we hebben maar weinig
kunnen samen werken, maar jullie waren er toch altijd voor de aangename babbel en hebben
me waar mogelijk wegwijs geholpen, bedankt! Dominique, de vele inspanning die jij voor het
cardioteam hebt gedaan zijn ontelbaar. Ook bedankt om me wegwijs te maken in de
echocardiografie, elektrocardiografie, universitaire politicologie en interne geneeskunde van
de paarden! Ik heb ook even het plezier gehad om uw bureaugenoot te kunnen zijn. Daar, en
tijdens de hele vele mapping uren hebben we vele gesprekken gehad die ik zeker mis. Ik hou
je er nog steeds aan om iets te gaan drinken eens deze Corona maatregelen voorbij zijn! En
ik wens je ook nog veel succes in je nieuwe carrière. Alex en Ellen, de newbies in het equine
cardioteam maar de ervaren rotten in het kliniek team van de inwendige ziekten. Ik ben blij dat
ik delen van mijn werk in jullie deskundige handen mag overlaten. Ingrid, je bent de jongste
newbie van ons cardioteam, maar toch voelt het alsof we elkaar al veel langer kennen. Daar
zullen onze vele carpool ritjes zeker voor iets tussen zitten. Eindelijk eens een sparringpartner
waartegen ik mijn meest uiteenlopende hypotheses eens kan toetsen! Ik beloof je dan ook dat
ik mijn oplossing voor het “sterven” gedeelte bij gravitationele space-time dilatatie met je zal
delen eens ik dit gevonden heb, kwestie dat je dan al de tijd van de wereld hebt om je PhD af
te werken. Je zal dit waarschijnlijk nodig hebben als je ooit het nut van 3D echo wilt aantonen
😊. En als laatste cardioteam lid: Lisse, mijn partner in crime en mijn ‘meter’ sinds het begin
van mijn PhD. Je hebt me vanaf de start op sleeptouw genomen en me uitgelegd wat er van
me werd verwacht. We hebben samen vaak tot in de late uren doorge(werkt) tijdens de

D a n k w o o r d | 211
varkensproeven, de mappingproeven, het scannen van de vele friezen en warmbloeden en
tijdens de congressen. We hebben vele goede en soms minder goede momenten
meegemaakt, maar mede dankzij je niet aflatende enthousiasme en de fijne gesprekken
beëindigden we de dag altijd met een lach. Zoals Tim Vandecasteele het in zijn dankwoord
beschreef, samen zijn we een top duo! Ik wens je nog heel veel succes in je verdere carrière
en met je kleine meid en hoop dat onze vriendschap nog lang mag duren.
DI12 is uiteraard veel meer dan het cardioteam alleen. Laurence, Caroline, Joke, Ellen, Alex,
Zoë en Lisa: jullie houden de kliniek dag en nacht draaiende. Ook bedankt voor al onze
patiënten altijd uitstekend te hebben opgevolgd en de vele hilarische gesprekken aan de
middagtafel! En Lisa, ik heb je hierboven eigenlijk niet vermeld bij het cardioteam, maar voor
mij maak je daar ook 100% deel van uit, zijnde het officieel als jouw kleine zijprojectje 😉. Ook
bedankt voor het controleren, of misschien eerder herschrijven, van de Franse abstracts (jij
ook Zoë!). Hopelijk kunnen we tegen November samen naar Marseille. Ik wens jullie beide ook
nog veel succes toe voor jullie residentie, Yes you can (do it in a single try)!
Komen we bij het runderteam (voor de vrienden en famillie: ik ben bijna bij jullie, eerst wat
ongeschreven protocollen afwerken). Bedankt dat ik van jullie af en toe eens een ander dier
mocht scannen dan een paard: een kalf, een varken of een alpaca (voor de lezer: dit waren
effectief dieren, niet het personeel of studenten) het was eens iets anders. Lieze, Katharina,
Laura: bedankt voor de koffie en de bijbehorende babbels. Ik wens jullie allen nog veel succes
in jullie verdere carrières! Mathilde en Jade, neen ik ben jullie deze keer bijna niet vergeten!
Jullie zullen dat zeker goed doen! Bart, je hebt ondertussen ook al een prachtig team
opgebouwd. Ik kan me geen betere kandidaat voorstellen om de nalatenschap van prof.
Deprez op te volgen. Daarenboven verheug ik me onze gesprekken en samenwerking nog
verder te zetten!
En dan zijn er natuurlijk nog degenen die ervoor zorgen dat het kliniekleven vlot kan verlopen:
Hans, dank je voor alle goedemorgens en alle keren dat ik wat “meer toegang” nodig had tot
het UGentNet! Elvin, dankzij jou was ons materiaal altijd in orde. Sylvie en Sabrina bedankt
voor alle bloedbuisjes die jullie al hebben afgedraaid, ik hoop van harte dat ze ooit van nut
zullen zijn (al vrees ik er een beetje voor…). Tony, Julien, Balder, Carlos en Saar: bedankt
voor het verzorgen van al onze paarden. Ook al stonden ze er soms enkele maanden, ze
zagen er nog altijd top uit! (Misschien iets te dik…). En dan ook nog de vele interns die de
revue zijn gepasseerd. Met sommige onder jullie heb ik al meer contact gehad dan met de
andere in mijn veredelde bezemkast (aka mijn bureau), maar ik wil me alsnog excuseren voor
de vele problemen met de ECGs, ik doe mijn best die “ooit” opgelost te krijgen! En Anke,

212 | D a n k w o o r d
bedankt voor de frieten die je me samen met Lisse’s avonds laat op het ECEIM nog hebt
gebracht, de frieten waren koud, maar de boodschap was warm.
Helaas heb ik nog vele personen niet genoemd, maar dan zou mijn lijst wat te lang worden.
En ik zal eerlijk zijn: ik ben ook enorm slecht in namen, jullie willen niet weten hoeveel ik van
bovenstaande al heb moeten opzoeken… Maar de mensen van Heelkunde, Medische
beeldvorming (Stijn!), Morfologie, Pathologie, Verloskunde, UZ Gent, kleine huisdieren (we
gaan toch eens een hond ableren eh!), Fulgur en Maastricht UMC+ wil ik zeker ook bedanken.
Nog een special shoutout naar het Skillslab (Valentine en Pia!) jullie doen een fantastische
taak om onze toekomstige dierenartsen praktijk klaar te maken!
Ik had misschien beter een index gemaakt voor mijn vrienden en familie, maar ik ben eindelijk
bij jullie aangekomen. Mijn excuses dat jullie eerst door het bovenstaande geen moesten
lezen, want jullie zijn zeker niet minder belangrijk geweest.
Jeroen, Jules, Bob, Lukas, Eveline, Wouter, Tessa, Karel, Igor, Diana: ik ben samen met jullie
aan de opleiding diergeneeskunde begonnen, behalve Diana, die was iets vroeger begonnen
😊, en jullie hebben ervoor gezorgd dat ik een fantastische studententijd heb mogen
meemaken! Sommige van jullie zie ik niet vaak meer en daar moeten we zeker eens
verandering in brengen. Jeroen, je hebt trouwens ook nog een vrijgezellenfeest van ons te
goed, en de ideeën komen er niet milder op met de tijd…
Floris en Tim, we kennen elkaar bijna reeds een kwarteeuw. Ook al zagen we elkaar soms
een een hele tijd niet, jullie bleven altijd trouwe vrienden en als we samen komen leek het nooit
langer geleden dan gisteren. Floris, my best man, bedankt ook voor de lange avonden in het
begin van mijn PhD om mij de beginselen van het programmeren duidelijk te maken! De
jaarlijkse barbecue is dit jaar op mijn kosten.
Dan is er nog een lange lijst van vrienden en (schoon)familie die me elk op hun manier hebben
gebracht tot waar ik nu ben. Helaas heeft niet iedereen het tot dit punt gehaald, maar ook hen
ben en ga ik nooit vergeten. Ik zou hier inderdaad een lange lijst van namen2 kunnen zetten
en bij iedereen iets kunnen vermelden, maar dan nog zou ik nooit volledig genoeg kunnen zijn
wat jullie voor mij hebben betekend: bedankt!
2Niemand die me belet om hier een onvolledige lange lijst van namen te zetten, in alfabetische volgorde: Alex, Alidor, Amber, Amely, Andy, Benedicte, Claudette, Frits, Germain, Ghislaine, Godelieve, Google (laat ons eerlijk zijn, die heeft me ook veel geholpen), Hedwige, Jonathan, Joran, Lieve, Linda, Marc, Maria, Martine, Patrick, Therese, Veronique: bedankt!

D a n k w o o r d | 213
Ma en Pa. Zonder jullie was ik hier niet geweest, en was het dus ook logischerwijs onmogelijk
geweest om dit te schrijven. Maar daarnaast ook bedankt dat jullie me altijd hebben gesteund
in wat ik wou doen, en me altijd hebben laten doen wat ik wou. Ook al was (is) het eindpunt
niet altijd even duidelijk. Zonder jullie steun en hulp was ik hier heel zeker nooit geraakt, en
daarvoor kan ik jullie niet genoeg bedanken!
En dan als laatste, maar heel zeker niet de minste: Sarah. Ik heb voor jou een bijna lege pagina
voorzien maar zelfs dit volledige boekje is eigenlijk niet voldoende om uit te leggen wat jij voor
mij, jouw ‘prins op het bruine paard’, betekent. I haven’t got a clue, but let me start by saying:
I love you.