Basic and Bedside Electrocardiography - 1 File Download
464
Basic and Bedside Electrocardiography
-
Upload
khangminh22 -
Category
Documents
-
view
0 -
download
0
Transcript of Basic and Bedside Electrocardiography - 1 File Download
Basic and Bedside Electrocardiography
LWBK271-FM_i-x.qxd 1/29/09 1:58 PM Page i LWBK271-C01_01-08.qxd

LWBK271-FM_i-x.qxd 1/29/09 1:58 PM Page ii LWBK271-C01_01-08.qxd

Basic and Bedside Electrocardiography
Romulo F. Baltazar, MD, FACCDirector, Noninvasive Cardiology
Sinai Hospital of Baltimore
Assistant Professor, Medicine
Johns Hopkins University
Baltimore, Maryland
LWBK271-FM_i-x.qxd 1/29/09 1:58 PM Page iii LWBK271-C01_01-08.qxd

Acquisitions Editor: Frances DestefanoManaging Editor: Leanne McMillanMarketing Manager: Kimberly SchonbergerProduction Editor: Beth MartzDesign Coordinator: Stephen DrudingCompositor: Aptara, Inc.
Copyright © 2009 Lippincott Williams & Wilkins, a Wolters Kluwer business.
351 West Camden Street 530 Walnut StreetBaltimore, MD 21201 Philadelphia, PA 19106
Printed in China
All rights reserved. This book is protected by copyright. No part of this book may be reproduced ortransmitted in any form or by any means, including as photocopies or scanned-in or other electroniccopies, or utilized by any information storage and retrieval system without written permission fromthe copyright owner, except for brief quotations embodied in critical articles and reviews. Materialsappearing in this book prepared by individuals as part of their official duties as U.S. govern-ment employees are not covered by the above-mentioned copyright. To request permission,please contact Lippincott Williams & Wilkins at 530 Walnut Street, Philadelphia, PA 19106, via emailat [email protected], or via website at lww.com (products and services).
9 8 7 6 5 4 3 2 1
Library of Congress Cataloging-in-Publication Data
Baltazar, Romulo F.Basic and bedside electrocardiography / Romulo F. Baltazar.
p. ; cm.Includes index.ISBN-13: 978-0-7817-8804-5ISBN-10: 0-7817-8804-8
1. Electrocardiography. I. Title.[DNLM: 1. Electrocardiography. 2. Heart Diseases—diagnosis. 3. Heart
Diseases—therapy. WG 140 B197b 2009]RC683.5.E5B283 2009616.1�207547—dc22
2008056135
DISCLAIMER
Care has been taken to confirm the accuracy of the information present and to describe gener-ally accepted practices. However, the authors, editors, and publisher are not responsible for errors oromissions or for any consequences from application of the information in this book and make nowarranty, expressed or implied, with respect to the currency, completeness, or accuracy of the con-tents of the publication. Application of this information in a particular situation remains the profes-sional responsibility of the practitioner; the clinical treatments described and recommended may notbe considered absolute and universal recommendations.
The authors, editors, and publisher have exerted every effort to ensure that drug selection anddosage set forth in this text are in accordance with the current recommendations and practice at thetime of publication. However, in view of ongoing research, changes in government regulations, andthe constant flow of information relating to drug therapy and drug reactions, the reader is urged tocheck the package insert for each drug for any change in indications and dosage and for added warn-ings and precautions. This is particularly important when the recommended agent is a new or infre-quently employed drug.
Some drugs and medical devices presented in this publication have Food and Drug Administra-tion (FDA) clearance for limited use in restricted research settings. It is the responsibility of the healthcare provider to ascertain the FDA status of each drug or device planned for use in their clinical practice.
To purchase additional copies of this book, call our customer service department at (800) 638-3030or fax orders to (301) 223-2320. International customers should call (301) 223-2300.
Visit Lippincott Williams & Wilkins on the Internet: http://www.lww.com. Lippincott Williams &Wilkins customer service representatives are available from 8:30 am to 6:00 pm, EST.
LWBK271-FM_i-x.qxd 1/29/09 1:58 PM Page iv LWBK271-C01_01-08.qxd

This book is dedicated to my wife, Ophelia,
for her inspiration, support and encouragement in
the preparation of this book.
LWBK271-FM_i-x.qxd 1/29/09 1:58 PM Page v LWBK271-C01_01-08.qxd

LWBK271-FM_i-x.qxd 1/29/09 1:58 PM Page vi LWBK271-C01_01-08.qxd
Preface
vii
More than 100 years since its introduction, electrocar-diography continues to provide invaluable clinical
information. Even with the development of modern andmore expensive technologies, its significance has not de-clined. To the contrary, its clinical application continuesto expand, and presently, it is the most utilized diagnosticmodality in the whole practice of medicine. In the hospi-tal setting, it is routinely used to monitor both cardiac andnoncardiac patients, especially in acute care units andduring the performance of various cardiac and noncar-diac procedures. Thus, the information provided by theelectrocardiogram should be standard knowledge forevery medical and paramedical professional who is in-volved with patient care.
This book is purposely written in a format that willassist the beginner, including medical students, nurses,and paramedical professionals, in understanding basicelectrocardiography. It is also intended for interns, resi-dents, physician assistants, fellows, anesthesiologists, andclinical cardiologists by including standard of care treat-ment of patients with electrocardiographic abnormalitiesbased on the most recent practice guidelines when guide-lines are available. Thus, the book is a combination ofboth basic and bedside electrocardiography.
The book integrates the comments and suggestions ofmany interns, residents, and attending physicians towhom I owe a great deal of gratitude. I would like to thankDrs. Miruais Hamed, Paul Aoun, Eileen Zingman, OlgaSzalasny, Katja Vassiliades, Manish Arora, Onyi Onuoha,Brandon Togioka, Darshana Purohit, Ranjani Ra-manathan, Binu Matthew, Paolo Caimi, Mulugeta Fissha,Hany Bashandy, Cindy Huang, Suzan Fattohy, Rachel
Hartman, Kevin Hayes, Khawaja Farook, Jason Javillo,Jennifer Morales, Ubadullah Sharief, Ledys de Marsico,Celian Valero, Samarina Ahmad, Kweku Hayford, HarithaPendli, Maya Morrison, and many others. I am also grate-ful to Kittane Vishnupriya for his very helpful commentsand for the ECG that he painstakingly obtained to illus-trate the significance of the posterior leads in the diagno-sis of posterolateral myocardial infarction when he was acoronary care resident. I am also grateful to Drs. GabrielaSzabo, Ameena Etherington, and Soma Sengupta for re-viewing chapters in the book, and Laura Baldwin, our su-perb cardiology technician, who has taught me how to re-trieve and record electrocardiograms from our archives.
I am also grateful to Dr. Morton Mower who has beenmy mentor since I was a resident. His suggestions for im-proving the book are greatly appreciated. I would also liketo express my deep appreciation to Dr. Steven Gambert,Chief of the Department of Medicine, Johns HopkinsUniversity/Sinai Hospital Program in Internal Medicine,for his support and encouragement and for his enthusi-asm in having this book published.
Finally, I am grateful to my daughter, Cristina, who isinstrumental in teaching me how to use the computer inthe preparation of this book and my son Romulo, Jr whodecided on Radiology as his specialty, for his commentsand suggestions for simplifying some of the chapters,especially those dealing with Basic Electrocardiography.
Romulo F. Baltazar, MD, FACCDirector, Noninvasive Cardiology, Department of Medicine
Johns Hopkins University/Sinai Hospital Program inInternal Medicine
LWBK271-FM_i-x.qxd 1/29/09 1:58 PM Page vii LWBK271-C01_01-08.qxd

LWBK271-FM_i-x.qxd 1/29/09 1:58 PM Page viii LWBK271-C01_01-08.qxd
ix
Contents
Preface vii
Basic Anatomy and Electrophysiology . . . . . . . . . . . . . . . . . . . . . . . . . . . . 1
Basic Electrocardiography . . . . . . . . . . . . . . . . . . . . . . . . . . . . . . . . . . . . . . 9
The Lead System . . . . . . . . . . . . . . . . . . . . . . . . . . . . . . . . . . . . . . . . . . . . 23
The Electrical Axis and Cardiac Rotation . . . . . . . . . . . . . . . . . . . . . . . . . 30
Heart Rate and Voltage . . . . . . . . . . . . . . . . . . . . . . . . . . . . . . . . . . . . . . . 48
Depolarization and Repolarization . . . . . . . . . . . . . . . . . . . . . . . . . . . . . . 55
Chamber Enlargement and Hypertrophy . . . . . . . . . . . . . . . . . . . . . . . . . 62
Atrioventricular Block . . . . . . . . . . . . . . . . . . . . . . . . . . . . . . . . . . . . . . . . 80
Intraventricular Conduction Defect: Fascicular Block . . . . . . . . . . . . . . 112
Intraventricular Conduction Defect: Bundle Branch Block . . . . . . . . . . 120
Intraventricular Conduction Defect: Trifascicular Block . . . . . . . . . . . . 138
Sinus Node Dysfunction . . . . . . . . . . . . . . . . . . . . . . . . . . . . . . . . . . . . . 148
Premature Supraventricular Complexes . . . . . . . . . . . . . . . . . . . . . . . . . 167
Sinus Tachycardia . . . . . . . . . . . . . . . . . . . . . . . . . . . . . . . . . . . . . . . . . . . 180
Supraventricular Tachycardia . . . . . . . . . . . . . . . . . . . . . . . . . . . . . . . . . 184
Supraventricular Tachycardia due to Reentry . . . . . . . . . . . . . . . . . . . . . 187
Supraventricular Tachycardia due to Altered Automaticity . . . . . . . . . . 211
Atrial Flutter . . . . . . . . . . . . . . . . . . . . . . . . . . . . . . . . . . . . . . . . . . . . . . . 233
Atrial Fibrillation . . . . . . . . . . . . . . . . . . . . . . . . . . . . . . . . . . . . . . . . . . . 246
Wolff-Parkinson-White Syndrome . . . . . . . . . . . . . . . . . . . . . . . . . . . . . 262
Ventricular Arrhythmias . . . . . . . . . . . . . . . . . . . . . . . . . . . . . . . . . . . . . 287
Wide Complex Tachycardia . . . . . . . . . . . . . . . . . . . . . . . . . . . . . . . . . . . 310
Acute Coronary Syndrome: ST Elevation Myocardial Infarction . . . . . . 331
Acute Coronary Syndrome: Non-ST Elevation Myocardial
Infarction and Unstable Angina . . . . . . . . . . . . . . . . . . . . . . . . . . . . . . . 379
Electrolyte Abnormalities . . . . . . . . . . . . . . . . . . . . . . . . . . . . . . . . . . . . 396
The ECG of Cardiac Pacemakers . . . . . . . . . . . . . . . . . . . . . . . . . . . . . . . 414
Appendix: Commonly Used Injectable Pharmacologic Agents . . . . . . . . . . . . . 435
Index . . . . . . . . . . . . . . . . . . . . . . . . . . . . . . . . . . . . . . . . . . . . . . . . . . . . . . . . . . 449
26
25
24
23
22
21
20
19
18
17
16
15
14
13
12
11
10
9
8
7
6
5
4
3
2
1
LWBK271-FM_i-x.qxd 1/29/09 1:58 PM Page ix LWBK271-C01_01-08.qxd

LWBK271-FM_i-x.qxd 1/29/09 1:58 PM Page x LWBK271-C01_01-08.qxd

Basic Anatomy of the Heart
■ The cardiac chambers: The heart is the center of thecirculatory system and is the organ that pumps bloodto the different parts of the body. It consists of two up-per receiving chambers—the right atrium and leftatrium—and two lower pumping muscular cham-bers—the right ventricle and left ventricle (Fig. 1.1).■ Right atrium: The right atrium receives venous
blood from the different parts of the body throughthe superior and inferior vena cavae and directs theblood to the right ventricle.
■ Right ventricle: The right ventricle pumps bloodto the pulmonary artery for delivery to the lungs.
■ Left atrium: The left atrium receives oxygenatedblood from the lungs through four separate pul-monary veins and delivers blood to the left ventricle.
■ Left ventricle: The left ventricle pumps oxygenatedblood to the aorta for delivery to the different partsof the body.
The Sinus Node and Intraventricular Conduction System
■ The sinus node and conduction system: The hearthas a generator that gives rise to an electrical impulseand an electrical circuit; this allows the cardiac impulseto propagate from atria to ventricles in an orderly se-quence. The generator of the heart is the sinus nodeand the electrical circuit is the intraventricular conduc-tion system (Fig. 1.2A, B).
■ Intraventricular conduction system: The bundle ofHis, right and left bundle branches, the fascicularbranches of the left bundle branch, and Purkinje fibersconstitute the intraventricular conduction system.Their cells are specialized for rapid and orderly con-duction of the electrical impulse and may be regardedas the electrical circuit of the heart.
Basic Anatomy of the Heart
■ Sinus node: The sinus node is the origin of the cardiacimpulse and is the pacemaker of the heart. It is locatedhigh within the right atrium near the entrance of thesuperior vena cava.
■ Atria: The atria consist of a thin layer of muscle cellsthat conduct the sinus impulse directly to the atrioven-tricular (AV) node. The atria also contracts upon ar-rival of the impulse from the sinus node. With contrac-tion of the atria, additional blood is pumped to theventricles.
■ AV node: The AV node is the only pathway throughwhich the sinus impulse can reach the ventricles. It islocated at the floor of the right atrium, adjacent tothe ventricular septum. The AV node slows down theconduction of the sinus impulse to the ventricles sothat contraction of the atria and ventricles does notoccur simultaneously. This results in a better cardiacoutput.
1Basic Anatomy and
Electrophysiology
1
Pulmonaryvein
Pulmonaryartery
Aorta
To LungsTo SystemicCirculation
Superiorvena cava
Inferior
vena cava
From Lungs
Right atrium
Right Ventricle
Left atrium
Left ventricle
Figure 1.1: Anatomy of the Heart. Diagrammaticrepresentation of the heart showing two upper receivingchambers—the right and left atria—and two lower muscularpumping chambers—the right and left ventricles. Arrows pointto the direction of blood flow.
LWBK271-C01_01-08.qxd 1/29/09 11:25 AM Page 1 LWBK271-C01_01-08.qxd
2 Chapter 1
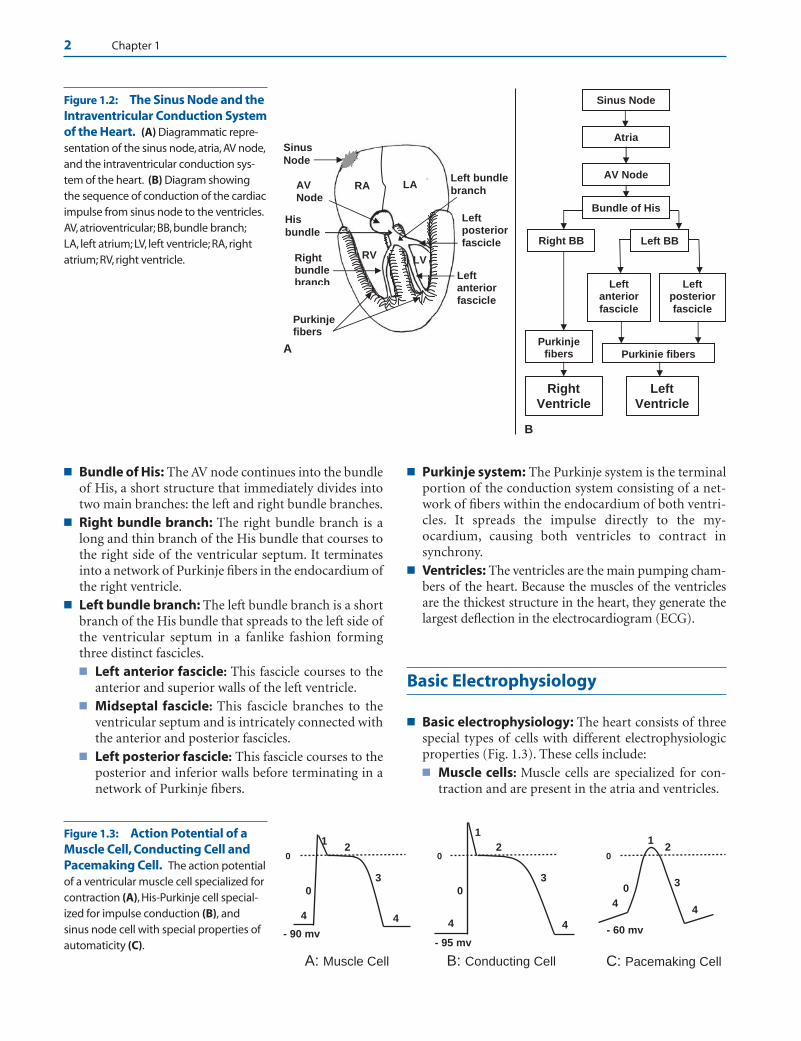
■ Bundle of His: The AV node continues into the bundleof His, a short structure that immediately divides intotwo main branches: the left and right bundle branches.
■ Right bundle branch: The right bundle branch is along and thin branch of the His bundle that courses tothe right side of the ventricular septum. It terminatesinto a network of Purkinje fibers in the endocardium ofthe right ventricle.
■ Left bundle branch: The left bundle branch is a shortbranch of the His bundle that spreads to the left side ofthe ventricular septum in a fanlike fashion formingthree distinct fascicles.■ Left anterior fascicle: This fascicle courses to the
anterior and superior walls of the left ventricle.■ Midseptal fascicle: This fascicle branches to the
ventricular septum and is intricately connected withthe anterior and posterior fascicles.
■ Left posterior fascicle: This fascicle courses to theposterior and inferior walls before terminating in anetwork of Purkinje fibers.
■ Purkinje system: The Purkinje system is the terminalportion of the conduction system consisting of a net-work of fibers within the endocardium of both ventri-cles. It spreads the impulse directly to the my-ocardium, causing both ventricles to contract insynchrony.
■ Ventricles: The ventricles are the main pumping cham-bers of the heart. Because the muscles of the ventriclesare the thickest structure in the heart, they generate thelargest deflection in the electrocardiogram (ECG).
Basic Electrophysiology
■ Basic electrophysiology: The heart consists of threespecial types of cells with different electrophysiologicproperties (Fig. 1.3). These cells include:■ Muscle cells: Muscle cells are specialized for con-
traction and are present in the atria and ventricles.
AV Node
Left posterior fascicle
Left anterior fascicle
Right bundle branch
Purkinje fibers
His
bundle
Left bundle branch
Sinus
Node
RV LV
RA LA
Sinus Node
Atria
AV Node
Bundle of His
Right BB Left BB
Left anterior fascicle
Left posterior fascicle
Purkinje fibers Purkinje fibers
Right Ventricle
A
B
Left Ventricle
Figure 1.2: The Sinus Node and theIntraventricular Conduction Systemof the Heart. (A) Diagrammatic repre-sentation of the sinus node, atria, AV node,and the intraventricular conduction sys-tem of the heart. (B) Diagram showingthe sequence of conduction of the cardiacimpulse from sinus node to the ventricles.AV, atrioventricular; BB, bundle branch;LA, left atrium; LV, left ventricle; RA, rightatrium; RV, right ventricle.
4 4
3
2
0
1
0
C: Pacemaking Cell
- 60 mv 4 4
3
2
0
1
0
- 95 mv
B: Conducting Cell
4 4
3
2
0
1
0
- 90 mv
A: Muscle Cell
Figure 1.3: Action Potential of aMuscle Cell, Conducting Cell andPacemaking Cell. The action potentialof a ventricular muscle cell specialized forcontraction (A), His-Purkinje cell special-ized for impulse conduction (B), andsinus node cell with special properties ofautomaticity (C).
LWBK271-C01_01-08.qxd 1/29/09 11:25 AM Page 2 LWBK271-C01_01-08.qxd
Basic Anatomy and Electrophysiology 3
■ Conducting cells: Conducting cells are specializedfor rapid conduction of the electrical impulse andare present within the entire His-Purkinje system.
■ Pacemaking cells: Pacemaking cells have proper-ties of automaticity and are capable of generatingelectrical impulses. These cells are present in the si-nus node and throughout the His-Purkinje system.
■ All myocardial cells are electrically polarized withthe inside of the cell more electrically negative thanthe outside. This negative potential is due to the dif-ference in concentration of electrolytes inside thecell compared with outside. Because the cells are po-larized, they are capable of being discharged. Whenthe cells are discharged, an action potential is gener-ated. Recordings of action potentials of a ventricularmuscle cell, conducting cell from the His-Purkinjesystem and a pacemaking cell from the sinus nodeare shown in Figure 1.3.
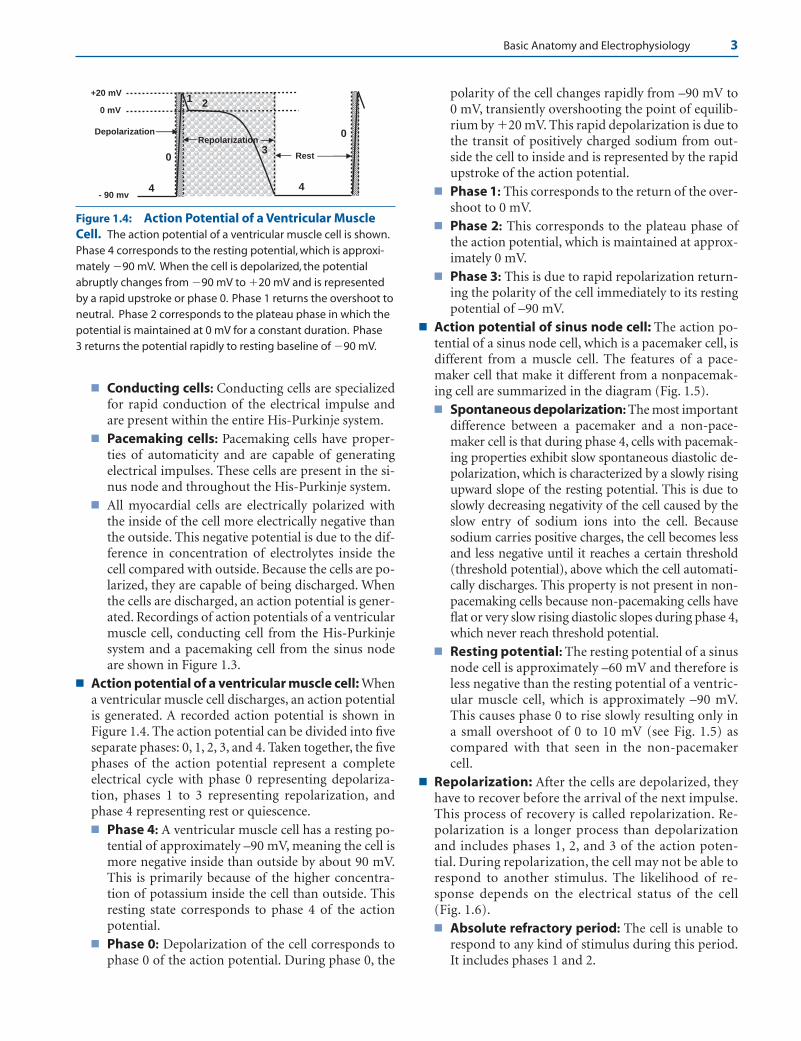
■ Action potential of a ventricular muscle cell: Whena ventricular muscle cell discharges, an action potentialis generated. A recorded action potential is shown inFigure 1.4. The action potential can be divided into fiveseparate phases: 0, 1, 2, 3, and 4. Taken together, the fivephases of the action potential represent a completeelectrical cycle with phase 0 representing depolariza-tion, phases 1 to 3 representing repolarization, andphase 4 representing rest or quiescence.■ Phase 4: A ventricular muscle cell has a resting po-
tential of approximately –90 mV, meaning the cell ismore negative inside than outside by about 90 mV.This is primarily because of the higher concentra-tion of potassium inside the cell than outside. Thisresting state corresponds to phase 4 of the actionpotential.
■ Phase 0: Depolarization of the cell corresponds tophase 0 of the action potential. During phase 0, the
polarity of the cell changes rapidly from –90 mV to0 mV, transiently overshooting the point of equilib-rium by �20 mV. This rapid depolarization is due tothe transit of positively charged sodium from out-side the cell to inside and is represented by the rapidupstroke of the action potential.
■ Phase 1: This corresponds to the return of the over-shoot to 0 mV.
■ Phase 2: This corresponds to the plateau phase ofthe action potential, which is maintained at approx-imately 0 mV.
■ Phase 3: This is due to rapid repolarization return-ing the polarity of the cell immediately to its restingpotential of –90 mV.
■ Action potential of sinus node cell: The action po-tential of a sinus node cell, which is a pacemaker cell, isdifferent from a muscle cell. The features of a pace-maker cell that make it different from a nonpacemak-ing cell are summarized in the diagram (Fig. 1.5).■ Spontaneous depolarization: The most important
difference between a pacemaker and a non-pace-maker cell is that during phase 4, cells with pacemak-ing properties exhibit slow spontaneous diastolic de-polarization, which is characterized by a slowly risingupward slope of the resting potential. This is due toslowly decreasing negativity of the cell caused by theslow entry of sodium ions into the cell. Becausesodium carries positive charges, the cell becomes lessand less negative until it reaches a certain threshold(threshold potential), above which the cell automati-cally discharges. This property is not present in non-pacemaking cells because non-pacemaking cells haveflat or very slow rising diastolic slopes during phase 4,which never reach threshold potential.
■ Resting potential: The resting potential of a sinusnode cell is approximately –60 mV and therefore isless negative than the resting potential of a ventric-ular muscle cell, which is approximately –90 mV.This causes phase 0 to rise slowly resulting only ina small overshoot of 0 to 10 mV (see Fig. 1.5) ascompared with that seen in the non-pacemakercell.
■ Repolarization: After the cells are depolarized, theyhave to recover before the arrival of the next impulse.This process of recovery is called repolarization. Re-polarization is a longer process than depolarizationand includes phases 1, 2, and 3 of the action poten-tial. During repolarization, the cell may not be able torespond to another stimulus. The likelihood of re-sponse depends on the electrical status of the cell(Fig. 1.6).■ Absolute refractory period: The cell is unable to
respond to any kind of stimulus during this period.It includes phases 1 and 2.
4 4
0
0 mV
- 90 mv
+20 mV
Depolarization
2 1
Rest
Repolarization3
0
Figure 1.4: Action Potential of a Ventricular MuscleCell. The action potential of a ventricular muscle cell is shown.Phase 4 corresponds to the resting potential, which is approxi-mately �90 mV. When the cell is depolarized, the potentialabruptly changes from �90 mV to �20 mV and is representedby a rapid upstroke or phase 0. Phase 1 returns the overshoot toneutral. Phase 2 corresponds to the plateau phase in which thepotential is maintained at 0 mV for a constant duration. Phase3 returns the potential rapidly to resting baseline of �90 mV.
LWBK271-C01_01-08.qxd 1/29/09 11:25 AM Page 3 LWBK271-C01_01-08.qxd

4 Chapter 1
■ Effective refractory period: The cell is able to gen-erate a potential; however, it is too weak to be propa-gated. This includes a small portion of phase 3.
■ Relative refractory period: The cell is partially re-polarized and may be able to respond to a stimulusif the stimulus is stronger than usual. This period in-cludes a portion of phase 3 extending to thresholdpotential, which is about –70 mV.
■ Supernormal phase: The cell may respond to aless than normal stimulus. This period includes theend of phase 3 when repolarization is almost com-
plete and has reached a potential that is more nega-tive than the threshold potential of –70 mV.
Basic Anatomy andElectrophysiology
Basic Anatomy
■ The sinus node: The sinus node is located in the superiorand lateral border of the right atrium. The most cranial por-tion starts from the epicardium at the junction of the supe-rior vena cava and right atrium. Its most caudal portion is lo-cated subendocardially. The sinus node contains pacemakercells that are widely distributed throughout its entire length.These cells have properties of automaticity and are capable ofdischarging spontaneously. Although there are other cells in the heart that are also capable of discharging sponta-neously, the cells in the sinus node have the fastest rate of dis-charge. The sinus node therefore is the pacemaker of theheart. The sinus node is supplied by the sinus node arterythat originates from the right coronary artery 60% to 65% ofthe time. The rest of the vascular supply originates from theleft circumflex coronary artery.
■ Internodal tracts: There are three internodal tracts con-necting the sinus node to the AV node namely the anterior,posterior, and middle internodal tracts. The significance ofthese internodal tracts is uncertain because the sinus impulseis conducted to the AV node through the atria.
■ The AV node: The AV node is smaller than the sinus nodeand is located in the lower right atrium just above the inser-tion of the septal leaflet of the tricuspid valve and anterior tothe entrance of the coronary sinus to the lower right atrium.The AV node consists of three areas with distinct properties:the upper, middle, and lower portions. The upper portionalso called AN (atrionodal) region connects the atria to the
4
0
0
- 90 mv
2 1
Threshold potential
Supernormal Period
3
Relative RP
Repolarization (Phases 1-3)
Absolute RP
EffectiveRP
Figure 1.6: Repolarization and Refractory Periods. Re-polarization includes phases 1 to 3 of the action potential. Theabsolute refractory period includes phases 1 and 2 in which thecell cannot be stimulated by any impulse. The effective refractory period includes a small portion of phase 3 in which astimulus can elicit a local response but not strong enough to bepropagated. Relative refractory period is that portion of phase 3that extends to threshold potential. The cell will respond to astimulus that is stronger than normal. The supernormal phasestarts just below threshold potential where the cell can respondto a stimulus that is less than normal. RP, refractory period.
3
- 60 mv
Phase 4: Slow spontaneous depolarization
- 40 mv
0 mv
Phase 0 is slow rising
0
4
Small and blunted
overshoot of 0-10 mV
Resting potential is -60 mV
Threshold
Potential
4 4
Figure 1.5: Action Potential of a Sinus Node Cell. The action potential of a sinusnode cell is shown. The resting potential is approximately �60 mV and is less negative thanthe resting potential of a ventricular muscle cell, which is approximately �90 mV. Slow spon-taneous depolarization is present during phase 4. Phase 0 is slow rising with only a smallovershoot. These features differentiate a pacemaking cell from a non-pacemaking cell andare highlighted.
LWBK271-C01_01-08.qxd 1/29/09 11:25 AM Page 4 LWBK271-C01_01-08.qxd

Basic Anatomy and Electrophysiology 5
middle portion, which is called N (nodal) region. The lowerportion, also called NH (nodo-His) region, connects withthe bundle of His. The middle region is primarily responsiblefor delaying AV conduction. It is also where acetylcholine isreleased. It has no automatic properties in contrast to the up-per and lower regions, which contain cells with properties ofautomaticity. In 90% of patients, the AV node is supplied bythe AV nodal artery, which is a branch of the right coronaryartery. In the remaining 10%, the AV node artery comes fromthe left circumflex coronary artery.
■ The His-Purkinje system: The AV node continues as theHis bundle, which immediately divides into the right and theleft bundle branches. The right bundle branch is a direct con-tinuation of the bundle of His and continues down the rightside of the interventricular septum toward the right ventric-ular apex and base of the anterior papillary muscle. The leftbundle branch fans into several branches. These branchescan be grouped into three main subdivisions or fascicles: theanterior, midseptal, and posterior fascicles. These fasciclesare interconnected with each other. The significance of themidseptal fascicle is uncertain, although it is probably re-sponsible for the initial depolarization of the ventricular sep-tum. The right bundle branch and the fascicles end into anetwork of Purkinje fibers over the endocardial surface ofboth ventricles. Conduction across the His-Purkinje systemis not significantly affected by sympathetic and parasympa-thetic influences. The blood supply of the His bundle comesfrom both anterior and posterior descending coronary arter-ies through their septal branches.
Basic Electrophysiology
■ There are three special types of cells in the heart, each with itsown distinctive electrophysiologic property. They includemuscle cells such as those of the atria and ventricles, con-ducting cells such as those of the His-Purkinje system, andpacemaking cells such as those of the sinus node.
■ All cells are polarized with the inside of the cell more nega-tive than the outside. This difference in the electrical chargeis due to the different concentration of electrolytes inside thecell compared with outside. The major electrolytes that de-termine the difference in gradient between the inside andoutside the cell are:
■ Potassium—the concentration of K� is 30 to 50 timeshigher inside than outside the cell.
■ Sodium—the concentration of Na� is reversed from thatof potassium and is almost 10 times higher outside thaninside the cell.
■ Calcium—the concentration of Ca2� is higher outsidethan inside the cell.
■ The cell membrane is relatively impermeable to electrolytes.The movement of ions into and out of the cell membrane iscontrolled by channels that are specific to certain ions. Na�
channels are present that are specific only for sodium ions.K� and Ca2� channels are also present that are specific only
for potassium and calcium ions, respectively. These ions,however, cannot enter into and out of the cell any time. Thechannels open and close only at given moment. In otherwords, they are gated. The voltage of the cell membrane con-trols the gates; thus, opening and closing of these channelsare voltage sensitive. Channels that are specific only forsodium ions, called fast sodium channels, are closed whenthe potential or voltage of the cell is –90 mV (resting poten-tial). The fast sodium channels will open only when the cell isdepolarized, resulting in rapid entry of sodium ions into thecell. This corresponds to the rapid upstroke (phase 0) of theaction potential.
The Action Potential of Muscle Cells in theAtria and Ventricles
■ The sodium pump: The resting potential of muscle cells inthe ventricles is approximately –90 mV. It is slightly less inthe atria. During the resting state, the cell membrane is im-permeable to sodium. A higher concentration of sodium ismaintained outside the cell compared with inside the cell,because of the presence of a Na�/K� pump located in the cellmembrane. The Na�/K� pump exchanges three Na� ionsfrom inside the cell for two K� ions outside the cell. This ex-change process requires energy, which is derived from the hy-drolysis of adenosine triphosphate by the enzyme sodium-potassium adenosine triphosphatase (ATPase). Because thereare three ions of Na� exchanged for two ions of K�, a positiveion is lost during the exchange making the inside of the cellmore negative.
■ The increasing negativity of the cell when Na� is ex-changed for K� is due to the presence of large negativelycharged proteins inside the cell. These large proteins areunable to diffuse out of the cell because of their size.Thus, when three ions of Na� exit the cell in exchange fortwo ions of K� entering the cell, the large proteins willhave one negative charge that is not neutralized, makingthe inside of the cell more negative until a potential of –90mV is reached.
■ Mechanism of action of digitalis: If the Na�/K� AT-Pase pump is inhibited, sodium is removed through theNa�/Ca2� exchange mechanism. Sodium inside the cell isexchanged for calcium, which causes calcium to accumu-late within the cell. This increase in intracellular calciumthrough inhibition of the Na/K ATPase pump is themechanism by which digitalis exerts its inotropic effect.In the presence of digitalis toxicity, this exchange can con-tinue even after the cell has completed its repolarization(beyond phase 3). This may cause the potential of the cellto become transiently less negative, resulting in delayedafterdepolarization. Such afterdepolarizations do not al-ways reach threshold potential. In the case when thresh-old potential is reached, it may result in repeated oscilla-tions of the cell membrane and can cause tachycardia dueto triggered activity.
LWBK271-C01_01-08.qxd 1/29/09 11:25 AM Page 5 LWBK271-C01_01-08.qxd
6 Chapter 1
■ An action potential has five phases—phases 0, 1, 2, 3, and 4.A complete electrical cardiac cycle includes depolarization(which corresponds to phase 0), repolarization (phases 1, 2,and 3), and a period of rest or quiescence (corresponding tophase 4 of the action potential).
■ Phase 0: Phase 0 corresponds to the very rapid upstrokeof the action potential.
n Phase 0 starts when the muscle cell is depolarized bythe sinus impulse, which is propagated from one cell tothe next adjacent cell. When the cell is depolarized, thefast Na� channels in the cell membrane are activated,allowing sodium ions to enter the cell. Because sodiumions are positively charged, they neutralize the negativeions making the potential inside the cell less negative.After the threshold potential of approximately –70 mVis reached, all fast sodium channels open, allowingsodium, which is approximately 10 to 15 times higheroutside than inside the cell, to enter rapidly. The explo-sive entry of Na� into the cell is the cause of the rapidupstroke of the action potential where the polarity ofthe cell not only becomes neutral (0 mV) but will re-sult in an overshoot of approximately �20 to �30 mV.
n The entry of Na� into the cell occurs only over a frac-tion of a second, because the fast sodium channelcloses immediately when the membrane potential be-comes neutral. After the fast sodium channel closes, itcannot be reactivated again and will not reopen untilthe potential of the cell is restored to its original rest-ing potential of –90 mV.
n Depolarization or phase 0 of the action potential isequivalent to the R wave (or QRS complex) of a singlemyocardial cell. Because there are millions of myocar-dial cells within the ventricles that are simultaneouslydepolarizing, it will take approximately 0.06 to 0.10seconds to depolarize all the myocardial cells in bothventricles. This period corresponds to the total dura-tion of the QRS complex in the surface ECG. Thus,when there is left ventricular hypertrophy or whenthere is bundle branch block, the duration of the QRScomplex becomes wider because it will take longer toactivate the entire ventricle.
n After depolarization, the cell has to repolarize so thatit can prepare itself for the next wave of excitation.Repolarization includes phases 1 to 3 of the action po-tential.
■ Phase 1: Early rapid repolarization starts immediately af-ter phase 0, with the return of the polarity of the cell fromapproximately �20 to �30 mV to almost neutral (0 mV).
n The decrease in potential from �20 to �30 mV to 0mV is due to the abrupt closure of fast sodium chan-nels and transient activation of the potassium chan-nels causing outward movement of K�
. This transientoutward movement of potassium is more prominentin the epicardium compared with endocardium,which may explain the shorter action potential dura-
tion of epicardial cells compared with endocardialcells. This difference in action potential duration isclinically important because this can favor reentry(see Brugada syndrome, Chapter 23, Acute CoronarySyndrome—ST Elevation Myocardial Infarction).
n In the surface ECG, phase 1 and early phase 2 coin-cides with the J point, which marks the end of theQRS complex and beginning of the ST segment.
■ Phase 2: Phase 2 represents the plateau phase in whichthe potential of the cell remains unchanged at approxi-mately 0 mV for a sustained duration.
n The opening of the fast sodium channels during phase0 of the action potential is also accompanied by theopening of the calcium channels when the voltage ofthe cell has reached approximately –40 mV. Unlike thefast sodium channel that opens and closes transiently,the flow of calcium into the cell is slower but is moresustained. Because the cell membrane is much morepermeable to potassium ions than to other ions andbecause there is a much higher concentration ofpotassium inside than outside the cell, potassiumleaks out of the cell (loss of positive ions), counterbal-ancing the entry of calcium into the cell (gain of pos-itive ions). These two opposing forces maintain thepolarity of the cell in equilibrium at approximately 0mV for a sustained duration that corresponds to theplateau of the action potential.
n The entry of calcium into the cell also triggers the re-lease of more calcium from storage sites in the sar-coplasmic reticulum. This “calcium-triggered calciumrelease” mechanism is responsible for initiating con-traction of the muscle cell. Throughout the durationof phase 2, the cells in the ventricles remain in a sus-tained state of contraction. During this period, thecells remain absolutely refractory and cannot be depo-larized by an external stimulus.
n Phase 2 corresponds to the ST segment in the ECG,which normally remains isoelectric throughout its du-ration.
■ Phase 3: Phase 3 represents rapid ventricular repolariza-tion. During phase 3, the polarity of the cell becomesmore negative until it reaches its original resting potentialof –90 mV.
n The increasing negativity of the cell during phase 3 isdue to inactivation of the calcium channels with de-creased entry of calcium into the cell. However, the ef-flux of potassium out of the cell continues, making thepotential of the cell more negative until it reaches –90mV. After the resting potential of –90 mV is reached,repolarization of the cell is complete, and the cell isagain ready to be depolarized.
n Phase 3, or rapid ventricular repolarization, corre-sponds to the T wave in the ECG. The end of the re-polarization period corresponds to the end of the Twave and marks the beginning of phase 4.
LWBK271-C01_01-08.qxd 1/29/09 11:25 AM Page 6 LWBK271-C01_01-08.qxd
Basic Anatomy and Electrophysiology 7
■ Phase 4: Phase 4 represents the resting or quiescent stateof the myocardial cell. The polarity of the cell when repo-larization is completed is approximately –90 mV.
n During the resting state, the K� channels in the cellmembrane are open while the channels of other ionsremain closed. Because of the much higher concentra-tion of K� inside than outside the cell, outward flow ofK� continues. The loss of K� ions increases the nega-tivity inside the cell. As the potential of the cell be-comes more negative, an electrical force is created thatattracts the positively charged potassium ions backinto the cell against its concentration gradient. Thus,during phase 4, two forces acting in opposite directionscause the K� ions either to migrate in (because of elec-trical force) or migrate out (because of difference inK� concentration across the cell membrane) until asteady state is reached where migration of the K� intoand out of the cell reaches an equilibrium. This corre-sponds to the final resting potential of a ventricularmuscle cell, which is approximately –90 mV. This rest-ing electrical potential can be predicted for potassiumusing the Nernst equation, where the resting potentialof the cell is influenced by the difference in concentra-tion of K� across the cell membrane and by the electri-cal forces attracting K� back into the cell.
n In ventricular muscle cells, phase 4 is maintained con-stantly at approximately –90 mV, making the sloperelatively flat. The muscle cell can be discharged onlyby an outside stimulus, which is the arrival of thepropagated sinus impulse.
n Phase 4 corresponds to the T-Q interval in the ECG.This interval is isoelectric until it is interrupted by thenext wave of depolarization.
Conducting Cells of the His-Purkinje System
■ The His-Purkinje system is specialized for rapid conduction.The action potential of the His-Purkinje cells is very similar tothat of atrial and ventricular muscle cells except that the rest-ing potential is less negative at approximately –95 mV. Themore negative the action potential, the faster is the rate of riseof phase 0 of the action potential. This results in a more rapid(steeper) slope of phase 0, a higher overshoot and a more pro-longed duration of the action potential. This explains whyconduction of impulses across the His-Purkinje fibers is ap-proximately five times faster than ordinary muscle cells.
Pacemaker Cells in the Sinus Node
■ Pacemaker cells in the sinus node and AV junction haveproperties of automaticity. These cells can discharge sponta-neously independent of an outside stimulus. Muscle cells inthe atria and ventricles, in contrast, do not possess the prop-erty of automaticity. However, they may develop this prop-erty if they are injured or become ischemic.
■ The action potentials of automatic cells of the sinus nodeand AV node differ from those of non-pacemaker cells. Mostimportantly, they demonstrate a slow spontaneous diastolicdepolarization during phase 4 of the action potential. Thesedifferences are discussed next.
■ Phase 4:n During phase 4, the resting potential of the automatic
cells exhibit spontaneous depolarization. The poten-tial of the pacemaker cell becomes less and less nega-tive until it reaches threshold potential. This decreas-ing negativity of the resting potential is called slowspontaneous diastolic depolarization. This is the mostimportant property that differentiates a pacemakingcell from a non-pacemaking cell. The non-pacemak-ing cell has a flat diastolic slope during phase 4 anddoes not exhibit slow spontaneous depolarization.Thus, the potential of the non-pacemaking cell neverreaches threshold.
n The presence of spontaneous diastolic depolarizationis due to the presence of sodium channels that areopen during diastole. These sodium channels are notthe same as the fast sodium channels that are respon-sible for phase 0 of the action potential. They are acti-vated immediately after the cell reaches its most nega-tive potential, causing sodium ions to enter the cellslowly. This slow entry of sodium into the cell is calledpacemaker or funny current. This renders the polarityof the cell during phase 4 less and less negative untilthe threshold potential is reached.
n Also during phase 4, the resting potential of pacemak-ing cells of the sinus node measures approximately–50 to –60 mV and is therefore less negative than theresting potential of atrial and ventricular muscle cells,which measures approximately –90 mV. This less neg-ative potential of no more than –50 to –60 mV causesthe fast sodium channel to be inactivated perma-nently. The resting potential of the cell has to be re-stored to –90 mV before the fast sodium channels canbe activated. Thus, phase 0 of the action potential ofthe sinus node and pacemaking cells of the AV junc-tion is not due to the entry of sodium through fastsodium channels, but is mediated by the entry of cal-cium into the cell. After phase 4 reaches threshold po-tential, which is approximately –40 mV, the calciumchannels open, resulting in the entry of calcium intothe cell, which causes phase 0 of the action potential.
n Among all cells of the heart with pacemaking proper-ties, the cells in the sinus node have the fastest rate ofrise during phase 4 of the action potential. This ac-counts for why the sinus node has the fastest cyclicalrate per minute and is the pacemaker of the heart.Other cells with automatic properties can be found inparts of the atria, AV junction, His-Purkinje system,and muscle cells of the mitral and tricuspid valves.Although these cells also exhibit slow diastolic depo-
LWBK271-C01_01-08.qxd 1/29/09 11:25 AM Page 7 LWBK271-C01_01-08.qxd
8 Chapter 1
larization, the rate of rise of the diastolic slope ofphase 4 of these cells is much slower. Thus, these cellswill be discharged by the propagated sinus impulsebefore their potential can reach threshold potential.
n There is an hierarchical order in the AV conductionsystem in which cells that are closest to the AV nodehave the fastest rate of rise during phase 4 of the ac-tion potential compared with cells that are locatedmore distally. Thus, when the sinus node fails as thepacemaker of the heart, cells in the AV node at itsjunction with the bundle of His usually come to therescue because these automatic cells have the fastestrate compared with other potential pacemakers of theheart.
■ Phase 0:n As previously mentioned, the fast sodium channels do
not play any role in triggering phase 0 of the actionpotential in the pacemaker cells of the sinus node andAV junction since the resting potential of these cellsare not capable of reaching –90 mV. Thus, the fastsodium channels remain closed and do not contributeto phase 0 of the action potential.
n Depolarization of the cell occurs through calciumchannels that open when the resting potential of thecell spontaneously reaches –40 mV.
n Because the resting potential is less negative at –60mV and phase 0 is mediated by calcium ions, the rateof rise of phase 0 is slower. This results in a slope thatis less steep with a lower overshoot than that of mus-cle cells of the atria and ventricles.
Refractory Periods
■ The myocardial cell needs to repolarize before the arrival ofthe next impulse. If complete repolarization has not beenachieved, the cell may or may not respond to a stimulus, de-pending on the intensity of the stimulus and the extent towhich the cell has recovered at the time the stimulus is deliv-ered. Not surprisingly, refractory periods are defined accord-ing to the phase of the action potential at which the impulsearrives.
■ Absolute refractory period: The absolute refractoryperiod is the period in the action potential during whichthe cell cannot respond to any stimulus. This period in-cludes phase 1 and phase 2 of the action potential.
■ Effective refractory period: The effective refractory pe-riod is the period during which the cell can be stimulated;however, the action potential that is generated is notstrong enough to propagate to other cells. This period in-cludes a short interval of phase 3 (approximately –25 mV).
■ Relative refractory period: The relative refractory pe-riod starts from the end of the effective refractory periodand extends to a potential slightly less negative than –70mV, which is the threshold potential. Not all of the fastsodium channels are fully recovered at this time. Thus, thepotential generated has a lower amplitude and a slowerrate of rise of phase 0 of the action potential. The impulsewill still be propagated but conduction velocity is slower.
■ Supernormal period: The cell may respond to less thanordinary stimuli if the cell is stimulated at a potential thatis slightly below (more negative than) its threshold poten-tial of –70 mV. The potential of the cell would thereforebe only a few millivolts from becoming threshold poten-tial. Thus, a smaller than normal stimulus is sufficient toexcite the cell. This short interval corresponds to the su-pernormal period of repolarization.
Suggested Readings
Conover MB. Normal electrical activation of the heart. In: Un-derstanding Electrocardiography. 8th ed. St. Louis: Mosby;2003:8–22.
Dunn MI, Lipman BS. Basic physiologic principles. In: Lipman-Massie Clinical Electrocardiography. 8th ed. Chicago: Year-book Medical Publishers Inc; 1989:24–50.
Greineder K, Strichartz GR, Lilly LS. Basic cardiac structure andfunction. In: Lilly LS, ed. Pathophysiology of Heart Disease.2nd ed. Baltimore: Lippincott Williams & Wilkins; 1993:1– 23.
Shih H-T. Anatomy of the action potential in the heart. TexasHeart J. 1994;21:30–41.
LWBK271-C01_01-08.qxd 1/29/09 11:25 AM Page 8 LWBK271-C01_01-08.qxd
The Normal Sinus Impulse
■ The sinus node is the origin of the normal electricalimpulse. Although there are other cells in the heart thatcan also discharge spontaneously, the sinus node hasthe fastest rate of discharge and is the pacemaker of theheart.
■ Normal Sinus Rhythm: Any impulse originating fromthe sinus node is called normal sinus rhythm. The sinusnode discharges at a rate of 60 to 100 beats per minute(bpm), although the rate could vary depending on themetabolic needs of the body.■ Sinus bradycardia: When the rate of the sinus
node is �60 bpm, the rhythm is called sinus brady-cardia.
■ Sinus tachycardia: When the rate is �100 bpm,the rhythm is called sinus tachycardia.
■ Sinus arrhythmia: When the sinus impulse is ir-regular, the rhythm is called sinus arrhythmia.
■ The electrical impulse that is generated from the sinusnode spreads from the atria to the ventricles in an or-derly sequence. In this manner, contraction of the atriaand ventricles is closely synchronized to maximize theefficiency of the heart as a pump (Fig. 2.1).
Activation of the Atria—The P Wave
■ The Sinus Impulse: When the sinus node discharges,no deflection is recorded because the impulse from thesinus node is not strong enough to generate an electri-cal signal. The first deflection that is recorded after thesinus node discharges is the P wave.
■ P Wave: The P wave is the first deflection in the electro-cardiogram (ECG) and is due to activation of the atria.■ Configuration: The configuration of the normal si-
nus P wave is smooth and well rounded. Because thesinus node is located at the upper border of the rightatrium, the sinus impulse has to travel from the rightatrium to the left atrium on its way to the ventricles.The first half of the P wave therefore is due to activa-tion of the right atrium (Fig. 2.2A). The second halfis due to activation of the left atrium (Fig. 2.2B).
■ Duration: The width or duration of the normalsinus P wave measures �2.5 small blocks (�0.10seconds). This is the length of time it takes to acti-vate both atria.
■ Amplitude: The height or amplitude of the normalsinus P wave also measures �2.5 small blocks(�0.25 mV).
2Basic Electrocardiography
9
Right Atrium
Ventricles
AV Node
Bundle of His
Left Bundle
Sinus Node
Left Atrium
IntraventricularConductionSystem Right
Bundle
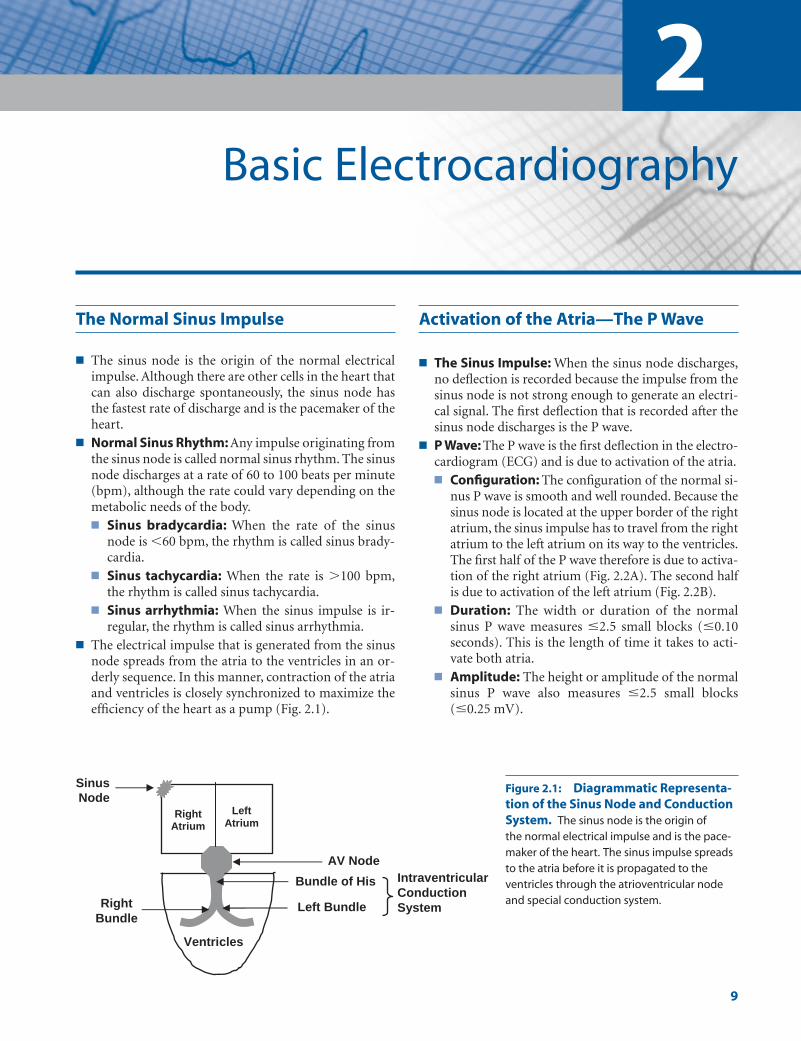
Figure 2.1: Diagrammatic Representa-tion of the Sinus Node and ConductionSystem. The sinus node is the origin of the normal electrical impulse and is the pace-maker of the heart. The sinus impulse spreadsto the atria before it is propagated to theventricles through the atrioventricular nodeand special conduction system.
LWBK271-C02_09-22.qxd 1/29/09 1:51 PM Page 9 LWBK271-C01_01-08.qxd

10 Chapter 2
Activation of the Atrioventricular Node
■ After depolarization of the atria, the only pathway bywhich the sinus impulse can reach the ventricles isthrough the atrioventricular (AV) node and intraven-tricular conduction system.
■ The AV node: The AV node consists of a network ofspecial cells that normally delay conduction of theatrial impulse to the ventricles. As the impulse traversesthe AV node on its way to the ventricles, it does notgenerate any electrical activity in the ECG. Therefore,an isoelectric or flat line is recorded immediately afterthe P wave (Fig. 2.3).
Intraventricular Conduction System
After the impulse emerges from the AV node, it is con-ducted rapidly through the His bundle, bundle branches,
and fascicles, which constitute the intraventricular con-duction system, before terminating in a branching net-work of Purkinje fibers. The spread of the electrical im-pulse in the His-Purkinje system also does not cause anydeflection in the ECG, similar to that of the AV node. Thisis represented as a continuation of the isoelectric or flatline after the P wave.
Activation of the Ventricles—The QRS Complex
■ QRS Complex: The QRS complex represents activa-tion of the ventricles. The QRS complex generatesthe largest deflection in the ECG because the ventri-cles contain the largest mass of muscle cells in theheart, collectively referred to as the myocardium(Fig. 2.4).
Right atrium
Left atrium
Ventricles
Right atrium
Left
atrium
Ventricles
A B
The initial half ofthe P wave is due
to activation ofthe right atrium
The terminal halfof the P wave isdue to activation
of the left atrium
Figure 2.2: Atrial Activation—the P Wave. When the sinus nodedischarges, no electrical activity isrecorded in the electrocardiogram.The first deflection is the P wave,which represents activation of theatria. The initial half of the P waverepresents activation of the rightatrium and the terminal half repre-sents activation of the left atrium.
No electrical activity is recorded in the ECG as the impulse traverses the AV node, His bundle, bundle branches, fascicles and Purkinje fibers
AV Node
Left posterior fascicle
Left anterior fascicle Right bundle branch
Purkinje fibers
His bundle
Left bundle branch
AV node His-Purkinje system Figure 2.3: Activation of the Atrioventricular Node and His-Purkinje System. Propagation of theimpulse at the atrioventricular nodeand His-Purkinje system will not causeany deflection in the electrocardiogramand is represented as an isoelectric orflat line after the P wave.
LWBK271-C02_09-22.qxd 1/29/09 1:51 PM Page 10 LWBK271-C01_01-08.qxd
Basic Electrocardiography 11
■ The spread of the sinus impulse through the His-Purkinje system is very rapid and efficient, but iselectrically silent with no impulse recorded in theECG. The QRS complex is recorded only whenthe impulse has spread from the Purkinje fibers tothe myocardium.
■ The myocardium can be arbitrarily divided intothree layers: the endocardium, which is the innerlayer, the mid-myocardium, and the epicardium,which is the outer layer of the myocardium.
■ The Purkinje fibers are located in the endocardiumof both ventricles. Because the electrical impulsearrives first at the Purkinje fibers, the ventricles areactivated from endocardium to epicardium in anoutward direction.
■ The QRS complex corresponds to phase 0 of the ac-tion potential of all individual myocardial cells ofboth ventricles. Because the ventricles consist of athick layer of myocardial cells, not all cells are depo-larized at the same time. Depolarization of thewhole myocardium can vary from 0.06 to 0.10seconds or longer. This duration corresponds to thewidth of the QRS complex in the ECG.
The QRS Complex
■ QRS Complex: The QRS complex has various wavesthat go up and down from baseline. These waves areidentified as follows: Q, R, S, R�, and S�. If additionalwaves are present, R� or S� designations may beadded. Regardless of the size of the deflections, cap-ital and small letters are used empirically mainly forconvenience, although, generally, capital letters des-ignate large waves and small letters, small waves(Fig. 2.5).■ Q wave: The Q wave is defined as the first wave of
the QRS complex below the baseline. If only a deepQ wave is present (no R wave), the QRS complex isdescribed as a QS complex.
■ R wave: The R wave is defined as the first positive(upward) deflection of the QRS complex. If only anR wave is present (no Q wave or S wave), the QRScomplex is described as an R wave.
■ S wave: The S wave is the negative deflection afterthe R wave.
■ R�: The R� (R prime) is the next positive wave afterthe S wave.
■ S�: The S� (S prime) is the next negative deflectionafter the R�.
■ R� or S�: These waves are rarely used, however if ad-ditional waves are needed to describe the QRS com-plex, the letter R� (R double prime) is used for thenext positive wave and S� (S double prime) for thenext negative wave.
■ QRS complex: The QRS complex is identified as aQRS complex regardless of the number of wavespresent. Thus, a tall R wave without a Q wave or Swave is still identified as a QRS complex.
The J Point, ST Segment, and T Wave
■ The QRS complex is followed by a flat line called the STsegment. The end of the QRS complex and beginningof the ST segment is called the J point. The flat STsegment is followed immediately by another positivedeflection called the T wave.
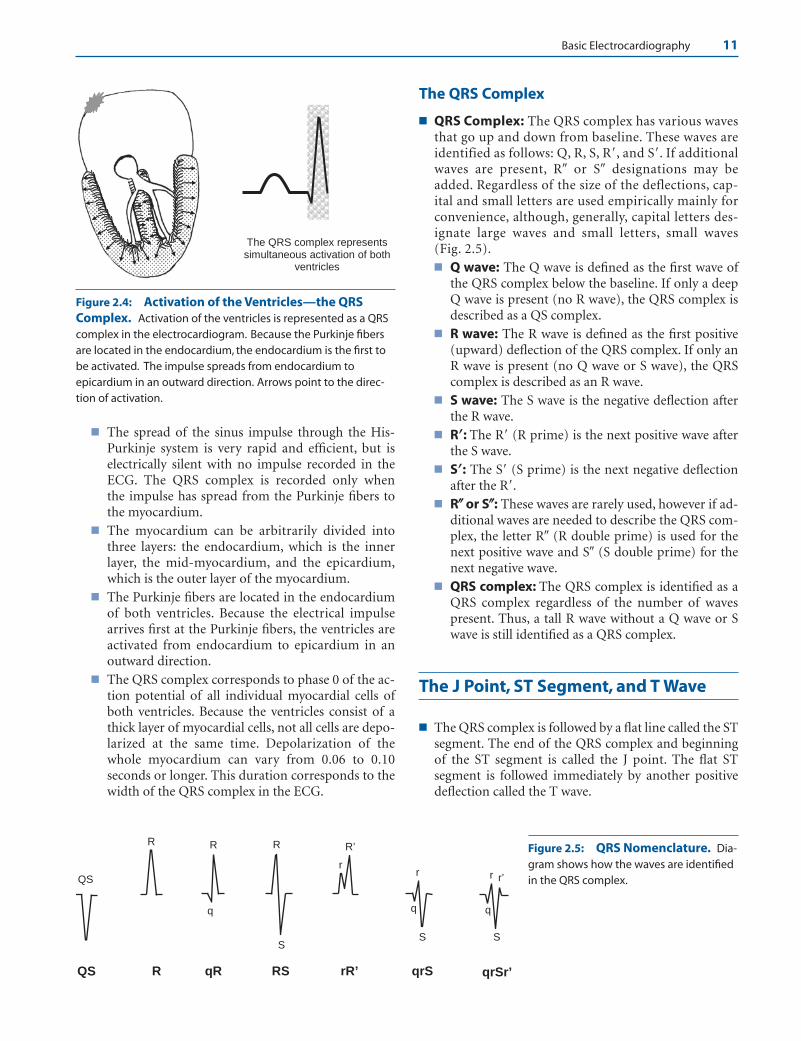
The QRS complex represents simultaneous activation of both
ventricles
Figure 2.4: Activation of the Ventricles—the QRSComplex. Activation of the ventricles is represented as a QRScomplex in the electrocardiogram. Because the Purkinje fibersare located in the endocardium, the endocardium is the first tobe activated. The impulse spreads from endocardium toepicardium in an outward direction. Arrows point to the direc-tion of activation.
SS
r
R R
q
r r’
S
r
R’ R
qrSqR RS rR’QS R qrSr’
QS
Figure 2.5: QRS Nomenclature. Dia-gram shows how the waves are identifiedin the QRS complex.
LWBK271-C02_09-22.qxd 1/29/09 1:51 PM Page 11 LWBK271-C01_01-08.qxd

12 Chapter 2
■ J point: The J point, also called the J junction,marks the end of the QRS complex and beginning ofthe ST segment (Fig. 2.6).
■ ST segment: The ST segment starts from the Jpoint to the beginning of the T wave. The ST seg-ment is flat or isoelectric and corresponds to phase 2(plateau phase) of the action potential of the ven-tricular myocardial cells. It represents the time whenall cells have just been depolarized and the musclecells are in a state of sustained contraction. The ven-tricular muscle cells are completely refractory dur-ing this period and cannot be excited by an outsidestimulus.
■ T wave: The T wave represents rapid ventricular re-polarization. This segment of ventricular repolar-ization corresponds to phase 3 of the transmem-brane action potential. During phase 3, the actionpotential abruptly returns to its resting potential of–90 mV.
■ The J point, ST segment, and T wave represent thewhole process of ventricular repolarization correspon-ding to phases 1, 2, and 3 of the transmembrane actionpotential. Repolarization returns the polarity of themyocardial cells to resting potential and prepares theventricles for the next wave of depolarization.
The PR Interval, QRS Complex,and QT Interval
■ The duration of the PR interval, QRS complex, and QTinterval are routinely measured in the standard 12-leadECG. These intervals are shown in Figure 2.7.■ PR interval: The PR interval is measured from the
beginning of the P wave to the beginning of the QRS
complex. If the QRS complex starts with a Q wave,the PR interval is measured from the beginning ofthe P wave to the beginning of the Q wave (P-Q in-terval), but is nevertheless called PR interval. Thenormal PR interval measures 0.12 to 0.20 seconds inthe adult. It includes the time it takes for the sinusimpulse to travel from atria to ventricles. The PR in-terval is prolonged when there is delay in conduc-tion of the sinus impulse to the ventricles and isshortened when there is an extra pathway connect-ing the atrium directly to the ventricle.
■ QRS complex: The QRS complex is measured fromthe beginning of the first deflection, whether it startswith a Q wave or an R wave, and extends to the endof the last deflection. The normal QRS durationvaries from 0.06 to 0.10 seconds. The QRS durationis increased when there is ventricular hypertrophy,bundle branch block, or when there is prematureexcitation of the ventricles because of the presenceof an accessory pathway.
The QT Interval
■ QT Interval: The QT interval includes the QRS com-plex, ST segment, and T wave corresponding to phases0 to 3 of the action potential. It is measured from thebeginning of the QRS complex to the end of the Twave. Note that the presence of a U wave is not in-cluded in the measurement. In assessing the durationof the QT interval, multiple leads should be selectedand the QT interval is the longest QT that can be meas-ured in the whole 12-lead ECG recording.
■ QTc: The QT interval is affected by heart rate. It be-comes longer when the heart rate is slower and shorter
J Point
T Wave
ST Segment
Figure 2.6: Repolarization of the Ventricles. Ventricularrepolarization begins immediately after depolarization andstarts at the J point, which marks the end of the QRS complex,and extends to the end of the T wave. This corresponds tophases 1, 2, and 3 of the action potential. Ventricular repolariza-tion allows the ventricles to recover completely and preparesthe myocardial cells for the next wave of depolarization.
QRS Complex
PR Interval QT Interval
P T
Figure 2.7: The PR Interval, QRS Complex, and QT Interval. The PR interval is measured from the beginning ofthe P wave to the beginning of the QRS complex. The QRS com-plex is measured from the beginning of the first deflection to theend of the last deflection and the QT interval is measured fromthe beginning of the QRS complex to the end of the T wave.
LWBK271-C02_09-22.qxd 1/29/09 1:51 PM Page 12 LWBK271-C01_01-08.qxd
Basic Electrocardiography 13
when the heart rate is faster. The QT interval thereforeshould always be corrected for heart rate. The correctedQT interval is the QTc.■ The simplest and most commonly used formula for
correcting the QT interval for heart rate is the Bazettformula shown here.
■ The normal QTc should not exceed 0.42 seconds inmen and 0.44 seconds in women. The QTc is pro-longed when it measures �0.44 seconds in men and�0.46 seconds in women and children.
■ An easy rule to remember in calculating the QTcwhen the heart rate is �70 bpm is that the QTc isnormal (�0.46 seconds) if the QT interval is equalto or less than half the R-R interval (Fig. 2.8).
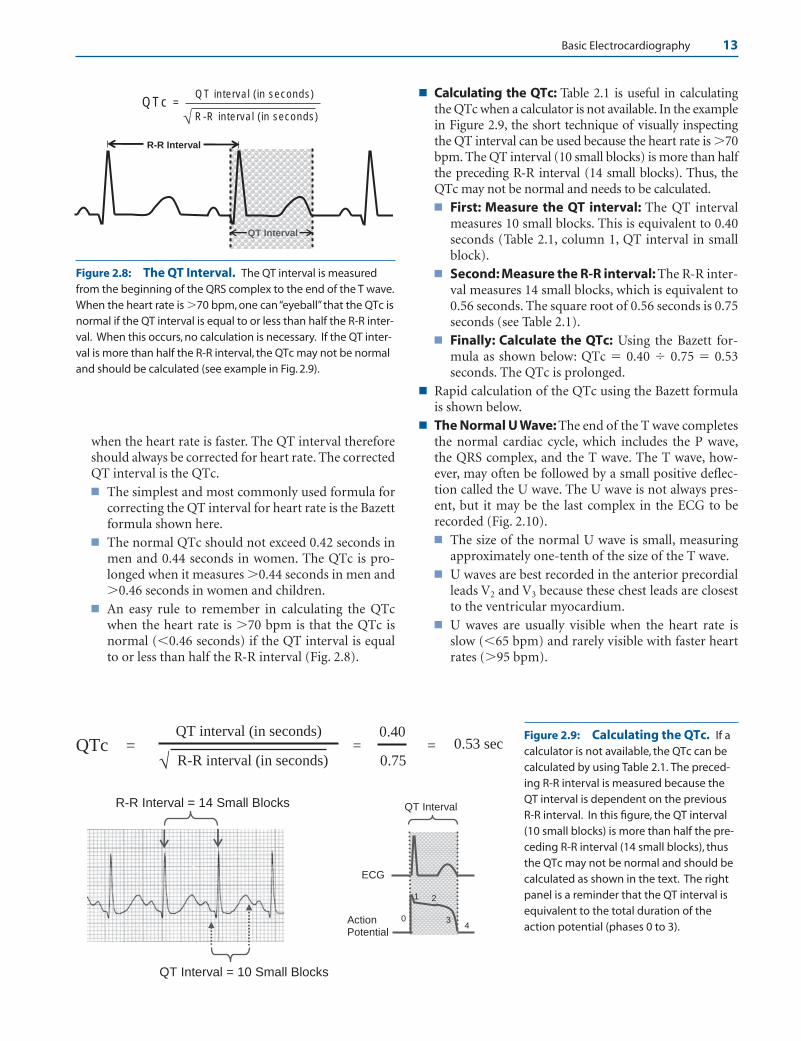
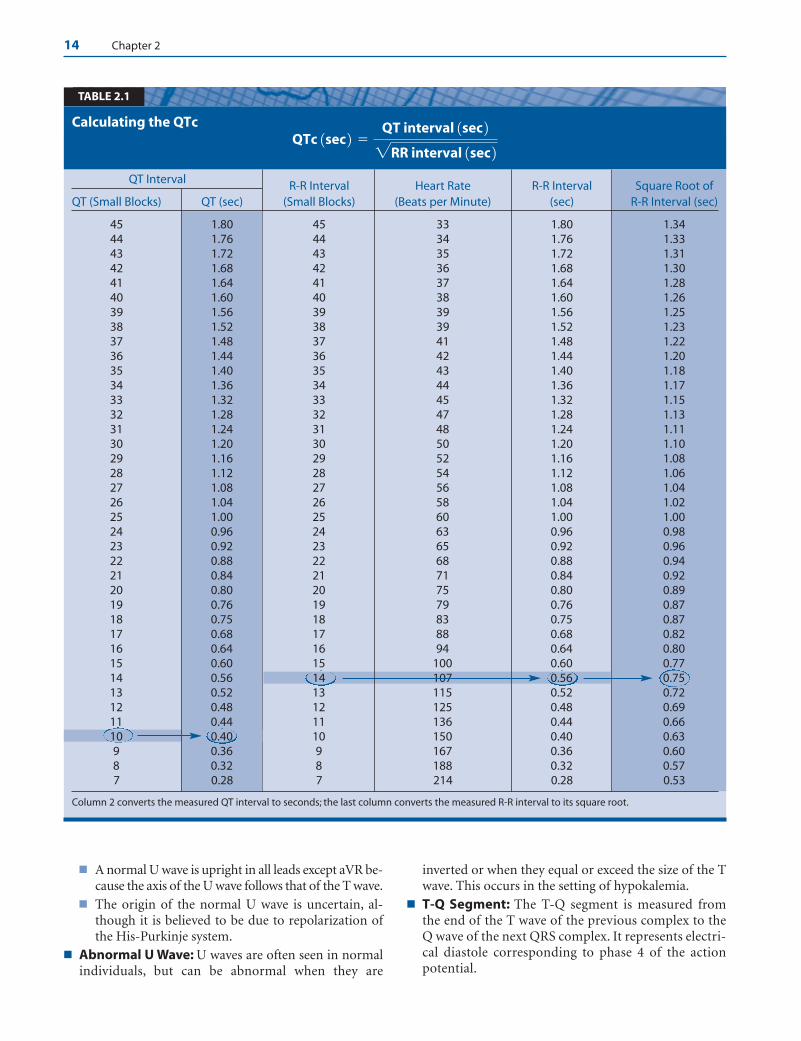
■ Calculating the QTc: Table 2.1 is useful in calculatingthe QTc when a calculator is not available. In the examplein Figure 2.9, the short technique of visually inspectingthe QT interval can be used because the heart rate is �70bpm. The QT interval (10 small blocks) is more than halfthe preceding R-R interval (14 small blocks). Thus, theQTc may not be normal and needs to be calculated.■ First: Measure the QT interval: The QT interval
measures 10 small blocks. This is equivalent to 0.40seconds (Table 2.1, column 1, QT interval in smallblock).
■ Second: Measure the R-R interval: The R-R inter-val measures 14 small blocks, which is equivalent to0.56 seconds. The square root of 0.56 seconds is 0.75seconds (see Table 2.1).
■ Finally: Calculate the QTc: Using the Bazett for-mula as shown below: QTc � 0.40 � 0.75 � 0.53seconds. The QTc is prolonged.
■ Rapid calculation of the QTc using the Bazett formulais shown below.
■ The Normal U Wave: The end of the T wave completesthe normal cardiac cycle, which includes the P wave,the QRS complex, and the T wave. The T wave, how-ever, may often be followed by a small positive deflec-tion called the U wave. The U wave is not always pres-ent, but it may be the last complex in the ECG to berecorded (Fig. 2.10).■ The size of the normal U wave is small, measuring
approximately one-tenth of the size of the T wave.■ U waves are best recorded in the anterior precordial
leads V2 and V3 because these chest leads are closestto the ventricular myocardium.
■ U waves are usually visible when the heart rate isslow (�65 bpm) and rarely visible with faster heartrates (�95 bpm).
R-R Interval
QT Interval
QTc = QT interval (in seconds)
R-R interval (in seconds) √
Figure 2.8: The QT Interval. The QT interval is measuredfrom the beginning of the QRS complex to the end of the T wave.When the heart rate is �70 bpm, one can “eyeball” that the QTc isnormal if the QT interval is equal to or less than half the R-R inter-val. When this occurs, no calculation is necessary. If the QT inter-val is more than half the R-R interval, the QTc may not be normaland should be calculated (see example in Fig. 2.9).
QTc = QT interval (in seconds)
R-R interval (in seconds) √
R-R Interval = 14 Small Blocks
=
QT Interval = 10 Small Blocks
0.40
0.75 = 0.53 sec
QT Interval
ECG
Action Potential
0
1 2
34
Figure 2.9: Calculating the QTc. If acalculator is not available, the QTc can becalculated by using Table 2.1. The preced-ing R-R interval is measured because theQT interval is dependent on the previousR-R interval. In this figure, the QT interval(10 small blocks) is more than half the pre-ceding R-R interval (14 small blocks), thusthe QTc may not be normal and should becalculated as shown in the text. The rightpanel is a reminder that the QT interval isequivalent to the total duration of theaction potential (phases 0 to 3).
LWBK271-C02_09-22.qxd 1/29/09 1:51 PM Page 13 LWBK271-C01_01-08.qxd
14 Chapter 2
■ A normal U wave is upright in all leads except aVR be-cause the axis of the U wave follows that of the T wave.
■ The origin of the normal U wave is uncertain, al-though it is believed to be due to repolarization ofthe His-Purkinje system.
■ Abnormal U Wave: U waves are often seen in normalindividuals, but can be abnormal when they are
inverted or when they equal or exceed the size of the Twave. This occurs in the setting of hypokalemia.
■ T-Q Segment: The T-Q segment is measured fromthe end of the T wave of the previous complex to theQ wave of the next QRS complex. It represents electri-cal diastole corresponding to phase 4 of the action potential.
Calculating the QTcQTc 1sec 2 �
QT interval 1sec 22RR interval 1sec 2
TABLE 2.1
QT Interval R-R Interval Heart Rate R-R Interval Square Root of QT (Small Blocks) QT (sec) (Small Blocks) (Beats per Minute) (sec) R-R Interval (sec)
45 1.80 45 33 1.80 1.3444 1.76 44 34 1.76 1.3343 1.72 43 35 1.72 1.3142 1.68 42 36 1.68 1.3041 1.64 41 37 1.64 1.2840 1.60 40 38 1.60 1.2639 1.56 39 39 1.56 1.2538 1.52 38 39 1.52 1.2337 1.48 37 41 1.48 1.2236 1.44 36 42 1.44 1.2035 1.40 35 43 1.40 1.1834 1.36 34 44 1.36 1.1733 1.32 33 45 1.32 1.1532 1.28 32 47 1.28 1.1331 1.24 31 48 1.24 1.1130 1.20 30 50 1.20 1.1029 1.16 29 52 1.16 1.0828 1.12 28 54 1.12 1.0627 1.08 27 56 1.08 1.0426 1.04 26 58 1.04 1.0225 1.00 25 60 1.00 1.0024 0.96 24 63 0.96 0.9823 0.92 23 65 0.92 0.9622 0.88 22 68 0.88 0.9421 0.84 21 71 0.84 0.9220 0.80 20 75 0.80 0.8919 0.76 19 79 0.76 0.8718 0.75 18 83 0.75 0.8717 0.68 17 88 0.68 0.8216 0.64 16 94 0.64 0.8015 0.60 15 100 0.60 0.7714 0.56 14 107 0.56 0.7513 0.52 13 115 0.52 0.7212 0.48 12 125 0.48 0.6911 0.44 11 136 0.44 0.6610 0.40 10 150 0.40 0.639 0.36 9 167 0.36 0.608 0.32 8 188 0.32 0.577 0.28 7 214 0.28 0.53
Column 2 converts the measured QT interval to seconds; the last column converts the measured R-R interval to its square root.
LWBK271-C02_09-22.qxd 1/29/09 1:51 PM Page 14 LWBK271-C01_01-08.qxd

Basic Electrocardiography 15
Summary of ECG Deflections
See Figure 2.11.■ P wave: The P wave represents activation of the atria.■ PR interval: The PR interval starts from the beginning
of the P wave to the beginning of the QRS complex andrepresents the time required for the sinus impulse totravel from the atria to the ventricles.
■ PR segment: The PR segment starts at the end of the Pwave to the beginning of the QRS complex and corre-sponds to the time it takes for the impulse to travelfrom AV node to ventricles.
■ QRS complex: This represents activation of all themuscle cells in the ventricles and corresponds to phase0 of the action potential.
■ J point: The J point marks the end of the QRS complexand beginning of the ST segment. It corresponds tophase 1 of the action potential.
■ ST segment: The ST segment is the isoelectric portionbetween the J point and the beginning of the T wave. Itcorresponds to phase 2 (plateau) of the action poten-tial.
■ T wave: The T wave represents rapid repolarization ofthe ventricles and corresponds to phase 3 of the actionpotential.
■ QT: The QT interval is measured from the beginning ofthe QRS complex to the end of the T wave and corre-sponds to electrical systole.
■ TQ: The TQ segment starts from the end of the T waveto the beginning of the next QRS complex. This repre-sents phase 4 of the action potential and correspondsto electrical diastole.
■ U wave: The U wave, if present, is the last positive de-flection in the ECG. It is likely due to repolarization ofthe His-Purkinje system.
Abnormal Waves in the ECG
■ There are other waves in the ECG that have been de-scribed. These waves are not normally present butshould be recognized because they are pathologic anddiagnostic of a clinical entity when present.■ Delta wave: The delta wave is a slow and slurred
upstroke of the initial portion of the QRS complexand is usually seen in conjunction with a short PRinterval (Fig. 2.12A). Its presence is diagnostic of theWolff-Parkinson-White syndrome. Delta waves arecaused by an accessory pathway that connects theatrium directly to the ventricles across the atrioven-tricular groove resulting in pre-excitation of theventricles (see Chapter 20, Wolff-Parkinson-WhiteSyndrome).
■ Osborn wave: The Osborn wave, also called a Jwave, is a markedly exaggerated elevation of the Jpoint that results in an H shape configuration of
U
T-Q Segment
Figure 2.10: The U Wave and T-Q Segment. The U waveis the last deflection in the electrocardiogram and is bestrecorded in leads V2 and V3 because of the close proximity ofthese leads to the ventricular myocardium. The cause of theU wave is most likely the repolarization of the His-Purkinjesystem. U waves are abnormal when they are inverted or becomeunduly prominent, as may be seen in the setting of hypokalemia.The T-Q segment corresponds to phase 4 of the action potential.It marks the end of the previous action potential and the begin-ning of the next potential.
U
P
T
QT Interval
PR Interval
TQ Segment
J Point PR
Segment
QRS
ST Segment
Figure 2.11: Summary of theElectrocardiogram Waves, Inter-vals, and Segments.
LWBK271-C02_09-22.qxd 1/29/09 1:51 PM Page 15 LWBK271-C01_01-08.qxd

16 Chapter 2
the QRS complex. The presence of the Osborn waveis associated with hypothermia or hypercalcemia(Fig. 2.12B).
■ Epsilon wave: The epsilon wave is an extra notchat the end of the QRS or early portion of the ST seg-ment most commonly seen in V1 to V3. This extranotch represents delayed activation of the outflowtract of the right ventricle and is diagnostic ofarrhythmogenic right ventricular dysplasia, alsocalled arrhythmogenic right ventricular cardiomy-opathy (Fig. 2.12C). Arrhythmogenic right ventric-ular dysplasia is an inherited form of cardiomyopa-thy characterized by the presence of fibro-fattyinfiltrates within the myocardium of the right ven-tricle that can result in ventricular arrhythmias. It isa common cause of sudden cardiac death in youngindividuals.
Transmembrane Action Potential andthe Surface ECG
■ The diagram (Fig. 2.13) shows the relationship betweenthe action potential of a single ventricular myocardialcell and the surface ECG. A complete cardiac cycle canbe divided into two phases: systole and diastole.■ Systole: Systole corresponds to the QT interval and
includes:n Depolarization: Depolarization is phase 0 of the
action potential. This is equivalent to the QRScomplex in the ECG.
n Repolarization: Repolarization includes phases1, 2, and 3, which correspond to the J point, STsegment, and T wave in the ECG.
Epsilon wave
C
Osborn wave
BA
Delta wave
Figure 2.12: Abnormal Waves in the electrocardiogram. (A) Delta waves char-acterized by slowly rising upstroke of the QRS complex from preexcitation (Wolff-Parkinson-White syndrome). (B) Osborn waves, which resemble an “h” because of hypothermia and hypercalcemia. (C) Epsilon waves seen as extra notch after the QRS in V1, V2, or V3
diagnostic of arrhythmogenic right ventricular dysplasia.
P
ST Segment(Phase 2)
B
QT IntervalPhase 0-3
Electrical Systole
4
3
2
0
1
A
0
- 90 mv
1
J Point
(Phase 1)
0
4
TQ Segment Phase 4
Electrical Diastole
QRS(Phase 0)
T Wave(phase 3)
Figure 2.13: The Transmembrane ActionPotential and the Surface Electro-cardiogram. Transmembrane action potentialof a ventricular myocardial cell (A) and the corre-sponding surface electrocardiogram (B). Phase 0of the action potential is equivalent to the QRScomplex, phase 1 the J point, phase 2 the ST seg-ment, phase 3 the T wave, and phase 4 the TQ seg-ment. Note that repolarization and depolarizationof the myocardium occur during systole, whichcorresponds to the QT interval. Diastole, which isphase 4, the rest period, corresponds to the TQ interval.
LWBK271-C02_09-22.qxd 1/29/09 1:51 PM Page 16 LWBK271-C01_01-08.qxd
Basic Electrocardiography 17
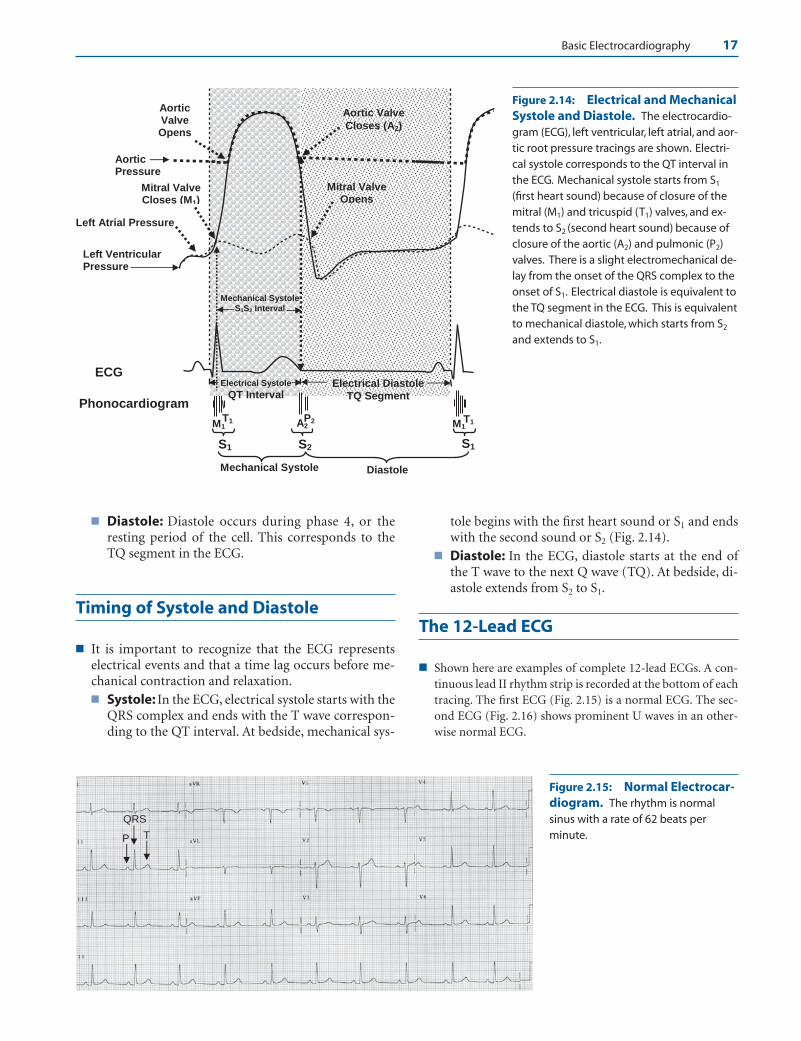
■ Diastole: Diastole occurs during phase 4, or theresting period of the cell. This corresponds to theTQ segment in the ECG.
Timing of Systole and Diastole
■ It is important to recognize that the ECG representselectrical events and that a time lag occurs before me-chanical contraction and relaxation.■ Systole: In the ECG, electrical systole starts with the
QRS complex and ends with the T wave correspon-ding to the QT interval. At bedside, mechanical sys-
tole begins with the first heart sound or S1 and endswith the second sound or S2 (Fig. 2.14).
■ Diastole: In the ECG, diastole starts at the end ofthe T wave to the next Q wave (TQ). At bedside, di-astole extends from S2 to S1.
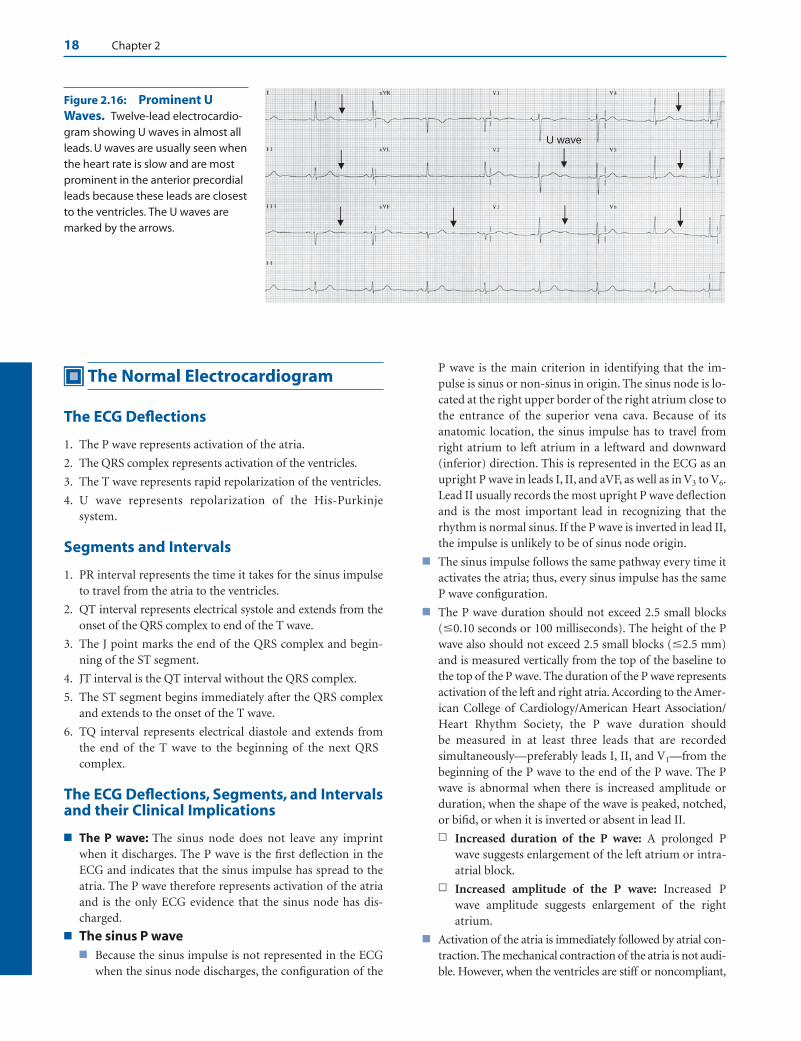
The 12-Lead ECG
■ Shown here are examples of complete 12-lead ECGs. A con-tinuous lead II rhythm strip is recorded at the bottom of eachtracing. The first ECG (Fig. 2.15) is a normal ECG. The sec-ond ECG (Fig. 2.16) shows prominent U waves in an other-wise normal ECG.
Aortic Valve Opens
Mitral Valve Closes (M1)
M1T1
S1 S2
A2P2
Aortic Pressure
Left Ventricular Pressure
Left Atrial Pressure
ECG
Phonocardiogram
M1T1
S1
Mechanical Systole Diastole
Electrical Systole
QT Interval
Mechanical SystoleS1S2 Interval
Mitral Valve Opens
Electrical Diastole TQ Segment
Aortic Valve
Closes (A2)
Figure 2.14: Electrical and MechanicalSystole and Diastole. The electrocardio-gram (ECG), left ventricular, left atrial, and aor-tic root pressure tracings are shown. Electri-cal systole corresponds to the QT interval inthe ECG. Mechanical systole starts from S1
(first heart sound) because of closure of themitral (M1) and tricuspid (T1) valves, and ex-tends to S2 (second heart sound) because ofclosure of the aortic (A2) and pulmonic (P2)valves. There is a slight electromechanical de-lay from the onset of the QRS complex to theonset of S1. Electrical diastole is equivalent tothe TQ segment in the ECG. This is equivalentto mechanical diastole, which starts from S2
and extends to S1.
P
QRS
T
Figure 2.15: Normal Electrocar-diogram. The rhythm is normal sinus with a rate of 62 beats perminute.
LWBK271-C02_09-22.qxd 1/29/09 1:51 PM Page 17 LWBK271-C01_01-08.qxd
18 Chapter 2
The Normal Electrocardiogram
The ECG Deflections
1. The P wave represents activation of the atria.
2. The QRS complex represents activation of the ventricles.
3. The T wave represents rapid repolarization of the ventricles.
4. U wave represents repolarization of the His-Purkinjesystem.
Segments and Intervals
1. PR interval represents the time it takes for the sinus impulseto travel from the atria to the ventricles.
2. QT interval represents electrical systole and extends from theonset of the QRS complex to end of the T wave.
3. The J point marks the end of the QRS complex and begin-ning of the ST segment.
4. JT interval is the QT interval without the QRS complex.
5. The ST segment begins immediately after the QRS complexand extends to the onset of the T wave.
6. TQ interval represents electrical diastole and extends fromthe end of the T wave to the beginning of the next QRScomplex.
The ECG Deflections, Segments, and Intervalsand their Clinical Implications
■ The P wave: The sinus node does not leave any imprintwhen it discharges. The P wave is the first deflection in theECG and indicates that the sinus impulse has spread to theatria. The P wave therefore represents activation of the atriaand is the only ECG evidence that the sinus node has dis-charged.
■ The sinus P wave■ Because the sinus impulse is not represented in the ECG
when the sinus node discharges, the configuration of the
P wave is the main criterion in identifying that the im-pulse is sinus or non-sinus in origin. The sinus node is lo-cated at the right upper border of the right atrium close tothe entrance of the superior vena cava. Because of itsanatomic location, the sinus impulse has to travel fromright atrium to left atrium in a leftward and downward(inferior) direction. This is represented in the ECG as anupright P wave in leads I, II, and aVF, as well as in V3 to V6.Lead II usually records the most upright P wave deflectionand is the most important lead in recognizing that therhythm is normal sinus. If the P wave is inverted in lead II,the impulse is unlikely to be of sinus node origin.
■ The sinus impulse follows the same pathway every time itactivates the atria; thus, every sinus impulse has the sameP wave configuration.
■ The P wave duration should not exceed 2.5 small blocks(�0.10 seconds or 100 milliseconds). The height of the Pwave also should not exceed 2.5 small blocks (�2.5 mm)and is measured vertically from the top of the baseline tothe top of the P wave. The duration of the P wave representsactivation of the left and right atria. According to the Amer-ican College of Cardiology/American Heart Association/Heart Rhythm Society, the P wave duration should be measured in at least three leads that are recordedsimultaneously—preferably leads I, II, and V1—from thebeginning of the P wave to the end of the P wave. The Pwave is abnormal when there is increased amplitude orduration, when the shape of the wave is peaked, notched,or bifid, or when it is inverted or absent in lead II.
n Increased duration of the P wave: A prolonged Pwave suggests enlargement of the left atrium or intra-atrial block.
n Increased amplitude of the P wave: Increased P wave amplitude suggests enlargement of the rightatrium.
■ Activation of the atria is immediately followed by atrial con-traction. The mechanical contraction of the atria is not audi-ble. However, when the ventricles are stiff or noncompliant,
U wave
Figure 2.16: Prominent UWaves. Twelve-lead electrocardio-gram showing U waves in almost allleads. U waves are usually seen whenthe heart rate is slow and are mostprominent in the anterior precordialleads because these leads are closestto the ventricles. The U waves aremarked by the arrows.
LWBK271-C02_09-22.qxd 1/29/09 1:51 PM Page 18 LWBK271-C01_01-08.qxd
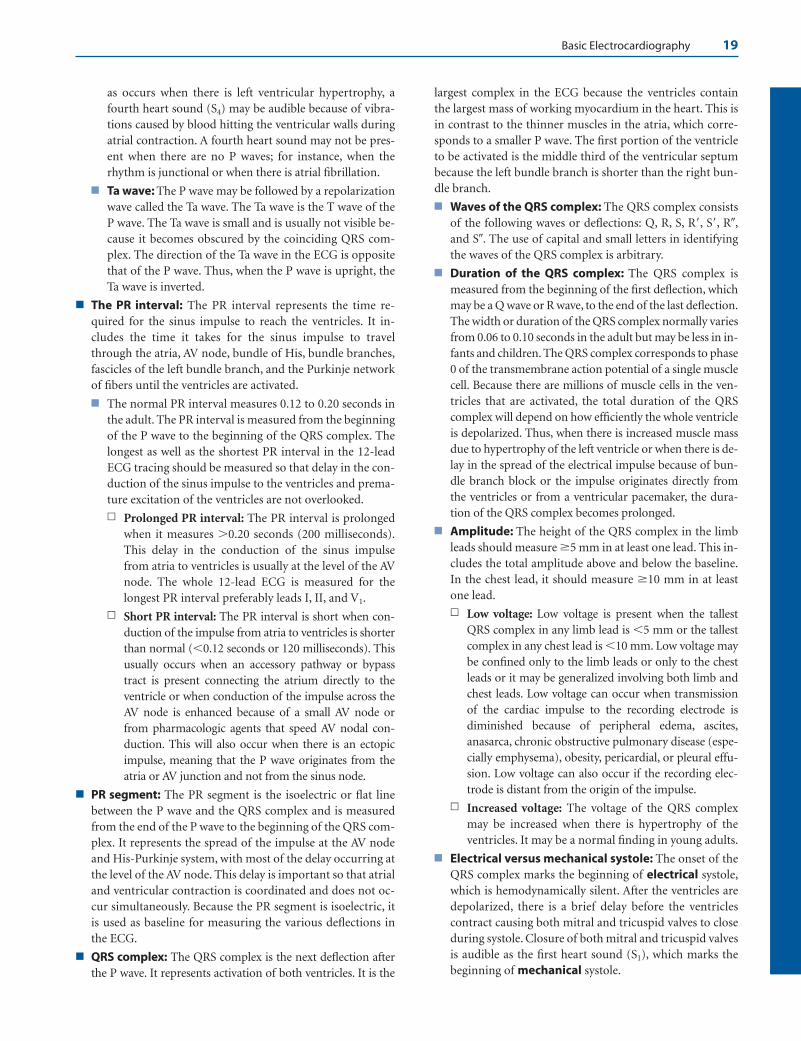
Basic Electrocardiography 19
as occurs when there is left ventricular hypertrophy, afourth heart sound (S4) may be audible because of vibra-tions caused by blood hitting the ventricular walls duringatrial contraction. A fourth heart sound may not be pres-ent when there are no P waves; for instance, when therhythm is junctional or when there is atrial fibrillation.
■ Ta wave: The P wave may be followed by a repolarizationwave called the Ta wave. The Ta wave is the T wave of theP wave. The Ta wave is small and is usually not visible be-cause it becomes obscured by the coinciding QRS com-plex. The direction of the Ta wave in the ECG is oppositethat of the P wave. Thus, when the P wave is upright, theTa wave is inverted.
■ The PR interval: The PR interval represents the time re-quired for the sinus impulse to reach the ventricles. It in-cludes the time it takes for the sinus impulse to travelthrough the atria, AV node, bundle of His, bundle branches,fascicles of the left bundle branch, and the Purkinje networkof fibers until the ventricles are activated.
■ The normal PR interval measures 0.12 to 0.20 seconds inthe adult. The PR interval is measured from the beginningof the P wave to the beginning of the QRS complex. Thelongest as well as the shortest PR interval in the 12-leadECG tracing should be measured so that delay in the con-duction of the sinus impulse to the ventricles and prema-ture excitation of the ventricles are not overlooked.
n Prolonged PR interval: The PR interval is prolongedwhen it measures �0.20 seconds (200 milliseconds).This delay in the conduction of the sinus impulsefrom atria to ventricles is usually at the level of the AVnode. The whole 12-lead ECG is measured for thelongest PR interval preferably leads I, II, and V1.
n Short PR interval: The PR interval is short when con-duction of the impulse from atria to ventricles is shorterthan normal (�0.12 seconds or 120 milliseconds). Thisusually occurs when an accessory pathway or bypasstract is present connecting the atrium directly to theventricle or when conduction of the impulse across theAV node is enhanced because of a small AV node orfrom pharmacologic agents that speed AV nodal con-duction. This will also occur when there is an ectopicimpulse, meaning that the P wave originates from theatria or AV junction and not from the sinus node.
■ PR segment: The PR segment is the isoelectric or flat linebetween the P wave and the QRS complex and is measuredfrom the end of the P wave to the beginning of the QRS com-plex. It represents the spread of the impulse at the AV nodeand His-Purkinje system, with most of the delay occurring atthe level of the AV node. This delay is important so that atrialand ventricular contraction is coordinated and does not oc-cur simultaneously. Because the PR segment is isoelectric, itis used as baseline for measuring the various deflections inthe ECG.
■ QRS complex: The QRS complex is the next deflection afterthe P wave. It represents activation of both ventricles. It is the
largest complex in the ECG because the ventricles containthe largest mass of working myocardium in the heart. This isin contrast to the thinner muscles in the atria, which corre-sponds to a smaller P wave. The first portion of the ventricleto be activated is the middle third of the ventricular septumbecause the left bundle branch is shorter than the right bun-dle branch.
■ Waves of the QRS complex: The QRS complex consistsof the following waves or deflections: Q, R, S, R�, S�, R�,and S�. The use of capital and small letters in identifyingthe waves of the QRS complex is arbitrary.
■ Duration of the QRS complex: The QRS complex ismeasured from the beginning of the first deflection, whichmay be a Q wave or R wave, to the end of the last deflection.The width or duration of the QRS complex normally variesfrom 0.06 to 0.10 seconds in the adult but may be less in in-fants and children. The QRS complex corresponds to phase0 of the transmembrane action potential of a single musclecell. Because there are millions of muscle cells in the ven-tricles that are activated, the total duration of the QRScomplex will depend on how efficiently the whole ventricleis depolarized. Thus, when there is increased muscle massdue to hypertrophy of the left ventricle or when there is de-lay in the spread of the electrical impulse because of bun-dle branch block or the impulse originates directly fromthe ventricles or from a ventricular pacemaker, the dura-tion of the QRS complex becomes prolonged.
■ Amplitude: The height of the QRS complex in the limbleads should measure 5 mm in at least one lead. This in-cludes the total amplitude above and below the baseline.In the chest lead, it should measure 10 mm in at leastone lead.
n Low voltage: Low voltage is present when the tallestQRS complex in any limb lead is �5 mm or the tallestcomplex in any chest lead is �10 mm. Low voltage maybe confined only to the limb leads or only to the chestleads or it may be generalized involving both limb andchest leads. Low voltage can occur when transmissionof the cardiac impulse to the recording electrode isdiminished because of peripheral edema, ascites,anasarca, chronic obstructive pulmonary disease (espe-cially emphysema), obesity, pericardial, or pleural effu-sion. Low voltage can also occur if the recording elec-trode is distant from the origin of the impulse.
n Increased voltage: The voltage of the QRS complexmay be increased when there is hypertrophy of theventricles. It may be a normal finding in young adults.
■ Electrical versus mechanical systole: The onset of theQRS complex marks the beginning of electrical systole,which is hemodynamically silent. After the ventricles aredepolarized, there is a brief delay before the ventriclescontract causing both mitral and tricuspid valves to closeduring systole. Closure of both mitral and tricuspid valvesis audible as the first heart sound (S1), which marks thebeginning of mechanical systole.
LWBK271-C02_09-22.qxd 1/29/09 1:51 PM Page 19 LWBK271-C01_01-08.qxd
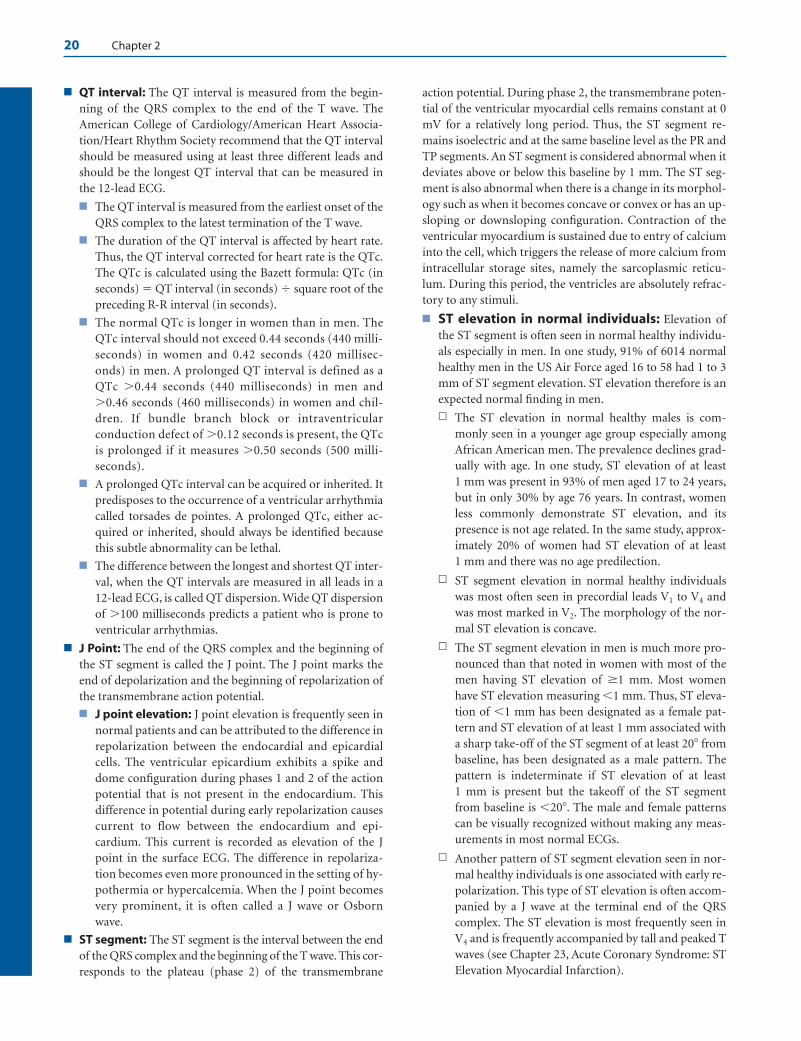
20 Chapter 2
■ QT interval: The QT interval is measured from the begin-ning of the QRS complex to the end of the T wave. TheAmerican College of Cardiology/American Heart Associa-tion/Heart Rhythm Society recommend that the QT intervalshould be measured using at least three different leads andshould be the longest QT interval that can be measured inthe 12-lead ECG.
■ The QT interval is measured from the earliest onset of theQRS complex to the latest termination of the T wave.
■ The duration of the QT interval is affected by heart rate.Thus, the QT interval corrected for heart rate is the QTc.The QTc is calculated using the Bazett formula: QTc (inseconds) � QT interval (in seconds) � square root of thepreceding R-R interval (in seconds).
■ The normal QTc is longer in women than in men. TheQTc interval should not exceed 0.44 seconds (440 milli-seconds) in women and 0.42 seconds (420 millisec-onds) in men. A prolonged QT interval is defined as aQTc �0.44 seconds (440 milliseconds) in men and�0.46 seconds (460 milliseconds) in women and chil-dren. If bundle branch block or intraventricularconduction defect of �0.12 seconds is present, the QTc is prolonged if it measures �0.50 seconds (500 milli-seconds).
■ A prolonged QTc interval can be acquired or inherited. Itpredisposes to the occurrence of a ventricular arrhythmiacalled torsades de pointes. A prolonged QTc, either ac-quired or inherited, should always be identified becausethis subtle abnormality can be lethal.
■ The difference between the longest and shortest QT inter-val, when the QT intervals are measured in all leads in a12-lead ECG, is called QT dispersion. Wide QT dispersionof �100 milliseconds predicts a patient who is prone toventricular arrhythmias.
■ J Point: The end of the QRS complex and the beginning ofthe ST segment is called the J point. The J point marks theend of depolarization and the beginning of repolarization ofthe transmembrane action potential.
■ J point elevation: J point elevation is frequently seen innormal patients and can be attributed to the difference inrepolarization between the endocardial and epicardialcells. The ventricular epicardium exhibits a spike anddome configuration during phases 1 and 2 of the actionpotential that is not present in the endocardium. Thisdifference in potential during early repolarization causescurrent to flow between the endocardium and epi-cardium. This current is recorded as elevation of the Jpoint in the surface ECG. The difference in repolariza-tion becomes even more pronounced in the setting of hy-pothermia or hypercalcemia. When the J point becomesvery prominent, it is often called a J wave or Osbornwave.
■ ST segment: The ST segment is the interval between the endof the QRS complex and the beginning of the T wave. This cor-responds to the plateau (phase 2) of the transmembrane
action potential. During phase 2, the transmembrane poten-tial of the ventricular myocardial cells remains constant at 0mV for a relatively long period. Thus, the ST segment re-mains isoelectric and at the same baseline level as the PR andTP segments. An ST segment is considered abnormal when itdeviates above or below this baseline by 1 mm. The ST seg-ment is also abnormal when there is a change in its morphol-ogy such as when it becomes concave or convex or has an up-sloping or downsloping configuration. Contraction of theventricular myocardium is sustained due to entry of calciuminto the cell, which triggers the release of more calcium fromintracellular storage sites, namely the sarcoplasmic reticu-lum. During this period, the ventricles are absolutely refrac-tory to any stimuli.
■ ST elevation in normal individuals: Elevation ofthe ST segment is often seen in normal healthy individu-als especially in men. In one study, 91% of 6014 normalhealthy men in the US Air Force aged 16 to 58 had 1 to 3mm of ST segment elevation. ST elevation therefore is anexpected normal finding in men.
n The ST elevation in normal healthy males is com-monly seen in a younger age group especially amongAfrican American men. The prevalence declines grad-ually with age. In one study, ST elevation of at least 1 mm was present in 93% of men aged 17 to 24 years,but in only 30% by age 76 years. In contrast, womenless commonly demonstrate ST elevation, and itspresence is not age related. In the same study, approx-imately 20% of women had ST elevation of at least 1 mm and there was no age predilection.
n ST segment elevation in normal healthy individualswas most often seen in precordial leads V1 to V4 andwas most marked in V2. The morphology of the nor-mal ST elevation is concave.
n The ST segment elevation in men is much more pro-nounced than that noted in women with most of themen having ST elevation of 1 mm. Most womenhave ST elevation measuring �1 mm. Thus, ST eleva-tion of �1 mm has been designated as a female pat-tern and ST elevation of at least 1 mm associated witha sharp take-off of the ST segment of at least 20 frombaseline, has been designated as a male pattern. Thepattern is indeterminate if ST elevation of at least 1 mm is present but the takeoff of the ST segmentfrom baseline is �20. The male and female patternscan be visually recognized without making any meas-urements in most normal ECGs.
n Another pattern of ST segment elevation seen in nor-mal healthy individuals is one associated with early re-polarization. This type of ST elevation is often accom-panied by a J wave at the terminal end of the QRScomplex. The ST elevation is most frequently seen inV4 and is frequently accompanied by tall and peaked Twaves (see Chapter 23, Acute Coronary Syndrome: STElevation Myocardial Infarction).
LWBK271-C02_09-22.qxd 1/29/09 1:51 PM Page 20 LWBK271-C01_01-08.qxd

Basic Electrocardiography 21
n Another ST elevation considered normal variant is thepresence of ST elevation accompanied by inversion ofthe T wave in precordial leads V3 to V5.
■ Abnormal ST elevation: Abnormal causes of ST eleva-tion include acute myocardial infarction, coronary va-sospasm, acute pericarditis, ventricular aneurysm, leftventricular hypertrophy, hyperkalemia, left bundlebranch block, and the Brugada syndrome. This is furtherdiscussed in Chapter 23, Acute Coronary Syndrome: STElevation Myocardial Infarction.
■ T wave: The T wave corresponds to phase 3 of the trans-membrane action potential and represents rapid repolariza-tion. The different layers of the myocardium exhibit differentrepolarization characteristics.
■ Repolarization of the myocardium normally starts fromepicardium to endocardium because the action potentialduration of epicardial cells is shorter than the other cellsin the myocardium. Thus, the onset of the T wave repre-sents the beginning of repolarization of the epicardiumand the top of the T wave corresponds to the complete re-polarization of the epicardium.
■ Repolarization of the endocardium takes longer than re-polarization of the epicardium. Therefore, the repolariza-tion of the endocardium is completed slightly later at thedownslope of the T wave.
■ In addition to the endocardial and epicardial cells, thereis also a population of M cells constituting 30% to 40%of the mid-myocardium. The M cells have different elec-trophysiologic properties with repolarization takingeven longer than that seen in epicardial and endocardialcells. M cell repolarization consequently corresponds tothe end of the T wave.
■ The duration and amplitude of the T wave is variable, al-though, generally, the direction (axis) of the T wave inthe 12-lead ECG follows the direction of the QRS com-plex. Thus, when the R wave is tall, the T wave is upright,and when the R wave is smaller than the size of the Swave, the T wave is inverted.
■ The shape of the normal T wave is rounded and smoothand slightly asymmetric with the upstroke inscribed slowlyand the downslope more steeply. The T wave is consideredabnormal if the shape becomes peaked, notched, or dis-torted or if the amplitude is increased to more than 5 mmin the limb leads and �10 mm in the precordial leads. It isalso abnormal when the T wave becomes symmetrical orinverted. This is further discussed in Chapter 24 (AcuteCoronary Syndrome: Non-ST Elevation Myocardial Infarc-tion and Unstable Angina).
■ At bedside, the end of the T wave coincides with the clo-sure of the aortic and pulmonic valves. This is audible asS2 during auscultation. The aortic second heart soundtherefore can be used for timing purposes to identify theend of left ventricular systole and beginning of diastole.Any event before the onset of S2 is systolic and any eventoccurring after S2 (but before the next S1) is diastolic.
■ TQ interval: The TQ interval is measured from the end ofthe T wave to the onset of the next QRS complex. It corre-sponds to phase 4 of the transmembrane action potential.The T-P or TQ segment is used as the isoelectric baseline formeasuring deviations of the J point or ST segment (eleva-tion or depression) because the transmembrane action po-tential is at baseline and there is no ongoing electrical activ-ity at this time. Thus, the TQ segment is not affected byother waves. However, if there is sinus tachycardia and thePR interval is markedly prolonged and the P wave is in-scribed at the end of the T wave, then the long PR segmentis used as an alternate baseline for measuring deviations ofthe J point or ST segment.
■ T-P segment: The T-P segment is a subportion of theTQ interval, which represents the interval between theend of ventricular repolarization (end of T wave) and theonset of the next sinus impulse (P wave). It marks the endof the previous cycle and the start of the next cardiac cy-cle beginning with the sinus impulse. This segment usu-ally serves as baseline for measuring deviations of the Jpoint or ST segment.
■ At bedside, diastole starts with the closure of the aortic andpulmonic valves (audible as the second heart sound S2) andcontinues until the closure of the mitral and tricuspid valves(audible as the first heart sound S1). This closely correspondsto the TQ interval in the ECG.
■ The U wave: Although a U wave may be seen as another de-flection after the T wave, this is not consistently present. Uwaves are commonly visible when the heart rate is slow (usu-ally �65 bpm) and are rarely recorded with heart rates above95 bpm. U waves are best recorded in the anterior precordialleads due to the proximity of these leads to the ventricularmyocardium. Repolarization of the His-Purkinje system co-incides with the inscription of the U wave in the ECG and ismore delayed than the repolarization of the M cells. The Uwave therefore is most probably because of repolarization ofthe His-Purkinje system.
■ The U wave follows the direction of the T wave and QRScomplex. Thus, the U wave is upright when the T wave isupright. When the U wave is inverted or prominent, it isconsidered pathologic.
■ An abnormal U wave indicates the presence of myocardialdisease or electrolyte abnormality. Prominent U wavesmay be due to hypokalemia or drugs such as quinidine.Inversion of the U wave is always pathologic and is mostcommonly due to myocardial ischemia, hypertension, orvalvular regurgitation. Its presence may be transient or itmay be more persistent.
■ Abnormal waves: The delta wave, epsilon wave, and Os-born wave are other waves in the ECG that should be recog-nized because these waves are pathologic. J. Willis Hursttraced the historical origin of these waves as follows:
■ Delta wave: The slow, slurred upstroke of the QRScomplex, associated with the Wolff-Parkinson-White syn-drome, is due to premature excitation of the ventricle
LWBK271-C02_09-22.qxd 1/29/09 1:51 PM Page 21 LWBK271-C01_01-08.qxd
22 Chapter 2
because of the presence of an accessory pathway connect-ing the atrium directly to the ventricle. This early deflec-tion of the QRS complex is called the delta wave becauseit resembles the shape of a triangle (�) which is the sym-bol of the Greek capital letter delta. (Note that the slowslurred upslope of the initial QRS complex resembles theleft side of the triangle.)
■ Epsilon wave: The epsilon wave is associated with rightventricular dysplasia and represents late activation of theright ventricular free wall. This is represented as a small de-flection at the end of the QRS complex and is best recordedin leads V1 to V3. Epsilon comes next to the Greek letterdelta. The delta wave occurs at the beginning of the QRScomplex (because of early activation of the ventricle and is apreexcitation wave), whereas the epsilon wave occurs at theend of the QRS complex (because of late activation of thefree wall of the right ventricle and is a postexcitation wave).
■ Osborn wave: When the J point is exaggerated, it iscalled J wave. The wave is named after Osborn, who de-scribed the association of this wave to hypothermia.
Suggested Readings
Antzelevitch C. The M Cell. J Cardiovasc Pharmacol Ther.1997;2:73–76.
Ariyarajah V, Frisella ME, Spodick DH. Reevaluation of the cri-terion for interatrial block. Am J Cardiol. 2006;98:936–937.
Buxton AE, Calkins H, Callans DJ, et al. ACC/AHA/HRS 2006key data elements and definitions for electrophysiology stud-ies and procedures: a report of the American College of Car-diology/American Heart Association Task Force on Clinical
Data Standards (ACC/AHA/HRS Writing Committee toDevelop Data Standards on Electrophysiology). J Am CollCardiol. 2006;48:2360–2396.
Correale E, Battista R, Ricciardiello V, et al. The negative U wave:a pathogenetic enigma but a useful often overlooked bedsidediagnostic and prognostic clue in ischemic heart disease.Clin Cardiol. 2004;27:674–677.
Dunn MI, Lipman BS. Basic physiologic principles. In: Lipman-Massie Clinical Electrocardiography. 8th ed. Chicago: Year-book Medical Publishers, Inc; 1989:24–50.
Hurst JW. Naming of the waves in the ECG, with a brief accountof their genesis. Circulation. 1998;98:1937–1942.
Marriott HJL. Complexes and intervals. In: Practical Electrocar-diography. 5th ed. Baltimore: Williams and Wilkins; 1972:16–33.
Moss AJ. Long QT syndrome. JAMA. 2003;289:2041–2044.Phoon CKL. Mathematic validation of a shorthand rule for cal-
culating QTc. Am J Cardiol. 1998;82:400–402.Sgarbossa EB, Wagner GS. Electrocardiography. In: Textbook of
Cardiovascular Medicine. 2nd ed. Editor is Topol EJ Philadel-phia: Lippincott-Williams and Wilkins; 2002:1330–1383.
Surawicz B. U waves: facts, hypothesis, misconceptions and mis-nomers. J Cardiovasc Electrophysiol. 1998;9:1117–1128.
Surawicz B, Parikh SR. Prevalence of male and female patternsof early ventricular repolarization in the normal ECG ofmales and females from childhood to old age. J Am Coll Car-diol. 2002;40:1870–1876.
Yan GX, Antzelevitch C. Cellular basis for the normal T waveand the electrocardiographic manifestations of the long-QTsyndrome. Circulation. 1998;98:1928–1936.
Yan GX, Lankipalli RS, Burke JF, et al. Ventricular repolarizationcomponents of the electrocardiogram, cellular basis andclinical significance. J Am Coll Cardiol. 2003;42:401–409.
Yan GX, Shimizu W, Antzelevitch C. Characteristics and distri-bution of M cells in arterially perfused canine left ventricularwedge preparations. Circulation. 1998;98:1921–1927.
LWBK271-C02_09-22.qxd 1/29/09 1:51 PM Page 22 LWBK271-C01_01-08.qxd

Basic Principles
■ The electrical impulses originating from the heart canbe transmitted to the body surface because the bodycontains fluids and chemicals that can conduct electric-ity. These electrical impulses can be recorded by placingelectrodes to the different areas of the body. Thus, if aleft arm electrode is connected to the positive pole of agalvanometer and a right arm electrode is connected tothe negative pole, the magnitude as well as the directionof the electrical impulse can be measured.■ Any flow of current directed toward the positive
(left arm) electrode is conventionally recorded as anupright deflection (Fig. 3.1A).
■ Any flow of current away from the positive electrodeis recorded as a downward deflection (Fig. 3.1B).
■ The height of the electrocardiogram (ECG) deflec-tion represents the difference in potential betweenthe two electrodes.
Bipolar Leads I, II, and III
■ Bipolar Leads: An imaginary line connecting anytwo electrodes is called a lead. A lead is bipolar whenboth positive and negative electrodes contribute tothe deflection in the ECG. The positive and negativeelectrodes are placed at an equal distance away fromthe heart and the resulting ECG deflection is thesum of the electrical forces going in opposite direc-tions. Leads I, II, and III are examples of bipolarleads.■ Lead I: Lead I is conventionally constructed such
that the left arm electrode is attached to the positivepole of the galvanometer and the right arm to thenegative pole (Fig. 3.2A). If the direction of the im-pulse is toward the left arm, an upward or positivedeflection is recorded. If the direction of the im-pulse is toward the right arm, a negative or down-ward deflection is recorded.
3The Lead System
23
G- +
A
RPositive Electrode
(Left Arm)
Galvanometer
Negative Electrode (Right Arm)
A downward deflection is recorded if the flow of current is away from the positive electrode
Lead
B
L
An upward deflection is recorded if the flow of current is toward the positive electrode
Figure 3.1: Lead. The direction andmagnitude of the electrical impulse can bemeasured with a galvanometer (G). The leftarm electrode is conventionally attached tothe positive pole of the galvanometer andthe right arm electrode to the negativepole. An imaginary line connecting the twoelectrodes is called a lead. Any flow of cur-rent directed toward the positive electrodewill be recorded as an upright deflection(A). Any current moving away from thepositive electrode is recorded as adownward deflection (B).
LWBK271-C03_23-29.qxd 29/1/09 8:44 pm Page 23 LWBK270-4119G-C02_073-110.qxd
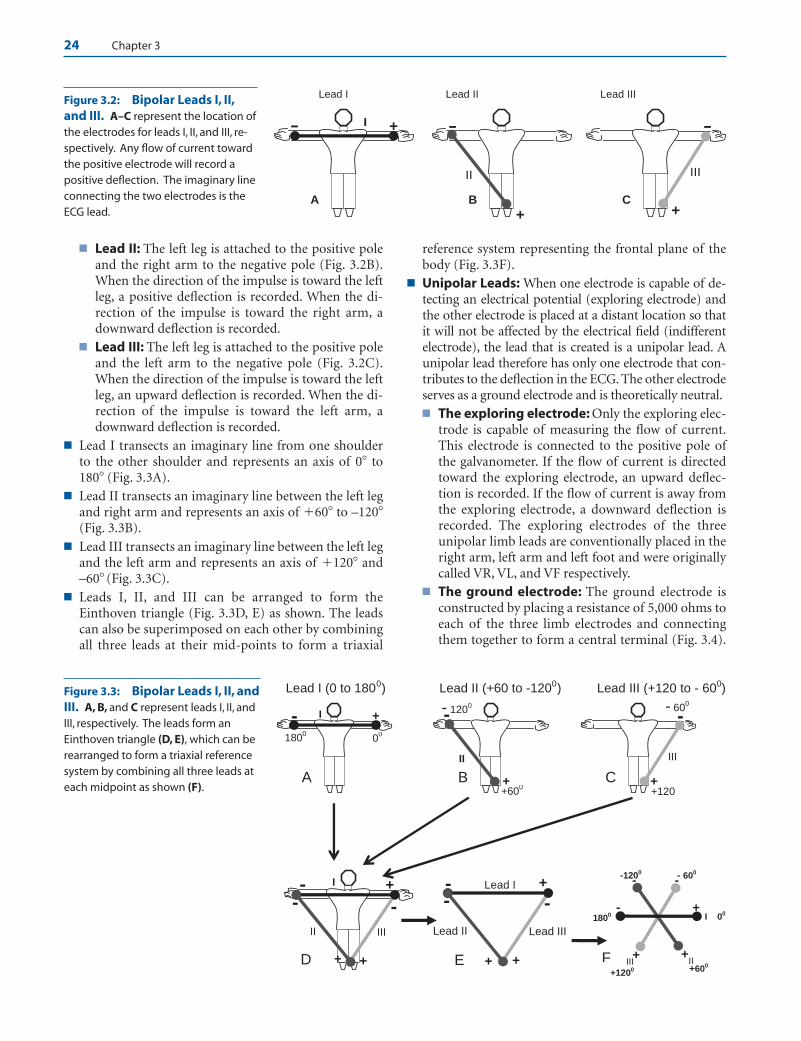
24 Chapter 3
■ Lead II: The left leg is attached to the positive poleand the right arm to the negative pole (Fig. 3.2B).When the direction of the impulse is toward the leftleg, a positive deflection is recorded. When the di-rection of the impulse is toward the right arm, adownward deflection is recorded.
■ Lead III: The left leg is attached to the positive poleand the left arm to the negative pole (Fig. 3.2C).When the direction of the impulse is toward the leftleg, an upward deflection is recorded. When the di-rection of the impulse is toward the left arm, adownward deflection is recorded.
■ Lead I transects an imaginary line from one shoulderto the other shoulder and represents an axis of 0� to180� (Fig. 3.3A).
■ Lead II transects an imaginary line between the left legand right arm and represents an axis of �60� to –120�(Fig. 3.3B).
■ Lead III transects an imaginary line between the left legand the left arm and represents an axis of �120� and–60� (Fig. 3.3C).
■ Leads I, II, and III can be arranged to form theEinthoven triangle (Fig. 3.3D, E) as shown. The leadscan also be superimposed on each other by combiningall three leads at their mid-points to form a triaxial
reference system representing the frontal plane of thebody (Fig. 3.3F).
■ Unipolar Leads: When one electrode is capable of de-tecting an electrical potential (exploring electrode) andthe other electrode is placed at a distant location so thatit will not be affected by the electrical field (indifferentelectrode), the lead that is created is a unipolar lead. Aunipolar lead therefore has only one electrode that con-tributes to the deflection in the ECG. The other electrodeserves as a ground electrode and is theoretically neutral.■ The exploring electrode: Only the exploring elec-
trode is capable of measuring the flow of current.This electrode is connected to the positive pole ofthe galvanometer. If the flow of current is directedtoward the exploring electrode, an upward deflec-tion is recorded. If the flow of current is away fromthe exploring electrode, a downward deflection isrecorded. The exploring electrodes of the threeunipolar limb leads are conventionally placed in theright arm, left arm and left foot and were originallycalled VR, VL, and VF respectively.
■ The ground electrode: The ground electrode isconstructed by placing a resistance of 5,000 ohms toeach of the three limb electrodes and connectingthem together to form a central terminal (Fig. 3.4).
Lead I Lead II Lead III
-
C+
III
-
B
+
II
- +
A
I
Figure 3.2: Bipolar Leads I, II,and III. A–C represent the location ofthe electrodes for leads I, II, and III, re-spectively. Any flow of current towardthe positive electrode will record apositive deflection. The imaginary lineconnecting the two electrodes is theECG lead.
Lead I (0 to 1800) Lead II (+60 to -1200) Lead III (+120 to - 600)
I
II III+
00
+600
+1200
-1200 - 600
F +
+
- -
-1800
+
+
Lead II Lead III
Lead I -- -
+E
+
+
II III
I-- -
D +
-
C ++120
- 600
III
-
B ++60
0
- 1200
II
- +
A
00180
0
I
Figure 3.3: Bipolar Leads I, II, andIII. A, B, and C represent leads I, II, andIII, respectively. The leads form anEinthoven triangle (D, E), which can berearranged to form a triaxial referencesystem by combining all three leads ateach midpoint as shown (F).
LWBK271-C03_23-29.qxd 29/1/09 8:44 pm Page 24 LWBK270-4119G-C02_073-110.qxd
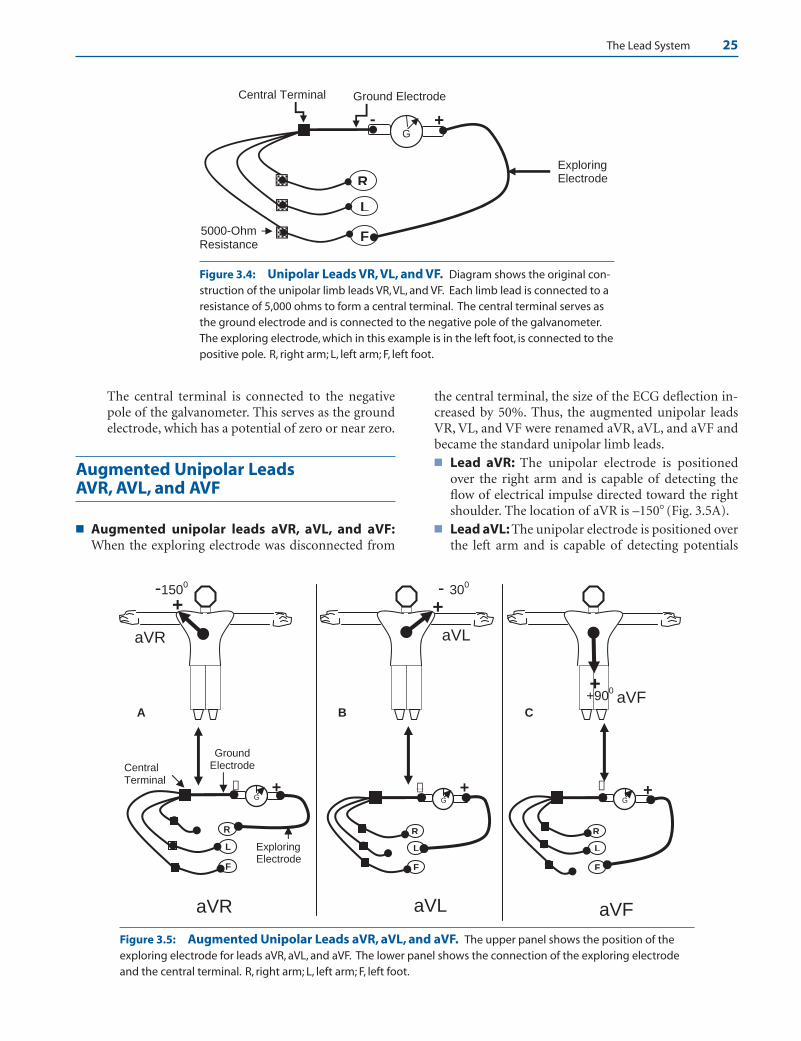
The Lead System 25
The central terminal is connected to the negativepole of the galvanometer. This serves as the groundelectrode, which has a potential of zero or near zero.
Augmented Unipolar Leads AVR, AVL, and AVF
■ Augmented unipolar leads aVR, aVL, and aVF:When the exploring electrode was disconnected from
the central terminal, the size of the ECG deflection in-creased by 50%. Thus, the augmented unipolar leadsVR, VL, and VF were renamed aVR, aVL, and aVF andbecame the standard unipolar limb leads.■ Lead aVR: The unipolar electrode is positioned
over the right arm and is capable of detecting theflow of electrical impulse directed toward the rightshoulder. The location of aVR is –150� (Fig. 3.5A).
■ Lead aVL: The unipolar electrode is positioned overthe left arm and is capable of detecting potentials
G
Exploring Electrode
Central Terminal
F
L
R
5000-Ohm Resistance
Ground Electrode
+-
Figure 3.4: Unipolar Leads VR, VL, and VF. Diagram shows the original con-struction of the unipolar limb leads VR, VL, and VF. Each limb lead is connected to aresistance of 5,000 ohms to form a central terminal. The central terminal serves asthe ground electrode and is connected to the negative pole of the galvanometer.The exploring electrode, which in this example is in the left foot, is connected to thepositive pole. R, right arm; L, left arm; F, left foot.
+900+
CaVF
- 300
+
aVL
B
-1500
+
aVR
A
G
F
L
R
+−G
F
L
R
+−G
Central Terminal
F
L
R
+
Exploring Electrode
−
GroundElectrode
aVR aVL aVF
Figure 3.5: Augmented Unipolar Leads aVR, aVL, and aVF. The upper panel shows the position of theexploring electrode for leads aVR, aVL, and aVF. The lower panel shows the connection of the exploring electrodeand the central terminal. R, right arm; L, left arm; F, left foot.
LWBK271-C03_23-29.qxd 29/1/09 8:44 pm Page 25 LWBK270-4119G-C02_073-110.qxd
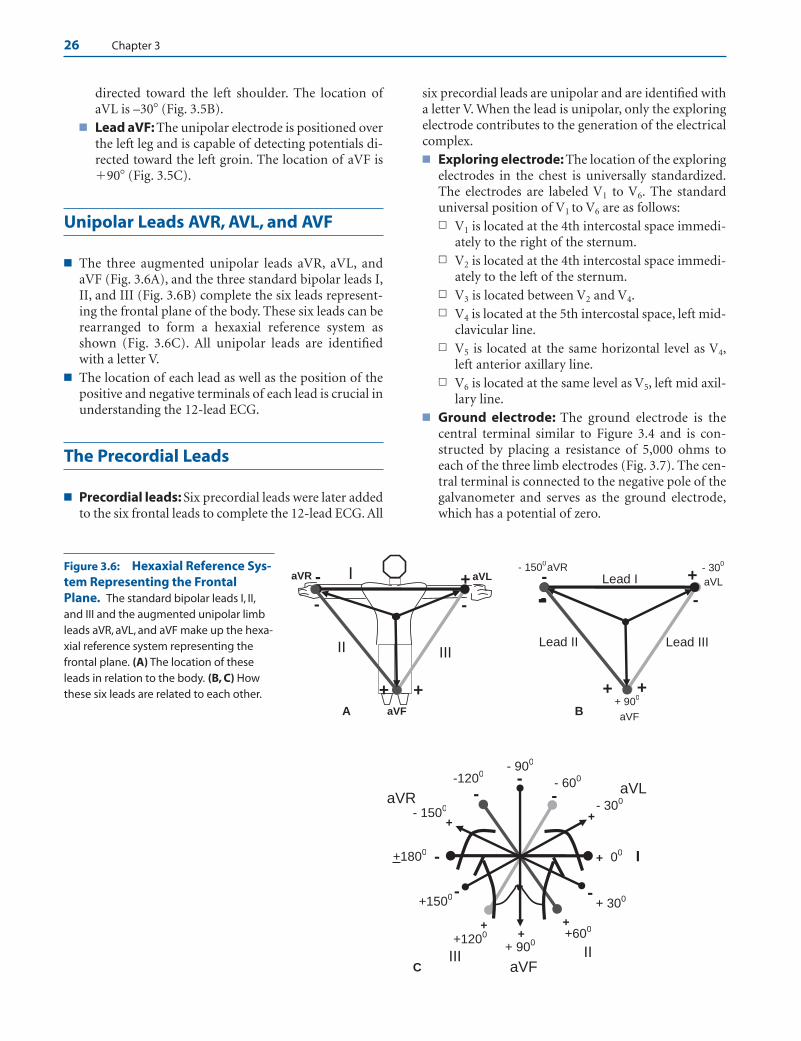
26 Chapter 3
directed toward the left shoulder. The location ofaVL is –30� (Fig. 3.5B).
■ Lead aVF: The unipolar electrode is positioned overthe left leg and is capable of detecting potentials di-rected toward the left groin. The location of aVF is�90� (Fig. 3.5C).
Unipolar Leads AVR, AVL, and AVF
■ The three augmented unipolar leads aVR, aVL, andaVF (Fig. 3.6A), and the three standard bipolar leads I,II, and III (Fig. 3.6B) complete the six leads represent-ing the frontal plane of the body. These six leads can berearranged to form a hexaxial reference system asshown (Fig. 3.6C). All unipolar leads are identifiedwith a letter V.
■ The location of each lead as well as the position of thepositive and negative terminals of each lead is crucial inunderstanding the 12-lead ECG.
The Precordial Leads
■ Precordial leads: Six precordial leads were later addedto the six frontal leads to complete the 12-lead ECG. All
six precordial leads are unipolar and are identified witha letter V. When the lead is unipolar, only the exploringelectrode contributes to the generation of the electricalcomplex.■ Exploring electrode: The location of the exploring
electrodes in the chest is universally standardized.The electrodes are labeled V1 to V6. The standarduniversal position of V1 to V6 are as follows:n V1 is located at the 4th intercostal space immedi-
ately to the right of the sternum.n V2 is located at the 4th intercostal space immedi-
ately to the left of the sternum.n V3 is located between V2 and V4.n V4 is located at the 5th intercostal space, left mid-
clavicular line.n V5 is located at the same horizontal level as V4,
left anterior axillary line.n V6 is located at the same level as V5, left mid axil-
lary line.■ Ground electrode: The ground electrode is the
central terminal similar to Figure 3.4 and is con-structed by placing a resistance of 5,000 ohms toeach of the three limb electrodes (Fig. 3.7). The cen-tral terminal is connected to the negative pole of thegalvanometer and serves as the ground electrode,which has a potential of zero.
I
II
+
+ 00
+600
+1200
-
-
--1200
- 600
+1800
- 300aVR- 1500
+ 900
+
+ 300
- 900
aVL
+
+1500
+
aVF
+
III C
-
--
+
+
Lead II Lead III
Lead I -
- -
+
aVL
+ 900
- 1500
aVF
-
- 300aVR
B
+
+
II III
I-
- -
+
aVR aVL
aVF A
Figure 3.6: Hexaxial Reference Sys-tem Representing the FrontalPlane. The standard bipolar leads I, II,and III and the augmented unipolar limbleads aVR, aVL, and aVF make up the hexa-xial reference system representing thefrontal plane. (A) The location of theseleads in relation to the body. (B, C) Howthese six leads are related to each other.
LWBK271-C03_23-29.qxd 29/1/09 8:44 pm Page 26 LWBK270-4119G-C02_073-110.qxd
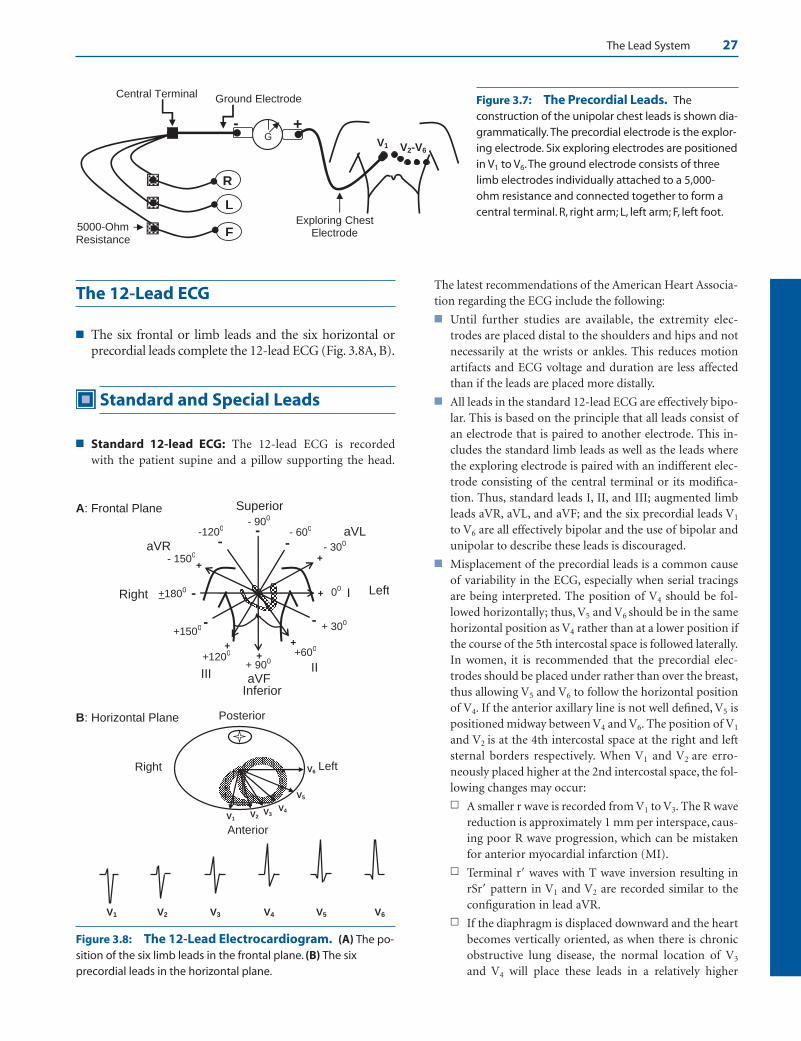
The Lead System 27
The 12-Lead ECG
■ The six frontal or limb leads and the six horizontal orprecordial leads complete the 12-lead ECG (Fig. 3.8A, B).
Standard and Special Leads
■ Standard 12-lead ECG: The 12-lead ECG is recorded with the patient supine and a pillow supporting the head.
The latest recommendations of the American Heart Associa-tion regarding the ECG include the following:
■ Until further studies are available, the extremity elec-trodes are placed distal to the shoulders and hips and notnecessarily at the wrists or ankles. This reduces motionartifacts and ECG voltage and duration are less affectedthan if the leads are placed more distally.
■ All leads in the standard 12-lead ECG are effectively bipo-lar. This is based on the principle that all leads consist ofan electrode that is paired to another electrode. This in-cludes the standard limb leads as well as the leads wherethe exploring electrode is paired with an indifferent elec-trode consisting of the central terminal or its modifica-tion. Thus, standard leads I, II, and III; augmented limbleads aVR, aVL, and aVF; and the six precordial leads V1
to V6 are all effectively bipolar and the use of bipolar andunipolar to describe these leads is discouraged.
■ Misplacement of the precordial leads is a common causeof variability in the ECG, especially when serial tracingsare being interpreted. The position of V4 should be fol-lowed horizontally; thus, V5 and V6 should be in the samehorizontal position as V4 rather than at a lower position ifthe course of the 5th intercostal space is followed laterally.In women, it is recommended that the precordial elec-trodes should be placed under rather than over the breast,thus allowing V5 and V6 to follow the horizontal positionof V4. If the anterior axillary line is not well defined, V5 ispositioned midway between V4 and V6. The position of V1
and V2 is at the 4th intercostal space at the right and leftsternal borders respectively. When V1 and V2 are erro-neously placed higher at the 2nd intercostal space, the fol-lowing changes may occur:
n A smaller r wave is recorded from V1 to V3. The R wavereduction is approximately 1 mm per interspace, caus-ing poor R wave progression, which can be mistakenfor anterior myocardial infarction (MI).
n Terminal r� waves with T wave inversion resulting inrSr� pattern in V1 and V2 are recorded similar to theconfiguration in lead aVR.
n If the diaphragm is displaced downward and the heartbecomes vertically oriented, as when there is chronicobstructive lung disease, the normal location of V3
and V4 will place these leads in a relatively higher
G
Exploring Chest Electrode F
L
R
5000-Ohm Resistance
Ground Electrode
+
Central Terminal
V1
-
V2-V6
Figure 3.7: The Precordial Leads. Theconstruction of the unipolar chest leads is shown dia-grammatically. The precordial electrode is the explor-ing electrode. Six exploring electrodes are positionedin V1 to V6.The ground electrode consists of threelimb electrodes individually attached to a 5,000-ohm resistance and connected together to form acentral terminal. R, right arm; L, left arm; F, left foot.
I
II
+
+ 00
+600
+1200
-
-
--1200 - 600
+1800
- 300aVR- 1500
+ 900
+
+ 300
- 900
aVL
+
+1500
+
aVF
+
III
Superior
Right Left
Inferior
A: Frontal Plane
-
--
V1V2
V3V4
V5
V6
V5 V6
Posterior
Right Left
Anterior
B: Horizontal Plane
V1 V2 V3 V4
Figure 3.8: The 12-Lead Electrocardiogram. (A) The po-sition of the six limb leads in the frontal plane. (B) The sixprecordial leads in the horizontal plane.
LWBK271-C03_23-29.qxd 29/1/09 8:44 pm Page 27 LWBK270-4119G-C02_073-110.qxd

28 Chapter 3
position than the ventricles; thus, deep S waves will berecorded in these leads, which can be mistaken for an-terior MI.
■ Finally, when the extremity leads are modified so that theleads are placed in the torso rather than the extremities,the ECG is not considered equivalent to the standardECG. Similarly, tracings obtained in the sitting or uprightposition is not equivalent to the standard ECG, which isrecorded supine.
■ It has also been observed that when V1 and V2 are placedhigher than their normal location, small q waves may berecorded in V2 and V3, especially in the presence of left an-terior fascicular block.
■ Special Electrodes: In addition to the 12 standard ECGleads, special leads can be created by repositioning some elec-trodes to the different areas on the chest.
■ Special leads V7,V8, and V9: V7 is located at the left pos-terior axillary line at the same level as V6. V8 is located justbelow the angle of the left scapula at the same level as V7
and V9 just lateral to the spine at the same level as V8.These leads supplement the 12-lead ECG in the diagnosisof posterolateral ST elevation MI and should be recordedwhen reciprocal ST segment depression is present in V1 toV3.
■ Right sided precordial leads V3R, V4R, V5R, and V6R:After recording the usual standard 12-lead ECG, specialleads V3R, V4R, V5R, and V6R can be added by movingprecordial leads V3, V4, V5, and V6 to the right side of thechest corresponding to the same location as that on theleft. These leads are very useful in the diagnosis of rightventricular MI, dextrocardia, and right ventricular hyper-trophy. These leads should be recorded routinely whenthere is acute coronary syndrome with ST elevation MIinvolving the inferior wall (leads II, III, and aVF).
■ Other lead placement used for detection ofarrhythmias:n CF, CL, and CR leads: Bipolar leads have electrodes
positioned in the arms or leg, which are equidistantfrom the heart. When one electrode is moved to theprecordium and the other electrode is retained in itsoriginal position in the arm or leg, the chest electrodewill contribute more to the recording than the remoteelectrode.
n Thus, a CL lead is created if one electrode is placed onthe chest and the more remote electrode is retained inits original position in the left arm. If the chest elec-trode is placed in V1 and the remote electrode is at theleft arm, the lead is identified as CL1.
n CR lead is created when the remote electrode is re-tained in the right arm. If the chest electrode is placedin V1 and the remote electrode is at the right arm, thelead is identified as CR1.
n CF lead is created when the remote electrode is re-tained in the left foot. If the chest electrode is placed in
V1 and the remote electrode is at the left foot, the leadis identified as CF1.
n Modified CL1 or MCL1: MCL1 is a lead that resemblesV1. The lead is bipolar and is a modified CL1 lead. Thepositive electrode is placed at V1 and the negative elec-trode is placed close to the left shoulder. A groundelectrode is placed at the other shoulder. It is fre-quently used for detecting arrhythmias during contin-uous monitoring of patients admitted to the coronarycare unit.
n Lewis lead: When the P wave is difficult to recognize,the right arm electrode is moved to the 2nd right in-tercostal space just beside the sternum and the leftarm electrode to the 4th right intercostal space alsobeside the sternum. Lead I is used for recording.
n Fontaine lead: The Fontaine leads are special leads forrecording epsilon waves in patients with arrhythmo-genic right ventricular dysplasia. The epsilon waves areusually difficult to record using only the standard 12leads. The right arm electrode is placed at themanubrium and the left arm electrode at the xiphoid.Additionally, the left foot electrode may be moved toposition V4. Leads I, II, and III are used for recording.
n Other modifications: Other special leads can be cre-ated if the P waves cannot be visualized by placing theright arm electrode at V1 position and the left armelectrode anywhere to the left of the sternum or moreposteriorly at V7 position. Lead I is recorded.
n Esophageal and intracardiac electrodes: These elec-trodes can be connected to any precordial or V lead,usually V1, for recording atrial activity (P waves) if theP wave cannot be visualized in the surface ECG.
n A pill electrode can be swallowed and positionedbehind the left atrium in the esophagus and con-nected to a precordial lead usually V1. The ECG isrecorded in V1.
n An electrode can also be inserted transvenously andpositioned into the right atrium. The electrode isconnected to a precordial lead and recorded as above.
n A central venous catheter, which is often already inplace for intravenous administration of medica-tions, is filled with saline. A syringe needle is in-serted to the injecting port of the central line and at-tached with an alligator clamp to a precordial lead,usually V1. The ECG is recorded in V1. This speciallead is for recording atrial activity if the P waves arenot visible in the surface ECG.
Suggested Readings
Burch GE, Winsor T. Principles of electrocardiography. In: APrimer of Electrocardiography, 5th ed. Philadelphia: Lea andFebiger; 1966;17–66.
LWBK271-C03_23-29.qxd 29/1/09 8:44 pm Page 28 LWBK270-4119G-C02_073-110.qxd
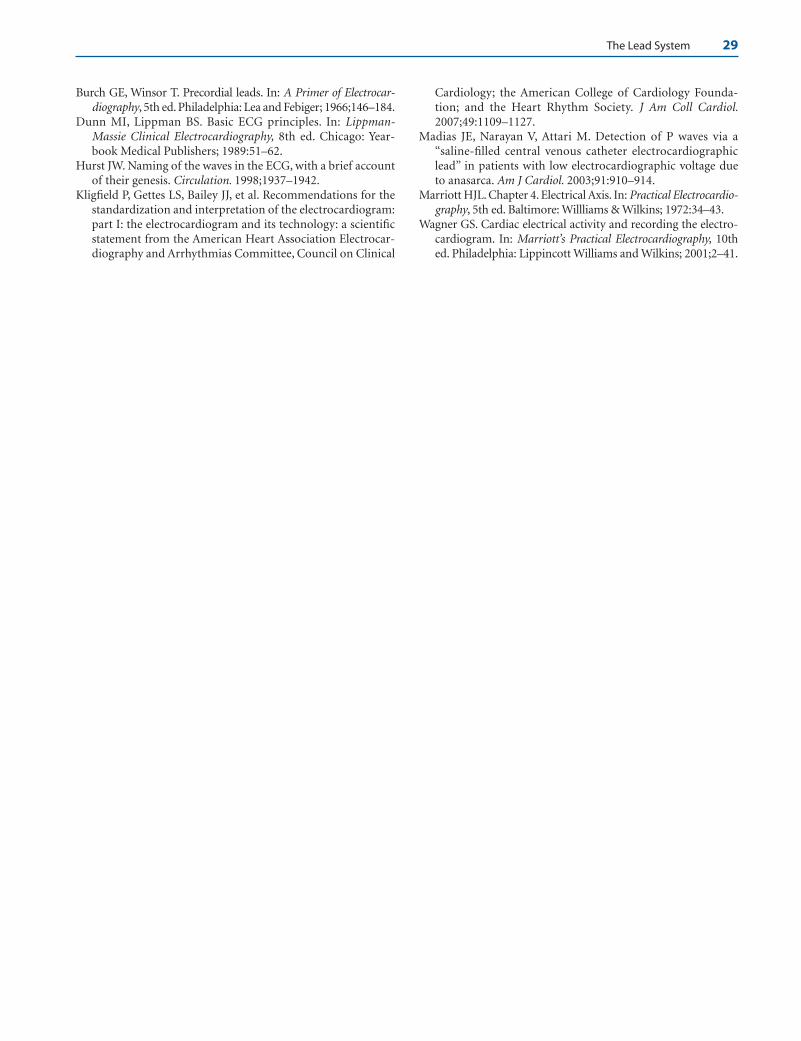
The Lead System 29
Burch GE, Winsor T. Precordial leads. In: A Primer of Electrocar-diography, 5th ed. Philadelphia: Lea and Febiger; 1966;146–184.
Dunn MI, Lippman BS. Basic ECG principles. In: Lippman-Massie Clinical Electrocardiography, 8th ed. Chicago: Year-book Medical Publishers; 1989:51–62.
Hurst JW. Naming of the waves in the ECG, with a brief accountof their genesis. Circulation. 1998;1937–1942.
Kligfield P, Gettes LS, Bailey JJ, et al. Recommendations for thestandardization and interpretation of the electrocardiogram:part I: the electrocardiogram and its technology: a scientificstatement from the American Heart Association Electrocar-diography and Arrhythmias Committee, Council on Clinical
Cardiology; the American College of Cardiology Founda-tion; and the Heart Rhythm Society. J Am Coll Cardiol.2007;49:1109–1127.
Madias JE, Narayan V, Attari M. Detection of P waves via a“saline-filled central venous catheter electrocardiographiclead” in patients with low electrocardiographic voltage dueto anasarca. Am J Cardiol. 2003;91:910–914.
Marriott HJL. Chapter 4. Electrical Axis. In: Practical Electrocardio-graphy, 5th ed. Baltimore: Willliams & Wilkins; 1972:34–43.
Wagner GS. Cardiac electrical activity and recording the electro-cardiogram. In: Marriott’s Practical Electrocardiography, 10thed. Philadelphia: Lippincott Williams and Wilkins; 2001;2–41.
LWBK271-C03_23-29.qxd 29/1/09 8:44 pm Page 29 LWBK270-4119G-C02_073-110.qxd

4The Electrical Axis and Cardiac Rotation
30
The Frontal and Horizontal Planes
■ Figuring the direction or axis of the QRS complex (orany wave in the electrocardiogram [ECG]) requires athorough understanding of the location of each of thedifferent leads in the 12-lead ECG. This knowledge iscrucial and provides the basic foundation for under-standing electrocardiography. Before attempting toread this chapter, a review of the previous chapter ismandatory.
■ The ECG mirrors both frontal and horizontal planes ofthe body and is thus tridimensional.■ Frontal plane: The frontal plane is represented by
leads I, II, III, aVR, aVL, and aVF. It includes theleft/right and superior/inferior orientation of thebody (Fig. 4.1A). The electrical position of the heartin the frontal plane is described as axis deviation.Thus, the axis of the QRS complex may be normalor it may be deviated to the left, to the right or to thenorthwest quadrant.
■ Horizontal plane: The horizontal plane is repre-sented by leads V1 to V6 (Fig. 4.1B). It includesleft/right and anteroposterior orientation of thebody. The position of the heart in the horizontalplane is described as rotation. Thus, the rotation of
the heart may be normal or it may be rotated clock-wise or counterclockwise.
The Frontal Plane
■ Frontal plane: Using the hexaxial reference system(Fig. 4.2), the frontal plane can be divided into fourquadrants.■ Normal quadrant: The left lower quadrant be-
tween 0� and �90� represents normal quadrant.■ Left upper quadrant: The left upper quadrant be-
tween 0� and �90� represents left axis deviation.■ Right lower quadrant: The right lower quadrant
between �90� and �180� represents right axis devi-ation.
■ Right upper quadrant: The quadrant between–90� and �180� is either extreme right or extremeleft axis deviation. Often, it is not possible to differ-entiate whether the axis has deviated extremely tothe right or extremely to the left; thus, this axis is of-ten called northwest axis.
■ Normal axis: The normal QRS axis depends on the ageof the patient.
V6
V5
V4V3V2
V1
Left
Anterior
00
300
600
750
900120
0
Posterior
B
Right I +-
+ 900
- 900
+
aVF
Superior
Left
A
Normal Axis
LeftAxis
RightAxis
00
1800
-
Right
Northwest Axis
Inferior
Figure 4.1: The 12-LeadElectrocardiogram. The lo-cation of the different leads inthe frontal (A) and horizontal(B) planes is shown.
LWBK271-C04_30-47.qxd 1/30/09 11:22 AM Page 30 Aptara Inc.

The Electrical Axis and Cardiac Rotation 31
■ In newborns up to 6 months of age, the normal QRSaxis is ��90� (vertical axis). With increasing age,the axis moves horizontally leftward toward 0�. It israre in children to have a horizontal axis.
■ In adults, the normal axis extends horizontally from�90� to –30�. The axis –1� to –30� is located in theleft upper quadrant and is left axis deviation. How-
ever, because the normal axis extends up to –30�, anaxis of –1� to –30� is considered part of the normalaxis (Fig. 4.2).
Figuring Out the Electrical Axis
■ Basic considerations: Before attempting to deter-mine the axis of any deflection in the ECG, the locationof all the six leads in the frontal plane as well as the lo-cation of the positive and negative terminals of eachlead should be mastered. The ECG deflection is maxi-mally upright if the flow of current is directed towardthe positive side of the lead and is maximally inverted ifthe flow of current is directed toward the negative side.Thus, if the flow of current is parallel to lead I (0� to180�), lead I will record the tallest deflection if the flowof current is directed toward 0� and the deepest deflec-tion if the flow of current is directed toward 180� (Fig.4.3A, B).
■ The lead perpendicular to lead I will record an iso-electric complex. Isoelectric or equiphasic impliesthat the deflection above and below the baseline areabout equal. Since lead aVF is perpendicular to leadI, lead aVF will record an isoelectric deflection (Fig.4.3C, D).
■ Determining the electrical axis: The electrical axisor direction of the QRS complex (or any wave in theECG) can be determined by several methods. Althoughthe area under the QRS complex provides a more accu-rate electrical axis, the area is not readily measurable.For convenience, the amplitude of the QRS complex ismeasured instead.
I
II IIIaVF
aVL aVR
+ 600
00
- 300-1500
+ 1200
- 600
+ 300
LR
+90
SUP
INF
-90
0-1200
+ 1800
LADNorthwest
Axis
RAD+ 1500
NormalQuadrant
Normal Axis-30 to +90
0
Figure 4.2: The Frontal Plane and the Hexaxial Refer-ence System. The frontal plane is represented by the six limbleads. The position of the limb leads and the location of the dif-ferent quadrants in the frontal plane are shown. Note that theleads are 30� apart. The normal axis in the adult extends from�30� to �90�, thus �1� to �30� is considered normal axis. LAD,left axis deviation; RAD, right axis deviation; L, left; R, right; SUP,superior; INF, inferior.
I+ 0
0-1800
aVF+90
0
-900
Dor
I+ 0
0-1800
aVF+90
0
-900
or C
I+
00-
1800
I+
00-180
0
B A
Figure 4.3: Leads I and aVF.Lead I and aVF are perpendicularto each other. The electrocardio-gram deflection in lead I will reg-ister the tallest deflection if thecurrent is directed toward thepositive electrode (0�) as shownin A. It will record the deepestdeflection if the current isdirected toward 180� or the neg-ative electrode as shown in B.The lead perpendicular to lead Iwill record an isoelectric deflec-tion. Because aVF is perpendicu-lar to lead I, aVF will record anisoelectric complex (C, D).
LWBK271-C04_30-47.qxd 1/30/09 11:22 AM Page 31 Aptara Inc.

32 Chapter 4
■ Method 1: Look for an isoelectric complex: When anisoelectric QRS complex is present in any lead in thefrontal plane, the axis of the QRS complex is perpendicu-lar to the lead with the isoelectric complex. The followingleads in the frontal plane are perpendicular to each other.■ Lead I is perpendicular to lead aVF (Fig. 4.4A).
n When an equiphasic QRS complex is recorded inlead I (0�), the axis of the QRS complex is �90�or �90�.
n Similarly, when an equiphasic QRS complex isrecorded in lead aVF (+90�), the axis of the QRScomplex is 0� or 180�.
■ Lead II is perpendicular to lead aVL (Fig. 4.4B).n When an equiphasic QRS complex is recorded in
lead II (+60�), the axis of the QRS complex is–30� or �150�.
n Similarly, when an equiphasic QRS complex isrecorded in lead aVL (–30�), the axis of the QRScomplex is �60� or �120�.
■ Lead III is perpendicular to lead aVR (Fig. 4.4C).n When an equiphasic QRS complex is recorded in
lead III (�120�), the axis of the QRS complex is�150� or �30�.
n Similarly, when an equiphasic QRS complex isrecorded in lead aVR (�150�), the axis of theQRS complex is �120� or �60�.
Figuring Out the Electrical Axis when an Equiphasic Complex is Present
■ Lead I is equiphasic: If the QRS complex in lead I (0�)is equiphasic, the flow of current is toward lead aVF, be-cause lead aVF is perpendicular to lead I. If the flow ofcurrent is toward �90�, which is the positive side of aVF,the tallest deflection will be recorded in aVF (Fig. 4.5A).If the flow of current is toward �90� away from the
positive side of aVF, lead aVF will record the deepestdeflection (Fig. 4.5B).
■ Figures 4.5C and D summarize the possible deflectionsof the other leads in the frontal plane if lead I isequiphasic.
■ Lead II is equiphasic: If lead II (�60�) is equiphasic,the flow of current is in the direction of lead aVL, be-cause lead aVL is perpendicular to lead II. If the electri-cal current is directed toward �30�, the tallest deflec-tion will be recorded in lead aVL (Fig. 4.6A) becausethis is the positive side of lead aVL. On the other hand,if the flow of current is toward �150�, lead aVL willrecord the deepest deflection, because this is away fromthe positive side of lead aVL (Fig. 4.6B).
■ Figures 4.6C and D summarize the possible deflectionsof the different leads in the frontal plane of the ECG iflead II is equiphasic.
■ Lead III is equiphasic: If the QRS complex in lead III(�120�) is equiphasic, the flow of current is in the direc-tion of lead aVR, because lead aVR is perpendicular tolead III. If the electrical current is directed toward�150�, the tallest deflection will be recorded in lead aVR(Fig. 4.7A) because this is the positive side of lead aVR.On the other hand, if the flow of current is toward �30�,lead aVR will record the deepest deflection because thisis the negative side of lead aVR (Fig. 4.7B).
■ Figures 4.7C and D summarize the possible deflectionsof the different leads in the frontal plane if lead III isequiphasic.
Figuring Out the Axis of the QRSComplex; Summary and PracticeTracings
■ When an isoelectric deflection is recorded in any leadin the frontal plane, the mean axis of the QRS complexcan be easily calculated (Figs. 4.8–4.13).
III+ 120
0
C
Leads III and aVR
+300
- 600
aVL
II+ 60
0
B
Leads II and aVL
- 300
-1200
+1500
I
aVF
+ 900
Leads I and aVF
A
1800
00
- 900
aVR - 150
0
Figure 4.4: PerpendicularLeads. In the frontal plane, thefollowing leads are perpendicularto each other: Leads I and aVF (A),Leads II and aVL (B) and lead IIIand aVR (C).
LWBK271-C04_30-47.qxd 1/30/09 11:22 AM Page 32 Aptara Inc.
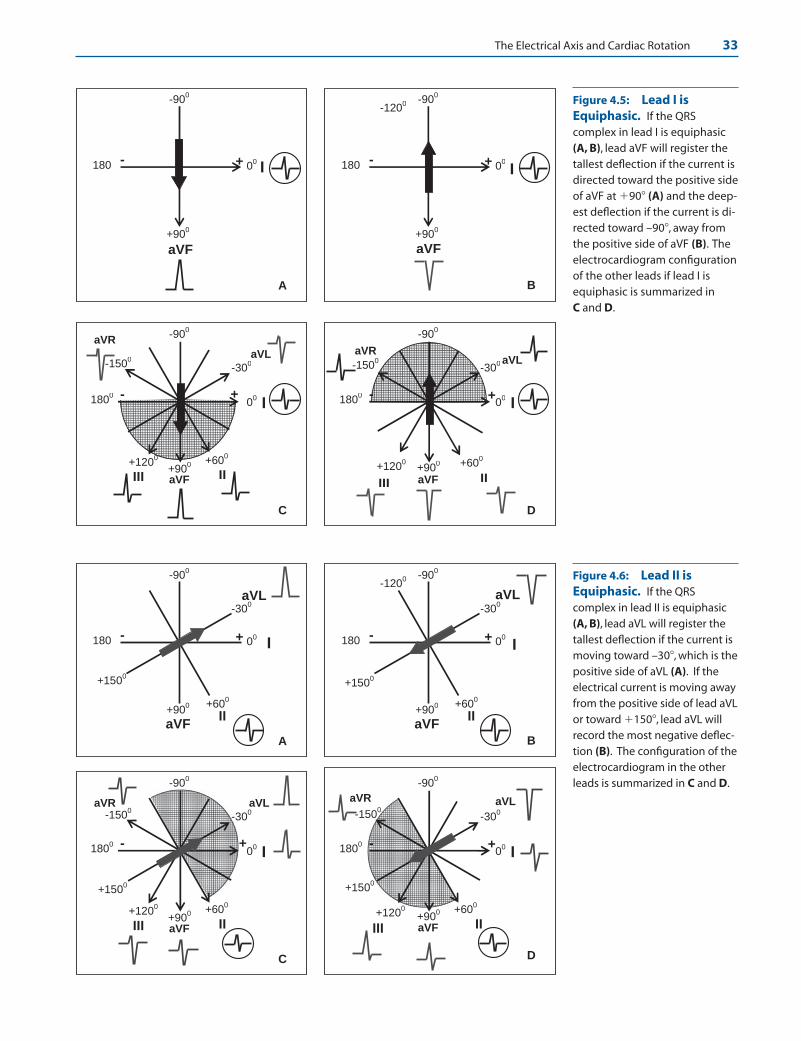
The Electrical Axis and Cardiac Rotation 33
I00-180
0
aVF+90
0
-900
II+60
0
-300aVL
aVR
-1500
III+120
0
+
C
I00-180
0
aVF+90
0
-900
II
+600
-300 aVL
aVR
III
+1200
+
D
-1500
I+ 0
0-180
aVF+90
0
-900
B
-1200
I+ 00-180
aVF
+900
-900
A
I00-180
0
aVF+90
0
-900
II+60
0
-300aVLaVR
-1500
III+120
0
+
C
+1500
I00-180
0
aVF+90
0
-900
II+60
0
-300
aVL aVR
-1500
III
+1200
+
+1500
D
I+ 0
0-180
aVF +90
0
-900
II+60
0
-300aVL
-1200
+1500
B
I+ 00-180
aVF +90
0
-900
A
II+60
0
-300
aVL
+1500
Figure 4.5: Lead I isEquiphasic. If the QRScomplex in lead I is equiphasic(A, B), lead aVF will register thetallest deflection if the current isdirected toward the positive sideof aVF at �90� (A) and the deep-est deflection if the current is di-rected toward –90�, away fromthe positive side of aVF (B). Theelectrocardiogram configurationof the other leads if lead I isequiphasic is summarized in C and D.
Figure 4.6: Lead II isEquiphasic. If the QRScomplex in lead II is equiphasic(A, B), lead aVL will register thetallest deflection if the current ismoving toward –30�, which is thepositive side of aVL (A). If theelectrical current is moving awayfrom the positive side of lead aVLor toward �150�, lead aVL willrecord the most negative deflec-tion (B). The configuration of theelectrocardiogram in the otherleads is summarized in C and D.
LWBK271-C04_30-47.qxd 1/30/09 11:22 AM Page 33 Aptara Inc.

34 Chapter 4
I00
aVF+90
0
-900
II+60
0
-300aVLaVR
-1500
III+120
0
+
-600
-180
0
C
I00-180
0
aVF+90
0
-900
II+60
0
-300aVL
aVR
-1500
III+120
0
+
D
-600
I+ 0
0-1800
aVF+90
0
-900
III
-1500
aVR
+1200
+
-600
+300
B
I+ 0
0-1800
aVF+90
0
-900
III
+300
-1500
aVR
+
-600
+1200
A
Figure 4.7: Lead III isEquiphasic. If the QRScomplex in lead III is equiphasic(A, B), lead aVR will register thetallest deflection if the current ismoving toward �150�, which isthe positive side of aVR (A). If thecurrent is moving away from thepositive side of lead aVR toward�30�, lead aVR will record themost negative deflection (B). Theconfiguration of the electrocar-diogram in the other leads whenlead III is equiphasic issummarized in C and D.
I 00
aVF
900
Figure 4.8: IsoelectricDeflection in Lead I. Lead I isisoelectric. Because lead I isperpendicular to aVF, and leadaVF has a tall complex, the axisis �90�.
aVL
II
600
-300
Figure 4.9: IsoelectricDeflection in aVL. Lead aVL isisoelectric. Because lead aVL isperpendicular to lead II, and leadII shows the tallest deflection, theaxis is +60�.
LWBK271-C04_30-47.qxd 1/30/09 11:22 AM Page 34 Aptara Inc.

The Electrical Axis and Cardiac Rotation 35
aVR
III
1200
-1500
-600
Figure 4.10: Isoelectric De-flection in aVR. Lead aVR isisoelectric. Because aVR isperpendicular to lead III, and leadIII has the deepest complex, theaxis is �60�. Note that tall Rwaves are present in aVL (�30�),which is beside the negative sideof lead III.
aVR
III
1200
-1500
300
I 00
aVF
900
Figure 4.11: Isoelectric Deflection in III. Lead III is isoelectric. Because III is perpendicular to lead aVR,and lead aVR has a negative complex, the axis is away from the positive side of aVR or �30�. This is substan-tiated by the presence of tall R waves in leads I and lead II. These leads flank the negative side of lead aVR.
Figure 4.12: Isoelectric Deflection in aVF. Lead aVF is isoelectric. Because aVF is perpendicular tolead I, and lead I has the tallest complex, the axis is 0�.
LWBK271-C04_30-47.qxd 1/30/09 11:22 AM Page 35 Aptara Inc.
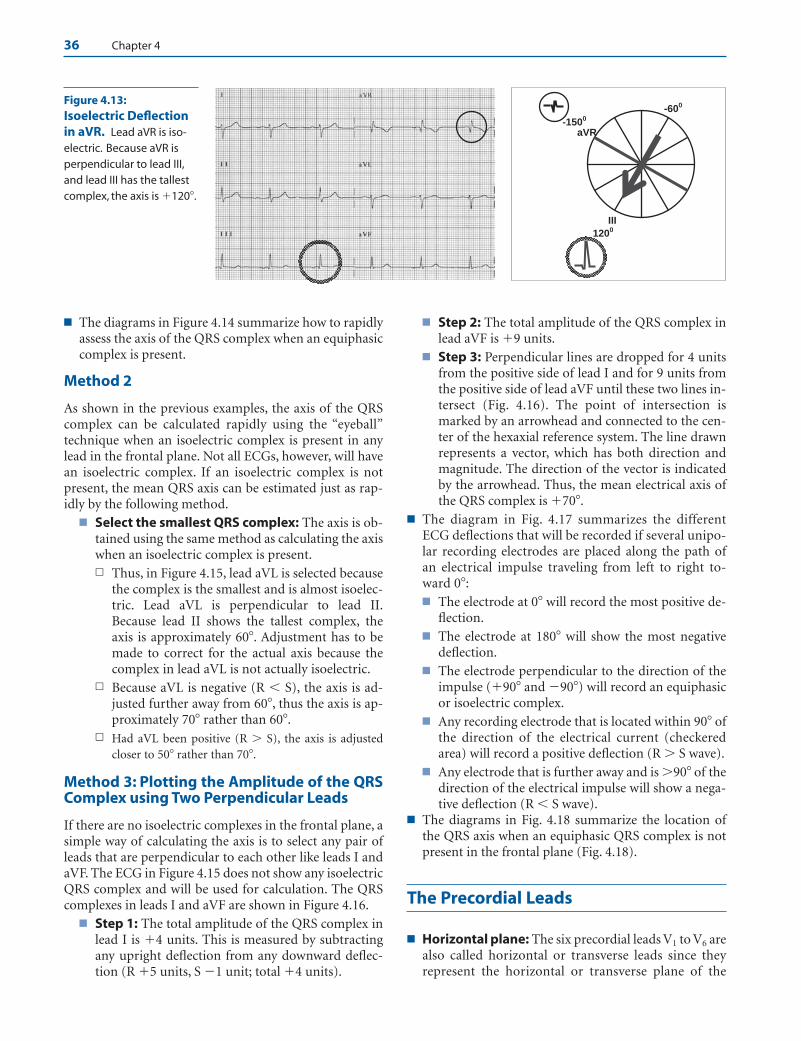
36 Chapter 4
■ The diagrams in Figure 4.14 summarize how to rapidlyassess the axis of the QRS complex when an equiphasiccomplex is present.
Method 2
As shown in the previous examples, the axis of the QRScomplex can be calculated rapidly using the “eyeball”technique when an isoelectric complex is present in anylead in the frontal plane. Not all ECGs, however, will havean isoelectric complex. If an isoelectric complex is notpresent, the mean QRS axis can be estimated just as rap-idly by the following method.
■ Select the smallest QRS complex: The axis is ob-tained using the same method as calculating the axiswhen an isoelectric complex is present.n Thus, in Figure 4.15, lead aVL is selected because
the complex is the smallest and is almost isoelec-tric. Lead aVL is perpendicular to lead II.Because lead II shows the tallest complex, theaxis is approximately 60�. Adjustment has to bemade to correct for the actual axis because thecomplex in lead aVL is not actually isoelectric.
n Because aVL is negative (R � S), the axis is ad-justed further away from 60�, thus the axis is ap-proximately 70� rather than 60�.
n Had aVL been positive (R � S), the axis is adjustedcloser to 50� rather than 70�.
Method 3: Plotting the Amplitude of the QRSComplex using Two Perpendicular Leads
If there are no isoelectric complexes in the frontal plane, asimple way of calculating the axis is to select any pair ofleads that are perpendicular to each other like leads I andaVF. The ECG in Figure 4.15 does not show any isoelectricQRS complex and will be used for calculation. The QRScomplexes in leads I and aVF are shown in Figure 4.16.
■ Step 1: The total amplitude of the QRS complex inlead I is �4 units. This is measured by subtractingany upright deflection from any downward deflec-tion (R �5 units, S �1 unit; total �4 units).
■ Step 2: The total amplitude of the QRS complex inlead aVF is �9 units.
■ Step 3: Perpendicular lines are dropped for 4 unitsfrom the positive side of lead I and for 9 units fromthe positive side of lead aVF until these two lines in-tersect (Fig. 4.16). The point of intersection ismarked by an arrowhead and connected to the cen-ter of the hexaxial reference system. The line drawnrepresents a vector, which has both direction andmagnitude. The direction of the vector is indicatedby the arrowhead. Thus, the mean electrical axis ofthe QRS complex is �70�.
■ The diagram in Fig. 4.17 summarizes the differentECG deflections that will be recorded if several unipo-lar recording electrodes are placed along the path ofan electrical impulse traveling from left to right to-ward 0�:■ The electrode at 0� will record the most positive de-
flection.■ The electrode at 180� will show the most negative
deflection.■ The electrode perpendicular to the direction of the
impulse (�90� and �90�) will record an equiphasicor isoelectric complex.
■ Any recording electrode that is located within 90� ofthe direction of the electrical current (checkeredarea) will record a positive deflection (R � S wave).
■ Any electrode that is further away and is �90� of thedirection of the electrical impulse will show a nega-tive deflection (R � S wave).
■ The diagrams in Fig. 4.18 summarize the location ofthe QRS axis when an equiphasic QRS complex is notpresent in the frontal plane (Fig. 4.18).
The Precordial Leads
■ Horizontal plane: The six precordial leads V1 to V6 arealso called horizontal or transverse leads since theyrepresent the horizontal or transverse plane of the
aVR
III
1200
-1500
-600Figure 4.13:Isoelectric Deflectionin aVR. Lead aVR is iso-electric. Because aVR isperpendicular to lead III,and lead III has the tallestcomplex, the axis is �120�.
LWBK271-C04_30-47.qxd 1/30/09 11:22 AM Page 36 Aptara Inc.

The Electrical Axis and Cardiac Rotation 37
III
+300
-1500aVR
-600
+1200
+1200 III
+300
-1500aVR
-600
+1200
-600III
+300
-1500aVR
-600
+1200
+300
II+600
-300aVL
+1500
-1200
-1200
III
+300
-1500aVR
-600
+1200
-1500
II+600
-300
aVL
+1500
+600
-1200
II+600
-300
aVL
+1500
+1500
II+600
-300
aVL
+1500
-300
I00180
aVF
+900
-900
1800
I00180
aVF
+900
-900
00
I00180
aVF
+900
-900
-900
I00180
aVF
+900
-900
+900
Figure 4.14: Diagrams Showing the Location of the QRS. Bold arrows point to the QRS axis when anequiphasic complex is present.
LWBK271-C04_30-47.qxd 1/30/09 11:22 AM Page 37 Aptara Inc.

38 Chapter 4
chest. The horizontal plane includes the left/right aswell as the anteroposterior sides of the chest (Fig. 4.19).■ Leads V1 and V2: Leads V1 and V2 are right-sided
precordial leads and are positioned directly over theright ventricle. The QRS complexes in V1 and V2
represent electrical forces generated from the right
I
II IIIaVF
aVL aVR
+600
00
-300-1500
+1200
-600
+300
LR
+900
SUP
-900
-1200
+1800
INF
Figure 4.15: Figuring Out the Axis when no Isoelectric Complex is Present. Lead aVL is selectedbecause the complex is the smallest and almost isoelectric. Lead aVL is perpendicular to lead II. Because lead IIshows the tallest complex, the axis is close to 60�. Lead aVL, however, is not actually isoelectric but is negative (r �S); thus, the axis of the QRS complex is adjusted further away and is closer to 70� (dotted arrow) than 60�.
I
aVF
+ 900
00+4
+9
+ 700
Lead aVF= 9 unitsLead I = 4 units
Figure 4.16: Figuring the QRS Axis. The electrocardiogramshowing leads I and aVF. The total amplitude of the QRS complexof �4 units is identified on the positive side of lead I. The totalamplitude of �9 units is also identified on the positive side oflead aVF. Lines are dropped perpendicularly from leads I andaVF until the line intersects. The lines intersect at �70�, whichmark the axis of the QRS complex.
001800
+900
-900
Figure 4.17: The Electrocardiogram Configurations ofan Electrical Impulse Traveling Toward 0�. The diagramsummarizes the different electrocardiogram configurations ofan impulse traveling at 0� if several electrodes are placed alongits path. Any lead within 90� of the direction of the electrical im-pulse (checkered area) will record a positive deflection. Any leadthat is further away (�90�) will record a negative deflection. Themost positive or tallest deflection is recorded by the electrodepositioned at 0� and the most negative by the electrode at 180�.
LWBK271-C04_30-47.qxd 1/30/09 11:22 AM Page 38 Aptara Inc.
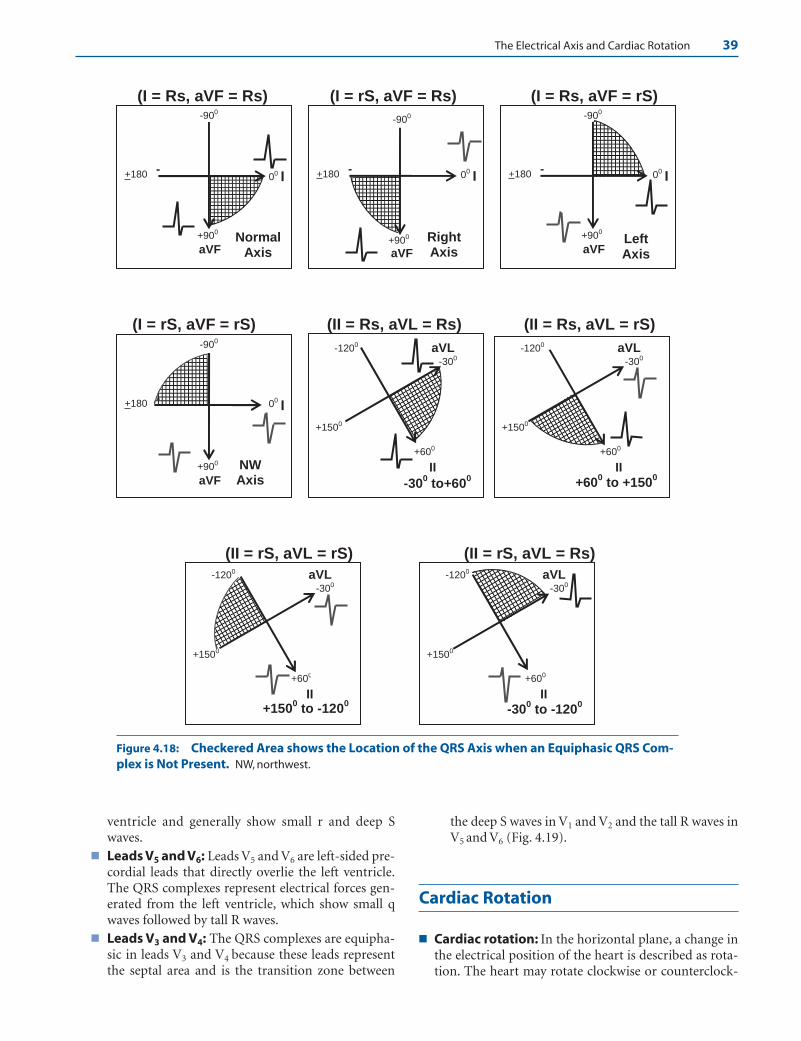
The Electrical Axis and Cardiac Rotation 39
(I = Rs, aVF = Rs) (I = rS, aVF = Rs) (I = Rs, aVF = rS)
(I = rS, aVF = rS) (II = Rs, aVL = Rs) (II = Rs, aVL = rS)
(II = rS, aVL = rS) (II = rS, aVL = Rs)
II
+600
-300
aVL
+1500
-1200
+600 to +150
0
II
+600
-300
aVL
+1500
-1200
+1500 to -120
0II
+600
-300
aVL
+1500
-1200
-300 to -120
0
II
+600
-300
aVL
+1500
-1200
-300 to+60
0
I00-+180
aVF+900
-900
RightAxis
I00-+180
aVF
+900
-900
NW Axis
I00-+180
aVF
+900
-900
LeftAxis
I00-+180
aVF
+900
-900
NormalAxis
Figure 4.18: Checkered Area shows the Location of the QRS Axis when an Equiphasic QRS Com-plex is Not Present. NW, northwest.
ventricle and generally show small r and deep Swaves.
■ Leads V5 and V6: Leads V5 and V6 are left-sided pre-cordial leads that directly overlie the left ventricle.The QRS complexes represent electrical forces gen-erated from the left ventricle, which show small qwaves followed by tall R waves.
■ Leads V3 and V4: The QRS complexes are equipha-sic in leads V3 and V4 because these leads representthe septal area and is the transition zone between
the deep S waves in V1 and V2 and the tall R waves inV5 and V6 (Fig. 4.19).
Cardiac Rotation
■ Cardiac rotation: In the horizontal plane, a change inthe electrical position of the heart is described as rota-tion. The heart may rotate clockwise or counterclock-
LWBK271-C04_30-47.qxd 1/30/09 11:22 AM Page 39 Aptara Inc.
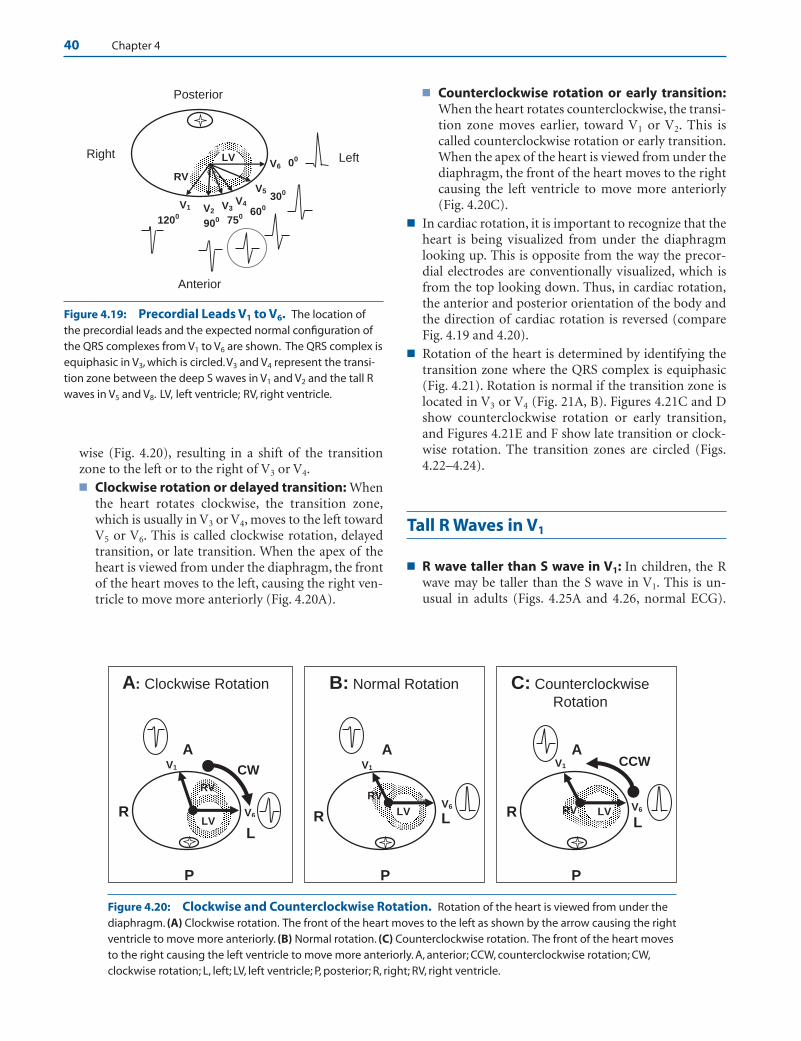
40 Chapter 4
■ Counterclockwise rotation or early transition:When the heart rotates counterclockwise, the transi-tion zone moves earlier, toward V1 or V2. This iscalled counterclockwise rotation or early transition.When the apex of the heart is viewed from under thediaphragm, the front of the heart moves to the rightcausing the left ventricle to move more anteriorly(Fig. 4.20C).
■ In cardiac rotation, it is important to recognize that theheart is being visualized from under the diaphragmlooking up. This is opposite from the way the precor-dial electrodes are conventionally visualized, which isfrom the top looking down. Thus, in cardiac rotation,the anterior and posterior orientation of the body andthe direction of cardiac rotation is reversed (compareFig. 4.19 and 4.20).
■ Rotation of the heart is determined by identifying thetransition zone where the QRS complex is equiphasic(Fig. 4.21). Rotation is normal if the transition zone islocated in V3 or V4 (Fig. 21A, B). Figures 4.21C and Dshow counterclockwise rotation or early transition,and Figures 4.21E and F show late transition or clock-wise rotation. The transition zones are circled (Figs.4.22–4.24).
Tall R Waves in V1
■ R wave taller than S wave in V1: In children, the Rwave may be taller than the S wave in V1. This is un-usual in adults (Figs. 4.25A and 4.26, normal ECG).
V6
V5
V4V3V2V1
Right Left
Anterior
00
300
600
7509001200
Posterior
LV
RV
Figure 4.19: Precordial Leads V1 to V6. The location ofthe precordial leads and the expected normal configuration ofthe QRS complexes from V1 to V6 are shown. The QRS complex isequiphasic in V3, which is circled.V3 and V4 represent the transi-tion zone between the deep S waves in V1 and V2 and the tall Rwaves in V5 and V8. LV, left ventricle; RV, right ventricle.
V6
V1
A
RL
P
LV RV
CCW
C: Counterclockwise Rotation
V6
V1
A
R L
P
LV
RV
B: Normal Rotation
V6
V1
A
R
L
P
LV
CW
A: Clockwise Rotation
RV
Figure 4.20: Clockwise and Counterclockwise Rotation. Rotation of the heart is viewed from under thediaphragm. (A) Clockwise rotation. The front of the heart moves to the left as shown by the arrow causing the rightventricle to move more anteriorly. (B) Normal rotation. (C) Counterclockwise rotation. The front of the heart movesto the right causing the left ventricle to move more anteriorly. A, anterior; CCW, counterclockwise rotation; CW,clockwise rotation; L, left; LV, left ventricle; P, posterior; R, right; RV, right ventricle.
wise (Fig. 4.20), resulting in a shift of the transitionzone to the left or to the right of V3 or V4.■ Clockwise rotation or delayed transition: When
the heart rotates clockwise, the transition zone,which is usually in V3 or V4, moves to the left towardV5 or V6. This is called clockwise rotation, delayedtransition, or late transition. When the apex of theheart is viewed from under the diaphragm, the frontof the heart moves to the left, causing the right ven-tricle to move more anteriorly (Fig. 4.20A).
LWBK271-C04_30-47.qxd 1/30/09 11:23 AM Page 40 Aptara Inc.

The Electrical Axis and Cardiac Rotation 41
DL
P
R
F
R
P
L
ER
P
L
CL
P
R
BL
A
R
A
A
R
P
L
Figure 4.21: Transition Zones. (A, B) Nor-mal transition where the R and S waves areequiphasic in V3 or V4. (C, D) Early transition orcounterclockwise rotation with the transitionzone in V1 or V2. (E, F) Late transition orclockwise rotation with the equiphasic QRScomplex in V5 or V6. The transition zones are cir-cled. A, anterior; P, posterior; R, right; L, left.
V2
Figure 4.22: Normal Rotation.Precordial leads V1 to V6 are shown.There is gradual progression of the Rwaves from V1 to V6. V4 is equiphasic(circled), representing the normaltransition zone.
LWBK271-C04_30-47.qxd 1/30/09 11:23 AM Page 41 Aptara Inc.

42 Chapter 4
Figure 4.23: CounterclockwiseRotation or Early Transition.There is early transition of the QRScomplexes with the equiphasic zone inV1. This represents counterclockwiserotation or early transition.
Figure 4.24: Clockwise Rotationor Late Transition. There is gradualprogression of the R wave from V1 to V6
until the QRS complex becomesequiphasic in V6. This represents clock-wise rotation or late transition.
When R wave is taller than the S wave in V1, the follow-ing should be excluded before this finding is considereda normal variant.■ Right bundle branch block (RBBB)■ Right ventricular hypertrophy■ Pre-excitation or Wolff Parkinson White (WPW)
ECG■ Straight posterior myocardial infarction (MI)
■ Pacemaker rhythm■ Ventricular ectopic impulses
■ RBBB: In RBBB, the QRS complexes are wide measur-ing �0.12 seconds (Figs. 4.25B and 4.27). This is themost important feature distinguishing RBBB from theother entities with tall R waves in V1. Terminal Rwaves are also present in V1 and wide S waves are pres-ent in V5 and V6 or lead I (see Chapter 10, Intraven-tricular Conduction Defect: Bundle Branch Block).
LWBK271-C04_30-47.qxd 1/30/09 11:23 AM Page 42 Aptara Inc.
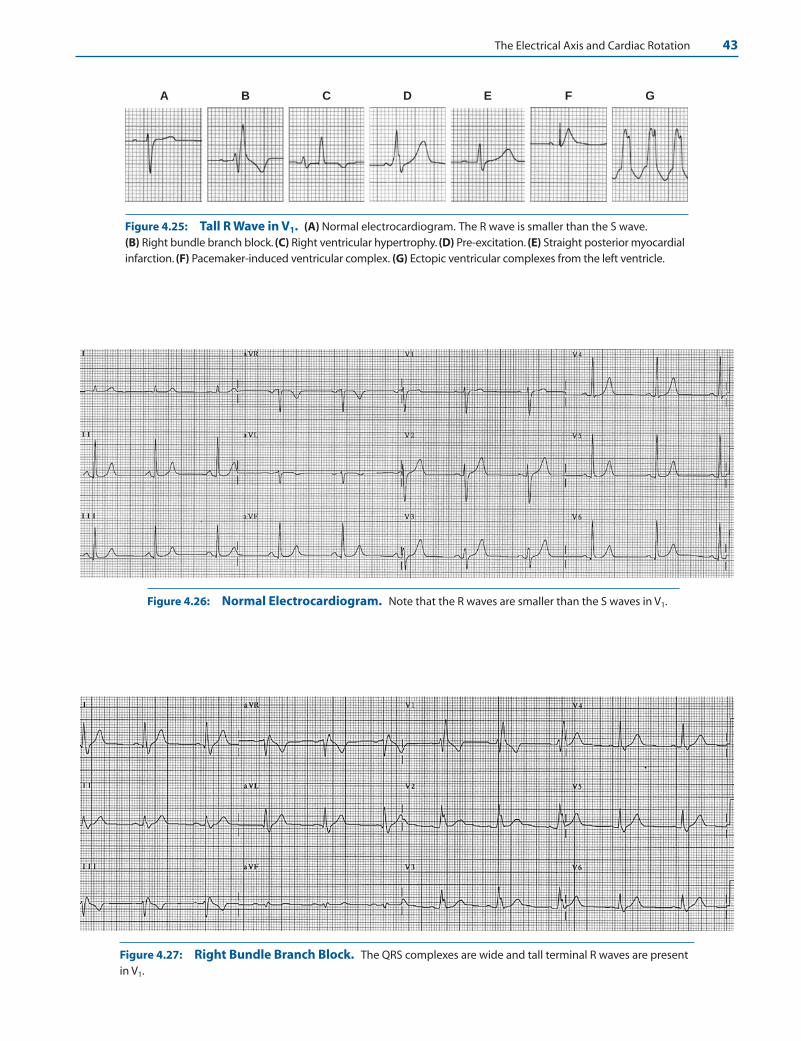
The Electrical Axis and Cardiac Rotation 43
A B C D E F G
Figure 4.25: Tall R Wave in V1. (A) Normal electrocardiogram. The R wave is smaller than the S wave.(B) Right bundle branch block. (C) Right ventricular hypertrophy. (D) Pre-excitation. (E) Straight posterior myocardialinfarction. (F) Pacemaker-induced ventricular complex. (G) Ectopic ventricular complexes from the left ventricle.
Figure 4.26: Normal Electrocardiogram. Note that the R waves are smaller than the S waves in V1.
Figure 4.27: Right Bundle Branch Block. The QRS complexes are wide and tall terminal R waves are presentin V1.
LWBK271-C04_30-47.qxd 1/30/09 11:23 AM Page 43 Aptara Inc.
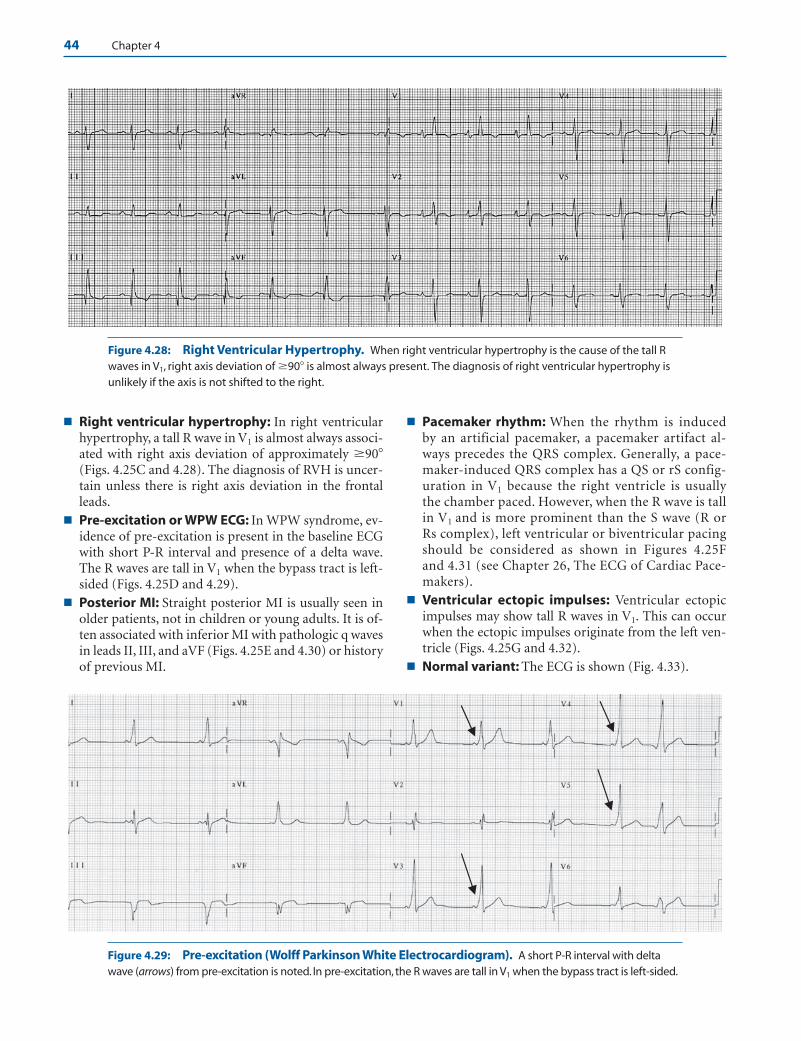
44 Chapter 4
■ Right ventricular hypertrophy: In right ventricularhypertrophy, a tall R wave in V1 is almost always associ-ated with right axis deviation of approximately �90�(Figs. 4.25C and 4.28). The diagnosis of RVH is uncer-tain unless there is right axis deviation in the frontalleads.
■ Pre-excitation or WPW ECG: In WPW syndrome, ev-idence of pre-excitation is present in the baseline ECGwith short P-R interval and presence of a delta wave.The R waves are tall in V1 when the bypass tract is left-sided (Figs. 4.25D and 4.29).
■ Posterior MI: Straight posterior MI is usually seen inolder patients, not in children or young adults. It is of-ten associated with inferior MI with pathologic q wavesin leads II, III, and aVF (Figs. 4.25E and 4.30) or historyof previous MI.
■ Pacemaker rhythm: When the rhythm is induced by an artificial pacemaker, a pacemaker artifact al-ways precedes the QRS complex. Generally, a pace-maker-induced QRS complex has a QS or rS config-uration in V1 because the right ventricle is usuallythe chamber paced. However, when the R wave is tallin V1 and is more prominent than the S wave (R orRs complex), left ventricular or biventricular pacingshould be considered as shown in Figures 4.25Fand 4.31 (see Chapter 26, The ECG of Cardiac Pace-makers).
■ Ventricular ectopic impulses: Ventricular ectopicimpulses may show tall R waves in V1. This can occurwhen the ectopic impulses originate from the left ven-tricle (Figs. 4.25G and 4.32).
■ Normal variant: The ECG is shown (Fig. 4.33).
Figure 4.28: Right Ventricular Hypertrophy. When right ventricular hypertrophy is the cause of the tall Rwaves in V1, right axis deviation of �90� is almost always present. The diagnosis of right ventricular hypertrophy isunlikely if the axis is not shifted to the right.
Figure 4.29: Pre-excitation (Wolff Parkinson White Electrocardiogram). A short P-R interval with deltawave (arrows) from pre-excitation is noted. In pre-excitation, the R waves are tall in V1 when the bypass tract is left-sided.
LWBK271-C04_30-47.qxd 1/30/09 11:23 AM Page 44 Aptara Inc.

Figure 4.30: Posterior Myocardial Infarction. In posterior myocardial infarction (MI), tall R waves in V1 isusually associated with inferior MI. Note the presence of pathologic q waves in leads II, III, and aVF.
Figure 4.31: Pacemaker-induced QRS Complexes. Tall R waves in V1 from pacemaker-induced rhythm. Ar-rows point to the pacemaker artifacts.
Figure 4.32: Wide Complex Tachycardia with Tall R Waves in V1. Tall R waves in V1 may be due to ectopicimpulses originating from the left ventricle.
45
LWBK271-C04_30-47.qxd 1/30/09 11:23 AM Page 45 Aptara Inc.

Clockwise Rotation
■ Clockwise rotation: In clockwise rotation or late transi-tion, the transition zone of the QRS complexes in theprecordial leads is shifted to the left of V4 resulting indeep S waves from V1 to V5 or often up to V6 (Fig. 4.34).Clockwise rotation is usually the result of the following:■ Left ventricular hypertrophy: This can be due to
several causes, including dilated cardiomyopathy orleft-sided valvular insufficiency.
■ Right ventricular hypertrophy: Depending onthe cause of the right ventricular hypertrophy,clockwise rotation may be present instead of a tall R
in V1. This often occurs when there is mitral steno-sis, pulmonary hypertension and chronic obstruc-tive pulmonary disease (see Chapter 7, ChamberEnlargement and Hypertrophy).
■ Biventricular hypertrophy: Both ventricles areenlarged.
■ Chronic obstructive pulmonary disease: Inchronic obstructive pulmonary disease such as em-physema or chronic bronchitis, the diaphragm isdisplaced downward causing the heart to rotateclockwise and become vertically oriented (Fig.4.34).
■ Acute pulmonary embolism: See Chapter 7,Chamber Enlargement and Hypertrophy.
Figure 4.33: Normal Variant. The electrocardiogram shows tall R waves in V1 and V2 in a patient withcompletely normal cardiac findings. Before considering tall R waves in V1 and V2 as normal variant, other causesshould be excluded.
Figure 4.34: Clockwise Rotation. In clockwise rotation, the transition zone is shifted to the left, resulting indeep S waves from V1 to V6. Note that the R waves are smaller than the S wave in V5 and in V6 because of a shift inthe transition zone to the left of V6. The electrocardiogram also shows right axis deviation; peaked P waves in II, III,and aVF; and low voltage in lead I. The cardiac rotation is due to chronic obstructive pulmonary disease.
46 Chapter 4
LWBK271-C04_30-47.qxd 1/30/09 11:23 AM Page 46 Aptara Inc.

The Electrical Axis and Cardiac Rotation 47
■ Left anterior fascicular block: See Chapter 9, In-traventricular Conduction Defect: Fascicular Block.
■ Other causes: Cardiac rotation resulting from shiftin mediastinum or thoracic deformities includingpectus excavatum.
Suggested Readings
Burch GE, Winsor T. Principles of electrocardiography. In: APrimer of Electrocardiography, 5th ed. Philadelphia: Lea andFebiger; 1966:17–66.
Burch GE, Winsor T. Precordial leads. In: A Primer of Electrocar-diography, 5th ed. Philadelphia: Lea and Febiger; 1966:146–184.
Dunn MI, Lippman BS. Basic ECG principles. In: Lippman-Massie Clinical Electrocardiography, 8th ed. Chicago: Year-book Medical Publishers; 1989:51–62.
Marriott HJL. Electrical axis. In: Practical Electrocardiography,5th ed. Baltimore: Willliams & Wilkins; 1972:34–43.
Wagner GS. Cardiac electrical activity. In: Marriott’s PracticalElectrocardiography, 10th ed. Philadelphia: LippincottWilliams & Wilkins; 2001;2–19.
Wagner GS. Recording the electrocardiogram. In: Marriott’sPractical Electrocardiography, 10th ed. Philadelphia: Lippin-cott Williams & Wilkins; 2001;26–41.
LWBK271-C04_30-47.qxd 1/30/09 11:23 AM Page 47 Aptara Inc.
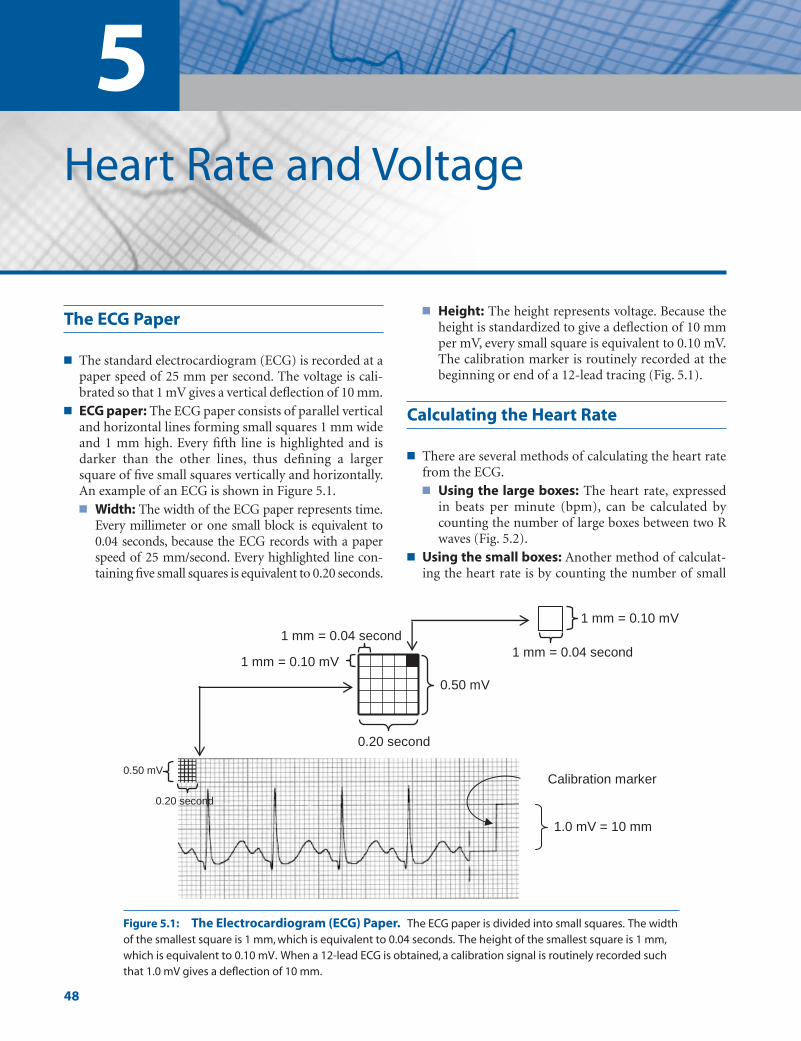
5Heart Rate and Voltage
48
The ECG Paper
■ The standard electrocardiogram (ECG) is recorded at apaper speed of 25 mm per second. The voltage is cali-brated so that 1 mV gives a vertical deflection of 10 mm.
■ ECG paper: The ECG paper consists of parallel verticaland horizontal lines forming small squares 1 mm wideand 1 mm high. Every fifth line is highlighted and isdarker than the other lines, thus defining a largersquare of five small squares vertically and horizontally.An example of an ECG is shown in Figure 5.1.■ Width: The width of the ECG paper represents time.
Every millimeter or one small block is equivalent to0.04 seconds, because the ECG records with a paperspeed of 25 mm/second. Every highlighted line con-taining five small squares is equivalent to 0.20 seconds.
■ Height: The height represents voltage. Because theheight is standardized to give a deflection of 10 mmper mV, every small square is equivalent to 0.10 mV.The calibration marker is routinely recorded at thebeginning or end of a 12-lead tracing (Fig. 5.1).
Calculating the Heart Rate
■ There are several methods of calculating the heart ratefrom the ECG.■ Using the large boxes: The heart rate, expressed
in beats per minute (bpm), can be calculated bycounting the number of large boxes between two Rwaves (Fig. 5.2).
■ Using the small boxes: Another method of calculat-ing the heart rate is by counting the number of small
1.0 mV = 10 mm
0.20 second
1 mm = 0.04 second
0.50 mV
1 mm = 0.10 mV
0.50 mV
0.20 second
1 mm = 0.04 second
1 mm = 0.10 mV
Calibration marker
Figure 5.1: The Electrocardiogram (ECG) Paper. The ECG paper is divided into small squares. The widthof the smallest square is 1 mm, which is equivalent to 0.04 seconds. The height of the smallest square is 1 mm,which is equivalent to 0.10 mV. When a 12-lead ECG is obtained, a calibration signal is routinely recorded suchthat 1.0 mV gives a deflection of 10 mm.
LWBK271-C05_48-54.qxd 1/29/09 11:13 AM Page 48 LWBK271-C01_01-08.qxd
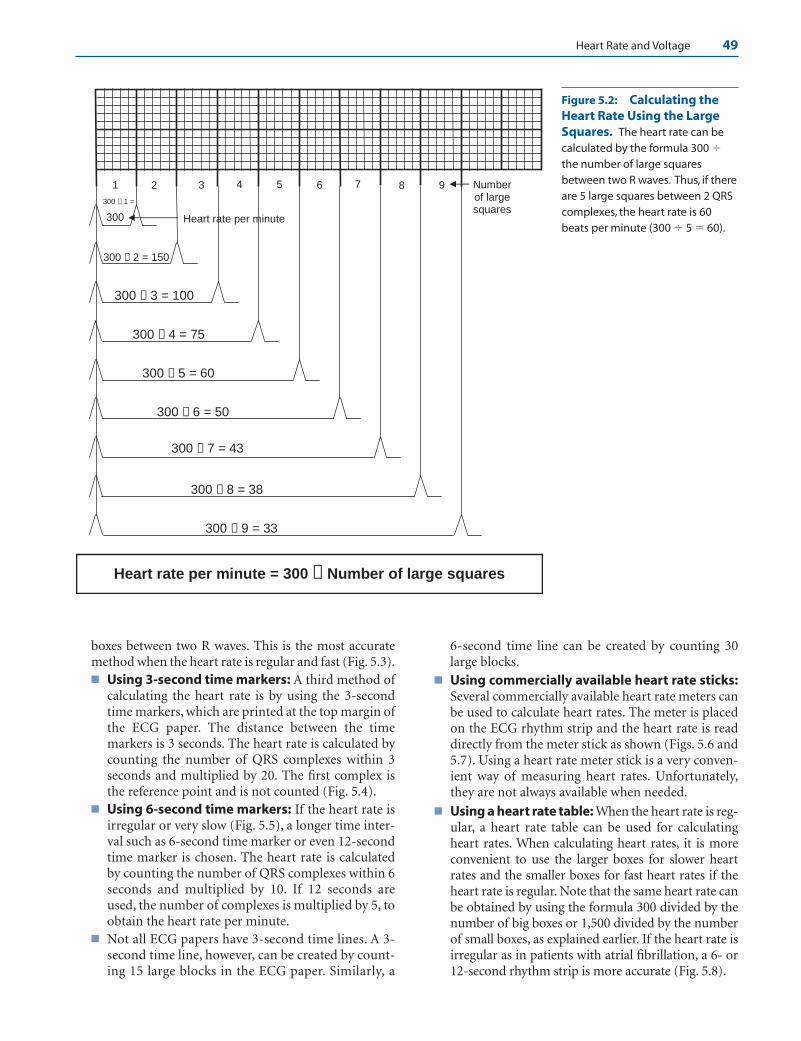
Heart Rate and Voltage 49
boxes between two R waves. This is the most accuratemethod when the heart rate is regular and fast (Fig. 5.3).■ Using 3-second time markers: A third method of
calculating the heart rate is by using the 3-secondtime markers, which are printed at the top margin ofthe ECG paper. The distance between the timemarkers is 3 seconds. The heart rate is calculated bycounting the number of QRS complexes within 3seconds and multiplied by 20. The first complex isthe reference point and is not counted (Fig. 5.4).
■ Using 6-second time markers: If the heart rate isirregular or very slow (Fig. 5.5), a longer time inter-val such as 6-second time marker or even 12-secondtime marker is chosen. The heart rate is calculatedby counting the number of QRS complexes within 6seconds and multiplied by 10. If 12 seconds areused, the number of complexes is multiplied by 5, toobtain the heart rate per minute.
■ Not all ECG papers have 3-second time lines. A 3-second time line, however, can be created by count-ing 15 large blocks in the ECG paper. Similarly, a
6-second time line can be created by counting 30large blocks.
■ Using commercially available heart rate sticks:Several commercially available heart rate meters canbe used to calculate heart rates. The meter is placedon the ECG rhythm strip and the heart rate is readdirectly from the meter stick as shown (Figs. 5.6 and5.7). Using a heart rate meter stick is a very conven-ient way of measuring heart rates. Unfortunately,they are not always available when needed.
■ Using a heart rate table: When the heart rate is reg-ular, a heart rate table can be used for calculatingheart rates. When calculating heart rates, it is moreconvenient to use the larger boxes for slower heartrates and the smaller boxes for fast heart rates if theheart rate is regular. Note that the same heart rate canbe obtained by using the formula 300 divided by thenumber of big boxes or 1,500 divided by the numberof small boxes, as explained earlier. If the heart rate isirregular as in patients with atrial fibrillation, a 6- or12-second rhythm strip is more accurate (Fig. 5.8).
300
300 ÷ 2 = 150
300 ÷ 3 = 100
300 ÷ 4 = 75
300 ÷ 5 = 60
300 ÷ 6 = 50
300 ÷ 7 = 43
300 ÷ 8 = 38
300 ÷ 9 = 33
321 4 5 6 7 8 9
Heart rate per minute = 300 ÷ Number of large squares
Number of large squares
Heart rate per minute
300 ÷ 1 =
Figure 5.2: Calculating theHeart Rate Using the LargeSquares. The heart rate can becalculated by the formula 300 �the number of large squaresbetween two R waves. Thus, if thereare 5 large squares between 2 QRScomplexes, the heart rate is 60beats per minute (300 � 5 � 60).
LWBK271-C05_48-54.qxd 1/29/09 11:13 AM Page 49 LWBK271-C01_01-08.qxd

50 Chapter 5
300
1500 ÷ 11 = 136
1500 ÷ 13 = 116
1500 ÷ 15 = 100
1500 ÷ 17 = 88
1500 ÷ 19 = 79
1500 ÷ 21 = 71
5 7 9 1311 15 17 19
Heart rate per minute = 1500 ÷ Number of small squares
21
1500 ÷ 5 =
1500 ÷ 7 =
1500 ÷ 9 = 167
188
Number of small squares
Heart rate per minute
Figure 5.3: Calculating theHeart Rate Using the SmallSquares. Using the small squares,the heart rate can be calculated by theformula 1,500 � the number of smallboxes between two R waves. Thus, ifthere are 5 small squares between 2QRS complexes, the heart rate is 300beats per minute (1,500 � 5 � 300).
3 seconds
1 2 3 4 5 6 70
HR = 7 X 20 = 140 BPM
6 seconds
1 432 0
HR = 4 X 10 = 40 BPM
Figure 5.4: Calculating the Heart Rate Using the 3-Second Time Markers. Thereare seven complexes within the 3-second time line.The heart rate is 7 � 20 � 140 beats perminute. Note that the first QRS complex is the reference point and is not counted.
Figure 5.5: Calculating the Heart Rate Using the Time Markers. Because the heartrate is very slow, a longer interval is measured and two 3-second markers (6 seconds) areused. There are four complexes within the 6-second time line. Thus, the heart rate is 4 � 10 �40 beats per minute.
LWBK271-C05_48-54.qxd 1/29/09 11:13 AM Page 50 LWBK271-C01_01-08.qxd

1 2
Heart Rate = 76 BPM
Heart RateStick
Start Here
0
1 2 3
Heart Rate = 76 BPMStart Here
0
Figure 5.6: Heart Rate Meter StickUsing Two Cardiac Cycles. An exampleof a heart rate meter stick is shown. Thisheart rate stick uses two cardiac cycles tomeasure the heart rate. Two QRS complexesare measured starting from the referencepoint, which is identified by an arrow on theleft side of the meter stick. The heart rate isread directly from the meter stick and is 76beats per minute.
Figure 5.7: Heart Rate Meter StickUsing Three Cardiac Cycles. This particu-lar meter stick uses three cardiac cycles to cal-culate the heart rate. Three cardiac cycles arecounted starting from the reference point,which is at the left side of the meter stick. Theheart rate is read directly from the meter stickand is 76 beats per minute.
1 2 3 4 5 6 7 8 9
300
Number of Large Boxes = Heart Rate per Minute
Reference Point
300250
214188
167
150136
100 75 60 50 43 38 33
125115
107
9488
79
7168
6663
5856
5452
4847
4445
1500= Heart Rate per Minute
Number of Small Boxes
Number of Large Boxes
Number of Small Boxes
8338
3941
42 37 36
3534
HR = 300
HR =
150 100 75 60 50 43 38 33
105 15 20 25 30 35 40 45
Reference Point
Figure 5.8: Figuring the Heart Rate. When the rhythm is regular, the heart rate can be calculated by measuringthe distance between two QRS complexes using the large boxes (upper portion of the diagram) or the small boxes(lower portion of the diagram). The larger boxes are more convenient to use when the heart rate is �100 beats perminute, whereas the smaller boxes are more accurate to use when the heart rate is faster and �100 beats per minute.
LWBK271-C05_48-54.qxd 1/29/09 11:13 AM Page 51 LWBK271-C01_01-08.qxd
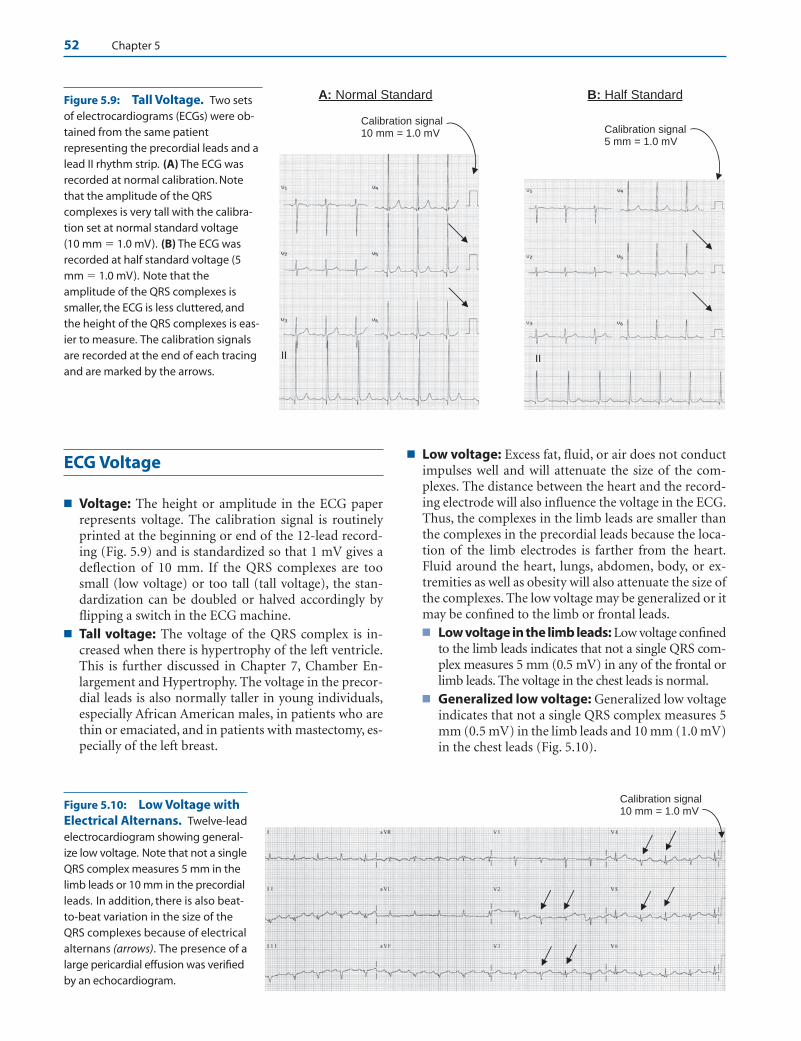
52 Chapter 5
ECG Voltage
■ Voltage: The height or amplitude in the ECG paperrepresents voltage. The calibration signal is routinelyprinted at the beginning or end of the 12-lead record-ing (Fig. 5.9) and is standardized so that 1 mV gives adeflection of 10 mm. If the QRS complexes are toosmall (low voltage) or too tall (tall voltage), the stan-dardization can be doubled or halved accordingly byflipping a switch in the ECG machine.
■ Tall voltage: The voltage of the QRS complex is in-creased when there is hypertrophy of the left ventricle.This is further discussed in Chapter 7, Chamber En-largement and Hypertrophy. The voltage in the precor-dial leads is also normally taller in young individuals,especially African American males, in patients who arethin or emaciated, and in patients with mastectomy, es-pecially of the left breast.
■ Low voltage: Excess fat, fluid, or air does not conductimpulses well and will attenuate the size of the com-plexes. The distance between the heart and the record-ing electrode will also influence the voltage in the ECG.Thus, the complexes in the limb leads are smaller thanthe complexes in the precordial leads because the loca-tion of the limb electrodes is farther from the heart.Fluid around the heart, lungs, abdomen, body, or ex-tremities as well as obesity will also attenuate the size ofthe complexes. The low voltage may be generalized or itmay be confined to the limb or frontal leads.■ Low voltage in the limb leads: Low voltage confined
to the limb leads indicates that not a single QRS com-plex measures 5 mm (0.5 mV) in any of the frontal orlimb leads. The voltage in the chest leads is normal.
■ Generalized low voltage: Generalized low voltageindicates that not a single QRS complex measures 5mm (0.5 mV) in the limb leads and 10 mm (1.0 mV)in the chest leads (Fig. 5.10).
Figure 5.10: Low Voltage withElectrical Alternans. Twelve-leadelectrocardiogram showing general-ize low voltage. Note that not a singleQRS complex measures 5 mm in thelimb leads or 10 mm in the precordialleads. In addition, there is also beat-to-beat variation in the size of theQRS complexes because of electricalalternans (arrows). The presence of alarge pericardial effusion was verifiedby an echocardiogram.
Calibration signal 5 mm = 1.0 mV
Calibration signal 10 mm = 1.0 mV
A: Normal Standard B: Half Standard
II II
Calibration signal 10 mm = 1.0 mV
Figure 5.9: Tall Voltage. Two setsof electrocardiograms (ECGs) were ob-tained from the same patientrepresenting the precordial leads and alead II rhythm strip. (A) The ECG wasrecorded at normal calibration. Notethat the amplitude of the QRScomplexes is very tall with the calibra-tion set at normal standard voltage (10 mm � 1.0 mV). (B) The ECG wasrecorded at half standard voltage (5mm � 1.0 mV). Note that theamplitude of the QRS complexes issmaller, the ECG is less cluttered, andthe height of the QRS complexes is eas-ier to measure. The calibration signalsare recorded at the end of each tracingand are marked by the arrows.
LWBK271-C05_48-54.qxd 1/29/09 11:13 AM Page 52 LWBK271-C01_01-08.qxd
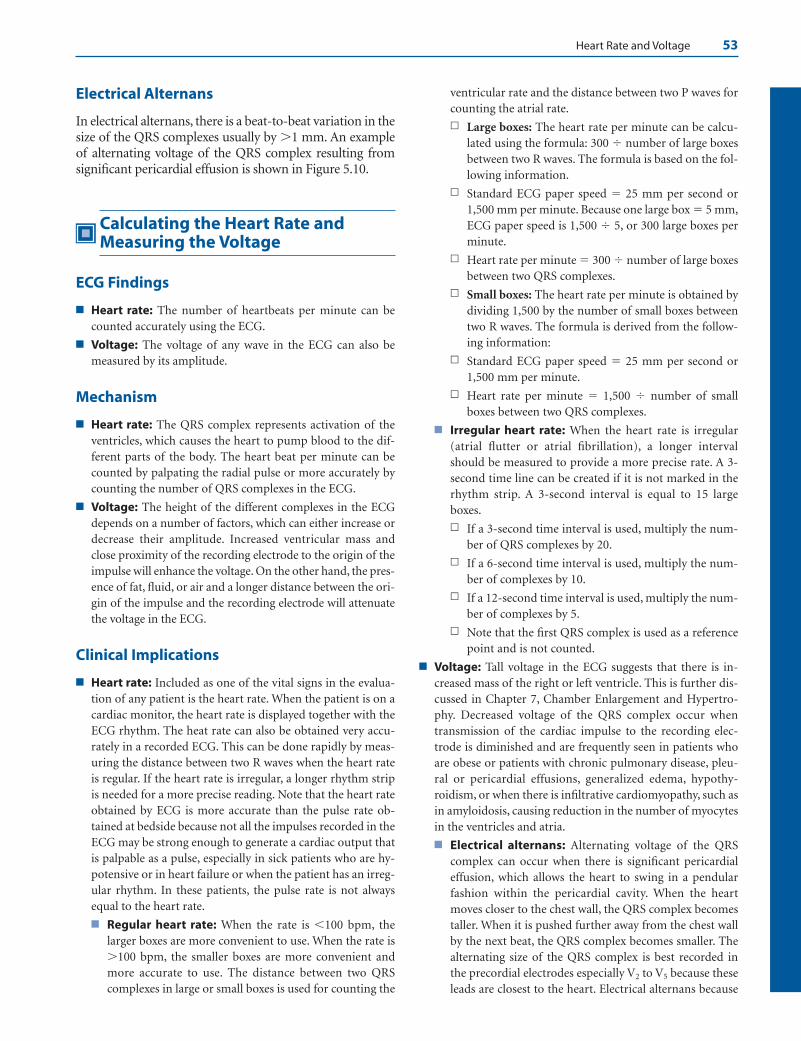
Heart Rate and Voltage 53
Electrical Alternans
In electrical alternans, there is a beat-to-beat variation in thesize of the QRS complexes usually by �1 mm. An exampleof alternating voltage of the QRS complex resulting fromsignificant pericardial effusion is shown in Figure 5.10.
Calculating the Heart Rate andMeasuring the Voltage
ECG Findings
■ Heart rate: The number of heartbeats per minute can becounted accurately using the ECG.
■ Voltage: The voltage of any wave in the ECG can also bemeasured by its amplitude.
Mechanism
■ Heart rate: The QRS complex represents activation of theventricles, which causes the heart to pump blood to the dif-ferent parts of the body. The heart beat per minute can becounted by palpating the radial pulse or more accurately bycounting the number of QRS complexes in the ECG.
■ Voltage: The height of the different complexes in the ECGdepends on a number of factors, which can either increase ordecrease their amplitude. Increased ventricular mass andclose proximity of the recording electrode to the origin of theimpulse will enhance the voltage. On the other hand, the pres-ence of fat, fluid, or air and a longer distance between the ori-gin of the impulse and the recording electrode will attenuatethe voltage in the ECG.
Clinical Implications
■ Heart rate: Included as one of the vital signs in the evalua-tion of any patient is the heart rate. When the patient is on acardiac monitor, the heart rate is displayed together with theECG rhythm. The heat rate can also be obtained very accu-rately in a recorded ECG. This can be done rapidly by meas-uring the distance between two R waves when the heart rateis regular. If the heart rate is irregular, a longer rhythm stripis needed for a more precise reading. Note that the heart rateobtained by ECG is more accurate than the pulse rate ob-tained at bedside because not all the impulses recorded in theECG may be strong enough to generate a cardiac output thatis palpable as a pulse, especially in sick patients who are hy-potensive or in heart failure or when the patient has an irreg-ular rhythm. In these patients, the pulse rate is not alwaysequal to the heart rate.
■ Regular heart rate: When the rate is �100 bpm, thelarger boxes are more convenient to use. When the rate is�100 bpm, the smaller boxes are more convenient andmore accurate to use. The distance between two QRScomplexes in large or small boxes is used for counting the
ventricular rate and the distance between two P waves forcounting the atrial rate.
n Large boxes: The heart rate per minute can be calcu-lated using the formula: 300 � number of large boxesbetween two R waves. The formula is based on the fol-lowing information.
n Standard ECG paper speed � 25 mm per second or1,500 mm per minute. Because one large box � 5 mm,ECG paper speed is 1,500 � 5, or 300 large boxes perminute.
n Heart rate per minute � 300 � number of large boxesbetween two QRS complexes.
n Small boxes: The heart rate per minute is obtained bydividing 1,500 by the number of small boxes betweentwo R waves. The formula is derived from the follow-ing information:
n Standard ECG paper speed � 25 mm per second or1,500 mm per minute.
n Heart rate per minute � 1,500 � number of smallboxes between two QRS complexes.
■ Irregular heart rate: When the heart rate is irregular(atrial flutter or atrial fibrillation), a longer intervalshould be measured to provide a more precise rate. A 3-second time line can be created if it is not marked in therhythm strip. A 3-second interval is equal to 15 largeboxes.
n If a 3-second time interval is used, multiply the num-ber of QRS complexes by 20.
n If a 6-second time interval is used, multiply the num-ber of complexes by 10.
n If a 12-second time interval is used, multiply the num-ber of complexes by 5.
n Note that the first QRS complex is used as a referencepoint and is not counted.
■ Voltage: Tall voltage in the ECG suggests that there is in-creased mass of the right or left ventricle. This is further dis-cussed in Chapter 7, Chamber Enlargement and Hypertro-phy. Decreased voltage of the QRS complex occur whentransmission of the cardiac impulse to the recording elec-trode is diminished and are frequently seen in patients whoare obese or patients with chronic pulmonary disease, pleu-ral or pericardial effusions, generalized edema, hypothy-roidism, or when there is infiltrative cardiomyopathy, such asin amyloidosis, causing reduction in the number of myocytesin the ventricles and atria.
■ Electrical alternans: Alternating voltage of the QRScomplex can occur when there is significant pericardialeffusion, which allows the heart to swing in a pendularfashion within the pericardial cavity. When the heartmoves closer to the chest wall, the QRS complex becomestaller. When it is pushed further away from the chest wallby the next beat, the QRS complex becomes smaller. Thealternating size of the QRS complex is best recorded inthe precordial electrodes especially V2 to V5 because theseleads are closest to the heart. Electrical alternans because
LWBK271-C05_48-54.qxd 1/29/09 11:13 AM Page 53 LWBK271-C01_01-08.qxd
54 Chapter 5
of pericardial effusion can occur only if the pericardial ef-fusion is large enough to allow the heart to swing withinthe pericardial cavity. Alternation of the QRS complex be-cause of pericardial effusion is a sign of cardiac tampon-ade. Electrical alternans can also occur even in the ab-sence of pericardial effusion when there is abnormalconduction of the electrical impulse in the ventricles al-ternating with normal conduction. It can also occur dur-ing supraventricular tachycardia or when there is severemyocardial ischemia. Electrical alternans can involve any
wave of the ECG including P waves, QRS complexes, andT waves.
Suggested Readings
Marriot HJL. Rhythm and rate. In: Practical Electrocardiography.5th ed. Baltimore: Williams & Wilkins; 1972;11–15.
Surawicz B, Fisch C. Cardiac alternans: diverse mechanisms andclinical manifestations. J Am Coll Cardiol. 1992;20:483–499.
LWBK271-C05_48-54.qxd 1/29/09 11:13 AM Page 54 LWBK271-C01_01-08.qxd

Single Muscle Cell
■ Deflections in the electrocardiogram (ECG) includ-ing the P waves, QRS complexes, and T waves are dueto depolarization and repolarization of the atria andventricles. The following discussion will provide a ba-sic understanding of how these ECG deflections aregenerated.
■ Every heartbeat is preceded by an electrical impulsethat originates from the sinus node. This impulse ispropagated from one cell to the next adjacent cell untilthe whole myocardium is depolarized. After it is dis-charged, the muscle cell immediately undergoes aprocess of repolarization that permits the cell to againdepolarize at the arrival of the next impulse.
■ Single muscle cell: The resting potential of a singlemuscle cell is approximately –90 mV with the inside ofthe cell more negative than the outside (Fig. 6.1A). Thisdifference in potential makes the cell capable of beingdischarged. When the myocardial cell is depolarized,the polarity reverses with the inside of the cell becom-ing more positive than the outside (Fig. 6.1B).
Depolarization of a Single Muscle Cell
■ Depolarization: During depolarization, the activa-tion wave travels from one end of the myocardial cell tothe other end (Fig. 6.2A).
■ Positive deflection: If a recording electrode isplaced in front of the traveling impulse (at position1, Fig. 6.2B), a positive deflection is recorded.
■ Negative deflection: If a recording electrode isplaced behind the moving impulse (at position 2), anegative deflection is recorded.
■ Moving dipole: A positive deflection is recordedwhen the activation wave is advancing toward therecording electrode because the activation wave is trav-eling with the positive charge in front, which is facingthe recording electrode. When the activation wave ismoving away from a recording electrode, a negative de-flection is recorded because the activation wave has anegative charge behind, which is facing the recordingelectrode. The activation wave in essence is a movingvector with opposite charges, one positive and theother negative. This moving vector with oppositecharges is called a dipole (Fig. 6.2B). During depolar-ization, the dipole always travels with the positivecharge in front and the negative charge behind.
Repolarization of a Single Muscle Cell
■ Repolarization: Repolarization restores the polarityof the cell to its original potential of –90 mV and isrecorded as a T wave in the ECG. In a single myocardialcell, repolarization starts in the same area where the cellwas first depolarized, because this part of the cell hashad the most time to recover. The repolarization wave
6Depolarization and
Repolarization
55
A. Resting Myocardial Cell
Inside is
negative
Outside is
positive
_+_ _ _
_ _ _ _
+ + +
+ + + +
+_
__++
+ +
_
_
__
_ _
_ _
++
+_
_
+ + +
+ + +Outside becomes negative
Insidebecomes
positive
B. During Depolarization
_ Figure 6.1: Muscle Cell at Rest andDuring Depolarization. (A) The restingmyocardial cell is negative inside the cell rel-ative to the outside. (B) During depolariza-tion, the activation wave travels from oneend to the other end, changing the polarityinside the cell from negative to positive. Ar-rows point to the direction of depolarization.
LWBK271-C06_55-61.qxd 29/1/09 10:09 pm Page 55 LWBK270-4119G-C02_073-110.qxd
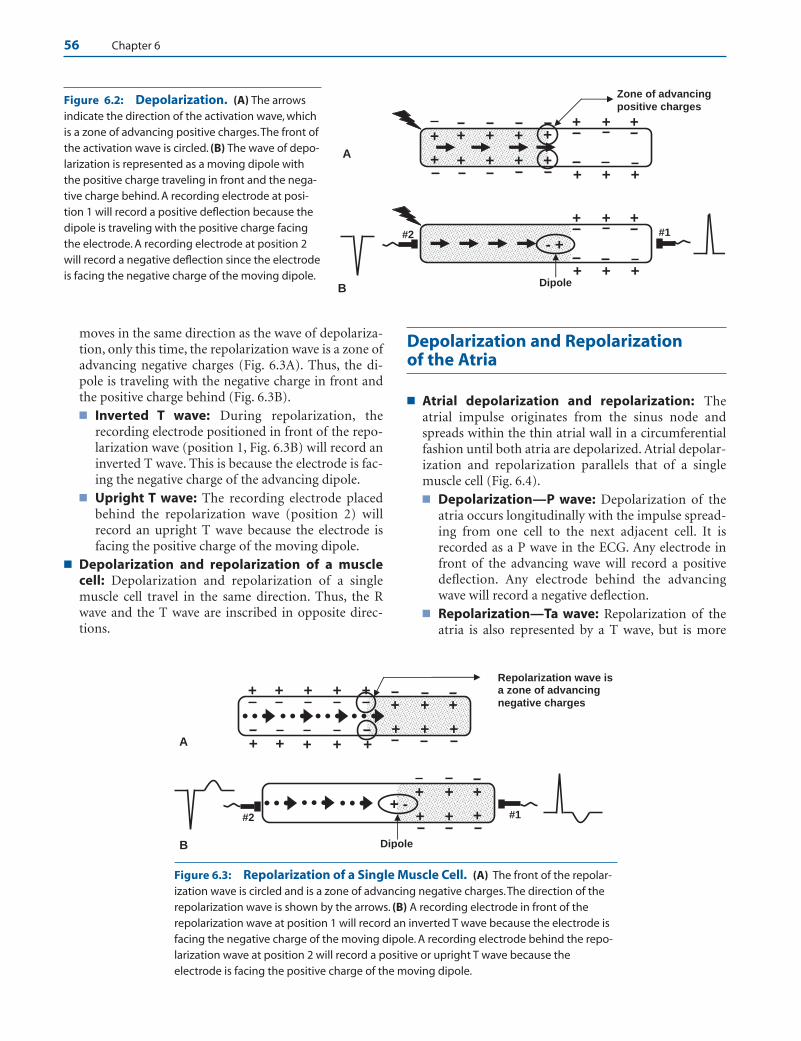
56 Chapter 6
moves in the same direction as the wave of depolariza-tion, only this time, the repolarization wave is a zone ofadvancing negative charges (Fig. 6.3A). Thus, the di-pole is traveling with the negative charge in front andthe positive charge behind (Fig. 6.3B).■ Inverted T wave: During repolarization, the
recording electrode positioned in front of the repo-larization wave (position 1, Fig. 6.3B) will record aninverted T wave. This is because the electrode is fac-ing the negative charge of the advancing dipole.
■ Upright T wave: The recording electrode placedbehind the repolarization wave (position 2) willrecord an upright T wave because the electrode isfacing the positive charge of the moving dipole.
■ Depolarization and repolarization of a musclecell: Depolarization and repolarization of a singlemuscle cell travel in the same direction. Thus, the Rwave and the T wave are inscribed in opposite direc-tions.
Depolarization and Repolarization of the Atria
■ Atrial depolarization and repolarization: Theatrial impulse originates from the sinus node andspreads within the thin atrial wall in a circumferentialfashion until both atria are depolarized. Atrial depolar-ization and repolarization parallels that of a singlemuscle cell (Fig. 6.4).■ Depolarization—P wave: Depolarization of the
atria occurs longitudinally with the impulse spread-ing from one cell to the next adjacent cell. It isrecorded as a P wave in the ECG. Any electrode infront of the advancing wave will record a positivedeflection. Any electrode behind the advancingwave will record a negative deflection.
■ Repolarization—Ta wave: Repolarization of theatria is also represented by a T wave, but is more
B
+ +
+ + +
_ _ _
_ _ _+
- + #1 #2
Dipole
A_ _ _ _ _
+ +
+ + +
_ _ _
_ _ __ _ _ _ _ +
Zone of advancing positive charges
+ + + +
+ + + +
+
+
Figure 6.2: Depolarization. (A) The arrowsindicate the direction of the activation wave, whichis a zone of advancing positive charges.The front ofthe activation wave is circled. (B) The wave of depo-larization is represented as a moving dipole withthe positive charge traveling in front and the nega-tive charge behind. A recording electrode at posi-tion 1 will record a positive deflection because thedipole is traveling with the positive charge facingthe electrode. A recording electrode at position 2will record a negative deflection since the electrodeis facing the negative charge of the moving dipole.
+ + + + +_ _ _ _+
Repolarization wave is a zone of advancing negative charges
+ + +
_
+
____
_
_
_
+
_ +
_ _ _
A
+ +
+ +
___
_ _ _
#2 #1
B Dipole
+ + +
+ +++ -
Figure 6.3: Repolarization of a Single Muscle Cell. (A) The front of the repolar-ization wave is circled and is a zone of advancing negative charges.The direction of therepolarization wave is shown by the arrows. (B) A recording electrode in front of therepolarization wave at position 1 will record an inverted T wave because the electrode isfacing the negative charge of the moving dipole. A recording electrode behind the repo-larization wave at position 2 will record a positive or upright T wave because theelectrode is facing the positive charge of the moving dipole.
LWBK271-C06_55-61.qxd 29/1/09 10:09 pm Page 56 LWBK270-4119G-C02_073-110.qxd
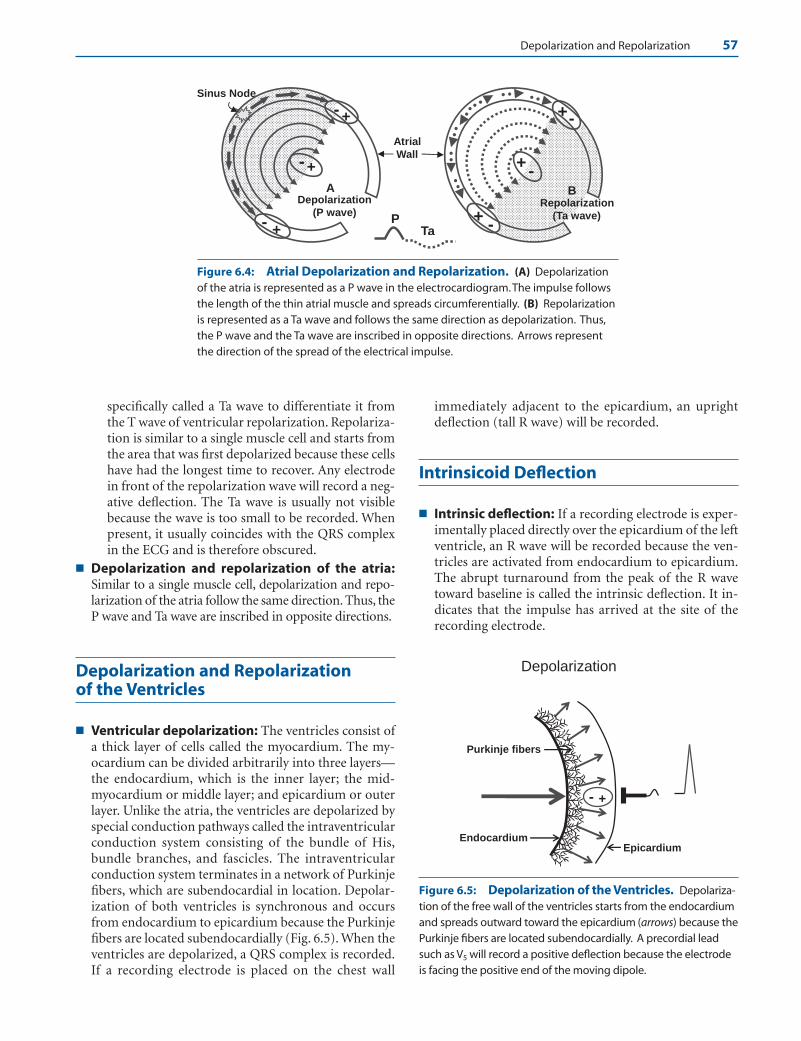
Depolarization and Repolarization 57
specifically called a Ta wave to differentiate it fromthe T wave of ventricular repolarization. Repolariza-tion is similar to a single muscle cell and starts fromthe area that was first depolarized because these cellshave had the longest time to recover. Any electrodein front of the repolarization wave will record a neg-ative deflection. The Ta wave is usually not visiblebecause the wave is too small to be recorded. Whenpresent, it usually coincides with the QRS complexin the ECG and is therefore obscured.
■ Depolarization and repolarization of the atria:Similar to a single muscle cell, depolarization and repo-larization of the atria follow the same direction. Thus, theP wave and Ta wave are inscribed in opposite directions.
Depolarization and Repolarization of the Ventricles
■ Ventricular depolarization: The ventricles consist ofa thick layer of cells called the myocardium. The my-ocardium can be divided arbitrarily into three layers—the endocardium, which is the inner layer; the mid-myocardium or middle layer; and epicardium or outerlayer. Unlike the atria, the ventricles are depolarized byspecial conduction pathways called the intraventricularconduction system consisting of the bundle of His,bundle branches, and fascicles. The intraventricularconduction system terminates in a network of Purkinjefibers, which are subendocardial in location. Depolar-ization of both ventricles is synchronous and occursfrom endocardium to epicardium because the Purkinjefibers are located subendocardially (Fig. 6.5). When theventricles are depolarized, a QRS complex is recorded.If a recording electrode is placed on the chest wall
immediately adjacent to the epicardium, an uprightdeflection (tall R wave) will be recorded.
Intrinsicoid Deflection
■ Intrinsic deflection: If a recording electrode is exper-imentally placed directly over the epicardium of the leftventricle, an R wave will be recorded because the ven-tricles are activated from endocardium to epicardium.The abrupt turnaround from the peak of the R wavetoward baseline is called the intrinsic deflection. It in-dicates that the impulse has arrived at the site of therecording electrode.
Endocardium Epicardium
Depolarization
+-
Purkinje fibers
A
Atrial Wall
+
+
PTa
Sinus Node
-
Depolarization(P wave)
- -+
-+
+-
Repolarization (Ta wave)
B
-+
Figure 6.4: Atrial Depolarization and Repolarization. (A) Depolarizationof the atria is represented as a P wave in the electrocardiogram.The impulse followsthe length of the thin atrial muscle and spreads circumferentially. (B) Repolarizationis represented as a Ta wave and follows the same direction as depolarization. Thus,the P wave and the Ta wave are inscribed in opposite directions. Arrows representthe direction of the spread of the electrical impulse.
Figure 6.5: Depolarization of the Ventricles. Depolariza-tion of the free wall of the ventricles starts from the endocardiumand spreads outward toward the epicardium (arrows) because thePurkinje fibers are located subendocardially. A precordial leadsuch as V5 will record a positive deflection because the electrodeis facing the positive end of the moving dipole.
LWBK271-C06_55-61.qxd 29/1/09 10:09 pm Page 57 LWBK270-4119G-C02_073-110.qxd
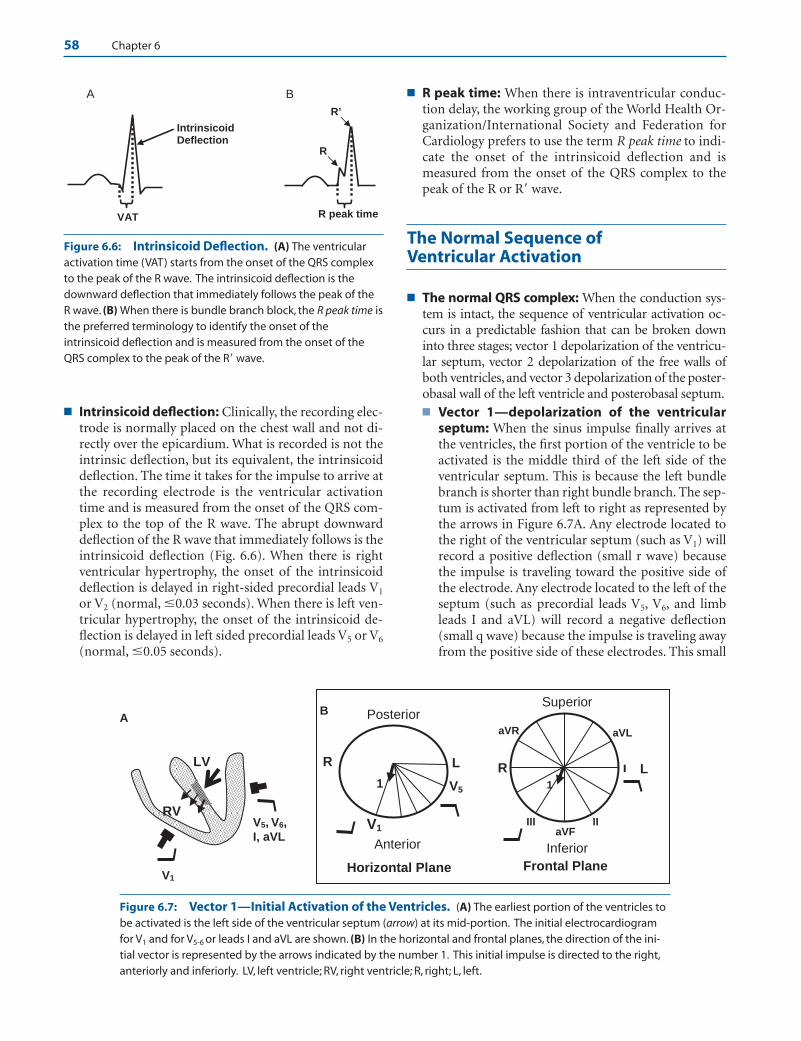
58 Chapter 6
■ Intrinsicoid deflection: Clinically, the recording elec-trode is normally placed on the chest wall and not di-rectly over the epicardium. What is recorded is not theintrinsic deflection, but its equivalent, the intrinsicoiddeflection. The time it takes for the impulse to arrive atthe recording electrode is the ventricular activationtime and is measured from the onset of the QRS com-plex to the top of the R wave. The abrupt downwarddeflection of the R wave that immediately follows is theintrinsicoid deflection (Fig. 6.6). When there is rightventricular hypertrophy, the onset of the intrinsicoiddeflection is delayed in right-sided precordial leads V1
or V2 (normal, �0.03 seconds). When there is left ven-tricular hypertrophy, the onset of the intrinsicoid de-flection is delayed in left sided precordial leads V5 or V6
(normal, �0.05 seconds).
■ R peak time: When there is intraventricular conduc-tion delay, the working group of the World Health Or-ganization/International Society and Federation forCardiology prefers to use the term R peak time to indi-cate the onset of the intrinsicoid deflection and ismeasured from the onset of the QRS complex to thepeak of the R or R� wave.
The Normal Sequence of Ventricular Activation
■ The normal QRS complex: When the conduction sys-tem is intact, the sequence of ventricular activation oc-curs in a predictable fashion that can be broken downinto three stages; vector 1 depolarization of the ventricu-lar septum, vector 2 depolarization of the free walls ofboth ventricles, and vector 3 depolarization of the poster-obasal wall of the left ventricle and posterobasal septum.■ Vector 1—depolarization of the ventricular
septum: When the sinus impulse finally arrives atthe ventricles, the first portion of the ventricle to beactivated is the middle third of the left side of theventricular septum. This is because the left bundlebranch is shorter than right bundle branch. The sep-tum is activated from left to right as represented bythe arrows in Figure 6.7A. Any electrode located tothe right of the ventricular septum (such as V1) willrecord a positive deflection (small r wave) becausethe impulse is traveling toward the positive side ofthe electrode. Any electrode located to the left of theseptum (such as precordial leads V5, V6, and limbleads I and aVL) will record a negative deflection(small q wave) because the impulse is traveling awayfrom the positive side of these electrodes. This small
aVF II III
I
aVL aVR
Superior
Frontal Plane
Inferior
L1
R
V1
Posterior
Anterior
1 V5
L
B
Horizontal Plane
R
RV
LV
A
V1
V5, V6,
I, aVL
A
VAT
IntrinsicoidDeflection
R peak time
R
R’
B
Figure 6.6: Intrinsicoid Deflection. (A) The ventricularactivation time (VAT) starts from the onset of the QRS complexto the peak of the R wave. The intrinsicoid deflection is thedownward deflection that immediately follows the peak of theR wave. (B) When there is bundle branch block, the R peak time isthe preferred terminology to identify the onset of theintrinsicoid deflection and is measured from the onset of theQRS complex to the peak of the R� wave.
Figure 6.7: Vector 1—Initial Activation of the Ventricles. (A) The earliest portion of the ventricles tobe activated is the left side of the ventricular septum (arrow) at its mid-portion. The initial electrocardiogramfor V1 and for V5-6 or leads I and aVL are shown. (B) In the horizontal and frontal planes, the direction of the ini-tial vector is represented by the arrows indicated by the number 1. This initial impulse is directed to the right,anteriorly and inferiorly. LV, left ventricle; RV, right ventricle; R, right; L, left.
LWBK271-C06_55-61.qxd 29/1/09 10:09 pm Page 58 LWBK270-4119G-C02_073-110.qxd
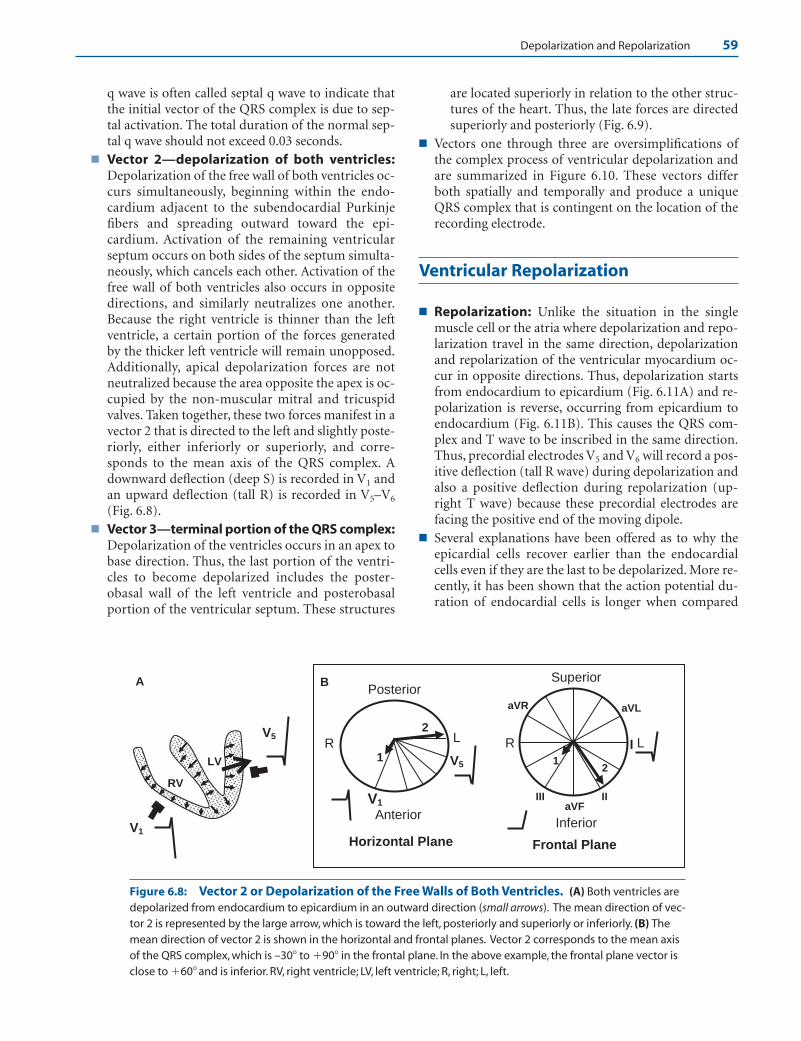
Depolarization and Repolarization 59
q wave is often called septal q wave to indicate thatthe initial vector of the QRS complex is due to sep-tal activation. The total duration of the normal sep-tal q wave should not exceed 0.03 seconds.
■ Vector 2—depolarization of both ventricles:Depolarization of the free wall of both ventricles oc-curs simultaneously, beginning within the endo-cardium adjacent to the subendocardial Purkinjefibers and spreading outward toward the epi-cardium. Activation of the remaining ventricularseptum occurs on both sides of the septum simulta-neously, which cancels each other. Activation of thefree wall of both ventricles also occurs in oppositedirections, and similarly neutralizes one another.Because the right ventricle is thinner than the leftventricle, a certain portion of the forces generatedby the thicker left ventricle will remain unopposed.Additionally, apical depolarization forces are notneutralized because the area opposite the apex is oc-cupied by the non-muscular mitral and tricuspidvalves. Taken together, these two forces manifest in avector 2 that is directed to the left and slightly poste-riorly, either inferiorly or superiorly, and corre-sponds to the mean axis of the QRS complex. Adownward deflection (deep S) is recorded in V1 andan upward deflection (tall R) is recorded in V5–V6
(Fig. 6.8).■ Vector 3—terminal portion of the QRS complex:
Depolarization of the ventricles occurs in an apex tobase direction. Thus, the last portion of the ventri-cles to become depolarized includes the poster-obasal wall of the left ventricle and posterobasalportion of the ventricular septum. These structures
are located superiorly in relation to the other struc-tures of the heart. Thus, the late forces are directedsuperiorly and posteriorly (Fig. 6.9).
■ Vectors one through three are oversimplifications ofthe complex process of ventricular depolarization andare summarized in Figure 6.10. These vectors differboth spatially and temporally and produce a uniqueQRS complex that is contingent on the location of therecording electrode.
Ventricular Repolarization
■ Repolarization: Unlike the situation in the singlemuscle cell or the atria where depolarization and repo-larization travel in the same direction, depolarizationand repolarization of the ventricular myocardium oc-cur in opposite directions. Thus, depolarization startsfrom endocardium to epicardium (Fig. 6.11A) and re-polarization is reverse, occurring from epicardium toendocardium (Fig. 6.11B). This causes the QRS com-plex and T wave to be inscribed in the same direction.Thus, precordial electrodes V5 and V6 will record a pos-itive deflection (tall R wave) during depolarization andalso a positive deflection during repolarization (up-right T wave) because these precordial electrodes arefacing the positive end of the moving dipole.
■ Several explanations have been offered as to why theepicardial cells recover earlier than the endocardialcells even if they are the last to be depolarized. More re-cently, it has been shown that the action potential du-ration of endocardial cells is longer when compared
aVF II III
I
aVL aVR
Superior
Frontal Plane
Inferior
L
12
R
V1
Posterior
Anterior
Horizontal Plane
1
2
V5
L
B
RV5
V1
RV
LV
A
Figure 6.8: Vector 2 or Depolarization of the Free Walls of Both Ventricles. (A) Both ventricles aredepolarized from endocardium to epicardium in an outward direction (small arrows). The mean direction of vec-tor 2 is represented by the large arrow, which is toward the left, posteriorly and superiorly or inferiorly. (B) Themean direction of vector 2 is shown in the horizontal and frontal planes. Vector 2 corresponds to the mean axisof the QRS complex, which is –30� to �90� in the frontal plane. In the above example, the frontal plane vector isclose to �60� and is inferior. RV, right ventricle; LV, left ventricle; R, right; L, left.
LWBK271-C06_55-61.qxd 29/1/09 10:09 pm Page 59 LWBK270-4119G-C02_073-110.qxd

aVF II III
I
aVL aVR
Superior
Frontal Plane
Inferior
L1
2
3
R 1
2 3
V1
V5
Posterior
Anterior
Horizontal Plane
1
23
R L
B
1
2 3
V5
V1
RV
LV
A
Figure 6.9: Vector 3—Terminal Portion of the QRS Complex. (A) The posterobasal portion of the sep-tum and left ventricle are the last segments to be depolarized. The terminal vector is directed superiorly and pos-teriorly. (B) The direction of vector 3 in the horizontal and frontal planes is shown. L, left; R, right; LV, left ventricle;RV, right ventricle.
Figure 6.11: Ventricular Repolarization. (A) Diagram showing depolarization ofthe ventricular myocardium, which starts from endocardium to epicardium.This causesthe QRS complex to be upright since the depolarization wave is advancing toward therecording electrode. Arrows point to the direction of depolarization. (B) Repolarization ofthe ventricular myocardium is from epicardium to endocardium. Because the repolariza-tion wave is moving away from the recording electrode, the recording electrode is facingthe positive side of the moving dipole.Thus, a positive deflection (upright T wave) isrecorded. Arrows point to the direction of repolarization.
Endocardium Epicardium
A. Depolarization
- +
Epicardium
B: Repolarization
Endocardium
+-
V5
V1
C
V5
V1
BA
V1
V5
Figure 6.10: Summary of the Sequence of Ventricular Activation. Theinitial vector (A) represents depolarization of the left side of the ventricular septumat its mid-portion, which is directed to the right, anteriorly and inferiorly. (B) Vector2 is directed to the left, posteriorly and superiorly or inferiorly corresponding to themean axis of the QRS complex. (C) Vector 3 is directed superiorly and posteriorly.
60
LWBK271-C06_55-61.qxd 29/1/09 10:09 pm Page 60 LWBK270-4119G-C02_073-110.qxd
Depolarization and Repolarization 61
with epicardial cells. This is most probably the mainreason why the epicardial cells recover earlier than en-docardial cells causing repolarization to start fromepicardium to endocardium.
Depolarization and Repolarizationof the Atria and Ventricles
Depolarization and Repolarization
■ Single muscle cell: In a single muscle cell, depolarizationand repolarization travel in the same direction. Thus, the Rwave and the T wave are normally inscribed in opposite di-rections. If the QRS complex is upright or positive, thenthe T wave is normally inverted, and if the QRS is negativeor inscribed downward, then the T wave is normally upright.
■ Atria: The direction of depolarization and repolarization ofthe atria is similar to that of a single muscle cell. The sinusimpulse spreads longitudinally from right atrium to leftatrium. Repolarization occurs in the same direction. Thus, ifan electrode records an upright P wave, the repolarization orTa wave is inverted and if the electrode records an inverted Pwave, the Ta wave is upright.
■ Ventricles: Depolarization and repolarization of the ventri-cles occur in opposite directions. Thus, if the QRS complex isupright or positive, then the T wave is also upright. If theQRS complex is negative, then the T wave is inverted.
Mechanism
■ Single muscle cell: In a single muscle cell, depolarizationand repolarization occur in the same direction because thearea that is first depolarized has had a longer time to recover.
■ Atria: The atria consist of a thin layer of cells. Unlike the ven-tricles, the atria do not have a special conducting system.Thus, the impulse is spread from one muscle cell to the nextmuscle cell longitudinally until both atria are depolarized.Depolarization and repolarization is similar to a single mus-cle cell and occur in the same direction.
■ Ventricles: The ventricles consist of a thick layer of musclecells and are depolarized from endocardium to epicardium
because the Purkinje fibers are located subendocardially. Un-like the atria and the single muscle cell where depolarizationand repolarization occur in the same direction, depolariza-tion and repolarization of the ventricles occur in opposite di-rections. The reason as to why the epicardial cells recover ear-lier than the endocardial cells despite being the last to bedepolarized may be due to the following reasons.
■ The endocardial cells have longer action potential dura-tion compared with epicardial cells.
■ Myocardial perfusion occurs mainly during diastole whenthe ventricles are relaxed and the pressures within the cav-ities are lowest. Because repolarization (T wave) occursduring systole when the myocardium is mechanicallycontracting, there is no significant myocardial perfusionwithin the subendocardial layer because it is subjected toa much higher tension than the epicardium.
■ The endocardium has a higher rate of metabolism ascompared with the epicardium and thus requires moreoxygen than the epicardium.
■ The subendocardial layer is the deepest part of the my-ocardium. Because the coronary arteries are anatomicallyepicardial in location, the subendocardial areas are the far-thest from the coronary circulation, making the endo-cardium relatively ischemic as compared with the epi-cardium.
Suggested Readings
Burch GE, Winsor T. Principles of electrocardiography. In: APrimer of Electrocardiography. 5th ed. Philadelphia: Lea &Febiger; 1966;1–66.
Dunn MI, Lipman BS. Basic physiologic principles. In: Lipman-Massie Clinical Electrocardiography. 8th ed. Chicago: Year-book Medical Publishers; 1989;24–50.
Marriott HJL. Genesis of the precordial pattern. In: PracticalElectrocardiography. 5th ed. Baltimore: Williams & WilkinsCo.; 1972;44–55.
Sgarbossa EB, Wagner GS. Electrocardiography. In: Topol EJ ed.Textbook of Cardiovascular Medicine. 2nd ed. Philadelphia:Lippincott Williams & Wilkins; 2002:1330–1383.
Willems JL, Robles de Medina EO, Bernard R, et al. Criteria forintraventricular conduction disturbances and pre-excita-tion. J Am Coll Cardiol. 1985;1261–1275.
LWBK271-C06_55-61.qxd 29/1/09 10:09 pm Page 61 LWBK270-4119G-C02_073-110.qxd
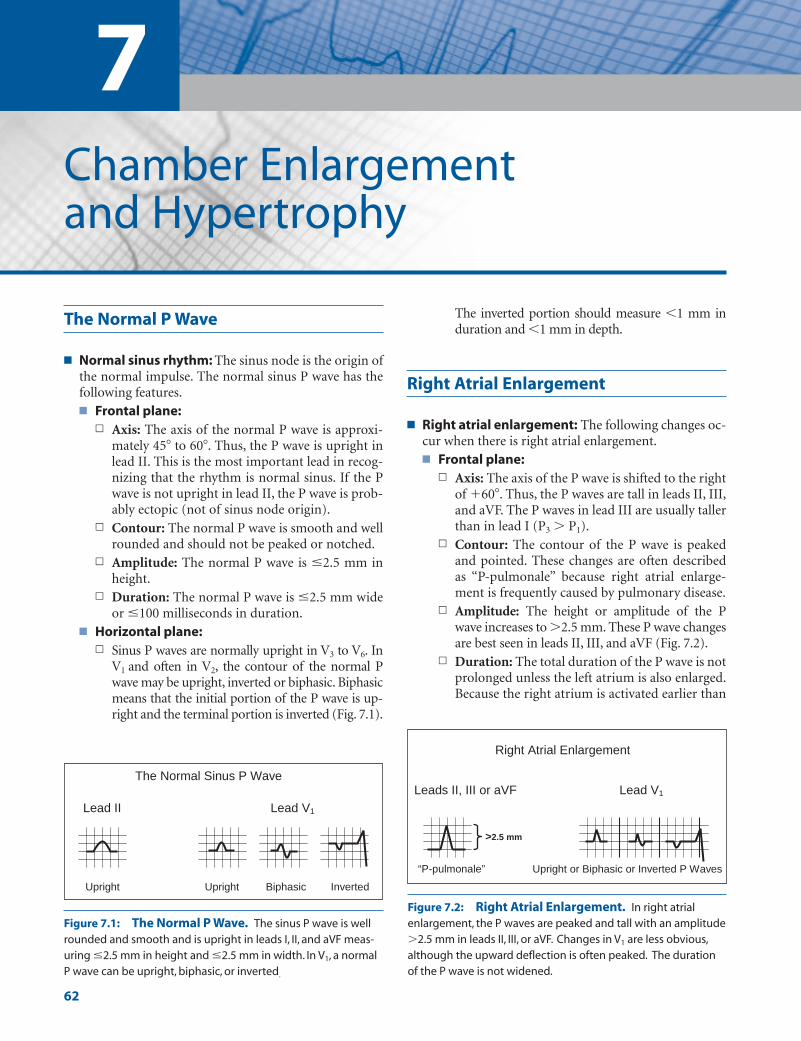
7Chamber Enlargement and Hypertrophy
62
The Normal P Wave
■ Normal sinus rhythm: The sinus node is the origin ofthe normal impulse. The normal sinus P wave has thefollowing features.■ Frontal plane:
n Axis: The axis of the normal P wave is approxi-mately 45� to 60�. Thus, the P wave is upright inlead II. This is the most important lead in recog-nizing that the rhythm is normal sinus. If the Pwave is not upright in lead II, the P wave is prob-ably ectopic (not of sinus node origin).
n Contour: The normal P wave is smooth and wellrounded and should not be peaked or notched.
n Amplitude: The normal P wave is �2.5 mm inheight.
n Duration: The normal P wave is �2.5 mm wideor �100 milliseconds in duration.
■ Horizontal plane:n Sinus P waves are normally upright in V3 to V6. In
V1 and often in V2, the contour of the normal Pwave may be upright, inverted or biphasic. Biphasicmeans that the initial portion of the P wave is up-right and the terminal portion is inverted (Fig. 7.1).
The inverted portion should measure �1 mm induration and �1 mm in depth.
Right Atrial Enlargement
■ Right atrial enlargement: The following changes oc-cur when there is right atrial enlargement.■ Frontal plane:
n Axis: The axis of the P wave is shifted to the rightof �60�. Thus, the P waves are tall in leads II, III,and aVF. The P waves in lead III are usually tallerthan in lead I (P3 � P1).
n Contour: The contour of the P wave is peakedand pointed. These changes are often describedas “P-pulmonale” because right atrial enlarge-ment is frequently caused by pulmonary disease.
n Amplitude: The height or amplitude of the Pwave increases to �2.5 mm. These P wave changesare best seen in leads II, III, and aVF (Fig. 7.2).
n Duration: The total duration of the P wave is notprolonged unless the left atrium is also enlarged.Because the right atrium is activated earlier than
Biphasic
V daeL II daeL 1
The Normal Sinus P Wave
Upright Inverted Upright
Figure 7.1: The Normal P Wave. The sinus P wave is wellrounded and smooth and is upright in leads I, II, and aVF meas-uring �2.5 mm in height and �2.5 mm in width. In V1, a normalP wave can be upright, biphasic, or inverted.
Figure 7.2: Right Atrial Enlargement. In right atrialenlargement, the P waves are peaked and tall with an amplitude�2.5 mm in leads II, III, or aVF. Changes in V1 are less obvious,although the upward deflection is often peaked. The durationof the P wave is not widened.
“P-pulmonale”
Leads II, III or aVF 1
>2.5 mm
Right Atrial Enlargement
Lead V
Upright or Biphasic or Inverted P Waves
LWBK271-C07_62-79.qxd 29/1/09 8:55 pm Page 62 LWBK270-4119G-C02_073-110.qxd
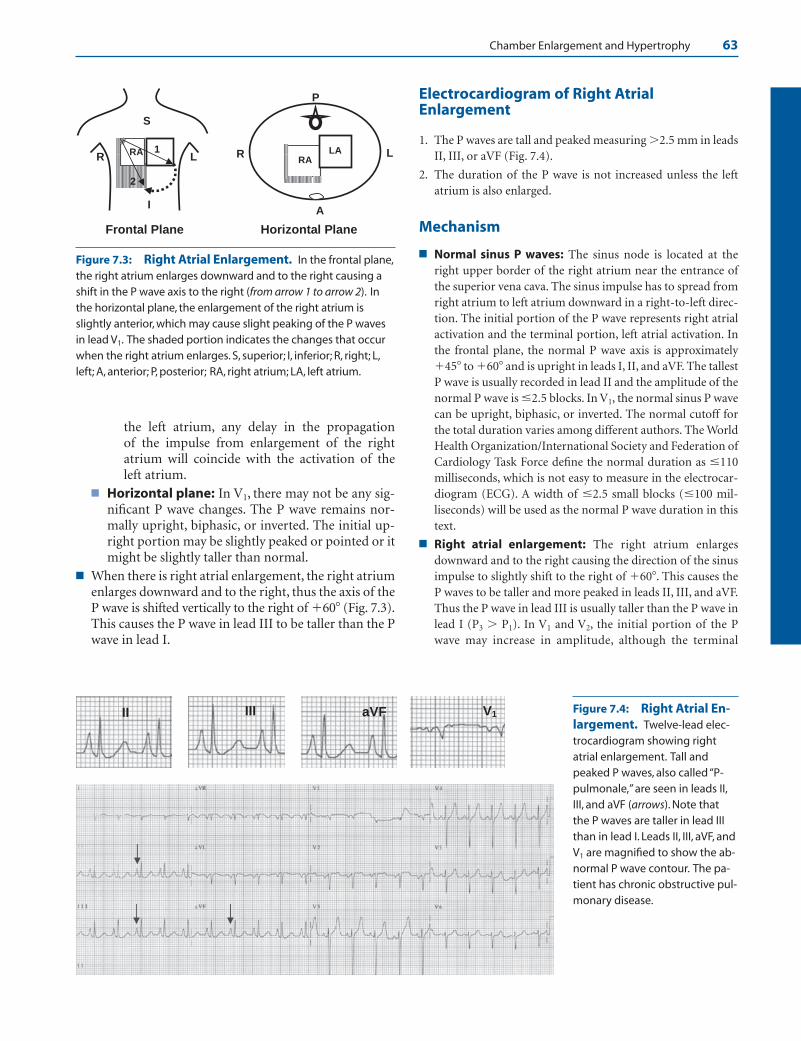
Chamber Enlargement and Hypertrophy 63
the left atrium, any delay in the propagation of the impulse from enlargement of the rightatrium will coincide with the activation of theleft atrium.
■ Horizontal plane: In V1, there may not be any sig-nificant P wave changes. The P wave remains nor-mally upright, biphasic, or inverted. The initial up-right portion may be slightly peaked or pointed or itmight be slightly taller than normal.
■ When there is right atrial enlargement, the right atriumenlarges downward and to the right, thus the axis of theP wave is shifted vertically to the right of �60� (Fig. 7.3).This causes the P wave in lead III to be taller than the Pwave in lead I.
Electrocardiogram of Right AtrialEnlargement
1. The P waves are tall and peaked measuring �2.5 mm in leadsII, III, or aVF (Fig. 7.4).
2. The duration of the P wave is not increased unless the leftatrium is also enlarged.
Mechanism
■ Normal sinus P waves: The sinus node is located at theright upper border of the right atrium near the entrance ofthe superior vena cava. The sinus impulse has to spread fromright atrium to left atrium downward in a right-to-left direc-tion. The initial portion of the P wave represents right atrialactivation and the terminal portion, left atrial activation. Inthe frontal plane, the normal P wave axis is approximately�45� to �60� and is upright in leads I, II, and aVF. The tallestP wave is usually recorded in lead II and the amplitude of thenormal P wave is �2.5 blocks. In V1, the normal sinus P wavecan be upright, biphasic, or inverted. The normal cutoff forthe total duration varies among different authors. The WorldHealth Organization/International Society and Federation ofCardiology Task Force define the normal duration as �110milliseconds, which is not easy to measure in the electrocar-diogram (ECG). A width of �2.5 small blocks (�100 mil-liseconds) will be used as the normal P wave duration in thistext.
■ Right atrial enlargement: The right atrium enlargesdownward and to the right causing the direction of the sinusimpulse to slightly shift to the right of �60�. This causes theP waves to be taller and more peaked in leads II, III, and aVF.Thus the P wave in lead III is usually taller than the P wave inlead I (P3 � P1). In V1 and V2, the initial portion of the Pwave may increase in amplitude, although the terminal
Figure 7.4: Right Atrial En-largement. Twelve-lead elec-trocardiogram showing rightatrial enlargement. Tall andpeaked P waves, also called “P-pulmonale,” are seen in leads II,III, and aVF (arrows). Note thatthe P waves are taller in lead IIIthan in lead I. Leads II, III, aVF, andV1 are magnified to show the ab-normal P wave contour. The pa-tient has chronic obstructive pul-monary disease.
Figure 7.3: Right Atrial Enlargement. In the frontal plane,the right atrium enlarges downward and to the right causing ashift in the P wave axis to the right (from arrow 1 to arrow 2). Inthe horizontal plane, the enlargement of the right atrium isslightly anterior, which may cause slight peaking of the P wavesin lead V1. The shaded portion indicates the changes that occurwhen the right atrium enlarges. S, superior; I, inferior; R, right; L,left; A, anterior; P, posterior; RA, right atrium; LA, left atrium.
II III aVF V1
Frontal Plane
RA RA
L LLR R
IA
Horizontal Plane
S
P
2
1 LA
LWBK271-C07_62-79.qxd 29/1/09 8:55 pm Page 63 LWBK270-4119G-C02_073-110.qxd

64 Chapter 7
portion representing left atrial activation is not affected.Because the right atrium is activated earlier than the left atrium, any delay in activation of the atria due to en-largement of the right atrium will coincide with activationof the left atrium. Thus, the duration of the P wave is notprolonged.
Clinical Implications
■ Enlargement of the right or left atrium occurring inde-pendently is rare. It is usually associated with disease of thevalvular structures or the ventricles. The most commoncause of right atrial enlargement without left atrial enlarge-ment in the adult population is pulmonary disease. Thus,the tall, narrow, and peaked P wave of right atrial enlarge-ment is often described as “P-pulmonale.” Right atrial en-largement can be due to tricuspid or pulmonary valve dis-ease, pulmonary hypertension, acute pulmonary embolism,and right ventricular failure or hypertrophy from variedcauses.
■ Enlargement of either atria predisposes to atrial arrhyth-mias, especially atrial flutter or atrial fibrillation. It is uncommon for atrial flutter or fibrillation to become sus-tained and self-perpetuating unless the atria are enlarged ordiseased.
■ When the lungs are hyperinflated because of emphysema,the diaphragm is pushed downward. The right atrium mayalso be displaced downward. When this occurs, the P wavein V1 may become totally inverted because the diaphragmand the heart are pushed vertically downward while thestandard location of the V1 electrode remains unchangedat the 4th intercostal space to the right of the sternum. Theinverted P wave may be mistaken for an enlarged leftatrium.
■ Right atrial enlargement is due to volume or pressureoverload within the right atria. This causes the right atrialsize to increase. Right atrial enlargement is recognized atbedside by the presence of distended neck veins. When thepatient is semirecumbent at an angle of 45�, and the neckveins are distended above the clavicle, the pressure in theright atrium is elevated.
Treatment and Prognosis
■ The treatment and prognosis of right atrial enlargement willdepend on the etiology of the right atrial enlargement.
Left Atrial Enlargement
■ Left atrial enlargement: The ECG changes of leftatrial enlargement are best reflected in the terminalhalf of the P wave because the right atrium is activatedearlier than the left atrium. The ECG features of leftatrial enlargement are summarized in Figure 7.5.■ Frontal plane:
n Axis: The axis of the P wave is shifted to the left,thus the P waves are taller in lead I than in leadIII (P1 � P3).
n Contour: The contour of the P wave is bifid or“M” shaped. The first hump represents activa-tion of the right atrium and the second humprepresents activation of the left atrium. Thesetwo humps are separated by at least one smallblock and are best seen in leads I, II, aVF, V5, andV6. This type of P wave is often called “P-mitrale,”indicating that at some time in the past, mitral
Figure 7.5: Left Atrial Enlargement. The duration of the P wave is prolonged meas-uring �2.5 mm in leads I, II, or aVF, with a bifid or M-shaped configuration. This type of P wave is called “P-mitrale.” In lead V1, the P wave may be totally inverted or it may be biphasic. The inverted portion is broad and deep measuring �1 mm wide and �1 mmdeep.
detrevnI yllatoT ”elartim-P“ Terminally inverted
Leads I, II or aVF Lead V1
>2 ½ mm >1 mm
>1 mm >1 mm
>1 mm
Left Atrial Enlargement
LWBK271-C07_62-79.qxd 29/1/09 8:55 pm Page 64 LWBK270-4119G-C02_073-110.qxd
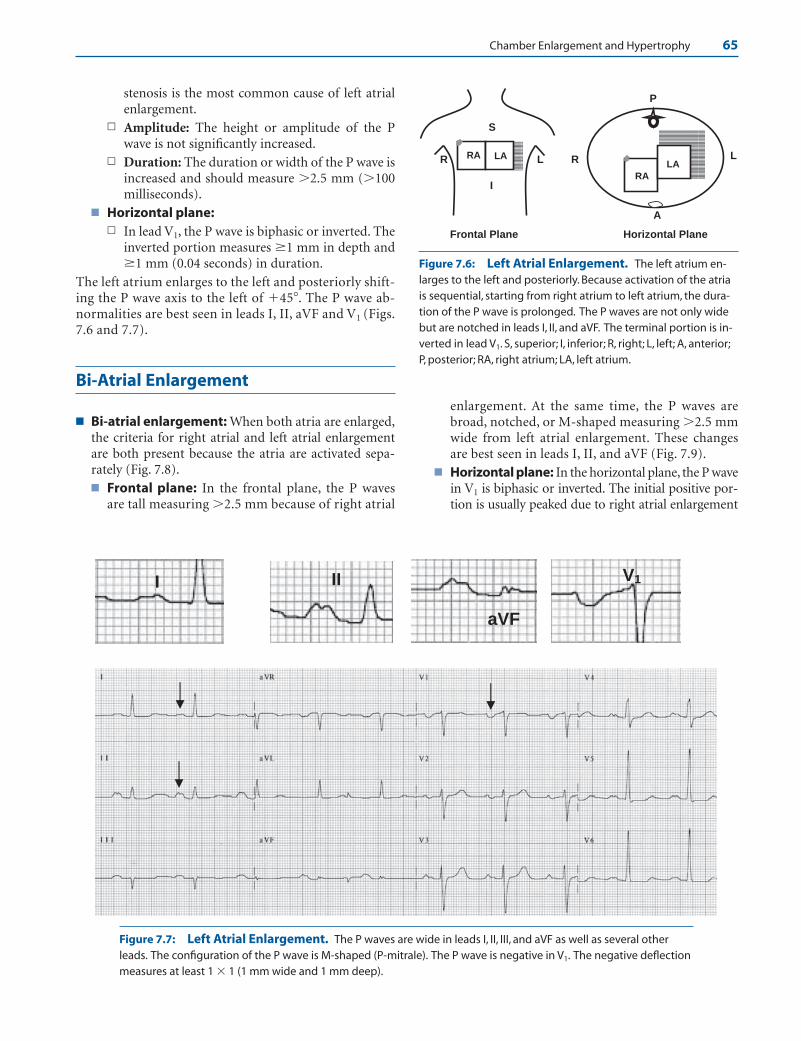
Chamber Enlargement and Hypertrophy 65
stenosis is the most common cause of left atrialenlargement.
n Amplitude: The height or amplitude of the Pwave is not significantly increased.
n Duration: The duration or width of the P wave isincreased and should measure �2.5 mm (�100milliseconds).
■ Horizontal plane:n In lead V1, the P wave is biphasic or inverted. The
inverted portion measures �1 mm in depth and�1 mm (0.04 seconds) in duration.
The left atrium enlarges to the left and posteriorly shift-ing the P wave axis to the left of �45�. The P wave ab-normalities are best seen in leads I, II, aVF and V1 (Figs.7.6 and 7.7).
Bi-Atrial Enlargement
■ Bi-atrial enlargement: When both atria are enlarged,the criteria for right atrial and left atrial enlargementare both present because the atria are activated sepa-rately (Fig. 7.8).■ Frontal plane: In the frontal plane, the P waves
are tall measuring �2.5 mm because of right atrial
enlargement. At the same time, the P waves arebroad, notched, or M-shaped measuring �2.5 mmwide from left atrial enlargement. These changesare best seen in leads I, II, and aVF (Fig. 7.9).
■ Horizontal plane: In the horizontal plane, the P wavein V1 is biphasic or inverted. The initial positive por-tion is usually peaked due to right atrial enlargement
Figure 7.6: Left Atrial Enlargement. The left atrium en-larges to the left and posteriorly. Because activation of the atriais sequential, starting from right atrium to left atrium, the dura-tion of the P wave is prolonged. The P waves are not only widebut are notched in leads I, II, and aVF. The terminal portion is in-verted in lead V1. S, superior; I, inferior; R, right; L, left; A, anterior;P, posterior; RA, right atrium; LA, left atrium.
II
aVF
V1I
Frontal Plane
RA
RA
LL RR
I
A
Horizontal Plane
S
P
LALA
Figure 7.7: Left Atrial Enlargement. The P waves are wide in leads I, II, III, and aVF as well as several otherleads. The configuration of the P wave is M-shaped (P-mitrale). The P wave is negative in V1. The negative deflectionmeasures at least 1 � 1 (1 mm wide and 1 mm deep).
LWBK271-C07_62-79.qxd 29/1/09 8:55 pm Page 65 LWBK270-4119G-C02_073-110.qxd

66 Chapter 7
and the terminal negative portion is �1 mm wideand �1 mm deep from left atrial enlargement.
Intra-Atrial Block
■ Intra-atrial block: According to an ad hoc workinggroup organized by the World Health Organizationand International Society and Federation in Cardi-ology, the P wave duration should not exceed 0.11seconds in the adult. The normal cutoff for the Pwave duration, however, varies among authors. In-creased duration of the P wave implies that there isintra-atrial block that may be due to left atrial en-
largement but can also be caused by scarring or fi-brosis of the atria.
■ Left atrial enlargement: In left atrial enlargement, the Pwave duration is always prolonged because of intra-atrialblock or prolonged atrial conduction. Increased left atrialpressure or volume is not always present. Thus, left atrialabnormality may be a better terminology to describe the Pwave changes associated with left atrial enlargement.
■ A 12-lead ECG is shown in Figure 7.10. The P waves arenotched with an M-shape configuration in lead II. The Pwave measures �2.5 mm wide with both peaks separatedby one small block. The configuration of the P wave isconsistent with “P-mitrale.” The P wave in V1 is not deepor wide. Although there is intra-atrial block, not all the Pwave changes satisfy the criteria for left atrial enlargement.
Leads II, III or aVF
>2.5 mm
>2.5 mm
Lead V1
>1 mm
>1 mm
Bi-atrial Enlargement
>2.5 mm
>2.5 mm >1 mm
>1mm
Figure 7.8: Bi-atrial Enlargement. Bi-atrial enlargement is characterized by tall andbroad P waves measuring �2.5 mm in height and �2.5 mm in duration. In V1, the P wave isbiphasic or inverted. The initial portion may be peaked due to right atrial enlargement. Theinverted portion is broad and deep measuring �1 mm wide and �1 mm deep because of leftatrial enlargement.
Figure 7.9: Electrocardiogram of Bi-atrial Enlargement. The P waves are peaked and wide. In leads II andaVF, the P waves are �2.5 mm tall and �2.5 mm wide (�100 milliseconds in duration). In V1, the P waves are termi-nally negative and are 1 mm wide and 1 mm deep.
LWBK271-C07_62-79.qxd 29/1/09 8:55 pm Page 66 LWBK270-4119G-C02_073-110.qxd

Chamber Enlargement and Hypertrophy 67
Left Atrial Enlargement
ECG of Left Atrial Enlargement
1. The duration of the P wave is increased in leads I, II, or aVF.The P waves are often notched with M shape pattern meas-uring �2.5 mm in width or �100 milliseconds in duration.
2. Terminally inverted P waves in V1 measuring �1 mm in depthand �1 mm in duration.
Mechanism
■ When there is left atrial enlargement, the initial portion of theP wave representing right atrial activation is not altered. Theterminal portion representing left atrial activation becomeslonger, resulting in a broader P wave. Thus, the total durationof the P wave is prolonged. The general direction of the P waveis slightly altered becoming more horizontal at 20� to 40�.Thus, the P wave in lead I is taller than the P wave in lead III (P1
� P3). The P wave abnormalities are best seen in lead II and of-ten in leads I and aVF and precordial leads V5 and V6. The Pwave is frequently bifid with two separate humps, at least 0.04seconds apart. The first hump represents right atrial activation
and the second hump represents activation of the enlarged left atrium. Because mitral valve disease is a common causeof left atrial enlargement, the notched and M-shaped P waveof left atrial enlargement is described as “P-mitrale.”
■ Because the left atrium is oriented to the left and posterior tothat of the right atrium, an enlarged left atrium will cause theterminal forces of the P wave to be directed to the left andposteriorly. In V1, the terminal portion, which represents leftatrial activation, will be oriented more posteriorly than nor-mal, causing the P wave to be broad and deep measuring atleast 1 mm wide and 1 mm deep equivalent to one small box.
Clinical Significance
■ Primary disease involving the left atrium alone is rare. Enlarge-ment of the left atrium, therefore, is secondary to abnormalitiesinvolving the mitral valve or the left ventricle including mitralstenosis or insufficiency, left ventricular systolic, or diastolicdysfunction from several causes such as hypertension, coronaryartery disease, cardiomyopathy, and aortic valve disease.
■ Left atrial enlargement is a common finding in patients with leftventricular hypertrophy (LVH). The presence of left atrial en-largement is one of the criteria for the ECG diagnosis of LVH.
Lead II Lead V1
Figure 7.10: Intra-atrial Block. Any sinus P wave that is prolonged, measuring �2.5 blocks is intra-atrial block.This could be due to left atrial enlargement, but could also be due to other causes. Leads II and V1 are enlarged sothat the P waves are better visualized.
LWBK271-C07_62-79.qxd 29/1/09 8:55 pm Page 67 LWBK270-4119G-C02_073-110.qxd
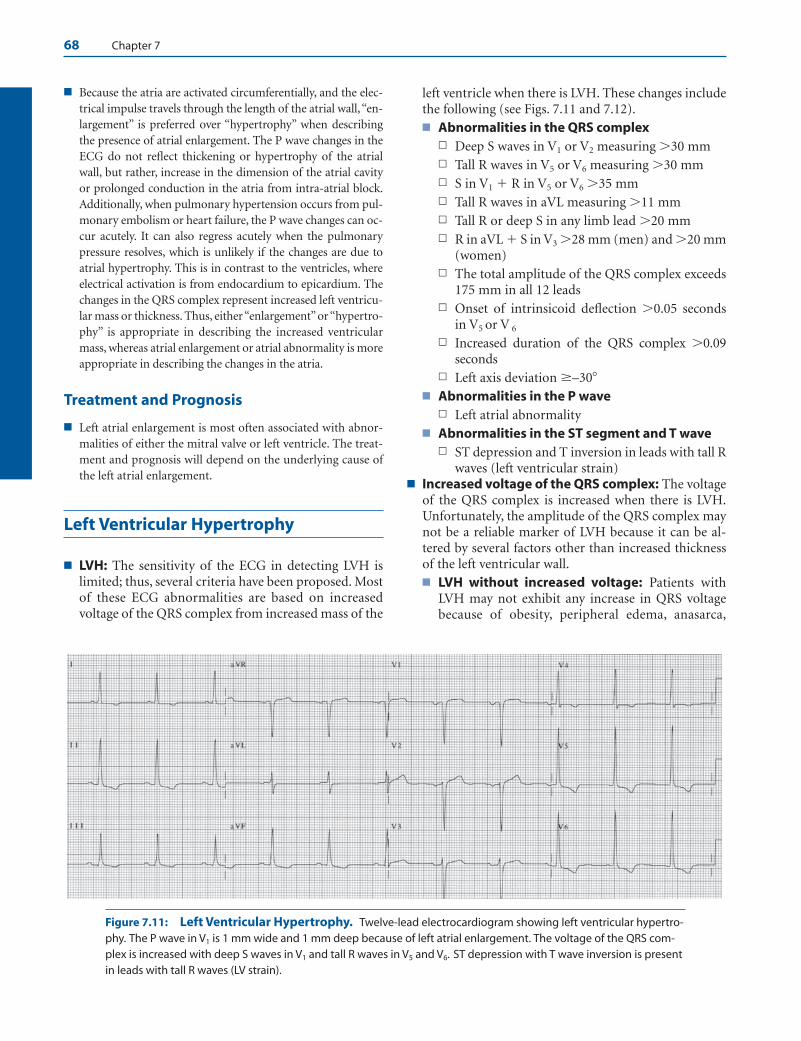
68 Chapter 7
■ Because the atria are activated circumferentially, and the elec-trical impulse travels through the length of the atrial wall, “en-largement” is preferred over “hypertrophy” when describingthe presence of atrial enlargement. The P wave changes in theECG do not reflect thickening or hypertrophy of the atrialwall, but rather, increase in the dimension of the atrial cavityor prolonged conduction in the atria from intra-atrial block.Additionally, when pulmonary hypertension occurs from pul-monary embolism or heart failure, the P wave changes can oc-cur acutely. It can also regress acutely when the pulmonarypressure resolves, which is unlikely if the changes are due toatrial hypertrophy. This is in contrast to the ventricles, whereelectrical activation is from endocardium to epicardium. Thechanges in the QRS complex represent increased left ventricu-lar mass or thickness. Thus, either “enlargement”or “hypertro-phy” is appropriate in describing the increased ventricularmass, whereas atrial enlargement or atrial abnormality is moreappropriate in describing the changes in the atria.
Treatment and Prognosis
■ Left atrial enlargement is most often associated with abnor-malities of either the mitral valve or left ventricle. The treat-ment and prognosis will depend on the underlying cause ofthe left atrial enlargement.
Left Ventricular Hypertrophy
■ LVH: The sensitivity of the ECG in detecting LVH islimited; thus, several criteria have been proposed. Mostof these ECG abnormalities are based on increasedvoltage of the QRS complex from increased mass of the
left ventricle when there is LVH. These changes includethe following (see Figs. 7.11 and 7.12).■ Abnormalities in the QRS complex
n Deep S waves in V1 or V2 measuring �30 mmn Tall R waves in V5 or V6 measuring �30 mmn S in V1 � R in V5 or V6 �35 mmn Tall R waves in aVL measuring �11 mmn Tall R or deep S in any limb lead �20 mmn R in aVL � S in V3 �28 mm (men) and �20 mm
(women)n The total amplitude of the QRS complex exceeds
175 mm in all 12 leadsn Onset of intrinsicoid deflection �0.05 seconds
in V5 or V 6
n Increased duration of the QRS complex �0.09seconds
n Left axis deviation �–30�
■ Abnormalities in the P waven Left atrial abnormality
■ Abnormalities in the ST segment and T waven ST depression and T inversion in leads with tall R
waves (left ventricular strain) ■ Increased voltage of the QRS complex: The voltage
of the QRS complex is increased when there is LVH.Unfortunately, the amplitude of the QRS complex maynot be a reliable marker of LVH because it can be al-tered by several factors other than increased thicknessof the left ventricular wall.■ LVH without increased voltage: Patients with
LVH may not exhibit any increase in QRS voltagebecause of obesity, peripheral edema, anasarca,
Figure 7.11: Left Ventricular Hypertrophy. Twelve-lead electrocardiogram showing left ventricular hypertro-phy. The P wave in V1 is 1 mm wide and 1 mm deep because of left atrial enlargement. The voltage of the QRS com-plex is increased with deep S waves in V1 and tall R waves in V5 and V6. ST depression with T wave inversion is presentin leads with tall R waves (LV strain).
LWBK271-C07_62-79.qxd 29/1/09 8:55 pm Page 68 LWBK270-4119G-C02_073-110.qxd

Chamber Enlargement and Hypertrophy 69
increased diameter of the chest, lung disease espe-cially emphysema, large breasts, biventricular hyper-trophy, amyloidosis, pericardial effusion, pleuraleffusion, and hypothyroidism.
■ Increased voltage not resulting from LVH: Con-versely, increased voltage of the QRS complex may bepresent even in the absence of LVH in adolescent boys,anemia, left mastectomy, and in thin individuals.
■ Left atrial abnormality: Enlargement of the leftatrium is included as one of the diagnostic hallmarks ofLVH. During diastole when the mitral valve is open, theleft atrium and left ventricle behave as a commonchamber. Thus, changes in pressure and volume in theleft ventricle are also reflected in the left atrium.
■ Ventricular activation time: Ventricular activationtime represents the time it takes for the ventricular im-pulse to arrive at the recording electrode and is measuredfrom the onset of the QRS complex to the top of the R orR wave (Fig. 7.13A, B). The thicker the myocardium, thelonger it takes for the impulse to travel from endo-cardium to epicardium. Thus, when there is LVH, theventricular activation time of leads overlying the left ven-tricle (V5 or V6) is prolonged (�0.05 seconds).
■ Intrinsicoid deflection: The intrinsicoid deflectioncorresponds to the time that the depolarization wavehas arrived at the recording electrode and is repre-sented by the sudden downward deflection of the Rwave toward baseline. If there is LVH, the onset of the
VAT > 0.05 second
Ventricular Activation Time (VAT)
Intrinsicoid deflection
A
Epicardium
Onset of intrinsicoiddeflection
VAT
Precordial
Electrode
Endocardium
VAT
V1
V6
B
R wave in aVL >11 mm
Left axis deviation ≥-30
0
Lead aVL
Deep S in V1 or V2
Tall R in V5 or V6
Left ventricular strain
Left atrial abnormality
Lead V1
Lead V5 or V6
Delayed onset of intrinsicoid deflection >0.05 second
S in V1 + R in V5 or V6 = >35 mm
“P-mitrale”
Slight widening of the QRS complex
Figure 7.12: Left VentricularHypertrophy. Diagrammaticrepresentation of the differentelectrocardiogram changes in leftventricular hypertrophy.
Figure 7.13: Intrinsicoid Deflection. The ventricular activation time (VAT) ismeasured from the onset of the QRS complex to the top of the R wave. The intrinsicoid de-flection is represented by the immediate downward deflection of the R wave toward base-line (A). When there is left ventricular hypertrophy, the onset of the intrinsicoid deflection(dotted lines in A and B) is delayed in V5 or V6.When there is right ventricular hypertrophy,the onset of the intrinsicoid deflection is delayed in V1 or V2.
LWBK271-C07_62-79.qxd 29/1/09 8:55 pm Page 69 LWBK270-4119G-C02_073-110.qxd

70 Chapter 7
intrinsicoid deflection in leads V5 or V6 is delayed (Fig.7.13B).
■ Abnormalities in the ST segment and T wave: Be-cause depolarization of the left ventricle is abnormal,repolarization is also abnormal resulting in ST segmentdepression and T wave inversion in leads with tall Rwaves. Left ventricular strain is frequently used to de-scribe this pattern of ST depression and T wave inver-sion (Fig. 7.12).
■ LVH is a compensatory mechanism in response to bothpressure and volume overload.■ Pressure overload: LVH from pressure overload is
usually due to systemic hypertension, aortic steno-sis, coarctation of the aorta, or hypertrophic ob-structive cardiomyopathy. When there is pressure orsystolic overload, the left ventricle becomes concen-trically hypertrophied. The walls of the left ventricleare thickened although the size of the left ventricu-lar cavity remains normal. The ECG shows tall Rwaves in V5 and V6 associated with depression of theST segment and inversion of the T wave. These ST-Tchanges are often described as due to left ventricular“strain” (Figs. 7.11 and 7.12).
■ Volume overload: This type of LVH is due to in-creased volume of the left ventricle as would occurwhen there is mitral regurgitation, aortic regurgita-tion, ventricular septal defect, peripheral arteriove-nous shunts, anemia, and thyrotoxicosis. Whenthere is volume or diastolic overload, the left ventri-cle becomes eccentrically hypertrophied. The leftventricular cavity becomes dilated. There is also in-creased left ventricular mass. The ECG showsprominent Q waves, tall R waves, and tall and up-right T waves in V5 and V6 (Fig. 7.14).
■ LVH associated with left ventricular strain is morecommon than LVH from volume overload because hy-pertension is the most common cause of LVH.
The ECG of LVH
■ Several ECG criteria have been used in the diagnosis of LVH.These include:
■ Increased amplitude or voltage of the QRS complexn Limb leads
n R wave in any limb lead measuring �20 mm
n S wave in any limb lead measuring �20 mm
n R wave in aVL �11 mm
n R in lead I � S in III �25 mm
n Precordial leadsn S wave in V1 or V2 �30 mm
n R wave in V5 or V6 �30 mm
n R wave in V5 or V6 �26 mm
n S wave in V1, V2 or V3 �25 mm
n R wave in V4, V5 or V6 �25 mm
n SV1 � RV5 or V6 �35 mm
n Tallest S � tallest R in V1 to V6 �45 mm
n R wave in V6 � R wave in V5
n Limb � Precordial leadsn R wave in aVL � S wave in V3 �20 mm in females
n R wave in aVL � S wave in V3 �28 mm in males
n Total QRS voltage from all 12 ECG leads �175 mm
■ Increased duration of the QRS complexn Delayed onset of intrinsicoid deflection �0.05 sec-
onds in V5 or V6
n Increased duration of the QRS complex �0.09 seconds
Figure 7.14: Left Ventricular Hypertrophy from Volume Overload. Twelve-lead electrocardiogram (ECG)showing tall voltage measuring �45 mm in V5 and �25 mm in V6 combined with prominent Q waves and tall Twaves. This pattern of LVH is usually due to volume overload. This ECG is from a 55-year-old man with sickle cellanemia with gross cardiomegaly by chest x-ray.
LWBK271-C07_62-79.qxd 29/1/09 8:55 pm Page 70 LWBK270-4119G-C02_073-110.qxd
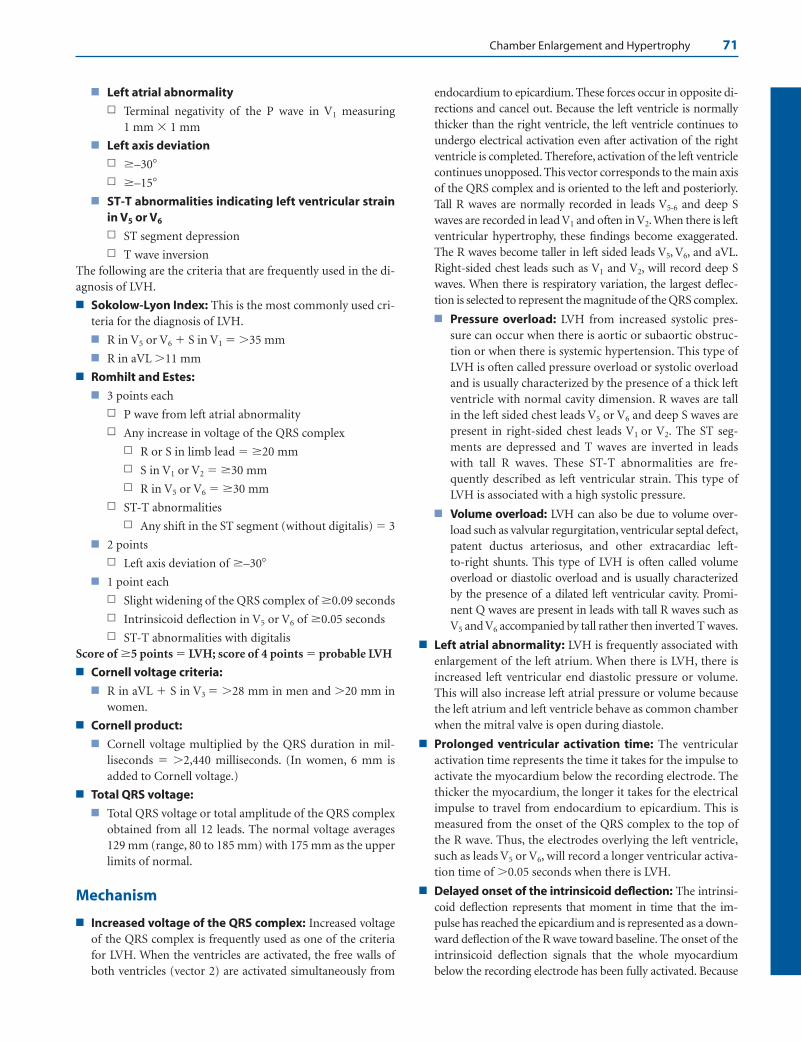
Chamber Enlargement and Hypertrophy 71
■ Left atrial abnormalityn Terminal negativity of the P wave in V1 measuring
1 mm � 1 mm
■ Left axis deviationn �–30�
n �–15�
■ ST-T abnormalities indicating left ventricular strainin V5 or V6
n ST segment depression
n T wave inversionThe following are the criteria that are frequently used in the di-agnosis of LVH.
■ Sokolow-Lyon Index: This is the most commonly used cri-teria for the diagnosis of LVH.
■ R in V5 or V6 � S in V1 �35 mm
■ R in aVL �11 mm
■ Romhilt and Estes:
■ 3 points each
n P wave from left atrial abnormality
n Any increase in voltage of the QRS complex
n R or S in limb lead �20 mm
n S in V1 or V2 �30 mm
n R in V5 or V6 �30 mm
n ST-T abnormalities
n Any shift in the ST segment (without digitalis) 3
■ 2 points
n Left axis deviation of �–30�
■ 1 point each
n Slight widening of the QRS complex of �0.09 seconds
n Intrinsicoid deflection in V5 or V6 of �0.05 seconds
n ST-T abnormalities with digitalis Score of �5 points LVH; score of 4 points probable LVH
■ Cornell voltage criteria:
■ R in aVL � S in V3 �28 mm in men and �20 mm inwomen.
■ Cornell product:
■ Cornell voltage multiplied by the QRS duration in mil-liseconds �2,440 milliseconds. (In women, 6 mm isadded to Cornell voltage.)
■ Total QRS voltage:
■ Total QRS voltage or total amplitude of the QRS complexobtained from all 12 leads. The normal voltage averages129 mm (range, 80 to 185 mm) with 175 mm as the upperlimits of normal.
Mechanism
■ Increased voltage of the QRS complex: Increased voltageof the QRS complex is frequently used as one of the criteriafor LVH. When the ventricles are activated, the free walls ofboth ventricles (vector 2) are activated simultaneously from
endocardium to epicardium. These forces occur in opposite di-rections and cancel out. Because the left ventricle is normallythicker than the right ventricle, the left ventricle continues toundergo electrical activation even after activation of the rightventricle is completed. Therefore, activation of the left ventriclecontinues unopposed. This vector corresponds to the main axisof the QRS complex and is oriented to the left and posteriorly.Tall R waves are normally recorded in leads V5-6 and deep Swaves are recorded in lead V1 and often in V2. When there is leftventricular hypertrophy, these findings become exaggerated.The R waves become taller in left sided leads V5, V6, and aVL.Right-sided chest leads such as V1 and V2, will record deep Swaves. When there is respiratory variation, the largest deflec-tion is selected to represent the magnitude of the QRS complex.
■ Pressure overload: LVH from increased systolic pres-sure can occur when there is aortic or subaortic obstruc-tion or when there is systemic hypertension. This type ofLVH is often called pressure overload or systolic overloadand is usually characterized by the presence of a thick leftventricle with normal cavity dimension. R waves are tallin the left sided chest leads V5 or V6 and deep S waves arepresent in right-sided chest leads V1 or V2. The ST seg-ments are depressed and T waves are inverted in leadswith tall R waves. These ST-T abnormalities are fre-quently described as left ventricular strain. This type ofLVH is associated with a high systolic pressure.
■ Volume overload: LVH can also be due to volume over-load such as valvular regurgitation, ventricular septal defect,patent ductus arteriosus, and other extracardiac left-to-right shunts. This type of LVH is often called volumeoverload or diastolic overload and is usually characterizedby the presence of a dilated left ventricular cavity. Promi-nent Q waves are present in leads with tall R waves such asV5 and V6 accompanied by tall rather then inverted T waves.
■ Left atrial abnormality: LVH is frequently associated withenlargement of the left atrium. When there is LVH, there isincreased left ventricular end diastolic pressure or volume.This will also increase left atrial pressure or volume becausethe left atrium and left ventricle behave as common chamberwhen the mitral valve is open during diastole.
■ Prolonged ventricular activation time: The ventricularactivation time represents the time it takes for the impulse toactivate the myocardium below the recording electrode. Thethicker the myocardium, the longer it takes for the electricalimpulse to travel from endocardium to epicardium. This ismeasured from the onset of the QRS complex to the top ofthe R wave. Thus, the electrodes overlying the left ventricle,such as leads V5 or V6, will record a longer ventricular activa-tion time of �0.05 seconds when there is LVH.
■ Delayed onset of the intrinsicoid deflection: The intrinsi-coid deflection represents that moment in time that the im-pulse has reached the epicardium and is represented as a down-ward deflection of the R wave toward baseline. The onset of theintrinsicoid deflection signals that the whole myocardiumbelow the recording electrode has been fully activated. Because
LWBK271-C07_62-79.qxd 29/1/09 8:55 pm Page 71 LWBK270-4119G-C02_073-110.qxd
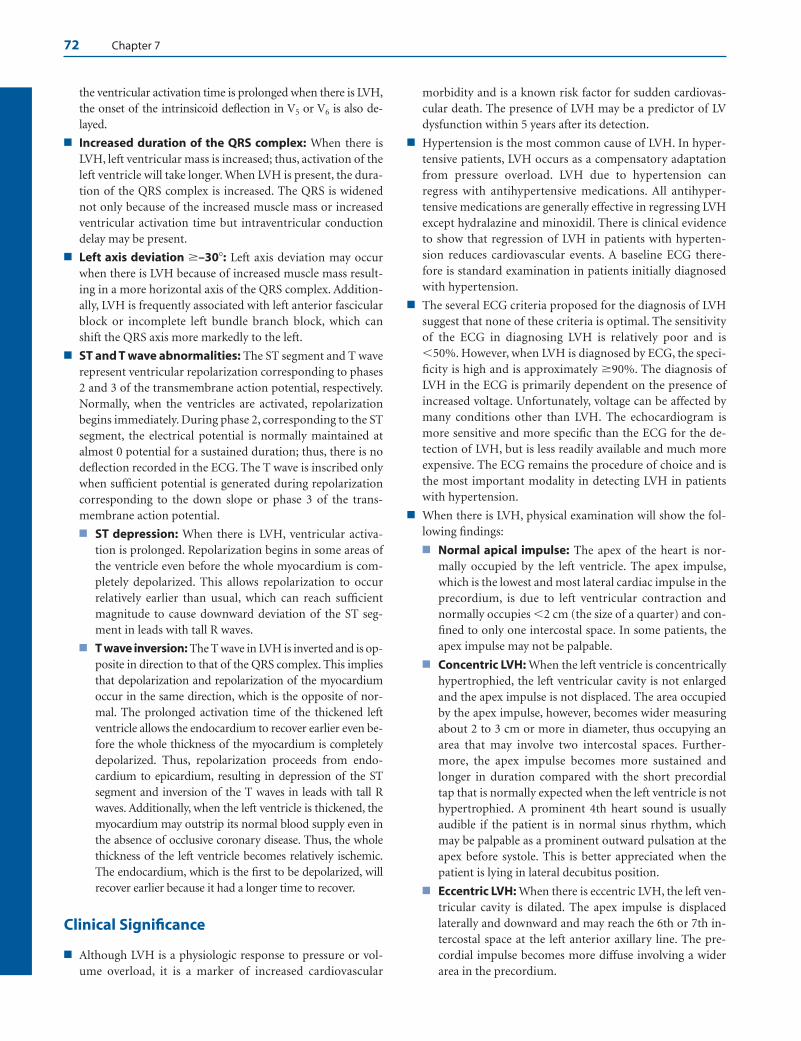
72 Chapter 7
the ventricular activation time is prolonged when there is LVH,the onset of the intrinsicoid deflection in V5 or V6 is also de-layed.
■ Increased duration of the QRS complex: When there isLVH, left ventricular mass is increased; thus, activation of theleft ventricle will take longer. When LVH is present, the dura-tion of the QRS complex is increased. The QRS is widenednot only because of the increased muscle mass or increasedventricular activation time but intraventricular conductiondelay may be present.
■ Left axis deviation �–30�: Left axis deviation may occurwhen there is LVH because of increased muscle mass result-ing in a more horizontal axis of the QRS complex. Addition-ally, LVH is frequently associated with left anterior fascicularblock or incomplete left bundle branch block, which canshift the QRS axis more markedly to the left.
■ ST and T wave abnormalities: The ST segment and T waverepresent ventricular repolarization corresponding to phases2 and 3 of the transmembrane action potential, respectively.Normally, when the ventricles are activated, repolarizationbegins immediately. During phase 2, corresponding to the STsegment, the electrical potential is normally maintained atalmost 0 potential for a sustained duration; thus, there is nodeflection recorded in the ECG. The T wave is inscribed onlywhen sufficient potential is generated during repolarizationcorresponding to the down slope or phase 3 of the trans-membrane action potential.
■ ST depression: When there is LVH, ventricular activa-tion is prolonged. Repolarization begins in some areas ofthe ventricle even before the whole myocardium is com-pletely depolarized. This allows repolarization to occurrelatively earlier than usual, which can reach sufficientmagnitude to cause downward deviation of the ST seg-ment in leads with tall R waves.
■ T wave inversion: The T wave in LVH is inverted and is op-posite in direction to that of the QRS complex. This impliesthat depolarization and repolarization of the myocardiumoccur in the same direction, which is the opposite of nor-mal. The prolonged activation time of the thickened leftventricle allows the endocardium to recover earlier even be-fore the whole thickness of the myocardium is completelydepolarized. Thus, repolarization proceeds from endo-cardium to epicardium, resulting in depression of the STsegment and inversion of the T waves in leads with tall Rwaves. Additionally, when the left ventricle is thickened, themyocardium may outstrip its normal blood supply even inthe absence of occlusive coronary disease. Thus, the wholethickness of the left ventricle becomes relatively ischemic.The endocardium, which is the first to be depolarized, willrecover earlier because it had a longer time to recover.
Clinical Significance
■ Although LVH is a physiologic response to pressure or vol-ume overload, it is a marker of increased cardiovascular
morbidity and is a known risk factor for sudden cardiovas-cular death. The presence of LVH may be a predictor of LVdysfunction within 5 years after its detection.
■ Hypertension is the most common cause of LVH. In hyper-tensive patients, LVH occurs as a compensatory adaptationfrom pressure overload. LVH due to hypertension canregress with antihypertensive medications. All antihyper-tensive medications are generally effective in regressing LVHexcept hydralazine and minoxidil. There is clinical evidenceto show that regression of LVH in patients with hyperten-sion reduces cardiovascular events. A baseline ECG there-fore is standard examination in patients initially diagnosedwith hypertension.
■ The several ECG criteria proposed for the diagnosis of LVHsuggest that none of these criteria is optimal. The sensitivityof the ECG in diagnosing LVH is relatively poor and is�50%. However, when LVH is diagnosed by ECG, the speci-ficity is high and is approximately �90%. The diagnosis ofLVH in the ECG is primarily dependent on the presence ofincreased voltage. Unfortunately, voltage can be affected bymany conditions other than LVH. The echocardiogram ismore sensitive and more specific than the ECG for the de-tection of LVH, but is less readily available and much moreexpensive. The ECG remains the procedure of choice and isthe most important modality in detecting LVH in patientswith hypertension.
■ When there is LVH, physical examination will show the fol-lowing findings:
■ Normal apical impulse: The apex of the heart is nor-mally occupied by the left ventricle. The apex impulse,which is the lowest and most lateral cardiac impulse in theprecordium, is due to left ventricular contraction andnormally occupies �2 cm (the size of a quarter) and con-fined to only one intercostal space. In some patients, theapex impulse may not be palpable.
■ Concentric LVH: When the left ventricle is concentricallyhypertrophied, the left ventricular cavity is not enlargedand the apex impulse is not displaced. The area occupiedby the apex impulse, however, becomes wider measuringabout 2 to 3 cm or more in diameter, thus occupying anarea that may involve two intercostal spaces. Further-more, the apex impulse becomes more sustained andlonger in duration compared with the short precordialtap that is normally expected when the left ventricle is nothypertrophied. A prominent 4th heart sound is usuallyaudible if the patient is in normal sinus rhythm, whichmay be palpable as a prominent outward pulsation at theapex before systole. This is better appreciated when thepatient is lying in lateral decubitus position.
■ Eccentric LVH: When there is eccentric LVH, the left ven-tricular cavity is dilated. The apex impulse is displacedlaterally and downward and may reach the 6th or 7th in-tercostal space at the left anterior axillary line. The pre-cordial impulse becomes more diffuse involving a widerarea in the precordium.
LWBK271-C07_62-79.qxd 29/1/09 8:55 pm Page 72 LWBK270-4119G-C02_073-110.qxd

Chamber Enlargement and Hypertrophy 73
Treatment and Prognosis
■ LVH detected by ECG is a risk factor for increased cardiovas-cular death. When ECG changes of LVH occur, the risk forcardiovascular morbidity and mortality increases, and therisk is even higher when ST and T wave abnormalities arealso present. The treatment and prognosis of patients withLVH will depend on the etiology of the LVH. In patients withhypertension, regression of LVH with antihypertensiveagents is possible. There are clinical data to show that regres-sion of LVH in patients with hypertension decreases mortal-ity and morbidity from cardiovascular death.
Right Ventricular Hypertrophy
■ Right ventricular hypertrophy: Right ventricularhypertrophy (RVH) is recognized in the ECG by thefollowing findings (Fig. 7.15).■ Abnormalities in the QRS complex
n Right axis deviation of approximately �90�. Thisshould always be present before the diagnosis ofRVH is considered.
n qR complex in V1
n R wave measuring �7 mm in V1
n R wave taller than the S wave in V1 (R/S ratio �1)n Delayed onset of the intrinsicoid deflection in V1
�0.03 seconds n rS complex from V1 to V6 with right axis deviationn S1 S2 S3 pattern in adults
■ Abnormalities in the P waven Right atrial abnormality (P-pulmonale)
■ Abnormalities in the ST segment and T waven ST segment depression and T wave inversion in
anterior precordial leads (V1 and V2)■ In adult patients, the thickness of the right ventricle sel-
dom exceeds that of the left ventricle even when RVH ispresent. Because both ventricles are activated simultane-ously, the forces generated by the right ventricle aremasked by the forces generated by the left ventricle. Thus,the diagnosis of RVH by ECG may be difficult unless theright ventricle is severely hypertrophied.
■ Types of RVH: The ECG manifestations of RVH maybe different. Three different types have been described:types A, B, and C (Fig. 7.16).
Other Patterns of RVH
■ Chronic pulmonary disease: When there is chronicobstructive pulmonary disease such as emphysema orchronic bronchitis, the overinflated lungs push the di-aphragm downward, causing the heart to become verti-cally oriented. When this occurs, the axes of the P wave,QRS complex, and T wave are all shifted rightward andinferiorly toward lead aVF (90�), resulting in the socalled “lead I sign.” Because lead I (0�) is perpendicularto lead aVF, lead I and often V6 will conspicuously showsmall deflections (Fig. 7.17) because the P, QRS, and Twaves become isoelectric in these leads. The ventriclesalso rotate in a clockwise fashion, causing poor R waveprogression and delay in the transition zone. Othersigns of type C RVH like right axis deviation and P-pul-monale are usually present.
■ S1 S2 S3 pattern: S1 S2 S3 pattern implies that S waves arepresent in leads I, II, and III. When the S1 S2 S3 pattern ispresent, the direction of the mean QRS axis is superior
Figure 7.15: Right Ventricular Hypertrophy. There is right axis deviation, the QRS complexes are tall in V1 andP waves are peaked in II and aVF. This pattern of right ventricular hypertrophy is described as type A and is frequentlyseen in severe right ventricular hypertrophy often associated with congenital heart disease or severe mitral stenosis.
LWBK271-C07_62-79.qxd 29/1/09 8:55 pm Page 73 LWBK270-4119G-C02_073-110.qxd
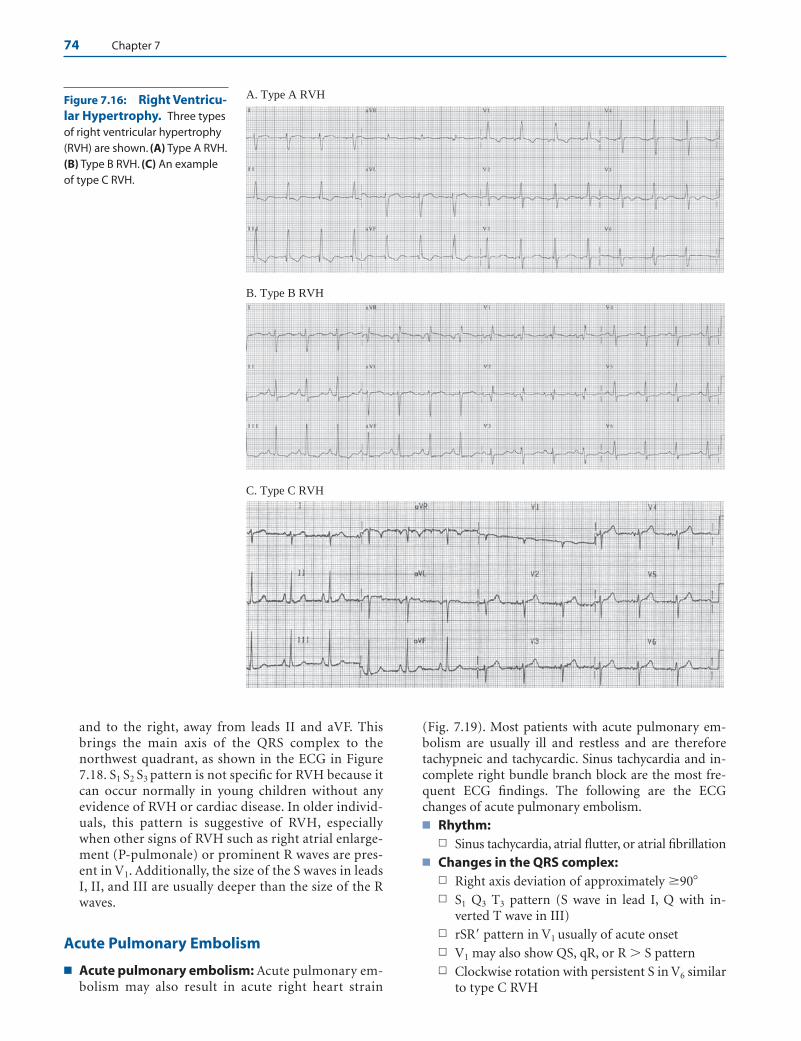
74 Chapter 7
A. Type A RVH
B. Type B RVH
C. Type C RVH
Figure 7.16: Right Ventricu-lar Hypertrophy. Three typesof right ventricular hypertrophy(RVH) are shown. (A) Type A RVH.(B) Type B RVH. (C) An exampleof type C RVH.
and to the right, away from leads II and aVF. Thisbrings the main axis of the QRS complex to thenorthwest quadrant, as shown in the ECG in Figure7.18. S1 S2 S3 pattern is not specific for RVH because itcan occur normally in young children without anyevidence of RVH or cardiac disease. In older individ-uals, this pattern is suggestive of RVH, especiallywhen other signs of RVH such as right atrial enlarge-ment (P-pulmonale) or prominent R waves are pres-ent in V1. Additionally, the size of the S waves in leadsI, II, and III are usually deeper than the size of the Rwaves.
Acute Pulmonary Embolism
■ Acute pulmonary embolism: Acute pulmonary em-bolism may also result in acute right heart strain
(Fig. 7.19). Most patients with acute pulmonary em-bolism are usually ill and restless and are thereforetachypneic and tachycardic. Sinus tachycardia and in-complete right bundle branch block are the most fre-quent ECG findings. The following are the ECGchanges of acute pulmonary embolism.■ Rhythm:
n Sinus tachycardia, atrial flutter, or atrial fibrillation■ Changes in the QRS complex:
n Right axis deviation of approximately �90�n S1 Q3 T3 pattern (S wave in lead I, Q with in-
verted T wave in III)n rSR pattern in V1 usually of acute onsetn V1 may also show QS, qR, or R � S pattern n Clockwise rotation with persistent S in V6 similar
to type C RVH
LWBK271-C07_62-79.qxd 29/1/09 8:55 pm Page 74 LWBK270-4119G-C02_073-110.qxd
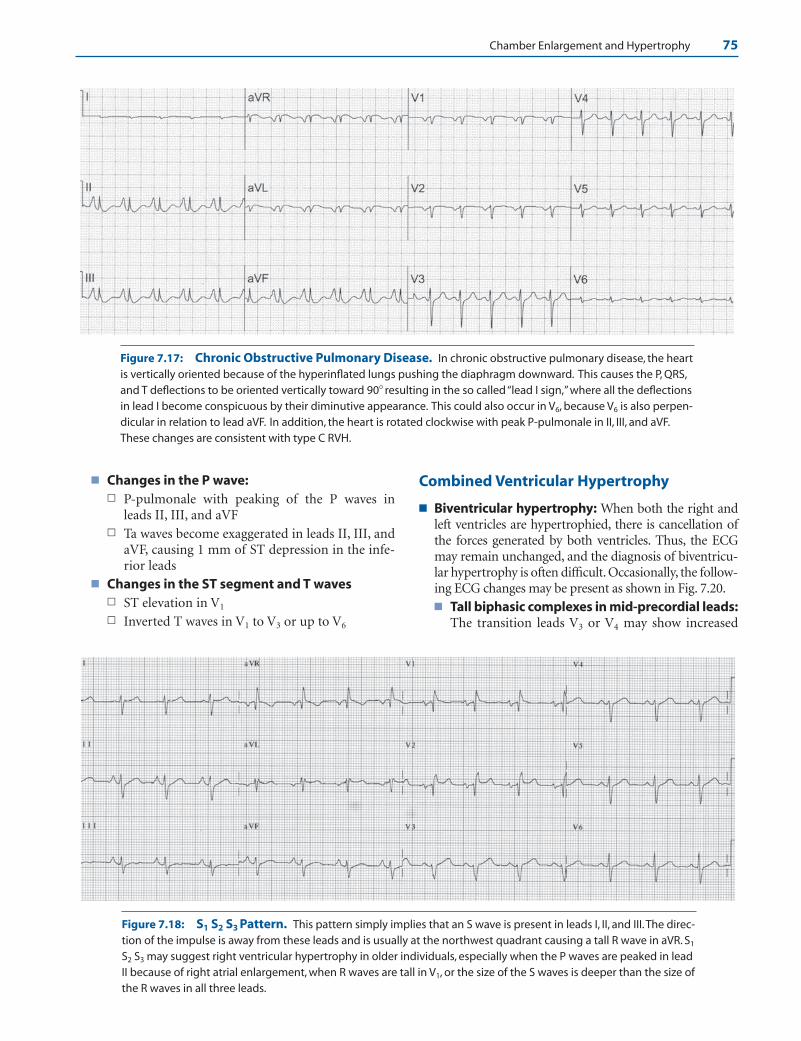
Chamber Enlargement and Hypertrophy 75
■ Changes in the P wave:n P-pulmonale with peaking of the P waves in
leads II, III, and aVFn Ta waves become exaggerated in leads II, III, and
aVF, causing 1 mm of ST depression in the infe-rior leads
■ Changes in the ST segment and T wavesn ST elevation in V1
n Inverted T waves in V1 to V3 or up to V6
Combined Ventricular Hypertrophy
■ Biventricular hypertrophy: When both the right andleft ventricles are hypertrophied, there is cancellation ofthe forces generated by both ventricles. Thus, the ECGmay remain unchanged, and the diagnosis of biventricu-lar hypertrophy is often difficult. Occasionally, the follow-ing ECG changes may be present as shown in Fig. 7.20.■ Tall biphasic complexes in mid-precordial leads:
The transition leads V3 or V4 may show increased
Figure 7.17: Chronic Obstructive Pulmonary Disease. In chronic obstructive pulmonary disease, the heartis vertically oriented because of the hyperinflated lungs pushing the diaphragm downward. This causes the P, QRS,and T deflections to be oriented vertically toward 90� resulting in the so called “lead I sign,” where all the deflectionsin lead I become conspicuous by their diminutive appearance. This could also occur in V6, because V6 is also perpen-dicular in relation to lead aVF. In addition, the heart is rotated clockwise with peak P-pulmonale in II, III, and aVF.These changes are consistent with type C RVH.
Figure 7.18: S1 S2 S3 Pattern. This pattern simply implies that an S wave is present in leads I, II, and III.The direc-tion of the impulse is away from these leads and is usually at the northwest quadrant causing a tall R wave in aVR. S1
S2 S3 may suggest right ventricular hypertrophy in older individuals, especially when the P waves are peaked in leadII because of right atrial enlargement, when R waves are tall in V1, or the size of the S waves is deeper than the size ofthe R waves in all three leads.
LWBK271-C07_62-79.qxd 29/1/09 8:55 pm Page 75 LWBK270-4119G-C02_073-110.qxd
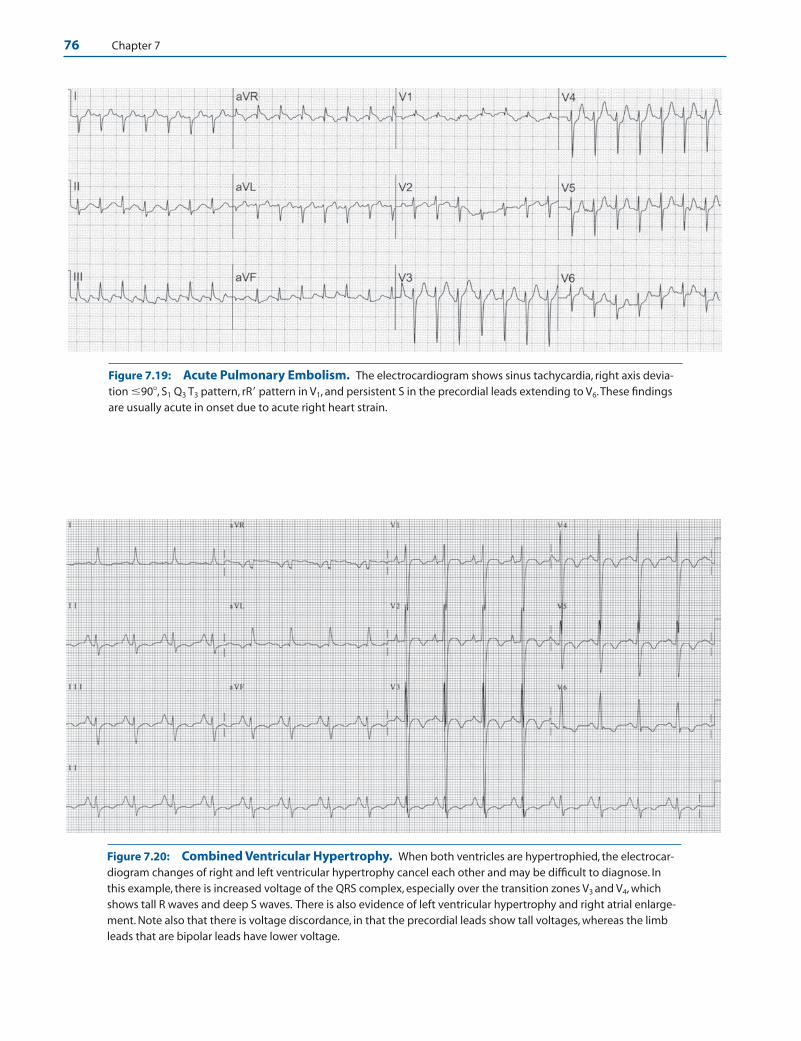
76 Chapter 7
Figure 7.19: Acute Pulmonary Embolism. The electrocardiogram shows sinus tachycardia, right axis devia-tion �90�, S1 Q3 T3 pattern, rR pattern in V1, and persistent S in the precordial leads extending to V6.These findingsare usually acute in onset due to acute right heart strain.
Figure 7.20: Combined Ventricular Hypertrophy. When both ventricles are hypertrophied, the electrocar-diogram changes of right and left ventricular hypertrophy cancel each other and may be difficult to diagnose. Inthis example, there is increased voltage of the QRS complex, especially over the transition zones V3 and V4, whichshows tall R waves and deep S waves. There is also evidence of left ventricular hypertrophy and right atrial enlarge-ment. Note also that there is voltage discordance, in that the precordial leads show tall voltages, whereas the limbleads that are bipolar leads have lower voltage.
LWBK271-C07_62-79.qxd 29/1/09 8:55 pm Page 76 LWBK270-4119G-C02_073-110.qxd
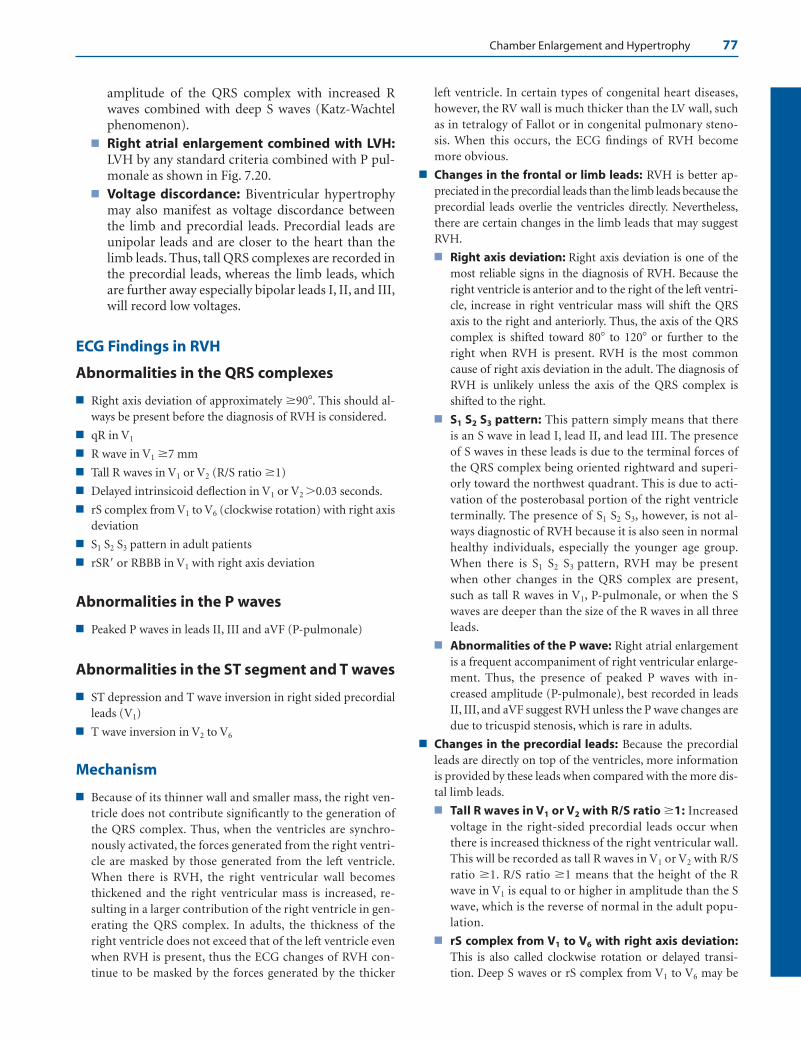
Chamber Enlargement and Hypertrophy 77
amplitude of the QRS complex with increased Rwaves combined with deep S waves (Katz-Wachtelphenomenon).
■ Right atrial enlargement combined with LVH:LVH by any standard criteria combined with P pul-monale as shown in Fig. 7.20.
■ Voltage discordance: Biventricular hypertrophymay also manifest as voltage discordance betweenthe limb and precordial leads. Precordial leads areunipolar leads and are closer to the heart than thelimb leads. Thus, tall QRS complexes are recorded inthe precordial leads, whereas the limb leads, whichare further away especially bipolar leads I, II, and III,will record low voltages.
ECG Findings in RVH
Abnormalities in the QRS complexes
■ Right axis deviation of approximately �90�. This should al-ways be present before the diagnosis of RVH is considered.
■ qR in V1
■ R wave in V1 �7 mm
■ Tall R waves in V1 or V2 (R/S ratio �1)
■ Delayed intrinsicoid deflection in V1 or V2 �0.03 seconds.
■ rS complex from V1 to V6 (clockwise rotation) with right axisdeviation
■ S1 S2 S3 pattern in adult patients
■ rSR or RBBB in V1 with right axis deviation
Abnormalities in the P waves
■ Peaked P waves in leads II, III and aVF (P-pulmonale)
Abnormalities in the ST segment and T waves
■ ST depression and T wave inversion in right sided precordialleads (V1)
■ T wave inversion in V2 to V6
Mechanism
■ Because of its thinner wall and smaller mass, the right ven-tricle does not contribute significantly to the generation ofthe QRS complex. Thus, when the ventricles are synchro-nously activated, the forces generated from the right ventri-cle are masked by those generated from the left ventricle.When there is RVH, the right ventricular wall becomesthickened and the right ventricular mass is increased, re-sulting in a larger contribution of the right ventricle in gen-erating the QRS complex. In adults, the thickness of theright ventricle does not exceed that of the left ventricle evenwhen RVH is present, thus the ECG changes of RVH con-tinue to be masked by the forces generated by the thicker
left ventricle. In certain types of congenital heart diseases,however, the RV wall is much thicker than the LV wall, suchas in tetralogy of Fallot or in congenital pulmonary steno-sis. When this occurs, the ECG findings of RVH becomemore obvious.
■ Changes in the frontal or limb leads: RVH is better ap-preciated in the precordial leads than the limb leads because theprecordial leads overlie the ventricles directly. Nevertheless,there are certain changes in the limb leads that may suggestRVH.
■ Right axis deviation: Right axis deviation is one of themost reliable signs in the diagnosis of RVH. Because theright ventricle is anterior and to the right of the left ventri-cle, increase in right ventricular mass will shift the QRSaxis to the right and anteriorly. Thus, the axis of the QRScomplex is shifted toward 80� to 120� or further to theright when RVH is present. RVH is the most commoncause of right axis deviation in the adult. The diagnosis ofRVH is unlikely unless the axis of the QRS complex isshifted to the right.
■ S1 S2 S3 pattern: This pattern simply means that thereis an S wave in lead I, lead II, and lead III. The presenceof S waves in these leads is due to the terminal forces ofthe QRS complex being oriented rightward and superi-orly toward the northwest quadrant. This is due to acti-vation of the posterobasal portion of the right ventricleterminally. The presence of S1 S2 S3, however, is not al-ways diagnostic of RVH because it is also seen in normalhealthy individuals, especially the younger age group.When there is S1 S2 S3 pattern, RVH may be presentwhen other changes in the QRS complex are present,such as tall R waves in V1, P-pulmonale, or when the Swaves are deeper than the size of the R waves in all threeleads.
■ Abnormalities of the P wave: Right atrial enlargementis a frequent accompaniment of right ventricular enlarge-ment. Thus, the presence of peaked P waves with in-creased amplitude (P-pulmonale), best recorded in leadsII, III, and aVF suggest RVH unless the P wave changes aredue to tricuspid stenosis, which is rare in adults.
■ Changes in the precordial leads: Because the precordialleads are directly on top of the ventricles, more informationis provided by these leads when compared with the more dis-tal limb leads.
■ Tall R waves in V1 or V2 with R/S ratio �1: Increasedvoltage in the right-sided precordial leads occur whenthere is increased thickness of the right ventricular wall.This will be recorded as tall R waves in V1 or V2 with R/Sratio �1. R/S ratio �1 means that the height of the Rwave in V1 is equal to or higher in amplitude than the Swave, which is the reverse of normal in the adult popu-lation.
■ rS complex from V1 to V6 with right axis deviation:This is also called clockwise rotation or delayed transi-tion. Deep S waves or rS complex from V1 to V6 may be
LWBK271-C07_62-79.qxd 29/1/09 8:55 pm Page 77 LWBK270-4119G-C02_073-110.qxd

78 Chapter 7
due to RVH or LVH. For RVH to be present there shouldalso be right axis deviation. When RVH is present, theright ventricle rotates anteriorly, causing the left ventricleto rotate in a more posterior orientation. If the ventriclesare viewed from below looking upward, the rotation ofboth ventricles will be clockwise when there is right ven-tricular enlargement. Because the precordial leads arerecorded in their standard location from V1 to V6, the tran-sition zone is not crossed unless the electrodes are movedto the left and more posteriorly. This type of RVH is fre-quently associated with chronic lung disease (type C RVH).
■ Prolonged ventricular activation time with delayedonset of the intrinsicoid deflection in V1 or V2. Whenthe ventricular activation time is prolonged, the onset ofthe intrinsicoid deflection is delayed. The ventricular acti-vation time of the right ventricle is measured in V1 fromthe onset of the QRS complex to the peak of the R or R′wave and represents the time required for the impulse toactivate the right ventricular wall. The ventricular activa-tion time of the right ventricle normally measures �0.03seconds and is increased to �0.04 seconds when there isright ventricular hypertrophy. The onset of the intrinsi-coid deflection, measured in V1 or V2, represents the timewhen the electrical impulse has reached the right ventric-ular epicardium and generally coincides with the peak ofthe R wave or immediately thereafter, when the R wave isdeflected downward toward baseline.
Clinical Significance
■ In adults, RVH can result from many different causes. RVHmay be due to pressure overload such as pulmonic stenosisor primary pulmonary hypertension. This type of RVH pre-dominantly results in increased thickness of the right ventri-cle. It may also be due to volume overload such as atrial sep-tal defect and tricuspid or pulmonic regurgitations,resulting in volume overload with dilatation of the rightventricular cavity. RVH can also result from the presence oflung disease, which may distort the anatomical relationshipbetween the heart and the chest wall. Or it may be due to leftheart failure where an increase in left ventricular mass is as-sociated with an increase in right ventricular mass. Thesechanges may develop insidiously or abruptly, as when pul-monary hypertension occurs in the setting of acute pul-monary embolism. The ECG presentations of RVH, there-fore, in these different clinical settings are not necessarilysimilar. Different patterns of RVH have been describedwhich includes types A, B, and C based on the morphologyof the QRS complex in the precordial leads. Types A and Bare easy to recognize as RVH because the size of the R waveis taller than the S wave in V1, whereas in type C the size ofthe R wave is smaller than the S wave in V1 and may not berecognized as RVH. In all three types, the axis of the QRScomplex is shifted to the right.
■ Type A RVH: This is the most recognizable type of RVH.The R waves are tall in V1, often in V2 and V3. The R wave
is usually monophasic (no S wave) in V1. If an S wave ispresent, the R wave is always taller than the height of the Swave with an R/S ratio �1. V5 and V6 may show deeper Swaves than R waves. In type A RVH, the thickness of theright ventricle is greater than the thickness of the left ven-tricle, and the right ventricle is the dominant ventricle.This type of RVH is the most commonly recognized andis seen in severe pulmonic stenosis, primary pulmonaryhypertension, or mitral stenosis with severe pulmonaryhypertension. The axis of the QRS complex is signifi-cantly deviated to the right at approximately �120�.
■ Type B RVH: The R wave in V1 is slightly taller than the Swave or the ratio between the R wave and S wave is �1. V1
may also exhibit an rsr pattern. The QRS complex in V5
and V6 is not different from normal. This type of RVH isusually due to atrial septal defect or mitral stenosis withmild to moderate pulmonary hypertension. The frontalaxis is vertical at approximately 90�.
■ Type C RVH: This type of RVH is difficult to recognizeand is frequently missed because the R wave in V1 is nottall and is smaller than the S wave. Instead, a deep S waveis present in V1 and in V2 that extends up to V6. Thus, V1
to V6 will show rS complexes. In V6, the R wave continuesto be smaller in amplitude than the S wave. The axis of theQRS complex is approximately 90� or less. This type ofRVH is usually due to chronic obstructive lung diseasebut could also occur acutely as a manifestation of acutepulmonary embolism.
■ Prolongation of the QRS complex usually does not occurwhen there is RVH because the thickness of the right ventri-cle wall usually does not exceed that of the left ventricle, evenwhen RVH is present. Thus, the forces generated by the rightventricle are cancelled by the forces from the left ventricle.When widening of the QRS complex is present, there may beassociated right bundle branch block because the right bun-dle branch is very susceptible to injury when there is in-creased right ventricular pressure.
■ The right ventricle is to the right and anterior to that of theleft ventricle. Pulsations from the right ventricle are not nor-mally visible or palpable. However, when the right ventricleis enlarged or hypertrophied, a sustained systolic precordialimpulse is palpable along the left parasternal area. Prominent“a” waves are seen in the neck veins. Very often, tricuspid re-gurgitation is also present causing a “cv” wave in the jugularneck veins accompanied by prominent pulsations of the liveror the ear lobes bilaterally. Third and fourth gallop soundsmay also be audible along the lower left sternal border. Theirright ventricular origin can be verified by increase in inten-sity of these gallop sounds with inspiration.
Treatment and Prognosis
■ When RVH is present, the underlying cause should be evalu-ated. The treatment and prognosis will depend on the etiol-ogy of the RVH.
LWBK271-C07_62-79.qxd 29/1/09 8:55 pm Page 78 LWBK270-4119G-C02_073-110.qxd

Chamber Enlargement and Hypertrophy 79
Suggested Readings
Ariyarajah V, Frisella ME, Spodick DH. Reevaluation of the cri-terion for interatrial block. Am J Cardiol. 2006;98:936–937.
Buxton AE, Calkins H, Callans DJ, et al. ACC/AHA/HRS 2006key data elements and definitions for electrophysiologicalstudies and procedures: a report of the American College ofCardiology/American Heart Association Task Force on clini-cal data standards (ACC/AHA/HRS writing committee todevelop data standards on electrophysiology. J Am Coll Car-diol. 2006;48:2360–2396.
Casale PN, Devereux RB, Alonso DR, et al. Improved sex-specific criteria of left ventricular hypertrophy for clinicaland computer interpretation of electrocardiograms: valida-tion with autopsy findings. Circulation. 1987;75:565–572.
Chow TC, Helm RA, Kaplan S. Right Ventricular Hypertrophy inClinical Vectorcardiography. 2nd ed. New York: Grune andStratton; 1974.
Conover MB. Chamber hypertrophy and enlargement. In: Un-derstanding Electrocardiography. 8th ed. St. Louis: Mosby;2003:407–419.
Devereux RB, Wachtell K, Gerdts E, et al. Prognostic significanceof left ventricular mass change during treatment of hyper-tension. JAMA 2004;292:2350–2356.
Dunn MI, Lipman BS. Lipman-Massie Clinical Electrocardiogra-phy. Chicago: Yearbook Medical Publishers, Inc.; 1989.
Gardin JM, Lauer MS. Left ventricular hypertrophy: the nexttreatable silent killer. JAMA. 2004;292:2396–2398.
Haider AW, Larson MG, Benjamin EJ, et al. Increased left ven-tricular mass and hypertrophy are associated with increasedrisk for sudden death. J Am Coll Cardiol. 1998;32:1454–1459.
Josephson ME, Kastor JA, Morganroth J. Electrocardiographicleft atrial enlargement. Electrophysiologic, echocardio-
graphic and hemodynamic correlates. J Am Coll Cardiol.1977;39:967–971.
Kligfield P, Gettes LS, Bailey JJ, et al. Recommendations for thestandardization and interpretation of the electrocardiogram.J Am Coll Cardiol. 2007;49:1109–1127.
Marriott HJL. Chamber enlargement. In: Practical Electrocardio-graphy. 5th ed. Baltimore: The William and Wilkins Com-pany; 1972:56–66.
Mirvis DM, Goldberger AL. Electrocardiography. In: Zipes DP,Libby P, Bonow RO, et al., eds. Braunwald’s Heart Disease, aTextbook of Cardiovascular Medicine. 7th ed. Philadelphia:Elsevier Saunders; 2005:118–125.
Nicholas WJ, Liebson PR. ECG changes in COPD: what do theymean? J Respir Dis. 1987;8:103–120.
Odom II H, Davis L, Dinh HA, et al. QRS voltage measurementsin autopsied men free of cardiopulmonary disease: a basisfor evaluating total QRS voltage as an index of left ventricu-lar hypertrophy. Am J Cardiol. 1986;58:801–804.
Okin PM, Roman MU, Devereux RB, et al. Time-voltage QRSarea of the 12-lead electrocardiogram: detection of left ven-tricular hypertrophy. Hypertension. 1998:31:937–942.
Okin PM, Devereux RB, Jern S, et al. Regression of electrocar-diographic left ventricular hypertrophy during antihyper-tensive treatment and the prediction of major cardiovascularevents. JAMA. 2004;292:2343–2349.
Romhilt DW, Estes EH Jr. A point-score system for the ECG di-agnosis of left ventricular hypertrophy. Am Heart J.1968;75:752.
Sokolow M, Lyon TP. The ventricular complex in left ventricularhypertrophy as obtained by unipolar precordial and limbleads. Am Heart J. 1949;37:161–186.
Willems JL, Robles de Medina EO, Bernard R, et al. Criteria forintraventricular conduction disturbances and pre-excita-tion. J Am Coll Cardiol. 1985;5:1261–1275.
LWBK271-C07_62-79.qxd 29/1/09 8:55 pm Page 79 LWBK270-4119G-C02_073-110.qxd
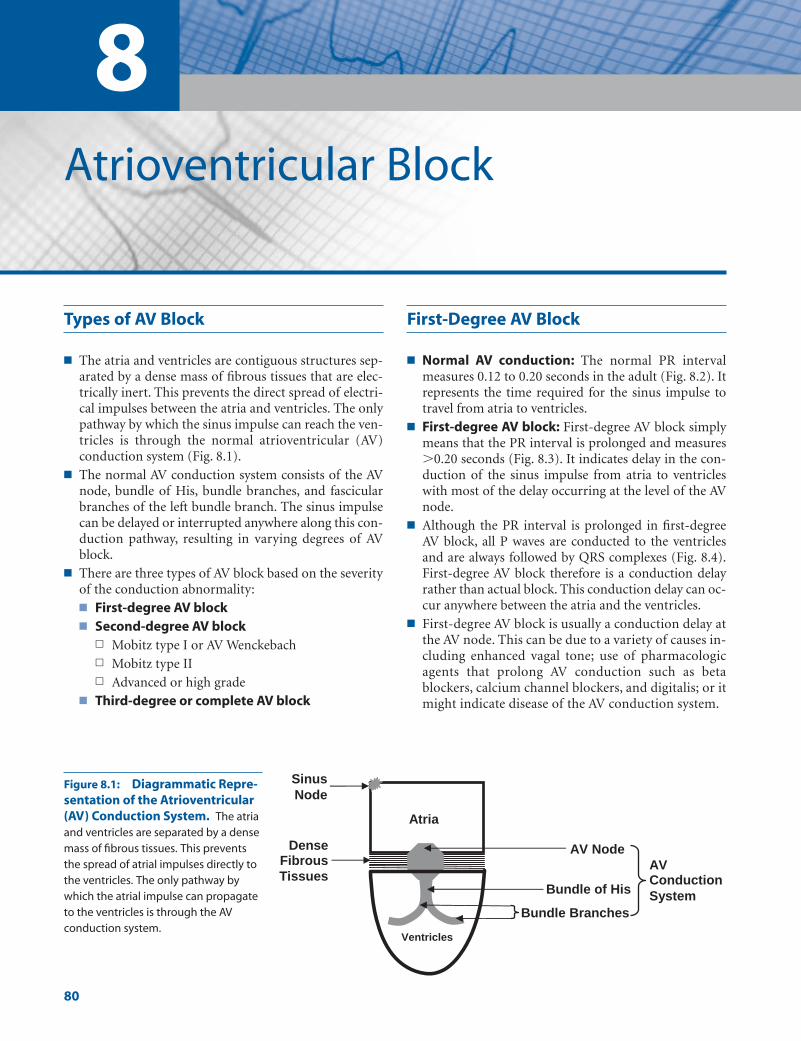
8Atrioventricular Block
80
Types of AV Block
■ The atria and ventricles are contiguous structures sep-arated by a dense mass of fibrous tissues that are elec-trically inert. This prevents the direct spread of electri-cal impulses between the atria and ventricles. The onlypathway by which the sinus impulse can reach the ven-tricles is through the normal atrioventricular (AV)conduction system (Fig. 8.1).
■ The normal AV conduction system consists of the AVnode, bundle of His, bundle branches, and fascicularbranches of the left bundle branch. The sinus impulsecan be delayed or interrupted anywhere along this con-duction pathway, resulting in varying degrees of AVblock.
■ There are three types of AV block based on the severityof the conduction abnormality:■ First-degree AV block■ Second-degree AV block
n Mobitz type I or AV Wenckebachn Mobitz type IIn Advanced or high grade
■ Third-degree or complete AV block
First-Degree AV Block
■ Normal AV conduction: The normal PR intervalmeasures 0.12 to 0.20 seconds in the adult (Fig. 8.2). Itrepresents the time required for the sinus impulse totravel from atria to ventricles.
■ First-degree AV block: First-degree AV block simplymeans that the PR interval is prolonged and measures�0.20 seconds (Fig. 8.3). It indicates delay in the con-duction of the sinus impulse from atria to ventricleswith most of the delay occurring at the level of the AVnode.
■ Although the PR interval is prolonged in first-degreeAV block, all P waves are conducted to the ventriclesand are always followed by QRS complexes (Fig. 8.4).First-degree AV block therefore is a conduction delayrather than actual block. This conduction delay can oc-cur anywhere between the atria and the ventricles.
■ First-degree AV block is usually a conduction delay atthe AV node. This can be due to a variety of causes in-cluding enhanced vagal tone; use of pharmacologicagents that prolong AV conduction such as betablockers, calcium channel blockers, and digitalis; or itmight indicate disease of the AV conduction system.
Atria
Ventricles
Sinus
Node
AV Node
Bundle of His
Bundle Branches
AV Conduction
System
DenseFibrous Tissues
Figure 8.1: Diagrammatic Repre-sentation of the Atrioventricular(AV) Conduction System. The atriaand ventricles are separated by a densemass of fibrous tissues. This preventsthe spread of atrial impulses directly tothe ventricles. The only pathway bywhich the atrial impulse can propagateto the ventricles is through the AV conduction system.
LWBK271-C08_80-111.qxd 1/29/09 12:00 PM Page 80 LWBK271-C01_01-08.qxd
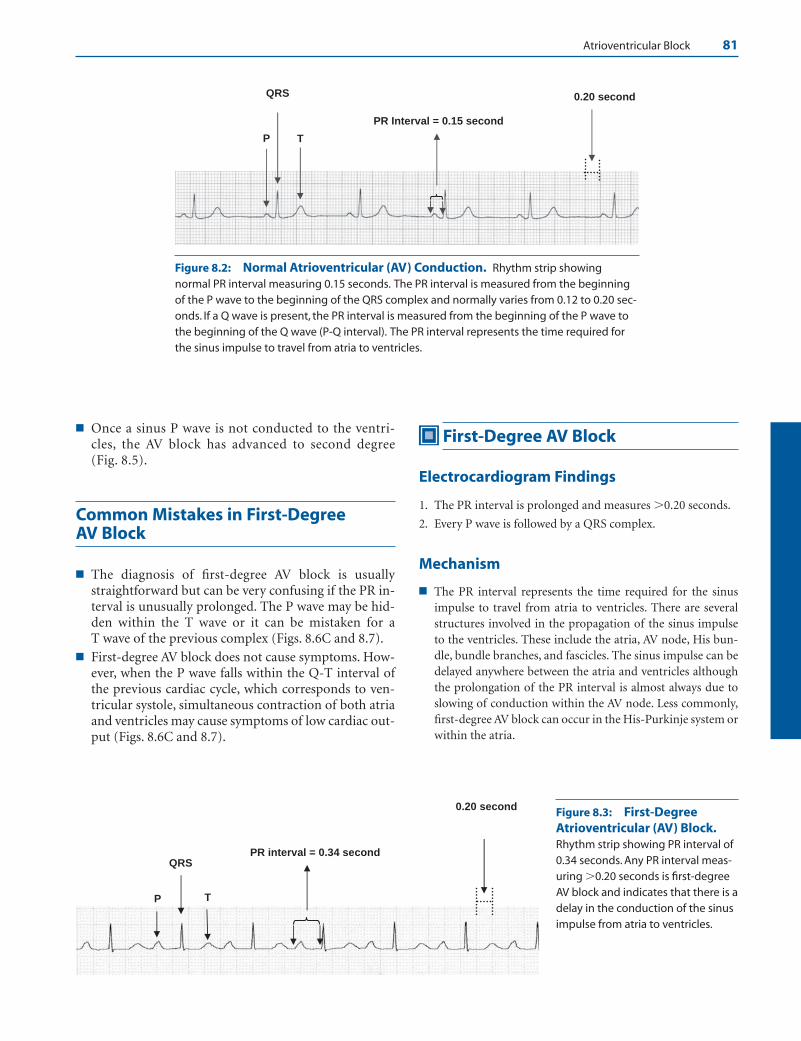
Atrioventricular Block 81
PR Interval = 0.15 second
0.20 second
P
QRS
T
Figure 8.2: Normal Atrioventricular (AV) Conduction. Rhythm strip showingnormal PR interval measuring 0.15 seconds. The PR interval is measured from the beginningof the P wave to the beginning of the QRS complex and normally varies from 0.12 to 0.20 sec-onds. If a Q wave is present, the PR interval is measured from the beginning of the P wave tothe beginning of the Q wave (P-Q interval). The PR interval represents the time required forthe sinus impulse to travel from atria to ventricles.
PR interval = 0.34 second
0.20 second
P
QRS
T
Figure 8.3: First-DegreeAtrioventricular (AV) Block.Rhythm strip showing PR interval of0.34 seconds. Any PR interval meas-uring �0.20 seconds is first-degreeAV block and indicates that there is adelay in the conduction of the sinusimpulse from atria to ventricles.
■ Once a sinus P wave is not conducted to the ventri-cles, the AV block has advanced to second degree(Fig. 8.5).
Common Mistakes in First-Degree AV Block
■ The diagnosis of first-degree AV block is usuallystraightforward but can be very confusing if the PR in-terval is unusually prolonged. The P wave may be hid-den within the T wave or it can be mistaken for a T wave of the previous complex (Figs. 8.6C and 8.7).
■ First-degree AV block does not cause symptoms. How-ever, when the P wave falls within the Q-T interval ofthe previous cardiac cycle, which corresponds to ven-tricular systole, simultaneous contraction of both atriaand ventricles may cause symptoms of low cardiac out-put (Figs. 8.6C and 8.7).
First-Degree AV Block
Electrocardiogram Findings
1. The PR interval is prolonged and measures �0.20 seconds.
2. Every P wave is followed by a QRS complex.
Mechanism
■ The PR interval represents the time required for the sinusimpulse to travel from atria to ventricles. There are severalstructures involved in the propagation of the sinus impulseto the ventricles. These include the atria, AV node, His bun-dle, bundle branches, and fascicles. The sinus impulse can bedelayed anywhere between the atria and ventricles althoughthe prolongation of the PR interval is almost always due toslowing of conduction within the AV node. Less commonly,first-degree AV block can occur in the His-Purkinje system orwithin the atria.
LWBK271-C08_80-111.qxd 1/29/09 12:00 PM Page 81 LWBK271-C01_01-08.qxd

82 Chapter 8
0.20 second PR Interval = 0.42 second
Figure 8.4: First-Degree Atrioventricular (AV) Block. The PR interval measures 0.42 seconds and is unusually prolonged. Regardless of the duration of the PR interval aslong as every P wave is followed by a QRS complex, the conduction abnormality is first-degree AV block.
Figure 8.5: Second-Degree Atrioventricular (AV) Block. When a sinus P wave is notconducted to the ventricles and is not followed by a QRS complex (star), the conductionabnormality is no longer first-degree but has advanced to second-degree AV block.
A
B
C PR = 0.41 second
Lead II Rhythm Strips
PR = 0.36 second
PR = 0.20 second
Figure 8.6: First-Degree Atrioventricular (AV) Block. When the PR interval is un-usually prolonged, the P wave may be mistaken for a T wave. Rhythm strips (A, B, C) arefrom the same patient taken on separate occasions. (A) Top normal PR interval of 0.20 sec-onds. Arrows identify the P waves.The PR interval is longer in (B) (0.36 seconds) and iseven much longer in (C) (0.41 seconds). In (C), the PR interval is unusually prolonged suchthat the P waves can be mistaken for T waves of the previous complex.
PR Interval = 0.46 second
PPP
Figure 8.7: First-Degree Atrioventricular (AV) Block with Unusually ProlongedPR Interval. The PR interval measures 0.46 seconds and is unusually prolonged.The P waveis difficult to recognize (arrows) because it is superimposed on the T wave of the previouscomplex.This can result in synchronous contraction of both atria and ventricles, which maycause symptoms of low cardiac output.
LWBK271-C08_80-111.qxd 1/29/09 12:00 PM Page 82 LWBK271-C01_01-08.qxd
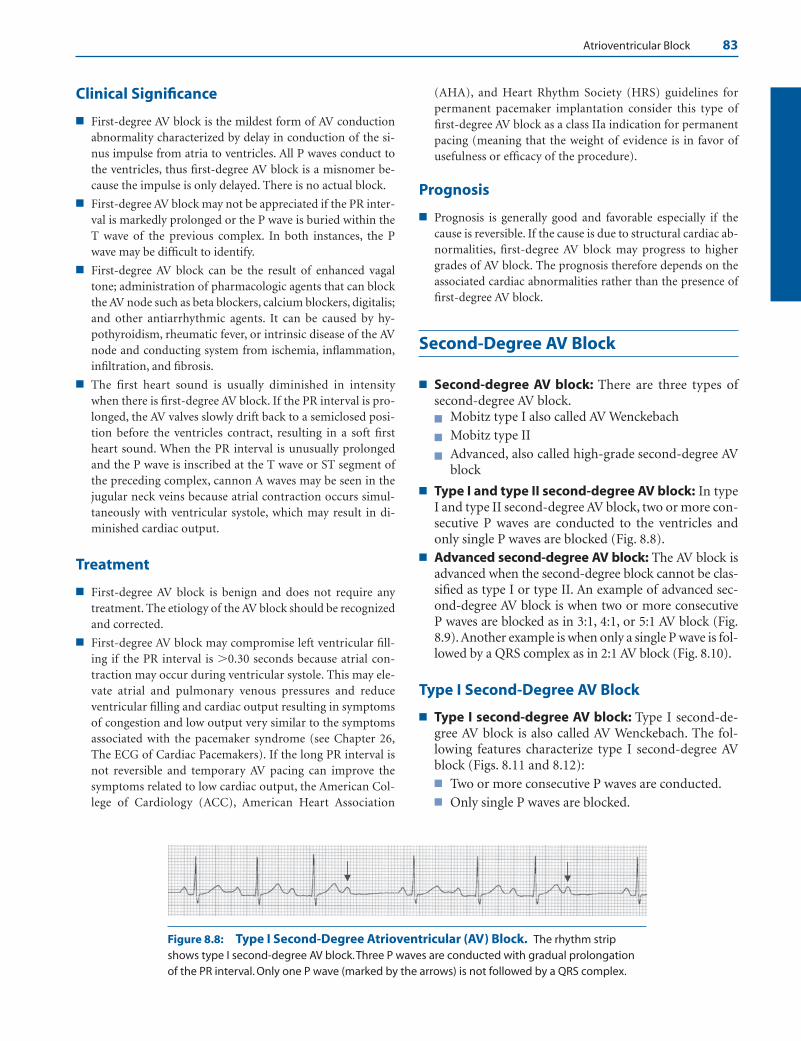
Atrioventricular Block 83
Clinical Significance
■ First-degree AV block is the mildest form of AV conductionabnormality characterized by delay in conduction of the si-nus impulse from atria to ventricles. All P waves conduct tothe ventricles, thus first-degree AV block is a misnomer be-cause the impulse is only delayed. There is no actual block.
■ First-degree AV block may not be appreciated if the PR inter-val is markedly prolonged or the P wave is buried within theT wave of the previous complex. In both instances, the Pwave may be difficult to identify.
■ First-degree AV block can be the result of enhanced vagaltone; administration of pharmacologic agents that can blockthe AV node such as beta blockers, calcium blockers, digitalis;and other antiarrhythmic agents. It can be caused by hy-pothyroidism, rheumatic fever, or intrinsic disease of the AVnode and conducting system from ischemia, inflammation,infiltration, and fibrosis.
■ The first heart sound is usually diminished in intensitywhen there is first-degree AV block. If the PR interval is pro-longed, the AV valves slowly drift back to a semiclosed posi-tion before the ventricles contract, resulting in a soft firstheart sound. When the PR interval is unusually prolongedand the P wave is inscribed at the T wave or ST segment ofthe preceding complex, cannon A waves may be seen in thejugular neck veins because atrial contraction occurs simul-taneously with ventricular systole, which may result in di-minished cardiac output.
Treatment
■ First-degree AV block is benign and does not require anytreatment. The etiology of the AV block should be recognizedand corrected.
■ First-degree AV block may compromise left ventricular fill-ing if the PR interval is �0.30 seconds because atrial con-traction may occur during ventricular systole. This may ele-vate atrial and pulmonary venous pressures and reduceventricular filling and cardiac output resulting in symptomsof congestion and low output very similar to the symptomsassociated with the pacemaker syndrome (see Chapter 26,The ECG of Cardiac Pacemakers). If the long PR interval isnot reversible and temporary AV pacing can improve thesymptoms related to low cardiac output, the American Col-lege of Cardiology (ACC), American Heart Association
(AHA), and Heart Rhythm Society (HRS) guidelines forpermanent pacemaker implantation consider this type offirst-degree AV block as a class IIa indication for permanentpacing (meaning that the weight of evidence is in favor ofusefulness or efficacy of the procedure).
Prognosis
■ Prognosis is generally good and favorable especially if thecause is reversible. If the cause is due to structural cardiac ab-normalities, first-degree AV block may progress to highergrades of AV block. The prognosis therefore depends on theassociated cardiac abnormalities rather than the presence offirst-degree AV block.
Second-Degree AV Block
■ Second-degree AV block: There are three types ofsecond-degree AV block.■ Mobitz type I also called AV Wenckebach
■ Mobitz type II
■ Advanced, also called high-grade second-degree AVblock
■ Type I and type II second-degree AV block: In typeI and type II second-degree AV block, two or more con-secutive P waves are conducted to the ventricles andonly single P waves are blocked (Fig. 8.8).
■ Advanced second-degree AV block: The AV block isadvanced when the second-degree block cannot be clas-sified as type I or type II. An example of advanced sec-ond-degree AV block is when two or more consecutive P waves are blocked as in 3:1, 4:1, or 5:1 AV block (Fig.8.9). Another example is when only a single P wave is fol-lowed by a QRS complex as in 2:1 AV block (Fig. 8.10).
Type I Second-Degree AV Block
■ Type I second-degree AV block: Type I second-de-gree AV block is also called AV Wenckebach. The fol-lowing features characterize type I second-degree AVblock (Figs. 8.11 and 8.12):■ Two or more consecutive P waves are conducted.■ Only single P waves are blocked.
Figure 8.8: Type I Second-Degree Atrioventricular (AV) Block. The rhythm stripshows type I second-degree AV block.Three P waves are conducted with gradual prolongationof the PR interval. Only one P wave (marked by the arrows) is not followed by a QRS complex.
LWBK271-C08_80-111.qxd 1/29/09 12:00 PM Page 83 LWBK271-C01_01-08.qxd
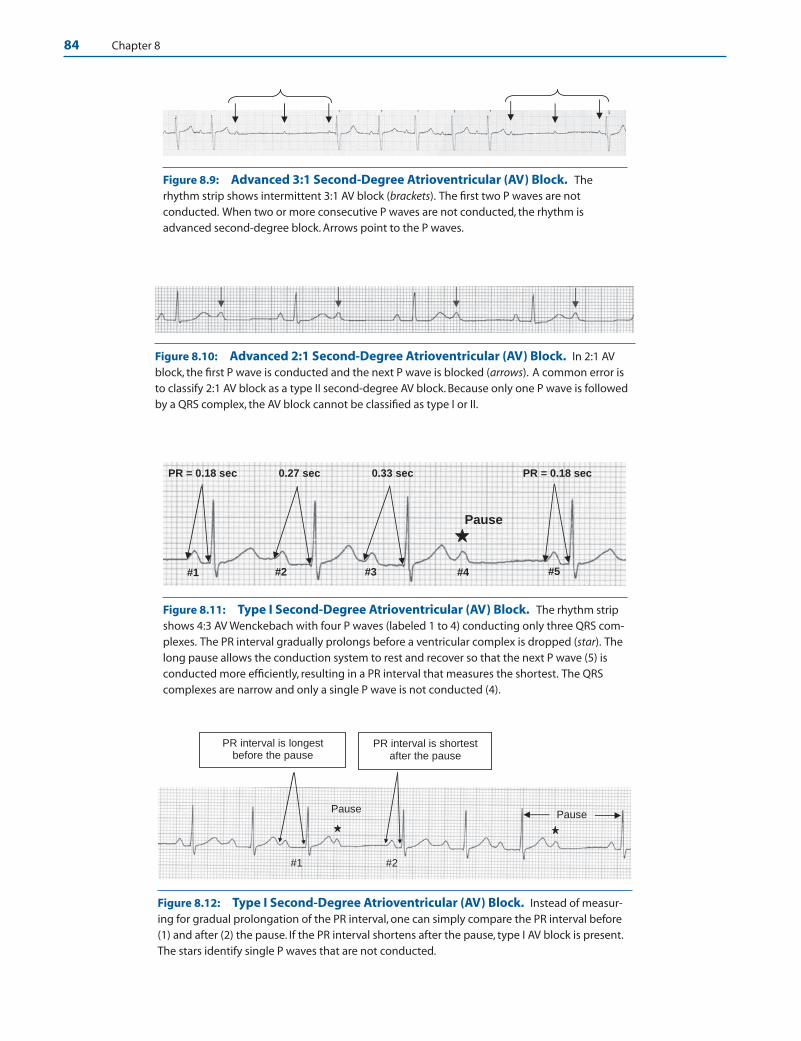
84 Chapter 8
Figure 8.9: Advanced 3:1 Second-Degree Atrioventricular (AV) Block. Therhythm strip shows intermittent 3:1 AV block (brackets). The first two P waves are notconducted. When two or more consecutive P waves are not conducted, the rhythm isadvanced second-degree block. Arrows point to the P waves.
Figure 8.10: Advanced 2:1 Second-Degree Atrioventricular (AV) Block. In 2:1 AVblock, the first P wave is conducted and the next P wave is blocked (arrows). A common error isto classify 2:1 AV block as a type II second-degree AV block. Because only one P wave is followedby a QRS complex, the AV block cannot be classified as type I or II.
#1 #2 #3
PR = 0.18 sec 0.27 sec 0.33 sec PR = 0.18 sec
#4 #5
Pause
Figure 8.11: Type I Second-Degree Atrioventricular (AV) Block. The rhythm stripshows 4:3 AV Wenckebach with four P waves (labeled 1 to 4) conducting only three QRS com-plexes. The PR interval gradually prolongs before a ventricular complex is dropped (star). Thelong pause allows the conduction system to rest and recover so that the next P wave (5) isconducted more efficiently, resulting in a PR interval that measures the shortest. The QRScomplexes are narrow and only a single P wave is not conducted (4).
Pause
PR interval is longest before the pause
PR interval is shortest after the pause
Pause
#1 #2
Figure 8.12: Type I Second-Degree Atrioventricular (AV) Block. Instead of measur-ing for gradual prolongation of the PR interval, one can simply compare the PR interval before(1) and after (2) the pause. If the PR interval shortens after the pause, type I AV block is present.The stars identify single P waves that are not conducted.
LWBK271-C08_80-111.qxd 1/29/09 12:00 PM Page 84 LWBK271-C01_01-08.qxd

Atrioventricular Block 85
■ There is gradual prolongation of the PR interval be-fore a ventricular complex is dropped.
■ The PR interval always shortens immediately afterthe pause.
■ The QRS complexes may be narrow or wide but aretypically narrow.
Type I Second-Degree AV Block
■ There are additional features commonly seen in classi-cal type I second-degree AV block:■ Group beating is present (Fig. 8.13)■ The R-R intervals (distance between two R waves)
are variable (Fig. 8.14). The R-R interval straddlinga blocked P wave is less than the R-R interval strad-dling a conducted sinus impulse.
■ Conduction ratio: The conduction ratio refers to thetotal number of P waves to the total number of QRScomplexes that are conducted. Thus, a 4:3 AVWenckebach implies that of four consecutive P waves,only three are conducted; a 5:4 AV Wenckebachmeans that of five consecutive P waves, only four areconducted.
■ Shortening of the PR interval after a pause is much eas-ier to recognize than gradual prolongation of the PRinterval, as shown in Figure 8.15. This always favorssecond-degree type I AV block.
■ Type I second-degree AV block may have narrow orwide QRS complexes.
■ Localizing the AV block: Type I second-degree AVblock is almost always localized at the level of the AVnode, although it can also occur below the AV node(infranodal) at the level of the His-Purkinje system.The presence of bundle branch block (Fig. 8.16) or my-ocardial infarction (Fig. 8.17) may be helpful in localiz-ing whether the block is nodal or infranodal.■ Narrow QRS complexes: When the QRS com-
plexes are narrow, the block is almost always con-fined to the AV node (Fig. 8.18). A block occurringat the bundle of His (intra-His block) is possible,but is rare.
■ Wide QRS complexes: When the QRS complexesare wide because of the presence of bundle branchblock, the block may be AV nodal although an infra-nodal block at the level of the bundle branches ismore likely (Fig. 8.16).
# 2 # 1 4 #3 #
Figure 8.13: Group Beating. Group beating simply means that if you “eyeball” the trac-ing from left to right, one gets the impression that the beats (the QRS complexes) aregrouped together because of the spaces created by P waves without QRS complexes (stars).Four such groups can be identified in the above tracing (groups 1 to 4). Group beating is fre-quently seen in type I atrioventricular (AV) block because AV Wenckebach has a tendency tobe repetitive. The above is an example of 4:3 AV Wenckebach meaning that there are four Pwaves for every three QRS complexes.
0.80 s 0.72 s1.2 s
Pause
1.52 s
Figure 8.14: Varying R-R Interval in Type I Second-Degree Atrioventricular(AV) Block. Type I can be differentiated from type II second-degree AV block by the R-Rintervals. In type I AV block, the R-R intervals are variable because the PR intervals are alsovariable. Note that the R-R interval straddling a blocked P wave (1.2 seconds) is less than theR-R interval straddling a conducted sinus impulse (1.52 seconds). This is in contrast to typeII block, where the R-R intervals are fixed because the PR intervals are also fixed (see Fig.8.20).The longest R-R interval occurs immediately after the pause (0.80 seconds) with grad-ual shortening of the next R-R interval (0.72 seconds). The stars mark the P waves that arenot conducted.
LWBK271-C08_80-111.qxd 1/29/09 12:00 PM Page 85 LWBK271-C01_01-08.qxd

86 Chapter 8
■ Acute myocardial infarction (MI):n Acute inferior MI: When AV block occurs in the
setting of an acute inferior MI, the location of theAV block is at the AV node (Fig. 8.17, see also Figs.8.30 and 8.39). The QRS complexes are narrow.
n Acute anterior MI: When AV block occurs in thesetting of an acute anterior MI, the AV block is below the AV node (infranodal block). TheQRS complexes are usually wide (See section onComplete AV Block).
ECG Findings of Type I AV Block
1. Two or more consecutive P waves are conducted.
2. Only single P waves are blocked.
3. There is gradual prolongation of the PR interval before a ven-tricular complex is dropped.
4. The PR interval always shortens immediately after thepause.
5. The QRS complexes are usually narrow.
6. Group beating is present.
7. The R-R intervals are variable. The longest R-R interval isnoted immediately after the pause and shortening of the R-Rinterval occurs successively thereafter.
Mechanism
■ Type I second-degree AV block or AV Wenckebach is usu-ally a block at the level of the AV node although it can occur
PR interval longer
PR interval shortens after
the pause
Pause
Figure 8.15: Type I Second-Degree Atrioventricular (AV) Block. The PR interval looksfixed but suddenly shortens after the pause.The shortening of the PR interval is characteristic oftype I second-degree AV block. The star identifies a P wave without a QRS complex. Note thatgradual lengthening of the PR interval is not obvious before the pause.
PR = 0.32 sec PR = 0.25 sec
Figure 8.16: Second-Degree Atrioventricular (AV) Block with Wide QRS Complexes. The QRScomplexes in AV Wenckebach are usually narrow. In this example, the QRS complexes are wide because of the pres-ence of right bundle branch block and left anterior fascicular block. The rhythm strip at the bottom of the tracingshows 3:2 AV Wenckebach. Note that the PR interval is longer before the pause (0.32 seconds) and shortens immedi-ately after the pause (0.25 seconds). Shortening of the PR interval after the pause is consistent with type I second-degree AV block. The P waves that are not conducted are identified by the stars.
LWBK271-C08_80-111.qxd 1/29/09 12:00 PM Page 86 LWBK271-C01_01-08.qxd
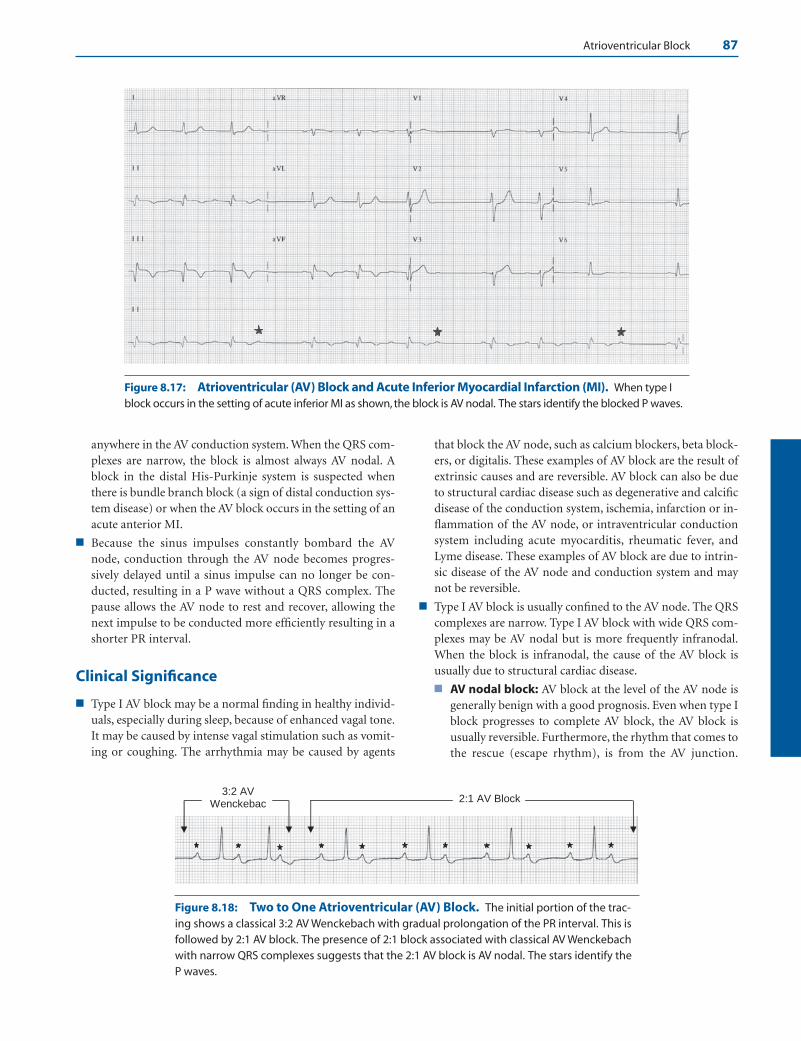
Atrioventricular Block 87
Figure 8.17: Atrioventricular (AV) Block and Acute Inferior Myocardial Infarction (MI). When type Iblock occurs in the setting of acute inferior MI as shown, the block is AV nodal. The stars identify the blocked P waves.
2:1 AV Block3:2 AV
Wenckebac
Figure 8.18: Two to One Atrioventricular (AV) Block. The initial portion of the trac-ing shows a classical 3:2 AV Wenckebach with gradual prolongation of the PR interval. This isfollowed by 2:1 AV block. The presence of 2:1 block associated with classical AV Wenckebachwith narrow QRS complexes suggests that the 2:1 AV block is AV nodal. The stars identify the P waves.
anywhere in the AV conduction system. When the QRS com-plexes are narrow, the block is almost always AV nodal. Ablock in the distal His-Purkinje system is suspected whenthere is bundle branch block (a sign of distal conduction sys-tem disease) or when the AV block occurs in the setting of anacute anterior MI.
■ Because the sinus impulses constantly bombard the AVnode, conduction through the AV node becomes progres-sively delayed until a sinus impulse can no longer be con-ducted, resulting in a P wave without a QRS complex. Thepause allows the AV node to rest and recover, allowing thenext impulse to be conducted more efficiently resulting in ashorter PR interval.
Clinical Significance
■ Type I AV block may be a normal finding in healthy individ-uals, especially during sleep, because of enhanced vagal tone.It may be caused by intense vagal stimulation such as vomit-ing or coughing. The arrhythmia may be caused by agents
that block the AV node, such as calcium blockers, beta block-ers, or digitalis. These examples of AV block are the result ofextrinsic causes and are reversible. AV block can also be dueto structural cardiac disease such as degenerative and calcificdisease of the conduction system, ischemia, infarction or in-flammation of the AV node, or intraventricular conductionsystem including acute myocarditis, rheumatic fever, andLyme disease. These examples of AV block are due to intrin-sic disease of the AV node and conduction system and maynot be reversible.
■ Type I AV block is usually confined to the AV node. The QRScomplexes are narrow. Type I AV block with wide QRS com-plexes may be AV nodal but is more frequently infranodal.When the block is infranodal, the cause of the AV block isusually due to structural cardiac disease.
■ AV nodal block: AV block at the level of the AV node isgenerally benign with a good prognosis. Even when type Iblock progresses to complete AV block, the AV block isusually reversible. Furthermore, the rhythm that comes tothe rescue (escape rhythm), is from the AV junction.
LWBK271-C08_80-111.qxd 1/29/09 12:00 PM Page 87 LWBK271-C01_01-08.qxd

88 Chapter 8
AV junctional rhythm is more stable and more physio-logic than a ventricular escape rhythm and has a relativelyfast rate that can be further enhanced with atropine.
■ Infranodal block: Type I block with wide QRS com-plexes may be nodal or infranodal. Infranodal AV blockmay occur at the level of the bundle of His, bundlebranches, or distal fascicles. Infranodal AV block is almostalways associated with bundle branch block and the im-mediate prognosis is more ominous when compared withthat occurring at the AV node (Fig. 8.19).
■ Type I AV block is a common complication of acute infe-rior MI and is usually reversible since the block is at thelevel of the AV node.
Treatment
■ Symptomatic patients:
■ For symptomatic patients with type I second-degree AVblock that does not resolve, especially in patients with left
ventricular systolic dysfunction, the ACC/AHA/HRSguidelines recommend the insertion of a permanentpacemaker as a Class I indication regardless of the loca-tion of the AV block. (Class I means there is evidence orgeneral agreement that the procedure is beneficial, useful,and effective.)
■ Patients with second-degree AV block with symptomssimilar to those of the pacemaker syndrome; insertion ofa permanent pacemaker is a Class IIa recommendation.
■ Patients with neuromuscular disease with second-degreeAV block with or without symptoms; insertion of a per-manent pacemaker is a Class IIb recommendation.
■ Asymptomatic patients: Type I second-degree AV nodalblock is usually reversible and generally does not require anytherapy. The cause of the AV block should be identified andcorrected. The following are the ACC/AHA/HRS recommen-dations regarding insertion of permanent pacemakers incompletely asymptomatic patients with type I second-degreeAV block.
A B C D
AV Nodal Block Infranodal Block
A.
B.
Figure 8.19: Complete Atrioventricular (AV) block and Junctional Escape Rhythm. Complete AVblock can occur anywhere in the conduction system. In the upper column, complete AV block is at the AV node(A); in (B), at the bundle of His; in (C), both bundle branches; and in (D), right bundle branch and both fascicles ofthe left bundle. If the block is AV nodal (A), the escape rhythm will be AV junctional (star) and will have narrow QRScomplexes (electrocardiogram A). However, if the block is infranodal (diagrams B, C, and D), AV junctional rhythmis not possible and the escape rhythm will be ventricular with wide QRS complex (electrocardiogram B).
LWBK271-C08_80-111.qxd 1/29/09 12:00 PM Page 88 LWBK271-C01_01-08.qxd
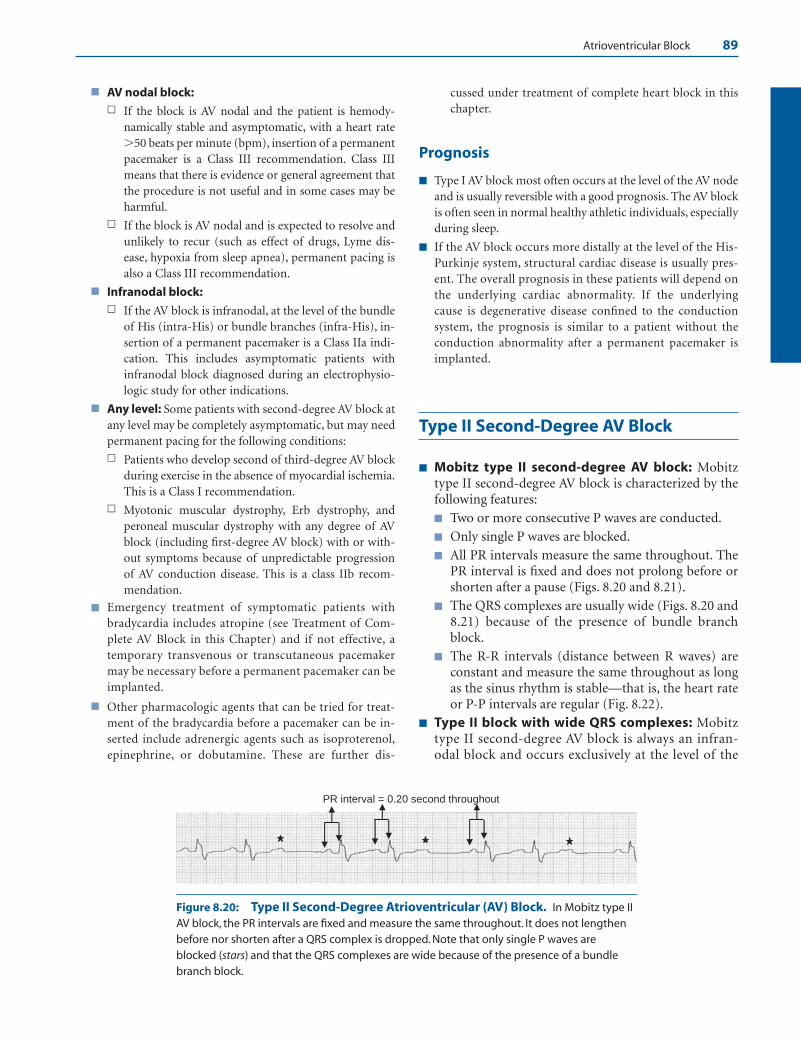
Atrioventricular Block 89
■ AV nodal block:n If the block is AV nodal and the patient is hemody-
namically stable and asymptomatic, with a heart rate�50 beats per minute (bpm), insertion of a permanentpacemaker is a Class III recommendation. Class IIImeans that there is evidence or general agreement thatthe procedure is not useful and in some cases may beharmful.
n If the block is AV nodal and is expected to resolve andunlikely to recur (such as effect of drugs, Lyme dis-ease, hypoxia from sleep apnea), permanent pacing isalso a Class III recommendation.
■ Infranodal block:n If the AV block is infranodal, at the level of the bundle
of His (intra-His) or bundle branches (infra-His), in-sertion of a permanent pacemaker is a Class IIa indi-cation. This includes asymptomatic patients withinfranodal block diagnosed during an electrophysio-logic study for other indications.
■ Any level: Some patients with second-degree AV block atany level may be completely asymptomatic, but may needpermanent pacing for the following conditions:
n Patients who develop second of third-degree AV blockduring exercise in the absence of myocardial ischemia.This is a Class I recommendation.
n Myotonic muscular dystrophy, Erb dystrophy, andperoneal muscular dystrophy with any degree of AVblock (including first-degree AV block) with or with-out symptoms because of unpredictable progressionof AV conduction disease. This is a class IIb recom-mendation.
■ Emergency treatment of symptomatic patients withbradycardia includes atropine (see Treatment of Com-plete AV Block in this Chapter) and if not effective, atemporary transvenous or transcutaneous pacemakermay be necessary before a permanent pacemaker can beimplanted.
■ Other pharmacologic agents that can be tried for treat-ment of the bradycardia before a pacemaker can be in-serted include adrenergic agents such as isoproterenol,epinephrine, or dobutamine. These are further dis-
cussed under treatment of complete heart block in thischapter.
Prognosis
■ Type I AV block most often occurs at the level of the AV nodeand is usually reversible with a good prognosis. The AV blockis often seen in normal healthy athletic individuals, especiallyduring sleep.
■ If the AV block occurs more distally at the level of the His-Purkinje system, structural cardiac disease is usually pres-ent. The overall prognosis in these patients will depend onthe underlying cardiac abnormality. If the underlyingcause is degenerative disease confined to the conductionsystem, the prognosis is similar to a patient without theconduction abnormality after a permanent pacemaker isimplanted.
Type II Second-Degree AV Block
■ Mobitz type II second-degree AV block: Mobitztype II second-degree AV block is characterized by thefollowing features:
■ Two or more consecutive P waves are conducted.
■ Only single P waves are blocked.
■ All PR intervals measure the same throughout. ThePR interval is fixed and does not prolong before orshorten after a pause (Figs. 8.20 and 8.21).
■ The QRS complexes are usually wide (Figs. 8.20 and8.21) because of the presence of bundle branchblock.
■ The R-R intervals (distance between R waves) areconstant and measure the same throughout as longas the sinus rhythm is stable—that is, the heart rateor P-P intervals are regular (Fig. 8.22).
■ Type II block with wide QRS complexes: Mobitztype II second-degree AV block is always an infran-odal block and occurs exclusively at the level of the
PR interval = 0.20 second throughout
Figure 8.20: Type II Second-Degree Atrioventricular (AV) Block. In Mobitz type IIAV block, the PR intervals are fixed and measure the same throughout. It does not lengthenbefore nor shorten after a QRS complex is dropped. Note that only single P waves areblocked (stars) and that the QRS complexes are wide because of the presence of a bundlebranch block.
LWBK271-C08_80-111.qxd 1/29/09 12:00 PM Page 89 LWBK271-C01_01-08.qxd
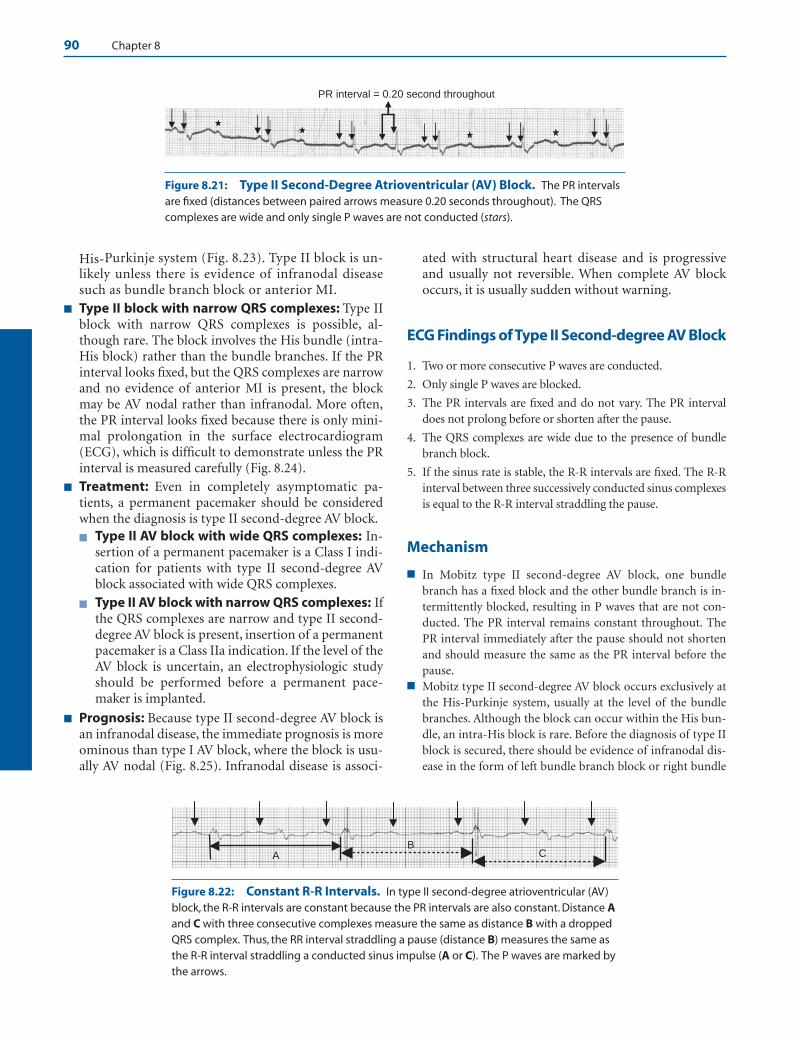
90 Chapter 8
His-Purkinje system (Fig. 8.23). Type II block is un-likely unless there is evidence of infranodal diseasesuch as bundle branch block or anterior MI.
■ Type II block with narrow QRS complexes: Type IIblock with narrow QRS complexes is possible, al-though rare. The block involves the His bundle (intra-His block) rather than the bundle branches. If the PRinterval looks fixed, but the QRS complexes are narrowand no evidence of anterior MI is present, the blockmay be AV nodal rather than infranodal. More often,the PR interval looks fixed because there is only mini-mal prolongation in the surface electrocardiogram(ECG), which is difficult to demonstrate unless the PRinterval is measured carefully (Fig. 8.24).
■ Treatment: Even in completely asymptomatic pa-tients, a permanent pacemaker should be consideredwhen the diagnosis is type II second-degree AV block.
■ Type II AV block with wide QRS complexes: In-sertion of a permanent pacemaker is a Class I indi-cation for patients with type II second-degree AVblock associated with wide QRS complexes.
■ Type II AV block with narrow QRS complexes: Ifthe QRS complexes are narrow and type II second-degree AV block is present, insertion of a permanentpacemaker is a Class IIa indication. If the level of theAV block is uncertain, an electrophysiologic studyshould be performed before a permanent pace-maker is implanted.
■ Prognosis: Because type II second-degree AV block isan infranodal disease, the immediate prognosis is moreominous than type I AV block, where the block is usu-ally AV nodal (Fig. 8.25). Infranodal disease is associ-
ated with structural heart disease and is progressiveand usually not reversible. When complete AV blockoccurs, it is usually sudden without warning.
ECG Findings of Type II Second-degree AV Block
1. Two or more consecutive P waves are conducted.
2. Only single P waves are blocked.
3. The PR intervals are fixed and do not vary. The PR intervaldoes not prolong before or shorten after the pause.
4. The QRS complexes are wide due to the presence of bundlebranch block.
5. If the sinus rate is stable, the R-R intervals are fixed. The R-Rinterval between three successively conducted sinus complexesis equal to the R-R interval straddling the pause.
Mechanism
■ In Mobitz type II second-degree AV block, one bundlebranch has a fixed block and the other bundle branch is in-termittently blocked, resulting in P waves that are not con-ducted. The PR interval remains constant throughout. ThePR interval immediately after the pause should not shortenand should measure the same as the PR interval before thepause.
■ Mobitz type II second-degree AV block occurs exclusively atthe His-Purkinje system, usually at the level of the bundlebranches. Although the block can occur within the His bun-dle, an intra-His block is rare. Before the diagnosis of type IIblock is secured, there should be evidence of infranodal dis-ease in the form of left bundle branch block or right bundle
PR interval = 0.20 second throughout
Figure 8.21: Type II Second-Degree Atrioventricular (AV) Block. The PR intervalsare fixed (distances between paired arrows measure 0.20 seconds throughout). The QRScomplexes are wide and only single P waves are not conducted (stars).
B A C
Figure 8.22: Constant R-R Intervals. In type II second-degree atrioventricular (AV)block, the R-R intervals are constant because the PR intervals are also constant. Distance Aand C with three consecutive complexes measure the same as distance B with a droppedQRS complex. Thus, the RR interval straddling a pause (distance B) measures the same asthe R-R interval straddling a conducted sinus impulse (A or C). The P waves are marked bythe arrows.
LWBK271-C08_80-111.qxd 1/29/09 12:00 PM Page 90 LWBK271-C01_01-08.qxd

Atrioventricular Block 91
Figure 8.23: Mobitz Type II Second-Degree Atrioventricular (AV) Block. The 12-lead electro-cardiogram shows all the findings of type II second-degree AV block. The PR interval is fixed, only single Pwaves are blocked (stars), two consecutive P waves are conducted, and there is left bundle branch block.
Figure 8.24: Fixed PR Interval with Narrow QRS Complexes. The PR interval looks fixed and theQRS complexes are narrow. However, if the PR interval is measured carefully, there is subtle shortening imme-diately after the pause. Shortening of the PR interval after a pause suggests type I second-degree atrioventric-ular block. The stars identify the nonconducted P waves.
A: Type I B: Type II
Atria
Ventricles
Atria
Ventricles
His Bundle
Bundle Branches
AV Node
Figure 8.25: Location of Atrioventricular (AV) Block. In type I second-degree AV block or AVWenckebach (A), the AV block is almost always at the AV node although it can also occur anywhere in theHis-Purkinje system. In type II second-degree AV block (B), the AV block occurs exclusively at the bundle ofHis, bundle branches, and distal conduction system. The lines transecting the AV conduction system indi-cate the potential sites of AV block.
LWBK271-C08_80-111.qxd 1/29/09 12:00 PM Page 91 LWBK271-C01_01-08.qxd

92 Chapter 8
branch block with or without fascicular block. When onebundle branch is blocked, intermittent block of the otherbundle causes the QRS complex to be dropped intermit-tently. If the QRS complex is narrow and the PR intervallooks fixed, the possibility of a block at the level of the bun-dle of His is likely (intra-His block), although this is rare and,more commonly, may be due to AV nodal block with mini-mal prolongation of the PR interval that may be difficult toappreciate in the surface ECG unless the PR interval is meas-ured carefully.
Clinical Significance
■ Type II block is an infranodal disease involving the bundle ofHis, and, more commonly, the bundle branches and fascicles.Type II block does not occur at the level of the AV node.
■ It is a common mistake to include 2:1 AV block as Mobitztype II block. It is not possible to distinguish type I from typeII block when there is 2:1 AV block because prolongation ofthe PR interval cannot be observed when only one P wave isconducted. In 2:1 AV block, the PR interval looks fixed be-cause only a single P wave is conducted.
■ When an acute infarct is complicated by type II second-de-gree AV block, the location of the infarct is anterior. Evenwith insertion of a pacemaker, mortality remains high be-cause an anterior infarct with second-degree AV block is usu-ally an extensive infarct.
■ If there is difficulty in differentiating type I (usually AV nodal)from type II (always infranodal) block, sympathetic andparasympathetic manipulation may be tried. Both sinus nodeand AV node are influenced by sympathetic and parasympa-thetic stimulation, whereas the intraventricular conductionsystem below the AV node is affected mainly by sympatheticbut not by parasympathetic stimuli. Sympathetic stimulationsuch as exercise increases the rate of the sinus node and en-hances conduction across the AV node. Atropine and adrener-gic agents can cause the same effect. Thus, exercise, atropine,or adrenergic agents will increase the sinus rate and will alsoimprove AV nodal block, but will not improve and may evenworsen type II or infranodal block. On the other hand,parasympathetic stimulation such as carotid sinus compres-sion can improve infranodal block by slowing the sinus rateand prolonging AV conduction, thus allowing the distal con-duction system and infranodal block more time to recover.
■ Type II block is usually caused by structural cardiac diseasesuch as sclerosis or calcification of the conducting system re-sulting from aging. It can also be due to ischemia, infarction,and infiltrative diseases including sarcoid, amyloid, and neu-romuscular dystrophy. It can occur postoperatively after car-diac surgery or ablation procedures.
Treatment
■ Because type II block is an infranodal disease, a permanentpacemaker should be inserted even in asymptomatic pa-
tients. If type II AV block is associated with wide QRS com-plexes, this is a Class I indication for permanent pacing, ac-cording to the ACC/AHA/HRS guidelines. If the QRS com-plexes are narrow, the recommendation becomes Class IIa.
■ Patients with type II block can develop complete heart blocksuddenly without warning. Thus, a transcutaneous pace-maker or a temporary pacemaker should be available even ifthe patient is not bradycardic. If the patient suddenly devel-ops complete AV block before a pacemaker can be inserted,adrenergic agents such as isoproterenol or epinephrine maybe given to increase the intrinsic rate of the escape rhythm.Infranodal block will not respond to atropine (see Treatmentof Complete AV Block in this Chapter).
■ When the QRS complexes are narrow and the PR intervalslook fixed, the diagnosis of Mobitz type II block may bequestionable. If the diagnosis of type II block is uncertain, anelectrophysiologic study may be necessary to ascertain thatthe block is infranodal before a permanent pacemaker is im-planted, especially in asymptomatic patients with second-degree AV block.
Prognosis
■ Because type II block is an infranodal disease, the immedi-ate prognosis is more ominous than type I second-degreeAV block. When complete AV block occurs, the escaperhythm has to originate below the level of the block. Thus,only a ventricular escape rhythm can come to the rescue.Unlike type I block, type II block is commonly associatedwith structural heart disease; therefore, the conductionabnormality is usually not reversible and progression tocomplete AV block may be sudden without warning (seecomplete AV block).
■ The overall prognosis of type II block depends on the pres-ence or absence of associated cardiac abnormalities.
■ If the AV block is confined to the conduction system andno evidence of structural cardiac disease is present, inser-tion of a permanent pacemaker to correct the conductionabnormality will result in the same natural history as apatient without the conduction abnormality.
■ If the conduction abnormality is associated with struc-tural cardiac disease, such as ischemic heart disease orcardiomyopathy, the prognosis will depend on the etiol-ogy of the cardiac abnormality.
Advanced 2:1 Second-Degree AV Block
■ Advanced second-degree AV block: 2:1 AV block isan example of advanced second-degree AV block.■ In 2:1 block, every other P wave is conducted alter-
nating with every other P wave that is blocked(Figs. 8.26 and 8.27).
LWBK271-C08_80-111.qxd 1/29/09 12:00 PM Page 92 LWBK271-C01_01-08.qxd

Atrioventricular Block 93
■ The QRS complexes may be narrow or wide (Figs.8.26 and 8.27).
■ A common error is to include 2:1 AV block as a typeII block because the PR interval is fixed. Two to oneAV block is neither type I nor type II second-degreeblock. The PR interval looks fixed because only asingle P wave is conducted, thus only one PR inter-val can be measured. To differentiate type I fromtype II block, at least two consecutive P wavesshould be conducted so that the lengthening of thePR interval can be observed.
■ Ventriculophasic sinus arrhythmia: During 2:1 AVblock, sinus arrhythmia may be present. The sinus ar-rhythmia is ventriculophasic if the P-P interval with aQRS complex is shorter than the P-P interval without aQRS complex (Fig. 8.26).
■ 2:1 AV block may be nodal or infranodal. To differenti-ate one from the other, continuous monitoring shouldbe performed until conduction improves and morethan one consecutive P wave is conducted (3:2 or bet-ter). When this occurs, the level of the AV block may belocalized.■ When conduction improves and 2:1 block is seen in as-
sociation with type I block, the block is AV nodal (Fig.8.28).
■ When conduction improves and 2:1 block is seen inassociation with type II block (fixed PR intervalsand wide QRS complexes), the block is infranodal(Fig. 8.29).
■ Acute MI and AV block: When 2:1 block complicatesacute MI, the location of the infarct is helpful in identi-fying the level of the AV block. If the infarct is inferiorand the QRS complexes are narrow, the AV block is atthe level of the AV node (Fig. 8.30).
Advanced Second-Degree AV Block: 3:1 and Higher
■ Advanced second-degree AV block: When the AVblock is 2:1, 3:1, 4:1, or higher, the AV block cannot beclassified as type I or type II because only a single Pwave is conducted (2:1 block) or two or more consecu-tive P waves are blocked (3:1 AV block or higher).These are examples of advanced second-degree AVblock (Figs. 8.31–8.33).
■ The conduction ratio refers to the number of P wavesthat are blocked before a P wave is conducted. Thus, a3:1 conduction ratio implies that of three consecutive Pwaves, only one is conducted.
■ Advanced AV block with narrow QRS complexes maybe nodal or infranodal (Figs. 8.31 and 8.32). When theQRS complexes are wide, the block is almost always in-franodal (Fig. 8.33).
ECG Findings of Advanced Second-Degree AV Block
1. Advanced or high-grade AV block is a form of second-degree block where two or more consecutive P waves are not
870 ms 870 ms sm 208 ms 208
Figure 8.26: 2:1 Second-Degree Atrioventricular (AV) Block with Narrow QRS Complexes. Everyother P wave is conducted alternating with every other P wave that is blocked (arrows) consistent with 2:1 AVblock. Two to one AV block is not a type II block because only a single P wave is conducted. Note that the QRS com-plexes are narrow, thus an infranodal block is unlikely. Because there is no evidence of distal conduction systemdisease, the 2:1 AV block is most likely at the level of the AV node. Note also that the P-P interval with a QRScomplex is shorter (820 milliseconds) than the P-P interval without a QRS complex (870 milliseconds) because ofventriculophasic sinus arrhythmia.
Figure 8.27: 2:1 Second-Degree Atrioventricular (AV) Block with Wide QRS Complexes. The rhythmis 2:1 AV block similar to Figure 8.26. In this example, the QRS complexes are wide because of right bundle branchblock, a sign of distal conduction system disease. This type of 2:1 block can be infranodal occurring at the level ofthe bundle branches although AV nodal block is also possible. The stars point to the nonconducted P waves.
LWBK271-C08_80-111.qxd 1/29/09 12:00 PM Page 93 LWBK271-C01_01-08.qxd

94 Chapter 8
#1
#2
Figure 8.28: 2:1 Second-Degree Atrioventricular (AV) Block Occurring with AV Wenckebach.Rhythm strip 1 shows 2:1 AV block. Rhythm strip 2 is from the same patient taken several minutes later showing3:2 AV Wenckebach. Because 2:1 AV block is seen in association with classical AV Wenckebach with narrowcomplexes, the 2:1 block is at the level of the AV node.The stars identify the blocked P waves.
#1
#2
#3
1.4 sec 1.4 sec
Figure 8.29: 2:1 Second-Degree Atrioventricular (AV) Block with Wide QRSComplexes. The rhythm strips labeled 1, 2, and 3 are continuous. Rhythm strip1 shows 2:1AV block; rhythm strip 2 shows three consecutively conducted P waves with a classical Mob-itz type II pattern. The PR interval is fixed and the R-R interval is also fixed. In rhythm strip 3,2:1 AV block is again present. The transient occurrence of Mobitz type II AV block, which is aninfranodal block, suggests that the 2:1 block is infranodal, occurring at the level of the bundlebranches. The stars identify the blocked P waves.
conducted as in 3:1, 4:1, or 5:1 AV block. A 2:1 AV block is alsoincluded as a form of advanced second-degree AV block be-cause only a single P wave is conducted.
2. The QRS complexes may be narrow or wide.
3. The long pauses are often terminated by escape beats.
Mechanism
■ Advanced second-degree AV block can occur at the level ofthe AV node (AV nodal block). It can also occur more distallyat the level of the His-Purkinje system (infranodal block).
■ AV nodal block: Advanced second-degree AV block oc-curring at the AV node may have narrow or wide QRScomplexes, although typically the QRS complexes arenarrow.
■ Infranodal block: Advanced second-degree AV blockcan occur at the level of the bundle of His or more distallyat the level of the bundle branches. The QRS complexesmay be narrow or wide, although typically the QRS com-plexes are wide.
n Bundle of His: Advanced second-degree block canoccur at the level of the bundle of His, but this type ofAV block (intra-His block) is uncommon. The QRScomplexes are narrow.
n Bundle branches: When the block is at the level of thebundle branches, the baseline ECG will show wideQRS complexes because of right or left bundle branchblock.
■ Ventriculophasic sinus arrhythmia may occur when there is2:1 AV block. The P-P interval with a QRS complex is shorterthan the P-P interval without a QRS complex. The P-P inter-val with a QRS complex has stroke volume that can stretch thecarotid baroreceptors, causing vagal inhibition that is mostpronounced in the next cardiac cycle. This results in a longerP-P interval in the cardiac cycle without a QRS complex.
Clinical Significance
■ It is a common mistake to classify 2:1 AV block always as atype II block because the PR interval is fixed. Because there is
LWBK271-C08_80-111.qxd 1/29/09 12:00 PM Page 94 LWBK271-C01_01-08.qxd
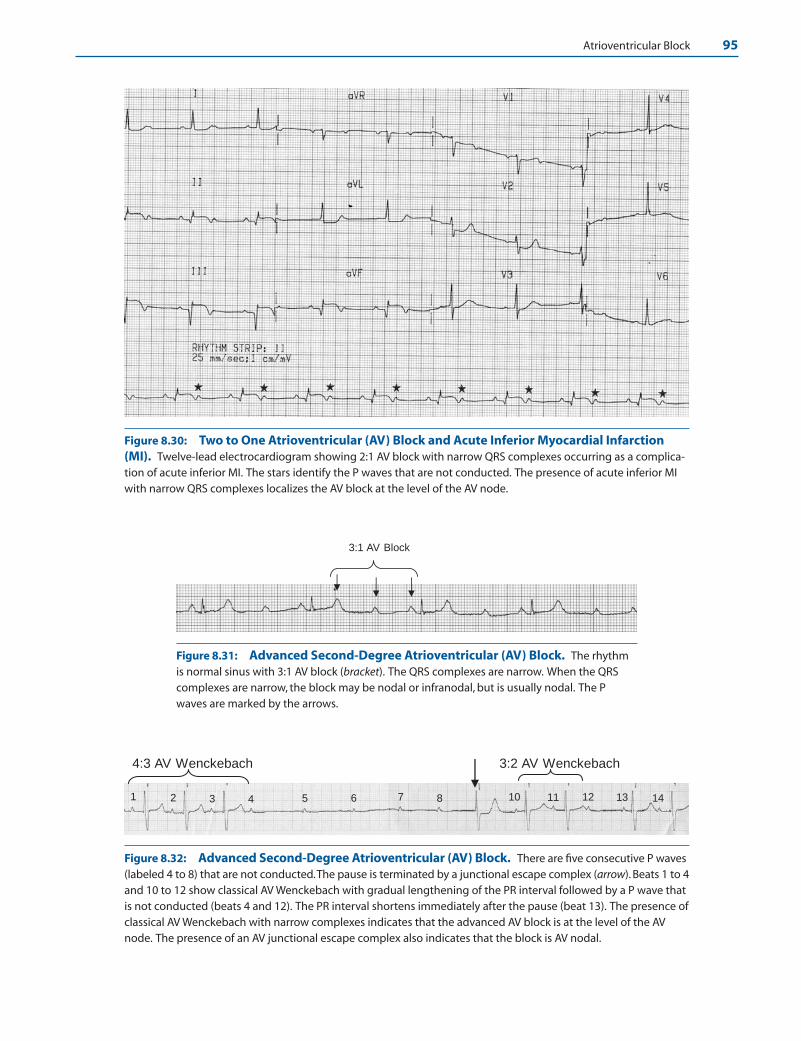
Atrioventricular Block 95
Figure 8.30: Two to One Atrioventricular (AV) Block and Acute Inferior Myocardial Infarction(MI). Twelve-lead electrocardiogram showing 2:1 AV block with narrow QRS complexes occurring as a complica-tion of acute inferior MI. The stars identify the P waves that are not conducted. The presence of acute inferior MIwith narrow QRS complexes localizes the AV block at the level of the AV node.
3:1 AV Block
Figure 8.31: Advanced Second-Degree Atrioventricular (AV) Block. The rhythmis normal sinus with 3:1 AV block (bracket). The QRS complexes are narrow. When the QRScomplexes are narrow, the block may be nodal or infranodal, but is usually nodal. The Pwaves are marked by the arrows.
4 5 6 7 8 10 11 12 13 14
3:2 AV Wenckebach
1 2 3
4:3 AV Wenckebach
Figure 8.32: Advanced Second-Degree Atrioventricular (AV) Block. There are five consecutive P waves(labeled 4 to 8) that are not conducted.The pause is terminated by a junctional escape complex (arrow). Beats 1 to 4and 10 to 12 show classical AV Wenckebach with gradual lengthening of the PR interval followed by a P wave thatis not conducted (beats 4 and 12). The PR interval shortens immediately after the pause (beat 13). The presence ofclassical AV Wenckebach with narrow complexes indicates that the advanced AV block is at the level of the AVnode. The presence of an AV junctional escape complex also indicates that the block is AV nodal.
LWBK271-C08_80-111.qxd 1/29/09 12:00 PM Page 95 LWBK271-C01_01-08.qxd
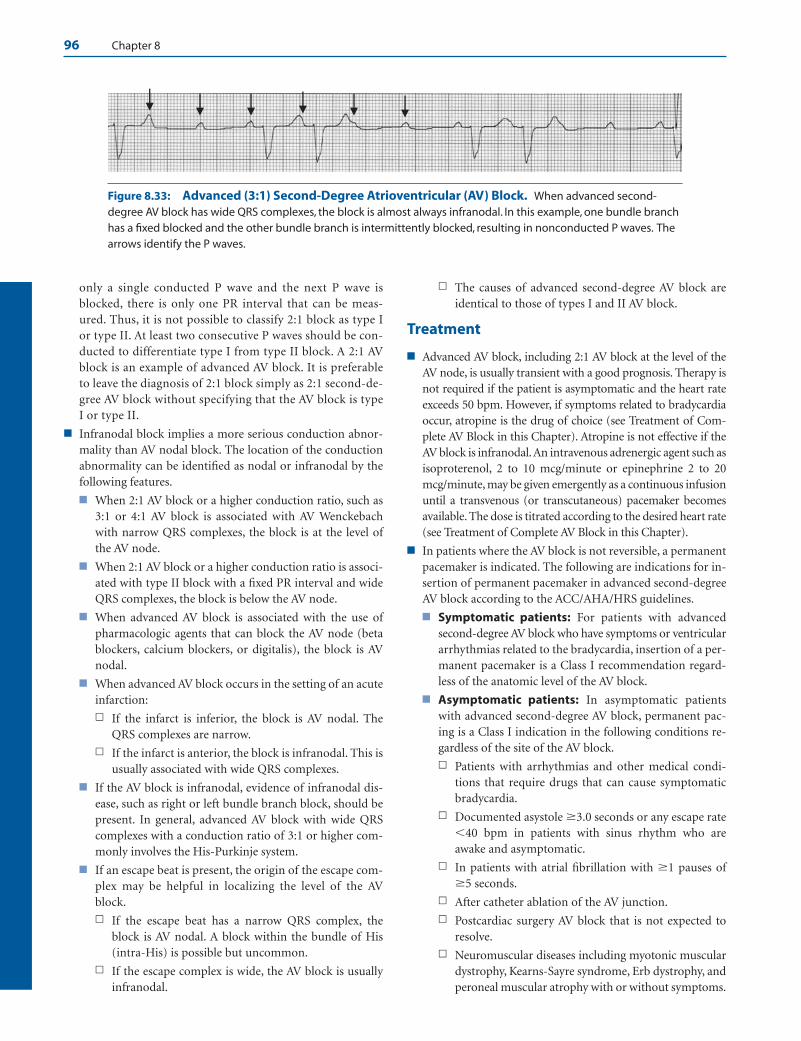
96 Chapter 8
only a single conducted P wave and the next P wave isblocked, there is only one PR interval that can be meas-ured. Thus, it is not possible to classify 2:1 block as type Ior type II. At least two consecutive P waves should be con-ducted to differentiate type I from type II block. A 2:1 AVblock is an example of advanced AV block. It is preferableto leave the diagnosis of 2:1 block simply as 2:1 second-de-gree AV block without specifying that the AV block is typeI or type II.
■ Infranodal block implies a more serious conduction abnor-mality than AV nodal block. The location of the conductionabnormality can be identified as nodal or infranodal by thefollowing features.
■ When 2:1 AV block or a higher conduction ratio, such as3:1 or 4:1 AV block is associated with AV Wenckebachwith narrow QRS complexes, the block is at the level ofthe AV node.
■ When 2:1 AV block or a higher conduction ratio is associ-ated with type II block with a fixed PR interval and wideQRS complexes, the block is below the AV node.
■ When advanced AV block is associated with the use ofpharmacologic agents that can block the AV node (betablockers, calcium blockers, or digitalis), the block is AVnodal.
■ When advanced AV block occurs in the setting of an acuteinfarction:
n If the infarct is inferior, the block is AV nodal. TheQRS complexes are narrow.
n If the infarct is anterior, the block is infranodal. This isusually associated with wide QRS complexes.
■ If the AV block is infranodal, evidence of infranodal dis-ease, such as right or left bundle branch block, should bepresent. In general, advanced AV block with wide QRScomplexes with a conduction ratio of 3:1 or higher com-monly involves the His-Purkinje system.
■ If an escape beat is present, the origin of the escape com-plex may be helpful in localizing the level of the AVblock.
n If the escape beat has a narrow QRS complex, theblock is AV nodal. A block within the bundle of His(intra-His) is possible but uncommon.
n If the escape complex is wide, the AV block is usuallyinfranodal.
n The causes of advanced second-degree AV block areidentical to those of types I and II AV block.
Treatment
■ Advanced AV block, including 2:1 AV block at the level of theAV node, is usually transient with a good prognosis. Therapy isnot required if the patient is asymptomatic and the heart rateexceeds 50 bpm. However, if symptoms related to bradycardiaoccur, atropine is the drug of choice (see Treatment of Com-plete AV Block in this Chapter). Atropine is not effective if theAV block is infranodal.An intravenous adrenergic agent such asisoproterenol, 2 to 10 mcg/minute or epinephrine 2 to 20mcg/minute, may be given emergently as a continuous infusionuntil a transvenous (or transcutaneous) pacemaker becomesavailable. The dose is titrated according to the desired heart rate(see Treatment of Complete AV Block in this Chapter).
■ In patients where the AV block is not reversible, a permanentpacemaker is indicated. The following are indications for in-sertion of permanent pacemaker in advanced second-degreeAV block according to the ACC/AHA/HRS guidelines.
■ Symptomatic patients: For patients with advancedsecond-degree AV block who have symptoms or ventriculararrhythmias related to the bradycardia, insertion of a per-manent pacemaker is a Class I recommendation regard-less of the anatomic level of the AV block.
■ Asymptomatic patients: In asymptomatic patientswith advanced second-degree AV block, permanent pac-ing is a Class I indication in the following conditions re-gardless of the site of the AV block.
n Patients with arrhythmias and other medical condi-tions that require drugs that can cause symptomaticbradycardia.
n Documented asystole �3.0 seconds or any escape rate�40 bpm in patients with sinus rhythm who areawake and asymptomatic.
n In patients with atrial fibrillation with �1 pauses of�5 seconds.
n After catheter ablation of the AV junction.
n Postcardiac surgery AV block that is not expected toresolve.
n Neuromuscular diseases including myotonic musculardystrophy, Kearns-Sayre syndrome, Erb dystrophy, andperoneal muscular atrophy with or without symptoms.
Figure 8.33: Advanced (3:1) Second-Degree Atrioventricular (AV) Block. When advanced second-degree AV block has wide QRS complexes, the block is almost always infranodal. In this example, one bundle branchhas a fixed blocked and the other bundle branch is intermittently blocked, resulting in nonconducted P waves. Thearrows identify the P waves.
LWBK271-C08_80-111.qxd 1/29/09 12:00 PM Page 96 LWBK271-C01_01-08.qxd
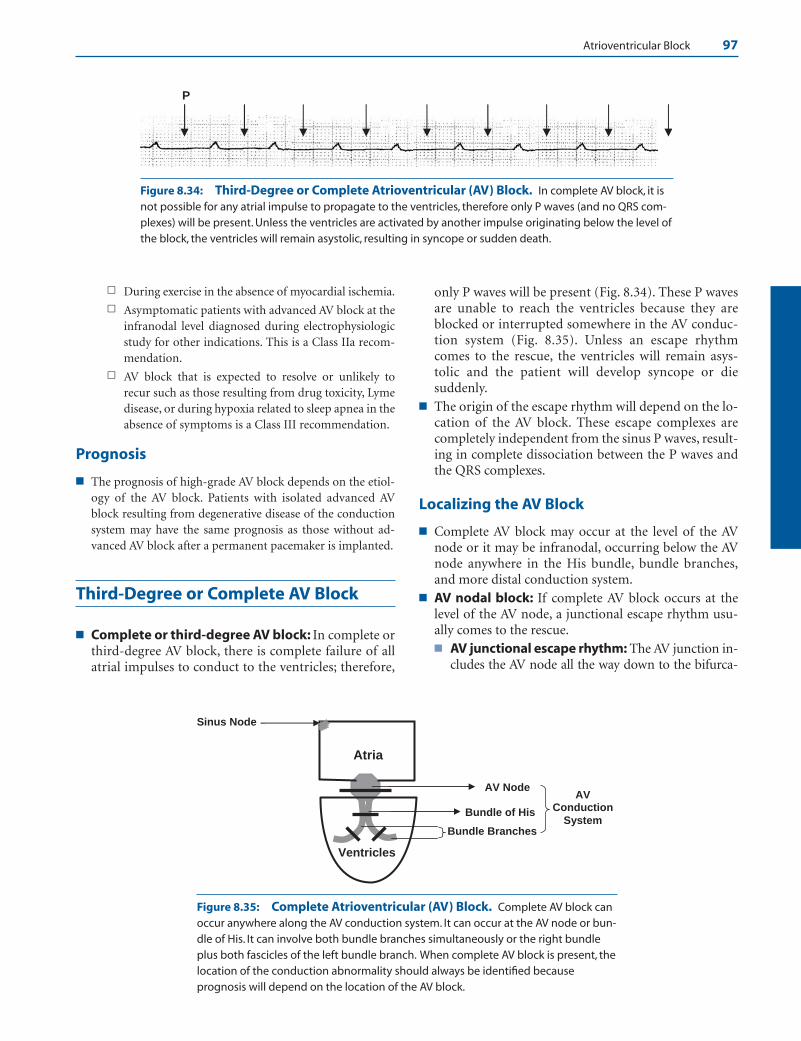
Atrioventricular Block 97
n During exercise in the absence of myocardial ischemia.
n Asymptomatic patients with advanced AV block at theinfranodal level diagnosed during electrophysiologicstudy for other indications. This is a Class IIa recom-mendation.
n AV block that is expected to resolve or unlikely torecur such as those resulting from drug toxicity, Lymedisease, or during hypoxia related to sleep apnea in theabsence of symptoms is a Class III recommendation.
Prognosis
■ The prognosis of high-grade AV block depends on the etiol-ogy of the AV block. Patients with isolated advanced AVblock resulting from degenerative disease of the conductionsystem may have the same prognosis as those without ad-vanced AV block after a permanent pacemaker is implanted.
Third-Degree or Complete AV Block
■ Complete or third-degree AV block: In complete orthird-degree AV block, there is complete failure of allatrial impulses to conduct to the ventricles; therefore,
only P waves will be present (Fig. 8.34). These P wavesare unable to reach the ventricles because they areblocked or interrupted somewhere in the AV conduc-tion system (Fig. 8.35). Unless an escape rhythmcomes to the rescue, the ventricles will remain asys-tolic and the patient will develop syncope or diesuddenly.
■ The origin of the escape rhythm will depend on the lo-cation of the AV block. These escape complexes arecompletely independent from the sinus P waves, result-ing in complete dissociation between the P waves andthe QRS complexes.
Localizing the AV Block
■ Complete AV block may occur at the level of the AVnode or it may be infranodal, occurring below the AVnode anywhere in the His bundle, bundle branches,and more distal conduction system.
■ AV nodal block: If complete AV block occurs at thelevel of the AV node, a junctional escape rhythm usu-ally comes to the rescue.■ AV junctional escape rhythm: The AV junction in-
cludes the AV node all the way down to the bifurca-
P
Figure 8.34: Third-Degree or Complete Atrioventricular (AV) Block. In complete AV block, it isnot possible for any atrial impulse to propagate to the ventricles, therefore only P waves (and no QRS com-plexes) will be present. Unless the ventricles are activated by another impulse originating below the level ofthe block, the ventricles will remain asystolic, resulting in syncope or sudden death.
Atria
Ventricles
Sinus Node
AV Node
Bundle of His
Bundle Branches
AV Conduction
System
Figure 8.35: Complete Atrioventricular (AV) Block. Complete AV block canoccur anywhere along the AV conduction system. It can occur at the AV node or bun-dle of His. It can involve both bundle branches simultaneously or the right bundleplus both fascicles of the left bundle branch. When complete AV block is present, thelocation of the conduction abnormality should always be identified becauseprognosis will depend on the location of the AV block.
LWBK271-C08_80-111.qxd 1/29/09 12:00 PM Page 97 LWBK271-C01_01-08.qxd
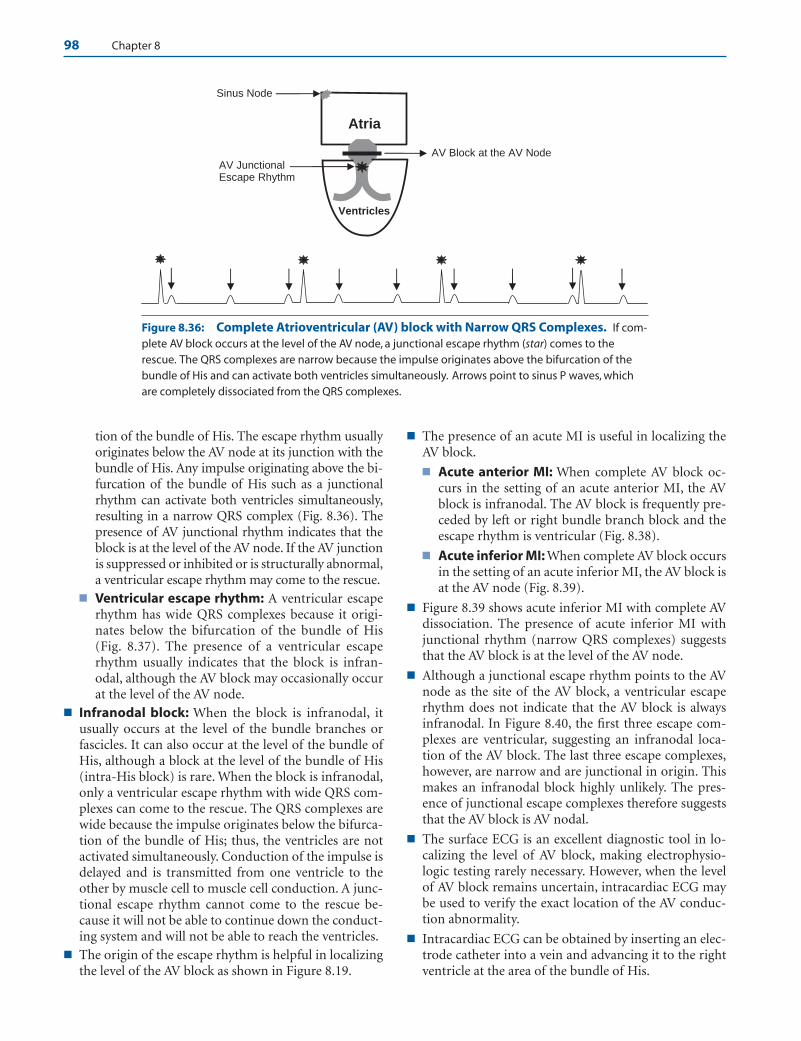
98 Chapter 8
tion of the bundle of His. The escape rhythm usuallyoriginates below the AV node at its junction with thebundle of His. Any impulse originating above the bi-furcation of the bundle of His such as a junctionalrhythm can activate both ventricles simultaneously,resulting in a narrow QRS complex (Fig. 8.36). Thepresence of AV junctional rhythm indicates that theblock is at the level of the AV node. If the AV junctionis suppressed or inhibited or is structurally abnormal,a ventricular escape rhythm may come to the rescue.
■ Ventricular escape rhythm: A ventricular escaperhythm has wide QRS complexes because it origi-nates below the bifurcation of the bundle of His(Fig. 8.37). The presence of a ventricular escaperhythm usually indicates that the block is infran-odal, although the AV block may occasionally occurat the level of the AV node.
■ Infranodal block: When the block is infranodal, itusually occurs at the level of the bundle branches orfascicles. It can also occur at the level of the bundle ofHis, although a block at the level of the bundle of His(intra-His block) is rare. When the block is infranodal,only a ventricular escape rhythm with wide QRS com-plexes can come to the rescue. The QRS complexes arewide because the impulse originates below the bifurca-tion of the bundle of His; thus, the ventricles are notactivated simultaneously. Conduction of the impulse isdelayed and is transmitted from one ventricle to theother by muscle cell to muscle cell conduction. A junc-tional escape rhythm cannot come to the rescue be-cause it will not be able to continue down the conduct-ing system and will not be able to reach the ventricles.
■ The origin of the escape rhythm is helpful in localizingthe level of the AV block as shown in Figure 8.19.
■ The presence of an acute MI is useful in localizing theAV block.
■ Acute anterior MI: When complete AV block oc-curs in the setting of an acute anterior MI, the AVblock is infranodal. The AV block is frequently pre-ceded by left or right bundle branch block and theescape rhythm is ventricular (Fig. 8.38).
■ Acute inferior MI: When complete AV block occursin the setting of an acute inferior MI, the AV block isat the AV node (Fig. 8.39).
■ Figure 8.39 shows acute inferior MI with complete AVdissociation. The presence of acute inferior MI withjunctional rhythm (narrow QRS complexes) suggeststhat the AV block is at the level of the AV node.
■ Although a junctional escape rhythm points to the AVnode as the site of the AV block, a ventricular escaperhythm does not indicate that the AV block is alwaysinfranodal. In Figure 8.40, the first three escape com-plexes are ventricular, suggesting an infranodal loca-tion of the AV block. The last three escape complexes,however, are narrow and are junctional in origin. Thismakes an infranodal block highly unlikely. The pres-ence of junctional escape complexes therefore suggeststhat the AV block is AV nodal.
■ The surface ECG is an excellent diagnostic tool in lo-calizing the level of AV block, making electrophysio-logic testing rarely necessary. However, when the levelof AV block remains uncertain, intracardiac ECG maybe used to verify the exact location of the AV conduc-tion abnormality.
■ Intracardiac ECG can be obtained by inserting an elec-trode catheter into a vein and advancing it to the rightventricle at the area of the bundle of His.
Atria
Ventricles
AV Block at the AV Node AV Junctional
Sinus Node
Escape Rhythm
Figure 8.36: Complete Atrioventricular (AV) block with Narrow QRS Complexes. If com-plete AV block occurs at the level of the AV node, a junctional escape rhythm (star) comes to therescue. The QRS complexes are narrow because the impulse originates above the bifurcation of thebundle of His and can activate both ventricles simultaneously. Arrows point to sinus P waves, whichare completely dissociated from the QRS complexes.
LWBK271-C08_80-111.qxd 1/29/09 12:00 PM Page 98 LWBK271-C01_01-08.qxd
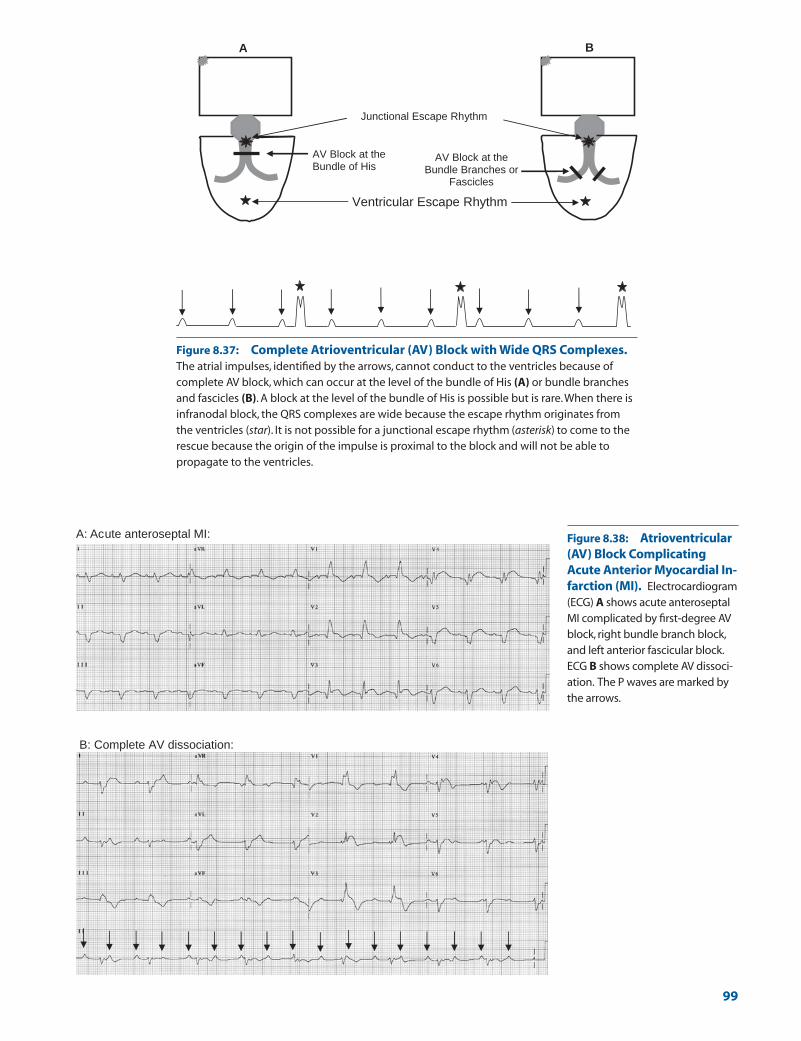
AV Block at the Bundle of His
AV Block at the Bundle Branches or
Fascicles
Ventricular Escape Rhythm
B A
Junctional Escape Rhythm
Figure 8.37: Complete Atrioventricular (AV) Block with Wide QRS Complexes.The atrial impulses, identified by the arrows, cannot conduct to the ventricles because ofcomplete AV block, which can occur at the level of the bundle of His (A) or bundle branchesand fascicles (B). A block at the level of the bundle of His is possible but is rare.When there isinfranodal block, the QRS complexes are wide because the escape rhythm originates fromthe ventricles (star). It is not possible for a junctional escape rhythm (asterisk) to come to therescue because the origin of the impulse is proximal to the block and will not be able topropagate to the ventricles.
A: Acute anteroseptal MI:
B: Complete AV dissociation:
Figure 8.38: Atrioventricular(AV) Block ComplicatingAcute Anterior Myocardial In-farction (MI). Electrocardiogram(ECG) A shows acute anteroseptalMI complicated by first-degree AVblock, right bundle branch block,and left anterior fascicular block.ECG B shows complete AV dissoci-ation. The P waves are marked bythe arrows.
99
LWBK271-C08_80-111.qxd 1/29/09 12:00 PM Page 99 LWBK271-C01_01-08.qxd
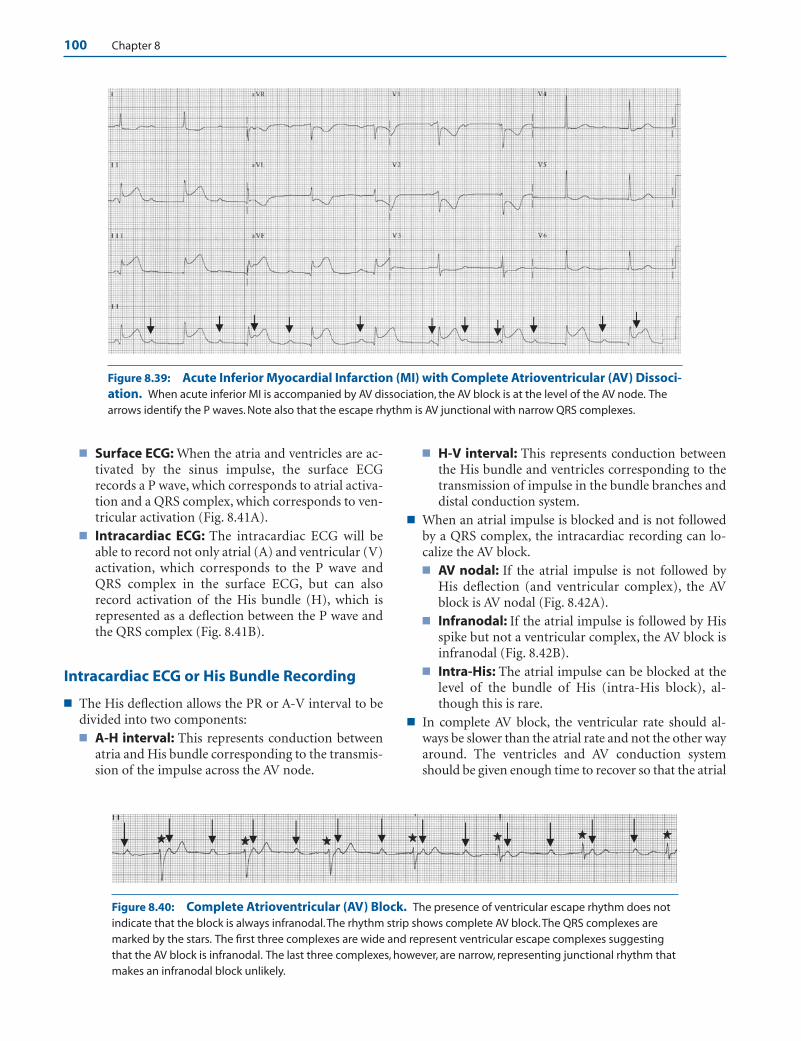
100 Chapter 8
■ Surface ECG: When the atria and ventricles are ac-tivated by the sinus impulse, the surface ECGrecords a P wave, which corresponds to atrial activa-tion and a QRS complex, which corresponds to ven-tricular activation (Fig. 8.41A).
■ Intracardiac ECG: The intracardiac ECG will beable to record not only atrial (A) and ventricular (V)activation, which corresponds to the P wave andQRS complex in the surface ECG, but can alsorecord activation of the His bundle (H), which isrepresented as a deflection between the P wave andthe QRS complex (Fig. 8.41B).
Intracardiac ECG or His Bundle Recording
■ The His deflection allows the PR or A-V interval to bedivided into two components:■ A-H interval: This represents conduction between
atria and His bundle corresponding to the transmis-sion of the impulse across the AV node.
■ H-V interval: This represents conduction betweenthe His bundle and ventricles corresponding to thetransmission of impulse in the bundle branches anddistal conduction system.
■ When an atrial impulse is blocked and is not followedby a QRS complex, the intracardiac recording can lo-calize the AV block.■ AV nodal: If the atrial impulse is not followed by
His deflection (and ventricular complex), the AVblock is AV nodal (Fig. 8.42A).
■ Infranodal: If the atrial impulse is followed by Hisspike but not a ventricular complex, the AV block isinfranodal (Fig. 8.42B).
■ Intra-His: The atrial impulse can be blocked at thelevel of the bundle of His (intra-His block), al-though this is rare.
■ In complete AV block, the ventricular rate should al-ways be slower than the atrial rate and not the other wayaround. The ventricles and AV conduction systemshould be given enough time to recover so that the atrial
Figure 8.39: Acute Inferior Myocardial Infarction (MI) with Complete Atrioventricular (AV) Dissoci-ation. When acute inferior MI is accompanied by AV dissociation, the AV block is at the level of the AV node. Thearrows identify the P waves. Note also that the escape rhythm is AV junctional with narrow QRS complexes.
Figure 8.40: Complete Atrioventricular (AV) Block. The presence of ventricular escape rhythm does notindicate that the block is always infranodal.The rhythm strip shows complete AV block.The QRS complexes aremarked by the stars. The first three complexes are wide and represent ventricular escape complexes suggestingthat the AV block is infranodal. The last three complexes, however, are narrow, representing junctional rhythm thatmakes an infranodal block unlikely.
LWBK271-C08_80-111.qxd 1/29/09 12:00 PM Page 100 LWBK271-C01_01-08.qxd

Atrioventricular Block 101
impulse will not find the ventricles refractory. Thus, theventricular rate should not only be slower than theatrial rate but should be �50 bpm, usually in the low tomid-40s before the AV block is considered complete.
■ Complete AV block can occur regardless of the atrialrhythm, which could be normal sinus (Fig. 8.43), atrialflutter (Fig. 8.44), or atrial fibrillation (Fig. 8.45).
Common Mistakes in AV Block
■ Sinus arrest: When only QRS complexes are present andatrial activity is absent (no P waves), the rhythm is sinusarrest and not complete AV block (Figs. 8.46 and 8.47).
■ Complete AV block versus advanced second-degree AVblock: In complete AV block, there should be completedissociation between the P waves and the QRS com-plexes. If a single P wave captures a QRS complex, theAV block is no longer complete (Fig. 8.48).
■ Blocked Premature Atrial Complexes (PACs): Blockedpremature atrial complexes may be mistaken for non-conducted sinus P waves and mistaken for second-degree AV block (Fig. 8.49).
■ Concealed conduction: Concealed conduction is com-monly mistaken for AV block.Concealed conduction indi-cates that a previous impulse had infiltrated the conduc-tion system. This will have an effect on the next impulse.Figure 8.50 shows a sinus P wave (star) that is not followedby a QRS complex. This can be mistaken for second-de-gree AV block. Although a nonconducted sinus P wave isobvious, there is a premature ventricular impulse preced-ing the P wave. This premature impulse depolarized notonly the ventricles, but also the AV conduction system ret-rogradely, rendering the AV node refractory. The effect ofthe premature impulse on the conduction system is notapparent until the arrival of the next sinus impulse, whichis unable to conduct to the ventricles because the AV nodeis still refractory. This is an example of concealed conduc-tion and not second-degree AV block. Figure 8.51 is a sim-ilar example of concealed conduction showing sinus Pwaves that are not conducted (arrows). The blocked Pwaves are preceded by premature ventricular complexes.
Intracardiac
A
P
HV H H H
QRS
A
B
Surface ECG
Figure 8.41: The Surface Electrocardiogram (ECG) and Intrac-ardiac Recording. The surface ECG is capable of recording only the Pwave and the QRS complex, whereas an intracardiac study is capable ofrecording not only atrial (A) and ventricular (V) activation but also that ofthe His (H) bundle. The presence of the His deflection allows the PR inter-val to be divided into two main components: the A-H interval (atrium toHis interval), which represents conduction through the AV node (normal60 to 125 milliseconds) and H-V interval, which represents conductionthrough the distal conduction system between the His bundle and ventri-cles (normal, 35 to 55 milliseconds).
P
AH V A
H
QR
A
B A
Figure 8.42: Intracardiac Electrocardiogram (ECG).(A) Atrioventricular (AV) block at the level of the AV node. Thesurface ECG shows a P wave that is not conducted (arrow). Theintracardiac ECG shows an atrial deflection (A) that is notfollowed by a His deflection thus the AV block is AV nodal. (B) AVblock involving the distal conduction system.The surface ECGshows a P wave that is not conducted (arrow). Intracardiac ECGshows an atrial deflection followed by a His deflection but not aventricular deflection suggesting that the AV block is distal tothe His bundle at the bundle branches and distal conductionsystem. A, atrial complex; H, His spike; V, ventricular complex.
LWBK271-C08_80-111.qxd 1/29/09 12:00 PM Page 101 LWBK271-C01_01-08.qxd
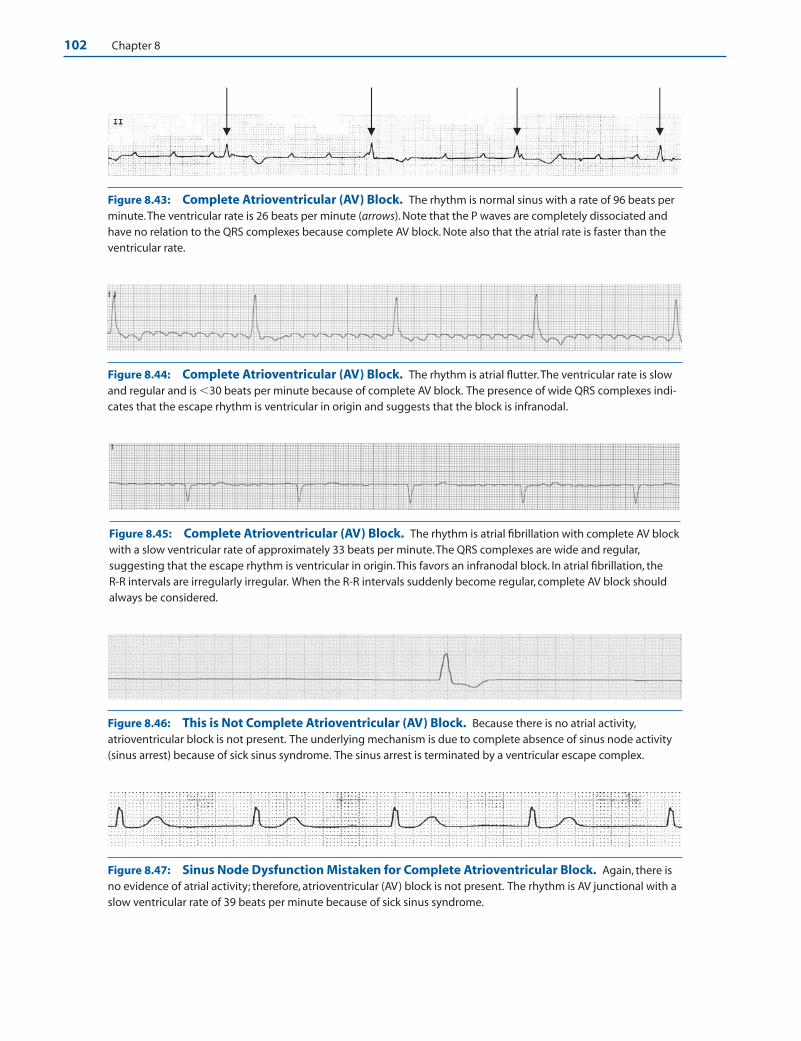
102 Chapter 8
Figure 8.43: Complete Atrioventricular (AV) Block. The rhythm is normal sinus with a rate of 96 beats perminute.The ventricular rate is 26 beats per minute (arrows). Note that the P waves are completely dissociated andhave no relation to the QRS complexes because complete AV block. Note also that the atrial rate is faster than theventricular rate.
Figure 8.44: Complete Atrioventricular (AV) Block. The rhythm is atrial flutter.The ventricular rate is slowand regular and is �30 beats per minute because of complete AV block. The presence of wide QRS complexes indi-cates that the escape rhythm is ventricular in origin and suggests that the block is infranodal.
Figure 8.45: Complete Atrioventricular (AV) Block. The rhythm is atrial fibrillation with complete AV blockwith a slow ventricular rate of approximately 33 beats per minute.The QRS complexes are wide and regular,suggesting that the escape rhythm is ventricular in origin.This favors an infranodal block. In atrial fibrillation, the R-R intervals are irregularly irregular. When the R-R intervals suddenly become regular, complete AV block shouldalways be considered.
Figure 8.46: This is Not Complete Atrioventricular (AV) Block. Because there is no atrial activity,atrioventricular block is not present. The underlying mechanism is due to complete absence of sinus node activity(sinus arrest) because of sick sinus syndrome. The sinus arrest is terminated by a ventricular escape complex.
Figure 8.47: Sinus Node Dysfunction Mistaken for Complete Atrioventricular Block. Again, there isno evidence of atrial activity; therefore, atrioventricular (AV) block is not present. The rhythm is AV junctional with aslow ventricular rate of 39 beats per minute because of sick sinus syndrome.
LWBK271-C08_80-111.qxd 1/29/09 12:00 PM Page 102 LWBK271-C01_01-08.qxd
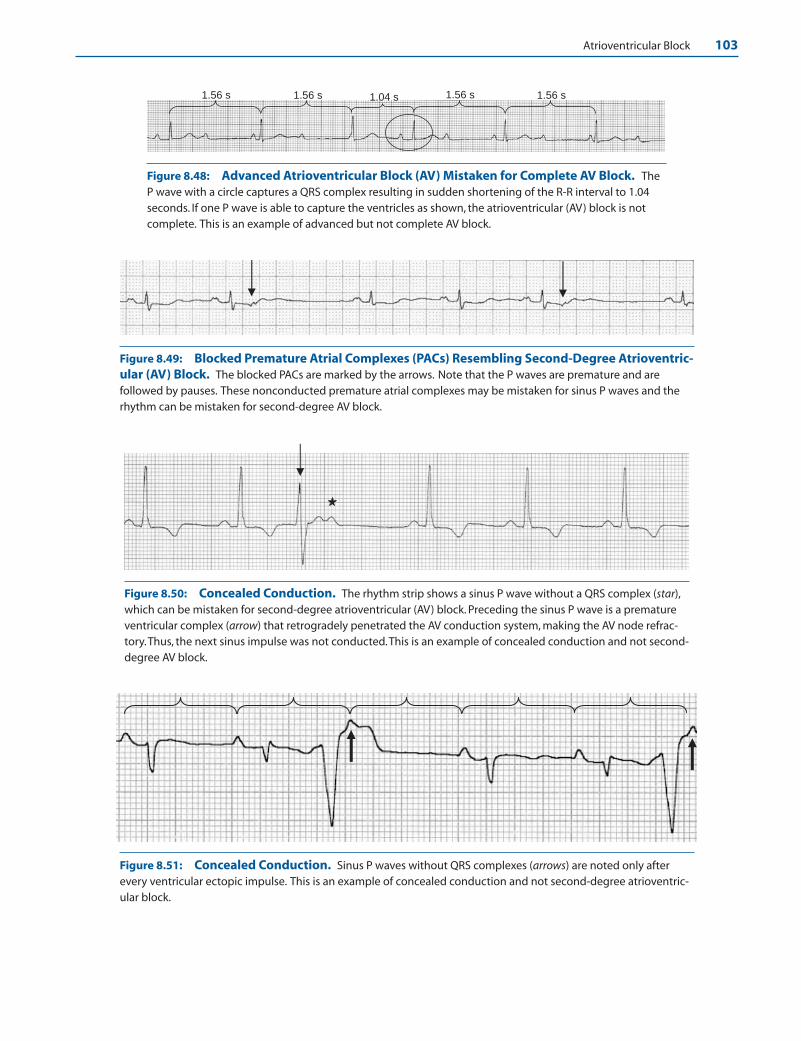
Atrioventricular Block 103
1.56 s 1.56 s 1.56 s 1.56 s 1.04 s
Figure 8.48: Advanced Atrioventricular Block (AV) Mistaken for Complete AV Block. TheP wave with a circle captures a QRS complex resulting in sudden shortening of the R-R interval to 1.04seconds. If one P wave is able to capture the ventricles as shown, the atrioventricular (AV) block is notcomplete. This is an example of advanced but not complete AV block.
Figure 8.49: Blocked Premature Atrial Complexes (PACs) Resembling Second-Degree Atrioventric-ular (AV) Block. The blocked PACs are marked by the arrows. Note that the P waves are premature and arefollowed by pauses. These nonconducted premature atrial complexes may be mistaken for sinus P waves and therhythm can be mistaken for second-degree AV block.
Figure 8.50: Concealed Conduction. The rhythm strip shows a sinus P wave without a QRS complex (star),which can be mistaken for second-degree atrioventricular (AV) block. Preceding the sinus P wave is a prematureventricular complex (arrow) that retrogradely penetrated the AV conduction system, making the AV node refrac-tory.Thus, the next sinus impulse was not conducted.This is an example of concealed conduction and not second-degree AV block.
Figure 8.51: Concealed Conduction. Sinus P waves without QRS complexes (arrows) are noted only afterevery ventricular ectopic impulse. This is an example of concealed conduction and not second-degree atrioventric-ular block.
LWBK271-C08_80-111.qxd 1/29/09 12:00 PM Page 103 LWBK271-C01_01-08.qxd
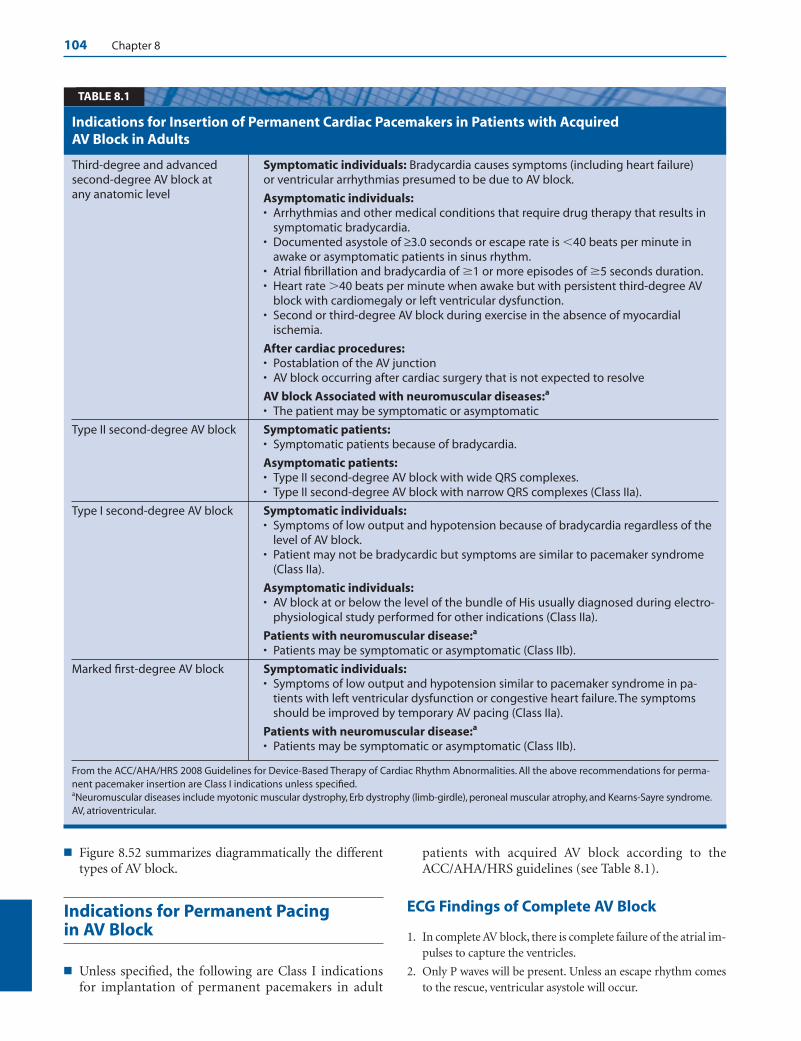
104 Chapter 8
■ Figure 8.52 summarizes diagrammatically the differenttypes of AV block.
Indications for Permanent Pacing in AV Block
■ Unless specified, the following are Class I indicationsfor implantation of permanent pacemakers in adult
patients with acquired AV block according to theACC/AHA/HRS guidelines (see Table 8.1).
ECG Findings of Complete AV Block
1. In complete AV block, there is complete failure of the atrial im-pulses to capture the ventricles.
2. Only P waves will be present. Unless an escape rhythm comesto the rescue, ventricular asystole will occur.
Third-degree and advanced Symptomatic individuals: Bradycardia causes symptoms (including heart failure)second-degree AV block at or ventricular arrhythmias presumed to be due to AV block.any anatomic level Asymptomatic individuals:
• Arrhythmias and other medical conditions that require drug therapy that results insymptomatic bradycardia.
• Documented asystole of ≥3.0 seconds or escape rate is �40 beats per minute inawake or asymptomatic patients in sinus rhythm.
• Atrial fibrillation and bradycardia of �1 or more episodes of �5 seconds duration.• Heart rate �40 beats per minute when awake but with persistent third-degree AV
block with cardiomegaly or left ventricular dysfunction.• Second or third-degree AV block during exercise in the absence of myocardial
ischemia.
After cardiac procedures:• Postablation of the AV junction• AV block occurring after cardiac surgery that is not expected to resolve
AV block Associated with neuromuscular diseases:a
• The patient may be symptomatic or asymptomatic
Type II second-degree AV block Symptomatic patients:• Symptomatic patients because of bradycardia.
Asymptomatic patients:• Type II second-degree AV block with wide QRS complexes.• Type II second-degree AV block with narrow QRS complexes (Class IIa).
Type I second-degree AV block Symptomatic individuals:• Symptoms of low output and hypotension because of bradycardia regardless of the
level of AV block.• Patient may not be bradycardic but symptoms are similar to pacemaker syndrome
(Class IIa).
Asymptomatic individuals:• AV block at or below the level of the bundle of His usually diagnosed during electro-
physiological study performed for other indications (Class IIa).
Patients with neuromuscular disease:a
• Patients may be symptomatic or asymptomatic (Class IIb).
Marked first-degree AV block Symptomatic individuals:• Symptoms of low output and hypotension similar to pacemaker syndrome in pa-
tients with left ventricular dysfunction or congestive heart failure. The symptomsshould be improved by temporary AV pacing (Class IIa).
Patients with neuromuscular disease:a
• Patients may be symptomatic or asymptomatic (Class IIb).
From the ACC/AHA/HRS 2008 Guidelines for Device-Based Therapy of Cardiac Rhythm Abnormalities. All the above recommendations for perma-nent pacemaker insertion are Class I indications unless specified.aNeuromuscular diseases include myotonic muscular dystrophy, Erb dystrophy (limb-girdle), peroneal muscular atrophy, and Kearns-Sayre syndrome.AV, atrioventricular.
Indications for Insertion of Permanent Cardiac Pacemakers in Patients with Acquired AV Block in Adults
TABLE 8.1
LWBK271-C08_80-111.qxd 1/29/09 12:00 PM Page 104 LWBK271-C01_01-08.qxd

Atrioventricular Block 105
3. The escape rhythm (the QRS complexes) can be narrow orwide.
4. The P waves and QRS complexes are completely dissociated.
5. The ventricular rate should be slower than the atrial rate andshould be �50 bpm, usually in the mid- to low 40s.
Mechanism
■ The intraventricular conduction system contains special cellswith automatic properties that are capable of becomingpacemakers. These cells are called latent pacemakers becausetheir rate of discharge is slower than the sinus node and donot become manifest because they are depolarized by thepropagated sinus impulse. When the sinus impulse isblocked or when there is significant slowing of the sinusnode, these latent pacemakers can become the dominantpacemaker of the heart. Cells in the middle portion of the AVnode called the N region do not have automatic properties
and cannot become pacemakers. Cells at the upper portionof the AV node at its junction with the atria (AN region),lower portion of the AV node at its junction with the bundleof His (NH region) and His-Purkinje system have pacemak-ing properties. Cells with automatic properties that are lo-cated higher in the conduction system (closer to the AVnode) have higher rates than cells that are located more dis-tally. Thus, the intrinsic rate of the AV junction is 40 to 60 bpmand cells that are located more distally in the His-Purkinjesystem have slower rates of 20 to 40 bpm.
■ Complete AV block can occur anywhere in the AV conduc-tion system. It can occur at the level of the AV node, bundleof His, both bundle branches, or the right bundle branch incombination with block involving both fascicular branchesof the left bundle branch. If complete AV block is present,the sinus impulse will not be able to reach the ventricles be-cause the AV conduction system is the only pathway bywhich the sinus impulse can reach the ventricles. This will
Summary of the Different Types of AV Block
1° AV Block
Advanced 2:12° AV Block
Advanced 3:12° AV Block
Complete AVBlock (AV Nodal)
Type I 2° AV Block
Type II 2° AV Block
Complete AVBlock (Infranodal)
Complete AVDissociation(JunctionalTachycardia)
Figure 8.52: Atrioventricular(AV) Block. The figure summarizesthe different types of AV block.
LWBK271-C08_80-111.qxd 1/29/09 12:00 PM Page 105 LWBK271-C01_01-08.qxd

106 Chapter 8
result in syncope or sudden death unless an ectopic impulsecomes to the rescue and initiates a ventricular rhythm. Theescape rhythm has to originate below the level of the AVblock. Thus, if the AV block is at the AV node, a junctionalescape rhythm with narrow QRS complex usually comes tothe rescue, and if the AV block is at the level of the His-Purkinje system, a ventricular escape rhythm with wide QRScomplex is usually the escape mechanism. The presence ofcomplete AV block is not certain unless the ventricles andAV conduction system are given enough time to recoverfrom the previous impulse. For this to occur, the ventricularrate should be slower than the atrial rate and should be �50bpm, usually in the mid- to low 40s.
Clinical Implications
■ Complete AV block can occur suddenly and can cause syn-cope or sudden death. The location of the AV block has prog-nostic significance and should be localized in all patientswith AV block. The origin of the escape rhythm as well as theclinical setting in which the AV block occur are useful in lo-calizing the AV block.
■ If the escape rhythm is AV junctional, the block is at thelevel of the AV node. In infranodal block, the escaperhythm is always ventricular.
■ The presence of bundle branch block before the onset ofcomplete AV block suggests that there is distal conductiondisease and favors an infranodal block.
■ If the patient is taking pharmacologic agents that blockthe AV node, such as digitalis, calcium channel blockers,or beta blockers, the block is AV nodal.
■ When complete AV block occurs in the setting of an acuteinferior MI and the QRS complexes are narrow, the AVblock is AV nodal.
■ When complete AV block occurs in the setting of acute an-terior MI, the AV block is infranodal. When the AV block isinfranodal, bundle branch block is usually present.
■ There are multiple causes of complete AV block. Complete AVblock may be congenital, occurring at birth, or advanced ageresulting from calcification of the aortic ring and mitral annu-lus (also called Lev disease) and fibrosis or sclerodegenerativechanges involving the conduction system (also called Lenègredisease). It could also be due to acute MI, inflammation of theconduction system as in Lyme disease, diphtheria, or Chagasdisease, or from infiltrative diseases such as sarcoid or amyloid,hypothyroidism, and neuromuscular diseases. It could also bedue to drugs that block the AV node or distal conducting sys-tem or during intracardiac surgery or ablation procedures.
■ Physical examination of a patient with complete AV block willshow cannon A waves in the jugular neck veins, variable inten-sity of the first heart sound, and variable pulse volume. This issimilar to the physical findings of ventricular tachycardia (seeChapter 22, Wide Complex Tachycardia). These physical find-ings are due to the presence of complete AV dissociation.
■ Cannon A waves in the neck: When there is completeAV dissociation, there is no relationship between atrialand ventricular contraction; thus, atrial contraction oftenoccurs during systole when the tricuspid and mitral valvesare closed, resulting in prominent jugular neck vein pul-sations called cannon A waves. These cannon A waves oc-cur intermittently, only when atrial and ventricular con-tractions are simultaneous.
■ Varying intensity of the first heart sound: The inten-sity of the first heart sound depends on the position ofthe mitral and tricuspid valves at the onset of systole.When the valves are wide open, the first heart sound ismarkedly accentuated because of the wide distance theleaflets have to travel to their closure points. On the otherhand, when the valves are near their coaptation points,the first heart sound will be very soft and hardly audiblebecause the leaflets are almost in a semiclosed position atthe onset of systole. During atrial contraction correspon-ding to the P wave in the ECG, the mitral and tricuspidleaflets are pushed wide open toward the ventricles awayfrom their closure points. If this is immediately followedby ventricular contraction (as when the PR interval isshort), closure of the mitral and tricuspid leaflets will beloud and often booming. On the other hand, if atrialcontraction is not immediately followed by ventricularcontraction (as when the PR interval is unduly pro-longed), the closure of the leaflets will be soft or inaudi-ble because the leaflets are allowed to drift back to asemiclosed position at the onset of ventricular contrac-tion. Because the PR interval is variable when there iscomplete AV dissociation, the intensity of the first heartsound will also be variable.
■ Varying pulse volume: When the P waves and the QRScomplexes are completely dissociated, some ventricularbeats will be preceded by atrial contraction, whereas otherbeats are not. When a P wave precedes a QRS complex,ventricular filling is augmented, resulting in a largerstroke volume, whereas QRS complexes without preced-ing P waves will have a lower stroke volume.
■ Jugular venous pulsations: The jugular venous pulsationsmay be useful in the diagnosis of cardiac arrhythmias. In1899, Wenckebach described the second-degree AV blockthat bears his name without using an ECG by examiningjugular pulse tracings. The jugular pulse consists of threepositive waves (a, c, and v waves) and two negative waves (xand y descents). To identify these waves and descents at bed-side, the patient should be positioned properly and lightingshould be adequate. The internal jugular veins lie deep be-hind the sternocleidomastoid muscle; thus, the venous col-umn is not normally visible unless there is increased venouspressure because of right heart failure. The internal jugularpulsations, however, can be identified because they are trans-mitted superficially to the skin. Simultaneous auscultation ofthe heart or palpation of the radial pulse or opposite carotidartery is useful in timing the pulsations.
LWBK271-C08_80-111.qxd 1/29/09 12:00 PM Page 106 LWBK271-C01_01-08.qxd

Atrioventricular Block 107
■ Jugular versus carotid pulsations: If there is difficultyin differentiating jugular venous from carotid arterialpulsations, the patient should be positioned more verti-cally upright because the venous pulse may disappear,whereas the arterial pulse does not disappear with any po-sition. The venous pulse has two waves, with an inwardmotion corresponding to the x and y descents, whereasthe arterial pulse has a single wave with an outward mo-tion. If there is still doubt whether the pulse is venous orarterial, the base of the neck above the clavicle should becompressed. If the pulsation is venous, the pulse will dis-appear. Deep inspiration may enhance the venous pulsa-tions, whereas the carotid pulse is not altered by pressureor by inspiration.
n The “a” wave: The “a” wave corresponds to the P wavein the ECG and is due to the rise in jugular venouspressure during atrial contraction. There is slight me-chanical delay in the transmission of the atrial pulse tothe neck; thus, the peak of the “a” wave usually coin-cides with the onset of the first heart sound. The “a”wave is prominent when there is increased resistanceto the flow of blood to the right ventricle, as whenthere is tricuspid stenosis, right ventricular hypertro-phy, pulmonic stenosis, or pulmonary hypertension. Itis also prominent when there is left ventricular hyper-trophy because the septum is shared by both ventri-cles. The “a” wave is absent if there is atrial fibrillationor the rhythm is AV junctional.
n The x descent: The x descent is the most conspicuousjugular motion occurring immediately after the “a”wave and is due to atrial relaxation and downwardmotion of the tricuspid annulus during systole.Because timing is systolic, it is easy to identify usingthe heart sounds or radial pulse. The x descent isprominent when the “a” wave is prominent. It is alsoprominent in constrictive pericarditis and in cardiactamponade. The x descent is absent when there is no“a” wave, such as when there is AV junctional rhythmor atrial fibrillation.
n The “c” wave: The x descent in the jugular pulse is ofteninterrupted by the “c” wave, which is due to transmittedpulsation from the carotid artery. Additionally, duringright ventricular contraction, there is bulging of the tri-cuspid leaflets into the right atrium. The x descent con-tinues as the x� descent after the c wave. The “c” wave isprominent when there is tricuspid regurgitation, oftencombining with the “v” wave to form a prominent “cv”wave. In some normal individuals, the “c” wave may notbe demonstrable.
n The “v” wave: The “v” wave is due to the rise in rightatrial pressure as blood accumulates in the atriumwhen the tricuspid valve is closed during systole. Thepeak of the “v” wave occurs with the onset of the sec-ond heart sound. The “v” wave becomes a large “cv”wave when there is tricuspid regurgitation. It is also
prominent when there is increased right atrial pres-sure resulting from cardiomyopathy or increased vol-ume due to atrial septal defect.
n The y descent: The y descent follows the downslope ofthe “v” wave and is due to the fall in right atrial pressurewhen the tricuspid valve opens during diastole. The ydescent occurs after the second heart sound or after theradial pulse and is prominent in restrictive cardiomy-opathy, constrictive pericarditis, right ventricular in-farction, and tricuspid regurgitation. The y descent be-comes diminished when there is tricuspid stenosis.
■ The jugular neck vein pulsations may be helpful in the di-agnosis of certain arrhythmias:n First-degree AV block: When the PR interval is pro-
longed, the “a” to “c” interval is wide.n Type I second-degree AV block or AV Wenckebach:
In AV Wenckebach, the interval between the “a” waveand “c” wave gradually widens until the “a” wave is notfollowed by a “v” wave. Additionally, as the PR intervalbecomes longer, the intensity of the first heart soundbecomes softer until a dropped beat occurs.
n Type II block: When there is type II block, the intervalbetween the “a” and “c” waves do not vary. The inten-sity of the first heart sound will not vary because thePR interval is fixed.
n Other arrhythmias: Cannon A waves are intermittentlypresent when there is complete AV dissociation resultingfrom complete AV block or ventricular tachycardia.Cannon A waves are constantly present when the PR in-terval is markedly prolonged (see First-Degree AV Blockin this chapter) when there is AV junctional rhythm,supraventricular tachycardia from AV nodal reentry, orAV reentry (see Chapter 16, Supraventricular Tachy-cardia.) or when there is ventricular tachycardia withretrograde conduction to the atria.
Treatment
■ If complete AV block occurs at the level of the AV node andthe patient is asymptomatic with narrow QRS complexes anda heart rate of at least 50 bpm, no treatment is necessary,other than further monitoring and observation. Any agentthat can cause AV block should be discontinued.
■ Patients with AV block may become symptomatic becauseof bradycardia, which includes hypotension, altered mentalstatus, ischemic chest pain, or signs of heart failure and lowcardiac output. Treatment of the bradycardia includes air-way and blood pressure support and identification of im-mediately reversible causes of AV block, including respira-tory causes and blood gas and electrolyte abnormalities,hypovolemia, hypothermia, hypoglycemia, and acute coro-nary vasospasm.
■ The following intravenous agents may be useful in increasingthe ventricular rate or improving AV conduction. Theseagents can enhance myocardial oxygen consumption and
LWBK271-C08_80-111.qxd 1/29/09 12:00 PM Page 107 LWBK271-C01_01-08.qxd

108 Chapter 8
therefore should be used cautiously in the setting of acute MIbecause this may result in further extension of the myocar-dial infarct.
■ Atropine: The drug of choice for the treatment ofbradycardia is atropine. If there are no immediately re-versible causes of AV block, this agent remains the drugof choice for symptomatic bradycardia and receives aClass IIa recommendation according to the AHA guide-lines for cardiopulmonary resuscitation and emergencycardiovascular care.
n Atropine 0.5 mg should be given intravenously every 3 to 5 minutes until a desired heart rate is achieved.Complete vagal blockade is expected when a total doseof 0.04 mg/kg or 3.0 mg is given intravenously over 2 hours.
n Atropine should not be given in doses smaller than0.5 mg because small doses stimulate the vagal nucleiand may enhance parasympathetic activity, resultingin paradoxical slowing and worsening of the AVblock.
n The drug can be given intratracheally during resusci-tation, although subcutaneous or intramuscular ad-ministration should be avoided because these routesof administration can also result in paradoxicalslowing.
n Atropine is not effective in patients with AV block atthe infranodal level. If the AV block is infranodal orthe bradycardia does not respond to atropine, tran-scutaneous pacing should be instituted immediatelyin patients who are symptomatic.
■ Alternative medications: There are other medicationsthat can be tried for the treatment of bradycardia if at-ropine is not effective. These drugs are given only as alter-native agents and receive a Class IIb recommendation ac-cording to the AHA guidelines.
n Epinephrine: This can be given as an alternate to at-ropine if atropine is not effective or the AV block is in-franodal and transcutaneous pacing is not available orhas failed. This will serve as a temporizing measure be-fore a transvenous pacemaker can be inserted. For thetreatment of bradycardia and or hypotension, the infu-sion is prepared by adding 1 mg to 500 mL saline orD5W and started at an initial infusion of 1 �g/minute.The recommended dose is 1 to 10 �g/minute titratedaccording to the desired heart rate.
n Dopamine: Dopamine may be given instead of at-ropine or epinephrine. It can be given as monotherapyor in combination with epinephrine. The dose is 2 to10 �g/kg/minute titrated according to the desiredheart rate.
n Glucagon: If atropine is not effective, glucagon hasbeen shown to improve symptomatic bradycardia in-duced by drugs such as beta blockers and calciumchannel blockers. The dose is 3 mg given intra-venously followed by infusion of 3 mg/hour if needed.
n Digibind: If complete AV block is due to digitalis ex-cess, digitalis should be discontinued and Digibindgiven as an antidote.
■ Transcutaneous pacing: This intervention receives aClass I recommendation in patients who do not respondto atropine. Transcutaneous pacing is easier to performthan transvenous pacing and can be provided by mosthospital personnel because the procedure is noninvasive.
■ Transvenous pacing: Transvenous pacing should be per-formed if transcutaneous pacing is ineffective or unsuccess-ful or if the patient cannot tolerate transcutaneous pacing.This procedure is invasive and takes longer to accomplish,but provides more stable pacing.
■ Permanent pacing: The following are indications for inser-tion of permanent pacemaker in complete AV block accordingto the ACC/AHA/HRS guidelines. In patients in whom the AVblock is not reversible, a permanent pacemaker is indicated.
■ Symptomatic patients: Patients with complete AVblock at any anatomic level with symptoms related to thebradycardia, insertion of a permanent pacemaker is aClass I recommendation.
■ Asymptomatic patients: Asymptomatic patients withcomplete AV block, permanent pacing is a Class I indica-tion in the following conditions.
n Patients with arrhythmias and other medical condi-tions that require drugs that can cause symptomaticbradycardia.
n Documented asystole �3.0 seconds or any escape rate�40 bpm in patients with sinus rhythm who areawake and asymptomatic.
n After catheter ablation of the AV junction.
n Postcardiac surgery AV block that is not expected toresolve.
n Neuromuscular diseases including myotonic muscu-lar dystrophy, Kearns-Sayre syndrome, Erb dystrophy,and peroneal muscular atrophy with or withoutsymptoms.
n The recommendation is Class IIa in asymptomatic pa-tients with complete AV block at any level with aver-age awake ventricular rates of �40 bpm if car-diomegaly or left ventricular dysfunction is present.
■ A permanent pacemaker should not be inserted if the AVblock is expected to resolve or is unlikely to recur, such asthose resulting from drug toxicity, Lyme disease, or duringhypoxia related to sleep apnea in the absence of symptoms.These are Class III recommendations.
Prognosis
■ In patients with congenital complete AV block, the block isalmost always at the level of the AV node. The escape rhythmis AV junctional and most patients remain stable and mini-mally symptomatic without therapy. These patients willeventually have permanent pacemakers implanted.
LWBK271-C08_80-111.qxd 1/29/09 12:00 PM Page 108 LWBK271-C01_01-08.qxd
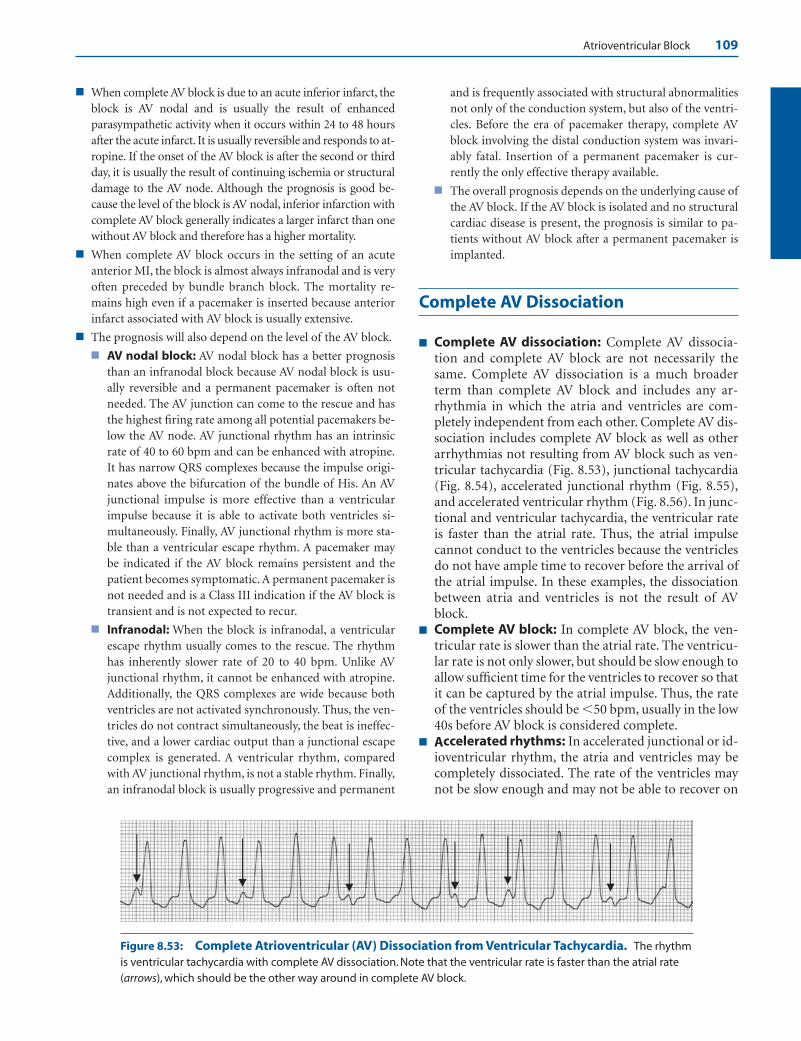
Atrioventricular Block 109
Figure 8.53: Complete Atrioventricular (AV) Dissociation from Ventricular Tachycardia. The rhythmis ventricular tachycardia with complete AV dissociation. Note that the ventricular rate is faster than the atrial rate(arrows), which should be the other way around in complete AV block.
■ When complete AV block is due to an acute inferior infarct, theblock is AV nodal and is usually the result of enhancedparasympathetic activity when it occurs within 24 to 48 hoursafter the acute infarct. It is usually reversible and responds to at-ropine. If the onset of the AV block is after the second or thirdday, it is usually the result of continuing ischemia or structuraldamage to the AV node. Although the prognosis is good be-cause the level of the block is AV nodal, inferior infarction withcomplete AV block generally indicates a larger infarct than onewithout AV block and therefore has a higher mortality.
■ When complete AV block occurs in the setting of an acuteanterior MI, the block is almost always infranodal and is veryoften preceded by bundle branch block. The mortality re-mains high even if a pacemaker is inserted because anteriorinfarct associated with AV block is usually extensive.
■ The prognosis will also depend on the level of the AV block.
■ AV nodal block: AV nodal block has a better prognosisthan an infranodal block because AV nodal block is usu-ally reversible and a permanent pacemaker is often notneeded. The AV junction can come to the rescue and hasthe highest firing rate among all potential pacemakers be-low the AV node. AV junctional rhythm has an intrinsicrate of 40 to 60 bpm and can be enhanced with atropine.It has narrow QRS complexes because the impulse origi-nates above the bifurcation of the bundle of His. An AVjunctional impulse is more effective than a ventricularimpulse because it is able to activate both ventricles si-multaneously. Finally, AV junctional rhythm is more sta-ble than a ventricular escape rhythm. A pacemaker maybe indicated if the AV block remains persistent and thepatient becomes symptomatic. A permanent pacemaker isnot needed and is a Class III indication if the AV block istransient and is not expected to recur.
■ Infranodal: When the block is infranodal, a ventricularescape rhythm usually comes to the rescue. The rhythmhas inherently slower rate of 20 to 40 bpm. Unlike AVjunctional rhythm, it cannot be enhanced with atropine.Additionally, the QRS complexes are wide because bothventricles are not activated synchronously. Thus, the ven-tricles do not contract simultaneously, the beat is ineffec-tive, and a lower cardiac output than a junctional escapecomplex is generated. A ventricular rhythm, comparedwith AV junctional rhythm, is not a stable rhythm. Finally,an infranodal block is usually progressive and permanent
and is frequently associated with structural abnormalitiesnot only of the conduction system, but also of the ventri-cles. Before the era of pacemaker therapy, complete AVblock involving the distal conduction system was invari-ably fatal. Insertion of a permanent pacemaker is cur-rently the only effective therapy available.
■ The overall prognosis depends on the underlying cause ofthe AV block. If the AV block is isolated and no structuralcardiac disease is present, the prognosis is similar to pa-tients without AV block after a permanent pacemaker isimplanted.
Complete AV Dissociation
■ Complete AV dissociation: Complete AV dissocia-tion and complete AV block are not necessarily thesame. Complete AV dissociation is a much broaderterm than complete AV block and includes any ar-rhythmia in which the atria and ventricles are com-pletely independent from each other. Complete AV dis-sociation includes complete AV block as well as otherarrhythmias not resulting from AV block such as ven-tricular tachycardia (Fig. 8.53), junctional tachycardia(Fig. 8.54), accelerated junctional rhythm (Fig. 8.55),and accelerated ventricular rhythm (Fig. 8.56). In junc-tional and ventricular tachycardia, the ventricular rateis faster than the atrial rate. Thus, the atrial impulsecannot conduct to the ventricles because the ventriclesdo not have ample time to recover before the arrival ofthe atrial impulse. In these examples, the dissociationbetween atria and ventricles is not the result of AVblock.
■ Complete AV block: In complete AV block, the ven-tricular rate is slower than the atrial rate. The ventricu-lar rate is not only slower, but should be slow enough toallow sufficient time for the ventricles to recover so thatit can be captured by the atrial impulse. Thus, the rateof the ventricles should be �50 bpm, usually in the low40s before AV block is considered complete.
■ Accelerated rhythms: In accelerated junctional or id-ioventricular rhythm, the atria and ventricles may becompletely dissociated. The rate of the ventricles maynot be slow enough and may not be able to recover on
LWBK271-C08_80-111.qxd 1/29/09 12:00 PM Page 109 LWBK271-C01_01-08.qxd

110 Chapter 8
Figure 8.54: Complete Atrioventricular (AV) Dissociation from Junctional Tachycardia. Therhythm is junctional tachycardia with a rate of 101 beats per minute. Both P waves and QRS complexes are regu-lar but are completely dissociated. Although the P waves have no relation to the QRS complexes, complete AVblock is not present because the ventricular rate is not slow enough to be captured by the atrial impulse. Thearrows identify the P waves, which have no relation to the QRS complexes.
Figure 8.55: Complete Atrioventricular (AV) Dissociation from Accelerated Junctional Rhythm.Lead II rhythm strip showing complete AV dissociation with an atrial rate of 100 beats per minute and a ventricularrate at 80 beats per minute. The dissociation between the atria and ventricles may not be due to AV block. In com-plete AV block, the ventricular rate should be in the 40s to allow enough time for the conduction system and theventricles to recover completely before the arrival of the next impulse. The P waves are marked by the arrows.
Figure 8.56: Complete Atrioventricular (AV) Dissociation from Accelerated IdioventricularRhythm. There is complete AV dissociation with an atrial rate of almost 100 beats per minute and ventricular rateof 56 beats per minute. The QRS complexes are wide because of accelerated idioventricular rhythm. Although thedissociation between the P waves and QRS complex may be due to complete AV block, this cannot be certainbecause the ventricular rate is not slow enough. Thus, the rhythm is more appropriately complete AV dissociationrather than complete AV block. The arrows identify the sinus P waves.
Complete AV block
Ventricular tachycardia
with complete AV
dissociation
Accelerated idioventricular rhythm with complete AV dissociation
Junctional tachycardia
with complete AV dissociation
Junctional rhythm with complete AV dissociation
Complete AV Dissociation Figure 8.57: CompleteAtrioventricular (AV) Dissocia-tion. Complete AV block is an exam-ple of complete AV dissociation. Theother arrhythmias in which completeAV dissociation may occur are shown.
LWBK271-C08_80-111.qxd 1/29/09 12:00 PM Page 110 LWBK271-C01_01-08.qxd
Atrioventricular Block 111
time before the arrival of the atrial impulse. This mayresult in complete AV dissociation, not necessarily AVblock. Figure 8.57 shows the different arrhythmias thatcan result in AV dissociation.
ECG Findings in Complete AV Dissociation
1. P waves and QRS complexes are completely dissociated andhave no relation to each other.
2. In complete AV dissociation, the underlying rhythm may beventricular tachycardia, junctional tachycardia, acceleratedjunctional rhythm, accelerated ventricular rhythm, or com-plete AV block.
Mechanism
■ Complete AV dissociation occurs when two completely inde-pendent pacemakers, one controlling the atria and the othercontrolling the ventricles, are present.
■ When there is ventricular tachycardia, junctional tachy-cardia or accelerated junctional, or ventricular rhythms,the sinus impulse may not be able to propagate to the ven-tricles because the ventricular rate is faster than the atrialrate. Absence of ventricular capture when the ventricularrate is faster than the atrial rate is not necessarily becauseof complete AV block, but may be from the ventricles be-ing completely refractory every time atrial impulses arriveat the ventricles. This is a form of electrical interferenceresulting in AV dissociation. In these examples, completeAV block is not present.
■ In complete AV block, there is complete absence of AVconduction. The atrial impulse is unable to conductthrough the ventricles because of an abnormality in theconduction system. The atrial impulse is given the oppor-tunity to conduct to the ventricles, but is unable to do sowhen complete AV block is present.
Clinical Implications
■ Complete AV dissociation is a broader term that includes anyrhythm where the atria and ventricles are completely inde-pendent from each other and includes complete AV block aswell as other arrhythmias not resulting from complete AVblock such as ventricular tachycardia, junctional tachycardia,AV junctional, or ventricular rhythm.
■ Complete AV block is just one of the many examples ofcomplete AV dissociation. For complete AV block to occur,the ventricular rate should be slower than the atrial rateand should be �50 bpm, usually in the low to mid-40s.This will allow enough time for the ventricles to recoverbefore the next atrial impulse arrives. If the atrial impulsecannot capture the ventricles even when the ventricular
rate is slow, then complete AV block is the cause of the AVdissociation.
Treatment and Prognosis
■ Because there are other causes of complete AV dissociationother than complete AV block, treatment and prognosis willdepend on the specific arrhythmia causing the AV dissociation.
Suggested Readings
2005 American Heart Association guidelines for cardiopul-monary resuscitation and emergency cardiovascular care.Part 7.3: management of symptomatic bradycardia andtachycardia. Circulation. 2005;112:67–77.
2005 American Heart Association guidelines for cardiopul-monary resuscitation and emergency cardiovascular care.Part 7.4: monitoring and medications. Circulation. 2005;112:78–83.
Barold SS, Hayes DL. Second-degree atrioventricular block: areappraisal. Mayo Clin Proc. 2001;76:44–57.
Chatterjee K. Physical examination. In: Topol EJ, ed. Textbook ofCardiovascular Medicine. 2nd ed. Philadelphia: LippincottWilliams & Wilkins; 2002:280–284.
Gregoratos G, Abrams J, Epstein AE, et al. ACC/AHA/NASPE2002 guideline update for implantation of cardiac pacemak-ers and antiarrhythmia devices: summary article: a report ofthe American College of Cardiology/American Heart Associ-ation Task Force on Practice Guidelines (ACC/AHA/NASPECommittee to update the 1998 pacemaker guidelines). Circu-lation. 2002;106:2145–2161.
Epstein AE, DiMarco JP, Ellenbogen KA, et. al. ACC/AHA/HRS2008 guidelines for device-based therapy of cardiac rhythmabnormalities: a report of the American College ofCardiology/American Heart Association Task Force on Prac-tice Guidelines (Writing Committee to Revise the ACC/AHA/NASPE 2002 Guideline Update for Implantation ofCardiac Pacemakers and Antiarrhythmia Devices). Circula-tion 2008;117:e350-e408.
Mangrum JM, DiMarco JP. The evaluation and management ofbradycardia. N Engl J Med. 2000;342:703–709.
Marriot HJL. Intra-atrial, sino-atrial and atrio-ventricularblock. In: Practical Electrocardiography. 5th ed. Baltimore:Williams & Wilkins; 1972:194–211.
Marriott HJL, Menendez MM. A-V dissociation revisited. ProgCardiovas Dis. 1966;8:522–538.
Narula OS, Scherlag BJ, Samet P, et al. Atrioventricular block.Am J Med. 1971;50:146–165.
Zipes DP, DiMarco JP, Gillette PC, et al. Guidelines for clinical in-tracardiac electrophysiological and catheter ablation proce-dures: a report of the American College of Cardiology/Ameri-can Heart Association Task Force on Practice Guidelines(Committee on Clinical Intracardiac Electrophysiologic andCatheter Ablation Procedures), developed in collaborationwith the North American Society of Pacing and Electrophysiol-ogy. J Am Coll Cardiol. 1995;26:555–573.
LWBK271-C08_80-111.qxd 1/29/09 12:00 PM Page 111 LWBK271-C01_01-08.qxd
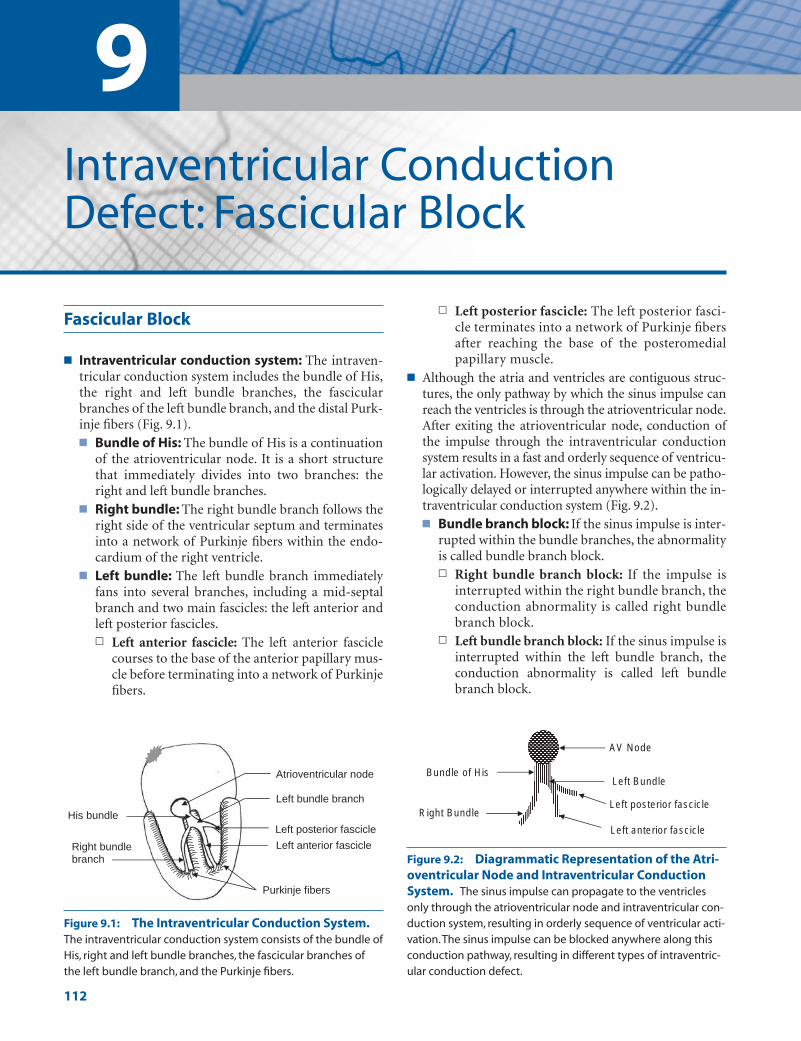
9Intraventricular ConductionDefect: Fascicular Block
112
Fascicular Block
■ Intraventricular conduction system: The intraven-tricular conduction system includes the bundle of His,the right and left bundle branches, the fascicularbranches of the left bundle branch, and the distal Purk-inje fibers (Fig. 9.1).■ Bundle of His: The bundle of His is a continuation
of the atrioventricular node. It is a short structurethat immediately divides into two branches: theright and left bundle branches.
■ Right bundle: The right bundle branch follows theright side of the ventricular septum and terminatesinto a network of Purkinje fibers within the endo-cardium of the right ventricle.
■ Left bundle: The left bundle branch immediatelyfans into several branches, including a mid-septalbranch and two main fascicles: the left anterior andleft posterior fascicles.n Left anterior fascicle: The left anterior fascicle
courses to the base of the anterior papillary mus-cle before terminating into a network of Purkinjefibers.
n Left posterior fascicle: The left posterior fasci-cle terminates into a network of Purkinje fibersafter reaching the base of the posteromedialpapillary muscle.
■ Although the atria and ventricles are contiguous struc-tures, the only pathway by which the sinus impulse canreach the ventricles is through the atrioventricular node.After exiting the atrioventricular node, conduction ofthe impulse through the intraventricular conductionsystem results in a fast and orderly sequence of ventricu-lar activation. However, the sinus impulse can be patho-logically delayed or interrupted anywhere within the in-traventricular conduction system (Fig. 9.2).■ Bundle branch block: If the sinus impulse is inter-
rupted within the bundle branches, the abnormalityis called bundle branch block.n Right bundle branch block: If the impulse is
interrupted within the right bundle branch, theconduction abnormality is called right bundlebranch block.
n Left bundle branch block: If the sinus impulse isinterrupted within the left bundle branch, theconduction abnormality is called left bundlebranch block.
Left posterior fascicle
Left anterior fascicle Right bundle branch
Purkinje fibers
His bundle
Left bundle branch
Atrioventricular node
Figure 9.1: The Intraventricular Conduction System.The intraventricular conduction system consists of the bundle ofHis, right and left bundle branches, the fascicular branches ofthe left bundle branch, and the Purkinje fibers.
AV Node
Bundle of His
Right Bundle
Left Bundle
Left anterior fascicle
Left posterior fascicle
Figure 9.2: Diagrammatic Representation of the Atri-oventricular Node and Intraventricular ConductionSystem. The sinus impulse can propagate to the ventriclesonly through the atrioventricular node and intraventricular con-duction system, resulting in orderly sequence of ventricular acti-vation.The sinus impulse can be blocked anywhere along thisconduction pathway, resulting in different types of intraventric-ular conduction defect.
LWBK271-C09_112-119.qxd 1/30/09 12:02 PM Page 112 Aptara Inc.

Intraventricular Conduction Defect: Fascicular Block 113
■ Fascicular block: If the sinus impulse is inter-rupted within the fascicles, the conduction abnor-mality is called fascicular block.n Left anterior fascicular block: If the sinus im-
pulse is interrupted within the left anterior fasci-cle, the conduction abnormality is called left an-terior fascicular block (LAFB).
n Left posterior fascicular block: If the sinus im-pulse is interrupted within the left posterior fas-cicle, the conduction abnormality is called leftposterior fascicular block (LPFB).
Left Anterior Fascicular Block
■ Left anterior fascicular block: LAFB occurs whenthe sinus impulse is delayed or interrupted within theleft anterior fascicle. LAFB is the most common intra-ventricular conduction abnormality because the leftanterior fascicle is a long and thin structure that ismore delicate and more vulnerable to injury than therest of the conduction system.
■ Electrocardiogram findings: LAFB alters the elec-trocardiogram (ECG) by abnormally shifting the axisof the QRS complex to the left of –30�. The most im-portant leads in detecting the abnormal left axis devia-tion are leads II and aVL.■ Lead II: This is the most important lead in suspect-
ing that LAFB is present. In lead II, the QRS com-plex is negative with an rS configuration (r wave issmaller than the S wave). Leads III and aVF will alsoshow an rS pattern.
■ Lead aVL: A tall R wave in lead I (Rs complex) anda qR pattern in aVL will confirm that the axis hasshifted to the left.
■ In LAFB, the right ventricle continues to be supplied bythe right bundle branch, and the left ventricle contin-ues to be supplied by the left posterior fascicle. Therefore,
activation of both ventricles remains synchronous andthe duration of the QRS complex is not increased. Itnormally remains at 0.08 to 0.10 seconds.
■ The ECG findings of LAFB are shown in Figures 9.3and 9.4.
■ Common mistakes in left anterior fascicular block:■ LAFB mistaken for anterior infarct: LAFB may
cause small q waves in V2 and in V3, which can bemistaken for anteroseptal infarct (Fig. 9.5). Thesemicro–q waves may become more exaggerated if V1
and V2 are inadvertently positioned at a higher loca-tion on the patient’s chest (at the 2nd rather thanthe 4th intercostal space).
■ LAFB mistaken for inferior infarct: LAFB may beconfused with inferior myocardial infarction (MI)because both can shift the QRS axis to the left of–30�. However, inferior MI will show initial q wavesin leads II, III, and aVF (Fig. 9.6), whereas the QRScomplex in LAFB start with a small r wave in II, III,and aVF (Fig. 9.5).
■ LAFB and inferior MI: LAFB and inferior MI may bedifficult to recognize when they occur together unlessthe leads are recorded simultaneously (Fig. 9.7A).■ LAFB: For LAFB to be present, (1) the axis of the
QRS complex should exceed –30�, (2) both aVR andaVL should end with R waves, and (3) the peak ofthe R wave in aVL should occur earlier than the peakof the R wave in aVR (Fig. 9.7B).
■ LAFB � inferior MI: When LAFB is associated withinferior MI, a q wave in lead II should be present(Fig. 9.8A) in addition to criteria 1, 2, and 3 forLAFB listed previously (Fig. 9.8B).
ECG of LAFB
1. Frontal or limb leads:
■ Left axis deviation �–30� (rS complexes in II, III, and aVFand qR in I and aVL).
■ Normal QRS duration.
Frontal Leads - Left Axis Deviation >-300
Precordial Leads - No Diagnostic Pattern
aVL II
I
Left Anterior Fascicular Block
III aVF
aVR
Figure 9.3: Left Anterior Fascicular Block.The hallmark of LAFB is the presence of left axis de-viation �–30� with rS complexes in leads II, III, andaVF and tall R waves in leads I and aVL. Briefly, LAFBshould always be suspected when there is negativeor rS complex in lead II with a tall R wave in lead I(the essential leads are framed).
LWBK271-C09_112-119.qxd 1/30/09 12:02 PM Page 113 Aptara Inc.
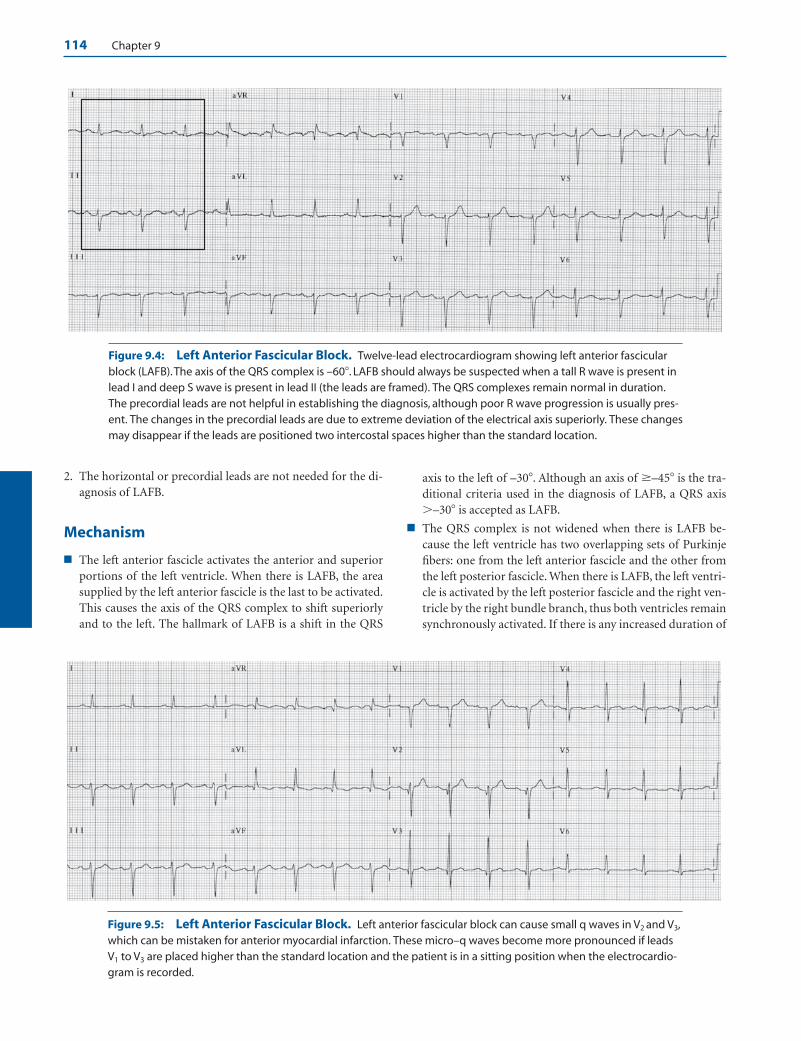
114 Chapter 9
Figure 9.4: Left Anterior Fascicular Block. Twelve-lead electrocardiogram showing left anterior fascicularblock (LAFB).The axis of the QRS complex is –60�. LAFB should always be suspected when a tall R wave is present inlead I and deep S wave is present in lead II (the leads are framed). The QRS complexes remain normal in duration.The precordial leads are not helpful in establishing the diagnosis, although poor R wave progression is usually pres-ent. The changes in the precordial leads are due to extreme deviation of the electrical axis superiorly. These changesmay disappear if the leads are positioned two intercostal spaces higher than the standard location.
Figure 9.5: Left Anterior Fascicular Block. Left anterior fascicular block can cause small q waves in V2 and V3,which can be mistaken for anterior myocardial infarction. These micro–q waves become more pronounced if leadsV1 to V3 are placed higher than the standard location and the patient is in a sitting position when the electrocardio-gram is recorded.
2. The horizontal or precordial leads are not needed for the di-agnosis of LAFB.
Mechanism
■ The left anterior fascicle activates the anterior and superiorportions of the left ventricle. When there is LAFB, the areasupplied by the left anterior fascicle is the last to be activated.This causes the axis of the QRS complex to shift superiorlyand to the left. The hallmark of LAFB is a shift in the QRS
axis to the left of –30�. Although an axis of �–45� is the tra-ditional criteria used in the diagnosis of LAFB, a QRS axis�–30� is accepted as LAFB.
■ The QRS complex is not widened when there is LAFB be-cause the left ventricle has two overlapping sets of Purkinjefibers: one from the left anterior fascicle and the other fromthe left posterior fascicle. When there is LAFB, the left ventri-cle is activated by the left posterior fascicle and the right ven-tricle by the right bundle branch, thus both ventricles remainsynchronously activated. If there is any increased duration of
LWBK271-C09_112-119.qxd 1/30/09 12:02 PM Page 114 Aptara Inc.

Figure 9.6: Inferior Myocardial Infarction. Left anterior fascicular block should not be confused with inferior my-ocardial infarction (MI). In inferior MI, leads II, III, and aVF start with a q wave as shown here, rather than with a small r.
Peak of the R wave in aVR occurs later
Peak of the R wave in aVL occurs earlier
A B
Figure 9.7: Left Anterior Fascicular Block. When leads aVR and aVL are simultaneously recorded (A), left an-terior fascicular block is present when there is left axis deviation �–30� and aVR and aVL both terminate with an Rwave. (B) Magnified to show that the peak of the R wave in aVL occurs earlier than the peak of the R wave in aVR.
A B
QS
Figure 9.8: Left Anterior Fascicular Block with Inferior MI. (A) Leads aVR and aVL arerecorded simultaneously and are magnified in (B). Note that the terminal R wave in aVR (arrow)occurs later than the terminal R wave in aVL, consistent with left anterior fascicular block. In addi-tion, q waves (QS) are present in lead II (A), consistent with inferior myocardial infarction.
115
LWBK271-C09_112-119.qxd 1/30/09 12:02 PM Page 115 Aptara Inc.

116 Chapter 9
the QRS complex, it will be minimal and should not exceed0.01 to 0.02 seconds above baseline. Thus, the total durationof the QRS complex will remain within 0.10 seconds unlessthere is MI or left ventricular hypertrophy.
■ In LAFB, the left ventricle is initially activated by the left pos-terior fascicle. Thus, the initial QRS vector is directed inferi-orly and to the right, often causing q waves in V2 and V3. Thisbecomes exaggerated if the electrodes are positioned higheron the chest or if the heart is oriented vertically.
Clinical Significance
■ The left anterior fascicle is a long and thin structure that termi-nates into a network of Purkinje fibers at the base of the ante-
rior papillary muscle. It courses subendocardially in the direc-tion of the outflow tract of the left ventricle, and thus is subjectto higher intraventricular pressure than the rest of the conduc-tion system. Because of its structure and location, LAFB is themost common intraventricular conduction abnormality.
■ LAFB is a common cause of left axis deviation and should beconsidered immediately when left axis deviation exceeds–30�. LAFB may be difficult to recognize when combinedwith inferior MI because both can cause left axis deviation.
■ LAFB: In LAFB, the QRS axis is �–30� and leads II, III,and aVF start with small r waves. The terminal QRS vectorloop in the frontal plane is directed superiorly and left-ward in a counterclockwise direction. Thus, the peak ofthe R in aVL occurs earlier than the peak of the R in aVR.
Left Posterior Fascicular Block
III
I
aVF
Precordial Leads = No Diagnostic Pattern
II
aVR
aVL
Left posterior Fascicular Block
• Frontal leads:Axis: Right axis deviation >900. Other causes are excluded.
Lead I: rS complex Lead aVF: Tall R in aVF and lead III with qR pattern
The duration of the QRS complex remains normal • Precordial leads: No diagnostic changes
Frontal Leads = Right Axis Deviation >900
Figure 9.9: Left Posterior Fascicular Block.The most important feature of left posterior fascicu-lar block (LPFB) is the presence of right axis devia-tion �90�. The diagnosis should be considered onlyafter chronic obstructive pulmonary disease andother causes of right ventricular hypertrophy areexcluded. The presence of LPFB is suspected whendeep S wave is present in lead I (rS complex) andtall R wave (Rs complex) is present in lead II (theleads are framed).
Figure 9.10: Normal Electrocardiogram. The QRS complexes are not widened, with normal axis of approxi-mately 75�.
LWBK271-C09_112-119.qxd 1/30/09 12:02 PM Page 116 Aptara Inc.
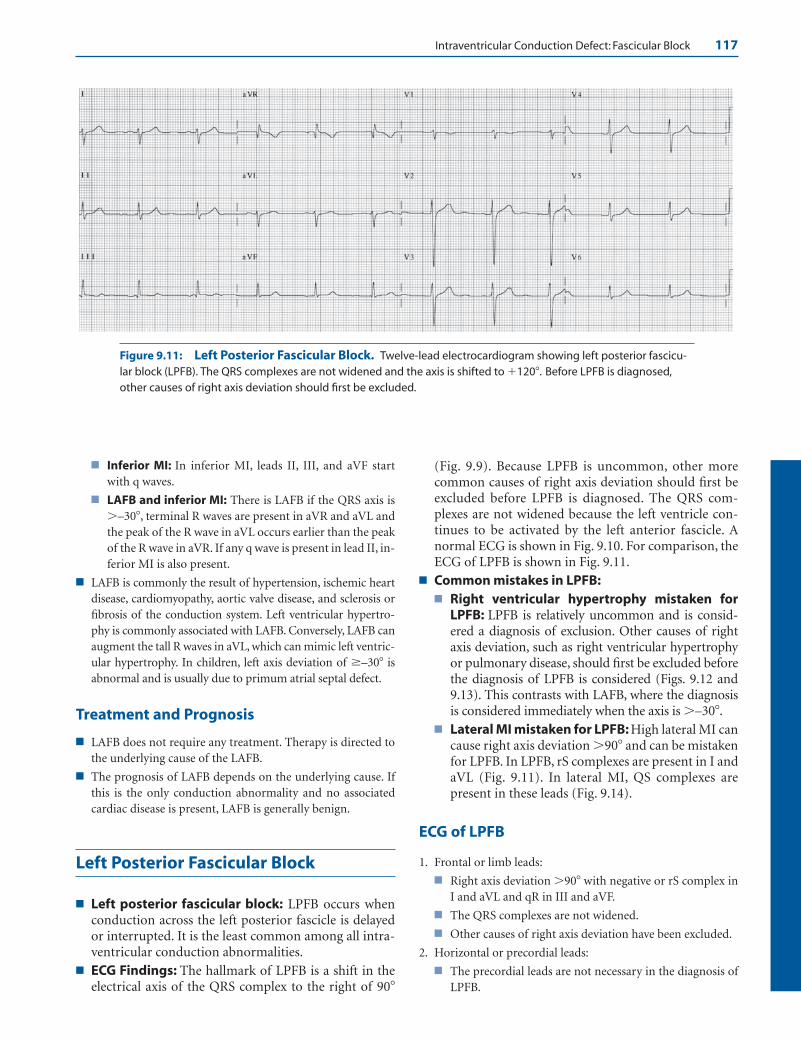
Intraventricular Conduction Defect: Fascicular Block 117
■ Inferior MI: In inferior MI, leads II, III, and aVF startwith q waves.
■ LAFB and inferior MI: There is LAFB if the QRS axis is�–30�, terminal R waves are present in aVR and aVL andthe peak of the R wave in aVL occurs earlier than the peakof the R wave in aVR. If any q wave is present in lead II, in-ferior MI is also present.
■ LAFB is commonly the result of hypertension, ischemic heartdisease, cardiomyopathy, aortic valve disease, and sclerosis orfibrosis of the conduction system. Left ventricular hypertro-phy is commonly associated with LAFB. Conversely, LAFB canaugment the tall R waves in aVL, which can mimic left ventric-ular hypertrophy. In children, left axis deviation of �–30� isabnormal and is usually due to primum atrial septal defect.
Treatment and Prognosis
■ LAFB does not require any treatment. Therapy is directed tothe underlying cause of the LAFB.
■ The prognosis of LAFB depends on the underlying cause. Ifthis is the only conduction abnormality and no associatedcardiac disease is present, LAFB is generally benign.
Left Posterior Fascicular Block
■ Left posterior fascicular block: LPFB occurs whenconduction across the left posterior fascicle is delayedor interrupted. It is the least common among all intra-ventricular conduction abnormalities.
■ ECG Findings: The hallmark of LPFB is a shift in theelectrical axis of the QRS complex to the right of 90�
(Fig. 9.9). Because LPFB is uncommon, other morecommon causes of right axis deviation should first beexcluded before LPFB is diagnosed. The QRS com-plexes are not widened because the left ventricle con-tinues to be activated by the left anterior fascicle. Anormal ECG is shown in Fig. 9.10. For comparison, theECG of LPFB is shown in Fig. 9.11.
■ Common mistakes in LPFB:■ Right ventricular hypertrophy mistaken for
LPFB: LPFB is relatively uncommon and is consid-ered a diagnosis of exclusion. Other causes of rightaxis deviation, such as right ventricular hypertrophyor pulmonary disease, should first be excluded beforethe diagnosis of LPFB is considered (Figs. 9.12 and9.13). This contrasts with LAFB, where the diagnosisis considered immediately when the axis is �–30�.
■ Lateral MI mistaken for LPFB: High lateral MI cancause right axis deviation �90� and can be mistakenfor LPFB. In LPFB, rS complexes are present in I andaVL (Fig. 9.11). In lateral MI, QS complexes arepresent in these leads (Fig. 9.14).
ECG of LPFB
1. Frontal or limb leads:
■ Right axis deviation �90� with negative or rS complex inI and aVL and qR in III and aVF.
■ The QRS complexes are not widened.
■ Other causes of right axis deviation have been excluded.
2. Horizontal or precordial leads:
■ The precordial leads are not necessary in the diagnosis ofLPFB.
Figure 9.11: Left Posterior Fascicular Block. Twelve-lead electrocardiogram showing left posterior fascicu-lar block (LPFB). The QRS complexes are not widened and the axis is shifted to �120�. Before LPFB is diagnosed,other causes of right axis deviation should first be excluded.
LWBK271-C09_112-119.qxd 1/30/09 12:02 PM Page 117 Aptara Inc.
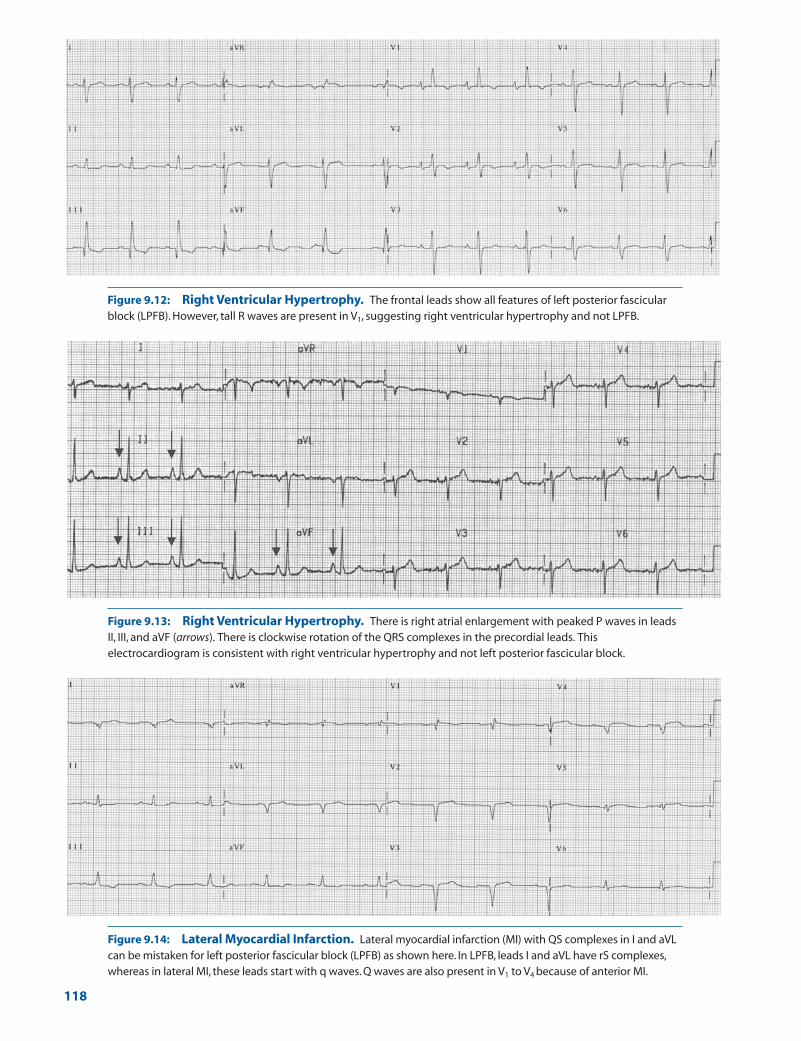
Figure 9.12: Right Ventricular Hypertrophy. The frontal leads show all features of left posterior fascicularblock (LPFB). However, tall R waves are present in V1, suggesting right ventricular hypertrophy and not LPFB.
Figure 9.13: Right Ventricular Hypertrophy. There is right atrial enlargement with peaked P waves in leadsII, III, and aVF (arrows). There is clockwise rotation of the QRS complexes in the precordial leads. Thiselectrocardiogram is consistent with right ventricular hypertrophy and not left posterior fascicular block.
Figure 9.14: Lateral Myocardial Infarction. Lateral myocardial infarction (MI) with QS complexes in I and aVLcan be mistaken for left posterior fascicular block (LPFB) as shown here. In LPFB, leads I and aVL have rS complexes,whereas in lateral MI, these leads start with q waves. Q waves are also present in V1 to V4 because of anterior MI.
118
LWBK271-C09_112-119.qxd 1/30/09 12:02 PM Page 118 Aptara Inc.

Intraventricular Conduction Defect: Fascicular Block 119
Mechanism
■ The left posterior fascicle activates the posteroinferior leftventricular free wall, which is to the right and inferior to thatactivated by the left anterior fascicle. This portion of the leftventricle is the last to be activated when there is LPFB, thuscausing the axis of the QRS complex to shift inferiorly and tothe right. While a QRS axis �100� is traditionally used toidentify LPFB, a QRS axis �90� is generally accepted asLPFB.
■ The QRS complex is not widened when there is LPFB becausethe left ventricle continues to be activated by the left anteriorfascicle and the right ventricle by the right bundle branch, re-sulting in synchronous activation of both ventricles.
Clinical Significance
■ LPFB is a diagnosis of exclusion since LPFB is relatively un-common. This contrasts with LAFB, in which the diagnosis isconsidered outright when there is left axis deviation �–30�.Before the diagnosis of LPFB is considered, other, more com-mon, causes of right axis deviation such as pulmonary dis-ease and other causes of right ventricular hypertrophyshould first be excluded.
■ In contrast to the left anterior fascicle, the left posterior fasci-cle has a dual blood supply, originating from the septal per-forating branches of the left anterior descending coronaryartery anteriorly and from the septal perforating branches ofthe posterior descending artery posteriorly. It is short, thick,and broad and courses along the inflow tract of the left ven-tricle before terminating into a network of Purkinje fibers atthe base of the posteromedial papillary muscle. It is thereforeprotected and subjected to less intraventricular pressurecompared with the left anterior fascicle. Because of its struc-ture, location, and blood supply, LPFB is the least commonamong all intraventricular conduction abnormalities.
■ The most important lead in recognizing LPFB is lead I. Thiswill show a negative or rS complex, with the S wave deeperthan the size of the r wave. This is accompanied by tall Rwaves in leads aVF and III.
■ Right axis deviation due to high lateral MI can be mistakenfor LPFB. Correspondingly, LPFB can obscure the ECGchanges of inferior MI.
■ The causes of LPFB are the same as that of LAFB and includecoronary disease, hypertension, cardiomyopathy, acute my-ocarditis, valvular disease (especially aortic stenosis), and de-generative diseases of the conduction system.
Treatment
■ Treatment is directed toward the underlying cause of the LPFB.
Prognosis
■ Because the left posterior fascicle is the least vulnerable andthe last to be involved when there is intraventricular conduc-tion defect, LPFB seldom occurs independently and is fre-quently seen in combination with right bundle branch blockor with LAFB. LPFB, therefore, indicates a more significantand more advanced form of conduction abnormality thanLAFB. LPFB in combination with LAFB can result in leftbundle branch block. The prognosis depends on the cause ofthe conduction abnormality.
Suggested Readings
Dunn MI, Lipman BS. Abnormalities of ventricular conduction:fascicular block, infarction block, and parietal block. In:Lippman-Massie Clinical Electrocardiography. 8th ed. Chicago:Yearbook Medical Publishers, Inc.; 1989:148–159.
Elizari MV, Acunzo RS, Ferreiro M. Hemiblocks revisited. Circu-lation. 2007;115:1154–1163.
Marriott HJL. The hemiblocks and trifascicular block. In: PracticalElectrocardiography. 5th ed. Baltimore: The Williams andWilkins Company; 1972:86–94.
Sgarbossa EB, Wagner GS. Electrocardiography: In: Topol EJ, ed.Textbook of Cardiovascular Medicine. 2nd ed. Philadelphia:Lippincott Williams & Wilkins; 2002:1330–1354.
Warner RA, Hill NE, Mookherjee S, et al. Electrocardiographiccriteria for the diagnosis of combined inferior MI and leftanterior hemiblock. Am J Cardiol. 1983;51:718–722.
Warner RA, Hill NE, Mookherjee S, et al. Improved electrocar-diographic criteria for the diagnosis of left anterior hemi-block. Am J Cardiol. 1983;51:723–726.
Willems JL, Robles de Medina EO, Bernard R, et al. Criteria forintraventricular conduction disturbances and pre-excitation.J Am Coll Cardiol. 1985;5:1261–1275.
LWBK271-C09_112-119.qxd 1/30/09 12:02 PM Page 119 Aptara Inc.
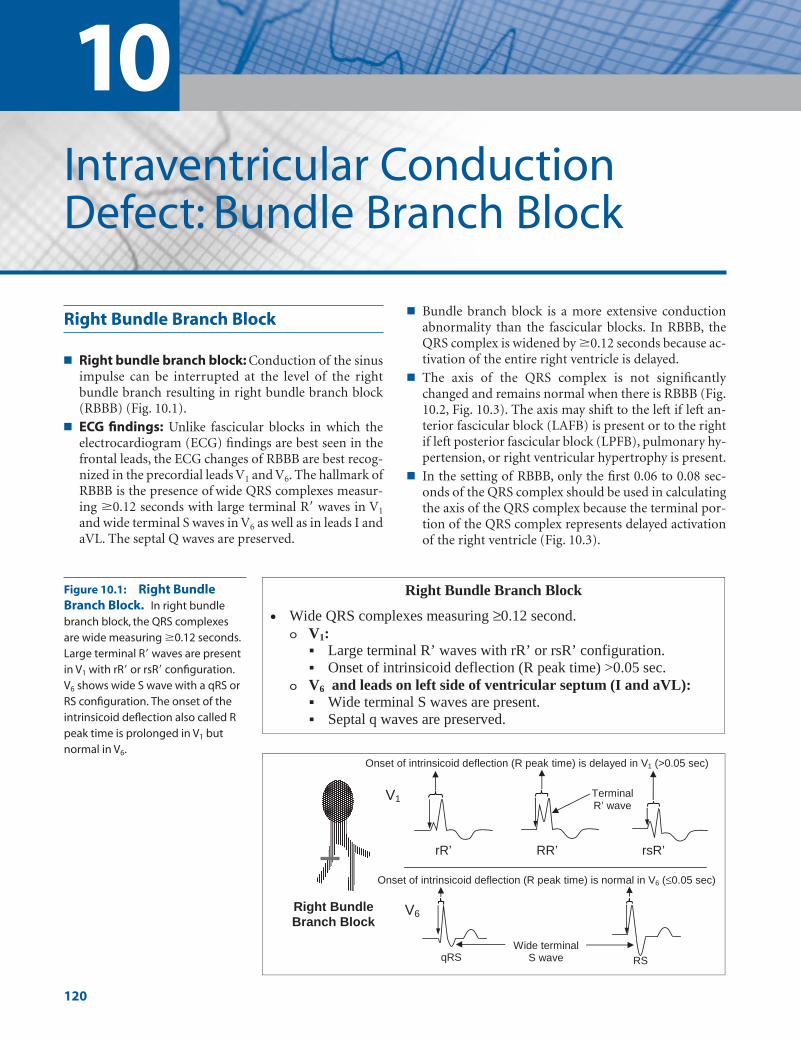
10Intraventricular ConductionDefect: Bundle Branch Block
Right Bundle Branch Block
■ Right bundle branch block: Conduction of the sinusimpulse can be interrupted at the level of the rightbundle branch resulting in right bundle branch block(RBBB) (Fig. 10.1).
■ ECG findings: Unlike fascicular blocks in which theelectrocardiogram (ECG) findings are best seen in thefrontal leads, the ECG changes of RBBB are best recog-nized in the precordial leads V1 and V6. The hallmark ofRBBB is the presence of wide QRS complexes measur-ing �0.12 seconds with large terminal R� waves in V1
and wide terminal S waves in V6 as well as in leads I andaVL. The septal Q waves are preserved.
■ Bundle branch block is a more extensive conductionabnormality than the fascicular blocks. In RBBB, theQRS complex is widened by �0.12 seconds because ac-tivation of the entire right ventricle is delayed.
■ The axis of the QRS complex is not significantlychanged and remains normal when there is RBBB (Fig.10.2, Fig. 10.3). The axis may shift to the left if left an-terior fascicular block (LAFB) is present or to the rightif left posterior fascicular block (LPFB), pulmonary hy-pertension, or right ventricular hypertrophy is present.
■ In the setting of RBBB, only the first 0.06 to 0.08 sec-onds of the QRS complex should be used in calculatingthe axis of the QRS complex because the terminal por-tion of the QRS complex represents delayed activationof the right ventricle (Fig. 10.3).
V1
Right Bundle Branch Block
RR’ rsR’ rR’
RS
V6
qRS
Terminal R’ wave
Wide terminal S wave
Onset of intrinsicoid deflection (R peak time) is delayed in V1 (>0.05 sec)
Onset of intrinsicoid deflection (R peak time) is normal in V6 (≤0.05 sec)
Right Bundle Branch Block
• Wide QRS complexes measuring ≥0.12 second.V1:
Large terminal R’ waves with rR’ or rsR’ configuration.Onset of intrinsicoid deflection (R peak time) >0.05 sec.
V6 and leads on left side of ventricular septum (I and aVL):Wide terminal S waves are present.Septal q waves are preserved.
Figure 10.1: Right BundleBranch Block. In right bundlebranch block, the QRS complexesare wide measuring �0.12 seconds.Large terminal R� waves are presentin V1 with rR� or rsR� configuration.V6 shows wide S wave with a qRS orRS configuration. The onset of theintrinsicoid deflection also called Rpeak time is prolonged in V1 butnormal in V6.
120
LWBK271-C10_120-137.qxd 1/30/09 12:04 PM Page 120 Aptara Inc.

Intraventricular Conduction Defect: Bundle Branch Block 121
RBBB � LAFB
■ Right bundle branch block � left anterior fascicu-lar block: RBBB can occur in combination with a fas-cicular block. Thus, RBBB � LAFB are present if the si-nus impulse is simultaneously interrupted at the rightbundle branch and left anterior fascicular branch.RBBB in combination with LAFB is an example of a bi-fascicular block because two conduction pathways areinterrupted. Activation of the ventricles can occur onlythrough the remaining left posterior fascicle.
■ ECG findings: The typical features of RBBB are seen inthe precordial leads and that of LAFB in the frontalleads (Fig. 10.4).■ RBBB: The QRS complexes are wide measuring
�0.12 seconds because of the presence of RBBB.The characteristic rR� or rsR� pattern is present inV1, and wide S waves are present in V6.
■ LAFB: In the frontal plane, the axis of the QRS com-plex is �–30� with rS in lead II and tall R wave inaVL.
■ RBBB � LPFB: RBBB � LPFB can occur when conduc-tion across the right bundle and left posterior fascicle is
Figure 10.2: Complete Right Bundle Branch Block. The QRS complexes are wide measuring �0.12seconds. rsR� configuration is present in V1 and qRs configuration is present in V6. Wide S waves are present in leads Iand V6. The axis of the QRS complex in the frontal plane is normal.
Figure 10.3: Right Bundle Branch Block Alternating with Normal Conduction. Note that when rightbundle branch block occurs (arrows), the axis of the QRS complex using only the first 0.06 to 0.08 seconds is not sig-nificantly changed when compared with the normally conducted QRS complexes.
LWBK271-C10_120-137.qxd 1/30/09 12:04 PM Page 121 Aptara Inc.

122 Chapter 10
simultaneously interrupted. RBBB � LPFB is also anexample of bifascicular block (Fig. 10.5, Fig. 10.6, Fig.10.7, Fig. 10.8).
■ ECG findings: The presence of RBBB and LPFB is rec-ognized separately.■ RBBB: The typical features of RBBB are best recog-
nized in the precordial leads as widening of the QRS
complex (�0.12 seconds) with a characteristic largeterminal R� (rR� or rsR�) in V1 and wide S in V6.
■ LPFB: LPFB is best recognized in the frontal plane asa shift in the QRS axis �90�. Deep S waves are pres-ent in lead I, with tall R waves in leads III and aVF.For LPFB to be considered, other causes of right axisdeviation should first be excluded.
RBBB and Fascicular Block
V1
Frontal Leads = Right Axis Deviation > 900
RBBB + LPFB
Lead I
Lead aVF
Precordial Leads = Classical RBBB
V6
RBBB + LPFB
• Wide QRS complexes measuring ≥0.12 seconds due to RBBBPrecordial leads: RBBB in V1 and in V6
Frontal leads: LPFB with right axis deviation >900
V1
Frontal leads = Left axis deviation >-300
RBBB + LAFB
Lead II
V6
Precordial leads = classical RBBB
rR’ RR’ rsR’
aVL
RBBB + LAFB
• The QRS complexes measure ≥0.12 second due to RBBBPrecordial leads: RBBB in V1 and in V6
Frontal leads: LAFB with left axis deviation >-300
Figure 10.4: Diagrammatic Representation ofRight Bundle Branch Block � Left Anterior Fas-cicular Block. The QRS complexes are wide. The pre-cordial leads show classical RBBB with rR�, RR�, or rsR� inV1 and qRS in V6. The limb leads show left axis deviation�–30� with deep rS complex in lead II and tall R in aVL.
Figure 10.5: Diagrammatic Rep-resentation of Right BundleBranch Block � Left PosteriorFascicular Block. The classical pat-tern of right bundle branch block is rec-ognized in the precordial leads with rR�
or rsR� in V1 and qRS in V6. The limbleads show right axis deviation �90�
with rS in lead I and tall R wave in leadaVF from left posterior fascicular block.
LWBK271-C10_120-137.qxd 1/30/09 12:04 PM Page 122 Aptara Inc.
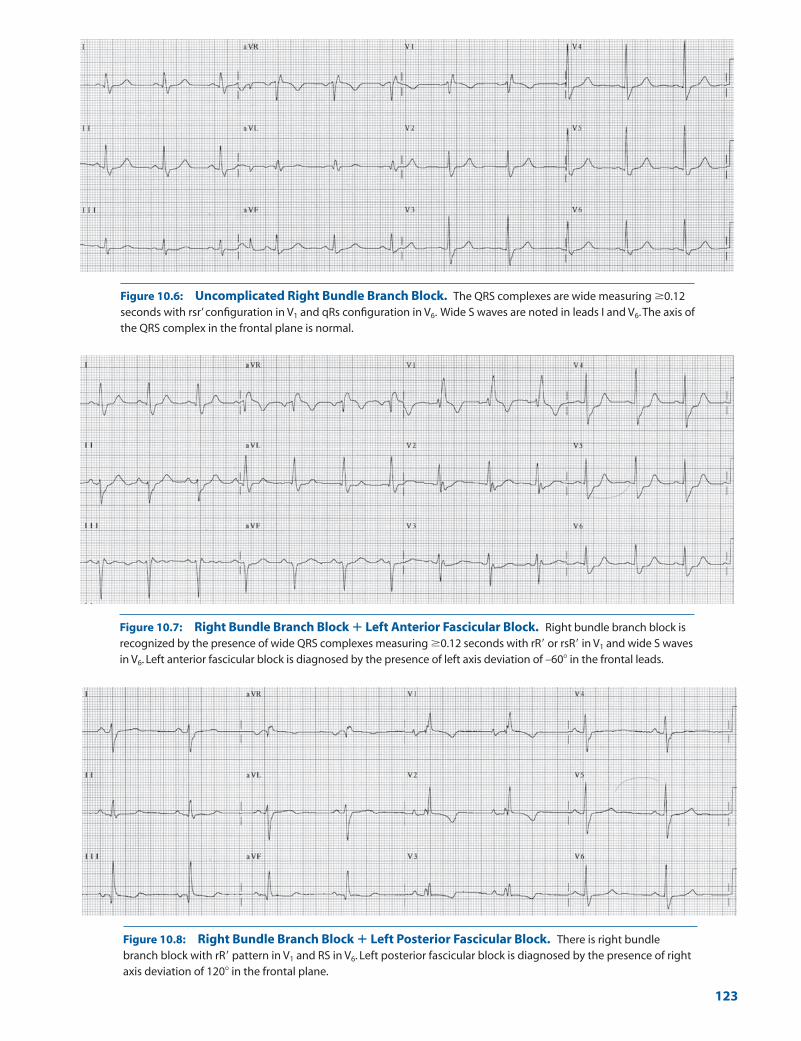
Figure 10.6: Uncomplicated Right Bundle Branch Block. The QRS complexes are wide measuring �0.12seconds with rsr’ configuration in V1 and qRs configuration in V6. Wide S waves are noted in leads I and V6.The axis ofthe QRS complex in the frontal plane is normal.
Figure 10.7: Right Bundle Branch Block � Left Anterior Fascicular Block. Right bundle branch block isrecognized by the presence of wide QRS complexes measuring �0.12 seconds with rR� or rsR� in V1 and wide S wavesin V6. Left anterior fascicular block is diagnosed by the presence of left axis deviation of –60� in the frontal leads.
Figure 10.8: Right Bundle Branch Block � Left Posterior Fascicular Block. There is right bundlebranch block with rR� pattern in V1 and RS in V6. Left posterior fascicular block is diagnosed by the presence of rightaxis deviation of 120� in the frontal plane.
123
LWBK271-C10_120-137.qxd 1/30/09 12:04 PM Page 123 Aptara Inc.
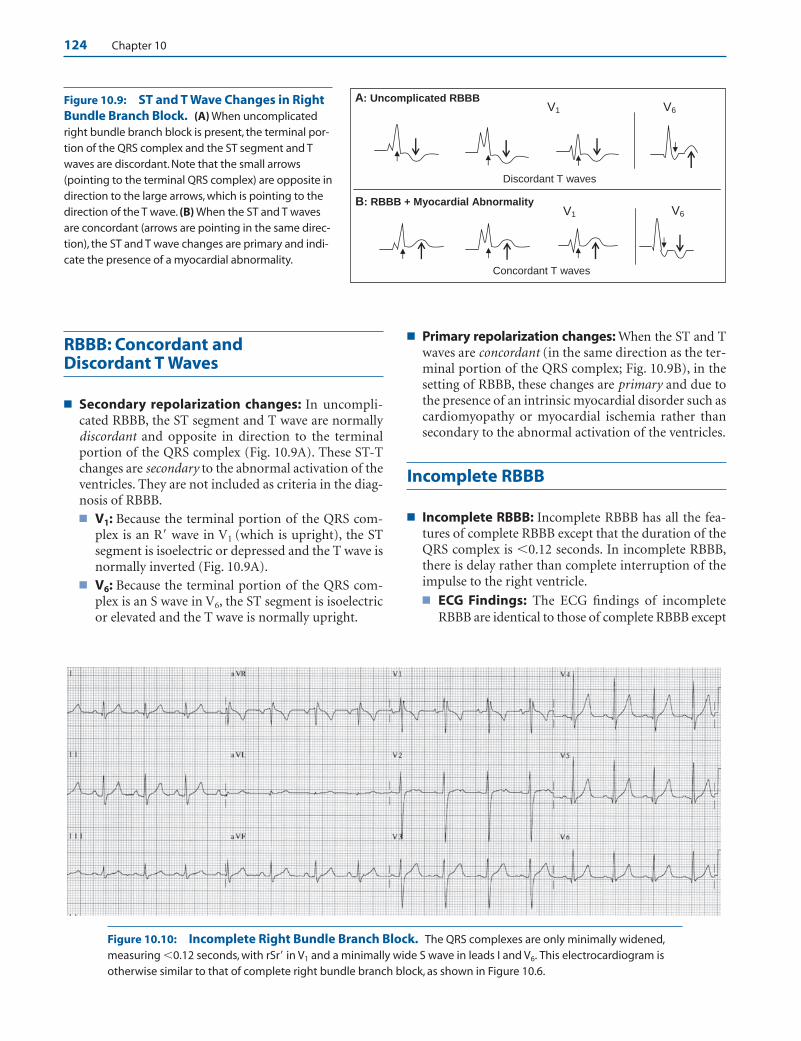
124 Chapter 10
RBBB: Concordant and Discordant T Waves
■ Secondary repolarization changes: In uncompli-cated RBBB, the ST segment and T wave are normallydiscordant and opposite in direction to the terminalportion of the QRS complex (Fig. 10.9A). These ST-Tchanges are secondary to the abnormal activation of theventricles. They are not included as criteria in the diag-nosis of RBBB.■ V1: Because the terminal portion of the QRS com-
plex is an R� wave in V1 (which is upright), the STsegment is isoelectric or depressed and the T wave isnormally inverted (Fig. 10.9A).
■ V6: Because the terminal portion of the QRS com-plex is an S wave in V6, the ST segment is isoelectricor elevated and the T wave is normally upright.
■ Primary repolarization changes: When the ST and Twaves are concordant (in the same direction as the ter-minal portion of the QRS complex; Fig. 10.9B), in thesetting of RBBB, these changes are primary and due tothe presence of an intrinsic myocardial disorder such ascardiomyopathy or myocardial ischemia rather thansecondary to the abnormal activation of the ventricles.
Incomplete RBBB
■ Incomplete RBBB: Incomplete RBBB has all the fea-tures of complete RBBB except that the duration of theQRS complex is �0.12 seconds. In incomplete RBBB,there is delay rather than complete interruption of theimpulse to the right ventricle.■ ECG Findings: The ECG findings of incomplete
RBBB are identical to those of complete RBBB except
Discordant T waves
V6V1
B: RBBB + Myocardial Abnormality V1 V6
A: Uncomplicated RBBB
Concordant T waves
Figure 10.10: Incomplete Right Bundle Branch Block. The QRS complexes are only minimally widened,measuring �0.12 seconds, with rSr� in V1 and a minimally wide S wave in leads I and V6. This electrocardiogram isotherwise similar to that of complete right bundle branch block, as shown in Figure 10.6.
Figure 10.9: ST and T Wave Changes in RightBundle Branch Block. (A) When uncomplicatedright bundle branch block is present, the terminal por-tion of the QRS complex and the ST segment and Twaves are discordant. Note that the small arrows(pointing to the terminal QRS complex) are opposite indirection to the large arrows, which is pointing to thedirection of the T wave. (B) When the ST and T wavesare concordant (arrows are pointing in the same direc-tion), the ST and T wave changes are primary and indi-cate the presence of a myocardial abnormality.
LWBK271-C10_120-137.qxd 1/30/09 12:04 PM Page 124 Aptara Inc.
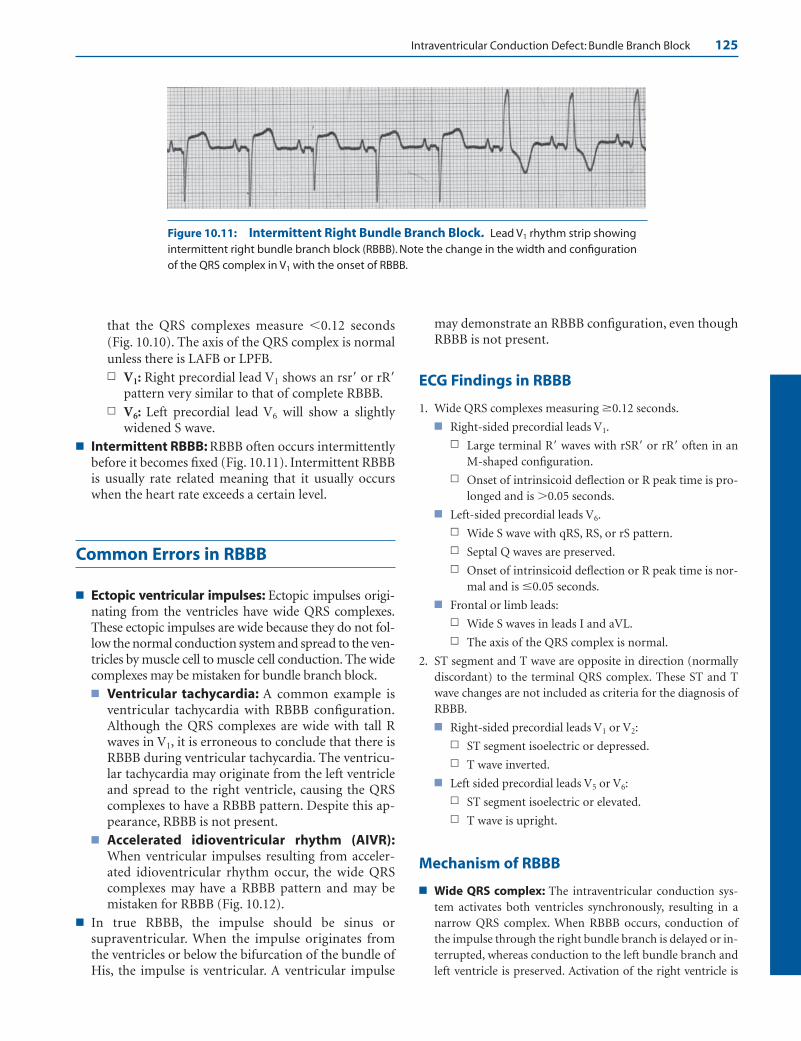
Intraventricular Conduction Defect: Bundle Branch Block 125
Figure 10.11: Intermittent Right Bundle Branch Block. Lead V1 rhythm strip showingintermittent right bundle branch block (RBBB). Note the change in the width and configurationof the QRS complex in V1 with the onset of RBBB.
that the QRS complexes measure �0.12 seconds(Fig. 10.10). The axis of the QRS complex is normalunless there is LAFB or LPFB.n V1: Right precordial lead V1 shows an rsr� or rR�
pattern very similar to that of complete RBBB.n V6: Left precordial lead V6 will show a slightly
widened S wave.■ Intermittent RBBB: RBBB often occurs intermittently
before it becomes fixed (Fig. 10.11). Intermittent RBBBis usually rate related meaning that it usually occurswhen the heart rate exceeds a certain level.
Common Errors in RBBB
■ Ectopic ventricular impulses: Ectopic impulses origi-nating from the ventricles have wide QRS complexes.These ectopic impulses are wide because they do not fol-low the normal conduction system and spread to the ven-tricles by muscle cell to muscle cell conduction. The widecomplexes may be mistaken for bundle branch block.■ Ventricular tachycardia: A common example is
ventricular tachycardia with RBBB configuration.Although the QRS complexes are wide with tall Rwaves in V1, it is erroneous to conclude that there isRBBB during ventricular tachycardia. The ventricu-lar tachycardia may originate from the left ventricleand spread to the right ventricle, causing the QRScomplexes to have a RBBB pattern. Despite this ap-pearance, RBBB is not present.
■ Accelerated idioventricular rhythm (AIVR):When ventricular impulses resulting from acceler-ated idioventricular rhythm occur, the wide QRScomplexes may have a RBBB pattern and may bemistaken for RBBB (Fig. 10.12).
■ In true RBBB, the impulse should be sinus orsupraventricular. When the impulse originates fromthe ventricles or below the bifurcation of the bundle ofHis, the impulse is ventricular. A ventricular impulse
may demonstrate an RBBB configuration, even thoughRBBB is not present.
ECG Findings in RBBB
1. Wide QRS complexes measuring �0.12 seconds.
■ Right-sided precordial leads V1.
n Large terminal R� waves with rSR� or rR� often in anM-shaped configuration.
n Onset of intrinsicoid deflection or R peak time is pro-longed and is �0.05 seconds.
■ Left-sided precordial leads V6.
n Wide S wave with qRS, RS, or rS pattern.
n Septal Q waves are preserved.
n Onset of intrinsicoid deflection or R peak time is nor-mal and is �0.05 seconds.
■ Frontal or limb leads:
n Wide S waves in leads I and aVL.
n The axis of the QRS complex is normal.
2. ST segment and T wave are opposite in direction (normallydiscordant) to the terminal QRS complex. These ST and Twave changes are not included as criteria for the diagnosis ofRBBB.
■ Right-sided precordial leads V1 or V2:
n ST segment isoelectric or depressed.
n T wave inverted.
■ Left sided precordial leads V5 or V6:
n ST segment isoelectric or elevated.
n T wave is upright.
Mechanism of RBBB
■ Wide QRS complex: The intraventricular conduction sys-tem activates both ventricles synchronously, resulting in anarrow QRS complex. When RBBB occurs, conduction ofthe impulse through the right bundle branch is delayed or in-terrupted, whereas conduction to the left bundle branch andleft ventricle is preserved. Activation of the right ventricle is
LWBK271-C10_120-137.qxd 1/30/09 12:04 PM Page 125 Aptara Inc.

126 Chapter 10
abnormal because the impulse must originate from the leftventricle by muscle cell to muscle cell conduction. Because theventricles are activated sequentially instead of synchronously,the QRS complexes are wide measuring �0.12 seconds. Thewide QRS complex can be divided into two halves: the initialhalf representing left ventricular activation and the terminalhalf representing right ventricular activation.■ Vector 1: In RBBB, vector 1 or septal activation is not al-
tered, thus the initial portion of the QRS complex re-mains preserved. A small r wave is normally recorded inlead V1, and a normal septal q wave is recorded in V6 aswell as in leads located on the left side of the ventricularseptum (leads I and aVL).
■ Vector 2: Activation of the left ventricular free wall orvector 2 is also preserved and normally occurs from en-docardium to epicardium in a right to left direction. Thisresult in deep S waves in V1 and tall R waves in V6. Activa-tion of the right side of the septum, however, is no longerpossible because the right bundle branch is blocked.Thus, septal activation continues unopposed in a left toright direction, which is opposite the direction of activa-tion of the left ventricular free wall. Because the septumand left ventricular free wall are activated in opposite di-rections, the depth of the S wave in V1 and the height ofthe R wave in V6 are smaller than normal.
■ Vector 3: Whenever there is an intraventricular conduc-tion abnormality, the area with the conduction abnor-mality is always the last to be activated. Activation of the
right ventricle, therefore, is the last to occur in RBBB (vec-tor 3). Because the right bundle branch supplies the rightventricle, and the right ventricle is located anterior and tothe right of the left ventricle, the terminal impulse will bedirected to the right and anteriorly. This results in a largeterminal R� in V1 and wide terminal S in V6 (and also inleads I and aVL). This is the most distinctive abnormalityof RBBB. This terminal impulse is slow because it is con-ducted by direct myocardial spread and is unopposed be-cause activation of the right ventricle is still ongoing,whereas activation of the rest of the ventricle is alreadycompleted.
■ Delayed onset of the intrinsicoid deflection or R peaktime: The ventricular activation time is the time from onsetof the ventricular impulse to the arrival of the impulse at therecording precordial electrode. It is measured from the onsetof the QRS complex to the height of the R or R� wave. Theturning point or abrupt downward deflection of the R or R�
wave toward baseline is called the intrinsicoid deflection (seeChapter 6, Depolarization and Repolarization). For practi-cal purposes, the R peak time has been recommended bythe Cardiology Task Force of the World Health Organiza-tion/International Society and Federation to represent the on-set of the intrinsicoid deflection. The normal onset of the in-trinsicoid deflection in V1 is �0.03 seconds. When there isRBBB, the onset of the intrinsicoid deflection in V1 is pro-longed and measures �0.05 seconds because conduction of theimpulse across the right ventricle is delayed. The onset of the
Figure 10.12: Accelerated Idioventricular Rhythm. The rhythm is normal sinus as shown by the first two complexes on the left. The wide QRS complexes that follow (arrows) look like intermittent right bundle branch block with tall R waves in V1. The wide QRS complexes are ventricular escape complexes because ofaccelerated idioventricular rhythm. Note that the wide QRS complexes are not preceded by P waves and occur only when there is slowing of the sinus node.
LWBK271-C10_120-137.qxd 1/30/09 12:04 PM Page 126 Aptara Inc.

Intraventricular Conduction Defect: Bundle Branch Block 127
intrinsicoid deflection in leads V5 or V6 is preserved (normal�0.05 seconds) because the left bundle branch is intact.
■ Abnormal ST-T changes: The ST and T abnormalities inRBBB are secondary to abnormal activation of the ventriclesand are normally discordant to the terminal portion of theQRS complex. The ST-T changes are not considered criteriafor the diagnosis of RBBB.
■ QRS Axis: In uncomplicated RBBB, the axis of the QRScomplex is within normal limits. However, when RBBB oc-curs in association with pulmonary hypertension or condi-tions that can cause right ventricular hypertrophy, the axis ofthe QRS complex may shift to the right. The axis of the QRScomplex can also become abnormal when there is fascicularblock or previous myocardial infarct.
Clinical Significance
■ Incomplete RBBB with a terminal r� wave in V1 or V2 doesnot always imply that a conduction block is present in theright bundle branch. This ECG pattern could also be due todelayed conduction of the impulse to the right ventricle,causing the right ventricle to be partly activated by the leftbundle branch. It could also be due to delayed activation ofthe base of the right or left ventricle due to a focal area of hy-pertrophy. For example, in infants and children, the terminalr� in V1 may be due to hypertrophy of the outflow tract of theright ventricle, a condition that may persist through adult-hood. It has also been shown than an rSr� pattern in V1 or V2
may occur if the precordial leads V1 and V2 are inadvertentlypositioned higher than the correct location at the 4th inter-costal space, a common error among house officers or tech-nicians who are not properly trained to record ECGs.
■ Because the right bundle branch is partially subendocardial inlocation, it is vulnerable to sudden and severe increases in rightventricular pressure. RBBB can therefore occur in the settingof pulmonary hypertension or acute pulmonary embolism.The right bundle branch is also vulnerable to local injury dur-ing right heart catheterization. Thus, extreme caution shouldbe exercised when inserting a pulmonary artery catheter in apatient who has preexistent left bundle branch block (LBBB).
■ RBBB may initially occur intermittently before it becomesfixed. When RBBB is intermittent, it is usually rate related. Inrate-related bundle branch block, bundle branch block oc-curs only when the heart rate increases above a certainthreshold. Normal conduction is restored when the heartrate slows down to baseline. The presence of rate-relatedbundle branch block is often suspected when the wide QRScomplexes normalize after a long compensatory pause of apremature ectopic impulse.
■ Clinical significance: RBBB can occur as an isolated findingin the general population, including young individuals withoutevidence of cardiac disease. Among 110,000 subjects screenedfor cardiovascular disease during a 25-year period, isolatedRBBB (no evidence of heart disease or hypertension) occurredin 198 cases (0.18%) and was associated with an excellent prog-nosis. In another study consisting of 1,142 elderly men fol-
lowed in the Baltimore Longitudinal Study on Aging, 39 or3.4% had complete RBBB. Twenty-four of these patients hadno evidence of heart disease. Long-term follow-up of patientswho are apparently healthy and completely asymptomatic hadnot shown any adverse effects on mortality and morbidity.
■ RBBB and LAFB is a common combination because the rightbundle and left anterior fascicle are adjacent to each other,straddling both sides of the ventricular septum. Both are sup-plied by the left anterior descending coronary artery. Thus, aconcurrent RBBB and LAFB is a common complication ofacute anteroseptal myocardial infarction (MI). When RBBBwith fascicular block is due to acute anterior MI, the myocardialdamage is usually extensive, resulting in a higher incidence ofatrioventricular (AV) block, pump failure, and ventriculararrhythmias. However, if the RBBB is due to degenerative dis-ease of the conduction system with preservation of myocardialfunction, progression to complete AV block is slow, and long-term prognosis is good.
■ RBBB and MI: The presence of RBBB generally does notconceal the ECG changes associated with Q wave MI. Thiscontrasts with LBBB, where ECG changes of acute MI areusually masked by the conduction abnormality. Thus, Qwaves will continue to be useful in signifying acute or remoteMI in patients with RBBB.
■ RBBB and stress testing: According to the American Collegeof Cardiology/American Heart Association guidelines forchronic stable angina, the presence of RBBB on a baseline ECGduring exercise stress testing will not interfere with the detectionof myocardial ischemia. The ST segment depression in leads V1
to V3 may not be related to myocardial ischemia; however, STdepression in leads V5, V6, II, and aVF is as reliable in indicatingmyocardial ischemia as in ECGs without RBBB. Thus, patientswith RBBB on baseline ECG may undergo ECG exercise stresstesting similar to patients without the conduction abnormality.This contrasts with patients with LBBB in whom ST depressiondoes not necessarily imply the presence of myocardial ischemia(see Left Bundle Branch Block section in this chapter). Unlikepatients with RBBB, patients with LBBB should undergo imag-ing in conjunction with ECG stress testing.
■ RBBB and congestive heart failure: In patients with se-vere left ventricular dysfunction with ongoing symptoms ofcongestive heart failure intractable to standard medical ther-apy, the presence of wide QRS complexes—including patientswith RBBB—may be candidates for resynchronization ther-apy (see Left Bundle Branch Block section in this chapter).
■ Causes of RBBB: RBBB can be due to several causes, includ-ing acute MI, cardiomyopathy, pulmonary hypertension, pul-monary embolism, cor pulmonale, acute myocarditis, valvularheart disease (especially aortic stenosis), sclerodegenerativechanges involving the conduction system, infiltrative diseasessuch as sarcoidosis and amyloidosis, Chagas disease, and con-genital heart disease such as tetralogy of Fallot and Ebstein’sanomaly. It may occur as a complication of cardiac surgery orinterventional procedures such as cardiac catheterization,percutaneous coronary intervention, radiofrequency ablation,or alcohol ablation of the ventricular septum in patients with
LWBK271-C10_120-137.qxd 1/30/09 12:04 PM Page 127 Aptara Inc.
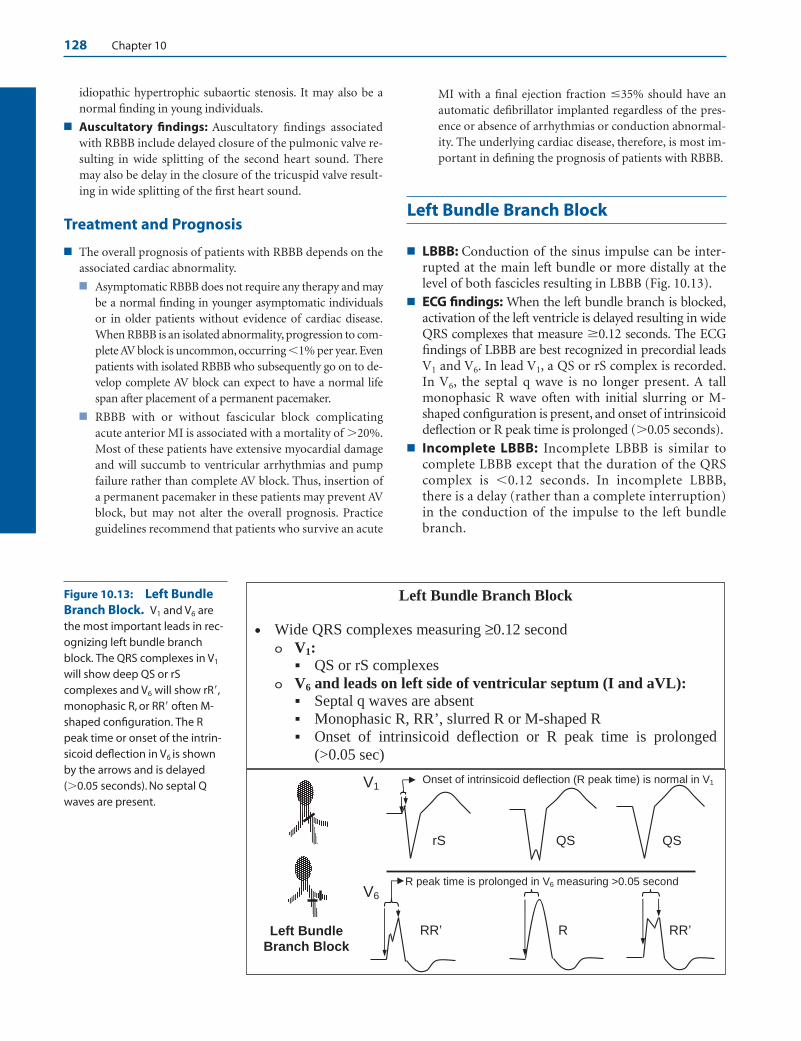
128 Chapter 10
idiopathic hypertrophic subaortic stenosis. It may also be anormal finding in young individuals.
■ Auscultatory findings: Auscultatory findings associatedwith RBBB include delayed closure of the pulmonic valve re-sulting in wide splitting of the second heart sound. Theremay also be delay in the closure of the tricuspid valve result-ing in wide splitting of the first heart sound.
Treatment and Prognosis
■ The overall prognosis of patients with RBBB depends on theassociated cardiac abnormality.
■ Asymptomatic RBBB does not require any therapy and maybe a normal finding in younger asymptomatic individualsor in older patients without evidence of cardiac disease.When RBBB is an isolated abnormality, progression to com-plete AV block is uncommon, occurring �1% per year. Evenpatients with isolated RBBB who subsequently go on to de-velop complete AV block can expect to have a normal lifespan after placement of a permanent pacemaker.
■ RBBB with or without fascicular block complicatingacute anterior MI is associated with a mortality of �20%.Most of these patients have extensive myocardial damageand will succumb to ventricular arrhythmias and pumpfailure rather than complete AV block. Thus, insertion ofa permanent pacemaker in these patients may prevent AVblock, but may not alter the overall prognosis. Practiceguidelines recommend that patients who survive an acute
MI with a final ejection fraction �35% should have anautomatic defibrillator implanted regardless of the pres-ence or absence of arrhythmias or conduction abnormal-ity. The underlying cardiac disease, therefore, is most im-portant in defining the prognosis of patients with RBBB.
Left Bundle Branch Block
■ LBBB: Conduction of the sinus impulse can be inter-rupted at the main left bundle or more distally at thelevel of both fascicles resulting in LBBB (Fig. 10.13).
■ ECG findings: When the left bundle branch is blocked,activation of the left ventricle is delayed resulting in wideQRS complexes that measure �0.12 seconds. The ECGfindings of LBBB are best recognized in precordial leadsV1 and V6. In lead V1, a QS or rS complex is recorded.In V6, the septal q wave is no longer present. A tallmonophasic R wave often with initial slurring or M-shaped configuration is present, and onset of intrinsicoiddeflection or R peak time is prolonged (�0.05 seconds).
■ Incomplete LBBB: Incomplete LBBB is similar tocomplete LBBB except that the duration of the QRScomplex is �0.12 seconds. In incomplete LBBB,there is a delay (rather than a complete interruption)in the conduction of the impulse to the left bundlebranch.
V1
V6
R peak time is prolonged in V6 measuring >0.05 second
Left Bundle Branch Block
rS QS
RR’ R RR’
QS
Onset of intrinsicoid deflection (R peak time) is normal in V1
Left Bundle Branch Block
• Wide QRS complexes measuring ≥0.12 secondV1:
QS or rS complexes V6 and leads on left side of ventricular septum (I and aVL):
Septal q waves are absentMonophasic R, RR’, slurred R or M-shaped R Onset of intrinsicoid deflection or R peak time is prolonged (>0.05 sec)
Figure 10.13: Left BundleBranch Block. V1 and V6 arethe most important leads in rec-ognizing left bundle branchblock. The QRS complexes in V1
will show deep QS or rScomplexes and V6 will show rR�,monophasic R, or RR� often M-shaped configuration. The Rpeak time or onset of the intrin-sicoid deflection in V6 is shownby the arrows and is delayed(�0.05 seconds). No septal Qwaves are present.
LWBK271-C10_120-137.qxd 1/30/09 12:04 PM Page 128 Aptara Inc.
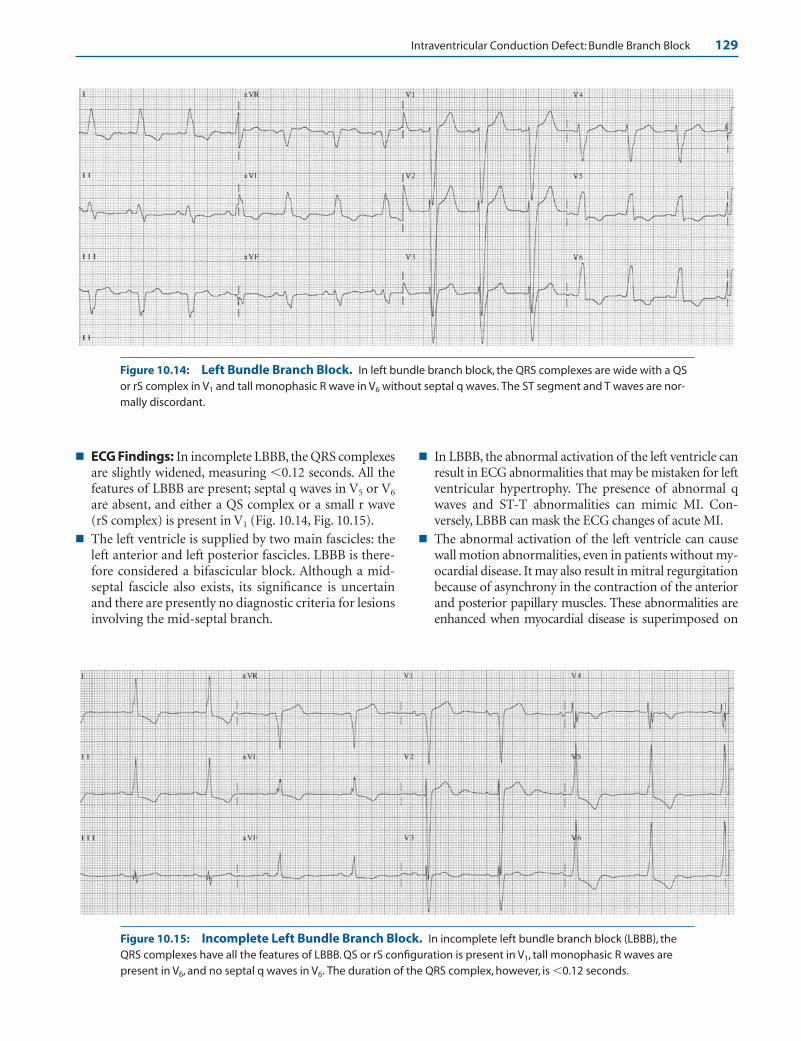
Intraventricular Conduction Defect: Bundle Branch Block 129
Figure 10.14: Left Bundle Branch Block. In left bundle branch block, the QRS complexes are wide with a QSor rS complex in V1 and tall monophasic R wave in V6 without septal q waves. The ST segment and T waves are nor-mally discordant.
■ ECG Findings: In incomplete LBBB, the QRS complexesare slightly widened, measuring �0.12 seconds. All thefeatures of LBBB are present; septal q waves in V5 or V6
are absent, and either a QS complex or a small r wave(rS complex) is present in V1 (Fig. 10.14, Fig. 10.15).
■ The left ventricle is supplied by two main fascicles: theleft anterior and left posterior fascicles. LBBB is there-fore considered a bifascicular block. Although a mid-septal fascicle also exists, its significance is uncertainand there are presently no diagnostic criteria for lesionsinvolving the mid-septal branch.
■ In LBBB, the abnormal activation of the left ventricle canresult in ECG abnormalities that may be mistaken for leftventricular hypertrophy. The presence of abnormal qwaves and ST-T abnormalities can mimic MI. Con-versely, LBBB can mask the ECG changes of acute MI.
■ The abnormal activation of the left ventricle can causewall motion abnormalities, even in patients without my-ocardial disease. It may also result in mitral regurgitationbecause of asynchrony in the contraction of the anteriorand posterior papillary muscles. These abnormalities areenhanced when myocardial disease is superimposed on
Figure 10.15: Incomplete Left Bundle Branch Block. In incomplete left bundle branch block (LBBB), theQRS complexes have all the features of LBBB. QS or rS configuration is present in V1, tall monophasic R waves arepresent in V6, and no septal q waves in V6. The duration of the QRS complex, however, is �0.12 seconds.
LWBK271-C10_120-137.qxd 1/30/09 12:04 PM Page 129 Aptara Inc.

130 Chapter 10
V5 or V6
A. Uncomplicated LBBB
V1, V2 or V3 V5, V6, I or aVL V1, V2 or V3
B. LBBB + Myocardial abnormality
Discordant T waves Concordant T waves
the conduction defect. In general, patients with LBBBwith very wide QRS complexes (Fig. 10.16) have moresevere contraction abnormalities and lower ejectionfractions compared with patients with LBBB with nar-rower complexes.
■ The axis of the QRS complex in LBBB is variable. WhenLBBB is associated with left axis deviation, the conduc-tion abnormality is more widespread and may involvethe distal fascicles and Purkinje system. When rightaxis deviation is present, it may be associated with dif-fuse myocardial disease and biventricular enlargement.
■ Secondary ST and T wave changes: Similar toRBBB, the ST-T changes are not included as criteria inthe ECG diagnosis of LBBB. The ST-T changes associ-ated with uncomplicated LBBB are secondary to abnor-mal activation of the left ventricle. The direction of theST segment and T wave is normally discordant or op-posite that of the QRS complex (Fig. 10.17A).■ V1: In V1, the ST segment is normally elevated and
the T wave upright because the terminal portion ofthe QRS complex is an S wave, which is negative ordownward.
Figure 10.16: Left Bundle Branch Block with Unusually Wide QRS Complexes. The QRS complexesmeasure almost 0.20 seconds and the axis is shifted to the left. The unusual width of the QRS complexes is often amarker of severe myocardial disease, especially when there is right or left axis deviation.
Figure 10.17: ST Segment and T Waves in Left Bundle BranchBlock. (A) The ST segment and T wave are normally opposite in direction(discordant) from that of the QRS complex when there is uncomplicated leftbundle branch block. Note that the small arrow (pointing to the QRS com-plex) is opposite in direction to the large arrow, which is pointing to the Twave. (B) When there is myocardial disease, such as myocardial ischemia orcardiomyopathy, the ST segments and T waves become concordant and fol-low the direction of the QRS complex. Note that the small and large arrowsare pointing in the same direction.
LWBK271-C10_120-137.qxd 1/30/09 12:04 PM Page 130 Aptara Inc.
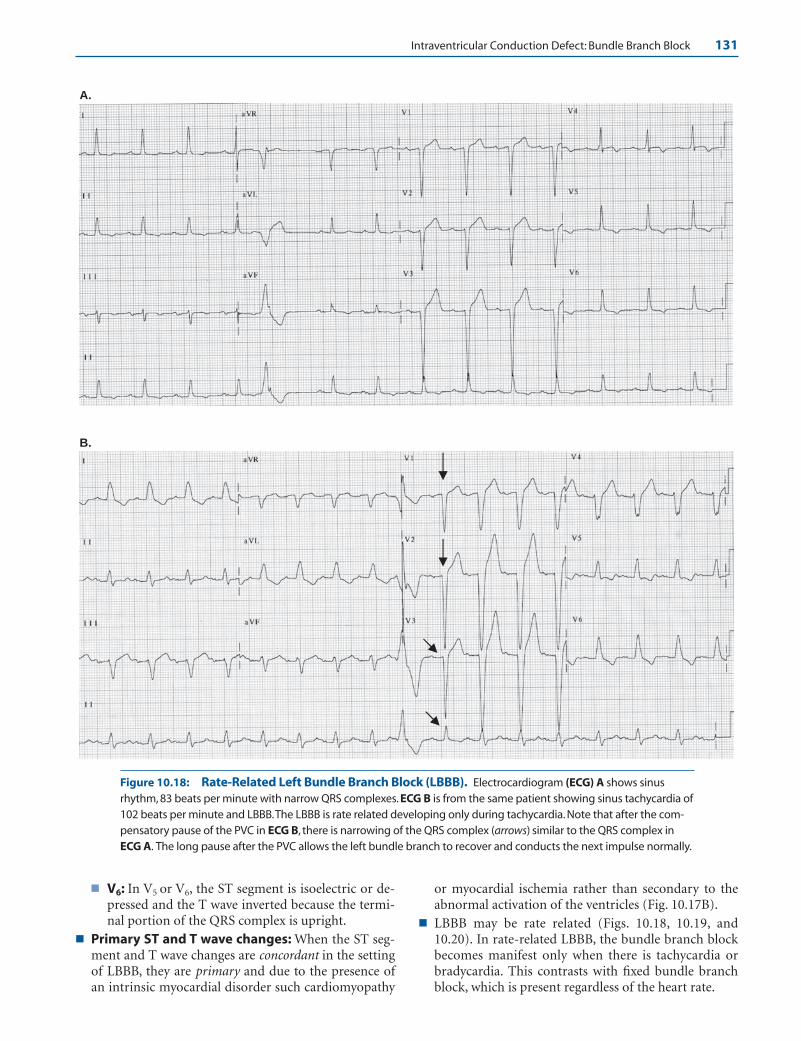
Intraventricular Conduction Defect: Bundle Branch Block 131
■ V6: In V5 or V6, the ST segment is isoelectric or de-pressed and the T wave inverted because the termi-nal portion of the QRS complex is upright.
■ Primary ST and T wave changes: When the ST seg-ment and T wave changes are concordant in the settingof LBBB, they are primary and due to the presence ofan intrinsic myocardial disorder such cardiomyopathy
or myocardial ischemia rather than secondary to theabnormal activation of the ventricles (Fig. 10.17B).
■ LBBB may be rate related (Figs. 10.18, 10.19, and10.20). In rate-related LBBB, the bundle branch blockbecomes manifest only when there is tachycardia orbradycardia. This contrasts with fixed bundle branchblock, which is present regardless of the heart rate.
B.
A.
Figure 10.18: Rate-Related Left Bundle Branch Block (LBBB). Electrocardiogram (ECG) A shows sinusrhythm, 83 beats per minute with narrow QRS complexes. ECG B is from the same patient showing sinus tachycardia of102 beats per minute and LBBB.The LBBB is rate related developing only during tachycardia. Note that after the com-pensatory pause of the PVC in ECG B, there is narrowing of the QRS complex (arrows) similar to the QRS complex inECG A. The long pause after the PVC allows the left bundle branch to recover and conducts the next impulse normally.
LWBK271-C10_120-137.qxd 1/30/09 12:04 PM Page 131 Aptara Inc.
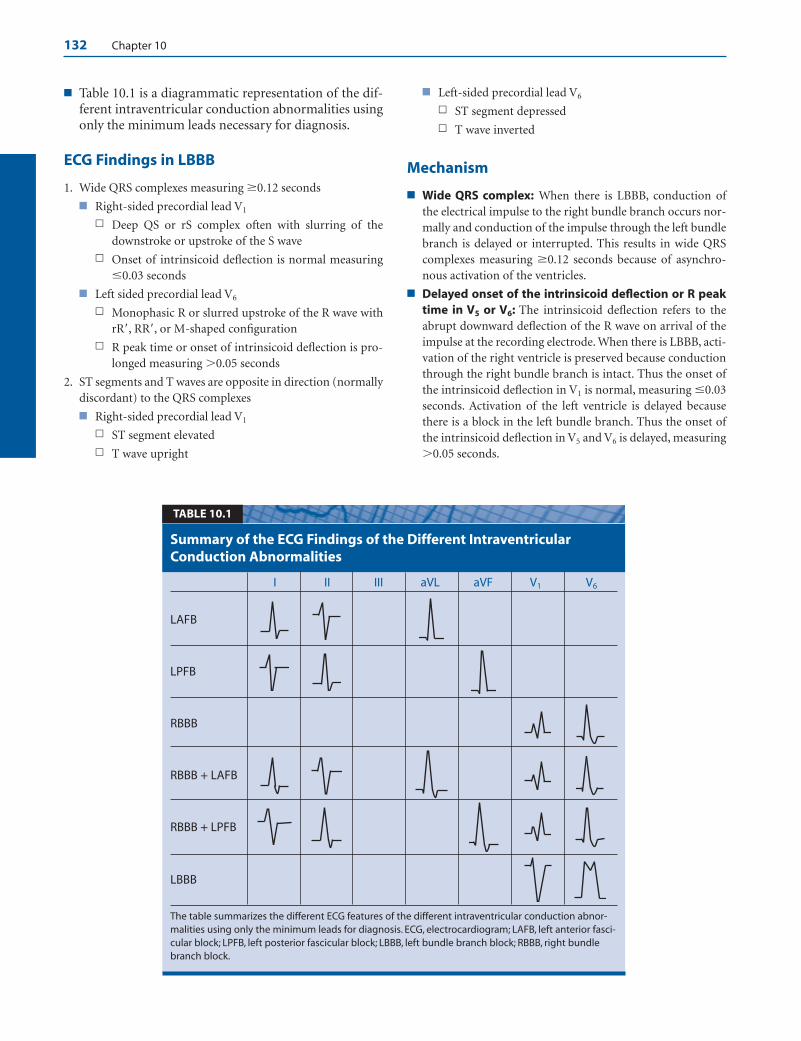
132 Chapter 10
■ Table 10.1 is a diagrammatic representation of the dif-ferent intraventricular conduction abnormalities usingonly the minimum leads necessary for diagnosis.
ECG Findings in LBBB
1. Wide QRS complexes measuring �0.12 seconds
■ Right-sided precordial lead V1
n Deep QS or rS complex often with slurring of thedownstroke or upstroke of the S wave
n Onset of intrinsicoid deflection is normal measuring�0.03 seconds
■ Left sided precordial lead V6
n Monophasic R or slurred upstroke of the R wave withrR�, RR�, or M-shaped configuration
n R peak time or onset of intrinsicoid deflection is pro-longed measuring �0.05 seconds
2. ST segments and T waves are opposite in direction (normallydiscordant) to the QRS complexes
■ Right-sided precordial lead V1
n ST segment elevated
n T wave upright
■ Left-sided precordial lead V6
n ST segment depressed
n T wave inverted
Mechanism
■ Wide QRS complex: When there is LBBB, conduction ofthe electrical impulse to the right bundle branch occurs nor-mally and conduction of the impulse through the left bundlebranch is delayed or interrupted. This results in wide QRScomplexes measuring �0.12 seconds because of asynchro-nous activation of the ventricles.
■ Delayed onset of the intrinsicoid deflection or R peaktime in V5 or V6: The intrinsicoid deflection refers to theabrupt downward deflection of the R wave on arrival of theimpulse at the recording electrode. When there is LBBB, acti-vation of the right ventricle is preserved because conductionthrough the right bundle branch is intact. Thus the onset ofthe intrinsicoid deflection in V1 is normal, measuring �0.03seconds. Activation of the left ventricle is delayed becausethere is a block in the left bundle branch. Thus the onset ofthe intrinsicoid deflection in V5 and V6 is delayed, measuring�0.05 seconds.
I II III aVL aVF V1 V6
LAFB
LPFB
RBBB
RBBB + LAFB
RBBB + LPFB
LBBB
The table summarizes the different ECG features of the different intraventricular conduction abnor-malities using only the minimum leads for diagnosis. ECG, electrocardiogram; LAFB, left anterior fasci-cular block; LPFB, left posterior fascicular block; LBBB, left bundle branch block; RBBB, right bundlebranch block.
Summary of the ECG Findings of the Different IntraventricularConduction Abnormalities
TABLE 10.1
LWBK271-C10_120-137.qxd 1/30/09 12:04 PM Page 132 Aptara Inc.

Intraventricular Conduction Defect: Bundle Branch Block 133
B. LBBB
A. Baseline ECG
Figure 10.19: Rate-Related Left Bundle Branch Block (LBBB). (A) A 12-lead electrocardiogram (ECG) ob-tained a few hours before (B).The QRS complexes are narrow with left axis deviation because of left anterior fascicu-lar block. (B) ECG from the same patient a few hours later showing LBBB. QS complexes with tall voltages arepresent in V1 to V3, which can be mistaken for anteroseptal myocardial infarction or left ventricular hypertrophy.Marked ST depression is noted in I and aVL and marked ST elevation is noted in V1 to V3, which can be mistaken foracute coronary syndrome.
Figure 10.20: Bradycardia-Dependent Bundle Branch Block. Rhythm strip showing widening of the QRScomplex (arrow) after a pause from bradycardia-dependent bundle branch block.
LWBK271-C10_120-137.qxd 1/30/09 12:04 PM Page 133 Aptara Inc.
134 Chapter 10
■ Absence of septal q wave in V5 or V6: Normally, the ventric-ular septum is activated by the left bundle branch in a left toright direction (vector 1) resulting in a small septal q wave in V5
or V6 and a small r wave in V1. When there is LBBB, the ventric-ular septum is no longer activated in a left-to-right direction.Rather, it is activated by the right bundle branch in a right-to-left direction, which is the reverse of normal. The normal septalq wave in V5 or V6 is no longer recorded and should not be pres-ent when there is LBBB. V1 and V2 may record a small r wave,representing activation of the right ventricular wall and apex.The small r wave in V1 does not represent septal activation.
■ Slurring of the upstroke of the R wave with rR� or RR�(M-shaped) configuration of the QRS complex in V6: Af-ter the right ventricle is activated, the impulse moves fromright ventricle to left ventricle across the interventricularseptum by myocardial cell to myocardial cell conduction.This results in tall R waves in V6 and deep S waves in V1 andV2. The initial R wave in V6 represents activation of the ven-tricular septum, and the larger terminal R� deflection repre-sents activation of the left ventricular free wall. The dip ornotch between the initial R and terminal R� is due to activa-tion of a smaller mass of myocardium between the septumand left ventricular free wall. Deep S waves often with slurreddownstroke are recorded in V1 and V2.
■ Absence of terminal r� in V1 and absence of terminal swaves in V6: Whenever there is an intraventricular conduc-tion abnormality, the area supplied by the blocked bundlebranch is delayed and will be the last to be activated. Becausethe left bundle branch supplies the left ventricle and the leftventricle is located to the left and posterior to the right ven-tricle, the terminal impulse will be directed to the left andposteriorly. Right-sided precordial leads such as V1 or V2
should not record a terminal r� wave, and left sided precor-dial leads V5 or V6 should not record a terminal S or s wave.
■ Rate-related bundle branch block: Bundle branch block,left or right, may be rate related before it becomes fixed.When LBBB is rate related, LBBB occurs only when the heartrate becomes increased or decreased. When LBBB is fixed orpermanent, LBBB persists regardless of the heart rate.
■ Bradycardia-dependent bundle branch block: Inbradycardia-dependent bundle branch block, RBBB orLBBB occurs only when there is bradycardia or slowing ofthe heart rate. Bradycardia-dependent bundle branchblock is due to phase 4 diastolic depolarization, which isinherently present in cells with automatic properties,including cells within the intraventricular conductionsystem. When there is a long R-R interval, cells with auto-matic properties undergo spontaneous phase 4 diastolicdepolarization resulting in a transmembrane potentialthat slowly becomes less and less negative. Thus, the sinusimpulse may not be able to conduct across a bundlebranch that is partially depolarized.
■ Tachycardia-related bundle branch block: The re-fractory period of one bundle branch is usually longerthan the refractory period of the other bundle branch.
When the heart rate is relatively slow, both bundlebranches are given enough time to repolarize. However,when the heart rate is faster, the impulses may arrive wellbefore the bundle branch with a longer refractory periodhas a chance to recover. This may result in bundle branchblock that is evident during tachycardia, that resolveswhen the heart rate slows down to baseline. The longerrefractory period of one bundle branch is due to its longeraction potential duration when compared with the otherbundle branch. This type of rate-related bundle branchblock is called phase 3 aberration.
Clinical Significance
■ Unlike the right bundle branch, which is long and thin, theleft bundle branch immediately divides into two main fasci-cles: the left anterior and left posterior fascicles. A midseptalbranch also exists, although there are no criteria diagnosticof a midseptal lesion. LBBB therefore is an example of bifas-cicular block. LBBB can occur in the main left bundle (predi-visional) or at the level of the fascicles (postdivisional). It canalso occur at the level of the bundle of His.
■ Clinical significance: LBBB can occur as an isolated findingin normal, asymptomatic individuals without evidence ofcardiac disease but is rare.
■ In a study of 122,043 asymptomatic and healthy airmen,only 17 individuals were noted to have LBBB comparedwith 231 with RBBB. In this study, none of 44,231 menyounger than age 25 had LBBB.
■ In another study of 110,000 individuals, isolated LBBBoccurred in 112 cases (0.1%) without apparent or sus-pected heart disease, compared with 198 cases of isolatedRBBB (0.28%). The overall mortality in patients with iso-lated LBBB was not increased when compared with pa-tients with RBBB during a mean follow-up of 9.5 years.However, patients with isolated LBBB but not RBBB hadincreased risk of developing overt cardiovascular disease,which may, in the long run, translate into a higher mor-bidity and mortality.
n In the Framingham study, 55 of 5,209 individuals(1%) developed new-onset LBBB during a follow-upperiod of 18 years. The mean age of onset was 62years. LBBB was associated with hypertension (de-fined as blood pressure of �160/95 mm Hg), ischemicheart disease, or primary myocardial disease among47 of the 55 patients. Only 9 of 55 patients (16%) werefree of cardiovascular disease during a mean follow-up period of 6 years after the onset of LBBB.
n A 40-year follow-up study of 17,361 subjects inHiroshima and Nagasaki, Japan, who underwent bien-nial health examinations showed 110 subjects withLBBB. The average age at diagnosis was 69.6 10years in men and 68.3 10.9 years in women, withprogressive increase in the incidence of LBBB withage. There was a higher incidence of hypertension,
LWBK271-C10_120-137.qxd 1/30/09 12:04 PM Page 134 Aptara Inc.

Intraventricular Conduction Defect: Bundle Branch Block 135
ischemic heart disease, left ventricular hypertrophywith ST-T abnormalities, and increased cardiotho-racic ratio among patients who developed LBBB whencompared with controls. Age at death was similar forpatients with LBBB and controls, although mortalityfrom congestive heart failure and myocardial infarc-tion was significantly higher in patients with LBBB.
n Finally, among 723 asymptomatic patients with normalleft ventricular ejection fraction incidentally diagnosedto have bundle branch block (58.1% LBBB and 41.9%RBBB) in a community-based patient population, retro-spective analysis of computerized medical records after24 years’ follow-up showed that isolated bundle branchblock is not a benign finding. Cardiac-related morbidityand mortality is similar to patients with known conven-tional risk factors without bundle branch block.
■ Etiology:LBBB is an acquired conduction disorder and is usu-ally a marker of an underlying cardiac abnormality in contrastto RBBB, which may be congenital and may remain as an iso-lated finding. The majority of patients with LBBB, but notRBBB, have cardiac disease. If cardiac disease is not apparent, itis very likely that overt cardiac abnormality will subsequentlydevelop. The common causes of LBBB include hypertension,coronary artery disease, valvular diseases (especially aorticstenosis), cardiomyopathy, acute myocarditis, and degenerativedisease of the conduction system. LBBB is generally a markerof left ventricular disease and is the most common conductionabnormality in patients with primary cardiomyopathy.
■ Hemodynamic abnormalities: LBBB can diminish cardiacperformance even in the absence of associated myocardialdisease. In LBBB, the ventricles are activated sequentiallyrather than synchronously. Thus, left and right ventricularcontraction is not simultaneous. Furthermore, because con-duction of the impulse within the left ventricle is by directmyocardial spread, contraction of the left ventricle is notsynchronized and can result in wall motion abnormalities.Mitral regurgitation can occur when the two papillary mus-cles are not simultaneously activated. The significance ofthese contraction abnormalities may not be apparent in pa-tients with reasonably good left ventricular systolic function.However, in patients who have myocardial disease and severeleft ventricular dysfunction, the presence of LBBB can makesystolic dysfunction even more pronounced.
■ LBBB makes diagnosis of certain disorders difficult:When LBBB is present, the ECG becomes unreliable as a di-agnostic tool for identifying a variety of clinical entities.
■ Left ventricular hypertrophy: Left ventricular hyper-trophy will be difficult to diagnose when there is LBBB be-cause of the tall voltage and secondary ST-T changes asso-ciated with LBBB. Nevertheless, approximately 85% ofpatients with LBBB will have left ventricular hypertrophy.
■ Acute MI: Acute MI is difficult to diagnose when LBBB ispresent because q waves and ST-T abnormalities associ-ated with acute MI can be obscured by the LBBB. Con-versely, when LBBB is present, Q waves or QS complexes
may occur in the anterior precordial leads and may mimica myocardial infarct. The ST-T changes of LBBB can alsobe mistaken for current of injury (see acute MI and LBBBChapter 23, Acute Coronary Syndrome: ST ElevationMyocardial Infarction). The following findings suggestthe presence of MI when there is LBBB.
n Acute MI should be suspected when there is concor-dant ST segment depression or concordant ST seg-ment elevation �1 mm in a patient with symptoms ofmyocardial ischemia. Concordant ST segment depres-sion is present when the QRS complex is negative andthe ST segment is depressed. Concordant ST segmentelevation is present when the QRS complex is positiveand the ST segment is elevated.
n Acute MI should also be suspected when there is dis-cordant ST segment elevation �5 mm accompaniedby symptoms of ischemia. This implies that ST seg-ment elevation of at least 5 mm is present in leadswith deep S waves such as V1, V2, or V3.
n Notching of the upstroke of the S wave in V3 or V4,also called Cabrera sign, or the upstroke of the R wavein V5 or V6, also called Chapman sign, are highly spe-cific but not very sensitive for MI.
n Q waves in leads V5 or V6 or leads located at the leftside of the ventricular septum (I or aVL) indicate anMI, which may be recent or remote.
■ During stress testing: LBBB can cause a false-positiveor a false-negative stress test.n ECG stress testing: During stress testing, LBBB may
mask the ECG changes of myocardial ischemia result-ing in a false-negative stress test. Conversely, LBBB canresult in a false-positive stress test because it can causesecondary ST-T changes in the ECG, which may be mis-interpreted as being due to ischemia. Thus, the AmericanCollege of Cardiology/American Heart Associationguideline on chronic stable angina does not recommendstress testing in patients with LBBB using ECG alone asa marker for myocardial ischemia. This is a Class III in-dication, meaning that there is evidence that the proce-dure is not useful. Stress testing of patients with com-plete LBBB on baseline ECG should always include animaging modality, preferably a nuclear perfusion scan.
n Stress testing with imaging: Nuclear scan uses perfu-sion mismatch, whereas echo uses wall motion ab-normality as the end point for detecting myocardialischemia. Because left ventricular wall motion abnor-malities inherently occur when there is LBBB, a nu-clear perfusion scan is preferred over echocardiogra-phy as the imaging modality during stress testing.Pharmacologic stress testing is preferred over exercisewhen LBBB is present because exercise can furtheraugment the wall motion abnormalities of LBBB evenin the absence of ischemia. Dipyridamole or adeno-sine (but not dobutamine) are preferred because bothagents do not alter contractility.
LWBK271-C10_120-137.qxd 1/30/09 12:04 PM Page 135 Aptara Inc.

136 Chapter 10
n Auscultatory findings: The presence of LBBB willdelay closure of the mitral and aortic valves. This willcause the first heart sound to become single and thesecond heart sound to be paradoxically split. Whenparadoxical splitting of the second heart sound is pres-ent, the second heart sound becomes single or nar-rowly split with inspiration and widely split with expi-ration. This pattern is the opposite of normal. A shortmurmur of mitral regurgitation may be audible duringearly systole because of asynchrony in contraction ofthe papillary muscles. The presence of mild mitral re-gurgitation from LBBB, however, is better shown withcolor Doppler imaging during echocardiography.
Treatment
■ LBBB is usually associated with cardiac disease more com-monly coronary disease, hypertension, valvular disease, orcardiomyopathy. Overall treatment depends on the underly-ing cardiac condition. In completely asymptomatic patientswithout known cardiac disease, no treatment is required.
■ LBBB is a bifascicular block that may progress to trifascicularblock or complete AV block. In patients with trifascicularblock, insertion of a permanent pacemaker is warranted(see Chapter 11, Intraventricular Conduction Defect: Trifas-cicular Block; see also the American College of Cardiology/American Heart Association/Heart Rhythm Society guide-lines on permanent pacemaker implantation in patients withbifascicular and trifascicular block).
■ Patients with systolic left ventricular dysfunction who con-tinue to have symptoms of heart failure despite receiving opti-mal medical therapy may benefit from cardiac resynchroniza-tion therapy if they have LBBB. Cardiac resynchronizationinvolves insertion of a biventricular pacemaker that can stim-ulate both right and left ventricles simultaneously. Pacing bothventricles simultaneously significantly decreases the delay inthe spread of electrical impulse in patients with wide QRScomplexes and has been shown to improve cardiac output anddiminish mitral regurgitation. The patient should be in nor-mal sinus rhythm so that timing of atrial and ventricular con-traction can be synchronized. Although most patients whohave received biventricular pacemakers have LBBB, the widthof the QRS complex rather than the type of bundle branchblock is the main indication for biventricular pacing. Patientswho are candidates for cardiac resynchronization therapyshould have all of the following features:
■ Patients with wide QRS complexes (�0.12 seconds)
■ Normal sinus rhythm
■ Systolic dysfunction (ejection fraction �35%) because ofischemic or nonischemic cardiomyopathy
■ New York Heart Association functional class III or IVheart failure
■ Patients continue to have heart failure in spite of optimalmedical therapy
Prognosis
■ Similar to RBBB, the overall prognosis depends on the etiol-ogy of the LBBB.
■ In the Framingham study, patients who did well werethose with normal axis of the QRS complex (to the rightof 0�), those without any left atrial abnormality or leftatrial conduction delay and those who did not havechanges in the ECG before the development of LBBB.
■ Among older patients with LBBB, majority had an-tecedent cardiomegaly, hypertension, or coronary disease.If they did not have any of these findings, the majoritywent on to develop one of these cardiovascular abnormal-ities. The presence of these cardiovascular diseases willtranslate into a higher mortality.
■ Finally, long-term follow-up studies show that patientswith LBBB have a higher incidence of cardiovascular dis-ease with higher mortality from congestive heart failureand acute MI, although all-cause mortality may not besignificantly different among patients with LBBB com-pared with those who do not.
Suggested Readings
Bax JJ, Ansalone G, Breithardt OA, et al. Echocardiographic evalu-ation of cardiac resynchronization therapy: ready for routineclinical use? A critical appraisal. J Am Coll Cardiol. 2004;44:1–9.
Dunn MI, Lipman BS. Abnormalities of ventricular conduction:right bundle-branch block. In: Lippman-Massie Clinical Elec-trocardiography. 8th ed. Chicago: Yearbook Medical Publish-ers, Inc.; 1989:117–132.
Dunn MI, Lipman BS. Abnormalities of ventricular conduction:left bundle-branch block. In: Lippman-Massie Clinical Elec-trocardiography. 8th ed. Chicago: Yearbook Medical Publish-ers, Inc.; 1989:133–147.
Epstein AE, DiMarco JP, Ellenbogen KA, et al. ACC/AHA/HRS2008 guidelines for device-based therapy of cardiac rhythmabnormalities: a report of the American College of Cardiology/American Heart Association Task Force on Practice Guide-lines (Writing Committee to Revise the ACC/AHA/ NASPE2002 Guideline Update for Implantation of Cardiac Pace-makers and Antiarrhythmia Devices). Circulation. 2008;117:e350–e408.
Fahy GJ, Pinski SL, Miller DP, et al. Natural history of isolatedbundle branch block. Am J Cardiol. 1996;77:1185–1190.
Fleg JL, Das DW, Lakatta EG. Right bundle branch block: longterm prognosis in apparently healthy men. J Am Cardiol.1983;1:887–892.
Francia P, Balla C, Paneni F, et al. Left bundle-branch block—pathophysiology, prognosis, and clinical management. ClinCardiol. 2007;30:110–115.
Gibbons RJ, Abrams J, Chatterjee K, et al. ACC/AHA 2002guideline update for the management of patients withchronic stable angina: a report of the American College ofCardiology/American Heart Association Task Force on
LWBK271-C10_120-137.qxd 1/30/09 12:04 PM Page 136 Aptara Inc.
Intraventricular Conduction Defect: Bundle Branch Block 137
Practice Guidelines (Committee to Update the 1999 Guidelinesfor the Management of Patients with Chronic Stable Angina.www.acc.org/clinical/guidelines/stable/stable.pdf.
Goldberger AL, Arnsdorf MF. Electrocardiographic diagnosisof myocardial infarction in the presence of bundle branch blockor a paced rhythm. 2008 UpToDate. www. uptodate.com.
Hiss RG, Lamb LE. Electrocardiographic findings in 122,043 in-dividuals. Circulation. 1962;25:947–961.
Imanishi R, Seto S, Ichimaru S, et al. Prognostic significance ofincident left bundle branch block observed over a 40-yearperiod. Am J Cardiol. 2006;98:644–648.
Marriott HJL. The hemiblocks and trifascicular block. In: Practi-cal Electrocardiography. 5th ed. Baltimore: The Williams andWilkins Company, 1972:86–94.
Miller WL, Ballman KV, Hodge DO, et al. Risk factor implica-tions of incidentally discovered uncomplicated bundlebranch block. Mayo Clinic Proc. 2005;80:1585–1590.
Schneider JF, Thomas Jr HE, McNamara PM, et al. Clinical-electrocardiographic correlates of newly acquired left bundlebranch block: the Framingham study. Am J Cardiol. 1985;55:1332–1338.
Sgarbossa EB, Pinski SL, Barbagelata A, et al. Electrocardio-graphic diagnosis of evolving acute myocardial infarction inthe presence of left bundle branch block. N Engl J Med.1996;334:481–487.
Sgarbossa EB, Wagner GS. Electrocardiography: In: Topol EJ, ed.Textbook of Cardiovascular Medicine. 2nd ed. Philadelphia:Lippincott Williams & Wilkins; 2002:1330–1354.
Strickberger SA, Conti J, Daoud EG, et al. Patient selection forcardiac resynchronization therapy. Circulation. 2005;111:2146–2150.
Trevino AJ, Beller BM. Conduction disturbance of the left bun-dle branch system and their relationship to complete heartblock I. A review of experimental, electrophysiologic andelectrocardiographic aspects. Am J Med. 1971;51:362–373.
Trevino AJ, Beller BM. Conduction disturbance of the left bun-dle branch system and their relationship to complete heartblock II.A review of differential diagnosis, pathology andclinical significance. Am J Med. 1971;51:374–382.
Willems JL, Robles de Medina EO, Bernard R, et al. Criteria forintraventricular conduction disturbances and pre-excitation.J Am Coll Cardiol. 1985;5:1261–1275.
LWBK271-C10_120-137.qxd 1/30/09 12:04 PM Page 137 Aptara Inc.
11Intraventricular ConductionDefect: Trifascicular Block
138
Trifascicular Block
■ Types of intraventricular conduction defect: In-stead of two main branches, the bundle of His can besimplified as dividing into three discrete pathways;namely, the right bundle branch, the left anterior, andthe left posterior fascicles. Thus, the following abnor-malities can occur:■ Unifascicular block (block involves one fascicle):
n Left anterior fascicular block (LAFB)n Left posterior fascicular block (LPFB)n Right bundle branch block (RBBB)
■ Bifascicular block (block involves two fascicles):n Left bundle branch block (LBBB)n RBBB � LAFBn RBBB � LPFB
■ Definite trifascicular block (block involves allthree fascicles). The following are examples of defi-nite trifascicular block.n Alternating bundle branch blockn RBBB � alternating fascicular blockn RBBB � Mobitz type II second-degree atrioven-
tricular (AV) blockn LBBB � Mobitz type II second-degree AV block
■ Possible trifascicular block: The following are ex-amples of possible trifascicular block.n Complete AV block with ventricular escape
rhythmn Any bifascicular block � first-degree or second-
degree AV blockn RBBB � LAFB � first-degree or second-de-
gree AV blockn RBBB � LPFB � first-degree or second-de-
gree AV blockn LBBB � first-degree or second-degree AV block
■ Nonspecific intraventricular block: This type ofelectrocardiogram (ECG) abnormality does notconform to any of the above intraventricular blocks.
■ Trifascicular block indicates that some form of con-duction abnormality is present in all three fascicles.The conduction abnormality may be due to simple de-lay (first-degree block), intermittent block (second-degree block), or complete interruption (third-degreeblock) of the sinus impulse to all three fascicles. Trifas-cicular block does not imply that the block is alwayscomplete in all three fascicles.
Bilateral Bundle Branch Block
■ Alternating bundle branch block: Whether it is aRBBB alternating with LBBB, or a RBBB recorded atone time and a LBBB recorded at some other time,such a block would constitute a trifascicular block be-cause there is evidence that both bundle branches, andtherefore all three fascicles of the conduction system,are involved. Example of RBBB and LBBB occurring inthe same patient is shown in Figure 11.1. Anotherexample of LBBB and RBBB occurring in the samepatient is shown in Figure 11.2A, B. When LBBB andRBBB occur in the same patient, bilateral bundlebranch block is present. This is an example of trifas-cicular block.
■ RBBB � alternating fascicular block: When RBBB isfixed and is accompanied by LAFB that alternates withLPFB, a trifascicular block is present because all threefascicles are involved (Fig. 11.3). This is a rare presenta-tion of trifascicular block.
■ RBBB or LBBB � Mobitz type II second-degree AVblock: Mobitz type II second-degree AV block is an in-franodal block (see Chapter 8, Atrioventricular Block).When there is RBBB or LBBB with a type II second-de-gree AV block, the AV block is at the level of the His-Purkinje system. Thus, a RBBB or LBBB with a type IIsecond-degree AV block suggests the presence of a tri-fascicular block (Fig. 11.4).
■ Complete AV block with ventricular escaperhythm: The ultimate manifestation of trifascicularblock is complete block involving all three fascicles or
LWBK271-C11_138-147.qxd 29/1/09 7:40 pm Page 138 LWBK270-4119G-C02_073-110.qxd

Intraventricular Conduction Defect:Trifascicular Block 139
both bundle branches. When this occurs, only a ven-tricular escape impulse can maintain the cardiacrhythm (Fig. 11.5A). Complete AV block with ventric-ular escape rhythm is most often a trifascicular block.However, should the complete block occur at the levelof the AV node, it would not constitute a trifascicularblock.
■ Complete AV block with ventricular escaperhythm: Another example of complete AV block withventricular escape rhythm is shown in Figure 11.6. Theinitial ECG showed LBBB with first-degree AV block.When a bifascicular or trifascicular block deterioratesinto complete AV block with ventricular escaperhythm, the AV block is almost always trifascicular.
A.
B.
Figure 11.1: Bilateral Bundle Branch Block. Electrocardiogram (ECG) A and ECG B are from the samepatient taken 6 months apart. (A) Right bundle branch block (RBBB) with left anterior fascicular block. (B) Left bun-dle branch block (LBBB) with type II second-degree AV block. The presence of RBBB and LBBB in the same patientsuggests bilateral bundle branch block. (B) also shows Mobitz type II second-degree AV block. Mobitz type IIsecond-degree AV block in addition to LBBB is also indicative of trifascicular block.
LWBK271-C11_138-147.qxd 29/1/09 7:40 pm Page 139 LWBK270-4119G-C02_073-110.qxd

140 Chapter 11
A.
B.
Figure 11.2: Bilateral Bundle Branch Block. (A, B) From the same patient. The initial electrocardiogram(ECG) (A) shows left bundle branch block (LBBB) with deep S waves in V1. Subsequent ECG taken a year later (B)shows right bundle branch block (RBBB) � left anterior fascicular block. The presence of LBBB and RBBB in the samepatient is consistent with bilateral bundle branch block. Note also that there is first-degree atrioventricular block inboth ECGs, which in the presence of bifascicular block, is also indicative of trifascicular block.
LWBK271-C11_138-147.qxd 29/1/09 7:40 pm Page 140 LWBK270-4119G-C02_073-110.qxd

Intraventricular Conduction Defect:Trifascicular Block 141
■ Any bifascicular block � first-degree or second-degree AV block: RBBB � LAFB � second-degree AVblock (Fig. 11.7), RBBB � LPFB � second-degree AVblock (Fig. 11.8), and LBBB � second-degree AV blockare all possible examples of trifascicular block. Bifascic-ular block with second-degree AV block is not alwaysthe result of trifascicular block because the AV block canoccur at the AV node instead of the remaining fascicle.
■ When there is a bifascicular block such as RBBB �LAFB, the only pathway by which the atrial impulse canreach the ventricles is through the remaining posteriorfascicle. Note that the atrial impulse may be delayed or
interrupted at the level of the AV node or at the distalconducting system resulting in first-degree or second-degree AV block. Should the first-degree or second-de-gree AV block involve the remaining fascicle, a trifascic-ular block would be present. Should the first-degree orsecond-degree AV block occur at the AV node, it wouldnot qualify as a trifascicular block. This latter conditionmust therefore be excluded before diagnosing a trifasci-cular block. RBBB � LAFB � type I second-degree AVblock is shown in Figure 11.9. This is usually an AVnodal block, but it is also possible that the block is tri-fascicular, involving the remaining fascicle.
Figure 11.3: Fixed Right Bundle Branch Block (RBBB) � Left Anterior Fascicular Block Alternat-ing with Left Posterior Fascicular Block. The precordial leads show RBBB. The frontal leads show left ante-rior fascicular block alternating with left posterior fascicular block. This conduction abnormality is an example oftrifascicular block.
Figure 11.4: Mobitz Type II Second-Degree Atrioventricular (AV) Block. Mobitz type II second-degreeAV block is a disease of the distal conduction system.The rhythm strip above was recorded in lead V1. It shows rightbundle branch block (RBBB) and second-degree AV block with a fixed PR interval from Mobitz type II AV block. Thepresence of RBBB and Mobitz type II AV block is consistent with trifascicular block.
LWBK271-C11_138-147.qxd 29/1/09 7:40 pm Page 141 LWBK270-4119G-C02_073-110.qxd

142 Chapter 11
A.
B.
Figure 11.5: Complete Atrioventricular (AV) Block with Ventricular Escape Rhythm. Electrocardiogram(ECG) A shows complete AV block with ventricular escape rhythm. ECG B was obtained from the same patient sev-eral hours earlier showing right bundle branch block � left anterior fascicular block. The presence of ventricular escape rhythm and a previous ECG showing bifascicular block suggests that the complete AV block is infranodal.
LWBK271-C11_138-147.qxd 29/1/09 7:40 pm Page 142 LWBK270-4119G-C02_073-110.qxd
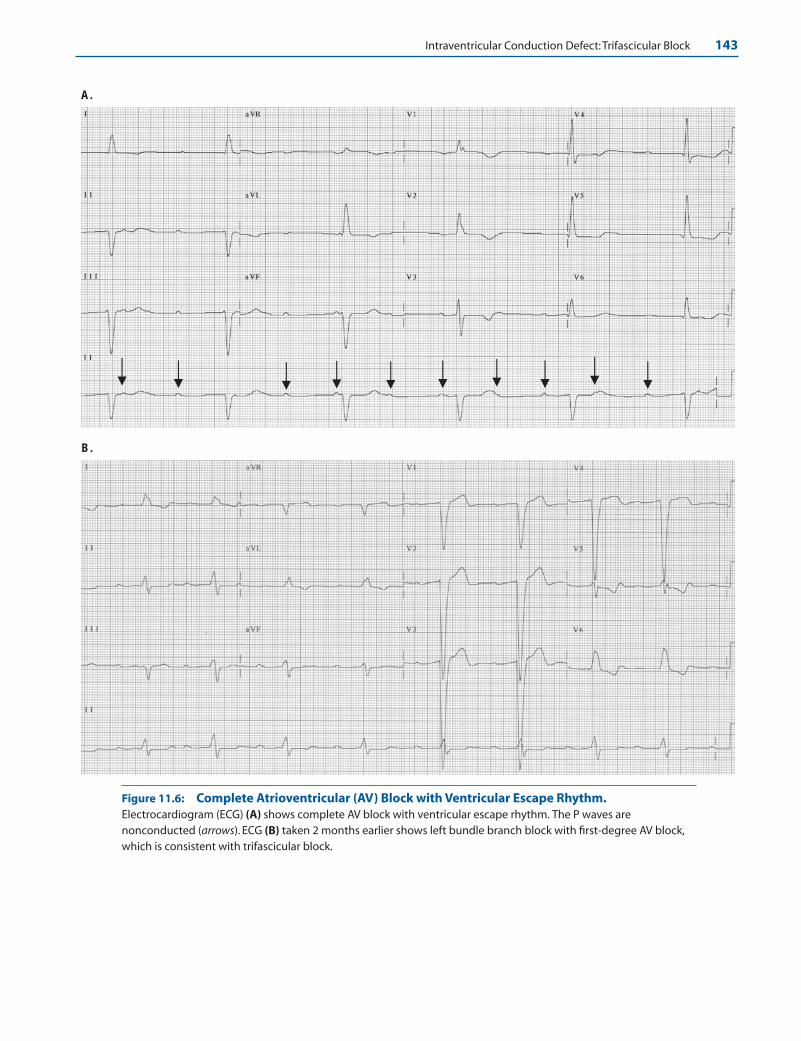
Intraventricular Conduction Defect:Trifascicular Block 143
A.
B.
Figure 11.6: Complete Atrioventricular (AV) Block with Ventricular Escape Rhythm.Electrocardiogram (ECG) (A) shows complete AV block with ventricular escape rhythm. The P waves arenonconducted (arrows). ECG (B) taken 2 months earlier shows left bundle branch block with first-degree AV block,which is consistent with trifascicular block.
LWBK271-C11_138-147.qxd 29/1/09 7:40 pm Page 143 LWBK270-4119G-C02_073-110.qxd
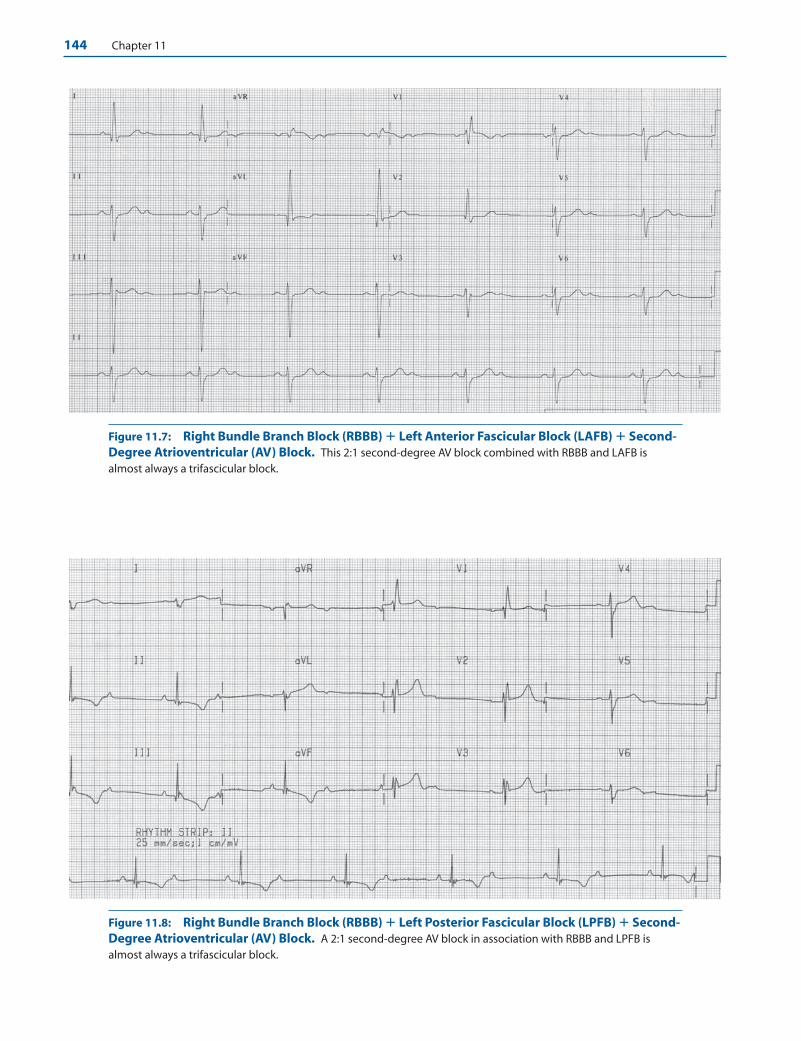
144 Chapter 11
Figure 11.7: Right Bundle Branch Block (RBBB) � Left Anterior Fascicular Block (LAFB) � Second-Degree Atrioventricular (AV) Block. This 2:1 second-degree AV block combined with RBBB and LAFB isalmost always a trifascicular block.
Figure 11.8: Right Bundle Branch Block (RBBB) � Left Posterior Fascicular Block (LPFB) � Second-Degree Atrioventricular (AV) Block. A 2:1 second-degree AV block in association with RBBB and LPFB isalmost always a trifascicular block.
LWBK271-C11_138-147.qxd 29/1/09 7:40 pm Page 144 LWBK270-4119G-C02_073-110.qxd
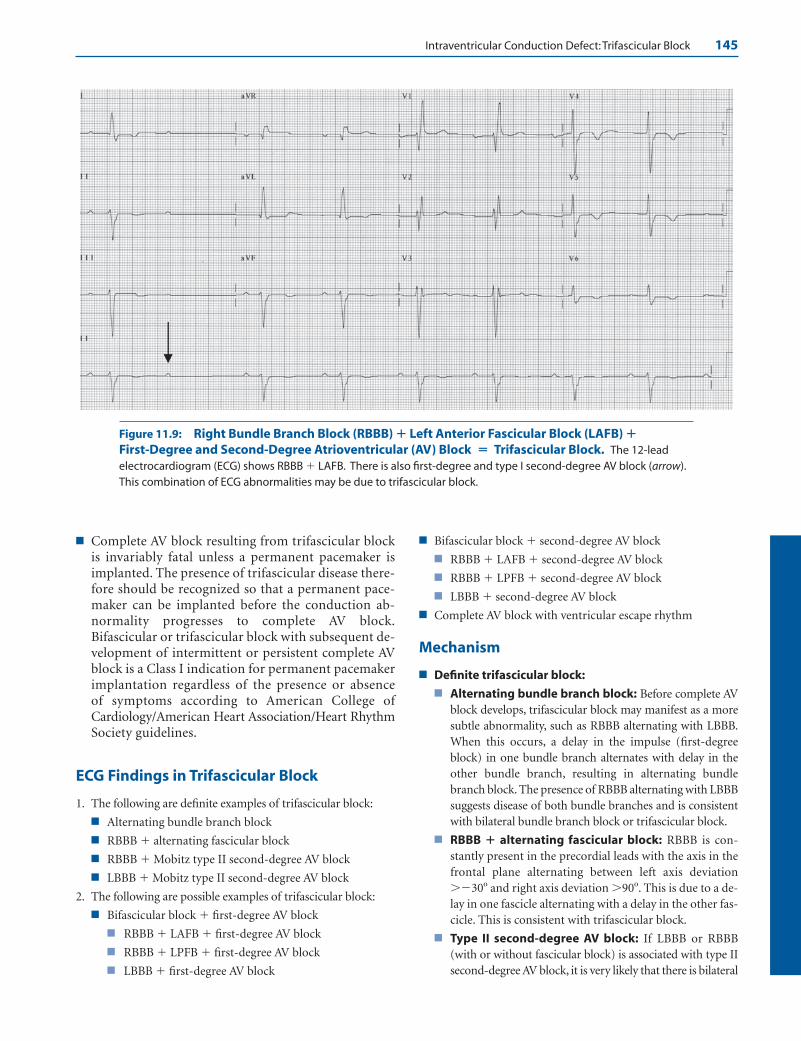
Intraventricular Conduction Defect:Trifascicular Block 145
■ Complete AV block resulting from trifascicular blockis invariably fatal unless a permanent pacemaker isimplanted. The presence of trifascicular disease there-fore should be recognized so that a permanent pace-maker can be implanted before the conduction ab-normality progresses to complete AV block.Bifascicular or trifascicular block with subsequent de-velopment of intermittent or persistent complete AVblock is a Class I indication for permanent pacemakerimplantation regardless of the presence or absenceof symptoms according to American College ofCardiology/American Heart Association/Heart RhythmSociety guidelines.
ECG Findings in Trifascicular Block
1. The following are definite examples of trifascicular block:
■ Alternating bundle branch block
■ RBBB � alternating fascicular block
■ RBBB � Mobitz type II second-degree AV block
■ LBBB � Mobitz type II second-degree AV block
2. The following are possible examples of trifascicular block:
■ Bifascicular block � first-degree AV block
■ RBBB � LAFB � first-degree AV block
■ RBBB � LPFB � first-degree AV block
■ LBBB � first-degree AV block
■ Bifascicular block � second-degree AV block
■ RBBB � LAFB � second-degree AV block
■ RBBB � LPFB � second-degree AV block
■ LBBB � second-degree AV block
■ Complete AV block with ventricular escape rhythm
Mechanism
■ Definite trifascicular block:
■ Alternating bundle branch block: Before complete AVblock develops, trifascicular block may manifest as a moresubtle abnormality, such as RBBB alternating with LBBB.When this occurs, a delay in the impulse (first-degreeblock) in one bundle branch alternates with delay in theother bundle branch, resulting in alternating bundlebranch block. The presence of RBBB alternating with LBBBsuggests disease of both bundle branches and is consistentwith bilateral bundle branch block or trifascicular block.
■ RBBB � alternating fascicular block: RBBB is con-stantly present in the precordial leads with the axis in thefrontal plane alternating between left axis deviation��30� and right axis deviation �90�. This is due to a de-lay in one fascicle alternating with a delay in the other fas-cicle. This is consistent with trifascicular block.
■ Type II second-degree AV block: If LBBB or RBBB(with or without fascicular block) is associated with type IIsecond-degree AV block, it is very likely that there is bilateral
Figure 11.9: Right Bundle Branch Block (RBBB) � Left Anterior Fascicular Block (LAFB) �First-Degree and Second-Degree Atrioventricular (AV) Block � Trifascicular Block. The 12-leadelectrocardiogram (ECG) shows RBBB � LAFB. There is also first-degree and type I second-degree AV block (arrow).This combination of ECG abnormalities may be due to trifascicular block.
LWBK271-C11_138-147.qxd 29/1/09 7:40 pm Page 145 LWBK270-4119G-C02_073-110.qxd
146 Chapter 11
bundle branch block because type II second-degree AVblock involves only the distal conduction system.
■ Possible trifascicular block:
■ Bifascicular block � first-degree or second-degreeAV block: First-degree AV block as well as type 1 second-degree AV block can occur anywhere within the conduc-tion system including the AV node or more distally withinthe bundle branches or fascicles. When AV block occurs inthe setting of bifascicular block, the AV block may involvethe third or remaining fascicle, in which case a trifascicu-lar block would be present. It is also possible that the AVblock may not be in the third fascicle, but at the level ofthe AV node, in which case it would not be a trifascicu-lar block. The block is trifascicular only if the first-degree or second-degree AV block involves the remainingfascicle.
■ Complete AV block with ventricular escape rhythm:Trifascicular block is present when there is simultaneousblock involving both bundle branches or all three fasciclesof the conduction system. The ECG will show completeAV block. The escape rhythm can originate only from theventricles. If bifascicular or trifascicular block is presentin previous ECGs, complete AV block with a ventricularescape rhythm is almost always the result of a block in theHis-Purkinje system.
Clinical Implications
■ Patients with trifascicular block are at risk for developingcomplete AV block. The AV block can occur suddenly andcan result in syncope (Stokes-Adams syndrome) or suddendeath. The presence of trifascicular block should be recog-nized before complete AV block develops.
■ When complete AV block occurs, the level of the AV blockshould always be localized. AV block at the level of the AV nodeis often reversible and has a better prognosis than AV block oc-curring more distally at the level of the His-Purkinje system.The patient’s history, previous ECG, presence and location ofthe acute myocardial infarction (MI), and the origin of theescape rhythm are helpful in localizing the level of the AVblock.
■ History: The block is most likely AV nodal if the patientgives a history of taking medications that can block theAV node such as beta blockers, calcium channel blockers(verapamil and diltiazem), and digitalis.
■ Previous ECG: The presence of distal conduction systemdisease such as bundle branch block, bifascicular block, ortrifascicular block suggest that the AV block is in the dis-tal conduction system.
■ Acute MI: When acute MI is associated with AV block,the AV block is at the level of the AV node if the MI is in-ferior. It is infranodal and at the level of the His-Purkinjesystem if the MI is anterior.
■ Escape rhythm: When the AV block is infranodal, the es-cape rhythm is always ventricular. When the AV block is at
the level of the AV node, the escape rhythm is usually AVjunctional.
■ The presence of bundle branch block (especially LBBB) maybe a marker of severe myocardial disease and left ventricularsystolic dysfunction. When a patient with bifascicular or tri-fascicular block presents with syncope, progression to com-plete AV block is likely. However, one should not overlook thepossibility that ventricular tachycardia rather than completeAV block may be the cause of the syncope. Insertion of a per-manent pacemaker to prevent bradyarrhythmia may not alterthe prognosis of patients with severe myocardial disease if thecause of the syncope is a ventricular arrhythmia.
■ The causes of trifascicular block include idiopathic car-diomyopathy, ischemic heart disease, hypertension, valvularheart diseases (especially calcific aortic stenosis), fibrosis orcalcification of the conduction system, infiltrative cardiacdiseases such as sarcoidosis, hypothyroidism, myocarditis,and other inflammatory heart diseases such as Dengue fever,diphtheria, leishmania, and Lyme disease.
Treatment
The following are the indications for implantation of permanentpacemakers in patients with chronic bifascicular and trifascicularblock according to the American College of Cardiology/AmericanHeart Association/Heart Rhythm Society guidelines.
Class I: Condition in which there is evidence or agreement thata given procedure or treatment is useful and effective.
Symptomatic and Asymptomatic Patients:
1. Advanced second-degree or intermittent third-degree AV block
2. Type II second-degree AV block
3. Alternating bundle branch block
Class IIa: The weight of evidence is in favor of usefulness or ef-ficacy of a procedure or treatment.
Symptomatic Patients:
1. Syncope not demonstrated to be due to AV block when otherlikely causes have been excluded, specifically ventriculartachycardia.
Asymptomatic Patients:
1. Incidental finding at electrophysiological study of markedlyprolonged HV interval (�100 milliseconds).
2. Incidental finding at electrophysiological study of pacing in-duced infra-His block that is not physiological.
Class IIb: Usefulness or efficacy of the procedure or treat-ment is less well established.
Symptomatic or Asymptomatic Patients:
1. Neuromuscular diseases with bifascicular block or any fascic-ular block with or without symptoms. These include my-otonic muscular dystrophy, Erb dystrophy, and peroneal mus-cular atrophy.
Class III: The procedure is not useful or effective and in somecases may be harmful.
LWBK271-C11_138-147.qxd 29/1/09 7:40 pm Page 146 LWBK270-4119G-C02_073-110.qxd

Intraventricular Conduction Defect:Trifascicular Block 147
Asymptomatic Patients:
Permanent pacemaker implantation is not indicated for:1. Fascicular block without AV block or symptoms.
2. Fascicular block with first-degree AV block without symptoms.
■ Complete AV block involving the distal conducting system isoften sudden and unexpected. Thus, the ECG manifestationsof trifascicular block should be recognized before completeAV block becomes manifest. When there is evidence of trifas-cicular block, a permanent pacemaker should be inserted,even in asymptomatic patients, because there is no effectivemedical therapy for complete AV block at the level of the dis-tal conduction system.
■ Therapy should target the underlying cause of the conduc-tion abnormality, such as ischemic cardiomyopathy, hy-pothyroidism, sarcoidosis, myocarditis, or other inflamma-tory diseases. Whenever there is a need for permanent pacingin patients with bifascicular or trifascicular disease, left ven-tricular systolic function should be evaluated with an imag-ing procedure such as echocardiography. In this era of ad-vanced technology, the need for permanent pacing forbradycardia should also take into consideration the need forbiventricular pacing and automatic defibrillation in patientswith severe left ventricular systolic dysfunction.
Prognosis
■ Prognosis depends on the cause of the trifascicular block. Ifthe conduction abnormality is an isolated abnormalityresulting from sclerosis or degenerative disease of the con-
duction system, prognosis after insertion of a permanentpacemaker is the same as for patients without the conduc-tion abnormality. Most patients with trifascicular diseasemay have associated myocardial disease. The prognosis ofthese patients depends on the etiology of the conductionabnormality.
Suggested Readings
Dunn MI, Lipman BS. Abnormalities of ventricular conduction:fascicular block, infarction block, and parietal block. In:Lippman-Massie Clinical Electrocardiography. 8th ed. Chicago:Yearbook Medical Publishers, Inc; 1989:148–159.
Epstein AE, DiMarco JP, Ellenbogen KA, et al. ACC/AHA/HRS2008 guidelines for device-based therapy of cardiac rhythmabnormalities: a Report of the American College of Cardiology/American Heart Association Task Force on Practice Guide-lines (Writing Committee to Revise the ACC/AHA/NASPE2002 Guideline Update for Implantation of Cardiac Pace-makers and Antiarrhythmia Devices). J Am Coll Cardiol.2008;51:2085-2105.
Marriott HJL. The hemiblocks and trifascicular block. In:Practical Electrocardiography. 5th ed. Baltimore: The Williamsand Wilkins Company; 1972:86–94.
Sgarbossa EB, Wagner GS. Electrocardiography: In: Topol EJ, ed.Textbook of Cardiovascular Medicine. 2nd ed. Philadelphia:Lippincott Williams & Wilkins; 2002:1330–1354.
Willems JL, Robles de Medina EO, Bernard R, et al. Criteria forintraventricular conduction disturbances and pre-excitation.J Am Coll Cardiol. 1985:1261–1275.
LWBK271-C11_138-147.qxd 29/1/09 7:40 pm Page 147 LWBK270-4119G-C02_073-110.qxd
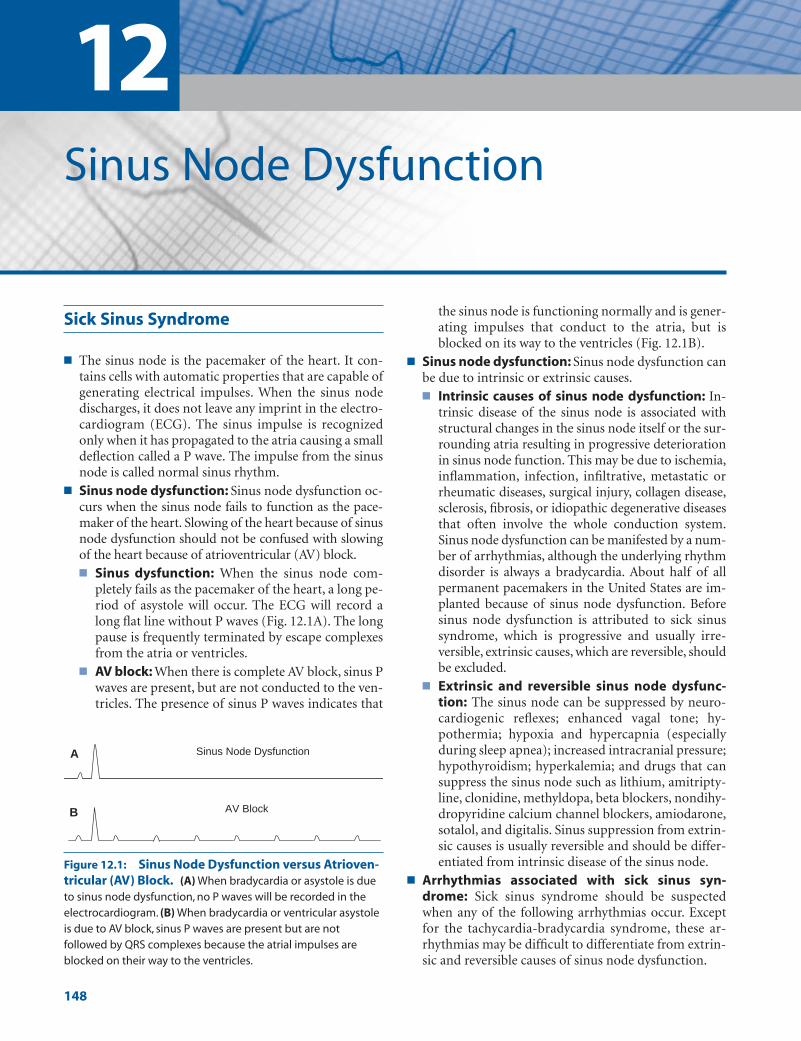
12Sinus Node Dysfunction
148
Sick Sinus Syndrome
■ The sinus node is the pacemaker of the heart. It con-tains cells with automatic properties that are capable ofgenerating electrical impulses. When the sinus nodedischarges, it does not leave any imprint in the electro-cardiogram (ECG). The sinus impulse is recognizedonly when it has propagated to the atria causing a smalldeflection called a P wave. The impulse from the sinusnode is called normal sinus rhythm.
■ Sinus node dysfunction: Sinus node dysfunction oc-curs when the sinus node fails to function as the pace-maker of the heart. Slowing of the heart because of sinusnode dysfunction should not be confused with slowingof the heart because of atrioventricular (AV) block.■ Sinus dysfunction: When the sinus node com-
pletely fails as the pacemaker of the heart, a long pe-riod of asystole will occur. The ECG will record along flat line without P waves (Fig. 12.1A). The longpause is frequently terminated by escape complexesfrom the atria or ventricles.
■ AV block: When there is complete AV block, sinus Pwaves are present, but are not conducted to the ven-tricles. The presence of sinus P waves indicates that
the sinus node is functioning normally and is gener-ating impulses that conduct to the atria, but isblocked on its way to the ventricles (Fig. 12.1B).
■ Sinus node dysfunction: Sinus node dysfunction canbe due to intrinsic or extrinsic causes.■ Intrinsic causes of sinus node dysfunction: In-
trinsic disease of the sinus node is associated withstructural changes in the sinus node itself or the sur-rounding atria resulting in progressive deteriorationin sinus node function. This may be due to ischemia,inflammation, infection, infiltrative, metastatic orrheumatic diseases, surgical injury, collagen disease,sclerosis, fibrosis, or idiopathic degenerative diseasesthat often involve the whole conduction system.Sinus node dysfunction can be manifested by a num-ber of arrhythmias, although the underlying rhythmdisorder is always a bradycardia. About half of allpermanent pacemakers in the United States are im-planted because of sinus node dysfunction. Before sinus node dysfunction is attributed to sick sinussyndrome, which is progressive and usually irre-versible, extrinsic causes, which are reversible, shouldbe excluded.
■ Extrinsic and reversible sinus node dysfunc-tion: The sinus node can be suppressed by neuro-cardiogenic reflexes; enhanced vagal tone; hy-pothermia; hypoxia and hypercapnia (especiallyduring sleep apnea); increased intracranial pressure;hypothyroidism; hyperkalemia; and drugs that cansuppress the sinus node such as lithium, amitripty-line, clonidine, methyldopa, beta blockers, nondihy-dropyridine calcium channel blockers, amiodarone,sotalol, and digitalis. Sinus suppression from extrin-sic causes is usually reversible and should be differ-entiated from intrinsic disease of the sinus node.
■ Arrhythmias associated with sick sinus syn-drome: Sick sinus syndrome should be suspectedwhen any of the following arrhythmias occur. Exceptfor the tachycardia-bradycardia syndrome, these ar-rhythmias may be difficult to differentiate from extrin-sic and reversible causes of sinus node dysfunction.
B AV Block
A Sinus Node Dysfunction
Figure 12.1: Sinus Node Dysfunction versus Atrioven-tricular (AV) Block. (A) When bradycardia or asystole is dueto sinus node dysfunction, no P waves will be recorded in theelectrocardiogram. (B) When bradycardia or ventricular asystoleis due to AV block, sinus P waves are present but are notfollowed by QRS complexes because the atrial impulses areblocked on their way to the ventricles.
LWBK271-C12_148-166.qxd 29/1/09 9:04 pm Page 148 LWBK270-4119G-C02_073-110.qxd
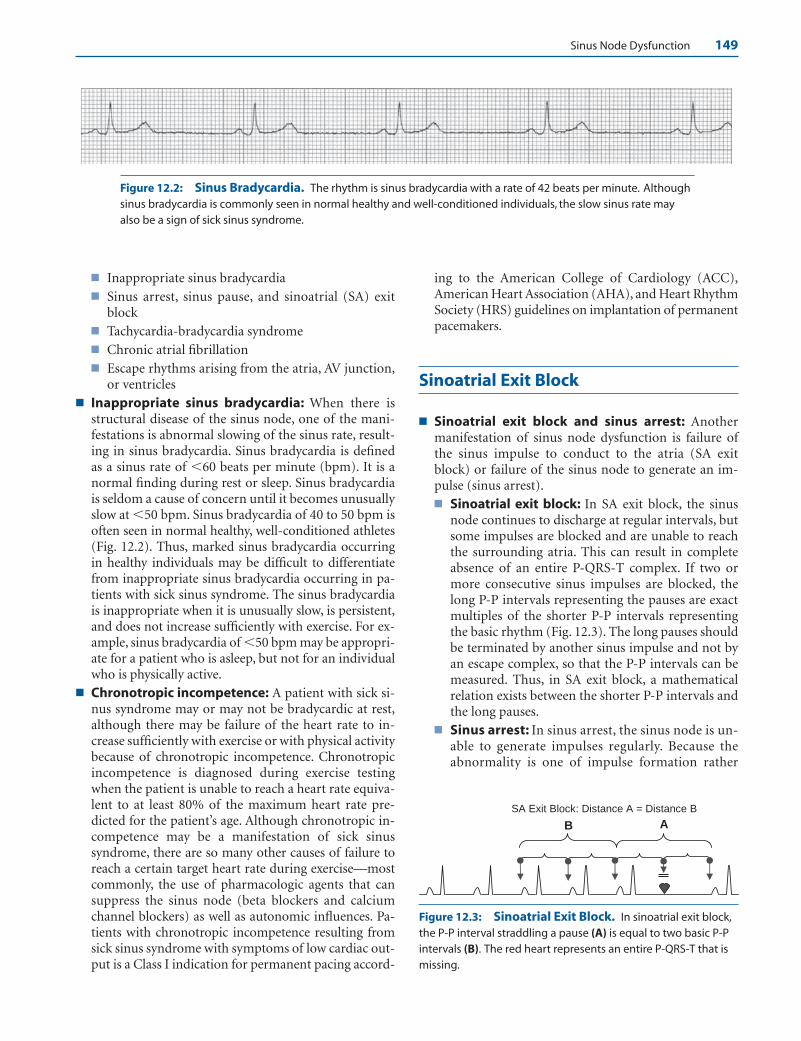
Sinus Node Dysfunction 149
■ Inappropriate sinus bradycardia■ Sinus arrest, sinus pause, and sinoatrial (SA) exit
block■ Tachycardia-bradycardia syndrome■ Chronic atrial fibrillation■ Escape rhythms arising from the atria, AV junction,
or ventricles ■ Inappropriate sinus bradycardia: When there is
structural disease of the sinus node, one of the mani-festations is abnormal slowing of the sinus rate, result-ing in sinus bradycardia. Sinus bradycardia is definedas a sinus rate of �60 beats per minute (bpm). It is anormal finding during rest or sleep. Sinus bradycardiais seldom a cause of concern until it becomes unusuallyslow at �50 bpm. Sinus bradycardia of 40 to 50 bpm isoften seen in normal healthy, well-conditioned athletes(Fig. 12.2). Thus, marked sinus bradycardia occurringin healthy individuals may be difficult to differentiatefrom inappropriate sinus bradycardia occurring in pa-tients with sick sinus syndrome. The sinus bradycardiais inappropriate when it is unusually slow, is persistent,and does not increase sufficiently with exercise. For ex-ample, sinus bradycardia of �50 bpm may be appropri-ate for a patient who is asleep, but not for an individualwho is physically active.
■ Chronotropic incompetence: A patient with sick si-nus syndrome may or may not be bradycardic at rest,although there may be failure of the heart rate to in-crease sufficiently with exercise or with physical activitybecause of chronotropic incompetence. Chronotropicincompetence is diagnosed during exercise testingwhen the patient is unable to reach a heart rate equiva-lent to at least 80% of the maximum heart rate pre-dicted for the patient’s age. Although chronotropic in-competence may be a manifestation of sick sinussyndrome, there are so many other causes of failure toreach a certain target heart rate during exercise—mostcommonly, the use of pharmacologic agents that cansuppress the sinus node (beta blockers and calciumchannel blockers) as well as autonomic influences. Pa-tients with chronotropic incompetence resulting fromsick sinus syndrome with symptoms of low cardiac out-put is a Class I indication for permanent pacing accord-
ing to the American College of Cardiology (ACC),American Heart Association (AHA), and Heart RhythmSociety (HRS) guidelines on implantation of permanentpacemakers.
Sinoatrial Exit Block
■ Sinoatrial exit block and sinus arrest: Anothermanifestation of sinus node dysfunction is failure ofthe sinus impulse to conduct to the atria (SA exitblock) or failure of the sinus node to generate an im-pulse (sinus arrest).■ Sinoatrial exit block: In SA exit block, the sinus
node continues to discharge at regular intervals, butsome impulses are blocked and are unable to reachthe surrounding atria. This can result in completeabsence of an entire P-QRS-T complex. If two ormore consecutive sinus impulses are blocked, thelong P-P intervals representing the pauses are exactmultiples of the shorter P-P intervals representingthe basic rhythm (Fig. 12.3). The long pauses shouldbe terminated by another sinus impulse and not byan escape complex, so that the P-P intervals can bemeasured. Thus, in SA exit block, a mathematicalrelation exists between the shorter P-P intervals andthe long pauses.
■ Sinus arrest: In sinus arrest, the sinus node is un-able to generate impulses regularly. Because theabnormality is one of impulse formation rather
Figure 12.2: Sinus Bradycardia. The rhythm is sinus bradycardia with a rate of 42 beats per minute. Althoughsinus bradycardia is commonly seen in normal healthy and well-conditioned individuals, the slow sinus rate mayalso be a sign of sick sinus syndrome.
B A
SA Exit Block: Distance A = Distance B
Figure 12.3: Sinoatrial Exit Block. In sinoatrial exit block,the P-P interval straddling a pause (A) is equal to two basic P-Pintervals (B). The red heart represents an entire P-QRS-T that ismissing.
LWBK271-C12_148-166.qxd 29/1/09 9:04 pm Page 149 LWBK270-4119G-C02_073-110.qxd

150 Chapter 12
than impulse conduction, the pauses represented bythe long P-P intervals, are not exact multiples of theshorter P-P intervals representing the basic sinusrhythm (Fig. 12.4).
■ Sinus pause: Sinus pause and sinus arrest are similarand either one can be used interchangeably to describethe other. Additionally, sinus arrest may be difficult todifferentiate from SA exit block when the P-P intervalsare irregular, such as when there is sinus arrhythmia orwhen an escape complex terminates a pause (Fig. 12.5).When these occur, the pause is simply a sinus pausebecause it cannot be identified as sinus arrest or exitblock (Figs. 12.6 and 12.7).
■ Sinoatrial exit block:Similar to AV block, SA exit blockcan be divided into first-degree, second-degree, andthird-degree block. First- and third-degree SA exit blockare not recognizable in the surface ECG because the si-nus node does not leave any imprint when it discharges.Only second-degree SA exit block can be identified.
■ Second-degree SA exit block: Second-degree SAexit block is further subdivided into type I, also calledSA Wenckebach, and type II, SA exit block. The differ-ence between type I and type II exit block is shown inFigure 12.8B, C.
Sinoatrial Wenckebach
■ SA Wenckebach: Second-degree type I SA block or SAWenckebach should always be suspected when there isgroup beating. In this group beating, some QRS com-
plexes are clustered together because they are separatedby pauses representing sinus impulses not conductedto the atria. Group beating is commonly seen in type Iblock because this type of block has a tendency to berepetitive. In SA Wenckebach, there is gradual delay inconduction between the sinus node and the atrium.Because sinus node to atrial interval cannot be meas-ured, only the gradual shortening of the P-P or R-R in-tervals before the pause may be the only indication thatSA Wenckebach is present (Fig. 12.9).
■ Thus, group beating with shortening of the P-P inter-val before the pause should always raise the possibilityof SA Wenckebach as shown in Figures 12.8B, 12.9, and12.10. In Figure 12.9, there is group beatings labeled #1to #3. The shortening of the R-R (or P-P) intervalsbefore the pause is better appreciated by the distancesbetween the arrows at the bottom of the tracing, whichrepresent the R-R intervals.
Tachycardia-Bradycardia Syndrome
■ Tachycardia-bradycardia syndrome: When the si-nus node fails to function as the pacemaker of theheart, ectopic rhythms come to the rescue, which en-hances the vulnerability of the patient to develop atrialarrhythmias, including atrial tachycardia, atrial flutter,or atrial fibrillation. These arrhythmias are usuallysustained and most often become the dominantrhythm. During tachycardia or during atrial flutter orfibrillation, the presence of sinus node dysfunction isnot obvious until the atrial arrhythmia terminatesspontaneously. If there is sick sinus syndrome, the sinus node is unable to take over the pacemaking func-tion of the heart and the long pause that follows is afrequent cause of syncope in tachycardia-bradycardiasyndrome (Figs. 12.11 and 12.12).
Chronic Atrial Fibrillation
■ Chronic atrial fibrillation: Atrial fibrillation is not anuncommon sequela of sick sinus syndrome. Before the
AB
Sinus Arrest: Distance A is longer than distance B
Figure 12.4: Sinus Arrest. The long pause (A) contains a P-P interval that is not equal to two basic P-P intervals (B). Thepause represents sinus arrest.
Figure 12.5: Sinus Pause. A long pause of more than 3 seconds is terminated by a junctional escape complex(arrow). A long pause is usually due to sinus arrest. It is also called sinus pause.
LWBK271-C12_148-166.qxd 29/1/09 9:04 pm Page 150 LWBK270-4119G-C02_073-110.qxd

Sinus Node Dysfunction 151
A
B
840 ms 840 ms 840 ms 840 ms 840 ms
Figure 12.6: Sinoatrial Exit Block. The rhythm strips are continuous. A long period of asystole labeleddistance A is equal to distance B. A contains three P-QRS-T complexes that are missing, which are marked by the redhearts.The long pause is due to sinoatrial exit block. ms, milliseconds.
2080 ms 2080 ms
1040 ms 1040 ms 1040 ms 1040 ms 1040 ms 1040 ms
2080 ms
Figure 12.7: Sinoatrial Exit Block. In sinoatrial exit block, the P-P intervals are fixed.Note that the longer P-P intervals measure 2,080 milliseconds and are equal to two shorterP-P intervals, which measure 1,040 milliseconds. This is due to SA exit block. Each red heartrepresents an entire P-QRS-T complex that is missing. ms, milliseconds.
#1 #2 #3
P-P interval shortens before the pause
B.
C. 2° Type II SAExit Block
P-P intervals are fixed
A.
780 ms 680 ms 1140 ms
1280 ms 1280 ms 1280 ms
D. Probable 3° SA Exit Block or Sinus Arrest
2° Type I or SAWenckebach
Normal Baseline:
Figure 12.8: Sinoatrial (SA) ExitBlock. (A) Normal sinus rhythm.(B) Type I second degree SA Wenckebach.Shortening of the P-P intervals before apause is the hallmark of SA Wenckebach.P-P interval #2 is shorter than P-P inter-val #1. The pause is represented by P-Pinterval #3. (C) Type II second-degreeSA exit block. An entire P-QRS-Tcomplex represented by the red heart ismissing. This long P-P interval is equiva-lent to two P-P intervals straddling a sinus complex. (D) This rhythm is con-sistent with third-degree SA exit block,although this cannot be distinguishedfrom sinus arrest. The sinus impulsecannot conduct to the atria hence sinusP waves are not present.
LWBK271-C12_148-166.qxd 29/1/09 9:04 pm Page 151 LWBK270-4119G-C02_073-110.qxd

152 Chapter 12
3 #2 #1 #
710 680 700 6701170 1150
Figure 12.9: Sinoatrial (SA) Wenckebach. The rhythm strips were recorded in lead II. SAWenckebach should always be suspected when there is group beating labeled #1 to #3. These QRS com-plexes are grouped together because they are separated by pauses, which represent the sinus impulsesthat are not conducted to the atrium. Note also that there is gradual shortening of the R-R (or P-P) intervalsbefore the pause as shown by the distances between the arrows. This is the hallmark of SA Wenckebach.The numbers between the arrows (between the QRS complexes) are in milliseconds.
Figure 12.10: Group Beating in Sinoatrial (SA) Wenckebach. Lead II rhythm strip showing group beatingsimilar to the electrocardiogram in Figure 12.9. There is also shortening of the R-R (or P-P) intervals before the longpauses consistent with SA Wenckebach.
Figure 12.11: Tachycardia-Bradycardia Syndrome. The rhythm strips are continuous. Note that the atrialtachycardia is paroxysmal with sudden onset and termination. When the tachycardia terminates abruptly, longpauses follow, which are terminated by marked sinus bradycardia.
LWBK271-C12_148-166.qxd 29/1/09 9:04 pm Page 152 LWBK270-4119G-C02_073-110.qxd

Sinus Node Dysfunction 153
era of cardiac pacemakers, atrial fibrillation may havebeen the only spontaneous cure for patients with signifi-cant bradycardia resulting from sinus node dysfunction.Unfortunately, atrial fibrillation may be intermittent andimpermanent. When it terminates spontaneously, the sinus node is unable to provide any rhythm and a longasystole can occur (Figs. 12.13 and 12.14).
■ Patients with chronic atrial fibrillation frequently un-dergo electrical cardioversion to convert the atrial fib-rillation to normal sinus rhythm. After the atrial fibril-lation is terminated by an electrical shock, the sinusnode is unable to provide a sinus impulse, thus a longperiod of asystole may occur if the atrial fibrillation isdue to sick sinus syndrome. Sick sinus syndromeshould be suspected in patients with chronic atrial fib-rillation when the ventricular rate is slow but are noton AV nodal blocking agents because sick sinus syn-drome is often due to degenerative disease that involvesnot only the sinus node, but also the whole AV conduc-tion system.
Escape Rhythms
■ Escape rhythms: When the rate of the sinus node be-comes unusually slow, escape rhythms may originatefrom the atria, AV junction, or ventricles. These cellshave intrinsically slower rates than the sinus node andusually do not become manifest because they are depo-larized by the propagated sinus impulse. When there issinus node dysfunction or when there is AV block (seeChapter 8, Atrioventricular Block), these latent pace-makers may become the dominant pacemaker of theheart.■ Atrial escape rhythm: The atrial impulse origi-
nates from cells in the atria usually at the area of thecoronary sinus and is followed by a narrow QRScomplex (Fig. 12.15).
■ AV junctional rhythm: The AV junction includesthe AV node down to the bifurcation of the bundleof His. The escape impulse usually originates below
Figure 12.12: Prolonged Asystole as a Result of Tachycardia-Bradycardia Syndrome. The tworhythm strips are simultaneous showing a supraventricular tachycardia followed by a long pause of more than 5 seconds before a junctional escape complex comes to the rescue.
Figure 12.13: Sick Sinus Syndrome Manifesting as Atrial Fibrillation. Lead II rhythm strip showingatrial fibrillation. Long pauses can occur when there is sick sinus syndrome because the sinus node is unable toprovide a sinus impulse when the atrial fibrillation terminates spontaneously. These long pauses can cause syncopeor sudden death.
LWBK271-C12_148-166.qxd 29/1/09 9:04 pm Page 153 LWBK270-4119G-C02_073-110.qxd

154 Chapter 12
the AV node at its junction with the bundle of Hisand has a rate of 40 to 60 bpm 12.16).
■ Ventricular escape rhythm: Instead of the atria orAV junction, the ventricles may be the origin of theescape complex. A ventricular escape complex iswide, measuring �0.12 seconds because it origi-nates below the bifurcation of the bundle of His(Fig. 12.17).
Junctional Escape Rhythms
■ AV junctional escape complex: AV junctional escaperhythms are the most common escape rhythms whenthere is bradycardia resulting from sinus node dysfunc-tion or AV block (Fig. 12.18). The ectopic impulse mayor may not be associated with retrograde P waves.When retrograde P waves are present, they may occurbefore or after the QRS complex and are inverted inleads II, III, and aVF (Fig. 12.19).■ P waves before the QRS complex: Retrograde P
waves will occur in front of the QRS complex if con-duction of the impulse to the atria is faster than con-duction of the impulse to the ventricles. This type ofjunctional escape rhythm may be difficult to differ-entiate from an atrial escape complex. If the impulseis junctional, the PR interval is usually short, meas-uring �0.12 seconds, and the retrograde P waves areusually narrow because the impulse originates fromthe AV node, causing both atria to be activated simultaneously.
■ No P waves: When P waves are absent, the im-pulse may be blocked at the AV node or the retro-grade P wave may be synchronous with the QRScomplex. This occurs when the speed of conduc-tion of the impulse to the atria is the same as the
speed of conduction of the impulse to the ventri-cles (Fig. 12.18).
■ P waves after the QRS complex: The retrograde Pwaves may occur after the QRS complex if conduc-tion of the impulse to the ventricles is faster thanconduction of the impulse to the atria.
■ The 12-lead ECG of a patient with AV junctional escaperhythm resulting from sinus node dysfunction (Fig.12.20) and another patient with ventricular escaperhythm also from sinus node dysfunction (Fig. 12.21)are shown.
■ Wandering atrial pacemaker: Escape complexes mayoriginate from two or more locations in the atria andcompete with the sinus node as the pacemaker of theheart (Fig. 12.22). Ectopic impulses from the AV junc-tion may also compete as pacemaker as shown in Figure12.23. In wandering atrial pacemaker, the ectopic atrialimpulses have the same rate as the sinus node (Figs.12.22 and 12.23) and may even be late or slower (Fig.12.24). Thus, the rhythm passively shifts from sinusnode to ectopic atrial. They should not be confusedwith multifocal or chaotic atrial rhythm where the atrialcomplexes are premature and anticipate the next sinusimpulse.
■ Accelerated rhythms: Very often, these escaperhythms become accelerated and develop a rate that isfaster than their intrinsic rates. Thus, when the rate ofthe AV junction is �40 to 60 bpm, the rhythm is calledaccelerated junctional rhythm (Fig. 12.25); when theventricles exceed their intrinsic rate of 20 to 40 bpm,the rhythm is called accelerated idioventricular rhythm(Figs. 12.26 and 12.27).
■ Accelerated idioventricular rhythm: Two examples ofaccelerated idioventricular rhythm are shown in Figures12.26 and 12.27. Accelerated idioventricular rhythm is arhythm that is often confusing and difficult to recognize
Figure 12.14: Sick Sinus Syndrome and Atrial Fibrillation. Rhythm strip showing atrial fibrillationfollowed by a long period of asystole of �5 seconds spontaneously terminated by a junctional escape complex.
Figure 12.15: Atrial Escape Rhythm. Atrial escape complexes (arrows) can become the dominant pacemakerwhen there is slowing of the sinus impulse.
LWBK271-C12_148-166.qxd 29/1/09 9:04 pm Page 154 LWBK270-4119G-C02_073-110.qxd
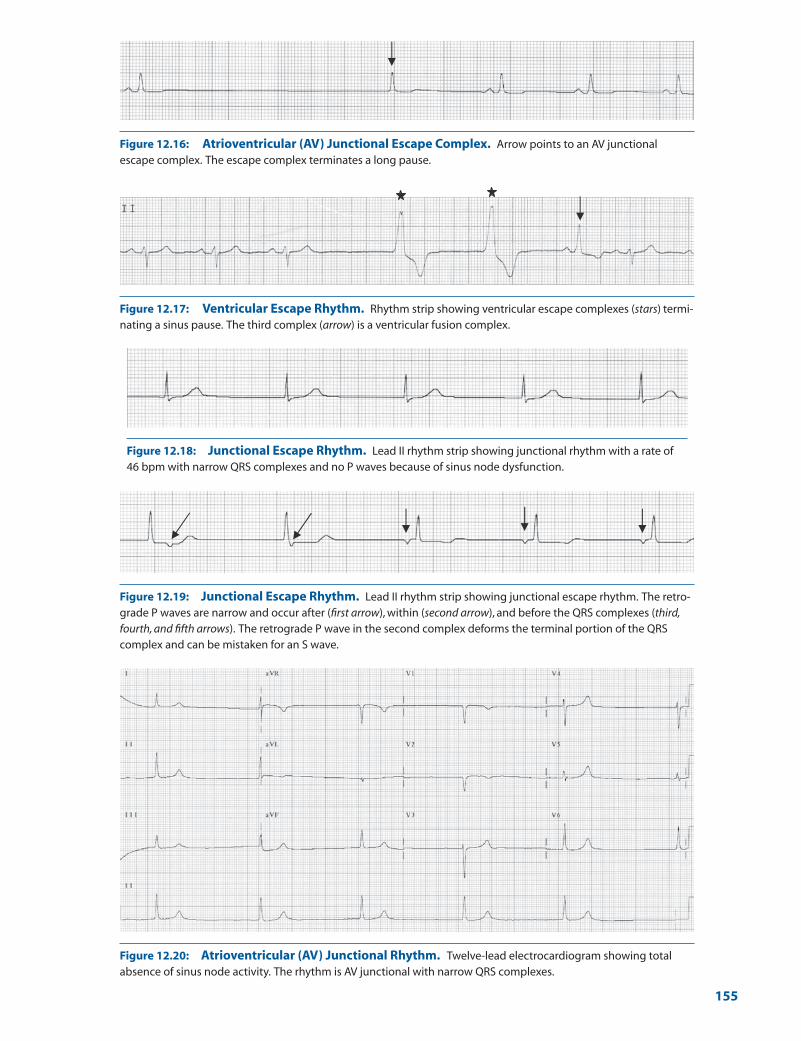
Figure 12.16: Atrioventricular (AV) Junctional Escape Complex. Arrow points to an AV junctionalescape complex. The escape complex terminates a long pause.
Figure 12.17: Ventricular Escape Rhythm. Rhythm strip showing ventricular escape complexes (stars) termi-nating a sinus pause. The third complex (arrow) is a ventricular fusion complex.
Figure 12.18: Junctional Escape Rhythm. Lead II rhythm strip showing junctional rhythm with a rate of46 bpm with narrow QRS complexes and no P waves because of sinus node dysfunction.
Figure 12.19: Junctional Escape Rhythm. Lead II rhythm strip showing junctional escape rhythm. The retro-grade P waves are narrow and occur after (first arrow), within (second arrow), and before the QRS complexes (third,fourth, and fifth arrows). The retrograde P wave in the second complex deforms the terminal portion of the QRScomplex and can be mistaken for an S wave.
Figure 12.20: Atrioventricular (AV) Junctional Rhythm. Twelve-lead electrocardiogram showing totalabsence of sinus node activity. The rhythm is AV junctional with narrow QRS complexes.
155
LWBK271-C12_148-166.qxd 29/1/09 9:04 pm Page 155 LWBK270-4119G-C02_073-110.qxd
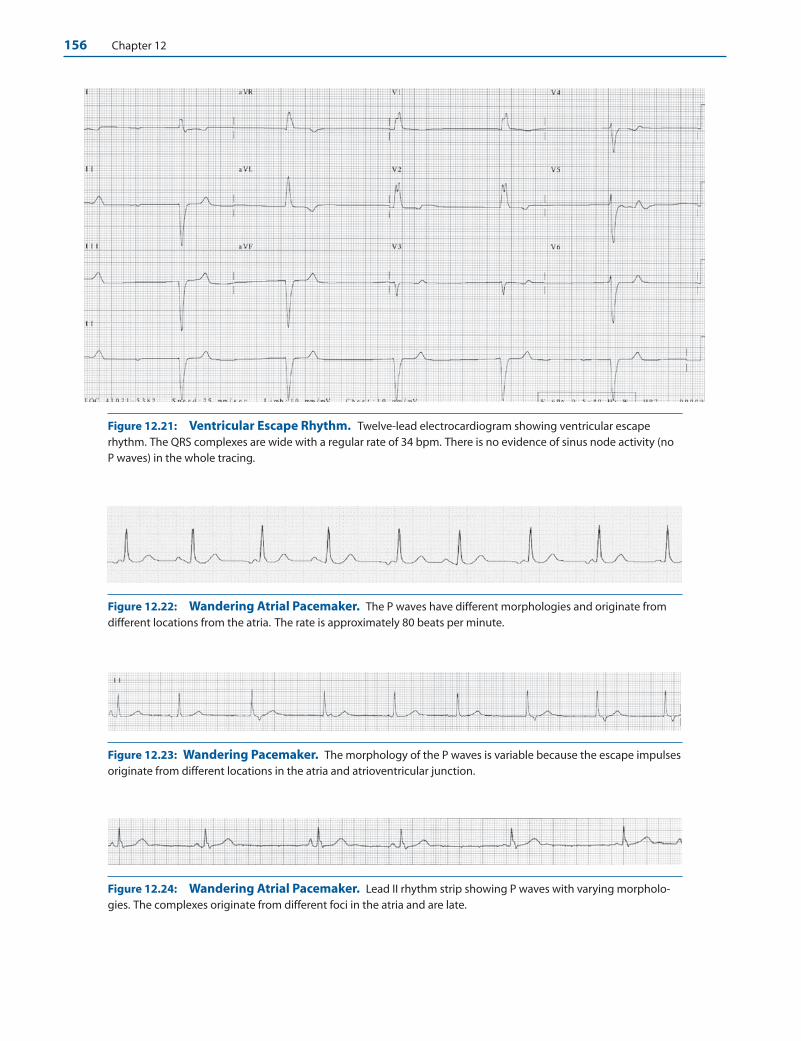
156 Chapter 12
Figure 12.21: Ventricular Escape Rhythm. Twelve-lead electrocardiogram showing ventricular escaperhythm. The QRS complexes are wide with a regular rate of 34 bpm. There is no evidence of sinus node activity (noP waves) in the whole tracing.
Figure 12.22: Wandering Atrial Pacemaker. The P waves have different morphologies and originate fromdifferent locations from the atria. The rate is approximately 80 beats per minute.
Figure 12.23: Wandering Pacemaker. The morphology of the P waves is variable because the escape impulsesoriginate from different locations in the atria and atrioventricular junction.
Figure 12.24: Wandering Atrial Pacemaker. Lead II rhythm strip showing P waves with varying morpholo-gies. The complexes originate from different foci in the atria and are late.
LWBK271-C12_148-166.qxd 29/1/09 9:04 pm Page 156 LWBK270-4119G-C02_073-110.qxd

Sinus Node Dysfunction 157
Figure 12.25: Accelerated Junctional Rhythm. Lead II rhythm strip showing accelerated AV junctionalrhythm, 73 bpm with retrograde P waves after the QRS complexes (arrows).
Figure 12.26: Accelerated Idioventricular Rhythm (AIVR). The ventricular rate is 70 bpm. The QRS com-plexes are wide measuring �0.12 seconds, consistent with AIVR. The QRS complexes have right bundle branchblock configuration and no P waves are present.
Figure 12.27: Accelerated Idioventricular Rhythm (AIVR) with Ventriculoatrial Conduction. Theventricular rate is 54 bpm with wide QRS complexes consistent with AIVR. The configuration of the QRS complexesis different when compared with that shown in Figure 12.26. In addition, there is ventriculoatrial conduction withretrograde P waves after the QRS complexes (arrows).
LWBK271-C12_148-166.qxd 29/1/09 9:04 pm Page 157 LWBK270-4119G-C02_073-110.qxd

158 Chapter 12
because the configuration of the QRS complexes variesdepending on the origin of the ectopic impulse.
Reversible Causes of Sinus Dysfunction
■ Extrinsic causes of sinus node dysfunction: Exam-ples of sinus node dysfunction not from sick sinus syn-drome are shown in Figs. 12.28 and 12.29.■ Hypersensitive carotid sinus: Extrinsic or re-
versible causes of sinus node dysfunction includeautonomic reflexes as well as the presence of hyper-sensitive carotid sinus. During carotid sinus stimu-lation, a long period of asystole can occur. In normalindividuals, the pause should not exceed 3 seconds.A pause of 3 seconds or more is abnormal and sug-
gests that a hypersensitive carotid sinus is present(Fig. 12.28).
■ Hyperkalemia: Hyperkalemia can also suppress sinus node function resulting in junctional escaperhythm as shown in Figure 12.29.
Common Mistakes in Sinus Node Dysfunction
■ Blocked premature atrial complex (PAC): One of themost common errors in the diagnosis of sinus node dys-function is the presence of blocked PACs. When a PAC isblocked, a pause follows because the atrial impulse is notconducted to the ventricles and is not followed by a QRScomplex (see Chapter 13, Premature Supraventricular
4 seconds
Figure 12.28: Hypersensitive Carotid Sinus. Sinus dysfunction is often due to vagalinfluences, including the presence of hypersensitive carotid sinus. When the carotid sinus isstimulated as shown, the pauses that follow generally do not last more than 3 secondsbecause they are normally terminated by escape complexes. Pauses of �3 seconds that oc-cur spontaneously or during carotid sinus stimulation are abnormal, as in this example, indi-cating the presence of hypersensitive carotid sinus without adequate escape complexes.
Figure 12.29: Hyperkalemia. In hyperkalemia, P waves may disappear because of sinus suppression ormarked slowing in the conduction of the sinus impulse in the atria. Impairment in sinus node function associatedwith hyperkalemia is reversible.
LWBK271-C12_148-166.qxd 29/1/09 9:04 pm Page 158 LWBK270-4119G-C02_073-110.qxd
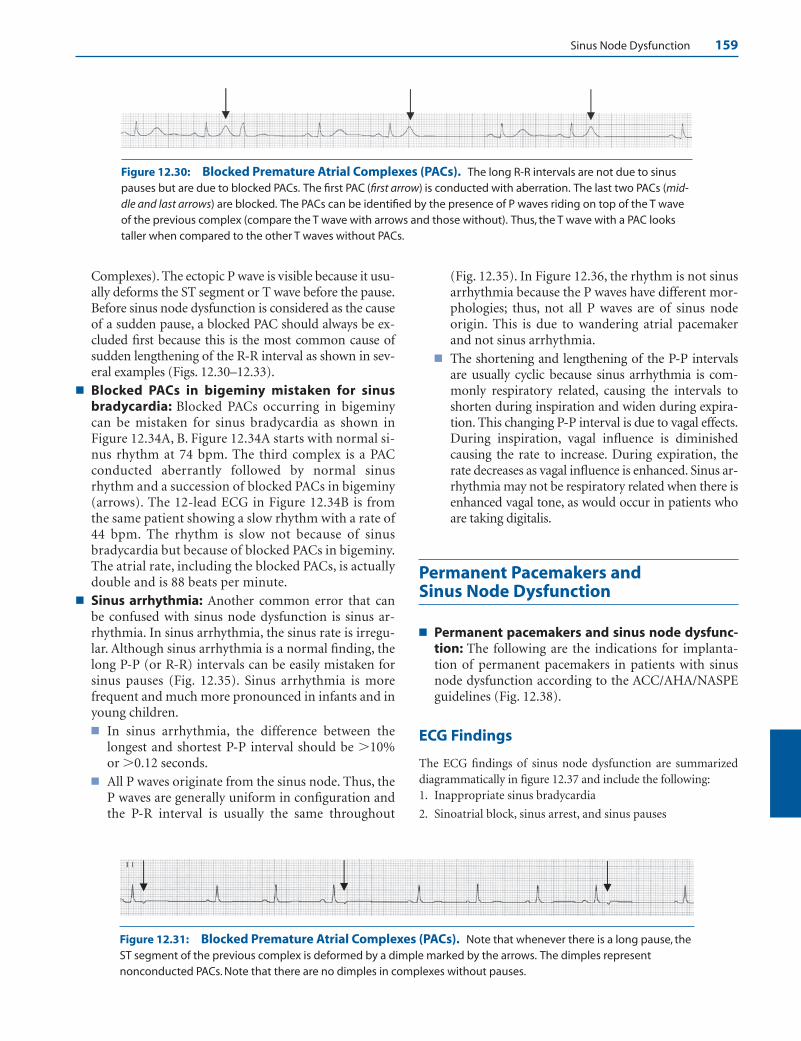
Sinus Node Dysfunction 159
Complexes). The ectopic P wave is visible because it usu-ally deforms the ST segment or T wave before the pause.Before sinus node dysfunction is considered as the causeof a sudden pause, a blocked PAC should always be ex-cluded first because this is the most common cause ofsudden lengthening of the R-R interval as shown in sev-eral examples (Figs. 12.30–12.33).
■ Blocked PACs in bigeminy mistaken for sinusbradycardia: Blocked PACs occurring in bigeminycan be mistaken for sinus bradycardia as shown inFigure 12.34A, B. Figure 12.34A starts with normal si-nus rhythm at 74 bpm. The third complex is a PACconducted aberrantly followed by normal sinusrhythm and a succession of blocked PACs in bigeminy(arrows). The 12-lead ECG in Figure 12.34B is fromthe same patient showing a slow rhythm with a rate of44 bpm. The rhythm is slow not because of sinusbradycardia but because of blocked PACs in bigeminy.The atrial rate, including the blocked PACs, is actuallydouble and is 88 beats per minute.
■ Sinus arrhythmia: Another common error that canbe confused with sinus node dysfunction is sinus ar-rhythmia. In sinus arrhythmia, the sinus rate is irregu-lar. Although sinus arrhythmia is a normal finding, thelong P-P (or R-R) intervals can be easily mistaken forsinus pauses (Fig. 12.35). Sinus arrhythmia is morefrequent and much more pronounced in infants and inyoung children.■ In sinus arrhythmia, the difference between the
longest and shortest P-P interval should be �10%or �0.12 seconds.
■ All P waves originate from the sinus node. Thus, theP waves are generally uniform in configuration andthe P-R interval is usually the same throughout
(Fig. 12.35). In Figure 12.36, the rhythm is not sinusarrhythmia because the P waves have different mor-phologies; thus, not all P waves are of sinus nodeorigin. This is due to wandering atrial pacemakerand not sinus arrhythmia.
■ The shortening and lengthening of the P-P intervalsare usually cyclic because sinus arrhythmia is com-monly respiratory related, causing the intervals toshorten during inspiration and widen during expira-tion. This changing P-P interval is due to vagal effects.During inspiration, vagal influence is diminishedcausing the rate to increase. During expiration, therate decreases as vagal influence is enhanced. Sinus ar-rhythmia may not be respiratory related when there isenhanced vagal tone, as would occur in patients whoare taking digitalis.
Permanent Pacemakers and Sinus Node Dysfunction
■ Permanent pacemakers and sinus node dysfunc-tion: The following are the indications for implanta-tion of permanent pacemakers in patients with sinusnode dysfunction according to the ACC/AHA/NASPEguidelines (Fig. 12.38).
ECG Findings
The ECG findings of sinus node dysfunction are summarizeddiagrammatically in figure 12.37 and include the following:1. Inappropriate sinus bradycardia
2. Sinoatrial block, sinus arrest, and sinus pauses
Figure 12.30: Blocked Premature Atrial Complexes (PACs). The long R-R intervals are not due to sinuspauses but are due to blocked PACs. The first PAC (first arrow) is conducted with aberration. The last two PACs (mid-dle and last arrows) are blocked. The PACs can be identified by the presence of P waves riding on top of the T waveof the previous complex (compare the T wave with arrows and those without). Thus, the T wave with a PAC lookstaller when compared to the other T waves without PACs.
Figure 12.31: Blocked Premature Atrial Complexes (PACs). Note that whenever there is a long pause, theST segment of the previous complex is deformed by a dimple marked by the arrows. The dimples representnonconducted PACs. Note that there are no dimples in complexes without pauses.
LWBK271-C12_148-166.qxd 29/1/09 9:04 pm Page 159 LWBK270-4119G-C02_073-110.qxd
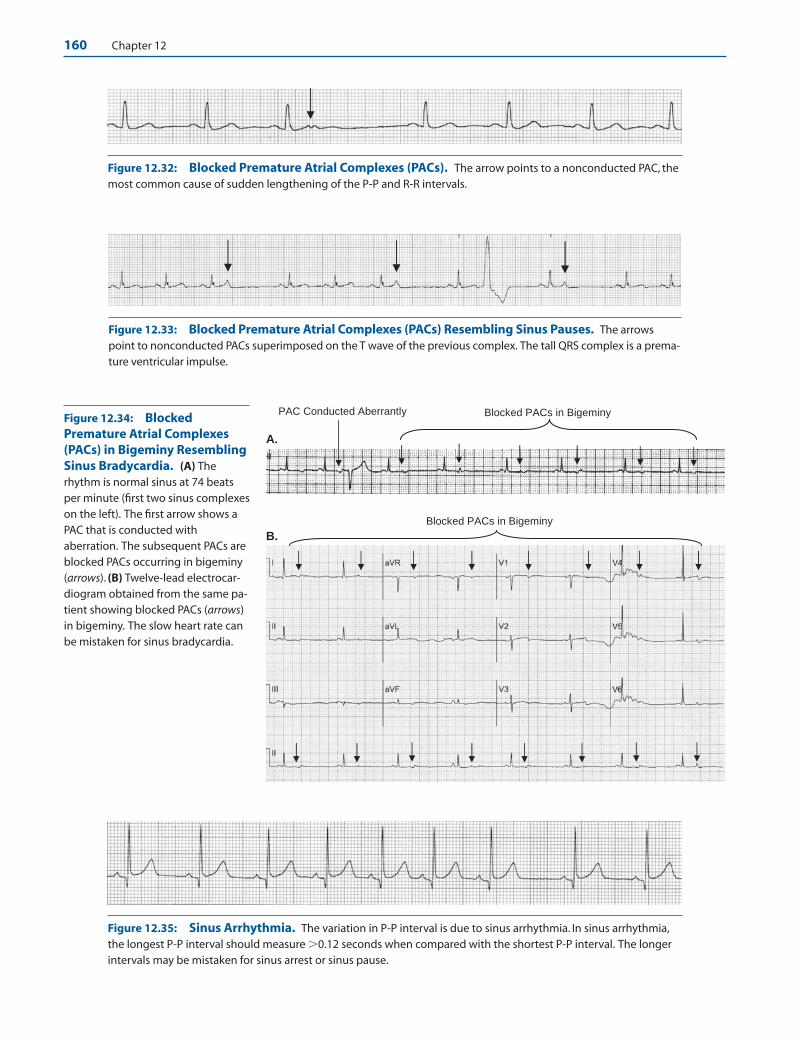
Figure 12.32: Blocked Premature Atrial Complexes (PACs). The arrow points to a nonconducted PAC, themost common cause of sudden lengthening of the P-P and R-R intervals.
Figure 12.33: Blocked Premature Atrial Complexes (PACs) Resembling Sinus Pauses. The arrowspoint to nonconducted PACs superimposed on the T wave of the previous complex. The tall QRS complex is a prema-ture ventricular impulse.
A.
B.
Blocked PACs in Bigeminy PAC Conducted Aberrantly
Blocked PACs in Bigeminy
Figure 12.34: BlockedPremature Atrial Complexes(PACs) in Bigeminy ResemblingSinus Bradycardia. (A) Therhythm is normal sinus at 74 beatsper minute (first two sinus complexeson the left). The first arrow shows aPAC that is conducted withaberration. The subsequent PACs areblocked PACs occurring in bigeminy(arrows). (B) Twelve-lead electrocar-diogram obtained from the same pa-tient showing blocked PACs (arrows)in bigeminy. The slow heart rate canbe mistaken for sinus bradycardia.
Figure 12.35: Sinus Arrhythmia. The variation in P-P interval is due to sinus arrhythmia. In sinus arrhythmia,the longest P-P interval should measure �0.12 seconds when compared with the shortest P-P interval. The longerintervals may be mistaken for sinus arrest or sinus pause.
160 Chapter 12
LWBK271-C12_148-166.qxd 29/1/09 9:04 pm Page 160 LWBK270-4119G-C02_073-110.qxd

Sinus Node Dysfunction 161
Figure 12.36: This is not Sinus Arrhythmia. The rhythm strip shows irregular R-R intervals; however, the P waves (arrows) are not the same throughout because some are ectopic in origin. The rhythm is wandering atrialpacemaker. In sinus arrhythmia, all P waves should originate from the sinus node and should have the same config-uration throughout.
Summary of ECG Findings in Sick Sinus Syndrome
Chronic Atrial Fibrillation with Slow Ventricular Rate
7
Tachycardia-Bradycardia Syndrome
6
Junctional Escape Rhythm due to Complete SA Block or Sinus Arrest
5
Sinus Arrest or Sinus Pause
4
Sinus Arrest
3
Sino-Atrial Exit Block
2
Inappropriate Sinus Bradycardia
1
Figure 12.37: Diagrammatic Representa-tion of the Different ArrhythmiasAssociated with Sick Sinus Syndrome. Thearrows point to sinus P waves and the red heartsrepresent sinus impulses that are blocked.
3. Tachycardia-bradycardia syndrome
4. Chronic atrial fibrillation
5. Escape rhythms from the atria, AV junction, or ventricles
Mechanism
■ The sinus node is the pacemaker of the heart and is the ori-gin of the sinus impulse. Because the electrical impulse fromthe sinus node is not of sufficient magnitude, it does notcause any deflection in the surface ECG. The sinus impulse is
recognized only when it has spread to the atria and is in-scribed as a P wave in the ECG. The anatomy and electro-physiology of the sinus node and normal sinus rhythm hasalready been discussed elsewhere (see Chapter 1, BasicAnatomy and Electrophysiology).
■ When the sinus node fails to function as the pacemaker ofthe heart, supraventricular or ventricular escape impulsesusually come to the rescue. If there are no escape impulses,the ultimate expression of total sinus failure is complete ab-sence of P waves in the ECG, which is represented by a long
LWBK271-C12_148-166.qxd 29/1/09 9:04 pm Page 161 LWBK270-4119G-C02_073-110.qxd
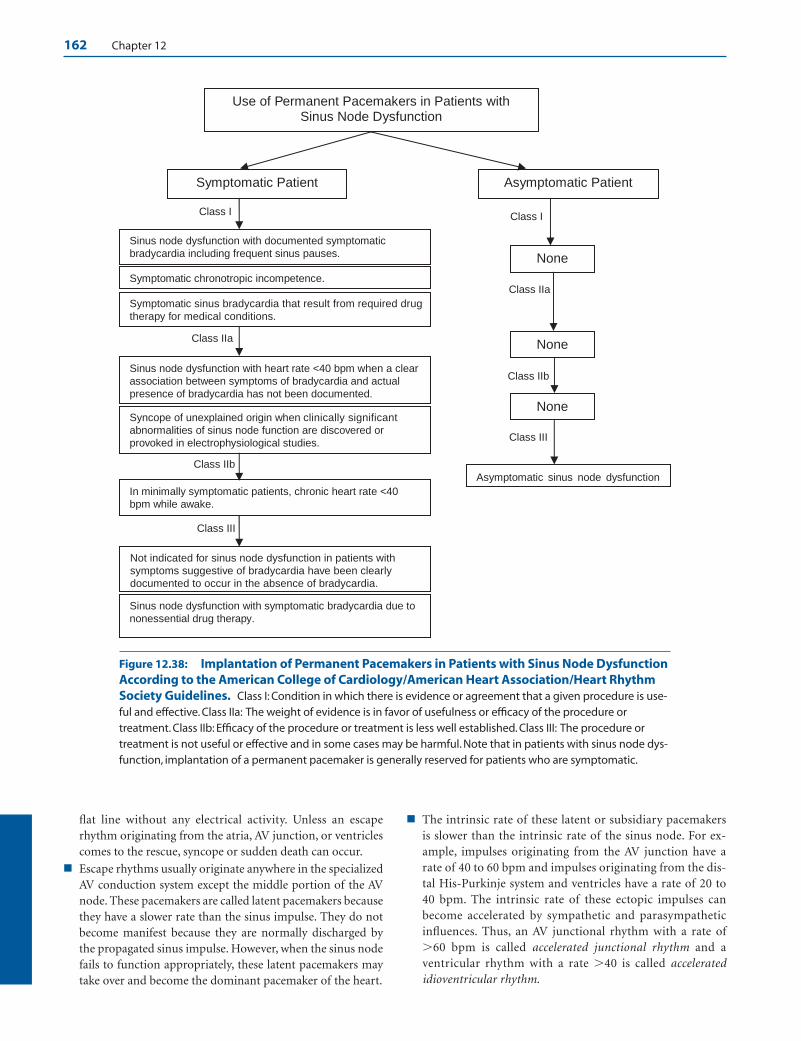
162 Chapter 12
flat line without any electrical activity. Unless an escaperhythm originating from the atria, AV junction, or ventriclescomes to the rescue, syncope or sudden death can occur.
■ Escape rhythms usually originate anywhere in the specializedAV conduction system except the middle portion of the AVnode. These pacemakers are called latent pacemakers becausethey have a slower rate than the sinus impulse. They do notbecome manifest because they are normally discharged bythe propagated sinus impulse. However, when the sinus nodefails to function appropriately, these latent pacemakers maytake over and become the dominant pacemaker of the heart.
■ The intrinsic rate of these latent or subsidiary pacemakersis slower than the intrinsic rate of the sinus node. For ex-ample, impulses originating from the AV junction have arate of 40 to 60 bpm and impulses originating from the dis-tal His-Purkinje system and ventricles have a rate of 20 to40 bpm. The intrinsic rate of these ectopic impulses canbecome accelerated by sympathetic and parasympatheticinfluences. Thus, an AV junctional rhythm with a rate of�60 bpm is called accelerated junctional rhythm and aventricular rhythm with a rate �40 is called acceleratedidioventricular rhythm.
Use of Permanent Pacemakers in Patients with Sinus Node Dysfunction
Symptomatic Patient Asymptomatic Patient
Class I
Sinus node dysfunction with documented symptomatic bradycardia including frequent sinus pauses.
Class I
None
Asymptomatic sinus node dysfunction
Class IIa
Symptomatic sinus bradycardia that result from required drugtherapy for medical conditions.
Symptomatic chronotropic incompetence.
Sinus node dysfunction with heart rate <40 bpm when a clearassociation between symptoms of bradycardia and actualpresence of bradycardia has not been documented.
Class IIa
Syncope of unexplained origin when clinically significantabnormalities of sinus node function are discovered orprovoked in electrophysiological studies.
Class IIb
In minimally symptomatic patients, chronic heart rate <40 bpm while awake.
Class III
Not indicated for sinus node dysfunction in patients withsymptoms suggestive of bradycardia have been clearlydocumented to occur in the absence of bradycardia.
Sinus node dysfunction with symptomatic bradycardia due to nonessential drug therapy.
None
Class IIb
None
Class III
Figure 12.38: Implantation of Permanent Pacemakers in Patients with Sinus Node DysfunctionAccording to the American College of Cardiology/American Heart Association/Heart RhythmSociety Guidelines. Class I: Condition in which there is evidence or agreement that a given procedure is use-ful and effective. Class IIa: The weight of evidence is in favor of usefulness or efficacy of the procedure ortreatment. Class IIb: Efficacy of the procedure or treatment is less well established. Class III: The procedure ortreatment is not useful or effective and in some cases may be harmful. Note that in patients with sinus node dys-function, implantation of a permanent pacemaker is generally reserved for patients who are symptomatic.
LWBK271-C12_148-166.qxd 29/1/09 9:04 pm Page 162 LWBK270-4119G-C02_073-110.qxd
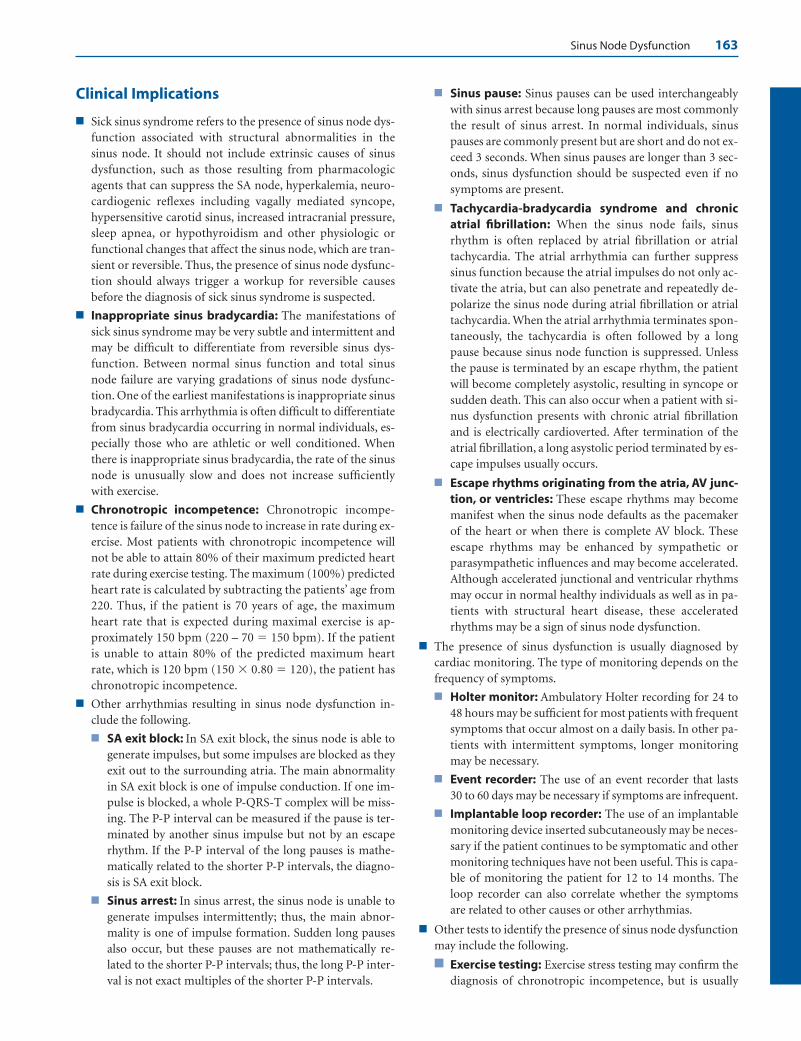
Sinus Node Dysfunction 163
Clinical Implications
■ Sick sinus syndrome refers to the presence of sinus node dys-function associated with structural abnormalities in the sinus node. It should not include extrinsic causes of sinusdysfunction, such as those resulting from pharmacologicagents that can suppress the SA node, hyperkalemia, neuro-cardiogenic reflexes including vagally mediated syncope,hypersensitive carotid sinus, increased intracranial pressure,sleep apnea, or hypothyroidism and other physiologic orfunctional changes that affect the sinus node, which are tran-sient or reversible. Thus, the presence of sinus node dysfunc-tion should always trigger a workup for reversible causes before the diagnosis of sick sinus syndrome is suspected.
■ Inappropriate sinus bradycardia: The manifestations ofsick sinus syndrome may be very subtle and intermittent andmay be difficult to differentiate from reversible sinus dys-function. Between normal sinus function and total sinusnode failure are varying gradations of sinus node dysfunc-tion. One of the earliest manifestations is inappropriate sinusbradycardia. This arrhythmia is often difficult to differentiatefrom sinus bradycardia occurring in normal individuals, es-pecially those who are athletic or well conditioned. Whenthere is inappropriate sinus bradycardia, the rate of the sinusnode is unusually slow and does not increase sufficientlywith exercise.
■ Chronotropic incompetence: Chronotropic incompe-tence is failure of the sinus node to increase in rate during ex-ercise. Most patients with chronotropic incompetence willnot be able to attain 80% of their maximum predicted heartrate during exercise testing. The maximum (100%) predictedheart rate is calculated by subtracting the patients’ age from220. Thus, if the patient is 70 years of age, the maximumheart rate that is expected during maximal exercise is ap-proximately 150 bpm (220 – 70 � 150 bpm). If the patientis unable to attain 80% of the predicted maximum heartrate, which is 120 bpm (150 � 0.80 � 120), the patient haschronotropic incompetence.
■ Other arrhythmias resulting in sinus node dysfunction in-clude the following.
■ SA exit block: In SA exit block, the sinus node is able togenerate impulses, but some impulses are blocked as theyexit out to the surrounding atria. The main abnormalityin SA exit block is one of impulse conduction. If one im-pulse is blocked, a whole P-QRS-T complex will be miss-ing. The P-P interval can be measured if the pause is ter-minated by another sinus impulse but not by an escaperhythm. If the P-P interval of the long pauses is mathe-matically related to the shorter P-P intervals, the diagno-sis is SA exit block.
■ Sinus arrest: In sinus arrest, the sinus node is unable togenerate impulses intermittently; thus, the main abnor-mality is one of impulse formation. Sudden long pausesalso occur, but these pauses are not mathematically re-lated to the shorter P-P intervals; thus, the long P-P inter-val is not exact multiples of the shorter P-P intervals.
■ Sinus pause: Sinus pauses can be used interchangeablywith sinus arrest because long pauses are most commonlythe result of sinus arrest. In normal individuals, sinuspauses are commonly present but are short and do not ex-ceed 3 seconds. When sinus pauses are longer than 3 sec-onds, sinus dysfunction should be suspected even if nosymptoms are present.
■ Tachycardia-bradycardia syndrome and chronicatrial fibrillation: When the sinus node fails, sinusrhythm is often replaced by atrial fibrillation or atrialtachycardia. The atrial arrhythmia can further suppresssinus function because the atrial impulses do not only ac-tivate the atria, but can also penetrate and repeatedly de-polarize the sinus node during atrial fibrillation or atrialtachycardia. When the atrial arrhythmia terminates spon-taneously, the tachycardia is often followed by a longpause because sinus node function is suppressed. Unlessthe pause is terminated by an escape rhythm, the patientwill become completely asystolic, resulting in syncope orsudden death. This can also occur when a patient with si-nus dysfunction presents with chronic atrial fibrillationand is electrically cardioverted. After termination of theatrial fibrillation, a long asystolic period terminated by es-cape impulses usually occurs.
■ Escape rhythms originating from the atria, AV junc-tion, or ventricles: These escape rhythms may becomemanifest when the sinus node defaults as the pacemakerof the heart or when there is complete AV block. These escape rhythms may be enhanced by sympathetic orparasympathetic influences and may become accelerated.Although accelerated junctional and ventricular rhythmsmay occur in normal healthy individuals as well as in pa-tients with structural heart disease, these acceleratedrhythms may be a sign of sinus node dysfunction.
■ The presence of sinus dysfunction is usually diagnosed bycardiac monitoring. The type of monitoring depends on thefrequency of symptoms.
■ Holter monitor: Ambulatory Holter recording for 24 to48 hours may be sufficient for most patients with frequentsymptoms that occur almost on a daily basis. In other pa-tients with intermittent symptoms, longer monitoringmay be necessary.
■ Event recorder: The use of an event recorder that lasts 30 to 60 days may be necessary if symptoms are infrequent.
■ Implantable loop recorder: The use of an implantablemonitoring device inserted subcutaneously may be neces-sary if the patient continues to be symptomatic and othermonitoring techniques have not been useful. This is capa-ble of monitoring the patient for 12 to 14 months. Theloop recorder can also correlate whether the symptomsare related to other causes or other arrhythmias.
■ Other tests to identify the presence of sinus node dysfunctionmay include the following.
■ Exercise testing: Exercise stress testing may confirm thediagnosis of chronotropic incompetence, but is usually
LWBK271-C12_148-166.qxd 29/1/09 9:04 pm Page 163 LWBK270-4119G-C02_073-110.qxd

164 Chapter 12
not useful in the diagnosis of other arrhythmias resultingfrom sinus node dysfunction.
■ Electrophysiologic testing: This is an invasive test inwhich electrodes are introduced transvenously into theheart. Sinus node function is evaluated by measuring si-nus node recovery time. This is performed by rapid atrialpacing resulting in overdrive suppression of the sinusnode. When atrial pacing is abruptly discontinued, sinoa-trial recovery time is measured from the last paced beat tothe next spontaneously occurring sinus impulse, which isprolonged when there is sick sinus syndrome. The sensi-tivity of electrophysiologic testing in the diagnosis ofbradyarrhythmias is generally low and is not routinelyrecommended. This is more commonly used to excludeventricular arrhythmias in patients with coronary disease,especially when there is history of syncope.
■ Sick sinus syndrome may be due to ischemia, inflammation,infection including Lyme disease, rheumatic heart disease,pericarditis, collagen disease, muscular dystrophy, infiltrativediseases such as amyloid, sarcoid, hemochromatosis, hy-pothyroidism, and vascular diseases due to ischemia or my-ocardial infarction. It also includes sclerosis and other degen-erative changes that involve not only the sinus node but thewhole AV conduction system.
■ Sick sinus syndrome may manifest abruptly with frank syn-cope or sudden death. It can also occur more insidiously andmay remain asymptomatic for several years before it be-comes fully manifests. Thus, it may be difficult to differenti-ate sick sinus syndrome from reversible causes of sinus nodedysfunction.
■ Among the more common conditions that can be mistakenfor sinus node dysfunction are blocked PACs and sinusarrhythmia.
■ Blocked PACs: When a premature atrial complex or PACoccurs too prematurely, before the AV node or the rest ofthe conduction system has fully recovered from the previ-ous impulse, the PAC can be blocked at the AV node re-sulting in premature ectopic P wave that is not followedby a QRS complex. This is usually identified by the pres-ence of nonconducted P wave superimposed on the Twave of the previous complex. Nonconducted PACs andnot sinus pauses are the most common causes of suddenlengthening of the P-P or R-R intervals. NonconductedPACs should be recognized because they are benign anddo not have the same prognosis as patients with sinusnode dysfunction. The pause caused by the noncon-ducted PAC is not an indication for pacemaker therapy.
■ Sinus arrhythmia: Sinus arrhythmia is present when thedifference between the shortest and longest P-P interval is�10% or 0.12 seconds (120 milliseconds). Sinus arrhyth-mia is a normal finding; however, the irregularity in theheart rate can be mistaken for sinus pauses, especiallywhen there is marked variability in the R-R (or P-P) in-tervals. The pause resulting from sinus arrhythmia is notan indication for pacemaker therapy.
n Respiratory sinus arrhythmia: Sinus arrhythmia isusually cyclic because it is respiratory related, result-ing in increase in sinus rate with inspiration and de-crease in rate with expiration. This has been ascribedto reduction of vagal inhibition during inspiration, re-sulting in shortening of the P-P and R-R intervals. Themarked variability in the sinus rate is more pro-nounced in infants and young children.
n Nonrespiratory: Sinus arrhythmia may be nonrespi-ratory related as would occur with digitalis therapy.
n Absence of sinus arrhythmia: Absence of heart ratevariability is more common in the elderly and in pa-tients with diabetic neuropathy, which increases therisk of cardiovascular events. Thus, absence of sinusrate variability is often used as a marker for increasedrisk of sudden cardiovascular death similar to patientswith low ejection fraction or nonsustained ventriculararrhythmias after acute myocardial infarction or inpatients with cardiomyopathy and poor left ventricu-lar systolic function.
■ Hypersensitive carotid sinus syndrome: Hypersensitivecarotid sinus syndrome should always be excluded in a pa-tient with history of syncope who is suspected to have sinusnode dysfunction as the cause of the syncope. The symptomsare often precipitated by head turning. The diagnosis of hy-persensitive carotid sinus can be confirmed by carotid sinuspressure while a rhythm strip is being recorded (see tech-nique of performing carotid sinus pressure in Chapter 16,Supraventricular Tachycardia due to Reentry). A pause thatexceeds 3 seconds during carotid stimulation is consideredabnormal.
Treatment
■ The presence of sinus dysfunction does not always indicatesick sinus syndrome. Extrinsic causes of sinus dysfunctionare often reversible and should always be excluded. If sinusdysfunction is due to extrinsic causes such as hypothy-roidism or sleep apnea, treatment of the hypothyroid state orthe sleep apnea may not only prevent or delay progression ofsinus node dysfunction, but may be able to reverse theprocess. Medications that can cause slowing of sinus rhythmsuch as beta blockers, non-dihydropyridine calcium channelblockers, rauwolfia alkaloids, digitalis, and antiarrhythmicand antipsychotic agents should be eliminated. Thus, treat-ment should be directed to the underlying condition, whichis often successful in reversing the arrhythmia.
■ In patients with sinus bradycardia, sinus pauses, or supraven-tricular and ventricular rhythms with rates �50 bpm whoremain asymptomatic, no therapy is indicated other than toidentify and correct the cause of the bradycardia. Althoughsinus pauses of 3 or more seconds is considered pathologic, itdoes not necessarily imply that a permanent pacemakershould be implanted if the patient is completely asympto-matic.
LWBK271-C12_148-166.qxd 29/1/09 9:04 pm Page 164 LWBK270-4119G-C02_073-110.qxd

Sinus Node Dysfunction 165
■ When prolonged asystole occurs during cardiac monitoringand the patient is still conscious, forceful coughing should beinstituted immediately. Forceful coughing is commonly usedto terminate bradyarrhythmias in patients undergoing coro-nary angiography but is seldom tried in other clinical settings.Because it needs the cooperation of a conscious patient, itshould be tried as early as possible. Cough may be able tomaintain the level of consciousness for 90 seconds and canserve as a self-administered cardiopulmonary resuscitation.
■ When there is symptomatic bradyarrhythmia because ofsinus dysfunction, atropine is the initial drug of choice.Atropine is given intravenously with an initial dose of 0.5 mg.The dose can be repeated every 3 to 5 minutes until a totaldose of 0.04 mg/kg or approximately 3 mg is given within 2 to 3 hours. This dose will result in full vagal blockade. If thebradycardia remains persistent in spite of atropine, transcu-taneous pacing should be instituted. If a transcutaneouspacemaker is not effective, is not tolerable, or is not available,sympathetic agents such as epinephrine, dopamine, isopro-terenol, or dobutamine may be given until a temporarytransvenous pacemaker can be inserted. The treatment ofsymptomatic bradycardia is discussed in more detail inChapter 8, Atrioventricular Block.
■ The use of permanent pacemakers is the only effective treat-ment available but is usually reserved for symptomatic pa-tients with sick sinus syndrome. The symptoms should be re-lated to the sinus node dysfunction before a permanentpacemaker is inserted. In patients with the tachycardia-bradycardia syndrome, insertion of a permanent pacemakeris the only therapy that is appropriate, because there is gener-ally no effective therapy for bradycardia. Furthermore, phar-macologic treatment to control tachycardia or to control theventricular rate in atrial fibrillation will result in further de-pression of the sinus node, in turn resulting in more pro-nounced bradycardia when the patient converts to normal si-nus rhythm. The indications for insertion of permanentpacemakers in patients with sinus node dysfunction accord-ing to the ACC/AHA/HRS guidelines on permanent pace-makers are summarized in Figure 12.38.
■ Sick sinus syndrome from idiopathic degenerative disease isusually progressive and may involve not only the sinus node,but also the whole conduction system. Thus, atrial pacingcombined with ventricular pacing should be considered inthese patients. When AV conduction is intact, a single-channelAAI pacemaker may be sufficient. Dual-chamber programma-ble pacemaker with automatic mode switching from AAI toDDD may be more appropriate in anticipation of AV block oratrial fibrillation that often develops in patients with sick sinussyndrome (see Chapter 26, The ECG of Cardiac Pacemakers).
■ The use of dual-chamber pacemakers compared with single-chamber VVI devices may diminish the incidence of atrialfibrillation in patients with sick sinus syndrome. Modeswitching pacemaker, capable of automatically switchingfrom DDD to VVI, may be advantageous in patients with in-termittent atrial fibrillation.
■ Anticoagulation should be given to patients with chronicatrial fibrillation to prevent thromboembolism. This is oneof the common causes of death in patients with sick sinussyndrome manifesting with chronic atrial fibrillation (seeChapter 19, Atrial Fibrillation).
■ In patients with sinus node dysfunction who are completelyasymptomatic, there are no clear-cut indications for insertionof a permanent pacemaker according to the ACC/AHA/HRSguidelines.
■ Although there is no effective chronic oral therapy for brady-cardia associated with sick sinus syndrome, some patientswith sinus pauses �2.5 seconds who are symptomatic but re-fuse permanent pacemaker insertion, slow-release theo-phylline, 200 to 400 mg daily given in two divided doses, maybe tried. This is based on the observation that sick sinus syn-drome is associated with increased sensitivity to adenosine.Thus, theophylline, which is the antidote to adenosine, maybe able to reverse the bradycardia resulting from sinuspauses. Hydralazine in small doses of 15 to 100 mg daily individed doses has also been tried with varying results.
Prognosis
■ When sinus dysfunction is due to isolated degenerative dis-ease of the conduction system, the prognosis in these pa-tients with sick sinus syndrome who receive permanent pace-makers is good and is similar to patients in the same agegroup without sick sinus syndrome.
■ The prognosis of other patients depends on the underlyingdisease causing the sick sinus syndrome.
Suggested Readings
2005 American Heart Association guidelines for cardiopul-monary resuscitation and emergency cardiovascular care:Part 7.3, Management of symptomatic bradycardia andtachycardia. Circulation. 2005;112:67–77.
Belic N, Talano JV. Current concepts in sick sinus syndrome II.ECG manifestation and diagnostic and therapeutic ap-proaches. Arch Intern Med. 1985;145:722–726.
Blaufuss AH, Brown DC, Jackson B, et al. Does coughing pro-duce cardiac output during cardiac arrest? [abstract] Circu-lation. 1978;55–56 (Suppl III):III-68.
Buxton AE, Calkins H, Callans DJ, et al. ACC/AHA/HRS 2006key data elements and definitions for electrophysiology stud-ies and procedures: a report of the American College ofCardiology/American Heart Association Task Force on Clin-ical Data Standards (ACC/AHA/HRS Writing Committee toDevelop Data Standards on Electrophysiology. J Am CollCardiol. 2006;48:2360–2396.
Criley JM, Blaufuss AH, Kissel GL. Cough-induced cardiaccompression. JAMA. 1976;236:1246–1250.
Ferrer MI. The Sick Sinus Syndrome. Mount Kisco, NY: FuturaPublishing Company; 1974:7–122.
LWBK271-C12_148-166.qxd 29/1/09 9:04 pm Page 165 LWBK270-4119G-C02_073-110.qxd
166 Chapter 12
Epstein AE, DiMarco JP, Ellenbogen KA, et al. ACC/AHA/HRS2008 guidelines for device-based therapy of cardiac rhythmabnormalities: a Report of the American College of Cardiology/American Heart Association Task Force on Practice Guide-lines (Writing Committee to Revise the ACC/AHA/NASPE2002 Guideline Update for Implantation of Cardiac Pace-makers and Antiarrhythmia Devices). Circulation. 2008;117:e350–e408.
Lamas GA, Lee KL, Sweeney MO, et al. Ventricular pacing ordual-chamber pacing for sinus-node dysfunction. N Engl JMed. 2002;346:1854–1862.
Mangrum JM, DiMarco JP. The evaluation and management ofbradycardia. N Engl J Med. 2000;342:703–709.
Olgin JE, Zipes DP. Specific arrhythmias: diagnosis and treat-ment. In: Libby P, Bonow RO, Mann DL, et al. eds. Braun-wald’s Heart Disease, A Textbook of Cardiovascular Medicine.7th ed. Philadelphia: Elsevier Saunders; 2005:803–810.
Saito D, Matsubara K, Yamanari H, et al. Effects of oral theo-phylline on sick sinus syndrome. J Am Coll Cardiol. 1993;21:1199–1204.
Strickberger SA, Benson W, Biaggioni I, et al. AHA/ACCF scien-tific statement on the evaluation of syncope. J Am Coll Car-diol. 2006;47:473–484.
Vijayaraman P, Ellenbogen KA. Bradyarrhythmias and pace-makers. In: Fuster V, Alexander RW, O’Rourke RA, eds.Hurst’s The Heart. 11th ed. New York: McGraw-Hill MedicalPublishing Division; 2004:893–907.
Weiss AT, Rod JL, Lewis BS. Hydralazine in the management ofsymptomatic sinus bradycardia. Eur J Cardiol. 1981;12:261.
Wolbrette DL, Naccarelli GV. Bradycardias: sinus nodal dys-function and atrioventricular conduction disturbances.In: Topol EJ, ed. Textbook of Cardiovascular Medicine. 2nd ed. Philadelphia: Lippincott Williams and Wilkins; 2002:1385–1402.
LWBK271-C12_148-166.qxd 29/1/09 9:04 pm Page 166 LWBK270-4119G-C02_073-110.qxd

Premature Atrial Complex
■ Ectopic impulse: Any impulse that does not originatefrom the sinus node is an ectopic impulse. The ectopicimpulse may be supraventricular or ventricular in origin.■ Supraventricular impulse: The impulse is supra-
ventricular if it originates from the atria or atri-oventricular (AV) junction or anywhere above thebifurcation of the bundle of His (Fig. 13.1).Supraventricular impulses have narrow QRS com-plexes because they follow the normal AV conductionsystem and activate both ventricles synchronously.
■ Ventricular impulse: The impulse is ventricular ifit originates in the ventricles or anywhere below thebifurcation of the bundle of His. The ventricularimpulse has wide QRS complex because the impulsedoes not follow the normal AV conduction system.It activates the ventricles sequentially by spreadingfrom one ventricle to the other by muscle cell to muscle cell conduction. Ventricular complexeswill be further discussed in Chapter 21, Ventricular Arrhythmias.
■ Supraventricular complexes may be premature or theymay be late.■ Premature supraventricular complex: The
supraventricular complex is premature if it occurs
earlier than the next expected normal sinus impulse(Fig. 13.2A). The premature supraventricular im-pulse may originate from the atria or AV junction.n Premature atrial complex: An early impulse
originating from the atria is called a prematureatrial complex (PAC).
n Premature junctional complex: An early im-pulse originating from the AV junction is called apremature junctional complex (PJC).
■ Late or escape supraventricular complex: Thesupraventricular impulse is late if it occurs laterthan the next expected normal sinus impulse (Fig.13.2B). Similar to premature complexes, late com-plexes may originate from the atria or AV junction.Late impulses are also called escape complexes. Lateor escape complexes were previously discussed inChapter 12, Sinus Node Dysfunction.
■ Premature atrial complex: A PAC is easy to recog-nize because the impulse is premature and is followedby a pause.■ Typical presentation: The typical presentation of
a PAC is shown in Figure 13.2A. Because the PACoriginates from the atria, the atria are always acti-vated earlier than the ventricles; thus, the P wave al-ways precedes the QRS complex. The P wave is notonly premature, but also looks different in size andshape compared with a normal sinus P wave. The
13Premature Supraventricular
Complexes
167
Atria Atrial
VentricularImpulses
Junctional
Ventricles
Supraventricular Impulses
Bifurcation of the Bundle of His
AV node
Sinus node Figure 13.1: Ectopic Impulses.Ectopic impulses may be supraventricularor ventricular in origin. Supraventricularimpulses originate anywhere above thebifurcation of the bundle of His and couldbe atrial or atrioventricular junctional.Ventricular impulses originate from theventricles or anywhere below the bifurca-tion of the bundle of His. The stars repre-sent the origin of the ectopic impulses.
LWBK271-C13_167-179.qxd 29/1/09 9:52 pm Page 167 LWBK270-4119G-C02_073-110.qxd

168 Chapter 13
QRS complex is typically narrow similar to a nor-mally conducted sinus impulse (Fig. 13.2A).
■ Other presentations:n Blocked or nonconducted PAC: The PAC may
be completely blocked, meaning that the atrialimpulse may not be conducted to the ventricles.
n PAC conducted with prolonged PR interval:The PAC may be conducted to the ventricles witha prolonged PR interval.
n PAC conducted with aberration: The PAC maybe conducted to the ventricles with a wide QRScomplex and mistaken for PVC.
■ Blocked PAC: A premature atrial impulse may not beconducted to the ventricles because of a refractory AVnode or His-Purkinje system. This usually occurs when
the PAC is too premature and the AV node or His-Purkinje system has not fully recovered from the previ-ous impulse. This is seen as a premature P wave with-out a QRS complex (Fig. 13.3). The P wave may bedifficult to recognize if it is hidden in the T wave of theprevious complex or the P wave is flat or isoelectric andis not visible in the lead used for recording.
■ PAC with prolonged PR interval: Instead of the pre-mature P wave being completely blocked without aQRS complex, the atrial impulse may be delayed at theAV node resulting in a prolonged PR interval measur-ing �0.20 seconds (Fig. 13.4).
■ PAC conducted with aberration: The prematureatrial impulse may be conducted normally across theAV node and bundle of His, but may find one of the
Atria
Ventricles
Premature atrial complex
Late or escape atrial complex
A
B
Figure 13.2: Premature and Late Atrial Complexes. The diagram on the leftshows an impulse originating from the atria (star). This ectopic impulse may be pre-mature or late. A premature atrial impulse is shown in rhythm strip A. The atrialimpulse occurs earlier than the next normal sinus impulse.The premature P wave isrecognized as a notch superimposed on the down slope of the T wave of the previouscomplex (arrow). This premature impulse is followed by a narrow QRS complex.Thelower rhythm strip B shows a late atrial complex (arrow). The atrial complex occurslater than the next expected sinus impulse with a P wave configuration that is differ-ent from the sinus P waves. This late impulse is also called an escape atrial complex.
Figure 13.3: Blocked PAC. The arrow points to a premature P wave without a QRS complex. This is an example ofa blocked or nonconducted PAC. The premature P wave can not conduct across the AV node because the AV node isstill refractory from the previous impulse. The premature P wave may not be apparent because it is hidden by the T wave of the previous complex, thus the pause following the PAC may be mistaken for sinus arrest or sinoatrial block.
LWBK271-C13_167-179.qxd 29/1/09 9:52 pm Page 168 LWBK270-4119G-C02_073-110.qxd
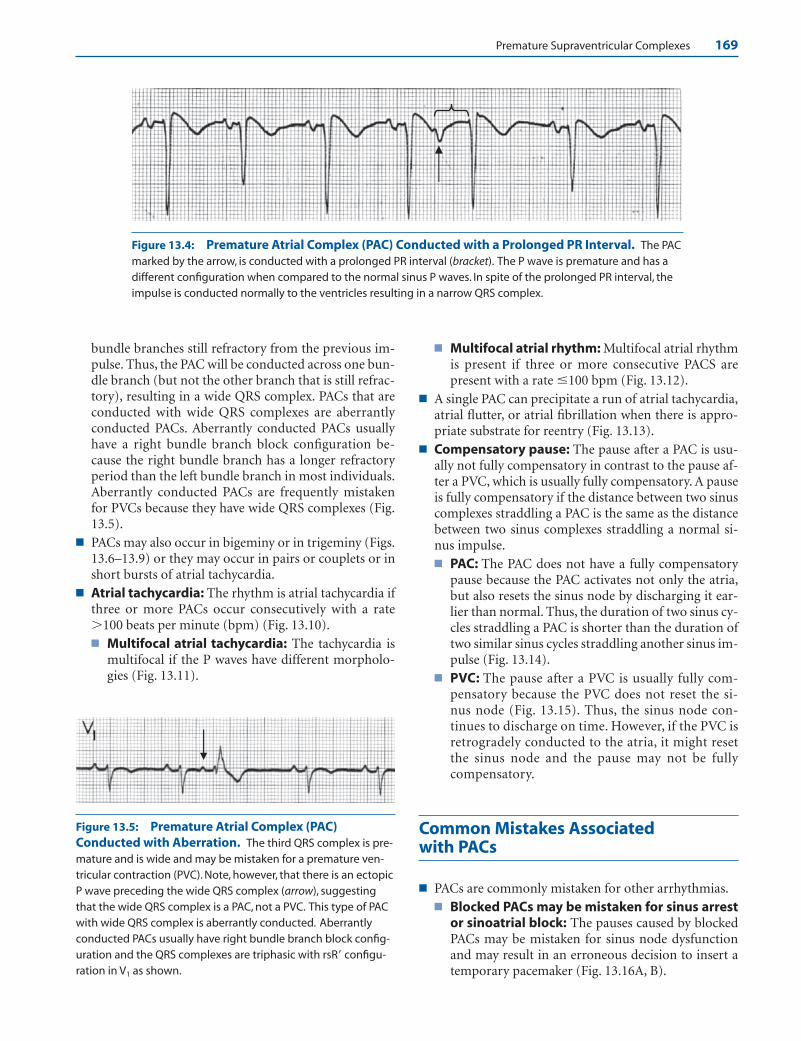
Premature Supraventricular Complexes 169
bundle branches still refractory from the previous im-pulse. Thus, the PAC will be conducted across one bun-dle branch (but not the other branch that is still refrac-tory), resulting in a wide QRS complex. PACs that areconducted with wide QRS complexes are aberrantlyconducted PACs. Aberrantly conducted PACs usuallyhave a right bundle branch block configuration be-cause the right bundle branch has a longer refractoryperiod than the left bundle branch in most individuals.Aberrantly conducted PACs are frequently mistakenfor PVCs because they have wide QRS complexes (Fig.13.5).
■ PACs may also occur in bigeminy or in trigeminy (Figs.13.6–13.9) or they may occur in pairs or couplets or inshort bursts of atrial tachycardia.
■ Atrial tachycardia: The rhythm is atrial tachycardia ifthree or more PACs occur consecutively with a rate�100 beats per minute (bpm) (Fig. 13.10).■ Multifocal atrial tachycardia: The tachycardia is
multifocal if the P waves have different morpholo-gies (Fig. 13.11).
■ Multifocal atrial rhythm: Multifocal atrial rhythmis present if three or more consecutive PACS arepresent with a rate �100 bpm (Fig. 13.12).
■ A single PAC can precipitate a run of atrial tachycardia,atrial flutter, or atrial fibrillation when there is appro-priate substrate for reentry (Fig. 13.13).
■ Compensatory pause: The pause after a PAC is usu-ally not fully compensatory in contrast to the pause af-ter a PVC, which is usually fully compensatory. A pauseis fully compensatory if the distance between two sinuscomplexes straddling a PAC is the same as the distancebetween two sinus complexes straddling a normal si-nus impulse.■ PAC: The PAC does not have a fully compensatory
pause because the PAC activates not only the atria,but also resets the sinus node by discharging it ear-lier than normal. Thus, the duration of two sinus cy-cles straddling a PAC is shorter than the duration oftwo similar sinus cycles straddling another sinus im-pulse (Fig. 13.14).
■ PVC: The pause after a PVC is usually fully com-pensatory because the PVC does not reset the si-nus node (Fig. 13.15). Thus, the sinus node con-tinues to discharge on time. However, if the PVC isretrogradely conducted to the atria, it might resetthe sinus node and the pause may not be fullycompensatory.
Common Mistakes Associated with PACs
■ PACs are commonly mistaken for other arrhythmias.■ Blocked PACs may be mistaken for sinus arrest
or sinoatrial block: The pauses caused by blockedPACs may be mistaken for sinus node dysfunctionand may result in an erroneous decision to insert atemporary pacemaker (Fig. 13.16A, B).
Figure 13.5: Premature Atrial Complex (PAC)Conducted with Aberration. The third QRS complex is pre-mature and is wide and may be mistaken for a premature ven-tricular contraction (PVC). Note, however, that there is an ectopicP wave preceding the wide QRS complex (arrow), suggestingthat the wide QRS complex is a PAC, not a PVC. This type of PACwith wide QRS complex is aberrantly conducted. Aberrantlyconducted PACs usually have right bundle branch block config-uration and the QRS complexes are triphasic with rsR� configu-ration in V1 as shown.
Figure 13.4: Premature Atrial Complex (PAC) Conducted with a Prolonged PR Interval. The PACmarked by the arrow, is conducted with a prolonged PR interval (bracket). The P wave is premature and has adifferent configuration when compared to the normal sinus P waves. In spite of the prolonged PR interval, theimpulse is conducted normally to the ventricles resulting in a narrow QRS complex.
LWBK271-C13_167-179.qxd 29/1/09 9:52 pm Page 169 LWBK270-4119G-C02_073-110.qxd
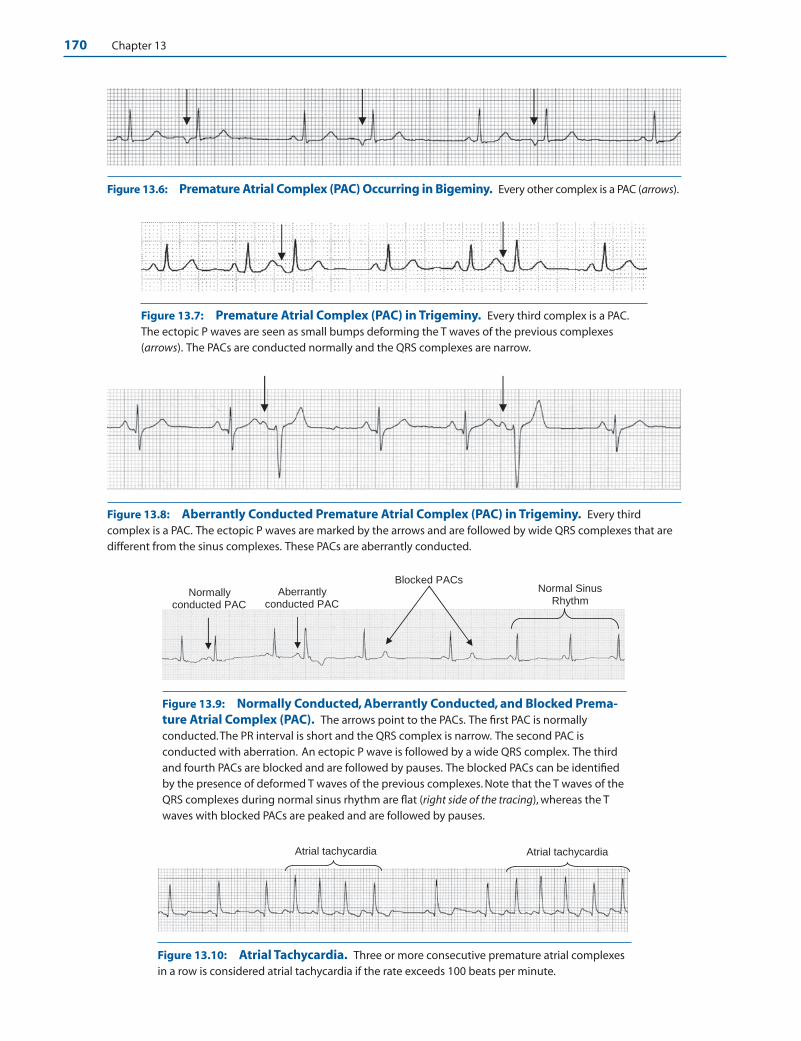
170 Chapter 13
Figure 13.6: Premature Atrial Complex (PAC) Occurring in Bigeminy. Every other complex is a PAC (arrows).
Atrial tachycardia Atrial tachycardia
Aberrantly conducted PAC
Normally conducted PAC
Normal Sinus Rhythm
Blocked PACs
Figure 13.7: Premature Atrial Complex (PAC) in Trigeminy. Every third complex is a PAC.The ectopic P waves are seen as small bumps deforming the T waves of the previous complexes(arrows). The PACs are conducted normally and the QRS complexes are narrow.
Figure 13.9: Normally Conducted, Aberrantly Conducted, and Blocked Prema-ture Atrial Complex (PAC). The arrows point to the PACs. The first PAC is normallyconducted.The PR interval is short and the QRS complex is narrow. The second PAC isconducted with aberration. An ectopic P wave is followed by a wide QRS complex. The thirdand fourth PACs are blocked and are followed by pauses. The blocked PACs can be identifiedby the presence of deformed T waves of the previous complexes. Note that the T waves of theQRS complexes during normal sinus rhythm are flat (right side of the tracing), whereas the Twaves with blocked PACs are peaked and are followed by pauses.
Figure 13.8: Aberrantly Conducted Premature Atrial Complex (PAC) in Trigeminy. Every thirdcomplex is a PAC. The ectopic P waves are marked by the arrows and are followed by wide QRS complexes that aredifferent from the sinus complexes. These PACs are aberrantly conducted.
Figure 13.10: Atrial Tachycardia. Three or more consecutive premature atrial complexesin a row is considered atrial tachycardia if the rate exceeds 100 beats per minute.
LWBK271-C13_167-179.qxd 29/1/09 9:52 pm Page 170 LWBK270-4119G-C02_073-110.qxd
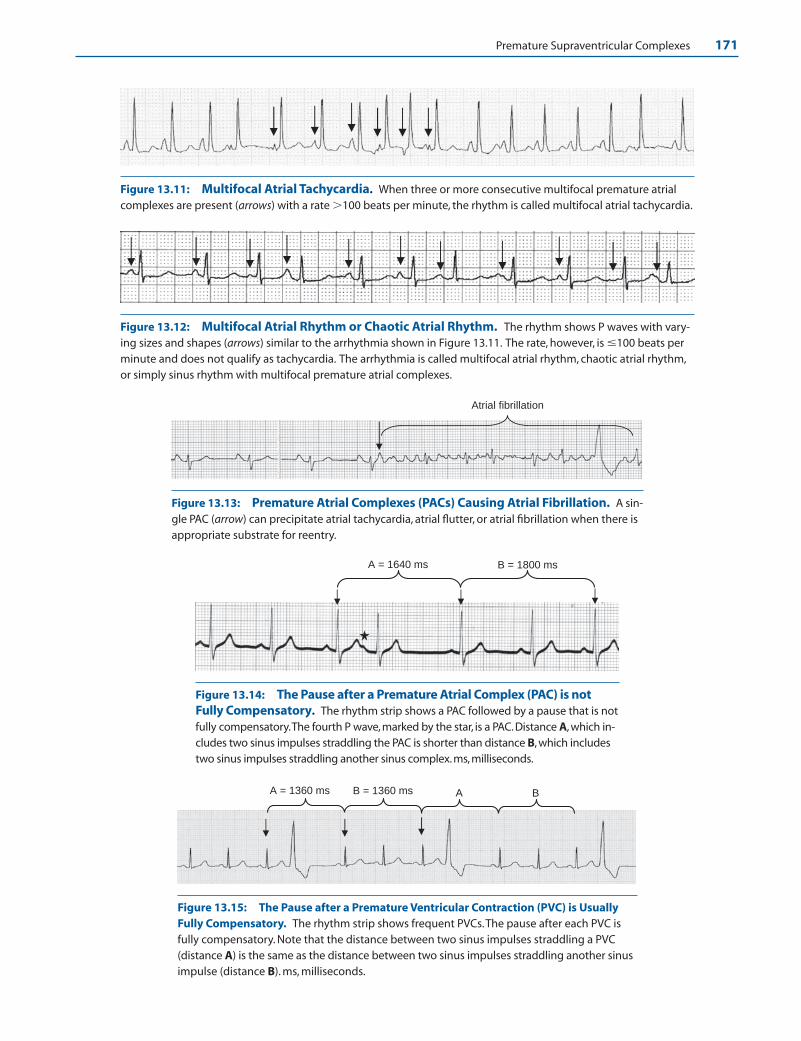
Premature Supraventricular Complexes 171
B = 1360 ms AA = 1360 ms B
B = 1800 ms A = 1640 ms
Atrial fibrillation
Figure 13.11: Multifocal Atrial Tachycardia. When three or more consecutive multifocal premature atrialcomplexes are present (arrows) with a rate �100 beats per minute, the rhythm is called multifocal atrial tachycardia.
Figure 13.12: Multifocal Atrial Rhythm or Chaotic Atrial Rhythm. The rhythm shows P waves with vary-ing sizes and shapes (arrows) similar to the arrhythmia shown in Figure 13.11. The rate, however, is �100 beats perminute and does not qualify as tachycardia. The arrhythmia is called multifocal atrial rhythm, chaotic atrial rhythm,or simply sinus rhythm with multifocal premature atrial complexes.
Figure 13.13: Premature Atrial Complexes (PACs) Causing Atrial Fibrillation. A sin-gle PAC (arrow) can precipitate atrial tachycardia, atrial flutter, or atrial fibrillation when there isappropriate substrate for reentry.
Figure 13.14: The Pause after a Premature Atrial Complex (PAC) is notFully Compensatory. The rhythm strip shows a PAC followed by a pause that is notfully compensatory.The fourth P wave, marked by the star, is a PAC. Distance A, which in-cludes two sinus impulses straddling the PAC is shorter than distance B, which includestwo sinus impulses straddling another sinus complex. ms, milliseconds.
Figure 13.15: The Pause after a Premature Ventricular Contraction (PVC) is UsuallyFully Compensatory. The rhythm strip shows frequent PVCs.The pause after each PVC isfully compensatory. Note that the distance between two sinus impulses straddling a PVC(distance A) is the same as the distance between two sinus impulses straddling another sinusimpulse (distance B). ms, milliseconds.
LWBK271-C13_167-179.qxd 29/1/09 9:52 pm Page 171 LWBK270-4119G-C02_073-110.qxd
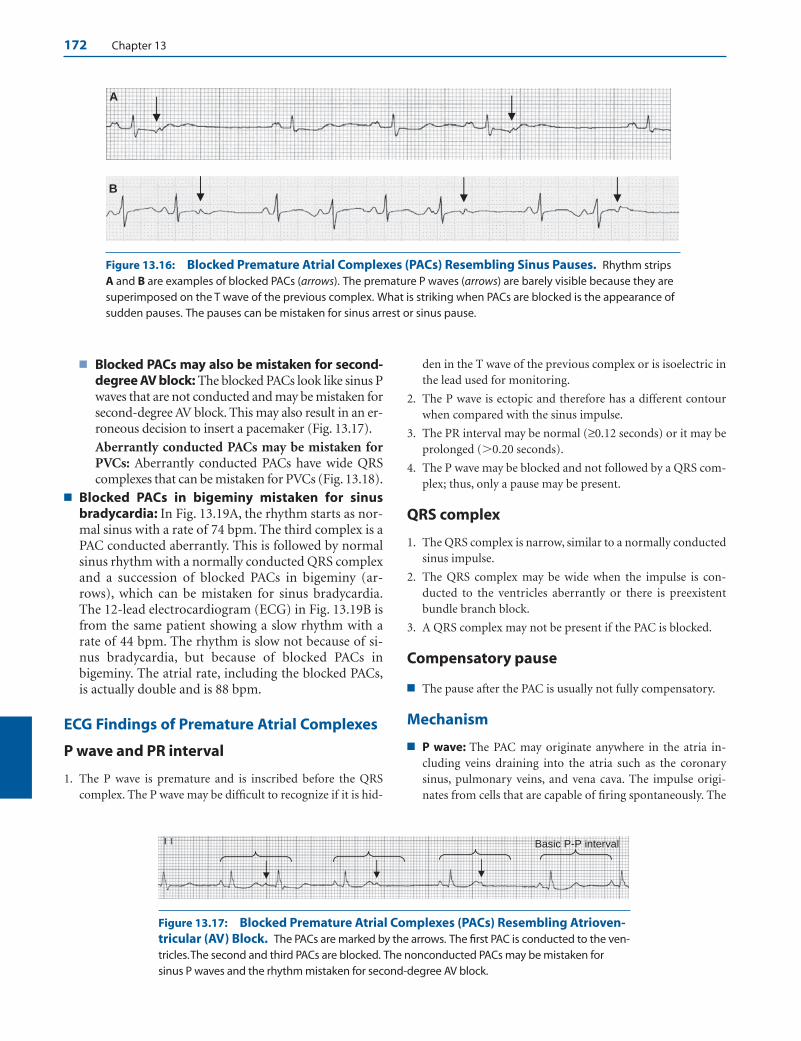
172 Chapter 13
■ Blocked PACs may also be mistaken for second-degree AV block: The blocked PACs look like sinus Pwaves that are not conducted and may be mistaken forsecond-degree AV block. This may also result in an er-roneous decision to insert a pacemaker (Fig. 13.17).
Aberrantly conducted PACs may be mistaken forPVCs: Aberrantly conducted PACs have wide QRScomplexes that can be mistaken for PVCs (Fig. 13.18).
■ Blocked PACs in bigeminy mistaken for sinusbradycardia: In Fig. 13.19A, the rhythm starts as nor-mal sinus with a rate of 74 bpm. The third complex is aPAC conducted aberrantly. This is followed by normalsinus rhythm with a normally conducted QRS complexand a succession of blocked PACs in bigeminy (ar-rows), which can be mistaken for sinus bradycardia.The 12-lead electrocardiogram (ECG) in Fig. 13.19B isfrom the same patient showing a slow rhythm with arate of 44 bpm. The rhythm is slow not because of si-nus bradycardia, but because of blocked PACs inbigeminy. The atrial rate, including the blocked PACs,is actually double and is 88 bpm.
ECG Findings of Premature Atrial Complexes
P wave and PR interval
1. The P wave is premature and is inscribed before the QRScomplex. The P wave may be difficult to recognize if it is hid-
den in the T wave of the previous complex or is isoelectric inthe lead used for monitoring.
2. The P wave is ectopic and therefore has a different contourwhen compared with the sinus impulse.
3. The PR interval may be normal (≥0.12 seconds) or it may beprolonged (�0.20 seconds).
4. The P wave may be blocked and not followed by a QRS com-plex; thus, only a pause may be present.
QRS complex
1. The QRS complex is narrow, similar to a normally conductedsinus impulse.
2. The QRS complex may be wide when the impulse is con-ducted to the ventricles aberrantly or there is preexistentbundle branch block.
3. A QRS complex may not be present if the PAC is blocked.
Compensatory pause
■ The pause after the PAC is usually not fully compensatory.
Mechanism
■ P wave: The PAC may originate anywhere in the atria in-cluding veins draining into the atria such as the coronary sinus, pulmonary veins, and vena cava. The impulse origi-nates from cells that are capable of firing spontaneously. The
A
B
Basic P-P interval
Figure 13.16: Blocked Premature Atrial Complexes (PACs) Resembling Sinus Pauses. Rhythm stripsA and B are examples of blocked PACs (arrows). The premature P waves (arrows) are barely visible because they aresuperimposed on the T wave of the previous complex. What is striking when PACs are blocked is the appearance ofsudden pauses. The pauses can be mistaken for sinus arrest or sinus pause.
Figure 13.17: Blocked Premature Atrial Complexes (PACs) Resembling Atrioven-tricular (AV) Block. The PACs are marked by the arrows. The first PAC is conducted to the ven-tricles.The second and third PACs are blocked. The nonconducted PACs may be mistaken forsinus P waves and the rhythm mistaken for second-degree AV block.
LWBK271-C13_167-179.qxd 29/1/09 9:52 pm Page 172 LWBK270-4119G-C02_073-110.qxd
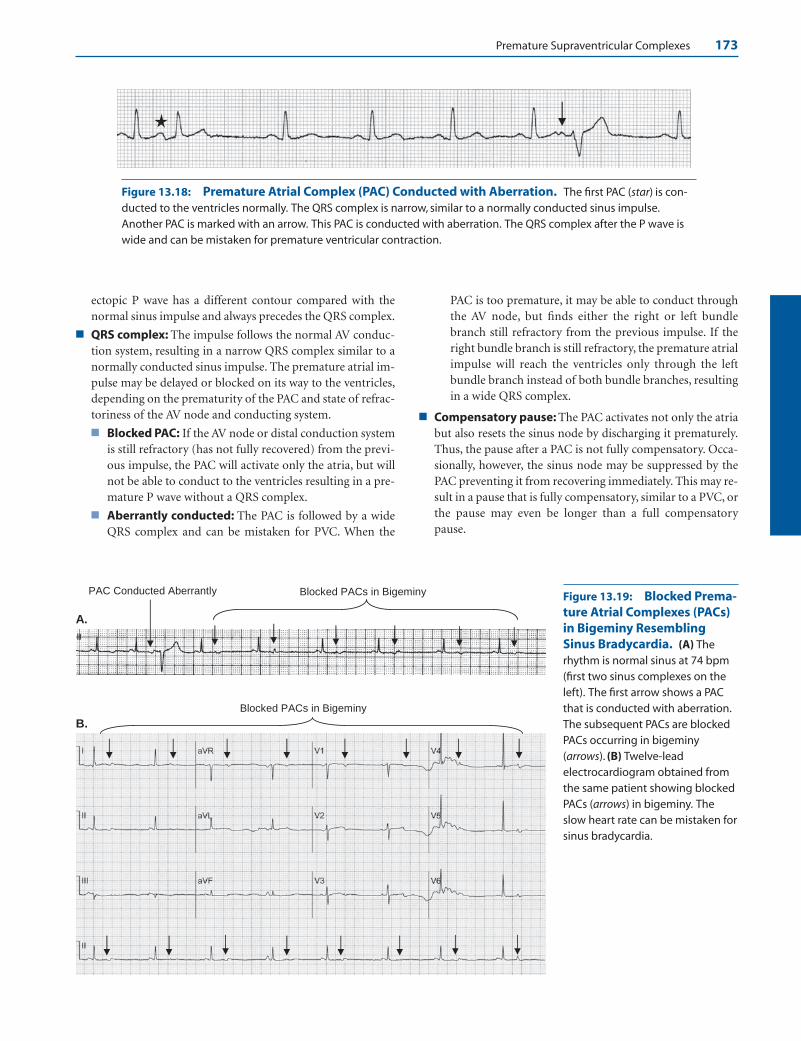
Premature Supraventricular Complexes 173
A.
B.
Blocked PACs in Bigeminy PAC Conducted Aberrantly
Blocked PACs in Bigeminy
Figure 13.18: Premature Atrial Complex (PAC) Conducted with Aberration. The first PAC (star) is con-ducted to the ventricles normally. The QRS complex is narrow, similar to a normally conducted sinus impulse.Another PAC is marked with an arrow. This PAC is conducted with aberration. The QRS complex after the P wave iswide and can be mistaken for premature ventricular contraction.
Figure 13.19: Blocked Prema-ture Atrial Complexes (PACs)in Bigeminy ResemblingSinus Bradycardia. (A) Therhythm is normal sinus at 74 bpm(first two sinus complexes on theleft). The first arrow shows a PACthat is conducted with aberration.The subsequent PACs are blockedPACs occurring in bigeminy(arrows). (B) Twelve-leadelectrocardiogram obtained fromthe same patient showing blockedPACs (arrows) in bigeminy. Theslow heart rate can be mistaken forsinus bradycardia.
ectopic P wave has a different contour compared with thenormal sinus impulse and always precedes the QRS complex.
■ QRS complex: The impulse follows the normal AV conduc-tion system, resulting in a narrow QRS complex similar to anormally conducted sinus impulse. The premature atrial im-pulse may be delayed or blocked on its way to the ventricles,depending on the prematurity of the PAC and state of refrac-toriness of the AV node and conducting system.
■ Blocked PAC: If the AV node or distal conduction systemis still refractory (has not fully recovered) from the previ-ous impulse, the PAC will activate only the atria, but willnot be able to conduct to the ventricles resulting in a pre-mature P wave without a QRS complex.
■ Aberrantly conducted: The PAC is followed by a wideQRS complex and can be mistaken for PVC. When the
PAC is too premature, it may be able to conduct throughthe AV node, but finds either the right or left bundlebranch still refractory from the previous impulse. If theright bundle branch is still refractory, the premature atrialimpulse will reach the ventricles only through the leftbundle branch instead of both bundle branches, resultingin a wide QRS complex.
■ Compensatory pause: The PAC activates not only the atriabut also resets the sinus node by discharging it prematurely.Thus, the pause after a PAC is not fully compensatory. Occa-sionally, however, the sinus node may be suppressed by thePAC preventing it from recovering immediately. This may re-sult in a pause that is fully compensatory, similar to a PVC, orthe pause may even be longer than a full compensatorypause.
LWBK271-C13_167-179.qxd 29/1/09 9:52 pm Page 173 LWBK270-4119G-C02_073-110.qxd

174 Chapter 13
Clinical Significance
■ PACs frequently occur in normal individuals as well as thosewith structural heart disease. These extra heartbeats maycause symptoms of palpitations. Most PACs, however, do notcause symptoms and most individuals are not aware thatthey have premature atrial impulses. They may be detectedduring routine ECG, which may be taken for reasons otherthan palpitations.
■ PACs, especially when frequent, may be caused by excessivecoffee or tea, smoking, diet pills, thyroid hormones, digitalis,antiarrhythmic agents, isoproterenol, theophylline, and al-buterol. They can also occur in the presence of electrolyteabnormalities, congestive heart failure, coronary disease,valvular heart disease (especially mitral valve prolapse),cardiomyopathy and other noncardiac conditions such aspulmonary diseases, infections, thyroid disorders, and othermetabolic abnormalities.
■ PACs may be mistaken for PVCs when they are aberrantlyconducted or sinus pauses when they are nonconducted.Blocked PACs is the most common cause of sudden length-ening of the P-P or R-R interval and should always be sus-pected before sinus node dysfunction is considered.
■ Although single or repetitive PACs are benign, they may trig-ger sustained arrhythmias (atrial tachycardia, atrial flutter, oratrial fibrillation) when there is appropriate substrate for reen-try. Similar to the ventricles, the atria have a vulnerable periodin which a premature atrial impulse can precipitate atrial fib-rillation. This often occurs when the PAC is very prematurewith coupling interval that is �50% of the basic P-P interval(P to PAC interval is �50% of the basic rhythm). Thus, over-all treatment of atrial tachycardia, flutter, or fibrillation mayinclude suppression or elimination of ectopic atrial impulses.
Treatment
■ Ectopic atrial impulses generally do not cause symptoms. Ifthe patient is symptomatic and the palpitations have beenidentified as resulting from PACs, treatment usually involvescorrection of any underlying abnormality, electrolyte disor-der, or any precipitating cause that can be identified such asexposure to nicotine, caffeine, or any pharmacologic agentthat can cause the arrhythmia. Treatment also includes reas-surance that the arrhythmia is benign. Pharmacologic therapyis not necessary. When reassurance is not enough, especially ifthe patient is symptomatic, beta blockers may be tried and ifcontraindicated because of reactive airway disease, nondihy-dropyridine calcium channel blockers (diltiazem or vera-pamil) may be used as alternative.
Prognosis
■ Single or repetitive atrial complexes are benign in patientswithout cardiac disease. In patients with known cardiac dis-ease, the prognosis depends on the nature of the cardiac ab-normality and not the presence of atrial ectopy.
Premature Junctional Complex
■ Atrioventricular junction: The AV junction includesthe AV node down to the bifurcation of the bundle ofHis. It is the center of the heart because it is locatedmidway between the atria and ventricles.
■ Atrioventricular node: The AV node can be dividedinto three distinct areas with different electrophysio-logic properties. These include the upper, middle, andlower AV node (Fig. 13.20).■ Upper AV node: The upper portion or head of the
AV node is directly contiguous to the atria. Thisportion is called AN, or atrionodal region. It re-ceives impulses from the atria and relays it to therest of the conduction system. This area of the AVnode contains cells that are capable of firing spon-taneously.
■ Middle AV node: The middle portion of the AVnode is also called the N (nodal) region. This is thebody or AV node proper. This portion of the AVnode contains cells that conduct slowly and is re-sponsible for the delay in the spread of the atrialimpulse to the ventricles. This portion of the AVnode does not contain cells that are capable of fir-ing spontaneously and therefore can not initiate anectopic impulse.
■ Lower AV node: The tail or lower portion of the AVnode is directly contiguous with the bundle of Hisand is called NH or nodo-His region. This portionof the AV node contains cells with pacemakingproperties and is usually the site of origin of thejunctional impulse.
■ The AV junction is the only pathway by which the sinusimpulse is conducted to the ventricles. The AV junctionis also the origin of the junctional impulse.
■ Any impulse originating from the AV node or bundleof His is a junctional impulse.
Upper or AN Region
Mid or N Region
Lower or NH Region
AV Node
Bundle of His
AV Junction
Figure 13.20: Diagrammatic Representation of theAtrioventricular (AV) Junction. The AV junction includesthe AV node down to the bifurcation of the bundle of His. TheAV node consists of the upper (AN region), mid- or AV nodeproper (N region), and lower AV node (nodo-His) region.
LWBK271-C13_167-179.qxd 29/1/09 9:52 pm Page 174 LWBK270-4119G-C02_073-110.qxd

Premature Supraventricular Complexes 175
■ Atrial activation: An impulse originating from theAV junction will activate the atria retrogradely frombelow upward because the AV junction is located be-low the atria. This causes the P wave to be inverted inleads II, III, and aVF. Both left and right atria are acti-vated synchronously, causing the P wave to be narrow.
■ Ventricular activation: Because the AV junction islocated above the ventricles, an impulse originatingfrom the AV junction will activate the ventricles an-terogradely through the normal AV conduction sys-tem, resulting in narrow QRS complexes similar to anormally conducted sinus impulse.
■ ECG findings: A PJC can manifest in several differentpatterns, depending on the speed of conduction of thejunctional impulse to the atria and to the ventricles.Thus, the retrograde P wave may occur before or afterthe QRS complex or it may occur synchronously withthe QRS complex.■ Retrograde P wave before the QRS complex:
Retrograde P wave occurring in front of the QRS
complex suggests that the speed of conduction ofthe junctional impulse to the atria is faster than thespeed of conduction of the impulse to the ventricles(Fig. 13.21A).
■ Retrograde P wave after the QRS complex: Ret-rograde P wave occurring after the QRS complex sug-gests that the speed of conduction of the junctionalimpulse to the ventricles is faster than the speed ofconduction of the impulse to the atria (Fig. 13.21B).
■ Retrograde P wave synchronous with the QRScomplex: When there is simultaneous activation ofthe atria and ventricles, the retrograde P wave willbe superimposed on the QRS complex and will notbe visible. Only a QRS complex will be recorded(Fig. 13.21C). The retrograde P wave may also beabsent if the junctional impulse is blocked at the AVnode on its way to the atria but is conducted nor-mally to the ventricles.
■ Figure 13.21 shows the different patterns of prematurejunctional impulse when recorded in lead II.
Atria
Ventricles
No P wave. The atria and ventricles are activated simultaneously and the retrograde P wave is buried within the QRS complex.
C
Atria
Ventricles
or
B
or
P P P
Retrograde P wave follows the QRS complex (the ventricles are activated before the atria). The retrograde P wave can be mistaken for an S wave or it may be further away from the QRS complex.
Atria
Ventricles
PJC
A
or or
P P P
Retrograde P wave is in front of the QRS complex (theatria are activated before the ventricles). The PR interval is usually short measuring <0.12 second and can be mistaken for a Q wave although it can be longer if the impulse is delayed on its way to the atria.
Figure 13.21: Premature JunctionalComplex (PJC). The different patterns of PJCare shown. (A) Retrograde P wave is inscribedbefore the QRS complex. (B) Retrograde P waveis inscribed after the QRS complex. (C)Retrograde P wave is synchronous with the QRScomplex or the impulse is blocked on its way tothe atria, but is normally conducted to the ven-tricles.
LWBK271-C13_167-179.qxd 29/1/09 9:52 pm Page 175 LWBK270-4119G-C02_073-110.qxd
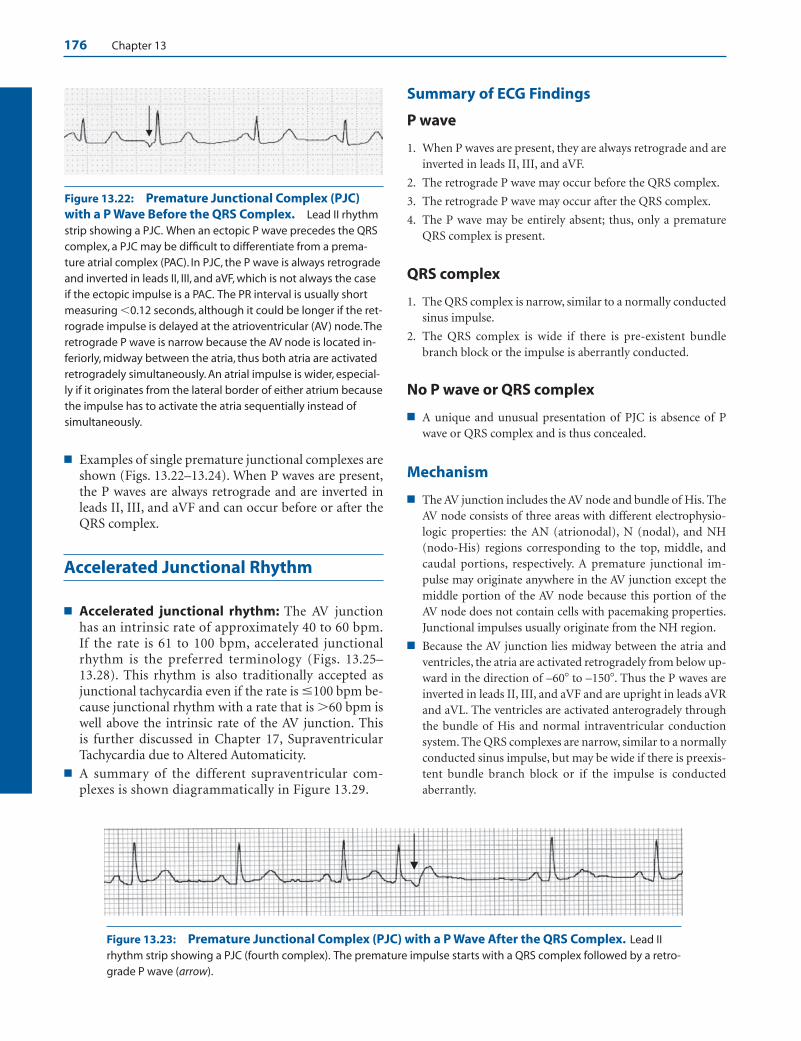
176 Chapter 13
■ Examples of single premature junctional complexes areshown (Figs. 13.22–13.24). When P waves are present,the P waves are always retrograde and are inverted inleads II, III, and aVF and can occur before or after theQRS complex.
Accelerated Junctional Rhythm
■ Accelerated junctional rhythm: The AV junctionhas an intrinsic rate of approximately 40 to 60 bpm.If the rate is 61 to 100 bpm, accelerated junctionalrhythm is the preferred terminology (Figs. 13.25–13.28). This rhythm is also traditionally accepted asjunctional tachycardia even if the rate is �100 bpm be-cause junctional rhythm with a rate that is �60 bpm iswell above the intrinsic rate of the AV junction. This is further discussed in Chapter 17, SupraventricularTachycardia due to Altered Automaticity.
■ A summary of the different supraventricular com-plexes is shown diagrammatically in Figure 13.29.
Summary of ECG Findings
P wave
1. When P waves are present, they are always retrograde and areinverted in leads II, III, and aVF.
2. The retrograde P wave may occur before the QRS complex.
3. The retrograde P wave may occur after the QRS complex.
4. The P wave may be entirely absent; thus, only a prematureQRS complex is present.
QRS complex
1. The QRS complex is narrow, similar to a normally conductedsinus impulse.
2. The QRS complex is wide if there is pre-existent bundlebranch block or the impulse is aberrantly conducted.
No P wave or QRS complex
■ A unique and unusual presentation of PJC is absence of Pwave or QRS complex and is thus concealed.
Mechanism
■ The AV junction includes the AV node and bundle of His. TheAV node consists of three areas with different electrophysio-logic properties: the AN (atrionodal), N (nodal), and NH(nodo-His) regions corresponding to the top, middle, andcaudal portions, respectively. A premature junctional im-pulse may originate anywhere in the AV junction except themiddle portion of the AV node because this portion of theAV node does not contain cells with pacemaking properties.Junctional impulses usually originate from the NH region.
■ Because the AV junction lies midway between the atria andventricles, the atria are activated retrogradely from below up-ward in the direction of –60� to –150�. Thus the P waves areinverted in leads II, III, and aVF and are upright in leads aVRand aVL. The ventricles are activated anterogradely throughthe bundle of His and normal intraventricular conductionsystem. The QRS complexes are narrow, similar to a normallyconducted sinus impulse, but may be wide if there is preexis-tent bundle branch block or if the impulse is conductedaberrantly.
Figure 13.22: Premature Junctional Complex (PJC)with a P Wave Before the QRS Complex. Lead II rhythmstrip showing a PJC. When an ectopic P wave precedes the QRScomplex, a PJC may be difficult to differentiate from a prema-ture atrial complex (PAC). In PJC, the P wave is always retrogradeand inverted in leads II, III, and aVF, which is not always the caseif the ectopic impulse is a PAC. The PR interval is usually shortmeasuring �0.12 seconds, although it could be longer if the ret-rograde impulse is delayed at the atrioventricular (AV) node.Theretrograde P wave is narrow because the AV node is located in-feriorly, midway between the atria, thus both atria are activatedretrogradely simultaneously. An atrial impulse is wider, especial-ly if it originates from the lateral border of either atrium becausethe impulse has to activate the atria sequentially instead ofsimultaneously.
Figure 13.23: Premature Junctional Complex (PJC) with a P Wave After the QRS Complex. Lead IIrhythm strip showing a PJC (fourth complex). The premature impulse starts with a QRS complex followed by a retro-grade P wave (arrow).
LWBK271-C13_167-179.qxd 29/1/09 9:52 pm Page 176 LWBK270-4119G-C02_073-110.qxd
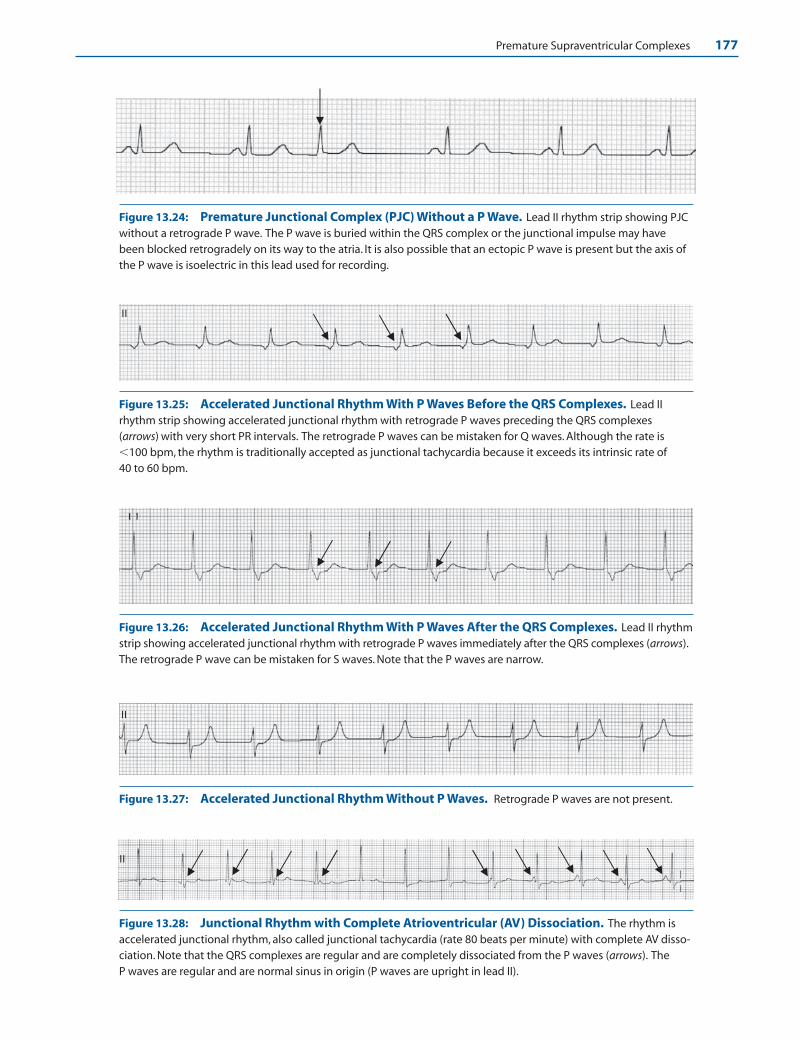
Premature Supraventricular Complexes 177
II
Figure 13.24: Premature Junctional Complex (PJC) Without a P Wave. Lead II rhythm strip showing PJCwithout a retrograde P wave. The P wave is buried within the QRS complex or the junctional impulse may havebeen blocked retrogradely on its way to the atria. It is also possible that an ectopic P wave is present but the axis ofthe P wave is isoelectric in this lead used for recording.
II
Figure 13.25: Accelerated Junctional Rhythm With P Waves Before the QRS Complexes. Lead IIrhythm strip showing accelerated junctional rhythm with retrograde P waves preceding the QRS complexes(arrows) with very short PR intervals. The retrograde P waves can be mistaken for Q waves. Although the rate is�100 bpm, the rhythm is traditionally accepted as junctional tachycardia because it exceeds its intrinsic rate of 40 to 60 bpm.
Figure 13.26: Accelerated Junctional Rhythm With P Waves After the QRS Complexes. Lead II rhythmstrip showing accelerated junctional rhythm with retrograde P waves immediately after the QRS complexes (arrows).The retrograde P wave can be mistaken for S waves. Note that the P waves are narrow.
Figure 13.27: Accelerated Junctional Rhythm Without P Waves. Retrograde P waves are not present.
II
Figure 13.28: Junctional Rhythm with Complete Atrioventricular (AV) Dissociation. The rhythm isaccelerated junctional rhythm, also called junctional tachycardia (rate 80 beats per minute) with complete AV disso-ciation. Note that the QRS complexes are regular and are completely dissociated from the P waves (arrows). The P waves are regular and are normal sinus in origin (P waves are upright in lead II).
LWBK271-C13_167-179.qxd 29/1/09 9:52 pm Page 177 LWBK270-4119G-C02_073-110.qxd

178 Chapter 13
■ The retrograde P wave is usually narrow because both atriaare activated simultaneously. The P wave may occur before,after, or within the QRS complex. The position of the P wavein relation the QRS complex depends on the speed of con-duction of the junctional impulse retrogradely to the atriaand anterogradely to the ventricles and not from the area oforigin of the impulse within the AV junction. There are otherpossible ECG presentations of junctional rhythm. These in-clude the following.
■ Complete AV dissociation: When there is junctionalrhythm, the junctional impulse may control the ventri-cles, but not the atria. Thus, the P wave and the QRS com-plex may be completely dissociated. When this occurs, the
atria are independently controlled by normal sinusrhythm or by atrial fibrillation. The ventricles are inde-pendently controlled by the junctional impulse.
■ Concealed junctional impulses—no P wave, no QRScomplex: It is possible that the junctional impulse isblocked retrogradely on its way to the atria and antero-gradely on its way to the ventricles; thus, no P wave orQRS complex will be recorded. When this occurs, the PJCis concealed or is nonconducted. The presence of a non-conducted junctional impulse is not visible in the ECG,but its presence can be inferred because it will affect thenext sinus impulse by rendering the AV node refractory.This may result in varying degrees of pseudo-AV block.
Normal Sinus
Rhythm
PAC Conducted
with Aberration
Blocked PAC
Premature Junctional
Complex
Premature Junctional
Complex
Premature Junctional
Complex
Premature Atrial
Complex
Atrial Tachycardia
(Multifocal)
Figure 13.29: Premature Supraventricular Complexes. Diagram shows the differ-ent types of supraventricular impulses. Arrows point to the ectopic supraventricularcomplexes.
LWBK271-C13_167-179.qxd 29/1/09 9:52 pm Page 178 LWBK270-4119G-C02_073-110.qxd
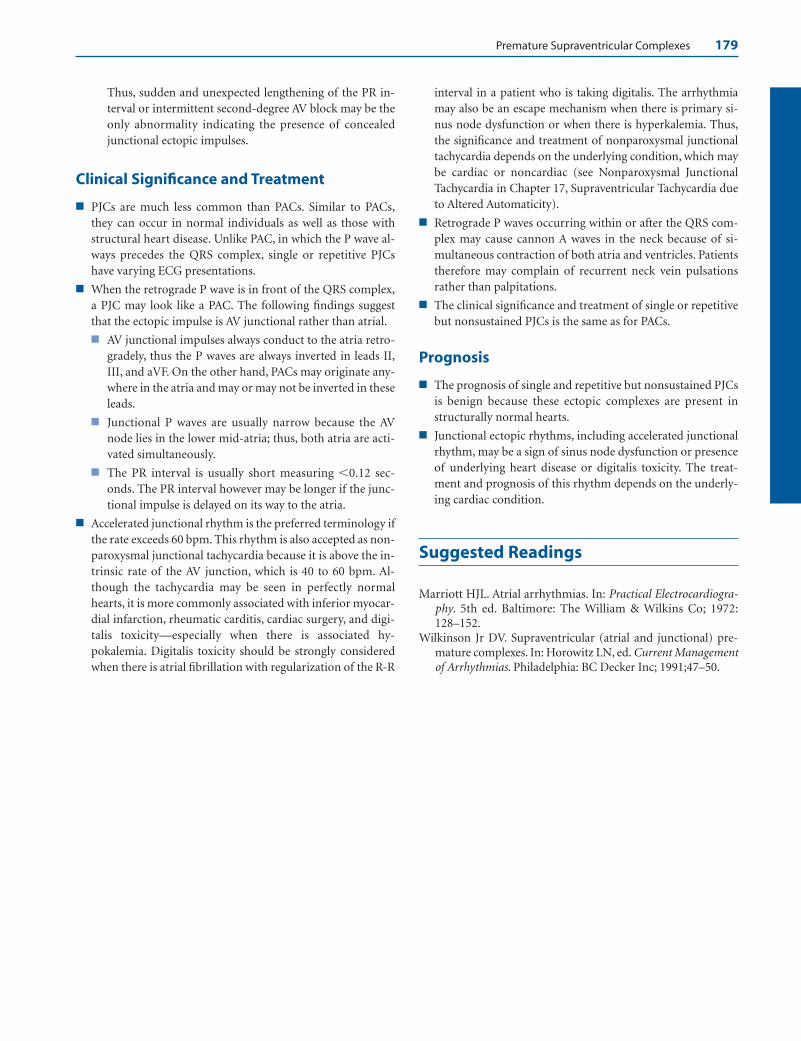
Premature Supraventricular Complexes 179
Thus, sudden and unexpected lengthening of the PR in-terval or intermittent second-degree AV block may be theonly abnormality indicating the presence of concealedjunctional ectopic impulses.
Clinical Significance and Treatment
■ PJCs are much less common than PACs. Similar to PACs,they can occur in normal individuals as well as those withstructural heart disease. Unlike PAC, in which the P wave al-ways precedes the QRS complex, single or repetitive PJCshave varying ECG presentations.
■ When the retrograde P wave is in front of the QRS complex,a PJC may look like a PAC. The following findings suggestthat the ectopic impulse is AV junctional rather than atrial.
■ AV junctional impulses always conduct to the atria retro-gradely, thus the P waves are always inverted in leads II,III, and aVF. On the other hand, PACs may originate any-where in the atria and may or may not be inverted in theseleads.
■ Junctional P waves are usually narrow because the AVnode lies in the lower mid-atria; thus, both atria are acti-vated simultaneously.
■ The PR interval is usually short measuring �0.12 sec-onds. The PR interval however may be longer if the junc-tional impulse is delayed on its way to the atria.
■ Accelerated junctional rhythm is the preferred terminology ifthe rate exceeds 60 bpm. This rhythm is also accepted as non-paroxysmal junctional tachycardia because it is above the in-trinsic rate of the AV junction, which is 40 to 60 bpm. Al-though the tachycardia may be seen in perfectly normalhearts, it is more commonly associated with inferior myocar-dial infarction, rheumatic carditis, cardiac surgery, and digi-talis toxicity—especially when there is associated hy-pokalemia. Digitalis toxicity should be strongly consideredwhen there is atrial fibrillation with regularization of the R-R
interval in a patient who is taking digitalis. The arrhythmiamay also be an escape mechanism when there is primary si-nus node dysfunction or when there is hyperkalemia. Thus,the significance and treatment of nonparoxysmal junctionaltachycardia depends on the underlying condition, which maybe cardiac or noncardiac (see Nonparoxysmal JunctionalTachycardia in Chapter 17, Supraventricular Tachycardia dueto Altered Automaticity).
■ Retrograde P waves occurring within or after the QRS com-plex may cause cannon A waves in the neck because of si-multaneous contraction of both atria and ventricles. Patientstherefore may complain of recurrent neck vein pulsationsrather than palpitations.
■ The clinical significance and treatment of single or repetitivebut nonsustained PJCs is the same as for PACs.
Prognosis
■ The prognosis of single and repetitive but nonsustained PJCsis benign because these ectopic complexes are present instructurally normal hearts.
■ Junctional ectopic rhythms, including accelerated junctionalrhythm, may be a sign of sinus node dysfunction or presenceof underlying heart disease or digitalis toxicity. The treat-ment and prognosis of this rhythm depends on the underly-ing cardiac condition.
Suggested Readings
Marriott HJL. Atrial arrhythmias. In: Practical Electrocardiogra-phy. 5th ed. Baltimore: The William & Wilkins Co; 1972:128–152.
Wilkinson Jr DV. Supraventricular (atrial and junctional) pre-mature complexes. In: Horowitz LN, ed. Current Managementof Arrhythmias. Philadelphia: BC Decker Inc; 1991;47–50.
LWBK271-C13_167-179.qxd 29/1/09 9:52 pm Page 179 LWBK270-4119G-C02_073-110.qxd
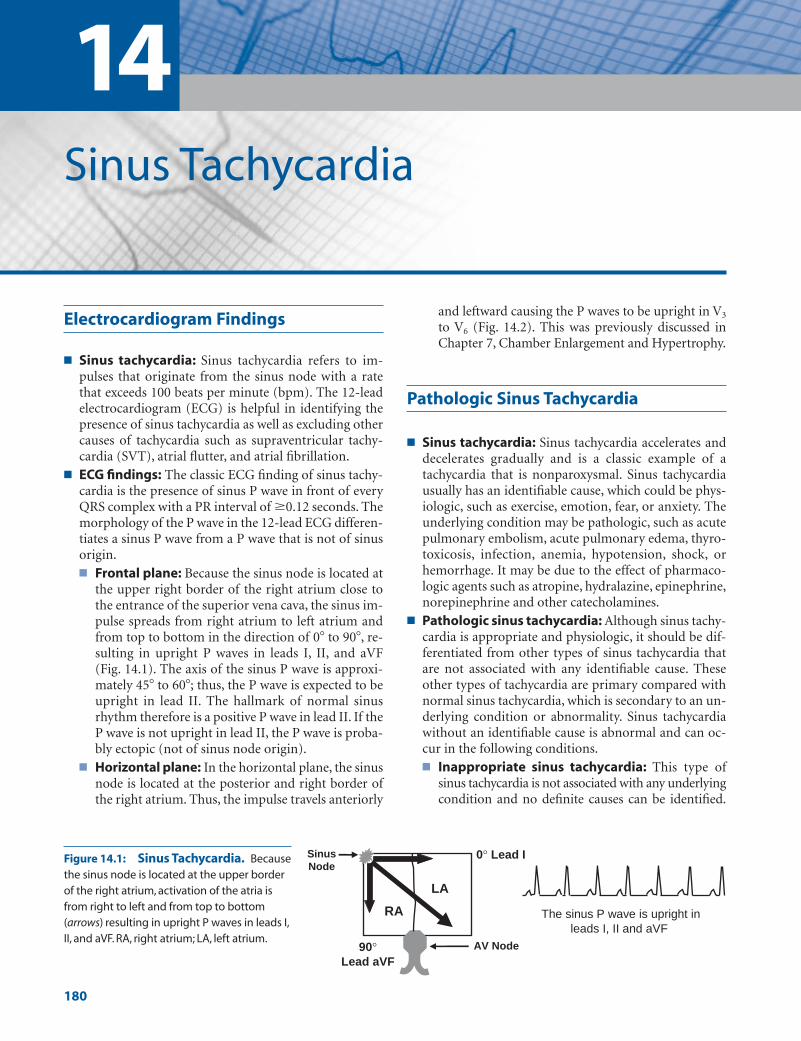
14Sinus Tachycardia
180
Electrocardiogram Findings
■ Sinus tachycardia: Sinus tachycardia refers to im-pulses that originate from the sinus node with a ratethat exceeds 100 beats per minute (bpm). The 12-leadelectrocardiogram (ECG) is helpful in identifying thepresence of sinus tachycardia as well as excluding othercauses of tachycardia such as supraventricular tachy-cardia (SVT), atrial flutter, and atrial fibrillation.
■ ECG findings: The classic ECG finding of sinus tachy-cardia is the presence of sinus P wave in front of everyQRS complex with a PR interval of �0.12 seconds. Themorphology of the P wave in the 12-lead ECG differen-tiates a sinus P wave from a P wave that is not of sinusorigin.■ Frontal plane: Because the sinus node is located at
the upper right border of the right atrium close tothe entrance of the superior vena cava, the sinus im-pulse spreads from right atrium to left atrium andfrom top to bottom in the direction of 0� to 90�, re-sulting in upright P waves in leads I, II, and aVF(Fig. 14.1). The axis of the sinus P wave is approxi-mately 45� to 60�; thus, the P wave is expected to beupright in lead II. The hallmark of normal sinusrhythm therefore is a positive P wave in lead II. If theP wave is not upright in lead II, the P wave is proba-bly ectopic (not of sinus node origin).
■ Horizontal plane: In the horizontal plane, the sinusnode is located at the posterior and right border ofthe right atrium. Thus, the impulse travels anteriorly
and leftward causing the P waves to be upright in V3
to V6 (Fig. 14.2). This was previously discussed inChapter 7, Chamber Enlargement and Hypertrophy.
Pathologic Sinus Tachycardia
■ Sinus tachycardia: Sinus tachycardia accelerates anddecelerates gradually and is a classic example of atachycardia that is nonparoxysmal. Sinus tachycardiausually has an identifiable cause, which could be phys-iologic, such as exercise, emotion, fear, or anxiety. Theunderlying condition may be pathologic, such as acutepulmonary embolism, acute pulmonary edema, thyro-toxicosis, infection, anemia, hypotension, shock, orhemorrhage. It may be due to the effect of pharmaco-logic agents such as atropine, hydralazine, epinephrine,norepinephrine and other catecholamines.
■ Pathologic sinus tachycardia: Although sinus tachy-cardia is appropriate and physiologic, it should be dif-ferentiated from other types of sinus tachycardia thatare not associated with any identifiable cause. Theseother types of tachycardia are primary compared withnormal sinus tachycardia, which is secondary to an un-derlying condition or abnormality. Sinus tachycardiawithout an identifiable cause is abnormal and can oc-cur in the following conditions.■ Inappropriate sinus tachycardia: This type of
sinus tachycardia is not associated with any underlyingcondition and no definite causes can be identified.
The sinus P wave is upright in leads I, II and aVF
LA
AV Node 90° Lead aVF
Sinus Node
0° Lead I
RA
Figure 14.1: Sinus Tachycardia. Becausethe sinus node is located at the upper borderof the right atrium, activation of the atria isfrom right to left and from top to bottom (arrows) resulting in upright P waves in leads I,II, and aVF. RA, right atrium; LA, left atrium.
LWBK271-C14_180-183.qxd 29/1/09 9:06 pm Page 180 LWBK270-4119G-C02_073-110.qxd

Sinus Tachycardia 181
Very often, the rate of the tachycardia is inappropri-ately high at rest or during physical activity. Increasein sinus rate during exercise is very often out of pro-portion to the expected level of response. The sinustachycardia is due to enhanced automaticity of thecells within the sinus node.
■ Postural orthostatic tachycardia syndrome(POTS): This is similar to inappropriate sinus tachy-cardia except that the tachycardia is initiated by theupright posture and is relieved by recumbency. InPOTS, there should be no significant orthostatic hy-potension or autonomic dysfunction because sinustachycardia becomes appropriate when these enti-ties are present.
■ Sinoatrial reentry: This tachycardia is a type of SVTresulting from re-entry where the sinus node is part ofthe reentrant pathway. When this occurs, the P wavesresemble that of sinus tachycardia. It is paroxysmal incontrast to the other types of sinus tachycardia thatare nonparoxysmal. This tachycardia will be discussedin more detail under SVT from sinoatrial reentry.
Sinus Tachycardia
■ The 12-lead ECG alone cannot differentiate physiologicsinus tachycardia from sinus tachycardia that is patho-logic and inappropriate because the ECG findings of
these two clinical entities are identical. The diagnosis ofpathologic sinus tachycardia therefore is based on addi-tional clinical information demonstrating that the sinustachycardia is not associated with any underlying con-dition. Continuous monitoring is often helpful indemonstrating that the tachycardia is inappropriate. Itis also helpful in showing that the sinus tachycardia canbe paroxysmal and can be precipitated or terminated bypremature atrial complexes, suggesting that the tachy-cardia is due to sinoatrial reentry.
■ The following ECG shows sinus tachycardia (Fig. 14.2).The P waves are upright in leads I, II, and aVF and in V3
to V6. Each P wave is in front of the QRS complex witha PR interval of �0.12 seconds.
Summary of ECG Findings
1. Sinus P waves are present with a rate >100 bpm.
2. The sinus P waves precede each QRS complex with a PR in-terval �0.12 seconds.
3. The morphology of the P wave should be upright in leads I,II, and aVF and in V3 to V6.
Mechanism
■ The sinus impulse arises from the sinus node, which containsautomatic cells with pacemaking properties. Pacemaking cellsexhibit slow spontaneous diastolic depolarization duringphase 4 of the action potential (see Chapter 1, Basic Anatomy
Figure 14.2: Sinus Tachycardia. Twelve-lead electrocardiogram showing sinus tachycardia. Sinus tachycardiais identified by the presence of upright P waves in leads I, II, and aVF and also in V3 to V6. The axis of the P wave isclosest to lead II, which is the most important lead in identifying the presence of sinus rhythm.
LWBK271-C14_180-183.qxd 29/1/09 9:06 pm Page 181 LWBK270-4119G-C02_073-110.qxd

182 Chapter 14
and Electrophysiology). The sinus node has the fastest rate ofspontaneous depolarization occurring more than one persecond. As a result, the rhythm originating from the sinusnode is the most dominant and is the pacemaker of the heart.
■ The rate of the sinus node is usually modified by a number ofstimuli, most notably sympathetic and parasympatheticevents, but it could also be influenced by other conditionssuch as stretch, temperature, and hypoxia. It responds appro-priately to physiologic as well as pathologic stimuli. Whenthe sinus tachycardia is inappropriate, it may be due to en-hance firing rate of the automatic cells in the sinus node orautonomic regulation of the sinus node may be abnormalwith increased response to sympathetic stimuli or decreasedresponse to parasympathetic influences.
■ Pacemaker cells are not localized to a specific area, but arewidely distributed throughout the sinus node. Cells withfaster rates occupy the more cranial portion, whereas cellswith slower rates occupy the more caudal portion of the sinus node. During sinus tachycardia, the impulses do notoriginate from a single stationary focus, but migrate from acaudal area to a more cranial location as the rate of the tachy-cardia increases. This shift in the origin of the sinus impulseto a more cranial location may change the morphology of theP wave, resulting in a P wave axis that is slightly more vertical(toward 90�) during faster heart rates and slightly more hor-izontal (toward 0�) during slower sinus rates. This change inthe origin of the impulse during sinus tachycardia has clini-cal and therapeutic implications. Patients with inappropriatesinus tachycardia, where the primary abnormality is due toinappropriate increase in automaticity in the sinus node cellsand are refractory to medical therapy, may respond to selec-tive ablation of certain portions of the sinus node.
Clinical Implications
■ Sinus tachycardia is a physiologic mechanism occurring ap-propriately in response to known stimuli. This includes hypotension, fever, anemia, thyrotoxicosis, and pain, amongother things.
■ Sinus tachycardia is appropriate when it is due to a secondarycause. Sinus tachycardia however may be difficult to differen-tiate from SVT, especially if the P waves are obscured by theT waves of the preceding complex. The clinical significanceand therapy of sinus tachycardia are different from that ofSVT, and every attempt should be made to differentiate onefrom the other.
■ Although sinus tachycardia is usually physiologic and appro-priate in response to a variety of clinical conditions, sinustachycardia may result in unnecessary increase in heart ratewithout a definite secondary cause. When this occurs, the sinus tachycardia is abnormal and could be due to inappro-priate sinus tachycardia, postural orthostatic tachycardiasyndrome, or sinoatrial reentrant tachycardia.
■ Inappropriate sinus tachycardia: Sinus tachycardia isinappropriate when there is no known cause for the sinus
tachycardia. Inappropriate sinus tachycardia occurs usu-ally in young females in their 30s. Most are health careworkers. Inappropriate sinus tachycardia is important todifferentiate from appropriate sinus tachycardia becausethe abnormality may reside in the sinus node itself due toinappropriate enhancement in automaticity of the sinusnode cells rather than due to secondary causes.
■ POTS: This type of sinus tachycardia is similar to inap-propriate sinus tachycardia except that the tachycardia istriggered by the upright posture and is relieved by recum-bency. The tilt table test may result in increase in heartrate �30 bpm from baseline or increase in heart rate�120 bpm without significant drop in blood pressure.The drop in blood pressure should not be �30 mm Hgsystolic or �20 mm Hg mean blood pressure within 3 minutes of standing or tilt. The cause of POTS is multi-factorial and approximately half of patients have an-tecedent viral infection. It may be due to the presence of alimited autonomic neuropathy associated with postgan-glionic sympathetic denervation of the legs, resulting inabnormality in vasomotor tone and blood pooling. It mayalso be due to a primary abnormality of the sinus nodecells similar to inappropriate sinus tachycardia. Other sec-ondary causes such as venous pooling in the splanchnicbed, hypovolemia, or failure to vasoconstrict have alsobeen implicated. Because the abnormality in POTS maybe in the sinus node itself (primary), but could also bedue to abnormalities outside the sinus node (secondarycauses), response to therapy may be difficult to predict.Thus, therapy to suppress sinus node automaticity withthe use of pharmacologic agents or radiofrequency mod-ification of the sinus node may be appropriate if the ab-normality is in the sinus node itself, but may not be effec-tive if the abnormality is due to secondary causes.
■ Sinoatrial reentrant tachycardia: This is further dis-cussed in Chapter 17, Supraventricular Tachycardia due toReentry. The tachycardia can be precipitated or terminatedby a premature ectopic atrial impulse. Unlike the othertypes of sinus tachycardia, sinoatrial reentrant tachycardiais usually associated with structural cardiac disease.
Treatment
■ Sinus tachycardia: Appropriate sinus tachycardia does notneed any pharmacologic therapy to suppress the arrhythmia.The underlying cause of the tachycardia should be recog-nized and corrected.
■ Occasionally, sinus tachycardia may occur in a setting thatis not advantageous to the patient. For example, sinustachycardia may be related to pericarditis, acute myocar-dial infarction, congestive heart failure, or thyrotoxicosis.In these patients, it may be appropriate to slow down theheart rate with beta blockers and identify other causes ofsinus tachycardia that can be corrected. Beta blockers arestandard drugs for congestive heart failure resulting from
LWBK271-C14_180-183.qxd 29/1/09 9:06 pm Page 182 LWBK270-4119G-C02_073-110.qxd

Sinus Tachycardia 183
systolic dysfunction as well as for patients with acute my-ocardial infarction, whether or not sinus tachycardia ispresent. It is also commonly used to control sinus tachy-cardia associated with thyrotoxicosis.
■ Inappropriate sinus tachycardia: If secondary causes havebeen excluded and the sinus tachycardia is deemed inappro-priate, therapy includes beta blockers and nondihydropyri-dine calcium channel blockers such as diltiazem and vera-pamil. Beta blockers may be used as first-line therapy unlessthese agents are contraindicated. In patients who are resist-ant to pharmacologic therapy or patients who are unable totake oral therapy, sinus node modification using radiofre-quency ablation has been used successfully. This carries a riskof causing sinus node dysfunction and permanent pacingand should be considered only as a last resort.
■ POTS: Because the cause of POTS may be a primary sinusnode abnormality but could also be due to secondary causes,response to therapy is unpredictable.
■ Nonpharmacologic therapy: Volume expansion maybe required with proper regular oral hydration combinedwith high-sodium intake of up to 10 to 15 g daily, use ofcompressive stockings, sleeping with the head of the bedtilted up, and resistance training such as weight lifting.
■ Pharmacologic therapy: Pharmacologic therapy hasbeen shown to provide short-term, partial relief of symp-toms in approximately half of patients, regardless of theagent used.
n Beta blockers: If nonpharmacologic therapy is not effective, low-dose beta blockers such as propranolol20 to 30 mg three to four times daily may be tried be-cause the abnormality may be in the sinus node cellsor the result of hypersensitivity to endogenous betaagonists.
n Calcium channel blockers: If beta blockers are not effective or are contraindicated because of bron-chospastic pulmonary disease, calcium channel block-ers such as diltiazem or verapamil may be given. Thesedrugs are contraindicated when there is left ventricu-lar systolic dysfunction.
n Mineralocorticoids: Mineralocorticoids, such as flu-drocortisone 0.1 to 0.3 mg orally once daily, may beuseful when there is hypovolemia, which is often seenin POTS. This should be considered only after non-pharmacologic therapy has been tried. These agentsare usually combined with hydration and high sodiumintake.
n Adrenoceptor agonists: Adrenoceptor agonist such asmidodrine 2.5 to 10 mg three times daily orally hasbeen shown to improve symptoms during tilt tabletesting, although its efficacy during long-term therapyis not known.
n Serotonin reuptake inhibitors: Response to selectiveserotonin reuptake inhibitors is similar to that ofother pharmacologic agents.
■ Catheter ablation: Although catheter ablation or cathetermodification has been performed in some patients withPOTS, response to this type of therapy may be difficult topredict because the abnormality may be primarily in thesinus node but could also be due to secondary causes.
Prognosis
■ Appropriate sinus tachycardia: Sinus tachycardia is phys-iologic and is an expected normal response to a variety ofclinical situations. The overall prognosis of a patient with si-nus tachycardia depends on the underlying cause of the sinustachycardia and not the sinus tachycardia itself.
■ Pathologic sinus tachycardia: Therapy for pathologic si-nus tachycardia is given primarily to improve the quality oflife rather than to prolong survival. In supraventriculartachycardia from sinoatrial reentry, the tachycardia may beassociated with structural cardiac disease. The prognosis willdepend on the nature of the underlying cause. Pathologicsinus tachycardia has not been shown to cause tachycardiamediated cardiomyopathy.
■ POTS: Up to 80% of patients with POTS improve with mostreturning to normal functional capacity. Those with an-tecedent viral infection seem to have a better outcome.
Suggested Readings
Blomstrom-Lundqvist C, Scheinman MM, Aliot EM, et al.ACC/AHA/ESC guidelines for the management of patientswith supraventricular arrhythmias—executive summary: areport of the American College of Cardiology/AmericanHeart Association Task Force on Practice Guidelines, and theEuropean Society of Cardiology Committee for PracticeGuidelines (Writing Committee to Develop Guidelines forthe Management of Patients With Supraventricular Arrhyth-mias). J Am Coll Cardiol. 2003;42:1493–531.
Freeman R, Kaufman H. Postural tachycardia syndrome. 2007UptoDate. www.utdol.com.
Sandroni P, Opfer-Gehrking TL, McPhee BR, et al. Posturaltachycardia syndrome: clinical features and follow-up study.Mayo Clin Proc. 1999;74:1106–1110.
Singer W, Shen WK, Opfer-Gehrking TL, et al. Evidence of anintrinsic sinus node abnormality in patients with posturaltachycardia syndrome. Mayo Clin Proc. 2002;77:246–252.
Thieben MJ, Sandroni P, Sletten DM, et al. Postural orthostatictachycardia syndrome: the Mayo Clinic experience. MayoClin Proc. 2007;82:308–313.
Yussuf S, Camm J. Deciphering the sinus tachycardias. Clin Car-diol. 2005;28:267–276.
LWBK271-C14_180-183.qxd 29/1/09 9:06 pm Page 183 LWBK270-4119G-C02_073-110.qxd

15Supraventricular Tachycardia
184
Introduction
■ Tachycardia refers to a heart rate �100 beats per minute(bpm). The tachycardia may be supraventricular orventricular depending on the origin of the arrhythmia.■ Supraventricular tachycardia (SVT): If the tachy-
cardia originates above the bifurcation of the bundleof His, usually in the atria or atrioventricular (AV)junction, the tachycardia is supraventricular (Fig.15.1A). Supraventricular impulses follow the nor-mal AV conduction system, activate the ventriclessynchronously and will have narrow QRS complexesmeasuring �120 milliseconds. The QRS may bewide if there is preexistent bundle branch block,ventricular aberration, or the impulse is conductedthrough a bypass tract.
■ Ventricular tachycardia (VT): If the tachycardiaoriginates below the bifurcation of the bundle ofHis, the tachycardia is ventricular (Fig. 15.1B). Theimpulse will spread to the ventricles outside the nor-mal AV conduction system. Activation of the ventri-cles will not be synchronous resulting in wide QRScomplexes measuring �120 milliseconds.
■ There are other types of tachycardias with narrow QRScomplexes other than SVT. These include sinus tachy-cardia, atrial flutter, and atrial fibrillation. These tachy-cardias should be distinguished from each other be-cause the treatment of these various arrhythmias isdifferent.■ Sinus tachycardia: Sinus tachycardia implies that
the rhythm originates from the sinus node with arate that exceeds 100 bpm. Sinus tachycardia is anormal finding, which is usually an appropriate response to a physiologic or pathologic condition.This was previously discussed in Chapter 14, SinusTachycardia.
■ Atrial flutter: The diagnosis of atrial flutter is basedon the presence of a very regular atrial rate of 300 �50 bpm. This will be discussed separately in Chap-ter 18.
■ Atrial fibrillation: The diagnosis of atrial fibrilla-tion is based on an atrial rate of 400 � 50 bpm withcharacteristic baseline fibrillatory pattern and irreg-ularly irregular R-R intervals. This will also be dis-cussed separately.
■ Table 15.1 classifies the different types of narrow com-plex tachycardias.
■ SVT: SVT is a narrow complex tachycardia originatingoutside the sinus node but above the bifurcation of thebundle of His, with a rate that exceeds 100 bpm. Severaltypes of SVT are present and are classified according tothree general mechanisms: reentry, enhanced auto-maticity, and triggered activity.■ Reentry: SVT due to reentry is an abnormality in
the propagation of the electrical impulse resultingfrom the presence of two separate pathways withdifferent electrophysiologic properties (Fig. 15.2A).
Atria
Ventricles
B. Ventricular Tachycardia
Atria
Ventricles
A. Supraventricular
Tachycardia
Bifurcation of the Bundle of
His
Figure 15.1: Supraventricular and VentricularTachycardia (VT). (A) In supraventricular tachycardia, the im-pulses originate above the bifurcation of the bundle of His, fol-low the normal AV conduction system, and activate both ventri-cles synchronously resulting in narrow QRS complexes. (B) In VT,the impulses originate below the bifurcation of the bundle ofHis. Activation of the ventricles is not synchronous because theimpulse has to spread outside the normal conduction systemresulting in wide QRS complexes. The stars represent the originof the impulse. The horizontal line represents the bifurcation ofthe bundle of His.
LWBK271-C15_184-186.qxd 29/1/09 7:43 pm Page 184 LWBK270-4119G-C02_073-110.qxd

Supraventricular Tachycardia 185
■ Enhanced automaticity: This is an abnormality ininitiation rather than conduction of the electricalimpulse. Some cells in the atria or AV junction mayexhibit phase 4 diastolic depolarization and mayspontaneously discharge faster than that of the sinusnode if the discharge rate is enhanced (Fig. 15.2B).
■ Triggered activity: This is also an abnormality in initiation of the electrical impulse resulting from occurrence of afterdepolarizations. Afterdepolariza-tions are secondary depolarizations that are triggeredby the initial impulse (Fig. 15.2C). The afterdepolar-ization does not always reach threshold potential, butwhen it does, it may be followed by repetitive firing of
the membrane voltage. Triggered activity is usuallyseen in association with digitalis toxicity, calcium ex-cess, or increased catecholamines.
■ SVT from reentry usually occurs in normal individualswithout evidence of structural cardiac disease. SVT fromenhanced automaticity may occur in normal individu-als, although they are more frequently associated withstructural cardiac diseases, abnormalities in electrolytesand blood gasses, or use of pharmacologic agents. SVTfrom triggered activity usually occurs with digitalis ex-cess or after cardiac surgery. The differences betweenSVT from reentry, from enhanced automaticity, andfrom triggered activity are summarized in Table 15.2.
12
3
44
Late Afterdepolarizations
4
0 0
1
3
2
Early Afterdepolarizations
0 0
44
Slow diastolic depolarization Slow Pathway
Fast Pathway
A B C
Initial Impulse
Figure 15.2: Mechanisms of Supraventricular tachycardia (SVT). (A) Reentry is the most common mecha-nism of all SVT. In reentry, two separate pathways with different electrophysiologic properties are present.(B) Diagram of action potential of a cell with automatic properties.These cells exhibit slow phase 4 diastolic depo-larization, which may dominate as the pacemaker if the discharge rate is enhanced. (C) Diagram of action potentialof a cell with triggered activity. Oscillations occur early during phase 2 or phase 3, or late during phase 4 of theaction potential. The dotted horizontal lines in (B) and (C) represent threshold potential. Numbers 0 to 4 representthe different phases of the action potential. Adapted and modified from Wellens and Conover.
Sinus Atrial Atrial Tachycardia SVT Flutter Fibrillation
Sinus Rate Reentrant Automatic Atrial Rate Atrial Rate�100 • AVNRT • Atrial 300 � 50 400 � 50
• AVRT � Focal or unifocal• Intraatrial � Multifocal• Sinoatrial • Junctional
� Paroxysmal� Nonparoxysmal
Atrial Rate 200 � 50
Table shows the different tachycardias that can result in narrow QRS complexes. Generally, the atrialrate of atrial fibrillation is 400 � 50 bpm, for atrial flutter 300 � 50 bpm, for SVT approximately 200 � 50 and for sinus tachycardia �100 bpm. AVNRT, atrioventricular nodal reentrant tachycardia;AVRT, atrioventricular reciprocating tachycardia; SVT, supraventricular tachycardia.
Narrow Complex Tachycardia
TABLE 15.1
LWBK271-C15_184-186.qxd 29/1/09 7:43 pm Page 185 LWBK270-4119G-C02_073-110.qxd

186 Chapter 15
Suggested Readings
Conover MB. Arrhythmogenesis. In: Understanding Electrocar-diography. 5th ed. St. Louis: Mosby; 1988:31–41.
Wellens HJJ, Conover M. Drug induced arrhythmic emergencies.In: The ECG in Emergency Decision Making. 2nd ed. St. Louis:Saunders Elsevier; 2006:178.
Wit AL, Rosen MR. Cellular electrophysiology of cardiac ar-rhythmias. Part I. Arrhythmias caused by abnormal im-pulse generation. Mod Concepts Cardiovasc Dis. 1981;50:1–6.
Wit AL, Rosen MR. Cellular electrophysiology of cardiac ar-rhythmias. Part II. Arrhythmias caused by abnormal im-pulse conduction. Mod Concepts Cardiovasc Dis. 1981;50:7–12.
Reentry Enhanced Automaticity Triggered Activity
Mechanism
Initiation
Termination\
Underlying Condition
Examples of SVT
SVT, supraventricular tachycardia; AT, atrial tachycardia; AV, atrioventricular.
Differences between SVT because of Reentry, Enhanced Automaticity, and Triggered Activity
TABLE 15.2
This is an abnormality inimpulse conduction. Areentrant circuit is present.
Initiated by prematureimpulses or by rapid pacing.
Terminated by vagal maneuvers,AV nodal blockers, ectopicimpulses, overdrive pacing, orelectrical cardioversion.
Frequently seen in structurallynormal hearts.
• AV nodal reentry• AV reentry • Sinoatrial reentry• Intraatrial reentry
This is an abnormality in impulseinitiation. Cells with automaticproperties become thedominant pacemaker.
Initiated by increased firing rateof automatic cells in the atria orAV junction.
Not usually terminated by vagalmaneuvers, AV nodal blockers,ectopic impulses, overdrivepacing or electrical cardioversion.
Frequently seen in patients withmetabolic or pulmonarydisorders or patients onadrenergic drugs, caffeine,theophylline, or other agents.
• AT� Focal AT� Multifocal AT
• Junctional tachycardia� Focal or paroxysmal� Nonparoxysmal
Early or late after-depolarizations are present.
Initiation is not well defined.
May be terminated bypremature impulses,overdrive pacing, orelectrical cardioversion.
Frequently seen in patientswith digitalis toxicity orpostcardiac surgery.
• Atrial tachycardia with 2:1AV block
• Nonparoxysmal junctionaltachycardia
LWBK271-C15_184-186.qxd 29/1/09 7:43 pm Page 186 LWBK270-4119G-C02_073-110.qxd

Types of Reentrant SupraventricularTachycardia
■ Supraventricular tachycardia (SVT) from reentry:This accounts for approximately 80% to 90% of all sus-tained SVT in the general population. Reentrant SVTresults from abnormal propagation of the electricalimpulse because of the presence of two separate path-ways with different electrophysiologic properties.
■ There are four types of SVT from reentry. They are di-agrammatically shown in Figure 16.1A–D.■ Atrioventricular nodal reentrant tachycardia
(AVNRT): The reentrant circuit consists of a slowand fast pathway that circles around the AV node(Fig. 16.1A).
■ Atrioventricular reciprocating (or reentrant)tachycardia (AVRT): The tachycardia is associated
with a bypass tract connecting the atrium directly tothe ventricle (Fig. 16.1B).
■ Sinoatrial reentrant tachycardia (SART): Thetachycardia involves the sinus node and contiguousatrium (Fig. 16.1C).
■ Intra-atrial reentrant tachycardia (IART): Thetachycardia is confined to a small circuit within theatrium (Fig. 16.1D).
Atrioventricular Nodal Reentrant Tachycardia
■ AVNRT: AVNRT is the most common SVT occurring inthe general population. It usually affects young and healthyindividuals without evidence of structural heart diseaseand is twice more common in women than in men.
16Supraventricular Tachycardia
due to Reentry
187
Bypasstract
Sinus node
A B C D
Figure 16.1: Supraventricular Tachycardia (SVT) from Reentry. (A) AV nodal reentranttachycardia. The two pathways circle the AV node. This is the most common, occurring in more than60% of all reentrant narrow complex tachycardia. (B) AV reciprocating tachycardia. This type of SVT is as-sociated with a bypass tract connecting the atrium and ventricle. This is the next common occurring inapproximately 30% of all reentrant SVT. (C) Sinoatrial reentrant tachycardia. The reentrant circuit involvesthe sinus node and adjacent atrium. This type of SVT is rare. (D) Intraatrial reentrant tachycardia. A micro-reentrant circuit is present within the atria. This type of SVT is also rare. The red circles represent thereentrant circuit.The arrows point to the direction of the reentrant circuit. AV, atrioventricular.
LWBK271-C16_187-210.qxd 1/30/09 11:24 AM Page 187 Aptara Inc.
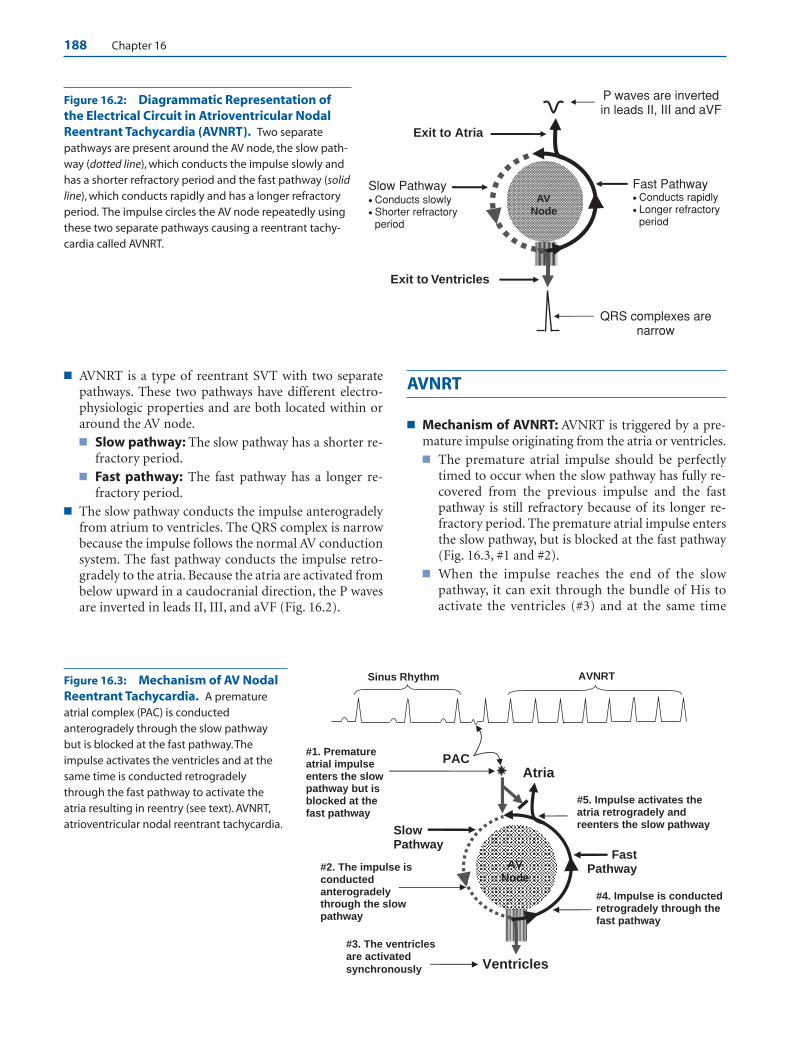
188 Chapter 16
■ AVNRT is a type of reentrant SVT with two separatepathways. These two pathways have different electro-physiologic properties and are both located within oraround the AV node.■ Slow pathway: The slow pathway has a shorter re-
fractory period.■ Fast pathway: The fast pathway has a longer re-
fractory period.■ The slow pathway conducts the impulse anterogradely
from atrium to ventricles. The QRS complex is narrowbecause the impulse follows the normal AV conductionsystem. The fast pathway conducts the impulse retro-gradely to the atria. Because the atria are activated frombelow upward in a caudocranial direction, the P wavesare inverted in leads II, III, and aVF (Fig. 16.2).
AVNRT
■ Mechanism of AVNRT: AVNRT is triggered by a pre-mature impulse originating from the atria or ventricles.■ The premature atrial impulse should be perfectly
timed to occur when the slow pathway has fully re-covered from the previous impulse and the fastpathway is still refractory because of its longer re-fractory period. The premature atrial impulse entersthe slow pathway, but is blocked at the fast pathway(Fig. 16.3, #1 and #2).
■ When the impulse reaches the end of the slowpathway, it can exit through the bundle of His toactivate the ventricles (#3) and at the same time
Slow Pathway • Conducts slowly • Shorter refractory
period
Fast Pathway • Conducts rapidly • Longer refractory
period
Exit to Atria
Exit to Ventricles
QRS complexes are narrow
P waves are inverted in leads II, III and aVF
AVNode
Figure 16.2: Diagrammatic Representation ofthe Electrical Circuit in Atrioventricular NodalReentrant Tachycardia (AVNRT). Two separatepathways are present around the AV node, the slow path-way (dotted line), which conducts the impulse slowly andhas a shorter refractory period and the fast pathway (solidline), which conducts rapidly and has a longer refractoryperiod. The impulse circles the AV node repeatedly usingthese two separate pathways causing a reentrant tachy-cardia called AVNRT.
Slow Pathway
Fast Pathway
Atria
Ventricles
#1. Prematureatrial impulse enters the slow pathway but is blocked at the fast pathway
#2. The impulse is conducted anterogradely through the slow pathway
#3. The ventricles are activated
synchronously
#4. Impulse is conducted retrogradely through the fast pathway
#5. Impulse activates the atria retrogradely and reenters the slow pathway
PAC
Sinus Rhythm AVNRT
AVNode
Figure 16.3: Mechanism of AV NodalReentrant Tachycardia. A prematureatrial complex (PAC) is conductedanterogradely through the slow pathwaybut is blocked at the fast pathway.Theimpulse activates the ventricles and at thesame time is conducted retrogradelythrough the fast pathway to activate theatria resulting in reentry (see text). AVNRT,atrioventricular nodal reentrant tachycardia.
LWBK271-C16_187-210.qxd 1/30/09 11:24 AM Page 188 Aptara Inc.
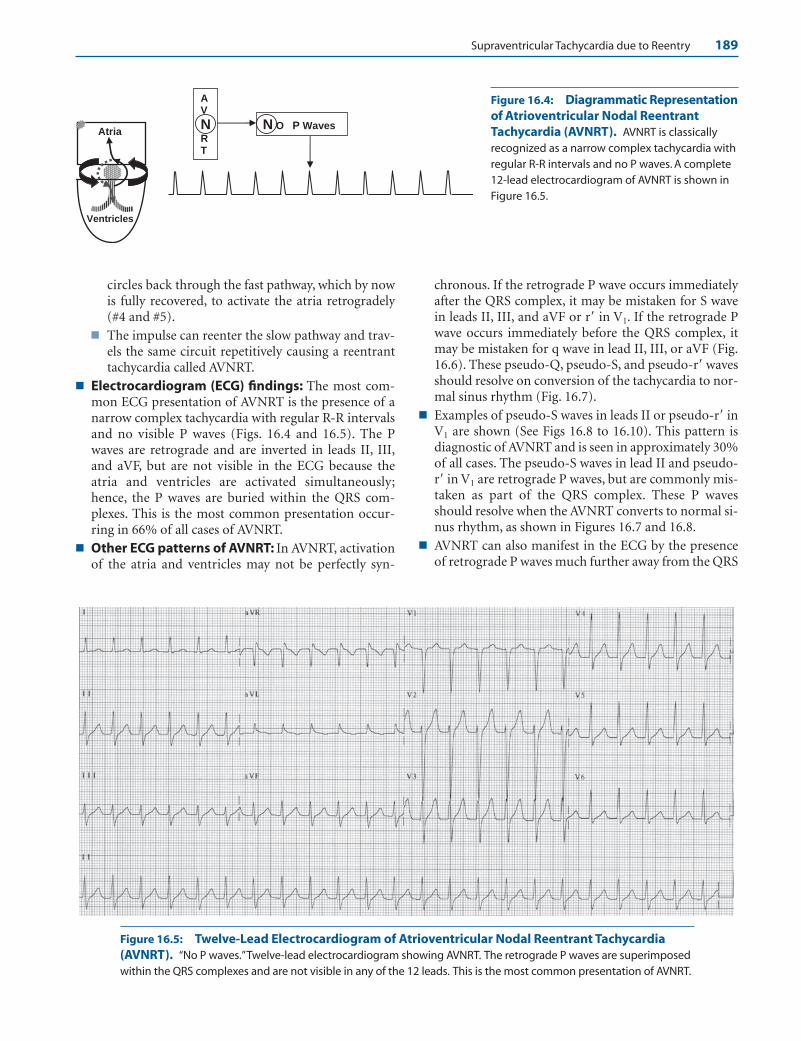
Supraventricular Tachycardia due to Reentry 189
circles back through the fast pathway, which by nowis fully recovered, to activate the atria retrogradely(#4 and #5).
■ The impulse can reenter the slow pathway and trav-els the same circuit repetitively causing a reentranttachycardia called AVNRT.
■ Electrocardiogram (ECG) findings: The most com-mon ECG presentation of AVNRT is the presence of anarrow complex tachycardia with regular R-R intervalsand no visible P waves (Figs. 16.4 and 16.5). The Pwaves are retrograde and are inverted in leads II, III,and aVF, but are not visible in the ECG because theatria and ventricles are activated simultaneously;hence, the P waves are buried within the QRS com-plexes. This is the most common presentation occur-ring in 66% of all cases of AVNRT.
■ Other ECG patterns of AVNRT: In AVNRT, activationof the atria and ventricles may not be perfectly syn-
chronous. If the retrograde P wave occurs immediatelyafter the QRS complex, it may be mistaken for S wavein leads II, III, and aVF or r� in V1. If the retrograde Pwave occurs immediately before the QRS complex, itmay be mistaken for q wave in lead II, III, or aVF (Fig.16.6). These pseudo-Q, pseudo-S, and pseudo-r� wavesshould resolve on conversion of the tachycardia to nor-mal sinus rhythm (Fig. 16.7).
■ Examples of pseudo-S waves in leads II or pseudo-r� inV1 are shown (See Figs 16.8 to 16.10). This pattern isdiagnostic of AVNRT and is seen in approximately 30%of all cases. The pseudo-S waves in lead II and pseudo-r� in V1 are retrograde P waves, but are commonly mis-taken as part of the QRS complex. These P wavesshould resolve when the AVNRT converts to normal si-nus rhythm, as shown in Figures 16.7 and 16.8.
■ AVNRT can also manifest in the ECG by the presenceof retrograde P waves much further away from the QRS
Atria
Ventricles
N O P Waves
AV
NRT
Figure 16.4: Diagrammatic Representationof Atrioventricular Nodal ReentrantTachycardia (AVNRT). AVNRT is classicallyrecognized as a narrow complex tachycardia withregular R-R intervals and no P waves. A complete12-lead electrocardiogram of AVNRT is shown inFigure 16.5.
Figure 16.5: Twelve-Lead Electrocardiogram of Atrioventricular Nodal Reentrant Tachycardia(AVNRT). “No P waves.”Twelve-lead electrocardiogram showing AVNRT. The retrograde P waves are superimposedwithin the QRS complexes and are not visible in any of the 12 leads. This is the most common presentation of AVNRT.
LWBK271-C16_187-210.qxd 1/30/09 11:24 AM Page 189 Aptara Inc.
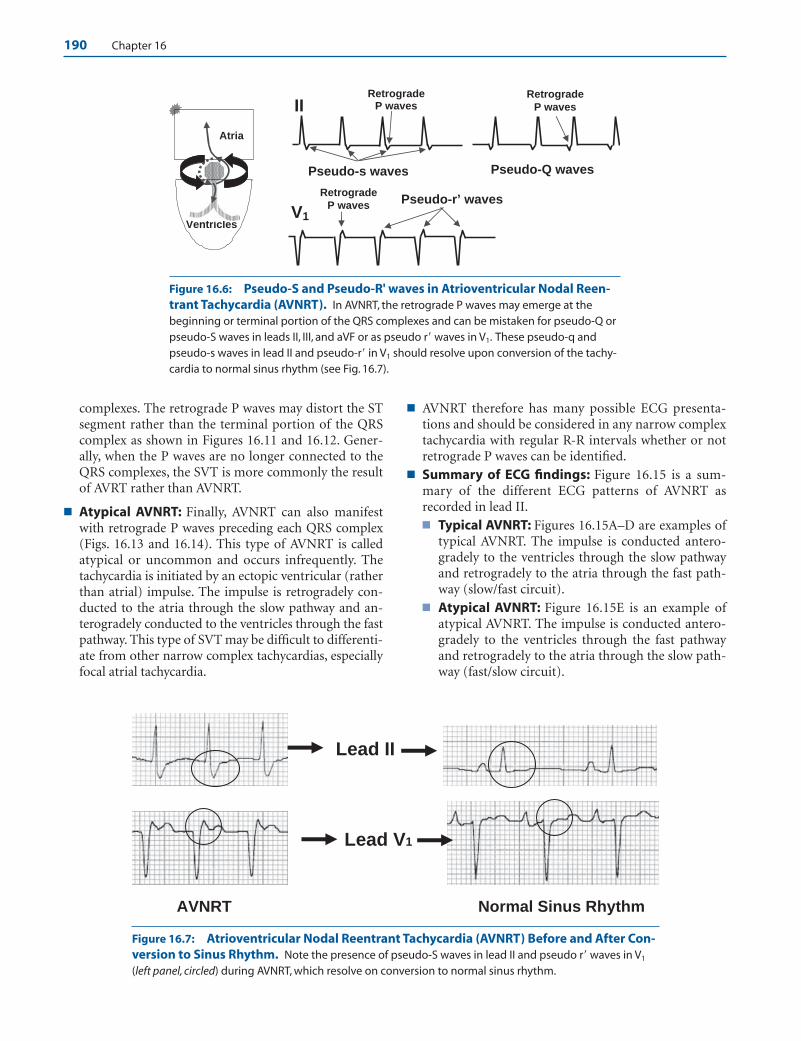
190 Chapter 16
complexes. The retrograde P waves may distort the STsegment rather than the terminal portion of the QRScomplex as shown in Figures 16.11 and 16.12. Gener-ally, when the P waves are no longer connected to theQRS complexes, the SVT is more commonly the resultof AVRT rather than AVNRT.
■ Atypical AVNRT: Finally, AVNRT can also manifestwith retrograde P waves preceding each QRS complex(Figs. 16.13 and 16.14). This type of AVNRT is calledatypical or uncommon and occurs infrequently. Thetachycardia is initiated by an ectopic ventricular (ratherthan atrial) impulse. The impulse is retrogradely con-ducted to the atria through the slow pathway and an-terogradely conducted to the ventricles through the fastpathway. This type of SVT may be difficult to differenti-ate from other narrow complex tachycardias, especiallyfocal atrial tachycardia.
■ AVNRT therefore has many possible ECG presenta-tions and should be considered in any narrow complextachycardia with regular R-R intervals whether or notretrograde P waves can be identified.
■ Summary of ECG findings: Figure 16.15 is a sum-mary of the different ECG patterns of AVNRT asrecorded in lead II.■ Typical AVNRT: Figures 16.15A–D are examples of
typical AVNRT. The impulse is conducted antero-gradely to the ventricles through the slow pathwayand retrogradely to the atria through the fast path-way (slow/fast circuit).
■ Atypical AVNRT: Figure 16.15E is an example ofatypical AVNRT. The impulse is conducted antero-gradely to the ventricles through the fast pathwayand retrogradely to the atria through the slow path-way (fast/slow circuit).
AVNRT Normal Sinus Rhythm
Lead II
Lead V1
Atria
Ventricles
Pseudo-r’ waves
Pseudo-s waves
V1
II
Pseudo-Q waves
Retrograde
P waves
RetrogradeP waves
RetrogradeP waves
Figure 16.6: Pseudo-S and Pseudo-R' waves in Atrioventricular Nodal Reen-trant Tachycardia (AVNRT). In AVNRT, the retrograde P waves may emerge at thebeginning or terminal portion of the QRS complexes and can be mistaken for pseudo-Q orpseudo-S waves in leads II, III, and aVF or as pseudo r� waves in V1. These pseudo-q andpseudo-s waves in lead II and pseudo-r� in V1 should resolve upon conversion of the tachy-cardia to normal sinus rhythm (see Fig. 16.7).
Figure 16.7: Atrioventricular Nodal Reentrant Tachycardia (AVNRT) Before and After Con-version to Sinus Rhythm. Note the presence of pseudo-S waves in lead II and pseudo r� waves in V1
(left panel, circled) during AVNRT, which resolve on conversion to normal sinus rhythm.
LWBK271-C16_187-210.qxd 1/30/09 11:24 AM Page 190 Aptara Inc.

Supraventricular Tachycardia due to Reentry 191
A. During tachycardia
B. Upon conversion to normal sinus rhythm
Pseudo-r’ waves Figure 16.8: AtrioventricularNodal Reentrant Tachycardia(AVNRT) with Pseudo-S andPseudo-R' waves. Complete 12-lead electrocardiogram duringAVNRT is shown (A). Note thepseudo-S waves in leads II and aVFand pseudo-r� in V1 (arrows), whichare no longer present on conversionof the AVNRT to normal sinusrhythm (B).
A. During Tachycardia
B.
Pseudo-S waves have disappeared upon conversion to sinus rhythm Pseudo-S waves
Figure 16.9: SpontaneousConversion of Atrioventricu-lar Nodal Reentrant Tachycar-dia (AVNRT) to Normal SinusRhythm. (A) A 12-lead ECG during AVNRT showing pseudo-Swaves in lead II (arrows). (B) Lead IIrhythm strip recorded from thesame patient during tachycardia(left half of rhythm strip) and afterspontaneous conversion to normalsinus rhythm (right half of rhythmstrip). Note that the pseudo-Swaves during AVNRT havedisappeared (arrow).
LWBK271-C16_187-210.qxd 1/30/09 11:24 AM Page 191 Aptara Inc.
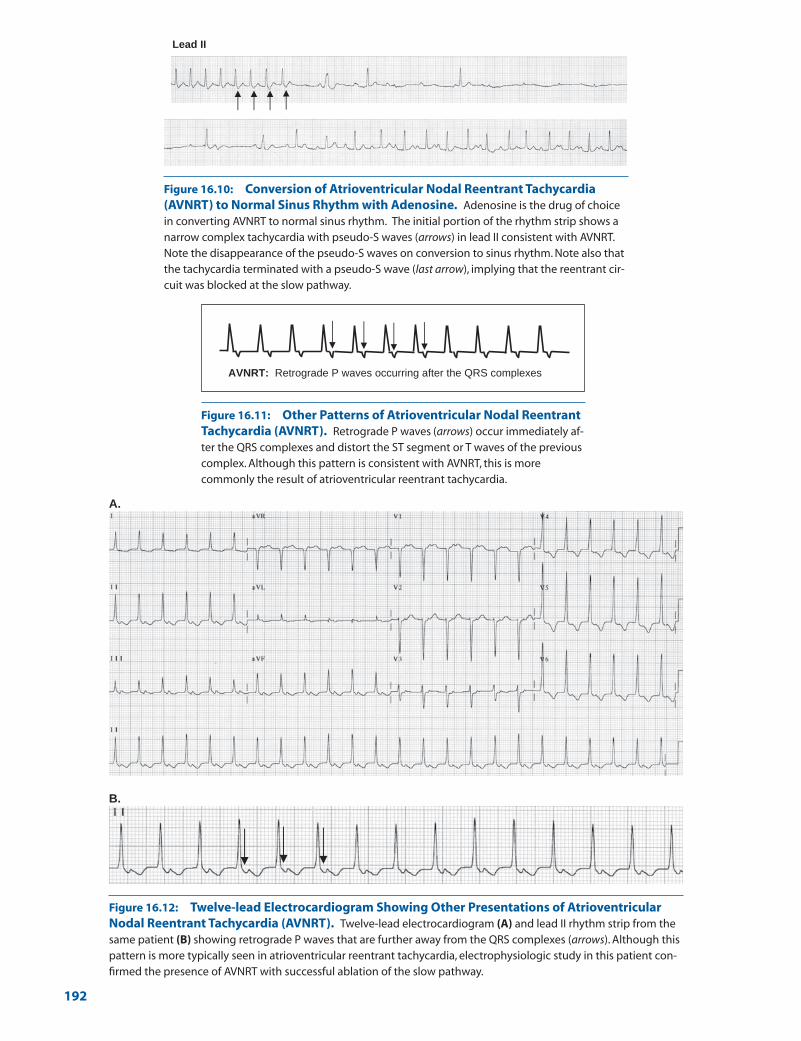
A.
B.
AVNRT: Retrograde P waves occurring after the QRS complexes
Lead II
Figure 16.10: Conversion of Atrioventricular Nodal Reentrant Tachycardia(AVNRT) to Normal Sinus Rhythm with Adenosine. Adenosine is the drug of choicein converting AVNRT to normal sinus rhythm. The initial portion of the rhythm strip shows anarrow complex tachycardia with pseudo-S waves (arrows) in lead II consistent with AVNRT.Note the disappearance of the pseudo-S waves on conversion to sinus rhythm. Note also thatthe tachycardia terminated with a pseudo-S wave (last arrow), implying that the reentrant cir-cuit was blocked at the slow pathway.
Figure 16.11: Other Patterns of Atrioventricular Nodal ReentrantTachycardia (AVNRT). Retrograde P waves (arrows) occur immediately af-ter the QRS complexes and distort the ST segment or T waves of the previouscomplex. Although this pattern is consistent with AVNRT, this is morecommonly the result of atrioventricular reentrant tachycardia.
Figure 16.12: Twelve-lead Electrocardiogram Showing Other Presentations of AtrioventricularNodal Reentrant Tachycardia (AVNRT). Twelve-lead electrocardiogram (A) and lead II rhythm strip from thesame patient (B) showing retrograde P waves that are further away from the QRS complexes (arrows). Although thispattern is more typically seen in atrioventricular reentrant tachycardia, electrophysiologic study in this patient con-firmed the presence of AVNRT with successful ablation of the slow pathway.
192
LWBK271-C16_187-210.qxd 1/30/09 11:24 AM Page 192 Aptara Inc.
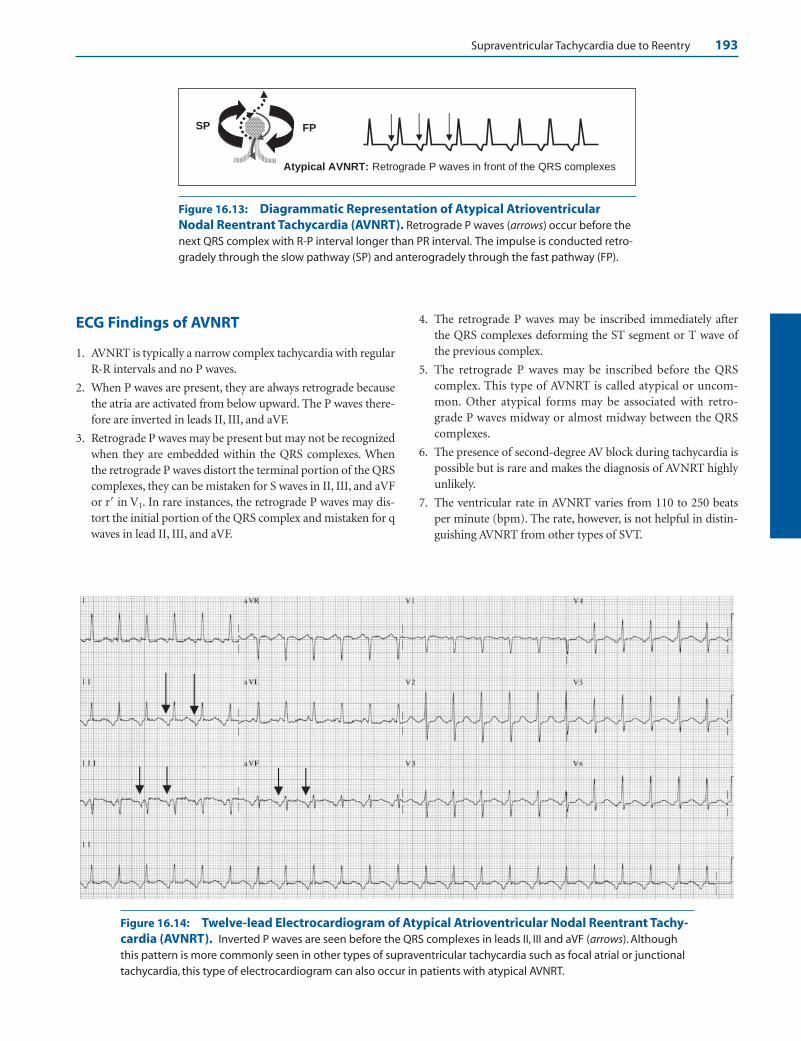
Supraventricular Tachycardia due to Reentry 193
Atypical AVNRT: Retrograde P waves in front of the QRS complexes
SP FP
Figure 16.13: Diagrammatic Representation of Atypical AtrioventricularNodal Reentrant Tachycardia (AVNRT). Retrograde P waves (arrows) occur before thenext QRS complex with R-P interval longer than PR interval. The impulse is conducted retro-gradely through the slow pathway (SP) and anterogradely through the fast pathway (FP).
Figure 16.14: Twelve-lead Electrocardiogram of Atypical Atrioventricular Nodal Reentrant Tachy-cardia (AVNRT). Inverted P waves are seen before the QRS complexes in leads II, III and aVF (arrows). Althoughthis pattern is more commonly seen in other types of supraventricular tachycardia such as focal atrial or junctionaltachycardia, this type of electrocardiogram can also occur in patients with atypical AVNRT.
ECG Findings of AVNRT
1. AVNRT is typically a narrow complex tachycardia with regularR-R intervals and no P waves.
2. When P waves are present, they are always retrograde becausethe atria are activated from below upward. The P waves there-fore are inverted in leads II, III, and aVF.
3. Retrograde P waves may be present but may not be recognizedwhen they are embedded within the QRS complexes. Whenthe retrograde P waves distort the terminal portion of the QRScomplexes, they can be mistaken for S waves in II, III, and aVFor r� in V1. In rare instances, the retrograde P waves may dis-tort the initial portion of the QRS complex and mistaken for qwaves in lead II, III, and aVF.
4. The retrograde P waves may be inscribed immediately afterthe QRS complexes deforming the ST segment or T wave ofthe previous complex.
5. The retrograde P waves may be inscribed before the QRScomplex. This type of AVNRT is called atypical or uncom-mon. Other atypical forms may be associated with retro-grade P waves midway or almost midway between the QRScomplexes.
6. The presence of second-degree AV block during tachycardia ispossible but is rare and makes the diagnosis of AVNRT highlyunlikely.
7. The ventricular rate in AVNRT varies from 110 to 250 beatsper minute (bpm). The rate, however, is not helpful in distin-guishing AVNRT from other types of SVT.
LWBK271-C16_187-210.qxd 1/30/09 11:24 AM Page 193 Aptara Inc.

194 Chapter 16
8. AVNRT should always be considered as a possible diagnosis inany narrow complex tachycardia with regular R-R intervals,regardless of the presence or absence of retrograde P waves be-cause this is the most common type of SVT.
Mechanism
■ AVNRT is an example of microreentry associated with a cir-cuit within or around the AV node. The reentrant circuitconsists of two separate pathways with different electricalproperties. The slow pathway has a short refractory periodand the fast pathway has a longer refractory period. Thetachycardia is precipitated by an ectopic impulse originatingfrom the atria or ventricles. The impulse has to occur whenone pathway is still refractory and the other has completelyrecovered. The tachycardia has a narrow QRS complex be-cause the impulse follows the normal conduction system andactivates the ventricles normally. The rate of the tachycardiais very regular because the impulse follows a fixed circuit.
■ Second-degree AV block is unusual but is possible duringAVNRT. It can potentially occur at the level of the His bundleor more distally, which is extremely rare when the tachycar-dia has narrow QRS complexes.
■ There are two types of AVNRT: typical and atypical.
■ Typical presentation: This is the most common presen-tation of AVNRT occurring in more than 90% of all cases.The slow pathway conducts the impulse to the ventriclesand the fast pathway conducts the impulse to the atria.This type of AVNRT is often called the slow/fast circuit.
n No P Waves: This is the most typical and most commonpresentation, occurring in approximately 66% of allAVNRT. The atrial impulse is conducted anterogradelyto the ventricles through the slow pathway and retro-gradely to the atria through the fast pathway. Activationof both atria and ventricles are simultaneous; thus, theP waves and QRS complexes are inscribed synchro-nously and no P waves are evident in the ECG.
n Retrograde P waves: When P waves are present, theyare inverted in leads II, III, and aVF because the atriaare activated from below upward. The P waves maydeform the terminal portion of the QRS complexesand mistaken for S waves in II, III, and aVF or r� in V1.This occurs in approximately 30% of all AVNRT. Theretrograde P waves may deform the initial portion ofthe QRS complex and mistaken for q waves in II, III,and aVF. This occurs in 4% of all AVNRT. The retro-grade P waves may also deform the ST segment or theinitial portion of the T wave, although this type ofAVNRT is rare.
■ Atypical presentation: The fast pathway conducts theimpulse to the ventricles and the slow pathway conductsthe impulse to the atria. This fast/slow circuit is rare.
n The atypical form is characterized by retrograde Pwaves in front of the QRS complexes. This is oftenprecipitated by an ectopic ventricular impulse retro-gradely conducted to the atria through the slow path-way and anterogradely conducted to the ventriclesthrough the fast pathway.
ECG of AVNRT in Lead II
A
B
C
D
E
No P waves. This is the most commonpresentation of AVNRT occurring in66% of all cases. The P waves are
centered within the QRS complexes.
Retrograde P waves after the QRScomplex. This is rare and is almostalways due to AVRT.
Atypical AVNRT: This is rare and ismore commonly due to focal atrialtachycardia.
Pseudo S waves: 30%
Pseudo q waves: 4%.
Figure 16.15: Summary of the Differ-ent Patterns of AtrioventricularNodal Reentrant Tachycardia(AVNRT). (A–E) The different possibleelectrocardiogram patterns of AVNRT in leadII. Arrows identify the retrograde P waves.
LWBK271-C16_187-210.qxd 1/30/09 11:24 AM Page 194 Aptara Inc.

Supraventricular Tachycardia due to Reentry 195
n Other atypical forms may be associated with retro-grade P waves midway or almost midway between theQRS complexes.
Clinical Significance
■ SVT from reentry is the most common sustained narrowcomplex tachycardia in the general population accountingfor approximately 80% to 90% of all SVT. Among the SVTdue to reentry, AVNRT is the most common occurring inmore than 60% of all reentrant SVT. AVNRT is frequentlyseen in normal healthy individuals without structural car-diac disease and is more common in females.
■ AVNRT can occur suddenly and terminate abruptly and istherefore paroxysmal. This contrasts with sinus tachycardiawhere the tachycardia is nonparoxysmal with gradual onset andgradual termination. SVT from reentry are usually episodic oc-curring for a few minutes to a few hours and are recurrent. Un-like SVT from enhanced automaticity, they are rarely incessant,meaning that the tachycardia rarely persists for �12 hours a day.
■ AVNRT is generally tolerable except in patients with stenoticvalves, ischemic heart disease, left ventricular (LV) dysfunc-tion, or cardiomyopathy. In these patients, hypotension orsymptoms of low cardiac output, myocardial ischemia, heartfailure, or actual syncope may occur during tachycardia. It canalso cause symptoms even among healthy patients when thetachycardia is unusually rapid; thus, syncope can occur whenthe tachycardia starts abruptly with a very fast rate or termi-nates with a very long pause because of overdrive suppressionof the sinus node. The latter occurs when the tachycardia isassociated with sinus node dysfunction. It is rarely associatedwith mortality or morbidity in otherwise healthy individuals.
■ Although physical examination is usually not helpful in thediagnosis of SVT, prominent neck vein pulsations are oftenpresent and may be the patient’s chief complaint duringtachycardia. These neck vein pulsations are due to cannon Awaves, which occur when atrial contraction is simultaneouswith ventricular contraction due to retrograde P waves oc-curring within or immediately after the QRS complex. Thetachycardia causes atrial stretch, which may be followed by aperiod of diuresis due to release of atrial natriuretic peptide.
Acute Treatment
■ Unless the patient is severely hypotensive or in cardiogenicshock, immediate electrical cardioversion is rarely necessaryin patients with AVNRT because the tachycardia is well toler-ated. Vagal maneuvers and pharmacologic therapy are usu-ally very effective in terminating the tachycardia.
■ Vagal maneuvers: Vagal stimulation should be attemptedas the initial therapeutic maneuver before any pharmaco-logic agent is given. The ECG should be recorded when vagalstimulation is performed because vagal stimulation is notonly effective in terminating the tachycardia, but is also help-ful as a diagnostic maneuver if the tachycardia turns out to bedue to other arrhythmias.
■ Carotid sinus pressure: The most commonly used andmost effective vagal maneuver in terminating SVT iscarotid sinus pressure. Carotid sinus pressure is alwaysperformed under cardiac monitoring in the recumbentposition. With the neck hyperextended, the commoncarotid artery is identified by its pulsations and followeddistally as close to the mandible as possible, usually at theangle of the jaw where the artery bifurcates into externaland internal carotid arteries. It is at this bifurcation wherethe carotid sinus is located. Carotid sinus pressure is per-formed by applying gentle but constant pressure to thepulsating artery using both middle and index fingers. Pres-sure should be applied initially only for a few seconds un-til slowing of the heart rate can be identified in the cardiacmonitor. The maneuver can be repeated several moretimes by pressing the artery at longer intervals if needed,especially if the previous maneuvers are unsuccessful ineliciting any response. There is no need to rub or massagethe artery or press the pulsating artery for longer than 5 seconds at a time. Constant gentle pressure on the arteryis all that is necessary. Only one artery should be pressed atany time. If there is no response, the same maneuvershould be tried on the other carotid artery. This maneuvercan also be repeated if the SVT persists after a pharmaco-logic agent has been given, but is not effective in terminat-ing the tachycardia. Occasionally, a tachycardia that is previously unresponsive to carotid sinus pressure may be-come more responsive after an intravenous medicationsuch as calcium channel blocker or digoxin has been given.If carotid stenosis is suspected by the presence of a carotidbruit, carotid sinus pressure should not be attempted.
■ Pharyngeal stimulation: A tongue blade is positionedat the back of the tongue as if performing a routineoropharyngeal examination. The tongue blade is gentlybrushed to the pharynx to make the patient gag.
■ Valsalva maneuver: This can be performed by severalmethods. The simplest is to instruct the patient to tense theabdominal muscles by exhaling forcefully against a closedglottis. The examiner can also make a fist, which is gentlyplaced on the patient’s abdomen. The patient, who is re-cumbent, is instructed to resist by tensing the abdominalmuscles as the examiner’s fist is gently pressed on the ab-domen. The procedure can also be performed by blowingforcefully through a spirometer, balloon, or brown bag.This can also be done by straining, as if the patient is liftinga heavy object. The patient, who is recumbent, is asked tocross both legs on top of one another and instructed to liftthem together while resistance is being applied to preventthe legs from being lifted. The Valsalva maneuver shouldnot be performed if the patient is severely hypertensive, incongestive failure, or if an acute coronary event is suspectedor patient is hemodynamically unstable.
■ Forceful coughing.
■ Diving reflex: When the face comes in contact with coldwater, bradycardia usually occurs and is known as the diving
LWBK271-C16_187-210.qxd 1/30/09 11:24 AM Page 195 Aptara Inc.

196 Chapter 16
reflex. This can be done at bedside by immersing the facein iced water.
■ Ocular pressure: This vagal maneuver is not recom-mended since retinal detachment may occur as a poten-tial complication of the procedure especially if doneforcefully.
■ Pharmacologic therapy: ABCD are the drugs of choice forthe treatment of AVNRT. (A, adenosine; B, beta blockers; C,calcium channel blockers; D, digoxin). These drugs are notnecessarily given in alphabetical order.
■ Adenosine: If vagal maneuvers are not successful in termi-nating the tachycardia, adenosine is the drug of choice forterminating AVNRT.
■ Adenosine should not be given if the patient has bron-chospastic pulmonary disease because adenosine can pre-cipitate asthma.
■ The initial dose of adenosine is 6 mg given as an intravenousbolus. The injection should be given rapidly within 1 to 2seconds preferably to a proximal vein followed by a salineflush. If a peripheral vein is used, the arm where the injec-tion was given should be immediately raised. If the arrhyth-mia has not converted to normal sinus rhythm, another bo-lus using a bigger dose of 12 mg is given IV. A third and finaldose of 12 mg may be repeated if the tachycardia has not re-sponded to the two previous doses. Approximately 60% ofpatients with AVNRT will convert with the first dose within1 minute and up to 92% after a 12-mg dose.
■ Adenosine is very effective in terminating AVNRT, but isalso helpful in the diagnosis of other arrhythmias espe-cially atrial flutter with 2:1 block. A 12-lead ECG or arhythm strip should be recorded when adenosine is in-jected. When adenosine converts AVNRT to normal sinusrhythm, the tachycardia ends with a retrograde P wave,implying that the tachycardia was blocked at the slowpathway, which is usually the most vulnerable part of thereentrant circuit. The response of AVRT to adenosine issimilar, ending with a retrograde P wave because bothtachycardias are AV node–dependent. Focal atrial tachy-cardia is not AV node–dependent, although it may re-spond to adenosine. When focal atrial tachycardia termi-nates, the tachycardia ends with a QRS complex ratherthan a P wave. Atrial flutter with 2:1 block will not re-spond to adenosine, but will slow the ventricular rate sig-nificantly allowing the diagnosis of atrial flutter to be-come obvious by the presence of a regular sawtooth, wavyundulating baseline between the QRS complexes.
■ Adenosine is potentiated by dipyridamole, since dipyri-damole prevents the metabolic breakdown of adenosine. Itis also potentiated by carbamazepine, which may result inprolonged asystole on conversion of the tachycardia to nor-mal sinus rhythm. If the patient is taking dipyridamole orcarbamazepine, the initial dose should be cut in half to 3 mg.
■ Theophylline is the antidote for adenosine. If the patientis on theophylline, higher doses of adenosine may begiven to treat the SVT if there is no history of bron-
chospastic pulmonary disease. If the patient has reactiveairway disease, adenosine can cause bronchospasm.
■ If the SVT has not responded after three doses of adenosineor if adenosine is contraindicated, another pharmacologicagent should be tried. The choice of the next pharmacologicagent will depend on the presence or absence of LV dysfunc-tion or clinical congestive heart failure.
■ Preserved LV functionn Calcium channel clockers: In patients with preserved
LV function, the next drug of choice after failure to ter-minate AVNRT with adenosine is verapamil or dilti-azem. If the patient is not hypotensive, 2.5 to 5 mg ofverapamil is given IV slowly over 2 minutes undercareful ECG and blood pressure monitoring. If there isno response and the patient remains stable, additionaldoses of 5 to 10 mg may be given every 15 to 30 min-utes until a total dose of 20 mg is given. Alternate dos-ing with verapamil is to give 5 mg boluses every 15minutes not to exceed 30 mg. Verapamil is effective inup to 90% of patients. Verapamil is a hypotensive andnegatively inotropic agent and should not be givenwhen there is congestive heart failure or LV dysfunc-tion. Diltiazem is another calcium channel blocker thatcan be given at an initial dose of 0.25 mg per kg (equiv-alent to approximately 15 to 20 mg in a 70-kg patient)over 2 minutes. If the tachycardia has not terminatedwith the first bolus, a higher dose of 0.35 mg/kg or 25mg is given after 15 minutes. This is followed by amaintenance IV dose of 5 to 15 mg/hour if needed.Diltiazem is shorter acting and less hypotensive thanverapamil and may be better tolerated in some pa-tients. In patients who become hypotensive with vera-pamil or diltiazem, calcium gluconate or calcium chlo-ride 5% 10 mL may be given intravenously to reversethe hypotension. For more detailed dosing of vera-pamil or diltiazem, see Appendix.
n Beta Blockers: Beta blockers (metoprolol, atenolol,propranolol, or esmolol) may be tried if the patienthas not responded to the above therapy. Beta blockersshould not be given when there is congestive heartfailure or evidence of LV systolic dysfunction, hy-potension, or bronchospastic pulmonary disease.
n Metoprolol is given intravenously slowly at a dose of5 mg and repeated two more times every 5 minutesif necessary for a total dose of 15 mg in 15 minutes.
n Atenolol is given IV slowly 5 mg over 5 minutesand repeated once after 10 minutes if needed if thefirst dose was well tolerated.
n Propranolol is given at a dose of 0.1 mg/kg. The drugis given IV slowly not to exceed 1 mg per minuteuntil the arrhythmia is terminated. A second dosemay be repeated after 2 minutes if needed.
n Esmolol is given at an initial dose of 0.5 mg/kg in-fused over a minute. This is followed by a mainte-nance infusion of 0.05 mg/kg/min for the next 4
LWBK271-C16_187-210.qxd 1/30/09 11:24 AM Page 196 Aptara Inc.
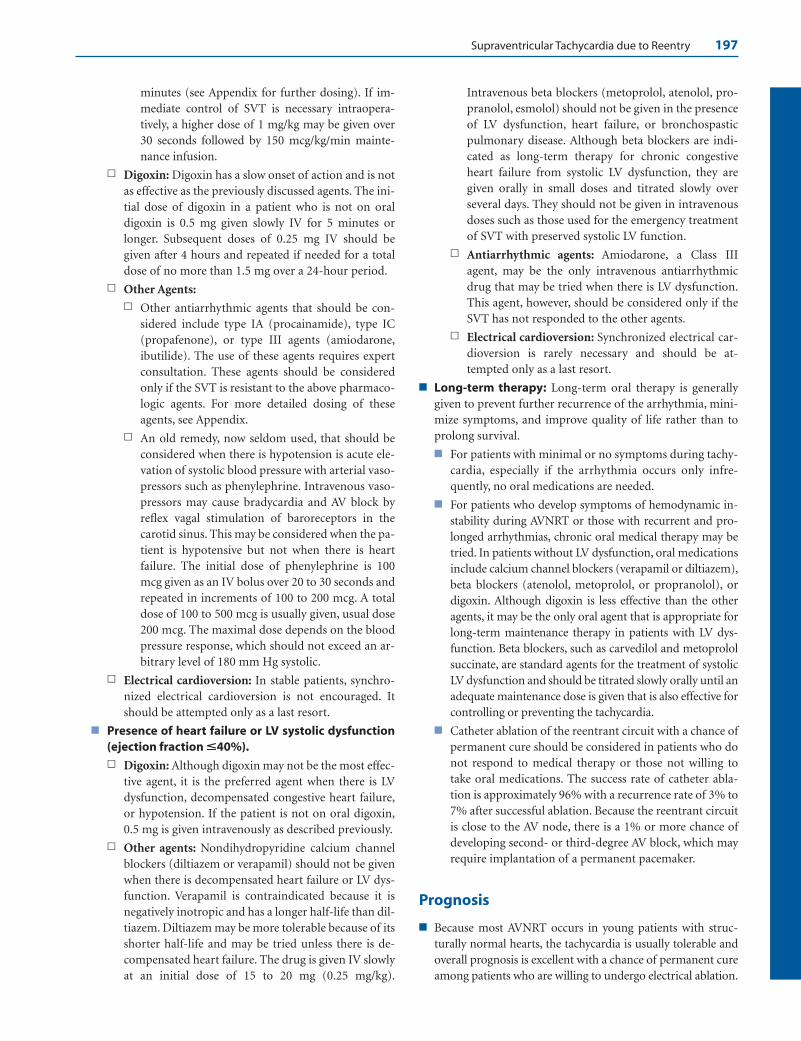
Supraventricular Tachycardia due to Reentry 197
minutes (see Appendix for further dosing). If im-mediate control of SVT is necessary intraopera-tively, a higher dose of 1 mg/kg may be given over30 seconds followed by 150 mcg/kg/min mainte-nance infusion.
n Digoxin: Digoxin has a slow onset of action and is notas effective as the previously discussed agents. The ini-tial dose of digoxin in a patient who is not on oraldigoxin is 0.5 mg given slowly IV for 5 minutes orlonger. Subsequent doses of 0.25 mg IV should begiven after 4 hours and repeated if needed for a totaldose of no more than 1.5 mg over a 24-hour period.
n Other Agents:n Other antiarrhythmic agents that should be con-
sidered include type IA (procainamide), type IC(propafenone), or type III agents (amiodarone,ibutilide). The use of these agents requires expertconsultation. These agents should be consideredonly if the SVT is resistant to the above pharmaco-logic agents. For more detailed dosing of theseagents, see Appendix.
n An old remedy, now seldom used, that should beconsidered when there is hypotension is acute ele-vation of systolic blood pressure with arterial vaso-pressors such as phenylephrine. Intravenous vaso-pressors may cause bradycardia and AV block byreflex vagal stimulation of baroreceptors in thecarotid sinus. This may be considered when the pa-tient is hypotensive but not when there is heartfailure. The initial dose of phenylephrine is 100mcg given as an IV bolus over 20 to 30 seconds andrepeated in increments of 100 to 200 mcg. A totaldose of 100 to 500 mcg is usually given, usual dose200 mcg. The maximal dose depends on the bloodpressure response, which should not exceed an ar-bitrary level of 180 mm Hg systolic.
n Electrical cardioversion: In stable patients, synchro-nized electrical cardioversion is not encouraged. Itshould be attempted only as a last resort.
■ Presence of heart failure or LV systolic dysfunction(ejection fraction �40%).n Digoxin: Although digoxin may not be the most effec-
tive agent, it is the preferred agent when there is LVdysfunction, decompensated congestive heart failure,or hypotension. If the patient is not on oral digoxin,0.5 mg is given intravenously as described previously.
n Other agents: Nondihydropyridine calcium channelblockers (diltiazem or verapamil) should not be givenwhen there is decompensated heart failure or LV dys-function. Verapamil is contraindicated because it isnegatively inotropic and has a longer half-life than dil-tiazem. Diltiazem may be more tolerable because of itsshorter half-life and may be tried unless there is de-compensated heart failure. The drug is given IV slowlyat an initial dose of 15 to 20 mg (0.25 mg/kg).
Intravenous beta blockers (metoprolol, atenolol, pro-pranolol, esmolol) should not be given in the presenceof LV dysfunction, heart failure, or bronchospasticpulmonary disease. Although beta blockers are indi-cated as long-term therapy for chronic congestiveheart failure from systolic LV dysfunction, they aregiven orally in small doses and titrated slowly overseveral days. They should not be given in intravenousdoses such as those used for the emergency treatmentof SVT with preserved systolic LV function.
n Antiarrhythmic agents: Amiodarone, a Class IIIagent, may be the only intravenous antiarrhythmicdrug that may be tried when there is LV dysfunction.This agent, however, should be considered only if theSVT has not responded to the other agents.
n Electrical cardioversion: Synchronized electrical car-dioversion is rarely necessary and should be at-tempted only as a last resort.
■ Long-term therapy: Long-term oral therapy is generallygiven to prevent further recurrence of the arrhythmia, mini-mize symptoms, and improve quality of life rather than toprolong survival.
■ For patients with minimal or no symptoms during tachy-cardia, especially if the arrhythmia occurs only infre-quently, no oral medications are needed.
■ For patients who develop symptoms of hemodynamic in-stability during AVNRT or those with recurrent and pro-longed arrhythmias, chronic oral medical therapy may betried. In patients without LV dysfunction, oral medicationsinclude calcium channel blockers (verapamil or diltiazem),beta blockers (atenolol, metoprolol, or propranolol), ordigoxin. Although digoxin is less effective than the otheragents, it may be the only oral agent that is appropriate forlong-term maintenance therapy in patients with LV dys-function. Beta blockers, such as carvedilol and metoprololsuccinate, are standard agents for the treatment of systolicLV dysfunction and should be titrated slowly orally until anadequate maintenance dose is given that is also effective forcontrolling or preventing the tachycardia.
■ Catheter ablation of the reentrant circuit with a chance ofpermanent cure should be considered in patients who donot respond to medical therapy or those not willing totake oral medications. The success rate of catheter abla-tion is approximately 96% with a recurrence rate of 3% to7% after successful ablation. Because the reentrant circuitis close to the AV node, there is a 1% or more chance ofdeveloping second- or third-degree AV block, which mayrequire implantation of a permanent pacemaker.
Prognosis
■ Because most AVNRT occurs in young patients with struc-turally normal hearts, the tachycardia is usually tolerable andoverall prognosis is excellent with a chance of permanent cureamong patients who are willing to undergo electrical ablation.
LWBK271-C16_187-210.qxd 1/30/09 11:24 AM Page 197 Aptara Inc.

198 Chapter 16
Atrioventricular ReciprocatingTachycardia
■ AVRT: AVRT is the second most common SVT occur-ring in approximately 30% of all reentrant SVT. Thistype of SVT is associated with a bypass tract that con-nects the atrium directly to the ventricle.
■ Normally, an atrial impulse can conduct to the ventriclesonly through the AV node. When a bypass tract is pres-ent, a second pathway is created for reentry to occur.Thus, an atrial impulse can enter the ventricles throughthe AV node and return to the atria through the bypasstract (Fig. 16.16A) or enter the ventricle through the by-pass tract and return to the atria through the AV node(Fig. 16.16B).
■ AVRT may have narrow or wide QRS complexes:■ AVRT with narrow QRS complexes: When the
atrial impulse enters the ventricles through the AVnode and returns to the atria through the bypass
tract, the QRS complex will be narrow. This type oftachycardia is called orthodromic AVRT (Fig. 16.16A).
■ AVRT with wide QRS complexes: When the atrialimpulse enters the ventricles through the bypasstract and returns to the atria through the AV node,the QRS complex will be wide. This type of tachy-cardia is called antidromic AVRT (Fig. 16.16B). An-tidromic AVRT is an example of SVT with wide QRScomplexes and will be further discussed in Chapter20, Wolff-Parkinson-White Syndrome.
■ Mechanism: AVRT with narrow QRS complexes istriggered by a premature impulse originating from theatria or ventricles. The diagram below illustrates howthe tachycardia is initiated by a premature atrial com-plex (PAC) (Fig. 16.17).■ The PAC should be perfectly timed to occur when
the AV node (the slow pathway) has fully recovered,while the bypass tract (the fast pathway) is still re-fractory from the previous impulse. Because the AVnode has a shorter refractory period, the premature
(#2) The impulse isconducted throughthe AV node slowly
(#4) Impulseenters bypasstract fromventricles toatrium
Atria
Ventricles
PAC(#5) Impulse activatesatria retrogradely andreenters AV node
(#3) Both ventriclesare activated
synchronously
(#1) Prematureatrial complexenters the AVnode but notthe bypasstract
QRS complexes arenarrow since theventricles are activatedthrough the AV node
Atrial Impulseenters AV node
Atrial Impulse
enters bypass tract
QRS complexes arewide since ventriclesare activated through
the bypass tract
A. Orthodromic AVRT
Bypass tract
B. Antidromic AVRT
Figure 16.16: Orthodromic andAntidromic Atrioventricular Reen-trant Tachycardia (AVRT).In orthodromic AVRT (A), the QRS com-plexes are narrow since the ventriclesare activated through the normal AVconduction system. In antidromic AVRT(B), the QRS complexes are widebecause the ventricles are activatedthrough the bypass tract.
Figure 16.17: Mechanism of NarrowComplex Atrioventricular ReentrantTachycardia (AVRT). The diagramshows how a narrow complex AVRT is initi-ated by a premature atrial complex (PAC).The PAC finds the bypass tract stillrefractory because of its longer refractoryperiod but is conducted through the AVnode, which has a shorter refractory period,resulting in AVRT with narrow QRScomplexes (see text).
LWBK271-C16_187-210.qxd 1/30/09 11:24 AM Page 198 Aptara Inc.

Supraventricular Tachycardia due to Reentry 199
atrial impulse will enter the AV node but not the by-pass tract (Fig. 16.17, #1).
■ The impulse conducts slowly through the AV node(#2) and activates the ventricles normally resulting ina narrow QRS complex (#3). After the ventricles areactivated, the impulse circles back through the bypasstract (#4) and activates the atria retrogradely (#5).
■ After the atria are activated, the impulse can againenter the AV node and the circuit starts all over again.
■ In AVRT, the reentrant circuit involves a large mass oftissue consisting of the atria, AV node, bundle of His,bundle branches and fascicles, ventricles, and bypasstract before returning to the atria. AVRT therefore is aform of macro-reentry.
■ ECG Findings: Narrow complex AVRT has the follow-ing features:■ The atria and ventricles are essential components of
the circuit; thus, activation of the atria and ventri-cles cannot be simultaneous. The P wave, therefore,cannot be buried within the QRS complex. It shouldalways be inscribed outside the QRS complexes.
■ Because the atria are activated from the bypass tract,the P waves are inscribed retrogradely. The P wavesare usually inverted in II, III, and aVF although theconfiguration of the P wave may vary depending onthe location of the bypass tract.
■ Typically, the retrograde P waves are inscribed im-mediately after the QRS complexes and deform theST segments. Thus, the R-P interval is shorter thanthe PR interval (Fig. 16.18). This is the typical ormost common presentation of AVRT.
■ AV block is not possible during AVRT because theatria and ventricles are essential components of thecircuit; thus, every retrograde P wave is always fol-lowed by a QRS complex during tachycardia. WhenAV block occurs, the reentrant circuit (and thereforethe tachycardia) will terminate.
■ An example of AVRT is shown in Figure 16.19. Notethat the P waves are retrograde and are inverted in leadsII, III, and aVF and also in V4 to V6. The retrograde P
wave is inscribed immediately after the QRS complex,deforming the ST segment of the previous QRS complexwith an R-P interval that is shorter than the PR interval.
■ Other examples of narrow complex tachycardia withretrograde P waves immediately after the QRS complexare shown in Figs. 16.20 to 16.22. The retrograde Pwaves may be mistaken for inverted T waves.
■ There are two types of narrow complex (orthodromic)AVRT: typical and atypical (see Figs. 16.22 to 16.25).■ Typical AVRT: AVRT is typical when the retrograde P
waves are inscribed immediately after the QRS com-plex and deform the ST segment or T wave of the pre-ceding complex (Figs. 16.21 and 16.22). Conductionfrom ventricle to atrium across the bypass tract (R-Pinterval) is faster than conduction from atrium toventricle across the AV node (PR interval); thus, theR-P interval is shorter than the PR interval. In typicalAVRT, the AV node is the slow pathway and the by-pass tract is the fast pathway (slow/fast activation).Virtually all cases of AVRT present in this manner.
■ Atypical AVRT: AVRT is atypical when the retro-grade P waves occur in front of the QRS complexes(Fig. 16.23); thus, the R-P interval is longer than thePR interval. Atypical AVRT is associated with aslowly conducting bypass tract. Conduction fromventricle to atrium across the bypass tract (R-P in-terval) is slower than conduction from atrium toventricle (PR interval) across the AV node (fast/slowactivation). This type of AVRT is rare. The ECG ofatypical AVRT is similar to that of atypical AVNRT.
■ Typical AVRT versus AVNRT: When retrograde Pwaves are inscribed immediately after the QRS com-plexes during tachycardia, AVRT may be difficult to dif-ferentiate from AVNRT (Fig. 16.24). One clue in differ-entiating AVRT from AVNRT is the duration of the R-Pinterval (Figs. 16.21 and 16.22A). The R-P interval inAVRT should measure �80 milliseconds in the surfaceECG because this is the minimum time required for theimpulse to travel from ventricles to atria across the by-pass tract. If the retrograde P wave is too close to the QRScomplex and the R-P interval is �80 milliseconds, as
Retrograde P wave is closer to theprevious QRS Comple
R-P Interval shorter PR Interval longer
Leads II, III or aVF Figure 16.18: Typical Atrioventric-ular Reentrant Tachycardia(AVRT). In AVRT, the retrograde Pwave is inscribed immediately after theQRS complex with the R-P intervalshorter than the PR interval.This is thetypical or most common presentationof AVRT.
LWBK271-C16_187-210.qxd 1/30/09 11:24 AM Page 199 Aptara Inc.
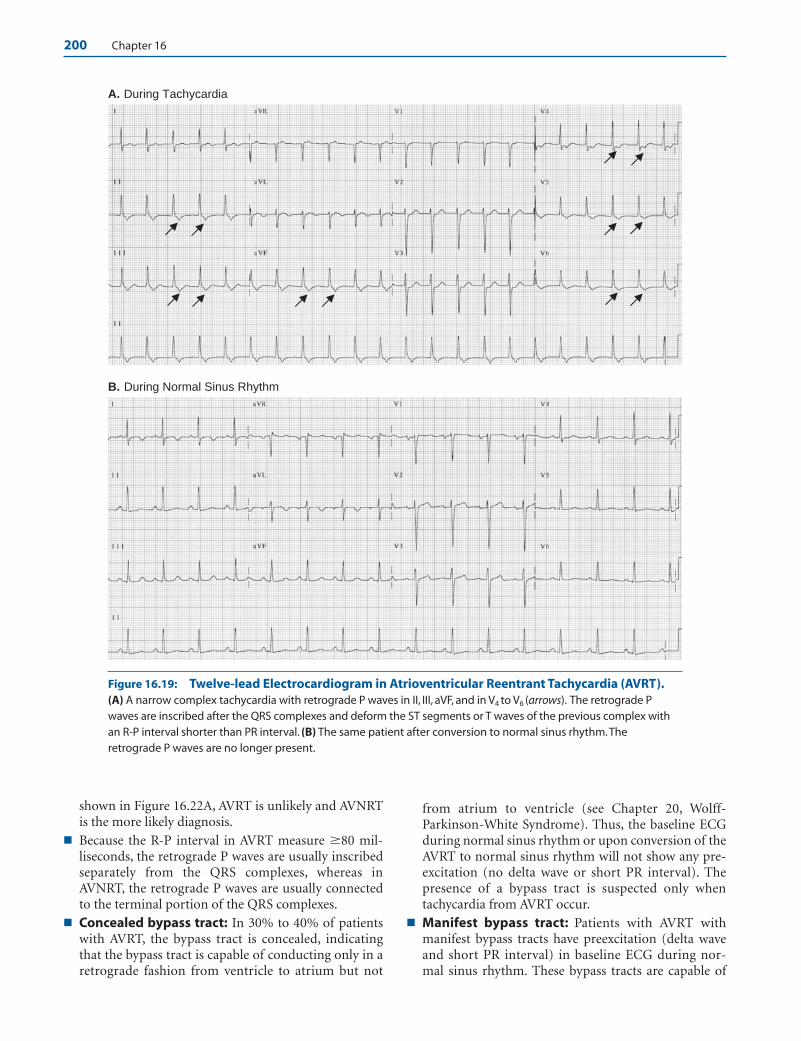
200 Chapter 16
shown in Figure 16.22A, AVRT is unlikely and AVNRTis the more likely diagnosis.
■ Because the R-P interval in AVRT measure �80 mil-liseconds, the retrograde P waves are usually inscribedseparately from the QRS complexes, whereas inAVNRT, the retrograde P waves are usually connectedto the terminal portion of the QRS complexes.
■ Concealed bypass tract: In 30% to 40% of patientswith AVRT, the bypass tract is concealed, indicatingthat the bypass tract is capable of conducting only in aretrograde fashion from ventricle to atrium but not
from atrium to ventricle (see Chapter 20, Wolff-Parkinson-White Syndrome). Thus, the baseline ECGduring normal sinus rhythm or upon conversion of theAVRT to normal sinus rhythm will not show any pre-excitation (no delta wave or short PR interval). Thepresence of a bypass tract is suspected only whentachycardia from AVRT occur.
■ Manifest bypass tract: Patients with AVRT withmanifest bypass tracts have preexcitation (delta waveand short PR interval) in baseline ECG during nor-mal sinus rhythm. These bypass tracts are capable of
A. During Tachycardia
B. During Normal Sinus Rhythm
Figure 16.19: Twelve-lead Electrocardiogram in Atrioventricular Reentrant Tachycardia (AVRT).(A) A narrow complex tachycardia with retrograde P waves in II, III, aVF, and in V4 to V6 (arrows). The retrograde Pwaves are inscribed after the QRS complexes and deform the ST segments or T waves of the previous complex withan R-P interval shorter than PR interval. (B) The same patient after conversion to normal sinus rhythm.Theretrograde P waves are no longer present.
LWBK271-C16_187-210.qxd 1/30/09 11:24 AM Page 200 Aptara Inc.
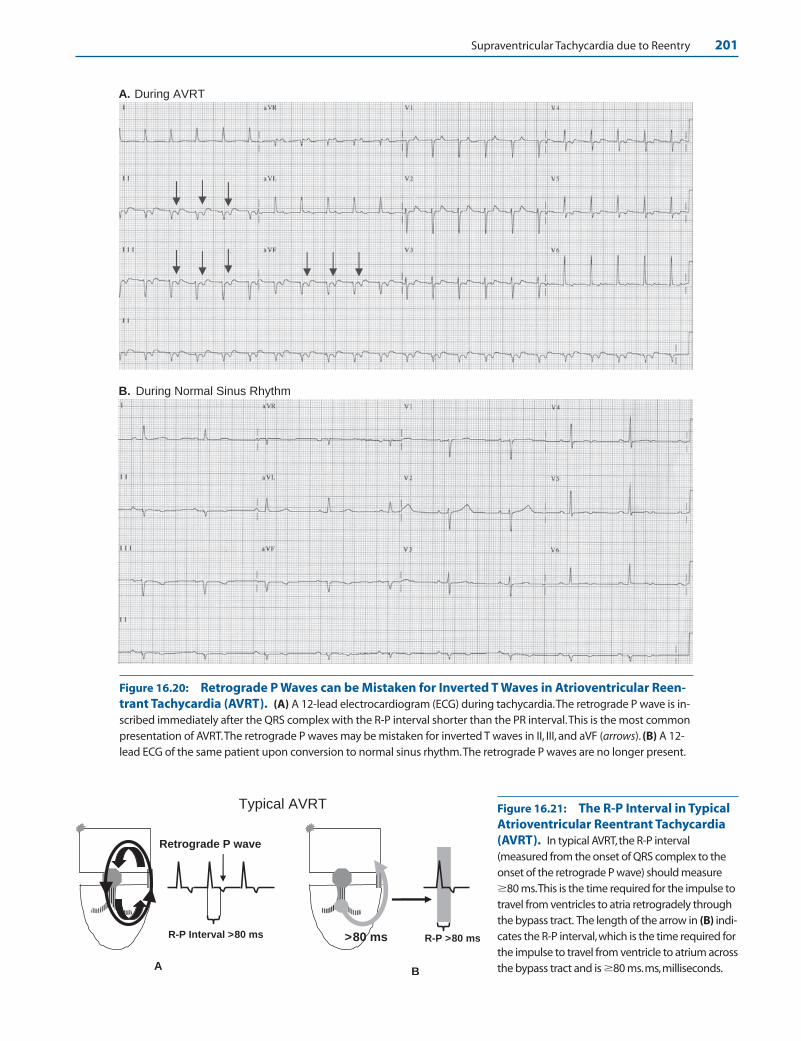
Supraventricular Tachycardia due to Reentry 201
A. During AVRT
B. During Normal Sinus Rhythm
Figure 16.20: Retrograde P Waves can be Mistaken for Inverted T Waves in Atrioventricular Reen-trant Tachycardia (AVRT). (A) A 12-lead electrocardiogram (ECG) during tachycardia.The retrograde P wave is in-scribed immediately after the QRS complex with the R-P interval shorter than the PR interval.This is the most commonpresentation of AVRT.The retrograde P waves may be mistaken for inverted T waves in II, III, and aVF (arrows). (B) A 12-lead ECG of the same patient upon conversion to normal sinus rhythm.The retrograde P waves are no longer present.
R-P >80 ms
B
>80 ms
Retrograde P wave
R-P Interval >80 ms
A
Typical AVRT Figure 16.21: The R-P Interval in TypicalAtrioventricular Reentrant Tachycardia(AVRT). In typical AVRT,the R-P interval(measured from the onset of QRS complex to theonset of the retrograde P wave) should measure�80 ms.This is the time required for the impulse totravel from ventricles to atria retrogradely throughthe bypass tract. The length of the arrow in (B) indi-cates the R-P interval,which is the time required forthe impulse to travel from ventricle to atrium acrossthe bypass tract and is �80 ms.ms,milliseconds.
LWBK271-C16_187-210.qxd 1/30/09 11:24 AM Page 201 Aptara Inc.

202 Chapter 16
Retrograde P waves
PR Intervalshorter
R-P Intervallonger
Atypical AVRT – retrograde P waves are in front of the QRS complexes
Leads II, III or aVF
A B
Figure 16.22: Atrioventricular Nodal Reentrant Tachycardia (AVNRT). (A) RetrogradeP waves are inscribed immediately behind the QRS complexes during tachycardia. Note thatthe R-P interval is �80 ms (distance between the two arrows), hence the tachycardia is AVNRTand not atrioventricular reentrant tachycardia (AVRT). In AVRT, at least 80 ms is required for theimpulse to travel from ventricle to atrium across the bypass tract in the surface electrocardio-gram. (B) Same patient on conversion to normal sinus rhythm. ms, milliseconds.
Figure 16.23: Atypical Atrioventricular Reentrant Tachycardia (AVRT). In atypi-cal AVRT, the retrograde P waves are inscribed in front of the QRS complexes with the R-P in-terval longer than PR interval. Atypical AVRT is associated with a slowly conducting bypasstract resulting in a long R-P interval.
Figure 16.24: Typical Atrioventricular Reentrant Tachycardia (AVRT). Twelve-lead electrocardiogram showing typical AVRT. Retrograde P waves are present in leads II, III,and aVF (arrows) with R-P interval measuring 80 milliseconds. The R-P interval is shorterthan the PR interval.
LWBK271-C16_187-210.qxd 1/30/09 11:24 AM Page 202 Aptara Inc.

Supraventricular Tachycardia due to Reentry 203
conducting from atrium to ventricle and also from ven-tricle to atrium. This will be discussed more extensivelyin Chapter 20, Wolff-Parkinson-White Syndrome.
■ Electrical alternans: In electrical alternans, the ampli-tude of the QRS complexes alternates by more than 1mm. Although electrical alternans is more commonlyseen in AVRT (Fig. 16.26), electrical alternans can alsooccur with other types of SVT. Electrical alternans ismore commonly a function of the heart rate rather thanthe type or mechanism of the SVT.
■ Localizing the bypass tract: Most bypass tracts arelocated at the free wall of the left ventricle (50% to60%) followed by the posteroseptal area (20% to 30%),free wall of the right ventricle (10% to 20%), and theanteroseptal area (5%). The atrial insertion of the by-pass tract can be localized by the configuration of the Pwave during AVRT. The bypass tract can also be local-ized during sinus rhythm if the baseline ECG showsventricular preexcitation. This is further discussed inChapter 20, Wolff-Parkinson-White Syndrome.
Figure 16.25: Atypical Atrioventricular Reentrant Tachycardia (AVRT). In atypical AVRT, retrograde P wavesare in front of the QRS complex (R-P interval longer than PR interval) because of the presence of a slowly conductingbypass tract.The supraventricular tachycardia is terminated by a perfectly timed premature atrial complex (arrow).
Figure 16.26: Electrical Alternans. In electrical alternans, taller QRS complexes alternatewith shorter QRS complexes by more than 1 mm. Arrows point to a tall QRS complex alternatingwith a smaller QRS complex. Electrical alternans is more commonly seen in atrioventricular reen-trant tachycardia (AVRT) than with other types of supraventricular tachycardia (SVT) because theventricular rate of AVRT is generally faster when compared with other types of SVT.
LWBK271-C16_187-210.qxd 1/30/09 11:24 AM Page 203 Aptara Inc.
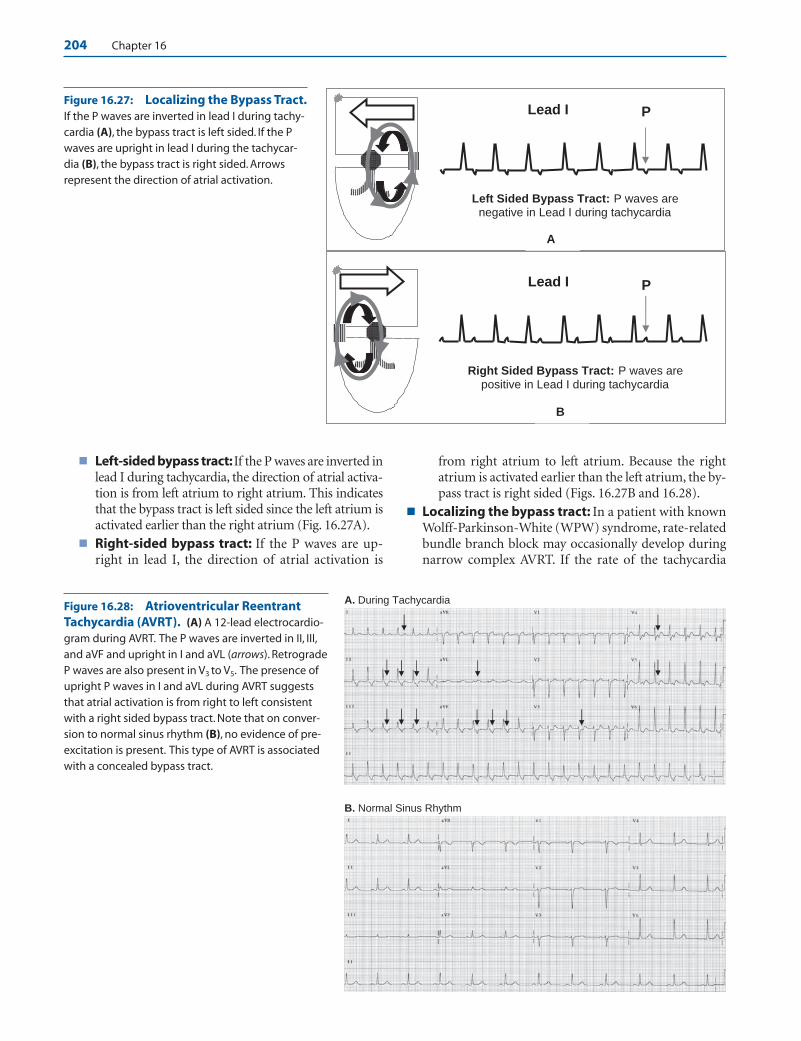
204 Chapter 16
■ Left-sided bypass tract:If the P waves are inverted inlead I during tachycardia, the direction of atrial activa-tion is from left atrium to right atrium. This indicatesthat the bypass tract is left sided since the left atrium isactivated earlier than the right atrium (Fig. 16.27A).
■ Right-sided bypass tract: If the P waves are up-right in lead I, the direction of atrial activation is
from right atrium to left atrium. Because the rightatrium is activated earlier than the left atrium, the by-pass tract is right sided (Figs. 16.27B and 16.28).
■ Localizing the bypass tract: In a patient with knownWolff-Parkinson-White (WPW) syndrome, rate-relatedbundle branch block may occasionally develop duringnarrow complex AVRT. If the rate of the tachycardia
A. During Tachycardia
B. Normal Sinus Rhythm
Lead I
Right Sided Bypass Tract: P waves are positive in Lead I during tachycardia
P
B
Lead I
Left Sided Bypass Tract: P waves are negative in Lead I during tachycardia
P
A
Figure 16.27: Localizing the Bypass Tract.If the P waves are inverted in lead I during tachy-cardia (A), the bypass tract is left sided. If the Pwaves are upright in lead I during the tachycar-dia (B), the bypass tract is right sided. Arrowsrepresent the direction of atrial activation.
Figure 16.28: Atrioventricular ReentrantTachycardia (AVRT). (A) A 12-lead electrocardio-gram during AVRT. The P waves are inverted in II, III,and aVF and upright in I and aVL (arrows). RetrogradeP waves are also present in V3 to V5. The presence ofupright P waves in I and aVL during AVRT suggeststhat atrial activation is from right to left consistentwith a right sided bypass tract. Note that on conver-sion to normal sinus rhythm (B), no evidence of pre-excitation is present. This type of AVRT is associatedwith a concealed bypass tract.
LWBK271-C16_187-210.qxd 1/30/09 11:24 AM Page 204 Aptara Inc.

Supraventricular Tachycardia due to Reentry 205
becomes slower when the rate-related bundle branchblock occurs, the bypass tract is on the same side as thebundle branch block. For example:■ RBBB: If a rate-related RBBB occurs during tachy-
cardia and the ventricular rate becomes slower, thebypass tract is right sided (Fig. 16.29).
■ LBBB: If a rate-related LBBB occurs and the ventric-ular rate becomes slower during the tachycardia, thebypass tract is left sided. Conversely, if the heart ratedoes not become slower, the bypass tract is at theopposite side.
ECG Findings of Orthodromic AVRT
1. Orthodromic AVRT is a narrow complex tachycardia with reg-ular R-R intervals.
2. The P waves and QRS complexes are inscribed separately be-cause the atria and ventricles are part of the reentrant circuit.
3. The configuration of the retrograde P waves may be different,depending on the location of the bypass tract. The P waves arecommonly inverted in leads II, III, and aVF because the atriaare activated by the bypass tract from below upward.
4. In typical AVRT, the retrograde P wave may be inscribed atthe ST segment or T wave of the previous complex, thus, theretrograde P wave is closer to the previous QRS complex
than the next QRS complex (R-P interval is shorter than thePR interval).
5. In atypical AVRT, the retrograde P waves are inscribed before theQRS complex and are closer to the next QRS complex than to theprevious QRS complex (R-P interval longer than PR interval).
6. AV block is not possible during tachycardia. AVRT is excludedif AV block occurs.
7. Electrical alternans favors AVRT but does not exclude othertypes of SVT.
Mechanism
■ AVRT is a reentrant tachycardia associated with a bypasstract. The bypass tract connects the atrium directly to theventricle and provides an alternate route by which the atrialimpulse can conduct anterogradely to the ventricles and theventricular impulse retrogradely to the atrium.
■ The tachycardia is precipitated by an ectopic impulse origi-nating from the atria or ventricles. The ectopic impulseshould occur when one pathway (either the AV node or by-pass tract) has fully recovered and the other pathway is stillrefractory.
■ The tachycardia is very regular because the impulse follows afixed pathway consisting of the AV node, bundle of His, a bun-dle branch, ventricle, bypass tract, and atrium. Second-degree
Atria
Rate Related LBBB(No change in circuit)
B
Atria
Rate Related RBBB(Circuit is longer)
C
Atria
Narrow Complex AVRT
A
(A) Narrow Complex AVRT (B) Rate Related LBBB Rate is the same
(C) Rate Related RBBB Rate becomes slower
Figure 16.29: Localizing the Bypass Tract. The diagrams explain how a rate-related bundle branch block will slow down the ventricular rate during AVRT if thebypass tract is on the same side as the bundle branch block. (A) Narrow complexAVRT with a right-sided bypass tract. (B) If a rate-related LBBB develops during tachy-cardia, the circuit is not altered by the bundle branch block and the rate of the tachy-cardia remains unchanged. (C) If a rate-related right bundle branch block occurs, therate of the tachycardia will become slower if the bypass tract is right sided becausethe right ventricle and bypass tract have to be activated from the left bundle branch,resulting in a longer and slower circuit. AVRT, atrioventricular reentrant tachycardia;LBBB, left bundle branch block; RBBB, right bundle branch block.
LWBK271-C16_187-210.qxd 1/30/09 11:24 AM Page 205 Aptara Inc.

206 Chapter 16
AV block is not possible since the AV node is an essentialcomponent of the reentrant circuit. If the impulse is blockedat the AV node, the reentrant circuit will terminate.
■ The tachycardia may have wide or narrow complexes de-pending on how the ventricles are activated.
■ Antidromic AVRT: Antidromic AVRT is associated withwide QRS complexes. The QRS complex is wide becausethe atrial impulse activates the ventricles anterogradelythrough the bypass tract. Because the impulse is con-ducted outside the normal conduction system, the QRScomplexes are wide measuring �0.12 seconds. An-tidromic AVRT is a classic example of wide complextachycardia due to SVT. This type of SVT can be mistakenfor ventricular tachycardia. This is further discussed inChapter 20, Wolff-Parkinson-White Syndrome.
■ Orthodromic AVRT: Orthodromic AVRT is associatedwith narrow QRS complexes. The QRS complex is narrowbecause the atrial impulse activates the ventricles antero-gradely through the AV node. Because the ventricles areactivated normally, the QRS complexes are narrow meas-uring �0.12 seconds. Orthodromic AVRT can be typicalor atypical.
n Typical AVRT: The P waves deform the ST segment orearly portion of the T wave of the previous complex,thus the R-P interval is shorter than the PR interval. Intypical AVRT, the AV node is the slow pathway and thebypass tract the fast pathway (slow/fast activation).
n Atypical AVRT: The P waves precede the QRS com-plexes, thus, the R-P interval is longer than the PR in-terval. In atypical AVRT, the AV node is the fast path-way and the bypass tract the slow pathway (fast/slowactivation). This type of AVRT is rare.
Clinical Significance
■ AVRT is the second most common SVT, occurring in ap-proximately 30% of all reentrant SVT. It is another classic ex-ample of a tachycardia that is paroxysmal with abrupt onsetand abrupt termination.
■ The bypass tract may be capable of conducting only retro-gradely (ventricle to atrium) but not anterogradely(atrium to ventricle). Such bypass tracts are called con-cealed bypass tracts. When the bypass tract is concealed,preexcitation (presence of short PR interval and deltawave) is not present in the 12-lead ECG during normal si-nus rhythm. Patients with AVRT with preexcitation duringnormal sinus rhythm have manifest bypass tracts. Thesepatients with preexcitation and symptoms of tachycardiahave WPW syndrome.
■ The location of the bypass tract can be diagnosed by themorphology of the P waves during SVT.
■ If the bypass tract is left sided, activation of the left atriumoccurs earlier than the right atrium resulting in inverted Pwaves in lead I during the tachycardia.
■ If the bypass tract is right sided, the right atrium is acti-vated before the left atrium, resulting in upright P wavesin lead I during the tachycardia.
■ When a rate-related bundle branch block occurs and therate of the tachycardia slows down, the bypass tract is on thesame side as the bundle branch block. Thus, if rate-relatedRBBB occurs and the rate of the tachycardia is slower, thebypass tract is right sided. If LBBB occurs and the rate ofthe tachycardia is slower, the bypass tract is left sided.
■ Atypical AVRT: Although AVRT is almost always precipi-tated by an ectopic impulse, there is a subset of atypicalAVRT in which the tachycardia may occur spontaneouslyduring an abrupt onset of sinus tachycardia—such as dur-ing exertion, excitement, or enhanced sympathetic activity.This type of SVT should be recognized because it is usuallyincessant (the tachycardia lasts more than 12 hours per day)and may result in tachycardia mediated cardiomyopathy.This type of tachycardia is also called permanent junctionalreciprocating tachycardia or PJRT. The tachycardia is asso-ciated with a slowly conducting bypass tract; thus, the Pwaves are in front of the QRS complex with R-P intervallonger than PR interval. The bypass tract is located at theposteroseptal area very close to the orifice of the coronarysinus and may be treated successfully with radiofrequencyablation. The tachycardia is usually poorly responsive tomedical therapy.
■ Because the retrograde P waves occur at the ST segment or Twaves during tachycardia, contraction of the atria occursduring systole when the mitral and tricuspid valves areclosed. This can cause cannon A waves, which are prominentjugular neck vein pulsations during tachycardia. The pres-ence of cannon A waves in the neck during SVT suggestsAVNRT or AVRT as the cause of the tachycardia.
Acute Treatment
■ The acute treatment of narrow complex AVRT is identical tothat of AVNRT (see Treatment of AVNRT). Because AVRT isdependent on the AV node for perpetuation of the arrhyth-mia, treatment includes vagal maneuvers and pharmacologicagents that block the AV node. Similar to AVNRT, adenosinegiven intravenously is the drug of choice to terminate thetachycardia. The tachycardia ends with a retrograde P wave,meaning that the last part of the tachycardia to be recordedbefore the rhythm becomes sinus is a retrograde P wave. Thisimplies that the tachycardia was blocked at the level of the AV node, regardless whether the AV node is a fast or slowpathway. Similar to adenosine, AV nodal blockers such asverapamil and diltiazem terminate the tachycardia at thelevel of the AV node causing a P wave to be inscribed last,before the rhythm converts to normal sinus.
■ Although adenosine is the drug of choice among patientswith paroxysmal SVT, adenosine can precipitate asthma andshould not be given to patients with history of severe reactiveairway disease. Some of these patients with asthma may
LWBK271-C16_187-210.qxd 1/30/09 11:24 AM Page 206 Aptara Inc.

Supraventricular Tachycardia due to Reentry 207
already be on theophylline, which is the antidote for adeno-sine. Adenosine is less effective for the treatment of SVT inpatients who are already on theophylline.
■ Adenosine can potentially cause atrial fibrillation in 1% to10% of patients. This can result in potential lethal complica-tion among patients with AVRT with manifest bypass tracts(preexcitation or WPW pattern is present in baseline ECG).Atrial fibrillation in these patients can result in very rapidventricular responses, which can result in hemodynamic col-lapse. This complication should be anticipated when treatingAVRT so that a defibrillator is available if needed.
Prognosis
■ The prognosis of patients with orthodromic AVRT with con-cealed bypass tracts (no evidence of preexcitation in baselineECG) is good. Similar to AVNRT, the arrhythmia can be per-manently cured with electrical ablation. Patients should bereferred to a facility with extensive experience. Early referralshould be done if the tachycardia is recurrent or the patientcannot tolerate medications.
■ Patients with evidence of preexcitation during normal sinusrhythm may have a different prognosis (see Chapter 20,Wolff-Parkinson-White Syndrome). These patients may de-velop atrial fibrillation as a complication of the SVT andtherefore can potentially develop arrhythmias that are morelethal. These patients with manifest bypass tracts and knownWPW syndrome should be referred to an electrophysiologistfor further evaluation.
Other Types of SVT from Reentry
■ There are two other types of SVT due to reentry: sinoa-trial reentrant tachycardia (SART) and intra-atrialreentrant tachycardia (IART). These two types of reen-trant SVT are relatively uncommon.
■ SART: SART is a type of micro-reentrant tachycardiainvolving the sinus node and contiguous atrium. Thetachycardia is difficult to differentiate from sinus tachy-cardia because the sinus node is part of the reentrantcircuit. During tachycardia, the P waves are identical tosinus P waves (Figs. 16.30 and 16.31) and easily mis-taken for sinus tachycardia.
■ The tachycardia is usually precipitated and terminated bya premature atrial impulse and is therefore paroxysmalwith an abrupt onset and abrupt termination (Fig.16.30). This is in contrast to sinus tachycardia, which hasa slow onset and gradual termination and is nonparoxys-mal. SART can also be terminated by vagal maneuvers aswell as agents that block the AV node because AV nodalblocking agents also inhibit the sinus node. This includesadenosine, beta blockers, calcium blockers, and digoxin.
■ Figure 16.31A,B show the difficulty in making a diag-nosis of SART. Except for the abrupt onset and termi-nation, the tachycardia is identical and easily mistakenfor sinus tachycardia.
ECG Findings of SART
1. The ECG of SART is identical to that of sinus tachycardia. TheP waves precede the QRS complexes and are upright in leads I,II, and aVF.
2. The tachycardia is paroxysmal with abrupt onset and ter-mination.
3. It is usually precipitated and can be terminated by prematureatrial complexes.
4. The atrial rate is usually not very rapid and is usually 120 to150 bpm but can be �100 bpm.
Mechanism
■ SART is another example of microreentry. The reentrantSVT includes the sinus node and surrounding atrial tissue.Because the sinus node is part of the reentrant pathway, the
A. Diagrammatic Representation of SART
B. Lead II Rhythm Strip
Lead II
2
1
Figure 16.30: Sinoatrial Reentrant Tachycar-dia (SART). (A) Diagrammatic representation ofSART. Because the sinus node is part of thereentrant circuit, the P waves resemble sinus tachy-cardia and are upright in leads II, III, and aVF. (B) Con-tinuous lead II rhythm strip of a patient thought tohave SART.The SART can be terminated (arrow 1) orprecipitated (arrow 2) by premature atrialcomplexes and is paroxysmal.
LWBK271-C16_187-210.qxd 1/30/09 11:24 AM Page 207 Aptara Inc.
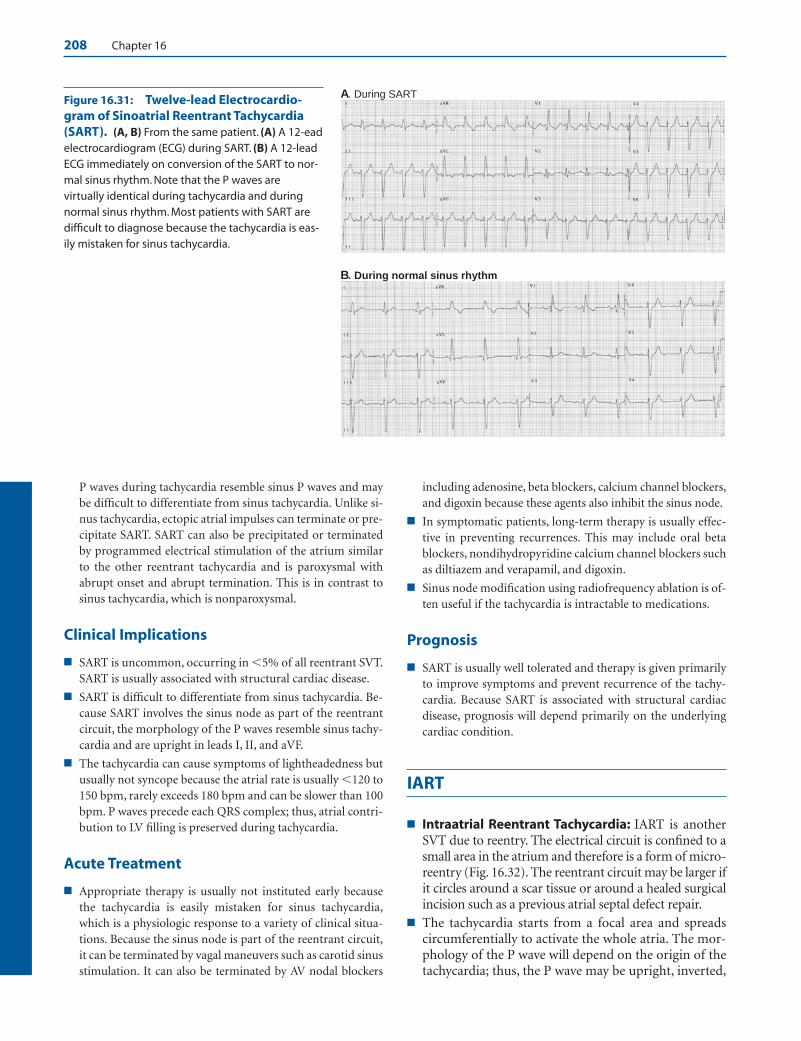
208 Chapter 16
P waves during tachycardia resemble sinus P waves and maybe difficult to differentiate from sinus tachycardia. Unlike si-nus tachycardia, ectopic atrial impulses can terminate or pre-cipitate SART. SART can also be precipitated or terminatedby programmed electrical stimulation of the atrium similarto the other reentrant tachycardia and is paroxysmal withabrupt onset and abrupt termination. This is in contrast tosinus tachycardia, which is nonparoxysmal.
Clinical Implications
■ SART is uncommon, occurring in �5% of all reentrant SVT.SART is usually associated with structural cardiac disease.
■ SART is difficult to differentiate from sinus tachycardia. Be-cause SART involves the sinus node as part of the reentrantcircuit, the morphology of the P waves resemble sinus tachy-cardia and are upright in leads I, II, and aVF.
■ The tachycardia can cause symptoms of lightheadedness butusually not syncope because the atrial rate is usually �120 to150 bpm, rarely exceeds 180 bpm and can be slower than 100bpm. P waves precede each QRS complex; thus, atrial contri-bution to LV filling is preserved during tachycardia.
Acute Treatment
■ Appropriate therapy is usually not instituted early becausethe tachycardia is easily mistaken for sinus tachycardia,which is a physiologic response to a variety of clinical situa-tions. Because the sinus node is part of the reentrant circuit,it can be terminated by vagal maneuvers such as carotid sinusstimulation. It can also be terminated by AV nodal blockers
including adenosine, beta blockers, calcium channel blockers,and digoxin because these agents also inhibit the sinus node.
■ In symptomatic patients, long-term therapy is usually effec-tive in preventing recurrences. This may include oral betablockers, nondihydropyridine calcium channel blockers suchas diltiazem and verapamil, and digoxin.
■ Sinus node modification using radiofrequency ablation is of-ten useful if the tachycardia is intractable to medications.
Prognosis
■ SART is usually well tolerated and therapy is given primarilyto improve symptoms and prevent recurrence of the tachy-cardia. Because SART is associated with structural cardiacdisease, prognosis will depend primarily on the underlyingcardiac condition.
IART
■ Intraatrial Reentrant Tachycardia: IART is anotherSVT due to reentry. The electrical circuit is confined to asmall area in the atrium and therefore is a form of micro-reentry (Fig. 16.32). The reentrant circuit may be larger ifit circles around a scar tissue or around a healed surgicalincision such as a previous atrial septal defect repair.
■ The tachycardia starts from a focal area and spreadscircumferentially to activate the whole atria. The mor-phology of the P wave will depend on the origin of thetachycardia; thus, the P wave may be upright, inverted,
A. During SART
B. During normal sinus rhythm
Figure 16.31: Twelve-lead Electrocardio-gram of Sinoatrial Reentrant Tachycardia(SART). (A, B) From the same patient. (A) A 12-eadelectrocardiogram (ECG) during SART. (B) A 12-leadECG immediately on conversion of the SART to nor-mal sinus rhythm. Note that the P waves arevirtually identical during tachycardia and duringnormal sinus rhythm. Most patients with SART aredifficult to diagnose because the tachycardia is eas-ily mistaken for sinus tachycardia.
LWBK271-C16_187-210.qxd 1/30/09 11:24 AM Page 208 Aptara Inc.
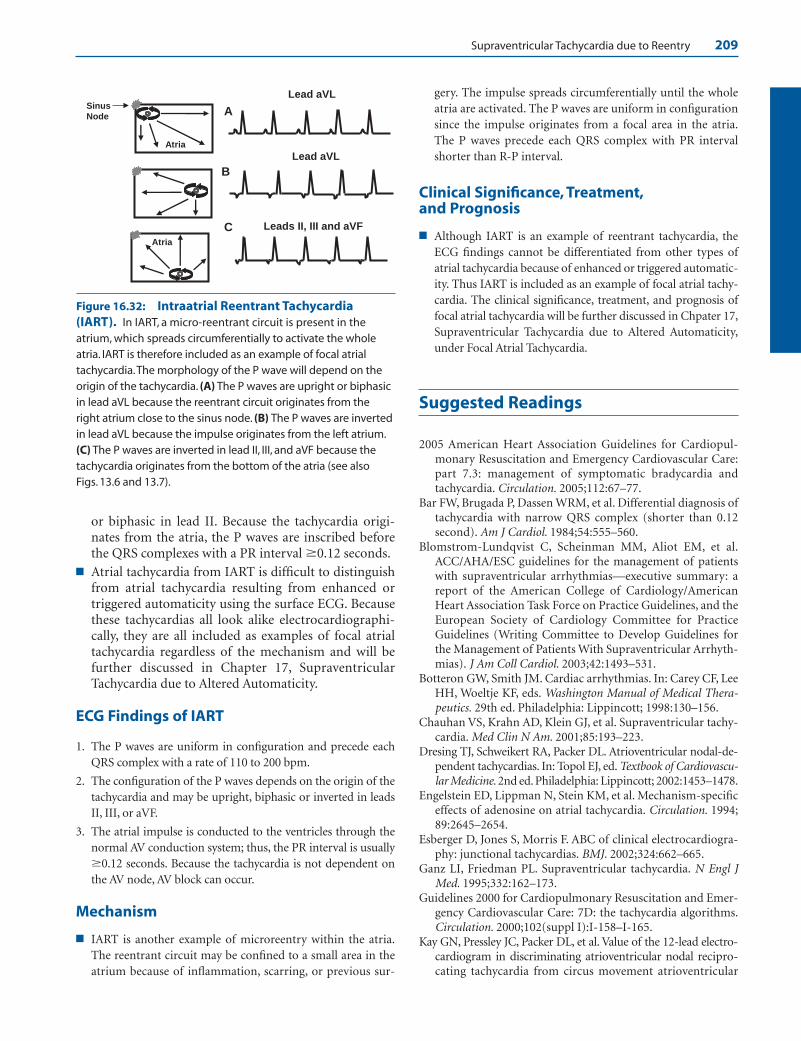
Supraventricular Tachycardia due to Reentry 209
or biphasic in lead II. Because the tachycardia origi-nates from the atria, the P waves are inscribed beforethe QRS complexes with a PR interval �0.12 seconds.
■ Atrial tachycardia from IART is difficult to distinguishfrom atrial tachycardia resulting from enhanced ortriggered automaticity using the surface ECG. Becausethese tachycardias all look alike electrocardiographi-cally, they are all included as examples of focal atrialtachycardia regardless of the mechanism and will befurther discussed in Chapter 17, SupraventricularTachycardia due to Altered Automaticity.
ECG Findings of IART
1. The P waves are uniform in configuration and precede eachQRS complex with a rate of 110 to 200 bpm.
2. The configuration of the P waves depends on the origin of thetachycardia and may be upright, biphasic or inverted in leadsII, III, or aVF.
3. The atrial impulse is conducted to the ventricles through thenormal AV conduction system; thus, the PR interval is usually�0.12 seconds. Because the tachycardia is not dependent onthe AV node, AV block can occur.
Mechanism
■ IART is another example of microreentry within the atria.The reentrant circuit may be confined to a small area in theatrium because of inflammation, scarring, or previous sur-
gery. The impulse spreads circumferentially until the wholeatria are activated. The P waves are uniform in configurationsince the impulse originates from a focal area in the atria.The P waves precede each QRS complex with PR intervalshorter than R-P interval.
Clinical Significance, Treatment,and Prognosis
■ Although IART is an example of reentrant tachycardia, theECG findings cannot be differentiated from other types ofatrial tachycardia because of enhanced or triggered automatic-ity. Thus IART is included as an example of focal atrial tachy-cardia. The clinical significance, treatment, and prognosis offocal atrial tachycardia will be further discussed in Chpater 17,Supraventricular Tachycardia due to Altered Automaticity,under Focal Atrial Tachycardia.
Suggested Readings
2005 American Heart Association Guidelines for Cardiopul-monary Resuscitation and Emergency Cardiovascular Care:part 7.3: management of symptomatic bradycardia andtachycardia. Circulation. 2005;112:67–77.
Bar FW, Brugada P, Dassen WRM, et al. Differential diagnosis oftachycardia with narrow QRS complex (shorter than 0.12second). Am J Cardiol. 1984;54:555–560.
Blomstrom-Lundqvist C, Scheinman MM, Aliot EM, et al.ACC/AHA/ESC guidelines for the management of patientswith supraventricular arrhythmias—executive summary: areport of the American College of Cardiology/AmericanHeart Association Task Force on Practice Guidelines, and theEuropean Society of Cardiology Committee for PracticeGuidelines (Writing Committee to Develop Guidelines forthe Management of Patients With Supraventricular Arrhyth-mias). J Am Coll Cardiol. 2003;42:1493–531.
Botteron GW, Smith JM. Cardiac arrhythmias. In: Carey CF, LeeHH, Woeltje KF, eds. Washington Manual of Medical Thera-peutics. 29th ed. Philadelphia: Lippincott; 1998:130–156.
Chauhan VS, Krahn AD, Klein GJ, et al. Supraventricular tachy-cardia. Med Clin N Am. 2001;85:193–223.
Dresing TJ, Schweikert RA, Packer DL. Atrioventricular nodal-de-pendent tachycardias. In: Topol EJ, ed. Textbook of Cardiovascu-lar Medicine. 2nd ed. Philadelphia: Lippincott; 2002:1453–1478.
Engelstein ED, Lippman N, Stein KM, et al. Mechanism-specificeffects of adenosine on atrial tachycardia. Circulation. 1994;89:2645–2654.
Esberger D, Jones S, Morris F. ABC of clinical electrocardiogra-phy: junctional tachycardias. BMJ. 2002;324:662–665.
Ganz LI, Friedman PL. Supraventricular tachycardia. N Engl JMed. 1995;332:162–173.
Guidelines 2000 for Cardiopulmonary Resuscitation and Emer-gency Cardiovascular Care: 7D: the tachycardia algorithms.Circulation. 2000;102(suppl I):I-158–I-165.
Kay GN, Pressley JC, Packer DL, et al. Value of the 12-lead electro-cardiogram in discriminating atrioventricular nodal recipro-cating tachycardia from circus movement atrioventricular
Figure 16.32: Intraatrial Reentrant Tachycardia(IART). In IART, a micro-reentrant circuit is present in theatrium, which spreads circumferentially to activate the wholeatria. IART is therefore included as an example of focal atrialtachycardia.The morphology of the P wave will depend on theorigin of the tachycardia. (A) The P waves are upright or biphasicin lead aVL because the reentrant circuit originates from theright atrium close to the sinus node. (B) The P waves are invertedin lead aVL because the impulse originates from the left atrium.(C) The P waves are inverted in lead II, III, and aVF because thetachycardia originates from the bottom of the atria (see also Figs. 13.6 and 13.7).
Lead aVL
Atria
A
B
CAtria
Leads II, III and aVF
Lead aVL
Sinus Node
LWBK271-C16_187-210.qxd 1/30/09 11:24 AM Page 209 Aptara Inc.
210 Chapter 16
tachycardia utilizing a retrograde accessory pathway. Am JCardiol. 1987;59:296–300.
Manolis AS, Mark Estes III NA. Supraventricular tachycardia mech-anisms and therapy. Arch Intern Med. 1987;147:1706–1716.
Olgen JE, Zipes DE. Specific arrhythmias: diagnosis and treat-ment. In: Libby P, Bonow RO, Mann DL, et al. eds. Braun-wald’s Heart Disease, A Textbook of Cardiovascular Medicine.7th ed. Philadelphia: Elsevier Saunders; 2005:803–863.
Saoudi N, Cosio F, Waldo A, et al. Classification of atrial flutterand regular atrial tachycardia according to electrophysiolog-ical mechanisms and anatomical bases. Eur Heart J. 2001;22:1162–1182.
Sinai Policies and Procedures on Intravenous Medications. LBH-Web at Sinai Hospital. Belvedere Avenue, Greenspring, Balti-more, MD: Sinai Policy and Procedures; January 15, 2003.
Wagner GS. Reentrant junctional tachyarrhythmias. In: Marriott’sPractical Electrocardiography. 10th ed. Philadelphia: Lippincott;2001:328–344.
Waldo AL, Biblo LA. Atrioventricular nodal-independentsupraventricular tachycardias. In: Topol EJ, ed. Textbook ofCardiovascular Medicine. 2nd ed. Philadelphia: Lippincott;2002:1453–1478.
Waxman MB, Wald RW, Sharma AD, et al. Vagal techniques fortermination of paroxysmal supraventricular tachycardia. AmJ Cardiol. 1980;46:655–664.
Wellens HJJ, Conover MB. Narrow QRS tachycardia. In: TheECG in Emergency Decision Making. 2nd ed. St. Louis: Saun-ders/Elsevier; 2006:92–126.
Xie B, Thakur RK, Shah CP, et al. Clinical differentiation ofnarrow QRS complex tachycardias. In: Thakur RK, Reis-dorff EJ, eds. Emergency Medicine Clinics of North America.Emergency Management of Cardiac Arrhythmias. 1998:295–330.
Webb JG, Kerr CR. Paroxysmal supraventricular tachycardiaand bundle branch block. Arch Intern Med. 1987;147:367–369.
LWBK271-C16_187-210.qxd 1/30/09 11:24 AM Page 210 Aptara Inc.
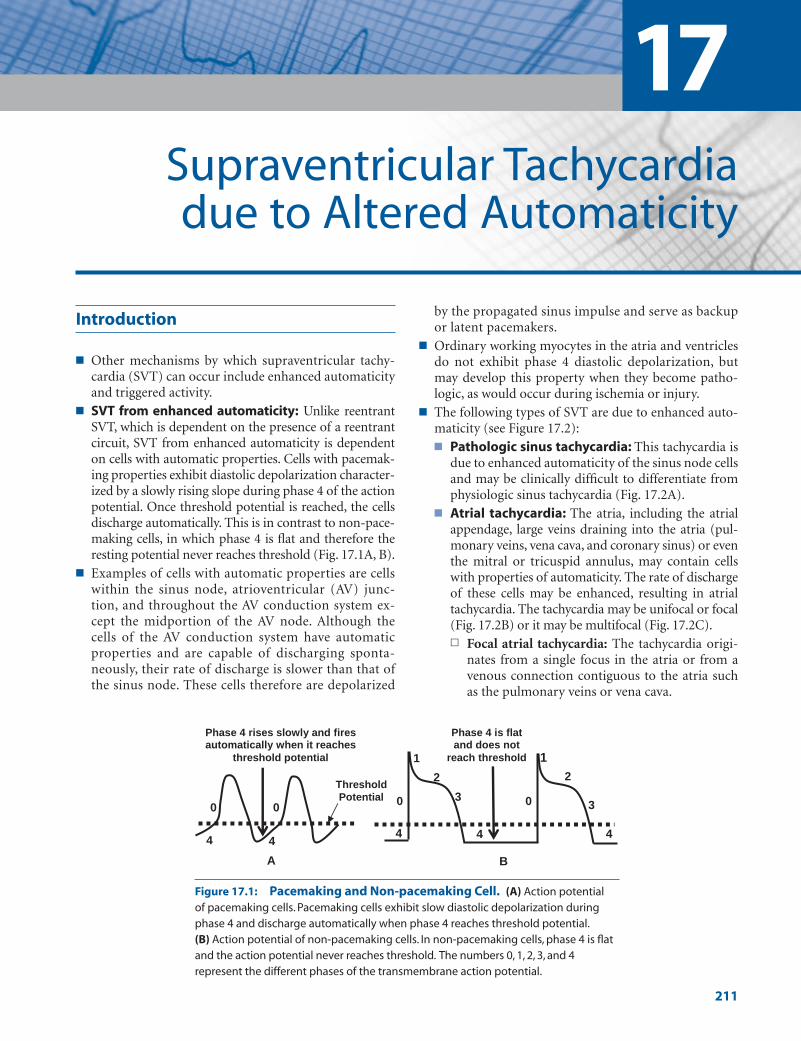
Introduction
■ Other mechanisms by which supraventricular tachy-cardia (SVT) can occur include enhanced automaticityand triggered activity.
■ SVT from enhanced automaticity: Unlike reentrantSVT, which is dependent on the presence of a reentrantcircuit, SVT from enhanced automaticity is dependenton cells with automatic properties. Cells with pacemak-ing properties exhibit diastolic depolarization character-ized by a slowly rising slope during phase 4 of the actionpotential. Once threshold potential is reached, the cellsdischarge automatically. This is in contrast to non-pace-making cells, in which phase 4 is flat and therefore theresting potential never reaches threshold (Fig. 17.1A, B).
■ Examples of cells with automatic properties are cellswithin the sinus node, atrioventricular (AV) junc-tion, and throughout the AV conduction system ex-cept the midportion of the AV node. Although thecells of the AV conduction system have automaticproperties and are capable of discharging sponta-neously, their rate of discharge is slower than that ofthe sinus node. These cells therefore are depolarized
by the propagated sinus impulse and serve as backupor latent pacemakers.
■ Ordinary working myocytes in the atria and ventriclesdo not exhibit phase 4 diastolic depolarization, butmay develop this property when they become patho-logic, as would occur during ischemia or injury.
■ The following types of SVT are due to enhanced auto-maticity (see Figure 17.2):■ Pathologic sinus tachycardia: This tachycardia is
due to enhanced automaticity of the sinus node cellsand may be clinically difficult to differentiate fromphysiologic sinus tachycardia (Fig. 17.2A).
■ Atrial tachycardia: The atria, including the atrialappendage, large veins draining into the atria (pul-monary veins, vena cava, and coronary sinus) or eventhe mitral or tricuspid annulus, may contain cellswith properties of automaticity. The rate of dischargeof these cells may be enhanced, resulting in atrialtachycardia. The tachycardia may be unifocal or focal(Fig. 17.2B) or it may be multifocal (Fig. 17.2C).n Focal atrial tachycardia: The tachycardia origi-
nates from a single focus in the atria or from avenous connection contiguous to the atria suchas the pulmonary veins or vena cava.
17Supraventricular Tachycardia due to Altered Automaticity
211
1
2
3
44
00
1
3
2
4
B
Phase 4 is flat and does not
reach threshold
0 0
44
Phase 4 rises slowly and fires automatically when it reaches
threshold potential
A
ThresholdPotential
Figure 17.1: Pacemaking and Non-pacemaking Cell. (A) Action potential of pacemaking cells. Pacemaking cells exhibit slow diastolic depolarization duringphase 4 and discharge automatically when phase 4 reaches threshold potential.(B) Action potential of non-pacemaking cells. In non-pacemaking cells, phase 4 is flatand the action potential never reaches threshold. The numbers 0, 1, 2, 3, and 4represent the different phases of the transmembrane action potential.
LWBK271-C17_211-232.qxd 29/1/09 7:44 pm Page 211 LWBK270-4119G-C02_073-110.qxd

212 Chapter 17
n Multifocal atrial tachycardia: The tachycardia ismultifocal if several ectopic foci are present inthe atria.
■ AV junctional tachycardia: The tachycardia arisesfrom the AV junction, which includes the AV nodedown to the bifurcation of the bundle of His (Fig.17.2D). Junctional tachycardia can be paroxysmal ornonparoxysmal.n Nonparoxysmal junctional tachycardia: The
tachycardia arises from a focus in the AV junc-tion and has a relatively slow rate of 70 to 120beats per minute (bpm).
n Paroxysmal junctional tachycardia: The tachy-cardia is paroxysmal because it starts abruptlyand terminates suddenly. The tachycardia has afaster rate varying from 120 to 180 bpm.
Focal Atrial Tachycardia
■ Focal atrial tachycardia: Focal atrial tachycardia im-plies that the tachycardia arises from a single location inthe atria. The atrial impulse spreads in a circumferentialmanner regardless of the mechanism of the tachycardia.Thus, the tachycardia may be due to enhanced auto-maticity (automatic atrial tachycardia), intra-atrialmicro-reentry (intraatrial reentrant tachycardia), ortriggered automaticity (atrial tachycardia with 2:1 AVblock). The mechanisms underlying these tachycardiascannot be differentiated from one another with a 12-lead electrocardiogram (ECG). Because these tachycar-dias all look similar, any tachycardia originating from asingle focus in the atria that spreads circumferentially isfocal atrial tachycardia (Figure 17.3).
■ The ECG findings of focal atrial tachycardia includethe following:
■ Presence of a regular narrow complex tachycardia�100 bpm.
■ Ectopic P waves, which are different from sinus Pwaves, precede the QRS complexes usually with a PRinterval �0.12 seconds.
■ The P waves are uniform and the atrial rate varies toas high as 250 bpm. The baseline between the Pwaves is usually flat or isoelectric and not wavy orundulating as in atrial flutter.
■ Second-degree or higher grades of AV block may oc-cur because the tachycardia is not dependent on theAV node.
■ The tachycardia terminates with a QRS complex incontrast to reentrant SVT (atrioventricular nodalreentrant tachycardia [AVNRT] and atrioventricu-lar reentrant tachycardia [AVRT]), which usuallyterminates with a retrograde P wave (Fig. 17.4).
■ Although nonsustained focal atrial tachycardia is fre-quently seen during cardiac monitoring in the coro-nary or intensive care units, sustained focal atrialtachycardia is rare, occurring in �0.5% of sympto-matic patients. The sustained form is slightly morecommon in children than in adults but is also a rareclinical entity. The tachycardia can be incessant (per-sists more than 12 hours per day), which can result intachycardia-mediated cardiomyopathy.
■ Focal atrial discharges do not occur randomly. Theyfrequently cluster in certain areas in the atria such asthe mitral or tricuspid annulus, atrial appendages, os-tium of the coronary sinus, and along the crista termi-nalis. Spontaneous focal discharges from the pul-monary veins are too small to be recorded in thesurface ECG, but have been recorded by intracardiactechniques. These focal discharges can result in SVTand have also been implicated as an important cause ofatrial fibrillation.
AV Junction
A DB C
Figure 17.2: Automatic Supraventricular Tachycardia (SVT). Automatic SVT can occur any-where in the atria or atrioventricular junction. (A) Pathologic or inappropriate sinus tachycardia. (B) Focalatrial tachycardia arising from a single focus in the atria. (C) Multifocal atria tachycardia showing multi-ple foci in the atria. (D) Junctional tachycardia, which can be paroxysmal or nonparoxysmal.
LWBK271-C17_211-232.qxd 29/1/09 7:44 pm Page 212 LWBK270-4119G-C02_073-110.qxd

Supraventricular Tachycardia due to Altered Automaticity 213
■ Localizing the origin of the tachycardia: In focalatrial tachycardia, the origin of the tachycardia may belocalized by the morphology of the P waves. The mostuseful lead is V1 followed by lead aVL (see Fig. 17.5).■ Right atrial vs left atrial origin:
n Right atrial origin: If the tachycardia is of rightatrial origin, the P waves are inverted in V1. Ifbiphasic in V1, the P waves are initially positive
(upright) and terminally negative (inverted). Inlead aVL, the P waves are upright or biphasic (Fig.17.5A).
n Left atrial origin: If the tachycardia is left atrial inorigin, the P waves are upright in V1. If V1 is bipha-sic, the P waves are initially negative (inverted)and terminally positive (upright). In aVL, the Pwaves are negative or isoelectric (flat) (Fig. 17.5B).
A.
B.
During tachycardia Spontaneous conversion to normal sinus rhythm
Figure 17.3: Focal Atrial Tachycardia. (A) A 12-lead electrocardiogram showing focalatrial tachycardia with a rate of 136 beats per minute. The P waves are uniform in configurationand are upright in I, II, III, aVF, and V1. The tachycardia can be mistaken for sinus tachycardia.(B) Lead II rhythm strip showing spontaneous conversion of the tachycardia to normal sinusrhythm. Note that the P wave morphology is different during tachycardia and during normal sinus rhythm. Note also that the tachycardia terminated with a QRS complex (block arrow) ratherthan a retrograde P wave, suggesting that the SVT is due to focal atrial tachycardia.
SVT Sinus Rhythm
Figure 17.4: Focal Atrial Tachycardia. The rhythm strip was recorded in lead II. The leftside of the rhythm strip shows focal atrial tachycardia with P waves between QRS complexes(arrows). The tachycardia terminated spontaneously followed by a sinus P wave and back to backventricular complexes. Normal sinus rhythm followed as shown on the right side of the tracing.Note that the tachycardia terminated with a ventricular complex (block arrow) rather than a Pwave. SVT terminating with a QRS complex is usually from focal atrial tachycardia. This type ofSVT may not respond to adenosine.
LWBK271-C17_211-232.qxd 29/1/09 7:44 pm Page 213 LWBK270-4119G-C02_073-110.qxd

214 Chapter 17
■ Localizing the tachycardia:■ Superior versus inferior origin:
n Superior origin: If the tachycardia originates su-periorly in either right or left atria, the P wavesare upright in II, III, and aVF. Superior origin ofthe atrial tachycardia includes the atrial ap-pendages and superior pulmonary veins (Fig.17.6A). The tachycardia may be difficult to dif-ferentiate from sinus tachycardia.
n Inferior origin: If the tachycardia originates in-feriorly in either right or left atria, the P wavesare inverted in leads II, III, and aVF. Inferior ori-gin of the atrial tachycardia includes the inferiorvena cava and coronary sinus orifice as well asthe inferior pulmonary veins (Fig. 17.6B).
■ Examples of focal atrial tachycardia are shown inFigs. 17.7 to 17.10.
ECG Findings of Focal Atrial Tachycardia
1. Presence of a regular narrow complex tachycardia �100 bpm.
2. The P waves are uniform in configuration but are differentin morphology when compared with P waves of normalsinus origin.
3. The P waves precede the QRS complexes with a PR intervalshorter than the R-P interval. This finding, however, may bereversed depending on the integrity of the AV node and pres-ence of AV conduction abnormality. The PR interval generallymeasures �0.12 seconds.
4. Second degree or higher grades of AV block may occur becausethe tachycardia is not dependent on the AV node.
5. The baseline between 2 P waves is isoelectric unlike atrial flut-ter where the baseline is wavy and undulating.
6. The tachycardia terminates with a QRS complex rather than aP wave.
Right Atrial vs Left Atrial Origin of the SVT
RA
Right Atrial Focus
B.
LA
RALA
Lead aVL
Left Atrial Focus
A.
Lead V1
AV Node
Sinus Node
Sinus Node
AV Node
Lead V1 Lead aVL
OR
OR OR
OR
Figure 17.5: Focal Atrial Tachycardia.The origin of the tachycardia can be identifiedas right atrial or left atrial based on the config-uration of the P waves in leads V1 and aVL. Ifthe ectopic focus is in the right atrium (A), theP waves are inverted in V1 or if biphasic are ini-tially upright and terminally negative. In leadaVL, the P waves are upright or biphasic. If theectopic focus is in the left atrium (B), the Pwaves are positive in V1. If biphasic, the Pwaves are initially inverted and terminally up-right. In lead aVL, the P waves are isoelectric(flat) or inverted. AV, atrioventricular; RA, rightatrium; LA, left atrium.
Lead II, III and aVF
Atria
B
A
Lead II, III and aVF
Superior
Atria
Inferior
Figure 17.6: Focal Atrial Tachycardia. If the P wavesare upright in II, III and aVF, the origin of the tachycardia is inthe superior right or left atria (A). If the P waves are invertedin II, III, and aVF, the origin of the tachycardia is in the inferiorright or left atria (B).
LWBK271-C17_211-232.qxd 29/1/09 7:44 pm Page 214 LWBK270-4119G-C02_073-110.qxd
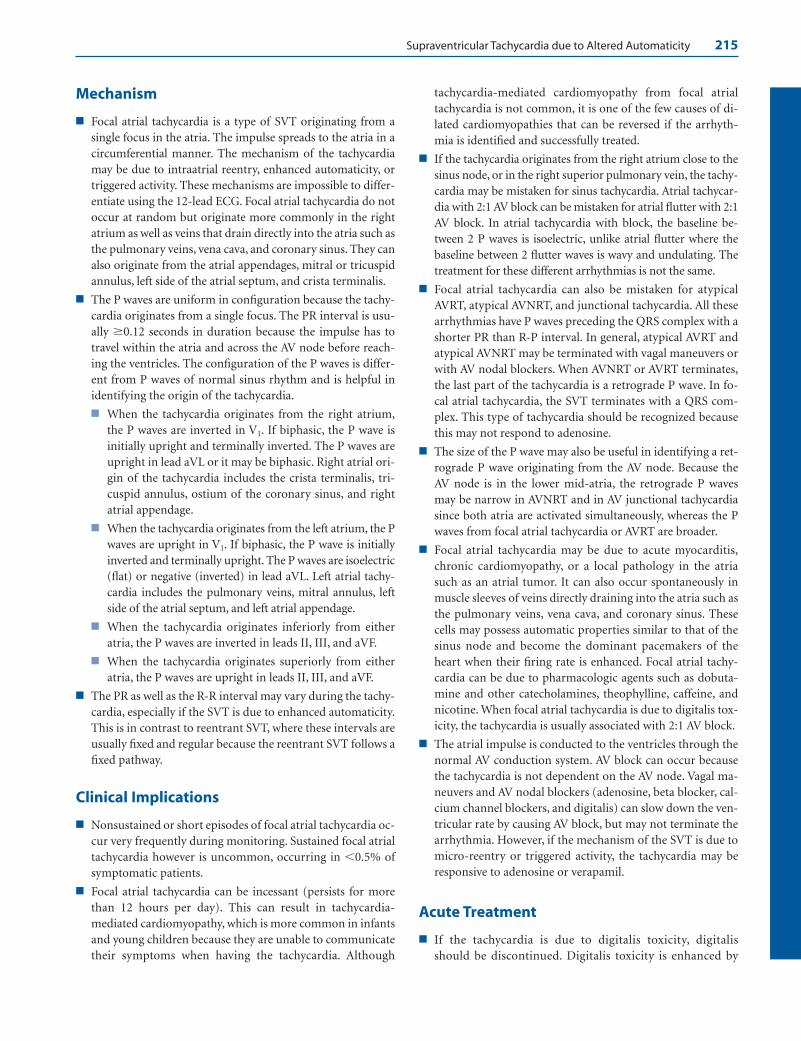
Mechanism
■ Focal atrial tachycardia is a type of SVT originating from asingle focus in the atria. The impulse spreads to the atria in acircumferential manner. The mechanism of the tachycardiamay be due to intraatrial reentry, enhanced automaticity, ortriggered activity. These mechanisms are impossible to differ-entiate using the 12-lead ECG. Focal atrial tachycardia do notoccur at random but originate more commonly in the rightatrium as well as veins that drain directly into the atria such asthe pulmonary veins, vena cava, and coronary sinus. They canalso originate from the atrial appendages, mitral or tricuspidannulus, left side of the atrial septum, and crista terminalis.
■ The P waves are uniform in configuration because the tachy-cardia originates from a single focus. The PR interval is usu-ally �0.12 seconds in duration because the impulse has totravel within the atria and across the AV node before reach-ing the ventricles. The configuration of the P waves is differ-ent from P waves of normal sinus rhythm and is helpful inidentifying the origin of the tachycardia.
■ When the tachycardia originates from the right atrium,the P waves are inverted in V1. If biphasic, the P wave isinitially upright and terminally inverted. The P waves areupright in lead aVL or it may be biphasic. Right atrial ori-gin of the tachycardia includes the crista terminalis, tri-cuspid annulus, ostium of the coronary sinus, and rightatrial appendage.
■ When the tachycardia originates from the left atrium, the Pwaves are upright in V1. If biphasic, the P wave is initiallyinverted and terminally upright. The P waves are isoelectric(flat) or negative (inverted) in lead aVL. Left atrial tachy-cardia includes the pulmonary veins, mitral annulus, leftside of the atrial septum, and left atrial appendage.
■ When the tachycardia originates inferiorly from eitheratria, the P waves are inverted in leads II, III, and aVF.
■ When the tachycardia originates superiorly from eitheratria, the P waves are upright in leads II, III, and aVF.
■ The PR as well as the R-R interval may vary during the tachy-cardia, especially if the SVT is due to enhanced automaticity.This is in contrast to reentrant SVT, where these intervals areusually fixed and regular because the reentrant SVT follows afixed pathway.
Clinical Implications
■ Nonsustained or short episodes of focal atrial tachycardia oc-cur very frequently during monitoring. Sustained focal atrialtachycardia however is uncommon, occurring in �0.5% ofsymptomatic patients.
■ Focal atrial tachycardia can be incessant (persists for morethan 12 hours per day). This can result in tachycardia-mediated cardiomyopathy, which is more common in infantsand young children because they are unable to communicatetheir symptoms when having the tachycardia. Although
tachycardia-mediated cardiomyopathy from focal atrialtachycardia is not common, it is one of the few causes of di-lated cardiomyopathies that can be reversed if the arrhyth-mia is identified and successfully treated.
■ If the tachycardia originates from the right atrium close to thesinus node, or in the right superior pulmonary vein, the tachy-cardia may be mistaken for sinus tachycardia. Atrial tachycar-dia with 2:1 AV block can be mistaken for atrial flutter with 2:1AV block. In atrial tachycardia with block, the baseline be-tween 2 P waves is isoelectric, unlike atrial flutter where thebaseline between 2 flutter waves is wavy and undulating. Thetreatment for these different arrhythmias is not the same.
■ Focal atrial tachycardia can also be mistaken for atypicalAVRT, atypical AVNRT, and junctional tachycardia. All thesearrhythmias have P waves preceding the QRS complex with ashorter PR than R-P interval. In general, atypical AVRT andatypical AVNRT may be terminated with vagal maneuvers orwith AV nodal blockers. When AVNRT or AVRT terminates,the last part of the tachycardia is a retrograde P wave. In fo-cal atrial tachycardia, the SVT terminates with a QRS com-plex. This type of tachycardia should be recognized becausethis may not respond to adenosine.
■ The size of the P wave may also be useful in identifying a ret-rograde P wave originating from the AV node. Because theAV node is in the lower mid-atria, the retrograde P wavesmay be narrow in AVNRT and in AV junctional tachycardiasince both atria are activated simultaneously, whereas the Pwaves from focal atrial tachycardia or AVRT are broader.
■ Focal atrial tachycardia may be due to acute myocarditis,chronic cardiomyopathy, or a local pathology in the atriasuch as an atrial tumor. It can also occur spontaneously inmuscle sleeves of veins directly draining into the atria such asthe pulmonary veins, vena cava, and coronary sinus. Thesecells may possess automatic properties similar to that of thesinus node and become the dominant pacemakers of theheart when their firing rate is enhanced. Focal atrial tachy-cardia can be due to pharmacologic agents such as dobuta-mine and other catecholamines, theophylline, caffeine, andnicotine. When focal atrial tachycardia is due to digitalis tox-icity, the tachycardia is usually associated with 2:1 AV block.
■ The atrial impulse is conducted to the ventricles through thenormal AV conduction system. AV block can occur becausethe tachycardia is not dependent on the AV node. Vagal ma-neuvers and AV nodal blockers (adenosine, beta blocker, cal-cium channel blockers, and digitalis) can slow down the ven-tricular rate by causing AV block, but may not terminate thearrhythmia. However, if the mechanism of the SVT is due tomicro-reentry or triggered activity, the tachycardia may beresponsive to adenosine or verapamil.
Acute Treatment
■ If the tachycardia is due to digitalis toxicity, digitalisshould be discontinued. Digitalis toxicity is enhanced by
Supraventricular Tachycardia due to Altered Automaticity 215
LWBK271-C17_211-232.qxd 29/1/09 7:44 pm Page 215 LWBK270-4119G-C02_073-110.qxd

216 Chapter 17
hypokalemia, hypomagnesemia, and hypercalcemia. Theseelectrolyte abnormalities should be corrected. Potassiumsupplements are usually given to minimize the effects ofdigitalis toxicity. The use of digoxin binding agents shouldbe considered if the arrhythmia is persistent and is poorlytolerated.
■ Tachycardia is also precipitated by metabolic and blood gasdisorders or use of pharmacologic agents such as theo-phylline, albuterol, or catecholamines. These metabolic andrespiratory abnormalities should be corrected and the of-fending agents should be discontinued.
■ Because focal atrial tachycardia is a regular narrow complextachycardia, the tachycardia is difficult to distinguish fromatypical AVNRT and atypical AVRT. Thus, the acute treat-ment for the tachycardia is similar to any regular narrowcomplex SVT. These include vagal maneuvers, AV nodalblockers such as adenosine, beta blocker, calcium channelblockers, and digitalis (if digitalis is not the cause of thetachycardia). A significant number of focal atrial tachycardia(atrial tachycardia due to microreentry or triggered activity)may respond to adenosine or verapamil. Thus, adenosine re-mains the drug of choice for any regular narrow complextachycardia and should be tried before other agents are con-sidered. If the tachycardia is not responsive to adenosine orAV block occurs without converting the SVT to normal sinusrhythm, longer acting AV nodal agents such as diltiazem, ve-rapamil, or beta blockers can be given to slow down the ven-tricular rate by causing AV block.
■ Focal atrial tachycardia from enhanced automaticity gener-ally will not respond to adenosine. Class IA (procainamide),
Class IC (flecainide and propafenone), or Class III (sotalol,amiodarone) antiarrhythmic agents should be considered if adenosine and other AV nodal blocking agents are noteffective.
■ Electrical cardioversion is not effective when the mechanismof the tachycardia is due to enhanced automaticity but maybe effective if the tachycardia is due to intra-atrial reentry ortriggered activity. Unless patient is in circulatory shock, elec-trical cardioversion is contraindicated when the tachycardiais known to be due to digitalis toxicity (atrial tachycardiawith 2:1 AV block with history of digitalis intake) or thetachycardia is due to metabolic or electrolyte abnormalities.
■ When the tachycardia is intractable to medical therapy, elec-trical ablation (or if not feasible, surgical excision) of the ar-rhythmogenic focus should be considered.
Prognosis
■ In infants and young children, in whom the tachycardia ismore difficult to detect, the mortality is high because a tachy-cardia-mediated cardiomyopathy may occur. This type ofcardiomyopathy is reversible if the tachycardia is recognizedas the cause of the cardiomyopathy.
■ Focal atrial tachycardia is usually associated with structuralcardiac diseases. The prognosis will depend on the etiologyof the cardiac abnormality. The overall prognosis of focalatrial tachycardia from digitalis excess and metabolic, respi-ratory, or electrolyte abnormalities will depend on the un-derlying condition. In the absence of structural cardiac dis-ease, the overall prognosis is generally good.
Figure 17.7: Focal Atrial Tachycardia. The electrocardiogram is from a patient with acute exacerbation ofasthma.The P waves are inverted in aVL and are upright in leads II, III, and aVF suggesting a superior left atrial originof the impulse. Electrical alternans is seen in leads II and in all precordial leads (arrows). Although electrical alternansis frequently associated with AVRT, it is also seen in other types of supraventricular tachycardia as shown here. AVRT,atrioventricular reentrant tachycardia.
LWBK271-C17_211-232.qxd 29/1/09 7:44 pm Page 216 LWBK270-4119G-C02_073-110.qxd
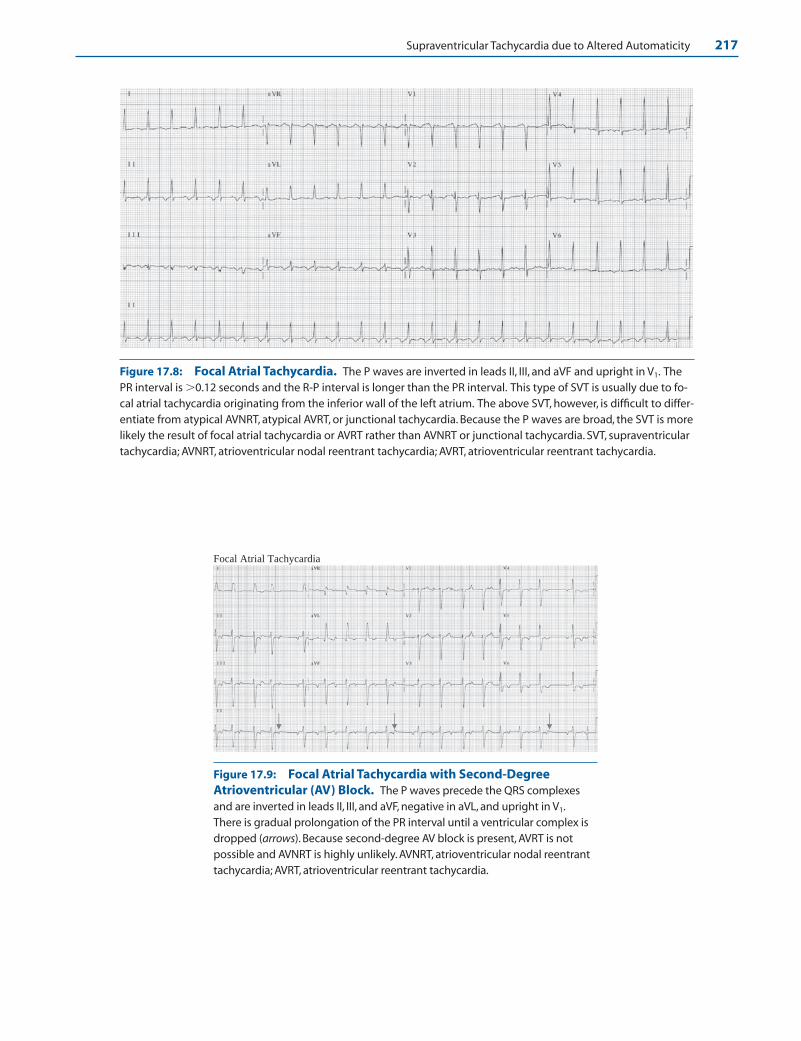
Supraventricular Tachycardia due to Altered Automaticity 217
Figure 17.8: Focal Atrial Tachycardia. The P waves are inverted in leads II, III, and aVF and upright in V1. ThePR interval is �0.12 seconds and the R-P interval is longer than the PR interval. This type of SVT is usually due to fo-cal atrial tachycardia originating from the inferior wall of the left atrium. The above SVT, however, is difficult to differ-entiate from atypical AVNRT, atypical AVRT, or junctional tachycardia. Because the P waves are broad, the SVT is morelikely the result of focal atrial tachycardia or AVRT rather than AVNRT or junctional tachycardia. SVT, supraventriculartachycardia; AVNRT, atrioventricular nodal reentrant tachycardia; AVRT, atrioventricular reentrant tachycardia.
Focal Atrial Tachycardia
Figure 17.9: Focal Atrial Tachycardia with Second-DegreeAtrioventricular (AV) Block. The P waves precede the QRS complexesand are inverted in leads II, III, and aVF, negative in aVL, and upright in V1.There is gradual prolongation of the PR interval until a ventricular complex isdropped (arrows). Because second-degree AV block is present, AVRT is not possible and AVNRT is highly unlikely. AVNRT, atrioventricular nodal reentranttachycardia; AVRT, atrioventricular reentrant tachycardia.
LWBK271-C17_211-232.qxd 29/1/09 7:44 pm Page 217 LWBK270-4119G-C02_073-110.qxd

218 Chapter 17
Multifocal Atrial Tachycardia
■ Multifocal atrial tachycardia (MAT): MAT is charac-terized by the presence of atrial complexes originatingfrom different foci in the atria. The P waves are irregu-lar with varying sizes and shapes and varying PR andR-R intervals (Figs. 17.11–17.14). Because the R-Rintervals are irregular, the arrhythmia can be mistakenfor atrial fibrillation.
■ The diagnosis of MAT is based on the presence of threeor more consecutive P waves of different morphologieswith an isoelectric baseline between P waves with a rate�100 bpm.
■ Typical examples of MAT are shown in Figures 17.12 to17.14.
ECG Findings of MAT
1. At least three consecutive P waves with different morphologieswith a rate �100 bpm should be present.
2. The PR as well as the R-R interval is variable with isoelectricbaseline between P waves.
Mechanism
■ MAT is most probably due to enhanced automaticity. Multi-ple independent automatic foci are present in the atria, re-sulting in varying configurations of the P wave.
Atria
Ventricle
Multifocal atrial tachycardia (MAT).
Figure 17.11: Multifocal Atrial Tachycardia(MAT). Diagrammatic representation of MAT show-ing at least three consecutive P waves of differentsizes and shapes with a rate �100 beats per minute.
Figure 17.10: Focal Atrial Tachycardia with Second-Degree Atrioventricular (AV) Block. A 12-leadelectrocardiogram showing focal atrial tachycardia with second-degree AV Wenckebach. The P waves precede theQRS complexes with a rate of 150 beats per minute. The mechanism of the focal atrial tachycardia was thought tobe IART because the patient had previous atrial septal defect repair, which is a possible focus of reentry. The patientwas successfully cardioverted electrically to normal sinus rhythm. Focal atrial tachycardia from enhanced automatic-ity generally does not respond to electrical cardioversion. The presence of AV block excludes AVRT and upright Pwaves in II, III, and aVF makes AVNRT unlikely. AVNRT, atrioventricular nodal reentrant tachycardia; AVRT, atrioventric-ular reentrant tachycardia; IART, intraatrial reentrant tachycardia. Arrows point to the nonconducted P waves.
LWBK271-C17_211-232.qxd 29/1/09 7:44 pm Page 218 LWBK270-4119G-C02_073-110.qxd
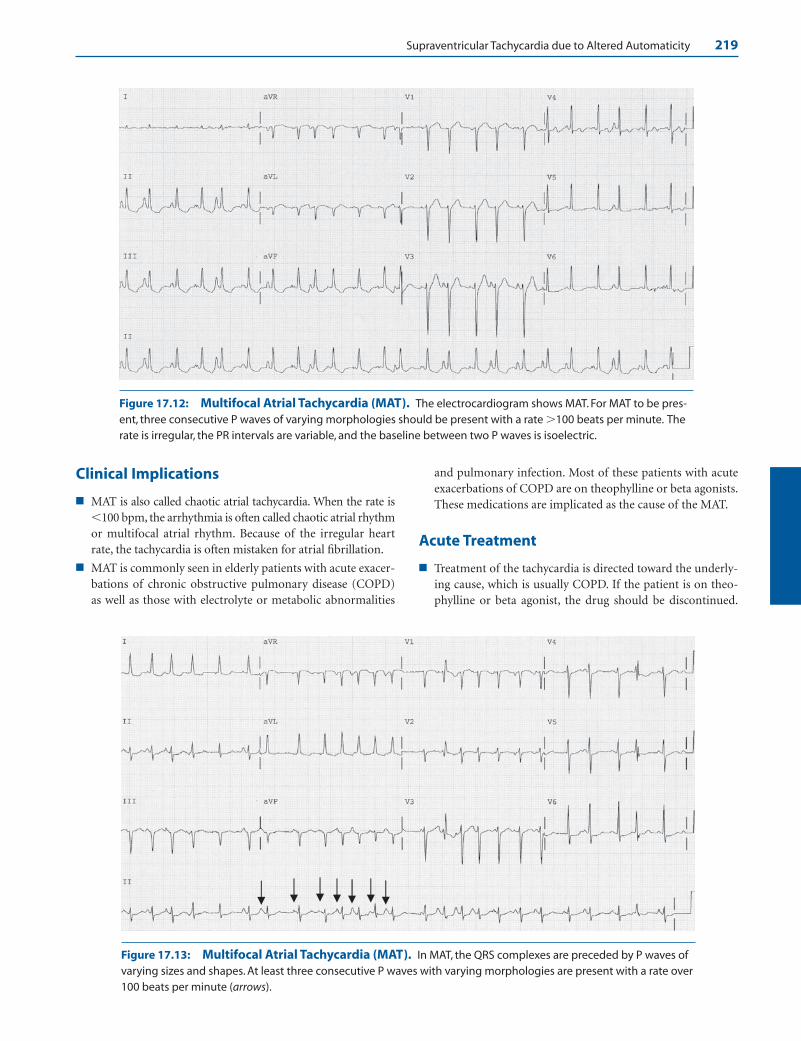
Supraventricular Tachycardia due to Altered Automaticity 219
Clinical Implications
■ MAT is also called chaotic atrial tachycardia. When the rate is�100 bpm, the arrhythmia is often called chaotic atrial rhythmor multifocal atrial rhythm. Because of the irregular heartrate, the tachycardia is often mistaken for atrial fibrillation.
■ MAT is commonly seen in elderly patients with acute exacer-bations of chronic obstructive pulmonary disease (COPD)as well as those with electrolyte or metabolic abnormalities
and pulmonary infection. Most of these patients with acuteexacerbations of COPD are on theophylline or beta agonists.These medications are implicated as the cause of the MAT.
Acute Treatment
■ Treatment of the tachycardia is directed toward the underly-ing cause, which is usually COPD. If the patient is on theo-phylline or beta agonist, the drug should be discontinued.
Figure 17.12: Multifocal Atrial Tachycardia (MAT). The electrocardiogram shows MAT. For MAT to be pres-ent, three consecutive P waves of varying morphologies should be present with a rate �100 beats per minute. Therate is irregular, the PR intervals are variable, and the baseline between two P waves is isoelectric.
Figure 17.13: Multifocal Atrial Tachycardia (MAT). In MAT, the QRS complexes are preceded by P waves ofvarying sizes and shapes. At least three consecutive P waves with varying morphologies are present with a rate over100 beats per minute (arrows).
LWBK271-C17_211-232.qxd 29/1/09 7:44 pm Page 219 LWBK270-4119G-C02_073-110.qxd

220 Chapter 17
Any electrolyte, blood gas, or metabolic abnormality shouldbe corrected. Any associated cardiac disease or pulmonaryinfection should be treated.
■ MAT should be differentiated from atrial fibrillation. Pa-tients with atrial fibrillation need to be anticoagulated,whereas patients with MAT do not need anticoagulation.
■ The rate of the tachycardia is usually not rapid and usuallydoes not exceed 130 bpm. However, because MAT occurs morefrequently in elderly individuals with COPD, the rate may notbe tolerable especially when there is heart failure, ischemicheart disease, or respiratory insufficiency. Pharmacologic ther-apy may be necessary to control the rate of the tachycardia.
■ Nondihydropyridine calcium channel blockers may be used tocontrol the ventricular rate and diminish the number of ec-topic atrial impulses. Diltiazem (20 mg IV) or verapamil (5 to10 mg IV) may be given intravenously. Diltiazem may becontinued as an IV infusion drip at 5 to 15 mg per hour af-ter the rate has been controlled with the initial bolus. Vera-pamil should not be given if there is left ventricular dys-function (ejection fraction �40%) or there is heart failure.
■ Although beta blockers are also effective, these drugs areusually contraindicated because MAT is frequently seen inthe setting of bronchospastic pulmonary disease. In pa-tients without reactive airway disease, beta blockers are ef-fective agents.
■ Although antiarrhythmic agents are usually not indicatedfor MAT, amiodarone may be tried for rate control andfor suppression of ectopic atrial impulses if the arrhyth-mia has not improved with the above agents. Magne-sium given intravenously has also been used with varyingsuccess when other agents have failed even in the absenceof hypomagnesemia.
■ Digitalis is not effective and has a narrow margin of safetyin patients with chronic pulmonary disease and shouldnot be given.
■ MAT frequently deteriorates to atrial fibrillation. The ratein atrial fibrillation may be easier to control than the ratein MAT; however, anticoagulation may be necessary.
■ Electrical cardioversion has no place in the therapy of MAT.MAT is an example of SVT from enhanced automaticity andelectrical cardioversion will not be effective.
Prognosis
■ The arrhythmia is usually well tolerated and prognosis de-pends on the underlying medical condition.
Junctional Tachycardia
■ Junctional tachycardia: AV junctional tachycardia isdue to repetitive impulses originating from the AVnode or bundle of His. The impulse follows the normalAV conduction system resulting in narrow QRS com-plexes. There are two types of junctional tachycardia:■ Nonparoxysmal junctional tachycardia: The SVT
has a slower rate of 70 to 120 bpm. Despite the veryslow rate of �100 bpm, the arrhythmia is considereda tachycardia since the intrinsic rate of the AV junc-tion is exceeded, which is usually 40 to 60 bpm (Fig.17.15). AV junctional rhythm with a rate �100 bpmis more appropriately called accelerated junctionalrhythm rather than junctional “tachycardia.” Thetachycardia is nonparoxysmal with a slow onset and
Figure 17.14: Multifocal Atrial Tachycardia. Note the presence of P waves of varying morphologies pre-ceding each QRS complex (arrows) in the long lead rhythm strip at the bottom of the tracing. The baselinebetween P waves remains isoelectric.
LWBK271-C17_211-232.qxd 29/1/09 7:44 pm Page 220 LWBK270-4119G-C02_073-110.qxd

Supraventricular Tachycardia due to Altered Automaticity 221
A
C
D
B
Atria
Atria
Atria
Atria
PR interval <0.12 secondPseudo q waves
Lead II
Complete AV Dissociation
#1: Normal Sinus Rhythm #2: Atrial Fibrillation
R-P interval ≤0.20 second
No P waves
Figure 17.15: Nonparoxysmal Junctional Tachycardia. No P waves are noted in the entire 12-lead electro-cardiogram. Although the ventricular rate is �100 beats per minute, the arrhythmia is accepted as junctional tachy-cardia since the rate exceeds the intrinsic rate of the atrioventricular junction, which is 60 beats per minute.
Figure 17.16: Junctional Tachycardia. (A) Atrialactivation occurs earlier than ventricular activation (P wave is infront of the QRS complex). (B) Atrial activation is synchronouswith ventricular activation (no P waves are present). (C) Ventric-ular activation occurs earlier than atrial activation (P waves oc-cur after the QRS complex). (D) Complete atrioventricular disso-ciation during normal sinus rhythm (#1) and during atrialfibrillation (#2).
termination. This type of tachycardia may be due toenhanced automaticity or triggered activity.
■ Paroxysmal or focal junctional tachycardia:This type of tachycardia is rare. The tachycardia isalso called junctional ectopic tachycardia or auto-matic junctional tachycardia. The American Collegeof Cardiology/American Heart Association TaskForce on Practice Guidelines/European Society ofCardiology guidelines on SVT refer to this tachycar-dia as focal junctional tachycardia. The tachycardiavaries from 110 to 250 bpm and is often paroxysmalwith sudden onset and abrupt termination. Themechanism of the tachycardia is due to enhancedautomaticity or triggered activity.
■ ECG findings: The ECG of AV junctional tachycardiaoverlaps those of other SVT. Because the tachycardia isnot dependent on the atria or ventricles, the relation-ship between the P wave and the QRS complex is vari-able. The retrograde P waves are narrow and may occurbefore or after the QRS complex. It may also be syn-chronous with the QRS complex. When this occurs, theP waves are not visible. The diagrams in Fig. 17.16summarize the ECG findings of junctional tachycardia.
Nonparoxysmal Junctional Tachycardia
■ When the retrograde P wave precedes the QRS com-plex, the PR interval is usually �0.12 seconds. Thewidth of the retrograde P wave is usually thinner thana normal sinus P wave, because the impulse originatesfrom the AV node. Thus, both atria are activated
LWBK271-C17_211-232.qxd 29/1/09 7:44 pm Page 221 LWBK270-4119G-C02_073-110.qxd

222 Chapter 17
Figure 17.18: Nonparoxysmal Junctional Tachycardia. Lead II rhythm strip again showing acceleratedjunctional rhythm at 73 beats per minute. Note that the retrograde P waves are inscribed after the QRS complexesand are narrow (arrows). Because the P waves occur during ventricular systole, this can result in cannon A waves inthe jugular neck veins.
Figure 17.19: Nonparoxysmal Junctional Tachycardia. The initial half of the tracing shows nonparoxysmaljunctional tachycardia of 106 beats per minute. There is isorhythmic atrioventricular dissociation (arrows) until thesinus P waves capture the QRS complexes at a slightly higher rate of 110 beats per minute.
Figure 17.20: Accelerated Junctional Rhythm with Complete Atrioventricular Dissociation. Theatrial and ventricular rates are almost similar at 80 beats per minute. The sinus P waves however are completely dis-sociated from the QRS complexes. Arrows point to the P waves.
Figure 17.17: Nonparoxysmal Junctional Tachycardia. Lead II rhythm strip showing accelerated junctionalrhythm at 87 beats per minute. Retrograde P waves are inscribed just before the QRS complexes (arrows), which canbe mistaken for Q waves (pseudo-Q waves). Note that the P waves are narrow measuring less than 0.05 seconds.
LWBK271-C17_211-232.qxd 29/1/09 7:44 pm Page 222 LWBK270-4119G-C02_073-110.qxd
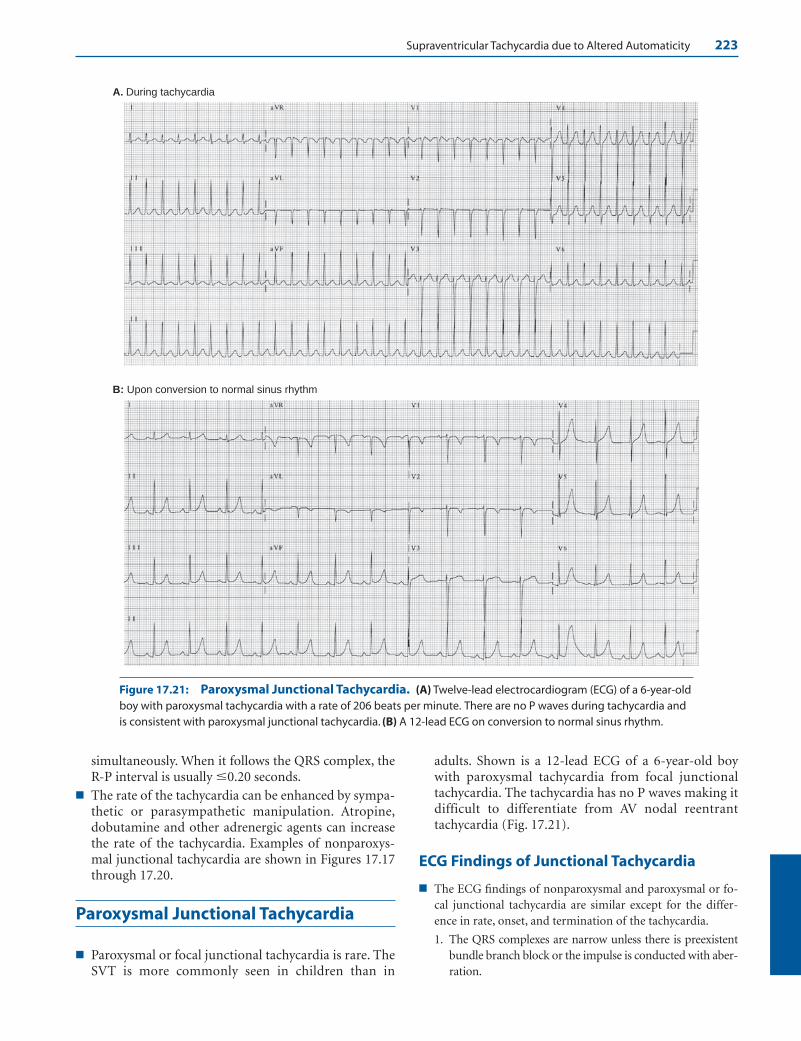
Supraventricular Tachycardia due to Altered Automaticity 223
A. During tachycardia
B: Upon conversion to normal sinus rhythm
Figure 17.21: Paroxysmal Junctional Tachycardia. (A) Twelve-lead electrocardiogram (ECG) of a 6-year-oldboy with paroxysmal tachycardia with a rate of 206 beats per minute. There are no P waves during tachycardia andis consistent with paroxysmal junctional tachycardia. (B) A 12-lead ECG on conversion to normal sinus rhythm.
simultaneously. When it follows the QRS complex, theR-P interval is usually �0.20 seconds.
■ The rate of the tachycardia can be enhanced by sympa-thetic or parasympathetic manipulation. Atropine,dobutamine and other adrenergic agents can increasethe rate of the tachycardia. Examples of nonparoxys-mal junctional tachycardia are shown in Figures 17.17through 17.20.
Paroxysmal Junctional Tachycardia
■ Paroxysmal or focal junctional tachycardia is rare. TheSVT is more commonly seen in children than in
adults. Shown is a 12-lead ECG of a 6-year-old boywith paroxysmal tachycardia from focal junctionaltachycardia. The tachycardia has no P waves making itdifficult to differentiate from AV nodal reentranttachycardia (Fig. 17.21).
ECG Findings of Junctional Tachycardia
■ The ECG findings of nonparoxysmal and paroxysmal or fo-cal junctional tachycardia are similar except for the differ-ence in rate, onset, and termination of the tachycardia.
1. The QRS complexes are narrow unless there is preexistentbundle branch block or the impulse is conducted with aber-ration.
LWBK271-C17_211-232.qxd 29/1/09 7:44 pm Page 223 LWBK270-4119G-C02_073-110.qxd
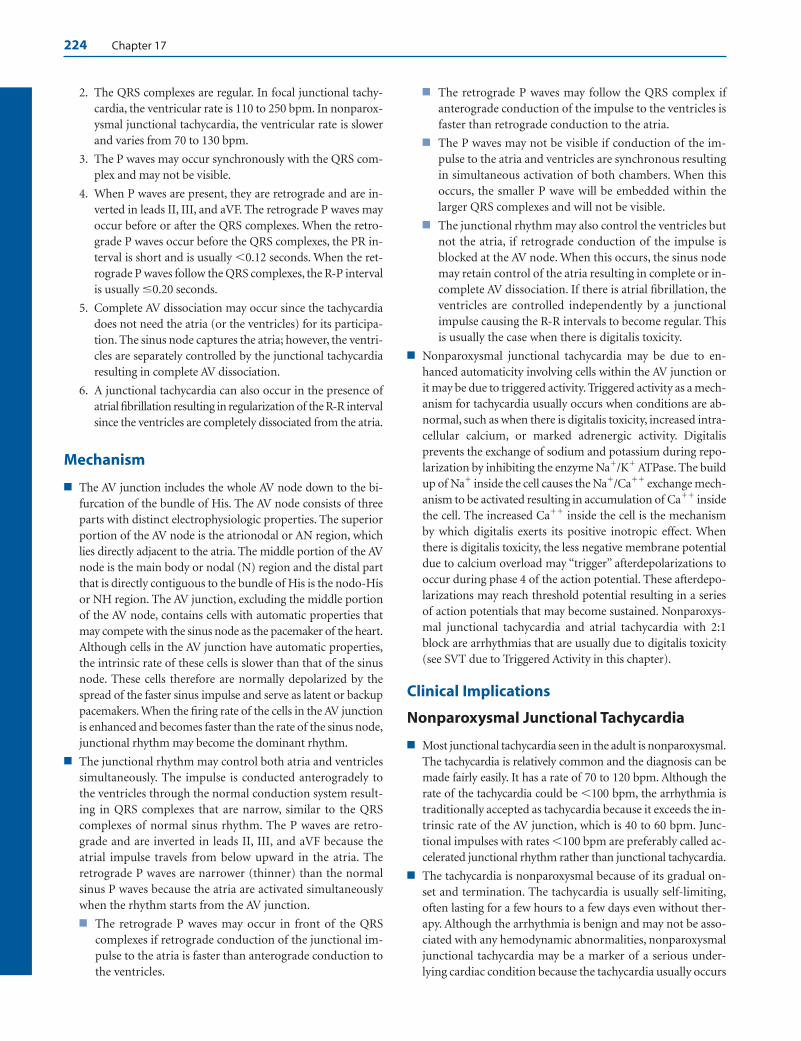
224 Chapter 17
2. The QRS complexes are regular. In focal junctional tachy-cardia, the ventricular rate is 110 to 250 bpm. In nonparox-ysmal junctional tachycardia, the ventricular rate is slowerand varies from 70 to 130 bpm.
3. The P waves may occur synchronously with the QRS com-plex and may not be visible.
4. When P waves are present, they are retrograde and are in-verted in leads II, III, and aVF. The retrograde P waves mayoccur before or after the QRS complexes. When the retro-grade P waves occur before the QRS complexes, the PR in-terval is short and is usually �0.12 seconds. When the ret-rograde P waves follow the QRS complexes, the R-P intervalis usually �0.20 seconds.
5. Complete AV dissociation may occur since the tachycardiadoes not need the atria (or the ventricles) for its participa-tion. The sinus node captures the atria; however, the ventri-cles are separately controlled by the junctional tachycardiaresulting in complete AV dissociation.
6. A junctional tachycardia can also occur in the presence ofatrial fibrillation resulting in regularization of the R-R intervalsince the ventricles are completely dissociated from the atria.
Mechanism
■ The AV junction includes the whole AV node down to the bi-furcation of the bundle of His. The AV node consists of threeparts with distinct electrophysiologic properties. The superiorportion of the AV node is the atrionodal or AN region, whichlies directly adjacent to the atria. The middle portion of the AVnode is the main body or nodal (N) region and the distal partthat is directly contiguous to the bundle of His is the nodo-Hisor NH region. The AV junction, excluding the middle portionof the AV node, contains cells with automatic properties thatmay compete with the sinus node as the pacemaker of the heart.Although cells in the AV junction have automatic properties,the intrinsic rate of these cells is slower than that of the sinusnode. These cells therefore are normally depolarized by thespread of the faster sinus impulse and serve as latent or backuppacemakers. When the firing rate of the cells in the AV junctionis enhanced and becomes faster than the rate of the sinus node,junctional rhythm may become the dominant rhythm.
■ The junctional rhythm may control both atria and ventriclessimultaneously. The impulse is conducted anterogradely tothe ventricles through the normal conduction system result-ing in QRS complexes that are narrow, similar to the QRScomplexes of normal sinus rhythm. The P waves are retro-grade and are inverted in leads II, III, and aVF because theatrial impulse travels from below upward in the atria. Theretrograde P waves are narrower (thinner) than the normalsinus P waves because the atria are activated simultaneouslywhen the rhythm starts from the AV junction.
■ The retrograde P waves may occur in front of the QRScomplexes if retrograde conduction of the junctional im-pulse to the atria is faster than anterograde conduction tothe ventricles.
■ The retrograde P waves may follow the QRS complex ifanterograde conduction of the impulse to the ventricles isfaster than retrograde conduction to the atria.
■ The P waves may not be visible if conduction of the im-pulse to the atria and ventricles are synchronous resultingin simultaneous activation of both chambers. When thisoccurs, the smaller P wave will be embedded within thelarger QRS complexes and will not be visible.
■ The junctional rhythm may also control the ventricles butnot the atria, if retrograde conduction of the impulse isblocked at the AV node. When this occurs, the sinus nodemay retain control of the atria resulting in complete or in-complete AV dissociation. If there is atrial fibrillation, theventricles are controlled independently by a junctionalimpulse causing the R-R intervals to become regular. Thisis usually the case when there is digitalis toxicity.
■ Nonparoxysmal junctional tachycardia may be due to en-hanced automaticity involving cells within the AV junction orit may be due to triggered activity. Triggered activity as a mech-anism for tachycardia usually occurs when conditions are ab-normal, such as when there is digitalis toxicity, increased intra-cellular calcium, or marked adrenergic activity. Digitalisprevents the exchange of sodium and potassium during repo-larization by inhibiting the enzyme Na�/K� ATPase. The buildup of Na� inside the cell causes the Na�/Ca�� exchange mech-anism to be activated resulting in accumulation of Ca�� insidethe cell. The increased Ca�� inside the cell is the mechanismby which digitalis exerts its positive inotropic effect. Whenthere is digitalis toxicity, the less negative membrane potentialdue to calcium overload may “trigger” afterdepolarizations tooccur during phase 4 of the action potential. These afterdepo-larizations may reach threshold potential resulting in a seriesof action potentials that may become sustained. Nonparoxys-mal junctional tachycardia and atrial tachycardia with 2:1block are arrhythmias that are usually due to digitalis toxicity(see SVT due to Triggered Activity in this chapter).
Clinical Implications
Nonparoxysmal Junctional Tachycardia
■ Most junctional tachycardia seen in the adult is nonparoxysmal.The tachycardia is relatively common and the diagnosis can bemade fairly easily. It has a rate of 70 to 120 bpm. Although therate of the tachycardia could be �100 bpm, the arrhythmia istraditionally accepted as tachycardia because it exceeds the in-trinsic rate of the AV junction, which is 40 to 60 bpm. Junc-tional impulses with rates �100 bpm are preferably called ac-celerated junctional rhythm rather than junctional tachycardia.
■ The tachycardia is nonparoxysmal because of its gradual on-set and termination. The tachycardia is usually self-limiting,often lasting for a few hours to a few days even without ther-apy. Although the arrhythmia is benign and may not be asso-ciated with any hemodynamic abnormalities, nonparoxysmaljunctional tachycardia may be a marker of a serious under-lying cardiac condition because the tachycardia usually occurs
LWBK271-C17_211-232.qxd 29/1/09 7:44 pm Page 224 LWBK270-4119G-C02_073-110.qxd
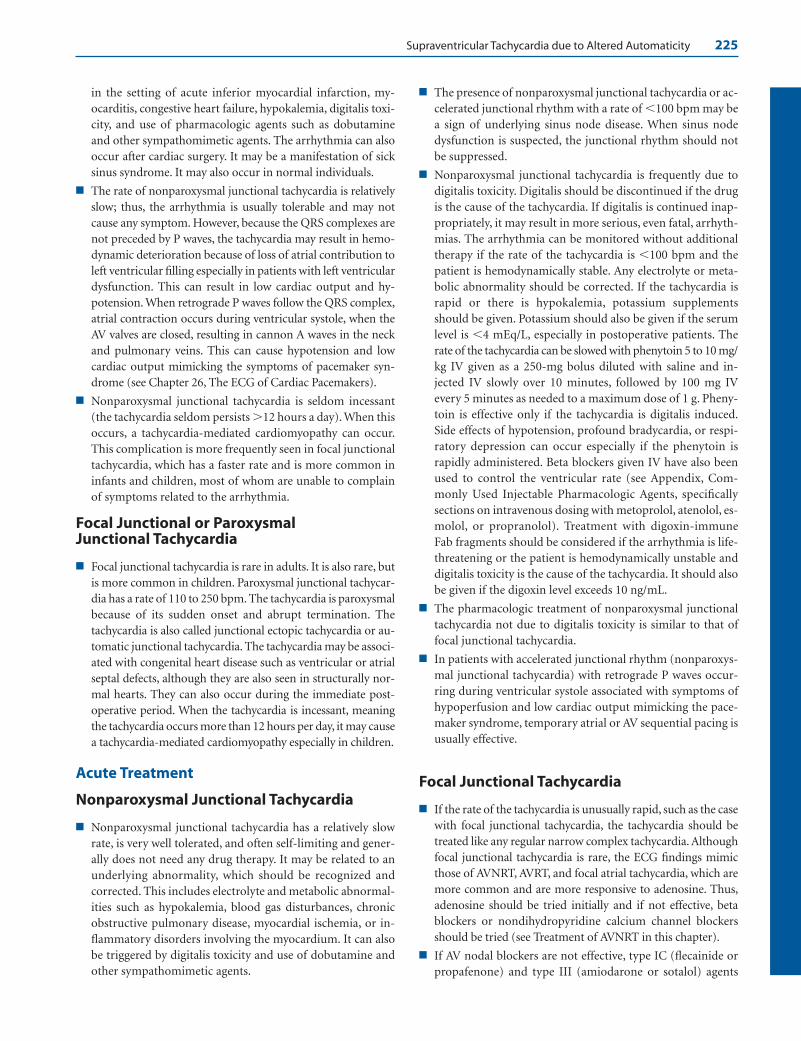
in the setting of acute inferior myocardial infarction, my-ocarditis, congestive heart failure, hypokalemia, digitalis toxi-city, and use of pharmacologic agents such as dobutamineand other sympathomimetic agents. The arrhythmia can alsooccur after cardiac surgery. It may be a manifestation of sicksinus syndrome. It may also occur in normal individuals.
■ The rate of nonparoxysmal junctional tachycardia is relativelyslow; thus, the arrhythmia is usually tolerable and may notcause any symptom. However, because the QRS complexes arenot preceded by P waves, the tachycardia may result in hemo-dynamic deterioration because of loss of atrial contribution toleft ventricular filling especially in patients with left ventriculardysfunction. This can result in low cardiac output and hy-potension. When retrograde P waves follow the QRS complex,atrial contraction occurs during ventricular systole, when theAV valves are closed, resulting in cannon A waves in the neckand pulmonary veins. This can cause hypotension and lowcardiac output mimicking the symptoms of pacemaker syn-drome (see Chapter 26, The ECG of Cardiac Pacemakers).
■ Nonparoxysmal junctional tachycardia is seldom incessant(the tachycardia seldom persists �12 hours a day). When thisoccurs, a tachycardia-mediated cardiomyopathy can occur.This complication is more frequently seen in focal junctionaltachycardia, which has a faster rate and is more common ininfants and children, most of whom are unable to complainof symptoms related to the arrhythmia.
Focal Junctional or Paroxysmal Junctional Tachycardia
■ Focal junctional tachycardia is rare in adults. It is also rare, butis more common in children. Paroxysmal junctional tachycar-dia has a rate of 110 to 250 bpm. The tachycardia is paroxysmalbecause of its sudden onset and abrupt termination. Thetachycardia is also called junctional ectopic tachycardia or au-tomatic junctional tachycardia. The tachycardia may be associ-ated with congenital heart disease such as ventricular or atrialseptal defects, although they are also seen in structurally nor-mal hearts. They can also occur during the immediate post-operative period. When the tachycardia is incessant, meaningthe tachycardia occurs more than 12 hours per day, it may causea tachycardia-mediated cardiomyopathy especially in children.
Acute Treatment
Nonparoxysmal Junctional Tachycardia
■ Nonparoxysmal junctional tachycardia has a relatively slowrate, is very well tolerated, and often self-limiting and gener-ally does not need any drug therapy. It may be related to anunderlying abnormality, which should be recognized andcorrected. This includes electrolyte and metabolic abnormal-ities such as hypokalemia, blood gas disturbances, chronicobstructive pulmonary disease, myocardial ischemia, or in-flammatory disorders involving the myocardium. It can alsobe triggered by digitalis toxicity and use of dobutamine andother sympathomimetic agents.
■ The presence of nonparoxysmal junctional tachycardia or ac-celerated junctional rhythm with a rate of �100 bpm may bea sign of underlying sinus node disease. When sinus nodedysfunction is suspected, the junctional rhythm should notbe suppressed.
■ Nonparoxysmal junctional tachycardia is frequently due todigitalis toxicity. Digitalis should be discontinued if the drugis the cause of the tachycardia. If digitalis is continued inap-propriately, it may result in more serious, even fatal, arrhyth-mias. The arrhythmia can be monitored without additionaltherapy if the rate of the tachycardia is �100 bpm and thepatient is hemodynamically stable. Any electrolyte or meta-bolic abnormality should be corrected. If the tachycardia israpid or there is hypokalemia, potassium supplementsshould be given. Potassium should also be given if the serumlevel is �4 mEq/L, especially in postoperative patients. Therate of the tachycardia can be slowed with phenytoin 5 to 10 mg/kg IV given as a 250-mg bolus diluted with saline and in-jected IV slowly over 10 minutes, followed by 100 mg IVevery 5 minutes as needed to a maximum dose of 1 g. Pheny-toin is effective only if the tachycardia is digitalis induced.Side effects of hypotension, profound bradycardia, or respi-ratory depression can occur especially if the phenytoin israpidly administered. Beta blockers given IV have also beenused to control the ventricular rate (see Appendix, Com-monly Used Injectable Pharmacologic Agents, specificallysections on intravenous dosing with metoprolol, atenolol, es-molol, or propranolol). Treatment with digoxin-immuneFab fragments should be considered if the arrhythmia is life-threatening or the patient is hemodynamically unstable anddigitalis toxicity is the cause of the tachycardia. It should alsobe given if the digoxin level exceeds 10 ng/mL.
■ The pharmacologic treatment of nonparoxysmal junctionaltachycardia not due to digitalis toxicity is similar to that offocal junctional tachycardia.
■ In patients with accelerated junctional rhythm (nonparoxys-mal junctional tachycardia) with retrograde P waves occur-ring during ventricular systole associated with symptoms ofhypoperfusion and low cardiac output mimicking the pace-maker syndrome, temporary atrial or AV sequential pacing isusually effective.
Focal Junctional Tachycardia
■ If the rate of the tachycardia is unusually rapid, such as the casewith focal junctional tachycardia, the tachycardia should betreated like any regular narrow complex tachycardia. Althoughfocal junctional tachycardia is rare, the ECG findings mimicthose of AVNRT, AVRT, and focal atrial tachycardia, which aremore common and are more responsive to adenosine. Thus,adenosine should be tried initially and if not effective, betablockers or nondihydropyridine calcium channel blockersshould be tried (see Treatment of AVNRT in this chapter).
■ If AV nodal blockers are not effective, type IC (flecainide orpropafenone) and type III (amiodarone or sotalol) agents
Supraventricular Tachycardia due to Altered Automaticity 225
LWBK271-C17_211-232.qxd 29/1/09 7:44 pm Page 225 LWBK270-4119G-C02_073-110.qxd
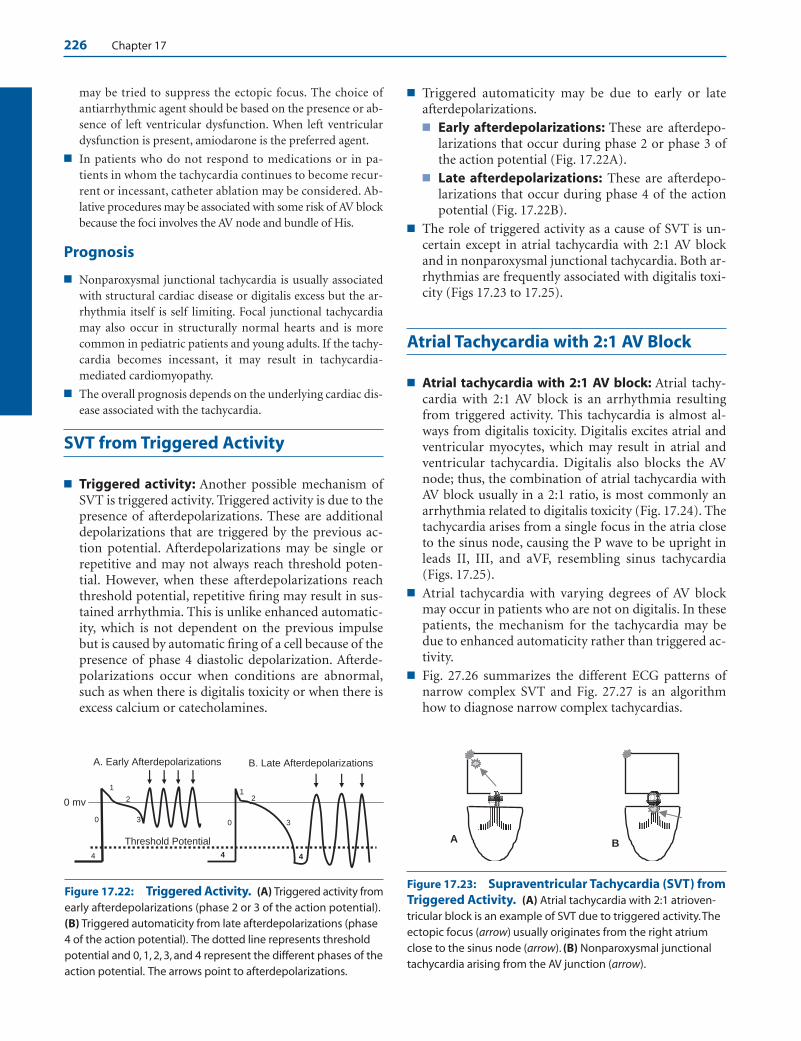
226 Chapter 17
may be tried to suppress the ectopic focus. The choice ofantiarrhythmic agent should be based on the presence or ab-sence of left ventricular dysfunction. When left ventriculardysfunction is present, amiodarone is the preferred agent.
■ In patients who do not respond to medications or in pa-tients in whom the tachycardia continues to become recur-rent or incessant, catheter ablation may be considered. Ab-lative procedures may be associated with some risk of AV blockbecause the foci involves the AV node and bundle of His.
Prognosis
■ Nonparoxysmal junctional tachycardia is usually associatedwith structural cardiac disease or digitalis excess but the ar-rhythmia itself is self limiting. Focal junctional tachycardiamay also occur in structurally normal hearts and is morecommon in pediatric patients and young adults. If the tachy-cardia becomes incessant, it may result in tachycardia-mediated cardiomyopathy.
■ The overall prognosis depends on the underlying cardiac dis-ease associated with the tachycardia.
SVT from Triggered Activity
■ Triggered activity: Another possible mechanism ofSVT is triggered activity. Triggered activity is due to thepresence of afterdepolarizations. These are additionaldepolarizations that are triggered by the previous ac-tion potential. Afterdepolarizations may be single orrepetitive and may not always reach threshold poten-tial. However, when these afterdepolarizations reachthreshold potential, repetitive firing may result in sus-tained arrhythmia. This is unlike enhanced automatic-ity, which is not dependent on the previous impulsebut is caused by automatic firing of a cell because of thepresence of phase 4 diastolic depolarization. Afterde-polarizations occur when conditions are abnormal,such as when there is digitalis toxicity or when there isexcess calcium or catecholamines.
■ Triggered automaticity may be due to early or late afterdepolarizations.■ Early afterdepolarizations: These are afterdepo-
larizations that occur during phase 2 or phase 3 ofthe action potential (Fig. 17.22A).
■ Late afterdepolarizations: These are afterdepo-larizations that occur during phase 4 of the actionpotential (Fig. 17.22B).
■ The role of triggered activity as a cause of SVT is un-certain except in atrial tachycardia with 2:1 AV blockand in nonparoxysmal junctional tachycardia. Both ar-rhythmias are frequently associated with digitalis toxi-city (Figs 17.23 to 17.25).
Atrial Tachycardia with 2:1 AV Block
■ Atrial tachycardia with 2:1 AV block: Atrial tachy-cardia with 2:1 AV block is an arrhythmia resultingfrom triggered activity. This tachycardia is almost al-ways from digitalis toxicity. Digitalis excites atrial andventricular myocytes, which may result in atrial andventricular tachycardia. Digitalis also blocks the AVnode; thus, the combination of atrial tachycardia withAV block usually in a 2:1 ratio, is most commonly anarrhythmia related to digitalis toxicity (Fig. 17.24). Thetachycardia arises from a single focus in the atria closeto the sinus node, causing the P wave to be upright inleads II, III, and aVF, resembling sinus tachycardia(Figs. 17.25).
■ Atrial tachycardia with varying degrees of AV blockmay occur in patients who are not on digitalis. In thesepatients, the mechanism for the tachycardia may bedue to enhanced automaticity rather than triggered ac-tivity.
■ Fig. 27.26 summarizes the different ECG patterns ofnarrow complex SVT and Fig. 27.27 is an algorithmhow to diagnose narrow complex tachycardias.
0
1
2
3
44
A. Early Afterdepolarizations B. Late Afterdepolarizations
4
Threshold Potential
0 mv 1
2
30
Figure 17.22: Triggered Activity. (A) Triggered activity fromearly afterdepolarizations (phase 2 or 3 of the action potential).(B) Triggered automaticity from late afterdepolarizations (phase 4 of the action potential). The dotted line represents threshold potential and 0, 1, 2, 3, and 4 represent the different phases of theaction potential. The arrows point to afterdepolarizations.
A B
Figure 17.23: Supraventricular Tachycardia (SVT) fromTriggered Activity. (A) Atrial tachycardia with 2:1 atrioven-tricular block is an example of SVT due to triggered activity.Theectopic focus (arrow) usually originates from the right atriumclose to the sinus node (arrow). (B) Nonparoxysmal junctionaltachycardia arising from the AV junction (arrow).
LWBK271-C17_211-232.qxd 29/1/09 7:44 pm Page 226 LWBK270-4119G-C02_073-110.qxd

Supraventricular Tachycardia due to Altered Automaticity 227
Lead V1
Figure 17.25: Atrial Tachycardia with 2:1 Atrioventricular Block. The patient is not on digitalis. The atrialrate is approximately 180 beats per minute and the baseline between the P waves is isoelectric.
Approach to a Patient with NarrowComplex Tachycardia
■ When a narrow complex tachycardia with a QRS du-ration of �0.12 seconds is present, the ECG shouldfirst be inspected for gross irregularity of the R-Rintervals.
■ Grossly irregular R-R intervals (Fig. 17.28):■ Multifocal atrial tachycardia: Distinct P waves of
different configurations are present preceding eachQRS complex.
■ Atrial fibrillation: The baseline shows fibrillatorywaves. No definite P waves or flutter waves arepresent.
■ Atrial flutter: Flutter waves are present with a sawtooth or undulating baseline.
■ Regular R-R intervals with no visible P waves(Fig. 17.29):■ AVNRT ■ Junctional tachycardia (paroxysmal or nonparo-
xysmal)
Narrow Complex Tachycardia withRegular R-R Intervals
■ Regular R-R intervals with upright P waves infront of the QRS complexes (Fig. 17.30): If the Pwaves are upright in lead II, retrograde activation of
the atria (AVNRT or AVRT) is excluded. The mostlikely possibilities are:■ Sinus tachycardia■ Focal atrial tachycardia■ Sinoatrial reentrant tachycardia
■ Regular R-R intervals with retrograde P waves infront of the QRS complexes (Fig. 17.31): The pres-ence of retrograde P waves in front of the QRS com-plexes excludes sinus tachycardia and SART and favors:■ Focal atrial tachycardia■ Junctional tachycardia (paroxysmal or nonparo-
xysmal)■ Atypical AVNRT■ Atypical AVRT
■ Retrograde P waves between QRS complexes (Fig.17.32): Retrograde P waves between QRS complexeswith R-P interval equal to PR interval. This excludes si-nus tachycardia and SART and includes the followingpossible arrhythmias:
■ Regular R-R intervals with retrograde P waves af-ter the QRS complexes (Fig. 17.33): When R-P inter-val is shorter than PR interval, the possible arrhythmiasinclude:■ AVRT: (R-P interval �80 milliseconds)■ AVNRT: (R-P interval �80 milliseconds)■ Junctional tachycardia (paroxysmal or nonparoxys-
mal)■ Complete AV dissociation with regular R-R inter-
vals (Fig. 17.34): When there is complete AV dissocia-tion with regular R-R intervals, AVRT is not possibleand AVNRT is highly unlikely. This is almost always
Lead II
Figure 17.24: Atrial Tachycardia with 2:1 Atrioventricular (AV) Block. The P waves (arrows) are uprightin lead II with a rate of 230 beats per minute. Atrial tachycardia with 2:1 AV block is usually from digitalis toxicity. Theconfiguration of the ST segment is typical of digitalis effect.
LWBK271-C17_211-232.qxd 29/1/09 7:44 pm Page 227 LWBK270-4119G-C02_073-110.qxd

228 Chapter 17
due to junctional tachycardia with complete AV disso-ciation.■ Junctional tachycardia with complete AV dis-
sociation■ Retrograde P Waves with second-degree AV
Wenckebach (Fig. 17.35): This is almost always dueto focal atrial tachycardia. This excludes AVRT andmakes AVNRT highly unlikely.
ECG of Narrow Complex Tachycardia
1. When the R-R interval is irregular, atrial fibrillation, multifo-cal atrial tachycardia, and atrial flutter with variable AV block
Summary of the Different SVT and Possible Diagnoses
AVRT Atrial Flutter with 2:1 AV Block AVNRT Focal Atrial Tachycardia Junctional Tachycardia
Nonparoxysmal Junctional Tachycardia with Complete AV Dissociation
Multifocal Atrial Tachycardia
Junctional TachycardiaAVNRT
AVRTAVNRT Junctional Tachycardia
AVNRTJunctional Tachycardia
AVNRTJunctional Tachycardia
Lead II Possible Diagnoses
Sinus Tachycardia Sinoatrial Reentrant Tachycardia Focal Atrial Tachycardia
Focal Atrial Tachycardia Junctional Tachycardia Atypical AVNRT Atypical AVRT
Figure 17.26: Different Electrocardio-gram Patterns of Narrow ComplexSupraventricular Tachycardia in LeadII. The best possible diagnosis ishighlighted in bold letters and is listed fromtop to bottom. The algorithm for diagnosingnarrow complex tachycardia is shown in thenext page. AVNRT, atrioventricular nodalreentrant tachycardia; AVRT, atrioventricularreentrant tachycardia.
are the main considerations. Focal atrial tachycardia with vari-able AV block is also possible although rare.
2. When the R-R interval is regular, the diagnosis of the tachycardiadepends on the location and polarity of the P waves in lead II.
■ No P waves are present
■ AVNRT
■ Junctional tachycardia
■ If the P waves are upright in lead II, the primary consid-erations are:
■ Sinus tachycardia
■ Focal atrial tachycardia
■ SART
LWBK271-C17_211-232.qxd 29/1/09 7:44 pm Page 228 LWBK270-4119G-C02_073-110.qxd
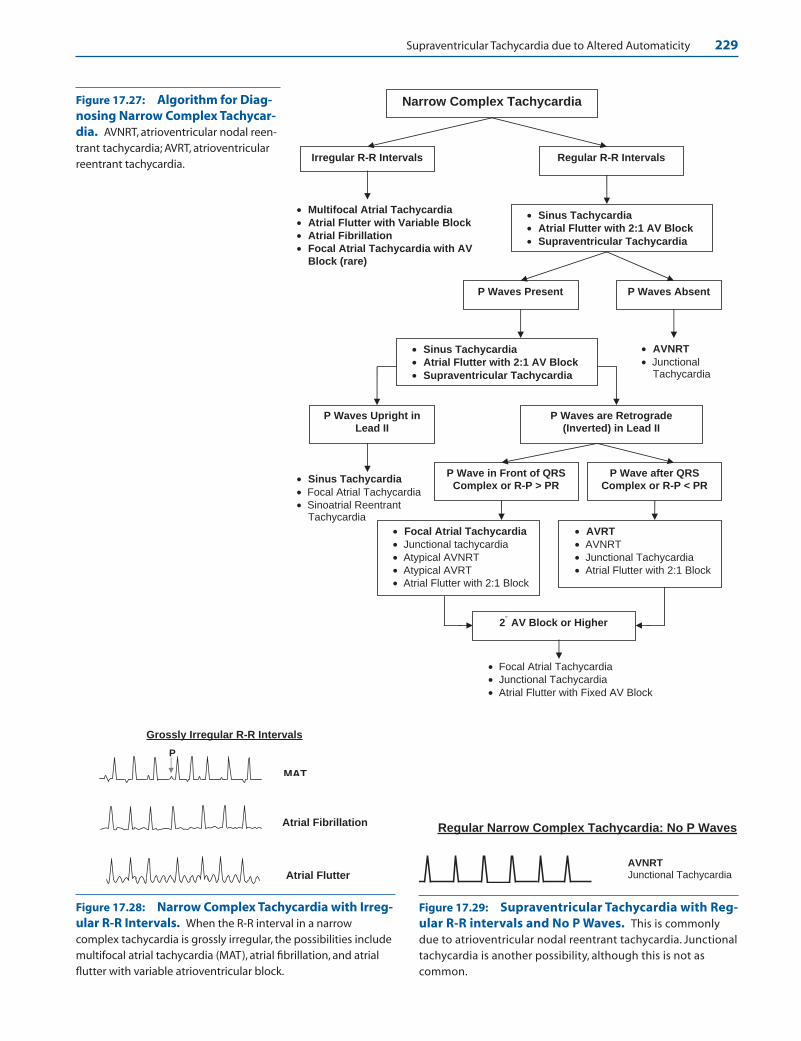
Supraventricular Tachycardia due to Altered Automaticity 229
MAT
Atrial Fibrillation
Atrial Flutter
P
Grossly Irregular R-R Intervals
Narrow Complex Tachycardia
Irregular R-R Intervals Regular R-R Intervals
• Multifocal Atrial Tachycardia
• Atrial Flutter with Variable Block
• Atrial Fibrillation
• Focal Atrial Tachycardia with AVBlock (rare)
• Sinus Tachycardia
• Atrial Flutter with 2:1 AV Block
• Supraventricular Tachycardia
• Sinus Tachycardia
• Atrial Flutter with 2:1 AV Block
• Supraventricular Tachycardia
• AVNRT
• Junctional Tachycardia
P Waves Present P Waves Absent
P Waves Upright in Lead II
• Sinus Tachycardia
• Focal Atrial Tachycardia • Sinoatrial Reentrant
Tachycardia
P Waves are Retrograde (Inverted) in Lead II
P Wave in Front of QRS Complex or R-P > PR
P Wave after QRS Complex or R-P < PR
• Focal Atrial Tachycardia
• Junctional tachycardia • Atypical AVNRT • Atypical AVRT • Atrial Flutter with 2:1 Block
• AVRT
• AVNRT • Junctional Tachycardia • Atrial Flutter with 2:1 Block
2 AV Block or Higher °
• Focal Atrial Tachycardia • Junctional Tachycardia • Atrial Flutter with Fixed AV Block
Figure 17.27: Algorithm for Diag-nosing Narrow Complex Tachycar-dia. AVNRT, atrioventricular nodal reen-trant tachycardia; AVRT, atrioventricularreentrant tachycardia.
Figure 17.28: Narrow Complex Tachycardia with Irreg-ular R-R Intervals. When the R-R interval in a narrowcomplex tachycardia is grossly irregular, the possibilities includemultifocal atrial tachycardia (MAT), atrial fibrillation, and atrialflutter with variable atrioventricular block.
AVNRTJunctional Tachycardia
Regular Narrow Complex Tachycardia: No P Waves
Figure 17.29: Supraventricular Tachycardia with Reg-ular R-R intervals and No P Waves. This is commonlydue to atrioventricular nodal reentrant tachycardia. Junctionaltachycardia is another possibility, although this is not as common.
LWBK271-C17_211-232.qxd 29/1/09 7:44 pm Page 229 LWBK270-4119G-C02_073-110.qxd

230 Chapter 17
Retrograde P Waves with R-P Interval = PR Interval
Atrial Flutter with 2:1 AV Block AVRT Focal Atrial Tachycardia Atypical AVNRT Junctional Tachycardia (Excludes Sinus tachycardia and SART)
Figure 17.32: Retrograde P Waves with R-P Interval Equal to PRInterval. Atrial flutter with 2:1 AV block is a distinct possibility with the secondflutter wave embedded within the QRS complexes.This can also be due to AVRT,focal atrial tachycardia, atypical AVNRT and junctional tachycardia both paroxysmaland nonparoxysmal. AV, atrioventricular; AVNRT, atrioventricular nodal reentranttachycardia; AVRT, atrioventricular reentrant tachycardia.
AVRT (R-P ≥80 milliseconds) AVNRT (R-P <80 milliseconds) Junctional Tachycardia Focal Atrial Tachycardia with 1 AV Block
0
Retrograde P Waves after QRS Complex
R-P Interval
Junctional Tachycardia with complete AV dissociation. The P waves are sinus in origin and are independent from the QRS complex.
Figure 17.33: Retrograde P Waves with R-P Interval � PR Interval. Thisis typically from atrioventricular reentrant tachycardia. Other possibilities includeatrioventricular nodal reentrant tachycardia and junctional tachycardia both parox-ysmal and nonparoxysmal. Arrow points to the retrograde P wave.
Figure 17.34: Junctional Tachycardia with Complete AV Dissociation. TheP waves are upright in lead II and are completely dissociated from the QRS complexes.The upright P waves represent normal sinus rhythm.
Focal Atrial Tachycardia Atypical AVNRT Atypical AVRT Junctional Tachycardia (Excludes Sinus tachycardia and SART)
Retrograde P Waves in Front of QRS Complexes
Figure 17.31: Retrograde P Waves in Front of the QRS Complex. This ismost commonly the result of focal atrial tachycardia. Other possibilities include atyp-ical atrioventricular nodal reentrant tachycardia, atypical atrioventricular reentranttachycardia, and junctional tachycardia, both paroxysmal and nonparoxysmal.
Sinus tachycardia
SART
Upright P waves in front of the QRS complexes in Lead II
Focal AT
(Excludes AVNRT and AVRT)
Figure 17.30: Regular R-R Intervals with Upright PWaves before QRS complexes in Lead II. This is almostalways the result of sinus tachycardia. Focal atrial tachycardiaand sino-atrial reentrant tachycardia are other possibilities.
LWBK271-C17_211-232.qxd 29/1/09 7:45 pm Page 230 LWBK270-4119G-C02_073-110.qxd
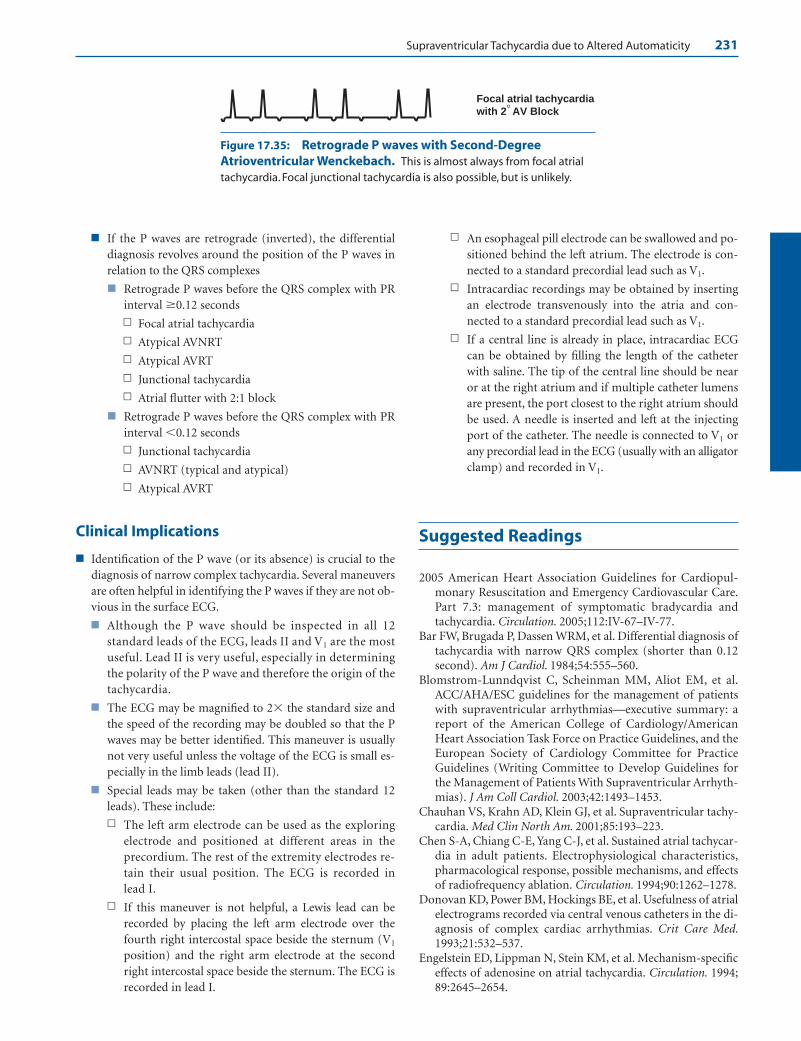
Supraventricular Tachycardia due to Altered Automaticity 231
■ If the P waves are retrograde (inverted), the differentialdiagnosis revolves around the position of the P waves inrelation to the QRS complexes
■ Retrograde P waves before the QRS complex with PRinterval �0.12 seconds
n Focal atrial tachycardia
n Atypical AVNRT
n Atypical AVRT
n Junctional tachycardia
n Atrial flutter with 2:1 block
■ Retrograde P waves before the QRS complex with PRinterval �0.12 seconds
n Junctional tachycardia
n AVNRT (typical and atypical)
n Atypical AVRT
Clinical Implications
■ Identification of the P wave (or its absence) is crucial to thediagnosis of narrow complex tachycardia. Several maneuversare often helpful in identifying the P waves if they are not ob-vious in the surface ECG.
■ Although the P wave should be inspected in all 12standard leads of the ECG, leads II and V1 are the mostuseful. Lead II is very useful, especially in determiningthe polarity of the P wave and therefore the origin of thetachycardia.
■ The ECG may be magnified to 2� the standard size andthe speed of the recording may be doubled so that the Pwaves may be better identified. This maneuver is usuallynot very useful unless the voltage of the ECG is small es-pecially in the limb leads (lead II).
■ Special leads may be taken (other than the standard 12leads). These include:
n The left arm electrode can be used as the exploringelectrode and positioned at different areas in theprecordium. The rest of the extremity electrodes re-tain their usual position. The ECG is recorded inlead I.
n If this maneuver is not helpful, a Lewis lead can berecorded by placing the left arm electrode over thefourth right intercostal space beside the sternum (V1
position) and the right arm electrode at the secondright intercostal space beside the sternum. The ECG isrecorded in lead I.
n An esophageal pill electrode can be swallowed and po-sitioned behind the left atrium. The electrode is con-nected to a standard precordial lead such as V1.
n Intracardiac recordings may be obtained by insertingan electrode transvenously into the atria and con-nected to a standard precordial lead such as V1.
n If a central line is already in place, intracardiac ECGcan be obtained by filling the length of the catheterwith saline. The tip of the central line should be nearor at the right atrium and if multiple catheter lumensare present, the port closest to the right atrium shouldbe used. A needle is inserted and left at the injectingport of the catheter. The needle is connected to V1 orany precordial lead in the ECG (usually with an alligatorclamp) and recorded in V1.
Suggested Readings
2005 American Heart Association Guidelines for Cardiopul-monary Resuscitation and Emergency Cardiovascular Care.Part 7.3: management of symptomatic bradycardia andtachycardia. Circulation. 2005;112:IV-67–IV-77.
Bar FW, Brugada P, Dassen WRM, et al. Differential diagnosis oftachycardia with narrow QRS complex (shorter than 0.12second). Am J Cardiol. 1984;54:555–560.
Blomstrom-Lunndqvist C, Scheinman MM, Aliot EM, et al.ACC/AHA/ESC guidelines for the management of patientswith supraventricular arrhythmias—executive summary: areport of the American College of Cardiology/AmericanHeart Association Task Force on Practice Guidelines, and theEuropean Society of Cardiology Committee for PracticeGuidelines (Writing Committee to Develop Guidelines forthe Management of Patients With Supraventricular Arrhyth-mias). J Am Coll Cardiol. 2003;42:1493–1453.
Chauhan VS, Krahn AD, Klein GJ, et al. Supraventricular tachy-cardia. Med Clin North Am. 2001;85:193–223.
Chen S-A, Chiang C-E, Yang C-J, et al. Sustained atrial tachycar-dia in adult patients. Electrophysiological characteristics,pharmacological response, possible mechanisms, and effectsof radiofrequency ablation. Circulation. 1994;90:1262–1278.
Donovan KD, Power BM, Hockings BE, et al. Usefulness of atrialelectrograms recorded via central venous catheters in the di-agnosis of complex cardiac arrhythmias. Crit Care Med.1993;21:532–537.
Engelstein ED, Lippman N, Stein KM, et al. Mechanism-specificeffects of adenosine on atrial tachycardia. Circulation. 1994;89:2645–2654.
Focal atrial tachycardiawith 2 AV Block °
Figure 17.35: Retrograde P waves with Second-DegreeAtrioventricular Wenckebach. This is almost always from focal atrialtachycardia. Focal junctional tachycardia is also possible, but is unlikely.
LWBK271-C17_211-232.qxd 29/1/09 7:45 pm Page 231 LWBK270-4119G-C02_073-110.qxd

232 Chapter 17
Esberger D, Jones S, Morris F. ABC of clinical electro-cardiography: junctional tachycardias. BMJ. 2002;324:662–665.
Farre J, Wellens HJJ. The Value of the electrocardiogram in diag-nosing site of origin and mechanism of supraventriculartachycardia. In: Wellens HJJ, Kulbertus HE, eds. What’s Newin Electrocardiography. Boston: Martinus Nijhoff; 1981.
Ganz LI, Friedman PL. Supraventricular tachycardia. N Engl JMed. 1995;332:162–173.
Guidelines 2000 for Cardiopulmonary Resuscitation and Emer-gency Cardiovascular Care: 7D: the tachycardia algorithms.Circulation. 2000;102(Suppl I):I-158–I-165.
Haissaguerre MH, Sanders P, Hocini M, et al. Pulmonary veinsin the substrate for atrial fibrillation. J Am Coll Cardiol.2004;43:2290–2292.
Kastor JA. Multifocal atrial tachycardia. N Engl J Med. 1990;322:1713–1717.
Kistler PM, Roberts-Thomson KC, Haqqani HM, et al. P-wavemorphology in focal atrial tachycardia. Development of analgorithm to predict the anatomic site of origin. J Am CollCardiol. 2006;48:1010–1017.
Kistler PM, Sanders P, Hussin A. Focal atrial tachycardia arisingfrom the mitral annulus. Electrocardiographic and electro-physiologic characterization. J Am Coll Cardiol. 2003;41:2212–2219.
Kumagai K, Ogawa M, Noguchi H, et al. Electrophysiologicproperties of pulmonary veins assessed using microelectrodebasket catheter. J Am Coll Cardiol. 2004;43:2281–2289.
Levine JH, Michael JR, Guarnieri T. Treatment of multifocal atrialtachycardia with verapamil. N Engl J Med. 1985;312:21–25.
Madias JE, Bazar R, Agarwal H. Anasarca-mediated attenuationof the amplitude of ECG complexes: a description of aheretofore unrecognized phenomenon. J Am Coll Cardiol.2001;38:756–764.
Madias JE, Narayan V, Attari M. Detection of P waves via a“saline-filled central venous catheter electrocardiographiclead” in patients with low electrocardiographic voltage dueto anasarca. J Am Coll Cardiol. 2003;91:910–914.
Manolis AS, Mark Estes III NA. Supraventricular tachycar-dia mechanisms and therapy. Arch Intern Med. 1987;147:1706–1716.
Marrouche NF, SippensGroenewegen A, Yang Y, et al. Clinicaland electrophysiologic characteristics of left septal atrialtachycardia. J Am Coll Cardiol. 2002;40:1133–1139.
Mehta AV, Perlman PE. Ectopic automatic atrial tachycardiain children: an overview. J Arrhythmia Manage. 1990:12–19.
Olgen JE, Zipes DE. Specific arrhythmias: diagnosis and treat-ment. In: Libby P, Bonow RO, Mann DL, et al. eds. Braun-wald’s Heart Disease, A Textbook of Cardiovascular Medi-cine. 8th ed., Philadelphia, PA: Elsevier Saunders; 2005:863–931.
Reddy CP and Arnett JD. Automatic atrial tachycardia andnonparoxysmal atrioventricular junctional tachycardia.In: Horowitz LN, ed. Current Management of Arrhyth-mias. South Hamilton, Ontario: BC Decker Inc; 1991:67–73.
Salerno JC, Kertesz NJ, Friedman RA, et al. Clinical course ofatrial ectopic tachycardia is age-dependent: Results andtreatment in children �3 or �3 years of age. J Am Coll Car-diol. 2004;43:438–444.
Saoudi N, Cosio F, Waldo A, et al. Classification of atrial flutterand regular atrial tachycardia according to electrophysiolog-ical mechanisms and anatomical bases. Eur Heart J.2001;22:1162–1182.
Tang CW, Scheinman MM, Van Hare GF. Use of P wave config-uration during atrial tachycardia to predict site of origin. JAm Coll Cardiol. 1995;26:1315–1324.
Wagner GS. Ventricular preexcitation. In: Marriott’s PracticalElectrocardiography. 10th ed. Philadelphia: Lippincott Williamsand Wilkins; 2001:124–137.
Wagner GS. Reentrant junctional tachyarrhythmias. In: Mar-riott’s Practical Electrocardiography. 10th ed. Philadelphia:Lippincott Williams and Wilkins; 2001:330–344.
Wellens HJJ. Atrial tachycardia. How important is the mecha-nism? Circulation. 1994;90:1576–1577.
Wellens HJJ, Conover MB. Narrow QRS tachycardia. In: TheECG in Emergency Decision Making. 2nd ed. St. Louis: W.B.Saunders/Elsevier; 2006:92–106.
Wellens HJJ, Conover MB. Digitalis-induced emergencies. In:The ECG in Emergency Decision Making. 2nd ed. St. Louis:W.B. Saunders/Elsevier; 2006:158–176.
Xie B, Thakur RK, Shah CP, et al. Clinical differentiation of nar-row QRS complex tachycardias. Emerg Med Clin North Am.1998;16:295–330.
Yamane T, Shah DC, Peng JT, et al. Morphological characteristicsof P waves during selective pulmonary vein pacing. J Am CollCardiol. 2001;38:1505–1510.
LWBK271-C17_211-232.qxd 29/1/09 7:45 pm Page 232 LWBK270-4119G-C02_073-110.qxd

Electrocardiogram Findings
■ Atrial flutter is a supraventricular arrhythmia with aregular atrial rate of 300 � 50 beats per minute (Fig. 18.1).Other features include:■ Very regular and uniform flutter waves with a saw
tooth or picket fence appearance.■ The flutter waves are typically inverted in leads II,
III, and aVF and upright in V1.■ The ventricular rate is variable depending on the
number of atrial impulses conducted through theatrioventricular (AV) node.
■ The QRS complexes are narrow unless there ispreexistent bundle branch block or the atrial im-pulses are conducted aberrantly or through a by-pass tract.
■ Atrial flutter is due to reentry within the atria.There are two types of atrial flutter based on elec-
trocardiogram (ECG) presentation: typical and re-verse typical.■ Typical atrial flutter: This is the most common
ECG pattern occurring in 90% of all atrial flutter. Intypical atrial flutter, the atrial impulse travels fromtop to bottom across the lateral wall of the rightatrium and circles back from bottom to top acrossthe atrial septum. The flutter waves are inverted inlead II and upright in V1 (Fig. 18.2A).
■ Reverse typical atrial flutter: This type is uncom-mon occurring only in 10% of cases. The atrial im-pulse travels down the atrial septum and up thelateral wall of the right atrium, which is the reverseof typical atrial flutter. This will cause the flutterwaves to become upright in lead II and inverted inV1 (Fig. 18.2B).
■ Atrial rate: The diagnosis of atrial flutter is based on theatrial rate, which is regular with a sawtooth configurationand is typically 300 � 50 beats per minute (bpm). The
18Atrial Flutter
233
A.
B.
1 2 3 45 small blocks
Figure 18.1: Atrial Flutter.(A) Twelve-lead ECG showing atrialflutter. The flutter waves are regularwith saw tooth or picket fenceappearance and are typicallyinverted in leads II, III, and aVF andupright in V1 (arrows). (B) Lead II ismagnified from the ECG in (A) toshow the appearance of the flutterwaves. There is 4:1 AV conduction,meaning that there are four flutterwaves (arrows) for every QRS com-plex. The flutter waves are separatedby five small blocks, which is equiva-lent to a rate of 300 beats perminute. ECG, electrocardiogram; AV,atrioventricular.
LWBK271-C18_233-245.qxd 1/29/09 12:30 PM Page 233 LWBK271-C01_01-08.qxd
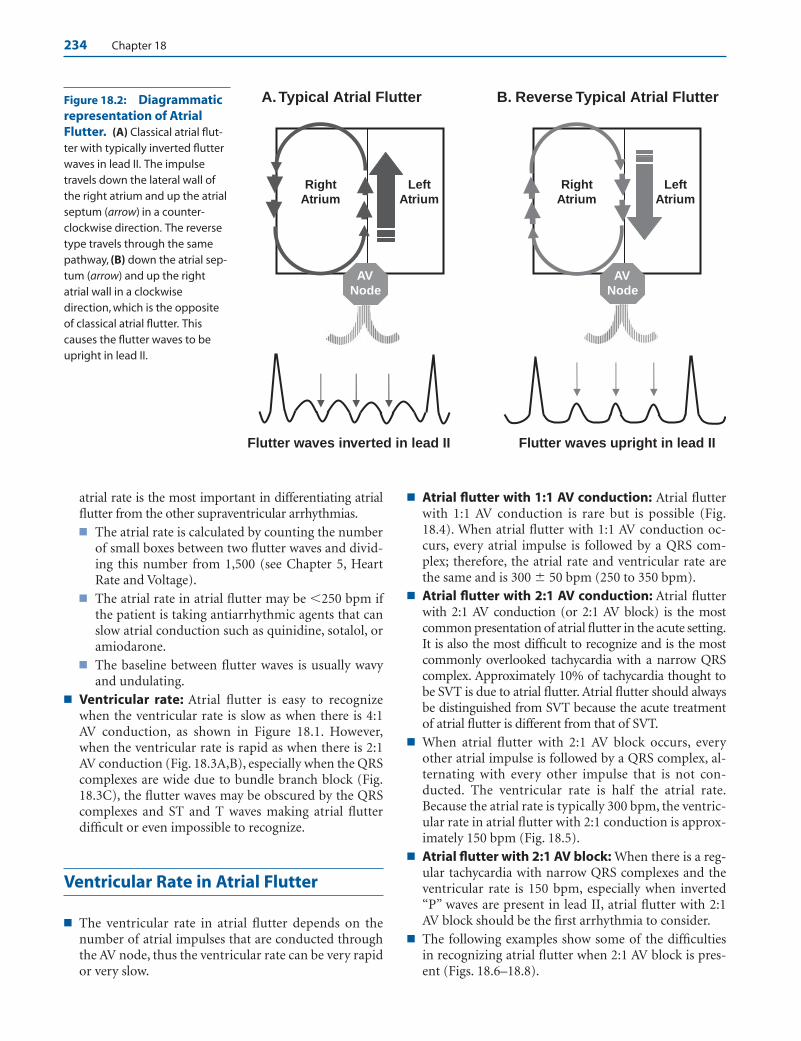
234 Chapter 18
atrial rate is the most important in differentiating atrialflutter from the other supraventricular arrhythmias.■ The atrial rate is calculated by counting the number
of small boxes between two flutter waves and divid-ing this number from 1,500 (see Chapter 5, HeartRate and Voltage).
■ The atrial rate in atrial flutter may be �250 bpm ifthe patient is taking antiarrhythmic agents that canslow atrial conduction such as quinidine, sotalol, oramiodarone.
■ The baseline between flutter waves is usually wavyand undulating.
■ Ventricular rate: Atrial flutter is easy to recognizewhen the ventricular rate is slow as when there is 4:1AV conduction, as shown in Figure 18.1. However,when the ventricular rate is rapid as when there is 2:1AV conduction (Fig. 18.3A,B), especially when the QRScomplexes are wide due to bundle branch block (Fig.18.3C), the flutter waves may be obscured by the QRScomplexes and ST and T waves making atrial flutterdifficult or even impossible to recognize.
Ventricular Rate in Atrial Flutter
■ The ventricular rate in atrial flutter depends on thenumber of atrial impulses that are conducted throughthe AV node, thus the ventricular rate can be very rapidor very slow.
■ Atrial flutter with 1:1 AV conduction: Atrial flutterwith 1:1 AV conduction is rare but is possible (Fig.18.4). When atrial flutter with 1:1 AV conduction oc-curs, every atrial impulse is followed by a QRS com-plex; therefore, the atrial rate and ventricular rate arethe same and is 300 � 50 bpm (250 to 350 bpm).
■ Atrial flutter with 2:1 AV conduction: Atrial flutterwith 2:1 AV conduction (or 2:1 AV block) is the mostcommon presentation of atrial flutter in the acute setting.It is also the most difficult to recognize and is the mostcommonly overlooked tachycardia with a narrow QRScomplex. Approximately 10% of tachycardia thought tobe SVT is due to atrial flutter. Atrial flutter should alwaysbe distinguished from SVT because the acute treatmentof atrial flutter is different from that of SVT.
■ When atrial flutter with 2:1 AV block occurs, everyother atrial impulse is followed by a QRS complex, al-ternating with every other impulse that is not con-ducted. The ventricular rate is half the atrial rate.Because the atrial rate is typically 300 bpm, the ventric-ular rate in atrial flutter with 2:1 conduction is approx-imately 150 bpm (Fig. 18.5).
■ Atrial flutter with 2:1 AV block: When there is a reg-ular tachycardia with narrow QRS complexes and theventricular rate is 150 bpm, especially when inverted“P” waves are present in lead II, atrial flutter with 2:1AV block should be the first arrhythmia to consider.
■ The following examples show some of the difficultiesin recognizing atrial flutter when 2:1 AV block is pres-ent (Figs. 18.6–18.8).
RightAtrium
A. Typical Atrial Flutter B. Reverse Typical Atrial Flutter
LeftAtrium
RightAtrium
Left Atrium
Flutter waves inverted in lead II
AV Node
AVNode
Flutter waves upright in lead II
Figure 18.2: Diagrammaticrepresentation of AtrialFlutter. (A) Classical atrial flut-ter with typically inverted flutterwaves in lead II. The impulsetravels down the lateral wall ofthe right atrium and up the atrialseptum (arrow) in a counter-clockwise direction. The reversetype travels through the samepathway, (B) down the atrial sep-tum (arrow) and up the rightatrial wall in a clockwisedirection, which is the oppositeof classical atrial flutter. Thiscauses the flutter waves to beupright in lead II.
LWBK271-C18_233-245.qxd 1/29/09 12:30 PM Page 234 LWBK271-C01_01-08.qxd

Atrial Flutter 235
Atrial Flutter and SupraventricularTachycardia
■ Differentiating atrial flutter from supraventricu-lar tachycardia (SVT): When the diagnosis of atrialflutter is uncertain, vagal maneuvers such as carotid si-nus pressure, is useful in differentiating atrial flutterfrom other types of regular narrow complex SVT asshown (Fig. 18.9).■ Atrial flutter: In atrial flutter, carotid sinus pressure
or AV nodal blockers such as adenosine or verapamilwill slow AV nodal conduction resulting in a slowerventricular rate but will not convert atrial flutter tonormal sinus rhythm (Figs. 18.9 and 18.10).
■ Regular narrow complex SVT: When the narrowcomplex tachycardia is due to SVT, the tachycardiamay convert to normal sinus rhythm with carotidstimulation. SVT from reentry but not atrial flutter(Fig. 18.10) is frequently terminated by AV nodalblockers to normal sinus rhythm (see Chapter 16,Supraventricular Tachycardia due to Reentry).
■ Atrial flutter versus atrial tachycardia: Atrial flutterwith 2:1 AV block may be mistaken for atrial tachycar-dia with 2:1 AV block. Atrial tachycardia with 2:1 AVblock is usually from digitalis toxicity, whereas atrialflutter with 2:1 AV block is unrelated to digitalis and the
patient may in fact require digitalis or other AV nodalblocking agents to slow down the ventricular rate.■ Atrial rate: The atrial rate is the most important fea-
ture in distinguishing atrial flutter from atrial tachycar-dia (Figs. 18.11 to 18.14). In atrial flutter with 2:1 AVblock, the atrial rate is approximately 300 � 50 bpmwith the lowest rate at 240 to 250 bpm. In atrial tachy-cardia with 2:1 AV block, the atrial rate is approxi-mately 200 � 50 bpm (150 to 250 bpm) (Fig. 18.11).
■ Morphology of the P wave: When the atrial rateof atrial flutter and atrial tachycardia overlaps, thetwo arrhythmias may be differentiated by the mor-phology of the P wave. In atrial flutter, the flutterwaves are typically inverted in leads II, III, and aVFand the baseline between the QRS complexes iswavy and undulating (Fig. 18.12). In atrial tachycar-dia with AV block, the P waves are typically uprightin leads II, III, and aVF and the baseline between theP waves is isoelectric or flat (Fig. 18.11).
■ Atrial flutter with variable block: As shown in Fig-ures 18.15 through 18.17, atrial flutter is easy to recog-nize when the ventricular rate is slow as when AV con-duction is 3:1 or higher. In atrial flutter with variableAV block, the number of flutter waves for every QRScomplex varies from beat to beat (Fig. 18.17).
■ Atrial flutter with complete AV block: The diagnosisof complete AV block during atrial flutter should be
A.
B.
C.
5 Atrial rate = 1500/5 = 300 bpm
Figure 18.3: Atrial Flutter. (A) The diagnosis of atrial flutter is based on the presence of flutter waves with typi-cal saw tooth appearance with a rate of 300 � 50 beats per minute. The atrial rate is calculated by measuring thedistance between two flutter waves and dividing the number of small blocks from 1500 as shown in (A). When theventricular rate is rapid because of 2:1 atrioventricular conduction (marked by the brackets in A and B), especiallywhen the QRS complexes are wide because of bundle branch block as shown in (C), the diagnosis of atrial flutter isdifficult and may not be possible unless there is slowing of the ventricular rate so that the flutter waves can be rec-ognized (arrows).
LWBK271-C18_233-245.qxd 1/29/09 12:30 PM Page 235 LWBK271-C01_01-08.qxd

236 Chapter 18
considered when the ventricular rate is regular and is inthe low 40s, as shown in Figure 18.18. When completeAV block occurs, the R-R intervals become regular be-cause of the presence of a ventricular escape rhythm,independent of the atrial rhythm.
Common Mistakes in Atrial Flutter
■ Atrial flutter can be confused with other conditionsother than SVT. Although the diagnosis of atrial flutteris straightforward when the ventricular rate is slow, thepresence of motion artifacts, especially in patients withtremors such as those with Parkinson disease or pa-
tients receiving intravenous infusion from a volumetricinfusion pump, can be mistaken for flutter waves (Figs.18.19 to 18.22).
ECG Findings of Atrial Flutter
1. Atrial rate of 300 � 50 bpm with a minimum atrial rate of 240to 250 bpm.
2. Very regular and uniform flutter waves with a saw tooth orpicket fence appearance.
3. Flutter waves are typically inverted in leads II, III, and aVF andupright in V1 in 90% of cases, although this may be reversed in10% of cases, `becoming upright in leads II, III, and aVF andinverted in V1.
A.
B.
C.
6 small blocks = 250 bpm
5 small blocks = 300 bpm
Atrial flutter with 1:1 AV conduction
Magnified lead II rhythm strip
Same patient with 2:1 AV conduction
Figure 18.4: Atrial Flutter with 1:1 Atrioventricular (AV) Conduction. (A–C) From the same patient.(A, B) Atrial flutter with 1:1 AV conduction. (C) The same patient during 2:1 AV conduction. Arrows point to the flutter waves, which are typically inverted in lead II with a rate �250 beats per minute.
LWBK271-C18_233-245.qxd 1/29/09 12:30 PM Page 236 LWBK271-C01_01-08.qxd

Atrial Flutter 237
Lead II: Atrial flutter with 2:1 AV block
1 2
A. Atrial flutter with 2:1 AV block
B. Atrial flutter with 2:1 AV block
1
1
1
1
2
2
2
2
Figure 18.5: Atrial Flutter with 2:1 Atrioventricular (AV) Block. (A) A 12-lead electrocardiogram showingatrial flutter with 2:1 AV block. There are two flutter waves for every ventricular complex. The two flutter waves areidentified by the arrows and are labeled 1 and 2. The first flutter wave in lead II (arrow 1) may be mistaken for S waveand the arrhythmia may be misdiagnosed as SVT. (B) Lead II rhythm strip from (A), which is magnified to show theflutter waves (arrows).
Lead II: Atrial flutter with 2:1 AV block
1 2
Figure 18.6: Atrial Flutter with 2:1 Atrioventricular Block. The first flutter wave (arrow 1) deforms the ter-minal portion of the QRS complex and may be mistaken for an S wave. The second flutter wave (arrow 2) is more ob-vious and precedes the QRS complex but can be mistaken for an inverted P wave. Thus, the arrhythmia can be mis-taken for supraventricular tachycardia.
Figure 18.7: Atrial Flutter with 2:1 Atrioventricular Block. The first flutter wave (arrow 1) may bemistaken for a depressed ST segment or inverted T wave.
LWBK271-C18_233-245.qxd 1/29/09 12:30 PM Page 237 LWBK271-C01_01-08.qxd

A .
B.
21
Upright P waves, rate 200 ± 50 bpm Flat or isoelectric baseline
Figure 18.8: Atrial Flutter with 2:1 Atrioventricular (AV) Block. The diagnosis of atrial flutter with 2:1 AV blockis not possible in rhythm strip (A). The first flutter wave (arrow 1) is buried within the QRS complex and the second flutterwave (arrow 2) can be mistaken for an inverted T wave. The diagnosis became evident only after sudden spontaneousslowing of the ventricular rate (B) (arrows), revealing the classical saw tooth flutter waves between the QRS complexes.
Figure 18.9: Atrial Flutter. When the diagnosis is in doubt, carotid sinus stimulation may slow down the ven-tricular rate so that the flutter waves (arrows) can be identified. Atrial flutter will not convert to normal sinus rhythmwith carotid sinus pressure or with atrioventricular nodal blockers.
Figure 18.10: Atrial Flutter Resembling Atrioventricular Nodal Reentrant Tachycardia. Leads I, II,and III are simultaneously recorded. A narrow complex tachycardia with a rate of 125 beats per minute is seen onthe left half of the tracing. The tachycardia was thought to be due to AV nodal reentrant tachycardia because no obvious P waves were noted. Adenosine was given intravenously, resulting in AV block. Upright flutter waves arenow obvious in leads II and III with a rate of 250 beats per minute (six small blocks). The tachycardia is due to atrialflutter with 2:1 AV block. AV, atrioventricular.
Figure 18.11: Atrial Tachycardia with 2:1 Atrioventricular Block. The atrial rate is typ-ically 200 � 50 beats per minute and the P waves are upright and separated by an isoelectric orflat line in lead II.
LWBK271-C18_233-245.qxd 1/29/09 12:30 PM Page 238 LWBK271-C01_01-08.qxd

A. Before
B. After
Atrial Flutter with 2:1 AV Block
• Atrial rate approximately 300 ± 50 bpm (minimum rate 240-250 bpm)• Inverted atrial complexes in lead II• Undulating or wavy baseline
Atrial rate = 1500/6 = 250 bpm
Atrial rate = 1500/8 = 188 bpm
Atrial Flutter and Atrial Tachycardia with 2:1 AV Block
Atrial Tachycardia with 2:1 AV Block
• Atrial rate approximately 200 ± 50 bpm or 150 - 250 bpm• Upright P waves in lead II• Isoelectric baseline
Lead II
Undulating or wavy baseline Inverted flutter waves: (minimum rate 240-250 bpm)
Figure 18.12: Atrial Flutter with 2:1 Atrioventricular Block. In atrial flutter, the atrialrate is 300 � 50 beats per minute. The flutter waves are typically inverted in lead II (arrows) andare separated by a continuously wavy baseline.
Figure 18.13: Atrial Tachycardia with 2:1 Atrioventricular (AV) Block. Lead II rhythmstrip showing atrial tachycardia with 2:1 AV block with an atrial rate of 230 beats per minute (6.5small blocks). In atrial tachycardia, the atrial rate is typically 150–250 beats per minute. Note alsothat the P waves are upright in lead II with an isoelectric baseline. Atrial tachycardia with 2:1 AVblock is usually due to digitalis toxicity and the ST segment depression shown above ischaracteristic of digitalis effect.
Figure 18.14: Atrial Flutter (AF) Before and After Administration ofAntiarrhythmic Agent. Lead II rhythm strips from the same patient before (A) and after (B)giving sotalol orally. The atrial rate in AF can become slower than 240 to 250 beats per minute ifan antiarrhythmic agent is given that can slow the atrial rate. (A) The atrial rate was 250 beats perminute before receiving sotalol. (B) The atrial rate had decreased to 188 beats per minute aftertherapy. The flutter waves retain their typically inverted pattern in lead II, an important feature indifferentiating atrial tachycardia from atrial flutter with 2:1 atrioventricular block.
239
LWBK271-C18_233-245.qxd 1/29/09 12:30 PM Page 239 LWBK271-C01_01-08.qxd
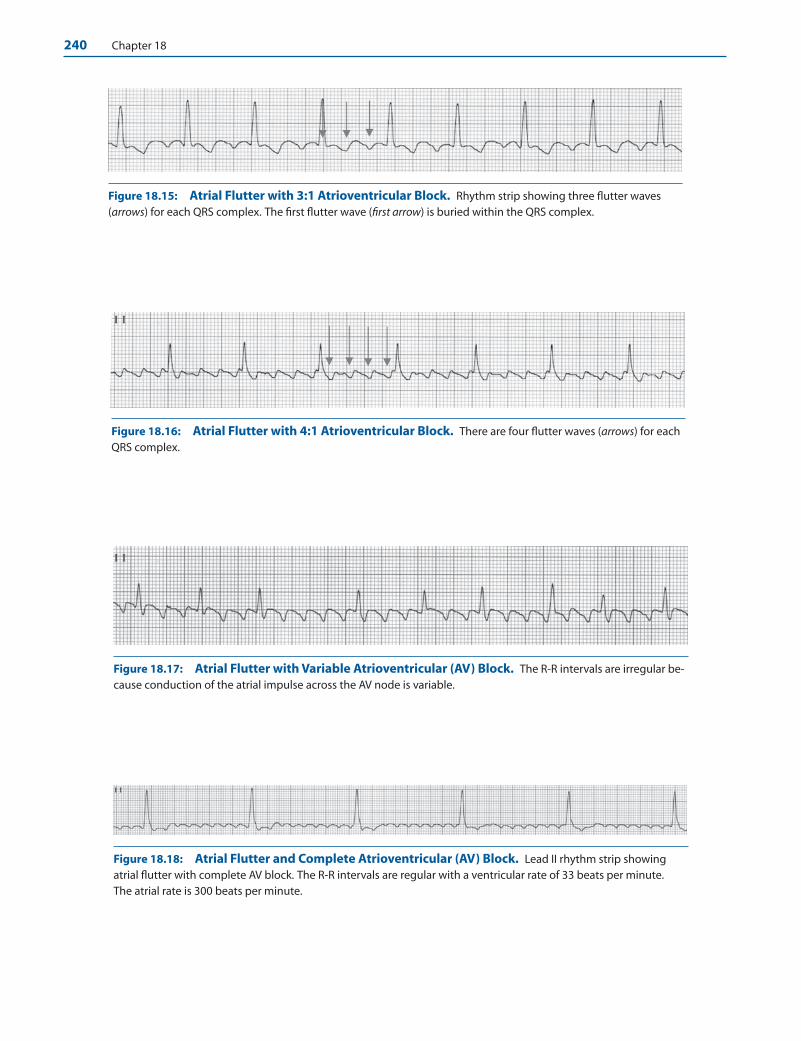
240 Chapter 18
Figure 18.15: Atrial Flutter with 3:1 Atrioventricular Block. Rhythm strip showing three flutter waves (arrows) for each QRS complex. The first flutter wave (first arrow) is buried within the QRS complex.
Figure 18.16: Atrial Flutter with 4:1 Atrioventricular Block. There are four flutter waves (arrows) for eachQRS complex.
Figure 18.18: Atrial Flutter and Complete Atrioventricular (AV) Block. Lead II rhythm strip showingatrial flutter with complete AV block. The R-R intervals are regular with a ventricular rate of 33 beats per minute.The atrial rate is 300 beats per minute.
Figure 18.17: Atrial Flutter with Variable Atrioventricular (AV) Block. The R-R intervals are irregular be-cause conduction of the atrial impulse across the AV node is variable.
LWBK271-C18_233-245.qxd 1/29/09 12:30 PM Page 240 LWBK271-C01_01-08.qxd
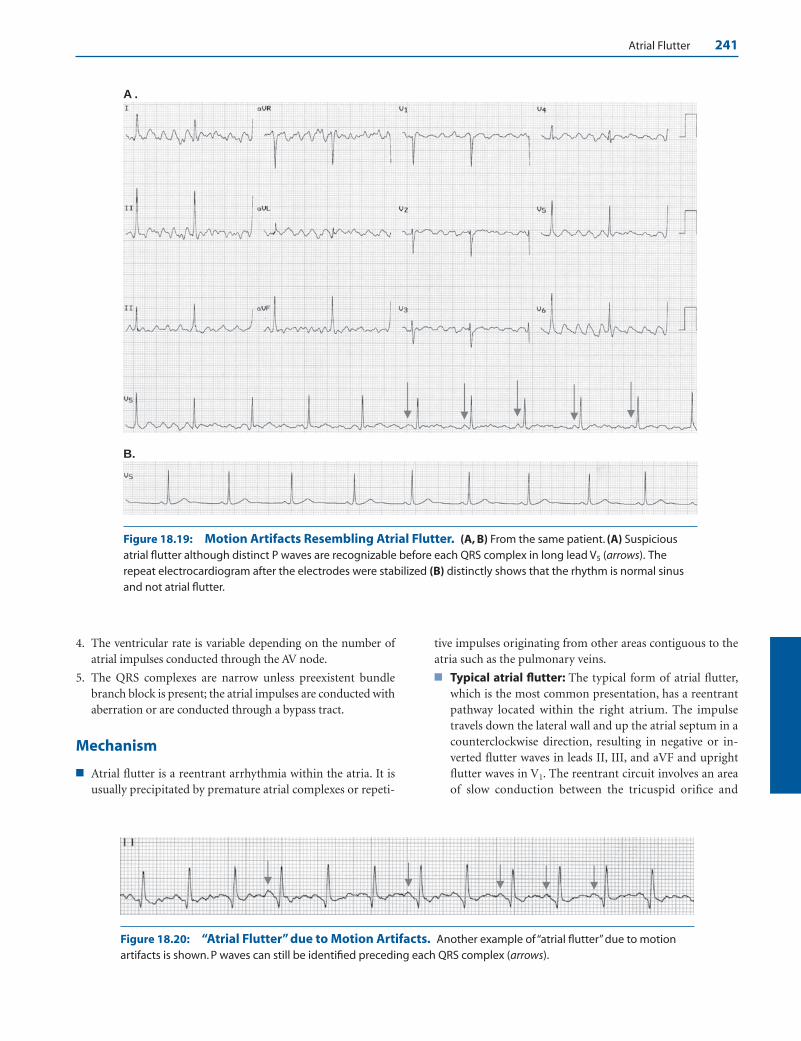
Atrial Flutter 241
A .
B.
Figure 18.19: Motion Artifacts Resembling Atrial Flutter. (A, B) From the same patient. (A) Suspiciousatrial flutter although distinct P waves are recognizable before each QRS complex in long lead V5 (arrows). Therepeat electrocardiogram after the electrodes were stabilized (B) distinctly shows that the rhythm is normal sinusand not atrial flutter.
Figure 18.20: “Atrial Flutter” due to Motion Artifacts. Another example of “atrial flutter” due to motionartifacts is shown. P waves can still be identified preceding each QRS complex (arrows).
4. The ventricular rate is variable depending on the number ofatrial impulses conducted through the AV node.
5. The QRS complexes are narrow unless preexistent bundlebranch block is present; the atrial impulses are conducted withaberration or are conducted through a bypass tract.
Mechanism
■ Atrial flutter is a reentrant arrhythmia within the atria. It isusually precipitated by premature atrial complexes or repeti-
tive impulses originating from other areas contiguous to theatria such as the pulmonary veins.
■ Typical atrial flutter: The typical form of atrial flutter,which is the most common presentation, has a reentrantpathway located within the right atrium. The impulsetravels down the lateral wall and up the atrial septum in acounterclockwise direction, resulting in negative or in-verted flutter waves in leads II, III, and aVF and uprightflutter waves in V1. The reentrant circuit involves an areaof slow conduction between the tricuspid orifice and
LWBK271-C18_233-245.qxd 1/29/09 12:30 PM Page 241 LWBK271-C01_01-08.qxd

242 Chapter 18
mouth of the inferior vena cava called the cavotricuspidisthmus. This is the usual site of radiofrequency ablation.
■ Reverse typical atrial flutter: The other form of atrialflutter, which is less common, has the same reentrant cir-cuit but is reversed in direction. The atrial impulse travelsdown the atrial septum and up the lateral wall in a clock-
wise direction, resulting in flutter waves that are uprightin leads II, III, and aVF and inverted in V1.
■ The reentrant circuit in atrial flutter can also occur in otherlocations other than the right atrium and includes the leftatrium, in the area of the pulmonary veins, or around a scaror surgical lesion within the atria. Atrial flutter within the
A. Lead II rhythm strip
B. Lead II rhythm strip
Figure 18.21: Artifacts Resembling Atrial Flutter. The patient was referred with a diagnosis of atrial flutterbased on the electrocardiogram obtained from a doctor’s office. The tracing shows that there are definite sinus Pwaves preceding the QRS complexes especially in leads I, II, and also in V1 to V6 (arrows). The rhythm therefore is notatrial flutter but normal sinus and the flutter-like undulations seen in leads II, III, and aVF are due to artifacts. Normalsinus rhythm was verified when the patient arrived for the consultation.
Figure 18.22: “Atrial Flutter” Caused by Infusion Pump. (A, B) From the same patient. The rhythm strip in(A) shows artifacts caused by infusion of intravenous fluids using an IVAC volumetric infusion pump. The artifactscan be mistaken for atrial flutter. The lead II rhythm strip in (B) was taken after the IV infusion pump was discontin-ued. IV, intravenous.
LWBK271-C18_233-245.qxd 1/29/09 12:30 PM Page 242 LWBK271-C01_01-08.qxd

Atrial Flutter 243
left atrium is more difficult to map because of its left atriallocation.
Clinical Significance
■ The incidence of atrial flutter is variable. It is more common inmen than in women. Although atrial flutter may occasionallybecome persistent lasting for days or months, it seldom occursas a chronic rhythm, very often converting to normal sinusrhythm or deteriorating to atrial fibrillation. Atrial flutter andatrial fibrillation are frequently associated arrhythmias.
■ Atrial flutter is usually associated with organic or structuralcardiac disease or it may be precipitated by an acute condition.
■ An acute precipitating cause, usually surgery (cardiac ornoncardiac), pneumonia, acute myocardial infarction, orcongestive heart failure can be identified in 60% of cases.
■ The remaining cases are associated with chronic cardiacor pulmonary diseases or hypertension.
■ Atrial flutter not accompanied by structural cardiac diseaseor any precipitating condition is called lone atrial flutter.Lone atrial flutter is rare occurring only in 1.7% of all cases.
■ Atrial flutter with a rapid ventricular rate of 150 bpm with2:1 AV conduction is the most frequent presentation in theacute setting. Less frequently, it may occur at a slower ratewith a conduction ratio of 4:1. Atrial flutter with an odd con-duction ratio of 1:1, 3:1, or 5:1 are much less common.
■ The rapid ventricular rate associated with atrial flutter may oc-cur in patients with accessory pathways. It can also occur whenthere is increased adrenergic activity or when there is thyro-toxicosis. In patients with atrial fibrillation or atrial flutter whoare being converted to normal sinus with Class IA (quinidine,procainamide, and disopyramide) and Class IC (propafenoneor flecainide) agents, atrial flutter with 1:1 AV conduction canoccur. Atrial flutter with fast ventricular rate may cause hemo-dynamic collapse and symptoms of low cardiac output, result-ing in dizziness or frank syncope especially when there is leftventricular dysfunction or obstructive valvular disease.
■ Because atrial flutter follows a fixed pathway within the atria,the atrial rate is regular and is one of the most regular amongall supraventricular tachyarrhythmias. Atrial flutter with 2:1AV block may be confused with SVT, especially when oneflutter wave is buried within the QRS complex and the otherflutter wave is inscribed midway between two QRS com-plexes. The flutter waves can be identified by slowing the ven-tricular rate with vagal maneuvers or, if unsuccessful, withAV nodal blocking agents. Adenosine, however, should notbe injected when the tachycardia has wide QRS complexesbecause hypotension or ventricular fibrillation may occur ifthe tachycardia turns out to be ventricular.
■ Atrial flutter with 2:1 AV block should be differentiated fromatrial tachycardia with 2:1 AV block. Atrial tachycardia with2:1 AV block is commonly associated with digitalis toxicity,whereas atrial flutter with 2:1 block may require more digi-talis to slow the ventricular rate.
■ Atrial rate: In atrial flutter, the minimum atrial rate is240 to 250 bpm. In atrial tachycardia with 2:1 AV block,the atrial rate is usually 200 � 50 bpm.
■ Morphology of the P waves: In atrial flutter, the flutterwaves are inverted in II, III, and aVF and the baseline be-tween the flutter waves is usually wavy and undulating. Inatrial tachycardia with 2:1 AV block, the P waves are up-right in II, III, and aVF and the baseline between the Pwaves is usually isoelectric or flat.
■ Similar to atrial fibrillation, atrial flutter can cause systemicthromboembolism and the incidence of stroke approachesthat of atrial fibrillation.
■ Because atrial flutter is associated with mechanical atrialcontraction, the physical findings of atrial flutter often showjugular neck vein pulsations coincident with each flutterwave in the ECG. Thus, the number of atrial pulsations (Awaves) will be faster than the ventricular rate because atrialflutter is usually associated with AV block. When there isvariable AV block, an irregular heart rate will be present,which can be mistaken for atrial fibrillation. The intensity ofthe first heart sound is constant when the AV block is fixedbut is variable when there is varying AV conduction.
Therapy
■ In patients who are hemodynamically unstable and are hy-potensive with low cardiac output, immediate direct currentcardioversion is indicated and receives a Class I recommenda-tion according to the 2003 American College of Cardiology/American Heart Association Task Force on Practice Guide-lines, and the European Society of Cardiology practice guide-lines for the management of patients with supraventriculararrhythmias. Immediate cardioversion is also indicatedamong stable patients and also carries a Class I recommenda-tion since atrial flutter can be easily converted to normal sinusrhythm with low energy settings of 50 joules or less usingmonophasic shocks. Therapy of atrial flutter is similar to thatof atrial fibrillation and includes three considerations:
■ Anticoagulation to prevent thromboembolism
■ Control of ventricular rate
■ Conversion of atrial flutter to normal sinus rhythm
■ Anticoagulation to prevent thromboembolism: Antico-agulation should always be considered in all patients if theduration of atrial flutter is �48 hours or the duration is notdefinitely known. Atrial flutter, similar to atrial fibrillation, isassociated with increased incidence of thromboembolism.This is further discussed in Chapter 19, Atrial Fibrillation.
■ Control of ventricular rate: Control of ventricular rate inatrial flutter is frequently more difficult than control of ven-tricular rate in atrial fibrillation. The pharmacologic agentsthat are commonly used include AV nodal blocking agentssuch as calcium channel blockers (verapamil or diltiazem),beta blockers, digitalis, and amiodarone. The agent of choicedepends on the clinical status of the patient. The followingare the recommendations for control of ventricular rate in
LWBK271-C18_233-245.qxd 1/29/09 12:30 PM Page 243 LWBK271-C01_01-08.qxd
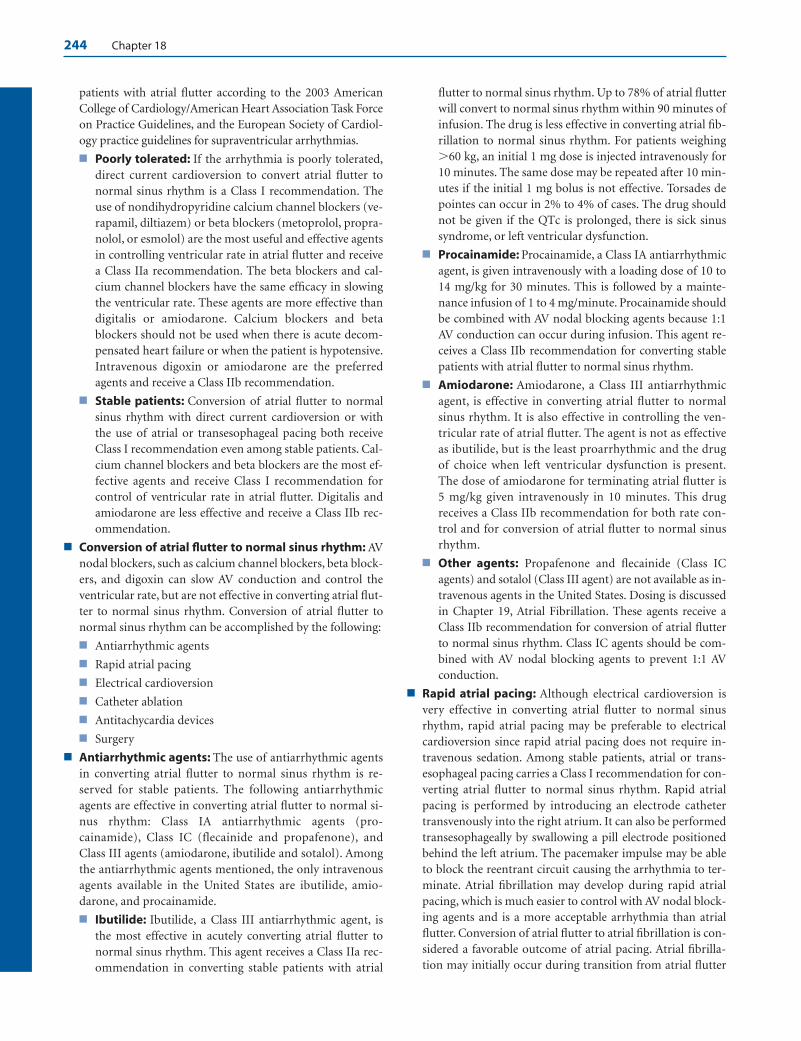
244 Chapter 18
patients with atrial flutter according to the 2003 AmericanCollege of Cardiology/American Heart Association Task Forceon Practice Guidelines, and the European Society of Cardiol-ogy practice guidelines for supraventricular arrhythmias.
■ Poorly tolerated: If the arrhythmia is poorly tolerated,direct current cardioversion to convert atrial flutter tonormal sinus rhythm is a Class I recommendation. Theuse of nondihydropyridine calcium channel blockers (ve-rapamil, diltiazem) or beta blockers (metoprolol, propra-nolol, or esmolol) are the most useful and effective agentsin controlling ventricular rate in atrial flutter and receivea Class IIa recommendation. The beta blockers and cal-cium channel blockers have the same efficacy in slowingthe ventricular rate. These agents are more effective thandigitalis or amiodarone. Calcium blockers and betablockers should not be used when there is acute decom-pensated heart failure or when the patient is hypotensive.Intravenous digoxin or amiodarone are the preferredagents and receive a Class IIb recommendation.
■ Stable patients: Conversion of atrial flutter to normalsinus rhythm with direct current cardioversion or withthe use of atrial or transesophageal pacing both receiveClass I recommendation even among stable patients. Cal-cium channel blockers and beta blockers are the most ef-fective agents and receive Class I recommendation forcontrol of ventricular rate in atrial flutter. Digitalis andamiodarone are less effective and receive a Class IIb rec-ommendation.
■ Conversion of atrial flutter to normal sinus rhythm: AVnodal blockers, such as calcium channel blockers, beta block-ers, and digoxin can slow AV conduction and control theventricular rate, but are not effective in converting atrial flut-ter to normal sinus rhythm. Conversion of atrial flutter tonormal sinus rhythm can be accomplished by the following:
■ Antiarrhythmic agents
■ Rapid atrial pacing
■ Electrical cardioversion
■ Catheter ablation
■ Antitachycardia devices
■ Surgery
■ Antiarrhythmic agents: The use of antiarrhythmic agentsin converting atrial flutter to normal sinus rhythm is re-served for stable patients. The following antiarrhythmicagents are effective in converting atrial flutter to normal si-nus rhythm: Class IA antiarrhythmic agents (pro-cainamide), Class IC (flecainide and propafenone), andClass III agents (amiodarone, ibutilide and sotalol). Amongthe antiarrhythmic agents mentioned, the only intravenousagents available in the United States are ibutilide, amio-darone, and procainamide.
■ Ibutilide: Ibutilide, a Class III antiarrhythmic agent, isthe most effective in acutely converting atrial flutter tonormal sinus rhythm. This agent receives a Class IIa rec-ommendation in converting stable patients with atrial
flutter to normal sinus rhythm. Up to 78% of atrial flutterwill convert to normal sinus rhythm within 90 minutes ofinfusion. The drug is less effective in converting atrial fib-rillation to normal sinus rhythm. For patients weighing�60 kg, an initial 1 mg dose is injected intravenously for10 minutes. The same dose may be repeated after 10 min-utes if the initial 1 mg bolus is not effective. Torsades depointes can occur in 2% to 4% of cases. The drug shouldnot be given if the QTc is prolonged, there is sick sinussyndrome, or left ventricular dysfunction.
■ Procainamide: Procainamide, a Class IA antiarrhythmicagent, is given intravenously with a loading dose of 10 to14 mg/kg for 30 minutes. This is followed by a mainte-nance infusion of 1 to 4 mg/minute. Procainamide shouldbe combined with AV nodal blocking agents because 1:1AV conduction can occur during infusion. This agent re-ceives a Class IIb recommendation for converting stablepatients with atrial flutter to normal sinus rhythm.
■ Amiodarone: Amiodarone, a Class III antiarrhythmicagent, is effective in converting atrial flutter to normalsinus rhythm. It is also effective in controlling the ven-tricular rate of atrial flutter. The agent is not as effectiveas ibutilide, but is the least proarrhythmic and the drugof choice when left ventricular dysfunction is present.The dose of amiodarone for terminating atrial flutter is5 mg/kg given intravenously in 10 minutes. This drugreceives a Class IIb recommendation for both rate con-trol and for conversion of atrial flutter to normal sinusrhythm.
■ Other agents: Propafenone and flecainide (Class ICagents) and sotalol (Class III agent) are not available as in-travenous agents in the United States. Dosing is discussedin Chapter 19, Atrial Fibrillation. These agents receive aClass IIb recommendation for conversion of atrial flutterto normal sinus rhythm. Class IC agents should be com-bined with AV nodal blocking agents to prevent 1:1 AVconduction.
■ Rapid atrial pacing: Although electrical cardioversion isvery effective in converting atrial flutter to normal sinusrhythm, rapid atrial pacing may be preferable to electricalcardioversion since rapid atrial pacing does not require in-travenous sedation. Among stable patients, atrial or trans-esophageal pacing carries a Class I recommendation for con-verting atrial flutter to normal sinus rhythm. Rapid atrialpacing is performed by introducing an electrode cathetertransvenously into the right atrium. It can also be performedtransesophageally by swallowing a pill electrode positionedbehind the left atrium. The pacemaker impulse may be ableto block the reentrant circuit causing the arrhythmia to ter-minate. Atrial fibrillation may develop during rapid atrialpacing, which is much easier to control with AV nodal block-ing agents and is a more acceptable arrhythmia than atrialflutter. Conversion of atrial flutter to atrial fibrillation is con-sidered a favorable outcome of atrial pacing. Atrial fibrilla-tion may initially occur during transition from atrial flutter
LWBK271-C18_233-245.qxd 1/29/09 12:30 PM Page 244 LWBK271-C01_01-08.qxd

Atrial Flutter 245
to normal sinus rhythm. There are two types of atrial flutterbased on response to rapid atrial pacing:
■ Type I. Atrial flutter is called type I if it can be convertedto normal sinus rhythm with rapid atrial pacing. Theatrial rate in type I atrial flutter is classically �240 bpmand includes both typical and reverse typical atrial flutteras well as atrial flutter associated with reentry around sur-gical lesions within the atria.
■ Type II. Atrial flutter is called type II when it can not be in-terrupted by rapid atrial pacing. The atrial rate is more rapidthan type I atrial flutter and exceeds 340 beats per minute.
■ Electrical cardioversion. Atrial flutter is one of the mostresponsive arrhythmias that can be terminated successfullywith very low energy settings. Approximately 25 to 50 joulesor less may be enough to terminate atrial flutter especially ifbiphasic current is used. Fifty to 100 joules is usually neededduring elective cardioversion and is effective in �95% of pa-tients. Direct current cardioversion is the treatment of choicewhen rapid conversion to normal sinus rhythm is desiredand receives a Class I recommendation for both stable andunstable patients.
■ Catheter ablation of the reentrant pathway: Long-termtherapy of atrial flutter especially when recurrent includes abla-tion of the reentrant pathway with an endocardial catheter. Intypical atrial flutter, the reentry is confined to the right atriumand part of the pathway involves an area between the tricuspidorifice and mouth of the inferior vena cava called the cavotri-cuspid isthmus. This is the area where the reentrant circuit isusually interrupted by radiofrequency ablation.
■ Antitachycardia devices: Permanent pacemakers are capa-ble of delivering rapid atrial pacing and can be implanted inpatients who are responsive to rapid atrial pacing. Devicescapable of delivering shocks within the atrium are also capa-ble of converting atrial flutter to normal sinus rhythm. Thesedevices, however, are currently not available for clinical use.
■ Surgery: This is similar to radiofrequency ablation exceptthat surgery is performed to ablate the reentrant circuit. Thisapproach is feasible in patients who are also scheduled to un-dergo coronary bypass surgery or open heart surgery forvalvular disease.
Prognosis
■ Unlike atrial fibrillation, atrial flutter does not continue in-definitely and usually lasts only for a few days or a few weeks,
although atrial flutter have been documented to last for sev-eral years. Atrial flutter usually degenerates to atrial fibrilla-tion. It can result in tachycardia-mediated cardiomyopathy ifthe ventricular rate is not controlled. It may also causethromboembolic events similar to atrial fibrillation.
■ Atrial flutter is usually associated with cardiac or pulmonarydisease or an acute precipitating event. Unlike lone atrial fib-rillation where 10% to 30% of patients do not have associ-ated cardiac or pulmonary disease, lone atrial flutter is rare.The prognosis of atrial flutter therefore depends on the un-derlying condition.
Suggested Readings
Blomstrom-Lundqvist C, Scheinman MM, Aliot EM, et al.ACC/AHA/ESC guidelines for the management of patientswith supraventricular arrhythmias—executive summary. Areport of the American College of Cardiology/AmericanHeart Association Task Force on Practice Guidelines, and theEuropean Society of Cardiology Committee for PracticeGuidelines (Writing Committee to Develop Guidelines forthe Management of Patients with Supraventricular Arrhyth-mias). J Am Coll Cardiol. 2003;42:1493–1531.
Fuster V, Ryden LE, Cannom DS, et al. ACC/AHA/ESC 2006Guidelines for the management of patients with atrial fibril-lation: A report of the American College of Cardiology/American Heart Association Task Force on Practice Guide-lines and the European Society of Cardiology Committee forPractice Guidelines (Writing Committee to Revise 2001Guidelines for the Management of Patients with Atrial Fib-rillation). J Am Coll Cardiol. 2006;48:e149–e246.
Ghali WA, Wasil BI, Brant R, et al. Atrial flutter and the risk ofthromboembolism: a systematic review and meta-analysis.Am J Med. 2005;118:101–107.
Saoudi N, Cosio F, Waldo A, et al. A classification of atrial flutterand regular atrial tachycardia according to electrophysiolog-ical mechanisms and anatomical basis. A statement from ajoint expert group from the working group of arrhythmias ofthe European Society of Cardiology and the North AmericanSociety of Pacing and Electrophysiology. Eur Heart J. 2001;22:1162–1182.
Waldo AL, Biblo LA. Atrioventricular nodal-independentsupraventricular tachycardias. In: Topol E, ed. Textbook inCardiovascular Medicine. 2nd ed. Philadelphia: LippincottWilliams & Wilkins; 2002:1429–1451.
Wellens HJJ. Contemporary management of atrial flutter. Circu-lation. 2002:106:649–652.
LWBK271-C18_233-245.qxd 1/29/09 12:30 PM Page 245 LWBK271-C01_01-08.qxd

19Atrial Fibrillation
246
Electrocardiogram Findings
■ Prevalence: Atrial fibrillation (AF) is the most com-mon sustained arrhythmia that one encounters in clin-ical practice. It accounts for approximately one third ofall hospitalizations from cardiac arrhythmias. In thegeneral population, approximately 2.2 million Ameri-cans or �1% have AF; however, the prevalence variesaccording to the age group and is higher in the elderly.■ AF is rare in children and young adults.■ It is also rare in individuals younger than age 60
years because �1% of the population in this agegroup has AF.
■ It increases to more than 8% among patients olderthan 80 years of age.
■ The median age of patients with AF is approxi-mately 75 years.
■ Electrocardiogram (ECG) findings: AF is a commoncause of stroke in the elderly. AF therefore should berecognized because the risk of stroke can be minimizedif the arrhythmia is treated appropriately. The follow-ing are the ECG features of AF.■ Presence of very irregular and disorganized atrial
activity represented in the ECG as fibrillatory waves.These fibrillatory waves, also called “F” waves, aredue to several independent reentrant waveletswithin the atria (Fig. 19.1).
■ The fibrillatory waves may be fine or coarse andhave varying morphologies, which can be mistakenfor P waves.
■ Fibrillatory waves may not be present. Instead, a flatline with irregularly irregular R-R intervals may bepresent.
■ The atrial rate in AF is �350 beats per minute (bpm).■ The ventricular rate is irregularly irregular and de-
pends on the number of atrial impulses conductedthrough the atrioventricular (AV) node.
■ The QRS complexes are narrow unless there isbundle branch block, aberrant conduction, or pre-excitation.
Atrial Fibrillation
■ Atrial rate: There are no distinct P waves in AF. In-stead, fibrillatory or F waves are present with a rate thatexceeds 350 bpm. The F waves vary in size and shapeand may be coarse or fine or, in some instances, it maynot be visible in any lead of a complete 12-lead ECG.When fibrillatory waves are not visible, the diagnosis ofAF is based on the presence of irregularly irregular R-Rintervals as shown (Fig. 19.2B).
Ventricular Rate
■ Ventricular rate: The ventricular response during AFis irregularly irregular and the rate will depend on thestate of the AV node. When there is heightened parasym-pathetic activity or AV nodal disease, the ventricular ratemay be very slow. Conversely, when there increasedsympathetic activity, the ventricular rate may be very
Lead II
Figure 19.1: Atrial Fibrillation. Rhythm strip showing atrial fibrillation. Note the presence of fibrillatory waves(arrows) between irregularly irregular R-R intervals.
LWBK271-C19_246-261.qxd 1/29/09 12:57 PM Page 246 LWBK271-C01_01-08.qxd
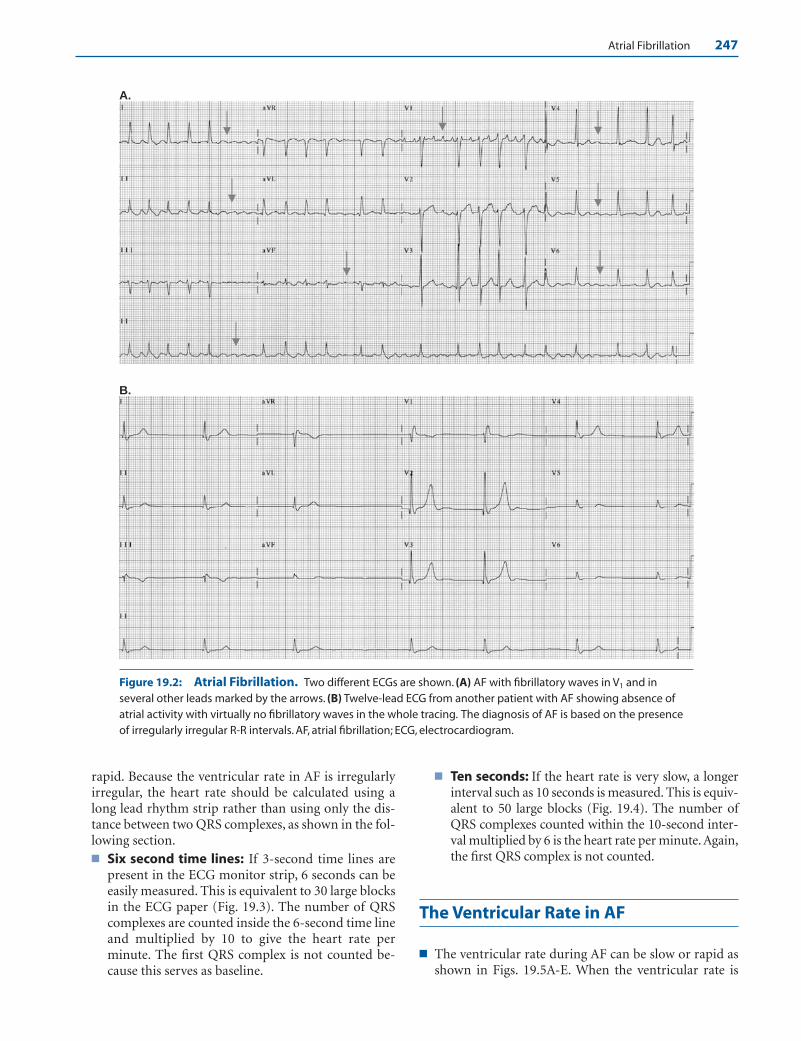
Atrial Fibrillation 247
rapid. Because the ventricular rate in AF is irregularlyirregular, the heart rate should be calculated using along lead rhythm strip rather than using only the dis-tance between two QRS complexes, as shown in the fol-lowing section.■ Six second time lines: If 3-second time lines are
present in the ECG monitor strip, 6 seconds can beeasily measured. This is equivalent to 30 large blocksin the ECG paper (Fig. 19.3). The number of QRScomplexes are counted inside the 6-second time lineand multiplied by 10 to give the heart rate perminute. The first QRS complex is not counted be-cause this serves as baseline.
■ Ten seconds: If the heart rate is very slow, a longerinterval such as 10 seconds is measured. This is equiv-alent to 50 large blocks (Fig. 19.4). The number ofQRS complexes counted within the 10-second inter-val multiplied by 6 is the heart rate per minute. Again,the first QRS complex is not counted.
The Ventricular Rate in AF
■ The ventricular rate during AF can be slow or rapid asshown in Figs. 19.5A-E. When the ventricular rate is
A.
B.
Figure 19.2: Atrial Fibrillation. Two different ECGs are shown. (A) AF with fibrillatory waves in V1 and inseveral other leads marked by the arrows. (B) Twelve-lead ECG from another patient with AF showing absence ofatrial activity with virtually no fibrillatory waves in the whole tracing. The diagnosis of AF is based on the presenceof irregularly irregular R-R intervals. AF, atrial fibrillation; ECG, electrocardiogram.
LWBK271-C19_246-261.qxd 1/29/09 12:57 PM Page 247 LWBK271-C01_01-08.qxd

248 Chapter 19
slow (Figs. 19.5A–C), AF can be easily recognized.However, when the ventricular rate is faster (Fig.19.5D,E), AF is more difficult to diagnose because theQRS complexes are clustered together and the undulat-ing baseline and irregularly irregular R-R intervals be-come more difficult to evaluate.
Clinical Classification of AF
■ Classification: AF may be classified according to itsclinical rather than its electrocardiographic presenta-tion. The American College of Cardiology/AmericanHeart Association Task Force on Practice Guidelines,and the European Society of Cardiology Committee(ACC/AHA/ESC) 2006 guidelines for the managementof AF identify several types of AF.■ Nonvalvular AF: AF is considered nonvalvular when
it occurs in the absence of rheumatic mitral valve dis-ease, prosthetic heart valve, or mitral valve repair.
■ Valvular AF: AF is considered valvular when it is as-sociated with rheumatic mitral stenosis, prostheticheart valve, or the patient has previously undergonevalve repair.
■ Lone AF: AF occurring in individuals �60 years ofage with structurally normal hearts and no evidenceof pulmonary disease. These individuals are not hy-pertensive and have no clinical or echocardio-graphic evidence of cardiac or pulmonary disease.These patients are important to identify becausethey are low risk for thromboembolism.
■ First detected: As the name implies, AF is detectedfor the first time, regardless of duration or previousepisodes. A number of patients with first-detectedAF have the potential to revert to normal sinusrhythm spontaneously.
■ Recurrent: AF is recurrent if two or more episodeshave occurred. The AF may be paroxysmal or per-sistent.
■ Paroxysmal: When recurrent AF has sudden onsetand abrupt termination. The episodes are usuallyself terminating lasting for �7 days with mostepisodes lasting �2 hours.
■ Persistent: AF is persistent if the arrhythmia is morethan 7 days in duration. This also includes AF of muchlonger duration, including those lasting for more than1 year. In persistent AF, the episodes are no longer selfterminating, although the AF can be terminated withpharmacologic agents or with electrical cardioversion.
■ Permanent: AF is permanent if the arrhythmia canno longer be converted to normal sinus rhythm withelectrical cardioversion or pharmacologic agents.The arrhythmia is usually persistent, lasting �1 year,or a previous electrical cardioversion has failed.
■ Associated diseases: The most common diseases asso-ciated with AF include hypertension, ischemic heart dis-ease, heart failure, valvular diseases, and diabetes mellitus.
■ Mechanism: AF is a reentrant arrhythmia character-ized by the presence of multiple independent reentrantwavelets within the atria (Fig. 19.6). The fibrillatorywaves have a rate of �350 bpm. These fibrillatory wavesare often precipitated by premature atrial complexes
10 Seconds (50 large blocks)
0 1 2 3 4 5 6 7
Heart Rate = 7 × 6 = 42 bpm
6 Seconds (30 large blocks)
1 2 3 8 4 5 6 7 9 10 0
Heart Rate = 10.5 × 10 = 105 bpm
Figure 19.3: Six-Second Markers. Thirty large blocks is equivalent to 6 seconds. In this ex-ample, there are 10.5 QRS complexes within the 6-second time markers, thus the heart rate is10.5 � 10 � 105 beats per minute.
Figure 19.4: Ten-Second Markers. When the heart rate is very slow, 10 seconds is a moreaccurate marker. This is equivalent to 50 large blocks. In the above example, there are seven QRScomplexes within the 10-second time marks. The heart rate is 7 � 6 � 42 beats per minute.
LWBK271-C19_246-261.qxd 1/29/09 12:57 PM Page 248 LWBK271-C01_01-08.qxd
deb
Highlight
deb
Highlight
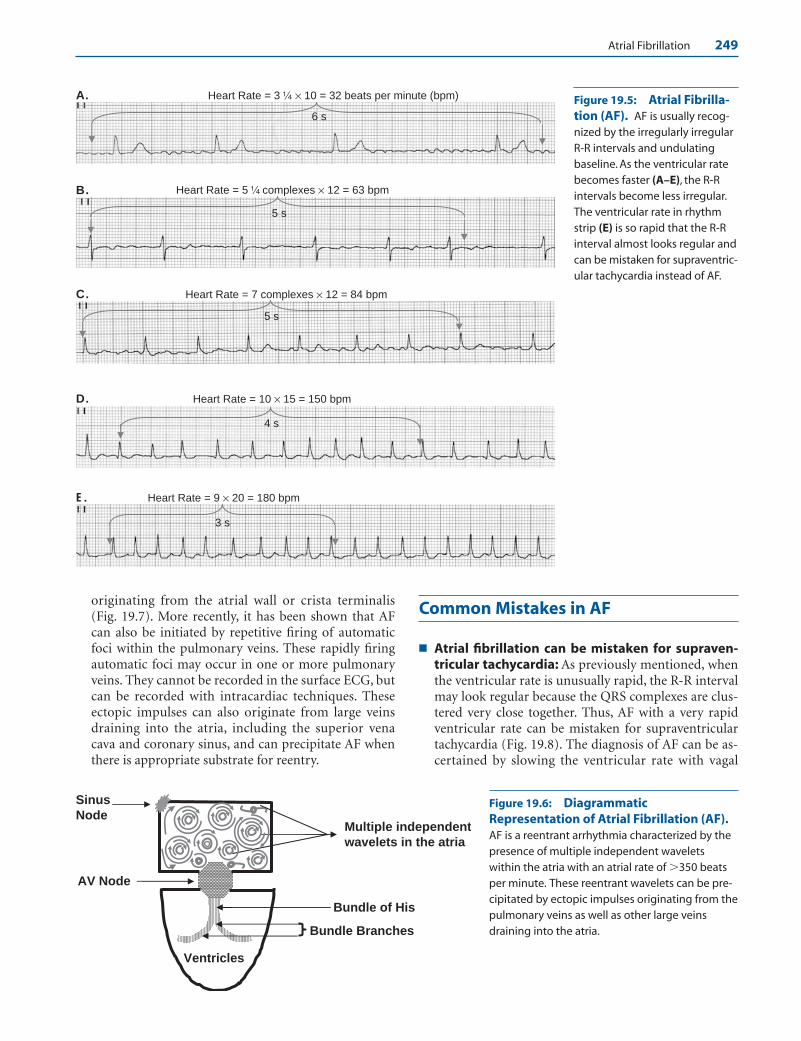
Atrial Fibrillation 249
A.
B.
C. Heart Rate = 7 complexes × 12 = 84 bpm
Heart Rate = 5 complexes × 12 = 63 bpm
Heart Rate = 3 × 10 = 32 beats per minute (bpm)
D. Heart Rate = 10 × 15 = 150 bpm
4 s
5 s
5 s
6 s
Figure 19.5: Atrial Fibrilla-tion (AF). AF is usually recog-nized by the irregularly irregularR-R intervals and undulatingbaseline. As the ventricular ratebecomes faster (A–E), the R-R intervals become less irregular.The ventricular rate in rhythmstrip (E) is so rapid that the R-Rinterval almost looks regular andcan be mistaken for supraventric-ular tachycardia instead of AF.
Ventricles
AV Node
Bundle of His
Bundle Branches
Sinus
NodeMultiple independent
wavelets in the atria
Figure 19.6: DiagrammaticRepresentation of Atrial Fibrillation (AF).AF is a reentrant arrhythmia characterized by thepresence of multiple independent waveletswithin the atria with an atrial rate of �350 beatsper minute. These reentrant wavelets can be pre-cipitated by ectopic impulses originating from thepulmonary veins as well as other large veinsdraining into the atria.
originating from the atrial wall or crista terminalis(Fig. 19.7). More recently, it has been shown that AFcan also be initiated by repetitive firing of automaticfoci within the pulmonary veins. These rapidly firingautomatic foci may occur in one or more pulmonaryveins. They cannot be recorded in the surface ECG, butcan be recorded with intracardiac techniques. Theseectopic impulses can also originate from large veinsdraining into the atria, including the superior venacava and coronary sinus, and can precipitate AF whenthere is appropriate substrate for reentry.
Common Mistakes in AF
■ Atrial fibrillation can be mistaken for supraven-tricular tachycardia: As previously mentioned, whenthe ventricular rate is unusually rapid, the R-R intervalmay look regular because the QRS complexes are clus-tered very close together. Thus, AF with a very rapidventricular rate can be mistaken for supraventriculartachycardia (Fig. 19.8). The diagnosis of AF can be as-certained by slowing the ventricular rate with vagal
E. Heart Rate = 9 × 20 = 180 bpm
3 s
LWBK271-C19_246-261.qxd 1/29/09 12:57 PM Page 249 LWBK271-C01_01-08.qxd
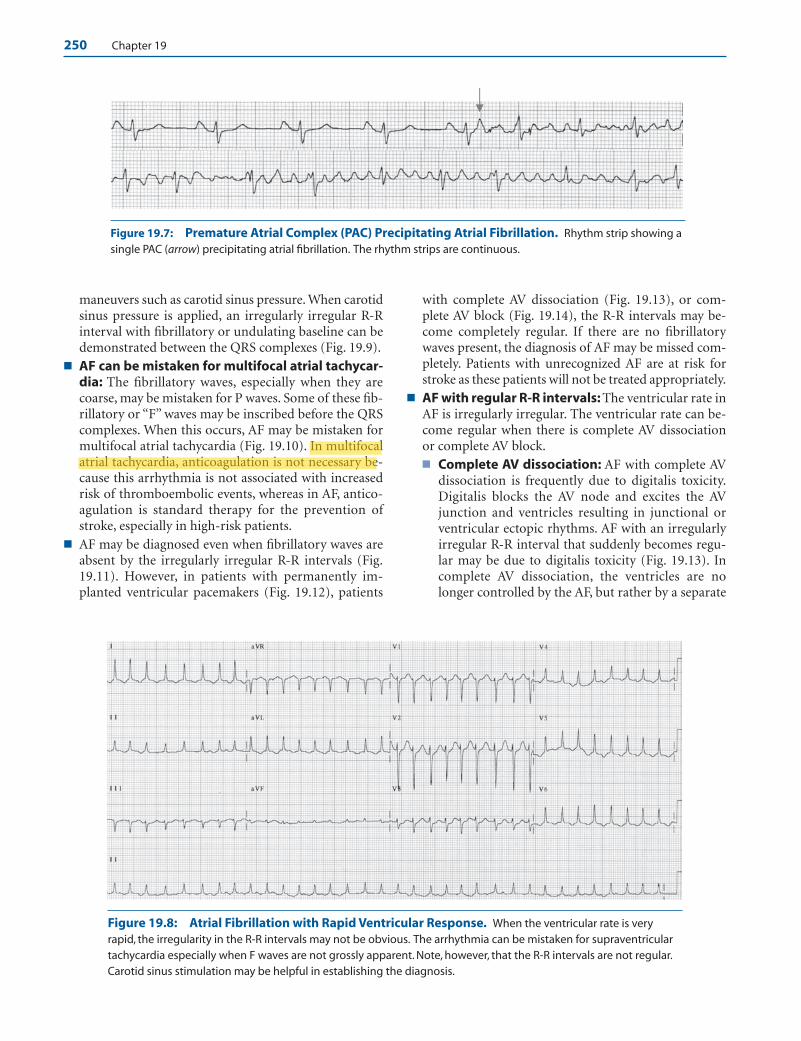
250 Chapter 19
maneuvers such as carotid sinus pressure. When carotidsinus pressure is applied, an irregularly irregular R-Rinterval with fibrillatory or undulating baseline can bedemonstrated between the QRS complexes (Fig. 19.9).
■ AF can be mistaken for multifocal atrial tachycar-dia: The fibrillatory waves, especially when they arecoarse, may be mistaken for P waves. Some of these fib-rillatory or “F” waves may be inscribed before the QRScomplexes. When this occurs, AF may be mistaken formultifocal atrial tachycardia (Fig. 19.10). In multifocalatrial tachycardia, anticoagulation is not necessary be-cause this arrhythmia is not associated with increasedrisk of thromboembolic events, whereas in AF, antico-agulation is standard therapy for the prevention ofstroke, especially in high-risk patients.
■ AF may be diagnosed even when fibrillatory waves areabsent by the irregularly irregular R-R intervals (Fig.19.11). However, in patients with permanently im-planted ventricular pacemakers (Fig. 19.12), patients
with complete AV dissociation (Fig. 19.13), or com-plete AV block (Fig. 19.14), the R-R intervals may be-come completely regular. If there are no fibrillatorywaves present, the diagnosis of AF may be missed com-pletely. Patients with unrecognized AF are at risk forstroke as these patients will not be treated appropriately.
■ AF with regular R-R intervals: The ventricular rate inAF is irregularly irregular. The ventricular rate can be-come regular when there is complete AV dissociationor complete AV block.■ Complete AV dissociation: AF with complete AV
dissociation is frequently due to digitalis toxicity.Digitalis blocks the AV node and excites the AVjunction and ventricles resulting in junctional orventricular ectopic rhythms. AF with an irregularlyirregular R-R interval that suddenly becomes regu-lar may be due to digitalis toxicity (Fig. 19.13). Incomplete AV dissociation, the ventricles are nolonger controlled by the AF, but rather by a separate
Figure 19.7: Premature Atrial Complex (PAC) Precipitating Atrial Fibrillation. Rhythm strip showing asingle PAC (arrow) precipitating atrial fibrillation. The rhythm strips are continuous.
Figure 19.8: Atrial Fibrillation with Rapid Ventricular Response. When the ventricular rate is veryrapid, the irregularity in the R-R intervals may not be obvious. The arrhythmia can be mistaken for supraventriculartachycardia especially when F waves are not grossly apparent. Note, however, that the R-R intervals are not regular.Carotid sinus stimulation may be helpful in establishing the diagnosis.
LWBK271-C19_246-261.qxd 1/29/09 12:57 PM Page 250 LWBK271-C01_01-08.qxd
deb
Highlight
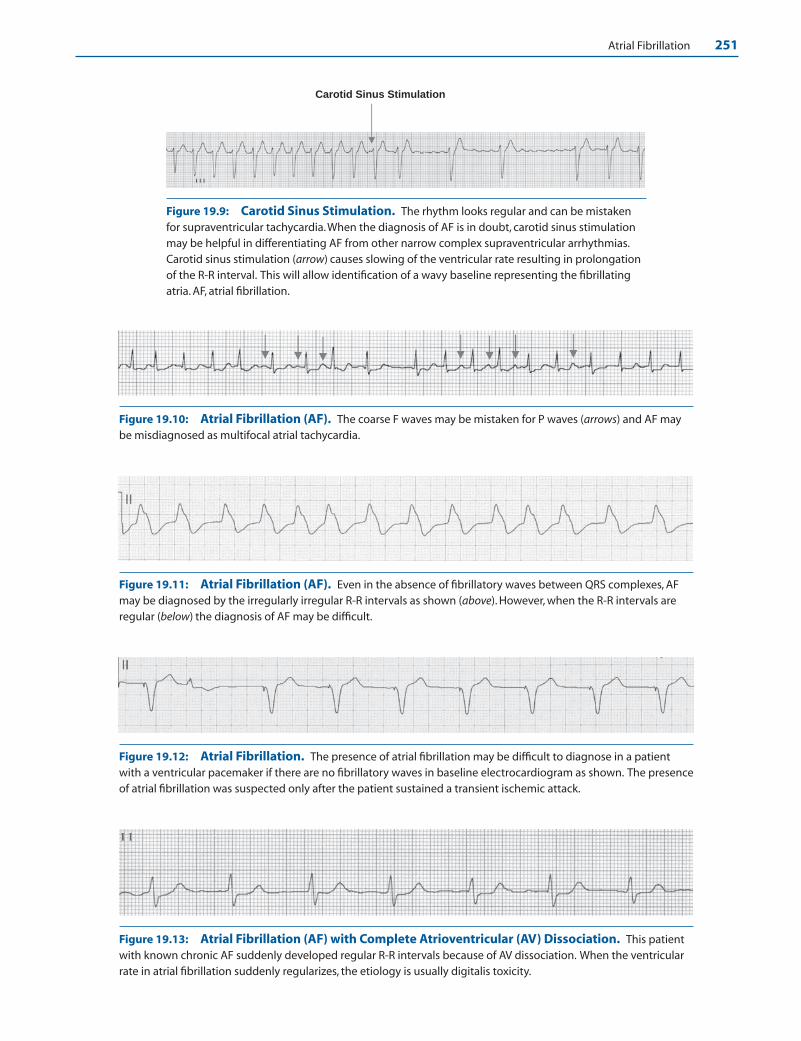
Atrial Fibrillation 251
Carotid Sinus Stimulation
Figure 19.13: Atrial Fibrillation (AF) with Complete Atrioventricular (AV) Dissociation. This patientwith known chronic AF suddenly developed regular R-R intervals because of AV dissociation. When the ventricularrate in atrial fibrillation suddenly regularizes, the etiology is usually digitalis toxicity.
Figure 19.12: Atrial Fibrillation. The presence of atrial fibrillation may be difficult to diagnose in a patientwith a ventricular pacemaker if there are no fibrillatory waves in baseline electrocardiogram as shown. The presenceof atrial fibrillation was suspected only after the patient sustained a transient ischemic attack.
Figure 19.11: Atrial Fibrillation (AF). Even in the absence of fibrillatory waves between QRS complexes, AFmay be diagnosed by the irregularly irregular R-R intervals as shown (above). However, when the R-R intervals areregular (below) the diagnosis of AF may be difficult.
Figure 19.10: Atrial Fibrillation (AF). The coarse F waves may be mistaken for P waves (arrows) and AF maybe misdiagnosed as multifocal atrial tachycardia.
Figure 19.9: Carotid Sinus Stimulation. The rhythm looks regular and can be mistakenfor supraventricular tachycardia.When the diagnosis of AF is in doubt, carotid sinus stimulationmay be helpful in differentiating AF from other narrow complex supraventricular arrhythmias.Carotid sinus stimulation (arrow) causes slowing of the ventricular rate resulting in prolongationof the R-R interval. This will allow identification of a wavy baseline representing the fibrillatingatria. AF, atrial fibrillation.
LWBK271-C19_246-261.qxd 1/29/09 12:57 PM Page 251 LWBK271-C01_01-08.qxd
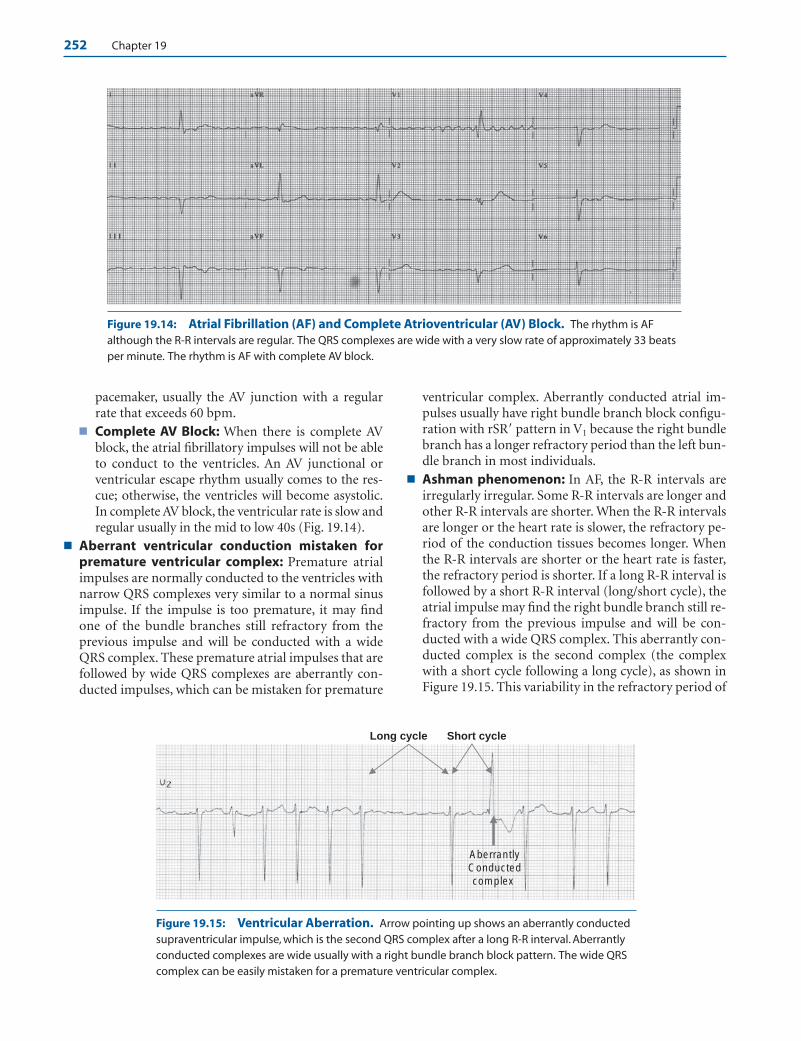
252 Chapter 19
pacemaker, usually the AV junction with a regularrate that exceeds 60 bpm.
■ Complete AV Block: When there is complete AVblock, the atrial fibrillatory impulses will not be ableto conduct to the ventricles. An AV junctional orventricular escape rhythm usually comes to the res-cue; otherwise, the ventricles will become asystolic.In complete AV block, the ventricular rate is slow andregular usually in the mid to low 40s (Fig. 19.14).
■ Aberrant ventricular conduction mistaken forpremature ventricular complex: Premature atrialimpulses are normally conducted to the ventricles withnarrow QRS complexes very similar to a normal sinusimpulse. If the impulse is too premature, it may findone of the bundle branches still refractory from theprevious impulse and will be conducted with a wideQRS complex. These premature atrial impulses that arefollowed by wide QRS complexes are aberrantly con-ducted impulses, which can be mistaken for premature
ventricular complex. Aberrantly conducted atrial im-pulses usually have right bundle branch block configu-ration with rSR� pattern in V1 because the right bundlebranch has a longer refractory period than the left bun-dle branch in most individuals.
■ Ashman phenomenon: In AF, the R-R intervals areirregularly irregular. Some R-R intervals are longer andother R-R intervals are shorter. When the R-R intervalsare longer or the heart rate is slower, the refractory pe-riod of the conduction tissues becomes longer. Whenthe R-R intervals are shorter or the heart rate is faster,the refractory period is shorter. If a long R-R interval isfollowed by a short R-R interval (long/short cycle), theatrial impulse may find the right bundle branch still re-fractory from the previous impulse and will be con-ducted with a wide QRS complex. This aberrantly con-ducted complex is the second complex (the complexwith a short cycle following a long cycle), as shown inFigure 19.15. This variability in the refractory period of
Long cycle
AberrantlyConductedcomplex
Short cycle
Figure 19.14: Atrial Fibrillation (AF) and Complete Atrioventricular (AV) Block. The rhythm is AFalthough the R-R intervals are regular. The QRS complexes are wide with a very slow rate of approximately 33 beatsper minute. The rhythm is AF with complete AV block.
Figure 19.15: Ventricular Aberration. Arrow pointing up shows an aberrantly conductedsupraventricular impulse, which is the second QRS complex after a long R-R interval. Aberrantlyconducted complexes are wide usually with a right bundle branch block pattern. The wide QRScomplex can be easily mistaken for a premature ventricular complex.
LWBK271-C19_246-261.qxd 1/29/09 12:57 PM Page 252 LWBK271-C01_01-08.qxd

Atrial Fibrillation 253
the conduction system during long/short cycles in AFis called the Ashman phenomenon.
Atrial Fibrillation and Wolff-Parkinson-White Syndrome
■ Atrial fibrillation and Wolff-Parkinson-White (WPW)syndrome: The most dreadful complication of AF canoccur in patients with WPW syndrome (see Chapter20, Wolff-Parkinson-White Syndrome). In WPW syn-drome, an accessory pathway connects the atrium di-rectly to the ventricles; thus, the atrial impulse canreach the ventricles not only through the AV node butalso through the bypass tract. AF associated with a by-pass tract can deteriorate to ventricular fibrillation andcan cause sudden cardiac death (Fig. 19.16).■ Unlike the AV node, which consists of special cells
with long refractory periods, the bypass tract con-sists of ordinary working myocardium with muchshorter refractory period. Thus, during atrial flutter(atrial rate �250 bpm) or AF (atrial rate �350bpm), the rapid atrial impulses which are normallydelayed or blocked at the AV node due to its longerrefractory period, may be conducted directly to theventricles through the bypass tract resulting in veryrapid ventricular rate.
■ AV nodal blocking agents are standard drugs forcontrolling the ventricular rate in AF. These drugs
are contraindicated when there is WPW syndromebecause they enhance conduction across the bypasstract resulting in rapid ventricular rate and hemo-dynamic collapse (see Chapter 20, Wolff-Parkinson-White Syndrome).
ECG Findings
1. Fibrillatory waves are present in baseline ECG representingdisorganized atrial activity.
2. The R-R intervals are irregularly irregular.
3. The ventricular rate is variable and depends on the number ofatrial impulses conducted through the AV node. In youngerindividuals, the ventricular rate is faster and usually variesfrom 120 to 150 bpm, but is slower in older individuals.
4. The QRS complexes are narrow unless there is preexistentbundle branch block, ventricular aberration, or preexcitation.
Mechanism
■ In AF, multiple independent reentrant wavelets are presentwithin the atria. These reentrant wavelets may be precipi-tated by premature atrial complexes or spontaneous depolar-izations originating from pulmonary veins as well as otherlarge veins draining into the atria.
■ For AF to become sustained, the atria is usually enlarged andstructural changes such as scarring and fibrosis are usuallypresent. These structural changes in the atria provide a sub-strate for reentry.
Figure 19.16: Atrial Fibrillation (AF) and Wolff-Parkinson-White (WPW) Syndrome. Note thepresence of irregularly irregular R-R intervals with very bizarre QRS complexes because of AF with varying degreesof ventricular fusion. AF occurring in the presence of WPW syndrome may result in hemodynamic instability andsudden cardiac death due to ventricular fibrillation.
LWBK271-C19_246-261.qxd 1/29/09 12:57 PM Page 253 LWBK271-C01_01-08.qxd
254 Chapter 19
Clinical Significance
■ The prevalence of AF increases with age. At age 50, approxi-mately 0.5% have AF. This increases to more than 8% by age80 years. The median age of a patient with AF is 75 years. Theincidence of AF is higher among patients with congestiveheart failure and high blood pressure, which can be reducedwith angiotensin-converting enzyme inhibitors or with an-giotensin receptor blockers.
■ AF and atrial flutter are the only two arrhythmias that in-crease the risk for stroke and thromboembolism. The throm-bus is usually located in the left atrial appendage. Thrombusconfined to the left atrial appendage can not be diagnosed bytransthoracic echocardiography. Transesophageal echo is thebest imaging modality that can detect a left atrial appendagethrombus.
■ Valvular AF: Valvular AF includes patients with AF associatedwith rheumatic mitral valve disease, especially those with mi-tral stenosis and patients with prosthetic mitral valve or previ-ous mitral valve repair. These patients are high risk for strokeand should be adequately anticoagulated with warfarin.
■ Nonvalvular AF: Patients with AF who do not have any ofthese features have nonvalvular AF. The risk of stroke for pa-tients with nonvalvular AF is low unless they have markersthat increase their risk for thromboembolism. These markerscome under the eponym of CHADS2 (Cardiac failure, Hy-pertension, Age �75 years, Diabetes, and Stroke). History ofstroke or previous transient ischemic attack carries a risk thatis twice that of the other risks features, thus a factor of 2 isadded under Stroke.
■ Lone AF: When AF is not associated with any known causeor any evidence of cardiopulmonary disease in a patientyounger than 60 years of age, lone AF is present. This is seenin up to 20% to 25% of all patients with persistent AF.Patients with lone AF should be identified because these pa-tients are low risk for thromboembolism.
■ AF may be reversible and transient when it occurs acutely inthe setting of pneumonia or other acute respiratory infec-tions, acute myocarditis, pericarditis, thyrotoxicosis, pul-monary embolism, acute myocardial infarction, or after car-diac or noncardiac surgery. It may also be precipitated byexcess intake of alcohol often called “holiday heart syndrome”and other metabolic abnormalities. AF may spontaneouslyconvert to normal sinus rhythm if the cause is reversibleand may not recur when these conditions are corrected orstabilized.
■ Symptoms of AF may vary from a completely asymptomaticpatient to one with frank syncope. When the ventricular rateis unusually rapid exceeding 150 bpm, symptoms of hy-potension, dizziness, even frank syncope, congestive heartfailure, or myocardial ischemia may occur because of de-creased cardiac output. The decreased cardiac output is dueto loss of atrial contribution to left ventricular (LV) filling.The rapid ventricular rate also shortens diastole further de-creasing ventricular filling.
■ AF can cause tachycardia mediated cardiomyopathy. It mayprecipitate heart failure and pulmonary edema in patientswith LV dysfunction and stenotic valves including mitralstenosis especially when the ventricular rate is not controlled.
■ When AF is present, the most common underlying abnor-mality is usually hypertension or coronary artery disease.Other frequent underlying conditions associated with AF in-clude cardiomyopathy, hyperthyroidism, valvular heart dis-ease (especially mitral stenosis or insufficiency), chronic ob-structive pulmonary disease, and pericarditis.
■ Congestive heart failure, regardless of etiology, is now in-creasingly recognized as a cause of AF. The use of an-giotensin-converting enzyme inhibitors and blockers of therenin-angiotensin aldosterone system has been shown to de-crease the incidence of AF in patients with heart failure aswell as in patients with high blood pressure, especially thosewith LV hypertrophy.
■ The physical findings in AF include:
■ Disappearance of the jugular “A” waves in the neck be-cause of the loss of normal sinus rhythm
■ Absence of fourth heart sound
■ Varying intensity of the first heart sound because of thevarying R-R intervals. When the R-R interval is pro-longed, the intensity of the first heart sound is softer.When the R-R interval is short, the intensity of the firstheart sound is louder.
■ When a systolic murmur is present, AF may be useful indifferentiating whether the heart murmur is outflow (aorticstenosis or functional murmur) or inflow (mitral regurgita-tion) in origin. If the intensity of the murmur increases aftera long R-R interval, the murmur is outflow in origin. If theintensity of the murmur does not change following a longR-R interval, the murmur is due to mitral regurgitation.
Treatment
■ Treatment of AF is similar to that of atrial flutter and revolvesaround three conditions:
■ Rate control: The ventricular rate should be adequatelycontrolled in all patients with AF.
■ Rhythm control: AF should be converted to normal si-nus rhythm with electrical cardioversion or pharmaco-logic therapy in selected patients with AF.
■ Prevention of thromboembolism: Anticoagulation isone of the cornerstones in the therapy of AF. It should beconsidered in all patients who are high risk for stroke.
Rate Control
■ The ventricular rate should always be adequately controlledin all patients with AF. ABCD are the drugs of choice forcontrolling the ventricular rate in AF as well as in atrialflutter (Amiodarone, Beta blockers, Calcium channelblockers, Digoxin). The drugs of choice are not necessarily
LWBK271-C19_246-261.qxd 1/29/09 12:57 PM Page 254 LWBK271-C01_01-08.qxd
deb
Highlight

Atrial Fibrillation 255
in alphabetical order. Beta blockers, nondihydropyridinecalcium channel blockers, and digoxin are effective for ratecontrol. They are not effective in converting AF to normal si-nus rhythm. They should not be given when there is preexci-tation. Amiodarone is effective both for rate control and forrhythm control (conversion of AF to normal sinus rhythm)but has several side effects and is not approved by the Foodand Drug Administration for rate control or for rhythm con-trol in AF. This agent nevertheless is included as a therapeuticagent based on recommended guidelines and clinical efficacyreported in the literature.
■ The choice of the most appropriate agent for controlling theventricular rate in AF in the acute setting depends on theclinical presentation.
■ Normal systolic function: In stable patients with normalsystolic function, intravenous nondihydropyridine calciumchannel blockers and beta blockers receive Class I recom-mendation for control of ventricular rate in AF. Intravenousdigoxin or amiodarone also receive Class I recommendationwhen there is LV dysfunction and heart failure or when theuse of other AV nodal blocking agents are inappropriate.
n Nondihydropyridine calcium channel blockers:n Diltiazem: Diltiazem is a nondihydropyridine cal-
cium channel blocker. The initial dose is 0.25 mg/kg(or 15 to 20 mg) given IV over 2 minutes. The heartrate and blood pressure should be monitored care-fully. The drug has a rapid onset of action and shouldcontrol the ventricular rate within 5 to 10 minutes ofadministration. If the heart rate remains tachycardic10 minutes after the initial bolus, a higher dose of0.35 mg/kg (or 20 to 25 mg) is given IV similar to thefirst dose. The second dose may be more hypotensivethan the initial dose and should be given more slowly.This will allow the blood pressure and heart rate to bemonitored more carefully while the drug is being ad-ministered. When the heart rate is controlled, usuallybelow 100 bpm, a maintenance dose of 5 to 15mg/hour (usually 10 mg/hr) is infused. Diltiazem hasa short half life of 3 to 4 hours, but becomes moreprolonged when maintenance infusion is added. TheIV maintenance dose is titrated according to the de-sired heart rate. An oral maintenance dose of dilti-azem is started within 3 hours after the initial IV doseso that the IV infusion can be discontinued within24 hours. The total oral dose is usually 1.5 times theexpected 24-hour cumulative IV dose. A total of 120to 360 mg of short-acting diltiazem is given orally inthree to four divided doses. A long-acting prepara-tion can be given once or twice daily.
n Verapamil: Verapamil is another nondihydropyri-dine calcium channel blocker. The initial dose is0.075 to 0.15 mg/kg (or 5 to 10 mg) given IV over2 minutes. The same dose can be repeated after 15to 30 minutes if needed. Verapamil has a longerduration of action of 4 to 12 hours and, unlike
diltiazem, does not need a continuous mainte-nance IV infusion. It is more hypotensive andmore negatively inotropic than diltiazem; thus, thepatient should be carefully monitored especially ifthe patient is already on a beta blocker. The hy-potension may respond to calcium gluconate given1 gram IV. Oral maintenance dose is 120 to 360 mgdaily in divided doses. A long-acting preparationcan be given once daily.
n Beta blockers: Beta blockers are preferred in patientswith myocardial ischemia or thyrotoxicosis and alsoreceive Class I recommendation for rate control.
n Metoprolol: Metoprolol is a selective �1 blocker.The initial dose is 2.5 to 5 mg IV over 2 minutes upto three doses (maximum dose of 15 mg givenwithin 15 minutes). This is followed by an oralmaintenance dose of 25 to 100 mg (usually 50 mg)given twice daily. The oral dose is titrated accord-ing to the desired heart rate.
n Atenolol: Atenolol is also a selective ß1 blocker. Itdoes not carry indication for controlling the ven-tricular rate of AF, but is approved for use in hy-pertension and acute myocardial infarction. Theinitial dose is 5 mg IV over 5 minutes. A seconddose may be given 10 minutes later if needed, for atotal intravenous dose of 10 mg. This is followedby an oral dose of 50 mg 10 minutes after the lastintravenous dose and another 50 mg 12 hourslater. A maintenance oral dose of 50 mg is givenonce daily. The oral dose is titrated according tothe desired heart rate.
n Propranolol: This is a nonselective ß1 ß2 blocker.The initial dose is 0.15 mg/kg IV. Up to 10 mg isgiven slowly IV at 1 mg per minute. The IV dose isfollowed by an oral dose of 80 to 240 mg dailygiven in divided doses. The oral dose is titrated ac-cording to the heart rate. A long-acting prepara-tion is also available and is given once daily.
n Esmolol: This agent is ultra–short-acting with ahalf-life of 9 minutes. A loading dose is needed,which is 0.5 mg/kg (500 mcg/kg) infused over aminute. This is followed by an initial maintenancedose of 0.05 mg/kg/min (50 mcg/kg/minute) in-fused for 4 minutes. The patient is evaluated after5 minutes if a higher maintenance dose is needed.The patient should be carefully monitored duringinfusion so that the appropriate maintenance dosecan be adjusted, which can vary up to 60 to 200 mcg/kg/minute. See Appendix: Commonly Used InjectablePharmacologic Agents for further dosing.
n Digoxin: This agent is not the preferred agent when LVfunction is preserved. However, when there is hypoten-sion (preventing the use of calcium channel blockersor beta blockers) or the patient has bronchospasticpulmonary disease (preventing the use of beta blockers)
LWBK271-C19_246-261.qxd 1/29/09 12:57 PM Page 255 LWBK271-C01_01-08.qxd

256 Chapter 19
or patient has LV dysfunction or heart failure, thisagent receives a Class I recommendation. It is not effective as monotherapy and is generally combinedwith other AV nodal blocking agents for rate control.Dosing is described under LV dysfunction.
n Amiodarone: In patients with normal systolic func-tion, amiodarone given intravenously receives a ClassIIa recommendation for rate control when other AVnodal blocking agents are ineffective or inappropriate.It receives a Class IIb recommendation when givenorally to control heart rate when other agents havebeen tried and are unsuccessful in controlling the ven-tricular rate at rest or during exercise. Dosing is de-scribed under LV dysfunction.
■ Patients with LV systolic dysfunction: In patients withheart failure, digoxin and amiodarone are the preferredagents.
n Digoxin: Digoxin receives a Class I recommendationwhen given orally or intravenously when there is heartfailure from LV systolic dysfunction. A loading dose isnecessary and may vary. For rapid control of ventricularrate in the acute setting, the initial dose recommendedby the ACC/AHA/ESC 2006 guidelines on the manage-ment of AF is 0.25 mg IV over 2 minutes every 2 hours.The dose should not exceed 1.5 mg IV within 24 hours.Maintenance dose is 0.125 to 0.375 mg daily given in-travenously or orally. For heart rate control in a non-acute setting, an oral dose of 0.5 mg daily may be givenfor 2 to 4 days followed by an oral maintenance dose of0.125 to 0.375 mg daily. Digoxin has a very slow onset ofaction (1 hour or more) and its maximal effect is notuntil after 6 hours. It is usually not a very effective agentin controlling the ventricular rate in AF when used asmonotherapy and receives a Class III recommendationwhen given as the sole agent in patients with paroxys-mal AF. It may be effective in controlling heart rates atrest as well as in individuals who are sedentary but con-trol of the rate of atrial fibrillation is lost during physi-cal activity or in conditions associated with adrenergicstress such as febrile illnesses, hyperthyroidism, or exac-erbations of chronic obstructive pulmonary disease.
n Amiodarone: Intravenous amiodarone receives aClass I recommendation to control the ventricularrate in patients with AF with heart failure. In the acutesetting when rate control is necessary, 150 mg is givenIV over 10 minutes followed by a maintenance infu-sion of 1 mg/minute IV for 6 hours and 0.5mg/minute IV for the next 18 hours. The oral dose hasa very slow onset of action and is more appropriate touse in nonacute setting. The oral dose is 800 mg dailyin divided doses for 1 week. Another option is to givea lower dose of 600 mg daily in divided doses for 1week or 400 mg daily in divided doses for 4 to 6 weeks.Any of these regimens is followed by long-term oralmaintenance dose of 200 mg daily. Amiodarone affects
the pharmacokinetics of warfarin, verapamil, anddigoxin. The dose of these pharmacologic agentsshould be reduced when amiodarone is started.
n Other agents: Intravenous injection of nondihydropy-ridine calcium channel blockers and beta blockers maybe given cautiously for rate control when there is LVdysfunction. These agents however are contraindicated(Class III) when the patient is acutely decompensated.Diltiazem has a shorter half-life and is less negativelyinotropic than verapamil and may be more tolerable.
■ WPW syndrome: In patients with WPW syndrome, theuse of AV nodal blocking agents to control ventricularrate during AF is inappropriate and may be dangerous.Inhibition of the AV node with any AV nodal blockingagents such as calcium channel blockers, beta blockers, ordigitalis will allow atrial fibrillatory impulses to pass moreefficiently through the bypass tract, which may result inventricular fibrillation. Instead of AV nodal blockers, an-tiarrhythmic agents that increase the refractory period ofthe bypass tract such as type IA agents (procainamide) ordrugs that can inhibit both AV node and bypass tract suchas type IC and type III agents (ibutilide or amiodarone),may be given intravenously to hemodynamically stablepatients to control the ventricular rate. Otherwise, the AFshould be converted to normal sinus with electrical car-dioversion. The treatment of AF in patients with WPWsyndrome is further discussed in Chapter 20, Wolff-Parkinson-White Syndrome.
■ Nonpharmacologic control of ventricular rate in AF:The following are used only when pharmacologic agents arenot effective in controlling the ventricular rate, especiallywhen there is tachycardia-mediated cardiomyopathy.
■ AV nodal ablation: If the ventricular rate in AF can notbe controlled with AV nodal blocking agents or other an-tiarrhythmic agents, radiofrequency ablation of the AVnode combined with insertion of a permanent ventricularpacemaker is an option. Before AV nodal ablation is con-sidered, the patient should be tried on medications andperformed as a last resort especially in patients withtachycardia-mediated cardiomyopathy.
■ Pulmonary vein isolation: Isolation of the pulmonaryveins may be performed either surgically or with radio-frequency ablation to maintain normal sinus rhythm (seeRhythm Control in this chapter) rather that for control ofventricular rate during AF.
■ Rate control: The following is a summary of pharmacologicagents recommended by the ACC/AHA/ESC guidelines forrate control in AF (Table 19.1).
Rhythm Control
■ Rhythm control or conversion of AF to normal sinus rhythmis not necessary in all patients with AF. In the AFFIRM (AtrialFibrillation Follow-up Investigation of Rhythm Manage-ment) and RACE (Rate Control vs. Electrical Cardioversion
LWBK271-C19_246-261.qxd 1/29/09 12:57 PM Page 256 LWBK271-C01_01-08.qxd
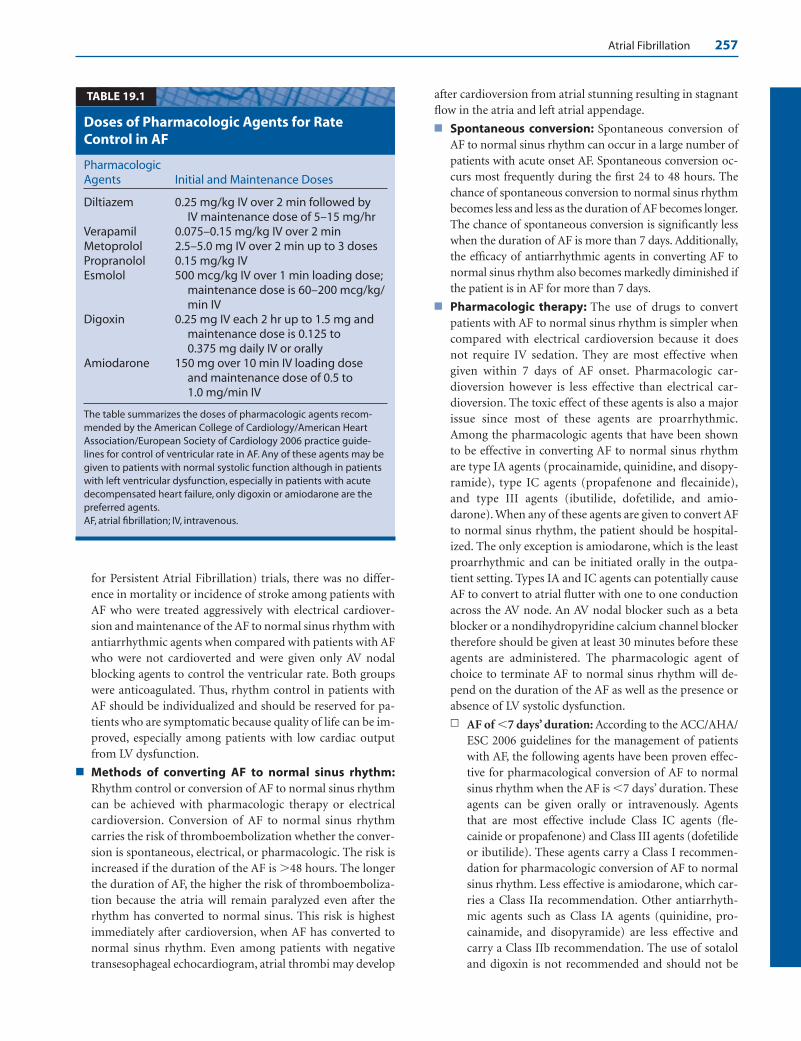
Atrial Fibrillation 257
for Persistent Atrial Fibrillation) trials, there was no differ-ence in mortality or incidence of stroke among patients withAF who were treated aggressively with electrical cardiover-sion and maintenance of the AF to normal sinus rhythm withantiarrhythmic agents when compared with patients with AFwho were not cardioverted and were given only AV nodalblocking agents to control the ventricular rate. Both groupswere anticoagulated. Thus, rhythm control in patients withAF should be individualized and should be reserved for pa-tients who are symptomatic because quality of life can be im-proved, especially among patients with low cardiac outputfrom LV dysfunction.
■ Methods of converting AF to normal sinus rhythm:Rhythm control or conversion of AF to normal sinus rhythmcan be achieved with pharmacologic therapy or electricalcardioversion. Conversion of AF to normal sinus rhythmcarries the risk of thromboembolization whether the conver-sion is spontaneous, electrical, or pharmacologic. The risk isincreased if the duration of the AF is �48 hours. The longerthe duration of AF, the higher the risk of thromboemboliza-tion because the atria will remain paralyzed even after therhythm has converted to normal sinus. This risk is highestimmediately after cardioversion, when AF has converted tonormal sinus rhythm. Even among patients with negativetransesophageal echocardiogram, atrial thrombi may develop
after cardioversion from atrial stunning resulting in stagnantflow in the atria and left atrial appendage.
■ Spontaneous conversion: Spontaneous conversion ofAF to normal sinus rhythm can occur in a large number ofpatients with acute onset AF. Spontaneous conversion oc-curs most frequently during the first 24 to 48 hours. Thechance of spontaneous conversion to normal sinus rhythmbecomes less and less as the duration of AF becomes longer.The chance of spontaneous conversion is significantly lesswhen the duration of AF is more than 7 days. Additionally,the efficacy of antiarrhythmic agents in converting AF tonormal sinus rhythm also becomes markedly diminished ifthe patient is in AF for more than 7 days.
■ Pharmacologic therapy: The use of drugs to convertpatients with AF to normal sinus rhythm is simpler whencompared with electrical cardioversion because it doesnot require IV sedation. They are most effective whengiven within 7 days of AF onset. Pharmacologic car-dioversion however is less effective than electrical car-dioversion. The toxic effect of these agents is also a majorissue since most of these agents are proarrhythmic.Among the pharmacologic agents that have been shownto be effective in converting AF to normal sinus rhythmare type IA agents (procainamide, quinidine, and disopy-ramide), type IC agents (propafenone and flecainide),and type III agents (ibutilide, dofetilide, and amio-darone). When any of these agents are given to convert AFto normal sinus rhythm, the patient should be hospital-ized. The only exception is amiodarone, which is the leastproarrhythmic and can be initiated orally in the outpa-tient setting. Types IA and IC agents can potentially causeAF to convert to atrial flutter with one to one conductionacross the AV node. An AV nodal blocker such as a betablocker or a nondihydropyridine calcium channel blockertherefore should be given at least 30 minutes before theseagents are administered. The pharmacologic agent ofchoice to terminate AF to normal sinus rhythm will de-pend on the duration of the AF as well as the presence orabsence of LV systolic dysfunction.
n AF of �7 days’ duration: According to the ACC/AHA/ESC 2006 guidelines for the management of patientswith AF, the following agents have been proven effec-tive for pharmacological conversion of AF to normalsinus rhythm when the AF is �7 days’ duration. Theseagents can be given orally or intravenously. Agentsthat are most effective include Class IC agents (fle-cainide or propafenone) and Class III agents (dofetilideor ibutilide). These agents carry a Class I recommen-dation for pharmacologic conversion of AF to normalsinus rhythm. Less effective is amiodarone, which car-ries a Class IIa recommendation. Other antiarrhyth-mic agents such as Class IA agents (quinidine, pro-cainamide, and disopyramide) are less effective andcarry a Class IIb recommendation. The use of sotaloland digoxin is not recommended and should not be
PharmacologicAgents Initial and Maintenance Doses
Diltiazem 0.25 mg/kg IV over 2 min followed by IV maintenance dose of 5–15 mg/hr
Verapamil 0.075–0.15 mg/kg IV over 2 minMetoprolol 2.5–5.0 mg IV over 2 min up to 3 doses Propranolol 0.15 mg/kg IVEsmolol 500 mcg/kg IV over 1 min loading dose;
maintenance dose is 60–200 mcg/kg/min IV
Digoxin 0.25 mg IV each 2 hr up to 1.5 mg and maintenance dose is 0.125 to 0.375 mg daily IV or orally
Amiodarone 150 mg over 10 min IV loading dose and maintenance dose of 0.5 to 1.0 mg/min IV
The table summarizes the doses of pharmacologic agents recom-mended by the American College of Cardiology/American HeartAssociation/European Society of Cardiology 2006 practice guide-lines for control of ventricular rate in AF. Any of these agents may begiven to patients with normal systolic function although in patientswith left ventricular dysfunction, especially in patients with acutedecompensated heart failure, only digoxin or amiodarone are thepreferred agents.AF, atrial fibrillation; IV, intravenous.
Doses of Pharmacologic Agents for RateControl in AF
TABLE 19.1
LWBK271-C19_246-261.qxd 1/29/09 12:57 PM Page 257 LWBK271-C01_01-08.qxd
258 Chapter 19
administered for conversion of AF to normal sinusrhythm (Class III recommendation).
■ Preserved systolic function: There are several agentsthat can be used to convert AF to normal sinus rhythmwhen LV systolic function is preserved.
■ Flecainide: This agent receives Class I recommendationand can be given orally or intravenously. The oral dose forflecainide is 200 to 300 mg given once. The oral doseshould not be given out of hospital for the patient to selfadminister as a “pill in the pocket strategy” unless thedrug has been tried and proven to be safe and effectiveduring initial hospitalization. An AV nodal blocker suchas a calcium channel blocker or a beta blocker should begiven at least 30 minutes before flecainide is given to pre-vent rapid ventricular rates from occurring should therhythm convert to atrial flutter. The IV dose is 1.5 to 3.0mg/kg given over 10 to 20 minutes. The intravenouspreparation is not available in the United States.
■ Propafenone: The drug also receives a Class I recom-mendation and can be given orally or intravenously. Theoral dose is 600 mg given once. The IV dose is 1.5 to 2.0mg/kg given over 10 to 20 minutes. The intravenouspreparation is not available in the United States. The suc-cess rate varies from 56% to 83%. Similar to flecainide,the agent can be prescribed for self-administration by thepatient as a “pill in the pocket strategy” only after initialtherapy in the hospital has shown that the drug is safe andeffective and the patient does not have any evidence ofsick sinus syndrome or structural cardiac disease. AVnodal blockers are routinely given as background therapyin AF. Otherwise, if the patient is not on AV nodal blocker,it should be given at least 30 minutes before taking a typeIC agent to prevent one to one conduction across the AVnode should the patient develop atrial flutter.
■ Ibutilide: The drug is available only intravenously andreceives a Class I recommendation. The drug is given over10 minutes as a 1 mg dose, diluted or undiluted. The doseis repeated after 10 minutes if the rhythm has not con-verted.
■ Dofetilide: The drug is given only orally and receives aClass I recommendation. Its use is restricted to cardiolo-gists who are allowed access to this agent. Initial dosing isbased on kidney function and is contraindicated in pa-tients with severe renal dysfunction (creatinine clearanceof �20 mL/minute). In patients with normal renal func-tion (creatinine clearance �60 mL/minute), the dose is500 mcg twice daily. Maintenance dose is 500 to 1,000mcg daily. The QT interval should be carefully monitoredduring therapy.
■ Amiodarone: The drug can be given intravenously ororally and receives a Class IIa recommendation. The IVdose is 5 to 7 mg/kg over 30 to 60 minutes followed by 1.2to 1.8 g per day of continuous infusion or in divided oraldoses until a total dose of 10 g is given. The maintenancedose is 200 to 400 mg per day. The oral dose is given only
if immediate conversion of AF to normal sinus rhythm isnot essential. The oral in-hospital dose is 1.2 to 1.8 g/dayin divided doses until 10 g is given. Maintenance dose is200 is 400 mg/day. Another option is to give 30 mg/kg assingle dose. Amiodarone is the only antiarrhythmic agentthat can be initiated without hospitalizing the patient. Inoutpatients, a smaller dose of 600 to 800 mg is given orallydaily in divided doses until a total of 10 g is given. This isfollowed by a lower maintenance dose of 200 to 400 mg aday. Amiodarone enhances the effect of warfarin anddigoxin. The doses of both agents should be reducedwhen amiodarone is initiated.
■ Quinidine: Quinidine is given only orally and receives aClass IIb recommendation. The dose is 0.75 to 1.5 g in di-vided doses over 6 to 12 hours. The drug is combinedwith an AV nodal blocker to prevent increase in ventricu-lar rate before AF converts to normal sinus. The drug canprolong the QT interval and can cause torsades depointes. If patient is on digoxin, serum levels should becarefully monitored because quinidine increases the levelsof digoxin, which can result in digitalis toxicity.
■ Left ventricular (LV) dysfunction: When LV dysfunc-tion (LV ejection fraction 40%) or congestive heart fail-ure is present, only amiodarone and dofetilide (both typeIII agents) are the preferred agents for conversion of AF tonormal sinus rhythm. These are the least negatively in-otropic antiarrhythmic agents.
■ Amiodarone: Loading dose is described above. Themaintenance dose is 100 to 400 mg daily.
■ Dofetilide: The drug is given orally and its use is re-stricted to cardiologists who are familiar with the use ofthis agent. Dosing is described previously.
■ AF of more than 7 days’ duration: When AF is morethan 7 days’ duration, only Class III agents (amiodarone,ibutilide, and dofetilide) are effective and are the only an-tiarrhythmic agents recommended. Most patients withAF of more than 7 days’ duration have persistent AF.Class IA and Class IC agents are less effective and carrya Class IIb recommendation. According to the ACC/AHA/ESC 2006 guidelines for the management of pa-tients with AF, sotalol and digoxin may be harmful andare not recommended for pharmacologic conversion ofAF to normal sinus rhythm regardless of the duration of AF.
■ Rhythm control: The following is a summary of pharmaco-logic agents for rhythm control according to the ACC/AHA/ESC practice guidelines for management of patients with AF(Table 19.2).
■ Electrical or direct current cardioversion: This proce-dure is performed under intravenous sedation. If the AFis more than 48 hours’ duration, DC cardioversionshould not be performed until after the patient is ade-quately anticoagulated for a minimum of 3 weeks. If theneed for conversion to normal sinus rhythm is more im-mediate, electrical cardioversion can be carried out if atransesophageal echocardiogram can be performed and
LWBK271-C19_246-261.qxd 1/29/09 12:57 PM Page 258 LWBK271-C01_01-08.qxd

Atrial Fibrillation 259
no evidence of intracardiac thrombi can be demon-strated.
n Electrical cardioversion is the most effective in con-verting AF to normal sinus rhythm. Most patients willneed an initial energy setting of 200 joules for conver-sion. The energy setting is increased gradually if theinitial shock is unsuccessful. The shock is synchronizedwith the QRS complex to prevent the delivery of theshock during the vulnerable phase of the cardiac cycle,which can result in ventricular fibrillation. Devicesthat deliver direct current cardioversion with biphasicwaveform have been shown to be more effective thandevices that deliver the monophasic waveform.
n The patient should be adequately anticoagulated andshould preferably be on antiarrhythmic agent beforeelectrical cardioversion is performed.
■ Nonpharmacologic therapy: This is another option inconverting patients with AF especially in symptomaticpatients with recurrent AF who are not responsive tomedical therapy.
n Surgical ablation: Maze procedure is performed bymaking atrial incisions at certain critical geographiclocation in the atria so that AF will not become sus-tained. This is usually performed in patients with AFin conjunction with other cardiac surgical procedures
such as replacement or repair of mitral valve or duringcoronary bypass surgery.
n Catheter ablation: This procedure involves isolationof the pulmonary veins similar to a surgical maze pro-cedure but is performed with catheterization tech-niques. The pulmonary veins are usually the site ofectopic foci that can precipitate AF.
Prevention of Stroke
■ AF is a common cause of stroke in the elderly. The use of an-tithrombotic agents therefore is one of the cornerstones in thetherapy of AF and is the standard of care in preventing strokesin patients with AF. Patients with AF who are high risk for strokeshould be identified so that they can be protected with adequateanticoagulation. This is regardless whether the AF is paroxys-mal, persistent, or permanent. Similarly, patients with AF whoare low risk for stroke should also be identified so that they donot have to be exposed to the side effects of anticoagulation.
■ Highest risk of stroke: Patients with AF who are highestrisk of stroke (�6% per year) needs to be fully anticoagu-lated with warfarin. The following patients with AF arehighest risk for stroke:
n Valvular AF: Patients with valvular AF are very highrisk for developing stroke. Valvular AF includes patients
Pharmacologic Agents Recommended Doses
Amiodarone Oral: 1.2–1.8 g daily in divided doses until 10 g total(Class III agent) then maintain dose to 200–400 mg daily or 30 mg/kg
as a single doseIV/oral: 5–7 mg/kg over 30–60 min IV, then 1.2–1.8 g
daily continuous IV or orally in divided doses until atotal of 10 g, then 200–400 mg daily
Dofetilide (Class III) Oral only: Normal kidney function (creatinine clearance �60 mL/min, 500 mcg BID. The dose is adjusted in patients with renal dysfunction
Ibutilide (Class III) IV only: 1 mg over 10 min. Repeat after 10 min with thesame dose if necessary
Flecainide (Class IC) Oral: 200–300 mg one doseIV: 1.5 to 3.0 mg/kg over 10–20 min (the IV dose is not
available in the United States)Propafenone (Class IC) Oral: 600 mg one dose
IV: 1.5 to 2.0 mg/kg over 10–20 min (the IV dose is notavailable in the United States)
Quinidine (Class IA) Oral only: 0.75 to 1.5 g in divided doses over 6–12 h usuallywith another agent that will slow ventricular rate
The table summarizes the doses of pharmacologic agents recommended by the American College ofCardiology/American Heart Association/European Society of Cardiology practice guidelines for con-version of AF to normal sinus rhythm. In patients with left ventricular dysfunction, only amiodaroneand dofetilide are the preferred agents.AF, atrial fibrillation; IV, intravenous.
Pharmacologic Agents for Conversion of AF to Normal Sinus Rhythm
TABLE 19.2
LWBK271-C19_246-261.qxd 1/29/09 12:57 PM Page 259 LWBK271-C01_01-08.qxd

260 Chapter 19
with rheumatic mitral stenosis as well as patients withprosthetic mitral valve or previous mitral valve repair.Their risk for thromboembolism is approximately 15to 20 times that of patients with AF but without thesecardiac abnormalities. Patients with mitral prostheticvalves should be anticoagulated with warfarin to anInternational Normalized Ratio (INR) of 2.5 to 3.5.Patients with mitral stenosis and previous mitral valverepair should be anticoagulated to an INR of 2.0 to 3.0.
n Previous history of thromboembolism: Patients withAF with previous history of stroke, transient ischemicaccident (TIA), or other forms of thromboembolismare also at high risk for developing stroke. Their risk isincreased 2.5 times those with AF but without previ-ous history of thromboembolism. These patientsshould also be anticoagulated with warfarin to an INRof 2.0 to 3.0.
■ Lowest risk of stroke: Patients with AF who are lowestrisk for stroke (2% per year) are patients with lone AF.The ACC/AHA/ESC 2006 guidelines on AF defines loneAF as patients who are �60 years of age and have no evi-dence of cardiac or pulmonary disease. These patients arenot hypertensive and have normal echocardiograms andare low risk for thromboembolism. The guidelines rec-ommend that these patients should be on aspirin, 81 to325 mg daily although they also have the option of receiv-ing no therapy. Among patients �60 years of age withheart disease but none of the risk features for throm-boembolism, these patients are also low risk for stroke butshould be on aspirin 81 to 325 mg daily. These patients donot need to be anticoagulated with warfarin.
■ Intermediate or moderate risk for stroke: Some pa-tients with nonvalvular AF (no prosthetic mitral valve orrheumatic mitral stenosis) may have risk features forstroke that are intermediate (3% to 5% per year) whencompared with patients in AF, but without these risk fea-tures. These intermediate risk markers come under theeponym of CHADS2.
n C � Cardiac failure or left ventricular dysfunction(ejection fraction 35%)
n H � Hypertension
n A � Advanced age (�75 years)
n D � Diabetes mellitus
n S2 � Stroke, TIA, or previous history of thromboem-bolism.
n In nonvalvular AF, each of the above risk featuresincreases the incidence of stroke and receives aweight of one except stroke/TIA or previous his-tory of thromboembolism, which gives the patienttwo times the risk of the other risk features and isthus equivalent to a weight of 2, thus S2.
n CHADS2 serves as a useful guide in determiningthe intensity of antithrombotic therapy in patientswith nonvalvular AF.
■ One intermediate risk feature: Any one of the aboverisk features: cardiac failure, hypertension, advanced age,and diabetes (CHAD) but not stroke or TIA, is an inter-mediate risk for thromboembolism. These patients havethe option of either taking aspirin 81 to 325 mg daily orwarfarin monitored to an INR of 2 to 3.
■ Previous history of stroke or two or more risk fac-tors: Patients with history of stroke or TIA or with 2 ormore intermediate risk features should receive warfarinand should be anticoagulated to an INR of 2.0 to 3.0.
■ Anticoagulation during electrical or pharmacologiccardioversion: If cardioversion is planned in patients withAF of more than 48 hours’ duration or the duration of AF isnot known, these patients should be anticoagulated for atleast 3 to 4 weeks before electrical or pharmacologic car-dioversion is attempted. If immediate cardioversion isplanned, the patient should undergo transesophagealechocardiography to exclude thrombus in the left atrial ap-pendage. If a thrombus is present, cardioversion is delayedand the patient is fully anticoagulated for at least 3 to 4 weeksbefore electrical cardioversion can be performed. If a throm-bus is not present, intravenous heparin is given and electricalcardioversion is performed under intravenous anesthesia.Anticoagulation is continued after successful cardioversionfor at least 3 to 4 weeks preferably 12 weeks. This includes pa-tients with lone AF who undergo cardioversion. In many pa-tients who are successfully cardioverted, the normal sinusrhythm in the ECG is often not accompanied by effectiveatrial contraction. This electromechanical dissociation maypersist for several days or weeks. Thus, anticoagulationshould be continued. The risk of stroke is similar among pa-tients undergoing pharmacologic or electrical cardioversionand is highest within 3 days after the procedure. Among pa-tients developing strokes after cardioversion, all episodes oc-curred within 10 days after the procedure.
■ Warfarin is the standard treatment for anticoagulating pa-tients with AF. Aspirin does not equal the protection given bywarfarin except in patients with lone AF or those with a 0 to1 risk factor for stroke.
■ Table 19.3 summarizes the use of antithrombotic agents inpatients with AF.
Prognosis
■ AF is more common in the elderly and is an independent riskfactor for death. The mortality in patients with AF is twicethat of patients in normal sinus rhythm. This increase inmortality is associated with the severity of the underlyingheart disease.
■ AF is associated with increased risk of stroke and heart fail-ure. It is a common cause of morbidity in elderly patientswith approximately 15% of all thromboembolic strokes fromAF.
■ In patients younger than 60 years of age without clinical orechocardiographic evidence of structural heart disease or
LWBK271-C19_246-261.qxd 1/29/09 12:57 PM Page 260 LWBK271-C01_01-08.qxd

Atrial Fibrillation 261
chronic pulmonary disease, AF is generally benign. The riskof stroke, however, increases above this age or when associ-ated with conditions that are known to increase the risk forstroke.
Suggested Readings
The Atrial Fibrillation Follow-up Investigation of Rhythm Man-agement (AFFIRM) Investigators. A comparison of rate con-trol and rhythm control in patients with atrial fibrillation.N Engl J Med. 2002;347:1825–1833.
Blomstrom-Lundqvist C, Scheinman MM, Aliot EM, et al.ACC/AHA/ESC Guidelines for the management of pa-tients with supraventricular arrhythmias—executive sum-mary. A report of the American College of Cardiology/American Heart Association Task Force on Practice Guide-lines, and the European Society of Cardiology Committeefor Practice Guidelines (Writing Committee to DevelopGuidelines for the Management of Patients with Supraven-tricular Arrhythmias). J Am Coll Cardiol. 2003;42:1493–1531.
Botteron GW, Smith JM. Cardiac arrhythmias. In: Carey CF, LeeHH, Woeltje KF, eds. The Washington Manual of MedicalTherapeutics. 29th ed. Philadelphia: Lippincott Williams &Wilkins; 1998:130–156.
Capucci A, Villani GQ, Piepoli MF. Reproducible efficacy ofloading oral propafenone in restoring sinus rhythm in pa-tients with paroxysmal atrial fibrillation. Am J Cardiol. 2003;92:1345–1347.
Fuster V, Ryden LE, Cannom DS, et al. ACC/AHA/ESC 2006guidelines for the management of patients with atrial fibril-lation—executive summary; a report of the American Col-lege of Cardiology/American Heart Association Task Forceand the European Society of Cardiology Committee on Prac-tice Guidelines and the European Society of CardiologyCommittee for Practice Guidelines (Writing Committee toRevise the 2001 Guidelines for the Management of Patientswith Atrial Fibrillation). J Am Coll Cardiol. 2006;48:854–906.
Gage BF, Waterman AD, Shannon W, et al. Validation of clinicalclassification schemes for predicting stroke: results from theNational Registry of Atrial Fibrillation. JAMA. 2001;285:2864–2870.
Rockson SG, Albers GW. Comparing the guidelines: anticoagu-lation therapy to optimize stroke prevention in patients withatrial fibrillation. J Am Coll Cardiol. 2004;43:929–935.
Roy D, Talajic M, Nattel S, et al. Rhythm control versus rate con-trol for atrial fibrillation and heart failure. N Engl J Med.2008;358:2667–2677.
Sherman DG, Kim SG, Boop BS, et al. Occurrence and charac-teristics of stroke events in the atrial fibrillation follow-upinvestigation of sinus rhythm management (AFFIRM) study.Arch Intern Med. 2005;165;1185–1198.
Singh BN, Singh SN, Reda DJ, et al. Amiodarone versus sotalolfor atrial fibrillation. N Engl J Med. 2005;352:1861–1872.
Van Gelder IC, Hagens VE, Bosker HA, et al. A comparison of ratecontrol and rhythm control in patients with recurrent persist-ent atrial fibrillation. N Engl J Med. 2002;92:1834–1840.
van Walraven WC, Hart RG, Wells GA, et al. A clinical predictionrule to identify patients with atrial fibrillation and a low riskfor stroke while taking aspirin. Arch Intern Med. 2003;163:936–943.
Low Risk Moderate Risk High Risk
The table summarizes the antithrombotic agents recommended by the 2006 American College ofCardiology/American Heart Association/European Society of Cardiology guidelines for prevention ofstroke in patients with AF.AF, atrial fibrillation; IV, intravenous; INR, International Normalized Ratio.
Antithrombotic Agents for Prevention of Stroke in AF
TABLE 19.3
• Lone atrial fibrilla-tion
Aspirin 81–325 mg daily
or no therapy
• Age �60 years, hasheart disease butno risk features
Aspirin 81–325 mg daily
• Any one of the follow-ing intermediate riskfeatures:
Congestive heart failureor ejection fraction35%, hypertension, age�75 years or diabetes
Aspirin 81–325 mg daily or
Warfarin (INR 2.0–3.0)
• Valvular AF or previoushistory of stroke or tran-sient ischemic attack or 2or more intermediate riskfeatures
Warfarin (INR of 2.0–3.0)
• For mechanical mitralvalve
Warfarin (INR 2.5–.5)
LWBK271-C19_246-261.qxd 1/29/09 12:57 PM Page 261 LWBK271-C01_01-08.qxd

20Wolff-Parkinson-WhiteSyndrome
262
Anatomy of the Conduction System
■ Wolff-Parkinson-White (WPW) syndrome: WPWsyndrome is a clinical entity characterized by preexcita-tion of the ventricles with symptoms of paroxysmaltachycardia.■ Normal atrioventricular (AV) conduction: In nor-
mal individuals, the atria and ventricles are separatedby a dense mass of fibrous tissues that prevent thespread of electrical impulses from atria to ventricles.The only pathway by which the atrial impulse canreach the ventricles is through the AV node and nor-mal intraventricular conduction system (Fig. 20.1A).
■ WPW syndrome: In WPW syndrome, a bypasstract is present, which connects the atrium directlyto the ventricle. The atrial impulse therefore is ableto reach the ventricles not only through the AVnode, but also through the bypass tract (Fig. 20.1B).
This accessory pathway can cause premature activa-tion of the ventricles. It can also serve as a pathwayfor reentry, which may result in clinical symptomsof paroxysmal tachycardia.
Preexcitation of the Ventricles
■ Ventricular preexcitation: When a bypass tract ispresent, conduction of the sinus impulse to the ventri-cles is altered as shown in Figure 20.2.■ Atrial activation: During normal sinus rhythm, ac-
tivation of the atria is not altered. The sinus P waveremains normal.
■ Ventricular activation: When a bypass tract ispresent, the ventricles are activated through twoseparate pathways: the AV node and bypass tract.The QRS complex represents a fusion complex.
Atria
Ventricles Ventricles
Atria
Sinus Node
A. Normal AV Conduction B. WPW Syndrome
Bypass tract
Fibrous
Tissues AV Node
AV Node
Figure 20.1: The Conduction System in Normal Individuals and in Patients withthe WPW Syndrome. (A) The normal AV conduction system. The atrial impulse can enterthe ventricles only through the AV node (arrow). (B) A bypass tract connecting the atriumdirectly to the ventricle across the AV groove. When a bypass tract is present, an atrial impulsecan enter the ventricles not only through the AV node but also through the bypass tract(arrows). AV, atrioventricular.
LWBK271-C20_262-286.qxd 1/29/09 1:43 PM Page 262 LWBK271-C01_01-08.qxd

Wolff-Parkinson-White Syndrome 263
n Bypass tract: Unlike in normal individuals inwhom the sinus impulse can reach the ventriclesonly through the AV node, the presence of a bypasstract allows the atrial impulse to be conducted di-rectly to the ventricles thus activating the ventriclesprematurely. This causes the PR interval to beshorter than normal (Fig. 20.2B). The impulsespreads by muscle cell to muscle cell conductioncausing the initial portion of the QRS complex tobe inscribed slowly. This slow initial upstroke ofthe QRS complex is called the delta wave.
n AV node: The sinus impulse is normally delayedat the AV node. As the impulse emerges fromthe AV node, it activates the ventricles rapidlythrough the normal conduction system causing therest of the QRS complex to be inscribed normally(Fig. 20.2C).
Electrocardiogram Findings
■ Electrocardiogram (ECG) findings: The classicalECG findings in WPW syndrome include a short PRinterval, a delta wave, and secondary ST and T wave ab-normalities.■ Short PR interval: The PR interval is short since
the bypass tract conducts more rapidly than the AVnode causing the ventricles to be excited prema-turely. The PR interval is shorter than normal, butdoes not have to measure �0.12 seconds.
■ Delta wave: The delta wave is the initial portion ofthe QRS complex with a slow upstroke, as shown inFigure 20.3. It represents premature activation ofthe ventricles at the area of insertion of the bypass
tract. Because conduction of the impulse is by directmuscle spread, which is slow and inefficient, thiscauses the initial portion of the QRS complex to beinscribed sluggishly. This initial portion with theslurred upstroke is called the delta wave.
■ ST and T wave abnormalities: The ST and T wavechanges are secondary to the abnormal activation ofthe ventricles. The direction of the ST segment andT wave is opposite that of the delta wave.
The Bypass Tract
■ Bypass tract: Unlike the His-Purkinje system, the by-pass tract consists of ordinary heart muscle and doesnot contain cells that are specialized for conduction.■ The bypass tract may be left sided or right sided.■ It may be single or multiple.■ Conduction may be constant or intermittent (Figs.
20.4 and 20.5).■ The bypass tracts may be active or inactive.■ The bypass tract may conduct only anterogradely
(from atrium to ventricle), only retrogradely (fromventricle to atrium) or both.n Manifest or overt bypass tract: The bypass tract
is manifest or overt if it is capable of conductinganterogradely from atrium to ventricle resultingin the classical pattern of preexcitation.
n Concealed bypass tract: The bypass tract is con-cealed if it is capable of conducting only retro-gradely from ventricle to atrium. The baselineECG will not show any evidence of preexcitationduring normal sinus rhythm, but the presence of
Ventricles
Atria
Ventricles
Atria
A B C
AV Node
Bypass tract
Atria
Ventricle is activated
prematurely
Impulse is delayed at the AV
node Ventricles
Delta wave Delta wave
Figure 20.2: Ventricular Preexcitation. (A) The sinus impulse activates the atria and a P waveis normally recorded. (B) The sinus impulse is normally delayed at the AV node but is conducteddirectly through the bypass tract causing the ventricles to be prematurely activated. This causes thePR interval to shorten and the initial portion of the QRS complex to be slurred. (C) The impulsefinally emerges from the atrioventricular node and activates the rest of the ventricles normally.
LWBK271-C20_262-286.qxd 1/29/09 1:43 PM Page 263 LWBK271-C01_01-08.qxd

264 Chapter 20
V1
Normal Conduction Preexcitation
Short PR Interval
Delta wave
ST and T wave abnormalities
Figure 20.3: Ventricular Preexcitation. A QRS complex is magnified from the rhythm strip to show the shortPR interval measuring 0.11 seconds, delta wave, and ST-T abnormalities.
# 1 # 2 # 3 # 4
Figure 20.4: Intermittent Preexcitation. The rhythm strip is recorded in V1. The first threecomplexes show no evidence of preexcitation. The PR interval is prolonged and the QRScomplexes are narrow. The last three complexes show ventricular preexcitation. The PR intervalis short, the QRS complexes are wide and delta waves are present.The ST segments are also de-pressed with inverted T waves pointing away from the direction of the delta wave.
Figure 20.5: Intermittent Preexcitation. Intermittent preexcitation is shown by arrows #1–#4. The othercomplexes are conducted normally without preexcitation.
LWBK271-C20_262-286.qxd 1/29/09 1:43 PM Page 264 LWBK271-C01_01-08.qxd

Wolff-Parkinson-White Syndrome 265
a bypass tract can potentially cause a reentranttachycardia to occur.
The Delta Wave
■ Size of the delta wave: The delta wave may be veryconspicuous or it may be barely recognizable in thebaseline ECG, depending on the amount of ventricularmyocardium activated from the bypass tract.■ Small delta wave: The delta wave may be barely rec-
ognizable if only a small amount of ventricular my-ocardium is activated from the bypass tract. This oc-curs if the bypass tract is left sided because a left-sidedbypass tract is farther from the sinus node comparedwith a right-sided bypass tract. The farther the dis-tance from the sinus node, the longer it takes for the si-nus impulse to reach the bypass tract (Fig. 20.6A). Thismay result in normal or near normal PR interval. Thedelta wave is also small and inconspicuous if the atrialimpulse is efficiently conducted through the AV node.
■ Large or prominent delta wave: The delta wave isprominent if a larger portion of the myocardium isactivated from the bypass tract (Fig. 20.6B). This oc-curs when the bypass tract is right sided bringing itcloser to the sinus node. The delta wave is also promi-nent if the sinus impulse is delayed at the AV node.
Localizing the Bypass Tract
■ An ECG is helpful in predicting the location of the bypasstract during normal sinus rhythm, during narrow com-plex tachycardia, and during wide complex tachycardia.
■ After preexcitation is diagnosed in the 12-lead ECG,the bypass tract can be localized during sinus rhythmby the following observations.■ Left-sided bypass tract: When the bypass tract is
left sided, the left ventricle is activated earlier thanthe right ventricle. The impulse will travel from leftventricle to right ventricle in the direction of V1,which is located on the right side of the sternum(Fig. 20.7). Thus, during normal sinus rhythm, apositive delta wave or tall R or Rs complex will berecorded in V1. This pattern of preexcitation is alsocalled type A. Tall R waves in V1 can be mistaken forright bundle branch block, right ventricular hyper-trophy or posterior infarction.
■ Right-sided bypass tract: When the bypass tract isright sided, the right ventricle is activated earlierthan the left ventricle. The impulse spreads fromright ventricle to left ventricle away from lead V1.This results in a negative delta wave with deep S orrS complex in V1 (Fig. 20.8). This pattern of preex-citation is also called type B. Because the S wavesare deeper than the R waves in V1, the ECG may be
Atria
Ventricles
Atria
Ventricles
A B
AV
Node
Left sided bypass tract is farther from sinus
node
Right sided bypass tract is
closer to sinus node
The delta wave is barely recognizable (arrows)
The delta wave is very prominent (arrows)
Figure 20.6: Size of the Delta Wave. (A) The delta wave is barely recognizable because of asmaller amount of myocardium activated from the bypass tract. This occurs when the bypass tract is leftsided or conduction through the AV node is enhanced. (B) The delta wave is more prominent because alarger amount of myocardium is activated from the bypass tract. This is often seen in right sided bypasstracts or when there is delay in the conduction of the impulse at the AV node. AV, atrioventricular.
LWBK271-C20_262-286.qxd 1/29/09 1:43 PM Page 265 LWBK271-C01_01-08.qxd

266 Chapter 20
Atria
Ventricles
Left Sided Bypass Tract
Left ventricle is prematurely excited. Impulse travels in the direction of V .1
V1 is located at the 4th
intercostal space at the right of the sternum
mistaken for left bundle branch block, left ventricularhypertrophy, or anteroseptal myocardial infarction.
■ Location: Approximately 50% to 60% of all bypasstracts are located at the free wall of the left ventricle,20% to 30% at the posteroseptal area (left or right),10% to 20% at the free wall of the right ventricle andthe remaining 5% are located in the anteroseptal area(mostly right sided).
■ Left sided versus right sided: The morphology ofthe QRS complex in V1 is useful in differentiating a left-sided from a right-sided bypass tract.■ Right-sided bypass tracts: As previously dis-
cussed, the bypass tract is right sided if the QRScomplex is predominantly negative (QS or rS) in V1.Right-sided bypass tracts may be located at the pos-teroseptal area, right ventricular free wall or an-teroseptal area (Figs. 20.9 and 20.10).
■ Left-sided bypass tracts: If the QRS complex ispredominantly upright (tall R or Rs) in V1, the by-pass tract is left sided. Left-sided bypass tracts maybe located at the left ventricular free wall or the pos-
teroseptal area. Anterior or anteroseptal bypasstracts rarely exist because the aortic annulus andmitral annulus are contiguous structures (Fig. 20.9).
■ Several methods of predicting the location of the bypasstract during normal sinus rhythm have been described.The bypass tract can be more accurately localized if thedelta wave contributes significantly to the QRS complex.Although there are limitations in using the 12-lead ECGfor localizing the bypass tract, the algorithm of Olgin andZipes, shown below, is the simplest and most practical.■ Step 1. Configuration of the QRS complex in V1:
n A tall R wave in V1 indicates that the bypass tractis left sided.
n A deep S wave in V1 indicates that the bypasstract is right sided.
■ Step 2A. Right-sided bypass tract: If the bypasstract is right sided, it may be posteroseptal, an-teroseptal, or free wall in location.n Posteroseptal: QS complexes in the leads II, III,
and aVF indicate that the bypass tract is pos-teroseptal in location.
Figure 20.7: Left-Sided Bypass Tract. When the bypass tract is left sided, the initial impulse spreads from leftventricle to right ventricle during normal sinus rhythm as shown in the above diagram (arrows). This will result intall R waves in V1. In this example, the bypass tract was localized at the posterior wall of the left ventricle and wassuccessfully ablated.
LWBK271-C20_262-286.qxd 1/29/09 1:43 PM Page 266 LWBK271-C01_01-08.qxd

V1
Figure 20.8: Right-Sided Bypass Tract. When the bypass tract is right sided, the right ventricle is activatedearlier than the left ventricle. This causes the initial impulse to spread from right ventricle to left ventricle away fromlead V1 resulting in QS or rS complexes in V1. This electrocardiogram can be mistaken for left bundle branch block,left ventricular hypertrophy, or anteroseptal myocardial infarction.
Posterior
LeftRight MA TA
RightVentricular Free Wall
Anterior
Left Ventricular
Free Wall
Ao
Posteroseptal
Anteroseptal PA
Figure 20.9: Location of the Bypass Tract. The position of the bypass tract at the level ofthe AV grove is shown by the diagram. Right-sided bypass tracts are located at the right ventric-ular free wall, posteroseptal, or anteroseptal areas, whereas left-sided bypass tracts are located atthe left ventricular free wall or posteroseptal area. The left anteroseptal area is occupied by theaortic root and the presence of a left sided anteroseptal bypass tract is rare. Ao, aorta; AV,atrioventricular; MA, mitral annulus; PA, pulmonary artery; TA, tricuspid annulus.
LWBK271-C20_262-286.qxd 1/29/09 1:43 PM Page 267 LWBK271-C01_01-08.qxd
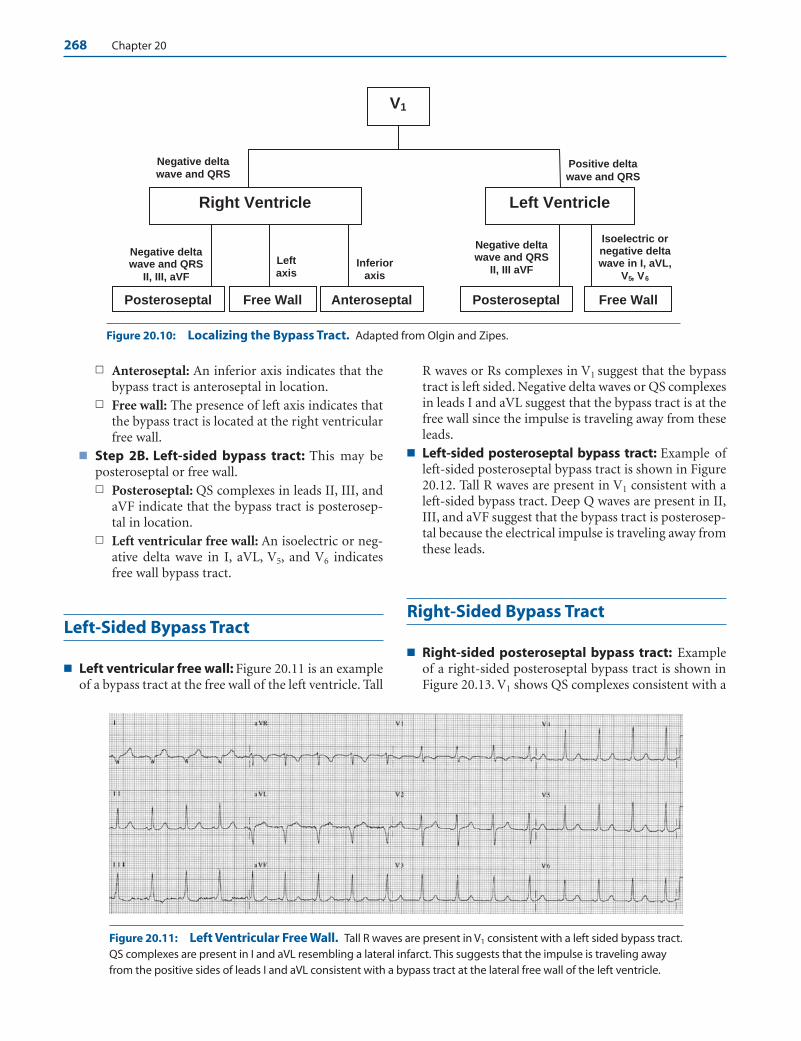
268 Chapter 20
n Anteroseptal: An inferior axis indicates that thebypass tract is anteroseptal in location.
n Free wall: The presence of left axis indicates thatthe bypass tract is located at the right ventricularfree wall.
■ Step 2B. Left-sided bypass tract: This may beposteroseptal or free wall.n Posteroseptal: QS complexes in leads II, III, and
aVF indicate that the bypass tract is posterosep-tal in location.
n Left ventricular free wall: An isoelectric or neg-ative delta wave in I, aVL, V5, and V6 indicatesfree wall bypass tract.
Left-Sided Bypass Tract
■ Left ventricular free wall: Figure 20.11 is an exampleof a bypass tract at the free wall of the left ventricle. Tall
R waves or Rs complexes in V1 suggest that the bypasstract is left sided. Negative delta waves or QS complexesin leads I and aVL suggest that the bypass tract is at thefree wall since the impulse is traveling away from theseleads.
■ Left-sided posteroseptal bypass tract: Example ofleft-sided posteroseptal bypass tract is shown in Figure20.12. Tall R waves are present in V1 consistent with aleft-sided bypass tract. Deep Q waves are present in II,III, and aVF suggest that the bypass tract is posterosep-tal because the electrical impulse is traveling away fromthese leads.
Right-Sided Bypass Tract
■ Right-sided posteroseptal bypass tract: Exampleof a right-sided posteroseptal bypass tract is shown inFigure 20.13. V1 shows QS complexes consistent with a
V1
Left Ventricle Right Ventricle
Negative delta wave and QRS
Posteroseptal Free Wall Anteroseptal
Positive delta
wave and QRS
Negative delta wave and QRS
II, III, aVF
Left axis
Inferior axis
Negative delta wave and QRS
II, III aVF
Posteroseptal Free Wall
Isoelectric or negative delta wave in I, aVL,
V , V5 6
Figure 20.10: Localizing the Bypass Tract. Adapted from Olgin and Zipes.
Figure 20.11: Left Ventricular Free Wall. Tall R waves are present in V1 consistent with a left sided bypass tract.QS complexes are present in I and aVL resembling a lateral infarct. This suggests that the impulse is traveling awayfrom the positive sides of leads I and aVL consistent with a bypass tract at the lateral free wall of the left ventricle.
LWBK271-C20_262-286.qxd 1/29/09 1:43 PM Page 268 LWBK271-C01_01-08.qxd
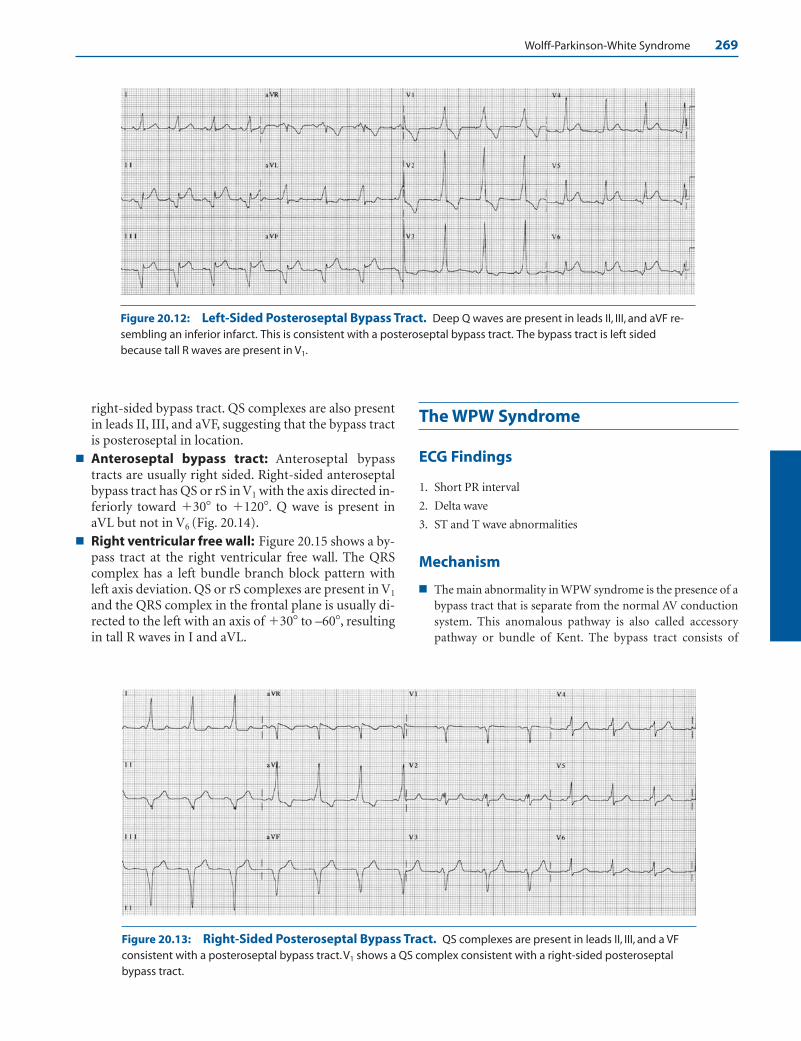
Wolff-Parkinson-White Syndrome 269
right-sided bypass tract. QS complexes are also presentin leads II, III, and aVF, suggesting that the bypass tractis posteroseptal in location.
■ Anteroseptal bypass tract: Anteroseptal bypasstracts are usually right sided. Right-sided anteroseptalbypass tract has QS or rS in V1 with the axis directed in-feriorly toward �30� to �120�. Q wave is present inaVL but not in V6 (Fig. 20.14).
■ Right ventricular free wall: Figure 20.15 shows a by-pass tract at the right ventricular free wall. The QRScomplex has a left bundle branch block pattern withleft axis deviation. QS or rS complexes are present in V1
and the QRS complex in the frontal plane is usually di-rected to the left with an axis of �30� to –60�, resultingin tall R waves in I and aVL.
The WPW Syndrome
ECG Findings
1. Short PR interval
2. Delta wave
3. ST and T wave abnormalities
Mechanism
■ The main abnormality in WPW syndrome is the presence of abypass tract that is separate from the normal AV conductionsystem. This anomalous pathway is also called accessorypathway or bundle of Kent. The bypass tract consists of
Figure 20.12: Left-Sided Posteroseptal Bypass Tract. Deep Q waves are present in leads II, III, and aVF re-sembling an inferior infarct. This is consistent with a posteroseptal bypass tract. The bypass tract is left sidedbecause tall R waves are present in V1.
Figure 20.13: Right-Sided Posteroseptal Bypass Tract. QS complexes are present in leads II, III, and a VFconsistent with a posteroseptal bypass tract.V1 shows a QS complex consistent with a right-sided posteroseptalbypass tract.
LWBK271-C20_262-286.qxd 1/29/09 1:43 PM Page 269 LWBK271-C01_01-08.qxd

270 Chapter 20
ordinary myocardium that bridges the atrium directly to theventricle across the AV groove.
■ During normal sinus rhythm, the only pathway by which thesinus impulse can reach the ventricles is through the AVnode. The impulse is normally delayed at the AV node, re-sulting in a PR interval of 0.12 to 0.20 seconds. If a bypasstract is present, a second pathway is created by which theventricles can be activated. Thus, during normal sinusrhythm, the impulse is normally delayed at the AV node butis conducted directly to the ventricle through the bypasstract. This causes the ventricle to be prematurely activatedresulting in a shorter than normal PR interval usually meas-uring �0.12 seconds. As the impulse finally emerges from
the AV node, it is conducted rapidly through the His-Purk-inje system allowing the rest of the ventricles to be activatednormally and more efficiently.
■ Preexcitation of the ventricle is seen in the ECG as a short PRinterval with a delta wave.
■ Shortened PR interval: The PR interval is short becausethe atrial impulse reaches the ventricle faster through thebypass tract than through the AV node. The PR intervalusually measures �0.12 seconds when there is preexcita-tion. However, the PR interval does not always have to be�0.12 seconds for preexcitation to occur. A normal PRinterval �0.12 seconds is seen in approximately 25% ofpatients with preexcitation.
Figure 20.14: Right-Sided Anteroseptal Bypass Tract. QS complexes are present in V1 and V2 consistentwith a right sided bypass tract. The axis of the QRS complex in the frontal plane is inferior (��60�).This is consistentwith an anteroseptal bypass tract.
Figure 20.15: Right Ventricular Free Wall. QS complexes are present in V1 consistent with a right-sidedbypass tract.There is also left axis deviation of the QRS complexes of approximately –30� consistent with a bypasstract at the right ventricular free wall.
LWBK271-C20_262-286.qxd 1/29/09 1:43 PM Page 270 LWBK271-C01_01-08.qxd
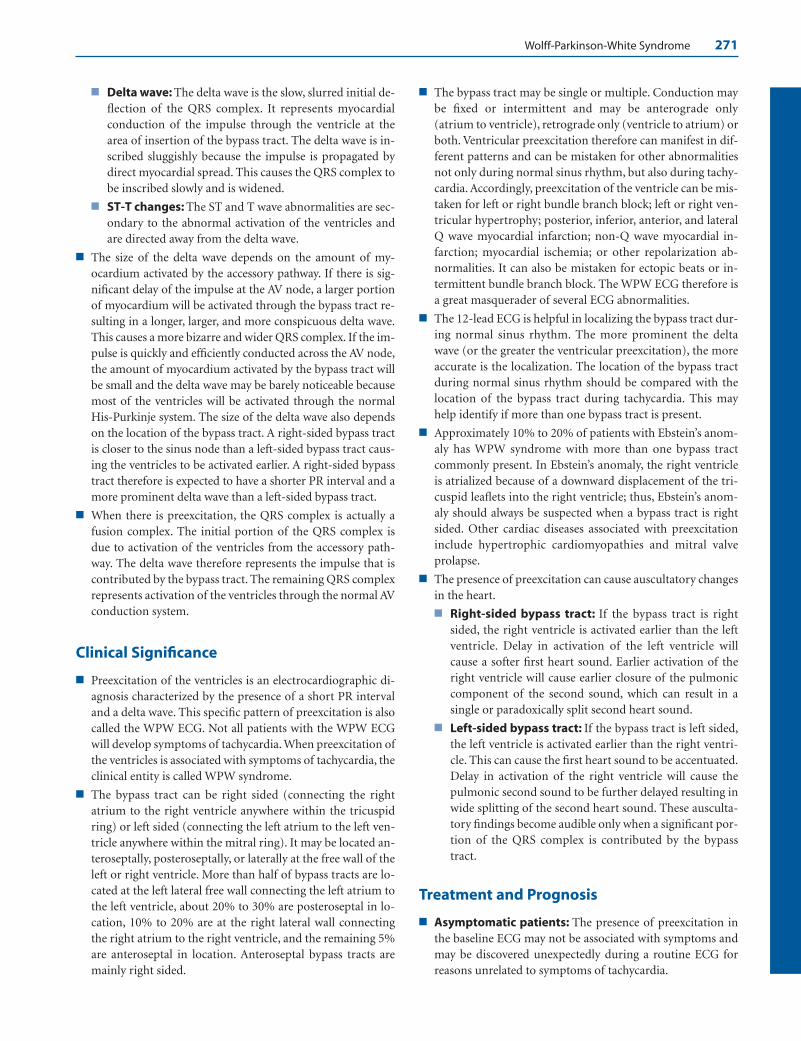
Wolff-Parkinson-White Syndrome 271
■ Delta wave: The delta wave is the slow, slurred initial de-flection of the QRS complex. It represents myocardialconduction of the impulse through the ventricle at thearea of insertion of the bypass tract. The delta wave is in-scribed sluggishly because the impulse is propagated bydirect myocardial spread. This causes the QRS complex tobe inscribed slowly and is widened.
■ ST-T changes: The ST and T wave abnormalities are sec-ondary to the abnormal activation of the ventricles andare directed away from the delta wave.
■ The size of the delta wave depends on the amount of my-ocardium activated by the accessory pathway. If there is sig-nificant delay of the impulse at the AV node, a larger portionof myocardium will be activated through the bypass tract re-sulting in a longer, larger, and more conspicuous delta wave.This causes a more bizarre and wider QRS complex. If the im-pulse is quickly and efficiently conducted across the AV node,the amount of myocardium activated by the bypass tract willbe small and the delta wave may be barely noticeable becausemost of the ventricles will be activated through the normalHis-Purkinje system. The size of the delta wave also dependson the location of the bypass tract. A right-sided bypass tractis closer to the sinus node than a left-sided bypass tract caus-ing the ventricles to be activated earlier. A right-sided bypasstract therefore is expected to have a shorter PR interval and amore prominent delta wave than a left-sided bypass tract.
■ When there is preexcitation, the QRS complex is actually afusion complex. The initial portion of the QRS complex isdue to activation of the ventricles from the accessory path-way. The delta wave therefore represents the impulse that iscontributed by the bypass tract. The remaining QRS complexrepresents activation of the ventricles through the normal AVconduction system.
Clinical Significance
■ Preexcitation of the ventricles is an electrocardiographic di-agnosis characterized by the presence of a short PR intervaland a delta wave. This specific pattern of preexcitation is alsocalled the WPW ECG. Not all patients with the WPW ECGwill develop symptoms of tachycardia. When preexcitation ofthe ventricles is associated with symptoms of tachycardia, theclinical entity is called WPW syndrome.
■ The bypass tract can be right sided (connecting the rightatrium to the right ventricle anywhere within the tricuspidring) or left sided (connecting the left atrium to the left ven-tricle anywhere within the mitral ring). It may be located an-teroseptally, posteroseptally, or laterally at the free wall of theleft or right ventricle. More than half of bypass tracts are lo-cated at the left lateral free wall connecting the left atrium tothe left ventricle, about 20% to 30% are posteroseptal in lo-cation, 10% to 20% are at the right lateral wall connectingthe right atrium to the right ventricle, and the remaining 5%are anteroseptal in location. Anteroseptal bypass tracts aremainly right sided.
■ The bypass tract may be single or multiple. Conduction maybe fixed or intermittent and may be anterograde only(atrium to ventricle), retrograde only (ventricle to atrium) orboth. Ventricular preexcitation therefore can manifest in dif-ferent patterns and can be mistaken for other abnormalitiesnot only during normal sinus rhythm, but also during tachy-cardia. Accordingly, preexcitation of the ventricle can be mis-taken for left or right bundle branch block; left or right ven-tricular hypertrophy; posterior, inferior, anterior, and lateralQ wave myocardial infarction; non-Q wave myocardial in-farction; myocardial ischemia; or other repolarization ab-normalities. It can also be mistaken for ectopic beats or in-termittent bundle branch block. The WPW ECG therefore isa great masquerader of several ECG abnormalities.
■ The 12-lead ECG is helpful in localizing the bypass tract dur-ing normal sinus rhythm. The more prominent the deltawave (or the greater the ventricular preexcitation), the moreaccurate is the localization. The location of the bypass tractduring normal sinus rhythm should be compared with thelocation of the bypass tract during tachycardia. This mayhelp identify if more than one bypass tract is present.
■ Approximately 10% to 20% of patients with Ebstein’s anom-aly has WPW syndrome with more than one bypass tractcommonly present. In Ebstein’s anomaly, the right ventricleis atrialized because of a downward displacement of the tri-cuspid leaflets into the right ventricle; thus, Ebstein’s anom-aly should always be suspected when a bypass tract is rightsided. Other cardiac diseases associated with preexcitationinclude hypertrophic cardiomyopathies and mitral valveprolapse.
■ The presence of preexcitation can cause auscultatory changesin the heart.
■ Right-sided bypass tract: If the bypass tract is rightsided, the right ventricle is activated earlier than the leftventricle. Delay in activation of the left ventricle willcause a softer first heart sound. Earlier activation of theright ventricle will cause earlier closure of the pulmoniccomponent of the second sound, which can result in asingle or paradoxically split second heart sound.
■ Left-sided bypass tract: If the bypass tract is left sided,the left ventricle is activated earlier than the right ventri-cle. This can cause the first heart sound to be accentuated.Delay in activation of the right ventricle will cause thepulmonic second sound to be further delayed resulting inwide splitting of the second heart sound. These ausculta-tory findings become audible only when a significant por-tion of the QRS complex is contributed by the bypasstract.
Treatment and Prognosis
■ Asymptomatic patients: The presence of preexcitation inthe baseline ECG may not be associated with symptoms andmay be discovered unexpectedly during a routine ECG forreasons unrelated to symptoms of tachycardia.
LWBK271-C20_262-286.qxd 1/29/09 1:43 PM Page 271 LWBK271-C01_01-08.qxd
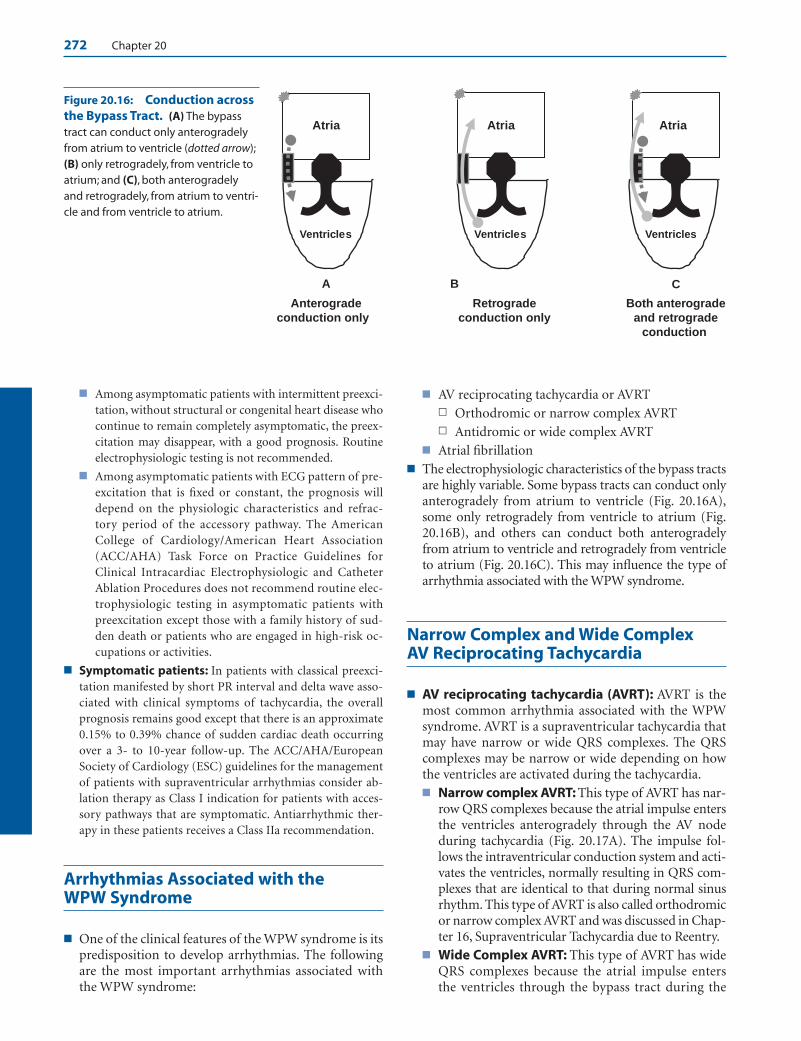
272 Chapter 20
■ Among asymptomatic patients with intermittent preexci-tation, without structural or congenital heart disease whocontinue to remain completely asymptomatic, the preex-citation may disappear, with a good prognosis. Routineelectrophysiologic testing is not recommended.
■ Among asymptomatic patients with ECG pattern of pre-excitation that is fixed or constant, the prognosis willdepend on the physiologic characteristics and refrac-tory period of the accessory pathway. The AmericanCollege of Cardiology/American Heart Association(ACC/AHA) Task Force on Practice Guidelines forClinical Intracardiac Electrophysiologic and CatheterAblation Procedures does not recommend routine elec-trophysiologic testing in asymptomatic patients withpreexcitation except those with a family history of sud-den death or patients who are engaged in high-risk oc-cupations or activities.
■ Symptomatic patients: In patients with classical preexci-tation manifested by short PR interval and delta wave asso-ciated with clinical symptoms of tachycardia, the overallprognosis remains good except that there is an approximate0.15% to 0.39% chance of sudden cardiac death occurringover a 3- to 10-year follow-up. The ACC/AHA/EuropeanSociety of Cardiology (ESC) guidelines for the managementof patients with supraventricular arrhythmias consider ab-lation therapy as Class I indication for patients with acces-sory pathways that are symptomatic. Antiarrhythmic ther-apy in these patients receives a Class IIa recommendation.
Arrhythmias Associated with the WPW Syndrome
■ One of the clinical features of the WPW syndrome is itspredisposition to develop arrhythmias. The followingare the most important arrhythmias associated withthe WPW syndrome:
■ AV reciprocating tachycardia or AVRTn Orthodromic or narrow complex AVRT n Antidromic or wide complex AVRT
■ Atrial fibrillation■ The electrophysiologic characteristics of the bypass tracts
are highly variable. Some bypass tracts can conduct onlyanterogradely from atrium to ventricle (Fig. 20.16A),some only retrogradely from ventricle to atrium (Fig.20.16B), and others can conduct both anterogradelyfrom atrium to ventricle and retrogradely from ventricleto atrium (Fig. 20.16C). This may influence the type ofarrhythmia associated with the WPW syndrome.
Narrow Complex and Wide Complex AV Reciprocating Tachycardia
■ AV reciprocating tachycardia (AVRT): AVRT is themost common arrhythmia associated with the WPWsyndrome. AVRT is a supraventricular tachycardia thatmay have narrow or wide QRS complexes. The QRScomplexes may be narrow or wide depending on howthe ventricles are activated during the tachycardia.■ Narrow complex AVRT: This type of AVRT has nar-
row QRS complexes because the atrial impulse entersthe ventricles anterogradely through the AV nodeduring tachycardia (Fig. 20.17A). The impulse fol-lows the intraventricular conduction system and acti-vates the ventricles, normally resulting in QRS com-plexes that are identical to that during normal sinusrhythm. This type of AVRT is also called orthodromicor narrow complex AVRT and was discussed in Chap-ter 16, Supraventricular Tachycardia due to Reentry.
■ Wide Complex AVRT: This type of AVRT has wideQRS complexes because the atrial impulse enters the ventricles through the bypass tract during the
Atria
Ventricles
Atria
Ventricles
Atria
Ventricles
BA C
Anterogradeconduction only
Retrogradeconduction only
Both anterogradeand retrograde
conduction
Figure 20.16: Conduction acrossthe Bypass Tract. (A) The bypasstract can conduct only anterogradelyfrom atrium to ventricle (dotted arrow);(B) only retrogradely, from ventricle toatrium; and (C), both anterogradelyand retrogradely, from atrium to ventri-cle and from ventricle to atrium.
LWBK271-C20_262-286.qxd 1/29/09 1:43 PM Page 272 LWBK271-C01_01-08.qxd
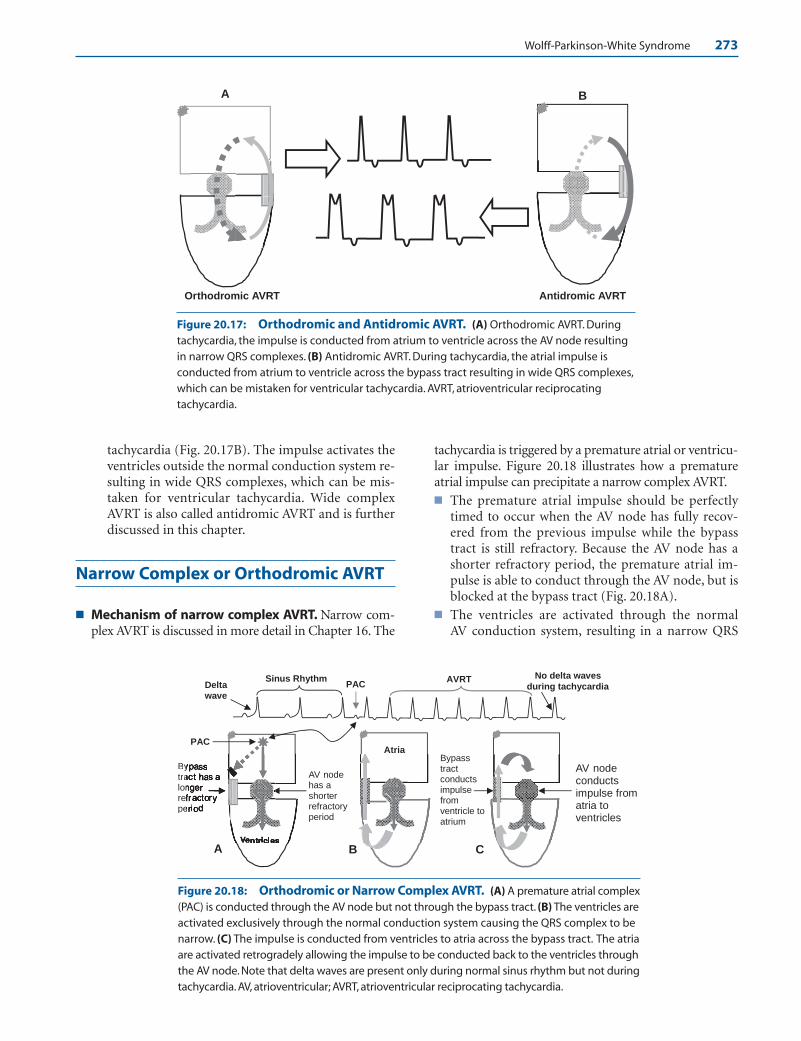
Wolff-Parkinson-White Syndrome 273
tachycardia (Fig. 20.17B). The impulse activates theventricles outside the normal conduction system re-sulting in wide QRS complexes, which can be mis-taken for ventricular tachycardia. Wide complexAVRT is also called antidromic AVRT and is furtherdiscussed in this chapter.
Narrow Complex or Orthodromic AVRT
■ Mechanism of narrow complex AVRT. Narrow com-plex AVRT is discussed in more detail in Chapter 16. The
tachycardia is triggered by a premature atrial or ventricu-lar impulse. Figure 20.18 illustrates how a prematureatrial impulse can precipitate a narrow complex AVRT.■ The premature atrial impulse should be perfectly
timed to occur when the AV node has fully recov-ered from the previous impulse while the bypasstract is still refractory. Because the AV node has ashorter refractory period, the premature atrial im-pulse is able to conduct through the AV node, but isblocked at the bypass tract (Fig. 20.18A).
■ The ventricles are activated through the normal AV conduction system, resulting in a narrow QRS
A B
Antidromic AVRTOrthodromic AVRT
Atria
Ventricles
C B
Bytralonrefpe
AV node has a shorter refractory period
PAC
Bypass tract conducts impulse from ventricle to atrium
A
PAC Sinus Rhythm AVRT
Delta wave
No delta waves during tachycardia
AV node conducts impulse from atria to ventricles
Figure 20.17: Orthodromic and Antidromic AVRT. (A) Orthodromic AVRT. Duringtachycardia, the impulse is conducted from atrium to ventricle across the AV node resultingin narrow QRS complexes. (B) Antidromic AVRT. During tachycardia, the atrial impulse is conducted from atrium to ventricle across the bypass tract resulting in wide QRS complexes,which can be mistaken for ventricular tachycardia. AVRT, atrioventricular reciprocating tachycardia.
Figure 20.18: Orthodromic or Narrow Complex AVRT. (A) A premature atrial complex(PAC) is conducted through the AV node but not through the bypass tract. (B) The ventricles areactivated exclusively through the normal conduction system causing the QRS complex to benarrow. (C) The impulse is conducted from ventricles to atria across the bypass tract. The atriaare activated retrogradely allowing the impulse to be conducted back to the ventricles throughthe AV node. Note that delta waves are present only during normal sinus rhythm but not duringtachycardia. AV, atrioventricular; AVRT, atrioventricular reciprocating tachycardia.
LWBK271-C20_262-286.qxd 1/29/09 1:43 PM Page 273 LWBK271-C01_01-08.qxd
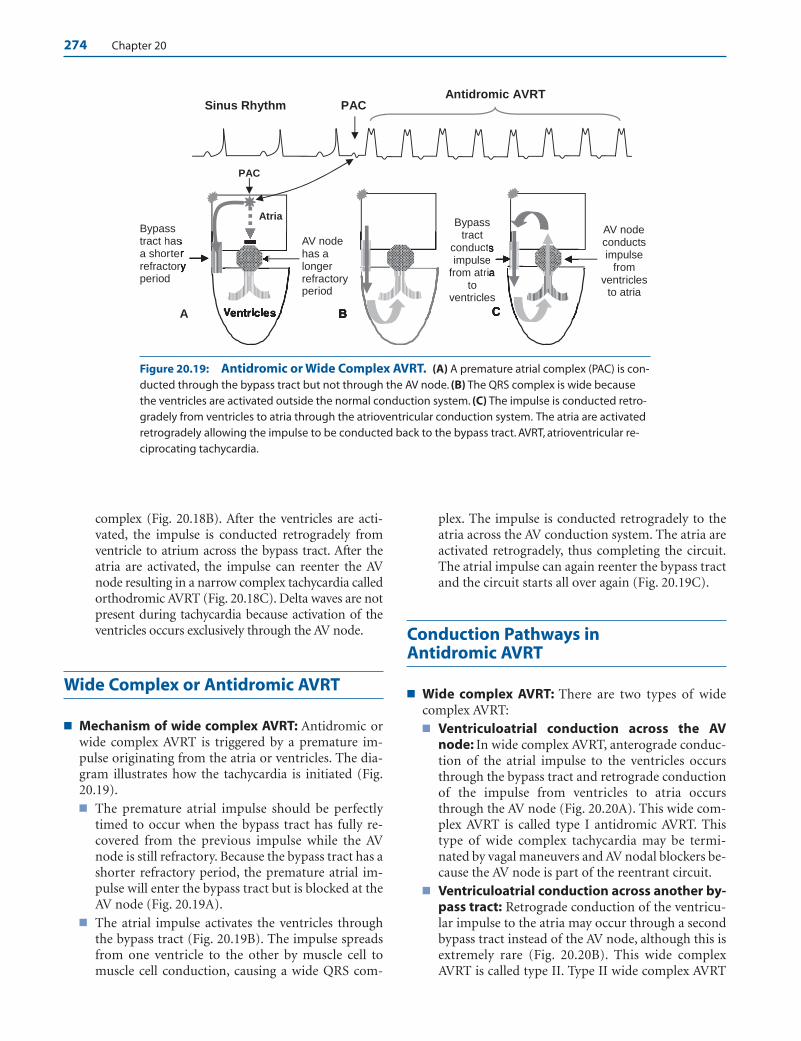
274 Chapter 20
complex (Fig. 20.18B). After the ventricles are acti-vated, the impulse is conducted retrogradely fromventricle to atrium across the bypass tract. After theatria are activated, the impulse can reenter the AVnode resulting in a narrow complex tachycardia calledorthodromic AVRT (Fig. 20.18C). Delta waves are notpresent during tachycardia because activation of theventricles occurs exclusively through the AV node.
Wide Complex or Antidromic AVRT
■ Mechanism of wide complex AVRT: Antidromic orwide complex AVRT is triggered by a premature im-pulse originating from the atria or ventricles. The dia-gram illustrates how the tachycardia is initiated (Fig.20.19).■ The premature atrial impulse should be perfectly
timed to occur when the bypass tract has fully re-covered from the previous impulse while the AVnode is still refractory. Because the bypass tract has ashorter refractory period, the premature atrial im-pulse will enter the bypass tract but is blocked at theAV node (Fig. 20.19A).
■ The atrial impulse activates the ventricles throughthe bypass tract (Fig. 20.19B). The impulse spreadsfrom one ventricle to the other by muscle cell tomuscle cell conduction, causing a wide QRS com-
plex. The impulse is conducted retrogradely to theatria across the AV conduction system. The atria areactivated retrogradely, thus completing the circuit.The atrial impulse can again reenter the bypass tractand the circuit starts all over again (Fig. 20.19C).
Conduction Pathways in Antidromic AVRT
■ Wide complex AVRT: There are two types of widecomplex AVRT:■ Ventriculoatrial conduction across the AV
node: In wide complex AVRT, anterograde conduc-tion of the atrial impulse to the ventricles occursthrough the bypass tract and retrograde conductionof the impulse from ventricles to atria occursthrough the AV node (Fig. 20.20A). This wide com-plex AVRT is called type I antidromic AVRT. Thistype of wide complex tachycardia may be termi-nated by vagal maneuvers and AV nodal blockers be-cause the AV node is part of the reentrant circuit.
■ Ventriculoatrial conduction across another by-pass tract: Retrograde conduction of the ventricu-lar impulse to the atria may occur through a secondbypass tract instead of the AV node, although this isextremely rare (Fig. 20.20B). This wide complexAVRT is called type II. Type II wide complex AVRT
Atria
VA
Bypass tract hasa shorterefractorperiod
AV node has a longer refractory period
PAC
Bypass tract
conductsimpulse
from atriato
ventricles
AV node conducts impulse
fromventricles
to atria
PACAntidromic AVRT
Sinus Rhythm
Figure 20.19: Antidromic or Wide Complex AVRT. (A) A premature atrial complex (PAC) is con-ducted through the bypass tract but not through the AV node. (B) The QRS complex is wide becausethe ventricles are activated outside the normal conduction system. (C) The impulse is conducted retro-gradely from ventricles to atria through the atrioventricular conduction system. The atria are activatedretrogradely allowing the impulse to be conducted back to the bypass tract. AVRT, atrioventricular re-ciprocating tachycardia.
LWBK271-C20_262-286.qxd 1/29/09 1:43 PM Page 274 LWBK271-C01_01-08.qxd
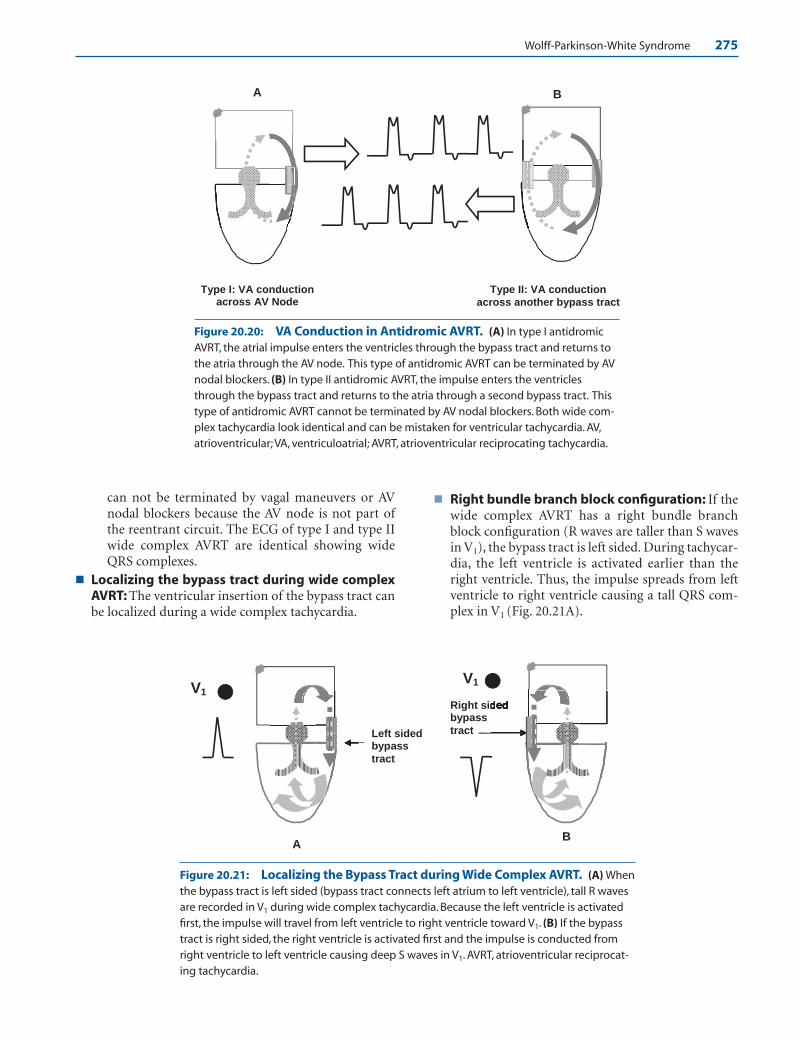
Wolff-Parkinson-White Syndrome 275
can not be terminated by vagal maneuvers or AVnodal blockers because the AV node is not part ofthe reentrant circuit. The ECG of type I and type IIwide complex AVRT are identical showing wideQRS complexes.
■ Localizing the bypass tract during wide complexAVRT: The ventricular insertion of the bypass tract canbe localized during a wide complex tachycardia.
■ Right bundle branch block configuration: If thewide complex AVRT has a right bundle branchblock configuration (R waves are taller than S wavesin V1), the bypass tract is left sided. During tachycar-dia, the left ventricle is activated earlier than theright ventricle. Thus, the impulse spreads from leftventricle to right ventricle causing a tall QRS com-plex in V1 (Fig. 20.21A).
A B
Type I: VA conduction across AV Node
Type II: VA conduction across another bypass tract
AB
V1
V1
Right sidbypass tract Left sided
bypass tract
Figure 20.20: VA Conduction in Antidromic AVRT. (A) In type I antidromicAVRT, the atrial impulse enters the ventricles through the bypass tract and returns tothe atria through the AV node. This type of antidromic AVRT can be terminated by AVnodal blockers. (B) In type II antidromic AVRT, the impulse enters the ventriclesthrough the bypass tract and returns to the atria through a second bypass tract. Thistype of antidromic AVRT cannot be terminated by AV nodal blockers. Both wide com-plex tachycardia look identical and can be mistaken for ventricular tachycardia. AV,atrioventricular; VA, ventriculoatrial; AVRT, atrioventricular reciprocating tachycardia.
Figure 20.21: Localizing the Bypass Tract during Wide Complex AVRT. (A) Whenthe bypass tract is left sided (bypass tract connects left atrium to left ventricle), tall R wavesare recorded in V1 during wide complex tachycardia. Because the left ventricle is activatedfirst, the impulse will travel from left ventricle to right ventricle toward V1. (B) If the bypasstract is right sided, the right ventricle is activated first and the impulse is conducted fromright ventricle to left ventricle causing deep S waves in V1. AVRT, atrioventricular reciprocat-ing tachycardia.
LWBK271-C20_262-286.qxd 1/29/09 1:43 PM Page 275 LWBK271-C01_01-08.qxd

276 Chapter 20
■ Left bundle branch block configuration: If thewide complex AVRT has a left bundle branch blockconfiguration (S waves are deeper than the R wavesin V1), the bypass tract is right sided. During widecomplex AVRT, the right ventricle is activated earlierthat the left ventricle. Thus, the ventricular impulsespreads from right ventricle to left ventricle causinga negative complex in V1 (Fig. 20.21B).
■ Figure 20.22 is from a patient with right-sided bypasstract. During wide complex AVRT (Fig. 20.22B), theQRS complexes have a left bundle branch block config-uration consistent with a right-sided bypass tract. Dur-ing narrow complex AVRT (Fig. 20.22C,D), the retro-grade P waves are upright in leads I and aVL, which isalso consistent with a right-sided bypass tract. The lo-cation of the bypass tract during narrow complexAVRT matches the location of the bypass tract duringwide complex AVRT and during normal sinus rhythm.If the location of the bypass tract during tachycardiaand during normal sinus rhythm does not match, morethan one bypass tract may be present.
■ Figures 20.22C,D are from the same patient as Figures20.22A, B. Retrograde P waves (arrows) are upright inleads I and aVL during narrow complex AVRT consis-tent with right-sided bypass tract.
Antidromic or Wide Complex AVRT
■ Another example of wide complex AVRT is shown inFig. 20.23. The QRS complexes are tall in V1 consistentwith a left-sided bypass tract.
Wide Complex AVRT
■ Treatment: The reentrant pathway during wide com-plex AVRT generally involves the same structures asthat during narrow complex AVRT. Thus, vagal ma-neuvers and AV nodal blockers are usually effective interminating the tachycardia (Fig. 20.24A). Before AVnodal blocking agents are given, it should be ascer-tained that the wide complex tachycardia is not ven-tricular tachycardia because catastrophic results mayoccur if the tachycardia turns out to be ventricularrather than supraventricular. Furthermore, adenosine,which is a very effective agent in converting AVRT tonormal sinus rhythm, can cause atrial fibrillation in upto 10% of patients. This may be catastrophic if the pa-tient has preexcitation. Additionally, if the wide com-plex AVRT uses a second bypass tract for ventriculoa-trial conduction (type II wide complex AVRT), AV nodalblockers will not be effective in terminating the tachycar-dia because the AV node is not part of the reentrant path-
way. Thus, ibutilide, procainamide, or flecainide, whichare capable of blocking the reentrant circuit at the level ofthe bypass tract (Fig. 20.24B), are the preferred agents ac-cording to the ACC/AHA/ESC guidelines in the manage-ment of patients with supraventricular arrhythmias.
ECG Findings of Antidromic or Wide Complex AVRT
1. The QRS complexes are wide measuring �120 milliseconds.The tachycardia is difficult to distinguish from ventriculartachycardia.
2. The tachycardia is very regular because the tachycardia uses afixed reentrant circuit.
3. AV block is not possible because the atria and ventricles arepart of the reentrant pathway.
4. Although retrograde P waves are present, similar to ortho-dromic AVRT, the P waves can not be identified because theyare obscured by the ST segment.
Mechanism
■ AVRT is possible only when a bypass tract is present. Fortachycardia to occur, the AV node and bypass tract shouldhave different electrophysiologic properties. The tachycardiacan be triggered by a premature atrial or ventricular impulseand can be narrow complex (orthodromic) or wide complex(antidromic).
■ Orthodromic or narrow complex AVRT: If the bypasstract has a longer refractory period than the AV node, a per-fectly timed premature atrial impulse is blocked at the by-pass tract, but is conducted to the AV node and His-Purkinjesystem, resulting in a narrow complex or orthodromicAVRT. Unlike the baseline ECG in which delta waves arepresent due to preexcitation, there are no delta waves dur-ing the tachycardia because the ventricles are activated ex-clusively from the AV node. This tachycardia was alreadydiscussed in Chapter 16, Supraventricular Tachycardia dueto Reentry.
■ Antidromic or wide complex AVRT: If the AV node hasa longer refractory period than the bypass tract, a prema-ture atrial impulse can enter the bypass tract but not theAV node, resulting in wide complex or antidromic AVRT.In antidromic AVRT, the premature atrial impulse is con-ducted through the bypass tract and activates the ventri-cles by direct myocardial spread resulting in a wide QRScomplex. The ventricular impulse is conducted retro-gradely to the atria across the AV node and reenters theventricles through the bypass tract. The reentrant tachy-cardia involves a large circuit consisting of the bypasstract, ventricles, bundle branches, bundle of His, AVnode, and atria before circling back to the bypass tract toactivate the ventricles. Because the ventricles are activatedexclusively from the bypass tract, the whole QRS complexis not a fusion complex and is essentially a delta wave.
LWBK271-C20_262-286.qxd 1/29/09 1:43 PM Page 276 LWBK271-C01_01-08.qxd
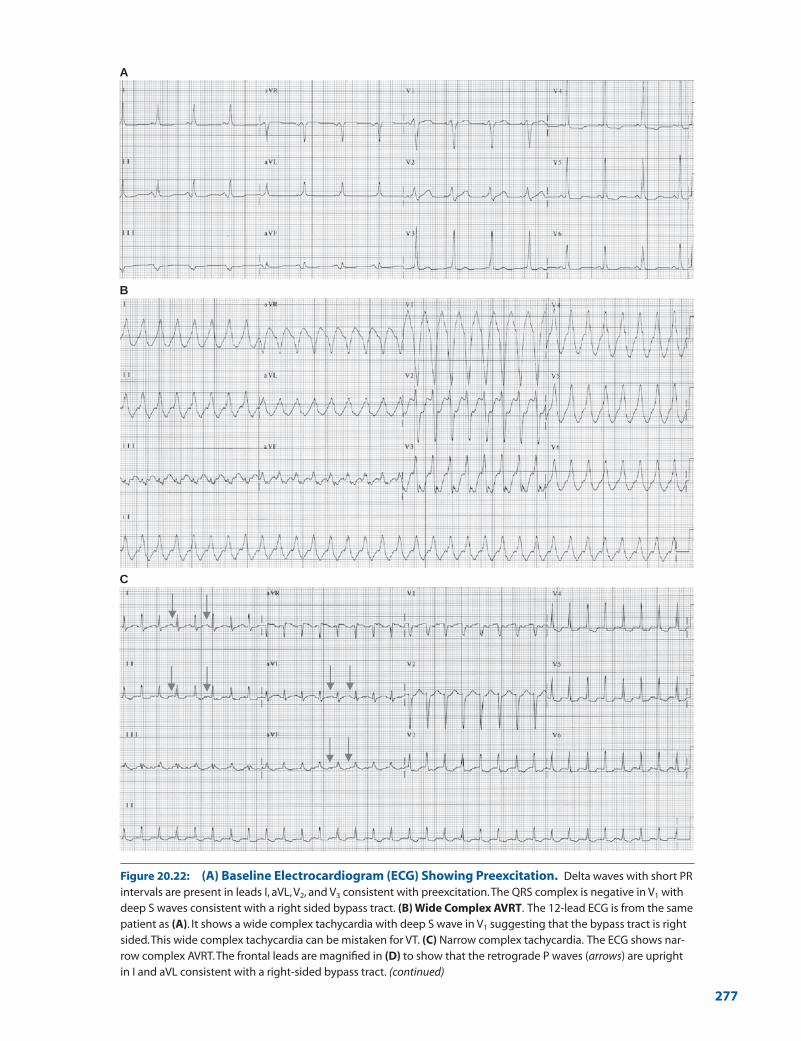
A
B
C
Figure 20.22: (A) Baseline Electrocardiogram (ECG) Showing Preexcitation. Delta waves with short PRintervals are present in leads I, aVL, V2, and V3 consistent with preexcitation.The QRS complex is negative in V1 withdeep S waves consistent with a right sided bypass tract. (B) Wide Complex AVRT. The 12-lead ECG is from the samepatient as (A). It shows a wide complex tachycardia with deep S wave in V1 suggesting that the bypass tract is rightsided.This wide complex tachycardia can be mistaken for VT. (C) Narrow complex tachycardia. The ECG shows nar-row complex AVRT.The frontal leads are magnified in (D) to show that the retrograde P waves (arrows) are uprightin I and aVL consistent with a right-sided bypass tract. (continued)
277
LWBK271-C20_262-286.qxd 1/29/09 1:43 PM Page 277 LWBK271-C01_01-08.qxd
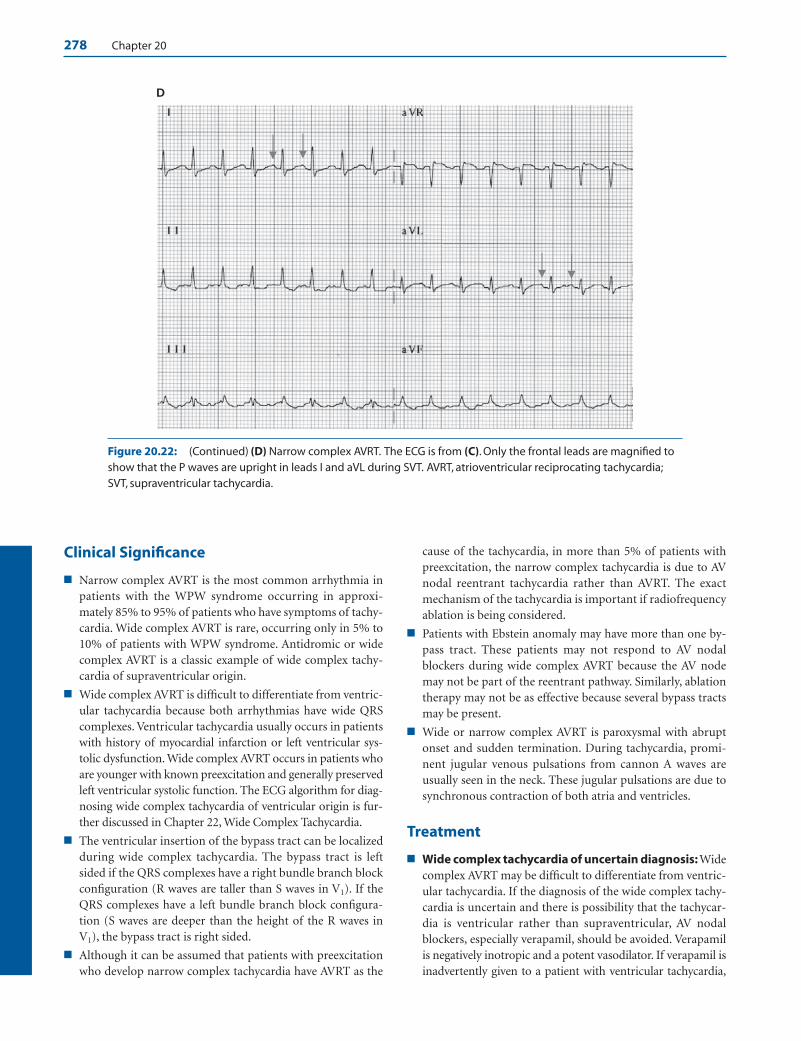
278 Chapter 20
Clinical Significance
■ Narrow complex AVRT is the most common arrhythmia inpatients with the WPW syndrome occurring in approxi-mately 85% to 95% of patients who have symptoms of tachy-cardia. Wide complex AVRT is rare, occurring only in 5% to10% of patients with WPW syndrome. Antidromic or widecomplex AVRT is a classic example of wide complex tachy-cardia of supraventricular origin.
■ Wide complex AVRT is difficult to differentiate from ventric-ular tachycardia because both arrhythmias have wide QRScomplexes. Ventricular tachycardia usually occurs in patientswith history of myocardial infarction or left ventricular sys-tolic dysfunction. Wide complex AVRT occurs in patients whoare younger with known preexcitation and generally preservedleft ventricular systolic function. The ECG algorithm for diag-nosing wide complex tachycardia of ventricular origin is fur-ther discussed in Chapter 22, Wide Complex Tachycardia.
■ The ventricular insertion of the bypass tract can be localizedduring wide complex tachycardia. The bypass tract is leftsided if the QRS complexes have a right bundle branch blockconfiguration (R waves are taller than S waves in V1). If theQRS complexes have a left bundle branch block configura-tion (S waves are deeper than the height of the R waves inV1), the bypass tract is right sided.
■ Although it can be assumed that patients with preexcitationwho develop narrow complex tachycardia have AVRT as the
cause of the tachycardia, in more than 5% of patients withpreexcitation, the narrow complex tachycardia is due to AVnodal reentrant tachycardia rather than AVRT. The exactmechanism of the tachycardia is important if radiofrequencyablation is being considered.
■ Patients with Ebstein anomaly may have more than one by-pass tract. These patients may not respond to AV nodalblockers during wide complex AVRT because the AV nodemay not be part of the reentrant pathway. Similarly, ablationtherapy may not be as effective because several bypass tractsmay be present.
■ Wide or narrow complex AVRT is paroxysmal with abruptonset and sudden termination. During tachycardia, promi-nent jugular venous pulsations from cannon A waves areusually seen in the neck. These jugular pulsations are due tosynchronous contraction of both atria and ventricles.
Treatment
■ Wide complex tachycardia of uncertain diagnosis: Widecomplex AVRT may be difficult to differentiate from ventric-ular tachycardia. If the diagnosis of the wide complex tachy-cardia is uncertain and there is possibility that the tachycar-dia is ventricular rather than supraventricular, AV nodalblockers, especially verapamil, should be avoided. Verapamilis negatively inotropic and a potent vasodilator. If verapamil isinadvertently given to a patient with ventricular tachycardia,
D
Figure 20.22: (Continued) (D) Narrow complex AVRT. The ECG is from (C). Only the frontal leads are magnified toshow that the P waves are upright in leads I and aVL during SVT. AVRT, atrioventricular reciprocating tachycardia;SVT, supraventricular tachycardia.
LWBK271-C20_262-286.qxd 1/29/09 1:43 PM Page 278 LWBK271-C01_01-08.qxd
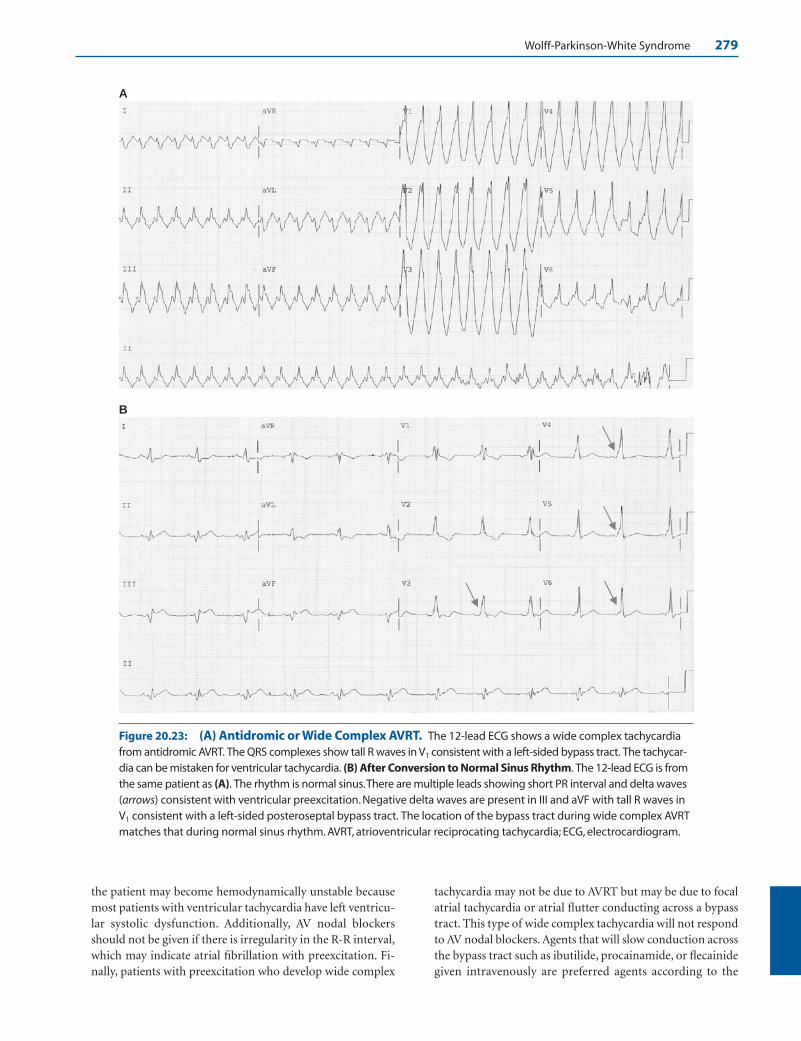
Wolff-Parkinson-White Syndrome 279
the patient may become hemodynamically unstable becausemost patients with ventricular tachycardia have left ventricu-lar systolic dysfunction. Additionally, AV nodal blockersshould not be given if there is irregularity in the R-R interval,which may indicate atrial fibrillation with preexcitation. Fi-nally, patients with preexcitation who develop wide complex
tachycardia may not be due to AVRT but may be due to focalatrial tachycardia or atrial flutter conducting across a bypasstract. This type of wide complex tachycardia will not respondto AV nodal blockers. Agents that will slow conduction acrossthe bypass tract such as ibutilide, procainamide, or flecainidegiven intravenously are preferred agents according to the
A
B
Figure 20.23: (A) Antidromic or Wide Complex AVRT. The 12-lead ECG shows a wide complex tachycardiafrom antidromic AVRT. The QRS complexes show tall R waves in V1 consistent with a left-sided bypass tract. The tachycar-dia can be mistaken for ventricular tachycardia. (B) After Conversion to Normal Sinus Rhythm. The 12-lead ECG is fromthe same patient as (A). The rhythm is normal sinus.There are multiple leads showing short PR interval and delta waves(arrows) consistent with ventricular preexcitation. Negative delta waves are present in III and aVF with tall R waves inV1 consistent with a left-sided posteroseptal bypass tract. The location of the bypass tract during wide complex AVRTmatches that during normal sinus rhythm. AVRT, atrioventricular reciprocating tachycardia; ECG, electrocardiogram.
LWBK271-C20_262-286.qxd 1/29/09 1:43 PM Page 279 LWBK271-C01_01-08.qxd

280 Chapter 20
ACC/AHA/ESC guidelines for the management of patientswith supraventricular arrhythmias.
■ Wide complex AVRT: Wide complex AVRT can be termi-nated by slowing conduction across the AV node or bypasstract. The most vulnerable arm of the tachycardia circuit isthe AV node, which can be inhibited with vagotonic maneu-vers such as Valsalva, carotid sinus pressure, immersion ofthe face in cold water (diving reflex), gagging, coughing, orstraining. If vagotonic maneuvers are not effective, pharma-cologic therapy should be considered among stable patientsand electrical cardioversion among patients who are not sta-ble. Electrical cardioversion is also an option even amongstable patients, especially if the etiology or mechanism of thewide complex tachycardia is uncertain.
■ Pharmacologic agents: AV nodal blockers and antiar-rhythmic agents that inhibit conduction across the bypasstract are both effective in terminating wide complex AVRT.
n Adenosine: Although adenosine is effective in termi-nating AVRT, it is not the best agent when there iswide complex AVRT for the following reasons:
n Adenosine can cause atrial fibrillation in up to 10%of patients, which may be catastrophic in patientswith preexcitation. Thus, resuscitative equipmentshould be available if adenosine is being given to apatient with known WPW syndrome.
n There is a subset of antidromic AVRT in which AVconduction of the impulse occurs through one by-pass tract and ventriculoatrial conduction occursthrough another bypass tract. AV nodal blockerssuch as adenosine will not be effective because thistype of AVRT does not use the AV node as part ofthe reentrant circuit.
n Finally, there are other supraventricular arrhyth-mias such as focal atrial tachycardia and atrialflutter that can result in wide complex tachycar-dia when a bypass tract is present. These arrhyth-mias will conduct to the ventricles across the by-
pass tract and will not respond to adenosine be-cause the AV node is not involved with the tachy-cardia. Thus, antiarrhythmic agents that can slowthe impulse at the bypass tract are preferredagents.
n Antiarrhythmic agents: According to the ACC/AHA/ESC guidelines for the management of patientswith supraventricular arrhythmias, antiarrhythmicagents that block the bypass tract are more effectiveand are preferred in the acute treatment of wide com-plex AVRT. This includes procainamide, ibutilide, orflecainide. Flecainide is not available intravenously inthe United States.
n Procainamide: Procainamide is the drug of choiceand is given intravenously to a total dose of 10 to12 mg/kg, not to exceed 1,000 mg. The dose isgiven within 30 minutes at the rate of 100 mg every2 to 3 minutes followed by a maintenance infusionof 1 to 4 mg/minute.
n Ibutilide: One mg is given intravenously over 10minutes. The 10-mL solution can be injectedslowly IV or diluted with D5W to a total volume of100 mL and infused over 10 minutes. If the widecomplex AVRT has not converted to normal sinusrhythm after 10 minutes, the same dose is re-peated. Experience with ibutilide is not as exten-sive as that with procainamide although the drugmay be as effective.
n Other antiarrhythmic agents: Other Class IA (quini-dine and disopyramide) IC (propafenone) and ClassIII agents (sotalol) are not available as intravenouspreparations, but are effective for long-term therapyby inhibiting the bypass tract. These agents are nega-tively inotropic and should not be given when there isleft ventricular dysfunction or heart failure. If the pa-tient has left ventricular systolic dysfunction, amio-darone is the preferred agent. Amiodarone, however,
A: VA conduction across AV Node
B: VA conduction across
another bypass tract
Vagal Maneuvers AV Nodal Blockers
• Adenosine* • ß-Blockers* • Ca Channel Blockers* • Digitalis*
Type I A
• Procainamide*
• Quinidine
• Disopyramide
Type I C
• Propafenone
• Flecainide
Type III
• Ibutilide*
• Sotalol
• Amiodarone*
Figure 20.24: Effect of AV Nodal Block-ers in Wide Complex AVRT. If theretrograde pathway involves the AV node asshown in (A), vagal maneuvers and AV nodalblockers will be effective in terminating thetachycardia. However, if the AV node is not partof the reentrant pathway (B), AV nodal block-ers will not be effective in terminating thetachycardia. Antiarrhythmic agents that canblock the impulse at the bypass tract are thepreferred agents for terminating the tachycar-dia. The asterisks indicate that the drugs areavailable as intravenous preparations.VA, ven-triculoatrial; AV, atrioventricular.
LWBK271-C20_262-286.qxd 1/29/09 1:43 PM Page 280 LWBK271-C01_01-08.qxd
Wolff-Parkinson-White Syndrome 281
has not been shown to be more effective than otheragents and has several long-term toxic effects and isreserved in the treatment of patients with structuralcardiac disease.
■ Electrical cardioversion: Electrical cardioversion isreserved for patients who are hemodynamically unsta-ble with hypotension, congestive heart failure, or withsymptoms of ischemia from tachycardia. It is also aninitial option to patients who are hemodynamicallystable. It should also be considered if the patient doesnot respond to initial pharmacologic therapy or whenthe diagnosis of the wide complex tachycardia remainsuncertain. In stable patients, a low energy setting isgenerally adequate in terminating the tachycardia (50joules).
■ Intracardiac pacing: The tachycardia can also be ter-minated by a perfectly timed premature atrial complexor premature ventricular complex because the atria andventricles are part of the reentrant circuit. Before theera of radiofrequency ablation, insertion of permanentpacemakers with antitachycardia properties has beenused in the treatment of both antidromic and ortho-dromic AVRT. The device can detect the tachycardiaand paces the atria or ventricles to interrupt the arrhythmia.
■ Radiofrequency ablation: Radiofrequency ablation ofthe bypass tract using catheter techniques is now the pre-ferred therapy and receives a Class I recommendation insymptomatic patients with preexcitation especially inyounger individuals to obviate the need for long-term an-tiarrhythmic therapy. The procedure is usually very effec-tive with more than 95% chance of cure. If radiofre-quency ablation is not technically feasible, ablationsurgery should be considered.
Prognosis
■ Patients with preexcitation who develop symptoms fromtachycardia, overall prognosis remains good. These patientsshould be referred to an electrophysiologist for further eval-uation with a chance for complete cure.
Atrial Fibrillation
■ Atrial fibrillation is one of the most dreadful arrhyth-mias associated with WPW syndrome. This arrhythmiahas the potential of degenerating to ventricular fibrilla-tion, which can result in sudden cardiac death. TheECG findings of atrial fibrillation in the presence ofpreexcitation are:■ Irregularly irregular R-R intervals.■ Varying morphologies of the QRS complexes.■ The ventricular rate is usually rapid.
■ During atrial fibrillation, the atrial impulses can reachthe ventricles through both AV node and bypass tractresulting in varying degrees of ventricular fusion. Be-cause the bypass tract consists of ordinary myocardium,it can allow atrial complexes to enter the ventricles re-sulting in very rapid ventricular rates (Fig. 20.25).
■ Atrial fibrillation degenerating to ventricular fibrilla-tion is rare, even among symptomatic patients withWPW syndrome. Atrial fibrillation however carries thepotential for sudden death. Patients with WPW syn-drome with bypass tracts that are capable of conductingat rates �240 beats per minute (R-R interval betweentwo preexcited complexes �250 milliseconds or �6small blocks) are at risk for sudden death as shown inFigures 20.25 and 20.26.
Atrial Fibrillation in Patients with WPW Syndrome
■ Treatment: The standard treatment of atrial fibrilla-tion is to slow the ventricular rate with AV nodal block-ing agents such as calcium channel blockers, beta block-ers, and digoxin. In patients with preexcitation, the useof these agents is not only contraindicated, but also maybe catastrophic. AV nodal blockers slow down conduc-tion and decrease the number of impulses entering theventricles anterogradely through the AV node. This willreduce the number of impulses bombarding the ven-tricular end of the bypass tract, rendering the bypasstract less refractory (Fig. 20.27). Calcium channelblockers can also cause peripheral vasodilatation, whichmay result in reflex increase in sympathetic tone. Thismay increase conduction through the bypass tract. Theuse of digitalis is particularly dangerous because digi-talis does not only block the AV node, but also enhancesconduction through the bypass tract.
■ Electrical cardioversion is the treatment of choice inpatients with atrial fibrillation who are unstable. In sta-ble patients, procainamide is the pharmacologic agentof choice. Ibutilide, amiodarone, propafenone, and so-talol are also effective. These agents can slow the ventric-ular rate but can also convert atrial fibrillation to sinusrhythm.
Atrial Fibrillation and WPWSyndrome
ECG Findings of Atrial Fibrillation and WPW Syndrome
1. The R-R intervals are irregularly irregular.
2. The ventricular rate is unusually rapid.
LWBK271-C20_262-286.qxd 1/29/09 1:43 PM Page 281 LWBK271-C01_01-08.qxd
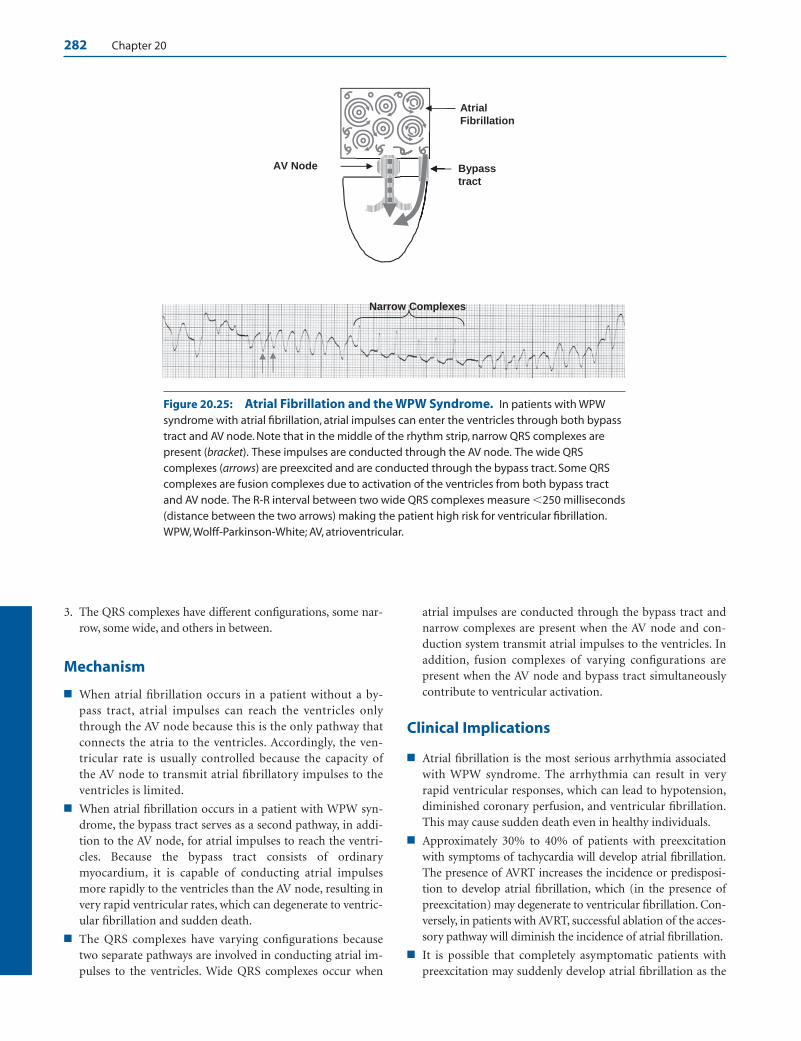
282 Chapter 20
3. The QRS complexes have different configurations, some nar-row, some wide, and others in between.
Mechanism
■ When atrial fibrillation occurs in a patient without a by-pass tract, atrial impulses can reach the ventricles onlythrough the AV node because this is the only pathway thatconnects the atria to the ventricles. Accordingly, the ven-tricular rate is usually controlled because the capacity ofthe AV node to transmit atrial fibrillatory impulses to theventricles is limited.
■ When atrial fibrillation occurs in a patient with WPW syn-drome, the bypass tract serves as a second pathway, in addi-tion to the AV node, for atrial impulses to reach the ventri-cles. Because the bypass tract consists of ordinarymyocardium, it is capable of conducting atrial impulsesmore rapidly to the ventricles than the AV node, resulting invery rapid ventricular rates, which can degenerate to ventric-ular fibrillation and sudden death.
■ The QRS complexes have varying configurations becausetwo separate pathways are involved in conducting atrial im-pulses to the ventricles. Wide QRS complexes occur when
atrial impulses are conducted through the bypass tract andnarrow complexes are present when the AV node and con-duction system transmit atrial impulses to the ventricles. Inaddition, fusion complexes of varying configurations arepresent when the AV node and bypass tract simultaneouslycontribute to ventricular activation.
Clinical Implications
■ Atrial fibrillation is the most serious arrhythmia associatedwith WPW syndrome. The arrhythmia can result in veryrapid ventricular responses, which can lead to hypotension,diminished coronary perfusion, and ventricular fibrillation.This may cause sudden death even in healthy individuals.
■ Approximately 30% to 40% of patients with preexcitationwith symptoms of tachycardia will develop atrial fibrillation.The presence of AVRT increases the incidence or predisposi-tion to develop atrial fibrillation, which (in the presence ofpreexcitation) may degenerate to ventricular fibrillation. Con-versely, in patients with AVRT, successful ablation of the acces-sory pathway will diminish the incidence of atrial fibrillation.
■ It is possible that completely asymptomatic patients withpreexcitation may suddenly develop atrial fibrillation as the
Bypass
tract
AV Node
Atrial
Fibrillation
Narrow Complexes
Figure 20.25: Atrial Fibrillation and the WPW Syndrome. In patients with WPWsyndrome with atrial fibrillation, atrial impulses can enter the ventricles through both bypasstract and AV node. Note that in the middle of the rhythm strip, narrow QRS complexes arepresent (bracket). These impulses are conducted through the AV node. The wide QRScomplexes (arrows) are preexcited and are conducted through the bypass tract. Some QRScomplexes are fusion complexes due to activation of the ventricles from both bypass tractand AV node. The R-R interval between two wide QRS complexes measure �250 milliseconds(distance between the two arrows) making the patient high risk for ventricular fibrillation.WPW, Wolff-Parkinson-White; AV, atrioventricular.
LWBK271-C20_262-286.qxd 1/29/09 1:43 PM Page 282 LWBK271-C01_01-08.qxd
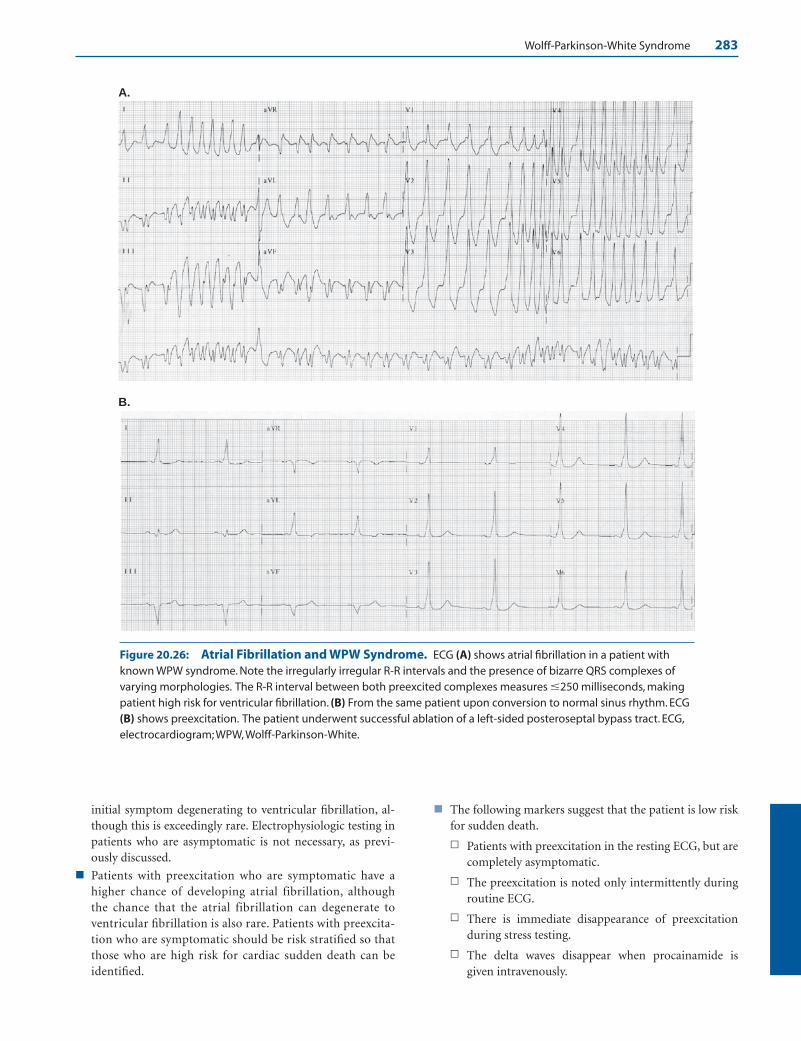
Wolff-Parkinson-White Syndrome 283
initial symptom degenerating to ventricular fibrillation, al-though this is exceedingly rare. Electrophysiologic testing inpatients who are asymptomatic is not necessary, as previ-ously discussed.
■ Patients with preexcitation who are symptomatic have ahigher chance of developing atrial fibrillation, althoughthe chance that the atrial fibrillation can degenerate toventricular fibrillation is also rare. Patients with preexcita-tion who are symptomatic should be risk stratified so thatthose who are high risk for cardiac sudden death can beidentified.
■ The following markers suggest that the patient is low riskfor sudden death.
n Patients with preexcitation in the resting ECG, but arecompletely asymptomatic.
n The preexcitation is noted only intermittently duringroutine ECG.
n There is immediate disappearance of preexcitationduring stress testing.
n The delta waves disappear when procainamide isgiven intravenously.
A.
B.
Figure 20.26: Atrial Fibrillation and WPW Syndrome. ECG (A) shows atrial fibrillation in a patient withknown WPW syndrome. Note the irregularly irregular R-R intervals and the presence of bizarre QRS complexes ofvarying morphologies. The R-R interval between both preexcited complexes measures �250 milliseconds, makingpatient high risk for ventricular fibrillation. (B) From the same patient upon conversion to normal sinus rhythm. ECG(B) shows preexcitation. The patient underwent successful ablation of a left-sided posteroseptal bypass tract. ECG,electrocardiogram; WPW, Wolff-Parkinson-White.
LWBK271-C20_262-286.qxd 1/29/09 1:43 PM Page 283 LWBK271-C01_01-08.qxd

284 Chapter 20
■ The following are markers of a high-risk patient. Theseobservations suggest that the bypass tract has a short re-fractory period and is capable of conducting atrial im-pulses rapidly.
n The delta wave persists during stress testing.
n The refractory period of the bypass tract is short meas-uring �250 milliseconds between preexcited com-plexes. This can be measured during spontaneously oc-curring atrial fibrillation or it can be induced in theelectrophysiology lab during electrophysiologic testing.
n History of cardiac arrest from ventricular fibrillation.
n Presence of multiple accessory pathways.
n Presence of Ebstein anomaly.
Treatment
■ Treatment of atrial fibrillation in patients with WPW syn-drome associated with wide QRS complexes includes directcurrent cardioversion, use of antiarrhythmic agents, and ra-diofrequency ablation.
■ Direct current cardioversion: In hemodynamically unsta-ble patients associated with rapid ventricular rates, directcurrent cardioversion receives a Class I recommendation. Itcarries a Class II a recommendation among patients who arestable according to the 2006 ACC/AHA/ESC guidelines inthe management of patients with atrial fibrillation.
■ Antiarrhythmic agents: In patients with atrial fibrillationwho are not hemodynamically unstable and do not need tobe cardioverted, pharmacologic agents that block the bypasstract can be given as initial therapy.
■ Procainamide: Procainamide is the drug of choice and isgiven intravenously at a dose of 10 to 12 mg/kg within 30minutes at the rate of 100 mg every 2 to 3 minutes, not to ex-ceed 1,000 mg. This is followed by a maintenance infusionof 1 to 4 mg/minute. This is effective not only in slowing theventricular rate, but also in converting atrial fibrillation tonormal sinus rhythm in more than 50% of patients withatrial fibrillation. This drug carries a Class I indication ac-cording to the 2006 ACC/AHA/ESC practice guidelines.
■ Ibutilide: One mg of ibutilide is given IV slowly over 10minutes and repeated if needed after an interval of 10 min-utes. Ibutilide can block both bypass tract and AV node.This is effective in converting atrial fibrillation to normalsinus rhythm and also carries a Class I recommendation.
■ Flecainide: Intravenous flecainide receives a Class IIa rec-ommendation in stable patients with atrial fibrillation withrapid ventricular rates with wide QRS complexes. The intra-venous dose is 1.5 to 3.0 mg/kg over 10 to 20 minutes. Thisagent is not available intravenously in the United States.
■ Other antiarrhythmic agents: Amiodarone, quinidine,and disopyramide can also inhibit the bypass tract andcarry a Class IIb recommendation. Only amiodarone isavailable intravenously. The other agents are not availableas IV preparations in the United States.
pass
ct AV Nodal Blockers
B
Less
inhibition
Bypass ract AV
Node
A
More inhibition
Figure 20.27: Atrial Fibrillation and the WPW Syndrome. (A) During atrial fib-rillation, atrial impulses can enter the ventricles through the AV node and bypass tract.Atrial impulses entering the AV node can activate the ventricles and at the same timedepolarize the ventricular end of the bypass tract retrogradely (arrows). This can renderthe bypass tract refractory, thus slowing down the number of atrial impulses enteringthe ventricles through the bypass tract. (B) When AV nodal agents are given, the numberof atrial impulses entering the AV node is decreased. This will also decrease the numberof impulses depolarizing the ventricular end of the bypass tract. Because there is less in-hibition of the ventricular end of the bypass tract, the bypass tract is less refractory andwill allow more atrial impulses to enter the ventricles through the bypass tract antero-gradely. AV, atrioventricular; WPW, Wolff-Parkinson-White.
LWBK271-C20_262-286.qxd 1/29/09 1:43 PM Page 284 LWBK271-C01_01-08.qxd
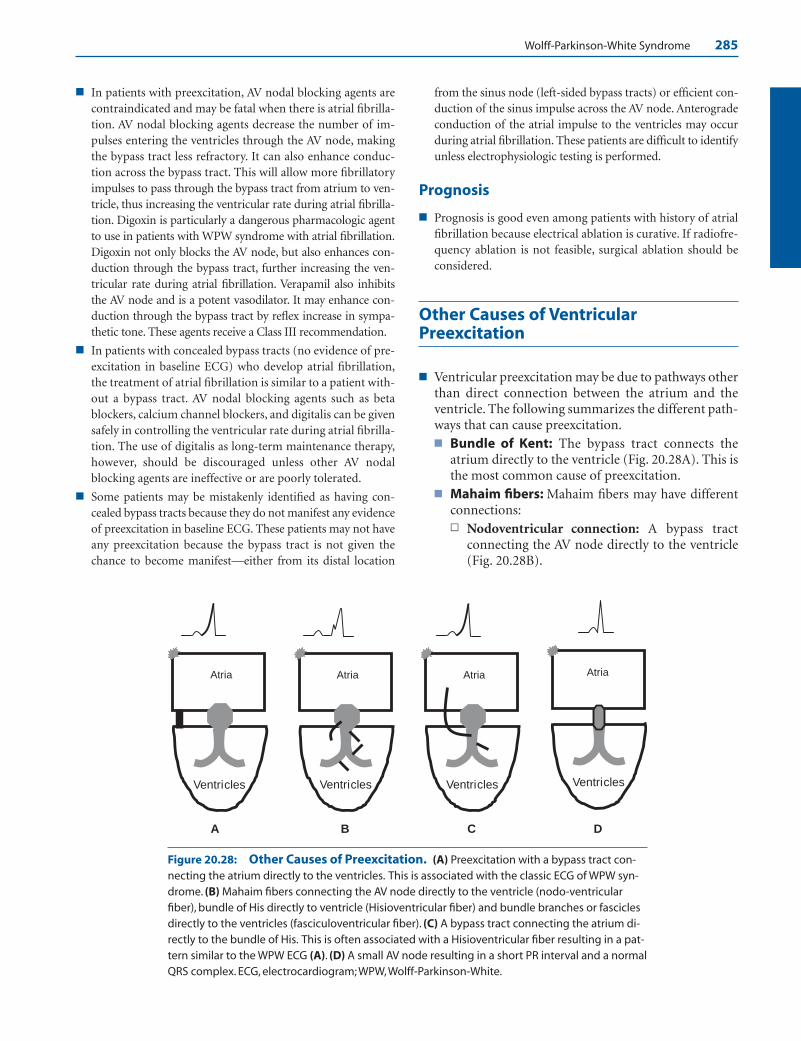
Wolff-Parkinson-White Syndrome 285
■ In patients with preexcitation, AV nodal blocking agents arecontraindicated and may be fatal when there is atrial fibrilla-tion. AV nodal blocking agents decrease the number of im-pulses entering the ventricles through the AV node, makingthe bypass tract less refractory. It can also enhance conduc-tion across the bypass tract. This will allow more fibrillatoryimpulses to pass through the bypass tract from atrium to ven-tricle, thus increasing the ventricular rate during atrial fibrilla-tion. Digoxin is particularly a dangerous pharmacologic agentto use in patients with WPW syndrome with atrial fibrillation.Digoxin not only blocks the AV node, but also enhances con-duction through the bypass tract, further increasing the ven-tricular rate during atrial fibrillation. Verapamil also inhibitsthe AV node and is a potent vasodilator. It may enhance con-duction through the bypass tract by reflex increase in sympa-thetic tone. These agents receive a Class III recommendation.
■ In patients with concealed bypass tracts (no evidence of pre-excitation in baseline ECG) who develop atrial fibrillation,the treatment of atrial fibrillation is similar to a patient with-out a bypass tract. AV nodal blocking agents such as betablockers, calcium channel blockers, and digitalis can be givensafely in controlling the ventricular rate during atrial fibrilla-tion. The use of digitalis as long-term maintenance therapy,however, should be discouraged unless other AV nodalblocking agents are ineffective or are poorly tolerated.
■ Some patients may be mistakenly identified as having con-cealed bypass tracts because they do not manifest any evidenceof preexcitation in baseline ECG. These patients may not haveany preexcitation because the bypass tract is not given thechance to become manifest—either from its distal location
from the sinus node (left-sided bypass tracts) or efficient con-duction of the sinus impulse across the AV node. Anterogradeconduction of the atrial impulse to the ventricles may occurduring atrial fibrillation. These patients are difficult to identifyunless electrophysiologic testing is performed.
Prognosis
■ Prognosis is good even among patients with history of atrialfibrillation because electrical ablation is curative. If radiofre-quency ablation is not feasible, surgical ablation should beconsidered.
Other Causes of VentricularPreexcitation
■ Ventricular preexcitation may be due to pathways otherthan direct connection between the atrium and theventricle. The following summarizes the different path-ways that can cause preexcitation.■ Bundle of Kent: The bypass tract connects the
atrium directly to the ventricle (Fig. 20.28A). This isthe most common cause of preexcitation.
■ Mahaim fibers: Mahaim fibers may have differentconnections:n Nodoventricular connection: A bypass tract
connecting the AV node directly to the ventricle(Fig. 20.28B).
Ventricles
Atria
C
Ventricles
Atria
B
Ventricles
Atria
D
Ventricles
Atria
A
Figure 20.28: Other Causes of Preexcitation. (A) Preexcitation with a bypass tract con-necting the atrium directly to the ventricles. This is associated with the classic ECG of WPW syn-drome. (B) Mahaim fibers connecting the AV node directly to the ventricle (nodo-ventricularfiber), bundle of His directly to ventricle (Hisioventricular fiber) and bundle branches or fasciclesdirectly to the ventricles (fasciculoventricular fiber). (C) A bypass tract connecting the atrium di-rectly to the bundle of His. This is often associated with a Hisioventricular fiber resulting in a pat-tern similar to the WPW ECG (A). (D) A small AV node resulting in a short PR interval and a normalQRS complex. ECG, electrocardiogram; WPW, Wolff-Parkinson-White.
LWBK271-C20_262-286.qxd 1/29/09 1:43 PM Page 285 LWBK271-C01_01-08.qxd

286 Chapter 20
n Hisioventricular connection: A bypass tractconnecting the His bundle directly to the ventri-cle (Fig. 20.28B,C).
n Fasciculoventricular connection: A bypass tractconnecting the right bundle, left bundle, or fasci-cles directly to the ventricles (Fig. 20.28B)
n Atrio-Hisian connection: Connects the atria di-rectly to the His bundle, thus bypassing the AVnode (Fig. 20.28C).
■ Superconducting AV node: Small AV node result-ing in a short PR interval with normal QRS complex(Fig. 20.28D).
Suggested Readings
Blomstrom-Lundqvist C, Scheinman MM, Aliot EM, et al.ACC/AHA/ESC guidelines for the management of patientswith supraventricular arrhythmias—executive summary: areport of the American College of Cardiology/AmericanHeart Association Task Force on Practice Guidelines, and theEuropean Society of Cardiology Committee for PracticeGuidelines (Writing Committee to Develop Guidelines forthe Management of Patients With Supraventricular Arrhyth-mias). J Am Coll Cardiol. 2003;42:1493–1531.
Boahene KA, Klein GJ, Yee R, et al. Atrial fibrillation in theWolff-Parkinson-White syndrome. Diagnostic and manage-ment strategies. In: Horowitz LN, ed. Current Management ofArrhythmias. Philadelphia: BC Decker; 1991:123–129.
Cain ME, Lindsay BD. Preexcitation syndromes: diagnostic andmanagement strategies. In: Horowitz LN, ed. Current Man-agement of Arrhythmias. Philadelphia: BC Decker; 1991:91–103.
Calkins H, Langberg J, Sousa J, et al. Radiofrequency catheterablation of accessory atrioventricular connections in 250 pa-tients. Circulation. 1992;85:1337–1346.
Castellanos A, Interian Jr A, Myerburg RJ. The resting electro-cardiogram. In: Fuster V, Alexander RW, O’Rourke RA, eds.Hurst’s The Heart. 11th ed. New York: McGraw-Hill;2004:295–324.
Dresing TJ, Schweikert RA, Packer DL. Atrioventricular nodal-dependent tachycardias. In: Topol EJ, ed. Textbook of Cardio-vascular Medicine. 2nd ed. Philadelphia: Lippincott;2002:1453–1478.
Fuster V, Ryden LE, Cannom DS, et al. ACC/AHA/ESC 2006guidelines for the management of patients with atrial fibril-lation—executive summary; a report of the American Col-lege of Cardiology/American Heart Association Task Forceand the European Society of Cardiology Committee on Prac-
tice Guidelines and the European Society of CardiologyCommittee for Practice Guidelines (Writing Committee toRevise the 2001 Guidelines for the Management of Patientswith Atrial Fibrillation). J Am Coll Cardiol. 2006;48:854–906.
Gallagher JJ, Pritchett ELC, Sealy WC, et al. The preexcitationsyndromes. Progr Cardiovasc Dis. 1978;20:285–327.
Guidelines 2000 for Cardiopulmonary Resuscitation and Emer-gency Cardiovascular Care: 7D: the tachycardia algorithms.Circulation. 2000;102 (Suppl I):I-158–I-165.
Klein GJ, Bashore TM, Sellers TD, et al. Ventricular fibrillationin the Wolff-Parkinson-White syndrome. N Engl J Med.1979;301:1078–1079.
Krahn AD, Manfreda J, Tate RB, et al. The natural history ofelectrocardiographic preexcitation in men. The ManitobaFollow-up Study. Ann Intern Med. 1992;456–460.
Lindsay BD, Crossen KJ, Cain ME. Concordance of distinguish-ing electrocardiographic features during sinus rhythm withthe location of accessory pathways in Wolff-Parkinson-White syndrome. Am J Cardiol. 1987;59:1093–1102.
March HW, Selzer A, Hultgren HN. The mechanical conse-quences of anomalous atrioventricular excitation (WPWsyndrome). Circulation. 1961;23:582–592.
Michelson EL. Clinical perspectives in management of Wolff-Parkinson-White syndrome, Part 1: recognition, diagnosis, andarrhythmias. Mod Concepts Cardiovasc Dis. 1989;58:43–48.
Michelson EL. Clinical perspectives in management of Wolff-Parkinson-White syndrome, Part 2: diagnostic evaluationand treatment strategies. Modern Concepts Cardiovasc Dis.1989;58:49–54.
Olgin JE, Zipes DP. Specific arrhythmia: diagnosis and treat-ment. In: Libby P, Bonow RO, Mann DL, et al., eds. Braun-wald’s Heart Disease, A Textbook of Cardiovascular Medicine.8th ed. Philadelphia: Elsevier Saunders; 2008:863–931.
Pappone C, Manguso F, Santinelli R, et al. Radiofrequency abla-tion in children with asymptomatic Wolf-Parkinson-Whitesyndrome. N Engl J Med. 2004;351:1197–1205.
Reddy GV, Schamroth L. The localization of bypass tracts in theWolff-Parkinson-White syndrome from the surface electro-cardiogram. Am Heart J. 1987;113:984–993.
Wellens HJJ. Wolff-Parkinson-White syndrome Part I. Diagno-sis, arrhythmias, and identification of the high risk patient.Mod Concepts Cardiovasc Dis. 1983;52:53–56.
Wellens HJJ. Wolff-Parkinson-White syndrome Part II. Treat-ment. Mod Concepts Cardiovasc Dis. 1983;52:57–59.
Wellens HJJ, Conover MB. Narrow QRS tachycardia. The ECG in Emergency Decision Making. Philadelphia: WB Saunders;1992:73–103.
Wellens HJJ, Gorgels AP. The electrocardiogram 102 years afterEinthoven. Circulation. 2004;109:562–564.
Zuberbuhler JR, Bauersfeld SR. Paradoxical splitting of the sec-ond heart sound in the Wolff-Parkinson-White syndrome.Am Heart J. 1965;70:595–602.
LWBK271-C20_262-286.qxd 1/29/09 1:43 PM Page 286 LWBK271-C01_01-08.qxd
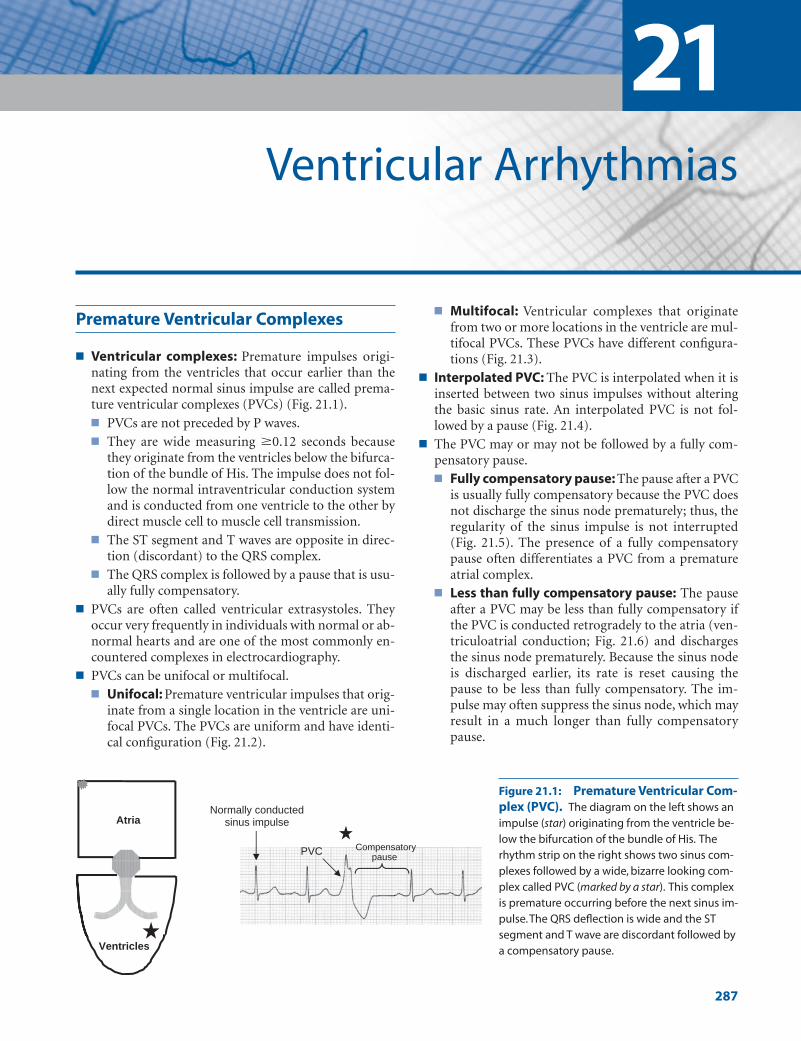
Premature Ventricular Complexes
■ Ventricular complexes: Premature impulses origi-nating from the ventricles that occur earlier than thenext expected normal sinus impulse are called prema-ture ventricular complexes (PVCs) (Fig. 21.1).■ PVCs are not preceded by P waves.■ They are wide measuring �0.12 seconds because
they originate from the ventricles below the bifurca-tion of the bundle of His. The impulse does not fol-low the normal intraventricular conduction systemand is conducted from one ventricle to the other bydirect muscle cell to muscle cell transmission.
■ The ST segment and T waves are opposite in direc-tion (discordant) to the QRS complex.
■ The QRS complex is followed by a pause that is usu-ally fully compensatory.
■ PVCs are often called ventricular extrasystoles. Theyoccur very frequently in individuals with normal or ab-normal hearts and are one of the most commonly en-countered complexes in electrocardiography.
■ PVCs can be unifocal or multifocal.■ Unifocal: Premature ventricular impulses that orig-
inate from a single location in the ventricle are uni-focal PVCs. The PVCs are uniform and have identi-cal configuration (Fig. 21.2).
■ Multifocal: Ventricular complexes that originatefrom two or more locations in the ventricle are mul-tifocal PVCs. These PVCs have different configura-tions (Fig. 21.3).
■ Interpolated PVC: The PVC is interpolated when it isinserted between two sinus impulses without alteringthe basic sinus rate. An interpolated PVC is not fol-lowed by a pause (Fig. 21.4).
■ The PVC may or may not be followed by a fully com-pensatory pause.■ Fully compensatory pause: The pause after a PVC
is usually fully compensatory because the PVC doesnot discharge the sinus node prematurely; thus, theregularity of the sinus impulse is not interrupted(Fig. 21.5). The presence of a fully compensatorypause often differentiates a PVC from a prematureatrial complex.
■ Less than fully compensatory pause: The pauseafter a PVC may be less than fully compensatory ifthe PVC is conducted retrogradely to the atria (ven-triculoatrial conduction; Fig. 21.6) and dischargesthe sinus node prematurely. Because the sinus nodeis discharged earlier, its rate is reset causing thepause to be less than fully compensatory. The im-pulse may often suppress the sinus node, which mayresult in a much longer than fully compensatorypause.
21Ventricular Arrhythmias
287
Atria
Ventricles
PVC
Normally conducted sinus impulse
Compensatory pause
Figure 21.1: Premature Ventricular Com-plex (PVC). The diagram on the left shows animpulse (star) originating from the ventricle be-low the bifurcation of the bundle of His. Therhythm strip on the right shows two sinus com-plexes followed by a wide, bizarre looking com-plex called PVC (marked by a star). This complexis premature occurring before the next sinus im-pulse.The QRS deflection is wide and the STsegment and T wave are discordant followed bya compensatory pause.
LWBK271-C21_287-309.qxd 29/1/09 9:23 pm Page 287 LWBK270-4119G-C02_073-110.qxd

288 Chapter 21
A = 1360 ms B = 1360 ms
A = 1200 ms = B = 1200 ms
A (1340 ms) B (1340 ms)=
Figure 21.2: Unifocal Premature Ventricular Complexes (PVCs). The two PVCsnoted in the rhythm strip, marked by stars, are identical in configuration and are unifocal inorigin. Note also that the pause following the PVC is fully compensatory, meaning that dis-tance A, which straddles the PVC, measures the same as distance B, which straddles anormal sinus impulse. ms, milliseconds.
Figure 21.3: Multifocal Premature Ventricular Complexes (PVCs). The PVCs markedby the stars have different configurations and are multiformed. These PVCs originate from differ-ent locations in the ventricles and are multifocal in origin.
Figure 21.4: Interpolated Premature Ventricular Complex (PVC). The PVC (star) isinterpolated if it is sandwiched between two sinus complexes and is not followed by a pause.Note that the basic rate is not altered by the PVC (distance A, which represents the basic sinusrate is the same as distance B, which straddles a PVC). ms, milliseconds.
Figure 21.5: Fully Compensatory Pause. Rhythm strip shows a premature ventricularcomplex (PVC) with a fully compensatory pause.The pause after a PVC is fully compensatory ifthe PVC does not reset the sinus node; thus, distance A, which straddles a PVC, measures thesame as distance B, which straddles a normal sinus impulse.
LWBK271-C21_287-309.qxd 29/1/09 9:23 pm Page 288 LWBK270-4119G-C02_073-110.qxd

Ventricular Arrhythmias 289
■ Ventriculoatrial conduction: The ventricular im-pulse may conduct retrogradely across the atrioven-tricular (AV) node to activate the atria (Fig. 21.6). Al-though retrograde conduction to the atria may occurafter a PVC, the retrograde P waves are not always vis-ible because they are buried within the ST-T complex.
■ R on T phenomenon: This refers to an early PVCstriking the terminal portion of the T wave of the pre-vious complex (Fig. 21.7). A PVC manifesting the R onT phenomenon has a short coupling interval.
■ End-diastolic PVC: The PVC is end-diastolic if it oc-curs very late in diastole, so late that the next sinus Pwave is already inscribed (Fig. 21.8). This usually re-sults in a fusion complex. An end-diastolic PVC has along coupling interval.
■ Coupling interval: The coupling interval is the dis-tance between the PVC and the preceding QRS com-plex. The coupling interval of most PVCs is usuallyconstant. End-diastolic PVCs have long coupling inter-vals because they occur very late during diastole afterthe sinus P wave is inscribed (Fig. 21.8). Conversely,PVCs manifesting the R on T phenomenon have shortcoupling intervals, usually measuring �0.40 seconds.Because the coupling interval is short, the PVCs occurat the downslope of the T wave of the previous com-plex (Fig. 21.7), which corresponds to the vulnerableperiod of the ventricles. This may potentially trigger aventricular arrhythmia.
■ PVCs can occur as single beats but can be repetitive, oc-curring in bigeminy, trigeminy, quadrigeminy, etc.■ PVCs in bigeminy: PVCs are bigeminal if every
other complex is a PVC (Fig. 21.9).■ PVCs in trigeminy: PVCs are trigeminal if every
third complex is a PVC (Fig. 21.10). It is also trigem-inal if there are two consecutive PVCs and the thirdcomplex is a sinus impulse (Fig. 21.11).
■ PVCs in quadrigeminy: The PVCs are quadrige-minal if every fourth complex is a PVC (Fig. 21.12).
■ Paired PVCs: PVCs occur in pairs or in coupletswhen two PVCs occur consecutively (Fig. 21.11).
■ PVCs may originate from the right ventricle or left ven-tricle. The electrocardiogram (ECG) is helpful in dif-ferentiating one from the other.
PVCs from the Right Ventricle
■ Right ventricular PVC: PVC that originates from theright ventricle has a left bundle branch block (LBBB)configuration. Right ventricular PVCs may originatefrom any of the following locations (Fig. 21.13):■ Right ventricular apex: The PVC has LBBB con-
figuration and the axis in the frontal plane is devi-ated to the left (Fig. 21.14).
A = 2160 ms B = 2360 ms Retrograde Pwaves
Figure 21.6: Less Than Fully Compensatory Pause. Rhythm strip shows two prema-ture ventricular complexes (PVCs) with retrograde conduction to the atria.When this occurs,the PVC may reset the sinus node. Note that the distance between two sinus impulses strad-dling a PVC (distance A) is shorter than the distance between two impulses straddling asinus impulse (distance B). ms, milliseconds.
PVC Coupling interval Coupling interval PVC
Figure 21.7: R on T Phenomenon. The premature ventricular complexes (PVCs)occur early, hitting the T wave of the previous complex. These PVCs have short couplingintervals of �0.40 seconds. The down slope of the T wave corresponds to the vulnera-ble period of the ventricle when the ventricular myocytes are in the process of repolariza-tion. This can result in reentry within the ventricles when a stimulus like a PVC occurs.
LWBK271-C21_287-309.qxd 29/1/09 9:23 pm Page 289 LWBK270-4119G-C02_073-110.qxd
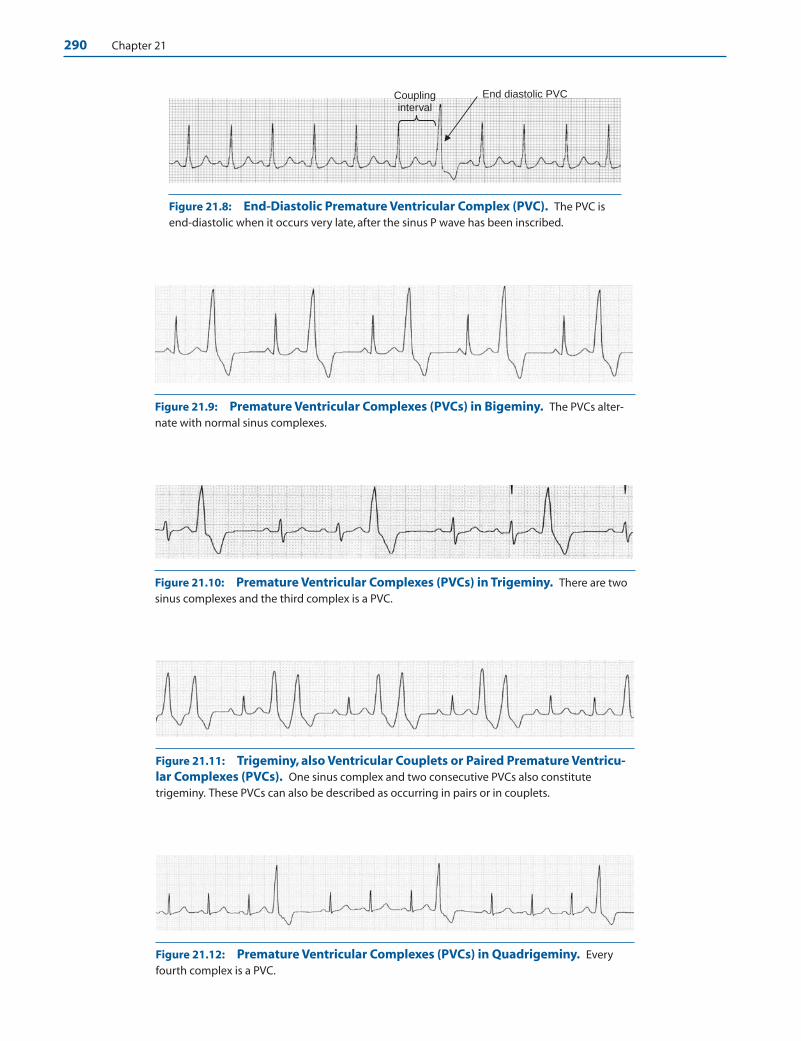
290 Chapter 21
End diastolic PVC Coupling interval
Figure 21.8: End-Diastolic Premature Ventricular Complex (PVC). The PVC isend-diastolic when it occurs very late, after the sinus P wave has been inscribed.
Figure 21.10: Premature Ventricular Complexes (PVCs) in Trigeminy. There are twosinus complexes and the third complex is a PVC.
Figure 21.9: Premature Ventricular Complexes (PVCs) in Bigeminy. The PVCs alter-nate with normal sinus complexes.
Figure 21.11: Trigeminy, also Ventricular Couplets or Paired Premature Ventricu-lar Complexes (PVCs). One sinus complex and two consecutive PVCs also constitutetrigeminy. These PVCs can also be described as occurring in pairs or in couplets.
Figure 21.12: Premature Ventricular Complexes (PVCs) in Quadrigeminy. Everyfourth complex is a PVC.
LWBK271-C21_287-309.qxd 29/1/09 9:23 pm Page 290 LWBK270-4119G-C02_073-110.qxd

Ventricular Arrhythmias 291
V1
LBBB configuration RBBB configuration
Right Ventricle Left Ventricle
Apex Outflow Inflow* Anterosuperior Inferoposterior
LAD Normal Axis RAD
RAD LAD
Figure 21.13: Localizing the Origin of the Premature Ventricular Complex (PVC). Seetext for explanation. LAD, left axis deviation; LBBB, left bundle branch block; RAD, right axis deviation;RBBB, right bundle branch block. *When the PVC has a normal axis, the PVC could originate from theright ventricular inflow or the area between the right ventricular apex and right ventricular outflow.
Figure 21.14: PrematureVentricular Complexes(PVCs) of Right VentricularOrigin. PVCs originating fromthe right ventricular apex haveleft bundle branch block (LBBB)configuration (rS complex in V1
and tall R in V6) with left axis de-viation.The pattern is very similarto a pacemaker induced ventric-ular rhythm with the endocardialelectrode positioned at the apexof the right ventricle.
Figure 21.15: PrematureVentricular Complexes(PVCs) Originating from theRight Ventricular Outflow.The PVCs have left bundle branchblock (LBBB) configuration withrS in V1 and tall R waves in V6.There is right axis deviation ofthe PVC in the frontal plane.These PVCs originate below thepulmonic valve in the right ven-tricular outflow area.
LWBK271-C21_287-309.qxd 29/1/09 9:23 pm Page 291 LWBK270-4119G-C02_073-110.qxd
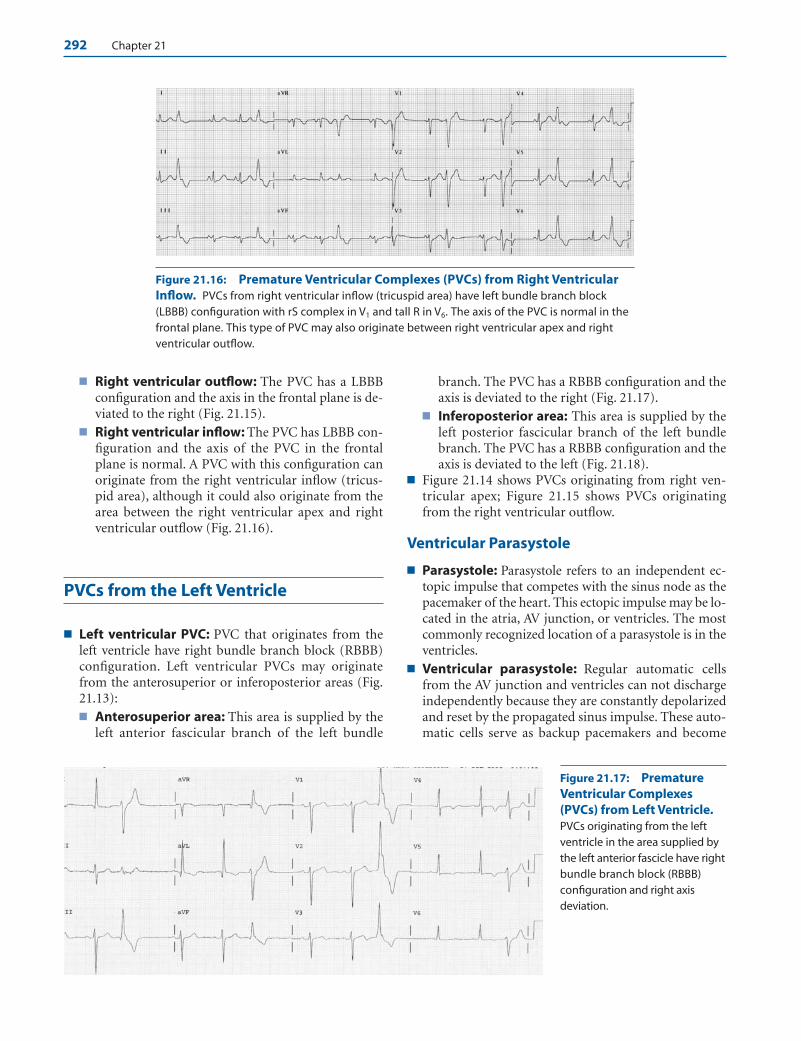
292 Chapter 21
■ Right ventricular outflow: The PVC has a LBBBconfiguration and the axis in the frontal plane is de-viated to the right (Fig. 21.15).
■ Right ventricular inflow: The PVC has LBBB con-figuration and the axis of the PVC in the frontalplane is normal. A PVC with this configuration canoriginate from the right ventricular inflow (tricus-pid area), although it could also originate from thearea between the right ventricular apex and rightventricular outflow (Fig. 21.16).
PVCs from the Left Ventricle
■ Left ventricular PVC: PVC that originates from theleft ventricle have right bundle branch block (RBBB)configuration. Left ventricular PVCs may originatefrom the anterosuperior or inferoposterior areas (Fig.21.13):■ Anterosuperior area: This area is supplied by the
left anterior fascicular branch of the left bundle
branch. The PVC has a RBBB configuration and theaxis is deviated to the right (Fig. 21.17).
■ Inferoposterior area: This area is supplied by theleft posterior fascicular branch of the left bundlebranch. The PVC has a RBBB configuration and theaxis is deviated to the left (Fig. 21.18).
■ Figure 21.14 shows PVCs originating from right ven-tricular apex; Figure 21.15 shows PVCs originatingfrom the right ventricular outflow.
Ventricular Parasystole
■ Parasystole: Parasystole refers to an independent ec-topic impulse that competes with the sinus node as thepacemaker of the heart. This ectopic impulse may be lo-cated in the atria, AV junction, or ventricles. The mostcommonly recognized location of a parasystole is in theventricles.
■ Ventricular parasystole: Regular automatic cellsfrom the AV junction and ventricles can not dischargeindependently because they are constantly depolarizedand reset by the propagated sinus impulse. These auto-matic cells serve as backup pacemakers and become
Figure 21.16: Premature Ventricular Complexes (PVCs) from Right VentricularInflow. PVCs from right ventricular inflow (tricuspid area) have left bundle branch block(LBBB) configuration with rS complex in V1 and tall R in V6. The axis of the PVC is normal in thefrontal plane. This type of PVC may also originate between right ventricular apex and rightventricular outflow.
Figure 21.17: PrematureVentricular Complexes(PVCs) from Left Ventricle.PVCs originating from the leftventricle in the area supplied bythe left anterior fascicle have rightbundle branch block (RBBB)configuration and right axis deviation.
LWBK271-C21_287-309.qxd 29/1/09 9:23 pm Page 292 LWBK270-4119G-C02_073-110.qxd
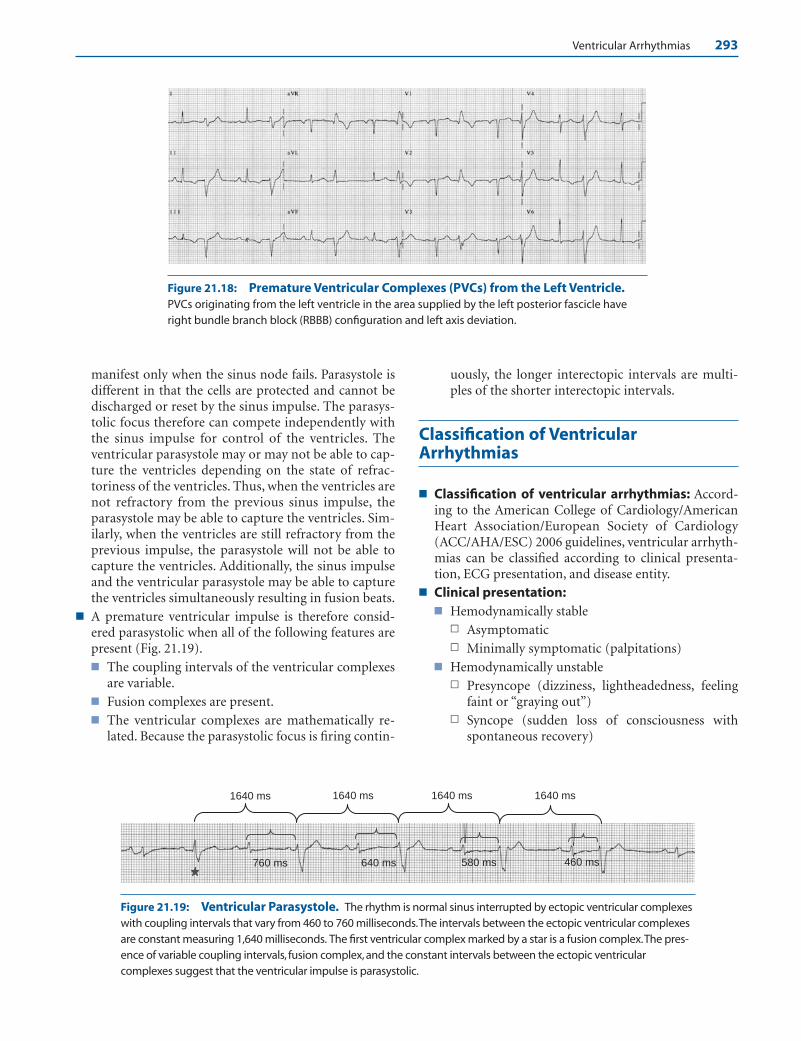
Ventricular Arrhythmias 293
manifest only when the sinus node fails. Parasystole isdifferent in that the cells are protected and cannot bedischarged or reset by the sinus impulse. The parasys-tolic focus therefore can compete independently withthe sinus impulse for control of the ventricles. Theventricular parasystole may or may not be able to cap-ture the ventricles depending on the state of refrac-toriness of the ventricles. Thus, when the ventricles arenot refractory from the previous sinus impulse, theparasystole may be able to capture the ventricles. Sim-ilarly, when the ventricles are still refractory from theprevious impulse, the parasystole will not be able tocapture the ventricles. Additionally, the sinus impulseand the ventricular parasystole may be able to capturethe ventricles simultaneously resulting in fusion beats.
■ A premature ventricular impulse is therefore consid-ered parasystolic when all of the following features arepresent (Fig. 21.19).■ The coupling intervals of the ventricular complexes
are variable.■ Fusion complexes are present.■ The ventricular complexes are mathematically re-
lated. Because the parasystolic focus is firing contin-
uously, the longer interectopic intervals are multi-ples of the shorter interectopic intervals.
Classification of VentricularArrhythmias
■ Classification of ventricular arrhythmias: Accord-ing to the American College of Cardiology/AmericanHeart Association/European Society of Cardiology(ACC/AHA/ESC) 2006 guidelines, ventricular arrhyth-mias can be classified according to clinical presenta-tion, ECG presentation, and disease entity.
■ Clinical presentation:■ Hemodynamically stable
n Asymptomaticn Minimally symptomatic (palpitations)
■ Hemodynamically unstablen Presyncope (dizziness, lightheadedness, feeling
faint or “graying out”)n Syncope (sudden loss of consciousness with
spontaneous recovery)
1640 ms 1640 ms1640 ms 1640 ms
640 ms 580 ms 460 ms760 ms
Figure 21.18: Premature Ventricular Complexes (PVCs) from the Left Ventricle.PVCs originating from the left ventricle in the area supplied by the left posterior fascicle haveright bundle branch block (RBBB) configuration and left axis deviation.
Figure 21.19: Ventricular Parasystole. The rhythm is normal sinus interrupted by ectopic ventricular complexeswith coupling intervals that vary from 460 to 760 milliseconds.The intervals between the ectopic ventricular complexesare constant measuring 1,640 milliseconds. The first ventricular complex marked by a star is a fusion complex.The pres-ence of variable coupling intervals, fusion complex, and the constant intervals between the ectopic ventricularcomplexes suggest that the ventricular impulse is parasystolic.
LWBK271-C21_287-309.qxd 29/1/09 9:23 pm Page 293 LWBK270-4119G-C02_073-110.qxd

294 Chapter 21
n Sudden cardiac death (death from unexpectedcirculatory arrest occurring within an hour afteronset of symptoms).
n Sudden cardiac arrest (death from unexpectedcirculatory arrest usually from cardiac arrhyth-mia occurring within an hour after onset ofsymptoms in which medical intervention such asdefibrillation reverses the event).
■ Electrocardiographic presentation:■ Nonsustained ventricular tachycardia (VT)
n Monomorphic (Fig. 21.21)n Polymorphic
■ Sustained VT n Monomorphic (Fig. 21.22)n Polymorphic
■ Bundle branch reentrant tachycardia■ Bidirectional VT (Fig. 21.23)■ Torsades de pointes (Figs. 21.24 to 21.29)■ Ventricular flutter (Fig. 21.30)■ Ventricular fibrillation (Fig. 21.31)
■ Disease entity: The clinical and disease entities inwhich ventricular arrhythmias may occur includecoronary disease, heart failure, congenital heart dis-ease, neurological disorders, structurally normalhearts, sudden infant death syndrome, and cardiomy-opathies (dilated, hypertrophic, and arrhythmogenicright ventricular cardiomyopathy).
Ventricular Tachycardia
■ VT: Three PVCs in a row is a triplet. Three or more con-secutive PVCs with a rate that exceeds 100 beats perminute (bpm) is VT. VT can be classified as sustainedor nonsustained, monomorphic or polymorphic.■ Nonsustained VT: VT is nonsustained if the tachy-
cardia terminates spontaneously within 30 seconds(Fig. 21.21).
■ Sustained VT: VT is sustained if the tachycardialasts more than 30 seconds (Fig. 21.22). It is alsosustained if the tachycardia is associated with hemo-dynamic compromise, such as dizziness, hypoten-sion, or near syncope, even if the duration of the VTis �30 seconds.
■ Monomorphic VT: VT is monomorphic if the ven-tricular complexes have a single or uniform config-uration and may be nonsustained (Fig. 21.21) orsustained (Fig. 21.22).
■ Polymorphic VT: VT is polymorphic if the QRScomplexes are multiformed or have different config-urations and may be nonsustained (Fig. 21.24) orsustained (Fig. 21.25 and Figs. 21.27-21.28).
■ Bundle branch reentrant tachycardia: This type ofVT is due to reentry. The pathway usually involves the leftbundle branch, bundle of His, right bundle branch, ven-tricular septum, and back to the left bundle branch and
Figure 21.20: Ventricular Parasystole. The rhythm is normal sinus. Parasystolic impulses compete with thesinus rhythm resulting in ventricular complexes (arrows) with variable coupling intervals (dotted brackets). Fusioncomplexes (marked by stars) are also present. The last parasystolic impulse occurred during the refractory period ofthe ventricles and was not captured (last arrow).
Figure 21.21: Nonsustained Monomorphic Ventricular Tachycardia (VT). Three ormore consecutive premature ventricular complexes (PVCs) with a rate of �100 complexes perminute is VT. The VT is monomorphic because the ventricular complexes have the same configu-ration. The VT is nonsustained because the duration of the tachycardia is �30 seconds.
LWBK271-C21_287-309.qxd 29/1/09 9:23 pm Page 294 LWBK270-4119G-C02_073-110.qxd

Figure 21.22: Sustained Monomorphic Ventricular Tachycardia (VT). The VT ismonomorphic because the QRS complexes are uniform.VT is sustained if the duration is �30 seconds or the tachycardia is associated with hemodynamic symptoms of hypotension,dizziness or near syncope even if the tachycardia terminates spontaneously within 30 seconds.
Figure 21.23: Bidirectional Ventricular Tachycardia. The QRS complexes have rightbundle branch block (RBBB) configuration with tall R waves in V1. The axis of the QRS complex inthe frontal leads alternates from left axis to right axis indicating that the origin of the tachycardiaalternates between left anterior and left posterior fascicles.
Figure 21.24: Polymorphic Ventricular Tachycardia (PVT). Twelve-lead electrocardiogram showing non-sustained PVT. The rate of the PVT is very rapid and irregular and the QRS complexes have varying morphologies.The QTc is �0.46 seconds and is prolonged.When the QTc is prolonged, the PVT is called torsades de pointes. Lead IIrhythm strips are recorded at the bottom of the tracing.
295
LWBK271-C21_287-309.qxd 29/1/09 9:23 pm Page 295 LWBK270-4119G-C02_073-110.qxd

Figure 21.25: Polymorphic Ventricular Tachycardia (PVT). (A) Twelve-lead electrocardiogram (ECG)showing PVT.The QRS complexes have different sizes and shapes and the rate is very rapid and irregular at almost300 beats per minute. (B) The ECG immediately after successful cardioversion showed acute inferior myocardial in-farction with a QTc of �0.44 seconds.
A.
B. Long cycle Short cycle
Figure 21.26: Torsades dePointes. Electrocardiogram (ECG)(A): Baseline 12-lead ECG showingunusually prolonged QTc of �0.70seconds. Rhythm strip (B) is from thesame patient showing nonsustainedtorsades de pointes. There arepauses (long cycles) on terminationof the tachycardia. These pausesprolong the QT interval of the nextcomplex. The compensatory pausesof single PVCs also result in long cy-cles, which also prolong the QTc ofthe next complex and facilitates theonset of torsades de pointes.
296
A.
B.
LWBK271-C21_287-309.qxd 29/1/09 9:23 pm Page 296 LWBK270-4119G-C02_073-110.qxd

Ventricular Arrhythmias 297
Figure 21.27: Torsades de Pointes. The classical pattern of torsades de pointes is seen inthe rhythm strip. The polarity of the QRS complexes keeps changing. Some QRS complexes seemto point up and others down. An isoelectric zone is marked by the arrow, which represents the“node.” The taller complexes represent the “spindle.”
Figure 21.28: Polymorphic Ventricular Tachycardia. The ventricular tachycardia startswith the fourth complex and continues to the end of the rhythm strip. Note that the rate of thetachycardia is unusually rapid and the ventricular complexes are polymorphic with some com-plexes pointing downward and other complexes pointing upward as shown by the arrows.
Figure 21.29: PolymorphicVentricular Tachycardia(PVT). Continuous rhythm stripshowing sustained PVT deterio-rating to ventricular fibrillationterminated by DC shock of 200joules. The small arrow at thesecond rhythm strip is a precor-dial thump that was not success-ful in terminating the tachycar-dia. The QTc is not prolonged.
LWBK271-C21_287-309.qxd 29/1/09 9:23 pm Page 297 LWBK270-4119G-C02_073-110.qxd
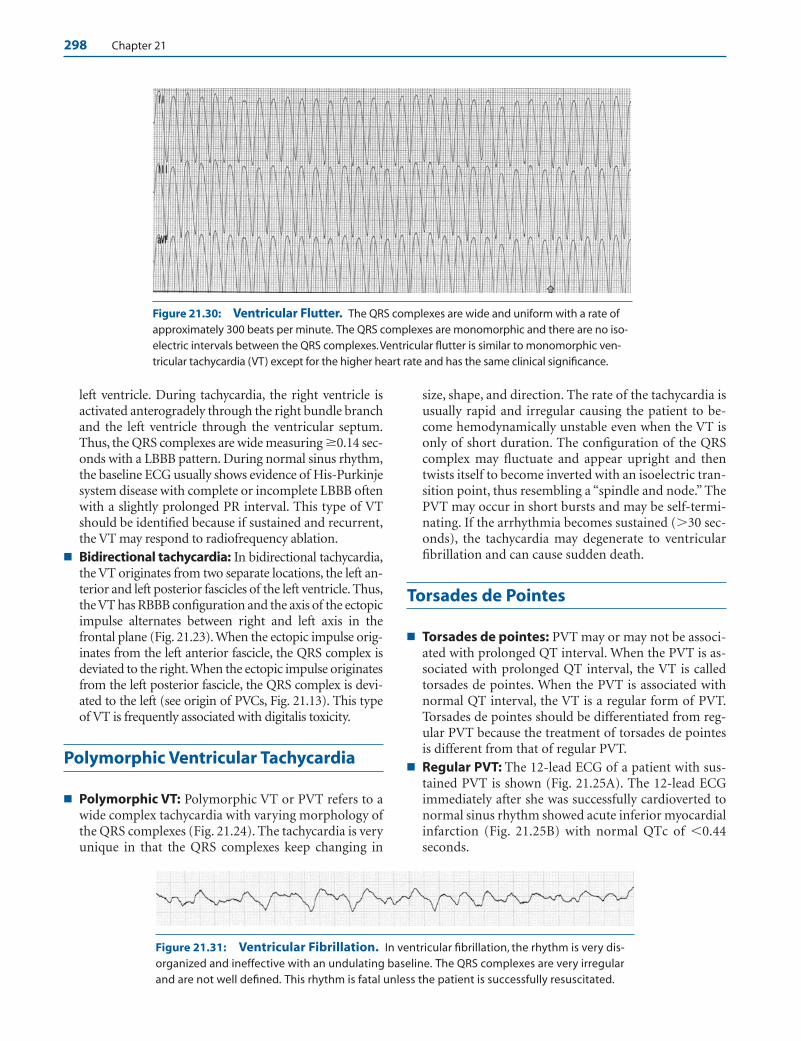
298 Chapter 21
left ventricle. During tachycardia, the right ventricle isactivated anterogradely through the right bundle branchand the left ventricle through the ventricular septum.Thus, the QRS complexes are wide measuring �0.14 sec-onds with a LBBB pattern. During normal sinus rhythm,the baseline ECG usually shows evidence of His-Purkinjesystem disease with complete or incomplete LBBB oftenwith a slightly prolonged PR interval. This type of VTshould be identified because if sustained and recurrent,the VT may respond to radiofrequency ablation.
■ Bidirectional tachycardia: In bidirectional tachycardia,the VT originates from two separate locations, the left an-terior and left posterior fascicles of the left ventricle. Thus,the VT has RBBB configuration and the axis of the ectopicimpulse alternates between right and left axis in thefrontal plane (Fig. 21.23). When the ectopic impulse orig-inates from the left anterior fascicle, the QRS complex isdeviated to the right.When the ectopic impulse originatesfrom the left posterior fascicle, the QRS complex is devi-ated to the left (see origin of PVCs, Fig. 21.13). This typeof VT is frequently associated with digitalis toxicity.
Polymorphic Ventricular Tachycardia
■ Polymorphic VT: Polymorphic VT or PVT refers to awide complex tachycardia with varying morphology ofthe QRS complexes (Fig. 21.24). The tachycardia is veryunique in that the QRS complexes keep changing in
size, shape, and direction. The rate of the tachycardia isusually rapid and irregular causing the patient to be-come hemodynamically unstable even when the VT isonly of short duration. The configuration of the QRScomplex may fluctuate and appear upright and thentwists itself to become inverted with an isoelectric tran-sition point, thus resembling a “spindle and node.” ThePVT may occur in short bursts and may be self-termi-nating. If the arrhythmia becomes sustained (�30 sec-onds), the tachycardia may degenerate to ventricularfibrillation and can cause sudden death.
Torsades de Pointes
■ Torsades de pointes: PVT may or may not be associ-ated with prolonged QT interval. When the PVT is as-sociated with prolonged QT interval, the VT is calledtorsades de pointes. When the PVT is associated withnormal QT interval, the VT is a regular form of PVT.Torsades de pointes should be differentiated from reg-ular PVT because the treatment of torsades de pointesis different from that of regular PVT.
■ Regular PVT: The 12-lead ECG of a patient with sus-tained PVT is shown (Fig. 21.25A). The 12-lead ECGimmediately after she was successfully cardioverted tonormal sinus rhythm showed acute inferior myocardialinfarction (Fig. 21.25B) with normal QTc of �0.44seconds.
Figure 21.30: Ventricular Flutter. The QRS complexes are wide and uniform with a rate ofapproximately 300 beats per minute. The QRS complexes are monomorphic and there are no iso-electric intervals between the QRS complexes.Ventricular flutter is similar to monomorphic ven-tricular tachycardia (VT) except for the higher heart rate and has the same clinical significance.
Figure 21.31: Ventricular Fibrillation. In ventricular fibrillation, the rhythm is very dis-organized and ineffective with an undulating baseline. The QRS complexes are very irregularand are not well defined. This rhythm is fatal unless the patient is successfully resuscitated.
LWBK271-C21_287-309.qxd 29/1/09 9:23 pm Page 298 LWBK270-4119G-C02_073-110.qxd
Ventricular Arrhythmias 299
■ Torsades de pointes: The presence of prolonged QTcdifferentiates torsades de pointes from regular PVT.The QT interval is measured during normal sinusrhythm before or immediately on termination of thetachycardia. The QT interval should be corrected forheart rate because the QT interval measures longerwith slower heart rates and shorter with faster heartrates. The QT interval corrected for heart rate is theQTc. The QTc is prolonged when it measures �0.44seconds in men and �0.46 seconds in women and inchildren. Prolonged QTc should always be recognizedbecause it predisposes to torsades de pointes evenamong patients without cardiac disease, which can befatal. The step by step calculation of the QTc is shownin Chapter 2, Basic Electrocardiography.
■ Prolongation of the QTc may be inherited or it may beacquired.■ Inherited prolongation of the QTc: These pa-
tients are usually young and have family history ofsudden death, often occurring at a young age. Insome patients with congenitally prolonged QTc, theQTc does not stay prolonged, but may vary. Thus,screening of asymptomatic patients with family his-tory of prolonged QTc may not show QT prolonga-tion in the initial ECG examination. Additionally,about a third of patients who are known carriers oflong QT syndrome confirmed by genetic testing willnot show QTc prolongation. The duration of theQTc parallels the risk of developing torsades depointes and sudden death. A long QTc of �0.50 sec-onds in patients with congenitally prolonged QTsyndrome is a marker of increased cardiovascularrisk. Because the QT duration exhibits marked vari-ability, the longest QTc measured at any time duringfollow-up of a patient with congenital long QT syn-drome provides important prognostic information.
■ Acquired prolongation of the QTc: In normal in-dividuals, QTc prolongation can occur during acutemyocardial ischemia, electrolyte abnormalities (hy-pokalemia, hypocalcemia, and hypomagnesemia),use of antiarrhythmic agents (Class IA and ClassIII), antihistaminics, antifungals, antimicrobials, tri-cyclic antidepressants, and nutritional causes result-ing from alcohol, liquid protein diet, anorexia, andstarvation. A long list of agents that can cause pro-longed QTc can be accessed through Web sites atwww.torsades.org or www.qtdrugs.org.
■ During tachycardia, the QRS complexes of torsades depointes and regular PVT are similar and are both poly-morphic. During normal sinus rhythm, the QTc of tor-sades de pointes is prolonged, whereas the QTc of reg-ular PVT is not. Torsades de pointes is pausedependent, occurring when there is bradycardia, whichis known to prolong the QTc. The arrhythmia is fre-quently seen in the setting of long/short cycles asshown in Figure 21.26B.
■ PVT with or without prolongation of the QTc is a seriousarrhythmia that can become sustained and can causesudden death. Even when the tachycardia is short andself-terminating, it is associated with symptoms and isusually not tolerable because of the very rapid ventricularrate as shown in the examples (Figs. 21.28 and 21.29).
■ Ventricular flutter: Ventricular flutter is similar tomonomorphic VT except for a higher heart rate of ap-proximately 300 bpm. There is no isoelectric intervalbetween the QRS complexes. Because of the unusuallyrapid ventricular rate, the arrhythmia is seldom toler-ated (Fig. 21.30). Ventricular flutter and VT are treatedsimilarly.
■ Ventricular fibrillation: Ventricular fibrillation is adisorganized ventricular rhythm with poorly definedQRS complexes. The baseline is undulating and theQRS complexes are very irregular with varying sizes andshapes (Fig. 21.31). Monomorphic and polymorphicVT and ventricular fibrillation are frequently seen inpatients with cardiac disease and severe left ventriculardysfunction. It can also occur in patients with struc-turally normal hearts such as patients with prolongedQT syndrome or patients with the Brugada syndrome.
■ Figure 21.32 summarizes diagrammatically the differ-ent ventricular arrhythmias.
Summary of ECG Findings
1. A PVC is a premature complex that is wide with an ST segmentand T wave that are opposite in direction to the QRS complex.This is followed by a pause that is fully compensatory. PVCsare often called ventricular extrasystoles with coupling inter-vals that are fixed.
2. A ventricular parasystole is a ventricular ectopic impulse that isprotected. It is identified by the presence of fusion complexes,variable coupling intervals, and longer interectopic intervals thatare mathematically related to the shorter interectopic intervals.
3. VT is present when three or more PVCs occur consecutivelywith a rate �100 bpm. VT can be sustained or nonsustained,monomorphic, or polymorphic.
■ The VT is nonsustained if the duration of the tachycardiais �30 seconds.
■ The VT is sustained if the duration is �30 seconds or if thetachycardia is associated with hemodynamic symptomssuch as hypotension, dizziness, or syncope even if the tachy-cardia is self-terminating with a duration of �30 seconds.
■ VT is monomorphic if the QRS complexes are uniform inconfiguration.
■ VT is polymorphic if the QRS complexes have varyingmorphologies.
■ Torsades de pointes is a special form of polymorphicVT associated with prolonged QTc.
■ Regular polymorphic VT is similar to torsades de pointesexcept that the baseline QT interval is not prolonged.
LWBK271-C21_287-309.qxd 29/1/09 9:23 pm Page 299 LWBK270-4119G-C02_073-110.qxd

300 Chapter 21
4. Ventricular flutter has monomorphic ventricular complexeswith a rate of approximately �250 bpm. The QRS complexesare not separated by isoelectric intervals.
5. Ventricular fibrillation has very disorganized rhythm withpoorly defined QRS complexes with a rate of �300 bpm and isfatal if not emergently cardioverted.
Mechanism
■ PVCs look different from normally conducted sinus im-pulses because PVCs originate from the ventricles below thebifurcation of the bundle of His. The impulse activates theventricles sequentially by spreading from one ventricle to
the other. This is in contrast to a supraventricular impulse,which originates above the bifurcation of the bundle of His,resulting in activation of both ventricles synchronouslycausing the QRS complexes to be narrow.
■ PVCs are commonly extrasystolic and are usually related tothe preceding impulse most probably because of reentry ofthe impulse within the ventricles. Thus, the coupling inter-vals of extrasystoles are constant or fixed.
■ A ventricular parasystole is an independent pacemaker thatis protected and is not depolarized by the propagated sinusimpulse. It can therefore compete with the sinus node inde-pendently for control of the ventricles. Unlike ventricular
Summary of the Different Types of Ventricular Complexes
PVCs in Bigeminy
PVCs in Trigeminy
Multifocal PVCs also in Bigeminy
Paired or Back to Back PVCs
Nonsustained monomorphic VT
Interpolated PVC
Nonsustained Polymorphic VT
Ventricular Fibrillation
Figure 21.32: Ventricular Arrhythmias. Diagram shows examples of different ventriculararrhythmias. Arrows point to the ventricular ectopic complexes.
LWBK271-C21_287-309.qxd 29/1/09 9:23 pm Page 300 LWBK270-4119G-C02_073-110.qxd
Ventricular Arrhythmias 301
extrasystoles, it bears no relationship to the preceding ven-tricular complex; thus, the coupling interval is not fixed. Theimpulse can capture the ventricles only when the ventriclesare not refractory from the previous sinus impulse. Fusionbeats are therefore present and the intervals between parasys-tolic impulses are mathematically related.
■ The origin of the ventricular impulse can be predicted by ex-amining the morphology of the QRS complex in the 12-leadECG. Briefly, ectopic ventricular complexes originating fromthe left ventricle will show positive or tall R waves in V1
(RBBB pattern) because the impulse has to travel from leftventricle to right ventricle toward lead V1. Ventricular com-plexes originating from the right ventricle will show negativeor deep S waves in V1 (LBBB pattern) because the impulse hasto travel from right ventricle to left ventricle away from V1.
■ VT both sustained and nonsustained may be due to en-hanced automaticity of cells within the myocardium or His-Purkinje system. It could also be due to triggered activity, asin digitalis toxicity. It can also be due to reentry requiring thepresence of two separate pathways with different electro-physiologic properties within the ventricles.
■ Repolarization of the millions of individual myocardial cells inthe ventricles is not homogeneous because there are intrinsicdifferences in the action potential duration among the variouscells composing the myocardium. This inhomogeneity or dis-persion in ventricular repolarization will cause some cells tobecome excitable, whereas others continue to be refractory.This period may be extended when phase 3 is delayed or whenthere is prolongation of the action potential duration and QTinterval. An ectopic impulse presented to the ventricles duringthis vulnerable period, which corresponds to the mid and ter-minal portion of phase 3 of the action potential, representedby the downslope of the T wave in the ECG (R on T phenom-enon) may cause a reentrant tachycardia within the ventricles.Thus, QT dispersion �100 milliseconds, representing the dif-ference between the longest and shortest QT interval in the 12-lead ECG, may be helpful in predicting those who are high riskfor ventricular arrhythmias.
■ When acute myocardial ischemia and injury are present, thetriggering impulse may not have to occur during the vulnerablephase of ventricular repolarization to cause ventricular arrhyth-mias because the presence of injured myocardium can furtherincrease QT dispersion. Thus, in the setting of acute myocardialinfarction, early and late PVCs are as likely to trigger VT.
Clinical Significance
■ Simple PVCs: Single and frequent PVCs including multi-formed complexes are commonly seen in patients with car-diac disease, although they are also present in healthy individ-uals with structurally normal hearts. In normal individuals,the frequency of ectopic ventricular complexes increases withincreasing age.
■ During infancy: PVCs are rare during infancy. In a 24-hour Holter study of 134 healthy, full-term newborn in-fants, 19 had premature complexes, all supraventricular.
■ During childhood: Among healthy children, ages 7 to 11years, 24-hour Holter monitor showed premature com-plexes only in 20 of 92 children. The premature com-plexes were supraventricular in 19 children and only 1had a PVC.
■ Medical students: Among 50 healthy male medical stu-dents, 24-hour Holter study showed isolated PVCs in 25(50%) and were multifocal in 6 (12%). One (2%) hadcouplets and another (2%) had nonsustained VT definedas three or more PVCs in a row with a rate �100 bpm.
■ Elderly population: Among 98 healthy elderly patientsaged 60 to 85, 78 (80%) had ventricular arrhythmias. Ven-tricular couplets were present in 11 (11%) and nonsustainedVT in 4 (4%). Multiformed PVCs were present in 34 (35%),12 (12%) had �30 PVCs any hour, 7 (7%) have �60 PVCsany hour, and 17 (17%) had total of �100 PVCs in 24 hours.
■ Frequent and complex PVCs: Complex PVCs consisting offrequent multiformed ventricular complexes and nonsus-tained monomorphic VT are generally benign in completelyasymptomatic individuals if there is no demonstrable car-diac disease and left ventricular systolic function is pre-served. However, in patients with structural cardiac diseases,especially those with left ventricular dysfunction, these ven-tricular arrhythmias need further evaluation.
■ Healthy population: Long-term follow-up (3 to 9.5 years,mean 6.5 years) of 73 asymptomatic and healthy individu-als, age 18 to 72 years, with frequent complex ventricularectopy including those with nonsustained VT by 24-hourHolter (mean PVCs per hour 566, multiformed PVCs 63%,ventricular couplets 60%, nonsustained VT 26%), showedno increased mortality and a long-term prognosis similarto that of the general healthy population.
■ Patients with left ventricular dysfunction: Althoughthese ventricular arrhythmias are not targets for pharma-cologic therapy in the hospital or outpatient setting, pa-tients with left ventricular dysfunction (ejection fractionof �40%) with frequent and complex ventricular ectopyshould be referred for further evaluation because theymay be at risk for more serious arrhythmias.
■ Ventricular parasystole: Ventricular arrhythmias that areknown to be parasystolic are considered benign and requireno therapy. A ventricular parasystole should always be sus-pected when the coupling intervals of the PVCs are not fixed.They are also recognized by fusion beats and the intervals be-tween complexes are mathematically related.
■ Sustained VT and ventricular fibrillation: Sustained VTand ventricular fibrillation are malignant arrhythmias thatcan cause sudden death. They commonly occur as a compli-cation of acute myocardial infarction. They are also seen inpatients with structural cardiac diseases especially ischemic,nonischemic, and hypertrophic cardiomyopathies. It is rarein patients with structurally normal hearts unless there is:
■ Long QT syndrome, acquired or congenital
■ Brugada syndrome
■ Wolff-Parkinson-White syndrome
LWBK271-C21_287-309.qxd 29/1/09 9:23 pm Page 301 LWBK270-4119G-C02_073-110.qxd

302 Chapter 21
■ The long QT syndrome: The QT interval is prolonged whenthe QTc measures �0.44 seconds (or �440 milliseconds) inmen and �0.46 seconds (or �460 milliseconds) in women.A long QT interval predisposes to torsades de pointes, whichis a special type of polymorphic VT. The following is a sim-plified review of the ionic changes that occur in the ventricu-lar myocyte that can result in prolongation of the QT inter-val (see Chapter 1, Basic Anatomy and Electrophysiology).
■ Mechanism of the prolongation of the QT interval:During depolarization or phase 0 of the action potential,the fast sodium channels open briefly allowing sodium ionsto enter the cell. The entry of positive ions into the cellcauses the polarity of the cell to change abruptly from �90to �10 to �20 mV. Depolarization is immediately followedby repolarization consisting of phases 1 through 3 of theaction potential. This corresponds to the J point extendingto the end of the T wave in the surface ECG. During phase2, which corresponds to the plateau phase of the action po-tential, the polarity of the cell is maintained at approxi-mately 0 mV for a sustained duration. This is due to entryof calcium into the cell because of activation of the slow or“L-type” calcium channels during depolarization. Thisslow but sustained flow of positive ions into the cell iscounterbalanced by the flow of potassium out of the cellbecause the cell membrane is more permeable to potas-sium than other ions. This loss of potassium makes the in-side of the cell more negative as positive ions are lost. Thus,the entry of calcium into the cell (entry of positive ions)combined with flow of potassium out of the cell (loss ofpositive ions) results in an equilibrium that is sustained fora prolonged duration corresponding to the plateau orphase 2 of the action potential. When the calcium channelsare inactivated, the entry of calcium into the cell is sud-denly prevented although the outward flow of potassiumcontinues. This inequity in calcium entry and potassiumoutflow advances the action potential to phase 3. Phase 3 orrapid repolarization is due to continuous efflux of potas-sium from the cell causing the cell to become more negativeuntil the resting potential of –90 mV is reached. This marksthe end of phase 3 of the action potential, which corre-sponds to the end of the T wave in the surface ECG.
■ As long as the potential of the ventricular myocyte is pre-vented from reaching –90 mV, which is the normal restingpotential, the cell is not fully repolarized. Thus, any mech-anism that will prolong or increase the entry of sodium orcalcium into the cell will make the inside of the cell morepositive and will delay or prolong the duration of the ac-tion potential. Similarly, any mechanism that will inhibitor delay the exit of potassium out of the cell will make thecell less negative. This will also prolong the duration ofthe action potential.
■ Phases 0 through 3 of the transmembrane action poten-tial correspond to the duration of the action potential ofindividual myocardial cells. This is equivalent to the QTinterval in the surface ECG. Prolongation of phases 1 through 3 will result in prolongation of the QT interval.
■ Causes of prolonged QT interval: Prolongation of theQT interval may be acquired or it may be congenital.
n Acquired long QT: In normal individuals with normalQTc, several pharmacologic agents can prolong the QTinterval. These include type IA antiarrhythmic agents(quinidine, disopyramide, and procainamide), type IIIantiarrhythmic drugs (dofetilide, ibutilide, sotalol, andamiodarone), antipsychotic agents (chlorpromazine,thioridazine, and haloperidol), macrolide antibiotics(erythromycin, clarithromycin), antifungal agents (ket-onazole and itraconazole), electrolyte disturbances no-tably hypomagnesemia and hypokalemia, and otheragents such as pentamidine and methadone. A long listof pharmacologic agents that can prolong the QT in-terval can be accessed at www.torsades.org. Althoughthe use of a single pharmacologic agent (quinidine oributilide) may cause QT prolongation and torsades depointes almost immediately, occasionally, a combina-tion of two agents may be needed to prolong the QTinterval such as the concurrent use of erythromycinand ketonazole. Erythromycin, a macrolide antibiotic,and ketonazole, an antifungal agent, are both metabo-lized by the liver through the cytochrome P-450 3A4(CYP 3A4) metabolic pathway. Either agent can poten-tially prolong the QT interval although prolongationof the QT interval is more significant when both agentsare taken concurrently because they compete for thesame metabolic pathway resulting in increased plasmaconcentration of both agents. Similarly, an agent thatdoes not prolong the QT interval but depends on theCYP 3A4 metabolic pathway for clearance such as acalcium channel blocker (verapamil) when combinedwith a drug that prolongs the QT interval such aserythromycin can result in further prolongation of theQT interval since verapamil also depends on the samepathway as that of erythromycin for clearance. The ef-fect on QT prolongation and potential for torsades depointes may be more delayed, however.
n Congenital long QT: Congenital or inherited prolon-gation of the QT interval affects young individuals es-pecially the first 2 decades of life and is a commoncause of sudden death in this age group. Two types oflong QT syndrome have been clinically described.
n The first familial long QT syndrome described byJervell and Lange-Nielsen is associated with sen-sorineural deafness. This type of long QT syndromeis inherited as autosomal recessive. The second fa-milial long QT syndrome is the Romano-Ward syn-drome and is inherited as autosomal dominant butis not associated with congenital deafness.
n With the advent of genetic testing, seven long QTsyndromes have been described thus far and are la-beled LQT1 to LQT7 according to the sequence inwhich the abnormal locus of the genetic defecthave been discovered. The first three entities—LQT1, LQT2, and LQT3—are the most common
LWBK271-C21_287-309.qxd 29/1/09 9:23 pm Page 302 LWBK270-4119G-C02_073-110.qxd
Ventricular Arrhythmias 303
and comprise almost 95% of all identified cases ofcongenital long QT syndromes. The prolongationof the QT is due to a genetic defect involving thepotassium channel in most cases except LQT3 andLQT4, which are due to a defect in sodium trans-port. The genetic abnormality involves the ionchannel in almost all cases except LQT4, whichdoes not affect the ion channel directly, but only itssupporting structure.
n Patients with long QT syndrome can be confirmedby genetic testing, although a negative genetic testwill not exclude the presence of congenital longQT syndrome because up to 40% of patients withcongenital long QT have not been linked to any ge-netic abnormality. Additionally, the use of genetictesting remains very expensive and may not be af-fordable when screening several family memberswith history of long QT syndrome or known sud-den death in the family. It also takes several weeksbefore the results are known. Thus, the diagnosisof long QT syndrome is more commonly based onphenotypic ECG abnormalities.
n When the ECG is used in the diagnosis of patientswith congenital long QT syndrome, marked vari-ability in the duration of the QTc in serial ECGscan occur. Even in normal individuals, the QT in-terval can vary by as much as 50 to 75 millisecondsover a 24-hour period. Thus, screening of individ-uals with family history of long QT syndrome andsudden death may not show any initial QT prolon-gation. Additionally, almost a third of patients whoare confirmed carriers have normal or borderlineQTc of 0.40 to 0.46 seconds. The longest QTc, in-cluding those measured before age 10 years, pro-vides important prognostic information duringadolescence in patients with congenital long QTsyndrome. Thus, a long QTc measuring �0.50 sec-onds identifies a patient who has increased risk ofcardiovascular events and shorter QT intervals of�0.50 seconds decreases the risk of cardiovascularevents. In these patients, however, there is no clearcut QT interval that is considered safe because QTcof �0.46 seconds are also at risk for syncope andsudden death.
n The following is a summary of the known long QTsyndromes:
■ LQT1: Long QT1 is the first mutation to be identified. Itis one of the most common, accounting for approxi-mately 50% of known long QT abnormalities. The ab-normality involves the short arm of chromosome 11.The gene was identified using cloning techniques andwas named KvLQT1 because it encodes a potassiumchannel, but was eventually renamed KCNQ1. Homozy-gous mutation of the gene causes the Jervell and Lange-Nielsen syndrome. The syndrome is associated withcongenital deafness, which is also due to the abnormality
in the same potassium channels involved with the pro-duction of potassium-rich endolymph in the inner ear.It is a much more common cause of sudden deathyounger than age 10 years when compared with theother long QT syndromes. Prolongation of the QT is dueto delay in phase 3 of the action potential because of de-lay in the transport of potassium (�-subunit of the slowpotassium rectifier or IKs). In addition to the prolongedQT, the T wave in the ECG has a slow indistinct onset,but is otherwise normal. Patients with LQT1 are mostsymptomatic during exertion because the QT intervalbecomes longer with exercise in contrast to patients withLQT3 who are most symptomatic during rest or sleep.The QT interval can be prolonged by intravenous injec-tion of epinephrine. Thus, in symptomatic individuals,if the initial QT is not prolonged, the long QT can be un-masked with epinephrine.
■ LQT2: Long QT2 is also one of the most common longQT abnormalities with up to 40% of all congenital casesof long QT syndrome. The defect resides in chromosome7 and the identified gene is called HERG (human ether a-go-go related gene) or KCNH2. Similar to LQT1, this geneis also involved with the potassium current. Unlike LQT1that affects the slow potassium currents (called slow Krectifier or IKs), the gene is involved with the fast potas-sium currents (called rapid K rectifier or IKr), which isthe most important in determining the duration of theaction potential. Most pharmacologic agents that prolongthe QT interval also inhibit the same potassium channel.In LQT2, the shape of the T wave in the ECG is bifid orsplit. Mutation of the HERG gene causes another abnor-mality characterized by an unusually short QT interval of�0.30 seconds called congenital short QT syndrome,which is also associated with sudden death.
■ LQT3: Unlike LQT1 and LQT2, which are involved withpotassium transport, LQT3 involves mutation of the geneencoding a sodium channel. The abnormality is located inchromosome 3 and the gene is called SCN5A. LQT3 is lesscommon than the first two long QT syndromes. The ab-normality in the sodium channel causes prolongation ofphase 2 of the action potential. This is due to delayed clo-sure of the fast sodium channels on completion of rapiddepolarization resulting in continuous entry of sodiumions into the cell, thus prolonging the duration of the ac-tion potential. The baseline ECG will show asymmetric Twaves with a steep downslope. Most patients are sympto-matic at rest or sleep, which causes the QT interval to pro-long because of bradycardia. Mutation of the geneSCN5A has been implicated as the cause of the Brugadasyndrome, where most of the arrhythmic events occurduring sleep (see Brugada Syndrome).
■ LQT4: Long QT4 is the only other long QT syndrome asso-ciated with abnormality in sodium transport. It is the onlylong QT syndrome that is not a “channelopathy” becausethe abnormality does not directly involve an ion channelbut its supporting structure. The abnormality resides in
LWBK271-C21_287-309.qxd 29/1/09 9:23 pm Page 303 LWBK270-4119G-C02_073-110.qxd
304 Chapter 21
chromosome 4 and the gene is called ankyrin-B. The ab-normality affects the sinus node and the clinical manifesta-tions include symptoms of sinus node dysfunction. This ismanifested as bradyarrhythmias as well as tachyarrhyth-mias including the tachycardia bradycardia syndrome.
■ LQT5: This abnormality involves mutation of geneKCNE1 in chromosome 21. The gene is also called minK.This type of long QT syndrome is rare. Homozygous mu-tation of this gene can also cause the Jervell and Lange-Nielsen syndrome. The abnormality involves the trans-port of potassium (-subunit of the slow K rectifier orIKs) similar to LQT1. Prolongation of the action potentialis due to delay in phase 3. The surface ECG usually showsT wave with a wide base.
■ LQT6: The abnormality also resides in chromosome 21 andinvolves the KCNE2 gene. This type of long QT syndromeis rare. The abnormality affects the rapid outward potas-sium transport (outward rapid K rectifier or IKr) resultingin decreased potassium efflux with prolongation of phase 3of the action potential. The T wave has low amplitude.
■ LQT7: The abnormality resides in chromosome 17 and thegene involved is called KCNJ2. This abnormality prolongsthe action potential duration through its effect on the in-ward rectifying currents involved with potassium trans-port, thus delaying phase 3. Both cardiac and skeletal mus-cle cells can be affected resulting in prolongation of the QTand hypokalemia induced periodic paralysis with a large Uwave looking component in the ECG. This disorder is veryrare and is often referred to as the Andersen syndrome.
■ Timothy syndrome often identified as LQT8: Timothysyndrome involves mutation of the L-type calcium channel.The defect involves chromosome 12 and the identified geneis CACNA1C. Calcium channel dysfunction causes multi-system involvement with osseous deformities includingdysmorphic features and syndactyly in addition to autism,cognitive defects, and malignant ventricular arrhythmias.This very rare syndrome has also been referred to as LQT8.
■ Brugada syndrome: Another example in which malignantventricular arrhythmias can occur in individuals with struc-turally normal hearts is the Brugada syndrome. Patients withthis syndrome can be identified by the presence of a peculiarelectrocardiographic pattern in baseline ECG characterized byRBBB with rSR configuration confined to V1 to V3. In V1 orV2, the J point and ST segment are elevated with a coved or up-ward convexity terminating into an inverted T wave (type I). Insome patients, the elevated ST segment may assume a saddleback configuration (type II) or often a triangular pattern in-stead of a coved appearance (type III). Types II and III termi-nate in upright T waves. The ST elevation is confined to theright-sided precordial leads and is not accompanied by recip-rocal ST depression. It may be permanent in some individuals,although, in others, it may vary from time to time. When theseECG changes are not present, the ST segment abnormalitiescan be unmasked by administration of sodium channel blockersuch as procainamide, flecainide, or ajmaline. The QTc is not
prolonged. Examples of the Brugada ECG are shown in Chap-ter 23,Acute Coronary Syndrome: ST Elevation Myocardial In-farction, differential diagnosis of ST segment elevation. Ap-proximately 90% of patients with the Brugada ECG are males.
■ Mechanism: The abnormality has been identified to be amutation in chromosome 3 involving gene SCN5A. Onlythe epicardial cells of the right ventricle are affected.These epicardial cells have abnormal sodium channels,which causes premature repolarization. The prematurerepolarization causes shortening of the duration of theaction potential only of the abnormal cells. Repolariza-tion of normal endocardial cells is not affected. Theshortened duration of repolarization of the epicardialcells will cause these cells to repolarize earlier when com-pared with endocardial cells. Thus, during repolarization,a gradient between the abnormal epicardial and the nor-mally repolarizing endocardial cells is created duringphase 2 of the action potential resulting in elevation ofthe ST segment, only in the right precordial leads V1 to V3.This difference in repolarization between normal and ab-normal cells can facilitate a reentrant arrhythmia.
■ This syndrome is a genetic defect without associatedstructural cardiac disease and can cause sudden deathfrom polymorphic VT. Thus, the syndrome is primarilyan electrical abnormality because it has no other clinicalmanifestations other than the ventricular arrhythmia.This clinical entity is endemic in Southeast Asia includingThailand, Japan, and the Philippines and affects mostlymales in their mid to late 30s. The ECG abnormalities aswell as the ventricular arrhythmias are enhanced by vagalactivity; thus, the ventricular arrhythmias are commonlymanifested during sleep. Because of its nocturnalfrequency, it is often called sudden unexpected nocturnaldeath syndrome or SUNDS. Fever has also been shown tobe a predisposing factor. The syndrome is inherited as au-tosomal dominant with variable expression similar to ar-rhythmogenic right ventricular cardiomyopathy.
■ In patients with the Brugada ECG who are symptomaticwith syncope because of polymorphic VT or ventricular fib-rillation, mortality is high. The incidence of VT and fibrilla-tion is similar whether the patient is on a beta blocker, tak-ing an antiarrhythmic agent (amiodarone) or the patienthas an implanted automatic defibrillator. Only an im-planted defibrillator is effective in preventing sudden deathand therefore the only known effective therapy in reducingmortality. According to the ACC/AHA/ESC 2006 guidelineson ventricular arrhythmias, the implantable defibrillator re-ceives Class I recommendation in patients with previouscardiac arrest and Class IIa recommendation in patientswith history of syncope or documented VT. There are onlyfew agents that are useful during an arrhythmic event. Thisincludes isoproterenol, which receives a Class IIa recom-mendation and quinidine, a Class IIb recommendation.
■ Although symptomatic patients with the Brugada ECGare high risk for sudden death, the significance of the
LWBK271-C21_287-309.qxd 29/1/09 9:23 pm Page 304 LWBK270-4119G-C02_073-110.qxd

Ventricular Arrhythmias 305
Brugada ECG in the general asymptomatic population isuncertain because not all patients with the Brugada ECGwill develop VT or ventricular fibrillation.
n Among 63 patients with the Brugada ECG reported byBrugada et al. in 1998, 41 were diagnosed after resus-citated cardiac arrest or syncope and 22 were asymp-tomatic, detected incidentally because of family his-tory of sudden death. Of the 22 asymptomaticindividuals, 6 (27%) developed ventricular arrhyth-mias during a mean follow-up of 27 months, whereasamong the 41 symptomatic patients, 14 (34%) had arecurrence of the ventricular arrhythmia during amean follow-up of 37 months. They concluded thatasymptomatic patients with the Brugada ECG havethe same risk of developing a cardiac arrhythmiawhen compared with patients who had previous his-tory of aborted sudden death.
n However, among 32 cases with the Brugada ECG de-tected in a population-based study of 4,788 asympto-matic Japanese individuals younger than 50 years ofage who had biennial examinations and were followedfor 41 years, there were 7 (26%) unexpected deaths inpatients with the Brugada ECG compared with 20(74%) in the control group. In most cases, the ECGfinding was intermittent and was nine times higher inmen than in women.
n In another community-based study of 13,929 subjectsalso in Japan, the Brugada ECG was found in 98. Therewas one death during a follow-up of 2.6 years comparedwith 139 deaths among those without the Brugada ECG.The total mortality of patients with the Brugada ECGwas not different from those without the abnormality.
■ Wolff-Parkinson-White (WPW) syndrome: The WPWsyndrome is another clinical entity in which malignant ven-tricular arrhythmias can occur in the absence of structuralcardiac disease that can result in sudden death. The ECGrecognition, mechanism and the different arrhythmias asso-ciated with the syndrome, is further discussed in Chapter 20,Wolff-Parkinson-White Syndrome.
Acute Therapy
■ Ventricular fibrillation: The emergency treatment of pa-tients with ventricular fibrillation is direct current electricaldefibrillation.
■ Direct current defibrillation: Direct current unsyn-chronized shocks set at 360 joules if monophasic (or 200joules if biphasic) should be delivered immediately. TheACC/AHA/ESC 2006 guidelines for management of ven-tricular arrhythmias, recommends that if the initial shockis unsuccessful, five cycles of cardiopulmonary resuscita-tion should be provided before delivering the secondshock and if the second shock is also not effective, an-other five cycles of cardiopulmonary resuscitation isprovided before delivering the third shock. The previous
recommendation was to deliver three shocks in a rowfollowed by cardiopulmonary resuscitation.
■ Precordial thump: An initial option, which is a Class IIbrecommendation, is that a single precordial thump can bedelivered by the responder. This can be tried if the patientcannot be immediately defibrillated. (Class IIb meansthat the usefulness or efficacy of the procedure/therapy isless well established by evidence/opinion.)
■ Cardiopulmonary resuscitation: If the patient hasbeen in cardiac arrest for more than 5 minutes, a brief pe-riod of cardiopulmonary resuscitation is initially recom-mended before the patient is electrically defibrillated.
■ Pharmacologic agents:n Epinephrine: If the arrhythmia is refractory to electri-
cal defibrillation, epinephrine 1 mg is given IV and re-peated every 3 to 5 minutes while providing continu-ous cardiopulmonary resuscitation.
n Vasopressin: An alternative is to give vasopressin 40 UIV given once to substitute for the first or second doseof epinephrine.
n Amiodarone: If ventricular fibrillation is refractory toelectrical defibrillation, amiodarone is also given IVwith a loading dose of 300 mg or 5 mg/kg and electricaldefibrillation repeated. An additional dose of 150 mg ofamiodarone may be given once only. Amiodarone iscontinued at 1.0 mg/minute for 6 hours followed by0.5 mg/minute for the next 18 hours when the patienthas stabilized. It is not necessary to give amiodaroneroutinely if the patient responds to the initial shockfollowed by a stable rhythm.
n Electrolytes: After ventricular fibrillation is stabilized,all electrolyte and acid base abnormalities should becorrected. Serum potassium should be �4 mEq/L andmagnesium �2.0 mg/dL.
n Beta blockers: Beta blockers, unless contraindicated,should also be given as prophylactic therapy.
■ Other measures: There are conditions that may haveprecipitated or contributed to the arrhythmia. Accordingto the ACC/AHA/ESC 2006 practice guidelines on ven-tricular arrhythmias, the contributing conditions include6 Hs and 5 Ts. They are Hypovolemia, Hypoxia, Hydrogenion (acidosis), Hypo- or hyperkalemia, Hypoglycemia,Hypothermia, Toxins, Tamponade, Tension pneumotho-rax, Thrombosis (coronary or pulmonary), and Trauma.These conditions should be identified and corrected.
■ Sustained monomorphic VT: The acute treatment of sus-tained monomorphic VT depends on whether or not the pa-tient is hemodynamically stable. However, because electricalcardioversion is so effective in terminating monomorphic VT,cardioversion should be considered as initial therapy regard-less of symptoms. Among stable patients with monomorphicVT, pharmacologic therapy can be an option. If the patientdoes not respond to the initial pharmacologic agent, the VTshould be terminated with electrical cardioversion.
LWBK271-C21_287-309.qxd 29/1/09 9:23 pm Page 305 LWBK270-4119G-C02_073-110.qxd

306 Chapter 21
■ Hemodynamically unstable patients with sustainedmonomorphic VT: Unstable patients with monomor-phic VT who are hypotensive (blood pressure �90 mmHg), in pulmonary edema or have symptoms of myocar-dial ischemia from the tachycardia, the ACC/AHA/ESC2006 guidelines for ventricular arrhythmias and theACC/AHA guidelines for the management of ST eleva-tion myocardial infarction recommend synchronized car-dioversion with appropriate sedation starting at 100joules of monophasic shock followed by escalating energylevels of 200 to 300 and finally 360 joules, if the initialshocks are unsuccessful.
■ Hemodynamically stable: In hemodynamically stablepatients with sustained monomorphic VT, electrical car-dioversion remains an option. Antiarrhythmic agents,however, may be considered instead of electrical car-dioversion. The preferred antiarrhythmic agent will de-pend on the presence or absence of left ventricular sys-tolic dysfunction.
n Hemodynamically stable patients with preserved leftventricular function: The acute pharmacologic treat-ment of sustained VT for patients who are stable withgood left ventricular systolic function includes pro-cainamide, amiodarone, lidocaine, or sotalol. Only oneantiarrhythmic agent should be given to minimize theproarrhythmic effect of multiple drugs. If the chosenantiarrhythmic agent is not effective, electrical car-dioversion should be performed to terminate the VT.
n Procainamide: The ACC/AHA/ESC 2006 guidelinesfor management of patients with ventricular arrhyth-mias recommend procainamide as the initial agent inpatients with monomorphic VT who are hemody-namically stable with good left ventricular function.This agent receives a Class IIa recommendation.Procainamide is more effective than amiodarone inthe early termination of stable monomorphic VT.The maximum loading dose of procainamide shouldnot exceed 17 mg/kg. The loading dose is given as anintravenous infusion until the tachycardia is sup-pressed. The infusion should not exceed 50 mg/minute or a total loading dose of 1 g over 30 minutes.This is followed by a maintenance dose of 1 to 4mg/minute. This drug is preferred among all otherdrugs in sustained monomorphic VT if the patient isstable and has preserved systolic function. It shouldnot be given when there is systolic left ventriculardysfunction or there is evidence of heart failure.
n Amiodarone: Amiodarone is one of the few agentsthat can be given to patients with good LV functionor with LV dysfunction. Although amiodarone isthe recommended antiarrhythmic agent (Class I)for stable patients with sustained monomorphicVT according to the ACC/AHA 2004 practiceguidelines for ST elevation myocardial infarction,it is not as effective as procainamide for early
termination of stable monomorphic VT accordingto the ACC/AHA/ESC 2006 guidelines for ventric-ular arrhythmias and receives a Class IIa recom-mendation when the VT is refractory to electricalcardioversion or if the VT is unstable or recurrentin spite of therapy with intravenous procainamideor other drugs. The dose of amiodarone is 150 mgIV given as a bolus within 10 minutes and may berepeated every 10 to 15 minutes as needed. This isfollowed by an IV infusion of 1 mg/minute for thenext 6 hours and 0.5 mg/minute for the next 18hours. The total intravenous dose should not ex-ceed 2.2 g during the first 24 hours.
n Lidocaine: If the monomorphic VT is known to bedue to acute myocardial ischemia or a complica-tion of acute myocardial infarction, lidocaine maybe given as initial therapy. This agent receives aClass IIb recommendation according to theACC/AHA/ESC 2006 practice guidelines for themanagement of patients with ventricular arrhyth-mias. Lidocaine is given IV at an initial bolus of 1mg per kg body weight. The initial bolus shouldnot exceed 100 mg. If the first bolus is unsuccess-ful, a second bolus of 0.5 to 0.75 mg/kg IV is givenand a third and final bolus may be necessary. Thetotal IV dose within the first 3 hours should notexceed 3 mg/kg body weight. The infusion is fol-lowed by a maintenance dose of 1 to 4 mg/minute.
n Sotalol: This agent is not available in the UnitedStates as an IV preparation. Similar to pro-cainamide, it should not be given when there is LVdysfunction. Dosing is discussed in the Appendix:Commonly Used Injectable Pharmacologic Agents.
n Other options:n Electrical cardioversion: Even among stable pa-
tients, electrical cardioversion may be consideredas initial therapy instead of giving antiarrhythmicagents. If antiarrhythmic therapy was decided andwas not effective, the patient should be electricallycardioverted. In stable patients, low monophasicenergy settings starting at 50 joules can be givenunder adequate sedation.
n Temporary pacing: Temporary pacing receives aClass IIa recommendation for overdrive suppressionin patients refractory to cardioversion or in patientswith recurrent VT in spite of antiarrhythmic therapy.
n Hemodynamically stable patients with impaired leftventricular function: The acute therapy of patientswith monomorphic VT who are hemodynamicallystable but have systolic LV dysfunction (ejection frac-tion �40 % or evidence of congestive heart failure) islimited to amiodarone and lidocaine. Agents that canfurther depress systolic function such as sotalol andprocainamide are proarrhythmic and negatively in-otropic and should not be given.
LWBK271-C21_287-309.qxd 29/1/09 9:23 pm Page 306 LWBK270-4119G-C02_073-110.qxd
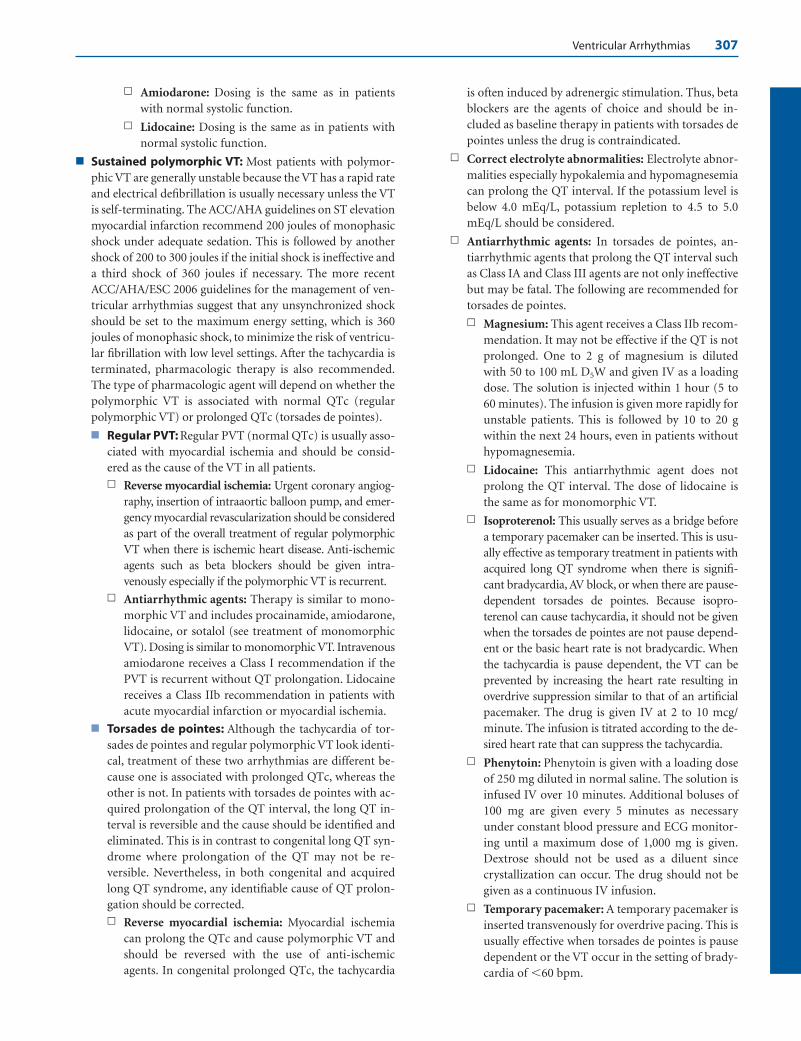
Ventricular Arrhythmias 307
n Amiodarone: Dosing is the same as in patientswith normal systolic function.
n Lidocaine: Dosing is the same as in patients withnormal systolic function.
■ Sustained polymorphic VT: Most patients with polymor-phic VT are generally unstable because the VT has a rapid rateand electrical defibrillation is usually necessary unless the VTis self-terminating. The ACC/AHA guidelines on ST elevationmyocardial infarction recommend 200 joules of monophasicshock under adequate sedation. This is followed by anothershock of 200 to 300 joules if the initial shock is ineffective anda third shock of 360 joules if necessary. The more recentACC/AHA/ESC 2006 guidelines for the management of ven-tricular arrhythmias suggest that any unsynchronized shockshould be set to the maximum energy setting, which is 360joules of monophasic shock, to minimize the risk of ventricu-lar fibrillation with low level settings. After the tachycardia isterminated, pharmacologic therapy is also recommended.The type of pharmacologic agent will depend on whether thepolymorphic VT is associated with normal QTc (regularpolymorphic VT) or prolonged QTc (torsades de pointes).
■ Regular PVT: Regular PVT (normal QTc) is usually asso-ciated with myocardial ischemia and should be consid-ered as the cause of the VT in all patients.n Reverse myocardial ischemia: Urgent coronary angiog-
raphy, insertion of intraaortic balloon pump, and emer-gency myocardial revascularization should be consideredas part of the overall treatment of regular polymorphicVT when there is ischemic heart disease. Anti-ischemicagents such as beta blockers should be given intra-venously especially if the polymorphic VT is recurrent.
n Antiarrhythmic agents: Therapy is similar to mono-morphic VT and includes procainamide, amiodarone,lidocaine, or sotalol (see treatment of monomorphicVT). Dosing is similar to monomorphic VT. Intravenousamiodarone receives a Class I recommendation if thePVT is recurrent without QT prolongation. Lidocainereceives a Class IIb recommendation in patients withacute myocardial infarction or myocardial ischemia.
■ Torsades de pointes: Although the tachycardia of tor-sades de pointes and regular polymorphic VT look identi-cal, treatment of these two arrhythmias are different be-cause one is associated with prolonged QTc, whereas theother is not. In patients with torsades de pointes with ac-quired prolongation of the QT interval, the long QT in-terval is reversible and the cause should be identified andeliminated. This is in contrast to congenital long QT syn-drome where prolongation of the QT may not be re-versible. Nevertheless, in both congenital and acquiredlong QT syndrome, any identifiable cause of QT prolon-gation should be corrected.n Reverse myocardial ischemia: Myocardial ischemia
can prolong the QTc and cause polymorphic VT andshould be reversed with the use of anti-ischemicagents. In congenital prolonged QTc, the tachycardia
is often induced by adrenergic stimulation. Thus, betablockers are the agents of choice and should be in-cluded as baseline therapy in patients with torsades depointes unless the drug is contraindicated.
n Correct electrolyte abnormalities: Electrolyte abnor-malities especially hypokalemia and hypomagnesemiacan prolong the QT interval. If the potassium level isbelow 4.0 mEq/L, potassium repletion to 4.5 to 5.0mEq/L should be considered.
n Antiarrhythmic agents: In torsades de pointes, an-tiarrhythmic agents that prolong the QT interval suchas Class IA and Class III agents are not only ineffectivebut may be fatal. The following are recommended fortorsades de pointes.
n Magnesium: This agent receives a Class IIb recom-mendation. It may not be effective if the QT is notprolonged. One to 2 g of magnesium is dilutedwith 50 to 100 mL D5W and given IV as a loadingdose. The solution is injected within 1 hour (5 to60 minutes). The infusion is given more rapidly forunstable patients. This is followed by 10 to 20 gwithin the next 24 hours, even in patients withouthypomagnesemia.
n Lidocaine: This antiarrhythmic agent does notprolong the QT interval. The dose of lidocaine isthe same as for monomorphic VT.
n Isoproterenol: This usually serves as a bridge beforea temporary pacemaker can be inserted. This is usu-ally effective as temporary treatment in patients withacquired long QT syndrome when there is signifi-cant bradycardia, AV block, or when there are pause-dependent torsades de pointes. Because isopro-terenol can cause tachycardia, it should not be givenwhen the torsades de pointes are not pause depend-ent or the basic heart rate is not bradycardic. Whenthe tachycardia is pause dependent, the VT can beprevented by increasing the heart rate resulting inoverdrive suppression similar to that of an artificialpacemaker. The drug is given IV at 2 to 10 mcg/minute. The infusion is titrated according to the de-sired heart rate that can suppress the tachycardia.
n Phenytoin: Phenytoin is given with a loading doseof 250 mg diluted in normal saline. The solution isinfused IV over 10 minutes. Additional boluses of100 mg are given every 5 minutes as necessaryunder constant blood pressure and ECG monitor-ing until a maximum dose of 1,000 mg is given.Dextrose should not be used as a diluent sincecrystallization can occur. The drug should not begiven as a continuous IV infusion.
n Temporary pacemaker: A temporary pacemaker isinserted transvenously for overdrive pacing. This isusually effective when torsades de pointes is pausedependent or the VT occur in the setting of brady-cardia of �60 bpm.
LWBK271-C21_287-309.qxd 29/1/09 9:23 pm Page 307 LWBK270-4119G-C02_073-110.qxd

308 Chapter 21
■ The following (Table 21.1) is a summary of the recom-mended initial and subsequent shocks during electrical car-dioversion in patients with sustained ventricular arrhyth-mias according to the 2004 ACC/AHA guidelines on STelevation myocardial infarction. All shocks are monophasic.
Long-Term Therapy
■ Ventricular fibrillation and sustained VT: Patients whohave survived an episode of sustained VT or ventricular fibril-lation are high risk for sudden death and should be referred toan electrophysiologist. These patients usually have structuralcardiac disease with severe LV dysfunction. Any reversiblecondition that can cause arrhythmia such as electrolyte ab-normalities, myocardial ischemia, severe blood gas abnor-malities, or the use of agents that are proarrhythmic shouldbe identified and corrected. Beta blockers and anticongestiveagents that prolong survival in patients with left ventricularsystolic dysfunction such as angiotensin-converting enzymeinhibitors, angiotensin receptor blockers, aldosterone antag-onists, and, among African Americans, a hydralazine/nitratecombination should be given unless these drugs are con-traindicated. In patients with poor LV systolic function, im-plantation of an automatic defibrillator for secondary pre-vention is recommended. In these patients, the use ofantiarrhythmic agents does not match the efficacy of the au-tomatic defibrillator in reducing mortality.
■ Nonsustained VT: Patients who are completely asympto-matic but have frequent multiformed PVCs with nonsustainedmonomorphic VT need to be referred for further cardiac eval-uation. The arrhythmia is most probably benign in asympto-matic patients with structurally normal hearts. However, inpatients with impaired LV function, especially those who havesurvived an acute myocardial infarction, the patient has to bereferred for further evaluation and therapy. Similarly, in pa-
tients with PVT, even when nonsustained, treatment and fur-ther evaluation is warranted. Treatment of systolic dysfunctionwith beta blockers, angiotensin-converting enzyme inhibitors,or angiotensin receptor blockers and aldosterone antagonistsshould be considered in addition to correction of myocardialischemia or other metabolic, electrolyte, and blood gas abnor-malities that may be present. No antiarrhythmic therapy isnecessary in asymptomatic patients with nonsustained VTwho have been evaluated to have structurally normal hearts.
■ PVCs: PVCs from ventricular parasystole is considered a be-nign finding. Similarly, simple, benign ventricular extrasys-toles are commonly seen in normal healthy individuals. Theseectopic impulses may be associated with smoking; excessivecoffee, tea, or alcohol; use of diet pills, sympathetic agents,thyroid hormones, diuretics; and medications for commoncolds or asthma, antipsychotic agents and electrolyte abnor-malities. A previously asymptomatic and presumably healthyindividual with a structurally normal heart who develops pal-pitations from simple, benign PVCs should be evaluated forthese possible causes. Treatment is simply reassurance that thearrhythmia is benign and the possible cause eliminated.
Prognosis
■ Prognosis will depend on the type of ventricular arrhythmiaand the underlying cardiac abnormality.
■ Sustained VT or ventricular fibrillation are serious andlife-threatening arrhythmias. Most of these arrhythmiasare frequently seen in patients with severe left ventriculardysfunction and has high mortality. Prognosis is im-proved with appropriate therapy.
■ Patients with structurally normal hearts who develop ma-lignant ventricular arrhythmias are also at risk for suddendeath. These include patients with prolonged QTc,
Initial Shock Second Third
Ventricular fibrillation or 200 Joules* 200–300 Joules* 360 Joulespulseless VT (unsynchronized) (unsynchronized) (unsynchronized)
Unstable polymorphic VT 200 Joules* 200–300 Joules* 360 Joules(unsynchronized) (unsynchronized) (unsynchronized)
Sustained unstable 100 Joulesmonomorphic VT (synchronized) Escalating energy levels
(synchronized)
Sustained stable 50 Joules Escalating energy levels monomorphic VT (Synchronized) (Synchronized)
*The more recent American College of Cardiology/American Heart Association/European Society of Cardiology 2006 guidelines for managementof ventricular arrhythmias recommend maximal defibrillator settings (360 joules of monophasic shock) if unsynchronized shock is delivered tominimize the risk of ventricular fibrillation with low settings.VT, ventricular tachycardia.
Recommended Settings for External Defibrillation According to the ACC/AHA Guidelines for ST-Elevation Myocardial Infarction
TABLE 21.1
LWBK271-C21_287-309.qxd 29/1/09 9:23 pm Page 308 LWBK270-4119G-C02_073-110.qxd

Ventricular Arrhythmias 309
Brugada syndrome, and arrhythmogenic right ventricularcardiomyopathy. Prognosis is improved with medicaltherapy. In properly selected patients, implantation of anautomatic defibrillator may be indicated.
■ In the general population, VT or ventricular fibrillationcan occur as a complication of acute myocardial infarc-tion and is a common cause of sudden death.
■ PVCs that are parasystolic are considered benign. Al-though acute treatment of frequent parasystolic and ex-trasystolic PVCs and nonsustained VT is not indicated,long-term prognosis will depend on the presence or ab-sence of cardiac disease.
■ PVT with or without QTc prolongation, even when self-terminating and of short duration, may incur an immedi-ate risk of morbidity and mortality. The long-term prog-nosis will depend on the cause of the PVT and underlyingcardiac abnormality.
Suggested Readings
2005 American Heart Association guidelines for cardiopul-monary resuscitation and emergency cardiovascular care.Part 7.3: management of symptomatic bradycardia andtachycardia. Circulation. 2005;112:67–77.
Ackerman MJ. The long QT syndrome: ion channel diseases ofthe heart. Mayo Clin Proc. 1998;73:250–269.
Antman EM,Anbe DT,Armstrong PW, et al.ACC/AHA guidelinesfor the management of patients with ST elevation myocardialinfarction: executive summary: a report of the ACC/AHA TaskForce on Practice Guidelines (Committee to Revise the 1999Guidelines on the management of patients with acute myocar-dial infarction). J Am Coll Cardiol. 2004;44:671–719.
Arizona Center for Education and Research on Therapeutics.QT drug lists. www.torsades.org
Bigger JT Jr. Ventricular arrhythmias: classification and generalprinciples of therapy. In: Horowitz LN, ed. Current Managementof Arrhythmias. Philadelphia: BC Decker Inc; 1991:130–137.
Botteron GW, Smith JM. Cardiac arrhythmias. In: Carey CF, LeeHH, Woeltje KF, eds. The Washington Manual of MedicalTherapeutics. 29th ed. Philadelphia: Lippincott Williams &Wilkins; 1998:130–156.
Brodsky M, Wu D, Denes P, et al. Arrhythmias documented by24 hour continuous electrocardiographic monitoring in 50male medical students without apparent heart disease. Am JCardiol. 1977;39:390–395.
Brugada J, Brugada R, Brugada P. Right bundle-branch blockand ST-segment elevation in leads V1 through V3. A markerfor sudden death in patients without demonstrable struc-tural heart disease. Circulation. 1998;97:457–460.
Castellanos Jr A, Ortiz JM, Pastis N, et al. The electrocardiogram inpatients with pacemakers. Progr Cardiovasc Dis. 1970;13:190–209.
Conover MB. Monomorphic ventricular rhythms. In: Under-standing Electrocardiography. 8th ed. St. Louis: CV MosbyCo.; 2003:151–170.
Conover MB. Congenital long QT syndrome. In: UnderstandingElectrocardiography. 8th ed. St. Louis: CV Mosby Co.; 2003:369–380.
Fleg JL, Kennedy HL. Cardiac arrhythmias in a healthy elderlypopulation: detection by 24-hour ambulatory electrocardio-graphy. Chest. 1982;81:302–307.
Goldenberg I, Mathew J, Moss AJ, et al. Corrected QT variabilityin serial electrocardiograms in long QT syndrome. The im-portance of the maximum corrected QT for risk stratifica-tion. J Am Coll Cardiol. 2006;48:1047–1052.
Guidelines 2000 for cardiopulmonary resuscitation and emer-gency cardiovascular care, an international consensus onscience. The American Heart Association in Collaborationwith the International Liaison Committee on Resuscitation.7D: the tachycardia algorithms. Circulation. 2000;102:I-158–I-165.
Gussak I, Antzelevitch C, Bjerregaard P, et al. The Brugada syn-drome: clinical, electrophysiologic and genetic aspects. J AmColl Cardiol. 1999;33:5–15.
Kennedy HL, Whitlock JA, Sprague MK, et al. Long-term follow-up of asymptomatic healthy subjects with frequent and com-plex ventricular ectopy. N Engl J Med. 1985;312:193–197.
Locati ET. QT interval duration remains a major risk factor inlong QT syndrome patients. J Am Coll Cardiol. 2006;48:1053–1055.
Matsuo K, Akahoshi M, Nakashima E, et al. The prevalence, in-cidence and prognostic value of the Brugada-type electro-cardiogram. A population-based study. J Am Coll Cardiol.2001;38:765–770.
Miyasaka Y, Tsuji H, Yamada K, et al. Prevalence and mortality ofthe Brugada-type electrocardiogram in one city in Japan. JAm Coll Cardiol. 2001;38:771–774.
Moss AJ. Long QT syndrome. JAMA. 2003;289:2041–2044.Priori SG, Napolitano C, Gasparini M, et al. Natural history of
Brugada syndrome. Insights for risk stratification and man-agement. Circulation. 2002;105:1342–1347.
Priori SG, Schwartz PJ, Napolitano C, et al. Risk stratificationin the long-QT syndrome. N Engl J Med. 2003;348:1866–1874.
Southall DP, Johnston F, Shinebourne EA, et al. 24-hour elec-trocardiographic study of heart rate and rhythm patterns inpopulation of healthy children. Br Heart J. 1981;45:281–291.
Southall DP, Richards J, Mitchell P, et al. Study of cardiac rhythmin healthy newborn infants. Br Heart J. 1980;43:14–20.
Wellens HJJ, Conover M. Drug-induced arrhythmic emergen-cies. In: The ECG in Emergency Decision Making. 2nd edition.St. Louis: Saunders/Elsevier; 2006:177–186.
Zimetbaum PJ, Josephson ME, Kwaku KF. Genetics of congeni-tal and acquired long QT syndrome. 2007 UpToDate.
Zipes DP, Camm AJ, Borggrefe M, et al. ACC/AHA/ESC 2006guidelines for management of patients with ventricular ar-rhythmias and the prevention of sudden cardiac death: a re-port of the American College of Cardiology/American HeartAssociation Task Force and the European Society of Cardiol-ogy Committee for Practice Guidelines (Writing Committeeto Develop Guidelines for management of patients with ven-tricular arrhythmias and the prevention of sudden cardiacdeath). J Am Coll Cardiol. 2006,48:e247–e346.
LWBK271-C21_287-309.qxd 29/1/09 9:23 pm Page 309 LWBK270-4119G-C02_073-110.qxd

22Wide Complex Tachycardia
310
Causes of Wide Complex Tachycardia
■ Wide complex tachycardia indicates the presence offast and regular heart rate of �100 beats per minute(bpm) associated with wide QRS complexes measuringat least 120 milliseconds.
■ A wide complex tachycardia can be ventricular orsupraventricular.■ Ventricular tachycardia (VT) has a wide QRS
complex because the arrhythmia originates belowthe bifurcation of the bundle of His. The impulsedoes not follow the normal atrioventricular (AV)conduction system and activation of the ventriclesdoes not occur simultaneously (Fig. 22.1A).
■ Supraventricular tachycardia (SVT) has narrowQRS complexes because the impulse originatesabove the bifurcation of the bundle of His. The im-pulse follows the normal AV conduction system andactivation of both ventricles is simultaneous. SVTcan have wide QRS complexes when there is:n Preexistent bundle branch block (B).n AV reciprocating tachycardia (AVRT) due to the
presence of a bypass tract. This wide complextachycardia is also called antidromic AVRT (C).
n Ventricular aberration or rate related bundlebranch block (D).
Wide QRS Complex from VentricularTachycardia
■ Distinguishing VT from wide complex SVT is always adiagnostic challenge. Unless the patient is unstable, a12-lead electrocardiogram (ECG) should always berecorded when there is wide complex tachycardia be-cause it provides much more diagnostic informationthan a single-lead rhythm strip.
■ Single-lead rhythm strip: Very often, the tachycardiais recorded only on a rhythm strip obtained from a car-diac monitor. When only a single-lead ECG is availablefor interpretation, any of the following findings is diag-nostic of VT:■ Unusually wide QRS complexes (Fig. 22.2).■ Complete AV dissociation (Fig. 22.3).■ Ventricular fusion complex (Figs. 22.4 to 22.6).■ Sinus captured complex or Dressler beat (Fig. 22.7).■ Ventriculoatrial conduction with block (Figs. 22.8
and 22.9).■ Unusually wide QRS complexes:
■ When the tachycardia has a right bundle branchblock (RBBB) configuration, the tachycardia is ven-tricular if the width of the QRS complex exceeds0.14 seconds. If the tachycardia has a left bundle
Ventricular Tachycardia Supraventricular Tachycardia
A B C DFigure 22.1: Wide Complex Tachy-cardia. (A) Ventricular tachycardia.(B–D) Examples of supraventricular (SVT)with wide QRS complexes. (B) SVT withpreexistent bundle branch block. (C)Antidromic atrioventricular reciprocatingtachycardia from the presence of abypass tract. (D) SVT is conducted withaberration. ( ) indicates the origin ofthe impulse; (arrows) the direction of thespread of the electrical impulse.
LWBK271-C22_310-330.qxd 29/1/09 7:48 pm Page 310 LWBK270-4119G-C02_073-110.qxd
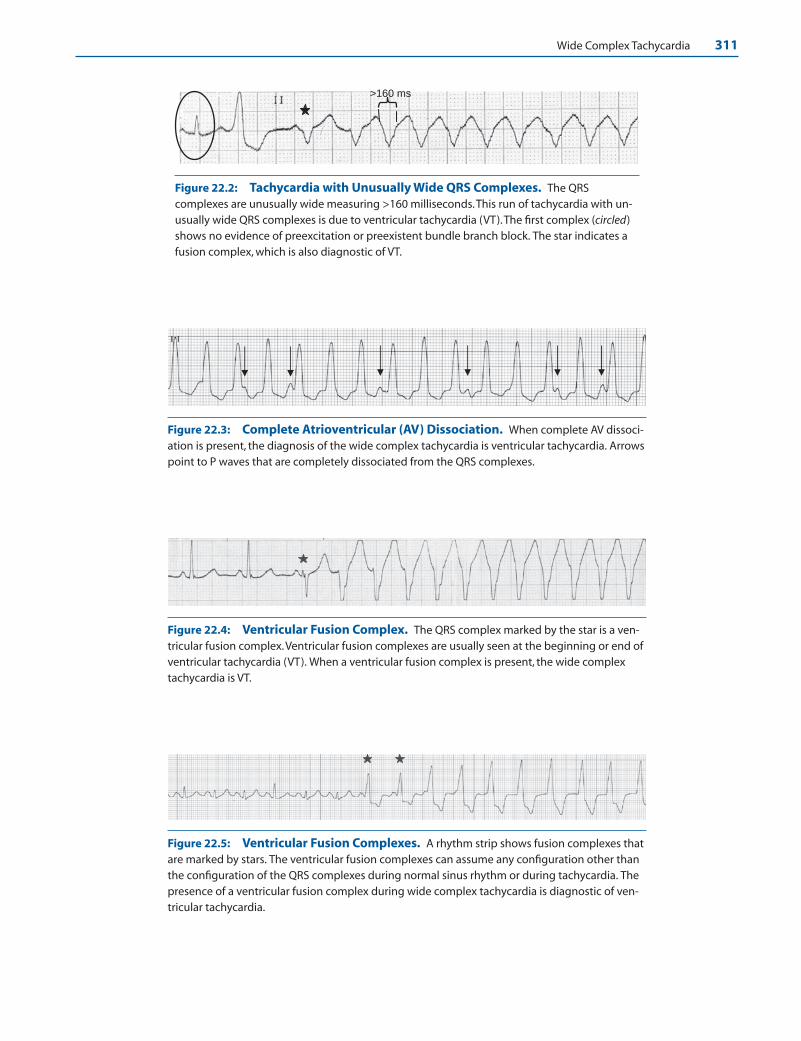
Wide Complex Tachycardia 311
>160 ms
Figure 22.2: Tachycardia with Unusually Wide QRS Complexes. The QRScomplexes are unusually wide measuring >160 milliseconds.This run of tachycardia with un-usually wide QRS complexes is due to ventricular tachycardia (VT).The first complex (circled)shows no evidence of preexcitation or preexistent bundle branch block. The star indicates afusion complex, which is also diagnostic of VT.
Figure 22.3: Complete Atrioventricular (AV) Dissociation. When complete AV dissoci-ation is present, the diagnosis of the wide complex tachycardia is ventricular tachycardia. Arrowspoint to P waves that are completely dissociated from the QRS complexes.
Figure 22.4: Ventricular Fusion Complex. The QRS complex marked by the star is a ven-tricular fusion complex.Ventricular fusion complexes are usually seen at the beginning or end ofventricular tachycardia (VT). When a ventricular fusion complex is present, the wide complextachycardia is VT.
Figure 22.5: Ventricular Fusion Complexes. A rhythm strip shows fusion complexes thatare marked by stars. The ventricular fusion complexes can assume any configuration other thanthe configuration of the QRS complexes during normal sinus rhythm or during tachycardia. Thepresence of a ventricular fusion complex during wide complex tachycardia is diagnostic of ven-tricular tachycardia.
LWBK271-C22_310-330.qxd 29/1/09 7:48 pm Page 311 LWBK270-4119G-C02_073-110.qxd

312 Chapter 22
A B C
Ventricular Fusion Complex Two supraventricular impulses can not cause a ventricular fusion complex because they have to follow the same pathway to the ventricles
Figure 22.6: Ventricular FusionComplex. (A) Two separate impulses,ventricular and supraventricular, simulta-neously activate the ventricles to cause aventricular fusion complex. (B) A fusioncomplex occurs when two separate ven-tricular impulses activate the ventriclessimultaneously. (C) A ventricular fusioncomplex is not possible with twoseparate supraventricular impulsesbecause both are obligated to follow thesame pathway to the ventricles.
A. 12 lead ECG during tachycardia
B. Lead II during normal sinus rhythm
Lead II during tachycardia Sinus capturedcomplex
F
F
F
F
F F
F
F F
Figure 22.7: Sinus Capturedand Ventricular FusionComplexes. (A) 12-lead electrocar-diogram during wide complex tachy-cardia. Ventricular fusion complexesare marked by the letter F. The fusioncomplexes are preceded by sinus Pwaves (arrowheads). A sinus capturedcomplex, also called Dressler’s beat, iscircled. (B) Lead II rhythm strip fromthe same patient recorded separatelyduring normal sinus rhythm. Thesinus-captured complex recorded inlead II is identical to the QRScomplex during sinus rhythm andare both circled for comparison.
Figure 22.8: Wide ComplexTachycardia with 2:1Ventriculoatrial (V-A) Block.V-A conduction is shown in leadsII, III, and aVF.The retrogradelyconducted P waves (arrows)occur after every other QRS com-plex representing 2:1 second-degree V-A block. V-A conductionwith intermittent V-A block isdiagnostic of ventriculartachycardia.
LWBK271-C22_310-330.qxd 29/1/09 7:48 pm Page 312 LWBK270-4119G-C02_073-110.qxd

Wide Complex Tachycardia 313
branch block (LBBB) configuration, the tachycardiais ventricular if the QRS complex exceeds 0.16 sec-onds. There should be no preexistent bundle branchblock or preexcitation in baseline ECG and the pa-tient should not be taking any antiarrhythmic med-ication that prolongs intraventricular conduction.
■ Differentiating a wide complex tachycardia as havinga RBBB or LBBB configuration may be difficult ifonly a single-lead monitor strip is available for inter-pretation (Fig. 22.2). However, an unusually wideQRS complex measuring >0.16 seconds is usually VT,regardless of the configuration of the QRS complex.
Ventricular Tachycardia
■ Complete AV dissociation: When sinus P waves arepresent and there is no relationship between the Pwaves and the QRS complexes, complete AV dissocia-tion is present (Fig. 22.3). Complete AV dissociationoccurs when two separate pacemakers are present: onecapturing the atria and the other the ventricles. DuringVT, the rate of the ventricles is faster than the rate ofthe atria; thus, the slower atrial impulse will usuallyfind the ventricles refractory. Complete AV dissociationoccurring during a wide complex tachycardia is diag-nostic of VT.
■ Ventricular fusion complex: In VT, the sinus impulsemay be able to capture the ventricles if the sinus im-pulse is perfectly timed to occur when the ventricles arenot refractory. A ventricular fusion complex may occurif the ventricles are partly activated by the sinus im-pulse and partly by the VT (Figs. 22.4–22.6).
Ventricular Fusion Complex
■ Ventricular fusion complex: A ventricular fusioncomplex results when the ventricles are simultaneously
activated by two separate impulses, causing a change inthe pattern of ventricular activation. At least one of theimpulses should originate from the ventricles. A ven-tricular fusion complex therefore can occur if one im-pulse is ventricular and the other supraventricular (Fig.22.6A). It can also occur if both impulses originatefrom two different locations in the ventricles (Fig.22.6B). Two separate supraventricular impulses cannotproduce a ventricular fusion complex because bothsupraventricular impulses are obligated to follow thesame conduction pathway on their way to the ventri-cles and will not alter the pattern of ventricular activa-tion (Fig. 22.6C). Thus, when a ventricular fusion com-plex occurs during a wide complex tachycardia, thediagnosis is VT. The fusion complex can assume anyconfiguration other than the configuration of the QRScomplex during sinus rhythm or during the wide com-plex tachycardia. Examples of ventricular fusion com-plexes are shown in Figures 22.2, 22.4, and 22.5.
Sinus Captured Complex
■ Sinus captured complex: In VT, the atrium andventricles are completely dissociated with the ven-tricular rate faster than the sinus rate. The sinus im-pulse is, therefore, unable to capture the ventricles,because the ventricles are almost always refractory onarrival of the sinus impulse to the ventricles. If aproperly timed sinus impulse arrives at the ventricleswhen the ventricles are not refractory, the sinus im-pulse may be able to capture the ventricles partially(resulting in a fusion complex) or completely (result-ing in sinus captured complex). A sinus-capturedcomplex during VT is a narrow QRS complex identi-cal to a normally conducted sinus impulse (Fig.22.7). Very often, sinus P waves are visible precedingfusion or sinus captured complexes. The presence ofa sinus-captured complex during wide complextachycardia is diagnostic of VT.
3:2 2:1 2:1 3:2 3:2 3:2
Figure 22.9: Ventriculoatrial (V-A) Wenckebach. Lead II rhythm strip shows 2:1 V-Ablock and 3:2 V-A Wenckebach (arrows on the left half of the rhythm strip) with gradual prolon-gation of the R-P interval until a ventricular impulse is not followed by an atrial complex. Thepresence of intermittent V-A conduction suggests that the origin of the tachycardia isventricular.
LWBK271-C22_310-330.qxd 29/1/09 7:48 pm Page 313 LWBK270-4119G-C02_073-110.qxd
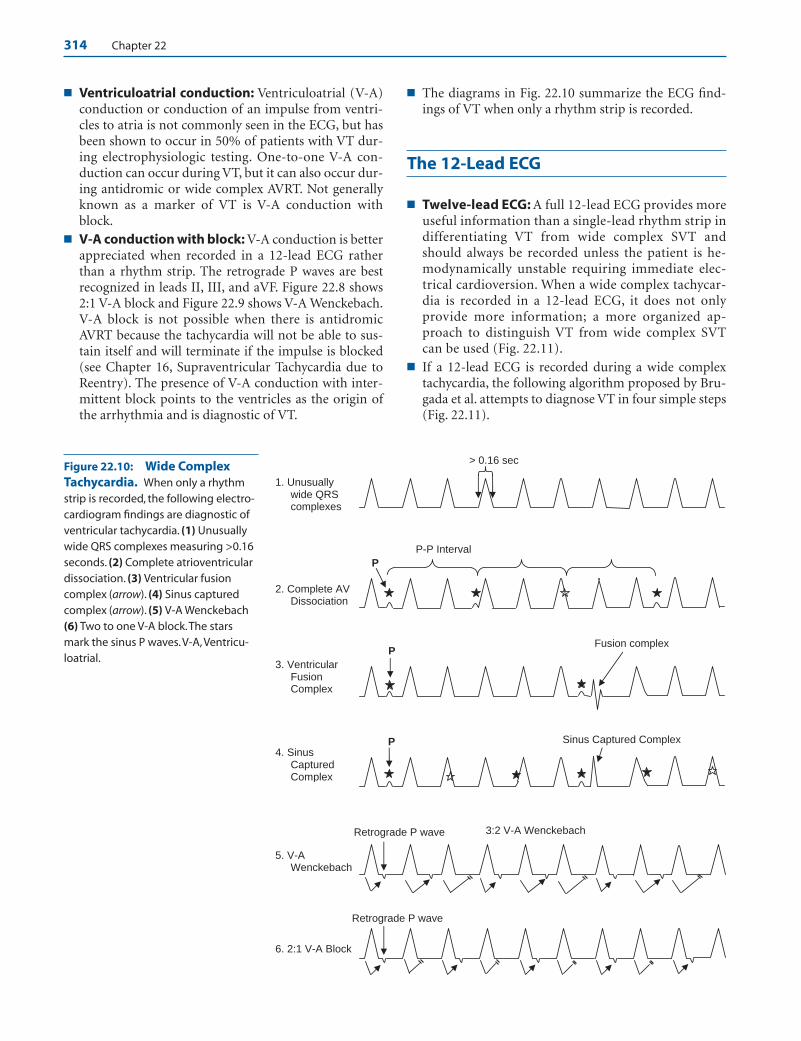
314 Chapter 22
■ Ventriculoatrial conduction: Ventriculoatrial (V-A)conduction or conduction of an impulse from ventri-cles to atria is not commonly seen in the ECG, but hasbeen shown to occur in 50% of patients with VT dur-ing electrophysiologic testing. One-to-one V-A con-duction can occur during VT, but it can also occur dur-ing antidromic or wide complex AVRT. Not generallyknown as a marker of VT is V-A conduction withblock.
■ V-A conduction with block: V-A conduction is betterappreciated when recorded in a 12-lead ECG ratherthan a rhythm strip. The retrograde P waves are bestrecognized in leads II, III, and aVF. Figure 22.8 shows2:1 V-A block and Figure 22.9 shows V-A Wenckebach.V-A block is not possible when there is antidromicAVRT because the tachycardia will not be able to sus-tain itself and will terminate if the impulse is blocked(see Chapter 16, Supraventricular Tachycardia due toReentry). The presence of V-A conduction with inter-mittent block points to the ventricles as the origin ofthe arrhythmia and is diagnostic of VT.
■ The diagrams in Fig. 22.10 summarize the ECG find-ings of VT when only a rhythm strip is recorded.
The 12-Lead ECG
■ Twelve-lead ECG: A full 12-lead ECG provides moreuseful information than a single-lead rhythm strip indifferentiating VT from wide complex SVT andshould always be recorded unless the patient is he-modynamically unstable requiring immediate elec-trical cardioversion. When a wide complex tachycar-dia is recorded in a 12-lead ECG, it does not onlyprovide more information; a more organized ap-proach to distinguish VT from wide complex SVTcan be used (Fig. 22.11).
■ If a 12-lead ECG is recorded during a wide complextachycardia, the following algorithm proposed by Bru-gada et al. attempts to diagnose VT in four simple steps(Fig. 22.11).
1. Unusually wide QRS complexes
> 0.16 sec
6. 2:1 V-A Block
Retrograde P wave
5. V-A Wenckebach
3:2 V-A WenckebachRetrograde P wave
4. Sinus Captured Complex
Sinus Captured Complex P
3. Ventricular Fusion Complex
Fusion complex P
2. Complete AV Dissociation
P-P Interval
P
Figure 22.10: Wide ComplexTachycardia. When only a rhythmstrip is recorded, the following electro-cardiogram findings are diagnostic ofventricular tachycardia. (1) Unusuallywide QRS complexes measuring >0.16seconds. (2) Complete atrioventriculardissociation. (3) Ventricular fusioncomplex (arrow). (4) Sinus capturedcomplex (arrow). (5) V-A Wenckebach(6) Two to one V-A block.The starsmark the sinus P waves.V-A, Ventricu-loatrial.
LWBK271-C22_310-330.qxd 29/1/09 7:48 pm Page 314 LWBK270-4119G-C02_073-110.qxd

Wide Complex Tachycardia 315
■ Step 1: Look for an RS complex in V1 to V6. If thereis no RS complex, the diagnosis is VT and no furtheranalysis is needed. If an RS complex is present, pro-ceed to step 2.
■ Step 2: Measure the RS duration. If the RS durationis >100 milliseconds, the diagnosis is VT and no fur-ther analysis is needed. If the RS duration is �100milliseconds, proceed to step 3.
■ Step 3: Look for AV dissociation. If there is AV dis-sociation, the diagnosis is VT and no further analy-sis is needed. If AV dissociation is not present, pro-ceed to step 4.
■ Step 4: The morphologic criteria are used to diag-nose VT (Figure 22.11)n If the QRS complex is positive in V1, the mor-
phologic criteria for RBBB are used to diagnoseVT.
n If the QRS complex is negative in V1, the mor-phologic criteria for LBBB are used to diagnoseVT.
■ The full algorithm is shown in Figure 22.11. If the diag-nosis of VT is not possible after going through thesefour simple steps, the patient should be further evalu-ated for other signs of VT using all possible diagnostic
Algorithm for the Diagnosis of VT
No RS ComplexDiagnosis: VT
RS Complex is present. Proceed to Step II
II. Measure Duration of RS Complex
RS Complex ≤ 100 msProceed to Step III
RS Complex >100 ms Diagnosis: VT
III. Look for AV Dissociation
AV Dissociation Diagnosis: VT
No AV Dissociation Proceed to Step IV
IV. Morphologic Criteria
I. Look for an RS Complex in V1 to V6
Right Bundle Branch Block Morphology Left Bundle Branch Block Morphology
Monophasic
Biphasic
V1
V6
V1/V2
V6
R rSqR qr QSAny Q in V6
R ≥ 0.04 RS ≥ 0.07 Slurred S
Any pattern in V1 and V6 = VT Any pattern in V1 or V2 and V6 = VT
Figure 22.11: Algorithm forWide Complex Tachycardia.(Modified from Brugada et al.)
LWBK271-C22_310-330.qxd 29/1/09 7:48 pm Page 315 LWBK270-4119G-C02_073-110.qxd
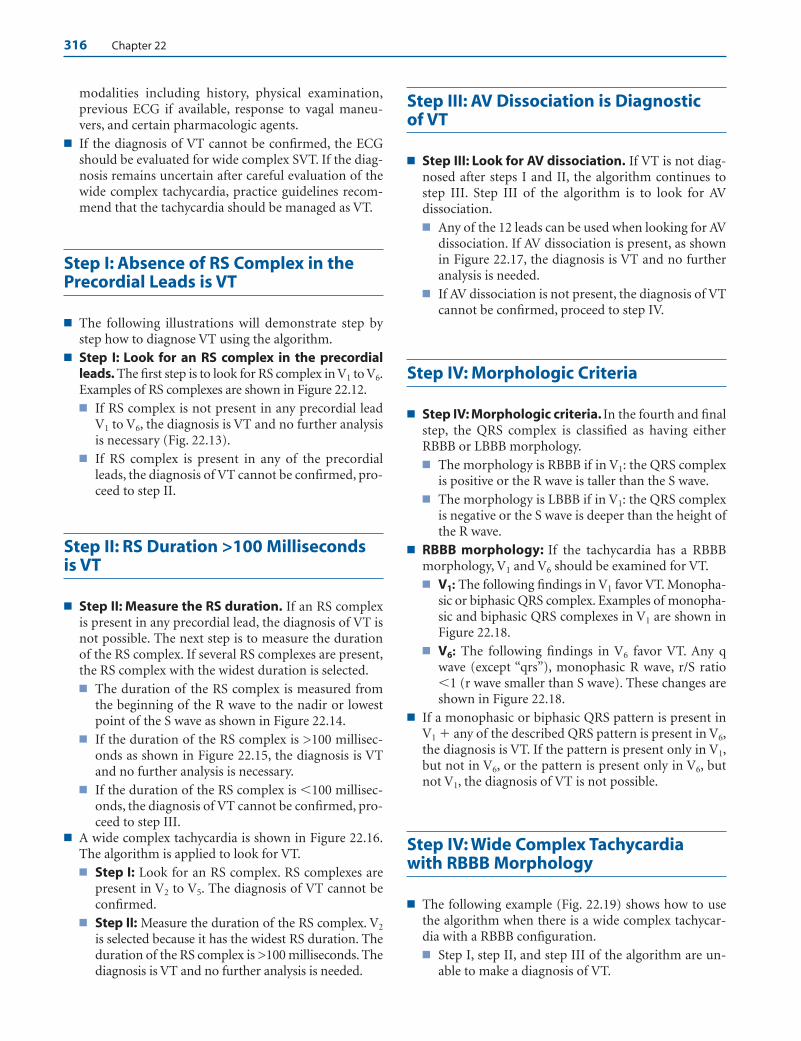
316 Chapter 22
modalities including history, physical examination,previous ECG if available, response to vagal maneu-vers, and certain pharmacologic agents.
■ If the diagnosis of VT cannot be confirmed, the ECGshould be evaluated for wide complex SVT. If the diag-nosis remains uncertain after careful evaluation of thewide complex tachycardia, practice guidelines recom-mend that the tachycardia should be managed as VT.
Step I: Absence of RS Complex in thePrecordial Leads is VT
■ The following illustrations will demonstrate step bystep how to diagnose VT using the algorithm.
■ Step I: Look for an RS complex in the precordialleads. The first step is to look for RS complex in V1 to V6.Examples of RS complexes are shown in Figure 22.12.■ If RS complex is not present in any precordial lead
V1 to V6, the diagnosis is VT and no further analysisis necessary (Fig. 22.13).
■ If RS complex is present in any of the precordialleads, the diagnosis of VT cannot be confirmed, pro-ceed to step II.
Step II: RS Duration >100 Milliseconds is VT
■ Step II: Measure the RS duration. If an RS complexis present in any precordial lead, the diagnosis of VT isnot possible. The next step is to measure the durationof the RS complex. If several RS complexes are present,the RS complex with the widest duration is selected.■ The duration of the RS complex is measured from
the beginning of the R wave to the nadir or lowestpoint of the S wave as shown in Figure 22.14.
■ If the duration of the RS complex is >100 millisec-onds as shown in Figure 22.15, the diagnosis is VTand no further analysis is necessary.
■ If the duration of the RS complex is �100 millisec-onds, the diagnosis of VT cannot be confirmed, pro-ceed to step III.
■ A wide complex tachycardia is shown in Figure 22.16.The algorithm is applied to look for VT.■ Step I: Look for an RS complex. RS complexes are
present in V2 to V5. The diagnosis of VT cannot beconfirmed.
■ Step II: Measure the duration of the RS complex. V2
is selected because it has the widest RS duration. Theduration of the RS complex is >100 milliseconds. Thediagnosis is VT and no further analysis is needed.
Step III: AV Dissociation is Diagnostic of VT
■ Step III: Look for AV dissociation. If VT is not diag-nosed after steps I and II, the algorithm continues tostep III. Step III of the algorithm is to look for AVdissociation.■ Any of the 12 leads can be used when looking for AV
dissociation. If AV dissociation is present, as shownin Figure 22.17, the diagnosis is VT and no furtheranalysis is needed.
■ If AV dissociation is not present, the diagnosis of VTcannot be confirmed, proceed to step IV.
Step IV: Morphologic Criteria
■ Step IV: Morphologic criteria. In the fourth and finalstep, the QRS complex is classified as having eitherRBBB or LBBB morphology.■ The morphology is RBBB if in V1: the QRS complex
is positive or the R wave is taller than the S wave.■ The morphology is LBBB if in V1: the QRS complex
is negative or the S wave is deeper than the height ofthe R wave.
■ RBBB morphology: If the tachycardia has a RBBBmorphology, V1 and V6 should be examined for VT.■ V1: The following findings in V1 favor VT. Monopha-
sic or biphasic QRS complex. Examples of monopha-sic and biphasic QRS complexes in V1 are shown inFigure 22.18.
■ V6: The following findings in V6 favor VT. Any qwave (except “qrs”), monophasic R wave, r/S ratio�1 (r wave smaller than S wave). These changes areshown in Figure 22.18.
■ If a monophasic or biphasic QRS pattern is present inV1 � any of the described QRS pattern is present in V6,the diagnosis is VT. If the pattern is present only in V1,but not in V6, or the pattern is present only in V6, butnot V1, the diagnosis of VT is not possible.
Step IV: Wide Complex Tachycardia with RBBB Morphology
■ The following example (Fig. 22.19) shows how to usethe algorithm when there is a wide complex tachycar-dia with a RBBB configuration.■ Step I, step II, and step III of the algorithm are un-
able to make a diagnosis of VT.
LWBK271-C22_310-330.qxd 29/1/09 7:48 pm Page 316 LWBK270-4119G-C02_073-110.qxd
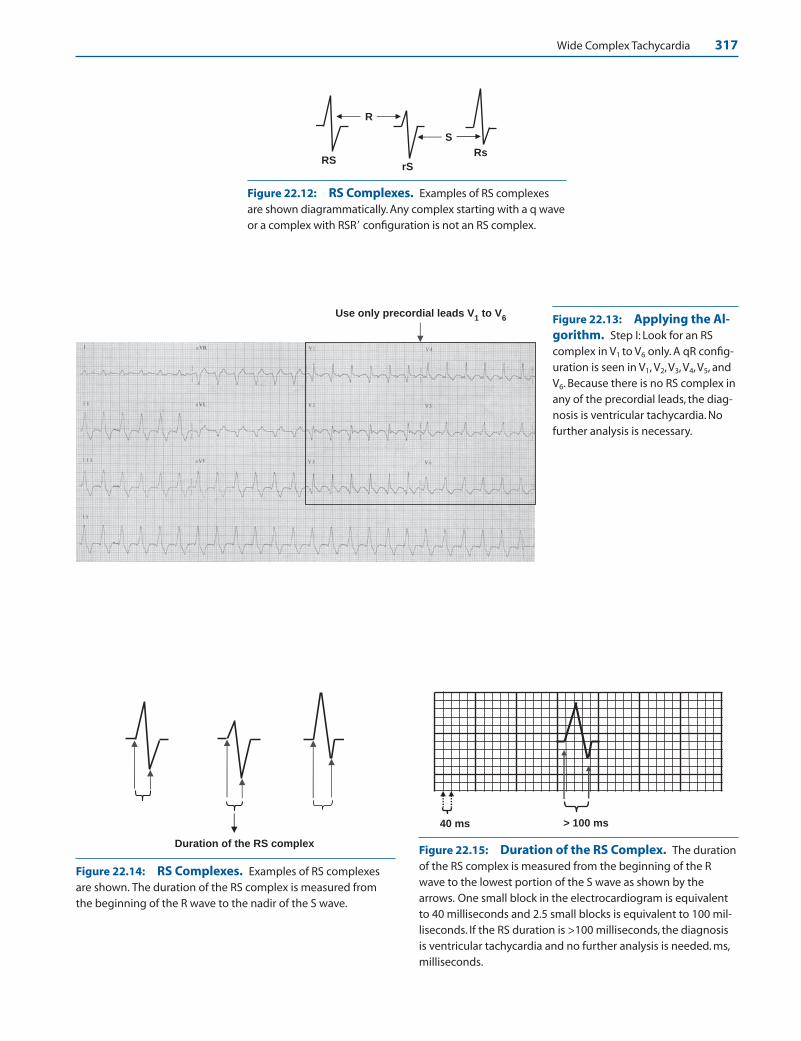
Wide Complex Tachycardia 317
R
S
RS rS
Rs
Figure 22.12: RS Complexes. Examples of RS complexesare shown diagrammatically. Any complex starting with a q waveor a complex with RSR� configuration is not an RS complex.
Use only precordial leads V1 to V
6 Figure 22.13: Applying the Al-gorithm. Step I: Look for an RScomplex in V1 to V6 only. A qR config-uration is seen in V1, V2, V3, V4, V5, andV6. Because there is no RS complex inany of the precordial leads, the diag-nosis is ventricular tachycardia. Nofurther analysis is necessary.
Duration of the RS complex
Figure 22.14: RS Complexes. Examples of RS complexesare shown. The duration of the RS complex is measured fromthe beginning of the R wave to the nadir of the S wave.
> 100 ms 40 ms
Figure 22.15: Duration of the RS Complex. The durationof the RS complex is measured from the beginning of the Rwave to the lowest portion of the S wave as shown by thearrows. One small block in the electrocardiogram is equivalentto 40 milliseconds and 2.5 small blocks is equivalent to 100 mil-liseconds. If the RS duration is >100 milliseconds, the diagnosisis ventricular tachycardia and no further analysis is needed. ms,milliseconds.
LWBK271-C22_310-330.qxd 29/1/09 7:48 pm Page 317 LWBK270-4119G-C02_073-110.qxd

318 Chapter 22
RS = 120 ms (3 small blocks)
Magnified V2
1 small block = 40 ms
Figure 22.16: Step II: Measurethe Duration of the RSComplex. Step I: Look for an RScomplex in the precordial leads. RScomplexes are seen in V2, V3, V4, V5,and probably V6. Because RScomplexes are present, the diagnosisof ventricular tachycardia (VT)cannot be confirmed. Step II: The du-ration of the RS complex is measured.V2 has the widest RS duration and ismagnified to show how the RS ismeasured. The RS measures 120 mil-liseconds. The diagnosis is VT and nofurther analysis is needed. ms,milliseconds.
A.
B.
Figure 22.17: Step III: Look for Atrioventricular (AV) Dissociation. Step I: Lookfor an RS complex. Because an RS complex is present in V1, V2, and V3, the diagnosis of ven-tricular tachycardia (VT) can not be confirmed. Step II: Measure the duration of the RScomplex. The RS duration in V2 and in V3 is �100 milliseconds. Because the duration of theRS complex is �100 milliseconds, diagnosis of VT can not be confirmed. Step III: Look forAV dissociation. (B) This is the same lead II rhythm strip shown in (A) and is magnified toshow the AV dissociation. The P waves (arrows) are completely dissociated from the QRScomplexes.When complete AV dissociation is present, the diagnosis is VT and no furtheranalysis is necessary. ms, milliseconds.
LWBK271-C22_310-330.qxd 29/1/09 7:48 pm Page 318 LWBK270-4119G-C02_073-110.qxd
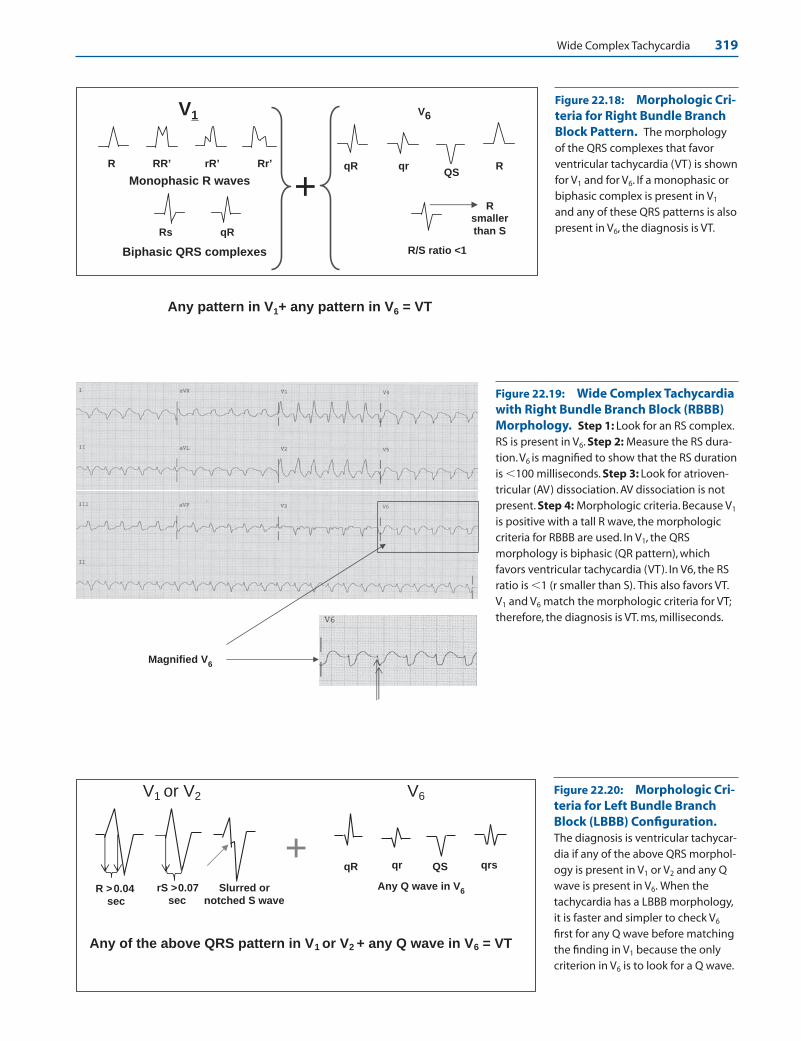
Wide Complex Tachycardia 319
Monophasic R waves
Biphasic QRS complexes
R RR’ rR’ Rr’
Rs qR
V1 V6
qrQS
R/S ratio <1
RqR
+
Any pattern in V1+ any pattern in V6 = VT
Rsmaller than S
Figure 22.18: Morphologic Cri-teria for Right Bundle BranchBlock Pattern. The morphologyof the QRS complexes that favorventricular tachycardia (VT) is shownfor V1 and for V6. If a monophasic orbiphasic complex is present in V1
and any of these QRS patterns is alsopresent in V6, the diagnosis is VT.
Magnified V6
Figure 22.19: Wide Complex Tachycardiawith Right Bundle Branch Block (RBBB)Morphology. Step 1: Look for an RS complex.RS is present in V6. Step 2: Measure the RS dura-tion.V6 is magnified to show that the RS durationis �100 milliseconds. Step 3: Look for atrioven-tricular (AV) dissociation. AV dissociation is notpresent. Step 4: Morphologic criteria. Because V1
is positive with a tall R wave, the morphologiccriteria for RBBB are used. In V1, the QRSmorphology is biphasic (QR pattern), whichfavors ventricular tachycardia (VT). In V6, the RSratio is �1 (r smaller than S). This also favors VT.V1 and V6 match the morphologic criteria for VT;therefore, the diagnosis is VT. ms, milliseconds.
V1 or V2 V6
R >0.04sec
rS >0.07 sec
Slurred or notched S wave
qR qr QS qrs +
Any of the above QRS pattern in V1 or V2 + any Q wave in V6 = VT
Any Q wave in V6
Figure 22.20: Morphologic Cri-teria for Left Bundle BranchBlock (LBBB) Configuration.The diagnosis is ventricular tachycar-dia if any of the above QRS morphol-ogy is present in V1 or V2 and any Qwave is present in V6. When thetachycardia has a LBBB morphology,it is faster and simpler to check V6
first for any Q wave before matchingthe finding in V1 because the onlycriterion in V6 is to look for a Q wave.
LWBK271-C22_310-330.qxd 29/1/09 7:48 pm Page 319 LWBK270-4119G-C02_073-110.qxd

320 Chapter 22
■ Step IV of the algorithm shows RBBB configuration;thus, the RBBB morphologic criteria are used asshown in Figure 22.18.
Step IV: Wide Complex Tachycardia with LBBB Morphology
■ LBBB Morphology: When the wide complex tachy-cardia has a LBBB configuration, V1 or V2 can be used.This is unlike wide complex tachycardia with RBBBconfiguration, where only lead V1 is used. The diagno-sis is VT if any of the following findings is present in V1
or V2 and also in V6 (Fig. 22.20):■ V1 or V2:
n R wave duration in V1 or V2 is �0.04 seconds or40 milliseconds
n RS duration in V1 or V2 is �0.07 seconds or 70milliseconds
n Slurring or notching of the downslope of the Swave.
■ V6: Any q wave in V6 will favor VT (Fig. 22.20). Thismay be a qR, qr, QS, or QRS.
■ If any of these QRS morphologies is present in V1 or V2
� any of the QRS morphologies is present in V6, the di-agnosis is VT. If the QRS morphology is present only in
V1 or V2, but not in V6, or the QRS morphology is pres-ent only in V6, but not in V1 or V2, the diagnosis of VTis not possible.
■ When the tachycardia has LBBB morphology, it is sim-pler to evaluate V6 before V1 because the only criterionin V6 is simply to look for any “q” wave. If a q wave isnot present, the diagnosis of VT is not possible. If thetachycardia has RBBB morphology, V1 should be in-spected first because the only criterion in V1 is to lookfor a monophasic or biphasic complex.
■ The ECG in Figure 22.21 shows a wide complex tachy-cardia with LBBB morphology (rS complex is presentin V1). Steps I to III of the algorithm are unable to makea diagnosis of VT. Using step IV of the algorithm, theQRS complex has a LBBB configuration; thus, the mor-phologic criteria for LBBB are used (see Figure 22.21).
Other Findings Diagnostic of VT
■ Other findings: If VT cannot be diagnosed after goingthrough the algorithm, there are other ECG findingsnot included in the algorithm that may suggest VT.■ RBBB morphology with left axis deviation >–30�
(Fig. 22.22).■ LBBB morphology with right axis deviation >�90�
(Fig. 22.23).
Magnified V1V
2
V1
V2
V6
Figure 22.21: Applying the Algorithm.Step IV: Steps I, II, and III of the algorithm areunable to diagnose ventricular tachycardia (VT).Step IV: Because the QRS complex in V1 is nega-tive or the S wave is deeper than the R wave, themorphologic criteria for left bundle branch blockare used. V6 starts with a q wave. This favors VT.V1 has RS duration of 0.07 seconds. There is alsonotching of the downslope of the S wave in V2
(bold arrow). Either of these findings favors VT.V1–2 and V6 match the morphologic criteria forVT; therefore, the diagnosis is VT.
LWBK271-C22_310-330.qxd 29/1/09 7:48 pm Page 320 LWBK270-4119G-C02_073-110.qxd

Wide Complex Tachycardia 321
■ Northwest axis: The QRS axis is between –90� to–180� (Fig. 22.24).
■ Concordant QRS complexes: All QRS complexes inV1 to V6 are similar and are all pointing upward(positive concordance) or downward (negative con-cordance), as shown in Figures 22.24 and 22.25.
■ Previous ECG: A previous ECG shows myocardialinfarction (Fig. 22.26) or previous ECG shows thatduring sinus rhythm, bifascicular block is present,which changes in configuration during tachycardia(Fig. 22.27).
■ Concordance: Negative concordance implies that allQRS complexes in the chest leads are pointing down-ward. Positive concordance implies that all the QRScomplexes are pointing upward (Figs. 22.24 and22.25).
■ Previous ECG: If myocardial infarction is present ina previous ECG, the wide complex tachycardia is VT.This is based on the observation that VT is frequentlyassociated with structural cardiac disease especially
when there is left ventricular dysfunction (Fig.22.26).
■ Previous ECG: If LBBB or a preexistent bifascicularblock such as RBBB plus a fascicular block is present ina previous ECG and the morphology of the QRS com-plex changes during the tachycardia, the diagnosis isVT (Fig. 22.27). This is based on the assumption thatventricular aberration cannot occur when only one fas-cicle is intact.
Findings Favoring SVT
■ Wide complex SVT: After evaluating the ECG for VTand the diagnosis of VT cannot be confirmed, the fol-lowing findings in the 12-lead ECG suggest that thewide complex tachycardia is supraventricular.■ Triphasic pattern in V1 and in V6: SVT with RBBB
configuration has a triphasic rSR� pattern in V1 and
Figure 22.22: Right Bundle Branch Block with Left Axis Deviation. This finding favors ventricular tachy-cardia.
Figure 22.23: Left BundleBranch Block with RightAxis >90�. This finding usuallyindicates ventricular tachycardia(VT). Note also the presence ofcomplete AV dissociation(arrows), which also indicates VT.
LWBK271-C22_310-330.qxd 29/1/09 7:48 pm Page 321 LWBK270-4119G-C02_073-110.qxd
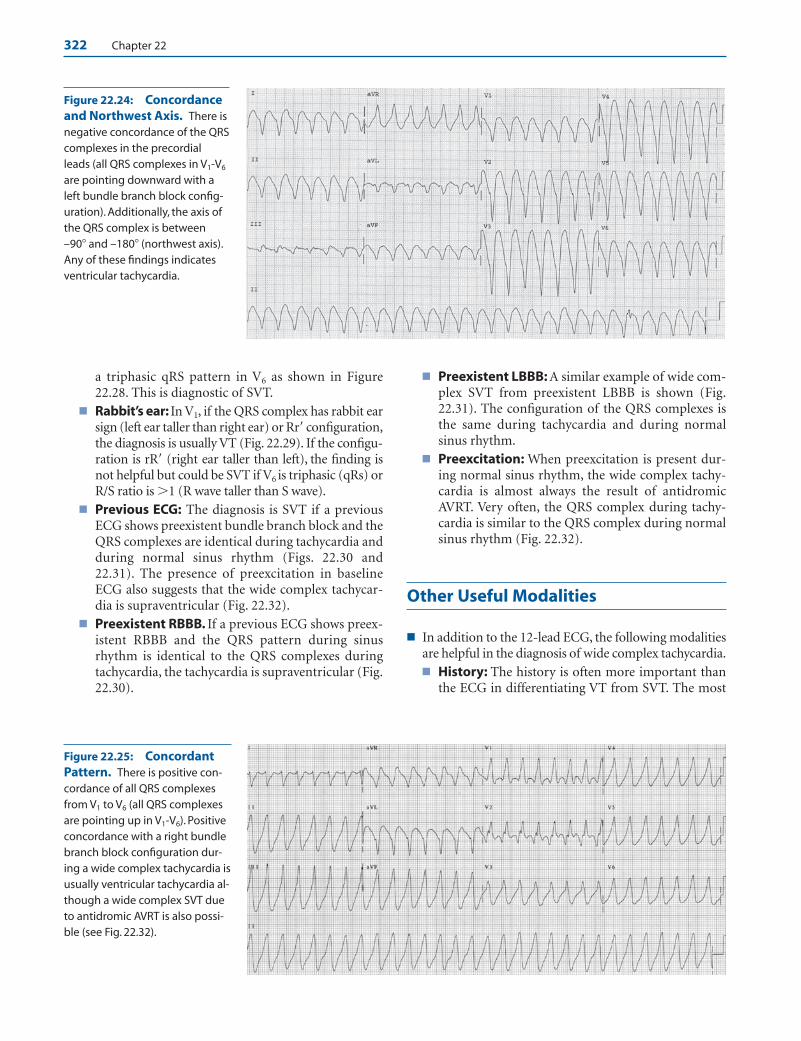
322 Chapter 22
Figure 22.24: Concordanceand Northwest Axis. There isnegative concordance of the QRScomplexes in the precordialleads (all QRS complexes in V1-V6
are pointing downward with aleft bundle branch block config-uration). Additionally, the axis ofthe QRS complex is between–90� and –180� (northwest axis).Any of these findings indicatesventricular tachycardia.
Figure 22.25: ConcordantPattern. There is positive con-cordance of all QRS complexesfrom V1 to V6 (all QRS complexesare pointing up in V1-V6). Positiveconcordance with a right bundlebranch block configuration dur-ing a wide complex tachycardia isusually ventricular tachycardia al-though a wide complex SVT dueto antidromic AVRT is also possi-ble (see Fig. 22.32).
a triphasic qRS pattern in V6 as shown in Figure22.28. This is diagnostic of SVT.
■ Rabbit’s ear: In V1, if the QRS complex has rabbit earsign (left ear taller than right ear) or Rr� configuration,the diagnosis is usually VT (Fig. 22.29). If the configu-ration is rR� (right ear taller than left), the finding isnot helpful but could be SVT if V6 is triphasic (qRs) orR/S ratio is �1 (R wave taller than S wave).
■ Previous ECG: The diagnosis is SVT if a previousECG shows preexistent bundle branch block and theQRS complexes are identical during tachycardia andduring normal sinus rhythm (Figs. 22.30 and22.31). The presence of preexcitation in baselineECG also suggests that the wide complex tachycar-dia is supraventricular (Fig. 22.32).
■ Preexistent RBBB. If a previous ECG shows preex-istent RBBB and the QRS pattern during sinusrhythm is identical to the QRS complexes duringtachycardia, the tachycardia is supraventricular (Fig.22.30).
■ Preexistent LBBB: A similar example of wide com-plex SVT from preexistent LBBB is shown (Fig.22.31). The configuration of the QRS complexes isthe same during tachycardia and during normalsinus rhythm.
■ Preexcitation: When preexcitation is present dur-ing normal sinus rhythm, the wide complex tachy-cardia is almost always the result of antidromicAVRT. Very often, the QRS complex during tachy-cardia is similar to the QRS complex during normalsinus rhythm (Fig. 22.32).
Other Useful Modalities
■ In addition to the 12-lead ECG, the following modalitiesare helpful in the diagnosis of wide complex tachycardia.■ History: The history is often more important than
the ECG in differentiating VT from SVT. The most
LWBK271-C22_310-330.qxd 29/1/09 7:48 pm Page 322 LWBK270-4119G-C02_073-110.qxd
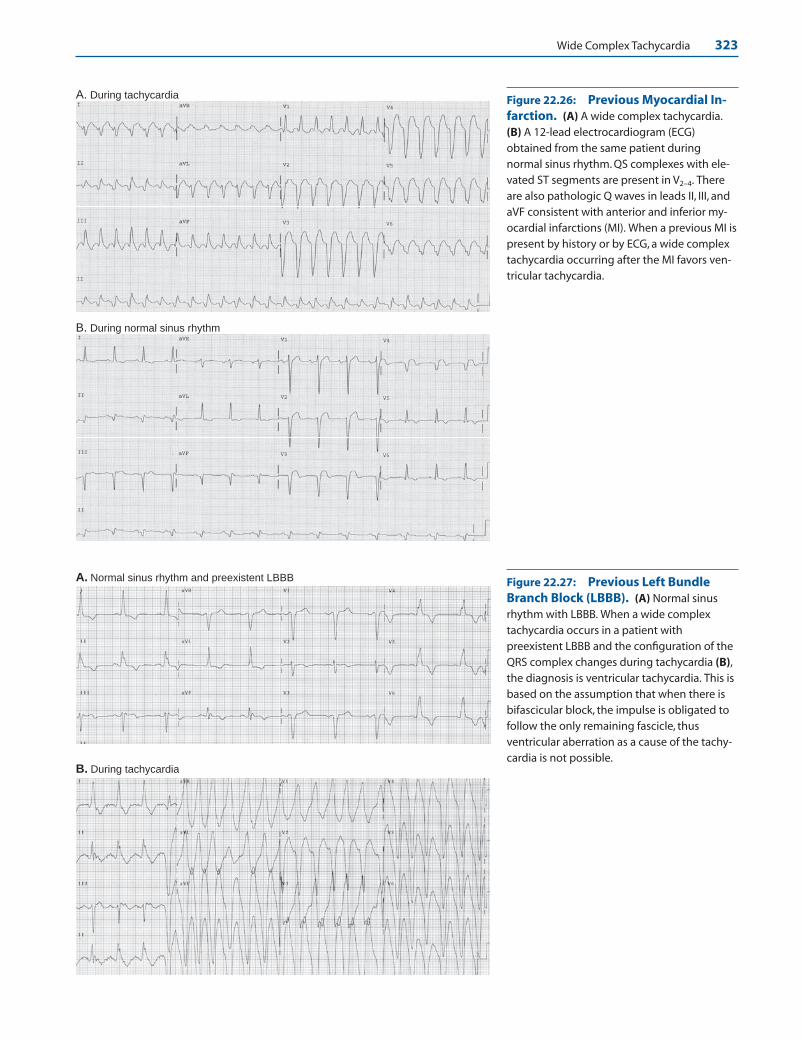
Wide Complex Tachycardia 323
Figure 22.27: Previous Left BundleBranch Block (LBBB). (A) Normal sinusrhythm with LBBB. When a wide complextachycardia occurs in a patient withpreexistent LBBB and the configuration of theQRS complex changes during tachycardia (B),the diagnosis is ventricular tachycardia. This isbased on the assumption that when there isbifascicular block, the impulse is obligated tofollow the only remaining fascicle, thusventricular aberration as a cause of the tachy-cardia is not possible.
A. During tachycardia
B. During normal sinus rhythm
Figure 22.26: Previous Myocardial In-farction. (A) A wide complex tachycardia.(B) A 12-lead electrocardiogram (ECG)obtained from the same patient duringnormal sinus rhythm. QS complexes with ele-vated ST segments are present in V2–4. Thereare also pathologic Q waves in leads II, III, andaVF consistent with anterior and inferior my-ocardial infarctions (MI). When a previous MI ispresent by history or by ECG, a wide complextachycardia occurring after the MI favors ven-tricular tachycardia.
A. Normal sinus rhythm and preexistent LBBB
B. During tachycardia
LWBK271-C22_310-330.qxd 29/1/09 7:48 pm Page 323 LWBK270-4119G-C02_073-110.qxd

324 Chapter 22
rSR’
R’
r
S
R
q
S
qRS
+V1 V6
Figure 22.28: Wide Complex Supraventricular Tachy-cardia (SVT). Triphasic rSR� pattern in V1 combined withtriphasic qRS pattern in V6 favor the diagnosis of SVT.
r R ’
V1
rR’ is not helpful but is SVTif V
6 is triphasic or R>S
Br’
R
V1
Rr’ “rabbit ear sign” favors VT
A
Figure 22.29: Wide Complex Supraventricular Tachycar-dia (SVT). (A) When lead V1 shows Rr� (left rabbit’s ear taller thanright rabbit’s ear), the pattern favors ventricular tachycardia. (B) Iflead V1 shows rR� (also called right rabbit ear taller than left rabbitear), the finding is not specific but could be SVT if V6 is triphasic(qRS) or the R wave is taller than S wave (R/S ratio �1).
A. During normal sinus rhythm
B. During tachycardia
Figure 22.30: Wide ComplexSupraventricular Tachycardia (SVT) fromPreexistent Right Bundle Branch Block(RBBB). Electrocardiogram (A) and (B) are fromthe same patient. Note that the configuration ofthe QRS complexes during normal sinus rhythm(A) is identical to the QRS complexes duringtachycardia (B) because of preexistent RBBB.
important feature in the history that will favor VT isthe presence of a previous MI.n If the patient had a previous MI and the tachy-
cardia occurred after the MI, the diagnosis is VT.n If the patient has history of tachycardia and has
preexcitation, the diagnosis is SVT.■ Physical examination: The presence of hemody-
namic instability does not differentiate ventricularfrom supraventricular tachycardia with a wide QRScomplex. The following physical findings howeverare diagnostic of VT.n Cannon “A” wavesn Varying intensity of the first heart soundn Varying volume of the arterial pulse
■ Vagal stimulation: If the wide complex tachycar-dia is due to SVT, vagal stimulation may terminatethe arrhythmia or may cause significant slowing ofthe heart rate. This will allow the arrhythmia to bediagnosed more appropriately (Fig. 22.33). Therhythm should be recorded during vagal stimula-tion.
■ Pharmacologic agents: Adenosine, a short-actingAV nodal blocker, is useful in terminating widecomplex SVT that are AV nodal–dependent. The
LWBK271-C22_310-330.qxd 29/1/09 7:48 pm Page 324 LWBK270-4119G-C02_073-110.qxd

Wide Complex Tachycardia 325
A. During normal sinus rhythm
B. During tachycardia
Figure 22.31: Wide ComplexSupraventricular Tachycardia (SVT) fromPreexistent Left Bundle Branch Block(LBBB). Electrocardiogram (A) and (B) are fromthe same patient. Figure (A) shows the patientduring normal sinus rhythm and (B) duringtachycardia. Note that the configuration of theQRS complexes during the tachycardia (B) is thesame as during normal sinus rhythm (A) consis-tent with SVT with preexistent LBBB.
A. During normal sinus rhythm
B. During tachycardia
Figure 22.32: Wide Complex Supraventric-ular Tachycardia (SVT) from a BypassTract. (A) Normal sinus rhythm with short PR in-terval and delta waves (arrows) frompreexcitation. (B) From the same patient duringwide complex tachycardia. The presence of preex-citation in baseline electrocardiogram suggeststhat the wide complex tachycardia is due toantidromic atrioventricular reciprocatingtachycardia.
LWBK271-C22_310-330.qxd 29/1/09 7:48 pm Page 325 LWBK270-4119G-C02_073-110.qxd

326 Chapter 22
tachycardia should be recorded while adenosine isbeing injected. The cause of the tachycardia may beidentified even if the tachycardia does not respondto adenosine (Fig. 22.34).
■ If the diagnosis of the wide complex tachycardia re-mains uncertain after careful evaluation of all availableclinical information, practice guidelines recommendthat the patient should be treated as VT.
Pharmacologic Agents
■ Figure 22.34 shows a wide complex tachycardia fromSVT diagnosed with injection of adenosine, a short-acting AV nodal blocker. It should be given only ifthe wide complex SVT is known to be supraventric-ular in origin. It should not be given if the diagnosis
is uncertain. It is also helpful in identifying themechanisms of other types of wide complex tachy-cardia by slowing the heart rate, as shown in Figure22.34B.
Wide Complex Tachycardia
Summary of ECG Findings
■ VT: Any of the following ECG findings suggests VT:
■ Complete AV dissociation
■ Ventricular fusion complex
■ Sinus captured complex
■ Ventriculoatrial conduction with second degree block
■ Wide QRS complexes measuring >140 milliseconds whenthe tachycardia has a RBBB pattern or >160 milliseconds
Figure 22.33: Wide Complex Tachycardia from Atrial Flutter. Carotid sinusstimulation can slow the ventricular rate transiently resulting in lengthening of the R-R intervals.This will allow the baseline to be inspected for atrial activity. Atrial flutter waves can be demon-strated during transient lengthening of the R-R interval (arrows). The tachycardia is due to atrialflutter and the wide QRS complexes are due to preexistent bundle branch block.
A. Wide complex tachycardia
B. Adenosine IV
I
II
III
Figure 22.34: Wide Complex Tachycardiaand Intravenous Adenosine. (A) Twelve-lead electrocardiogram showing a wide complextachycardia. (B) Leads I, II, and III were recordedwhile adenosine was being injectedintravenously. Although the ventricular rateslowed significantly, the configuration of the QRScomplexes remained unchanged because of pre-existent bundle branch block. Arrows point to thepresence of atrial tachycardia with a rate of 167beats per minute. The atrial rate is the same as therate of the wide complex tachycardia.
LWBK271-C22_310-330.qxd 29/1/09 7:48 pm Page 326 LWBK270-4119G-C02_073-110.qxd

Wide Complex Tachycardia 327
when the tachycardia has a LBBB pattern. This observa-tion is not helpful if there is preexistent bundle branchblock, preexcitation, or the patient is taking antiarrhyth-mic medications that prolong intraventricular conduc-tion such as type IA or IC agents.
■ If there is no RS complex in the precordial leads.
■ If RS complex is present in the precordial leads and the RSduration measures >100 milliseconds.
■ If the QRS complex in V1 has RBBB configuration that ismonophasic or biphasic and the configuration in V6 is qR,QS, monophasic R wave or rS (R/S �1).
■ When there is LBBB morphology with right axis devia-tion >�90� or >–60�.
■ When there is RBBB morphology with left axis deviation>–30�.
■ If the axis of the QRS complex is between –90� and –180�
also called northwest axis.
■ When QRS complexes are concordant in the precordialleads:
n LBBB morphology: When the QRS complexes in theprecordial leads are negatively concordant with LBBBmorphology, this is almost always from VT.
n RBBB morphology: When the QRS complexes arepositively concordant with RBBB morphology, this isusually VT although wide complex SVT from an-tidromic AVRT is also possible.
■ If a previous 12-lead ECG is available, the diagnosis is VT if:
n A previous myocardial infarction (MI) is present.
n Bifascicular block is present during normal sinus rhythm(LBBB or RBBB � a fascicular block) and the QRS mor-phology becomes different during the tachycardia.
■ SVT: Any of the following ECG findings is consistent withSVT:
■ The tachycardia has RBBB configuration with a triphasicrSR� pattern in V1 and a triphasic qRS pattern in V6.
■ In V1, right rabbit ear is taller than left. In V6, there is atriphasic QRS complex or R wave is taller than S wave(R/S ratio >1).
■ When a previous 12-lead ECG is available, the diagnosis isSVT if:
n Bundle branch block is present during normal sinusrhythm and the QRS configuration is identical duringtachycardia (wide complex SVT from preexistent bun-dle branch block).
n Preexcitation or Wolff-Parkinson-White (WPW) ECGis present during normal sinus rhythm (antidromicAVRT).
Mechanism
■ Complete AV dissociation: In VT, the ventricles are drivenby an impulse that is faster and separate from that of theatria. Generally, the atria continue to be controlled by nor-mal sinus rhythm, which has a slower rate and is independ-
ent from the ectopic activity occurring in the ventricles. Thepresence of two independent pacemakers, one controllingthe atria and the other the ventricles, will result in completeAV dissociation.
■ Wide QRS complexes: Ventricular tachycardia has wideQRS complex because the ventricles are driven by an impulseoccurring below the bifurcation of the bundle of His. Thus,the ventricles are not activated simultaneously because theimpulse has to spread from one ventricle to the other ventri-cle outside the normal conduction system. This causes theQRS complexes to be wide measuring �120 milliseconds.
■ Absence of RS complex in the precordial leads: Absenceof RS complex in the precordial leads indicates VT. When thisoccurs, the QRS complex usually starts with a q wave. The qwaves indicate that the ectopic ventricular impulse originatesfrom the epicardium and spreads from epicardium to endo-cardium, causing q waves in the precordial leads. This is incontrast to SVT, which usually activates the ventriclesthrough the His-Purkinje system and therefore the spread ofthe ventricular impulse is from endocardium to epicardium,causing an RS complex to be inscribed in at least one of theprecordial leads.
■ Wide RS interval: The RS interval, measured from the be-ginning of the R wave to the lowest point of the S wave isequivalent to the spread of the impulse across the thicknessof the myocardium. If the RS interval exceeds 100 millisec-onds, the diagnosis is VT. This is based on the assumptionthat in VT, activation of the ventricles will be less efficientand will take longer because the impulse is propagated bymuscle cell to muscle cell conduction, as opposed to SVTwhere activation of the myocardium will be faster becausethe impulse is conducted through the more efficient His-Purkinje system.
■ Fusion and sinus captured complexes: Although theatrial rate or the rate of the sinus impulse is slower than therate of the ventricles during VT, a properly timed sinus im-pulse may arrive at the ventricles when the ventricles are notrefractory and may be able to capture the ventricles partially(resulting in fusion complexes) or completely (resulting insinus captured beats). Thus, when fusion or sinus capturedcomplexes are present, the diagnosis is VT.
■ V-A conduction: When there is VT, the ventricular impulsemay be conducted to the atria retrogradely across the AVnode, causing the atria to be activated from below upward.This will result in inverted P waves in leads II, III, and aVF.V-A conduction is not uncommon during VT. Wellens et al.showed that in 70 patients with VT, approximately 50% hadV-A conduction during electrophysiologic testing, with 23having 1:1 V-A conduction, 7 having 2:1 V-A, conduction,and 2 having V-A Wenckebach. V-A block may occur sponta-neously. It could also be induced by carotid sinus pressure.One to one V-A conduction is not diagnostic of VT becausethis can also occur in wide complex AVRT. However, inter-mittent V-A conduction from V-A block is diagnostic of VT.V-A block is not generally known as a marker of VT becauseV-A conduction is not commonly seen in the surface ECG.
LWBK271-C22_310-330.qxd 29/1/09 7:48 pm Page 327 LWBK270-4119G-C02_073-110.qxd
328 Chapter 22
Clinical Findings
■ Other modalities that are useful in differentiating VTfrom wide complex SVT: Although the 12-lead ECG servesas the foundation for differentiating VT from wide complexSVT, there are other modalities that are also useful. These in-clude the history, physical examination, response to carotidsinus pressure, and other vagal maneuvers.
■ Clinical presentation: The hemodynamic condition ofthe patient is not reliable in distinguishing VT from SVT.A patient presenting with hypotension, dizziness, or syn-cope does not necessarily imply that the tachycardia isventricular. Conversely, a patient who is hemodynami-cally stable during the tachycardia does not necessarily in-dicate that the tachycardia is supraventricular. When theheart rate is very rapid (usually �150 beats per minute),patients usually become symptomatic and even patientswith SVT may become hemodynamically unstable whenthere is associated left ventricular systolic or diastolic dys-function.
■ History: The history is often more important than theECG in differentiating VT from wide complex SVT.
n History of previous MI favors VT. The tachycardiashould occur after (not before) the onset of the MI.
n History of preexcitation (WPW syndrome) indicateswide complex SVT.
■ Physical examination: The following physical findingssuggest VT. The findings are based on the presence of AVdissociation, which is very specific for VT.
n Cannon “A” waves in the neck veins: When atrial andventricular contractions are completely dissociated,simultaneous contraction of the atria and ventriclesmay occur intermittently. When atrial contraction issimultaneous with ventricular contraction, cannon“A” waves will appear in the neck representing con-traction of the atria against a closed tricuspid valve.This is manifested as intermittent prominent pulsa-tions in the neck veins.
n Varying intensity of the first heart sound. Anothersign of AV dissociation is varying intensity of the firstheart sound. The mechanism for the varying intensityof the first heart sound has been previously discussedin Chapter 8, Atrioventricular Block. The first heartsound is due to closure of the AV valves and the inten-sity depends on the position of the valves at the onsetof systole. If the AV valves are widely open when sys-tole occurs, the first heart sound will be loud. If the AVvalves are almost closed at the onset of systole, the firstheart sound will be very soft. Because the atrial kick (Pwave) pushes the AV valves away from their coapta-tion points, a short PR interval will cause the ventri-cles to contract immediately when the AV valves arewidely open, which will result in a loud first heartsound. If the PR interval is unusually prolonged, theAV valves will float back to a semiclosed position be-
fore the onset of ventricular contraction; thus, the firstheart sound will be softer. Because AV dissociation isassociated with varying PR intervals, the position ofthe AV valves at the onset of systole will be variable;hence, the intensity of the first heart sound will also bevariable.
n Varying pulse volume: If atrial contraction is per-fectly timed to occur just before ventricular contrac-tion, ventricular filling is augmented and a larger vol-ume is ejected. Because the PR interval is variablewhen there is AV dissociation, atrial contribution toleft ventricular filling will vary resulting in varyingpulse volume.
■ Carotid sinus pressure and other vagal maneuvers:Another method of distinguishing VT from SVT is to per-form vagal maneuvers including carotid sinus pressure.These procedures may terminate wide complex SVT, butnot VT.
Acute Therapy
■ Immediate therapy depends on the clinical presentation ofthe patient.
■ Unstable patient: If the patient is unstable with hy-potension or gross heart failure or the patient is havingsymptoms of severe ischemia related to the tachycardia,electrical cardioversion is indicated whether the widecomplex tachycardia is ventricular or supraventricular.
■ Stable patient: If the patient is stable, pharmacologictherapy can be used. Elective cardioversion is also an op-tion in stable patients if the tachycardia is due to VT orthere is uncertainty about the etiology of the wide com-plex tachycardia. Carotid sinus stimulation and other va-gal maneuvers are also helpful and should be tried ini-tially to terminate SVT. It is also helpful in distinguishingVT from wide complex SVT.
■ Pharmacologic therapy: Among stable patients, the typeof pharmacologic agent will depend on whether the tachy-cardia is known to be ventricular, supraventricular, or theetiology of the wide complex tachycardia remains uncertain.
■ Wide complex tachycardia due to SVT: The treatmentfor wide complex SVT is similar to the treatment of nar-row complex SVT. Carotid sinus pressure may terminatethe arrhythmia and should be attempted before intra-venous medications are given. If the arrhythmia cannotbe terminated with vagal maneuvers, the drug of choice isadenosine given intravenously. If adenosine is not effec-tive, another AV nodal blocker may be given. The choiceof the AV nodal blocking agent will depend on the pres-ence or absence of LV dysfunction as described under thetreatment of narrow complex SVT.
n Wide complex tachycardia due to antidromic AVRT:If the wide complex SVT is due to antidromic AVRT(WPW syndrome), the AV node may not be part ofthe reentrant circuit (see the Wide Complex or
LWBK271-C22_310-330.qxd 29/1/09 7:48 pm Page 328 LWBK270-4119G-C02_073-110.qxd
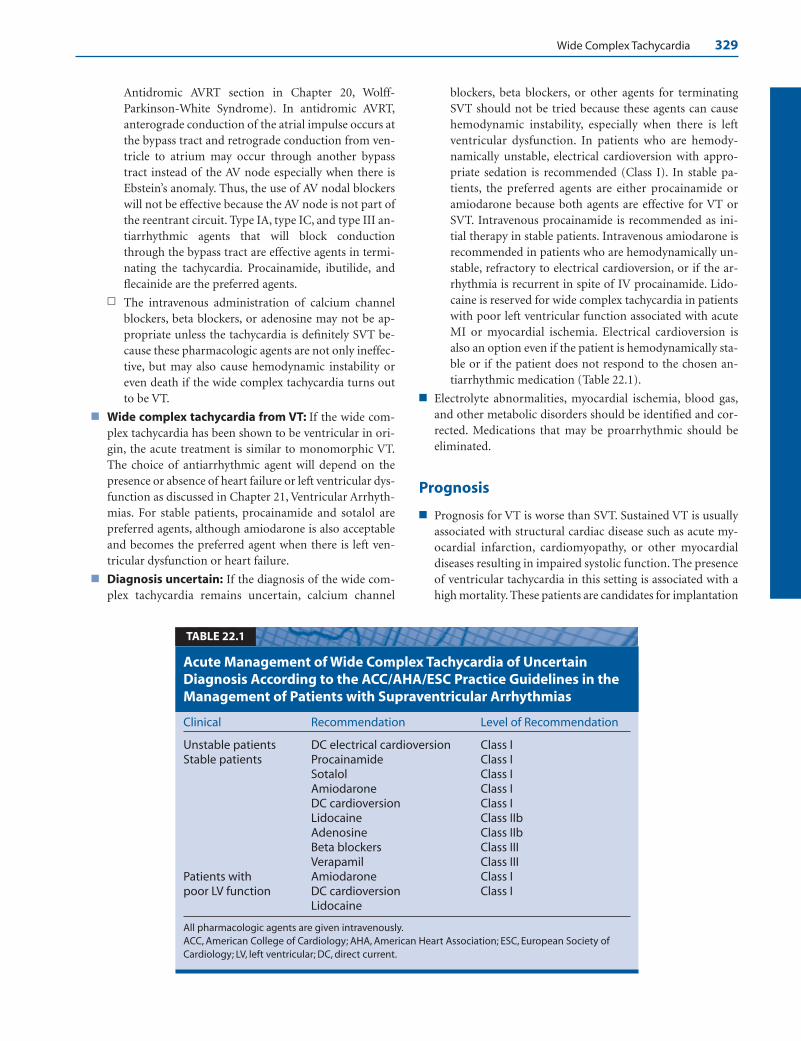
Wide Complex Tachycardia 329
Antidromic AVRT section in Chapter 20, Wolff-Parkinson-White Syndrome). In antidromic AVRT,anterograde conduction of the atrial impulse occurs atthe bypass tract and retrograde conduction from ven-tricle to atrium may occur through another bypasstract instead of the AV node especially when there isEbstein’s anomaly. Thus, the use of AV nodal blockerswill not be effective because the AV node is not part ofthe reentrant circuit. Type IA, type IC, and type III an-tiarrhythmic agents that will block conductionthrough the bypass tract are effective agents in termi-nating the tachycardia. Procainamide, ibutilide, andflecainide are the preferred agents.
n The intravenous administration of calcium channelblockers, beta blockers, or adenosine may not be ap-propriate unless the tachycardia is definitely SVT be-cause these pharmacologic agents are not only ineffec-tive, but may also cause hemodynamic instability oreven death if the wide complex tachycardia turns outto be VT.
■ Wide complex tachycardia from VT: If the wide com-plex tachycardia has been shown to be ventricular in ori-gin, the acute treatment is similar to monomorphic VT.The choice of antiarrhythmic agent will depend on thepresence or absence of heart failure or left ventricular dys-function as discussed in Chapter 21, Ventricular Arrhyth-mias. For stable patients, procainamide and sotalol arepreferred agents, although amiodarone is also acceptableand becomes the preferred agent when there is left ven-tricular dysfunction or heart failure.
■ Diagnosis uncertain: If the diagnosis of the wide com-plex tachycardia remains uncertain, calcium channel
blockers, beta blockers, or other agents for terminatingSVT should not be tried because these agents can causehemodynamic instability, especially when there is leftventricular dysfunction. In patients who are hemody-namically unstable, electrical cardioversion with appro-priate sedation is recommended (Class I). In stable pa-tients, the preferred agents are either procainamide oramiodarone because both agents are effective for VT orSVT. Intravenous procainamide is recommended as ini-tial therapy in stable patients. Intravenous amiodarone isrecommended in patients who are hemodynamically un-stable, refractory to electrical cardioversion, or if the ar-rhythmia is recurrent in spite of IV procainamide. Lido-caine is reserved for wide complex tachycardia in patientswith poor left ventricular function associated with acuteMI or myocardial ischemia. Electrical cardioversion isalso an option even if the patient is hemodynamically sta-ble or if the patient does not respond to the chosen an-tiarrhythmic medication (Table 22.1).
■ Electrolyte abnormalities, myocardial ischemia, blood gas,and other metabolic disorders should be identified and cor-rected. Medications that may be proarrhythmic should beeliminated.
Prognosis
■ Prognosis for VT is worse than SVT. Sustained VT is usuallyassociated with structural cardiac disease such as acute my-ocardial infarction, cardiomyopathy, or other myocardialdiseases resulting in impaired systolic function. The presenceof ventricular tachycardia in this setting is associated with ahigh mortality. These patients are candidates for implantation
Clinical Recommendation Level of Recommendation
Unstable patients DC electrical cardioversion Class IStable patients Procainamide Class I
Sotalol Class IAmiodarone Class IDC cardioversion Class ILidocaine Class IIbAdenosine Class IIbBeta blockers Class IIIVerapamil Class III
Patients with Amiodarone Class Ipoor LV function DC cardioversion Class I
Lidocaine
All pharmacologic agents are given intravenously.ACC, American College of Cardiology; AHA, American Heart Association; ESC, European Society ofCardiology; LV, left ventricular; DC, direct current.
Acute Management of Wide Complex Tachycardia of UncertainDiagnosis According to the ACC/AHA/ESC Practice Guidelines in theManagement of Patients with Supraventricular Arrhythmias
TABLE 22.1
LWBK271-C22_310-330.qxd 29/1/09 7:48 pm Page 329 LWBK270-4119G-C02_073-110.qxd
330 Chapter 22
of automatic implantable defibrillator. Overall prognosis de-pends on the underlying cardiac disease and severity of leftventricular dysfunction.
■ If the wide complex tachycardia is due to SVT, prognosis isthe same as for narrow complex SVT.
Suggested Readings
2005 American Heart Association guidelines for cardiopul-monary resuscitation and emergency cardiovascular care.Part 7.3: management of symptomatic bradycardia andtachycardia. Circulation. 2005;112[Suppl]:IV-67–IV-77.
Akhtar M. Electrophysiologic bases for wide complex tachycar-dia. PACE. 1983;6:81.
Baltazar RF, Javillo JS. Images in cardiology. Ventriculo-atrialWenckebach during wide complex tachycardia. Clin Cardiol.2006;29:513.
Blomstrom-Lundqvist C, Scheinman MM, Aliot EM, et al.ACC/AHA/ESC Guidelines for the management of patientswith supraventricular arrhythmias—executive summary. Areport of the American College of Cardiology/AmericanHeart Association Task Force on Practice Guidelines, and theEuropean Society of Cardiology Committee for PracticeGuidelines (Writing Committee to Develop Guidelines forthe Management of Patients with Supraventricular Arrhyth-mias) J Am Coll Cardiol. 2003;42:1493–1531.
Brugada P, Brugada J, Mont L, et al. A new approach to the dif-ferential diagnosis of a regular tachycardia with a wide QRScomplex. Circulation. 1991;83:1649–1659.
Edhouse J, Morris F. ABC of clinical electrocardiography. Broadcomplex tachycardia—part I. BMJ. 2002;324:719–722.
Edhouse J, Morris F. ABC of clinical electrocardiography. Broadcomplex tachycardia—part II. BMJ. 2002;324:776–779.
Garratt CJ, Griffith MJ, Young G, et al. Value of physical signs inthe diagnosis of ventricular tachycardia. Circulation. 1994;90:3103–3107.
Gozensky C, Thorne D. Rabbit ears: an aid in distinguishingventricular ectopy from aberration. Heart Lung. 1975;3:634.
Griffith MJ, Garratt CJ, Mounsey P, et al. Ventricular tachycardiaas default diagnosis in broad complex tachycardia. Lancet.1994;343:386–388.
Guidelines 2000 for cardiopulmonary resuscitation and emer-gency cardiovascular care, an international consensus on sci-ence. The American Heart Association in Collaboration withthe International Liaison Committee on Resuscitation. 7D:the tachycardia algorithms. Circulation. 2000;102[Suppl I]:-I-158–I-165.
Harvey WP, Ronan JA, Jr. Bedside diagnosis of arrhythmias.Prog Cardiovasc Dis. 1966;8:419–445.
Stewart RB, Bardy GH, Greene HL. Wide complex tachycardia:misdiagnosis and outcome after emergent therapy. Ann In-tern Med. 1986;104:766–771.
Surawicz B, Uhley H, Borun R, et al. Task Force I: standardiza-tion of terminology and interpretation. Am J Cardiol. 1978;41:130–144.
Tchou P, Young P, Mahmud R, et al. Useful clinical criteria forthe diagnosis of ventricular tachycardia. Am J Med. 1988;84:53–56.
Wellens HJ. Electrocardiographic diagnosis of arrhythmias. In:Topol EJ, ed. Textbook of Cardiovascular Disease. 2nd ed.Philadelphia: Lippincott William & Wilkins; 2002:1665–1683.
Wellens HJJ, Bar FWHM, Lie KI. The value of the electrocardio-gram in the differential diagnosis of a tachycardia with awidened QRS complex. Am J Med. 1978;64:27–33.
Wellens HJJ, Conover MB. Wide QRS tachycardia. In: The ECGin Emergency Decision Making. Philadelphia: WB SaundersCo; 1992:37–72.
WHO/ISC Task Force. Definition of terms related to cardiacrhythm. Am Heart J. 1978;95:796–806.
Zipes DP, Camm AJ, Borggrefe M, et al. ACC/AHA/ESC 2006guidelines for management of patients with ventricular ar-rhythmias and the prevention of sudden cardiac death: a re-port of the American College of Cardiology/American HeartAssociation Task Force and the European Society of Cardiol-ogy Committee for Practice Guidelines (Writing Committeeto Develop Guidelines for Management of Patients with Ven-tricular Arrhythmias and the Prevention of Sudden CardiacDeath). J Am Coll Cardiol. 2006,48:e247–e346.
LWBK271-C22_310-330.qxd 29/1/09 7:48 pm Page 330 LWBK270-4119G-C02_073-110.qxd

23Acute Coronary Syndrome: ST
Elevation Myocardial Infarction
331
The Electrocardiogram (ECG) in AcuteCoronary Syndrome
■ When a patient presents to the emergency departmentwith chest discomfort or symptoms suspicious of acutemyocardial infarction (MI), the standard of care requiresthat a full 12-lead ECG be obtained and interpretedwithin 10 minutes after the patient enters the medical fa-cility. The ECG can provide the following useful informa-tion in patients with acute coronary syndrome:■ The ECG is the only modality capable of making a
diagnosis of ST elevation MI. It is the most impor-tant tool in defining the onset of the coronary eventand the urgency for immediate revascularization. Itserves as the only basis for deciding whether or notthe patient is a candidate for thrombolytic therapyor primary angioplasty. It therefore remains centralto the decision making process in managing patientswith acute coronary syndrome.
■ It provides useful information on whether or notreperfusion therapy has been successful.
■ It can identify the culprit vessel, localize whether thelesion is proximal or distal, and therefore predictsthe extent of jeopardized myocardium. Localizingthe culprit vessel will also help in predicting poten-tial complications that may inherently occur basedon the geographic location of the MI.
■ It is the simplest and most useful tool in the diagno-sis of right ventricular MI.
■ It is the most useful modality in identifying severalcomplications of acute MI, including the variousatrioventricular and intraventricular conduction ab-normalities as well as the different bradycardias andtachycardias, which are frequent during hospitaliza-tion especially after the initial onset of symptoms.
■ In this era of modern and expensive technology, the ECGremains the most important and least expensive modal-ity in evaluating and managing patients suspected of hav-ing acute symptoms from coronary artery disease. TheECG therefore remains the cornerstone in evaluating andmanaging patients with acute coronary syndrome andcontinues to provide very useful information that is notobtainable with other more expensive technologies.
Acute Coronary Syndrome
■ It is well recognized that acute coronary syndrome iscaused by rupture of an atheromatous plaque, resultingin partial or total occlusion of the vessel lumen by athrombus. Depending on how severely the coronaryflow is compromised, varying degrees of myocardial is-chemia will occur resulting in ST elevation MI, non-STelevation MI, or unstable angina (Fig. 23.1).
Vulnerable Plaque
Plaque Rupture
Non-ST Elevation – Vessel Lumen is Partially Occluded
ST Elevation – Vessel Lumen is Completely Occluded ECG
Figure 23.1: ElectrocardiogramChanges of Acute CoronarySyndrome. Complete occlusion ofthe vessel lumen by a thrombuscauses ST elevation whereas partialocclusion of the vessel lumen will re-sult in ST depression, T-waveinversion, or other less-specific STand T-wave abnormalities.
LWBK271-C23_331-378.qxd 29/1/09 7:17 pm Page 331 LWBK270-4119G-C02_073-110.qxd
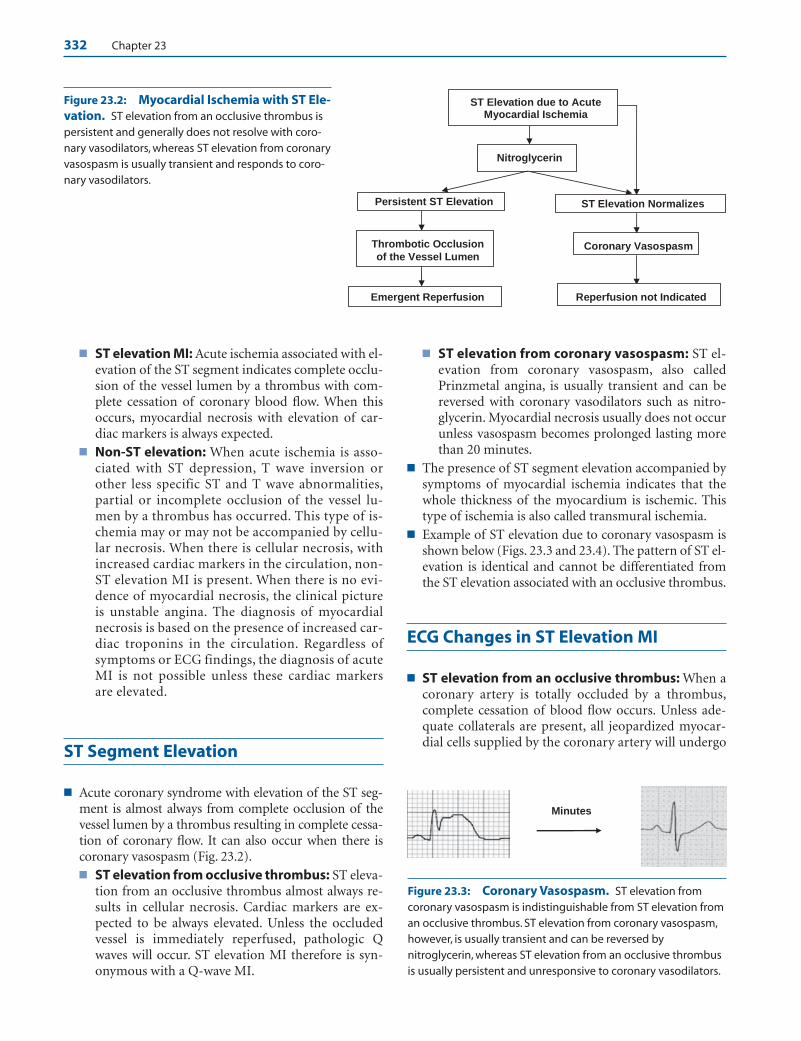
332 Chapter 23
■ ST elevation MI: Acute ischemia associated with el-evation of the ST segment indicates complete occlu-sion of the vessel lumen by a thrombus with com-plete cessation of coronary blood flow. When thisoccurs, myocardial necrosis with elevation of car-diac markers is always expected.
■ Non-ST elevation: When acute ischemia is asso-ciated with ST depression, T wave inversion orother less specific ST and T wave abnormalities,partial or incomplete occlusion of the vessel lu-men by a thrombus has occurred. This type of is-chemia may or may not be accompanied by cellu-lar necrosis. When there is cellular necrosis, withincreased cardiac markers in the circulation, non-ST elevation MI is present. When there is no evi-dence of myocardial necrosis, the clinical pictureis unstable angina. The diagnosis of myocardialnecrosis is based on the presence of increased car-diac troponins in the circulation. Regardless ofsymptoms or ECG findings, the diagnosis of acuteMI is not possible unless these cardiac markersare elevated.
ST Segment Elevation
■ Acute coronary syndrome with elevation of the ST seg-ment is almost always from complete occlusion of thevessel lumen by a thrombus resulting in complete cessa-tion of coronary flow. It can also occur when there iscoronary vasospasm (Fig. 23.2).■ ST elevation from occlusive thrombus: ST eleva-
tion from an occlusive thrombus almost always re-sults in cellular necrosis. Cardiac markers are ex-pected to be always elevated. Unless the occludedvessel is immediately reperfused, pathologic Qwaves will occur. ST elevation MI therefore is syn-onymous with a Q-wave MI.
■ ST elevation from coronary vasospasm: ST el-evation from coronary vasospasm, also calledPrinzmetal angina, is usually transient and can bereversed with coronary vasodilators such as nitro-glycerin. Myocardial necrosis usually does not occurunless vasospasm becomes prolonged lasting morethan 20 minutes.
■ The presence of ST segment elevation accompanied bysymptoms of myocardial ischemia indicates that thewhole thickness of the myocardium is ischemic. Thistype of ischemia is also called transmural ischemia.
■ Example of ST elevation due to coronary vasospasm isshown below (Figs. 23.3 and 23.4). The pattern of ST el-evation is identical and cannot be differentiated fromthe ST elevation associated with an occlusive thrombus.
ECG Changes in ST Elevation MI
■ ST elevation from an occlusive thrombus: When acoronary artery is totally occluded by a thrombus,complete cessation of blood flow occurs. Unless ade-quate collaterals are present, all jeopardized myocar-dial cells supplied by the coronary artery will undergo
Minutes
ST Elevation due to Acute Myocardial Ischemia
Thrombotic Occlusion
of the Vessel Lumen Coronary Vasospasm
Persistent ST Elevation
Nitroglycerin
ST Elevation Normalizes
Emergent Reperfusion Reperfusion not Indicated
Figure 23.2: Myocardial Ischemia with ST Ele-vation. ST elevation from an occlusive thrombus ispersistent and generally does not resolve with coro-nary vasodilators, whereas ST elevation from coronaryvasospasm is usually transient and responds to coro-nary vasodilators.
Figure 23.3: Coronary Vasospasm. ST elevation fromcoronary vasospasm is indistinguishable from ST elevation froman occlusive thrombus. ST elevation from coronary vasospasm,however, is usually transient and can be reversed bynitroglycerin, whereas ST elevation from an occlusive thrombusis usually persistent and unresponsive to coronary vasodilators.
LWBK271-C23_331-378.qxd 29/1/09 7:17 pm Page 332 LWBK270-4119G-C02_073-110.qxd
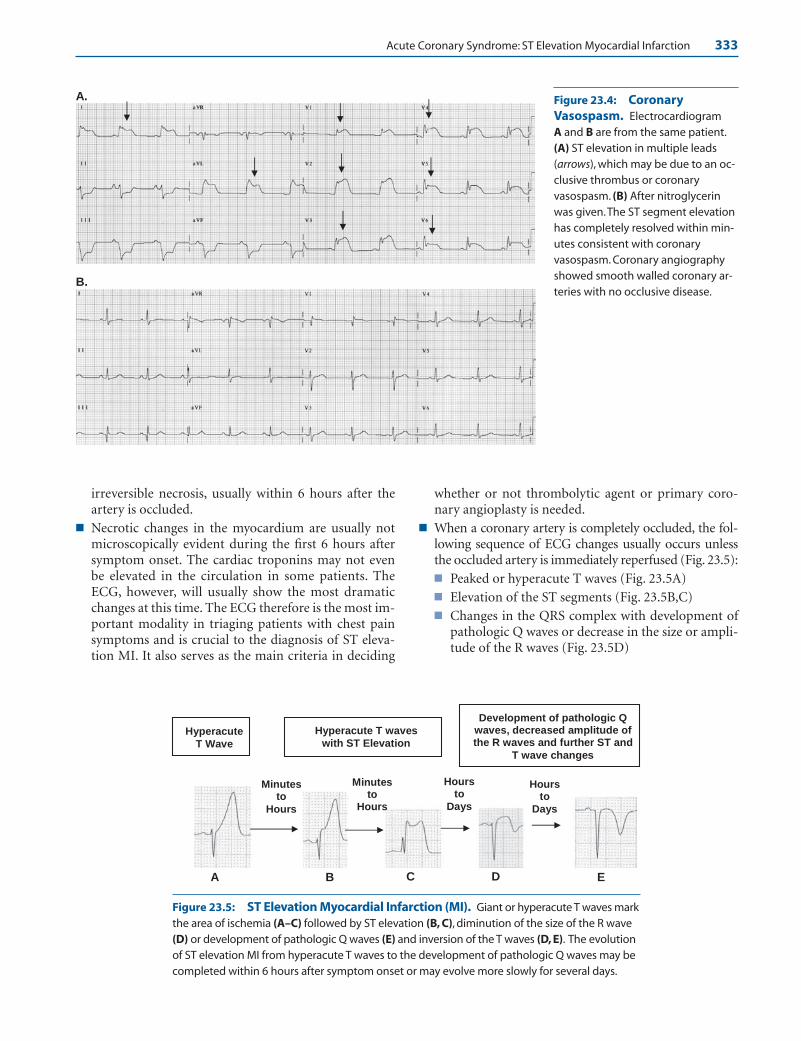
Acute Coronary Syndrome: ST Elevation Myocardial Infarction 333
irreversible necrosis, usually within 6 hours after theartery is occluded.
■ Necrotic changes in the myocardium are usually notmicroscopically evident during the first 6 hours aftersymptom onset. The cardiac troponins may not evenbe elevated in the circulation in some patients. TheECG, however, will usually show the most dramaticchanges at this time. The ECG therefore is the most im-portant modality in triaging patients with chest painsymptoms and is crucial to the diagnosis of ST eleva-tion MI. It also serves as the main criteria in deciding
whether or not thrombolytic agent or primary coro-nary angioplasty is needed.
■ When a coronary artery is completely occluded, the fol-lowing sequence of ECG changes usually occurs unlessthe occluded artery is immediately reperfused (Fig. 23.5):■ Peaked or hyperacute T waves (Fig. 23.5A)■ Elevation of the ST segments (Fig. 23.5B,C)■ Changes in the QRS complex with development of
pathologic Q waves or decrease in the size or ampli-tude of the R waves (Fig. 23.5D)
A.
B.
Figure 23.4: CoronaryVasospasm. Electrocardiogram A and B are from the same patient.(A) ST elevation in multiple leads (arrows), which may be due to an oc-clusive thrombus or coronaryvasospasm. (B) After nitroglycerinwas given.The ST segment elevationhas completely resolved within min-utes consistent with coronaryvasospasm. Coronary angiographyshowed smooth walled coronary ar-teries with no occlusive disease.
Hyperacute T Wave
Hyperacute T waves with ST Elevation
Development of pathologic Q waves, decreased amplitude of the R waves and further ST and
T wave changes
Minutes to
Hours
Hours to
Days
Minutes to
Hours
A B C D E
Hours to
Days
Figure 23.5: ST Elevation Myocardial Infarction (MI). Giant or hyperacute T waves markthe area of ischemia (A–C) followed by ST elevation (B, C), diminution of the size of the R wave(D) or development of pathologic Q waves (E) and inversion of the T waves (D, E). The evolutionof ST elevation MI from hyperacute T waves to the development of pathologic Q waves may becompleted within 6 hours after symptom onset or may evolve more slowly for several days.
LWBK271-C23_331-378.qxd 29/1/09 7:17 pm Page 333 LWBK270-4119G-C02_073-110.qxd

334 Chapter 23
■ Further changes in the ST segment and T waves(Fig. 23.5D,E)
■ Peaked or hyperacute T waves: One of the earliestECG abnormalities to occur in ST elevation MI isthe development of tall and peaked T waves overlyingthe area of ischemia (Fig. 23.6A). These hyperacute Twaves usually precede or accompany the onset of STsegment elevation and are useful in identifying theculprit vessel and timing the onset of acute ischemia.
■ ST segment elevation: Hyperacute T waves areaccompanied or immediately followed by ST seg-ment elevation. ST segment elevation with symptomsof chest discomfort indicates an acute process. Theleads with ST elevation are usually adjacent to eachother and mark the area of injury and are helpful inidentifying the culprit vessel. The extent of ST seg-ment elevation is also helpful in predicting the severityof myocardial involvement.
Thrombolytic Therapy
■ ST elevation from acute coronary syndrome is amedical emergency requiring immediate reperfusionof the occluded artery with a thrombolytic agent or
with primary percutaneous coronary intervention(PCI). The extent of myocardial necrosis can be mini-mized if reperfusion of the occluded artery is timelyand successful.
■ Thrombolytic Therapy: According to American Col-lege of Cardiology (ACC)/American Heart Association(AHA) guidelines, thrombolytic therapy is indicatedup to 12 hours after onset of symptoms. It may even beextended to 24 hours if the patient’s symptoms persistor the chest pain is “stuttering” (waxing and waning)and the ST segments remain elevated at the time ofentry. The thrombolytic agent should be infusedwithin 30 minutes after the patient enters the medicalfacility on his own (door to needle time) or within 30minutes after contact with emergency service person-nel (medical contact to needle time).■ The best results are obtained if the thrombolytic
agent is given within 1 to 2 hours after symptom on-set because thrombolytic therapy is time dependentand is more effective when given early.
■ The criteria for initiating a thrombolytic agent in apatient with symptoms of acute ischemia are ST seg-ment elevation or new (or presumably new) onsetleft bundle branch block (LBBB).n ST segment elevation:
A
B
Figure 23.6: (A) Hyperacute TWaves. The initial electrocardiogram(ECG) of a patient presenting withacute onset of chest pain is shown.Tall, hyperacute T waves (arrows) areseen in V1 to V4 with elevation of theST segments in V3–4. Note that the hy-peracute T waves are confined to thedistribution of the occluded vesseland are usually the first to occur be-fore the ST segments becomeelevated. Subsequent ECGs areshown in (B–D). (B) ST elevationMyocardial Infarction (MI). Thistracing was recorded 15 minutes af-ter the initial ECG. In addition to thehyperacute T waves, ST elevation hasdeveloped in V1 to V4 (arrows).(continued)
LWBK271-C23_331-378.qxd 29/1/09 7:17 pm Page 334 LWBK270-4119G-C02_073-110.qxd

Acute Coronary Syndrome: ST Elevation Myocardial Infarction 335
n ST elevation �1 mm in any two or more adja-cent precordial or limb leads.
n ST elevation is measured at the J point. The Jpoint is the junction between the terminalportion of the QRS complex and beginning ofthe ST segment. The preceding T-P segmentserves as baseline for measuring the ST eleva-tion. The PR interval is used if the T-P seg-ment is too short or is obscured by a U waveor a P wave of sinus tachycardia.
n New-onset LBBB: The presence of LBBB willmask the ECG changes of acute MI. If the LBBBis new or presumably new and accompanied bysymptoms of acute myocardial ischemia, throm-bolytic therapy is indicated.
■ Thrombolytic therapy is not indicated (and may becontraindicated) in patients with acute ischemia asso-ciated with ST depression or T wave inversion even ifthe cardiac markers (troponins) are elevated.
■ The ECG is the most important modality not only in se-lecting patients for thrombolytic therapy but also in mon-itoring successful response to therapy. One of the earliestsigns of successful reperfusion during thrombolytic ther-apy is relief of chest pain and resolution of the initial STsegment elevation by at least 50% within 60 to 90 minutes
after initiation of therapy (Fig. 23.7). If ST segment reso-lution does not occur within 90 minutes after initiatingthrombolytic therapy, rescue PCI should be considered.
■ Other signs of successful reperfusion include T waveinversion occurring during the first hours of reperfu-sion therapy and the presence of accelerated idioven-tricular rhythm.
Primary Angioplasty
■ Primary PCI: Primary PCI requires immediate cardiaccatheterization and is the preferred method for revascu-larizing patients with ST elevation MI (Fig. 23.8). TheACC/AHA guidelines recommend that primary PCIshould be performed within 90 minutes after first med-ical contact with emergency personnel (door to balloonor medical contact to balloon) time. Unlike thromboly-sis, it is more effective in reestablishing coronary bloodflow regardless of the duration of symptoms. It is thepreferred method in patients who are unstable, are he-modynamically decompensated, when symptoms ex-ceed 3 hours in duration or the diagnosis of ST eleva-tion MI is in doubt.
D
C Figure 23.6: (Continued) (C) STElevation MI. The above ECG wasrecorded approximately 1.5 hoursfrom the initial ECG (see A).The STsegments continued to evolve evenafter thrombolytic therapy. ST eleva-tion has become more pronouncedin V2 to V6 and slight elevation of theST segments is noted in II, III, and aVF.Hyperacute T waves are still presentin V2 to V5 (arrows). (D) ST ElevationMI. ECG recorded 13 days later. QScomplexes or decreased amplitudeof the r waves are seen in V1 to V5.
The ST segments are isoelectric andthe T waves are inverted from V1–6
and leads I, II, and aVL.
LWBK271-C23_331-378.qxd 29/1/09 7:17 pm Page 335 LWBK270-4119G-C02_073-110.qxd
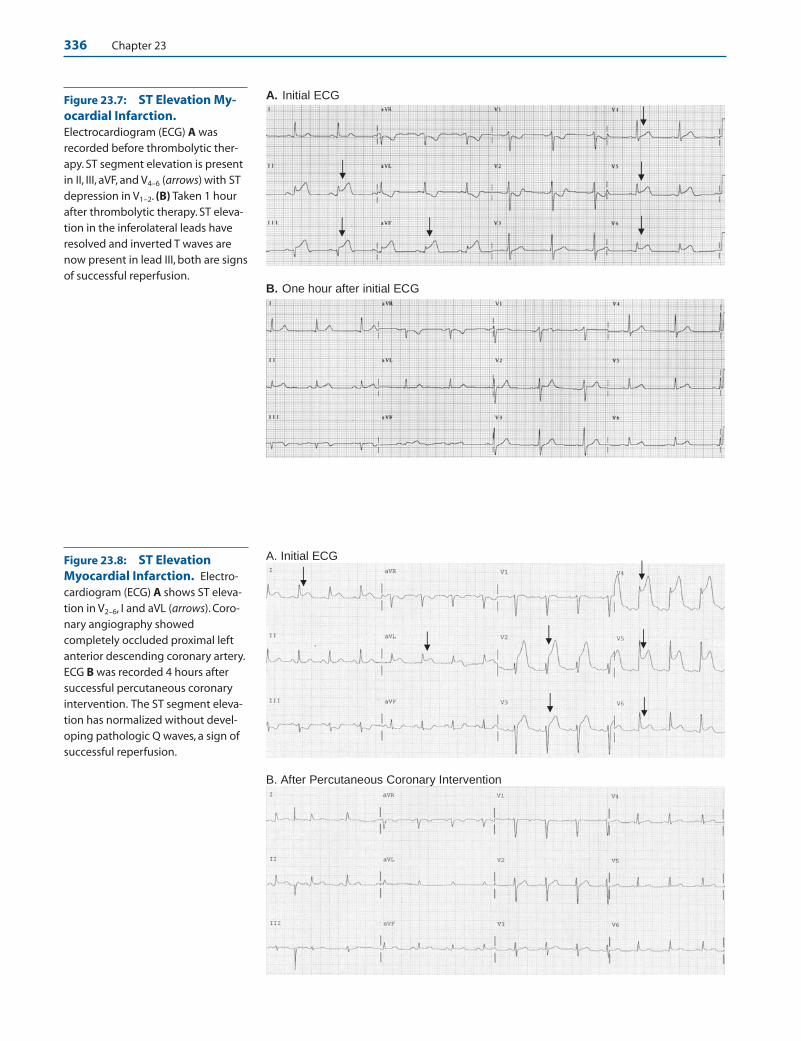
336 Chapter 23
A. Initial ECG
B. One hour after initial ECG
Figure 23.7: ST Elevation My-ocardial Infarction.Electrocardiogram (ECG) A wasrecorded before thrombolytic ther-apy. ST segment elevation is presentin II, III, aVF, and V4–6 (arrows) with STdepression in V1–2. (B) Taken 1 hourafter thrombolytic therapy. ST eleva-tion in the inferolateral leads haveresolved and inverted T waves arenow present in lead III, both are signsof successful reperfusion.
Figure 23.8: ST ElevationMyocardial Infarction. Electro-cardiogram (ECG) A shows ST eleva-tion in V2–6, I and aVL (arrows). Coro-nary angiography showedcompletely occluded proximal leftanterior descending coronary artery.ECG B was recorded 4 hours aftersuccessful percutaneous coronaryintervention. The ST segment eleva-tion has normalized without devel-oping pathologic Q waves, a sign ofsuccessful reperfusion.
A. Initial ECG
B. After Percutaneous Coronary Intervention
LWBK271-C23_331-378.qxd 29/1/09 7:17 pm Page 336 LWBK270-4119G-C02_073-110.qxd
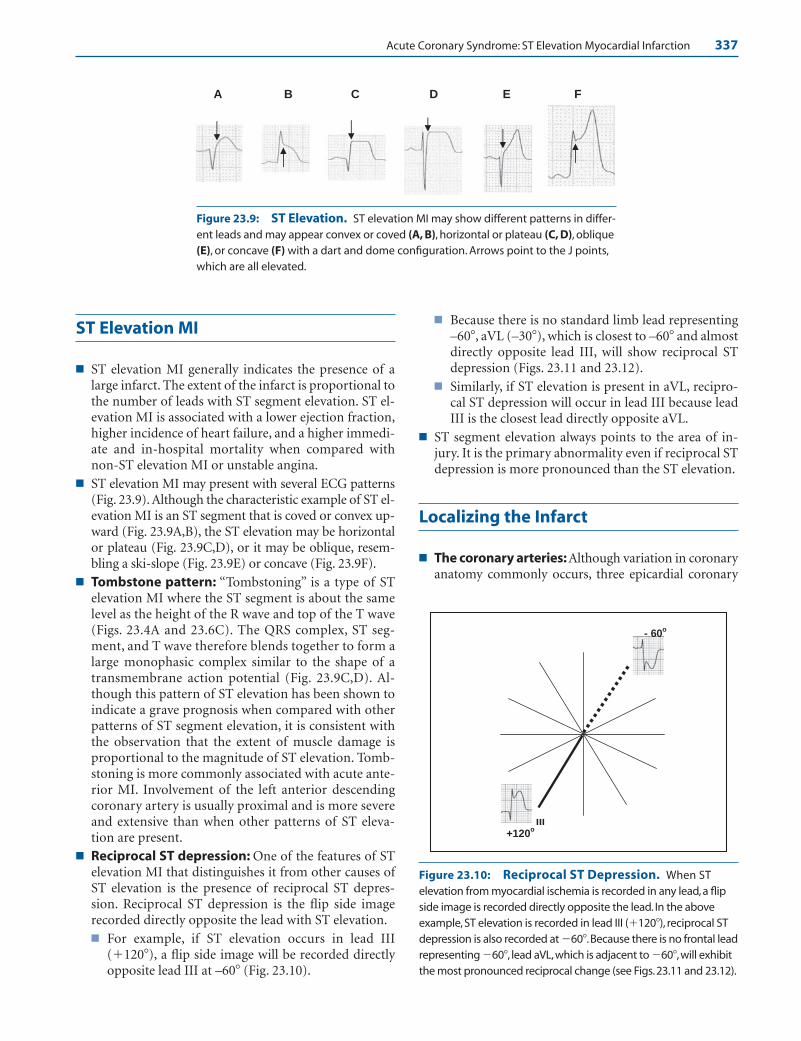
Acute Coronary Syndrome: ST Elevation Myocardial Infarction 337
ST Elevation MI
■ ST elevation MI generally indicates the presence of alarge infarct. The extent of the infarct is proportional tothe number of leads with ST segment elevation. ST el-evation MI is associated with a lower ejection fraction,higher incidence of heart failure, and a higher immedi-ate and in-hospital mortality when compared withnon-ST elevation MI or unstable angina.
■ ST elevation MI may present with several ECG patterns(Fig. 23.9). Although the characteristic example of ST el-evation MI is an ST segment that is coved or convex up-ward (Fig. 23.9A,B), the ST elevation may be horizontalor plateau (Fig. 23.9C,D), or it may be oblique, resem-bling a ski-slope (Fig. 23.9E) or concave (Fig. 23.9F).
■ Tombstone pattern: “Tombstoning” is a type of STelevation MI where the ST segment is about the samelevel as the height of the R wave and top of the T wave(Figs. 23.4A and 23.6C). The QRS complex, ST seg-ment, and T wave therefore blends together to form alarge monophasic complex similar to the shape of atransmembrane action potential (Fig. 23.9C,D). Al-though this pattern of ST elevation has been shown toindicate a grave prognosis when compared with otherpatterns of ST segment elevation, it is consistent withthe observation that the extent of muscle damage isproportional to the magnitude of ST elevation. Tomb-stoning is more commonly associated with acute ante-rior MI. Involvement of the left anterior descendingcoronary artery is usually proximal and is more severeand extensive than when other patterns of ST eleva-tion are present.
■ Reciprocal ST depression: One of the features of STelevation MI that distinguishes it from other causes ofST elevation is the presence of reciprocal ST depres-sion. Reciprocal ST depression is the flip side imagerecorded directly opposite the lead with ST elevation.■ For example, if ST elevation occurs in lead III
(�120�), a flip side image will be recorded directlyopposite lead III at –60� (Fig. 23.10).
■ Because there is no standard limb lead representing–60�, aVL (–30�), which is closest to –60� and almostdirectly opposite lead III, will show reciprocal STdepression (Figs. 23.11 and 23.12).
■ Similarly, if ST elevation is present in aVL, recipro-cal ST depression will occur in lead III because leadIII is the closest lead directly opposite aVL.
■ ST segment elevation always points to the area of in-jury. It is the primary abnormality even if reciprocal STdepression is more pronounced than the ST elevation.
Localizing the Infarct
■ The coronary arteries: Although variation in coronaryanatomy commonly occurs, three epicardial coronary
+120o
- 60o
III
A B C D E F
Figure 23.9: ST Elevation. ST elevation MI may show different patterns in differ-ent leads and may appear convex or coved (A, B), horizontal or plateau (C, D), oblique(E), or concave (F) with a dart and dome configuration. Arrows point to the J points,which are all elevated.
Figure 23.10: Reciprocal ST Depression. When ST elevation from myocardial ischemia is recorded in any lead, a flipside image is recorded directly opposite the lead. In the above example, ST elevation is recorded in lead III (�120�), reciprocal ST depression is also recorded at �60�.Because there is no frontal leadrepresenting �60�, lead aVL,which is adjacent to �60�,will exhibitthe most pronounced reciprocal change (see Figs.23.11 and 23.12).
LWBK271-C23_331-378.qxd 29/1/09 7:17 pm Page 337 LWBK270-4119G-C02_073-110.qxd

338 Chapter 23
arteries are generally present. Each artery supplies specificregional areas in the heart. These areas are topographi-cally represented by the following groups of leads:■ Left anterior descending (LAD) coronary ar-
tery: The LAD supplies the anterior, anteroseptal oranterolateral wall of the left ventricle (LV) (leads V1-V6, I, and aVL).
■ Right coronary artery (RCA): The RCA suppliesthe inferior wall (leads II, III, and aVF), often pos-terolateral wall of the LV (special leads V7, V8, V9).The RCA is the only artery that supplies the rightventricular free wall (special leads V3R to V6R).
■ Left circumflex (LCx) coronary artery: The LCxsupplies the anterolateral (leads I, aVL, V5, and V6)and posterolateral (special leads V7, V8, V9) walls ofthe LV. In 10% to 15% of patients, it supplies the in-ferior wall of the LV (leads II, III, and aVF).
■ The following groups of leads represent certain areas ofthe heart:■ V1–2: ventricular septum.■ V2–4: anterior wall of the LV. V2 overlaps the septum
and anterior wall and is both a septal and anterior lead.■ V1-V3: anteroseptal wall of the LV.■ V4-V6, I, and aVL: anterolateral wall of the LV.■ V4-V6: lateral wall of the LV. V4 overlaps the anterior
and lateral walls of the LV and is both an anteriorand lateral lead.
■ V7-V9: (special leads) posterolateral wall of the LV.■ V3R to V6R: (special right-sided precordial leads)
right ventricle.■ I and aVL: basal anterolateral or high lateral wall of
the LV.■ II, III, and aVF: inferior or diaphragmatic wall of the
LV.■ Not all the areas of the heart are represented by the
12-lead ECG. The areas not represented include theright ventricle and posterolateral wall of the LV. Specialleads V3R to V6R and V7 to V9 are needed to record theseareas, respectively. ST elevation involving the postero-lateral wall of the LV is suspected when there is ST de-pression in leads V1 to V3.
■ ST segment elevation points to the area of injury and ishelpful in identifying the infarct related artery. AcuteMI presenting as ST depression is frequently associatedwith multivessel coronary disease and is less specific inlocalizing the culprit vessel.
Myocardial Distribution of the Three Main Coronary Arteries
■ The myocardial distribution of the three coronary ar-teries is shown in Figure 23.13.
Left Anterior Descending Coronary Artery
■ Anatomy: The left main coronary artery divides intotwo large branches: the LAD and the LCx coronaryarteries. The LAD courses toward the apex throughthe anterior interventricular groove and supplies theanterior wall of the LV. The artery may continue tothe inferoapical wall by wrapping around the apex ofthe LV (Fig. 23.14).■ First branch: The first branch of the LAD is the first
diagonal artery. This branch runs parallel to the LCxcoronary artery and supplies the basal anterolateralwall of the LV. If the first diagonal is a large branch,complete occlusion of this artery causes ST eleva-tion in leads I and aVL with reciprocal ST depres-sion in III and aVF. These ECG changes may be in-distinguishable from that due to occlusion of a smallLCx coronary artery.
■ Second branch: The second branch of the LAD isthe first septal branch. This artery may be the firstinstead of the second branch. The artery penetratesthe ventricular septum perpendicularly and suppliesthe basal septum including the proximal conductionsystem. Involvement of the first septal perforator
ECG Changes in ST Elevation MI
III
aVL
II
I
aVR
aVF
−60o
−30o
+ 120o
Figure 23.11: Reciprocal ST Depression. ST elevation inlead III is associated with reciprocal ST depression directly oppo-site lead III. Because lead aVL is the closest lead opposite lead III,aVL will show the most pronounced reciprocal ST depressionamong the standard electrocardiogram (ECG) leads.Thestandard limb lead ECG is shown in Figure 23.12.
LWBK271-C23_331-378.qxd 29/1/09 7:17 pm Page 338 LWBK270-4119G-C02_073-110.qxd

Acute Coronary Syndrome: ST Elevation Myocardial Infarction 339
Figure 23.12: Reciprocal ST Depression. ST elevation ispresent in leads II, III, and aVF and is most marked in lead III (arrows). Reciprocal ST depression is most pronounced in aVL(double arrows) because aVL is almost directly opposite lead III(see Fig. 23.11).
LAD LCx RCA
2: Short Axis, LV Papillary Muscle 3: Short Axis, LV Apex
Inferior LV wall = RCA
Anterior
LeftRight
Posterior
LV
LAD artery
MV
Right
Ventricle
Lateral LV wall
Anterior
Left Right
Posterior Descending
Artery
Posterior
Anterior LV Wall
Ao
LA
LV
RV
PA
1
LAD artery
LV Anterolateral PM
Posteromedial PM
RV
Lateral LV wallLCx Artery
Anterior
Left Right
PDA
Posterior
Anterior LV Wall
V6V4 V5
2
3
RA
V3
V2V1
will cause ST elevation in V1. It may also involve theconduction system causing new onset right bundlebranch block.
■ Anterior MI: Depending on the location of the coro-nary lesion and whether the LAD is large or small,complete occlusion of the LAD will cause extensive an-terior MI with varying degrees of ST elevation in V1 toV6 as well as leads I and aVL.■ Before the first branch: If the LAD is occluded
proximally at the ostium or before the first branch(first diagonal), ST elevation will occur in V1 to V4
(or up to V6) and leads I and aVL from extensive an-terior MI. The ST elevation in leads I and AVL rep-resent involvement of the first diagonal branch andis usually accompanied by reciprocal ST depressionin III and aVF (Figs. 23.15 and 23.16).
■ Between the first and second branches: If thelesion is distal to the first diagonal (but proximal tothe first septal branch), ST elevation will include V1
to V4 but not leads I and aVL consistent with acuteanteroseptal MI. ST elevation in V1 indicates in-volvement of the first septal branch (Fig. 23.17).
■ After the second branch: If the lesion is distal tothe first diagonal and first septal branches, ST eleva-tion will involve V2-V4 but not V1 or I and aVL con-sistent with anterior often called apical MI.
■ Occlusion of the first diagonal branch: If alarge first diagonal branch is the only artery oc-cluded, and the LAD is spared, ST elevation isconfined to leads I and aVL consistent with highlateral MI, which involves the base of the LV (Fig.23.18).
Figure 23.13: Myocardial Distribu-tion of the Coronary Arteries. Thediagrams summarize the myocardial dis-tribution of the three coronary arteries.The diagram in the upper left representsthe frontal view of the heart. The leftventricle is transected by three lineslabeled 1, 2, and 3. Line 1 is at the level ofthe mitral valve which corresponds to thebase of the left ventricle. The short axisview is shown on the upper rightdiagram. Line 2 corresponds to the mid-ventricle and the short axis is shown atthe lower left. Line 3 corresponds to theapex of the left ventricle and the shortaxis is shown at the lower right. Ao, Aorta;LA, left atrium; LV, left ventricle; LAD, leftanterior descending; LCx, left circumflex;LV, left ventricle; MV, mitral valve; PA, pul-monary artery; PDA, posterior descend-ing artery; PM, papillary muscle; RA, rightatrium; RCA, right coronary artery; V1 toV6, the precordial electrodessuperimposed on the heart.
LWBK271-C23_331-378.qxd 29/1/09 7:17 pm Page 339 LWBK270-4119G-C02_073-110.qxd
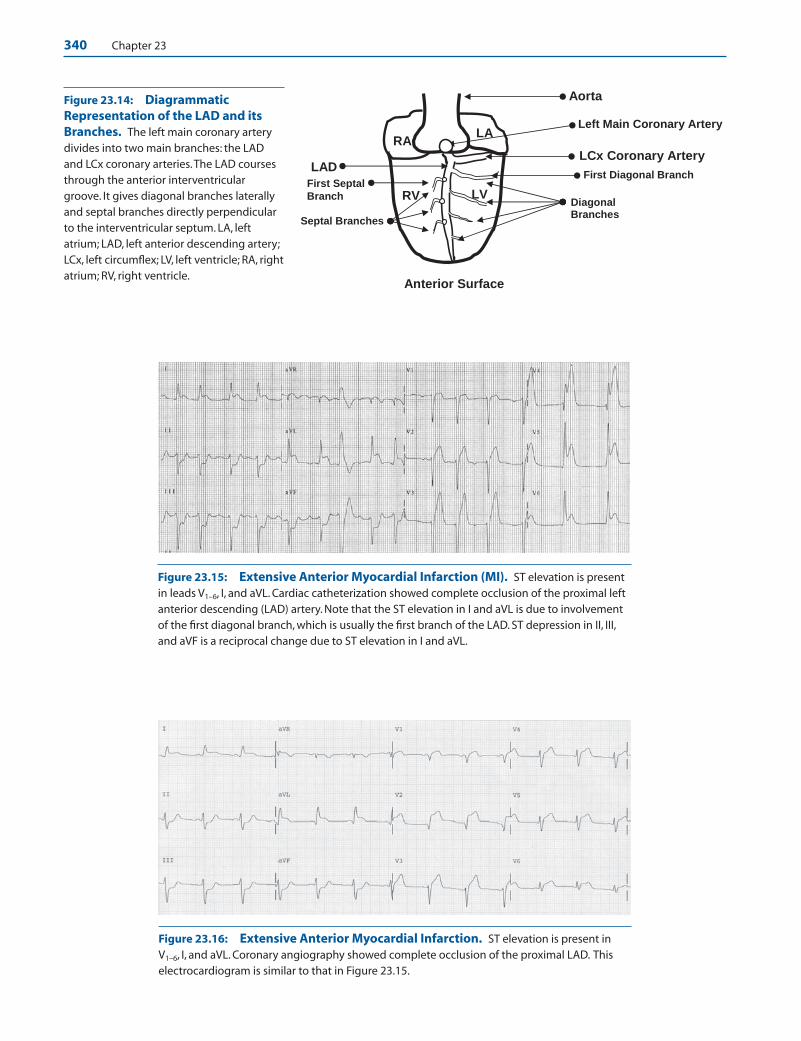
340 Chapter 23
Aorta
RV
LCx Coronary Artery
First Septal
Branch Diagonal Branches
LV
First Diagonal Branch LAD
RA LA
Septal Branches
Left Main Coronary Artery
Anterior Surface
Figure 23.14: DiagrammaticRepresentation of the LAD and itsBranches. The left main coronary arterydivides into two main branches: the LADand LCx coronary arteries.The LAD coursesthrough the anterior interventriculargroove. It gives diagonal branches laterallyand septal branches directly perpendicularto the interventricular septum. LA, leftatrium; LAD, left anterior descending artery;LCx, left circumflex; LV, left ventricle; RA, rightatrium; RV, right ventricle.
Figure 23.15: Extensive Anterior Myocardial Infarction (MI). ST elevation is presentin leads V1–6, I, and aVL. Cardiac catheterization showed complete occlusion of the proximal leftanterior descending (LAD) artery. Note that the ST elevation in I and aVL is due to involvementof the first diagonal branch, which is usually the first branch of the LAD. ST depression in II, III,and aVF is a reciprocal change due to ST elevation in I and aVL.
Figure 23.16: Extensive Anterior Myocardial Infarction. ST elevation is present inV1–6, I, and aVL. Coronary angiography showed complete occlusion of the proximal LAD. Thiselectrocardiogram is similar to that in Figure 23.15.
LWBK271-C23_331-378.qxd 29/1/09 7:17 pm Page 340 LWBK270-4119G-C02_073-110.qxd
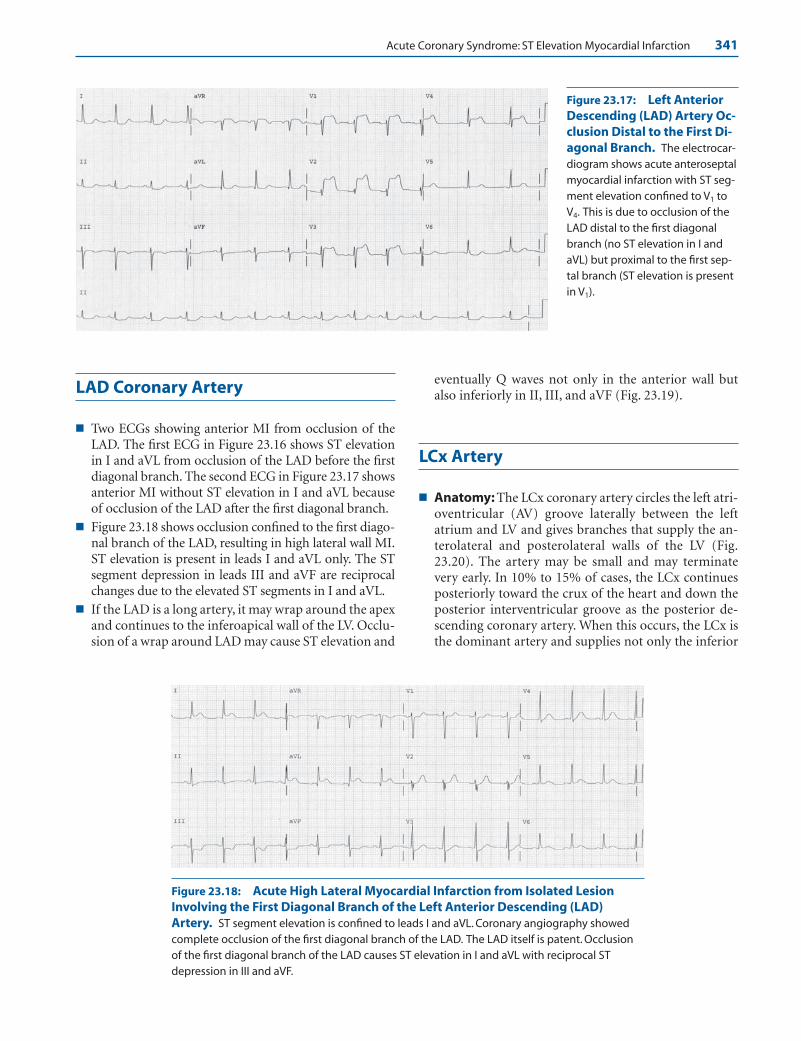
Acute Coronary Syndrome: ST Elevation Myocardial Infarction 341
LAD Coronary Artery
■ Two ECGs showing anterior MI from occlusion of theLAD. The first ECG in Figure 23.16 shows ST elevationin I and aVL from occlusion of the LAD before the firstdiagonal branch. The second ECG in Figure 23.17 showsanterior MI without ST elevation in I and aVL becauseof occlusion of the LAD after the first diagonal branch.
■ Figure 23.18 shows occlusion confined to the first diago-nal branch of the LAD, resulting in high lateral wall MI.ST elevation is present in leads I and aVL only. The STsegment depression in leads III and aVF are reciprocalchanges due to the elevated ST segments in I and aVL.
■ If the LAD is a long artery, it may wrap around the apexand continues to the inferoapical wall of the LV. Occlu-sion of a wrap around LAD may cause ST elevation and
eventually Q waves not only in the anterior wall butalso inferiorly in II, III, and aVF (Fig. 23.19).
LCx Artery
■ Anatomy: The LCx coronary artery circles the left atri-oventricular (AV) groove laterally between the leftatrium and LV and gives branches that supply the an-terolateral and posterolateral walls of the LV (Fig.23.20). The artery may be small and may terminatevery early. In 10% to 15% of cases, the LCx continuesposteriorly toward the crux of the heart and down theposterior interventricular groove as the posterior de-scending coronary artery. When this occurs, the LCx isthe dominant artery and supplies not only the inferior
Figure 23.18: Acute High Lateral Myocardial Infarction from Isolated LesionInvolving the First Diagonal Branch of the Left Anterior Descending (LAD)Artery. ST segment elevation is confined to leads I and aVL. Coronary angiography showedcomplete occlusion of the first diagonal branch of the LAD. The LAD itself is patent. Occlusionof the first diagonal branch of the LAD causes ST elevation in I and aVL with reciprocal STdepression in III and aVF.
Figure 23.17: Left AnteriorDescending (LAD) Artery Oc-clusion Distal to the First Di-agonal Branch. The electrocar-diogram shows acute anteroseptalmyocardial infarction with ST seg-ment elevation confined to V1 toV4. This is due to occlusion of theLAD distal to the first diagonalbranch (no ST elevation in I andaVL) but proximal to the first sep-tal branch (ST elevation is presentin V1).
LWBK271-C23_331-378.qxd 29/1/09 7:17 pm Page 341 LWBK270-4119G-C02_073-110.qxd

342 Chapter 23
wall of the LV but also gives rise to the artery to the AVnode. Occlusion of the LCx artery will cause:■ Anterolateral MI: When the LCx coronary artery is
occluded proximally, ST elevation will occur in leadsI, aVL, V5, and V6. The MI is confined to the areabounded by the two papillary muscles posterolater-ally from the base to the proximal two thirds of theLV (Fig. 23.21). The ST elevation may occur only inleads I and aVL and may be difficult to differentiatefrom an occluded first diagonal branch of the LAD(Figs. 23.18 and 23.22).
■ Posterolateral MI: The posterolateral wall of theLV is not directly represented by any standard ECGlead. When posterolateral MI occurs, reciprocal STdepression is noted in V1-V3. V5, and V6 may showST elevation (Fig. 23.23).
■ The myocardial distribution of the LCx coronary arteryis shown in Fig. 23.21. Acute MI from occlusion of theLCx coronary artery is shown in the ECG in Figure 23.22.
■ Posterolateral MI: Occlusion of the LCx artery cancause posterior, straight posterior, or posterolateral MI.Because there are no leads representing the posterolat-eral wall of the LV, a posterolateral MI is suspected inthe 12-lead ECG when there is ST depression in V1 toV3. These leads are directly opposite the posterolateralwall and will show reciprocal ST depression when a pos-terior MI is present. Posterior MI can be confirmed byplacing extra electrodes in V7, V8, and V9 (V7 is locatedat the left posterior axillary line, V8 at the tip of the leftscapula, and V9 at the left of the spinal column in thesame horizontal plane as V4–6). These special leads willshow Q waves with ST elevation if a posterolateral MI ispresent. Prominent R waves may or may not be presentin the anterior precordial leads (Fig. 23.23).
■ Although ST depression is not an indication forthrombolytic therapy, ST depression in V1 to V3 maybe due to posterior MI, which represents a true STelevation MI. Before thrombolytic therapy is given,leads V7–9 should be recorded to verify that the ST de-pression in V1–3 is due to posterior MI and not fromsubendocardial injury involving the anterior wall ofthe LV.
■ ST elevation confined to leads I and aVL usually indi-cate lateral MI due to involvement of the LCx coronaryartery (Fig. 23.24). ST elevation in leads I, aVL, V5, andV6 is often accompanied by ST elevation in V7 to V9 andreciprocal ST depression in V1 to V3 from posterolat-eral MI. ST elevation in V6 is usually accompanied byST elevation in V7 to V9 because these leads are adjacentto V6 (Figs. 23.25 and 23.26).
■ Figure 23.26 shows the importance of recording specialleads V7 to V9 when a posterolateral MI is suspected.
Aorta
TAMA
LCx Coronary
Artery
ObtuseMarginalBranches
PosterolateralBranches
RV LV
Left Atrioventricular Branch
Posterior DescendingArtery (10-15%)
Left Anterior Descending
Posterior View of the Heart
Figure 23.19: Anterior and Inferior Myocardial Infarction. QS complexes with ST ele-vation is noted in V1 to V5 (anterior wall) and also in leads II, III, and aVF (inferior wall) due to anoccluded left anterior descending artery that wraps around the apex of the left ventricleextending to the inferoapical left ventricular wall. The right coronary artery is small but patent.
Figure 23.20: Left Circumflex (LCx) Coronary Artery.The diagram represents the LCx artery and its main branches. In10% to 15% of patients, the LCx artery is the dominant artery bycontinuing as the posterior descending artery (dotted lines) andsupplying the artery to the AV node. LV, left ventricle; MA, mitralannulus; RV, right ventricle; TA, tricuspid annulus.
LWBK271-C23_331-378.qxd 29/1/09 7:17 pm Page 342 LWBK270-4119G-C02_073-110.qxd
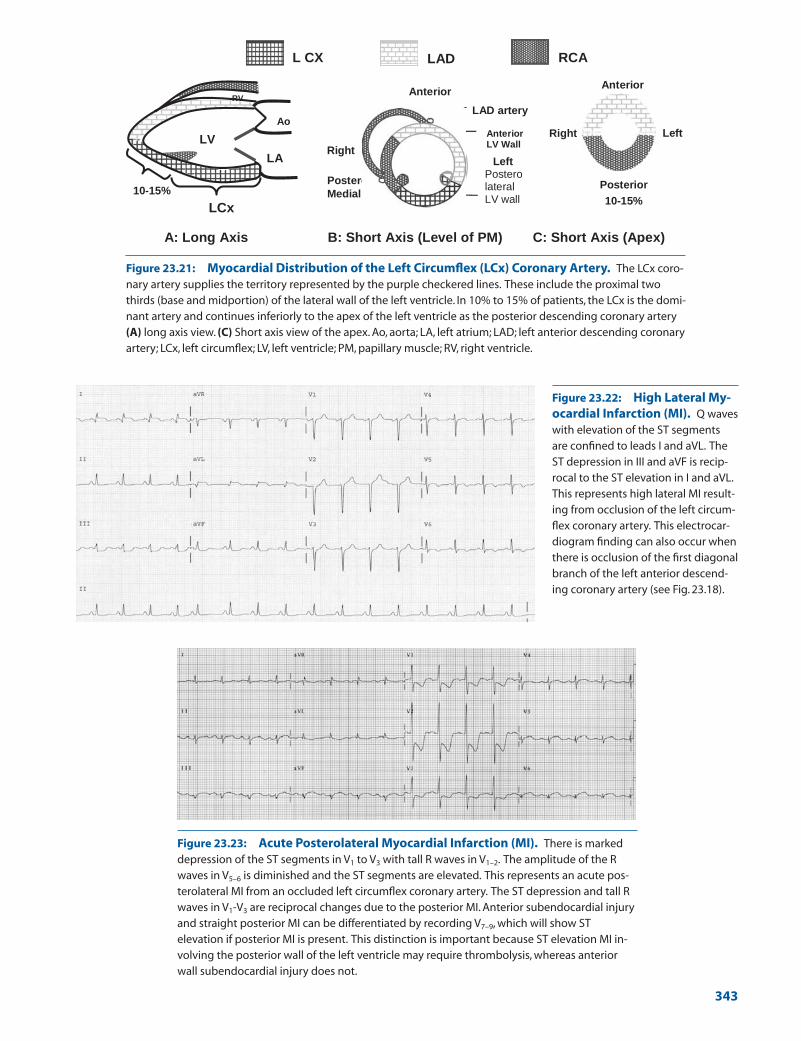
A: Long Axis B: Short Axis (Level of PM) C: Short Axis (Apex)
LV
LAD artery
Anterior
Left
Anterior LV WallLV
RV
LA
Ao RV
Postero
Medial PM
LV Right
Postero lateral LV wall
Anterior
Left Right
Posterior
LCx
10-15% 10-15%
LAD RCAL CX
Figure 23.21: Myocardial Distribution of the Left Circumflex (LCx) Coronary Artery. The LCx coro-nary artery supplies the territory represented by the purple checkered lines. These include the proximal twothirds (base and midportion) of the lateral wall of the left ventricle. In 10% to 15% of patients, the LCx is the domi-nant artery and continues inferiorly to the apex of the left ventricle as the posterior descending coronary artery(A) long axis view. (C) Short axis view of the apex. Ao, aorta; LA, left atrium; LAD; left anterior descending coronaryartery; LCx, left circumflex; LV, left ventricle; PM, papillary muscle; RV, right ventricle.
Figure 23.22: High Lateral My-ocardial Infarction (MI). Q waveswith elevation of the ST segmentsare confined to leads I and aVL. TheST depression in III and aVF is recip-rocal to the ST elevation in I and aVL.This represents high lateral MI result-ing from occlusion of the left circum-flex coronary artery. This electrocar-diogram finding can also occur whenthere is occlusion of the first diagonalbranch of the left anterior descend-ing coronary artery (see Fig. 23.18).
Figure 23.23: Acute Posterolateral Myocardial Infarction (MI). There is markeddepression of the ST segments in V1 to V3 with tall R waves in V1–2. The amplitude of the Rwaves in V5–6 is diminished and the ST segments are elevated. This represents an acute pos-terolateral MI from an occluded left circumflex coronary artery. The ST depression and tall Rwaves in V1-V3 are reciprocal changes due to the posterior MI. Anterior subendocardial injuryand straight posterior MI can be differentiated by recording V7–9, which will show STelevation if posterior MI is present. This distinction is important because ST elevation MI in-volving the posterior wall of the left ventricle may require thrombolysis, whereas anteriorwall subendocardial injury does not.
343
LWBK271-C23_331-378.qxd 29/1/09 7:17 pm Page 343 LWBK270-4119G-C02_073-110.qxd

344 Chapter 23
The standard 12-lead ECG shows ST depression in V1
to V3 and ST elevation in V5 and V6. Special leads V7 toV9 recorded posteriorly shows Q waves with ST seg-ment elevation similar to V6. These changes are consis-tent with a transmural posterolateral MI. The coronaryangiogram confirmed the presence of a completely oc-cluded LCx artery.
■ Inferior MI: Acute inferior MI is due to occlusion ofthe RCA in 85% to 90% of patients but it can occur in10% to 15% of patients when the LCx is the dominantartery. In acute inferior MI, the ST segments are ele-vated in II, III, aVF. If the LCx is the culprit vessel, theST elevation in lead II is greater than or equal to the STelevation in lead III (Fig. 23.27).
■ If the LCx is small and nondominant, occlusion of theartery may not show any ECG changes (Fig. 23.28).Thus, a normal ECG does not exclude acute MI espe-cially when the LCx is the culprit vessel because most ofthe area supplied by the LCx is not represented in thestandard 12-lead ECG.
Right Coronary Artery
■ Anatomy: The RCA courses around the medial AVgroove between the right atrium and right ventricle andsupplies acute marginal branches to the right ventricle. In85% to 90% of cases, it is the dominant artery in that itgives rise to the artery to the AV node before continuingposteriorly toward the apex of the LV as the posterior de-scending artery, which supplies the inferior wall of the LV.The artery often continues posterolaterally beyond thecrux to the opposite (lateral or left) AV groove and sendsposterolateral branches to the LV (Fig. 23.29).
■ Total occlusion of the RCA will cause the followingECG changes:■ Inferior MI: ST elevation in leads II, III, and aVF with
reciprocal ST depression in I and aVL (Fig. 23.30).■ Inferolateral MI: ST elevation in leads II, III, aVF,V5,
and V6. ST elevation in V5-V6 suggests that the lateralwall of the LV is also involved (Figs. 23.31 and 23.32).
Figure 23.24: Acute HighLateral Myocardial Infarction.ST segment elevation is noted in Iand aVL with reciprocal STdepression in III and aVF from occlu-sion of the left circumflex coronaryartery. The ST depression in II, III, andaVF is reciprocal to the ST elevationin I and aVL.
Figure 23.25: Acute Posterolateral Myocardial Infarction (MI). ST depression ispresent in V1-V4.These changes can represent subendocardial injury involving the anteriorwall or ST elevation MI involving the posterior wall of the left ventricle. The presence of STelevation in V6, I, and aVL favors acute posterolateral MI rather than anterior wall injury. Thiscan be confirmed by recording V7–9, which will show ST elevation if posterior MI is present.
LWBK271-C23_331-378.qxd 29/1/09 7:17 pm Page 344 LWBK270-4119G-C02_073-110.qxd
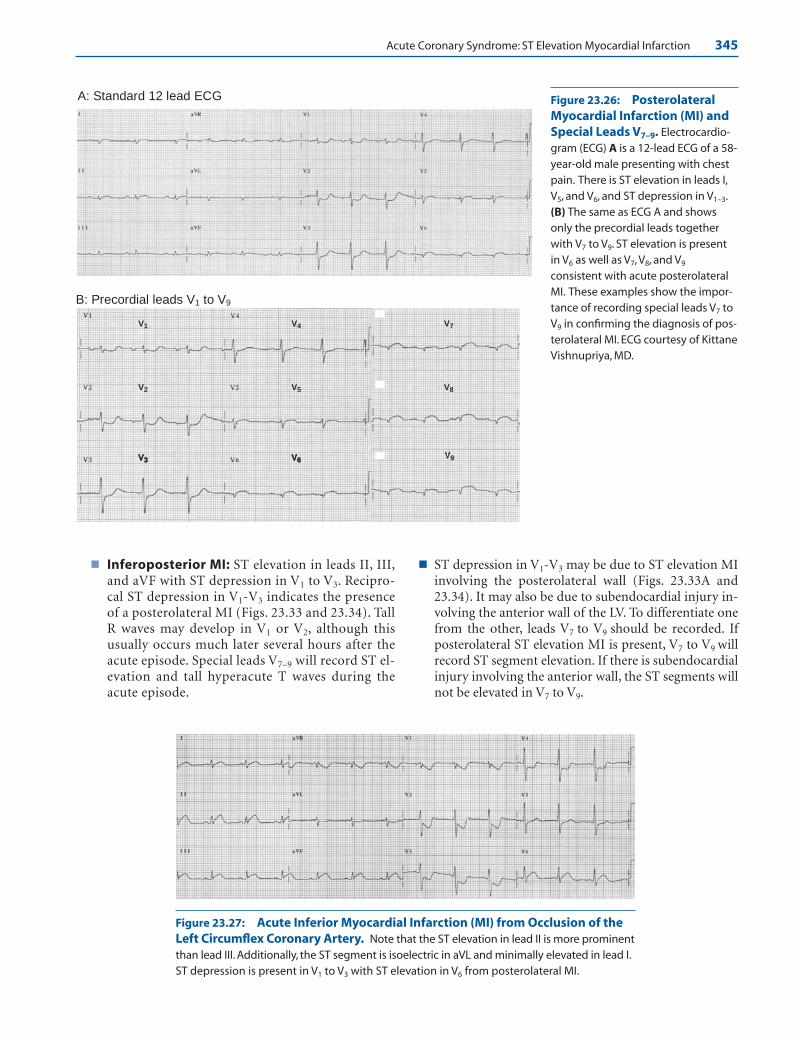
Acute Coronary Syndrome: ST Elevation Myocardial Infarction 345
■ Inferoposterior MI: ST elevation in leads II, III,and aVF with ST depression in V1 to V3. Recipro-cal ST depression in V1-V3 indicates the presenceof a posterolateral MI (Figs. 23.33 and 23.34). TallR waves may develop in V1 or V2, although thisusually occurs much later several hours after theacute episode. Special leads V7–9 will record ST el-evation and tall hyperacute T waves during theacute episode.
■ ST depression in V1-V3 may be due to ST elevation MIinvolving the posterolateral wall (Figs. 23.33A and23.34). It may also be due to subendocardial injury in-volving the anterior wall of the LV. To differentiate onefrom the other, leads V7 to V9 should be recorded. Ifposterolateral ST elevation MI is present, V7 to V9 willrecord ST segment elevation. If there is subendocardialinjury involving the anterior wall, the ST segments willnot be elevated in V7 to V9.
A: Standard 12 lead ECG
B: Precordial leads V1 to V9
V6
V5
V4
V8
V7
V2
V1
V3
Figure 23.26: PosterolateralMyocardial Infarction (MI) andSpecial Leads V7–9. Electrocardio-gram (ECG) A is a 12-lead ECG of a 58-year-old male presenting with chestpain. There is ST elevation in leads I,V5, and V6, and ST depression in V1–3.(B) The same as ECG A and showsonly the precordial leads togetherwith V7 to V9. ST elevation is presentin V6 as well as V7, V8, and V9
consistent with acute posterolateralMI. These examples show the impor-tance of recording special leads V7 toV9 in confirming the diagnosis of pos-terolateral MI. ECG courtesy of KittaneVishnupriya, MD.
Figure 23.27: Acute Inferior Myocardial Infarction (MI) from Occlusion of theLeft Circumflex Coronary Artery. Note that the ST elevation in lead II is more prominentthan lead III. Additionally, the ST segment is isoelectric in aVL and minimally elevated in lead I.ST depression is present in V1 to V3 with ST elevation in V6 from posterolateral MI.
LWBK271-C23_331-378.qxd 29/1/09 7:17 pm Page 345 LWBK270-4119G-C02_073-110.qxd
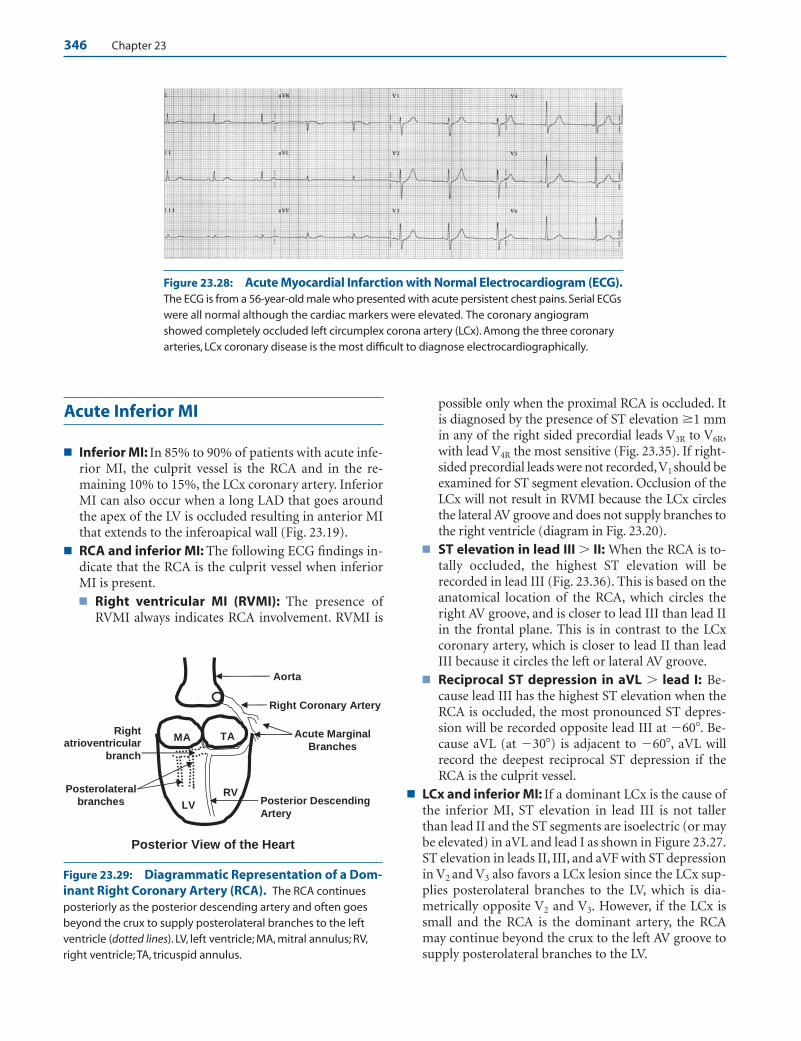
346 Chapter 23
Acute Inferior MI
■ Inferior MI: In 85% to 90% of patients with acute infe-rior MI, the culprit vessel is the RCA and in the re-maining 10% to 15%, the LCx coronary artery. InferiorMI can also occur when a long LAD that goes aroundthe apex of the LV is occluded resulting in anterior MIthat extends to the inferoapical wall (Fig. 23.19).
■ RCA and inferior MI: The following ECG findings in-dicate that the RCA is the culprit vessel when inferiorMI is present.■ Right ventricular MI (RVMI): The presence of
RVMI always indicates RCA involvement. RVMI is
possible only when the proximal RCA is occluded. Itis diagnosed by the presence of ST elevation �1 mmin any of the right sided precordial leads V3R to V6R,with lead V4R the most sensitive (Fig. 23.35). If right-sided precordial leads were not recorded,V1 should beexamined for ST segment elevation. Occlusion of theLCx will not result in RVMI because the LCx circlesthe lateral AV groove and does not supply branches tothe right ventricle (diagram in Fig. 23.20).
■ ST elevation in lead III � II: When the RCA is to-tally occluded, the highest ST elevation will berecorded in lead III (Fig. 23.36). This is based on theanatomical location of the RCA, which circles theright AV groove, and is closer to lead III than lead IIin the frontal plane. This is in contrast to the LCxcoronary artery, which is closer to lead II than leadIII because it circles the left or lateral AV groove.
■ Reciprocal ST depression in aVL � lead I: Be-cause lead III has the highest ST elevation when theRCA is occluded, the most pronounced ST depres-sion will be recorded opposite lead III at �60�. Be-cause aVL (at �30�) is adjacent to �60�, aVL willrecord the deepest reciprocal ST depression if theRCA is the culprit vessel.
■ LCx and inferior MI: If a dominant LCx is the cause ofthe inferior MI, ST elevation in lead III is not tallerthan lead II and the ST segments are isoelectric (or maybe elevated) in aVL and lead I as shown in Figure 23.27.ST elevation in leads II, III, and aVF with ST depressionin V2 and V3 also favors a LCx lesion since the LCx sup-plies posterolateral branches to the LV, which is dia-metrically opposite V2 and V3. However, if the LCx issmall and the RCA is the dominant artery, the RCAmay continue beyond the crux to the left AV groove tosupply posterolateral branches to the LV.
Aorta
Right Coronary Artery
MA TA Acute Marginal
Branches
Posterior Descending
Artery
RV
LV
Posterior View of the Heart
Right atrioventricular
branch
Posterolateral branches
Figure 23.28: Acute Myocardial Infarction with Normal Electrocardiogram (ECG).The ECG is from a 56-year-old male who presented with acute persistent chest pains. Serial ECGswere all normal although the cardiac markers were elevated. The coronary angiogramshowed completely occluded left circumplex corona artery (LCx). Among the three coronaryarteries, LCx coronary disease is the most difficult to diagnose electrocardiographically.
Figure 23.29: Diagrammatic Representation of a Dom-inant Right Coronary Artery (RCA). The RCA continuesposteriorly as the posterior descending artery and often goesbeyond the crux to supply posterolateral branches to the leftventricle (dotted lines). LV, left ventricle; MA, mitral annulus; RV,right ventricle; TA, tricuspid annulus.
LWBK271-C23_331-378.qxd 29/1/09 7:17 pm Page 346 LWBK270-4119G-C02_073-110.qxd

Acute Coronary Syndrome: ST Elevation Myocardial Infarction 347
Figure 23.30: Acute InferiorMyocardial Infarction (MI). STsegment elevation is present in II, III,and aVF with reciprocal STdepression in I and aVL consistentwith acute inferior MI. This is due toocclusion of the right coronaryartery.
III
aVL
II
I
aVR
aVF
−60
−30
+120
V6
V1
V3
V2
V9
V8
R
B
L
Posterior
PosterolateralMI
A
Figure 23.31: AcuteInferolateral Myocardial Infarc-tion. The ST segments are elevatedin leads II, III, and aVF with reciprocalST depression in aVL. ST segmentsare elevated in V5 and V6 with ST seg-ment depression in V1 and V2. Coro-nary angiography showed completeocclusion of the proximal right coro-nary artery.
Figure 23.32: Acute Inferolat-eral Myocardial Infarction. STelevation is noted in II, III, aVF, and V4
to V6 with reciprocal ST depression inI and aVL.The findings are similar tothose in Figure 23.31.
Figure 23.33: Posterolateral Myocardial Infarc-tion (MI). Posterolateral MI is a true ST segment ele-vation MI. This is suspected when there is ST segmentdepression in V1–3 (A). The ST depression in V1–3 is a reciprocal pattern due to ST elevation in the posterolat-eral wall similar to the reciprocal pattern seen in aVLwhen there is ST elevation in lead III (B). PosterolateralMI can be verified by recording special leads V7–9, whichwill confirm the presence of ST elevation in this area.
LWBK271-C23_331-378.qxd 29/1/09 7:17 pm Page 347 LWBK270-4119G-C02_073-110.qxd

348 Chapter 23
V1 V2
V6
V5
V3R
V4R
V5R
V6R
V3
V4
Figure 23.34: Acute Inferopos-terior Myocardial Infarction(MI). ST segments are elevated in II,III, and aVF with reciprocal ST depres-sion in leads I and aVL consistentwith an acute inferior MI.There is alsoST depression in V1 to V4 and ST ele-vation in V6 from posterolateral MI.The P waves (arrows) are completelydissociated from the QRS complexesbecause of AV block.
Figure 23.35: Right-Sided Precordial Leads. The right-sided precordial leads are labeled V3R to V6R (open circles).Theleads are obtained by repositioning the standard precordialelectrodes V3–6 (dark circles) to the right side of the chest. LeadsV1 and V2 remain in their original location.
Figure 23.36: Acute Inferior Myocardial Infarction (MI). The 12-lead electrocardio-gram shows ST segment elevation in II, III, and aVF with reciprocal ST depression in I and aVLfrom acute inferior MI. There is also reciprocal ST depression in V2 and V3 from involvement ofthe posterior wall of the left ventricle. Note that the ST elevation in lead III is higher than the STelevation in lead II and ST depression in aVL is deeper than the ST depression in I, suggestingthat the culprit vessel is the right coronary artery. The right-sided precordial leads are shown.
LWBK271-C23_331-378.qxd 29/1/09 7:17 pm Page 348 LWBK270-4119G-C02_073-110.qxd

Acute Coronary Syndrome: ST Elevation Myocardial Infarction 349
Right Ventricular Myocardial Infarction
■ RVMI: RVMI is a common complication of acute infe-rior MI. If the initial ECG confirms the diagnosis ofacute inferior MI, right-sided precordial leads should berecorded immediately (Fig. 23.37). This is a Class I indi-cation according to the 2004 ACC/AHA guidelines onST elevation MI. If right-sided precordial leads are notimmediately recorded, ST elevation in the right precor-dial leads may disappear within 10 hours after symptomonset in approximately half of patients with RVMI.
■ Right sided precordial leads are recorded by reposition-ing the precordial leads V3, V4, V5, and V6 to the rightside of the chest in the same standard location as thaton the left (Fig. 23.35). Right-sided precordial leads are
not routinely recorded if there is no evidence of acuteinferior MI.
■ Any ST elevation �1 mm in any of the right sided pre-cordial leads V3R to V6R is consistent with RVMI. Theseleads, especially V4R, are the most sensitive and mostspecific for the diagnosis of RVMI.
■ RVMI is possible only when the proximal RCA is oc-cluded. It does not occur when the distal RCA or LCxcoronary artery is involved. This is important prognosti-cally because occlusion of the proximal RCA usually im-plies the presence of a larger infarct and is associatedwith a high incidence of AV nodal block when comparedto occlusion of a nondominant LCx or distal RCA.
■ RVMI: Very often, right-sided precordial leads are notrecorded at the time of entry. These leads are specialleads and are not routine in a regular 12-lead ECG.
V4R
V5R
V6RV3R
V2
V1
Figure 23.37: Acute Inferior MI with Right Ventricular Myocardial Infarction(RVMI). The diagnosis of RVMI is based on the presence of �1 mm ST elevation in any ofthe right sided precordial leads V3R to V6R (arrows). The electrocardiogram shows at least 1mm of ST elevation in V4R, V5R, and V6R consistent with RVMI. It is not necessary to switch V1
and V2, as was done above when recording right-sided precordial leads. The presence ofRVMI suggests that the culprit vessel is the proximal right coronary artery.
Figure 23.38: Right VentricularMyocardial Infarction (RVMI).The diagnosis of RVMI should alwaysbe suspected in the standard 12-leadelectrocardiogram when acute infe-rior MI is present. ST elevation in leadIII greater than lead II and presenceof ST elevation in V1 indicate RVMI asshown above. If the ST elevation in V1
extends to V2 or V3, it may resembleacute anterior MI.
LWBK271-C23_331-378.qxd 29/1/09 7:17 pm Page 349 LWBK270-4119G-C02_073-110.qxd
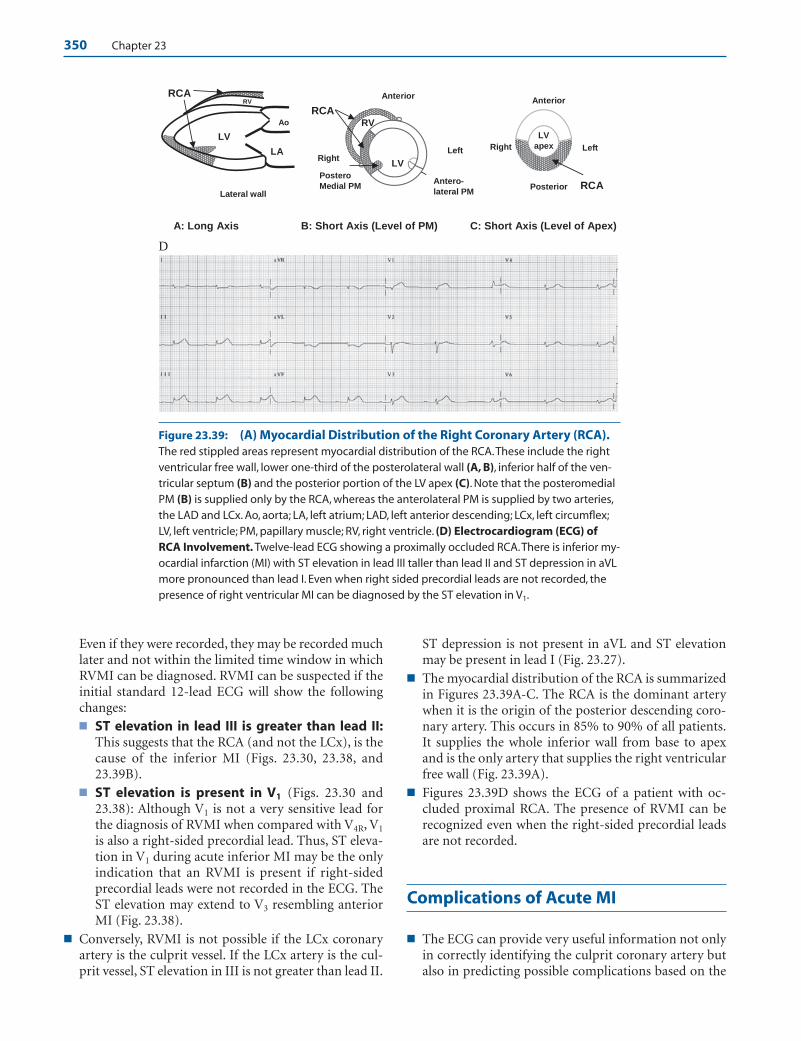
350 Chapter 23
Even if they were recorded, they may be recorded muchlater and not within the limited time window in whichRVMI can be diagnosed. RVMI can be suspected if theinitial standard 12-lead ECG will show the followingchanges:■ ST elevation in lead III is greater than lead II:
This suggests that the RCA (and not the LCx), is thecause of the inferior MI (Figs. 23.30, 23.38, and23.39B).
■ ST elevation is present in V1 (Figs. 23.30 and23.38): Although V1 is not a very sensitive lead forthe diagnosis of RVMI when compared with V4R, V1
is also a right-sided precordial lead. Thus, ST eleva-tion in V1 during acute inferior MI may be the onlyindication that an RVMI is present if right-sidedprecordial leads were not recorded in the ECG. TheST elevation may extend to V3 resembling anteriorMI (Fig. 23.38).
■ Conversely, RVMI is not possible if the LCx coronaryartery is the culprit vessel. If the LCx artery is the cul-prit vessel, ST elevation in III is not greater than lead II.
ST depression is not present in aVL and ST elevationmay be present in lead I (Fig. 23.27).
■ The myocardial distribution of the RCA is summarizedin Figures 23.39A-C. The RCA is the dominant arterywhen it is the origin of the posterior descending coro-nary artery. This occurs in 85% to 90% of all patients.It supplies the whole inferior wall from base to apexand is the only artery that supplies the right ventricularfree wall (Fig. 23.39A).
■ Figures 23.39D shows the ECG of a patient with oc-cluded proximal RCA. The presence of RVMI can berecognized even when the right-sided precordial leadsare not recorded.
Complications of Acute MI
■ The ECG can provide very useful information not onlyin correctly identifying the culprit coronary artery butalso in predicting possible complications based on the
A: Long Axis B: Short Axis (Level of PM) C: Short Axis (Level of Apex)
D
Anterior
Left
LV
LA
Ao
RCA
RCA
LV
RV
RCA
Right
Right
Anterior
Posterior Lateral wall
Left
LV
apex
Postero
Medial PM Antero-
lateral PM
RV
Figure 23.39: (A) Myocardial Distribution of the Right Coronary Artery (RCA).The red stippled areas represent myocardial distribution of the RCA.These include the rightventricular free wall, lower one-third of the posterolateral wall (A, B), inferior half of the ven-tricular septum (B) and the posterior portion of the LV apex (C). Note that the posteromedialPM (B) is supplied only by the RCA, whereas the anterolateral PM is supplied by two arteries,the LAD and LCx. Ao, aorta; LA, left atrium; LAD, left anterior descending; LCx, left circumflex;LV, left ventricle; PM, papillary muscle; RV, right ventricle. (D) Electrocardiogram (ECG) ofRCA Involvement. Twelve-lead ECG showing a proximally occluded RCA.There is inferior my-ocardial infarction (MI) with ST elevation in lead III taller than lead II and ST depression in aVLmore pronounced than lead I. Even when right sided precordial leads are not recorded, thepresence of right ventricular MI can be diagnosed by the ST elevation in V1.
LWBK271-C23_331-378.qxd 29/1/09 7:17 pm Page 350 LWBK270-4119G-C02_073-110.qxd
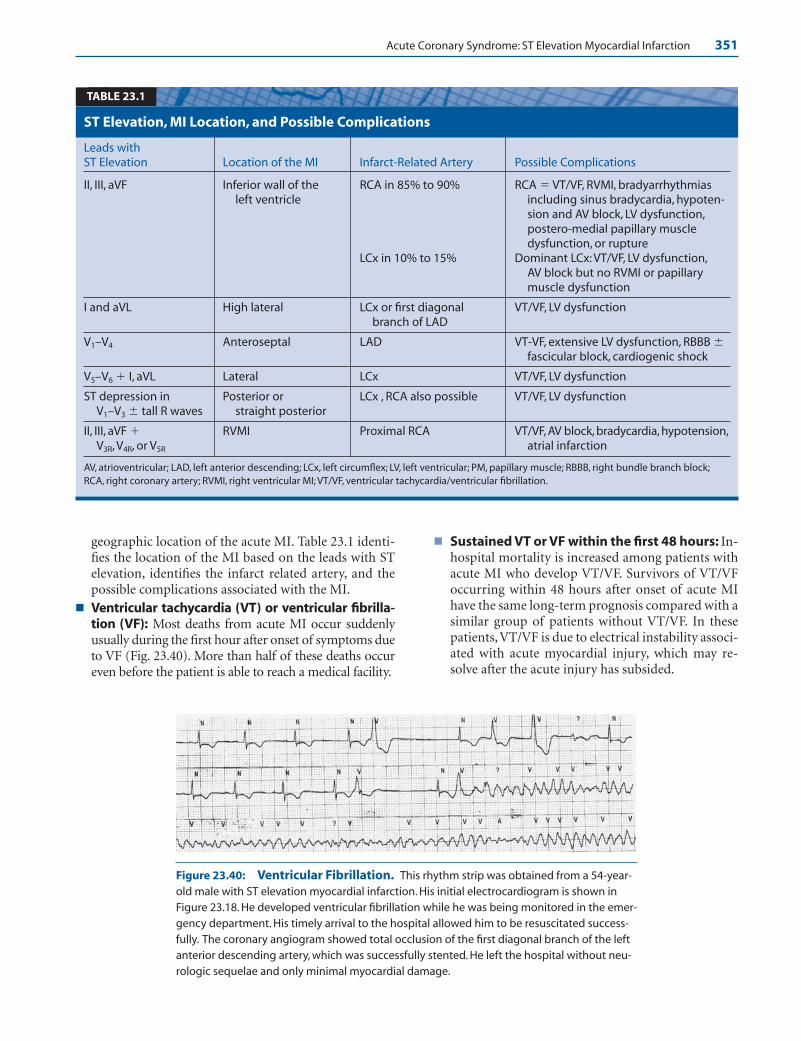
Acute Coronary Syndrome: ST Elevation Myocardial Infarction 351
geographic location of the acute MI. Table 23.1 identi-fies the location of the MI based on the leads with STelevation, identifies the infarct related artery, and thepossible complications associated with the MI.
■ Ventricular tachycardia (VT) or ventricular fibrilla-tion (VF): Most deaths from acute MI occur suddenlyusually during the first hour after onset of symptoms dueto VF (Fig. 23.40). More than half of these deaths occureven before the patient is able to reach a medical facility.
■ Sustained VT or VF within the first 48 hours: In-hospital mortality is increased among patients withacute MI who develop VT/VF. Survivors of VT/VFoccurring within 48 hours after onset of acute MIhave the same long-term prognosis compared with asimilar group of patients without VT/VF. In thesepatients, VT/VF is due to electrical instability associ-ated with acute myocardial injury, which may re-solve after the acute injury has subsided.
Leads with ST Elevation Location of the MI Infarct-Related Artery Possible Complications
II, III, aVF Inferior wall of the RCA in 85% to 90% RCA � VT/VF, RVMI, bradyarrhythmiasleft ventricle including sinus bradycardia, hypoten-
sion and AV block, LV dysfunction,postero-medial papillary muscledysfunction, or rupture
LCx in 10% to 15% Dominant LCx: VT/VF, LV dysfunction,AV block but no RVMI or papillary muscle dysfunction
I and aVL High lateral LCx or first diagonal VT/VF, LV dysfunctionbranch of LAD
V1–V4 Anteroseptal LAD VT-VF, extensive LV dysfunction, RBBB �fascicular block, cardiogenic shock
V5–V6 � I, aVL Lateral LCx VT/VF, LV dysfunction
ST depression in Posterior or LCx , RCA also possible VT/VF, LV dysfunctionV1–V3 � tall R waves straight posterior
II, III, aVF � RVMI Proximal RCA VT/VF, AV block, bradycardia, hypotension,V3R, V4R, or V5R atrial infarction
AV, atrioventricular; LAD, left anterior descending; LCx, left circumflex; LV, left ventricular; PM, papillary muscle; RBBB, right bundle branch block;RCA, right coronary artery; RVMI, right ventricular MI; VT/VF, ventricular tachycardia/ventricular fibrillation.
ST Elevation, MI Location, and Possible Complications
TABLE 23.1
Figure 23.40: Ventricular Fibrillation. This rhythm strip was obtained from a 54-year-old male with ST elevation myocardial infarction. His initial electrocardiogram is shown inFigure 23.18. He developed ventricular fibrillation while he was being monitored in the emer-gency department. His timely arrival to the hospital allowed him to be resuscitated success-fully. The coronary angiogram showed total occlusion of the first diagonal branch of the leftanterior descending artery, which was successfully stented. He left the hospital without neu-rologic sequelae and only minimal myocardial damage.
LWBK271-C23_331-378.qxd 29/1/09 7:17 pm Page 351 LWBK270-4119G-C02_073-110.qxd

352 Chapter 23
■ Sustained VT or VF after 48 hours: Survivors ofcardiac arrest due to VT/VF occurring after 48 hoursof acute MI continue to be at risk for VT/VF. Unlessthe arrhythmia has been shown to be due to elec-trolyte abnormalities or due to recurrent acute is-chemia, which are reversible, these patients are athigh risk for developing recurrence of VT/VF andwill benefit from implantation of an automatic de-fibrillator even without electrophysiologic testing.
■ One of the most important factors that determine theprognosis of patients with acute MI is the extent of my-ocardial damage. The presence of severe myocardialdamage and a low left ventricular ejection fraction pre-disposes to ventricular arrhythmias, which may causesudden death.
■ Other ventricular arrhythmias: Some arrhythmiasmay be related to reperfusion after successful throm-bolysis and should be recognized. The most frequentECG finding associated with successful reperfusion isaccelerated idioventricular rhythm (AIVR).
■ AIVR: AIVR is a ventricular rhythm with a rate of 60 to110 beats per minute (bpm). AIVR commonly occursas a reperfusion arrhythmia and is more commonlyseen after thrombolysis rather than with primary PCI.It occurs with about equal frequency in patients withacute inferior (Fig. 23.41) and anterior MI (Fig. 23.42).
The arrhythmia is generally benign and does not re-quire any therapy.
■ AIVR may be difficult to recognize and may be mis-taken for ventricular tachycardia or new onset bundlebranch block (Fig. 23.42). In AIVR, the QRS complexesare not preceded by P waves or there is complete AVdissociation. This may result in decreased cardiac out-put because atrial contraction no longer contributes toleft ventricular filling.
■ Acute inferior MI and AV block: When acute inferiorMI causes AV block, the AV block is at the level of theAV node (Figs. 23.43 and 23.44).
Acute MI and Right Bundle BranchBlock (RBBB)
■ Among 26,003 patients with acute MI studied inGUSTO-1 (Global Utilization of Streptokinase and tPAfor Occluded Coronary Arteries), 289 patients (1.1%)had RBBB. Most of these patients with RBBB had ante-rior MI. In 133 patients, only RBBB was present. In 145patients, left anterior fascicular block was also present.Only 11 patients had RBBB with left posterior fascicularblock.
A.
B.
Figure 23.41: AcceleratedIdioventricular Rhythm. The 12-lead electrocardiogram (ECG) in A shows normal sinus rhythm andacute inferior MI. (B) The samepatient a few minutes after ECG Awas recorded, showing acceleratedidioventricular rhythm.
LWBK271-C23_331-378.qxd 29/1/09 7:17 pm Page 352 LWBK270-4119G-C02_073-110.qxd

Acute Coronary Syndrome: ST Elevation Myocardial Infarction 353
B.
A. Figure 23.42: AcceleratedIdioventricular Rhythm. Electro-cardiogram (ECG) A shows normalsinus rhythm with acute anterosep-tal MI. ECG B shows a sudden changein the configuration of the QRS com-plexes with tall R waves in V1 and arightward shift in the axis of the QRScomplex in the frontal plane due toaccelerated idioventricular rhythm.This ECG can be mistaken for new-onset right bundle branch blockwith left posterior fascicular block.
Figure 23.43: Acute Inferior Myocardial Infarction (MI) and CompleteAtrioventricular (AV) Block. The P waves (arrows) and QRS complexes are completelydissociated consistent with complete AV block.When complete AV block occurs in thesetting of an acute inferior MI, the AV block is at the level of the AV node. The AV block is usu-ally reversible and permanent pacing is usually not indicated.
LWBK271-C23_331-378.qxd 29/1/09 7:17 pm Page 353 LWBK270-4119G-C02_073-110.qxd

354 Chapter 23
■ Changes in the ST segment and T wave whenthere is (RBBB): The diagnosis of acute MI is not diffi-cult when there is RBBB. Changes in the Q waves, STsegment, and T waves continue to be useful.■ RBBB without MI: In RBBB without MI, the ST
segments and T waves are normally discordant (op-posite in direction) in relation to the terminal por-tion of the QRS complex. Thus, in V1, the T wavesare normally inverted and the ST segments are de-pressed because terminal R waves are present whenthere is RBBB. In V6, the T waves are upright and theST segments are elevated since terminal S waves arepresent (Figs. 23.45A and 23.46).
■ RBBB with acute MI: When ST elevation MI iscomplicated by RBBB, the ST segments becomeconcordant (same direction) in relation to the ter-
minal portion of the QRS complex. Thus, in ante-rior MI, the ST segments are elevated in V1 and of-ten in V2 because terminal R waves are normallypresent in these leads. Similar concordant changesmay be noted in leads II, III, and aVF when there isinferior MI (Figs. 23.47 and 23.48B).
■ Two examples of RBBB are shown in Figure 23.46, inwhich the RBBB is uncomplicated without evidenceof MI. Note the presence of normally discordant STsegments and T waves. The second patient has inferiorMI complicated by RBBB (Fig. 23.47). Note the pres-ence of concordant ST elevation in leads III, aVF, andV1, and concordant ST depression in leads I, aVL, andV2.
■ Q wave changes: RBBB does not interfere with the di-agnosis of acute ST elevation MI. Changes in the
V6
B: RBBB with MI
S wave down
ST and Twave up
V1 V1 ST and T wave also
down
S wave down
R’ wave up
ST and T wave
are also up
V6
R’ wave up
ST and T
wave down
A: Uncomplicated RBBB
Figure 23.44: Acute Inferolat-eral Myocardial Infarction with2:1 Atrioventricular (AV) Block.The electrocardiogram shows 2:1 AVblock. The arrows identify thesecond P wave that is notconducted.
Figure 23.45: ST-T Changes in Right Bundle Branch Block (RBBB). (A) In uncompli-cated RBBB, the ST segment and T wave are normally discordant (opposite in direction) to theterminal portion of the QRS complex. (B) When ST elevation myocardial infarction occurs, the STsegment (and T wave) becomes concordant (same direction) in relation to the terminal portionof the QRS complex.
LWBK271-C23_331-378.qxd 29/1/09 7:17 pm Page 354 LWBK270-4119G-C02_073-110.qxd
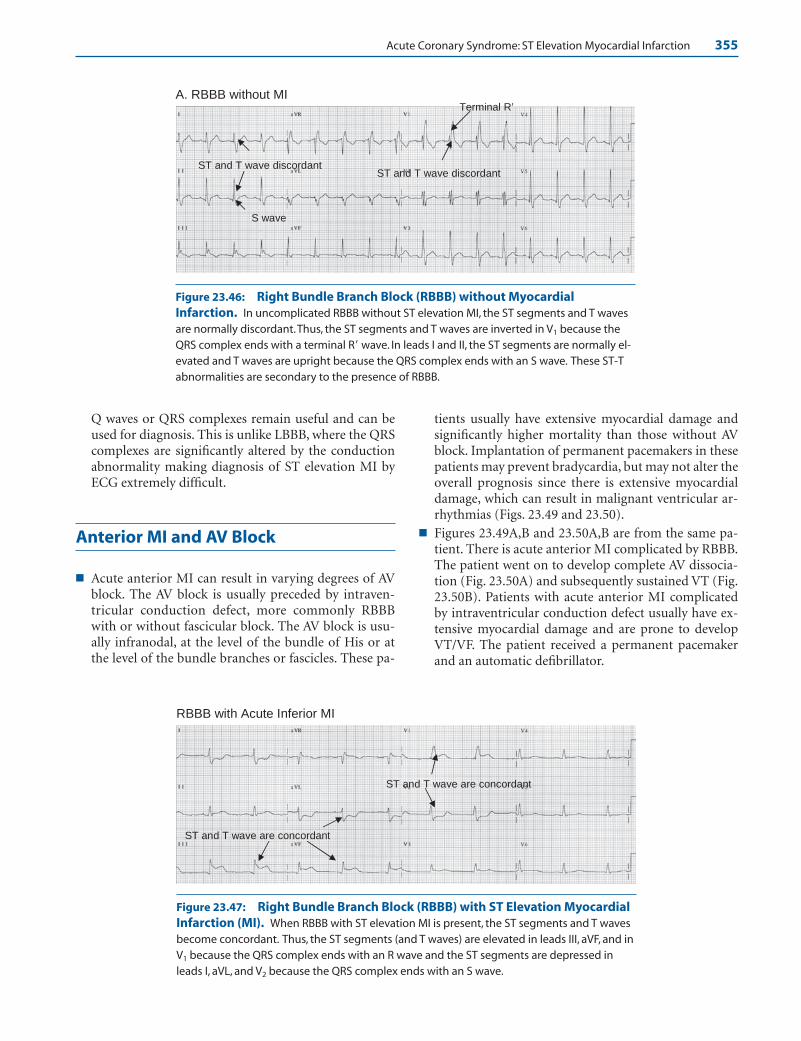
Acute Coronary Syndrome: ST Elevation Myocardial Infarction 355
Q waves or QRS complexes remain useful and can beused for diagnosis. This is unlike LBBB, where the QRScomplexes are significantly altered by the conductionabnormality making diagnosis of ST elevation MI byECG extremely difficult.
Anterior MI and AV Block
■ Acute anterior MI can result in varying degrees of AVblock. The AV block is usually preceded by intraven-tricular conduction defect, more commonly RBBBwith or without fascicular block. The AV block is usu-ally infranodal, at the level of the bundle of His or atthe level of the bundle branches or fascicles. These pa-
tients usually have extensive myocardial damage andsignificantly higher mortality than those without AVblock. Implantation of permanent pacemakers in thesepatients may prevent bradycardia, but may not alter theoverall prognosis since there is extensive myocardialdamage, which can result in malignant ventricular ar-rhythmias (Figs. 23.49 and 23.50).
■ Figures 23.49A,B and 23.50A,B are from the same pa-tient. There is acute anterior MI complicated by RBBB.The patient went on to develop complete AV dissocia-tion (Fig. 23.50A) and subsequently sustained VT (Fig.23.50B). Patients with acute anterior MI complicatedby intraventricular conduction defect usually have ex-tensive myocardial damage and are prone to developVT/VF. The patient received a permanent pacemakerand an automatic defibrillator.
A. RBBB without MI Terminal R’
ST and T wave discordant
S wave
ST and T wave discordant
RBBB with Acute Inferior MI
ST and T wave are concordant
ST and T wave are concordant
Figure 23.46: Right Bundle Branch Block (RBBB) without MyocardialInfarction. In uncomplicated RBBB without ST elevation MI, the ST segments and T wavesare normally discordant.Thus, the ST segments and T waves are inverted in V1 because theQRS complex ends with a terminal R wave. In leads I and II, the ST segments are normally el-evated and T waves are upright because the QRS complex ends with an S wave. These ST-Tabnormalities are secondary to the presence of RBBB.
Figure 23.47: Right Bundle Branch Block (RBBB) with ST Elevation MyocardialInfarction (MI). When RBBB with ST elevation MI is present, the ST segments and T wavesbecome concordant. Thus, the ST segments (and T waves) are elevated in leads III, aVF, and inV1 because the QRS complex ends with an R wave and the ST segments are depressed inleads I, aVL, and V2 because the QRS complex ends with an S wave.
LWBK271-C23_331-378.qxd 29/1/09 7:17 pm Page 355 LWBK270-4119G-C02_073-110.qxd
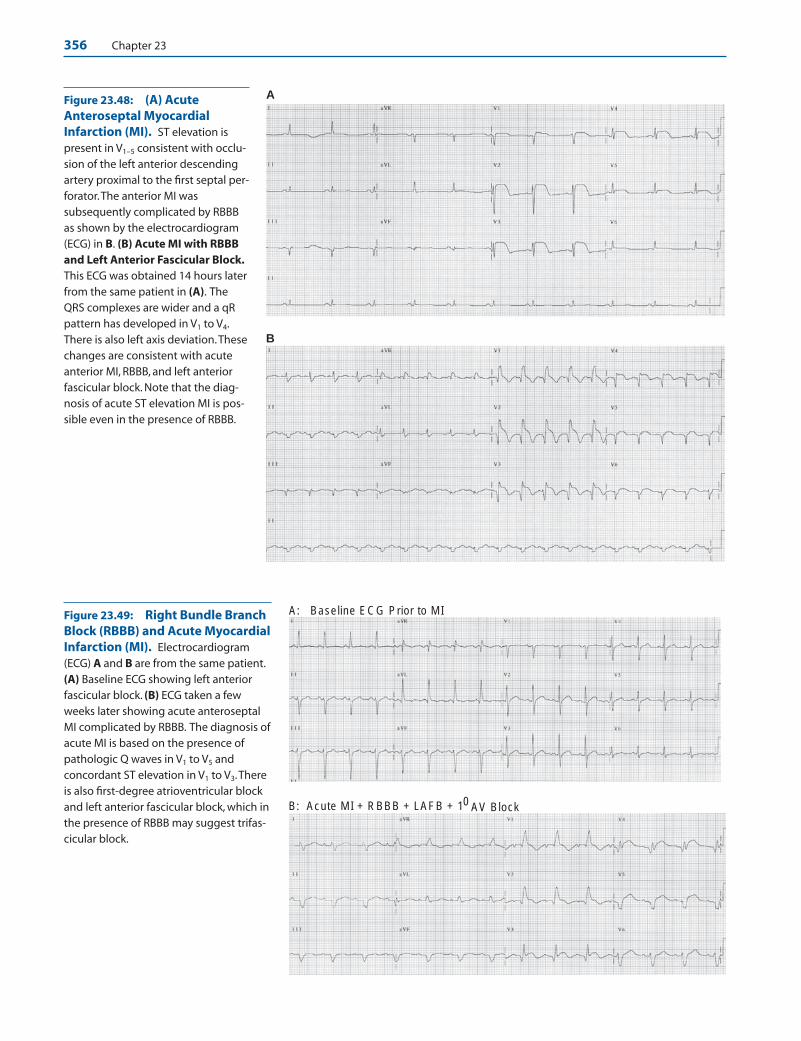
356 Chapter 23
B
AFigure 23.48: (A) AcuteAnteroseptal MyocardialInfarction (MI). ST elevation ispresent in V1–5 consistent with occlu-sion of the left anterior descendingartery proximal to the first septal per-forator.The anterior MI wassubsequently complicated by RBBBas shown by the electrocardiogram(ECG) in B. (B) Acute MI with RBBBand Left Anterior Fascicular Block.This ECG was obtained 14 hours laterfrom the same patient in (A). TheQRS complexes are wider and a qRpattern has developed in V1 to V4.There is also left axis deviation.Thesechanges are consistent with acuteanterior MI, RBBB, and left anteriorfascicular block. Note that the diag-nosis of acute ST elevation MI is pos-sible even in the presence of RBBB.
A: Baseline ECG Prior to MI
B: Acute MI + RBBB + LAFB + 10 AV Block
Figure 23.49: Right Bundle BranchBlock (RBBB) and Acute MyocardialInfarction (MI). Electrocardiogram(ECG) A and B are from the same patient.(A) Baseline ECG showing left anteriorfascicular block. (B) ECG taken a fewweeks later showing acute anteroseptalMI complicated by RBBB. The diagnosis ofacute MI is based on the presence ofpathologic Q waves in V1 to V5 andconcordant ST elevation in V1 to V3.Thereis also first-degree atrioventricular blockand left anterior fascicular block, which inthe presence of RBBB may suggest trifas-cicular block.
LWBK271-C23_331-378.qxd 29/1/09 7:17 pm Page 356 LWBK270-4119G-C02_073-110.qxd
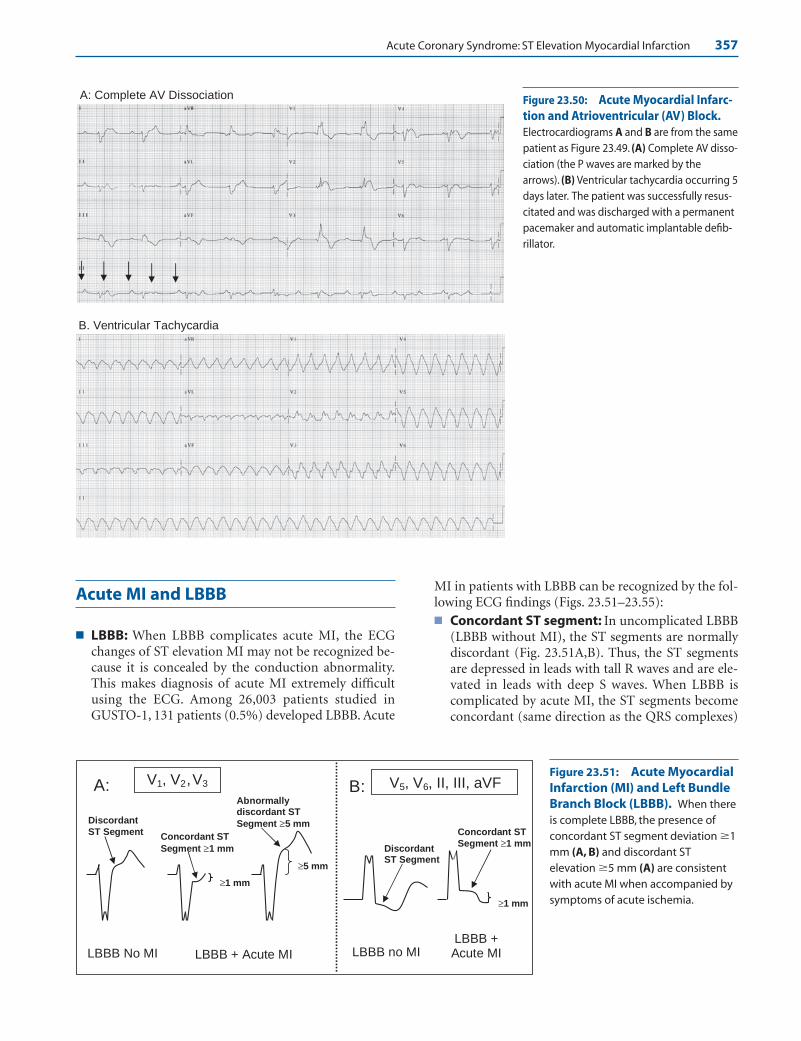
Acute Coronary Syndrome: ST Elevation Myocardial Infarction 357
Acute MI and LBBB
■ LBBB: When LBBB complicates acute MI, the ECGchanges of ST elevation MI may not be recognized be-cause it is concealed by the conduction abnormality.This makes diagnosis of acute MI extremely difficultusing the ECG. Among 26,003 patients studied inGUSTO-1, 131 patients (0.5%) developed LBBB. Acute
MI in patients with LBBB can be recognized by the fol-lowing ECG findings (Figs. 23.51–23.55):■ Concordant ST segment: In uncomplicated LBBB
(LBBB without MI), the ST segments are normallydiscordant (Fig. 23.51A,B). Thus, the ST segmentsare depressed in leads with tall R waves and are ele-vated in leads with deep S waves. When LBBB iscomplicated by acute MI, the ST segments becomeconcordant (same direction as the QRS complexes)
A: Complete AV Dissociation
B. Ventricular Tachycardia
Figure 23.50: Acute Myocardial Infarc-tion and Atrioventricular (AV) Block.Electrocardiograms A and B are from the samepatient as Figure 23.49. (A) Complete AV disso-ciation (the P waves are marked by thearrows). (B) Ventricular tachycardia occurring 5days later. The patient was successfully resus-citated and was discharged with a permanentpacemaker and automatic implantable defib-rillator.
≥5 mm
LBBB + Acute MI
Discordant ST Segment
Abnormallydiscordant ST
Segment ≥5 mmDiscordant
ST SegmentConcordant ST
Segment ≥1 mm
≥1 mm
Concordant ST Segment ≥1 mm
LBBB no MILBBB + Acute MILBBB No MI
≥1 mm
V1, V ,2 V3 V5, V6, II, III, aVFA: B:Figure 23.51: Acute MyocardialInfarction (MI) and Left BundleBranch Block (LBBB). When thereis complete LBBB, the presence ofconcordant ST segment deviation �1mm (A, B) and discordant STelevation �5 mm (A) are consistentwith acute MI when accompanied bysymptoms of acute ischemia.
LWBK271-C23_331-378.qxd 29/1/09 7:17 pm Page 357 LWBK270-4119G-C02_073-110.qxd

358 Chapter 23
and measure �1 mm. Thus, ST segment depression�1 mm in leads with deep S waves (V1, V2, or V3;Fig. 23.51A) or ST elevation �1 mm in leads withtall R waves (V5, V6, and often in II, III, and aVF; Fig.23.51B) are consistent with acute ST elevation MI.
■ Discordant ST segment: Acute MI can also be di-agnosed if the ST segments are abnormally discor-dant (opposite direction to the QRS complexes) andmeasure �5 mm. Thus, ST elevation �5 mm in anylead with deep S waves such as V1 to V3 is consistentwith acute MI when accompanied by symptoms ofacute ischemia (Fig. 23.51A).
■ The two ECGs (Figs. 23.54 and 23.55) show discordantST segments. In Figure 23.54, discordant ST segmentelevation of more than 5 mm is present in V2 and V3.
These ECG changes are associated with symptoms ofacute ischemia. In Figure 23.55, there is concordant STsegment depression in V4, which is accepted as a crite-rion for acute MI. In addition, there is also discordantST segment depression of 5 mm in V5. Presently, dis-cordant ST depression �5 mm is not included in theliterature as a criterion for acute MI in the presence ofLBBB.
Common Mistakes in ST Elevation MI
■ Other causes of ST elevation: There are several othercauses of ST elevation other than acute MI. These entities
A. Initial ECG:
B. Same Patient as ECG A showing LBBB:
Figure 23.52: Acute Anterosep-tal Myocardial Infarction (MI).The initial electrocardiogram (ECG)(A) shows acute anteroseptal MI. ECG(B) taken a few hours later show leftbundle branch block withconcordant ST elevation �1 mm inlead aVL (arrow).
Figure 23.53: Acute MyocardialInfarction (MI) and Left BundleBranch Block (LBBB). LBBB ispresent with wide QRS complexesmeasuring �0.12 seconds.Concordant ST segment elevation�1 mm is present in leads with tall Rwaves including V5, V6, and leads II, III,and aVF (arrows) consistent withacute ST elevation MI.
LWBK271-C23_331-378.qxd 29/1/09 7:18 pm Page 358 LWBK270-4119G-C02_073-110.qxd

Acute Coronary Syndrome: ST Elevation Myocardial Infarction 359
should be recognized especially when thrombolyticagents are being considered as therapy for the acute MI.■ Normal elevation of the ST segment at the transi-
tion zone■ Early repolarization■ LBBB■ Left ventricular hypertrophy (LVH)■ Acute pericarditis■ Left ventricular aneurysm ■ Electrolyte abnormalities: hyperkalemia and hyper-
calcemia■ Wolff-Parkinson-White (WPW) syndrome■ Osborn wave of hypothermia■ Brugada ECG■ Others: Pacemaker rhythm, ectopic ventricular
complexes, Takotsubo cardiomyopathy, tumors ortrauma involving the ventricles.
■ ST elevation at the transition zone: Elevation of theST segment is common in normal individuals at theprecordial transition zones V2, V3, or V4. The transitionzone is at the mid-precordial leads, where the R wavebecomes equal to the S wave as the precordial elec-trodes move up from V1 to V6. The ST segments inthese transition leads have upsloping configurationand are usually not isoelectric. The elevation of the ST
segment is a normal and expected finding and shouldnot be considered a variant of normal (Fig. 23.56).
■ Early Repolarization: J point elevation with ST eleva-tion from early repolarization is common in normalindividuals. The ST elevation is usually seen in the pre-cordial leads and can be mistaken for transmural my-ocardial injury. The following are the characteristic fea-tures of early repolarization:■ ST elevation is commonly seen in leads V2 to V6 and
also in leads II, III, and aVF. The ST elevation is con-cave upward (Fig. 23.57).
■ Early repolarization is not accompanied by recipro-cal depression of the ST segment.
■ A prominent notch is usually inscribed at the termi-nal portion of the QRS complex in leads with STelevation (Fig. 23.57).
■ The ST elevation usually becomes isoelectric or lesspronounced during tachycardia and becomes moreaccentuated during bradycardia (Figs. 23.58 and23.59).
■ The T waves in V6 are usually tall when compared withthe height of the ST segment. Thus, the ratio betweenthe height of ST segment and that of the T wave isusually 25 % in V6. This ratio is helpful when peri-carditis is being considered. Elevation of the ST seg-ments in pericarditis is usually prominent. Thus,
Figure 23.54: Acute MyocardialInfarction (MI) and Left BundleBranch Block (LBBB). LBBB ispresent with discordant ST segment el-evation �5 mm in V2 and in V3 (arrows),which in the presence of symptomschest pain indicate acute MI.
Figure 23.55: DiscordantPattern. This patient ruled in foracute myocardial infarction (MI) withmarkedly elevated troponins. Theelectrocardiogram shows left bundlebranch block (LBBB) with concordantST segment depression �1 mm in V4.There is also discordant ST segmentdepression �5 mm in V5 (arrows).Discordant ST depression ispresently not included as a criterionfor acute MI when there is LBBB.
LWBK271-C23_331-378.qxd 29/1/09 7:18 pm Page 359 LWBK270-4119G-C02_073-110.qxd

360 Chapter 23
HR 92 BPM HR 70 BPM HR 44 BPM
Concave ST elevation
Notch at the J point
ST-T ratio in V6 <25%
1 mm
6 mm
Figure 23.56: Normal ST Elevation at the Transition Zone. Elevation of the ST seg-ment is common in normal individuals at the transition zone which is usually in V2,V3, or V4
(arrows).This is a normal finding often described as “high take-off” of the ST segment.Veryoften, the T waves are also peaked and taller than the R wave at the transition zone. This isalso a normal finding.
Figure 23.57: Early Repolarization. ST segment elevation is noted in V3 to V6 (arrows), which can bemistaken for acute myocardial injury. There is no reciprocal ST depression in any lead and a prominent notch ispresent at the end of the R wave in V4. Note that the height of the ST segment in V6 measures 1.0 mm and theheight of the T wave measures 6 mm (ST elevation/T wave ratio �25%). A ratio 25% suggests early repolariza-tion. If pericarditis is being considered, the ratio is �25% because the height of the T waves is generally lower inpericarditis.
Figure 23.58: Early Repolarization during Holter Monitoring. Three rhythmstrips with different heart rates are shown above in the same patient undergoing Holtermonitoring. Note that there is more pronounced ST segment elevation because of early re-polarization when the heart rate is slower than when the heart rate is faster. Arrows point tothe ST segment elevation. HR, heart rate.
LWBK271-C23_331-378.qxd 29/1/09 7:18 pm Page 360 LWBK270-4119G-C02_073-110.qxd

Acute Coronary Syndrome: ST Elevation Myocardial Infarction 361
when the ratio between the height of the ST segmentcompared with that of the height of the T wave is�25% in V6, pericarditis is the more likely diagnosis.
■ In early repolarization, the ST segment elevation ismore prominent when the heart rate is slower as shownin Figures 23.58 and 23.59.
■ Hyperkalemia: Hyperkalemia can cause elevation ofthe ST segment in the ECG (see Chapter 25, Elec-trolyte Abnormalities). The ST segment elevation canbe mistaken for acute ST elevation MI (Fig. 23.60).When ST segment elevation of this magnitude occurduring hyperkalemia, the serum potassium level isusually �8 mEq/L.
■ LBBB: In LBBB, the ST segments and T waves are nor-mally discordant with the QRS complex. Thus, ST seg-ment elevation and upright T waves are recorded in
leads with deep S waves such as V1 to V3 and ST de-pression with inverted T waves recorded in leads withtall R waves such as V5 or V6 (Fig. 23.61).
■ LVH: When LVH is present, the ST segment and T wavebecome discordant. ST depression and T wave inversionare recorded in leads with tall R waves; ST elevationand upright T waves are recorded in leads with deep Swaves. Thus, ST elevation is usually present in V1 to V3
because deep S waves are normally expected in theseleads when there is LVH (Fig. 23.62).
■ Brugada ECG: The Brugada ECG is an electrocardio-graphic abnormality confined to leads V1 and V3. Thereis RBBB configuration with rSR pattern in V1 or V2.The J point and ST segment are elevated measuring �1mm, with a coved or upward convexity terminatinginto an inverted T wave (Fig. 23.63).
A: Baseline ECG (HR 84 BPM) B: Maximal Exercise (HR 146 BPM) Figure 23.59: EarlyRepolarization Before and Dur-ing Maximal Exercise. (A) A 12-lead baseline electrocardiogram froma 56-year-old male.The baseline heartrate was 84 beats per minute. ST seg-ments were elevated in II, III, aVF, andV2 to V6. (B) The same patient duringmaximal exercise. Heart rate was 146beats per minute. The ST segmentshave become isoelectric.
Figure 23.60: ST Elevation fromHyperkalemia. The electrocardio-gram can be mistaken for acute my-ocardial infarction (MI) resulting fromthe marked ST-T changes resemblingacute ST elevation MI. Note the pres-ence of peaked T waves in virtuallyall leads.
LWBK271-C23_331-378.qxd 29/1/09 7:18 pm Page 361 LWBK270-4119G-C02_073-110.qxd

362 Chapter 23
■ Brugada ECG: The Brugada ECG associated withsymptoms of VT/VF is called the Brugada syndrome.The Brugada syndrome is not associated with struc-tural heart disease or prolonged QTc, but is a geneticdisease that can cause sudden cardiac death. The ab-normality is the result of a defect in the sodium chan-nel of myocytes in the epicardium of the right ventricleand is inherited as an autosomal dominant pattern.The ST elevation in V1 and in V2 may be saddle shapedor triangular instead of coved in configuration and theECG abnormality may wax and wane (Fig. 23.64A,B).The significance as well as prognosis of asymptomaticpatients with the Brugada ECG is unknown since notall patients with the Brugada ECG will develop ventric-ular arrhythmias or syncope (see Chapter 21, Ventricu-lar Arrhythmias).
■ Hypothermia: Hypothermia is characterized by Jpoint elevation. The J point marks the end of the QRScomplex and beginning of the ST segment. A markedlyelevated J point is also known as J wave or Osbornwave. The J wave is shaped like a letter “h.” The magni-tude of the J point elevation follows the severity of thehypothermia (Fig. 23.65A) and disappears when thetemperature is restored to normal (Fig. 23.65B).
■ Acute pericarditis: Acute pericarditis or inflamma-tion of the pericardium is associated with diffuse STsegment elevation (Fig. 23.66A). The ST elevation usu-
ally involves almost all leads. Reciprocal ST depressionis confined to leads V1 and aVR. Depression of the P-Rsegment is often present. Unlike ST elevation MI, theST elevation in acute pericarditis does not evolve into qwaves. The ST elevation usually persists for a week fol-lowed by T wave inversion. It may take another week ormore before the inverted T waves revert to normal.
■ Left ventricular aneurysm: ST segment elevationthat does not resolve after acute transmural MI usuallysuggests the presence of a left ventricular aneurysm.The ST segment elevation is present in leads with Qwaves. The T waves are usually inverted. Almost allaneurysms are located at the anteroapical wall of theLV and, much less commonly, the base of the inferiorwall. The elevation of the ST segment is usually perma-nent (Fig. 23.67). In this era of reperfusion therapy, thepresence of a left ventricular aneurysm should besuspected in patients with ST elevation MI whenpathologic Q waves occur and the ST elevation doesnot resolved within a few days.
■ Pacemaker-induced ventricular complexes: ST el-evation is also seen in pacemaker captured ventricularcomplexes (Fig. 23.68) and ectopic ventricular rhythms.The ST elevation is secondary to the abnormal activa-tion of the ventricles.
■ Takotsubo cardiomyopathy: Takotsubo cardiomy-opathy (CMP), also called left ventricular apical
Figure 23.61: ST Elevation fromLeft Bundle Branch Block(LBBB). In LBBB, ST elevation(arrows) is usually seen in leads withdeep S waves such as V1 to V3.
Figure 23.62: ST Elevationfrom Left Ventricular Hypertro-phy (LVH). Elevation of the ST seg-ment in LVH is frequently seen in V2
and V3, as shown by the arrows.
LWBK271-C23_331-378.qxd 29/1/09 7:18 pm Page 362 LWBK270-4119G-C02_073-110.qxd
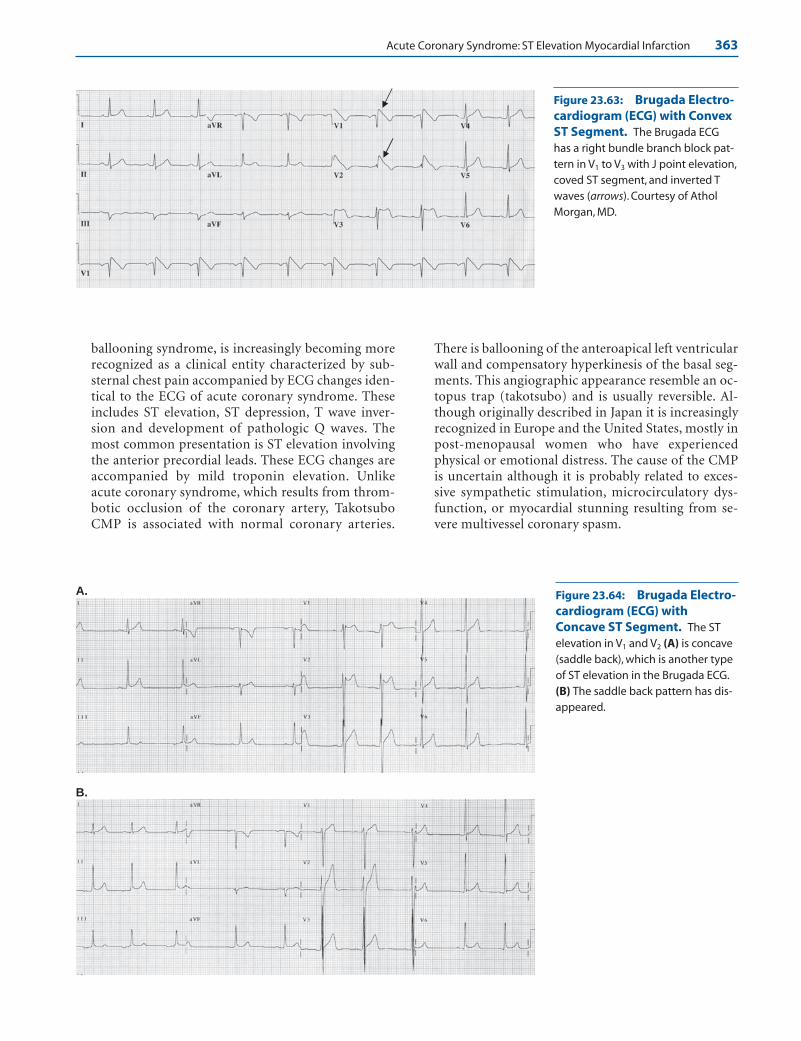
Acute Coronary Syndrome: ST Elevation Myocardial Infarction 363
ballooning syndrome, is increasingly becoming morerecognized as a clinical entity characterized by sub-sternal chest pain accompanied by ECG changes iden-tical to the ECG of acute coronary syndrome. Theseincludes ST elevation, ST depression, T wave inver-sion and development of pathologic Q waves. Themost common presentation is ST elevation involvingthe anterior precordial leads. These ECG changes areaccompanied by mild troponin elevation. Unlikeacute coronary syndrome, which results from throm-botic occlusion of the coronary artery, TakotsuboCMP is associated with normal coronary arteries.
There is ballooning of the anteroapical left ventricularwall and compensatory hyperkinesis of the basal seg-ments. This angiographic appearance resemble an oc-topus trap (takotsubo) and is usually reversible. Al-though originally described in Japan it is increasinglyrecognized in Europe and the United States, mostly inpost-menopausal women who have experiencedphysical or emotional distress. The cause of the CMPis uncertain although it is probably related to exces-sive sympathetic stimulation, microcirculatory dys-function, or myocardial stunning resulting from se-vere multivessel coronary spasm.
A.
B.
Figure 23.63: Brugada Electro-cardiogram (ECG) with ConvexST Segment. The Brugada ECGhas a right bundle branch block pat-tern in V1 to V3 with J point elevation,coved ST segment, and inverted Twaves (arrows). Courtesy of AtholMorgan, MD.
Figure 23.64: Brugada Electro-cardiogram (ECG) withConcave ST Segment. The ST elevation in V1 and V2 (A) is concave(saddle back), which is another typeof ST elevation in the Brugada ECG.(B) The saddle back pattern has dis-appeared.
LWBK271-C23_331-378.qxd 29/1/09 7:18 pm Page 363 LWBK270-4119G-C02_073-110.qxd

A. On admission
B. 5 weeks later
A. a
B. 4 hours later
Figure 23.65: Hypothermia.The initial electrocardiogram (ECG)shows Osborn waves (arrows) repre-senting elevation of the J point dueto hypothermia. There is also sinusbradycardia with a rate of 50 beatsper minute. ECG B was taken 4 hoursafter the initial ECG. The Osbornwaves have disappeared.
Figure 23.66: Acute Pericarditis.The initial electrocardiogram (ECG)(A) on admission shows diffuse ST el-evation in almost all leads consistentwith acute pericarditis. The ST-T ratioin V6 is �25% (arrow). ECG (B) wasobtained 4 to 5 weeks later showingST depression,T inversion but nopathologic Q waves.
364
LWBK271-C23_331-378.qxd 29/1/09 7:18 pm Page 364 LWBK270-4119G-C02_073-110.qxd

Acute Coronary Syndrome: ST Elevation Myocardial Infarction 365
Q Waves
■ Q waves: Q waves associated with acute ST elevationMI generally indicate transmural myocardial necrosis,which is a more advanced stage of myocardial involve-ment. Q waves, which mark the area of transmuralnecrosis, signify permanent myocardial damage. Al-though Q waves are the usual sequelae of ST elevationMI, not all patients with ST elevation MI will developQ waves. Additionally, some patients with non-ST ele-vation MI may develop Q waves. Thus, ST elevation MIis a more concise terminology instead of Q-wave MI.
■ The development of Q waves during ST elevation MImay take a few hours to several days, depending oncollateral flow. When collaterals are absent or are in-adequate, Q waves may develop very early, within afew hours after symptom onset and may be presentwhen the initial ECG is recorded (Fig. 23.69). Similarto ST elevation, pathologic Q wave serves as a usefulmarker in identifying the infarct related coronary ar-tery, even after the ST-T abnormalities have resolved.Pathologic Q waves may be recorded unexpectedly in
a routine ECG and may be the only marker that a pre-vious MI had occurred.
■ The presence of Q waves during ST elevation MI is nota contraindication to thrombolytic therapy. Progres-sion of ST elevation MI to a Q wave MI may be pre-vented if reperfusion is timely and successful.
■ Normal Q waves: Q waves may be normal or abnor-mal. Normal Q waves represent activation of the ven-tricular septum in a left to right direction (see Chap-ter 6. Depolarization and Repolarization). These Qwaves are often called septal Q waves. Septal Q wavesare normally recorded in leads located at the left sideof the ventricular septum including V5, V6, and leadsI and aVL. The size of the normal Q wave is variableand depends on the thickness of the ventricular sep-tum. In normal individuals, the Q waves are usuallynarrow measuring �0.03 seconds in duration andare �25% of the height of the R wave. Q waves inlead III do not represent septal Q waves. Thus, the Qwaves in lead III may be wide and deep but are notnecessarily pathologic even when it exceeds 0.03 sec-onds in duration.
■ Abnormal Q waves: The differential diagnosis ofabnormal Q waves is limited to a few conditions.
Figure 23.68: ST Elevation from Pacemaker-Induced Ventricular Rhythm. LeadII rhythm strip showing ST elevation during pacemaker captured ventricular complexes (ar-rows) but not in normally conducted complexes. The ST segment elevation is secondary toabnormal activation of the ventricles.
Figure 23.67: Left Ventricular Aneurysm. ST segment elevation persists more than 5years after acute ST elevation myocardial infarction from left ventricular aneurysm. Note thatthe ST segment elevation is confined to leads with pathologic Q waves V1 to V4 (arrows).TheST segments have an upward convexity and the T waves are inverted. Echocardiogram andnuclear perfusion scans confirmed the presence of an anteroapical left ventricular aneurysm.
LWBK271-C23_331-378.qxd 29/1/09 7:18 pm Page 365 LWBK270-4119G-C02_073-110.qxd

366 Chapter 23
These include transmural MI, idiopathic hyper-trophic subaortic cardiomyopathy, LVH, abnormalactivation of the ventricles from WPW syndrome,LBBB and fascicular blocks, myocardial scarringfrom cardiomyopathy, infiltrative disease involvingthe myocardium, or when the rhythm is ectopic orpacemaker induced.
Pathologic Q Waves
■ Pathologic Q waves from transmural myocardialnecrosis: Pathologic Q waves from transmuralnecrosis are easy to identify during the acute episodewhen they are accompanied by ST elevation and T-wave abnormalities. However, when the MI is remoteand the ST-T abnormalities have resolved, Q wavesfrom transmural necrosis may be difficult to differ-entiate from normal septal Q waves. The followingare the features of pathologic Q waves due to trans-mural myocardial necrosis or clinically establishedMI according to a joint European Society of Cardiol-ogy and American College of Cardiology committeeproposal.■ In leads I, II, aVL, aVF, V4, V5, or V6: a pathologic
Q wave should measure �0.03 seconds in dura-tion. The abnormal Q wave must be present inany two contiguous leads and should be �1 mmdeep.
■ In V1, V2, and V3: any Q wave is pathologic regard-less of size or duration.
■ QRS confounders such as LBBB, LVH, and WPWsyndrome should not be present.
■ Similar to ST segment elevation, pathologic Q wavesare specific in localizing the area of the transmural MI.Some Q waves, however, are not permanent. Contrac-tion of the scar tissue may occur during the healingprocess and may cause the Q waves to become nar-rower and may even disappear.
■ Inferior MI: The diagnosis of inferior MI is based onthe following:■ Q in II and aVF are �0.03 seconds in duration and
are �1 mm deep.■ Q in Lead III �0.04 seconds in duration or the Q
waves have an amplitude of 5 mm or �25% of theheight of the R wave plus a Q wave in aVF that is�0.03 seconds in duration and �1 mm deep.
■ A QS complex in lead III alone, no matter how deep orwide, is not enough to make a diagnosis of inferior MI.
■ Anterior MI: The diagnosis of anterior MI is based onthe following:■ Q waves in V1: Although the 2000 European Soci-
ety of Cardiology (ESC)/ACC proposal on the rede-finition of MI mentions that any size Q wave is ab-normal in V1, V2, or V3, the more recent 2007 ESC/American College of Cardiology Foundation(ACCF)/AHA/World Health Federation (WHF)consensus document on the universal definition ofMI considers a QS complex in V1 as a normal find-ing. Q waves in V1 and in V2 have also been shown tobe normal in some patients with chronic pulmonarydisease because the diaphragm is displaced down-ward. It may also be a normal finding when the elec-trodes are inadvertently misplaced at a higher loca-tion at the second instead of the fourth intercostalspace.
Figure 23.69: Acute Anteroseptal Myocardial Infarction (MI). Initial electrocardio-gram of a patient with chest pain showing deep Q waves in V1 to V3 with marked STelevation across the precordium consistent with acute extensive anterior MI. Note the earlyappearance of QS complexes in V1 to V3, suggesting the presence of transmural myocardialnecrosis involving the anteroseptal wall. Coronary angiography showed complete occlusionof the left anterior descending coronary artery after the first diagonal branch.
LWBK271-C23_331-378.qxd 29/1/09 7:18 pm Page 366 LWBK270-4119G-C02_073-110.qxd

Acute Coronary Syndrome: ST Elevation Myocardial Infarction 367
■ Q waves in V1 To V3: When Q waves are present inV1 to V3, they are pathologic regardless of size or du-ration since normal septal q waves are not normallyrecorded in all three leads. Other causes of q wavessuch as LVH, fascicular block, LBBB, and WPWECG should be absent.
■ Poor R wave progression: The size of the R wavedoes not increase from V1 to V4. This may be due toanterior MI, although this finding is less specificfor anterior MI because this may be caused by sev-eral other conditions that can cause clockwise ro-tation (see Chapter 4, The Electrical Axis and Car-diac Rotation).
■ Posterior or inferobasal MI: Posterior MI willshow tall R waves in V1 or V2. The tall R waves are re-ciprocal changes due to the presence of deep Qwaves over the posterior wall. If special leads V7 to V9
are recorded, QS complexes will be present. Othercauses of tall R waves in V1 and V2 are further dis-cussed in Chapter 4, The Electrical Axis and CardiacRotation.
■ Lateral MI: Q waves �0.03 seconds in I and aVL or inV5 and V6 or in all four leads are pathologic and consis-tent with lateral MI.
Other Causes of Pathologic Q Waves
■ Pathologic Q waves resulting from idiopathic hy-pertrophic subaortic stenosis (IHSS): When there isexcessive thickening of the ventricular septum such asIHSS, the septal Q waves become exaggerated and canbe mistaken for Q waves of MI (Fig. 23.70).
■ Pathologic Q waves from preexcitation: The pres-ence of preexcitation (WPW ECG) can also cause abnor-mal Q waves that can be mistaken for MI (Fig. 23.71).
■ Pathologic Q waves from LBBB: Activation of the LV isabnormal when there is LBBB. In LBBB, deep QS com-plexes in V1,2,3 and often in leads II, III, and aVF are notnecessarily pathologic (Fig. 23.72). However, any size Qwave in V5 and V6 is pathologic when there is LBBB be-cause the ventricular septum is activated from right to leftand Q waves should not be present in these leads. InLBBB, Q waves in V5,6 indicate a septal infarct (Fig. 23.73).
■ Pathologic Q waves resulting from ectopic ven-tricular rhythms: Accelerated idioventricular rhythm,ventricular tachycardia, or ventricular pacemakerrhythm may cause Q waves from abnormal activationof the ventricles.
Figure 23.70: Pathologic Qwaves due to Idiopathic Hyper-trophic Subaortic Stenosis(IHSS). Pathologic Q waves arenoted in V2–6, as well as in leads I andaVL from idiopathic hypertrophiccardiomyopathy. The Q waves inIHSS represent normal activation ofan unusually thick septum, which isoften two to three times thicker thana normal septum.These Q waves canbe mistaken for anterolateralmyocardial infarction.
Figure 23.71: Pathologic Qwaves from Preexcitation. DeepQ waves are seen in V1, V2, V3, andleads III and aVF from preexcitation(Wolff-Parkinson-Whiteelectrocardiogram).These Q wavesrepresent delta waves directed pos-teriorly and inferiorly can bemistaken for anteroseptal or inferiormyocardial infarction.
LWBK271-C23_331-378.qxd 29/1/09 7:18 pm Page 367 LWBK270-4119G-C02_073-110.qxd
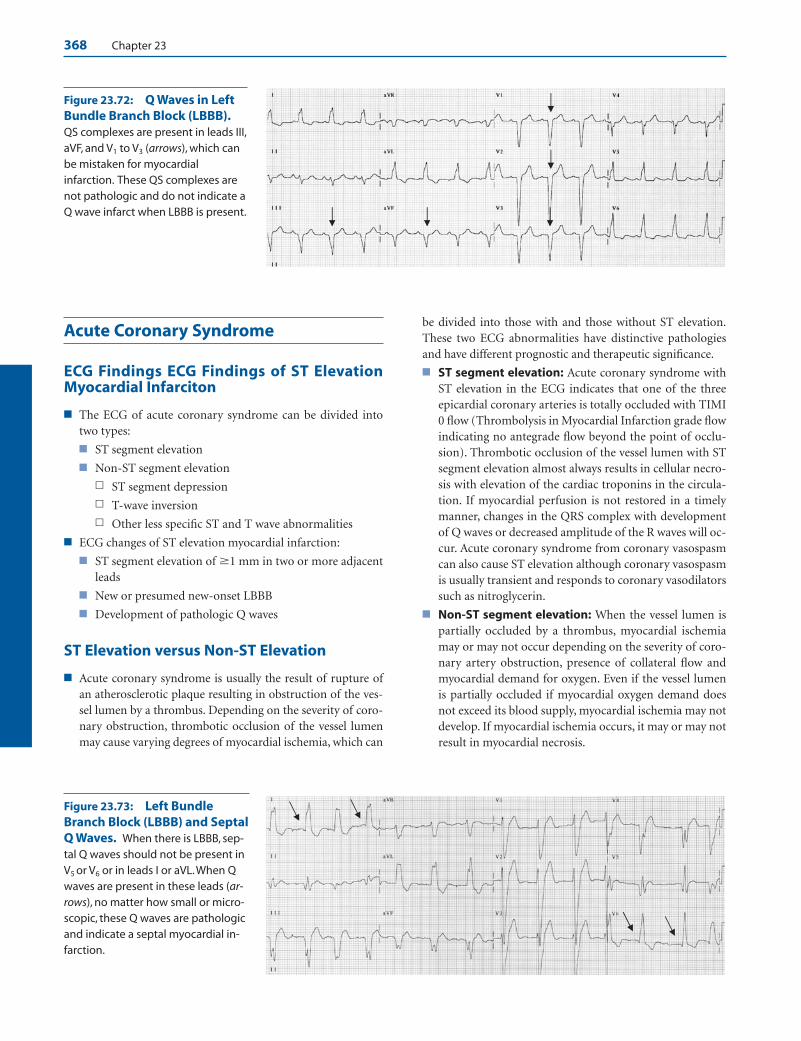
368 Chapter 23
Acute Coronary Syndrome
ECG Findings ECG Findings of ST ElevationMyocardial Infarciton
■ The ECG of acute coronary syndrome can be divided intotwo types:
■ ST segment elevation
■ Non-ST segment elevation
n ST segment depression
n T-wave inversion
n Other less specific ST and T wave abnormalities
■ ECG changes of ST elevation myocardial infarction:
■ ST segment elevation of �1 mm in two or more adjacentleads
■ New or presumed new-onset LBBB
■ Development of pathologic Q waves
ST Elevation versus Non-ST Elevation
■ Acute coronary syndrome is usually the result of rupture ofan atherosclerotic plaque resulting in obstruction of the ves-sel lumen by a thrombus. Depending on the severity of coro-nary obstruction, thrombotic occlusion of the vessel lumenmay cause varying degrees of myocardial ischemia, which can
be divided into those with and those without ST elevation.These two ECG abnormalities have distinctive pathologiesand have different prognostic and therapeutic significance.
■ ST segment elevation: Acute coronary syndrome withST elevation in the ECG indicates that one of the threeepicardial coronary arteries is totally occluded with TIMI0 flow (Thrombolysis in Myocardial Infarction grade flowindicating no antegrade flow beyond the point of occlu-sion). Thrombotic occlusion of the vessel lumen with STsegment elevation almost always results in cellular necro-sis with elevation of the cardiac troponins in the circula-tion. If myocardial perfusion is not restored in a timelymanner, changes in the QRS complex with developmentof Q waves or decreased amplitude of the R waves will oc-cur. Acute coronary syndrome from coronary vasospasmcan also cause ST elevation although coronary vasospasmis usually transient and responds to coronary vasodilatorssuch as nitroglycerin.
■ Non-ST segment elevation: When the vessel lumen ispartially occluded by a thrombus, myocardial ischemiamay or may not occur depending on the severity of coro-nary artery obstruction, presence of collateral flow andmyocardial demand for oxygen. Even if the vessel lumenis partially occluded if myocardial oxygen demand doesnot exceed its blood supply, myocardial ischemia may notdevelop. If myocardial ischemia occurs, it may or may notresult in myocardial necrosis.
Figure 23.72: Q Waves in LeftBundle Branch Block (LBBB).QS complexes are present in leads III,aVF, and V1 to V3 (arrows), which canbe mistaken for myocardialinfarction. These QS complexes arenot pathologic and do not indicate aQ wave infarct when LBBB is present.
Figure 23.73: Left BundleBranch Block (LBBB) and SeptalQ Waves. When there is LBBB, sep-tal Q waves should not be present inV5 or V6 or in leads I or aVL.When Qwaves are present in these leads (ar-rows), no matter how small or micro-scopic, these Q waves are pathologicand indicate a septal myocardial in-farction.
LWBK271-C23_331-378.qxd 29/1/09 7:18 pm Page 368 LWBK270-4119G-C02_073-110.qxd
Acute Coronary Syndrome: ST Elevation Myocardial Infarction 369
n Non-ST elevation MI: Partial occlusion of the vessellumen accompanied by cellular necrosis indicatesnon-ST elevation MI. The most important marker ofcellular necrosis is increased cardiac troponins in thecirculation. The diagnosis of non-ST elevation MI isnot established unless these cardiac markers are ele-vated. The ECG will show ST segment depression, Twave inversion, or less-specific ST and T wave abnor-malities. Occasionally, the ECG may not show any sig-nificant abnormalities.
n Unstable angina: In unstable angina, the ECG changesare identical to that of non-ST elevation MI, althoughthe cardiac troponins are not elevated in the circulation.
■ Acute MI: With the advent of troponins as a marker of my-ocardial necrosis, acute MI was redefined in 2000 by a con-sensus document of the ESC/ACC and again in 2007 by theESC/ACCF/AHA/WHF, as myocardial necrosis in a clinicalsetting consistent with myocardial ischemia.
■ Myocardial necrosis: Myocardial necrosis is based onthe rise and/or fall of cardiac troponins.
■ Myocardial ischemia: Evidence of myocardial ischemiais based on any of the following:
n Clinical symptoms of ischemia
n ECG changes indicative of new ischemia, which in-cludes any of the following:
n New ST-T changes
n New LBBB
n Development of pathologic Q waves
n Imaging abnormalities
n New loss of viable myocardium
n New regional wall motion abnormality
■ Thus, increased in cardiac troponins in the circulation is themost important marker of myocardial necrosis. The diagno-sis of acute MI is not possible unless the troponins areelevated. If sudden cardiac death occur before blood samplesfor troponins could be obtained or before troponins becomeelevated, acute MI is diagnosed by the associated symptomsand ECG changes of myocardial ischemia.
Clinical Implications
■ ST segment elevation from acute coronary syndrome indi-cates complete obstruction of the vessel lumen. Therapy re-quires that coronary blood flow be restored immediately.T-wave inversion and ST segment depression indicate less se-vere form of myocardial ischemia from a combination of di-minished coronary blood flow and increased myocardialoxygen demand. Immediate therapy for T-wave inversionand ST segment depression is directed toward stabilizing thethrombus and lowering myocardial demand for oxygen.
■ ST segment elevation: Thrombotic occlusion of the vessellumen with persistent elevation of the ST segment is always as-sociated with troponin elevation. Unless adequate collateralsare present or unless the occluded coronary artery is immedi-
ately reperfused, virtually all myocardial cells supplied by thetotally occluded artery become irreversibly damaged within 6hours after symptom onset. No significant pathologic abnor-malities in the myocardium may be detected microscopically,if the patient dies suddenly within this period. The ECG, how-ever, is very useful in identifying the presence of acute trans-mural ischemia and in timing the various stages of the infarct.
■ Hyperacute T waves: Hyperacute T waves are usuallythe earliest ECG abnormality to occur in ST elevation MI.The presence of peaked and tall T waves overlying thearea of ischemia often occur very early during the initialonset of symptoms and is often helpful in timing the on-set of an acute ischemic process. The hyperacute T wavesmay be due to local hyperkalemia or presence of an elec-trical gradient between normal and injured myocardialcells during electrical systole.
■ ST Elevation: When ST elevation is present, it is usuallythe most striking abnormality in the ECG during the acutephase of myocardial ischemia. The magnitude of ST eleva-tion is measured at the J point. ST elevation is usually con-fined to leads geographically representing the territorysupplied by the occluded artery. Thus, the presence of STelevation is helpful in identifying the infarct related artery.The greater the number of leads with ST elevation and themore pronounced the ST elevation, the more severe themyocardial ischemia and the more extensive the myocar-dial damage. Myocardial ischemia, which is reversible, maybe severe and relentless and transition to necrosis, which isirreversible, may be completed within 6 to 24 hours afteronset of symptoms. This transition is highly variable andoften unpredictable because of collateral flow and remod-eling within the thrombus. For example, if the thrombusundergoes spontaneous lysis and rethrombosis, the symp-toms and ECG findings may wax and wane and the abovesequence of evolution may take several days or even weeksbefore the infarct is finally completed.
■ Q waves: ST elevation MI generally results in the devel-opment of pathologic Q waves or diminution in the sizeof the R waves. Q waves are pathologic when they meas-ure �0.03 seconds in duration and are at least �1 mmdeep in leads I, II, AVF, aVL, and V4 to V6. Any size Q waveis pathologic when present in V2 and also in V3. The pres-ence of pathologic q waves indicates transmural necrosis,which is usually permanent. Although ST elevation MI issynonymous with Q wave MI, Q waves may not alwaysoccur especially if the occluded coronary artery is revas-cularized in a timely fashion. Additionally, approximately25% of patients with non-ST elevation MI may develop Qwaves; thus, non-ST elevation MI rather than Q wave MIis the preferred terminology.
Identifying the Infarct-Related Artery
■ ST segment elevation or pathologic Q waves in the ECG isuseful in identifying the location of the infarct-related artery.
LWBK271-C23_331-378.qxd 29/1/09 7:18 pm Page 369 LWBK270-4119G-C02_073-110.qxd
370 Chapter 23
■ When ST elevation or Q waves are localized in the ante-rior precordial leads V1 to V4 (or to V6), acute anterior MIis present. This identifies the LAD artery as the culpritvessel. The ESC/ACC task force on the redefinition ofacute MI requires that ST elevation in V1 to V3 should bepresent in at least two leads and should measure �2 mmin contrast to other leads which requires only 1 mm of STelevation.
■ When ST elevation or pathologic Q waves occur in leadsII, III, and aVF, acute inferior MI from occlusion of theposterior descending coronary artery is present. The RCAis the culprit vessel in 85% to 90% of patients with acuteinferior MI and the LCx coronary artery in the remaining10% to 15%. Inferior MI may also occur when there is an-terior MI because the LAD may circle the apex of the LVand extend inferoapically. This is not a true inferior MIbecause the posterior descending coronary artery is notinvolved. This is merely an extension of the anterior MI.
■ When ST elevation or pathologic Q waves are confined toleads I and aVL or leads V5 and V6, acute lateral MI ispresent and identifies the LCx coronary artery as the cul-prit vessel. This is often associated with ST depression inV2 and in V3.
■ The posterolateral wall of the LV is not represented in thestandard 12-lead ECG. Acute posterolateral MI with STsegment elevation in V7, V8, and V9 may not be recognizedbecause these leads are not routinely recorded. It is usu-ally suspected when there is ST elevation in V6 and ST de-pression in V2 and V3. Tall R waves may also be present inV1 and V2, which are reciprocal changes due to the pres-ence of deep Q waves posterolaterally. This usually identi-fies the LCx as the culprit lesion, although, occasionally, itmay be due to a dominant RCA.
LAD Coronary Artery
■ Area supplied: The LAD is a large artery that supplies thewhole anterior wall of the LV. It is the main blood supply tothe intraventricular conduction system including the bundleof His, bundle branches, and distal fascicular system.
■ Anatomy: The LAD courses through the anterior interven-tricular groove and supplies the ventricular septum and an-terior wall of the LV.
■ The length of the LAD can be short (terminates before theapex), medium (terminates at the apex), or large (wrapsaround the apex and continues to the inferior wall of the LV).
■ The first branch of the LAD is the first diagonal (D1),which courses laterally between the LAD and left circum-flex coronary artery. Usually one to three diagonalbranches are given off by the LAD. D1 is often the largestdiagonal branch and supplies the base of the anterolateralwall of the LV.
■ The second branch is the first septal branch (S1). S1 maybe the first instead of the second branch. About three tofive septal branches arise at right angles from the LAD
and directly insert perpendicularly into the myocardiumand supply the anterior two thirds of the ventricular sep-tum. S1 supplies the basal anteroseptal region of the LVand is the main blood supply of the distal His bundle andproximal left and right bundle branches.
■ Occlusion of the proximal LAD: The following is a sum-mary of the ECG findings when complete occlusion involvesthe proximal LAD:
■ Occlusion of the LAD before the first branch (D1 or S1):n ST elevation in V1 to V4 (anteroseptal) and leads I and
aVL (basal lateral or high lateral wall). Because thefirst septal branch or S1 supplies the base of the ven-tricular septum, ST elevation will occur in V1.
n ST elevation in aVL. Because the first diagonal branchor D1 supplies the base of the lateral wall, ST elevationwill occur in aVL.
n Reciprocal ST depression is present in III and aVF(from ST elevation in aVL, which is diametrically op-posite lead III)
n If ST elevation is confined to V1 to V3, reciprocal STdepression may be present in V5 or V6.
n Complete RBBB may occur.
n If the LAD is large and extends to the left ventricularapex and contiguous inferior wall, ST elevation mayoccur in leads II, III, and aVF (acute inferior MI), inaddition to the ST elevation in the precordial leads.
n ST elevation may be present in aVR.
■ Occlusion of the LAD distal to the first diagonal andfirst septal branches:n Occlusion of the LAD distal to D1 and S1 results in a
less extensive infarct compared with a more proximallesion and will cause ST elevation only in V2 to V4.
n ST elevation will not occur in V1 nor lead aVL or leadI because the first septal and first diagonal branchesare spared. Because ST elevation is not present inlead aVL, reciprocal ST depression will not occur inlead III.
■ Common Complications Associated with Acute Ante-rior MI:
■ Tachyarrhythmias: Ventricular fibrillation is the mostcommon cause of death usually within the first few hoursafter symptom onset. Although ventricular tachycardiaand fibrillation can occur in any patient with acute MI,acute anterior myocardial infarction is more commonlyassociated with tachyarrhythmias including sinus tachy-cardia, ventricular tachycardia, and ventricular fibrilla-tion in contrast to inferior MI, which is usually associatedwith bradyarrhythmias such as sinus bradycardia andvarying degrees of AV block.
■ Intraventricular conduction defects: Occlusion of theLAD proximal to the first septal branch can jeopardize theconduction system and can cause transient or permanentconduction abnormalities.
LWBK271-C23_331-378.qxd 29/1/09 7:18 pm Page 370 LWBK270-4119G-C02_073-110.qxd
Acute Coronary Syndrome: ST Elevation Myocardial Infarction 371
n RBBB with or without fascicular block: This is usuallyfrom the involvement of the first septal branch of theLAD. Diagnosis of acute MI in the presence or RBBB isnot difficult because activation of the LV is not altered.
n LBBB: LBBB is less frequently seen as a complicationof MI compared with RBBB. Although LAD disease iscommonly expected to cause LBBB, LBBB complicat-ing acute MI are usually non-anterior in location withthe lesion more commonly associated with the rightrather than left coronary artery as shown in the subsetanalysis of patients with acute MI in the GUSTO-1databases. The diagnosis of acute MI in the presenceof LBBB is difficult because the LV is activated abnor-mally from the right bundle branch. This was previ-ously discussed in Chapter 10, IntraventricularConduction Defect: Bundle Branch Block.
■ Complete AV block: When complete AV block occurs inthe setting of acute anterior MI, the AV block is infran-odal because the LAD supplies most of the distal intra-ventricular conduction system. The AV block is often pre-ceded by RBBB with or without fascicular block.Prognosis remains poor even with temporary or perma-nent pacing because occlusion of the LAD complicated byRBBB is usually an extensive MI. Atropine does not re-verse the AV block because the conduction abnormality isinfranodal, at the His-Purkinje level. The indication forthe implantation of permanent pacemakers in patientswith intraventricular conduction defect and AV block as-sociated with acute MI is discussed under treatment.
■ LV dysfunction and pump failure: Acute anterior MI isassociated with a higher incidence of heart failure andcardiogenic shock. Cardiogenic shock usually occurswhen at least 40% of the left ventricular myocardium isinvolved. Heart failure and cardiogenic shock are morecommon with acute anterior MI because acute anteriorMI is generally a large infarct.
■ Late ventricular arrhythmias and sudden death: Pa-tients with extensive myocardial damage and severe left ven-tricular dysfunction who survive their MI are at high risk forventricular arrhythmias and sudden death. These complica-tions are more frequently seen in patients with anterior MI.
LCx Artery
■ Anatomy and area supplied: The LCx coronary artery cir-cles around the left or lateral AV groove and sends three ormore obtuse marginal branches to the lateral wall of the LV.It continues posteriorly as the posterior AV artery sendingthree or more posterolateral branches to the LV. In 10% to15% of patients, the LCx artery continues as the posterior de-scending coronary artery, which supplies the inferior wall ofthe LV. When this occurs, the pattern of coronary distribu-tion is described as left dominant.
■ Occlusion of the LCx: The following is a summary of theECG changes when the LCx coronary artery is occluded:
■ Acute lateral MI with ST elevation (or pathologic Qwaves) in I and aVL or V5 and V6 with or without ST de-pression in V1 to V3.
■ Acute inferior MI with ST elevation or pathologic Q wavesin II, III, and aVF if the LCx artery is the dominant artery.
■ No significant ECG changes. When acute MI is diagnosedclinically without significant ECG changes, the culpritvessel is usually the LCx coronary artery.
■ Unless there is unusual variation in coronary anatomy,occlusion of the LCx coronary artery does not result inright ventricular infarction.
■ Straight posterior MI or acute posterolateral MI withprominent q waves and ST elevation in special leads V7,V8, and V9. Tall R waves may be present in V1 and V2 withreciprocal ST depression from V1 to V3.
n If the MI involves the basal posterior wall of the LV oris directly posterior or posterolateral, the ECG willshow reciprocal ST depression in V1 to V3 becausethese leads are diametrically opposite the posterior orposterolateral wall. Unfortunately, ST depression in V1
to V3 can be mistaken for ischemia involving the ante-rior wall of the LV rather than a transmural posteriorMI. This dilemma can be resolved by recording extraleads V7, V8, and V9, which overlie the posterolateralwall of the LV. Leads V7 to V9 will show ST elevation ifan acute transmural posterolateral MI is present butnot when there is anterior wall ischemia and injury.ST elevation of 0.5 mm is significant because of thewider distance between these leads in relation to theheart. ST elevation in V7 to V9 makes the patient a can-didate for thrombolytic therapy.
n Tall R waves in V1 to V2 may also occur although thesechanges usually develop several hours later.
■ Common Complications Associated with Acute Lateralor Posterolateral MI:
■ Tachyarrhythmias: Ventricular tachycardia and ventric-ular fibrillation can occur similar to any acute MI duringthe first few hours after onset of symptoms.
■ Left ventricular dysfunction: This can occur as a com-plication if the artery is large and supplies a significantportion of the myocardium.
■ AV block: AV can occur at the level of the AV node only ifthe LCx coronary artery is dominant and there is associ-ated inferior MI.
Right Coronary Artery
■ Anatomy and area supplied: The right coronary artery(RCA) courses around the right or medial AV groove andgives acute marginal branches to the right ventricle. The RCAis the dominant artery in 85% to 90% of cases by continuingposteriorly to the crux of the heart and giving rise to abranch that supplies the AV node and the posterior descend-ing artery, which supplies the inferior wall of the LV. The
LWBK271-C23_331-378.qxd 29/1/09 7:18 pm Page 371 LWBK270-4119G-C02_073-110.qxd

372 Chapter 23
RCA often continues beyond the crux toward the left AVgroove as the right posterior AV artery, which gives postero-lateral branches to the LV.
■ Occlusion of the RCA:
■ Occlusion of the RCA will cause acute inferior MI with STelevation in II, III, and aVF.
■ ST elevation in V5 and V6 may occur because of postero-lateral involvement of the LV.
■ Reciprocal ST depression in V1 to V3 with inferior MI sug-gests the presence of a posterolateral MI. This can be veri-fied by recording extra precordial leads V7, V8, and V9
which will show ST elevation consistent with a transmuralposterolateral MI (see LCx Coronary Artery Occlusion).
■ Acute inferior MI is usually due to occlusion of the RCA, ex-cept in some patients where the LCx is the dominant artery.Occlusion of the proximal RCA can cause right ventricularinfarction, which does not occur if the LCx coronary artery isthe culprit vessel. Inferior MI complicated by right ventricu-lar infarction is a large infarct with a high mortality of 25%to 30% compared with inferior MI without RV infarction,which has a mortality of approximately 6%.
■ Acute inferior MI from occlusion of the RCA can be differ-entiated from acute inferior MI due to occlusion of the LCxcoronary artery by the following ECG findings:
■ If ST elevation in lead III � lead II, the RCA is the culpritvessel. This is based on the anatomical location of theRCA, which circles the right AV groove and is closer tolead III than lead II whereas the LCx circles the left AVgroove and is closer to lead II than lead III. Thus, if ST el-evation in lead III � lead II, the proximal or mid RCA isthe culprit vessel, whereas if ST elevation in lead II � leadIII or ST elevation in III is not greater than II, the LCx ar-tery is the culprit vessel.
■ ST depression in lead aVL � lead I, RCA is the culprit le-sion. This is corollary to the observation mentioned pre-viously, that lead III has a higher ST elevation when theRCA is the culprit vessel. Because lead III is diametricallyopposite aVL, reciprocal ST depression will be more pro-nounced in aVL than in lead I.
■ RV infarction can occur only if the proximal or mid RCAis occluded (but not the LCx or distal RCA). The presenceof RV infarct is best diagnosed by recording right sidedprecordial leads.
■ Complications of Acute Inferior MI:
■ VT and VF: This is similar to the complications of anyacute MI.
■ Bradyarrhythmias and AV block: Sinus bradycardiaand other sinus disturbances are very common findingsin acute inferior MI and are more common when theRCA is involved. The RCA carries vagal afferent fibers,which can cause sinus bradycardia due to reflex stimula-tion rather than due to direct suppression of sinus nodefunction. Varying degrees of AV block (first, second, andthird degree) can occur with acute inferior MI. The AV
block is at the level of the AV node because the RCA sup-plies the AV node in 85% to 90% of patients and by theLCx in the remaining 10% to 15%. AV block at the level ofthe AV node has a better prognosis than AV block occur-ring in the distal conduction system. AV block occurringduring the first few hours of a myocardial infarct is usu-ally due to a vagal mechanism and has a better prognosiscompared to AV block occurring late post-MI.
■ Intraventricular conduction defect: Intraventricularconduction defect (IVCD), either RBBB or LBBB, may oc-cur as a complication of acute MI. IVCD complicatingacute MI is usually associated with an extensive MI andmortality is much higher when compared with patientswho do not develop IVCD. These patients have higher in-cidence of asystole, AV block, VF, both primary and late,as well as cardiogenic shock. The IVCD may be transientor persistent. When the IVCD is transient, the prognosisseems to be similar to patients who never developed theconduction abnormality. Acute (new-onset) LBBB or apreviously existent (old) LBBB may conceal the ECGchanges of acute MI, whereas the ECG diagnosis of acuteMI can be recognized even when RBBB is present.
■ Atrial ischemia or infarction: Atrial branches to theright atrium are usually supplied by the RCA which canresult in atrial ischemia or infarction when there is occlu-sion of the proximal RCA. The acute onset of atrial fibril-lation may be the only clue that atrial infarction had oc-curred. Atrial infarction can also be diagnosed whendepression of the P-Q segment is present in the setting ofacute inferior MI.
■ Papillary muscle rupture: Most papillary muscle ruptureinvolves the posteromedial papillary muscle because it hasa single blood supply originating from the RCA. The an-terolateral papillary muscle is less prone to rupture becauseit has dual blood supply from the LAD and LCx coronaryarteries. Papillary muscle rupture is rare but is incompati-ble with life because of acute severe mitral regurgitation.
■ RVMI: RVMI can occur only with acute inferior infarc-tion due to occlusion of the proximal or probably mid-RCA. It does not occur when the lesion involves the distalRCA or LCx coronary artery.
n When acute inferior MI is diagnosed, RVMI shouldalways be routinely excluded by recording right-sidedprecordial leads. The right-sided precordial leadsshould be recorded immediately, because the ECGchanges in half of patients with RVMI may resolvewithin 10 hours after the onset of symptoms. Right-sided precordial leads are the most sensitive, most spe-cific, and the least expensive procedure in the diagno-sis of RVMI. ST elevation of �1 mm in any of theright-sided precordial leads is diagnostic of RVMIwith lead V4R the most sensitive. Changes in the QRScomplex is not a criteria for the diagnosis of RVMI be-cause the right ventricle does not contribute signifi-cantly in the generation of the QRS complex.
LWBK271-C23_331-378.qxd 29/1/09 7:18 pm Page 372 LWBK270-4119G-C02_073-110.qxd
Acute Coronary Syndrome: ST Elevation Myocardial Infarction 373
n If right-sided precordial leads were not recorded orwere recorded late during the course of the MI, the di-agnosis of RVMI may be missed. Using the standard12-lead ECG, RVMI is suspected when ST elevation inlead III is greater than lead II (suggesting proximalRCA occlusion) and ST elevation is present in V1.
n RVMI often presents with a special hemodynamicsubset of patients with acute MI who can develop theclinical triad of hypotension, jugular neck vein disten-sion, and clear lungs. This subset of patients can bemistaken for cardiogenic shock. The presence ofKussmaul sign characterized by distension of the neckveins during inspiration is diagnostic of RVMI whenacute inferior MI is present. Approximately one thirdto one half of patients with acute inferior MI haveRVMI but only 10% to 15% of patients with RVMIwill manifest the hemodynamic abnormality. The he-modynamic picture of RVMI usually disappears aftera few weeks, suggesting that the RVMI is due to my-ocardial stunning rather than necrosis. The thin-walled right ventricle has a lower oxygen demand andmay partially receive its blood supply from the bloodwithin the right ventricular cavity, thus limiting theextent of myocardial necrosis.
Treatment
■ The ECG remains the most useful test in planning the initialstrategies in the therapy of a patient with acute coronary syn-drome. If a patient presents to a medical facility with symp-toms of acute ischemia, the ACC/AHA guidelines recom-mend that the ECG should be obtained and interpretedwithin 10 minutes after patient entry. If ST elevation is pres-ent in the initial ECG and patient is having symptoms due tomyocardial ischemia, 0.4 mg of sublingual nitroglycerinshould be given immediately, if not previously given, and re-peated every 5 minutes for three doses. This is a Class I indi-cation according to the ACC/AHA guidelines on ST eleva-tion MI. Nitroglycerin is helpful in excluding vasospasm asthe cause of the ST segment elevation. If the ST elevationpersists after three successive doses, immediate reperfusionof the occluded artery with a thrombolytic agent or with pri-mary PCI should be considered without waiting for the re-sults of cardiac troponins. Although acute coronary syn-drome with ST segment elevation is almost always associatedwith increased troponins in the circulation, the troponinsmay not be elevated in some patients presenting to the hos-pital within 6 hours after symptom onset.
■ Thrombolytic therapy: Thrombolytic therapy or primaryPCI should be considered if the chest pain is at least 20 min-utes in duration.
■ The following are the ECG criteria for immediate throm-bolytic therapy or PCI:
n ST elevation �1 mm is present in any two adjacentleads.
n New or presumably new-onset LBBB associated withsymptoms of ischemia.
n ST segment depression even in the presence of cellularnecrosis (elevated cardiac troponins) is not an indica-tion for thrombolytic therapy. The only exception is STsegment depression in V1 to V3, which may represent astraight posterior or posterolateral infarct. A posteriorinfarct is a transmural infarct and can be verified bythe presence of ST elevation in leads V7 to V9.
■ Virtually all myocardial cells supplied by the infarct re-lated artery become necrotic within 6 hours after symp-tom onset, unless collateral flow is adequate. Thus, ifthrombolytic therapy is elected, it should be given within30 minutes after patient entry to the emergency depart-ment (door to needle time) or first contact with emer-gency personnel (medical contact to needle time).Thrombolytic therapy is most effective when given within2 hours after symptom onset. With further delay, the ben-efits of any type of reperfusion therapy decline.
■ The therapeutic window for thrombolytic therapy is up to12 hours after symptom onset. This may be extended to24 hours for some patients who continue to have stutter-ing symptoms of chest pain with persistent ST elevation.
■ Absolute contraindications to thrombolytic therapy accord-ing to the 2004 ACC/AHA guidelines include: any prior in-tracranial hemorrhage, known structural cerebrovascularlesion such as arteriovenous malformation, known malig-nant intracranial neoplasm either primary or metastatic, is-chemic stroke within 3 months, suspected aortic dissection,active bleeding or bleeding diathesis other than menses, andsignificant closed head or facial trauma within 3 months.
■ Relative contraindications include history of chronic se-vere, poorly controlled hypertension, severe uncon-trolled hypertension on presentation (systolic bloodpressure �180 mm Hg or diastolic blood pressure �110mm Hg), history of prior ischemic stroke �3 months,dementia or known intracranial pathology that is not in-cluded under absolute contraindications, traumatic orprolonged cardiac resuscitation �10 minutes, major sur-gery �3 weeks, recent (within 2 to 4 weeks) internalbleeding, noncompressible vascular punctures, preg-nancy, active peptic ulcer, current use of anticoagulants(the higher the International Normalized Ratio, thehigher the risk of bleeding), and prior exposure (�5days) to streptokinase/anistreplase or prior allergic reac-tion to these agents.
■ Intracerebral hemorrhage is a major complication and isexpected to occur in approximately 1% of patients receiv-ing thrombolytic therapy. It is fatal in up to two thirds ofpatients with this complication. Patients older than 65years, a low body weight of �70 kg, and alteplase (as op-posed to streptokinase) as the thrombolytic agent, are asso-ciated with higher incidence of intracerebral hemorrhage.
■ There are five thrombolytic agents approved for intravenoususe: (1) tissue plasminogen activator or tPa (alteplase),
LWBK271-C23_331-378.qxd 29/1/09 7:18 pm Page 373 LWBK270-4119G-C02_073-110.qxd
374 Chapter 23
(2) recombinant tissue plasminogen activator or rtPa(reteplase), (3) tenecteplase, (4) streptokinase, and (5)anistreplase. Alteplase, reteplase, and tenecteplase are plas-minogen activators. These are selective agents that specifi-cally convert plasminogen to plasmin and are givenconcomitantly with intravenous heparin infusion. Streptok-inase and anistreplase do not require heparin infusion be-cause these nonselective thrombolytic agents can cause de-pletion of the coagulation factors and produce massiveamounts of fibrin degradation products, which have antico-agulant properties. If patient is a high risk for systemic em-boli such as the presence of a large infarct, atrial fibrillation,left ventricular thrombus, or previous embolus, Activatedpartial thromboplastin time should be checked 4 hours afterthese nonselective thrombolytic agents have been given andheparin started when activated partial thromboplastin timeis �2 times control (or �70 seconds).
■ Additional medical therapy for ST elevation MI include:
■ Aspirin: The initial dose of aspirin is 162 to 325 mgorally. This should be given immediately even before thepatient arrives to a medical facility. Plain aspirin (not en-teric coated), should be chewed. Maintenance dose of 75to 162 mg daily is continued indefinitely thereafter.
n If the patient is allergic to aspirin, clopidogrel shouldbe given as a substitute.
n In patients undergoing coronary bypass surgery, as-pirin should be started within 48 hours after surgeryto reduce closure of the saphenous vein grafts.
n Patients who have PCI with stents placed should ini-tially receive the higher dose of aspirin at 162 to 325 mgdaily for one month for bare metal stent, 3 months forsirolimus and 6 months for paclitaxel eluting stent andcontinued at a dose of 75 to 162 mg daily indefinitely.
■ Clopidogrel: Similar to aspirin, clopidogrel is consideredstandard therapy and is a Class I recommendation in pa-tients with acute coronary syndrome including patientswith ST elevation MI with or without reperfusion therapyaccording to the 2007 focused update of the ACC/AHA2004 guidelines for ST elevation MI. The maintenancedose is 75 mg orally daily for a minimum of 14 days andreasonably up to a year. The loading dose is 300 mg orally,although in elderly patients �75 years especially thosegiven fibrinolytics, the loading dose needs further study.
n In patients undergoing coronary bypass surgery,clopidogrel should be discontinued at least 5 days andpreferably for 7 days unless the need for surgery out-weighs the risk of bleeding.
■ Unfractionated heparin: When unfractionated heparinis given concomitantly with a selective thrombolytic agentsuch as tPA, rtPA, or tenecteplase, the recommended doseis 60 U/kg given as an IV bolus. The initial dose should notexceed 4,000 U. This is followed by a maintenance dose of12 U/kg/hour not to exceed 1,000 U/hour for patientsweighing more than 70 kg. Activated partial thromboplas-tin time should be maintained to 50 to 70 seconds or 1.5 to
2 times baseline. Heparin is usually given for 48 hours, butmay be given longer if there is atrial fibrillation, left ven-tricular thrombi, pulmonary embolism, or congestiveheart failure. Platelets should be monitored daily. Whengiven to patients not on thrombolytic therapy, the dose is60 to 70 U/kg bolus followed by maintenance infusion of12 to 15 U/kg/hour. According to the ACC/AHA 2007 re-vised guidelines on unstable angina and non-ST elevationMI, patients who did not receive thrombolytic therapymay receive other types of heparin other than unfraction-ated heparin for the whole duration of hospitalization orfor a total of 8 days. This includes low-molecular-weightheparin (enoxaparin) and fondaparinux.
n Enoxaparin: An initial 30 mg IV bolus is followed by asubcutaneous injection of 1 mg/kg every 12 hours. Forpatients older than 75 years of age, the initial bolus isomitted and the subcutaneous dose is 0.75 mg/kg every12 hours. The dose should be adjusted if the serum crea-tinine is �2.5 mg/dL in men and �2.0 mg/dL in women.
n Fondaparinux: The initial dose is 2.5 mg IV followedby subcutaneous doses of 2.5 mg once daily up to theduration of hospitalization or a maximum of 8 daysprovided that the creatinine is �3.0 mg/dL.
■ Nitroglycerin: Nitroglycerin is initially given sublin-gually unless the patient is hypotensive with a blood pres-sure �90 mm Hg or heart rate is �50 bpm or there is sus-pected RVMI. Intravenous nitroglycerin is given whenthere are symptoms of ongoing ischemia or congestiveheart failure or for uncontrolled hypertension.
■ Oxygen: Oxygen supplementation is given to improvearterial saturation.
■ Morphine sulfate: Morphine sulfate is the analgesic ofchoice with a Class I recommendation for pain relief for STelevation MI but only a Class IIa recommendation for non-ST elevation MI. The dose is 2 to 4 mg IV and repeated inincrements of 2 to 8 mg at 5- to 15-minute intervals.
■ Beta blockers: Beta blockers should be given orally in thefirst 24 hours unless the patient has contraindications tobeta blocker therapy such as PR interval �0.24 seconds,second-degree AV block or higher, signs of heart failure, orlow cardiac output and bronchospastic pulmonary disease.This is given a Class I recommendation in the ACC/AHAguidelines. Beta blockers have been shown to decrease theincidence of ventricular arrhythmias after acute MI. Betablockers may be administered IV if hypertension is present.This carries a Class IIa recommendation.
■ Antagonists of the renin-angiotensin system: The useof angiotensin-converting enzyme inhibitors is a Class Irecommendation in patients with ST elevation MI. Itshould be given orally (not IV) and continued indefinitelyin patients with ST elevation MI with left ventricular ejec-tion fraction 40% and patients with hypertension, dia-betes, or chronic renal disease in the absence of con-traindications to angiotensin-converting enzyme inhibitortherapy. Angiotensin receptor blockers, specifically valsartan
LWBK271-C23_331-378.qxd 29/1/09 7:18 pm Page 374 LWBK270-4119G-C02_073-110.qxd
Acute Coronary Syndrome: ST Elevation Myocardial Infarction 375
or candesartan, may be given if the patient cannot tolerateangiotensin-converting enzyme inhibitors. The routine useof angiotensin-converting enzyme inhibitors or an-giotensin receptor blockers is reasonable in patients withacute ST elevation MI without any of the above indica-tions. This carries a Class IIa recommendation.
■ Aldosterone antagonist: Aldosterone antagonists(eplerenone in post-MI patients and spironolactone inpatients with chronic heart failure), have been shown toreduce mortality. The 2007 focused update of theACC/AHA 2004 guidelines on ST elevation MI gives aClass I recommendation for the use of aldosterone block-ers to patients with ejection fraction of 40% and haveeither diabetes or heart failure unless there is renal dys-function (serum creatinine �2.5 mg/dL in men and �2.0mg/dL in women and potassium �5.0 mEq/L).
■ Cholesterol-lowering agents: Statins or if contraindi-cated, other lipid-lowering agents, should be given tolower low-density lipoprotein cholesterol to �100 mg/dLin all patients and further lowering to �70 mg/dL is rea-sonable in some patients.
■ IIB/IIIA inhibitors: Other antiplatelet agents such asIIB/IIIA inhibitors (abciximab, eptifibatide, and tirofiban)are not indicated in the treatment of ST elevation MI un-less the patient is being readied for primary PCI. The useof standard dose IIB/IIIA inhibitor (abciximab) in com-bination with half-dose thrombolytic agent (reteplase)has not been shown to improve mortality in the shortterm (30 days) or long term (1 year) compared with theuse of the thrombolytic agent alone.
■ Primary PCI: Primary PCI is the most effective reperfusionmethod and has now become the standard therapy for reper-fusing ST elevation MI in centers that are capable of doingthe procedure in a timely fashion. The success rate of beingable to reperfuse the occluded artery with primary PCI is�90%, whereas the 90-minute patency rate with throm-bolytic therapy is approximately 65% to 75%. Unfortunately,PCI can be performed only in centers with interventionalcardiac catheterization laboratories, and in some states, onlywhen backup cardiac surgery is available. The most recent2007 focused update of the ACC/AHA guidelines on ST ele-vation MI reemphasizes the previous recommendation thatreperfusion of the occluded artery should be started as earlyas possible since the greatest benefit of any type of reperfu-sion therapy depends on the shortest time in which completereperfusion is achieved. Therefore, the delay in performingPCI should be considered when deciding whether throm-bolytic therapy or primary PCI is the best modality of reper-fusion. Thus, if the patient is admitted to a hospital that is ca-pable of doing PCI, the procedure should be performedwithin 90 minutes after first medical contact. If the patient isadmitted to a facility that is not capable of doing PCI and itis not possible to perform PCI within 90 minutes with inter-hospital transfer, thrombolytic therapy should be given unlesscontraindicated, within 30 minutes of hospital presentation.
Transfer to another hospital with PCI capabilities should beconsidered when:
■ Thrombolytic therapy is contraindicated.
■ PCI can be performed within 90 minutes (door to balloontime) of first medical contact.
■ Thrombolytic therapy had been tried but failed to reper-fuse the occluded artery (rescue PCI).
■ PCI is also the therapy of choice when the patient is hemo-dynamically unstable especially when there is cardiogenicshock or pump failure, onset of symptoms is more than 3hours or the diagnosis of ST elevation MI is in doubt.
■ Facilitated PCI: This involves the administration of heparinin high doses, IIb/IIIa antagonists, fibrinolytic agents in lessthan full doses or a combination of the agents discussed pre-viously before PCI is attempted. Full dose thrombolytic ther-apy followed by immediate PCI may be harmful and is notrecommended (Class III recommendation according to the2007 focused update ACC/AHA 2004 guidelines for themanagement of patients with ST elevation MI). These an-tithrombotic agents are given to improve patency of the oc-cluded coronary artery. Facilitated PCI is performed if pri-mary PCI is not available within 90 minutes after firstmedical contact. This is usually performed when the patientis initially admitted to a hospital without PCI capabilitiesand interhospital transfer is being planned to a facility that iscapable of doing PCI.
■ Cardiac pacemakers and acute MI:
■ In patients with acute MI complicated by AV block, im-plantation of permanent pacemakers depends on the lo-cation of the AV block (which should be infranodal),rather than the presence or absence of symptoms. Mostpatients with infranodal block have wide QRS complexes.However, when AV block is persistent and is associatedwith symptoms, the AV block may or may not be infran-odal before a permanent pacemaker is implanted.
■ Whenever a patient who has survived an acute MI be-comes a candidate for permanent pacemaker, two otherconditions should be answered. These include the need forbiventricular pacing because most of these patients willhave an intraventricular conduction defect and the needfor implantable cardioverter defibrillator (ICD) becausemost of these patients have left ventricular dysfunction.
■ Indications of implantation of permanent pace-maker after acute MI: The following are indications forinsertion of a permanent pacemaker following acute STelevation MI according to the ACC/AHA/Heart RhythmSociety (HRS) 2008 guidelines for device-based therapyof cardiac rhythm abnormalities and the ACC/AHA 2004guidelines for the management of ST elevation MI.
n Class I recommendation:
n Persistent second-degree AV block in the His-Purkinje system with bilateral bundle-branchblock or third-degree AV block within or below theHis-Purkinje system.
LWBK271-C23_331-378.qxd 29/1/09 7:18 pm Page 375 LWBK270-4119G-C02_073-110.qxd

376 Chapter 23
n Transient advanced second- or third-degree AVblock at the infranodal level and associated bundlebranch block. An electrophysiologic study may benecessary if the site of the block is uncertain.
n Persistent and symptomatic second- or third-degree AV block.
n Class IIb recommendation:
n Persistent second- or third-degree AV block at thelevel of the AV node.
n Class III recommendation: permanent pacing is notrecommended in the following conditions:
n Transient AV block without intraventricular con-duction defect.
n Transient AV block in the presence of isolated leftanterior fascicular block.
n Acquired left anterior fascicular block in the ab-sence of AV block.
n Persistent first-degree AV block in the presence ofbundle branch block, old or indeterminate.
■ Ventricular and supraventricular tachycardia: Thetreatment of ventricular and supraventricular tachycardiafollowing acute MI is similar to the general management ofthese arrhythmias in patients without ischemic heartdisease.
■ Implantation of ICD after acute MI: In patients with acuteMI, the following are indications for implantation of ICD ac-cording to the ACC/AHA 2004 guidelines for the manage-ment of ST elevation MI:
■ Class I recommendation:
n Patients with VF or hemodynamically significant VTmore than 2 days after acute MI not from reversible is-chemia or from reinfarction.
n Left ventricular ejection fraction of 31% to 40% atleast 1 month after acute MI even in the absence ofspontaneous VT/VF or have inducible VT/VF on elec-trophysiological testing.
■ Class IIa recommendation:
n Left ventricular dysfunction (ejection fraction 30%)at least 1 month after acute MI and 3 months aftercoronary artery revascularization.
■ Class IIb recommendation:
n Left ventricular dysfunction (ejection fraction 31% to40%) at least 1 month after acute ST elevation MIwithout additional evidence of electrical instabilitysuch as nonsustained VT.
n Left ventricular dysfunction (ejection fraction 31% to40%) at least 1 month after acute ST elevation MI andadditional evidence of electrical instability such asnonsustained VT but do not have inducible VF or sus-fained VT on electrophysiologi testing.
■ Class III recommendation: ICD is not indicated whenejection fraction is �40% at least 1 month after acute STelevation MI.
■ RVMI: Left ventricular preload may be diminished fromright ventricular failure and volume is needed to optimizediastolic filling and cardiac output. Treatment of RVMItherefore usually requires adequate hydration with IVfluids.
■ The use of nitroglycerin may further reduce preloadand potentiate the hemodynamic abnormalities associ-ated with RVMI and should be used cautiously whenacute inferior MI is present. It is contraindicated ifsystolic blood pressure is �90 mm Hg or heart rate is �50 bpm.
■ Acute inferior MI complicated by RVMI involves not onlythe right ventricle but may be associated with significantleft ventricular dysfunction. If left ventricular output islow and LV filling pressure is high (high pulmonarywedge pressure), inotropic support with dopamine ordobutamine should be considered.
■ Complete AV block may occur as a complication ofRVMI because the artery to the AV node is usually com-promised when there is occlusion of the proximal ormid-RCA. If the AV block is associated with a low ven-tricular rate of �50 bpm or patient is hemodynamicallyunstable with low output, atropine is the drug of choice.The dose is 0.5 to 1.0 mg IV repeated every 3 to 5 minutesuntil a total dose of 3 mg (0.04 mg/kg) is given within aperiod of 3 hours. This dose can result in complete vagalblockade and need not be exceeded. Doses of �0.5 mgshould be discouraged because it may slow instead of in-crease heart rate by stimulation of the vagal nuclei cen-trally resulting in parasympathomimetic response. If AVblock does not respond to atropine, temporary dualchamber pacing to preserve AV synchrony may beneeded to optimize left ventricular output because ven-tricular performance is dependent on atrial contributionto left ventricular filling.
Prognosis
■ Acute MI continues to be the leading cause of death and dis-ability in spite of the advances in the diagnosis and therapy ofcoronary disease. About half of all deaths from acute MI willoccur during the initial hours after the onset of symptomswith most deaths from ventricular fibrillation. Most deathsoccur before the patients are able to reach a medical facility.Of those who survive and are able to seek medical care, prog-nosis is dependent on the extent and severity of myocardialdamage.
■ ST elevation MI is more extensive than non-ST elevation MIresulting in a lower ejection fraction, higher incidence ofheart failure, ventricular arrhythmias, and higher immedi-ate and in-hospital mortality of up to 10% compared withnon-ST elevation MI, which has a lower incidence of theabove complications and a lower in-hospital mortality of1% to 3%.
LWBK271-C23_331-378.qxd 29/1/09 7:18 pm Page 376 LWBK270-4119G-C02_073-110.qxd
Acute Coronary Syndrome: ST Elevation Myocardial Infarction 377
Suggested Readings
Anderson JL, Adams CD, Antman EM, et al. ACC/AHA 2007guidelines for the management of patients with unstableangina/non-ST-elevation myocardial infarction. J Am CollCardiol. 2007;50:e1–157.
Antman EM, Anbe DT, Armstrong PW, et al. ACC/AHA guide-lines for the management of patients with ST elevation my-ocardial infarction: executive summary: a report of theACC/AHA Task Force on Practice Guidelines (Committee toRevise the 1999 Guidelines on the Management of Patientswith Acute Myocardial Infarction). J Am Coll Cardiol.2004;44:671–719.
Antman EM, Hand M, Armstrong PW, et al. 2007 Focused up-date of the ACC/AHA 2004 guidelines for the managementof patients with ST elevation myocardial infarction. J AmColl Cardiol. 2008;51:210–247.
Assali AR, Sclarovsky S, Hertz I, et al. Comparison of patientswith inferior wall acute myocardial infarction with versuswithout ST-segment elevation in leads V5 and V6. Am J Car-diol. 1998;81:81–83.
Balci B, Yesildag O. Correlation between clinical findings andthe “tombstoning” electrocardiographic pattern in patientswith anterior wall acute myocardial infarction. J Am CollCardiol. 2003;92:1316–1318.
Birnbaum Y, Sclarovsky S, Solodky A, et al. Prediction of thelevel of left anterior descending coronary artery obstruc-tion during anterior wall acute myocardial infarction by theadmission electrocardiogram. Am J Cardiol. 1993;72:823–826.
Birnbaum Y, Solodky A, Hertz I, et al. Implications of inferiorST-segment depression in anterior acute myocardial infarc-tion: electrocardiographic and angiographic correlation. AmHeart J. 1994;127:1467–1473.
Braunwald E, Antman EM, Beasley JW, et al. ACC/AHA guide-lines for the management of patients with unstable anginaand non-ST segment elevation myocardial infarction: a re-port of the ACC/AHA Task Force on Practice Guidelines(Committee on the Management of Patients with UnstableAngina). J Am Coll Cardiol. 2000;36:970–1062.
Braunwald E, Antman EM, Beasley JW, et al. ACC/AHA 2002guideline update for the management of patients with unsta-ble angina and non-ST segment elevation myocardial infarc-tion: Summary article: a report of the ACC/AHA Task Forceon Practice Guidelines (Committee on the Management ofPatients with Unstable Angina. Circulation. 2002;106:1893–1900.
Brugada R, Brugada J, Antzelevitch C, et al. Sodium channelblockers identify risk for sudden death in patients with STsegment elevation and right bundle branch block but struc-turally normal hearts. Circulation. 2000;101:510–515.
Dunn MI, Lipman BS. Myocardial Infarction, injury and is-chemia. In: Clinical Electrocardiography. 8th ed. Chicago:Year Book Medical Publishers, Inc; 1989:160–209.
Edhouse J, Brady WJ, Morris F. ABC of clinical electrocardiogra-phy. Acute myocardial infarction—part II. BMJ. 2002;324:963–966.
Engelen DJ, Gorgels AP, Cheriex EC, et al. Value of the electro-cardiogram in localizing the occlusion site in the left anterior
descending coronary artery in acute anterior myocardial in-farction. J Am Coll Cardiol. 1999;34:389–395.
Epstein AE, DiMarco JP, Ellenbogen KA, et al.ACC/AHA/HRS 2008guidelines for device-based therapy of cardiac rhythm abnor-malities: a report of the American College of Cardiology/Ameri-can Heart Association Task Force on Practice Guidelines (Writ-ing Committee to Revise the ACC/AHA/NASPE 2002 GuidelineUpdate for Implantation of Cardiac Pacemakers and Antiar-rhythmia Devices). Circulation, 2008; 117:e350–e408.
Ginzton LE, Laks MM. The differential diagnosis of acute peri-carditis from normal variant: new electrocardiographic cri-teria. Circulation. 1982;65:1004–1009.
Goldberger AL. Electrocardiogram in the diagnosis of myocar-dial ischemia and infarction. 2007 UpToDate.
Goldberger AL. Pathogenesis and diagnosis of Q waves in theelectrocardiogram. 2007 UpToDate.
Goldberger A, Goldberger E. Myocardial ischemia and infarc-tion I and II. In: Clinical Electrocardiography. 5th ed. Mosby-Year Book, Inc; 1994:87–122.
Gregoratos G, Abrams J, Epstein AE, et al. ACC/AHA/NASPE2002 guideline update for implantation of cardiac pacemak-ers and antiarrhythmia devices: summary article. Circula-tion. 2002;106:2145–2161.
Guo XH, Yap YG, Chen LJ, et al. Correlation of coronary an-giography with “tombstoning” electrocardiographic patternin patients after acute myocardial infarction. Clin Cardiol.2000;23:347–352.
Hertz, I, Assali AR, Adler Y, et al. New electrocardiographic cri-teria for predicting either the right or left circumflex arteryas the culprit coronary artery in inferior wall acute myocar-dial infarction. Am J Cardiol. 1997;80:1343–1345.
The Joint European Society of Cardiology/American College ofCardiology Committee. Myocardial infarction redefined—aconsensus document of the joint European Society of Cardi-ology/American College of Cardiology Committee for theRedefinition of Myocardial Infarction. J Am Coll Cardiol.2000;36:959–969.
Kontos MC, Desai PV, Jesse RL, et al. Usefulness of the admis-sion electrocardiogram for identifying the infarct-related-artery in inferior wall acute myocardial infarction. Am J Car-diol. 1997;79:182–184.
Kosuge M, Kimura K, Ishikawa T, et al. Electrocardiographiccriteria for predicting total occlusion of the proximal leftanterior descending coronary artery in anterior wall acutemyocardial infarction. Clin Cardiol. 2001;24:33–38.
Kosuge M, Kimura K, Ishikawa T, et al. New electrocardio-graphic criteria for predicting the site of coronary artery oc-clusion in inferior wall acute myocardial infarction. Am JCardiol. 1998;82:1318–1322.
Kulkarni AU, Brown R, Ayoubi M, et al. Clinical use of posteriorelectrocardiographic leads: A prospective electrocardio-graphic analysis during coronary occlusion. Am Heart J.1996;131:736–741.
Kyuhyun W, Asinger RW, Marriott HJL. ST-segment elevationin conditions other than acute myocardial infarction. N EnglJ Med. 2003;349:2128–2135.
Kurisu S, Sato H, Kawagoe T, et al. Tako-tsubo-like left ventric-ular dysfunction with ST-segment elevation: a novel cardiacsyndrome mimicking acute myocardial infarction. Am HeartJ. 2002;143:448–455.
LWBK271-C23_331-378.qxd 29/1/09 7:18 pm Page 377 LWBK270-4119G-C02_073-110.qxd

378 Chapter 23
Matetsky S, Freimark D, Chouraqui P, et al. Significance of STsegment elevations in posterior chest leads (V7 to V9) in pa-tients with acute inferior myocardial infarction: applicationfor thrombolytic therapy. J Am Coll Cardiol. 1998;31:506–511.
Matsuo K, Akahoshi M, Nakashima E, et al. The prevalence, in-cidence and prognostic value of the Brugada-type electro-cardiogram. A population based study of four decades. J AmColl Cardiol. 2001;38:765–770.
Mirvis DM, Goldberger AL. Electrocardiography. In: Zipes DP,Libby P, Bonow RO, Braunwald E, eds. Braunwald’s HeartDisease: A Textbook of Cardiovascular Medicine. 7th ed.Philadelphia: Elsevier Saunders; 2005:107–148.
Morris F, Brady WJ. ABC of clinical electrocardiography. Acutemyocardial infarction—part I. BMJ. 2002;324:831–834.
Pitt B, Remme W, Zannad F, et al., for the Eplerenone Post-Acute Myocardial Infarction Heart Failure Efficacy and Sur-vival Study investigators. Eplerenone, a selective aldosteroneblocker, in patients with left ventricular dysfunction aftermyocardial infarction. N Engl J Med. 2003;348:1309–1321.
Reeder GS, Kennedy HL. Diagnosis of an acute myocardial in-farction. 2007 UpToDate.
Ryan TJ, Antman EM, Brooks NH, et al. 1999 update:ACC/AHA guidelines for the management of patients withacute myocardial infarction: executive summary and recom-mendations: a report of the American College of Cardiol-ogy/American Heart Association Task Force on PracticeGuidelines (Committee on Management of Acute Myocar-dial Infarction). Circulation. 1999;100:1016–1030.
Ryan TJ, Anderson JL, Antman EM, et al. American College ofCardiology/American Heart Association guidelines for themanagement of patients with acute myocardial infarction: a re-port of the American College of Cardiology/American HeartAssociation Task Force on Practice Guidelines (Committee onManagement of Acute Myocardial Infarction). J Am CollCardiol. 1996;28:1328–1428.
Sabatine MS, Cannon CP, Gibson M, et al. Addition of clopidogrelto aspirin and fibrinolytic therapy for myocardial infarctionwith ST-segment elevation. N Engl J Med. 2005; 352;1179–1189.
Sgarbossa EB, Pinski SL, Topol EJ, et al. Acute myocardial in-farction and complete bundle branch block at hospital ad-mission: clinical characteristics and outcome in the throm-bolytic era. J Am Coll Cardiol. 1998;31:105–110.
Sgarbossa EB, Pinski SL, Barbagelata A, et al. Electrocardio-graphic diagnosis of evolving acute myocardial infarction in
the presence of left bundle-branch block. N Engl J Med.1996;334:481–487.
Sgarbossa EB, Wagner GS. Electrocardiography. In: Topol EJ, ed.Textbook of Cardiovascular Medicine. 2nd ed. Philadelphia:Lippincott Williams & Wilkins; 2002:1329–1363.
Smith SC, Allen J, Blair SN, et al. AHA/ACC guidelines for sec-ondary prevention for patients with coronary and other ath-erosclerotic vascular disease: 2006 update. Circulation.2006;113:2363–2372.
Surawicz B, Parikh SR. Prevalence of male and female patternsof early ventricular repolarization in the normal ECG ofmales and females from childhood to old age. J Am Coll Car-diol. 2002;40:1870–1876.
Thygesen K, Alpert JS, White HD, et al. ESC/ACCF/AHA/WHFexpert consensus document. Universal definition of myocar-dial infarction. J Am Coll Cardiol. 2007;50:2173–2195.
Virmani R, Burke AP. Pathology of myocardial ischemia, infarc-tion, reperfusion and sudden death. In: Zipes DP, Libby P,Bonow RO, Braunwald E, eds. Braunwald’s Heart Disease: ATextbook of Cardiovascular Medicine. 7th ed. Philadelphia:Elsevier Saunders; 2005:107–148.
Wimalaratna HSK. “Tombstoning” of ST segment in acute my-ocardial infarction. Lancet. 1993;342:496 [letter].
Wang K, Asinger RW, Marriott HJL. ST-segment elevation inconditions other than acute myocardial infarction. N Engl JMed. 2003;349:2128–2135.
Zimetbaum PJ, Josephson ME. Use of the electrocardiogram inacute myocardial infarction. N Engl J Med. 2003;348:933–940.
Zimetbaum PJ, Krishnan S, Gold A, et al. Usefulness of ST-seg-ment elevation in lead III exceeding that of lead II for identi-fying the location of the totally occluded coronary artery ininferior wall myocardial infarction. Am J Cardiol.1998;82:918–919.
Zipes DP, Camm AJ, Borggrefe M, et al. ACC/AHA/ESC 2006guidelines for management of patients with ventricular ar-rhythmias and the prevention of sudden cardiac death: exec-utive summary: a report of the American College of Cardiol-ogy/American Heart Association Task Force and theEuropean Society of Cardiology Committee for PracticeGuidelines (Writing Committee to Develop Guidelines forManagement of Patients with Ventricular Arrhythmias andthe Prevention of Sudden Cardiac Death). Circulation.2006;114:1088–1132.
LWBK271-C23_331-378.qxd 29/1/09 7:18 pm Page 378 LWBK270-4119G-C02_073-110.qxd
■ Acute coronary syndrome: Acute coronary syn-drome is usually from plaque rupture, resulting invarying degrees of myocardial ischemia. The electro-cardiogram (ECG) provides useful information thatcannot be obtained with other diagnostic proceduresand is the most important modality in the initial man-agement of patients with this disorder.
■ ECG findings: Patients with acute coronary syndromecan be classified according to their ECG presentationand include those with ST segment elevation and thosewithout ST elevation.■ ST elevation: Almost all patients with acute coro-
nary syndrome with ST segment elevation will de-velop myocardial necrosis with increased cardiactroponins in the circulation. These patients have anoccluded coronary artery with completely ob-structed flow and are candidates for immediatereperfusion with a thrombolytic agent or with pri-mary percutaneous coronary intervention (PCI).This was discussed in Chapter 23, Acute CoronarySyndrome: ST Elevation Myocardial Infarction.
■ Non-ST elevation:Patients with acute coronary syn-drome without ST segment elevation usually have STdepression, T-wave inversion, or less-specific ST andT wave abnormalities. Some patients may not showany changes in the ECG. These patients will eitherhave unstable angina with no evidence of myocardialnecrosis or non-ST elevation myocardial infarction(MI) when evidence of myocardial necrosis is pres-ent. The presence or absence of myocardial necrosis isbased on whether or not cardiac troponins are ele-vated in the circulation. Unstable angina and non-STelevation MI have the same pathophysiology, similarECG findings, similar clinical presentation, and simi-lar management and are discussed together.
■ The ECG is also helpful in providing prognostic infor-mation in acute coronary syndrome based on the ini-tial presentation.
■ Patients with acute coronary syndrome accompa-nied by ST segment elevation carries the highest riskof death during the acute phase.
■ Patients presenting with ST segment depression havethe highest overall mortality over a period of 6 months.
■ Patients with isolated T wave inversion or those withno significant ECG abnormalities incur the lowest risk.
The Normal T Wave
■ The normal T wave: The T wave normally follows thedirection of the QRS complex. Thus, in leads wherethe R waves are tall, the T waves are also tall. In leadswhere the S waves are deep and the R waves are small,as in leads III or aVL, the T waves may be flat or in-verted. Determining the direction or axis of any wavein the ECG such as the QRS complex was previouslydiscussed in Chapter 4, The Electrical Axis and Car-diac Rotation.■ Frontal plane: In the frontal plane, the axis of the
normal T wave is within 45� of the axis of the QRScomplex (Figs. 24.1 and 24.2). This is also called theQRS/T angle, which is the angle formed between theaxis of the QRS complex and that of the T wave.When this angle is increased, myocardial ischemiashould be considered, although this is usually not aspecific finding. The tallest T wave in the limb leadsis approximately 5 mm but could reach up to 8 mm.
■ Horizontal plane: In the horizontal plane, the axisof the normal T wave is within 60� of the axis of theQRS complex. Calculation of the T-wave axis in thehorizontal plane is usually not necessary, becausethe T waves are expected to be upright in most pre-cordial leads other than V1 or V2. If the T waves areinverted in V1, V2, and also in V3, this is abnormal(Fig. 24.3), except in children and young adults.
24Acute Coronary Syndrome:
Non-ST Elevation MyocardialInfarction and Unstable Angina
379
LWBK271-C24_379-395.qxd 1/29/09 1:55 PM Page 379 LWBK271-C01_01-08.qxd

380 Chapter 24
Because the precordial leads are closer to the heartthan the limb leads, the T waves are taller in the pre-cordial leads, especially V2–V4, and usually measureup to 10 mm but can reach up to 12 mm.
■ The normal T wave:■ In Figure 24.2, the axis of the T wave and QRS com-
plex is almost 0�. Although the T wave is inverted inlead III (arrows), this is not abnormal because theaxis of the T wave is within 45� of the axis of the QRScomplex. In the horizontal plane, the T wave is in-verted in V1 and upright in V2 to V6. This is also anormal finding.
■ In Figure 24.3, the T waves are inverted in V1, V2 andV3 (arrows). This is abnormal in adults. However,inversion of the T wave from V1 to V3 is entirely nor-mal in children. This T-wave inversion may nor-mally persist through adulthood in some patientsand is called persistent juvenile pattern.
Abnormal T Waves
■ T waves: Figure 24.4 shows different examples of Twaves, both normal and abnormal.
■ Normal T wave: A normal T wave is upright andasymmetric. The initial upstroke is inscribed slowlyand the terminal downstroke is inscribed more rap-idly (Fig. 24.4A).
■ Ischemic T waves: Figure 24.4B–D show typical is-chemic T waves. Ischemic T waves are symmetrical.They are symmetrically tall when the ischemia issubendocardial and are deeply symmetrically in-verted, measuring at least 2 mm when the ischemiais subepicardial or transmural. These T-wave abnor-malities when accompanied by symptoms of my-ocardial ischemia may or may not be associated withtroponin elevation.
■ Nonspecific T waves: The other T-wave abnormal-ities shown in Figure 24.4E–G are nonspecific.These include T waves that are inverted but are �2mm in amplitude. They may nevertheless occur asthe only ECG abnormality associated with acutemyocardial ischemia and may or may not be associ-ated with troponin elevation. It is also possible thatthe ECG may not show any definite abnormalitieswhen there is myocardial ischemia.
■ Interpretation of any T-wave abnormality should al-ways include all available clinical information be-cause the T-wave abnormalities are not always fromischemia, even if they look typical for myocardial ischemia.
■ Abnormal T-wave changes from myocardial ischemia: When coronary blood flow is diminished orwhen myocardial oxygen demand exceeds blood sup-ply, changes in the T waves are the earliest to occur.Electrocardiographically, changes confined to the Twaves indicate myocardial ischemia, which may besubendocardial or transmural.■ Subendocardial ischemia: Myocardial ischemia is
subendocardial when it is localized to the subendo-cardial area. It is usually manifested in the ECG aspeaking of the T waves over the area of ischemia.
■ Transmural ischemia: The ischemia is transmuralor subepicardial when it involves the whole thick-ness of the myocardium. This is usually manifestedin the ECG as deeply and symmetrically inverted Twaves over the area of ischemia.
+15°
+105° +60° QRS
I 0°
III+120°
aVR°
-150 aVL - 30°
II +60°
+30
aVF+90°
°
Figure 24.1: Axis of the T Wave in the Frontal Plane. Ifthe axis of the QRS is 60�, the T wave should be within 45� (shaded)to the left or right of the axis of the QRS complex as shown.
Figure 24.2: T Wave Axis in theFrontal Plane. Although the Twaves are inverted in lead III (arrows),the axis of the T wave is within 45� ofthe axis of the QRS complex (QRSaxis 0�,T wave axis –5�), thus the Twave inversion in lead III is expected.This is not an abnormal finding.
LWBK271-C24_379-395.qxd 1/29/09 1:55 PM Page 380 LWBK271-C01_01-08.qxd

Acute Coronary Syndrome: Non-ST Elevation Myocardial Infarction and Unstable Angina 381
■ Subendocardial ischemia: The typical pattern ofsubendocardial ischemia is the presence of tall and sym-metrically peaked T waves (Fig. 24.5). The configura-tion of the T wave is similar to that of hyperkalemia ex-cept that in subendocardial ischemia, the base is usuallybroad and the QT interval is slightly prolonged. Peakingof the T waves is confined to the area of ischemia unlikehyperkalemia where peaking is generalized (Fig. 24.6).Peaking of the T waves may also occur in fluoride intox-ication and left ventricular hypertrophy from volumeoverload such as aortic regurgitation. It can also occuras a normal finding (Fig. 24.7) or when there is a meta-bolic abnormality (Fig. 24.8) especially over the precor-dial transition zone V2 to V4. Thus, peaking of the Twave is not specific for myocardial ischemia.
■ Transmural ischemia: T waves that are symmetricallyand deeply inverted may indicate transmural ischemia,which involves the whole thickness of the myocardium.In transmural or subepicardial ischemia, the T wave ispointed downward, often resembling an arrowhead. Ifthe T wave is divided equally into two halves by draw-ing a perpendicular line at the middle of the T wave,the left half of the inverted T wave resembles the other
half. The ST segment may or may not be depressed.The QTc may be slightly prolonged (Fig. 24.9). Whenacute symptoms of ischemia are also present, these Twaves may or may not be associated with troponin ele-vation. When troponins are elevated in the circulation,non-ST elevation MI or more specifically a T-wave in-farct is present; otherwise, the T wave changes are dueto unstable angina.
■ Other causes of deep T-wave inversion: There areseveral other causes of deep and symmetrical T-wave in-version other than myocardial ischemia. These includehypertrophic cardiomyopathy especially the apical type,pericarditis, pulmonary embolism, mitral valve prolapse,metabolic conditions, electrolyte disorders, and effect ofdrugs such as tricyclic antidepressants and antiarrhyth-mic agents. It can also be due to noncardiac conditionssuch as cerebrovascular accidents or other craniocerebralabnormalities, peptic ulcer perforation, acute cholecysti-tis, and acute pancreatitis. It may even be a variant of nor-mal especially in young African American males. Deepsymmetrical inversion of the T wave, therefore, is notspecific and does not necessarily imply that the T-waveabnormality is due to transmural myocardial ischemia.■ Figure 24.10 is the initial ECG of a patient who pre-
sented with chest discomfort. There was deep andsymmetrical T-wave inversion across the pre-cordium. The cardiac troponins were elevated con-sistent with non-ST elevation MI or, more specifi-cally, a T-wave infarct.
■ Figure 24.11 is the 12-lead ECG of a 37-year-oldwoman, without history of cardiac disease and is 6months postpartum when she developed cerebralhemorrhage. Deep T-wave inversion is noted in thelimb and precordial leads resembling transmural is-chemia.
■ Secondary ST and T wave abnormalities: The ab-normality in the T wave as well as the ST segment issecondary if it is caused by abnormal depolarization ofthe ventricles, as would occur when there is bundlebranch block, ventricular hypertrophy, preexcitation ofthe ventricles, or when the rhythm is ectopic or in-duced by a ventricular pacemaker. These secondary ST
Figure 24.3: Persistent JuvenilePattern. The electrocardiogram isfrom a 25-year-old asymptomatic fe-male showing inversion of the Twave in V1 to V3 (arrows). This is a nor-mal finding in children, which maynormally persist to adulthood and iscalled persistent juvenile pattern.
CBA D
GE F
Figure 24.4: T Waves. (A) Normal T wave. (B) Peaked Twaves from subendocardial ischemia. (C) Classical deep T-waveinversion due to transmural ischemia. (D) Symmetrically but lessdeeply inverted T wave also due to transmural ischemia. (E)Shallow T-wave inversion (F) Biphasic T wave. (G) Low, flat, or iso-electric T wave. Although the T-wave configuration of B, C, andD suggests myocardial ischemia, these T-wave abnormalitiesmay also be due to other causes.
LWBK271-C24_379-395.qxd 1/29/09 1:56 PM Page 381 LWBK271-C01_01-08.qxd

382 Chapter 24
Figure 24.5: Subendocardial Ischemia. Peaking of the T waves is confined to V1 to V4
consistent with subendocardial ischemia involving the anterior wall. Note also that the Twaves are taller in V1 than in V6 and are biphasic in leads II, III, and aVF. Peaking of the T wavesmark the area of ischemia and can occur as the initial manifestation of acute coronarysyndrome before the onset of ST segment elevation.
Figure 24.6: Hyperkalemia.Peaking of the T waves from hyper-kalemia (serum potassium � 6.6mEq/L). In subendocardial ischemia,the abnormally peaked T waves arelocalized to the ischemic area. In hy-perkalemia, peaking of the T waves isgeneralized (arrows).
Figure 24.7: Peaked T Waves.Routine electrocardiogram obtainedfrom an asymptomatic middle-agemale. Peaked T waves are presentrepresenting a normal variant.Peaked T waves are often associatedwith early repolarization. Potassiumlevel was 3.8 mEq/L.
Figure 24.8: Giant T Waves.Twelve-lead electrocardiogram (ECG)of a 33-year-old alcoholic man show-ing giant T waves with prolongedQTc. The T waves are tall and peakedwith a broad base. The cause of theECG abnormality was thought to bedue to alcohol or associatedmetabolic abnormality.
LWBK271-C24_379-395.qxd 1/29/09 1:56 PM Page 382 LWBK271-C01_01-08.qxd
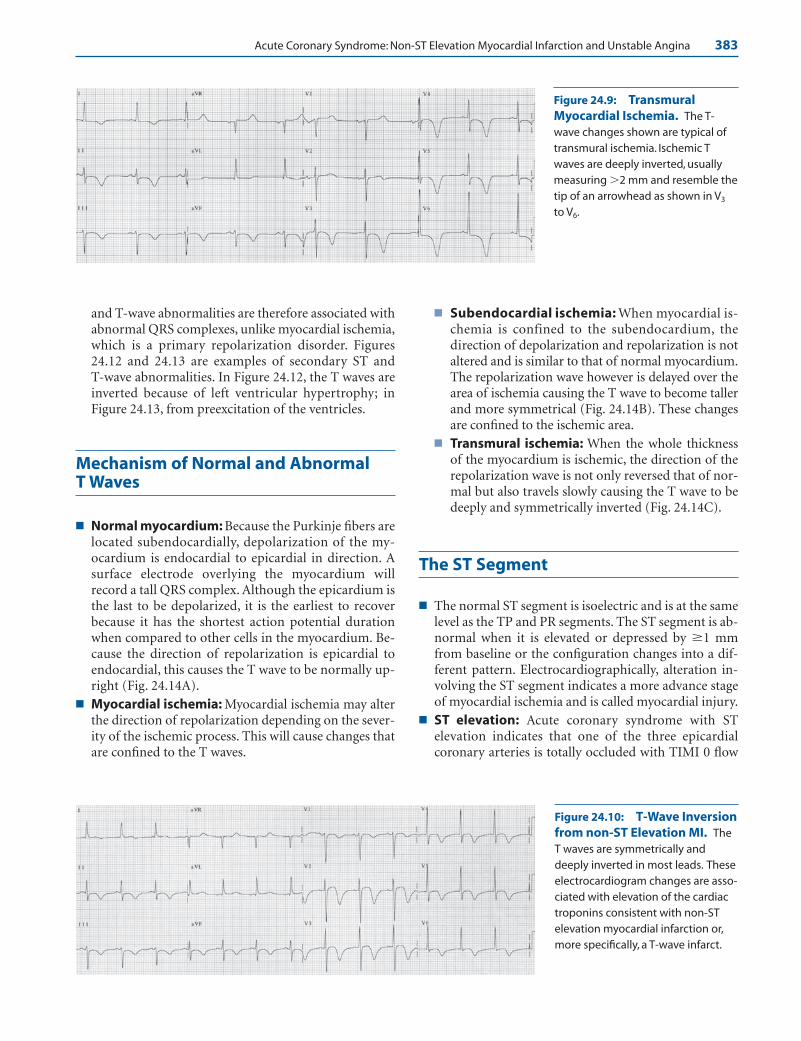
Acute Coronary Syndrome: Non-ST Elevation Myocardial Infarction and Unstable Angina 383
Figure 24.9: TransmuralMyocardial Ischemia. The T-wave changes shown are typical oftransmural ischemia. Ischemic Twaves are deeply inverted, usuallymeasuring �2 mm and resemble thetip of an arrowhead as shown in V3
to V6.
Figure 24.10: T-Wave Inversionfrom non-ST Elevation MI. TheT waves are symmetrically anddeeply inverted in most leads. Theseelectrocardiogram changes are asso-ciated with elevation of the cardiactroponins consistent with non-ST elevation myocardial infarction or,more specifically, a T-wave infarct.
and T-wave abnormalities are therefore associated withabnormal QRS complexes, unlike myocardial ischemia,which is a primary repolarization disorder. Figures24.12 and 24.13 are examples of secondary ST and T-wave abnormalities. In Figure 24.12, the T waves areinverted because of left ventricular hypertrophy; inFigure 24.13, from preexcitation of the ventricles.
Mechanism of Normal and Abnormal T Waves
■ Normal myocardium: Because the Purkinje fibers arelocated subendocardially, depolarization of the my-ocardium is endocardial to epicardial in direction. Asurface electrode overlying the myocardium willrecord a tall QRS complex. Although the epicardium isthe last to be depolarized, it is the earliest to recoverbecause it has the shortest action potential durationwhen compared to other cells in the myocardium. Be-cause the direction of repolarization is epicardial toendocardial, this causes the T wave to be normally up-right (Fig. 24.14A).
■ Myocardial ischemia: Myocardial ischemia may alterthe direction of repolarization depending on the sever-ity of the ischemic process. This will cause changes thatare confined to the T waves.
■ Subendocardial ischemia: When myocardial is-chemia is confined to the subendocardium, thedirection of depolarization and repolarization is notaltered and is similar to that of normal myocardium.The repolarization wave however is delayed over thearea of ischemia causing the T wave to become tallerand more symmetrical (Fig. 24.14B). These changesare confined to the ischemic area.
■ Transmural ischemia: When the whole thicknessof the myocardium is ischemic, the direction of therepolarization wave is not only reversed that of nor-mal but also travels slowly causing the T wave to bedeeply and symmetrically inverted (Fig. 24.14C).
The ST Segment
■ The normal ST segment is isoelectric and is at the samelevel as the TP and PR segments. The ST segment is ab-normal when it is elevated or depressed by �1 mmfrom baseline or the configuration changes into a dif-ferent pattern. Electrocardiographically, alteration in-volving the ST segment indicates a more advance stageof myocardial ischemia and is called myocardial injury.
■ ST elevation: Acute coronary syndrome with STelevation indicates that one of the three epicardialcoronary arteries is totally occluded with TIMI 0 flow
LWBK271-C24_379-395.qxd 1/29/09 1:56 PM Page 383 LWBK271-C01_01-08.qxd

384 Chapter 24
Figure 24.11: T-Wave Inversion from Cerebrovascular Accident Hemorrhage.The electrocardiogram (ECG) is from a 37-year-old woman 6 months postpartum who devel-oped a left occipital hemorrhage. Note that the T-wave inversion is deep and symmetrical inV2 to V6 and also in leads I, II, and aVF resembling transmural myocardial ischemia. Note thesimilarity of this ECG from that in Figure 24.10.
Figure 24.12: Secondary ST and T-Wave Abnormality. The electrocardiogramshows left ventricular hypertrophy. Tall R waves are present with downsloping ST depressionand T wave-inversion (arrows). These ST-T changes are secondary to abnormal activation ofthe ventricles.
Figure 24.13: Secondary T-Wave Abnormality. Twelve-leadelectrocardiogram showing preexci-tation. The ST-T abnormalities(arrows) are secondary to abnormalactivation of the ventricles.
LWBK271-C24_379-395.qxd 1/29/09 1:56 PM Page 384 LWBK271-C01_01-08.qxd

Acute Coronary Syndrome: Non-ST Elevation Myocardial Infarction and Unstable Angina 385
indicating no perfusion or antegrade flow beyond thepoint of occlusion. Thrombotic occlusion of the vessellumen with ST segment elevation almost always resultsin cellular necrosis with elevation of the cardiac tro-ponins in the circulation. ST elevation electrocardio-graphically indicates transmural or subepicardial injury,which involves the whole thickness of the myocardium.
■ ST depression: ST depression from acute coronarysyndrome electrocardiographically indicates suben-docardial myocardial injury. Unlike ST elevation,which is almost always accompanied by cellularnecrosis, ST depression may or may not be associatedwith troponin elevation. ST depression may be hori-zontal (Fig. 24.15A,B), downsloping (C,D), scooping(E), slow upsloping (F), or fast upsloping (G). TypicalST depression from subendocardial injury is usually
horizontal (A,B), downsloping (C), or slow upsloping(F) accompanied by depression of the J point. Thesetypes of ST segment depression, however, may becaused by other conditions that may be cardiac ornoncardiac and similar to T-wave inversion, are notspecific for myocardial injury.
■ The typical ST depression associated with acute coro-nary syndrome has a horizontal or downsloping con-figuration with depression of the J point of at least 1 mm as shown in Figures 24.15A–C, 24.16, and 24.17.Other types of ST segment depression are less specific.
■ Unlike ST elevation, ST depression from acute myocar-dial injury, even when accompanied by troponin eleva-tion, is not an indication for thrombolytic therapy. Itusually indicates multivessel coronary disease, includ-ing significant stenosis of the left main coronary artery.
A: Normal Myocardium B: Subendocardial Ischemia C: Transmural Ischemia
Repolarization
Depolarization
Repolarization
Depolarization
Repolarization
Endo-
Depolarization
Epi-
Figure 24.14: (A) The T Wave Normal myocardium. Depolarization starts from endocardium to epi-cardium since the Purkinje fibers are located subendocardially. Repolarization is reversed and is epicar-dial to endocardial, thus the T wave and QRS complex are both upright. (B) Subendocardial Ischemia.The shaded portion represents the area of ischemia. The direction of depolarization and repolarization issimilar to normal myocardium. After the repolarization wave reaches the ischemic area, therepolarization wave is delayed causing the T wave to be tall and symmetrical. (C) Transmural Ischemia.The direction of repolarization is reversed that of normal and is endocardial to epicardial resulting indeeply and symmetrically inverted T waves.
A B C D E F G
Figure 24.15: ST Segment Depression. (A, B) Horizontal ST depression. (C, D)Downsloping ST segment depression. (E) Scooping ST segment depression frequentlyfrom digitalis effect. (F) Slow upsloping ST segment depression. (G) Fast upsloping ST seg-ment depression frequently a normal finding. (A, B, C, F) Typical ischemic ST depression.(D) Left ventricular strain frequently associated with left ventricular hypertrophy. Arrowsindicate the J point.
LWBK271-C24_379-395.qxd 1/29/09 1:56 PM Page 385 LWBK271-C01_01-08.qxd

386 Chapter 24
ST Segment Depression
■ ST depression in V1 to V3: Acute coronary syndromewith ST segment depression in the ECG is a contraindi-cation to thrombolytic therapy. One exception is ST seg-ment depression in V1 to V3, which may represent a trueposterolateral ST elevation MI from total occlusion of theleft circumflex coronary artery (Fig. 24.17). When STsegment depression is present in V1 to V3, special leads V7
to V9 should be recorded to exclude a true posterolateralMI, which represents a true ST elevation MI. This hasbeen previously discussed in Chapter 23, Acute CoronarySyndrome: ST Elevation Myocardial Infarction (see Fig.23.26A,B). Because leads V7 to V9 are not routinelyrecorded, ST depression confined to V1 to V3 can be mis-taken for non-ST elevation MI or unstable angina.
■ Occlusion of the left main coronary artery: Totalocclusion of the left main coronary artery is usually fa-tal and most patients do not survive to reach a medicalfacility. Total or subtotal occlusion of the left maincoronary artery will show diffuse ST segment depres-sion in multiple leads especially V4 to V6 and in leads I,II, and aVL. Leads aVR and V1 show elevation of the STsegments with ST elevation in aVR � ST elevation inV1 (Fig. 24.18, arrows). Because these leads are not ad-jacent to each other, thrombolytic therapy is not indi-
cated. This type of ST segment depression may also oc-cur when there is severe triple vessel disease. TheseECG changes indicate extensive myocardial injury thatwill require aggressive therapy including early coro-nary revascularization.
■ Digitalis effect: The scooping type of ST depression,as shown in Figure 24.19, is usually from digitalis effect.
■ Secondary ST segment depression: Secondary STdepression from left ventricular hypertrophy withstrain pattern is shown in Figure 24.20.
Mechanism of ST Elevation and STDepression
■ Deviation of the ST segment as a result of myocardialischemia has been ascribed to two different mecha-nisms namely systolic current of injury or diastoliccurrent of injury.
Systolic Current of Injury
■ ST elevation and ST depression from systoliccurrent of injury: When the myocardial cells are
Figure 24.16: ST Segment De-pression. Horizontal ST depressionis seen in leads I and II and horizontalto downsloping ST depression in V3
to V6 consistent with subendocardialinjury. Serial troponins were not ele-vated and the patient’s symptomswere consistent with unstableangina.
Figure 24.17: ST Segment Depression in the Anterior Pre-cordial Leads. The ST depressionin the anterior precordial leads mayrepresent anterior subendocardial in-jury, although this may alsorepresent a true ST elevation myocar-dial infarction involving the left ven-tricle posterolaterally.
LWBK271-C24_379-395.qxd 1/29/09 1:56 PM Page 386 LWBK271-C01_01-08.qxd
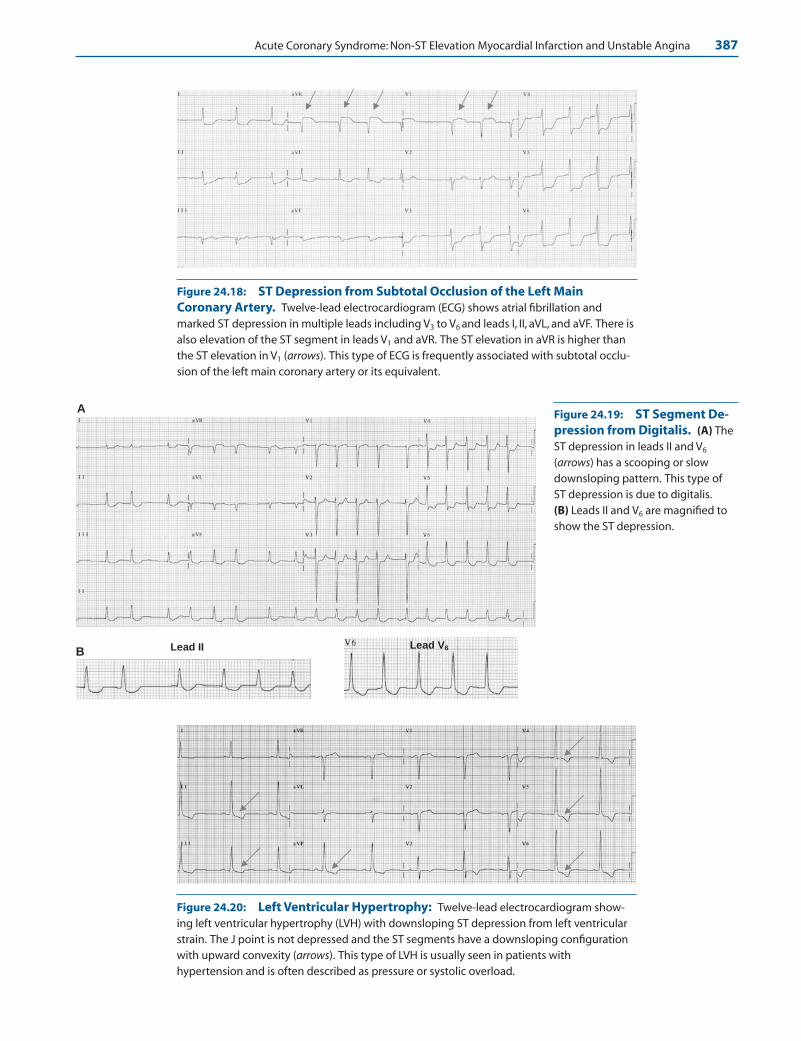
Acute Coronary Syndrome: Non-ST Elevation Myocardial Infarction and Unstable Angina 387
Lead II Lead V6B
A
Figure 24.18: ST Depression from Subtotal Occlusion of the Left MainCoronary Artery. Twelve-lead electrocardiogram (ECG) shows atrial fibrillation andmarked ST depression in multiple leads including V3 to V6 and leads I, II, aVL, and aVF. There isalso elevation of the ST segment in leads V1 and aVR. The ST elevation in aVR is higher thanthe ST elevation in V1 (arrows). This type of ECG is frequently associated with subtotal occlu-sion of the left main coronary artery or its equivalent.
Figure 24.19: ST Segment De-pression from Digitalis. (A) TheST depression in leads II and V6
(arrows) has a scooping or slowdownsloping pattern. This type of ST depression is due to digitalis.(B) Leads II and V6 are magnified toshow the ST depression.
Figure 24.20: Left Ventricular Hypertrophy: Twelve-lead electrocardiogram show-ing left ventricular hypertrophy (LVH) with downsloping ST depression from left ventricularstrain. The J point is not depressed and the ST segments have a downsloping configurationwith upward convexity (arrows). This type of LVH is usually seen in patients withhypertension and is often described as pressure or systolic overload.
LWBK271-C24_379-395.qxd 1/29/09 1:56 PM Page 387 LWBK271-C01_01-08.qxd

388 Chapter 24
ST elevation due to systolic current of injury
of injury
After transmural Injury
-60 Mv
ECG
Onset of Injury
4
0 3
2
Action Potential
1Onset of Injury
-90 Mv
Normal Myocardium
Systolic Current
Injuredmyocardium
ST Elevation
ST elevation due to diastolic current of injury
4
After transmural Injury
Previous Baseline
Diastolic Current of
Injury
-60 Mv
4
0 3
2
Action Potential
1
Onset of Injury
Phase 4 becomes less negative
-90 Mv
Onset of Injury
Previous Baseline Apparent ST
Elevation
ECG baseline (T-Q segment) shifted downward
T-Q segment ECG
Figure 24.21: Systolic Current of Injury. The upper row represents transmembraneaction potentials before and after myocardial injury and the lower row the corresponding elec-trocardiogram (ECG). A change in resting potential from –90 to approximately –60 mV will occurwhen cells are injured. A less negative resting potential causes the amplitude and duration of theaction potential to diminish when compared to normal cells. This difference in potential createsa current of injury during electrical systole (corresponding to phases 1–3 of the action potentialequivalent to the ST segment and T wave in the ECG) between normal and injured myocardium.This current flows from normal myocardium toward the injured myocardium.Thus, if the injury issubepicardial or transmural, the current of injury is directed toward the overlying electroderesulting in ST elevation. (0 to 4 represent the different phases of the action potential.)
Figure 24.22: Diastolic Current of Injury. The yellow shaded areas in the upper and lowerdiagrams represent electrical diastole showing a change in resting potential from –90 to –60 mVafter myocardial injury. Because the resting potential of injured cells is less negative, the cells arerelatively in a state of partial depolarization.Thus, the extracellular membrane of the injured cellsis more negative (less positive) compared with that of normal myocardium causing a diastoliccurrent of injury directed away from the injured myocardium. This diastolic current of injurycauses the TQ segment to be displaced downward away from the overlying electrode. When allcells are discharged during systole, the potential gradient between injured and normal cells is di-minished, shifting the electrocardiogram baseline to its original position, resulting in apparent STelevation.
LWBK271-C24_379-395.qxd 1/29/09 1:56 PM Page 388 LWBK271-C01_01-08.qxd

Acute Coronary Syndrome: Non-ST Elevation Myocardial Infarction and Unstable Angina 389
injured, the resting potential of injured cells is less neg-ative compared with normal cells. A less negative restingpotential will diminish the height, amplitude, and dura-tion of the action potential (Fig. 24.21). This differencein the action potential between normal cells and injuredcells creates a current of injury during electrical systole(phases 1–3 or ST segment and T wave in the ECG) thatis directed toward the injured myocardium. Thus, if theinjury is transmural or subepicardial, the injury currentis directed subepicardially resulting in elevation of theST segment in the recording ECG electrodes that overliethe area of injury (Fig. 24.21). If the injury is confined tothe subendocardium, the current of injury is directedsubendocardially, away from the recording electrodes,resulting in depression of the ST segment.
Diastolic Current of Injury
■ Apparent ST segment elevation from diastoliccurrent of injury: The resting potential of injured my-ocardial cells is less negative compared with normal
cells. This difference in potential occurs during phase4, which corresponds to the TQ segment in the ECG.Because the injured cells have a less negative resting po-tential, they will have a more negative (less positive) ex-tracellular charge relative to normal myocardium. Thisdifference in potential between normal and injuredmyocardium will create an electrical gradient duringdiastole that is directed away from the injured cells, to-ward the more positive normal myocardium. Thiscauses the ECG baseline (TQ segment) to shift down-ward, away from the surface electrode overlying thearea of injury (Fig. 24.22). During systole, all myocar-dial cells are discharged, erasing the potential differ-ence between injured cells and normal cells. This willcause the ECG to compensate and return the ST seg-ment to its previous baseline before the injury, result-ing in apparent ST elevation. The opposite will occur ifthe injury is subendocardial.
■ Apparent ST segment depression from diastoliccurrent of injury: The mechanism of ST segment de-pression from subendocardial injury is shown in Figure24.23. When there is subendocardial injury, phase 4 or resting potential of the injured subendocardial
Figure 24.24: Q Waves. Diagrammatic representation of a transmural infarct. Thenecrotic area (black) involves the whole thickness of the myocardium and consists ofcells that cannot be depolarized. Thus, an electrode overlying the necrotic area will normally record the electrical activity on the opposite side of the myocardium (red arrow),resulting in q waves.
ST depression due to diastolic current of injury
4
After subendocardial Injury
Epicardial Cells Phase 4 more
negative
Diastolic Current of
Injury
-60 Mv
Onset of Injury will shift baseline away from subendocardium
toward the electrode
Previous Baseline Apparent ST
Depression
ECG ECG baseline (T-Q segment)
shifted upward
4
0 3
2
Action Potential
1
Onset of Injury
Endocardial Cells Phase 4 less
negative
-90 Mv
Figure 24.23: ST SegmentDepression. When there issubendocardial injury, the ST seg-ment is depressed because thebaseline is shifted upward awayfrom the injured subendocardiumtoward the direction of therecording electrode. See text.
Depolarization
Zone of necrosis
Zone of injury
Zone of ischemia
LWBK271-C24_379-395.qxd 1/29/09 1:56 PM Page 389 LWBK271-C01_01-08.qxd

390 Chapter 24
myocardial cells is less negative when compared withnormal myocardial cells. This difference in potential be-tween normal and injured myocardium will create anelectrical gradient during diastole. Because the injuredcells are in a state of partial depolarization, a diastoliccurrent of injury is directed away from the injured suben-docardium toward the normal subepicardium causingthe TQ segment to shift upward toward the surface elec-trode overlying the ischemic area. During systole, all my-ocardial cells are discharged simultaneously, erasing thediastolic gradient between injured cells and normal cells.This will cause the ECG to compensate and return theST segment to its previous baseline before the injury, re-sulting in apparent ST segment depression (Fig. 24.23).
■ In summary, the direction of systolic current of injuryis always toward the injured myocardium, whereas di-astolic current of injury, equivalent to the TQ segment,is always directed away from the injured myocardium.
Q Waves
■ Pathologic Q waves: Pathologic Q waves can be pre-vented if the ischemic process is relieved within a timelyfashion. However, if myocardial injury progresses, my-ocardial necrosis will occur resulting in pathologic Qwaves. Electrocardiographically, Q waves indicate trans-mural myocardial necrosis, which signify permanentmyocardial damage and are usually not reversible.However, some Q waves may reverse because of con-traction of the scar tissue during the healing process.Additionally, the injured myocardium may be tem-porarily stunned during the acute episode and may beunable to conduct an electrical impulse locally, whichmay be transient and reversible. Pathologic Q waves isthe usual sequelae of ST elevation MI, although it mayalso occur in approximately 25% of patients with non-ST elevation MI. Abnormal Q waves have been previ-ously discussed in Chapter 23, Acute Coronary Syn-drome: ST Elevation Myocardial Infarction.
■ Summary of the evolution of the ECG in acutecoronary syndrome:■ T-wave abnormalities: Alterations confined to the
T waves indicate myocardial ischemia. These T-waveabnormalities are reversible. However, if the is-chemic process continues unabated, alterations inthe ST segment will follow.
■ ST segment abnormalities: Changes involvingthe ST segment suggest a more advance stage of my-ocardial ischemia and indicate myocardial injury.Alterations involving the ST segment and T wavemay be reversible. However, if the ischemic processcontinues unrelieved, changes in the QRS complexwill follow.
■ Q waves: Q waves indicate the presence of myocar-dial necrosis and are usually not reversible.
Non-ST Elevation MI and Unstable Angina
ECG of Non-ST Elevation MI and Unstable Angina
1. J point and ST segment depression of �1 mm below baseline.
2. Symmetrically inverted T waves measuring �2 mm.
3. The ST and T wave abnormalities may be less specific.
Mechanism
■ Normal ventricular myocardium: Unlike the single musclecell where depolarization and repolarization occur in thesame direction, depolarization and repolarization of the nor-mal ventricular myocardium occur in opposite directions.Thus, depolarization of the myocardium is endocardial toepicardial because the impulse originates from the Purkinjefibers, which are located subendocardially. An electrodeoverlying the myocardium will record a tall QRS complex.Although the epicardium is the last to be depolarized, it is theearliest to recover because it has shorter action potential du-ration compared to other cells in the myocardium. Thus, therepolarization wave travels from epicardium to endo-cardium, away from the recording electrode resulting in up-right T wave in the ECG. In addition to the shorter action po-tential duration of epicardial cells, there are other reasonswhy the epicardium recovers earlier than the endocardium,even if the epicardium is the last to be depolarized.
■ The subendocardium has a higher rate of metabolism,thus requiring more oxygen when compared with the epi-cardium.
■ The subendocardium is the deepest portion of the my-ocardium and is farthest from the coronary circulation.
■ The subendocardium is immediately adjacent to the ven-tricular cavities. Because the ventricles generate the highestpressure in the cardiovascular system, the subendocardiumis subject to a higher tension than the epicardium.
■ Repolarization (the ST segment and T wave) occurs dur-ing systole when the myocardium is mechanically con-tracting. There is no significant myocardial perfusionduring systole especially in the subendocardium at thetime of repolarization.
■ Myocardial ischemia: Myocardial ischemia is a pathologiccondition resulting from an imbalance between oxygen sup-ply and demand. Depending on the severity of myocardial is-chemia, the ECG changes may involve the T wave, the ST seg-ment, or the QRS complex. Changes confined to the T wavesare traditionally called myocardial ischemia. Alterations inthe ST segment are described as myocardial injury and when
LWBK271-C24_379-395.qxd 1/29/09 1:56 PM Page 390 LWBK271-C01_01-08.qxd
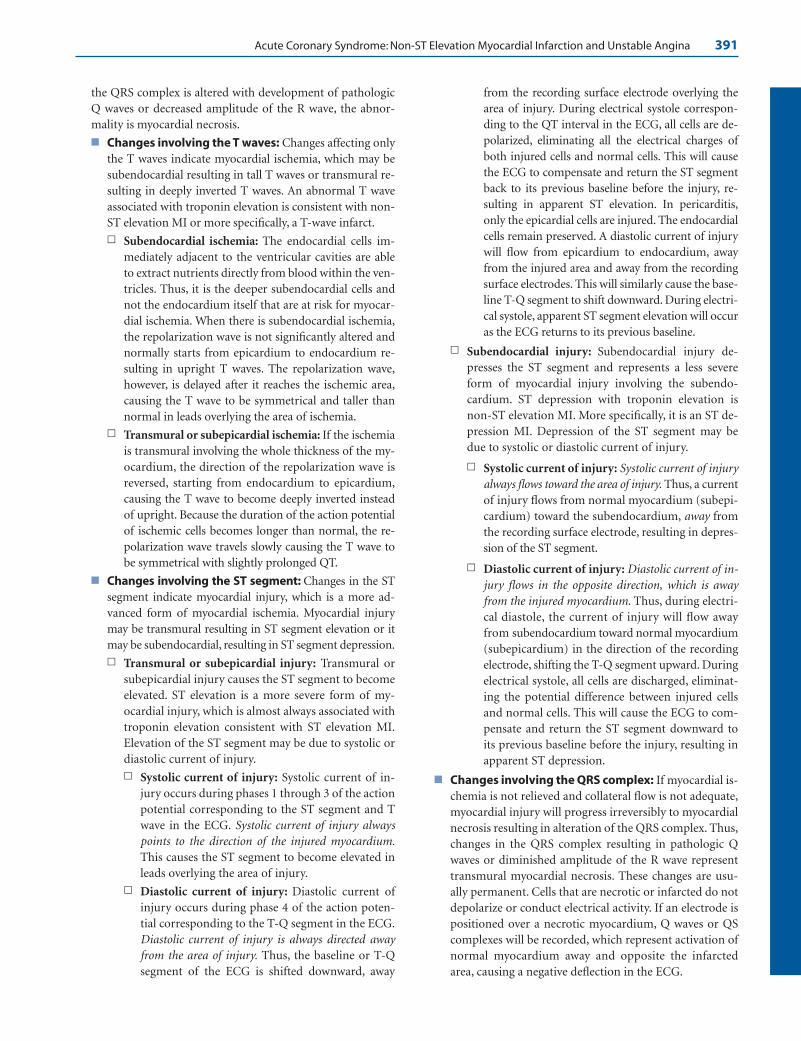
Acute Coronary Syndrome: Non-ST Elevation Myocardial Infarction and Unstable Angina 391
the QRS complex is altered with development of pathologicQ waves or decreased amplitude of the R wave, the abnor-mality is myocardial necrosis.
■ Changes involving the T waves: Changes affecting onlythe T waves indicate myocardial ischemia, which may besubendocardial resulting in tall T waves or transmural re-sulting in deeply inverted T waves. An abnormal T waveassociated with troponin elevation is consistent with non-ST elevation MI or more specifically, a T-wave infarct.n Subendocardial ischemia: The endocardial cells im-
mediately adjacent to the ventricular cavities are ableto extract nutrients directly from blood within the ven-tricles. Thus, it is the deeper subendocardial cells andnot the endocardium itself that are at risk for myocar-dial ischemia. When there is subendocardial ischemia,the repolarization wave is not significantly altered andnormally starts from epicardium to endocardium re-sulting in upright T waves. The repolarization wave,however, is delayed after it reaches the ischemic area,causing the T wave to be symmetrical and taller thannormal in leads overlying the area of ischemia.
n Transmural or subepicardial ischemia: If the ischemiais transmural involving the whole thickness of the my-ocardium, the direction of the repolarization wave isreversed, starting from endocardium to epicardium,causing the T wave to become deeply inverted insteadof upright. Because the duration of the action potentialof ischemic cells becomes longer than normal, the re-polarization wave travels slowly causing the T wave tobe symmetrical with slightly prolonged QT.
■ Changes involving the ST segment: Changes in the STsegment indicate myocardial injury, which is a more ad-vanced form of myocardial ischemia. Myocardial injurymay be transmural resulting in ST segment elevation or itmay be subendocardial, resulting in ST segment depression.n Transmural or subepicardial injury: Transmural or
subepicardial injury causes the ST segment to becomeelevated. ST elevation is a more severe form of my-ocardial injury, which is almost always associated withtroponin elevation consistent with ST elevation MI.Elevation of the ST segment may be due to systolic ordiastolic current of injury.n Systolic current of injury: Systolic current of in-
jury occurs during phases 1 through 3 of the actionpotential corresponding to the ST segment and Twave in the ECG. Systolic current of injury alwayspoints to the direction of the injured myocardium.This causes the ST segment to become elevated inleads overlying the area of injury.
n Diastolic current of injury: Diastolic current ofinjury occurs during phase 4 of the action poten-tial corresponding to the T-Q segment in the ECG.Diastolic current of injury is always directed awayfrom the area of injury. Thus, the baseline or T-Qsegment of the ECG is shifted downward, away
from the recording surface electrode overlying thearea of injury. During electrical systole correspon-ding to the QT interval in the ECG, all cells are de-polarized, eliminating all the electrical charges ofboth injured cells and normal cells. This will causethe ECG to compensate and return the ST segmentback to its previous baseline before the injury, re-sulting in apparent ST elevation. In pericarditis,only the epicardial cells are injured. The endocardialcells remain preserved. A diastolic current of injurywill flow from epicardium to endocardium, awayfrom the injured area and away from the recordingsurface electrodes. This will similarly cause the base-line T-Q segment to shift downward. During electri-cal systole, apparent ST segment elevation will occuras the ECG returns to its previous baseline.
n Subendocardial injury: Subendocardial injury de-presses the ST segment and represents a less severeform of myocardial injury involving the subendo-cardium. ST depression with troponin elevation isnon-ST elevation MI. More specifically, it is an ST de-pression MI. Depression of the ST segment may bedue to systolic or diastolic current of injury.
n Systolic current of injury: Systolic current of injuryalways flows toward the area of injury. Thus, a currentof injury flows from normal myocardium (subepi-cardium) toward the subendocardium, away fromthe recording surface electrode, resulting in depres-sion of the ST segment.
n Diastolic current of injury: Diastolic current of in-jury flows in the opposite direction, which is awayfrom the injured myocardium. Thus, during electri-cal diastole, the current of injury will flow awayfrom subendocardium toward normal myocardium(subepicardium) in the direction of the recordingelectrode, shifting the T-Q segment upward. Duringelectrical systole, all cells are discharged, eliminat-ing the potential difference between injured cellsand normal cells. This will cause the ECG to com-pensate and return the ST segment downward toits previous baseline before the injury, resulting inapparent ST depression.
■ Changes involving the QRS complex: If myocardial is-chemia is not relieved and collateral flow is not adequate,myocardial injury will progress irreversibly to myocardialnecrosis resulting in alteration of the QRS complex. Thus,changes in the QRS complex resulting in pathologic Qwaves or diminished amplitude of the R wave representtransmural myocardial necrosis. These changes are usu-ally permanent. Cells that are necrotic or infarcted do notdepolarize or conduct electrical activity. If an electrode ispositioned over a necrotic myocardium, Q waves or QScomplexes will be recorded, which represent activation ofnormal myocardium away and opposite the infarctedarea, causing a negative deflection in the ECG.
LWBK271-C24_379-395.qxd 1/29/09 1:56 PM Page 391 LWBK271-C01_01-08.qxd

392 Chapter 24
Clinical Implications
■ Myocardial ischemia with elevation of the ST segment is dueto complete occlusion of the vessel lumen. When blood sup-ply is completely interrupted for a duration of more than 20minutes, myocardial necrosis always occurs and troponin el-evation is always expected.
■ Myocardial ischemia with depression of the ST segment orinversion of the T wave may be due to either diminishedcoronary flow or increased myocardial oxygen demand or acombination of both. It may also be due to a completely oc-cluded artery, but has collateral flow. These ST and T waveabnormalities may or may not be associated with troponinelevation, depending on the severity of myocardial ischemia.When cardiac troponins are elevated in the circulation, non-ST elevation MI is present. If the troponins are not elevated,the clinical picture is one of unstable angina. These patientswith non-ST elevation MI or unstable angina may not showany abnormalities in the ECG.
■ Unlike ST segment elevation and pathologic Q waves,T-wave inversion is not specific for myocardial ischemia.Although deep and symmetrical T-wave inversions measur-ing �2 mm are typical for myocardial ischemia, ischemic-looking T waves may be seen in patients without ischemicheart disease.
■ ST depression from myocardial injury usually measures �1mm. The ST depression may be horizontal, downsloping, orslow upsloping in configuration. The J point (junction be-tween the QRS complex and ST segment) should be de-pressed by �1 mm if the ST depression is from myocardialischemia. ST depression is less specific if the J point is not de-pressed or if the J point is depressed by �0.5 mm. ST depres-sion is not only the result of myocardial ischemia, but couldalso be due to the effect of drugs such as digitalis, antiar-rhythmic agents, Ritalin, and tricyclic antidepressants. ST de-pression can also occur in patients with cardiac diseases notdue to ischemia such as left ventricular hypertrophy, elec-trolyte abnormalities, mitral valve prolapse, and other non-cardiac abnormalities, including anemia.
■ The severity of ST depression and T wave inversion provideimportant diagnostic and prognostic information. For ex-ample, patients with ST depression �0.5 mm have highermorbidity and mortality compared to patients with T waveinversion or those without ECG findings.
■ Although ST elevation MI is synonymous with a Q wave MI,not all patients with ST elevation will develop Q waves. Ad-ditionally, approximately 25% of patients with non-ST eleva-tion MI will also develop Q waves. The rest (75%) will have anon-Q wave MI. Thus, ST elevation MI and non-ST eleva-tion MI are preferred over Q wave and non-Q wave MI. Sim-ilarly, Hurst emphasizes that non-ST elevation MI, which isthe terminology used in the American College of Cardiology/American Heart Association (ACC/AHA) guidelines, doesnot specify the abnormality present in the ECG. Thus, whena non-ST elevation MI occurs, he prefers to identify the
infarct either as a T-wave MI or ST depression MI ratherthan a non-ST elevation MI.
■ The infarct related artery can be predicted using the 12-leadECG when there is ST elevation MI, T-wave MI, or Q-waveMI. Identifying the culprit vessel is more difficult when theMI is associated with ST segment depression. Very often, my-ocardial ischemia with ST segment depression is due to mul-tivessel coronary disease, including the possibility of a signif-icant left main coronary artery lesion.
Treatment
■ Unlike ST elevation MI, which indicates that the coronary ar-tery is completely occluded and there is urgency in immedi-ately establishing coronary flow with a thrombolytic agent orprimary PCI, non-ST elevation MI and unstable angina indi-cate that the coronary artery is partially occluded, resultingin imbalance between oxygen supply and demand. Thus, thepatient can be initially risk stratified so that patients who arehigh risk for reinfarction or death should undergo an earlyinvasive strategy, whereas patients who are not identified asbeing high risk can undergo an early conservative approach.
■ Early conservative: The early conservative approach in-cludes mainly medical therapy. Cardiac catheterization isreserved only when there is evidence of continuing is-chemia either spontaneously occurring or exercise in-duced in spite of intensive medical therapy.
■ Early invasive: The early aggressive approach includesmedical therapy and an early invasive strategy with car-diac catheterization and revascularization of the occludedvessel performed within 4 to 24 hours after the patient ishospitalized regardless of the presence or absence of con-tinuing ischemia.
■ High-risk patients: According to the ACC/AHA 2007guidelines for the management of patients with unstableangina and non-ST elevation MI, high-risk patients includeany of the following findings:
■ Recurrent angina or ischemia at rest or with low-level ac-tivities despite intensive medical therapy
■ Elevated cardiac biomarkers
■ New or presumably new ST depression
■ Signs or symptoms of heart failure or new or worseningmitral regurgitation
■ High-risk findings from noninvasive testing
■ Hemodynamically unstable patient
■ Sustained ventricular tachycardia
■ Left ventricular dysfunction with ejection fraction of�40%
■ Previous PCI within 6 months
■ Prior coronary artery bypass surgery
■ High risk score using risk stratification models
■ Antiplatelet and anticoagulant therapy: Antithromboticagents are the mainstay in the therapy of patients with non-ST
LWBK271-C24_379-395.qxd 1/29/09 1:56 PM Page 392 LWBK271-C01_01-08.qxd

Acute Coronary Syndrome: Non-ST Elevation Myocardial Infarction and Unstable Angina 393
elevation MI and unstable angina, whether or not an earlyconservative or a more aggressive strategy is used.
■ Aspirin: Aspirin should be given as soon as possible, oftenin the prehospital setting when diagnosis of acute coronarysyndrome is suspected. The initial dose of aspirin is 162 to325 mg of plain (nonenteric coated) aspirin given orally.
n Medically treated patients: Among patients who aretreated medically and are not stented, aspirin is con-tinued at a dose of 75 to 162 mg daily indefinitely.
n Stented patients: In patients undergoing PCI withstent placement, the dose of enteric-coated aspirin de-pends on the type of stent used.
n Bare metal stent: Aspirin is given at a dose of 162 to325 mg daily given for at least 1 month if a bare metalstent was deployed. This is followed by 75 to 162 mgdaily indefinitely.
n Drug-eluting stent: The dose of aspirin is 162 to 325 mgdaily for at least 3 months if a sirolimus-coated stentwas deployed and for at least 6 months for paclitaxel-coated stent. This is followed by a maintenance doseof 75 to 162 mg daily indefinitely.
■ Clopidogrel: The loading dose of clopidogrel is usually300 mg given orally. A higher loading dose of 600 to 900mg inhibits platelets more rapidly, although its safety andclinical efficacy needs to be established.
n Medically treated patients: Among medically treatedpatients who are not stented, 75 mg of clopidogrel isgiven daily for at least 1 month and ideally up to 1 year. Clopidogrel should not be given or should bediscontinued for 5 to 7 days in patients undergoingcoronary bypass surgery.
n Bare metal stent: Clopidogrel is given at a maintenancedose of 75 mg/day for at least 1 month and ideally up to1 year for patients who have bare metal stents.
n Drug-eluting stent: The maintenance dose is 75 mgdaily for at least 1 year.
■ Table 24.1 summarizes the initial dose, minimum dura-tion, and maintenance dose of aspirin and clopidogrel ac-cording to the ACC/AHA 2007 guidelines on non-ST ele-vation MI and unstable angina.
■ Unfractionated heparin or low-molecular-weightheparinn Patients undergoing PCI: Intravenous unfractionated
heparin or subcutaneous low-molecular-weight he-parin in addition to aspirin and clopidogrel is aClass I recommendation in patients undergoingPCI. Enoxaparin, a low-molecular-weight heparin, ispreferred to unfractionated heparin except when thereis renal failure or when bypass surgery is plannedwithin 24 hours. The use of bivalirudin or fonda-parinux also receives a Class I recommendation.
n Patients not undergoing PCI: The use of unfraction-ated heparin, enoxaparin, and fondaparinux amongpatients who are treated conservatively also receives aClass I recommendation. Fondaparinux is the pre-ferred agent when there is increased risk of bleeding.Enoxaparin and fondaparinux is preferred over un-fractionated heparin unless bypass surgery is beingplanned within 24 hours.
■ IIb/IIIa antagonists:n Patients undergoing PCI: The use of IIb/IIIa platelet
antagonists such as abciximab (ReoPro), eptifibatide
Medically TreatedPercutaneous Coronary Intervention
(No Stent) Bare Metal Stent Sirolimus Stent Paclitaxel Stent
Aspirin (initial dose) 162–325 mg 162–325 mg 162–325 mg 162–325 mg
Minimum duration 162–325 mg for 162–325 mg for 162–325 mg for �1 month �3 months �6 months
Maintenance dose 75–162 mg daily 75–162 mg daily 75–162 mg daily 75–162 mg daily indefinitely indefinitely indefinitely indefinitely
Clopidogrel 300–600 mg 300–600 mg 300–600 mg 300–600 mg loading (initial dose) loading dose loading dose loading dose dose
Minimum duration 75 mg daily for 75 mg daily for 75 mg daily for 75 mg daily for �1 month �1 month �12 months �12 months
Maintenance dose Ideally up to Ideally up to Ideally up to Ideally up to 12 months12 months 12 months 12 months
Summary of the Initial and Maintenance Doses of Aspirin and Clopidogrel according to the AmericanCollege of Cardiology/American Hospital Association 2007 Guidelines on Non-ST ElevationMyocardial Infarction and Unstable Angina
TABLE 24.1
LWBK271-C24_379-395.qxd 1/29/09 1:56 PM Page 393 LWBK271-C01_01-08.qxd
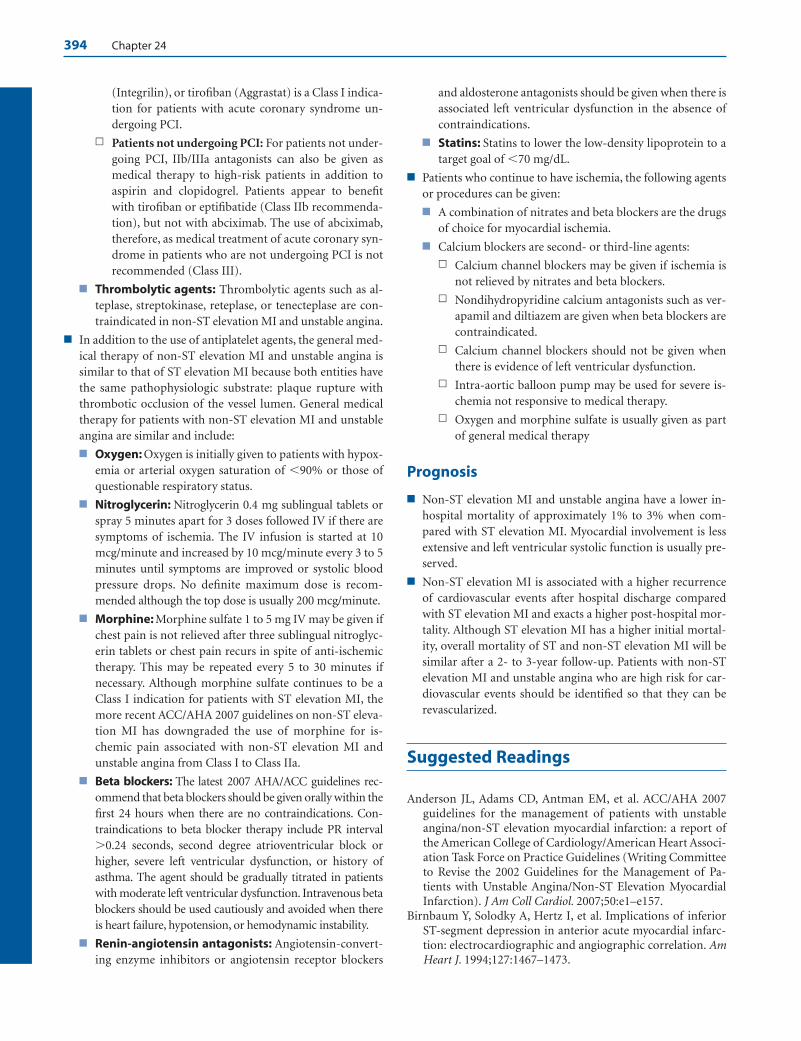
394 Chapter 24
(Integrilin), or tirofiban (Aggrastat) is a Class I indica-tion for patients with acute coronary syndrome un-dergoing PCI.
n Patients not undergoing PCI: For patients not under-going PCI, IIb/IIIa antagonists can also be given asmedical therapy to high-risk patients in addition toaspirin and clopidogrel. Patients appear to benefitwith tirofiban or eptifibatide (Class IIb recommenda-tion), but not with abciximab. The use of abciximab,therefore, as medical treatment of acute coronary syn-drome in patients who are not undergoing PCI is notrecommended (Class III).
■ Thrombolytic agents: Thrombolytic agents such as al-teplase, streptokinase, reteplase, or tenecteplase are con-traindicated in non-ST elevation MI and unstable angina.
■ In addition to the use of antiplatelet agents, the general med-ical therapy of non-ST elevation MI and unstable angina issimilar to that of ST elevation MI because both entities havethe same pathophysiologic substrate: plaque rupture withthrombotic occlusion of the vessel lumen. General medicaltherapy for patients with non-ST elevation MI and unstableangina are similar and include:
■ Oxygen: Oxygen is initially given to patients with hypox-emia or arterial oxygen saturation of �90% or those ofquestionable respiratory status.
■ Nitroglycerin: Nitroglycerin 0.4 mg sublingual tablets orspray 5 minutes apart for 3 doses followed IV if there aresymptoms of ischemia. The IV infusion is started at 10mcg/minute and increased by 10 mcg/minute every 3 to 5minutes until symptoms are improved or systolic bloodpressure drops. No definite maximum dose is recom-mended although the top dose is usually 200 mcg/minute.
■ Morphine: Morphine sulfate 1 to 5 mg IV may be given ifchest pain is not relieved after three sublingual nitroglyc-erin tablets or chest pain recurs in spite of anti-ischemictherapy. This may be repeated every 5 to 30 minutes ifnecessary. Although morphine sulfate continues to be aClass I indication for patients with ST elevation MI, themore recent ACC/AHA 2007 guidelines on non-ST eleva-tion MI has downgraded the use of morphine for is-chemic pain associated with non-ST elevation MI andunstable angina from Class I to Class IIa.
■ Beta blockers: The latest 2007 AHA/ACC guidelines rec-ommend that beta blockers should be given orally within thefirst 24 hours when there are no contraindications. Con-traindications to beta blocker therapy include PR interval�0.24 seconds, second degree atrioventricular block orhigher, severe left ventricular dysfunction, or history ofasthma. The agent should be gradually titrated in patientswith moderate left ventricular dysfunction. Intravenous betablockers should be used cautiously and avoided when thereis heart failure, hypotension, or hemodynamic instability.
■ Renin-angiotensin antagonists: Angiotensin-convert-ing enzyme inhibitors or angiotensin receptor blockers
and aldosterone antagonists should be given when there isassociated left ventricular dysfunction in the absence ofcontraindications.
■ Statins: Statins to lower the low-density lipoprotein to atarget goal of �70 mg/dL.
■ Patients who continue to have ischemia, the following agentsor procedures can be given:
■ A combination of nitrates and beta blockers are the drugsof choice for myocardial ischemia.
■ Calcium blockers are second- or third-line agents:
n Calcium channel blockers may be given if ischemia isnot relieved by nitrates and beta blockers.
n Nondihydropyridine calcium antagonists such as ver-apamil and diltiazem are given when beta blockers arecontraindicated.
n Calcium channel blockers should not be given whenthere is evidence of left ventricular dysfunction.
n Intra-aortic balloon pump may be used for severe is-chemia not responsive to medical therapy.
n Oxygen and morphine sulfate is usually given as partof general medical therapy
Prognosis
■ Non-ST elevation MI and unstable angina have a lower in-hospital mortality of approximately 1% to 3% when com-pared with ST elevation MI. Myocardial involvement is lessextensive and left ventricular systolic function is usually pre-served.
■ Non-ST elevation MI is associated with a higher recurrenceof cardiovascular events after hospital discharge comparedwith ST elevation MI and exacts a higher post-hospital mor-tality. Although ST elevation MI has a higher initial mortal-ity, overall mortality of ST and non-ST elevation MI will besimilar after a 2- to 3-year follow-up. Patients with non-STelevation MI and unstable angina who are high risk for car-diovascular events should be identified so that they can berevascularized.
Suggested Readings
Anderson JL, Adams CD, Antman EM, et al. ACC/AHA 2007guidelines for the management of patients with unstableangina/non-ST elevation myocardial infarction: a report ofthe American College of Cardiology/American Heart Associ-ation Task Force on Practice Guidelines (Writing Committeeto Revise the 2002 Guidelines for the Management of Pa-tients with Unstable Angina/Non-ST Elevation MyocardialInfarction). J Am Coll Cardiol. 2007;50:e1–e157.
Birnbaum Y, Solodky A, Hertz I, et al. Implications of inferiorST-segment depression in anterior acute myocardial infarc-tion: electrocardiographic and angiographic correlation. AmHeart J. 1994;127:1467–1473.
LWBK271-C24_379-395.qxd 1/29/09 1:56 PM Page 394 LWBK271-C01_01-08.qxd
Acute Coronary Syndrome: Non-ST Elevation Myocardial Infarction and Unstable Angina 395
Braunwald E, Antman EM, Beasley JW, et al. ACC/AHA guide-lines for the management of patients with unstable anginaand non-ST segment elevation myocardial infarction: a re-port of the ACC/AHA Task Force on Practice Guidelines(Committee on the Management of Patients with UnstableAngina). J Am Coll Cardiol. 2000;36:970–1062.
Braunwald E, Antman EM, Beasley JW, et al. ACC/AHA 2002guideline update for the management of patients with unstableangina and non-ST segment elevation myocardial infarction:Summary article: a report of the ACC/AHA Task Force onPractice Guidelines (Committee on the Management of Pa-tients with Unstable Angina. Circulation. 2002;106:1893–1900.
Channer K, Morris F. ABC of clinical electrocardiography. My-ocardial ischaemia. BMJ. 2002;324:1023–1026.
Dunn MI, Lipman BS. Myocardial Infarction, injury and is-chemia. In: Clinical Electrocardiography. 8th ed. Chicago:Year Book Medical Publishers, Inc; 1989:160–209.
Edhouse J, Brady WJ, Morris F.ABC of clinical electrocardiography.Acute myocardial infarction-Part II. BMJ. 2002;324:963–966.
Goldberger A, Goldberger E. Myocardial ischemia and infarc-tion I and II. Clinical Electrocardiography. 5th ed. St. Louis:Mosby-Year Book, Inc. 1994:87–122.
Grines CL, Bonow RO, Casey DE, et al. Prevention of prematurediscontinuation of dual antiplatelet therapy in patients withcoronary artery stents: a science advisory from the AmericanHeart Association, American College of Cardiology, Societyfor Cardiovascular Angiography and Interventions, AmericanCollege of Surgeons, and American Dental Association, withrepresentation from the American College of Physicians.J Am Coll Cardiol. 2007;49:734–739.
Hurst JW. Abnormalities of the S-T segment—part I. Clin Car-diol. 1997;20:511–520.
Hurst JW. Abnormalities of the S-T segment—part II. Clin Car-diol. 1997;20:595–600.
Hurst JW. Thoughts about the ventricular gradient and its cur-rent clinical use (part I of II). Clin Cardiol. 2005;28:175–180.
Hurst JW. Thoughts about the ventricular gradient and its cur-rent clinical use (part II of II). Clin Cardiol. 2005;28:219–224.
Hurst JW. Thoughts about the abnormalities in the electrocar-diogram of patients with acute myocardial infarction withemphasis on a more accurate method of interpreting ST seg-ment displacement: part I. Clin Cardiol. 2007;30:381–390.
Hurst JW. Thoughts about the abnormalities in the electrocar-diogram of patients with acute myocardial infarction withemphasis on a more accurate method of interpreting ST seg-ment displacement: part II. Clin Cardiol. 2007;30:443–449.
The Joint European Society of Cardiology/American College ofCardiology Committee. Myocardial infarction redefined—aconsensus document of the joint European Society of Cardi-ology/American College of Cardiology Committee for theredefinition of myocardial infarction. J Am Coll Cardiol2000;36:959–969.
Mirvis DM, Goldberger AL. Electrocardiography. In: Zipes DP,Libby P, Bonow RO, et al, eds. Braunwald’s Heart Disease, ATextbook of Cardiovascular Medicine. 7th ed. Philadelphia:Elsevier/Saunders; 2005:107–148.
Morris F, Brady WJ. ABC of clinical electrocardiography. Acutemyocardial infarction—part I. BMJ. 2002;324:831–834.
Nomenclature and criteria for diagnosis of ischemic heart dis-ease. Report of the Joint International Society and Federa-tion of Cardiology/World Health Organization task force onstandardization of clinical nomenclature. Circulation.1979;59:607–609.
Sgarbossa EB, Wagner GS. Electrocardiography. In: Topol EJ, ed.Textbook of Cardiovascular Medicine. 2nd ed. Philadelphia:Lippincott Williams & Wilkins; 2002:1329–1363.
Wagner GS. Ischemia and injury due to insufficient bloodsupply. In: Marriott’s Practical Electrocardiography. 10thed. Philadelphia: Lippincott Williams & Wilkins; 2001:163–178.
Yan G-X, Antzelevitch C. Cellular basis for the normal T waveand the electrocardiographic manifestations of the long-QTsyndrome. Circulation. 1998;98:1928–1936.
Yan G-X, Lankipalli RS, Burke JF, et al. Ventricular repolariza-tion components on the electrocardiogram. Cellular basisand clinical significance. J Am Coll Cardiol. 2003;42:401–409.
LWBK271-C24_379-395.qxd 1/29/09 1:56 PM Page 395 LWBK271-C01_01-08.qxd
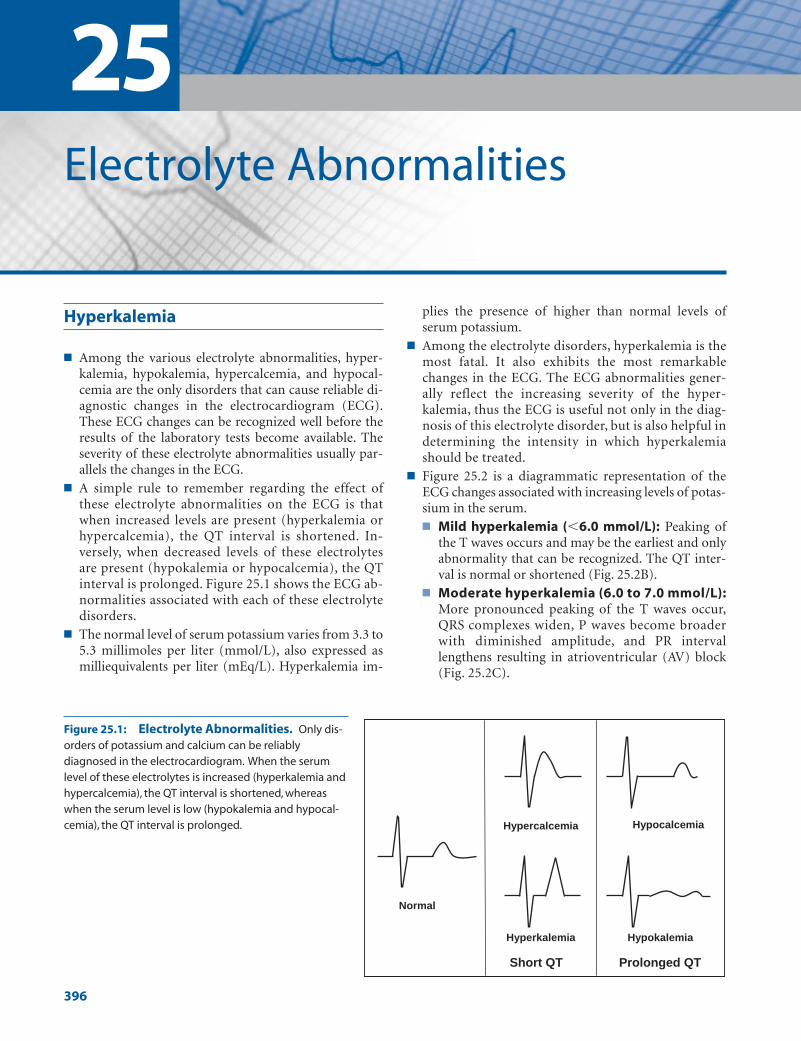
Hyperkalemia
■ Among the various electrolyte abnormalities, hyper-kalemia, hypokalemia, hypercalcemia, and hypocal-cemia are the only disorders that can cause reliable di-agnostic changes in the electrocardiogram (ECG).These ECG changes can be recognized well before theresults of the laboratory tests become available. Theseverity of these electrolyte abnormalities usually par-allels the changes in the ECG.
■ A simple rule to remember regarding the effect ofthese electrolyte abnormalities on the ECG is thatwhen increased levels are present (hyperkalemia orhypercalcemia), the QT interval is shortened. In-versely, when decreased levels of these electrolytesare present (hypokalemia or hypocalcemia), the QTinterval is prolonged. Figure 25.1 shows the ECG ab-normalities associated with each of these electrolytedisorders.
■ The normal level of serum potassium varies from 3.3 to5.3 millimoles per liter (mmol/L), also expressed asmilliequivalents per liter (mEq/L). Hyperkalemia im-
plies the presence of higher than normal levels ofserum potassium.
■ Among the electrolyte disorders, hyperkalemia is themost fatal. It also exhibits the most remarkablechanges in the ECG. The ECG abnormalities gener-ally reflect the increasing severity of the hyper-kalemia, thus the ECG is useful not only in the diag-nosis of this electrolyte disorder, but is also helpful indetermining the intensity in which hyperkalemiashould be treated.
■ Figure 25.2 is a diagrammatic representation of theECG changes associated with increasing levels of potas-sium in the serum.■ Mild hyperkalemia (�6.0 mmol/L): Peaking of
the T waves occurs and may be the earliest and onlyabnormality that can be recognized. The QT inter-val is normal or shortened (Fig. 25.2B).
■ Moderate hyperkalemia (6.0 to 7.0 mmol/L):More pronounced peaking of the T waves occur,QRS complexes widen, P waves become broaderwith diminished amplitude, and PR intervallengthens resulting in atrioventricular (AV) block(Fig. 25.2C).
25Electrolyte Abnormalities
396
Hypercalcemia Hypocalcemia
Hyperkalemia Hypokalemia
Normal
Short QT Prolonged QT
Figure 25.1: Electrolyte Abnormalities. Only dis-orders of potassium and calcium can be reliablydiagnosed in the electrocardiogram. When the serumlevel of these electrolytes is increased (hyperkalemia andhypercalcemia), the QT interval is shortened, whereaswhen the serum level is low (hypokalemia and hypocal-cemia), the QT interval is prolonged.
LWBK271-C25_396-413.qxd 29/1/09 7:20 pm Page 396 LWBK270-4119G-C02_073-110.qxd
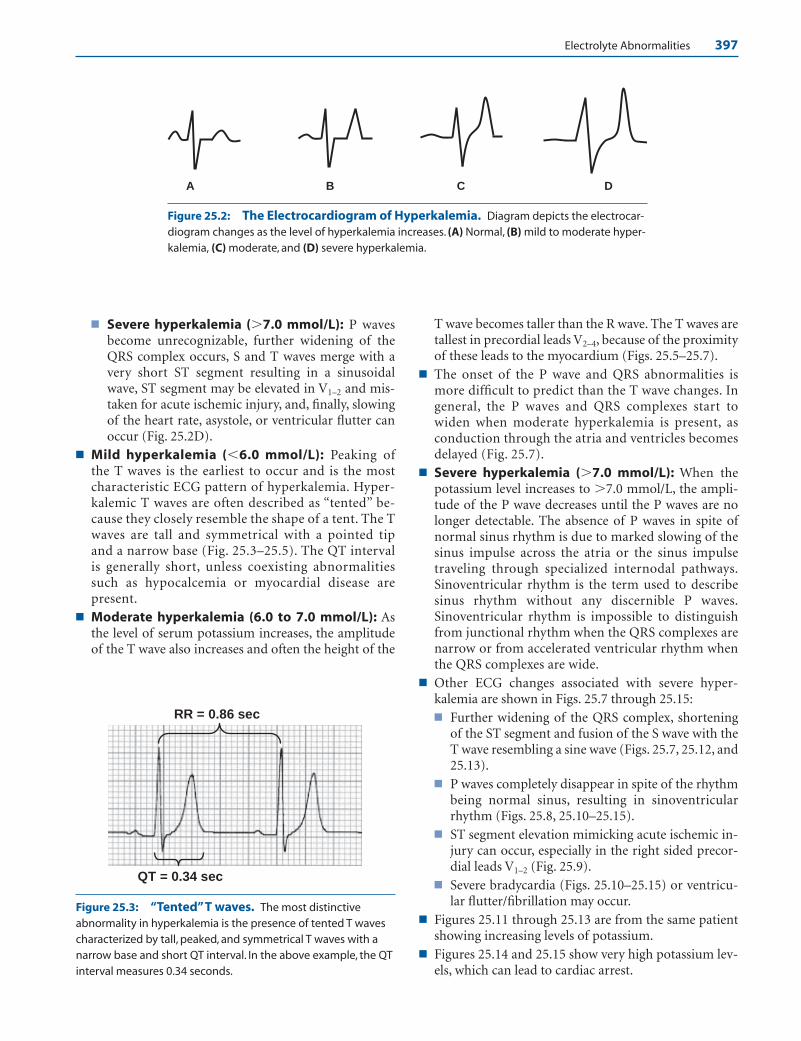
Electrolyte Abnormalities 397
A B C D
QT = 0.34 sec
RR = 0.86 sec
Figure 25.2: The Electrocardiogram of Hyperkalemia. Diagram depicts the electrocar-diogram changes as the level of hyperkalemia increases. (A) Normal, (B) mild to moderate hyper-kalemia, (C) moderate, and (D) severe hyperkalemia.
Figure 25.3: “Tented”T waves. The most distinctiveabnormality in hyperkalemia is the presence of tented T wavescharacterized by tall, peaked, and symmetrical T waves with anarrow base and short QT interval. In the above example, the QTinterval measures 0.34 seconds.
■ Severe hyperkalemia (�7.0 mmol/L): P wavesbecome unrecognizable, further widening of theQRS complex occurs, S and T waves merge with avery short ST segment resulting in a sinusoidalwave, ST segment may be elevated in V1–2 and mis-taken for acute ischemic injury, and, finally, slowingof the heart rate, asystole, or ventricular flutter canoccur (Fig. 25.2D).
■ Mild hyperkalemia (�6.0 mmol/L): Peaking ofthe T waves is the earliest to occur and is the mostcharacteristic ECG pattern of hyperkalemia. Hyper-kalemic T waves are often described as “tented” be-cause they closely resemble the shape of a tent. The Twaves are tall and symmetrical with a pointed tipand a narrow base (Fig. 25.3–25.5). The QT intervalis generally short, unless coexisting abnormalitiessuch as hypocalcemia or myocardial disease arepresent.
■ Moderate hyperkalemia (6.0 to 7.0 mmol/L): Asthe level of serum potassium increases, the amplitudeof the T wave also increases and often the height of the
T wave becomes taller than the R wave. The T waves aretallest in precordial leads V2–4, because of the proximityof these leads to the myocardium (Figs. 25.5–25.7).
■ The onset of the P wave and QRS abnormalities ismore difficult to predict than the T wave changes. Ingeneral, the P waves and QRS complexes start towiden when moderate hyperkalemia is present, asconduction through the atria and ventricles becomesdelayed (Fig. 25.7).
■ Severe hyperkalemia (�7.0 mmol/L): When thepotassium level increases to �7.0 mmol/L, the ampli-tude of the P wave decreases until the P waves are nolonger detectable. The absence of P waves in spite ofnormal sinus rhythm is due to marked slowing of thesinus impulse across the atria or the sinus impulsetraveling through specialized internodal pathways.Sinoventricular rhythm is the term used to describesinus rhythm without any discernible P waves.Sinoventricular rhythm is impossible to distinguishfrom junctional rhythm when the QRS complexes arenarrow or from accelerated ventricular rhythm whenthe QRS complexes are wide.
■ Other ECG changes associated with severe hyper-kalemia are shown in Figs. 25.7 through 25.15:■ Further widening of the QRS complex, shortening
of the ST segment and fusion of the S wave with theT wave resembling a sine wave (Figs. 25.7, 25.12, and25.13).
■ P waves completely disappear in spite of the rhythmbeing normal sinus, resulting in sinoventricularrhythm (Figs. 25.8, 25.10–25.15).
■ ST segment elevation mimicking acute ischemic in-jury can occur, especially in the right sided precor-dial leads V1–2 (Fig. 25.9).
■ Severe bradycardia (Figs. 25.10–25.15) or ventricu-lar flutter/fibrillation may occur.
■ Figures 25.11 through 25.13 are from the same patientshowing increasing levels of potassium.
■ Figures 25.14 and 25.15 show very high potassium lev-els, which can lead to cardiac arrest.
LWBK271-C25_396-413.qxd 29/1/09 7:20 pm Page 397 LWBK270-4119G-C02_073-110.qxd
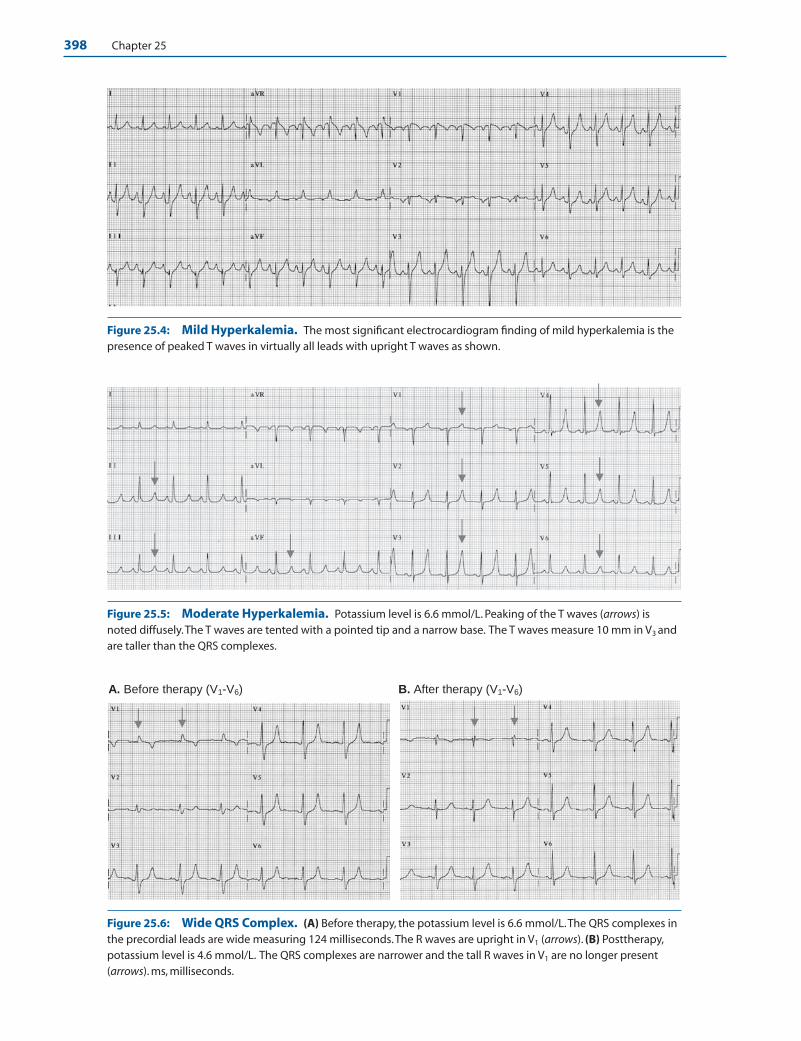
398 Chapter 25
Figure 25.4: Mild Hyperkalemia. The most significant electrocardiogram finding of mild hyperkalemia is thepresence of peaked T waves in virtually all leads with upright T waves as shown.
Figure 25.5: Moderate Hyperkalemia. Potassium level is 6.6 mmol/L. Peaking of the T waves (arrows) isnoted diffusely.The T waves are tented with a pointed tip and a narrow base. The T waves measure 10 mm in V3 andare taller than the QRS complexes.
A. Before therapy (V1-V6) B. After therapy (V1-V6)
Figure 25.6: Wide QRS Complex. (A) Before therapy, the potassium level is 6.6 mmol/L.The QRS complexes inthe precordial leads are wide measuring 124 milliseconds.The R waves are upright in V1 (arrows). (B) Posttherapy,potassium level is 4.6 mmol/L. The QRS complexes are narrower and the tall R waves in V1 are no longer present(arrows). ms, milliseconds.
LWBK271-C25_396-413.qxd 29/1/09 7:20 pm Page 398 LWBK270-4119G-C02_073-110.qxd

Electrolyte Abnormalities 399
Figure 25.7: Severe Hyperkalemia with Widening of the QRS Complexes. Potassium level is 7.6mmol/L. The PR interval is slightly prolonged. The QRS complexes are wide with marked peaking of the T waves.TheS wave continues directly into the T wave in leads II, aVF, and V2 to V5, resembling a sine wave.
Figure 25.8: Marked Bradycardia in a Patient with Severe Hyperkalemia. Potassium level is 8.3 mmol/L. The QRS complexes are widened and are not preceded by P waves. There is marked peaking of the Twaves, which is the hallmark of hyperkalemia. The rhythm is often called junctional, but is impossible to differenti-ate from sinoventricular rhythm, which is sinus rhythm without discernible P waves.
Figure 25.9: Severe Hyperkalemia with ST Elevation in V1V2 Resembling Acute ST ElevationMyocardial Infarction. Potassium level is 8.6 mmol/L. The T waves are markedly peaked in all leads especially V1
to V5, II, III, and aVF. The T wave in V3 measures almost 25 mm and most T waves are taller than the QRS complexes. STsegment elevation in V1–2 can be mistaken for acute myocardial infarction or the ST elevation associated with theBrugada electrocardiogram.
LWBK271-C25_396-413.qxd 29/1/09 7:20 pm Page 399 LWBK270-4119G-C02_073-110.qxd

400 Chapter 25
Figure 25.10: Absent P waves and Wide QRS Complexes in Severe Hyperkalemia. Potassium level is9.0 mmol/L. P waves are absent and the QRS complexes are wide with a left bundle branch block configuration. Therhythm is often called sinoventricular, although this is difficult to differentiate from accelerated idioventricular rhythm.
Figure 25.11: Generalized Peaking of the T Waves is the Hallmark of Hyperkalemia. Potassium levelis 8.7 mmol/L. In hyperkalemia, peaking of the T waves is generalized, occurring in almost all T waves that areupright. Note that some of the T waves are taller than the QRS complexes.
Figure 25.12: The Presence of Sine Waves Indicate that the Hyperkalemia is Severe. Potassium levelis 8.9 mmol/L. Note that the sine waves are formed by the short ST segment causing the S waves to continue intothe T waves.These are seen in both limb and precordial leads.
LWBK271-C25_396-413.qxd 29/1/09 7:20 pm Page 400 LWBK270-4119G-C02_073-110.qxd

Electrolyte Abnormalities 401
Figure 25.13: Marked Widening of the QRS Complexes Indicates More Advanced Hyperkalemia.Potassium level is �10.0 mmol/L.
Figure 25.14: Slow Ventricular Rhythm and Unusually Wide QRS Complexes. Potassium level is �10mmol/L.The rhythm is unusually slow at �30 beats per minute with unusually wide QRS complexes with a leftbundle branch block pattern, peaked T waves, and no P waves. This rhythm usually precedes asystole or ventricularfibrillation.
ECG Findings of Hyperkalemia
1. Increased amplitude and peaking of the T waves. This is theearliest, most consistent, and most characteristic ECG abnor-mality associated with hyperkalemia. T-wave peaking persistsand worsens with increasing levels of hyperkalemia.
2. The QT interval is short or normal.
3. As hyperkalemia worsens, the QRS complexes widen.
4. The P wave becomes broader and the amplitude becomeslower.
5. AV conduction becomes prolonged.
6. The P waves eventually disappear resulting in sinoventricularrhythm.
7. The S wave continues into the T wave resulting in a sine waveconfiguration.
8. Cardiac arrest from marked bradycardia, asystole, or ventricularflutter/fibrillation.
Mechanism
■ The normal serum potassium varies from 3.3 to 5.3 mmol/L.Hyperkalemia occurs when serum potassium exceeds 5.3mmol/L. When extracellular potassium is increased, the ratiobetween intracellular and extracellular potassium is decreasedand the resting membrane potential becomes less negative(��90 mV). This will affect the height and velocity of phase
LWBK271-C25_396-413.qxd 29/1/09 7:20 pm Page 401 LWBK270-4119G-C02_073-110.qxd

402 Chapter 25
0 of the action potential. Slowing in conduction velocity inthe atria and ventricles will cause widening of the P wave andQRS complex. As the severity of the hyperkalemia further in-creases, the resting potential becomes less and less negative re-sulting in further widening of the QRS complex and P wave.Hyperkalemia also shortens phase 2, which is equivalent tothe plateau phase of the action potential. This will shorten theST segment in the ECG resulting in a shorter QT interval. Italso causes a more rapid phase 3 or steeper downslope of theaction potential resulting in peaking of the T waves.
■ Although the ECG findings may not consistently correlatewith the level of serum potassium, the following are the ECGfindings associated with increasing severity of hyperkalemia:
■ Mild hyperkalemia: �6.0 mmol/Ln Increased amplitude with peaking of the T waves is the
first abnormality to be detected when the potassiumlevel rises between 5 and 6 mmol/L. HyperkalemicT waves are typical and diagnostic in that the T wavesare tall and pointed with a narrow base and a normalor short QT. The T waves become taller and morepeaked as the level of hyperkalemia progresses. The di-agnosis of hyperkalemia is untenable unless the aboveT-wave abnormalities are present. The T waves areoften taller than the R waves in precordial leads V2 to V4.
n The QT or corrected QT interval (QTc) is normal orshortened. It is prolonged only when hyperkalemia isassociated with other electrolyte abnormalities such ashypocalcemia or when there is associated myocardialdisease. This combination of hyperkalemia and hypo-calcemia is commonly seen in patients with chronicrenal disease.
■ Moderate hyperkalemia: 6.0 to 7.0 mmol/Ln Widening of the P wave and QRS complex starts to
occur when the potassium level exceeds 6.0 mmol/L.Widening of the QRS complex may be mistaken forbundle branch block. Widening of the QRS complexassociated with hyperkalemia is reversible after theelectrolyte abnormality is corrected unlike preexistentbundle branch block, which is persistent.
n Broadening of the P waves occurs when there is slowingof conduction of the impulse across the atria. When theP wave starts to widen, slight prolongation of the PR in-terval and varying degrees of AV block may occur.
■ Severe Hyperkalemia: �7.0 mmol/Ln With increasing levels of serum potassium, further
widening of the QRS complex occurs accompanied byshortening of the ST segment. The wide QRS complexwill eventually merge into the tall and peaked T waveresembling a sine wave. The ST segments are often el-evated in V1–2 and may be mistaken for acute ST ele-vation myocardial infarction.
n Even when the rhythm remains normal sinus, the Pwave may not be evident in the ECG. The absence of Pwaves in hyperkalemia even when the rhythm remainsnormal sinus is called sinoventricular rhythm. The ab-sence of P waves may be due to slow conduction of thesinus impulse across the atria or the sinus impulse beingconducted through special internodal tracts between thesinus node and AV node. Because the QRS complexesare no longer preceded by P waves, the rhythm is impos-sible to differentiate from AV junctional rhythm (whenthe QRS complexes are narrow) or accelerated idioven-
Figure 25.15: Marked Bradycardia with Wide Complexes, a Late Manifestation of SevereHyperkalemia. The initial potassium level is unknown. After the patient was resuscitated, the potassium levelwas checked and found to be 8.8 mmol/L. The QRS complexes are wide with a very slow ventricular rate of 26 beatsper minute. No P waves can be identified. Peaking of the T waves persists in V2 and V3.
LWBK271-C25_396-413.qxd 29/1/09 7:20 pm Page 402 LWBK270-4119G-C02_073-110.qxd

Electrolyte Abnormalities 403
tricular rhythm (when the QRS complexes are wide).Cardiac arrest may occur when the potassium level ex-ceeds 8.5 mmol/L. This is preceded by marked slowingof the heart rate, further widening of the QRS complexes,asystole, or ventricular flutter/fibrillation.
Clinical Implications
■ Potassium is the major intracellular ion in the body. Approxi-mately 98% of the total amount of potassium is intracellularand the remaining 2% extracellular. This difference in concen-tration between intracellular and extracellular potassium isdue to the presence of sodium potassium adenosine triphos-phatase pump where 3 units of sodium is pumped out of thecell in exchange for 2 units of potassium. The ratio between in-tracellular and extracellular potassium makes the restingmembrane potential negative at approximately –90 mV.
■ Increased extracellular potassium may be due to increasedpotassium load, worsening renal function, or acute shift ofintracellular potassium extracellularly. Increased potassiumin the diet by itself rarely causes hyperkalemia. Some drugscan also cause hyperkalemia when there is renal dysfunction.These include potassium supplements, potassium sparing di-uretics (triamterene and amiloride), aldosterone antagonists(spironolactone and eplerenone), angiotensin-convertingenzyme inhibitors, angiotensin receptor blockers, and non-steroidal anti-inflammatory agents including the selectivecyclo-oxygenase 2 inhibitors. More commonly, hyperkalemiais due to renal failure. It may also be the result of acute shiftof intracellular potassium to the extracellular space as whencells are damaged from hemolysis or rhabdomyolysis. Acido-sis can also cause a shift of H� ions into the cell in exchangefor potassium that moves out of the cell. For every 0.1 unitdecrease in blood pH, the level of potassium in the serum in-creases by approximately 0.5 mmol/L.
■ Among the electrolyte abnormalities, hyperkalemia causesthe most remarkable ECG abnormalities. The ECG changesfrequently parallel the severity of the electrolyte disorder.The expected ECG findings, however, may not correlate wellwith the potassium level because the effect of hyperkalemiaon the ECG depends on several factors and not just theserum potassium level. These include the baseline level ofpotassium, the rate of rise of potassium in the blood, coexist-ing electrolyte abnormalities, coexisting metabolic abnor-malities, and the presence or absence of myocardial disease.
■ Mild or moderate hyperkalemia is usually asymptomatic.When significant hyperkalemia occurs usually �7.0 mmol/L,symptoms include generalized weakness, paralysis, respiratoryfailure from respiratory muscle weakness, and cardiac arrest.
■ Among all the electrolyte abnormalities, hyperkalemia is themost fatal. Because severe hyperkalemia can be diagnosed inthe ECG, this will allow emergency treatment of the elec-trolyte abnormality even before the results of the laboratorybecome available.
■ Similarly, the ECG is useful in the diagnosis of pseudohyper-kalemia. The laboratory may mistakenly report a high potas-
sium level not the result of actual hyperkalemia but from he-molysis after the blood is collected. If there are no associatedECG changes, the diagnosis of hyperkalemia is unlikely. Thiswill obviate the need for unnecessary therapy.
Therapy
■ Treatment should be tailored according to the severity of thehyperkalemia. The ECG abnormalities together with theserum potassium level serve as useful guide in dictating theintensity of management.
■ The American Heart Association (AHA) guidelines of car-diopulmonary resuscitation and emergency cardiovascular carerecommend the following for the treatment of hyperkalemia.
■ Mild hyperkalemia, potassium level �6.0 mmol/L:Potassium level �6.0 mmol/L is seldom of great concern.The only therapy that may be needed is to identify the causeof the hyperkalemia so that further increases in serum potas-sium can be prevented. In addition, therapy may include re-moval of potassium from the body.
■ Loop diuretics: Furosemide 40 to 80 mg IV or bumetanide1 mg IV to enhance excretion of potassium.
■ Cation-exchange resin: Sodium polystyrene sulfonate(Kayexalate) is given orally or by retention enema. Theoral dose can vary from 15 to 60 g daily. Fifteen grams isgiven orally one to four times per day. Sorbitol 20%, 10 to20 mL is given every 2 hours or as needed to prevent con-stipation. Lower doses of Kayexalate of 5 to 10 g may begiven up to three times per day without laxative therapy. Ifthe patient is unable to take the resin orally, it can be givenas retention enema, 30 to 50 g every 6 hours in a warmemulsion such as 50 mL 70% sorbitol mixed with 100 to150 mL tap water and retained for at least 30 to 60 min-utes. Each gram of Kayexalate removes approximately 1mmol of potassium and takes at least 30 minutes to 2hours to take effect. The resin binder carries a high sodiumload and should be given cautiously to patients in conges-tive heart failure. The resin can also bind other cationssuch as magnesium and calcium. These electrolytes shouldbe monitored together with the level of serum potassium.Patients on digitalis should be monitored closely since hy-pokalemia can aggravate digitalis toxicity.
■ Moderate hyperkalemia, potassium level 6.0 to 7.0mmol/L: When moderate hyperkalemia is present, therapyshould be more emergent. In addition to eliminating thecause of the hyperkalemia and removal of excess potassiumfrom the blood with loop diuretics and cation exchangeresins, the level of serum potassium can be lowered morerapidly by shifting extracellular potassium intracellularly.
■ Glucose plus insulin:Twenty-five grams of glucose (50 mL50% dextrose) is mixed with 10 units of regular insulin.The solution is injected IV for over 15 to 30 minutes. Tenunits of regular insulin can also be mixed with 500 mL10% glucose. The solution is given IV for 60 minutes. Theeffect may last for 4 to 6 hours.
LWBK271-C25_396-413.qxd 29/1/09 7:20 pm Page 403 LWBK270-4119G-C02_073-110.qxd

404 Chapter 25
■ Sodium bicarbonate: 50 mEq is given IV over 5 min-utes. Sodium bicarbonate lowers extracellular potassiumby shifting potassium into the cells. This agent is more ef-fective when hyperkalemia is associated with metabolicacidosis. The effect may last for 2 hours and may be re-peated as necessary.
■ Nebulized albuterol: 10 to 20 mg nebulized over 15minutes. B2 agonists shifts extracellular potassium intra-cellularly and the effect may last for �2 hours. If insulin isbeing given concomitantly, albuterol can attenuate its hy-poglycemic effect.
■ Severe hyperkalemia and critical hyperkalemia, potas-sium level �7.0 mmol/L: When serum potassium level ex-ceeds 7.0 mmol/L or when the ECG abnormalities includeabsent P waves and changes in the QRS, ST segment and Twaves, AV block or slowing of the heart rate, treatment of hy-perkalemia should be very aggressive because severe hyper-kalemia may cause lethal arrhythmias and cardiac arrest. Thefollowing agents are given in order of priority according tothe AHA guidelines.
■ Calcium chloride: 10% 5 to 10 mL (500 to 1,000 mg) givenIV over 2 to 5 minutes. Calcium does not lower the level ofserum potassium but will stabilize myocardial membraneagainst the toxic effects of potassium, thereby lowering therisk of fatal arrhythmias including ventricular fibrillation.The effect of calcium is immediate but lasts only for 20 to 40minutes and repeated dosing may be needed.
■ Sodium bicarbonate: 50 mEq given IV over 5 minutes.This should be injected using a separate tubing or IV linefrom that used for calcium chloride.
■ Glucose plus insulin: Mix 10 units of regular insulinwith 50 mL 50% dextrose. The solution is given IV over15 to 30 minutes.
■ Nebulized albuterol: 10 to 20 mg nebulized over 15minutes.
■ Loop diuretics: as above.
■ Kayexalate enema: 15 to 60 g plus sorbitol given orallyor rectally as above.
■ Dialysis: If above therapy is unsuccessful, emergent dial-ysis should be considered especially in patients with renalfailure even if not previously on dialysis.
Prognosis
■ Severe hyperkalemia is the most fatal among all electrolyteabnormalities and is a medical emergency. Overall prognosisof hyperkalemia depends on the potassium level, efficacy oftherapy, and comorbidities associated with the hyper-kalemia. The presence of diabetic ketoacidosis and renal fail-ure as the cause of the hyperkalemia often confer a poorprognosis.
Hypokalemia
■ Hypokalemia is defined as the presence of serumpotassium that is lower than normal. The normal valuefor serum potassium is 3.3 to 5.3 mmol/L.
■ The most important ECG finding in hypokalemia isthe presence of prominent U waves. As the hy-pokalemia becomes more profound, the amplitude ofthe T wave becomes lower as the size of the U wavebecomes larger until both T and U waves bond to-gether and become indistinguishable (Figs. 25.16 and25.17).
■ Normal U wave: The U wave follows the T wave and isthe last component of ventricular repolarization. Thenormal U wave is small measuring less than a quarterof the size of the T wave. The exact origin of the normalU wave is uncertain but is most probably from the re-polarization of the Purkinje fibers.
■ Hypokalemic U wave: The U wave in hypokalemia islarge and pathologic. It is much larger than the T waveand its origin is not the same as that of the normal Uwave. It has been shown that in hypokalemia, the nor-mal T wave becomes interrupted, splitting into twocomponents. The T wave represents the first compo-nent and the U wave the second component. Thus, theQ-U interval truly represents the actual QT intervaland is prolonged. The QT interval represents only thefirst component of the split T wave, and is equal to oreven shorter than the normal QT interval (Figs.25.18–25.21).
A B C D
Figure 25.16: The Electrocardiogram of Hypokalemia. (A–D) Varyinglevels of serum potassium. (A) Normal level of serum potassium. (B) Mildhypokalemia. A prominent U wave is present. (C) Moderate hypokalemia.The Uwave becomes more prominent than the T wave. (D) Severe hypokalemia.Thereis fusion of the T and U waves.
LWBK271-C25_396-413.qxd 29/1/09 7:20 pm Page 404 LWBK270-4119G-C02_073-110.qxd

Electrolyte Abnormalities 405
Lead V3
Lead II
U Wave
Q-U Interval
QT Interval
Figure 25.17: Prominent U Waves in Hypokalemia. Potassium level is 2.7 mm/L.The 12-lead electrocardio-gram shows the classical finding of hypokalemia characterized by prominent U waves (arrows). Fusion of the T andU waves is seen in V3; thus, the T and U waves become indistinguishable.
Figure 25.18: The QT and the Q-U Interval inHypokalemia. Lead V3 and lead II were simulta-neously recorded. In lead II, the U waves areseparately inscribed from the T waves and the twohumps resemble the back of a camel. If the QT inter-val is measured in lead II, the QT interval is shortsince it represents only the first component of a splitT wave. It does not represent the real QT interval. InV3, the U waves are very prominent and can not beseparated from the T wave.This QU intervalrepresents the actual QT interval and is prolonged.The 12-lead electrocardiogram is shown in Figure25.17.
Figure 25.19: Prolonged QU Interval in Hypokalemia. Potassium level is 3.1 mmol/L.The U waves areprominent in V2–6 with prolonged QU interval.
LWBK271-C25_396-413.qxd 29/1/09 7:20 pm Page 405 LWBK270-4119G-C02_073-110.qxd

406 Chapter 25
ECG Findings of Hypokalemia
1. Prominent U waves
2. Nonspecific ST depression and T-wave flattening as the Uwave becomes more prominent
3. Prolongation of the QU interval
4. Fusion of the T and U waves
5. Ventricular arrhythmias, especially torsade de pointes
Mechanism
■ The ratio between intracellular and extracellular potassiumdetermines the resting potential of a cell, which is normally–90 mV. When there is hypokalemia, extracellular potassium
is decreased and the ratio between intracellular and extracel-lular potassium becomes higher. Thus, the cells become morenegative than –90 mV and the resting potential is hyperpo-larized. This will cause lengthening of the duration of the ac-tion potential resulting in a longer QT interval in the surfaceECG. This will increase the frequency of ventricular arrhyth-mias especially torsade de pointes.
■ The ECG hallmark of hypokalemia is the presence of promi-nent U waves and prolongation of the QU interval. As hy-pokalemia worsens, the T wave flattens, a U wave emerges,and a seesaw effect between the amplitude of the T and Uwave occurs. As the U wave grows larger, the T wave be-comes smaller. Merging of the T and U waves eventually oc-cur; thus, the T and U waves become indistinguishable fromone another.
Figure 25.20: Prominent U Waves and Prolonged QU Interval in Hypokalemia. Potassium level is 2.8mmol/L. The U waves are more prominent than the T waves and are most prominent in V3 to V5. The QU interval isprolonged.
Figure 25.21: Hypokalemia with "Roller Coaster" ST-T Configuration. Potassium level is 1.7 mmol/L.The Twaves have merged with the U waves in V4–6. The QU interval is prolonged with a “roller coaster”configuration in V2–6.
LWBK271-C25_396-413.qxd 29/1/09 7:20 pm Page 406 LWBK270-4119G-C02_073-110.qxd
Electrolyte Abnormalities 407
■ In hypokalemia, phase 3 of the transmembrane action poten-tial is less steep causing a small or attenuated intramyocardialvoltage gradient, resulting in low T waves. This is opposite tothat of hyperkalemia, where phase 3 has a steeper slope, whichtranslates into a higher intramyocardial voltage gradient, re-sulting in T waves that are taller and more peaked.
■ According to Yan et al., the mechanism of a pathologic Uwave resulting from hypokalemia is different from the mech-anism of a normal U wave. When hypokalemia is present, theabnormal T-U complex has been shown to be due to splittingof the ascending limb of the normal T wave into two compo-nents. The first component of the split T wave is the originalT wave and the other component becomes a separate U wave,which is actually the other half of the split T wave. If only theQT interval is measured, which represents only the first com-ponent of the bifid T wave, the QT interval is equal to or evenshorter than the normal QT interval. Thus, in hypokalemia,measurement of the true QT interval should include the Uwave and is measured as the QU interval.
Clinical Implications
■ The normal level of potassium in the blood is 3.3 to 5.3mmol/L. Hypokalemia refers to the presence of lower thannormal potassium in the blood, which is �3.3 mmol/L.
■ The normal daily intake of potassium varies from 80 to 120mEq/day. Almost 90% of dietary potassium is excreted by thekidneys and the rest by the gastrointestinal (GI) tract.
■ Hypokalemia usually occurs from potassium loss in the kid-neys, frequently brought about by chronic diuretic therapyor potassium loss in the GI tract as a result of frequent vom-iting, continuous gastric suction, or diarrhea.
■ Hypokalemia also occurs when there is acute shift of extracel-lular potassium intracellularly from metabolic alkalosis ordrugs such as insulin and beta agonists. Alkalosis causes extra-cellular potassium to move into the cell in exchange for H�, re-sulting in a lower level of serum potassium. Metabolic alkalosisdecreases serum potassium by 0.8 mmol/L for every 0.1 unit in-crease in pH above normal. Acidosis causes a reverse effect withintracellular potassium moving out of the cell in exchange forH�. Thus, an acidotic patient with a normal potassium level isexpected to develop hypokalemia once the acidosis is corrected.
■ Symptoms of hypokalemia usually occur when significant elec-trolyte depletion has occurred. This is usually manifested asgeneralized weakness, fatigue, and paralysis. In patients who arebeing weaned off a respirator, it is important that potassiumlevel should be checked because hypokalemia can cause muscleweakness that can result in respiratory failure. If hypokalemia ispresent, the electrolyte abnormality should be corrected. Hy-pokalemia can affect the muscles of the GI tract, resulting inileus or constipation. It can also affect the muscles of the lowerextremities, resulting in leg cramps and paresthesias.
■ Arrhythmias including torsade de pointes and pulseless elec-trical activity may occur when the QT (or QU) interval isprolonged.
Therapy
■ Because potassium is predominantly an intracellular ion, hy-pokalemia may occur even when total body potassium isnormal or higher than normal. Generally however, when hy-pokalemia is present and is from chronic loss of potassium, adecrease in serum potassium of 1 mmol/L is equivalent to adeficit of approximately 150 to 400 mmol of body potassium.
■ Therapy of hypokalemia includes identification and correc-tion of the underlying abnormality.
■ Aggressive intravenous replacement of potassium may be as-sociated with hyperkalemia and cardiac arrhythmias. Thus,intravenous administration of potassium is preferred whenarrhythmias are present or when hypokalemia is severe(�2.5 mEq/L). Oral replacement is given if the patient isclinically stable without arrhythmias and the potassium levelis �2.5 mmol/L because administration of potassium orallyis much safer and can be given in higher doses.
■ Replacement therapy of approximately 200 to 300 mmolpotassium is needed to increase the serum potassium level by1 mmol/L. However, it may take several days to correct theelectrolyte abnormality because the administered potassiumis also excreted in the urine. Since intravenous replacementof potassium can potentially cause cardiac arrhythmias, theAHA guidelines recommend the following:
■ The maximum infusion of potassium should not exceed10 to 20 mmol/hour and should be infused under contin-uous cardiac monitoring.
■ Potassium when given �20 mmol/hour should be infusedwith a central line. This concentration of potassium maybe painful when given IV because it may cause sclerosis ofthe veins. The tip of the central catheter should not ex-tend to the right atrium or ventricle because this maycause local hyperkalemia.
■ If severe life-threatening arrhythmias are present and a morerapid infusion is necessary, an initial infusion of 10 mmolIV is given over 5 minutes and repeated once if necessary.
■ Potassium is preferably mixed with non-glucose solutions toprevent insulin secretion, which can shift potassium intra-cellularly.
■ Hypokalemia is usually associated with other electrolyte ab-normalities, especially hypomagnesemia. When there is hy-pomagnesemia, it might be difficult to correct the potassiumdeficiency because magnesium is necessary for the move-ment of electrolytes in and out of the cell including potas-sium; therefore, correcting both electrolyte abnormalityshould be done simultaneously.
■ The use of potassium sparing diuretics should be consideredin hypokalemic patients requiring long term diuretic therapy.
Prognosis
■ Hypokalemia can cause ventricular arrhythmias and may befatal if left uncorrected. It is usually from aggressive use ofdiuretics or gastrointestinal losses. Unlike patients with
LWBK271-C25_396-413.qxd 29/1/09 7:20 pm Page 407 LWBK270-4119G-C02_073-110.qxd

408 Chapter 25
hyperkalemia, the renal function in hypokalemic patients isusually preserved. After the hypokalemia is corrected,prognosis will depend on the underlying cause of thehypokalemia.
Hypercalcemia
■ Hypercalcemia refers to the presence of elevated cal-cium level above normal. The normal level of totalserum calcium varies from 8.5 to 10.5 mg/dL or forionized calcium 4.2 to 4.8 mg/dL.
■ When extracellular calcium is increased, the durationof the action potential is shortened. Shortening of theaction potential duration results in shortening of theQT interval.
■ The ECG findings of hypercalcemia include (Figs.25.22 and 25.23):■ Shortening of the QT interval. This is due to short-
ening of phase 2 of the action potential correspon-ding to the ST segment in the ECG.
■ Elevation of the ST segment especially in the precordialleads. This may be mistaken for acute ischemic injury.
ECG Findings of Hypercalcemia
1. Short QT interval from shortening of the ST segment
2. Flattened and widened T wave with ST elevation
3. Prolonged P-R interval
4. Widened QRS complex
5. Increased QRS voltage
6. Notching of the terminal portion of the QRS complex from aprominent J wave
7. AV block progressing to complete heart block and cardiac ar-rest when serum calcium �15 to 20 mg/dL.
Mechanism
■ Increasing levels of serum calcium may cause changes in theECG. Unlike hyperkalemia, in which the ECG changes aremore dramatic, the ECG abnormalities associated with hy-percalcemia are less specific and should not be used as thebasis for making the diagnosis of hypercalcemia.
■ Hypercalcemia shortens the duration of the action poten-tial of the myocyte, resulting in a shortened QT interval.This usually occurs when the serum calcium is �13 mg/dL.Because the duration of ventricular systole is short-ened, ventricular refractoriness is shortened, rendering the
A B C
Figure 25.22: The Electrocardiogram of Hypercalcemia.Diagrammatic representation of the electrocardiogram changesassociated with hypercalcemia. (A) Normal. (B) Hypercalcemia:the ST segment is shortened because of shortening of phase 2 of the action potential. (C) Hypercalcemia with ST segmentelevation. Fusion of the QRS complex and T wave occur due tofurther shortening of the ST segment.
Figure 25.23: The ST and T Wave Configuration in Hypercalcemia. Total calcium level is 16.0 mg/dL.Note the short ST segment and ST elevation in V3 to V6. Prominent J wave or Osborn wave may also occur whenthere is hypercalcemia.
LWBK271-C25_396-413.qxd 29/1/09 7:20 pm Page 408 LWBK270-4119G-C02_073-110.qxd
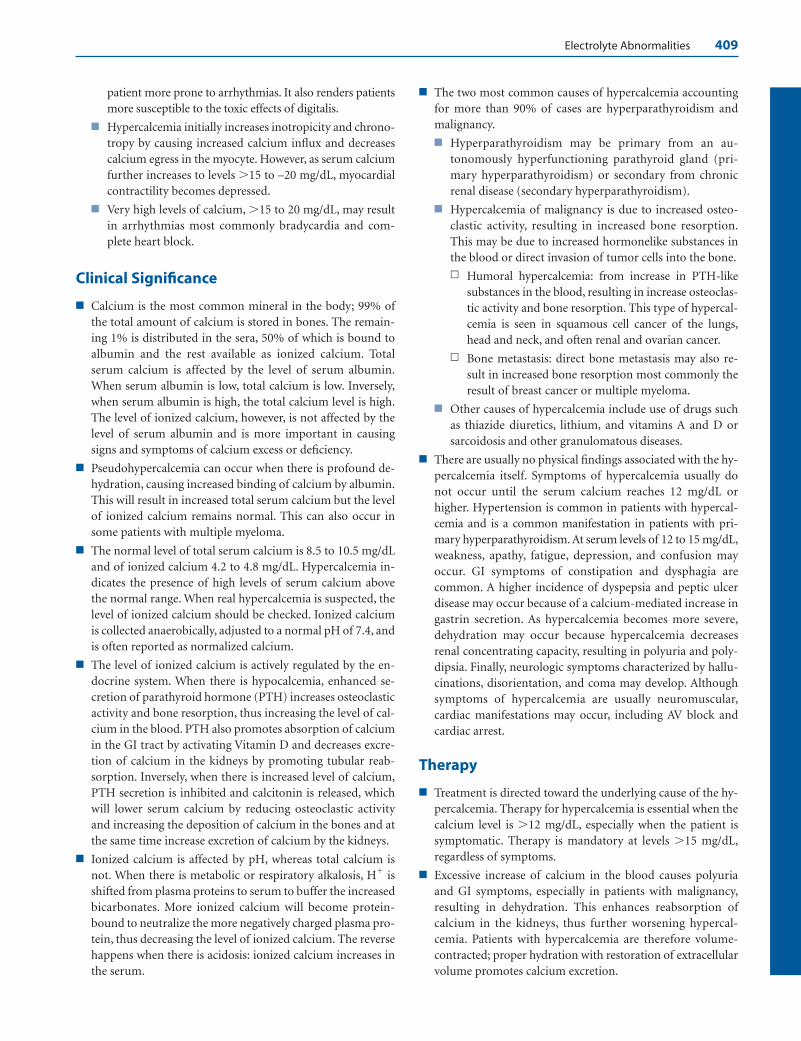
Electrolyte Abnormalities 409
patient more prone to arrhythmias. It also renders patientsmore susceptible to the toxic effects of digitalis.
■ Hypercalcemia initially increases inotropicity and chrono-tropy by causing increased calcium influx and decreasescalcium egress in the myocyte. However, as serum calciumfurther increases to levels �15 to –20 mg/dL, myocardialcontractility becomes depressed.
■ Very high levels of calcium, �15 to 20 mg/dL, may resultin arrhythmias most commonly bradycardia and com-plete heart block.
Clinical Significance
■ Calcium is the most common mineral in the body; 99% ofthe total amount of calcium is stored in bones. The remain-ing 1% is distributed in the sera, 50% of which is bound toalbumin and the rest available as ionized calcium. Totalserum calcium is affected by the level of serum albumin.When serum albumin is low, total calcium is low. Inversely,when serum albumin is high, the total calcium level is high.The level of ionized calcium, however, is not affected by thelevel of serum albumin and is more important in causingsigns and symptoms of calcium excess or deficiency.
■ Pseudohypercalcemia can occur when there is profound de-hydration, causing increased binding of calcium by albumin.This will result in increased total serum calcium but the levelof ionized calcium remains normal. This can also occur insome patients with multiple myeloma.
■ The normal level of total serum calcium is 8.5 to 10.5 mg/dLand of ionized calcium 4.2 to 4.8 mg/dL. Hypercalcemia in-dicates the presence of high levels of serum calcium abovethe normal range. When real hypercalcemia is suspected, thelevel of ionized calcium should be checked. Ionized calciumis collected anaerobically, adjusted to a normal pH of 7.4, andis often reported as normalized calcium.
■ The level of ionized calcium is actively regulated by the en-docrine system. When there is hypocalcemia, enhanced se-cretion of parathyroid hormone (PTH) increases osteoclasticactivity and bone resorption, thus increasing the level of cal-cium in the blood. PTH also promotes absorption of calciumin the GI tract by activating Vitamin D and decreases excre-tion of calcium in the kidneys by promoting tubular reab-sorption. Inversely, when there is increased level of calcium,PTH secretion is inhibited and calcitonin is released, whichwill lower serum calcium by reducing osteoclastic activityand increasing the deposition of calcium in the bones and atthe same time increase excretion of calcium by the kidneys.
■ Ionized calcium is affected by pH, whereas total calcium isnot. When there is metabolic or respiratory alkalosis, H� isshifted from plasma proteins to serum to buffer the increasedbicarbonates. More ionized calcium will become protein-bound to neutralize the more negatively charged plasma pro-tein, thus decreasing the level of ionized calcium. The reversehappens when there is acidosis: ionized calcium increases inthe serum.
■ The two most common causes of hypercalcemia accountingfor more than 90% of cases are hyperparathyroidism andmalignancy.
■ Hyperparathyroidism may be primary from an au-tonomously hyperfunctioning parathyroid gland (pri-mary hyperparathyroidism) or secondary from chronicrenal disease (secondary hyperparathyroidism).
■ Hypercalcemia of malignancy is due to increased osteo-clastic activity, resulting in increased bone resorption.This may be due to increased hormonelike substances inthe blood or direct invasion of tumor cells into the bone.
n Humoral hypercalcemia: from increase in PTH-likesubstances in the blood, resulting in increase osteoclas-tic activity and bone resorption. This type of hypercal-cemia is seen in squamous cell cancer of the lungs,head and neck, and often renal and ovarian cancer.
n Bone metastasis: direct bone metastasis may also re-sult in increased bone resorption most commonly theresult of breast cancer or multiple myeloma.
■ Other causes of hypercalcemia include use of drugs suchas thiazide diuretics, lithium, and vitamins A and D orsarcoidosis and other granulomatous diseases.
■ There are usually no physical findings associated with the hy-percalcemia itself. Symptoms of hypercalcemia usually donot occur until the serum calcium reaches 12 mg/dL orhigher. Hypertension is common in patients with hypercal-cemia and is a common manifestation in patients with pri-mary hyperparathyroidism. At serum levels of 12 to 15 mg/dL,weakness, apathy, fatigue, depression, and confusion may occur. GI symptoms of constipation and dysphagia are common. A higher incidence of dyspepsia and peptic ulcerdisease may occur because of a calcium-mediated increase ingastrin secretion. As hypercalcemia becomes more severe,dehydration may occur because hypercalcemia decreases renal concentrating capacity, resulting in polyuria and poly-dipsia. Finally, neurologic symptoms characterized by hallu-cinations, disorientation, and coma may develop. Althoughsymptoms of hypercalcemia are usually neuromuscular,cardiac manifestations may occur, including AV block andcardiac arrest.
Therapy
■ Treatment is directed toward the underlying cause of the hy-percalcemia. Therapy for hypercalcemia is essential when thecalcium level is �12 mg/dL, especially when the patient issymptomatic. Therapy is mandatory at levels �15 mg/dL,regardless of symptoms.
■ Excessive increase of calcium in the blood causes polyuriaand GI symptoms, especially in patients with malignancy,resulting in dehydration. This enhances reabsorption ofcalcium in the kidneys, thus further worsening hypercal-cemia. Patients with hypercalcemia are therefore volume-contracted; proper hydration with restoration of extracellularvolume promotes calcium excretion.
LWBK271-C25_396-413.qxd 29/1/09 7:20 pm Page 409 LWBK270-4119G-C02_073-110.qxd

410 Chapter 25
■ Saline diuresis: In symptomatic patients with severe hy-percalcemia �15 mg/dL who have reasonably preservedcardiovascular and renal function and are dehydrated, the2005 AHA guidelines for cardiopulmonary resuscitationand emergency cardiovascular care recommends intra-venous infusion of 300 to 500 mL/hour of 0.9% saline un-til any fluid deficit is corrected or until patient starts todiurese adequately. After the patient is properly hydrated,IV hydration is continued at 100 to 200 mL/hour to main-tain adequate diuresis and promote calcium excretion. Atleast 3 to 4 L is usually needed in the first 24 hours. Otherelectrolytes, especially potassium and magnesium, shouldbe monitored carefully.
■ Loop diuretics: Loop diuretics (e.g., furosemide [20–40mg 2 to 4 times daily] or bumetanide [1 to 2 mg twicedaily]), may be used in patients with heart failure, al-though their use in the treatment of the hypercalcemiaitself is controversial and should be used only after appro-priate volume repletion with normal saline. Thiazidediuretics should not be substituted for loop diuretics be-cause they prevent calcium excretion.
■ Calcitonin: Calcitonin lowers serum calcium by inhibitingbone resorption and promoting urinary calcium excretion.
■ Bisphosphonates: Biphosphonic acid lowers serum cal-cium by inhibiting osteoclastic bone resorption. The follow-ing bisphosphonates are commonly used in the treatment ofhypercalcemia associated with malignancy.
■ Pamidronate: Pamidronate is given as an intravenousinfusion. It can be combined with calcitonin to provide alonger effect. There is risk of renal toxicity if given rapidlyor in high doses.
■ Zoledronic acid: Zoledronic acid is preferred as it is morepotent than pamidronate. It can be infused over a shorterperiod. The drug can also cause renal damage if the infu-sion is given rapidly or in high doses. Renal function shouldbe reassessed if a second infusion is necessary. Patients re-ceiving the infusion should be properly hydrated.
■ Steroids: Glucocorticoids reduce calcium level by severalmechanisms. They inhibit intestinal absorption, increase uri-nary excretion of calcium, and have cytolytic effect to sometumor cells, especially multiple myeloma and other malig-nancies. They also inhibit calcitriol production by mononu-clear cells in lungs and lymph nodes; thus, they are effectivein hypercalcemia associated with granulomatous diseasesand occasionally with lymphoma.
■ Phosphates: Phosphates are given orally to prevent calciumabsorption. It combines with calcium to form complexes thatlimits its absorption. It also increases calcium deposition inbones.
■ Hemodialysis: Hemodialysis should be considered whenthere is need to promptly decrease the level of serum calciumin patients with heart failure or renal failure who cannottolerate saline infusion. The dialysis fluid should be alteredbecause the conventional dialysis solution may have a com-
position that may not be ideally suited for rapid correction ofthe electrolyte abnormality.
Prognosis
■ Prognosis depends on the underlying condition. Hypercal-cemia is commonly associated with malignancy; thus, the in-tensity of therapy should be individualized and should con-sider the overall clinical picture.
Hypocalcemia
■ Hypocalcemia is defined as a calcium level below thenormal range. The normal serum calcium level variesfrom 8.5 to 10.5 mg/dL and the normal level of ionizedcalcium is 4.2 to 4.8 mg/dL.
■ When the level of extracellular calcium is decreased,the following ECG changes occur:■ The QT interval is prolonged. Prolongation of the QT
interval is due to prolongation of phase 2 of the ac-tion potential, which corresponds to the ST segmentin the ECG. Thus, prolongation of the QT interval ismainly due to prolongation of the ST segment. The Twave is not significantly affected. Terminal inversionof the T waves may occur (Figs. 25.24–25.27).
■ Heart block may occur when the hypocalcemia ismore severe.
Hypokalemia
Hypocalcemia
Normal
Prolonged QU
Prolonged ST segment
QT is prolonged due to a wide ST segment
The QT is prolonged due to prominent U
wave
A.
B.
C.
Figure 25.24: The QT Interval of Hypocalcemia andHypokalemia. In hypokalemia, the prolongation of the QT orQU interval is due to the presence of prominent U waves (B). Inhypocalcemia, prolongation of the QT interval is primarily dueto lengthening of the ST segment (C).
LWBK271-C25_396-413.qxd 29/1/09 7:20 pm Page 410 LWBK270-4119G-C02_073-110.qxd
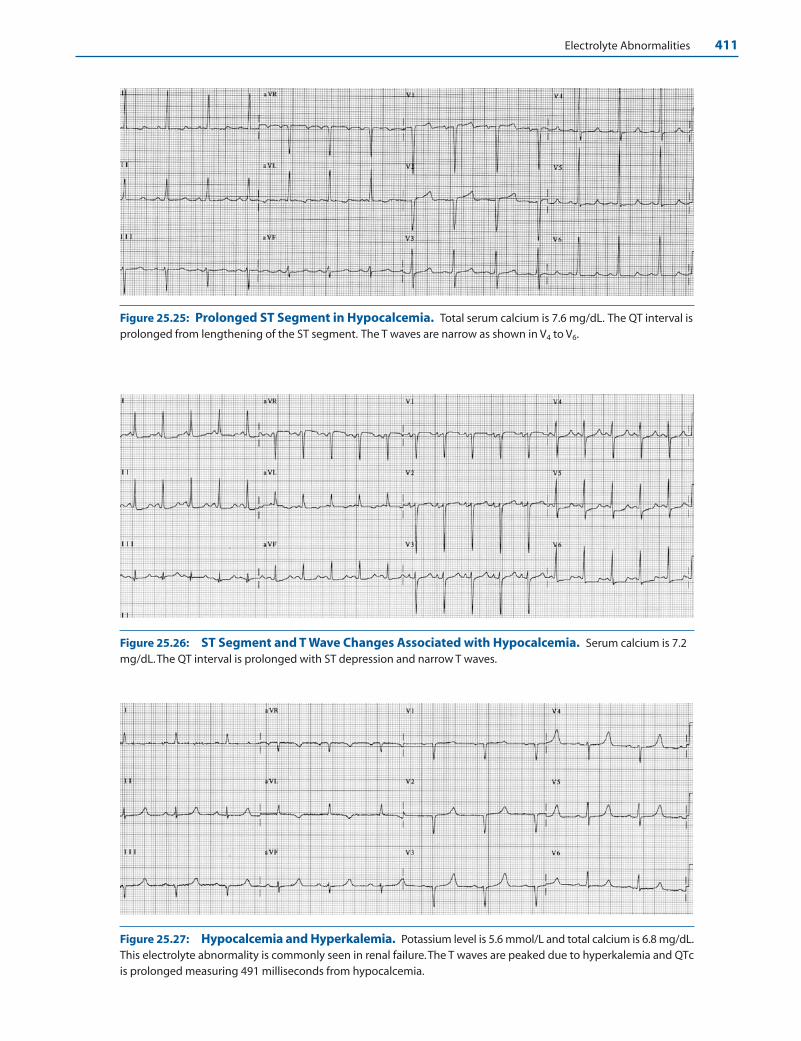
Electrolyte Abnormalities 411
Figure 25.25: Prolonged ST Segment in Hypocalcemia. Total serum calcium is 7.6 mg/dL. The QT interval isprolonged from lengthening of the ST segment. The T waves are narrow as shown in V4 to V6.
Figure 25.26: ST Segment and T Wave Changes Associated with Hypocalcemia. Serum calcium is 7.2mg/dL.The QT interval is prolonged with ST depression and narrow T waves.
Figure 25.27: Hypocalcemia and Hyperkalemia. Potassium level is 5.6 mmol/L and total calcium is 6.8 mg/dL.This electrolyte abnormality is commonly seen in renal failure.The T waves are peaked due to hyperkalemia and QTcis prolonged measuring 491 milliseconds from hypocalcemia.
LWBK271-C25_396-413.qxd 29/1/09 7:20 pm Page 411 LWBK270-4119G-C02_073-110.qxd

412 Chapter 25
ECG Abnormalities of Hypocalcemia
1. Prolonged QT interval due to lengthening of the ST segment.
2. Flat ST segment and terminal T-wave inversion.
3. Heart block and ventricular fibrillation when hypocalcemia issevere.
Mechanism
■ ECG findings include:■ Prolongation of the QT interval. Prolongation of the QT
interval is due to lengthening of phase 2 of the action po-tential. Because phase 2 of the action potential corre-sponds to the ST segment, prolongation of the QT intervalis mainly from lengthening of the JT interval, which repre-sents the interval between the end of the QRS complex andthe end of the T wave. Although the ST segment lengthens,the size of the T wave is not altered. This is the most diag-nostic ECG abnormality associated with hypocalcemia.This is in contrast to hypokalemia where a prominent Uwave is present resulting in prolongation of the QT (QU)interval. Other ECG findings include flat ST segment,widening of the QRS complex, and AV block. Ventricularfibrillation may occur when hypocalcemia is severe.
Clinical Implications
■ Hypocalcemia refers to a low level of serum calcium belowthe normal range of 8.5 to 10.5 mg/dL (or 2.1 to 2.6mmol/L). It is also defined as below the normal level of ion-ized calcium, which is 4.2 to 4.8 mg/dL (or �1.0 mmol/L).
■ The recommended daily calcium is 1,200 mg. Hypocalcemiacan occur when there is:
■ Decreased intake or diminished absorption of calcium: Vita-min D is necessary for absorption of calcium in the GI tract.Vitamin D deficiency can occur in patients who are not ex-posed to sunlight or do not have adequate vitamin D in thediet. In chronic renal failure, there is defective hydroxylationof vitamin D to active vitamin D. Secondary increase in PTHmay occur in an effort to maintain serum calcium levels.
■ Parathyroid hormone deficiency: This is usually the resultof inadvertent removal of the parathyroid glands duringthyroid surgery. The parathyroid glands are also affectedby tumor or by infiltrative disorders, such as hemochro-matosis or sarcoidosis.
■ Alkalosis: Metabolic or respiratory alkalosis decreases thelevel of ionized calcium.
■ Chelation of calcium with citrate and other substances:Hypocalcemia may occur following transfusion of �6 unitsof citrated blood. Increased phosphates from acute renalfailure and exogenous bicarbonates and free fatty acids dur-ing acute pancreatitis can also result in chelation of calcium.
■ Signs and symptoms of hypocalcemia are dependent not onlyon the level of free or ionized calcium, but also on the rapid-ity in which calcium declines. In renal patients, hypocalcemia
may not be clinically manifest because of coexistent acidosis,which increases the level of ionized calcium and may abruptlymanifest only when the acidosis is corrected.
■ Symptoms of hypocalcemia usually do not occur until thelevel of ionized calcium falls below 0.7 mmol/L. This includesgeneralized irritability, hyperreflexia, muscle cramps, tetany,carpopedal spasm, seizures, and neuromuscular excitabilitycharacterized by a positive Chvostek and Trousseau signs.
■ Chvostek sign is elicited by tapping the facial nerve on theface anterior to the ear resulting in twitching of the facialmuscles on the same side.
■ Trousseau sign involves inflating a blood pressure cuff abovethe systolic pressure for 3 minutes, resulting in muscularcontraction with flexion of the wrist, thumbs, and metacar-pophalangeal joints and hyperextension of the fingers.
■ Although symptoms of hypocalcemia are predominantlyneuromuscular and include weakness, tetany, confusion andseizures, hypocalcemia can also cause arrhythmias, decreasein myocardial contractility, heart failure, and hypotension.
■ Hypocalcemia usually develops in association with otherelectrolyte abnormalities such as hyperkalemia and hypo-magnesemia. The combination of hypocalcemia and hyper-kalemia is commonly seen in patients with renal failure.
Therapy
■ Treatment of hypocalcemia includes measurement of theionized level of serum. When symptoms are present, calciumshould be given intravenously even before the result of ion-ized calcium is available. Between 100 and 300 mg of ele-mental calcium is given intravenously, which will increaseserum calcium for 1 to 2 hours; thus, repeated doses may benecessary. Calcium is given as calcium chloride or calciumgluconate. Calcium chloride has a higher amount of elemen-tal calcium compared to calcium gluconate:
■ Calcium chloride 10% 10 mL contains 360 mg of elemen-tal calcium, whereas calcium gluconate 10% 10 mL con-tains 93 mg of elemental calcium.
■ Calcium is given IV over 10 minutes (90 to 180 mg ele-mental calcium) followed by an IV drip of 540 to 720 mgin 500 to 1,000 mL D5W. The serum calcium level shouldbe monitored every 4 to 6 hours and maintained at thelow normal range of 7 to 9 mg/dL.
■ Calcium should be injected cautiously to patients receiv-ing digitalis because it may cause digitalis toxicity.
■ If symptoms are not present, oral calcium supplements 1 to 4 g daily in divided doses may suffice.
■ Therapy includes correction of other electrolyte abnormali-ties because calcium entry into the cells is dependent on thepresence of normal levels of magnesium and potassium.
Prognosis
■ Prognosis of patients with hypocalcemia will depend on theunderlying medical condition.
LWBK271-C25_396-413.qxd 29/1/09 7:20 pm Page 412 LWBK270-4119G-C02_073-110.qxd
Electrolyte Abnormalities 413
Suggested Readings
2005 American Heart Association guidelines for cardiopul-monary resuscitation and emergency cardiovascular care.Part 10.1: life-threatening electrolyte abnormalities. Circula-tion. 2005;112:IV-121–I-125.
Agus ZS. Etiology of hypercalcemia. 2008 UpToDate. www.utdol.com.
Agus ZS, Berenson JR. Treatment of hypercalcemia. 2008UpToDate. www.utdol.com.
Dagogo-Jack S. Mineral and metabolic bone disease. In: CareyCF, Lee HH, Woeltje KF, eds. The Washington Manual ofMedical Therapeutics. 29th ed. Philadelphia: LippincottWilliams & Wilkins; 1998:441–455.
Gibbs MA, Wolfson AB, Tayal WS. Electrolyte disturbances. In:Marx JA, ed. Rosen’s Emergency Medicine, Concepts and ClinicalPractice. 5th ed. St. Louis: Mosby; 2002:1724–1744.
Inzucchi SE. Understanding hypercalcemia. Postgrad Med. 2004;115:69–76.
Palmer BF. Managing hyperkalemia caused by inhibitors or therenin-angiotensin-aldosterone system. N Engl J Med. 2004;351:585–592.
Rose BD. Clinical manifestations and treatment of hyper-kalemia. 2008 UpToDate. www.utdol.com.
Rose BD. Clinical manifestations and treatment of hypokalemia.2008 UpToDate. www.utdol.com.
Rutecki GW, Whittier FC. Recognizing hypercalcemia: the “3-hormone, 3-organ rule.” J Crit Illness. 1998;13:59–66.
Singer GG. Fluid and electrolyte management. In: Carey CF, LeeHH, Woeltje KF, eds. The Washington Manual of MedicalTherapeutics. 29th ed. Philadelphia: Lippincott Williams &Wilkins; 1998:39–60.
Urbano FL. Signs of hypocalcemia: Chvostek’s and Trousseau’ssigns. Hosp Physician. 2000;36:43–45.
Yan GX, Shimizu W, Antzelevitch C. Cellular basis for the nor-mal T-wave and the electrocardiographic manifestations ofthe long-QT syndrome. Circulation. 1998;98:1921–1927.
Yan GX, Lankipalli RS, Burke JF, et al. Ventricular repolariza-tion components of the electrocardiogram, cellular basisand clinical significance. J Am Coll Cardiol. 2003;42:401–409.
Zaloga GP, RR Kirby, WC Bernards, et al. Fluids and elec-trolytes. In: Civetta JM, Taylor RW Kirby RR, eds. CriticalCare. 3rd ed. Philadelphia: Lippincott-Raven Publishers;1997:413–429.
LWBK271-C25_396-413.qxd 29/1/09 7:20 pm Page 413 LWBK270-4119G-C02_073-110.qxd
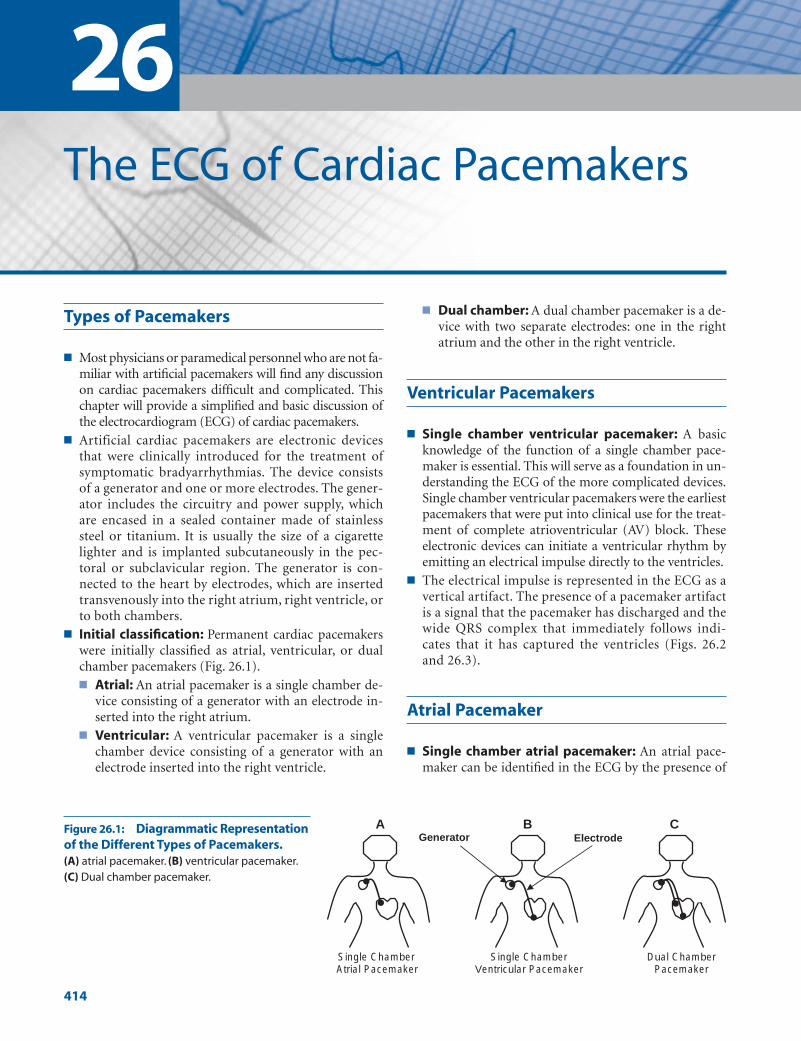
Types of Pacemakers
■ Most physicians or paramedical personnel who are not fa-miliar with artificial pacemakers will find any discussionon cardiac pacemakers difficult and complicated. Thischapter will provide a simplified and basic discussion ofthe electrocardiogram (ECG) of cardiac pacemakers.
■ Artificial cardiac pacemakers are electronic devicesthat were clinically introduced for the treatment ofsymptomatic bradyarrhythmias. The device consistsof a generator and one or more electrodes. The gener-ator includes the circuitry and power supply, whichare encased in a sealed container made of stainlesssteel or titanium. It is usually the size of a cigarettelighter and is implanted subcutaneously in the pec-toral or subclavicular region. The generator is con-nected to the heart by electrodes, which are insertedtransvenously into the right atrium, right ventricle, orto both chambers.
■ Initial classification: Permanent cardiac pacemakerswere initially classified as atrial, ventricular, or dualchamber pacemakers (Fig. 26.1).■ Atrial: An atrial pacemaker is a single chamber de-
vice consisting of a generator with an electrode in-serted into the right atrium.
■ Ventricular: A ventricular pacemaker is a singlechamber device consisting of a generator with anelectrode inserted into the right ventricle.
■ Dual chamber: A dual chamber pacemaker is a de-vice with two separate electrodes: one in the rightatrium and the other in the right ventricle.
Ventricular Pacemakers
■ Single chamber ventricular pacemaker: A basicknowledge of the function of a single chamber pace-maker is essential. This will serve as a foundation in un-derstanding the ECG of the more complicated devices.Single chamber ventricular pacemakers were the earliestpacemakers that were put into clinical use for the treat-ment of complete atrioventricular (AV) block. Theseelectronic devices can initiate a ventricular rhythm byemitting an electrical impulse directly to the ventricles.
■ The electrical impulse is represented in the ECG as avertical artifact. The presence of a pacemaker artifactis a signal that the pacemaker has discharged and thewide QRS complex that immediately follows indi-cates that it has captured the ventricles (Figs. 26.2and 26.3).
Atrial Pacemaker
■ Single chamber atrial pacemaker: An atrial pace-maker can be identified in the ECG by the presence of
26The ECG of Cardiac Pacemakers
414
A
Single Chamber Atrial Pacemaker
B
Single Chamber Ventricular Pacemaker
C
Dual Chamber Pacemaker
Generator ElectrodeFigure 26.1: Diagrammatic Representationof the Different Types of Pacemakers.(A) atrial pacemaker. (B) ventricular pacemaker.(C) Dual chamber pacemaker.
LWBK271-C26_414-434.qxd 29/1/09 9:42 pm Page 414 LWBK270-4119G-C02_073-110.qxd
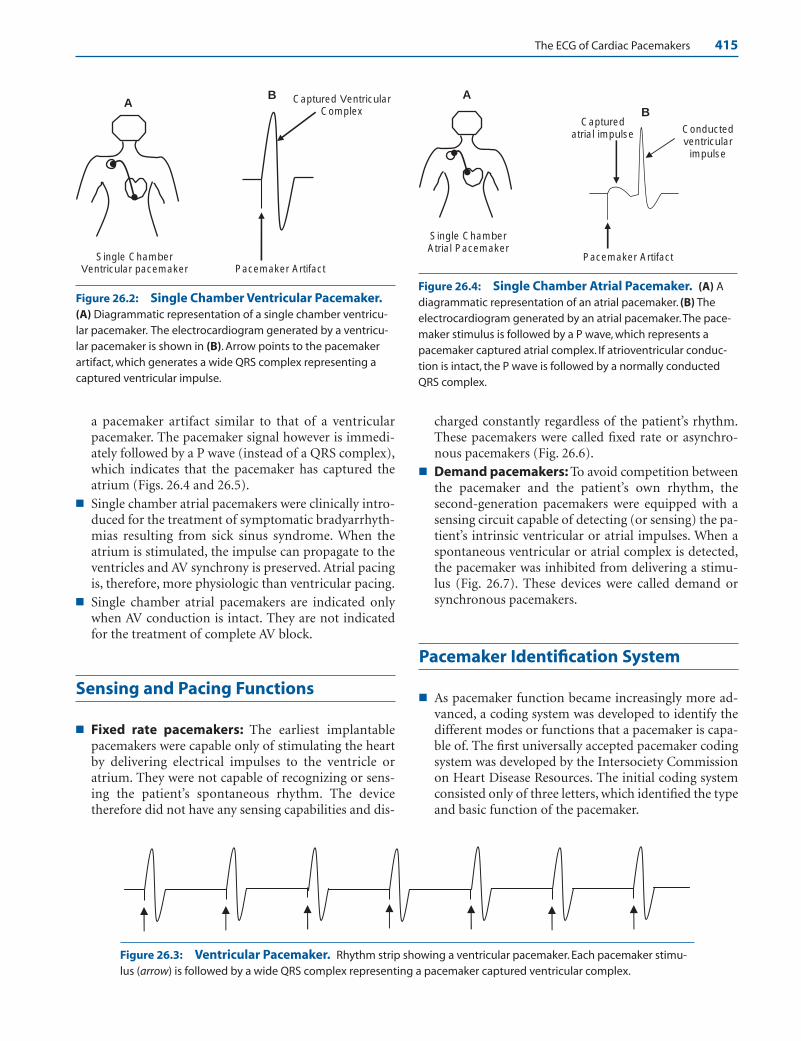
The ECG of Cardiac Pacemakers 415
a pacemaker artifact similar to that of a ventricularpacemaker. The pacemaker signal however is immedi-ately followed by a P wave (instead of a QRS complex),which indicates that the pacemaker has captured theatrium (Figs. 26.4 and 26.5).
■ Single chamber atrial pacemakers were clinically intro-duced for the treatment of symptomatic bradyarrhyth-mias resulting from sick sinus syndrome. When theatrium is stimulated, the impulse can propagate to theventricles and AV synchrony is preserved. Atrial pacingis, therefore, more physiologic than ventricular pacing.
■ Single chamber atrial pacemakers are indicated onlywhen AV conduction is intact. They are not indicatedfor the treatment of complete AV block.
Sensing and Pacing Functions
■ Fixed rate pacemakers: The earliest implantablepacemakers were capable only of stimulating the heartby delivering electrical impulses to the ventricle oratrium. They were not capable of recognizing or sens-ing the patient’s spontaneous rhythm. The devicetherefore did not have any sensing capabilities and dis-
charged constantly regardless of the patient’s rhythm.These pacemakers were called fixed rate or asynchro-nous pacemakers (Fig. 26.6).
■ Demand pacemakers: To avoid competition betweenthe pacemaker and the patient’s own rhythm, the second-generation pacemakers were equipped with asensing circuit capable of detecting (or sensing) the pa-tient’s intrinsic ventricular or atrial impulses. When aspontaneous ventricular or atrial complex is detected,the pacemaker was inhibited from delivering a stimu-lus (Fig. 26.7). These devices were called demand orsynchronous pacemakers.
Pacemaker Identification System
■ As pacemaker function became increasingly more ad-vanced, a coding system was developed to identify thedifferent modes or functions that a pacemaker is capa-ble of. The first universally accepted pacemaker codingsystem was developed by the Intersociety Commissionon Heart Disease Resources. The initial coding systemconsisted only of three letters, which identified the typeand basic function of the pacemaker.
A
Single Chamber Ventricular pacemaker
B Captured Ventricular Complex
Pacemaker Artifact
BCaptured
atrial impulse
Pacemaker Artifact
Conducted ventricular
impulse
A
Single Chamber Atrial Pacemaker
Figure 26.2: Single Chamber Ventricular Pacemaker.(A) Diagrammatic representation of a single chamber ventricu-lar pacemaker. The electrocardiogram generated by a ventricu-lar pacemaker is shown in (B). Arrow points to the pacemakerartifact, which generates a wide QRS complex representing acaptured ventricular impulse.
Figure 26.4: Single Chamber Atrial Pacemaker. (A) Adiagrammatic representation of an atrial pacemaker. (B) Theelectrocardiogram generated by an atrial pacemaker.The pace-maker stimulus is followed by a P wave, which represents apacemaker captured atrial complex. If atrioventricular conduc-tion is intact, the P wave is followed by a normally conductedQRS complex.
Figure 26.3: Ventricular Pacemaker. Rhythm strip showing a ventricular pacemaker. Each pacemaker stimu-lus (arrow) is followed by a wide QRS complex representing a pacemaker captured ventricular complex.
LWBK271-C26_414-434.qxd 29/1/09 9:42 pm Page 415 LWBK270-4119G-C02_073-110.qxd
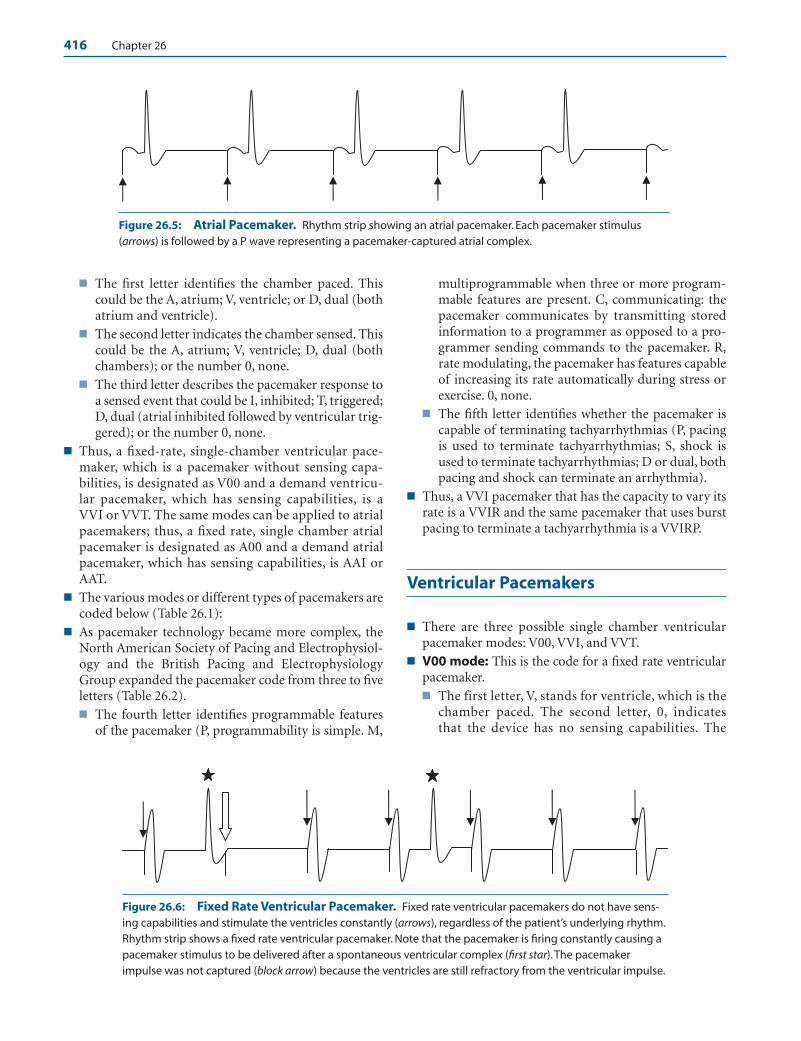
416 Chapter 26
■ The first letter identifies the chamber paced. Thiscould be the A, atrium; V, ventricle; or D, dual (bothatrium and ventricle).
■ The second letter indicates the chamber sensed. Thiscould be the A, atrium; V, ventricle; D, dual (bothchambers); or the number 0, none.
■ The third letter describes the pacemaker response toa sensed event that could be I, inhibited; T, triggered;D, dual (atrial inhibited followed by ventricular trig-gered); or the number 0, none.
■ Thus, a fixed-rate, single-chamber ventricular pace-maker, which is a pacemaker without sensing capa-bilities, is designated as V00 and a demand ventricu-lar pacemaker, which has sensing capabilities, is aVVI or VVT. The same modes can be applied to atrialpacemakers; thus, a fixed rate, single chamber atrialpacemaker is designated as A00 and a demand atrialpacemaker, which has sensing capabilities, is AAI orAAT.
■ The various modes or different types of pacemakers arecoded below (Table 26.1):
■ As pacemaker technology became more complex, theNorth American Society of Pacing and Electrophysiol-ogy and the British Pacing and ElectrophysiologyGroup expanded the pacemaker code from three to fiveletters (Table 26.2).■ The fourth letter identifies programmable features
of the pacemaker (P, programmability is simple. M,
multiprogrammable when three or more program-mable features are present. C, communicating: thepacemaker communicates by transmitting storedinformation to a programmer as opposed to a pro-grammer sending commands to the pacemaker. R,rate modulating, the pacemaker has features capableof increasing its rate automatically during stress orexercise. 0, none.
■ The fifth letter identifies whether the pacemaker iscapable of terminating tachyarrhythmias (P, pacingis used to terminate tachyarrhythmias; S, shock isused to terminate tachyarrhythmias; D or dual, bothpacing and shock can terminate an arrhythmia).
■ Thus, a VVI pacemaker that has the capacity to vary itsrate is a VVIR and the same pacemaker that uses burstpacing to terminate a tachyarrhythmia is a VVIRP.
Ventricular Pacemakers
■ There are three possible single chamber ventricularpacemaker modes: V00, VVI, and VVT.
■ V00 mode: This is the code for a fixed rate ventricularpacemaker.■ The first letter, V, stands for ventricle, which is the
chamber paced. The second letter, 0, indicatesthat the device has no sensing capabilities. The
Figure 26.5: Atrial Pacemaker. Rhythm strip showing an atrial pacemaker. Each pacemaker stimulus (arrows) is followed by a P wave representing a pacemaker-captured atrial complex.
Figure 26.6: Fixed Rate Ventricular Pacemaker. Fixed rate ventricular pacemakers do not have sens-ing capabilities and stimulate the ventricles constantly (arrows), regardless of the patient’s underlying rhythm.Rhythm strip shows a fixed rate ventricular pacemaker. Note that the pacemaker is firing constantly causing apacemaker stimulus to be delivered after a spontaneous ventricular complex (first star).The pacemakerimpulse was not captured (block arrow) because the ventricles are still refractory from the ventricular impulse.
LWBK271-C26_414-434.qxd 29/1/09 9:42 pm Page 416 LWBK270-4119G-C02_073-110.qxd
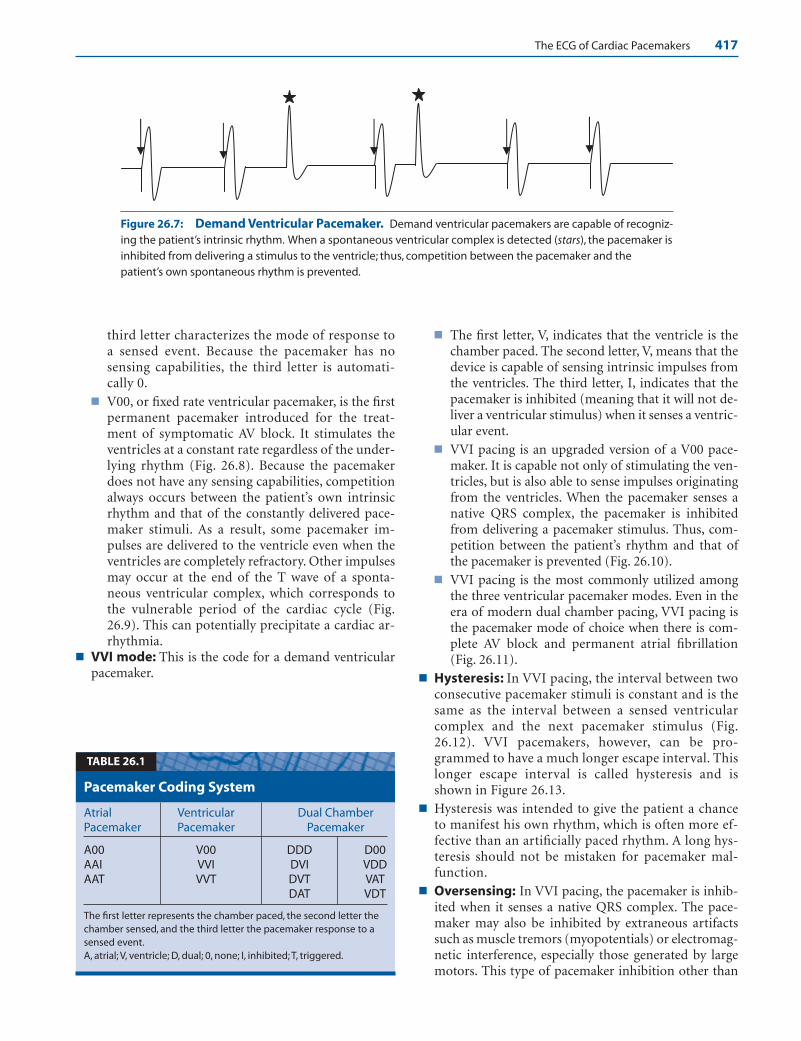
The ECG of Cardiac Pacemakers 417
third letter characterizes the mode of response toa sensed event. Because the pacemaker has nosensing capabilities, the third letter is automati-cally 0.
■ V00, or fixed rate ventricular pacemaker, is the firstpermanent pacemaker introduced for the treat-ment of symptomatic AV block. It stimulates theventricles at a constant rate regardless of the under-lying rhythm (Fig. 26.8). Because the pacemakerdoes not have any sensing capabilities, competitionalways occurs between the patient’s own intrinsicrhythm and that of the constantly delivered pace-maker stimuli. As a result, some pacemaker im-pulses are delivered to the ventricle even when theventricles are completely refractory. Other impulsesmay occur at the end of the T wave of a sponta-neous ventricular complex, which corresponds tothe vulnerable period of the cardiac cycle (Fig.26.9). This can potentially precipitate a cardiac ar-rhythmia.
■ VVI mode: This is the code for a demand ventricularpacemaker.
■ The first letter, V, indicates that the ventricle is thechamber paced. The second letter, V, means that thedevice is capable of sensing intrinsic impulses fromthe ventricles. The third letter, I, indicates that thepacemaker is inhibited (meaning that it will not de-liver a ventricular stimulus) when it senses a ventric-ular event.
■ VVI pacing is an upgraded version of a V00 pace-maker. It is capable not only of stimulating the ven-tricles, but is also able to sense impulses originatingfrom the ventricles. When the pacemaker senses anative QRS complex, the pacemaker is inhibitedfrom delivering a pacemaker stimulus. Thus, com-petition between the patient’s rhythm and that ofthe pacemaker is prevented (Fig. 26.10).
■ VVI pacing is the most commonly utilized amongthe three ventricular pacemaker modes. Even in theera of modern dual chamber pacing, VVI pacing isthe pacemaker mode of choice when there is com-plete AV block and permanent atrial fibrillation(Fig. 26.11).
■ Hysteresis: In VVI pacing, the interval between twoconsecutive pacemaker stimuli is constant and is thesame as the interval between a sensed ventricularcomplex and the next pacemaker stimulus (Fig.26.12). VVI pacemakers, however, can be pro-grammed to have a much longer escape interval. Thislonger escape interval is called hysteresis and isshown in Figure 26.13.
■ Hysteresis was intended to give the patient a chanceto manifest his own rhythm, which is often more ef-fective than an artificially paced rhythm. A long hys-teresis should not be mistaken for pacemaker mal-function.
■ Oversensing: In VVI pacing, the pacemaker is inhib-ited when it senses a native QRS complex. The pace-maker may also be inhibited by extraneous artifactssuch as muscle tremors (myopotentials) or electromag-netic interference, especially those generated by largemotors. This type of pacemaker inhibition other than
Figure 26.7: Demand Ventricular Pacemaker. Demand ventricular pacemakers are capable of recogniz-ing the patient’s intrinsic rhythm. When a spontaneous ventricular complex is detected (stars), the pacemaker isinhibited from delivering a stimulus to the ventricle; thus, competition between the pacemaker and thepatient’s own spontaneous rhythm is prevented.
Atrial Ventricular Dual ChamberPacemaker Pacemaker Pacemaker
A00 V00 DDD D00AAI VVI DVI VDDAAT VVT DVT VAT
DAT VDT
The first letter represents the chamber paced, the second letter thechamber sensed, and the third letter the pacemaker response to asensed event.A, atrial; V, ventricle; D, dual; 0, none; I, inhibited; T, triggered.
Pacemaker Coding System
TABLE 26.1
LWBK271-C26_414-434.qxd 29/1/09 9:42 pm Page 417 LWBK270-4119G-C02_073-110.qxd

418 Chapter 26
Position I II III IV V
Chamber(s) Chamber(s) Response Programmability, AntitachyarrhythmiaCategory Paced Sensed to Sensing Rate Modulation Function(s)
0 0 0 0 0
A A T P P*
V V I M S*
D D D# C D*
R
Manufacturers’ S, single S, single designation only (A or V) (A or V)
NASPE, North American Society of Pacing and Electrophysiology; BPEG, British Pacing and Electrophysiology Group; 0, none; A, atrium; V, ventricle;D, dual (atrium � ventricle); T, triggered; I, inhibited; D#, dual (triggered � inhibited); P, simple programmable; M, multiprogrammable; C, communi-cating; R, rate modulation; P*, pacing (antitachyarrhythmia); S*, shock; D*, dual (pacing and shock).
NASPE/BPEG Generic Pacemaker Code
TABLE 26.2
Figure 26.8: V00 or Fixed Rate Single Chamber Ventricular Pacemaker. V00 pacemakers operate verysatisfactorily when there is no competing rhythm as shown. Note that all pacemaker artifacts (arrows) arecaptured by the ventricles resulting in wide QRS complexes.
Figure 26.9: V00 or Fixed Rate Ventricular Pacemaker. When fixed rate pacing is used, pacemakerartifacts are delivered constantly regardless of the patient’s rhythm (arrows). If the patient has an intrinsic rhythm(stars), some pacemaker artifacts may be delivered at end of the T wave of the preceding intrinsic QRS complex(block arrows) corresponding to the vulnerable period of the cardiac cycle.
Figure 26.10: VVI Pacing. In VVI pacing, the pacemaker is capable of stimulating the ventricles and sensingspontaneous ventricular impulses. The fourth complex is a spontaneous QRS complex (star), which was sensed bythe pacemaker and was inhibited from delivering a ventricular impulse.
LWBK271-C26_414-434.qxd 29/1/09 9:42 pm Page 418 LWBK270-4119G-C02_073-110.qxd
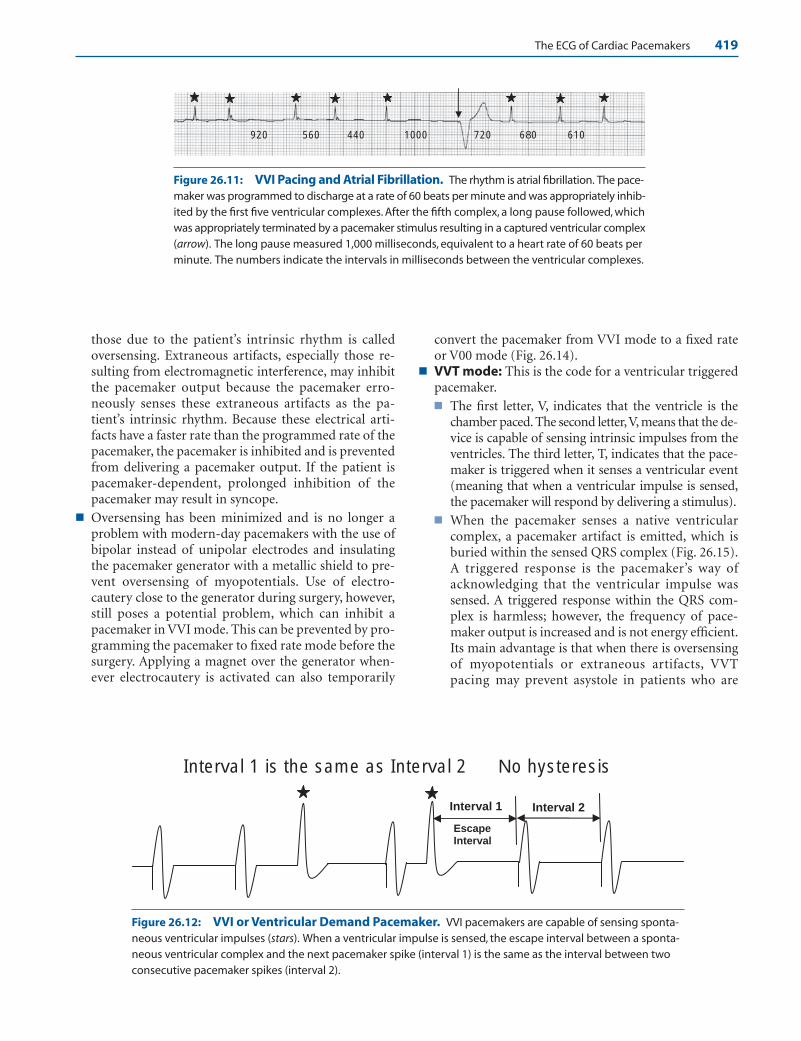
The ECG of Cardiac Pacemakers 419
920 560 440 1000 720 680 610
Interval 2
Escape Interval
Interval 1
Interval 1 is the same as Interval 2 No hysteresis
Figure 26.11: VVI Pacing and Atrial Fibrillation. The rhythm is atrial fibrillation. The pace-maker was programmed to discharge at a rate of 60 beats per minute and was appropriately inhib-ited by the first five ventricular complexes. After the fifth complex, a long pause followed, whichwas appropriately terminated by a pacemaker stimulus resulting in a captured ventricular complex(arrow). The long pause measured 1,000 milliseconds, equivalent to a heart rate of 60 beats perminute. The numbers indicate the intervals in milliseconds between the ventricular complexes.
Figure 26.12: VVI or Ventricular Demand Pacemaker. VVI pacemakers are capable of sensing sponta-neous ventricular impulses (stars). When a ventricular impulse is sensed, the escape interval between a sponta-neous ventricular complex and the next pacemaker spike (interval 1) is the same as the interval between twoconsecutive pacemaker spikes (interval 2).
those due to the patient’s intrinsic rhythm is calledoversensing. Extraneous artifacts, especially those re-sulting from electromagnetic interference, may inhibitthe pacemaker output because the pacemaker erro-neously senses these extraneous artifacts as the pa-tient’s intrinsic rhythm. Because these electrical arti-facts have a faster rate than the programmed rate of thepacemaker, the pacemaker is inhibited and is preventedfrom delivering a pacemaker output. If the patient ispacemaker-dependent, prolonged inhibition of thepacemaker may result in syncope.
■ Oversensing has been minimized and is no longer aproblem with modern-day pacemakers with the use ofbipolar instead of unipolar electrodes and insulatingthe pacemaker generator with a metallic shield to pre-vent oversensing of myopotentials. Use of electro-cautery close to the generator during surgery, however,still poses a potential problem, which can inhibit apacemaker in VVI mode. This can be prevented by pro-gramming the pacemaker to fixed rate mode before thesurgery. Applying a magnet over the generator when-ever electrocautery is activated can also temporarily
convert the pacemaker from VVI mode to a fixed rateor V00 mode (Fig. 26.14).
■ VVT mode: This is the code for a ventricular triggeredpacemaker.■ The first letter, V, indicates that the ventricle is the
chamber paced. The second letter,V, means that the de-vice is capable of sensing intrinsic impulses from theventricles. The third letter, T, indicates that the pace-maker is triggered when it senses a ventricular event(meaning that when a ventricular impulse is sensed,the pacemaker will respond by delivering a stimulus).
■ When the pacemaker senses a native ventricularcomplex, a pacemaker artifact is emitted, which isburied within the sensed QRS complex (Fig. 26.15).A triggered response is the pacemaker’s way ofacknowledging that the ventricular impulse wassensed. A triggered response within the QRS com-plex is harmless; however, the frequency of pace-maker output is increased and is not energy efficient.Its main advantage is that when there is oversensingof myopotentials or extraneous artifacts, VVTpacing may prevent asystole in patients who are
LWBK271-C26_414-434.qxd 29/1/09 9:42 pm Page 419 LWBK270-4119G-C02_073-110.qxd

420 Chapter 26
Escape Interval
Interval 2Interval 1
Hysteresis = Interval 1 > Interval 2
Magnet On Magnet Off
Figure 26.13: Hysteresis. Hysteresis is present when the escape interval after a sensed impulse (interval 1)is longer than the interval between two consecutive pacemaker stimuli (interval 2). The presence of hysteresisshould not be mistaken for pacemaker malfunction.
Figure 26.14: Application of a Magnet. Application of a magnet to the pacemaker generator will con-vert the device to a fixed rate mode. Thus, a VVI pacemaker is converted to a V00 pacemaker with application ofa magnet as shown above. After the magnet is taken off the pacemaker, the pacemaker reverts to a VVI mode.
pacemaker-dependent by delivering a ventricularoutput as opposed to a pacemaker in VVI mode,which is inhibited by these extraneous artifacts.
■ Triggered responses are no longer used in singlechamber pacemakers, but are commonly used indual chamber pacing. For example, when one cham-ber such as the atria senses a native atrial complex,the dual chamber pacemaker is triggered to deliveran output to the ventricles after a programmed in-terval to preserve AV synchrony (see Dual ChamberPacemakers).
Atrial Pacemakers
■ Atrial pacemakers are similar to ventricular pacemak-ers except that the pacemaker generator is connected tothe atrium instead of the ventricle.■ A00 mode: A00 or fixed rate atrial pacemaker con-
tinuously stimulates the atrium regardless of theatrial rhythm (Fig. 26.16).
■ AAI mode: In atrial demand pacemaker, thepacemaker is inhibited from delivering a stimulus
when a spontaneous atrial impulse is sensed (Fig.26.17).
■ AAT mode: When the pacemaker is atrial triggered,the pacemaker is required to deliver a stimulus coin-ciding with the sensed P wave when a spontaneousatrial complex is sensed (Fig. 26.18).
Pacemaker Electrodes
■ Pacemaker electrodes: Most pacemaker electrodesare endocardial electrodes and are inserted transve-nously into the right atrium or right ventricle. Theright atrial electrode is usually anchored to the rightatrial appendage and the ventricular electrode at theapex of the right ventricle. In rare cases in which trans-venous insertion is not possible, a myocardial or epi-cardial lead is sutured into the atrial or ventricular my-ocardium using a transthoracic or subcostal approach.
■ There are two types of pacemaker electrodes: bipolarand unipolar.■ Bipolar: A bipolar electrode has the stimulating
electrode (or cathode) at the tip of the catheter andthe negative electrode (or anode) just below the
LWBK271-C26_414-434.qxd 29/1/09 9:42 pm Page 420 LWBK270-4119G-C02_073-110.qxd
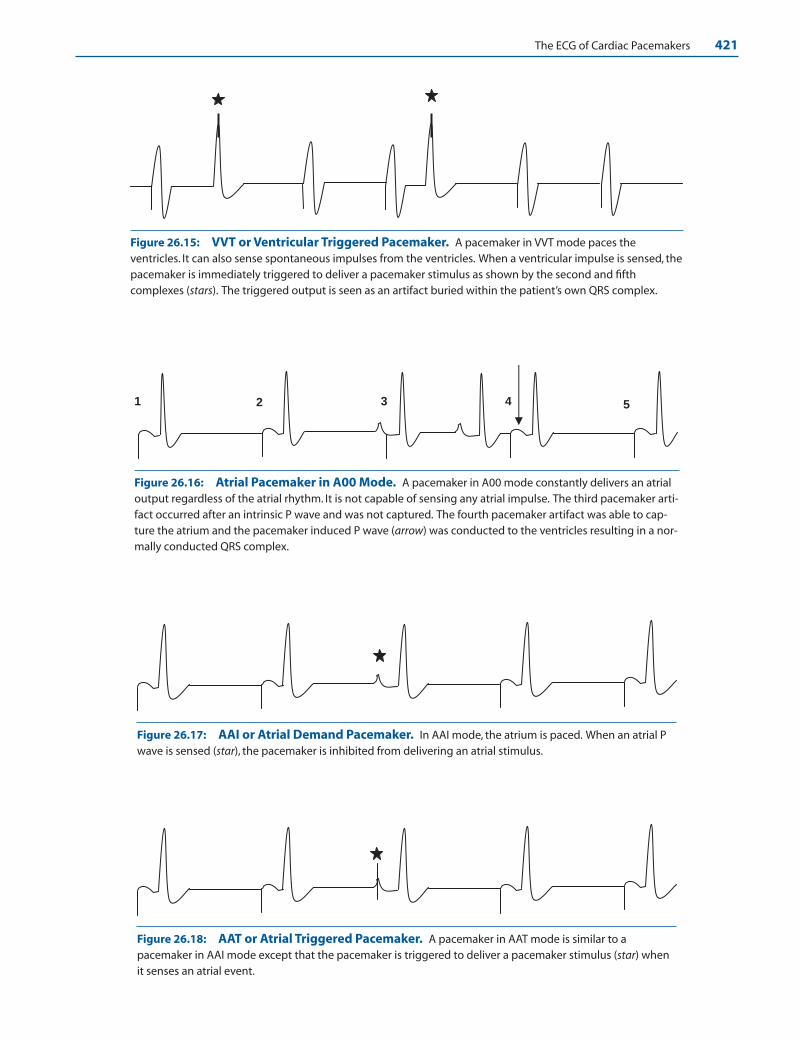
The ECG of Cardiac Pacemakers 421
Figure 26.15: VVT or Ventricular Triggered Pacemaker. A pacemaker in VVT mode paces theventricles. It can also sense spontaneous impulses from the ventricles. When a ventricular impulse is sensed, thepacemaker is immediately triggered to deliver a pacemaker stimulus as shown by the second and fifthcomplexes (stars). The triggered output is seen as an artifact buried within the patient’s own QRS complex.
1 2 3 4 5
Figure 26.16: Atrial Pacemaker in A00 Mode. A pacemaker in A00 mode constantly delivers an atrialoutput regardless of the atrial rhythm. It is not capable of sensing any atrial impulse. The third pacemaker arti-fact occurred after an intrinsic P wave and was not captured. The fourth pacemaker artifact was able to cap-ture the atrium and the pacemaker induced P wave (arrow) was conducted to the ventricles resulting in a nor-mally conducted QRS complex.
Figure 26.17: AAI or Atrial Demand Pacemaker. In AAI mode, the atrium is paced. When an atrial Pwave is sensed (star), the pacemaker is inhibited from delivering an atrial stimulus.
Figure 26.18: AAT or Atrial Triggered Pacemaker. A pacemaker in AAT mode is similar to apacemaker in AAI mode except that the pacemaker is triggered to deliver a pacemaker stimulus (star) whenit senses an atrial event.
LWBK271-C26_414-434.qxd 29/1/09 9:42 pm Page 421 LWBK270-4119G-C02_073-110.qxd

422 Chapter 26
cathode at a distance of about 10 mm (Fig. 26.19A).The short distance between the two terminals causesa smaller pacemaker artifact in the ECG and asmaller antenna effect; thus, the pacemaker is less af-fected by electronic artifacts. Virtually all pacemak-ers today have bipolar electrodes.
■ Unipolar: A unipolar electrode has the stimulatingelectrode (or cathode) at the tip of the catheter andthe negative electrode (or anode) in the metalhousing of the pacemaker generator (Fig. 26.19B).Because the flow of current extends from the apexof the right ventricle (where the cathode is lo-cated), to the pacemaker generator (where the an-ode is located), the pacemaker artifact is unusuallylarge. The wide distance between the two elec-trodes also causes a large antenna effect, renderingthe pacemaker vulnerable to interference by elec-tromagnetic forces.
■ The location of the pacemaker electrode determinesthe morphology of the QRS complex. Stimulation ofthe right ventricle will result in a left bundle branchblock configuration of the QRS complexes (Fig. 26.20).Stimulation of the left ventricle will generate a QRS
complex with a right bundle branch block configura-tion (Fig. 26.21). Not all pacemaker-induced rightbundle branch block patterns are due to left ventricularpacing, however.
Pacemaker Syndrome
■ Pacemaker syndrome: Symptoms of low output,hypotension, and even syncope or near syncope canoccur in patients with cardiac pacemakers, especiallyin VVI mode. This constellation of symptoms duringventricular pacing is called the pacemaker syndrome.Pacemaker syndrome can occur if there is retrogradeconduction of the ventricular impulse to the atria(Fig. 26.22), causing both atria and ventricles to con-tract simultaneously. When the atria contractsagainst a closed mitral and tricuspid valves, pul-monary venous hypertension, low cardiac output,and reflex hypotension can occur. This can be mini-mized with insertion of a dual chamber cardiac pace-maker.
Anode or negative electrode -
+Cathode or stimulating electrode
A BBipolar Catheter
Unipolar Catheter
+
Figure 26.19: Bipolar and UnipolarElectrodes. (A) A bipolar electrode. Both positiveand negative electrodes are a short distance fromeach other within the area of the right ventricle. (B) Aunipolar electrode.The stimulating electrode or cath-ode is located at the tip of the catheter and the nega-tive electrode is in the metal housing of thepacemaker generator.
Figure 26.20: Right Ven-tricular Pacing. When thestimulating electrode is in theright ventricle, the QRS com-plexes have a left bundlebranch block configurationwith deep S waves in V1–V2.
LWBK271-C26_414-434.qxd 29/1/09 9:42 pm Page 422 LWBK270-4119G-C02_073-110.qxd

The ECG of Cardiac Pacemakers 423
Dual Chamber Pacemakers
■ Dual chamber pacemakers: Dual chamber pacingwas introduced to preserve AV synchrony. It has sepa-rate electrodes, one in the ventricle and the other in theatrium. Dual chamber pacing is easy to recognize in theECG when there are two separate pacemaker stimuli,one capturing the atria and the other the ventricles. Itsfunction is more complicated than a single chamber
device because it combines atrial and ventricular sens-ing with atrial and ventricular pacing.
■ The different ECG patterns associated with a dualchamber pacemaker are shown in Figure 26.23.■ Atrial pacing in combination with ventricular pacing ■ Atrial pacing in combination with ventricular sensing■ Atrial sensing in combination with ventricular
pacing■ Atrial sensing in combination with ventricular sensing
Figure 26.21: Left Ventric-ular Pacing. A transvenouscatheter was inserted into theleft ventricle after inadvertentlycrossing a patent foramenovale. Note that the QRS com-plexes in V1 have right bundlebranch block configuration indicative of left ventricularpacing.
Figure 26.22: Ventriculoatrial Conduction during VVI Pacing. Ventriculoatrial (V-A) conduction or conduc-tion of the ventricular impulse to the atria can occur during ventricular pacing resulting in retrograde P waves. TheP waves are seen after the QRS complexes (arrows) and are due to retrograde conduction of the ventricular impulseto the atria across the AV conduction system. Pacemaker syndrome is due to simultaneous contraction of both atriaand ventricles when there is V-A conduction. V-A conduction is possible even in patients with complete AV block.
LWBK271-C26_414-434.qxd 29/1/09 9:42 pm Page 423 LWBK270-4119G-C02_073-110.qxd
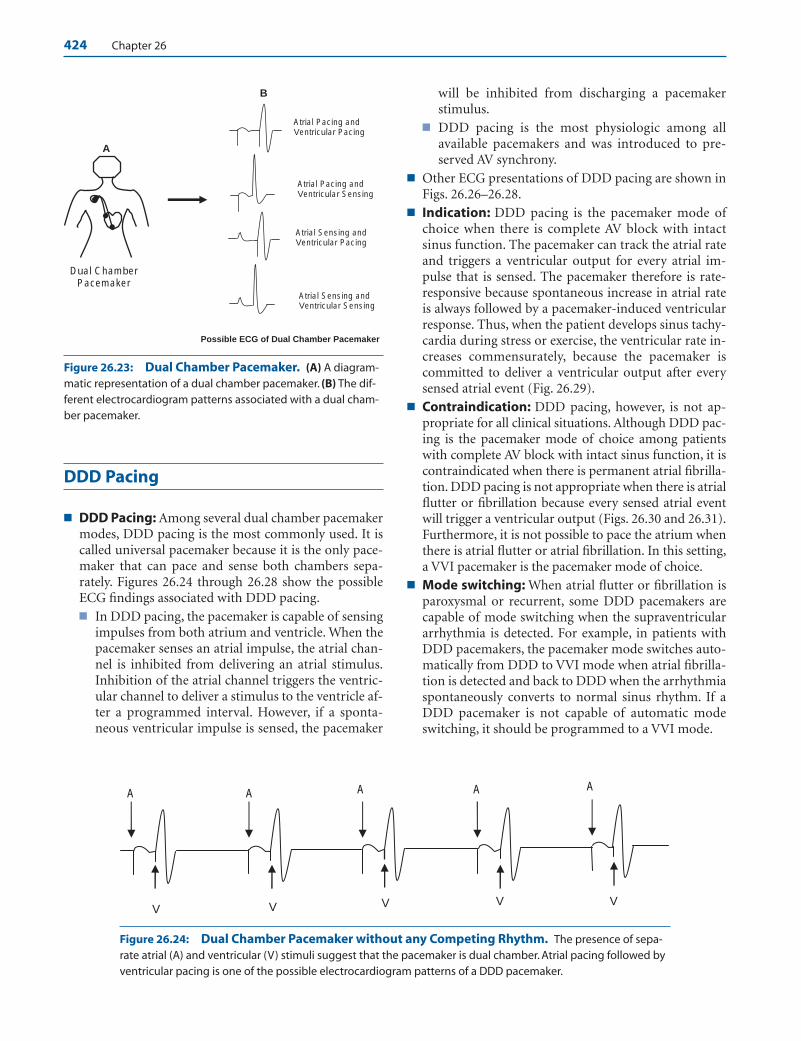
424 Chapter 26
DDD Pacing
■ DDD Pacing: Among several dual chamber pacemakermodes, DDD pacing is the most commonly used. It iscalled universal pacemaker because it is the only pace-maker that can pace and sense both chambers sepa-rately. Figures 26.24 through 26.28 show the possibleECG findings associated with DDD pacing.■ In DDD pacing, the pacemaker is capable of sensing
impulses from both atrium and ventricle. When thepacemaker senses an atrial impulse, the atrial chan-nel is inhibited from delivering an atrial stimulus.Inhibition of the atrial channel triggers the ventric-ular channel to deliver a stimulus to the ventricle af-ter a programmed interval. However, if a sponta-neous ventricular impulse is sensed, the pacemaker
will be inhibited from discharging a pacemakerstimulus.
■ DDD pacing is the most physiologic among allavailable pacemakers and was introduced to pre-served AV synchrony.
■ Other ECG presentations of DDD pacing are shown inFigs. 26.26–26.28.
■ Indication: DDD pacing is the pacemaker mode ofchoice when there is complete AV block with intactsinus function. The pacemaker can track the atrial rateand triggers a ventricular output for every atrial im-pulse that is sensed. The pacemaker therefore is rate-responsive because spontaneous increase in atrial rateis always followed by a pacemaker-induced ventricularresponse. Thus, when the patient develops sinus tachy-cardia during stress or exercise, the ventricular rate in-creases commensurately, because the pacemaker iscommitted to deliver a ventricular output after everysensed atrial event (Fig. 26.29).
■ Contraindication: DDD pacing, however, is not ap-propriate for all clinical situations. Although DDD pac-ing is the pacemaker mode of choice among patientswith complete AV block with intact sinus function, it iscontraindicated when there is permanent atrial fibrilla-tion. DDD pacing is not appropriate when there is atrialflutter or fibrillation because every sensed atrial eventwill trigger a ventricular output (Figs. 26.30 and 26.31).Furthermore, it is not possible to pace the atrium whenthere is atrial flutter or atrial fibrillation. In this setting,a VVI pacemaker is the pacemaker mode of choice.
■ Mode switching: When atrial flutter or fibrillation isparoxysmal or recurrent, some DDD pacemakers arecapable of mode switching when the supraventriculararrhythmia is detected. For example, in patients withDDD pacemakers, the pacemaker mode switches auto-matically from DDD to VVI mode when atrial fibrilla-tion is detected and back to DDD when the arrhythmiaspontaneously converts to normal sinus rhythm. If aDDD pacemaker is not capable of automatic modeswitching, it should be programmed to a VVI mode.
B
A
Possible ECG of Dual Chamber Pacemaker
Dual Chamber Pacemaker
Atrial Pacing and Ventricular Pacing
Atrial Pacing and Ventricular Sensing
Atrial Sensing and Ventricular Pacing
Atrial Sensing and Ventricular Sensing
A
V
A A A A
VVV V
Figure 26.23: Dual Chamber Pacemaker. (A) A diagram-matic representation of a dual chamber pacemaker. (B) The dif-ferent electrocardiogram patterns associated with a dual cham-ber pacemaker.
Figure 26.24: Dual Chamber Pacemaker without any Competing Rhythm. The presence of sepa-rate atrial (A) and ventricular (V) stimuli suggest that the pacemaker is dual chamber. Atrial pacing followed byventricular pacing is one of the possible electrocardiogram patterns of a DDD pacemaker.
LWBK271-C26_414-434.qxd 29/1/09 9:42 pm Page 424 LWBK270-4119G-C02_073-110.qxd
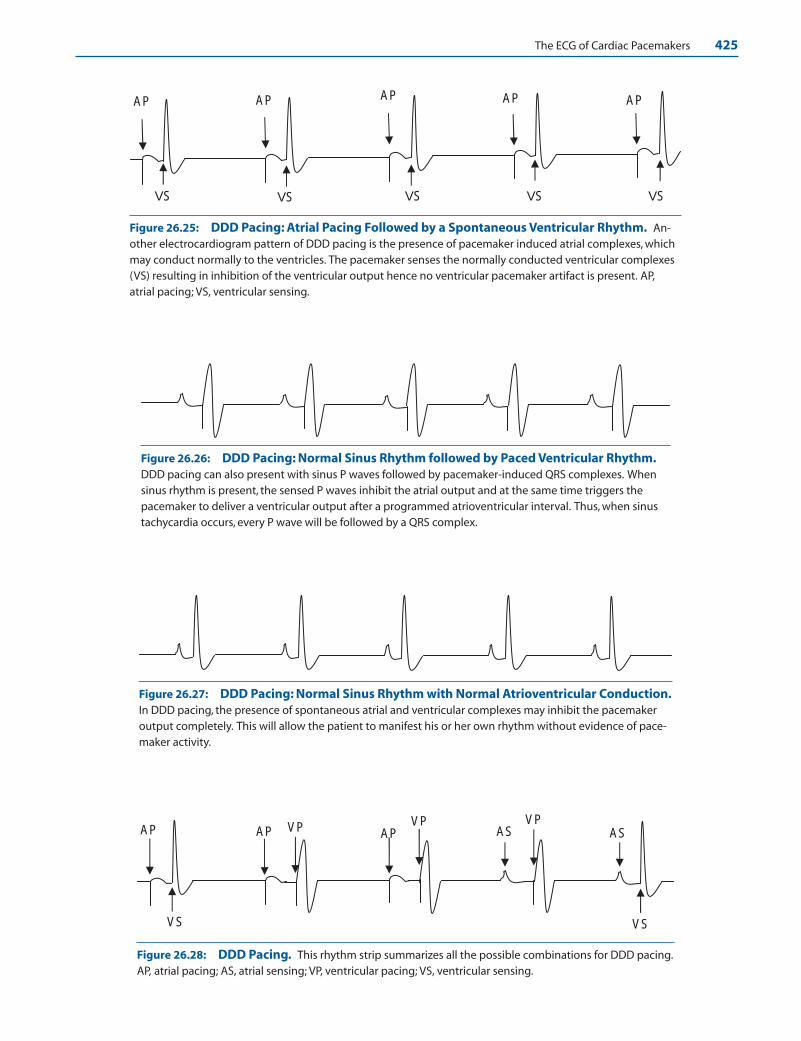
The ECG of Cardiac Pacemakers 425
AP
VS
AP AP
VS VS VS
AP
VS
AP
Figure 26.25: DDD Pacing: Atrial Pacing Followed by a Spontaneous Ventricular Rhythm. An-other electrocardiogram pattern of DDD pacing is the presence of pacemaker induced atrial complexes, whichmay conduct normally to the ventricles. The pacemaker senses the normally conducted ventricular complexes(VS) resulting in inhibition of the ventricular output hence no ventricular pacemaker artifact is present. AP,atrial pacing; VS, ventricular sensing.
AP AP AP AS ASVP VP VP
VS VS
Figure 26.26: DDD Pacing: Normal Sinus Rhythm followed by Paced Ventricular Rhythm.DDD pacing can also present with sinus P waves followed by pacemaker-induced QRS complexes. Whensinus rhythm is present, the sensed P waves inhibit the atrial output and at the same time triggers thepacemaker to deliver a ventricular output after a programmed atrioventricular interval. Thus, when sinustachycardia occurs, every P wave will be followed by a QRS complex.
Figure 26.27: DDD Pacing: Normal Sinus Rhythm with Normal Atrioventricular Conduction.In DDD pacing, the presence of spontaneous atrial and ventricular complexes may inhibit the pacemakeroutput completely. This will allow the patient to manifest his or her own rhythm without evidence of pace-maker activity.
Figure 26.28: DDD Pacing. This rhythm strip summarizes all the possible combinations for DDD pacing.AP, atrial pacing; AS, atrial sensing; VP, ventricular pacing; VS, ventricular sensing.
LWBK271-C26_414-434.qxd 29/1/09 9:42 pm Page 425 LWBK270-4119G-C02_073-110.qxd
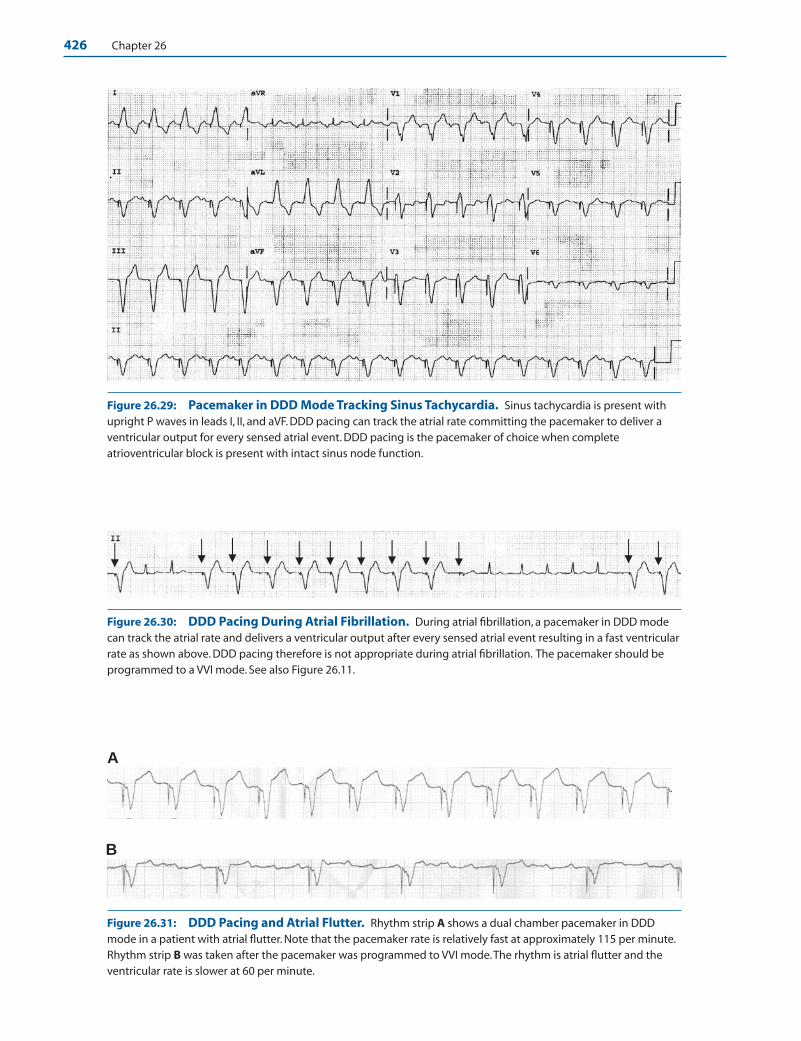
426 Chapter 26
A
B
Figure 26.29: Pacemaker in DDD Mode Tracking Sinus Tachycardia. Sinus tachycardia is present withupright P waves in leads I, II, and aVF. DDD pacing can track the atrial rate committing the pacemaker to deliver aventricular output for every sensed atrial event. DDD pacing is the pacemaker of choice when completeatrioventricular block is present with intact sinus node function.
Figure 26.30: DDD Pacing During Atrial Fibrillation. During atrial fibrillation, a pacemaker in DDD modecan track the atrial rate and delivers a ventricular output after every sensed atrial event resulting in a fast ventricularrate as shown above. DDD pacing therefore is not appropriate during atrial fibrillation. The pacemaker should beprogrammed to a VVI mode. See also Figure 26.11.
Figure 26.31: DDD Pacing and Atrial Flutter. Rhythm strip A shows a dual chamber pacemaker in DDDmode in a patient with atrial flutter. Note that the pacemaker rate is relatively fast at approximately 115 per minute.Rhythm strip B was taken after the pacemaker was programmed to VVI mode.The rhythm is atrial flutter and theventricular rate is slower at 60 per minute.
LWBK271-C26_414-434.qxd 29/1/09 9:42 pm Page 426 LWBK270-4119G-C02_073-110.qxd
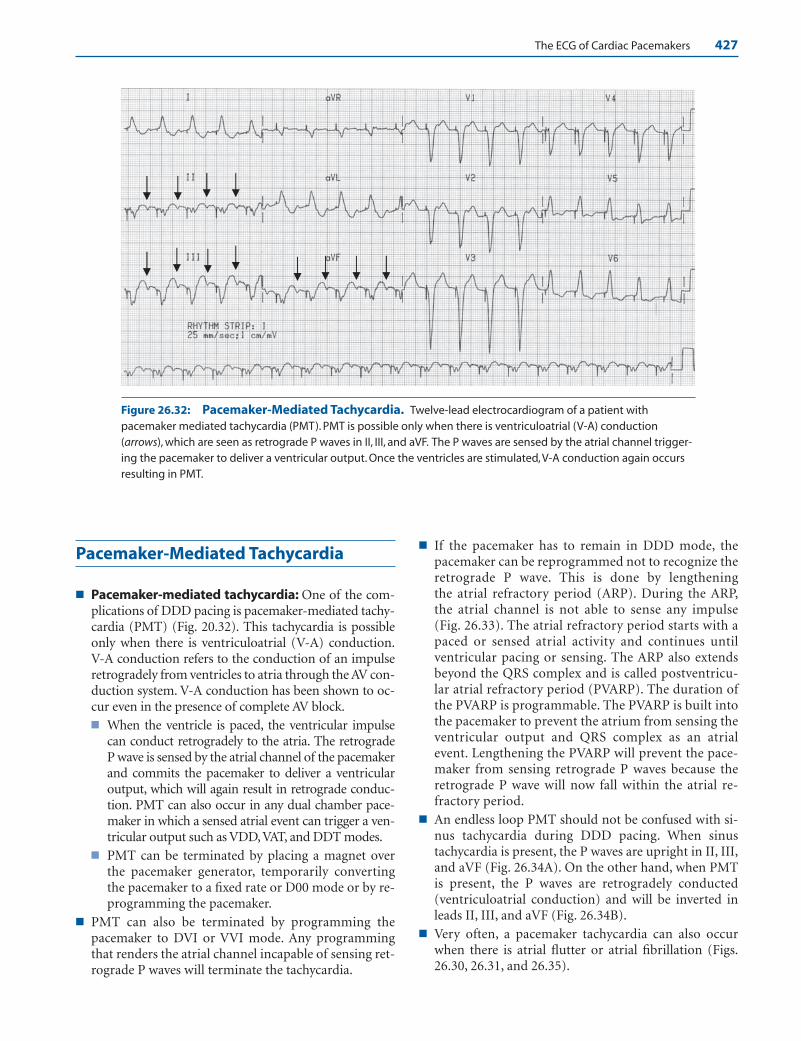
The ECG of Cardiac Pacemakers 427
Pacemaker-Mediated Tachycardia
■ Pacemaker-mediated tachycardia: One of the com-plications of DDD pacing is pacemaker-mediated tachy-cardia (PMT) (Fig. 20.32). This tachycardia is possibleonly when there is ventriculoatrial (V-A) conduction.V-A conduction refers to the conduction of an impulseretrogradely from ventricles to atria through the AV con-duction system. V-A conduction has been shown to oc-cur even in the presence of complete AV block.■ When the ventricle is paced, the ventricular impulse
can conduct retrogradely to the atria. The retrograde P wave is sensed by the atrial channel of the pacemakerand commits the pacemaker to deliver a ventricularoutput, which will again result in retrograde conduc-tion. PMT can also occur in any dual chamber pace-maker in which a sensed atrial event can trigger a ven-tricular output such as VDD, VAT, and DDT modes.
■ PMT can be terminated by placing a magnet overthe pacemaker generator, temporarily convertingthe pacemaker to a fixed rate or D00 mode or by re-programming the pacemaker.
■ PMT can also be terminated by programming thepacemaker to DVI or VVI mode. Any programmingthat renders the atrial channel incapable of sensing ret-rograde P waves will terminate the tachycardia.
■ If the pacemaker has to remain in DDD mode, thepacemaker can be reprogrammed not to recognize theretrograde P wave. This is done by lengthening the atrial refractory period (ARP). During the ARP,the atrial channel is not able to sense any impulse(Fig. 26.33). The atrial refractory period starts with apaced or sensed atrial activity and continues untilventricular pacing or sensing. The ARP also extendsbeyond the QRS complex and is called postventricu-lar atrial refractory period (PVARP). The duration ofthe PVARP is programmable. The PVARP is built intothe pacemaker to prevent the atrium from sensing theventricular output and QRS complex as an atrialevent. Lengthening the PVARP will prevent the pace-maker from sensing retrograde P waves because theretrograde P wave will now fall within the atrial re-fractory period.
■ An endless loop PMT should not be confused with si-nus tachycardia during DDD pacing. When sinustachycardia is present, the P waves are upright in II, III,and aVF (Fig. 26.34A). On the other hand, when PMTis present, the P waves are retrogradely conducted(ventriculoatrial conduction) and will be inverted inleads II, III, and aVF (Fig. 26.34B).
■ Very often, a pacemaker tachycardia can also occurwhen there is atrial flutter or atrial fibrillation (Figs.26.30, 26.31, and 26.35).
Figure 26.32: Pacemaker-Mediated Tachycardia. Twelve-lead electrocardiogram of a patient withpacemaker mediated tachycardia (PMT). PMT is possible only when there is ventriculoatrial (V-A) conduction(arrows), which are seen as retrograde P waves in II, III, and aVF. The P waves are sensed by the atrial channel trigger-ing the pacemaker to deliver a ventricular output. Once the ventricles are stimulated, V-A conduction again occursresulting in PMT.
LWBK271-C26_414-434.qxd 29/1/09 9:42 pm Page 427 LWBK270-4119G-C02_073-110.qxd
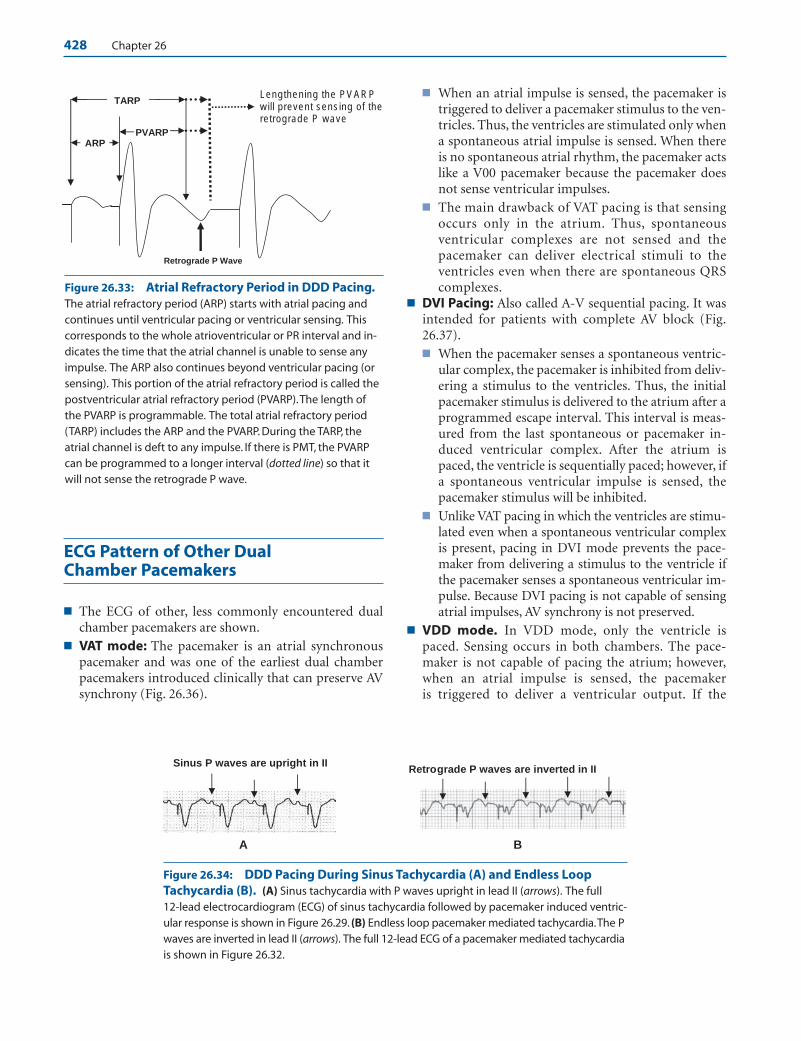
428 Chapter 26
ECG Pattern of Other Dual Chamber Pacemakers
■ The ECG of other, less commonly encountered dualchamber pacemakers are shown.
■ VAT mode: The pacemaker is an atrial synchronouspacemaker and was one of the earliest dual chamberpacemakers introduced clinically that can preserve AVsynchrony (Fig. 26.36).
■ When an atrial impulse is sensed, the pacemaker istriggered to deliver a pacemaker stimulus to the ven-tricles. Thus, the ventricles are stimulated only whena spontaneous atrial impulse is sensed. When thereis no spontaneous atrial rhythm, the pacemaker actslike a V00 pacemaker because the pacemaker doesnot sense ventricular impulses.
■ The main drawback of VAT pacing is that sensingoccurs only in the atrium. Thus, spontaneousventricular complexes are not sensed and thepacemaker can deliver electrical stimuli to theventricles even when there are spontaneous QRScomplexes.
■ DVI Pacing: Also called A-V sequential pacing. It wasintended for patients with complete AV block (Fig.26.37).■ When the pacemaker senses a spontaneous ventric-
ular complex, the pacemaker is inhibited from deliv-ering a stimulus to the ventricles. Thus, the initialpacemaker stimulus is delivered to the atrium after aprogrammed escape interval. This interval is meas-ured from the last spontaneous or pacemaker in-duced ventricular complex. After the atrium ispaced, the ventricle is sequentially paced; however, ifa spontaneous ventricular impulse is sensed, thepacemaker stimulus will be inhibited.
■ Unlike VAT pacing in which the ventricles are stimu-lated even when a spontaneous ventricular complexis present, pacing in DVI mode prevents the pace-maker from delivering a stimulus to the ventricle ifthe pacemaker senses a spontaneous ventricular im-pulse. Because DVI pacing is not capable of sensingatrial impulses, AV synchrony is not preserved.
■ VDD mode. In VDD mode, only the ventricle ispaced. Sensing occurs in both chambers. The pace-maker is not capable of pacing the atrium; however,when an atrial impulse is sensed, the pacemaker is triggered to deliver a ventricular output. If the
PVARP
TARP
ARP
Lengthening the PVARP will prevent sensing of the retrograde P wave
Retrograde P Wave
Figure 26.33: Atrial Refractory Period in DDD Pacing.The atrial refractory period (ARP) starts with atrial pacing andcontinues until ventricular pacing or ventricular sensing. Thiscorresponds to the whole atrioventricular or PR interval and in-dicates the time that the atrial channel is unable to sense anyimpulse. The ARP also continues beyond ventricular pacing (orsensing). This portion of the atrial refractory period is called thepostventricular atrial refractory period (PVARP).The length ofthe PVARP is programmable. The total atrial refractory period(TARP) includes the ARP and the PVARP. During the TARP, theatrial channel is deft to any impulse. If there is PMT, the PVARPcan be programmed to a longer interval (dotted line) so that itwill not sense the retrograde P wave.
Sinus P waves are upright in II Retrograde P waves are inverted in II
A B
Figure 26.34: DDD Pacing During Sinus Tachycardia (A) and Endless LoopTachycardia (B). (A) Sinus tachycardia with P waves upright in lead II (arrows). The full 12-lead electrocardiogram (ECG) of sinus tachycardia followed by pacemaker induced ventric-ular response is shown in Figure 26.29. (B) Endless loop pacemaker mediated tachycardia.The Pwaves are inverted in lead II (arrows). The full 12-lead ECG of a pacemaker mediated tachycardiais shown in Figure 26.32.
LWBK271-C26_414-434.qxd 29/1/09 9:42 pm Page 428 LWBK270-4119G-C02_073-110.qxd
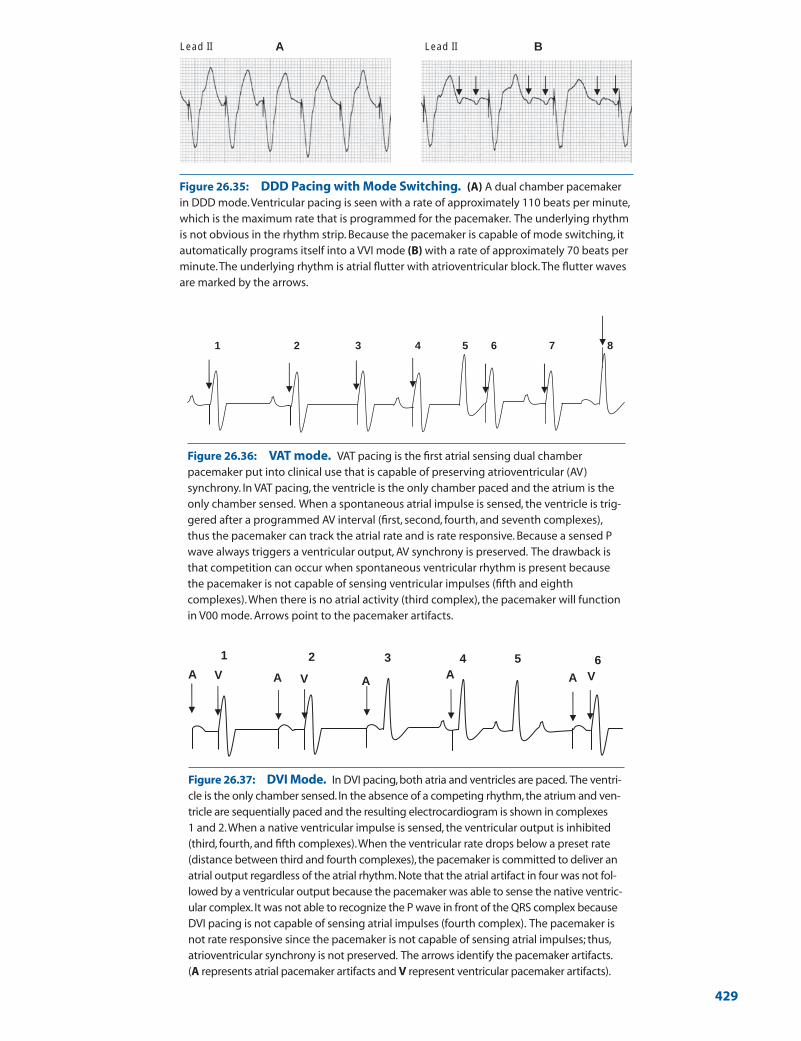
A BLead II Lead II
Figure 26.35: DDD Pacing with Mode Switching. (A) A dual chamber pacemakerin DDD mode.Ventricular pacing is seen with a rate of approximately 110 beats per minute,which is the maximum rate that is programmed for the pacemaker. The underlying rhythmis not obvious in the rhythm strip. Because the pacemaker is capable of mode switching, itautomatically programs itself into a VVI mode (B) with a rate of approximately 70 beats perminute.The underlying rhythm is atrial flutter with atrioventricular block.The flutter wavesare marked by the arrows.
1 2 3 4 6 75 8
A A AAA V VV
3 4 51 2 6
Figure 26.36: VAT mode. VAT pacing is the first atrial sensing dual chamberpacemaker put into clinical use that is capable of preserving atrioventricular (AV)synchrony. In VAT pacing, the ventricle is the only chamber paced and the atrium is theonly chamber sensed. When a spontaneous atrial impulse is sensed, the ventricle is trig-gered after a programmed AV interval (first, second, fourth, and seventh complexes),thus the pacemaker can track the atrial rate and is rate responsive. Because a sensed Pwave always triggers a ventricular output, AV synchrony is preserved. The drawback isthat competition can occur when spontaneous ventricular rhythm is present becausethe pacemaker is not capable of sensing ventricular impulses (fifth and eighthcomplexes).When there is no atrial activity (third complex), the pacemaker will functionin V00 mode. Arrows point to the pacemaker artifacts.
Figure 26.37: DVI Mode. In DVI pacing, both atria and ventricles are paced. The ventri-cle is the only chamber sensed. In the absence of a competing rhythm, the atrium and ven-tricle are sequentially paced and the resulting electrocardiogram is shown in complexes 1 and 2.When a native ventricular impulse is sensed, the ventricular output is inhibited(third, fourth, and fifth complexes).When the ventricular rate drops below a preset rate(distance between third and fourth complexes), the pacemaker is committed to deliver anatrial output regardless of the atrial rhythm. Note that the atrial artifact in four was not fol-lowed by a ventricular output because the pacemaker was able to sense the native ventric-ular complex. It was not able to recognize the P wave in front of the QRS complex becauseDVI pacing is not capable of sensing atrial impulses (fourth complex). The pacemaker isnot rate responsive since the pacemaker is not capable of sensing atrial impulses; thus,atrioventricular synchrony is not preserved. The arrows identify the pacemaker artifacts.(A represents atrial pacemaker artifacts and V represent ventricular pacemaker artifacts).
429
LWBK271-C26_414-434.qxd 29/1/09 9:42 pm Page 429 LWBK270-4119G-C02_073-110.qxd

430 Chapter 26
pacemaker senses a spontaneous ventricular complex, itis inhibited from delivering a pacemaker stimulus to theventricles. The pacemaker will function as a VVI pacer ifit does not sense any spontaneous atrial complex (Fig.26.38).
■ DDI pacing: In DDI pacing, the atrial or ventricular out-puts are inhibited when atrial or ventricular impulses aresensed. Although atrial sensing occurs, the pacemaker isnot triggered to deliver a ventricular stimulus, thus thepacemaker is not rate responsive (Fig. 26.39).
Pacemaker with AntitachycardiaProperties
■ Pacemakers are also capable of terminating ventriculartachycardia. The rhythm strips in Figures 26.40 and26.41 show a VVIRP pacemaker, which is capable of
terminating ventricular tachycardia with burst pacing.This is usually accomplished by delivering a series ofventricular pacemaker stimuli in an attempt to capturethe ventricles during the tachycardia. Figure 26.40shows ventricular tachycardia terminated successfullyby burst pacing.
■ In Figure 26.41, burst pacing was delivered inappropri-ately during a sinus tachycardia, which was mistakenfor ventricular tachycardia. After burst pacing wascompleted, the rhythm had deteriorated from sinustachycardia to ventricular tachycardia.
Biventricular Pacemakers andCardioverter Defibrillators
■ Biventricular pacemakers: Patients with wide QRScomplexes resulting from left or right bundle branch
321 5 64
1 2 4 653
Figure 26.38: VDD Mode. In VDD mode only the ventricle is paced. The pacemaker iscapable of sensing impulses from both atrium and ventricle (first two complexes). Whenan atrial impulse is sensed, the pacemaker is triggered to deliver a ventricular output aftera programmed atrioventricular (AV) interval (third and fourth complexes). When a ventricu-lar complex is sensed, the pacemaker is inhibited from delivering a ventricular output (fifthcomplex). When the atrial rate is fast, the pacemaker can track the atrial rate and is thereforerate responsive similar to a DDD pacemaker. However, when the atrial rate is unusually slowor when there is no atrial activity (pause after the fifth complex), the pacemaker functionsin the VVI mode (sixth complex) because the pacemaker is not capable of pacing theatrium and loses its advantage as a dual chamber pacemaker in preserving AV synchrony.
Figure 26.39: DDI mode. Both atrium and ventricle are paced (first two complexes).The pacemaker is capable of sensing impulses from both atrium and ventricle. When anatrial impulse is sensed (star), the pacemaker is inhibited from delivering an atrial output.When a ventricular impulse is sensed (third and fifth complexes), the pacemaker isinhibited from delivering a ventricular output. When the atrial rhythm is unusually slow orwhen there is no atrial activity (pause after the fifth complex), atrial pacing is initiated whenthe lower rate limit of the pacemaker is reached (sixth complex). This is followed by a ven-tricular output unless a spontaneous ventricular complex occurs. Although the pacemakeris capable of sensing atrial impulses, the ventricular output is not triggered when an atrialimpulse is sensed (star). The pacemaker therefore is not rate responsive since it is not capa-ble of increasing the ventricular rate when the atrial rate increases during stress or exercise.
LWBK271-C26_414-434.qxd 29/1/09 9:42 pm Page 430 LWBK270-4119G-C02_073-110.qxd

The ECG of Cardiac Pacemakers 431
block, severe left ventricular systolic dysfunction (ejec-tion fraction �35%), and symptoms of heart failure inspite of optimal medical therapy are candidates for im-plantation of biventricular pacemakers. Biventricularpacing is performed by pacing both ventricles simultane-ously, even in the absence of bradyarrhythmias from AVblock or sinus node dysfunction. Biventricular pacingsynchronizes ventricular contraction in patients withbundle branch block and has been shown to improvecardiac output in patients with wide QRS complexes whoalso have severe left ventricular dysfunction. The left ven-tricle is paced with an electrode inserted through thecoronary sinus. The right atrium and right ventricle arepaced conventionally. Patients with severe left ventriculardysfunction are also at risk for malignant ventricular ar-rhythmias. Thus, patients with heart failure requiringbiventricular pacemakers are also candidates for implan-tation of devices with defibrillating properties.
■ Automatic implantable devices: Patients who aresurvivors of cardiac arrest or patients who are high riskfor ventricular tachycardia or fibrillation are candi-dates for implantation of automatic cardioverter defib-rillators. These devices are commonly integrated withbiventricular pacemakers in patients undergoing car-
diac resynchronization therapy. Thus, automatic im-plantable defibrillators are commonly integrated withpacemakers and permanent pacemakers are integratedwith defibrillating properties, making them capable oftreating both bradycardia and tachycardia. An exampleof a patient with an implantable cardioverter/defibrilla-tor (ICD) whose ventricular tachycardia is terminatedby delivery of an electrical shock is shown in Figure26.42. Although the defibrillator also has pacemakingproperties, pacemaker activity was not necessary aftersuccessful cardioversion.
Artificial Cardiac Pacemakers:Clinical Implications
■ Permanent pacemakers were clinically introduced for thetreatment of symptomatic bradyarrhythmias from completeAV block and sinus node dysfunction. Single chamber ven-tricular pacemakers were the first generation of implantabledevices used for this purpose. Single chamber ventricularpacemakers, however, do not preserve AV synchrony. Further-more, ventricular pacing can result in pacemaker syndrome.
Overdrive Pacing Ventricular Tachycardia Normal Sinus Rhythm
Sinus Tachycardia Mistaken for
Ventricular Tachycardia Overdrive Pacing Ventricular Tachycardia
Figure 26.40: Overdrive Pacing Terminating Ventricular Tachycardia. The left side of the tracingshows ventricular tachycardia with a rate of 180 beats per minute. The pacemaker recognizes the ventriculartachycardia and delivers a burst of ventricular pacemaker stimuli, which is faster than the rate of the ventricu-lar tachycardia. The pacemaker successfully captures the ventricles during pacing. When pacing is terminated,the rhythm is successfully converted to a slower ventricular rhythm followed by normal sinus rhythm.
Figure 26.41: VVIRP. Rhythm strip shows a rate responsive VVI pacemaker with features capable ofterminating a tachyarrhythmia using burst pacing (VVIRP). In the rhythm strip, the pacemaker mistookthe sinus tachycardia for ventricular tachycardia and inappropriately delivered a burst of 10 ventricularpacemaker stimuli, which is successful in capturing the ventricles. When pacing was terminated, therhythm had changed to ventricular tachycardia as noted at the end of the rhythm strip.
LWBK271-C26_414-434.qxd 29/1/09 9:42 pm Page 431 LWBK270-4119G-C02_073-110.qxd

432 Chapter 26
■ Pacemaker syndrome is a hemodynamic consequence ofventricular pacing. This is mainly from retrograde or ven-triculoatrial conduction of the paced ventricular impulse tothe atria. This is characterized by cannon A waves in the neckfrom contraction of the atria when the mitral and tricuspidvalves are closed. Increase in atrial and pulmonary venouspressures can occur when the atria are contracting against aclosed AV valve, resulting in shortness of breath as well as re-flex drop in blood pressure. This overall symptom complexof hypotension, shortness of breath, and low cardiac outputis called the pacemaker syndrome.
■ Single chamber ventricular pacemakers have been replacedby dual chamber pacemakers, which are more physiologic,because AV synchrony is preserved. Although single channelAAI pacemakers can also preserve AV synchrony, they arelimited to patients with intact AV conduction and are not in-dicated in the presence of complete AV block. VVI pacemak-ers remain the most commonly implanted pacemaker world-wide. In the United States, most pacemakers that areimplanted are dual chamber devices in DDD mode.
■ VVI pacing continues to be the pacemaker mode of choicewhen complete AV block occurs in the setting of permanentatrial fibrillation. DDD pacing is contraindicated because itis not possible to pace the atrium when there is atrial flutteror fibrillation. Furthermore, the presence of atrial flutter orfibrillation will commit the pacemaker to deliver a ventricu-lar output for every sensed atrial event resulting in unneces-sary tachycardia.
■ Although single chamber atrial pacemaker is the most ap-propriate device for patients with sick sinus syndrome, dualchamber pacing in DDD mode is more often used. Sick sinussyndrome is most commonly the result of degenerative dis-ease that affects not only the sinus node but may eventuallyinvolve the AV node and distal conduction system.
■ Pacemakers are sometimes inappropriately inhibited by extra-neous impulses such as muscle tremors, electrocautery, mi-crowaves, magnetic fields, and other artifacts. Oversensing ofthese artifacts has been minimized with the use of bipolar elec-trodes where the anode or negative electrode is mounted just ashort distance from the tip of the catheter thus shortening thedistance between the two electrodes and the size of the antenna.If electrocautery is performed during a surgical procedure, it
should not involve the area of the pacemaker generator. If thiscannot be avoided, the pacemaker can be programmed to afixed rate mode or a magnet can be placed over the generator totemporarily convert the pacemaker to a fixed rate mode. Pace-makers with sensing capabilities (VVI, DDD pacemakers) aretemporarily converted to a fixed rate (V00, D00) mode when amagnet is placed over a pacemaker generator.
■ Endless loop or pacemaker-mediated tachycardia can occurwith DDD pacing as well as with other modes of pacing suchas VDD, VAT, and DDT. The tachycardia can be terminatedby reprogramming the pacemaker to other modes such asVVI or DVI or a magnet can be applied to the pacemakergenerator, temporarily converting the pacemaker to a fixedrate or D00 mode. If the pacemaker needs to remain in DDDmode, the pacemaker can be programmed not to recognizethe retrograde P wave by lengthening the refractory period ofthe atrial channel.
■ Permanent pacemakers: The indications for insertion ofpermanent pacemakers in patients with acquired AV block arediscussed in Chapter 8, Atrioventricular Block; for patientswith intraventricular conduction defect, in Chapter 11, Intra-ventricular Conduction Defect: Trifascicular Block; and forpatients with sick sinus syndrome, in Chapter 12, Sinus NodeDysfunction.
■ Whenever there is a need for a permanent pacemaker, twoother conditions should always be considered before the per-manent pacemaker is implanted: the need for biventricularpacemaker in patients with bundle branch block and theneed for ICD in patients with left ventricular dysfunction.
■ Biventricular pacemakers: Implantation of biventricularpacemaker (also called cardiac resynchronization therapy),is indicated in patients with a QRS duration of �0.12 sec-onds, who have systolic left ventricular dysfunction (ejec-tion fraction �35%) and continue to have symptoms ofheart failure (Class III or Class IV) in spite of optimal med-ical therapy for heart failure. Cardiac resynchronization isperformed by pacing both ventricles simultaneously. Si-multaneous pacing of both ventricles will significantly de-crease the delay in the spread of electrical impulse to bothventricles when there is bundle branch block. Biventricularpacing has been shown to improve cardiac output in patientswith wide QRS complexes. The patient should be in normal
Figure 26.42: Automatic Implantable Cardioverter Defibrillator (AICD). Rhythm strip showing a widecomplex tachycardia on the left half of the rhythm strip.The AICD was able to recognize the ventricular tachycardiaand automatically delivered an electrical shock (arrow) that successfully converted the rhythm to normal sinus (rightside of the tracing).
LWBK271-C26_414-434.qxd 29/1/09 9:42 pm Page 432 LWBK270-4119G-C02_073-110.qxd
The ECG of Cardiac Pacemakers 433
sinus rhythm so that timing of atrial and ventricular con-traction can be synchronized. Although most patients whohave received biventricular pacemakers have left bundlebranch block, currently, the width of the QRS complexrather than the type of bundle branch block is the main in-dication for biventricular pacing.
■ Implantable cardioverter defibrillators: Patients withsevere left ventricular dysfunction are at risk for suddencardiac death due to ventricular tachycardia or ventricu-lar fibrillation. These patients therefore are also candi-dates for implantation of ICD.
n Secondary prevention: ICD may be implanted forsecondary prevention of sudden cardiac death imply-ing that these patients have experienced and surviveda previous episode of cardiac arrest or sustained ven-tricular tachycardia.
n Primary prevention: These patients have not experi-enced any previous arrhythmias or cardiac arrest butare high risk for ventricular tachycardia or ventricularfibrillation. For primary prevention of sudden cardiacdeath, the following are Class I indications for implan-tation of ICD according to the American College ofCardiology/American Heart Association/Heart RhythmSociety 2008 guidelines for device-based therapy ofcardiac rhythm abnormalities.
n Left ventricular ejection fraction �35% due toprior myocardial infarction (MI) who are at least40 days post-MI and are in New York HeartAssociation (NYHA) functional Class II or III.
n Nonischemic dialated cardiomyopathy with ejec-tion fraction �35% and who are in NYHA func-tional Class II or III.
n The following are Class IIa recommendations forprimary prevention of sudden cardiac death.
n Left ventricular dysfunction due to prior MI whoare at least 40 days post-MI, have an ejection frac-tion �30% and are in NYHA functional Class I.
n Selected patients with idiopathic hypertrophicsubaortic stenosis who have 1 or more major riskfactors for sudden cardiac death. This includesstrong family history of sudden cardiac death, ab-normal blood pressure response during exercisetesting, unusually thick ventricular septum �3.0cm, and spontaneous nonsustained VT or unex-plained syncope.
n Patients with arrhythmogenic right ventriculardysplasia or cardiomyopathy who have 1 or morerisk factors for sudden cardiac death. This includesmale gender, severe right ventricular (RV) dilata-tion and extensive RV involvement, LV involve-ment, young age (�5 years) and nonsustainedventricular tachycardia during monitoring or in-duction of ventricular tachycardia during electro-physiologic testing.
■ Similar to pacemakers, ICDs may be affected by electromag-netic interferences including those emitted by electronic arti-cle surveillance system, which are deployed as antitheft de-vices in shopping centers. This may cause the ICD todischarge inappropriately if the patient is exposed longenough to the effects of the antitheft device.
Suggested Readings
Bernstein AD, Camm AJ, Fletcher RD, et al. NASPE/BPEGgeneric pacemaker code for antibradyarrhythmia and adaptive-rate pacing and antitachyarrhythmia devices. Pacing ClinElectrophysiol. 1987;10:794–799.
Epstein AE, DiMarco JP, Ellenbogen KA, et al. ACC/AHA/HRS2008 guidelines for device-based therapy of cardiac rhythmabnormalities: a report of the American College of Cardiol-ogy/American Heart Association Task Force on PracticeGuidelines (Writing Committee to Revise the ACC/AHA/NASPE 2002 Guideline Update for Implantation of CardiacPacemakers and Antiarrhythmia Devices). Circulation. 2008;117:e350–e408.
Gimbel JR, Cox Jr, JW. Electronic article surveillance systemsand interactions with implantable cardiac devices: risk of ad-verse interactions in public and commercial spaces. MayoClin Proc. 2007;82:318–322.
Hayes DL. Pacemakers. In: Topol EJ, ed. Textbook of Cardiovas-cular Medicine. 2nd ed. Philadelphia: Lippincott Williams &Wilkins; 2002:1571–1596.
Mower MM, Aranaga CE, Tabatznik B. Unusual patterns of con-duction produced by pacemaker stimuli. Am Heart J. 1967;74:24–30.
Parsonnet V, Furman S, Smyth PD. A revised code for pace-maker identification. Pacemaker Study Group. Circulation.1981;64:60A–62A.
Surawicz B, Uhley H, Borun R, et al. Task Force I: standardiza-tion of terminology and interpretation. Am J Cardiol.1978;41:130–144.
LWBK271-C26_414-434.qxd 29/1/09 9:42 pm Page 433 LWBK270-4119G-C02_073-110.qxd

LWBK271-C26_414-434.qxd 29/1/09 9:42 pm Page 434 LWBK270-4119G-C02_073-110.qxd

Adenosine (Adenocard): PregnancyCategory C
■ Indication: Drug of choice for the conversion ofparoxysmal supraventricular tachycardia (PSVT) tonormal sinus rhythm.
■ Mechanism of action: Adenosine is an atrioventricu-lar (AV) nodal blocker and can interrupt supraventric-ular arrhythmias that are AV node–dependent. It alsoinhibits the sinus node resulting in depression of sinusnode function.
■ Intravenous dose:■ Rapid bolus of 6 mg given intravenously as quickly as
possible (within 1 to 2 seconds) preferably to a proxi-mal vein. The injection should be followed by a flushof 10 to 20 mL normal saline using a separate syringe.To enhance delivery of the pharmacologic agent tothe heart, the arm should be elevated immediately af-ter the injection especially if a distal vein is used.
■ If the supraventricular tachycardia (SVT) is notconverted after 1 to 2 minutes, a higher dose of 12mg is given.
■ If the SVT has not converted, a third and final doseof 12 mg is given.
■ A rhythm strip should always be recorded during in-jection, which may be useful in the diagnosis of othertachycardias other than paroxysmal SVT (PSVT).
■ Contraindications:■ Adenosine can cause bronchoconstriction in pa-
tients with asthma or in patients with history ofbronchospastic pulmonary disease.
■ Patients with sick sinus syndrome may develop pro-nounced bradycardia after the PSVT is terminated.
■ Other things you should know about adenosine:■ Intravenous doses of more than 12 mg are not rec-
ommended.■ Injection into a central IV line may result in a more
pronounced effect. Consider giving a smaller initialdose of 3 mg if adenosine is injected into a central line.
■ Carbamazepine and dipyridamole potentiate the ef-fects of adenosine. If the patient is on any of theseagents, the initial dose of adenosine should also bereduced to 3 mg.
■ Methylxanthines such as caffeine and theophyllineis the antidote of adenosine. The usual dose ofadenosine may not be effective in patients who areon theophylline. Larger doses are necessary, butshould not be given if the patient is taking theo-phylline for bronchospastic pulmonary disease.
■ Sixty percent of patients with PSVT will convert tonormal sinus rhythm within 1 minute after an initialbolus of 6 mg and up to 92% after a 12-mg bolus.
■ The elimination half-life of adenosine is �10 seconds.Transient periods of asystole, AV block, or bradycardiafrequently occur before conversion to normal sinusrhythm. The antidote for adenosine is aminophyllinegiven intravenously. The antidote is rarely needed be-cause the half-life of adenosine is very short.
■ When given to patients with wide complex tachycar-dia, adenosine can depress left ventricular function,but because of its short half-life, its effect is transientand is usually tolerable even in patients with poor leftventricular dysfunction. It receives a Class IIb recom-mendation by the American College of Cardiology/American Heart Association/European Society ofCardiology guidelines on supraventricular arrhyth-mias when given to patients with wide complextachycardia of unknown origin.
■ Adenosine should be used cautiously in patientswith severe coronary artery disease because adeno-sine is a potent coronary vasodilator and can causeischemia by redistributing coronary flow to normalvessels.
■ Prolonged asystole, ventricular tachycardia, andventricular fibrillation may occur.
■ Atrial fibrillation can occur in up to 10% of patientsand may be catastrophic in a patient with Wolff-Parkinson-White (WPW) syndrome.
■ Adenosine does not convert atrial flutter or atrialfibrillation to normal sinus rhythm but can slow
Appendix
Commonly Used InjectablePharmacologic Agents
435
LWBK271-App_435-448.qxd 29/1/09 9:34 pm Page 435 LWBK270-4119G-C02_073-110.qxd

436 Appendix
ventricular rate transiently, which may be useful ifthe diagnosis of the narrow complex tachycardia isuncertain.
Amiodarone (Cordarone): PregnancyCategory D
■ Indication: Amiodarone is indicated only for thetreatment of ventricular arrhythmias. The use of amio-darone in the treatment of supraventricular arrhyth-mias and control of ventricular rate in atrial flutter orfibrillation is not recommended by the Food and DrugAdministration (FDA) and its use is based solely onpublished information.■ Ventricular arrhythmias:
n Amiodarone IV is indicated for the treatment ofventricular tachycardia (VT) in patients withnormal left ventricular systolic function and inpatients with systolic dysfunction.
n It is also indicated for the treatment of ventricu-lar fibrillation (VF) and pulseless VT.
n Indicated for the treatment of wide complextachycardia of uncertain etiology.
■ Supraventricular arrhythmias:n Accepted as a second- or third-line agent for the
termination of atrial tachycardia from enhancedautomaticity including focal atrial tachycardia,multifocal atrial tachycardia, and other types ofatrial tachycardia resulting from reentry that arerefractory to medical therapy.
n Although amiodarone is extensively used and iseffective in controlling the ventricular rate in atrialfibrillation and converting patients with atrial fib-rillation to normal sinus rhythm, it has not beenapproved by the FDA for these indications.
■ Mechanism of action: Amiodarone is generally aClass III antiarrhythmic agent, but exhibits all Class Ito IV properties of the Vaughan Williams classification.Thus, similar to Class I agents, it is a sodium channelblocker; similar to beta blockers (Class II), it has anti-sympathetic properties; and similar to Class III agents,it blocks the potassium channel and therefore prolongsthe duration of the action potential, slows conductionand prolongs the refractory period. It also has Class IVnegative chronotropic effects on AV nodal tissues simi-lar to calcium blockers thereby slowing AV conduction.
■ Intravenous dose:■ Sustained VT or wide complex tachycardia of
unknown origin:n Initial bolus: 150 mg given IV rapidly for 10
minutes (150 mg or 3 mL of amiodarone is di-luted with 100 mL D5W and infused over 10minutes equivalent to 15 mg/minute).
n This infusion may be repeated every 10 minutesas needed.
■ Cardiac arrest from pulseless VT or VF:n Initial bolus: Amiodarone is given at a bigger
dose of 300 mg diluted to 20 to 30 mL of salineor D5W given IV push.
n This may be followed by supplementary boluses of150 mg IV given by IV push every 3 to 5 minutes.
■ Next 6 hours: Follow initial bolus with an IV drip of1 mg/minute � 6 hours (total � 360 mg). The solu-tion is prepared by adding 900 mg of 18 mL of amio-darone to 500 mL D5W (or 450 mg in 250 mL D5W).n If the arrhythmia keeps recurring, an alternative
is to give the solution as 150 mg IV boluses for 10minutes every 10 to 15 minutes as needed, in-stead of giving the solution by IV drip.
■ Next 18 hours: Continue the IV drip to a lowerdose of 0.5 mg/minute � 18 hours (total � 540 mg).The maximum total cumulative dose including doseused in resuscitation should not exceed 2.2 g in thefirst 24 hours.
■ After 24 hours: The intravenous dose is main-tained after 24 hours:n The infusion is continued at 0.5 mg/minute � 24
hours. Maintenance infusion of 0.5 mg/minutecan be continued for several days and if neces-sary up to 2 to 3 weeks.
n If patient develops recurrence of the ventriculararrhythmia at any time during infusion, a sup-plemental bolus of 150 mg diluted with 100 mLD5W may be given IV over 10 minutes.
n The maximum daily dose should not exceed2,100 mg. Intravenous dosing should be switchedto oral medication when the arrhythmia hasbeen suppressed.
n Doses �2,200 mg/24 hours are associated withsignificant hypotension.
■ Other things you should know about amio-darone:■ Amiodarone is the preferred drug for ventricular ar-
rhythmias and some atrial arrhythmias when there isleft ventricular systolic dysfunction (ejection fraction�40% or when congestive heart failure is present).Amiodarone is indicated only for the treatment ofVT/VF but is also effective in the following conditions:n It is effective in persistent VT or VF after defibril-
lation.n It is effective in stable monomorphic VT.n It is indicated for wide complex tachycardia that
has not been diagnosed to be either VT or widecomplex SVT.
n It is effective in regular polymorphic VT (no QTprolongation).
LWBK271-App_435-448.qxd 29/1/09 9:34 pm Page 436 LWBK270-4119G-C02_073-110.qxd
Commonly Used Injectable Pharmacologic Agents 437
n It can be used as second- to third-line therapy forconversion of SVT to normal sinus rhythm whenother drugs are not effective.
n It is effective in conversion of atrial fibrillation tonormal sinus rhythm.
n It is also effective in controlling ventricular ratein atrial fibrillation especially in patients withWPW syndrome.
■ Amiodarone prolongs the QTc and is proarrhythmic.Its proarrhythmic effect however is much less thanthe other antiarrhythmic agents. It should not be ad-ministered with other agents that prolong the QTc.
■ The half-life of intravenous boluses varies from 4.8to 68 hours and becomes longer as tissues becomesaturated. After steady state is reached, amiodaronehas a long and variable half-life from 40 days to 3 to5 months.
■ It can cause multiple organ toxicity including hepa-tocellular damage, hyper- or hypothyroidism, opticneuritis, and pulmonary disorders including acuterespiratory distress syndrome.
■ Acute hepatocellular injury may occur with dosesthat are larger than recommended.
■ Its hypotensive and bradycardic effects are fre-quently related to the rapidity of infusion ratherthan the dose.
■ It is metabolized through the cytochrome P450(CYP 450) 3A4 and 2C9 pathways and therefore hasthe potential for several drug-drug interactions.n Statins (lovastatin, atorvastatin, and simvastatin
but not pravastatin or rosuvastatin) are metabo-lized through the CYP 450 3A4 pathway. Serumconcentration of these statins can increase result-ing in higher incidence of myopathy or rhab-domyolysis.
n Calcium channel blockers such as verapamil anddiltiazem are also metabolized through the CYP450 3A4 pathway. The effects of these agents canbe potentiated by amiodarone resulting in signif-icant bradycardia.
n CYP 450 3A4 inhibitors such as grapefruit juice,protease inhibitors, and cimetidine may increasethe serum levels of amiodarone and can poten-tially cause amiodarone toxicity.
n Agents that accelerate the CYP 450 3A4 meta-bolic pathway such as rifampin, barbiturates, andSt. John’s wort may decrease the blood levels ofamiodarone making it subtherapeutic.
n Amiodarone is also metabolized through theCYP 450 2C9 pathway and therefore competeswith the metabolism of warfarin resulting inprolongation of the prothrombin time. Themaintenance dose of warfarin should be reducedwhen amiodarone is started. Patients on warfarin
should have prothrombin tests monitored care-fully.
n Beta blockers in combination with amiodaronecan cause profound bradycardia.
n Amiodarone can also potentiate the effect of dig-italis; hence, the maintenance dose of digoxinshould be reduced by half when amiodarone isgiven.
n Effective plasma concentration of amiodarone isbetween 1 to 2 mcg/mL. The plasma concentra-tion of amiodarone may be helpful in monitor-ing the efficacy but not toxicity. The effectivetherapeutic levels of amiodarone overlap withtoxic levels and should not exceed 3 to 4 mcg/L.
Atenolol (Tenormin): PregnancyCategory D
■ Indication: Atenolol is indicated in the managementof patients with angina pectoris, acute myocardial in-farction, and control of hypertension. Althoughatenolol does not carry indication for termination ofSVT or for controlling the ventricular rate in atrial flut-ter or fibrillation, it is frequently used for this purposebased on published information.
■ Mechanism of action: Atenolol is a synthetic selective�1 adrenergic blocking agent. When given in high doses,�1 receptor blocking agents including atenolol are notspecific �1 blockers but also blocks �2 receptors, whichare present in bronchial and vascular smooth muscles.
■ Dose: The IV dose of atenolol for patients with acutemyocardial infarction (or for the management ofsupraventricular arrhythmias), is 5 mg IV given slowlyover 5 minutes. Injection rate should not exceed 1mg/minute. A second dose of 5 mg is given IV after 10minutes if the first dose was well tolerated. The bloodpressure, heart rate, and electrocardiogram should bemonitored during the intravenous infusion. If the in-travenous dose is well tolerated, an oral dose of 50 mgis given 10 minutes after the last IV dose followed byanother 50 mg 12 hours later. The maintenance dose is50 mg twice daily or 100 mg once daily.
■ Other things you should know about atenolol:■ Unlike metoprolol or propranolol, atenolol is pri-
marily excreted by the kidneys (85%) and is not me-tabolized or is only minimally metabolized by theliver. Thus, atenolol given orally does not undergofirst pass degradation by the liver. When there is re-nal failure, the dose should be adjusted.
■ When atenolol is given orally, only approximately50% is absorbed. The other half is excreted un-changed in the gastrointestinal tract. This is unlikemetoprolol where absorption is rapid and complete
LWBK271-App_435-448.qxd 29/1/09 9:34 pm Page 437 LWBK270-4119G-C02_073-110.qxd

438 Appendix
when given orally. Metoprolol is primarily metabo-lized in the liver and 50% of the oral dose is elimi-nated during first pass.
■ The elimination half-life of atenolol is approxi-mately 7 hours, but is much longer when there is re-nal dysfunction.
■ Abrupt discontinuation or cessation of any betablocker, including atenolol, in patients with knowncoronary disease and symptoms of angina may re-sult in exacerbation of anginal symptoms or occur-rence of acute coronary syndrome.
■ The latest 2007 focused update of the American Col-lege of Cardiology/American Heart Association 2004guidelines raises doubt about the safety of intra-venous beta blockers in acute ST elevation myocar-dial infarction and should not be given to patients atincreased risk for cardiogenic shock (see Metoprolol).
■ Atenolol is the only beta blocker that receives a cate-gory D pregnancy risk classification by the FDA. Allother beta blockers receive a category C classifica-tion. Sotalol, which also has beta blocking proper-ties, carry a category B classification.
Atropine Sulfate: Pregnancy Category C
■ Indication: According to the 2005 American Heart As-sociation guidelines for cardiopulmonary resuscitationand emergency cardiovascular care, atropine remainsthe first-line drug for the treatment of acute sympto-matic bradycardia. It is indicated for the treatment ofacute symptomatic bradyarrhythmia due to sinus nodedysfunction, AV nodal block, and increased vagal activ-ity. It is the second drug of choice after epinephrine orvasopressin, in patients with ventricular asystole andpulseless electrical activity.
■ Mechanism of action: Atropine is an anticholinergicagent and increases ventricular rate by reversing vagallymediated mechanisms of bradycardia and hypotension.
■ Dosing:■ Asystole: For asystole or slow pulseless electrical ac-
tivity, a dose of 1.0 mg is given IV. If not effective, thedose is repeated every 3 to 5 minutes until a maxi-mum dose of 3.0 mg is given. Complete vagal block-ade occurs at a total dose of 0.04 mg/kg, which is 2.0mg for a 50-kg and almost 3.0 mg for a 70-kg patient.
■ Bradycardia from AV block or sinus dysfunc-tion: The initial dose is 0.5 to 1.0 mg IV every 3 to 5 minutes as needed until the maximum dose is given.
■ Other things you should know about atropine:■ For the treatment of bradycardia, doses of �0.5 mg
should not be given because small doses of atropinecan cause paradoxical slowing of the heart rate.
Small doses of atropine are parasympathomimetic.It stimulates the vagal nuclei, resulting in paradoxi-cal slowing. This paradoxical effect can also occur ifinjected subcutaneously or intramuscularly. At-ropine should always be given IV. If an IV route isnot available during cardiac resuscitation, it can begiven intratracheally at a dose of 2 to 3 mg dilutedwith 10 mL normal saline.
■ It is not effective and should not be given to patientswith infranodal blocks (AV block below the level ofthe AV node) such as those due to Mobitz II second-degree AV block and complete AV block below thelevel of the AV node with wide QRS escape com-plexes (Class IIb recommendation).
■ Should be avoided in patients with bradycardiafrom hypothermia.
■ The use of atropine should not delay the insertion oftranscutaneous or transvenous pacing in patientswith symptomatic bradycardia with low cardiacoutput.
Beta Blockers: Beta Blockers are Class II Agents According to theVaughan Williams Classification of Anti-Arrhythmic Agents
■ Beta blockers that are available intravenously includeatenolol, esmolol, metoprolol, and propranolol. Thesedifferent beta blockers are discussed individually in al-phabetical listing.
Digoxin (Lanoxin): Pregnancy Category C
■ Indication: Control of ventricular rate in atrial fibril-lation. It is also used for control of ventricular rate inatrial flutter and conversion of PSVT to normal sinusrhythm although these two indications have not beenapproved by the FDA.
■ Mechanism of action:■ Digoxin inhibits sodium-potassium ATPase, which
is an enzyme that regulates the exchange of sodiumand potassium inside the cells. When ATPase is in-hibited, sodium builds up within the cells. Sodiumbuildup activates the sodium-calcium exchangemechanism. Increase in calcium inside the cell acti-vates the intracellular cytosol system to release morecalcium. The increased calcium inside the cell en-hances myocardial inotropicity with increased my-ocardial systolic contraction.
LWBK271-App_435-448.qxd 29/1/09 9:34 pm Page 438 LWBK270-4119G-C02_073-110.qxd
Commonly Used Injectable Pharmacologic Agents 439
■ Digoxin also affects the cardiovascular system indi-rectly by its effect on the autonomic nervous system.n It has parasympathetic effects, which inhibits the
sinus node, thus slowing the heart rate and slow-ing conduction at the AV node.
n It reduces activity of the sympathetic nervoussystem and renin-angiotensin-aldosterone-system,thus reducing the activation of the neurohor-monal system. This is mediated through barore-ceptors sensitization, which causes increasedafferent inhibitory activities.
■ Intravenous dose:■ Before giving a full loading dose, first ascertain that
the patient is not already on digoxin.■ The ideal serum therapeutic level of digoxin is 0.7 to 1.1
ng/mL. The dose of digoxin that is needed to achievethis level in a 70-kg man is 0.6 to 1.0 mg (10 to 15mcg/kg). The total dose depends on the lean body mass(and not total body weight) and renal function. Fiftypercent of the total dose is given initially. Subsequentadditional doses are given at 6- to 8-hour intervals.
■ Thus, if the patient weighs 70 kg, the total digitaliz-ing dose is approximately 1.0 mg. Half the total doseor 0.5 mg, is given IV followed by another 0.25 mgIV in 6 hours and 0.25 mg IV after another 6 hours.The patient will have received the full digitalizingdose of 1.0 mg in 12 hours.
■ Digoxin is excreted primarily in the kidneys. Renalexcretion is dependent on glomerular filtration. Inpatients with renal dysfunction, the creatinine clear-ance should be calculated using the Cockroft andGault formula: Creatinine clearance for men � {(140 –age) � (weight in kg)} divided by 72 � serum crea-tinine (in mg/mL). The calculated renal clearancefor men is multiplied by 0.85 for women.n If the creatinine clearance is 90, the normal
dosage is unchanged.n If the creatinine clearance is 60 to 89, mainte-
nance dose is 0.125 mg daily.n If the creatinine clearance is 30 to 59, 0.125 mg is
given every other day.n If the creatinine clearance is �29, use digoxin
very cautiously.■ Other things you should know about digoxin:
■ Intramuscular injection of digoxin is very painful.Parenteral injections therefore should be limited in-travenously.
■ Rapid injection or infusion can cause systemic andcoronary constriction. Injection of digoxin there-fore should be given slowly over 5 minutes or longerand not given as a bolus injection.
■ Serum concentrations of digoxin are not altered sig-nificantly by increase in body fat, thus lean body
weight and not total body weight correlates bestwith the distribution space of digoxin.
■ The half-life of digoxin in patients with normal kid-ney function is 1.5 to 2 days. In anuric patients, it isprolonged to 3.5 to 5 days. Maintenance dosing canbe given once per day.
■ Elderly patients, especially those with renal dysfunc-tion, may be difficult to digitalize because mainte-nance dosing may be difficult; hence, serum digoxinlevel should be monitored.
■ When assessing for serum digoxin level, bloodshould be drawn after steady state is reached to allowproper equilibration between serum and tissue lev-els. Therefore, the level should be assayed just beforethe next daily dose. If not possible, at least 6 to 8hours after the last dose should have elapsed regard-less whether oral or IV preparation is being given.The serum level will be 10% to 25% lower after 24hours as compared with 8 hours with once-dailydosing, but minor differences in serum level withtwice-daily dosing at 8 or 12 hours after last dose.
■ The initial high levels of digoxin do not reflect theactual concentration at the site of action until asteady state of distribution occurs during chronicuse. Serum level reflects pharmacologic effect whenserum concentrations are in equilibrium with tissueconcentrations.
■ The serum level of digoxin should not exceed 1.3ng/mL. Higher levels may be necessary to controlthe ventricular rate in atrial fibrillation as comparedwith digoxin being given for inotropic support inheart failure; nevertheless, higher serum digoxinlevels were associated with a higher mortality in theDigitalis Investigation Group study.
■ Digoxin competes with amiodarone and quinidine.These two drugs are the most significant in increas-ing the digoxin levels. Therefore, the dose of digoxinshould generally be halved when giving digoxin incombination with these drugs. Digoxin level shouldbe monitored.
■ Digitalis has a tendency to increase automaticityand at the same time cause AV block; thus, auto-matic atrial tachycardia with 2:1 AV block is usuallya manifestation of digitalis toxicity. Other arrhyth-mias associated with digitalis include ventricular ec-topy, bidirectional ventricular tachycardia, sinusdysfunction, and all degrees of AV block.
■ Digoxin is not removed by dialysis; therefore, dialy-sis or exchange transfusion is not effective in treat-ing digitalis toxicity. Most of the drug is bound totissue and does not circulate freely.
■ Digibind is the antidote for digitalis toxicity. This isgiven intravenously and the dose is calculated ac-cording to the serum digoxin level. Digibind should
LWBK271-App_435-448.qxd 29/1/09 9:34 pm Page 439 LWBK270-4119G-C02_073-110.qxd
440 Appendix
be given only for life-threatening arrhythmias suchas paroxysmal atrial tachycardia with block or sig-nificant bradyarrhythmias from AV block or sinusdysfunction.
■ Digibind is excreted by the kidneys as a digoxin-Digibind complex. When there is renal failure, theDigibind-digoxin complex may not be excreted orexcretion may be significantly delayed. Thus, digi-talis toxicity may recur after 72 hours because the effect of Digibind in binding be effective after thattime.
■ The serum level of digoxin does not reflect thedigoxin level after Digibind is given. Thus it is notpossible to reassess digoxin toxicity after the antidoteis given.
■ Slowing of the ventricular rate in patients with heartfailure is more pronounce when digoxin is com-bined with a beta blocker (such as carvedilol) com-pared with the use of either drug alone.
■ Avoid electrical cardioversion if patient is ondigoxin. If cardioversion is necessary, use lower cur-rent during cardioversion.
Diltiazem (Cardizem Injectable or Lyo-Jet Syringe): Pregnancy Category C
■ Indication: Conversion of paroxysmal supraventricu-lar tachycardia to normal sinus rhythm, control of ven-tricular rate in atrial flutter, or fibrillation or in patientswith multifocal atrial tachycardia.
■ Mechanism of action: Diltiazem, like verapamil, is anondihydropyridine calcium channel blocker. It in-creases refractoriness of the AV node and can slowdown the rate of the sinus node. It is a negative in-otropic agent and can decrease myocardial contractil-ity. It relaxes vascular smooth muscle resulting in peri-pheral vasodilatation.
■ Intravenous dose:■ Initial bolus of 0.25 mg/kg (approximately 15 to 20
mg for a 70-kg patient) given slowly IV over 2 min-utes. If not effective, a second dose of 0.35 mg/kg(approximately 20 to 25 mg for a 70-kg patient) maybe given after 15 minutes, slowly, IV. The heart rateand blood pressure should be monitored during IVinfusion.
■ To prolong the half-life of diltiazem and maintaincontrol of ventricular rate in atrial fibrillation, anintravenous drip of 5 to 15 mg/hour should bestarted after giving the intravenous bolus.
■ Additional small boluses of 5 mg may be given in-termittently during infusion if ventricular rate is notoptimally controlled with maintenance IV infusion.
■ Other things you should know about diltiazem:■ Diltiazem is just as effective as verapamil in convert-
ing PSVT to normal sinus rhythm, but is less nega-tively inotropic and may be used cautiously in pa-tients with left ventricular dysfunction who are nothemodynamically decompensated.
■ The elimination half life of IV diltiazem is approxi-mately 3 to 5 hours and is shorter than verapamil.Because of the relatively short half-life, a mainte-nance infusion is necessary when controlling theheart rate in atrial fibrillation. The maintenance in-fusion dose is 5 to 15 mg/hour. While on mainte-nance infusion, an oral dose should be startedwithin 3 hours after the initial IV dose so that the in-fusion can be discontinued within 24 hours unlessthe patient can not take oral medications.
■ Although IV diltiazem may be tolerable in patientswith atrial arrhythmias with mild heart failure,they should not be given to patients with acutelydecompensated heart failure. Oral nondihydropy-ridine calcium channel blockers, including oraldiltiazem, should not be given when there is leftventricular dysfunction. It should not be given forwide complex tachycardia of unknown origin, sicksinus syndrome, or atrial fibrillation associatedwith WPW syndrome.
■ Severe bradycardia and hypotension may occurwhen diltiazem is combined with beta blockers.
Dobutamine (Dobutrex): PregnancyCategory B
■ Indication: Dobutamine is indicated for the treat-ment of heart failure. It is also used off-label for thetreatment of bradyarrhythmias and heart block notresponsive to atropine, especially in treatment of in-franodal AV block.
■ Mechanism of action: Dobutamine is a synthetic cat-echolamine with predominantly �1 and slight �2
adrenergic properties and mild to moderate proper-ties.
■ Dosing: Given as IV infusion with an initial dose of1 mcg/kg/minute and increased to 2.5 to 5.0 mcg/kg/minute. This can be titrated gradually every 3 min-utes according to heart rate to a maximum dose of 20mcg/kg/minute. Higher doses up to 40 mcg/kg/minutecan be given but are usually associated with atrial andventricular arrhythmias. The use of dobutamine for AVblock and bradyarrhythmias should only be tempo-rary, before a temporary pacemaker can be inserted.The drug very often comes in premix infusion of 500mg in 250 mL D5W.
LWBK271-App_435-448.qxd 29/1/09 9:34 pm Page 440 LWBK270-4119G-C02_073-110.qxd

Commonly Used Injectable Pharmacologic Agents 441
■ Other things you should know about dobutamine:■ Dobutamine has a short elimination half-life of 2
minutes and should be given as a continuous intra-venous infusion.
■ It is indicated for the treatment of patients with lowcardiac output or heart failure. It is also used off-labelas temporary measure for treatment of sympto-matic bradyarrhythmia before a pacemaker can beinserted. It is the preferred agent in infranodal AVblock with wide escape complexes, because atropineis not effective when AV block is infranodal. It canalso be tried in patients with symptomatic brad-yarrhythmias not responsive to atropine before apacemaker can be inserted.
■ The chronotropic effect of dobutamine is not as po-tent as dopamine or isoproterenol and is more oftenused as an inotropic agent in acute heart failurerather than for its chronotropic effect in patientswith bradyarrhythmias or AV block. If dobutamineis not effective in increasing the heart rate, isopro-terenol should be given instead.
Epinephrine: Pregnancy Category C
■ Indication: Epinephrine is indicated for cardiac arrestdue to VF or pulseless VT. It is also indicated for thetreatment of anaphylaxis and syncope from completeheart block or hypersensitive carotid sinus and for thetreatment of asthma.
■ Mechanism of action: The drug is a sympath-omimetic catecholamine with -, �1-, and �2-adrener-gic activity. It has the most potent -adrenergic effectresulting in intense vasoconstriction, which can resultin coronary and cerebral perfusion pressure duringcardiopulmonary resuscitation. It is this intense -adrenergic effect that is useful in cardiac arrest.
■ Dose: According to the 2005 American Heart Associa-tion guidelines for cardiopulmonary resuscitation, thedose of epinephrine in cardiac resuscitation is 1 mggiven by intravenous or if not possible by intraosseousadministration every 3 to 5 minutes. Higher doses maybe given to overcome beta blocker or calcium channeloverdose. If intravenous or intraosseous administra-tion is not possible during resuscitation, it may begiven intratracheally at a dose of 2 to 2.5 mg. Higherdoses of epinephrine has not been shown to be moreeffective than standard doses during cardiopulmonaryresuscitation.■ For anaphylaxis, the drug is given intramuscularly
0.3 mg, which may be repeated if needed. It may alsobe given subcutaneously at a dose of 0.2 to 1.0 mg.
■ For asthma, the drug is given subcutaneously 0.2 to0.5 mg. If needed for severe attacks, a second and
third dose may be given every 20 minutes for a max-imum of three doses.
Esmolol (Brevibloc): PregnancyCategory C
■ Indication: Esmolol is indicated for the conversion ofSVT to normal sinus rhythm and control of ventricularrate in patients with atrial fibrillation or atrial flutter.Alsoindicated for the treatment of inappropriate, noncom-pensatory sinus tachycardia and hypertension that occurduring induction and tracheal intubation, during surgeryor emergence from anesthesia and postoperative period.
■ Mechanism of action: Esmolol is a selective �1
blocker.■ Dose: The dose of esmolol is quite complicated
because the drug is very short acting and may need frequent retitration:■ The initial IV loading dose is 0.5 mg/kg over 1
minute followed by an infusion of 50 mcg/kg/minute for 4 minutes. If effective, the infusion rate iscontinued. The dose can be titrated depending onthe desired ventricular rate during atrial flutter orfibrillation. Thus, the maintenance infusion rate canbe increased from 50 to 100 mcg/kg/minute, and after 4 or more minutes to 150 mcg/kg/minute andsubsequently up to a maximum of 200 mcg/kg/minute.
■ If the first bolus is not effective, another option is togive a second bolus of 0.5 mg/kg over 1 minute andincrease infusion rate by 50 mcg for an infusion rateof 100 mcg/kg/minute for 4 minutes. If effective,continue the infusion rate.
■ If not effective, give a third and final bolus of 0.5 mg/kgover 1 minute and increase infusion rate by 50 mcg foran infusion rate of 150 mcg/kg/minute for 4 minutes.The infusion rate can be increased by 50 mcg/kg/minute to a maximum of 200 mcg/kg/minute.
■ The usual maintenance infusion rate is 50 to 200mcg/kg/minute. Maintenance infusion can be givenfor 24 hours if necessary; however, the patient shouldbe monitored for hypotension and bradycardia.
■ A higher maximum maintenance infusion dose of50 to 300 mcg/kg/minute may be given for the treat-ment of hypertension.
■ Other things you should know about esmolol:■ Esmolol has a very short half-life of only 2 to 9 min-
utes. The drug is too short-acting, making routineuse for control of ventricular rate in atrial flutterand fibrillation difficult to maintain in the medicalintensive care unit, more especially when long-termcontrol is necessary. The short half-life, however,
LWBK271-App_435-448.qxd 29/1/09 9:34 pm Page 441 LWBK270-4119G-C02_073-110.qxd

442 Appendix
may be advantageous to patients who develop ar-rhythmia during the perioperative and immediatepostoperative period where immediate and short-term control is all that is needed.
■ Esmolol is also indicated for hypertension occurringduring the perioperative and immediate postopera-tive period. For control of hypertension, a highermaintenance infusion dose of up to 250 to 300 mcg/kg/minute may be necessary (see dosing). It can alsobe given as treatment for noncompensatory sinustachycardia, which, according to the judgment ofthe physician, may be inappropriate and needs to becontrolled.
■ Dosing is not affected by hepatic or renal disease.■ Can cause slowing of the sinus node, thus the agent
should be given cautiously when there is history ofsick sinus syndrome or previous bradycardia.
■ The maximum infusion dose should not exceed 200mcg/kg/minute and the agent may be continued asan infusion up to 24 hours.
Ibutilide (Corvert): Pregnancy Category C
■ Indication: Rapid conversion of atrial flutter or atrialfibrillation to normal sinus rhythm
■ Mechanism of Action: Ibutilide is a Class III antiar-rhythmic agent. Class III agents block the potassiumchannel and therefore prolong the duration of the ac-tion potential. Conduction is slowed and atrial andventricular refractoriness are prolonged. The effect ofibutilide is different when compared to other Class IIIagents because it prolongs the action potential dura-tion by slowing the inward flow of sodium during re-polarization in contrast to most type III agents, whichslow the outward flow of potassium.
■ Dosing:■ Before converting atrial flutter or atrial fibrillation
to normal sinus rhythm with ibutilide, any patientknown to have the arrhythmia for more than 48 hours should first be adequately anticoagulatedfor at least 3 weeks before attempting conversion tonormal sinus rhythm. However, if a more immedi-ate cardioversion seems necessary, a transesophagealechocardiogram should be performed to excludethrombi in the atria or left atrial appendage. Car-dioversion may then be carried out under adequateanticoagulation if no thrombi are demonstrated.
■ For patients weighing 60 kg, the dose of ibutilideis 1 mg given intravenously for 10 minutes. For pa-tients weighing �60 kg, the dose is 0.01 mg/kg or amaximum of 0.6 mg. One mg of ibutilide is avail-
able as a 10-mL preparation and is injected at a rateof 1 mL/minute. The 10-mL preparation (1 mg) canbe injected directly IV (10 minutes) without dilu-tion. It could also be diluted to a larger volume of 50mL and infused intravenously for 10 minutes.
■ If the arrhythmia has not converted 10 minutes afterinjection, the same dose can be repeated with thesame rate of administration. There is a 50% to 70%chance for atrial flutter and 30% to 50% chance foratrial fibrillation to convert to normal sinus rhythmalmost immediately after the drug is administered.If the arrhythmia has not converted after the seconddose, no further injections should be given.
■ For postcardiac surgery patients weighing �60 kg,0.5 mg (0.005 mg/kg per dose) given as a single ordouble dose, was effective for atrial fibrillation andflutter.
■ Other things you should know about ibutilide:■ Sustained polymorphic ventricular tachycardia
(PVT) requiring cardioversion can occur in approx-imately 1.7% of patients receiving intravenous ibu-tilide. This arrhythmia can be fatal if not immedi-ately recognized. PVT may or may not be associatedwith baseline QTc prolongation; the tachycardia iscalled torsades de pointes.
■ The initial episode of PVT can occur up to 40 min-utes after initial infusion, although recurrence ofPVT can occur up to 3 hours after initial infusion.
■ Sustained PVT is more common in patients withlow ejection fraction or patients with history of con-gestive heart failure, especially where there is base-line QT prolongation. The drug, therefore, shouldnot be given to patients who are hemodynamicallyunstable or in heart failure, in patients with recentmyocardial infarction or angina, patients with elec-trolyte and blood gas abnormalities including pa-tients with baseline QT prolongation, or those whoare metabolically deranged.
■ Nonsustained PVT occurred in an additional 2.7% ofpatients and nonsustained monomorphic VT in 4.9%.
■ Cardiac monitoring should be continued for at least 4 hours after infusion or until QTc is back to baseline.Longer monitoring is required for patients with he-patic dysfunction. Prolongation of the QT interval isrelated to the dose and infusion rate. Patients devel-oping PVT should be monitored for a longer period.
■ The hemodynamic effect of the drug is similar inpatients with systolic dysfunction and those with-out. No significant effect in cardiac output or pul-monary wedge pressure has been noted. The drughas not been shown to increase the duration of theQRS complex.
■ When giving ibutilide, the QTc interval shouldpreferably be �440 milliseconds and the serum
LWBK271-App_435-448.qxd 29/1/09 9:34 pm Page 442 LWBK270-4119G-C02_073-110.qxd
Commonly Used Injectable Pharmacologic Agents 443
potassium at least 4.0 mEq/L. Patients with QTc�440 milliseconds and potassium �4.0 mEq/Lwere not allowed to participate when clinical trialswith ibutilide were conducted.
■ Although torsade is the most common arrhythmiaassociated with the drug, sinus arrest and completeasystole can occur during conversion from atrialflutter or atrial fibrillation to normal sinus rhythmespecially in patients with sick sinus syndrome.
■ The drug is more effective in atrial flutter than inatrial fibrillation. Approximately 53% of patientswith atrial flutter will convert with the first 1 mgdose and 70% after the second dose. In atrial fibril-lation, approximately 22% will convert with the firstdose and 43% after the second dose. Conversion oc-curred within 30 minutes after the start of infusion.This is in contrast to intravenous sotalol (1.5mg/kg), where only 18% of patients with atrial flut-ter and 10% with atrial fibrillation converted duringclinical trials with the drug.
■ If atrial flutter or atrial fibrillation has not convertedafter 90 minutes after the infusion is completed, thepatient can be electrically cardioverted if appropri-ate. Other antiarrhythmic agents can also be started4 hours after the infusion is completed.
■ Patients with more recent onset atrial flutter oratrial fibrillation (within 30 days) have a higherchance of conversion to normal sinus rhythm com-pared with patients whose arrhythmias were oflonger duration. The efficacy of ibutilide has notbeen tested in patients with atrial flutter or atrial fib-rillation longer than 90 days in duration.
Isoproterenol (Isuprel): PregnancyCategory C
■ Indication: As a temporizing measure for the treat-ment of heart block or symptomatic bradyarrhythmiaswhen atropine or dobutamine has failed. It is also givenas a temporizing measure for the treatment of torsadesde pointes before a pacemaker can be inserted.
■ Mechanism of Action: Isoproterenol is a �-adrener-gic agonist with very potent �1 and �2 properties.Similar to other �-adrenergic agents, it increasescyclic AMP by stimulating adenyl cyclase, eventuallyincreasing intracellular calcium. It has very potentchronotropic and inotropic properties and preventsbronchospasm.
■ Dose: Given as an intravenous infusion at 2 to 10 mcg/minute titrated according to the heart rate, It is usuallyprepared by diluting 1 mg of isoproterenol to 500 mLD5W, resulting in a concentration of 2 mcg/mL.
■ Other things you should know about isopro-terenol:■ Isoproterenol is the drug of choice for the tempo-
rary treatment of infranodal AV block. It shortensthe refractory period of the AV node and enhancesAV conduction. It also increases automaticity allow-ing latent pacemakers to become manifest. Becauseof its serious side effects, it is potentially dangerousto use routinely and should be used cautiously onlyas a temporizing measure for the treatment of heartblock and bradyarrhythmias before a temporarypacemaker can be inserted or after atropine ordobutamine has failed.
■ Isoproterenol is a very potent �1- and �2-adrenergicagent. It increases automaticity not only of the sinusnode but all cells with pacemaking potential, result-ing in ectopic rhythms that may dominate over thatof the sinus node. It can cause ectopic atrial tachy-cardia, atrial flutter, atrial fibrillation, and ventricu-lar tachycardia or fibrillation even in patients withstructurally normal hearts.
■ Isoproterenol increases inotropicity and cardiacoutput and markedly increases oxygen consump-tion. It can provoke ischemia in patients with coro-nary disease and can provoke arrhythmias especiallyin patients with left ventricular dysfunction.
■ Torsades de pointes: Isoproterenol may be used asa temporizing procedure in patients with bradycar-dia dependent torsades de pointes before a tempo-rary pacemaker can be inserted.
■ Isoproterenol should be given at the lowest dosepossible. Because it enhances myocardial oxygenconsumption, it can expand infarct size and cause complex ventricular and supraventriculararrhythmias.
Labetalol (Normodyne): PregnancyCategory C
■ Indication: Intravenous labetalol is indicated for theemergency treatment of hypertension. It does not carryindication for the treatment of cardiac arrhythmias.
■ Mechanism: Labetalol is a nonspecific beta blockerwith 1-, �1- and �2-adrenergic receptor blockingproperties. In addition, it also has intrinsic sympath-omimetic activity.
■ Dose: For the treatment of hypertension, 10 mg isgiven IV push over 1 to 2 minutes. The dose is re-peated or doubled every 10 minutes if needed to amaximum dose of 150 mg. Another option is to givean initial bolus followed by an infusion of 2 to 8 mg/minute.
LWBK271-App_435-448.qxd 29/1/09 9:34 pm Page 443 LWBK270-4119G-C02_073-110.qxd

444 Appendix
Lidocaine (Xylocaine HCL): PregnancyCategory B
■ Indication: For acute suppression of VT or VF.■ Mechanism of Action: Lidocaine is Class IB antiar-
rhythmic agent. It blocks the sodium channel but hasno effect on potassium channel. It does not prolongand may even shorten action potential duration and ef-fective refractory period of the His-Purkinje system.
■ Dosing:■ In cardiac arrest, an initial bolus of 1.0 to 1.5 mg/kg
is given. The higher dose is given only for ventricu-lar fibrillation or pulseless VT after defibrillationand epinephrine has failed.
■ For refractory VT or VF, an additional bolus of 0.5 to0.75 mg/kg is given IV over 3 to 5 minutes. The rateshould not exceed 50 mg/minute. Lidocaine is distrib-uted rapidly out of the plasma in �10 minutes. Theinitial dose therefore is only transiently therapeuticand additional boluses have to be given repeatedlyevery 5 to 10 minutes, as needed, for a maximum totalloading dose of 3 mg/kg over 1 hour. The loading doseshould be decreased in patients with heart failure.
■ The initial loading dose is followed by an IV infusion of1 to 4 mg/minute to maintain therapeutic blood levels.Maintenance infusion should be adjusted to a lowerrate in patients with heart failure and liver disease.
■ The volume of distribution does not reach steadystate until after 8 to 10 hours or even longer, up to 24 hours in patients with liver disease, heart failure,or low output states.
■ Other things you should know about lidocaine:■ Lidocaine does not prolong action potential dura-
tion and therefore does not prolong the QT interval.The drug is useful in patients with normal or pro-longed QT intervals or patients with monomorphicor polymorphic VT.
■ Is primarily indicated for patients with ischemicVT/VF and is the drug of choice for VT/VF associ-ated with acute myocardial infarction.
■ Unlike most antiarrhythmic agents, lidocaine can beused in patients with impaired left ventricular function.
■ It is not effective in blocking the AV node and there-fore is not useful in supraventricular arrhythmias. Itmay even enhance AV conduction, which can resultin 1:1 AV conduction in atrial flutter.
■ Lidocaine as well as its metabolites undergoesdegradation through the CYP 450 3A4 pathway.Continuous infusion of lidocaine at the same dosefor 24 to 48 hours increases its half-life and generallyleads to toxicity.
■ Symptoms of toxicity are usually from central nerv-ous system involvement, which include seizures,
dysarthria or slurred speech, muscle twitching,drowsiness, altered consciousness, or even coma.
■ Lidocaine should generally be discontinued 12hours after the arrhythmia has been successfullysuppressed unless there is an indication to infuse themedication for a longer period.
■ After the infusion is terminated, plasma levels slowlydecline over several hours. If the medication is nolonger needed, the medication can be discontinuedoutright without tapering the dose.
■ Therapeutic blood levels can be monitored, whichranges from 1.5 to 5 mcg/mL.
Magnesium Sulfate: PregnancyCategory C
■ Indication: Replacement therapy in the presence ofmagnesium deficiency. Also used in the treatment oftorsade de pointes characterized by polymorphous VTwith prolonged QT interval.
■ Mechanism of Action: Severe magnesium deficiencycan cause cardiac arrhythmias including ventricularfibrillation and sudden cardiac death. Hypomagne-semia also prevents the correction of potassium defi-ciency.
■ Dosing:■ For refractory VF: In emergent conditions where
there is refractory VF associated with magnesiumdeficiency, dilute 1 to 2 g magnesium sulfate in 100mL D5W and inject IV over 1 to 2 minutes.
■ For torsade: Even in the absence of magnesium de-ficiency, give a loading dose of 1 to 2 g mixed with 50to 100 mL D5W injected IV over 5 to 60 minutes, de-pending on the urgency of administration. Followwith a continuous IV infusion of 0.5 to 1.0 g/hour.
■ For magnesium deficiency: Dilute 5 g in 1 L D5W,0.9% NaCl or lactated Ringers solution and given asa continuous infusion. Maximum concentration is 4 g in 250 mL given IV over 3 hours. Dose shouldnot exceed a total of 30 to 40 g in adults and rateshould not exceed 50 mg/minute.
Metoprolol (Lopressor): PregnancyCategory C
■ Indication: Metoprolol is indicated for reduction ofmortality in acute myocardial infarction. It is also indi-cated for angina and hypertension. It is effective as anantiarrhythmic agent in supraventricular arrhythmiasand reduces incidence of ventricular tachycardia/fibril-lation in patients with acute myocardial infarction.
LWBK271-App_435-448.qxd 29/1/09 9:34 pm Page 444 LWBK270-4119G-C02_073-110.qxd
Commonly Used Injectable Pharmacologic Agents 445
■ Mechanism of action: Metoprolol is a cardioselective�1-adrenergic blocking agent.
■ Dose: The initial IV dose is 5 mg slowly over 5 min-utes. May be repeated every 5 minutes if well toleratedfor a total of three doses or 15 mg over 15 minutes. Ifmaintenance oral dose is necessary and patient is post-operative or NPO, give IV piggyback 20 mg over 2 hours. This is equal to 50 mg of oral metoprolol. TheIV dose is followed by an oral dose of 50 mg BID �24 hours, then 100 mg BID.
■ Other things you should know about metoprolol:■ The most recent 2007 focused update of the Ameri-
can College of Cardiology/American Heart Associa-tion 2004 guidelines for the management of ST ele-vation MI raises doubt about the safety of IVmetoprolol or similar beta blockers based on the re-sults of a large clinical trial (Clopidogrel and Meto-prolol in Myocardial Infarction). Although meto-prolol IV has been shown to decrease reinfarctionand ventricular fibrillation in this study, there weremore episodes of cardiogenic shock. Thus, the use ofmetoprolol IV is reasonable only when hyperten-sion is present and the patient does not have any ofthe following findings:n Signs of heart failuren Low output staten Increased risk for cardiogenic shock (age �70
years, systolic blood pressure �120 mm Hg,sinus tachycardia �100 beats per minute, orheart rate �60 beats per minute and increasedtime since onset of acute MI).
n Contraindications to beta blockade (PR �0.24second, second- or third-degree AV block, reac-tive airway disease or active asthma).
■ The long-term use of beta blockers remains a Class Irecommendation when given orally within 24 hoursto patients who do not have contraindications and arenot high risk for hypotension or cardiogenic shock.
■ In patients with left ventricular dysfunction, oralbeta blocker therapy is recommended but should begradually titrated.
Norepinephrine: Pregnancy Category C
■ Indication: Cardiac arrest and hypotension ■ Mechanism of Action: Norepinephrine is a sympath-
omimetic agent with both alpha and beta adrenergicactivity.
■ Dosing: The initial dose is 0.5 to 1 mcg/minute givenIV titrated to 8 to 30 mcg/minute. The dose is adjustedaccording to the blood pressure.
■ Other things you should know about norepi-nephrine:
■ The solution should be given IV using a large vein.Extravasation may cause sloughing and necrosis be-cause of its -adrenergic effect resulting in vasocon-striction. After extravasation occurs, the area shouldbe immediately injected with 10 to 15 mL of salinecontaining 10 mg of phentolamine.
Procainamide: Pregnancy Category C
■ Indication: Effective for both supraventricular andventricular arrhythmias. It is indicated for conversionof atrial flutter and atrial fibrillation to normal sinusrhythm, for control of ventricular rate in atrial fibrilla-tion in the setting of WPW syndrome, and for stablemonomorphic wide complex tachycardia that may beventricular or supraventricular.
■ Mechanism of Action: Procainamide is a type IAantiarrhythmic agent (Class I agents inhibit the fastinward sodium channel causing a decrease in the maxi-mum depolarization rate during phase 0 of the actionpotential). It decreases automaticity by decreasing the slope of spontaneous (phase 4) depolarization.Procainamide also inhibits the potassium channel andtherefore prolongs the duration of the action potential.Conduction velocity in the atrium, AV node, His-Purkinje system, and ventricles is prolonged. The drug ismetabolized to N-acetylprocainamide (NAPA), which isalso an effective antiarrhythmic agent but has Class IIIeffects. Class III drugs prolong the action potential dura-tion as well as refractoriness of cardiac tissues.
■ Dosing:■ Procainamide is given IV at an infusion rate of 20 mg/
minute. The dose should not exceed 17 mg/kg. Theinfusion is given until the arrhythmia is suppressedor toxic complications from the drug is manifestedsuch as widening of the QRS complex by 50% whencompared with baseline, prolongation of the QT in-terval or hypotension occurs.
■ When more rapid infusion is needed, an alternativeis to give intravenous boluses of �100 mg for 3 min-utes every 5 minutes. The drug can also be given at afaster infusion rate of 50 mg/minute, to a total doseof 17 mg/kg during cardiac resuscitation.
■ Infusion is maintained at 1 to 4 mg/minute butshould be reduced if there is renal dysfunction.
■ Other things you should know about procainamide:■ Is effective for both atrial and ventricular arrhythmias.■ The drug should not be given to patients with pro-
longed QT interval.■ Procainamide is negatively inotropic and is pro-
arrhythmic and should not be given to patients withcongestive heart failure or patients with systolic leftventricular dysfunction (ejection fraction �40%).
LWBK271-App_435-448.qxd 29/1/09 9:34 pm Page 445 LWBK270-4119G-C02_073-110.qxd

446 Appendix
■ Hypotension can be precipitated if the drug is in-jected too rapidly.
■ Unlike quinidine, another type IA antiarrhythmicagent, procainamide does not increase digoxin levels.
■ The drug is metabolized to NAPA, which is also aneffective antiarrhythmic agent. When procainamideblood levels are checked, NAPA levels should be in-cluded. Therapeutic level of procainamide is 4 to 8mcg/mL and for NAPA 7 to 15 mcg/mL.
■ The drug is mainly excreted through the kidneys un-changed with a half-life of approximately 3 hours.Excretion is delayed when there is renal dysfunctionor heart failure.
■ Blood levels should be checked when there is renaldysfunction or maintenance infusion exceeds 2 mg/minute or infusion exceeds 48 hours.
■ Can cause drug induced lupus when oral therapy iscontinued for prolonged periods.
Propranolol (Inderal): PregnancyCategory C
■ Indication: Propranolol has approved indications forhypertension, angina pectoris, acute myocardial infarc-tion, and treatment of cardiac dysrhythmias includingconversion of SVT to normal sinus rhythm.
■ Mechanism: Propranolol is a nonselective beta blockerwith �1- and �2-adrenergic blocking properties.
■ Dose: Approximately 1 to 3 mg is initially given. IV ad-ministration should not exceed 1 mg/minute. Addi-tional doses may be repeated after 2 minutes if needed.The total IV dose should not exceed 10 mg adminis-tered in three equal parts. The total dose can also begiven IV piggyback over 10 to 15 minutes. The IV doseis followed by a maintenance oral dose of 180 to 320 mgdaily in divided doses.
■ Other things you should know about propranolol:■ The elimination half-life of propranolol is 4 hours.
After the initial dose, additional IV doses should notbe given until after 4 hours after the last dose.
■ The drug is eliminated by hepatic metabolism.
Sotalol: Pregnancy Category B
■ Indication:■ Sotalol is indicated in converting atrial fibrillation
to normal sinus rhythm in patients with WPW syn-drome when the duration of the atrial fibrillation is�48 hours.
■ It is also indicated for monomorphic ventriculartachycardia.
■ Mechanism of action: Sotalol is a Class III antiar-rhythmic agent. Similar to amiodarone, it prolongs ac-tion potential duration and increases refractoriness ofatrial and ventricular myocardium. It also has nonse-lective beta blocking properties.
■ Dosing: The dose is 1 to 1.5 mg/kg given IV at 10mg/minute.
■ Other things you should know about sotalol:■ The intravenous preparation of sotalol is not avail-
able in the United States.■ According to the American College of Cardiology/
American Heart Association/European Society ofCardiology 2006 guidelines for the management ofpatients with atrial fibrillation, sotalol is not effec-tive for conversion of atrial fibrillation to sinusrhythm but is effective for maintenance of sinusrhythm and is used for preventing recurrence ofatrial fibrillation after the patient has converted tonormal sinus rhythm.
■ In patients with monomorphic VT, sotalol shouldbe given only when left ventricular systolic functionis preserved.
■ Sotalol has beta blocking properties. It should not begiven to patients who are already on beta blockers.
■ The intravenous infusion can cause bradycardia andhypotension. Sotalol is also proarrhythmic and cancause torsade de pointes.
Vasopressin (Pitressin): PregnancyCategory C
■ Indication: VT/VF. Intended as an alternative to epi-nephrine during cardiac resuscitation.
■ Mechanism of action: Vasopressin is a non-adrenergicperipheral vasoconstrictor that is naturally present inthe body. It is an antidiuretic hormone. The agent be-comes a powerful peripheral vasoconstrictor when givenin much higher doses than normally present in the body.It does not have beta adrenergic activity and directlystimulates non-adrenergic smooth muscle receptors. Itmimics the positive effects but not the adverse effects ofepinephrine and has a longer half-life of 10 to 20 minutescompared with epinephrine, which is 3 to 5 minutes.
■ Dosing: A one-time bolus injection of 40 units givenIV during cardiac resuscitation for VT/VF. This substi-tutes for epinephrine during resuscitation for cardiacarrest, although epinephrine can still be given in re-peated doses if necessary after 10 to 20 minutes if vaso-pressin is not effective.
■ Other things you should know about vasopressin:■ Vasopressin is a powerful non-adrenergic vasocon-
strictor given as a one-time dose of 40 units. It is
LWBK271-App_435-448.qxd 29/1/09 9:34 pm Page 446 LWBK270-4119G-C02_073-110.qxd

Commonly Used Injectable Pharmacologic Agents 447
effective even in the presence of severe acidosis,which commonly occurs during cardiac resuscita-tion.
■ May be effective in asystole and pulseless electricalactivity.
Verapamil (Isoptin): PregnancyCategory C
■ Indication: Conversion of paroxysmal supraventricu-lar tachycardia to normal sinus rhythm, control of ven-tricular rate in atrial flutter, or fibrillation or in patientswith multifocal atrial tachycardia.
■ Mechanism of action: Verapamil is a nondihydropy-ridine calcium channel blocker that increases refrac-toriness of the AV node. It can also slow down the rateof the sinus node. It is a negative inotropic agent andcan decrease myocardial contractility resulting inheart failure in patients with left ventricular dysfunc-tion. It is also a peripheral vasodilator and can causehypotension.
■ Intravenous dose: The drug should not be given topatient with left ventricular dysfunction. Give slowlyIV 2.5 to 5 mg over 2 minutes, longer in elderly pa-tients, under continuous electrocardiogram and bloodpressure monitoring. If not effective, and no adverseevent is noted, repeat with another dose of 5 to 10 mgevery 15 to 30 minutes to a maximum dose of 20 mg.Another option is to give 5-mg boluses every 15 min-utes to a maximum dose of 30 mg.
■ Other things you should know about verapamil:■ Nondihydropyridine calcium channel blockers such
as verapamil and diltiazem are very effective agentsin converting PSVT to normal sinus rhythm. Theyare the next agents that should be used for conver-sion of PSVT to normal sinus rhythm if adenosine isnot effective or is contraindicated.
■ Verapamil is a vasodilator and is negatively inotropic.It should not be given to patients with left ventriculardysfunction or patients with congestive heart failure.
■ Verapamil should be given only to paroxysmalsupraventricular tachycardia with narrow complexesor supraventricular tachycardia with wide QRS com-plexes with normal left ventricular function. Whenthere is wide complex tachycardia and the diagnosisof the tachycardia is uncertain, verapamil should not
be given. If the wide complex tachycardia turns outto be ventricular, the administration of verapamilmay cause severe hypotension or even death.
■ Intravenous hydration and calcium chloride or cal-cium gluconate IV may be given to counteract thehypotensive effect of verapamil or diltiazem withoutdiminishing its antiarrhythmic effect.
Suggested Readings
2005 American Heart Association Guidelines for cardiopul-monary resuscitation and emergency cardiovascular care.Part 7.2: management of cardiac arrest. Circulation. 2005:112;58–66.
Antman EM, Hand M, Armstrong PW, et al. 2007 focused up-date of the ACC/AHA 2004 guidelines for the managementof patients with ST-elevation myocardial infarction. J AmColl Cardiol. 2008;51:210–247.
Blomstrom-Lundqvist C, Scheinman MM, Aliot EM, et al.ACC/AHA/ESC guidelines for the management of patientswith supraventricular arrhythmias—executive summary. Areport of the American College of Cardiology/AmericanHeart Association Task Force on Practice Guidelines and theEuropean Society of Cardiology Committee for PracticeGuidelines. J Am Coll Cardiol. 2003;42:1493–1531.
Fuster V, Ryden LE, Cannom DS, et al. ACC/AHA/ESC 2006guidelines for the management of patients with atrial fibril-lation—executive summary; a report of the American Col-lege of Cardiology/American Heart Association Task Forceand the European Society of Cardiology Committee on Prac-tice Guidelines and the European Society of CardiologyCommittee for Practice Guidelines (Writing Committee toRevise the 2001 Guidelines for the Management of Patientswith Atrial Fibrillation). J Am Coll Cardiol. 2006;48:854–906.
Hazinski MF, Cummins RO, Field JM, eds. AHA 2002 Handbookof Emergency Cardiovascular Care. 4th ed. Dallas: AmericanHeart Association; 2002.
Micromedex Healthcare Series. Thomson Healthcare. http://www.thomsonhc.com. Accessed January 2008.
Physicians’ Desk Reference. 62nd ed. Montvale: Thomson Health-care Inc; 2008.
Zipes DP, Camm AJ, Borggrefe M, et al. ACC/AHA/ESC 2006guidelines for management of patients with ventricular ar-rhythmias and the prevention of sudden cardiac death: a re-port of the American College of Cardiology/American HeartAssociation Task Force and the European Society of Cardiol-ogy Committee for Practice Guidelines (Writing Committeeto Develop Guidelines for management of patients with ven-tricular arrhythmias and the prevention of sudden cardiacdeath). J Am Coll Cardiol. 2006,48:e247–e346.
LWBK271-App_435-448.qxd 29/1/09 9:34 pm Page 447 LWBK270-4119G-C02_073-110.qxd

LWBK271-App_435-448.qxd 29/1/09 9:34 pm Page 448 LWBK270-4119G-C02_073-110.qxd
Aberrant ventricular conduction, 168–169, 170,172–173, 252, 310 (see also Rate relatedbundle branch block)
Absolute refractory period, 3, 4, 8Accelerated idioventricular rhythm (AIVR), 110,
125–126, 154, 157, 162, 335, 352–353,367, 400, 402
Accelerated junctional rhythm, 109–111, 154,157, 162, 176–177, 179, 220, 222, 224, 225
Accessory pathway (see Bypass tract)Action potentials, 2–4, 7, 12, 13, 16, 19–21, 72,
211, 224, 302, 337, 388, 407of non-pacemaking cells, 211of pacemaking cells, 211
Acute anterior MI, 86, 87, 98, 106, 109, 127, 128,337, 349, 355, 356, 370, 371
Acute coronary syndrome, 331–413AV block, 352–353complications of acute MI, 350–358, 351tIV conduction defect, 354–358LBBB and, 357–358left anterior descending coronary artery
(LAD), 338–341left circumflex coronary artery (LCx), 341–344left ventricular dysfunction, 351tnon-ST elevation MI and unstable angina,
379–413other causes of ST elevation, 358–364primary angioplasty, 335–337RBBB and, 354–356right coronary artery (RCA), 344–350right ventricular MI, 249–250, 251trole of ECG in acute coronary syndrome,
331–333, 379ST-elevation MI, 331–378thrombolytic therapy, 334–335ventricular arrhythmias, 351–352ventricular arrhythmias, 351–352ventricular fibrillation, 351–352ventricular tachycardia, 351–352
Acute inferior MI, 86–88, 95, 98, 100, 106, 344,346, 349, 350, 352, 353, 370–373, 376
and AV block, 352Acute myocardial infarction (see Acute
coronary syndrome)Acute pulmonary embolism, 46, 64, 74, 76, 78,
127, 180Adenosine, 165, 192, 196, 206–209, 213,
215–216, 225, 231, 235, 238, 243, 276,280, 326, 328, 329t, 435
Advanced AV block (see Atrioventricular block)Afterdepolarizations, 5, 185t, 224, 226AIVR (see Accelerated idioventricular rhythm)Aldosterone antagonist, 308t, 375, 394, 403Algorithms
for diagnosing narrow complex tachycardia,229
for wide complex tachycardia, 315Alteplase, 373, 374, 394
Alternans (see Electrical alternans)Amiodarone, 148, 197, 216, 220, 225, 226, 234,
243, 244, 254–259, 261t, 280, 281, 284,302, 304–307, 329t, 436–437, 439
Aneurysm (see Left ventricular aneurysm)Angina (see Unstable angina)Angiotensin-converting enzyme (ACE)
inhibitors, 254, 308t, 374, 375, 394, 403Angiotensin receptor blockers (ARB), 254, 308t,
374, 375, 394, 403Anode, 420, 422, 432Anterior MI, 28, 90, 118, 339, 341, 346, 350, 352,
354, 366–367, 370, 371and AV block, 355
Anterograde conduction, 271, 272Antiarrhythmia devices, 111, 136, 147, 166, 377,
433Anticoagulation
in atrial fibrillation, 165, 259–260in atrial flutter, 243
Antidromic atrioventricular reciprocatingtachycardia (AVRT), 198, 206, 273–276,279, 280, 310, 314, 322, 327–329
Antitachyarrhythmia, 418tAntitachycardia devices, 244, 245, 430, 431Antithrombotic agents, 259–261, 375, 392ARP (see Atrial refractory period)Arrhythmogenic right ventricular dysplasia
(ARVD), (see Right ventricular dysplasia)Artery, coronary, 195, 333, 338, 340–342, 344,
350–351, 369, 371, 373, 376, 392dominant coronary, 341–344, 346, 350, 371, 372
posterior descending, 119, 339, 342, 344,346, 371
Ashman phenomenon, 252–253Aspirin, 260–261, 374, 378, 393t, 394Asystole, 148, 151, 153, 154, 158Atenolol, 196–197, 225, 255, 437–438Atrial
contraction, 18, 19, 83, 106, 107, 195, 225,328, 352
deflection, 101depolarization, 56depolarization and repolarization, 57enlargement, 68escape rhythm, 153, 154, 167, 168infarction, 351t, 372ischemia, 372left, 17, 66, 213, 214right, 65, 213, 214
Atrial abnormality, left, 66, 68, 69, 71, 136Atrial activation, 10, 100, 175, 204, 221, 262
left, 63, 64, 67right, 63, 67
Atrial fibrillation, 246–261Ashman phenomenon, 252aspirin, 260, 261t,atrial rate, 246classification, 248
Index
449
common mistakes in, 249–252control of ventricular rate (see Rate control)conversion to sinus rhythm (see Rhythm
control)ECG findings, 246–248, 249first detected, 248incidence of, 165, 282lone, 248, 254, 261tmechanism, 248nonvalvular, 248, 254pacemaker (see Pacemaker, cardiac)paroxysmal, 248permanent, 248persistent, 248prevalence, 246, 254prevention of stroke, 259–260rate control, 254–256rhythm control, 257–259, 437, 446–447treatment of, 254–260valvular, 248, 254ventricular rate, 246–247warfarin, 260, 261tWPW syndrome and, 253, 256, 281–285
Atrial flutter, 233–245ablation of, 245artifacts resembling, 242atrial pacing, 244–245atrial rate, 233, 243common mistakes in, 236, 237–241complete AV block and, 235, 240control of ventricular rate, 243–244conversion to sinus rhythm, 244–245, 442electrical cardioversion, 245ECG findings, 233, 236lone, 243, 245mechanism of, 233, 241reverse typical, 233, 242therapy, 243–245two to one block, 234, 237, 238, 239typical, 233, 241–242ventricular rate, 234versus atrial tachycardia, 235, 238, 239
Atrial pacing (see Pacemakers, cardiac)rapid, 164, 244–245
Atrial refractory period (ARP), 427–428Atrial rhythm, 101, 236, 420, 421, 430
chaotic, 154, 171, 219Atrial septal defect, 78, 107, 225
repair, 208, 218Atrial tachycardia, 150, 152, 163, 169–170, 174,
178, 186t, 209, 211, 212, 214–216,226–227, 231, 232, 235, 238, 239, 243, 436
Atrial triggered pacemaker, 421Atrioventricular block, 80–111
acute MI and, 86, 93, 98, 99, 100, 352, 353,355, 356, 357, 375–376
advanced second degree, 83, 92–97, 93atrial fibrillation and, 252atrial flutter and, 234–235, 240
Pages numbers in italics denote figures; those followed by a t denote tables.
LWBK271-Ind_449-454.qxd 03-02-2009 08:32 PM Page 449 Aptara Inc
Atrioventricular block (continued)classification of, 80common mistakes in, 101, 102, 103complete (see Third degree)first degree, 83–87, 104t, 145–147high grade (see Advanced second degree)His recording and, 100–101indications for pacing, 104t, 104, 105, 107infranodal, 89–90localizing site of, 85, 98, 100nodal 87–89permanent pacing in, 104tphysical findings in, 105–106second degree, 83–89third degree, 97–102, 104t, 104–105three to one, 93treatment of, 96–97, 107two to one, 92, 93type I (AV Wenckebach), 83–89type II (Mobitz II), 89–92, 91, 89–90, 92
Atrioventricular nodal reentrant tachycardia(AVNRT), 185t, 187–197, 199–200, 202,206, 207, 212, 215, 217–218, 225,227–231, 238
Atrioventricular node, 9, 10, 112, 174, 263Atrioventricular reciprocating tachycardia (see
Atrioventricular reentrant tachycardia[AVRT])
Atrioventricular reentrant tachycardia (AVRT),185t, 187, 190, 192, 194, 196, 198–207,212, 215–218, 225, 227–230, 272–276,278–280, 282, 310
Atropine, 88, 89, 92, 96, 108–109, 165, 180, 223,371, 376, 438, 440, 441, 443
small doses of, 438Atypical AVNRT, 190, 193, 194, 199, 215–217,
227, 229–231Atypical AVRT, 199, 202, 203, 205, 206, 215–217,
227–231Automatic cells, 7, 8, 181, 182, 186t, 292Automatic defibrillator, 128, 308t, 309, 352, 355Automaticity, 2, 7, 182, 439, 443, 445
enhanced, 181, 185–186, 195, 211, 215–216,218, 220, 221, 224, 226, 301, 436
triggered, 209, 212, 226AV block (see Atrioventricular block)AV dissociation, 100, 106, 111, 251, 315,
317–319, 328AV junction, 7, 8, 19, 87, 96–98, 104t, 105, 108,
109, 149, 153–154, 161–163, 167, 174–176,178, 179, 185t, 186t, 212, 224, 292
AV junctional escape rhythms, 97, 154AV junctional rhythm, 88, 98, 107, 109, 153,
162, 220, 402AV junctional tachycardia, 212, 215, 220AV nodal ablation, 256AV Wenckebach (see Atrioventricular block)AVNRT (see Atrioventricular nodal reentrant
tachycardia)AVRT (see Atrioventricular reentrant
tachycardia)
Bazett formula, 13, 20Beta blockers, 148, 149, 182–183, 196–197, 207,
208, 215, 216, 220, 225, 243, 244,254–258, 304, 305, 307–308, 374, 394,436–438, 440, 441, 445, 446
450 Index
Bi-atrial enlargement, 65–66Bidirectional ventricular tachycardia, 295, 298Bifascicular block, 121, 122, 129, 134, 136, 138,
140–142, 145–146, 321, 323, 327Bigeminy, 159–160, 169, 170, 172–173, 289, 290,
300Bilateral bundle branch block, 138–140, 145Biphasic QRS complexes, 318, 316Bipolar electrodes, 420, 422, 432Biventricular hypertrophy, 46, 75, 77Biventricular pacemakers, 136, 430–433Blocked premature atrial complexes, 101, 103,
158–160, 164, 168–170, 172–174, 178Bradycardia-dependent bundle branch block,
133–134Broad complex tachycardia (see Wide complex
tachycardia)Brugada ECG, 304–305, 309, 359, 361–363Brugada syndrome, 6, 21, 299, 301, 303–304,
309, 362, 433Bundle branch block, 120–137
acute MI and (see Acute coronary syndrome)
bilateral, 138, 139, 140, 141incomplete LBBB, 72, 129incomplete RBBB, 74, 124left, 128–137rate related, 127, 131, 133, 134, 204–206right, 120–128
Bundle branch reentrant tachycardia, 294Burst pacing, 430, 431Bypass tract, 263–272
auscultatory findings, 271concealed, 200, 206, 263–264location, 203–205, 265–269, 275–276manifest, 200, 206, 263rapidly conducting, 199, 206slowly conducting, 199, 206
Calcitonin, 409, 410Calcium, 5–6, 20, 302, 396, 403, 404, 409, 410,
412, 438Calcium channel blockers, 80, 106, 108, 146,
149, 183, 195–197, 208, 215, 216, 243,244, 254–256, 258, 281, 285, 302, 394
nondihydropyridine, 183, 255Calcium chloride, 404, 412, 447Cardiac
markers, 332, 335, 346, 369pacemakers, 414–433resynchronization therapy, 136, 137, 432rotation, 39–40, 46, 47troponins, 333, 368, 369, 373, 379, 381, 383,
392Cardiomyopathy, tachycardia-mediated, 212,
215, 216, 225, 226, 245, 256Cardioversion, 257t, 260, 296, 305, 306, 431,
440, 442direct current, 243–245, 258, 259t, 284
Carotid sinus pressure, 158, 164, 195, 208, 235,238, 250, 251, 280, 326, 327, 328
Cathode, 420, 422Chamber enlargement and hypertrophy, 62–79
bi-atrial, 65–66combined ventricular, 75–77left atrial, 64–65, 66–68left ventricular, 68–73
right atrial, 62–64right ventricular, 73–75, 77–78
Children, 13, 19, 20, 31, 40, 44, 117, 127,212, 223, 225, 232, 246, 286, 299, 301,379–381
Chronic obstructive pulmonary disease(COPD), 19, 46, 63, 73, 75, 116, 219, 220,225, 254, 256
Chronotropic incompetence, 149, 163Clockwise rotation, 40–42, 46, 74, 77, 118, 367Clopidogrel, 374, 378, 393t, 394, 445Compensatory pause, 131, 169, 172, 173, 287,
296Complete atrioventricular (AV) block, 80,
86–90, 92, 96–111, 127, 128, 136,138–139, 142, 143, 145–148, 235, 236,250, 252, 371, 423, 424, 427, 428, 431,432 (see also Atrioventricular block)
Complete atrioventricular (AV) dissociation, 98,99, 105–107, 109–111, 177, 178, 221, 224,227–228, 230, 250, 310, 311, 313, 314,318, 321, 326, 327, 352, 357
Complete right bundle branch block (seeBundle branch block)
Complete vagal blockade, 108, 376, 438Concealed bypass tracts, 200, 204, 206, 207, 263,
285Concealed conduction, 101, 103Concordance
negative, 321, 322positive, 321–322
COPD (see Chronic obstructive pulmonarydisease)
Coronary arteries, 5, 61, 332, 333, 337–339, 340,341, 342, 343, 346, 350, 365, 370, 371,385–387, 392
Coronary vasospasm, 21, 332–333, 368Cough CPR, 165Counterclockwise rotation, 40–42Coupling intervals, 174, 289, 293, 299–301
long, 289short, 289
Delta wave, 15–16, 21–22, 44, 200, 206,263–266, 269–274, 276, 277, 279, 283,284, 325, 367
negative, 265, 268, 279Depolarization, 3, 6–8, 10–12, 16, 20, 55–61, 70,
72, 226, 302, 383, 385, 389, 390, 445and repolarization, 55–57, 59, 61, 126, 365
Diastole, 7, 16–17, 21, 61, 69, 71, 107, 289, 389,390
electrical, 14–18, 388, 391Diastolic depolarization, 134, 185t, 211, 226
slow spontaneous, 3, 7, 181Digibind, 108, 439–440Digitalis, 5, 71, 80, 83, 87, 96, 106, 108, 179,
185t, 186t, 215–216, 224–227, 235, 239,243–244, 250, 251, 258, 280, 281, 285,298, 301, 387, 403, 412, 439, 440
Digoxin, 195–197, 207, 208, 244, 254–258, 281,285, 437–440
dose of, 439levels, 225, 258, 439, 440, 446
Diltiazem, 146, 174, 183, 196–197, 208, 216, 220,243, 244, 255–257, 394, 437, 440, 447
Dipole, 55–56
LWBK271-Ind_449-454.qxd 03-02-2009 08:32 PM Page 450 Aptara Inc
Discordant ST segment depression, 358, 359Disopyramide, 243, 257t, 280, 284, 302Dobutamine, 89, 135, 165, 223, 225, 376,
440–441, 443Dofetilide, 257–259, 302Dual chamber pacemakers (see Pacemakers,
cardiac)
Early afterdepolarizations, 185t, 226Early repolarization, 20, 359–361, 382Ebstein’s anomaly, 127, 271, 329Effective refractory period, 4, 8, 444Electrical alternans, 52–54, 203, 205, 216Electrical axis, 29, 31, 32, 36, 47, 114, 117
and cardiac rotation, 30, 31, 33, 35, 37, 39, 41,43, 47, 367, 379
Electrolytes, abnormalities, 21, 107, 174, 216,299, 307, 308t, 329t, 352, 359, 361, 392,396, 397, 399, 401–405, 407, 409–413
End-diastolic PVCs, 289Endocardium, 2, 6, 11, 20–21, 57, 59–61, 68, 69,
71–72, 112, 126, 327, 385, 390–391Enoxaparin, 374, 393Epicardial cells, 6, 20, 21, 61, 304, 391
potential duration of, 21, 390Epicardium, 4, 6, 11, 20, 21, 57–61, 68, 69, 71,
72, 126, 327, 362, 383, 385, 390–391Epinephrine, 89, 92, 96, 108, 165, 180, 303, 305,
438, 441, 444, 446Epsilon wave, 16, 21, 22, 28Equiphasic, 31–34, 36, 37, 39–42Erythromycin, 302Escape
beats, 94, 96interval, 417t, 419–420rhythm, 87, 88, 92, 97–100, 102, 104–106,
108, 146, 149, 153, 154, 161–163Esmolol, 196, 197, 225, 244, 255, 257t, 438, 441,
442Exit block, 149–151, 163
Fascicular Block, 47, 92, 112–113, 117, 119–121,127, 145–147, 321, 327, 351t, 355,366, 371
alternating, 138, 145Fast sodium channels, 5–8, 302, 303First-degree AV block, 80–83, 89, 99, 107, 139,
143, 145–147First diagonal branch, 339–343, 351t, 366, 370Flecainide, 216, 225, 243, 244, 257–259, 276,
279, 280, 284, 304, 329Flutter, atrial (see Atrial flutter)Flutter, ventricular, 294, 297, 299Focal atrial tachycardia, 190, 194, 196, 209,
211–218, 225, 227–232, 279, 280, 436Focal atrial tachycardia junctional tachycardia,
228Focal junctional tachycardia, 221, 223–226, 231Fondaparinux, 374, 393Frontal plane, 24, 26–27, 30–32, 36, 58–60,
62–65, 116, 121–123, 145, 180, 269, 270,289, 291, 292, 298, 346, 379–380
Fully compensatory pause, 288, 289Fusion complexes, 262, 271, 276, 282, 289, 293,
294, 299, 311–314, 327, 397, 404–406,408
wide complex tachycardia, 312
Ground electrode, 24–28Group beating, 85–86Heart block (see Atrioventricular block)
rate, 12–14, 20–21, 48–51, 53, 89, 96, 107, 108,134, 149, 182, 247–249, 252, 255, 256,298, 299, 360–361, 437–441
rate and voltage, 48, 49, 53, 234rate meter stick, 49, 51rate table, 49rates, calculating, 49
Heparin, 374, 375His-Purkinje
cells, 2, 7system, 3, 5, 7, 10, 14t, 15, 18, 21, 81, 85, 90,
91, 94, 96, 105, 146, 168, 444, 445Hisioventricular fiber, 285Horizontal plane, 27, 30, 36, 38, 39, 58–60, 62,
63, 65, 180, 342, 379, 380Hypercalcemia, 16, 20, 216, 396, 408–410, 413Hyperkalemia, 21, 148, 158, 163, 179, 305, 359,
361, 381–382, 396–397, 401–404,407–408, 411, 412
severe, 397, 399–404treatment of, 403
Hypersensitive carotid sinus syndrome, 158,163, 164, 441
Hypertension, 21, 67, 70, 72–73, 79, 117, 119,127, 134–136, 146, 243, 248, 254, 255,260, 261t, 374, 441–446
Hypocalcemia, 299, 396, 397, 402, 409–413symptoms of, 412
Hypokalemia, 14t, 15, 21, 216, 225, 299, 302,304, 307, 396, 404–408, 410, 412, 413
Hypomagnesemia, 216, 220, 299, 302, 307, 407,412, 444
Hypothermia, 16, 20, 22, 107, 148, 305, 359, 362,364, 438
Hysteresis, 417t, 419, 420
IART (see Intra-atrial reentrant tachycardia)Ibutilide, 197, 244, 256–259, 276, 279–281, 284,
302, 329t, 442–443ICD (see Implantable cardioverter defibrillator)Idiopathic Hypertrophic Subaortic Stenosis
(IHSS), 367IHSS (see Idiopathic Hypertrophic Subaortic
Stenosis)Implantable cardioverter defibrillator (ICD),
375–376, 431–433Inappropriate sinus bradycardia, 149, 159, 161,
163Inappropriate sinus tachycardia, 180–183, 212Incomplete LBBB, 128, 129, 298Incomplete RBBB, 124, 127Increased voltage, 19, 68–69, 71, 72, 76, 77Inferior myocardial infarction (MI), 44, 45, 113,
115–117, 119, 344, 346, 350, 354, 366,370, 372
and AV Block, 352diagnosis of, 366
Infranodal block, 86, 88–89, 92–94, 96, 98–100,102, 106, 109, 138, 375, 438, 440, 441, 443
Injurydiastolic current of, 386, 388–391subendocardial, 342, 344, 345, 385, 386, 389,
391INR (see International normalized ratio)
Insulin, 403, 404, 407Intermittent preexcitation, 264, 272Intermittent right bundle branch block, 125, 126International normalized ratio (INR), 260–261,
373Internodal tracts, 4Intra-atrial block, 66–68Intra-atrial reentrant tachycardia (IART), 187,
207–209, 218Intra-atrial reentry, 186t, 215Intracellular potassium, acute shift of, 402, 403Intraventricular conduction defect, 20, 42, 47, 112,
113, 117, 119–121, 125, 127, 129, 131, 133,135–139, 355, 370–372, 375, 376, 432
Intraventricular conduction system, 1–2, 9, 10,57, 87, 92, 105, 112, 125, 134, 272, 370
Intrinsicoid deflection, 57, 58Ionized calcium, 408, 409, 412
level of, 409, 412normal level of, 410, 412
Ischemia, myocardial (see Myocardial ischemia)Isoproterenol, 89, 92, 96, 165, 174, 304, 307, 441,
443
J point, 11, 12, 15, 18, 20J point elevation, 20J wave, 20 (see also Osborn wave)JT interval, 18, 412Jugular venous pulse, 105–108Junctional escape rhythm, 88, 97–99, 106,
154–155, 158, 161Junctional rhythm, 98, 100, 110, 155, 176–178,
224, 225, 397accelerated, 176–177, 722
Junctional tachycardia, 105, 109–111, 176, 177,186t, 193, 209, 212, 215, 217, 220–221,223, 224, 227–232
automatic, 221, 225Juvenile pattern (see Persistent juvenile pattern)
Ketonazole, 302
L-type calcium channels, 302, 304LAD (see Left anterior descending)LAFB (see Left anterior fascicular block)Late afterdepolarizations, 185t, 226Late impulses, 167, 168Late transition, 40–42, 46Lateral MI, 117, 118, 342, 367LBBB (see Left bundle branch block)LCx (see Left circumflex)Left anterior descending (LAD), 31, 291,
338–343, 350–351, 370–371coronary artery, 119, 127, 336–338, 343, 366,
377Left anterior fascicle, 2, 10, 112–114, 116, 117,
119, 127, 292, 298Left anterior fascicular block (LAFB), 28, 47, 72,
86, 99, 113–117, 119–123, 125, 127, 132t,133, 138–142, 144–145, 354, 356
diagnosis of, 114Left atrial
conduction delay, 136enlargement, 64–68, 79origin, 213, 214pressure, 17, 71tachycardia, 215
Index 451
LWBK271-Ind_449-454.qxd 03-02-2009 08:32 PM Page 451 Aptara Inc
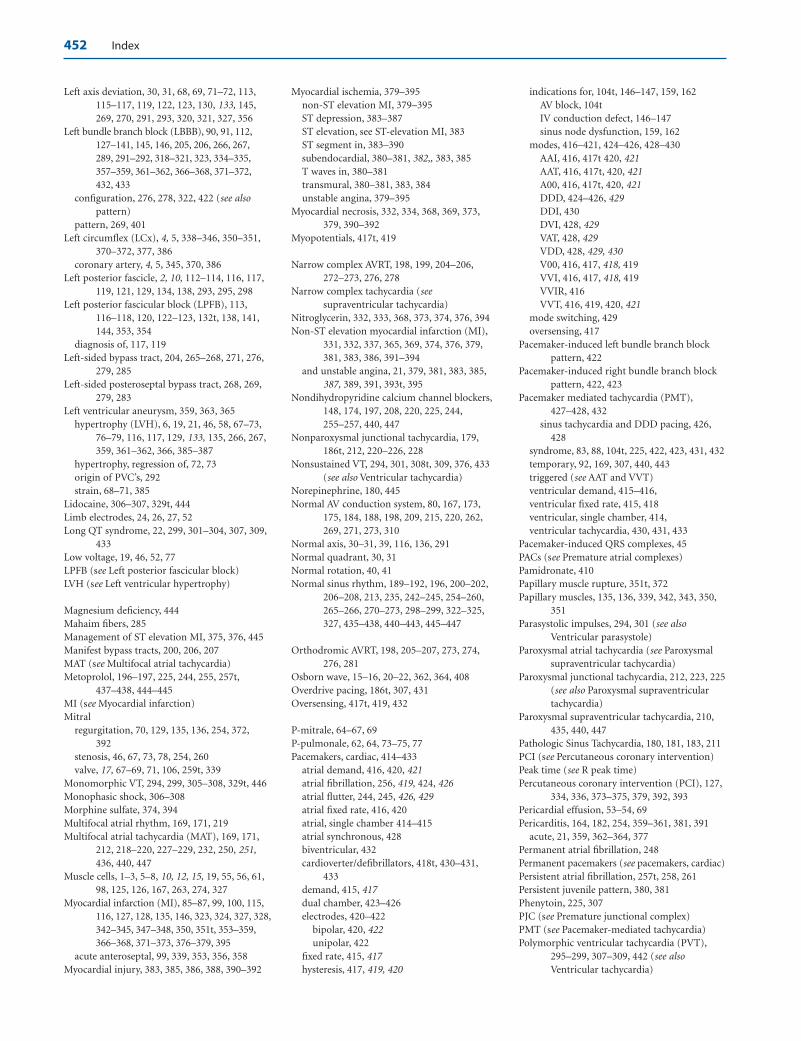
Left axis deviation, 30, 31, 68, 69, 71–72, 113,115–117, 119, 122, 123, 130, 133, 145,269, 270, 291, 293, 320, 321, 327, 356
Left bundle branch block (LBBB), 90, 91, 112,127–141, 145, 146, 205, 206, 266, 267,289, 291–292, 318–321, 323, 334–335,357–359, 361–362, 366–368, 371–372,432, 433
configuration, 276, 278, 322, 422 (see alsopattern)
pattern, 269, 401Left circumflex (LCx), 4, 5, 338–346, 350–351,
370–372, 377, 386coronary artery, 4, 5, 345, 370, 386
Left posterior fascicle, 2, 10, 112–114, 116, 117,119, 121, 129, 134, 138, 293, 295, 298
Left posterior fascicular block (LPFB), 113,116–118, 120, 122–123, 132t, 138, 141,144, 353, 354
diagnosis of, 117, 119Left-sided bypass tract, 204, 265–268, 271, 276,
279, 285Left-sided posteroseptal bypass tract, 268, 269,
279, 283Left ventricular aneurysm, 359, 363, 365
hypertrophy (LVH), 6, 19, 21, 46, 58, 67–73,76–79, 116, 117, 129, 133, 135, 266, 267,359, 361–362, 366, 385–387
hypertrophy, regression of, 72, 73origin of PVC’s, 292strain, 68–71, 385
Lidocaine, 306–307, 329t, 444Limb electrodes, 24, 26, 27, 52Long QT syndrome, 22, 299, 301–304, 307, 309,
433Low voltage, 19, 46, 52, 77LPFB (see Left posterior fascicular block)LVH (see Left ventricular hypertrophy)
Magnesium deficiency, 444Mahaim fibers, 285Management of ST elevation MI, 375, 376, 445Manifest bypass tracts, 200, 206, 207MAT (see Multifocal atrial tachycardia)Metoprolol, 196–197, 225, 244, 255, 257t,
437–438, 444–445MI (see Myocardial infarction)Mitral
regurgitation, 70, 129, 135, 136, 254, 372,392
stenosis, 46, 67, 73, 78, 254, 260valve, 17, 67–69, 71, 106, 259t, 339
Monomorphic VT, 294, 299, 305–308, 329t, 446Monophasic shock, 306–308Morphine sulfate, 374, 394Multifocal atrial rhythm, 169, 171, 219Multifocal atrial tachycardia (MAT), 169, 171,
212, 218–220, 227–229, 232, 250, 251,436, 440, 447
Muscle cells, 1–3, 5–8, 10, 12, 15, 19, 55, 56, 61,98, 125, 126, 167, 263, 274, 327
Myocardial infarction (MI), 85–87, 99, 100, 115,116, 127, 128, 135, 146, 323, 324, 327, 328,342–345, 347–348, 350, 351t, 353–359,366–368, 371–373, 376–379, 395
acute anteroseptal, 99, 339, 353, 356, 358Myocardial injury, 383, 385, 386, 388, 390–392
452 Index
Myocardial ischemia, 379–395non-ST elevation MI, 379–395ST depression, 383–387ST elevation, see ST-elevation MI, 383ST segment in, 383–390subendocardial, 380–381, 382,, 383, 385T waves in, 380–381transmural, 380–381, 383, 384unstable angina, 379–395
Myocardial necrosis, 332, 334, 368, 369, 373,379, 390–392
Myopotentials, 417t, 419
Narrow complex AVRT, 198, 199, 204–206,272–273, 276, 278
Narrow complex tachycardia (seesupraventricular tachycardia)
Nitroglycerin, 332, 333, 368, 373, 374, 376, 394Non-ST elevation myocardial infarction (MI),
331, 332, 337, 365, 369, 374, 376, 379,381, 383, 386, 391–394
and unstable angina, 21, 379, 381, 383, 385,387, 389, 391, 393t, 395
Nondihydropyridine calcium channel blockers,148, 174, 197, 208, 220, 225, 244,255–257, 440, 447
Nonparoxysmal junctional tachycardia, 179,186t, 212, 220–226, 228
Nonsustained VT, 294, 301, 308t, 309, 376, 433(see also Ventricular tachycardia)
Norepinephrine, 180, 445Normal AV conduction system, 80, 167, 173,
175, 184, 188, 198, 209, 215, 220, 262,269, 271, 273, 310
Normal axis, 30–31, 39, 116, 136, 291Normal quadrant, 30, 31Normal rotation, 40, 41Normal sinus rhythm, 189–192, 196, 200–202,
206–208, 213, 235, 242–245, 254–260,265–266, 270–273, 298–299, 322–325,327, 435–438, 440–443, 445–447
Orthodromic AVRT, 198, 205–207, 273, 274,276, 281
Osborn wave, 15–16, 20–22, 362, 364, 408Overdrive pacing, 186t, 307, 431Oversensing, 417t, 419, 432
P-mitrale, 64–67, 69P-pulmonale, 62, 64, 73–75, 77Pacemakers, cardiac, 414–433
atrial demand, 416, 420, 421atrial fibrillation, 256, 419, 424, 426atrial flutter, 244, 245, 426, 429atrial fixed rate, 416, 420atrial, single chamber 414–415atrial synchronous, 428biventricular, 432cardioverter/defibrillators, 418t, 430–431,
433demand, 415, 417dual chamber, 423–426electrodes, 420–422
bipolar, 420, 422unipolar, 422
fixed rate, 415, 417hysteresis, 417, 419, 420
indications for, 104t, 146–147, 159, 162AV block, 104tIV conduction defect, 146–147sinus node dysfunction, 159, 162
modes, 416–421, 424–426, 428–430AAI, 416, 417t 420, 421AAT, 416, 417t, 420, 421A00, 416, 417t, 420, 421DDD, 424–426, 429DDI, 430DVI, 428, 429VAT, 428, 429VDD, 428, 429, 430V00, 416, 417, 418, 419VVI, 416, 417, 418, 419VVIR, 416VVT, 416, 419, 420, 421
mode switching, 429oversensing, 417
Pacemaker-induced left bundle branch blockpattern, 422
Pacemaker-induced right bundle branch blockpattern, 422, 423
Pacemaker mediated tachycardia (PMT),427–428, 432
sinus tachycardia and DDD pacing, 426,428
syndrome, 83, 88, 104t, 225, 422, 423, 431, 432temporary, 92, 169, 307, 440, 443triggered (see AAT and VVT)ventricular demand, 415–416,ventricular fixed rate, 415, 418 ventricular, single chamber, 414,ventricular tachycardia, 430, 431, 433
Pacemaker-induced QRS complexes, 45PACs (see Premature atrial complexes)Pamidronate, 410Papillary muscle rupture, 351t, 372Papillary muscles, 135, 136, 339, 342, 343, 350,
351Parasystolic impulses, 294, 301 (see also
Ventricular parasystole)Paroxysmal atrial tachycardia (see Paroxysmal
supraventricular tachycardia)Paroxysmal junctional tachycardia, 212, 223, 225
(see also Paroxysmal supraventriculartachycardia)
Paroxysmal supraventricular tachycardia, 210,435, 440, 447
Pathologic Sinus Tachycardia, 180, 181, 183, 211PCI (see Percutaneous coronary intervention)Peak time (see R peak time)Percutaneous coronary intervention (PCI), 127,
334, 336, 373–375, 379, 392, 393Pericardial effusion, 53–54, 69Pericarditis, 164, 182, 254, 359–361, 381, 391
acute, 21, 359, 362–364, 377Permanent atrial fibrillation, 248Permanent pacemakers (see pacemakers, cardiac)Persistent atrial fibrillation, 257t, 258, 261Persistent juvenile pattern, 380, 381Phenytoin, 225, 307PJC (see Premature junctional complex)PMT (see Pacemaker-mediated tachycardia)Polymorphic ventricular tachycardia (PVT),
295–299, 307–309, 442 (see alsoVentricular tachycardia)
LWBK271-Ind_449-454.qxd 03-02-2009 08:32 PM Page 452 Aptara Inc
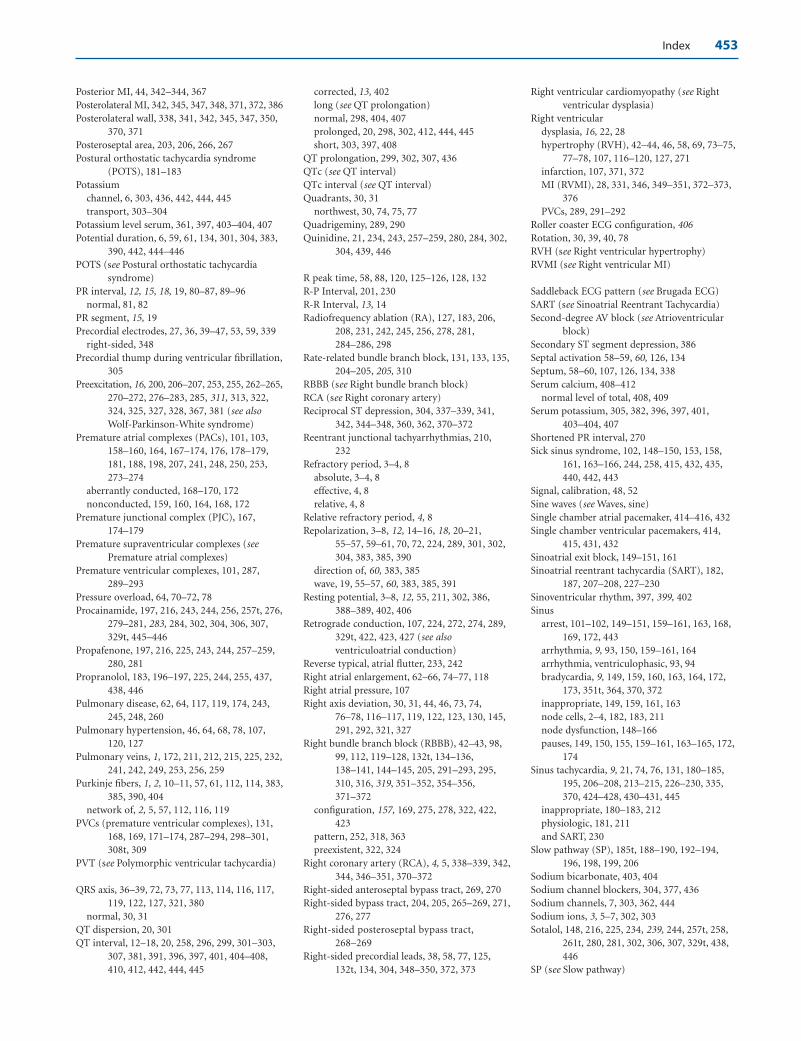
Posterior MI, 44, 342–344, 367Posterolateral MI, 342, 345, 347, 348, 371, 372, 386Posterolateral wall, 338, 341, 342, 345, 347, 350,
370, 371Posteroseptal area, 203, 206, 266, 267Postural orthostatic tachycardia syndrome
(POTS), 181–183Potassium
channel, 6, 303, 436, 442, 444, 445transport, 303–304
Potassium level serum, 361, 397, 403–404, 407Potential duration, 6, 59, 61, 134, 301, 304, 383,
390, 442, 444–446POTS (see Postural orthostatic tachycardia
syndrome)PR interval, 12, 15, 18, 19, 80–87, 89–96
normal, 81, 82PR segment, 15, 19Precordial electrodes, 27, 36, 39–47, 53, 59, 339
right-sided, 348Precordial thump during ventricular fibrillation,
305 Preexcitation, 16, 200, 206–207, 253, 255, 262–265,
270–272, 276–283, 285, 311, 313, 322,324, 325, 327, 328, 367, 381 (see alsoWolf-Parkinson-White syndrome)
Premature atrial complexes (PACs), 101, 103,158–160, 164, 167–174, 176, 178–179,181, 188, 198, 207, 241, 248, 250, 253,273–274
aberrantly conducted, 168–170, 172nonconducted, 159, 160, 164, 168, 172
Premature junctional complex (PJC), 167,174–179
Premature supraventricular complexes (seePremature atrial complexes)
Premature ventricular complexes, 101, 287,289–293
Pressure overload, 64, 70–72, 78Procainamide, 197, 216, 243, 244, 256, 257t, 276,
279–281, 283, 284, 302, 304, 306, 307,329t, 445–446
Propafenone, 197, 216, 225, 243, 244, 257–259,280, 281
Propranolol, 183, 196–197, 225, 244, 255, 437,438, 446
Pulmonary disease, 62, 64, 117, 119, 174, 243,245, 248, 260
Pulmonary hypertension, 46, 64, 68, 78, 107,120, 127
Pulmonary veins, 1, 172, 211, 212, 215, 225, 232,241, 242, 249, 253, 256, 259
Purkinje fibers, 1, 2, 10–11, 57, 61, 112, 114, 383,385, 390, 404
network of, 2, 5, 57, 112, 116, 119PVCs (premature ventricular complexes), 131,
168, 169, 171–174, 287–294, 298–301,308t, 309
PVT (see Polymorphic ventricular tachycardia)
QRS axis, 36–39, 72, 73, 77, 113, 114, 116, 117,119, 122, 127, 321, 380
normal, 30, 31QT dispersion, 20, 301QT interval, 12–18, 20, 258, 296, 299, 301–303,
307, 381, 391, 396, 397, 401, 404–408,410, 412, 442, 444, 445
corrected, 13, 402long (see QT prolongation)normal, 298, 404, 407prolonged, 20, 298, 302, 412, 444, 445short, 303, 397, 408
QT prolongation, 299, 302, 307, 436QTc (see QT interval)QTc interval (see QT interval)Quadrants, 30, 31
northwest, 30, 74, 75, 77Quadrigeminy, 289, 290Quinidine, 21, 234, 243, 257–259, 280, 284, 302,
304, 439, 446
R peak time, 58, 88, 120, 125–126, 128, 132R-P Interval, 201, 230R-R Interval, 13, 14Radiofrequency ablation (RA), 127, 183, 206,
208, 231, 242, 245, 256, 278, 281,284–286, 298
Rate-related bundle branch block, 131, 133, 135,204–205, 205, 310
RBBB (see Right bundle branch block)RCA (see Right coronary artery)Reciprocal ST depression, 304, 337–339, 341,
342, 344–348, 360, 362, 370–372Reentrant junctional tachyarrhythmias, 210,
232Refractory period, 3–4, 8
absolute, 3–4, 8effective, 4, 8relative, 4, 8
Relative refractory period, 4, 8Repolarization, 3–8, 12, 14–16, 18, 20–21,
55–57, 59–61, 70, 72, 224, 289, 301, 302,304, 383, 385, 390
direction of, 60, 383, 385wave, 19, 55–57, 60, 383, 385, 391
Resting potential, 3–8, 12, 55, 211, 302, 386,388–389, 402, 406
Retrograde conduction, 107, 224, 272, 274, 289,329t, 422, 423, 427 (see alsoventriculoatrial conduction)
Reverse typical, atrial flutter, 233, 242Right atrial enlargement, 62–66, 74–77, 118Right atrial pressure, 107Right axis deviation, 30, 31, 44, 46, 73, 74,
76–78, 116–117, 119, 122, 123, 130, 145,291, 292, 321, 327
Right bundle branch block (RBBB), 42–43, 98,99, 112, 119–128, 132t, 134–136,138–141, 144–145, 205, 291–293, 295,310, 316, 319, 351–352, 354–356,371–372
configuration, 157, 169, 275, 278, 322, 422,423
pattern, 252, 318, 363preexistent, 322, 324
Right coronary artery (RCA), 4, 5, 338–339, 342,344, 346–351, 370–372
Right-sided anteroseptal bypass tract, 269, 270Right-sided bypass tract, 204, 205, 265–269, 271,
276, 277Right-sided posteroseptal bypass tract,
268–269Right-sided precordial leads, 38, 58, 77, 125,
132t, 134, 304, 348–350, 372, 373
Right ventricular cardiomyopathy (see Rightventricular dysplasia)
Right ventriculardysplasia, 16, 22, 28hypertrophy (RVH), 42–44, 46, 58, 69, 73–75,
77–78, 107, 116–120, 127, 271infarction, 107, 371, 372MI (RVMI), 28, 331, 346, 349–351, 372–373,
376PVCs, 289, 291–292
Roller coaster ECG configuration, 406Rotation, 30, 39, 40, 78RVH (see Right ventricular hypertrophy)RVMI (see Right ventricular MI)
Saddleback ECG pattern (see Brugada ECG)SART (see Sinoatrial Reentrant Tachycardia)Second-degree AV block (see Atrioventricular
block)Secondary ST segment depression, 386Septal activation 58–59, 60, 126, 134Septum, 58–60, 107, 126, 134, 338Serum calcium, 408–412
normal level of total, 408, 409Serum potassium, 305, 382, 396, 397, 401,
403–404, 407Shortened PR interval, 270Sick sinus syndrome, 102, 148–150, 153, 158,
161, 163–166, 244, 258, 415, 432, 435,440, 442, 443
Signal, calibration, 48, 52Sine waves (see Waves, sine)Single chamber atrial pacemaker, 414–416, 432Single chamber ventricular pacemakers, 414,
415, 431, 432Sinoatrial exit block, 149–151, 161Sinoatrial reentrant tachycardia (SART), 182,
187, 207–208, 227–230Sinoventricular rhythm, 397, 399, 402Sinus
arrest, 101–102, 149–151, 159–161, 163, 168,169, 172, 443
arrhythmia, 9, 93, 150, 159–161, 164arrhythmia, ventriculophasic, 93, 94bradycardia, 9, 149, 159, 160, 163, 164, 172,
173, 351t, 364, 370, 372inappropriate, 149, 159, 161, 163node cells, 2–4, 182, 183, 211node dysfunction, 148–166pauses, 149, 150, 155, 159–161, 163–165, 172,
174Sinus tachycardia, 9, 21, 74, 76, 131, 180–185,
195, 206–208, 213–215, 226–230, 335,370, 424–428, 430–431, 445
inappropriate, 180–183, 212physiologic, 181, 211and SART, 230
Slow pathway (SP), 185t, 188–190, 192–194,196, 198, 199, 206
Sodium bicarbonate, 403, 404Sodium channel blockers, 304, 377, 436Sodium channels, 7, 303, 362, 444Sodium ions, 3, 5–7, 302, 303Sotalol, 148, 216, 225, 234, 239, 244, 257t, 258,
261t, 280, 281, 302, 306, 307, 329t, 438,446
SP (see Slow pathway)
Index 453
LWBK271-Ind_449-454.qxd 03-02-2009 08:32 PM Page 453 Aptara Inc
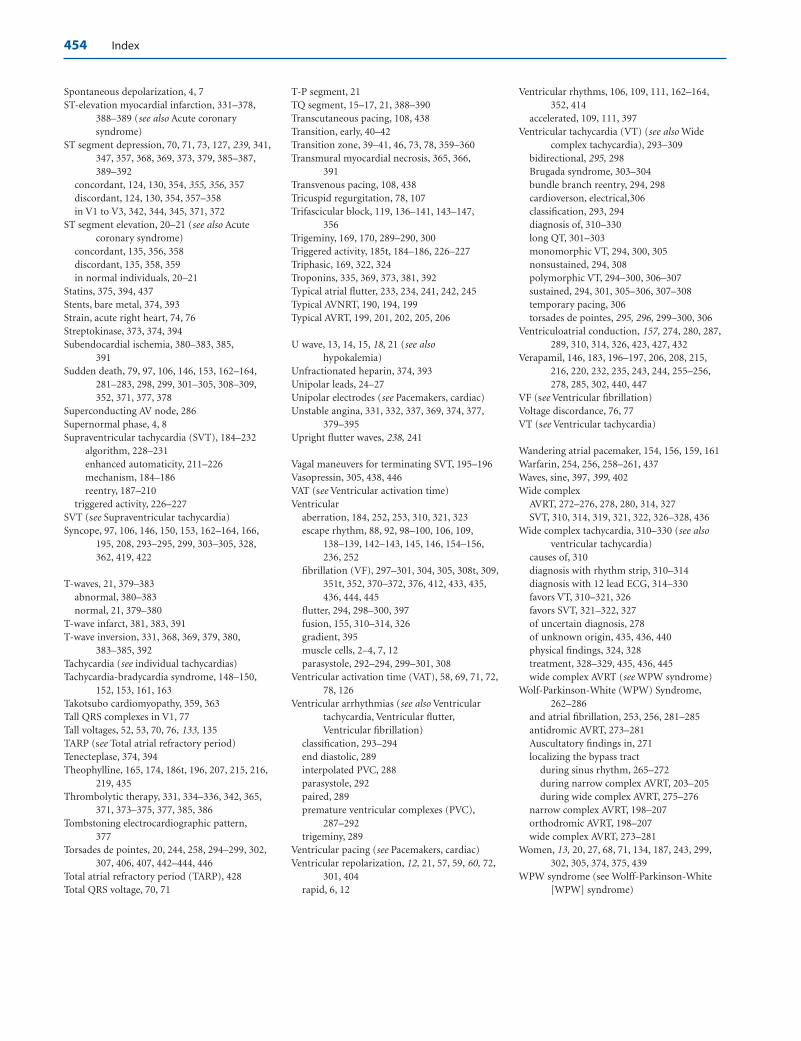
Spontaneous depolarization, 4, 7ST-elevation myocardial infarction, 331–378,
388–389 (see also Acute coronarysyndrome)
ST segment depression, 70, 71, 73, 127, 239, 341,347, 357, 368, 369, 373, 379, 385–387,389–392
concordant, 124, 130, 354, 355, 356, 357discordant, 124, 130, 354, 357–358in V1 to V3, 342, 344, 345, 371, 372
ST segment elevation, 20–21 (see also Acutecoronary syndrome)
concordant, 135, 356, 358discordant, 135, 358, 359in normal individuals, 20–21
Statins, 375, 394, 437Stents, bare metal, 374, 393Strain, acute right heart, 74, 76Streptokinase, 373, 374, 394Subendocardial ischemia, 380–383, 385,
391Sudden death, 79, 97, 106, 146, 153, 162–164,
281–283, 298, 299, 301–305, 308–309,352, 371, 377, 378
Superconducting AV node, 286Supernormal phase, 4, 8Supraventricular tachycardia (SVT), 184–232
algorithm, 228–231enhanced automaticity, 211–226mechanism, 184–186reentry, 187–210
triggered activity, 226–227SVT (see Supraventricular tachycardia)Syncope, 97, 106, 146, 150, 153, 162–164, 166,
195, 208, 293–295, 299, 303–305, 328,362, 419, 422
T-waves, 21, 379–383abnormal, 380–383normal, 21, 379–380
T-wave infarct, 381, 383, 391T-wave inversion, 331, 368, 369, 379, 380,
383–385, 392Tachycardia (see individual tachycardias)Tachycardia-bradycardia syndrome, 148–150,
152, 153, 161, 163Takotsubo cardiomyopathy, 359, 363Tall QRS complexes in V1, 77Tall voltages, 52, 53, 70, 76, 133, 135TARP (see Total atrial refractory period)Tenecteplase, 374, 394Theophylline, 165, 174, 186t, 196, 207, 215, 216,
219, 435Thrombolytic therapy, 331, 334–336, 342, 365,
371, 373–375, 377, 385, 386Tombstoning electrocardiographic pattern,
377Torsades de pointes, 20, 244, 258, 294–299, 302,
307, 406, 407, 442–444, 446Total atrial refractory period (TARP), 428Total QRS voltage, 70, 71
454 Index
T-P segment, 21TQ segment, 15–17, 21, 388–390Transcutaneous pacing, 108, 438Transition, early, 40–42Transition zone, 39–41, 46, 73, 78, 359–360Transmural myocardial necrosis, 365, 366,
391Transvenous pacing, 108, 438Tricuspid regurgitation, 78, 107Trifascicular block, 119, 136–141, 143–147,
356Trigeminy, 169, 170, 289–290, 300Triggered activity, 185t, 184–186, 226–227Triphasic, 169, 322, 324Troponins, 335, 369, 373, 381, 392Typical atrial flutter, 233, 234, 241, 242, 245Typical AVNRT, 190, 194, 199Typical AVRT, 199, 201, 202, 205, 206
U wave, 13, 14, 15, 18, 21 (see alsohypokalemia)
Unfractionated heparin, 374, 393Unipolar leads, 24–27Unipolar electrodes (see Pacemakers, cardiac)Unstable angina, 331, 332, 337, 369, 374, 377,
379–395Upright flutter waves, 238, 241
Vagal maneuvers for terminating SVT, 195–196Vasopressin, 305, 438, 446VAT (see Ventricular activation time)Ventricular
aberration, 184, 252, 253, 310, 321, 323escape rhythm, 88, 92, 98–100, 106, 109,
138–139, 142–143, 145, 146, 154–156,236, 252
fibrillation (VF), 297–301, 304, 305, 308t, 309,351t, 352, 370–372, 376, 412, 433, 435,436, 444, 445
flutter, 294, 298–300, 397fusion, 155, 310–314, 326gradient, 395muscle cells, 2–4, 7, 12parasystole, 292–294, 299–301, 308
Ventricular activation time (VAT), 58, 69, 71, 72,78, 126
Ventricular arrhythmias (see also Ventriculartachycardia, Ventricular flutter,Ventricular fibrillation)
classification, 293–294end diastolic, 289interpolated PVC, 288parasystole, 292paired, 289premature ventricular complexes (PVC),
287–292trigeminy, 289
Ventricular pacing (see Pacemakers, cardiac)Ventricular repolarization, 12, 21, 57, 59, 60, 72,
301, 404rapid, 6, 12
Ventricular rhythms, 106, 109, 111, 162–164,352, 414
accelerated, 109, 111, 397Ventricular tachycardia (VT) (see also Wide
complex tachycardia), 293–309bidirectional, 295, 298Brugada syndrome, 303–304bundle branch reentry, 294, 298cardioverson, electrical,306classification, 293, 294diagnosis of, 310–330long QT, 301–303monomorphic VT, 294, 300, 305nonsustained, 294, 308polymorphic VT, 294–300, 306–307sustained, 294, 301, 305–306, 307–308temporary pacing, 306torsades de pointes, 295, 296, 299–300, 306
Ventriculoatrial conduction, 157, 274, 280, 287,289, 310, 314, 326, 423, 427, 432
Verapamil, 146, 183, 196–197, 206, 208, 215,216, 220, 232, 235, 243, 244, 255–256,278, 285, 302, 440, 447
VF (see Ventricular fibrillation)Voltage discordance, 76, 77VT (see Ventricular tachycardia)
Wandering atrial pacemaker, 154, 156, 159, 161Warfarin, 254, 256, 258–261, 437Waves, sine, 397, 399, 402Wide complex
AVRT, 272–276, 278, 280, 314, 327SVT, 310, 314, 319, 321, 322, 326–328, 436
Wide complex tachycardia, 310–330 (see alsoventricular tachycardia)
causes of, 310diagnosis with rhythm strip, 310–314diagnosis with 12 lead ECG, 314–330favors VT, 310–321, 326favors SVT, 321–322, 327of uncertain diagnosis, 278of unknown origin, 435, 436, 440physical findings, 324, 328treatment, 328–329, 435, 436, 445wide complex AVRT (see WPW syndrome)
Wolf-Parkinson-White (WPW) Syndrome,262–286
and atrial fibrillation, 253, 256, 281–285antidromic AVRT, 273–281Auscultatory findings in, 271localizing the bypass tract
during sinus rhythm, 265–272during narrow complex AVRT, 203–205during wide complex AVRT, 275–276
narrow complex AVRT, 198–207orthodromic AVRT, 198–207wide complex AVRT, 273–281
Women, 13, 20, 27, 68, 71, 134, 187, 243, 299,302, 305, 374, 375, 439
WPW syndrome (see Wolff-Parkinson-White[WPW] syndrome)
LWBK271-Ind_449-454.qxd 03-02-2009 08:32 PM Page 454 Aptara Inc