development of genomic methods and tools for an equine model
145
DEVELOPMENT OF GENOMIC METHODS AND TOOLS FOR AN EQUINE MODEL A Dissertation Presented to the Faculty of the Graduate School of Cornell University In Partial Fulfillment of the Requirements for the Degree of Doctor of Philosophy in Animal Science by Mohammed Ali Obaid Al Abri August 2015
-
Upload
khangminh22 -
Category
Documents
-
view
0 -
download
0
Transcript of development of genomic methods and tools for an equine model

DEVELOPMENT OF GENOMIC METHODS AND TOOLS FOR AN EQUINE MODEL
A Dissertation
Presented to the Faculty of the Graduate School
of Cornell University
In Partial Fulfillment of the Requirements for the Degree of
Doctor of Philosophy in Animal Science
by
Mohammed Ali Obaid Al Abri
August 2015

© 2015 Mohammed Ali Al Abri

DEVELOPMENT OF GENOMIC METHODS AND TOOLS FOR AN EQUINE MODEL
Mohammed Ali Al Abri, Ph.D.
Cornell University 2015
The advent of genomic analysis has identified regions of functional significance in several
mammalian species. However, for horses, relatively little such work was done compared to other
farm animals. The current archive of genetic variations in the horse is mostly based on the
Thoroughbred mare upon which the reference sequence (EquCab2.0) was generated. Thus, more
investigation of the equine genomic architecture is critical to better understand the equine
genome.
Chapter 2 of this dissertation represents an analyses of next generation sequencing data of six
horses from a diverse genetic background. I have utilized the most advanced techniques to
identify, and annotate genetic variants including single nucleotide polymorphism, copy number
variations and structural variations pertaining to these horse breeds. The analysis discovered
thousands of novel SNPs and INDELs and hundreds of CNVs and SVs in each of the horses.
These newly identified variants where formatted as online tracks and should provide a
foundational database for future studies in horse genomics. Chapter three of the thesis discusses
a genome wide association study aimed at the discovery of QTLs affecting body size variation in
horses. I used the Illumina Equine SNP50 BeadChip to genotype 48 horses from diverse breeds
and representing the extremes in body size in horses. Unlike most association studies, I have
utilized a dominant model to identify these QTLs. The analysis revealed an association in
chromosome one at the ANKRD1 gene (involved in muscle myocytes and cardiomyocyte growth

and differentiation). In chapter four, I represent the results of a genomic study in which 36
Egyptian Arabian horses were genotyped using the Illumina Equine SNP70 BeadChip. The study
was conducted to elucidate the genetic background of the herd, relatedness within the herd and to
estimate genomic inbreeding values. I was able to re-establish the genetic links between the
horses and to confirm their Egyptian ancestry among other Arabian horse bloodlines. Genomic
inbreeding values were highly correlated with the pedigree estimated ones. Altogether, our
results signify the benefit of using this BeadChip technology to infer relationships within herds
and ancestry of herds and to estimate inbreeding in herds lacking pedigree recording.

v
BIOGRAPHICAL SKETCH
Mohammed Ali Al Abri was born in Shimla, Himachal Pradesh in India. He spent the first five
years of his life in Egypt and then moved to Oman. In Oman, he grew up inspired by his hard
working father who always pushed him for the next big thing. He was fond of reading and
learning new things and was always inquisitive. He joined the College of Agriculture at the
Sultan Qaboos University in the year 2000 and graduated with a BSc in Animal Science in 2004.
In the summer of 2004 he joined the Animal Science department as a faculty member. Between
2005 and 2008, he attended McGill University where he completed a master degree in dairy
cattle quantitative genetics under the supervision of Roger I. Cue. He was admitted to Cornell
University in 2011 to pursue his PhD in animal genetics. In 2012 he was very lucky to join Dr.
Samantha Brooks equine genetics lab where he was trained in horse genetics and genomics.
Mohammed also received a minor in applied statistics and completed online USDA-funded
M.Sc. level modules in animal breeding. He is interested in philosophy and history and enjoys
learning new programming languages.

vi
DEDICATION
I dedicate this thesis to my mother, my father, my sweet wife Abeer and my wonderful joyful
son Yazeed. I also dedicate it to my friends, Jonathan Wijtman, Paul Robillard and Tatu Lukka.
This thesis is especially dedicated to my PhD supervisor Dr Samantha Brooks; without her
continuous support, help and dedication it would not have been possible.

vii
ACKNOWLEDGMENTS
I would like to thank my father who encouraged me along the way and taught me to aim high,
my mother who taught me many valuable life lessons and always had faith in me. A sincere
thank you goes to my wife Abeer. Without the comfort and support she provided me;
accomplishing this wouldn’t have been an achievable task. I would also like to thank my
amazing and supportive adviser Dr. Samantha Brooks. She was always patient, understanding,
and flexible and she enthusiastically supervised my research. I am very grateful for Dr. Roger
Ian Cue, whose supervision and teaching during my MSc prepared me for much of the
programming skills and animal genetics knowledge I needed in my PhD. My gratitude goes to
Dr. Albano Beja Pereira (University of Porto) for all the valuable and fruitful discussions on my
projects. I would like to also thank Didier Chételat for his help and encouragement in my
statistics classes and to Kaixiong Ye for his inspiring thoughts and collaboration in the classes
we took together. From our lab, I would like to thank Heather Holl, Chris Posbergh and Ann
Staiger for always been there when I needed help. Special thanks as well go to Dr. Ron Lewis of
Virginia Tech for admitting me to the online graduate courses in animal breeding and genetics.
These courses have been wonderful and very beneficial in increasing my understanding of
animal breeding. I would like to additionally thank my committee members, Dr. Jason Mezey
who was always there for me whenever I needed advices throughout my PhD, Dr. James Booth
and Dr. Adam Boyko who provided me the support and guidance related to my project and
studies in general.

viii
TABLE OF CONTENTS
Biographical Sketch …………………………………………………………………...v Dedication …………………………………………………………………………….vi Acknowledgements …………………………………………………………………..vii Table of Contents ........................................................................................................viii List of Figures ………………………………………………………………………....x List of Tables…………………………………………………………………………..xi Chapter One: Introduction…………………………………………………………..1
References...........................................................................................12 Chapter Two: Whole genome detection of sequence and structural polymorphism in six diverse horses reveals loci under selection for body size and athleticism....18
Introduction…………………………………………………………………...20 Materials and Methods......................................................................................22
DNA Collection and Whole Genome Sequencing……………………22 Read Filtering and Alignment………………………………………...23 Base Quality Score Recalibration and Calling SNPs and small INDELs…………………………………......23 Identifying Structural Variations and Copy Number Variations……...25 Variant Annotation……………………………………………………26 RT q-PCR analysis of the Latherin CNV……………………………..27
Results and Discussion..................................................................................... 28 Whole genome sequencing and alignment…………………………....28 Identification of Variants……………………………………………...30
SNPs and INDELs…………………………………………….30 CNVs and SVs………………………………………………...36
Annotation of Detected Variants……………………………………...37 Genome-wide diversity (π) ……………………………………...........43
Conclusion…………………………………………………………………….48 References…………………………………………………………………….49
Chapter Three: Genome-wide scans reveal QTLs for withers height in horses near ANKRD1 and IGF2BP2……………………………………………………………..62
Introduction…………………………………………………………………...64 Materials and Methods………………………………………………………..65
Animal resources, samples collection and genotyping……………….65 SNPs quality control………………………………………………….67 Statistical analyses for the GWAS……………………………………67 Genome-wide search for selective sweeps……………………………68 Functional annotation of GWAS results and selective sweeps regions………………………………………….69 PCR–RFLP detection…………………………………………………70
Results and Discussion………………………………………………………..70

ix
Association analysis…………………………………………………..70 Identification of signals for selective sweeps…………………………75 Validation of the ANKRD1 locus in a second population of animals…79
Conclusions……………………………………………………………………80 Acknowledgements……………………………………………………………80 References ……….……………………………………………………………81
Chapter Four: Estimation of genome-wide inbreeding and population structure in an Arabian horse herd…………………………………………………………………..93
Introduction…………………………………………………………………...95 Materials and Methods………………………………………………………..96
Pedigree completeness DNA extraction and genotyping……………..97 Pedigree based inbreeding and pair-wise relationships……………….99 Genotypes summary, filtering and genomic inbreeding calculation….99 Estimation of the minimum number of markers sufficient for genomic inbreeding calculation using bootstrap……………………………….100 Pair-wise IBS, genetic distance and genetic background analysis…....101 Genomic relationship measures……………………………………….102
Results and Discussion………………………………………………………..103 Pedigree completeness index……………………………………….....103 Pedigree inbreeding, genomic inbreeding and homozygosity………...103 Estimation of the minimum number of markers sufficient for inbreeding calculation…………………………………………………108 Evaluation of genetic relationships methods..........................................110 Genetic structure and relationships within the herd...............................111 Genetic Similarity of the Herd to Other Arabian Horses……………...119
Conclusions……………………………………………………………………122 References ……….……………………………………………………………123
Chapter Five: Summary……………………………………………………………..127 References ……….……………………………………………………………132

x
LIST OF FIGURES
Figure 2.1. Tranches plot generated by GATK VariantRecallibration procedure…….25 Figure 2.2. An overview of the pipeline used in the reads processing and variant detection………………………………………………………………………………..30 Figure 2.3. The allele frequencies of SNPs from whole-genome sequence data of the six horses…………………………………………………………………………...33 Figure 2.4. Comparison of SNP data detected in the present study with SNPs currently deposited Ensembl and dbSNP databases…………………………………...34 Figure 2.5. RT-qPCR results of the LATH CNV region…………………………...….41 Figure 2.6. Circos plot summarizing the genetic variants detected in each horse….....45 Figure 3.1. Illustration of the withers height phenotype………………………………66 Figure 3.2. Distribution of withers height in cm………………………………………69 Figure 3.3. QQ plot for the GWAS analysis………………………………………..…72 Figure 3.4. Manhattan plot and genome wide FST statistic values…………………...73 Figure 3.5. Boxplot at ANKRD1 locus genotypes by withers height using a dominant model………………………………………………………………………………......79 Figure 4.1. Pedigree of sampled population of horses………………………………...98 Figure 4.2. Average pedigree completeness index by year of birth…………………..103 Figure 4.3. A. Pedigree Inbreeding vs Genomic Inbreeding values…………………..105 Figure 4.3. B. Pair-wise Pedigree Relationships vs Genomic Relationships………....105 Figure 4.4. Pedigree estimated inbreeding values (F) and genomic inbreeding for the herd over the years………………………………………………………………...108 Figure 4.5. Mean correlations and Inbreeding (with 95% confidence intervals) from the bootstrap analysis…………………………………………………………………..110 Figure 4.6. Pair-wise correlations between various programs used to estimate relationships and the pedigree estimated relationships………………………………...113 Figure 4.7. Within herd multidimensional scaling analysis of genotypes………….....118 Figure 4.8. a. Population of origin assignments using STRUCTURE for the animals with the group to each of the five clusters……………………………………………...120
Figure 4.8. b. Population of origin assignments using STRUCTURE for the group’s founders amongst other Arabian horses to each of the three clusters………………….120 Figure 4.8. c. Multidimensional scaling of the group’s founders amongst other Arabian horses………………………………………………………………………….120

xi
LIST OF TABLES
Table 2.1. Real-time quantitative PCR primers……………………………………….27 Table 2.2: Yield, filtering and mapping summary of the next generation sequencing data of six horses from different breeds………………………………………………..29 Table 2.3: Genotype categories of SNPs and INDELs and counts of CNVs and SVs in the six horses………………………………………………………………………..32 Table 2.4. Annotation of SNPs and INDELs by type in the six horses genomes……...38 Table 3.1. The breed name and mean withers height for each breed…………………..67 Table 3.2. Genes within 50 KB of the GWAS, FST and XP-CLR significant regions..78 Table 4.1. Summary of the pedigree used for the inbreeding and relationships calculation……………………………………………………………………………...97 Table 4.2. Pedigree estimated inbreeding values and percentage of homozygous markers across the genome for each animal in the herd………………………………..106 Table 4.3. Pairwise identity-by-state (IBS) genetic similarity between individuals…...114

1
CHAPTER 1
INTRODUCTION
Producing a whole-genome sequence of an organism is a fundamental step towards understanding
its genetic architecture, identifying the sequence and special pattern of expressed genes, and
characterizing genomic variations at the base pair level. It also helps understanding the
demographic and evolutionary history of various breeds/varieties and to catalog them according to
their significance. Therefore, the availability of genomic sequence data is essential for the
characterization and conservation work carried out on both captive and wild horse populations.
The works documented in the subsequent chapters discuss the evolution of sequencing and
genotyping technologies and the related statistical techniques used to leverage their capabilities.
Additionally, the novel genomic techniques and their potential in improving our understanding of
the horse genome, genes and diversity are discussed.
DNA sequencing technology began with the development of the Sanger sequencing (Sanger et al.
1977) in the late 1970s. This sequencing method uses chain termination of dideoxynucleotides
followed by capillary electrophoresis size separation of fragments and finally detection of
nucleotide bases using florescence dyes. Gradual development of the Sanger sequencing method
has improves sequence length up to approximately 1000 bp with per-base accuracies as high as
99.99% (Wang et al. 2012). Excellent accuracy and long reads quickly established the Sanger
sequencing method as a standard in the industry. Dominating the DNA sequencing market for
nearly two decades, it lead to the completion of a number of high quality whole genome sequences
including that of the humans (Metzker 2010). However, the cost and long run time for the Sanger
sequencing technology made it prohibitive to utilize for project with limited funding.
The demand for cheaper and faster sequencing methods resulted in the development of what is

2
now known as Next Generation Sequencing (NGS) technologies in the mid-2000. NGS technology
can be generally divided into 2nd and 3rd generations sequencing technologies (Glenn 2011). Most
2nd generation sequencing platforms, such as the 454/Roche, Solexa/Illumina, and the SOLiD
platform (Applied Biosystems), follow the cyclic array sequencing approach (Shendure et al.
2008). In principle, the approach is inspired by the shotgun sequencing which was first
implemented by the Human Genome Project (Zhang et al. 2011) in order to refine the human
genome. It basically involves shearing the genomic DNA, ligating adapters unto it, amplifying a
library of millions of similar DNA fragments through polymerase chain reaction (PCR) and then
sequencing using an approach unique to each platform.
On the other, hand 3rd generation sequencing platforms sequence individual DNA molecules
directly without the need for amplification. It is generally faster in both sample preparation and run
time required. Additionally, the sequences are typically longer than 2nd generation sequencing, for
example the PacBio RS system can reach up to tens of kilobases (van Dijk et al. 2014). This made
it the method of choice for improving current genome assemblies especially in highly repetitive
areas of the genome. However, high error rates and relatively low throughput are still limiting
factors for 3rd generation sequencing technologies (van Dijk et al. 2014).
Compared to Sanger sequencing, NGS technologies are much faster and cheaper and have
outperformed Sanger technology by a factor of 100-1000 in terms of daily yield (Kircher & Kelso
2010). Using Sanger technology, the estimated cost of the human genome project which took
approximately 13 years to complete was about 3 billion dollars (Hayden 2014). On the other hand,
re-sequencing a human genome using current NGS platforms typically costs less than $10,000 and
takes about a week. However, NGS technologies come with their own disadvantages, notably short
read length and higher error rate compared to Sanger sequencing.

3
Illumina technology is one of the most widely used sequencing technologies and currently
outperforms other NGS in the number and percentage of error-free reads (Glenn 2011). The
Illimina Hi-Seq 2000 Genome Analyzer released in 2010 is able to produce > 200 giga basepair
(Gbp) of 2 × 100 base reads per run, with a raw accuracy of the bases higher than 99.5% (Zhang
et al. 2011). The extremely high throughput produced by this machine translates to a higher depth
of coverage across the genome, providing more certainty to the genomic variants called using this
technology. In early 2014, Illumina announced the release of the HiSeq X Ten (a collection of ten
HiSeq X sequencers) which is capable of producing 1.8 Tera base pairs of sequence per run at a
cost of only $1000 dollars.
Illumina paired end reads (reads of both ends of a DNA fragment) are generated by sequencing
from each end of DNA template, leaving out the middle portion of the template, in a process
known as bridge amplification. These reads can be very useful for detecting genomic variants and
chromosomal rearrangements such as deletions, insertion and inversion. However, the same reads
can be also used to detect copy number (CNVs) as well as single nucleotide polymorphisms
(SNPs). In principle, there are two ways to analyze these reads. The first one is to generate a de
novo assembly of the genome followed by variants discovery using specialized software. De novo
assembly can be either guided or unguided by the reference genome of the organism and is usually
computationally demanding, especially when utilizing the relatively short 100 bp paired end reads.
The second method, guided assembly, maps the reads to the reference and then calls variants.
The assembly of the current equine reference (EquCab 2) was completed in 2009 by the Broad
Institute of MIT and Harvard (Wade et al. 2009) after sequencing the DNA of an inbred
Thoroughbred Mare named Twilight using primarily the Sanger method off sequencing. The
genome is considered of a high quality since its depth of coverage is 6.8x and > 95% of its

4
assembled sequences were anchored to the equine chromosomes. Also, the N50 contig size of the
genome is 112-kb and it has a 46-Mb N50 scaffold size. With 53% of horse genome showing
similarity to a single human chromosome, it is considered closer in structure to the human genome
than many mammalian genomes including the dog (which has just 29% homology to humans)
(Wade et al. 2009). Therefore, it is not surprising to know that the horse shares about 90 genetic
disorders that may serve as models for human disorders (Wade et al. 2009). However, in spite of
the fact that the horse genome is considered high quality, about 5 % of the sequences were not
anchored to chromosomes and now make up what is known as chromosome unknown (chrUn) in
the current, EquCab2.0, assembly. Utilization of the current genome assembly is also hindered by
a lack of horse specific annotation as most genes are based on computational predictions from
other species. Realizing the potential for improvement of EquCab2, a team of equine geneticists
have recently begun work on the third version of the assembly and has so far generated 40X of
Illumina paired end and mate pair sequence data from Twilight to complement the existing Sanger
sequencing data used to create EquCab2 (Kalbfleisch T 2015).
In addition to the lack of gene annotations, the archive of genetic variations in the horse includes
variants from only a handful of breeds. The current database includes variants that were primarily
identified by the Horse Genome Project , and re-sequencing studies of the Quarter horse (Doan et
al. 2012) and the Marwari horse (Jun et al. 2014). The total number of non-redundant SNPs
yielded by these studies is approximately 6 million SNPs. Nevertheless, there are approximately
400 distinct breeds of horses each with a unique physical characteristics (Hendricks 1995).
Therefore, to capture the breadth of existing functional variation in the horse, additional horse
breeds need to be sequenced. The genetic variation that would be discovered in these breeds is a
valuable addition to the variants currently available and aid investigating the relationships among

5
them in a comparative genomics framework. Additionally, breed specific variants shed more light
on the genetic uniqueness of each of the breeds and its selection and domestication history.
In chapter one, we utilized Illumina NGS technology to fully re-sequence six horses from diverse
breeds using the paired end sequencing approach. After filtering and mapping the reads to
EquCab2 we used cutting edge variant discovery tools in order to discover genetic variation unique
to each horse. These newly discovered variants will enrich the current genetic variant archive of
the horse. They are now available to the horse genomics community and can be loaded easily into
genome viewing web interfaces such as University of California Santa Cruz (UCSC) genome
browser.
Obtaining a complete archive of genetic variants is imperative since variation at the sequence level
is eventually manifested as phenotypic variation between individuals. Genetic mapping, or
association, is aimed at the detection and localization of genetic variation underlying phenotypic
variation. The idea of genetic association studies is not new. In the 1950s, a study suggested the
association between blood-group antigens and peptic ulceration (Aird et al. 1954). In the 1980s,
apolipoprotein E locus (APOE) was found associated with variations in the onset and risk of
Alzheimer's disease (Strittmatter & Roses 1996). In general, most early genetic mapping studies
used only a handful of genetic markers. Recently however, the developments of SNP genotyping
arrays for humans as well as the majority of economically important livestock species have
revolutionized genetic mapping. These arrays provide genotypic information on thousands to
millions of SNPs across the genome depending on species of interest. Genome wide association
studies (GWAS) are a form of genetic mapping that involves utilizing these arrays in genotyping
SNPs of many individuals to find genetic variations associated with the phenotype or phenotypes
of interest. These studies have detected a number of loci involved in human phenotypes such as

6
height (Li et al. 2010), breast cancer (Easton et al. 2007) and schizophrenia (Lencz et al. 2013). In
horses, GWAS has also been successful in detecting loci linked to height (Makvandi-Nejad et al.
2012), Guttural Pouch Tympany (Metzger et al. 2012) and Lavender Foal Syndrome (Brooks et al.
2010a).
However, the systematic sharing of ancestry in cases and controls can create allele frequency
differences between them leading to spurious associations or false positives unrelated to the
outcome of interest (Hoffman et al. 2014). This systematic sharing of ancestry is commonly called
population structure. Early methods suggested to help account for the population structure in
GWAS beginning with genomic control (GC) (Devlin & Roeder 1999) and later principle
component analysis (PCA) (Price et al. 2006). However, GC correction may over or under correct
certain SNPs depending on their ancestry. On the other hand, if the population structure is the
result of several discrete subpopulations, PCA analysis will not be able adjust for it since it uses
eigenvectors as continuous covariates (Liu et al. 2013). Additionally, these methods do not always
account for the relatedness (kinship) between individuals. In recent years, many studies have
suggested using linear mixed model (LMM) to correct for population structure and kinship
simultaneously (Hoffman 2013). Mixed models equations (MME) were first suggested by
Henderson in 1949 (Henderson 1949) but were only formalized in 1963 (Henderson 1963). Since
then, they have been used successfully up to this day in genetic evaluations to predict the genetic
merit of animals and in genetic evaluations of dairy cattle, and soon after, beef cattle in the US.
Predictions from MME are known as Best Linear Unbiased Predictions or BLUP, a term first
coined by Goldberger (Goldberger 1964). Typically, mixed models account for relatedness by
fitting the Wright’s numerator relationship matrix (or the A matrix) in the as a random effect in the
mixed models equations (MME). The relationship matrix can nowadays be estimated from

7
genotypic data and would then be called the genomic relationship matrix or the G matrix.
When applying mixed models to GWAS, the G matrix can be included in the random part of the
mixed model GWAS which is then defined as follows:
� = �� + �� + �
Where y is an n × 1 vector of phenotypes, X is an n × q matrix of fixed effects including mean,
the SNPs being tested, in addition to other confounding variables such as age or gender. β is a
q × 1 vector of fixed effects coefficients vector. Z is an incidence matrix that maps the phenotype
to the corresponding breed or strain. u is the random effect with Var (u) = ��� K, where K is a � × �
genomic relationship matrix and e ~ N(0, I ���) is the residual effect. The phenotypic variance
covariance matrix is given by � = �� � �� �� + ��
��.
In chapter two, we fitted a G matrix in our GWAS using the software EMMA (Kang et al. 2008).
EMMA uses a simple method to estimate the G matrix that guarantees positive semidefiniteness in
GWAS. Additionally, the global restricted maximum likelihood (REML) solutions for variance
components are attained using a Newton-Raphson search algorithm which is guaranteed to
converge as long as the kinship is positive semidenfinite (Kang et al. 2008).
By fitting relationships between individuals as random effects in our GWAS, we were able to
account for the cryptic relatedness between individuals and account for the population structure
correctly. Using the same method in an additive model framework, Makvandi-Nejad et al. (2012)
discovered four loci that account for more than 80% of the variation in horse body size. Using a
dominant model, we detected a locus in chromosome one that was highly associated with height
variation in horses. We also successfully accounted for the existing cryptic relatedness between the
horses used in the study. Our finding was later confirmed using a PCR and Restricted Fragment
Length Polymorphism (RFLP) test in an independent set of American Minature and Falabela

8
horses.
Typically, mixed models GWAS presume that the trait follows an infinitesimal genetic
architecture i.e all SNPs are assumed to contribute equally to the variation in phenotype. However,
for dichotomous traits such as health disorders, that assumption may not be true as these traits
could be affected by few major genes as in Lavender Foal Syndrome (Brooks et al. 2010a).
Modeling the genetic architecture using a noninfinitesimal model so that most SNPs have a small
effect while others have major effect can therefore increase the GWAS power for such traits
(Tucker et al. 2014). Bayesian models allow for the flexibility of specifying the genetic
architecture of the trait so that, depending on prior knowledge of its nature, its genetic architecture
can be modeled more accurately.
Akin to mixed models, Bayesian models in animal breeding were developed to be used primarily
for genetic evaluations. However, many researchers started using them for GWAS due to their
flexibility in modeling the genetic variance attributed to SNPs. A fundamental difference between
Bayesian and Mixed models GWAS is that Bayesian models fits all the SNPs as random effects in
the model simultaneously where as in Mixed models, SNPs are fitted individually and their effects
are estimated separately from one another. Additionally, in the mixed models framework, each
SNP is assigned a p-value indicating the magnitude of its association with the phenotype where as
in Bayesian models GWAS, the SNP effects are calculated as percentage of variance explained
inferred from posterior distributions. The general form of the Bayesian statistical model is:
� = �� + � ��� ��
�
���
+ �
where y is the vector of phenotypes, X is the fixed effects incidence matrix, � is the fixed effects
solutions vector, K is the number of SNPs, ��� is the value of the SNP k (k= 0, 1, or 2) pertaining

9
to individual i . �� is the substitution effect of SNP k, with �� sampled from N(0, � ) with a
probability of (1−π) and ��=0 with probability π, where π is the fraction of SNPs with no effect.
When π =0.5 half of the SNPs will be drown from a distribution with 0 effects and the other half
from N (0, σ��� ). σ��
� has a scaled inverse chi square distribution with 4 degrees of freedom (�� =
4) and a scale parameter S�� =
���(����)
(���)∑ ���(����)������
where �� is the allele frequency and ��� is
the additive genetic variance inferred from the markers. e ~ N(0, I ���) is the residual effect. The
variance explained by the SNP is usually estimated using the Monte-Carlo means or medians of
the posterior distribution computed by a Gibbs sampling. These Bayesian models or have been
successful in mapping threshold traits in livestock species such as calving ease in beef cattle
(Peters et al. 2013) and continuous traits such as body composition in pigs (Fan et al. 2011).
Another application of the genome-wide SNP genotypes provided by high-throughput arrays is the
calculation of genomic inbreeding values. Calculating inbreeding and relationships between
individuals is another advantageous use of these genomic data especially in situations where
pedigree information is not available or is imprecise. The classical measure of inbreeding as first
proposed by Wright (1922) was calculated using pedigree information. This measure was meant to
estimate the proportion of the genome that is identical by descent (IBD) and homozygous. This
statistic, termed “F”, was defined as the inbreeding coefficient and is equal to one half the additive
relationships between parents of an individual. Then the path method was introduced (Wright
1934) in and improved the calculation of Wright’s inbreeding coefficient. Later, a recursive
method to calculate relationships and inbreeding coefficient was introduced and greatly
accelerated the calculation of inbreeding coefficients in large pedigrees (Emik & Terrill 1949).
The negative impact of mating individuals whose parents are related, i.e inbred animals, has long
been recognized by biologists (Darwin.C 1868). Compared with outbred populations, inbred

10
populations have a higher prevalence of recessive genetic disorders (Modell & Darr 2002).
Therefore, accurate estimates of inbreeding are essential in mating decisions and assessment of
herd genetic diversity. In the field of animal breeding, algorithms were developed to directly
control long term inbreeding while maximizing genetic gain in what is known as optimal
contribution selection (Meuwissen 1997). However, pedigree based inbreeding estimates are only
as good as the pedigree they were estimated from. The depth and quality of the pedigree can
largely impact them and imprecise pedigrees can largely compromise their value. Also, because
they consider only the additive alleles (estimated shared loci) from parent to offspring, they do not
account for mendelian sampling variation between half sibs. With the development of genotyping
arrays for most agriculturally important animal and species, genome-wide inbreeding values for an
individual can now be estimated empirically from levels of genomic homozygosity. Simulation
results have shown that genomic calculations of inbreeding and relationships are closer to the true
values than those estimated from pedigrees (Keller et al. 2011). This could be explained by the fact
that they reflect mendelian sampling which pedigree inbreeding calculations cannot directly
observe (Hill & Weir 2011). The benefit of such genomic inbreeding values was demonstrated
previously in the Thoroughbred horse (Binns et al. 2012) and more recently in a variety of other
breeds (Petersen et al. 2013). Within the Arabian horse population the impacts of popular sires
could increase inbreeding by reducing the overall pool of mates. Therefore, obtaining accurate
measures of inbreeding is imperative in order to monitor genomic diversity within breeding
programs. In chapter three, we use genotypic data on a herd of 36 German Arabian horse herd and
estimate various measures of inbreeding and also reconstruct genetic relationships between
individuals in the herd.

11
The tools and techniques discussed above have certainly yielded valuable findings in each of the
corresponding projects. We demonstrated the utility of those tools in the discovery of novel
genetic variants, assessing the diversity of horses and enriching the current catalog of the horse
genetic variation. Our findings can be utilized in improving our understanding of the horse biology
and provide a starting point for future investigations.

12
REFERENCES
Aird I., Bentall H.H., Mehigan J.A. & Roberts J.A.F. (1954) The blood groups in relation to peptic
ulceration and carcinoma of colon, rectum, breast, and bronchus; an association between
the ABO groups and peptic ulceration. British medical journal 2, 315-21.
Binns M.M., Boehler D.a., Bailey E., Lear T.L., Cardwell J.M. & Lambert D.H. (2012) Inbreeding
in the Thoroughbred horse. Animal genetics 43, 340-2.
Brooks S.A., Gabreski N., Miller D., Brisbin A., Brown H.E., Streeter C., Mezey J., Cook D. &
Antczak D.F. (2010) Whole-genome SNP association in the horse: identification of a
deletion in myosin Va responsible for Lavender Foal Syndrome. PLoS genetics 6,
e1000909-e.
Darwin.C (1868) The Variation of Animals and Plants Under Domestication, Murray:London.
Devlin B. & Roeder K. (1999) Genomic control for association studies. Biometrics 55, 997-1004.
Doan R., Cohen N.D., Sawyer J., Ghaffari N., Johnson C.D. & Dindot S.V. (2012) Whole-genome
sequencing and genetic variant analysis of a Quarter Horse mare. BMC Genomics 13, 78-.
Easton D.F., Pooley K.A., Dunning A.M., Pharoah P.D.P., Thompson D., Ballinger D.G.,
Struewing J.P., Morrison J., Field H., Luben R., Wareham N., Ahmed S., Healey C.S.,
Bowman R., Meyer K.B., Haiman C.A., Kolonel L.K., Henderson B.E., Le Marchand L.,
Brennan P., Sangrajrang S., Gaborieau V., Odefrey F., Shen C.-Y., Wu P.-E., Wang H.-C.,
Eccles D., Evans D.G., Peto J., Fletcher O., Johnson N., Seal S., Stratton M.R., Rahman N.,
Chenevix-Trench G., Bojesen S.E., Nordestgaard B.G., Axelsson C.K., Garcia-Closas M.,
Brinton L., Chanock S., Lissowska J., Peplonska B., Nevanlinna H., Fagerholm R., Eerola
H., Kang D., Yoo K.-Y., Noh D.-Y., Ahn S.-H., Hunter D.J., Hankinson S.E., Cox D.G.,
Hall P., Wedren S., Liu J., Low Y.-L., Bogdanova N., Schürmann P., Dörk T., Tollenaar
R.A.E.M., Jacobi C.E., Devilee P., Klijn J.G.M., Sigurdson A.J., Doody M.M., Alexander
B.H., Zhang J., Cox A., Brock I.W., MacPherson G., Reed M.W.R., Couch F.J., Goode
E.L., Olson J.E., Meijers-Heijboer H., van den Ouweland A., Uitterlinden A., Rivadeneira

13
F., Milne R.L., Ribas G., Gonzalez-Neira A., Benitez J., Hopper J.L., McCredie M.,
Southey M., Giles G.G., Schroen C., Justenhoven C., Brauch H., Hamann U., Ko Y.-D.,
Spurdle A.B., Beesley J., Chen X., Mannermaa A., Kosma V.-M., Kataja V., Hartikainen
J., Day N.E., Cox D.R. & Ponder B.A.J. (2007) Genome-wide association study identifies
novel breast cancer susceptibility loci. Nature 447, 1087-93.
Emik L.O. & Terrill C.E. (1949) Systematic Procedures for Calculating Inbreeding Coefficients. J.
Hered. 40, 51-5.
Fan B., Onteru S.K., Du Z.-Q., Garrick D.J., Stalder K.J. & Rothschild M.F. (2011) Genome-wide
association study identifies Loci for body composition and structural soundness traits in
pigs. Plos One 6, e14726-e.
Glenn T.C. (2011) Field guide to next-generation DNA sequencers. Molecular ecology resources
11, 759-69.
Goldberger A.S. (1964) Econometric Theory. John Wiley & Sons, Inc, New York.
Hayden E.C. (2014) Technology: The $1,000 genome. Nature 507, 294-5.
Henderson C.R. (1949) Estimation of changes in herd environment. J. Dairy Sci., 32:706 (Abstr.)-
32: (Abstr.).
Henderson C.R. (1963) Selection index and expected genetic advance. NAS-NRC 982, p.141-63.
Hendricks B. (1995) International Encyclopedia of Horse Breeds. (ed. by Press. UO).
Hill W.G. & Weir B.S. (2011) Variation in actual relationship as a consequence of Mendelian
sampling and linkage. Genet Res (Camb) 93, 47-64.
Hoffman G.E. (2013) Correcting for Population Structure and Kinship Using the Linear Mixed
Model: Theory and Extensions. Plos One 8, e75707-e.

14
Hoffman G.E., Mezey J.G. & Schadt E.E. (2014) lrgpr: interactive linear mixed model analysis of
genome-wide association studies with composite hypothesis testing and regression
diagnostics in R. Bioinformatics (Oxford, England) 30, 3134-5.
Jun J., Cho Y., Hu H., Kim H.-M., Jho S., Gadhvi P., Park K., Lim J., Paek W., Han K., Manica
A., Edwards J.S. & Bhak J. (2014) Whole genome sequence and analysis of the Marwari
horse breed and its genetic origin. BMC Genomics 15, S4-S.
Kalbfleisch T R.-M.J.O.L.M.J.N. (2015) Work Toward EquCab3: A New Reference Genome
Sequence for the Domestic Horse. Plant and Animal Genome XXII. January 12th, San
Diego, California, USA.
Kang H.M., Zaitlen N.a., Wade C.M., Kirby A., Heckerman D., Daly M.J. & Eskin E. (2008)
Efficient control of population structure in model organism association mapping. Genetics
178, 1709-23.
Keller M.C., Visscher P.M. & Goddard M.E. (2011) Quantification of inbreeding due to distant
ancestors and its detection using dense single nucleotide polymorphism data. Genetics 189,
237-49.
Kircher M. & Kelso J. (2010) High-throughput DNA sequencing--concepts and limitations.
BioEssays : news and reviews in molecular, cellular and developmental biology 32, 524-
36.
Lencz T., Guha S., Liu C., Rosenfeld J., Mukherjee S., DeRosse P., John M., Cheng L., Zhang C.,
Badner J.A., Ikeda M., Iwata N., Cichon S., Rietschel M., Nöthen M.M., Cheng A.T.A.,
Hodgkinson C., Yuan Q., Kane J.M., Lee A.T., Pisanté A., Gregersen P.K., Pe'er I.,
Malhotra A.K., Goldman D. & Darvasi A. (2013) Genome-wide association study
implicates NDST3 in schizophrenia and bipolar disorder. Nature communications 4, 2739-.
Liu L., Zhang D., Liu H. & Arendt C. (2013) Robust methods for population stratification in
genome wide association studies. BMC bioinformatics 14, 132-.
15
Makvandi-Nejad S., Hoffman G.E., Allen J.J., Chu E., Gu E., Chandler A.M., Loredo A.I., Bellone
R.R., Mezey J.G., Brooks S.a. & Sutter N.B. (2012) Four loci explain 83% of size variation
in the horse. Plos One 7, e39929-e.
Metzger J., Ohnesorge B. & Distl O. (2012) Genome-wide linkage and association analysis
identifies major gene loci for guttural pouch tympany in Arabian and German warmblood
horses. Plos One 7, e41640-e.
Metzker M.L. (2010) Sequencing technologies - the next generation. Nature reviews. Genetics 11,
31-46.
Meuwissen T.H. (1997) Maximizing the response of selection with a predefined rate of inbreeding.
Journal of animal science 75, 934-40.
Modell B. & Darr A. (2002) Science and society: genetic counselling and customary
consanguineous marriage. Nature reviews. Genetics 3, 225-9.
Peters S.O., Kizilkaya K., Garrick D.J., Fernando R.L., Reecy J.M., Weaber R.L., Silver G.A. &
Thomas M.G. (2013) Heritability and Bayesian genome-wide association study of first
service conception and pregnancy in Brangus heifers. Journal of animal science 91, 605-
12.
Petersen J.L., Mickelson J.R., Cothran E.G., Andersson L.S., Axelsson J., Bailey E., Bannasch D.,
Binns M.M., Borges A.S., Brama P., Machado A.D., Distl O., Felicetti M., Fox-Clipsham
L., Graves K.T., Guerin G., Haase B., Hasegawa T., Hemmann K., Hill E.W., Leeb T.,
Lindgren G., Lohi H., Lopes M.S., McGivney B.A., Mikko S., Orr N., Penedo M.C.T.,
Piercy R.J., Raekallio M., Rieder S., Roed K.H., Silvestrelli M., Swinburne J., Tozaki T.,
Vaudin M., Wade C.M. & McCue M.E. (2013) Genetic Diversity in the Modern Horse
Illustrated from Genome-Wide SNP Data. Plos One 8.
Price A.L., Patterson N.J., Plenge R.M., Weinblatt M.E., Shadick N.A. & Reich D. (2006)
Principal components analysis corrects for stratification in genome-wide association
studies. Nature Genetics 38, 904-9.

16
Sanger F., Nicklen S. & Coulson A.R. (1977) DNA sequencing with chain-terminating inhibitors.
Proceedings of the National Academy of Sciences of the United States of America 74,
5463-7.
Shendure J.A., Porreca G.J. & Church G.M. (2008) Overview of DNA sequencing strategies.
Current protocols in molecular biology / edited by Frederick M. Ausubel ... [et al.]
Chapter 7, Unit 7.1-Unit 7.1.
Strittmatter W.J. & Roses A.D. (1996) Apolipoprotein E and Alzheimer's disease. Annual review
of neuroscience 19, 53-77.
Tucker G., Price A.L. & Berger B. (2014) Improving the power of GWAS and avoiding
confounding from population stratification with PC-Select. Genetics 197, 1045-9.
van Dijk E.L., Auger H., Jaszczyszyn Y. & Thermes C. (2014) Ten years of next-generation
sequencing technology. Trends in Genetics 30, 418-26.
Wade C.M., Giulotto E., Sigurdsson S., Zoli M., Gnerre S., Imsland F., Lear T.L., Adelson D.L.,
Bailey E., Bellone R.R., Blöcker H., Distl O., Edgar R.C., Garber M., Leeb T., Mauceli E.,
MacLeod J.N., Penedo M.C.T., Raison J.M., Sharpe T., Vogel J., Andersson L., Antczak
D.F., Biagi T., Binns M.M., Chowdhary B.P., Coleman S.J., Della Valle G., Fryc S.,
Guérin G., Hasegawa T., Hill E.W., Jurka J., Kiialainen a., Lindgren G., Liu J., Magnani
E., Mickelson J.R., Murray J., Nergadze S.G., Onofrio R., Pedroni S., Piras M.F.,
Raudsepp T., Rocchi M., Røed K.H., Ryder O.a., Searle S., Skow L., Swinburne J.E.,
Syvänen a.C., Tozaki T., Valberg S.J., Vaudin M., White J.R., Zody M.C., Lander E.S. &
Lindblad-Toh K. (2009) Genome sequence, comparative analysis, and population genetics
of the domestic horse. Science (New York, N.Y.) 326, 865-7.
Wang X.V., Blades N., Ding J., Sultana R. & Parmigiani G. (2012) Estimation of sequencing error
rates in short reads. BMC bioinformatics 13, 185-.
Wright S. (1922) Coefficients of inbreeding and relationship. Am Nat 56, 330-8.

17
Wright S. (1949) THE GENETICAL STRUCTURE OF POPULATIONS. Annals of Eugenics 15,
323-54.
Yang J., Benyamin B., McEvoy B.P., Gordon S., Henders A.K., Nyholt D.R., Madden P.A., Heath
A.C., Martin N.G., Montgomery G.W., Goddard M.E. & Visscher P.M. (2010) Common
SNPs explain a large proportion of the heritability for human height. Nature Genetics 42,
565-9.
Zhang J., Chiodini R., Badr A. & Zhang G.F. (2011) The impact of next-generation sequencing on
genomics. Journal of Genetics and Genomics 38, 95-109.

18
WHOLE GENOME DETECTION OF SEQUENCE AND STRUCTURAL POLYMORPHISM IN SIX DIVERSE HORSES REVEALS LOCI UNDER SELECTION FOR BODY SIZE AND
ATHLETICISM
Mohammed A Al Abri1,2, Sara E Kalla3, Douglas F. Antczak4, Nate Sutter5 and Samantha Brooks6
1Department of Animal Science, Cornell University, Ithaca, NY 14853, USA
2Department of Animal and Veterinary Sciences,College of Agriculture and Marine Sciences,
Sultan Qaboos University, PO box 34 Al Khod, Postal Code 123, Muscat, Oman
3Department of Clinical Sciences, College of Veterinary Medicine, Cornell University, Ithaca, NY
14853, USA
4Baker Institute for Animal Health, Cornell University, Ithaca, NY 14853, USA
5La Sierra University, Department of Biology, 4500 Riverwalk Parkway, Riverside, CA 92515
6Department of Animal Science, University of Florida, PO Box 110910,Gainesville, FL 32611
*Corresponding author
*Now Department of Animal Sciences, University of Florida, Gainesville, FL 32611, USA

19
ABSTRACT
Completed in 2009, the reference genome assembly of the domesticated horse (EquCab 2.0)
produced the majority of publically available annotations of genetic variations in this species.
Following that effort a few other projects have focused on variant discovery, but only in a
particular breed or two. In this project we aim to identify and annotate single nucleotide
polymorphisms (SNPs), insertions and deletions (INDELs), copy number variations (CNVs) and
structural variations (SVs) in the genomes six horses of diverse genetic background using next
generation sequencing. We used paired-end Illumina sequencing to interrogate the genomes of an
Arabian, a Percheron, an American Miniature, Mangalarga Marchador (Brazil), Native Mongolian
Chakouyi, and a Tennessee Walking Horse to an average sequence coverage of 10x to 24x.
Employing the GATK haplotype caller as well as the existing dbSNP variants as priors, we utilized
an iterative approach for variant discovery that resulted in the identification of 8,128,658 SNPs and
830,370 INDELs. We also discovered an average of 924 CNVs and 5336 SVs regions in each of
the horses and functionally annotated these features using ENSEMBL gene models. To facilitate
accessibility to our findings, we formatted all the discovered variants into user friendly tracks,
currently hosted in public databases. Genome-wide diversity (π) revealed regions involved in
skeletal development in the Percheron horse including MYO3B, HOXD12, and HOXD1 on ECA 18
and ANKRD1 (ECA 1). Our SV analysis also detected a putatively functional duplication in ZFAT
gene (ECA 9) unique to the American Miniature horse and an inverted duplication unique to the
Percheron horse in HMGA1. Our CNV analysis detected a copy number gain in a gene cluster that
includes the latherin gene (LATH) that could be the result of an evolutionary selection for heat
endurance and athleticism in the horse.

20
INTRODUCTION
Understanding genetic variation is an important theme in modern biology and population genetics.
Technological advances in genomics in recent years greatly benefitted livestock genomics in that
they allow examination of genetic variation at an unprecedented scale and resolution. Cataloging
that variation lays the ground for dissecting the complex genetic architecture of different traits
which has a much anticipated application in livestock health, welfare, physiology and production
traits (Womack 2005; Daetwyler et al. 2014). It also improves inference of ancient demographic
and evolutionary histories and the mechanisms underlying the adaptability of the species (Orlando
et al. 2013). In addition, cross-species comparison of genetic variation allows a better
understanding of the mammalian genome through comparative genomic studies (Thomas et al.
2003).
Domesticated approximately 5,500 years ago, horses are one of the oldest livestock species to be
domesticated and were historically used for transportation, trade warfare and as draught animals
(Schubert et al. 2014). Throughout domestication, horses were selected for a range of physical and
behaviorally desirable traits resulting in the formation of more than 400 horse breeds (Warmuth et
al. 2015) . A study comparing ancient to domesticated horses genomes revealed 125 potential
domestication target genes that have undergone positive selection (Schubert et al. 2014).
Advantageously, the equid species possess a particularly old and diverse fossil record, aiding not
only in characterizing their demographic history but also ancient human movement and migration
(Orlando et al. 2013; Schubert et al. 2014; Warmuth et al. 2015). Nevertheless, compared to other
livestock species, relatively few studies have focused on the discovery of the standing genetic
variation within different horse breeds (Doan et al. 2012).

21
Currently, there are only about 5,572,537 SNPs (www.ncbi.nlm.nih.gov/projects/SNP/ [build 144])
cataloged in the database for genetic variation (dbSNP) for the horse. The majority of these SNPs
were discovered in only two studies, one of which was the genome assembly project (Wade et al.
2009) and the other a genome re-sequencing study limited to a single American Quarter Horse
(Doan et al. 2012). Therefore, additional investigation of the equine genomic architecture is
critical for a better understanding of the equine genome per se, and also for expanded comparisons
of variation across diverse mammalian species. Furthermore, the equine industry itself provides an
eager opportunity to apply genomic discoveries towards improvements in the health and well-
being of this valuable livestock species.
Our objective was to enrich the current collection of genetic variants in the horse, and to provide
some functional prediction for these newly identified variants, including single nucleotide
polymorphisms (SNPs), copy number variations (CNVs) and structural variations (SV). As a result
of its remarkably high sequencing throughput, Next Generation Sequencing (NGS) provides access
to the large collection of the existing genetic variation in the genome. Therefore, we used Illumina
paired-end NGS technology to sequence the genomes of six horses belonging to six diverse horse
breeds. Namely, the chosen individuals were two females, an American Miniature and a
Percheron, as well as four males, an Arabian, a Mangalarga Marchador, a Native Mongolian
Chakouyi, and a Tennessee Walking Horse. Aside from an extreme contrast in body size, these
horses were also selected to perform distinct tasks and, hence, each has developed its own unique
adaptive physiology. After applying rigorous filtration criteria to the read qualities, we detected
and annotated SNPs, INDELs, CNVs and SVs in the six horses. These genetic variants will be
useful for many future research projects. They are now publically available in dbSNP, dbVAR as
well as in the National Animal Genome Research Program (NAGRP) VCF Data Repository.

22
CNVs and SVs are often difficult to access in public databases, therefore we have processed these
novel variants into user-friendly tracks available for download at
http://www.animalgenome.org/repository/horse.
MATERIALS AND METHODS
DNA Collection and Whole Genome Sequencing
DNA was extracted from either blood using Puregene whlole-blood extraction kit ( Qiagen INc.,
Valencia, CA, USA) or hair samples using previously published methods (Locke et al. 2002).
Paired-end sequencing was performed at the Biotechnology Resource Center, Cornell University.
For the construction of sequencing libraries, genomic DNA was sheared using a Covaris acoustic
sonicator (Covaris, Woburn MA) and converted to Illumina sequencing libraries by blunt end-repair
of the sheared DNA fragments, adenylation, ligation with paired-end adaptors, and enriched by PCR
according to the manufacturer’s protocol (Illumina, San Diego CA). The size of the sequencing
library was estimated by capillary electrophoresis using a Fragment Analyzer (AATI, Ames IA) and
Qubit quantification (Life Technologies, Carlsbad CA). Cluster generation and paired-end
sequencing on Illumina HiSeq instruments were performed according to the manufacturer’s
protocols (Illumina, San Diego) at the Biotechnology Resource Center, Cornell University. The
Percheron (PER), Miniature and Arabian horse (AMH) had a library read length of 100 bp and an
average insert size of 188 bp, 181 bp and 181 bp respectively. On the other hand, the Brazilian
Mangalarga Marchador (MM), a Native Mongolian Chakouyi (CH) and a Tennessee walking horse
(TWH) had a library read length of 140 bp and an average insert size of 248 bp, 168 bp and 207 bp
respectively.

23
Read Filtering and Alignment
The raw reads were first inspected using the quality control check program FastQC v10.1
(http://www.bioinformatics.babraham.ac.uk/projects/fastqc/). Then, the reads were quality filtered
using Trimmomatic (Bolger et al. 2014) which also removed the adapter sequences from the reads.
The quality filtering utilized a sliding window of 4 bp and required a minimum mean Phred quality
score of 20 within each window. Windows with an average quality less than 20 were sequentially
removed from a read. Subsequently, reads with less than 60 bp of sequence remaining were
removed from analysis along with their corresponding pairs. The genomes were then aligned to
EquCab2 using BWA (Li & Durbin 2009) in the bwa aln procedure and the aligned .sai files were
combined into Sequence Alignment (SAM) files using bwa sampe procedure designated for paired
end sequences. The SAM files were sorted and converted to Binary Alignment (BAM) files using
PICARD toolkit v1.89 (http://sourceforge.net/projects/picard/) using SortSam.jar, then, the
duplicate reads in the BAM file were removed using MarkDuplicates.jar in the same toolkit. The
Genome Analysis Toolkit (GATK) v2.6-5 (DePristo et al. 2011), procedures
RealignerTargetCreator and IndelRealigner, were used to perform local realignment of the BAM
file reads around the INDELs in order to correct misalignments due to the presence of INDELs.
Base Quality Score Recalibration and Calling SNPs and small INDELs
SNPs and small INDELs (<50bp) were detected using the GATK HaplotypeCaller procedure (Van
der Auwera et al. 2013). The GATK HaplotypeCaller was designed to be very permissive so that it
did not miss rare variants. In order to recalibrate base quality scores we used the BaseRecalibrator
procedure in GATK. Since we do not currently have a gold standard set of variants for the horse
(required by the procedure), we undertook an iterative approach (described in the GATK best
24
practices (version 2.4-3). The approach simultaneously recalibrated base quality scores and
eventually resulted in the final set of variants. First, the GATK HaplotypeCaller procedure (Van
der Auwera et al. 2013) obtains an initial set of variants subsequently used to recalibrate base quality
scores and generate recalibrated BAM files for each genome. The recalibrated files were then used
to call variants in the next iteration. Subsequently, variants called in each iteration were used as a
bootstrap set in place of gold standard variants to recalibrate the base quality scores in the following
iterations. The procedure was iterated until the number of variants and the base quality score
recalibrations stabilized, which in our pipeline occurred following the fifth iteration. After that, we
used the GATK VariantRecalibrator procedure to recalibrate the variants using polymorphisms
obtained from the horse genome assembly project as training set
(www.ncbi.nlm.nih.gov/projects/SNP/). The VariantRecalibrator algorithm is designed to assign
probabilities and quality scores used to filter out those false positives using a statistical machine
learning approach. The algorithm learns the best quality score filters based on the data itself and
allows the user to trade off sensitivity and specificity. It builds a Gaussian mixture model which uses
variants from the input set that overlap variants in the training set. Once the model is trained, variants
in the input set that have desired properties as determined by the Gaussian mixture model were
filtered using the ApplyRecalibration procedure. After careful examination of the tranches plot
(resulting from ApplyRecalibration) a tranches filter level of 99 was used (Figure 2.1). This tranches
level was chosen because it resulted in the highest number of true positive SNPs while minimizing
false positives.

25
Figure 2.1: Tranches plot generated by GATK VariantRecallibration procedure. The plot shows the
trade off in (gain in cumulative false positives (FP)) resulting from choosing a certain level of
cumulative true positive (TPs) variants. Tranche specific true positives and false positives are shown
in blue and orange respectively.
Identifying Structural Variations and Copy Number Variations
The structural variations (SVs) and large INDELs were identified using SVDetect (Zeitouni et al.
2010). The program uses anomalously mapped read pairs to localize rearrangements within the
genome and classify them into their various types. After filtering out correctly mapped pairs, we
used a sliding window of size 2μ + 2√2σ to partition the genome, where � is the estimated insert
size and � is the standard deviation. The length of steps in which the sliding window moved across
the genome were set to half of the window size. Control-Freec (Boeva et al. 2012) was used to
detect copy number variations (CNVs). The program uses GC-content and mapability profiles to

26
normalize read count and therefore gives a better estimate of copy number profiles in high GC or
low coverage regions (Boeva et al. 2012). A breakpoint threshold of 0.6 and a coefficient of
variation of 0.05 were used in the analysis.
Variant Annotation
We used SNPEff v4.0 (Cingolani et al. 2012) to annotate the SNPs and short INDELs using the
latest available ENSEMBL gene annotation database (EquCab2.76). The output of SNPEff is a full
list of effects per variant. SNPs and Indels located within 5,000 bases (5 kb) upstream or
downstream genes as well as those within exons, introns, splice sites, and 5’ and 3’ untranslated
regions (UTRs) were also annotated. Since SNPEff output can be integrated into GATK VCF file,
we have produced an annotated version of the GATK VCF file which can be loaded and viewed
easily in genome browsers. The CNVs and SV breakpoints overlapping ENSEMBL genes were
detected using Bedtools (v2.23.0). Ensembl gene IDs were then converted to gene names using
Biomart.
We used the Nucleotide Diversity (π) to identify candidate regions targeted by selection using an
empirically based outlier approach described in (Kolaczkowski et al. 2011). For each of the
genomes, the nucleotide diversity (π) was calculated for the SNPs in 1 MB non-overlapping
windows using VCFtools v1.10 (Danecek et al. 2011). Regions in the lower 1% tail of the π
distribution were considered under positive or balancing selection. Genes in these regions were
annotated for biological process, using Panther v10.0 (Mi et al. 2013). Circos plots (Krzywinski et
al. 2009) summarizing the distribution of the genomic variations were then created for each of the
genomes and a summary circos plot was created to highlight variants in common between the six
genomes. To enhance visualization, we removed the small intrachromosomal elements (endpoints
size <10 bp) and interchromosomal elements (endpoints size <500 bp) due to their abundance in

27
the output which makes it difficult to visualize in the circos plot.
RT q-PCR analysis of the Latherin CNV
We used Quantitative PCR to quantify the copy number variation within each exon in the horses
included in this experiment, the EquCab 2.0 reference genome horse and a control horse. Primers
were targeted within exons overlapping the copy number variation and were designed in Primer3
(Untergasser et al. 2012) (Table 2.1). Genomic DNA (25 ng) was amplified in 10 uL reactions
using the Quanta Biosciences PerfeCta SYBR Green (FastMix) as per the manufacturers
recommended conditions (Gaithersburg, MD, USA). ASIP exon 2 was amplified as reference
single-copy gene. Thermocycling and detection were performed using PCR on the Illumina Eco
Real-Time PCR System using parameters recommended for the Quanta Mix (58°C annealing).
Copy numbers were calculated relative to the reference genome horse. We substituted the
Percheron and American Miniature horses by horses from the same breed, as DNA samples from
the original two horses was unavailable.
Table 2.1: Real-time quantitative PCR primers.
Gene Forward primer Reverse primer Amplicon size (BP)
LATH AGGACTCCTTGACGGGAACT AGGGCCAACCAAGATGTTC 112
BPIFA1 GGAGAAGCACTCACCAGCTC CTCCAGAGTTCCCGTTTCCT 207
BPIFB4 TGTTGGTGGTGTTCCCTACA TAGTCGCCATTTCGAAGGTC 198
BPIFA2 CGTTTTTGTCAGGTGTCTTCC CCCAAAGAACCATCCACAGT 157

28
RESULTS AND DISCUSSION
Whole genome sequencing and alignment
Sequencing was completed using the Illumina HiSeq2500 (Illumina, San Diego, CA) with
manufacturer recommended reagents and procedures by the Biotechnology Resource Center at
Cornell University. The number of the paired-end reads before and after filtering and their
corresponding depth of coverage values are given in Table 2.2. The raw number of reads resulting
from sequencing the six horses ranged between 324,123,384 reads on the American miniature to
142,502,233 reads on the Native Mongolian horse. After filtering the reads, between 83,123,251
reads (Mangalarga Marchadore) and 187,223,705 reads (Percheron) were retained. This
corresponded to an average depth of coverage of 6.16 x to 13.87 x on the filtered reads. After
mapping, the average depth of coverage ranged from 10.03 to 16.7845x (Table 2.2). The
percentage of reads where both pairs successfully mapped were between 91.57% and 97.20%,
which indicates a fairly successful mapping procedure comparable to previous studies (Doan et al.
2012). A diagram summarizing the process of reads filtering, mapping, variant identification and
the tools used in each step is shown in Figure 2.2.

29
Table 2.2: Yield, filtering and mapping summary of the next generation sequencing data of six horses from different breeds.
Arabian Percheron
American Miniature
Tennessee Walking
Mangalarga Marchador
Native Mongolian Chakouyi
Number of paired end reads
before trimming 241,480,555 296,460,133 324,123,384 198,749,393 169,680,137 142,502,233
Read lengths 100/100 100/100 100/100 150/150 150/150 150/150
Estimated average depth of
coverage before trimming1 17.8x 21.96x 24x 14.72x 12.57x 10.56x
Number of paired end reads
after trimming 165,277,009 187,223,705 138,772,441 161,659,278 83,123,251 121,744,242
Estimated average depth of
coverage after trimming1 12.24x 13.87x 10.28x 11.97x 6.16x 9.02x
Total number of aligned
reads 330,554,018 374,447,410 277,544,882 323,318,556 269,464,788 243,488,484
Percentage of mapped reads 98% 93% 93% 97% 95% 96%
Percentage of reads where
both pairs mapped 97% 92% 92% 96% 94% 94%
1. Estimated using the formula C= L*N/G

30
Figure 2.2: An overview of the pipeline used in the reads processing and variant detection. Description of the step and the name of the program/software given in parenthesis.
Identification of Variants
SNPs and INDELs
In total, 8,562,696 SNPs were detected using the GATK HaplotypeCaller. These were processed
using the GATK VariantRecalibrator procedure, producing a final set of 8,128,658 SNPs. The
number of SNPs is about 0.3 % of the size of the genome (about 1 every 300 base pairs) which is

31
very similar to the percentage of SNPs estimated in the human genome (Gibbs et al. 2003).
Amongst those, 11,537 SNPs (0.14 %) were multi-allelic. The mean transition to transversion ratio
in these horses is 1.998 (range 1.991 to 2.008) (Table 2.3) which is very similar to other
mammalian species (Abecasis et al. 2012). The allelic frequency spectrum (Figure 2.3) showed an
expected decline in the frequency of SNPs as the observed number of the alternative allele
increased, as observed in other studies (Manske et al. 2012),(Gravel et al. 2011). The mean,
median and standard deviation of Phred-scaled quality scores for the SNPs were 785.78, 543 and
732.85, respectively, which signifies a very high call accuracy. Relative to the chromosome size,
the highest proportion of SNPs was found in chromosome 12 (0.5 %) followed by chromosome 20
(0.4%) (Figure 2.5).
Genotype counts of homozygous reference, heterozygous, homozygous alternative, as well as the
number of missing SNPs for each of the horses is shown in Table 2.3. A close examination of the
table reveals that the numbers in each category were generally similar in all horses. The highest
numbers of SNPs calls were homozygous reference calls, comprising 43 to 47 % of the genotypes
in each horse (Table 2.3). An interesting observation is that the highest proportion of homozygous
reference genotypes was found in the Arabian horse. This may be explained by the fact that,
among the breeds included, the Arabian horse has the closest historical relationship to the
reference genome derived from a mare of the Thoroughbred breed. In fact, the Thoroughbred horse
population originated by mating three prominent Arabian stallions to native mares in England
during the 17th century (Bower et al. 2012).

32
Table 2.3: Genotype categories of SNPs and INDELs and counts of CNVs and SVs in the six horses.
A comparison of these SNPs with the horse SNP database in dbSNP
(www.ncbi.nlm.nih.gov/projects/SNP/) and Ensembl (ftp://ftp.ensembl.org/pub/release80/
variation/vcf/equus caballus/Equus caballus.vcf.gz) showed that 5,221,242 novel and 2,907,416
known variants (Figure 2.4). Two of the sequenced horses were genotyped previously using the
Illumina EquineSNP50 array (Illumina Inc.) enabling a test of the genotype concordance between
the two methods. The concordance of the genotypes detected using the Equine SNP50 genotyping
array and those detected by NGS was 96% for the American Miniature and 98% for the Percheron
horse, illustrating that the SNPs detection is comparable to array-based methods and is reliable for
the purposes of this study.
Arabian Percheron American
Miniature Tennessee Walking
Mangalarga Marchador
Native Mongolian Chakouyi
SNPs Homozygous Reference 3861988 3549746 3814288 3530966 3731291 3577545
Heterozygous 2328125 2491424 2266059 2658622 2387676 2513707 Homozygous Alternative 1907689 2054426 1998897 1922879 1954411 1989304
Missing 30856 33062 49414 16191 55280 48102
Transitions 4090739 4406054 4179785 4335010 4194652 4321840
Transversions 2052764 2194222 2084068 2169370 2101846 2170475
INDELs Homozygous Reference 272640 254728 276892 255475 277540 244701
Heterozygous 193566 198211 182198 208226 189440 210612 Homozygous Alternative 356999 370374 357710 359412 337514 360065
Missing 7165 7057 13570 7257 25876 14992
CNVs 999 1007 923 976 934 706
Gains 854 863 776 814 794 613
Losses 145 145 147 162 141 96
Structural Variations 3166 4072 10707 4385 8296 1394
Interchromosomal 178 201 116 708 1495 198
Intrachromosomal 2988 3871 10591 3677 6801 1196

33
Figure 2.3: The allele frequencies of SNPs from whole-genome sequence data of the six horses showing a lower frequency as observations of the alternate allele increased.

34
Figure 2.4: Comparison of SNP data detected in the present study with SNPs currently deposited Ensembl and dbSNP databases. The present study was the highest in terms of the number of private SNPs.
35
It is well established that INDELs are the second most common form of genomic variations,
altering a similar total proportion of base pairs as SNPs (Mullaney et al. 2010). We detected
830,370 small INDEL loci jointly with the SNPs in the GATK HaplotypeCaller procedure.
Within this set, 10,811 INDELs were multi-allelic. The mean, median and standard deviation of
Phred-scaled quality scores for the INDELs were 1,025, 785 and 1,076 respectively which
signifies a higher accuracy, but more dispersion in accuracy, to their SNPs counterparts. The
INDELs size ranged between 0 and 219, with mean of 1.164 bp and the majority of INDELs
were < 10 bp. The INDELs were split almost equally between insertions and deletions (48 % and
52 % respectively), as is observed in the pattern of INDELs in humans (Mills et al. 2006),
(Bhangale et al. 2005). Unlike SNPs, the most frequent small INDELs calls were the
homozygous alternative calls which ranged between 40 and 44 % of the total INDELs calls in
different horses. INDELs are more rare events than SNPs and are thus more likely to be unique
to a breed of horses than to be shared between breeds (Ajawatanawong & Baldauf 2013). In fact,
the resolution of the Eukaryotic phylogenetic tree can be improved by incorporating INDELs
(Bapteste & Philippe 2002). It is noteworthy to indicate that the incidence of homozygous
alternative (non-reference homozygous) SNPs and INDELs genotypes was highest in the
Percheron horse. This could be a result of a larger evolutionary distance between the reference
genome and the Percheron relative to the other breeds. The SNPs and INDELs missingness was
the highest in the Mangalarga Marchadore (the sample with the lowest coverage) and was
inversely correlated with the aligned read depth (Tables 2.2 and 2.3).

36
CNVs and SVs
CNVs and SVs are often complex and may contain DNA sequence belonging to different sites in
the genome. However, genome-wide datasets produced by NGS technologies are revealing a
wealth of knowledge about their frequency and structure. The number of CNVs and SVs in
various horses is given in Table 2.3. Of the identified CNVs, the number of gains was
consistently higher than the number of losses for all horses. Since many of the gains are shared
between horses, we hypothesize that the excess of gains is an artifacts of the computational
assembly of EquCab2.0, compressing regions of repetitive sequences and highly homologous
gene families. Numerous regions (or genes) in the genome could be actual duplication events, yet
a failure to assign these sequences to their correct locus, often annotating them as ChrUn by
default, has rendered them difficult to study.
Additionally, we also observe a consistent excess of intrachromosomal SVs compared to the
interchromosomal SVs (Table 2.3). Bias towards intrachromosomal SVs is not uncommon in
this type of analysis and is often due to intrachromosomal joining bias resulting from the relative
closer proximity of genomic regions and has been observed studies of the mouse (Klein et al.
2011), humans (Lieberman-Aiden et al. 2009) and chicken (Bourque et al. 2005). It is proposed
that a biological mechanism preferring proximal intrachromosomal rearrangement reduces large-
scale genomic alterations, and therefore maintains genomic stability (Klein et al. 2011).
Compared to other horses, the American miniature horse possessed the highest number of the
Intrachromosomal SVs (n= 10591) and the Mangalarga Marchador the largest number of
Interchromosomal translocations (n=1495). These results are more than double the average of
the corresponding values in the other horses and may be an artifact of imperfect library

37
preparation or fragment size selection prior to sequencing. Indeed, filtering of such artifacts is a
significant challenge for reliable discovery and genotyping of SVs by sequence based methods.
We formatted our SVs into two separate tracks for inter- and intra- chromosomal translocations
with different colored assigned to different SV types. Interchromosomal translocations were
formatted into a click button format such that clicking on the feature link the user to the
chromosomal address of the other end of the feature. For the intrachromosmal translocations, the
putative breakpoints of the feature are displayed in a GFF style joined together. The CNVs were
formatted into a bed format with different colors for gains, losses and normal copy numbers.
These tracks are available for download at http://www.animalgenome.org/repository/horse and
can be loaded directly into UCSC genome browser. The resulting CNVs and SVs were annotated
using the ENSEMBL genes they overlap with and the results can also be downloaded at
http://www.animalgenome.org/repository/horse.
Annotation of Detected Variants
The majority of SNPs were intergenic, followed by intronic, comprising 60 % and 27 % of
SNPs, respectively (Table2.4) (Zhao et al. 2003). The small proportion of exonic SNPs likely
results from strong negative selective pressure exerted on coding regions due to functional
implications of these alterations (Bhangale et al. 2005). Likewise, lower diversity was observed
for SNPs around 3’ UTR, 5’ UTR and coding regions compared to other regions which was also
reported in other studies (Zhao et al. 2003) (Table2.4). A lower allelic diversity within the 5’
UTRs and around coding regions was also observed in the INDEL category of polymorphisms, a
phenomenon also found in studies of the human genome (Bhangale et al. 2005).

38
Table 2.4: Annotation of SNPs and INDELs by type in the six horses genomes.
SNPs INDELs
Effects according to region Exon 7383 0.08% 618 0.06% Intergenic 5760944 60.29% 583364 57.94% Intron 2601880 27.23% 289589 28.76% 3’-UTR 4665 0.05% 707 0.07% 5’-UTR 1657 0.02% 418 0.04% Downstream 286342 3.00% 49622 4.93% Start lost 28 0.00% 1 0.00% Stop gained 242 0.00% 5 0.00% Upstream 413882 4.33% 48894 4.86% Unclassified 286342 3.00% 26758 2.66% Effects according to functional impact (SNPs only) Non synonymous coding 26322 0.28% Non synonymous start 4 0.00% Splice site acceptor 187 0.00% Splice site donor 269 0.00% Splice site region 6188 0.07% Start gained 255 0.00% Stop lost 17 0.00% Synonymous coding 33593 0.35% Synonymous stop 15 0.00% Effects according to functional impact (INDELs only) Codon change plus codon deletion 55 0.01% Codon change plus codon insertion 37 0.00% Codon deletion 83 0.01% Codon insertion 80 0.01% Frame shift 2863 0.28% Frame shift+start lost 5 0.00% Frame shift+stop gained 11 0.00% Frame shift+stop lost 3 0.00% Intragenic 3 0.00% Splice site acceptor 669 0.07% Splice site donor 645 0.06%
Splice site region 2396 0.24%
39
In terms of predicted functional impact, the majority of SNPs found in coding sequences (33593,
0.35%) were likely synonymous. Yet, 26322 (0.28 %) SNPs are predicted to result in a non-
synonymous amino acid change. This proximity in percentage of Synonymous and non-
synonymous SNPs was previously reported in the quarter horse (Doan et al. 2012). On the other
hand, 2863 (0.28%) INDELs caused frame-shifts, which is number very similar to that obtained
in a previous study in the Quarter horse genome (Jun et al. 2014),(Doan et al. 2012).
Copy number variation and structural variations are given relatively less attention than SNPs in
studies of diversity. Nevertheless, they are ubiquitous in the horse genome and influence a
number of phenotypes (Gizaw et al. 2013; Wang et al. 2014). We found that chromosomes 12
and 20 had the highest density of CNVs. Functional annotation of these regions revealed genes
involved in olfactory reception and immunity which are also enriched in genes overlapping
human CNVs (Nguyen et al. 2006). This observation was previously reported in a CNV an
analysis of six horse breeds (Wang et al. 2014). Additionally, our CNV annotation showed a
copy number gain in a gene cluster that includes latherin gene in all the horses in this study. This
copy number gain was previously reported in the quarter horse using NGS data (Doan et al.
2012), although using array CGH a copy number loss was observed in the same region (Wang et
al. 2014). LATH (also known as BPIFA4) is a member of the palate lung and nasal epithelium
clone (PLUNC) family of proteins that is common in the oral cavity and saliva of mammals
(Bingle et al. 2011; Vance et al. 2013). In horses and other equids this gene produces a surfactant
protein that is expressed in the saliva and sweat (McDonald et al. 2009). Equine latherin protein
is postulated to play a role in mastication of fibrous food and evaporative cooling in horses
(Vance et al. 2013). Therefore, it is reasonable to postulate that the gain in LATH copies
observed in this study results from an evolutionary pressure for improved evaporative dissipation

40
of heat, yielding athleticism and endurance in hot environments.
Our RT-qPCR analysis of the CNV region in a number of horses (Figure 2.5) revealed evidence
of between 2 and 6 copies of LATH relative to a single copy control gene. Our analysis also
suggested polymorphism in the number of copies of nearby genes BPIFB4, BPIFA2 and
BPIFA1. Accumulation of copies of these genes could be an adaptation to improve evaporative
cooling. Validation of this CNV polymorphism is challenging due to a poor quality of assembly,
a complex structure within that part of the genome, and the technical limitations of qPCR. Thus,
precise determination of polymorphisms in LATH will require more precise techniques like
digital qPCR (Baker 2012).
Our annotation of the SVs showed duplication events within the ZFAT gene (ECA 9)
unique to the American Miniature horse. ZFAT gene was previously shown to be associated with
withers height and overall skeletal size in horses (Makvandi-Nejad et al. 2012; Signer-Hasler et
al. 2012). We also detected an inverted duplication unique to the Percheron horse in HMGA1.
HMGA1 appears to play a role in overall body size. HMGA1 showed a reduced body weight and
size compared to wild type mice (Federico et al. 2014). These small SVs may impact regulatory
motifs in these genes, leading to the size phenotypes observed in these breeds, though additional
work is required to investigate this.

41
Figure 2.5: RT-qPCR results of the LATH CNV region. Results for different primers are
shown relative to their position in the genome. Evidence of a copy number variation is seen in
BPIFB4 (a) and BPIFA1 (d) genes that flank LATH (c).

42
43
Genome-wide diversity (π)
Nucleotide diversity (π) (Nei & Li 1979) is defined as the average number of nucleotide
differences per site between two randomly chosen sequences in a population. Assessment of
nucleotide diversity provides a valuable insight into the divergence of populations, inferring the
demographic history of the species, as well as the historical size of the population (Yu et al.
2004). Areas of lower than expected nucleotide diversity may signify signatures of past selection
events (Quach et al. 2009). In order to find such regions we calculated the nucleotide diversity
(π) for the resulting SNPs belonging to each horse using 1 megabase (MB) non-overlapping
windows.
The average nucleotide diversity across all six horses was 0.00097 for all SNP polymorphisms,
and ranged from a minimum of 0.00090 for the American Miniature Horse and 0.0011 for the
Tennessee Walking Horse. This could reflect a higher inbreeding in the American Miniature
horse compared to the Tennessee Walking Horse sequenced in this study. Average diversity in
the autosomal chromosomes for all horses was 0.0010, which is four times as high as the mean
diversity observed in the X chromosome (0.00026). Since the X chromosome has three-quarters
the effective population size (Ne) of that of the autosomes, lower nucleotide diversity for the X
chromosome is to be expected. However, a lower diversity level could also be due to a lower
mutation rate (μ). Besides that, the fact that the reference genome was based on a female horse
has largely impacted the nucleotide diversity levels in the male horses used in this study (Figure
2.6). It is expected to observe more differences (homozygous alternate SNPs) between the
reference genome X chromosome and two copies of the X chromosomes in female horses
compared to males horses with only one copy.

44
Notably, the SNP dense region on ECA20 and ECA12 were amongst the highest 1% regions in
nucleotide diversity (π) (Figure 2.6). PANTHER statistical over-representation analysis of genes
in these regions revealed that they are enriched for immune response and immunological
response and antigen processing (ECA20) and metabolic and sensory perception in (ECA12). On
the other hand, among the lowest 1% of the empirical distribution of π values, the most
represented GO terms categories in all six horses were metabolic process (42.32 %) followed by
cellular process (29 %) and biological regulation (18.45 %). Remarkably, statistical over-
representation analysis of those regions in respective horses showed enrichment for skeletal and
digestive system development in the Percheron horse. Regions with lowest 1% π values in the
Percheron included HOXD12, MYO3B, and HOXD1 on ECA 18 and ANKRD1 (ECA 1).
HOXD12 and HOXD1 belong to the HOX family of transcription factor genes are known for
their role in skeletal and limb development (Knezevic et al. 1997; Pitera et al. 2001; Di-Poï et al.
2009). ANKRD1 is a transcriptional factor to the muscle ankyrin repeat proteins (MARP) family
(Duboscq-Bidot et al. 2009) and linked to size by GWAS in chapter two of this work. MARP
proteins are expressed in developing skeletal muscles and are important for muscle development
(Baumeister et al. 1997).On the other hand Myo3B belongs to the class III myosin genes and is
expressed primarily in the retina but is also expressed in the kidney, and testis (Dose & Burnside
2002; Dosé et al. 2003).

45
Figure 2.6: Circos plot summarizing the genetic variants detected in each horse. From the inside
out, each plot shows two endpoints of the inter- (orange) and intra- (blue) chromosomal
translocations. Intrachromosomal translocations > 5MB are in dark blue. The yellow ring shows
the copy number variations (green =normal, blue = loss, red=gain). The histogram (in orange)
shows the density of SNPs detected using 1MB windows. The outermost track in yellow marks
the lower 1% (red) and upper 1% (blue) values of the average nucleotide diversity calculated
using 1 MB windows. Lower nucleotide diversity levels in the X chromosomes can be seen in
male vs female horses. The dense clustering of SNPs amidst chromosomes 12 and 20 was
expected given that both chromosomes contain structurally complex regions important for
immunity. To enhance visualization, intrachromosomal translocations with end points <10bp and
interchromosomal translocations with end points < 500 bp are not displayed here.

46
.

47
We compared our findings with two previous studies that investigated signatures of selection in
the horse. The first study (Petersen et al. 2013) used an Illumina SNP50 Beadchip to scan the
genome of multiple breeds using an FST-based statistic, while the second study compared NGS
data on ancient Przewalski’s horses to modern domesticated horses to pinpoint selection
signatures in modern breeds (Schubert et al. 2014). We found no overlap between genes under
selection found in this study and those reported in (Petersen et al. 2013) possibly due to the
technical difference and genome coverage between NGS used in this study and the Illumina
SNP50 Beadchip. However, three genes under selection reported in (Schubert et al. 2014) were
also found in this study, namely NINJ1 and SEC63 in the Tennessee walking horse and
COMMD1 in the Arabian horse. NINJ1 codes for ninjurin a protein that is highly expressed in
human brain endothelial (Ifergan et al. 2011) and becomes up-regulated after nerve injuries in
Schwann cells and in dorsal root ganglion neurons (Araki & Milbrandt 1996). SEC63 encodes a
membrane protein of the Endoplasmic Reticulum which is highly conserved in humans and is
part of protein translocation apparatus of the endoplasmic reticulum (Davila et al. 2004). Certain
mutations in SEC63 cause autosomal dominant polycystic liver disease in humans (Davila et al.
2004). On the other hand, COMMD1 is involved in copper storage in dogs and copper-storage
disorder in Bedlington terriers is a known autosomal recessive disorder that causes rapid
accumulation of copper in the liver of affected dogs (Fedoseienko et al. 2015).

48
CONCLUSION
We present a next generation sequencing and variants detection analysis of six horses belonging
to six different breeds. Functional annotation of the detected variants was indicative of selection
pressure for specific phenotypic characteristics in the breeds of horses included in this study. We
detected a copy number gain in the Latherin gene common to all horses that could be the result
of an evolutionary selection for athleticism and heat tolerance. Our results also revealed
putatively functional variants unique to each horse including HOXD12 and HOXD1 and
ANKRD1 and HMGA1 in the Percheron and ZFAT gene in the American Miniature horse. Our
results also showed a copy number gain of genes involved in immunity and olfactory reception
in ECA 20 ECA 12 respectively.

49
REFERENCES
Comprehensive identification and characterization of diallelic insertion-deletion polymorphisms
in 330 human candidate genes.
Abecasis G.R., Auton A., Brooks L.D., DePristo M.A., Durbin R.M., Handsaker R.E., Kang
H.M., Marth G.T. & McVean G.A. (2012) An integrated map of genetic variation from
1,092 human genomes. Nature 491, 56-65.
Ajawatanawong P. & Baldauf S.L. (2013) Evolution of protein indels in plants, animals and
fungi. BMC evolutionary biology 13, 140-.
Araki T. & Milbrandt J. (1996) Ninjurin, a novel adhesion molecule, is induced by nerve injury
and promotes axonal growth. Neuron 17, 353-61.
Baker M. (2012) Digital PCR hits its stride. Nature methods 9, 541-4.
Bapteste E. & Philippe H. (2002) The Potential Value of Indels as Phylogenetic Markers:
Position of Trichomonads as a Case Study.
Baumeister A., Arber S. & Caroni P. (1997) Accumulation of Muscle Ankyrin Repeat Protein
Transcript Reveals Local Activation of Primary Myotube Endcompartments during
Muscle Morphogenesis.
Bhangale T.R., Rieder M.J., Livingston R.J. & Nickerson D.A. (2005) Comprehensive
identification and characterization of diallelic insertion-deletion polymorphisms in 330
human candidate genes. Hum Mol Genet 14, 59-69.
Bingle C., Seal R. & Craven C. (2011) Systematic nomenclature for the
PLUNC/PSP/BSP30/SMGB proteins as a subfamily of the BPI fold-containing
superfamily. Biochem Soc Trans 39, 977-83.

50
Boeva V., Popova T., Bleakley K., Chiche P., Cappo J., Schleiermacher G., Janoueix-Lerosey I.,
Delattre O. & Barillot E. (2012) Control-FREEC: a tool for assessing copy number and
allelic content using next-generation sequencing data. Bioinformatics (Oxford, England)
28, 423-5.
Bolger A.M., Lohse M. & Usadel B. (2014) Trimmomatic: a flexible trimmer for Illumina
sequence data. Bioinformatics (Oxford, England) 30, 2114-20.
Bourque G., Zdobnov E.M., Bork P., Pevzner P.A. & Tesler G. (2005) Comparative
architectures of mammalian and chicken genomes reveal highly variable rates of genomic
rearrangements across different lineages. Genome Res 15, 98-110.
Bower M.A., McGivney B.A., Campana M.G., Gu J., Andersson L.S., Barrett E., Davis C.R.,
Mikko S., Stock F., Voronkova V., Bradley D.G., Fahey A.G., Lindgren G., MacHugh
D.E., Sulimova G. & Hill E.W. (2012) The genetic origin and history of speed in the
Thoroughbred racehorse. Nature communications 3, 643.
Cingolani P., Platts A., Wang le L., Coon M., Nguyen T., Wang L., Land S.J., Lu X. & Ruden
D.M. (2012) A program for annotating and predicting the effects of single nucleotide
polymorphisms, SnpEff: SNPs in the genome of Drosophila melanogaster strain w1118;
iso-2; iso-3. In: Fly (Austin) (pp. 80-92, United States.
Daetwyler H.D., Capitan A., Pausch H., Stothard P., Binsbergen R.v., Brøndum R.F., Liao X.,
Djari A., Rodriguez S.C., Grohs C., Esquerré D., Bouchez O., Rossignol M.-N., Klopp
C., Rocha D., Fritz S., Eggen A., Bowman P.J., Coote D., Chamberlain A.J., Anderson
C., VanTassell C.P., Hulsegge I., Goddard M.E., Guldbrandtsen B., Lund M.S.,
Veerkamp R.F., Boichard D.A., Fries R. & Hayes B.J. (2014) Whole-genome sequencing
of 234 bulls facilitates mapping of monogenic and complex traits in cattle. Nature
Genetics 46, 858-65.

51
Danecek P., Auton A., Abecasis G., Albers C.A., Banks E., DePristo M.A., Handsaker R.E.,
Lunter G., Marth G.T., Sherry S.T., McVean G. & Durbin R. (2011) The variant call
format and VCFtools. Bioinformatics (Oxford, England) 27, 2156-8.
Davila S., Furu L., Gharavi A.G., Tian X., Onoe T., Qian Q., Li A., Cai Y., Kamath P.S., King
B.F., Azurmendi P.J., Tahvanainen P., Kääriäinen H., Höckerstedt K., Devuyst O., Pirson
Y., Martin R.S., Lifton R.P., Tahvanainen E., Torres V.E. & Somlo S. (2004) Mutations
in SEC63 cause autosomal dominant polycystic liver disease. Nature Genetics 36, 575-7.
DePristo M.a., Banks E., Poplin R., Garimella K.V., Maguire J.R., Hartl C., Philippakis A.a., del
Angel G., Rivas M.a., Hanna M., McKenna A., Fennell T.J., Kernytsky A.M.,
Sivachenko A.Y., Cibulskis K., Gabriel S.B., Altshuler D. & Daly M.J. (2011) A
framework for variation discovery and genotyping using next-generation DNA
sequencing data. Nature genetics 43, 491-8.
Di-Poï N., Montoya-Burgos J.I. & Duboule D. (2009) Atypical relaxation of structural
constraints in Hox gene clusters of the green anole lizard. Genome Res 19, 602-10.
Doan R., Cohen N.D., Sawyer J., Ghaffari N., Johnson C.D. & Dindot S.V. (2012) Whole-
genome sequencing and genetic variant analysis of a Quarter Horse mare. BMC
Genomics 13, 78-.
Dose A.C. & Burnside B. (2002) A class III myosin expressed in the retina is a potential
candidate for Bardet-Biedl syndrome. Genomics 79, 621-4.
Dosé A.C., Hillman D.W., Wong C., Sohlberg L., Lin-Jones J. & Burnside B. (2003) Myo3A,
One of Two Class III Myosin Genes Expressed in Vertebrate Retina, Is Localized to the
Calycal Processes of Rod and Cone Photoreceptors and Is Expressed in the Sacculus.
Duboscq-Bidot L., Charron P., Ruppert V., Fauchier L., Richter A., Tavazzi L., Arbustini E.,
Wichter T., Maisch B., Komajda M., Isnard R. & Villard E. (2009) Mutations in the
ANKRD1 gene encoding CARP are responsible for human dilated cardiomyopathy. In:

52
Eur Heart J (pp. 2128-36, England.
Federico A., Forzati F., Esposito F., Arra C., Palma G., Barbieri A., Palmieri D., Fedele M.,
Pierantoni G.M., De Martino I. & Fusco A. (2014) Hmga1/Hmga2 double knock-out
mice display a “superpygmy” phenotype. In: Biol Open (pp. 372-8.
Fedoseienko A., Netherlands M.G.s.U.o.G.U.M.C.G.G.t., Bartuzi P., Netherlands
M.G.s.U.o.G.U.M.C.G.G.t., Sluis B. & Netherlands M.G.s.U.o.G.U.M.C.G.G.t. (2015)
Functional understanding of the versatile protein copper metabolism MURR1 domain 1
(COMMD1) in copper homeostasis. Annals of the New York Academy of Sciences 1314,
6-14.
Gibbs R.A., Belmont J.W., Hardenbol P., Willis T.D., Yu F., Yang H., Ch'ang L.-Y., Huang W.,
Liu B., Shen Y., Tam P.K.-H., Tsui L.-C., Waye M.M.Y., Wong J.T.-F., Zeng C., Zhang
Q., Chee M.S., Galver L.M., Kruglyak S., Murray S.S., Oliphant A.R., Montpetit A.,
Hudson T.J., Chagnon F., Ferretti V., Leboeuf M., Phillips M.S., Verner A., Kwok P.-Y.,
Duan S., Lind D.L., Miller R.D., Rice J.P., Saccone N.L., Taillon-Miller P., Xiao M.,
Nakamura Y., Sekine A., Sorimachi K., Tanaka T., Tanaka Y., Tsunoda T., Yoshino E.,
Bentley D.R., Deloukas P., Hunt S., Powell D., Altshuler D., Gabriel S.B., Zhang H.,
Matsuda I., Fukushima Y., Macer D.R., Suda E., Rotimi C.N., Adebamowo C.A.,
Aniagwu T., Marshall P.A., Matthew O., Nkwodimmah C., Royal C.D.M., Leppert M.F.,
Dixon M., Stein L.D., Cunningham F., Kanani A., Thorisson G.A., Chakravarti A., Chen
P.E., Cutler D.J., Kashuk C.S., Donnelly P., Marchini J., McVean G.A.T., Myers S.R.,
Cardon L.R., Abecasis G.R., Morris A., Weir B.S., Mullikin J.C., Sherry S.T., Feolo M.,
Daly M.J., Schaffner S.F., Qiu R., Kent A., Dunston G.M., Kato K., Niikawa N.,
Knoppers B.M., Foster M.W., Clayton E.W., Wang V.O., Watkin J., Sodergren E.,
Weinstock G.M., Wilson R.K., Fulton L.L., Rogers J., Birren B.W., Han H., Wang H.,
Godbout M., Wallenburg J.C., L'Archevêque P., Bellemare G., Todani K., Fujita T.,
Tanaka S., Holden A.L., Lai E.H., Collins F.S., Brooks L.D., McEwen J.E., Guyer M.S.,
Jordan E., Peterson J.L., Spiegel J., Sung L.M., Zacharia L.F., Kennedy K., Dunn M.G.,
Seabrook R., Shillito M., Skene B., Stewart J.G., (chair) D.L.V., (co-chair) E.W.C., (co-

53
chair) L.B.J., Cho M.K., Duster T., Jasperse M., Licinio J., Long J.C., Ossorio P.N.,
Spallone P., Terry S.F., (chair) E.S.L., (co-chair) E.H.L., (co-chair) D.A.N., Boehnke M.,
Douglas J.A., Hudson R.R., Kruglyak L. & Nussbaum R.L. (2003) The International
HapMap Project. Nature 426, 789-96.
Gizaw S., Getachew T., Goshme S., Mwai O. & Dessie T. (2013) A cooperative village breeding
scheme for smallholder sheep farming systems in Ethiopia. 5689.
Gravel S., Henn B.M., Gutenkunst R.N., Indap A.R., Marth G.T., Clark A.G., Yu F., Gibbs R.A.,
Project T.G., Bustamante C.D., Altshuler D.L., Durbin R.M., Abecasis G.R., Bentley
D.R., Chakravarti A., Clark A.G., Collins F.S., Vega F.M.D.L., Donnelly P., Egholm M.,
Flicek P., Gabriel S.B., Gibbs R.A., Knoppers B.M., Lander E.S., Lehrach H., Mardis
E.R., McVean G.A., Nickerson D.A., Peltonen L., Schafer A.J., Sherry S.T., Wang J.,
Wilson R.K., Gibbs R.A., Deiros D., Metzker M., Muzny D., Reid J., Wheeler D., Wang
J., Li J., Jian M., Li G., Li R., Liang H., Tian G., Wang B., Wang J., Wang W., Yang H.,
Zhang X., Zheng H., Lander E.S., Altshuler D.L., Ambrogio L., Bloom T., Cibulskis K.,
Fennell T.J., Gabriel S.B., Jaffe D.B., Shefler E., Sougnez C.L., Bentley D.R., Gormley
N., Humphray S., Kingsbury Z., Koko-Gonzales P., Stone J., McKernan K.J., Costa G.L.,
Ichikawa J.K., Lee C.C., Sudbrak R., Lehrach H., Borodina T.A., Dahl A., Davydov
A.N., Marquardt P., Mertes F., Nietfeld W., Rosenstiel P., Schreiber S., Soldatov A.V.,
Timmermann B., Tolzmann M., Egholm M., Affourtit J., Ashworth D., Attiya S.,
Bachorski M., Buglione E., Burke A., Caprio A., Celone C., Clark S., Conners D.,
Desany B., Gu L., Guccione L., Kao K., Kebbel A., Knowlton J., Labrecque M., McDade
L., Mealmaker C., Minderman M., Nawrocki A., Niazi F., Pareja K., Ramenani R.,
Riches D., Song W., Turcotte C., Wang S., Mardis E.R., Wilson R.K., Dooling D., Fulton
L., Fulton R., Weinstock G., Durbin R.M., Burton J., Carter D.M., Churcher C., Coffey
A., Cox A., Palotie A., Quail M., Skelly T., Stalker J., Swerdlow H.P., Turner D., Witte
A.D., Giles S., Gibbs R.A., Wheeler D., Bainbridge M., Challis D., Sabo A., Yu F., Yu J.,
Wang J., Fang X., Guo X., Li R., Li Y., Luo R., Tai S., Wu H., Zheng H., Zheng X.,
Zhou Y., Li G., Wang J., Yang H., Marth G.T., Garrison E.P., Huang W., Indap A., Kural
D., Lee W.-P., Leong W.F., Quinlan A.R., Stewart C., Stromberg M.P., Ward A.N., Wu

54
J., Lee C., Mills R.E., Shi X., Daly M.J., DePristo M.A., Altshuler D.L., Ball A.D., Banks
E., Bloom T., Browning B.L., Cibulskis K., Fennell T.J., Garimella K.V., Grossman S.R.,
Handsaker R.E., Hanna M., Hartl C., Jaffe D.B., Kernytsky A.M., Korn J.M., Li H.,
Maguire J.R., McCarroll S.A., McKenna A., Nemesh J.C., Philippakis A.A., Poplin R.E.,
Price A., Rivas M.A., Sabeti P.C., Schaffner S.F., Shefler E., Shlyakhter I.A., Cooper
D.N., Ball E.V., Mort M., Phillips A.D., Stenson P.D., Sebat J., Makarov V., Ye K.,
Yoon S.C., Bustamante C.D., Clark A.G., Boyko A., Degenhardt J., Gravel S.,
Gutenkunst R.N., Kaganovich M., Keinan A., Lacroute P., Ma X., Reynolds A., Clarke
L., Flicek P., Cunningham F., Herrero J., Keenen S., Kulesha E., Leinonen R., McLaren
W.M., Radhakrishnan R., Smith R.E., Zalunin V., Zheng-Bradley X., Korbel J.O., Stütz
A.M., Humphray S., Bauer M., Cheetham R.K., Cox T., Eberle M., James T., Kahn S.,
Murray L., Chakravarti A., Ye K., Vega F.M.D.L., Fu Y., Hyland F.C.L., Manning J.M.,
McLaughlin S.F., Peckham H.E., Sakarya O., Sun Y.A., Tsung E.F., Batzer M.A.,
Konkel M.K., Walker J.A., Sudbrak R., Albrecht M.W., Amstislavskiy V.S., Herwig R.,
Parkhomchuk D.V., Sherry S.T., Agarwala R., Khouri H.M., Morgulis A.O., Paschall
J.E., Phan L.D., Rotmistrovsky K.E., Sanders R.D., Shumway M.F., Xiao C., McVean
G.A., Auton A., Iqbal Z., Lunter G., Marchini J.L., Moutsianas L., Myers S., Tumian A.,
Desany B., Knight J., Winer R., Craig D.W., Beckstrom-Sternberg S.M., Christoforides
A., Kurdoglu A.A., Pearson J.V., Sinari S.A., Tembe W.D., Haussler D., Hinrichs A.S.,
Katzman S.J., Kern A., Kuhn R.M., Przeworski M., Hernandez R.D., Howie B., Kelley
J.L., Melton S.C., Abecasis G.R., Li Y., Anderson P., Blackwell T., Chen W., Cookson
W.O., Ding J., Kang H.M., Lathrop M., Liang L., Moffatt M.F., Scheet P., Sidore C.,
Snyder M., Zhan X., Zöllner S., Awadalla P., Casals F., Idaghdour Y., Keebler J., Stone
E.A., Zilversmit M., Jorde L., Xing J., Eichler E.E., Aksay G., Alkan C., Hajirasouliha I.,
Hormozdiari F., Kidd J.M., Sahinalp S.C., Sudmant P.H., Mardis E.R., Chen K.,
Chinwalla A., Ding L., Koboldt D.C., McLellan M.D., Dooling D., Weinstock G., Wallis
J.W., Wendl M.C., Zhang Q., Durbin R.M., Albers C.A., Ayub Q., Balasubramaniam S.,
Barrett J.C., Carter D.M., Chen Y., Conrad D.F., Danecek P., Dermitzakis E.T., Hu M.,
Huang N., Hurles M.E., Jin H., Jostins L., Keane T.M., Le S.Q., Lindsay S., Long Q.,
MacArthur D.G., Montgomery S.B., Parts L., Stalker J., Tyler-Smith C., Walter K.,
Zhang Y., Gerstein M.B., Snyder M., Abyzov A., Balasubramanian S., Bjornson R., Du
55
J., Grubert F., Habegger L., Haraksingh R., Jee J., Khurana E., Lam H.Y.K., Leng J., Mu
X.J., Urban A.E., Zhang Z., Li Y., Luo R., Marth G.T., Garrison E.P., Kural D., Quinlan
A.R., Stewart C., Stromberg M.P., Ward A.N., Wu J., Lee C., Mills R.E., Shi X.,
McCarroll S.A., Banks E., DePristo M.A., Handsaker R.E., Hartl C., Korn J.M., Li H.,
Nemesh J.C., Sebat J., Makarov V., Ye K., Yoon S.C., Degenhardt J., Kaganovich M.,
Clarke L., Smith R.E., Zheng-Bradley X., Korbel J.O., Humphray S., Cheetham R.K.,
Eberle M., Kahn S., Murray L., Ye K., Vega F.M.D.L., Fu Y., Peckham H.E., Sun Y.A.,
Batzer M.A., Konkel M.K., Walker J.A., Xiao C., Iqbal Z., Desany B., Blackwell T.,
Snyder M., Xing J., Eichler E.E., Aksay G., Alkan C., Hajirasouliha I., Hormozdiari F.,
Kidd J.M., Chen K., Chinwalla A., Ding L., McLellan M.D., Wallis J.W., Hurles M.E.,
Conrad D.F., Walter K., Zhang Y., Gerstein M.B., Snyder M., Abyzov A., Du J., Grubert
F., Haraksingh R., Jee J., Khurana E., Lam H.Y.K., Leng J., Mu X.J., Urban A.E., Zhang
Z., Gibbs R.A., Bainbridge M., Challis D., Coafra C., Dinh H., Kovar C., Lee S., Muzny
D., Nazareth L., Reid J., Sabo A., Yu F., Yu J., Marth G.T., Garrison E.P., Indap A.,
Leong W.F., Quinlan A.R., Stewart C., Ward A.N., Wu J., Cibulskis K., Fennell T.J.,
Gabriel S.B., Garimella K.V., Hartl C., Shefler E., Sougnez C.L., Wilkinson J., Clark
A.G., Gravel S., Grubert F., Clarke L., Flicek P., Smith R.E., Zheng-Bradley X., Sherry
S.T., Khouri H.M., Paschall J.E., Shumway M.F., Xiao C., McVean G.A., Katzman S.J.,
Abecasis G.R., Blackwell T., Mardis E.R., Dooling D., Fulton L., Fulton R., Koboldt
D.C., Durbin R.M., Balasubramaniam S., Coffey A., Keane T.M., MacArthur D.G.,
Palotie A., Scott C., Stalker J., Tyler-Smith C., Gerstein M.B., Balasubramanian S.,
Chakravarti A., Knoppers B.M., Abecasis G.R., Bustamante C.D., Gharani N., Gibbs
R.A., Jorde L., Kaye J.S., Kent A., Li T., McGuire A.L., McVean G.A., Ossorio P.N.,
Rotimi C.N., Su Y., Toji L.H., TylerSmith C., Brooks L.D., Felsenfeld A.L., McEwen
J.E., Abdallah A., Juenger C.R., Clemm N.C., Collins F.S., Duncanson A., Green E.D.,
Guyer M.S., Peterson J.L., Schafer A.J., Abecasis G.R., Altshuler D.L., Auton A., Brooks
L.D., Durbin R.M., Gibbs R.A., Hurles M.E. & McVean G.A. (2011) Demographic
history and rare allele sharing among human populations.

56
Ifergan I., Kebir H., Terouz S., Alvarez J.I., Lecuyer M.A., Gendron S., Bourbonniere L., Dunay
I.R., Bouthillier A., Moumdjian R., Fontana A., Haqqani A., Klopstein A., Prinz M.,
Lopez-Vales R., Birchler T. & Prat A. (2011) Role of Ninjurin-1 in the migration of
myeloid cells to central nervous system inflammatory lesions. Ann Neurol 70, 751-63.
Jun J., Cho Y., Hu H., Kim H.-M., Jho S., Gadhvi P., Park K., Lim J., Paek W., Han K., Manica
A., Edwards J.S. & Bhak J. (2014) Whole genome sequence and analysis of the Marwari
horse breed and its genetic origin. BMC Genomics 15, S4-S.
Klein Isaac A., Resch W., Jankovic M., Oliveira T., Yamane A., Nakahashi H., Di Virgilio M.,
Bothmer A., Nussenzweig A., Robbiani Davide F., Casellas R. & Nussenzweig Michel C.
(2011) Translocation-Capture Sequencing Reveals the Extent and Nature of
Chromosomal Rearrangements in B Lymphocytes. Cell 147, 95-106.
Knezevic V., De Santo R., Schughart K., Huffstadt U., Chiang C., Mahon K.A. & Mackem S.
(1997) Hoxd-12 differentially affects preaxial and postaxial chondrogenic branches in the
limb and regulates Sonic hedgehog in a positive feedback loop. Development 124, 4523-
36.
Kolaczkowski B., Kern A.D., Holloway A.K. & Begun D.J. (2011) Genomic differentiation
between temperate and tropical Australian populations of Drosophila melanogaster.
Genetics 187, 245-60.
Krzywinski M., Schein J., Birol I., Connors J., Gascoyne R., Horsman D., Jones S.J. & Marra
M.A. (2009) Circos: an information aesthetic for comparative genomics. Genome Res 19,
1639-45.
Li H. & Durbin R. (2009) Fast and accurate short read alignment with Burrows-Wheeler
transform. Bioinformatics (Oxford, England) 25, 1754-60.
Lieberman-Aiden E., Berkum N.L.v., Williams L., Imakaev M., Ragoczy T., Telling A., Amit I.,

57
Lajoie B.R., Sabo P.J., Dorschner M.O., Sandstrom R., Bernstein B., Bender M.A.,
Groudine M., Gnirke A., Stamatoyannopoulos J., Mirny L.A., Lander E.S. & Dekker J.
(2009) Comprehensive Mapping of Long-Range Interactions Reveals Folding Principles
of the Human Genome.
Locke M.M., Penedo M.C.T., Bricker S.J., Millon L.V. & Murray J.D. (2002) Linkage of the
grey coat colour locus to microsatellites on horse chromosome 25. Animal genetics 33,
329-37.
Makvandi-Nejad S., Hoffman G.E., Allen J.J., Chu E., Gu E., Chandler A.M., Loredo A.I.,
Bellone R.R., Mezey J.G., Brooks S.a. & Sutter N.B. (2012) Four loci explain 83% of
size variation in the horse. PLoS ONE 7, e39929-e.
Manske M., Miotto O., Campino S., Auburn S., Almagro-Garcia J., Maslen G., O’Brien J.,
Djimde A., Doumbo O., Zongo I., Ouedraogo J.-B., Michon P., Mueller I., Siba P., Nzila
A., Borrmann S., Kiara S.M., Marsh K., Jiang H., Su X.-Z., Amaratunga C., Fairhurst R.,
Socheat D., Nosten F., Imwong M., White N.J., Sanders M., Anastasi E., Alcock D.,
Drury E., Oyola S., Quail M.A., Turner D.J., Ruano-Rubio V., Jyothi D., Amenga-Etego
L., Hubbart C., Jeffreys A., Rowlands K., Sutherland C., Roper C., Mangano V.,
Modiano D., Tan J.C., Ferdig M.T., Amambua-Ngwa A., Conway D.J., Takala-Harrison
S., Plowe C.V., Rayner J.C., Rockett K.A., Clark T.G., Newbold C.I., Berriman M.,
MacInnis B. & Kwiatkowski D.P. (2012) Analysis of Plasmodium falciparum diversity in
natural infections by deep sequencing. Nature 487, 375-9.
McDonald R.E., Fleming R.I., Beeley J.G., Bovell D.L., Lu J.R., Zhao X., Cooper A. &
Kennedy M.W. (2009) Latherin: A Surfactant Protein of Horse Sweat and Saliva. Plos
One 4, e5726.
Mi H., Muruganujan A., Casagrande J.T. & Thomas P.D. (2013) Large-scale gene function
analysis with the PANTHER classification system. Nature protocols 8, 1551-66.

58
Mills R.E., Luttig C.T., Larkins C.E., Beauchamp A., Tsui C., Pittard W.S. & Devine S.E. (2006)
An initial map of insertion and deletion (INDEL) variation in the human genome.
Genome Res 16, 1182-90.
Mullaney J.M., Mills R.E., Pittard W.S. & Devine S.E. (2010) Small insertions and deletions
(INDELs) in human genomes.
Nei M. & Li W.H. (1979) Mathematical model for studying genetic variation in terms of
restriction endonucleases. Proc Natl Acad Sci U S A 76, 5269-73.
Nguyen D.Q., Webber C. & Ponting C.P. (2006) Bias of selection on human copy-number
variants. PLoS Genet 2, e20.
Orlando L., Ginolhac A., Zhang G., Froese D., Albrechtsen A., Stiller M., Schubert M.,
Cappellini E., Petersen B., Moltke I., Johnson P.L.F., Fumagalli M., Vilstrup J.T.,
Raghavan M., Korneliussen T., Malaspinas A.-S., Vogt J., Szklarczyk D., Kelstrup C.D.,
Vinther J., Dolocan A., Stenderup J., Velazquez A.M.V., Cahill J., Rasmussen M., Wang
X., Min J., Zazula G.D., Seguin-Orlando A., Mortensen C., Magnussen K., Thompson
J.F., Weinstock J., Gregersen K., Røed K.H., Eisenmann V., Rubin C.J., Miller D.C.,
Antczak D.F., Bertelsen M.F., Brunak S., Al-Rasheid K.A.S., Ryder O., Andersson L.,
Mundy J., Krogh A., Gilbert M.T.P., Kjær K., Sicheritz-Ponten T., Jensen L.J., Olsen
J.V., Hofreiter M., Nielsen R., Shapiro B., Wang J. & Willerslev E. (2013) Recalibrating
Equus evolution using the genome sequence of an early Middle Pleistocene horse. Nature
499, 74-8.
Petersen J.L., Mickelson J.R., Rendahl A.K., Valberg S.J., Andersson L.S., Axelsson J., Bailey
E., Bannasch D., Binns M.M., Borges A.S., Brama P., da Câmara Machado A.,
Capomaccio S., Cappelli K., Cothran E.G., Distl O., Fox-Clipsham L., Graves K.T.,
Guérin G., Haase B., Hasegawa T., Hemmann K., Hill E.W., Leeb T., Lindgren G., Lohi
H., Lopes M.S., McGivney B.a., Mikko S., Orr N., Penedo M.C.T., Piercy R.J., Raekallio
M., Rieder S., Røed K.H., Swinburne J., Tozaki T., Vaudin M., Wade C.M. & McCue
59
M.E. (2013) Genome-wide analysis reveals selection for important traits in domestic
horse breeds. PLoS genetics 9, e1003211-e.
Pitera J.E., Milla P.J., Scambler P. & Adjaye J. (2001) Cloning of HOXD1 from unfertilised
human oocytes and expression analyses during murine oogenesis and embryogenesis.
Mechanisms of Development 109, 377-81.
Quach H., Barreiro L.B., Laval G., Zidane N., Patin E., Kidd K.K., Kidd J.R., Bouchier C.,
Veuille M., Antoniewski C. & Quintana-Murci L. (2009) Signatures of Purifying and
Local Positive Selection in Human miRNAs. The American Journal of Human Genetics
84, 316-27.
Schubert M., Jónsson H., Chang D., Sarkissian C.D., Ermini L., Ginolhac A., Albrechtsen A.,
Dupanloup I., Foucal A., Petersen B., Fumagalli M., Raghavan M., Seguin-Orlando A.,
Korneliussen T.S., Velazquez A.M.V., Stenderup J., Hoover C.A., Rubin C.-J., Alfarhan
A.H., Alquraishi S.A., Al-Rasheid K.A.S., MacHugh D.E., Kalbfleisch T., MacLeod J.N.,
Rubin E.M., Sicheritz-Ponten T., Andersson L., Hofreiter M., Marques-Bonet T., Gilbert
M.T.P., Nielsen R., Excoffier L., Willerslev E., Shapiro B. & Orlando L. (2014)
Prehistoric genomes reveal the genetic foundation and cost of horse domestication.
Signer-Hasler H., Flury C., Haase B., Burger D., Simianer H., Leeb T. & Rieder S. (2012) A
Genome-Wide Association Study Reveals Loci Influencing Height and Other
Conformation Traits in Horses. Plos One 7, e37282.
Thomas J.W., Touchman J.W., Blakesley R.W., Bouffard G.G., Beckstrom-Sternberg S.M.,
Margulies E.H., Blanchette M., Siepel A.C., Thomas P.J., McDowell J.C., Maskeri B.,
Hansen N.F., Schwartz M.S., Weber R.J., Kent W.J., Karolchik D., Bruen T.C., Bevan
R., Cutler D.J., Schwartz S., Elnitski L., Idol J.R., Prasad A.B., Lee-Lin S.Q., Maduro
V.V., Summers T.J., Portnoy M.E., Dietrich N.L., Akhter N., Ayele K., Benjamin B.,
Cariaga K., Brinkley C.P., Brooks S.Y., Granite S., Guan X., Gupta J., Haghighi P., Ho
S.L., Huang M.C., Karlins E., Laric P.L., Legaspi R., Lim M.J., Maduro Q.L., Masiello

60
C.A., Mastrian S.D., McCloskey J.C., Pearson R., Stantripop S., Tiongson E.E., Tran
J.T., Tsurgeon C., Vogt J.L., Walker M.A., Wetherby K.D., Wiggins L.S., Young A.C.,
Zhang L.H., Osoegawa K., Zhu B., Zhao B., Shu C.L., De Jong P.J., Lawrence C.E., Smit
A.F., Chakravarti A., Haussler D., Green P., Miller W. & Green E.D. (2003)
Comparative analyses of multi-species sequences from targeted genomic regions. Nature
424, 788-93.
Untergasser A., Cutcutache I., Koressaar T., Ye J., Faircloth B.C., Remm M. & Rozen S.G.
(2012) Primer3--new capabilities and interfaces. Nucleic Acids Res 40, e115.
Van der Auwera G.A., Carneiro M.O., Hartl C., Poplin R., del Angel G., Levy-Moonshine A.,
Jordan T., Shakir K., Roazen D., Thibault J., Banks E., Garimella K.V., Altshuler D.,
Gabriel S. & DePristo M.A. (2013) From fastQ data to high-confidence variant calls: The
genome analysis toolkit best practices pipeline. Current Protocols in Bioinformatics.
Vance S.J., McDonald R.E., Cooper A., Smith B.O. & Kennedy M.W. (2013) The structure of
latherin, a surfactant allergen protein from horse sweat and saliva.
Wade C.M., Giulotto E., Sigurdsson S., Zoli M., Gnerre S., Imsland F., Lear T.L., Adelson D.L.,
Bailey E., Bellone R.R., Blöcker H., Distl O., Edgar R.C., Garber M., Leeb T., Mauceli
E., MacLeod J.N., Penedo M.C.T., Raison J.M., Sharpe T., Vogel J., Andersson L.,
Antczak D.F., Biagi T., Binns M.M., Chowdhary B.P., Coleman S.J., Della Valle G.,
Fryc S., Guérin G., Hasegawa T., Hill E.W., Jurka J., Kiialainen a., Lindgren G., Liu J.,
Magnani E., Mickelson J.R., Murray J., Nergadze S.G., Onofrio R., Pedroni S., Piras
M.F., Raudsepp T., Rocchi M., Røed K.H., Ryder O.a., Searle S., Skow L., Swinburne
J.E., Syvänen a.C., Tozaki T., Valberg S.J., Vaudin M., White J.R., Zody M.C., Lander
E.S. & Lindblad-Toh K. (2009) Genome sequence, comparative analysis, and population
genetics of the domestic horse. Science (New York, N.Y.) 326, 865-7.
Wang W., Wang S., Hou C., Xing Y., Cao J., Wu K., Liu C., Zhang D., Zhang L., Zhang Y. &
Zhou H. (2014) Genome-Wide Detection of Copy Number Variations among Diverse
Horse Breeds by Array CGH. Plos One 9, e86860.

61
Warmuth V., UK U.o.C.D.o.Z.C., Manica A., UK U.o.C.D.o.Z.C., Eriksson A., UK
U.o.C.D.o.Z.C., Barker G., UK U.o.C.M.I.f.A.R.C., Bower M. & UK U.o.C.M.I.f.A.R.C.
(2015) Autosomal genetic diversity in non‐breed horses from eastern Eurasia provides
insights into historical population movements. Animal genetics 44, 53-61.
Womack J.E. (2005) Advances in livestock genomics: Opening the barn door.
Yu N., Jensen-Seaman M.I., Chemnick L., Ryder O. & Li W.-H. (2004) Nucleotide Diversity in
Gorillas.
Zeitouni B., Boeva V., Janoueix-Lerosey I., Loeillet S., Legoix-né P., Nicolas A., Delattre O. &
Barillot E. (2010) SVDetect: a tool to identify genomic structural variations from paired-
end and mate-pair sequencing data. Bioinformatics (Oxford, England) 26, 1895-6.
Zhao Z., Fu Y.-X., Hewett-Emmett D. & Boerwinkle E. (2003) Investigating single nucleotide
polymorphism (SNP) density in the human genome and its implications for molecular
evolution. Gene 312, 207-13.

62
CHAPTER 3
GENOME-WIDE SCANS REVEAL QTLs FOR WITHERS HEIGHT IN HORSES NEAR ANKRD1 AND IGF2BP2
Mohammed A. Al Abri1,2, Christian Posbergh1, Nathan B. Sutter3, John Eberth4, Gabriel E. Hoffman5, and Samantha A. Brooks1*
1Department of Animal Science, 149 Morrison Building, Cornell University, Ithaca, NY 14853,
USA
2Department of Animal and Veterinary Sciences, College of Agriculture and Marine Sciences,
Sultan Qaboos University, PO box 34 Al Khod, Postal Code 123, Muscat, Oman
3Department of Biology, La Sierra University, 4500 Riverwalk Parkway, Riverside, CA 9251
4University of Kentucky, 900 W. P. Garrigus Building, Lexington, KY 40546
5Mount Sinai Hospital, Icahn Medical Institute, Floor 3 Room L3-70, Desk 26, 1425 Madison
Avenue, New York, NY 10029
*Corresponding author
*Now Department of Animal Sciences, University of Florida, Gainesville, FL 32611, USA

63
ABSTRACT Withers height is an important trait for the American Miniature horses since the breed objective
is to produce the small and proportionate animals. Accordingly, the breed registry dictates that
the height of the mature Miniature horse at the withers must not exceed 34 inches (0.864 meters)
(American Miniature Horse Association Accessed April 28, 2014). Therefore, identification of
Quantitative Trait Loci (QTLs) affecting this trait will result in a better understanding of the
genetic architecture and biological pathways contributing to skeletal height in the horse. Using
the Equine SNP50 bead chip (Illumina Inc), we previously genotyped 48 horses from 16
different breeds that represent extremes in body size (Makvandi-Nejad et al. 2012). We
applied a dominant model Genome Wide Association Study (GWAS) and found loci affecting
size variation in the horse that were not previously reported. We complemented our GWAS
findings by conducting a genome wide FST estimation as well as a cross-population composite
likelihood ratio test (XP-CLR) test between the eight large and eight small breeds. The ECA1:
37676322 bp markers, positioned within an intron of the ANKRD1 gene, were detected by both
the GWAS and the XP-CLR scan. To confirm our findings at this locus, we used a PCR–
Restriction Fragment Length Polymorphism (PCR-RFLP) to genotype 90 additional American
Miniature horses. Within this population we verified that ECA1: 37676322 bp marker indeed
follows a dominant mode of inheritance. Horses possessing the GG or AG genotypes were 4.064
cm (1.6 inches) taller on average than horses with the AA genotype. ANKRD1 is a transcription
factor that is involved in muscle myocytes and cardiomyocyte growth and differentiation and
may contribute to height by influencing the overall growth of the horses. This marker will be a
valuable tool for selection of breeding stock in breeds with height restrictions for registration.

64
INTRODUCTION Horses have been selected for generations for diverse skeletal compositions in order to perform
various tasks (Brooks et al. 2010b). As a result of that selection, they now have ample skeletal
size variability both within and between breeds. Skeletal size in the horse is highly heritable with
an overall mean heritability of 0.49 ± 0.065 (Saastamoinen (1990). This means that 49 % of the
variation in horse height is due to additive genetic inheritance. The genetic architecture of horse
size variation seems to be controlled by a few genes due to intense selection for size. Makvandi-
Nejad et al. (2012) found 4 loci that together explained 83% in horse size variation. In contrast,
height variation in humans is controlled by over 600 loci and only 36% of the variability could
be explained by these loci (Wood et al. 2014). Withers height was used successfully to map
QTLs involved in height variation in horses close to LCORL/NCAPG genes in chromosome 3
and ZFAT gene in chromosome 9 (Signer-Hasler et al. 2012). However, the first principal
component (PC1), created by pooling 33 body measurements, is a comprehensive, quantitative
trait that explained the majority (65.9%) of skeletal size variation in horses (Makvandi-Nejad et
al. 2012).
Using genome-wide association study (GWAS) has aided researchers to identify biologically
meaningful candidate genes close to the significant SNPs. The availability of a high-density SNP
chip for the horse, helped conducting GWAS that resulted in mapping QTLs at a very fine-scale
(Brooks et al. 2010a). Mixed model GWAS greatly reduces the population structure, and
therefore false positive results (Shin & Lee 2015), which narrows down the regions of the
genome that are more likely to contain the causative mutations. Therefore, they are used
extensively in studies involving admixed or related groups of individuals e.g (Sutter et al. 2007)
and (Guo et al. 2012). SNP chip genotypes can also be used in screening the genome for regions
containing signatures of selection. This lead to the discovery of various biologically relevant

65
genes in cattle (Pérez O’Brien et al. 2014), pig (Rubin et al. 2012) and sheep (McRae et al.
2014).
The aim of this study was to identify QTLs controlling size variation in withers height in the
horse. We used withers height as a proxy to measure skeletal size phenotype as it is easy to
measure and is highly correlated with PC1 (r=0.93, p<0.005). Instead of the standard additive
model GWAS, we used dominance and a recessive mixed model GWAS. Advantageously, our
data set was comprised of diverse breeds representing the extremes in skeletal morphology in an
equal proportion. We therefore decided to conduct a genome-wide search for regions harboring
signatures of selection using two methods by splitting the animals into two groups of large and
small breeds. The first method was the FST genetic differentiation test to search (Weir &
Cockerham 1984). The second method is called the cross-population composite likelihood ratio
test (XP-CLR) test which is based on the multi-locus allele frequency differentiation between
two populations (Chen et al. 2010). Both the FST and XP-CLR utilize the variation in allele
frequencies between two populations to detect selective sweeps. We found that, using a
dominance model, we could detect loci that were not previously reported. Using both, GWAS
and XP-CLR, we detected that ANKRD1 is significantly associated with withers height variation
in the horse.
MATERIALS AND METHODS
Animal resources, samples collection and genotyping
The trait withers height was defined following Brooks et al. (2010b), as the measure from the
ground to the highest point of the withers as shown in Figure 3.1. Samples and measurements
were taken from horses of volunteering horse owners. In total, there were 48 horses belonging to

66
16 different breeds (3 from each breed) used in this study (Table 3.1). Horses were measured
either by their owners or by laboratory staff and collaborators. The breed identity and animal age
were provided by the owner and confirmed by examining the photo of each animal. DNA was
collected either from whole blood or tail hair bulbs using standard methods as previously
described in (Cook et al. 2010). Genotyping was performed using the equine SNP 50 Illumina
BeadChip (GeneSeek, Lincoln, NE, USA).
Figure 3.1. Illustration of the withers height phenotype shown as the measure from the ground to the highest point of the withers.

67
Table 3.1. Three horses of each of the following horse breeds have been genotyped for the study.
The breed name and mean withers height for each breed in cm are given.
SNPs quality control
SNPs with more than 20% missingness rate or those with a minor allele frequency less than 10%
were filtered out of the dataset. Of the initial set of 54,624 SNPs, 16,938 SNPs were removed
due to low minor allele frequency and 505 SNPs (0.92%) were removed due genotype
missingness, leaving 37,584 SNPs for analysis. We also tested for samples duplicates using
identity by state (IBS) check in PLINK (Purcell et al. 2007) and detected no sample duplicates.
Statistical analyses for the GWAS
We first performed the GWAS analysis using a standard dominance model association (with
gender as a covariate) using the option --dominant in PLINK. Later we ran the same analysis
using EMMA (Kang et al. 2008) which, unlike the standard linear model, includes the kinship as
a random effect in a mixed model approach. Using a mixed model for the analysis allowed us to
Breed Mean withers Height American Belgian 171.0 American Miniature 77.6 Ardennais 155.4 Brabant 168.9 Caspian 116.4 Clydesdale 179.5 Dartmoor Pony 125.3 Falabella 87.6 Friesian 163.8 Percheron 177.0 Puerto Rican Paso Fino 133.8 Shetland Pony 109.5 Shire 190.9 Suffolk Punch 165.1 Welsh Mountain Pony 119.8 Welsh Pony 126.4

68
account for the population structure and therefore reducing false positive hits (Kang et al. 2008).
Our model was as follows:
� = �� + �� + �
Where y is the vector of phenotypic values of withers height in inches, X is a 48 by 3 matrix of
fixed effects including the mean (μ) , SNPs, and gender. β is the fixed effects coefficients
vector. Z is a design matrix that maps the phenotype to the corresponding breed. u is the random
effect with Var (u) = ��� K, where K is the genomic kinship relationship matrix and e is the
residual effect where e ~ N(0, I ���). Assuming that A and a be the major and minor alleles at a
SNP respectively, our genotype coding (scores) for the dominant model was 0, 1, 1 for AA,
Aa/Aa, aa. The genotype coding for the recessive model was 0, 0, 1 for AA, Aa/Aa, aa.
Genome-wide search for selective sweeps
First, the animals were separated into a large and a small breeds group. A cutoff of 60 inches
(152 meters) was chosen to separate the animals into these small (24 animals) and large (24
animals) groups, based on the distribution of withers height measurements (Figure 3.2). In order
to search for regions with unusually strong polymorphism patterns genome wide ( i.e regions of
elevated population subdivision signals), the FST genetic differentiation test was calculated (Weir
& Cockerham 1984). The FST test was performed using the R package pegas (Paradis 2010). To
search for regions were the change in allele frequency occurred quickly, perhaps as a result of
random drift, we calculated the cross population XP-CLR scores using the script available at
(http://genetics.med.harvard.edu/reich/Reich_Lab/Software.html). Our parameters were as
follows: non-overlapping sliding windows of 50 kb with a maximum number of SNPs per
window being 30 SNPs and a correlation level of 0.95 was required to down-weight the

69
contribution of SNPs to XP-CLR. The top 1% values of the empirical distribution of FST and XP-
CLR values were considered ‘selection outliers’, i.e suggestive of a positive and/or divergent
selection.
Figure 3.2. Horses for this study were selected to represent the extremes of skeletal size variation. Distribution of withers height in cm is shown in the figure. For the Fst and XP-CLR analysis a cut off of 152 cm was chosen representing the midpoint of the distribution.
Functional annotation of GWAS results and selective sweeps regions
Loci surpassing a genome wide significance level as well as genomic regions with “significant”
selection signals identified by Fst and XP-CLR tests were annotated to the closest ENSEMBLE
genes in EquCab2. Genes overlapping a span of 50 KB around significant selection signals
positions were considered candidate genes. A span of 50 KB was used since it is the average LD
length across breeds of horse (Wade et al. 2009).

70
PCR–RFLP detection
Genomic DNA was amplified for the ANKRD1 locus by PCR using the primers: ANKRD1_F2
5’- GTC TGT GAC GAG GTA AGG CT – 3’ and ANKRD1_R2 5’ – GCC AAA TGT CCT
TCC AAG CA – 3’. Reactions were made to a 20 µl volume using FastStart Taq DNA
Polymerase and all necessary reagents according to the manufacturers recommended conditions
(Roche Diagnostics, Indianapolis, IN). Thermocycling on an Eppendorf Mastercycler Ep
Gradient (Eppendorf Corp., Westbury, NY) was also according to the manufacturer's
recommendations with an annealing temperature of 58°C and a total of 40 cycles for this primer
pair. The restriction digest used 10 µl PCR product, 0.5 U of Cac8I (New England Biolabs Inc.
(NEB), Ipswitch, MA), 1x NEB Cutsmart Buffer, and enough MilliQ water to achieve a total
volume of 20 µl per reaction, and were incubated at 37°C for two hours. The digest products
were visualized following electrophoresis on a 2% agarose gel (Omnipur Agarose, EMD
Chemicals Inc, Gibbstown, NJ). Agarose gels were stained (SYBRsafe DNA gel stain (10,000X)
concentrate, Invitrogen Molecular Probes, Eugene, OR) and visualized under UV illumination
(FluroChem HD2, Alpha Innotec Corp., San Leandro CA). The G allele resulting in fragments
of 675, 402, and 20bp in size, while the A allele produced 1077 and 20bp fragments.
RESULTS AND DISCUSSION
Association analysis
The QQ plot of GWAS p-values for the linear model (PLINK) and the mixed model (EMMA),
presented in Figure 3.3, shows clearly the EMMA correction for the population structure within
this population. The genomic inflation factor (λ) after EMMA correction was 1.0695, which is
suitable for GWAS. We detected no significant associations using the recessive model. Using
the dominance model we detected 3 out of the 4 loci found by Makvandi-Nejad et al. 2012

71
(Figure 3.4.a). In addition, we detected two novel loci; the first locus was within an intron of the
Ankyrin Repeat Domain 1 (ANKRD1) gene at ECA1: 37676322. ANKRD1 is a transcriptional
factor that belongs to the muscle ankyrin repeat proteins (MARP) family, and encodes a cardiac
ankyrin repeat protein (CARP) (Duboscq-Bidot et al. 2009). Of the members of the MARP
protein family, ANKRD1 (CARP) is mainly expressed in cardiac muscle. The other two members
of the MARP family are the Ankyrin repeat domain protein 2 (Ankrd2/Arpp) is expressed in
skeletal muscle, and the diabetes related ankyrin repeat protein (Ankrd23/ DARP) which is
expressed at similar amounts in cardiac and skeletal muscle (Bang et al. 2014). During
embryonic development, MARP proteins are expressed in developing skeletal muscles and are a
vital for muscle morphogenesis (Baumeister et al. 1997). It is suggested that MARP as a nuclear
cofactor is crucial in the signaling pathways starting with prospective tendon mesenchyme to
forming muscle. It is also deemed to be involved in the signaling pathways from activated
muscle interstitial cells to denervated muscle fibers (Baumeister et al. 1997). It is well
established that the ANKRD1 is upregulated in response to cardiac hypertrophy (Aihara et al.
2000). Missense mutations in ANKRD1 were found to be causative of hypertrophic
cardiomyopathy (Arimura et al. 2009). Nevertheless, Bang et al. (2014) showed that mice knock
out for all three MARP genes (MKO mice) have normal heart morphology and function. MKO
mice had an increased expression of the MyoD and Muscle LIM protein genes, suggestive of the
role of the MARP proteins play in the expression regulation of muscle genes (Barash et al.
2007). ANKRD1 itself is involved in the signaling pathways of muscle remodeling and

72
Figure 3.3 : The QQ plots for the GWAS analysis. The QQ-plot of the mixed model analysis using EMMA (solid circles) shows the considerable control of population structure (genomic
inflation factor of 1.0695) compared to the standard linear model analysis in PLINK (solid triangles).

73
Figure 3.4: a. Manhattan plot of withers height of 48 horses from 16 breeds of extreme size based on a dominant model GWAS conducted in EMMA. The horizontal line indicates a genome-wide significance (alpha =0.05). b. Genome wide FST statistic values. The horizontal line at 0.75 is the significance level i.e line above which the highest 0.01 of the FST hits belong.

74
differentiation (Kojic et al. 2011). It was also found to be involved in wound healing through
stimulating collagen gel contraction and actin fiber organization (Samaras et al. 2015). The
second marker we identified as associated with height in the horse was within an intron in
insulin-like growth factor 2 mRNA binding protein 2 (IGF2BP2) which is at ECA19: 23815750.
IGF2BP2 is best known for its role in insulin regulation (Groenewoud et al. 2008) and risk of
type 2 diabetes (Saxena et al. 2007). It is a member of the conserved family of Insulin-like
growth factor 2 mRNA-binding proteins family (IGF2BP) which also includes IF2BP1 and
IGF2BP3. The IGF2BP family is highly expressed in embryonic development, specifically in the
period between zygote and embryo stages (Hansen et al. 2004). IGF2BP1 and IGF2BP3 are
primarily expressed during embryonic development rather than in adult tissues (Bell et al. 2013).
Although IGF2BP2 is also expressed in embryonic development, it continues to be expressed in
adult mice and human tissues such as the brain, muscles, kidney, liver and bone marrow
(Christiansen et al. 2009). Targeted silencing of HMGA2, a gene previously implicated to affect
overall size in horses (Makvandi-Nejad et al. 2012), causes the downregulation of IGF2BP2 but
not its family members IGF2BP1 and IGF2BP3 (Brants et al. 2004). HMGA2-deficient mice
display the pygmy-phenotype and their IGF2BP2 expression was below detectable levels which
is suggestive of the role of IGF2BP2 in embryogenesis, growth and development (Brants et al.
2004). The involvement of the HMGA2-IGF2BP2 axis in myoblast growth and overall
development are supported by a similar but more recent experiment in which expression
IGF2BP2 rescued the phenotype strongly supporting its involvement in growth (Li et al. 2012).

75
Identification of signals for selective sweeps
Loci bearing signatures of selection may elucidate the forces that helped shape an animal during
evolution and domestication, and can facilitate the identification of variants that affect different
morphologies. Scanning the genome for such signatures in domestic animals is particularly
interesting as they harbor more phenotypic diversity than experimental organisms (Andersson et
al. 2015). In a way, humans have conducted a long term genetic experiment in which they have
altered the frequency of desired/undesired mutations in domesticated species to their advantage.
The horse breeds used in this study have been selected for millennia for different skeletal types
in order to meet specific tasks. Therefore, searching for selection signatures in such a set of
extreme morphology for size can show how artificial selection has rapidly shaped this
phenotype. These scans have previously shed light on the genomic regions affecting size
variation in humans (Jarvis et al. 2012) and horses (Petersen et al. 2013b).
Numerous methods exist to search for selection signatures using genotypic data. These can be
broadly divided into between populations and within population methods. Example of the within
population methods include Tajima's D (Tajima 1989) and the integrated haplotype score ( iHS)
(Voight et al. 2006) and Compsite Likelihood Ratio Test (CLR) (Nielsen et al. 2005). Both
Tjima’s D and CLR test are based on the change on the allele frequency around a sweep whereas
the iHS is based on LD patterns around the sweep. Here we utilized two different between
populations methods to infer putative selective sweeps. The first was the FST statistic (Wright
1949) and is a more traditional method for that uses variation of allele frequency between two
populations to detect selection footprints. Since its introduction, different flavors of it were
developed such as the Fst-based Bayesian hierarchical model (Riebler et al. 2008) and the two-
76
step Fst method (Gianola et al. 2010). The second method was the Cross Population Composite
Likelihood Ratio (XP-CLR) (Chen et al. 2010) is composite likelihood method that uses an
outgroup population to detect departures from neutrality which maybe be compatible with soft or
hard sweeps close to the beneficial allele. Like FST, XP-CLR also utilizes the variation of allele
frequency between two populations to identify signatures of selection. A possible downside to
this method is that it is sensitive to recent selection and could miss selective events that occurred
a long time ago (Ma et al. 2014).Other methods to detect selective sweeps by comparing two
populations exist such as the Cross Population Extend Haplotype Homozygosity Test (XPEHH)
which searches for the selection footprint around beneficial sites through assessing linkage
disequlibrium (LD) patterns (Sabeti et al. 2007).
We identified four sweep regions using a genome-wide FST approach (Figure 3.4.b). The four
markers suggestive of a recent selective sweep were within introns of the R3H domain and
coiled-coil containing 1-like (R3HCC1L), Microtubule-Actin Crosslinking Factor 1 (MACF1),
Calcineurin Binding Protein 1 (CABIN1), and IGF2BP2 genes. R3HCC1L, is known to be
involved in growth inhibition and differentiation (www.genecards.org). On the other hand,
MACF1 is involved in microtubule actin cross-linking development and mice with MACF1
deletion (MACF1−/−) exhibit growth retardation (Chen et al. 2006). CABIN1 was found to play
a role in skeletal muscle development (Friday et al. 2000). Given that all these genes are
involved in growth related functions, it is plausible that they may also exert an effect in skeletal
size variation in horse. This is specially the case for the IGF2BP2 locus which was also detected
in the GWAS analysis. In addition, genes within a 50 KB window of significant FST locations
(Table 3.2) include D-dopachrome tautomerase (DDT) and deSUMOylation (SENP2). DDT
77
produces a cytokine that is up-regulated in Patients with Sepsis or Invasive Cancer (Merk et al.
2011) whereas SENP2 is involved in liver cancer cell proliferation (Tu et al. 2015).
Genes within 50 KB of the XP-CLR sweeps are shown in Table 3.2. The four highest genome-
wide XP-CLR scores were at the ANKRD1 locus, providing further evidence for its role in
growth and development of the horse. Amongst the loci within the top 1% of XP-CLR scores we
also detected the High-mobility group AT-hook (HMGA2). HMGA2 is primarily expressed
during embryonic development but is also found in human benign tumors of mesenchymal origin
(Fedele et al. 2002). Over-expression of HMGA2 leads to increased secretion prolactin/growth
hormone leading to cell pituitary adenomas (Fedele et al. 2002).The product of the HMGA2 gene
is suggested to confer variation in growth through regulation of cellular proliferation (Young &
Narita 2007). The gene was also previously reported in height GWAS studies of height in dogs
(Boyko et al. 2010) and humans (Weedon et al. 2007). In humans, an overgrowth syndrome
affected an individual who carried a chromosomal inversion truncating the HMGA2 (Ligon et al.
2005). In mice deletions of homolog of IGF2BP2 result in dwarfism (Zhou et al. 1995) and the
dwarf phenotype in chicken was mapped to syntenic region (Ruyter-Spira et al. 1998). As noted
earlier, HMGA2 is hypothesized to alter skeletal growth by directly regulating the IGF2BP2 gene
(Li et al. 2012).

78
Table 3.2. Genes within 50 KB of the GWAS, FST and XP-CLR significant regions. ANKRD1
was detected using the XP-CLR and the GWAS, while IGF2BP2 was detected using the GWAS
and the FST scan.
XP-CLR GWAS FST
ANKRD1 ANKRD1 R3HCC1L RPP30 RPP30 MACF1 HTR7 HTR7 CABIN1 HMGA2 HMGA2 DDT ZAP70 IGF2BP2 IGF2BP2 TMEM131 SNORD61 SENP2 RUNX3 ECA-MIR-763 CLIC4 ABCA9 ACTR1B ABCA8 CDC42EP1 RPL23 LGALS2 FBXO47 ANKRD54 LASP1 TRIOBP SNORA21 GCAT C17ORF98 PLCE1 CWC25
HSPB9 KAT2A DHX58 ZNF385C NKIRAS2 DNAJC7 SEMA6A GORASP2 TLK1 ENOX1 AGBL4 LMO4 TFEC MRPS6 MICU3 FGF20

79
Validation of the ANKRD1 locus in a second population of animals
We chose markers near ANKRD1 for subsequent validation as these possessed the highest XP-
CLR score and the smallest p-value in the GWAS. We used a custom PCR-RFLP assay to
genotype a total of 90 American miniature horses at for the A>G SNP at ECA1: 37676322 bp.
Our PCR-RFLP results verified that there was a significant association between this locus and
the height at the withers in this second sample set (p-value < 0.0005). Horses carrying the GG or
AG genotypes at ANKRD1 were taller on average (mean = 34.36, SD= 2.31) than individuals
with the AA genotype (mean= 32.76, SD=2.31) (Figure 3.5).
Figure 3.5. Boxplot at ANKRD1 locus (at ECA1: 37676322 bp) genotypes by withers height (in inches) using a dominant model. Horses with the GG or GA genotypes are on average 1.6 inches (4.064 cm) taller than those possessing the AA genotype horses.

80
CONCLUSIONS
In the present study we have identified QTLs contributing to size variation in the horse. Some of
the significant QTL markers discovered were located within or near genes previously reported to
influence size variation in the horse, while others are reported for the first time. Among the
newly discovered QTLs affecting the withers height phenotype, the A>G SNP in an intron of the
ANKRD1 gene at ECA1: 37676322 bp variant was verified in an independent set of 90 American
Miniature horses. The ANKRD1 gene is a transcriptional factor that is apparently involved in
determining the overall size by affecting muscle growth and differentiation. Further investigation
is required to determine the mechanism by which ANKRD1 affects the overall size in the horse.
ACKNOWLEDGEMENTS
We would like to thank the many horse owners for volunteering to provide samples for DNA and
measurements of their horses. We would also like to thank Allison Seebald for assistance in
processing the DNA samples. This work was supported by the USDA National Institute of Food
and Agriculture, Hatch project NYC-127454. Any opinions, findings, conclusions, or
recommendations expressed in this publication are those of the author(s) and do not necessarily
reflect the view of the National Institute of Food and Agriculture (NIFA) or the United States
Department of Agriculture (USDA).
81
REFERENCES
Aihara Y., Kurabayashi M., Saito Y., Ohyama Y., Tanaka T., Takeda S., Tomaru K., Sekiguchi
K., Arai M., Nakamura T. & Nagai R. (2000) Cardiac ankyrin repeat protein is a novel
marker of cardiac hypertrophy: role of M-CAT element within the promoter.
Hypertension 36, 48-53.
American Miniature Horse Association (Accessed April 28, 2014) American Miniature Horse
Association Rule Book. In: http://www.amha.org/.
Andersson L., From the Science for Life Laboratory D.o.M.B.a.M., Uppsala University, and
Department of Animal Breeding and Genetics S.U.o.A.S. & Uppsala S. (2015) How
selective sweeps in domestic animals provide new insight into biological mechanisms.
Journal of Internal Medicine 271, 1-14.
Arimura T., Bos J.M., Sato A., Kubo T., Okamoto H., Nishi H., Harada H., Koga Y., Moulik M.,
Doi Y.L., Towbin J.A., Ackerman M.J. & Kimura A. (2009) Cardiac ankyrin repeat
protein gene (ANKRD1) mutations in hypertrophic cardiomyopathy. J Am Coll Cardiol
54, 334-42.
Bang M.-L., Gu Y., Dalton N.D., Peterson K.L., Chien K.R. & Chen J. (2014) The Muscle
Ankyrin Repeat Proteins CARP, Ankrd2, and DARP Are Not Essential for Normal
Cardiac Development and Function at Basal Conditions and in Response to Pressure
Overload. PLoS ONE 9, e93638.
Barash I.A., Bang M.L., Mathew L., Greaser M.L., Chen J. & Lieber R.L. (2007) Structural and
regulatory roles of muscle ankyrin repeat protein family in skeletal muscle. Am J Physiol
Cell Physiol 293, C218-27.
Baumeister A., Arber S. & Caroni P. (1997) Accumulation of muscle ankyrin repeat protein

82
transcript reveals local activation of primary myotube endcompartments during muscle
morphogenesis. Journal of Cell Biology 139, 1231-42.
Bell J.L., Wächter K., Mühleck B., Pazaitis N., Köhn M., Lederer M. & Hüttelmaier S. (2013)
Insulin-like growth factor 2 mRNA-binding proteins (IGF2BPs): post-transcriptional
drivers of cancer progression? Cell Mol Life Sci 70, 2657-75.
Boyko A.R., Quignon P., Li L., Schoenebeck J.J., Degenhardt J.D., Lohmueller K.E., Zhao K.Y.,
Brisbin A., Parker H.G., vonHoldt B.M., Cargill M., Auton A., Reynolds A., Elkahloun
A.G., Castelhano M., Mosher D.S., Sutter N.B., Johnson G.S., Novembre J., Hubisz M.J.,
Siepel A., Wayne R.K., Bustamante C.D. & Ostrander E.A. (2010) A Simple Genetic
Architecture Underlies Morphological Variation in Dogs. PLoS biology 8.
Brants J.R., Ayoubi T.A.Y., Chada K., Marchal K., Van de Ven W.J.M. & Petit M.M.R. (2004)
Differential regulation of the insulin-like growth factor II mRNA-binding protein genes
by architectural transcription factor HMGA2. FEBS letters 569, 277-83.
Brooks S.A., Gabreski N., Miller D., Brisbin A., Brown H.E., Streeter C., Mezey J., Cook D. &
Antczak D.F. (2010a) Whole-genome SNP association in the horse: identification of a
deletion in myosin Va responsible for Lavender Foal Syndrome. PLoS genetics 6,
e1000909-e.
Brooks S.a., Makvandi-Nejad S., Chu E., Allen J.J., Streeter C., Gu E., McCleery B., Murphy
B.a., Bellone R. & Sutter N.B. (2010b) Morphological variation in the horse: defining
complex traits of body size and shape. Animal Genetics 41 Suppl 2, 159-65.
Chen H., Patterson N. & Reich D. (2010) Population differentiation as a test for selective
sweeps. Genome Res 20, 393-402.
Chen H.J., Lin C.M., Lin C.S., Perez-Olle R., Leung C.L. & Liem R.K. (2006) The role of

83
microtubule actin cross-linking factor 1 (MACF1) in the Wnt signaling pathway. Genes
Dev 20, 1933-45.
Christiansen J., Kolte A.M., Hansen T.V.O. & Nielsen F.C. (2009) IGF2 mRNA-binding protein
2: biological function and putative role in type 2 diabetes. Journal of Molecular
Endocrinology 43, 187-95.
Cook D., Gallagher P.C. & Bailey E. (2010) Genetics of swayback in American Saddlebred
horses. Animal Genetics 41 Suppl 2, 64-71.
Duboscq-Bidot L., Charron P., Ruppert V., Fauchier L., Richter A., Tavazzi L., Arbustini E.,
Wichter T., Maisch B., Komajda M., Isnard R. & Villard E. (2009) Mutations in the
ANKRD1 gene encoding CARP are responsible for human dilated cardiomyopathy. In:
Eur Heart J (pp. 2128-36, England.
Fedele M., Battista S., Kenyon L., Baldassarre G., Fidanza V., Klein-Szanto A.J., Parlow A.F.,
Visone R., Pierantoni G.M., Outwater E., Santoro M., Croce C.M. & Fusco A. (2002)
Overexpression of the HMGA2 gene in transgenic mice leads to the onset of pituitary
adenomas. Oncogene 21, 3190-8.
Friday B.B., Horsley V. & Pavlath G.K. (2000) Calcineurin activity is required for the initiation
of skeletal muscle differentiation. J Cell Biol 149, 657-66.
Gianola D., Simianer H. & Qanbari S. (2010) A two-step method for detecting selection
signatures using genetic markers. Genet Res (Camb) 92, 141-55.
Groenewoud M.J., Dekker J.M., Fritsche A., Reiling E., Nijpels G., Heine R.J., Maassen J.A.,
Machicao F., Schafer S.A., Haring H.U., t Hart L.M. & van Haeften T.W. (2008)
Variants of CDKAL1 and IGF2BP2 affect first-phase insulin secretion during
hyperglycaemic clamps. Diabetologia 51, 1659-63.

84
Guo J., Jorjani H. & Carlborg Ö. (2012) A genome-wide association study using international
breeding-evaluation data identifies major loci affecting production traits and stature in the
Brown Swiss cattle breed. BMC genetics 13, 82.
Hansen T.V.O., Hammer N.A., Nielsen J., Madsen M., Dalbaeck C., Wewer U.M., Christiansen J. & Nielsen F.C. (2004) Dwarfism and impaired gut development in insulin-like growth factor II mRNA-binding protein 1-deficient mice. Molecular and Cellular Biology 24, 4448-64.
Jarvis J.P., Scheinfeldt L.B., Soi S., Lambert C., Omberg L., Ferwerda B., Froment A., Bodo J.-
M., Beggs W., Hoffman G., Mezey J. & Tishkoff S.A. (2012) Patterns of Ancestry,
Signatures of Natural Selection, and Genetic Association with Stature in Western African
Pygmies. PLoS Genet 8, e1002641.
Kang H.M., Zaitlen N.a., Wade C.M., Kirby A., Heckerman D., Daly M.J. & Eskin E. (2008)
Efficient control of population structure in model organism association mapping.
Genetics 178, 1709-23.
Kojic S., Radojkovic D. & Faulkner G. (2011) Muscle ankyrin repeat proteins: their role in
striated muscle function in health and disease. Crit Rev Clin Lab Sci 48, 269-94.
Li Z., Gilbert Jason A., Zhang Y., Zhang M., Qiu Q., Ramanujan K., Shavlakadze T., Eash
John K., Scaramozza A., Goddeeris Matthew M., Kirsch David G., Campbell Kevin P.,
Brack Andrew S. & Glass David J. (2012) An HMGA2-IGF2BP2 Axis Regulates
Myoblast Proliferation and Myogenesis. Developmental Cell 23, 1176-88.
Ligon A.H., Moore S.D., Parisi M.A., Mealiffe M.E., Harris D.J., Ferguson H.L., Quade B.J. &
Morton C.C. (2005) Constitutional rearrangement of the architectural factor HMGA2: a
novel human phenotype including overgrowth and lipomas. Am J Hum Genet 76, 340-8.
Ma Y., Zhang H., Zhang Q. & Ding X. (2014) Identification of Selection Footprints on the X
Chromosome in Pig. PLoS ONE 9, e94911.

85
Makvandi-Nejad S., Hoffman G.E., Allen J.J., Chu E., Gu E., Chandler A.M., Loredo A.I.,
Bellone R.R., Mezey J.G., Brooks S.a. & Sutter N.B. (2012) Four loci explain 83% of
size variation in the horse. PLoS ONE 7, e39929-e.
McRae K.M., McEwan J.C., Dodds K.G. & Gemmell N.J. (2014) Signatures of selection in
sheep bred for resistance or susceptibility to gastrointestinal nematodes. BMC Genomics
15, 637.
Merk M., Zierow S., Leng L., Das R., Du X., Schulte W., Fan J., Lue H.Q., Chen Y.B., Xiong
H.B., Chagnon F., Bernhagen J., Lolis E., Mor G., Lesur O. & Bucala R. (2011) The D-
dopachrome tautomerase (DDT) gene product is a cytokine and functional homolog of
macrophage migration inhibitory factor (MIF). Proceedings of the National Academy of
Sciences of the United States of America 108, E577-E85.
Nielsen R., Williamson S., Kim Y., Hubisz M.J., Clark A.G. & Bustamante C. (2005) Genomic
scans for selective sweeps using SNP data. Genome research 15, 1566-75.
Paradis E. (2010) pegas: an R package for population genetics with an integrated-modular
approach. Bioinformatics (Oxford, England) 26, 419-20.
Pérez O’Brien A.M., Utsunomiya Y.T., Mészáros G., Bickhart D.M., Liu G.E., Van Tassell C.P.,
Sonstegard T.S., Da Silva M.V., Garcia J.F. & Sölkner J. (2014) Assessing signatures of
selection through variation in linkage disequilibrium between taurine and indicine cattle.
Genetics Selection Evolution 46, 19.
Petersen J.L., Mickelson J.R., Rendahl A.K., Valberg S.J., Andersson L.S., Axelsson J., Bailey
E., Bannasch D., Binns M.M., Borges A.S., Brama P., da Câmara Machado A.,
Capomaccio S., Cappelli K., Cothran E.G., Distl O., Fox-Clipsham L., Graves K.T.,
Guérin G., Haase B., Hasegawa T., Hemmann K., Hill E.W., Leeb T., Lindgren G., Lohi
H., Lopes M.S., McGivney B.a., Mikko S., Orr N., Penedo M.C.T., Piercy R.J., Raekallio

86
M., Rieder S., Røed K.H., Swinburne J., Tozaki T., Vaudin M., Wade C.M. & McCue
M.E. (2013) Genome-wide analysis reveals selection for important traits in domestic
horse breeds. PLoS genetics 9, e1003211-e.
Purcell S., Neale B., Todd-Brown K., Thomas L., Ferreira Manuel A R., Bender D., Maller J.,
Sklar P., de Bakker Paul I W., Daly Mark J. & Sham Pak C. (2007) PLINK: A Tool Set
for Whole-Genome Association and Population-Based Linkage Analyses. American
journal of human genetics 81, 559-75.
Riebler A., Held L. & Stephan W. (2008) Bayesian variable selection for detecting adaptive
genomic differences among populations. Genetics 178, 1817-29.
Rubin C.J., Megens H.J., Barrio A.M., Maqbool K., Sayyab S., Schwochow D., Wang C.,
Carlborg O., Jern P., Jorgensen C.B., Archibald A.L., Fredholm M., Groenen M.A.M. &
Andersson L. (2012) Strong signatures of selection in the domestic pig genome.
Proceedings of the National Academy of Sciences of the United States of America 109,
19529-36.
Ruyter-Spira C.P., de Groof A.J., van der Poel J.J., Herbergs J., Masabanda J., Fries R. &
Groenen M.A. (1998) The HMGI-C gene is a likely candidate for the autosomal dwarf
locus in the chicken. J Hered 89, 295-300.
Saastamoinen M. (1990) Heritabilities for Body Size and Growth-Rate and Phenotypic Correlations among Measurements in Young Horses. Acta Agriculturae Scandinavica 40, 377-86.
Sabeti P.C., Varilly P., Fry B., Lohmueller J., Hostetter E., Cotsapas C., Xie X., Byrne E.H.,
McCarroll S.A., Gaudet R., Schaffner S.F., Lander E.S., Frazer K.A., Ballinger D.G.,
Cox D.R., Hinds D.A., Stuve L.L., Gibbs R.A., Belmont J.W., Boudreau A., Hardenbol
P., Leal S.M., Pasternak S., Wheeler D.A., Willis T.D., Yu F., Yang H., Zeng C., Gao Y.,

87
Hu H., Hu W., Li C., Lin W., Liu S., Pan H., Tang X., Wang J., Wang W., Yu J., Zhang
B., Zhang Q., Zhao H., Zhao H., Zhou J., Gabriel S.B., Barry R., Blumenstiel B.,
Camargo A., Defelice M., Faggart M., Goyette M., Gupta S., Moore J., Nguyen H.,
Onofrio R.C., Parkin M., Roy J., Stahl E., Winchester E., Ziaugra L., Altshuler D., Shen
Y., Yao Z., Huang W., Chu X., He Y., Jin L., Liu Y., Shen Y., Sun W., Wang H., Wang
Y., Wang Y., Xiong X., Xu L., Waye M.M.Y., Tsui S.K.W., Xue H., Wong J.T.-F.,
Galver L.M., Fan J.-B., Gunderson K., Murray S.S., Oliphant A.R., Chee M.S., Montpetit
A., Chagnon F., Ferretti V., Leboeuf M., Olivier J.-F., Phillips M.S., Roumy S., Sallée
C., Verner A., Hudson T.J., Kwok P.-Y., Cai D., Koboldt D.C., Miller R.D.,
Pawlikowska L., Taillon-Miller P., Xiao M., Tsui L.-C., Mak W., Song Y.Q., Tam
P.K.H., Nakamura Y., Kawaguchi T., Kitamoto T., Morizono T., Nagashima A., Ohnishi
Y., Sekine A., Tanaka T., Tsunoda T., Deloukas P., Bird C.P., Delgado M., Dermitzakis
E.T., Gwilliam R., Hunt S., Morrison J., Powell D., Stranger B.E., Whittaker P., Bentley
D.R., Daly M.J., Bakker P.I.W.d., Barrett J., Chretien Y.R., Maller J., McCarroll S.,
Patterson N., Pe’er I., Price A., Purcell S., Richter D.J., Sabeti P., Saxena R., Sham P.C.,
Stein L.D., Krishnan L., Smith A.V., Tello-Ruiz M.K., Thorisson G.A., Chakravarti A.,
Chen P.E., Cutler D.J., Kashuk C.S., Lin S., Abecasis G.R., Guan W., Li Y., Munro
H.M., Qin Z.S., Thomas D.J., McVean G., Auton A., Bottolo L., Cardin N.,
Eyheramendy S., Freeman C., Marchini J., Myers S., Spencer C., Stephens M., Donnelly
P., Cardon L.R., Clarke G., Evans D.M., Morris A.P., Weir B.S., Johnson T.A., Mullikin
J.C., Sherry S.T., Feolo M., Skol A., Zhang H., Matsuda I., Fukushima Y., Macer D.R.,
Suda E., Rotimi C.N., Adebamowo C.A., Ajayi I., Aniagwu T., Marshall P.A.,
Nkwodimmah C., Royal C.D.M., Leppert M.F., Dixon M., Peiffer A., Qiu R., Kent A.,
Kato K., Niikawa N., Adewole I.F., Knoppers B.M., Foster M.W., Clayton E.W., Watkin
J., Muzny D., Nazareth L., Sodergren E., Weinstock G.M., Yakub I., Birren B.W.,
Wilson R.K., Fulton L.L., Rogers J., Burton J., Carter N.P., Clee C.M., Griffiths M.,
Jones M.C., McLay K., Plumb R.W., Ross M.T., Sims S.K., Willey D.L., Chen Z., Han
H., Kang L., Godbout M., Wallenburg J.C., L'Archevêque P., Bellemare G., Saeki K.,
Wang H., An D., Fu H., Li Q., Wang Z., Wang R., Holden A.L., Brooks L.D., McEwen
J.E., Guyer M.S., Wang V.O., Peterson J.L., Shi M., Spiegel J., Sung L.M., Zacharia
L.F., Collins F.S., Kennedy K., Jamieson R. & Stewart J. (2007) Genome-wide detection

88
and characterization of positive selection in human populations. Nature 449, 913-8.
Samaras S.E., Almodovar-Garcia K., Wu N., Yu F. & Davidson J.M. (2015) Global deletion of
Ankrd1 results in a wound-healing phenotype associated with dermal fibroblast
dysfunction. Am J Pathol 185, 96-109.
Saxena R., Voight B.F., Lyssenko V., Burtt N.P., de Bakker P.I.W., Chen H., Roix J.J.,
Kathiresan S., Hirschhorn J.N., Daly M.J., Hughes T.E., Groop L., Altshuler D., Almgren
P., Florez J.C., Meyer J., Ardlie K., Bostrom K.B., Isomaa B., Lettre G., Lindblad U.,
Lyon H.N., Melander O., Newton-Cheh C., Nilsson P., Orho-Melander M., Rastam L.,
Speliotes E.K., Taskinen M.R., Tuomi T., Guiducci C., Berglund A., Carlson J., Gianniny
L., Hackett R., Hall L., Holmkvist J., Laurila E., Sjogren M., Sterner M., Surti A.,
Svensson M., Svensson M., Tewhey R., Blumenstiel B., Parkin M., DeFelice M., Barry
R., Brodeur W., Camarata J., Chia N., Fava M., Gibbons J., Handsaker B., Healy C.,
Nguyen K., Gates C., Sougnez C., Gage D., Nizzari M., Gabriel S.B., Chirn G.W., Ma
Q.C., Parikh H., Richardson D., Ricke D., Purcell S., In D.G.I.B. & Res N.I.B. (2007)
Genome-wide association analysis identifies loci for type 2 diabetes and triglyceride
levels. Science 316, 1331-6.
Shin J. & Lee C. (2015) A mixed model reduces spurious genetic associations produced by
population stratification in genome-wide association studies. Genomics 105, 191-6.
Signer-Hasler H., Flury C., Haase B., Burger D., Simianer H., Leeb T. & Rieder S. (2012) A
Genome-Wide Association Study Reveals Loci Influencing Height and Other
Conformation Traits in Horses. PLoS ONE 7, e37282.

89
Sutter N.B., Bustamante C.D., Chase K., Gray M.M., Zhao K., Zhu L., Padhukasahasram B.,
Karlins E., Davis S., Jones P.G., Quignon P., Johnson G.S., Parker H.G., Fretwell N.,
Mosher D.S., Lawler D.F., Satyaraj E., Nordborg M., Lark K.G., Wayne R.K. &
Ostrander E.A. (2007) A Single IGF1 Allele Is a Major Determinant of Small Size in
Dogs. Science 316, 112-5.
Tajima F. (1989) Statistical-Method for Testing the Neutral Mutation Hypothesis by DNA
Polymorphism. Genetics 123, 585-95.
Tu J., Chen Y.L., Cai L.L., Xu C.M., Zhang Y., Chen Y.M., Zhang C., Zhao J., Cheng J.K., Xie H.W., Zhong F. & He F.C. (2015) Functional Proteomics Study Reveals SUMOylation of TFII-I is Involved in Liver Cancer Cell Proliferation. Journal of Proteome Research 14, 2385-97.
Voight B.F., Kudaravalli S., Wen X. & Pritchard J.K. (2006) A Map of Recent Positive Selection
in the Human Genome. PLoS Biol 4, e72.
Wade C.M., Giulotto E., Sigurdsson S., Zoli M., Gnerre S., Imsland F., Lear T.L., Adelson D.L.,
Bailey E., Bellone R.R., Blöcker H., Distl O., Edgar R.C., Garber M., Leeb T., Mauceli
E., MacLeod J.N., Penedo M.C.T., Raison J.M., Sharpe T., Vogel J., Andersson L.,
Antczak D.F., Biagi T., Binns M.M., Chowdhary B.P., Coleman S.J., Della Valle G.,
Fryc S., Guérin G., Hasegawa T., Hill E.W., Jurka J., Kiialainen a., Lindgren G., Liu J.,
Magnani E., Mickelson J.R., Murray J., Nergadze S.G., Onofrio R., Pedroni S., Piras
M.F., Raudsepp T., Rocchi M., Røed K.H., Ryder O.a., Searle S., Skow L., Swinburne
J.E., Syvänen a.C., Tozaki T., Valberg S.J., Vaudin M., White J.R., Zody M.C., Lander
E.S. & Lindblad-Toh K. (2009) Genome sequence, comparative analysis, and population
genetics of the domestic horse. Science (New York, N.Y.) 326, 865-7.
Weedon M.N., Lettre G., Freathy R.M., Lindgren C.M., Voight B.F., Perry J.R.B., Elliott K.S.,
Hackett R., Guiducci C., Shields B., Zeggini E., Lango H., Lyssenko V., Timpson N.J.,
90
Burtt N.P., Rayner N.W., Saxena R., Ardlie K., Tobias J.H., Ness A.R., Ring S.M.,
Palmer C.N.A., Morris A.D., Peltonen L., Salomaa V., Smith G.D., Groop L.C.,
Hattersley A.T., McCarthy M.I., Hirschhorn J.N. & Frayling T.M. (2007) A common
variant of HMGA2 is associated with adult and childhood height in the general
population. Nature genetics 39, 1245-50.
Weir B.S. & Cockerham C.C. (1984) Estimating F-Statistics for the Analysis of Population
Structure. Evolution 38, 1358-70.
Wood A.R., Esko T., Yang J., Vedantam S., Pers T.H., Gustafsson S., Chu A.Y., Estrada K.,
Luan J.a., Kutalik Z., Amin N., Buchkovich M.L., Croteau-Chonka D.C., Day F.R., Duan
Y., Fall T., Fehrmann R., Ferreira T., Jackson A.U., Karjalainen J., Lo K.S., Locke A.E.,
Mägi R., Mihailov E., Porcu E., Randall J.C., Scherag A., Vinkhuyzen A.A.E., Westra
H.-J., Winkler T.W., Workalemahu T., Zhao J.H., Absher D., Albrecht E., Anderson D.,
Baron J., Beekman M., Demirkan A., Ehret G.B., Feenstra B., Feitosa M.F., Fischer K.,
Fraser R.M., Goel A., Gong J., Justice A.E., Kanoni S., Kleber M.E., Kristiansson K.,
Lim U., Lotay V., Lui J.C., Mangino M., Leach I.M., Medina-Gomez C., Nalls M.A.,
Nyholt D.R., Palmer C.D., Pasko D., Pechlivanis S., Prokopenko I., Ried J.S., Ripke S.,
Shungin D., Stancáková A., Strawbridge R.J., Sung Y.J., Tanaka T., Teumer A., Trompet
S., Laan S.W.v.d., Setten J.v., Vliet-Ostaptchouk J.V.V., Wang Z., Yengo L., Zhang W.,
Afzal U., Ärnlöv J., Arscott G.M., Bandinelli S., Barrett A., Bellis C., Bennett A.J.,
Berne C., Blüher M., Bolton J.L., Böttcher Y., Boyd H.A., Bruinenberg M., Buckley
B.M., Buyske S., Caspersen I.H., Chines P.S., Clarke R., Claudi-Boehm S., Cooper M.,
Daw E.W., Jong P.A.D., Deelen J., Delgado G., Denny J.C., Dhonukshe-Rutten R.,
Dimitriou M., Doney A.S.F., Dörr M., Eklund N., Eury E., Folkersen L., Garcia M.E.,
Geller F., Giedraitis V., Go A.S., Grallert H., Grammer T.B., Gräßler J., Grönberg H.,
Groot L.C.P.G.M.d., Groves C.J., Haessler J., Hall P., Haller T., Hallmans G.,
Hannemann A., Hartman C.A., Hassinen M., Hayward C., Heard-Costa N.L., Helmer Q.,
Hemani G., Henders A.K., Hillege H.L., Hlatky M.A., Hoffmann W., Hoffmann P.,
Holmen O., Houwing-Duistermaat J.J., Illig T., Isaacs A., James A.L., Jeff J., Johansen
B., Johansson Å., Jolley J., Juliusdottir T., Junttila J., Kho A.N., Kinnunen L., Klopp N.,

91
Kocher T., Kratzer W., Lichtner P., Lind L., Lindström J., Lobbens S., Lorentzon M., Lu
Y., Lyssenko V., Magnusson P.K.E., Mahajan A., Maillard M., McArdle W.L.,
McKenzie C.A., McLachlan S., McLaren P.J., Menni C., Merger S., Milani L., Moayyeri
A., Monda K.L., Morken M.A., Müller G., Müller-Nurasyid M., Musk A.W., Narisu N.,
Nauck M., Nolte I.M., Nöthen M.M., Oozageer L., Pilz S., Rayner N.W., Renstrom F.,
Robertson N.R., Rose L.M., Roussel R., Sanna S., Scharnagl H., Scholtens S.,
Schumacher F.R., Schunkert H., Scott R.A., Sehmi J., Seufferlein T., Shi J., Silventoinen
K., Smit J.H., Smith A.V., Smolonska J., Stanton A.V., Stirrups K., Stott D.J., Stringham
H.M., Sundström J., Swertz M.A., Syvänen A.-C., Tayo B.O., Thorleifsson G., Tyrer
J.P., Dijk S.v., Schoor N.M.v., Velde N.v.d., Heemst D.v., Oort F.V.A.v., Vermeulen
S.H., Verweij N., Vonk J.M., Waite L.L., Waldenberger M., Wennauer R., Wilkens L.R.,
Willenborg C., Wilsgaard T., Wojczynski M.K., Wong A., Wright A.F., Zhang Q.,
Arveiler D., Bakker S.J.L., Beilby J., Bergman R.N., Bergmann S., Biffar R., Blangero J.,
Boomsma D.I., Bornstein S.R., Bovet P., Brambilla P., Brown M.J., Campbell H.,
Caulfield M.J., Chakravarti A., Collins R., Collins F.S., Crawford D.C., Cupples L.A.,
Danesh J., Faire U.d., Ruijter H.M.d., Erbel R., Erdmann J., Eriksson J.G., Farrall M.,
Ferrannini E., Ferrières J., Ford I., Forouhi N.G., Forrester T., Gansevoort R.T., Gejman
P.V., Gieger C., Golay A., Gottesman O., Gudnason V., Gyllensten U., Haas D.W., Hall
A.S., Harris T.B., Hattersley A.T., Heath A.C., Hengstenberg C., Hicks A.A., Hindorff
L.A., Hingorani A.D., Hofman A., Hovingh G.K., Humphries S.E., Hunt S.C., Hypponen
E., Jacobs K.B., Jarvelin M.-R., Jousilahti P., Jula A.M., Kaprio J., Kastelein J.J.P.,
Kayser M., Kee F., Keinanen-Kiukaanniemi S.M., Kiemeney L.A., Kooner J.S.,
Kooperberg C., Koskinen S., Kovacs P., Kraja A.T., Kumari M., Kuusisto J., Lakka T.A.,
Langenberg C., Marchand L.L., Lehtimäki T., Lupoli S., Madden P.A.F., Männistö S.,
Manunta P., Marette A., Matise T.C., McKnight B., Meitinger T., Moll F.L.,
Montgomery G.W., Morris A.D., Morris A.P., Murray J.C., Nelis M., Ohlsson C.,
Oldehinkel A.J., Ong K.K., Ouwehand W.H., Pasterkamp G., Peters A., Pramstaller P.P.,
Price J.F., Qi L., Raitakari O.T., Rankinen T., Rao D.C., Rice T.K., Ritchie M., Rudan I.,
Salomaa V., Samani N.J., Saramies J., Sarzynski M.A., Schwarz P.E.H., Sebert S., Sever
P., Shuldiner A.R., Sinisalo J., Steinthorsdottir V., Stolk R.P., Tardif J.-C., Tönjes A.,
Tremblay A., Tremoli E., Virtamo J., Vohl M.-C., Consortium T.E.M.R.a.G.e.,

92
Consortium T.M., Consortium T.P., Study T.L.C., Amouyel P., Asselbergs F.W.,
Assimes T.L., Bochud M., Boehm B.O., Boerwinkle E., Bottinger E.P., Bouchard C.,
Cauchi S., Chambers J.C., Chanock S.J., Cooper R.S., Bakker P.I.W.d., Dedoussis G.,
Ferrucci L., Franks P.W., Froguel P., Groop L.C., Haiman C.A., Hamsten A., Hayes
M.G., Hui J., Hunter D.J., Hveem K., Jukema J.W., Kaplan R.C., Kivimaki M., Kuh D.,
Laakso M., Liu Y., Martin N.G., März W., Melbye M., Moebus S., Munroe P.B.,
Njølstad I., Oostra B.A., Palmer C.N.A., Pedersen N.L., Perola M., Pérusse L., Peters U.,
Powell J.E., Power C., Quertermous T., Rauramaa R., Reinmaa E., Ridker P.M.,
Rivadeneira F., Rotter J.I., Saaristo T.E., Saleheen D., Schlessinger D., Slagboom P.E.,
Snieder H., Spector T.D., Strauch K., Stumvoll M., Tuomilehto J., Uusitupa M., Harst
P.v.d., Völzke H., Walker M., Wareham N.J., Watkins H., Wichmann H.-E., Wilson J.F.,
Zanen P., Deloukas P., Heid I.M., Lindgren C.M., Mohlke K.L., Speliotes E.K.,
Thorsteinsdottir U., Barroso I., Fox C.S., North K.E., Strachan D.P., Beckmann J.S.,
Berndt S.I., Boehnke M., Borecki I.B., McCarthy M.I., Metspalu A., Stefansson K.,
Uitterlinden A.G., Duijn C.M.v., Franke L., Willer C.J., Price A.L., Lettre G., Loos
R.J.F., Weedon M.N., Ingelsson E., O'Connell J.R., Abecasis G.R., Chasman D.I.,
Goddard M.E., Visscher P.M., Hirschhorn J.N. & Frayling T.M. (2014) Defining the role
of common variation in the genomic and biological architecture of adult human height.
Nature genetics 46, 1173-86.
Wright S. (1949) THE GENETICAL STRUCTURE OF POPULATIONS. Annals of Eugenics
15, 323-54.
Young A.R. & Narita M. (2007) Oncogenic HMGA2: short or small? Genes Dev 21, 1005-9.
Zhou X.J., Benson K.F., Ashar H.R. & Chada K. (1995) Mutation Responsible for the Mouse Pygmy Phenotype in the Developmentally-Regulated Factor Hmgi-C. Nature 376, 771-4.

93
CHAPTER 4
ESTIMATION OF GENOME-WIDE INBREEDING AND POPULATION STRUCTURE IN
AN ARABIAN HORSE HERD
M.A Al Abri1, 2, U. König von Borstel3, V. Strecker3, S. A. Brooks1*
1Department of Animal Science, Cornell University, Ithaca, NY 14853, USA
2Department of Animal and Veterinary Sciences,College of Agriculture and Marine Sciences,
Sultan Qaboos University, PO box 34 Al Khod, Postal Code 123, Muscat, Oman
3Department of Animal Breeding and Genetics, Göttingen University. Göttingen, Germany
*Corresponding author
*Now Department of Animal Sciences, University of Florida, Gainesville, FL 32611, USA

94
ABSTRACT
Horse breeders rely heavily on the accurate identification of individual ancestry through
pedigrees. Errors in such pedigrees may inaccurately assign horses to false lineages or breed
memberships, and can result in inaccurate estimates of inbreeding. Moreover, discrepancies in
pedigree records can lead horse owners into making misguided purchasing and breeding
decisions. Genome-wide SNP data provides a robust and quantitative tool to resolve lineage
assignments errors and provide genomic measures of inbreeding. The aim of this project was to
pilot a comparison between pedigree and genomic relatedness and inbreeding measures in a
closed herd. Here, we describe a herd of 36 pedigreed Egyptian Arabian horses genotyped using
the Equine SNP70 (Geneseek, Inc.). Genomic inbreeding values and pair-wise relatedness
between horses within the herd were estimated from the genotypic data. Multi-dimensional
Scaling Analysis (MDS), and clustering analysis were performed to describe the relationships
within the herd and the results were compared to the pedigree information. Pedigree inbreeding
values had a moderate but significant correlation with the genomic inbreeding values (r = 0.406,
p=0.014). Conversely, the correlation was higher between genomic relationships and pedigree
relationships (r=0.77, p<0.005). Although first degree relationships between individuals were
successfully reconstructed, more distant relationships were more difficult to resolve. In
comparing the herd to a sample of US, Polish and Egyptian Arabian horse populations the herds’
historically recorded Egyptian lineage was successfully recovered among other Arabian horse
sub-groups. Our conclusion is that genome-wide genotypes are superior to pedigree derived
inbreeding predictions and have utility in verification of the integrity of pedigrees where records
are unavailable or in doubt. Although still considered costly, application of genomic tools in a
breeding program can be advantageously utilized to measure inbreeding in valuable lines of

95
horse, and in breeds already at risk for loss of genomic diversity.
INTRODUCTION
Throughout a long history alongside humans Arabian horses were selected for their endurance,
intelligence and beauty (Porter V 2002). Therefore, the Arabian horse breed contributed during
the development of many of the modern horse breeds like the Thoroughbred (Bower et al. 2012)
, Marwari (Jun et al. 2014), French horses (Pirault et al. 2013) and a number of Spanish Arabian
horse breeds (Cervantes et al. 2009). Yet, in recent history stringent selective breeding within the
Arabian horse may result in a loss of heterozygosity within the breed, and potentially inbreeding
depression. Arabian horses tend to have relatively high inbreeding levels (Pirault et al. 2013)
which may be the result of the intentional mating of relatives within the breed (Moureaux et al.
1996). In Arabian horses, inbreeding has resulted in elevation of the incidence of recessive
genetic disorders such as Lavender Foal Syndrome (Brooks et al. 2010a) and Severe Combined
Immunodeficiency (Wiler et al. 1995). Presently, horse breeders can utilize commercially
available single-locus tests for a number of genetic disorders to make informed breeding
decisions. However, the need for precise quantification of inbreeding is imperative for
maintenance of genetic diversity and avoidance of yet undiscovered recessive conditions.
Moreover, high inbreeding levels can result in a reduced fitness of the population as a whole.
Incomplete or erroneous pedigrees may lead to inaccurate estimates of the inbreeding
coefficient (Mucha & Windig 2009). Furthermore, the reliability of inbreeding estimates from
pedigrees depends largely on its depth (Lutaaya et al. 1999). Even in the presence of deep
pedigrees, like those available for the Arabian Horse, these estimates could be of a limited value
as they converge to one as the pedigree depth increases unless the pedigree is truncated at some
generation in the past (Speed & Balding 2014).

96
In recent years, the availability of equine genome-wide SNP genotyping platforms provided an
alternative to estimate inbreeding and relationships measures without relying on pedigrees. This
had enabled the comparison of genomic inbreeding levels between horse breeds (McCue et al.
2012) and to assess its extent within a given breed (Binns et al. 2012). In this project, we
compared pedigree inbreeding and relationship values to their genomic counterparts in a herd of
36 Arabian horses genotyped using the Equine SNP70 (Illumina Inc). Additionally, we compared
various clustering and genetic similarity measures within the herd and in comparison to Arabian
horses from a diverse background.
MATERIALS AND METHODS
Description of the herd
This herd provides an excellent test population for this comparison due to the availability of high
quality pedigrees and a recent bottleneck event following closure of the herd to outside
bloodstock in 1981. Pedigree information was obtained for the 36 horses of the herd from the
German National Genetic Evaluation Centre and traced back to 1840, yielding a total of 1130
ancestors born between 1840 and 2013. A detailed description of the herd’s pedigree is given in
Table 4.1.

97
Table 4.2. Summary of the pedigree used for the inbreeding and relationships calculation.
Category Count
Number of Sires 374
Number of Dams 534
Number of Sires’ progeny 898
Number of Dams’ progeny 880
Individuals with no progeny 222
Number of individuals with both known parents 874
Pedigree Completeness DNA extraction and genotyping
36 Arabian horses representing the last three generations in the pedigree were chosen for
genotyping (Figure 4.1). DNA was extracted from hair following a modified Puregene protocol
(Cook et al. 2010). The DNA samples were then genotyped using the equine SNP 70 Illumina
BeadChip (GeneSeek, Lincoln, NE, USA). Additionally, 36 US Arabian, 15 Egyptian Arabian
and 11 Polish Arabian horses that are part of an unpublished study were genotyped using SNP 50
Illumina BeadChip (GeneSeek, Lincoln, NE, USA).
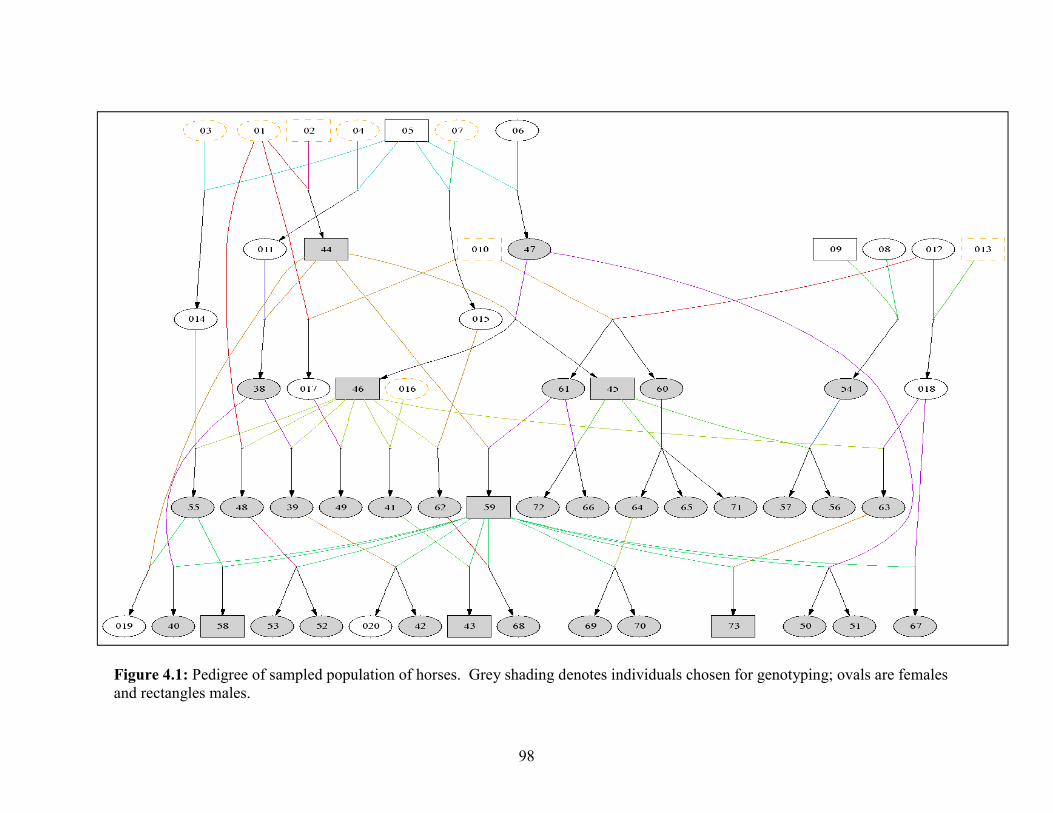
98
Figure 4.1: Pedigree of sampled population of horses. Grey shading denotes individuals chosen for genotyping; ovals are females and rectangles males.

99
To ensure a fair comparison between the pedigree and genomic inbreeding values, we sought to
assess the extent of the pedigree completeness for all the genotyped individuals. Therefore, the
pedigree completeness index (PCI) was calculated using three generations back using the method
proposed by MacCluer et al. (1983). In order to void animals with less complete pedigrees, we
chose the year 1941 as reasonable truncation point in the pedigree and calculated PCI values for
animals born in that year onwards.
For each animals, PCI = ������ ����
����������
Where the terms Csire and Cdam correspond to the contributions from the paternal and maternal
lines respectively.
C= �
� ∑ ��
����
ai is the proportion of known ancestors in generation i; and g is the number of generations
considered (g = 3).
Pedigree based inbreeding and pair-wise relationships
Pedigree-based inbreeding was calculated using the indirect method proposed by (Colleau 2002)
using the program CFC (Sargolzaei et al. 2006). Pair-wise pedigree relationships based on the
additive numerator relationship matrix were also calculated using CFC. We included animals
born in the year 1941 and onwards to avoid over estimating pair-wise relatedness between
individuals.
Genotypes summary, filtering and genomic inbreeding calculation
The Equine SNP70 array produced genotypes for 65,157 markers. As a quality control,
markers with a minor allele frequency (MAF) less than 10% or with a missingness rate greater

100
than 20% were excluded from the analysis. This reduced the number of markers to 25666
markers. We further pruned the data by linkage disequilibrium before calculating inbreeding
values such that we have a set of markers that is in linkage equilibrium. This was done in order
to avoid over-estimating inbreeding due to areas in the bead-chip where markers in tight LD
occur in higher density. In the pruning process, we randomly discarded one of a pair of markers
in a given window of 50 markers (step size 5 markers) if the LD between them was larger than
��=90. After pruning by LD, 7217 markers remained for the analysis. Genomic inbreeding and
homozygosity values for each animal were then calculated based on these markers in PLINK
(v1.07) (Purcell et al. 2007) using the command --het. The percent homozygosity was calculated
as the ratio of the observed homozygous markers to the total number of markers.
Estimation of the minimum number of markers sufficient for genomic inbreeding calculation using bootstrap We investigated the ability of various sizes of reduced sets of randomly chosen SNPs (n=500,
1000, 2000, 3000 and 5000) in obtaining genomic inbreeding estimates comparable to those
obtained using the full set of markers in linkage equilibrium. 1000 samples were generated of
each set size by sampling from the 7217 SNPs in linkage equilibrium using the --thin command
in PLINK. The gain in accuracy as the number of SNPs was increased was measured using the
correlation between the inbreeding values in each sample of a reduced set and the full set in
linkage equilibrium. Additionally, we calculated the mean inbreeding for each sample of the
reduced SNP set. Overall means of inbreeding values, their correlations with the full set and
corresponding 95% confidence intervals were calculated for the 1000 samples of each set in
Microsoft Excel (2007).
101
Pair-wise IBS, genetic distance and genetic background analysis Genome wide markers have remarkable power to discern cryptic relationships between
individuals and detect pedigree errors. In order to leverage that ability, we used PLINK to
generate a pair-wise identity by state (IBS) matrix of individuals using the option -
-cluster --matrix.
The --genome command then calculates an IBS distance (Dst) metric which represents the
proportion of IBS alleles shared and is defined as follows:
��� =���2 + 0.5 × ���1
�
Where IBS2 and IBS1 are the number of loci that share 2 or 1 alleles IBS, respectively, and N is
the number of loci tested.
We used the IBS distance metric (Dst) to calculate the genetic distance (D) between individuals
in pair-wise combinations following Ai et al. (2013), where D was defined as 1-Dst.
Additionally, we performed a multidimensional scaling analysis (MDS) to assess clustering
within group (i.e the herd itself) and for the herd’s founders amongst other Arabian horses using
the command --cluster --mds-plot in PLINK.
In order to further describe relatedness among these horses, we assessed the genetic admixture
within the group and for the group’s founders amongst other Arabian horses using the bayesian
clustering algorithm STRUCTURE (Pritchard et al. 2000) using a burn-in period of 10,000
iterations followed by 20,000 iterations from which estimates were obtained. For the choice of
the optimal number of putative genetically-defined populations i.e K, 20 structure runs were
conducted for each K value from K=1 to K=8. The best K was determined using the method of
(Evanno et al. 2005) which is based on the change in the log probability of data between
successive K values. The analysis showed that the best K value was 3 for the analysis of the herd

102
amongst American, Polish and Egyptian Arabian horses. The within herd analysis best K value
was 5. The results were plotted using CLUMPP (Jakobsson & Rosenberg 2007).
Genomic relationship measures Although we recognize the potential for a better pair-wise relatedness measure from SNPs, we
chose the concordance with the pedigree as a criterion to compare between methods as it was
previously used as gold standard in other studies e.g Lopes et al. (2013b) and (Santure et al.
2010). Also, the Arabian horse is a well-documented breed, and we had a deep pedigree with a
high PCI for all genotyped animals. We compared the relationship coefficients obtained from the
following four software packages to the pedigree relationships:
1) The R package GenABEL (Aulchenko et al. 2007) was used to obtain kinships measures
weighed by the frequency of the alleles using the IBS function.
2) In the program KING (Manichaikul et al. 2010), we used the Robust estimator which
assumes all individuals are unrelated. For comparison, we also used the --homo option
which assumes all samples are from a homogeneous population.
3) We used the R package SNPRelate (Zheng et al. 2012), to obtain the method of moments
as well as the maximum likelihood estimated of pair-wise relatedness using the
snpgdsIBDMoM (essentially equal to PLINK’s IBD relationship estimate i.e PI HAT) and
snpgdsIBDMLE functions respectively.
4) Pair-wise kinship measures were obtained in GCTA (Yang et al. 2011) using the
command --make-grm.
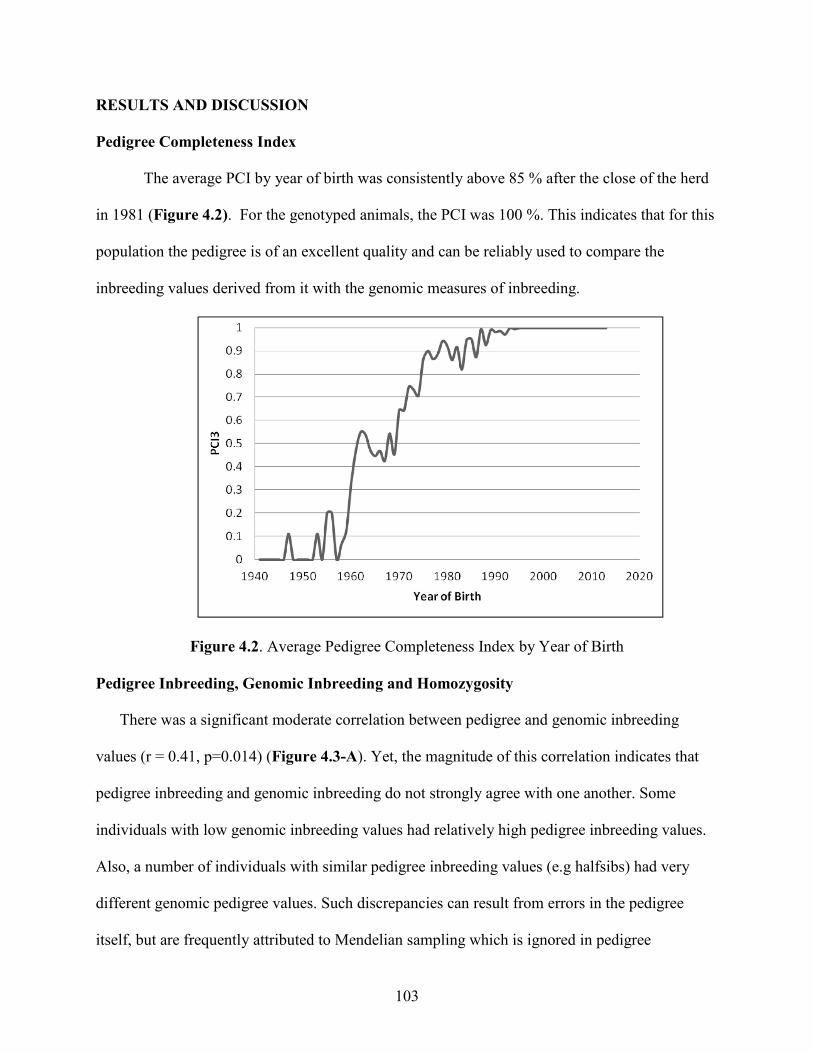
103
RESULTS AND DISCUSSION
Pedigree Completeness Index
The average PCI by year of birth was consistently above 85 % after the close of the herd
in 1981 (Figure 4.2). For the genotyped animals, the PCI was 100 %. This indicates that for this
population the pedigree is of an excellent quality and can be reliably used to compare the
inbreeding values derived from it with the genomic measures of inbreeding.
Figure 4.2. Average Pedigree Completeness Index by Year of Birth
Pedigree Inbreeding, Genomic Inbreeding and Homozygosity
There was a significant moderate correlation between pedigree and genomic inbreeding
values (r = 0.41, p=0.014) (Figure 4.3-A). Yet, the magnitude of this correlation indicates that
pedigree inbreeding and genomic inbreeding do not strongly agree with one another. Some
individuals with low genomic inbreeding values had relatively high pedigree inbreeding values.
Also, a number of individuals with similar pedigree inbreeding values (e.g halfsibs) had very
different genomic pedigree values. Such discrepancies can result from errors in the pedigree
itself, but are frequently attributed to Mendelian sampling which is ignored in pedigree

104
inbreeding. Also, the small herd size of 36 horses could have contributed to a bias in the
estimation of the actual allelic frequencies as these are derived only from the genotypes of these
36 animals. In an ideal situation allelic frequencies in the base population would be used but in
practice this is not often possible (Speed & Balding 2014). In a simulation study, use of allele
frequencies estimated in the base population resulted in improved agreement between pedigree
and genomic estimated inbreeding values (VanRaden 2008). In fact, adjusting for allele
frequencies in the base population also made genomic estimated breeding values (GEBVs) more
accurate (VanRaden et al. 2011). Nevertheless, we used the correlation between pedigree and
genomic inbreeding values as an easy way to check the concordance of these two approaches.
The pedigree estimated inbreeding values (FPED), their corresponding genomic inbreeding values
(FSNP) and percentage of homozygous markers for each individual are shown in Table 4.2. The
overwhelming majority of the animals had negative genomic inbreeding values with a mean of -
0.184 (SD=0.128). This is a result of the usage of the current population as the base population
to estimate allelic frequencies as mentioned above (Powell et al. 2010). However, it is indicative
that for most animals, the observed homozygosity at the individual level is lower than the
expected by chance (Purcell et al. (2007) and Powell et al. (2010) ). Therefore, the inbreeding
value of each animal should be interpreted in the context of the rest of the animals in this herd.
The genomic inbreeding value and percentage of homozygous markers were very highly
correlated (r=0.99, p < 2.2e-16). Indeed the genomic inbreeding estimates implemented in the
PLINK software rely on the number of homozygous SNPs expected by chance and the number
of homozygous SNPs observed (Purcell et al. 2007) .

105
Figure 4.3. A. Pedigree Inbreeding vs Genomic Inbreeding values. B. Pair-wise Pedigree Relationships vs Genomic Relationships.

106
Table 4.2. Pedigree estimated inbreeding values and percentage of homozygous markers across the genome for each animal in the herd.
Animal ID
Year of Birth
Pedigree inbreeding (F)
Genomic inbreeding % Homozygosity
42 2013 0.383 -0.342 45.75
44 1996 0.242 -0.4174 42.79
47 1992 0.235 -0.2874 48.26
56 2010 0.163 -0.2658 49.04
46 2005 0.285 -0.5317 38.16
65 2009 0.291 -0.2915 48.02
72 2013 0.292 -0.3393 45.92
66 2010 0.291 -0.4106 42.77
54 2001 0.166 -0.05591 57.53
50 2010 0.287 -0.2592 49.28
41 2007 0.314 -0.2351 50.34
63 2008 0.283 -0.1757 52.76
55 2005 0.278 -0.1335 54.45
43 2012 0.341 -0.1545 53.50
45 2001 0.285 -0.2037 51.64
51 2011 0.287 -0.2417 49.87
71 2013 0.291 -0.1578 53.48
60 1998 0.273 -0.161 53.35
59 2005 0.294 -0.1713 52.89
62 2006 0.325 -0.1869 52.23
61 2001 0.273 -0.1663 53.13
38 2001 0.306 -0.2169 51.03
67 2010 0.317 -0.1016 55.76
53 2013 0.365 -0.1072 55.52
64 2008 0.291 -0.168 52.98
48 2004 0.376 -0.107 55.50
39 2008 0.383 -0.1049 55.50
73 2013 0.383 -0.1812 52.50
49 2005 0.344 -0.09916 55.84
52 2012 0.365 -0.05799 57.50
70 2013 0.369 -0.05088 57.79
40 2009 0.383 -0.06017 57.42
69 2012 0.369 0.04782 61.74
58 2012 0.321 0.005146 60.01
68 2012 0.355 0.05384 61.99
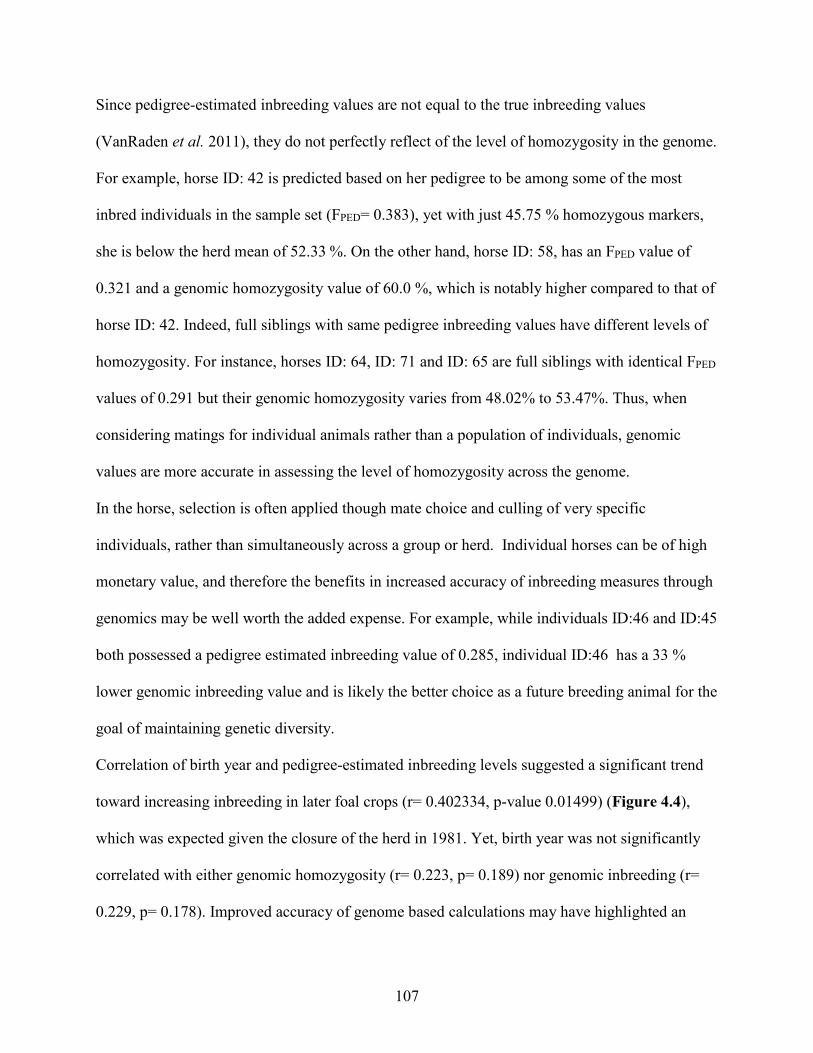
107
Since pedigree-estimated inbreeding values are not equal to the true inbreeding values
(VanRaden et al. 2011), they do not perfectly reflect of the level of homozygosity in the genome.
For example, horse ID: 42 is predicted based on her pedigree to be among some of the most
inbred individuals in the sample set (FPED= 0.383), yet with just 45.75 % homozygous markers,
she is below the herd mean of 52.33 %. On the other hand, horse ID: 58, has an FPED value of
0.321 and a genomic homozygosity value of 60.0 %, which is notably higher compared to that of
horse ID: 42. Indeed, full siblings with same pedigree inbreeding values have different levels of
homozygosity. For instance, horses ID: 64, ID: 71 and ID: 65 are full siblings with identical FPED
values of 0.291 but their genomic homozygosity varies from 48.02% to 53.47%. Thus, when
considering matings for individual animals rather than a population of individuals, genomic
values are more accurate in assessing the level of homozygosity across the genome.
In the horse, selection is often applied though mate choice and culling of very specific
individuals, rather than simultaneously across a group or herd. Individual horses can be of high
monetary value, and therefore the benefits in increased accuracy of inbreeding measures through
genomics may be well worth the added expense. For example, while individuals ID:46 and ID:45
both possessed a pedigree estimated inbreeding value of 0.285, individual ID:46 has a 33 %
lower genomic inbreeding value and is likely the better choice as a future breeding animal for the
goal of maintaining genetic diversity.
Correlation of birth year and pedigree-estimated inbreeding levels suggested a significant trend
toward increasing inbreeding in later foal crops (r= 0.402334, p-value 0.01499) (Figure 4.4),
which was expected given the closure of the herd in 1981. Yet, birth year was not significantly
correlated with either genomic homozygosity (r= 0.223, p= 0.189) nor genomic inbreeding (r=
0.229, p= 0.178). Improved accuracy of genome based calculations may have highlighted an

108
underlying effect of simultaneous selection for overall health. The lack of correlation here is
perhaps more reflective of the reality within the herd as there is a rigorous effort to select horses
based on health and conformation traits. This selection could be enough to favor individuals with
higher heterozygosity and choosing them would therefore maintain genomic diversity within the
herd.
Figure 4.4. Pedigree estimated inbreeding values (F) and genomic inbreeding for the herd over the years.
Estimation of the minimum number of markers sufficient for inbreeding calculation
Although the cost of genotyping by high throughput arrays is falling, application of these
technologies in animal production is still economically challenging for most producers.
Therefore, determining the minimum number of unlinked loci required to provide a reasonable
estimate of inbreeding is important for future development of low-cost genotyping panels. We
-0.6
-0.5
-0.4
-0.3
-0.2
-0.1
0
0.1
0
0.05
0.1
0.15
0.2
0.25
0.3
0.35
0.4
0.45
1990 1995 2000 2005 2010 2015
Pedigree Inbreeding Genomic Inbreeding
Year of Birth
Ped
igre
e In
bre
edin
g
Gen
om
icIn
bre
edin
g

109
found that decreasing the number of unlinked SNPs used to measure genomic inbreeding did
decrease the correlation of these values with those obtained using the full set of 7219 SNPs in
linkage equilibrium (Figure 4.5). The correlations ranged from 0.77 to 0.83 for subsets
comprised of 500 to 5000 SNPs. The true mean inbreeding value of -0.1843 was captured
successfully by all reduced sets, although the 95% confidence interval was 5 times wider in the
smallest (500 SNPs, CI = 0.0027) than that in the largest set (5000 SNPs, CI = 0.00052).
However, increasing the number of markers from 2000 to 5000 did not considerably increase the
correlation, which improved only by 1% (from 0.82 to 0.83). Therefore, we recommend that sets
of at least 2000 markers in linkage equilibrium be used for inbreeding estimation in the Arabian
horse and breeds of similar structure. The same number of markers was found sufficient for
calculating inbreeding in pigs (Lopes et al. 2013a) and is very close to the 2500 SNPs suggested
for beef cattle to estimate relationships (Rolf et al. 2010). However, as other horse breeds and
livestock species may possess significantly different haplotype length across the genome, this
marker depth is likely not universally appropriate.

110
Figure 4.5. Mean correlations and Inbreeding (with 95% confidence intervals) from the bootstrap analysis. The x-axis represents different numbers of linkage equilibrium randomly chosen SNPs in each of the 1000 replicates. Squares shows the mean correlation between the inbreeding measures using the full set (7217 SNPs) and diamonds shows mean inbreeding obtained for each run.
Evaluation of Genetic Relationships Methods
Since the utility of genomic markers gained traction, numerous methods/software packages for
measuring genetic similarity have been developed. Thus, the choice of an effective measure of
genomic relationships can be challenging and here, we chose the genomic relationships that
correlated the most with pedigree relationships. Pair-wise correlations between relationships
estimated between those programs are shown in Figure 4.6. The KING program, using the
Robust estimator, produced the most concordant (r= 0.77, p < 0.005) pair-wise relationship
estimates to the pedigree relationship coefficients (Figure 4.3-B) and therefore we decided to use
its estimates in this study. This correlation was surprisingly low given the number of SNPs used.
However, it was still within the range of 0.73 and 0. 858 previously reported by Santure et al.
(2010) and Lopes et al. (2013b) respectively. It is worth mentioning that the SNPRelate (MOM)
-0.186
-0.1855
-0.185
-0.1845
-0.184
-0.1835
-0.183
0.5
0.55
0.6
0.65
0.7
0.75
0.8
0.85
0 500 1000 1500 2000 2500 3000 3500 4000 4500 5000 5500
Number of SNPs per simulation
Mean Correlation
Mean Inbreeding
111
ranked the second with a correlation of (r=0.71, p < 0.005). Although theoretically MLE
estimates are more reliable (Zheng et al. 2012), SNPRelate (MLE) estimate did not perform as
well as their MOM counterparts (r=0.58, p < 0.0005). This may be due a result of the
asymptotically unbiased nature of MLE estimates, requiring larger sample sizes to yield accurate
estimates.
Genetic Structure and Relationships within the Herd
Relationship measures derived from genomic data are more accurate as they are derived from
identity by state sharing of alleles, rather than the probability of sharing by descent predicted
from pedigrees (Speed & Balding 2014). Thus, genotype based methods allow observation of
between-sibling variation resulting from Mendelian sampling (Lopes et al. 2013b). Pedigree
estimates of relatedness also assume that founder animals are unrelated (Wang et al. (2014) and
Speed and Balding (2014)). Yet, this assumption is unrealistic as all individuals are related at
some time point in the past (Powell et al. 2010). As expected, pair-wise D values were inversely
correlated with the pedigree relationships (r= -0.75, p= 2.2e-16). This means that the genetic
distance between pairs of individuals became less the higher the pedigree relationships between
them and vise versa. However, the mean pair-wise D value for these animals was only 0.28 (SD
=0.036), which is only slightly higher than the within breed mean of 0.23 (SD=0.009) observed
by McCue et al. (2012) for Arabian horses. It is remarkable that the two values are this close,
given that the animals used in our study belong to the same herd.

112
The matrix of proportion of alleles identical by state (IBS) between horses can be found in Table
4.3. It is a straightforward calculation of the proportion of markers that are identical in genotype
between all possible pairs of two individuals. This matrix is useful in finding pairs of individuals
that are more similar or different from each other than would be expected by chance in a random
homogenous sample. For instance, in the two daughters of the dam ID: 47, daughter ID: 51 is
0.784 similar to her mother, while daughter ID: 50 is 0.773 similar (despite identical pedigree
derived relationship values). An interesting observation was that of horse ID: 54 has an
overwhelming majority of pair-wise IBS values below 0.65 which is in agreement of the
pedigree (Figure 4.1). On the other hand, most pair-wise IBS values for horses ID: 59 and ID: 45
are relatively high (> 0.80). This makes sense since they have the largest contribution of progeny
in this herd.

113
Figure 4.6. Pair-wise correlations between various programs used to estimate relationships and the pedigree estimated relationships.
Name of the program is shown in the diagonals. Upper diagonal elements represent correlations (their significance in parenthesis)
between relationships measures of various programs. King_1= King (assuming homogenous population, King_2=King (robust
estimation), SNP_relate_MLE= SNPRelate (using maximum likelihood estimation), SNP_relate_MOM= SNPRelate (using the
method of moments), Genabel=GenABEL (using allele frequencies), GCTA=GCTA (using the default kinship measure).

114
Table 4.3. Pairwise identity-by-state (IBS) genetic similarity between individuals depicting a higher genome sharing between close relatives. Relatives with the same pedigree based relationships (e.g half sibs) can have different IBS values.
1642 1650 1658 1666 1643 1651 1659 1667 1644 1652 1660 1668
1642 1 0.736711 0.724093 0.705788 0.733695 0.736798 0.776804 0.720573 0.784708 0.736784 0.679901 0.71382
1650 0.736711 1 0.73584 0.715398 0.735832 0.759266 0.775801 0.735308 0.709387 0.725515 0.68914 0.757775
1658 0.724093 0.73584 1 0.689189 0.743137 0.739835 0.784592 0.745425 0.732438 0.729329 0.685865 0.740894
1666 0.705788 0.715398 0.689189 1 0.707659 0.731974 0.7349 0.693317 0.744997 0.692229 0.720926 0.684279
1643 0.733695 0.735832 0.743137 0.707659 1 0.723501 0.79562 0.736975 0.751651 0.726125 0.69412 0.743517
1651 0.736798 0.759266 0.739835 0.731974 0.723501 1 0.793517 0.716621 0.717547 0.748594 0.696157 0.725534
1659 0.776804 0.775801 0.784592 0.7349 0.79562 0.793517 1 0.79948 0.775597 0.776814 0.730189 0.80893
1667 0.720573 0.735308 0.745425 0.693317 0.736975 0.716621 0.79948 1 0.719717 0.724602 0.725127 0.756513
1644 0.784708 0.709387 0.732438 0.744997 0.751651 0.717547 0.775597 0.719717 1 0.754314 0.685881 0.729654
1652 0.736784 0.725515 0.729329 0.692229 0.726125 0.748594 0.776814 0.724602 0.754314 1 0.691452 0.722149
1660 0.679901 0.68914 0.685865 0.720926 0.69412 0.696157 0.730189 0.725127 0.685881 0.691452 1 0.672559
1668 0.71382 0.757775 0.740894 0.684279 0.743517 0.725534 0.80893 0.756513 0.729654 0.722149 0.672559 1
1645 0.750642 0.749604 0.753168 0.689848 0.729258 0.747714 0.723186 0.705151 0.747079 0.737703 0.663999 0.737511
1653 0.720954 0.744838 0.758682 0.692265 0.7453 0.767449 0.809637 0.750807 0.756567 0.779892 0.687044 0.752417
1661 0.702355 0.720607 0.721708 0.751714 0.728284 0.740474 0.789925 0.749782 0.679607 0.710519 0.818642 0.699971
1669 0.711867 0.730562 0.724176 0.711249 0.724003 0.706742 0.792994 0.742736 0.741553 0.709116 0.727002 0.741073
1638 0.747304 0.684151 0.681145 0.689297 0.686762 0.69372 0.715053 0.692935 0.805054 0.70327 0.671102 0.687775
1646 0.720858 0.711819 0.683295 0.798127 0.694629 0.723611 0.704413 0.674323 0.79783 0.699202 0.671394 0.680886
1654 0.650729 0.667786 0.656504 0.653846 0.640913 0.652351 0.658664 0.659547 0.647562 0.650682 0.656439 0.636115
1662 0.691145 0.716338 0.689626 0.70678 0.710686 0.718901 0.710183 0.720707 0.718954 0.710171 0.694773 0.797409
1670 0.719027 0.725901 0.731752 0.729294 0.727864 0.74207 0.805958 0.740163 0.734609 0.728231 0.739896 0.751164
1639 0.782438 0.686894 0.694652 0.684894 0.703422 0.702304 0.695168 0.668756 0.789948 0.709008 0.664109 0.68751
1647 0.699265 0.773412 0.689313 0.716249 0.676792 0.784718 0.681232 0.681885 0.663415 0.693793 0.67175 0.688767
1655 0.696959 0.693451 0.786501 0.682635 0.697724 0.704954 0.691494 0.711911 0.709913 0.692873 0.675997 0.694772
1663 0.714445 0.696021 0.703401 0.688509 0.69368 0.714745 0.710909 0.758656 0.702858 0.686562 0.679718 0.728373
1671 0.701991 0.707804 0.681194 0.739385 0.686388 0.69718 0.732244 0.68915 0.724729 0.677464 0.796736 0.705534
1640 0.740213 0.702459 0.722392 0.680935 0.70889 0.711893 0.792645 0.740185 0.766492 0.721936 0.673379 0.71725
1648 0.691233 0.677635 0.698305 0.67749 0.692166 0.71479 0.686957 0.678292 0.750717 0.804032 0.646285 0.689497
1656 0.670702 0.688007 0.672739 0.716143 0.659576 0.688607 0.678392 0.673209 0.70523 0.659665 0.664834 0.661252
1664 0.672999 0.675512 0.681271 0.757433 0.67774 0.684027 0.7038 0.688445 0.702759 0.668956 0.760451 0.684159
1672 0.723669 0.715098 0.696069 0.796208 0.710775 0.719488 0.765805 0.705622 0.744285 0.698002 0.71323 0.688469
1641 0.734571 0.721567 0.718915 0.704328 0.787607 0.711574 0.719835 0.707154 0.744842 0.700859 0.676867 0.721002
1649 0.682255 0.687724 0.685218 0.691074 0.684576 0.689292 0.681884 0.65912 0.710679 0.692119 0.670789 0.68834
1657 0.705482 0.68722 0.690513 0.724346 0.685109 0.690532 0.705043 0.6774 0.72598 0.697204 0.675529 0.673477
1665 0.693672 0.689144 0.680868 0.762589 0.675278 0.6956 0.707997 0.671609 0.717367 0.682547 0.763725 0.657452
1673 0.719858 0.720014 0.704515 0.715328 0.723227 0.733578 0.792152 0.767198 0.719372 0.71853 0.701355 0.734562

115
Table 4.3 (Continued)
1645 1653 1661 1669 1638 1646 1654 1662 1670 1639 1647 1655 1642 0.750642 0.720954 0.702355 0.711867 0.747304 0.720858 0.650729 0.691145 0.719027 0.782438 0.699265 0.696959 1650 0.749604 0.744838 0.720607 0.730562 0.684151 0.711819 0.667786 0.716338 0.725901 0.686894 0.773412 0.693451 1658 0.753168 0.758682 0.721708 0.724176 0.681145 0.683295 0.656504 0.689626 0.731752 0.694652 0.689313 0.786501 1666 0.689848 0.692265 0.751714 0.711249 0.689297 0.798127 0.653846 0.70678 0.729294 0.684894 0.716249 0.682635 1643 0.729258 0.7453 0.728284 0.724003 0.686762 0.694629 0.640913 0.710686 0.727864 0.703422 0.676792 0.697724 1651 0.747714 0.767449 0.740474 0.706742 0.69372 0.723611 0.652351 0.718901 0.74207 0.702304 0.784718 0.704954 1659 0.723186 0.809637 0.789925 0.792994 0.715053 0.704413 0.658664 0.710183 0.805958 0.695168 0.681232 0.691494 1667 0.705151 0.750807 0.749782 0.742736 0.692935 0.674323 0.659547 0.720707 0.740163 0.668756 0.681885 0.711911 1644 0.747079 0.756567 0.679607 0.741553 0.805054 0.79783 0.647562 0.718954 0.734609 0.789948 0.663415 0.709913 1652 0.737703 0.779892 0.710519 0.709116 0.70327 0.699202 0.650682 0.710171 0.728231 0.709008 0.693793 0.692873 1660 0.663999 0.687044 0.818642 0.727002 0.671102 0.671394 0.656439 0.694773 0.739896 0.664109 0.67175 0.675997 1668 0.737511 0.752417 0.699971 0.741073 0.687775 0.680886 0.636115 0.797409 0.751164 0.68751 0.688767 0.694772 1645 1 0.760905 0.666885 0.714546 0.699495 0.750409 0.647072 0.784323 0.720396 0.781751 0.793015 0.777446 1653 0.760905 1 0.725755 0.716854 0.703281 0.699959 0.654548 0.712395 0.744054 0.70312 0.720752 0.728102 1661 0.666885 0.725755 1 0.706659 0.66353 0.65841 0.671323 0.698752 0.735699 0.645757 0.701161 0.692274 1669 0.714546 0.716854 0.706659 1 0.695172 0.73238 0.639852 0.707634 0.817271 0.689302 0.682552 0.673932 1638 0.699495 0.703281 0.66353 0.695172 1 0.726003 0.652447 0.690553 0.700584 0.799293 0.664337 0.676375 1646 0.750409 0.699959 0.65841 0.73238 0.726003 1 0.656376 0.727996 0.727217 0.735535 0.738562 0.688367 1654 0.647072 0.654548 0.671323 0.639852 0.652447 0.656376 1 0.651311 0.631138 0.635363 0.67285 0.675008 1662 0.784323 0.712395 0.698752 0.707634 0.690553 0.727996 0.651311 1 0.706081 0.723829 0.745064 0.73216 1670 0.720396 0.744054 0.735699 0.817271 0.700584 0.727217 0.631138 0.706081 1 0.68728 0.690822 0.672031 1639 0.781751 0.70312 0.645757 0.689302 0.799293 0.735535 0.635363 0.723829 0.68728 1 0.697278 0.718465 1647 0.793015 0.720752 0.701161 0.682552 0.664337 0.738562 0.67285 0.745064 0.690822 0.697278 1 0.7294 1655 0.777446 0.728102 0.692274 0.673932 0.676375 0.688367 0.675008 0.73216 0.672031 0.718465 0.7294 1 1663 0.786266 0.712123 0.685586 0.69936 0.686158 0.696381 0.657883 0.764323 0.702135 0.709274 0.736172 0.747965 1671 0.695977 0.688876 0.729934 0.738137 0.704227 0.752305 0.644701 0.684219 0.745592 0.697798 0.709696 0.673666 1640 0.673933 0.750417 0.708622 0.717437 0.799296 0.688868 0.644394 0.660044 0.730335 0.719579 0.650272 0.657141 1648 0.790385 0.797743 0.64687 0.666592 0.703775 0.713761 0.651852 0.708178 0.67364 0.7195 0.731881 0.718825 1656 0.688928 0.688511 0.658309 0.691092 0.670469 0.760076 0.77263 0.682772 0.685598 0.662971 0.728678 0.682361 1664 0.687491 0.682919 0.692816 0.787813 0.686027 0.760565 0.634468 0.692308 0.801053 0.673913 0.704792 0.676072 1672 0.692301 0.712448 0.740627 0.73682 0.698464 0.777816 0.647018 0.697533 0.730246 0.703444 0.705388 0.682475 1641 0.798481 0.718509 0.680553 0.704061 0.723745 0.729045 0.647527 0.741958 0.700857 0.76856 0.73246 0.724246 1649 0.762796 0.690484 0.665721 0.666561 0.676151 0.713763 0.625184 0.718662 0.661204 0.718858 0.715706 0.68749 1657 0.702953 0.691576 0.669409 0.713229 0.692196 0.773155 0.770731 0.703201 0.692044 0.684949 0.712878 0.694385 1665 0.694938 0.69441 0.719147 0.706961 0.690923 0.781399 0.654612 0.683307 0.729832 0.680689 0.728114 0.683483 1673 0.716896 0.745312 0.758854 0.709411 0.667062 0.711948 0.647029 0.734166 0.718168 0.682072 0.701456 0.690919

116
Table 4.3 (Continued)
1663 1671 1640 1648 1656 1664 1672 1641 1649 1657 1665 1673
1642 0.714445 0.701991 0.740213 0.691233 0.670702 0.672999 0.723669 0.734571 0.682255 0.705482 0.693672 0.719858
1650 0.696021 0.707804 0.702459 0.677635 0.688007 0.675512 0.715098 0.721567 0.687724 0.68722 0.689144 0.720014
1658 0.703401 0.681194 0.722392 0.698305 0.672739 0.681271 0.696069 0.718915 0.685218 0.690513 0.680868 0.704515
1666 0.688509 0.739385 0.680935 0.67749 0.716143 0.757433 0.796208 0.704328 0.691074 0.724346 0.762589 0.715328
1643 0.69368 0.686388 0.70889 0.692166 0.659576 0.67774 0.710775 0.787607 0.684576 0.685109 0.675278 0.723227
1651 0.714745 0.69718 0.711893 0.71479 0.688607 0.684027 0.719488 0.711574 0.689292 0.690532 0.6956 0.733578
1659 0.710909 0.732244 0.792645 0.686957 0.678392 0.7038 0.765805 0.719835 0.681884 0.705043 0.707997 0.792152
1667 0.758656 0.68915 0.740185 0.678292 0.673209 0.688445 0.705622 0.707154 0.65912 0.6774 0.671609 0.767198
1644 0.702858 0.724729 0.766492 0.750717 0.70523 0.702759 0.744285 0.744842 0.710679 0.72598 0.717367 0.719372
1652 0.686562 0.677464 0.721936 0.804032 0.659665 0.668956 0.698002 0.700859 0.692119 0.697204 0.682547 0.71853
1660 0.679718 0.796736 0.673379 0.646285 0.664834 0.760451 0.71323 0.676867 0.670789 0.675529 0.763725 0.701355
1668 0.728373 0.705534 0.71725 0.689497 0.661252 0.684159 0.688469 0.721002 0.68834 0.673477 0.657452 0.734562
1645 0.786266 0.695977 0.673933 0.790385 0.688928 0.687491 0.692301 0.798481 0.762796 0.702953 0.694938 0.716896
1653 0.712123 0.688876 0.750417 0.797743 0.688511 0.682919 0.712448 0.718509 0.690484 0.691576 0.69441 0.745312
1661 0.685586 0.729934 0.708622 0.64687 0.658309 0.692816 0.740627 0.680553 0.665721 0.669409 0.719147 0.758854
1669 0.69936 0.738137 0.717437 0.666592 0.691092 0.787813 0.73682 0.704061 0.666561 0.713229 0.706961 0.709411
1638 0.686158 0.704227 0.799296 0.703775 0.670469 0.686027 0.698464 0.723745 0.676151 0.692196 0.690923 0.667062
1646 0.696381 0.752305 0.688868 0.713761 0.760076 0.760565 0.777816 0.729045 0.713763 0.773155 0.781399 0.711948
1654 0.657883 0.644701 0.644394 0.651852 0.77263 0.634468 0.647018 0.647527 0.625184 0.770731 0.654612 0.647029
1662 0.764323 0.684219 0.660044 0.708178 0.682772 0.692308 0.697533 0.741958 0.718662 0.703201 0.683307 0.734166
1670 0.702135 0.745592 0.730335 0.67364 0.685598 0.801053 0.730246 0.700857 0.661204 0.692044 0.729832 0.718168
1639 0.709274 0.697798 0.719579 0.7195 0.662971 0.673913 0.703444 0.76856 0.718858 0.684949 0.680689 0.682072
1647 0.736172 0.709696 0.650272 0.731881 0.728678 0.704792 0.705388 0.73246 0.715706 0.712878 0.728114 0.701456
1655 0.747965 0.673666 0.657141 0.718825 0.682361 0.676072 0.682475 0.724246 0.68749 0.694385 0.683483 0.690919
1663 1 0.694846 0.668531 0.704164 0.68163 0.684833 0.683239 0.71364 0.704703 0.685027 0.676695 0.780831
1671 0.694846 1 0.685168 0.656926 0.702082 0.784203 0.771212 0.70695 0.689232 0.705594 0.784545 0.684535
1640 0.668531 0.685168 1 0.695312 0.67314 0.68305 0.72291 0.703891 0.680641 0.683857 0.686465 0.71206
1648 0.704164 0.656926 0.695312 1 0.693073 0.68912 0.679922 0.730119 0.742156 0.707904 0.693936 0.69524
1656 0.68163 0.702082 0.67314 0.693073 1 0.727086 0.722232 0.69437 0.675958 0.808449 0.731535 0.689223
1664 0.684833 0.784203 0.68305 0.68912 0.727086 1 0.754434 0.708833 0.67874 0.726731 0.805432 0.698004
1672 0.683239 0.771212 0.72291 0.679922 0.722232 0.754434 1 0.71201 0.70444 0.737691 0.767972 0.747631
1641 0.71364 0.70695 0.703891 0.730119 0.69437 0.708833 0.71201 1 0.742747 0.717135 0.710518 0.718268
1649 0.704703 0.689232 0.680641 0.742156 0.675958 0.67874 0.70444 0.742747 1 0.683632 0.689575 0.694717
1657 0.685027 0.705594 0.683857 0.707904 0.808449 0.726731 0.737691 0.717135 0.683632 1 0.737163 0.70748
1665 0.676695 0.784545 0.686465 0.693936 0.731535 0.805432 0.767972 0.710518 0.689575 0.737163 1 0.710625
1673 0.780831 0.684535 0.71206 0.69524 0.689223 0.698004 0.747631 0.718268 0.694717 0.70748 0.710625 1

117
The within herd MDS analysis (Figure 4.7-A and 4.7-B) allows consideration of
components of variation from across the entire herd, rather than only between pairs of animals.
Therefore, horses with similar genetic makeup cluster together in multidimensional space. The
MDS analysis demonstrates the uniqueness of horse ID:54 which is clearly separated from the
herd. The within herd STRUCTURE analysis showed that the best K value is K=5, which is
approximately equal to the number of families in the herd. The STRUCTURE analysis (Figure
4.8-a) supports the MDS analysis on horse ID:54 and assigns her and her daughters to the same
sub-group membership, which agrees with the reported recent addition of this individual to the
herd. The MDS analysis also confirms the high degree of relatedness of horses ID: 59 and ID: 45
to a many members of this group. STRUCTURE analysis also detected this relationship,
depicting ID: 59 and 45 as ancestors in the herd with many individuals sharing their ancestry.
The STRUCTURE analysis also accurately captured parent-offspring relationships. For example,
parent ID: 38 and offspring ID: 39 as well as parents ID: 59 and ID: 64 and their offspring ID: 69
and ID: 70. Each of these methods demonstrates the power and utility of SNPs as a tool for
reconstructing unknown, prehistoric or erroneous pedigree relationships.

118
Figure 4.7. Within herd multidimensional scaling analysis of genotypes. A. Dimension one vs two right B. Dimension two vs three.

119
Genetic Similarity of the Herd to Other Arabian Horses
As a whole, this herd of horses is markedly genetically similar to the reference Arabian
horses of Egyptian origin. The founders of this herd are clearly clustered by the MDS analysis
within the Egyptian Arabians (Figure 4.8-c). The extension of this analysis (dimension two vs
three) adds detail, separating horse ID: 54 from the other founder animals of this herd and closer
to the other Egyptian and US Arabians. The STRUCTURE analysis comparing the herd to other
Arabian horses also supported their reported Egyptian ancestry (Figure 4.8-b). The herd’s
grandparents share ancestry with most of the Egyptian Arabian reference individuals (shown in
brown). The best K value of 3 was expected since we had Arabian horse belonging to 3 distinct
origins (American, Polish and Egyptian Arabian horses). Differences among the founders are
also apparent. Horse ID: 44, for example, possesses a 4 % proportion of his ancestry in common
with polish bloodlines (shown in yellow). Also, horse ID: 54 has some 4.2 % similarity to the
reference US-registered horses (as detected by the MDS analysis, Figure 4.8-c). The results also
showed that an individual identified as Egyptian Arabian had a striking similarity of 99% to US
Arabian horses. This finding was also supported by the MDS analysis (Figure 4.8-c) where the
horse clusters with US Arabian horses. Given the evidence from all aforementioned analyses, we
presume that this may be a result of misidentification of the horse as such a finding is difficult to
have arisen due to chance alone. Altogether, the three types of population genetic analyses
strongly illustrate the Egyptian Arabian ancestry of the herd.

120
Figure 4.8. a. Population of origin assignments using STRUCTURE for the animals with
the group to each of the five clusters. Different colors indicate different assignment combinations
(proportions of membership). Animals’ IDs are shown in the labels below the figure. b.
Population of origin assignments using STRUCTURE for the group’s founders amongst other
Arabian horses to each of the three clusters. Actual population of origin for each individual is
shown in labels below the figure. Proportion of membership is colored in Blue for US Arabian,
yellow for Polish Arabian and brown for Egyptian Arabian horses. c. Multidimensional scaling
of the group’s founders amongst other Arabian horses. Left figure is dimension one vs two and
right figure is dimension two vs three.

121

122
CONCLUSION
The purpose of this study was to elucidate the genetic background of the herd using modern
high-throughput genotyping techniques. Estimates of relatedness within the herd and amongst
the herd founders and other Arabian Horses highlighted some key differences from pedigree
inferred relationships and historical data. Additionally, analysis based on genotypes enabled re-
capitulation of the familial relationships among these horses and demonstrated their Egyptian
ancestry among other Arabian horse bloodlines. Altogether, our results signify the practical
benefits of genome-wide genotyping methods for quantification of inbreeding and inference of
relationships beyond those illustrated in the pedigree.

123
REFERENCES
Ai H., Huang L. & Ren J. (2013) Genetic diversity, linkage disequilibrium and selection
signatures in chinese and Western pigs revealed by genome-wide SNP markers. Plos One
8, e56001-e.
Aulchenko Y.S., Ripke S., Isaacs A. & van Duijn C.M. (2007) GenABEL: an R library for
genome-wide association analysis. Bioinformatics (Oxford, England) 23, 1294-6.
Binns M.M., Boehler D.a., Bailey E., Lear T.L., Cardwell J.M. & Lambert D.H. (2012)
Inbreeding in the Thoroughbred horse. Animal genetics 43, 340-2.
Bower M.A., McGivney B.A., Campana M.G., Gu J., Andersson L.S., Barrett E., Davis C.R.,
Mikko S., Stock F., Voronkova V., Bradley D.G., Fahey A.G., Lindgren G., MacHugh
D.E., Sulimova G. & Hill E.W. (2012) The genetic origin and history of speed in the
Thoroughbred racehorse. Nature communications 3, 643.
Brooks S.a., Gabreski N., Miller D., Brisbin A., Brown H.E., Streeter C., Mezey J., Cook D. &
Antczak D.F. (2010) Whole-genome SNP association in the horse: identification of a
deletion in myosin Va responsible for Lavender Foal Syndrome. PLoS genetics 6,
e1000909-e.
Cervantes I., Gutiérrez J.P., Molina A., Goyache F. & Valera M. (2009) Genealogical analyses in
open populations: the case of three Arab-derived Spanish horse breeds. Journal of animal
breeding and genetics = Zeitschrift für Tierzüchtung und Züchtungsbiologie 126, 335-47.
Colleau J.-J., . (2002) An indirect approach to the extensive calculation of relationship
coefficients. Genetics, selection, evolution : GSE 34, 409-21.
124
Cook D., Gallagher P.C. & Bailey E. (2010) Genetics of swayback in American Saddlebred
horses. Animal genetics 41 Suppl 2, 64-71.
Evanno G., Regnaut S. & Goudet J. (2005) Detecting the number of clusters of individuals using
the software STRUCTURE: a simulation study. Molecular ecology 14, 2611-20.
Jakobsson M. & Rosenberg N.A. (2007) CLUMPP: a cluster matching and permutation program
for dealing with label switching and multimodality in analysis of population structure.
Bioinformatics (Oxford, England) 23, 1801-6.
Jun J., Cho Y., Hu H., Kim H.-M., Jho S., Gadhvi P., Park K., Lim J., Paek W., Han K., Manica
A., Edwards J.S. & Bhak J. (2014) Whole genome sequence and analysis of the Marwari
horse breed and its genetic origin. BMC Genomics 15, S4-S.
Lopes M., Silva F., Harlizius B., Duijvesteijn N., Lopes P., Guimaraes S. & Knol E. (2013a)
Improved estimation of inbreeding and kinship in pigs using optimized SNP panels. BMC
genetics 14, 92.
Lopes M.S., Silva F.F., Harlizius B., Duijvesteijn N., Lopes P.S., Guimarães S.E. & Knol E.F.
(2013b) Improved estimation of inbreeding and kinship in pigs using optimized SNP
panels. BMC genetics 14, 92.
Lutaaya B.E., Misztal I., Bertrand J.K. & Mabry J.W. (1999) Inbreeding in populations with
incomplete pedigrees. Journal of Animal Breeding and Genetics 116, 475-80.
MacCluer J.W., Boyce A.J., Dyke B., Weitkamp L.R., Pfenning D.W. & Parsons C.J. (1983)
Inbreeding and pedigree structure in Standardbred horses. J. Hered. 74, 394-9.
Manichaikul A., Mychaleckyj J.C., Rich S.S., Daly K., Sale M. & Chen W.-M. (2010) Robust
relationship inference in genome-wide association studies. Bioinformatics (Oxford,
England) 26, 2867-73.
McCue M.E., Bannasch D.L., Petersen J.L., Gurr J., Bailey E., Binns M.M., Distl O., Guérin G.,
Hasegawa T., Hill E.W., Leeb T., Lindgren G., Penedo M.C.T., Røed K.H., Ryder O.a.,

125
Swinburne J.E., Tozaki T., Valberg S.J., Vaudin M., Lindblad-Toh K., Wade C.M. &
Mickelson J.R. (2012) A high density SNP array for the domestic horse and extant
Perissodactyla: utility for association mapping, genetic diversity, and phylogeny studies.
PLoS genetics 8, e1002451-e.
Moureaux S., Verrier É., Ricard A. & Mériaux J.C. (1996) Genetic variability within French race
and riding horse breeds from genealogical data and blood marker polymorphisms.
Genetics Selection Evolution 28, 83.
Mucha S. & Windig J.J. (2009) Effects of incomplete pedigree on genetic management of the
Dutch Landrace goat. Journal of Animal Breeding and Genetics 126, 250-6.
Pirault P., Danvy S., Verrier E. & Leroy G. (2013) Genetic Structure and Gene Flows within
Horses: A Genealogical Study at the French Population Scale. PLoS ONE 8, e61544.
Porter V M.L. (2002) A world dictionary of livestock breeds, types and varieties. Wallingford:
CABI Publishing.
Powell J.E., Visscher P.M. & Goddard M.E. (2010) Reconciling the analysis of IBD and IBS in
complex trait studies. Nature reviews. Genetics 11, 800-5.
Pritchard J.K., Stephens M. & Donnelly P. (2000) Inference of population structure using
multilocus genotype data. Genetics 155, 945-59.
Purcell S., Neale B., Todd-Brown K., Thomas L., Ferreira Manuel A R., Bender D., Maller J.,
Sklar P., de Bakker Paul I W., Daly Mark J. & Sham Pak C. (2007) PLINK: A Tool Set
for Whole-Genome Association and Population-Based Linkage Analyses. American
journal of human genetics 81, 559-75.
Rolf M.M., Taylor J.F., Schnabel R.D., McKay S.D., McClure M.C., Northcutt S.L., Kerley
M.S. & Weaber R.L. (2010) Impact of reduced marker set estimation of genomic
relationship matrices on genomic selection for feed efficiency in Angus cattle. BMC
Genetics 11, 24.

126
Santure A.W., Stapley J., Ball A.D., Birkhead T.R., Burke T. & Slate J. (2010) On the use of
large marker panels to estimate inbreeding and relatedness: empirical and simulation
studies of a pedigreed zebra finch population typed at 771 SNPs. Molecular ecology 19,
1439-51.
Sargolzaei M., Iwaisaki H. & Colleau J.J. (2006) CFC: a tool for monitoring genetic diversity.
pp. 27-8. Instituto Prociência.
Speed D. & Balding D.J. (2014) Relatedness in the post-genomic era: is it still useful? Nature
Reviews Genetics 16, 33-44.
VanRaden P.M. (2008) Efficient methods to compute genomic predictions. Journal of Dairy
Science 91, 4414-23.
VanRaden P.M., Olson K.M., Wiggans G.R., Cole J.B. & Tooker M.E. (2011) Genomic
inbreeding and relationships among Holsteins, Jerseys, and Brown Swiss. Journal of
Dairy Science 94, 5673-82.
Wang H., Misztal I. & Legarra A. (2014) Differences between genomic-based and pedigree-
based relationships in a chicken population, as a function of quality control and pedigree
links among individuals. Journal of animal breeding and genetics = Zeitschrift für
Tierzüchtung und Züchtungsbiologie 131, 445-51.
Wiler R., Leber R., Moore B.B., VanDyk L.F., Perryman L.E. & Meek K. (1995) Equine severe
combined immunodeficiency: a defect in V(D)J recombination and DNA-dependent
protein kinase activity. Proceedings of the National Academy of Sciences 92, 11485-9.
Yang J., Lee S.H., Goddard M.E. & Visscher P.M. (2011) GCTA: a tool for genome-wide
complex trait analysis. Am J Hum Genet 88, 76-82.
Zheng X., Levine D., Shen J., Gogarten S.M., Laurie C. & Weir B.S. (2012) A high-performance
computing toolset for relatedness and principal component analysis of SNP data.
Bioinformatics (Oxford, England) 28, 3326-8.

127
CHAPTER 5
SUMMARY
The recent improvements in the methods of whole genome sequencing and genotyping have
largely benefitted the horse genetics community as well as other livestock and non-model
organisms. These improvements coincided with a rapid development of tools and applications as
well as in computational power available to analyze the relatively large amount of data resulting
from sequencing and genotyping projects.
Following completion of the horse genome in 2009, a plethora of studies have utilized the
sequence information. The SNPs identified as part of the equine genome project helped design
the 50K and later 70K Illumina equine genotyping array. These genotyping arrays assisted in the
characterization of the phylogenetic, diversity and inbreeding measures in a large number of
horse breeds (Binns et al. 2012; McCue et al. 2012; Petersen et al. 2013). Additionally, these
genotyping arrays enabled mapping a number of important morphological and health traits in the
horse (Brooks et al. 2010; Makvandi-Nejad et al. 2012). The falling cost of next generation
sequencing technology resulted in generation of a number of sequences for several breeds of
horse (Doan et al. 2012; Jun et al. 2014). To date these projects have added to the known
variants for each of those breeds.
In chapter two of the thesis, variants discovered by next generation paired-end sequencing
technology generated were annotated in six genomes belonging horses from six different breeds.
This technology proved to be very successful recently in genome annotation and variants
discovery in cattle and chicken (Daetwyler et al. 2014; Yan et al. 2014). The functional
Annotation of Animal Genomes (FAANG) project, an international efforts in annotating various
livestock genomes is primarily utilizing next generation sequencing technologies to achieve its

128
objectives (Andersson et al. 2015). The work in this dissertation adds to the growing wealth of
genomic data made available for the horse. We detected and functionally annotated 8,128,658
SNPs and 830,370 small INDELs. Of the SNPs we detected, 5,221,242 SNPs were novel SNPs
not reported previously in ENSEMBL or dbSNP data bases. Additionally, we were able to detect
structural and copy number variations unique to each of six horses that we also functionally
annotated. Incorporating a larger number of breeds than previous studies enabled us to discover a
larger number of variants of all types. It also enabled us to determine the private variants
pertaining to each horse which is informative of the specific biology of these horse breeds. These
variations are a valuable addition to the existing genomic variation in the horse. We formatted
them into user friendly tracks and are now available publically on-line for the horse genetics
community for future studies. These annotations will be utilized in the construction of SNPs and
INDELs marker panels as well as in the creation of high density linkage maps. In addition, our
analysis revealed a copy number gain at the latherin locus (LATH) in all six horses but the
magnitude of the gain was different between different horses. Latherin is a surface-active, non-
glycosylated protein that is hypothesized to play an important role in the thermoregulation of the
horse. It is presumed to do that by acting as a wetting agent that facilitates evaporative cooling
by reducing water surface tension at low concentrations (McDonald et al. 2009).
In chapter three, a mixed model based GWAS study was used to identify QTLs contributing to
the variation in height at the withers in horses. Mapping QTLs in the horse was largely based on
traditional methods such as linkage mapping. However, the availability of genome-wide
genotyping arrays revolutionized the QTL mapping studies by making available thousands of
SNPs across the genome that were used in GWAS studies to map QTLs. However, a hurdle that
was always of concern when conducting a GWAS was the existence of confounding factors such

129
as kinship and population structure which results in false positive results. Mixed models are very
powerful in accounting for both these factors in GWAS studies and are now considered the gold
standard method for that purpose (Hoffman 2013). Unlike most GWAS studies which assume an
additive model, we used a dominant model to map the QTLs which enabled us to discover QTLs
affecting withers height dominantly. To complement GWAS, a cross-population composite
likelihood ratio test (XP-CLR) test was applied in order to search for regions under selection in
the genomes of horses of large versus small skeletal size. Both the GWAS and the XP-CLR test
detected a significant locus at ECA1: 37676322 in an intron of the ANKRD1 gene. ANKRD1 is
involved in the signaling pathways of muscle remodeling and differentiation which is suggestive
of the role it might be playing in influencing withers height variation between horses. We were
able to verify our finding by genotyping an independent sample of 90 American Miniature
horses. Our results showed that horses possessing the GG or AG genotypes were 4.064 cm taller
than those with the AA genotype.
Chapter four of this thesis demonstrates the utility of the Equine SNP70 genotyping array in
assessing relatedness, inbreeding and genetic structure in an Arabian horse herd. Traditionally,
the genetic structure was assessed using microsatalite markers (Khanshour et al. 2013) and
inbreeding was calculated using pedigree information (Pirault et al. 2013). The Equine SNP70
genotyping array provided a very powerful alternative to microsatellite markers in assessing
inbreeding and genetic structure. Estimates of relatedness within the herd and amongst the herd
founders and other Arabian Horses highlighted some key differences from pedigree
relationships. Moreover, the analysis based on the SNP70 genotyping array enabled re-
capitulation of the familial relationships among these horses and demonstrated their Egyptian
ancestry among other Arabian horse bloodlines.

130
During the past decade, a remarkable improvement has taking place in the cost, speed and read
length of NGS technology. The ever increasing technological advancement will result in even
longer reads at a lower sequencing cost. For instance PacBio RS II system has a mean of 20
kilobases for a very competitive price making it an ideal tool to finish genome assemblies.
Nevertheless, errors during sample preparation or sequencing are still a limiting factor in NGS
technologies. Sequencing errors could be the result of amplification bias during PCR,
polymerase mistakes. These errors especially impact the ability to detect of rare variants (Edward
J Fox 2014). Therefore, future research needs to focus at improving the accuracy of base calling
in different NGS technologies. Future NGS platforms should also ideally be affordable, fast, and
have high accuracy. In addition, more advancement needs to be made both in computational
algorithms and molecular genotyping in detecting SNVs and SVs using NGS reads. More
specifically, more improvement in the boundaries of SVs and CNVs events and more precise
quantification of CNVs is required (Handsaker et al. 2015). New technologies such as droplet
digital PCR (ddPCR) proved to be very accurate in determining copy number variation (with a
concordance rate of 99.9%) although its cost is still a limiting factor. That been said, NGS is very
promising in revolutionizing genetic diagnostics, prognostics, disease association and clinical
microbiology (Salipante S. J. 2013; Lohmann & Klein 2014). An excellent example of the
application of NGS technology in diagnostics is the development of a NGS test for mutations
BRCA1 and BRCA2 genes implicated in the development of breast cancer in humans
(Feliubadaló et al. 2012). Also, in horses, NGS have proved successful for discovery and
screening of causal variants in rare genetic disorders such as Incontinentia Pigmenti (Towers et
al. 2013).

131
Being a non-model organism, variants in the equine genome are still poorly characterized. The
work presented in this thesis utilizes the recent advancements in sequencing and genotyping
technology and forms the basis for many future research studies. The NGS variants annotated in
this work could be utilized in the discovery of causal mutations for various production and health
traits in the horse. Moreover, these variants are a valuable asset to fully exploit the similarity
between the equine and human genomes in human biomedical research. In addition, the work
presented here utilized the equine Equine SNP50 and Equine SNP70 genotyping arrays for QTL
mapping and characterizing the genomic inbreeding of an Arabian horse herd respectively.
Therefore, the findings discussed in this dissertation can be utilized by equine breeders,
clinicians and researchers in future studies.
132
REFERENCES Andersson L., Archibald A.L., Bottema C.D., Brauning R., Burgess S.C., Burt D.W., Casas E.,
Cheng H.H., Clarke L., Couldrey C., Dalrymple B.P., Elsik C.G., Foissac S., Giuffra E.,
Groenen M.A., Hayes B.J., Huang L.S., Khatib H., Kijas J.W. & Kim H. (2015)
Coordinated international action to accelerate genome-to-phenome with FAANG, the
Functional Annotation of Animal Genomes project. Genome Biology 16, 57.
Binns M.M., Boehler D.a., Bailey E., Lear T.L., Cardwell J.M. & Lambert D.H. (2012)
Inbreeding in the Thoroughbred horse. Animal genetics 43, 340-2.
Brooks S.A., Gabreski N., Miller D., Brisbin A., Brown H.E., Streeter C., Mezey J., Cook D. &
Antczak D.F. (2010) Whole-genome SNP association in the horse: identification of a
deletion in myosin Va responsible for Lavender Foal Syndrome. PLoS genetics 6,
e1000909-e.
Daetwyler H.D., Capitan A., Pausch H., Stothard P., Binsbergen R.v., Brøndum R.F., Liao X.,
Djari A., Rodriguez S.C., Grohs C., Esquerré D., Bouchez O., Rossignol M.-N., Klopp
C., Rocha D., Fritz S., Eggen A., Bowman P.J., Coote D., Chamberlain A.J., Anderson
C., VanTassell C.P., Hulsegge I., Goddard M.E., Guldbrandtsen B., Lund M.S.,
Veerkamp R.F., Boichard D.A., Fries R. & Hayes B.J. (2014) Whole-genome sequencing
of 234 bulls facilitates mapping of monogenic and complex traits in cattle. Nature
Genetics 46, 858-65.
Doan R., Cohen N.D., Sawyer J., Ghaffari N., Johnson C.D. & Dindot S.V. (2012) Whole-
genome sequencing and genetic variant analysis of a Quarter Horse mare. BMC
Genomics 13, 78-.
Edward J Fox K.S.R.-B., Mary J Emond and Lawrence A Loeb (2014) Accuracy of Next
Generation Sequencing Platforms. Journal of Next Generation: Sequencing &
Applications 2014.
Feliubadaló L., Lopez-Doriga A., Castellsagué E., Valle J.d., Menéndez M., Tornero E., Montes

133
E., Cuesta R., Gómez C., Campos O., Pineda M., González S., Moreno V., Brunet J.,
Blanco I., Serra E., Capellá G. & Lázaro C. (2012) Next-generation sequencing meets
genetic diagnostics: development of a comprehensive workflow for the analysis of
BRCA1 and BRCA2 genes. European Journal of Human Genetics 21, 864-70.
Handsaker R.E., Doren V.V., Berman J.R., Genovese G., Kashin S., Boettger L.M. & McCarroll
S.A. (2015) Large multiallelic copy number variations in humans. Nature Genetics 47,
296-303.
Hoffman G.E. (2013) Correcting for Population Structure and Kinship Using the Linear Mixed
Model: Theory and Extensions. Plos One 8, e75707-e.
Jun J., Cho Y., Hu H., Kim H.-M., Jho S., Gadhvi P., Park K., Lim J., Paek W., Han K., Manica
A., Edwards J.S. & Bhak J. (2014) Whole genome sequence and analysis of the Marwari
horse breed and its genetic origin. BMC Genomics 15, S4-S.
Khanshour A., Conant E., Juras R. & Cothran E.G. (2013) Microsatellite analysis of genetic
diversity and population structure of Arabian horse populations. J Hered 104, 386-98.
Lohmann K. & Klein C. (2014) Next generation sequencing and the future of genetic diagnosis.
Neurotherapeutics 11, 699-707.
Makvandi-Nejad S., Hoffman G.E., Allen J.J., Chu E., Gu E., Chandler A.M., Loredo A.I.,
Bellone R.R., Mezey J.G., Brooks S.a. & Sutter N.B. (2012) Four loci explain 83% of
size variation in the horse. PLoS ONE 7, e39929-e.
McCue M.E., Bannasch D.L., Petersen J.L., Gurr J., Bailey E., Binns M.M., Distl O., Guérin G.,
Hasegawa T., Hill E.W., Leeb T., Lindgren G., Penedo M.C.T., Røed K.H., Ryder O.a.,
Swinburne J.E., Tozaki T., Valberg S.J., Vaudin M., Lindblad-Toh K., Wade C.M. &
Mickelson J.R. (2012) A high density SNP array for the domestic horse and extant
Perissodactyla: utility for association mapping, genetic diversity, and phylogeny studies.

134
PLoS genetics 8, e1002451-e.
McDonald R.E., Fleming R.I., Beeley J.G., Bovell D.L., Lu J.R., Zhao X., Cooper A. &
Kennedy M.W. (2009) Latherin: A Surfactant Protein of Horse Sweat and Saliva. Plos
One 4, e5726.
Petersen J.L., Mickelson J.R., Cothran E.G., Andersson L.S., Axelsson J., Bailey E., Bannasch
D., Binns M.M., Borges A.S., Brama P., da Câmara Machado A., Distl O., Felicetti M.,
Fox-Clipsham L., Graves K.T., Guérin G., Haase B., Hasegawa T., Hemmann K., Hill
E.W., Leeb T., Lindgren G., Lohi H., Lopes M.S., McGivney B.A., Mikko S., Orr N.,
Penedo M.C.T., Piercy R.J., Raekallio M., Rieder S., Røed K.H., Silvestrelli M.,
Swinburne J., Tozaki T., Vaudin M., C M.W. & McCue M.E. (2013) Genetic Diversity in
the Modern Horse Illustrated from Genome-Wide SNP Data. In: Plos One (
Pirault P., Danvy S., Verrier E. & Leroy G. (2013) Genetic structure and gene flows within
horses: a genealogical study at the french population scale. Plos One 8, e61544-e.
Salipante S. J. S.D.J., Rosenthal C, Costa G, Spangler J, Sims, E. H.,Jacobs, M. A., Miller, S. I.,
Hoogestraat, D. R., Cookson, B. T., McCoy, C. M.,Matsen, F. A., Shendure, J., Lee, C.,
Harkins, T. T., & Hoffman, N. G (2013) Rapid 16S rRNA Next-Generation Sequencing
of Polymicrobial Clinical Samplesfor Diagnosis of Complex Bacterial Infections. Plos
One 8(5).
Towers R.E., Murgiano L., Millar D.S., Glen E., Topf A., Jagannathan V., Drogemuller C.,
Goodship J.A., Clarke A.J. & Leeb T. (2013) A Nonsense Mutation in the IKBKG Gene
in Mares with Incontinentia Pigmenti. Plos One 8.
Yan Y., Yi G., Sun C., Qu L. & Yang N. (2014) Genome-Wide Characterization of Insertion and
Deletion Variation in Chicken Using Next Generation Sequencing. Plos One 9, e104652.