Measuring Equine-Assisted Therapy - MDPI
27
Citation: Stolz, I.; Anneken, V.; Froböse, I. Measuring Equine- Assisted Therapy: Validation and Confirmatory Factor Analysis of an ICF-Based Standardized Assessment- Tool. Int. J. Environ. Res. Public Health 2022, 19, 2738. https://doi.org/ 10.3390/ijerph19052738 Academic Editor: Alvaro N. Gurovich Received: 11 January 2022 Accepted: 23 February 2022 Published: 26 February 2022 Publisher’s Note: MDPI stays neutral with regard to jurisdictional claims in published maps and institutional affil- iations. Copyright: © 2022 by the authors. Licensee MDPI, Basel, Switzerland. This article is an open access article distributed under the terms and conditions of the Creative Commons Attribution (CC BY) license (https:// creativecommons.org/licenses/by/ 4.0/). International Journal of Environmental Research and Public Health Article Measuring Equine-Assisted Therapy: Validation and Confirmatory Factor Analysis of an ICF-Based Standardized Assessment-Tool Isabel Stolz 1,2, *, Volker Anneken 1 and Ingo Froböse 3 1 Research Institute for Inclusion through Physical Activity and Sport, German Sport University Cologne, 50226 Frechen, Germany; anneken@fi-bs.de 2 Research Institute of Movement and Neurosciences, German Sport University Cologne, 50933 Cologne, Germany 3 Institute of Health Promotion and Clinical Movement Science, German Sport University, 50933 Cologne, Germany; [email protected] * Correspondence: stolz@fi-bs.de; Tel.: +49-151-585-690-05 Abstract: The International Classification of Functioning, Disability, and Health (ICF) of the World Health Organization (WHO) was established as an international framework for monitoring rehabili- tation outcomes and the impacts of health interventions since, as the term “functioning” implies, it emphasizes a person’s “lived health” in addition to their biological health status. Equine-assisted therapy (EAT) represents a holistic intervention approach that aims to improve both biomedical functioning and the patient’s lived health in relation to performing activities and participating in social situations. In this study, the psychometric properties of an ICF-based digital assessment tool for the measurement of the rehabilitation impacts of EAT were analyzed via simultaneous confirmatory factor analyses (CFA) and reliability and sensitivity tests. In total, 265 patients from equine-assisted therapy centers in Germany were included for CFA. Change sensitivity was assessed via multi-level analyses based on 876 repeated assessments by 30 therapists. Results show satisfactory model-fit statistics; McDonald’s omega (ML) showed excellent scores for the total scale (ω = 0.96) and three subscales (ω = 0.95; ω = 0.95, ω = 0.93). The tool proved itself to be change sensitive and reliable (change sensitivity p ≤ 0.001), retest r = 0.745 **, p ≤ 0.001). Overall, the developed assessment tool satisfactorily fulfills psychometric requirements and can be applied in therapeutic practice. Keywords: (outcome) assessment; factor analysis; ICF; quantitative research; rehabilitation; therapy evaluation; validation 1. Introduction In international health systems, the International Classification of Functioning, Dis- ability, and Health (ICF) of the World Health Organization (WHO) plays a key role in patient recovery. The ICF has widely been established as an international standard for describing a person’s health status and for monitoring the impacts of health interventions to ensure favorable health and rehabilitation outcomes, since it unites biomedical and “lived health” perspectives on functioning and health status [1,2]. Operationalized via the biopsychosocial approach, a person’s functioning can be evaluated by the dynamic interaction between biological aspects, activities, and participation, as well as individual environmental and personal factors. Therefore, a holistic view of an individual’s function- ing status in rehabilitation contributes to monitoring the responses of health systems more precisely in relation to the suitability of said responses to their individual health needs [2]. Furthermore, in the WHO global health system, functioning has been considered a third health indicator, alongside mortality and morbidity, and has further been designated the key indicator for rehabilitation [2]. A global aim of successful health strategies has been the reduction in morbidity and mortality and the promotion and assurance of optimal Int. J. Environ. Res. Public Health 2022, 19, 2738. https://doi.org/10.3390/ijerph19052738 https://www.mdpi.com/journal/ijerph
-
Upload
khangminh22 -
Category
Documents
-
view
3 -
download
0
Transcript of Measuring Equine-Assisted Therapy - MDPI
�����������������
Citation: Stolz, I.; Anneken, V.;
Froböse, I. Measuring Equine-
Assisted Therapy: Validation and
Confirmatory Factor Analysis of an
ICF-Based Standardized Assessment-
Tool. Int. J. Environ. Res. Public Health
2022, 19, 2738. https://doi.org/
10.3390/ijerph19052738
Academic Editor: Alvaro N.
Gurovich
Received: 11 January 2022
Accepted: 23 February 2022
Published: 26 February 2022
Publisher’s Note: MDPI stays neutral
with regard to jurisdictional claims in
published maps and institutional affil-
iations.
Copyright: © 2022 by the authors.
Licensee MDPI, Basel, Switzerland.
This article is an open access article
distributed under the terms and
conditions of the Creative Commons
Attribution (CC BY) license (https://
creativecommons.org/licenses/by/
4.0/).
International Journal of
Environmental Research
and Public Health
Article
Measuring Equine-Assisted Therapy: Validation andConfirmatory Factor Analysis of an ICF-Based StandardizedAssessment-ToolIsabel Stolz 1,2,*, Volker Anneken 1 and Ingo Froböse 3
1 Research Institute for Inclusion through Physical Activity and Sport, German Sport University Cologne,50226 Frechen, Germany; [email protected]
2 Research Institute of Movement and Neurosciences, German Sport University Cologne,50933 Cologne, Germany
3 Institute of Health Promotion and Clinical Movement Science, German Sport University,50933 Cologne, Germany; [email protected]
* Correspondence: [email protected]; Tel.: +49-151-585-690-05
Abstract: The International Classification of Functioning, Disability, and Health (ICF) of the WorldHealth Organization (WHO) was established as an international framework for monitoring rehabili-tation outcomes and the impacts of health interventions since, as the term “functioning” implies, itemphasizes a person’s “lived health” in addition to their biological health status. Equine-assistedtherapy (EAT) represents a holistic intervention approach that aims to improve both biomedicalfunctioning and the patient’s lived health in relation to performing activities and participating insocial situations. In this study, the psychometric properties of an ICF-based digital assessment tool forthe measurement of the rehabilitation impacts of EAT were analyzed via simultaneous confirmatoryfactor analyses (CFA) and reliability and sensitivity tests. In total, 265 patients from equine-assistedtherapy centers in Germany were included for CFA. Change sensitivity was assessed via multi-levelanalyses based on 876 repeated assessments by 30 therapists. Results show satisfactory model-fitstatistics; McDonald’s omega (ML) showed excellent scores for the total scale (ω = 0.96) and threesubscales (ω = 0.95; ω = 0.95, ω = 0.93). The tool proved itself to be change sensitive and reliable(change sensitivity p ≤ 0.001), retest r = 0.745 **, p ≤ 0.001). Overall, the developed assessment toolsatisfactorily fulfills psychometric requirements and can be applied in therapeutic practice.
Keywords: (outcome) assessment; factor analysis; ICF; quantitative research; rehabilitation; therapyevaluation; validation
1. Introduction
In international health systems, the International Classification of Functioning, Dis-ability, and Health (ICF) of the World Health Organization (WHO) plays a key role inpatient recovery. The ICF has widely been established as an international standard fordescribing a person’s health status and for monitoring the impacts of health interventionsto ensure favorable health and rehabilitation outcomes, since it unites biomedical and“lived health” perspectives on functioning and health status [1,2]. Operationalized viathe biopsychosocial approach, a person’s functioning can be evaluated by the dynamicinteraction between biological aspects, activities, and participation, as well as individualenvironmental and personal factors. Therefore, a holistic view of an individual’s function-ing status in rehabilitation contributes to monitoring the responses of health systems moreprecisely in relation to the suitability of said responses to their individual health needs [2].Furthermore, in the WHO global health system, functioning has been considered a thirdhealth indicator, alongside mortality and morbidity, and has further been designated thekey indicator for rehabilitation [2]. A global aim of successful health strategies has beenthe reduction in morbidity and mortality and the promotion and assurance of optimal
Int. J. Environ. Res. Public Health 2022, 19, 2738. https://doi.org/10.3390/ijerph19052738 https://www.mdpi.com/journal/ijerph
Int. J. Environ. Res. Public Health 2022, 19, 2738 2 of 27
functioning [2]. Monitoring the performance and outcomes of rehabilitation interventionsand health services via the functioning indicator will be linkable to the ICF classification,as well as the upcoming ICD-11; therefore, the application and development of ICF-basedassessment tools represent a promising method to reduce the complexity of the ICF andcreate precisely tailored therapeutic interventions in rehabilitation systems [2].
The development and use of standardized and valid assessment in equine-assistedtherapy (EAT) has been a huge challenge in the scientific discourse in the past years.Scientific studies have identified EAT outcomes and effects in recent years, yet the absenceof both common and consistent terminology usage and clarity in intervention targets andintended therapy outcomes remains a major challenge in the professionalization of thefield [3]. EAT represents a holistic intervention approach through horse use, which aimsto improve both biomedical functioning and the patient’s lived health in relation to theirphysical and mental abilities to perform activities and participate in social situations. Theumbrella term EAT includes various subdisciplines of equine-assisted interventions, ofwhich the most salient are EAT as curative education in individual and group settings andhippotherapy, a horse-assisted form of physical therapy [3]. Additionally, equine-assistedpsychotherapy, trauma pedagogy, ergotherapy, and sports-related interventions representother areas of equine-assisted therapy and support [3].
A comparison and collection of EAT findings has been complicated in the past years,not only across languages and countries, but also with respect to the reported conditionsor intended outcomes of the target groups of EAT and its subdisciplines. As Wood et al.describe in their terminology consensus report, 78 scientific studies could be found that usedthe term “hippotherapy” in over 60 different ways to describe varying therapy contentsand outcomes [4]. Besides restraining progress in the collection of scientific evidence aboutfactors that influence the effects of EAT, this conceptual uncertainty poses a further practicaldifficulty in the form of reimbursement obstacles with stakeholders, for whom therapyorientations and outcomes might appear opaque [4].
In this regard, more accurately assessing EAT and its subdisciplines in interventionpractice could be a relevant step within the field of therapeutic subdisciplines, but thechallenge of making EAT rehabilitation outcomes comparable with the other health servicesand interventions within the global health care system must also be considered. To reliablymonitor EAT intervention outcomes and validly assess whether rehabilitation goals havebeen attained in a manner that combines both biological and lived health, the linking of EATto the ICF classification represents a promising approach to building the basis for systematicand standardized assessment in EAT. Since EAT goals are closely related to rehabilitationtargets in terms of functioning, as represented in the ICF via the biopsychosocial viewof the patient’s health, the incorporation of EAT outcomes and factors affecting theseoutcomes could provide an important step in collecting and comparing evidence relatedto EAT interventions. Furthermore, linking EAT to the ICF classification could provideincreased transparency for funding agencies and stakeholders by verifying and validatingthe effectiveness of therapy outcomes relative to other health care interventions.
In the past, a few studies have clinically tested the applicability of EAT interventionsto the ICF and shown promising tendencies [5–7]. In a study by Hsieh et al., the authorsconcluded that their ICF-CY (ICF children and youth version) assessment approach pro-vided a suitable framework to identify the physical benefits of hippotherapy for childrenwith cerebral palsy (N = 14) [6]. The findings of Borino et al. confirmed the suitability ofa self-developed ICF-based assessment tool for measuring behavioral changes and treat-ment effects in persons with intellectual disabilities participating in EAT and onotherapy(therapy with donkeys) (N = 23) [5]. Authors highlighted the suitability of the ICF-basedassessment in terms of quantification of therapy effects, individual treatment planning, andthe direct availability of health-related intervention outcomes to the international scientificcommunity [5]. Lanning et al. conducted both two standardized ICF-based questionnaires(the WHODAS 2.0 and the SF36v2) and an ICF-linked qualitative interview to measurethe effects of EAT on veterans with post-traumatic stress disorder (PTSD) (N = 51) [7]. The
Int. J. Environ. Res. Public Health 2022, 19, 2738 3 of 27
results indicated that the usage of the ICF provided a comprehensive view of the over-all functioning of PTSD-diagnosed individuals, examining changes on both mental andphysical levels, including dynamic intervention outcomes, and influencing factors, suchas environmental aspects and patients’ current health status [7]. The authors emphasizethe connection of these health states and physical and social environments in regard totheir impacts on an individual’s activities and participation domains, and stress the impor-tance of not overlooking these factors when diagnosing and treating persons with reactivedisorders such as PTSD [7].
Considering the promising tendencies of past studies, the aim of this study, realized bythe Research Institute for Inclusion through Physical Activity and Sport, was the validationand confirmation of the multidimensional factor structure of an ICF-based standardizedassessment tool for the measurement of functioning in EAT and its subdisciplines using theglobal language of the ICF. For this purpose, an ICF-based assessment tool was developedthrough an extensive scientific process, field tested in therapeutic practice, and analyzedwith regard to its psychometric properties (including both EAT in general and the mainsubdisciplines of individual EAT, group EAT, and hippotherapy).
2. Materials and Methods2.1. Study Design and Setting
The study employed a longitudinal design. The digital ICF-based assessment tool wastested in therapeutic practice by 30 therapists, who assessed 265 patients with indicationsfor EAT nationwide in 26 EAT centers in Germany. The data collection took place fromAugust 2020 to August 2021 (12 months). The collection period was extended from theoriginally planned eight-month period to twelve months due to restrictions caused bythe COVID-19 pandemic. Therapists also assessed the therapy progress of 127 of thesepatients with the digital assessment tool over 15 weeks (876 repeated assessments in total).Furthermore, within two additional datasets, therapists assessed retest reliability with aone-week interval and interrater reliability through three repeated measures of the samepatients, assessed by three raters.
2.2. Participants
Patients were included in the study if they had an indication for EAT and gave writteninformed consent (for children, this included the consent of parents or legal guardians).A medical declaration of no objection was conducted to carry out the therapy. Therapiesat all involved centers were conducted by professionals according to the standardized na-tionwide procedure regulations of the German Curatorship for Therapeutic Riding, whichadditionally ensured that no contraindications were present [8]. The study was approvedby the ethics committee of the German Sport University Cologne and in accordance withthe 1964 Helsinki Declaration and its later amendments (ethical approval code 076-2019).
2.3. Measures
The ICF-based assessment tool was administered using Questback UniPark (Quest-back GmbH, Cologne, Germany). It comprises a general module for the assessment offunctioning in EAT overall and three specialized submodules for the assessment of mainEAT subdisciplines (EAT in the individual setting, EAT in the group setting, and hippother-apy). The assessment tool was developed in a preliminary study, where a pilot tool wasdeveloped based on qualitative focus group findings, which was in turn linked to theICF via Cieza’s redefined linking rules [9]. Afterwards, it was field tested and modifiedafter performing exploratory factor analyses and bivariate correlations. Thereafter, theassessment tool was reintroduced to therapeutic practice and evaluated relative to itspsychometric properties in this study. The complete tool can be found in Appendix B withthe associated ICF code and descriptive statistics (Table A5 general EAT module and allsubmodules). It is differentiated in a general module, which is to be used superordinatedfor EAT, as well as the three specified submodules: EAT in the individual and group settings

Int. J. Environ. Res. Public Health 2022, 19, 2738 4 of 27
and hippotherapy, and is assessed using a unipolar ten-step Likert scale from “does notapply at all” to “applies fully”. Only endpoint categories were verbalized. The responsescaling was designed in this way in order to assess functioning in EAT with a high degreeof change sensitivity.
The general module contains 25 items, differentiated in three subscales (motor func-tioning, mental functioning, and psychosocial functioning). One example item, relatedto the mental functioning scale of the general module is G17. Can memorize processes andtasks in the therapy and reproduce them later, which is linked to the ICF code b1442 Retrievalof Memory. The submodule for EAT in the individual setting contains 11 items in total,differentiated in two subscales (specific motor functioning and specific mental functioning).An example item is IS05. Is able to adapt their movements to the movements of the horse in atargeted manner, linked to ICF code b1471 Quality of psychomotor functions of the specificmotor functioning scale. The submodule for EAT in the group setting also contains 11 items,differentiated in two subscales (interpersonal functioning and intrapersonal functioning).One example item is GS06. Can handle conflict constructively, linked to ICF code d7103Criticism in relationships, assigned to the interpersonal functioning scale. The hippother-apy submodule contains 16 items, which are differentiated in two subscales (movementfunctioning and motor control functioning). An example item for submodule H is H04.Can perceive proprioceptive stimuli (this includes, for example, the perception of movement andposition), which is coded with ICF b260 Proprioception function. It is part of the motorcontrol functioning scale.
All therapists evaluated both the general module and one specified submodule fortheir patients. In addition, demographic data (gender, age, disability, or chronic disease)were obtained.
2.4. Statistical Analyses
Statistical analyses were performed using the statistical software programs IBM SPSS27 (IBM Corp, Armonk, NY, USA) and IBM SPSS AMOS 26 (IBM Corp, Armonk, NY,USA). Descriptive statistics of the general module and submodules were calculated (fre-quencies, means, ± standard deviation). To determine the dimensionality and model fitof the conceptual model, confirmatory factor analyses (CFA) were carried out using thesample covariance matrix. Factorial validity was analyzed using maximum likelihood(ML) analysis. Global fit indices (χ2-Goodness-of-Fit-Test, number of degrees of freedom(df), chi-square fit statistics/degree of freedom (PCMIN/DF), comparative fit index (CFI),root mean square error of approximation (RMSEA), Akaike information criterion (AIC),consistent Akaike information criterion (CAIC), and modification indices (MI)) were ex-amined. As stated by Sherer et al., CFI levels greater than 0.90 were considered to beacceptable, while levels greater than 0.95 were considered to represent a very good fit [10].For RMSEA, levels of less than 0.08 indicated satisfactory model fit, whereas levels of <0.05were considered to be a very good fit [10]. AIC and CAIC were used in the fitting processas cutoff values indicating increased model fit. Accordingly, lower AIC and CAIC valuesindicated increased model fit of the models compared in the fitting process [10]. Constructvalidity was examined via Cronbach’s alpha (α) and McDonald’s omega (ω). Scales wereconsidered reliable with values of α/ω = 0.70 and α/ω = 0.80 [11,12]. Sensitivity wasdetermined based on an aggregated dataset via repeated measurements over 15 weeks,which were analyzed using hierarchical linear mixed models (GLMM, multi-level analyses).Test stability was assessed via retest reliability and inter-rater reliability on the basis of twoadditional datasets. Retest reliability was assessed with a one-week interval and analyzedvia Pearson correlations. Values greater than 0.7 were considered acceptable, and valuesgreater than 0.8 were considered good [13]. Inter-rater reliability was assessed via intraclasscorrelations (ICC) of three repeated measures of the same patients with equal intervals,each of which was evaluated by three therapists. Interclass correlations values over 0.6were considered good and values over 0.75 were considered as very good [14]. Because ofthe small subsample size, normality could not be assured in this test, therefore results of

Int. J. Environ. Res. Public Health 2022, 19, 2738 5 of 27
ICC were examined by the nonparametric Friedman test with Bonferroni adjustment, sincethe assumptions of repeated-measures ANOVA were not met.
3. Results
The sample included 265 patients in total (men = 119, women = 145, other = 1).Of these patients, 55 were adults (>18 years) and 209 were children (not specified: 1).Disabilities were heterogenous and mainly located in areas of motor development andmental-perceptual impairments, such as autism, attention deficit hyperactivity disorders,trisomy 21, or cerebral movement disorders and chronic degenerative diseases such asmultiple sclerosis. In addition, psychological diagnoses such as dissociative disorders andposttraumatic stress disorder were included but were uncommon among participants. Forthe submodule EAT in the individual setting, a total of 115 patients were analyzed, forthe submodule EAT in the group setting, a total of 87 patients were assessed, and for thesubmodule hippotherapy, a total of 60 patients could be included (descriptive data andthe correspondence of all items to the ICF classification can be obtained in Table A5 of theAppendix B).
3.1. General Module (G)
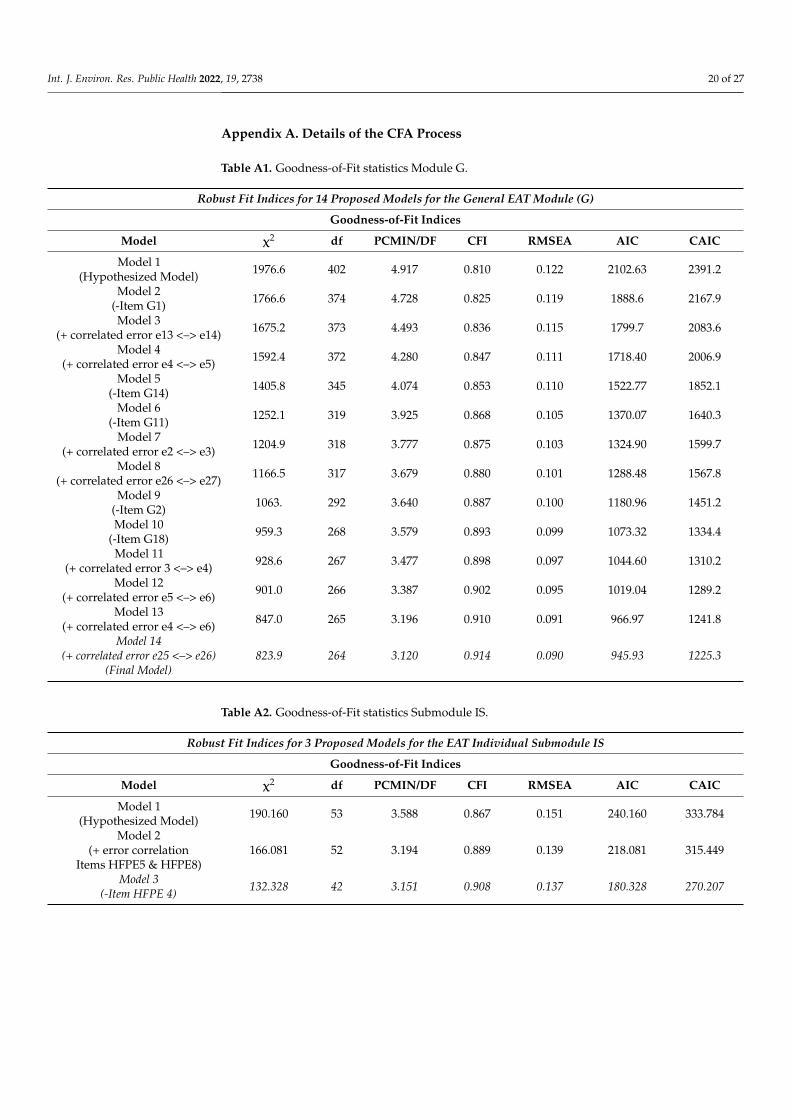
For the general module, a conceptual three-dimensional model was developed, basedon the results of a preliminary explorative factor analysis (EFA) based on a different sample.Confirmatory factor analysis (CFA) was performed to determine whether the proposedmultidimensional three-factor structure of the EFA (Scale 1: Motor functioning, Scale 2:Mental functioning, Scale 3: Psychosocial functioning) fits the data. As Tables 1 and A1(Appendix A) indicate, the three-factor structure of the hypothesized model represents anadequate fit for the data, which could be optimized via reduction in items and by allowingcross-loadings and error correlations. Factor loadings of the hypothesized model wereacceptable according to the usual criteria, but global fit statistics needed modification [15].
3.1.1. Hypothesized Model (Model 1) Module G
Table 1. AMOS Output for Hypothesized Model: Goodness-of-Fit Statistics.
Baseline Comparisons
RMSEA
Model CFI RMSEA LO 90 HI 90
Default model 0.810 0.122 0.116 0.127Saturated model 1.000
Independence model 0.000 0.269 0.264 0.274
AIC
Model AIC BCC BIC CAIC
Default model 2102.634 2119.398 2328.157 2391.157Saturated model 930.000 1053.734 2594.574 3059.574
Independence model 8801.598 8809.580 8908.989 8938.989
3.1.2. Final Model (Model 14) Module G
In the first step, Item G1 was removed (Model 2), because of cross-loadings withthe mental functioning and psychosocial functioning scales (G1 <— Mental functioningMI = 45; G1 <— Psychosocial functioning MI= 46). Factor loadings remain robust. Fitindices improved slightly (see Model 2, Table A1, Appendix A). Modification indicesshowed a residual correlation between Items G12 and G13 (e13 <–> e14 MI = 56) becauseboth items thematize the concept of “trust” as a psychosocial aspect. As such, an errorcorrelation was added and Model 3 was run. The global model fit of Model 3 increased,especially chi-squared (χ2 = 1675.2). Modification indices indicate that the error covariancerelated to Items G23 and G24 (e4 <–> e5 MI = 73) remains a strong misspecified parameter.
Int. J. Environ. Res. Public Health 2022, 19, 2738 6 of 27
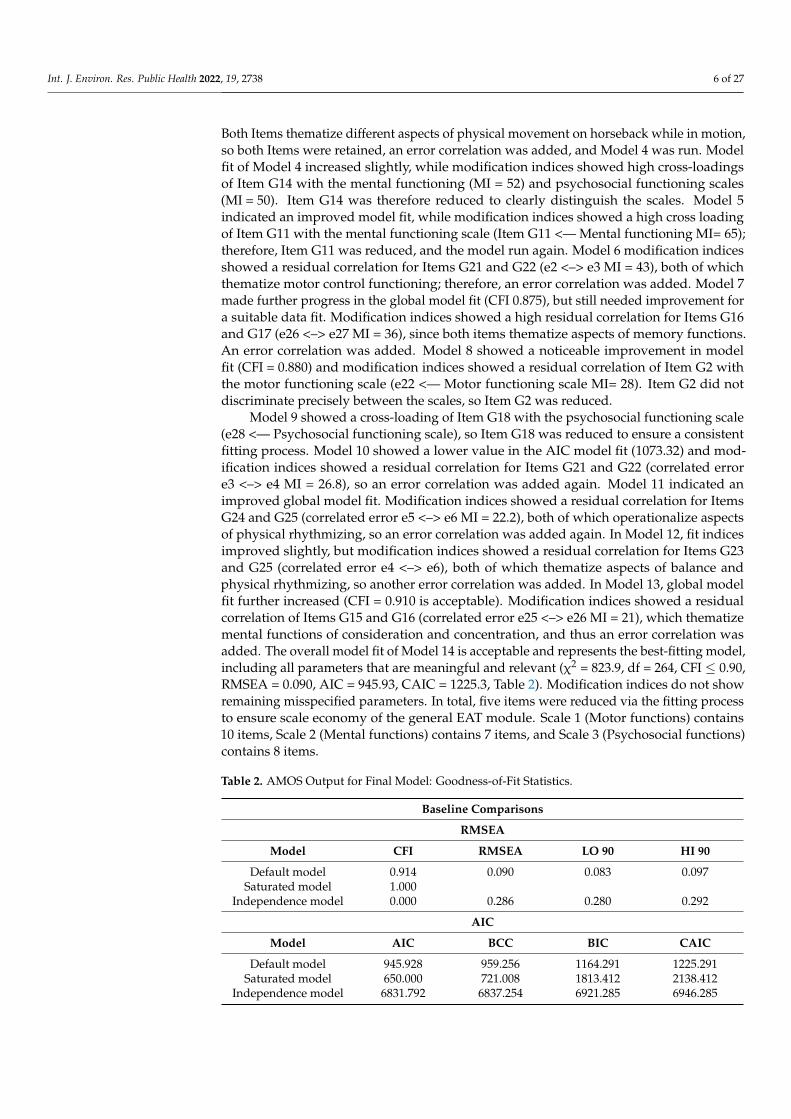
Both Items thematize different aspects of physical movement on horseback while in motion,so both Items were retained, an error correlation was added, and Model 4 was run. Modelfit of Model 4 increased slightly, while modification indices showed high cross-loadingsof Item G14 with the mental functioning (MI = 52) and psychosocial functioning scales(MI = 50). Item G14 was therefore reduced to clearly distinguish the scales. Model 5indicated an improved model fit, while modification indices showed a high cross loadingof Item G11 with the mental functioning scale (Item G11 <— Mental functioning MI= 65);therefore, Item G11 was reduced, and the model run again. Model 6 modification indicesshowed a residual correlation for Items G21 and G22 (e2 <–> e3 MI = 43), both of whichthematize motor control functioning; therefore, an error correlation was added. Model 7made further progress in the global model fit (CFI 0.875), but still needed improvement fora suitable data fit. Modification indices showed a high residual correlation for Items G16and G17 (e26 <–> e27 MI = 36), since both items thematize aspects of memory functions.An error correlation was added. Model 8 showed a noticeable improvement in modelfit (CFI = 0.880) and modification indices showed a residual correlation of Item G2 withthe motor functioning scale (e22 <— Motor functioning scale MI= 28). Item G2 did notdiscriminate precisely between the scales, so Item G2 was reduced.
Model 9 showed a cross-loading of Item G18 with the psychosocial functioning scale(e28 <— Psychosocial functioning scale), so Item G18 was reduced to ensure a consistentfitting process. Model 10 showed a lower value in the AIC model fit (1073.32) and mod-ification indices showed a residual correlation for Items G21 and G22 (correlated errore3 <–> e4 MI = 26.8), so an error correlation was added again. Model 11 indicated animproved global model fit. Modification indices showed a residual correlation for ItemsG24 and G25 (correlated error e5 <–> e6 MI = 22.2), both of which operationalize aspectsof physical rhythmizing, so an error correlation was added again. In Model 12, fit indicesimproved slightly, but modification indices showed a residual correlation for Items G23and G25 (correlated error e4 <–> e6), both of which thematize aspects of balance andphysical rhythmizing, so another error correlation was added. In Model 13, global modelfit further increased (CFI = 0.910 is acceptable). Modification indices showed a residualcorrelation of Items G15 and G16 (correlated error e25 <–> e26 MI = 21), which thematizemental functions of consideration and concentration, and thus an error correlation wasadded. The overall model fit of Model 14 is acceptable and represents the best-fitting model,including all parameters that are meaningful and relevant (χ2 = 823.9, df = 264, CFI ≤ 0.90,RMSEA = 0.090, AIC = 945.93, CAIC = 1225.3, Table 2). Modification indices do not showremaining misspecified parameters. In total, five items were reduced via the fitting processto ensure scale economy of the general EAT module. Scale 1 (Motor functions) contains10 items, Scale 2 (Mental functions) contains 7 items, and Scale 3 (Psychosocial functions)contains 8 items.
Table 2. AMOS Output for Final Model: Goodness-of-Fit Statistics.
Baseline Comparisons
RMSEA
Model CFI RMSEA LO 90 HI 90
Default model 0.914 0.090 0.083 0.097Saturated model 1.000
Independence model 0.000 0.286 0.280 0.292
AIC
Model AIC BCC BIC CAIC
Default model 945.928 959.256 1164.291 1225.291Saturated model 650.000 721.008 1813.412 2138.412
Independence model 6831.792 6837.254 6921.285 6946.285
Int. J. Environ. Res. Public Health 2022, 19, 2738 7 of 27
The reliabilities of the individual scales are in very good range (α = 0.95; α = 0.95;α = 0.93), while the reliability of the total scale of the general module is in excellent rangeα = 0.96. Due to the high reliability, a reduction in the instrument was possible for improvedtemporal–economic implementation. McDonald’s omega (ML) showed higher scores forthe total scale (ω = 0.96) motor functioning scale (ω = 0.95), mental functioning scale(ω = 0.95), and psychosocial functioning scale (ω = 0.93), and incorporated the loadingsand error correlations of the model (Brown, 2015) [15].
For retest reliability, Pearson correlations showed the test stability of the total scaleand all subscales: total scale r = 0.745 **, p < 0.001; motor functioning scale r = 0.678 **,p < 0.001, mental functioning scale r= 0.578 **, p < 0.001, psychosocial functioning scaler= 0.622 **, p < 0.001; (N = 71). Normality and linearity were tested via Q-Q diagrams andscatter plots.
For the measurement of inter-rater reliability, ten patients were assessed three timeseach by three independent raters. Intraclass correlation (ICC) is reported throughout theresults section with the average values, not individual measures. ICC for the total scaleshowed significant values over time, which remained robust for all raters (measurementtime 1: ICC = 0.788, α = 0.791, p = 0.002; measurement time 2: ICC = 0.775, α = 0.786,p = 0.003, measurement time 3: ICC = 0.811, α = 0.826, p = 0.001). The non-parametricFriedman test with Bonferroni adjustment confirmed significant values concerning the threemeasurement times; accordingly, patients improve significantly from one measurementtime to the next for all raters (Friedman Test: Chi-Square (2) = 7.800, p = 0.020, n = 10).Pairwise comparison shows significant changes between the first and the third measure-ment over time (p = 0.007). Between the first and the second measurement, as well asbetween the second and third measurement, the values show smaller changes (p = 0.044,p = 0.502). The ranks show steady progress from the first to the third measurement (firstmeasurement: mean rank = 1.30, second measurement: mean rank = 2.20, third measure-ment mean rank = 2.50). Descriptively, the first and second measurement ranks marks thelargest difference. With regard to inter-rater agreement, intraclass correlations did not showsignificant values, i.e., all raters measure a change, but this change is not measured in aconsistent way (ICC = 0.161, p = 0.352).
With respect to change sensitivity, Tables 3 and 4 show a significant positive changeover 15 weeks of therapy for the general module (total scale p < 0.001; subscales p < 0.001,p < 0.001, p = 0.007). An aggregated dataset based on repeated measurements over 15 weekswas analyzed using hierarchical linear mixed models (GLMM) to generate meaningfulresults. The results confirm that the general module sensitively depicts change in patientfunctioning over the course of therapy. The normal distribution test of the residualsconfirms this effect for all scales.
To locate the therapeutic effects exactly over the course of 15 weeks, an additionalspecific mixed linear model with “time” as a categorical variable was calculated. In thismodel, each measurement time point was compared to the remaining points, so as to showwhere the most significant changes were located. This cannot indicate significant treatmenteffects over time as precisely as the multilevel analysis presented in Tables 3–5, so it is onlyused for additional information. The model located the main therapy effects in the firstthree therapy weeks (week 1: p = 0.001, week 2: p = 0.019 and week 3: p = 0.036). Duringthe following therapy weeks, the p-values remained quite small, in week eight the p-valuebecame once again non-significantly larger (p = 0.180). Four-week time intervals confirmthe result (Table 6).
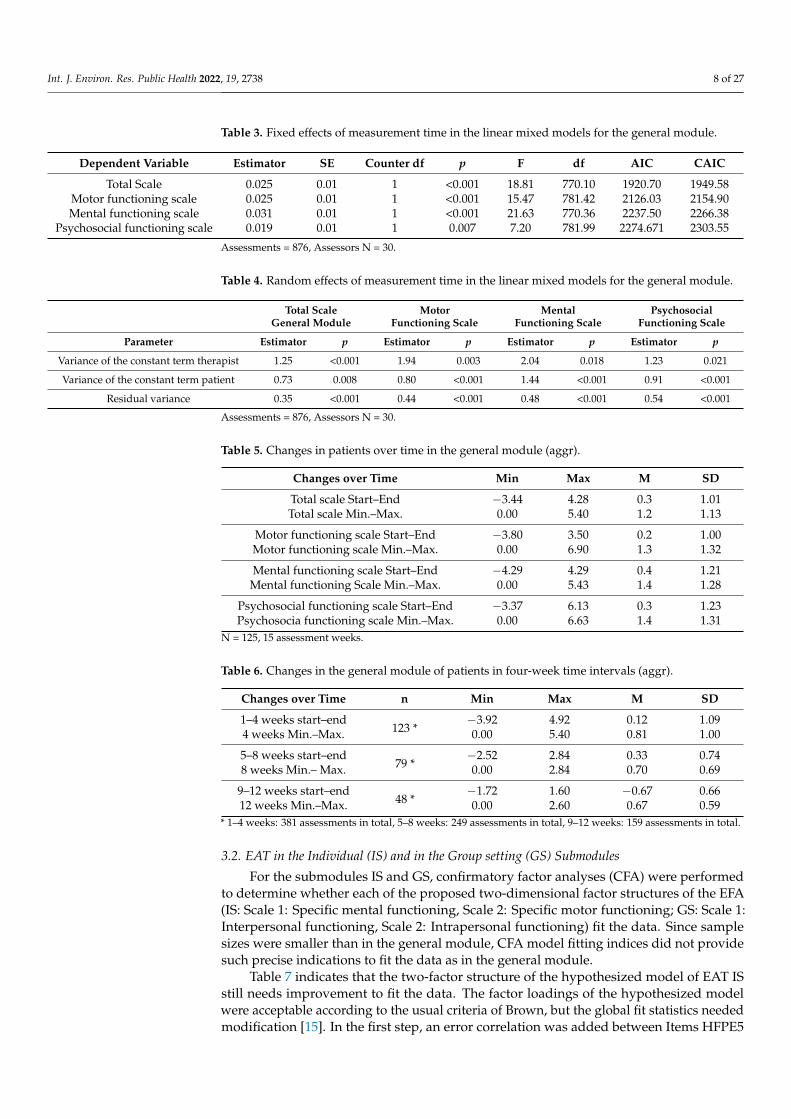
Int. J. Environ. Res. Public Health 2022, 19, 2738 8 of 27
Table 3. Fixed effects of measurement time in the linear mixed models for the general module.
Dependent Variable Estimator SE Counter df p F df AIC CAIC
Total Scale 0.025 0.01 1 <0.001 18.81 770.10 1920.70 1949.58Motor functioning scale 0.025 0.01 1 <0.001 15.47 781.42 2126.03 2154.90Mental functioning scale 0.031 0.01 1 <0.001 21.63 770.36 2237.50 2266.38
Psychosocial functioning scale 0.019 0.01 1 0.007 7.20 781.99 2274.671 2303.55
Assessments = 876, Assessors N = 30.
Table 4. Random effects of measurement time in the linear mixed models for the general module.
Total ScaleGeneral Module
MotorFunctioning Scale
MentalFunctioning Scale
PsychosocialFunctioning Scale
Parameter Estimator p Estimator p Estimator p Estimator p
Variance of the constant term therapist 1.25 <0.001 1.94 0.003 2.04 0.018 1.23 0.021
Variance of the constant term patient 0.73 0.008 0.80 <0.001 1.44 <0.001 0.91 <0.001
Residual variance 0.35 <0.001 0.44 <0.001 0.48 <0.001 0.54 <0.001
Assessments = 876, Assessors N = 30.
Table 5. Changes in patients over time in the general module (aggr).
Changes over Time Min Max M SD
Total scale Start–End −3.44 4.28 0.3 1.01Total scale Min.–Max. 0.00 5.40 1.2 1.13
Motor functioning scale Start–End −3.80 3.50 0.2 1.00Motor functioning scale Min.–Max. 0.00 6.90 1.3 1.32
Mental functioning scale Start–End −4.29 4.29 0.4 1.21Mental functioning Scale Min.–Max. 0.00 5.43 1.4 1.28
Psychosocial functioning scale Start–End −3.37 6.13 0.3 1.23Psychosocia functioning scale Min.–Max. 0.00 6.63 1.4 1.31
N = 125, 15 assessment weeks.
Table 6. Changes in the general module of patients in four-week time intervals (aggr).
Changes over Time n Min Max M SD
1–4 weeks start–end123 *
−3.92 4.92 0.12 1.094 weeks Min.–Max. 0.00 5.40 0.81 1.00
5–8 weeks start–end79 *
−2.52 2.84 0.33 0.748 weeks Min.– Max. 0.00 2.84 0.70 0.69
9–12 weeks start–end48 *
−1.72 1.60 −0.67 0.6612 weeks Min.–Max. 0.00 2.60 0.67 0.59
* 1–4 weeks: 381 assessments in total, 5–8 weeks: 249 assessments in total, 9–12 weeks: 159 assessments in total.
3.2. EAT in the Individual (IS) and in the Group setting (GS) Submodules
For the submodules IS and GS, confirmatory factor analyses (CFA) were performedto determine whether each of the proposed two-dimensional factor structures of the EFA(IS: Scale 1: Specific mental functioning, Scale 2: Specific motor functioning; GS: Scale 1:Interpersonal functioning, Scale 2: Intrapersonal functioning) fit the data. Since samplesizes were smaller than in the general module, CFA model fitting indices did not providesuch precise indications to fit the data as in the general module.
Table 7 indicates that the two-factor structure of the hypothesized model of EAT ISstill needs improvement to fit the data. The factor loadings of the hypothesized modelwere acceptable according to the usual criteria of Brown, but the global fit statistics neededmodification [15]. In the first step, an error correlation was added between Items HFPE5
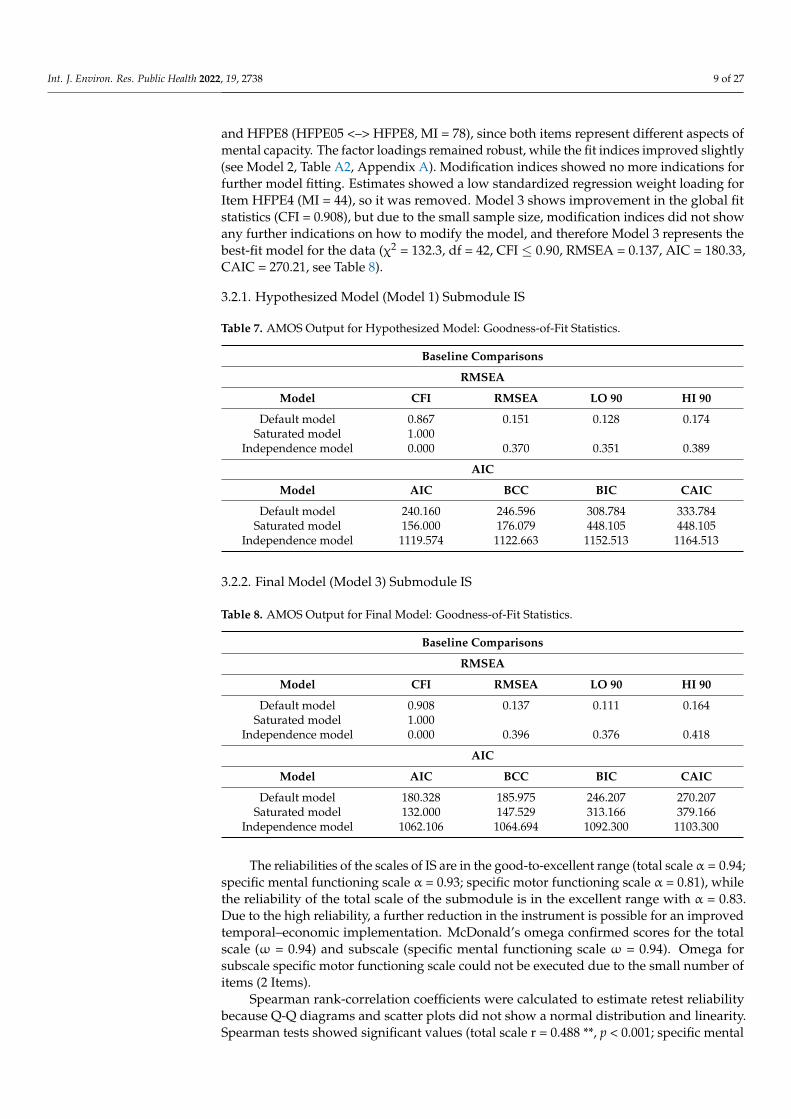
Int. J. Environ. Res. Public Health 2022, 19, 2738 9 of 27
and HFPE8 (HFPE05 <–> HFPE8, MI = 78), since both items represent different aspects ofmental capacity. The factor loadings remained robust, while the fit indices improved slightly(see Model 2, Table A2, Appendix A). Modification indices showed no more indications forfurther model fitting. Estimates showed a low standardized regression weight loading forItem HFPE4 (MI = 44), so it was removed. Model 3 shows improvement in the global fitstatistics (CFI = 0.908), but due to the small sample size, modification indices did not showany further indications on how to modify the model, and therefore Model 3 represents thebest-fit model for the data (χ2 = 132.3, df = 42, CFI ≤ 0.90, RMSEA = 0.137, AIC = 180.33,CAIC = 270.21, see Table 8).
3.2.1. Hypothesized Model (Model 1) Submodule IS
Table 7. AMOS Output for Hypothesized Model: Goodness-of-Fit Statistics.
Baseline Comparisons
RMSEA
Model CFI RMSEA LO 90 HI 90
Default model 0.867 0.151 0.128 0.174Saturated model 1.000
Independence model 0.000 0.370 0.351 0.389
AIC
Model AIC BCC BIC CAIC
Default model 240.160 246.596 308.784 333.784Saturated model 156.000 176.079 448.105 448.105
Independence model 1119.574 1122.663 1152.513 1164.513
3.2.2. Final Model (Model 3) Submodule IS
Table 8. AMOS Output for Final Model: Goodness-of-Fit Statistics.
Baseline Comparisons
RMSEA
Model CFI RMSEA LO 90 HI 90
Default model 0.908 0.137 0.111 0.164Saturated model 1.000
Independence model 0.000 0.396 0.376 0.418
AIC
Model AIC BCC BIC CAIC
Default model 180.328 185.975 246.207 270.207Saturated model 132.000 147.529 313.166 379.166
Independence model 1062.106 1064.694 1092.300 1103.300
The reliabilities of the scales of IS are in the good-to-excellent range (total scale α = 0.94;specific mental functioning scale α = 0.93; specific motor functioning scale α = 0.81), whilethe reliability of the total scale of the submodule is in the excellent range with α = 0.83.Due to the high reliability, a further reduction in the instrument is possible for an improvedtemporal–economic implementation. McDonald’s omega confirmed scores for the totalscale (ω = 0.94) and subscale (specific mental functioning scale ω = 0.94). Omega forsubscale specific motor functioning scale could not be executed due to the small number ofitems (2 Items).
Spearman rank-correlation coefficients were calculated to estimate retest reliabilitybecause Q-Q diagrams and scatter plots did not show a normal distribution and linearity.Spearman tests showed significant values (total scale r = 0.488 **, p < 0.001; specific mental
Int. J. Environ. Res. Public Health 2022, 19, 2738 10 of 27
functioning scale r= 0.461 **, p < 0.001, specific motor functioning scale r= 0.526 **, p < 0.001,N = 52).
For the measurement of inter-rater reliability, ICC showed significant values for timeeffects from the first until the third measurement (measurement time 1: ICC= 0.873,α = 0.895, p < 0.001; measurement time 2: ICC = 0.845, α = 0.855, p < 0.001, measure-ment time 3: ICC = 0.827, α = 0.840, p < 0.001, n = 10 assessed by three rater). A non-parametric Friedman test with Bonferroni correction showed significant values (Friedman-Test: Chi-Square (2) = 8.600, p = 0.014, n = 10). Pairwise comparison showed a significantchange between the first and third measurements (p = 0.004). The change in values be-tween the first and second and between the second and third measurements remainednon-significant (p = 0.074, p = 0.264). The consistency of rater agreement also remainednon-significant (ICC < 0, α = 0.079, p = 0.477; n = 10 assessed by three raters).
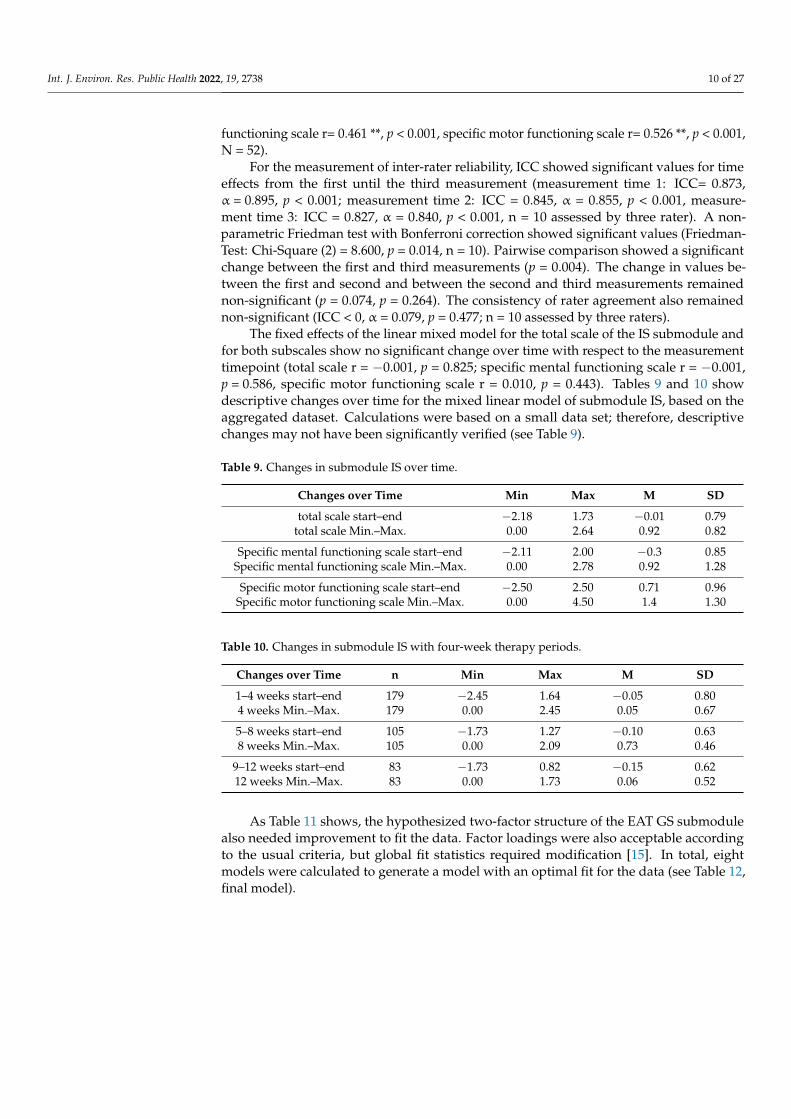
The fixed effects of the linear mixed model for the total scale of the IS submodule andfor both subscales show no significant change over time with respect to the measurementtimepoint (total scale r = −0.001, p = 0.825; specific mental functioning scale r = −0.001,p = 0.586, specific motor functioning scale r = 0.010, p = 0.443). Tables 9 and 10 showdescriptive changes over time for the mixed linear model of submodule IS, based on theaggregated dataset. Calculations were based on a small data set; therefore, descriptivechanges may not have been significantly verified (see Table 9).
Table 9. Changes in submodule IS over time.
Changes over Time Min Max M SD
total scale start–end −2.18 1.73 −0.01 0.79total scale Min.–Max. 0.00 2.64 0.92 0.82
Specific mental functioning scale start–end −2.11 2.00 −0.3 0.85Specific mental functioning scale Min.–Max. 0.00 2.78 0.92 1.28
Specific motor functioning scale start–end −2.50 2.50 0.71 0.96Specific motor functioning scale Min.–Max. 0.00 4.50 1.4 1.30
Table 10. Changes in submodule IS with four-week therapy periods.
Changes over Time n Min Max M SD
1–4 weeks start–end 179 −2.45 1.64 −0.05 0.804 weeks Min.–Max. 179 0.00 2.45 0.05 0.67
5–8 weeks start–end 105 −1.73 1.27 −0.10 0.638 weeks Min.–Max. 105 0.00 2.09 0.73 0.46
9–12 weeks start–end 83 −1.73 0.82 −0.15 0.6212 weeks Min.–Max. 83 0.00 1.73 0.06 0.52
As Table 11 shows, the hypothesized two-factor structure of the EAT GS submodulealso needed improvement to fit the data. Factor loadings were also acceptable accordingto the usual criteria, but global fit statistics required modification [15]. In total, eightmodels were calculated to generate a model with an optimal fit for the data (see Table 12,final model).
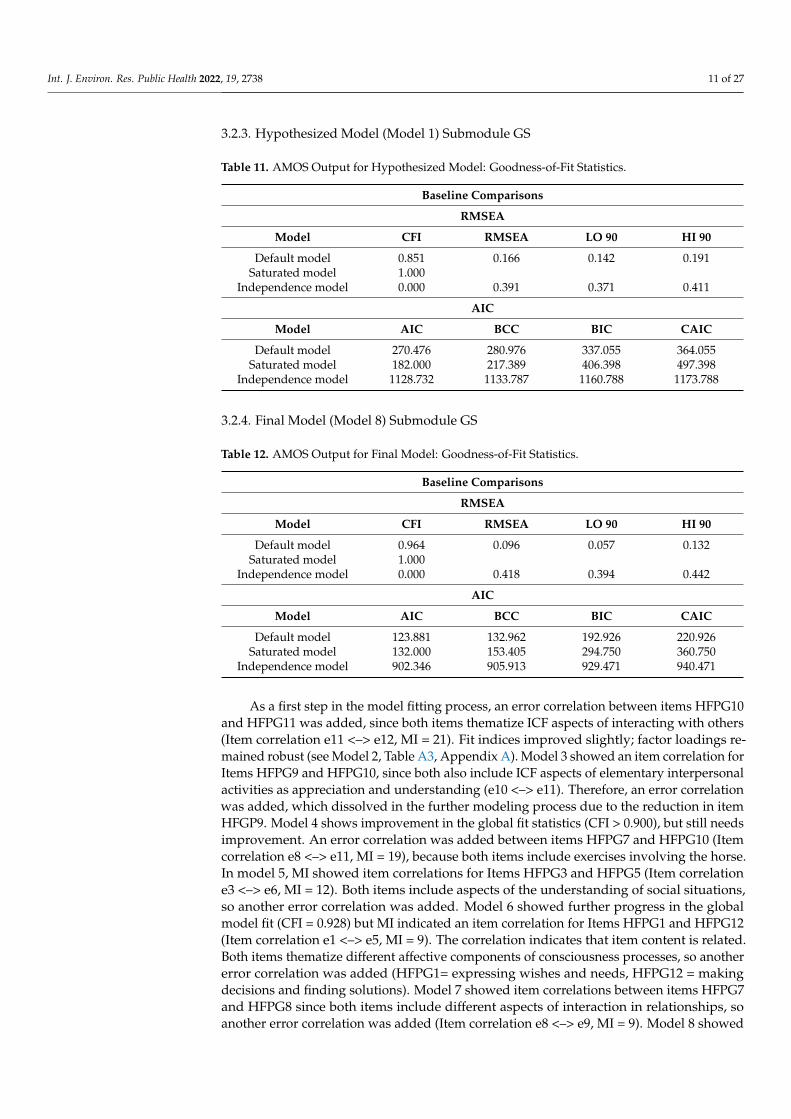
Int. J. Environ. Res. Public Health 2022, 19, 2738 11 of 27
3.2.3. Hypothesized Model (Model 1) Submodule GS
Table 11. AMOS Output for Hypothesized Model: Goodness-of-Fit Statistics.
Baseline Comparisons
RMSEA
Model CFI RMSEA LO 90 HI 90
Default model 0.851 0.166 0.142 0.191Saturated model 1.000
Independence model 0.000 0.391 0.371 0.411
AIC
Model AIC BCC BIC CAIC
Default model 270.476 280.976 337.055 364.055Saturated model 182.000 217.389 406.398 497.398
Independence model 1128.732 1133.787 1160.788 1173.788
3.2.4. Final Model (Model 8) Submodule GS
Table 12. AMOS Output for Final Model: Goodness-of-Fit Statistics.
Baseline Comparisons
RMSEA
Model CFI RMSEA LO 90 HI 90
Default model 0.964 0.096 0.057 0.132Saturated model 1.000
Independence model 0.000 0.418 0.394 0.442
AIC
Model AIC BCC BIC CAIC
Default model 123.881 132.962 192.926 220.926Saturated model 132.000 153.405 294.750 360.750
Independence model 902.346 905.913 929.471 940.471
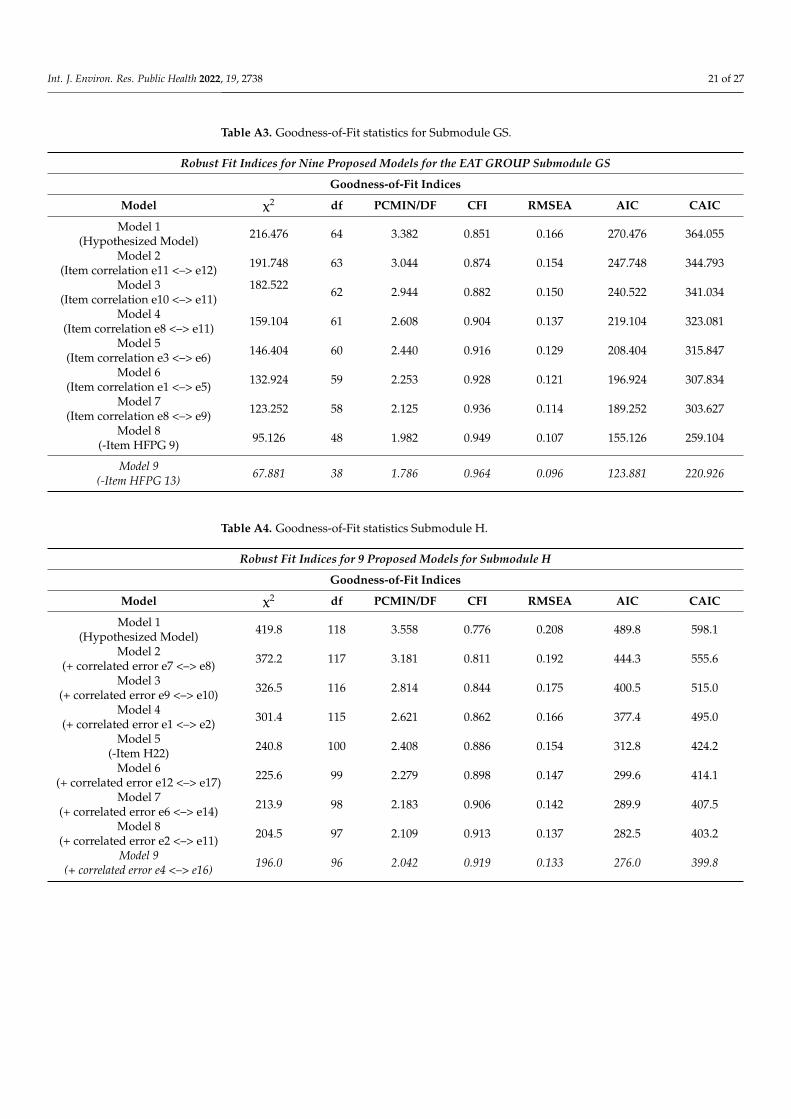
As a first step in the model fitting process, an error correlation between items HFPG10and HFPG11 was added, since both items thematize ICF aspects of interacting with others(Item correlation e11 <–> e12, MI = 21). Fit indices improved slightly; factor loadings re-mained robust (see Model 2, Table A3, Appendix A). Model 3 showed an item correlation forItems HFPG9 and HFPG10, since both also include ICF aspects of elementary interpersonalactivities as appreciation and understanding (e10 <–> e11). Therefore, an error correlationwas added, which dissolved in the further modeling process due to the reduction in itemHFGP9. Model 4 shows improvement in the global fit statistics (CFI > 0.900), but still needsimprovement. An error correlation was added between items HFPG7 and HFPG10 (Itemcorrelation e8 <–> e11, MI = 19), because both items include exercises involving the horse.In model 5, MI showed item correlations for Items HFPG3 and HFPG5 (Item correlatione3 <–> e6, MI = 12). Both items include aspects of the understanding of social situations,so another error correlation was added. Model 6 showed further progress in the globalmodel fit (CFI = 0.928) but MI indicated an item correlation for Items HFPG1 and HFPG12(Item correlation e1 <–> e5, MI = 9). The correlation indicates that item content is related.Both items thematize different affective components of consciousness processes, so anothererror correlation was added (HFPG1= expressing wishes and needs, HFPG12 = makingdecisions and finding solutions). Model 7 showed item correlations between items HFPG7and HFPG8 since both items include different aspects of interaction in relationships, soanother error correlation was added (Item correlation e8 <–> e9, MI = 9). Model 8 showed
Int. J. Environ. Res. Public Health 2022, 19, 2738 12 of 27
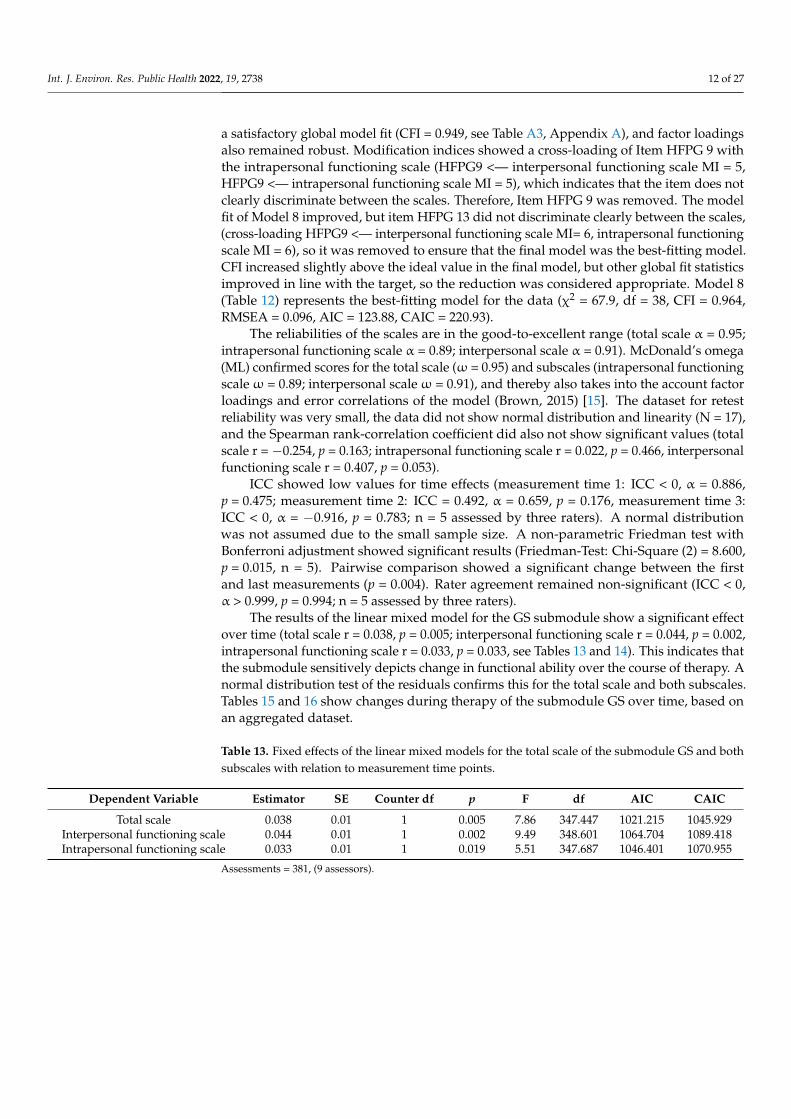
a satisfactory global model fit (CFI = 0.949, see Table A3, Appendix A), and factor loadingsalso remained robust. Modification indices showed a cross-loading of Item HFPG 9 withthe intrapersonal functioning scale (HFPG9 <— interpersonal functioning scale MI = 5,HFPG9 <— intrapersonal functioning scale MI = 5), which indicates that the item does notclearly discriminate between the scales. Therefore, Item HFPG 9 was removed. The modelfit of Model 8 improved, but item HFPG 13 did not discriminate clearly between the scales,(cross-loading HFPG9 <— interpersonal functioning scale MI= 6, intrapersonal functioningscale MI = 6), so it was removed to ensure that the final model was the best-fitting model.CFI increased slightly above the ideal value in the final model, but other global fit statisticsimproved in line with the target, so the reduction was considered appropriate. Model 8(Table 12) represents the best-fitting model for the data (χ2 = 67.9, df = 38, CFI = 0.964,RMSEA = 0.096, AIC = 123.88, CAIC = 220.93).
The reliabilities of the scales are in the good-to-excellent range (total scale α = 0.95;intrapersonal functioning scale α = 0.89; interpersonal scale α = 0.91). McDonald’s omega(ML) confirmed scores for the total scale (ω = 0.95) and subscales (intrapersonal functioningscaleω = 0.89; interpersonal scaleω = 0.91), and thereby also takes into the account factorloadings and error correlations of the model (Brown, 2015) [15]. The dataset for retestreliability was very small, the data did not show normal distribution and linearity (N = 17),and the Spearman rank-correlation coefficient did also not show significant values (totalscale r = −0.254, p = 0.163; intrapersonal functioning scale r = 0.022, p = 0.466, interpersonalfunctioning scale r = 0.407, p = 0.053).
ICC showed low values for time effects (measurement time 1: ICC < 0, α = 0.886,p = 0.475; measurement time 2: ICC = 0.492, α = 0.659, p = 0.176, measurement time 3:ICC < 0, α = −0.916, p = 0.783; n = 5 assessed by three raters). A normal distributionwas not assumed due to the small sample size. A non-parametric Friedman test withBonferroni adjustment showed significant results (Friedman-Test: Chi-Square (2) = 8.600,p = 0.015, n = 5). Pairwise comparison showed a significant change between the firstand last measurements (p = 0.004). Rater agreement remained non-significant (ICC < 0,α > 0.999, p = 0.994; n = 5 assessed by three raters).
The results of the linear mixed model for the GS submodule show a significant effectover time (total scale r = 0.038, p = 0.005; interpersonal functioning scale r = 0.044, p = 0.002,intrapersonal functioning scale r = 0.033, p = 0.033, see Tables 13 and 14). This indicates thatthe submodule sensitively depicts change in functional ability over the course of therapy. Anormal distribution test of the residuals confirms this for the total scale and both subscales.Tables 15 and 16 show changes during therapy of the submodule GS over time, based onan aggregated dataset.
Table 13. Fixed effects of the linear mixed models for the total scale of the submodule GS and bothsubscales with relation to measurement time points.
Dependent Variable Estimator SE Counter df p F df AIC CAIC
Total scale 0.038 0.01 1 0.005 7.86 347.447 1021.215 1045.929Interpersonal functioning scale 0.044 0.01 1 0.002 9.49 348.601 1064.704 1089.418Intrapersonal functioning scale 0.033 0.01 1 0.019 5.51 347.687 1046.401 1070.955
Assessments = 381, (9 assessors).
Int. J. Environ. Res. Public Health 2022, 19, 2738 13 of 27
Table 14. Random effects of the linear mixed model for the total scale and subscales submodule GS.
Dependent Variables Estimator p
Total scale variance of the constant term therapist 0.21 0.288Total scale variance of the constant term therapist*patient 0.67 <0.000
Residual variance 0.60 <0.001
Interpersonal functioning scale variance of the constant term therapist 0.16 0.350Interpersonal functioning scale variance of the constant term therapist*patient 0.70 <0.001
Residual variance 0.69 <0.000
Intrapersonal functioning scale variance of the constant term therapist 0.24 0.279Intrapersonal functioning scale variance of the constant term therapist*patient 0.72 <0.000
Residual variance 0.64 <0.000
Table 15. Changes in submodule GS over time.
Changes over Time Min Max M SD
total scale start–end −2.18 4.64 0.53 1.30total scale Min.–Max. 0.00 5.36 1.48 1.37
Interpersonal functioning scale start–end −2.60 4.80 0.60 1.38Interpersonal functioning scale Min.–Max. 0.00 5.80 0.92 1.43
Intrapersonal functioning scale start–end −2.00 4.50 0.47 1.30Intrapersonal functioning scale Min.–Max. 0.00 5.50 1.51 1.41
Table 16. Changes in submodule GS in the context of four-week therapy periods.
Changes over Time n Min Max M SD
1–4 weeks start–end 205 −2.36 5.36 0.38 1.584 weeks Min.–Max. 205 0.00 5.36 1.24 1.30
5–8 weeks start–end 123 −2.36 2.09 0.13 1.008 weeks Min.–Max. 123 0.00 2.36 1.10 0.70
9–12 weeks start–end 49 −0.91 2.73 0.36 0.9612 weeks Min.–Max. 49 0.00 2.73 0.91 0.74
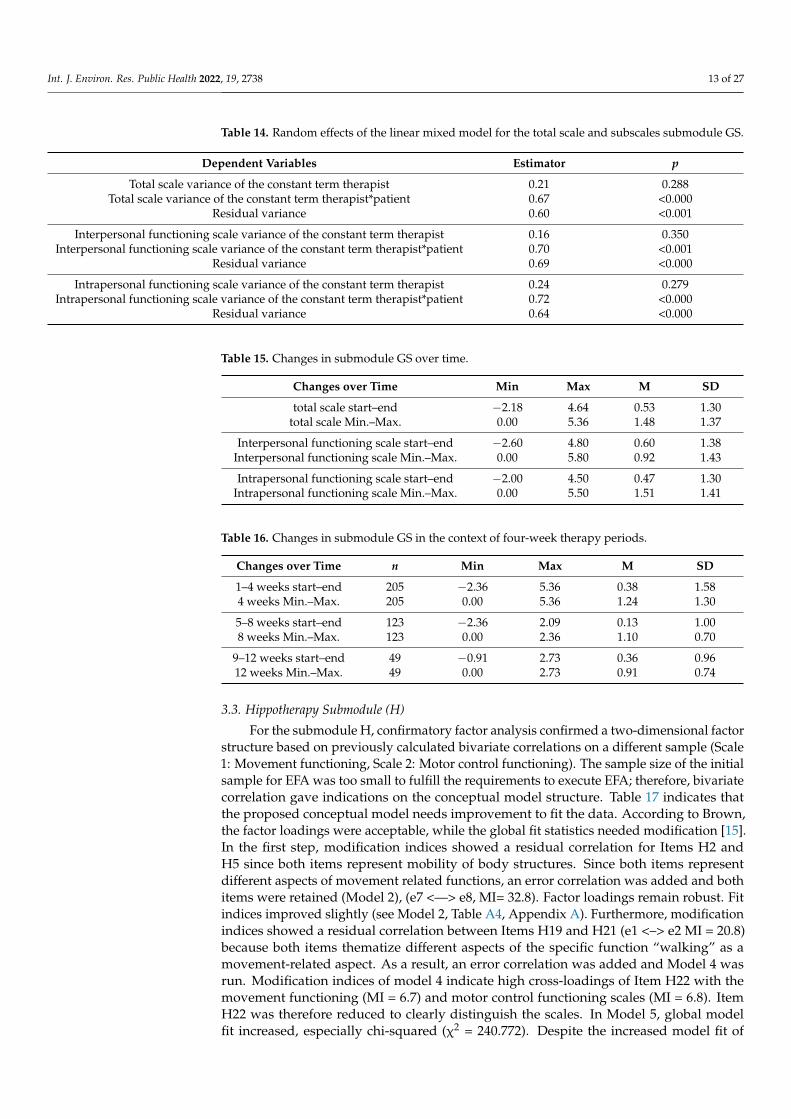
3.3. Hippotherapy Submodule (H)
For the submodule H, confirmatory factor analysis confirmed a two-dimensional factorstructure based on previously calculated bivariate correlations on a different sample (Scale1: Movement functioning, Scale 2: Motor control functioning). The sample size of the initialsample for EFA was too small to fulfill the requirements to execute EFA; therefore, bivariatecorrelation gave indications on the conceptual model structure. Table 17 indicates thatthe proposed conceptual model needs improvement to fit the data. According to Brown,the factor loadings were acceptable, while the global fit statistics needed modification [15].In the first step, modification indices showed a residual correlation for Items H2 andH5 since both items represent mobility of body structures. Since both items representdifferent aspects of movement related functions, an error correlation was added and bothitems were retained (Model 2), (e7 <—> e8, MI= 32.8). Factor loadings remain robust. Fitindices improved slightly (see Model 2, Table A4, Appendix A). Furthermore, modificationindices showed a residual correlation between Items H19 and H21 (e1 <–> e2 MI = 20.8)because both items thematize different aspects of the specific function “walking” as amovement-related aspect. As a result, an error correlation was added and Model 4 wasrun. Modification indices of model 4 indicate high cross-loadings of Item H22 with themovement functioning (MI = 6.7) and motor control functioning scales (MI = 6.8). ItemH22 was therefore reduced to clearly distinguish the scales. In Model 5, global modelfit increased, especially chi-squared (χ2 = 240.772). Despite the increased model fit of

Int. J. Environ. Res. Public Health 2022, 19, 2738 14 of 27
Model 5, modification indices showed a residual correlation between Items H11 and H16(e12 <–> e17 MI = 11.1), since both items thematize aspects of muscle activation; therefore,an error correlation was added, and the model was run again. Model 6 modification indicesshowed a residual correlation between Items H8 and H18 (e6 <–> e14 MI = 9.6), bothof which thematize the range of movement functioning; therefore, an error correlationwas added. Model 7 showed a noticeable improvement in model fit (CFI 0.906), butstill needed improvement for a suitable data fit. Modification indices showed a highresidual correlation for Items H7 and H19 (e2 <–> e11 MI = 8.5), since both items thematizefunctions of motion sequences responsible for movement patterns, and as such an errorcorrelation was added. Model 8 made further progress in the global model fit (CFI = 0.913):modification indices showed a residual correlation between Items H10 and H23 (e4 <–> e16MI = 7.9), and therefore an error correlation was added, and the model run again. Theoverall model fit of Model 9 was acceptable and represents the best fitting model for thedata, including all parameters that are meaningful and relevant (χ2 = 196.049, df = 96,CFI < 0.90, RMSEA = 0.133). The RMSEA could still be improved, since the limiting factorto further increasing the global model fit was the small sample size, which showed fewmodification indices, and would not improve global model fit of Model 9 significantly(N = 60). Therefore, to prevent overfitting of the model to this dataset, Model 9 representsthe best model fit (see Table 18).
3.3.1. Hypothesized Model (Model 1) Submodule H
Table 17. AMOS Output for Hypothesized Model: Goodness-of-Fit Statistics.
Baseline Comparisons
RMSEA
Model CFI RMSEA LO 90 HI 90
Default model 0.776 0.208 0.187 0.230Saturated model 1.000
Independence model 0.000 0.410 0.391 0.429
AIC
Model AIC BCC BIC CAIC
Default model 489.786 520.518 563.088 598.088Saturated model 306.000 440.341 626.435 779.435
Independence model 1518.155 1533.082 1553.759 1570.759
3.3.2. Final Model (Model 9) Submodule H
Table 18. AMOS Output for Final Model: Goodness-of-Fit Statistics.
Baseline Comparisons
RMSEA
Model CFI RMSEA LO 90 HI 90
Default model 0.919 0.133 0.106 0.159Saturated model 1.000
Independence model 0.000 0.418 0.398 0.438
AIC
Model AIC BCC BIC CAIC
Default model 276.049 308.430 359.823 399.823Saturated model 272.000 382.095 556.831 692.831
Independence model 1389.707 1402.660 1423.217 1439.217

Int. J. Environ. Res. Public Health 2022, 19, 2738 15 of 27
The reliabilities of the submodule H scales are in the excellent range (total scaleα = 0.97; movement functioning scale α = 0.95; motor control functioning scale α = 0.94).Due to the high reliability, a further reduction in the instrument is possible for an improvedtemporal–economic implementation. McDonald’s omega (ML) confirmed scores for thetotal scale (ω = 0.97) and subscales (movement functioning scale ω =0.96; motor controlfunctioning scaleω = 0.95), and via this procedure also considers the factor loadings anderror correlations of the model. The dataset for retest reliability was too small to computemeaningful results for submodule H (N = 2). ICC showed significant values for timeeffects from the first to the third measurement (measurement time 1: ICC = 0.990, α = 0.998,p < 0.001; measurement time 2: ICC = 0.991, α = 0.997, p < 0.001, measurement time 3:ICC = 0.991, α = 0.998, p < 0.001, N = 3, assessed by three raters). A non-parametric Fried-man test indicates no significant change during therapy (Chi-Square (2) = 2.000, p =0.368,n = 3). Multiple comparisons were not performed because the overall test resulted in thenull hypothesis. Rater agreement also remained non-significant (ICC: 0.068, α = −0.073,p = 0.400; N = 3 assessed by three raters).
Concerning change sensitivity, the linear mixed model for the H submodule shows asignificant effect over time in the movement functioning scale (r = 0.047, p = 0.009). The totalscale and motor control functioning scale do not show significant time effects (total scaler = 0.023, p = 0.183; interpersonal functioning scale r = 0.002, p = 0.935) (Tables 19 and 20).A normal distribution test of the residuals confirms the results for the total scale andsubscales. Random effects for the total scale and the motor control functioning scale couldnot generate meaningful results due to the small sample size.
Table 19. Fixed effects of the linear mixed models for the total scale of the submodule H and bothsubscales with relation to measurement time points.
Dependent Variable Estimator SE Counter df p F df AIC CAIC
Total Scale 0.023 0.02 42.5 0.183 68.2 10.076 122.939 137.695Movement functioning scale 0.047 0.02 42.4 0.009 7.6 42.364 125.568 140.325
Motor control functioning scale −0.002 0.02 42.7 0.935 0.0 42.694 136.022 150.779
Assessments = 52, (9 assessors, 10 patients).
Table 20. Random effects of the linear mixed model for the total scale and subscales, submodule H.
Dependent Variables Estimator p
Total scale variance of the constant term therapist 0.00 # #Total scale variance of the constant term therapist*patient 5.13 0.031
Residual variance 0.24 <0.001
Movement functioning scale variance of the constant term therapist 0.09 0.987Movement functioning scale variance of the constant term therapist*patient 5.90 0.359
Residual variance 0.25 <0.001
Motor control functioning scale variance of the constant term therapist 0.00 # #Motor control functioning scale variance of the constant term therapist*patient 4.72 0.034
Residual variance 0.34 <0.001
# Could not be calculated.
Tables 21 and 22 show changes during therapy of submodule H over time, calculatedusing linear mixed models based on aggregated data. The means in Table 21 show thatchanges over time result in negative values (total scale start–end: M = −0.02, motor controlfunctioning scale start–end: M = −0.13).
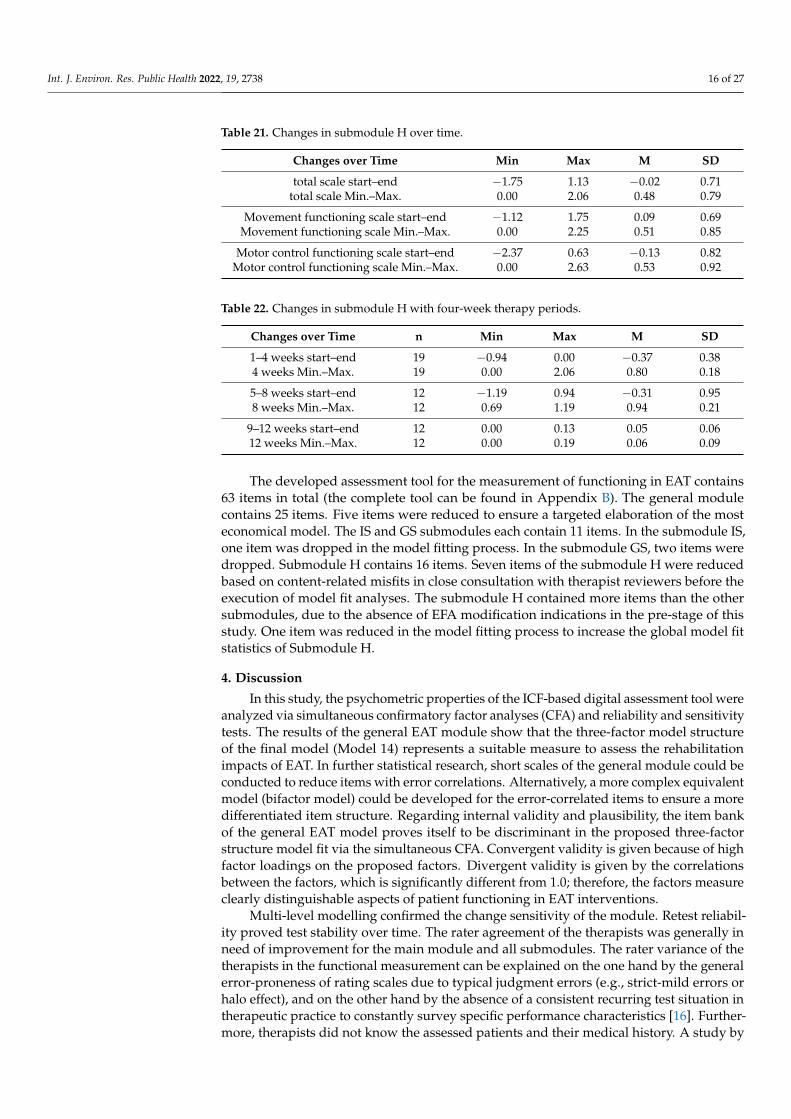
Int. J. Environ. Res. Public Health 2022, 19, 2738 16 of 27
Table 21. Changes in submodule H over time.
Changes over Time Min Max M SD
total scale start–end −1.75 1.13 −0.02 0.71total scale Min.–Max. 0.00 2.06 0.48 0.79
Movement functioning scale start–end −1.12 1.75 0.09 0.69Movement functioning scale Min.–Max. 0.00 2.25 0.51 0.85
Motor control functioning scale start–end −2.37 0.63 −0.13 0.82Motor control functioning scale Min.–Max. 0.00 2.63 0.53 0.92
Table 22. Changes in submodule H with four-week therapy periods.
Changes over Time n Min Max M SD
1–4 weeks start–end 19 −0.94 0.00 −0.37 0.384 weeks Min.–Max. 19 0.00 2.06 0.80 0.18
5–8 weeks start–end 12 −1.19 0.94 −0.31 0.958 weeks Min.–Max. 12 0.69 1.19 0.94 0.21
9–12 weeks start–end 12 0.00 0.13 0.05 0.0612 weeks Min.–Max. 12 0.00 0.19 0.06 0.09
The developed assessment tool for the measurement of functioning in EAT contains63 items in total (the complete tool can be found in Appendix B). The general modulecontains 25 items. Five items were reduced to ensure a targeted elaboration of the mosteconomical model. The IS and GS submodules each contain 11 items. In the submodule IS,one item was dropped in the model fitting process. In the submodule GS, two items weredropped. Submodule H contains 16 items. Seven items of the submodule H were reducedbased on content-related misfits in close consultation with therapist reviewers before theexecution of model fit analyses. The submodule H contained more items than the othersubmodules, due to the absence of EFA modification indications in the pre-stage of thisstudy. One item was reduced in the model fitting process to increase the global model fitstatistics of Submodule H.
4. Discussion
In this study, the psychometric properties of the ICF-based digital assessment tool wereanalyzed via simultaneous confirmatory factor analyses (CFA) and reliability and sensitivitytests. The results of the general EAT module show that the three-factor model structureof the final model (Model 14) represents a suitable measure to assess the rehabilitationimpacts of EAT. In further statistical research, short scales of the general module could beconducted to reduce items with error correlations. Alternatively, a more complex equivalentmodel (bifactor model) could be developed for the error-correlated items to ensure a moredifferentiated item structure. Regarding internal validity and plausibility, the item bankof the general EAT model proves itself to be discriminant in the proposed three-factorstructure model fit via the simultaneous CFA. Convergent validity is given because of highfactor loadings on the proposed factors. Divergent validity is given by the correlationsbetween the factors, which is significantly different from 1.0; therefore, the factors measureclearly distinguishable aspects of patient functioning in EAT interventions.
Multi-level modelling confirmed the change sensitivity of the module. Retest reliabil-ity proved test stability over time. The rater agreement of the therapists was generally inneed of improvement for the main module and all submodules. The rater variance of thetherapists in the functional measurement can be explained on the one hand by the generalerror-proneness of rating scales due to typical judgment errors (e.g., strict-mild errors orhalo effect), and on the other hand by the absence of a consistent recurring test situation intherapeutic practice to constantly survey specific performance characteristics [16]. Further-more, therapists did not know the assessed patients and their medical history. A study by
Int. J. Environ. Res. Public Health 2022, 19, 2738 17 of 27
Cronley, Marchant, and Caldarella showed for teachers that their assessments were highlyreliable in estimating the frequency of occurrence of behavior problems in pupils whenthe teachers knew how these behaviors presented themselves [16,17]. Accordingly, theassessing therapists should be intensively involved in the individual therapy to conduct as-sessments that are more reliable. However, this increases the risk of detection bias, in whicha therapist’s own intervention may be assessed as more effective because the therapist isnot blinded and is convinced of the effectiveness of their intervention.
Additionally, for the assessment of hippotherapy, seasonal influences were a causeof variance, since participants wore jackets in winter, which made the assessment of theirphysical functioning status particularly difficult to accurately assess. The 10-step Likertscale represents another cause of variance, given that too many response categories cannegatively affect the measurement properties of the items since the high degree of dif-ferentiation can overburden assessors [13]. Aside from reasons of the measurability ofchange sensitivity, the 10-step scale represented the most appropriate one for the developedassessment tool, since a more differentiated response format provides more opportunitiesto make distinctions between patients [13]. A promising approach for future researchwould be the test for inter-rater reliability using generalizability theory [16,18]. Accordingto this theory, the causes of measurement errors can be estimated and their conditions sim-ulated, so that relative and absolute comparisons of progress-diagnostics can be examinedprecisely [16,19]. Thus, according to the numerical invariance concept, it would not beproblematic that therapeutic professionals do not assess identically as long as they assesstrends in the same way, which is more realistic in behavioral observations over time [16,18].
Causes for negative and non-significant values in the submodule analyses of therapyprogress over time can also be explained by the functional capacities of the therapies’target groups. Patients with chronic degenerative diseases or multiple disabilities may facemental and motor functioning decreases over time (for example patients with multiplesclerosis). In these contexts, therapies succeed by delaying the degenerative progressionof the diseases. An improvement in functioning cannot always be achieved in therapyand therefore cannot be detected by assessment tools. Assessed patients in the ICC forsubmodule H were diagnosed with Huntington’s chorea, and Angelman’s syndrome;where maintaining the current functional state can already represent therapeutic successfor EAT. A study by Goudy et al. (2019) came to similar conclusions. Positive effects of anhippotherapy simulator program for older adults with Parkinson’s Syndrome were foundwith regard to an increase in balance and cognitive impairment [20]. The authors argue infavor of slowing the natural progression of the disease by improving symptoms such as anincreased balance and posture through these types of interventions [20]. Fizkova et al. (2013)point out that hippotherapy is effective in suppressing pathological stereotypy of musclegroups and promotes postural reflex mechanisms in children with cerebral palsy [21].Vermöhlen et al. (2017) showed positive effects of hippotherapy, alongside treatment asusual, in the improvement of balance, fatigue, spasticity, and quality of life in patients withmultiple sclerosis [22]. EAT interventions aim to influence components of balance andmotor control, which then promote motor problem solving skills that improve ambulationand sitting and other life-related activities [23]. Furthermore, positive effects in regard topost-traumatic stress disorders (PTSD) and psychosocial functioning have been found byJohnson et al. (2018) and Gabriels et al., 2015 [24,25]. The study results discussed thus farshow that these therapies are effective, but that instruments may not be accurately andadequately targeting their holistic therapy approaches. Researchers furthermore emphasizethat the field of EAT would benefit from future research testing different assessment toolsand intervention protocols to precisely assess therapy effects and evaluate therapeuticoutcomes [23]. In this respect, the general module of the assessment tool satisfactorilyfulfills psychometric requirements and can directly be applied in therapeutic practice.
Overall, the developed digital assessment tool represents a standardized ICF applica-tion suitable for targeted assessment of functioning in EAT. As previous studies indicate,the ICF defines a promising framework for the identification of beneficial aspects of holistic

Int. J. Environ. Res. Public Health 2022, 19, 2738 18 of 27
EAT interventions on human functioning combined with the possibility of quantification oftherapy effects. Therefore, the assessment tool developed and validated herein contributesto the joint efforts of the international scientific community to increase evidence of theeffects of EAT in international healthcare through systematic assessment strategies [5–7].The assessment tool can sensitively measure therapy progress change and also preciselydepict the effect factors of the therapy.
For the submodules, the small sample sizes for performing CFA and reliability andchange sensitivity tests were a limiting factor. The final CFA models of the submodules ISand GS still show deviating values in the global fit statistics, while modification indicesdid not provide further options to increase model fit. Test stability (retest and inter-raterreliability) could not be estimated in a target-oriented manner to depict significant effects.A cause of the small sample sizes was patient acquisition problems based on restrictionsdue to the COVID-19 pandemic in Germany during the data collection period from August2020–2021. Further research should determine reliability scores based on larger samplesizes. In respect to reliability, the possibility of distortive effects based on the assessmentscarried out by EAT therapists can also not be ruled out. In the future, the developed ICF-based assessment tool could be trialed in a controlled randomized study with a group ofpatients homogeneous with respect to age, gender, and disability or chronic disease. Thus,the effects of the EAT interventions and conclusions about reliability could be assessed in amore precise and differentiated manner.
Regarding process orientation, the developed assessment tool builds the basis to mon-itor rehabilitation impacts and guide the therapy progression of EAT within the WHO andICF frameworks, which represent the international standard of global health systems. Assuch, it refers to the innovative resource-orientated functioning approach, which opera-tionalizes a person’s “lived health” in addition to the biological health status to performactivities and participate in social situations. In the future, this assessment tool could beused in close coordination with physicians and multi-professional rehabilitation teamsfor a targeted overall rehabilitation process and electronic data interchange within insti-tutions [26]. Furthermore, for goal setting with clients, the assessment tool could be apromising instrument to align therapy goals related to desired life skills, as other studies in-dicate [26]. Past research has shown that the implementation of the ICF in the rehabilitationteam had a positive impact that manifested in a more systematic work approach, greaterinterdisciplinary cooperation, and a participatory orientation in the clinical setting [26].In addition, for funding agencies and stakeholders involved in the rehabilitation process,transparent planning of rehabilitative processes and services via the ICF could providea better insight into processes and their financial aspects, which may lead to increasedcost-reimbursements from public financiers and insurance companies [23,26]. For thefield of EAT, the prospective usage of the developed assessment tool builds a basis forincreased comparison and joint collection of EAT findings across languages and coun-tries [27]. It could encourage the usage of a common international terminology based onthe WHO language and thereby help incorporate EAT into global health systems. Therapycontents and outcomes could be assessed more precisely and linked back into the ICF-classification system to help gather scientific evidence about EAT effect factors throughinternational collaboration.
5. Conclusions
The validated assessment tool provides a nuanced framework for evaluating thetherapy outcomes and effect factors of EAT interventions in the common language of theICF. Through its connection to concrete ICF categories, EAT effects prospectively couldbe evaluated in a more standardized manner in multicultural and multi-professionalhealth care teams. Therapy effects could also be compared to other functioning-relatedintervention outcomes in international health systems. This could enable economic cost-effectiveness evaluations and therefore affect a targeted outcome measurement in thecontext of formal therapy evaluations based on functioning capabilities. Furthermore,
Int. J. Environ. Res. Public Health 2022, 19, 2738 19 of 27
common international efforts to create scientific databases with large-scale data frommulticenter studies and international research collaborations could be implemented in atargeted manner through unified study variables and specific therapy insights based onICF parameters.
6. Patents
A legally protected trademark is declared in 2022 by Research Institute for Inclusionthrough Physical Activity and Sport. Further information can be obtained from the authors.
Author Contributions: Conceptualization, methodology, and analysis: I.S. Supervision: V.A. Reviewand editing: I.F. All authors have read and agreed to the published version of the manuscript.
Funding: This research was funded by the Imhoff Foundation (Funding Number 2019-4-039), theKaempgen Foundation (Funding Number 3595/19), and the Marga and Walter Boll Foundation(Funding Number 210-03.04-19) with a share of 18.87% each. The Research Institute for Inclusionthrough Physical Activity and Sport and the participating centers for equine-assisted therapy financedthe remainder with their own resources. The authors report no involvement in the research by asponsor that could have influenced the outcome of this work.
Institutional Review Board Statement: The study was conducted according to the guidelines of theDeclaration of Helsinki and approved by Ethics Committee of German Sport University Cologne(076-2019, 17 September 2019).
Informed Consent Statement: Written informed consent was obtained from all subjects involved inthe study.
Data Availability Statement: Data can be obtained from the authors.
Acknowledgments: The authors acknowledge the involvement of EAT centers and therapists inGermany. We express our gratitude to the participants, therapists, and therapy horses involved inthis study. We especially acknowledge the involvement of three coordinating EAT centers: HorseSport and Horse-Riding Therapy Center of Gold-Kraemer Foundation in Frechen, the Center forTherapeutic Horse Riding of Imhoff Foundation in Cologne and the Center for Therapeutic HorseRiding Johannisberg e.V. of Willi Drache Foundation in Windhagen. We further thank the study teamincluding Marion Drache, Desriee Frerich, Inga Nelle, Anja Reinhardt, and Sabine Schickendantz.We also express our gratitude to Matthias Weigelt, Head of Psychology and Human Movement—Paderborn University, who has supervised the manuscript writing process.
Conflicts of Interest: The authors declare no conflict of interest. The funders had no role in the designof the study; in the collection, analyses, or interpretation of data; in the writing of the manuscript, orin the decision to publish the results.
Int. J. Environ. Res. Public Health 2022, 19, 2738 20 of 27
Appendix A. Details of the CFA Process
Table A1. Goodness-of-Fit statistics Module G.
Robust Fit Indices for 14 Proposed Models for the General EAT Module (G)
Goodness-of-Fit Indices
Model χ2 df PCMIN/DF CFI RMSEA AIC CAIC
Model 1(Hypothesized Model) 1976.6 402 4.917 0.810 0.122 2102.63 2391.2
Model 2(-Item G1) 1766.6 374 4.728 0.825 0.119 1888.6 2167.9
Model 3(+ correlated error e13 <–> e14) 1675.2 373 4.493 0.836 0.115 1799.7 2083.6
Model 4(+ correlated error e4 <–> e5) 1592.4 372 4.280 0.847 0.111 1718.40 2006.9
Model 5(-Item G14) 1405.8 345 4.074 0.853 0.110 1522.77 1852.1
Model 6(-Item G11) 1252.1 319 3.925 0.868 0.105 1370.07 1640.3
Model 7(+ correlated error e2 <–> e3) 1204.9 318 3.777 0.875 0.103 1324.90 1599.7
Model 8(+ correlated error e26 <–> e27) 1166.5 317 3.679 0.880 0.101 1288.48 1567.8
Model 9(-Item G2) 1063. 292 3.640 0.887 0.100 1180.96 1451.2
Model 10(-Item G18) 959.3 268 3.579 0.893 0.099 1073.32 1334.4
Model 11(+ correlated error 3 <–> e4) 928.6 267 3.477 0.898 0.097 1044.60 1310.2
Model 12(+ correlated error e5 <–> e6) 901.0 266 3.387 0.902 0.095 1019.04 1289.2
Model 13(+ correlated error e4 <–> e6) 847.0 265 3.196 0.910 0.091 966.97 1241.8
Model 14(+ correlated error e25 <–> e26)
(Final Model)823.9 264 3.120 0.914 0.090 945.93 1225.3
Table A2. Goodness-of-Fit statistics Submodule IS.
Robust Fit Indices for 3 Proposed Models for the EAT Individual Submodule IS
Goodness-of-Fit Indices
Model χ2 df PCMIN/DF CFI RMSEA AIC CAIC
Model 1(Hypothesized Model) 190.160 53 3.588 0.867 0.151 240.160 333.784
Model 2(+ error correlation
Items HFPE5 & HFPE8)166.081 52 3.194 0.889 0.139 218.081 315.449
Model 3(-Item HFPE 4) 132.328 42 3.151 0.908 0.137 180.328 270.207
Int. J. Environ. Res. Public Health 2022, 19, 2738 21 of 27
Table A3. Goodness-of-Fit statistics for Submodule GS.
Robust Fit Indices for Nine Proposed Models for the EAT GROUP Submodule GS
Goodness-of-Fit Indices
Model χ2 df PCMIN/DF CFI RMSEA AIC CAIC
Model 1(Hypothesized Model) 216.476 64 3.382 0.851 0.166 270.476 364.055
Model 2(Item correlation e11 <–> e12) 191.748 63 3.044 0.874 0.154 247.748 344.793
Model 3(Item correlation e10 <–> e11)
182.522 62 2.944 0.882 0.150 240.522 341.034
Model 4(Item correlation e8 <–> e11) 159.104 61 2.608 0.904 0.137 219.104 323.081
Model 5(Item correlation e3 <–> e6) 146.404 60 2.440 0.916 0.129 208.404 315.847
Model 6(Item correlation e1 <–> e5) 132.924 59 2.253 0.928 0.121 196.924 307.834
Model 7(Item correlation e8 <–> e9) 123.252 58 2.125 0.936 0.114 189.252 303.627
Model 8(-Item HFPG 9) 95.126 48 1.982 0.949 0.107 155.126 259.104
Model 9(-Item HFPG 13) 67.881 38 1.786 0.964 0.096 123.881 220.926
Table A4. Goodness-of-Fit statistics Submodule H.
Robust Fit Indices for 9 Proposed Models for Submodule H
Goodness-of-Fit Indices
Model χ2 df PCMIN/DF CFI RMSEA AIC CAIC
Model 1(Hypothesized Model) 419.8 118 3.558 0.776 0.208 489.8 598.1
Model 2(+ correlated error e7 <–> e8) 372.2 117 3.181 0.811 0.192 444.3 555.6
Model 3(+ correlated error e9 <–> e10) 326.5 116 2.814 0.844 0.175 400.5 515.0
Model 4(+ correlated error e1 <–> e2) 301.4 115 2.621 0.862 0.166 377.4 495.0
Model 5(-Item H22) 240.8 100 2.408 0.886 0.154 312.8 424.2
Model 6(+ correlated error e12 <–> e17) 225.6 99 2.279 0.898 0.147 299.6 414.1
Model 7(+ correlated error e6 <–> e14) 213.9 98 2.183 0.906 0.142 289.9 407.5
Model 8(+ correlated error e2 <–> e11) 204.5 97 2.109 0.913 0.137 282.5 403.2
Model 9(+ correlated error e4 <–> e16) 196.0 96 2.042 0.919 0.133 276.0 399.8

Int. J. Environ. Res. Public Health 2022, 19, 2738 22 of 27
Appendix B
Table A5. Descriptive statistics of the ICF-based assessment tool (general EAT module and all submodules).
ItemsGeneral Module ICF Code N Min Max Mean ±SD
G03. Can establish a stabilized state of mind b1263 Psychic stability 265 1 10 6.17 2.070
G04. Shows motivation b1301 Motivation 265 1 10 7.78 1.943
G05. Can express their own needs b130 Energy and drive functions 265 1 10 6.60 2.259
G06. Is able to realistically assess their own abilities b1800 Experience of self 265 1 10 5.29 2.257
G07. Is able to achieve intentions and goals through planned actions b1641 Organizing and planning 265 1 10 6.09 2.276
G08. Is able to adapt to new things or to face new experiences positively b1264 Openness to experience 265 1 10 6.23 2.169
G09. Is able to build trust in others b122 Global psychosocial functions 265 2 10 6.99 2.104
G10. Is able to regulate his/her feelings adequately in different situations. This includesdealing with anger or frustration b1521 Regulation of emotion 265 1 10 5.54 2.181
G12. Can build and maintain a trusting relationship with the therapist d7200 Forming relationships 265 1 10 7.48 1.909
G13. Can build and maintain a trusting relationship with the horse d7200 Forming relationships 265 1 10 7.46 2.015
G15. Can show consideration and tolerance and react to the same d7102 Tolerance in relationships 265 1 10 5.92 2.417
G16. Can engage in an activity for a period of time. The person/child is not distracted b1400 Sustaining attention 265 1 10 5.85 2.574
G17. Can memorize processes and tasks in the therapy and reproduce them later b1442 Retrieval of Memory 265 1 10 6.44 2.475
G19. Can understand the meaning of various facial expressions or nonverbalcommunication d3150 Communicating with—receiving—body gestures 265 1 10 6.73 2.197
G20. Can express herself/himself in a communicative way d330 Speaking 265 1 10 6.60 2.585
G21. Is able to stand up actively on horseback during movement d4106 Shifting the body’s center of gravity 265 1 10 8.56 1.940
G22. Can keep their head upright and move it in a controlled manner b760 Control of voluntary movement functions 265 1 10 7.46 2.294
G23. Is able to keep their balance while sitting on the horseback in motion b235 Vestibular functions 265 1 10 7.19 2.174
G24. Can feel vibrations on the horse’s back b2701 Sensitivity to vibration 265 1 10 7.19 1.953
G25. Can adjust their movements to a rhythm or adapt to it in an appropriate way, e.g.,swing with the movement of the horse b156 Perception functions 265 1 10 6.14 2.221
G26. Can control the tension of their muscles in a targeted manner b7356 Tone of all muscles of the body 265 1 10 5.78 2.285
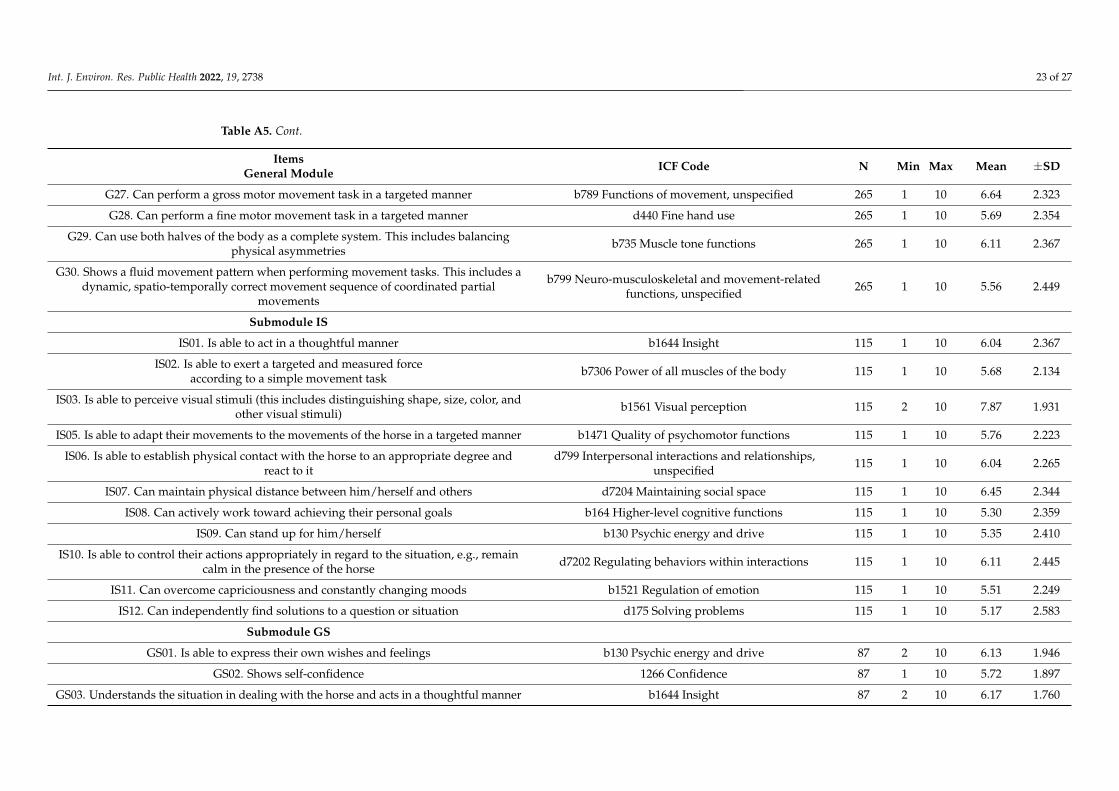
Int. J. Environ. Res. Public Health 2022, 19, 2738 23 of 27
Table A5. Cont.
ItemsGeneral Module ICF Code N Min Max Mean ±SD
G27. Can perform a gross motor movement task in a targeted manner b789 Functions of movement, unspecified 265 1 10 6.64 2.323
G28. Can perform a fine motor movement task in a targeted manner d440 Fine hand use 265 1 10 5.69 2.354
G29. Can use both halves of the body as a complete system. This includes balancingphysical asymmetries b735 Muscle tone functions 265 1 10 6.11 2.367
G30. Shows a fluid movement pattern when performing movement tasks. This includes adynamic, spatio-temporally correct movement sequence of coordinated partial
movements
b799 Neuro-musculoskeletal and movement-relatedfunctions, unspecified 265 1 10 5.56 2.449
Submodule IS
IS01. Is able to act in a thoughtful manner b1644 Insight 115 1 10 6.04 2.367
IS02. Is able to exert a targeted and measured forceaccording to a simple movement task b7306 Power of all muscles of the body 115 1 10 5.68 2.134
IS03. Is able to perceive visual stimuli (this includes distinguishing shape, size, color, andother visual stimuli) b1561 Visual perception 115 2 10 7.87 1.931
IS05. Is able to adapt their movements to the movements of the horse in a targeted manner b1471 Quality of psychomotor functions 115 1 10 5.76 2.223
IS06. Is able to establish physical contact with the horse to an appropriate degree andreact to it
d799 Interpersonal interactions and relationships,unspecified 115 1 10 6.04 2.265
IS07. Can maintain physical distance between him/herself and others d7204 Maintaining social space 115 1 10 6.45 2.344
IS08. Can actively work toward achieving their personal goals b164 Higher-level cognitive functions 115 1 10 5.30 2.359
IS09. Can stand up for him/herself b130 Psychic energy and drive 115 1 10 5.35 2.410
IS10. Is able to control their actions appropriately in regard to the situation, e.g., remaincalm in the presence of the horse d7202 Regulating behaviors within interactions 115 1 10 6.11 2.445
IS11. Can overcome capriciousness and constantly changing moods b1521 Regulation of emotion 115 1 10 5.51 2.249
IS12. Can independently find solutions to a question or situation d175 Solving problems 115 1 10 5.17 2.583
Submodule GS
GS01. Is able to express their own wishes and feelings b130 Psychic energy and drive 87 2 10 6.13 1.946
GS02. Shows self-confidence 1266 Confidence 87 1 10 5.72 1.897
GS03. Understands the situation in dealing with the horse and acts in a thoughtful manner b1644 Insight 87 2 10 6.17 1.760
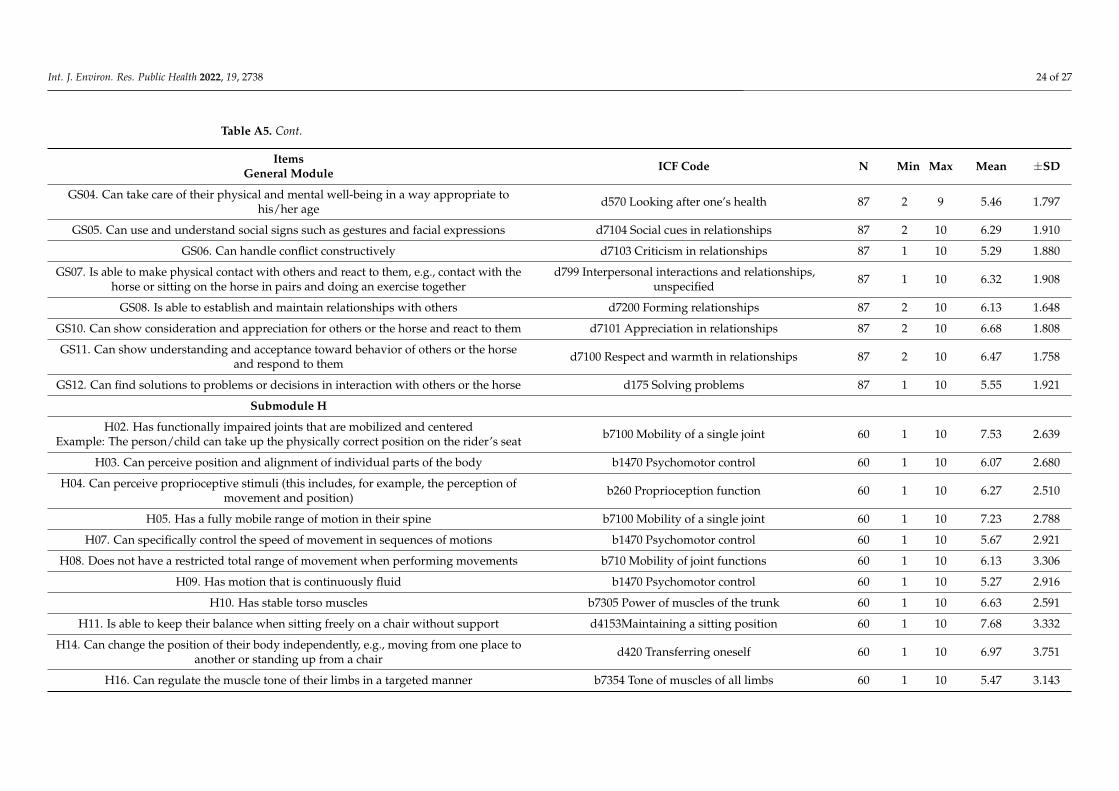
Int. J. Environ. Res. Public Health 2022, 19, 2738 24 of 27
Table A5. Cont.
ItemsGeneral Module ICF Code N Min Max Mean ±SD
GS04. Can take care of their physical and mental well-being in a way appropriate tohis/her age d570 Looking after one’s health 87 2 9 5.46 1.797
GS05. Can use and understand social signs such as gestures and facial expressions d7104 Social cues in relationships 87 2 10 6.29 1.910
GS06. Can handle conflict constructively d7103 Criticism in relationships 87 1 10 5.29 1.880
GS07. Is able to make physical contact with others and react to them, e.g., contact with thehorse or sitting on the horse in pairs and doing an exercise together
d799 Interpersonal interactions and relationships,unspecified 87 1 10 6.32 1.908
GS08. Is able to establish and maintain relationships with others d7200 Forming relationships 87 2 10 6.13 1.648
GS10. Can show consideration and appreciation for others or the horse and react to them d7101 Appreciation in relationships 87 2 10 6.68 1.808
GS11. Can show understanding and acceptance toward behavior of others or the horseand respond to them d7100 Respect and warmth in relationships 87 2 10 6.47 1.758
GS12. Can find solutions to problems or decisions in interaction with others or the horse d175 Solving problems 87 1 10 5.55 1.921
Submodule H
H02. Has functionally impaired joints that are mobilized and centeredExample: The person/child can take up the physically correct position on the rider’s seat b7100 Mobility of a single joint 60 1 10 7.53 2.639
H03. Can perceive position and alignment of individual parts of the body b1470 Psychomotor control 60 1 10 6.07 2.680
H04. Can perceive proprioceptive stimuli (this includes, for example, the perception ofmovement and position) b260 Proprioception function 60 1 10 6.27 2.510
H05. Has a fully mobile range of motion in their spine b7100 Mobility of a single joint 60 1 10 7.23 2.788
H07. Can specifically control the speed of movement in sequences of motions b1470 Psychomotor control 60 1 10 5.67 2.921
H08. Does not have a restricted total range of movement when performing movements b710 Mobility of joint functions 60 1 10 6.13 3.306
H09. Has motion that is continuously fluid b1470 Psychomotor control 60 1 10 5.27 2.916
H10. Has stable torso muscles b7305 Power of muscles of the trunk 60 1 10 6.63 2.591
H11. Is able to keep their balance when sitting freely on a chair without support d4153Maintaining a sitting position 60 1 10 7.68 3.332
H14. Can change the position of their body independently, e.g., moving from one place toanother or standing up from a chair d420 Transferring oneself 60 1 10 6.97 3.751
H16. Can regulate the muscle tone of their limbs in a targeted manner b7354 Tone of muscles of all limbs 60 1 10 5.47 3.143
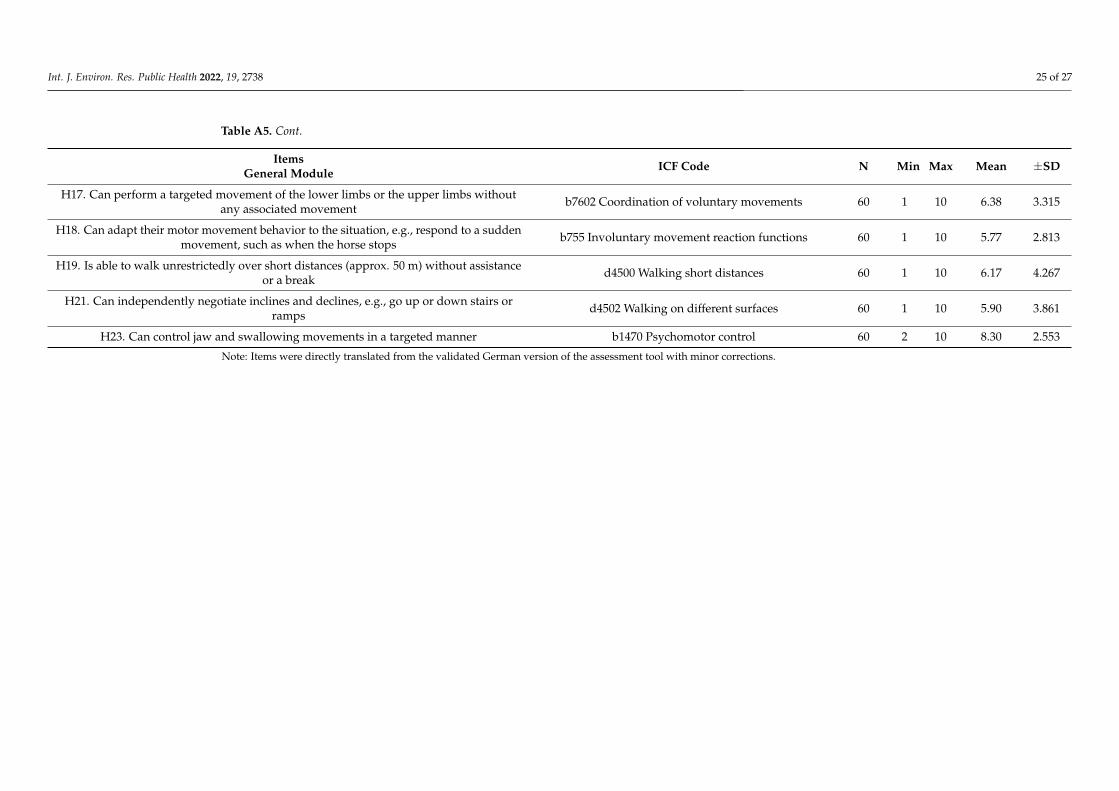
Int. J. Environ. Res. Public Health 2022, 19, 2738 25 of 27
Table A5. Cont.
ItemsGeneral Module ICF Code N Min Max Mean ±SD
H17. Can perform a targeted movement of the lower limbs or the upper limbs withoutany associated movement b7602 Coordination of voluntary movements 60 1 10 6.38 3.315
H18. Can adapt their motor movement behavior to the situation, e.g., respond to a suddenmovement, such as when the horse stops b755 Involuntary movement reaction functions 60 1 10 5.77 2.813
H19. Is able to walk unrestrictedly over short distances (approx. 50 m) without assistanceor a break d4500 Walking short distances 60 1 10 6.17 4.267
H21. Can independently negotiate inclines and declines, e.g., go up or down stairs orramps d4502 Walking on different surfaces 60 1 10 5.90 3.861
H23. Can control jaw and swallowing movements in a targeted manner b1470 Psychomotor control 60 2 10 8.30 2.553
Note: Items were directly translated from the validated German version of the assessment tool with minor corrections.
Int. J. Environ. Res. Public Health 2022, 19, 2738 26 of 27
References1. Maritz, R.; Aronsky, D.; Prodinger, B. The International Classification of Functioning, Disability and Health (ICF) in Electronic
Health Records. Appl. Clin. Inform. 2017, 8, 964–980. [CrossRef] [PubMed]2. Stucki, G.; Bickenbach, J. Functioning: The third health indicator in the health system and the key indicator for rehabilitation. Eur.
J. Phys. Rehabil. Med. 2017, 53, 134–138. [CrossRef] [PubMed]3. German Curatorship for Therapeutic Riding. The Areas of Therapeutic Riding Horse Assisted Therapy, Promotion and Sport.
Available online: https://www.dkthr.de/therapeutisches-reiten/ (accessed on 21 November 2021).4. Wood, W.; Alm, K.; Benjamin, J.; Thomas, L.; Anderson, D.; Pohl, L.; Kane, M. Optimal Terminology for Services in the United
States That Incorporate Horses to Benefit People: A Consensus Document. J. Altern. Complement. Med. 2021, 27, 88–95. [CrossRef][PubMed]
5. Borioni, N.; Marinaro, P.; Celestini, S.; Del Sole, F.; Magro, R.; Zoppi, D.; Mattei, F.; Dall’ Armi, V.; Mazzarella, F.; Cesario, A.; et al.Effect of equestrian therapy and onotherapy in physical and psycho-social performances of adults with intellectual disability: Apreliminary study of evaluation tools based on the ICF classification. Disabil. Rehabil. 2012, 34, 279–287. [CrossRef] [PubMed]
6. Hsieh, Y.-L.; Yang, C.-C.; Sun, S.-H.; Chan, S.-Y.; Wang, T.-H.; Luo, H.-J. Effects of hippotherapy on body functions, activitiesand participation in children with cerebral palsy based on ICF-CY assessments. Disabil. Rehabil. 2017, 39, 1703–1713. [CrossRef][PubMed]
7. Lanning, B.A.; Wilson, A.L.; Krenek, N.; Beaujean, A.A. Using Therapeutic Riding as an Intervention for Combat Veterans: AnInternational Classification of Functioning, Disability, and Health (ICF) Approach. Occup. Ther. Ment. Health 2017, 33, 259–278.[CrossRef]
8. DKThR. Standardized Procedure Regulations. Available online: https://www.dkthr.de/wp-content/uploads/2020/07/Durchfuehrungsbestimmungen_in_den_vier_Fachbereichen_des_Therapeutischen_Reitens__Stand_06.2019.pdf (accessed on 25February 2022).
9. Cieza, A.; Fayed, N.; Bickenbach, J.; Prodinger, B. Refinements of the ICF Linking Rules to strengthen their potential forestablishing comparability of health information. Disabil. Rehabil. 2019, 41, 574–583. [CrossRef] [PubMed]
10. Sherer, M.; Poritz, J.M.P.; Tulsky, D.; Kisala, P.; Leon-Novelo, L.; Ngan, E. Conceptual Structure of Health-Related Quality of Lifefor Persons with Traumatic Brain Injury: Confirmatory Factor Analysis of the TBI-QOL. Arch. Phys. Med. Rehabil. 2020, 101, 62–71.[CrossRef] [PubMed]
11. Bortz, J.D.N. Research Methods and Evaluation for Human and Social Sciences, 4th ed.; Springer: Berlin/Heidelberg, Germany, 2006.12. Kovaleva, A.; Beierlein, C.; Kemper, C.J.; Rammstedt, B. A Short Scale for Measuring Impulsivity According to the UPPS Approach:
The Impulsive Behavior Scale-8 (I-8): GESIS-Working Papers; GESIS—Leibnitz Institute for the Social Sciences: Mannheim, Germany,2012.
13. Bühner, M. Introduction to Test and Questionnaire Construction, 3rd Updated and Expanded ed.; Pearson Studium an imprint ofPearson Education: London, UK, 2011; ISBN 9783863265700.
14. Cicchetti, D.V. Guidelines, criteria, and rules of thumb for evaluating normed and standardized assessment instruments inpsychology. Psychol. Assess. 1994, 6, 284–290. [CrossRef]
15. Brown, T.A. Confirmatory Factor Analysis for Applied Research, 2nd ed.; The Guilford Press: New York, NY, USA, 2015; ISBN978-1462515363.
16. Casale, G.; Grosche, M.; Volpe, R.J.; Hennemann, T. Reliability of behavioral progression diagnostics across raters and measure-ment time points in students with externalizing behavior problems. Empir. Sonderpädagogik 2017, 9, 143–164.
17. Conley, L.; Marchant, M.; Caldarella, P. A Comparison of Teacher Perceptions and Research-Based Categories of Student BehaviorDifficulties. Education 2014, 134, 439–451.
18. Huber, C.; Rietz, C. Behavior Assessment Using Direct Behavior Rating (DBR)—A Study on the Criterion Validity 163 Zuverläs-sigkeit von Verhaltensverlaufsdiagnostik of DBR Single-Item-Scales. Insights Learn. Disabil. 2015, 12, 73–90.
19. Hintze, J.M.; Owen, S.V.; Shapiro, E.S.; Danl, E.J., III. Generalizability of oral reading fluency measures: Application of G theoryto curriculum-based measurement. Sch. Psychol. Q. 2000, 15, 52–68. [CrossRef]
20. Goudy, L.S.; Rigby, B.R.; Silliman-French, L.; Becker, K.A. Effects of Simulated Horseback Riding on Balance, Postural Sway, andQuality of Life in Older Adults with Parkinson’s Disease. Adapt. Phys. Activ. Q. 2019, 36, 413–430. [CrossRef] [PubMed]
21. Fízková, V.; Krejcí, E.; Svoboda, Z.; Elfmark, M.; Janura, M. The effect of hippotherapy on gait in patients with spastic cerebralpalsy. Acta Gymnica 2013, 43, 17–23. [CrossRef]
22. Vermöhlen, V.; Schiller, P.; Schickendantz, S.; Drache, M.; Hussack, S.; Gerber-Grote, A.; Pöhlau, D. Hippotherapy for patientswith multiple sclerosis: A multicenter randomized controlled trial (MS-HIPPO). Mult. Scler. 2018, 24, 1375–1382. [CrossRef][PubMed]
23. Anderson, S.K.; Loy, D.P.; Janke, M.C.; Watts, C.E. The Effects of Therapeutic Horseback Riding on Balance. TRJ 2019, 53, 307–321.[CrossRef]
24. Gabriels, R.L.; Pan, Z.; Dechant, B.; Agnew, J.A.; Brim, N.; Mesibov, G. Randomized Controlled Trial of Therapeutic HorsebackRiding in Children and Adolescents with Autism Spectrum Disorder. J. Am. Acad. Child Adolesc. Psychiatry 2015, 54, 541–549.[CrossRef] [PubMed]
Int. J. Environ. Res. Public Health 2022, 19, 2738 27 of 27
25. Johnson, R.A.; Albright, D.L.; Marzolf, J.R.; Bibbo, J.L.; Yaglom, H.D.; Crowder, S.M.; Carlisle, G.K.; Willard, A.; Russell, C.L.;Grindler, K.; et al. Effects of therapeutic horseback riding on post-traumatic stress disorder in military veterans. Mil. Med. Res.2018, 5, 3. [CrossRef] [PubMed]
26. Wenzel, T.; Moorfeld, M. The International Classification of Functioning, Disability and Health. An expertise on be-half of the German Society for Rehabilitation Sciences (DGRW e.V.).Volume 10. Stendal. 2015. Available online: https://www.researchgate.net/publication/281205343_Die_Internationale_Klassifikation_der_Funktionsfahigkeit_Behinderung_und_Gesundheit_-_Eine_Expertise_im_Auftrag_der_Deutschen_Gesellschaft_fur_Rehabilitationswissenschaften (accessed on 25February 2022).
27. Stolz, I.; Tillmann, V.; Anneken, V.; Froboese, I. Development of an ICF-based assessment tool for equine-assisted therapy: Modelstructure and reliability. Eur. J. Phys. Rehabil. Med. 2021, 11. [CrossRef] [PubMed]