ePrints Soton - University of Southampton
313
UNIVERSITY OF SOUTHAMPTON FACULTY OF ENGINEERING, SCIENCE AND MATHEMATICS SCHOOL OF OCEAN AND EARTH SCIENCES A comparative analysis of the calcification transcriptome and proteome of Emiliania huxleyi by Holger Anlauf Thesis for the degree of Doctor of Philosophy September 2015
-
Upload
khangminh22 -
Category
Documents
-
view
2 -
download
0
Transcript of ePrints Soton - University of Southampton

UNIVERSITY OF SOUTHAMPTON
FACULTY OF ENGINEERING, SCIENCE AND MATHEMATICS
SCHOOL OF OCEAN AND EARTH SCIENCES
A comparative analysis of the calcification transcriptome and
proteome of Emiliania huxleyi
by
Holger Anlauf
Thesis for the degree of Doctor of Philosophy
September 2015
UNIVERSITY OF SOUTHAMPTON
FACULTY OF NATURAL AND ENVIRONMENTAL SCIENCE
School of Ocean and Earth Science
Effect of increasing sea water temperature on the growth and toxin production of three harmful benthic dinoflagellates
isolated from the Fleet Lagoon, Dorset, UK.
by
Aldo Aquino-Cruz
Thesis for the degree of Doctor of Philosophy
March 2012


i
UNIVERSITY OF SOUTHAMPTON
ABSTRACT
FACULTY OF NATURAL AND ENVIRONMENTAL SCIENCES
Doctor of Philosophy
A COMPARATIVE ANALYSIS OF THE CALCIFICATION TRASNCRIPTOME AND PROTEOME OF EMILIANIA HUXLEYI
Holger Anlauf
Calcium carbonate precipitation by marine organisms is an acknowledged contributor to the global carbon cycle. Coccolithophores are unicellular marine phytoplankton, that by excreting calcium scales and performing photosynthesis, contribute largely to the flux of atmospheric carbon to the surface and deeper oceans. The impact of elevated future ocean temperature and ocean acidity on the mechanism and rates, by which coccolithophores secret their calcium carbonate scales internally and contribute to the global carbon cycle, has been widely studied. However, biomineralisation in coccolithophores, the expression of molecular pathways, and the timing of gene expression related to calcification are still poorly understood. To better understand the process of calcification the transcriptome and proteome of calcifying G1-phase Emiliania huxleyi cells were investigated in the light and dark using next generation techniques. The results showed clear differences in both the transcriptomic and proteomic profiles between the photosynthetically enhanced calcification and the dark calcification phase. Interestingly, the bulk of the biomineralisation genes were higher expressed in the dark calcification phase at low calcification rates, suggesting that a large proportion of the molecular calcification machinery is bound to the Golgi apparatus and endoplasmic reticulum, which are complemented in the early G1-phase following cytokinesis. Furthermore, the results suggest that a set of biomineralisation genes exhibits continuous expression in both conditions of the G1 phase, whereas other genes are more abundantly expressed in the calcification phase. The importance of the calcium binding proteins calreticulin, calnexin, and calmodulin in the calcification phase was confirmed by transcriptomic and proteomic data. Proton pumping V-type ATPases were found higher expressed in dark phase but was still highly expressed in the enhanced calcification phase in the light. Calcium transport related gene expression of members of the NCKX (Na+/Ca2+-K+ exchanger), NCX (Na+/Ca2+exchanger), and CAX (calcium exchanger) were stronger in the low calcification phase, whereas SERCA-type calcium transporting ATPases were nearly equally expressed in both condition but originating from different genes that were expressed in either the light or the dark. Furthermore, transcriptome exploration suggested syntaxin and synaptobrevin could play an important role in calcification related vesicle fusion. The results have important implications for better understanding the timing of calcification related gene expression throughout the E. huxleyi cell cycle and for potential transcriptomic plasticity in response to changing environmental conditions.

ii

iii
Table of Contents
Table of Contents iii!List of Tables ix!List of Figures xi!DECLARACTION OF AUTHORSHIP xv!Acknowledgements xvii!Abbreviations xix!Chapter 1.! General Introduction 1!1.1.! Phytoplankton evolution – Coccolithophores and the supremacy of Emiliania huxleyi 1!1.2.! The biogeochemical processes of the carbon cycle and the importance of
coccolithophores 3!1.3.! Coccolithophore biomineralisation – Coccolithogenesis 6!1.4.! The molecular basis of biomineralisation in coccolithophores 7!
Ca2+ transport 8!Inorganic carbon transport 8!H+ transport 9!
1.5.! The putative function of molecules involved in the nucleation of calcium carbonate 10!1.6.! Understanding cell functioning in the post-genome era 14!
1.6.1.! A history of transcriptome research technologies 15!1.6.2.! Next generation sequencing (NGS) 16!1.6.1.! Next generation high throughput transcriptomic methods 17!1.6.2.! HiSeq Illumina based RNA sequencing 18!1.6.3.! Advanced proteomics methods and principles of mass spectrometry proteomics 21!1.6.4.! MALDI quadrupole time-of-flight mass spectrometry 24!1.6.5.! Transcriptomics and proteomics in coccolithophore studies 26!1.6.6.! Key aims and Objectives 27!
Chapter 2.! Rates of photosynthesis and calcification in the cell cycle of Emiliania huxleyi
(Lohmann), Hay et Mohler 29!2.1.! Introduction 29!2.2.! Material and Methods 31!
2.2.1.! Culturing 31!2.2.2.! Experimental Design 31!2.2.3.! Assessment of DNA content per cell 32!2.2.4.! Cell density, cell volume, and growth rates assessment 33!2.2.5.! Particulate organic carbon (POC) and particulate organic nitrogen (PON) 33!2.2.6.! Particulate inorganic carbon (PIC) analysis 34!2.2.7.! Nutrient measurements and dissolved inorganic carbon (DIC) analyses 34!2.2.8.! Dissolved inorganic carbon (DIC) and total alkalinity (At) 35!

iv
2.2.9.! Chlorophyll a measurements 35!2.2.10.! Assessment of photosynthetic health 36!2.2.11.! Radioisotope measurements of photosynthesis and calcification 37!
2.3.! Results 39!2.3.1.! Dynamics of DNA content, cell density, growth rates, and cell volume of E.
huxleyi stock cultures over a 24 hour period 39!2.3.2.! Production of organic carbon, organic nitrogen, the ratio of organic carbon and
nitrogen and cell volume 41!2.3.3.! Production of Particulate inorganic carbon 42!2.3.4.! Nutrient concentrations, dissolved inorganic carbon and total alkalinity 43!2.3.5.! Chlorophyll contents and photosynthetic health over a 24-hour period 44!2.3.6.! Rates of photosynthesis and calcification from 14C-labelled NaHCO3 incubation
over a 24-hour period 45!2.4.! Discussion 47!
Chapter 3.! The transcriptome of Emiliania huxleyi at high and low calcification rates 53!3.1.! Introduction 53!
3.1.1.! Molecular controls of gene expression at the transcript level 54!3.1.2.! Physiological feedback mechanism in gene expression 56!3.1.3.! Gene expression related to biomineralisation in coccolithophores 58!3.1.4.! Strategies for gene-expression analysis 59!3.1.5.! Aims and Objectives 59!3.1.6.! Working hypothesis 61!
3.2.! Materials and Methods 63!3.2.1.! Experimental Design 63!3.2.2.! Algae Culturing 63!3.2.3.! Culture harvesting 64!3.2.4.! Assessment of physiological performance of E. huxleyi cells 65!3.2.5.! Statistics on non-molecular data 66!3.2.6.! RNA extractions 66!3.2.7.! RNA Quality and Quantity 67!3.2.8.! Independent approach of promoter expression analysis 68!3.2.9.! Illumina sequencing 68!3.2.10.! Processing of paired end Illumina output data 69!3.2.11.! Assessment of data quality and of transcript abundance 70!3.2.12.! Assessment of transcript abundance in the high rates of calcification (HC) and
low rates of calcification (LC) condition and overall identification success 70!3.2.13.! Modification of the Cuffdiff output 71!3.2.14.! Gene recruitment and annotation success 71!

v
3.2.15.! Assessment of functional differences between the high calcification (HC)
and low calcification (LC) condition using KOG-class annotations 71!3.2.16.! Assessment of gene expression differences between the high calcification (HC)
and low calcification (LC) condition 72!3.3.! Results 75!
3.3.1.! Cell fitness parameters in experimental Emiliania huxleyi cultures 75!! Cell culture growth 75!3.3.1.1.
! Particulate organic carbon (POC) per cell 75!3.3.1.2.
! Particulate Organic Nitrogen (PON) per cell 76!3.3.1.3.
! Particulate Carbon to Nitrogen ratio (C:N) per cell 77!3.3.1.4.
! Particulate Inorganic Carbon (PIC) per cell 77!3.3.1.5.
! Particulate Inorganic Carbon : Particulate Organic Carbon ratio (PIC:POC) 77!3.3.1.6.
! Photosynthetic health 77!3.3.1.7.
! Nutrient consumption 78!3.3.1.8.
3.3.2.! Dissolved inorganic carbon, total alkalinity and pH 78!3.3.3.! Transcriptomics 79!
! RNA quality and integrity 79!3.3.3.1.
! Illumina raw sequences quality check and results of sequencing 80!3.3.3.2.
! General results and quality control of the Tophat – Cufflinks pipeline 81!3.3.3.3.
! Transcript abundances relative to HC and LC condition 82!3.3.3.4.
General gene recruitment success with Cufflinks: 83!Annotation success: 84!KEGG-Pathway annotations: 84!Significantly different expressed genes: 85!
! Functional differences of the Emiliania huxleyi transcriptome in the HC and 3.3.3.5.
LC condition based on euKaryotic Orthologous groups (KOG) annotations 86!KOG-Group level: 86!KOG-Class level: 88!Comparison of unique and significantly higher expressed transcripts in the
high calcification (HC) and low calcification (LC) conditions of the G1
cell-cycle phase 92!Unique significant transcripts in the high calcification in the G1-phase
condition 92!Unique significant transcripts in the low calcification in the G1-phase
condition 93!! Transcripts from each KOG-class selected by means of graphical 3.3.3.6.
distinctiveness 98!

vi
! Transcript abundance in the high and low calcification rate conditions in 3.3.3.7.
the G1-phase of the E. huxleyi cell cycle of genes with a suggested role in the
calcification processes 105!Proton pumping pyrophosphatases (PPase), V-type (vacuolar) proton
ATPases, P-type proton ATPase, and clathrin expression 106!Expression of proton antiporter and proton exchanger and voltage
gated proton channels 107!Observed Ca2+ - transporter expression: 108!Observed calmodulin and Ca2+ - binding proteins expression 110!Observed Bicarbonate transport and carbonate anhydrase expression 111!
3.4.! Discussion 115!Methodological considerations of the E. huxleyi culture conditions 116!Methodological considerations of the transcriptome analysis 117!General expression patterns using functional physiological groups 118!Unique transcripts in the early and late G1-phase involved in
biomineralisation 119!Exploration for genes involved in calcification from the graphical
evaluation of significantly different transcript abundance 120!Discovering expressed biomineralisation gene using transcript
abundance 122!Expression of genes with a previously suggested role in coccolitho-
genesis in E. huxleyi 123!Biomineralisation gene expression in the G1 cell-cycle phase
of E. huxleyi 126!Considerations for Emiliania huxleyi calcification models 127!Outlook 128!
Chapter 4.! The proteome of Emiliania huxleyi at high and low calcification rates 131!4.1.! Introduction 131!
4.1.1.! Aims and Objectives 134!4.1.2.! Null hypothesis 134!
4.2.! Material and Method 135!4.2.1.! Experimental Design 135!4.2.2.! Extraction of proteins 135!4.2.3.! Protein quality assessment and troubleshooting 136!4.2.4.! Protein concentrations assessment 137!4.2.5.! iTRAQ®– labelling 137!4.2.6.! Liquid chromatography mass spectrometric analysis of peptides 138!4.2.7.! In silico identification of proteins 138!

vii
4.2.8.! Data processing 139!4.3.! Results 140!
4.3.1.! Protein yield and integrity of protein extract 140!4.3.2.! Peptide identification and annotation success 141!
! General identification and annotation success 141!4.3.2.1.
! Functional and localisation prediction annotation of proteins 142!4.3.2.2.
! Significantly expressed proteins in the highly and low calcifying 4.3.2.3.
E. huxleyi cells 146!! Proteins of interest involved in biomineralisation in highly calcifying 4.3.2.4.
and low calcifying E. huxleyi cells 152!! Consensus of transcriptome and proteome 154!4.3.2.5.
4.4.! Discussion 157!Consensus of transcriptome and proteome 161!Conclusions and outlook 163!
Chapter 5.! Synopsis and General Discussion 165!Project summary: 165!Evaluation of transcriptome analysis approach 166!Evaluation of cell harvesting, RNA, and protein extraction approach 167!Evaluation of proteome analysis approach 167!Dark calcification in the early G1-phase of the cell-cycle 168!Transcriptome and proteome patterns related to calcification in
different stages of Emiliania huxleyi G1-phase showing high
calcification and low calcification rates 170!New insights into the calcification mechanisms and gene expression
patterns in E. huxleyi from the synchronous study of the transcriptome
and proteome at a different calcification levels (low and high)
of the G1 phase 173!Concluding remarks and future work 175!
Appendix A!- Supplementary results - Chapter 3 - The transcriptome of Emiliania
huxleyi at high and low calcification rates in the G1-phase 179!Appendix B!– Supplementary results for Chapter 4 - The proteome of Emiliania
huxleyi at high and low rates of calcification of the G1-phase 227!References 259!Bibliography 286

viii

ix
List of Tables Table 1-1: Molecules potentially involved in calcification 12
Table 2-1: Experimental conditions and observed growth rates in previous
studies and this study 51!Table 3-1: Nutrient consumption in E. huxelyi cultures within the last day before culture
harvesting 78
Table 3-2: Seawater parameters in the E. huxelyi culture medium before the harvesting
of cultures 78
Table 3-3: NanoDrop parameters of RNA samples assigned for Illumina Transcriptome
sequencing 79!Table 3-4: RNA oncentrations and RQI values from chip-based electrophoresis RNA samples
for Illumina based transcriptome analysis. 79
Table 3-5: Basic results of the Illumina experiment 80!Table 3-6: Annotation success of transcripts. 83
Table 3-7: Annotation success of significantly different transcripts. 85
Table 3-8: KOG-group association of transcriptomes. 86
Table 3-9: Differences in transcriptomes by KOG-classes. 89
Table 3-10: KOG-class association of transcriptomes. 90!Table 3-11: Unique transcripts in the light and dark and their annotation success. 92!Table 3-12: Significantly higher abundant transcripts unique in the high calcification
(HC) condition of the G1-phase of the E. huxleyi cell cycle 94!Table 3-13: Significantly higher abundant transcripts unique in the low calcification
(LC) condition of the G1-phase of the E. huxleyi cell cycle 95!Table 3-14: Significantly more abundant transcripts potentially involved in the
calcification process of E. huxleyi by KOG-Class. 104!Table 4-1: Protein concentrations in extracts from the collected cell pellets from
experimental cultures 140
Table 4-2: Protein identification success in the identification pipeline and iTRAQ 141
Table 4-3: Counts of significantly more abundant peptides in the HC and LC
condition 142
Table 4-4: Success of gene ontology (GO) annotation of peptides in the HC and LC
condition 142
Table 4-5: Significantly overrepresented peptides in the HC condition by GO 143!Table 4-6: Significantly overrepresented peptides in the LC condition by GO 144
Table 4-7: Significantly overrepresented peptides in the light incubation period by GO 145
Table 4-8: Significantly overrepresented peptides in the dark incubation period by GO 146

x
Table 4-9: Significantly more abundant proteins in the HC and LC condition 147
Table 4-10: Proteins with potential role in calcification in the HC and LC condition. 153!Table 4-11: GO: calcification proteins in the HC and LC condition 153!Table 4-12: Proteome – transcriptome consensus. 155!Appendix A Table - 1: Statistical results comparing the physiological data 179!Appendix A Table - 2: Transcripts unique in highly calcifying cells of the late G1-phase. 181!Appendix A Table - 3: Transcripts unique in E. huxleyi early G1-phase
(low calcification rates) 188!Appendix A Table - 4: Transcript of the graphically comprised cohorts from
KOG-classes 196!Appendix A Table - 5: Transcripts matching proteins of the V-type proton ATPase
cluster and clathrin cluster 212!Appendix A Table - 6: Transcripts matching proteins of the proton exchanger cluster. 215!Appendix A Table - 7: Transcripts matching proteins of the Ca2+ - transport cluster. 215!Appendix A Table - 8: Transcripts matching calmodulin and calcium binding proteins. 220!Appendix A Table - 9: Bicarbonate transport protein cluster 221!Appendix A Table - 10: Aquaporin protein cluster. 223!Appendix A Table - 11: Details of transcript abundance of heat shock protein in
E. huxleyi cells showing high (HC) and low rates of calcification (LC). 224
Appendix A Table - 12: Selected transcripts with potential role in biomineralisation of
the 1000 most abundant transcripts in the light incubation period (high
calcification rate) of the cell cycle. 225
Appendix B Table - 1: Proteins identified in in E. huxleyi cells showing high (HC) and
low rates of calcification (LC) with significant expression direction ratios
LC: HC, and consensus sequences in phylogenetic homology analysis 228!Appendix B Table - 2: Gene ontology annotations of all proteins identified in E. huxleyi
showing highly calcifying cells of the late G1-phase 244!Appendix B Table - 3: Gene ontology annotations of all proteins identified E. huxleyi
showing low calcification rates in the early G1-phase 246!Appendix B Table - 4: Peptides matching the most recent E. huxleyi genome
(Read et al., 2013) 248!!!

xi
List of Figures Figure 1-1: Emiliania huxleyi SEM. 2
Figure 1-2: The global carbon cycle. 4
Figure 1-3: Cell structure of Emiliania huxleyi 13
Figure 1-4: Illumina Sequencing technology 20
Figure 1-5: Schematics of a mass spectrometer after Devon Fyson 21
Figure 1-6: MALDI QqTOF mass spectrometer design 25
Figure 2-1: Proposed general scheme of a cell cycle of a coccolithophore 30
Figure 2-2: Experimental setup – cell cycle related calcification rates of E. huxleyi 32
Figure 2-3: Relative DNA content in Emiliania huxleyi over a 24-hour period 39
Figure 2-4: Dynamics of cell density, growth rates, cell volume, and cell cycle
phase of E. huxleyi over a 24-hour period . 40
Figure 2-5: POC, PON, POC:PON dynamics of E. huxleyi over a 24-hour period 41
Figure 2-6: PIC dynamics of E. huxleyi over a 24-hour period 42
Figure 2-7: Macronutrients in E. huxleyi cultures over a 24-hour period 43
Figure 2-8: Chl a dynamics of E. huxleyi over a 24-hour period 44!Figure 2-9: Photosynthetic efficiency dynamics of E. huxleyi over a 24-hour period. 45
Figure 2-10: Rates of photosynthesis and calcification of E. huxleyi over
a 24-hour period 46
Figure 3-1: Harvesting workflow of E. huxleyi cultures. 65
Figure 3-2: Flowchart showing the bioinformatics pipeline and data analysis from
raw Illumina results 73
Figure 3-3: Cell fitness parameters of E. huxleyi cells in culture for transcriptome
and proteome analysis. 76
Figure 3-4: Virtual gel of RNA-samples from chip-based electrophoresis 80
Figure 3-5: Transcript frequencies of trascriptomic samples. 81!Figure 3-6: Dissimilarity-analysis of transcriptomic samples. 82
Figure 3-7: Transcript length versus transcript abundance in Light and Dark condition 82
Figure 3-8: Transcript annotation success 84
Figure 3-9: Significantly different and unique transcripts. 85
Figure 3-10: KOG-group association of transcriptomes. 87
Figure 3-11: Differences of transcriptomes by KOG-classes 91
Figure 3-12: Transcript abundance by KOG-class (1-6) 99!Figure 3-13: Transcript abundance by KOG class (7-12) 100!Figure 3-14: Transcript abundance by KOG-class (13-18) 101!Figure 3-15: Transcript abundance by KOG-class (19-24) 102!

xii
Figure 3-16: Transcript abundance by KOG-class (25) 103!Figure 3-17: Transcript abundance and expression ratios of vacuolar type membrane
proton pump ATPases (V-ATPase) 105!Figure 3-18: Transcript abundance and expression ratios of proton exchanger found
at light and dark incubation period 107
Figure 3-19: Transcript abundance and expression ratios of Ca2+ - transport
related proteins 109
Figure 3-20: Transcript abundance and expression ratios of calmodulin (CaM)
and Ca2+ - binding proteins 110
Figure 3-21: Transcript abundance and expression ratios of bicarbonate transport
and carbonic anhydrase 113
Figure 4-1: Example of results of 1D-SDS NuPage® gels 136
Appendix A Figure 1: Transcript abundance by KEGG-pathway classes 180!Appendix A Figure 2: Transcripts related to Heat Shock Protein 70 expression 224

xiii


xv
DECLARACTION OF AUTHORSHIP I, HOLGER ANLAUF
declare that this thesis and work presented in it are my own and has been generated by me as a
result of my own research.
A COMPARATIVE ANALYSIS OF THE CALCIFICATION TRASNCRIPTOME AND
PROTEOME OF EMILIANIA HUXLEYI
I confirm that:
1. This!work!done!wholly!or!mainly!while!in!candidature!for!a!research!degree!at!this!
University;!
2. Where!any!part!of!this!thesis!has!previously!been!submitted!for!a!degree!or!any!
other!qualification!at!this!University!or!any!other!institution,!this!has!been!clearly!
stated;!!
3. Where!I!have!quoted!from!the!work!of!others,!this!is!always!clearly!attributed;!!
4. Where!I!have!consulted!the!published!work!of!others,!the!source!is!always!given.!
With!the!exception!of!such!quotations,!this!thesis!is!entirely!my!own!work;!
5. I!acknowledged!all!main!sources!of!help;!
6. Where!the!thesis!is!based!on!work!done!by!myself!jointly!with!others,!I!have!made!
clear!exactly!what!was!done!by!others!and!what!I!have!contributed!myself;!
7. !None!of!this!work!has!been!published!before!submission.!
Sigend:
Date: 9th of September 2015


xvii
Acknowledgements So many people from all around the world have provided support, motivation and
encouragement throughout this bumpy road to the completion of my Ph.D.. These
Acknowledgements claim not be complete or represent any hierarchical order in appreciation.
However, at first I need to thank my final supervisors at the National Oceanography Centre, Dr.
Chris Hauton who, above all, believed in me and was committed to support me at all times and
gave important reviews on my writing. Chris kept the goal in sight.
Thanks to Dr. Debora Iglesias-Rodrigues, Dr. Julie LaRoche, and Dr. David O’Connor for their
support and giving me the opportunity to join NOCS and complete my Ph.D. within the
Calmaro program. Special thanks to Dr. Richard Edwards, Dr. Reider Andreson, and Paul Skipp
who were invaluable in finding my way through the transcriptomic and proteome jungle of my
data. Thanks to Dr. John Gittins for his directions in the lab and Dr. Bethan Jones for getting me
started with the E. huxleyi culturing and proteomics work. Dr. Alex Poulton was patient with me
and the E. hux cultures, which for some time had an experiment-fright and were committing
suicide instead of utilizing the isotopic carbon source we had prepared for them. Thanks to Dr.
Sophie Richier and Dr. Luke Mackinder for the valuable science think tanks on
biomineralisation and the molecular drivers. Special gratitude to Dr. Aldo-Aquino-Cruz for his
companionship and help during the 24-hour over-night sampling.
My family and so many friends at NOCS and outside have stayed with me on this road. Flo,
Frauke, Hanna, Alex, Lauren, Sophie, Christian, Martha, FE, Victoire, Lavinia, Sudipta, the
unknown George, Basti, Aaron, Christian K, Jan, Socratis, Katrin, Kathrine and more gave me
perspective, encouragement and laughs that kept me going. The community of the National
Oceanographic Centre and KAUST provided the important social and logistic infrastructures.
The completion of my Ph.D. would not have been possible without the boost of support I have
gotten at KAUST. Especially Dr. Susana Carvalho and Prof. Burt Jones made it possible and
relentlessly encouraged me to get it done.
A strong and important impulse came from my grandma that provided a necessary kick.
Personally, the PhD thesis has been the toughest challenge of my life so far. And I believe, that
it wouldn’t be as difficult to prepare for and complete a swim across the British Channel. It has
been a huge step for me but a relatively small one for science, I guess. At last, thanks to the
ocean, for providing the interest, passion, energy, and the subject of study.
.

xviii

xix
Abbreviations
2DE two dimensional electrophoresis
A adenine
ACC amorphous calcium carbonate
AS amino acid
At total alkalinity
ATP Adenosin-tri-phosphate
bp base pairs
CAP coccolith-associated polysaccharide
CAX calcium exchanger
CCMP canadian centre for the culture of microorganisms
CDC cell division control gene/protein
cDNA complementary deoxy-ribonucleic acid
Chl a chlorophyll a
Ci inorganic carbon
CP chloroplast
CRM certified reference material
CV coccolith vesicle
Dark experimental culture harvested in the dark period
DIC dissolved inorganic carbon
DNA deoxy-ribonucleic acid
DTT threo-1,4-Dimercapto-2,3-butanediol
ECB early cell cycle box
ER endoplasmic reticulum
EST expressed sequence tag
fg femto gram
Fm maximum fluorescence
Fo initial fluorescence
fpkm frames per kilobase per million kilobases (unit for transcript abundance)
Fv variable fluorescence
Fv/Fm photosynthetic quantum yield/ photosynthetic efficiency PS II
G1-phase Growth1 or Gap 1 phase of the cell cycle
G2-phase pre-mitotic phase or final phase of the interphase
Ga billion years
GB Golgi body

xx
GO gene ontology
GPA glutamic acid, proline and alanine
H3 Histone 3
HSP heat shock protein
ID identifier
JGI Joint Genome Institute
L Litre
LC liquid chromatography
LC/LC multidimensional liquid chromatography
LD light/dark cylce
LDS Lithium dodecyl sulphate
Light experimental culture harvested in the light period
ln natural logarithm basis e
M-phase mitotic phase / cell division
Ma million years
MADS-box gene-family for DNA-binding proteins/transcription factors
MALDI matrix-assisted laser desorption ionization
mE micro Einstein
µL micro Litre
mL milli Litre
µM micromolar
mM millimolar
MPSS massive parallel signature sequencing
mRNA messenger ribonucleic acid
MS mass spectrometer
MS/MS tandem mass spectrometer
NA not available
NCKX Na+/Ca2+-K+ exchanger
ncRNA non coding ribonucleic acid
NCX Na+/Ca2+exchanger
NGS next generation sequencing
NZEH New Zealand Emiliania huxleyi strain
OA Ocean Acidification
PCL member of the cyclin-dependent kinase family
pCO2 partial pressure of carbon dioxide
pI isoelectric value of protein
PIC particulate inorganic carbon

xxi
PLY Plymouth culture collection of marine microalgae
PM plasma membrane
POC particulate organic carbon
PON particulate organic nitrogen
PS I photosystem I
PS II photosystem II
PSC highly acidic polysaccharides
qPCR quantitative polymerase chain reaction
RNA-Seq RNA sequencing
rRNA ribosomal ribonucleic acid
RuBisCo Ribulose-1,5-bisphosphate carboxylase oxygenase
S-phase Synthesis phase of the cell cycle/replication of DNA
SAGE serial analysis of gene expression
SDS sodium dedecyl sulfate
SERCA sarco/endoplasmic reticulum Ca2+ - ATPase
SLC solute carrier
SSH suppressive subtractive hybridization
TPC total particulate carbon
tRNA transfer ribonucleic acid
v/v volume in volume
v/w mass in volume
VCX-type vacuolar cation exchangers


1
Chapter 1. General Introduction In nature the counterpart of chaos is not cosmos, but evolution
(Gould and Waller, 2008)
1.1. Phytoplankton evolution –
Coccolithophores and the supremacy of Emiliania huxleyi
The rise of marine photosynthetic organisms began with the evolution of prokaryotic
anoxygenic photoautotrophs ~3.5 Ga (billion years) ago (Finazzi and Moreau, 2010). Over
hundreds of millions of years, prokaryotic oxygenic photoautotrophs oxidized the Earth’s
atmosphere and the oceans by the fixation of CO2 using energy from sunlight (Gould and
Waller, 2008) and allowed the evolution of single celled eukaryotic microorganisms – Protista
(Haeckel, 1866). Circa 1.8 Ga ago an endosymbiotic event occurred. A photoautotroph
cyanobacterium was encapsulated by the early eukaryote establishing the ancestor of all
eukaryotic photosynthetic (Bhattacharya and Meldin, 1995; Keeling, 2004; Tirichine and
Bowler, 2011). The enslaved cyanobacterium evolved into a plastid, the organelles of plants and
algae that provide photosynthetic and other biochemical pathways. In a secondary
endosymbiotic event of still debated timeframe, around 1-1.9 Ga ago, the ancestral
phytoplankton host engulfed a red algae establishing the “red linage” of nanoplankton, which is
grouped within the chromalveolates (Yoon et al., 2004; de Vargas et al., 2007; Keeling, 2009).
Three phytoplankton groups of this “red linage” namely dinoflagellates, coccolithophores and
diatoms, all containing the photosynthetic pigments chlorophyll a + c (Saez et al., 2004),
dominate the modern ocean. The fossil record shows that the present dominance of
dinoflagellates, coccolithophores and diatoms began in the Mesozoic Era - 251 to 65 Ma
(million years) ago (Falkowski, 2004; Bown et al., 2004). Coccolithophores are the most
abundant group of the Haptophytes and contribute significantly to the group’s biodiversity
(Jordan and Chamberlain, 1997). The prymnesiophyte ancestor of the coccolithophores
developed the ability to form ornamented plate scales by controlled intracellular precipitation of
calcium carbonate (CaCO3) between 329 and 220 Ma ago (de Vargas et al., 2007; Liu et al.,
2010) and have played key roles in the global cycling of carbon and the development of Earth’s
present climate system through their photosynthetic fixation of carbon and calcium carbonate
precipitation (Thierstein et al., 1977; Robertson et al., 1994; Buitenhuis et al., 1996;
Holligan et al., 1993; Ridgwell, 2005). From the Triassic until the present, over 4000 discrete
morphological types of coccoliths have been confirmed in the geological record (de Vargas et

CHAPTER 1 - GENERAL INTRODUCTION
2
al., 2007). Today’s oceans inhabit only ~280 morphological distinct coccolithophores (Young
and Henriksen, 2003) of which Emiliania huxleyi (Lohmann) Hay et Mohler (Fig. 1) is the most
abundant cosmopolitan coccolithophore (Winter et al., 1994; Bijma et al., 2001; Beaufort et al.,
2007).
Figure 1-1: Emiliania huxleyi SEM. Scanning electron image (SEM) of an Emiliania huxleyi cell showing interlocking coccoliths creating the coccosphere. The specimen was isolated in a sample from Raunefjorden, Norway.
It is believed that E. huxleyi evolved around 250,000 years ago from the genus
Gephyrocapsa (Thierstein et al., 1977; de Vargas et al., 2007). Physiological, immunological,
and morphological differences separate 200 different strains within the species complex E.
huxleyi (van Bleijswijk et al., 1991; J. R. Young et al., 1992; Young, 1994; Medlin et al., 1996;
Young et al., 1999; Findlay and Giraudeau, 2000). Its cells are only 2.5 - 5.5 µm in diameter
(van Bleijswijk et al., 1991). When E. huxleyi blooms occur they may cover over 1 x 10⁶ km2
exceeding cell concentrations of 106 cells L-1 (Holligan et al., 1993; Tyrell & Merico, 2004).
Therefore, E. huxleyi blooms can affect a) regional weather patterns through the production of
dimethylsulfoniopropionate, which after more reaction steps to SO2 and sulphate acts as a cloud
formation nuclei (Charlson et al., 1987; Hegg et al., 1991), b) seawater alkalinity (Holligan et
al., 1993; Robertson et al., 1994), and c) the marine carbon pump (Buitenhuis et al., 1996; Rost
and Riebesell, 2003) (see Section 1.2). The ease of culturing and maintaining E. huxleyi in the
laboratory has allowed a great deal of scientific progress in terms of understanding the biology,
physiology and diversification of the E. huxleyi species complex. Although a single species, it is
1 µm

CHAPTER 1 - GENERAL INTRODUCTION
3
becoming increasingly evident that large genetic and physiological variations between E.
huxleyi strains exist (Medlin et al., 1996). Emiliania huxleyi shows a high intraspecific
physiological variability in the ability to grow in different salinities (Brand, 1984), synthesize
long chain lipids (Riebesell et al., 2000; Volkman et al., 1980), and to form coccoliths under
elevated CO2 in seawater (Langer et al., 2009; Lohbeck et al., 2014). A high genetic
heterogeneity has been suggested to explain the intraspecific physiological response variability
in E. huxleyi species complex and that this may also found its overall ecological success
(Lohbeck et al., 2012). High levels of genetic variability were also evident in blooms of E.
huxleyi showing differences between geographic locations, over time, within and in between
blooms and populations (Medlin et al., 1996; Iglesias-Rodriguez et al., 2006). This resulted in a
discussion about the species concept in E. huxleyi and a proposed bacterial-like pan-genome
(Medini et al., 2005). A pan-genome comprises a group of core genes (found in all strains) and
dispensable genes - specific only to certain strain (Medini et al., 2005; Read et al., 2013) and
could explain the physiological response variability between E. huxleyi strains.
1.2. The biogeochemical processes of the carbon cycle and the importance of
coccolithophores
The global carbon cycle describes the fluxes (pumps) of organic and inorganic carbon
between mayor reservoirs e.g. the terrestrial biosphere, the atmosphere, the lithosphere and the
oceans (Fig. 2). The fluxes of carbon between the carbon reservoirs are driven and
interconnected by physical, chemical and biological processes. The oceans store the largest
carbon dioxide inventory on the planet containing ~ 50-60 times more carbon than the
atmosphere (Siegenthaler and Sarmiento, 1993; Houghton, 2007; Riebesell et al., 2009). In the
ocean the solubility pump, biological pump, and carbonate counter pump (Volk and Hofert,
1985; Falkowski, 2000) describe the uptake of CO2 from the atmosphere, its biological fixation
to organic molecules by photosynthesis or respiratory processes and the release of CO2 from
biogenic calcification (Fig.2), respectively.

CHAPTER 1 - GENERAL INTRODUCTION
4
Figure 1-2: The global carbon cycle. Fluxes of carbon cycling between the biosphere, atmosphere and ocean. Dashed boxes label the major marine carbon pumps. The approximate storage capacities of the reservoirs (bold letters) is given in Pg C (1015 g C = gigatons C) after Zeebe and Ridgwell (2011).
In the Solubility pump (Figure 1-2) carbon dioxide dissolves in seawater and reacts with water
molecules forming carbonic acid subsequently dissociating to carbonate, bicarbonate, and
protons. This solubility pump is reflected by equation 1.
CO2 + H2O ⇄ H2CO3 ⇄ HCO3- + H+ ⇄ CO3
2- + 2H+ (Equation 1)
The biological pump (Figure 1-2) comprises the net carbon flux from biological processes
such as photosynthetic carbon fixation and respiration/degradation of organic matter into the
deep sea. Carbon fixation into 3-phosphoglycerate catalyzed by Ribulose-1,5-bisphosphate
carboxylase oxygenase (RuBisCo) is the main processes taking up CO2 from the surface ocean
and influencing the biological carbon pump. Regardless of their commonly microscopic size
between 0.4 and 200 µm unicellular marine phytoplankton provide 45% of the global annual net
primary production but represents less than 1% of the Earth’s photosynthetic biomass (Field et
al., 1998). Equation 2 shows the uptake of CO2 and its photosynthetic conversion to particulate
organic carbon (POC) by phytoplankton. Decomposition of organic matter and respiration are
described by the reversion of equation 2 to produce CO2.

CHAPTER 1 - GENERAL INTRODUCTION
5
CO2 + H2O −> CH2O + O2 (Equation 2)
Coccolithophores comprise around 10% of the phytoplankton biomass (Tyrrell and Young,
2009). While the contribution of coccolithophores to global marine photosynthetic carbon
fixation is relatively small (Gregg and Casey, 2007), coccolithophores have contributed largely
to the formation of deep-sea CaCO3 deposits around the globe (Volk and Hoffert, 1985;
Milliman and Droxler, 1996), driving the Carbonate counter pump (Fig. 2). Coccolithophores
and other marine calcifiers utilize HCO3- ions when producing CaCO3 minerals (Nimer et al.,
1992; Buitenhuis et al., 1999; Herfort et al., 2002). The reaction of CaCO3 precipitation requires
concentration of Ca2+ and CO32- ions above the saturation state (Equation 3.1). Carbonate ions
are indirectly produced in a high pH milieu (Equation 3.2). During the conversion of
bicarbonate to carbonate, H+ are produced, indirectly increasing CO2 levels due to lower pH
levels (Equation 3.3). Therefore, the process of calcification becomes a net source of CO2 when
HCO3- is utilized (Equation 3.4.).
Ca2+ + CO32- −>! CaCO3 (Equation 3.1)
HCO3- −> CO3
2- + H+ (Equation 3.2)
H+ + HCO3- −> H2O + CO2 (Equation 3.3)
Ca2+ + 2 HCO3- −>!CaCO3 + H2O + CO2 (Equation 3.4)
Coccolithophores, scleractinian corals, foraminifera, molluscs and coralline algae are the most
significant calcium carbonate producers in the ocean (Milliman, 1993; Iglesias-Rodriguez et al.,
2002). One third to half of the present marine CaCO3 is formed by coccolithophores (Milliman,
1993; Baumann et al., 2004) contributing largely to the global carbonate budget (Archer et al.,
2000). Up to 70% of coccolithophore scales dissolve in the upper 1300 m of the ocean, taking
up additional CO2 from seawater (Sabine et al., 2004). Coccolithophores’ calcite scales provide
also ballast for the export of particulate organic carbon (Milliman, 1993; Armstrong et al., 2001;
Klaas and Archer, 2002) and form large deep-sea sediments (Volk and Hoffert, 1985; Milliman
and Droxler, 1996). A reduction of calcification rates in coccolithophores would therefore
directly affect the marine carbon cycle (Zondervan et al., 2001). Less bicarbonate would be
converted to CO2 reducing the sea to air CO2-flux in the carbonate counter pump (Riebesell et
al., 2009). Furthermore, less organic matter would be stored in the deep ocean because
ballasting by coccoliths and sinking rates would decrease while CaCO3 - dissolution remains
(Armstrong et al., 2001; Klaas and Archer, 2002; Engel et al., 2009).

CHAPTER 1 - GENERAL INTRODUCTION
6
About half of the CO2 - emissions from fossil fuel combusted have sequestered in the ocean
where it has caused a decrease in oceanic pH by 0.1 units since pre-industrial times (Haugan
and Drange, 1996; Sabine et al., 2004). This phenomenon is termed ocean acidification (OA)
(Raven et al., 2005) and was found to affect the calcification and growth rates in
coccolithophores and other marine calcifiers (Riebesell et al., 2000; Reynaud et al., 2003;
Langer et al., 2006; Orr et al., 2005; Fabry, 2008). However, E. huxleyi’s calcification and
growth responds to OA is not uniform (e.g. Riebesell et al., 2000; Iglesias-Rodriguez et al.,
2008). Diverse responses in growth rates and the physiological processes involved in
calcification are the basis for the observed intraspecific variability (Langer et al., 2009). For a
wide range of marine metazoans the process of calcification has an important physiological role
that defines the organisms’ ecological niche (Cusack and Freer, 2008). Therefore, present
knowledge is far from developing a generalized model of calcification and its atmospheric
feedbacks if details of the processes involved in calcification remain illusive (Zondervan, 2007;
Riebesell et al., 2009). New incentive to study the biomineralisation physiology of E. huxleyi
were commenced a) to improve our understanding of the biochemical and molecular pathways
of the processes of calcification, b) to understand how the genetic plasticity can explain the
variable responses, and c) to develop a greater understanding of the likely feedbacks changes in
coccolithophore calcification suggest for the global carbon cycle.
1.3. Coccolithophore biomineralisation – Coccolithogenesis
Biomineralisation describes the production of minerals to form shells, scales and skeletons in
living organisms (Weiner et al., 2003). Biominerals nucleate in physically and chemically
isolated intracellular or extracellular compartments under rigorous biological control often
directly connected to an organic matrix (Lowenstam, 1981; Lowenstam and Weiner, 1989).
Therefore, specific morphological features have to be present in the organism to establish,
isolate and conserve the chemical gradients of pH homeostasis and ion concentrations (e.g.
Ca2+, carbonate ions) for the reaction towards the biogenic precipitation of the mineral.
The globally most abundant biogenic minerals are calcium carbonate minerals (Lowenstam
and Weiner, 1989), of which 7 polymorphs are crystalline and one amorphous. Crystalline
polymorphs of CaCO3 are calcite, aragonite and vaterite. Calcite is more resistant to dissolution
in seawater than aragonite and high-Mg calcite (Milliman, 1974). Magnesium calcite (Mg-
calcite) and protodolomite contain magnesium. Hydrocerussite contains lead and
monohydrocalcite water in combination CaCO3. Amorphous calcium carbonate (ACC) is a non-
crystalline precursor of calcium carbonate, which in marine species has been postulated to act as

CHAPTER 1 - GENERAL INTRODUCTION
7
a transport-form of calcium carbonate to the site of crystallization (Addadi et al., 2003; Weiner
et al., 2003).
The intracellular nature of the calcium carbonate mineralization process in coccolithophores is
a unique feature. Calcification in E. huxleyi is a process under intense biological control
(Paasche, 1962). From scanning electron microscopy (SEM) studies in the species E. huxleyi
(Wilbur and Watabe, 1963; Klaveness, 1976; van der Wal et al., 1983; van Emburg et al., 1986;
Westbroek et al., 1989; Young et al., 1999), Pleurochrysis carterae (Manton and Leedale, 1969;
van der Wal et al., 1987), Coccolithus pelagicus (Manton and Leedale, 1969; Taylor et al.,
2007), Scyphosphaera apsteinii (Drescher et al., 2012), and Hymenomonas coronata and
Ochrosphaera verrucosa (Inouye and Chihara, 1980), to name only a selection of studies, we
have learned about the morphology of biomineralisation in coccolithophores. The
mineralization of coccoliths occurs in an intracellular, Golgi-derived compartment, namely the
coccolith vesicle (CV). The CV is positioned adjacent to the nucleus (van der Wal et al., 1983).
The reticular body (RB) is a labyrinthine membrane system that connects distally to the CV
throughout the calcification process in E. huxleyi, Gephyrocapsa sp. and C. pelagicus
(Klaveness, 1976). However, a different feature is present in P. Carterae, where multiple
vesicles show coccoliths at varying growth stages and form a trans-Golgi without a RB (van der
Wal et al., 1983). The reticular body is expected to provide rapid ion transport and
supersaturated conditions inside the CV (Brownlee and Taylor, 2004; Taylor et al., 2011).
During coccolithogenesis, the coccolith-vesicle moves away from the nucleus, the CV
membrane and plasma membrane fuse and the coccolith is then extruded through the layer of
organic scales on the cell surface subsequently interlocking with adjacent coccoliths (Marsh,
2003; Taylor et al., 2007).
1.4. The molecular basis of biomineralisation in coccolithophores
Coccolithophogenesis is a complex process under rigorous genetic control involving the
expression of many proteins of yet unknown functions to provide a network of interacting
structural and regulatory molecules (Young and Henriksen, 2003; Henriksen et al., 2004; de
Vargas et al., 2007). For the precipitation of calcium carbonate ion concentrations of calcium
and carbonate above the saturation state of calcium carbonate must be reached inside the CV
and H+ ions need to be removed from the CV’s lumen. Ion-transporters or exchangers that
involve, transport, and co-transport Ca2+, Mg2+, H+, Cl-, Na+ ions, highly acidic calcium binding
proteins, carbonic anhydrase, and organic matrix-associated polysaccharides are generally
involved in controlling coccolithophogenesis. The following paragraphs will introduce specific

CHAPTER 1 - GENERAL INTRODUCTION
8
important macromolecules involved in molecular pathways for cell functioning and especially
calcification, such as Ca2+ transport, carbonate or inorganic carbon (Ci) transport, H+ transport,
and organizing and controlling the biomineralisation process. Table 1-1 summarizes the
molecules involved in the process of calcification in E. huxleyi. !
Ca2+ transport
In seawater – the external medium - calcium is a conservative element with concentrations of
around 10 mM. Net fluxes of Ca2+ and inorganic carbon (Ci) from the external medium to the
intracellular CV and low concentrations of free cytosolic Ca2+ of around << 1 µM have to be
sustained to guarantee coccolith production, avoid toxic effects of high Ca2+, and
coccolithophore functioning (Brownlee and Taylor, 2004; Verret et al., 2010; Araki and
Gonzales, 1998; Sanders et al., 2002; von Dassow, 2009). The absence of Ca2+ causes a decline
of growths rates by hampering important cell signalling processes involved in cell division and
lowers PIC production (Herfort et al., 2004; Timborn et al., 2007; Leonardos et al., 2009;
Mackinder et al., 2011). At the plasma membrane (PM) of coccolithophores a variety of Ca2+ -
channels/transporters were identified that modulate the Ca2+ PM passage. Voltage-gated Ca2+
permeable channels (CAv) were suggested to regulate the Ca2+ uptake from the external medium
(Mackinder et al., 2010; Dolphin, 2009). A recent model by Mackinder et al. (2011) suggests
that the peripheral endoplasmic reticulum adjacent to the PM might act as a trap and storage
pool for Ca2+ ions. The Ca2+ storage capabilities of the ER are well documented (Meldolesi and
Pozzan, 1998). In the ER proteins such as calreticulin bind calcium ions (Jacopo and Pozzan,
1998; Wahlund et al., 2004; Quinn et al., 2006). The calcium flux through the cytosol into the
CV and ER is probably mediated by SERCA-type ATPases (sarco/endoplasmic reticulum Ca2+
- ATPase) and Ca2+/H+ VCX-type (vacuolar cation exchangers) to enhance an Ca2+-rich lumen
of the ER and achieve the required supersaturated conditions for the precipitation of CaCO3
inside the CV (Mackinder et al., 2010).
Inorganic carbon transport
Evidence shows that bicarbonate is the primary carbon source for the synthesis of CaCO3 in
coccolithophores (Frankignoulle et al., 1994; Israel and González, 1996; Raven, 2011; Bach et
al., 2013). Transfer of bicarbonate along a gradient through the plasma membrane into the
cytosol is thought to occur passively (Brownlee et al., 1995; Anning et al., 1996). Furthermore,
recent finding also suggest the involvement of a putative HCO3- transporters of the SLC44
(SLC4 family) in the carbonate / bicarbonate balance in E. huxleyi (von Dassow et al., 2009).

CHAPTER 1 - GENERAL INTRODUCTION
9
The solute carrier SLC4 exchanging Cl- / HCO32- was successfully inhibited in E. huxleyi
(Herfort et al., 2002) and it was suggested that it might interact with carbonic anhydrase
enzymes (CA) in other eukaryotes (Vince and Reithmeier, 2000; Sterling et al., 2002).
Carbonic anhydrases are ubiquitous metalloenzymes and catalyze the reaction presented in
equation 4 in both directions.
CO2 + H2O ⇄! HCO3- + H+
(Equation 4)
The reaction is fundamental for the buffering of the bicarbonate system and therefore
acid/base compensation in most organisms throughout all kingdoms. In higher plants and
phytoplankton it is key to deliver CO2 to RuBisCo for photosynthesis but isoforms of CA were
suggested to be located in the cytosol and periplasmic space (Badger and Price, 1994;
Mackinder et al., 2010). It was suggested that CA facilitates the conversion of HCO3- into CO2
at the cytosolic face of the plasma membrane decreasing the local concentration of HCO3- at the
cytosolic transport site (Isenberg et al., 1963). The expression of transcripts was up-regulated in
calcifying versus non-calcifying phases supporting it (Quinn et al., 2006; Richier et al., 2009).
Twelve different transcripts of CA have been identified in E. huxleyi (von Dassow et al., 2009).
Specifically α-CA (prokaryotic like) and γ-CA - possibly located in or adjacent to the CV –
were confirmed to be involved in the calcification process (Soto et al., 2006; Quinn et al.,
2006). The CA reaction (Equation 4) also binds protons derived from the process of
calcification and produces CO2 for photosynthesis.
H+ transport
The regulation of proton levels is required to achieve certain membrane potentials, stable
conditions of cytosolic pH and to excrete protons derived from CA activity, in the chloroplast
and the CV to stabilize enzyme functioning, photosynthetic efficiency, and a regime for calcium
carbonate precipitation. Calcification and photosynthesis affect with cytosolic pH. Proton
pumping from the CV into the cytosol is necessary to create pH values of around 7 in the E.
huxleyi cytoplasma and around 8.2 in the CV favouring the passive conversion of HCO3- to
CO32- (Dixon et al., 1998; Brownlee et al., 1995). The synthesis of CaCO3 using HCO3
-
produces protons and decreases the pH in the CV (refer to equation 3) requiring further proton
pumping. Protons may also leak across membranes because of a conductive gradient that would
be present at the cytosolic CV boundary (Suffrian et al., 2011), requiring continuous proton
pumping. P-type (plasma membrane) ATPases and V- (vacuole) type ATPases are universal in
eukaryotes removing protons from the cytosol (Finbow et al., 1997) and the latter may be Ca2+

CHAPTER 1 - GENERAL INTRODUCTION
10
stimulated, as shown in Pleurochrysis sp. (Araki and Gonzalez, 1998; Corstjens et al., 2001).
The electrochemical gradient between seawater pH 8.2 and cytosol pH 7 creates a plasma
membrane potential greater than -60 mV where high voltage gated H+- permeable channels
(HVCN1) could remove intercellular H+ (Corstjens et al., 2001; Mackinder et al., 2010).
1.5. The putative function of molecules involved in the nucleation of calcium carbonate
An organic matrix within the CV is important for the ordered nucleation of calcium
carbonate in coccolithophores. At the initiation of the coccolith formation a proto-coccolith ring
forms around an organic base plate of highly acidic polysaccharides (PSC). Coccolithosomes,
Golgi-derived polysaccharide and Ca2+ dense vesicles, supply polysaccharides and Ca2+
to the
coccolith forming vesicles (Outka and Williams, 1973; van der Wal et al., 1983). In P. carterae
three highly acidic polysaccharides, PSC-1, PSC-2 and PSC-3, have been identified to play a
role in calcite precipitation (Marsh et al., 1992). Immunolocalization has identified that PSC-1
and PSC-2 are synthesized in the Golgi cisternae, stay associate with the organic base plate
from the onset of crystallization until and after the coccolith is extruded to the cell surface
(Marsh, 1994). Mutants without PSC-2 produced less than 5% calcite compared to wild-type
cells (Marsh and Dickinson, 1997) and PSC-3 mutants were unable to form mature coccoliths as
seen in wild-type cells (Marsh et al., 2002).
Emiliania huxleyi appears to have one polysaccharide termed the coccolith-associated
polysaccharide (CAP) associated with extracellular coccoliths (de Jong et al., 1976). This
complex polysaccharide is a galacturonomannan that consists of a sulphated mannan backbone
with a variety of side chains rich in galacturonic acid (Vliegenthart, 1981), showing similarities
to PSC-3 (Marsh, 2003). CAP has the ability to inhibit crystal formation in a supersaturated
solution of Ca2+ and CO3
2- (Borman et al., 1982) but also directs crystal growth by its specific
affinity to calcite (Henriksen et al., 2004). In E. huxleyi a highly acidic macromolecule
containing high levels of glutamic acid, proline and alanine (GPA) has potential Ca2+-binding
capacity (Corstjens et al., 1998) and has been identified in E. huxleyi morphotypes A and B. The
expression of the coccolith morphology motif (CMM) genomic region in the E. huxleyi
correlates with the morphotype of the coccoliths (Schroeder et al., 2005). Counter-intuitively, a
down regulation of GPA gene transcripts was found in calcifying cells suggesting a possible but
debatable inhibitor role of GPA at high Ca2+ concentrations (Mackinder et al., 2011).
Mackinder et al. (2010) suggested that an amorphous calcium carbonate (ACC) phase is being
created in smaller vesicles (precursor of CV compartments) or Golgi cisternae, transported and
merging into a CV, where the crystallization is directed by silk fibroin proteins in a non-

CHAPTER 1 - GENERAL INTRODUCTION
11
aqueous environment (Weiner et al., 1984). An transient precursor such as ACC is found in
mollusc larval shells transforming into aragonite (Weiss et al., 2002) and in the spicules of sea
urchin larvae eventually forming calcite (Beniash et al., 1997). The proposed presence of ACC
in coccolithophores finds theoretical support by the limits of the CV membrane that cannot fit
the required abundance of membrane associated transporters to establish the chemical
environment for CaCO3 precipitation and uphill Ca2+ -transport onto its surface (Mackinder et
al., 2010). If the larger surface of an endomembrane system as the Golgi body (cis-Golgi
network) could provide sufficient protein bound Ca2+ the coccolithosome would represent a
carrying vesicles and the CV would sustain precipitation favourable conditions. A likely acidic
lumen of the E. huxleyi Golgi body (Llopis et al., 1998) would support the directed movement
of calcium ions into the Golgi body.

12 Ta
ble
1-1:
Mol
ecul
es p
oten
tially
invo
lved
in c
alci
ficat
ion.
A se
lect
ion
of o
rgan
ic m
olec
ules
in E
. hux
leyi
pos
sibl
y in
volv
ed in
cal
cific
atio
n pr
oces
ses a
nd th
eir
pred
icte
d lo
catio
n, fu
nctio
n, a
nd re
fere
nce
(GB
/ER
: Gol
gi b
ody/
endo
plas
mat
ic re
ticul
um, C
V: c
occo
lith
vesi
cle,
CP:
chl
orop
last
, PM
: pla
sma
mem
bran
e, C
S:
cyto
sol).
Proc
ess
Prot
ein
Nam
e
Loca
tion
Prot
ein
func
tion/
orig
in
Rel
ated
pub
licat
ion
Ca2+
tran
spor
t Vac
uola
r Ca2+
/H+ a
ntip
orte
r G
B/E
R
Cat
ion-
exch
ange
r, (H
+ / C
a2+ -
VC
X1-
type
an
tipor
ter)
V
on D
asso
w e
t al.,
200
9
Pu
tativ
e N
a+ /Ca2+
exch
ange
r G
B/E
R
Efflu
x of
cyt
osol
ic C
a2+ (N
CK
X fa
mily
) V
on D
asso
w e
t al.,
200
9
SER
CA
-type
Ca2+
-pum
p G
B/E
R
ATP
driv
en, M
g2+, a
s cof
acto
r V
on D
asso
w e
t al.,
200
9
CA
v G
B/E
R
Vol
tage
gat
ed C
a2+ -
chan
nel
Ric
hier
et a
l., 2
011;
Dol
phin
, 200
9
Pu
tativ
e C
a2+ c
hann
els
PM
In fl
ux o
f Ca2+
, ATP
or e
lect
roch
emic
al
grad
ient
driv
en
Mac
kind
er e
t al.,
201
1
Ci –
tran
spor
t
Car
boni
c an
hydr
ases
, C
S D
IC re
gula
tion
(E. h
ux -
spec
ific
– δ-
EhC
A1,
γ-E
hCA
2)
Von
Das
sow
et a
l., 2
009;
R
ichi
er e
t al.,
201
1
C
l-/H
CO
3- exc
hang
er,
PM
Mem
bran
e tra
nspo
rter,
solu
te c
arrie
r 4
(SLC
4-f
amily
) V
on D
asso
w e
t al.,
200
9
H+ tr
ansp
ort
Vac
uolo
r typ
e H
+ - A
TPas
e C
V
H+
rem
oval
from
the
CV
, pos
sibl
y C
a2+
stim
ulat
ed
Cor
stje
ns e
t al.,
200
1 A
raki
and
Gon
zale
z, 1
998
C
lath
rin
CV
/ER
In
cla
thrin
-coa
ted
vesi
cles
, in
asso
ciat
ion
with
V-A
TPas
es
Jone
s et a
l., 2
011
P-
type
H+ -
ATP
ase
PM
Ara
ki a
nd G
onza
lez,
199
8 C
a2+ b
indi
ng
CA
P (C
occo
lith-
asso
ciat
ed
glut
amic
aci
d)
CV
R
egul
ates
dire
ctio
nal c
ryst
al g
row
th, s
imila
r to
aci
dic
poly
sacc
harid
es
de Jo
ng e
t al.,
197
6; M
arsh
, 200
3b;
Hen
rikse
n et
al.,
200
4
C
alre
ticul
in
Cal
nexi
n ER
, CV
C
a2+ h
omeo
stas
is, c
ellu
lar f
unct
ions
(Ca2+
, ch
aepe
rone
– a
ssis
t in
non-
cova
lent
fold
ing)
Wah
lund
et a
l., 2
004;
Q
uinn
et a
l., 2
006
C
alm
odul
in (C
aM)
ER, C
V
Cal
cium
-bin
ding
mes
seng
er p
rote
in
Soto
j et a
l., 2
006
Nuc
leat
ion
Hig
hly
acid
ic
poly
sach
harid
es
CV
In
itiat
ion
of c
occo
lith
form
atio
n. T
hree
id
entif
ied
form
s: P
SC1,
PSC
2, a
nd P
SC3.
O
utka
and
Will
iam
s, 19
73; v
an d
er
Wal
et a
l., 1
983;
Mar
sh e
t al.,
199
2
GPA
C
V
CaC
O3 n
ucle
atio
n an
d re
gula
ting
grow
th
Cor
stje
ns e
t al.,
199
8

CHAPTER 1 - GENERAL INTRODUCTION
13
Figure 1-3: Cell structure of Emiliania huxleyi showing cell structure, suggested transporters and molecules involved in biomineralisation according to the reviewed literature and summary in Table 1-1. ER: endoplasmic reticulum, N: nucleus, RB: reticular body, M: mitochondria, CP: chloroplast, P: pyrenoid, PER: peripheral endoplasmic reticulum, GB (cis and trans face): Golgi body. Italic letters show the suggested position of molecules involved in calcification processes, such as: cla: clathrin, CaM: calmodulin, crl: calreticulin, gpa: glutamic acid, proline and alanine, cap: coccolith-associated glutamic acid, psc: highly acidic polysachharides, and ca: carbonate anhydrase.

CHAPTER 1 - GENERAL INTRODUCTION
14
1.6. Understanding cell functioning in the post-genome era
In the post-genome era scientists are studying the products of the genome, namely proteins
and expressed RNAs, such as messenger RNA (mRNA), tRNA (transfer RNA) and rRNA
(ribosomal RNA) to quantify gene expression and unravel the relationship between the genome
and cell functioning. The cell’s functional properties are delivered by the transcription of the
coding regions of a gene (exon) into mRNA translation by ribosomes into amino acid (AS)
strands and the folding of such polypeptides into globular or fibrous forms, facilitating a
biological function. Cytosolic post-translational modification such as acetylation, adenylation,
phosphorylation, sulphuration or addition of N- or O-linked saccharide are critically influencing
the formation of the functional 3-D structure, activity, distribution, and the subcellular
compartmental placement of the protein (Kalia and Gupta, 2005). Stimuli to the cell can induce
transient event, where protein modification not necessarily requires the expression of a gene
(Mitton and Kranias, 2003).
In transcriptomic research all RNA molecules including mRNA, rRNA, tRNA and non-coding
RNA (ncRNA) (Huettenhofer and Vogel, 2006) are in the focus of interest. The transcripts
represent a signature of gene-expression and activated genes. The entity of transcripts also
provides the essence in understanding the functional and regulatory elements at the
transcriptional and post-transcriptional level. One application of transcriptomics is the
quantification of gene expression changes at different developmental stages or physiological
conditions (Wang et al., 2009). Furthermore, whole cell transcriptome assessments can be used
conduct de novo sequencing of an organism’s genome (Grabherr et al., 2011). In
metatranscriptomics RNA sequences from a group of interacting organisms are assessed and
may point to important and novel molecules in ecosystem functioning (Warnecke and Hess,
2009).
Unlike the transcriptome, which is subject to post-transcriptional modification, the proteome
gives insight into the protein inventory of a cell or organisms. Messenger RNA is often altered
or not translated into proteins at all (Anderson and Seilhamer, 1997; Chen et al.; 2002; Tian et
al., 2004; Choi et al., 2008). Proteins are much more stable and reflect active biochemical
pathways more effectively than transcripts. In proteomic research, the quantity, diversity,
structures and functions of proteins are studied (Anderson and Anderson, 1998; Blackstock and
Weir, 1999). The term proteome originally describes the ‘total protein complement of a
genome’ (Wasinger et al., 1995). Presently, most studies address the ‘whole cell proteome’,
which should reflect the entire protein inventory of the cell at a current physiological state or
point in time (Wilkins et al., 1996), but due to methodological constrains only subsets of the

CHAPTER 1 - GENERAL INTRODUCTION
15
‘whole cell proteome’ may be observed. Studying the physiological state of a cell at the protein
expression level considers post-translational modifications (Olsen et al., 2006; López, 2007),
non-translated mRNA (Eddy, 2001) and genetic regulatory processes. The proteome reflects a
snapshot of the putative effective cellular processes at a given moment (Wilkins et al., 1996).
Proteome studies in combination with transcriptome studies give comprehensive information
about cell gene expression, protein translation and the physiological status of the cell.
Because of modifications at the post-transcriptional and post-translational level, whole-cell
transcriptome and proteome assessments capture the complexity of cell functioning better than
the genome sequence. Because, the total mRNA population of a cell does not correlate with the
abundance of proteins (Anderson and Seilhamer, 1997; Chen et al. 2002; Tian et al., 2004; Choi
et al., 2008) the proteome gives improved information about current physiological processes.
Furthermore, the proteome is more stable than RNA transcripts (Anderson and Anderson,
1998). However, in standalone proteome or transcriptome studies limits of the inferences that
can be drawn exist. For instance, the amount of ncRNA may be very large, whereas in more
complex organisms only 5-10 % of the genetic code may be transcribed into mRNA (Frith et al.,
2005). Alternative splicing or alternative transcription initiation and termination, and RNA
editing can produce variants of mRNA that do not reflect the genetic origin. Protein’s dynamic
structure, their interaction with other proteins and molecules make it difficult to receive more
than a snapshot of the cell’s proteome (Humphrey-Smith et al., 1997). Furthermore, there are
many technical challenges in extracting and characterizing proteins that cannot be easily
amplified and have several post-translational modifications if they are yet unknown (Blackstock
and Weir, 1999).
1.6.1. A history of transcriptome research technologies
In the mid-1970s the first quantification of mRNA using the Northern blotting method,
which applies gel electrophoresis and blotting with hybridization probe-dependent detection of
target RNAs (Alwine et al., 1977) became available. Reverse Transcription quantitative
Polymerase Chain Reaction (RT-qPCR) improved the quantification of RNA from genes of
pathways of interest in 1992, because the produced complementary DNA (cDNA) was more
stable, easier to sequence and to quantify. RT-qPCR was further enhanced by the development
of real-time qPCR in 1996 that delivers immediate results (VanGuilder et al., 2008).

CHAPTER 1 - GENERAL INTRODUCTION
16
The era of transcriptomics and transcript discovery also began in the 1990s when great
progress in the analysis of transcripts was made by establishing high-density microarray
platforms. Microarray platforms allow parallel measurements of thousands of different
transcripts, revealing a snapshot of the wider transcriptional state of an organism rather than
looking at a limited number of transcripts of interest, as the case in PCR based studies
(VanGuilder et al., 2008). Microarrays are based on the hybridization of transcripts from a
biological sample to complementary DNA (cDNA) sequences, also called probes, located on a
solid surface, such as a chip. The probes are arranged spatially in cohorts (features) on the chip
for recruiting reverse transcribed sequences of the sample. The quantification of transcript
abundance is achieved by fluorescent signals emitted by the reverse transcribed RNA copies
recruiting to the features. For this, the extracted poly-adenylated mRNA was reverse transcribed
in the presence of nucleotides that are linked to fluorescent dyes. The resulting fluorescent
complementary DNA molecules bind to the sequences located on the microarray. A final
washing step removes unbound cDNA, before the microarray is scanned with a laser that excites
the fluorescent dye associated with the cDNA. The brightness of each feature is a measure of
the relative abundance of the transcripts of each gene that is represented on the array.
An early sequencing-based technology to measure the abundance of mRNA transcripts is the
Serial Analysis of Gene Expression (SAGE, Velculescu et al., 1995). In SAGE large numbers of
short sequence tags excised from mRNA transcripts are reverse transcribed and the cDNA
sequenced on genome sequencers. Bioinformatic tools are then used to identify the source gene
of the sequenced tags. The advantage of SAGE is that it holds the possibility to discover
unknown transcripts, isoforms or splicing products of transcripts (Velculescu et al., 1995).
1.6.2. Next generation sequencing (NGS)
More recently next-generation sequencing technologies have become available to assess the
total transcript diversity and abundance. This approach, called RNA-seq, is based on the general
procedure by which the selectively extracted RNA molecules of interest, such as eukaryotic
mRNA via poly-adenylated tags, are revers transcribed to cDNA. The cDNA sequences are
determined by rapid parallel sequencing (Wang et al., 2009). Next generation sequencing of
transcriptomes has advantages over microarray studies due to the potential of isoform discovery
and the ability to determine transcript abundances at a higher resolution than typically possible
with microarrays. With RNA-seq genome-wide transcription may be analysed, thus providing
additional features such as, analysis of novel transcripts, siRNA, miRNA and alternative
splicing events. Furthermore, RNA-seq holds keys to analyse the regulation of gene expression
by exposing transcribed but non-translated regions, such as UTR (un-translated regions) that

CHAPTER 1 - GENERAL INTRODUCTION
17
may act in regulating gene expression (Nookaew et al., 2012). A typical RNA-seq experiment
generates large numbers of short reads that are aligned to an annotated reference genome using
mapping tools (Martin and Wang, 2012). In next generation sequencing read lengths between 30
and 400 bp, depending on the sequencing technology and platform, are possible. Commonly,
used sequencing platforms are SOLEXA, 454, and Illumina platforms. The continuous advances
in sequencing technologies and protocols have established RNA-seq as an attractive analytical
tool in transcriptomics and reduced running costs of an experiment (Nookaew, 2012).
Next generation sequencing transcriptomic experiments produce large amounts of data.
Therefore, the bioinformatic toolbox is also in continuous expansion to increase the validity of
the assumptions of functional properties concluded from NGS experiments. Many statistical
methods applied in microarrays can be applied with a few modifications to NGS data sets (Fang
et al., 2012). The approach to analyse the data comprises three steps: data preprocessing,
statistical analysis, and functional interpretation. The data-preprocessing step includes artifact
filtering and short read alignment/assembly. To identify differentially expressed transcripts
among different samples or conditions statistical tests are performed. The results can be further
analyzed to gain functional insights using gene ontology annotations (Fang et al., 2012).
Statistical tools that distinguish for example the overexpression of transcripts comprised by a
functional group, such as GO (gene ontology), are also available (Chen et al., 2012). More
modern bioinformatic algorithms are able to conduct de-novo sequencing of a genome from the
transcriptome information (Birol et al., 2009).
1.6.1. Next generation high throughput transcriptomic methods
Originally a variety of transcriptome analysis methods were developed based on sequencing
previously cloned tags located in specific transcript locations (usually 3' or 5' ends) such as
serial analysis of gene expression (SAGE) (Velculescu et al., 1995) and massively parallel
signature sequencing (MPSS) (Brenner et al., 2000) Quantitative polymerase change reaction
(qPCR) - experiments and microarrays also use pre-selected sequences from known genomes to
assess transcripts at different physiological states of an organism (Quinn et al., 2006). Using
hybridization-based microarrays expression levels over the entire transcriptome are accessible.
However, background hybridization levels and different hybridization properties of the probes
may bias the results (Denoeud et al., 2008).
The Sanger – sequencing is a method along with computational means that has increased the
quality and speeds of DNA strand sequencing (Sanger et al., 1997). In expressed sequence tag
(EST) analysis, randomly picked complementary DNA (cDNA) representing RNA transcripts

CHAPTER 1 - GENERAL INTRODUCTION
18
are partially sequenced by Sanger sequencing and redundancies removed to create a cDNA
library (Nagaraj et al., 2006; Bonaldo et al., 1996). The double stranded cDNA is synthesized
by reverse transcription using a specialized enzyme, the reverse transcriptase. However this
approach is relatively low throughput, expensive and generally not quantitative (Wang et al.,
2009). Serial analysis of gene expression (SAGE) (Velculescu et al., 1995; Harbers et al., 2005),
cap analysis of gene expression (CAGE) (Kodzius et al., 2006), and massively parallel signature
sequencing (MPSS) (Brenner et al., 2000) use tags to provide higher throughput and gene
expression levels. However, expensive Sanger sequencing and short tags providing a limited
resolution of transcripts and isoforms are disadvantageous (Wang et al., 2009).
Denoeud et al. (2008) and Wang et al. (2009) introduced RNA-Seq (RNA sequencing) that
can create a library of cDNA fragments with adaptors attached to one or both ends and by this
assess the total RNA or a fraction, such as poly (A)+ - extracted. High-throughput sequencing
platforms such as those from SOLEXA or Illumina sequence each molecule from one end
(single-end sequencing) or both ends (pair-end sequencing) in the range of 30-400bp (base
pairs). The reads reflect the gene expression levels and structure for each gene after alignment
to a reference genome or reference transcripts. A greater number of alternative splicing events
can be revealed in RNA-seq and it promises the discovery of novel sequences and molecules
that have not been annotated or sequenced previously (Denoeud et al., 2008). The on-going
advances in next generation sequencing techniques and decreasing costs will continue to make
RNA-seq a broadly used technique addressing biological and ecological questions.
1.6.2. HiSeq Illumina based RNA sequencing
Next generation genomics apply massive parallel sequencing technologies followed by
computationally matching the readouts to known reference sequences. One of the PCR-based
next generation sequencing technologies for massive parallel RNA sequencing was introduced
in 2007; it utilizes the Illumina sequencing platform (Shokralla et al., 2012). The Illumina
platform comprises the steps of library preparation (ligation of Illumina specific adapters),
cluster generation (bridge amplification) and DNA sequencing. The general approach in most
next generation sequencing technologies is very similar. The DNA of interest is randomly
fragmented; the fragments are then ligated to custom linkers. The linkers establish a library on a
solid surface of the cell where the DNA is amplified and then sequenced by stepwise nucleotide
synthesis cycles. During each cycle of the sequencing process nucleotides attach to millions of
the amplified DNA-fragments of interest and are detected in parallel over the entire surface of a
flow cell lane by light sensitive sensors (Mardis, 2008). Each lane in an Illumina flow cell can
hold one DNA sample. The steps of cDNA fragmentation, adapter ligation, flow cell surface

CHAPTER 1 - GENERAL INTRODUCTION
19
attachment, bridge amplification, building of double stranded DNA strands, and denaturation of
double stranded are repeated until dNTPs are depleted and clusters of single-stranded DNA
were built (Figure 1-4). After attaching primers to the DNA during each sequencing cycle one
base labelled with a specific fluorescent dye is added. A camera records the position of the
fluorescent signal when the flow-cell is scanned with an excitation laser.

CHAPTER 1 - GENERAL INTRODUCTION
20
Figure 1-4: Illumina Sequencing technology. Illustration of the steps occurring in the flow cell up to DNA cluster generation using Illumina Sequencing technology. Image presented with courtesy of Illumina Incorporation.

CHAPTER 1 - GENERAL INTRODUCTION
21
1.6.3. Advanced proteomics methods and principles of mass spectrometry
proteomics
Traditionally, proteomic studies were conducted largely by high-resolution two
dimensional gel electrophoresis (2DE) that separates proteins according to their charge and size
(O'Farrell, 1975). The detection of some post-translational modifications of proteins is also
possible with 2DE (Anderson & Anderson, 1998). Though a promising technique at its time
2DE could not be improved to overcome issues of low sample throughput, poor reproducibility
and poor resolution for proteins of extreme isoelectric (pI) values, and high labour intensity
(O’Connor et al., 2000; Rehm, 2006). Modern quantitative high-resolution methods apply mass-
spectrometry (MS) that can identify large numbers of proteins by their biological mass at their
core (O'Connor et al., 2000; López, 2007).
In mass-spectrometry the mass to charge ratio of ions of an ionized samples is measured.
Electrical and magnetic fields within the mass spectrometer alter the speed and direction of the
injected ions. The degree by which the ion is deflected depends on its mass-to-charge ratio. The
principle parts of sections of a basic mass spectrometer are the ion source, deflector and detector
(see Figure 1 -5).
Figure 1-5: Schematics of a mass spectrometer after Devon Fyson (Wikimedia Commons), showing the key features of sample ionization, deflection and detection.
Ion sourcebeam focussingion acelerator
electron trapion repeller
gas inflowionizing filament
{m/q} = 46{m/q} = 45{m/q} = 44
magnetamplifiers
current
ratiooutput
DetectionFaradaycollectors
legend:m : ion massq : ion charge
Deflection

CHAPTER 1 - GENERAL INTRODUCTION
22
When a detector, such as discrete dynode electron multiplier, for example, receives the ions,
their relative abundance is displayed as spectra. Another approach to obtain mass analysis of
ions in mass spectrometry is by time of flight mass spectrometry (TOF) (Wiley and McLarren,
1955). In TOF, the mass-to-charge ratio is determined by the time it takes for ions with the same
kinetic energy to reach the detector. Accelerated by an electrical field the ions arrival at the
detector only depends on their mass-to-charge ratio (m/z). The principle design of MS and TOF
was further developed. In the tandem mass spectrometry (MS/MS) two mass spectrometry steps
excel the analytical capabilities of a single instrument. MS/MS involves that fragments of the
precursor ions are scanned. In the first MS – step ions are selected according to their m/z.
Fragment ions are produced by a variety of processes, for example, dissociation, collision, ion-
molecule reaction, or photo-dissociation. The separation and identification of fragment ions of a
particular mass-to-charge ratio occurs in the second stage of mass spectrometry. Quadrupoles
have become an important and economic part in mass spectrometer, as they can be utilized as
detector of m/z (Q), filter, focussing, or collision units (q) for ions of specific mass to charge
ratios if multiple quadrupoles are aligned. Four cylindrical parallel rods, of which opposing rods
receive an AC current with a DC offset for ion manipulation, are assembled in one quadrupole
(Gross, 2011). By operating quadrupoles with the AC current and DC offset at radio frequency
(r.f. mode) an average three-dimensional electrical force is created that focuses or traps
electrically charged ions (Watson and Sparkman, 2007).
In mass spectrometry proteomics research two general strategies are followed, which are
controlled by means of sample preparation. The bottom-up approach uses complete that are
enzymatically digested into peptides whereas in the top-down approach intact proteins or their
exact fragments are analyzed. The top-down approach requires large sample sizes and high
mass accuracy instruments compared to the more versatile bottom-up approach, in which a
greater variety of mass spectrometry instrument and reduced sample amount can be utilized.
When dealing with complex protein samples the bottom-up approach is preferred (Yates et al.,
2009). The investigation of a cell’s proteome follows the bottom-up approach and has
similarities to whole DNA sequencing, where small parts of the DNA sample are created and
clustering overlapping DNA sequences into larger sequences reveals the entire DNA sequence.
Because of the fractionation of DNA or protein digestion into peptides the techniques were
given the terms “shotgun genomics”, and “shotgun proteomics”, respectively (Wolters et al.,
2001; Aebersold and Mann, 2003). In shotgun proteomics the masses from peptides of a protein
digest are matched to known or predicted masses of peptides in database searches (Perkins et
al., 1999; Yates et al., 2009). Based on in silico-generated fragmentation patterns or reading
frame translations together with genetic database searches the components of the proteome can

CHAPTER 1 - GENERAL INTRODUCTION
23
be established (e.g. Jones et al., 2013). Bottom-up proteomic studies apply tandem mass
spectrometry and the associated computational pipelines as core instrumental features when
investigating chemical protein modification and conduct quantitative analysis of proteins in
cells or tissues. However, the data is not without bias and may show limited protein sequence
coverage of the identified peptides, missing post-translational modifications, and bias related to
the origin of redundant peptide sequences (Yates et al., 2009).
A liquid chromatograph (LC) or capillary electrophoresis system can separate polar peptides
of low volatility according to their net charge prior to mass spectrometric analysis. Thus, the
protein identification and quantification process in MS-proteomics becomes a multi-step
procedure. At first the protein-concoction is digested into a complex peptide mixture and run in
a LC, for example. The chromatographically focused fractions of the peptide mixture are
ionized and injected into the mass spectrometer for analysis. Nano-electrospray ionization
(Mann and Wilm, 1995), partial (no discharge) atmospheric pressure chemical ionization
(Cristoni et al., 2002), and matrix-assisted laser desorption ionization (MALDI) (Patterson and
Aebersold, 1995) are common ionization techniques in mass spectrometry. Electrospray
ionization multidimensional liquid chromatography combined with tandem mass spectrometry
(LC/LC-MS/MS) is a preferred method for dissolved protein samples and delivers weight
signatures of peptides that require further in silico annotation by reference genomes or EST
(expressed sequence tags) – libraries to identify the functional proteins (e.g. Jones et al., 2011).
The MALDI expanded the application field in biological research as it could be utilized to
ionize protein dots directly from 2D electrophoresis gels using automated stepper motors, for
example (Chernushevich et al., 2001). One downside of MALDI mass spectrometry is the lack
of sufficiently detecting peptides of low abundance from silver stained gels (Berndt et al, 1999).
However, the laser ionization was not restricted to samples attached to matrix or surfaces and
could also ionize elutes from continuous flow after liquid chromatography providing high
sample throughput rates and high mass accuracy (Pasch and Pode, 1995; Nagra and Li, 1995).
MALDI-generated ions are predominantly singly charged providing a preferable ion stream for
top-down analysis of high-molecular-weight proteins. The low shot-to-shot reproducibility and
labour intense sample preparation (Yates et al., 2009) evolved into a method using digested
proteins as a source and an optional layered methods. If the peptide passed the MALDI-TOF
MS without identification nanoelectrospray tandem mass spectrometry was applied to ensure
peptide identification (Shevchenko et al., 2000). By coupling MALDI with orthogonal injection
hybrid quadrupole time-of-flight mass spectrometer (MALDI QqTOF) a further substantial
breakthrough in proteomics research was made. However, the Orbitrap® is the state of the art
technology in bottom-up proteomic research. In Orbitrap®, ions are trapped in orbits around
static electric fields. The ions spin around a central electrode and oscillate in axial direction. The

CHAPTER 1 - GENERAL INTRODUCTION
24
axial oscillations of the ion rings are detected by an outer electrode and amplified. The m/z ratio
is calculated from imaged orbits based on the principle of Fourier transform ion cyclotron
resonance mass spectrometry. MALDI is the ionization method of choice in Orbitrap®, because
it works better with pulses of ions rather than continuous streams of ions (Yates et al., 2009;
Gross, 2011).
1.6.4. MALDI quadrupole time-of-flight mass spectrometry
MALDI QqTOF (Figure 1-5) is a next generation proteomic research tool that has been
appreciated by the analytical community for its robustness and its powerful and unique
capabilities (Chernushevich et al., 2001). The QqTOF mass spectrometry harvests the power of
analytical (Q) and collision (q) quadrupoles (Shevchenko et al., 2000; Chernushevich et al.,
2001). As the MALDI ionization produces pulses of ions rather than continuous beams it was
incompatible with scanning mass analysers. Hence a cooling and focussing quadrupole is added
immediately after the ionization (Figure 1-6). In MS mode the Q1 quadrupole could perform
MS analysis by using the TOF section as a total ion current detector only. The advantage of
better peptide identification through TOF spectra implies that the Q1 is used for Q1 calibration
and tuning only (Chernushevich et al., 2001). TOF measurements are of multiple ions are
synchronized by Q2, which traps ions before releasing modulated bursts into the TOF.

CHAPTER 1 - GENERAL INTRODUCTION
25
Figure 1-6: MALDI QqTOF mass spectrometer design shown with a matrix or gel source as samples (2D stage). In MALDI QpTOF, Q refers to a mass-resolving quadrupole (Q1), q refers to hexapole collision cell (Q2) (r.f.-only quadrupole) and TOF refers to a time-of-flight mass spectrometer. The Q0 is an additional r.f. quadrupole that was added to provide collisional cooling and focusing of the ions created by the laser impulse. In MS only operations the Q1 would act as the mass analyzer. Since the TOF provides improved spectra quality the Q1 is only used for calibration and tuning. The Q2 acts as a collision cell trapping ions before releasing short burst into the TOF modulator and finally to the TOF itself (after Chernushevich et al., 2001)
The resulting spectra benefit from the high resolution and mass accuracy of the TOF
instruments, and also from their ability to record all ions in parallel, without scanning
(Chernushevich et al., 2001). A MALDI QqTOF can identify the components of simple
mixtures if the relative abundance of the components differs by the factor 10. An upstream high
performance separation technique like UPLC or LC for complex protein mixtures with lower
relative abundance of peptides in a trypsin digested protein sample will increase the analytical
performance of MALDI QqTOF further, as the peptides entering the MS analysis have been
pre-fractionated by size (Reemtsma, 2003; Farré et al., 2007). Furthermore, chromatographic
fractionation in combination with QqTOF mass spectrometer provides a significantly higher
mass resolution than quadrupole analyzers by themselves and the available mass resolution of
TOF instruments diminish the problem of isobaric interferences allowing for analysis of
complex samples using of isobaric tags (Farré et al., 2007).

CHAPTER 1 - GENERAL INTRODUCTION
26
1.6.5. Transcriptomics and proteomics in coccolithophore studies
The genome E. huxleyi (strain CCMP1516) has been sequenced and is publically available at
the Joint Genome Institute (www.doe.jgi.gov). Recent studies on E. huxleyi have used this
reference and attempted to shed light into the function of transcripts and the molecular origin of
coccolith formation using expressed sequence tags (ESTs), suppressive subtractive
hybridization (SSH), serial analysis of gene expression (SAGE), cDNA microarrays, and qPCR
to identify numerous proteins and genes also found active in the biomineralisation process of
other marine organisms (Wahlund et al., 2004; Nguyen et al., 2005; Dyhrman et al., 2006;
Quinn et al., 2006; Fujiwara et al., 2007; Richier et al., 2009; Dassow et al., 2009; Richier et al.,
2011). These experiments were designed to reveal differences in gene expression related to
calcification rates using nutrient starvation or strains showing different calcification properties.
However, the transcripts provided only low recovery rates for proteins and their isoforms
putatively involved in the calcification process, encourages subsequent studies applying state of
the art sequencing techniques to unravel the genome functioning of Emiliania huxleyi and
coccolithophores (Dyhrman et al., 2006; Quinn et al., 2006).
Pioneering proteomics-research on coccolithophores by Jones et al. (2010) identified 99
proteins operating from a variety of physiological pathways in the E. huxleyi strain NZEH (PLY
♯ M219) (Jones et al., 2011). However, this protein recovery rate appears very low when
compared for example to Saccharomyces cerevisiae where 4300 verified proteins were
identified (King et al., 2006). To discover proteins involved in the calcification process, pCO2-
enrichment experiments, known to enhance calcification in E. huxleyi NZEH were conducted
(Jones et al., 2013). Under high pCO2 conditions, only 4 homologous protein groups were
significantly down-regulated in the NZEH strain, namely: Histones H2A, H3, and 4 (H4) and a
chloroplastic 30S ribosomal protein. Histone 4 is a structural component of the nucleosome and
is a methyl donor involved in transcription and translational processes (Chiang et al., 1996).
These results however are difficult to evaluate with respect to biomineralisation, because a) both
molecules are unlikely to play a role in biomineralisation process and b) E. huxleyi PLY♯
M219 under high pCO2 was found to accumulate more PIC. The underlying mechanism for the
increased PIC accumulation remains unclear. The identification of more key genes and proteins
is required to shed light the functioning of calcification processes (Richier et al., 2009).

CHAPTER 1 - GENERAL INTRODUCTION
27
1.6.6. Key aims and Objectives
• Determine the growth rates, physiological parameters, and rates of photosynthesis and
calcium carbonate production using stable isotope incubations over 24 hours.
• Investigate cell cycle related differences of DNA content over a 24-hour period to conclude
cell cycle phases.
• Determine adequate cell harvesting times for the sampling of transcriptome and proteome at
high and low calcification phases where other cell cycle phase related processes and the
involved gene expression are limited.
• Compare the transcriptomes at high and low calcification phases of the cell cycle of
Emiliania huxleyi with an emphasis on transcripts that are potentially involved in
biomineralisation using next generation sequencing techniques.
• Compare the proteome at high and low calcification phases of the Emiliania huxleyi cycle
with an emphasis on proteins that are potentially involved in biomineralisation applying
shotgun-proteomics for protein identification and protein quantification.
• Investigate general differences of the transcriptome and proteome at high and low
calcification phases of the Emiliania huxleyi cell cycle..
• Investigate coherent molecular and gene expression characteristics of the observed
transcriptome and proteome patterns.

CHAPTER 1 - GENERAL INTRODUCTION
28
!
29
Chapter 2. Rates of photosynthesis and
calcification in the cell cycle of Emiliania huxleyi
(Lohmann), Hay et Mohler
2.1. Introduction
Coccolithophores possess varying rates of cellular calcification based on their genetic
repertoire and plasticity, depending on environmental conditions, and cell or life cycle phases
(Paasche, 2002). For example, high, low- or non-calcifying strains of the coccolithophore E.
huxleyi have been observed, including the high calcifying strain NZEH (PLY# M219) (Iglesias-
Rodriguez et al., 2008; Shi et al., 2009) and the low calcifying strain 279 (Scottish Marine
Biological Association) (Nimer et al. 1992). Limited availability of phosphorous has been
shown to result in an increase of calcium carbonate per cell (Paasche, 1998; Müller et al., 2008)
as low light conditions were found to decrease net calcification rates (Bleijswijk et al., 1994).
The life cycle of E. huxleyi is characterised by three different life-cycle phases or cell types: 1)
diploid non-motile coccolith-bearing (calcified cells); 2) diploid non-motile non-calcified
(naked) cells; and 3) haploid non-calcified cells of the flagella phase bearing only organic
scales.
Within a natural 24 h cycle of light and dark, calcifying E. huxleyi cells generally undergo
phases of higher and lower calcification rates and pass through the cell cycle (Müller et al.,
2008; Paasche and Brubak, 1994; Paasche, 2002). These diurnal fluctuations in calcification
rates correlate with the two phases, which are dominated by photosynthetic carbon assimilation
and cell division. A more detailed look at the cell cycle with respect to cell division separates
four phases: the G1-phase of photosynthetic carbon assimilation (Mitchison, 1971), the S-phase
where the genomic information is replicated and the G2 and M-phases, where cell division is
arranged, coordinated and completed (Figure 2-1). In the cell cycle of E. huxleyi maximal
calcification rates are closely correlated with the photosynthetic carbon assimilation (G1-phase)
(Paasche, 1962). Calcification rates arrest when the DNA is replicated (S-phase) to prepare for
cell division (G2/M phase). As the majority of the cell population of E. huxleyi divided within a
short period cells subsequently continued into the early G1-phase, where no light for
photosynthesis existed (Müller et al., 2008). Some calcification in the S and G2/M phase were
reported to occur in E. huxleyi, but at much decreased rates compared to the photosynthetic
phase (Balch et al. 1992; Paasche and Brubak 1994; Sekino and Shiraiwa 1996). Furthermore, a
population of cells undergoing the cell cycle is not fully synchronized (Hagiwara et al., 2012).

CHAPTER 2 - THE CIRCADIAN CELL PHASES, RATES OF PHOTOSYNTHESIS AND CALCIFICATION RATES OF EMILIANIA HUXLEYI
30
Figure 2-1: Proposed general scheme of a cell cycle of a coccolithophore based on finding of Müller et al. 2008, showing G1 –assimilation phase or gap 1, S – DNA synthesis – phase, G2 + M-cell division - mitosis-phase. Calcification and photosynthetic carbon assimilation in the G1 – phase is illustrated as a relative increase in lith-numbers and cell size. The timing and the duration of the cell cycle phases are roughly estimated from Mueller et al., 2008 Figure B, whereas in reality the phases overlap and especially the S and G2+M-phase can not be clearly separated in a population of cells. The grey shaded area indicates the dark incubation phase.
Two general models describing the mechanisms driving the cell cycle have been proposed: an
internal clock (Edmunds and Adams, 1981) and a triggered oscillation, such as by the external
light dark cycle that solely triggers the cell cycle phases (Spudish and Sager, 1980). Recent
research has illuminated the controls of the cell cycle at the genome level (e.g. Kondorosi et al.,
2000; Bisova et al., 2005; Inzé et al., 2006; Carretero-Paulet et al., 2010). A cascade of
interacting molecules and gene clusters has been found to control the cell cycle oscillation. In
yeast, for example, cyclins (PCL9, CLN3) and regulators for DNA replication (CDC6) initiate
the cell cycle (Bastajian et al., 2013). A key role is played by the Early Cell cycle Box (ECB)
comprising a gene cluster, which is regulated by further transcription factors (MADS-box’s
Mcm1 or the repressors Yox1 or Yhp1) describing a principal cell cycle interface through which
the cell may change its fate (Bastajian et al., 2013). It is likely that a similar feature such as the
ECB is present in other organisms. A change of fate leading towards a delay of cell division
may occur if environmental conditions or resources within the cell are unfavourable. The
survival strategy for delayed or halted reproduction is known from higher plants and animals
and is a common feature in nature (e.g. Kirk, 1997). In E. huxleyi, a delay in cell division might
also reflect a response to adverse environmental conditions. Emiliania huxleyi’s cell division

CHAPTER 2 - THE CIRCADIAN CELL PHASES, RATES OF PHOTOSYNTHESIS AND CALCIFICATION RATES OF EMILIANIA HUXLEYI
31
rates were reported to reach up to 2.8 divisions per day when sufficient nutrients and light were
supplied (Price et al., 1998). Moreover, a surplus of nutrients or light was found to extend the
duration of the G1 phase and interrupt cell division leading to an increase of the CaCO3-content
per cell (Müller at al., 2008). An increase of calcium per cell was also found when E. huxleyi
was exposed to increased levels of CO2 (Iglesias-Rodriguez et al., 2008; Jones et al., 2013).
The research summarised in this chapter investigated the diurnal rates of photosynthesis and
calcification. Using 14C-radionuclide incorporation, together with flow-cytometric DNA-content
analysis for cell cycle phase determination, the diurnal cycle of the E. huxleyi strain PLY��
M217 was described. These data were used in subsequent experiments to identify the target
times to obtain samples for transcriptome and proteome analysis.
2.2. Material and Methods
2.2.1. Culturing
The strain Emiliania huxleyi PLY# M217 [also known as CCMP 1516 strain (Provasoli-
Guillard National Centre for the Culture of Marine Phytoplankton, Maine, USA)], was obtained
from the Plymouth Culture Collection of Marine Microalgae. At the National Oceanography
Centre, Southampton batch cultures of PLY# M217 were maintained in f/50-Si (Si-free)
seawater medium (Guillard, 1975; Balch et al., 1992). The culture medium was prepared from
filter-sterilised seawater obtained during a cruise offshore from Plymouth (U.K.) using a pore
size of 0.22 µm (Millipore, Billerica, USA). The medium contained final nutrient concentrations
of 36 µM nitrate and 1.45 µM phosphate.
To ensure that the cells were in exponential growth at the beginning of the experiment, the 1 L
medium in each replicate was inoculated to achieve 500 cells per mL. The pre-experimental
cultures were exposed to irradiance levels of 94 ± 4 µE m-1 sec-1 (n=20) over a 12:12 light: dark
(LD) cycle at 18 °C and were mixed daily. The pre-experimental cultures reared in exponential
growth for at least 20 generations prior to radioisotope incubations.
2.2.2. Experimental Design
Three stocks of 14 L culture media in 20L Nalgene® (Thermo Scientific™, Loughborough,
U.K.) culture vessels were inoculated with 2000 E. huxleyi cells in exponential growth. The
stock cultures were grown for five generations until cell densities reached 50000 to 100000 cells
mL-1. The stock cultures provided three aliquot cultures of 50 mL for radioisotope incubation

CHAPTER 2 - THE CIRCADIAN CELL PHASES, RATES OF PHOTOSYNTHESIS AND CALCIFICATION RATES OF EMILIANIA HUXLEYI
32
with 14C-labelled sodium bicarbonate (NOC/RAM/730A). The sampling of aliquot cultures
commenced at 10 am on the 19th April 2011 and then every other h until 10 am, of the 20th April
2011. Particulate organic carbon (POC) and particulate inorganic carbon (PIC) were measured
following the micro-diffusion technique after Paasche and Brubak (1994) and Balch et al.
(2000). For biogeochemical and chemical analysis including cell counts, nutrient measurements,
chlorophyll a per cell, particulate organic carbon and particulate organic nitrogen (PON), flow
cytometric DNA content analysis, chlorophyll, and photosynthetic health, a 250 ml sample was
obtained at each sampling time from stock culture (see Fig. 2-2).
Figure 2-2: Experimental setup – cell cycle related calcification rates of E. huxleyi. Sampling layout for two hourly measurements for each of three stock cultures growing Emiliania huxleyi
2.2.3. Assessment of DNA content per cell
For the assessment of DNA content per cell one sample of 1.8 mL was taken from the well-
mixed 250 mL culture aliquot and 0.2 mL of a glutaraledehyde-paraformaldehyde mixture (10%
and 5% (v/v)) was added to fix the sample. The samples were allowed to incubate for two hours
at room temperature and then stored at -80 oC until further analysis. The DNA content was
quantified by staining the defrosted samples with SYBR green I (Sigma-Aldrich, St. Louis,
USA) for 45 min. SYBR green specifically binds to double-stranded DNA and the emitted
fluorescent signal is proportional to the DNA content of the cells (Wittwer et al., 1997; Nunez,

CHAPTER 2 - THE CIRCADIAN CELL PHASES, RATES OF PHOTOSYNTHESIS AND CALCIFICATION RATES OF EMILIANIA HUXLEYI
33
2001). Multifluorescent beads (diameter 0.5 µm; Polysciences Europe GmbH, Heidelberg,
Germany) were added to each sample for size calibration. The fluorescence of the cells was
measured using a FACS Calibur flow cytometer (BD Biosciences, San Jose, CA, U.S.A.) with
assistance from Mr. Ross Holland (National Oceanography Centre, Southampton). The ratios of
cell cohorts in different cell cycle phases were then analysed using the WinMDI Vers. 2.8
software (Windows Multiple Document Interface for Flow Cytometry, Joe Trotter, San Diego,
USA).
2.2.4. Cell density, cell volume, and growth rates assessment
A sample of 5 mL, taken from the 250 mL aliquot, was used to quantify cell density and cell
volume. Duplicates of 1 mL from the samples were diluted 1:10 with 3 % NaCl (w/v) and
analysed using a Multisizer™ 3 Coulter Counter ® (Beckman Coulter (UK) Ltd, High
Wycombe, United Kingdom) fitted with a 70 µm aperture. Averages of triplicate cell counts and
cell volume measurements were assessed using the Multisizer 3 software package (Version
3.51, Beckman Coulter Inc, Brea, USA). Growth rates (µ) per h in each experimental stock
culture were calculated according to Equation 1.
Equation 1: !! = ! (lnC1!– !lnC0)/Δ!t!
2.2.5. Particulate organic carbon (POC) and particulate organic nitrogen (PON)
To assess the contents of organic carbon and organic nitrogen per cell, duplicates of 50 mL,
taken from the 250 mL culture aliquot, were filtered on pre-combusted (450oC for 12 hours) 25
mm diameter GF/F filters (Whatman, Maidstone, United Kingdom). The filters containing the
samples were then stored at -20 °C until further processing. Samples and blanks were prepared
for analysis by removing inorganic carbonates by sulphuric acid (H2SO4) fumes under vacuum
for 36 hours (Verado et al., 1990). After drying for 24 hours at 50 °C, the filters were pelleted in
pre-combusted aluminium foil discs (Elemental Microanalysis Ltd, Oakhampton, United
Kingdom). The final quantifications of POC and PON were completed by Mr. Robert Head,
Plymouth using a Thermo Finnigan Flash EA1112 elemental analyser (Thermo Scientific™,
Loughborough, United Kingdom) calibrated and standardised with acetanilide. Total organic
carbon and organic nitrogen production were then calculated per cell in pmol for every two-
hour sampling interval.
µ: Growth rate
C0: Initial or previous cell counts [cells/mL]
C1: Most recent cell counts [cells/mL]

CHAPTER 2 - THE CIRCADIAN CELL PHASES, RATES OF PHOTOSYNTHESIS AND CALCIFICATION RATES OF EMILIANIA HUXLEYI
34
2.2.6. Particulate inorganic carbon (PIC) analysis
To analyse the cellular PIC, duplicate samples of 50 mL from the 250 mL culture aliquot
were collected on 0.2 µm Nucleopore® filters (Whatman, Maidstone, United Kingdom). At the
end of the filtration each filter was rinsed with ~ 1 mL of alkaline ultrapure Milli-QTM water (pH
~9) and then stored at -20 oC until analysis. Eventually, the samples were defrosted and treated
overnight with 10 mL 0.1 M nitric acid (HNO3) (Romil, Cambridge, United Kingdom) to
dissolve the calcium carbonate containing coccoliths. Additionally, standards in the expected
concentration range were prepared in the same way. Prior to PIC analyses, samples and
standards were filtered through 0.22 µm Millex filters (Millipore, Billerica, MA, U.S.A) and
then analysed by Mr. Darryl Green (National Oceanography Centre, Southampton) on an
inductively coupled plasma-optical emission spectrometer (ICP-OES, Agilent Technologies,
Wokingham, United Kingdom).
2.2.7. Nutrient measurements and dissolved inorganic carbon (DIC) analyses
A sufficient supply of nutrients is vital for phytoplankton cultures. Reduced macronutrient
concentrations of N and P will alter cell physiology and in the case of E. huxleyi affect
calcification rates (Paasche, 2000; Mueller et al., 2008). Low nutrient consumption may indicate
an impaired physiological state. Nutrient concentrations of the stock cultures were measured
every two hours. By filtering 30mL of stock culture through 0.22 µm polycarbonate filters cells
were separated from the media. The filtrate was then transferred into a Falcon®-tube and stored
at -20 °C until further analysis. Nutrients were measured on a Skalar San+ auto analyser (Skalar
(UK) Ltd., Wheldrake, United Kingdom), calibrated for the expected range of nutrient
concentrations. The detection limit of NO3/NO2 and PO4 was 0.03 µmol L-1 and 0.01 µmol L-1,
respectively. The nutrient analysis was carried out by Mr. Mark Stinchcombe (NOCS, National
Oceanography Centre, Southampton). Each sample was analysed in duplicates and average
values were computed for each sampling point in replicate cultures. The nutrient consumption
rates were calculated per cell per hour.

CHAPTER 2 - THE CIRCADIAN CELL PHASES, RATES OF PHOTOSYNTHESIS AND CALCIFICATION RATES OF EMILIANIA HUXLEYI
35
2.2.8. Dissolved inorganic carbon (DIC) and total alkalinity (At)
To monitor any modifications of the carbonate system within the E. huxleyi cultures,
seawater carbonate chemistry parameters, such as dissolved inorganic carbon, total alkalinity,
and pH were assessed at three time points in the course of the experiment (at 10:00 am, 8:00
pm, and 8:00 am on the 20th April 2011). For this, approximately 250 mL of stock culture was
siphoned from the stock cultures into a borosilicate bottle (Duran, Fisher Scientific,
Leicestershire, UK). To prevent further changes of the carbonate chemistry 50 µL of 3.5% (w/v)
mercuric chloride (HgCl2) were added and the DIC samples stored in the dark until further
analysis. DIC and TA were then measured at the carbonate facility at the National
Oceanography Centre, Southampton by Dr. Cynthia Dumousseaud using an Apollo SciTech
DIC infrared analyser (AS-C3) (Apollo SciTech, Inc., Bogart, GA 30622 USA) and an Apollo
SciTech AS-ALK2 Alkalinity Titrator (Apollo SciTech, Inc., Bogart, GA 30622 USA).
Certified reference materials (CRM) provided by A. G. Dickson (Scripps Institution of
Oceanography, University of California San Diego, U.S.A) were used as standards to calibrate
the system prior each measurement. To correct the measurements for various parameters
including titration acid density, nutrient concentration of the sample, temperature, salinity and
CRM a MATLAB script (originally designed by Dr. Dorothee Bakker at University of East
Anglia, U.K. and modified by Dr. Cynthia Dumousseaud at National Oceanography Centre,
Southampton) was used.
2.2.9. Chlorophyll a measurements
Measurements of extracted chlorophyll a in algae are an established physiological parameter
that can indicate N or P limitation of the cell (Geider et al., 1993; La Roche et al., 1993; Geider
et al., 1998). Chlorophyll a (Chl a) concentrations were measured at 10:00 am, 4:00 pm, 8:00
pm, 0:00 am, 4:00 am + 1 day, 8:00 am + 1 day, and 10:00 am + 1 day. From the well-mixed
250 mL stock culture aliquot, a volume of 10 mL was gently vacuum filtered through a GF/F
filter (25 mm diameter). The filters were transferred into glass tubes and 6 ml of 90% acetone
was added. Chlorophyll pigments were extracted passively in acetone over night (12 hours) at
4° C in the dark. Quantification of chlorophyll a was completed on a 10AU Turner fluorometer
(Turner Designs, Sunnyvale, USA) using borosilicate test tubes (Turner Designs, Sunnyvale,
USA). The system was equipped with a blue mercury vapour lamp and excitation (436 nm) and
emission (680 nm) filters according to the method after Welschmeyer (1994). Chlorophyll a
concentrations in the acetone extract were calculated per mL sample after Equation 2 and are
presented as Chl a per E. huxleyi cell for each sampling time.

CHAPTER 2 - THE CIRCADIAN CELL PHASES, RATES OF PHOTOSYNTHESIS AND CALCIFICATION RATES OF EMILIANIA HUXLEYI
36
Equation 2: !ℎ!!!!!"#!. !g!ml!! = !!!!!(!!)
2.2.10. Assessment of photosynthetic health
The photosynthetic efficiency or quantum yield of photosynthesis (Fv/Fm) can provide a
measure of the physiological state of phytoplankton cells particularly when under nutrient stress
(Kobler et al., 1983; Geider et al., 1993; Beardall et al., 2001; Moore et al., 2006). The
photosynthetic quantum yield quantifies the efficiency by which the absorbed irradiance is
utilised by the Photosystem II complex (PSII) (Krause et al., 1991); the maximum PSII
photochemical efficiency typically decreases under nutrient starvation or extreme irradiance
(Kolber et al. 1988, 1994; Geider et al. 1993b). For Fv/Fm measurements a culture aliquot of ~
5 mL was stored in the dark for at least 25 min to relax the reaction centres of the PSII. Then
Fv/Fm values were assessed by measuring F0 and Fm, the minimum and the maximum in vivo
chlorophyll a fluorescence yield after dark-adaptation, using a Fast Repetition Rate Fluorometer
(FRRF, Chelsea II, Chelsea Technologies Group Ltd., West Molsey, United Kingdom). The
instrument fired 100 flashes of 440 nm at 1.1 µs intervals to saturate the PSII. Values for F0 and
Fm were directly read by the FastInP-software (Vers. 1.0.0, Chelsea Technologies Group Ltd.,
West Molsey, United Kingdom) on the FRRF-workstation. The Fv/Fm value was then
calculated based on the following equations:
Equation 3: !" = !" − !o!
Equation 4: !"/!"! = !"!!"!"
Values of Fv/Fm were plotted over time and compared to values reported in the literature, to
estimate the photosynthetic health of E. huxleyi cells in this experiment. Photosynthetic
quantum yield was assessed at 10:00 am, 12:00 am, 4:00 pm, 8:00 pm, 0:00 am, 4:00 am + 1
day, 8:00 am + 1 day, and 10:00 am + 1 day.
C= conc. of Chl a from Turner fluorometer
v= volume of acetone extract
V= volume of culture sample
Fv = Variable fluorescence
Fm = Maximum fluorescence
Fo = Initial fluorescence
Fv/fm = Photosynthetic efficiency of
photosystem II

CHAPTER 2 - THE CIRCADIAN CELL PHASES, RATES OF PHOTOSYNTHESIS AND CALCIFICATION RATES OF EMILIANIA HUXLEYI
37
2.2.11. Radioisotope measurements of photosynthesis and calcification
To measure the rates of photosynthesis and calcification in E. huxleyi, the 14C-incoporation
into the organic and inorganic carbon fractions of the cells was measured using the general
methodology described in Paasche and Brubak (1994) and Balch et al. (2000). Three aliquot
cultures of 50 mL were immediately spiked with 5.25 µCi (194.25 kBq) 14C-labelled sodium
bicarbonate (Sigma, NOC/RAM/730A). One aliquot was poisoned with two mL of borate-
buffered formaldehyde solution to create a blank that corrected for non-biological isotope
exchange (Paasche, 1963). All 14C-spiked aliquots were exposed to the same LD cycle as the
stock cultures for 2 hours to allow 14C incorporation into organic and inorganic fractions. As a
result incubations starting at 8:00 pm and 8:00 am were exposed to one hour of light and one
hour of darkness. The incomplete incubations of one hour in the light and one hour in the dark
were excluded from the data presentation. Following the incubation for two hours, duplicate 25
mL fractions were filtered onto 25 mm diameter 0.4 µm polycarbonate filters (Whatman,
Maidstone United Kingdom) for total particulate carbon (TPC) and incorporated particulate
inorganic carbon. The particulate organic carbon fraction was calculated as the difference of
TPC and PIC (Balch et al., 2000). For the assessment of radioisotope incorporation the TPC
filter was transferred to a scintillation vial and 15 mL of scintillation cocktail (Ultima GoldTM
Cocktail, Perkin Elmer, Cambridge, United Kingdom) were added. The PIC filter was
transferred to a separate 20 mL glass scintillation vial, which was sealed by a septum. The
septum had a plastic beaker attached to it, in which a GF/F (Whatman, Maidstone, United
Kingdom) filter drenched with 200 µL phenethylamine was placed. Phenethylamine has the
capacity to trap CO2 by forming a carbonate salt. After injecting one millilitre of 1%
phosphoric acid through the septum onto the PIC filter the inorganic carbon was freed as 14C-
labelled CO2. The phenethylamine-drenched filter captured the developing CO2 for radioisotope
determination (Woeller, 1961). The septum closed scintillation vial containing phosphoric acid
was left over night for a full dissolution of the particulate inorganic carbon fraction. Both, the
PIC-filter and phenethylamine drenched filter were then transferred into separate fresh 20 mL
glass vials and 15 mL of scintillation cocktail added to each. Eventually, the samples and
scintillation cocktail were incubated for 24 hours at room temperature. The activity originating
from the 14C-labelled sodium bicarbonate incorporation was assessed on a TriCarb 2100TR
(Perkin Elmer, Cambridge, United Kingdom) liquid scintillation spectrometry counter.

CHAPTER 2 - THE CIRCADIAN CELL PHASES, RATES OF PHOTOSYNTHESIS AND CALCIFICATION RATES OF EMILIANIA HUXLEYI
38

CHAPTER 2 - THE CIRCADIAN CELL PHASES, RATES OF PHOTOSYNTHESIS AND CALCIFICATION RATES OF EMILIANIA HUXLEYI
39
2.3. Results
The following sections will summarize the data collected from an E. huxleyi culture over a
period of 24 hours using isotopic and non-isotopic methods with particular focus on
calcification rates, rates of photosynthesis, and the diurnal DNA contents.
2.3.1. Dynamics of DNA content, cell density, growth rates, and cell volume of
E. huxleyi stock cultures over a 24 hour period
To determine the cell cycle phase in E. huxleyi stock cultures the relative DNA content
calculated by the WinMDI software was assessed every two hours over a period of 24 hours.
The histograms in Figure 2-3 showed an increase of relative DNA content compared to the total
DNA content in the first 16 hours (until 2 am in the Dark period) of the measurements. After 2
am the peak of lower relative DNA content increased while less cells with higher DNA content
were observed. The histograms show no clear separation of cell cycle phases.
Figure 2-3: Relative DNA content in Emiliania huxleyi over 24-hour, showing relative DNA fluorescence histograms of E. huxleyi PLY# M217 at sampling times over the duration of the cell cycle experiment.
The percentages of cells in cell cycle phase were derived from the data presented in the
histograms (Figure 2-3) and are presented in Figure 2-4D. A doubling of the relative DNA
content of the G1-phase concluded the separation of S-Phase from the G1-phase. The G2+M
phase could not be clearly separated from the S-phase, because of intermediate character and
short duration of the G2+M cell phase. The 1-n cells in the early G1-phase were more apparent

CHAPTER 2 - THE CIRCADIAN CELL PHASES, RATES OF PHOTOSYNTHESIS AND CALCIFICATION RATES OF EMILIANIA HUXLEYI
40
allowing for a better separation of the G2+M phase from the early G1-phase. Therefore, a
combined S+G2+M cell phase was presented in Figure 2-4D. During the light period, the
greatest proportion of cells (> 85 %) was in the G1-phase. Relative DNA content increased from
10:00 pm to 2:00 am 20th April 2011 when the greatest proportion of cells was observed in the
S+G2+M-phase. By 6:00 am the relative DNA content in the majority of had dropped to G1-
phase values. Over the course of the 24-hour experiment cell densities increased more than 2
fold (in detail 2.8, 2.3, and 2.1 fold in the stock cultures PLY217-1, PLY217-2, and PLY217-3,
respectively; see Figure 2-4A). The most dramatic increase in cell densities occurred between
0:00 am and 4:00 am in the Dark period. The cell population continued to grow at
approximately half as fast between 4:00 am and 6:00 am. This was also reflected by the highest
calculated growth rates per hour at 2:00 am in the stock cultures PLY217-1, PLY217-2, and
PLY217-3 with 0.15, 0.15, and 0.14 µ h-1, respectively (see Figure 2-4B). The cell volume was
greatest between 4:00 pm 19th April 2011 and 2:00 pm 20th April 2011 into the dark period (see
Figure 2-4C). The average cell volume in this time frame was 94 µm3. The average cell volume
had decreased to around 50 µm3 per cell at the end of the 24 hours of measurements.
Figure 2-4: Dynamics of cell density, growth rates, cell volume, and cell cycle phase of E. huxleyi over a 24-hour period.. A) Cell density; B) Growth rates [µ h-1], C) Cell volume [µm·cell-1], D) Percentages of cells in each cell cycle phase; G1 (solid line) and S+G2+M (dotted line). For A), B), and C) the measurement in the replicate cultures PLY217-1, PLY217-2, and PLY217-3 are presented (see legend Figure A). Grey areas represent the dark incubation phase of the 12:12 hours LD cycle. Error bars represent one standard deviation of three measurements from three independent experiments.
�
������������
��������������������������
�������������������������
���������������������������
�
��� ��������!����
�
"
��
�"
������������ ����#������#������#������#������#������#������#��
$������%�%&���������%���
�
��
��
��
��
���
'�()'�)*
� �
����
����#������#������#������#������#������#������#��
�����+��&��������������
�
��
��
��
��
���

CHAPTER 2 - THE CIRCADIAN CELL PHASES, RATES OF PHOTOSYNTHESIS AND CALCIFICATION RATES OF EMILIANIA HUXLEYI
41
2.3.2. Production of organic carbon, organic nitrogen, the ratio of organic carbon
and nitrogen and cell volume
The production of organic carbon and organic nitrogen occurred during the light incubation
period of the LD-cycle and correlated with the extension of the cell volume. The highest values
for particulate organic carbon were observed at 8:00 pm with 1.33 ± 0.05 µmol cell-1 and lowest
organic carbon contents per cell were found at 8:00 am + 1day with 0.62 ± 0.07 µmol cell-1,
showing less than half of the maximum value (see Figure 2-5). Organic nitrogen per cell was at
maximum at 12:00 am with 0.145 ± 0.01 µmol cell-1 and at minimum at 8:00 am 20th April 2011
with 0.078 ± 0.01 µmol cell-1. The ratio of organic carbon to organic nitrogen showed a peak at
8:00 pm with 14.2 and was smallest at 8:00 am 20th April 2011 day with 7.9 (Figure 2-5).
Figure 2-5: POC, PON, POC:PON dynamics of E. huxleyi over a 24-hour period. Averages of A) Particulate organic carbon, B) Particulate organic nitrogen, C) Ratios of particulate organic carbon to organic nitrogen, and D) Cell volume measurements of three stock cultures over a period of 24 hours are presented. Grey areas represent the dark incubation phase of the 12:12 hours light-dark incubation cycle. Error bars represent one standard deviation of three measurements from three independent experiments.
����������� �
���
���
���
���
���
��
��
��
����������� �
����
����
����
����
����
�� �
�� �
�� �
�� �
���������������
�� ������ ������ ��������������������������� ����
�������
����� � � � �
� �
� �
���������������
�� ������ ������ ��������������������������� ����
�����������
� ��� �
�
��
��
��
��
��
��

CHAPTER 2 - THE CIRCADIAN CELL PHASES, RATES OF PHOTOSYNTHESIS AND CALCIFICATION RATES OF EMILIANIA HUXLEYI
42
2.3.3. Production of Particulate inorganic carbon
Figure 2-6: PIC dynamics of E. huxleyi over a 24-hour period, showing A) Averages of particulate inorganic carbon (CaCO3) per cell and B) Measurement of total particulate inorganic carbon per mL of E. huxleyi culture in the replicate stock culture PLY217-1, PLY217-2, and PLY217-3.Grey areas represent the dark incubation phase of the 12:12 hours Light-Dark incubation cycle. Error bars represent one standard deviation of three measurements from three independent experiments.
The accumulation of PIC is equivalent to the production of calcium carbonate scales by
coccolithophores. The amount of PIC per cell increased steadily during the illuminated period
of the LD-cycle. The maximum of about 0.39 ± 0.008 pmol cell-1 was reached at 12:00 am
(Figure 2-6A). After the initiation of cell division at around 2 am the PIC content per cell
decreased. Between 10:00 am and 8:00 am the PIC production rate was calculated at an average
of 0.0152 pmol cell-1 h-1. Assuming that the average calcium content of a single coccolith was
6.69 fmol lith-1 (Fagerbakke et al., 1994) between 10:00 am and 8:00 pm coccoliths were
produced at a rate of 2.24 liths h-1. In the dark phase PIC per cell decreased at rate a of 0.0154
pmol cell-1 h-1. The total PIC per ml increased from 18.7 ± 1.2 nmol mL-1 to 51.1 ± 7.4 nmol
mL-1 in the course of 24 hours (see Figure 2-6B). An increase of total PIC ml-1 was also
observed at lower rates throughout the dark period.
������������ �������������������������������������������������
������
�����
������
��������������������������� ���������
������������������
������������ �������������������������������������������������
�����
��!�����
�
�
��
��
��
��" #

CHAPTER 2 - THE CIRCADIAN CELL PHASES, RATES OF PHOTOSYNTHESIS AND CALCIFICATION RATES OF EMILIANIA HUXLEYI
43
2.3.4. Nutrient concentrations, dissolved inorganic carbon and total alkalinity
Figure 2-7: Macronutrients in E. huxleyi cultures over a 24-hour period. Macro nutrient concentrations and seawater carbonate chemistry parameters in the replicate stock cultures PLY217-1, PLY217-2, and PLY217-3 are presented: A) Phosphate and B) Nitrate and nitrite over a period of 24 hours. The seawater carbonate chemistry parameters dissolved inorganic carbon C) and total alkalinity D) at 10:00, 20:00 and 10:00 the following morning are presented. Grey areas represent the dark incubation phase of the 12:12 hours Light-Dark incubation cycle.
E. huxleyi cells did not exhaust the macro nutrients PO4 and NO3 in any of the replicate stock
cultures and did not alter total alkalinity and dissolved inorganic carbon in seawater. The
average nutrient consumption per cell per h in both the light and dark incubation phase is given
in Figure 2-7. The consumption of nitrogen was significantly higher in the light with 14.0 ± 5.20
10-9 mmol cell-1 h-1 compared to 3.41 ± 1.91 10-9 mmol cell-1 h-1 in the dark (p < 0.001; two
tailed t-test). In the dark, nitrogen uptake rates were decreased by 76% in the dark and
phosphorous uptake rates decreased by 39% (Figure 2-7A and B). The calculated average
consumption rate of phosphate was 4.42 ± 2.94 10-10 mmol cell-1 h-1 in the light and 27.0 ± 2.72
10-11 mmol cell-1 h-1 in the dark. The corresponding ratios of nitrogen and phosphorous uptake
Light:Dark ratios were N:P light 33.6 ± 9.48 and N:P dark = 9.60 ± 1.17 (mean ± s.d., n=3).
The concentrations of dissolved inorganic carbon concentrations per kilogram seawater (SW)
showed an average of 26 µmol kg-1 SW during the day, while at night DIC decreased only by 6
µmol kg-1 SW. Total alkalinity decreased by 150 µmol kg-1 SW during the day and increased by
15 µmol kg-1 SW during night time (see Figure 2-7C and D).
���
����
���
���
� ��
�
���
���
���
���
���
���� �������� �������� �������
��������������������������������������������������������������
� !
���
���"
#������
�����
����
�$��
����
����
����
����
%��&
���
�'��
%��&
����
���
� ��
�
���(
�(��
���(
����
���(
�(��
��������������������������������������������������������������
)*��
���
�"#��
�
����
����
����
*��� �������*��� �������*��� �������
� �
� �

CHAPTER 2 - THE CIRCADIAN CELL PHASES, RATES OF PHOTOSYNTHESIS AND CALCIFICATION RATES OF EMILIANIA HUXLEYI
44
2.3.5. Chlorophyll contents and photosynthetic health over a 24-hour period
Figure 2-8: Chl a dynamics of E. huxleyi over a 24-hour period. Average of chlorophyll a content in E. huxleyi cells in fg cell-1 over the period of 24 hours. Grey-shaded area illustrates the dark incubation period.
To assess the photo-physiological health of the E. huxleyi cells in the stock cultures over the
duration of the cell cycle experiment the chlorophyll a content per cell and the photosynthetic
efficiency were assessed. Chlorophyll a showed steady increase from 10:00 am to 4:00 am the
next morning. After 4:00 am the chlorophyll content per cell decreased (Figure 2-8). The
chlorophyll a contents per cell were smallest at the begin of the light period at 10:00 am with 51
± 6 fg Chl a cell-1 (Figure 2-8). The concentration then ranged between 65 ± 15 and 82 ± 9
(maximum at 4:00 am + 1 day) fg Chl a cell-1. By 10:00 am + 1 day Chl a contents had reached
the values from the previous day, measuring 51 ± 9 fg Chl a cell-1.
������������ �������������������������������������������������
����������������������
�
��
��
��
��
���

CHAPTER 2 - THE CIRCADIAN CELL PHASES, RATES OF PHOTOSYNTHESIS AND CALCIFICATION RATES OF EMILIANIA HUXLEYI
45
Figure 2-9: Photosynthetic efficiency dynamics of E. huxleyi over a 24-hour period. Photosynthetic efficiency (Fv/Fm) of E. huxleyi cells in the replicate stock cultures PLY217-1, PLY217-2, and PLY217-3 over a period of 24 hours. Grey-shaded area indicates the dark incubation phase.
The quantum yield of photosynthesis in the PSII was similar in all stock cultures (PLY217-1,
PLY217-2, and PLY217-3; Figure 2-9). The Fv/Fm values in the light incubation period ranged
between 0.436 ± 0.022 and 0.471 ± 0.01. Within the dark incubation period Fv/Fm values
increased reaching the maximum of 0.52 ± 0.007 at 8:00 am the next morning. With the onset of
the new light incubation period at 10:00 am 20th April 2011 the quantum yield in PSII dropped
to 0.444 ± 0.026.
2.3.6. Rates of photosynthesis and calcification from 14C-labelled NaHCO3
incubation over a 24-hour period
To determine the rates of photosynthesis and calcification E. huxleyi were exposed to 14C-
labelled bicarbonate source. The incorporation of 14C into particulate organic and particulate
inorganic carbon was assessed and the rate of photosynthesis and calcification rates derived.
Calcification and photosynthesis were both enhanced in the light incubation period. While
photosynthesis came to a complete stop in the dark incubation period, calcification continued at
strongly reduced rates. The 14C labelled bicarbonate incubations suggest that calcification rates
(in pmol CaCO3 cell-1 h-1) in E. huxleyi were at their maximum of 0.042 ± 0.002 pmol CaCO3
cell-1 h-1at 6:00 pm. Dark calcification was detected throughout the dark incubation period, but
at rates of only 0.005 to 0.008 pmol CaCO3 cell-1 h-1 (Figure 2-10A). The calculated maximum
coccolith production rate was 1.56 liths h-1 at 6 pm (Figure 2-10B). The highest rates of
photosynthetic carbon assimilation were observed at 4:00 pm with 0.048 ± 0.005 pmol CaCO3
cell-1 h-1, while photosynthesis came to a complete halt in the dark incubation period (Figure
4-10C). In the light incubation phase the ratio of calcification: photosynthesis (CF:PS) increased
������������ �������������������������������������������������
�����
����
����
����
����
����
����������������������������

CHAPTER 2 - THE CIRCADIAN CELL PHASES, RATES OF PHOTOSYNTHESIS AND CALCIFICATION RATES OF EMILIANIA HUXLEYI
46
gradually from 0.5 at 10 am to 1.1 at 6:00 pm (Figure 2-10D). The CF:PS - value of 1.4 at 8:00
pm is omitted from the evaluation because of the 1 h incubation light (see Section 2.2.2). In the
dark incubation period (CF:PS) increased to values of up to 22.7 due to low rates of
photosynthesis. Between 10:00 am and 8:00 pm the average CF: PS ratio was 0.9 ± 0.23.
Figure 2-10: Rates of photosynthesis and calcification of E. huxleyi over a 24-hour period. Photosynthesis and calcification measurements based on the incorporation of 14C-labelled bicarbonate. Incubations that started at 8:00 pm and 8:00 am were excluded from the presentation, because of only receiving one hour of light exposure. Rates for photosynthesis were set to zero in the dark and calcification: photosynthesis ratios not calculated for the dark incubation period. A) Calcification rates per cell; B) coccoliths production per cell and h; C) photosynthesis rates per cell; and D) calcification: photosynthesis. Error bars indicate one standard deviation of three independent replicates. The dark incubation phase is shaded grey.
����
�����
����
��
���
�����
�������
� �
����
����
����
����
����
����
��������������
����
���
����
����
���
� ���
�����
����
� �
����
����
����
����
����
����
���������������������������������������������������������������
����
�����
����
����
���
����
��
���
���
���
���
���
���
� �
� �
����
�����
�� �
�!��
���
���
���
���
���
���

CHAPTER 2 - THE CIRCADIAN CELL PHASES, RATES OF PHOTOSYNTHESIS AND CALCIFICATION RATES OF EMILIANIA HUXLEYI
47
2.4. Discussion
Within the focus of this study, the DNA content and physiological parameters of E. huxleyi
PLY♯ M217 were followed over a period of 24 hours to describe cell cycle phases and periods
of maximum and minimum calcification rates. The relative DNA content and the assessed
physiological parameters namely maximum rates of calcification and photosynthesis,
chlorophyll a content, particulate organic carbon and particulate organic nitrogen per cell, and
cell volume, followed a 24-hour periodicity as previously described (e.g. Bleijswijk et al., 1994;
Bleijswijk and Veldius, 1995; Paasche, 2002; Müller et al., 2008 ). Photosynthesis was linked to
the diurnal rhythm of light and dark. The maximum rates of calcification occurred during the
G1-phase of the cell cycle at the end of the light incubation phase between 6:00 and 8:00 pm
when photosynthetic activity was also high. In the combined S+G2+M phase (dark incubation)
calcification was observed only at rates of 12% to 19% of those measured during the late G1-
phase. The following paragraphs discuss the assessed physiological parameters of E. huxleyi
PLY♯ M217 in more detail. Furthermore, the adequate cell harvesting times for investigating
the transcriptome and proteome at rates of high and low calcification is concluded from the
relative DNA content per cell, the calcification rates over 24-hours, and knowledge of cell cycle
physiological characteristics.
Environmental factors such as elevated temperature, prolonged illumination and nutrient
replete conditions are known to encourage cell division in natural coccolithophore populations
and cultures (Paasche and Brubak, 1996; Paasche, 1967; Fritz and Balch, 1996; Price et al.,
1998; Müller et al., 2008; Poulton et al., 2010). The observed growth rate of 0.9, which is an
equivalent to 1.3 divisions per cell per day, suggests that some cell cohorts could have divided
multiple times within the 24 hours of sampling. Growth rates above 0.69 (equivalent to one
division per day) were also reported by Mullin et al. (1966), Paasche (1967), Balch et al. (1996),
Eker-Develi et al. (2006). Cell size, temperature, light and the proposed internal clock have
been reported as commonly active triggers for cell division in algae (Donnan et al., 1985; Lam
et al., 2001). Observations in mamallian cell lines showed that larger cells pass into the S-phase
more quickly than smaller cells (Ronning and Lindmo, 1983), with larger cells showing higher
rates of DNA synthesis (Ronning and Seglen, 1982). The average cell volume presented in
Figure 2-4C indicates that cell volume decreased over time but remained higher at the end of the
24 hours period compared to the start of the 24-hour monitoring period. Histograms of cell size
in the cultures at the end of the 24-hour monitoring period also showed cohorts of the cell with
larger cells after cell devisions had occurred (data not presented) compared to the beginning of

CHAPTER 2 - THE CIRCADIAN CELL PHASES, RATES OF PHOTOSYNTHESIS AND CALCIFICATION RATES OF EMILIANIA HUXLEYI
48
the monitoring period. These observations could support the assumption that a proportion of the
cell population were dividing multiple times. Further support of asynchronous and multiple
fissions per day is given by the DNA content of the cells. The histograms of relative DNA
content and cells in cell cycle phases (Figure 2-3 and Figure 2-4D) show that cells with 2n DNA
were still present in the morning of April 20th 2011 and that a proportion of the cell population
remained or returned into the S+G2+M -phase. This suggests that growth rates of 0.9 were
achieved by cohorts of cells passing the S+G2+M -phase multiple times (Chisholm et al. 1984).
Furthermore, asynchronous and multiple fission of cell cohorts in the culture justify the
conservative distinction between the G1 and S+G2+M phase because of cells with overlapping
cell cycle phases S, G2, and M in the cell population. Müller et al. (2008) and Bleijswijk and
Veldhuis (1995) investigated the cell cylce features of E. huxleyi CCMP 371 and also found
higher proportions of the cell population in the S-phase rather than the G2/M-phase.
Algal culture growth, kinetics of macronutrient uptake, cellular concentrations of chlorophyll
a, photosynthetic quantum yield (Fv/Fm), cellular POC, and cellular PON have been suggested
as measures for algae physiology impairment through nutrient limitation or other stressors
(Kobler et al., 1983; Geider et al., 1993; Beardall et al., 2001; Moore et al., 2006). Even though
natural E. huxleyi populations thrive well under both high and low nutrient regimes (Zondervan,
2007) E. huxleyi lab cultures limited in phosphorous showed reduced growth rates (Paasche,
1998; Riegman et al., 2000; Paasche 2002), increased cellular organic carbon content (Paasche
and Brubak, 1994; Paasche, 1998; Riegman et al., 2000; Shiraiwa et al., 2003), and an increase
in number of liths per cell (Paasche, 1998). Nitrogen limitation in lab cultures has been shown
to result in a reduction of cell size and putatively cellular organic carbon content and a small
increase in calcite per cell (Riegman et al., 2000; Sciandra et al., 2003, Zondervan, 2007;
Mueller et al., 2008). Therefore, it is not suggested by the observed growth rates, organic carbon
content per cell, and inorganic carbon per cell that macronutrients were limiting for growth (see
Section 2.3). The measurements of PIC per cell (Figure 2-6A), and particulate organic carbon
(Figure 2 – 5A) were not significantly different between the start and end of the 24-hour
sampling period (p < 0.05, two-tailed t-test, n = 6; data not shown). However, cell volume was
significantly lower at the end of the 24-hour sampling period (p = 0.04, two-tailed t-test, n = 6;
data not shown). Nevertheless, the slight significant decrease of cell volume within 24 hours
does not suggest that the cells were experiencing nutrient limitation.
A sufficient supply of the macronutrients nitrogen and phosphorous is central to cell
functioning, physiology, and cell division. The nutrient concentrations in this cell cylce

CHAPTER 2 - THE CIRCADIAN CELL PHASES, RATES OF PHOTOSYNTHESIS AND CALCIFICATION RATES OF EMILIANIA HUXLEYI
49
experiment were significantly reduced during the course of the 24-hour monitoring period. The
total uptake rates of nutrients in the light and dark incubation period were different with respect
to previously reported uptake rates (see Müller et al. 2008). Nitrogen uptake rates in the light
were around 5 times lower and nitrogen uptake in the dark was around 10 times lower in this
experiment compared to Müller et al. (2008). The phosphorous uptake rates in the light and dark
incubation period in this study were both 10 times lower compared to Müller et al. (2008; Table
1). The observed differences in nutrient uptake rates might be explained by the different genetic
repertoire of the strains CCMP 371 and PLY♯ M217. Despite the observaion of different
uptake rates of phosphorous is was confirmed that phospohorous uptake in the light and dark
are not significantly different (Müller et al., 2008). The uptake ratio of N:P in the light versus
the dark was significantly reduced by about 70% (p = 0.012, two-tailed t-test, n = 6; data not
shown) (compare Riegman et al., 2000; and Müller et al., 2008). Ronning and Lindmo, 1998
showed that the demand for nitrogen is lower in the dark because protein synthesis is
suppressed in the dark, in particular when cells pass through the S and G2/M-phase. In this
study the consumption of nitrogen was also significantly reduced in the dark (p < 0.001, two-
tailed t-test, n = 15; data not shown). Therfore it can be inferred that the higher nitrogen uptake
rates in the light also reflected elevated protein synthesis and biomass accumulation (compare
Ronning and Lindmo, 1998; Müller et al., 2008).
The chlorophyll a content per cell was found to be lower or within the range of previously
reported values (e.g. Muggli and Harrison, 1996, 1997; 49 to 130 fg Chl a cell-1; Eker-Develi et
al., 2006; 200 fg Chl a cell-1; Houdan et al., 2005; 117 fg Chl a cell-1; Suggett et al., 2007; 97 –
132 fg Chl a cell-1; Loebl et al., 2010; 140 fg Chl a cell-1). The lower values found in this study
could reflect a strain specific feature. From the lower Chl a content alone an impairment of E.
huxleyi physiology can not be inferred (Kruskopf and Flynn, 2005).
Measurements of photosynthetic health (Fv/Fm) can rapidly detect nutrient stress in
phytoplankton cultures that are not adapted to nutrient limitation (Parkhill et al., 2001) by
inducing only little stress on the cells (Falkowski and Kolber, 1995). Phytoplankton cells
require nitrogen to synthesize proteins for PSII repair, because light frequently damages the
PSII reaction centers (Nishiyama et al., 2006; Ragni et al., 2008). The observed photosythetic
efficiency (Fv/Fm) – measurements do not suggest an impairment of the photosystem II in E.
huxleyi cells and therefore nutrient starvation. Under nutrient starvation Fv/Fm was found to
decrease (Sugett et al., 2009). However, Ho et al. (2003) and Suggett et al. (2007) reported
generally higher values for Fv/Fm ranging between 0.557 and 0.58 for the E. huxleyi strains

CHAPTER 2 - THE CIRCADIAN CELL PHASES, RATES OF PHOTOSYNTHESIS AND CALCIFICATION RATES OF EMILIANIA HUXLEYI
50
B11, B92 and the field strain ASM 1, compared to the average range of Fv/Fm of 0.435 and
0.520 found in E. huxleyi strain PLY♯ M217. This difference is likely to represent a
‘taxonomic signature’ or difference in photophysiological performance between the strains
(Suggett et al., 2009). Interestingly, a peak value of photosythetic efficiency was observed at the
end of the dark incubation period (Figure 2-9) when most cells of the population were about 3
hours into the G1-phase. This peak in photosythetic efficiency can be explained by the ‘young
cells’ and ‘young photosystems’ showing increased values of Fv/Fm (Post et al., 1985).
Furthermore, a similar pattern of lower Fv/Fm values at the onset of the G2/M was shown in
diatoms (Claquin et al., 2004).
Nutrient limitation affects growth and carbon accumulation in E. huxleyi (reviewed by
Paasche, 2002). Any significant changes of the cellular organic carbon, cellular inorganic, and
organic nitrogen content were however not observed between the beginning and end of the 24-
hour experiment (p < 0.05 for POC, PIC and PON, two-tailed t-test, n = 6; data not shown), that
would indicate a limitation of P and N supply to the E. huxleyi cells. P limited cells in E. huxleyi
cultures are known to show an increase of organic carbon content per cell (e.g. Paasche and
Brubak, 1994; Riegman et al., 2000). Indicative of N limitation are a decrease in POC and in
cell volume (Riegman et al., 2000; Sciandra et al., 2003; Müller et al., 2008) and a moderate
increase or even a decrease in PIC (Paasche, 1998; Fritz, 1999). However, it should be noted
that Müller et al. (2008) found higher contents of POC and PON in the E. huxleyi strain CCMP
371 under nutrient replete conditions and observed similar concentrations of organic nitrogen
only in N-limited cultures.
One emphasis of this experiment was to measure the rates of photosynthesis and
calcification over a 24-hour period. The data presented here support previous conclusions that
rates of calcification and photosynthesis in E. huxleyi follow a light dark cycle (Müller et al.
2008; Paasche 1962). Calcification rates were found to be dependent on the irradiance levels
(Paasche, 1964; Paasche, 1965; Linschooten et al., 1991; Nimer and Merrett, 1993; Bleijswijk
1994; Paasche, 1999; Zondervan et al., 2002) and our results supported the coupling of
calcification on photosynthesis, suggesting that energy deriving from photosynthesis accelerates
the precipitation of CaCO3 (Anning et al., 1996). Dark calcification (Figure 2-10A) was
observed as was previously reported (Paasche, 1966; Balch et al., 1992; Nimer an Merrett,
1992; Paasche and Brubak, 1994; Sekino and Shiraiwa, 1994, 1996). Rates as low as 10 to 15 %
of the calcification rate in the light were reported for the dark (Paasche, 2002), which compare
to rates of between 12 and 19 % of the maximum calcification rate in the light incubation period
in this study. Mueller et al. (2008) however, reported an absence of dark calcification.

CHAPTER 2 - THE CIRCADIAN CELL PHASES, RATES OF PHOTOSYNTHESIS AND CALCIFICATION RATES OF EMILIANIA HUXLEYI
51
The energy required to drive dark calcification was suggested to derive from mitochondrial
respiration (Sekino and Shiraiwa, 1996). In this study a lag-phase was observed before the
maximum rates of calcification, rates of coccolith production, and photosynthesis were reached.
The inorganic carbon assimilation increased over a period of 9 hours until 6:00 pm when
maximum rates were reached. This might indicate the tight energetic coupling of photosynthesis
and calcification (Anning et al, 1996) or that the degree at which biochemical energy from
photosynthetic carbon fixation supplied for calcification was lower in the early hours of the
light incubation phase because other cellular processes had higher energetic demands. It is
known that the assimilated carbon is incorporated at different rates in molecular components
such as proteins, polysaccharides, lipids, and low molecular weight molecules throughout the
cell cycle (Fernandez et al., 1996). Therefore, it can be assumed that theses quotas change over
time and under different physiological demands of other cell processes.
A comparison with data from the available literature showed that calcification and
photosynthetic rates were within the range of previous results (see Table 2-1). The results were
closest to the studies by Paasche and Brubak (1994) and Balch et al. (1996). Those two studies
were also found to reflect rates similar to those found in natural subsurface calcifying
populations at the Iceland Basin (Poulton et al., 2010). However, notable differences between
the results presented here and those obtained by Mueller et al. (2008) were found. Nevertheless,
the different kinetics of inorganic and organic carbon assimilation did not affect the
characteristics of the E. huxleyi cell cycle.
Table 2-1: Experimental conditions and observed growth rates in previous studies and this study. Summary of experimental conditions and observed growth rates in previous studies using strains of Emiliania huxleyi, which investigated growth, calcification, photosynthesis properties applying 14C-labelling. CF: calcification, PS: photosynthesis. Values for CF and PS are given in fmol cell-1 h-1. Abbreviations: av = average and pk = peak value (maximum).
E. huxleyi Strain
Growth rate [m]
Medium/ condition
CF
PS CF : PS Reference
E88 n.a F/2, 50 mE m-2s-1 1.8 2.2 0.9 Nimer and Merrett (1992) 5/90/25j 1.26 P=0.6 mM, N=
125 mM, 20°C ~23.4-32.4
~26-36 ~0.82-0.9 Paasche and Brubak (1994)
E88 0.99 K, 17±0.5°C, cont.75 mE m-2s-
1 continuously
18 42 0.43 Balch et al. (1996)
CCMP371 0.72 F\50. 21°C 8 ~18.5 0.44 Mueller et al. (2008 Fig.2) PLY ♯ M217
0.9 F\50. 19°C 94 mE m-2 s-
av=29 pk=4
2
av=40 pk=48
av=0.75 pk=0.88
This study

CHAPTER 2 - THE CIRCADIAN CELL PHASES, RATES OF PHOTOSYNTHESIS AND CALCIFICATION RATES OF EMILIANIA HUXLEYI
52
It can be concluded that in this study, E. huxleyi cells were not exposed to nutrient
limitations and that their growth was well mantained in the culture conditions. The results of the 14C-bicarbonate incubation, the determination of calcification rates and rates of photosynthesis
over 24 hours, as well as the analysis of relative DNA content per cell, of three replicate
cultures of E. huxleyi PLY♯ M217 revealed a 24-hour pattern similar to previously reported
light dark periodicity (Müller et al. 2008; Paasche 1962). The bulk of calcification could be
correlated with the late G1-phase of the cell cycle. Due to the asynchronous cell cycle
progression and suggested multiple division of the cells in the dark it was uncertain to clearly
seaprate between the S and G2+M cell cycle phases. Therefore, only two cell cylce phases,
namely the G1 and S+G2+M phase, were separated. The observation that DNA replication and
nuclear and cellular division may overlap in non-G1 phases (Zachleder et al., 2016) supports the
functional separation in two cell cycle phases in this study in respect to subsequent molecular
studies. In the S+G2+M phase demands of nitrogen and showed lower deman for nitrogen in
the dark incubation period because protein synthesis is suppressed in the dark, when cells pass
through the S +G2+M-phase (Ronning and Lindmo, 1998). However, Ferandez et al. (1996)
suggested that the overall carbon incorporation into proteins is much higher in the dark than in
the light. Prevailing cell cycle processes of microalgae in the G1-phase suggest elevated
contents of RNA and proteins in the late G1-phase. In the early G1-phase, still in the dark
period, cell division was completed and RNA and proteins related to cell division processes,
which could provide noise in the transcriptome and preoteome analysis, were thought to be at
low levels (Zachleder and Šetlík, 1988; Zachleder et al., 2016). The results of cell population
growth and DNA content suggested that the cells were in the G1-phase at both harvesting time.
Therefore, the time windows for harvesting cells at low and high calcification rates for
transcriptome and proteome analysis were chosen between 7:00 pm in the light incubation
period, when maximum calcification rates were observed and the bulk of the cells were in the
late G1 cell-cycle phase. Hereafter, the samples of the late G1-phase are referred to as (high
calcification – late G1-phase (hc-lG1 or just HC) samples. The harvesting time at low
calcification rates was chosen at 7:00 am, the end of the dark incubation period, when cells
showed low calcification rates, the bulk of the cells had completed cell division, and cells had
transited into the early G1-phase. The harvesting time at 7:00 am is here after referred to as low
calcification – early G1-phase (lc-eG1 or just LC).

53
Chapter 3. The transcriptome of Emiliania huxleyi
at high and low calcification rates “Perhaps all forms of life on this planet use essentially the same genetic language.”
(Nirenberg, 1968)
3.1. Introduction
In all organisms genetic information is stored in DNA that is replicated during cell division
or transcribed to form proteins after gene expression. Gene expression and protein synthesis
comprises two steps: (1) transcription of DNA to RNA and (2) translation of RNA to proteins.
During transcription, RNA transcripts complementary to one strand of DNA are synthesised.
Throughout translation, the information in the RNA sequence is converted into sequences of
amino acids and polypeptides. This flow of genetic information for the purpose of DNA
replication or the transcription into RNA sequences and the translation into proteins is also
referred to as the central dogma of molecular biology. With the exception of RNA viruses,
where the information that is stored in RNA sequences can be reverse transcribed into DNA, the
direction of the flow of genetic information is from DNA to RNA to proteins (Snustad and
Simmons, 2000).
There are many types of RNA, such as mRNA (messenger RNA), tRNA (transfer RNA),
rRNA (ribosomal RNA), snRNA (small nuclear RNA), and small interfering RNA (siRNA)
(Kanno et al., 2005; Onodera et al., 2005). The information to synthesize polypeptides is stored
in the mRNA sequence. In eukaryotes pre-mRNA is an immature mRNA precursor that is
edited by affiliating additional 7-methyl guanosine caps or poly (A) (a sequence of many
adenosine nucleotides) to the transcript or splicing noncoding intron sequences from the
transcript. In eukaryotes, most of the maturation of mRNA occurs in the nucleus, whereas
polypeptide synthesis occurs in the ribosomes (macromolecular protein biosynthesis units
comprised of both protein and rRNA) of the cytoplasma. Ribosomal RNA is essential for the
growth of the polypeptide sequences in the ribosome, because rRNA catalyses the chemical
bond between two amino acids. Furthermore, rRNAs were found to evolve and are used for the
identification of taxonomic groups by separating rRNAs according to their rate of sedimentation
during sucrose gradient centrifugation. Transfer RNAs adapt specifically to amino acids and the
codon in the mRNA. The tRNA decodes the triplets of RNA bases (codon) into the according
amino acid. The following sections focus on the expression of protein coding genes and discuss
mRNA or transcripts abundance at high and low calcification rates in the coccolithophore E.
huxleyi.

CHAPTER 3 - THE TRANSCRIPTOME OF EMILIANIA HUXLEYI AT HIGH AND LOW CALCIFICATION RATES
54
3.1.1. Molecular controls of gene expression at the transcript level
Gene expression describes the process in which a protein is produced from the template of
genomic gene sequence. A regulatory macromolecular machinery selectively controls gene
expression in response to environmental factors, developmental stage or cell type; thus making
the processes contributing to gene expression highly dynamic. The regulation of gene
expression involves the interaction of activators and repressors that operate at different and
multiple layers of the transcription process and protein synthesis machinery. Activating or
repressing transcription factors (Eberhardy and Farnham, 2002), the coiling of the chromosomes
through nucleosome modification (Lee and Young, 2000), initiation cofactors for the RNA II
polymerase (Pol II) (Jang et al., 2005), the elongation (Aso et al., 1995) or pausing of mRNA
synthesis (Muse et al., 2007), and mRNA processing (Keller and Noon, 1984) are some of the
levels at which the expression of protein coding genes is regulated within the cell. Multiple
genes may be controlled by activating or repressing gene-regulatory processes (Lee and Young,
2000; Wijnen and Young, 2006). These regulatory processes might comprise just one of many
interacting activators or even a combination of activators and repressors (Levine and Tijan,
2003). Transcript synthesis in eukaryotes starts by binding activators of gene expression to
upstream activating sequences. A specific DNA-binding domain within the transcription factor
protein binds to the promoter DNA sequence of the gene. Transcription factors direct the
specific binding of the RNA polymerases I, II, and III to the DNA sequence and initiates the
transcripts synthesis (Snustad and Simmons, 2000; Lee and Young, 2000). The transcription
factors may act as an activator by attracting and stimulating the coupling of RNA polymerase to
the transcription start site gene sequences or as a repressors by preventing the binding of RNA
polymerase or other required proteins to the gene sequence (Lee and Young, 2000; Snustad and
Simmons, 2000). In Emiliania huxleyi a total of 419 different transcription factors were
identified, which contribute around 1% of its proteome (Rayko et al., 2010).
The degree of coiling of the DNA double helix not only establishes the condensation of
chromosomes but also exposes DNA sequences that are accessible to transcription. Histones
coil the DNA to form nucleosomes, which are the basic building blocks of the chromatin
structure. In supercoiled DNA, as in chromosomes, the transcription machinery is unlikely to
recruit to a promoter and start the transcription process. Processes that can unfold the chromatin
structure for transcription are modifications of the histone complexes, such as methylation as
well as acetylation and deacetylation (Margueron et al., 2005).

CHAPTER 3 - THE TRANSCRIPTOME OF EMILIANIA HUXLEYI AT HIGH AND LOW CALCIFICATION RATES
55
In eukaryotes an array of transcription factors, such as TFIIA, TFIIB, TFIID, TFIIE, TFIIF,
TFIIH, and TATA-box binding proteins, complement the RNA polymerase II holo-enzyme to
create the pre-initiation complex that defines the transcription start site (TSS) (Bengal et al.,
1991Chiang et al., 1993; Tan et al., 1994; Näär et al., 2001; Kettenberger et al., 2004; Thomas
and Chiang, 2006; Kwak and Lis, 2012). In regulated transcription additional general cofactors
are often required to mediate between the gene-specific activators and the general transcription
machinery (Dynlacht et al., 1991; Thomas et al., 2006). Both, stimulating and repressing co-
factors have been discovered that are important in binding the promoter to the specific
transcription factors regulate basal transcription (reviewed by Thomas et al., 2006).
Nuclear pre-mRNA is subject to post-transcriptional modifications. Once the modifications
are conducted the mRNA is ready for translation into the amino acid sequence. Post-
transcriptional modifications are the excision of non-coding introns from the transcript (Keller
and Noon, 1984), the addition of 7-methyl guanosine cap to the 5’ end of the transcript
(Shatkin, 1976), and polyadenylation to the 3’ end of the transcript. The capping of 7-methyl
guanosine caps occurs shortly after the initiation of transcription adding protection to the
growing RNA strand from degradation by nucleases. The addition of poly(A) tails occurs
through endonucleolytic cleavage in response of a downstream polyadenylation signal the
AAUAAA sequence (Snustad and Simmons, 2000). Non-coding introns are excised on complex
ribonucleoprotein structures called spliceosomes. In spliceosomes previously assembled snRNA
– protein complexes and protein splicing factors cut out non-coding sequences and ligate the
adjacent exons. In some cases the multiple introns are removed by splicing the pre-mRNA. If
two successive introns are excised, the exon between them will be cut out. Alternative splicing,
exon removal, and transcript isoforms create different polypeptides (Houk et al., 1991; Snustad
and Simmons, 2000).
Modulating the transcriptional outcome through RNA polymerase II (Pol II) pausing can
also control the process of transcript elongation. Hence, influencing the number of transcribed
sequences directly (Kwak and Lis, 2013). The control of transcript elongation occurs at early
elongation and productive elongation stages, adding a further level of gene expression control.
Early transcript elongation pausing in the promoter-proximal regions is required to add the 5’
caps (Rasmussen and Lis, 1993) and decrease the response time of the transcription machinery
to changes in physiological demands as during heat shock (Andrulis et al., 2000). Throughout
later periods of the transcription process Pol II passes through numerous obstacles, including

CHAPTER 3 - THE TRANSCRIPTOME OF EMILIANIA HUXLEYI AT HIGH AND LOW CALCIFICATION RATES
56
intrinsic pause sites and nucleosomes, at which point elongation factors are required to promote
the continuation of transcript elongation (Young and Lee, 2000). For elongation pausing,
passing elongation pausing or enhancements of the elongation process an array of
nucleoproteins are utilized (Kwak and Lis, 2013).
3.1.2. Physiological feedback mechanism in gene expression
The patterns of gene expression in a cell are a direct response to the cell cycle stage, cell
development, and environmental conditions (Snustad and Simmons, 2000). The changes in
transcription may be induced, for example, in response to light or temperature (Ritossa 1962;
Ballantuono et al., 2012) or internal triggers, such as hormones in multicellular eukaryotes or
the intrinsic circadian clock (Johnson et al., 1993; Snustad and Simmons, 2000; Farré 2012). An
induction of gene expression may involve a receptor, usually a receptor-protein that experiences
an alteration in its three dimensional structure in response to changes in the physical or chemical
environment of the cell (Urizar et al., 2000; Snustad and Simmons, 2000; Yamamoto, 2005).
The receptor-protein may undergo redox reactions or phosphorylation in the case of DNA-
binding proteins. These two examples of chemical reactions often occur at key molecules when
gene expression is induced or paused.
Heat or cold, for example, are an important inducer of heat shock proteins, which occur in all
organisms and assist in protein refolding under stress conditions (Feder and Hofmann, 1999;
Wang et al., 2004). However, other environmental stressors may also induce the production of
heat shock proteins, such as drought, oxidative stress, salinity, UV-radiation, or nutrient
depletion (Vierling 1991; Rizhsky et al., 2002; Pockley, 2003; Wang et al., 2004). Heat shock
proteins were also found to play an important role in cell signalling and immune response
(Pockley, 2003). In Drosophila melanogaster the promoter of the heat shock protein genes
hsp70 is induced by the heat shock transcription factor (Hsf). Under ambient temperature Hsf is
present in the nuclei as a non-promoter binding form. Upon heat stress Hsf is phosphorylated
and binds to the DNA sequence upstream hsp70, at the heat shock response element section of
the promoter (Snustad and Simmons, 2000).
Light acts as an important environmental factor inducing physiological responses and gene
expression in many organisms (Wijnen and Young, 2006). In photosynthetic organisms light
levels influence for example the state of the light-harvesting complexes and photomor-
phogenesis – the light mediated development in plants (Rochaix, 2014; Wu, 2014). For
example, light was found to induce transcription in the nucleus of Arabidopsis thaliana via
triggering the phytochrome RED/FAR RED (R/FR)-light photoreceptor, the UVB

CHAPTER 3 - THE TRANSCRIPTOME OF EMILIANIA HUXLEYI AT HIGH AND LOW CALCIFICATION RATES
57
photoreceptors and cytochrome directly (Chen, 2008; Fankhauser and Chen, 2010). The
photoreceptor triggering may spark further diverse processes of gene expression regulation,
such as photophysiological processes optimizing photosynthetic efficiency by readjusting the
absorption cross sections of PSII and PSI, whereas the mobile LHCII (Light harvesting
Complex of photosystem II) antenna is being redistributed. The redistribution of LHCII may
occur as a short-term response or through transcriptional and translational regulation of LHC
gene expression for prolonged modifications (Pfannschmidt et al., 2001; Rochaix, 2014).
Different light qualities and harmful UV light were found to trigger differential gene expression
of up to one third of genes in seedlings of Arabidopsis thaliana (Ma et al., 2001). Structural
modifications of the photosynthetic complexes and within the thylakoid membrane of the
LHCII (PSII) can induce protection mechanisms to avoid damage to the photosynthetic
apparatus by high intensities of light and harmful spectral characteristics of light (ultraviolet
light) (Rochaix, 2014). Light affects gene expression at the transcriptional, posttranscriptional,
and translational level in plants. Hundreds to thousands of genes are differently expressed
following changes in the light regime (Wu, 2014; Pfannschmidt et al., 2001; Wijnen and Young,
2006). In coccolithophores the rates of calcification are increasing in the Light period (e.g.
Paasche et al., 1969, Balch et al., 1993) by the higher availability of energy of carbon fixation
(Bach et al., 2013). Even though the suggestion that calcification acts as a carbon concentrating
mechanism was disproved (Bach et al., 2013) transcriptional responses in calcification related
genes were shown to depend on the light periodicity (Richier et al., 2009).
The periodicity of the diurnal light regime and the light/dark transition were found to act as
an additional “zeitgeber” for the in circadian gene expression fluctuations that activate
regulatory circuits preventing, for example, DNA damage from mutagenic ultra violet light
during cell division (Nikaido and Johnson, 2000; Chen and McKnight, 2007). Hence, the
diurnal light level fluctuations are closely linked with the endogenous timekeeping mechanism,
the circadian clock, which enables organisms to respond as they experience environmental
change and prepare for coming change (McClung, 2014). Therefore, gene expression in the
advanced dark phase may prepare photosynthetic cells for optimal physiological performance
during the light (Green et al., 2002; Dodd et al., 2005; Winjen et al., 2006).

CHAPTER 3 - THE TRANSCRIPTOME OF EMILIANIA HUXLEYI AT HIGH AND LOW CALCIFICATION RATES
58
3.1.3. Gene expression related to biomineralisation in coccolithophores
The genetic control of coccolithophogenesis involves the expression of many proteins of yet
unknown functions to provide a network of interacting structural and regulatory molecules
(Young and Henriksen, 2003; Henriksen et al., 2004; de Vargas et al., 2007). Previous
coccolithophore research identified molecules and genes of interest that are involved in
biomineralisation by comparing calcifying and non-calcifying strains, calcifying diploid and
naked (non-calcifying) haploid cells, stimulating or altering the calcification performance of
coccolithophores through culturing conditions (e.g. Nguyen et al., 2005; Quinn et al., 2006;
VanDassow et al., 2009, Mackinder et al., 2011; Emery et al., 2012). An outline of the
molecules involved in calcium carbonate crystallization in coccolithophores is given in chapter
1 of this monograph. Here, the results from studies comparing calcifying and non-calcifying
stages of coccolithophores are summarized in the context of this chapter, which investigates the
expression of genes involved in the biomineralisation process in the Dark period (low
calcification rates) and Light period (high rates of calcification).
Richier et al. (2009) investigated the expression of specific genes related to
biomineralisation in haploid and diploid cells in the light and dark period. Key proteins, such as
calmodulin, the E. huxleyi type of carbonic anhydrase (γ -EhCA2), and the calcium binding
protein (GPA) were significantly higher expressed in calcifying diploid cells in the light
(Richier et al., 2009). Comparative studies of gene expression related to biomineralisation in
phosphorous replete and phosphorous limited cultures showed that a significant number of
genes related to stress compensation and cell repair processes, such as HSP 70, HSP 80, HSP
81, HSP 82, and HSP 90, and the co-chaperonins Dna J and Dna K were also over-expressed
(Wahlund et al., 2004). Quinn et al. (2006) found 127 significantly up down regulated genes
when comparing phosphorous replete and phosphorous limited cultures. The majority of the
identified molecules were involved in cellular metabolism, ion channels, protein transport,
vesicular trafficking, and cell signaling. In phosphorous limited calcifying cells putative
gamma-carbonic anhydrase was significantly higher expressed (Quinn et al., 2006). Patterns of
gene expression in isogenic haploid non-calcifying flagellated cells and diploid calcifying cells
of different life cycle phases indicated diploid specific expression of genes potentially involved
in calcification. In diploid cells genes potentially related to biomineralisation included Ca2+, H+,
and HCO3- -pump coding sequences. Specifically, transcripts of Ca2+-transporting ATPase, K+ -
dependent Ca2+/Na+ exchanger NCKX1, and V-type H+ - ATPases subunits a, d, M9.7, c/c’, A,
B F, and H were more abundant in diploid calcifying cells (von Dassow et al., 2009). In naked
and coccoliths-bearing cells of Pleurochrysis haptonemofera Fujiwara et al. (2007) found 54

CHAPTER 3 - THE TRANSCRIPTOME OF EMILIANIA HUXLEYI AT HIGH AND LOW CALCIFICATION RATES
59
genes of 3-fold higher expression specific to the coccoliths-bearing phase of the life cycle, of
which 32 matched to registered sequences, among them sequences referring to carbonic
anhydrases, Myb1, and a mitochondrial Ca2+ - dependent solute carrier (for a summary, see
Table 1-1).
Additional knowledge of yet unidentified genes involved in the biomineralisation process in
the diurnal phases of coccolithophorgenesis is required to better understand the processes of
biomineralisation in general and the timing of relevant gene expression events. Recent studies,
have suggested molecules putatively involved in the biomineralisation processes in E. huxleyi
and extended existing models of calcification suggesting a role of putative Ca2+-channels in the
control of Ca2+ flux from the peripheral endoplasmic reticulum into the maturing CV, the
requirement of H+ removal from the cytosol by voltage gated H+ channels and an amorphous
calcium carbonate pre-cursor (Mackinder et al., 2010). This study aims to identify the patterns
of biomineralisation related gene expression and possibly identify new links of molecules and
biomineralisation applying next generation RNA sequencing techniques on calcifying and non-
calcifying E. huxleyi cells.
3.1.4. Strategies for gene-expression analysis
In transcriptome research the diversity, structure, and sequences of RNA molecules are
investigated with the aim to connect the genome to gene functioning. Two main approaches are
followed in transcriptome studies, the knowledge-driven and the data-driven approach. The
choice of the approach depends on the goals of the investigator. In the knowledge driven
approach the researcher knows the genes or physiological pathways and the proteins of interest
from a sequenced genome or the molecular process of interest. In a data-driven approach the
entire population of mRNA in a cell or tissue is sequenced. The data was analysed using known
sequences and gene homologies from other organisms. When supplemented with their functions
the discovered transcripts become truly meaningful and useful to increase our understanding of
the molecules involved in molecular physiology.
3.1.5. Aims and Objectives
Next generation sequencing techniques open the door to a wider exploration of the
transcriptomes of E. huxleyi showing elevated and no calcification, promising also the
illumination of new genes potentially involved in the calcification processes. Previously, the
molecular controls of calcification in E. huxleyi were studied using phosphorous limitation
(Wahlund et al., 2004a; Nguyen et al., 2005; Quinn et al., 2006), comparing isogenic non-

CHAPTER 3 - THE TRANSCRIPTOME OF EMILIANIA HUXLEYI AT HIGH AND LOW CALCIFICATION RATES
60
calcifying haploid with calcifying diploid life cycle-phases (Fujiwara et al., 2007; Richier et al.,
2009; von Dassow et al., 2009;), and relating isogenic non-calcifying cultures to calcifying
cultures (Mackinder et al., 2011). We have previously established (Chapter 2) that the bulk of
calcification in this E. huxleyi PLY♯ M217 took place during the light phase in the late G1-
phase and is presumably energetically driven by photosynthetic carbon fixation. Furthermore,
giving the assumption that higher gene expression related to biomineralisation processes is
linked to the higher rates of calcification, gene expression important to coccolithogenesis could
be explored by assessing the transcriptome in a high calcification late G1-phase (HC). Low
levels of biomineralisation related gene expression could be assumed when no photosynthesis is
occurring but cell are in the G1-phase (Paasche 2000) (see Chapter 2). In order to compare high
calcification rates related gene expression to low calcification rates related gene expression the
target cell harvesting time was chosen in the at low calcification rates in the early G1-phase
(LC). Investigating E. huxleyi at calcifying and low calcifying phases of the G1-phase has the
further advantage of limiting the degree of cell division derived gene expression noise.
Furthermore, by using the next generation full transcriptome analysis approach other levels of
molecular processes potentially involved in biomineralisation may become apparent. Therefore,
cultures of E. huxleyi strain PLY♯ M217 were harvested at low and high rates of calcification in
the G1-phase of the cell cycle. The transcriptomes at low and high calcification rates were
sequenced on Hi Seq Illumina platforms and significant differences in transcript abundance
between the low and high calcification phases were evaluated.

CHAPTER 3 - THE TRANSCRIPTOME OF EMILIANIA HUXLEYI AT HIGH AND LOW CALCIFICATION RATES
61
The aims of this investigation were:
• to sequence the transcriptomes of iso-genetic cultures from low and high calcification
phases in the G1–phase to reduce cell division related transcript recovery,
• to determine significant differences in transcript abundance and diversity between the
low and high calcification phase, and
• to investigate details of the molecular machinery that drives calcifcation.
3.1.6. Working hypothesis
The null hypothesises for these studies are:
• There are no differences in transcript abundance between the transcriptomes of E.
huxleyi PLY♯ M217 from the high and low rate calcification period within the G1-
phase;
• There are no differences in transcript diversity between the transcriptomes of E. huxleyi
PLY♯ M217 from the high and low rate calcification period within the G1-phase;
• The general expression of genes related to calcification is not enhanced in the high
calcification period when calcification rates were found to be at a maximum.

CHAPTER 3 - THE TRANSCRIPTOME OF EMILIANIA HUXLEYI AT HIGH AND LOW CALCIFICATION RATES
62

CHAPTER 3 - THE TRANSCRIPTOME OF EMILIANIA HUXLEYI AT HIGH AND LOW CALCIFICATION RATES
63
3.2. Materials and Methods
To identify the molecular processes involved in the formation of coccoliths RNA and
proteins were extracted from Emiliania huxleyi PLY♯ M217 cultures when cells were calcifying
at high and low rates. The timeframes for culture harvesting were determined from the results of
Chapter 2. The physiological performance of the cultures was assessed to exclude any potential
limitation of nutrients or alternations of the cell population development that would affect gene
expression. The extracted transcripts of messenger RNA at high and low calcification rates were
sequenced using next generation sequencing techniques. Subsequently, a thorough evaluation of
the gene expression patterns in respect to the conditions high calcification (light) and low
calcification (dark) was conducted and candidate genes involved in calcification were identified.
3.2.1. Experimental Design
Exponentially growing stock cultures of Emiliania huxleyi, strain PLY♯M217, previously
adjusted to light, temperature and nutrient regimes (F/50), were used to inoculate three 16-litres
stock cultures in 20L Nalgene® culture vessels. The 16L cultures were reared for 3 to 5
generations until cell densities exceeded 50000 to 100000 cells mL-1, in order to supply
sufficient coccolithophore biomass for RNA and protein extractions.
3.2.2. Algae Culturing
Stock cultures of Emiliania huxleyi PLY♯ M217 were reared for 20 generation in 2L culture
flasks in 1L filter-sterilized F/50 culture medium based on oceanic natural seawater (Guillard,
1975). The seawater was collected from offshore Plymouth (UK) and filtered through 0.22 μm
pore-size Millipore-filters (Millipore, Billerica, USA). All algae cultures were grown at 19 °C,
irradiance levels of 103 ±�6 µE sec-1 m-1 (n=32) in a 12:12 Light:Dark (LD) cycle using
Sylvania white fluorescent F36W/135-T8 bulbs (Havells Sylvania Europe, Raunheim,
Germany), and macronutrient concentrations of 36 µM nitrate and 1.45 µM phosphate at the
time of culture inoculation. The algae cultures were mixed daily and cell densities were
monitored using a Neubauer haemocytometer (Weber Scientific International, Teddington, UK).
Several 20 L Nalgene® culture vessels were prepared with16 litres of F/50 culture medium
based on sterilized oceanic seawater. Each culture medium was inoculated with 15000 cells ml-1
and reared for 3 to 5 generations until the cell densities exceeded 50000 to 100000 cells mL-1.
Throughout the experiment some cultures were aborted because the growth of the cell

CHAPTER 3 - THE TRANSCRIPTOME OF EMILIANIA HUXLEYI AT HIGH AND LOW CALCIFICATION RATES
64
population collapsed. Only E. huxleyi cultures that remained in the exponential growth phase
were used for transcriptome analysis. In total three replicate cultures for each calcification phase
(low and high) were harvested. Hereafter, the replicate cultures were referred to as HC-1 to HC-
3 and LC-1 to LC-3.
To estimate the physiological state of the E. huxleyi cells physiological and seawater
parameters, such as cell densities, cell volume, POC, PON, PIC, nutrient uptake, DIC, total
alkalinity, chlorophyll a, and photosynthetic health were assessed one day before culture
harvesting and at the day of culture harvesting. The methods used to assess the cell
physiological and seawater parameters were described in detail in Chapter 2 of this monograph.
Hereafter, only modifications from the methods described in Chapter 2 are elaborated.
3.2.3. Culture harvesting
Cells were harvested for biomass collection at 7:30 pm and 7:00 am for the light incubation
period and dark incubation period, respectively. The results of cell population growth and DNA
content (Chapter 2) suggested that the cells were in the G1-phase at both harvesting time.
Naturally RNA degrades rapidly (Jan, 2002; Baker et al., 2004; Deutscher, 2006). To limit RNA
alteration a flow through filtration set-up as shown in Figure 3-1 was used to collect the cells.
The cells were retrieved on 3 µm pore-size polycarbonate filters ∅147mm (Millipore Billerica,
MA, U.S.A) fitted in a pancake-filter holder (see Figure 3-1). A Watson-Marlow Bredel Pump
620S (Falmouth, Cornwall, UK) at 50 rpm gently pressed the total coccolithophore suspension
from the 20L Nalgene® culture vessels through the polycarbonate filter. To avoid sample
contamination especially with RNAses or proteases all parts of the filtration set-up, (e.g.
siphons, tubing, filter-holder, and filters) were washed for 24 hours in 10% hydrochloric acid
prior to commencing the cell harvesting. Once the total E. huxleyi – suspension was siphoned
through the filtration set-up the polycarbonate filter containing algae cells was transferred
quickly onto a sterile custom made ice cooled plastic half pipe (10 cm diameter). The cells were
washed off the filter with sterile filtered seawater (0.22 mm polycarbonate, Millepore®) and the
concentrated suspension collected in a 50 mL falcon tube. The cell suspension was immediately
centrifuged for 5 min at 4630 rpm and 4 °C (Rotanta 460R, Hettich Zentrifugen, Germany). The
seawater supernatant was discarded, the concentrated cell pellet snap-frozen in liquid nitrogen
and stored at -80 °C until RNA extractions were conducted. This harvesting procedure was
completed within 25-30 minutes.

CHAPTER 3 - THE TRANSCRIPTOME OF EMILIANIA HUXLEYI AT HIGH AND LOW CALCIFICATION RATES
65
Figure 3-1: Harvesting workflow of E. huxleyi cultures. I – Pumping of culture medium from culture vessel (1) through siphon (2) via peristaltic pumping (3) onto 147 mm diameter polycarbonate filters (5) fitted in pancake filter membrane holder (4). The filtrate is collected in another culture vessel for sterilization (6). II – Collection of coccolithophores from filters (5) in a half-pipe (7) with sterile filtered seawater under cooling, centrifugation (8) for 5 min at 4630 rpm, snap-freezing of pellet and storage at -80°C.
3.2.4. Assessment of physiological performance of E. huxleyi cells
To estimate the physiological performance of E. huxleyi cells during the experiment the
following parameters were assessed according to the methods described in Chapter 2 without
modifications:
• !Cell!density!• Growth!rate!• Photosynthetic!health!• Particulate!organic!carbon!(at!one!day!prior!and!the!day!of!harvesting)!• Particulate!organic!nitrogen!(at!one!day!prior!and!the!day!of!harvesting)!• Particulate!inorganic!carbon!(at!one!day!prior!and!the!day!of!harvesting)!• pH!!• DIC,!total!alkalinity,!salinity!(at!the!time!of!harvesting)!• Nutrient!concentrations!(at!the!time!of!harvesting)!

CHAPTER 3 - THE TRANSCRIPTOME OF EMILIANIA HUXLEYI AT HIGH AND LOW CALCIFICATION RATES
66
3.2.5. Statistics on non-molecular data
Differences in the physiological performance (see section 2.3) of Emiliania huxleyi cells in
cultures harvested during the light and in the dark were graphically presented using SigmaPlot
12.5 (Systat Software, Salisbury, UK). Statistical tests, such as two-sample t-test, Mann-
Whitney Rank Sum Test were applied on cell growth and fitness parameters to test for
differences between conditions (HC and LC). In the case of the larger data set sizes retrieved for
photosynthetic health and growth rate ANCOVA models in STATISTICA Version 10 (StatSoft
Inc., Tulsa, USA) were applied to test for significant changes over time and between the
conditions, using day as covariate. Shapiro-Wilk tests for normality and equal variance tests
were performed in SigmaPlot 12.5 to confirm the suitability of the parametric design. Results of
the normality tests and equal variance tests are not presented.
3.2.6. RNA extractions
Total RNA was extracted following a TRI Reagent® (Sigma-Aldrich, Dorset, UK) method.
The TRI® total RNA extraction protocol uses the principle of RNAse inactivation by
guanidinium isothiocyanate and an acidic phenol/chloroform separation of lipids and proteins
from the RNA containing aqueous phase. The greatest yields of RNA quantity and quality were
achieved using TRI Reagent® extraction followed by a Nucleospin® II (Machery-Nagel GmbH
& Co KG, Düren, Germany) standard clean up protocol, which was supported by two
subsequent DNA digestion steps. At first, a fraction of the frozen cell pellet (see section 3.2.3)
was separated and transferred to a DNA/RNA free 2 mL Eppendorf tube. Then, 1.5 mL of
cooled TRI Reagent® were added and the pellet resuspended by pipetting. Cell lysis was
achieved by vortexing the TRI Reagent® cell suspension for 5 minutes with 20 acid – washed
glass beads (0.5 mm diameter) added to the 2 mL Eppendorf tube. The suspension of disrupted
cells was allowed 15 minutes at 37 °C for a complete inactivation of RNAses and dissociation
of nucleoprotein complexes. The cell debris was separated from the suspension by
centrifugation at 14000 g, 15 min, 4 °C (Mikro 22R centrifuge, Hettich Zentrifugen, Germany).
Subsequently, the RNA was extracted and separated from DNA and proteins by adding 300 µL
of chloroform (Sigma-Aldrich, Dorset, UK) and vigorous vortexing for 15 seconds. After
allowing 2 min at room temperature centrifugation for 15 min at 12000 g and 4 °C (Mikro 22R
centrifuge, Hettich Zentrifugen, Germany) completed the formation of the aqueous phase. The
aqueous phase was pipetted into a fresh micro-centrifuge tube (1.5 mL) and another chloroform
wash step conducted to remove remaining lipids and proteins. From the final collected aqueous

CHAPTER 3 - THE TRANSCRIPTOME OF EMILIANIA HUXLEYI AT HIGH AND LOW CALCIFICATION RATES
67
phase the RNA was precipitated with - 20 °C isopropanol (Sigma-Aldrich, Dorset, UK),
incubated at - 20 °C for 20 min and the RNA pelleted by centrifugation for 15 min (12000g, 4
°C). After removal of the supernatant the RNA pellet was washed with 75% ethanol (Sigma-
Aldrich, Dorset, UK) once and dried on ice under sterile conditions (laminar flow system Foster
BHG 2006; Foster-air, Cornaredo, Italy). Subsequently, a first DNA digestion step using
Ambion®-Turbo DNAse-free (Life Technologies Co.) was performed following the
manufacturer’s instruction. Preliminary trials, revealed that residual DNA on acrylamide gels
was still present after the Ambion®-Turbo DNAse digestion step. Therefore, the resulting
sample was submitted to a second on column DNA-digestion step using standard Nucleospin® II
DNAse followed by a Nucleospin® II column clean up for RNA samples from reaction
mixtures. The purified RNA sample was diluted in 100 µL DNAse/RNAse - free water
(HyCloneTM, Thermo Scientific, Loughborough, UK) and stored on ice for shorter periods or at
- 80 °C until further processing.
3.2.7. RNA Quality and Quantity
The spectrometric absorbance ratio at wavelength 280 and 260 nm A260/A280 was analysed as
a measure for RNA purity and quantity (Glasel 1995) using a ND-1000 spectrophotometer
(NanoDrop®, Thermo Scientific, Wilmington, USA). The absorbance at 260 nm (A260) is a
measure of nucleic acid concentration, whereas the absorbance at 280 nm shows amounts of
contaminants, such as proteins or phenols, which may inhibit enzymatic reactions in
downstream protocols. An A260/A280 ratio of 1.8 to 2.0 is preferable for RNA sequencing or
complementary DNA library construction. RNA integrity describes the contribution of RNA
subsets of different lengths to a population of RNA and it is of greatest importance when
applications involve RNA quantitation for gene expression studies because it reflects the
degradation status of the isolated RNA (Denisov et al., 2008). Naturally, cells contain only
small amounts of messenger RNA but greater amounts of ribosomal RNA 18S and 28S
fractions (5 kb and 2 kb in size, respectively). Therefore, a 28S/18S rRNA ratio close to 2
should be indicative for intact mRNA (Sambrook et al., 1987). The RNA integrity in the
described experiments was measured on an automated capillary micro fluid electrophoresis
system - ExperionTM (ExperionTM Bio-Rad Laboratories, Inc., Hemel Hempstead, UK) (Imbeaud
et al., 2005) using StdSens chips and reagents. The ExperionTM - system delivers results in form
of a virtual gel (electropherogram) and the RNA Quality Indicator (RQI-value). Three regions
of the electropherogram are taken into account when calculating the RQI value: the 28S region,
the 18S region, and the pre - 18S regions. The ExperionTM Bio-Rad system compares the sample

CHAPTER 3 - THE TRANSCRIPTOME OF EMILIANIA HUXLEYI AT HIGH AND LOW CALCIFICATION RATES
68
to a standard and returns RQI values between 10 (intact RNA) and 1 (highly degraded RNA) for
each eukaryotic RNA sample (for details see Denisov et al., 2008). An electropherogram also
gives details about the presence of rRNA and tRNA segments – in the range of 5S and 5.8S - in
the sample. For the subsequent steps of RNASeq Illumina sequencing a RQI threshold of 7.5
was used as a minimum requirement. The ExperionTM Bio-Rad StdSens protocol and
recommendations were followed in detail to assess the integrity of the RNA samples. In the case
of poor RQI values the extraction from the frozen cell pellet (section 3.2.6) was repeated until
RNA quality specifications were affirmed. For sequencing 12 ng RNA diluted in TE-buffer (10
mM Tris-HCl pH 8.0, 1 mM EDTA) were aliquoted stored at - 80 °C.
3.2.8. Independent approach of promoter expression analysis
Following RNA extraction and RNA quality validation (section 3.2.7) another aliquot of 15
ng total RNA per sample was sent to DNAFORM Inc. (Leading Venture Plaza-275-1, Ono-cho,
Tsurumi-ku, Yokohama, Kanagawa 230-0046, Japan) for cap analysis of gene expression
(CAGE) (Shiraki et al., 2003; Kodzius et al., 2006). The CAGE identifies the exact transcription
start site by sequencing short 5’-sequences of the mRNA population. In CAGE the beginning of
the 5’mRNA is reverse transcribed after selecting the biotin residue at the cap sites using
streptavidin-coated magnetic beads (Corninci et al., 1996). CAGE raw sequences have ben
independently analysed by Dr. Reidar Andreson (University of Tartu, Estonia) to investigate
differential patterns of promoter expression in E. huxleyi PLY♯ M217 at rates of high and low
calcification.
3.2.9. Illumina sequencing
For the investigation of the transcriptomes from the at times of high and low calcification in
the cell cycle of E. huxleyi the extracted RNA was sent to the Institute of Clinical Molecular
Biology (IKMB) at the Christian-Albrechts-University Kiel, Germany for sequencing. In total 6
samples (3 x HC, 3 x LC condition) were shipped on dry ice to the IKMB for Illumina based
RNA sequencing. The IKMB followed the Illumina TrueSeq sample prepation guide. RNA was
reverse transcribed into cDNA using Sera Mag® oligo(dT)14 tags, magnetic Oligo(dT)
microparticles, which covalently bind specifically to polyadenylated mRNA and therefore
establishing a population of cDNA from purely eukaryotic mRNA (see Sera-Mag manual for
details). The prepared cDNA from low and high calcification periods of E. huxleyi was
sequenced using a raw Illumina 2000 system sequencing at a depths of 100 bp paired reads.

CHAPTER 3 - THE TRANSCRIPTOME OF EMILIANIA HUXLEYI AT HIGH AND LOW CALCIFICATION RATES
69
Raw sequence reads were provided by the IKMB and in silico processed by Dr. Reidar
Andreson, University of Tartu, Estonia.
3.2.10. Processing of paired end Illumina output data
The raw sequences from the Illumina sequencing were quality checked using FastQC
Version 0.11.4 (www.bioinformatics.babraham.ac.uk/projects/). The sequencing data was then
converted into sequence counts and gene expression analysis compatible data by Dr. Reidar
Andreson, University of Tartu, Estonia. The software package Tophat (Trapnell et al., 2009;
http://tophat.cbcb.umd.edu) was applied for clustering and mapping the transcript sequences to
the reference genome of E. huxleyi CCMP 1516 version from 25.4.2008 available at
http://genome.jgi.doe.gov/Emihu1/Emihu1.home.html. Then the Cufflinks package (Trapnell et
al. 2010, http://bio.math.berkeley.edu/cufflinks) was utilized to test for significant differences in
the abundance of transcripts between the light and dark condition.
Tophat uses a two-step read-mapping algorithm suitable for the alignment of reads from
RNA-Seq experiments (Trapnell et al., 2009). First, the sequences are mapped to the reference
genome using Bowtie, a short DNA sequence aligner (Langmead et al., 2009) that also accounts
for ‘initially unmapped reads’. The initial consensus of mapped regions is computed using the
subroutine Maq (Li et al., 2008). In the analysis Dr. Reidar Andreson applied the following
Tophat-parameters: number of threads 30 bases, inner-distance 300 bases, minimal intron length
20 bases, maximum intron-length 1000 bases, minimal anchor-length 10 bases, splice-
mismatches 1, minimum-closure-intron 20 bases, maximum-closure-intron 1000 bases, minimal
coverage-intron 20 bases, maximal coverage-intron 1000 bases, minimal segment-intron 20
bases, and maximal segment-intron 1000 bases. In the case of paired end reads, as produced by
the Illumina 2000® sequencer in this study, the counting of duplicate reads from the paired end
approach was avoided.
The Cufflinks package was applied to estimate the abundance of transcripts from the paired
end reads of the Illumina 2000® - data. Furthermore, Tophat-annotation was conducted to
compare the differences in gene expression levels. The algorithm aligns overlapping ‘bundles’
of fragments, identifying spliced mRNA isoforms as pairs of ‘incompatible’ fragments by
taking into account the distribution of fragment lengths for the identification of isoforms.
Cufflinks counts the transcript abundance in fpkm (fragments per kilobase per million) and
utilizes a beta-negative binomial model to estimate the variance of the RNA-Seq data and to

CHAPTER 3 - THE TRANSCRIPTOME OF EMILIANIA HUXLEYI AT HIGH AND LOW CALCIFICATION RATES
70
distinguish significant differences between treatment conditions such as the HC and LC running
a t-test-like statistic. The significance is based on q-values. The q-value is a correction of the p-
value that accounts for the likelihood of a type 1 error using a significance level threshold of
0.05 (see Benjamini and Hochberg, 1995). Cufflinks 2.0 produces multiple result tables that
contain transcript abundance, isoform abundance, promoter area usage, transcription start sites
counts, the coding sequence, and the significantly different transcripts. Subsequently, the R -
package CummeRbund (available http://compbio.mit.edu/cummeRbund/) (Trapnell et al., 2012)
was applied to build a database from the cufflinks output files. This database was used as the
core for the analysis of differential expression between the conditions HC and LC applying
procedures described in the CummeRbund manual and to create further tables isolating specific
results of interest and connecting transcripts with annotation data (see details in section 3.2.11).
The pipeline of transcript sequence mapping and differential gene expression analysis is
summarized in Figure 3.2.
3.2.11. Assessment of data quality and of transcript abundance
The cufflinks output files were connected using the R-package CummeRbund to create a
SQL – related database that linked transcripts with parameters such as expression data,
isoforms, and transcription start site. In order to investigate the general data for over-dispersion,
the quality of the sequencing data and the performance of the Tophat-Cufflinks pipeline
graphical visualization, Box-Plots, and hierarchical clustering techniques were applied.
3.2.12. Assessment of transcript abundance in the high rates of calcification
(HC) and low rates of calcification (LC) condition and overall
identification success
Overrepresented transcripts in the light were assigned to the HC condition and transcripts
overrepresented in the dark were assigned to the LC condition for all subsequent evaluations.
Histograms of the transcript abundances and the fragment-sizes were produced through the R -
package CummRbund to investigate general differences between the transcriptomes from the
HC and LC condition. The overall identification success of isoform, transcription start sites
(TSS), coding sequences (CDS), promoters, splicing regions, and regulated CDS was called
from the CummeRbund database. For details of the commands used refer to the CummeRbund
manual (http://compbio.mit.edu/cummeRbund/manual_2_0.html).

CHAPTER 3 - THE TRANSCRIPTOME OF EMILIANIA HUXLEYI AT HIGH AND LOW CALCIFICATION RATES
71
3.2.13. Modification of the Cuffdiff output
The cuffdiff output file “gene_exp_func.diff” was the source of differential gene expression
analysis between the HC and HC condition, whereas the significance level for differential gene
expression between the conditions was q < 0.05. In the original output file some transcripts
were present as duplicates and the clustering by the Tophat-Cufflinks pipeline was apparently
omitted. To correct duplicate transcripts, the cufflinks output table “gene_exp_func.diff “ was
modified for downstream analysis. Multiple expression values for the same transcript sequence
were simply summarized. According to Trapnell at al. (2012), adding transcript abundances
referring to the same gene or transcript is permitted because the fpkm-values are directly
proportional to the abundance of transcripts.
3.2.14. Gene recruitment and annotation success
The numbers of transcripts that could be recruited to genes of the JGI E. huxleyi reference
genome (http://genome.jgi.doe.gov/Emihu1/Emihu1.home.html) were counted. Additional
annotation information, such as KOG (euKaryotic Orthologous groups), KEGG (Kyoto
Encyclopedia of Genes and Genomes), and protein information based on non-redundant protein
NR, SwissProt and UniProt databases was downloaded from JGI sources and connected to the
gene expression results. Subsequently, the transcript annotation success was assessed at the
levels of gene recruitment, KOG annotations, KEGG annotations, and protein annotations and
differences between the conditions evaluated.
3.2.15. Assessment of functional differences between the high calcification (HC)
and low calcification (LC) condition using KOG-class annotations
The largest amount of functional annotations was provided by KOG information. Therefore,
the KOG annotations were used to investigate functional differences between the conditions.
The numbers of transcripts in relation to their predominance in the HC or LC condition were
used to investigate differences in functional expression within KOG-groups and KOG-classes.
The arbitrary significance level of p < 0.01 for Chi-Square tests was applied to classify
significant differences in gene expression between KOG-classes. The data provided low degrees
of freedom. Therefore, the Chi-square test with Yates-correction, was applied to distinguish
significant deviation of the ratio of the number of significantly overexpressed genes LC:HC in
each KOG-class to the overall ratio LC:HC of the gene expression by means of transcripts
(19093:15310). Furthermore, an arbitrary threshold for the ratio of gene expression of all genes

CHAPTER 3 - THE TRANSCRIPTOME OF EMILIANIA HUXLEYI AT HIGH AND LOW CALCIFICATION RATES
72
expressed in each KOG-class and the ratio of gene expression for significantly higher
expressedgenes was set at 2 and 0.5 to indicate difference in expression patterns in the
functional KOG-classes. This ratio is considered to be comparable to the Chi-square approach.
However, in those KOG-classes were omitted from consideration where the thresholds were
created by an absence of transcripts in either condition.
3.2.16. Assessment of gene expression differences between the high
calcification (HC) and low calcification (LC) condition
Gene expression differences between the HC and the LC condition were investigated using a
number of approaches. First, it was of interest which transcripts might be absent from the other
calcification condition in the G1-phase (HC or LC). Therefore, the genes unique to either
condition were investigated. Genes with a potential role in the calcification process in E. huxleyi
were taken in focus. Secondly, the functional groups according to KOG-annotations were
applied to subdivide HC and LC transcriptomes. Following this KOG-class grouping, the
frequency of transcripts in the HC condition was plotted against the frequency of transcripts in
the LC condition, marking non-significantly and significantly more abundant transcripts. This
graphical presentation of the transcripts in each KOG-class was used to identify interesting
clusters of significant transcripts. The genes and the functions of the members of the selected
transcripts were investigated in detail. Thirdly, a selection of molecules, previously reported in
the literature to play a role in the processes surrounding calcification and coccolith formation in
E. huxleyi, was made (Marsh et al. 1992; Wahlund et al., 2004; Nguyen et al. 2005; Quinn et al.,
2006; Richier et al., 2009; von Dassow, 2009; Macckinder et al., 2009, 2011, 2012; Emery et
al., 2012). The JGI gene ID were retrieved for the molecules of interest, such as V -type proton
ATPases, clathrin, P - type proton ATPase, proton exchanger, Ca2+ - transporters, calmodulin,
Ca2+ - binding proteins, GPA, bicarbonate transporter, and carbonate anhydrase (CA) and their
gene expression levels plotted.

CHAPTER 3 - THE TRANSCRIPTOME OF EMILIANIA HUXLEYI AT HIGH AND LOW CALCIFICATION RATES
73
lllumina Sequencing
HC - late G1 phase LC - early G1 phase
HC 1 HC 2 HC 3 LC 3 LC 1 LC 2
Tophat
CummeRbund
Cufflinks
Cuffdiff
Differential expression results
General expression plots (quality control)
Annotation of transcripts JGI, KOG, KEGG, NR, Swiss
Prot& UniProt
Removal of duplicate results
Modification of CuffDiff results
Check same transcript AND equal q-values AND equal fpkm
Final differential expression results
Unique transcripts of the HC and LC
condition
Graphical investigation of
abundant transcripts of KOG classes at
HC and LC
Expression of known calcification genes at HC and LC
Figure 3-2: Flowchart showing the bioinformatics pipeline and data analysis from raw Illumina results to differential expression results comparing gene expression at the transcript level in the high calcification rate (late G1-phase) and low calcification rate phase (early G1-phase) of Emiliania huxleyi PLY♯ M217.
FastQ

CHAPTER 3 - THE TRANSCRIPTOME OF EMILIANIA HUXLEYI AT HIGH AND LOW CALCIFICATION RATES
74

CHAPTER 3 - THE TRANSCRIPTOME OF EMILIANIA HUXLEYI AT HIGH AND LOW CALCIFICATION RATES
75
3.3. Results
The physiological parameters between the day before cell harvesting and the day of
harvesting showed significant differences for PON and PIC. No significant differences were
found between the high calcification and the low calcification condition. This suggests that the
physiology of the E. huxleyi cell population was not altered. The results are graphically
summarized in Figure 3.3.
3.3.1. Cell fitness parameters in experimental Emiliania huxleyi cultures
Growth rates per day were calculated from daily cell density measurements to assess the
development of the E. huxleyi PLY♯ M217 cultures. Furthermore, physiological growth
parameters such as particulate organic carbon per cell, particulate organic nitrogen, particulate
inorganic carbon, and the photosynthetic quantum yield (Fv/Fm) were quantified to judge the
fitness of the cells. The ratios of POC:PON and PIC:POC were calculated.
Cell culture growth 3.3.1.1.
E. huxleyi PLY♯ M217 grew exponentially in all F/50 natural seawater cultures. Figure 3-3
A and B illustrate cell densities and growth rates observed in the E. huxleyi cultures until cell
harvesting. Five out of 6 cultures showed a lag phase of one to two days before growth rates
increased to above 0.5 d-1 (Figure 3-3 B). In one cultures (HC 3) this lag phase extended over
two days. The maximum growth rate of 1.41 d-1 was observed in culture HC 3 between day 3
and day 4. Average growth rates of HC and LC cultures were 0.69 ± 0.02 (n=3; SD) and 0.68 ±
0.04 (n=3; SD), respectively. Despite the observed lag phase the growth rates in the culture
vessels were not significantly different (ANOVA; df: 4,27; F = 0.147, p = (0.978).
Particulate organic carbon (POC) per cell 3.3.1.2.
One day before harvesting POC was in average 1.36 ± 0.1 pmol cell-1 in the light and 1.40 ±
0.27 pmol cell-1 in the LC cultrues. At the day of harvest lower POC values were observed,
being 1.04 ± 0.09 pmol cell-1 and 1.19 ± 0.26 pmol cell-1, for the HC and LC cultures
respectively (see Figure 3-3 C). The sampling time was scheduled earlier than on the day before
the harvesting due the extended work plan at the day of harvesting. No significant differences
between conditions and sampling days became apparent (Kruskal-Wallis ANOVA; df: 3, H=
3.667, p = 0.381).

CHAPTER 3 - THE TRANSCRIPTOME OF EMILIANIA HUXLEYI AT HIGH AND LOW CALCIFICATION RATES
76
Figure 3-3: Cell fitness parameters of E. huxleyi cells in culture for transcriptome and proteome analysis. A - Cell densities in E. huxleyi cultures, B - Growth rates [µ] per day of E. huxleyi cultures; HC 1 to HC 3 replicate cultures for harvesting at high calcification rates and LC 1 to LC 3 for cultures harvested at low calcification rates. C – POC (Particulate Organic Carbon) content per cell, D – PON (Particulate Organic Nitrogen) content per cell, E – C:N (Ratios of particulate inorganic carbon to organic carbon), F – PIC (Particulate Inorganic Carbon) per cell, G – PIC:POC (Particulate Inorganic Carbon to Particulat Organic Carbon ratio), and H – Fv/Fm (average values of quantum yield of PSII based on FRRF, Chelsea II, measurements of E. huxleyi cells in cultures 1 day before and at the day of harvesting. For C, F, and H n = 3. For D, E, and G n = 2. Error bars show standard deviation from the mean.
Particulate Organic Nitrogen (PON) per cell 3.3.1.3.
Averages of PON at the time of harvesting were 0.082 ± 0.007 pmol cell-1 and 0.091 ± 0.018
pmol cell-1 for the HC and LC cultures, respectively (compare Figure 3-3 D). No significant
differences between conditions became apparent No significant difference was found in respect
to PON between the different sampling times (Kruskal-Wallis ANOVA; df: 3, H= 2.833, p =
0.543).
�������
�� �
��
��
��
���
��
����
����
����
����
������������
�� �
��
��
��
���
��
���
���
���
���
���
���
������������������� ������ ����
!����"�
�� �
�"�
���
��������
���� � � # � $
%��
& �
��� �
�'���
(
���
���
���
���
���
���� � � # � $
�� �
����
�
�
��$
�)��$
#)��$
�)��$ �����������#��������#
*����� ���+�, � -���%��& ���� �
%����.�"���
�� �
�.�
�"��
��
�����������#�����$���
/����.�
�� �
�.�
��
� ��
� ��
�����������#�����$���
����/�0/�
�� �
/�0/
�
�����������#�����$�����1

CHAPTER 3 - THE TRANSCRIPTOME OF EMILIANIA HUXLEYI AT HIGH AND LOW CALCIFICATION RATES
77
Particulate Carbon to Nitrogen ratio (C:N) per cell 3.3.1.4.
The ratios of organic carbon and nitrogen per cell at the day of sampling were 12.7 ± 1.8 and
13.1 ± 5.5 in the HC and LC cultures, respectively (see Figure 3 – 3 E). At the day before cell
harvest C:N values were slightly higher with 15.1 ± 4.0 and 12.5 ± 3.8 for the HC and LC
condition, respectively. No significant differences were found in the C:N values between the
HC and LC cultures and the different sampling times (Kruskal-Wallis ANOVA; df: 3, H =
4.167, p = 0.324).
Particulate Inorganic Carbon (PIC) per cell 3.3.1.5.
One day before the cell harvesting the PIC in the HC and LC cultures was 0.47 ± 0.01 and
0.41 ± 0.06, respectively. Just prior cell harvest the PIC content was 0.34 ± 0.05 pmol cell-1 and
0.32 ± 0.13 pmol cell-1 in the HC and LC condition, respectively (see Figure 3-3 F). No
significant difference was found for PIC between the conditions and the different sampling
times (ANOVA; df: 3,8, F = 3.212, p = 0.083).
Particulate Inorganic Carbon : Particulate Organic Carbon ratio 3.3.1.6.
(PIC:POC)
The ratio of PIC to POC was conserved over the two days of measurement (see Figure 3-3
G). It was between 0.35 ± 0.03 and 0.34 ± 0.05 for the HC cultures and between 0.29 ± 0.10 and
0.32 ± 0.13 in the LC cultures, for the day before harvest and the day of harvest respectively.
No significant difference was found in respect to PON between the HC cultures and the
different sampling times. There was no difference in PIC:POC between one day before
harvesting and the day of harvesting and the HC and the LC conditions (Kruskal-Wallis
ANOVA; df: 3, H = 5.500, p = 0.139).
Photosynthetic health 3.3.1.7.
The average photosynthetic efficiency was observed at 0.403 ± 0.024 (n=3; SD) in the HC
cultures and 0.377 ± 0.016 (n=3; SD) in the LC cultures one day before cell harvesting. At the
day of cell harvesting Fv/Fm values were 0.435 ± 0.122 (n=3; SD) at HC condition and 0.382 ±
0.025 (n=3; SD) at LC condition (see Figure Figure 3-3 H). No significant difference was found
in respect to Fv/Fm values between the HC and LC conditions and the different sampling times
(ANOVA; df: 3,8 , F = 2.153, p = 0.172).

CHAPTER 3 - THE TRANSCRIPTOME OF EMILIANIA HUXLEYI AT HIGH AND LOW CALCIFICATION RATES
78
Nutrient consumption 3.3.1.8.
Nutrient consumption of the cell populations in the cultures is shown in Table 3-1. Cells
consumed in average 14.3 ± 2.2 mmol L-1d-1 of nitrogen and 0.530 ± 0.08 mmol L-1d-1
phosphorous per day. No significant differences of nitrogen or phosphorous uptake within all E.
huxleyi cultures were found (ANOVA [N uptake]; df: 1,5, F = 0.126, p = 0.741; (ANOVA [P
uptake]; df: 1,5, F = 1.926, p = 0.237).
Table 3-1: Nutrient consumption in E. huxelyi cultures within the last day before culture harvesting.
N uptake P uptake Culture [µmol L-1d-1] [µmol L-1d-1] HC 1 15.57 0.64 HC 2 16.97 0.60 HC 3 11.30 0.46 LC 1 12.00 0.45 LC 2 14.89 0.51 LC 3 14.87 0.50
3.3.2. Dissolved inorganic carbon, total alkalinity and pH
Results for dissolved inorganic carbon, total alkalinity and pH are given in Table 3-2. In
average DIC was in average 1789 ± 159 mmol kg-1 SW in the HC cultures and 1945 ± 66 mmol
kg-1 SW in the LC cultures. Total alkalinity (At) means were 2102 ± 110 mmol kg-1 SW in the
HC condition samples and 2228 ± 48 mmol kg-1 SW in the LC condition samples. Values of pH
were 8.04 ± 0.02 in average in the HC cultures and 8.02 ± 0.03 in average in the LC cultures.
Table 3-2: Seawater parameters in the E. huxelyi culture medium before the harvesting of cultures. Dissolved inorganic carbon (DIC) and total alkalinity (At) are presented. Averaged values for pH and standard deviation over the growth period of 5 days for E. huxleyi cultures.
Culture DIC
[mmol kg-1 SW] At
[mmol kg-1 SW] pH (n = 5)
(Average ± SD) HC 1 1967.5 2222.7 8.02 ± 0.04 HC 2 1736.1 2076.9 8.05 ± 0.06 HC 3 1663.3 2007.4 8.04 ± 0.04 LC 1 1929.0 2223.2 7.99 ± 0.08 LC 2 1888.3 2183.0 8.03 ± 0.03 LC 3 2018.3 2278.3 8.05 ± 0.05

CHAPTER 3 - THE TRANSCRIPTOME OF EMILIANIA HUXLEYI AT HIGH AND LOW CALCIFICATION RATES
79
3.3.3. Transcriptomics
RNA quality and integrity 3.3.3.1.
The RNA purity achieved the recommended values for the ratios 260/230 and 260/280
(compare Table 3-3).
Table 3-3: NanoDrop parameters of RNA samples assigned for Illumina transcriptome sequencing
Sample - Label 260/230 260/280 HC 1 – L1 2.04 2.33 HC 2 – L2 2.05 2.01 HC 3 – L3 2.02 2.41 LC 1 – D1 2.04 2.32 LC 2 – D2 2.04 1.95 LC 3 – D3 2.04 2.38
Sufficient integrity of the RNA samples extracted from cells of the HC and LC conditions is
confirmed by the RQI values. The 28S:18S ribosomal RNA ratio is below 2 in all samples,
which is a common finding in algae and other marine organisms (Dr. John Gittins pers.
communication) (see Table 3-4 and Figure 3-11).
Table 3-4: RNA concentrations and RQI values from chip-based electrophoresis RNA samples for Illumina based transcriptome analysis.
Sample - Label RNA conc. [ng mL-1] Ratio [28S:18S] RQI
HC 1 – L1 417.0 1.67 8.8 HC 2 – L2 379.8 1.72 8.6 HC 3 – L3 468.4 1.57 8.4 LC 1 – D1 350.1 1.59 8.6 LC 2 – D2 468.2 1.68 9.0 LC 3 – D3 262.5 1.81 8.8

CHAPTER 3 - THE TRANSCRIPTOME OF EMILIANIA HUXLEYI AT HIGH AND LOW CALCIFICATION RATES
80
Figure 3-4: Virtual gel of RNA-samples from chip-based electrophoresis. R: Ladder, HC1 – HC3: Samples taken at the end of the Light period – HC-condition, LC1 – LC3: Samples taken at the end of the Dark period – LC-condition.
Illumina raw sequences quality check and results of sequencing 3.3.3.2.
The raw sequences from the Illumina sequencing were quality checked using FastQC
Version 0.11.4 (http://www.bioinformatics.bbsrc.ac.uk/projects/fastqc). All sequences were 101
bp long. No sequences of poor quality were observed (data not shown). No sequence was
flagged of poor quality. However, the per base sequence quality showed dropping reliability of
base identification after around 80 bp with quality score values below 25 in all replicate
samples. This is not an uncommon observation in Illumina sequencing and due to
photobleaching of the dyes from laser scanning. The per-sequence quality score was good in all
sequenced samples. No concerns resulted from using the Illumina raw sequences in the Tophat
– Cufflinks pipeline. Basic statistics of Illumina reads including total reads in each sample and
unique hits to the reference genome are summarized in Table 3-5.
Table 3 – 5: Basic results of the Illumina experiment.
Sample Total reads GC content Reads removed Unique hits to reference genome HC 1 14864840 66 % 0 73.36 HC 2 18687928 66 % 0 74.08 HC 3 14537310 66 % 0 73.62 LC 1 17147800 67 % 0 73.62 LC 2 15536898 67 % 0 73.72 LC 3 14313635 66 % 0 74.38

CHAPTER 3 - THE TRANSCRIPTOME OF EMILIANIA HUXLEYI AT HIGH AND LOW CALCIFICATION RATES
81
General results and quality control of the Tophat – Cufflinks 3.3.3.3.
pipeline
An over-dispersion of transcript frequencies or differences in the abundances of transcripts
of different length between the replicate samples was not observed. Over-dispersion of
transcripts in the RNASeq replicates was visualized using Box-plot (see Figure 3-5). The boxes
indicate that transcripts with higher fpkm were found in replicates of the LC condition. Outliers
with a high fpkm-value were represented more abundant in the HC condition (one fpkm equals
10000 transcripts per 100 ng RNA; Trapnell et al., 2010). In the dark (LC condition) outliers of
low fpkm-value appear to be more frequent. Replicate HC1 shows a greater abundance of
transcripts within the first to third quartile of the data. This represents a slight dissimilarity to
the replicates HC2 and HC3 and is reflected also in the hierarchical cluster analysis (see Figure
3-6). However, the dissimilarity is small and only present in one replicate. In subsequent
analyses of gene expression differences this circumstance is likely not to cause a significant
effect.
Figure 3-5: Transcript frequencies of trascriptomic samples. CummeRbund-Box-Plot showing the presence of transcripts in each replicate of the condition HC and LC in the G1-phase of Emiliania huxleyi (x-axis) presented as fragments per kilobase of transcript per million mapped (fpkm), including outliers. One fpkm equals 10000 transcripts per 100 ng RNA (Trapnell et al., 2010).

CHAPTER 3 - THE TRANSCRIPTOME OF EMILIANIA HUXLEYI AT HIGH AND LOW CALCIFICATION RATES
82
Figure 3-6: Dissimilarity-analysis of transcriptome samples. CummeRbund-Hierachical clustering analysis showing dissimilarities of all transcripts in the replciates of the conditions HC and LC.
Transcript abundances relative to HC and LC condition 3.3.3.4.
The frequency of transcripts relative to their length in fpkm is presented in Figure 3-7 to
visualize differences in the population of transcripts of different sequence length in the HC and
LC condition. It was obvious that transcripts of around 100.6 to 101.2 fpkm were more abundant
in the dark (low calcification rates condition). In the light (high calcification rates condition)
transcripts in the ranges of around 10-1 to 100.4 fpkm and around 102 to 103.2 fpkm were more
frequent.
Figure 3-7: Transcript length versus transcript abundance in HC and LC condition. Transcript abundance (density – y axis) in the HC and LC condition relative to transcript length (x-axis) is presented. In this presentation 5269 cases in the HC condition and 5263 cases in the LC condition were automatically removed by the CummeRbund package.

CHAPTER 3 - THE TRANSCRIPTOME OF EMILIANIA HUXLEYI AT HIGH AND LOW CALCIFICATION RATES
83
General gene recruitment success with Cufflinks:
Cufflinks conducted counts of reference genome matches in the combined transcriptomes of
E. huxleyi PLY♯ M217 in HC and LC conditions. A total of 43009 genes were counted in both
conditions. The original results from the Cufflinks differential expression analysis algorithm
were corrected and general statistics of sequence annotation were performed. Low quality or
inconclusive data (see Section 3.2.13) was omitted from the analysis and multiple gene hits
were merged by transcript abundances. Then the gene expression data set comprised of 34403
transcripts of which 24352 transcripts found matching sequences on the JGI E. huxleyi reference
genome and 9999 could be mapped to know genes of the JGI E. huxleyi reference genome (see
Table 3-6).
Table 3-6: Annotation success of transcripts. The table summarizes the transcripts found in E. huxleyi in the HC and LC condition, showing recruitment success to the JGI- reference genome, protein knowledge base matches of transcript clusters, and the number of retrieved KOG annotations. The number of transcripts found significantly more abundant in the HC or the LC condition are given in the columns: HC sig. (significantly more abundant transcripts in HC condition – high calcification and light incubation period) and LC sig. (significantly more abundant transcripts in LC condition – low calcification and dark incubation period).
Total HC total HC sig. LC total LC sig.
JGI reference gene hits 9999 6446 1846 3553 515 Protein Sequences hits 15150 7099 1332 8051 1299 Transcripts with KOG annotation 9974 4564 420 5410 1065 Total number of transcripts 34403 15310 3216 19093 3762

CHAPTER 3 - THE TRANSCRIPTOME OF EMILIANIA HUXLEYI AT HIGH AND LOW CALCIFICATION RATES
84
Annotation success:
A total of 15150 transcript-clusters, 44% of the transcriptomes, matched to known proteins.
Functional annotation based on euKaryotic Orthologous groups (KOG) could be provided for
22 % (7689) of the transcriptome (see Figure 3-8). However, 228 transcript-sequences had only
KOG annotation but no matches in protein databases. The total number of transcripts having
KOG annotations was 9974.
Figure 3-8: Transcript annotation success. The degree of non-redundant and UniProt protein and euKaryotic Orthologous groups (KOG) annotation in the combined transcriptomes of HC and LC conditions is presented.
KEGG-Pathway annotations:
Annotations of KEGG-pathways only provided annotations for 2748 recruited transcripts. A
figure presenting the transcripts abundance for each KEGG pathway class can be found in the
Appendix A of this monograph.
19253
7461
7689
no protein knowledge-base hit
With NR/UniProt hit only
With NR/UniProt annotation AND KOG-Group annotation

CHAPTER 3 - THE TRANSCRIPTOME OF EMILIANIA HUXLEYI AT HIGH AND LOW CALCIFICATION RATES
85
Significantly different expressed genes:
Between the HC and LC condition 6978 transcripts (20 %) out of the total 34403 transcripts
were significantly different expressed.
Figure 3-9: Significantly different and unique transcripts. Number of significantly different transcripts found in the transcriptomes of E. huxleyi in the HC and LC conditions are shown together with transcripts that were unique (bold letters) for the HC and LC conditions.
Table 3-7: Annotation success of significantly different transcripts. Number of transcripts found in the transcriptomes of E. huxleyi in the HC and LC conditions are presented in respect to counts of significantly different transcripts at the q-value threshold < 0.05 and numbers of transcripts with annotation information.
Category Total HC LC Significant
Total number 34403 15310 19093 6978 Significantly different (q =< 0.05) 6978 3216 3762 Unique transcripts (q =< 0.05) 28 121 All unique transcripts 153 177 NR/UniProt/SwissProt hit 15150 7099 8051 2631 Sig. with NR/UniProt/SwissProt hit 2631 1332 1299
A total of 3216 transcripts were significantly more frequent in the light (high calcification
condition), of which 28 transcripts were unique for the HC condition. In the dark (low
calcification condition) 121 transcripts were unique and 3641 transcripts significantly more
abundant (compare Figure 3-9 and Table 3-6). Out of the total of 15150 transcripts with protein
annotation 47% were higher expressed in the HC and 53% were higher expressed in the LC
condition. Only 2631 of the protein annotated transcripts showed significant differences, of
which 1332 were significantly higher expressed in the HC condition and 1299 significantly
higher expressed in the LC condition (compare Table 3-7).

CHAPTER 3 - THE TRANSCRIPTOME OF EMILIANIA HUXLEYI AT HIGH AND LOW CALCIFICATION RATES
86
Functional differences of the Emiliania huxleyi transcriptome in 3.3.3.5.
the HC and LC condition based on euKaryotic Orthologous groups
(KOG) annotations
The euKaryotic Orthologous groups (KOG) annotations provided the highest number of
functional annotations represented with 9974 transcripts. Therefore, KOG-groups and KOG-
classes were used to investigate general functional features of the transcriptomes at the HC and
LC condition. To evaluate differences in functional features between the HC and the LC
condition the number of transcripts for all featured KOG-groups and KOG-classes were counted
in respect to predominance in the HC or LC condition of the G1-phase of the cell cycle and their
significant different overexpression in the HC or LC condition.
KOG-Group level:
In this study it was observed that higher numbers of transcripts were more frequent in the
dark period (compare Table 3-6). This was also reflected by the counts of transcripts with KOG-
groups and KOG-class annotations. At the functional level of KOG-group no group showed
pronounced presence of genes relative to the condition and total ratio of transcript
predominance (see Table 3-8).
Table 3-8: KOG-group association of transcriptomes. Numbers of transcripts annotated with KOG-groups, for the total population, transcripts overexpressed in the Light or Dark condition, and significantly different transcripts in the HC or LC condition.
Overall at Significant at KOG-Group Total HC LC HC LC
Cellular processes and signalling 3357 1543 1814 277 343 Information storage and processing 2190 1081 1109 157 198 Metabolism 2242 934 1308 319 208 Poorly characterized 2185 1006 1179 178 205

CHAPTER 3 - THE TRANSCRIPTOME OF EMILIANIA HUXLEYI AT HIGH AND LOW CALCIFICATION RATES
87
The highest number of transcripts (3357) was found in the “Cellular processes and
signalling” group and provided 34 % of the transcripts, combined in the HC and LC condition.
Significantly more frequent transcripts in the LC and HC condition of the KOG-group ‘cellular
processes and signalling’ transcripts contributed 18 % and 17 % (343 and 277), respectively
(compare Figure 3-10). Twenty-two per cent of the transcripts in the HC and LC condition were
related to ‘Information storage and processing’. However, higher rates of significant gene
expression were found in the Dark condition. A portion of 22 % of the gene transcripts
attributed to the KOG-group ‘Metabolism’, which were slightly more frequent in the dark (58 %
of 2242). Only 25 % of the ‘Metabolism’ gene transcripts were significantly more abundant in
the light (HC condition) compared to 30 % significantly more abundant in the LC condition.
Another 22 % of the gene transcripts were ‘Poorly characterized’.
Figure 3-10: KOG-group association of transcriptomes. Number of transcript hits assigned to KOG-groups being singificantly or not significantly over-presented in the HC (high calcifcation) or LC (low calcifcation) condition. Significance level was set at q < 0.05.

CHAPTER 3 - THE TRANSCRIPTOME OF EMILIANIA HUXLEYI AT HIGH AND LOW CALCIFICATION RATES
88
KOG-Class level:
Functional differences in gene expression between the HC and LC condition were assessed
at KOG-class level. The ratio LC:HC of the number of all genes was used as the expected ratio
to which the ratio of significantly more abundant transcripts for each KOG-class was compared
by means of Chi-square statistics (see Table 3-9 for a summary of the statistical results).
Furthermore, the LC:HC ratio being equal or exceeding the arbitrary thresholds of 0.5 or 2 was
used to identify relevant KOG-classes for cell functional evaluation (see Table 3-10). The
LC:HC ratios of the KOG-classes ‘Translation, ribosomal structure and biogenesis’,
‘Posttranslational modification, protein turnover, and chaperones’, and ‘Lipid transport and
metabolism’ showed significant deviation from the expected ratio (Chi-square test, p < 0.01, see
Table 3-8).
The abundance ratios of the expressed genes from the entire gene population exceeded the
thresholds of 2 (higher abundance in the dark incubation period) only in the KOG-class
‘Nuclear structure’. However, ‘Nuclear structure’ expression was even higher for significantly
different expressed KOG-class annotated genes, showing a ratio of 4. For significantly different
expressed KOG-class annotated genes the ratios exceeded 2 also in the KOG-classes
‘Translation, ribosomal structure and biogenesis’, ‘Nucleotide transport and metabolism’,
‘Inorganic ion transport and metabolism’, ‘Extracellular structures’, ‘Cell cycle control, cell
division, chromosome partitioning’, ‘Carbohydrate transport and metabolism’, and ‘Amino acid
transport and metabolism’, showing higher numbers of KOG-class annotated genes to be
expressed in the LC condition. The results for significantly more abundant transcripts for each
KOG-class by means of Chi-square statistics and the abundance ratios of expressed KOG-class
annotated genes for the entire gene population and the significantly higher expressed genes are
summarized in Figure 3-11.

CHAPTER 3 - THE TRANSCRIPTOME OF EMILIANIA HUXLEYI AT HIGH AND LOW CALCIFICATION RATES
89
Table 3-9: Differences in transcriptomes by KOG-classes. Results of the analysis for significant differences between the expected LC:HC ratio from the whole transcriptome population and the observed LC:HC ratio of significantly more abundant transcript in each KOG-class from Chi-Square tests with Yates-correction (p<0.01) testing. KOG-classes that showed significantly different LC:HC ratios were marked bold. The transcript abundances in each KOG-Class can be found in Table 3-10.
All genes KOG class
vs. sig. KOG-Class
Translation, ribosomal structure and biogenesis <0.001 Transcription 0.812 Signal transduction mechanisms 0.224 Secondary metabolites biosynthesis, transport and catabolism
0.521 RNA processing and modification 0.045 Replication, recombination and repair 0.023 Posttranslational modification, protein turnover chaperones
0.001 Nucleotide transport and metabolism 0.313 Nuclear structure 0.099 Lipid transport and metabolism 0.009 Intracellular trafficking, secretion, and vesicular transport 0.101 Inorganic ion transport and metabolism 0.060 General function prediction only 0.608 Function unknown 0.016 Extracellular structures 0.022 Energy production and conversion 0.949 Defence mechanisms 0.176 Cytoskeleton 0.195 Coenzyme transport and metabolism 0.926 Chromatin structure and dynamics 0.873 Cell wall/membrane/envelope biogenesis 0.755 Cell motility 0.386 Cell cycle control, cell division, chromosome partitioning 0.012 Carbohydrate transport and metabolism 0.023 Amino acid transport and metabolism 0.032

90 Ta
ble
3-10
: KO
G-c
lass
ass
ocia
tion
of tr
ansc
ripto
mes
. Tot
al n
umbe
rs o
f tra
nscr
ipts
and
sign
ifica
ntly
hig
her a
bund
ant t
rans
crip
ts in
the
light
and
dar
k in
cuba
tion
perio
d (H
C a
nd L
C c
ondi
tion)
, whi
ch w
ere
KO
G-c
lass
ann
otat
ed, a
re p
rese
nted
. The
cal
cula
ted
ratio
s of t
rans
crip
t num
bers
LC
: HC
for t
he to
tal t
rans
crip
ts a
nd
sign
ifica
ntly
hig
her e
xpre
ssed
tran
scrip
ts a
re g
iven
. The
KO
G-c
lass
es a
re m
arke
d bo
ld u
pon
exce
edin
g ei
ther
the
arbi
trary
exp
ress
ion
ratio
thre
shol
ds o
f 2 o
r 0.5
. A
ster
isks
at t
he K
OG
-cla
ss n
ame
indi
cate
the
sign
ifica
nt d
iffer
ence
of g
ene
expr
essi
on ra
tios (
p <
0.01
) acc
ordi
ng to
Tab
le 3
-9.
LC
con
ditio
n
HC
con
ditio
n
Tota
l rat
io
LC:H
C
Rat
io S
ig.
KO
G c
lass
N
ot si
g.
sig.
U
niqu
e N
ot si
g.
sig.
un
ique
LC
:HC
T
rans
latio
n, r
ibos
omal
str
uctu
re a
nd b
ioge
nesi
s *
155
58
1 26
2 16
0
0.8
3.6
Tran
scrip
tion
29
2 74
0
240
56
0 1.
2 1.
3 Si
gnal
tran
sduc
tion
mec
hani
sms
387
112
1 27
1 73
4
1.4
1.5
Seco
ndar
y m
etab
olite
s bio
synt
hesi
s, tra
nspo
rt an
d ca
tabo
lism
71
33
2
56
32
0 1.
2 1.
0 R
NA
pro
cess
ing
and
mod
ifica
tion
274
32
1 26
9 42
0
1.0
0.8
Rep
licat
ion,
reco
mbi
natio
n an
d re
pair
10
0 15
0
80
26
0 1.
1 0.
6 Po
sttra
nsla
tiona
l mod
ifica
tion,
pro
tein
turn
over
cha
pero
nes *
48
0 75
0
491
101
0 0.
9 0.
7 N
ucle
otid
e tr
ansp
ort a
nd m
etab
olis
m
37
7 0
50
2 0
0.8
3.5
Nuc
lear
str
uctu
re
16
12
0 11
3
0 2.
0 4.
0 Li
pid
trans
port
and
met
abol
ism
*
130
27
0 13
2 42
3
0.9
0.6
Intra
cellu
lar t
raff
icki
ng, s
ecre
tion,
and
ves
icul
ar tr
ansp
ort
167
19
0 14
1 26
0
1.1
0.7
Inor
gani
c io
n tr
ansp
ort a
nd m
etab
olis
m
111
49
0 60
24
0
1.9
2.0
Gen
eral
func
tion
pred
ictio
n on
ly
711
163
2 54
6 12
2 1
1.3
1.3
Func
tion
unkn
own
26
3 42
1
282
56
0 0.
9 0.
8 E
xtra
cellu
lar
stru
ctur
es
143
42
1 10
6 17
1
1.5
2.5
Ener
gy p
rodu
ctio
n an
d co
nver
sion
12
2 33
2
127
26
1 1.
0 1.
3 D
efen
ce m
echa
nism
s 16
0
1 20
3
0 0.
7 0.
0 C
ytos
kele
ton
20
7 73
2
183
45
3 1.
2 1.
6 C
oenz
yme
trans
port
and
met
abol
ism
67
18
0
46
14
0 1.
4 1.
3 C
hrom
atin
stru
ctur
e an
d dy
nam
ics
90
19
0 73
17
0
1.2
1.1
Cel
l wal
l/mem
bran
e/en
velo
pe b
ioge
nesi
s 51
10
0
39
6 0
1.4
1.7
Cel
l mot
ility
4
0 0
4 2
0 0.
7 0.
0 C
ell c
ycle
con
trol
, cel
l div
isio
n, c
hrom
osom
e pa
rtiti
onin
g
63
26
1 39
7
0 1.
9 3.
7 C
arbo
hydr
ate
tran
spor
t and
met
abol
ism
21
3 63
0
117
31
0 1.
9 2.
0 A
min
o ac
id tr
ansp
ort a
nd m
etab
olis
m
175
63
1 99
30
1
1.8
2.1
Not
ann
otat
ed *
10
896
2697
1
8250
23
96
0 1.
3 1.
1

91
���������������� ������
�
���
���
���
����
����
�
����
�
����
�
������������
��������� ������������� �����������
������� ����������������� �����������
������������������������� ��������������������������������
�������������
����� ���!��������!�������������������
���������������������� � �������
����"���������������� �����������
�����#������
$����������������
%��������� ��������� �����������
%����������������������
&����������#�� �
'������������������ �����������
(������������������������� �����������
(������������������#������������������ ��������������������
)��� ������������� �����������
*����������������
*������� �������������� �����������
+������������������� ��������������������������������������
,���������������������������� �������
,*��������������� ��� ��������
-���� ������������������������������������������ �����������
-����������� �����������������
.������������
.���������������������������������� �����������
��������)��/�0����������� ������
1��
��
2�
)��1���������3�
)��1�����3�
0��1���������3�
0��1�����3�
������������������)�/0��
������������3�)��/�����3�0��
�
�
�
�
� �
� �
�� �
CHAPTER 3 - THE TRANSCRIPTOME OF EMILIANIA HUXLEYI AT ELEVATED AND NO CALCIFICATION RATES
Figu
re 3
-11:
Diff
eren
ces o
f tra
nscr
ipto
mes
by
KO
G-c
lass
es. N
umbe
r of t
rans
crip
ts (t
op x
-axi
s) p
er K
OG
-cla
ss v
indi
catin
g si
gnifi
cant
and
no
t sig
nific
ant d
iffer
ence
s in
LC a
nd H
C c
ondi
tions
(see
lege
nd) a
re p
rese
nted
. Sig
nific
ant d
iffer
ence
s of t
he o
bser
ved
trans
crip
t abu
ndan
ce
ratio
LC
:HC
of K
OG
-cla
ss a
gain
st e
ntire
tran
scrip
tom
es (p
< 0
.01,
Chi
-Squ
are
test
with
Yat
es-c
orre
ctio
n as
in T
able
3-8
) is i
ndic
ated
by
aste
risks
. (Δ
) Ind
icat
ing
expr
essi
on ra
tios L
C: H
C e
xcee
ding
the
thre
shol
d of
0.5
or 2
(see
Tab
le 3
- 9).

CHAPTER 3 - THE TRANSCRIPTOME OF EMILIANIA HUXLEYI AT HIGH AND LOW CALCIFICATION RATES
92
Comparison of unique and significantly higher expressed transcripts in the high
calcification (HC) and low calcification (LC) conditions of the G1 cell-cycle phase
The number of total unique transcripts and unique significant transcripts varied between the
conditions. In total 153 transcripts were unique in the HC condition and 177 transcripts were
unique in the LC condition. For a large number of unique transcripts no annotation data was
available. Only 28 unique transcripts were significantly increased at HC and 121 unique
transcripts were significantly increased in the LC condition. For the HC condition only 9 of the
significant transcripts matched known proteins. In total, gene annotations for 54 significantly
overexpressed and unique transcripts in the LC condition were retrieved. Further details of the
annotation success of unique transcripts are given in Table 3-11.
Table 3-11: Unique transcripts in the light and dark and their annotation success. Number of the light and dark condition with and without annotation (KOG-desc.: KOG-description, Sig.: significant, Not sig.: not significant)
HC conditions LC condition Grand
total
Total Not sig. Sig Total Not sig. Sig Sequenced transcripts 153 125 28 177 56 121 330 Recruited genes 82 73 9 97 46 51 179 With KOG-desc. 14 12 2 16 6 10 30 With protein annotation 40 34 6 54 27 27 94
Unique significant transcripts in the high calcification in the G1-phase condition
The three most frequent significantly unique transcripts in the HC condition with known
annotation were similar to a proton-coupled amino acid transporter 3 (JGI♯ 225551, UniProt ID
ID: Q4V8B1, q-value: 0.0096), a pentatricopeptide repeat-containing protein At2g18940 (JGI♯
205977, UniProt ID: Q64624, q-value: 0.1284), and a putative homeobox protein R749 (JGI♯
250018, UniProt ID: Q5UP03, q-value: 0.01298). The pentatricopeptide repeat-containing
protein At2g18940 was also unique and significantly transcribed by the JGI♯ 249953. For
further details of unique significant transcripts in HC condition refer to Table 3-12. The most
abundant transcript (JGI♯ 352298) only found at HC had an unknown function. The full list of
unique transcripts in the HC conditon is given in the Appendix A Table 2, including transcripts
not being significantly different, without annotation data or matching genes in the E. huxleyi
reference genome.

CHAPTER 3 - THE TRANSCRIPTOME OF EMILIANIA HUXLEYI AT HIGH AND LOW CALCIFICATION RATES
93
Unique significant transcripts in the low calcification in the G1-phase condition
In the LC condition the three most significantly and uniquely abundant transcripts were a
probable fatty acid methyltransferase (JGI♯ 454253, UniProt ID: P31049, q-value: 1.18 10-16),
a transcript recruiting to gene JGI♯ 446057, q-value: 2.54 10-15 without a known protein, and a
putative uncharacterized protein (JGI♯ 205338, UniProt ID: D8LH42, q-value: 2.88 10-15) with
a suggested signal transducer activity inferred from electronic annotation. For further details of
unique significant transcripts at LC refer to Table 3-13. The full list of unique transcripts found
in the LC condition treatment is given in the Appendix A Table 3, including transcripts without
being significantly different, having annotation data provided or recruiting to known genes in
the E. huxleyi reference genome.

94 Ta
ble
3-12
: Sig
nific
antly
hig
her a
bund
ant t
rans
crip
ts u
niqu
e in
the
high
cal
cific
atio
n (H
C) c
ondi
tion
of th
e G
1-ph
ase
of th
e E.
hux
leyi
cel
l cyc
le, w
ith m
atch
of
sequ
ence
to th
e re
fere
nce
gene
s (Si
g.: i
f sig
nific
ant).
Gen
e Tr
ansc
ripts
at
HC
[fpk
m]
q_va
lue
Sig.
U
niPr
ot ID
Fu
nctio
n
2255
51
8.63
0.
0096
ye
s Q
4V8B
1 Pr
oton
-cou
pled
am
ino
acid
tran
spor
ter 3
2059
77
2.48
0.
0128
ye
s O
6462
4 Pe
ntat
ricop
eptid
e re
peat
-con
tain
ing
prot
ein
At2
g189
40
2500
18
14.5
0 0.
0130
ye
s Q
5UP0
3 Pu
tativ
e ho
meo
box
prot
ein
R74
9
2499
53
1.67
0.
0153
ye
s O
6462
4 Pe
ntat
ricop
eptid
e re
peat
-con
tain
ing
prot
ein
At2
g189
40
2011
76
5.97
0.
0204
ye
s -
- 43
5200
1.
12
0.02
41
yes
Q6L
M37
Fl
avoh
emop
rote
in
3522
98
44.2
5 0.
0293
ye
s -
- 98
132
1.83
0.
0388
ye
s A
0PLM
4 Tr
ansc
riptio
nal r
egul
ator
y pr
otei
n 36
9373
1.
71
0.03
90
yes
*S
erin
e/th
reon
ine
prot
ein
kina
se
* ba
sed
on K
OG
def
initi
on

95 Ta
ble
3-13
: Sig
nific
antly
hig
her a
bund
ant t
rans
crip
ts u
niqu
e in
the
low
cal
cific
atio
n (L
C) c
ondi
tion
of th
e G
1-ph
ase
of th
e E.
hux
leyi
cel
l cyc
le w
ith m
atch
of
sequ
ence
to th
e re
fere
nce
gene
s (Si
g.: i
f sig
nific
ant).
Gen
e Tr
ansc
ripts
at
LC [f
pkm
] q_
valu
e Si
g.
Uni
Prot
ID
Func
tion
4542
53
24.8
7 1.
18E-
16
yes
P310
49
Prob
able
fatty
aci
d m
ethy
ltran
sfer
ase
4460
57
24.8
5 2.
54E-
15
yes
- -
2053
38
271.
96
2.88
E-15
ye
s D
8LH
42
Puta
tive
unch
arac
teriz
ed p
rote
in
4398
18
13.2
8 1.
54E-
14
yes
- *F
OG
: Zn-
finge
r 43
5479
12
.24
5.90
E-13
ye
s -
- 30
9174
27
.64
4.28
E-12
ye
s Q
8MTI
2 Pu
tativ
e su
rfac
e pr
otei
n bs
pA-li
ke
1962
75
6.57
8.
81E-
11
yes
Q9N
3Z3
Serin
e/th
reon
ine-
prot
ein
kina
se c
hk-1
45
0646
42
.00
1.12
E-10
ye
s -
- 45
5889
7.
65
3.08
E-09
ye
s -
*Col
lage
ns (t
ype
IV a
nd ty
pe X
III)
20
8723
10
.01
7.65
E-09
ye
s -
- 45
9932
5.
50
1.07
E-07
ye
s F0
Y85
8 Pu
tativ
e un
char
acte
rized
pro
tein
2084
70
4.09
2.
10E-
07
yes
Q54
Y32
M
AP
kina
se p
hosp
hata
se w
ith le
ucin
e-ric
h re
peat
s pro
tein
3
4563
41
5.24
2.
94E-
07
yes
F0Y
858
Puta
tive
unch
arac
teriz
ed p
rote
in
4567
91
4.31
4.
70E-
07
yes
- -
4500
77
4.62
7.
99E-
07
yes
- -
4351
46
5.27
1.
18E-
06
yes
- -
4563
40
4.40
1.
27E-
06
yes
P551
76
UPF
0012
hyd
rola
se in
pqq
F 5'
regi
on
2400
13
4.19
1.
42E-
06
yes
- -
2580
92
16.0
9 3.
01E-
06
yes
B7G
3J7
Form
amid
ase-
like
prot
ein
2212
72
3.30
3.
08E-
06
yes
A9A
494
Porp
hyro
mon
as-ty
pe p
eptid
yl-a
rgin
ine
deim
inas
e 21
7995
2.
94
2.40
E-05
ye
s C
1EIL
5 Pr
edic
ted
prot
ein
2339
51
2.78
6.
33E-
05
yes
F2TW
L3
Puta
tive
unch
arac
teriz
ed p
rote
in

96 Ta
ble
3 –
13 c
ontin
ued
Gen
e Tr
ansc
ripts
at
LC [f
pkm
] q_
valu
e Si
g.
Uni
Prot
ID
Func
tion
2072
72
4.43
7.
15E-
05
yes
F0Y
048
Puta
tive
unch
arac
teriz
ed p
rote
in
4543
51
3.58
9.
21E-
05
yes
B0G
143
Mito
chon
dria
l sub
stra
te c
arrie
r fam
ily
prot
ein
ucpB
24
7181
3.
97
0.00
015
yes
B7G
168
Pred
icte
d pr
otei
n 35
2052
6.
62
0.00
017
yes
- -
2495
02
100.
07
0.00
028
yes
- -
2187
52
1.60
0.
0003
1 ye
s A
9A49
4 Po
rphy
rom
onas
-type
pep
tidyl
-arg
inin
e de
imin
ase
2430
61
8.94
0.
0004
1 ye
s -
- 10
9294
2.
55
0.00
107
yes
- -
2225
16
3.89
0.
0011
1 ye
s Q
6DG
V7
Mpv
17-li
ke p
rote
in 2
23
7168
2.
44
0.00
123
yes
- -
2514
02
2.18
0.
0014
3 ye
s -
- 46
1189
2.
58
0.00
150
yes
Q9H
YH
5 Pu
tativ
e al
dola
se c
lass
2 p
rote
in P
A34
30
1172
79
0.96
0.
0016
9 ye
s -
*LR
R-c
onta
inin
g pr
otei
n 11
3812
0.
90
0.00
227
yes
Q99
NF1
B
eta,
beta
-car
oten
e 9'
,10'
-oxy
gena
se
Holger

97
* ba
sed
on K
OG
-def
initi
on
Tabl
e 3
– 13
con
tinue
d
Gen
e Tr
ansc
ripts
at
LC [f
pkm
] q_
valu
e Si
g.
Uni
Prot
ID
Func
tion
4240
57
4.73
0.
0025
8 ye
s -
- 23
2962
2.
56
0.00
335
yes
Q5T
Z51
Prot
ein
Mpv
17
2480
76
5.33
0.
0045
5 ye
s Q
8NU
I5
Lipa
se 1
2118
36
3.71
0.
0066
3 ye
s Q
1097
7 Ph
thio
cero
l syn
thes
is p
olyk
etid
e sy
ntha
se
type
I Pp
sA
1135
53
2.20
0.
0082
0 ye
s Q
99N
F1
Bet
a,be
ta-c
arot
ene
9',1
0'-o
xyge
nase
24
8875
0.
88
0.01
044
yes
P551
76
UPF
0012
hyd
rola
se in
pqq
F 5'
regi
on
2110
47
1.92
0.
0116
3 ye
s Q
5F37
1 Pr
otei
n st
raw
berr
y no
tch
hom
olog
1
3599
63
1.63
0.
0130
1 ye
s -
- 10
3163
1.
15
0.01
364
yes
- -
2321
78
1.77
0.
0149
0 ye
s C
1DZB
7 Pr
edic
ted
prot
ein
2498
76
1.54
0.
0158
1 ye
s -
- 24
4412
0.
97
0.01
944
yes
A9G
2Z3
Puta
tive
mem
bran
e pr
otei
n 25
5132
0.
88
0.02
808
yes
- -
2294
36
1.88
0.
0323
6 ye
s -
- 36
9188
1.
96
0.04
740
yes
- -

CHAPTER 3 - THE TRANSCRIPTOME OF EMILIANIA HUXLEYI AT HIGH AND LOW CALCIFICATION RATES
98
Transcripts from each KOG-class selected by means of graphical
distinctiveness
A graphical presentation approach was used to identify distinct significantly more abundant
transcripts in the high calcification (HC) and low calcification (LC) condition of the G1-phase
of the E. huxleyi cell cycle. Hence, the frequency of the transcripts of each KOG - class was
plotted for the light (x-axis; HC condition) and dark (y-axis; LC condition) and are presented
(see Figure 3-12 to Figure 3-16). From the figures significantly more abundant transcripts were
extracted and presented in the Appendix A Table 4. The focus was to extract transcripts from
genes, which are potentially involved in the calcification processes in E. huxleyi. Fifteen
transcripts potentially related to calcification in E. huxleyi were identified (see Table 3-14). Ten
of the identified transcripts were significantly more frequent in the HC condition and only 5
were significantly more frequent in the LC condition.
The three most abundant transcripts in the HC condition were from the clusters recruiting to
calreticulin (JGI♯ 426711, UniProt ID: P15253, q - value: 0.031, 1206 fpkm in the HC
condition, log2fold-value: -3.1), GPA - calcium binding protein (JGI♯ 431830, UniProt ID:
Q0MYW8, q - value: 1.29 10-5, 1026 fpkm in the HC condition, log2fold - value: -6.16), and a
synaptobrevin-B (JGI♯ 444996, UniProt ID: Q54GB3, q - value: 0.031, 561 fpkm in the HC
condition, log2fold-value: -2.84). The three most abundant transcripts in the LC condition were
from clusters recruiting to a sodium/potassium/calcium exchanger 1 (NCKX1) (JGI♯ 447939,
UniProt ID: Q9QZM6, q - value: 1.77 10-5, 897 fpkm in LC condition, log2fold-value: 4.03), a
probable sodium/potassium/calcium exchanger CG1090 (JGI♯ 354606, UniProt ID: Q9VN12,
q-value: 0.008, 553 fpkm in LC condition, log2fold -value: 2.62), and a vacuolar cation / proton
exchanger 5 (CAX5) (JGI♯ 416800, UniProt ID: Q8L783, q - value: 7.1 10-5, 549 fpkm in LC
condition, log2fold - value: 2.7). Further transcripts of the HC and LC condition identified by
graphical means and potentially involved in the coccoliths production processes are listed in
Table 3-43 and Appendix A Table 4.

CHAPTER 3 - THE TRANSCRIPTOME OF EMILIANIA HUXLEYI AT HIGH AND LOW CALCIFICATION RATES
99
Figure 3-12: Transcript abundance by KOG-class (1-6) in the light (HC condition) (x-axis) against transcript abundance in the dark (LC condition) (y-axis) for the KOG-classes A) General function prediction only, B) Posttranslational modification, protein turnover and chaperones, C) Replication, recombination and repair, D) RNA processing and modification, E) Intracellular trafficking, secretion, and vesicular transport, and F) Inorganic ion transport and metabolism. Small circles show not significant transcripts and small asterisks show significant transcripts. In red: transcripts overrepresented the HC condition and in black transcripts overrepresented in the LC condition. The ratios in red and black show the total number of non-significant and significant transcripts (bold) for the HC and LC condition, respectively. Clusters of significant transcripts of interest are selected by ellipses.

CHAPTER 3 - THE TRANSCRIPTOME OF EMILIANIA HUXLEYI AT HIGH AND LOW CALCIFICATION RATES
100
Figure 3-13: Transcript abundance by KOG class (7-12) in the light (HC condition) (x-axis) against transcript abundance in the dark (LC condition) (y-axis) for the KOG-classes A) Translation, ribosomal structure and biogenesis, B) unknown Function, C) Lipid transport and metabolism, D) Signal transduction mechanism, E) Nuclear structure, and F) Nucleotide transport and metabolism. Small circles show not significant transcripts and small asterisks show significant transcripts. In red: transcripts overrepresented the HC condition and in black transcripts overrepresented in the LC condition. The ratios in red and black show the total number of non-significant and significant transcripts (bold) for the HC and LC condition, respectively. Clusters of significant transcripts of interest are selected by ellipses.

CHAPTER 3 - THE TRANSCRIPTOME OF EMILIANIA HUXLEYI AT HIGH AND LOW CALCIFICATION RATES
101
Figure 3-14: Transcript abundance by KOG-class (13-18) in the light (HC condition) (x-axis) against transcript abundance in the dark (LC condition) (y-axis) for the KOG-classes A) Energy production and conversion, B) Transcription, C) Coenzyme transport and metabolism, D) Carbohydrate transport and metabolism, E) Cytoskeleton, and F) Amino acid transport and metabolism. In red: transcripts with abundance ratios towards the HC condition and in black with ratios towards the LC condition. Ratios in red and black show the total number of non-significant and significant transcripts (bold) for the HC and LC condition, respectively. Clusters of significant transcripts of interest are pooled by ellipses.
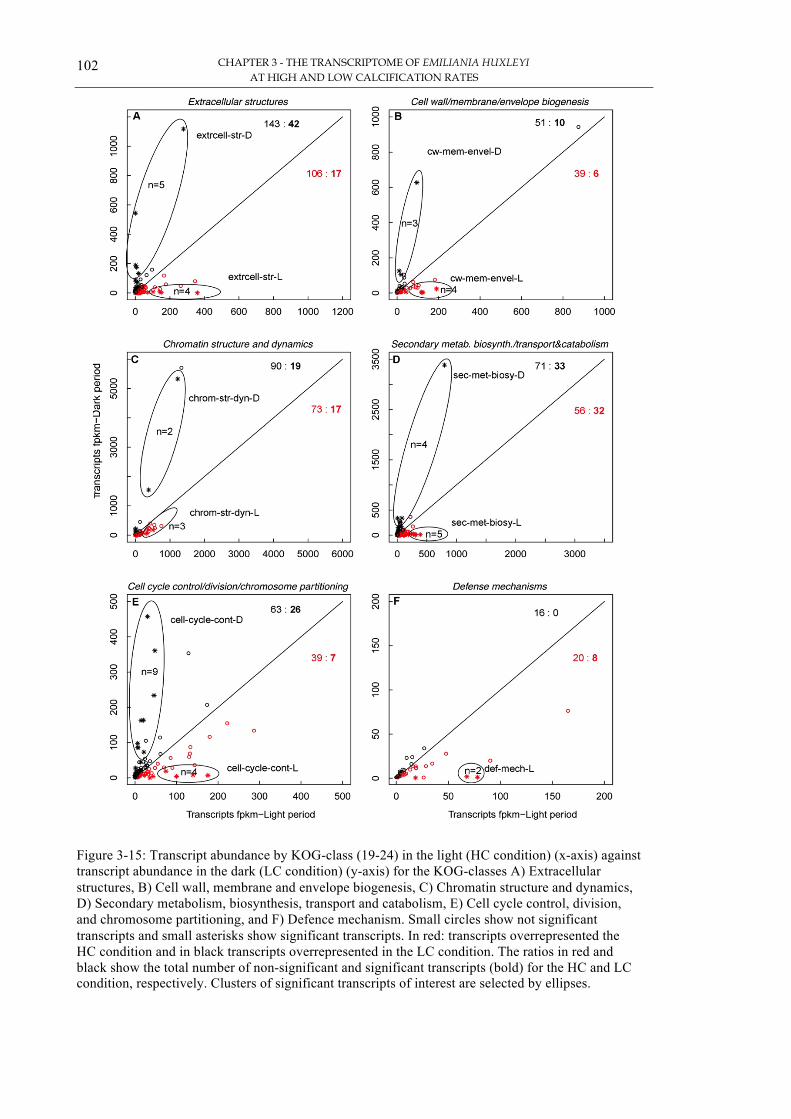
CHAPTER 3 - THE TRANSCRIPTOME OF EMILIANIA HUXLEYI AT HIGH AND LOW CALCIFICATION RATES
102
Figure 3-15: Transcript abundance by KOG-class (19-24) in the light (HC condition) (x-axis) against transcript abundance in the dark (LC condition) (y-axis) for the KOG-classes A) Extracellular structures, B) Cell wall, membrane and envelope biogenesis, C) Chromatin structure and dynamics, D) Secondary metabolism, biosynthesis, transport and catabolism, E) Cell cycle control, division, and chromosome partitioning, and F) Defence mechanism. Small circles show not significant transcripts and small asterisks show significant transcripts. In red: transcripts overrepresented the HC condition and in black transcripts overrepresented in the LC condition. The ratios in red and black show the total number of non-significant and significant transcripts (bold) for the HC and LC condition, respectively. Clusters of significant transcripts of interest are selected by ellipses.

CHAPTER 3 - THE TRANSCRIPTOME OF EMILIANIA HUXLEYI AT HIGH AND LOW CALCIFICATION RATES
103
Figure 3-16: Transcript abundance by KOG-class (25) in the light (HC condition) (x-axis) against transcript abundance in the dark (LC condition) (y-axis) for the KOG-classes cell motility. Small circles show not significant transcripts and small asterisks show significant transcripts. In red: transcripts overrepresented the HC condition and in black transcripts overrepresented in the LC condition. The ratios in red and black show the total number of non-significant and significant transcripts (bold) for the HC and LC condition, respectively. Clusters of significant transcripts of interest are selected by ellipses.

104 Ta
ble
3-14
: Sig
nific
antly
mor
e ab
unda
nt tr
ansc
ripts
pot
entia
lly in
volv
ed in
the
calc
ifica
tion
proc
ess o
f E. h
uxle
yi b
y K
OG
-Cla
ss. G
enes
wer
e se
lect
ed a
fter
clus
terin
g tra
nscr
ipts
bas
ed o
n K
OG
–an
nota
tion
as p
rese
nted
in F
igur
e 3-
12 to
Fig
ure
3-16
. All
gene
s sel
ecte
d pe
r KO
G –
cla
ss a
re g
iven
in th
e A
ppen
dix
A,
Tabl
e 4.
Con
ditio
n ab
unda
nce
in p
erio
d
JGI g
ene
JGI♯
fp
km a
t HC
pe
riod
fpkm
at L
C
perio
d U
niPr
ot ID
Sw
issP
rot I
D Fu
nctio
n or
KO
G-d
escr
iptio
n (K
OG
) H
C
4318
30
1029
14
Q
0MY
W8
GPA
- Pu
tativ
e ca
lciu
m b
indi
ng p
rote
in
HC
42
6711
12
06
141
P152
53
Cal
retic
ulin
H
C
4449
96
561
78
Q54
GB
3 Sy
napt
obre
vin-
B
HC
43
7571
26
6 39
P4
7193
V
esic
le-a
ssoc
iate
d m
embr
ane
prot
ein
2,
Syna
ptob
revi
n H
C
3510
06
162
27
O70
480
Ves
icle
-ass
ocia
ted
mem
bran
e pr
otei
n 4,
Sy
napt
obre
vin
HC
46
3384
10
0 12
D
3Z5L
6 M
FS-ty
pe tr
ansp
orte
r C6o
rf19
2 ho
mol
og,
Solu
te c
arrie
r fam
ily 1
8 m
embe
r B1
HC
46
0762
96
22
Q
9ZR
D6
VA
MP-
like
prot
ein
YK
T61,
Syn
apto
brev
in
HC
43
4324
85
14
P9
3654
Sy
ntax
in-2
2 H
C
4662
32
276
2 Q
9HG
M6
Puta
tive
trans
porte
r C54
3.05
c, H
CO
3 tra
nspo
rt H
C
3146
59
207
41
Q9H
GM
6 Pu
tativ
e tra
nspo
rter C
543.
05c,
HC
O3 t
rans
port
LC
9973
3 21
58
Q
84W
W5
Ves
icle
-ass
ocia
ted
prot
ein
1-3
LC
4479
39
55
897
Q9Q
ZM6
Sodi
um/p
otas
sium
/cal
cium
exc
hang
er 1
LC
35
4606
90
55
3 Q
9VN
12
Prob
able
sodi
um/p
otas
sium
/cal
cium
ex
chan
ger C
G10
90
LC
4168
00
84
549
Q8L
783
Vac
uola
r cat
ion/
prot
on e
xcha
nger
5
LC
4630
95
1 15
6 Q
9XES
1 C
alci
um-tr
ansp
ortin
g A
TPas
e 4,
ER
-type

CHAPTER 3 - THE TRANSCRIPTOME OF EMILIANIA HUXLEYI AT HIGH AND LOW CALCIFICATION RATES
105
Transcript abundance in the high and low calcification rate 3.3.3.7.
conditions in the G1-phase of the E. huxleyi cell cycle of genes with a
suggested role in the calcification processes
A selection of molecules, previously reported in the literature to play a role in the processes
surrounding calcification and coccolith formation in E. huxleyi (Marsh et al. 1992; Wahlund et
al., 2004; Nguyen et al., 2005; Quinn et al., 2006; Richier et al., 2009; von Dassow, 2009;
Mackinder et al., 2009, 2011, 2012; Emery et al., 2012) are presented in Figure 3-17 to Figure
3-21. The individual figures represent clusters of molecules according to their function and
characteristics.
Figure 3-17: Transcript abundance and expression ratios of vacuolar type membrane proton pump ATPases (V-ATPase) in light and dark incubation period (shaded grey), a regulator of V-ATPase assembly (RAVE), and clathrin. Positive 2X-fold expression values indicate elevated expression in the low calcification condition. The sizes of the circles indicate the total abundance of transcripts found in high and low calcification conditions. The results table can be found in Appendix A Table 5.
���������� ���������������������
������������������������� ����������!�"#�� ���������
�������$��%&�'�()���������*�����+����
�&,,���'�()��������*������-���.��/0/����$�',#�'�()��������*������-���.��/0/���
�"&�&#�'�()������/0/����(�,�&!��'�()������/0/����1��,$��'�()������/0/����233�"&�&��'�()������/0/����.
�$4%5��'�()������/0/������$'#���'�()������/0/�������$51&��'�()������/0/����6�$��4&�'�()������/0/����7�$�,!,�'�()������/0/����%�$84�"�'�()������/0/����
��)�9����('6���"�����0�0-�����:���()����
���&&��;-��<���<��=:�2<�������"�#!�;-��<���<��=:�2<������&�##�;-��<��������2���
������;(86���)���2�����+�*�
->��+-.��?�������2<��>�
�& �� ! � &
� �� ��� ���
�������� ��������� ������ ���������������� ����� �������� ����� ��
�
�

CHAPTER 3 - THE TRANSCRIPTOME OF EMILIANIA HUXLEYI AT HIGH AND LOW CALCIFICATION RATES
106
!
Proton pumping pyrophosphatases (PPase), V-type (vacuolar) proton ATPases, P-
type proton ATPase, and clathrin expression
V-type proton ATPases and PPases were suggested to paly an important role in the control
of the pH in organelles (Mackinder et al., 2010), where calcium carbonate is precipitated and to
stabilize the electrochemical gradient across membranes (Suffrian et al., 2011). Transcripts of
V-type proton ATPases and PPases with suggested vacuolar location were present in
transcriptomes of high and low calcificaion condition (compare Figure 3-17). Higher
abundances of transcripts of the V-type proton ATPases and PPases cluster were observed in the
low calcification (LC) condition. Three transcripts for pyrophosphate-energized vacuolar
membrane proton pumps (Na+ and H+-PPases) were found more abundant in low calcification
condition. Two genes expressed the H+-PPase with the UniProt ID: Q06572. Furthermore,
transcripts for 13 peptides of the V-type proton ATPase were present, whereas the 16 kDa
proteolipid subunit of the V-type ATPase formed a cluster by 7 genes, the V-type proton
ATPase 116 kDa subunit a isoform 1 and probable V-type proton ATPase subunit G formed
clusters of two genes (for details of the expression levels of each transcript refer to Appendix A
Table 5). Only the P21616 peptide of the H+-PPase of the described V-ATPase cluster was
higher expressed in the high calcification (HC) condition. None of the V-ATPase related
transcripts were significantly higher expressed in HC or LC condition. However, the predicted
RAVE (regulator of V-ATPase assembly) a complex subunit RAV1/DMX protein of the WD-
repeat superfamily, JGI♯ 461741 was significantly higher expressed in the LC condition,
showing 3-fold more transcripts in the dark and a total of 21 fkpm. Only the transcript of
P12522 being a P-type ATPase 1B was 9-fold significantly higher expressed in the LC
condition. The total abundance of transcripts in both periods was 11.15 fpkm.
Clathrin was suggested to play an indirect role in the calcification process by being present in
clathrin-coated vesicles and occurring together with V-type proton ATPases. The observed
expression of clathrin did show any significant increase in the HC or LC condition. Four genes
were expressed and the bulk of transcripts (801 fpkm) matched the clathrin heavy chain
P25870, whereas 25 % more were present in the LC condition (see Appendix A, Table 5 for
details).

CHAPTER 3 - THE TRANSCRIPTOME OF EMILIANIA HUXLEYI AT HIGH AND LOW CALCIFICATION RATES
107
Expression of proton antiporter and proton exchanger and voltage gated proton
channels
Further proton transport across membranes may involve sodium proton antiporters, chloride
proton exchanger transporters, proton sugar co-transporters, and voltage-gated H+ channel
proteins. The abundance of transcripts of the above-mentioned transporters is presented in
Figure 3-18.
Figure 3-18: Transcript abundance and expression ratios of proton exchanger found at light and dark incubation period (shaded grey). CPA1: monovalent cation: proton antiporter-1 family. HVCN: Voltage-gated H+ channel protein. Positive 2X-fold expression values indicate elevated expression in the low calcification condition. The sizes of the circles indicate the total abundance of transcripts found in high and low calcification conditions. The results table can be found in Appendix A Table 6.
Sodium proton antiporters, chloride proton exchanger transporters, proton sugar co-
transporters, and voltage-gated H+ channel proteins were present in the high and low
calcification rate conditions of the G1-phase of the E. huxleyi cell cycle. Significant differences
���������� ���������������������
��������������������������� �!�"�#�$��������������������� �!
��%&�$��������������������� �!��'(�%��������������������� �!
!)!*+)��������������������� �!�)!)!,�+��������������������� �!��-����)��.����/��������������������
0)-"���0�!�)�+�*��������01�����23 ��4����������5�$)5%"������01�����23 ��4����������5
�"567%������01�����23 ��4����������013!��%$�$������ �2���3���������
-��8%'��90�������
���������0!:-���,���3�����;�<�
14��;1=��2�������3 ��4�
�" �> �+ �� ' � + > "
� �� ��� ���
������� ��������� ���� ������
��
�

CHAPTER 3 - THE TRANSCRIPTOME OF EMILIANIA HUXLEYI AT HIGH AND LOW CALCIFICATION RATES
108
for the expression levels between the HC and LC condition were found for transcripts of the
Na+/H+ antiporter nhaA protein (UniProt ID Q30XM9) and Na+/H+ antiporter nhaA1 Protein
(UniProt ID ID A1AK41) in the LC condition representing 27 fpkm and 2 fpkm transcripts,
respectively (compare Appendix A Table 6). In the light incubation period (HC condition) the
H+/hexose co-transporter 3 was significantly higher expressed (280 fpkm transcripts).
Observed Ca2+ - transporter expression:
Calcium transporters are an important part of cell signalling pathways and fundamental for
reaching the saturation state for the precipitations of calcium carbonate. Calcium transporters of
the K+ dependent Ca2+/Na+ exchanger (NCKX), vacuolar cation/proton exchanger (VCX),
cation/proton exchanger (CAX), calcium transporting ATPase – endoplasmic reticulum
(SERCA) type, together with plasma membrane calcium-transporting ATPases (PMCA) and
voltage dependent calcium channels were found in the transcriptomes at high and low
calcification rate conditions of the G1-phase of the E. huxleyi cell cycle (compare Figure 3-19).
The clusters of transcripts for the NCKX1 protein (UniProt ID: Q9QZM), the probable sodium /
potassium / calcium exchanger CG1090 protein (UniProt ID Q9VN12), vacuolar cation/proton
exchanger 5 (UniProt ID: Q8L783).), the SERCA- type 4 ATPase (UniProt ID: Q9XES1), the
plasma membrane calcium-transporting ATPase 4 (UniProt ID: Q64542), and the voltage-
dependent calcium channel subunit alpha-2/delta-2 (UniProt ID Q9NY47) were significantly
more expressed in the LC condition. Furthermore, the long transient receptor potential cation
channel proteins (UniProt IDs: Q91YD4, P48994, and O94759) were expressed in the LC
condition. The E. huxleyi calcification specific cation/proton exchanger CAX 3 (von Dassow et
al., 2009) was apparently not found in the transcriptomes of the HC and LC conditions. For
details about transcript abundance refer to Appendix A Table 7.

CHAPTER 3 - THE TRANSCRIPTOME OF EMILIANIA HUXLEYI AT HIGH AND LOW CALCIFICATION RATES
109
Figure 3-19: Transcript abundance and expression ratios of Ca2+ - transport related proteins found at light and dark incubation period (shaded grey). NCKX: K+ dependent Ca2+/Na+ exchanger, VCX: vacuolar cation/proton exchanger, CAX: cation/proton exchanger, SERCA: calcium transporting ATPase – endoplasmic reticulum type, PMCA: plasma membrane calcium-transporting ATPase, VD: voltage dependent, Ca2+/Mg2+-permeable cation channels LTrpC: Long transient receptor potential cation channel. Positive 2X-fold expression values indicate elevated expression in the low calcification condition. The sizes of the circles indicate the total abundance of transcripts found in high and low calcification conditions. The results table can be found in Appendix A Table 7.
���������� ���������������������
���������������� !�����"��#��$�����"�!�%�������
����$"��&����'�����%�������(��%�������)�$�$
*����" +$$����&����'��������������������������������� ,�$"����"�,$ +�����"
� ���$��-�%�!.,!"��-�
����./�%�����"
����+%!!"��#��-��0��1���%2�-3����
����$,��#��-��0��1���%2�-3�����%���#����#��-��0��1���%2�-3�����+
������+ +%����-�+
�������� �!��'3�����%2��4����5
�, (�$���3���6���%2��4����5���7+,�(����%2�84����5��&9&�����5�4��%�:�5���"
����������������7�+�.3��%�+!��+�.3��
;�+, ��.3��%������
����������-.#���3���8�����<�=�
5*%�<5:��>�������84��*�
�! �� �+ �% $ % + � !
� �� ��� ���
�������� ��������� �������� ��
��
��
� �
��

CHAPTER 3 - THE TRANSCRIPTOME OF EMILIANIA HUXLEYI AT HIGH AND LOW CALCIFICATION RATES
110
Observed calmodulin and Ca2+ - binding proteins expression
Calcium binding proteins play an important part in reaching and maintaining saturated
concentrations of calcium ions prior to the precipitation calcium carbonate provide a pool of
calcium ions within the cell (Schroeder et al., 2005). The results of the observed transcripts for
calcium binding proteins are presented in Figure 3-20.
Figure 3-20: Transcript abundance and expression ratios of calmodulin (CaM) and Ca2+ - binding proteins found at light and dark incubation period (shaded grey). CABP: calcium binding protein. Positive 2X-fold expression values indicate elevated expression in the low calcification condition. The sizes of the circles indicate the total abundance of transcripts found in high and low calcification conditions. The results table can be found in Appendix A Table 8.
Calmodulin transcripts were more frequent in the HC condition, namely Q9HFY6, Q40302,
and the calmodulin like protein 6 (Q2R1Z5) (compare Figure 3-20 and Appendix A Table 8).
Transcripts of calmodulin like proteins were also observed in the low calcification rate
condition (LC) of the G1-phase of the E. huxleyi cell cycle but at much lower rates. However,
the only significant difference in expression rates between the HC and LC conditions was found
for clamodulin CaM-like protein 5 (Q9NZT1) showing only 1 fpkm transcripts. In total 4265
fpkm transcripts of the different calmodulin isoforms were found in the HC condition compared
� �� ��� ���
������������ ������������������������������
��� �
��
�
����������� ���������������������
������������� �!����
�!"�#!�����$�%�������� ���&'(�����$�%��������)��*�+"�����$�%��������"
�!�(&)��,����-������$�%���������
����.#���/�0���1�$1�,��2��3��4������������
�()!) ���$���1,$����
� �#("���$��5���6�$4����#"���$��5���6�$4
� #"�#���$��5���6�$4�!���
� #)�)��07�� �!(#��07��8��4����9
��������07����* "��������
��0*+���'���1�����:�%�
$4!�:$3��5�������16��4�
�# �� �� �! � ! � � #

CHAPTER 3 - THE TRANSCRIPTOME OF EMILIANIA HUXLEYI AT HIGH AND LOW CALCIFICATION RATES
111
to 1736 fpkm transcripts in the LC condition (see Appendix A Table 8). The known GPA calcium binding
protein (Q0MYW8) was significantly high expressed in the cells of the G1-phase showing higher
calcification rates in the light incubation period. In the HC 1029 fpkm compared to 14 fpkm in the LC
condition of GPA transcripts were observed. Two genes of calreticulin (UniProt ID: P15253) expressed
significantly higher transcripts in the HC condition (1516 fpkm) compared to 183 fpkm transcripts in the LC
condition. Furthermore, genes of calnexin homologs (UniProt ID: Q39817, Q6Q487, and Q38798) produced
significantly more transcripts in the HC condition (596 fpkm) compared to 67 fpkm to the LC condition.
Transcripts of the predicted calcium binding protein (UniProt ID: F31218) were also significantly higher
expressed in the HC condition.
Observed Bicarbonate transport and carbonate anhydrase expression
The transport of bicarbonate and activity of carbonate anhydrase provides CO2 and CO32- - ions for
photosynthesis and calcium carbonate synthesis in E. huxleyi (von Dassow et al., 2009; Richier et al., 2011).
A total of 20 genes of the E. huxleyi genome related to bicarbonate transport were tested for differential
expression between the high (HC) and low calcification rate (LC) conditions of the G1-phase of the E.
huxleyi cell cycle and results are presented in Figure 3-21. Transcripts relating to 9 genes showed
significantly different abundance in 4 gene clusters. Gene expression related to bicarbonate transport was
significantly higher for 5 out of 9 genes in the LC condition and for 4 out of 9 genes in the HC condition.
The genes JGI♯ 99943, 426735, 200137, 198643, and 120259 code for the isoforms of the anion exchanger 2
protein (UniProt ID: P23347) and were higher expressed in the LC condition comprising a total of 726 fpkm,
whereas transcripts of the genes JGI♯ 99943, 200137, 198643, and 120259 were significantly more abundant
in the LC condition. The putative Na+-independent Cl-/HCO3+ exchanger AE1 of the SLC4 family (UniProt.
ID: Q9HGM6) was more frequent in the HC condition and transcribed by 3 genes. Transcripts recruited to
the E. huxleyi gene JGI♯ 466232 showed 276 fpkm in the HC condition, which was significantly higher than
in the LC condition (2 fpkm). Transcripts recruited to the E. huxleyi gene JGI♯ 314659 were also
significantly more abundant in the HC condition showing 207 fpkm transcripts in the light incubation period
compared to 4 fpkm in the dark incubation period. The sodium bicarbonate co-transporter 3 of the SLC 7
family (JGI gene ♯ 469783, UniProt. ID: Q8BTY2) was significantly higher expressed in the LC condition
with 15 fpkm compared to one fpkm transcripts in the HC condition. Furthermore, the uncharacterized
vacuolar membrane protein of the SLC 26 family (UniProt. ID: YGR125W) involved in
sulphate/bicarbonate/oxalate exchanger was expressed by three genes, of which two were significantly more
expressed. Genes relating to the sulphate/bicarbonate/oxalate exchanger were significantly more expressed in
both the HC and LC condition, whereas JGI gene ♯ 98125 expression was significant for the HC condition
and JGI gene ♯ 460215 expression was significantly increased in the LC condition. The total transcript

CHAPTER 3 - THE TRANSCRIPTOME OF EMILIANIA HUXLEYI AT HIGH AND LOW CALCIFICATION RATES
112
abundance of the YGR125W homologs was 34 fpkm in the HC and LC condition. For details of transcript
abundance related to bicarbonate transport refer to Appendix A Table 9.
The gene expression differences in the HC and LC condition of seven genes related to carbonic anhydrase
were investigated. In general, carbonic anhydrase expression was elevated in the LC (low calcification)
condition compared to the HC (high calcification) condition (compare Figure 3-21). Increasingly expressed
genes for carbonic anhydrases were found significant in the LC condition. Three homologs of the carbonic
anhydrase (UniProt ID: O52535) were present, of which only transcripts recruiting to JGI gene ♯ 233460
were significant in the LC condition. Out of two homologs of carbonic anhydrase UniProt ID Q50940 in the
LC condition only transcripts mapping to JGI gene ♯ 62679 were significant. Interestingly, the sequences of
most transcripts were mapped to the E. huxleyi specific delta-carbonic anhydrase (UniProt ID: Q0ZB86, JGI
gene♯ 436031), which were only present in the LC condition with 74 fpkm transcripts. Details for all
transcripts related to carbonic anhydrases are given in Appendix A Table 9.

CHAPTER 3 - THE TRANSCRIPTOME OF EMILIANIA HUXLEYI AT HIGH AND LOW CALCIFICATION RATES
113
Figure 3-21: Transcript abundance and expression ratios of bicarbonate transport and carbonic anhydrase found at light and dark incubation period (shaded grey). AE: Anion exchanger. SLC: Solute carrier family. VMP: vacuolar membrane protein. Asterisks at the protein name indicate EuKaryotic Orthologous Groups (KOG) definition: Sulphate/bicarbonate/oxalate exchanger SAT-1 and related transporters (SLC26 family). Positive 2X-fold expression values indicate elevated expression in the low calcification condition. The sizes of the circles indicate the total abundance of transcripts found in high and low calcification conditions. The results table can be found in Appendix A Table 9.
���������� ���������������������
��������������������� ���!"��#���$%&'()*+�� ���!"��#���$%
&�(*,���!"����-���./�'����0����1����2�+��!"���%134��&',(5���0����1��� +���!"��#���$%
&�62*���!"���&/'������78��7���9�3�������"��,�-++7�����������78��7���9�3�:5��*(�+��;��
��������.������"�4��7���8%3���.������"�4��7���8%3���
&/<6�����$���7�4��7���8%3���&�/'�/�"�4��7���8%3���
&�:�)������7�$$0$��7�4��7���8%3���
����"�! ���2���7�����#�=�
$���#$3��>�������78����
�� �� �� �� / � � � �
� �� ��� ���
��������� ��������������� ��� ���������� �������������
�
���
�
��
����
�

CHAPTER 3 - THE TRANSCRIPTOME OF EMILIANIA HUXLEYI AT HIGH AND LOW CALCIFICATION RATES
114

CHAPTER 3 - THE TRANSCRIPTOME OF EMILIANIA HUXLEYI AT HIGH AND LOW CALCIFICATION RATES
115
3.4. Discussion
In this study, experimental cultures of the unicellular coccolithophore E. huxleyi PLY♯ M217 were reared
in F/50 medium to investigate the transcriptomes at high and low calcification rates of the G1-phase of the
cell cycle. Previous studies observed different gene expression in Emiliania huxleyi related to life cycle
phases, different cell cycle phases, under calcification stimulating by phosphorous limitation, and different
carbonate chemistry regimes (e.g. Quinn et al., 2006; von Dassow et al., 2009; Richier et al., 2009;
Mackinder et al., 2011; Bach et al., 2013). This study showed that gene expression related to
biomineralisation differs significantly within the G1 cell-cycle phase at high and low calcification rates, the
light and the dark incubation period, respectively. Interestingly, the expression of proteins, which were
previously reported to be involved in coccolithophogenesis, was more frequent in the low calcification phase
of the G1-phase. This suggests patterns of gene expression, in which a significant amount and molecules
involved in biomineralisation processes, namely ion transporting pathways, are expressed before the
calcification machinery maximizes under light exposure. For example, the bulk of V-type ATPases related
transcripts (see Appendix A Table 5 for details), around 75% of the cation proton exchanger CAX5
transcripts, the majority of K+ dependent Ca2+ / Na+ exchanger (NCKX) transcripts, and higher numbers of
clathrin transcripts were observed when cells were actually calcifying at low rates. This might suggest that
large proportion of the potential biomineralisation proteins is synthesized during or just after mitosis and that
a smaller degree of those proteins needs continuous synthesis during periods of highest calcification rates.
Furthermore, the observed gene expression patterns also support the general importance of calcium binding
proteins in the process of coccolithophogenesis. Calcium binding proteins were increasingly expressed in the
high calcification condition of the G1-phase, which could also indicate that many of those calcium-binding
proteins are lost during coccolithogenesis. In particular GPA showed 70-fold increase in the light enhanced
calcification phase.
The following paragraphs will lead to putting the gene expression results from the transcriptomes of early
and late G1-phase E. huxleyi cells, in a wider context. First, the experimental methodology, culturing
conditions, transcriptome analysis using functional groups and a graphical approach are reassessed and
discussed. Eventually existing models of calcification in coccolithophores are discussed with the results from
this study taking into account models of the algae cell cycle and cell division.

CHAPTER 3 - THE TRANSCRIPTOME OF EMILIANIA HUXLEYI AT HIGH AND LOW CALCIFICATION RATES
116
Methodological considerations of the E. huxleyi culture conditions
The culturing conditions, depletion of nutrients and the time point of cell harvesting may have affected
the physiological performance and therefore calcification of E. huxleyi in the presented study. Using cultures
of E. huxleyi grown in F/50 medium might have affected the general patterns of gene expression but should
not have affected the investigation of gene expression relevant to coccolithophogenesis. The F/50 medium is
considered to limit the supply of phosphate to coccolithophores and thereby increase the accumulation of
calcium carbonate per cell and cause physiological stress to the cells (Paasche, 2002; Wahlund et al., 2004).
Under phosphate limited conditions general gene expression was reduced in E. huxleyi compared to gene
expression in phosphate-replete conditions (Wahlund et al., 2004b; Nguyen et al., 2005). Phosphate
limitation was found to cause gene expression linked to stress and cell defence, among them genes coding
for homologs of HSP70 (Wahlund et al., 2004b). Testing the expression of HSP 70 homologs in the
transcriptomes of the high calcification period and low calcification period showed that 4 homologs were
significantly more frequent in the light period (high calcification condition) (see Appendix A Figure A-2 and
Appendix A Table 11), which could indicate phosphate depletion at the time of cell harvesting for
transcriptome analysis. The cells require phosphate for a diversity of processes such as the synthesis of DNA
and RNA. Under phosphate limited conditions cells might not be able to pass into cell division phase in the
dark because at earlier cell cycle check points the cell had not attained its critical size and energy reserves
(Zachleder et al., 2016). As a result of prolonged cell cycle and cell growth, more calcium carbonate per cell
is accumulated until the cellular reservoirs of phosphate have been filled. Only when phosphate pools were
restored the cells may pass through cell division. However, an accumulation of calcium carbonate per cell
(PIC increase) and a halting of the cell cycle cannot be concluded from the increase in cell densities and
growth rates (Figure 3-3 A and B). The PIC per cell (Figure 3-3 F) remained stable at the termination of the
experiment. Furthermore, the POC and PON results did not show any differences between the day before cell
harvest and the day of harvest. It was therefore thought that the cells were not altered in their physiology
during the experiment and a phosphate limitation was not given. If phosphate was depleted, even though the
data suggest otherwise, phosphate limitation should enhance gene expression related to biomineralisation in
E. huxleyi (Wahlund et al., 2004b; Nguyen et al., 2005; Quinn et al., 2006).

CHAPTER 3 - THE TRANSCRIPTOME OF EMILIANIA HUXLEYI AT HIGH AND LOW CALCIFICATION RATES
117
Methodological considerations of the transcriptome analysis
Matching the raw transcript sequences of late and early G1-phase to the Emiliania huxleyi genome v.1.0
(April 25, 2008; http://genome.jgi.doe.gov/Emihu1/Emihu1.home.html) identified 34403 transcripts using
NGS Illumina sequencing of mRNA. However, only 9999 gene transcripts matched to known proteins
suggesting the relatively poor annotation of the Emiliania huxleyi genome v.1.0, a large degree of regulatory
transcripts, and post-transcriptional modifications. Nevertheless, the present study revealed nearly twice the
number of transcripts as reported in the EST analysis by von Dassow et al. (2009) (19188 ESTs; strain RCC
1217). However, von Dassow et al. (2009) reported nearly twice as much transcripts using the strain CCMP
1516, B-morphotype, which showed 72,513 ESTs. From the most recent genome of E. huxleyi CCMP1516 it
is thought that the E. huxleyi genome comprises of 142Mb containing 30,569 protein-coding genes of which
28429 were matched to known transcripts in databases (Read et al., 2013). The results of this study found
9999 transcripts matching the 2008 version of the reference genome but 15150 transcripts matching known
protein sequences. Again the comprehensiveness of the Emiliania huxleyi genome v.1.0 (April 25, 2008)
might have influenced the annotation success of the observed transcripts. At the time of analysis the newly
sequenced genome http://www.ebi.ac.uk/ena/data/view/ GCA_000372725.1 (Read et al., 2013) was not
available at the time.
The Illumina sequencing and Tophat-cufflinks pipeline found large numbers of differentially expressed
transcripts. However, the Tophat-cufflinks pipeline has been criticized for its return of increased number of
false positives (Rapaport et al., 2013). The accuracy issues with significant differential gene expression in
the Tophat-cufflinks pipeline were addressed by the introduction of the q – value, which provides higher
correctness (Trapnell et al., 2012) and reduces false positive identifications (Rapaport et al., 2013).
Microarray based gene expression analysis applied thresholds of p < 0.01 and 2-fold-expression greater than
two to identify significantly different transcripts abundance in E. huxleyi cultures grown in nutrient replete
and nutrient deplete conditions (Quinn et al., 2006). In a simulation, the threshold values of Quinn et al.
(2006) were applied to the differential expression results of the Tophat-cufflinks pipeline. Thus, the numbers
of significantly different transcripts were reduced by 43% from 6978 significantly different expressed genes
(q < 0.5) to 3942 significantly different expressed genes (p < 0.01; 2-fold expression greater than 2). Quinn
et al. (2006) showed that of a total of 2298 ESTs 127 transcripts (5%) showed significantly different up or
down regulation. In this study 20% of the transcripts were significantly up or down regulated following the
Tophat-cufflinks pipeline and even after applying the additional thresholds (q < 0.01 and 2-fold expression
greater than 2) 11% of the transcripts were different in cells of the early G1-phase low-calcifying and late
G1-phase high calcifying conditions. Further transcriptome analysis was conducted without the
implementation of arbitrary thresholds because other means (e.g. graphical selection by transcript frequency
and previously reported genes) were used to select the differentially expressed genes of interest.

CHAPTER 3 - THE TRANSCRIPTOME OF EMILIANIA HUXLEYI AT HIGH AND LOW CALCIFICATION RATES
118
General expression patterns using functional physiological groups
The affiliations of the proteins transcribed by the observed transcripts to functional groups such as the
euKaryotic Orthologous groups (KOG) were used to investigate general functional differences in the
transcriptomes of the high calcification (HC) and low calcification (LC) condition of E. huxleyi cells in the
late and early G1phase, respectively. Functional KOG annotation groups showed the highest number of
KOG annotations and were therefore applied for the general inferences of functional characteristics of the
cells in the HC and LC condition. ‘Cell signalling’ was found to be the most important functional
characteristic of the expressed genes according to the retrieved transcripts with KOG-group annotation.
Genes involved in ‘Metabolism’ and ‘Information storage and processing’ were almost equally expressed in
the Light and Dark period. In all KOG-groups more transcripts were abundant in the LC condition (see Table
3-7). Wahlund et al. (2004) reported that most transcripts in nutrient replete and nutrient deplete cultures
referred to the functional group of ‘Metabolism’, and could not discover a pattern towards over-
representation relating to culture conditions, which increase calcification or alter calcification.
At the KOG-class the general expression patterns showed that transcripts belonging to ‘Translation,
ribosomal structure and biogenesis ‘, ‘Posttranslational modification, protein turnover, chaperones’, and
‘Lipid transport and metabolism’ were significantly different from the overall expression ratios in the HC
and LC condition. ‘Translation, ribosomal structure and biogenesis ‘ showed more significantly expressed
transcripts in the LC condition, whereas more significantly expressed genes of ‘Posttranslational
modification, protein turnover, chaperones’ and ‘Lipid transport and metabolism’ were observed in the HC
condition (late G1-phase). Increased numbers of significantly expressed genes of the KOG-class
‘Translation, ribosomal structure and biogenesis‘ in the LC condition could indicate that a higher general
activity of cell structure synthesis, due to internal ‘zeitgeber’, in preparation for the onset of the HC
condition (McClung, 2014) or for complementation of cell assemblies divided during cytokinesis. Elevated
gene expression related to the KOG-class ‘Translation, ribosomal structure and biogenesis‘in the early G1-
cell-cycle-phase enables photosynthetic organisms to efficiently produce carbohydrates at an early stage of
the photosynthetic period already (Green et al., 2002; Dodd et al., 2005; Winjen et al., 2006).
The ratio of genes showing significantly different expression was increased in the KOG-classes
‘Translation, ribosomal structure and biogenesis‘, ‘Nucleotide transport and metabolism’, ‘Inorganic ion
transport and metabolism’, ‘Extracellular structures’, ‘Cell cycle control, cell division, chromosome
partitioning’, ‘Carbohydrate transport and metabolism’, and ‘Amino acid transport and metabolism’ towards
the Dark period. Von Dassow et al. (2009) showed that transcripts belonging to the KOG-Classes ‘Signal
transduction mechanisms’ and ‘Cytoskeleton’ were significantly more abundant in non-calcifying 1N E.
huxleyi cells. In calcifying 2N E. huxleyi cells von Dassow et al. (2009) showed that transcripts of the KOG-

CHAPTER 3 - THE TRANSCRIPTOME OF EMILIANIA HUXLEYI AT HIGH AND LOW CALCIFICATION RATES
119
Class ‘Translation, ribosomal structure and biogenesis’, ‘Signal transduction mechanisms’, and
‘Cytoskeleton’ were overrepresented. Only the total ratios of genes expressed in the KOG-classes
‘Translation, ribosomal structure and biogenesis’ and ‘Nucleotide transport and metabolism’ were more
abundant in calcifying cells in the light phase of this study.
It was unexpected to find transcripts of the functional class summarizing ‘inorganic ion transport’ and
‘carbohydrate transport and metabolism mechanisms’ more abundant in the dark period (low calcification
condition), as genes of these groups should be more active during biomineralisation and photosynthesis.
However, the observed patterns further support that the readiness for biomineralisation and photosynthetic
machinery is established before the start of the light phase as part of the synthesis of cell structures (e.g.
Golgi apparatus), which were reduced in their extend during cell division (Nebenfuehr et al., 2000; Puhka et
al., 2007). This readiness could be accomplished by inducing gene expression in a periodicity that is slightly
uncoupled from the physiological activity and more related to the cell organelle construction.
It seems that care must be taken when estimations of the functional machinery are made from interpreting
functional annotations. The functional groups comprise transcripts, which are active in many physiological
pathways including calcification and photosynthesis. Furthermore, the evaluation does not consider
transcript abundance and the potential amount of translated proteins. The expression patterns by comparison
of KOG-class representatives, or by other functional annotations (e.g. GO annotations), could mask the
actual general gene expression patterns that equally account for transcript abundance.
Unique transcripts in the early and late G1-phase involved in biomineralisation
Previously, the observations of unique transcripts in conditions of increased or altered biomineralisation
of E. huxleyi suggested that the unique transcripts relate to genes, which could be involved in calcification
(Quinn et al., 2006). The gene expression analysis of transcripts in the high calcification (HC) and low
calcification (LC) conditions, when cells were in the late and early G1-phase, respectively, revealed 153
unique transcripts in the HC condition and 177 transcripts in the LC condition. The numbers of unique
transcripts in the HC and LC condition follow the general pattern of higher transcript abundance in the early
G1-phase (LC condition). However, only 18% of the unique transcripts in the late G1-phase and 68% of the
unique transcripts in the early G1-phase were found differently expressed (q < 0.05). In particular, in the late
G1-phase (high calcification condition) the percentage of significant transcripts was low.
Most of the transcripts unique in the HC conditions were not annotated and thus attributing functions to the
most abundant transcripts is lacking. However, the second most abundant unique transcript In the HC
condition is referred to Q5UP03 having a potential role in regulation of transcription. The third most
abundant unique to the HC condition transcript translated to the proton-coupled amino acid transporter 3

CHAPTER 3 - THE TRANSCRIPTOME OF EMILIANIA HUXLEYI AT HIGH AND LOW CALCIFICATION RATES
120
(UniProt ID: Q4V8B1), which could be part of processes involved in the precipitation of calcium carbonate
in E. huxleyi. Coccoliths are complex structures made generally of subsequent layers of organic matrix and
calcium carbonate. The organic matrix is important for the directed precipitation of calcium carbonate
forming the characteristic 3-D structure of the calcite scales (Marsh, 1986; Arias and Fernandez, 2008). The
intercellular location of Q4V8B1 is suggested in the endoplasmatic reticulum using Euk-mPLoc 2.0 (Chou
and Shen, 2010). Calcium carbonate and calcium binding proteins were found to be abundant in the ER and
the CV (Corstjens et al., 1998; Mackinder et al., 2010). Furthermore, single amino acids were found to
modulate the precipitation of calcium carbonate crystals in situ (Briegel et al. 2012) and amino acids were
also found stabilizing amorphous calcium carbonate (ACC) in vitro in the red claw crayfish Cherax
quadricarinatus (Bentov et al., 2010). In coccolithophores it was suggested that an ACC phase might play a
role in coccolithophore-genesis (Mackinder et al., 2010) additionally requiring transporters Mg2+ and protons
to sustain the pH and aqueous phase of ACC in the maturating CV before a directed precipitation of calcium
carbonate is mediated by an increase in pH in the coccolithosome. Hence, the proton-coupled amino acid
transporter 3 (UniProt ID: Q4V8B1) could be an important molecule under photosynthetically enhanced
calcification that in conserving the Ca2+ in coccolithosomes by ACC conformation and thereby reducing the
transport of protons from the ER, coccolithosomes, and CV into the cytosol. Four additional membrane-
associated proton-coupled amino acid transporters were found in the transcriptome, showing 224 fpkm. The
potential function in regard to ACC stabilization of these transporters in coccolithophores requires further
investigation.
In the non-calcifying state of E. huxleyi (LC condition) the abundance of unique transcripts was greater
than in the HC condition (see Table 3-10). In comparison Quinn et al. (2006) found more significantly up-
regulated genes by using micro-arrays, which can be explained by targeting ESTs that were previously
identified by Wahlund et al. (2004a). The restricted selection of target genes might have missed many
transcripts as the knowledge of the E. huxleyi genome was still at an early stage. The unique genes of the
Dark period of this study seem, as expected, to have no relevance for processes involved in calcification.
Exploration for genes involved in calcification from the graphical evaluation of significantly
different transcript abundance
The expressed transcripts were clustered according to KOG-Class annotations; their expression levels at
high and low calcification rates graphically illustrated, and thus obvious patterns of gene regulation explored.
Out of a total of 271 graphically selected transcripts fifteen genes with a putative involvement in
biomineralisation related processes were identified. Ten transcripts potentially involved in biomineralisation
were significantly overrepresented in the calcification phase (late G1-phase) and five transcripts showed
elevated frequencies in the low calcification phase (early G1-phase).

CHAPTER 3 - THE TRANSCRIPTOME OF EMILIANIA HUXLEYI AT HIGH AND LOW CALCIFICATION RATES
121
The most abundant transcript of those selected in the calcification phase (late G1-phase) was calreticulin
(UniProt ID: P15253) showing nearly nine times higher expression in the HC condition. Calreticulin binds
Ca2+ - ions and was found in other calcifying organisms such as corals (Tambutté et al., 2011) as well as E.
huxleyi (Wahlund et al., 2004b; Quinn et al., 2006; Mackinder et al., 2010). Calreticulin was reported to be
abundant in the endoplasmatic reticulum where it binds Ca2+ and buffering concentrations between 100-500
µM (Berridge, 2002) or it acts as a stress response protein (Pockley, 2003). Furthermore, calreticulin
regulates the expression of SERCA-type 2 Ca - ATP pumps (John et al., 1998). SERCA-type Ca transporters
were previously found in E. huxleyi (von Dassow et al., 2009) but the limited Ca - transport potential of the
SERCA-type Ca - ATP pump suggested to be insufficient to establish the required Ca – concentrations in the
CV alone (Mackinder et al., 2010). However, in combination with calsequestrin calreticulin may enable the
ER to modulate impulses of calcium flux (Berridge, 2002) that could initiate coccolithogenesis, if the
properties of the ER persist in the CV.
The second most abundant transcripts in the HC condition recruited to gene 431830 coding for a further
putative calcium binding protein GPA (Corstjens et al., 1998). GPA was found up-regulated in calcifying
cells (Quinn et al., 2006) and was present in calcifying 2N and non-calcifying 1N cells (Richier et al., 2009;
Mackinder et al., 2010). In this study, JGI gene ♯ 431830 was 70 fold (1029 fpkm in HC versus 14 fpkm in
LC) higher expressed in the calcification phase of E. huxleyi, supporting its direct or indirect involvement in
calcification. An elevation of GPA-expression in calcifying E. huxleyi cells in nutrient replete cultures was
previously reported (Richier et al., 2009), thus supporting the key importance of GPA in
coccolithophogenesis. Furthermore, Mackinder et al. (2010) suggested that the silk fibrion protein
similarities of GPA might make it important in the formation of amorphous calcium carbonate (ACC), as an
intermediate form in advance of calcium carbonate crystallisation. However, the existence of ACC in
coccolithophores is still debated.
Another potentially relevant process for coccolithogenesis might be membrane fusion and exocytosis, in
which syntaxin and synaptobrevin are part of the SNARE complex (Soluble NSF Attachment Protein
Receptor). Syntaxin and synaptobrevin were expressed through JGI gene ♯ 434324 and JGI gene ♯ 444996,
437571, 351006, and JGI gene ♯ 460762, respectively (compare Table 3-13). Both proteins are part of the
SNARE complex, which is involved in vesicle membrane fusion. During the calcification process it is
thought that coccoliths are formed in the CV. When the coccolith has formed the CV fuses with the cell
membrane to expose the coccoliths to the outside of the cell (Taylor, 2007). Furthermore, from the Golgi
apparatus polysaccharide and Ca2+ - rich vesicles, termed coccolithosomes, constantly supply polysaccharide
and Ca2+ to the coccolith-forming vesicles (Outka and Williams, 1971; van der Wal et al., 1983); a process
that also requires vesicle membranes to fuse.

CHAPTER 3 - THE TRANSCRIPTOME OF EMILIANIA HUXLEYI AT HIGH AND LOW CALCIFICATION RATES
122
Interestingly, significantly elevated transcript abundance of the MFS transporter homolog was also found
in the high calcification condition. MFS-type transporters are capable of transporting small solutes in
response to chemiosmotic ion gradients and are characterized as single-polypeptide secondary carriers.
However, it is not clear how MFS – transporter activity could assist the biomineralisation and what solutes
the MFS-transporters could process within the coccolithophores. In the low calcification condition, three
genes (JGI gene ♯ 354606, 447939 and 416800) were found to express the greatest number of sequences
similar to members of the Na+ / Ca2+ - K+ exchanger (NCKX) family. NCKX cation / Ca2+ - exchangers play
an important role in Ca2+ - homeostasis. Proteins of the NCKX – family were suggested to contribute
significantly to the Ca2+ transport into endomembrane precursor CV compartments (Mackinder et al., 2011).
Here however, the putative NCKX family member’s gene was expressed significantly higher in the low
calcification phase (early G1-phase), when no calcification occurred (refer to section 2, Figure 2.10).
Nevertheless, multiple genes in the E. huxleyi genome for NCKX – like proteins and their expression levels
will be discussed in more detail below to evaluate the potential activity of NCKX transporters during the
calcification phase. The calcium transporters that were expressed in non-calcifying early G1-phase cells
(compare Table 3 – 13) may still play a role in calcification during the light phase. In the early G1-phase
after cell division was completed general protein synthesis is increased (Snustad and Simmons, 2000).
Calcium transporters are most likely expressed as well to construct the functionality of organelles,
membranes and compartments to enable the establishment of Ca2+ gradients; for example between the
cytosol and the ER lumen before the onset of the Light period.
Discovering expressed biomineralisation gene using transcript abundance
An analysis of the top 1000 most abundant transcripts of the light phase demonstrated transcript
abundances ranging from 13 106 fpkm to 225 fpkm. The selection of the 1000 most frequent transcripts
coding for proteins potentially involved in calcification is presented in Appendix A Table 12. The most
abundant transcript in the light (JGI E. huxleyi scaffold 781:3342-3438) is newly described as an un-
reviewed hypothetical protein partial mRNA (NCBI XM_005771519.1; Read et al., 2013). One protein-
homologous group previously not discussed in this monograph was discovered in the 1000 most abundant
transcripts that indicates a potential role in the calcification processes. A GTP-binding protein SAR (UniProt
ID: Q01476) a subunit of the COPII vesicle coat complex showed 255 fpkm and 103 fpkm transcripts in
cells showing elevated and reduced calcification rates, respectively. Clathrin was previously identified as
another highly abundant transcript in the both conditions. Clathrin peptides were also identified to have
significantly higher relative abundance in calcifying E. huxleyi cells by the proteome analysis. Jones et al.
(2011) suggested clathrin to be important in the biomineralisation process because it occurs together with V-
type ATPase proton transporter in clathrin-coated vesicles (Forgac, 2000). Also vacuolar-type proton

CHAPTER 3 - THE TRANSCRIPTOME OF EMILIANIA HUXLEYI AT HIGH AND LOW CALCIFICATION RATES
123
pumping ATPase was identified in the coccolithophore vesicle membranes (Corstjens et al., 2001),
suggesting that these two molecules exist together in coccolith vesicles. Clathrin’s significance for vesicle-
mediated transport in the silica-precipitating diatom T. pseudonana was previously suggested from proteome
analysis (Nunn et al., 2009). Vesicle-mediated transport in coccolithophores with clathrin and/or GTP-
binding protein SAR could deliver minerals from the Golgi network to the CV via coccolithosomes. The V-
type ATPase could control the luminal pH of the coccolithosome and trigger forced alkalinisation. The
presence and location of clathrin and GTP-binding proteins using molecular staining should be investigated.
Such a study might reveal that clathrin and the COP vesicle coat complex should be placed in a more general
model for vesicle transport in marine phytoplankton if it is active in diatoms and coccolithophores alike.
Vesicle fusion assisted by the SNARE complex is another related process that was indicated by the
significant higher abundant transcripts of syntaxin and synaptobrevin, which are part of the SNARE
complex, in the light period (see Table 3-13).
Expression of genes with a previously suggested role in coccolithogenesis
in E. huxleyi
The expressions of known genes coding for vacuolar membrane proton pump ATPases (V-ATPase),
proton exchanger, Ca2+ - transport proteins, calmodulin (CaM) and Ca2+ - binding proteins, and bicarbonate
transport related protein were investigated in periods of calcification and no calcification over the cell cycle
of E. huxleyi. The general expression of these genes is higher in the early G1-phase (no calcification), with
the exception of genes coding for calmodulin (CaM) and Ca2+ - binding proteins. The genes (JGI♯ 373343,
442625, and 443126) coding for CaM (UniProt. ID: Q40302) were the highest expressed of the Ca2+ -
binding proteins. Previously, Richier et al. (2009) also found that CaM and GPA expression was elevated in
the Light period of diploid E. huxleyi RCC1217. As reported above calreticum and calnexin expression was
highly up-regulated in the calcification phase (Light period). The constant demand for calcium binding
proteins may result from the continuous construction of coccolithosomes to supply calcium to the CV. The
high abundance of transcripts of calcium binding proteins could also suggest that the molecules are instable
or are lost after the CV merges with the cell membrane and the coccolith is expelled to the outside of the cell.
Calnexin and calreticulin were assigned to the ER (Brodski and Skach, 2011), whereas no preferred location
for the calmodulin is known, as it may be found at different subcellular locations such as the cytoplasm,
organelles or plasma organelle membranes (InterPro Protein Archive). Hence, calmodulin in E. huxleyi could
also be a messenger protein for calcium transport to receiver proteins (Chou et al., 2001), such as other
calcium binding proteins. Continuous synthesis of calreticulin, calnexin, and CaM appeared to be present in
calcifying cells for the delivery of calcium or stabilization of calcium concentrations within coccolithosomes
and the CV.

CHAPTER 3 - THE TRANSCRIPTOME OF EMILIANIA HUXLEYI AT HIGH AND LOW CALCIFICATION RATES
124
The relatively under-represented transcripts of NCKX, CAX, and, calcium channels in the calcification
phase could indicate a lower significance of calcium transporter expression for the maintenance of
coccolithophogensis. In fact the low expression of NCKX, CAX, and calcium channels might also indicate
that the calcium transporters are more stable within the membrane of the ER and that there is a transverse
flow of calcium in the ER from areas with high abundance of NCKX, CAX, and calcium channels to areas of
coccolithosome-formation. Only the transporters that are lost from the ER by coccolithosome-formation
need to be resynthesized. This could explain why expression levels of NCKX, CAX, and calcium channels
were lower in the calcification period than in the low calcification period.
The control of the pH is vital for calcium carbonate precipitation and important for coccolith production.
Hence, proton levels need to be controlled by active proton pumping to establish low proton concentrations
inside the CV. Previously suggested proton pumps in E. huxleyi include Ca2+ -stimulated vacuolar V-type-
ATPase and P-type ATPase (inorganic pyrophosphate driven H+ pumps) (Corstjens et al., 2001). Only one
Vacuolar H+-pyrophosphatase (P21616) showed higher expression in the Light period. Nevertheless,
transcripts of V-type ATPase and P-type ATPase were also present in the calcification phase but at roughly
½ to 1/3 of the densities as in the Dark period, but still reaching frequencies of approximately 1000 and 130
fpkm per gene. The observed expression patterns suggest that V-type proton ATPase and P-type proton
ATPase are mainly translated during the Dark period and maybe at a very early stage of the Light period.
However, expression levels for V-type H+ ATPase and P-type H+ ATPase are also considerable in the
calcification period. Vacuolar type proton ATPases were suggested to be pivotal for proton pumping in
coccolithophores and were located at the coccolith producing membrane (Corstjens et al., 2001). Mackinder
et al. (2010) discussed the possibility of a unique pumping direction of V-type proton ATPases and V-
PPases, in which case proton pumping would occur from the organelle (CV) into the cytosol. Potentially, the
considerable expression of V-type H+ ATPase and P-type H+ ATPase during the Light period is required to
replace molecules that are lost during coccolithophogenesis, whereas the higher expression of V-type
ATPases and P-type ATPases in the Dark period implies that the molecules are required at many locations of
the cell for transporting protons and are incorporated into cell endosomal membranes, such as those of the
ER. Further proton exchangers were also more abundant in the Dark period. The significantly expressed
Na+/H+ antiporters (UniProt ID: Q39WP5 and Q30XM9) are both considered integral components of
membranes and are involved in pH regulation (Mackinder et al., 2010). However, both genes were
significantly higher expressed in the dark, showing only very little transcripts or none in the Light period
(see Appendix A Table 6 for details). Only the proton transporting protein H+/hexose cotransporter 3
(UniProt ID: Q39525) was more highly expressed in the calcification phase and is specifically involved in
co-transporting sugar across the plasmalemma (Stadler et al., 1995). H+/hexose cotransporter 3 was not
suggested to play a role in calcium carbonate precipitation in coccolithophores.

CHAPTER 3 - THE TRANSCRIPTOME OF EMILIANIA HUXLEYI AT HIGH AND LOW CALCIFICATION RATES
125
Interestingly, the voltage gated proton channel (UniProt ID: E2IJ90) that was suggested to play an
important role in pH homeostasis in calcifying cells of Coccolithus pelagicus ssp braarudii, as it mediates
rapid H+ efflux (Taylor et al., 2011), was not over expressed in calcifying cells of Emiliania huxleyi in the
Light period.
The intracellular calcification of coccolithophores requires constant fluxes of inorganic carbon and calcium
into the cell and the CV. A variety of potential Ca2+ -transporters, such as CAX, NCKX, NCX, and SERCA-
type Ca2+ -ATPases have been identified as important candidates to raise Ca2+ concentrations in the CV or its
precursors (Mackinder et al., 2010). The transcriptome analysis did ascertain the significantly over
expression of SERCA type calcium-transporting ATPase 4 (JGI gene ♯: 251608, UniProt ID: Q9XES1) in
the calcifying period and by JGI gene ♯: 463095 in the Dark period. But Q9XES1 was also expressed by JGI
gene ♯: 429294 in the HC condition, leading to almost balanced levels of Q9XES1 expression in the HC and
LC condition (compare Appendix A, Table 7). The SERCA – type calcium-transporting ATPase was found
to have limited calcium transport capacities to provide all the necessary calcium transport. Therefore,
NCKX/NCX, Ca2+/H+ exchangers, and Ca2+/Na+ exchangers were suggested to provide additional calcium
flux (Mackinder et al., 2010). Transcripts of greater abundance than 25 fpkm in the light were given by a
NCKX1 (JGI gene ♯: 447939), a probable sodium/potassium/calcium exchanger 1 of the NCKX1-type (JGI
gene ♯: 354606), CAX5 (JGI gene ♯: 416800 and 415715), and a transient receptor potential cation channel
subfamily M member (2 LTrpC-2, JGI gene ♯: 460292), which could help to recover the calcium fluxes
across the ER - membrane and potentially across the coccolithosome membrane.
The primary source of carbonate for the formation of calcium carbonate is bicarbonate (Nimer et al., 1997;
Paasche, 2001; Bach et al., 2012). In this study, the bulk of carbonic anhydrase was expressed in the early
G1-phase. Under low DIC conditions carbonic anhydrase was found more highly expressed (Mackinder et
al., 2011; Bach et al., 2012). However, the DIC characteristics of the cultures (concentrations of HCO3-,
CO32-, and CO2; data not shown) do not suggest that carbonic anhydrase expression was stimulated. Hence,
the CO2 levels in the cultures were sufficient for efficient photosynthesis (Ross et al., 2003; Bach et al.,
2012). Richier et al. (2009) reported elevated expression of E. huxleyi carbonic anhydrase in the light in K2
medium. The location of CA is assumed in cellular organelles and the plasmalemma (Kitao et al., 2008; Soto
et al, 2006). Recent data suggested an absence of cytosolic CA in E. huxleyi (Suffrian et al., 2012; Bach et
al., 2012). Under low CO2 concentration Bach et al. (2012) observed an increased expression of an anion
exchanger like protein 1 (AEL1) of the solute carrier 4 family (SLC4) with a suggested location at the
plasma membrane and induction at low CO2 concentrations.

CHAPTER 3 - THE TRANSCRIPTOME OF EMILIANIA HUXLEYI AT HIGH AND LOW CALCIFICATION RATES
126
Transcripts of AE1 like proteins (UniProt ID: Q9HGM6) were more abundant in the calcification period
and JGI gene ♯ 466232 and ♯ 314659 significantly more highly expressed, supporting the importance of the
AEL1 in coccolithophore calcification and photosynthesis. However, another AE1 related protein (UniProt
ID: P23347) was significantly higher expressed in the LC condition.
Biomineralisation gene expression in the G1 cell-cycle phase of E. huxleyi
The differences in the gene expression profiles between the high and low calcification conditions of the
G1-phase E. huxleyi cells became apparent at many levels of the analysis. The observed patterns of gene
expression presented here, however, were not related to sampling at different cell-cycle phases (G1, S, or
G2+M) but exclusively related to different calcification rates in dark and photosynthetically enhanced phases
of the G1-phase. Thus, the results presented here, are novel insights into the synthesis of compartments and
biological pathways in E. huxleyi and constitute that a status quo at the onset of the photosynthesis phase in a
diurnal cycle is reached, which facilitates immediately increasing calcification rates in the light phase.
Furthermore, the observed patterns show that a large proportion of the molecular machinery driving
calcification is bound to the general cell structure or cell compartments. Significantly higher gene expression
and transcript diversity was observed in non-calcifying early G1-phase E. huxleyi cells (see section 3.3.3)
compared to highly calcifying late G1-phase cells. The null hypothesis that there are no differences in gene
expression between non-calcifying early G1-phase cells and calcifying late G1-phase cell related to genes
involved in calcification processes in respect to transcript abundance and diversity, must be rejected. The
expression of many genes previously related to processes involved in calcification was found much higher in
the low calcifying early G1-phase compared to the highly calcifying late G1-phase cells. For example, all
investigated ion-transporter transcript clusters showed more transcripts in the Dark period. However, this
observation was sometimes offset by the higher expression of genes in the late G1-phase relating to the same
protein (e.g. SERCA type calcium-transporting ATPase 4, UniProt ID: Q9XES1), which could indicate
differences in gene expression triggering and control as well as that the transporter genes, which were highly
expressed in the late G1-phase period, are involved in coccolithophogenesis. On the other, this pattern may
also reflect the re-construction of molecular machinery that was separated during cytokinesis. Golgi stacks,
endoplasmic reticulum, ribosomes, mitochondria and chloroplasts are known to be equally partitioned
between daughter cells during cytokinesis (Nebenfuhr et al., 2000; Puhka et al., 2007). Following cytokinesis
the ER and Golgi membranes are synthesized, as the ribosomal-ER-Golgi cell physiological network is
pivotal for protein translation and posttranslational protein modifications. These networks ensure that at
dawn efficient photosynthetic carbon assimilation can render cell growth and accumulation of energy
reserves for passing cell division check points of the next cell division cycle (Green et al., 2002; Dodd et al.,
2005; Winjen et al., 2006b; Zachleder et al., 2016). The synchronisation gene expression and the

CHAPTER 3 - THE TRANSCRIPTOME OF EMILIANIA HUXLEYI AT HIGH AND LOW CALCIFICATION RATES
127
environmental light - dark rhythm improves the physiological performance of photosynthetic organisms
(Green et al., 2002; Dodd et al., 2005; Winjen et al., 2006b). Hence, serving the need for maximized cell
growth and ecological prevailing. It is an energetic advantage especially for photosynthetic cells to establish
the physiological networks before the next illumination period. Because calcification and photosynthesis in
coccolithophores is tightly coupled (Balch et al., 1992), the genes relating to the physiological networks for
biomineralisation, Golgi apparatus and ER for example, and photosynthesis were all expressed in the early
G1-phase. Therefore, the timing of the sampling can explain many biases of the expression levels observed
for molecules with known function in coccolith calcification. The model that gene expression of transporter
proteins potentially involved in coccolith production (e.g. NCKX, VCX) was increased in the early G1-phase
to complement the reduced cytoplasmic compartments of ER and Golgi apparatus after cytokinesis is
supported by elevated levels of gene expression of proteins with known involvement in either ribosomes,
mitochondria, or chloroplasts in the early G1-phase. Significantly higher expressed proteins in the early G1-
phase showed ratios of 35:39, 38:46, and 121:147 of significantly expressed in the dark versus total
significantly expressed protein for ribosomal, mitochondrial, and chloroplastic proteins, respectively. The
expression of chloroplastic, ribosomal and mitochondrial genes was found to be reduced in the G1-phase for
Cyanidioschyzon merolae. Periodicity of gene expression directly related to cell cycle phases or plastid gene
expression in the unicellular red alga Cyanidioschyzon merolae. 158 genes were only induced during the S or
G2/M-phase, of which 93 were known and contained genes related to mitochondrial division (Fujiwara et a.,
2009). Overall the observed gene expression patterns are likely following an endogenous clock set by
periodic environmental cues such as the diurnal cycle of light and dark in E. huxleyi cultures (Wijnen and
Young, 2006; McClung, 2014).
Considerations for Emiliania huxleyi calcification models
Genes that were previously reported to be involved in E. huxleyi calcification process are not necessarily
found at higher expression rates in the photosynthesizing late G1-phase cell. In fact, the transcriptome
patterns suggest that suggest that more and less expendable proteins interact during coccolithogenesis.
Nevertheless, null-hypothesis that the general expression of genes related to calcification is not enhanced in
the high calcification period when calcification rates were found to be at a maximum, can only be partly
rejected. Future models of biomineralisation for E. huxleyi should distinguish between proteins that are more
decisive for coccolithogenesis and such that are very relevant for general cell functioning but partly
expended in the process of coccolith production. The level at which proteins are conserved is partly due to
the membrane bound location of proteins involved in ion-transport, such as NCKX transporters, V-type
Ca2+/H+ antiporter, and V-type ATPases. However, in the scenario where coccolithosomes are expelled from
the membrane of the Golgi body some of the transporters are lost in the process; hence requiring expression
in the calcification phase of E. huxleyi. The expression of proteins with a high disposal rate such as calcium

CHAPTER 3 - THE TRANSCRIPTOME OF EMILIANIA HUXLEYI AT HIGH AND LOW CALCIFICATION RATES
128
binding proteins calmodulin, calreticulin, and calnexin was concentrated in the highly calcifying late G1-
phase. These expression patterns confirmed the importance of continuous calcium binding protein synthesis
in the calcification period to maintain coccolithophogenesis. The highly acidic and calcium binding
macromolecule, containing high levels of glutamic acid, proline and alanine, (GPA) was expressed 70 fold
higher in the sampled calcification period. Furthermore, the observations of genes uniquely expressed in the
HC and LC condition has suggested new genes with potential roles in the stabilisation of amorphous calcium
carbonate and processes of membrane fusion. However, the presence of ACC has yet not been confirmed and
the proton-coupled amino acid transporter 3 (UniProt ID: Q4V8B1) gene was not showing as high rates of
expression as the ion transporter genes in early G1-phase cells. The SNARE complex that combines the
revealed syntaxin and synaptobrevin proteins could be relevant for the fusion of vesicle membranes in the
growth of the CV. The functions and locations of the proton-coupled amino acid transporter 3 and the
SNARE related proteins within E. huxleyi should be further investigated to reveal or not to reveal their
involvement in processes related to calcification, ACC stabilisation, and vesicle membrane fusion.
Outlook
The results presented here are of high relevance for the design of future experiments and confirm the
great importance of Ca2+ binding proteins in coccolithophogenesis. The expression patterns clearly suggest
that a large proportion of biomineralisation genes are expressed in the early G1-phase of the E. huxleyi cell
cycle; in particular those genes transcribing proteins that were required to complement the reduced size of
cell compartment as a result of cytokinesis, but which also play an important role in the process of coccolith
production. More conserved proteins involved in biomineralisation of E. huxleyi, which were found to be
highly expressed in the non-coccolith producing early G1-phase, may provide the transport rates required to
create the high calcium concentrations in coccolithosomes. The ion transport proteins expressed in the
calcification phase are mainly required to maintain the ion concentrations in the coccolithosomes and CV
and replace proteins that were lost in the process of coccolithogenesis.

CHAPTER 3 - THE TRANSCRIPTOME OF EMILIANIA HUXLEYI AT HIGH AND LOW CALCIFICATION RATES
129

CHAPTER 3 - THE TRANSCRIPTOME OF EMILIANIA HUXLEYI AT HIGH AND LOW CALCIFICATION RATES
130

131
Chapter 4. The proteome of Emiliania huxleyi at
high and low calcification rates “Cellular reality is more elaborate than the dreams of even the nucleus itself.”
(Anderson and Anderson 1998)
4.1. Introduction
Studying the proteomes of marine organisms has developed into a new and ambitious field
of marine molecular biology that aims to provide deeper understanding of the physiological
functioning of species in the marine realm (López, 2007). At the organism as well as the
population level new insights gained by studying the proteome and therefore the drivers for the
organism’s physiological activity have increased our understanding of key ecological processes.
For example, a variety of quantitative expression proteomics studies have been conducted on
different marine taxa, such as on the bivalve Pinctada margaritifera (Joubert et al., 2010) –
focusing on the expression of shell matrix proteins using EST analysis of cells of the calcifying
mantle and verifying shell matrix protein presence using proteome analysis of the shell,
microalga such as the diatom Thalassiosira pseudonana - investigating the general physiology
and acclimation in response to nutrient availability (Dyhrman et al., 2012), on the bivalve
Mytilus galloprovincialis - investigating proteomic responses to different temperature regimes
(Tomanek & Zuzow, 2010), and Emiliania huxleyi - investigating changes due to ocean
acidification and light intensity (Jones et al., 2013; McKew et al., 2013). Meta-population
studies applying proteomics identified how the utilization of nutrients and energetic flows shift
over an environmental gradient of macronutrients in the South Atlantic. A significant fraction of
the microbes showed a high presence of TonB-dependent transporters, which are proteins able
to utilize light for generating a proton motive force that increases the efficiency of ATP
synthases and ATP independent nutrient uptake (Morris et al., 2010).
The importance of biomineralisation at the organismal level for the control of optimal
physiological conditions and on an ecosystem scale for the transport of inorganic carbon was
elaborated in Chapter 1. Proteomic studies have aimed to reveal the proteins involved in
constructing the underlying molecular and cellular mechanisms involved in calcification
(Joubert et al., 2010; Tomanek et al., 2011; Jones et al., 2013). In the coral Acropora millepora
Ramos-Silva et al. (2013) confirmed the importance of skeletal organic matrix proteins
(SOMPs) and inferred on the evolutionary origin of the transcoding SOMP genes. In close
relationship with polysaccharides, SOMPs and amino acids form the organic matrix directing
and controlling precipitation of calcium carbonate in the sub-calicoblastic space (Tambutte ́ et

CHAPTER 4 – THE PROTEOME OF EMILIANIA HUXLEYI AT HIGH AND LOW CALCIFICATION RATES
132
al., 2011; Venn et al., 2011; Ramos-Silva et al., 2013). A total of 36 SOMPs were identified in a study of the
proteome of Acropora millepora. Interestingly the evolutionary origin of many of the identified SOMPs
pointed towards non-calcifying cnidarians and only two homologs were restricted to Scleractinia (Ramos-
Silva et al., 2013).
The number of next generation proteomics studies on coccolithophores is still limited. Jones et al. (2011)
have published pioneering work on the proteome of E. huxleyi , identifying a set of 99 proteins in the strains
NZEH (PLY♯ M219), CCMP1516, and CCMP371. Some of the identified proteins, such as carbonic
anhydrase, vacuolar ATPase units, and clathrin were discussed to be involved in E. huxleyi calcification
processes (Jones et al., 2011). The importance of V-type ATPases in the establishment of proton gradients and
high pH values in the CV (coccolith vesicle) promoting calcium carbonate precipitation was supported
(Corstjens et al., 2001; Mackinder et al., 2010). Also, clathrin - coated vesicle membranes contain V- ATPases
in eukaryote cells (Kirchhausen, 2000), was found by Jones et al., (2011). Hence, Jones et al. (2011)
hypothesized that clathrin may constitute the membranes of the CV or ER in coccolithophores. Clathrin -
coated vesicles were found to provide membrane trafficking pathways within Golgi networks (Lewin and
Mellman, 1998; Kirchhausen, 2000).
More recently a quantitative E. huxleyi proteome study explored differences in the proteomes at ambient and
elevated CO2 concentrations (Jones et al., 2013). The study yielded 115 homologous protein groups of these,
46 could be explored in respect to their differential expression in the experimental treatments (Jones et al.,
2013). However, no proteins known or with a suggested role in coccolithogenesis were significantly affected
by ocean acidification. Only the histones H2A, H3 and H4 and a chloroplastic 30S ribosomal protein S7 were
down-regulated under elevated CO2 concentrations. But trends of membrane related processes, e.g. an up-
regulation of an acyl-carrier protein, could indicate increased lipid production and increased vesicle membrane
synthesis under elevated CO2. Furthermore, an up-regulation of vacuolar membrane bound V – type proton
ATPases could indicate stronger regulation of cellular and vesicle pH in an ocean acidification scenario. The
proteome studies on Emiliania huxleyi have been proven as very challenging due to protein extract quality
issues, possibly resulting from high levels of lipid, polysaccharide or salt contamination in the protein extracts
(Jones et al., 2009; Jones et al., 2013). Furthermore, the genomic data on coccolithophores has only recently
been improved by the publication of the pan genome of Emiliania huxleyi (Read et al., 2013). The protein
identification yield for Emiliania huxleyi was improved to 500 highly abundant and confident proteins from a
total of 1835 proteins in the study of McKew et al., 2013. The protein abundance in different light incubations
was investigated and showed that proteins of the photosystem I, photosystem II, and proteins involved in
biosynthesis and oxidative stresses were more abundant in the high light treatment (McKew et al., 2013).
Calcification rates also increased by two fold in the high light treatment (1000 µmol photons m-2 s-1). A
detailed study of the proteome harvested from cells showing higher calcification rates indicated that V-type

CHAPTER 4 – THE PROTEOME OF EMILIANIA HUXLEYI AT HIGH AND LOW CALCIFICATION RATES
133
proton ATPases and the calcium-binding protein calreticulin were more abundant (supplementary data from
McKew et al., 2013). The study by McKew and colleagues (2013) greatly increased recovery yields of
proteins predicted by the E. huxleyi 1516 ‘Filtered (“best”) Models’ gene set (http://genome.jgi-
psf.org/Emihu1/Emihu1.home.html; Read et al., 2013). However, the number of recovered proteins from the
E. huxleyi proteomes out of a 39126 predicted by gene models (Jones et al., 2013; McKew et al., 2013, Read
et al., 2013) is still relatively small in comparison to recovery rates in Saccharomyces cerevisiae where 4300
confirmed proteins were recovered from a genome of 5,770 genes (King et al., 2006).
In this study the proteomes from E. huxleyi cells from the late G1-phase (high calcification) and early G1-
phase (low calcification) (as described in Chapter 3) are compared using a quantitative shotgun proteomic
approach similar to Jones et al. (2011), to identify proteins of the calcification period that might be involved in
the process of biomineralisation in coccolithophores. The consensus of recovered proteins and observed
transcripts is evaluated.

CHAPTER 4 – THE PROTEOME OF EMILIANIA HUXLEYI AT HIGH AND LOW CALCIFICATION RATES
134
4.1.1. Aims and Objectives
The proteome directly reflects the given physiological state of the cells and in the case of Emiliania huxleyi
promises to show molecules utilized in calcification processes. By investigating differences in the proteomes
of cells harvested from cultures at time points where low and high rates of calcification were previously
confirmed (see Chapter 2), proteins involved in the calcification processes were identified. Therefore, proteins
were extracted from cells harvested in the late and early G1-phase (light and dark incubation period) and a
quantitative comparison of the proteomes of E. huxleyi by means of multidimensional liquid chromatography
tandem mass spectrometry (LC/LC-MS/MS) and iTRAQ labelling was conducted.
The aims of this study were:
• to assess the proteomes of iso-genetic cultures of Emiliania huxleyi at negligible (early G1-phase) and
high rates of calcification (late G1-phase) of the cell cycle,
• to compare the proteomes at negligible and high calcification rates for differences in protein
abundance,
• to elucidate proteins potentially involved in biomineralisation, and
• to evaluate the proteome with the transcriptome (see Chapter 3 ) for matching gene expression
patterns.
!
4.1.2. Null hypothesis
The working hypothesises for these studies are:
• There are no differences in proteomes of the highly calcifying and low calcifying E. huxleyi cells;
• Proteins potentially involved in the process of calcification are not expressed in the calcification
period (late G1-phase).

CHAPTER 4 – THE PROTEOME OF EMILIANIA HUXLEYI AT HIGH AND LOW CALCIFICATION RATES
135
4.2. Material and Method
4.2.1. Experimental Design
From the same exponentially growing cultures harvested as described in Chapter 3 proteins were extracted
and subjected to proteome analysis. Six batches of 16 L cultures of E. huxleyi PLY♯ M217 were grown with
starting cell densities of 5000 cell mL-1. Cell harvesting was conducted when cell densities exceeded 50,000 –
100,000 cells mL-1. Cells were harvested 9 hours into the light period and 10 hours into the dark period at 6:00
pm and 7:00 am using inline filtration (see Figure 3.1, Chapter 3). Samples for nutrient analysis, cell count,
cell volume, DIC, PIC, and POC were taken immediately before cell harvesting. The assessed biogeochemical
parameters were determined following the described methods in Chapter 3. Cells were collected from a 147
mm filter with sterile filtered seawater and concentrated by centrifugation for 5 min at 46000 g (Rotanta 460R,
Hettich Zentrifugen, Germany).
4.2.2. Extraction of proteins
Around 50% of the frozen cell pellet from 4.2.1 were transferred to a 50mL Falcon® tubes and ten
millilitres of 100 mM triethylammonium bicarbonate (TEAB, Sigma Aldrich, Poole, UK), 0.1% sodium
dodecyl sulphate (SDS, Sigma-Aldrich, WGK Germany) buffer were added. Probe-sonication on ice was
conducted to resuspend and break the cells by shearing forces using a VC300 Vibracell sonicator (Sonics and
Materials, USA, 20 kHz frequency, 10% duty cycle). Twenty-five, ten seconds bursts on output 3, with each
burst separated by a 30 second pause for cooling were most efficient to destroy the cells and solubilize the
proteins. The cell debris was separated from the protein extract by centrifugation (46000 g, 30min, 4°C,
Rotana 460R). The supernatant was transferred into a new 50mL Falcon tube. Four volumes of 100% Acetone
(HPLC-grade, Thermo-Fisher, Loughborough, UK) cooled to -20 °C were added and gently mixed with the
TEAB-buffer. The proteins were allowed 36 hours at -20 °C to precipitate. The precipitated proteins were
collected by centrifugation (20000 g, 30min, 4 °C). The acetone-supernatant was discarded and the protein
pellet resuspended in cold (-20°C) 80% acetone for further purification steps. After a resting time of around 5
minutes at -20 °C the protein was pelleted by centrifugation (20000 g, 30min, 4 °C). This washing procedure
with -20 °C 80% acetone was conducted twice. The final protein pellet was dried on ice in a laminar flow
environment and the protein sample re-dissolved in TEAB-buffer (100mM Triethylammonium bicarbonate
buffer 1.0 M, pH 8.5±0.1, 0.1% (w/v) SDS). The protein samples were stored at -20 °C until proteome
analysis.

CHAPTER 4 – THE PROTEOME OF EMILIANIA HUXLEYI AT HIGH AND LOW CALCIFICATION RATES
136
4.2.3. Protein quality assessment and troubleshooting
The thawed protein samples from 4.2.2 were resuspended by repeated cycles of vortexing and sonication at
37 °C to increase the solubility of proteins. The protein solution was centrifuged at 10000 g for 10 minutes to
pellet insoluble molecules. One-dimensional gradient SDS-polyacrylamide gel electrophoresis was performed
to assess protein quality. For SDS gel electrophoresis the samples were prepared by adding 30 µL of the
sample supernatant, 10 µL 4 x LDS-loading buffer (Invitrogen, Paisley, UK) and 2 µL of 0.5 M DTT (threo-
1,4-Dimercapto-2,3-butanediol, Sigma-Aldirch, UK). Samples were heated for 10 min at 75°C for protein
denaturation before loading the gel pockets. The separation of proteins into fractions was performed on a 4-
12% gradient SDS-polyacrylamide gel (NuPAGE®, dimensions: 8.0 cm x 8.0 cm, Invitrogen, Paisley, UK) in
NuPAGE® MOPS SDS running buffer (Thermo Fisher Scientific, UK) at 200 V for 55 min. Proteins were
stained with Colloidal Coomassie Brilliant Blue 0.2% (w/v) dye (Colloidal CBB, Sigma-Aldrich, Dorset, UK)
incubation for 30 minutes. Subsequently, de-staining using 30% methanol and 2.5% glacial acetic acid was
conducted over night. The de-stained gels were imaged on a VersaDoc imaging system and the PDQuest
software (Bio- Rad, Hercules, CA, USA).
Figure 4-1:Example of results of 1D-SDS NuPage® gels illustrating the encountered issue with smearing. (1) Protein weight ladder, (2) sample after additional ultra-sonication and acetone washing and (3) sample showing smearing of protein material.

CHAPTER 4 – THE PROTEOME OF EMILIANIA HUXLEYI AT HIGH AND LOW CALCIFICATION RATES
137
Early 1D-SDS gels showed smearing and low levels of protein fractioning (Figure 4-1). Lipids, DNA,
polysaccharides, and salts were observed to alter the quality of protein samples. Nagai et al. (2008) suggested
that viscous polysaccharides cause smearing on SDS-PAGE gels produced from protein extracts of kelp
(Ecklonia kurome). Furthermore, small amounts of lipids may deform the protein-fraction-bands on a gel
(Pokhariyal et al., 2014). Therefore, the cleaning steps were varied and tested to reduce the concentration of
contaminants that caused smearing. The attempts to improve protein quality included desalting columns,
additional washes with acetone after four short one-second bursts from the sonicator to resuspend the pellet,
and stronger as well as longer centrifugation at 10000g. The additional acetone washes in combination with re-
suspending the protein pellets with short sonication bursts showed the best fractionation of proteins (compare
Figure 4-1).
4.2.4. Protein concentrations assessment
Protein sample concentrations in 100 mM TEAB-buffer were assessed prior to the LC/LC-MS/MS runs
applying a bicinchoninic acid (BCA) protein assay (Pierce Biotechnology, Rockford, USA). The working
reagent was prepared for the 96-well microplate procedure following the manufacturer’s instructions.
Standards of BSA concentrations from 0.1 mg mL-1 to 1.0 mg mL-1 and sample aliquots were prepared using
20 µL of samples or standards in 200 µL of working reagent. Protein–stain was allowed to develop for 30 min
in the dark at room temperature. Plates were read at 570 nm using a Dynex plate reader and analysed with the
Revelation 3.2 software (Dynex Technologies Limited, Worthing, UK). For the iTRAQ® labelling and
subsequent tandem mass spectrometry quantification and identification of proteins the sample concentrations
were adjusted to be equal.
4.2.5. iTRAQ®– labelling
The iTRAQ® technique describes a non-gel proteomic approach simultaneously identifying and measuring
abundance levels of proteins in a mixture containing peptides from up to 8 different sample extracts (Applied
Biosystems, Foster City, U.S.A). The key is to assign the peptides to the different samples within the protein
cocktail by attaching probes – ‘tags’ - that differ in isotope composition to the N-terminus of the amino acids.
The isotopic signature of the iTRAQ® tags (reporter ions) are detected by the mass spectrometer without
interacting chemically or technically with the detection of the amino acids. By associating the relative
quantities of the reporter ions with the identified proteins the protein abundance levels in the different samples
in the mixture can be compared (Ross et al. 2004; Choe et al., 2007).
The procedure was kindly conducted by Dr. Paul Skipp, Institute for Life Sciences, and is briefly described
here (for details see Skipp et al., 2005; Jones et al., 2013). The manufacturer’s instructions (Applied
Biosystems, Foster City, U.S.A.) were followed to perform the iTRAQ®-labeling of samples. Accordingly,

CHAPTER 4 – THE PROTEOME OF EMILIANIA HUXLEYI AT HIGH AND LOW CALCIFICATION RATES
138
each sample containing around 100 µg protein was reduced, cysteine blocked, digested with 10 µL trypsin at
37 °C overnight, vacuum-dried for 1 hour at 45 °C, to which 30 µL iTRAQ® solution buffer were added. The
iTRAQ® labels 113 to 118 for Light and Dark period samples (three replicate samples per condition) were
attached to the N-terminus of peptides in isopropanol at pH above 7.5 within 2 hours of incubation. The
labelled samples were stored at -20 °C prior to liquid chromatography (LC) and tandem mass spectrometry
analysis.
4.2.6. Liquid chromatography mass spectrometric analysis of peptides
Dr. Paul Skipp at the Institute for Life Sciences (University of Southampton, UK) also conducted the
separation of peptides by liquid chromatography and identification by mass spectrometry as previously
described (Skipp et al., 2005). Hence, in the first step, the digested and iTRAQ® - labeled peptides were
injected onto a nano-capillary two dimensional reverse phase (2D-RP) LC system, using a Waters C18 RP, 3
µm, 100 Å (150 mm x 75 µm, internal diameter) column for separation of peptides based on their
hydrophobicity (Waters, Elstree, UK). The LC column reduced the complexity of the peptide-mixture and
before the separated peptides were ionized in an in-line Matrix-Assisted Laser Desorption/Ionization
(MALDI) phase of the hot plume of an ablated gas plasma. The ionized molecules were accelerated to the
quadrupole time-of flight tandem mass spectrometer (Q-Tof Global Ultima, Waters, Milford, USA).
According to the mass-to-charge-ratio (m/z) of the eluting peptide the collision energy was acquired during a
survey scan at m/z 300 to 1700 switching the criteria for MS to MS/MS, the ion intensity and charge state. The spectra of the peptides were compared to fragmentation data of the peptides in the database to identify the
proteins. During MALDI the iTRAQ®-tag is also separated from the peptide releasing a unique signal in the
mass spectrometer. A relative quantification of the number of peptides or their fragments of one sample (tag)
is achieved by comparing the number of reporter ions (tags) released in coherence with the peptide being
reported in other samples, for example between the peptide ratios of the same peptide labelled with the tags
113 and 114.
4.2.7. In silico identification of proteins
The MS/MS generated spectra of the peptides or fragments showed peaks that were compared against a
library of known mass fingerprints of amino acids and peptides within the MASCOT Distiller Software v.2.2.1
(Matrix Science, London, UK), applying a probabilistic scoring algorithm for statistical confirmation of
matches between observed and projected peptide fragments (Koenig et al., 2008). The peptide mass
fingerprinting is based on the assumption that a protein will produce a specific set of peptides when it is
digested with a site-specific protease such as trypsin, which represent a virtual set of masses to compare with

CHAPTER 4 – THE PROTEOME OF EMILIANIA HUXLEYI AT HIGH AND LOW CALCIFICATION RATES
139
the MS results. The matching of the experimental protein mass to the predicted masses of proteins is
conducted within the MASCOT Distiller Software referring to a large computer database containing predicted
proteins from various reference genomes. The MASCOT software compared the experimental spectra of
peptides against the predicted proteins of the Emiliania huxleyi CCMP1516 draft genome produced by the US
Department of Energy Joint Genome Institute (JGI; http://www.jgi.doe.gov, downloaded 22.2.2012, file:
“Emihu1_all_proteins.fasta”). The reference sequences consisted of 115,995 non-redundant sequences from
all models generated by the JGI annotation pipeline. Furthermore, the experimental scans were also searched
against a taxonomically restricted database, which contained 196,774 proteins (93,921,998 residues)
constructed from all Alveolata, Cryptophyta, Haptophyceae, Rhodophyta, and Stramenopile sequences
available at UniProtKB Release 15.1 (UniProt 2008). The mass tolerance for all searches was set at 150 ppm
and fragment mass tolerance at 0.25 Da. Additional settings were carbamidomethylation set to fixed
modification, oxidation of methionine to variable modification, and the maximum missing cleavage was set to
one. Protein matches were only accepted if supported by 2 or more peptides and under the significance
threshold of p < 0.05. Non - E. huxleyi proteins from the taxonomically restricted database (TAXDB) were
defined and removed as redundant if supported by less than 2 peptides. Protein matches to TAXDB were
validated using homology in a phylogenetic context by HAQESAC (Homologue Alignment Quality,
Establishment of Subfamilies and Ancestor Construction) (Edwards et al., 2007). The automated analysis
pipeline HAQESAC generated multiple sequence alignments and phylogenetic trees of protein families.
Proteins were searched using BLAST (e < 10-4) against the previously created taxonomically restricted
protein database (TAXDB) and the ≤ 50 closest homologues were aligned with MAFFT (Katoh and Toh,
2008). The homologues were used to construct a phylogenetic tree with 1000 bootstraps using FastTree (Price
et al., 2009). The findings of the protein identification by phylogenetic information were validated manually to
remove false positives and prefer proteins taxonomically closer to E. huxleyi. The database constructing and
bioinformatic processing was conducted by Dr. Richard Edwards (former Institute for Life Sciences,
University of Southampton, UK)
4.2.8. Data processing
Redundancy and duplicate matches of proteins to the E. huxleyi JGI reference genome data and the
TAXDB were manually removed by similarities of protein identifier, sequence length and quantitative iTRAQ
data. The redundancy filtered results of the MASCOT identification and iTRAQ relative protein quantification
for matches against the Emiliania huxleyi genome and the TAXDB were combined and annotated. Functional
annotations, such as gene ontology. (GO) biological process, molecular function, cellular component, and GO
IDs were retrieved from the UniProtKB ID mapping service (http://www.uniprot.org; Huntley et al., 2015).
KOG annotations were anticipated to allow functional comparison to the transcriptome. KOG annotations
from E. huxleyi JGI reference genome annotations yielded insufficient results for any functional conclusions.

CHAPTER 4 – THE PROTEOME OF EMILIANIA HUXLEYI AT HIGH AND LOW CALCIFICATION RATES
140
Only 5 out of 403 total proteins had KOG annotations provided by JGI. Hence, GO annotations were the
main feature to compare functional properties in the Light and Dark condition. For the functional annotation
GO biological process only the first GO term was used to summarize the results. The entire proteome was also
searched for proteins with a potential role in calcification based on protein description and GO annotations.
The significantly expressed proteins in the Light and Dark condition were filtered and evaluated for dominant
physiological processes. Furthermore, to find consensus of the proteomics and transcriptomics data (Chapter
3) the MASCOT proteins identified by the JGI E. huxleyi reference genome were investigated for consensus
hits using the JGI gene IDs of 34403 transcripts (Chapter 3) and the UniProt IDs of transcripts using R.
4.3. Results
The experimental design was the same as described in Chapter 3 of this monograph. The same
physiological parameters such as, PIC, POC, PON, growth rates, and nutrient consumption were relevant for
the evaluation of the cell cultures. In the following section, only additional proteome related results of E.
huxleyi in the highly calcifying late G1-phase and low calcifying early G1-phase, the light and dark incubation
period, respectively, are presented. The results for cell physiological parameters, calcification, nutrient
consumption, dissolved inorganic carbon, and irradiance levels are presented in subchapter 3.3.
4.3.1. Protein yield and integrity of protein extract
The extraction of proteins using TEAB-buffer yielded protein concentrations of 2.6 to 4.2 mg ml-1 (see Table
4-1) sufficient for iTRAQ labelling and MS/MS based peptide sequence assessment.
Table 4-1: Protein concentrations in extracts from the collected cell pellets from experimental cultures at the late G1-phase (highly calcifying cell, HC) and early G1-phase (low calcifying cells, LC)
Protein conc.
in mg ml-1 Culture HC-1 3.1 HC-2 3.3 HC-3 3.4 LC-1 2.6 LC-2 4.2 LC-3 3.2

CHAPTER 4 – THE PROTEOME OF EMILIANIA HUXLEYI AT HIGH AND LOW CALCIFICATION RATES
141
4.3.2. Peptide identification and annotation success
The following sections describe the general and more specific protein identification and annotation success,
in respect to functional categories, significantly more relatively higher abundant proteins, and proteins
potentially involved in the biomineralisation process in E. huxleyi.
General identification and annotation success 4.3.2.1.
The MASCOT-identified peptides were mapped against the E. huxleyi genome (dataset JGI) and
taxonomically restricted database (dataset TAXDB) (see section 4.2.7). In the identification pipeline a total of
496 hits to both reference databases were achieved. However, 55 of the hits to the JGI reference database did
not return a BLAST hit (e < 10-4). The remaining 441 proteins showing BLAST annotated findings recruited to
a total of 329 protein clusters (compare Table 4-2). Differences in the total yield of identified proteins
occurred in the iTRAQ experiment. Quantitative protein information was returned for 409 hits to JGI and
TAXDB reference databases in total. The iTRAQ pipeline returned a total of 403 non-redundant hits,
equivalent to 339 peptide matches, and recruiting to 287 protein clusters (for details see Table 4-2). In the
following sections the evaluation of the quantitative iTRAQ proteomics data is central for the presentation.
Table 4-2: Protein identification success in the identification pipeline and iTRAQ experiment (nr : non redundant; JGI: matches against the JGI reference genome of 22.2.2012; TAX DB: matches against the taxonomically restricted data base created be Dr. Richard Edwards, see Subchapter 4.2.8)
Identification pipeline iTRAQ experiment
Dataset Total peptide
hits
No Blast hits
removed
Protein clusters
iTRAQ peptide
hits
nr iTRAQ peptide
hits
nr protein
nr protein clusters
JGI 406 351 241 330 327 263 235 TAXDB 90 90 88 79 76 76 65 Total 496 441 329 409 403 339 287
In the HC condition 77 peptides matching to known proteins out of 90 total hits were up-regulated. Higher
abundance ratios of proteins in the LC condition were found in 26 cases, of which 23 returned protein
matches. The majority of the total hits and annotated protein showed no significantly increased relative
abundance in the HC or LC condition. This means that 26% of the identified proteins showed up or down
regulation in both experimental conditions (for details see Table 4-3).

CHAPTER 4 – THE PROTEOME OF EMILIANIA HUXLEYI AT HIGH AND LOW CALCIFICATION RATES
142
Table 4-3: Counts of significantly more abundant peptides in the HC and LC condition. (E.hux.G.: JGI E. huxleyi reference genome, Sig. higher rel. abund.: significant higher relative abundant proteins based on iTRAQ peptide ratios).
Total hits Hits with UniProt ID
Hits without UniProt ID
Hits in E. hux.G.
Hits in TaxaDB
HC 90 77 13 75 15 LC 26 23 3 19 7 Not sign. 287 239 48 233 54 Total 403 339 66 327 76
Functional and localisation prediction annotation of proteins 4.3.2.2.
Only 5 KOG annotations were returned from the JGI reference genome mapping results. Therefore,
functional information based on gene ontology (GO) annotation was more abundantly available. The UniProt
knowledge base GO annotation is evaluated at the level of biological process and cellular component. For the
summary of the GO annotation success refer to Table 4-4.
Table 4-4: Success of gene ontology (GO) annotation of peptides in the HC and LC condition at the levels biological process and cellular component (Sig. higher rel. abund.: significant higher relative abundant proteins based on iTRAQ peptide ratios).
Sig. higher rel. abund.
Gene Ontology (GO)
Gene Ontology (biological process)
Gene Ontology (cellular component)
HC 70 60 44 LC 18 12 13 Not sign. 210 211 116 Total 298 211 173
The number of proteins attributed to the dominant biological processes based on GO annotations in the HC
and LC condition are given in Table 4-5 and Table 4-6, respectively. Proteins involved in energy turnover
processes such as photosynthesis, ATP hydrolysis glycolysis, carbohydrate metabolism, cell homeostasis,
protein transport, and metabolism were activated in the HC condition (see Table 4-5 for details). In the dark
incubation period biological processes involved in mitosis (e.g. microtubule-based process [GO:0007017],
protein polymerization [GO:0051258], nucleosome assembly [GO:0006334]), protein synthesis (e.g. protein
folding [GO:0006457], translation [GO:0006412]), amino acid synthesis (e.g. gluconeogenesis [GO:0006094],
pyruvate metabolic process [GO:0006090], carboxylic acid metabolic process [GO:0019752]), and cell wall
synthesis (terpenoid biosynthetic process [GO:0016114]) are indicated.

CHAPTER 4 – THE PROTEOME OF EMILIANIA HUXLEYI AT HIGH AND LOW CALCIFICATION RATES
143
Table 4-5: Significantly overrepresented peptides in the HC condition by GO: biological processes. The number of significantly overrepresented peptides in the HC condition by Gene Ontology biological processes annotation is presented.
Gene Ontology – biological process [GO IDs]
Number of Peptides
Photosynthesis; light harvesting [GO:0009765]; protein-chromophore linkage [GO:0018298] 14
ATP hydrolysis coupled proton transport [GO:0015991]; ATP synthesis coupled proton transport [GO:0015986] 8
Glycolytic process [GO:0006096] 5 Protein folding [GO:0006457] 3 Carbohydrate metabolic process [GO:0005975]; glycerol-3-phosphate catabolic process [GO:0046168] 3
Glucose metabolic process [GO:0006006]; glycolytic process [GO:0006096] 2
ATP synthesis coupled proton transport [GO:0015986] 2 Cell redox homeostasis [GO:0045454]; cellular response to oxidative stress [GO:0034599]; glycerol ether metabolic process [GO:0006662]; oxidation-reduction process [GO:0055114]; protein folding [GO:0006457]; protein folding [GO:0006457]; sulphate assimilation [GO:0000103];
1
Photosynthesis; light harvesting [GO:0009765] 1 Protein transport [GO:0015031]; small GTPase mediated signal transduction [GO:0007264] 1
Mitochondrial respiratory chain complex III assembly [GO:0034551] 1
Carbohydrate metabolic process [GO:0005975] 1 Oxygen transport [GO:0015671] 1 Sulphate assimilation [GO:0000103] 1 One-carbon metabolic process [GO:0006730] 1 Glucose metabolic process [GO:0006006] 1 ATP hydrolysis coupled proton transport [GO:0015991] 1 Ubiquitin-dependent protein catabolic process [GO:0006511] 1 Gluconeogenesis [GO:0006094]; glycolytic process [GO:0006096] 1 Protein import [GO:0017038]; protein targeting [GO:0006605] 1 Arginyl-tRNA aminoacylation [GO:0006420] 1 ATP hydrolysis coupled proton transport [GO:0015991]; ATP metabolic process [GO:0046034] 1
Pyridoxal phosphate biosynthetic process [GO:0042823]; vitamin B6 biosynthetic process [GO:0042819] 1
Translation [GO:0006412] 1 Cell redox homeostasis [GO:0045454]; glutathione metabolic process [GO:0006749] 1
Peptidyl-pyrromethane cofactor linkage [GO:0018160]; tetrapyrrole biosynthetic process [GO:0033014] 1
Protein folding [GO:0006457]; response to stress [GO:0006950] 1 Reductive pentose-phosphate cycle [GO:0019253] 1 Photosynthetic electron transport in photosystem II [GO:0009772]; Protein-chromophore linkage [GO:0018298] 1
Carotenoid biosynthetic process [GO:0016117] 1
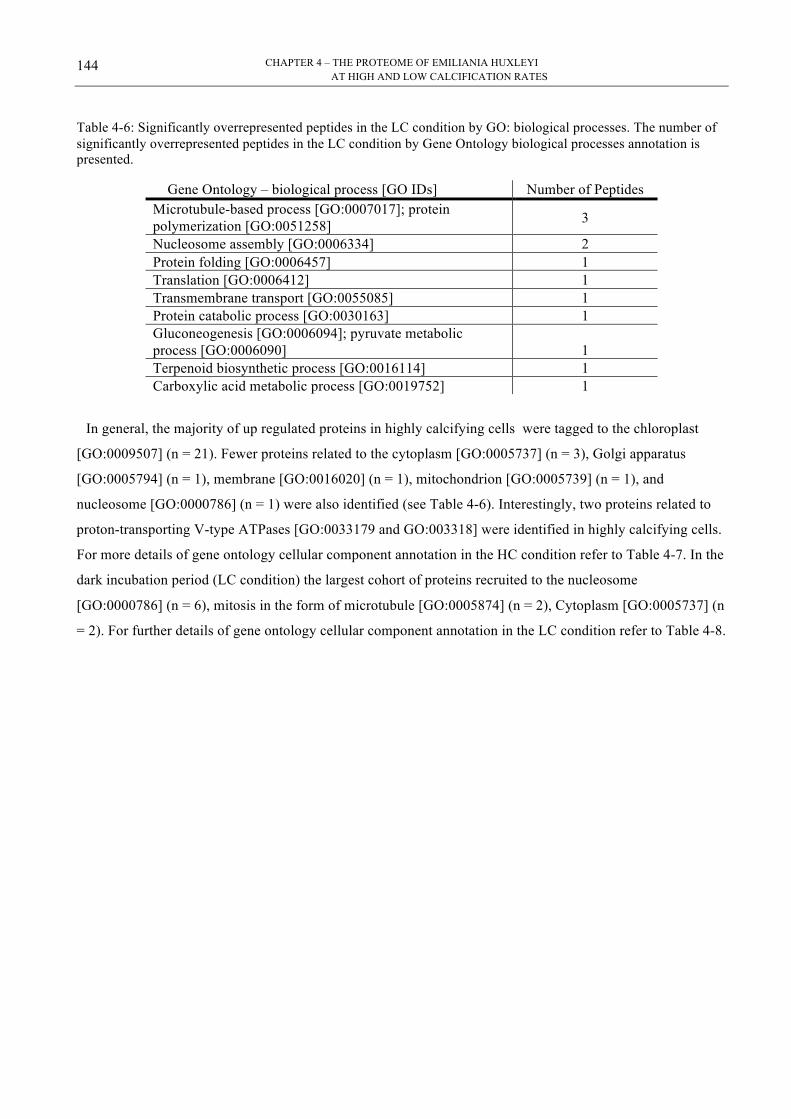
CHAPTER 4 – THE PROTEOME OF EMILIANIA HUXLEYI AT HIGH AND LOW CALCIFICATION RATES
144
Table 4-6: Significantly overrepresented peptides in the LC condition by GO: biological processes. The number of significantly overrepresented peptides in the LC condition by Gene Ontology biological processes annotation is presented.
Gene Ontology – biological process [GO IDs] Number of Peptides Microtubule-based process [GO:0007017]; protein polymerization [GO:0051258] 3
Nucleosome assembly [GO:0006334] 2 Protein folding [GO:0006457] 1 Translation [GO:0006412] 1 Transmembrane transport [GO:0055085] 1 Protein catabolic process [GO:0030163] 1 Gluconeogenesis [GO:0006094]; pyruvate metabolic process [GO:0006090] 1 Terpenoid biosynthetic process [GO:0016114] 1 Carboxylic acid metabolic process [GO:0019752] 1
In general, the majority of up regulated proteins in highly calcifying cells were tagged to the chloroplast
[GO:0009507] (n = 21). Fewer proteins related to the cytoplasm [GO:0005737] (n = 3), Golgi apparatus
[GO:0005794] (n = 1), membrane [GO:0016020] (n = 1), mitochondrion [GO:0005739] (n = 1), and
nucleosome [GO:0000786] (n = 1) were also identified (see Table 4-6). Interestingly, two proteins related to
proton-transporting V-type ATPases [GO:0033179 and GO:003318] were identified in highly calcifying cells.
For more details of gene ontology cellular component annotation in the HC condition refer to Table 4-7. In the
dark incubation period (LC condition) the largest cohort of proteins recruited to the nucleosome
[GO:0000786] (n = 6), mitosis in the form of microtubule [GO:0005874] (n = 2), Cytoplasm [GO:0005737] (n
= 2). For further details of gene ontology cellular component annotation in the LC condition refer to Table 4-8.

CHAPTER 4 – THE PROTEOME OF EMILIANIA HUXLEYI AT HIGH AND LOW CALCIFICATION RATES
145
Table 4-7: Significantly overrepresented peptides in the light incubation period by GO: cellular component. The number of significantly overrepresented peptides in the HC condition by Gene Ontology: cellular component annotation is presented.
Gene Ontology – cellular component [GO IDs] LIGHT
Number of
Peptides Chloroplast [GO:0009507]; integral component of membrane [GO:0016021]; photosystem II [GO:0009523] 14 Proton-transporting ATP synthase complex, catalytic core F(1) [GO:0045261] 6 Chloroplast thylakoid membrane [GO:0009535]; proton-transporting ATP synthase complex, catalytic core F(1) [GO:0045261] 4 Glycerol-3-phosphate dehydrogenase complex [GO:0009331] 3 Cytoplasm [GO:0005737] 2 Cell [GO:0005623] 1 Chloroplast [GO:0009507] 1 Chloroplast [GO:0009507]; integral component of membrane [GO:0016021]; photosystem II [GO:0009523]; thylakoid membrane [GO:0042651] 1 Chloroplast stroma [GO:0009570]; chloroplast thylakoid membrane [GO:0009535] 1 Chloroplast thylakoid membrane [GO:0009535]; integral component of membrane [GO:0016021]; light-harvesting complex [GO:0030076]; photosystem II [GO:0009523] 1 Clathrin coat of coated pit [GO:0030132]; clathrin coat of trans-Golgi network vesicle [GO:0030130] 1 Cytoplasm [GO:0005737]; nucleus [GO:0005634]; proteasome core complex, alpha-subunit complex [GO:0019773] 1 Golgi apparatus [GO:0005794] 1 Membrane [GO:0016020] 1 Mitochondrion [GO:0005739] 1 Nucleosome [GO:0000786]; nucleus [GO:0005634] 1 Phosphopyruvate hydratase complex [GO:0000015] 1 Plasma membrane [GO:0005886] 1 Proton-transporting V-type ATPase, V0 domain, across membrane transport [GO:0033179] 1 Proton-transporting V-type ATPase, V1 domain, across membrane transport [GO:0033180] 1 Ribosome [GO:0005840] 1

CHAPTER 4 – THE PROTEOME OF EMILIANIA HUXLEYI AT HIGH AND LOW CALCIFICATION RATES
146
Table 4-8: Significantly overrepresented peptides in the dark incubation period by GO: cellular component. The number of significantly overrepresented peptides in the LC condition by Gene Ontology: cellular component annotation is presented.
Gene Ontology – cellular component [GO IDs] DARK
Number of
Peptides Nucleosome [GO:0000786]; nucleus [GO:0005634] 6 Microtubule [GO:0005874] 2 Cytoplasm [GO:0005737] 1 Cytoplasm [GO:0005737]; microtubule [GO:0005874] 1 Integral component of membrane [GO:0016021] 1 Nucleus [GO:0005634] 1 Small ribosomal subunit [GO:0015935] 1
The gene ontology tables considering all protein hits can be found in Appendix B Table 2 and Table 3.
Significantly expressed proteins in the highly and low calcifying E. huxleyi 4.3.2.3.
cells
The quantitative proteomics experiment using iTRAQ showed that 110 peptides with known UniProt IDs
showed significant higher relative abundance in highly calcifying E. huxleyi cells and cells calcifying at low
rates (see Table 4-3 and Table 4-9). Protein function and gene ontology frequencies show a similar general
trend that distinct functional protein groups were up-regulation in either the light or dark incubation period
(Section 4.3.2.2.). Proteins involved in photosynthesis and ATP synthesis were up regulated in the HC
condition. Proteins suggested to be involved in the calcification process, namely clathrin (Dark:Light = 0.664;
UniProt ID: C1E1W7; JGI407983) and subunits of V-type proton ATPases (e.g. UniProt ID: D8TKK9,
JGI43077; Dark:Light = 0.813) were more abundant in the HC condition. In E. huxleyi cells calcifying at
lowest rates, if at all, histones and tubulins were significantly upregulated.

147
Tabl
e 4-
9: S
igni
fican
tly m
ore
abun
dant
pro
tein
s in
the
HC
and
LC
con
ditio
n. P
rote
ins
show
ing
sign
ifica
nt re
lativ
e up
- and
dow
n-re
gula
tion
of id
entif
ied
pept
ides
at
high
cal
cific
atio
n (H
C c
ondi
tion)
or i
n lo
w c
alci
fyin
g ce
ll (L
C c
ondi
tion)
. If L
C:H
C <
1 (p
rote
ins
in lo
w c
alci
fyin
g ce
lls v
ersu
s pr
otei
ns in
hig
h ca
lcify
ing
cells
ab
unda
nce
ratio
) pro
tein
s w
ere
mor
e ab
unda
nt in
hig
hly
calc
ifyin
g ce
lls. T
he a
bund
ance
ratio
of a
ll pe
ptid
es is
giv
en in
App
endi
x B
. LC
: HC
sig
. dir.
: ind
icat
ing
sign
ifica
nt m
ore
abun
dant
pep
tides
in th
e H
C o
r LC
con
ditio
n. (D
B ID
: ide
ntifi
er fo
r mat
ches
to T
axD
B a
nd J
GI r
efer
ence
gen
ome,
Con
sens
us: r
efer
ence
ID fo
r m
atch
in H
AQ
ESA
C. S
hadi
ng o
f tab
le ro
ws
indi
cate
s pr
otei
ns w
ith a
bund
ance
ratio
tow
ards
the
LC c
ondi
tion)
.
LC
:HC
sig
. dir
LC
:HC
LC
:HC
Min
LC
:HC
Max
C
onse
nsus
D
B ID
U
niPr
ot ID
Pr
otei
n de
scrip
tion
JGI6
5061
Q
2IA
28
Chl
orop
last
ligh
t har
vest
ing
prot
ein
isof
orm
12
HC
0.
594
0.43
3 0.
751
HA
JGI2
22
TAX
DB
13 Q
4G3F
4 R
ibul
ose
bisp
hosp
hate
car
boxy
lase
larg
e ch
ain
H
C
0.59
8 0.
544
0.66
0 TA
XD
B13
JG
I281
147
Q5U
U97
En
olas
e H
C
0.60
0 0.
447
0.72
9 H
AJG
I283
JG
I206
028
Q2I
A28
C
hlor
opla
st li
ght h
arve
stin
g pr
otei
n is
ofor
m 1
2 H
C
0.63
2 0.
487
0.76
3 H
AJG
I261
JG
I663
10
F0X
ZQ3
Puta
tive
unch
arac
teriz
ed p
rote
in
HC
0.
641
0.41
6 0.
911
HA
JGI0
43
TAX
DB
73 A
3FQ
F5
Unc
hara
cter
ized
pro
tein
H
C
0.64
7 0.
528
0.79
9 TA
XD
B73
JG
I269
056
Q39
709
Fuco
xant
hin-
chlo
roph
yll a
-c b
indi
ng p
rote
in
HC
0.
654
0.56
5 0.
845
HA
JGI3
82
TAX
DB
14 Q
4G39
6 Ph
otos
yste
m II
CP4
3 re
actio
n ce
nter
pro
tein
H
C
0.68
1 0.
581
0.80
1 TA
XD
B14
TA
XD
B22
B8C
4K2
Unc
hara
cter
ized
pro
tein
H
C
0.69
1 0.
443
0.95
0 TA
XD
B22
JG
I622
46
Q2I
A73
C
hlor
opla
st li
ght h
arve
stin
g pr
otei
n is
ofor
m 6
H
C
0.69
3 0.
544
0.78
7 H
AJG
I246
JG
I109
974
NA
N
A
HC
0.
699
0.47
9 0.
998
NA
JG
I220
283
NA
N
A
HC
0.
700
0.65
3 0.
772
NA
JG
I103
600
D8L
B65
G
luco
kina
se
HC
0.
703
0.52
2 0.
884
HA
JGI2
75
JGI6
7584
Q
2IA
28
Chl
orop
last
ligh
t har
vest
ing
prot
ein
isof
orm
12
HC
0.
704
0.48
9 0.
926
HA
JGI2
64
JGI2
1804
1 P5
1821
A
DP-
ribos
ylat
ion
fact
or 1
H
C
0.70
4 0.
568
0.92
4 H
AJG
I036
JG
I458
69
Q2I
A76
C
hlor
opla
st li
ght h
arve
stin
g pr
otei
n is
ofor
m 3
H
C
0.70
5 0.
538
0.93
7 H
AJG
I029
JG
I104
438
C1D
Z32
Pred
icte
d pr
otei
n H
C
0.71
0 0.
540
0.84
3 H
AJG
I260
JG
I281
510
F0Y
M05
Pu
tativ
e un
char
acte
rized
pro
tein
H
C
0.71
0 0.
589
0.85
3 H
AJG
I085
JG
I960
82
NA
N
A
HC
0.
718
0.59
4 0.
805
NA
TA
XD
B75
Q5E
NR
8 Ph
osph
ogly
cera
te k
inas
e
HC
0.
720
0.64
7 0.
818
TAX
DB
75
JGI9
0250
F0
YFF
1 Pu
tativ
e un
char
acte
rized
pro
tein
H
C
0.72
6 0.
630
0.80
4 H
AJG
I405
JG
I237
243
NA
N
A
HC
0.
727
0.49
8 0.
955
HA
JGI1
91
JGI2
7575
4 Q
5EN
S1
Chl
orop
last
pho
spho
ribul
okin
ase
HC
0.
727
0.60
4 0.
883
HA
JGI1
67
JGI6
7108
Q
2IA
72
Chl
orop
last
ligh
t har
vest
ing
prot
ein
isof
orm
7
HC
0.
728
0.59
6 0.
974
HA
JGI2
99

148
Tabl
e 4-
9: S
igni
fican
tly m
ore
abun
dant
pro
tein
s on
the
Ligh
t and
Dar
k ph
ase,
con
tinue
d.
DB
ID
Uni
Prot
ID
Prot
ein
desc
riptio
n
LC:H
C s
ig. d
ir LC
:HC
LC
:HC
Min
LC
:HC
Max
C
onse
nsus
JG
I407
983
C1E
1W7
Cla
thrin
hea
vy c
hain
H
C
0.66
4 0.
387
1.05
3 H
AJG
I365
JG
I283
485
B8C
FP9
Pred
icte
d pr
otei
n H
C
0.72
8 0.
573
0.87
7 H
AJG
I071
JG
I889
32
NA
N
A
HC
0.
732
0.67
9 0.
821
NA
TA
XD
B81
Q40
612
ATP
syn
thas
e su
buni
t bet
a, c
hlor
opla
stic
H
C
0.73
5 0.
622
0.86
4 TA
XD
B81
JG
I991
31
F0Y
6E3
Puta
tive
unch
arac
teriz
ed p
rote
in
HC
0.
744
0.58
9 0.
858
HA
JGI1
25
JGI4
0632
1 N
A
NA
H
C
0.75
1 0.
696
0.87
0 H
AJG
I381
JG
I120
262
F0Y
2W6
Puta
tive
unch
arac
teriz
ed p
rote
in
HC
0.
756
0.61
3 0.
881
HA
JGI1
86
JGI1
2082
9 Q
2IA
75
Chl
orop
last
ligh
t har
vest
ing
prot
ein
isof
orm
4
HC
0.
757
0.46
1 0.
998
HA
JGI0
25
JGI1
2297
0 Q
01A
H9
Hea
t sho
ck p
rote
in 7
0 / H
SP70
(ISS
) H
C
0.75
8 0.
664
0.86
1 H
AJG
I280
TA
XD
B85
D8T
RA
2 A
TP s
ynth
ase
subu
nit b
eta
HC
0.
760
0.67
2 0.
836
TAX
DB
85
JGI2
1640
2 G
4ZP2
5 Pu
tativ
e un
char
acte
rized
pro
tein
H
C
0.76
2 0.
587
0.97
5 H
AJG
I372
TA
XD
B61
Q4G
3C8
ATP
syn
thas
e su
buni
t bet
a, c
hlor
opla
stic
H
C
0.76
3 0.
659
0.89
2 TA
XD
B61
JG
I273
928
G5A
9A0
Puta
tive
unch
arac
teriz
ed p
rote
in
HC
0.
765
0.67
3 0.
870
HA
JGI2
59
JGI1
0363
7 Q
2IA
76
Chl
orop
last
ligh
t har
vest
ing
prot
ein
isof
orm
3
HC
0.
766
0.61
2 0.
945
HA
JGI0
35
JGI1
0270
1 Q
2IA
76
Chl
orop
last
ligh
t har
vest
ing
prot
ein
isof
orm
3
HC
0.
767
0.61
4 0.
953
HA
JGI2
09
JGI2
7133
1 D
0NEK
2 A
deno
sylh
omoc
yste
inas
e H
C
0.77
4 0.
760
0.79
2 H
AJG
I136
JG
I407
305
Q2I
A76
C
hlor
opla
st li
ght h
arve
stin
g pr
otei
n is
ofor
m 3
H
C
0.77
4 0.
688
0.84
5 H
AJG
I008
JG
I106
019
A8I
1X3
Puta
tive
unch
arac
teriz
ed p
rote
in
HC
0.
777
0.53
6 0.
996
HA
JGI1
40
JGI1
1270
2 N
A
NA
H
C
0.78
0 0.
617
0.96
1 N
A
JGI3
5814
1 Q
84LQ
0 C
ytos
olic
gly
cera
ldeh
yde
3-ph
osph
ate
dehy
drog
enas
e H
C
0.78
1 0.
661
0.95
0 H
AJG
I335
JGI2
3083
5 Q
2IA
55
Chl
orop
last
gly
cera
ldeh
yde-
3-ph
osph
ate
dehy
drog
enas
e H
C
0.78
2 0.
706
0.85
0 H
AJG
I027
JGI1
0290
1 Q
5QD
45
Plas
tid C
1 cl
ass
II fr
ucto
se b
isph
osph
ate
aldo
lase
H
C
0.78
6 0.
684
0.85
5 H
AJG
I079
TA
XD
B41
Q4G
3C9
ATP
syn
thas
e ep
silo
n ch
ain,
chl
orop
last
ic
HC
0.
797
0.68
7 0.
949
TAX
DB
41

149
Tabl
e 4-
9: S
igni
fican
tly m
ore
abun
dant
pro
tein
s on
the
Ligh
t and
Dar
k ph
ase,
con
tinue
d.
DB
ID
Uni
Prot
ID
Prot
ein
desc
riptio
n
LC:H
C si
g. d
ir LC
:HC
LC
:HC
Min
LC
:HC
Max
C
onse
nsus
TA
XD
B05
Q4G
397
ATP
synt
hase
subu
nit a
lpha
, chl
orop
last
ic
HC
0.
798
0.72
0 0.
909
TAX
DB
05
JGI8
8203
A
6YA
Z8
Puta
tive
plas
tid tr
ansk
etol
ase
HC
0.
799
0.75
0 0.
880
HA
JGI3
97
JGI2
1251
2 G
5A9A
0 Pu
tativ
e un
char
acte
rized
pro
tein
H
C
0.80
0 0.
712
0.88
7 H
AJG
I121
TA
XD
B88
Q2I
A54
G
lyce
rald
ehyd
e-3-
phos
phat
e de
hydr
ogen
ase
H
C
0.80
8 0.
758
0.87
8 TA
XD
B88
JG
I199
538
NA
N
A
HC
0.
810
0.71
7 0.
976
HA
JGI2
37
JGI4
3077
D
8TK
K9
Vac
uola
r H+
ATP
ase
V0
sect
or, s
ubun
it D
H
C
0.81
3 0.
751
0.88
7 H
AJG
I048
JG
I120
592
Q0M
YX
3 Pr
otea
som
e su
buni
t alp
ha ty
pe
HC
0.
817
0.67
0 0.
994
HA
JGI0
98
JGI6
1340
Q
2IA
74
Chl
orop
last
ligh
t har
vest
ing
prot
ein
isof
orm
5
HC
0.
818
0.72
4 0.
934
HA
JGI3
80
JGI8
7079
B
9PN
V8
Hea
t sho
ck p
rote
in, p
utat
ive
HC
0.
819
0.72
3 0.
935
HA
JGI1
62
JGI2
7039
9 Q
15G
C7
Trio
seph
osph
ate
isom
eras
e H
C
0.82
3 0.
725
0.99
5 H
AJG
I387
JG
I889
77
A4R
W83
Pr
otei
n tra
nslo
case
subu
nit S
ecA
, chl
orop
last
ic
HC
0.
824
0.69
7 0.
938
HA
JGI4
02
JGI3
6633
7 A
8J38
7 Pr
edic
ted
prot
ein
HC
0.
828
0.72
4 0.
919
HA
JGI2
66
JGI2
3510
6 N
A
NA
H
C
0.83
1 0.
739
0.96
5 H
AJG
I138
JG
I222
386
P484
14
V-ty
pe p
roto
n A
TPas
e ca
taly
tic su
buni
t A
HC
0.
833
0.68
1 0.
971
HA
JGI0
81
JGI2
7262
4 A
4S2C
6 Pr
edic
ted
prot
ein
HC
0.
833
0.70
3 0.
994
HA
JGI0
37
JGI9
6943
C
1EIH
7 Pu
tativ
e un
char
acte
rized
pro
tein
H
C
0.83
6 0.
726
0.93
1 H
AJG
I267
JG
I198
360
C5K
NV
3 M
olec
ular
cha
pero
ne, p
utat
ive
HC
0.
836
0.72
6 0.
931
HA
JGI0
07
JGI2
0643
8 D
0NB
Z5
Nuc
leol
ar p
rote
in N
OP5
H
C
0.83
9 0.
695
0.96
1 H
AJG
I097
JG
I265
597
G5A
9A0
Puta
tive
unch
arac
teriz
ed p
rote
in
HC
0.
839
0.77
3 0.
940
HA
JGI2
05
TAX
AN
A C
5K6Q
8 H
eat s
hock
pro
tein
, put
ativ
e H
C
0.84
1 0.
662
0.98
7 N
A
JGI1
0280
0 G
0QQ
50
Puta
tive
unch
arac
teriz
ed p
rote
in
HC
0.
843
0.67
1 0.
981
HA
JGI0
19
JGI2
5414
0 N
A
NA
H
C
0.84
3 0.
696
0.99
6 H
AJG
I026
JG
I100
088
NA
N
A
HC
0.
845
0.75
1 0.
905
HA
JGI3
49
JGI2
1808
1 Q
2IA
28
Chl
orop
last
ligh
t har
vest
ing
prot
ein
isof
orm
12
HC
0.
846
0.78
7 0.
948
HA
JGI2
42
JGI3
5057
0 N
A
NA
H
C
0.84
7 0.
709
0.94
9 N
A
JGI2
0296
8 F0
YD
68
Puta
tive
unch
arac
teriz
ed p
rote
in
HC
0.
848
0.74
9 0.
969
HA
JGI2
91
JGI2
5235
5 F0
XW
G3
Puta
tive
plas
tid li
ght h
arve
stin
g pr
otei
n is
ofor
m 4
0 H
C
0.85
1 0.
806
0.91
0 H
AJG
I030

150
Tabl
e 4-
9: S
igni
fican
tly m
ore
abun
dant
pro
tein
s on
the
Ligh
t and
Dar
k ph
ase,
con
tinue
d.
DB
ID
Uni
Prot
ID
Prot
ein
desc
riptio
n
LC:H
C s
ig. d
ir LC
:HC
LC
:HC
Min
LC
:HC
Max
C
onse
nsus
JG
I209
460
G4Y
JL5
Puta
tive
unch
arac
teriz
ed p
rote
in
HC
0.
854
0.57
7 0.
994
HA
JGI2
20
JGI4
0265
0 C
1EH
C0
ATP
syn
thas
e su
buni
t alp
ha
HC
0.
855
0.75
4 0.
951
HA
JGI3
77
JGI3
6098
5 G
4Z7L
2 Pu
tativ
e un
char
acte
rized
pro
tein
H
C
0.86
5 0.
713
0.96
9 H
AJG
I157
TA
XD
B90
G0Q
RF6
A
TP s
ynth
ase
subu
nit a
lpha
H
C
0.86
5 0.
741
0.99
8 TA
XD
B90
TA
XD
B48
Q49
JJ1
His
tone
H2A
H
C
0.86
7 0.
789
0.92
7 TA
XD
B48
JG
I997
24
D8L
HC
1 G
luta
thio
ne re
duct
ase
HC
0.
871
0.73
0 0.
979
HA
JGI3
86
JGI3
6089
1 N
A
NA
H
C
0.87
1 0.
770
0.97
0 N
A
JGI2
7262
6 F0
YA
X4
Puta
tive
unch
arac
teriz
ed p
rote
in
HC
0.
874
0.77
4 0.
962
HA
JGI0
38
JGI8
9571
Q
5EN
R5
Phos
phog
lyce
rate
kin
ase
HC
0.
877
0.76
8 0.
973
HA
JGI1
47
JGI2
7034
2 D
8U3I
9 Pu
tativ
e un
char
acte
rized
pro
tein
H
C
0.87
7 0.
752
0.98
7 H
AJG
I103
JG
I266
768
B8C
830
Thio
redo
xin
HC
0.
882
0.76
6 0.
978
HA
JGI2
00
JGI2
7614
1 D
0NY
29
60S
ribos
omal
pro
tein
L3
HC
0.
883
0.76
5 0.
968
HA
JGI0
73
JGI1
0542
0 Q
5DK
81
Hea
t sho
ck p
rote
in 9
0 H
C
0.88
7 0.
811
0.96
4 H
AJG
I092
JG
I197
716
Q2I
A11
A
TP s
ynth
ase
gam
ma
chai
n H
C
0.90
6 0.
870
0.96
4 H
AJG
I367
TA
XD
B77
D7F
XG
1 A
TP s
ynth
ase
subu
nit b
eta
H
C
0.92
4 0.
876
0.97
8 TA
XD
B77
JG
I412
390
C1F
E16
ATP
syn
thas
e su
buni
t bet
a H
C
0.93
8 0.
835
0.99
8 H
AJG
I058
JG
I975
45
B6K
VV
6 Pr
olife
ratio
n-as
soci
ated
pro
tein
2G
4, p
utat
ive
HC
0.
957
0.92
9 0.
999
HA
JGI0
17
JGI2
6687
8 F0
YE5
4 Pu
tativ
e un
char
acte
rized
pro
tein
LC
1.
081
1.00
7 1.
205
HA
JGI3
19
TAX
DB
02 C
1FFK
0 Pe
ptid
yl-p
roly
l cis
-tran
s is
omer
ase
(EC
5.
2.1.
8)
LC
1.10
7 1.
010
1.21
5 TA
XD
B02
JGI1
0514
6 C
1E0B
7 El
onga
tion
fact
or tu
gtp
-bin
ding
dom
ain
prot
ein
2 LC
1.
130
1.04
9 1.
209
HA
JGI1
04
JGI6
4083
F0
YST
3 Pu
tativ
e un
char
acte
rized
pro
tein
LC
1.
133
1.02
7 1.
267
HA
JGI2
89
JGI2
3132
4 D
0NEH
7 26
S pr
otea
se re
gula
tory
sub
unit
7 LC
1.
137
1.00
2 1.
312
HA
JGI2
35
JGI3
6519
6 B
6DX
96
Puta
tive
chlo
ropl
ast 4
-hyd
roxy
-3-m
ethy
lbut
-2-
en-1
-yl d
ipho
spha
te s
ynth
ase
LC
1.14
1 1.
022
1.25
9 H
AJG
I268
JG
I710
08
NA
N
A
LC
1.16
1 1.
007
1.37
2 N
A
JGI9
5565
Q
49JJ
2 H
isto
ne H
2A
LC
1.16
1 1.
017
1.36
8 H
AJG
I144

151
Tabl
e 4-
9: S
igni
fican
tly m
ore
abun
dant
pro
tein
s on
the
Ligh
t and
Dar
k ph
ase,
con
tinue
d.
DB
ID
Uni
Prot
ID
Prot
ein
desc
riptio
n
LC:H
C s
ig. d
ir LC
:HC
LC
:HC
Min
LC
:HC
Max
C
onse
nsus
JG
I267
796
Q1W
LZ2
40S
ribos
omal
pro
tein
S3
LC
1.16
5 1.
082
1.26
4 H
AJG
I296
JG
I279
740
C1F
FE2
Pred
icte
d pr
otei
n LC
1.
161
1.00
7 1.
372
HA
JGI0
74
JGI2
5683
0 N
A
NA
LC
1.
168
1.10
0 1.
280
HA
JGI2
08
JGI2
7145
5 F0
YFV
2 Pu
tativ
e un
char
acte
rized
pro
tein
LC
1.
170
1.03
4 1.
441
HA
JGI1
85
JGI9
6192
Q
013K
3 H
isto
ne H
2B
LC
1.20
7 1.
002
1.40
3 H
AJG
I401
TA
XD
B65
F0Y
8U4
Puta
tive
unch
arac
teriz
ed p
rote
in (F
ragm
ent)
LC
1.21
3 1.
052
1.39
7 TA
XD
B65
JG
I763
77
B7G
0V7
Pred
icte
d pr
otei
n LC
1.
244
1.03
0 1.
389
HA
JGI1
43
JGI2
0170
7 A
4RS6
2 H
isto
ne H
4 LC
1.
277
1.09
4 1.
524
HA
JGI3
79
JGI2
5547
7 A
7AT8
4 H
isto
ne H
3, p
utat
ive
LC
1.28
1 1.
063
1.50
2 H
AJG
I111
JG
I722
35
C1M
VY
5 H
isto
ne H
2A
LC
1.30
5 1.
156
1.47
7 H
AJG
I082
TA
XD
B19
Q00
Y53
H
isto
ne H
2B
LC
1.33
3 1.
076
1.63
1 TA
XD
B19
TA
XD
B71
D0M
WJ7
H
isto
ne H
2A
LC
1.36
2 1.
181
1.52
4 TA
XD
B71
TA
XD
B28
C1E
6T8
His
tone
H4
LC
1.37
3 1.
280
1.58
0 TA
XD
B28
JG
I277
202
Q5G
920
Alp
ha-tu
bulin
LC
1.
476
1.28
5 1.
821
HA
JGI1
56
TAX
DB
53 Q
5G91
7 A
lpha
-tubu
lin (F
ragm
ent)
LC
1.50
4 1.
242
1.70
9 TA
XD
B53
JG
I374
572
NA
N
A
LC
1.55
0 1.
147
1.91
6 H
AJG
I158
JG
I876
97
F0Y
9S1
Puta
tive
unch
arac
teriz
ed p
rote
in
LC
1.57
7 1.
383
1.76
4 H
AJG
I307
TA
XD
B72
F0X
W25
Tu
bulin
alp
ha-2
cha
in
LC
2.38
8 1.
484
3.44
8 TA
XD
B72

CHAPTER 4 – THE PROTEOME OF EMILIANIA HUXLEYI AT HIGH AND LOW CALCIFICATION RATES
152
Proteins of interest involved in biomineralisation in highly 4.3.2.4.
calcifying and low calcifying E. huxleyi cells
The abundance ratios for all identified proteins can be found in Appendix B Table 1. The
entire population of identified proteins was investigated for proteins involved in
biomineralisation at the gene ontology level and by protein name. The results show that four
proteins potentially involved in E. huxleyi biomineralisation were relatively more abundant in
calcifying cells of the late G1 cell cycle phase (see Table 4-10 and Table 4-11). The peptides
related to biomineralisation matched three proton V-ATPases and one clathrin (see section
4.3.2.3). Gene ontology suggested three proteins involved in the calcification process, whereas
two are predicted and uncharacterized. Furthermore, a putative alpha-actinin-1 and oxygen
evolving enhancer 1 (JGI265795, UniProt ID: Q8L878; Dark: Light = 0.944) was suggested by
gene ontology to play a role in calcification. In cells showing low rates of calcification (LC
condition) (JGI271455, UniProt ID: F0YFV2; LC: HC = 1.1170) was indicated to be involved
in calcification trusting GO annotations. However, WolfsPSort (Horton et al., 2007) predicts the
location of the uncharacterised protein in the chloroplast.

153 Ta
ble
4-10
: Pro
tein
s with
pot
entia
l rol
e in
cal
cific
atio
n in
the
HC
and
LC
con
ditio
n. K
now
n pr
otei
ns in
volv
ed in
bio
min
eral
isat
ion
obse
rved
in th
e pr
oteo
mes
of t
he H
C a
nd L
C c
ondi
tions
. LC
: HC
sig.
dir.
: ind
icat
ing
sign
ifica
ntly
mor
e ab
unda
nt p
eptid
es in
the
HC
or L
C c
ondi
tion.
(DB
ID:
iden
tifie
r for
mat
ches
to T
axD
B a
nd JG
I ref
eren
ce g
enom
e, C
onse
nsus
: ref
eren
ce ID
for m
atch
in H
AQ
ESA
C).
DB
ID
Uni
Prot
ID
Prot
ein
desc
riptio
n
LC:H
C si
g. d
ir LC
:HC
LC
:HC
Min
LC
:HC
Max
C
onse
nsus
JG
I430
77
D8T
KK
9 V
acuo
lar H
+ A
TPas
e V
0 se
ctor
, sub
unit
D
HC
0.
813
0.75
1 0.
887
HA
JGI0
48
JGI2
2238
6 P4
8414
V
-type
pro
ton
ATP
ase
cata
lytic
subu
nit A
H
C
0.83
3 0.
681
0.97
1 H
AJG
I081
JG
I276
075
D8U
1L3
Vac
uola
r ATP
synt
hase
subu
nit E
0.89
4 0.
772
1.04
7 H
AJG
I202
JG
I407
983
C1E
1W7
Cla
thrin
hea
vy c
hain
H
C
0.66
4 0.
387
1.05
3 H
AJG
I365
Ta
ble
4-11
: GO
: cal
cific
atio
n pr
otei
ns in
the
HC
and
LC
con
ditio
n. P
rote
ins w
ith “
calc
ifica
tion”
as a
key
wor
d in
gen
e on
tolo
gy a
nnot
atio
n in
the
prot
eom
es o
f the
HC
and
LC
con
ditio
n. L
C: H
C si
g. d
ir.: i
ndic
atin
g si
gnifi
cant
ly m
ore
abun
dant
pep
tides
in th
e H
C o
r LC
con
ditio
n. (D
B ID
: ide
ntifi
er
for m
atch
es to
Tax
DB
and
JGI r
efer
ence
gen
ome,
Con
sens
us: r
efer
ence
ID fo
r mat
ch in
HA
QES
AC
). Sh
adin
g of
tabl
e ro
ws i
ndic
ates
pro
tein
s with
ab
unda
nce
ratio
tow
ards
the
LC c
ondi
tion.
DB
ID
Uni
Prot
ID
Prot
ein
desc
riptio
n
LC:H
C si
g. d
ir LC
:HC
LC
:HC
Min
LC
:HC
Max
C
onse
nsus
JG
I408
848
D0N
LH6
Alp
ha-a
ctin
in-1
, put
ativ
e
0.91
8 0.
759
1.12
2 H
AJG
I110
JG
I113
436
A8I
JG5
Pred
icte
d pr
otei
n
0.94
2 0.
789
1.10
1 H
AJG
I262
JG
I265
795
Q8L
878
Oxy
gen
evol
ving
enh
ance
r 1
0.
944
0.76
5 1.
224
HA
JGI2
98
JGI2
7145
5 F0
YFV
2 Pu
tativ
e un
char
acte
rized
pro
tein
LC
1.
170
1.03
4 1.
441
HA
JGI1
85

CHAPTER 4 – THE PROTEOME OF EMILIANIA HUXLEYI AT HIGH AND LOW CALCIFICATION RATES
154
Consensus of transcriptome and proteome 4.3.2.5.
To find consensus of the proteomics and transcriptomics data (Chapter 3) the MASCOT
peptides identified by the JGI E. huxleyi reference genome and TAXDB were compared as
described in section 4.2.8. Out of 496 protein hits only 51 were found to show a consensus
transcript based on the JGI gene ID. A total of 20 matches based on protein identifies (UniProt
ID) were found in the proteome and transcriptome. After removing duplicates in the combined
results based on JGI gene ID 35 matches remained, of which 31 had relative expression /
abundance data. Of those 31 matches 12 showed the same direction towards the HC or LC
condition, whereas only 2 showed higher abundance in cells with low calcification rates. The
expression direction was found significantly different only in one case; the chloroplastic
fucoxanthin-chl a-c binding protein (JGI ID: 269056; UniProt ID: Q39709) was more abundant
in the HC condition. The protein matches in the proteome and transcriptome are presented in
Table 4-12. None of the proteins match by the proteome against the transcriptome appears to be
involved in biomineralisation.

155
Tabl
e 4-
12: P
rote
ome
– tra
nscr
ipto
me
cons
ensu
s. M
atch
ing
hits
(pro
tein
s) in
the
prot
eom
e an
d tra
nscr
ipto
me
data
sets
are
pre
sent
ed. A
bund
ance
ratio
s for
the
prot
eins
an
d tra
nscr
ipts
are
pre
sent
ed. d
ir. p
rot:
indi
catin
g si
gnifi
cant
pep
tide
ratio
. LC
:HC
: pep
tide
ratio
ave
rage
, LC
:HC
min
.: pe
ptid
e ra
tio m
inim
um, L
C:H
C m
ax.:
pept
ide
ratio
max
imum
, log
2x:
log
2-fo
ld ra
tio o
f tra
nscr
ipts
, dir
trans
cr.:
dire
ctio
n of
tran
scrip
t abu
ndan
ce, s
ig.:
sign
ifica
ntly
diff
eren
t tra
nscr
ipt a
bund
ance
. Ita
lic a
nd b
old
JGI I
D m
ark
mat
ches
whe
re th
e di
rect
ion
of a
bund
ance
ratio
of p
rote
ins a
nd tr
ansc
ripts
is th
e sa
me.
JGI I
D
Uni
Prot
ID D
escr
iptio
n di
r pr
ot.
LC: H
C
LC:H
C
min
. LC
:HC
m
ax.
log2
x
dir
trans
cr.
sig.
67
108
Q2I
A72
C
hlor
opla
st li
ght h
arve
stin
g pr
otei
n is
ofor
m 7
H
C
0.72
8 0.
596
0.97
4 0.
7 LC
no
2437
41 D
8TS4
9 C
ompo
nent
of c
ytos
olic
80S
ribo
som
e an
d 60
S la
rge
subu
nit
0.
872
0.59
6 1.
353
-1.2
8 H
C
no
2407
95 G
4ZPW
0 El
onga
tion
fact
or T
u
NA
N
A
NA
-0
.14
HC
no
2690
56 Q
3970
9 Fu
coxa
nthi
n-ch
loro
phyl
l a-c
bin
ding
pro
tein
, ch
loro
plas
tic
HC
0.
654
0.56
5 0.
845
-2.2
5 H
C
yes
1983
60 C
5KN
V3
Mol
ecul
ar c
hape
rone
, put
ativ
e
0.83
6 0.
726
0.93
1 -0
.5
HC
no
20
6438
D0N
BZ5
N
ucle
olar
pro
tein
NO
P5
0.
839
0.69
5 0.
961
-1.1
4 H
C
no
1939
27 B
8BU
34
Pred
icte
d pr
otei
n
0.88
0.
618
1.66
9 1.
78
LC
yes
1026
57 A
4RTV
8 Pr
edic
ted
prot
ein
0.
895
0.79
9 1.
055
-1.2
6 H
C
no
9645
3 B
8LEJ
5 Pr
edic
ted
prot
ein
0.
951
0.61
5 2.
008
5.22
LC
ye
s 20
0165
B7G
9A2
Pred
icte
d pr
otei
n
0.98
0.
808
1.16
4 -0
.51
HC
no
10
8180
C1N
4F5
Pred
icte
d pr
otei
n
1.05
8 0.
871
1.34
6 -1
.27
HC
no
27
9740
C1F
FE2
Pred
icte
d pr
otei
n LC
1.
161
1.00
7 1.
372
-1.0
7 H
C
no
2336
32 B
8CA
B4
Pred
icte
d pr
otei
n
1.79
5 0.
588
6.25
-3
.22
HC
ye
s 35
1398
B5Y
3N7
Pred
icte
d pr
otei
n
NA
N
A
NA
1.
87
LC
yes
1080
73 Q
50K
B1
Prot
ein
disu
lfide
-isom
eras
e-lik
e pr
otei
n Eh
Sep2
1.08
7 0.
781
1.54
6 -2
.4
HC
no
8897
7 A
4RW
83
Prot
ein
trans
loca
se su
buni
t Sec
A,
chlo
ropl
astic
H
C
0.82
4 0.
697
0.93
8 1.
84
LC
yes
2815
10 F
0YM
05
Puta
tive
unch
arac
teriz
ed p
rote
in
HC
0.
71
0.58
9 0.
853
4.01
LC
ye
s 10
6019
A8I
1X3
Puta
tive
unch
arac
teriz
ed p
rote
in
HC
0.
777
0.53
6 0.
996
-2.4
8 H
C
no
2029
68 F
0YD
68
Puta
tive
unch
arac
teriz
ed p
rote
in
HC
0.
848
0.74
9 0.
969
0.39
LC
no
21
2481
D7F
JQ9
Puta
tive
unch
arac
teriz
ed p
rote
in
0.
874
0.73
5 1.
167
1.92
LC
ye
s 36
5947
E1Z
DS1
Pu
tativ
e un
char
acte
rized
pro
tein
0.88
5 0.
690
1.11
7 -1
.21
HC
no

156
Tabl
e 4
12: P
rote
ome
– tra
nscr
ipto
me
cons
ensu
s co
ntin
ued:
JGI I
D
Uni
Prot
ID D
escr
iptio
n di
r pro
t. LC
: HC
LC
:HC
m
in.
LC:H
C
max
. lo
g2 x
di
r tra
nscr
. si
g.
2582
85 E
1Z34
3 Pu
tativ
e un
char
acte
rized
pro
tein
0.90
0 0.
706
1.11
6 -0
.83
HC
no
27
3308
B4Z
G44
Pu
tativ
e un
char
acte
rized
pro
tein
0.91
0.
781
1.05
4 4.
67
LC
yes
2693
05 F
0Y0B
9 Pu
tativ
e un
char
acte
rized
pro
tein
0.97
3 0.
829
1.23
3.
84
LC
yes
2161
06 D
8TLK
9 Pu
tativ
e un
char
acte
rized
pro
tein
1.02
4 0.
943
1.07
3 0.
78
LC
no
2843
52 D
7FSF
0 Pu
tativ
e un
char
acte
rized
pro
tein
1.12
2 0.
847
1.77
6 2.
67
LC
yes
8769
7 F0
Y9S
1 Pu
tativ
e un
char
acte
rized
pro
tein
LC
1.
577
1.38
3 1.
764
-3.1
5 H
C
yes
6146
7 F0
Y33
3 Pu
tativ
e un
char
acte
rized
pro
tein
NA
N
A
NA
0.
79
LC
no
2151
32 D
7G20
0 Pu
tativ
e un
char
acte
rized
pro
tein
NA
N
A
NA
-1
.91
HC
no
23
7243
no
mat
ch
NA
0.72
7 0.
498
0.95
5 0.
79
LC
no
1995
38 n
o m
atch
N
A
0.
810
0.71
7 0.
976
1.63
LC
ye
s 10
5039
no
mat
ch
NA
0.87
5 0.
750
1.01
5 -0
.27
HC
no
22
7764
no
mat
ch
NA
0.97
2 0.
509
1.55
5 1.
5 LC
ye
s 10
0546
no
mat
ch
NA
0.97
8 0.
791
1.15
3 0.
2 LC
no
22
0968
no
mat
ch
NA
1.19
9 0.
805
1.86
2 1.
56
LC
yes

CHAPTER 4 – THE PROTEOME OF EMILIANIA HUXLEYI AT HIGH AND LOW CALCIFICATION RATES
157
4.4. Discussion
To date five studies were investigating the proteome of the globally important marine
calcifying coccolithophore Emiliania huxleyi. Pioneering work on the E. huxleyi proteome by
Jones et al. (2011) identified 99 proteins operating from a variety of physiological pathways
applying a similar protocol for protein extraction and identification. Protein identification was
improved to 115 (Jones et al., 2013) by studying different E. huxleyi strains and the proteome
response to elevated CO2 conditions. In response to different light regimes 500 highly abundant
and confident proteins were identified (McKew et al., 2013). Furthermore, Rose et al. (2014)
explored microdomains in the host virus interaction of Emiliania huxleyi virus infections using
shotgun proteomics and observed proteins specifically associated with cellular stress, host
defence, programmed cell death and immunity pathways. Alcolombri et al. (2015) were
interested identifying the genetic origin of the enzymes for responsible forming dimethyl
sulphide (DMS) from dimethylsulfoniopropionate (DMSP) in Emiliania huxleyi. DMS is an
important signal in marine food webs and can influence local weather by affecting cloud
formation. Shotgun proteomics and transcriptomics were combined and identified the Alma1
gene in E. huxleyi, which yielded high DMSP-lyase activity.
In this study, the quantitative proteome characteristics of the unicellular coccolithophore E.
huxleyi PLY♯ M217 at high and low calcification rates of the G1-phase of the cell cycle were
investigated to determine abundance patterns of protein potentially involved in
biomineralisation. The proteome study also sought to find consensus with the transcriptome
(Chapter 3).
A total of 403 different peptides were identified during the iTRAQ experiment. Of those 339
were matching known non-redundant proteins in the UniProt database. The proteins comprised
of 287 protein clusters, which represent a significant improvement in protein identification yield
in comparison to Jones et al., 2013. The results showed that the proteomes of the late G1-phase
(high calcification) and early G1-phase (low calcification) showed significant differences in
relative protein abundance; however, only five proteins involved in calcification processes were
identified and quantified. Both null-hypotheses that there are no differences in proteomes of the
highly calcifying and low calcifying E. huxleyi cells and proteins potentially involved in the
process of calcification are not expressed in the calcification period (late G1-phase) must be
rejected. Significant up-regulation of calcification related proteins was accounted for three
proteins of clathrin and V-type proton ATPases in the calcification phase. The V-type ATPases
were suggested for proton pumping at the coccolith producing membrane (Corstjens et al.,

CHAPTER 4 – THE PROTEOME OF EMILIANIA HUXLEYI AT HIGH AND LOW CALCIFICATION RATES
158
2001) to establish a flux of protons into the cytosol to establish high pH conditions in the CV
(Mackinder et al., 2010). Furthermore, the identified clathrin (UniProt ID: C1E1W7;
JGI407983) is known to play a role in vesicle trafficking protein of trans-Golgi vesicle transport
(Kirchhausen, 2000) and occurs together with clathrin-coated vesicles (Forgac, 2000). Jones et
al. (2011) suggested an importance of clathrin in the biomineralisation process because it occurs
together with V-type ATPase proton transporter in clathrin-coated vesicles (Forgac, 2000).
Furthermore, clathrin was abundant in the proteome of the silica-precipitating diatom T.
pseudonana (Nunn et al., 2009). Hence, vesicle mediated transport of minerals from the Golgi
network and V-type ATPase forced alkanilisation could be a more general model for
biomineralisation if it is active in diatoms and coccolithophores alike. Furthermore, clathrin was
found in higher abundance in phosphate starved cultures of the brown alga Aureococcus
anophagefferens, which could suggest that clathrin coated vesicles may act in nutrient
scavenging from the environment (Wurch et al., 2011). The growth of the experimental E.
huxleyi cultures and observed nutrient concentrations, as documented in Chapter 3, did not
imply nutrient limitation. Therefore, an expression of clathrin in response to nutrient limitation
is not suggested and the bulk expression of clathrin is most likely related to clathrin-coated
vesicle construction.
Further exploration of the proteome using the keyword “calcification” in GO annotations
revealed additional proteins. Any role of these proteins selected by their gene ontology
annotation in coccolithogenesis has not been previously suggested. The α– actinin (JGI40884,
D0NLH6) has a known affection for Ca2+ – ions and has an important role in cytogenesis and
muscle function (Jayadev et al., 2014). The abundance ratio between the cell of the early and
late G1-phase showed no significant difference and so a role for α– actinin in the
biomineralisation processes could not be inferred. The oxygen evolving enhancer 1 (JGI265795,
UniProt ID: Q8L878, protein name: psbO) is part of a complex, comprised of a cluster of
manganese, calcium and chloride ions binding extrinsic proteins (Bricker et al., 2012), which
catalyse the splitting of water to O2 and 4 H+ (GO functional annotations, source
www.uniprot.org; Huntley et al., 2015). The location of psbO is at the thylakoid membrane
facing the thylakoid lumen (Ferreira et al., 2004). The binding of calcium ions within the
oxygen-evolving centre is fundamental for the mechanism of water oxidation (Siegbahn, 2002).
Therefore, it can be concluded that Q8L878 plays no role in biomineralisation and is closely
involved in photosynthetic processes.
In contrast to Jones (2010) Histone 4 (H4) and other histones were up regulated at low
calcification rates. Histone 4 was down regulated in E. huxleyi PLY♯ M219 under high pCO2

CHAPTER 4 – THE PROTEOME OF EMILIANIA HUXLEYI AT HIGH AND LOW CALCIFICATION RATES
159
levels (Jones, 2013). However, both observations are not in disagreement if under elevated CO2
the cell cycle and culture growth rates are slowed and the cells undergo mitosis less frequently.
Histone 4 is a structural component of the nucleosome and is a methyl donor involved in
transcription and translational processes (Chiang et al., 1996). Therefore, E. huxleyi cells could
require less newly synthesized histones for nucleosome construction under high CO2 (Jones,
2013).
Heat shock proteins play an important role in the proteome response to environmental
stressors, immune response, and cell signalling (Pockley, 2003; Wang et al., 2004). Here, heat
shock proteins are discussed because in previous proteome studies of E. huxleyi heat shock
proteins were observed (Jones et al., 2011; Jones et al., 2013, McKew et al., 2013) and nutrient
depletion stress can be inferred from their expression values, whereas higher expression of HSP
70 was found in phosphate limited cultures (Wahlund et al., 2004b). Heat shock protein (HSP)
expression responded when E. huxleyi cells were exposed to higher light intensities (McKew et
al., 2013). An elevation in HSP expression was also observed in the light incubation period in
this study, as 3 out of 10 observed HSPs were significantly upregulated in the HC condition.
Periodic expression patterns of HSPs in E. huxleyi have not been reported before. Human HSPs
expression was regulated and variable during the cell cycle, whereas a 10-to15-fold expression
increase of HSP 7O mRNA was found upon entry into S-phase; levels of HSP 70 expression
decreased by the late S and G2 phase (Milarski & Morimoto, 1986). Therefore, the observed
higher presence of heat shock proteins in the late G1-phase could be a result of the chosen
sampling times. The E. huxleyi cultures in this experiment were harvested in the late G1 and
early G1 phase, and the observed abundance of HSP could reflect the relative heat shock protein
abundance at these cell cycle phases. Furthermore, heat shock proteins are also involved in non-
stress related protein folding and housekeeping processes (Picard, 2002). The very balanced
expression of 8 peptides matching HSPs in the late and early G1-phase supports the
housekeeping function of HSP in E. huxleyi (see Appendix A Table 11). The maturation of
specific protein complexes also requires the presence of HSPs. For example, during the
insertion of the precursor of the major light-harvesting complex of photosystem II into the
thylakoid chloroplastic HSP 70 was found to play a key role (Yalosky et al, 1992). Because
photosynthesis-related proteins were most abundant in the Light condition it can be speculated
that a bulk of the expressed heat shock proteins was involved in protein folding processes of
photosynthesis related proteins. However, with the available data the dominant cause of higher
HSP expression in the late G1-phase remains unclear. It would require additional sampling
points throughout the cell cycle to improve the understanding of HSP expression in the cell
cycle of E. huxleyi, which was not the objective of this study.

CHAPTER 4 – THE PROTEOME OF EMILIANIA HUXLEYI AT HIGH AND LOW CALCIFICATION RATES
160
The observed overexpression of proteins related to pathways such as photosynthesis,
glycolysis, vesicle transport, and cell repair in the Light period was conclusive. The majority of
the identified proteins in the HC condition were associated with the chloroplast and inner cell
membranes, and for a minority of proteins a function in cytoplasm or the Golgi-network was
suggested. Considering that a large proportion of the biomineralisation proteins would be active
within endomembranes (e.g. V-type proton ATPases), finding only four proteins potentially
involved in biomineralisation could indicate insufficient extraction of proteins, issues with salt
contamination of the sample, or insufficient dynamic range of the mass spectrometer.
Previously, protein extraction of E. huxleyi using TEAB buffer and subsequent proteome
analysis revealed a maximum of 115 homologous protein groups when searched against JGI E.
huxleyi genome, the taxonomically restricted UniProt KB database, and an EST database were
combined. Of those 115 homologues protein groups 46 showed differential expression using
iTRAQ (Jones et al., 2013). This study, using only JGI E. huxleyi genome (version from
22.2.2012) and the taxonomically restricted database showed 105 homologous proteins with 35
homologous proteins being differentially expressed. However, the JGI-genome search by Jones
et al. (2013) yielded only 40 hits compared to 327 proteins (287 protein clusters) in this study,
using the same version of the reference genome. Previously, limitations in the protein extraction
using TEAB buffer were discussed (Jones, 2011); because of low protein recovery rates and
observed smearing in gel electrophoresis. In this study an optimized protocol to achieve a 4
times faster cell harvesting time in comparison to Jones et al. (2011) was implemented, which
might explain higher rates of protein matches and identification. However, E. huxleyi TEAB
buffer protein extraction appears to alter protein recovery when compared with SDS/TRIS-
buffer (Qiagen) extraction (McKew et al., 2013). The SDS/TRIS-buffer would allow for
simultaneous extraction of DNA, RNA, and proteins and appears to improve the protein
extraction greatly. McKew and colleagues identified 1835 proteins and 500 with high
confidence against the newly published JGI E. huxleyi genome using label free protein
quantification (McKew et al., 2013; Read et al., 2013). The iTRAQ – technique is not
compatible with reagents containing primary amines and the RLT Buffer was not considered as
a suitable extraction buffer for the iTRAQ experiment, as not recommended by the iTRAQ
manufacturer (Applied Biosystems, Foster City, U.S.A). Furthermore, the matrix-assisted laser
desorption ionization technique produced higher noise to sample ratios if salty elutes are
utilized (Yates et al., 2009). Salt were removed from the protein sample using desalination
column. However, non-covalently binding salt in the protein sample could have carried salts
over to the matrix-assisted laser desorption ionization and mass spectrometric analysis. The
utilized LC/LC-MS/MS (MALDI QqTOF, Global Ultima 2, Waters) has a lower dynamic rate,
lower protein discovery rates, and mass accuracy than an Orbitrap mass spectrometer (Yates et

CHAPTER 4 – THE PROTEOME OF EMILIANIA HUXLEYI AT HIGH AND LOW CALCIFICATION RATES
161
al., 2009). A hybrid high-resolution LTQ/Orbitrap Velos instrument (Thermo Scientific) was
used by McKew et al., 2009, which may explain the higher protein discovery rates in the
McKew study.
To exclude the possibility that the different protein discovery rates relate to the different
versions of the reference genome, MS/MS data were matched against the newly published JGI
E. huxleyi gene set (JGI; http://www.jgi.doe.gov, downloaded 15.6.2015, file:
“Emihu1_best_proteins.fasta”). Preliminary results suggested that the more recent reference
genome yielded 507 genome hits (see Appendix B Table 4), which is only around 28% of the
identification success achieved by McKew et al. (2013) but an improvement of 25 % more
identification compared with the older version of the reference genome. Therefore, using the
newly annotated E. huxleyi genome improves the yield of protein identification but may only
explain the differences in protein identification success between this study and McKew et al.
(2013) to some degree. Preliminary evaluation suggests that the yield of peptide identification
on the data presented in this study could be further improved by employing the BUDAPEST
pipeline (Bioinformatics Utility for Data Analysis of Proteomics using ESTs provided by Dr.
Richard Edwards and referenced in Jones et al., 2011; Jones et al., 2013) using an extended set
of reference genome databases. The extended in silico identification suggests 1372 peptide
matches (data not presented in this thesis). The identified 1372 proteins from searches against
the JGI genome, taxonomically restricted databases, metatranscriptomic databases, E. huxleyi
EST databases, and non-redundant protein sequences (Uniprot database) are believed to contain
redundancies that were not removed at the time of writing. Preliminary, results suggest that 350
homologous protein groups were identified, which would improve the protein clustering by 12
%. Clustering the protein matches from the matches against the JGI and TAXDB references
returned 287 protein clusters. Potentially, extended sequence database searches and
improvement of the protein extraction protocol, or a label free MS/MS protein quantification
approach could further improve yield of the E. huxleyi proteome. In the future, modifications of
protein extract preparation, selection of lysis-buffer, and the utilized MS protein identification
and quantification technology (e.g. Orbitrap) should be considered to achieve greater proteome
coverage and reveal additional proteins relevant to biomineralisation in E. huxleyi.
Consensus of transcriptome and proteome
The transcriptome and proteome of Emiliania huxleyi were evaluated with a focus on genes
significantly overexpressed and potentially involved in biomineralisation. Based on the protein
ID, a total of 35 genes were represented in both the transcriptome and proteome reflecting a 7 %

CHAPTER 4 – THE PROTEOME OF EMILIANIA HUXLEYI AT HIGH AND LOW CALCIFICATION RATES
162
success in identifying matches of proteins and transcript. Frith et al. (2005) note that translation
of only 5-10 % of mRNA occurs. Unfortunately, none of the matched genes in the
transcriptome and proteome indicated proteins potentially involved in calcification. The
indicated low rate of finding matches based on the JGI gene identifier (genetic sequence) could
imply high levels of post-translational modification. The annotated transcripts presented in
Chapter 3 of this monograph were related to the EuKaryotic Orthologous group class (KOG-
class) posttranslational modification, protein turnover chaperones in both cell showing high
rates of calcification and low rates of calcification, HC and LC condition, respectively. In the
Haptophyta Prymnesium parvum most of the discovered transcripts also belonged to the KOG-
class posttranslational modification, protein turnover chaperones (Claire, 2006). Therefore,
higher rates of posttranslational modifications could indicate a more general characteristic of
Haptophyta. However, it must be noted that the protein sequences were not directly matched
against the transcripts of the Illumina experiment described in Chapter 3. Here, the consensus
finding was based solely on gene identifier (JGI ID) and protein identifier (UniProt ID). A
sequence based matching of proteome and transcriptome data is future work.
A closer investigation of matching transcripts and proteins potentially involved in calcification
in E. huxelyi based on the protein function showed that V-type proton ATPases and clathrin
were represented in the transcriptomes and proteomes of the HC and LC condition. Vacuolar
proton ATPases and clathrin were previously observed in the proteome of E. huxleyi (Jones et
al., 2011; Jones et al., 2013). Transcripts and peptides matching V-type proton ATPase were
more present in the calcification phase. The proteomes showed an increased relative abundance
of clathrin in the calcification phase. However, the same gene or protein for clathrin was not
matched in the transcriptome and proteome. Furthermore, clathrin transcripts were less
abundant in the HC condition, 355 fpkm compared to 471 fpkm transcripts in the LC conditon.
In the case of clathrin protein and transcript abundance patterns in the HC and LC condition did
not agree. The high presence of clathrin would support the model of Golgi-derived vesicle
mediated growth of the coccolithosome (Jones et al., 2011). The transcriptome showed further
transcripts with high abundance in the calcification phase relating to the vesicle coating
complexes COP I and COP II (e.g. JGI ID: 432215, 57758). The COPI involve clathrin to
transport molecules between the Golgi and the endoplasmic reticulum (McMahon and Mills,
2004). The cell division cell cycle homolog 48 was observed by Jones (2010) in the proteomes
of E. huxleyi and suggested that it could be operating in vesicular transport from the transitional
ER to the Golgi. Cell cycle homolog 48 was also observed in the proteomes of the HC and LC
condition, the late and early G1-phase of the cell cycle. The transcriptome showed 68 transcripts

CHAPTER 4 – THE PROTEOME OF EMILIANIA HUXLEYI AT HIGH AND LOW CALCIFICATION RATES
163
transcribing for 51 different proteins that are involved in vesicle transport (data not presented in
this thesis). The majority of the transcripts related to proteins such as clathrin, vesicle complex
COP I and COP II, and alpha SNAP, a protein required for vesicle fusion. Vesicle transport is
important for coccolithogenesis and it appears that many proteins may be present in E. huxleyi,
which could be involved in vesicle formation, vesicular transport, vesicle fusion, and
coccolithosome merging. However, clathrin and other vesicle transport associated vesicle play a
role in numerous cellular processes.
Conclusions and outlook
This study presents the first results of proteomes of Emiliania huxleyi at different calcification
rates during the G1-phase of the cell cycle. Relative protein quantification shows clear
differences between the highly calcifying and the poorly calcifying phase. Photosynthesis and
calcification related proteins were present in the calcification phase. V-type proton ATPase
proteins and the calcium binding proteins clathrin relevant for biomineralisation were identified
in the calcification phase. The number of matches of proteins and transcripts was low; however
within the range of the suggested 5-10 % of transcripts being translated to proteins (Frith, et al.,
2005). Transcripts in the cells were represented by 7 % of the identified proteins. The direction
of transcript and protein abundance agreed in 34 % of the cases. Albeit the yield of protein
identification using TEAB-buffer for protein extraction was improved compare to previous
studies (Jones et al., 2011; Jones et al., 2013), the observed proteome is likely to present only a
fraction of the actual proteome of Emiliania huxleyi. Future work should address matching the
peptide information directly to the observed transcriptome and aim to apply the most state of the
art mass spectrometry proteomics technique for protein identification. The utilization of the
Orbitrap technology would greatly improve the protein discovery. Furthermore, label-free
quantification methods may provide a more elaborate choice of protein extraction buffer to
increase the knowledge of diurnal proteomes in coccolithophores. These initial novel results of
diurnal proteome characteristics in E. huxleyi should encourage to conduct further experiments
to extend the knowledge of cell cycle proteomes using additional sampling time-points and
improved protein extraction, identification, and quantification protocols.

164

165
Chapter 5. Synopsis and General Discussion
Project summary:
Identifying how marine organisms respond to changes in their environment at the
physiological level is fundamental to understand processes in nature, the ecology of organisms,
and their interactions at larger environmental scales. The motivation for this study was to
investigate the calcification processes of the coccolithophore Emiliania huxleyi because of its
importance for global biogeochemical cycles and to increase the understanding of the
fundamental molecular processes driving calcification in the species and in broader
phytoplankton communities. The high abundance and global distribution and the significant
contribution of coccolithophores to the global carbon cycle have brought them to the focus of
scientific endeavours. In recent decades the potential susceptibility of the carbon pumping by
coccolithophores’ photosynthesis and calcification due to ocean acidification was addressed by
many studies (e.g. Riebesell et al., 2000; Reynaud et al., 2003; Langer et al., 2006; Orr et al.,
2005; Fabry, 2008; Jones et al., 2013). Because biomineralisation in Emiliania huxleyi occurs
internally and cells rarely exceed 5 nm in diameter it has been difficult to study the biology of
coccolithogenesis. Molecular tools have already proven successful in improving our
understanding of biomineralisation in Emiliania huxleyi (e.g. Wahlund et al., 2004a; Nguyen et
al., 2005; van Dassow et al., 2009; Jones et al., 2011; McKew et al., 2013) and the response to
ocean acidification (Richier et al., 2011; Lohbeck et al., 2012; Bach et al., 2013; Jones et al.,
2013).
To better understand the fundamental processes driving calcification, unaltered
biomineralisation properties throughout the cell cycle were investigates by assessing
physiological parameters and a novel combination of whole cell transcriptome and proteome
analysis. First, the cell-cycle phases, calcification rates and rates of photosynthesis in Emiliania
huxleyi PLY♯ M217 were studied over a 24-hour period using flow cytometry and stable carbon
isotope incorporation to resolve appropriate sampling time points at high and low calcification
rates for whole cell transcriptome and whole cell proteome sampling. The cell-cyclic analysis of
DNA content per cell allowed for the separation of the G1-phase from a combined S+G2/M-
phase. The patterns of carbon assimilation showed a clear pattern of maximum calcification
occurring at 9 hours into the photosynthetic light period when coccolith production was found
to reach 1.6 per hour. At 9 hours into the dark phase calcification rates of 19 % of the maximum
calcification rates in the light were observed (see chapter 2). According to the analysis of cell
population growth and DNA content analysis cells were found to be G1-phase of the cell cycle

CHAPTER 5 – SYNOPSIS AND GENERAL DISCUSSION
166
at both sampling times. Dark calcifications rates of 10-15 % were reported in previous studies
(Paasche, 1966; Balch et al., 1992; Nimer an Merrett, 1992; Paasche and Brubak, 1994; Sekino
and Shiraiwa, 1994, 1996). The energy driving the dark calcification was suggested to derive
from mitochondrial respiration (Sekino and Shiraiwa, 1996). Calcification is significantly
enhanced in photosynthesizing cells (Paasche, 2002).
The transcriptome and proteome of Emiliania huxleyi were evaluated with a focus on genes
potentially involved in biomineralisation, which showed significant differential expression
between low and high calcification states of the G1 cell-cycle phase. Three general approaches
were undertaken to explore differential expression relevant to the calcification process in the
two conditions at transcriptome and proteome level: a) using functional KOG-class (euKaryotic
Orthologous groups) annotation groups or GO (gene ontology) groups to retrieve general
expression patterns, b) using a graphical approach to mine for clusters of significant differences
in higher abundant transcripts of biomineralisation genes in each KOG-class, and c) exploring
the differential expression of known biomineralisation relevant genes at peptide and transcript
level. The results have been discussed in respect to calcification physiology in coccolithophores
using the exclusive transcriptome and proteome data and the consensus of transcriptome and
proteome. Here methodological considerations are discussed and the results are put into a larger
context of coccolithophore biology, cell cycle regulated gene expression in Emiliania huxleyi,
and future research implications.
Evaluation of transcriptome analysis approach
The transcripts from the Illumina experiment described in Chapter 3 were matched against the
older JGI Emiliania huxleyi genome version from 23.8.2012 using the Tophat – cufflink
package (Trapnell et al., 2012). Subsequent to this work, a new version of the E. hux genome
has been released and, in future work, the transcripts could be matched against the most recent
version of the E. huxleyi genome (Read et al., 2013) to improve transcript annotations.
Furthermore, it should be thoroughly researched beforehand what features the transcriptome
analysis packages have and what kind of difficulties users have experienced. There are many
publically available molecular expression data analysis tools available through
www.bioconductor.org (Huber et al., 2014). A good choice of the analytical software package
should consider subsequent analysis. In this study it was difficult to apply the data from the
cufflinks output to other analysis tools due to compatibility issues that could not be resolved. An
enrichment analysis functional GO annotation using, for example the topGo R script (Alexa &
Rahnenfuhrer, 2010), was difficult to apply to the cufflinks output. Therefore, the analysis was

CHAPTER 5 – SYNOPSIS AND GENERAL DISCUSSION
167
based on a basic summary of KOG annotations. A functional or pathway analysis might reveal
insights into activated physiological pathways and interacting components. A combined RNA
and protein extraction protocol such as the AllPrep DNA/ RNA/Protein Mini Kit (Qiagen) may
have improved the overall quality of the proteome and transcriptome assessment.
Evaluation of cell harvesting, RNA, and protein extraction approach
RNA and proteins are vulnerable to degrading. The rapid sampling of live cells and RNA
extraction was pivotal for obtaining high quality data. Previous proteomics studies on E. huxleyi
at the National Oceanography Centre, Southampton in collaboration with the Institute for Life
Sciences, University of Southampton showed poorer yields in protein quality, whereas the
assessed proteomes were thought to represent only a part of the actual proteome of E. huxleyi.
Therefore, it was anticipated to accelerate the cell harvesting process and protein extraction. The
MASCOT software successfully fingerprinted Mass spectra of 409 different peptides. The
peptides were successfully matched to 287 different proteins, which is an increase in the
Emiliania huxleyi protein identification yield in an iTRAQ experiment of 250 % compared to
Jones et al. (2013). The accelerated cell harvesting method and the resulting shorter period until
snap freezing may have caused less protein degradation. The cell harvesting method described
in Chapter 3 took 25 to 30 minutes compared to 2 hours in previous studies (Jones et al. 2011;
Jones et al., 2013). Additional acetone wash steps as described in Chapter 3 may have further
improved the protein sample quality. The proteome discovery rate would be greatly improved
using a more advanced mass spectrometry system, such as the Orbitrab®.
Evaluation of proteome analysis approach
The quantitative proteomics approach for Emiliania huxleyi using isobaric tags (iTRAQ) has
been previously established at the Institute for Life Sciences, University of Southampton. The
iTRAQ method returns relative peptide abundance ratios between samples per peptide, from
which relative protein abundance between conditions can be concluded. The relative abundance
lacks information of absolute protein abundance in the cell. Information on absolute or relative
to the absolute proteome peptide abundance would be important to understand the kinetics of
biomineralisation in E. huxleyi. For example, it was estimated that 250,000 SERCA-type Ca2+
ATPase molecules would be required to provide the Ca2+ transport for one-hour’s coccolith
production (Mackinder et al., 2011). However, the Ca2+ transport by SERCA type Ca2+ ATPase
cannot be achieved alone and other Ca2+/H+ exchanger were suggested at other locations,
preferably the endoplasmic reticulum, to achieve the transport kinetics. A more accurate
quantification of protein abundance and diversity and compartmental location in E. huxleyi

CHAPTER 5 – SYNOPSIS AND GENERAL DISCUSSION
168
would be pivotal to better understand the ion transport kinetics. The technical implementation of
truly quantitative proteomics remains challenging. Improved MS/MS proteomics techniques
(e.g. Orbitrap®) are now available, which apply a combination of iTRAQ and unlabelled
proteomics techniques (SWATH-MS) (Basak et al., 2015) or novel isobaric-labelled techniques
using internal heavily labelled standards (Curran et al., 2015). Furthermore, peptide sequences
should be matched directly to the transcript sequences and subsequently matched to the most
recent E. huxleyi reference consensus analysis of proteome and transcriptome. The combination
of a simultaneous DNA/RNA/protein extraction and a label free quantitative proteomics
approach, such as by using normalized counts of MS/MS spectra assigned to a specific peptide,
protein abundances could be estimated and methodological bias from indices application could
be minimized (Schulze and Usadel, 2010; McKew et al., 2013). However, the protein
identification and relative quantification presented here was more successful than previously
reported for an iTRAQ experiment on Emiliania huxleyi (Jones et al., 2010). Out of 403
identified proteins using only the JGI E. huxleyi genome and taxonomically restricted reference
databases 116 peptides showed significantly different abundances between the early and late
G1-phase (dark and light incubation period). Interestingly, more proteins with relative
abundances were significantly higher in the high calcification rate phase (n = 90) compared to
the low calcification rate phase (n = 26).
Dark calcification in the early G1-phase of the cell-cycle
The assessment of calcification rates over 24 hours (Chapter 2) showed detectable
calcification in the dark phase in the range of those previously reported (Paasche, 2002). It was
argued that calcification is restricted to the G1-phase of the cell cycle. However, the existence
of dark calcification in coccolithophores has been discussed. During nuclear division electron
microscopy did not detect coccolith vesicles (van Emburg, 1989). Linschooten et al. (1991)
showed that dark calcification was not detectable in cultures of synchronous cell division using 45Ca as a tracer of biomineralisation. No existence of dark calcification is further supported by
dark calcification only being accountable to cells not undergoing cell division in the dark. As
such phosphorous-limited coccolithophore cultures, with inhibited nuclear division, were
showing dark calcification (Paasche and Brubak, 1994; van Bleijswijk et al., 1994). Dark
calcification requires energy for ion transport and synthesis of cellular structures, which is
supplied from respiration (Sekino and Shiraiwa, 1996). Transcription and protein synthesis also
require energy through hydrolysis of ATP (Snustad and Simmons, 2000; Robinson and Oijen,
2013). The observed transcript abundance shows that high rates of transcription occurred in the
early-G1 (experimental low calcification) phase in the E. huxleyi cultures, which suggests

CHAPTER 5 – SYNOPSIS AND GENERAL DISCUSSION
169
sufficient ATP availability. Therefore, it can be hypothesized that cohorts of old and new
generation of the cells performed the observed dark calcification, which were in the early G1-
phase. The results from the DNA content analysis support that the cell cycle of the cell
population was not synchronised. If we assume, that a fraction of the cell population was always
in the G1-phase and that proteins relevant to the calcification process were present the
observation of dark calcification throughout the dark incubation period is explained. A high
abundance of calcification specific transcripts in the early G1-phase and the nature of
cytokinesis, by which ER and Golgi networks are distributed equally between daughter cells,
further support that the proteins and calcification pathways were present at all times. The
available proteome data also shows that, for example the V-type ATPase proton transporter and
clathrin were present in the early G1-phase (compare Table 4.10). The raw MASCOT data from
the iTRAQ experiment suggests that a total of 23 V-type proton ATPases matching peptides and
10 clathrin peptides were counted in both conditions (data not shown). The average protein
abundance ratios were 0.847 for type proton ATPases and 0.664 for clathrin relative to the early
G1-phase, which would suggest that some of these proteins were present a could provide low
rates of calcium carbonate production. If cell structures and proteins were present and
synthesized in the early G1-phase a molecular biomineralisation machinery of smaller size
could be present in the cells, contributing to rates of dark calcification. It could be argued that
the observed biomineralisation peptides in the dark incubation period originated from those
cells, which did not pass cell division. However, the observed growth rates in this study
indicated that the cell population more than duplicated (average 2.4 fold, see section 2.3.1) over
the course of 24 hours, making it unlikely that cells were not passing through the S + G2/M
phase. Furthermore, during mitosis the proteins and cell structures are divided between the
daughter cells. Paasche (2002) noted that respiratory CO2 production would oppose calcification
in the absence of photosynthesis. However, E. huxleyi has a high internal buffering capacity for
CO2 and takes up external CO2 as its primary source for photosynthesis to reach maximum POC
production rates. Furthermore, bicarbonate was found to be the primary source for PIC
production and elevated CO2 did not affect calcification (Bach et al., 2013). The additional CO2
formed during dark calcification and respiration might be transported to the chloroplast or
buffered in the cytosol. This argument would support an effective dark calcification, which is
driven by the remaining and newly developing molecular biomineralisation machinery in the
targeted cell phase. To verify the observation of dark calcification the redevelopment of the CV
could be observed using cross-polarized light microscopy and electron microscopy alongside
isotope incorporation. Additional sampling point at which proteomes and transcriptomes are
analyzed could greatly improve our understanding of the natural gene expression and existing
molecular pathway in the cell cycle of E. huxleyi.

CHAPTER 5 – SYNOPSIS AND GENERAL DISCUSSION
170
Transcriptome and proteome patterns related to calcification in different stages of
Emiliania huxleyi G1-phase showing high calcification and low calcification rates
Cell cycle-specific transcription, targeted proteolytic degradation, and protein modification
are regulators of cell cycle progression (Cardone and Sassone-Corsi, 2003). Chauton et al.
(2013) showed high periodicity in gene regulation of carbon fixation, storage, and utilization in
the diurnal cycle related genes of the diatom Phaeodactylum tricornutum. Hence, a cell-cycle
regulation of gene expression related to calcification in Emiliania huxleyi was expected. The
transcriptome profiles from the light and dark incubation period from this study showed
significant differential expression. Interestingly, the transcriptome in the dark was 20 % larger
showing 19093 transcripts compared to 15310 transcripts in the light. This overall pattern of
higher transcript abundance in the dark is also reflected in, for example, the unique transcripts
observed at the dark and light sampling point, the higher abundance of transcripts belonging to
V-type-proton ATPases, SERCA-type calcium ATPases, and Na+ - dependent Ca2+ exchanger
(NCKX and NCX) (see Chapter 3 for details) in cells of the early G1-phase cells (dark period).
The finding of higher transcript abundance and significant differential expression of genes
potentially involved in calcification process in the dark is intriguing at first, knowing that the
bulk of calcification in coccolithophores is linked to the light period. Statistical analysis showed
that, 11 and 22 genes, with link to processes involved in calcification, were significantly higher
expressed in highly calcifying and low calcifying cells, respectively. The majority of
significantly expressed genes in the calcification phase indicated that calcium binding proteins
such as calreticulin, calnexin, and calmodulin are continuously highly expressed in the light.
Calreticulin transcripts, for example, were 8-fold more abundant in the light, at1516 fpkm.
Calcium binding protein seem to be in high demand in the light phase, which suggests that
continuous synthesis is required because the molecules are lost during coccolithophogenesis.
Cell cycle phase specific gene expression is widely supported in the scientific literature (e.g.
Rustici et al, 2004; Kanesaki et al., 2012; Bastajian et al., 2013), and is triggered by external
‘zeitgeber’, such as the light/dark cycle (Lorenzen, 1957). The periodicity of gene expression
was also found to be cell cycle-phase specific for mitochondria, chloroplast, and cell nucleus in
the in the Unicellular Red Alga Cyanidioschyzon merolae; whereas, for example, the cmdnm2
gene involved in plastid division was higher expressed in the G2/M phase and the ftsZ2-1 and
ftsZ2-2 gene, involved in mitochondrial division, in the S phase (Fujiwara et al., 2009). In the
diatom Phaeodactylum tricornutum microarray analysis from 8 sampling times showed
differential gene expression for 44 % of the whole transcriptome, with highest transcriptional
activity during the day. Six clusters of genes with differential expression and dominant

CHAPTER 5 – SYNOPSIS AND GENERAL DISCUSSION
171
physiological pathways were identified. Chloroplast and nucleus-encoded ribosomal genes were
upregulated in the light, heat shock proteins, chaeperones, and proteins involved in protein
modification/degradation were upregulated at midday, and proteins of cellular processes such as
carotenoid, chlorophyll, and fatty acid synthesis were down-regulated during night time, for
example (Chauton et al., 2013). The synchronisation of the circadian clock and the
environmental light - dark rhythm improves the physiological performance of photosynthetic
organisms (Green et al., 2002; Dodd et al., 2005; Winjen et al., 2006b). Therefore, it is an
energetic advantage, especially for photosynthetic cells, to establish the physiological networks
before the next illumination period.
The diurnal periodicity of gene expression in E. huxleyi is hardly known. Gene expression
studies using the dark phase as sampling point were focussing on three biomineralisation genes
(Richier et al, 2009). In this study, it was concluded that the majority of the cell populations at
the dark and light sampling points were in stages of the G1-phase (see Figure 2-4D), the late
and early G1-phase, respectively. As calcification in coccolithophores is restricted to the G1-
phase but increases significantly in photosynthesizing cells (Paasche 2000), the presence of
gene expression related to calcification was expected. However, the results presented in this
study are a novelty as they show that the larger number of known biomineralisation genes are
more highly expressed in the early G1-phase (dark period). The significantly higher expression
of, for example, gene 354606 (probable K+ dependent Ca2+/Na+ exchanger), gene 463095
(SERCA - calcium-transporting ATPase 4), and 109061 (calmodulin-like protein 5 / CLP 5) in
the dark would suggest that the proteins are not involved in calcification processes (see
Appendix A Table 7 and 8). WolfPSort (Horton et al., 2007) identifies the ER as the location of
the probable K+ dependent Ca2+/Na+ exchanger (gene 354606, UniProt ID: Q9VN12) and
SERCA - calcium-transporting ATPase 4 (gene 463095, UniProt ID: Q9XES1). The
calmodulin-like protein 5 / CLP 5 (gene 109061, UniProt ID: Q9NZT1) is of mitochondrial
location by WolfPSort. Therefore, the observed high general gene expression and high
expression of calcification related genes reflected the re-construction of molecular machinery
that was separated during cytokinesis. Golgi stacks, endosplasmic reticulum, ribosomes,
mitochondria and chloroplasts are known to be equally partitioned between daughter cells
during cytokinesis (Nebenfuhr et al., 2000; Puhka et al., 2007). Following cytokinesis the ER
and Golgi membranes are synthesized, as the ribosomal-ER-Golgi cell physiological network is
pivotal for protein translation and posttranslational protein modifications. In E. huxleyi
calcification the ER and Golgi-apparatus are important in Ca2+ rich coccolithosome production
that is pivotal for the precipitation of the coccolith in the coccolith vesicle. These networks also
ensure that at dawn efficient photosynthetic carbon assimilation can render cell growth and

CHAPTER 5 – SYNOPSIS AND GENERAL DISCUSSION
172
accumulation of energy reserves for passing cell division check points of the next cell division
cycle (Green et al., 2002; Dodd et al., 2005; Winjen et al., 2006b; Zachleder et al., 2016). The
ER and mitochondria related gene expression showed periodicity in cell-cycle of C. merolae
(Fujiwara et al., 2009) and it can be assumed that cell organelle related gene expression occurs
also in periodic waves throughout the cell cycle of E. huxleyi. The elevated gene expression of
proteins related to biomineralisation is coherent with the post cytokinesis G1-phase
characteristics of gene expression. Even the relatively high levels of calmodulin transcript
abundance in the dark period (~1650 fpkm), support the synthesis of the ER networks in the
early G1-phase, as calmodulin is an important component in maintaining high Ca2+
concentrations of the ER lumen.
Interestingly, more proteins with relative abundances were significantly higher in the late
G1-phase (n = 90) compared to the early G1-phase (n = 26). This observation stands in contrast
to the observed pattern of transcript abundance. The identified significantly more abundant
proteins in the light were mainly involved in processes related to photosynthesis (photosystem
II) and ATPase proton transport as indicated by counts of proteins’ function, subcellular
location, and GO cellular component annotations. The predicted locations of the proteins
identified to be relatively more abundant in the light were the chloroplast, cytoplasma, Golgi
apparatus, and plasma membrane. In the dark period proteins with higher relative abundance of
nucleosome and microtubule origin were more common. The proteome of the light reflected the
general catalytic activity in the photosynthesis phase and given by the higher relative abundance
proton transporting ATPases and clathrin calcification and coccolithogenesis. Vacuolar proton
ATPases and clathrin were previously observed in the proteome of E. huxleyi (Jones et al.,
2011; Jones et al., 2013). Both proteins may be directly associated in clathrin coated vesicles
(Forgac, 2000). However, both proteins have functions in a variety of cellular processes and
locations. Clathrin is generally the primary component of endocytic transport systems (Takei
and Hauke, 2001) and was also found to be highly expressed in the diatom Thalassiosira
pseudonana (Nunn et al., 2009). Clathrin has a versatile function in processes such as
endocytosis events that induce nutrient availability, growth of cell structures, protein transport,
stabilization of forming vesicles, and the reformation of synaptic vesicles (Kirchhausen 2000;
Takei and Hauke, 2001; Nunn et al., 2009). Synaptic vesicle recycling is also mediated by
clathrin (Marks and McMahon, 1998). The precise function of clathrin in coccolithophores
remains speculation. However, it can be assumed that clathrin coated vesicles may play a
significant role in the vesicle transport by coccolithosomes to the coccolith vesicle. Jones (2010)
also observed clathrin and COP in the proteomes of E. huxleyi and suggested that it could be
operating in vesicular transport from the transitional ER to the Golgi. Furthermore, V-type

CHAPTER 5 – SYNOPSIS AND GENERAL DISCUSSION
173
ATPases have been shown to be important for the acidification of cellular compartments, such
as neuron (Moriyama et al., 1992) and were proposed to contribute to acidification of the trans-
Golgi network in Arabidopsis (Dettmer et al., 2006). If clathrin-coated vesicles are associated
with V-type ATPase in Emiliania huxleyi they could be involved in the acidification of the
Golgi-derived coccolithosomes.
New insights into the calcification mechanisms and gene expression patterns in E.
huxleyi from the synchronous study of the transcriptome and proteome at a
different calcification levels (low and high) of the G1 phase
The proteome and transcriptome results of the calcification phase have so far accentuated the
importance of four functional proteins categories for coccolithophore calcification: calcium
binding proteins, clathrin-coated vesicle transport, membrane fusion, and proton-transport,
which can be considered to propose a model for vesicular transport of Ca2+ to the coccolith
vesicle. Calcium binding proteins, such as calmodulin and calreticulin have a higher affinity to
Ca ions in acidic conditions (Yoo and Lewis, 1992; Nash et al., 1994) and can bind up to 25
moles of Ca2+ per mol calreticulin (Baksch and Michalak, 1991). Calreticulin changes into a
tetramer in low pH with increased mass, with increasing Ca2+ binding capacity (Yoo and Lewis,
1992) and has high capacity low affinity Ca2+ binding characteristics (Corbett and Michalak,
2000). Calreticulin and other calcium binding proteins are associated and abundant in the Golgi
network and endoplasmic reticulum, which act as a Ca-ion buffering structure in cells and
modulates the uptake and release of Ca2+ in the endoplasmic reticulum (Corbett and Michalak,
2000; Arnaudeau 2002). Calcium loaded calreticulin could be included in coccolithosomes that
are released from the trans-Golgi. The vesicle-like coccolithosome membrane could be clathrin
coated (Takei and Hauke, 2001) and therefore contain numerous V-type proton ATPases.
Clathrin coated vesicles originating from the Golgi were previously identified (Orci et al.,
1986). Mackinder et al. (2011) suggested that a down-regulation of V-type proton ATPase
could promote calcium carbonate precipitation under supersaturated conditions of Ca2+ and
HCO3- and at pH 7.2. Calreticulin was found to change to a monomer under more alkaline
conditions and suggested to release calcium (Yoo and Lewis, 1992). Active V-type proton
ATPase could stabilize calreticulin and other calcium binding proteins at high calcium binding
capacities during trans-cytosolic migration to the CV. Clathrin and COP I, COP II, and SNARE
complexes may assist in the fusion of coccolithosome and coccolith vesicle membranes. The
CV might already show higher pH during this fusion. The V-type ATPases are at some point
down-regulated in the CV membranes to develop a more alkaline environment for calcium
carbonate precipitation. V-type proton ATPases were found to have peripheral complex

CHAPTER 5 – SYNOPSIS AND GENERAL DISCUSSION
174
V1 (Arai, 1989). The integral membrane complex membrane V0 and peripheral V1 complex are
easily dissociated reducing proton pumping across the membrane to a minimum (Kane, 1995;
Beyenbach and Wiezorek, 2006), which could regulate the pH of the CV in favour for calcium
carbonate precipitation if the CV maintained a cytoplasmic-side negative membrane potential
(Mackinder et al., 2011). The results presented here strongly suggest the requirement of V-type
proton ATPase, calcium binding proteins, and membrane fusion complexes, which would be
required for the above scenario. Future research on E. huxleyi calcification should attempt to
elucidate the location of calreticulin in the cell. A remaining questions, which may be very hard
to address experimentally, should address the differences of pH and composition of the
coccolithosomes to the CV. A lower pH value in the coccolithosomes than the CV would
support the above-proposed model that coccolithosomes carry higher loads of Ca2+ due to
calreticulin in acidified conditions.
Furthermore, the molecular results indicate some interesting characteristic of cell-cyclic gene
expression in E. huxleyi. The transcriptome analysis identified a few genes that transcribed for
the same protein but, interestingly, showed preferred expression in the early-G1-phase or late
G1-phase. Thus suggesting that different promoter sites and different gene regulation pathways
activated gene expression regulation. For example, the endoplasmic reticulum-type calcium
transporting ATPase 4 Q9XES1 was expressed by three genes (251608, 429294, 463095).
Genes 251608 and 429294 were dominantly expressed in the late G1-phase in highly calcifying
cells, whereas gene 463095 was expressed almost exclusively in the early G1-phase (dark
incubation period) when cell compartments like the endoplasmic reticulum were complemented
after cytokinesis (compare Appendix A Table 7). A more detailed investigation of the
transcriptome might reveal more such cases. Gene expression transcribing the same protein also
showed genes that with higher expression than others. For example, the expression of six genes
transcribing for V-type proton ATPase 16 kDa proteolipid subunit Q43362 were observed to
show higher transcript abundance in the early G1-phase. Among those, gene 359783 was at
least 3 times higher expressed than any other gene transcribing for Q43362. It is unclear if an
elevated physiological or environmental key could trigger higher expression of the other genes
and if all genes transcribing for Q43362, for example, could provide the same maximum
transcription rate. The outstanding cap analysis of gene expression will provide additional
insights in differences of gene expression patterns in the early and late G1-phase. A higher
plasticity of the transcriptome in respect to elevating the expression of genes that are not
transcribed at maximum rates, such as the V-type proton ATPases, suggests that E. huxleyi has a
potential to compensate for calcification altering effects of ocean acidification. In fact, after 500
generations of ocean acidification exposure E. huxelyi cells were found to show an adaptive

CHAPTER 5 – SYNOPSIS AND GENERAL DISCUSSION
175
response, which included a putative vacuolar type two-sector proton pump (Lohbeck et al.,
2014).
Concluding remarks and future work
The original outline of the project anticipated sampling a natural coccolithophore bloom, to
improve existing protocols of Emiliania huxleyi proteomics, and to find transcriptome and
proteome matches. The data presented and discussed in this monograph represents only a
fraction of the information that the whole cell transcriptomic and whole cell proteomic results
hold. Future, investigations should address functional network and predict the location of the
identified proteins. Furthermore, a great deal of data that was assessed during this PhD has not
been used in the framework of this PhD thesis. Due to time constraints, the metatranscriptomic
assessment of a natural Emiliania huxleyi bloom in Raunefjorden, Norway has not been fully
analysed and was not presented here; this work, among others, is on going.
The investigation of the transcriptome and proteome of unaltered diurnal biomineralisation
patterns has shown that multiple genes of homologous groups are expressed at different times
during the cell cycle. The observations imply that a bulk of proteins involved in coccolithophore
calcification, such as V-type-proton ATPases, SERCA-type calcium ATPases, and Na+ -
dependent Ca2+ exchanger (NCKX and NCX) are expressed in the early G1-phase of the cell
cycle and that ribosomal synthesis of these proteins occurs shortly after. Furthermore, the early
expression of the biomineralisation genes implies that they are part of compartmental systems
and organelles that are maturing in the early G1 phase. To decipher the molecular machinery at
the core of biomineralisation it is critical to further engage studies using modern genomic,
transcriptomic, proteomic and metabolomic techniques that target explore the expression and its
control (e.g. promoter expression analysis) additional time points throughout the cell cycle.
Chauton et al. (2013) have provided an example for cyclic diurnal gene expression study that
suggested clusters of genes that are expressed at different times throughout the cell cycle. A
similar study and molecular analysis could be conducted on coccolithophores. Furthermore,
knockout, knockdown and overexpression of genes, which have become apparent in this study,
should help to confirm the role of the genes putatively identified herein as being important for
biomineralisation. An analysis of gene expression, proteome patterns and calcification under
conditions of specifically knocked out ion transporter genes should help to differentiate between
a core set of ion transporter genes involved in calcification (core set) and secondary pathways.
Knockout or transformation techniques are now more widely available and have been more
frequently applied in marine species, such as Nannochloropsis gaditana to enhance their

CHAPTER 5 – SYNOPSIS AND GENERAL DISCUSSION
176
potential use in biofuel production (Radakovits et al., 2012). Such transformation techniques are
needed in coccolithophores to understand the fundamental mechanisms driving calcification. In
respect to the response of coccolithophores to ocean acidification a CO2 exposure experiment
could illuminate, if the early expression of biomineralisation proteins increases under CO2 or if
the responses occur with increasing rates of calcification during the light period. Such an
experiment may also help to decipher which genes that are involved in calcification are
activated as a response to elevated CO2 and which genes are more likely expressed because they
function in cellular compartments. The results presented in this study – the cell cycle phase of
sampling greatly matters when drawing conclusions from gene expression studies that address
biomineralisation - should be considered in the design of future experiments, in particular those
addressing the response to ocean acidification and adaptation to global change. Further
fundamental assessments of the calcification physiology at different cell cycle phases will
improve the understanding of the level at which adaptive processes to ocean acidification in
coccolithophores occur. Lohbeck et al. (2014) showed that after 500 generations of CO2
exposure Emiliania huxleyi showed an adaptive response and was able to reestablish partly the
calcification and growth rates. At a molecular level the adaptive response was observed as up-
regulation of genes of interest involved in pH regulation and carbon transport. As this study has
shown there are multiple genes that are active in processes, which could be important for
calcification and those genes may be expressed at an early stage of the cell cycle. It would be
most interesting to investigate how the adaptive processes are reflected in selected promoter
enhancement and transcriptome plasticity (transcribing at maximum gene expression rates) of
genes that are not fully expressed under ambient CO2 and whether or not the adaptive changes
are reflected in early G1-phase cells or in photosynthesizing cells of the late G1-phase. Early
G1-phase adaptive changes would suggest an “evolutionary” response in E. huxleyi to altering
ocean acidity because the extend of the ER and Golgi apparatus are improved, for example.
Changes of gene expression related to calcification in photosynthesizing cells of the late G1-
phase would indicate an improvement of the physiological pathways under photosynthetic
enhancement of the calcification process. Such insights would increase our detailed knowledge
of the molecular adaptation of E. huxleyi to the future high CO2 world and furthermore, help to
improve estimating the changes in future calcite production and the global carbon cycle.

CHAPTER 5 – SYNOPSIS AND GENERAL DISCUSSION
178

179
Appendices
Appendix A - Supplementary results - Chapter 3 - The transcriptome of Emiliania huxleyi at high and low calcification rates in the G1-phase
Physiological data: Appendix A Table - 1: Statistical results comparing the physiological data from the day before cell harvesting with the day of harvesting and the late and the early G1-phase. (KWA: Kruskal-Wallis ANOVA).
Parameter Comparison test n d.f. F-statistics H-statistics
p-value
Fv/Fm full ANOVA 12 3,8 F= 2.153 0.172
POC full KWA 8 3 H= 3.667 0.381
PON full KWA 8 3 H= 2.833 0.543
PIC full ANOVA 12 3,8 F= 3.212 0.083
C:N full KWA 8 3 H= 4.167 0.324
PIC:POC full KWA 8 3 H= 5.500 0.139

180 Tr
ansc
ripto
mic
s da
ta:
App
endi
x A
Fig
ure
1: T
rans
crip
t abu
ndan
ce b
y K
EGG
-pat
hway
cla
sses
for E
mili
ania
hux
leyi
cel
ls s
how
ing
high
and
low
cal
cific
atio
ns in
the
G1-
phas
e.

181 A
ppen
dix
A T
able
- 2:
Uni
que
trans
crip
ts in
hig
hly
calc
ifyin
g ce
lls o
f the
late
G1-
phas
e .
Uni
que
trans
crip
ts o
f the
late
JG
I/gen
e-ID
G1-
phas
e fp
km in
late
G
1-ph
ase
q_va
lue
Sig.
U
niPr
ot ID
Fu
nctio
n - /
XLO
C_0
2077
2 22
28.5
9 0.
2242
no
-
- - /
XLO
C_0
1981
8 59
2.35
0.
0917
no
-
- - /
XLO
C_0
2910
1 36
5.22
0.
2379
no
-
- - /
XLO
C_0
0695
6 32
5.07
0.
1550
no
-
- - /
XLO
C_0
3907
5 15
4.93
0.
0847
no
-
- - /
XLO
C_0
2433
4 68
.95
0.12
83
no
- -
- / X
LOC
_039
067
56.4
9 0.
0715
no
-
- - /
XLO
C_0
2251
1 46
.63
0.02
58
yes
- -
- / X
LOC
_018
847
45.7
6 0.
0135
ye
s -
- 35
2298
/ X
LOC
_008
894
44.2
5 0.
0293
ye
s -
- - /
XLO
C_0
2433
5 43
.29
0.04
52
yes
- -
- / X
LOC
_001
410
42.9
4 0.
0547
no
-
- - /
XLO
C_0
1513
9 33
.11
0.05
68
no
- -
- / X
LOC
_007
296
30.7
9 0.
1009
no
-
- - /
XLO
C_0
0084
5 24
.16
0.13
36
no
- -
- / X
LOC
_034
717
24.1
6 0.
1336
no
-
- - /
XLO
C_0
2191
3 24
.01
0.01
14
yes
- -
- / X
LOC
_031
851
23.8
9 0.
0446
ye
s -
- - /
XLO
C_0
1519
9 23
.42
0.11
28
no
- -
- / X
LOC
_003
721
20.5
5 0.
0612
no
-
- - /
XLO
C_0
0271
1 20
.42
0.03
51
yes
- -
- / X
LOC
_015
880
19.3
5 0.
1170
no
-
- 10
0679
/ X
LOC
_018
351
18.6
1 0.
0788
no
F0
Y85
4 Ex
pres
sed
prot
ein
- / X
LOC
_026
071
17.3
9 0.
0135
ye
s -
- - /
XLO
C_0
0729
5 16
.91
0.12
02
no
- -

182 U
niqu
e tra
nscr
ipts
of t
he la
te
JGI/g
ene-
ID
G1-
phas
e fp
km in
late
G
1-ph
ase
q_va
lue
Sig.
U
niPr
ot ID
Fu
nctio
n - /
XLO
C_0
1474
2 15
.20
0.06
79
no
- -
2500
18 /
XLO
C_0
4017
0 14
.50
0.01
30
yes
Q5U
P03
Puta
tive
hom
eobo
x pr
otei
n R
749
4446
3 / X
LOC
_018
334
13.9
7 0.
0865
no
Q
8LIG
4 C
BL-
inte
ract
ing
prot
ein
kina
se 3
25
5559
/ X
LOC
_024
876
13.0
1 0.
1927
no
-
- - /
XLO
C_0
0271
0 12
.42
0.04
54
yes
- -
- / X
LOC
_010
612
12.0
6 0.
0167
ye
s -
- - /
XLO
C_0
1232
8 11
.96
0.10
70
no
- -
- / X
LOC
_030
958
10.3
4 0.
0162
ye
s -
- - /
XLO
C_0
1090
0 10
.28
0.02
87
yes
- -
- / X
LOC
_008
618
9.88
0.
0271
ye
s -
- - /
XLO
C_0
4206
5 9.
88
0.17
00
no
- -
- / X
LOC
_007
297
8.86
0.
1472
no
-
- - /
XLO
C_0
1988
3 8.
79
0.04
09
yes
- -
2255
51 /
XLO
C_0
0537
1 8.
63
0.00
96
yes
Q4V
8B1
Prot
on-c
oupl
ed a
min
o ac
id
trans
porte
r 3
- / X
LOC
_004
089
8.54
0.
1875
no
-
- - /
XLO
C_0
1089
6 8.
46
0.15
23
no
- -
4481
3 / X
LOC
_006
798
8.27
0.
0841
no
P5
2046
3-
hydr
oxyb
utyr
yl-C
oA
dehy
drat
ase
2358
19 /
XLO
C_0
1660
5 7.
70
0.07
81
no
E1ZM
53
Puta
tive
unch
arac
teriz
ed p
rote
in
3580
42 /
XLO
C_0
3461
1 7.
68
0.17
63
no
- -
- / X
LOC
_022
048
7.28
0.
0736
no
-
- 31
7194
/ X
LOC
_038
198
6.98
0.
2272
no
-
- - /
XLO
C_0
0472
2 6.
76
0.12
34
no
- -
- / X
LOC
_016
788
6.44
0.
0279
ye
s -
- - /
XLO
C_0
3546
9 6.
33
0.15
68
no
- -
- / X
LOC
_017
020
6.16
0.
1266
no
-
- 20
1176
/ X
LOC
_005
902
5.97
0.
0204
ye
s -
-

183 U
niqu
e tra
nscr
ipts
of t
he la
te
JGI/g
ene-
ID
G1-
phas
e fp
km in
late
G
1-ph
ase
q_va
lue
Sig.
U
niPr
ot ID
Fu
nctio
n 22
5228
/ X
LOC
_005
039
5.95
0.
0668
no
-
- - /
XLO
C_0
1753
5 5.
72
0.14
77
no
- -
- / X
LOC
_031
076
5.63
0.
0249
ye
s -
- - /
XLO
C_0
3941
6 5.
62
0.02
36
yes
- -
2089
91 /
XLO
C_0
2522
8 5.
59
0.06
15
no
- -
- / X
LOC
_037
632
5.31
0.
0874
no
-
- 21
3562
/ X
LOC
_032
951
5.08
0.
0783
no
-
- - /
XLO
C_0
1876
6 4.
98
0.07
15
no
- -
- / X
LOC
_007
057
4.83
0.
0876
no
-
-
4444
2 / X
LOC
_013
259
4.71
0.
0820
no
Q
93V
D3
CB
L-in
tera
ctin
g se
rine/
thre
onin
e-pr
otei
n ki
nase
23
5948
6 / X
LOC
_033
585
4.60
0.
7657
no
P2
3253
Si
alid
ase
- / X
LOC
_032
599
4.43
0.
0388
ye
s -
- - /
XLO
C_0
1035
6 4.
38
0.10
77
no
- -
- / X
LOC
_008
965
4.29
0.
0828
no
-
- 24
3770
/ X
LOC
_026
235
3.95
0.
1367
no
-
- 21
9951
/ X
LOC
_040
503
3.88
0.
0513
no
-
- 24
2647
/ X
LOC
_025
007
3.83
0.
0805
no
-
- 99
134
/ XLO
C_0
1127
3 3.
79
0.07
04
no
P524
09
Glu
can
endo
-1,3
-bet
a-gl
ucos
idas
e
4428
81 /
XLO
C_0
1490
8 3.
73
0.11
15
no
B8G
AY
2 tR
NA
(gua
nine
-N(7
)-)-
met
hyltr
ansf
eras
e 43
2890
/ X
LOC
_036
316
3.70
0.
1640
no
Q
99PI
5 Ph
osph
atid
ate
phos
phat
ase
LPIN
2 - /
XLO
C_0
1728
3 3.
68
0.03
23
yes
- -
2603
14 /
XLO
C_0
0242
5 3.
67
0.12
96
no
Q0A
S57
Pept
idas
e S1
and
S6,
ch
ymot
ryps
in/H
ap (P
recu
rsor
) - /
XLO
C_0
0611
9 3.
64
0.14
04
no
- -
- / X
LOC
_033
682
3.61
0.
0770
no
-
- - /
XLO
C_0
3973
1 3.
60
0.07
36
no
- -

184 U
niqu
e tra
nscr
ipts
of t
he la
te
JGI/g
ene-
ID
G1-
phas
e fp
km in
late
G
1-ph
ase
q_va
lue
Sig.
U
niPr
ot ID
Fu
nctio
n - /
XLO
C_0
0857
3 3.
59
0.16
72
no
- -
- / X
LOC
_007
061
3.38
0.
0998
no
-
- - /
XLO
C_0
0729
4 3.
37
0.09
79
no
- -
- / X
LOC
_027
620
3.14
0.
0585
no
-
- - /
XLO
C_0
2350
9 3.
10
0.05
46
no
- -
3091
64 /
XLO
C_0
0289
9 2.
98
0.05
48
no
- -
2123
82 /
XLO
C_0
3146
5 2.
89
0.07
82
no
P479
80
Prot
ein
TIS1
1 35
7004
/ X
LOC
_031
810
2.86
0.
1074
no
-
- 23
6785
/ X
LOC
_017
870
2.68
0.
0769
no
P1
8126
En
dogl
ucan
ase
B
2606
25 /
XLO
C_0
0374
3 2.
64
0.50
47
no
- -
- / X
LOC
_029
150
2.56
0.
1853
no
-
- 23
6638
/ X
LOC
_017
485
2.53
0.
5858
no
Q
7ZV
E6
KD
EL m
otif-
cont
aini
ng p
rote
in 1
2059
77 /
XLO
C_0
1840
5 2.
48
0.01
28
yes
O64
624
Pent
atric
opep
tide
repe
at-
cont
aini
ng p
rote
in A
t2g1
8940
7038
1 / X
LOC
_004
911
2.46
0.
4439
no
Q
8GZ2
4 Pu
tativ
e un
char
acte
rized
pro
tein
A
t1g6
7060
/F1O
19_7
- /
XLO
C_0
3235
2 2.
45
0.06
94
no
- -
3687
20 /
XLO
C_0
2315
8 2.
44
0.05
99
no
- -
1146
81 /
XLO
C_0
1663
8 2.
24
0.09
72
no
- -
- / X
LOC
_033
459
2.15
0.
0990
no
-
- 10
1089
/ X
LOC
_019
781
2.14
0.
2364
no
F0
YC
E4
Puta
tive
unch
arac
teriz
ed p
rote
in
4602
67 /
XLO
C_0
4227
8 2.
13
0.73
76
no
- -
- / X
LOC
_016
541
2.10
0.
1596
no
-
- - /
XLO
C_0
2010
7 2.
09
0.09
71
no
- -
6608
0 / X
LOC
_028
085
2.06
0.
7310
no
Q
8WX
R4
Myo
sin-
IIIb
22
5509
/ X
LOC
_005
361
2.01
0.
2170
no
-
-
2389
19 /
XLO
C_0
2018
2 2.
00
0.55
98
no
Q7X
UR
2 Ly
sine
-spe
cific
his
tone
de
met
hyla
se 1
hom
olog
3

185 U
niqu
e tra
nscr
ipts
of t
he la
te
JGI/g
ene-
ID
G1-
phas
e fp
km in
late
G
1-ph
ase
q_va
lue
Sig.
U
niPr
ot ID
Fu
nctio
n 70
033
/ XLO
C_0
0332
9 1.
98
0.10
59
no
Q5U
R67
U
ncha
ract
eriz
ed p
rote
in R
617
- / X
LOC
_027
592
1.93
0.
1710
no
-
- 98
132
/ XLO
C_0
0595
9 1.
83
0.03
88
yes
A0P
LM4
Tran
scrip
tiona
l reg
ulat
ory
prot
ein
2086
52 /
XLO
C_0
2473
7 1.
79
0.25
11
no
C1N
072
Pred
icte
d pr
otei
n 23
8888
/ X
LOC
_020
156
1.78
0.
4115
no
Q
7VE2
4 A
deny
lyl-s
ulfa
te k
inas
e 35
3266
/ X
LOC
_014
417
1.75
0.
5695
no
-
- 10
7915
/ X
LOC
_042
479
1.73
0.
0689
no
Q
9Z1J
8 SE
C14
-like
pro
tein
3
3693
73 /
XLO
C_0
2495
1 1.
71
0.03
90
yes
- -
- / X
LOC
_017
838
1.70
0.
1686
no
-
-
2499
53 /
XLO
C_0
3994
1 1.
67
0.01
53
yes
O64
624
Pent
atric
opep
tide
repe
at-
cont
aini
ng p
rote
in A
t2g1
8940
23
4824
/ X
LOC
_015
193
1.65
0.
1199
no
-
- 22
4967
/ X
LOC
_004
763
1.63
0.
1550
no
-
-
4390
62 /
XLO
C_0
4143
2 1.
57
0.54
86
no
P599
68
Unc
hara
cter
ized
tRN
A/rR
NA
m
ethy
ltran
sfer
ase
Mb0
905
1953
28 /
XLO
C_0
2165
7 1.
56
0.22
62
no
- -
4391
35 /
XLO
C_0
4183
2 1.
56
0.37
94
no
- -
5554
4 / X
LOC
_038
225
1.48
0.
1340
no
Q
9ZU
I0
Puta
tive
leuc
ine-
rich
repe
at
rece
ptor
-like
serin
e/th
reon
ine-
prot
ein
kina
se A
t2g2
4130
20
9316
/ X
LOC
_025
921
1.46
0.
6886
no
-
- 22
8876
/ X
LOC
_009
104
1.45
0.
5235
no
-
- 35
9059
/ X
LOC
_037
819
1.42
0.
1057
no
-
- 19
4425
/ X
LOC
_000
234
1.41
0.
7671
no
E9
C98
2 Sj
ogre
n sy
ndro
me
antig
en B
99
618
/ XLO
C_0
1370
7 1.
39
0.12
31
no
Q6A
ZT7
Nep
hroc
ystin
-3
- / X
LOC
_004
217
1.36
0.
0629
no
-
- 23
8542
/ X
LOC
_019
899
1.34
0.
0890
no
-
- 25
9646
/ X
LOC
_042
244
1.33
0.
3827
no
-
-

186 U
niqu
e tra
nscr
ipts
of t
he la
te
JGI/g
ene-
ID
G1-
phas
e fp
km in
late
G
1-ph
ase
q_va
lue
Sig.
U
niPr
ot ID
Fu
nctio
n
5338
1 / X
LOC
_028
567
1.31
0.
0751
no
Q
9FY
A6
Bra
nche
d-ch
ain-
amin
o-ac
id
amin
otra
nsfe
rase
5, c
hlor
opla
stic
11
8001
/ X
LOC
_025
412
1.29
0.
0743
no
-
- 31
4118
/ X
LOC
_010
560
1.27
0.
2436
no
P5
2409
G
luca
n en
do-1
,3-b
eta-
gluc
osid
ase
- / X
LOC
_023
365
1.26
0.
1724
no
-
- - /
XLO
C_0
2270
9 1.
25
0.03
53
yes
- -
4419
95 /
XLO
C_0
1105
5 1.
23
0.21
90
no
- -
1964
64 /
XLO
C_0
2678
0 1.
17
0.19
61
no
- -
2521
31 /
XLO
C_0
0540
5 1.
15
0.08
16
no
- -
2395
76 /
XLO
C_0
2092
1 1.
15
0.08
16
no
- -
2283
79 /
XLO
C_0
0839
1 1.
15
0.33
87
no
- -
4352
00 /
XLO
C_0
1839
2 1.
12
0.02
41
yes
Q6L
M37
Fl
avoh
emop
rote
in
4357
22 /
XLO
C_0
2287
9 1.
11
0.67
50
no
Q91
FH7
Puta
tive
FAD
-link
ed su
lfhyd
ryl
oxid
ase
347L
- /
XLO
C_0
2336
6 1.
08
0.14
19
no
- -
1945
48 /
XLO
C_0
0028
1 1.
08
0.16
92
no
- -
2565
92 /
XLO
C_0
3090
6 1.
07
0.35
83
no
- -
2518
25 /
XLO
C_0
0424
7 1.
03
0.10
03
no
- -
2222
47 /
XLO
C_0
0154
1 1.
01
0.63
32
no
- -
2337
29 /
XLO
C_0
1410
9 1.
00
0.31
95
no
A0A
US0
W
D re
peat
, SA
M a
nd U
-box
do
mai
n-co
ntai
ning
pro
tein
1
2270
00 /
XLO
C_0
0687
0 0.
97
0.20
76
no
- -
3106
62 /
XLO
C_0
2527
0 0.
97
0.13
65
no
P554
95
Unc
hara
cter
ized
pro
tein
y4i
L - /
XLO
C_0
2736
4 0.
97
0.14
07
no
- -
1174
87 /
XLO
C_0
2394
4 0.
97
0.10
37
no
D6U
4E0
Acy
ltran
sfer
ase
3 23
6421
/ X
LOC
_017
284
0.95
0.
1996
no
-
-
2074
47 /
XLO
C_0
2229
7 0.
95
0.41
50
no
O59
843
1,4-
beta
-D-g
luca
n ce
llobi
ohyd
rola
se B

187 U
niqu
e tra
nscr
ipts
of t
he la
te
JGI/g
ene-
ID
G1-
phas
e fp
km in
late
G
1-ph
ase
q_va
lue
Sig.
U
niPr
ot ID
Fu
nctio
n 20
1173
/ X
LOC
_006
055
0.93
0.
3271
no
Q
6342
4 So
lute
car
rier f
amily
15
mem
ber 2
11
3645
/ X
LOC
_014
089
0.92
0.
0758
no
-
- - /
XLO
C_0
2312
9 0.
91
0.17
37
no
- -
2187
75 /
XLO
C_0
3934
9 0.
91
0.10
46
no
P143
28
Spor
e co
at p
rote
in S
P96

188 A
ppen
dix
A T
able
- 3:
Tra
nscr
ipts
uni
que
in E
. hux
leyi
ear
ly G
1-ph
ase
(low
cal
cific
atio
n ra
tes)
.
Uni
que
trans
crip
ts o
f the
ear
ly
JGI/g
ene-
ID
G1-
phas
e fp
km in
ear
ly
G1-
phas
e q_
valu
e si
g.
Uni
Prot
ID
Func
tion
- / X
LOC
_035
007
2873
.86
0.04
79
yes
- -
- / X
LOC
_007
334
461.
17
0.13
99
no
- -
2053
38 /
XLO
C_0
1755
7 27
1.96
0.
0000
ye
s D
8LH
42
Puta
tive
unch
arac
teriz
ed p
rote
in
- / X
LOC
_039
432
207.
08
0.02
58
yes
- -
- / X
LOC
_006
749
169.
45
0.01
70
yes
- -
- / X
LOC
_007
641
166.
95
0.00
50
yes
- -
- / X
LOC
_039
916
122.
87
0.00
00
yes
- -
- / X
LOC
_023
432
114.
46
0.00
34
yes
- -
2495
02 /
XLO
C_0
3842
8 10
0.07
0.
0003
ye
s -
- - /
XLO
C_0
2552
9 94
.24
0.00
00
yes
- -
- / X
LOC
_023
232
74.5
3 0.
0000
ye
s -
- - /
XLO
C_0
0526
9 66
.51
0.00
00
yes
- -
- / X
LOC
_006
849
50.6
7 0.
0005
ye
s -
- - /
XLO
C_0
3574
8 42
.20
0.00
26
yes
- -
4506
46 /
XLO
C_0
2030
5 42
.00
0.00
00
yes
- -
- / X
LOC
_024
344
34.1
6 0.
0062
ye
s -
- - /
XLO
C_0
0964
5 32
.75
0.00
00
yes
- -
- / X
LOC
_036
400
32.5
4 0.
0004
ye
s -
- 30
9174
/ X
LOC
_003
093
27.6
4 0.
0000
ye
s Q
8MTI
2 Pu
tativ
e su
rfac
e pr
otei
n bs
pA-li
ke
- / X
LOC
_001
858
26.4
0 0.
0000
ye
s -
- - /
XLO
C_0
3197
8 25
.80
0.00
91
yes
- -
4542
53 /
XLO
C_0
0202
4 24
.87
0.00
00
yes
P310
49
Prob
able
fatty
aci
d m
ethy
ltran
sfer
ase
4460
57 /
XLO
C_0
3373
0 24
.85
0.00
00
yes
- -
- / X
LOC
_026
248
23.1
9 0.
0011
ye
s -
- - /
XLO
C_0
3907
4 22
.64
0.00
00
yes
- -

189 U
niqu
e tra
nscr
ipts
of t
he e
arly
JG
I/gen
e-ID
G1-
phas
e fp
km in
ear
ly
G1-
phas
e q_
valu
e si
g.
Uni
Prot
ID
Func
tion
- / X
LOC
_036
606
20.7
2 0.
0000
ye
s -
- - /
XLO
C_0
2877
5 19
.77
0.01
89
yes
- -
- / X
LOC
_004
785
19.2
3 0.
0000
ye
s -
- - /
XLO
C_0
4037
2 19
.04
0.01
46
yes
- -
- / X
LOC
_008
781
18.2
7 0.
0133
ye
s -
-
2577
24 /
XLO
C_0
3522
2 18
.10
0.15
04
no
Q86
9P0
Prob
able
ATP
-dep
ende
nt R
NA
he
licas
e dd
x31
- / X
LOC
_021
020
16.9
0 0.
0002
ye
s -
- 25
8092
/ X
LOC
_036
904
16.0
9 0.
0000
ye
s B
7G3J
7 Fo
rmam
idas
e-lik
e pr
otei
n - /
XLO
C_0
1372
4 15
.67
0.00
05
yes
- -
- / X
LOC
_018
631
14.5
2 0.
0632
no
-
- - /
XLO
C_0
1314
4 13
.46
0.03
71
yes
- -
4398
18 /
XLO
C_0
0263
1 13
.28
0.00
00
yes
- -
- / X
LOC
_017
538
12.9
6 0.
0000
ye
s -
- 43
5479
/ X
LOC
_020
267
12.2
4 0.
0000
ye
s -
- - /
XLO
C_0
4238
8 11
.54
0.00
07
yes
- -
- / X
LOC
_005
332
11.3
0 0.
0000
ye
s -
- - /
XLO
C_0
1926
0 10
.99
0.00
57
yes
- -
2087
23 /
XLO
C_0
2476
4 10
.01
0.00
00
yes
- -
- / X
LOC
_011
815
9.90
0.
0088
ye
s -
- - /
XLO
C_0
1478
8 9.
80
0.00
00
yes
- -
- / X
LOC
_005
601
9.00
0.
0000
ye
s -
- 24
3061
/ X
LOC
_025
503
8.94
0.
0004
ye
s -
-
4939
4 / X
LOC
_027
735
8.77
0.
1721
no
P1
0979
G
lyci
ne-r
ich
RN
A-b
indi
ng,
absc
isic
aci
d-in
duci
ble
prot
ein
- / X
LOC
_038
400
8.51
0.
0000
ye
s -
- - /
XLO
C_0
1817
6 7.
91
0.00
01
yes
- -
- / X
LOC
_004
381
7.87
0.
0308
ye
s -
-

190 U
niqu
e tra
nscr
ipts
of t
he e
arly
JG
I/gen
e-ID
G1-
phas
e fp
km in
ear
ly
G1-
phas
e q_
valu
e si
g.
Uni
Prot
ID
Func
tion
4558
89 /
XLO
C_0
1028
5 7.
65
0.00
00
yes
- -
- / X
LOC
_029
998
7.52
0.
0027
ye
s -
- - /
XLO
C_0
2436
4 7.
18
0.00
30
yes
- -
- / X
LOC
_041
374
7.18
0.
0009
ye
s -
- - /
XLO
C_0
1364
0 7.
16
0.00
03
yes
- -
- / X
LOC
_023
541
6.87
0.
0040
ye
s -
- 35
2052
/ X
LOC
_007
394
6.62
0.
0002
ye
s -
- - /
XLO
C_0
2433
1 6.
57
0.02
99
yes
- -
1962
75 /
XLO
C_0
2642
0 6.
57
0.00
00
yes
Q9N
3Z3
Serin
e/th
reon
ine-
prot
ein
kina
se
chk-
1 - /
XLO
C_0
4077
2 6.
25
0.02
31
yes
- -
- / X
LOC
_013
190
6.22
0.
0030
ye
s -
- 45
2468
/ X
LOC
_034
205
6.14
0.
1689
no
E9
C64
5 Pu
tativ
e un
char
acte
rized
pro
tein
- /
XLO
C_0
3399
1 6.
05
0.01
31
yes
- -
- / X
LOC
_018
256
5.97
0.
0695
no
-
- - /
XLO
C_0
2723
8 5.
89
0.00
39
yes
- -
- / X
LOC
_024
385
5.88
0.
0009
ye
s -
- 45
9932
/ X
LOC
_036
896
5.50
0.
0000
ye
s F0
Y85
8 Pu
tativ
e un
char
acte
rized
pro
tein
- /
XLO
C_0
2312
1 5.
40
0.00
00
yes
- -
2480
76 /
XLO
C_0
3431
9 5.
33
0.00
45
yes
Q8N
UI5
Li
pase
1
4351
46 /
XLO
C_0
1833
9 5.
27
0.00
00
yes
- -
4563
41 /
XLO
C_0
1211
4 5.
24
0.00
00
yes
F0Y
858
Puta
tive
unch
arac
teriz
ed p
rote
in
2293
50 /
XLO
C_0
0955
3 5.
14
0.09
26
no
Q8T
7K0
ALG
-2 in
tera
ctin
g pr
otei
n X
- /
XLO
C_0
3384
8 4.
97
0.00
00
yes
- -
- / X
LOC
_001
985
4.91
0.
0035
ye
s -
-
2163
05 /
XLO
C_0
3579
5 4.
86
0.10
38
no
F0Y
502
Puta
tive
unch
arac
teriz
ed p
rote
in
(Fra
gmen
t) 42
4057
/ X
LOC
_014
299
4.73
0.
0026
ye
s -
-

191 U
niqu
e tra
nscr
ipts
of t
he e
arly
JG
I/gen
e-ID
G1-
phas
e fp
km in
ear
ly
G1-
phas
e q_
valu
e si
g.
Uni
Prot
ID
Func
tion
4500
77 /
XLO
C_0
1620
1 4.
62
0.00
00
yes
- -
7073
8 / X
LOC
_006
435
4.59
0.
1036
no
B
7NLB
5 Pe
roxy
urei
doac
ryla
te/u
reid
oacr
yla
te a
mid
ohyd
rola
se R
utB
20
7272
/ X
LOC
_022
237
4.43
0.
0001
ye
s F0
Y04
8 Pu
tativ
e un
char
acte
rized
pro
tein
4563
40 /
XLO
C_0
1211
3 4.
40
0.00
00
yes
P551
76
UPF
0012
hyd
rola
se in
pqq
F 5'
regi
on
4567
91 /
XLO
C_0
1424
4 4.
31
0.00
00
yes
- -
- / X
LOC
_031
251
4.28
0.
0390
ye
s -
- - /
XLO
C_0
2210
2 4.
22
0.00
08
yes
- -
2400
13 /
XLO
C_0
2189
0 4.
19
0.00
00
yes
- -
2084
70 /
XLO
C_0
2428
9 4.
09
0.00
00
yes
Q54
Y32
M
AP
kina
se p
hosp
hata
se w
ith
leuc
ine-
rich
repe
ats p
rote
in 3
- /
XLO
C_0
2011
1 4.
08
0.00
19
yes
- -
2471
81 /
XLO
C_0
3230
5 3.
97
0.00
01
yes
B7G
168
Pred
icte
d pr
otei
n 22
2516
/ X
LOC
_001
666
3.89
0.
0011
ye
s Q
6DG
V7
Mpv
17-li
ke p
rote
in 2
30
8883
/ X
LOC
_038
740
3.85
0.
6729
no
-
- - /
XLO
C_0
3428
9 3.
83
0.00
00
yes
- -
- / X
LOC
_018
175
3.83
0.
0004
ye
s -
- - /
XLO
C_0
2146
2 3.
79
0.00
04
yes
- -
- / X
LOC
_009
785
3.78
0.
0941
no
-
-
2118
36 /
XLO
C_0
3082
7 3.
71
0.00
66
yes
Q10
977
Phth
ioce
rol s
ynth
esis
pol
yket
ide
synt
hase
type
I Pp
sA
2231
70 /
XLO
C_0
0245
2 3.
69
0.18
88
no
E9C
G20
Em
bryo
gene
sis-
asso
ciat
ed p
rote
in
EMB
8
4543
51 /
XLO
C_0
0250
8 3.
58
0.00
01
yes
B0G
143
Mito
chon
dria
l sub
stra
te c
arrie
r fa
mily
pro
tein
ucp
B
- / X
LOC
_004
833
3.45
0.
0002
ye
s -
- - /
XLO
C_0
0527
0 3.
34
0.01
01
yes
- -
2212
72 /
XLO
C_0
4233
5 3.
30
0.00
00
yes
A9A
494
Porp
hyro
mon
as-ty
pe p
eptid
yl-

192 U
niqu
e tra
nscr
ipts
of t
he e
arly
JG
I/gen
e-ID
G1-
phas
e fp
km in
ear
ly
G1-
phas
e q_
valu
e si
g.
Uni
Prot
ID
Func
tion
argi
nine
dei
min
ase
- / X
LOC
_021
870
3.27
0.
0267
ye
s -
- - /
XLO
C_0
3368
9 3.
12
0.05
97
no
- -
1952
90 /
XLO
C_0
2164
5 3.
08
0.39
22
no
O31
404
Ace
toin
:2,6
-di
chlo
roph
enol
indo
phen
ol
oxid
ored
ucta
se su
buni
t alp
ha
2179
95 /
XLO
C_0
3799
6 2.
94
0.00
00
yes
C1E
IL5
Pred
icte
d pr
otei
n 23
3951
/ X
LOC
_014
272
2.78
0.
0001
ye
s F2
TWL3
Pu
tativ
e un
char
acte
rized
pro
tein
4265
99 /
XLO
C_0
1005
6 2.
72
0.51
38
no
Q9F
L69
Prob
able
AD
P-rib
osyl
atio
n fa
ctor
G
TPas
e-ac
tivat
ing
prot
ein
AG
D5
4611
89 /
XLO
C_0
2137
9 2.
58
0.00
15
yes
Q9H
YH
5 Pu
tativ
e al
dola
se c
lass
2 p
rote
in
PA34
30
2329
62 /
XLO
C_0
1317
8 2.
56
0.00
33
yes
Q5T
Z51
Prot
ein
Mpv
17
- / X
LOC
_008
610
2.56
0.
0627
no
-
- 10
9294
/ X
LOC
_004
057
2.55
0.
0011
ye
s -
- 25
5893
/ X
LOC
_027
244
2.54
0.
2228
no
-
- - /
XLO
C_0
1766
4 2.
51
0.03
08
yes
- -
- / X
LOC
_026
932
2.50
0.
0003
ye
s -
- 23
7168
/ X
LOC
_018
165
2.44
0.
0012
ye
s -
- - /
XLO
C_0
0870
7 2.
41
0.00
94
yes
- -
2547
52 /
XLO
C_0
1956
4 2.
37
0.41
52
no
- -
- / X
LOC
_003
248
2.34
0.
0232
ye
s -
- - /
XLO
C_0
0718
6 2.
32
0.04
61
yes
- -
- / X
LOC
_009
931
2.32
0.
0005
ye
s -
-
1135
53 /
XLO
C_0
1391
8 2.
20
0.00
82
yes
Q99
NF1
B
eta,
beta
-car
oten
e 9'
,10'
-ox
ygen
ase
1968
94 /
XLO
C_0
3037
3 2.
19
0.22
22
no
- -
2514
02 /
XLO
C_0
0273
8 2.
18
0.00
14
yes
- -

193 U
niqu
e tra
nscr
ipts
of t
he e
arly
JG
I/gen
e-ID
G1-
phas
e fp
km in
ear
ly
G1-
phas
e q_
valu
e si
g.
Uni
Prot
ID
Func
tion
3691
86 /
XLO
C_0
2447
1 2.
04
0.05
01
no
- -
- / X
LOC
_008
682
2.03
0.
0017
ye
s -
- 24
4577
/ X
LOC
_027
869
1.98
0.
1308
no
Q
9ST2
7 Ph
otot
ropi
n-2
2445
76 /
XLO
C_0
2786
8 1.
98
0.13
08
no
Q9S
T27
Phot
otro
pin-
2 20
8026
/ X
LOC
_023
608
1.98
0.
1308
no
Q
9ST2
7 Ph
otot
ropi
n-2
3691
88 /
XLO
C_0
2446
0 1.
96
0.04
74
yes
- -
- / X
LOC
_033
477
1.96
0.
0127
ye
s -
-
2110
47 /
XLO
C_0
2900
3 1.
92
0.01
16
yes
Q5F
371
Prot
ein
stra
wbe
rry
notc
h ho
mol
og
1 - /
XLO
C_0
3393
8 1.
90
0.08
95
no
- -
2294
36 /
XLO
C_0
0957
7 1.
88
0.03
24
yes
- -
4557
08 /
XLO
C_0
0945
0 1.
87
0.22
93
no
- -
4527
14 /
XLO
C_0
3541
1 1.
79
0.19
01
no
Q7P
C76
G
luco
man
nan
4-be
ta-
man
nosy
ltran
sfer
ase
1 23
2178
/ X
LOC
_012
271
1.77
0.
0149
ye
s C
1DZB
7 Pr
edic
ted
prot
ein
2081
11 /
XLO
C_0
2374
3 1.
74
0.60
37
no
B8B
XH
2 D
-lact
ate
dehy
drog
enas
e - /
XLO
C_0
1573
3 1.
70
0.26
07
no
- -
- / X
LOC
_004
041
1.67
0.
0064
ye
s -
- 21
1666
/ X
LOC
_029
727
1.65
0.
4960
no
-
- 35
9963
/ X
LOC
_041
264
1.63
0.
0130
ye
s -
- 24
5483
/ X
LOC
_029
078
1.62
0.
2712
no
F0
XX
34
DN
A p
olym
eras
e
2187
52 /
XLO
C_0
3920
8 1.
60
0.00
03
yes
A9A
494
Porp
hyro
mon
as-ty
pe p
eptid
yl-
argi
nine
dei
min
ase
2498
76 /
XLO
C_0
3971
7 1.
54
0.01
58
yes
- -
2142
86 /
XLO
C_0
3357
9 1.
39
0.11
44
no
- -
- / X
LOC
_023
263
1.38
0.
0035
ye
s -
- 11
5968
/ X
LOC
_019
986
1.34
0.
0794
no
-
- 21
1783
/ X
LOC
_030
802
1.28
0.
3546
no
-
-

194 U
niqu
e tra
nscr
ipts
of t
he e
arly
JG
I/gen
e-ID
G1-
phas
e fp
km in
ear
ly
G1-
phas
e q_
valu
e si
g.
Uni
Prot
ID
Func
tion
- / X
LOC
_015
760
1.28
0.
0604
no
-
-
2172
95 /
XLO
C_0
3731
5 1.
15
0.67
89
no
Q6Z
QP7
U
ncha
ract
eriz
ed p
rote
in
LOC
2848
61
1031
63 /
XLO
C_0
2930
4 1.
15
0.01
36
yes
- -
2161
81 /
XLO
C_0
3560
7 1.
15
0.06
12
no
B5Y
3V8
Pred
icte
d pr
otei
n 45
5975
/ X
LOC
_010
574
1.14
0.
5251
no
Q
2KH
Z2
HB
S1-li
ke p
rote
in
2303
53 /
XLO
C_0
1059
0 1.
14
0.49
36
no
- -
2024
97 /
XLO
C_0
1117
4 1.
13
0.39
32
no
- -
4490
16 /
XLO
C_0
0448
5 1.
11
0.21
10
no
Q9E
X73
M
onot
erpe
ne e
psilo
n-la
cton
e hy
drol
ase
2341
41 /
XLO
C_0
1471
2 1.
10
0.71
85
no
- -
2530
36 /
XLO
C_0
0939
3 1.
10
0.14
36
no
- -
2129
40 /
XLO
C_0
3213
6 1.
08
0.12
55
no
Q39
7B0
Tran
scrip
tiona
l reg
ulat
or, A
raC
fa
mily
2053
36 /
XLO
C_0
1755
6 1.
08
0.57
00
no
Q8B
Z25
Ank
yrin
repe
at a
nd p
rote
in k
inas
e do
mai
n-co
ntai
ning
pro
tein
1
2191
79 /
XLO
C_0
3975
0 1.
04
0.11
94
no
- -
2298
75 /
XLO
C_0
0994
2 1.
04
0.47
09
no
- -
- / X
LOC
_028
155
1.03
0.
0021
ye
s -
- 21
5526
/ X
LOC
_034
875
1.03
0.
4934
no
-
- 23
6751
/ X
LOC
_017
884
1.03
0.
5248
no
F0
VJG
8 Pu
tativ
e un
char
acte
rized
pro
tein
23
8038
/ X
LOC
_019
306
1.02
0.
4301
no
-
-
2068
47 /
XLO
C_0
1980
0 1.
01
0.54
87
no
Q0W
VK
7
Pent
atric
opep
tide
repe
at-
cont
aini
ng p
rote
in A
t1g0
5670
, m
itoch
ondr
ial
2444
12 /
XLO
C_0
2775
9 0.
97
0.01
94
yes
A9G
2Z3
Puta
tive
mem
bran
e pr
otei
n 11
7279
/ X
LOC
_023
358
0.96
0.
0017
ye
s -
- 42
6727
/ X
LOC
_012
634
0.93
0.
5608
no
Q
8T13
5 K
ines
in-r
elat
ed p
rote
in 5
23
6239
/ X
LOC
_017
181
0.90
0.
3933
no
A
4RY
54
Pred
icte
d pr
otei
n

195 U
niqu
e tra
nscr
ipts
of t
he e
arly
JG
I/gen
e-ID
G1-
phas
e fp
km in
ear
ly
G1-
phas
e q_
valu
e si
g.
Uni
Prot
ID
Func
tion
1138
12 /
XLO
C_0
1464
9 0.
90
0.00
23
yes
Q99
NF1
B
eta,
beta
-car
oten
e 9'
,10'
-ox
ygen
ase
2129
62 /
XLO
C_0
3214
5 0.
89
0.51
49
no
A0A
US0
W
D re
peat
, SA
M a
nd U
-box
do
mai
n-co
ntai
ning
pro
tein
1
2488
75 /
XLO
C_0
3689
7 0.
88
0.01
04
yes
P551
76
UPF
0012
hyd
rola
se in
pqq
F 5'
regi
on
- / X
LOC
_034
399
0.88
0.
0670
no
-
- 25
5132
/ X
LOC
_022
217
0.88
0.
0281
ye
s -
- 24
1150
/ X
LOC
_023
145
0.85
0.
7507
no
C
1EIX
2 Pr
edic
ted
prot
ein
1221
37 /
XLO
C_0
0363
0 0.
84
0.15
09
no
- -

196 A
ppen
dix
A T
able
- 4:
Tra
nscr
ipt o
f the
gra
phic
ally
com
pris
ed c
ohor
ts fr
om K
OG
-cla
sses
and
thei
r ann
otat
ion.
HC
or L
C
cond
ition
JG
I♯
fpkm
in H
C
cond
ition
fp
km in
LC
co
nditi
on
NR
Pro
t.ID
q_v
alue
Si
g.
Org
anis
m
Func
tion
Gen
eral
func
tion
HC
43
1830
10
29
14
Q0M
YW
8 1.
29E-
05
yes
Emili
ania
hux
leyi
Pu
tativ
e ca
lciu
m b
indi
ng p
rote
in
HC
36
6938
45
3 60
Q
8CIP
4 1.
34E-
02
yes
Mus
mus
culu
s M
AP/
mic
rotu
bule
aff
inity
-reg
ul. k
inas
e 4
HC
44
3010
40
3 53
-
4.57
E-02
ye
s -
- H
C
4397
33
377
74
- 3.
58E-
02
yes
- -
HC
35
4307
30
7 3
- 8.
12E-
11
yes
- -
HC
46
3672
29
5 12
Q
8H48
5 1.
92E-
04
yes
Ory
za sa
tiva
subs
p. ja
poni
ca
Tubb
y-lik
e F-
box
prot
ein
11
HC
43
2500
28
0 4
Q39
525
5.47
E-07
ye
s Pa
rach
lore
lla k
essl
eri
H(+
)/hex
ose
cotra
nspo
rter 3
LC
46
2385
54
78
8 P8
0030
1.
25E-
06
yes
Bras
sica
nap
us
Enoy
l-[ac
yl-c
arrie
r-pr
otei
n] re
duct
ase
[NA
DH
], ch
loro
plas
tic
LC
4653
64
3 39
4 P3
8230
0.
00E+
00
yes
Sacc
haro
myc
es c
erev
isia
e (s
train
A
TCC
204
508
/ S28
8c)
Prob
able
qui
none
oxi
dore
duct
ase
LC
4334
42
58
336
P296
18
2.27
E-03
ye
s O
ryza
sativ
a su
bsp.
japo
nica
C
yclin
-dep
ende
nt k
inas
e A
-1
LC
4425
61
2 25
4 Q
54FR
4 0.
00E+
00
yes
Dic
tyos
teliu
m d
isco
ideu
m
PXM
P2/4
fam
ily p
rote
in 4
Po
sttra
nsla
tiona
l mod
ifica
tion,
pro
tein
turn
over
, cha
pero
nes
HC
36
2359
21
39
48
P273
23
7.30
E-09
ye
s Ar
abid
opsi
s tha
liana
H
eat s
hock
pro
tein
90-
1 H
C
4209
62
1619
23
7 Q
9U63
9 1.
14E-
02
yes
Man
duca
sext
a H
eat s
hock
70
kDa
prot
ein
cogn
ate
4 H
C
3634
48
1481
26
3 Q
9SK
Q0
4.37
E-02
ye
s Ar
abid
opsi
s tha
liana
Pe
ptid
yl-p
roly
l cis
-tran
s iso
mer
ase
CY
P19-
2 H
C
4267
11
1206
14
1 P1
5253
4.
33E-
03
yes
Ory
ctol
agus
cun
icul
us
Cal
retic
ulin
H
C
4404
77
685
18
- 3.
14E-
03
yes
- -
HC
43
2765
50
1 46
Q
6YY
B0
3.02
E-04
ye
s O
ryza
sativ
a su
bsp.
japo
nica
U
ncha
ract
eriz
ed p
rote
in O
s08g
0359
500
HC
43
5425
50
1 88
Q
70Y
I1
1.41
E-02
ye
s Le
gion
ella
pne
umop
hila
O
uter
mem
bran
e pr
otei
n M
IP

197 A
ppen
dix
A -
Tabl
e - 4
: Tra
nscr
ipt o
f the
gra
phic
ally
com
pris
ed c
ohor
ts a
nd th
eir a
nnot
atio
n co
ntin
ued:
H
C o
r LC
co
nditi
on
JGI♯
fpkm
in H
C
cond
ition
fp
km in
LC
co
nditi
on
NR
Pro
t.ID
q_
valu
e Sig
. O
rgan
ism
Fu
nctio
n R
eplic
atio
n, re
com
bina
tion
and
repa
ir H
C
4090
9 26
8 31
P3
3991
4.
00E-
02
yes
Hom
o sa
pien
s D
NA
repl
icat
ion
licen
sing
fact
or M
CM
4 H
C
5159
7 25
2 28
P3
0664
1.
36E-
02
yes
Xeno
pus l
aevi
s D
NA
repl
icat
ion
licen
sing
fact
or m
cm4-
B
HC
35
8490
21
5 22
Q
9WU
K4
4.64
E-03
ye
s M
us m
uscu
lus
Rep
licat
ion
fact
or C
subu
nit 2
H
C
4478
64
152
10
Q6D
FV7
3.13
E-04
ye
s M
us m
uscu
lus
Nuc
lear
rece
ptor
coa
ctiv
ator
7
HC
75
254
137
8 P4
3299
1.
21E-
06
yes
Arab
idop
sis t
halia
na
Prot
ein
PRO
LIFE
RA
H
C
3162
05
135
10
P432
99
2.69
E-05
ye
s Ar
abid
opsi
s tha
liana
Pr
otei
n PR
OLI
FER
A
HC
31
0913
13
5 10
P4
3299
2.
72E-
05
yes
Arab
idop
sis t
halia
na
Prot
ein
PRO
LIFE
RA
H
C
4676
65
107
18
O60
182
9.75
E-03
ye
s Sc
hizo
sacc
haro
myc
es p
ombe
(s
train
972
/ A
TCC
248
43)
Rep
licat
ion
fact
or C
subu
nit 1
R
NA
pro
cess
ing
and
mod
ifica
tion
HC
44
3184
57
8 16
-
2.03
E-04
ye
s -
- H
C
4386
54
370
34
- 6.
10E-
04
yes
- -
HC
43
9979
15
2 15
-
3.46
E-04
ye
s -
- H
C
3738
06
140
8 -
8.37
E-08
ye
s -
- H
C
9804
1 11
1 12
-
6.95
E-04
ye
s -
- H
C
4340
23
90
13
Q0C
ER3
6.21
E-03
ye
s As
perg
illus
terr
eus (
stra
in N
IH
2624
/ FG
SC A
1156
) Pu
tativ
e un
char
acte
rized
pro
tein
H
C
4436
00
75
6 Q
5DU
56
1.06
E-03
ye
s M
us m
uscu
lus
Prot
ein
NLR
C3
LC
4606
85
15
207
- 9.
03E-
11
yes
- -
LC
4325
07
6 93
Q
0DM
51
3.24
E-13
ye
s O
ryza
sativ
a su
bsp.
japo
nica
D
EAD
-box
ATP
-dep
ende
nt R
NA
hel
icas
e 3,
ch
loro
plas
tic
LC
4678
48
7 76
Q
7ZW
M3
8.44
E-09
ye
s Xe
nopu
s lae
vis
CU
GB
P El
av-li
ke fa
mily
mem
ber 3
-B
LC
4370
70
19
72
D7F
JQ9
1.26
E-02
ye
s Ec
toca
rpus
silic
ulos
us
Puta
tive
unch
arac
teriz
ed p
rote
in

198 A
ppen
dix
A -
Tabl
e - 4
: Tra
nscr
ipt o
f the
gra
phic
ally
com
pris
ed c
ohor
ts a
nd th
eir a
nnot
atio
n co
ntin
ued:
HC
or L
C
cond
ition
JG
I♯
fpkm
in H
C
cond
ition
fp
km in
LC
co
nditi
on
NR
Pro
t.ID
q_
valu
e Sig
. O
rgan
ism
Fu
nctio
n In
trace
llula
r tra
ffic
king
, sec
retio
n, a
nd v
esic
ular
tran
spor
t H
C
4449
96
561
78
Q54
GB
3 3.
12E-
02
yes
Dic
tyos
teliu
m d
isco
ideu
m
Syna
ptob
revi
n-B
H
C
3162
56
465
125
Q9F
NC
9 8.
55E-
03
yes
Arab
idop
sis
thal
iana
M
itoch
ondr
ial i
mpo
rt re
cept
or su
buni
t TO
M22
hom
olog
2
HC
4431
86
377
15
P0C
M16
2.
49E-
04
yes
Cry
ptoc
occu
s ne
ofor
man
s va
r.
neof
orm
ans
sero
type
D (s
train
JE
C21
/ A
TCC
MY
A-5
65)
AD
P-rib
osyl
atio
n fa
ctor
H
C
4361
40
276
15
Q6A
XQ
8 4.
97E-
05
yes
Rattu
s no
rveg
icus
M
eios
is-s
peci
fic n
ucle
ar st
ruct
ural
pro
tein
1
HC
43
7571
26
6 39
P4
7193
9.
53E-
03
yes
Xeno
pus
laev
is
Ves
icle
-ass
ocia
ted
mem
bran
e pr
otei
n 2
HC
66
952
174
27
F1SR
I0
3.49
E-03
ye
s Su
s sc
rofa
Tr
affic
king
pro
tein
par
ticle
com
plex
subu
nit 2
H
C
4408
61
172
18
Q9F
MJ0
1.
04E-
02
yes
Arab
idop
sis
thal
iana
Ph
osph
atid
ylin
osito
l 4-k
inas
e be
ta 1
H
C
4323
31
162
11
Q01
968
2.26
E-03
ye
s H
omo
sapi
ens
Inos
itol p
olyp
hosp
hate
5-p
hosp
hata
se O
CR
L-1
HC
35
1006
16
2 27
O
7048
0 3.
31E-
02
yes
Mus
mus
culu
s V
esic
le-a
ssoc
iate
d m
embr
ane
prot
ein
4 H
C
4340
42
112
7 -
6.38
E-03
ye
s -
- H
C
4633
84
100
12
D3Z
5L6
3.05
E-02
ye
s M
us m
uscu
lus
MFS
-type
tran
spor
ter C
6orf
192
hom
olog
H
C
4607
62
96
22
Q9Z
RD
6 1.
01E-
02
yes
Arab
idop
sis
thal
iana
V
AM
P-lik
e pr
otei
n Y
KT6
1 H
C
4401
11
93
2 A
7YY
49
7.56
E-07
ye
s Bo
s ta
urus
Su
rfei
t loc
us p
rote
in 4
H
C
4343
24
85
14
P936
54
1.64
E-02
ye
s Ar
abid
opsi
s th
alia
na
Synt
axin
-22
LC
4650
64
35
138
B3R
PE1
3.44
E-03
ye
s Tr
icho
plax
adh
aere
ns
Puta
tive
unch
arac
teriz
ed p
rote
in
LC
5191
1 8
73
Q96
321
5.68
E-03
ye
s Ar
abid
opsi
s th
alia
na
Impo
rtin
subu
nit a
lpha
-1
LC
9973
3 21
58
Q
84W
W5
3.65
E-02
ye
s Ar
abid
opsi
s th
alia
na
Ves
icle
-ass
ocia
ted
prot
ein
1-3

199 A
ppen
dix
A -
Tabl
e - 4
: Tra
nscr
ipt o
f the
gra
phic
ally
com
pris
ed c
ohor
ts a
nd th
eir a
nnot
atio
n co
ntin
ued:
H
C o
r LC
co
nditi
on
JGI♯
fp
km in
HC
co
nditi
on
fpkm
in L
C
cond
ition
N
R P
rot.I
D
q_va
lue S
ig.
Org
anis
m
Func
tion
Inor
gani
c io
n tra
nspo
rt an
d m
etab
olis
m
HC
46
6232
27
6 2
Q9H
GM
6 4.
02E-
06
yes
Schi
zosa
ccha
rom
yces
pom
be
(stra
in 9
72 /
ATC
C 2
4843
) Pu
tativ
e tra
nspo
rter C
543.
05c
HC
31
4659
20
7 41
Q
9HG
M6
2.61
E-02
ye
s Sc
hizo
sacc
haro
myc
es p
ombe
(s
train
972
/ A
TCC
248
43)
Puta
tive
trans
porte
r C54
3.05
c H
C
1030
04
158
0 -
9.63
E-08
ye
s -
- H
C
4377
62
130
14
Q14
973
5.43
E-03
ye
s H
omo
sapi
ens
Sodi
um/b
ile a
cid
cotra
nspo
rter
LC
4479
39
55
897
Q9Q
ZM6
1.77
E-05
ye
s Ra
ttus
norv
egic
us
Sodi
um/p
otas
sium
/cal
cium
exc
hang
er 1
LC
35
4606
90
55
3 Q
9VN
12
7.82
E-03
ye
s D
roso
phila
mel
anog
aste
r Pr
obab
le so
dium
/pot
assi
um/c
alci
um
exch
ange
r CG
1090
LC
41
6800
84
54
9 Q
8L78
3 9.
64E-
04
yes
Arab
idop
sis
thal
iana
V
acuo
lar c
atio
n/pr
oton
exc
hang
er 5
LC
42
8968
14
18
1 P1
7847
2.
71E-
07
yes
Zea
may
s Fe
rred
oxin
--ni
trite
redu
ctas
e, c
hlor
opla
stic
(F
ragm
ent)
LC
4630
95
1 15
6 Q
9XES
1 0.
00E+
00
yes
Arab
idop
sis
thal
iana
C
alci
um-tr
ansp
ortin
g A
TPas
e 4,
end
opla
smic
re
ticul
um-ty
pe
LC
LC
4150
31
150
2730
Q
8DM
25
1.16
E-08
ye
s Th
erm
osyn
echo
cocc
us e
long
atus
(s
train
BP-
1)
50S
ribos
omal
pro
tein
L7/
L12
LC
7793
0 19
3 97
0 B
0K5S
7 6.
58E-
05
yes
Ther
moa
naer
obac
ter
sp. (
stra
in
X51
4)
50S
ribos
omal
pro
tein
L13
LC
72
821
167
855
B0K
5S7
4.50
E-05
ye
s Th
erm
oana
erob
acte
r sp
. (st
rain
X
514)
50
S rib
osom
al p
rote
in L
13
LC
4162
08
147
743
B2I
TN0
2.11
E-03
ye
s N
osto
c pu
nctif
orm
e (s
train
A
TCC
291
33 /
PCC
731
02)
50S
ribos
omal
pro
tein
L17
LC
69
198
93
674
P462
28
1.13
E-02
ye
s Sy
nech
ococ
cus
sp. (
stra
in A
TCC
27
144)
) 30
S rib
osom
al p
rote
in S
1 LC
49
364
124
666
P274
84
3.54
E-04
ye
s N
icot
iana
sylv
estri
s G
lyci
ne-r
ich
prot
ein
2

200 A
ppen
dix
A -
Tabl
e - 4
: Tra
nscr
ipt o
f the
gra
phic
ally
com
pris
ed c
ohor
ts a
nd th
eir a
nnot
atio
n co
ntin
ued:
HC
or L
C
cond
ition
JG
I♯
fpkm
in H
C
cond
ition
fp
km in
LC
co
nditi
on
NR
Pro
t.ID
q_
valu
e Sig
. O
rgan
ism
Fu
nctio
n Tr
ansl
atio
n, ri
boso
mal
stru
ctur
e an
d bi
ogen
esis
LC
46
8608
13
1 59
5 P3
6236
4.
52E-
03
yes
Syne
choc
ystis
sp.
(stra
in A
TCC
27
184
/ PC
C 6
803
/ N-1
) 50
S rib
osom
al p
rote
in L
1 LC
43
9611
95
57
6 B
0CA
C9
1.59
E-03
ye
s Ac
aryo
chlo
ris
mar
ina
(stra
in
MB
IC 1
1017
) 50
S rib
osom
al p
rote
in L
11
LC
4418
18
93
514
Q3M
FC0
9.58
E-03
ye
s An
abae
na v
aria
bilis
(stra
in
ATC
C 2
9413
/ PC
C 7
937)
50
S rib
osom
al p
rote
in L
4 Fu
nctio
n un
know
n H
C
4372
26
706
17
A7S
4N4
3.94
E-05
ye
s N
emat
oste
lla v
ecte
nsis
Pr
obab
le se
rine
inco
rpor
ator
H
C
3616
72
238
20
Q54
RS7
3.
29E-
03
yes
Dic
tyos
teliu
m d
isco
ideu
m
ELM
O d
omai
n-co
ntai
ning
pro
tein
C
HC
44
0226
20
2 16
-
3.68
E-04
ye
s -
- H
C
4413
26
150
40
Q9U
RW
6 3.
26E-
02
yes
Schi
zosa
ccha
rom
yces
pom
be
(stra
in 9
72 /
ATC
C 2
4843
) SH
3 do
mai
n-co
ntai
ning
pro
tein
PJ6
96.0
2 H
C
4460
71
130
9 Q
9H84
1 1.
16E-
03
yes
Hom
o sa
pien
s N
IPA
-like
pro
tein
2
HC
43
7398
12
5 26
Q
2KJ2
2 3.
23E-
02
yes
Bos
taur
us
Prot
ein
FAM
63A
H
C
3614
62
122
5 P1
0775
1.
12E-
04
yes
Sus
scro
fa
Rib
onuc
leas
e in
hibi
tor
HC
35
8812
11
4 18
Q
8BM
W7
3.51
E-02
ye
s M
us m
uscu
lus
Mag
nesi
um tr
ansp
orte
r NIP
A3
HC
43
3894
11
1 13
-
2.59
E-02
ye
s -
- H
C
4365
74
110
30
Q8B
K64
4.
33E-
02
yes
Mus
mus
culu
s A
ctiv
ator
of 9
0 kD
a he
at sh
ock
prot
ein
ATP
ase
hom
olog
1
LC
4692
13
33
189
B7G
571
9.35
E-03
ye
s Ph
aeod
acty
lum
tric
ornu
tum
(s
train
CC
AP
1055
/1)
Pred
icte
d pr
otei
n LC
43
3126
30
14
1 -
1.58
E-04
ye
s -
-

201 A
ppen
dix
A -
Tabl
e - 4
: Tra
nscr
ipt o
f the
gra
phic
ally
com
pris
ed c
ohor
ts a
nd th
eir a
nnot
atio
n co
ntin
ued:
HC
or L
C
cond
ition
JG
I♯
fpkm
in H
C
cond
ition
fp
km in
LC
co
nditi
on
NR
Pro
t.ID
q_
valu
e Sig
. O
rgan
ism
Fu
nctio
n Li
pid
trans
port
and
met
abol
ism
H
C
3602
81
820
116
P792
74
4.72
E-02
ye
s Su
s sc
rofa
Lo
ng-c
hain
spec
ific
acyl
-CoA
deh
ydro
gena
se,
mito
chon
dria
l H
C
4321
91
530
30
B8B
TZ6
8.15
E-04
ye
s Th
alas
sios
ira
pseu
dona
na
Pred
icte
d pr
otei
n H
C
4357
31
436
8 P4
6250
9.
08E-
05
yes
Can
dida
alb
ican
s (st
rain
SC
5314
/ A
TCC
MY
A-2
876)
SE
C14
cyt
osol
ic fa
ctor
H
C
4379
26
271
31
Q3Z
BF6
1.
01E-
02
yes
Bos
taur
us
Shor
t-cha
in sp
ecifi
c ac
yl-C
oA d
ehyd
roge
nase
, m
itoch
ondr
ial
HC
44
3385
25
8 3
- 2.
47E-
05
yes
- -
HC
44
5286
19
7 18
Q
8K21
4 7.
24E-
03
yes
Mus
mus
culu
s Po
lyco
mb
prot
ein
SCM
H1
HC
44
4795
15
5 9
Q9L
VZ3
8.
35E-
04
yes
Arab
idop
sis
thal
iana
Pr
obab
le li
pid
desa
tura
se A
DS3
.2,
chlo
ropl
astic
H
C
4426
14
139
22
Q7S
BB
6 2.
61E-
02
yes
Neu
rosp
ora
cras
sa (s
train
ATC
C
2469
8 / 7
4-O
R23
-1A
/ C
BS
708.
71 /
DSM
125
7 / F
GSC
987
) Pro
babl
e C
-5 st
erol
des
atur
ase
HC
43
8299
12
7 17
P0
4634
3.
25E-
02
yes
Rattu
s no
rveg
icus
G
astri
c tri
acyl
glyc
erol
lipa
se
HC
45
6684
12
0 15
Q
5ZK
R7
1.85
E-02
ye
s G
allu
s ga
llus
Long
-cha
in-f
atty
-aci
d--C
oA li
g. A
CSB
G2
HC
46
4665
11
7 26
P4
5954
4.
74E-
02
yes
Hom
o sa
pien
s Sh
ort/b
ranc
hed
chai
n sp
ecifi
c ac
yl-C
oA
dehy
drog
enas
e, m
itoch
ondr
ial
HC
44
2519
10
6 8
Q9R
008
1.58
E-03
ye
s M
us m
uscu
lus
Mev
alon
ate
kina
se
HC
44
2508
10
4 12
P1
9967
1.
03E-
02
yes
Dro
soph
ila m
elan
ogas
ter
Cyt
ochr
ome
b5-r
elat
ed p
rote
in
HC
43
5778
10
1 20
Q
9FS8
7 2.
14E-
02
yes
Sola
num
tube
rosu
m
Isov
aler
yl-C
oA d
ehyd
roge
nase
2,
mito
chon
dria
l (Fr
agm
ent)
LC
4552
80
25
889
P110
29
7.18
E-09
ye
s G
allu
s ga
llus
Ace
tyl-C
oA c
arbo
xyla
se
LC
4292
48
3 53
1 Q
0095
5 0.
00E+
00
yes
Sacc
haro
myc
es c
erev
isia
e (s
train
A
TCC
204
508
/ S28
8c)
Ace
tyl-C
oA c
arbo
xyla
se

202 A
ppen
dix
A -
Tabl
e - 4
: Tra
nscr
ipt o
f the
gra
phic
ally
com
pris
ed c
ohor
ts a
nd th
eir a
nnot
atio
n co
ntin
ued:
H
C o
r LC
co
nditi
on
JGI♯
fp
km in
HC
co
nditi
on
fpkm
in L
C
cond
ition
N
R P
rot.I
D
q_va
lue S
ig.
Org
anis
m
Func
tion
Lipi
d tra
nspo
rt an
d m
etab
olis
m
LC
4495
45
13
223
P110
29
2.98
E-05
ye
s G
allu
s ga
llus
Ace
tyl-C
oA c
arbo
xyla
se
LC
4440
84
43
209
Q92
038
2.67
E-03
ye
s C
ypri
nus
carp
io
Acy
l-CoA
des
atur
ase
LC
5462
9 68
18
1 Q
8R3F
5 2.
40E-
02
yes
Mus
mus
culu
s M
alon
yl-C
oA-a
cyl c
arrie
r pro
tein
tra
nsac
ylas
e, m
itoch
ondr
ial
LC
4475
35
27
153
Q92
038
2.59
E-05
ye
s C
ypri
nus
carp
io
Acy
l-CoA
des
atur
ase
LC
3514
92
0 13
8 Q
8BH
I7
0.00
E+00
ye
s M
us m
uscu
lus
Elon
gatio
n of
ver
y lo
ng c
hain
fatty
aci
ds
prot
ein
5 LC
43
8795
16
10
3 Q
9DEX
7 6.
64E-
06
yes
Dan
io r
erio
Fa
tty a
cid
desa
tura
se 2
LC
41
7285
25
10
3 A
4FV
48
2.57
E-03
ye
s Bo
s ta
urus
Fa
tty a
cid
desa
tura
se 2
LC
45
4147
11
94
Q
9DEX
7 8.
33E-
07
yes
Dan
io r
erio
Fa
tty a
cid
desa
tura
se 2
Si
gnal
tran
sduc
tion
mec
hani
sms
HC
44
4252
10
07
9 -
4.44
E-07
ye
s -
- H
C
4350
65
847
6 -
6.04
E-08
ye
s -
- H
C
4435
25
713
72
Q86
9W6
2.30
E-02
ye
s D
icty
oste
lium
dis
coid
eum
Pr
obab
le m
yosi
n lig
ht c
hain
kin
ase
H
C
4359
10
642
4 -
3.19
E-08
ye
s -
- H
C
4396
98
510
2 -
3.93
E-09
ye
s -
- H
C
4439
34
461
3 -
3.21
E-08
ye
s -
- H
C
4627
80
431
3 Q
9JM
A9
3.52
E-08
ye
s M
us m
uscu
lus
Sodi
um- a
nd c
hlor
ide-
depe
nden
t neu
tral a
nd
basi
c am
ino
acid
tran
spor
ter B
(0+)
H
C
4359
09
368
1 -
9.14
E-10
ye
s -
- H
C
4401
98
360
2 -
7.23
E-10
ye
s -
- H
C
4623
51
334
2 E9
AEM
9 1.
53E-
04
yes
Leis
hman
ia m
ajor
Pr
oteo
phos
phog
lyca
n 5
HC
43
1876
33
2 3
Q9S
N43
4.
74E-
07
yes
Arab
idop
sis
thal
iana
C
BL-
inte
ract
ing
serin
e/th
reon
ine-
prot
ein
kina
se 1
2

203 A
ppen
dix
A -
Tabl
e - 4
: Tra
nscr
ipt o
f the
gra
phic
ally
com
pris
ed c
ohor
ts a
nd th
eir a
nnot
atio
n co
ntin
ued:
HC
or L
C
cond
ition
JG
I♯
fpkm
in H
C
cond
ition
fp
km in
LC
co
nditi
on
NR
Pro
t.ID
q_
valu
e Si
g.
Org
anis
m
Func
tion
Sign
al tr
ansd
uctio
n m
echa
nism
s H
C
4408
93
310
33
B8C
AB
4 1.
99E-
02
yes
Thal
assi
osir
a ps
eudo
nana
Pr
edic
ted
prot
ein
HC
46
2359
30
5 6
- 2.
33E-
05
yes
- -
HC
36
5420
25
8 32
Q
3E9C
0 9.
12E-
03
yes
Arab
idop
sis
thal
iana
C
alci
um-d
epen
dent
pro
tein
kin
ase
34
LC
1255
88
55
475
A7B
Q37
4.
60E-
05
yes
Begg
iato
a sp
. PS
Rec
epto
r pro
tein
kin
ase
LC
4205
55
32
294
O22
437
3.16
E-04
ye
s Pi
sum
sat
ivum
M
agne
sium
-che
lata
se su
buni
t chl
D,
chlo
ropl
astic
LC
44
2554
21
25
0 P3
9442
3.
10E-
06
yes
Nat
rono
mon
as p
hara
onis
H
aloc
yani
n LC
68
547
42
208
Q8Y
P49
1.09
E-02
ye
s N
osto
c sp
. (st
rain
PC
C 7
120
/ U
TEX
257
6)
1-de
oxy-
D-x
ylul
ose
5-ph
osph
ate
redu
ctoi
som
eras
e LC
LC
44
1363
0
395
- 5.
37E-
07
yes
- -
LC
4553
97
16
209
C1N
6V7
8.01
E-06
ye
s M
icro
mon
as p
usill
a (s
train
C
CM
P154
5)
Pred
icte
d pr
otei
n LC
10
0060
3
63
E7F3
N4
7.66
E-11
ye
s D
anio
rer
io
Unc
hara
cter
ized
pro
tein
LC
43
2966
9
61
- 2.
82E-
05
yes
- -
LC
4322
37
0 56
-
2.71
E-11
ye
s -
- N
ucle
otid
e tra
nspo
rt an
d m
etab
olis
m
HC
36
5588
17
2 28
Q
56E6
2 4.
60E-
03
yes
Nic
otia
na ta
bacu
m
Nuc
leos
ide
diph
osph
ate
kina
se 1
LC
6097
8 17
28
2 Q
7Z8P
9 5.
28E-
13
yes
Neo
sart
orya
fum
igat
a (s
train
A
TCC
MY
A-4
609
/ Af2
93 /
CB
S 10
1355
/ FG
SC A
1100
) N
ucle
osid
e di
phos
phat
e ki
nase

204 A
ppen
dix
A -
Tabl
e - 4
: Tra
nscr
ipt o
f the
gra
phic
ally
com
pris
ed c
ohor
ts a
nd th
eir a
nnot
atio
n co
ntin
ued:
HC
or L
C
cond
ition
JG
I♯
fpkm
in H
C
cond
ition
fp
km in
LC
co
nditi
on
NR
Pro
t.ID
q_
valu
e Sig
. O
rgan
ism
Fu
nctio
n En
ergy
pro
duct
ion
and
conv
ersi
on
HC
45
1022
36
5 42
Q
4268
6 1.
18E-
03
yes
Chl
amyd
omon
as re
inha
rdtii
M
alat
e de
hydr
ogen
ase,
mito
chon
dria
l H
C
3498
15
241
55
P396
16
4.85
E-02
ye
s Ba
cillu
s sub
tilis
Pr
obab
le a
ldeh
yde
dehy
drog
enas
e yw
dH
LC
3617
37
125
1133
P4
1345
7.
37E-
04
yes
Ory
za sa
tiva
subs
p. ja
poni
ca
Ferr
edox
in--
NA
DP
redu
ctas
e, ro
ot is
ozym
e,
chlo
ropl
astic
LC
46
1699
13
3 10
37
Q06
908
5.11
E-03
ye
s O
dont
ella
sine
nsis
A
TP sy
ntha
se g
amm
a ch
ain,
chl
orop
last
ic
LC
4373
35
173
919
Q9L
XC
9 7.
28E-
03
yes
Arab
idop
sis t
halia
na
Solu
ble
inor
gani
c py
roph
osph
atas
e 1,
ch
loro
plas
tic
LC
4323
85
144
868
P413
45
6.08
E-03
ye
s O
ryza
sativ
a su
bsp.
japo
nica
Fe
rred
oxin
--N
AD
P re
duct
ase,
root
isoz
yme,
ch
loro
plas
tic
LC
4159
40
54
607
Q5X
IZ6
4.93
E-07
ye
s D
anio
reri
o G
lyce
rol-3
-pho
spha
te d
ehyd
roge
nase
1-li
ke
prot
ein
LC
4600
94
29
348
Q27
928
2.40
E-09
ye
s D
roso
phila
pse
udoo
bscu
ra
pseu
doob
scur
a G
lyce
rol-3
-pho
spha
te d
ehyd
roge
nase
[N
AD
+], c
ytop
lasm
ic
LC
4277
69
4 31
0 O
3507
7 0.
00E+
00
yes
Rattu
s nor
vegi
cus
Gly
cero
l-3-p
hosp
hate
deh
ydro
gena
se
[NA
D+]
, cyt
opla
smic
LC
45
312
80
285
Q02
585
1.24
E-02
ye
s N
icot
iana
taba
cum
C
ytoc
hrom
e b6
-f c
ompl
ex ir
on-s
ulfu
r sub
unit
2, c
hlor
opla
stic
LC
41
7078
13
28
3 Q
1XD
M1
8.33
E-07
ye
s Po
rphy
ra y
ezoe
nsis
Py
ruva
te d
ehyd
roge
nase
E1
com
pone
nt
subu
nit b
eta
LC
4489
08
8 27
8 Q
1RJT
3 8.
64E-
14
yes
Rick
etts
ia b
ellii
(str
ain
RML3
69-
C)
Dih
ydro
lipoy
llysi
ne-r
esid
ue a
cety
ltran
sfer
ase
com
p. o
f pyr
uvat
e de
hydr
ogen
ase
com
plex
LC
43
7063
7
265
O95
847
0.00
E+00
ye
s H
omo
sapi
ens
Mito
chon
dria
l unc
oupl
ing
prot
ein
4 LC
43
6192
0
212
Q93
Y52
0.
00E+
00
yes
Chl
amyd
omon
as re
inha
rdtii
So
lubl
e in
orga
nic
pyro
phos
phat
ase
1,
chlo
ropl
astic
LC
45
5448
46
21
1 B
0G14
3 2.
77E-
03
yes
Dic
tyos
teliu
m d
isco
ideu
m
Mito
chon
dria
l SLC
pro
tein
ucp
B

205 A
ppen
dix
A -
Tabl
e - 4
: Tra
nscr
ipt o
f the
gra
phic
ally
com
pris
ed c
ohor
ts a
nd th
eir a
nnot
atio
n co
ntin
ued:
H
C o
r LC
co
nditi
on
JGI♯
fp
km in
HC
co
nditi
on
fpkm
in L
C
cond
ition
N
R P
rot.I
D
q_va
lue S
ig.
Org
anis
m
Func
tion
Ener
gy p
rodu
ctio
n an
d co
nver
sion
Dar
k 42
0435
30
20
4 P7
2740
1.
24E-
04
yes
Syne
choc
ystis
sp. (
stra
in A
TCC
27
184
/ PC
C 6
803
/ N-1
) D
ihyd
rolip
oyl d
ehyd
roge
nase
Tr
ansc
riptio
n H
C
4335
98
539
5 P1
0243
3.
58E-
06
yes
Hom
o sa
pien
s M
yb-r
elat
ed p
rote
in A
H
C
4360
10
297
21
- 5.
76E-
04
yes
- -
HC
45
2735
25
6 14
Q
9H0I
3 2.
04E-
02
yes
Hom
o sa
pien
s C
oile
d-co
il do
mai
n-co
ntai
ning
pro
tein
113
H
C
4403
10
247
2 -
1.56
E-08
ye
s -
- H
C
4549
61
234
17
Q0J
IC2
4.56
E-03
ye
s O
ryza
sativ
a su
bsp.
japo
nica
Tr
ansc
riptio
n fa
ctor
GA
MY
B
HC
43
7110
23
0 45
-
4.81
E-02
ye
s -
- H
C
4364
79
215
22
Q4R
8Y1
4.25
E-04
ye
s M
acac
a fa
scic
ular
is
Bro
mod
omai
n te
stis
-spe
cific
pro
tein
H
C
4394
94
184
1 Q
9S7L
2 1.
23E-
09
yes
Arab
idop
sis t
halia
na
Tran
scrip
tion
fact
or M
YB
98
HC
44
1236
18
4 1
- 4.
13E-
08
yes
- -
LC
4496
60
0 35
2 P3
8529
8.
64E-
14
yes
Gal
lus g
allu
s H
eat s
hock
fact
or p
rote
in 1
LC
31
4592
42
22
7 P4
9263
1.
77E-
03
yes
Xeno
pus l
aevi
s Pe
ntra
xin
fusi
on p
rote
in
LC
3547
47
4 15
8 O
9767
0 9.
22E-
11
yes
Ory
ctol
agus
cun
icul
us
Hom
eobo
x ex
pres
sed
in E
S ce
lls 1
(Fra
gmen
t) C
oenz
yme
trans
port
and
met
abol
ism
H
C
4260
57
80
16
Q8V
HT6
7.
30E-
03
yes
Rattu
s nor
vegi
cus
Ars
enite
met
hyltr
ansf
eras
e H
C
3519
30
78
8 -
2.10
E-05
ye
s -
- LC
42
3968
85
47
6 Q
6H6D
2 2.
74E-
03
yes
Ory
za sa
tiva
subs
p. ja
poni
ca
Porp
hobi
linog
en d
eam
inas
e, c
hlor
opla
stic
LC
44
3289
60
41
5 Q
4269
8 1.
25E-
04
yes
Cat
hara
nthu
s ros
eus
Ger
anyl
gera
nyl p
yrop
hosp
hate
synt
hase
, ch
loro
plas
tic
LC
4329
24
65
291
P350
55
6.65
E-03
ye
s G
lyci
ne m
ax
Cop
ropo
rphy
rinog
en-I
II o
xida
se, c
hlor
opla
stic

206 A
ppen
dix
A -
Tabl
e - 4
: Tra
nscr
ipt o
f the
gra
phic
ally
com
pris
ed c
ohor
ts a
nd th
eir a
nnot
atio
n co
ntin
ued:
H
C o
r LC
co
nditi
on
JGI♯
fp
km in
HC
co
nditi
on
fpkm
in L
C
cond
ition
N
R P
rot.I
D
q_va
lue S
ig.
Org
anis
m
Func
tion
Coe
nzym
e tra
nspo
rt an
d m
etab
olis
m
LC
4278
95
44
289
Q55
467
3.82
E-05
ye
s Sy
nech
ocys
tis sp
. (st
rain
ATC
C
2718
4 / P
CC
680
3 / N
-1)
Mag
nesi
um-p
roto
porp
hyrin
O-
met
hyltr
ansf
eras
e LC
43
6908
61
27
4 Q
8S4R
4 1.
35E-
02
yes
Sola
num
lyco
pers
icum
Pr
olyc
open
e is
omer
ase,
chl
orop
last
ic
LC
3612
96
41
219
A5G
JR6
6.18
E-04
ye
s Sy
nech
ococ
cus s
p. (s
train
W
H78
03)
Uro
porp
hyrin
ogen
dec
arbo
xyla
se
LC
5601
1 20
20
7 A
7HSV
9 2.
99E-
04
yes
Parv
ibac
ulum
lava
men
tivor
ans
(stra
in D
S-1
/ DSM
130
23 /
NC
IMB
139
66)
Bifu
nctio
nal p
rote
in F
olD
LC
46
5530
19
84
B
1XIF
6 7.
52E-
04
yes
Syne
choc
occu
s sp.
(stra
in A
TCC
27
264
/ PC
C 7
002
/ PR
-6)
Uro
porp
hyrin
ogen
dec
arbo
xyla
se
LC
4350
69
22
79
Q2S
1W0
5.10
E-03
ye
s Sa
linib
acte
r rub
er (s
train
DSM
13
855
/ M31
) U
ropo
rphy
rinog
en d
ecar
boxy
lase
C
arbo
hydr
ate
trans
port
and
met
abol
ism
H
C
4367
25
776
15
- 7.
39E-
06
yes
- -
HC
43
8851
67
1 62
P2
9495
6.
86E-
04
yes
Prop
ioni
bact
eriu
m
freu
denr
eich
ii su
bsp.
sher
man
ii Py
roph
osph
ate-
-fru
ctos
e 6-
phos
phat
e 1-
phos
phot
rans
fera
se
HC
43
9674
52
6 36
Q
9UT6
3 1.
64E-
03
yes
Schi
zosa
ccha
rom
yces
pom
be
(stra
in 9
72 /
ATC
C 2
4843
) Pr
obab
le p
hosp
hogl
ycer
ate
mut
ase
C51
3.02
H
C
7032
3 27
2 24
P1
4618
2.
50E-
04
yes
Hom
o sa
pien
s Py
ruva
te k
inas
e is
ozym
es M
1/M
2 H
C
4395
93
205
1 Q
3UP7
5 2.
64E-
09
yes
Mus
mus
culu
s U
DP-
gluc
uron
osyl
trans
fera
se 3
A1
HC
31
7489
18
7 41
B
4ETL
7 2.
89E-
02
yes
Prot
eus m
irab
ilis (
stra
in H
I432
0) B
ifunc
tiona
l pol
ymyx
in re
sist
ance
pro
tein
A
rnA
LC
43
7959
20
5 14
56
Q55
6J0
1.13
E-02
ye
s D
icty
oste
lium
dis
coid
eum
Tr
ansk
etol
ase
LC
4365
50
153
1315
Q
0PA
S0
1.09
E-03
ye
s C
ampy
loba
cter
jeju
ni
Fruc
tose
-bis
phos
phat
e al
dola
se
LC
4175
37
156
1035
Q
9SB
N4
2.57
E-03
ye
s Vo
lvox
car
teri
Ph
osph
ogly
cera
te k
inas
e, c
hlor
opla
stic
LC
10
0158
10
5 49
6 Q
4297
1 6.
31E-
03
yes
Ory
za sa
tiva
subs
p. ja
poni
ca
Enol
ase

207 A
ppen
dix
A -
Tabl
e - 4
: Tra
nscr
ipt o
f the
gra
phic
ally
com
pris
ed c
ohor
ts a
nd th
eir a
nnot
atio
n co
ntin
ued:
HC
or L
C
cond
ition
JG
I♯
fpkm
in H
C
cond
ition
fp
km in
LC
co
nditi
on
NR
Pro
t.ID
q_
valu
e Sig
. O
rgan
ism
Fu
nctio
n C
arbo
hydr
ate
trans
port
and
met
abol
ism
LC
35
1398
12
1 44
2 Q
9ZU
38
2.58
E-02
ye
s Ar
abid
opsi
s th
alia
na
Prob
able
ribo
se-5
-pho
spha
te is
omer
ase
LC
4407
86
16
417
B6I
RB
5 8.
64E-
14
yes
Rhod
ospi
rillu
m c
ente
num
(stra
in
ATC
C 5
1521
/ SW
) 1-
deox
y-D
-xyl
ulos
e-5-
phos
phat
e sy
ntha
se
LC
4338
69
12
365
Q93
VR
3 4.
10E-
10
yes
Arab
idop
sis
thal
iana
G
DP-
man
nose
3,5
-epi
mer
ase
LC
4183
41
47
319
O52
402
2.98
E-03
ye
s Ed
war
dsie
lla ic
talu
ri (s
train
93-
146)
Fr
ucto
se-b
isph
osph
ate
aldo
lase
LC
44
4895
40
29
8 P5
1181
3.
18E-
04
yes
Baci
llus
liche
nifo
rmis
Py
ruva
te k
inas
e LC
43
8704
28
26
8 P0
AG
10
3.16
E-07
ye
s Sh
igel
la fl
exne
ri
Rib
ulos
e-ph
osph
ate
3-ep
imer
ase
LC
4384
92
28
267
P0A
G10
4.
44E-
07
yes
Shig
ella
flex
neri
R
ibul
ose-
phos
phat
e 3-
epim
eras
e LC
43
9215
26
23
2 P5
1181
2.
25E-
05
yes
Baci
llus
liche
nifo
rmis
Py
ruva
te k
inas
e C
ytos
kele
ton
HC
43
9339
48
2 19
-
4.78
E-04
ye
s -
- H
C
4447
47
301
26
- 1.
22E-
03
yes
- -
HC
43
2151
22
5 8
- 2.
27E-
04
yes
- -
LC
4326
36
163
1177
P2
6302
5.
11E-
03
yes
Triti
cum
aes
tivum
Ph
osph
orib
ulok
inas
e, c
hlor
opla
stic
LC
44
5562
14
0 11
38
Q40
832
1.08
E-03
ye
s Pe
lvet
ia fa
stig
iata
Tu
bulin
alp
ha-2
cha
in
LC
4164
24
155
704
Q40
832
2.61
E-02
ye
s Pe
lvet
ia fa
stig
iata
Tu
bulin
alp
ha-2
cha
in
LC
7824
4 10
5 30
8 Q
0811
4 4.
98E-
02
yes
Eupl
otes
oct
ocar
inat
us
Tubu
lin a
lpha
cha
in
LC
4599
06
32
307
Q63
425
4.35
E-05
ye
s Ra
ttus
norv
egic
us
Peria
xin
LC
4410
06
46
279
D8T
PL1
1.77
E-03
ye
s Vo
lvox
car
teri
M
etal
lopr
otei
nase
, ext
race
llula
r mat
rix
glyc
opro
tein
VM
P10
(Fra
gmen
t) LC
45
7781
13
26
2 -
7.44
E-08
ye
s -
-

208 A
ppen
dix
A -
Tabl
e - 4
: Tra
nscr
ipt o
f the
gra
phic
ally
com
pris
ed c
ohor
ts a
nd th
eir a
nnot
atio
n co
ntin
ued:
H
C o
r LC
co
nditi
on
JGI♯
fp
km in
HC
co
nditi
on
fpkm
in L
C
cond
ition
N
R P
rot.I
D
q_va
lue S
ig.
Org
anis
m
Func
tion
Am
ino
acid
tran
spor
t and
met
abol
ism
H
C
4386
42
883
21
O93
796
4.55
E-04
ye
s
Can
dida
gla
brat
a (s
train
ATC
C
2001
/ C
BS
138
/ JC
M 3
761
/ N
BR
C 0
622
/ NR
RL
Y-6
5)
Elon
gatio
n fa
ctor
3
HC
4525
97
736
90
Q9I
2V5
1.87
E-02
ye
s
Pseu
dom
onas
aer
ugin
osa
(stra
in
ATC
C 1
5692
/ PA
O1
/ 1C
/ PR
S 10
1 / L
MG
122
28)
Aco
nita
te h
ydra
tase
2
HC
43
3953
33
7 4
P297
86
3.39
E-07
ye
s Ae
des a
egyp
ti Tr
ypsi
n 3A
1 H
C
4374
87
294
70
P466
43
4.63
E-02
ye
s Ar
abid
opsi
s tha
liana
A
spar
tate
am
inot
rans
fera
se, m
itoch
ondr
ial
LC
4553
11
139
907
P568
59
2.73
E-02
ye
s Em
eric
ella
nid
ulan
s Ph
osph
oade
nosi
ne p
hosp
hosu
lfate
redu
c.
LC
4370
52
13
748
Q31
QJ2
0.
00E+
00
yes
Syne
choc
occu
s elo
ngat
us
Glu
tam
ate-
1-se
mia
ldeh
yde
2,1-
amin
omut
ase
LC
4437
53
37
455
Q5V
QL3
1.
72E-
07
yes
Ory
za sa
tiva
subs
p. ja
poni
ca
Phos
phoe
nolp
yruv
ate/
phos
phat
e tra
nslo
cato
r 3,
chl
orop
last
ic
LC
3520
50
94
450
Q9M
5A9
9.59
E-03
ye
s Ar
abid
opsi
s tha
liana
G
luco
se-6
-pho
spha
te/p
hosp
hate
tran
sloc
ator
1,
chl
orop
last
ic
LC
4327
85
36
439
Q5V
QL3
1.
71E-
07
yes
Ory
za sa
tiva
subs
p. ja
poni
ca
Phos
phoe
nolp
yruv
ate/
phos
phat
e tra
nslo
cato
r 3,
chl
orop
last
ic
LC
4412
99
112
408
A1S
JJ3
4.46
E-02
ye
s N
ocar
dioi
des s
p. (s
train
BA
A-
499
/ JS6
14)
Arg
inin
osuc
cina
te sy
ntha
se
LC
4535
25
63
283
P583
38
6.38
E-03
ye
s Rh
izob
ium
mel
iloti
(stra
in 1
021)
Orn
ithin
e cy
clod
eam
inas
e 1
LC
4275
26
61
219
P009
31
4.69
E-02
ye
s Sa
ccha
rom
yces
cer
evis
iae
(stra
in
ATC
C 2
0450
8 / S
288c
) Tr
ypto
phan
synt
hase
LC
42
0632
20
21
4 Q
54U
H8
1.43
E-04
ye
s D
icty
oste
lium
dis
coid
eum
D
-3-p
hosp
hogl
ycer
ate
dehy
drog
enas
e LC
41
8314
7
210
Q8R
XN
3 0.
00E+
00
yes
Arab
idop
sis t
halia
na
Phos
phoe
nolp
yruv
ate/
phos
phat
e tra
nslo
cato
r 1,
chl
orop
last
ic
LC
4166
26
32
173
Q9L
F61
7.86
E-04
ye
s Ar
abid
opsi
s tha
liana
X
ylul
ose
5-ph
osph
ate/
phos
phat
e tra
nslo
cato
r, ch
loro
plas
tic

209 A
ppen
dix
A -
Tabl
e - 4
: Tra
nscr
ipt o
f the
gra
phic
ally
com
pris
ed c
ohor
ts a
nd th
eir a
nnot
atio
n co
ntin
ued:
H
C o
r LC
co
nditi
on
JGI♯
fp
km in
HC
co
nditi
on
fpkm
in L
C
cond
ition
N
R P
rot.I
D
q_va
lue S
ig.
Org
anis
m
Func
tion
Am
ino
acid
tran
spor
t and
met
abol
ism
LC
47
1108
24
16
6 Q
9SE9
4 3.
25E-
04
yes
Zea
may
s M
ethy
lene
tetra
hydr
ofol
ate
redu
ctas
e 1
Extra
cellu
lar s
truct
ures
H
C
4318
08
359
1 -
5.34
E-10
ye
s -
- H
C
4367
56
150
3 -
4.20
E-07
ye
s -
- H
C
4426
09
142
9 -
6.67
E-04
ye
s -
- H
C
4370
49
103
8 A
4S1T
5 3.
85E-
02
yes
Ost
reoc
occu
s luc
imar
inus
(stra
in
CC
E990
1)
Pred
icte
d pr
otei
n LC
43
5083
27
9 11
18
- 4.
01E-
02
yes
- -
LC
4555
41
1 54
4 -
0.00
E+00
ye
s -
- LC
46
6583
2
189
Q8L
B31
0.
00E+
00
yes
Arab
idop
sis t
halia
na
Puta
tive
unch
arac
teriz
ed p
rote
in
LC
4636
30
7 17
5 P3
9442
8.
20E-
07
yes
Nat
rono
mon
as p
hara
onis
H
aloc
yani
n LC
43
2130
19
13
3 P7
4615
2.
21E-
06
yes
Syne
choc
ystis
sp. (
stra
in A
TCC
27
184
/ PC
C 6
803
/ N-1
) U
ncha
ract
eriz
ed p
rote
in sl
l148
3 C
ell w
all/m
embr
ane/
enve
lope
bio
gene
sis
HC
46
1984
19
0 24
Q
9UV
H3
9.38
E-03
ye
s M
ortie
rella
alp
ina
Palm
itoyl
trans
fera
se A
KR
1 (F
ragm
ent)
HC
35
8244
12
4 3
Q9S
YM
1 1.
15E-
04
yes
Arab
idop
sis t
halia
na
Unc
hara
cter
ized
msc
S fa
mily
pro
tein
A
t1g7
8610
H
C
4331
17
119
6 Q
6GQ
X6
1.55
E-07
ye
s M
us m
uscu
lus
Ank
yrin
repe
at a
nd S
AM
dom
ain-
cont
aini
ng
prot
ein
6 H
C
3582
42
118
3 Q
9SY
M1
7.68
E-05
ye
s Ar
abid
opsi
s tha
liana
U
ncha
ract
eriz
ed m
scS
fam
ily p
rote
in
At1
g786
10
LC
4662
30
95
627
Q84
KI6
4.
59E-
03
yes
Spin
acia
ole
race
a U
DP-
sulfo
quin
ovos
e sy
ntha
se, c
hlor
opla
stic
LC
44
8185
10
12
5 Q
9LX
T9
1.03
E-05
ye
s Ar
abid
opsi
s tha
liana
C
allo
se sy
ntha
se 3
LC
45
4930
18
10
5 Q
5W91
5 1.
48E-
03
yes
Pisu
m sa
tivum
U
DP-
suga
r pyr
opho
spha
ryla
se

210 A
ppen
dix
A -
Tabl
e - 4
: Tra
nscr
ipt o
f the
gra
phic
ally
com
pris
ed c
ohor
ts a
nd th
eir a
nnot
atio
n co
ntin
ued:
H
C o
r LC
co
nditi
on
JGI♯
fp
km in
HC
co
nditi
on
fpkm
in L
C
cond
ition
N
R P
rot.I
D
q_va
lue S
ig.
Org
anis
m
Func
tion
Chr
omat
in st
ruct
ure
and
dyna
mic
s H
C
5058
6 51
3 17
9 P8
2888
4.
22E-
02
yes
Olis
thod
iscu
s lut
eus
His
tone
H4
HC
35
0324
33
1 57
Q
9I8G
9 1.
21E-
02
yes
Gal
lus g
allu
s H
isto
ne-b
indi
ng p
rote
in R
BB
P7
HC
37
1985
22
1 69
P0
4735
3.
75E-
02
yes
Psam
mec
hinu
s mili
aris
La
te h
isto
ne H
2A.1
LC
46
0675
12
26
5329
-
4.74
E-02
ye
s -
- LC
44
2150
38
2 15
43
Q6Y
NC
8 4.
71E-
02
yes
Ovi
s ari
es
His
tone
H2A
.Z
Seco
ndar
y m
etab
olite
s bio
synt
hesi
s, tra
nspo
rt an
d ca
tabo
lism
H
C
3599
30
388
12
P259
70
2.41
E-04
ye
s M
yxoc
occu
s xan
thus
(stra
in D
K
1622
) U
ncha
ract
eriz
ed o
xido
redu
ctas
e M
XA
N_5
909
HC
53
289
306
3 O
2302
4 1.
90E-
03
yes
Arab
idop
sis t
halia
na
Flav
in-c
onta
inin
g m
onoo
xyge
nase
YU
CC
A3
HC
43
8972
30
2 16
Q
99J4
7 1.
16E-
03
yes
Mus
mus
culu
s D
ehyd
roge
nase
/redu
ctas
e SD
R fa
mily
m
embe
r 7B
H
C
4547
64
270
23
Q9Z
U35
1.
56E-
02
yes
Arab
idop
sis t
halia
na
AB
C tr
ansp
orte
r G fa
mily
mem
ber 7
LC
43
5829
79
8 33
84
Q1I
HZ5
2.
45E-
02
yes
Kor
ibac
ter v
ersa
tilis
(stra
in
Ellin
345)
A
cyl c
arrie
r pro
tein
LC
45
7138
78
34
0 Q
1IH
Z5
2.11
E-03
ye
s K
orib
acte
r ver
satil
is (s
train
El
lin34
5)
Acy
l car
rier p
rote
in
LC
4155
23
5 33
8 O
3434
0 0.
00E+
00
yes
Baci
llus s
ubtil
is
3-ox
oacy
l-[ac
yl-c
arrie
r-pr
otei
n] sy
ntha
se 2
LC
4619
62
44
267
P437
10
2.48
E-03
ye
s
Hae
mop
hilu
s inf
luen
zae
(stra
in
ATC
C 5
1907
/ D
SM 1
1121
/ K
W20
/ R
d)
3-ox
oacy
l-[ac
yl-c
arrie
r-pr
otei
n] sy
ntha
se 1
LC
43
8034
49
25
3 O
3434
0 1.
70E-
03
yes
Baci
llus s
ubtil
is
3-ox
oacy
l-[ac
yl-c
arrie
r-pr
otei
n] sy
ntha
se 2

211 A
ppen
dix
A -
Tabl
e - 4
: Tra
nscr
ipt o
f the
gra
phic
ally
com
pris
ed c
ohor
ts a
nd th
eir a
nnot
atio
n co
ntin
ued:
H
C o
r LC
co
nditi
on
JGI♯
fp
km in
HC
co
nditi
on
fpkm
in L
C
cond
ition
N
R P
rot.I
D
q_va
lue S
ig.
Org
anis
m
Func
tion
Cel
l cyc
le c
ontro
l, ce
ll di
visi
on, c
hrom
osom
e pa
rtitio
ning
H
C
1135
94
176
7 -
1.89
E-04
ye
s -
- H
C
3663
32
140
8 O
9458
0 2.
98E-
03
yes
Schi
zosa
ccha
rom
yces
pom
be
(stra
in 9
72 /
ATC
C 2
4843
) U
biqu
itin
and
WLM
dom
ain-
cont
aini
ng
prot
ein
C14
42.0
7c
HC
10
2888
10
0 4
- 6.
88E-
05
yes
- -
HC
37
4001
74
18
Q
0073
7 1.
16E-
02
yes
Emer
icel
la n
idul
ans
Chr
omos
ome
segr
egat
ion
prot
ein
sudA
LC
46
6575
30
45
7 P4
6277
5.
47E-
09
yes
Med
icag
o sa
tiva
subs
p. v
aria
G
2/m
itotic
-spe
cific
cyc
lin-1
LC
12
5202
48
36
1 P5
9241
8.
79E-
05
yes
Rat
tus n
orve
gicu
s A
uror
a ki
nase
A
LC
3598
88
46
234
P974
77
3.22
E-03
ye
s M
us m
uscu
lus
Aur
ora
kina
se A
LC
72
589
20
163
Q9F
JL0
1.70
E-06
ye
s A
rabi
dops
is th
alia
na
Stru
ctur
al m
aint
enan
ce o
f chr
omos
omes
pr
otei
n 4
LC
4653
21
14
163
Q54
PK4
7.69
E-04
ye
s D
icty
oste
lium
dis
coid
eum
St
ruct
ural
mai
nten
ance
of c
hrom
osom
es
prot
ein
2 LC
45
6538
6
98
Q9N
TJ3
3.24
E-13
ye
s H
omo
sapi
ens
Stru
ctur
al m
aint
enan
ce o
f chr
omos
omes
pr
otei
n 4
LC
4681
24
7 86
Q
9BPX
3 3.
26E-
04
yes
Hom
o sa
pien
s C
onde
nsin
com
plex
subu
nit 3
LC
44
8323
6
85
Q15
003
3.02
E-05
ye
s H
omo
sapi
ens
Con
dens
in c
ompl
ex su
buni
t 2
LC
4444
53
21
73
P0C
P40
1.14
E-02
ye
s
Cry
ptoc
occu
s neo
form
ans v
ar.
neof
orm
ans s
erot
ype
D (s
train
JE
C21
/ A
TCC
MY
A-5
65)
Prob
able
kin
etoc
hore
pro
tein
NU
F2
Def
ence
mec
hani
sms
HC
58
171
78
1 Q
54T7
6 2.
62E-
05
yes
Dic
tyos
teliu
m d
isco
ideu
m
Prob
able
dua
l spe
cific
ity p
rote
in p
hosp
hata
se
HC
44
6038
68
2
- 1.
70E-
11
yes
- -
Cel
l mot
ility
H
C
1222
22
211
21
E9A
EM8
2.79
E-03
ye
s Le
ishm
ania
maj
or
Prot
eoph
osph
ogly
can
ppg4

212 A
ppen
dix
A T
able
- 5:
Tra
nscr
ipts
mat
chin
g pr
otei
ns o
f the
V-ty
pe p
roto
n A
TPas
e cl
uste
r and
cla
thrin
clu
ster
.
Prot
ein
JGI♯
U
niPr
ot ID
Fu
nctio
n
Shor
t nam
e 2X
-fol
d ch
ange
. fpkm
HC
at
cond
ition
fp
km L
C a
t co
nditi
on
Sig.
K
OG
def
initi
on
V-ty
pe p
roto
n A
TPas
e an
d cl
athr
in !
4397
40
Q8P
YZ8
K
(+)-
stim
ulat
ed p
yrop
hosp
hate
-en
ergi
zed
sodi
um p
ump
H P
pase
1.
32
235
586
no "!
4150
47
P216
16
Pyro
phos
phat
e-en
ergi
zed
vacu
olar
mem
bran
e pr
oton
pum
p V
-type
PP
ase
-0.5
5 70
48
no
"!
5123
9 Q
0657
2 Py
roph
osph
ate-
ener
gize
d va
cuol
ar m
embr
ane
prot
on p
ump
V-ty
pe
PPas
e 0.
34
67
85
no "!
7503
2 Q
0657
2 Py
roph
osph
ate-
ener
gize
d va
cuol
ar m
embr
ane
prot
on p
ump
V-ty
pe
PPas
e 0.
5 20
28
no
"!
4647
67
Q9Z
1G4
V-ty
pe p
roto
n A
TPas
e 11
6 kD
a su
buni
t a is
ofor
m 1
V
-ATP
ase
0.
78
28
49
no V
acuo
lar H
+ -ATP
ase
V0
sect
or,
subu
nit a
6125
3 Q
9Z1G
4 V
-type
pro
ton
ATP
ase
116
kDa
subu
nit a
isof
orm
1
V-A
TPas
e
2.18
79
35
8 no
Vac
uola
r H+ -A
TPas
e V
0 se
ctor
, su
buni
t a
3134
22
Q43
362
V-ty
pe p
roto
n A
TPas
e 16
kD
a pr
oteo
lipid
subu
nit
V-A
TPas
e
1.25
11
6 27
7 no
Vac
uola
r H+ -A
TPas
e V
0 se
ctor
, su
buni
ts c
/c'
3597
83
Q43
362
V-ty
pe p
roto
n A
TPas
e 16
kD
a pr
oteo
lipid
subu
nit
V-A
TPas
e
0.96
74
8 14
60
no V
acuo
lar H
+ -ATP
ase
V0
sect
or,
subu
nits
c/c
'
3624
59
Q43
362
V-ty
pe p
roto
n A
TPas
e 16
kD
a pr
oteo
lipid
subu
nit
V-A
TPas
e
1.22
21
1 48
9 no
Vac
uola
r H+ -A
TPas
e V
0 se
ctor
, su
buni
ts c
/c'
3647
07
Q43
362
V-ty
pe p
roto
n A
TPas
e 16
kD
a pr
oteo
lipid
subu
nit
V-A
TPas
e
0.9
153
285
no V
acuo
lar H
+ -ATP
ase
V0
sect
or,
subu
nits
c/c
'
3665
12
Q43
362
V-ty
pe p
roto
n A
TPas
e 16
kD
a pr
oteo
lipid
subu
nit
V-A
TPas
e
1.18
81
18
4 no
Vac
uola
r H+ -A
TPas
e V
0 se
ctor
, su
buni
ts c
/c'
4573
32
Q43
362
V-ty
pe p
roto
n A
TPas
e 16
kD
a pr
oteo
lipid
subu
nit
V-A
TPas
e
1.74
10
8 36
1 no
Vac
uola
r H+ -A
TPas
e V
0 se
ctor
, su
buni
ts c
/c'
4518
83
Q91
V37
V
-type
pro
ton
ATP
ase
21 k
Da
prot
eolip
id su
buni
t V
-ATP
ase
1.
21
48
110
no V
acuo
lar H
+ -ATP
ase
V0
sect
or,
subu
nit c
''

213 A
ppen
dix
A -
Tabl
e - 5
: Tra
nscr
ipts
mat
chin
g pr
otei
ns o
f the
V-ty
pe p
roto
n A
TPas
e cl
uste
r and
cla
thrin
clu
ster
con
tinue
d:
Prot
ein
JGI♯
U
niPr
ot ID
Fun
ctio
n
Shor
t nam
e 2X
-fol
d ch
ange
. fp
km H
C
cond
ition
fpkm
LC
co
nditi
on S
ig. K
OG
def
initi
on
V-ty
pe p
roto
n A
TPas
e an
d cl
athr
in
4395
38
P546
47
V-ty
pe p
roto
n A
TPas
e ca
taly
tic
subu
nit A
V
-ATP
ase
1.
28
323
786
no V
acuo
lar H
+ -ATP
ase
V1
sect
or,
subu
nit A
4351
28
P314
08
V-ty
pe p
roto
n A
TPas
e su
buni
t B,
brai
n is
ofor
m
V-A
TPas
e
1.32
39
1 97
6 no
Vac
uola
r H+ -A
TPas
e V
1 se
ctor
, su
buni
t B
3138
00
P239
68
V-ty
pe p
roto
n A
TPas
e su
buni
t c''
V-A
TPas
e
1.28
15
4 37
4 no
Vac
uola
r H+ -A
TPas
e V
0 se
ctor
, su
buni
t c''
4139
49
P546
41
V-ty
pe p
roto
n A
TPas
e su
buni
t d
V-A
TPas
e
1.04
36
0 73
9 no
Vac
uola
r H+ -A
TPas
e V
0 se
ctor
, su
buni
t d
4200
05
Q9X
GM
1 V
-type
pro
ton
ATP
ase
subu
nit D
V
-ATP
ase
1.
2 76
17
5 no
Vac
uola
r H+ -A
TPas
e V
1 se
ctor
, su
buni
t D
4258
33
Q9V
7D2
V-ty
pe p
roto
n A
TPas
e su
buni
t D
1 V
-ATP
ase
0.
86
138
251
no V
acuo
lar H
+ -ATP
ase
V1
sect
or,
subu
nit D
4330
60
Q9M
B46
V
-type
pro
ton
ATP
ase
subu
nit E
V
-ATP
ase
0.
35
411
526
no V
acuo
lar H
+ -ATP
ase
V1
sect
or,
subu
nit E
3522
09
Q9Z
QX
4 V
-type
pro
ton
ATP
ase
subu
nit F
V
-ATP
ase
0.
95
128
246
no V
acuo
lar H
+ -ATP
ase
V1
sect
or,
subu
nit F
3559
49
P913
03
Prob
able
V-ty
pe p
roto
n A
TPas
e su
buni
t G
V-A
TPas
e
0.46
55
6 76
5 no
Vac
uola
r H+ -A
TPas
e V
1 se
ctor
, su
buni
t G
3693
92
P913
03
Prob
able
V-ty
pe p
roto
n A
TPas
e su
buni
t G
V-A
TPas
e
0.35
29
9 38
2 no
Vac
uola
r H+ -A
TPas
e V
1 se
ctor
, su
buni
t G
9554
3 Q
9LX
65
V-ty
pe p
roto
n A
TPas
e su
buni
t H
V-A
TPas
e 1.
25
217
518
no V
acuo
lar H
+ -ATP
ase
V1
sect
or,
subu
nit H
4617
41
Q8T
DJ6
R
AV
E (r
egul
ator
of V
-ATP
ase
asse
mbl
y) c
ompl
ex su
buni
t D
mX
1.
7 5
16
yes
RA
VE,
RA
V1/
DM
X p
rote
in, W
D
repe
at su
perf
amily
6708
1 P1
2522
Pr
obab
le p
roto
n A
TPas
e 1B
H
Ppa
se
3.18
1
10
yes
Plas
ma
mem
bran
e H
+ -tran
spor
ting
ATP
ase

214
App
endi
x A
- Ta
ble
- 5: T
rans
crip
ts m
atch
ing
prot
eins
of t
he V
-type
pro
ton
ATP
ase
clus
ter a
nd c
lath
rin c
lust
er c
ontin
ued:
Pr
otei
n JG
I♯
Uni
Prot
ID F
unct
ion
Sh
ort n
ame
2X-f
old
chan
ge.
fpkm
HC
co
nditi
on fp
km L
C
cond
ition
Sig
. KO
G d
efin
ition
V
-type
pro
ton
ATP
ase
and
clat
hrin
4564
39
P114
42
Cla
thrin
hea
vy c
hain
1
-0
.23
6 5
no V
esic
le c
oat p
rote
in c
lath
rin, h
eavy
ch
ain
4559
42
P258
70
Cla
thrin
hea
vy c
hain
-0.6
3 23
15
no
Ves
icle
coa
t pro
tein
cla
thrin
, hea
vy
chai
n
3521
14
P258
70
Cla
thrin
hea
vy c
hain
0.47
32
0 44
3 no
Ves
icle
coa
t pro
tein
cla
thrin
, hea
vy
chai
n
2095
58
Q14
677
Cla
thrin
inte
ract
or 1
0.47
6
8 no
Cla
thrin
coa
ted
vesi
cle

215 A
ppen
dix
A T
able
- 6:
Tra
nscr
ipts
mat
chin
g pr
otei
ns o
f the
pro
ton
exch
ange
r clu
ster
.
Prot
ein
JGI♯
U
niPr
ot ID
Fu
nctio
n Sh
ort
nam
e 2X
-fol
d ch
ange
fp
km H
C
cond
ition
fpkm
LC
co
nditi
on
sig.
K
OG
def
initi
on
Prot
on E
xcha
nger
46
9557
Q
2YM
B3
Na(
+)/H
(+) a
ntip
orte
r nha
A
Nha
A
3.1
19
14
no
- 42
3009
Q
2YM
B3
Na(
+)/H
(+) a
ntip
orte
r nha
A
Nha
A
3.1
19
15
no
- 46
8382
Q
8YFI
5 N
a(+)
/H(+
) ant
ipor
ter n
haA
N
haA
2.
6 7
12
no
Car
boni
c an
hydr
ase
4476
59
Q39
WP5
N
a(+)
/H(+
) ant
ipor
ter n
haA
N
haA
3.
2 11
30
no
-
1989
81
Q30
XM
9 N
a(+)
/H(+
) ant
ipor
ter n
haA
N
haA
3.
2 9
27
yes
- 21
9535
A
1AK
41
Na(
+)/H
(+) a
ntip
orte
r nha
A 1
N
haA
1.
1 0
2 ye
s -
1052
93
A1A
TB4
Na(
+)/H
(+) a
ntip
orte
r nha
A 2
N
haA
1.
9 3
5 no
Pa
ntot
hena
te k
inas
e an
d re
late
d pr
ot.
3659
93
E3PR
21
Puta
tive
Na(
+)/H
(+) a
ntip
orte
r N
haA
0.
9 1
1 no
-
3580
03
E3PR
21
Puta
tive
Na(
+)/H
(+) a
ntip
orte
r N
haA
1.
4 2
2 no
-
3593
72
C1E
8I2
Mon
oval
ent C
atio
n:Pr
oton
an
tipor
ter-
1 fa
mily
2.7
12
9
- 12
0657
C
1E8I
2 M
onov
alen
t Cat
ion:
Prot
on
antip
orte
r-1
fam
ily
2.
3 6
7
- 45
9148
Q
4PK
H3
H(+
)/Cl(-
) exc
hang
e tra
nspo
rter 7
C
lC-7
2.
6 5
13
no
Cl-
chan
nel C
LC-7
and
rela
ted
prot
eins
45
2730
Q
4PK
H3
H(+
)/Cl(-
) exc
hang
e tra
nspo
rter 7
C
lC-7
1.
5 2
3 no
C
l- ch
anne
l CLC
-7 a
nd re
late
d pr
otei
ns
2216
20
P517
98
H(+
)/Cl(-
) exc
hang
e tra
nspo
rter 7
C
lC-7
0.
6 0
1 no
C
l- ch
anne
l CLC
-7 a
nd re
late
d pr
otei
ns
4506
98
Q87
GZ9
H
(+)/C
l(-) e
xch.
tran
spor
ter C
lcA
C
lC-7
2.
1 5
6 no
C
l- ch
anne
l CLC
-7 a
nd re
late
d pr
otei
ns
4325
00
Q39
525
H(+
)/hex
ose
cotra
nspo
rter 3
-6.1
28
0 4
yes
Pred
icte
d tra
nspo
rter
4610
00
E2IJ
90
Vol
tage
-gat
ed H
+ ch
anne
l pro
tein
2 5
19
no
Bet
a-ca
teni
n-bi
ndin
g pr
otei
n A
PC

216 A
ppen
dix
A T
able
- 7:
Tra
nscr
ipts
mat
chin
g pr
otei
ns o
f the
Ca2+
- tra
nspo
rt cl
uste
r.
Pres
ence
of C
a2+ -
trans
port
trans
crip
ts
JGI♯
U
niPr
ot ID
Fu
nctio
n sh
ort
nam
e 2X
-fol
d ch
ange
fp
km H
C
cond
ition
fp
km L
C
cond
ition
si
g.
KO
G-D
efin
ition
K+
depe
nden
t Ca2
+/N
a+ e
xcha
nger
(NC
KX
)
4479
39
Q9Q
ZM6
Sodi
um/p
otas
sium
/cal
cium
exc
hang
er
1 N
CK
X1
4.0
55
897
yes
K+ -d
epen
dent
Ca2+
/Na+ e
xcha
nger
N
CK
X1
and
rela
ted
prot
eins
4610
99
Q9H
C58
So
dium
/pot
assi
um/c
alci
um e
xcha
nger
3
KC
KX
3 0.
4 23
29
no
K+ -d
epen
dent
Ca2+
/Na+ e
xcha
nger
N
CK
X1
and
rela
ted
prot
eins
4471
53
Q9E
PQ0
Sodi
um/p
otas
sium
/cal
cium
exc
hang
er
3 (F
ragm
ent)
NC
KX
3'
-0.4
14
11
no
K+ -d
epen
dent
Ca2+
/Na+ e
xcha
nger
N
CK
X1
and
rela
ted
prot
eins
4376
34
Q9E
PQ0
Sodi
um/p
otas
sium
/cal
cium
exc
hang
er
3 (F
ragm
ent)
NC
KX
3'
0.5
4 6
no -
3688
42
Q9E
PQ0
Sodi
um/p
otas
sium
/cal
cium
exc
hang
er
3 (F
ragm
ent)
NC
KX
3'
0.5
8 11
no
-
4506
81
Q8C
261
Sodi
um/p
otas
sium
/cal
cium
exc
hang
er
5 N
CK
X5
0.9
7 12
no
Splic
ing
coac
tivat
or S
Rm
160/
300,
su
buni
t SR
m30
0
2583
05
Q8C
261
Sodi
um/p
otas
sium
/cal
cium
exc
hang
er
5 N
CK
X5
1.6
1 2
no -
2128
84
Q8C
261
Sodi
um/p
otas
sium
/cal
cium
exc
hang
er
5 N
CK
X5
0.8
5 9
no -
4694
67
C1M
I03
Pred
icte
d pr
otei
n
0.8
2 4
no K
+ -dep
ende
nt C
a2+/N
a+ exc
hang
er
NC
KX
1 an
d re
late
d pr
otei
ns
3546
06
Q9V
N12
Pr
obab
le so
dium
/pot
assi
um/c
alci
um
exch
ange
r CG
1090
2.6
90
553
yes
K+ -d
epen
dent
Ca2+
/Na+ e
xcha
nger
N
CK
X1
and
rela
ted
prot
eins
2194
01
Q9V
N12
Pr
obab
le so
dium
/pot
assi
um/c
alci
um
exch
ange
r CG
1090
0.5
5 7
no K
+ -dep
ende
nt C
a2+/N
a+ exc
hang
er
NC
KX
1 an
d re
late
d pr
otei
ns
3540
01
- N
CK
X1
and
rela
ted
prot
eins
0.2
4 5
no K
+ -dep
ende
nt C
a2+/N
a+ exc
hang
er
NC
KX
1 an
d re
late
d pr
otei
ns
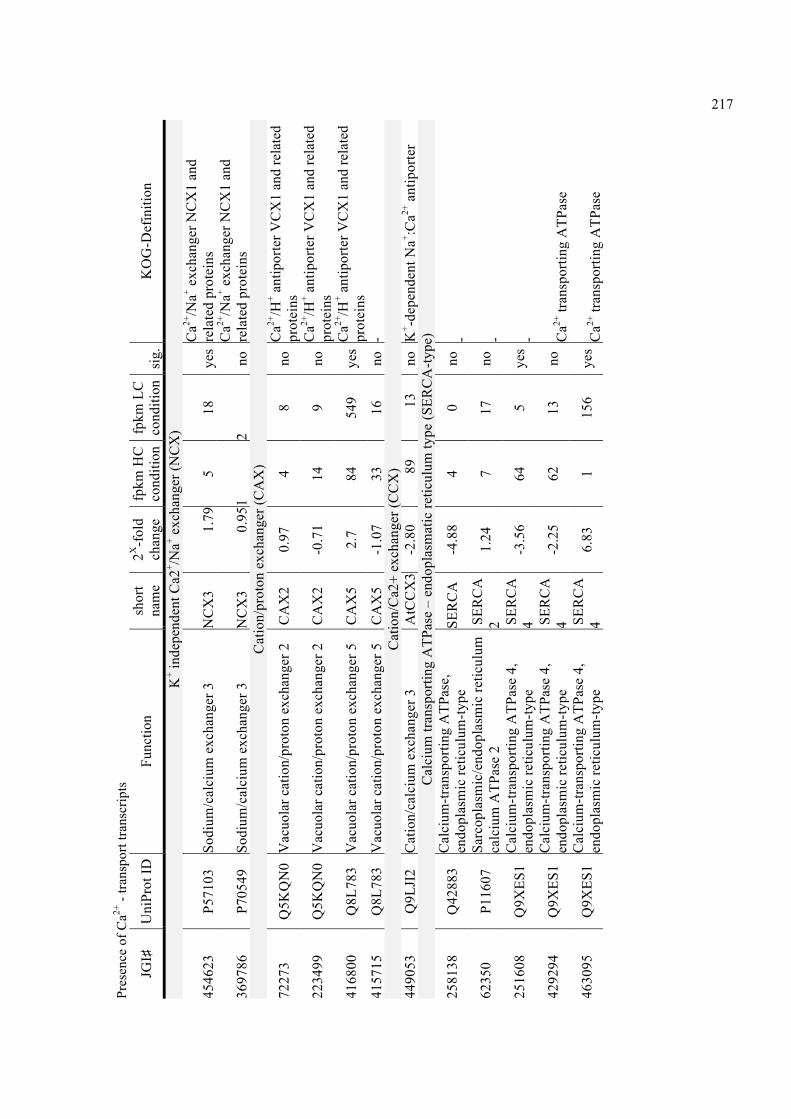
217 Pr
esen
ce o
f Ca2+
- tra
nspo
rt tra
nscr
ipts
JGI♯
U
niPr
ot ID
Fu
nctio
n sh
ort
nam
e 2X
-fol
d ch
ange
fp
km H
C
cond
ition
fp
km L
C
cond
ition
si
g.
KO
G-D
efin
ition
K+ in
depe
nden
t Ca2
+ /Na+ e
xcha
nger
(NC
X)
4546
23
P571
03
Sodi
um/c
alci
um e
xcha
nger
3
NC
X3
1.79
5
18
yes
Ca2+
/Na+ e
xcha
nger
NC
X1
and
rela
ted
prot
eins
3697
86
P705
49
Sodi
um/c
alci
um e
xcha
nger
3
NC
X3
0.95
1 2
no C
a2+/N
a+ exc
hang
er N
CX
1 an
d re
late
d pr
otei
ns
Cat
ion/
prot
on e
xcha
nger
(CA
X)
7227
3 Q
5KQ
N0
Vac
uola
r cat
ion/
prot
on e
xcha
nger
2
CA
X2
0.97
4
8 no
Ca2+
/H+ a
ntip
orte
r VC
X1
and
rela
ted
prot
eins
2234
99
Q5K
QN
0 V
acuo
lar c
atio
n/pr
oton
exc
hang
er 2
C
AX
2 -0
.71
14
9 no
Ca2+
/H+ a
ntip
orte
r VC
X1
and
rela
ted
prot
eins
4168
00
Q8L
783
Vac
uola
r cat
ion/
prot
on e
xcha
nger
5
CA
X5
2.7
84
549
yes
Ca2+
/H+ a
ntip
orte
r VC
X1
and
rela
ted
prot
eins
41
5715
Q
8L78
3 V
acuo
lar c
atio
n/pr
oton
exc
hang
er 5
C
AX
5 -1
.07
33
16
no -
C
atio
n/C
a2+
exch
ange
r (C
CX
) 44
9053
Q
9LJI
2 C
atio
n/ca
lciu
m e
xcha
nger
3
AtC
CX
3 -2
.80
89
13
no K
+ -dep
ende
nt N
a+ :Ca2+
ant
ipor
ter
Cal
cium
tran
spor
ting
ATP
ase
– en
dopl
asm
atic
retic
ulum
type
(SER
CA
-type
)
2581
38
Q42
883
Cal
cium
-tran
spor
ting
ATP
ase,
en
dopl
asm
ic re
ticul
um-ty
pe
SER
CA
-4
.88
4 0
no -
6235
0 P1
1607
Sa
rcop
lasm
ic/e
ndop
lasm
ic re
ticul
um
calc
ium
ATP
ase
2 S
ERC
A
2 1.
24
7 17
no
-
2516
08
Q9X
ES1
Cal
cium
-tran
spor
ting
ATP
ase
4,
endo
plas
mic
retic
ulum
-type
S
ERC
A
4 -3
.56
64
5 ye
s -
4292
94
Q9X
ES1
Cal
cium
-tran
spor
ting
ATP
ase
4,
endo
plas
mic
retic
ulum
-type
S
ERC
A
4 -2
.25
62
13
no C
a2+ tr
ansp
ortin
g A
TPas
e
4630
95
Q9X
ES1
Cal
cium
-tran
spor
ting
ATP
ase
4,
endo
plas
mic
retic
ulum
-type
S
ERC
A
4 6.
83
1 15
6 ye
s C
a2+ tr
ansp
ortin
g A
TPas
e

218 Pr
esen
ce o
f Ca2+
- tra
nspo
rt tra
nscr
ipts
JGI♯
U
niPr
ot ID
Fu
nctio
n sh
ort
nam
e 2X
-fol
d ch
ange
fp
km H
C
cond
ition
fp
km L
C
cond
ition
si
g.
KO
G-D
efin
ition
Pl
asm
a m
embr
ane
calc
ium
-tran
spor
ting
ATP
ase
(PM
CA
)
4665
67
Q64
542
Plas
ma
mem
bran
e ca
lciu
m-
trans
porti
ng A
TPas
e 4
PM
CA
4 0.
79
4 6
no C
alci
um tr
ansp
ortin
g A
TPas
e
4601
40
Q64
542
Plas
ma
mem
bran
e ca
lciu
m-
trans
porti
ng A
TPas
e 4
PM
CA
4 2.
6 0
2 ye
s C
alci
um tr
ansp
ortin
g A
TPas
e Pu
tativ
e pr
otei
ns
7874
6 P3
5315
Pr
obab
le c
alci
um-tr
ansp
ortin
g A
TPas
e
3.28
0
5 ye
s C
a2+ tr
ansp
ortin
g A
TPas
e 10
7905
B
7FR
E6
Pred
icte
d pr
otei
n
0.78
10
17
no
F0F
1-ty
pe A
TP sy
ntha
se, α
subu
nit
Cal
cium
Cha
nnel
s
1011
80
Q6S
5H8
Two
pore
cal
cium
cha
nnel
pro
tein
1
HvT
PC1
-0.0
7 3
3 no
Vol
tage
-gat
ed C
a2+ c
hann
els,
alph
a1
subu
nits
4527
41
Q75
VR
0 Tw
o po
re c
alci
um c
hann
el p
rote
in 1
B H
vTPC
1 0.
14
5 6
no V
olta
ge-g
ated
Ca2+
cha
nnel
s, al
pha1
su
buni
ts
4522
91
Q9N
Y47
V
olta
ge-d
epen
dent
cal
cium
cha
nnel
su
buni
t alp
ha-2
/del
ta-2
2.92
1
11
yes
L-ty
pe v
olta
ge-d
epen
dent
Ca2+
ch
anne
l, al
pha2
/del
ta su
buni
t Tr
ansi
ent r
ecep
tor p
oten
tial c
atio
n ch
anne
l
4685
87
Q91
YD
4 Tr
ansi
ent r
ecep
tor p
oten
tial c
atio
n ch
anne
l sub
fam
ily M
mem
ber 2
(1)
LTrp
C-2
1.
71
7 22
no
Ca2+
/Mg2+
-per
mea
ble
catio
n ch
anne
ls
(LTR
PC fa
mily
)
4621
71
P489
94
Tran
sien
t-rec
epto
r-po
tent
ial-l
ike
prot
ein
(1)
0.
32
8 10
no
Rec
epto
r-ac
tivat
ed C
a2+-p
erm
eabl
e ca
tion
chan
nels
(STR
PC fa
mily
)
4602
92
Q91
YD
4 Tr
ansi
ent r
ecep
tor p
oten
tial c
atio
n ch
anne
l sub
fam
ily M
mem
ber 2
(1)
LTrp
C-2
-0
.71
48
29
no C
a2+/M
g2+-p
erm
eabl
e ca
tion
chan
nels
(L
TRPC
fam
ily)
4557
60
O94
759
Tran
sien
t rec
epto
r pot
entia
l cat
ion
chan
nel s
ubfa
mily
M m
embe
r 2 (1
) L
TrpC
-2
1.76
7
25
no C
a2+ /M
g2+-p
erm
eabl
e ca
tion
chan
nels
(LTR
PC fa
mily
)
4499
85
O94
759
Tran
sien
t rec
epto
r pot
entia
l cat
ion
chan
nel s
ubfa
mily
M m
embe
r 2 (1
) L
TrpC
-2
1.68
7
22
no C
a2+/M
g2+-p
erm
eabl
e ca
tion
chan
nels
(L
TRPC
fam
ily)
2508
17
O94
759
Tran
sien
t rec
epto
r pot
entia
l cat
ion
chan
nel s
ubfa
mily
M m
embe
r 2 (1
) LT
rpC
-2
3.27
1
12
yes
-
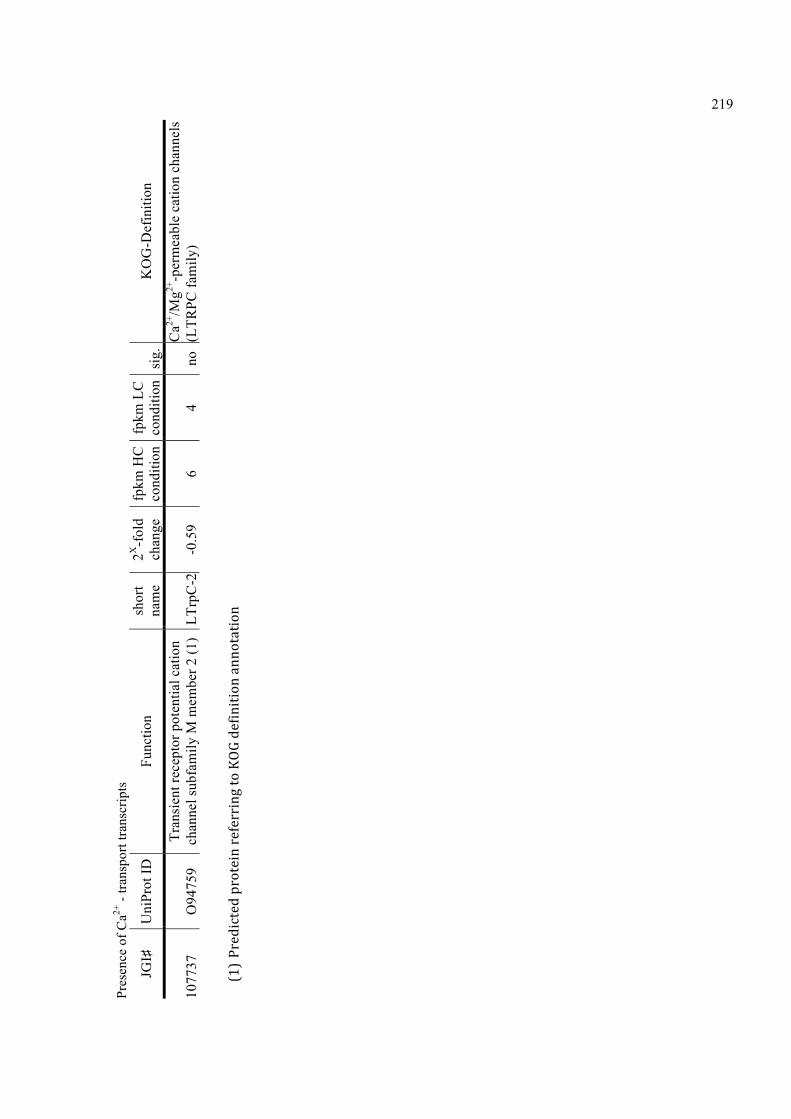
219 Pr
esen
ce o
f Ca2+
- tra
nspo
rt tra
nscr
ipts
JGI♯
U
niPr
ot ID
Fu
nctio
n sh
ort
nam
e 2X
-fol
d ch
ange
fp
km H
C
cond
ition
fp
km L
C
cond
ition
si
g.
KO
G-D
efin
ition
1077
37
O94
759
Tran
sien
t rec
epto
r pot
entia
l cat
ion
chan
nel s
ubfa
mily
M m
embe
r 2 (1
) L
TrpC
-2
-0.5
9 6
4 no
Ca2+
/Mg2+
-per
mea
ble
catio
n ch
anne
ls
(LTR
PC fa
mily
)
(1) Predicted+p
rotein+referring+to+KOG+definition+annotation
++

220 A
ppen
dix
A T
able
- 8:
Tra
nscr
ipts
mat
chin
g ca
lmod
ulin
and
cal
cium
bin
ding
pro
tein
s.
JGI♯
U
niPr
ot ID
Fu
nctio
n Sh
ort
nam
e 2X
-fol
d ch
ange
fp
km H
C
cond
ition
fp
km L
C
cond
ition
si
g.
KO
G-D
efin
ition
Tran
scrip
ts re
late
d to
Cal
mod
ulin
(CaM
) and
Ca2+
- bi
ndin
g pr
otei
n
4813
0 Q
9HFY
6 C
alm
odul
in
CaM
-0
.8
31
18
no
Cal
mod
ulin
and
rela
ted
prot
eins
58
485
Q9H
FY6
Cal
mod
ulin
C
aM
-0.8
31
18
no
C
alm
odul
in a
nd re
late
d pr
otei
ns
3733
43
Q40
302
Cal
mod
ulin
C
aM
-1.4
2
1 no
C
alm
odul
in a
nd re
late
d pr
otei
ns
4426
25
Q40
302
Cal
mod
ulin
C
aM
-1.3
25
39
1031
no
C
alm
odul
in a
nd re
late
d pr
otei
ns
4431
26
Q40
302
Cal
mod
ulin
C
aM
-1.4
15
40
579
no
Cal
mod
ulin
and
rela
ted
prot
eins
60
184
P274
82
Cal
mod
ulin
-like
pro
tein
3
CLP
3 0.
7 3
5 no
C
alm
odul
in a
nd re
late
d pr
otei
ns
4765
2 Q
9NZT
1 C
alm
odul
in-li
ke p
rote
in 5
C
LP5
1.8
1 2
no
Cal
mod
ulin
and
rela
ted
prot
eins
50
530
Q9N
ZT1
Cal
mod
ulin
-like
pro
tein
5
CLP
5 1.
8 1
2 no
N
ucle
olar
GTP
ase/
ATP
ase
p130
10
9061
Q
9NZT
1 C
alm
odul
in-li
ke p
rote
in 5
C
LP5
-2.9
1
0 ye
s C
alm
odul
in a
nd re
late
d pr
otei
ns
1189
82
Q9L
NE7
C
alm
odul
in-li
ke p
rote
in 7
C
LP7
3.1
0 2
no
Cal
mod
ulin
and
rela
ted
prot
eins
61
107
Q2R
1Z5
Puta
tive
calm
odul
in-li
ke p
rote
in 6
-0.3
96
78
no
C
alm
odul
in a
nd re
late
d pr
otei
ns
4318
30
Q0M
YW
8 Po
lysa
ccha
ride
asso
ciat
ed p
rote
in
GPA
G
PA
-6.2
10
29
14
yes
Puta
tive
calc
ium
bin
ding
pro
tein
44
6255
P1
5253
C
alre
ticul
in
ERp6
0 -2
.9
310
42
yes
Cal
retic
ulin
42
6711
P1
5253
C
alre
ticul
in
ERp6
0 -3
.1
1206
14
1 ye
s C
alre
ticul
in
4353
01
Q39
817
Cal
nexi
n ho
mol
og
-1
.4
82
31
no
Cal
nexi
n 42
2633
Q
6Q48
7 C
alne
xin
hom
olog
-3.7
19
9 15
ye
s C
alne
xin
4994
2 Q
3879
8 C
alne
xin
hom
olog
2
-3
.9
316
21
yes
Cal
nexi
n 95
284
P385
05
Cal
cium
-bin
ding
pro
tein
C
AB
P 0.
7 37
62
no
C
alm
odul
in a
nd re
late
d pr
otei
ns
4349
20
F3I2
18
Cal
cium
-bin
ding
pro
tein
(Fra
gmen
t) C
AB
P -2
.6
7 1
yes
-
1003
60
Q9F
IH9
Cal
cium
-bin
ding
pro
tein
CM
L37
CM
L37
0.4
8 11
no
A
ctin
fila
men
t-coa
ting
prot
ein
tropo
myo
sin

221 A
ppen
dix
A T
able
- 9:
Bic
arbo
nate
tran
spor
t pro
tein
clu
ster
JGI♯
U
niPr
ot ID
Fun
ctio
n sh
ort
nam
e 2X
-fol
d ch
ange
fpkm
HC
co
nditi
on
fpkm
LC
co
nditi
on
sig.
K
OG
Def
initi
on (s
ourc
e: JG
I ann
otat
ion)
Bic
arbo
nate
tran
spor
t 35
8486
-
- -
1.36
3
7 no
Su
lfate
/bic
arbo
nate
/oxa
late
exc
hang
er S
AT-
1 an
d re
late
d tra
nspo
rters
(SLC
26 fa
mily
) 99
943
P233
47
Ani
on e
xcha
nge
prot
ein
2 A
E 2
3.81
8
117
yes
Na+ -in
depe
nden
t Cl/H
CO
3 ex
chan
ger A
E1
and
rela
ted
trans
porte
rs (S
LC4
fam
ily)
4267
35
P233
47
Ani
on e
xcha
nge
prot
ein
2 A
E 2
1.31
60
15
0 no
N
a+ -inde
pend
ent C
l/HC
O3
exch
ange
r AE1
an
d re
late
d tra
nspo
rters
(SLC
4 fa
mily
20
0137
P2
3347
A
nion
exc
hang
e pr
otei
n 2
AE
2 2.
72
39
259
yes
Na+ -in
depe
nden
t Cl/H
CO
3 ex
chan
ger A
E1
and
rela
ted
trans
porte
rs (S
LC4
fam
ily
1986
43
P233
47
Ani
on e
xcha
nge
prot
ein
2 A
E 2
3.09
19
15
8 ye
s N
a+ -inde
pend
ent C
l/HC
O3
exch
ange
r AE1
an
d re
late
d tra
nspo
rters
(SLC
4 fa
mily
12
0259
P2
3347
A
nion
exc
hang
e pr
otei
n 2
AE
2 3.
60
3 35
ye
s N
a+ -inde
pend
ent C
l/HC
O3
exch
ange
r AE1
an
d re
late
d tra
nspo
rters
(SLC
4 fa
mily
) 45
0694
Q
9GK
Y1
Ani
on e
xcha
nge
prot
ein
4 A
E 4
0.67
16
26
no
N
a+ -inde
pend
ent C
l/HC
O3
exch
ange
r AE1
an
d re
late
d tra
nspo
rters
(SLC
4 fa
mily
) 19
6761
Q
9GK
Y1
Ani
on e
xcha
nge
prot
ein
4 A
E 4
1.25
5
12
no
Na+ -in
depe
nden
t Cl/H
CO
3 ex
chan
ger A
E1
and
rela
ted
trans
porte
rs (S
LC4
fam
ily)
4530
61
Q8G
YH
8 Pr
obab
le su
lfate
tran
spor
ter 4
.2
- 0.
24
6 7
no
Sulfa
te/b
icar
bona
te/o
xala
te e
xcha
nger
SA
T-1
and
rela
ted
trans
porte
rs (S
LC26
fam
ily)
4417
61
O06
984
Puta
tive
sulfa
te tr
ansp
orte
r yvd
B
- 1.
12
137
298
no
Sulfa
te/b
icar
bona
te/o
xala
te e
xcha
nger
SA
T-1
and
rela
ted
trans
porte
rs (S
LC26
fam
ily)
3638
09
O06
984
Puta
tive
sulfa
te tr
ansp
orte
r yvd
B
- -1
.81
40
11
no
Sulfa
te/b
icar
bona
te/o
xala
te e
xcha
nger
SA
T-1
and
rela
ted
trans
porte
rs (S
LC26
fam
ily)
4662
32
Q9H
GM
6 Pu
tativ
e tra
nspo
rter C
543.
05c
- -7
.07
276
2 ye
s N
a+ -inde
pend
ent C
l/HC
O3
exch
ange
r AE1
an
d re
late
d tra
nspo
rters
(SLC
4 fa
mily
) 43
6956
Q
9HG
M6
Puta
tive
trans
porte
r C54
3.05
c -
-2.2
5 90
19
no
N
a+ -inde
pend
ent C
l/HC
O3
exch
ange
r AE1
an
d re
late
d tra
nspo
rters
(SLC
4 fa
mily
) 31
4659
Q
9HG
M6
Puta
tive
trans
porte
r C54
3.05
c -
-2.3
3 20
7 41
ye
s N
a+ -inde
pend
ent C
l/HC
O3
exch
ange
r AE1

222
JGI♯
U
niPr
ot ID
Fun
ctio
n sh
ort
nam
e 2X
-fol
d ch
ange
fpkm
HC
co
nditi
on
fpkm
LC
co
nditi
on
sig.
K
OG
Def
initi
on (s
ourc
e: JG
I ann
otat
ion)
and
rela
ted
trans
porte
rs (S
LC4
fam
ily)
4697
83
Q8B
TY2
Sodi
um b
icar
bona
te c
otra
nspo
rter 3
SL
C7
4.00
1
15
yes
Na+ -in
depe
nden
t Cl/H
CO
3 ex
chan
ger A
E1
and
rela
ted
trans
porte
rs (S
LC7
fam
ily)
4487
06
Q09
764
Unc
hara
cter
ized
pro
tein
C24
H6.
11c
SLC
26
0.57
6
9 no
Su
lfate
/bic
arbo
nate
/oxa
late
exc
hang
er S
AT-
1 an
d re
late
d tra
nspo
rters
(SLC
26 fa
mily
) 12
1358
Q
0976
4 U
ncha
ract
eriz
ed p
rote
in C
24H
6.11
c SL
C26
-1
.62
6 2
no
Sulfa
te/b
icar
bona
te/o
xala
te e
xcha
nger
SA
T-1
and
rela
ted
trans
porte
rs (S
LC26
fam
ily)
9812
5 P5
3273
U
ncha
ract
eriz
ed v
acuo
lar m
embr
. pr
otei
n Y
GR
125W
SL
C26
-6
.90
19
0 ye
s Su
lfate
/bic
arbo
nate
/oxa
late
exc
hang
er S
AT-
1 an
d re
late
d tra
nspo
rters
(SLC
26 fa
mily
) 46
0215
P5
3273
U
ncha
ract
eriz
ed v
acuo
lar m
embr
. pr
otei
n Y
GR
125W
SL
C26
1.
09
4 8
no
Sulfa
te/b
icar
bona
te/o
xala
te e
xcha
nger
SA
T-1
and
rela
ted
trans
porte
rs (S
LC26
fam
ily)
4554
88
P532
73
Unc
hara
cter
ized
vac
uola
r mem
br.
prot
ein
YG
R12
5W
SLC
26
1.98
1
2 ye
s Su
lfate
/bic
arbo
nate
/oxa
late
exc
hang
er S
AT-
1 an
d re
late
d tra
nspo
rters
(SLC
26 fa
mily
) C
arbo
nic
anhy
dras
e
23
3460
O
5253
5 B
eta-
Car
boni
c an
hydr
ase
CA
2.
63
1 6
yes
Car
boni
c an
hydr
ase
2396
90
O53
573
Bet
a-C
arbo
nic
anhy
dras
e C
A
-0.3
1 1
1 no
C
arbo
nic
anhy
dras
e 11
5240
O
5357
3 B
eta-
Car
boni
c an
hydr
ase
CA
-0
.09
3 3
no
Car
boni
c an
hydr
ase
4360
31
Q0Z
B86
D
elta
-car
boni
c an
hydr
ase
δ-C
A
7.89
0
74
yes
Car
boni
c an
hydr
ase
6267
9 Q
5094
0 C
arbo
nic
anhy
dras
e C
A
1.68
1
4 no
C
arbo
nic
anhy
dras
e 45
6048
Q
5094
0 C
arbo
nic
anhy
dras
e C
A
2.61
2
14
yes
Car
boni
c an
hydr
ase
1955
75
Q6V
8K7
Intra
cellu
lar c
arbo
nic
anhy
dras
e C
A
1.13
11
25
no
C
arbo
nic
anhy
dras
e

223 A
ppen
dix
A T
able
- 10
: Aqu
apor
in p
rote
in c
lust
er.
JGI♯
U
niPr
ot ID
Fu
nctio
n sh
ort
nam
e 2X
-fol
d ch
ange
fpkm
HC
co
nditi
on
fpkm
LC
co
nditi
on
sig.
K
OG
def
initi
on
Aqu
apor
ins
7563
5 P4
2767
A
quap
orin
PIP
-type
A
P 0.
84
4 8
no
Aqu
apor
in (m
ajor
intri
nsic
pro
tein
fam
ily)
4581
01
Q94
CS9
Pr
obab
le a
quap
orin
TIP
1-2
OsT
IP1:
2 0.
05
45
46
no
Aqu
apor
in (m
ajor
intri
nsic
pro
tein
fam
ily)
4548
80
Q94
CS9
Pr
obab
le a
quap
orin
TIP
1-2
OsT
IP1;
2 0.
01
5 5
no
Aqu
apor
in (m
ajor
intri
nsic
pro
tein
fam
ily)
1113
79
O82
316
Aqu
apor
in T
IP4-
1 O
sTIP
1;4
1.55
10
29
no
N
ucle
ar re
cept
or c
oreg
ulat
or
SMR
T/SM
RTE
R, c
onta
ins M
yb-li
ke
dom
ains
46
2297
Q
1J3H
7 G
lyce
rol u
ptak
e fa
cilit
ator
Glp
F,
MIP
/aqu
apor
in fa
mily
(Pre
curs
or)
Glp
F 1.
51
1 3
no
Aqu
apor
in (m
ajor
intri
nsic
pro
tein
fam
ily)
4248
70
Q1J
3H7
Gly
cero
l upt
ake
faci
litat
or G
lpF,
M
IP/a
quap
orin
fam
ily (P
recu
rsor
) G
lpF
1.27
3
7 no
A
quap
orin
(maj
or in
trins
ic p
rote
in fa
mily
)
4327
61
P311
40
Gly
cero
l upt
ake
faci
litat
or p
rote
in
Glp
F -0
.81
10
6 no
A
quap
orin
(maj
or in
trins
ic p
rote
in fa
mily
)

APPENDIX A – SUPPLEMENTARY RESULTS – CHAPTER 3 – THE TRANSCRIPTOME OF EMILIANIA HUXLEYI AT HIGH AND LOW CALCIFCATION
RATES OF THE G1-PHASE
224
Appendix A Figure 2: Transcripts related to Heat Shock Protein 70 expression found in E. huxleyi cells showing high and low rates of calcification (shaded grey). Positive 2X-fold expression values indicate elevated expression in the Dark period. The sizes of the circles indicate the total abundance of transcripts found at Light and Dark period.
Appendix A Table - 11: Details of transcript abundance of heat shock protein in E. huxleyi cells showing high (HC) and low rates of calcification (LC).
JGI♯ UniProt ID Short name 2X-fold change
fpkm at HC
fpkm at LC sig.
311681 Q07437 HSP 70 kDa -3.24 42.8 4.5 yes 420962 Q9U639 HSP 70 kDa 4 cognate -2.77 1619.2 236.8 yes 421892 P27420 HSP 70 kDa C 0.01 10.9 10.9 no 423268 Q06248 HSP 70 kDa IV -0.14 16.2 14.7 no 441734 P27322 HSP 70 kDa 2 cognate -4.19 408.7 22.5 yes 47896 Q9LHA8 HSP 70 kDa 4 cognate -4.13 212.9 12.2 yes 59809 P29844 HSP 70 kDa 3 cognat -0.18 3.4 3.0 no 62931 P09446 HSP 70 kDa A 0.35 5.0 6.4 no
���������� ���������������������
��������������������������������������� �� ����������������!
��� �"�����������������#� �� ��������������� ��$�%"����������������� �"����������������������������������������%
��������������
�!%$&���'���������(�)�
*� �(*+��,��������-����
�" �� �� � � � � "
� �� ��� ���
������ ������������������������������
��
��

APPENDIX A – SUPPLEMENTARY RESULTS – CHAPTER 3 – THE TRANSCRIPTOME OF EMILIANIA HUXLEYI AT HIGH AND LOW CALCIFCATION
RATES OF THE G1-PHASE
225
225
Appendix A Table - 12: Selected transcripts with potential role in biomineralisation of the 1000 most abundant transcripts in the light incubation period (high calcification rate) of the cell cycle.
JGI♯ UniProt ID Function fpkm in Light
fpkm in Dark
2X-fold change q_value Sig.
442625 Q40302 Calmodulin 2539.2 1030.6 -1.3 0.5585 no 443126 Q40302 Calmodulin 1540.1 578.9 -1.41 0.3289 no 426711 P15253 Calreticulin 1206.0 141.0 -3.1 0.0043 yes 431830 Q0MYW8 GPA 1029.1 14.4 -6.16 0.0000 yes
359783 Q43362
V-type proton ATPase 16 kDa proteolipid subunit 748.2 1460.4 0.96 0.8089 no
443525 Q869W6
Ca2+/calmodulin-dependent protein kinase, EF-Hand 713.0 72.0 -3.31 0.0230 yes
355949 P91303 Probable V-type proton ATPase subunit G 556.2 765.2 0.46 0.7748 no
433060 Q9MB46 V-type proton ATPase subunit E 411.4 525.9 0.35 0.8586 no
435128 P31408 V-type proton ATPase subunit B, brain isoform 390.7 976.2 1.32 0.2916 no
413949 P54641 V-type proton ATPase subunit d 359.5 739.4 1.04 0.4089 no
439538 P54647 V-type proton ATPase catalytic subunit A 323.4 785.5 1.28 0.3852 no
352114 P25870 Clathrin heavy chain 320.5 443.1 0.47 0.7282 no 49942 Q38798 Calnexin homolog 2 316.2 21.1 -3.91 0.0000 yes 446255 P15253 Calreticulin 310.3 41.7 -2.9 0.0103 yes
432823 Q7T385 V-type proton ATPase subunit C 1-A 302.8 460.8 0.61 0.7537 no
369392 P91303 Probable V-type proton ATPase subunit G 299.3 381.5 0.35 0.8057 no
466232 Q9HGM6 Putative transporter C543.05c 275.6 2.0 -7.07 0.0000 yes
365420 Q3E9C0 Calcium-dependent protein kinase 34 257.5 31.5 -3.03 0.0091 yes
432215 Q01474 GTP-binding protein SAR1B 255.2 103.5 -1.3 0.3831 no
436781 P60881 Synaptosomal-associated protein 25 234.4 32.7 -2.84 0.0509 no

APPENDIX A – SUPPLEMENTARY RESULTS – CHAPTER 3 – THE TRANSCRIPTOME OF EMILIANIA HUXLEYI AT HIGH AND LOW CALCIFCATION
RATES OF THE G1-PHASE
226

227
Appendix B – Supplementary results for Chapter 4 - The proteome of Emiliania huxleyi at high and low rates of calcification of the G1-phase

228 A
ppen
dix
B T
able
- 1:
Pro
tein
s id
entif
ied
in in
E. h
uxle
yi c
ells
sho
win
g hi
gh (H
C) a
nd lo
w ra
tes
of c
alci
ficat
ion
(LC
) with
sig
nific
ant e
xpre
ssio
n di
rect
ion
ratio
s LC
: HC
, and
con
sens
us s
eque
nces
in p
hylo
gene
tic h
omol
ogy
anal
ysis
.
App
endi
x B
Ta
ble
1 D
B ID
U
niPr
ot
Des
crip
tion
Expr
essi
on
dire
ctio
n si
gnifi
cant
LC
:HC
LC
:HC
_M
in
LC:H
C_
Max
C
onse
nsus
JG
I650
61
Q2I
A28
C
hlor
opla
st li
ght h
arve
stin
g pr
otei
n is
ofor
m 1
2 H
C
0
.594
0.
433
0.75
1 H
AJG
I222
JG
I281
147
Q5U
U97
En
olas
e H
C
0.60
0 0.
447
0.72
9 H
AJG
I283
JG
I206
028
Q2I
A28
C
hlor
opla
st li
ght h
arve
stin
g pr
otei
n is
ofor
m 1
2 H
C
0.63
2 0.
487
0.76
3 H
AJG
I261
JG
I663
10
F0X
ZQ3
Puta
tive
unch
arac
teriz
ed p
rote
in
HC
0.
641
0.41
6 0.
911
HA
JGI0
43
JGI2
6905
6 Q
3970
9 Fu
coxa
nthi
n-ch
loro
phyl
l a-c
bin
ding
pro
tein
, ch
loro
plas
tic
HC
0.
654
0.56
5 0.
845
HA
JGI3
82
JGI4
0798
3 C
1E1W
7 C
lath
rin h
eavy
cha
in
0.
664
0.38
7 1.
053
HA
JGI3
65
JGI4
1107
4
0.67
2 0.
470
1.13
1 H
AJG
I055
JG
I622
46
Q2I
A73
C
hlor
opla
st li
ght h
arve
stin
g pr
otei
n is
ofor
m 6
H
C
0.69
3 0.
544
0.78
7 H
AJG
I246
JG
I313
236
A4S
0B8
Pred
icte
d pr
otei
n
0.69
4 0.
430
1.12
4 H
AJG
I177
JG
I109
974
N
A
HC
0.
699
0.47
9 0.
998
NA
JG
I220
283
N
A
HC
0.
700
0.65
3 0.
772
NA
JG
I103
600
D8L
B65
G
luco
kina
se
HC
0.
703
0.52
2 0.
884
HA
JGI2
75
JGI2
1804
1 P5
1821
A
DP-
ribos
ylat
ion
fact
or 1
H
C
0.70
4 0.
568
0.92
4 H
AJG
I036
JG
I675
84
Q2I
A28
C
hlor
opla
st li
ght h
arve
stin
g pr
otei
n is
ofor
m 1
2 H
C
0.70
4 0.
489
0.92
6 H
AJG
I264
JG
I458
69
Q2I
A76
C
hlor
opla
st li
ght h
arve
stin
g pr
otei
n is
ofor
m 3
H
C
0.70
5 0.
538
0.93
7 H
AJG
I029
JG
I104
438
C1D
Z32
Pred
icte
d pr
otei
n H
C
0.71
0 0.
540
0.84
3 H
AJG
I260
JG
I281
510
F0Y
M05
Pu
tativ
e un
char
acte
rized
pro
tein
H
C
0.71
0 0.
589
0.85
3 H
AJG
I085
JG
I626
34
A8J
7F6
Dih
ydro
lipoa
mid
e ac
etyl
trans
fera
se
0.
715
0.29
5 1.
168
HA
JGI0
21
JGI9
6082
NA
H
C
0.71
8 0.
594
0.80
5 N
A
JGI6
1814
D
8UI7
0 D
ual f
unct
ion
alco
hol d
ehyd
roge
nase
0.72
3 0.
577
1.01
7 H
AJG
I180
JG
I902
50
F0Y
FF1
Puta
tive
unch
arac
teriz
ed p
rote
in
HC
0.
726
0.63
0 0.
804
HA
JGI4
05
JGI2
7575
4 Q
5EN
S1
Chl
orop
last
pho
spho
ribul
okin
ase
HC
0.
727
0.60
4 0.
883
HA
JGI1
67
JGI2
3724
3
H
C
0.72
7 0.
498
0.95
5 H
AJG
I191
JG
I671
08
Q2I
A72
C
hlor
opla
st li
ght h
arve
stin
g pr
otei
n is
ofor
m 7
H
C
0.72
8 0.
596
0.97
4 H
AJG
I299
JG
I283
485
B8C
FP9
Pred
icte
d pr
otei
n H
C
0.72
8 0.
573
0.87
7 H
AJG
I071

229 A
ppen
dix
B
Tabl
e 1
DB
ID
Uni
Prot
D
escr
iptio
n
Expr
essi
on
dire
ctio
n si
gnifi
cant
LC
:HC
LC
:HC
_M
in
LC:H
C_
Max
C
onse
nsus
JG
I889
32
N
A
HC
0.
732
0.67
9 0.
821
NA
JG
I991
31
F0Y
6E3
Puta
tive
unch
arac
teriz
ed p
rote
in
HC
0.
744
0.58
9 0.
858
HA
JGI1
25
JGI1
9519
6 C
1N6Z
5 G
luta
thio
ne p
erox
idas
e
0.74
8 0.
378
1.25
5 H
AJG
I145
JG
I406
321
HC
0.
751
0.69
6 0.
870
HA
JGI3
81
JGI1
2026
2 F0
Y2W
6 Pu
tativ
e un
char
acte
rized
pro
tein
H
C
0.75
6 0.
613
0.88
1 H
AJG
I186
JG
I120
829
Q2I
A75
C
hlor
opla
st li
ght h
arve
stin
g pr
otei
n is
ofor
m 4
H
C
0.75
7 0.
461
0.99
8 H
AJG
I025
JG
I122
970
Q01
AH
9 H
eat s
hock
pro
tein
70
/ HSP
70 (I
SS)
HC
0.
758
0.66
4 0.
861
HA
JGI2
80
JGI2
1640
2 G
4ZP2
5 Pu
tativ
e un
char
acte
rized
pro
tein
H
C
0.76
2 0.
587
0.97
5 H
AJG
I372
JG
I273
928
G5A
9A0
Puta
tive
unch
arac
teriz
ed p
rote
in
HC
0.
765
0.67
3 0.
870
HA
JGI2
59
JGI1
0363
7 Q
2IA
76
Chl
orop
last
ligh
t har
vest
ing
prot
ein
isof
orm
3
HC
0.
766
0.61
2 0.
945
HA
JGI0
35
JGI1
0270
1 Q
2IA
76
Chl
orop
last
ligh
t har
vest
ing
prot
ein
isof
orm
3
HC
0.
767
0.61
4 0.
953
HA
JGI2
09
JGI6
8029
NA
0.77
0 0.
619
1.01
2 N
A
JGI4
0730
5 Q
2IA
76
Chl
orop
last
ligh
t har
vest
ing
prot
ein
isof
orm
3
HC
0.
774
0.68
8 0.
845
HA
JGI0
08
JGI2
7133
1 D
0NEK
2 A
deno
sylh
omoc
yste
inas
e H
C
0.77
4 0.
760
0.79
2 H
AJG
I136
JG
I106
019
A8I
1X3
Puta
tive
unch
arac
teriz
ed p
rote
in
HC
0.
777
0.53
6 0.
996
HA
JGI1
40
JGI1
1270
2
NA
H
C
0.78
0 0.
617
0.96
1 N
A
JGI3
5814
1 Q
84LQ
0 C
ytos
olic
gly
cera
ldeh
yde
3-ph
osph
ate
dehy
drog
enas
e H
C
0.78
1 0.
661
0.95
0 H
AJG
I335
JGI2
3083
5 Q
2IA
55
Chl
orop
last
gly
cera
ldeh
yde-
3-ph
osph
ate
dehy
drog
enas
e H
C
0.78
2 0.
706
0.85
0 H
AJG
I027
JG
I637
70
Q5E
NR
6 Ph
osph
ogly
cera
te k
inas
e
0.78
5 0.
613
1.00
6 H
AJG
I366
JGI1
0290
1 Q
5QD
45
Plas
tid C
1 cl
ass
II fr
ucto
se b
isph
osph
ate
aldo
lase
H
C
0.78
6 0.
684
0.85
5 H
AJG
I079
JG
I111
303
A8J
506
Arg
inin
osuc
cina
te s
ynth
ase
0.
795
0.62
9 1.
013
HA
JGI0
91
JGI8
8203
A
6YA
Z8
Puta
tive
plas
tid tr
ansk
etol
ase
HC
0.
799
0.75
0 0.
880
HA
JGI3
97
JGI2
1251
2 G
5A9A
0 Pu
tativ
e un
char
acte
rized
pro
tein
H
C
0.80
0 0.
712
0.88
7 H
AJG
I121
JG
I209
610
A8I
DN
1 C
hape
roni
n 10
0.80
2 0.
364
1.74
5 H
AJG
I369
JG
I199
538
HC
0.
810
0.71
7 0.
976
HA
JGI2
37

230 A
ppen
dix
B
Tabl
e 1
DB
ID
Uni
Prot
D
escr
iptio
n
Expr
essi
on
dire
ctio
n si
gnifi
cant
LC
:HC
LC
:HC
_M
in
LC:H
C_
Max
C
onse
nsus
JG
I622
35
B8B
Y55
S-
aden
osyl
met
hion
ine
synt
hase
0.81
3 0.
566
1.16
4 H
AJG
I086
JG
I430
77
D8T
KK
9 V
acuo
lar H
+ A
TPas
e V
0 se
ctor
, sub
unit
D
HC
0.
813
0.75
1 0.
887
HA
JGI0
48
JGI1
2059
2 Q
0MY
X3
Prot
easo
me
subu
nit a
lpha
type
H
C
0.81
7 0.
670
0.99
4 H
AJG
I098
JG
I613
40
Q2I
A74
C
hlor
opla
st li
ght h
arve
stin
g pr
otei
n is
ofor
m 5
H
C
0.81
8 0.
724
0.93
4 H
AJG
I380
JG
I870
79
B9P
NV
8 H
eat s
hock
pro
tein
, put
ativ
e H
C
0.81
9 0.
723
0.93
5 H
AJG
I162
JG
I103
121
0.
819
0.59
8 1.
209
HA
JGI1
74
JGI2
7039
9 Q
15G
C7
Trio
seph
osph
ate
isom
eras
e H
C
0.82
3 0.
725
0.99
5 H
AJG
I387
JG
I889
77
A4R
W83
Pr
otei
n tra
nslo
case
subu
nit S
ecA
, chl
orop
last
ic
HC
0.
824
0.69
7 0.
938
HA
JGI4
02
JGI3
6633
7 A
8J38
7 Pr
edic
ted
prot
ein
HC
0.
828
0.72
4 0.
919
HA
JGI2
66
JGI2
3510
6
H
C
0.83
1 0.
739
0.96
5 H
AJG
I138
JG
I970
31
D0N
EX4
D-3
-pho
spho
glyc
erat
e de
hydr
ogen
ase
0.
832
0.72
2 1.
008
HA
JGI0
42
JGI2
7262
4 A
4S2C
6 Pr
edic
ted
prot
ein
HC
0.
833
0.70
3 0.
994
HA
JGI0
37
JGI2
2238
6 P4
8414
V
-type
pro
ton
ATP
ase
cata
lytic
subu
nit A
, V-
ATP
ase
subu
nit A
H
C
0.83
3 0.
681
0.97
1 H
AJG
I081
JG
I620
38
F0Y
LJ3
Pept
idyl
-pro
lyl c
is-tr
ans i
som
eras
e
0.83
3 0.
513
1.02
5 H
AJG
I040
JG
I708
30
Q2I
A73
C
hlor
opla
st li
ght h
arve
stin
g pr
otei
n is
ofor
m 6
0.83
4 0.
677
1.01
8 H
AJG
I197
JG
I969
43
C1E
IH7
Puta
tive
unch
arac
teriz
ed p
rote
in
HC
0.
836
0.72
6 0.
931
HA
JGI2
67
JGI1
9836
0 C
5KN
V3
Mol
ecul
ar c
hape
rone
, put
ativ
e H
C
0.83
6 0.
726
0.93
1 H
AJG
I007
JG
I267
646
B8B
Y55
S-
aden
osyl
met
hion
ine
synt
hase
0.83
7 0.
617
1.14
5 H
AJG
I061
JG
I227
391
B5Y
MK
1 Pr
edic
ted
prot
ein
0.
837
0.56
2 1.
314
HA
JGI0
54
JGI2
6559
7 G
5A9A
0 Pu
tativ
e un
char
acte
rized
pro
tein
H
C
0.83
9 0.
773
0.94
0 H
AJG
I205
JG
I206
438
D0N
BZ5
N
ucle
olar
pro
tein
NO
P5
HC
0.
839
0.69
5 0.
961
HA
JGI0
97
JGI9
7087
B
8BY
55
S-ad
enos
ylm
ethi
onin
e sy
ntha
se
0.
839
0.60
4 1.
178
HA
JGI0
13
JGI1
0280
0 G
0QQ
50
Puta
tive
unch
arac
teriz
ed p
rote
in
HC
0.
843
0.67
1 0.
981
HA
JGI0
19
JGI2
5414
0
H
C
0.84
3 0.
696
0.99
6 H
AJG
I026
JG
I100
088
HC
0.
845
0.75
1 0.
905
HA
JGI3
49
JGI3
0872
4 Q
84K
Q0
Elon
gatio
n fa
ctor
-2
0.84
6 0.
665
1.07
9 H
AJG
I006
JG
I218
081
Q2I
A28
C
hlor
opla
st li
ght h
arve
stin
g pr
otei
n is
ofor
m 1
2 H
C
0.84
6 0.
787
0.94
8 H
AJG
I242

231 A
ppen
dix
B
Tabl
e 1
DB
ID
Uni
Prot
D
escr
iptio
n
Expr
essi
on
dire
ctio
n si
gnifi
cant
LC
:HC
LC
:HC
_M
in
LC:H
C_
Max
C
onse
nsus
JG
I350
570
N
A
HC
0.
847
0.70
9 0.
949
NA
JG
I110
945
B7F
UR
6 V
iola
xant
hin
deep
oxid
ase
0.84
7 0.
732
1.04
1 H
AJG
I350
JG
I202
968
F0Y
D68
Pu
tativ
e un
char
acte
rized
pro
tein
H
C
0.84
8 0.
749
0.96
9 H
AJG
I291
JG
I276
712
Q2I
A78
C
hlor
opla
st li
ght h
arve
stin
g pr
otei
n is
ofor
m 1
0.
848
0.70
9 1.
053
HA
JGI3
38
JGI2
5235
5 F0
XW
G3
Puta
tive
plas
tid li
ght h
arve
stin
g pr
otei
n is
ofor
m
40
HC
0.
851
0.80
6 0.
910
HA
JGI0
30
JGI2
0946
0 G
4YJL
5 Pu
tativ
e un
char
acte
rized
pro
tein
H
C
0.85
4 0.
577
0.99
4 H
AJG
I220
JG
I101
140
Q2I
A28
C
hlor
opla
st li
ght h
arve
stin
g pr
otei
n is
ofor
m 1
2
0.85
4 0.
714
1.00
4 H
AJG
I328
JG
I402
650
C1E
HC
0 A
TP s
ynth
ase
subu
nit a
lpha
H
C
0.85
5 0.
754
0.95
1 H
AJG
I377
JG
I231
101
F0Y
JF2
Puta
tive
unch
arac
teriz
ed p
rote
in
0.
855
0.69
9 1.
000
HA
JGI2
93
JGI9
9331
NA
0.85
5 0.
673
1.08
2 N
A
JGI2
0746
4 Q
7XY
98
40S
ribos
omal
pro
tein
S6
0.
857
0.66
7 1.
037
HA
JGI3
45
JGI6
5080
B
8BV
Q7
Pred
icte
d pr
otei
n
0.85
7 0.
688
1.02
1 H
AJG
I166
JG
I234
774
D0N
196
3-is
opro
pylm
alat
e de
hydr
ogen
ase
0.
860
0.63
3 1.
006
HA
JGI2
43
JGI8
6588
C
1E1M
5 Pr
edic
ted
prot
ein
0.
861
0.70
3 1.
031
HA
JGI1
29
JGI3
6098
5 G
4Z7L
2 Pu
tativ
e un
char
acte
rized
pro
tein
H
C
0.86
5 0.
713
0.96
9 H
AJG
I157
JG
I681
28
G4Z
AY
2 Pu
tativ
e un
char
acte
rized
pro
tein
0.86
7 0.
682
1.01
5 H
AJG
I355
JG
I360
891
N
A
HC
0.
871
0.77
0 0.
970
NA
JG
I997
24
D8L
HC
1 G
luta
thio
ne re
duct
ase
HC
0.
871
0.73
0 0.
979
HA
JGI3
86
JGI1
0894
4 G
4YS1
2 Pu
tativ
e un
char
acte
rized
pro
tein
0.87
1 0.
611
1.21
5 H
AJG
I016
JG
I871
66
A8J
BC
6 Py
ruva
te d
ehyd
roge
nase
E1
beta
sub
unit
0.
871
0.79
6 1.
015
HA
JGI3
47
JGI2
4374
1 D
8TS4
9 C
ompo
nent
of c
ytos
olic
80S
ribo
som
e &
60S
la
rge
subu
nit
0.
872
0.59
6 1.
353
HA
JGI1
54
JGI2
7262
6 F0
YA
X4
Puta
tive
unch
arac
teriz
ed p
rote
in
HC
0.
874
0.77
4 0.
962
HA
JGI0
38
JGI2
1248
1 D
7FJQ
9 Pu
tativ
e un
char
acte
rized
pro
tein
0.87
4 0.
735
1.16
7 H
AJG
I192
JG
I105
039
0.
875
0.75
0 1.
015
HA
JGI3
78
JGI2
6736
3 D
8TR
A0
Puta
tive
unch
arac
teriz
ed p
rote
in
0.
876
0.77
0 1.
014
HA
JGI3
08
JGI2
7359
7 C
5L4E
6 N
ad d
epen
dent
epi
mer
ase/
dehy
drat
ase,
put
ativ
e
0.87
7 0.
712
1.15
2 H
AJG
I403

232 A
ppen
dix
B
Tabl
e 1
DB
ID
Uni
Prot
D
escr
iptio
n
Expr
essi
on
dire
ctio
n si
gnifi
cant
LC
:HC
LC
:HC
_M
in
LC:H
C_
Max
C
onse
nsus
JG
I270
342
D8U
3I9
Puta
tive
unch
arac
teriz
ed p
rote
in
HC
0.
877
0.75
2 0.
987
HA
JGI1
03
JGI8
9571
Q
5EN
R5
Phos
phog
lyce
rate
kin
ase
HC
0.
877
0.76
8 0.
973
HA
JGI1
47
JGI1
9392
7 B
8BU
34
Pred
icte
d pr
otei
n
0.88
0 0.
618
1.66
9 H
AJG
I106
JG
I890
87
D8T
LB0
Puta
tive
unch
arac
teriz
ed p
rote
in
0.
881
0.77
6 1.
028
HA
JGI0
93
JGI2
6676
8 B
8C83
0 Th
iore
doxi
n H
C
0.88
2 0.
766
0.97
8 H
AJG
I200
JG
I893
11
Q2I
A66
C
hlor
opla
st li
ght h
arve
stin
g pr
otei
n is
ofor
m 1
3
0.88
3 0.
753
1.08
0 H
AJG
I305
JG
I276
141
D0N
Y29
60
S rib
osom
al p
rote
in L
3 H
C
0.88
3 0.
765
0.96
8 H
AJG
I073
JG
I365
947
E1ZD
S1
Puta
tive
unch
arac
teriz
ed p
rote
in
0.
885
0.69
0 1.
117
HA
JGI3
00
JGI1
0866
5 A
8J76
8 R
ibos
omal
pro
tein
S14
0.88
6 0.
762
1.00
4 H
AJG
I375
JG
I105
420
Q5D
K81
H
eat s
hock
pro
tein
90
HC
0.
887
0.81
1 0.
964
HA
JGI0
92
JGI1
1946
9 Q
5EN
P2
Chl
orop
last
pho
tosy
stem
II 1
2 kD
a ex
trins
ic
prot
ein
0.
887
0.82
2 1.
006
HA
JGI2
55
JGI6
8146
Q
2I7V
4 A
TP-d
epen
dent
Clp
pro
teas
e pr
oteo
lytic
sub
unit
0.
893
0.74
0 1.
111
HA
JGI2
25
JGI9
5447
B
6KPP
5 G
lyci
ne-r
ich
prot
ein
2, p
utat
ive
0.
894
0.76
3 1.
114
HA
JGI2
41
JGI2
7607
5 D
8U1L
3 V
acuo
lar A
TP s
ynth
ase
subu
nit E
0.89
4 0.
772
1.04
7 H
AJG
I202
JG
I102
657
A4R
TV8
Pred
icte
d pr
otei
n
0.89
5 0.
799
1.05
5 H
AJG
I179
JG
I966
08
C1F
G28
Pr
edic
ted
prot
ein
0.
895
0.73
2 1.
072
HA
JGI3
15
JGI1
0110
1 B
7FV
A8
Pred
icte
d pr
otei
n
0.89
7 0.
652
1.33
0 H
AJG
I130
JG
I729
05
Q2I
A22
R
ibos
omal
pro
tein
0.89
8 0.
763
1.00
5 H
AJG
I184
JG
I258
285
E1Z3
43
Puta
tive
unch
arac
teriz
ed p
rote
in
0.
900
0.70
6 1.
116
HA
JGI3
70
JGI2
1853
6 E1
Z823
40
S rib
osom
al p
rote
in S
18
0.
901
0.77
8 1.
014
HA
JGI1
46
JGI2
0796
0 E1
Z8Z5
Pu
tativ
e un
char
acte
rized
pro
tein
0.90
3 0.
721
1.04
5 H
AJG
I218
JG
I197
716
Q2I
A11
A
TP s
ynth
ase
gam
ma
chai
n H
C
0.90
6 0.
870
0.96
4 H
AJG
I367
JG
I902
54
D8L
P24
Pyru
vate
kin
ase
0.
906
0.82
4 1.
018
HA
JGI4
00
JGI8
7271
B
8BPW
0 Pu
tativ
e un
char
acte
rized
pro
tein
0.91
0 0.
788
1.09
4 H
AJG
I199
JG
I222
636
N
A
0.
910
0.78
1 1.
054
NA
JG
I273
308
B4Z
G44
Pu
tativ
e un
char
acte
rized
pro
tein
0.91
0 0.
781
1.05
4 H
AJG
I323
JG
I615
63
Q9A
R87
D
elta
-am
inol
evul
inic
aci
d de
hydr
atas
e
0.91
0 0.
711
1.18
6 H
AJG
I277

233 A
ppen
dix
B
Tabl
e 1
DB
ID
Uni
Prot
D
escr
iptio
n
Expr
essi
on
dire
ctio
n si
gnifi
cant
LC
:HC
LC
:HC
_M
in
LC:H
C_
Max
C
onse
nsus
JG
I628
64
F0Y
053
GTP
-bin
ding
nuc
lear
pro
tein
Ran
0.91
1 0.
792
1.04
7 H
AJG
I165
JG
I363
444
G4Z
RS7
A
deno
sylh
omoc
yste
inas
e
0.91
1 0.
812
1.02
9 H
AJG
I056
JG
I217
140
F0Y
C48
Pu
tativ
e un
char
acte
rized
pro
tein
0.91
1 0.
804
1.14
9 H
AJG
I155
JG
I235
076
C1N
337
Pred
icte
d pr
otei
n
0.91
4 0.
797
1.06
8 H
AJG
I134
JG
I268
670
E1ZA
W9
Puta
tive
unch
arac
teriz
ed p
rote
in
0.
914
0.73
5 1.
280
HA
JGI2
72
JGI3
6173
7
NA
0.91
4 0.
822
1.07
5 N
A
JGI2
6734
4 E1
Z8N
4 Pu
tativ
e un
char
acte
rized
pro
tein
0.91
5 0.
835
1.00
1 H
AJG
I279
JG
I103
652
0.
915
0.59
2 1.
399
HA
JGI0
83
JGI1
1218
5 D
8UEM
8 Pl
astid
/chl
orop
last
ribo
som
al p
rote
in L
4
0.91
6 0.
776
1.06
5 H
AJG
I122
JG
I270
085
G4Y
F15
Puta
tive
unch
arac
teriz
ed p
rote
in
0.
916
0.66
4 1.
437
HA
JGI3
92
JGI8
6826
A
4S2V
6 R
ibos
omal
pro
tein
L18
0.91
6 0.
791
1.08
0 H
AJG
I256
JG
I240
824
A8J
9T0
40S
ribos
omal
pro
tein
S12
0.91
7 0.
806
1.17
1 H
AJG
I139
JGI6
7049
D
8TJL
0 C
ompo
nent
of c
ytos
olic
80S
ribo
som
e an
d 40
S sm
all s
ubun
it
0.91
7 0.
704
1.14
4 H
AJG
I348
JG
I271
767
C1M
L75
Ace
tyl-c
oa c
arbo
xyla
se
0.
918
0.86
4 1.
010
HA
JGI1
31
JGI4
0884
8 D
0NLH
6 A
lpha
-act
inin
-1, p
utat
ive
0.
918
0.75
9 1.
122
HA
JGI1
10
JGI1
0403
2 B
8C07
0 Pr
edic
ted
prot
ein
0.
919
0.78
1 1.
073
HA
JGI1
17
JGI2
0227
0 D
7FU
X7
Puta
tive
unch
arac
teriz
ed p
rote
in
0.
919
0.75
6 1.
126
HA
JGI3
39
JGI2
1825
9
0.92
0 0.
751
1.26
1 H
AJG
I383
JGI5
7264
D
8UH
T7
Com
pone
nt o
f cyt
osol
ic 8
0S ri
boso
me
and
40S
smal
l sub
unit
0.
922
0.59
3 1.
311
HA
JGI2
38
JGI2
7221
3 C
1N8B
3 H
eat s
hock
pro
tein
70k
Da
0.
924
0.79
6 1.
032
HA
JGI4
04
JGI5
1375
C
1MK
E9 L
umin
al b
indi
ng h
eat s
hock
pro
tein
70
0.
927
0.75
8 1.
049
HA
JGI0
95
JGI1
0778
5 B
8C7K
5 Su
lfolip
id b
iosy
nthe
sis
prot
ein
0.
928
0.81
2 1.
138
HA
JGI2
29
JGI2
0165
7 A
4S2V
6 R
ibos
omal
pro
tein
L18
0.93
0 0.
822
1.06
7 H
AJG
I353
JG
I269
606
C1N
183
Pred
icte
d pr
otei
n
0.93
0 0.
741
1.14
2 H
AJG
I033
JG
I201
477
D8T
NL8
Pr
ohib
itin
0.
932
0.72
0 1.
189
HA
JGI0
14
JGI6
4811
NA
0.93
3 0.
835
1.01
5 N
A

234 A
ppen
dix
B
Tabl
e 1
DB
ID
Uni
Prot
D
escr
iptio
n
Expr
essi
on
dire
ctio
n si
gnifi
cant
LC
:HC
LC
:HC
_M
in
LC:H
C_
Max
C
onse
nsus
JG
I276
434
D8L
JS6
Cys
tath
ioni
ne g
amm
a-ly
ase
0.
936
0.72
7 1.
189
HA
JGI0
75
JGI6
1178
F2
WQ
20
Mal
ate
dehy
drog
enas
e
0.93
6 0.
850
1.01
4 H
AJG
I330
JG
I101
346
D0M
ZZ6
Cal
lose
synt
hase
, put
ativ
e
0.93
6 0.
710
1.11
1 H
AJG
I274
JG
I965
15
C1E
1B9
Pred
icte
d pr
otei
n
0.93
7 0.
795
1.11
1 H
AJG
I105
JG
I412
390
C1F
E16
ATP
synt
hase
subu
nit b
eta
HC
0.
938
0.83
5 0.
998
HA
JGI0
58
JGI6
3123
A
7ATH
4 R
ibos
omal
pro
tein
L13
, put
ativ
e
0.93
9 0.
765
1.06
2 H
AJG
I250
JG
I267
180
A4R
QS6
En
olas
e
0.94
1 0.
853
1.04
0 H
AJG
I178
JG
I271
119
D8L
HD
4 Pu
tativ
e le
ucin
e ric
h re
peat
pro
tein
0.94
1 0.
816
1.11
2 H
AJG
I257
JG
I113
436
A8I
JG5
Pred
icte
d pr
otei
n
0.94
2 0.
789
1.10
1 H
AJG
I262
JG
I105
359
C1E
5V7
Pred
icte
d pr
otei
n
0.94
3 0.
607
1.77
6 H
AJG
I133
JG
I105
526
B7F
TU0
Pred
icte
d pr
otei
n
0.94
4 0.
683
1.31
2 H
AJG
I324
JG
I265
795
Q8L
878
Oxy
gen
evol
ving
enh
ance
r 1
0.
944
0.76
5 1.
224
HA
JGI2
98
JGI4
1410
E1
ZQ58
Pu
tativ
e un
char
acte
rized
pro
tein
0.94
7 0.
880
1.02
4 H
AJG
I087
JG
I268
510
N
A
0.
948
0.88
1 1.
071
NA
JG
I704
81
C1F
E16
ATP
synt
hase
subu
nit b
eta
0.
948
0.84
8 1.
007
HA
JGI1
60
JGI1
0982
2
NA
0.94
9 0.
846
1.00
9 N
A
JGI6
4976
Q
2IA
28
Chl
orop
last
ligh
t har
vest
ing
prot
ein
isof
orm
12
0.
950
0.81
2 1.
136
HA
JGI2
53
JGI9
6453
B
8LEJ
5 Pr
edic
ted
prot
ein
0.
951
0.61
5 2.
008
HA
JGI0
89
JGI2
7062
9 F0
XX
48
Puta
tive
unch
arac
teriz
ed p
rote
in
0.
953
0.87
6 1.
070
HA
JGI1
50
JGI2
7419
0 E1
ZHB
0 Pu
tativ
e un
char
acte
rized
pro
tein
0.95
4 0.
567
1.38
5 H
AJG
I286
JG
I275
203
B7S
3L1
Pred
icte
d pr
otei
n
0.95
4 0.
845
1.19
6 H
AJG
I215
JG
I964
20
N
A
0.
954
0.81
9 1.
131
NA
JGI9
9777
D
0NV
C3
26S
prot
easo
me
non-
ATP
ase
regu
lato
ry su
buni
t 3
0.
954
0.75
4 1.
230
HA
JGI2
13
JGI7
6562
F0
YH
74
Puta
tive
unch
arac
teriz
ed p
rote
in
0.
955
0.80
4 1.
170
HA
JGI0
47
JGI2
8451
6 D
0P2Z
9 A
deny
late
kin
ase,
put
ativ
e
0.95
5 0.
772
1.07
1 H
AJG
I356
JG
I975
45
B6K
VV
6 Pr
olife
ratio
n-as
soci
ated
pro
tein
2G
4, p
utat
ive
HC
0.
957
0.92
9 0.
999
HA
JGI0
17
JGI2
6837
1 Q
2IA
78
Chl
orop
last
ligh
t har
vest
ing
prot
ein
isof
orm
1
0.
957
0.72
6 1.
217
HA
JGI2
11

235 A
ppen
dix
B
Tabl
e 1
DB
ID
Uni
Prot
D
escr
iptio
n
Expr
essi
on
dire
ctio
n si
gnifi
cant
LC
:HC
LC
:HC
_M
in
LC:H
C_
Max
C
onse
nsus
JG
I285
186
A4S
3B4
Cha
pero
nin
60, m
itoch
ondr
ial
0.
958
0.82
1 1.
098
HA
JGI1
69
JGI6
6519
C
1MZG
8 Pr
edic
ted
prot
ein
0.
959
0.80
5 1.
078
HA
JGI1
95
JGI9
7618
NA
0.95
9 0.
585
1.46
2 N
A
JGI2
8267
2 Q
8ID
D9
Ubi
quiti
n co
njug
atin
g en
zym
e, p
utat
ive
0.
960
0.76
5 1.
175
HA
JGI0
68
JGI2
0146
5
0.96
0 0.
728
1.49
3 H
AJG
I090
JGI2
1242
4 B
4ZFX
6
0.
960
0.82
6 1.
112
HA
JGI1
35
JGI2
3198
5 A
1YQ
X3
Nuc
leic
aci
d bi
ndin
g pr
otei
n
0.96
2 0.
623
1.84
2 H
AJG
I234
JG
I572
86
G5A
FK3
60S
ribos
omal
pro
tein
L13
0.96
2 0.
760
1.14
9 H
AJG
I080
JG
I281
076
A6M
VX
0 EL
onga
tion
fact
or T
s, ch
loro
plas
tic
0.
962
0.76
2 1.
142
HA
JGI1
12
JGI9
8483
Q
5UH
I6
EF-1
alp
ha-li
ke p
rote
in
0.
963
0.82
4 1.
098
HA
JGI3
68
JGI2
0398
0 G
5AFK
3 60
S rib
osom
al p
rote
in L
13
0.
963
0.72
3 1.
214
HA
JGI0
10
JGI1
0752
0 C
1EEB
4 El
onga
tion
fact
or tu
0.96
4 0.
905
1.04
1 H
AJG
I306
JG
I693
20
D2D
4K3
Cel
l div
isio
n cy
cle
prot
ein
48
0.
965
0.86
7 1.
048
HA
JGI0
53
JGI2
7173
5 A
7YX
U6
RN
A re
cogn
ition
mot
if pr
otei
n
0.96
5 0.
685
1.34
0 H
AJG
I344
JG
I662
49
Q01
7S6
Stre
ss-in
duce
d pr
otei
n st
i1-li
ke p
rote
in (I
SS)
0.
966
0.78
6 1.
119
HA
JGI0
77
JGI2
6744
0 B
8BX
A1
Enoy
l-red
ucta
se [N
AD
H]
0.
968
0.90
1 1.
063
HA
JGI3
76
JGI8
8834
D
8LK
S5
LRR
-GTP
ase
of th
e R
OC
O fa
mily
0.96
9 0.
847
1.16
6 H
AJG
I049
JG
I100
207
Q9S
WQ
1 Ty
pe 1
act
in
0.
970
0.70
8 1.
361
HA
JGI3
27
JGI2
0787
8
0.97
1 0.
712
1.24
5 H
AJG
I204
JG
I271
242
C1E
AX
2 Pr
edic
ted
prot
ein
0.
971
0.78
9 1.
143
HA
JGI3
02
JGI2
2776
4
0.97
2 0.
509
1.55
5 H
AJG
I052
JG
I203
470
N
A
0.
973
0.84
7 1.
144
NA
JG
I225
524
B8B
ZI8
Pred
icte
d pr
otei
n
0.97
3 0.
859
1.11
7 H
AJG
I332
JG
I269
305
F0Y
0B9
Puta
tive
unch
arac
teriz
ed p
rote
in
0.
973
0.82
9 1.
230
HA
JGI3
18
JGI2
7224
8
NA
0.97
4 0.
850
1.13
3 N
A
JGI2
6930
6 B
7FPZ
8 Pr
edic
ted
prot
ein
0.
975
0.76
2 1.
218
HA
JGI3
17
JGI2
1731
6 B
8C1N
2 Pr
edic
ted
prot
ein
0.
976
0.80
9 1.
133
HA
JGI2
69

236 A
ppen
dix
B
Tabl
e 1
DB
ID
Uni
Prot
D
escr
iptio
n
Expr
essi
on
dire
ctio
n si
gnifi
cant
LC
:HC
LC
:HC
_M
in
LC:H
C_
Max
C
onse
nsus
JG
I100
546
0.
978
0.79
1 1.
153
HA
JGI2
51
JGI2
7400
7 G
4YEF
7 Pu
tativ
e un
char
acte
rized
pro
tein
0.97
8 0.
820
1.25
3 H
AJG
I363
JG
I200
165
B7G
9A2
Pred
icte
d pr
otei
n
0.98
0 0.
808
1.16
4 H
AJG
I022
JG
I201
257
0.
980
0.73
2 1.
337
HA
JGI3
90
JGI2
0557
1
0.98
1 0.
791
1.20
0 H
AJG
I325
JGI3
5814
3 O
0483
9 G
lyco
lytic
gly
cera
ldeh
yde-
3-ph
osph
ate
dehy
drog
enas
e
0.98
1 0.
923
1.04
2 H
AJG
I394
JGI2
0131
7 D
7FW
04
Mag
nesi
um c
hela
tase
subu
nit H
, put
ativ
e ch
loro
plas
t
0.98
2 0.
894
1.14
7 H
AJG
I295
JG
I285
672
Q50
KB
1 Pr
otei
n di
sulfi
de-is
omer
ase-
like
prot
ein
EhSe
p2
0.
982
0.59
8 1.
890
HA
JGI3
93
JGI5
5967
D
8UA
34
Prot
easo
me
subu
nit a
lpha
type
0.98
3 0.
886
1.14
2 H
AJG
I183
JG
I271
180
F0Y
H80
U
ropo
rphy
rinog
en d
ecar
boxy
lase
0.98
3 0.
647
1.63
1 H
AJG
I132
JG
I268
401
F0Y
5H5
Puta
tive
unch
arac
teriz
ed p
rote
in
0.
984
0.82
1 1.
174
HA
JGI0
70
JGI2
5066
6
0.98
6 0.
894
1.10
0 H
AJG
I359
JG
I106
545
G5A
FG3
Puta
tive
unch
arac
teriz
ed p
rote
in
0.
988
0.83
8 1.
199
HA
JGI2
94
JGI4
0506
0 E7
D6U
3 G
luta
min
e sy
ntht
ease
III
0.
991
0.83
6 1.
116
HA
JGI1
27
JGI2
6141
0 F0
Y3Y
1 Pu
tativ
e un
char
acte
rized
pro
tein
0.99
1 0.
823
1.28
9 H
AJG
I287
JG
I230
942
0.
992
0.83
3 1.
215
HA
JGI1
48
JGI2
7223
3
0.99
2 0.
847
1.16
1 H
AJG
I159
JG
I210
921
A7A
S38
Poly
ubiq
uitin
, put
ativ
e
0.99
3 0.
817
1.27
7 H
AJG
I292
JG
I215
323
G4Y
SQ9
Puta
tive
unch
arac
teriz
ed p
rote
in
0.
993
0.81
7 1.
277
HA
JGI0
09
JGI4
0884
4
0.99
9 0.
809
1.25
2 H
AJG
I109
JG
I198
101
1.
000
0.84
7 1.
233
HA
JGI2
48
JGI2
6734
5 F0
VF2
6 Pu
tativ
e un
char
acte
rized
pro
tein
1.00
1 0.
684
1.31
9 H
AJG
I173
JG
I685
69
C1E
I97
Pred
icte
d pr
otei
n
1.00
1 0.
880
1.15
6 H
AJG
I313
JG
I267
273
E6Y
2N8
Puta
tive
mito
chon
dria
l AD
P/A
TP tr
ansl
ocas
e
1.00
4 0.
864
1.16
7 H
AJG
I371
JG
I265
835
N
A
1.
006
0.68
1 1.
332
NA
JG
I116
551
C1E
4H7
Puta
tive
unch
arac
teriz
ed p
rote
in
1.
007
0.85
3 1.
134
HA
JGI0
64

237 A
ppen
dix
B
Tabl
e 1
DB
ID
Uni
Prot
D
escr
iptio
n
Expr
essi
on
dire
ctio
n si
gnifi
cant
LC
:HC
LC
:HC
_M
in
LC:H
C_
Max
C
onse
nsus
JG
I277
072
C1N
2P4
Col
d-sh
ock
DN
A b
indi
ng p
rote
in
1.
007
0.86
1 1.
282
HA
JGI0
99
JGI2
6810
4 Q
1WLZ
5 14
-3-3
-like
pro
tein
-rel
ated
pro
tein
1.01
6 0.
914
1.12
5 H
AJG
I231
JG
I118
455
E1ZC
S2
Puta
tive
unch
arac
teriz
ed p
rote
in
1.
018
0.86
0 1.
120
HA
JGI0
78
JGI1
0074
6
1.02
3 0.
833
1.35
9 H
AJG
I107
JG
I216
106
D8T
LK9
Puta
tive
unch
arac
teriz
ed p
rote
in
1.
024
0.94
3 1.
073
HA
JGI2
24
JGI1
1658
1
1.02
4 0.
771
1.45
6 H
AJG
I050
JG
I722
37
D0N
VM
9 60
S ac
idic
ribo
som
al p
rote
in
1.
024
0.91
3 1.
143
HA
JGI2
90
JGI2
0474
7
NA
1.02
5 0.
945
1.16
6 N
A
JGI2
8221
3
1.03
2 0.
920
1.19
9 H
AJG
I163
JG
I279
225
Q2I
A80
C
hlor
opla
st O
-ace
tyl-s
erin
e ly
ase
1.
040
0.75
2 1.
475
HA
JGI3
09
JGI5
8448
D
8LG
N4
Puta
tive
unch
arac
teriz
ed p
rote
in
1.
047
0.84
9 1.
353
HA
JGI3
74
JGI2
8266
7 C
1E7E
6 SN
F2 su
per f
amily
1.04
7 0.
920
1.21
4 H
AJG
I020
JG
I275
346
B8B
TG2
60S
AC
IDIC
ribo
som
al p
rote
in P
2
1.05
1 0.
777
1.74
8 H
AJG
I258
JG
I278
306
Q1W
LZ5
14-3
-3-li
ke p
rote
in-r
elat
ed p
rote
in
1.
058
0.97
0 1.
136
HA
JGI0
60
JGI1
0818
0 C
1N4F
5 Pr
edic
ted
prot
ein
1.
058
0.87
1 1.
346
HA
JGI3
43
JGI7
5300
F0
Y2L
8 Pe
ptid
yl-p
roly
l cis
-tran
s iso
mer
ase
1.
060
0.98
1 1.
147
HA
JGI2
45
JGI1
1125
4 F0
Y4J
8 Pe
ptid
yl-p
roly
l cis
-tran
s iso
mer
ase
1.
060
0.98
1 1.
147
HA
JGI1
76
JGI2
1161
1 B
7FSL
9 Pr
edic
ted
prot
ein
1.
063
0.74
7 1.
497
HA
JGI2
63
JGI3
5737
4 Q
2IA
80
Chl
orop
last
O-a
cety
l-ser
ine
lyas
e
1.06
4 0.
766
1.47
5 H
AJG
I326
JG
I109
201
A8J
3W3
Pred
icte
d pr
otei
n
1.06
6 0.
978
1.16
0 H
AJG
I114
JG
I787
78
Q5U
HI6
EF
-1 a
lpha
-like
pro
tein
1.06
6 0.
906
1.27
4 H
AJG
I100
JG
I282
626
D8L
BF4
D
ihyd
rolip
oyl d
ehyd
roge
nase
1.06
8 0.
912
1.38
3 H
AJG
I126
JG
I269
934
1.
069
0.95
1 1.
208
HA
JGI2
06
JGI8
8448
D
7FY
P5
Puta
tive
unch
arac
teriz
ed p
rote
in
1.
071
0.80
4 1.
368
HA
JGI1
42
JGI2
7099
2
1.07
5 0.
833
1.40
6 H
AJG
I230
JG
I402
323
C5K
TL6
HSP
90 c
o-ch
aper
one,
put
ativ
e
1.07
7 0.
894
1.29
4 H
AJG
I310
JG
I688
19
B5Y
4R6
Pred
icte
d pr
otei
n
1.07
8 0.
709
1.39
5 H
AJG
I171
JG
I955
74
1.
080
0.75
1 1.
534
HA
JGI0
65

238 A
ppen
dix
B
Tabl
e 1
DB
ID
Uni
Prot
D
escr
iptio
n
Expr
essi
on
dire
ctio
n si
gnifi
cant
LC
:HC
LC
:HC
_M
in
LC:H
C_
Max
C
onse
nsus
JG
I266
878
F0Y
E54
Puta
tive
unch
arac
teriz
ed p
rote
in
LC
1.08
1 1.
007
1.20
5 H
AJG
I319
JG
I654
00
D7F
RM
9 40
S rib
osom
al p
rote
in S
28
1.
083
0.88
8 1.
256
HA
JGI1
87
JGI1
0959
3 D
0P3G
4 Pu
tativ
e un
char
acte
rized
pro
tein
1.08
6 0.
872
1.36
2 H
AJG
I240
JG
I108
073
Q50
KB
1 Pr
otei
n di
sulfi
de-is
omer
ase-
like
prot
ein
EhSe
p2
1.
087
0.78
1 1.
546
HA
JGI3
57
JGI8
6748
Q
2IA
86
Chl
orop
last
50S
ribo
som
al p
rote
in L
12
1.
088
0.83
5 1.
613
HA
JGI0
44
JGI7
1010
B
8C6L
5 Pu
tativ
e un
char
acte
rized
pro
tein
1.08
9 0.
977
1.18
3 H
AJG
I084
JG
I724
27
D0N
XH
1 U
biqu
itin,
put
ativ
e
1.09
1 0.
847
1.56
0 H
AJG
I364
JG
I195
071
1.
093
0.88
0 1.
318
HA
JGI1
90
JGI1
2246
8
1.09
5 0.
857
1.40
4 H
AJG
I223
JG
I278
991
C1E
BQ
0 Pr
edic
ted
prot
ein
1.
098
0.90
8 1.
379
HA
JGI0
01
JGI2
1427
4
NA
1.09
9 0.
711
1.65
6 N
A
JGI2
6727
4 E1
Z6A
8 Pu
tativ
e un
char
acte
rized
pro
tein
1.11
3 0.
604
1.89
4 H
AJG
I281
JG
I975
60
C1M
K47
Pr
edic
ted
prot
ein
1.
116
0.86
4 1.
383
HA
JGI3
98
JGI2
1056
3 Q
49JJ
1 H
isto
ne H
2A
1.
119
0.88
5 1.
422
HA
JGI2
65
JGI2
8435
2 D
7FSF
0 Pu
tativ
e un
char
acte
rized
pro
tein
1.12
2 0.
847
1.77
6 H
AJG
I244
JG
I257
539
Q49
JJ1
His
tone
H2A
1.12
3 0.
891
1.42
2 H
AJG
I252
JG
I691
83
D7F
RA
4 Pl
astid
ribo
som
al p
rote
in S
1
1.12
3 0.
967
1.37
0 H
AJG
I254
JGI1
0514
6 C
1E0B
7 El
onga
tion
fact
or tu
gtp
-bin
ding
dom
ain
prot
ein
2 LC
1.
130
1.04
9 1.
209
HA
JGI1
04
JGI6
4083
F0
YST
3 Pu
tativ
e un
char
acte
rized
pro
tein
LC
1.
133
1.02
7 1.
267
HA
JGI2
89
JGI1
0956
1 C
5L3N
3 3-
hydr
oxya
cyl-C
oA d
ehyr
ogen
ase,
put
ativ
e
1.13
5 0.
995
1.30
5 H
AJG
I354
JG
I231
324
D0N
EH7
26S
prot
ease
regu
lato
ry s
ubun
it 7
LC
1.13
7 1.
002
1.31
2 H
AJG
I235
JG
I110
032
Q2I
A85
C
hlor
opla
st 5
0S ri
boso
mal
pro
tein
L17
1.14
0 0.
640
2.27
8 H
AJG
I059
JGI3
6519
6 B
6DX
96
Puta
tive
chlo
ropl
ast 4
-hyd
roxy
-3-m
ethy
lbut
-2-
en-1
-yl d
ipho
spha
te s
ynth
ase
LC
1.14
1 1.
022
1.25
9 H
AJG
I268
JG
I116
827
B7F
ZI9
Pred
icte
d pr
otei
n
1.14
7 0.
770
1.95
7 H
AJG
I032
JG
I242
836
C1E
0T7
Pred
icte
d pr
otei
n
1.14
7 0.
911
1.43
9 H
AJG
I226
JG
I274
290
C1E
GC
2 Pr
edic
ted
prot
ein
1.
148
0.86
8 1.
866
HA
JGI2
14

239 A
ppen
dix
B
Tabl
e 1
DB
ID
Uni
Prot
D
escr
iptio
n
Expr
essi
on
dire
ctio
n si
gnifi
cant
LC
:HC
LC
:HC
_M
in
LC:H
C_
Max
C
onse
nsus
JG
I658
98
E1ZD
T5
Prot
easo
me
subu
nit b
eta
type
1.14
8 0.
861
1.35
7 H
AJG
I311
JG
I230
687
Q1M
WL3
Fuc
oxan
thin
chl
orop
hyll
a/c
bind
ing
prot
ein
1.
157
0.97
4 1.
321
HA
JGI2
12
JGI9
5565
Q
49JJ
2 H
isto
ne H
2A
LC
1.16
1 1.
017
1.36
8 H
AJG
I144
JG
I710
08
N
A
LC
1.16
1 1.
007
1.37
2 N
A
JGI2
7974
0 C
1FFE
2 Pr
edic
ted
prot
ein
LC
1.16
1 1.
007
1.37
2 H
AJG
I074
JG
I267
796
Q1W
LZ2
40S
ribos
omal
pro
tein
S3
LC
1.16
5 1.
082
1.26
4 H
AJG
I296
JG
I271
880
N
A
1.
167
0.93
5 1.
706
NA
JG
I215
648
1.
168
0.75
4 1.
789
HA
JGI1
15
JGI2
5683
0
LC
1.
168
1.10
0 1.
280
HA
JGI2
08
JGI2
7145
5 F0
YFV
2 Pu
tativ
e un
char
acte
rized
pro
tein
LC
1.
170
1.03
4 1.
441
HA
JGI1
85
JGI6
5368
1.17
3 0.
769
1.71
2 H
AJG
I072
JG
I105
819
A8I
ZW5
RA
N b
indi
ng p
rote
in, R
AN
BP1
1.17
5 0.
906
1.64
5 H
AJG
I346
JG
I270
764
F0Y
620
Puta
tive
unch
arac
teriz
ed p
rote
in
1.
179
0.94
1 1.
379
HA
JGI2
10
JGI1
0839
6 D
8TQ
04
ER lu
men
pro
tein
reta
inin
g re
cept
or
1.
185
0.86
7 1.
634
HA
JGI1
37
JGI2
2096
8
1.19
9 0.
805
1.86
2 H
AJG
I312
JG
I961
92
Q01
3K3
His
tone
H2B
LC
1.
207
1.00
2 1.
403
HA
JGI4
01
JGI2
0559
3 E1
Z2Y
1 Pu
tativ
e un
char
acte
rized
pro
tein
1.22
2 0.
848
1.73
0 H
AJG
I384
JG
I198
481
1.
227
0.81
5 2.
028
HA
JGI3
42
JGI9
4767
1.23
9 0.
637
2.43
3 H
AJG
I124
JG
I114
035
D0N
WQ
9 Pr
otei
n ki
nase
, put
ativ
e
1.24
0 0.
845
2.02
4 H
AJG
I232
JG
I763
77
B7G
0V7
Pred
icte
d pr
otei
n LC
1.
244
1.03
0 1.
389
HA
JGI1
43
JGI3
6497
4 D
7FPP
1 Tr
ifunc
tiona
l enz
yme
subu
nit a
lpha
1.24
6 0.
987
1.47
5 H
AJG
I284
JG
I372
283
N
A
1.
267
0.94
0 1.
486
NA
JG
I112
664
N
A
1.
277
0.94
0 1.
466
NA
JG
I201
707
A4R
S62
His
tone
H4
LC
1.27
7 1.
094
1.52
4 H
AJG
I379
JG
I255
477
A7A
T84
His
tone
H3,
put
ativ
e LC
1.
281
1.06
3 1.
502
HA
JGI1
11
JGI3
6921
7
1.30
3 0.
969
1.58
5 H
AJG
I322
JG
I722
35
C1M
VY
5 H
isto
ne H
2A
LC
1.30
5 1.
156
1.47
7 H
AJG
I082

240 A
ppen
dix
B
Tabl
e 1
DB
ID
Uni
Prot
D
escr
iptio
n
Expr
essi
on
dire
ctio
n si
gnifi
cant
LC
:HC
LC
:HC
_M
in
LC:H
C_
Max
C
onse
nsus
JG
I272
682
F0Y
AR
4 Pu
tativ
e un
char
acte
rized
pro
tein
1.32
7 0.
902
2.30
4 H
AJG
I193
JG
I270
658
B8B
TN5
Puta
tive
unch
arac
teriz
ed p
rote
in
1.
333
0.80
8 2.
433
HA
JGI3
16
JGI2
0394
6 B
7G4V
0 Pr
edic
ted
prot
ein
1.
456
0.98
0 2.
315
HA
JGI3
21
JGI3
4987
7
1.47
5 0.
966
2.13
2 H
AJG
I116
JG
I277
202
Q5G
920
Alp
ha-tu
bulin
LC
1.
476
1.28
5 1.
821
HA
JGI1
56
JGI3
7457
2
LC
1.
550
1.14
7 1.
916
HA
JGI1
58
JGI8
7697
F0
Y9S
1 Pu
tativ
e un
char
acte
rized
pro
tein
LC
1.
577
1.38
3 1.
764
HA
JGI3
07
JGI4
4488
A
8JD
V9
ATP
synt
hase
gam
ma
chai
n
1.70
0 0.
776
6.25
0 H
AJG
I271
JG
I233
632
B8C
AB
4 Pr
edic
ted
prot
ein
1.
795
0.58
8 6.
250
HA
JGI3
60
TAX
DB
13
Q4G
3F4
Rib
ulos
e bi
spho
spha
te c
arbo
xyla
se la
rge
chai
n (R
uBis
CO
larg
e su
buni
t) (E
C 4
.1.1
.39)
H
C
0.59
8 0.
544
0.66
0 N
A
TAX
DB
73
A3F
QF5
U
ncha
ract
eriz
ed p
rote
in
HC
0.
647
0.52
8 0.
799
TAX
DB
73
TAX
DB
68
Q4G
3F3
Rib
ulos
e 1,
5-bi
spho
spha
te
carb
oxyl
ase/
oxyg
enas
e sm
all s
ubun
it
0.67
3 0.
416
1.29
0 TA
XD
B68
TAX
DB
14
Q4G
396
Phot
osys
tem
II C
P43
reac
tion
cent
er p
rote
in
(PSI
I 43
kDa
prot
ein)
(Pro
tein
CP-
43)
HC
0.
681
0.58
1 0.
801
TAX
DB
14
TAX
DB
22
B8C
4K2
Unc
hara
cter
ized
pro
tein
H
C
0.69
1 0.
443
0.95
0 TA
XD
B22
TAX
DB
12
A8I
VJ3
Ph
osph
olip
id-tr
ansp
ortin
g A
TPas
e (E
C 3
.6.3
.1)
(Fra
gmen
t)
0.70
7 0.
488
1.18
9 TA
XD
B12
TA
XD
B75
Q
5EN
R8
Phos
phog
lyce
rate
kin
ase
(EC
2.7
.2.3
) H
C
0.72
0 0.
647
0.81
8 TA
XD
B75
TAX
DB
81
Q40
612
ATP
synt
hase
subu
nit b
eta,
chl
orop
last
ic (E
C
3.6.
3.14
) (A
TP sy
ntha
se F
1 se
ctor
subu
nit b
eta)
(F
-ATP
ase
subu
nit b
eta)
HC
0.73
5 0.
622
0.86
4 N
A
TAX
DB
85
D8T
RA
2 A
TP sy
ntha
se su
buni
t bet
a (E
C 3
.6.3
.14)
H
C
0.76
0 0.
672
0.83
6 TA
XD
B85
TAX
DB
61
Q4G
3C8
ATP
synt
hase
subu
nit b
eta,
chl
orop
last
ic (E
C
3.6.
3.14
) (A
TP sy
ntha
se F
1 se
ctor
subu
nit b
eta)
(F
-ATP
ase
subu
nit b
eta)
HC
0.76
3 0.
659
0.89
2 N
A
TAX
DB
57
C6K
IJ6
ATP
synt
hase
subu
nit a
lpha
, chl
orop
last
ic (E
C
3.6.
3.14
) (A
TP sy
ntha
se F
1 se
ctor
subu
nit a
lpha
)
0.77
4 0.
633
1.03
4 TA
XD
B57

241 A
ppen
dix
B
Tabl
e 1
DB
ID
Uni
Prot
D
escr
iptio
n
Expr
essi
on
dire
ctio
n si
gnifi
cant
LC
:HC
LC
:HC
_M
in
LC:H
C_
Max
C
onse
nsus
(F
-ATP
ase
subu
nit a
lpha
) TA
XD
B31
Q
9TA
H9
ATP
syn
thas
e su
buni
t alp
ha
0.
774
0.63
3 1.
034
TAX
DB
31
TAX
DB
41
Q4G
3C9
ATP
syn
thas
e ep
silo
n ch
ain,
chl
orop
last
ic (A
TP
synt
hase
F1
sect
or e
psilo
n su
buni
t) (F
-ATP
ase
epsi
lon
subu
nit)
HC
0.79
7 0.
687
0.94
9 N
A
TAX
DB
05
Q4G
397
ATP
syn
thas
e su
buni
t alp
ha, c
hlor
opla
stic
(EC
3.
6.3.
14) (
ATP
syn
thas
e F1
sec
tor s
ubun
it al
pha)
(F
-ATP
ase
subu
nit a
lpha
)
HC
0.79
8 0.
720
0.90
9 N
A
TAX
DB
01
C0J
WI5
Ph
otos
yste
m II
D2
prot
ein
(PSI
I D2
prot
ein)
(EC
1.
10.3
.9) P
hoto
syst
em Q
(A) p
rote
in)
0.
805
0.62
9 1.
011
TAX
DB
01
TAX
DB
88
Q2I
A54
G
lyce
rald
ehyd
e-3-
phos
phat
e de
hydr
ogen
ase
(EC
1.
2.1.
12)
HC
0.
808
0.75
8 0.
878
TAX
DB
88
TAX
DB
56
F0Y
KF4
S-
aden
osyl
met
hion
ine
synt
hase
(EC
2.5
.1.6
)
0.81
0 0.
497
1.23
9 TA
XD
B56
TA
XD
B67
F0
Y39
4 Ph
osph
ogly
cera
te k
inas
e (E
C 2
.7.2
.3)
0.
820
0.65
7 1.
024
TAX
DB
67
TAX
NA
C
5K6Q
8 H
eat s
hock
pro
tein
, put
ativ
e H
C
0.84
1 0.
662
0.98
7 N
A
TAX
DB
50
Q4G
398
ATP
syn
thas
e su
buni
t del
ta, c
hlor
opla
stic
0.84
8 0.
654
1.10
3 N
A
TAX
DB
66
A1E
8Z5
ATP
syn
thas
e su
buni
t bet
a (E
C 3
.6.3
.14)
(F
ragm
ent)
0.
853
0.73
7 1.
014
TAX
DB
66
TAX
DB
90
G0Q
RF6
A
TP s
ynth
ase
subu
nit a
lpha
H
C
0.86
5 0.
741
0.99
8 TA
XD
B90
TA
XD
B48
Q
49JJ
1 H
isto
ne H
2A
HC
0.
867
0.78
9 0.
927
TAX
DB
48
TAX
DB
42
Q4G
347
DN
A-d
irect
ed R
NA
pol
ymer
ase
subu
nit a
lpha
0.87
6 0.
656
1.12
2 N
A
TAX
DB
78
Q4G
368
Cyt
ochr
ome
c-55
0 (C
ytoc
hrom
e c5
50)
0.
877
0.78
3 1.
008
NA
TA
XD
B84
Q
309Z
7 A
TP s
ynth
ase
subu
nit b
eta
(EC
3.6
.3.1
4)
0.
879
0.77
3 1.
034
TAX
DB
84
TAX
DB
25
Q4G
3C5
Phot
osys
tem
II C
P47
reac
tion
cent
er p
rote
in
0.
881
0.76
6 1.
073
TAX
DB
25
TAX
DB
23
Q4G
399
ATP
syn
thas
e su
buni
t b, c
hlor
opla
stic
0.88
8 0.
746
1.03
4 N
A
TAX
DB
44
A9B
L97
Hsp
90
0.
893
0.78
2 1.
085
TAX
DB
44
TAX
DB
89
F0Y
FK1
ATP
syn
thas
e su
buni
t bet
a (E
C 3
.6.3
.14)
0.91
1 0.
795
1.03
1 TA
XD
B89
TA
XD
B45
Q
4G3A
0 A
TP s
ynth
ase
subu
nit b
', ch
loro
plas
tic
0.
914
0.81
9 1.
012
NA
TA
XD
B08
B
8C63
7 H
SP90
fam
ily m
embe
r
0.91
7 0.
808
1.09
9 TA
XD
B08

242 A
ppen
dix
B
Tabl
e 1
DB
ID
Uni
Prot
D
escr
iptio
n
Expr
essi
on
dire
ctio
n si
gnifi
cant
LC
:HC
LC
:HC
_M
in
LC:H
C_
Max
C
onse
nsus
TA
XD
B11
Q
6TP3
7 H
eat s
hock
pro
tein
90
(Fra
gmen
t)
0.91
7 0.
808
1.09
9 TA
XD
B11
TA
XD
B20
Q
5DK
79
Hea
t sho
ck p
rote
in 9
0 (F
ragm
ent)
0.
923
0.86
7 1.
041
TAX
DB
20
TAX
DB
77
D7F
XG
1 A
TP s
ynth
ase
subu
nit b
eta
(EC
3.6
.3.1
4)
HC
0.
924
0.87
6 0.
978
TAX
DB
77
TAX
DB
29
P816
43
Glu
tam
ine
synt
heta
se 2
isoz
yme
(Chl
orop
last
G
S2)
0.
937
0.82
9 1.
048
NA
TA
XD
B64
Q
5DK
81
Hea
t sho
ck p
rote
in 9
0 (F
ragm
ent)
0.
938
0.84
3 1.
065
TAX
DB
64
TAX
DB
33
D0N
GK
0 H
eat s
hock
pro
tein
70
0.
939
0.88
1 1.
045
TAX
DB
33
TAX
DB
76
G4Y
W40
Put
ativ
e un
char
acte
rized
pro
tein
0.93
9 0.
881
1.04
5 TA
XD
B76
TA
XD
B10
Q
4G34
2 El
onga
tion
fact
or T
u, c
hlor
opla
stic
0.94
2 0.
803
1.15
7 N
A
TAX
NA
F0
XY
Y5
Puta
tive
unch
arac
teriz
ed p
rote
in
0.
944
0.81
2 1.
093
NA
TA
XD
B27
Q
5UH
I6
EF-1
alp
ha-li
ke p
rote
in
0.
952
0.84
1 1.
070
TAX
DB
27
TAX
DB
80
Q5E
NS8
Fe
rred
oxin
--N
AD
P re
duct
ase
0.95
5 0.
869
1.10
4 TA
XD
B80
TA
XD
B79
Q
5CTI
3 Pu
tativ
e bi
otin
-(A
cety
l-CoA
car
boxy
lase
) lig
ase
0.
957
0.57
5 1.
456
TAX
DB
79
TAX
DB
87
Q4G
374
Rib
osom
al p
rote
in S
6
0.96
9 0.
840
1.07
0 TA
XD
B87
TA
XD
B58
Q
4G38
8 M
g-pr
otop
oryp
hyrin
IX c
hela
tase
0.97
3 0.
918
1.04
1 TA
XD
B58
TA
XD
B37
Q
4G3D
5 60
kD
a ch
aper
onin
, chl
orop
last
ic
0.
975
0.84
9 1.
075
NA
TA
XN
A
A8H
X38
Eu
kary
otic
tran
slat
ion
elon
gatio
n fa
ctor
1 a
lpha
1
0.97
7 0.
818
1.12
1 N
A
TAX
DB
82
A8I
FL6
Flag
ella
r ass
ocia
ted
prot
ein
0.
977
0.76
1 1.
188
TAX
DB
82
TAX
DB
38
Q4G
3D7
Cyt
ochr
ome
f
0.99
3 0.
833
1.15
3 N
A
TAX
DB
39
F0X
X48
Pu
tativ
e un
char
acte
rized
pro
tein
0.99
4 0.
917
1.09
6 TA
XD
B39
TA
XD
B04
C
1NA
A3
Pred
icte
d pr
otei
n
0.99
8 0.
862
1.13
3 TA
XD
B04
TA
XD
B59
B
4ZFX
6 G
luta
mat
e se
mia
ldeh
yde
synt
hase
0.99
9 0.
880
1.11
9 TA
XD
B59
TA
XD
B07
Q
4G3D
0 C
lp p
rote
ase
ATP
bin
ding
sub
unit
1.
001
0.87
6 1.
126
TAX
DB
07
TAX
DB
74
Q4G
366
Cha
pero
ne p
rote
in d
naK
(HSP
70)
1.
005
0.90
1 1.
135
NA
TA
XN
A
P307
22
Cha
pero
ne p
rote
in d
naK
(HSP
70)
1.
007
0.89
0 1.
148
NA
TA
XD
B55
Q
5EN
U6
ATP
syn
thas
e su
buni
t gam
ma
1.01
2 0.
850
1.25
3 TA
XD
B55
TA
XD
B32
C
1E1B
9 U
ncha
ract
eriz
ed p
rote
in
1.
013
0.89
4 1.
247
TAX
DB
32
TAX
DB
43
F0Y
RE3
40
S rib
osom
al p
rote
in S
14
1.
015
0.88
5 1.
181
TAX
DB
43

243 A
ppen
dix
B
Tabl
e 1
DB
ID
Uni
Prot
D
escr
iptio
n
Expr
essi
on
dire
ctio
n si
gnifi
cant
LC
:HC
LC
:HC
_M
in
LC:H
C_
Max
C
onse
nsus
TA
XD
B51
Q
9SW
P8
Type
4 a
ctin
1.01
7 0.
918
1.18
9 TA
XD
B51
TA
XD
B06
A
6XD
C6
Act
in
1.
037
0.91
4 1.
176
TAX
DB
06
TAX
NA
F0
Y16
9 Pu
tativ
e un
char
acte
rized
pro
tein
1.04
9 0.
814
1.42
9 N
A
TAX
DB
83
Q2I
A80
C
hlor
opla
st O
-ace
tyl-s
erin
e ly
ase
1.
086
0.80
6 1.
577
TAX
DB
83
TAX
DB
46
Q4G
354
30S
ribos
omal
pro
tein
S8,
chl
orop
last
ic
1.
097
0.72
7 1.
570
NA
TA
XD
B52
B
4ZFS
2 A
ctin
(Fra
gmen
t)
1.10
1 0.
984
1.20
5 TA
XD
B52
TA
XD
B34
D
8UM
U9
Puta
tive
unch
arac
teriz
ed p
rote
in
1.
105
0.99
5 1.
252
TAX
DB
34
TAX
NA
A
6YG
C8
50S
ribos
omal
pro
tein
L14
, chl
orop
last
ic
1.
105
0.99
5 1.
252
NA
TA
XD
B02
C
1FFK
0 Pe
ptid
yl-p
roly
l cis
-tran
s iso
mer
ase
( LC
1.
107
1.01
0 1.
215
TAX
DB
02
TAX
DB
54
Q4G
343
30S
ribos
omal
pro
tein
S7,
chl
orop
last
ic
1.
135
0.97
4 1.
339
NA
TA
XD
B26
Q
4G37
9 C
bbX
(Put
ativ
e ru
bisc
o ex
pres
sion
pro
tein
)
1.14
7 0.
878
1.75
7 TA
XD
B26
TA
XD
B65
F0
Y8U
4 Pu
tativ
e un
char
acte
rized
pro
tein
(Fra
gmen
t) LC
1.
213
1.05
2 1.
397
TAX
DB
65
TAX
DB
19
A4S
1C9
His
tone
H2B
LC
1.
333
1.07
6 1.
631
TAX
DB
19
TAX
DB
71
D0M
WJ7
His
tone
H2A
LC
1.
362
1.18
1 1.
524
TAX
DB
71
TAX
DB
28
C1E
6T8
His
tone
H4
LC
1.37
3 1.
280
1.58
0 TA
XD
B28
TA
XD
B53
Q
5G91
7 A
lpha
-tubu
lin (F
ragm
ent)
LC
1.50
4 1.
242
1.70
9 TA
XD
B53
TA
XD
B72
F0
XW
25
Tubu
lin a
lpha
-2 c
hain
LC
2.
388
1.48
4 3.
448
TAX
DB
72

APPENDIX B– SUPPLEMENTARY RESULTS – CHAPTER 4 – THE PROTEOME OF EMILIANIA HUXLEYI AT HIGH AND LOW CALCIFCATION
RATES OF THE G1-PHASE
244
Appendix B Table - 2: Gene ontology annotations of all proteins identified in E. huxleyi showing highly calcifying cells of the late G1-phase.
Appendix B Table -2 Gene Ontology – biological process [GO IDs] (non significantly higher expressed)
Number of Peptides
Translation [GO:0006412] 29 Photosynthesis; light harvesting [GO:0009765]; protein-chromophore linkage [GO:0018298] 7 Protein folding [GO:0006457] 6 ATP hydrolysis coupled proton transport [GO:0015991]; ATP synthesis coupled proton transport [GO:0015986] 6 Protein folding [GO:0006457]; response to stress [GO:0006950] 6 Glycolytic process [GO:0006096] 4 one-carbon metabolic process [GO:0006730]; S-adenosylmethionine biosynthetic process [GO:0006556] 4 ATP synthesis coupled proton transport [GO:0015986] 4 Protein refolding [GO:0042026] 3 Ubiquitin-dependent protein catabolic process [GO:0006511] 2 L-serine biosynthetic process [GO:0006564] 2 Pyridoxal phosphate biosynthetic process [GO:0042823]; vitamin B6 biosynthetic process [GO:0042819] 2 tRNA aminoacylation for protein translation [GO:0006418] 2 Leucine biosynthetic process [GO:0009098] 2 Photosynthesis [GO:0015979]; photosystem II stabilization [GO:0042549] 2 Tetrapyrrole biosynthetic process [GO:0033014] 2 Regulation of transcription; DNA-templated [GO:0006355] 2 Cell redox homeostasis [GO:0045454]; protein folding [GO:0006457] 2 Fatty acid metabolic process [GO:0006631] 2 Photosynthetic electron transport in photosystem II [GO:0009772]; protein-chromophore linkage [GO:0018298] 2 ATP synthesis coupled proton transport [GO:0015986]; methylglyoxal catabolic process to D-lactate [GO:0019243]; photorespiration [GO:0009853]; proteasome core complex assembly [GO:0080129]; response to misfolded protein [GO:0051788]; response to misfolded protein [GO:0051788]; ubiquitin-dependent protein catabolic process [GO:0006511]; 1 Cortical microtubule organization [GO:0043622]; gluconeogenesis [GO:0006094]; glycolytic process [GO:0006096]; protein folding [GO:0006457]; response to cadmium ion [GO:0046686]; response to cadmium ion [GO:0046686]; response to salt stress [GO:0009651]; 1 Intracellular protein transport [GO:0006886]; vesicle-mediated transport [GO:0016192] 1 Glycyl-tRNA aminoacylation [GO:0006426] 1 Response to oxidative stress [GO:0006979] 1 One-carbon metabolic process [GO:0006730] 1 Glucose metabolic process [GO:0006006] 1 Arginine biosynthetic process [GO:0006526]; nucleotide biosynthetic process [GO:0009165] 1 ATP hydrolysis coupled proton transport [GO:0015991] 1 Phospholipid metabolic process [GO:0006644] 1 Branched-chain amino acid metabolic process [GO:0009081] 1

APPENDIX B– SUPPLEMENTARY RESULTS – CHAPTER 4 – THE PROTEOME OF EMILIANIA HUXLEYI AT HIGH AND LOW CALCIFCATION
RATES OF THE G1-PHASE
245
Appendix B Table -2 Gene Ontology – biological process [GO IDs] (non significantly higher expressed)
Number of Peptides
GMP biosynthetic process [GO:0006177] 1 Cytoskeleton organization [GO:0007010] 1 Acetyl-CoA biosynthetic process from pyruvate [GO:0006086] 1 Folic acid-containing compound biosynthetic process [GO:0009396] 1 rRNA processing [GO:0006364] 1 Tricarboxylic acid cycle [GO:0006099] 1 Formation of translation preinitiation complex [GO:0001731]; regulation of translational initiation [GO:0006446] 1 Porphyrin-containing compound biosynthetic process [GO:0006779] 1 Intracellular protein transport [GO:0006886]; nucleocytoplasmic transport [GO:0006913] 1 Proteolysis [GO:0006508] 1 Fatty acid biosynthetic process [GO:0006633] 1 carbohydrate metabolic process [GO:0005975]; malate metabolic process [GO:0006108] 1 (1->3)-beta-D-glucan biosynthetic process [GO:0006075] 1 Regulation of protein catabolic process [GO:0042176] 1 Protein ubiquitination [GO:0016567]; ubiquitin-dependent protein catabolic process [GO:0006511] 1 Cell division [GO:0051301] 1 Small GTPase mediated signal transduction [GO:0007264] 1 Pteridine-containing compound metabolic process [GO:0042558] 1 'de novo' pyrimidine nucleobase biosynthetic process [GO:0006207] 1 Chlorophyll biosynthetic process [GO:0015995] 1 Protoporphyrinogen IX biosynthetic process [GO:0006782] 1 Nitrogen compound metabolic process [GO:0006807] 1 Transmembrane transport [GO:0055085] 1 Ribosome biogenesis [GO:0042254] 1 Translational elongation [GO:0006414] 1 Protein catabolic process [GO:0030163] 1 Cell redox homeostasis [GO:0045454] 1 Actin filament depolymerization [GO:0030042] 1 Threonyl-tRNA aminoacylation [GO:0006435] 1 Proteolysis involved in cellular protein catabolic process [GO:0051603] 1 Intracellular transport [GO:0046907] 1 Protein retention in ER lumen [GO:0006621]; protein transport [GO:0015031] 1 Transcription; DNA-templated [GO:0006351] 1 Cytochrome c-heme linkage [GO:0018063]; photosynthesis, light reaction [GO:0019684] 1 Nitrogen fixation [GO:0009399] 1 Cellular protein modification process [GO:0006464] 1 Chlorophyll biosynthetic process [GO:0015995]; photosynthesis [GO:0015979] 1 Oxidation-reduction process [GO:0055114]; photosynthesis [GO:0015979] 1

APPENDIX B– SUPPLEMENTARY RESULTS – CHAPTER 4 – THE PROTEOME OF EMILIANIA HUXLEYI AT HIGH AND LOW CALCIFCATION
RATES OF THE G1-PHASE
246
Appendix B Table - 3: Gene ontology annotations of all proteins identified in E. huxleyi showing low calcification rates in the early G1-phase
Appendix B Table 3 Gene Ontology – cellular component [GO IDs] (non significantly higher expressed)
Number of Peptides
Ribosome [GO:0005840] 21 Cytoplasm [GO:0005737] 14 Chloroplast [GO:0009507] 11 Chloroplast [GO:0009507]; integral component of membrane [GO:0016021]; photosystem II [GO:0009523] 7 Intracellular [GO:0005622] 5 Large ribosomal subunit [GO:0015934] 5 Proton-transporting ATP synthase complex, catalytic core F(1) [GO:0045261] 4 Chloroplast thylakoid membrane [GO:0009535]; proton-transporting ATP synthase complex, catalytic core F(1) [GO:0045261] 3 Cytosol [GO:0005829] 3 Chloroplast [GO:0009507]; ribosome [GO:0005840] 2 Chloroplast thylakoid membrane [GO:0009535]; integral component of membrane [GO:0016021]; proton-transporting ATP synthase complex, coupling factor F(o) [GO:0045263] 2 Endoplasmic reticulum [GO:0005783]; endoplasmic reticulum lumen [GO:0005788] 2 Nucleosome [GO:0000786]; nucleus [GO:0005634] 2 Nucleus [GO:0005634] 2 Small ribosomal subunit [GO:0015935] 2 1,3-beta-D-glucan synthase complex [GO:0000148] 1 3-isopropylmalate dehydratase complex [GO:0009316] 1 Actin cytoskeleton [GO:0015629] 1 Cell [GO:0005623] 1 Cell wall [GO:0005618]; chloroplast [GO:0009507]; mitochondrial proton-transporting ATP synthase complex [GO:0005753]; nucleolus [GO:0005730]; proton-transporting ATP synthase complex, catalytic core F(1) [GO:0045261] 1 Chloroplast [GO:0009507]; integral component of membrane [GO:0016021]; photosystem II [GO:0009523]; thylakoid membrane [GO:0042651] 1 Chloroplast [GO:0009507]; large ribosomal subunit [GO:0015934] 1 Chloroplast [GO:0009507]; mitochondrion [GO:0005739] 1 Chloroplast [GO:0009507]; small ribosomal subunit [GO:0015935] 1 Chloroplast envelope [GO:0009941]; mitochondrion [GO:0005739] 1 Chloroplast stroma [GO:0009570] 1 Chloroplast thylakoid membrane [GO:0009535]; integral component of membrane [GO:0016021]; photosystem II [GO:0009523] 1 Chloroplast thylakoid membrane [GO:0009535]; integral component of thylakoid membrane [GO:0031361] 1 Chloroplast thylakoid membrane [GO:0009535]; photosystem II [GO:0009523] 1 Clathrin coat of coated pit [GO:0030132]; clathrin coat of trans-Golgi network vesicle [GO:0030130] 1 Cullin-RING ubiquitin ligase complex [GO:0031461] 1

APPENDIX B– SUPPLEMENTARY RESULTS – CHAPTER 4 – THE PROTEOME OF EMILIANIA HUXLEYI AT HIGH AND LOW CALCIFCATION
RATES OF THE G1-PHASE
247
Appendix B Table 3 Gene Ontology – cellular component [GO IDs] (non significantly higher expressed)
Number of Peptides
Cytoplasm [GO:0005737]; nucleus [GO:0005634]; proteasome core complex [GO:0005839] 1 Cytoplasm [GO:0005737]; nucleus [GO:0005634]; proteasome core complex, alpha-subunit complex [GO:0019773] 1 Cytosol [GO:0005829]; prefoldin complex [GO:0016272] 1 Endoplasmic reticulum membrane [GO:0005789]; integral component of membrane [GO:0016021] 1 Eukaryotic 43S preinitiation complex [GO:0016282]; eukaryotic 48S preinitiation complex [GO:0033290]; eukaryotic translation initiation factor 3 complex [GO:0005852] 1 Extrinsic component of membrane [GO:0019898]; integral component of membrane [GO:0016021]; photosystem II oxygen evolving complex [GO:0009654] 1 Extrinsic component of membrane [GO:0019898]; photosystem II oxygen evolving complex [GO:0009654] 1 Integral component of membrane [GO:0016021] 1 Integral component of membrane [GO:0016021]; mitochondrial inner membrane [GO:0005743] 1 Membrane [GO:0016020] 1 Mitochondrion [GO:0005739]; proton-transporting ATP synthase complex, catalytic core F(1) [GO:0045261] 1 Motile cilium [GO:0031514] 1 Phosphopyruvate hydratase complex [GO:0000015] 1 Proteasome complex [GO:0000502] 1 Proton-transporting two-sector ATPase complex, catalytic domain [GO:0033178] 1

APPENDIX B– SUPPLEMENTARY RESULTS – CHAPTER 4 – THE PROTEOME OF EMILIANIA HUXLEYI AT HIGH AND LOW CALCIFCATION
RATES OF THE G1-PHASE
248
Appendix B Table - 4: Peptides matching the most recent E. huxleyi genome (Read et al., 2013)
Appendix B Table 4 E. hux JGI gene ID E Value Score Hit Sim. in % 100546 0 1667 100 102999 2.00E-129 365 100 105039 0 598 100 106019 4.00E-124 350 100 107385 4.00E-134 377 100 107385 4.00E-134 377 100 107385 5.00E-108 310 87 108180 0 572 100 109848 0 2969 100 109848 0 2969 100 113427 0 2357 100 114964 4.00E-80 234 100 116827 0 607 66 118474 0 4175 100 124604 4.00E-97 279 100 196702 4.00E-139 391 99 198024 0 2243 100 198360 0 764 100 199538 0 925 100 200700 0 535 100 200700 0 535 100 206438 0 713 100 216021 0 841 100 216021 0 835 100 220968 7.00E-69 205 100 227764 3.00E-152 425 100 237243 4.00E-95 274 100 243741 3.00E-163 454 100 245546 1.00E-108 310 100 246130 3.00E-69 206 100 246253 0 869 82 251065 2.00E-71 211 100 251065 2.00E-71 211 100 257439 2.00E-91 265 100 258285 3.00E-108 308 100 312577 0 1599 100 312577 0 1599 100 317426 0 2635 100 317426 0 2635 100 317426 0 2629 100 317615 5.00E-153 427 100 317615 7.00E-153 427 100 317615 1.00E-148 416 100 318009 0 701 100 318009 0 701 100 349981 0 558 100

APPENDIX B– SUPPLEMENTARY RESULTS – CHAPTER 4 – THE PROTEOME OF EMILIANIA HUXLEYI AT HIGH AND LOW CALCIFCATION
RATES OF THE G1-PHASE
249
Appendix B Table 4 E. hux JGI gene ID E Value Score Hit Sim. in % 351077 0 562 100 351077 0 505 91 351077 0 505 91 351730 2.00E-134 378 100 351730 2.00E-134 378 100 351730 2.00E-127 360 96 352634 0 532 100 352634 0 507 96 354741 8.00E-173 480 100 354741 8.00E-173 480 100 354741 9.00E-173 480 100 354741 9.00E-173 480 100 356661 0 941 100 356661 0 941 100 361737 0 608 75 361737 0 793 100 361737 0 793 100 362112 0 900 100 362112 0 900 100 362534 3.00E-180 504 68 362722 1.00E-63 191 100 363772 1.00E-151 424 100 363772 1.00E-151 424 100 363772 3.00E-144 405 98 364889 0 515 94 365175 0 833 100 365175 0 833 100 365175 0 833 100 365947 3.00E-108 309 100 369392 3.00E-70 209 100 369392 3.00E-70 209 100 369392 3.00E-70 209 100 369425 0 803 85 369425 0 944 100 369425 0 944 100 369425 0 944 100 372394 0 671 91 372663 0 533 100 373699 3.00E-66 197 100 374282 7.00E-82 239 100 374282 7.00E-82 239 100 374282 7.00E-82 239 100 414178 2.00E-143 402 100 414178 2.00E-143 402 100 414772 8.00E-153 427 100 414772 7.00E-150 420 100 415031 3.00E-109 312 100 415405 0 913 100 415433 4.00E-122 346 91

APPENDIX B– SUPPLEMENTARY RESULTS – CHAPTER 4 – THE PROTEOME OF EMILIANIA HUXLEYI AT HIGH AND LOW CALCIFCATION
RATES OF THE G1-PHASE
250
Appendix B Table 4 E. hux JGI gene ID E Value Score Hit Sim. in % 415729 0 516 100 415729 0 516 100 415729 0 516 100 415940 2.00E-151 423 100 415940 2.00E-151 423 100 416424 0 918 100 416424 0 918 100 416950 0 1315 100 416950 0 1315 100 416955 1.00E-95 275 100 417078 0 1602 100 417078 0 1602 100 417078 0 1602 100 417351 5.00E-106 314 36 417468 0 539 31 417537 0 525 100 417537 0 525 100 417537 0 525 100 417816 1.00E-88 257 97 418142 9.00E-100 286 100 418229 0 779 63 418599 0 548 47 418599 0 555 47 419966 2.00E-102 294 100 419966 2.00E-102 294 100 419966 4.00E-92 267 90 420527 0 1715 100 420527 0 1672 98 421023 0 2216 95 421349 0 1038 98 421356 0 1711 99 421356 0 1660 97 421960 0 1581 100 422643 0 560 100 422643 0 560 100 422643 3.00E-104 303 53 423073 0 2655 100 423073 0 2655 100 423357 4.00E-166 488 27 423968 0 771 100 423968 0 771 100 423968 4.00E-166 468 60 424731 0 739 100 424731 0 739 100 424731 6.00E-135 387 51 426056 0 525 86 426056 0 614 100 426056 0 614 100

APPENDIX B– SUPPLEMENTARY RESULTS – CHAPTER 4 – THE PROTEOME OF EMILIANIA HUXLEYI AT HIGH AND LOW CALCIFCATION
RATES OF THE G1-PHASE
251
Appendix B Table 4 E. hux JGI gene ID E Value Score Hit Sim. in % 426711 0 846 100 426711 0 846 100 427020 0 520 56 427625 0 1307 100 427625 0 719 56 427625 0 1266 98 427625 0 1132 90 428226 0 1041 54 429671 7.00E-142 397 100 429767 0 624 86 430738 2.00E-174 487 74 431703 6.00E-150 419 100 431703 6.00E-150 419 100 431703 3.00E-119 339 80 431800 8.00E-103 295 92 431974 0 583 81 431974 0 723 100 431974 0 723 100 432120 8.00E-77 226 100 432120 1.00E-76 226 100 432120 1.00E-76 226 100 432385 0 733 100 432385 0 733 100 432606 0 978 100 432636 0 521 69 432636 0 759 100 432636 0 759 100 432636 0 759 100 432765 2.00E-165 459 100 432765 3.00E-165 459 100 432765 3.00E-165 459 100 432765 3.00E-165 459 100 432823 0 748 100 432823 0 748 100 432864 0 552 69 432864 0 795 100 432864 0 795 100 432864 0 784 99 432900 5.00E-107 308 73 433142 0 1037 99 433142 0 1050 100 433142 0 1050 100 433142 0 1050 100 433309 0 744 100 433309 0 750 100 433309 0 750 100 433456 4.00E-61 187 66 433847 0 562 100 433847 0 562 100

APPENDIX B– SUPPLEMENTARY RESULTS – CHAPTER 4 – THE PROTEOME OF EMILIANIA HUXLEYI AT HIGH AND LOW CALCIFCATION
RATES OF THE G1-PHASE
252
Appendix B Table 4 E. hux JGI gene ID E Value Score Hit Sim. in % 433847 4.00E-140 396 69 433854 2.00E-132 373 100 434108 2.00E-149 418 100 434108 2.00E-149 418 100 434108 2.00E-124 353 83 434239 0 2522 100 434239 0 2522 100 434239 0 1522 90 434513 0 538 61 434648 0 517 83 434648 0 625 100 434648 0 625 100 434751 0 740 100 434751 0 719 98 435222 2.00E-175 487 100 435222 2.00E-175 487 100 435222 3.00E-161 449 91 435472 0 521 100 435472 0 521 100 435472 0 521 100 436026 0 565 39 436026 0 1337 100 436026 0 1337 100 436026 0 1337 100 436026 1.00E-10 54 3 436143 0 548 100 436409 3.00E-167 465 100 436495 0 573 72 436495 0 794 100 436495 0 794 100 436528 0 1214 100 436615 0 504 100 436903 6.00E-179 496 100 436903 6.00E-179 496 100 436903 2.00E-167 466 95 437052 0 920 100 437052 0 920 100 437052 0 879 97 437374 6.00E-141 395 100 437374 7.00E-141 395 100 437557 4.00E-137 388 88 437959 0 786 57 437959 0 1395 100 437959 0 1395 100 437959 0 1395 100 438040 0 928 100 438040 0 928 100 438194 0 1037 100

APPENDIX B– SUPPLEMENTARY RESULTS – CHAPTER 4 – THE PROTEOME OF EMILIANIA HUXLEYI AT HIGH AND LOW CALCIFCATION
RATES OF THE G1-PHASE
253
Appendix B Table 4 E. hux JGI gene ID E Value Score Hit Sim. in % 438194 0 1037 100 438194 0 858 88 438265 0 541 100 438462 0 541 100 438462 0 541 100 438462 0 541 100 438462 1.00E-179 498 94 439359 0 600 38 439359 0 1582 100 439359 0 1582 100 439359 0 1573 100 439359 8.00E-163 474 30 439486 5.00E-102 292 100 439486 5.00E-102 292 100 439486 5.00E-102 292 100 439486 5.00E-88 256 86 439538 0 1209 100 439538 2.00E-121 359 29 439544 0 1544 100 439544 2.00E-180 522 34 439617 0 816 100 439617 0 816 100 439617 0 701 88 439617 8.00E-174 489 60 439725 2.00E-174 483 100 439725 2.00E-174 483 100 439906 0 1098 82 439906 0 631 45 440119 0 729 74 440119 0 986 100 440119 0 986 100 440242 0 1400 100 440242 0 1400 100 440362 0 536 96 440362 0 560 100 440362 0 560 100 440362 0 560 100 440893 1.00E-89 281 17 440922 0 612 100 440922 0 612 100 440922 1.00E-111 323 52 441453 4.00E-145 406 100 441818 3.00E-122 350 83 441919 0 717 100 441919 0 717 100 441919 0 675 93 441942 0 756 100 442074 0 986 100 442074 0 986 100

APPENDIX B– SUPPLEMENTARY RESULTS – CHAPTER 4 – THE PROTEOME OF EMILIANIA HUXLEYI AT HIGH AND LOW CALCIFCATION
RATES OF THE G1-PHASE
254
Appendix B Table 4 E. hux JGI gene ID E Value Score Hit Sim. in % 442074 0 986 100 442074 2.00E-168 478 48 442092 0 1285 100 442092 0 1285 100 442209 0 1371 100 442209 0 1371 100 442340 0 1291 100 442340 0 1291 100 442340 4.00E-169 486 37 442429 9.00E-157 437 100 442429 1.00E-151 424 98 442429 2.00E-151 424 98 442547 0 514 54 442547 0 953 100 442547 0 953 100 442547 0 946 100 442739 2.00E-168 475 57 443305 0 529 100 443320 0 890 100 443778 0 1395 100 443778 0 1395 100 443778 0 1400 100 443778 1.00E-176 507 37 443828 2.00E-109 312 100 443828 2.00E-109 312 100 443828 2.00E-109 312 100 443878 3.00E-160 446 100 443878 3.00E-160 446 100 443878 3.00E-160 446 100 443878 3.00E-160 446 100 444144 5.00E-99 301 23 444382 0 976 100 444382 0 976 100 444382 2.00E-174 493 50 444779 8.00E-154 429 100 444876 2.00E-174 484 100 444895 0 954 100 444895 0 954 100 444895 0 928 99 444895 3.00E-138 399 42 444955 1.00E-173 482 100 444955 1.00E-171 477 99 445002 4.00E-101 294 68 445073 6.00E-85 247 98 445255 5.00E-83 243 88 445439 0 891 62 445439 0 891 62 445566 6.00E-129 363 97

APPENDIX B– SUPPLEMENTARY RESULTS – CHAPTER 4 – THE PROTEOME OF EMILIANIA HUXLEYI AT HIGH AND LOW CALCIFCATION
RATES OF THE G1-PHASE
255
Appendix B Table 4 E. hux JGI gene ID E Value Score Hit Sim. in % 445703 0 1545 100 445703 0 1545 100 445703 0 1404 93 445703 1.00E-167 487 32 446067 8.00E-175 484 99 446067 9.00E-167 464 98 446099 6.00E-175 485 100 446206 0 522 100 446206 4.00E-178 495 97 446237 1.00E-131 371 94 446255 0 511 61 446310 1.00E-154 431 100 446406 1.00E-166 464 100 446406 2.00E-111 321 68 446942 0 586 63 447219 6.00E-160 445 100 447219 7.00E-160 445 100 447219 7.00E-160 445 100 447219 3.00E-159 443 100 447372 2.00E-136 394 64 447695 0 566 60 448062 0 807 100 448062 0 807 100 448062 0 719 89 448193 0 1662 100 448193 0 1662 100 448193 3.00E-162 474 29 448569 0 688 100 448569 9.00E-157 442 65 448960 0 707 100 448960 0 707 100 448960 0 707 100 449047 2.00E-174 483 100 449047 2.00E-174 483 100 449865 0 1793 100 450336 0 1043 100 450336 0 1043 100 450594 2.00E-180 520 35 450615 0 1987 100 450615 0 1987 100 450615 0 1972 100 452198 0 569 74 452198 0 761 100 452198 0 761 100 452198 0 761 100 452284 1.00E-166 475 47 453068 6.00E-143 402 90 453373 0 672 100 453373 0 672 100

APPENDIX B– SUPPLEMENTARY RESULTS – CHAPTER 4 – THE PROTEOME OF EMILIANIA HUXLEYI AT HIGH AND LOW CALCIFCATION
RATES OF THE G1-PHASE
256
Appendix B Table 4 E. hux JGI gene ID E Value Score Hit Sim. in % 454897 0 1457 100 454897 0 1457 100 455078 0 1662 100 455078 0 1662 100 455280 0 3069 100 455280 5.00E-176 529 17 455300 1.00E-178 496 100 455406 0 803 100 455406 0 803 100 456187 3.00E-125 353 100 456239 0 1311 100 456254 0 602 98 457572 1.00E-125 355 100 457856 8.00E-170 472 100 458081 5.00E-108 310 95 458081 1.00E-81 241 72 458122 0 798 100 458122 0 750 95 459601 5.00E-159 443 100 459601 6.00E-159 443 100 459601 6.00E-159 443 100 459601 9.00E-144 404 94 459734 0 837 100 459734 0 837 100 459736 0 546 29 459736 0 1874 100 459736 0 1874 100 459873 0 966 100 460004 1.00E-129 367 74 460492 0 885 100 460492 0 885 100 461181 0 829 100 461699 0 657 97 461699 0 678 100 461699 0 678 100 462385 0 507 74 462385 0 681 99 462385 0 681 99 462385 0 689 100 462433 4.00E-134 377 100 462452 0 2905 100 462452 0 2905 100 462452 0 2905 100 462457 0 973 100 462457 0 975 100 462457 0 975 100 462645 0 593 100 462645 0 593 100

APPENDIX B– SUPPLEMENTARY RESULTS – CHAPTER 4 – THE PROTEOME OF EMILIANIA HUXLEYI AT HIGH AND LOW CALCIFCATION
RATES OF THE G1-PHASE
257
Appendix B Table 4 E. hux JGI gene ID E Value Score Hit Sim. in % 463036 0 666 92 463429 0 935 90 463837 0 2722 90 463837 0 3181 100 464103 0 778 99 464103 0 783 100 464103 0 783 100 464103 0 702 92 464599 0 1691 100 464599 0 1691 100 464599 0 1619 96 464740 0 4036 100 464740 0 4036 100 464972 0 514 89 464972 0 588 100 464972 0 588 100 465288 0 727 100 465288 0 727 100 465364 0 1316 100 465364 0 1279 99 465373 0 927 100 465373 5.00E-177 499 55 465509 0 1215 100 465509 0 1215 100 465509 0 1174 97 465547 0 628 100 465547 0 628 100 465547 1.00E-131 375 64 465676 0 1167 100 465926 8.00E-139 407 75 465926 3.00E-94 283 29 466230 0 783 87 466469 0 2164 58 466469 0 3430 93 466778 0 591 89 466893 0 1835 100 466893 0 1818 100 466893 2.00E-163 482 27 468608 6.00E-143 401 100 468608 6.00E-143 401 100 468689 0 671 96 470712 0 541 100 470712 0 541 100 470997 0 1500 100 49364 6.00E-52 159 100 54552 0 608 100 61467 6.00E-172 478 100 61745 8.00E-137 384 100 61745 8.00E-137 384 100

APPENDIX B– SUPPLEMENTARY RESULTS – CHAPTER 4 – THE PROTEOME OF EMILIANIA HUXLEYI AT HIGH AND LOW CALCIFCATION
RATES OF THE G1-PHASE
258
Appendix B Table 4 E. hux JGI gene ID E Value Score Hit Sim. in % 63832 0 830 100 64238 0 513 100 66170 1.00E-82 241 100 68547 0 835 93 68856 0 1446 100 68856 0 1446 100 68856 0 1446 100 69198 0 891 100 69198 0 891 100 69198 0 891 100 69773 5.00E-104 298 100 69773 5.00E-104 298 100 69773 5.00E-104 298 100 74095 0 501 100 74095 0 501 100 74335 4.00E-93 268 100 77411 0 658 100 77411 0 658 100 77411 0 658 100 77826 1.00E-152 426 96 78752 2.00E-175 487 100 78752 2.00E-175 487 100 78806 6.00E-58 176 100 79310 9.00E-131 368 100

259
References
Alabadı ́, D.; Oyama, T.; Yanovsky, M. J.; Harmon, F. G.; Más, P.; Kay, S. A. (2001) Reciprocal Regulation Between TOC1 and LHY/CCA1 Within the Arabidopsis Circadian Clock. Science, 293 (5531), 880–883.
Addadi, L.; Raz, S.; Weiner, S. (2003) Taking Advantage of Disorder: Amorphous Calcium Carbonate and Its Roles in Biomineralization. Adv. Mater., 15 (12), 959–970.
Alcolombri, U.; Ben-Dor, S.; Feldmesser, E.; Levin, Y.; Tawfik, D. S.; Vardi, A. (2015) Identification of the algal dimethyl sulfide-releasing enzyme: A missing link in the marine sulfur cycle. Science, 348 (6242), 1466–1469.
Alwine, J. C.; Kemp, D. J.; Stark, G. R. (1977) Method for detection of specific RNAs in agarose gels by transfer to diazobenzyloxymethyl-paper and hybridization with DNA probes. Proc. Natl. Acad. Sci. U.S.A., 74 (12), 5350–5354.
Anders, S.; Huber, W. (2010) Differential expression analysis for sequence count data. Genome Biol., 11 (10)
Anderson, L.; Seilhamer, J. (1997) A comparison of selected mRNA and protein abundances in human liver. Electrophoresis, 18 (3-4), 533–537.
Anderson, N. L.; Anderson, N. G. (1998) Proteome and proteomics: New technologies, new concepts, and new words. Electrophoresis, 19 (11), 1853–1861.
Andrulis, E. D.; Guzman, E.; Doering, P.; Werner, J.; Lis, J. T. (2000) High-resolution localization of Drosophila Spt5 and Spt6 at heat shock genes in vivo: roles in promoter proximal pausing and transcription elongation. Genes & Development, 14 (20), 2635–2649.
Anning, T.; Nimer, N.; Merrett, M. J.; Brownlee, C. (1996) Costs and benefits of calcification in coccolithophorids. Journal of Marine Systems, 9 (1-2), 45–56.
Arai, H.; Pink, S.; Forgac, M. (1989) Interaction of anions and ATP with the coated vesicle proton pump. Biochemistry, 28 (7), 3075–3082.
Araki, Y.; Gonzalez, E. L. (1998) V- and P-type Ca2+-stimulated ATPases in a calcifying strain of Pleurochrysis sp. (Haptophyceae). J Phycol, 34 (1), 79–88.
Archer, D.; Winguth, A.; Lea, D.; Mahowald, N. (2000) What caused the glacial/interglacial atmospheric pCO2 cycles? Rev. Geophys., 38 (2), 159–189.
Arias, J. L.; Fernández, M. S. (2008) Polysaccharides and Proteoglycans in Calcium Carbonate-based Biomineralization. Chem. Rev., 108 (11), 4475–4482.
Armstrong, R. A.; Lee, C.; Hedges, J. I.; Honjo, S.; Wakeham, S. G. (2001) A new, mechanistic model for organic carbon fluxes in the ocean based on the quantitative association of POC with ballast minerals. Deep-Sea Res. Part II-Top. Stud. Oceanogr., 49(1), 219–236.

260
Arnaudeau, S. (2002) Calreticulin Differentially Modulates Calcium Uptake and Release in the Endoplasmic Reticulum and Mitochondria. J Biol Chem, 277 (48), 46696–46705.
Ateweberhan, M.; Feary, D. A.; Keshavmurthy, S.; Chen, A.; Schleyer, M. H.; Sheppard, C. R. C. (2013) Climate change impacts on coral reefs: Synergies with local effects, possibilities for acclimation, and management implications. Palaeogeography, Palaeoclimatology, Palaeoecology.
Bach, L. T.; Mackinder, L. C. M.; Schulz, K. G.; Wheeler, G.; Schroeder, D. C.; Brownlee, C.; Riebesell, U. (2013) Dissecting the impact of CO2 and pH on the mechanisms of photosynthesis and calcification in the coccolithophore Emiliania huxleyi. J Phycol, 199 (1), 121–134.
Badger, M. R.; Price, G. D. (1994) The Role of Carbonic Anhydrase in Photosynthesis. Annu. Rev. Ecol. Evol. Syst., 45 (1), 369–392.
Baker, K. E.; Condon, C. (2004) Under the Tucson sun: a meeting in the desert on mRNA decay. RNA, Vol. 10, 1680–1691.
Balch, W. M.; Drapeau, D. T.; Fritz, J. J. (2000) Monsoonal forcing of calcification in the Arabian Sea. Deep-Sea Res. Part II-Top. Stud. Oceanogr., 47 (7-8), 1301–1337.
Balch, W. M.; Holligan, P. M.; Kilpatrick, K. A. (1992a) Calcification, photosynthesis and growth of the bloom-forming coccolithophore, Emiliania huxleyi. Continental Shelf Research, 12 (12), 1353–1374.
Balch, W. M.; Holligan, P. M.; Kilpatrick, K. A. (1992b) Calcification, photosynthesis and growth of the bloom-forming coccolithophore, Emiliania huxleyi. Continental Shelf Research, 12 (12), 1353–1374
Baumann, K. H.; Böckel, B.; Frenz, M. (2004) Coccolith contribution to South Atlantic carbonate sedimentation. In: Coccolithophores: from molecular processes to global impact (H. R. Thierstein & J. Young, eds.); Berlin: Springer.
Beardall, J.; Young, E.; Roberts, S. (2001) Approaches for determining phytoplankton nutrient limitation. Aquat. sci., 63 (1), 44–69.
Bellantuono, A. J.; Granados-Cifuentes, C.; Miller, D. J.; Hoegh-Guldberg, O.; Rodriguez-Lanetty, M. (2012) Coral thermal tolerance: tuning gene expression to resist thermal stress. PLoS ONE, 7 (11).
Bengal, E.; Flores, O.; Krauskopf, A.; Reinberg, D.; Aloni, Y. (1991) Role of the mammalian transcription factors IIF, IIS, and IIX during elongation by RNA polymerase II. Mol. Cell. Biol., 11 (3), 1195–1206.
Beniash, E.; Aizenberg, J.; Addadi, L.; Weiner, S. (1997) Amorphous calcium carbonate transforms into calcite during sea urchin larval spicule growth. Proceedings of the Royal Society of London. Series B: Biological Sciences, 264 (1380), 461–465.
261
Benjamini, Y.; Hochberg, Y. (1995) Controlling the False Discovery Rate - a Practical and Powerful Approach to Multiple Testing. Journal of the Royal Statistical Society Series B-Methodological, 57 (1), 289–300.
Bentov, S.; Weil, S.; Glazer, L.; Sagi, A.; Berman, A. (2010) Stabilization of amorphous calcium carbonate by phosphate rich organic matrix proteins and by single phosphoamino acids. Journal of Structural Biology, 171 (2), 207–215.
Berridge, M. J. (2002) The endoplasmic reticulum: a multifunctional signaling organelle. Cell Calcium, 32 (5), 235–249.
Beyenbach, K. W.; Wieczorek, H. (2006) The V-type H+ ATPase: molecular structure and function, physiological roles and regulation. J. Exp. Biol., 209 (Pt 4), 577–589.
Bhattacharya, D.; Medlin, L. (1995) Phylogeny of plastids A review based on comparisons of small subunit ribosomal RNA coding regions. J Phycol.
Birol, I.; Jackman, S. D.; Nielsen, C. B.; Qian, J. Q.; Varhol, R.; Stazyk, G.; Morin, R. D.; et al. (2009) De novo transcriptome assembly with ABySS. Bioinformatics, 25 (21), 2872–2877.
Bisova, K.; Krylov, D. M.; Umen, J. G. (2005) Genome-wide annotation and expression profiling of cell cycle regulatory genes in Chlamydomonas reinhardtii. Plant Physiol., 137 (2), 475–491.
Blackstock, W. P.; Weir, M. P. (1999) Proteomics: quantitative and physical mapping of cellular proteins. Trends in Biotechnology, 17 (3), 121–127.
Bonaldo, M. F.; Lennon, G.; Soares, M. B. (1996) Normalization and subtraction: two approaches to facilitate gene discovery. Genome Res., 6 (9), 791–806.
Borman, A. H.; Jong, E. W.; Huinzinga, M.; Kok, D.; Westbroek, P.; BOSCH, L. (1982) The role in CaCO3 crystallization of an acid Ca2+-Binding polysaccharide associated with coccoliths of Emiliania huxleyi. Eur J Biochem, 129 (1), 179–183.
Bown, P. R.; Lees, J. A.; Young, J. R. (2004) Calcareous nannoplankton evolution and diversity through time. Coccolithophores-from molecular processes to global impact.-Berlin (Springer), 481–508.
Brenner, S.; Johnson, M.; Bridgham, J.; Golda, G.; Lloyd, D. H.; Johnson, D.; Luo, S.; et al. (2000) Gene expression analysis by massively parallel signature sequencing (MPSS) on microbead arrays. Nat. Biotechnol., 18 (6), 630–634.
Bricker, T. M.; Roose, J. L.; Fagerlund, R. D.; Frankel, L. K.; Eaton-Rye, J. J. (2012) Biochimica et Biophysica Acta. BBA - Bioenergetics, 1817 (1), 121–142.
Briegel, C.; Seto, J. (2012) Single Amino Acids as Additives Modulating CaCO3 Mineralisation. In: Advanced Topics in Biomineralization (J. Seto, ed.), 1–16.

262
Brodsky, J. L.; Skach, W. R. (2011) Protein folding and quality control in the endoplasmic reticulum: Recent lessons from yeast and mammalian cell systems. Curr. Opin. Cell Biol., 23 (4), 464–475.
Brownlee, C.; Davies, M.; Nimer, N.; Dong, L.; Merrett, M. (1995) Calcification, photosynthesis and intracellular regulation in Emiliania huxleyi. Bulletin de l'Institut Oceanographique (Monaco), 14, 19–35.
Brownlee, C.; Taylor, A. (2004) Calcification in coccolithophores: A cellular perspective. In: Coccolithophores: from molecular processes to global impact (H. R. Thierstein & J. Young, eds.); Berlin: Springer.
Buitenhuis, E. T.; De Baar, H. J. W.; Veldhuis, M. J. W. (1999) Photosynthesis and calcification by Emiliania huxleyi (Prymnesiophyceae) as a function of inorganic carbon species. J Phycol, 35 (5), 949–959.
Buitenhuis, E. T.; Van Bleijswijk, J.; Bakker, D.; Veldhuis, M. J. W. (1996) Trends in inorganic and organic carbon in a bloom of Emiliania huxleyi. Mar Ecol-Prog Ser, 143, 271–282.
Cardone, L.; Sassone-Corsi, P. (2003) Timing the cell cycle. Nature Cell Biology 5(10),859–861.
Carretero-Paulet, L.; Galstyan, A.; Roig-Villanova, I.; Martínez-García, J. F.; Bilbao-Castro, J. R.; Robertson, D. L. (2010) Genome-wide classification and evolutionary analysis of the bHLH family of transcription factors in Arabidopsis, poplar, rice, moss, and algae. Plant Physiology, 153 (3), 1398–1412.
Charlson, R. J.; Lovelock, J. E.; Andreae, M. O.; Warren, S. G. (1987) Oceanic phytoplankton, atmospheric sulphur, cloud albedo and climate. Nature, 326 (6114), 655–661.
Chen, C.-M.; Shih, T.-H.; Pai, T.-W.; Liu, Z.-L.; Chang, M. D.-T. (2012) RNA-seq coverage effects on biological pathways and GO tag clouds, 240–245; IEEE.
Chen, G.; Gharib, T. G.; Huang, C.-C.; Taylor, J. M. G.; Misek, D. E.; Kardia, S. L. R.; Giordano, T. J.; et al. (2002) Discordant Protein and mRNA Expression in Lung Adenocarcinomas. Molecular & Cellular Proteomics, 1 (4), 304–313.
Chen, M. (2008) Phytochrome nuclear body: an emerging model to study interphase nuclear dynamics and signaling. Current Opinion in Plant Biology, 11 (5), 503–508.
Chen, Z.; McKnight, S. L. (2007) A conserved DNA damage response pathway responsible for coupling the cell division cycle to the circadian and metabolic cycles. Cell cycle, 6(23), 2906–2912.
Chiang, P.; Gordon, R.; Tal, J.; Zeng, G.; Doctor, B.; Pardhasaradhi, K.; McCann, P. (1996) S-Adenosylmethionine and methylation. The FASEB Journal, 10 (4), 471–480.
Chisholm, S. W.; Vaulot, D.; Olson, R. J. (1984) Cell cycle control in phytoplankton: comparative physiology and ecology. In: Cell cycle clocks (L. N. J. Edmunds, ed.), 365–394; New York (USA).

263
Choe, L.; D'Ascenzo, M.; Relkin, N. R.; Pappin, D.; Ross, P.; Williamson, B.; Guertin, S.; et al. (2007) 8-Plex quantitation of changes in cerebrospinal fluid protein expression in subjects undergoing intravenous immunoglobulin treatment for Alzheimer's disease. Proteomics, 7 (20), 3651–3660.
Choi, Y. W.; Park, S. A.; Lee, H. W.; Kim, D. S.; Lee, N. G. (2008) Analysis of growth phase-dependent proteome profiles reveals differential regulation of mRNA and protein in Helicobacter pylori. Proteomics, 8 (13), 2665–2675; WILEY-VCH Verlag.
Chou, J. J.; Li, S.; Klee, C. B.; Bax, A. (2001) Solution structure of Ca2+ - calmodulin reveals flexible hand-like properties of its domains. Nature, 8 (11), 990–997;
Chou, K.-C.; Shen, H.-B. (2010) A New Method for Predicting the Subcellular Localization of Eukaryotic Proteins with Both Single and Multiple Sites: Euk-mPLoc 2.0. (D. P. Martin, Ed.)PLoS ONE, 5 (4), e9931.
Claquin, P.; Kromkamp, J. C.; Martin-Jezequel, V. (2004) Relationship between photosynthetic metabolism and cell cycle in a synchronized culture of the marine alga Cylindrotheca fusiformis (Bacillariophyceae). European Journal of Phycology, 39 (1), 33–41.
Corstjens, P. L. A. M.; Araki, Y.; Gonzalez, E. L. (2001) A coccolithophorid calcifying vesicle with a vacuolar-type ATPase proton pump: cloning and immunolocalization of the V0 subunit C. J Phycol, 37 (1), 71–78.
Corstjens, P. L. A. M.; van der Kooij, A.; Linschooten, C.; Brouwers, G.-J.; Westbroek, P.; de Vrind-de Jong, E. W. (1998) GPA, a calcium-binding protein in the coccolithophorid Emiliania huxleyi (Prymnesiophyceae). J Phycol, 34 (4), 622–630.
Cusack, M.; Freer, A. (2008) Biomineralization: Elemental and Organic Influence in Carbonate Systems. Chem. Rev., 108 (11), 4433–4454.
Dassow, von, P.; Ogata, H.; Probert, I.; Wincker, P.; Da Silva, C.; Audic, S.; Claverie, J.-M.; et al. (2009) Transcriptome analysis of functional differentiation between haploid and diploid cells of Emiliania huxleyi, a globally significant photosynthetic calcifying cell. Genome Biol., 10 (10), R114.
de Jong, E. W.; Bosch, L.; Westbroek, P. (1976) Isolation and characterization of a Ca2+ -binding polysaccharide associated with coccoliths of Emiliania huxleyi (Lohmann) Kamptner. Eur J Biochem, 70, 611–621.
de Vargas, C.; Aubry, M.; Probert, I.; Young, J. (2007) Origin and evolution of coccolithophores: From coastal hunters to Oceanic farmers. (P. Falkowski & A. Knoll, Eds.), 251–285.
DeCoursey, P. J.; Walker, J. K.; Smith, S. A. (2000) A circadian pacemaker in free-living chipmunks: essential for survival? J. Comp. Physiol. A, 186 (2), 169–180.

264
Denoeud, F.; Aury, J.-M.; Da Silva, C.; Noel, B.; Rogier, O.; Delledonne, M.; Morgante, M.; et al. (2008) Annotating genomes with massive-scale RNA sequencing. Genome Biol., 9 (12), R175.
Deutscher, M. P. (2006) Degradation of RNA in bacteria: comparison of mRNA and stable RNA. Nucleic Acids Research, 34 (2), 659–666.
Dixon, G. K.; Brownlee, C.; Merrett, M. J. (1989) Measurement of internal pH in the coccolithophore Emiliania huxleyi using 2′,7′-bis-(2-carboxyethyl)-5(and-6) carboxyfluorescein acetoxymethylester and digital imaging microscopy. Planta, 178 (4), 443–449.
Dodd, A. N.; Salathia, N.; Hall, A.; Kévei, E.; Tóth, R.; Nagy, F.; Hibberd, J. M.; et al. (2005) Plant Circadian Clocks Increase Photosynthesis, Growth, Survival, and Competitive Advantage. Science, 309 (5734), 630–633.
Dolphin, A. C. (2009) Calcium channel diversity: multiple roles of calcium channel subunits. Curr. Opin. Neurobiol., 19 (3), 237–244.
Donnan, L.; Carvill, E. P.; Gilliland, T. J.; John, P. C. L. (1985) The cell cycles of Chlamydomonas and Chlorella. New Phytol, 99 (1), 1–40.
Drescher, B.; Dillaman, R. M.; Taylor, A. R. (2012) Coccolithogenesis in Scyphosphaera apsteinii (Prymnesiophyceae). J Phycol,48 (6) 1343-1361.
Dyczkowski, J.; Vingron, M. (2005) Comparative analysis of cell cycle regulated genes in eukaryotes. Genome Informatics Series.
Dyhrman, S. T.; Haley, S. T.; Birkeland, S. R.; Wurch, L. L.; Cipriano, M. J.; McArthur, A. G. (2006) Long serial analysis of gene expression for gene discovery and transcriptome profiling in the widespread marine coccolithophore Emiliania huxleyi. Appl. Environ. Microbiol., 72 (1), 252–260.
Dyhrman, S. T.; Jenkins, B. D.; Rynearson, T. A.; Saito, M. A.; Mercier, M. L.; Alexander, H.; Whitney, L. P.; et al. (2012) The Transcriptome and Proteome of the Diatom Thalassiosira pseudonana Reveal a Diverse Phosphorus Stress Response. (P. Santos, Ed.)PLoS ONE, 7 (3), e33768.
Eberhardy, S. R.; Farnham, P. J. (2002) Myc recruits P-TEFb to mediate the final step in the transcriptional activation of the cad promoter. J. Biol. Chem., 277 (42), 40156–40162.
Eddy, S. R. (2001) Non-coding RNA genes and the modern RNA world. Nat Rev Genet, 2 (12), 919–929.
Edmunds, L. N. J.; Adams, K. J. (1981) Clocked cell cycle clocks. Science, 211, 1002–1012.
Edwards, R. J.; Moran, N.; Devocelle, M.; Kiernan, A.; Meade, G.; Signac, W.; Foy, M.; et al. (2007) Bioinformatic discovery of novel bioactive peptides. Nat Chem Biol, 3 (2), 108–112.

265
Emery, L.; Whelan, S.; Hirschi, K. D.; Pittman, J. K. (2012) Protein Phylogenetic Analysis of Ca2+/cation Antiporters and Insights into their Evolution in Plants. Front Plant Sci, 3, 1.
Engel, A.; Szlosek, J.; Abramson, L.; Liu, Z. F.; Lee, C. (2009) Investigating the effect of ballasting by CaCO3 in Emiliania huxleyi: I. Formation, settling velocities and physical properties of aggregates. Deep-Sea Res. Part II-Top. Stud. Oceanogr., 56 (18), 1396–1407.
Fabry, V. J. (2008) Marine calcifiers in a high-CO2 ocean. Science, 320 (5879), 1020–1022.
Fagerbakke, K. M.; Heldal, M.; Norland, S.; Heimdal, B. R.; Båtvik, H. (1994) Emiliania huxleyi. Chemical composition and size of coccoliths from enclosure experiments and a Norwegian fjord. British Phycological Journal; Taylor & Francis Group.
Falkowski, P. (2000) The Global Carbon Cycle: A Test of Our Knowledge of Earth as a System. Science, 290 (5490), 291–296.
Falkowski, P. G. (2004) The Evolution of Modern Eukaryotic Phytoplankton. Science, 305 (5682), 354–360.
Falkowski, P. G.; Kolber, Z. (1995) Variations in Chlorophyll Fluorescence Yields in Phytoplankton in the World Oceans. Functional Plant Biol., 22 (2), 341–355.
Fankhauser, C.; Chen, M. (2008) Transposing phytochrome into the nucleus. Trends in Plant Science, 13 (11), 596–601.
Farre, E. M. (2012) The regulation of plant growth by the circadian clock. PLANT BIOLOGY, {14} ({3}), {401–410}.
Feder, M. E.; Hofmann, G. E. (1999) Heat-shock proteins, molecular chaperones, and the stress response: evolutionary and ecological physiology. Annu. Rev. Physiol., 61, 243–282.
Field, C. B.; Behrenfeld, M. J.; Randerson, J. T. (1998) Primary Production of the Biosphere: Integrating Terrestrial and Oceanic Components. Science.
Finazzi, G.; Moreau, H. (2010) Genomic insights into photosynthesis in eukaryotic phytoplankton. Trends in Plant Science.
Finbow, M. E.; Harrison, M. A. (1997) The vacuolar H+-ATPase: a universal proton pump of eukaryotes. The Royal Society, 324 ( Pt 3), 697–712.
Findlay, C. S.; Giraudeau, J. (2000) Extant calcareous nannoplankton in the Australian Sector of the Southern Ocean (austral summers 1994 and 1995). Marine Micropaleontology, 40 (4), 417–439.
Forgac, M. (2000) Structure, mechanism and regulation of the clathrin-coated vesicle and yeast vacuolar H+-ATPases. J. Exp. Biol., 203 (1), 71–80.
Frankignoulle, M.; Canon, C.; Gattuso, J.-P. (1994) Marine calcification as a source of carbon dioxide: positive feedback of increasing atmospheric CO2. Limnol. Oceanogr., 39 (2), 458–462.

266
Frith, M. C.; Pheasant, M.; Mattick, J. S. (2005) Genomics: The amazing complexity of the human transcriptome. Nature, 13 (8), 894–897.
Fritz, J. J. (1999) Carbon fixation and coccolith detachment in the coccolithophore Emiliania huxleyi in nitrate-limited cyclostats. Mar Biol, 133 (3), 509–518.
Fritz, J. J.; Balch, W. M. (1996) A light-limited continuous culture study of Emiliania huxleyi: determination of coccolith detachment and its relevance to cell sinking. Journal of Experimental Marine Biology and Ecology, 207 (1), 127–147.
Fujiwara, S.; Hirokawa, Y.; Takatsuka, Y.; Suda, K.; Asamizu, E.; Takayanagi, T.; Shibata, D.; et al. (2007) Gene Expression Profiling of Coccolith-Bearing Cells and Naked Cells in Haptophyte Pleurochrysis haptonemofera with a cDNA Macroarray System. Mar Biotechnol, 9 (5), 550–560.
Fujiwara, T.; Misumi, O.; Tashiro, K.; Yoshida, Y.; Nishida, K.; Yagisawa, F.; Imamura, S.; et al. (2009) Periodic Gene Expression Patterns during the Highly Synchronized Cell Nucleus and Organelle Division Cycles in the Unicellular Red Alga Cyanidioschyzon merolae. DNA Res., 16 (1), 59–72.
Gehlenborg, N.; O'Donoghue, S. I.; Baliga, N. S.; Goesmann, A.; Hibbs, M. A.; Kitano, H.; Kohlbacher, O.; et al. (2010) Visualization of omics data for systems biology. Nature Publishing Group, 7 (3s), S56–S68.
Geider, R. J.; Roche, J.; Greene, R. M.; Olaizola, M. (1993) Response of the photosynthetic apparatus of Phaeodactylum tricornutum (Bacillariophyceae) to nitrate, phosphate, or iron starvation1. J Phycol, 29 (6), 755–766.
Geider, R.; Macintyre; Graziano, L.; McKay, R. M. (1998) Responses of the photosynthetic apparatus of Dunaliella tertiolecta (Chlorophyceae) to nitrogen and phosphorus limitation. European Journal of Phycology, 33 (4), 315–332.
Gould, S. B.; Waller, R. F. (2008) Plastid evolution. Annu Rev Plant Biol.
Grabherr, M. G.; Haas, B. J.; Yassour, M.; Levin, J. Z.; Thompson, D. A.; Amit, I.; Adiconis, X.; et al. (2011) Full-length transcriptome assembly from RNA-Seq data without a reference genome. Nat. Biotechnol., 29 (7), 644–652.
Green, J. C.; Course, P. A.; Tarran, G. A. (1996) The life-cycle of Emiliania huxleyi: A brief review and a study of relative ploidy levels analysed by flow cytometry. Journal of Marine Systems, 9 (1-2), 33–44.
Green, R. M.; Tingay, S.; Wang, Z.-Y.; Tobin, E. M. (2002) Circadian rhythms confer a higher level of fitness to Arabidopsis plants. Plant Physiol., 129 (2), 576–584.
Gregg, W. W.; Casey, N. W. (2007) Modeling coccolithophores in the global oceans. Deep-Sea Res. Part II-Top. Stud. Oceanogr., 54 (5), 447–477.
Guillard, R. R. L. (1975) Culture of phytoplankton for feeding marine invertebrates. In: Culture of marine invertebrates (W. Smith & M. Chanley, eds.), 26–60.

267
Hagiwara, S.; Bolige, A.; Zhang, Y. L.; Takahashi, M.; Yamagishi, A.; Goto, K. (2002) Circadian gating of photoinduction of commitment to cell-cycle transitions in relation to photoperiodic control of cell reproduction in Euglena. Photchemistry and Photobiology, (76/1), (105–115).
Harbers, M. M.; Carninci, P. P. (2005) Tag-based approaches for transcriptome research and genome annotation. Nat Methods, 2 (7), 495–502.
Haugan, P. M.; Drange, H. (1996) Effects of CO2 on the ocean environment. Energy Conversion and Management, 37 (6-8), 1019–1022.
Hegg, D. A.; Ferek, R. J.; Hobbs, P. V.; Radke, L. F. (1991) Dimethyl sulfide and cloud condensation nucleus correlations in the northeast Pacific Ocean. J. Geophys. Res., 96, 13189–13191.
Henriksen, K.; Stipp, S. L. S.; Young, J. R.; Marsh, M. E. (2004) Biological control on calcite crystallization: AFM investigation of coccolith polysaccharide function. ammin, 89 (11-12), 1709–1716.
Herfort, L.; Loste, E.; Meldrum, F.; Thake, B. (2004) Structural and physiological effects of calcium and magnesium in Emiliania huxleyi (Lohmann) Hay and Mohler. Palaeogeography, Palaeoclimatology, Palaeoecology, 148 (3), 307–314.
Herfort, L.; Thake, B.; Roberts, J. (2002) Acquisition and use of bicarbonate by Emiliania huxleyi. New Phytol. 156, 427-456
Ho, T.-Y.; Quigg, A.; Finkel, Z. V.; Milligan, A. J.; Wyman, K.; Falkowski, P. G.; Morel, F. M. M. (2003) The elemental composition of some marine phytoplankton. J Phycol, 39 (6), 1145–1159.
Holligan, P. M.; Fernandez, E.; Aiken, J.; Balch, W. M.; Boyd, P.; Burkill, P. H.; Finch, M.; et al. (1993) A biogeochemical study of the coccolithophore, Emiliania huxleyi, in the North Atlantic. Global Biogeochem Cy, 7 (4), 879–900.
Horton, P.; Park, K.-J.; Obayashi, T.; Fujita, N.; Harada, H.; Adams-Collier, C. J.; Nakai, K. (2007) WoLF PSORT: protein localization predictor. Nucleic Acids Research, 35 (Web Server issue), W585–7.
Houck, K. A.; Ferrara, N.; Winer, J.; Cachianes, G.; Li, B.; Leung, D. W. (1991) the vascular endothelial growth factor family: identification of a fourth molecular species and characterization of alternative splicing of rna. Molecular Endocrinology, 5 (12), 1806–1814.
Houghton, R. A. (2007) Balancing the Global Carbon Budget. Annu. Rev. Earth Planet. Sci., 35 (1), 313–347.

268
Humphery-Smith, I.; Cordwell, S. J.; Blackstock, W. P. (1997) Proteome research: Complementarity and limitations with respect to the RNA and DNA worlds. J Phycol, 18 (8), 1217–1242.
Huntley, R. P.; Sawford, T.; Mutowo-Meullenet, P.; Shypitsyna, A.; Bonilla, C.; Martin, M. J.; O'Donovan, C. (2015) The GOA database: Gene Ontology annotation updates for 2015. Nucleic Acids Research, 43 (D1), D1057–D1063.
Hüttenhofer, A.; Vogel, J. (2006) Experimental approaches to identify non-coding RNAs. Nucleic Acids Research, 34 (2), 635–646.
Iglesias-Rodriguez, M. D.; Brown, C. W.; Doney, S. C.; Kleypas, J.; Kolber, D.; Kolber, Z.; Hayes, P. K.; et al. (2002) Representing key phytoplankton functional groups in ocean carbon cycle models: Coccolithophorids. Global Biogeochem Cy, 16 (4), –.
Iglesias-Rodriguez, M. D.; Halloran, P. R.; Rickaby, R. E. M.; Hall, I. R.; Colmenero-Hidalgo, E.; Gittins, J. R.; Green, D. R. H.; et al. (2008) Phytoplankton Calcification in a High-CO2 World. Science, 320 (5874), 336–340.
Iglesias-Rodriguez, M. D.; Schofield, O. M.; Batley, J.; Medlin, L. K.; Hayes, P. K. (2006) Intraspecific genetic diversity in the marine coccolithophore Emiliania huxleyi (Prymnesiophyceae): The use of microsatellite analysis in marine phytoplankton population studies. J Phycol, 42 (3), 526–536.
Inouye, I.; Chihara, M. (1980) Laboratory culture and taxonomy of Hymenomonas coronata and Ochrosphaera verrucosa (Class Prymnesiophyceae) from the Northwest Pacific. Bot Mag Tokyo, 93 (3), 195–208.
Inzé, D.; De Veylder, L. (2006) Cell cycle regulation in plant development 1. Annu. Rev. Genet., 40, 77–105.
Isenberg, H. D.; Lavine, L. S.; Weissfellner, H. (1963) The suppression of mineralization in a coccolithophorid by an inhibitor of carbonic anhydrase. J Eukaryotic Microbiology, 10 (4), 477–479.
Izban, M. G.; Luse, D. S. (1991) Transcription on nucleosomal templates by RNA polymerase II in vitro: inhibition of elongation with enhancement of sequence-specific pausing. Genes & Development, 5 (4), 683–696.
Jackowiak, P.; Nowacka, M.; Strozycki, P. M.; Figlerowicz, M. (2011) RNA degradome--its biogenesis and functions. Nucleic Acids Research, 39 (17), 7361–7370.
Jain, C. (2002) Degradation of mRNA in Escherichia coli. J Phycol, 54 (6), 315–321.
Jang, M. K.; Mochizuki, K.; Zhou, M.; Jeong, H.-S.; Brady, J. N.; Ozato, K. (2005) The bromodomain protein Brd4 is a positive regulatory component of P-TEFb and stimulates RNA polymerase II-dependent transcription. Mol. Cell, 19 (4), 523–534.
Jayadev, R.; Kuk, C. Y.; Low, S. H.; Murata-Hori, M. (2014) Calcium sensitivity of α-actinin is required for equatorial actin assembly during cytokinesis. Cell Cycle, 11 (10), 1929–1937.

269
John, L. M.; Lechleiter, J. D.; Camacho, P. (1998) Differential modulation of SERCA2 isoforms by calreticulin. J. Cell Biol., 142 (4), 963–973.
Johnson, C. H.; Golden, S. S.; Ishiura, M.; Kondo, T. (1996) Circadian clocks in prokaryotes. Molecular Microbiology, 21 (1), 5–11.
Jones, B. M.; Edwards, R. J.; Skipp, P. J.; O’Connor, C. D.; Iglesias-Rodriguez, M. D. (2011) Shotgun Proteomic Analysis of Emiliania huxleyi, a Marine Phytoplankton Species of Major Biogeochemical Importance. Mar Biotechnol, 13 (3), 496–504.
Jones, B. M.; Iglesias-Rodriguez, M. D.; Skipp, P. J.; Edwards, R. J.; Greaves, M. J.; Young, J. R.; Elderfield, H.; et al. (2013) Responses of the Emiliania huxleyi Proteome to Ocean Acidification. PLoS ONE, 8 (4), e61868.
Jordan, R. W.; Chamberlain, A. H. L. (1997) Biodiversity among haptophyte algae. Biodiversity and Conservation, 6 (1), 131–152.
Joubert, C.; Piquemal, D.; Marie, B.; Manchon, L.; Pierrat, F.; Zanella-Cléon, I.; Cochennec-Laureau, N.; et al. (2010) Transcriptome and proteome analysis of Pinctada margaritifera calcifying mantle and shell: focus on biomineralization. BMC Genomics, 11 (1), 613–.
Kalia, A.; Gupta, R. P. (2005) Proteomics: A Paradigm Shift. Critical Reviews in Biotechnology, 25 (4), 173–198.
Kane, P. M. (1995) Disassembly and reassembly of the yeast vacuolar H+-ATPase in vivo. J Biol Chem., 270 (28), 17025–17032.
Kanesaki, Y.; Imamura, S.; Minoda, A.; Tanaka, K. (2012) external light conditions and internal cell cycle phases coordinate accumulation of chloroplast and mitochondrial transcripts in the red alga cyanidioschyzon merolae. DNA Res., 19 (3), 289–303.
Kaniewska, P.; Anthony, K.; Sampayo, E. M. (2013) Implications of geometric plasticity for maximizing photosynthesis in branching corals. Mar Biol. DOI 10.1007/s00227-013-2336-z Kanno, T.; Huettel, B.; Mette, M. F.; Aufsatz, W.; Jaligot, E.; Daxinger, L.; Kreil, D. P.; et al.
(2005) Atypical RNA polymerase subunits required for RNA-directed DNA methylation. Nature, 37 (7), 761–765.
Karako-Lampert, S.; Katcoff, D. J.; Achituv, Y.; Dubinsky, Z.; Stambler, N. (2004) Do clades of symbiotic dinoflagellates in scleractinian corals of the Gulf of Eilat (Red Sea) differ from those of other coral reefs? Journal of Experimental Marine Biology and Ecology, 311 (2), 301–314.
Katoh, K.; Toh, H. (2008) Recent developments in the MAFFT multiple sequence alignment program. Briefings in Bioinformatics, 9 (4), 286–298.
Keeling, P. J. (2004) Diversity and evolutionary history of plastids and their hosts. Am. J. Bot., 91 (10), 1481–1493.

270
Keeling, P. J. (2009) Chromalveolates and the Evolution of Plastids by Secondary Endosymbiosis. Journal of Eukaryotic Microbiology, 56 (1), 1–8.
Keller, E. B.; Noon, W. A. (1984) Intron splicing: a conserved internal signal in introns of animal pre-mRNAs. Proc. Natl. Acad. Sci. U.S.A., 81 (23), 7417–7420.
Kettenberger, H.; Armache, K.-J.; Cramer, P. (2004) Complete RNA polymerase II elongation complex structure and its interactions with NTP and TFIIS. Mol. Cell, 16 (6), 955–965.
King, N. L.; Deutsch, E. W.; Ranish, J. A.; Nesvizhskii, A. I.; Eddes, J. S.; Mallick, P.; Eng, J.; et al. (2006) Analysis of the Saccharomyces cerevisiae proteome with PeptideAtlas. Genome Biol., 7 (11), R106.
Kirchhausen, T. (2000) Clathrin. Annu. Rev. Biochem., (69), 699–727.
Kirk, K. L. (1997) life-history responses to variable environments: starvation and reproduction in planktonic rotifers. Ecology, 78 (2), 434–441.
Kitao, Y.; Harada, H.; Matsuda, Y. (2008) Localization and targeting mechanisms of two chloroplastic beta-carbonic anhydrases in the marine diatom Phaeodactylum tricornutum. Physiol Plant, 133 (1), 68–77.
Klaas, C.; Archer, D. E. (2002) Association of sinking organic matter with various types of mineral ballast in the deep sea: Implications for the rain ratio. Global Biogeochem Cy, 16 (4), 1116; AGU.
Klaveness, D. (1972) Coccolithus huxleyi (Lohmann) Kamptner. 1. Morphological investigations on the vegetative cell and the process of coccolith formation. Protistologica (Paris. 1965), 8 (3).
Klaveness, D. (1976) Emiliania huxleyi (Lohmann) Hay and Mohler 3. Mineral deposition and origin of matrix during coccolith formation. Protistologica, 12, 217–224.
Kodzius, R.; Kojima, M.; Nishiyori, H.; Nakamura, M.; Fukuda, S.; Tagami, M.; Sasaki, D.; et al. (2006) CAGE: cap analysis of gene expression. Nat Methods, 3 (3), 211–222.
Koenig, T.; Menze, B. H.; Kirchner, M.; Monigatti, F.; Parker, K. C.; Patterson, T.; Steen, J. J.; et al. (2008) Robust prediction of the MASCOT score for an improved quality assessment in mass spectrometric proteomics. J Proteome Res, 7 (9), 3708–3717.
Kolber, Z. S.; Barber, R. T.; Coale, K. H.; Fitzwateri, S. E.; Greene, R. M.; Johnson, K. S.; Lindley, S.; et al. (1994) Iron limitation of phytoplankton photosynthesis in the equatorial Pacific Ocean. Nature, 371 (6493), 145–149.
Kolber, Z.; Zehr, J.; Falkowski, P. (1988) Effects of Growth Irradiance and Nitrogen Limitation on Photosynthetic Energy Conversion in Photosystem II. Plant Physiol., 88 (3), 923–929.
Kondorosi, E.; Roudier, F.; Gendreau, E. (2000) Plant cell-size control: growing by ploidy? Palaeogeography, Palaeoclimatology, Palaeoecology, 3 (6), 488–492.

271
Krause, G. H.; Weis, E. (1991) Chlorophyll fluorescence and photosynthesis: the basics. Annu Rev Plant Biol, 42 (1), 313–349.
Krause, G. H.; Winter, K.; Krause, B.; Virgo, A. (2015) Light-stimulated heat tolerance in leaves of two neotropical tree species, Ficus insipida and Calophyllum longifolium. Functional Plant Biol., 42 (1), 42.
Kruskopf, M.; Flynn, K. J. (2005) Chlorophyll content and fluorescence responses cannot be used to gauge reliably phytoplankton biomass, nutrient status or growth rate. New Phytol, 169 (3), 525–536.
La Claire, J. W. (2006) Analysis of Expressed Sequence Tags from the Harmful Alga, Prymnesium parvum (Prymnesiophyceae, Haptophyta). Mar Biotechnol, 8 (5), 534–546.
La Roche, J.; Geider, R. J.; Graziano, L. M.; Murray, H.; Lewis, K. (1993) Induction of specific proteins in eukaryotic algae grown under iron-, phosphorus-, or nitrogen-deficient conditions. J Phycol, 29 (6), 767–777.
Lam, C. M. C.; Chong, C.; Wong, J. T. Y. (2001) A dinoflagelalte mutant with higher frequency of multiple fission. Prtoplasma, 216, 75–79.
Langer, G.; Geisen, M.; Baumann, K.-H.; Klà s, J.; Riebesell, U.; Thoms, S.; Young, J. R. (2006) Species-specific responses of calcifying algae to changing seawater carbonate chemistry. Geochem. Geophys. Geosyst., 7, 1-12.
Langer, G.; Nehrke, G.; Probert, I.; Ly, J.; Ziveri, P. (2009) Strain-specific responses of Emiliania huxleyi to changing seawater carbonate chemistry. Biogeosciences, 6 (11), 2637–2646.
Leonardos, N.; Read, B.; Thake, B.; Young, J. R. (2009) No mechanistic dependence of photosynthesis on calcification in the coccolithophorid Emiliania huxleyi (Haptophyta). J Phycol, 45 (5), 1046–1051.
Levine, M.; Tjian, R. (2003) Transcription regulation and animal diversity. Nature, 424 (6945), 147–151.
Lewin, D. A.; Mellman, I. (1998) Sorting out adaptors. Biochim. Biophys. Acta, 1401 (2), 129–145.
Liu, H.; Aris-Brosou, S.; Probert, I.; de Vargas, C. (2010) A time line of the environmental genetics of the haptophytes. Mol. Biol. Evol., 27 (1), 161–176.
Llopis, J.; McCaffery, J. M.; Miyawaki, A.; Farquhar, M. G.; Tsien, R. Y. (1998) Measurement of cytosolic, mitochondrial, and Golgi pH in single living cells with green fluorescent proteins. Proc Natl Acad Sci U S A, 95 (12), 6803–6808.
Lohbeck, K. T.; Riebesell, U.; Reusch, T. B. H. (2012) Adaptive evolution of a key phytoplankton species to ocean acidification. Nature Geosci, advance online publication.

272
Lohbeck, K. T.; Riebesell, U.; Reusch, T. B. H. (2014) Gene expression changes in the coccolithophore Emiliania huxleyi after 500 generations of selection to ocean acidification. Proceedings of the Royal Society B: Biological Sciences, 281 (1786), 20140003–20140003.
Lorenzen, H. (1957) Synchrone Zellteilungen von Chlorella bei verschiedenen Licht-Dunkel-Wechseln. Flora (Jena), 144, 473–496.
Lowenstam, H. (1981) Minerals formed by organisms. Science, 211 (4487), 1126–1131.
Lowenstam, H. A.; Weiner, S. (1989) On Biomineralization; Oxford University Press.
López, J. L. (2007) Applications of proteomics in marine ecology. Mar Ecol-Prog Ser, 332, 275–279.
Mackinder, L.; Wheeler, G.; Schroeder, D.; Dassow, von, P.; Riebesell, U.; Brownlee, C. (2011) Expression of biomineralization-related ion transport genes in Emiliania huxleyi. Environ. Microbiol., 13 (12), 3250–3265.
Mackinder, L.; Wheeler, G.; Schroeder, D.; Riebesell, U.; Brownlee, C. (2010) Molecular Mechanisms Underlying Calcification in Coccolithophores. Geomicrobiology Journal, 27 (6), 585–595.
Mann, M.; Wilm, M. (1995) Electrospray mass spectrometry for protein characterization. Trends in Biochemical Sciences, 20 (6), 219–224.
Manton, I.; Leedale, G. F. (1969) Observations on the Microanatomy of Coccolithus Pelagicus and Cricosphaera Carterae, With Special Reference to the Origin and Nature of Coccoliths and Scales. J. Mar. Biol. Ass., 49 (01), 1–16.
Marsh, M. E. (1986) Biomineralization in the presence of calcium-binding phosphoprotein particles. J. Exp. Zool., 239 (2), 207–220.
Marsh, M. E. (1994) Polyanion-mediated mineralization assembly and reorganization of acidic polysaccharides in the Golgi system of a coccolithophorid alga during mineral deposition. Protoplasma.
Marsh, M. E. (2003) Regulation of CaCO3 formation in coccolithophores. Comp Biochem Physiol B Biochem Mol Biol, 136 (4), 743–754.
Marsh, M. E.; Chang, D. K.; King, G. C. (1992) Isolation and characterization of a novel acidic polysaccharide containing tartrate and glyoxylate residues from the mineralized scales of a unicellular coccolithophorid alga Pleurochrysis carterae. J Biol Chem, 267 (28), 20507–20512.
Marsh, M. E.; Dickinson, D. P. (1997) Polyanion-mediated mineralization — mineralization in coccolithophore (Pleurochrysis carterae) variants which do not express PS2, the most abundant and acidic mineral-associated polyanion in wild-type cells. Protoplasma, 199 (1-2), 9–17.

273
Marsh, M. E.; Ridall, A. L.; Azadi, P.; Duke, P. J. (2002) Galacturonomannan and Golgi-derived membrane linked to growth and shaping of biogenic calcite.
Martin, J. A.; Wang, Z. (2011) Next-generation transcriptome assembly. Nature, 12 (10), 671–682.
Matsuda, Y.; Nakajima, K.; Tachibana, M. (2011) Recent progresses on the genetic basis of the regulation of CO2 acquisition systems in response to CO2 concentration. Photosynthesis Research, 109 (1-3), 191–203.
Mattick, J. S.; Makunin, I. V. (2006) Non-coding RNA. Hum. Mol. Genet., 15 Spec No 1, R17–29.
Más, P. (2008) Circadian clock function in Arabidopsis thaliana: time beyond transcription. Trends Cell Biol., 18 (6), 273–281.
McKew, B. A.; Lefebvre, S. C.; Achterberg, E. P.; Metodieva, G.; Raines, C. A.; Metodiev, M. V.; Geider, R. J. (2013) Plasticity in the proteome of Emiliania huxleyi CCMP 1516 to extremes of light is highly targeted. New Phytol, 200 (1), 61–73.
McMahon, H. T.; Mills, I. G. (2004) COP and clathrin-coated vesicle budding: different pathways, common approaches. Curr. Opin. Cell Biol., 16 (4), 379–391.
Medini, D.; Donati, C.; Tettelin, H.; Masignani, V.; Rappuoli, R. (2005) The microbial pan-genome. Current Opinion in Genetics & Development, 15 (6), 589–594.
Medlin, L. K.; Barker, G. L. A.; Campbell, L.; Green, J. C.; Hayes, P. K.; Marie, D.; Wrieden, S.; et al. (1996) Genetic characterisation of Emiliania huxleyi (Haptophyta). Journal of Marine Systems, 9 (1‚Äì2), 13–31.
Meldolesi, J.; Pozzan, T. (1998) The endoplasmic reticulum Ca2+ store: a view from the lumen. Palaeogeography, Palaeoclimatology, Palaeoecology, 23 (1), 10–14.
Menges, M.; Hennig, L.; Gruissem, W.; Murray, J. A. H. (2002) Cell cycle-regulated gene expression in Arabidopsis. J. Biol. Chem., 277 (44), 41987–42002.
Milliman, J. D. (1974) Marine carbonates. Recent sedimentary carbonates; Springer.
Milliman, J. D. (1993) Production and accumulation of calcium carbonate in the ocean: Budget of a nonsteady state. Global Biogeochem Cy, 7 (4), 927–957; AGU.
Milliman, J.; Droxler, A. (1996) Neritic and pelagic carbonate sedimentation in the marine environment: ignorance is not bliss. Geologische Rundschau, 85 (3), 496–504.
Mitchison, J. M. (1971) The biology of the cell cycle; CUP Archive.
Mitton, B.; Kranias, E. G. (2003) Proteomics: Its potential in the post-genome era. Hellenic J Cardiol.

274
Montsant, A.; Allen, A. E.; Coesel, S.; Martino, A. D.; Falciatore, A.; Mangogna, M.; Siaut, M.; et al. (2007) Identification and comparative genomic analysis of signaling and regulatory components in the diatom Thalassiosira pseudonana. J Phycol, 43 (3), 585–604.
Moore, C. M.; Suggett, D. J.; Hickman, A. E.; Kim, Y.-N.; Tweddle, J. F.; Sharples, J.; Geider, R. J.; et al. (2006) Phytoplankton Photoacclimation and Photoadaptation in Response to Environmental Gradients in a Shelf Sea. Limnol. Oceanogr., 51 (2), 936–949.
Moriyama, Y.; Maeda, M.; Futai, M. (1992) The role of V-ATPase in neuronal and endocrine systems. J. Exp. Biol., 172, 171–178.
Morris, R. M.; Nunn, B. L.; Frazar, C.; Goodlett, D. R.; Ting, Y. S.; Rocap, G. (2010) Comparative metaproteomics reveals ocean-scale shifts in microbial nutrient utilization and energy transduction. Isme J, 4 (5), 673–685.
Muggli, D. L.; Harrison, P. J. (1997) Effects of iron on two oceanic phytoplankters grown in natural NE subarctic pacific seawater with no artificial chelators present. Journal of Experimental Marine Biology and Ecology, 212 (2), 225–237.
Muggli, D. L.; Lecourt, M.; Harrison, P. J. (1996) Effects of iron and nitrogen source on the sinking rate, physiology and metal composition of an oceanic diatom from the subarctic Pacific. Mar Ecol-Prog Ser, 132, 215–227.
Mullin, M. M.; Sloan, P. R.; Eppley, R. W. (1966) Relationship Between Carbon Content, Cell Volume, and Area in Phytoplankton. Limnol. Oceanogr., 11 (2), 307–311.
Muse, G. W.; Gilchrist, D. A.; Nechaev, S.; Shah, R.; Parker, J. S.; Grissom, S. F.; Zeitlinger, J.; et al. (2007) RNA polymerase is poised for activation across the genome. Nature, 39 (12), 1507–1511.
Müller, M. N.; Antia, A. N.; LaRoche, J. (2008) Influence of cell cycle phase on calcification in the coccolithophore Emiliania huxleyii. Limnol. Oceanogr., 53 (2), 7.
Nagai, K.; Yotsukura, N.; Ikegami, H.; Kimura, H.; Morimoto, K. (2008) Protein extraction for 2-DE from the lamina of Ecklonia kurome (Laminariales): recalcitrant tissue containing high levels of viscous polysaccharides. Electrophoresis, 29 (3), 672–681.
Nagaraj, S. H.; Gasser, R. B.; Ranganathan, S. (2006) A hitchhiker's guide to expressed sequence tag (EST) analysis. Briefings in Bioinformatics, 8 (1), 6–21.
Nash, P. D.; Opas, M.; Michalak, M. (1994) Calreticulin: not just another calcium-binding protein. Mol Cell Biochem, 135 (1), 71–78.
Nazareth Bastajian, H. F. B. J. A. (2013) Bck2 Acts through the MADS Box Protein Mcm1 to Activate Cell-Cycle-Regulated Genes in Budding Yeast. PLoS Genet, 9 (5)

275
Näär, A. M.; Lemon, B. D.; Tjian, R. (2001) Transcriptional cactivator complexes. Annu. Rev. Ecol. Evol. Syst., 70 (1), 475–501.
Nguyen, B.; Bowers, R. M.; Wahlund, T. M.; Read, B. A. (2005) Suppressive Subtractive Hybridization of and Differences in Gene Expression Content of Calcifying and Noncalcifying Cultures of Emiliania huxleyi Strain 1516. Appl. Environ. Microbiol., 71 (5), 2564–2575.
Nieduszynski, C. A.; Liti, G. (2011) From sequence to function: Insights from natural variation in budding yeasts. BBA - General Subjects, 1–8.
Nimer, N. A.; Dixon, G. K.; Merrett, M. J. (1992) Utilization of inorganic carbon by the coccolithophorid Emiliania huxleyi (Lohmann) Kamptner. New Phytol, 120 (1), 153–158.
Nimer, N. A.; Iglesias-Rodriguez, M. D.; Merrett, M. J. (1997) Bicarbonate utilization by marine phytoplankton species. J Phycol, 33 (4), 625–631.
Nimer, N. A.; Merrett, M. J. (1991) Calcification and utilization of inorganic carbon by the coccolithophorid Emiliania huxleyi Lohmann. New Phytol, 121 (2), 173–177.
Nimer, N. A.; Merrett, M. J. (1993) Calcification rate in Emiliania huxleyi Lohmann in response to light, nitrate and availability of inorganic carbon. New Phytol, 123 (4), 673–677.
Nishiyama, Y.; Allakhverdiev, S. I.; Murata, N. (2006) A new paradigm for the action of reactive oxygen species in the photoinhibition of photosystem II. Palaeogeography, Palaeoclimatology, Palaeoecology, 1757 (7), 742–749.
Nookaew, I.; Papini, M.; Pornputtapong, N.; Scalcinati, G.; Fagerberg, L.; Uhlen, M.; Nielsen, J. (2012) A comprehensive comparison of RNA-Seq-based transcriptome analysis from reads to differential gene expression and cross-comparison with microarrays: a case study in Saccharomyces cerevisiae. Nucleic Acids Research, 40 (20), 10084–10097.
Nunez, R. (2001) DNA measurement and cell cycle analysis by flow cytometry. Current issues in molecular biology, 3, 67–70.
Nunn, B. L.; Aker, J. R.; Shaffer, S. A.; Tsai, S.; Strzepek, R. F.; Boyd, P. W.; Freeman, T. L.; et al. (2009) Deciphering diatom biochemical pathways via whole-cell proteomics. Aquat. Microb. Ecol., 55 (3), 241–253.
O'Connor, C. D. C.; Adams, P. P.; Alefounder, P. P.; Farris, M. M.; Kinsella, N. N.; Li, Y. Y.; Payot, S. S.; et al. (2000) The analysis of microbial proteomes: strategies and data exploitation. Electrophoresis, 21 (6), 1178–1186.
O'Farrell, P. H. (1975) High resolution two-dimensional electrophoresis of proteins. J. Biol. Chem. 1975, 250:4007-4021.
Oehlen, L. J.; McKinney, J. D.; Cross, F. R. (1996) Ste12 and Mcm1 regulate cell cycle-dependent transcription of FAR1. Mol. Cell. Biol., 16 (6), 2830–2837.
Oliva, A.; Rosebrock, A.; Ferrezuelo, F.; Pyne, S.; Chen, H.; Skiena, S.; Futcher, B.; et al.

276
(2005) The Cell Cycle–Regulated Genes of Schizosaccharomyces pombe. PLoS Biol, 3 (7), e225.
Olsen, J. V.; Blagoev, B.; Gnad, F.; Macek, B.; Kumar, C.; Mortensen, P.; Mann, M. (2006) Global, In Vivo, and Site-Specific Phosphorylation Dynamics in Signaling Networks. Cell, 127 (3), 635–648.
Olson, R. J.; Vaulot, D.; Chisholm, S. W. (n.d.) Effects of Environmental Stresses on the Cell Cycle of Two Marine Phytoplankton Species.
Onodera, Y.; Haag, J. R.; Ream, T.; Costa Nunes, P.; Pontes, O.; Pikaard, C. S. (2005) Plant nuclear RNA polymerase IV mediates siRNA and DNA methylation-dependent heterochromatin formation. Cell, 120 (5), 613–622.
Orci, L.; Malhotra, V.; Amherdt; Serafini, T.; Rothman, J. E. (1986) Dissection of a single round of vesicular transport: sequential intermediates for intercisternal movement in the Golgi stack. Cell, 56 (3), 357–368.
Orr, J. C.; Fabry, V. J.; Aumont, O.; Bopp, L.; Doney, S. C.; Feely, R. A.; Gnanadesikan, A.; et al. (2005) Anthropogenic ocean acidification over the twenty-first century and its impact on calcifying organisms. Nature, 437 (7059), 681–686.
Outka, D. E.; Williams, D. C. (1971) Sequential Coccolith Morphogenesis in Hymenomonas carterae. J Eukaryotic Microbiology, 18 (2), 285–297.
Outka, D. E.; Williams, D. C. (1973) Green Algae - Carole A. Lembi - Google Books. Green algae.
Paasche, E. (1962) Coccolith Formation. Nature, 193 (4820), 1094–1095.
Paasche, E. (1963) The Adaptation of the Carbon-14 Method for the Measurement of Coccolith Production in Coccolithus huxleyi. Physiol Plant, 16 (1), 186–200; Blackwell Publishing Ltd.
Paasche, E. (1965) The Effect of 3-(p-Chlorophenyl)-1,1-Dimethylurea (CMU) on Photosynthesis and Light-Dependent Cocoolith Formation in Coccolithus huxleyi. Physiol Plant, 18 (1), 138–145.
Paasche, E. (1966) Adjustment to Light and Dark Rates of Coccolith Formation. Physiol Plant, 19 (2), 271–278.
Paasche, E. (1967) Marine Plankton Algae Grown with Light-Dark Cycles. I. Coccolithus huxleyi. Physiol Plant, 20 (4), 946–956
Paasche, E. (1998) Roles of nitrogen and phosphorus in coccolith formation in Emiliania huxleyi (Prymnesiophyceae). European Journal of Phycology, 33 (1), 33–42.

277
Paasche, E. (2002) A review of the coccolithophorid Emiliania huxleyi (Prymnesiophyceae), with particular reference to growth, coccolith formation, and calcification-photosynthesis interactions. Phycologia, 40 (6), 503–529
Paasche, E.; Brubak, S. (1994) Enhanced calcification in the coccolithophorid Emiliania huxleyi (Haptophyceae) under phosphorus limitation. Phycologia, 33 (5), 324–330.
Parkhill, J.-P.; Maillet, G.; Cullen, J. J. (2001) Fluorescence‐based maximal quantum yield for PSII as a diagnostic of nutrient stress. J Phycol, 37 (4), 517–529;
Patterson, S. D.; Aebersold, R. (1995) Mass spectrometric approaches for the identification of gel-separated proteins. Electrophoresis, 16 (10), 1791–1814.
Perales, M.; Más, P. (2007) A functional link between rhythmic changes in chromatin structure and the Arabidopsis biological clock. Plant Cell, 19 (7), 2111–2123.
Pockley, A. G. A. (2003) Heat shock proteins as regulators of the immune response. Lancet, 362 (9382), 469–476.
Pokhariyal, R.; Basnet, B.; Gupta, A. K.; Sehrawat, U.; Jain, S. K.; Hariprasad, G. (2014) Effect of Lipid on Gel Based Electrophoretic Proteomic Experiments. Journal of Proteins & Proteomics, 5 (2).
Post, A. F.; Eijgenraam, F.; Mur, L. R. (1985) Influence of light period length on photosynthesis and synchronous growth of the green alga Scenedesmus protuberans. British Phycological Journal, 20 (4), 391–397.
Poulton, A. J.; Charalampopoulou, A.; Young, J. R.; Tarran, G. A.; Lucas, M. I.; Quartly, G. D. (2010) Coccolithophore dynamics in non-bloom conditions during late summer in the central Iceland Basin (July-August 2007). Limnol. Oceanogr., 55 (4), 1601–1613.
Price, L. L.; Yin, K.; Harrison, P. J. (1998) Influence of continuous light and L:D cycles on the growth and chemical composition of Prymnesiophyceae including coccolithophores. Journal of Experimental Marine Biology and Ecology, 223 (2), 223–234.
Price, M. N.; Dehal, P. S.; Arkin, A. P. (2009) FastTree: Computing Large Minimum Evolution Trees with Profiles instead of a Distance Matrix. Mol. Biol. Evol., 26 (7), 1641–1650.
Quinn, P.; Bowers, R. M.; Zhang, X.; Wahlund, T. M.; Fanelli, M. A.; Olszova, D.; Read, B. A. (2006) cDNA Microarrays as a Tool for Identification of Biomineralization Proteins in the Coccolithophorid Emiliania huxleyi (Haptophyta). Appl. Environ. Microbiol., 72 (8), 5512–5526.
Ragni, M.; Airs, R. L.; Leonardos, N.; Geider, R. J. (2008) Photoinhibition of PSII in Emiliania huxleyi (Haptophyta) under high light stress: the roles of photoacclimation, photoprotection, and photorepair. J Phycol, 44 (3), 670–683.

278
Ramos-Silva, P.; Kaandorp, J.; Huisman, L.; Marie, B.; Zanella-Cléon, I.; Guichard, N.; Miller, D. J.; et al. (2013) The Skeletal Proteome of the Coral Acropora millepora: The Evolution of Calcification by Co-Option and Domain Shuffling. Mol. Biol. Evol. 30 (9) pp. 2099-2112
Rasmussen, E. B.; Lis, J. T. (1993) In vivo transcriptional pausing and cap formation on three Drosophila heat shock genes. Proc. Natl. Acad. Sci. U.S.A., 90 (17), 7923–7927.
Raven, J.; Caldeira, K.; Elderfield, H.; Hoegh-Guldberg, O.; Liss, P.; Riebesell, U.; Shepherd, J.; et al. (2005) Ocean acidification due to increasing atmospheric carbon dioxide. The Royal Society.
Rayko, E.; Maumus, F.; Maheswari, U.; Jabbari, K.; Bowler, C. (2010) Transcription factor families inferred from genome sequences of photosynthetic stramenopiles. J Phycol, 188 (1), 52–66.
Read, B. A.; Kegel, J.; Klute, M. J.; Kuo, A.; Lefebvre, S. C.; Maumus, F.; Mayer, C.; et al. (2013) Pan genome of the phytoplankton Emiliania underpins its global distribution. Nature, 499 (7457), 209–213; Nature Publishing Group.
Reynaud, S.; Leclercq, N.; Romaine-Lioud, S.; Ferrier-PagËs, C.; Jaubert, J.; Gattuso, J.-P. (2003) Interacting effects of CO2 partial pressure and temperature on photosynthesis and calcification in a scleractinian coral. Global Change Biol, 9 (11), 1660–1668.
Richier, S.; Kerros, M. E.; de Vargas, C.; Haramaty, L.; Falkowski, P. G.; Gattuso, J. P. (2009) Light-dependent transcriptional regulation of genes of biogeochemical interest in the diploid and haploid life cycle stages of Emiliania huxleyi. Appl. Environ. Microbiol., 75 (10), 3366–3369.
Riebesell, U.; Koertzinger, A.; Oschlies, A. (2009) Sensitivities of marine carbon fluxes to ocean change. Proc Natl Acad Sci U S A, 106 (49), 20602–20609.
Riebesell, U.; Zondervan, I.; Rost, B.; Tortell, P. D.; Zeebe, R. E.; Morel, F. M. M. (2000) Reduced calcification of marine plankton in response to increased atmospheric CO2. Nature, 407 (6802), 364–367.
Riegman, R.; Stolte, W.; Noordeloos, A. A. M.; Slezak, D. (2000) Nutrient Uptake and Alkaline Phosphatase (Ec 3:1:3:1) Activity of Emiliania Huxleyi (PRYMNESIOPHYCEAE) During Growth Under N and P Limitation in Continuous Cultures. J Phycol, 36 (1), 87–96.
Robbens, S.; Khadaroo, B.; Camasses, A.; Derelle, E.; Ferraz, C.; Inzé, D.; Van de Peer, Y.; et al. (2005) Genome-wide analysis of core cell cycle genes in the unicellular green alga Ostreococcus tauri. Mol. Biol. Evol., 22 (3), 589–597.
Robertson, J. E.; Robinson, C.; Turner, D. R.; Holligan, P.; Watson, A. J.; Boyd, P.; Fernandez, E.; et al. (1994) The impact of a coccolithophore bloom on oceanic carbon uptake in the northeast Atlantic during summer 1991. Deep-Sea Res Pt I, 41 (2), 297–314.

279
Robinson, A.; van Oijen, A. M. (2013) Bacterial replication, transcription and translation: mechanistic insights from single-molecule biochemical studies. Nat. Rev. Microbiol., 11 (5), 303–315.
Ronning, O. W.; Lindmo, T. (1983) Progress through G1 and S in relation to net protein accumulation in human NHIK 3025 cells. Experimental Cell Research, 144 (1), 171–179.
Rose, S. L.; Fulton, J. M.; Brown, C. M.; Natale, F.; Van Mooy, B. A. S.; Bidle, K. D. (2014) Isolation and characterization of lipid rafts in Emiliania huxleyi: a role for membrane microdomains in host-virus interactions. Environ. Microbiol., 16 (4), 1150–1166.
Rosenwasser, S.; Graff van Creveld, S.; Schatz, D.; Malitsky, S.; Tzfadia, O.; Aharoni, A.; Levin, Y.; et al. (2014) Mapping the diatom redox-sensitive proteome provides insight into response to nitrogen stress in the marine environment. Proc. Natl. Acad. Sci. U.S.A., 111 (7), 2740–2745.
Ross, P. L. (2004) Multiplexed Protein Quantitation in Saccharomyces cerevisiae Using Amine-reactive Isobaric Tagging Reagents. Molecular & Cellular Proteomics, 3 (12), 1154–1169.
Rost, B.; Riebesell, U.; Burkhardt, S.; Sültemeyer, D. (2003) Carbon Acquisition of Bloom-Forming Marine Phytoplankton. Limnol. Oceanogr., 48 (1), 55–67.
Rustici, G.; Mata, J.; Kivinen, K.; Lió, P.; Penkett, C. J.; Burns, G.; Hayles, J.; et al. (2004) Periodic gene expression program of the fission yeast cell cycle. Nat Genet, 36 (8), 809–817.
Rymarquis, L. A.; Kastenmayer, J. P.; Hüttenhofer, A. G.; Green, P. J. (2008) Diamonds in the rough: mRNA-like non-coding RNAs. Trends in Plant Science, 13 (7), 329–334.
Sabine, C. L.; Feely, R. A.; Gruber, N.; Key, R. M.; Lee, K.; Bullister, J. L.; Wanninkhof, R.; et al. (2004) The Oceanic Sink for Anthropogenic CO2. Science, 305 (5682), 367–371.
Saez, A. G.; Probert, I.; Young, J. R.; Edvardsen, B.; Eikrem, W.; Medlin, L. K. (2004) A review of the phylogeny of the Haptophyta. In "Coccolithophores: from Molecular Processes to Global Impact". Coccolithophores-from molecular processes to global impact . -Berlin (Springer).
Sanders, D.; Pelloux, J.; Brownlee, C.; Harper, J. F. (2002) Calcium at the crossroads of signaling. Plant Cell, 14, 401–417.
Sanger, F.; Nicklen, S.; Coulson, A. R. (1977) DNA sequencing with chain-terminating inhibitors. Proc. Natl. Acad. Sci. U.S.A., 74 (12), 5463–5467.
Schroeder, D. C.; Biggi, G. F.; Hall, M.; Davy, J.; Martínez, J. M.; Richardson, A. J.; Malin, G.; et al. (2005) A genetic marker to separate Emiliania huxleyi (Prymnesiophyceae) morphotypes. J Phycol, 41 (4), 874–879.
Schulze, W. X.; Usadel, B. (2010) Quantitation in Mass-Spectrometry-Based Proteomics. Annu Rev Plant Biol, 61 (1), 491–516.

280
Sciandra, A.; Harlay, J.; Lefèvre, D.; Lemée, R.; Rimmelin, P.; Denis, M.; Gattuso, J.-P. (2003) Response of coccolithophorid Emiliania huxleyi to elevated partial pressure of CO2 under nitrogen limitation. Mar Ecol-Prog Ser, 261.
Sekino, K.; Shiraiwa, Y. (1994) Accumulation and Utilization of Dissolved Inorganic Carbon by a Marine Unicellular Coccolithophorid, Emiliania huxleyi. Plant and Cell Physiology, 35 (3), 353–361.
Sekino, K.; Shiraiwa, Y. (1996) Evidence for the Involvement of Mitochondrial Respiration in Calcification in a Marine Coccolithophorid, Emiliania huxleyi. Plant and Cell Physiology, 37 (7), 1030–1033.
Shatkin, A. J. (1976) Capping of eucaryotic mRNAs. Cell, 9 (4), 645–653; Cell Press.
Shi, D.; Xu, Y.; Morel, F. M. M. (2009) Effects of the pH/pCO2 control method on medium chemistry and phytoplankton growth. Biogeosciences, 6 (7), 1199–1207.
Shiraiwa, Y. (2003) Physiological regulation of carbon fixation in the photosynthesis and calcification of coccolithophorids. Comp Biochem Physiol B Biochem Mol Biol, 136 (4), 775–783.
Shiraki, T.; Kondo, S.; Katayama, S.; Waki, K.; Kasukawa, T.; Kawaji, H.; Kodzius, R.; et al. (2003) Cap analysis gene expression for high-throughput analysis of transcriptional starting point and identification of promoter usage. Proc Natl Acad Sci U S A, 100 (26), 15776–15781.
Siegenthaler, U.; Sarmiento, J. L. (1993) Atmospheric carbon dioxide and the ocean. Nature, 119–125.
Skipp, P.; Robinson, J.; O’Connor, C. D.; Clarke, I. N. (2005) Shotgun proteomic analysis of Chlamydia trachomatis. Proteomics, 5 (6), 1558–1573.
Snustad, D. P.; Simmons, M. J. (2000) Principles of Genetics; John Wiley and Sons, Inc.
Soto, A. R.; Zheng, H.; Shoemaker, D.; Rodriguez, J.; Read, B. A.; Wahlund, T. M. (2006) Identification and Preliminary Characterization of Two cDNAs Encoding Unique Carbonic Anhydrases from the Marine Alga Emiliania huxleyi. Appl Environ Microbiol, 72 (8), 5500–5511.
Spudish, J. L.; Sager, R. (1980) Regulation of the Chlamydomonas cell cycle by light and dark. J. Cell Biol., 85, 136–145.
Stadler, R.; Wolf, K.; Hilgarth, C.; Tanner, W.; Sauer, N. (1995) Subcellular localization of the inducible Chlorella HUP1 monosaccharide-H+ symporter and cloning of a co-induced galactose-H+ symporter. Plant Physiol., 107 (1), 33–41; Am Soc Plant Biol.
Sterling, D.; Alvarez, B. V.; Casey, J. R. (2002) The extracellular component of a transport metabolon. Extracellular loop 4 of the human AE1 Cl-/HCO3- exchanger binds carbonic anhydrase IV. J Biol Chem, 277 (28), 25239–25246.

281
Suffrian, K.; Schulz, K. G.; Gutowska, M. A.; Riebesell, U.; Bleich, M. (2011) Cellular pH measurements in Emiliania huxleyi reveal pronounced membrane proton permeability. New Phytol, 190 (3), 595–608.
Suggett, D. J.; Le Floc’H, E.; Harris, G. N.; Leonardos, N.; Geider, R. J. (2007) Different strategies of photoacclimation by two strains of Emiliania huxleyi (Haptophyta) 1. J Phycol, 43 (6), 1209–1222.
Suggett, D. J.; Moore, C. M.; Hickman, A. E.; Geider, R. J. (2009) Interpretation of fast repetition rate (FRR) fluorescence: signatures of phytoplankton community structure versus physiological state. Mar Ecol-Prog Ser, 376, 1–19.
Takei, K.; Haucke, V. (2001) Clathrin-mediated endocytosis: membrane factors pull the trigger. Trends Cell Biol., 11 (9), 385–391.
Tambutte, E.; Tambutte, S.; Segonds, N.; Zoccola, D.; Venn, A.; Erez, J.; Allemand, D. (2011) Calcein labelling and electrophysiology: insights on coral tissue permeability and calcification. Proceedings of the Royal Society B: Biological Sciences, 279 (1726), 19–27.
Tambutté, S.; Holcomb, M.; Ferrier-PagËs, C.; Reynaud, S.; Tambutté, É.; Zoccola, D.; Allemand, D. (2011) Coral biomineralization: from the gene to the environment. Journal of Experimental Marine Biology and Ecology, 408 (1), 58–78.
Tan, S.; Conaway, R. C.; Conaway, J. W. (1995) Dissection of transcription factor TFIIF functional domains required for initiation and elongation. Proc. Natl. Acad. Sci. U.S.A., 92 (13), 6042–6046.
Taylor, A. R.; Chrachri, A.; Wheeler, G.; Goddard, H.; Brownlee, C. (2011) A voltage-gated H+ channel underlying pH homeostasis in calcifying coccolithophores. PLoS Biol, 9 (6), e1001085.
Taylor, A. R.; Russell, M. A.; Harper, G. M.; Collins, T. F. T.; Brownlee, C. (2007) Dynamics of formation and secretion of heterococcoliths by Coccolithus pelagicus ssp. braarudii. European Journal of Phycology, 42 (2), 125–136.
Thierstein, H. R.; Geitzenauer, K. R.; Molfino, B.; Shackleton, N. J. (1977) Global synchroneity of late Quaternary coccolith datum levels Validation by oxygen isotopes. Geology, 5 (7), 400–404.
Thomas, M. C.; Chiang, C.-M. (2006) The general transcription machinery and general cofactors. Crit. Rev. Biochem. Mol. Biol., 41 (3), 105–178.
Tian, Q.; Stepaniants, S. B.; Mao, M.; Weng, L.; Feetham, M. C.; Doyle, M. J.; Yi, E. C.; et al. (2004) Integrated Genomic and Proteomic Analyses of Gene Expression in Mammalian Cells. Molecular & Cellular Proteomics, 3 (10), 960–969.
Tirichine, L.; Bowler, C. (2011) Decoding algal genomes: tracing back the history of photosynthetic life on Earth. Plant J, 66 (1), 45–57.

282
Tomanek, L.; Zuzow, M. J. (2010) The proteomic response of the mussel congeners Mytilus galloprovincialis and M. trossulus to acute heat stress: implications for thermal tolerance limits and metabolic costs of thermal stress. Journal of Experimental Biology, 213 (20), 3559–3574.
Tomanek, L.; Zuzow, M. J.; Ivanina, A. V.; Beniash, E.; Sokolova, I. M. (2011) Proteomic response to elevated pCO2 levles in eastern oysters,Crassostrea virginica: eveidence for oxidative stress. Journal of Experimental Biology, 214, 1836–1844.
Trapnell, C.; Roberts, A.; Goff, L.; Pertea, G.; Kim, D.; Kelley, D. R.; Pimentel, H.; et al. (2012) Differential gene and transcript expression analysis of RNA-seq experiments with TopHat and Cufflinks. Nature, 7 (3), 562–578.
Trimborn, S.; Langer, G.; Rost, B. (2007) Effect of varying calcium concentrations and light intensities on calcification and photosynthesis in Emiliania huxleyi. Limnol. Oceanogr., 52 (5), 2285–2293.
Tyrell, T.; Merico, A. (2004) Emiliania huxleyi: bloom observations and the conditions that induce them. In: Coccolithophores: from molecular processes to global impact. (H. R. Thierstein & J. R. Young, eds.).
Tyrrell, T.; Young, J. R. (2009) COCCOLITHOPHORES. (J. H. Steele & K. K. Turekian, Eds.), 2nd ed., 606–614; Elsevier.
Urizar, N. L.; Dowhan, D. H.; Moore, D. D. (2000) The farnesoid X-activated receptor mediates bile acid activation of phospholipid transfer protein gene expression. J. Biol. Chem., 275 (50), 39313–39317.
Van Bleijswijk, J. D. L.; Kempers, R. S.; Veldhuis, M. J.; Westbroek, P. (1994) Cell and growth characteristics of types a and b of Emiliania huxleyi (Prymnesiophyceae) as determined by flow cytometry and chemical analyses. J Phycol, 30 (2), 230–241.
van Bleijswijk, JDL; Veldhuis, M. (1995) In situ gross growth rates of Emiliania huxleyi in enclosures with different phosphate loadings revealed by diel changes in DNA content. Mar Ecol-Prog Ser, 121, 271–277.
van Bleijswijk, Judith; Wal, P.; Kempers, R.; Veldhuis, M.; Young, J. R.; Muyzer, G.; Vrind-de Jong, E.; et al. (1991) Distribution of two types of Emiliania huxleyii (Prymnesiophyzeae) in the northeast Atlantic region as determined by immunofluorescence and coccolith morphology. J Phycol, 27 (5), 566–570.
van den Heuvel, S.; Harlow, E. (1993) Distinct roles for cyclin-dependent kinases in cell cycle control. Science, 262 (5142), 2050–2054.
van der Wal, P.; de Jong, E. W.; Westbroek, P.; de Bruijn, W. C.; Mulder-Stapel, A. A. (1983) Polysaccharide localization, coccolith formation, and golgi dynamics in the coccolithophorid Hymenomonas carterae. Journal of Ultrastructure Research, 85 (2), 139–158;

283
van der Wal, P.; de Vrind, J. P. M.; de Vrind-de Jong, E. W.; Borman, A. H. (1987) Incompleteness of the coccosphere as a possible stimulus for coccolith formation in Pleurochrysis carterae (Prymnesiophyceae). J Phycol, 23 (1), 218–221.
van der Wal, P.; Jong, E. W.; Westbroek, P.; Bruijn, W. C.; Mulder-Stapel, A. A. (1983) Ultrastructural polysaccharide localization in calcifying and naked cells of the coccolithophorid Emiliania huxleyi, 118 (2), 157–168.
Van Emburg, P. R. (1989, September 8) Coccolith formation in Emiliania huxleyi.
Van Emburg, P. R.; de Jong, E. W.; Daems, W. T. (1986) Immunochemical localization of a polysaccharide from biomineral structures (coccoliths) of Emiliania huxleyi. Journal of Ultrastructure and Molecular Structure Research, 94 (3), 246–259.
Vandenbussche, F.; Verbelen, J. P.; Van Der Straeten, D. (2005) Of light and length: regulation of hypocotyl growth in Arabidopsis. Bioessays, 27 (3), 275–284; Wiley Online Library.
VanGuilder, H. D.; Vrana, K. E.; Freeman, W. M. (2008) Twenty-five years of quantitative PCR for gene expression analysis. Biotechniques, 44 (5), 619–626.
Velculescu, V. E.; Zhang, L.; Vogelstein, B.; Kinzler, K. W. (1995) Serial analysis of gene expression. Science, 270 (5235), 484–487.
Venn, A.; Quinn, J.; Jones, R.; Bodnar, A. (2009) P-glycoprotein (multi-xenobiotic resistance) and heat shock protein gene expression in the reef coral Montastraea franksi in response to environmental toxicants. Aquat. Toxicol., 93 (4), 188–195.
Venn, A.; Tambutté, É.; Holcomb, M.; Allemand, D.; Tambutté, S. (2011) Live Tissue Imaging Shows Reef Corals Elevate pH under Their Calcifying Tissue Relative to Seawater. PLoS ONE, 6 (5), e2001.
Verardo, D. J.; Froelich, P. N.; McIntyre, A. (1990) Determination of organic carbon and nitrogen in marine sediments using the Carlo Erba NA-1500 analyzer. Deep Sea Research Part A. Oceanographic Research Papers, 37 (1), 157–165.
Verret, F.; Wheeler, G.; Taylor, A. R.; Farnham, G.; Brownlee, C. (2010) Calcium channels in photosynthetic eukaryotes: implications for evolution of calcium-based signalling. New Phytol, 187 (1), 23–43.
Vierling, E. (1991) The roles of heat shock proteins in plants. Annu Rev Plant Biol, 42 (1), 579–620.
Vince, J. W.; Reithmeier, R. A. (2000) Identification of the carbonic anhydrase II binding site in the Cl(-)/HCO(3)(-) anion exchanger AE1. Biochemistry, 39 (18), 5527–5533.
Vliegenthart, J.; van Halbeek, H.; Dorland, L. (1981) The aplicability of 50-Mhz high-resolution 1h-NMR spectroscopyfor the structure determination of carbohydrates derived from glycoproteins. Pure and Applied Chemistry, 53, 45–77.

284
Volk, T.; Hoffert, M. I. (1985) Ocean carbon pumps: Analysis of relative strengths and efficiencies in ocean-driven atmospheric CO2 changes. In: The Carbon Cycle and Atmospheric CO2: Natural Variations Archean to Present, Vol. 32, 99–110.
Volkman, J. K.; Eglinton, G.; Corner, E. D. S.; Sargent, J. R. (1980) Novel unsaturated straight-chain C37 C39 methyl and ethyl ketones in marine sediments and a coccolithophore Emiliania huxleyi. Palaeogeography, Palaeoclimatology, Palaeoecology, 12, 219–227.
Wahlund, T. M.; Hadaegh, A. R.; Clark, R.; Nguyen, B.; Fanelli, M.; Read, B. A. (2004) Analysis of Expressed Sequence Tags from Calcifying Cells of Marine Coccolithophorid (Emiliania huxleyi). Mar Biotechnol, 6 (3), 278–290.
Wahlund, T. M.; Zhang, X.; Read, B. A. (2004) Expressed sequence tag profiles from calcifying and non-calcifying cultures of Emiliania huxleyi. micropalaeontology, 50 (Suppl 1), 145–155.
Wang, W.; Vinocur, B.; Shoseyov, O.; Altman, A. (2004) Role of plant heat-shock proteins and molecular chaperones in the abiotic stress response. Trends in Plant Science, 9 (5), 244–252; Elsevier.
Wang, Z.; Gerstein, M.; Snyder, M. (2009) RNA-Seq: a revolutionary tool for transcriptomics. Nat Rev Genet, 10 (1), 57–63.
Warnecke, F.; Hess, M. (2009) A perspective: Metatranscriptomics as a tool for the discovery of novel biocatalysts. Journal of Biotechnology, 142 (1), 91–95.
Wasinger, V. C.; Cordwell, S. J.; Cerpa-Poljak, A.; Yan, J. X.; Gooley, A. A.; Wilkins, M. R.; Duncan, M. W.; et al. (1995) Progress with gene-product mapping of the Mollicutes:Mycoplasma genitalium. J Phycol, 16 (1), 1090–1094.
Weiner, S.; Dove, P. M.; De Yoreo, J. J. (2003) Biomineralization. (J. J. Rosso, Ed.)Reviews in Mineralogy and Geochemistry Reviews in Mineralogy and Geochemistry, Vol. 54.
Weiner, S.; Levi-Kalisman, Y.; Raz, S.; Addadi, L. (2003) Biologically Formed Amorphous Calcium Carbonate. Connective Tissue Research, 44 (1), 214–218.
Weiner, S.; Traub, W.; Parker, S. B. (1984) Macromolecules in mollusc shells and their functions in biomineralization. Philosophical Transactions of the Royal Society London B Biological Science, 304, 425–434.
Weiss, I. M.; Tuross, N.; Addadi, L.; Weiner, S. (2002) Mollusc larval shell formation: amorphous calcium carbonate is a precursor phase for aragonite. Journal of Experimental Zoology, 293 (5), 478–491.
Welschmeyer, N. A. (1994) Fluorometric Analysis of Chlorophyll a in the Presence of Chlorophyll b and Pheopigments. Limnol. Oceanogr., 39 (8), 1985–1992.
Westbroek, P.; Young, J. R.; Linschooten, K. (1989) Coccolith Production (Biomineralization) in the Marine Alga Emiliania huxleyi. Journal of Eukaryotic Microbiology, 36 (4), 368–373.

285
Wijnen, H.; Young, M. W. (2006) Interplay of circadian clocks and metabolic rhythms. Annual Review of Genetics, 40, 409–448.
Wilbur, K. M.; Watabe, N. (1963) Experimental Studies on Calcification in Molluscs and the Alga Coccolithus Huxleyi. J Phycol, 109 (1), 82–112.
Wilkins, M. R.; Pasquali, C.; Appel, R. D.; Ou, K.; Golaz, O.; Sanchez, J.-C.; Yan, J. X.; et al. (1996) From Proteins to Proteomes: Large Scale Protein Identification by Two-Dimensional Electrophoresis and Arnino Acid Analysis. Nat. Biotechnol., 14 (1), 61–65.
Wittwer, C. T.; Herrmann, M. G.; Moss, A. A.; Rasmussen, R. P. (1997) Continuous fluorescence monitoring of rapid cycle DNA amplification. Biotechniques, 22 (1), 130–1– 134–8.
Woeller, F. H. (1961) Liquid scintillation counting of C-14-labelled CO2 with phenethylamine. Anal Biochem, 2, 508–511.
Wurch, L. L.; Bertrand, E. M.; Saito, M. A.; Van Mooy, B. A. S.; Dyhrman, S. T. (2011) Proteome Changes Driven by Phosphorus Deficiency and Recovery in the Brown Tide-Forming Alga Aureococcus anophagefferens. PLoS ONE, 6 (12), e28949;
Yalovsky, S.; Paulsen, H.; Michaeli, D.; Chitnis, P. R.; Nechushtai, R. (1992) Involvement of a chloroplast HSP70 heat shock protein in the integration of a protein (light-harvesting complex protein precursor) into the thylakoid membrane. Proc. Natl. Acad. Sci. U.S.A., 89 (12), 5616–5619.
Yoo, S. H.; Lewis, M. S. (1992) Effects of pH and Ca2+ on monomer-dimer and monomer-tetramer equilibria of chromogranin A. J Biol Chem.
Yoon, H. S.; Hackett, J. D.; Ciniglia, C.; Pinto, G.; Bhattacharya, D. (2004) A molecular timeline for the origin of photosynthetic eukaryotes. Mol. Biol. Evol., 21 (5), 809–818.
Young, J. N. (1994) Functions of coccoliths. In: Coccolithophores (A. Winter & W. Siesser, eds.), 63–82; Cambridge University Press.
Young, J. R.; Andruleit, H.; Probert, I. (2009) Coccolith function and morphogenesis: insights from appendage-bearing coccolithophores of the family Syracosphaeraceae (Haptophyta). J Phycol, 45 (1), 213–226.
Young, J. R.; Davis, S. A.; Bown, P. R.; Mann, S. (1999) Coccolith Ultrastructure and Biomineralisation, 126 (3), 195–215.
Young, J. R.; Didymus, J. M.; Brown, P. R.; Prins, B.; Mann, S. (1992) Crystal assembly and phylogenetic evolution in heterococcoliths. Nature, 356 (6369), 516–518.
Young, J. R.; Henriksen, K. (2003) Biomineralization Within Vesicles: The Calcite of Coccoliths. Reviews in Mineralogy and Geochemistry, 54 (1), 189–215.
Zeebe, R.; Ridgwell, A. (2011) Past changes in ocean carbonate chemistry. In: Ocean Acidification (J. P. Gattuso, ed.), 21–40; Oxford University Press.

286
Zondervan, I. (2007) The effects of light, macronutrients, trace metals and CO2 on the production of calcium carbonate and organic carbon in coccolithophores‚ A review. Deep-Sea Res. Part II-Top. Stud. Oceanogr., 54 (5), 521–537.
Zondervan, I.; Rost, B.; Riebesell, U. (2002) Effect of CO2 concentration on the PIC/POC ratio in the coccolithophore Emiliania huxleyi grown under light-limiting conditions and different daylengths. Journal of Experimental Marine Biology and Ecology, 272 (1), 55–70.
Zondervan, I.; Zeebe, R. E.; Rost, B.; Riebesell, U. (2001) Decreasing marine biogenic calcification: a negative feedback on rising atmospheric pCO2. Global Biogeochem Cy, 15 (2), 507–516.
Bibliography
Jones, B., 2010. The proteome of Emiliania huxleyi and its responses to CO2 induced ocean acidification. University of Southampton, August 2010
Rehm, H. (2006) Protein biochemistry and proteomics; Elsevier.
Snustad, D.P. & Simmons, M.J., 2000. Principles of Genetics, John Wiley and Sons, Inc.
Tyrrell, T. & Young, J.R., 2009. Coccolithophores 2nd ed. J. H. Steele & K. K. Turekian, eds., Elsevier.
Weiner, S., Dove, P.M. & De Yoreo, J.J., 2003a. Biomineralization J. J. Rosso, ed., Mineralogical Society of America.
Zachleder, V., Bisova, K., Vitova, M., 2016. The Cell Cycle of Microalgae. In: The Physiology
of Microalgae. M.A. Borowitzka, J. Beardall, J.A. Raven, eds., Springer. pp. 3–46.