Flow Control with Rotating Cylinders - ePrints Soton
20
This draft was prepared using the LaTeX style file belonging to the Journal of Fluid Mechanics 1 Flow Control with Rotating Cylinders James C. Schulmeister 1 †, J. M. Dahl 2 G. D. Weymouth 3 and M. S. Triantafyllou 1 1 Department of Mechanical Engineering, Massachusetts Institute of Technology, 77 Massachusetts Ave., Cambridge, MA 02139 2 Department of Ocean Engineering, University of Rhode Island, 215 South Ferry Road, Narragansett, RI 02882 3 Southampton Marine and Maritime Institute, University of Southampton, Southampton SO17 1BJ, UK (Received xx; revised xx; accepted xx) We study the use of small counter-rotating cylinders to control the streaming flow past a larger main cylinder for drag reduction. In a water tunnel experiment at a Reynolds number of 47, 000 with a three-dimensional and turbulent wake, Particle Image Velocimetry (PIV) measurements show that rotating cylinders narrow the mean wake and shorten the recirculation length. The drag of the main cylinder was measured to reduce by up to 45%. To examine the physical mechanism of the flow control in detail, a series of two-dimensional numerical simulations at a Reynolds number equal to 500 were conducted. These simulations investigated a range of control cylinder diameters in addition to rotation rates and gaps to the main cylinder. Effectively controlled simulated flows present a streamline that separates from the main cylinder, passes around the control cylinder, and reattaches to the main cylinder at a higher pressure. The computed pressure recovery from the separation to reattachment points collapse with respect to a new scaling, which indicates that the control mechanism is viscous. 1. Introduction Flow separation from bluff bodies at moderate and high Reynolds numbers often causes large hydrodynamic forces. Mechanisms that mitigate separation can reduce both time- averaged and fluctuating forces, which is advantageous for many engineered structures and vehicles. Flow separation control has thus been a subject of intense investigative effort for much of the last century, beginning with Prandtl’s description of the boundary- layer in 1904 and demonstration of separation control via targeted actuation with the moving surface of a rotating circular cylinder (Prandtl 1925). Active flow separation control involves actuators that consume power (Choi et al. 2008) to inject momentum targeted at the boundary-layer to control separation and reduce drag (Cattafesta & Sheplak 2011). An actuator’s control authority is often highly correlated with its momentum flux or thrust. Seifert (2007) developed several non-dimensional numbers to evaluate actuators, also using a momentum coefficient to compare those with disparate physical mechanisms, such as synthetic jets, moving surfaces, and dialectric barrier discharge plasma actuators. The vortex shedding of a circular cylinder can be suppressed by the appropriate positioning of a smaller control cylinder in the near wake (Strykowski & Sreenivasan 1990), though only at very low Reynolds numbers. At higher Reynolds numbers, the flow past bluff shapes, as well as lifting airfoils, can be effectively controlled for drag † Email address for correspondence: [email protected] Page 1 of 20
-
Upload
khangminh22 -
Category
Documents
-
view
7 -
download
0
Transcript of Flow Control with Rotating Cylinders - ePrints Soton

This draft was prepared using the LaTeX style file belonging to the Journal of Fluid Mechanics 1
Flow Control with Rotating Cylinders
James C. Schulmeister1†, J. M. Dahl2 G. D. Weymouth3 and M. S.Triantafyllou1
1Department of Mechanical Engineering, Massachusetts Institute of Technology, 77Massachusetts Ave., Cambridge, MA 02139
2Department of Ocean Engineering, University of Rhode Island, 215 South Ferry Road,Narragansett, RI 02882
3Southampton Marine and Maritime Institute, University of Southampton, SouthamptonSO17 1BJ, UK
(Received xx; revised xx; accepted xx)
We study the use of small counter-rotating cylinders to control the streaming flowpast a larger main cylinder for drag reduction. In a water tunnel experiment at aReynolds number of 47, 000 with a three-dimensional and turbulent wake, Particle ImageVelocimetry (PIV) measurements show that rotating cylinders narrow the mean wakeand shorten the recirculation length. The drag of the main cylinder was measured toreduce by up to 45%. To examine the physical mechanism of the flow control in detail,a series of two-dimensional numerical simulations at a Reynolds number equal to 500were conducted. These simulations investigated a range of control cylinder diameters inaddition to rotation rates and gaps to the main cylinder. Effectively controlled simulatedflows present a streamline that separates from the main cylinder, passes around thecontrol cylinder, and reattaches to the main cylinder at a higher pressure. The computedpressure recovery from the separation to reattachment points collapse with respect to anew scaling, which indicates that the control mechanism is viscous.
1. Introduction
Flow separation from bluff bodies at moderate and high Reynolds numbers often causeslarge hydrodynamic forces. Mechanisms that mitigate separation can reduce both time-averaged and fluctuating forces, which is advantageous for many engineered structuresand vehicles. Flow separation control has thus been a subject of intense investigativeeffort for much of the last century, beginning with Prandtl’s description of the boundary-layer in 1904 and demonstration of separation control via targeted actuation with themoving surface of a rotating circular cylinder (Prandtl 1925).Active flow separation control involves actuators that consume power (Choi et al. 2008)
to inject momentum targeted at the boundary-layer to control separation and reduce drag(Cattafesta & Sheplak 2011). An actuator’s control authority is often highly correlatedwith its momentum flux or thrust. Seifert (2007) developed several non-dimensionalnumbers to evaluate actuators, also using a momentum coefficient to compare those withdisparate physical mechanisms, such as synthetic jets, moving surfaces, and dialectricbarrier discharge plasma actuators.The vortex shedding of a circular cylinder can be suppressed by the appropriate
positioning of a smaller control cylinder in the near wake (Strykowski & Sreenivasan1990), though only at very low Reynolds numbers. At higher Reynolds numbers, theflow past bluff shapes, as well as lifting airfoils, can be effectively controlled for drag
† Email address for correspondence: [email protected]
Page 1 of 20

2 J. C. Schulmeister et al
reduction by adding small control cylinders that are rotated rapidly (Modi 1997). Thecontrol cylinders, when placed in close proximity to a bluff body and rotated at highrates, interact with the separating boundary layer to cause it to reattach and reducepressure drag. The drag reduction is sensitive to the control cylinder position, diameter,and normalized surface speed, ξ = usurf/U∞. Here, usurf is the tip speed of the controlcylinder and U∞ is the free stream velocity.The flow actuator in this case, a rotating cylinder, experiences a lift force in a cross-
flow. Prandtl (1926) argued, based on a potential flow model, that this lift does notexceed a maximum value that is associated with the upstream and downstream stagnationpoints merging and then moving into the fluid as a saddle point. Tokumaru & Dimotakis(1993) present experimental measurements of the lift on a rotating cylinder that exceedPrandtl’s maximum lift by 20%. Sengupta et al. (2003b) identify in numerical simulationsa temporal flow instability in the wake at high rotation rates. This instability providesa mechanism for vorticity to be shed into the wake and Prandtl’s maximum lift to beexceeded. Vortex shedding at high rotation rates was shown experimentally by Kumaret al. (2011).
In the flow past a rotating cylinder near a plane wall, the gap width is an importantparameter in determining the forces on the cylinder, vortex shedding (Cheng & Luo2007) and three-dimensional instability (Rao et al. (2011) and Rao et al. (2015)). Inthe application of rotating control cylinders to bluff body flow control, Mittal (2001)found that the gap between the main and control cylinders is a critical parameter andsensitivity to the gap changes with Reynolds number. Mittal (2003) suggests that themechanism of the control is the injection of momentum from the outer flow into the wakeand therefore the circulation of the control cylinders is of primary importance. When thegap is large, the interaction will be too small to be effective. And, conversely, when thegap is small, sufficient circulation to control the flow won’t be generated, indicating theexistence of an optimal gap distance.
Water tunnel experiments (Korkischko & Meneghini 2012) and numerical simulations(Zhu et al. 2015) have shown that counter-rotating control cylinders suppress Vortex-Induced Vibrations (VIV) in addition to reducing drag of a larger main cylinder. Thesimulations additionally showed that the VIV suppression was optimized at a particularconfiguration of control cylinder rotation rate and position. Rotating cylinders have alsobeen used successfully in closed-loop feedback systems for the suppression of vortexshedding from bluff bodies. Examples can be found in the work by Muddada & Patnaik(2010), Beaudoin et al. (2006), and Patnaik & Wei (2002).
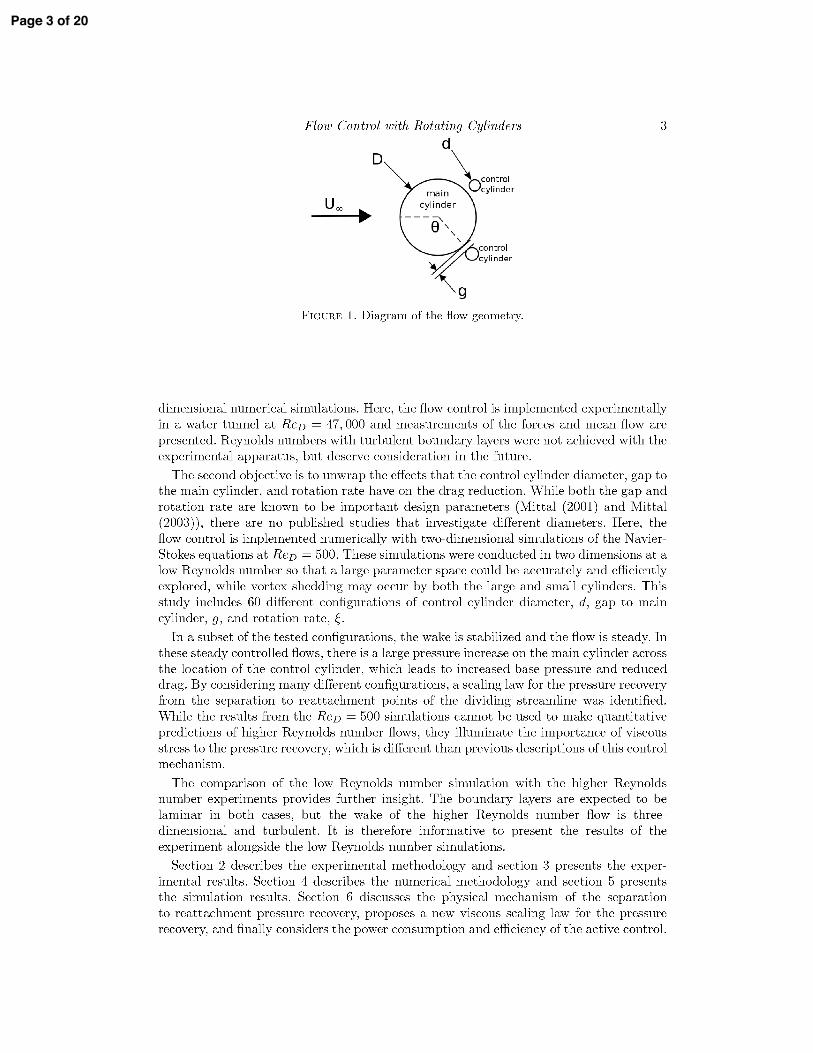
The geometry of both the experiments and numerical simulations presented hereincludes three bodies. A large main cylinder is accompanied by two smaller counter-rotating control cylinders, which are located symmetrically with respect to a uniformstreaming flow. Figure 1 shows a diagram of the arrangement of a main cylinder andcontrol cylinders. The Reynolds number is computed with the main cylinder diameter,D, length scale: ReD = DU∞
ν .In this article we address two objectives. The first is a demonstration of the drag
reduction of a circular cylinder with rotating control cylinders at ReD = 47, 000.Modi (1997) reports the results of numerous studies in this Reynolds number rangefor airfoils and non-circular cylinders. The highest Reynolds number studies for the dragreduction of a circular cylinder are the experiments by Korkischko & Meneghini (2012)up to ReD = 7500 and the numerical simulations by Mittal (2001) at ReD = 10, 000,who noted that the two-dimensional results should be considered an upper boundfor the lift of a rotating cylinder in three-dimensional flow. It is therefore importantto demonstrate drag reduction at higher Reynolds numbers in experiment or three-
Page 2 of 20
Page 3 of 20

4 J. C. Schulmeister et al
ReD g/D d/D θ ξ
47,000 0.025 0.125 120 [0, 0.68, 0.82, 0.96, ..., 3.4]
Table 1. Configurations tested in the water tunnel experiments (22 in total).
2. Experimental Method
Experiments were conducted in a recirculating water tunnel. An aluminum circularcylinder with outer diameter D = 0.0508 m and length L = 0.502 m (L/D = 9.875)was fixed at its center from the inside to a six-axis force transducer (AMTI MC1). Thecylinder nearly spanned the water tunnel test section to mitigate three-dimensional endeffects; the gap between the cylinder end and test section wall at both ends was equalto 6.25% of the main cylinder diameter. Morse et al. (2008) found that end effects aresmall for gaps between a cylinder end and an unattached end-plate of less than 15%of the cylinder diameter, which is a similar end condition to a gap to the test sectionwall. This near wall end condition was also used in Korkischko & Meneghini (2012). Thetest section is 1.47 m long and the cross-section is 0.508× 0.508 m. The free stream wasmeasured using Laser Doppler Velocimetry to have a mean velocity of 0.925 m/s andfree stream turbulence intensity of 4%. The cylinder was mounted in the center of thecross-section and the blockage ratio was 10%. West & Apelt (1982) report that whileblockage ratios of 6% to 16% alter the flow patterns compared to free stream flows, thedrag of a circular cylinder is not significantly changed.Two precision machined stainless steel shafts served as the rotating control cylinders.
The control cylinders were mounted separately from but in close proximity to the maincylinder and spanned the entire test section, being supported by bushings in the testsection walls. The control cylinders were rotated by two independent Yaskawa SigmaMini servo motors. The high speed motor shafts, rotating at speeds up to 10,000 RPM,penetrated the test section wall through teflon bushings and coupled co-axially to thecontrol cylinders through low inertia flexure couplings. The configuration parameters forthe water tunnel experiments are listed in table 1.Forces and moments exerted on the main cylinder were monitored with the force
transducer installed in-line with the coaxial sting mount. The smaller rotating controlcylinders, being supported by bushings in the test section wall and having no contact withthe main cylinder or its supporting sting, did not transmit loads to the force transducer.The force measurements therefore reflect the hydrodynamic forces exerted only on themain cylinder and do not include forces exerted on the control cylinders. The drag andlift forces were sampled at 1000 Hz and recorded continuously for 15 minutes at eachrotation rate. This corresponds to over 2,000 vortex shedding cycles. The uncertainty inthe force measurements is estimated by analyzing the standard deviation of the measuredtime series. Since the forces are unsteady due to vortex shedding at approximately 2.75Hz, the raw measurements were first filtered using a third-order Butterworth filter with a10 Hz low-pass cutoff frequency. This filtered signal was subtracted from the raw signal,leaving only noise at frequencies higher than the vortex shedding. The standard deviationof the noise did not exceed 5% of the mean drag force of the base cylinder without controlcylinders.In addition to force measurements, the mean flow field was measured with two-
dimensional planar PIV. A plane normal to the cylinder axis was illuminated with a532 nm laser sheet. The field of view was 8.19 cm in the stream direction and 14.85 cmin the transverse direction (1.6×2.9 D). A high-speed digital camera was focused on this
Page 4 of 20
Flow Control with Rotating Cylinders 5
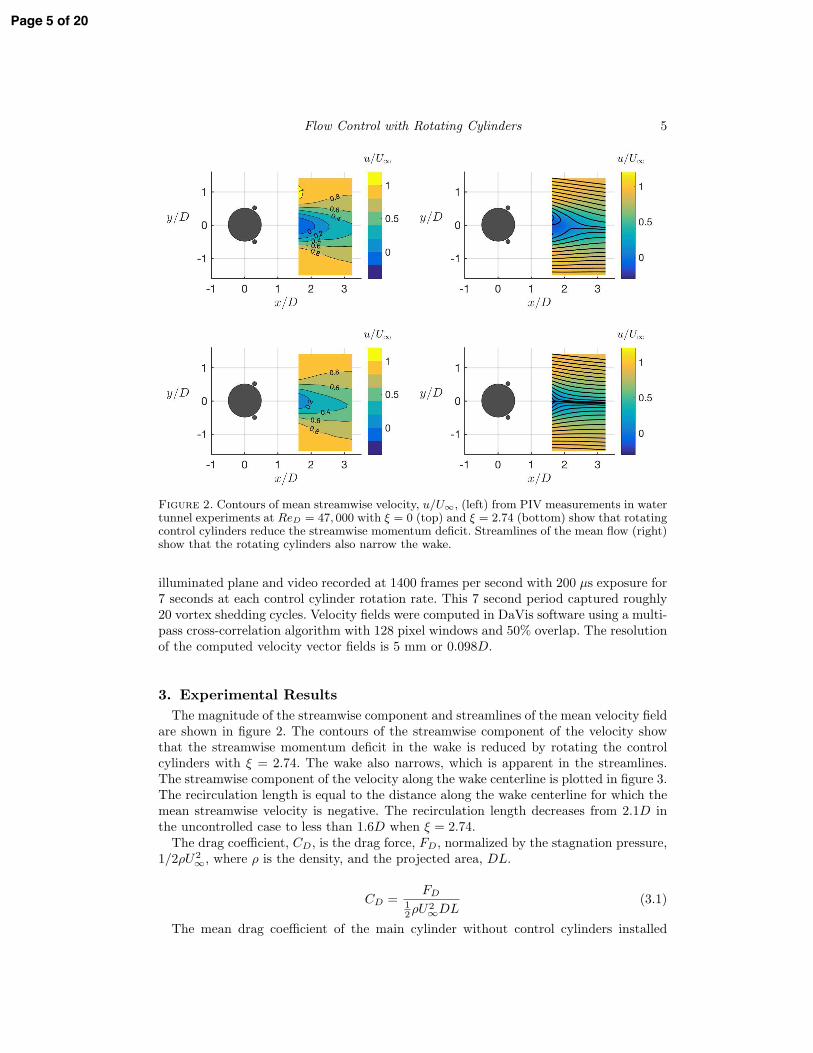
Figure 2. Contours of mean streamwise velocity, u/U∞, (left) from PIV measurements in watertunnel experiments at ReD = 47, 000 with ξ = 0 (top) and ξ = 2.74 (bottom) show that rotatingcontrol cylinders reduce the streamwise momentum deficit. Streamlines of the mean flow (right)show that the rotating cylinders also narrow the wake.
illuminated plane and video recorded at 1400 frames per second with 200 µs exposure for7 seconds at each control cylinder rotation rate. This 7 second period captured roughly20 vortex shedding cycles. Velocity fields were computed in DaVis software using a multi-pass cross-correlation algorithm with 128 pixel windows and 50% overlap. The resolutionof the computed velocity vector fields is 5 mm or 0.098D.
3. Experimental Results
The magnitude of the streamwise component and streamlines of the mean velocity fieldare shown in figure 2. The contours of the streamwise component of the velocity showthat the streamwise momentum deficit in the wake is reduced by rotating the controlcylinders with ξ = 2.74. The wake also narrows, which is apparent in the streamlines.The streamwise component of the velocity along the wake centerline is plotted in figure 3.The recirculation length is equal to the distance along the wake centerline for which themean streamwise velocity is negative. The recirculation length decreases from 2.1D inthe uncontrolled case to less than 1.6D when ξ = 2.74.The drag coefficient, CD, is the drag force, FD, normalized by the stagnation pressure,
1/2ρU2∞, where ρ is the density, and the projected area, DL.
CD =FD
12ρU2
∞DL
(3.1)
The mean drag coefficient of the main cylinder without control cylinders installed
Page 5 of 20

6 J. C. Schulmeister et al
1.5 2 2.5 3 3.5
x/D
-0.2
0
0.2
0.4
0.6
u/U∞
ξ = 0
ξ = 2.74
Figure 3. The streamwise component of the velocity along the wake centerline (y/D = 0).The recirculation length decreases from 2.1D to less than 1.6D when the control cylinders arerotated with ξ = 2.74.
0 0.5 1 1.5 2 2.5 3 3.5
ξ
0
0.5
1
1.5
CD
Figure 4. In water tunnel experiments at ReD = 47, 000, the measured mean drag decreaseswith increasing control cylinder rotation parameter, ξ, to 55% of the base flow drag when ξ = 3.4.
was measured to be CD = 1.05. This is somewhat lower than the expected value ofapproximately 1.2 for this Reynolds number (Zdravkovich 1997), possibly due to therelatively high free stream turbulence intensity of 4%, as well as the test section wallboundary layers incident on the ends of the cylinder.Figure 4 shows CD with the control cylinders installed and rotated at different rates.
The presence of the control cylinders increases CD to 1.33 with ξ = 0. Korkischko &Meneghini (2012) saw an increase in CD from 1.21 to 1.51 in a similar arrangement. Thedrag coefficient decreases approximately linearly with increasing rotation parameter. Thehighest drag reduction compared to the value with static control cylinders was 45% atξ = 3.4. This drag reduction represents the main cylinder only. The drag of the rotatingcontrol cylinders could not be measured with the experimental setup. The drag of theentire system, including the accompanying rotating control cylinders, may have reducedby a smaller margin due to the contribution of the force on the rotating control cylinders.
It is difficult to use PIV to make high spatial resolution measurements in the boundarylayer and gap between the main and control cylinders because the multiple cylindersobstruct the line of sight of both laser and camera. In addition, conducting experimentswith many different configurations is expensive. So, in order to study the flow controlmechanism in detail and also to efficiently investigate the sensitivity of the flow control tothe configuration parameters, we conduct a series of numerical simulations to supplement
Page 6 of 20

Flow Control with Rotating Cylinders 7
θ0 π/2 π
Cp
-2
-1.5
-1
-0.5
0
0.5
1
1.5
D = 38 grid points
D = 50 grid points
D = 77 grid points
D = 100 grid points
D = 200 grid points
h/D
10-2
10-1
Err
or
10-2
10-1
100
Figure 5. Pressure profile (left) and normalized simulation error of the base pressure (right)for the configuration with g/D = 0.01, d/D = 0.01, and ξ = 4 with respect to grid resolution.The error is computed relative to the base pressure obtained using a fine D = 200h referencegrid. The solid line indicates second-order convergence with h and the dashed line indicatesfirst-order convergence.
these promising experimental results. Two dimensional simulations at Reynolds number500 were selected for computational ease, with the anticipation that the mechanismscausing drag reduction are qualitatively similar.
4. Numerical Method
The Reynolds number based on the free stream and main cylinder diameter is setto ReD = 500 in these simulations so that both the main and control cylinders wouldexhibit vortex shedding in isolation. This was verified by observing vortex shedding in areference simulation of an isolated cylinder with diameter equal to the smallest controlcylinder considered in this study, with respect to both ReD and to the grid spacing, h.The boundary data immersion method (BDIM), (Weymouth & Yue (2011) and
Maertens & Weymouth (2015)), was used for these simulations. Cartesian-grid methodsare well established at dealing with multiply connected domains (Ye et al. 1999) andBDIM has been experimentally validated many times, including for the case of flow pasta circular cylinder with Re = 100 by Maertens & Weymouth (2015). A computationaldomain having dimensions 10D×10D was used for these simulations. The main cylinderis positioned with distances of 4D and 6D, respectively, from its center to the upstreamand downstream boundaries of the domain, and is centered in the direction transverseto the free stream. This domain has a blockage ratio of 10%, which is identical to theblockage ratio in the water tunnel experiments described in Section 2.Figure 5 presents the results of a grid convergence study on the base pressure coefficient
or pressure coefficient at θ = 180, for the configuration with g/D = 10%, d/D = 10%,and ξ = 4. The base pressure convergence is second-order with h and the difference in thesolution between the two finest grids is less than 3%. This demonstrates the convergenceof these simulations and the grid with 102.4 grid points spanning the main cylinderdiameter is used for this study.The torque, T , required to sustain the steady rotation of the control cylinders with
angular velocity, Ω, is balanced by shear stress around the circumference of the controlcylinder. The immersed boundary distorts the velocity gradients at the wall, so the torqueis computed by integrating the shear stress, τθ, on a circular contour with radius, Rc,concentric with the cylinder and one grid point larger than the immersed boundary. Inthese simulations, the immersed boundary extends to a radius of d/2 + ϵ, where ϵ = 2h
Page 7 of 20

8 J. C. Schulmeister et al
ReD d/D g/D θ ξ
500 0.1 [0.05, 0.06, 0.07, 0.08, 0.09, 0.1] 120 [0, 1, 2, 3, 4, 5]500 0.125 [0.05, 0.1] 120 [0, 1, 2, 3, 4, 5]500 0.15 [0.05, 0.06, 0.07, 0.08, 0.09, 0.1] 120 [0, 1, 2, 3, 4, 5]
Table 2. Configurations of the numerical simulations (60 in total).
and h = D/102.4. As a result, Rc = d/2+ ϵ+h was selected to ensure that the immersedboundary would not affect the computed shear stress.
TΩ =
! 2π
0
τθ(Rc, θ)uθ(Rc, θ)dθ (4.1)
The difference between the power consumption of the rotating cylinders computedwith (4.1) with the solutions from the two finest grids is 2.3%.Simulations were conducted for ranges of control cylinder diameter, d/D, gap to
main cylinder, g/D, and rotation rate, ξ. Table 2 shows the configurations of numericalsimulations.
5. Numerical Simulation Results
5.1. Wake Stabilization
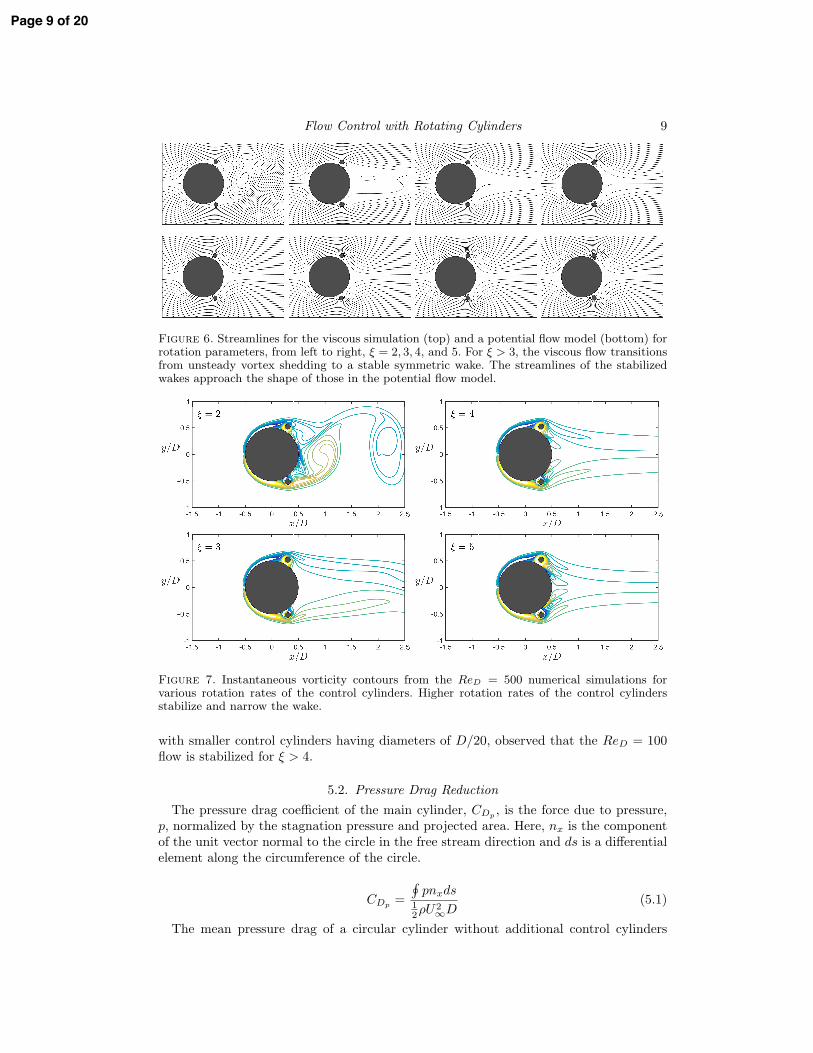
The uncontrolled flow past a circular cylinder at ReD = 500 exhibits periodic vortexshedding. All tested cases with stationary control cylinders also exhibited periodic vortexshedding. In contrast, rotating the control cylinders above a critical rate stabilized thewake. The ability of rotating cylinders to stabilize the wake of a main cylinder, especiallyat low Reynolds numbers, has been shown by Mittal (2001) and Muddada & Patnaik(2010).Figure 6 compares instantaneous simulation streamlines from the numerical simula-
tions with those from corresponding potential flow models. The instantaneous viscousflow streamlines show vortex shedding occurs for ξ < 3 and the wake is stable for ξ > 3.The streamlines of the higher rotation rate stable viscous flows approach the shape ofthe streamlines in the potential flow model. The vorticity contours, shown in figure 7,also show the stabilization and narrowing of the wake at higher control cylinder rotationrates.In both the viscous and potential flows, stagnation points straddle each control cylinder
in the configurations with stabilized wakes. The streamlines that connect these stagnationpoints divide the flow between fluid that recirculates around the control cylinders andfluid that streams into the steady wake.The stabilization of the wake for higher rotation parameters is also apparent in the
reduction in variance of pressure on the surface of the main cylinder. Figure 8 shows theroot mean square pressure coefficient as a shaded belt around the time-averaged pressurecoefficient at different rotation rates of control cylinders with g/D = 0.05 and d/D = 0.1.When ξ = 0, 1, and 2, the thick shaded belt indicates that the pressure fluctuates in timeand the wake is unsteady. When ξ = 3, 4, and 5, the pressure fluctuations disappear,showing that the flow is steady. This transition from an unsteady flow to a steady onewhen the rotation parameter is increased to ξ > 3 is consistent with the symmetricstreamlines in the wake shown in figure 6. Mittal (2001), in a similar configuration, but
Page 8 of 20
Flow Control with Rotating Cylinders 9
Figure 6. Streamlines for the viscous simulation (top) and a potential flow model (bottom) forrotation parameters, from left to right, ξ = 2, 3, 4, and 5. For ξ > 3, the viscous flow transitionsfrom unsteady vortex shedding to a stable symmetric wake. The streamlines of the stabilizedwakes approach the shape of those in the potential flow model.
Figure 7. Instantaneous vorticity contours from the ReD = 500 numerical simulations forvarious rotation rates of the control cylinders. Higher rotation rates of the control cylindersstabilize and narrow the wake.
with smaller control cylinders having diameters of D/20, observed that the ReD = 100flow is stabilized for ξ > 4.
5.2. Pressure Drag Reduction
The pressure drag coefficient of the main cylinder, CDp, is the force due to pressure,
p, normalized by the stagnation pressure and projected area. Here, nx is the componentof the unit vector normal to the circle in the free stream direction and ds is a differentialelement along the circumference of the circle.
CDp=
"
pnxds12ρU2
∞D
(5.1)
The mean pressure drag of a circular cylinder without additional control cylinders
Page 9 of 20

10 J. C. Schulmeister et al
Figure 8. The mean (solid line) and root mean square (shaded) pressure coefficient alongthe main cylinder circumference as a function of the control cylinder rotation rate, ξ, withg/D = 0.05 and d/D = 0.1. Above a critical rotation rate between ξ = 2 and ξ = 3, thefluctuations in the pressure profile are suppressed.
at ReD = 500 was found to be CDp= 1.326 with the present method. This compares
favorably, over-predicting by only 4%, the value CDp= 1.274 reported by Henderson
(1995) also at ReD = 500.The pressure drag of the main cylinder with the addition of stationary control cylinders
is greater than that of a bare cylinder, rising above 2 in some configurations as shownin figure 9. The presence of the control cylinders effectively increases the size of themain cylinder and increases the width of the wake. A similar increase was measured inthe ReD = 47, 000 experiment. As the control cylinders are rotated at faster rates, thepressure drag on the system, including the main cylinder and rotating control cylinders,decreases monotonically for all of the configurations. The contribution of the controlcylinders is small for low ξ, but becomes a significant component of the total force forξ > 3, which also corresponds to stable wakes. For ξ > 2, the total system drag is lessthan the drag on a bare cylinder without control cylinders, found to be CDp
= 1.326 withthe present method. At high ξ, the pressure drag on the system is less than zero for someof the cases, indicating the generation of thrust. Thrust generation by the rotation of thecontrol cylinders is consistent with the numerical simulations of a pair of counter-rotatingcylinders conducted by van Rees et al. (2015).The pressure profile along the main cylinder for the same set of configurations is also
shown in figure 10. The pressure on the upstream side of the main cylinder (θ < π/2) issimilar for all of the cases. In contrast, the pressure on the downstream side (θ > π/2)is increased by the rotating control cylinders, resulting in large drag reduction. Despitethe similarity between the streamlines with those of a potential flow model shown infigure 6, pressure peaks on the downstream side reach values significantly greater thanthe upstream stagnation point, which is inconsistent with potential flow. Inviscid modelsare therefore anticipated to be incomplete in describing the increase of pressure on thedownstream side of the main cylinder. Also of note is that the larger control cylindersincrease the base pressure and reduce drag by a greater margin at the same rotation ratethan smaller control cylinders.Increasing base pressure, Cp(θ = π), reduces the pressure drag, CDp
, which is a cleartrend for all of the simulations. This trend is presented in figure 11, which summarizesthe results for all of the cases with stable wakes.
Page 10 of 20

Flow Control with Rotating Cylinders 11
0 1 2 3 4 5
-0.5
0
0.5
1
1.5
2
2.5
Figure 9. The pressure drag for the configurations with g/D = 0.05 decreases with the rotationparameter, ξ. The pressure drag of the system including the main cylinder and rotating controlcylinders is indicated “System” and the contribution from the two control cylinders is indicated“Control” in the plot legend. Larger diameter control cylinders achieve a greater drag reductionthan smaller control cylinders at the same rotation rate.
θ0 π/2 π
Cp
-3
-2.5
-2
-1.5
-1
-0.5
0
0.5
1
1.5
2
2.5
ξ = 0
ξ = 3
ξ = 5
d/D = 10%
d/D = 12.5%d/D = 15%
Figure 10. The pressure recovery from separation to reattachment points is greater for largercontrol cylinders at the same rotation rate.
-0.4 -0.2 0 0.2 0.4 0.6 0.8
Cp(θ = π)
-0.5
0
0.5
CDp
d/D = 10%
d/D = 12.5%d/D = 15%
g/D = 5%
g/D = 6%
g/D = 7%
g/D = 8%
g/D = 9%
g/D = 10%
Figure 11. The pressure drag is correlated with the base pressure coefficient.
Page 11 of 20

12 J. C. Schulmeister et al
Separation
Reattachment
θ
0 π/2 π
Cp
-3
-2.5
-2
-1.5
-1
-0.5
0
0.5
1
1.5
2
∆ Cp
Figure 12. In the controlled steady flow, the pressure along the main cylinder presents twopeaks associated with the separation and reattachment points of the dividing streamline. Therotating cylinder imparts energy to the fluid along the dividing streamline such that there is apressure recovery, ∆Cp, from separation to reattachment.
6. Discussion
6.1. Mechanism of the Pressure Recovery
The controlled steady flows have a recirculating region around the control cylinderthat is bounded by a dividing streamline that separates from and then reattaches tothe main cylinder. This dividing streamline is shown in figure 12. Peaks in the pressurealong the circumference of the main cylinder accompany the separation and reattachmentpoints of the dividing streamline. Figure 12 also plots the pressure coefficient on themain cylinder for a controlled flow. The pressure at reattachment, pr, is greater thanthe pressure at separation, ps. This difference is the pressure recovery coefficient, ∆Cp =(pr − ps)/(
12ρU2
∞).
The pressure and kinetic energy along a streamline are governed by the Bernoulliequation, which is applied to steady, incompressible, viscous flow without body forces in(6.1), as is described by Synolakis & Badeer (1989). The velocity and pressure at twopoints along a streamline, denoted u1, u2, and p1, p2, are related by the work done byviscous force, fvis, along the streamline that connects them.
1
2|u1|
2 +p1ρ
=
! 2
1
fvisds+1
2|u2|
2 +p2ρ
(6.1)
Substituting the separation and reattachment points highlighted in figure 12 intoequation (6.1) shows that the pressure recovery is due to viscous force along the streamlinethat connects them, (pr − ps)/ρ = −
# rs fvisds.
The mechanical energy in the steady flow of an incompressible fluid is equal to thetotal pressure,
E =1
2|u|2 +
p
ρ. (6.2)
Differences in E along a streamline thus reflect the work done by viscous force alongthe streamline. An equation for E can be obtained by taking the divergence of theNavier-Stokes equation
∇2E = ω2 − u ·∇× ω, (6.3)
where ω is the vorticity. Equation (6.3) can be used to analyze instability by decom-posing a flow into mean and disturbance components and identifying sources and sinks of
Page 12 of 20

Flow Control with Rotating Cylinders 13
Figure 13. B, the total pressure or the sum of kinetic energy and pressure. At top, ξ = 3 andat bottom, ξ = 5. The wake recovery of B is greater for higher ξ.
mechanical energy of the disturbance flow (Sengupta et al. (2003a) and Sengupta et al.(2003b)).It is convenient to define
B = E − E∞, (6.4)
where E∞ = 12U2∞
+ p∞/ρ, so that B = 0 far upstream. Figure 13 shows B for flowswith ξ = 3 and ξ = 5 that are otherwise configured the same. B is nonzero only within thecylinder’s boundary layer and wake, highlighting the regions of the flow where viscousstress contributes to the mechanical energy balance. There is a local minimum in theboundary layer of the main cylinder upstream of the rotating control cylinders. As theseparating boundary layer flow passes the rotating control cylinders, B increases to avalue that is close to uniform in the wake. In the lower plot in figure 13, the largerrotation parameter (ξ = 5) results in a greater recovery of pressure in the wake than thesmaller rotation parameter in the upper plot (ξ = 3).The net viscous stress field associated with the integral term in the mechanical energy
balance of (6.1) is equal to the projection of the divergence of viscous stress onto the localdirection of the flow. The normalized net viscous stress field, denoted Sν , is presented in(6.5) for incompressible flow.
Sν =(u/U∞)
|u/U∞|· fvis =
(u/U∞)
|u/U∞|·
$
1
ReD∇2
$
u
U∞
%%
(6.5)
The power field associated with the viscous stress contribution to the mechanical energybalance of (6.1) is equal to the dot product of the net viscous stress with the velocity.The normalized viscous power field, denoted, Pν , is presented in (6.6) for incompressibleflow.
Page 13 of 20

14 J. C. Schulmeister et al
Figure 14. Net viscous shear power, Pν , in the vicinity of the rotating control cylinder. Thepositive regions of Pν , visible in the close view at bottom, are driven by the external forcesrequired to keep the control cylinder in steady rotation.
Pν =
$
u
U∞
%
·
$
1
ReD∇2
$
u
U∞
%%
(6.6)
The Pν field for a controlled steady flow is shown in figure 14. Negative power indicatesdecreasing B along the streamline and positive power indicates increasing B. Without anactive flow control actuator, Pν would be everywhere nonpositive. With active control,the external forces required to maintain the rotation of the control cylinder drive regionsof positive Pν via the moving cylinder wall.Figure 15 highlights a common streamline through the B and Sν fields in the top
two plots. The bottom plot shows values of B and Sν along the highlighted streamline.Upstream of the main cylinder (x/D < −0.5), both B and Sν are constant. This regionis outside of the boundary layer and the mechanical energy balance is dominated by theinviscid and reversible exchange of kinetic energy and pressure. In the boundary layerof the main cylinder upstream of the rotating control cylinder (−0.5 < x/D < 0.2),the negative Sν reduces B. As the streamline passes around the rotating control cylinder(0.2 < x/D < 0.5), the net viscous stress changes sign to positive as it passes through theregion of positive Sν created by the control cylinder. As a result, B increases, recoveringsome of the energy lost in the boundary layer of the main cylinder. Finally, as thestreamline enters the wake (x/D > 0.5), B and Sν are constant as the streamline returnsto a region dominated by an inviscid mechanical energy balance.
6.2. Pressure Recovery Scaling
The steady flow around the control cylinder is described by four dimensionless numbers(6.7 - 6.10), including a Reynolds number, pressure recovery coefficient, rotation pa-rameter, and normalized diameter. The main cylinder diameter is neglected from thesenumbers because it is much larger than the control cylinder diameter and gap width.
Page 14 of 20

Flow Control with Rotating Cylinders 15
Figure 15. The total pressure and viscous stress are plotted along the highlighted boundarylayer streamline. Near the rotating control cylinder, B recovers due to positive Sν .
There are two remaining length scales, the control cylinder diameter, d, and gap to maincylinder, g.
Red =ρU∞d
µ(6.7)
∆Cp =(pr − ps)
12ρU2
∞
(6.8)
ξ =usurf
U∞
(6.9)
d∗ =d
g(6.10)
Active flow control actuator performance is often highly correlated with the actuatormomentum flux (Cattafesta & Sheplak 2011). In the case of rotating circular cylinders incross-flow, there are two candidate momentum fluxes that could be used to predict thepressure recovery, an inviscid scaling and a viscous scaling.The inviscid scaling is the momentum flux associated with the lift force of a rotating
cylinder in a cross-flow. This flux is called “inviscid” because a lift force is present evenin inviscid flows, as long as there is bound circulation. The lift force of the rotatingcontrol cylinder can be modeled as the lift of a point vortex with the same circulation.Using this model, the inviscid scaling is expressed in (6.11). While it is well known thatinviscid models based on the circulation at the cylinder boundary over-estimate the lift,
Page 15 of 20

16 J. C. Schulmeister et al
Kang et al. (1999) show that the mean lift increases almost linearly with rotation rate.Therefore, we expect the linear relationship in this inviscid scaling to be accurate.
∆Cp ∝ρU∞usurfd12ρU2
∞D
∝ ξd∗ (6.11)
The viscous scaling is the momentum flux associated with the boundary layer of therotating control cylinder. The viscous diffusion of momentum from the rotating cylinderwall can be modeled simply as the laminar boundary layer over a flat plate with length,πd, and velocity, usurf . The laminar boundary layer thickness scales with πdRed
−1/2,and its momentum flux is proportional to 1
2ρu2
surfdRed−1/2. Normalizing this by the free
stream momentum flux results in a viscous scaling model for the pressure recovery in(6.12).
∆Cp ∝12ρu2
surfdRe−1/2d
12ρU2
∞D
∝ ξ2d∗Re−1/2d (6.12)
Recasting (6.12) in terms of the Reynolds number based on the main cylinder diameter,ReD, pulls all parameters associated with the control cylinders (d∗ and ξ) out of theReynolds number.
∆Cp ∝ ξ3/2d∗1/2Re−1/2D (6.13)
The viscous scaling in (6.13) represents the skin friction and so the torque required torotate the cylinder. The inviscid scaling in (6.11), on the other hand, is associated withthe lift force.The boundary layer profiles for a rotating cylinder and flow over a flat plate are
different, but the skin friction scales in the same way with respect to an appropriatelength and velocity for each. These are the diameter and surface speed for the rotatingcylinder and the plate length and free stream velocity for flow over a flat plate. Hoerner &Borst (1985) use this equivalent scaling to present an estimate of the torque of a rotatingcylinder using a flat plate skin friction coefficient.The results of the numerical simulations are plotted against both the inviscid scaling
from (6.11) and the viscous scaling from (6.13) in the top row of figure 16. The ReD termis neglected from the viscous scaling in the right plot of figure 16 because all simulationswere run at ReD = 500. The pressure recovery, ∆Cp, collapses with respect to the viscousscaling for this set of configurations, indicating that the mechanism of pressure recoveryis fundamentally viscous. The bottom row of figure 16 shows the results for the pressurerecovery from separation to the base of the main cylinder,∆Cpbase
= (pθ=π−ps)/(12ρU2
∞).
The trends for ∆Cpbaseare similar to those for ∆Cp, but with diminishing returns for
higher control effort. The diminishing returns are associated with the viscous loss ofmechanical energy between reattachment and the base of the main cylinder at θ = π,which is apparent in the pressure profiles for the ξ = 5 flows in figure 10. Despitethe additional viscous loss of pressure between reattachment and the base of the maincylinder, the viscous scaling better describes the mechanism of base pressure recoveryand pressure drag reduction than the inviscid scaling.A control cylinder can interact with a larger flow through a displacement effect, a
circulation effect (equation 6.11), and a viscous effect (equation 6.13). Strykowski &Sreenivasan (1990) demonstrate a displacement effect of a static control cylinder on thewake of a larger upstream cylinder. Lim et al. (2004) report experimental visualizationsof the influence of a displacement and also of a circulation effect of a rotating cylinder
Page 16 of 20

Flow Control with Rotating Cylinders 17
ξd∗4 6 8 10 12 14 16
∆Cp
1
1.5
2
2.5
3
3.5
d/D = 10%
d/D = 12.5%d/D = 15%
g/D = 5%
g/D = 6%
g/D = 7%
g/D = 8%
g/D = 9%
g/D = 10%
ξ3/2d∗1/26 8 10 12 14 16 18 20
∆Cp
1
1.5
2
2.5
3
3.5
d/D = 10%
d/D = 12.5%d/D = 15%
g/D = 5%
g/D = 6%
g/D = 7%
g/D = 8%
g/D = 9%
g/D = 10%
0 5 10 15
ξd∗
1
1.2
1.4
1.6
1.8
2
∆Cpbase
d/D = 10%
d/D = 12.5%d/D = 15%
g/D = 5%
g/D = 6%
g/D = 7%
g/D = 8%
g/D = 9%
g/D = 10%
5 10 15 20
ξ3/2d∗1/2
1
1.2
1.4
1.6
1.8
2
∆Cpbase
d/D = 10%
d/D = 12.5%d/D = 15%
g/D = 5%
g/D = 6%
g/D = 7%
g/D = 8%
g/D = 9%
g/D = 10%
Figure 16. The pressure recovery from separation to reattachment of the dividing streamline(top) and from separation to the base of the cylinder at θ = π (bottom), plotted with respect tothe inviscid momentum flux scaling, ξd∗ (left) and the viscous momentum flux scaling, ξ3/2d∗1/2
(right). The viscous scaling (right) more accurately describes the pressure recovery mechanism.
on a laminar flat plate boundary layer. In those experiments, the rotating cylinder waspositioned well outside of the flat plate boundary layer so the vorticity fields from eachdid not interact strongly. Control cylinders were placed in close proximity to the maincylinder in numerical simulations by Mittal (2001), but the diameter was constant and socirculation and viscous effects could not be easily distinguished. The present configurationlocates the control cylinder close to the main cylinder such that the vorticity fields of thetwo interact strongly, as can be seen in figure 7. Also, the diameter of the control cylinderis varied so that circulation effects can be distinguished from viscous effects. The resultis a new viscous scaling law, shown in comparison to the inviscid scaling or circulationeffect in figure 16.
6.3. Power consumption of control with rotating cylinders
The power consumption of active flow control actuators is an important performancemetric, particularly in applications in which the goal of flow control is to reduce the totalpower consumption of a system, such as a self-propelled vehicle. The rotational powerconsumption coefficient, Crot
pow, is equal to the sum of the power consumed by the tworotating cylinders that are driven with a torque, T , at angular velocity, Ω, normalizedby the free stream flux of kinetic energy through the projected area of the main cylinder.
Crotpow =
2TΩ12ρU3
∞D
(6.14)
The power consumption, Crotpow, for the numerical simulations is found by integrating
Page 17 of 20
18 J. C. Schulmeister et al
0 0.5 1 1.5
Crotpow
0
0.5
1
1.5
2
2.5
∆CDp
← ∆CDp = Crotpow
CT = Crotpow →
d/D = 10%
d/D = 12.5%d/D = 15%
g/D = 5%
g/D = 6%
g/D = 7%
g/D = 8%
g/D = 9%
g/D = 10%
Water Tunnel
(Re = 47,000)
-1
-0.5
0
0.5
1
CT
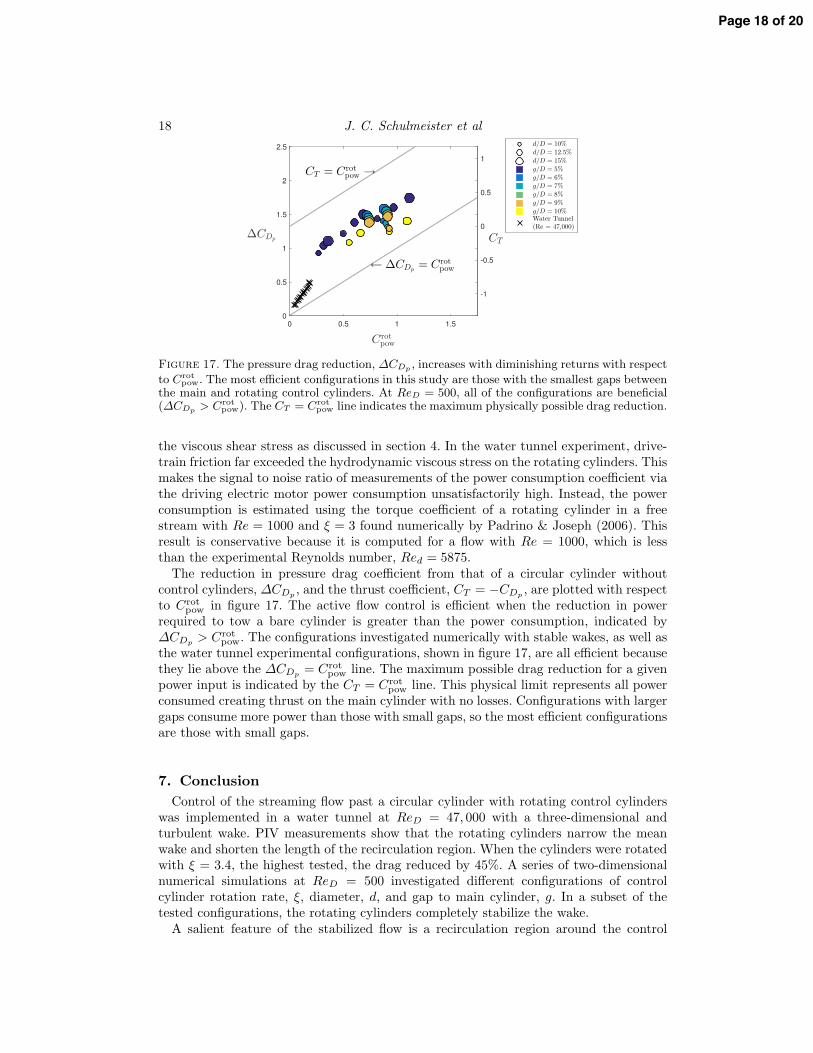
Figure 17. The pressure drag reduction, ∆CDp, increases with diminishing returns with respect
to Crotpow. The most efficient configurations in this study are those with the smallest gaps between
the main and rotating control cylinders. At ReD = 500, all of the configurations are beneficial(∆CDp
> Crotpow). The CT = Crot
pow line indicates the maximum physically possible drag reduction.
the viscous shear stress as discussed in section 4. In the water tunnel experiment, drive-train friction far exceeded the hydrodynamic viscous stress on the rotating cylinders. Thismakes the signal to noise ratio of measurements of the power consumption coefficient viathe driving electric motor power consumption unsatisfactorily high. Instead, the powerconsumption is estimated using the torque coefficient of a rotating cylinder in a freestream with Re = 1000 and ξ = 3 found numerically by Padrino & Joseph (2006). Thisresult is conservative because it is computed for a flow with Re = 1000, which is lessthan the experimental Reynolds number, Red = 5875.The reduction in pressure drag coefficient from that of a circular cylinder without
control cylinders, ∆CDp, and the thrust coefficient, CT = −CDp
, are plotted with respectto Crot
pow in figure 17. The active flow control is efficient when the reduction in powerrequired to tow a bare cylinder is greater than the power consumption, indicated by∆CDp
> Crotpow. The configurations investigated numerically with stable wakes, as well as
the water tunnel experimental configurations, shown in figure 17, are all efficient becausethey lie above the ∆CDp
= Crotpow line. The maximum possible drag reduction for a given
power input is indicated by the CT = Crotpow line. This physical limit represents all power
consumed creating thrust on the main cylinder with no losses. Configurations with largergaps consume more power than those with small gaps, so the most efficient configurationsare those with small gaps.
7. Conclusion
Control of the streaming flow past a circular cylinder with rotating control cylinderswas implemented in a water tunnel at ReD = 47, 000 with a three-dimensional andturbulent wake. PIV measurements show that the rotating cylinders narrow the meanwake and shorten the length of the recirculation region. When the cylinders were rotatedwith ξ = 3.4, the highest tested, the drag reduced by 45%. A series of two-dimensionalnumerical simulations at ReD = 500 investigated different configurations of controlcylinder rotation rate, ξ, diameter, d, and gap to main cylinder, g. In a subset of thetested configurations, the rotating cylinders completely stabilize the wake.A salient feature of the stabilized flow is a recirculation region around the control
Page 18 of 20

Flow Control with Rotating Cylinders 19
cylinder. The moving wall of the rotating cylinder drives a region of positive viscouspower, Pν , that energizes the dividing streamline, enabling it to reattach to the maincylinder. The streamline reattaches to the main cylinder with greater pressure than atseparation, resulting in increased base pressure and reduced pressure drag.The pressure recovery in the ReD = 500 numerical simulations scales with the
momentum flux of the control cylinder associated with viscous effects in its boundarylayer as opposed to the lift force. This is counter to the intuition that the circulation andlift force, which are present in inviscid flow, accurately describe the pressure recoverymechanism. This new viscous scaling could inform the design and development of rotatingcylinder and other implementations of moving boundary flow control.The power consumption of the rotating cylinders is computed in the ReD = 500
simulations and shown to be greater in configurations with large gaps between the mainand rotating control cylinders. As a result, of the configurations simulated, those withthe smallest gaps are the most efficient. All configurations, including both those in theReD = 500 numerical simulations and the ReD = 47, 000 water tunnel experiments, arebeneficial because they effect a reduction in the drag coefficient that is greater than thepower consumption, ∆CDp
> Crotpow.
Future work should investigate the Reynolds number dependence of the control mech-anism. In both the ReD = 500 numerical simulations and the ReD = 47, 000 watertunnel experiments, the boundary layers are expected to be laminar. At higher Reynoldsnumbers the boundary layers will transition to turbulence, which will influence both theefficacy and efficiency of flow control with rotating cylinders.
The authors acknowledge support from the Singapore-MIT Alliance for Research andTechnology, and the MIT Sea Grant Program.
REFERENCES
Beaudoin, J. F., Cadot, O., Aider, J. L & Wesfreid, J. E. 2006 Drag reduction of a bluffbody using adaptive control methods. Physics of Fluids 18, 1–10.
Cattafesta, L. N. & Sheplak, M. 2011 Actuators for active flow control. Annual Review ofFluid Mechanics 43, 247–272.
Cheng, M. & Luo, L. 2007 Characteristics of two-dimensional flow around a rotating circularcylinder near a plane wall. Physics of Fluids 19.
Choi, H., Jeon, W. & Kim, J. 2008 Control of flow over a bluff body. Annual Review of FluidMechanics 40, 113–139.
Henderson, R. D. 1995 Details of the drag curve near the onset of vortex shedding. Physicsof Fluids 7.
Hoerner, S.F. & Borst, H.V. 1985 Fluid-dynamic lift: practical information on aerodynamicand hydrodynamic lift . L.A. Hoerner.
Kang, S., Choi, H. & Lee, S. 1999 Laminar flow past a rotating circular cylinder. Physics ofFluids 11 (11).
Korkischko, I. & Meneghini, J. R. 2012 Suppression of vortex-induced vibration usingmoving surface boundary-layer control. Journal of Fluids and Structures 34, 259–270.
Kumar, S., Cantu, C. & Gonzalez, B. 2011 Flow past a rotating cylinder at low and highrotation rates. Journal of Fluids Engineering 133.
Lim, TT, Sengupta, TK & Chattopadhyay, M 2004 A visual study of vortex-inducedsubcritical instability on a flat plate laminar boundary layer. Experiments in Fluids 37 (1),47–55.
Maertens, A. P. & Weymouth, G. D. 2015 Accurate cartesian-grid simulations of near-bodyflows at intermediate reynolds numbers. Computer Methods in Applied Mechanics andEngineering 283, 106–129.
Mittal, S. 2001 Control of flow past bluff bodies using rotating control cylinders. Journal ofFluids and Structures 15, 291–326.
Page 19 of 20

20 J. C. Schulmeister et al
Mittal, S. 2003 Flow control using rotating cylinders: effect of gap. Journal of AppliedMechanics 70, 762–770.
Modi, V. J. 1997 Moving surface boundary-layer control: a review. Journal of Fluids andStructures 11, 627–663.
Morse, T. L., Govardhan, R. N. & Williamson, C. H. K. 2008 The effect of end conditionson the vortex-induced vibration of cylinders. Journal of Fluids and Structures 24.
Muddada, S. & Patnaik, B. S. B. 2010 An active flow control strategy for the suppression ofvortex structures behind a circular cylinder. European Journal of Mechanics - B/Fluids29, 93–104.
Padrino, J. C. & Joseph, D. D. 2006 Numerical study of the steady-state uniform flow pasta rotating cylinder. Journal of Fluid Mechanics 557, 191–223.
Patnaik, B. S. B. & Wei, G. W. 2002 Controlling wake turbulence. Physical Review Letters88.
Prandtl, L. 1925 Die Naturwissenschaften 13, 93–108.Prandtl, L. 1926 Application of the “magnus effect” to the wind propulsion of ships. NACA
TM 387.Rao, A., Stewart, B. E., Thompson, M. C., Leweke, T. & Hourigan, K. 2011 Flows past
rotating cylinders next to a wall. Journal of Fluids and Structures 27, 668–679.Rao, A., Thompson, M. C., Leweke, T. & Hourigan, K. 2015 Flow past a rotating cylinder
translating at different gap heights along a wall. Journal of Fluids and Structures 57.van Rees, W. M., Novati, G. & Koumoutsakos, P. 2015 Self-propulsion of a counter-rotating
cylinder pair in a viscous fluid. Physics of Fluids 27.Seifert, A. 2007 Closed-loop active flow control systems: actuators. In Active Flow Control
(ed. R. King), Notes on numerical fluid mechanics and multidisciplinary design, vol. 95,pp. 80–102. Springer.
Sengupta, T. K., De, S. & Sarkar, S. 2003a Vortex-induced instability of an incompressiblewall-bounded shear layer. Journal of Fluid Mechanics 493, 277–286.
Sengupta, T. K., Kasliwal, A., De, S. & Nair, M. 2003b Temporal flow instability formagnus-robins effect at high rotation rates. Journal of Fluids and Structures 17, 941–953.
Strykowski, P. J. & Sreenivasan, K. R. 1990 On the formation and suppression of vortex‘shedding’ at low reynolds numbers. Journal of Fluid Mechanics 218, 71–107.
Synolakis, C. E. & Badeer, H. S. 1989 On combining the bernoulli and poiseuille equation–aplea to authors of college physics texts. American Journal of Physics 57.
Tokumaru, P. T. & Dimotakis, P. E. 1993 The lift of a cylinder executing rotary motions ina uniform flow. Journal of Fluid Mechanics 255, 1–10.
West, G. S. & Apelt, C. J. 1982 The effects of tunnel blockage and aspect ratio on the meanflow past a circular cylinder with reynolds numbers between 104 and 105. Journal of FluidMechanics 114, 361–377.
Weymouth, G. D. & Yue, D. K. P. 2011 Boundary data immersion method for cartesian-gridsimulations of fluid-body interaction problems. Journal of Computational Physics 230,6233–6247.
Ye, T., Mittal, R., Udaykumar, H. S. & Shyy, W. 1999 An accurate cartesian gridmethod for viscous incompressible flows with complex immersed boundaries. Journal ofComputational Physics 156, 209–240.
Zdravkovich, M. M. 1997 Flow Around Circular Cylinders: Volume 1: Fundamentals. OxfordScience Publications.
Zhu, H., Yao, J., Ma, Y., Zhao, H. & Tang, Y. 2015 Simultaneous cfd evaluation of vivsuppression using smaller control cylinders. Journal of Fluids and Structures 57, 66–80.
Page 20 of 20