Natural Resources and the Demands of Equality - ePrints Soton
Upload
khangminh22Category
view
5download
0
University of Southampton Research Repository
Copyright © and Moral Rights for this thesis and, where applicable, any accompanying data are
retained by the author and/or other copyright owners. A copy can be downloaded for personal
non-commercial research or study, without prior permission or charge. This thesis and the
accompanying data cannot be reproduced or quoted extensively from without first obtaining
permission in writing from the copyright holder/s. The content of the thesis and accompanying
research data (where applicable) must not be changed in any way or sold commercially in any
format or medium without the formal permission of the copyright holder/s.
When referring to this thesis and any accompanying data, full bibliographic details must be given,
e.g.
Thesis: Ana Lages (2018) "Characterization of parallel G-quadruplex formation by highly conserved
G-rich motifs in INS intron 1", University of Southampton, Faculty of Medicine, PhD Thesis,
pagination.

FACULTY OF MEDICINE
Human Development and Health
Characterization of parallel G-quadruplex formation by highly
conserved G-rich motifs in INS intron 1
by
Ana Luísa Gonçalves das Lages
Thesis for the degree of Doctor of Philosophy
June 2018

i
UNIVERSITY OF SOUTHAMPTON
ABSTRACT
FACULTY OF MEDICINE
Human Development and Health
Thesis for the degree of Doctor of Philosophy
CHARACTERIZATION OF PARALLEL G-QUADRUPLEX FORMATION BY HIGHLY CONSERVED
G-RICH MOTIFS IN INS INTRON 1
Ana Luísa Gonçalves das Lages
Individuals predisposed to type 1 diabetes (T1DM) carry an adenine allele at rs689, a T-to-A genetic
variant located 6 nucleotides upstream of the 3’ splice site of INS intron 1. The A allele disrupts the
polypyrimidine tract (Py-tract) and impairs splicing, increasing intron retention (IR) levels in mature
transcripts. Intron 1-containing messenger RNAs have an extended 5’ untranslated region (5’UTR),
introducing an upstream open reading frame (uORF) and curtailing translation. IR can be reduced
using oligonucleotides complementary to an intronic segment flanked by G-rich sequences,
mitigating the splicing defect. To investigate their potential to form G-quadruplex (G4), a G4-specific
fluorescent probe, thioflavin T, was used to examine DNA and RNA G-tracts flanking the antisense
target region, in vitro. Fluorescence intensity was shown to be specific for G4 structures in DNA and
RNA. G4 formation was influenced by the adjacent target region in each direction and by
concentrations of K+ and Mg2+. G4s were also detected in RNA transcribed in real time and their
formation was influenced by mutations that affected intron 1 removal. To identify proteins binding
to this intronic region, in vitro RNA transcripts containing the antisense target region were used in
RNA pull-down assays with HeLa nuclear extracts, revealing heterogeneous nuclear
ribonucleoproteins (hnRNPs) F and H1 binding to G-rich segments. The G-rich 5’ UTRs of
representative primate species were also cloned into a dual-luciferase-reporter system to establish
primate-specific translation rates. Elimination of the Homoninae-specific uORF significantly
increased luciferase translation, demonstrating its importance for INS gene expression. Overall,
data obtained in this project has improved the understanding of the molecular mechanisms
underlying the allele-specific expression of preproinsulin expression. These results may facilitate
development of future preventative strategies for T1DM.

ii

iii
I. Table of Contents
ABSTRACT ..................................................................................................................... i
I. Table of Contents ......................................................................................... iii
II. List of Tables ................................................................................................ vii
III. List of Figures ................................................................................................xi
IV. DECLARATION OF AUTHORSHIP ................................................................... xiii
V. Acknowledgements ...................................................................................... xv
VI. Abbreviations ............................................................................................. xvii
Chapter 1: Introduction ....................................................................................... 1
1.1 Gene Expression ....................................................................................................... 3
1.1.1 Genome complexity and coding capacity .................................................. 4
1.1.2 Maturation of RNA ..................................................................................... 4
1.2 Pre-mRNA splicing .................................................................................................... 5
1.2.1 Cis-acting regulatory sequences and trans-acting factors ........................ 7
1.2.2 Alternative RNA processing ....................................................................... 9
1.2.3 Co-transcriptional splicing ....................................................................... 12
1.2.4 Introns in splicing ..................................................................................... 14
1.2.5 The importance of RNA secondary structure in splicing ......................... 16
1.2.6 Alternative splicing and human disease .................................................. 27
1.3 The potential of antisense oligonucleotide therapies for genetic diseases .......... 39
1.4 Diabetes: classification, pathophysiology and mechanism ................................... 44
1.4.1 Type 1 Diabetes ....................................................................................... 44
1.4.2 Preproinsulin gene (INS) .......................................................................... 47
1.5 Hypothesis.............................................................................................................. 51
1.6 Aims and Objectives ............................................................................................... 51
Chapter 2: General Material and Methods ......................................................... 53
2.1 Materials and reagents .......................................................................................... 55
2.2 Methods ................................................................................................................. 63
2.2.1 Prediction of G4 forming G-rich sequences in INS intron ....................... 63

iv
2.2.2 Screening for G4 formation by the thioflavin T (ThT) fluorescence assay
................................................................................................................. 64
2.2.3 Real-time monitoring of G-quadruplex formation during transcription in
vitro ......................................................................................................... 64
2.2.4 Identification of proteins that bind the antisense target regions for the
INS intron 1 retention.............................................................................. 65
2.2.5 Cloning, expression and purification of recombinant hnRNPs F and H1 and
RRMs ........................................................................................................ 66
2.2.6 Cloning and transfection of 5’UTR regions of Human and primates INS
gene ......................................................................................................... 67
2.2.7 Statistical analysis .................................................................................... 70
Chapter 3: Thioflavin T (ThT) as a fluorescent light-up probe for monitoring of G4
formation ..................................................................................................... 73
3.1 Introduction ........................................................................................................... 75
3.2 Results ................................................................................................................... 76
3.2.1 Optimization of experimental conditions ............................................... 76
3.2.2 G4 formation in INS intron 1 DNA-derived oligos ................................... 84
3.2.3 G4 formation in INS intron 1 RNA-derived oligos ................................... 95
Chapter 4: Identification of INS intron1-binding proteins .................................. 113
4.1 Identification and characterization of proteins binding to INS intron 1 antisense
target region ........................................................................................................ 115
4.1.1 Pull-down using INS intron 1 transcripts containing the antisense target
and flanking G-runs ............................................................................... 115
4.1.2 Cloning, expression and purification of full-length hnNRP F/H1 and their
individual RRM domains ........................................................................ 117
Chapter 5: Coupled INS 5’UTRs splicing and translation efficiency in higher
primates .................................................................................................... 123
5.1 Translation efficiency of human and primate INS 5’UTRs ................................... 125
5.1.1 Cloning ................................................................................................... 125
5.1.2 Transfection efficiency .......................................................................... 125

v
5.1.3 Conclusions ............................................................................................ 130
Chapter 6: General discussion...........................................................................131
VII. References .................................................................................................139
VIII. Appendices ................................................................................................175
Appendix A Supplementary figures ....................................................................177
Appendix B Supplementary tables......................................................................183
Appendix C Publications ....................................................................................247

vi

vii
II. List of Tables
Table 1 – Examples of genetic diseases caused by mutations or variants that alter splicing processes
(233,237). ......................................................................................................... 28
Table 2 - Examples of genetic diseases resulting from mutations or variants that create or eliminate
uORFs. .............................................................................................................. 36
Table 3 – General Reagent ........................................................................................................... 55
Table 4 – Reagents for RNA ......................................................................................................... 56
Table 5 – Primers for cloning ....................................................................................................... 57
Table 6 – Primers for PCR amplification of DNA templates for in vitro transcription ................. 58
Table 7 – Plasmid systems ........................................................................................................... 58
Table 8 – Enzymes and Buffers .................................................................................................... 58
Table 9 – Competent cells ............................................................................................................ 59
Table 10 – Primers for sequencing .............................................................................................. 59
Table 11 - Antibodies ................................................................................................................... 59
Table 12 – Commercial Laboratory Kits ....................................................................................... 59
Table 13 – DNA oligonucleotides tested for G4 detection with ThT ........................................... 60
Table 14 - Plasticware .................................................................................................................. 61
Table 15 - Apparatus .................................................................................................................... 62
Table 16 - Software ...................................................................................................................... 62
Table 17 – Secondary structure prediction of INS intron DNA-derived oligonucleotides ......... 183
Table 18 - Secondary structure prediction of INS intron 1 RNA-derived oligonucleotides ....... 187
Table 19 - Secondary structure prediction of INS RNA transcripts ............................................ 189

viii
Table 20 – Significance of ThT fluorescence differences in the time-course of G4-ThT complexes.
....................................................................................................................... 190
Table 21 – Significance of ThT-DNA G4 saturation curves. ....................................................... 191
Table 22 – Significance of ThT screening for G4 formation in vitro in INS intron 1. ................. 203
Table 23 - Significance of fluorescence variation of ThT in the presence of INS intron 1-derived Int1+.
....................................................................................................................... 209
Table 24 - Significance of fluorescence variation of ThT in the presence of INS intron 1-derived Int7+.
....................................................................................................................... 211
Table 25 – Significance of fluorescence variation of INS intron 1 DNA-derived oligos in the presence
of different solvents at neutral pH conditions. ............................................. 213
Table 26 – Significance of fluorescence variation of INS intron 1 DNA-derived oligos in the presence
of different solvents at acidic pH conditions. ................................................ 215
Table 27 – Significance of RNA fluorescence intensity compared to DNA. ............................... 217
Table 28 – Significance of fluorescence variation of INS intron 1 RNA-derived oligos in the presence
of different solvents at neutral pH conditions. ............................................. 219
Table 29 - Significance of fluorescence variation of INS intron 1 RNA-derived oligos in the presence
of different solvents at acidic pH conditions. ................................................ 221
Table 30 – Significance of fluorescence variation in the presence of RNA-derived oligos at neutral
and acidic pH conditions. .............................................................................. 223
Table 31 - Significance of fluorescence intensity of INS intron 1 RNA-derived oligos in the presence
of increasing potassium (K) concentrations. ................................................. 224
Table 32 - Significance of fluorescence intensity of INS intron 1 RNA-derived oligos in the presence
of increasing magnesium (Mg) concentrations. ............................................ 226
Table 33 - Significance of fluorescence intensity of INS intron 1 RNA-derived oligos in the presence
of combined potassium (K) and magnesium (Mg) concentrations. .............. 228
Table 34 – Proteins bound to INS WT transcript in pull-down assay, identified by mass spectrometry
....................................................................................................................... 232

ix
Table 35 - Proteins bound to INS del5 transcript in pull-down assay, identified by mass spectrometry
....................................................................................................................... 235
Table 36 - Proteins bound to beads in pull-down assay, identified by mass spectrometry ...... 239
Table 37 – Significance of transfection efficiencies of human and primates’ INS 5’ UTRs. ....... 244

x

xi
III. List of Figures
Figure 1 - Cis-acting elements involved in pre-mRNA splicing....................................................... 5
Figure 2 – Schematics of splicing reaction. .................................................................................... 7
Figure 3 – Schematics of gene expression regulatory alternative events. .................................. 10
Figure 4 – Schematics of alternative polyadenylation events that modulate gene expression. . 11
Figure 5 – Schematics of the secondary estructures adopted by RNase P RNA strand of
Methanococcus marapaludis. .......................................................................... 17
Figure 6 - Illustration of a G-tract folding into G4. ....................................................................... 21
Figure 7 - Allele-dependent INS expression. ................................................................................ 48
Figure 8 - Haplotype-dependent intron retention is modulated by G-rich motifs. .................... 50
Figure 9 – Fluorescence intensity of ThT variation with increasing dye or oligo concentrations.76
Figure 10 – Time-course of ThT fluorescence of G4-ThT complexes. .......................................... 77
Figure 11 - ThT fluorescence intensity increases linearly with increasing oligo concentrations. 79
Figure 12 – Saturation of G4 structures of various oligos by Thioflavin T. .................................. 81
Figure 13 – Comparison of fluorescence intensities of two oligo:ThT ratios. ............................. 82
Figure 14 - ThT screening for G4 formation in vitro in INS intron 1. ........................................... 85
Figure 15 - Variation of ThT fluorescence in the presence of INS intron 1- derived Int1 and Int7
extended oligos (denoted as Int1+ and Int7+ in (B)). ...................................... 89
Figure 16 – G4 formation dependence upon nucleotide’s number and percentage in Int1+ and Int7+
sequences. ....................................................................................................... 91
Figure 17 – ThT fluorescence intensity in the presence of DNA G4s formed in water or lithium
cacodylate buffer (Licac), at neutral or acidic pH conditions. ......................... 93
Figure 18 – ThT fluorescence intensity enhancement for DNA and RNA G4s. ............................ 96
Figure 19 - Screening for G4 formation in vitro in INS intron 1. .................................................. 98

xii
Figure 20 - ThT fluorescence intensity in the presence of RNA G4s formed in water or Licac, at
neutral or acidic pH conditions. .................................................................... 101
Figure 21 – Influence of KCl concentration on ThT fluorescence probing for RNA G4s. ........... 103
Figure 22 – Influence of MgCl2 concentration on ThT fluorescence probing for RNA G4s. ...... 104
Figure 23 - Influence of combined KCl and MgCl2 concentrations on ThT fluorescence probing for
RNA G4s. ........................................................................................................ 105
Figure 24 – Real-time monitoring of G4 formation during transcription using ThT. ................. 108
Figure 25 – Visualization of different native conformations in INS intron 1 RNA transcripts and RNA
derived oligos. ............................................................................................... 110
Figure 26 - Identification of proteins that interact with INS intron 1. ....................................... 116
Figure 27 - Cloning of hnRNP RRM constructs. ......................................................................... 118
Figure 28 – Expression of recombinant hnRNP F, H1 and RRM constructs. .............................. 119
Figure 29 - Purification of recombinant hnRNP F, H1 and RRM constructs. ............................. 121
Figure 30 - Luciferase expression system used in the study of the role of additional uORFs in
translation efficiency of five primate species. .............................................. 126
Figure 31 – Transfection efficiencies of human and primates INS 5’UTRs. ............................... 127
Figure 32 – Preliminary screening of G1 formation propensity using ThT fluorescence. ......... 177
Figure 33 – Nucleotide sequence of AmpliScribe™ T7-Flash™ Transcription Kit control template.
....................................................................................................................... 178
Figure 34 – Multiple alignment of amino acid sequences of hnRNP F and H1 RRM constructs.179
Figure 35 - Nucleotide sequences of hnRNPs F and H1 and respective RRM constructs. ......... 180
Figure 36 - Nucleotide sequences of primates INS 5’UTR constructs. ...................................... 181
Figure 37 - Potential non-canonical initiation codons in human INS 5’UTR. ............................. 182

xiii
IV. DECLARATION OF AUTHORSHIP
I, Ana Luísa Gonçalves das Lages declare that this thesis entitled Characterization of parallel G-
quadruplex formation by highly conserved G-rich motifs in INS intron 1, and the work presented in
it are my own and has been generated by me as the result of my own original research.
I confirm that:
1. This work was done wholly or mainly while in candidature for a research degree at this
University;
2. Where any part of this thesis has previously been submitted for a degree or any other
qualification at this University or any other institution, this has been clearly stated;
3. Where I have consulted the published work of others, this is always clearly attributed;
4. Where I have quoted from the work of others, the source is always given. With the exception
of such quotations, this thesis is entirely my own work;
5. I have acknowledged all main sources of help;
6. Where the thesis is based on work done by myself jointly with others, I have made clear exactly
what was done by others and what I have contributed myself;
7. Parts of this work have been published as:
Kralovicova J, Lages A, Patel A, Dhir A, Buratti E, Searle M, et al. Optimal antisense target reducing
INS intron 1 retention is adjacent to a parallel G quadruplex. Nucleic Acids Res.
2014;42(12):8161–73
Signed:
Date:

xiv

xv
V. Acknowledgements
The accomplishments in the present project result from the effort and contribution of several
people, to whom I would like to leave my sincere appreciation.
First of all, I would like to acknowledge my funding organization, Diabetes UK, for providing unique
opportunities to present my research and meet those involved in grant applications, students
funded by the charity, and extraordinary people that have to live with type 1 diabetes and were so
keen on understanding our research and share their life experiences as patients.
I would like to thank my supervisor, Dr Igor Vorechovsky, for his support, guidance and
encouragement throughout the project, as well as revising my drafts and refining my presentations.
I am grateful for the considerable time spent in meetings and all the constructive discussions
regarding this project. To my supervisors, Professor John Holloway and Professor Chris Proud, for
their availability to help and support, every single time.
I would like to thank Dr Mark Coldwell and Dr Joanne Cowan for sharing their knowledge in cell
culture and helping with the studies of the effect of uORFs in translation. To Professor Douglas Black
for the plasmids containing the cDNAs of hnRNPs F and H1.
A big thank you to all my friends. To the ones I left in Portugal who kept sending their words of
motivation and encouragement; the never-ending conversations were breaths of fresh air in so
many occasions. And to the ones I met in these last four years. We’ve spent many hours in countless
lunches, trips, coffees, chats and laughs. You’ve always had the right words at the right time. I hope
we can stay in touch, no matter where we all are.
At last but not the least, a very special thank you to my family. Adelina, Dionil and Nuno, you have
been my foundation. You have always pushed me to do more, to accomplish more, and to never
give up on anything. If it weren’t for your many advices and words of wisdom, I would never have
started this adventure, which made me grow up as a person. Isaura, António, Francisca and José,
your kind words of encouragement, love and comprehension for your granddaughter were always
a motivation to do better and keep going. Lurdes, thank you for the lovely holiday trips, the advices
to remain calm and to always see the bright side of everything. You have always been much more
than a godmother. Palmira, Pedro and José Manuel, for all the good laughs, lunches and chats. I
would like to thank you for your support and motivation as well.
I can never thank you enough for your immense love, patience, guidance and support, fundamental
throughout all the good and bad moments.

xvi

xvii
VI. Abbreviations
Abbreviation Full designation
3’ss 3’ splice site
3’UTR 3’ untranslated region
5’ss 5’ splice site
5’UTR 5’ untranslated region
7-deaza-GTP 7-Deazaguanosine-5'-Triphosphate
APA Alternative polyadenylation
AS Alternative splicing
DIs Detained introns
ESE Exonic splicing enhancer
ESS Exonic splicing silencer
G4 G-quadruplex
hnRNPs Heterogeneous nuclear ribonucleoproteins
IDDM2 Insulin-Dependent Diabetes Mellitus locus 2
INS Preproinsulin gene
IPTG Isopropyl-β-D-thiogalactopyranoside
IR Intron retention
ISE Intronic splicing enhancer
ISS Intronic splicing silencer
KCl Potassium chloride
Licac Lithium cacodylate
LiCl Lithium chloride
NMD Non-sense mediated decay
pIC pICtest2
Pre-mRNA Pre-messenger RNA

xviii
PTCs Premature termination codons
Py-tract Polypyrimidine tract
QGRS Quadruplex forming G-rich sequences
q-RRM quasi- RNA recognition motifs
RIs Retained introns
RBPs RNA-binding proteins
RIs Retained Introns
RNA Pol II RNA polymerase (Pol) II
RNPs Ribonucleoproteins
RRMs RNA recognition motifs
RT Room temperature
SNP Single nucleotide polymorphism
snRNPs Small nuclear ribonucleoproteins
SR-rich protein Serine/arginine-rich proteins
T1DM Diabetes mellitus type 1
ThT Thioflavin T
uORF Upstream open reading frame

1
Chapter 1: Introduction

2

Chapter 1
3
1.1 Gene Expression
Gene expression is the process through which a cell synthesizes functional biomolecules from its
DNA. Differential expression of genes determines cell differentiation, i.e., the expression of a
unique set of genes in each cell type accounts for the differences between muscle cells, skin cells,
neurons or any other cell type (1). In the first step of gene expression, transcription, genes are
copied into primary transcripts (precursor-messenger RNAs, pre-mRNAs), which have to be further
processed into functional RNAs. By default, eukaryotic genes are silenced, since DNA is tightly
bound to histones, one of the most evolutionary conserved protein families (1,2). Histones bind
tightly to DNA via electrostatic interactions established between positively charged amino acids of
proteins and negatively charged phosphate groups of DNA. About 146 base pairs of DNA fold
around eight histone proteins into a structure called nucleosome (3). Chromatin is formed by tight
coiling of 250 nm-wide fibers consisting of several nucleosomes (3,4). In order to alter the steady-
state of a gene, chromatin structure is altered via histone modifications, which leads to decreased
histone:DNA interactions and the overall structure gets opened. Interactions between DNA and
histones are weakened by chemical modification processes on histones: methylation, acetylation,
phosphorylation, ubiquitylation, sumoylation, ADP-ribosylation, deamination and proline
isomerization (5).
In general, the compact chromatin structure resulting from nucleosome assembly hides regulatory
binding sites, restricting access to DNA and downregulating processes like transcription, replication,
recombination and repair (4,6,7). This physical barrier is actively overcome and gene processes
initiated via interaction of DNA-binding factors to nucleosome-depleted regions (NDRs), like the
binding of transcription factors to promoter regions (6). Activation of gene expression is associated
and requires nucleosome organization and positioning which lead to chromatin structure opening
and increase gene accessibility (4,6,7).
It is, therefore, logical that nucleosomes and their positioning within chromatin also influence gene
expression regulation. Nucleosomes are generally located over the transcribed region of genes
(suppressing their activation) or over non-genic regions (7,8). In general, enhancer, promoter and
terminator regions of genes are depleted of nucleosomes (4,7,8). Most studies indicate that
nucleosome positioning is determined by a combination of factors: DNA sequence, DNA-binding
proteins, nucleosome remodelers and RNA pol II transcription machinery (7,8).
Once genes are accessible, many proteins, commonly named transcription factors (TFs), interact
with the DNA, activating or repressing transcription. (1).

Chapter 1
4
1.1.1 Genome complexity and coding capacity
Sequencing of the human genome increased our knowledge of the number of genes and encoded
proteins (9,10). There is still much to uncover and a consensus regarding the number of human
proteins and their encoding genes has not been reached yet (11). Recent data, obtained through
the analysis of gene expression of 30 histologically normal human cell and tissue types showed the
existence of 20687 proteins encoded by 17294 genes, including the evidence for the translation of
140 annotated pseudogenes and an annotated non-coding RNA that can be translated into five
peptides (9). Using mass-spectrometry data, Kim and co-workers claim to have identified isoform-
specific peptides for 2861 protein isoforms derived from 2450 genes (9). Thus, a single gene may
encode different mRNAs, which in turn, are translated into several isoforms of the same protein
(9,12,13). For example, the Fas receptor gene encodes isoforms involved in apoptosis. Two of these
isoforms have opposite effects on apoptosis. The soluble isoform blocks the programmed cell death
of tumour cell lines induced by the membrane-bound isoform of the protein (14,15). A second
example is the synthesis of at least three protein isoforms from the Drosophila fruitless gene, where
each isoform has a different function in male sexual behaviour (16).
1.1.2 Maturation of RNA
Expression of protein isoforms is predominantly regulated at the pre-mRNA maturation level.
Eukaryotic pre-mRNAs contain intervening non-coding sequences known as introns that separate
coding regions called exons (17). Maturation of pre-mRNA into mRNA (template for protein
translation) involves three major processes: 5’ capping, splicing and 3’ cleavage/polyadenylation
(18). Shortly after translation initiation, the 5’ end of pre-mRNA is blocked by the addition of a
modified guanine, 7-methylguanosine, in a process termed 5’ capping (18). 3’
cleavage/polyadenylation is a post-transcriptional modification comprising the sequential
endonucleotide cleavage and addition of poly(A)-rich sequences to the 3’ end of RNA transcripts
(19). Splicing removes introns and joins exons together (12,13), which can occur after 3’
cleavage/polyadenylation (in short transcripts) or simultaneously during transcription, particularly
in 5’ parts of genes with multiple exons (18).Usage of particular splice sites defines inclusion or
exclusion of exons leading to different mRNAs being translated into protein isoforms that may have
distinct functions, in a process called alternative splicing (AS) (20).
Although approximately 75% of the human genome is transcribed, not all transcripts are translated
into proteins (21,22). These noncoding RNAs include ribosomal RNA (rRNA), transfer RNA (tRNA),
small nuclear RNA (snRNA), small nucleolar RNA (snoRNA), microRNA, piwi-interacting RNA (piRNA)

Chapter 1
5
and small interfering RNA (siRNA), and are expressed at different levels; 80-90% of total RNA in
most cells corresponds to rRNA and the remaining 10% are non-coding RNAs (23). Most non-coding
RNAs are processed by capping, splicing and polyadenylation (22). However, various non-coding
RNAs are non-canonically processed, lacking 5’ cap, poly(A) tail or both, or containing retained
introns (RIs) or mutually exclusive exons, showing stable conformations and playing important
cellular roles (22). mRNA is the third more abundant RNA, after tRNA (10-15%), representing 3 to
7% of total RNA, approximately two orders of magnitude more than remaining non-coding RNAs
(23).
1.2 Pre-mRNA splicing
Production of different mRNAs from a single gene by splicing involves accurate recognition of
introns and exons, followed by precise removal of introns from pre-mRNA and ligation of exons
(24,25). Splicing requires conserved sequences within both introns and exons, that contain
dinucleotides GU and AG at the 5’ (donor) and 3’ (acceptor) exon-intron junctions, respectively
(24,26) (Figure 1).
The 5’ splice site (5’ss) consensus motif is characterized by a 9 nt long sequence (MAG/GURAGU,
where M denotes amino nucleotides, A or C, and R corresponds to purine nucleotides, A or G). The
3’ splice site (3’ss) consensus sequences include three motifs: the YAG/G (where Y is a pyrimidine,
C or T) motif at the intron-exon boundary, the branch-point (YNYURAY, with N representing any
nucleotide) and the polypyrimidine tract (Py-tract). Altogether, these three distinct elements define
a 3’ss region that may extend more than 100 nucleotides upstream of the 3’ss AG dinucleotide into
the intron (24,26,27) (Figure 1).
Figure 1 - Cis-acting elements involved in pre-mRNA splicing. Schematic representation of consensus sequences of splice sites, branch-point and Py-tract. Exons are shown as boxes, intron as a line. Intronic and exonic splicing enhancer and silencer elements are denoted as green and red boxes, respectively. Corresponding trans-acting factors are represented by green and red circles and their effects are indicated by coloured arrows.

Chapter 1
6
The 3’ and 5’ss are highly degenerate in eukaryotes and additional less conserved sequences
present in exons and introns regulate this process, increasing the overall splicing accuracy and
fidelity (24,28,29). These cis-acting regulatory sequences act by promoting or inhibiting recognition
efficiency and are known as exonic or intronic splicing enhancers (ESE, ISE) or silencers (ESS, ISS),
respectively (24,26). Although the role played by cis-acting elements varies according to the context
they are inserted in, splicing enhancers tend to have dominant roles in constitutive splicing and
silencers are usually more relevant in alternative splicing regulation (15,28,30–33). Both splicing
enhancer/silencer regions are thought to interact with a number of trans-acting factors, such as
serine/arginine (SR)-rich proteins or heterogeneous nuclear ribonucleoprotein (hnRNP) complexes
(Figure 1) (24,26). However, structural properties of cis-acting factors involved in the assembly of
ribonucleoproteins (RNPs) and how these motifs recruit and bind to proteins remain unclear
(29,34,35).
RNPs are essential for gene expression and its regulation. The spliceosome is a large RNP
responsible for pre-mRNA splicing, mainly constituted by uridine (U)-rich small nuclear RNPs
(snRNPs) (35). Spliceosome assembly occurs in a dynamic and stepwise manner, starting with the
interaction of U1 with the 5’ss (15,20). U2 auxiliary factor (U2AF) is recruited to the Py-tract and 3’
ss, resulting in the formation of the early (E) complex and the recruitment of the U2 snRNP to the
branch-point (formation of A complex). The mature spliceosome (C complex), in which the two-step
splicing process occurs, is then formed by the final association of U4-U5-U6 tri-snRNP (20).
The first step in splicing is a transesterification reaction (exchange of an esther R” group with an
alcohol R’ group), where the binding of U1 and U2 to RNA brings the splice sites into proximity (36).
The 2’-hydroxyl group of the A residue of the branch-point YNYURAY sequence reacts with the
phosphate group of the G residue at the 5’ss, cleaving the exon-intron bond at the intronic 5’-end
and forming a lariat structure (36,37). The exonic 3’-end has then a free 3’-hydroxyl group (37). The
final splicing reaction binds the phosphate group at the intronic 3’-end and the free end of the
detached exon together, releasing the intron in a lariat structure (f) (36,37).

Chapter 1
7
Figure 2 – Schematics of splicing reaction. (A) The hydroxyl group of the branch-point adenine residue reacts with the phosphate group of the 5’ss guanine, the intronic 5’end is cleaved and a lariat structure is formed (B). For the second step, snRNPs U4-U6 bind to the intron/exon 2 junction and the free hydroxyl group in exon 1 reacts with the phosphate group of the intronic 3’ss guanine. The exons are joined together and the intron is released in the lariat form within the spliceosome complex (C).
1.2.1 Cis-acting regulatory sequences and trans-acting factors
Splice-site selection and the choice as to whether splicing is activated or inhibited is influenced by
the non-spliceosomal RNA-binding proteins that interact with intronic and exonic cis-acting
elements (38). ESEs were traditionally associated with interactions with members of the SR-rich
protein family while ESSs may recruit hnRNPs (Figure 1) (15,29). In contrast to exons, intronic
splicing regulatory sequences and their binding properties have not been studied as extensively.
However, identical elements can, depending on the genomic context, act either as enhancers or
silencers. For example, the effect of CA-repeats on splice site recognition depends on their
proximity to the splice sites; these are bound by hnRNP L, which may promote or inhibit splicing
(39). The brain- and muscle-specific splicing factors Fox1/Fox2 bind to the ISEs UGCAUG
hexanucleotides. Pairs of YCAY motifs interact with Nova family factors, and as for CA-repeats, these
can function as either ESSs or ISSs (15,29,39,40). A third class of RNA-binding proteins (RBPs),
Chapter 1
8
termed tissue-specific RBPs, are also thought to bind to both types of cis-acting elements and act
as either activators or repressors (38).
SR-rich proteins (41) and hnRNPs (42) are the most abundant and best-characterized splicing factors.
SR proteins like SRSF1 (ASF/SF2) and SRSF2 (SC35) regulate splice site selection but also have roles
in mRNA export from the nucleous, localization, translation and non-mediated decay (NMD) (43).
SR-rich proteins bind to ESEs through their N-terminal RNA-recognition motifs (RRMs), recruiting
and interacting directly with spliceosomal machinery components via their C-terminal SR-rich
domains (41,43,44). It is still unclear whether SR proteins regulate splicing in an independent
manner with relation to other family members or in cooperativity with each other (43).
1.2.1.1 hnRNP family
The hnRNP family comprises a group of 20 abundant, major proteins named hnRNPs A-U, and other
less abundant, minor hnRNPs (45,46). hnRNPs have varied functions that depend on their cellular
localization, assisting in transcription, splicing regulation, 5’capping, polyadenylation, mRNA
cellular transport, translation and degradation processes (46,47). Although, most hnRNPs are
located in the nucleus, post-translational modifications (methylation, phosphorylation,
ubiquitination or sumoylation) or recruitment by other hnRNPs members lead to their translocation
to the cytosol (45–47). The different functions of hnRNPs are due to a multiplicity of interactions
with pre-mRNAs and other hnRNPs, giving rise to alternative splicing isoforms as a result of a
diversified combination of exons in mature transcripts (47).
hnRNPs have mainly been associated with splicing inhibitory mechanisms since they typically bind
to splicing silencer elements (15,29,48). Although hnRNP-mediated repression of spliceosomal
assembly has been associated with different phenomena such as multimerization along exons,
blockage of snRNP recruitment or looping out of exons, their underlying mechanism of action is not
yet fully understood (44,47).
hnRNPs structural properties arise from arrangements of a number of domains with different
functions (47). There are four types of unique RBPs as hnRNPs building-blocks: the RRM, the quasi-
RRM (q-RRM), the glycine-rich domain (repeats of Arg-Gly-Gly tripeptides that constitute RGG
boxes) and the KH domain (46,47). Similar RNA-binding properties and functions among hnRNPs
result from the presence of the same RBP, which facilitates classification into sub-families (46–48).
RRMs are responsible for the interaction of hnRNPs with single-stranded nucleic acids of variable
lengths (46), while the RGG box establishes interaction with other hnRNPS, and the KH domain

Chapter 1
9
specifically binds to RNA (45,47). qRRMs lack two degenerate RNP consensus sequences present in
RRMs, therefore recognizing and binding to RNA in a different manner, enclosing RNA G-tracts (46).
The hnRNP F/H family, including hnRNP F, H1 (H), H2 (H’) and H3 (2H9), lack the conservative
degenerate RNA-binding sequence present in most hnRNPs; therefore, their RBDs are described as
qRRMs (46,47,49,50). Each protein contains three qRRMS; qRRM3 is structurally similar to canonical
RRM but qRRM1 and qRRM2 adopt a different fold with a more exposed RNA-binding surface
(46,49).
hnRNP F and H specifically bind poly(G) tracts (51–53) and are highly similar in sequence and
structure (46). Although both proteins have been found to be involved in the regulation of
alternative splicing, the mechanisms that drive hnRNPs F/H interaction with pre-mRNAs and what
the role of this interaction is in splicing regulation of genes remain unknown (46,54–57).
1.2.2 Alternative RNA processing
The complexity of gene expression is increased by alternative transcriptional initiation (Figure 3A)
(58) and/or AS (Figure 3B) and/or polyadenylation events (Figure 4) (59–61), resulting in the
formation of multiple mRNA isoforms from the same gene by joining the exons in different
combinations (43,62). Alternative transcription initiation is generally associated with usage of
alternative promoters, rendering mRNAs with different starting exons (Figure 3A). AS may involve
mutually exclusive exons, alternative 5’ss, alternative 3’ss, cassette exon skipping, intron retention
(IR) (Figure 3B) (62–64). More complex splicing events may occur by combining two or more of
these events (12). Maturation of mRNA 3’ends occurs by RNA cleavage followed by the synthesis
of a poly(a) tail. Most genes contain more than one polyadenylation site, leading to the formation
of mRNAs with distinct 3’UTRs (60,61). As illustrated in Figure 4, four different types of alternative
polyadenylation (APA) events may occur: tandem 3’UTR APA, alternative terminal exon APA,
Intronic APA and internal exon APA (61).

Chapter 1
10
Figure 3 – Schematics of gene expression regulatory alternative events. (A) Alternative promoters for the same gene create mRNA diversity. Usage of promoter 1 (P1) leads to the constitutive inclusion of exons 1 (E1), 3 (E3) and 4 (E4) in the mature transcript, while the use of promoter 2 (P2) originates a final transcript including exons 2 (E2), 3 and 4. Exons are shown as numbered white boxes, introns as thick black lines. Promoters are denoted by black arrows. Splicing patterns are indicated by blue lines. (B) Several different mRNA isoforms may arise from alternative splicing events occurring within one gene. Beyond constitutive splicing, from which a single mRNA transcript is created, a specific exon may be partially or fully excluded from the mature transcript, via one out of four events: cassette exon skipping, alternative 5’ss, alternative 3’ss or mutually exclusive exons. Retention of introns leads to transcripts with extended segments, either in untranslated regions (UTR) or in the coding region.
Chapter 1
11
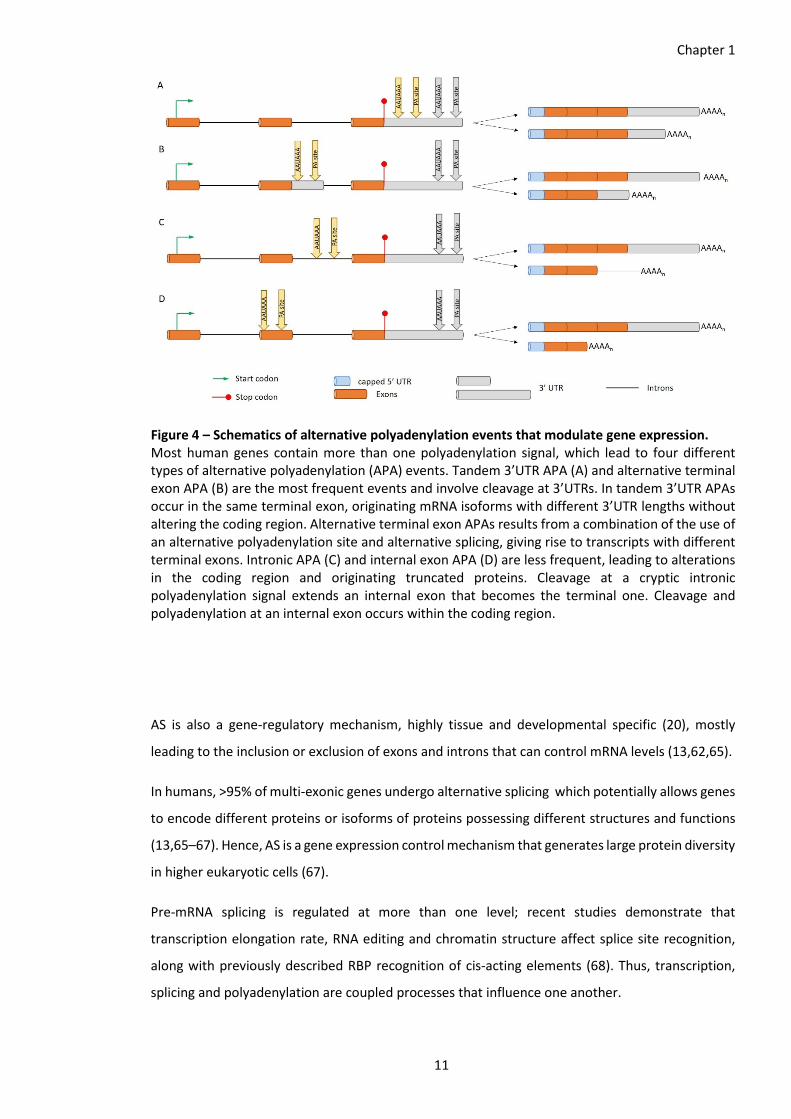
Figure 4 – Schematics of alternative polyadenylation events that modulate gene expression. Most human genes contain more than one polyadenylation signal, which lead to four different types of alternative polyadenylation (APA) events. Tandem 3’UTR APA (A) and alternative terminal exon APA (B) are the most frequent events and involve cleavage at 3’UTRs. In tandem 3’UTR APAs occur in the same terminal exon, originating mRNA isoforms with different 3’UTR lengths without altering the coding region. Alternative terminal exon APAs results from a combination of the use of an alternative polyadenylation site and alternative splicing, giving rise to transcripts with different terminal exons. Intronic APA (C) and internal exon APA (D) are less frequent, leading to alterations in the coding region and originating truncated proteins. Cleavage at a cryptic intronic polyadenylation signal extends an internal exon that becomes the terminal one. Cleavage and polyadenylation at an internal exon occurs within the coding region.
AS is also a gene-regulatory mechanism, highly tissue and developmental specific (20), mostly
leading to the inclusion or exclusion of exons and introns that can control mRNA levels (13,62,65).
In humans, >95% of multi-exonic genes undergo alternative splicing which potentially allows genes
to encode different proteins or isoforms of proteins possessing different structures and functions
(13,65–67). Hence, AS is a gene expression control mechanism that generates large protein diversity
in higher eukaryotic cells (67).
Pre-mRNA splicing is regulated at more than one level; recent studies demonstrate that
transcription elongation rate, RNA editing and chromatin structure affect splice site recognition,
along with previously described RBP recognition of cis-acting elements (68). Thus, transcription,
splicing and polyadenylation are coupled processes that influence one another.

Chapter 1
12
1.2.3 Co-transcriptional splicing
Separate analysis of different gene expression processes as static and independent steps may
facilitate their study, however, most of these dynamic processes are orchestrated (69,70).
Splicing frequently starts soon after transcription initiation; analysis of nascent RNA transcripts
showed degradation of the first intron while the second intron is still being transcribed (64). In
addition, immunofluorescence and chromatin immunoprecipitation assays show co-localization of
both splicing and transcriptional machineries (68,71).
The co-transcriptional nature of splicing involves a fine-tuned set of interlinked processes leading
to the production of functional mRNAs, via coordinated interaction of many proteins with DNA,
RNA and other proteins.
Any of these processes is the target of components from any of the other processes. Therefore,
formation of primary transcripts and release from the transcription machinery as pre-mRNAs,
around which spliceosome assembles to remove introns, might not exist separated mechanisms.
On the contrary, the co-transcriptional nature of splicing implies intron removal as soon as relevant
splice sites and splicing regulatory sequences are synthetized, especially in very long genes. The
strength of these newly transcribed splice sites, along with their positioning and proximity to
stronger or weaker splice sites, determines their efficient recognition and lead to different
alternative splicing events (Figure 3B) (72).
Currently, the model used to describe gene expression regulation states that coordination of
chromatin organization, histone modifications, direct association of RNA pol II CTD with splicing
factors, and RNA pol II elongation rate, is required for an accurate and efficient processing of RNA
transcripts. Therefore, chromatin, transcription and splicing are organized in such a way that ensure
temporal and spatial control of splicing (72).
Independently of whether splicing occurs co- or post-transcriptionally, splicing initiation relies on
the evaluation of which units are to be removed and which are joined together, along with the
identification of genuine splice sites amongst several pseudo sites (72,73). As previously mentioned,
the relative strength of genuine splice sites plays an important role on their selection. However,
many weak splice sites, located at suboptimal contexts, are efficiently identified, while other strong
splice sites are ignored by the splicing machinery (73). The selection of genuine splice sites occurs
concomitantly with the definition of exons and introns and the distinction between the two. There
are two mechanisms through which the splicing units are recognized: intron definition and exon
definition (73). Both mechanisms may take place in, virtually, any gene. Distinction between one or
the other is based on both intron and exon sizes (73,74). Intron definition mechanism is

Chapter 1
13
characterized by selection and binding of splicing factors to splice sites within intronic sequences,
as depicted in Figure 1 in section 1.2. On the other hand, intron definition tends to take place when
exons are long and introns short, while exon definition and splicing machinery assembly occurs if
exons are small and introns long (73,74). The exon definition mechanism is characterized by the
search and pairing of splice sites located across the exons. Selection of pairs of closely spaced splice
sites leads to recruitment and binding of splicing factors to the downstream 5’ss and the upstream
3’ss define the flanked exon. Following definition, interactions between splicing factors in individual
exons promote juxtaposition of neighbouring exons and introns are removed (74).
Although these two processes imply different coordinated interactions between splicing factors
and RNA cis-acting elements, the underlying spliceosome assembly mechanism is the same and
both exon and intron definition may occur in the same transcript (73).
Trans-acting factors recruitment, whether in exon or intron definition mechanism, occurs while the
transcript is in contact with DNA, via RNA pol II C-terminal domain (CTD) (72). CTD is highly
conserved through evolution, its length and structural diversity increasing with organisms’
complexity. Mammalian CTD is composed of 52 repeats, of which 21 consist of a conserved peptide
with the sequence Tyr1-Ser2-Pro3-Thr4-Ser5-Pro6-Ser7, and the remaining being more degenerate
(75). Such a repetitive sequence confers CTD with a highly flexible structure, enabling it the
potential to bind other splicing factors with diverse conformations (76).
Post-translational modifications, specifically phosphorylation at defined amino acid residues, also
regulate CTD activity (75–77). Residues Ser2 and Ser5 are the main targets of phosphorylation,
coordinating multiple events during RNA synthesis (75,76,78). Therefore, through changes in the
phosphorylation pattern, as RNA pol II translocates along the gene, CTD promotes the recruitment
of histone modifiers, chromatin remodelling complexes and splicing factors (76,78). Links of CTD
activity with many regulatory processes during transcription has been showed through the
identification of CTD-bound proteins with different functions. SR-like proteins, Prp40,
cleavage/polyadenylation factors and the capping enzyme complex, involved in RNA processing,
interact with phosphorylated CTD (78). The histone acetyltransferase PCAF and the histone
methyltransferase Set2 also interact with the phosphorylated form of CTD, facilitating RNA pol II
mobility through chromatin and transcription elongation, respectively (78). CTD may also play a role
in DNA damage responsiveness since it has been shown to interact with Hrr25, a protein kinase
involved in this process (78).
In summary, CTD of RNA Pol II acts as a bridge, recruiting and promoting the binding of transcription
and elongation factors, interacting and activating the 5’ capping enzyme factors, establishing links

Chapter 1
14
with histone modifications and chromatin remodelling, and being required for the localization of
splicing factors to transcription sites (64,68,76,78).
Histone modifications directly play important roles in RNA processing as well. A histone
acetyltransferase has been shown to regulate the association of U2 snRNP components to the
nascent transcript (79,80). Histone modifications direct nucleosome positioning and chromatin
remodelling through binding to SR proteins (79,81,82). SR proteins may directly affect transcription,
since some members of this family have been found to interact with intronless genes. However, the
presence of introns, in the vast majority of human genes, further promote transcription via
recruitment of transcription initiation factors and enhancement of the pre-initiation complex by
functional 5’ss (79,80,83–85).
All the above processes are, thus, interconnected and strongly influence one another. Disruption
of either mechanism may lead to impaired expression of one or several genes, simultaneously.
1.2.4 Introns in splicing
Introns have always been considered has having only two possible fates: removal from pre-mRNA
followed by degradation or retention in processed RNA transcripts. Recently, introns have been
classified as exitrons (86), retained introns (87) and detained introns (70), according to their
involvement in RNA transcripts fate and whether their splicing is co- or post-transcriptional (70,88).
IR is an alternative splicing regulatory event characterized by the presence of one or more introns
in polyadenylated mRNA (89,90). It can alter different gene expression steps, including transcription,
polyadenylation, mRNA export to the cytoplasm, translational efficiency and mRNA decay (91–93).
A detailed study of retained introns (90) showed that IR is widespread in mammals. IR is
characterized by a set of features that allow the distinction of retained from constitutive introns:
the former show reduced length, high G/C content, weaker splice sites, relative location in the
primary transcript, elevated G/C content in flanking exonic sequences and ratios of intron and
upstream exon lengths to downstream exon length.
Intron-retaining transcripts may potentially be removed by nuclear retention and exosome
degradation or by NMD. NMD is the cellular process through which mRNAs with premature
termination codons (PTCs) are degraded during the termination step of the first round of translation,
therefore preventing further translation into aberrant proteins (92–98). Most transcripts with
retained introns are, in fact, not exported from the nucleus and usually lead to the introduction of

Chapter 1
15
PTCs (90) or upstream open reading frames (uORFs) (99,100). PTCs in retained introns often give
rise to C-terminal truncated proteins that potentially have dominant negative properties, if PTCs
are not recognized by the NMD system (90,101), while the presence of uORFs usually correlate with
decreased protein expression. AUG-starting uORFs are often translated, which makes it difficult to
reinitiate translation at downstream canonical start codons, reducing the efficiency of translation
initiation of the main ORF, and often trigger mRNA decay (102,103).
Recently, a new set of transcripts containing slowly spliced introns has been described (70).
Detained introns (DIs) in polyadenylated RNAs are spliced post-transcriptionally, in agreement with
an earlier proposal that, within the same gene, 5’-end introns are generally co-transcriptionally
spliced while 3’-end introns are post-transcriptionally spliced (104,105). An extensive analysis of
transcripts containing DIs demonstrated that these introns are often found in the flanking regions
of alternatively spliced exons (70) and most DIs contain PTCs. Regardless of the presence of PTCs,
DI-containing transcripts are often held in a nuclear-detained pool until changes in the cellular
environment promote post-transcriptional splicing (70).
Nevertheless, not all intron-containing transcripts are degraded or retained in the nucleus, some
have been identified in close proximity with polysomes, indicating their transportation to the
cytoplasm (70,88).
Some retained introns show a G/C content and codon usage similar to coding exons and display the
capacity of encoding protein domains (91,106). For example, the retained intron positioned
between nucleotides 723 and 1207 in the Homo sapiens EF1a-like protein mRNA encodes the
Elongation factor Tu domain; the intron located between nucleotides 995 and 1176 in the H. sapiens
JM2 protein mRNA partially encodes a Fork Head domain (87).
Finally, a subset of retained introns, named exitrons (exon-like introns), have been found within
protein-coding exons and allow the preservation of the transcript’s protein-coding potential. Their
properties comprise a high G/C content, absence of PTCs, prevalence of synonymous substitutions
and highly conserved sequences (88).
Exitron splicing may strongly affect protein structure and function since they are mostly found in
intrinsically disordered regions and in coding regions associated with post-translational
modifications, such as phosphorylation, ubiquitylation, sumoylation, S-nitrosylation and lysine
acetylation (86,88).
Considering their described properties, exitrons have features in common with both introns and
exons. They show relatively weak splice sites and high G/C content, which leads to inefficient
splicing, just like in introns. However, Marquez and colleagues (86) have shown that exitron

Chapter 1
16
processing responds differently to distinct cellular environments, which distinguish them from
retained introns. Transcripts containing exitrons are exported to the cytoplasm and translated,
while transcripts with retained introns are usually kept in the nucleus and translation is prevented.
PTCs are generally a consequence of a retained intron, but are absent in transcripts containing
exitrons with a length divisible by three. Finally, a number of transcripts with retained introns were
reclassified as exitrons; 670 retained introns in 577 genes are now termed exitrons. These, together
with other previously classified exitrons, account for a total of 923 exitron events in 747 human
genes (86,88).
Hence, exitron splicing may be defined as another form of alternative splicing that, under different
cellular stress conditions, might significantly alter protein diversity.
Regardless of the classification of introns, their role in the fate of mRNAs demonstrated that introns
play important roles in gene expression and nuclear mRNA export regulation, as well as in the
synthesis of protein isoforms by alternative splicing (96).
1.2.5 The importance of RNA secondary structure in splicing
Like DNA and proteins, RNAs adopt highly versatile structures (Figure 5) and different
conformations that govern their function in the cell. This does not apply just to structured RNAs
such as tRNA or snRNA, but also to pre-mRNAs, where structural constraints can markedly influence
RNA processing, by both promoting or inhibiting it.
Pre-mRNAs are capable of adopting complex secondary and tertiary structures, considering the
large number of base-pairing possibilities (12,107). The same nucleotide sequence can form many
diverse structures (Figure 5), which can bring together or separate, as well as expose or hide,
splicing regulatory elements and modulate alternative splicing (27,107) (Figure 5).
Chapter 1
17
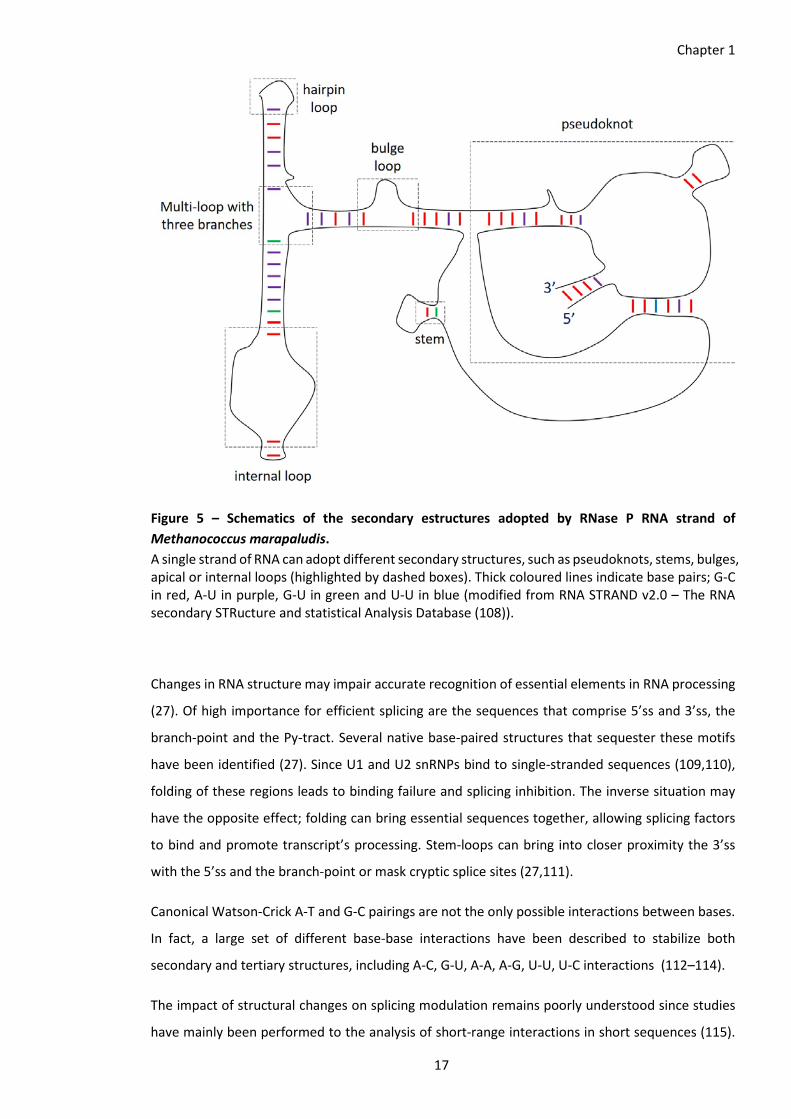
Figure 5 – Schematics of the secondary estructures adopted by RNase P RNA strand of Methanococcus marapaludis. A single strand of RNA can adopt different secondary structures, such as pseudoknots, stems, bulges, apical or internal loops (highlighted by dashed boxes). Thick coloured lines indicate base pairs; G-C in red, A-U in purple, G-U in green and U-U in blue (modified from RNA STRAND v2.0 – The RNA secondary STRucture and statistical Analysis Database (108)).
Changes in RNA structure may impair accurate recognition of essential elements in RNA processing
(27). Of high importance for efficient splicing are the sequences that comprise 5’ss and 3’ss, the
branch-point and the Py-tract. Several native base-paired structures that sequester these motifs
have been identified (27). Since U1 and U2 snRNPs bind to single-stranded sequences (109,110),
folding of these regions leads to binding failure and splicing inhibition. The inverse situation may
have the opposite effect; folding can bring essential sequences together, allowing splicing factors
to bind and promote transcript’s processing. Stem-loops can bring into closer proximity the 3’ss
with the 5’ss and the branch-point or mask cryptic splice sites (27,111).
Canonical Watson-Crick A-T and G-C pairings are not the only possible interactions between bases.
In fact, a large set of different base-base interactions have been described to stabilize both
secondary and tertiary structures, including A-C, G-U, A-A, A-G, U-U, U-C interactions (112–114).
The impact of structural changes on splicing modulation remains poorly understood since studies
have mainly been performed to the analysis of short-range interactions in short sequences (115).

Chapter 1
18
From these, however, evidence showing that pre-mRNA secondary structure plays an important
role in regulation of AS is clear (116–118).
The high flexibility of RNAs has led researchers to postulate that most pre-mRNAs exhibit only local
structures (118,119) and that their folding is strongly influenced by their context (length and
sequence of flanking segments) (118,120). Several reports show that pre-mRNA folding is transient
and structural stability time-windows in vivo are small (118,120).
Pre-mRNA folding occurs mainly co-transcriptionally, hence most in vivo pre-mRNA structures are
expected to be local (115). This is attributed to binding of splicing factors to the nascent RNA, which
limits molecular spatial freedom and sequence length available for conformational changes to 50nt
downstream of the transcribing polymerase. Therefore, short-range base-pair interactions are
preferred and long-range ones are disfavoured (121). In particular, simple local hairpin
conformations have been shown to be the most prevalent ones (121). Thus, most studies have been
applied to uncover the role of local secondary structures on AS events (115).
A very relevant study (122) showed that computational predictions of splice-sites are more robust
and accurate when pre-mRNA secondary structure data is combined with conventional prediction
algorithms for sequence-based splice-sites (122,123). In agreement with this, some studies showed
that alternative splice sites are generally flanked by structures with higher stability than the ones
surrounding constitutive and skipped splice-sites (123–125).
A few examples of alternative splicing events modulated by RNA secondary structure have been
well described. In example, sequestration of ESE and ESS elements in RNA structures reduces their
splicing regulatory activities (115).
Using computational analysis to determine propensity of splicing enhancer/silencer motifs for
folding, Michael et al. concluded that these elements are preferentially located in single-stranded
arrangements (118). Confirmation of their predictions was verified in transfected cells by stronger
activities of both elements when located in hairpin loops against activities in hairpin stems, leading
to stronger exon inclusion or skipping, respectively (118).
Wei Liu et al. showed the same tendency with a 7nt hairpin structure containing an ESE motif of a
SMN1 minigene model (121), which activity proved dependent on its sequence and location within
the hairpin structure. AG-rich ESE in the loop region were fully active, while UCG-rich ESE is prone
to non-canonical interactions, significantly decreasing enhancer activity (121). Furthermore, ESE
activity is very strong when these motif is located downstream of the hairpin, regardless of their
sequence, and is maximized when right adjacent to the hairpin 3’ end (121).

Chapter 1
19
Woodson SA and Cech TR showed that the Tetrahymena group I intron can adopt two alternative
secondary structures, one of which being a stable conserved hairpin that inhibits the use of the 5’ss
(117,126).
Long-range interactions have also been shown to modulate splicing. Introns within an exon cluster
of the Drosophila Dscam gene contain specific base-pairing sequences that seem to be required for
inclusion of exon 6 and which strength contributes to the frequency of exon 6 inclusion. These base-
pairing sequences have the potential to span several thousand nucleotides (115,127,128). Other
structures within Dscam gene modulate exon 4 inclusion or influence mutually exclusive exon
selection in exon 17 cluster (115,129,130). Mutations within 202 long-range structures in
Drosophila introns led to changes in the alternative splicing patterns of respective mutated genes
(115,131).
Secondary and tertiary structures do not determine, per se, whether an exposed splicing-regulatory
sequence is used or not; dynamic interactions with splicing regulatory factors or base pairing with
other RNAs followed by RNA:protein interaction is required (117).
Regulation of the human cardiac troponin T exon 5 splicing depends on the binding of the protein
MBNL1 at the 3’ end of the upstream intron, stabilizing a local hairpin and blocking U2AF65
association to pre-mRNA (115,132).
Recruitment of SR proteins by both ESE and ESS elements present in the EDA exon of the fibronectin
gene are highly dependent on the structural context comprising these elements (111,115,133). RNA
rearrangements leading to exposure of an ESE motif in a single-stranded loop followed by SF2/ASF
splicing factor binding enhance EDA splicing (111,121,133).
A deletion in EDA exon of SMN2 gene causes a structural rearrangement of a ESE from a single-
stranded to a stem conformation that sequesters the 3’ss and leads to the skipping of exon 7
(111,118,134).
Binding of splicing factors such as B52, SRp55, NOVA-1 and hnRNP A1, is highly dependent on the
presence of certain RNA secondary structures and nucleotide sequences (116,135–138).
RNA global structure is also affected by RNA:protein interactions. Association of U2AF65 to the 3’ss
drives pre-mRNA to undergo structural rearrangements forming a more compact structure that
brings together the 3’ss and the branch-site (116,139).
A growing number of genes reported to present a non-canonical secondary structure called G-
quadruplex, which is able to function as a cis-acting element that modulates splicing is another

Chapter 1
20
indicator of the important role of RNA secondary structure on alternative splicing events regulation
(140–142).
The potential role of these structures on splicing regulation has been shown through their
interaction with a number of trans-acting factors (140,143–149). Huilin Huang et al. demonstrated
that the cis-acting element termed I-8, located in the intron downstream from the CD44 variable
exon 8 (140,150), folds into this non-canonical secondary structure, G-quadruplex, promoting
alternative splicing and production of the epithelial-specific CD44v isoform through the binding of
the trans-acting factor hnRNP F to this secondary structure (140).
These data correlate with previous statements that formation of certain RNA secondary structures
mask some splicing regulatory motifs while exposing others, modulating RNA processing, either by
promoting or inhibiting (27,107).
1.2.5.1 G-quadruplex
A high-ordered structure characterized by non-canonical G-G pairing is commonly found in gene
regulatory regions. This conformation is referred to as G-quadruplex (G4) and occurs in both DNA
and RNA (151–153). G4s are usually found within sequences containing several repeats of two or
more consecutive guanines, also referred to as G-tracts (Figure 6A).
Guanines in G-tracts are able to serve as both donor and acceptor and form two stable hydrogen
bonds with one another, forming a square co-planar array of guanines, named G-tetrad or G-
quartet (Figure 6B). These cyclic Hoogsteen hydrogen bonds involve N1-O6 and N2-N7 pairings, in
a total of eight hydrogen bonds per tetrad, from single-stranded nucleic acids connected by loops
with diverse lengths (154–157) (Figure 6B). Four G-quartets further assemble into G4s (50,154,158),
G4s require a minimum of two contiguous G residues with typical gaps between G-strecthes of one
to seven nucleotides which comprise the loops formed in intramolecular G4 assemblies (157).
Intramolecular G4s are generally more complex than intermolecular ones, showing a variety of
topologies, loop conformations and capping structures (156). The same sequences may acquire
different topologies and this diversity is dependent on several factors, such as the number of
separate DNA/RNA strands involved in G4 formation, the pattern of strand orientation,
oligonucleotide sequence and length, length and nucleotide composition of loops, and type of alkali
metal ions present (153,156,157) (Figure 6C). G4s high polymorphism reflects a variety of different
conformations, generally grouped accordingly to their relative strand orientation
(154,156,159,160).

Chapter 1
21
Structural and topological variety is further enhanced by the presence of other secondary structures
within the G4 (160,161), such as homo-tetrads (A-, U-, T- or C-), mixed-tetrads (G:C:G:C, G:T:G:T or
A:T:A:T) (152), bulges (162) and/or vacancies (163).
Figure 6 - Illustration of a G-tract folding into G4. (A) A generic G-tract sequence that can form G4 structures. The letter N denotes any base. (B) Arrangement of guanine hydrogen bonds in a G-quartet coordinated with potassium ions (K+). Structure obtained with ACD/ChemSketch Freeware 1. (C) Examples of intermolecular and intramolecular G4 conformations, composed of three G-quartets. Intermolecular G4s result from the interaction between two or more separate DNA/RNA strands (i, ii); intramolecular G4s are formed by a single strand (iii, iv, v, vi). Purple semi-circles denote coordinated cations. 1 ACD/ChemSketch Freeware, version 15.01, Advanced Chemistry Development, Inc., Toronto, ON, Canada, www.acdlabs.com, 2015.
Although G4s may be tetra-, bi- or unimolecular, topological classification is mainly based on strand
orientation: parallel G4s contain strands oriented in the same direction with respect to one another,
while strands of anti-parallel G4s are opposite oriented to the two adjacent strands. Hybrid parallel
and anti-parallel strand orientations have also been observed (157,164,165).
Positively charged cations are essential for formation and stabilization of both DNA and RNA G4s,
in particular, potassium (K+) and sodium (Na+) (166). Depending on the physiological conditions,
different metal ions can induce considerable conformational changes (153,156,167). Independent
studies have shown that G4 topology may be determined by the coordinated cation. Each cation
has its own ionic radius, which determines ion-specific affinity and capacity for G4 stabilization and
transitions between different secondary structures (166). Potassium shows a stronger stabilization

Chapter 1
22
capacity when compared to other monovalent cations: K+ > Rb+ > Na+ > Li+ = Cs+. Lithium was usually
considered as a destabilizing cation; however, it may also play a neutral role (157). G4s may also
coordinate with divalent cations which were shown to stabilize these non-canonical structures in
the order of Sr2+ > Ba2+> Ca2+ > Mg2+ (157).
RNA structural diversity is much larger than its DNA counterpart, which can be partially explained
by the absence of a complementary strand competing for hybridization (157). RNA G4 assemblies
are more thermodynamically stable and show more compact structures with respect to DNA G4s.
G4-forming RNAs are structurally more homogeneous and the parallel conformation has been
found to be formed in the vast majority of studied sequences (157). Finally, it has been reported
that G4 antiparallel orientation is strongly disfavoured in RNAs, although it may be possible in a
very small set of sequences, such as the one found in the Spinach aptamer (168).
The role of G4s in gene expression in vitro has already been demonstrated by their presence in
specific regions such as splice sites, polyadenylation signals, 5’untranslated regions (5’UTRs) and
3’UTRs, telomeres, gene promoters and rRNA (158). For example, formation of an intramolecular
G4 in the 5’UTR of the human NRAS proto-oncogene mRNA is responsible for inhibition of its
translation (169). An intramolecular G4 in the 5’UTR of TERF2 mRNA prevents translation into the
telomeric specific protein TERF2 (170). G4s present in 3’UTR regions of LRP5 and FXR1 mRNAs led
to an increased protein expression (171). Decorsière and colleagues demonstrated that the
interaction between hnRNP F/H proteins with a G4 promoted TP53 pre-mRNA 3’-end processing,
and enhanced protein expression and p53-mediated apoptosis (53). Formation of these structures
within intron 3 of the same gene, TP53, correlated with a higher efficiency of intron 2 splicing (142).
As a last example, a G-rich sequence modulates selection of an alternative 5’ss of BACE1 exon 3 by
assembling into G4 and recruiting hnRNP H, activating production of the 501 isoform (172).
1.2.5.2 G4 detection tools and methodologies
G4s have diverse molecular structures (Figure 6). Understanding their chemical and biochemical
properties elucidates the role of G4 structures in gene expression regulation and provides insights
into development of G4 targeting ligands (173). Insights on biological applications of G4 structures
are obtained by tools used to identify G-tracts in sequences, predict G4 formation, and design
molecular and chemical methodologies for G4 detection in vitro and in vivo (173).
Any sequence containing four runs of at least three guanines separated by short stretches of any
other bases can potentially fold into intramolecular G4s, therefore, the propensity to form G4

Chapter 1
23
structures can be predicted by analysing the primary sequence in which these G-runs are contained
(173).
Several computational tools have been developed to predict the formation of both intra- and
intermolecular G4s directly by screening the primary sequence of both DNA and RNA (173–175).
The QGRS Mapper, G4P Calculator, nBMST, Pqsfinder and QGRS-H predictor are some examples.
QGRS Mapper (176) predictions are based on the presence of quadruplex forming G-rich sequences
in nucleotide sequences, through the identification of four sets of guanines with equal number of
guanines, separated by arbitrary nucleotide sequences. However, this tool is very limited since it
does not consider sequence and loop length and the number of tetrads, as well as the uniformity
of lengths between G-runs (176,177).
G4P Calculator algorithm (178) scans nucleotides sequences using windows of fixed length,
computing percentages of the number of G- and C-runs, total number of windows, number of
windows containing G- or C-runs and the sum of the two percentages. Therefore, G-quadruplex
propensity scoring is independent from sequence length (177,178).
nBMST algorithm (179) is designed to identify non-B motifs in nucleotide sequences, through the
recognition of four or more individual G-runs of at least three guanines with 1-7 nucleotides
between runs (177,179).
Pqsfinder (180) uses an algorithm that first identifies sequences of four consecutive G-runs. The
putative g-quadruplexes are identified on the basis of their start location, length (width), score,
number of G-tetrads, and loops lengths. This tool has the advantage of allowing the identification
of G4-forming sequences even if the analysed sequence partially mismatch the generic pattern
G≥3N1-7G≥3N1-7G≥3N1-7G≥3 (177,180–183).
QGRS-H predictor (176) analyses the composition and distribution of putative quadruplex G-rich
sequences in homologous RNAs, allowing the identification of evolutionary conserved motifs
expected to fold into these structures, which also helps the validation of computational predictions
by other tools (176,184).
QGRS Mapper was selected for G4 prediction of INS intron-derived oligonucleotides used in this
study, since it has been the most widely used tool for the prediction of these non-canonical
structures.
The consensus sequence, G≥3N1-7G≥3N1-7G≥3N1-7G≥3, for putative G4 segments (177) is increasingly
recognized to be inefficient for accurate prediction of G4-forming sequences, since it has been
shown that large loops or non-guanine bulges have been found to also stabilize G4 structures (173).

Chapter 1
24
Most algorithms allow the user to define loop length, but they do not count with non-guanine bases
interrupting three-guanine runs or the fact that G4s are also stably assembled by sequences
containing only two-guanine runs, particularly in RNA (173). Therefore, it is important for users to
refine the parameters considered by the algorithm, decreasing both false positive and negatives.
Computational predictions for putative G4-forming sequences should, thus, be confirmed using in
vitro and/or in vivo methodologies that allow the detection and characterization of G4 structures
in predicted sequences. Many biophysical and biochemical methodologies have been developed
and applied in combination for in vitro detection and characterization of G4 structures (173).
Each methodology is elucidative on a specific biophysical or biochemical property. Fluorescent dyes
have been used as in vitro light-up structural probes for the detection of G4s due to their
fluorescence enhancement in the presence of these structures (173). Fluorescent probes such as
the benzothiazole Thioflavin T (ThT) (185–190), N-methyl mesoporphyrin IX (NMM) (190–193),
triphenylmethane dyes (TPM) (190,194,195), thiazole orange (TO) (190,196) and triphenylamine
(TPA) (190,197) provide a sensitive and selective methodology for the detection and distinction of
G4 topologies among other secondary structures (173).
ThT is an efficient light-up probe that shows strong fluorescence enhancements and a red shift, in
its absorption spectrum, in the presence of G4 structures, when compared to its fluoroscopic
properties in water (190). High selectivity of ThT for G4 structures has been demonstrated, several
times, via observation of large increments of its fluorescence emission around 490 nm, in contrast
to very low emissions in the presence of double- or single-stranded DNA sequences (190), for which
ThT was selected as the dye for G4 detection in the present project.
Similarly, TPM dyes, such as malachite green (MG) (190,194) and crystal violet (CV) (190,193,195)
have proved as good sensors for detection of G4 formation. MG displays red shifts in both
absorption and fluorescence spectra in the presence of G4s. Fluorescence intensities of both dyes
are consistently largely increased for G4-forming sequences, when compared to fluorescence
intensities in the presence of double- or single-stranded DNAs. Two TPA-based dyes, cyanovinyl-
pyridinium triphenylamine (CPT) (190) derivatives 1 and 2, were designed for the same purpose and
display the same spectroscopic properties as ThT and TMP dyes (190).
G4s also bind and are stabilized by porphyrin and phthalocyanine derivatives. N-methyl
mesoporphyrin IX is the most well-studied derivative. Although, specific for these noncanonical
structures, NMM displays low-to-modest fluorescence enhancements in the presence of G4s.
Phthalocyanine derivatives show not only high specificity but also high affinity for G4s (190,198).

Chapter 1
25
However, G4 detection and binding properties for these two dyes had been less explored than ThT
at the moment this project design; hence the selection of ThT.
The presence of G4 structures can also be addressed via analysis of the thermal difference spectra
(TDS) of nucleic acid sequences (199). This technique provides distinct spectroscopic signatures for
each nucleic acid structure by determination of their thermodynamic stability at different
wavelengths. Determination of each nucleic acid structure is based on changes in ultraviolet
absorbance upon heat, reflecting conformational transitions caused by the disruption of base-
pairing interactions (199,200). The global shape of each spectrum, rather than specific wavelength
absorbance changes, should be considered to ascertain on each structure, due to ambiguity of
transitions observed at the same wavelength for more than one structure, i.e. both G4, Z-DNA, i-
motif, Hoogsteen duplex and pyrimidine triplex display an inverted transition at 295 nm (200).
Thermostability of G4s can also be determined by observing UV or CD spectra or gain/loss of signal
in fluorescence resonance energy transfer (FRET) assays (200–202). Using these techniques, the
denaturation process is monitored, relying on distinctive differences in spectroscopic properties
between the folded and unfolded states, which allows determination of G4 melting (denaturation)
temperature, specific for each structure (200,203). Characteristic UV- and CD-melting curves for G4
stability determination are measured at 295 nm and 264 nm, respectively (174,203). For detection
of G4 structures by FRET, oligonucleotides are labelled with two fluorophores acting as energy
donor and acceptor at different positions (203,204). To characterize thermal stability, fluorescence
emission from the acceptor fluorophore is measured as a function of temperature. Commonly,
labels are positioned as such to display fluorescence upon folded G4 structures and the signal
decreases with temperature as the structures unfold (203–206).
The topology of G4 structures can be addressed by measuring the CD signal of each conformation.
Parallel and antiparallel conformations show positive and negative peaks at specific wavelengths.
Parallel G4s have a negative signal at 240 nm and a positive one at 262 nm, while antiparallel
conformations show negative and positive signals at 262 and 295 nm, respectively (173). To
corroborate G-quadruplex formation, the structures spectra should also be performed in the
presence of different stabilizing ions, such as potassium, or destabilizing, like lithium (173).
Three-dimensional structures and interactions with ligands are obtained using NMR and X-ray
crystallography. These techniques provide high-resolution information, at atomic level, on
structures and data on kinetics and molecular interactions (207–209).
The majority of three-dimensional G4 structures, coupled with ligands, has been determined by X-
ray crystallography. Comparing to NMR, X-ray crystallography has the advantage of providing

Chapter 1
26
unambiguous ligand biding sites without prior prediction or knowledge of their location in the
structure, through electron density maps. As for protein crystallography, G4 crystals diffract high-
intensity X-rays to which they are exposed to and the intensity of the diffracted signal is measured.
Data collected allow not only the determination of the intensity of diffracted X-rays but also
recording the position of the crystal in relation to each diffraction signal measurement (210).
G4 structures originate NMR spectra with unique features. Chemical shifts of imino (R2C=NR)
protons from G-tetrads are observed within the range of 10-12 ppm, while the ones in Watson-
Crick base pairing exhibit chemical shifts within 13-14 ppm. The compact structure of G4s protects
imino protons from solvent exchange. Therefore, twelve sharp guanine imino protons consistent
with a three-layered G4 exchange very slowly with the solvent and are detectable long after
dissolving the structure in D2O solution. The NMR spectrum of a single G-rich sequence elucidates
on the presence of multiple conformations, by displaying a number of imino protons that exceeds
the number of guanines involved in the structure. Therefore, performing point sequence
modifications that favour one conformation over others allows accurate determination of all
possible conformations of a single sequence.
Different NMR techniques are also very useful for the determination of G4 stoichiometry (207).
These biophysical techniques (TDS, NMR, CD, UV and fluorescence) are widely used on the
characterization of G4 structures in vitro. However, they are expensive and limited to the analysis
of short oligonucleotides or isolated molecules and, therefore, do not account for the effect
flanking sequences may have on G4 folding (173,211,212).
The use of biochemical methods contributes to suppress these limitations and have been applied
to ascertain whether G4 structures assemble in long sequences, mimicking in vivo contexts. Precise
starting location of G4s, at nucleotide resolution, can be addressed using many different assays.
Formation of G4 structures in both DNA and RNA sequences can act as blocking elements, halting
either DNA polymerase or reverse transcriptase polymerization (173). Polymerase stop assay and
reverse transcriptase stalling (RTS) are confirmed by the presence of low molecular weight
segments observed by agarose or acrylamide electrophoresis (213–216). G4s are protected from
cleavage by piperidine, since N7 is protected from methylation caused by dimethyl sulfate (DMS).
The result is a pattern of cleavage-protected segments that include the G4 regions and allow
determination of guanines involved in G4s (173,213,217).
G4s in mRNAs have been reported in several studies in which the presence of these structures was
determined by in-line probing, characterized by the slow structure-dependent spontaneous
cleavage of RNA by alkaline hydrolysis or RNase T1 digestion (218,219). Results show
Chapter 1
27
electrophoretic bands corresponding to short lengths, indicative of cleavage in segments that does
not contain paired bases (218–220).
Chemical probing of RNAs with DMS and selective 2’hydroxyl acylation analysed by primer
extension (SHAPE) reagents are currently used in combination with other techniques like RTS to
demonstrate in vitro formation of G4s (173,218,221).
Assembly of these structures may be corroborated, independently of the followed methodology,
by comparing data obtained from WT sequences and 7-deazaguanine-subsituted RNAs (N7s of
guanines are modified, impeding Hoogsteen pairing and prohibiting G4 folding) (222). Based on this
principle, the FOLDeR (footprinting of long 7-deazaguanine-subsituted RNAs) method was designed
to compare the footprinting of G4-forming RNAs with RNAs that are not able to fold into G4s
(165,173,223,224).
Demonstrating formation of G4 structures in cells is of high importance for their structural
characterization. Combination of some of the techniques above mentioned with functional assays
may elucidate G4 roles in vivo.
A range of structure-dependent antibodies have been developed for accurate and specific detection
of G4s in eukaryotic cells via immunofluorescence. Although sensitivity has proved quite low for
most of them, antibodies BG4, Hf2 and 1H6 have proved as suitable for whole-cell
immunofluorescence; however, it is not clear yet whether high density of G4s is required (173).
Finally, G4 detection and localization in genomes can be addressed by antibody-mediated pulldown
or polymerase stalling followed by new generation sequencing (NGS) (173). Hf2 and BG4 antibodies
are being successfully used in chromatin immunoprecipitation (ChIP) of G4s, showing their
presence in noncoding regulatory regions of highly transcribed genes (225,226). 1H6 antibody has
been shown good reactivity in ELISA and microscale thermophoresis assays for intermolecular G4
with a (T4G4)2 sequence motif (227). Polymerase stalling followed by NGS provides a detection
method for location of G4-forming sequences that impede polymerization reaction and lead to
increased mutation rate in sequenced data at the G4 region (173,228–230).
1.2.6 Alternative splicing and human disease
Although tightly regulated, changes in cellular environment or pathological conditions may alter
the splicing pattern of a gene. These alterations often lead to the production of aberrant mRNA
transcripts, which are directly associated with disease development (24,231,232).

Chapter 1
28
Changes in the AS profile of a gene can dramatically affect its product’s phenotypes (233). Nonsense
or missense mutations and exonic deletions or insertions alter splicing and/or AS patterns by either
creating or disrupting exonic splicing enhancers or silencers, generating or eliminating splice sites,
strengthening cryptic splice sites or even promoting changes in RNA Pol II function (231). Mutations
that disrupt trans-acting factors may have even stronger effects since they can result in global
splicing defects (232).
A large number of mutations that alter splicing have been shown to cause genetic diseases. Several
studies (234–236) have been dedicated to understanding the fundamental processes and defects
involved in disease, and have uncovered a high number of disease-associated alleles that impaired
AS, including cassette exon inclusion or alternative splice site usage (Table 1). A brief description of
the genetic mutations and their role in splicing or splicing regulatory factors activity is presented.
Table 1 – Examples of genetic diseases caused by mutations or variants that alter splicing
processes (233,237).
Disease Gene/mechanism Splicing effect
Spinal muscular atrophy SMN1 Altered RNP metabolism
Limb girdle muscular dystrophy
type 1B 5’ss mutation on LMNA Intron 9 retention (NMD)
type 1G Mutations in HNRPDL HNRPDL target mis-splicing
Familial partial lipodystrophy type 2 5’ss mutation on LMNA Intron 8 retention (NMD)
Hutchinson-Gilford progeria syndrome
Alternative 5’ss activation on LMNA
Deletion of 150 nt in exon 11
Dilated cardiomyopathy
Alternative 3’ss activation on LMNA
9 nt extension of exon 4
RBM20 TTN mis-splicing
Familial dysautonomia Decreased U1 recruitment to
IKBKAP Exon 20 skipping
Duchenne muscular dystrophy Exons 45-55 deletions/skipping
on DMD Frameshift
Becker muscular dystrophy ESS creation in DMD Partial exon 31 skipping
Early-onset Parkinson disease Mutation of U1 binding site on
PINK1’s 5’ss Cryptic site site activation
and exon 7 skipping

Chapter 1
29
Frontotemporal dementia and parkinsonism linked to
chromosome 17 (FTDP-17) ESS mutation on MAPT Increased exon 10 inclusion
Retinitis pigmentosa
Missense mutation leads to abnormal PRPF6 localization
Decreased U4/U6 interaction
Mutation in SNRNP200 Inefficient ss recognition
Disease Gene/mechanism Splicing effect
Myelodysplastic syndromes Alteration of U2AF1 3’ss
preference Increased alternative 3’ss
usage
Microcephalic osteodysplastic primordial dwarfism type 1
5’ and 3’ mutations in RNU4ATAC Inefficient minor
spliceosome activity
Amyotrophic lateral sclerosis
Mutations in TARDP alter protein-protein interactions
TDP-43 target mis-splicing
Mutations in FUS decrease interaction with U1 and increase
SMN binding FUS target mis-splicing
Autosomal dominant leukodystrophy
Increased RAVER2 expression due to LMNB1 duplication
PTBP1 target mis-splicing
Different types of cancer
Mutation at a splice site in APC intron 4
Exon 4 skipping
Mutation at a splice site in APC intron 7
Cryptic ss creation
Nonsense mutation in BRCA1 exon 18
ASF/SF2 ESE disruption causing exon 18 skipping
Intronic point mutation in BRCA1 Cryptic 3’ss creation
Intronic point mutation in intron 5 of oestrogen receptor
Cryptic 5’ss creation in intron 5
Double point mutation in NF1 exon 7
ASF/SF2 and SC35 ESE binding sites disruption
Intron mutation in NF2 Consensus branch-site and cryptic splice site creation
Mutations in codon 659 of MLH1 Exon 17 skipping

Chapter 1
30
Spinal muscular atrophy (SMA) is an example of a disease caused by mutations that alter the splicing
profile of a gene. This is a neuromuscular disorder that is developed in individuals possessing a
mutation or deletion in the survival motor neuron 1 (SMN1) gene (238). Loss of SMN1 gene is not
caused by splicing defects, although it is a splicing event that determines disease severity (238,239).
SMN2 possesses a C to T transition in exon 7 that leads to skipping of this exon. Exon 7-lacking
transcripts originate truncated, not fully functional and easily degraded proteins. Low levels (5-10%)
of the full-length SMN protein are still produced from SMN2 but fail to compensate for the loss of
of SMN1 (238–240).
The LMNA gene codifies for a group of slightly different proteins named lamins that are involved in
mechanical stability of the inner nuclear membrane and play important roles in several processes,
such as nuclear positioning, chromatin structure, DNA replication, DNA damage response, amongst
others (241). LMNA gene is very susceptible to mutations or defective post-translational processing,
leading to the development of conditions generically termed laminopathies (241), such as Limb
girdle muscular dystrophy types 1B and 1G, Hutchinson-Gilford progeria syndrome and Dilated
cardiomyopathy.
Limb girdle muscular dystrophy type 1B is a slowly progressive form of a genetic myogenic disorder
caused by a transversion (substitution of purine for a pyrimidine or vice versa) in the consensus
splice donor site of intron 9 of LMNA gene, which leads to abnormal splicing corresponding to
retention of intron 9 (242,243). The intron-retained transcript contains a premature stop codon and
can be translated into a truncated protein lacking half of its globular tail domain. This domain is
responsible for protein interaction with chromatin and proteins of the inner nuclear membrane,
therefore, its malfunction and degradation by NMD is associated with disease development
(242,243).
Limb girdle muscular dystrophy type 1G is caused by two independent mutation in exon 6 of the
HNRPDL gene, which increases nuclear/cytoplasmic localization variability, altering its targets
splicing patterns (244).
Hutchinson-Gilford progeria syndrome is a laminopathy caused by a C-to-T substitution in codon
608 of LMNA gene, which activates a cryptic splice site in exon 11 that leads to an in-frame deletion
of a 50-amino acid-coding sequence containing a posttranslational cleavage site. The result protein
is not posttranslationally cleaved and induces nuclear membrane abnormalities (241).
Dilated cardiomyopathy (DCM) is the most common form of heart muscle disease, corresponding
to dilated and poorly functioning left or both ventricles (245). DCM development is associated with
genetic defects of structural elements of cardiomyocytes (245). One of the most common genes in

Chapter 1
31
familial DCM is LMNA (246,247). Recently, DCM has been associated with mutations in a ribonucleic
acid binding protein. RNA binding motif protein 20 (RBM20) encodes for a protein containing one
RRM followed by one RS domain involved in splicing regulation (246,247).
DCM has been associated with a set of heterozygous missense mutations with the RS domain coding
region. The mutations lead to a deletion of exons 2-14 of RBM20 and, consequently, to a loss of
protein function (248,249)s. As a splicing factor of the sarcomeric protein titin (TTN), disruption of
RBM20 function naturally impairs the normal splicing of TTN pre-mRNA. TTN is part of the
sarcomere, the contractile unit of muscles (247,250,251). Therefore, an abnormally spliced TTN
originates a truncated protein that decreases thick filament length and muscle force, leading to
dilated cardiomyopathy phenotypes.
Familial dysautonomia (FD) is a fatal hereditary autosomal recessive disease caused by a
homozygous T-to-C point mutation in the 5’ splice site region of intron 20 of IKBKAP/ELP1 gene
(252,253). The mutation impairs U1 snRNP binding, leading to exon 20 skipping and introducing a
frameshift in the final transcript. The exon-skipped transcript is translated into a truncated protein
(252,253).
Duchenne (DMD) and Becker (BMD) muscular dystrophy are two related disorders caused by
mutations in the dystrophin protein encoding gene (254,255). Dystrophin plays an important role,
acting as a structural linker between the cytoskeletal F-actin and β-dystroglycan (255).
DMD is characterised by the complete absence of dystrophin or the presence of non-functional
protein. In contrast, BMD individuals are able to produce dystrophin, but the protein is only partially
functional (254). Most mutations occur within exons 48-53 and dystrophin presence or absence is
dependent on maintenance of the reading frame in the mutated gene (254,255). In-frame
mutations are associated with the development of BMD, since translation is not prohibited, while
out-of-frame mutations abrogate protein synthesis leading to DMD (254,255). Examples of DMD
gene mutations leading to DMD are: exon 51 deletion, exon 50 duplication, nonsense mutation in
exon 51, insertion/deletion of one or two nucleotides causing a frameshift, missense mutation in
exon 51, and inclusion of a frameshifting pseudo-exon (intronic segment) in the final transcript
(254,255). In BMD, mutations are: deletion of exons 50 and 51, exon 49 duplication, nonsense
mutation that alters splicing signal, missense mutation in exon 51, and in-frame insertion of a
pseudo-exon (254,255).
In the absence of dystrophin, the muscle membrane is damaged, increasing serum levels of creatine
kinase and promoting calcium influx to the muscle fiber. Calcium-dependent proteases are
activated and the organism enters in a cycle of fiber necrosis, degeneration and regeneration,

Chapter 1
32
leading to fibrosis and fat replacement of muscles, with concomitant loss of muscle contractile
function (254).
Parkinson’s disease (PD) is a debilitating neurological disorder strongly associated with genetic
mutations that lead to alternative splicing of several genes (256). Mutations in PARK2 and PINK1
genes are the two most common causes of autosomal recessive early-onset Parkinson disease.
About 50% of the causes for development of this type of parkinsonism is related with variations on
differential expression of PARK2 alternative spliced transcripts. Loss-of-function mutations in PINK1
gene, the second most common early-onset parkinsonism cause, involve nonsense and missense
mutations, insertions and deletions, and single/multiple exon multiplications (256). PINK1 exon 7
splicing regulation has showed an important role for the development of this form of the disease.
Namely, a 23-bp deletion that disrupts its splice acceptor site, whole exon deletion or mutation of
a U1-dependent 5’ss, leads to the production of several aberrant transcripts (256). PINK1 proteins
are responsible for the recognition of dysfunctional mitochondria, recruiting Parkin (encoded by
PARK2 gene) to specifically ubiquitinate and target mitochondria for mitophagy. Therefore,
abnormal PINK1 proteins do not respond adequately to damaged mitochondria, which are directly
related to PD pathogenesis (256).
Frontotemporal dementia with parkinsonism chromosome 17 (FTDP-17) is an extremely rare
syndrome associated with 38 unique mutations (257). The majority of FTDP-17-causing mutations
are located within the MAPT gene that encodes for the tau protein (257). The MAPT gene produces
six tau isoforms through alternative splicing in the adult brain. All six isoforms are present in the
nervous system and are responsible for assembling and stabilization of microtubules and their role
in maintaining cell shape and assisting in cell division and molecular transport within cells (258–
260). Alterations to tau binding to microtubules are caused by mutations affecting alternative
splicing of exon 10. These mutations are either missense, silent or deletions in the coding region or
are located within the splice-donor site of the intron downstream to exon 10 (260).
Most of known mutations within or close to exon 10 of MAPT gene increase exon 10 inclusion in
mature transcripts, unbalancing the isoforms ratio (260,261). The microtubule-binding region of
tau is composed of three or four amino acid repeats, the difference being accounted for exon 10
exclusion or inclusion, respectively, in mature transcripts (260,261). Splicing of exon 10 increases
levels of the three or four-repeats isoforms, which have been directly associated with FTDP-17
development (260,261).
Retinitis pigmentosa is a genetic degenerative disease associated with mutations in more than 50
genes (262). Among these, mutations within the PRPF genes are of great importance since these
code for proteins composing the spliceosome (263). A missense mutation in codon 729, located in

Chapter 1
33
exon 16 of PRPF6, alters the codified amino acid, which is involved in protein:protein interactions
(262). The missense mutation in PRPF6 exon 6 affects PRPF6 protein role in spliceosome assembly,
by impairing U4/U6 snRNP interaction and, consequently, decreasing pre-mRNA splicing efficiency
(262). A missense mutation in exon 25 of SNRNP200 gene lead to slow ATP-dependent unwinding
of U4/U6 snRNP, necessary for the catalytic activation of the spliceosome (264).
Myelodysplastic syndrome is a disorder caused by the expansion of hematopoietic stem cells that
have acquired sequential somatic mutations (265). In general, the mutations occurring in these cells
are located within 3’ ss-binding spliceosome components. In particular, mutations in U2AF1 gene
alter 3’ ss preference of this splicing factor, increasing alternative 3’ ss usage and promoting exon
skipping (265).
Splicing of about 800 human introns is catalysed by the minor (U12-dependent) spliceosome, which
requires splicing factors distinct from the major (U2-dependent) spliceosome (266). The RNU4ATAC
gene encodes one of the splicing factors involved in minor spliceosome catalysis (266–268). Among
nine distinct mutations in this gene that are directly related to disease development, 6 are located
within the 5’ stem-loop domain, which interacts with and recruits other splicing factors. Therefore,
when assembly of the minor spliceosome is compromised, splicing efficiency is reduced, leading to
the development of microcephalic osteodysplastic primordial dwarfism type 1 (MOPD I) (266).
Individuals that develop amyotrophic lateral sclerosis (ALS) possess a common phenotype, the
deposition of the TAR-DNA binding protein (TDP)-43, which is a protein that mediates
protein:protein interactions involved in splicing and mRNA stabilization (269,270). TDP-43 is also
able to autoregulate its levels via TDP-43 RNA stabilization. TDP-43-linked ALS is related to 38
nonsynonymous mutations in TARDP gene that lead to protein aggregation and cytoplasmic
accumulation of insoluble deposits, C-terminal fragmentation and nuclear clearing in a subset of
motor neurons (269,270). Other ALS-linked mutations occur in RBP fused in sarcoma (FUS) gene,
leading to its mislocalization in the cytoplasm and aggregation (271). Both proteins are involved in
splicing and mRNA stabilization, therefore, TDP-43 and FUS targets show abnormally spliced
transcripts (269–271).
As a final example of abnormal splicing-related diseases, autosomal dominant leukodystrophy
(ADLD) develops from increased expression of lamin B1 (LMB1) mRNA and protein, due to the
duplication of LMB1 gene (272). LMB1 overexpression alters the expression of genes involved in
the immune system response and of RAVER2 and AFF3 genes, which modulate alternative splicing
(272). Specifically, RAVER2 mRNA expression is enhanced by LMB1 overexpression. Raver-2
interacts with PTB, also involved in splicing regulation. Therefore, PTB targets have shown abnormal
splicing patterns in ADLD individuals (272).

Chapter 1
34
Altered splicing events are common in several types of cancer. Processes such as apoptosis,
angiogenesis and metastasis are associated with a large number of genes affected by splice site
mutations leading to abnormal AS (273–276). Table 1 shows some examples of mutations in genes
generally related to many types of cancer and their effect on splicing events.
Such high number of gene mutations leading to altered AS events and development of dramatically
impairing diseases shows the importance of understanding underlying mechanisms that may allow
the development of new diagnostic or treatment approaches.
1.2.6.1 IR in 5’UTRs and human disease
AS events account for genome variability, determining protein sequence and function, intracellular
localization of expressed genes and post-translational modifications (56,57,62,277). AS is
responsible for the regulation of gene expression, controlling transcript abundance and translation
levels through coupling of splicing and NMD (277). Therefore, affecting more than 95% of human
multi-exonic genes, AS is one of the processes in the origin of broad cellular modulation and
maintenance (11,66–68,277,278).
Of the three main types of AS, IR is the least understood (278). Recent studies (87,90,91) have
shown that it is more prevalent than originally thought. IR relevance for cellular processes had been
often neglected due to difficulties in obtaining reliable measurements of intron-retained
transcripts. These difficulties arise from the fact that retained introns (RIs) tend to introduce fate-
determining elements that can either be functional or promote transcript elimination (278). An
example of a functional element in retained introns is the constitutive transport element present
in the Mason-Pfizer monkey virus and in alternatively spliced intron 10 of the Tap gene. The Tap
mRNA is present in polyribosomes and encodes for a small protein involved in nuclear RNA export
in both human and monkeys (279).
A characteristic feature of RIs is the presence of premature termination codons (PTCs) (277,278).
Computational analysis of the occurrence of PTCs in this type of introns revealed that “on average,
95% of the RIs have a PTC in more than one frame and 90% of the RIs have a PTC in all three frames”
(277). PTCs located more than 50 nucleotides upstream of the last exon splice junction are detected
by the splicing machinery components, which remain assembled in the transcript during nuclear
export and until translation, triggering NMD events (101,277).
NMD eliminates these transcripts preventing the expression of C-terminal truncated proteins that
could have nefarious effects to the cell and lead to disease development (101,277,278,280).

Chapter 1
35
Studies focused on determination of IR-NMD coupled events prevalence indicate that IR occurs
more often than previously considered (88,91,92,277,278). Although described abundances range
from 15-67% (277,278), data point towards an important role for IR in the regulation of alternatively
spliced transcripts in mammals (278,280,281).
IR-NMD events, thus, represent a selective regulatory mechanism for gene expression patterns,
driving cellular differentiation or homeostasis (101,280,281).
Some studies corroborate IR-NMD role on gene expression. Justin J.L. Wong et al. (95)
demonstrated that granulocyte differentiation is regulated via coordination of unique patterns of
alternative IR in different stages of cellular development. These IR patterns are associated with both
Lmnb1 and Upf1, modulating nuclear shape, granulocyte size and peripheral cellular numbers (95).
Differentiated neurons show low levels of the polypyrimidine tract-binding protein (PTBP1), while
it is expressed at high levels in both nonneuronal and neural stem cells (282,283). PTBP1 expression
is negatively autoregulated via alternative exon skipping within its own pre-mRNA that leads to the
introduction of a PTC, recognized by NMD machinery (282,284). PTBP1 also represses its own
expression and of the nervous system-specific gene Gabbr1 and Dig4 (285–289).
IR events are used in mammal cells to finely control the levels and production timings of mature
transcripts. An example is the regulation of O-linked b-N-acetylglucosamine (O-GlcNAc) transferase
(OGT) expression and O-GlcNAc homeostasis. O-GlcNAc increased levels induces retention of the
forth intron, leading to higher levels of intron-retained isoforms (290).
There is an apparent non-random distribution of retained introns within RNA transcripts, with a
high frequency in 5’ and 3’ UTRs (87). Retention of introns within 5’ UTRs may lead to the
introduction of uORFs (99) which have been shown to highly correlate with decreased translation
efficiency and, consequently, with reduced protein expression (102). Gene mutations that
disrupt/create uORFs or alter peptides encoded by uORFs have been associated with a growing
number of disorders (Table 2) (102).

Chapter 1
36
Table 2 - Examples of genetic diseases resulting from mutations or variants that create or eliminate uORFs.
Gene Disease References
uORFs created by polymorphisms/mutations, leading decreased translation efficiency
FXII Predisposition for thromboembolism (291,292)
HBB β-Thalassemia
(293)
PRKAR1A Carney complex type 1
IRF6 Van der Woude syndrome
SRY Gonadal dysgenesis
SPINK1 Hereditary pancreatitis
CDKN2A Susceptibility to malignant melanome (294,295)
LDLR Familial hypercholesterolemia (296)
CFTR Disseminated bronchiectasias (297)
KCNJ11 Congenital hyperinsulinism (298)
PEX7 Rhizomelic chondrodysplasia punctata (299)
POMC Propiomelanocortin deficiency (300)
GCH1 Levodopa-responsive dystonia (301)
HAMP Juvenile Hemochromatosis (302)
uORFs disrupted by polymorphisms/mutations, increasing translational efficiency
HR Marie Unna hereditary hypotrichosis (303)
TPO Thrombocythemia (304,305)
uORF-encoded peptide modified by polymorphisms/mutations, increasing protein levels
DRD3 Schizophrenia predisposition (306)
WDR46 Aspirin-exacerbated respiratory disease (307)
TGFβ3 Arrhythmogenic right ventricular cardiomyopathy (308)
HT3A Bipolar affective disorder and major depression (102)

Chapter 1
37
Gene Disease References
Other alterations, which increases expressed protein levels
C/EBPα (mice deficient of the C/EBPb uORF
initiation codon)
Acute myeloid leukaemia (309)
Breast cancer
MDM2 (switch between promoters P1
and P2) Cancer susceptibility (310)
BACE1 (uORFs repress translation)
Alzheimer’s disease (311)
Originally, NMD was considered as just a control mechanism that would be activated for
degradation of potentially toxic transcripts containing nonsense codons introduced by errors in
replication, transcription or splicing (312). However, NMD has gain relevance as a cellular regulatory
pathway by targeting naturally occurring transcripts (312,313). Any transcript containing PTCs less
than 50 nucleotides upstream of the last exon-exon junction, or downstream to it, is not targeted
to NMD (313). Therefore, naturally occurring transcripts, such as uORF-containing mRNAs, AS
products, by-products of gene recombination, and transcripts from transposons and retroviruses,
may only be targeted to NMD if a PTC is introduced >50 nucleotides upstream of the exon-exon
junction (312–314).
Computational analysis showed that uORFs are generally present in oncogenes and transcripts
encoding proteins involved in differentiation, cell cycle and stress response (102).
uORFs may inhibit translation by promoting ribosome pausing and blocking additional ribosomes
or impeding translation re-initiation at a downstream start codon, leading to dramatically
decreased efficiency of the main ORF (102). PTPRJ, AdoMetDC and the β2-adrenergic receptor are
examples of gene transcripts containing uORFs that block translation re-initiation.
uORFs may also trigger NMD events, which occur due to the recognition of the uORF termination
codon as a PTC, since this PTC is generally distant from the last exon-exon junction and the 3’UTR
signals (102). IFRD1, CFTR and SMG5 are examples of transcripts whose uORFs trigger NMD.
Five hundred and nine genes display uORFs that are either created or deleted by polymorphisms.
Among these, 143 have a single uORFs while the rest contain multiple ones. Protein levels were
uORF dependent and decreased 30-60% (102).

Chapter 1
38
A SNP located 4 nucleotides upstream of the human clotting factor XII (FXII) main ORF leads to
disruption of the Kozak context and introduces a short uORF (2 codons), reducing translation levels
and inducing thromboembolic conditions (102).
SNP located 6 nucleotides upstream of the INS main ORF induces intron 1 retention, which contains
an uORF coding for a 3aa peptide, curtailing protein expression and increasing susceptibility to
T1DM (100,315).
In both cases, the uORF does not affect mRNA levels but alter protein levels and can induce disease
development (100,102).
Mutations that create uORFs in HBB, PRKAR1A, IRF6, SRY and SPINK1 genes showed to decrease
protein levels by 30%, which leads to the development of β-Thalassemia, Carney complex type 1,
Van der Woude syndrome, Gonadal dysgenesis and Hereditary pancreatitis, respectively (102,316).
Considering the role of uORFs on translation efficiency, polymorphisms or mutations that create,
disrupt or modify uORFs may naturally affect protein expression and significantly impact individuals
with respect to disease susceptibility (102).
Translation initiation in mammals occurs by identification of the optimal sequence GCCRCCAUGG
(Kozak context), where the identity of the underlined nucleotides in the -3 and +4 positions, relative
to the “A” of AUG, is the most important. However, translation initiation may occur at non-AUG
codons, if a good Kozak context and a strong secondary structure ≈15 nt downstream of the
initiation site are present (317,318).
Some studies have demonstrated the presence of non-AUG uORFs and their regulatory role under
physiological conditions. Expression of ornithine decarboxylase is regulated by these non-canonical
start codons in many eukaryotic organisms (317,319). Studying the profile of ribosomal density,
Ingolia NT et al. (320) found the presence of translating ribosomes on more than 200 non-AUG
uORFS in yeast, which were upregulated under amino acid starvation conditions. Ivanov IP et al.
(321) showed that stringency of start codon selection correlates with eIF1 intracellular levels
variations (317). Performing a systematic analysis of codon substitution in several 5’UTRs of human
mRNAs, Ivaylo P. Ivanov et al. (317), found that translation may be initiated at non-AUG start codons
leading to the synthesis of alternative N-terminal extended isoforms.
Joanna D. Stewart et al. (318) analysed translation initiation efficiency in the presence of ATP
binding/hydrolysis-impaired ABC50, a protein involved in Met-tRNAMeti-eIF2 interaction
stabilization. Cells expressing ABC50 mutants show a higher capacity of initiating protein expression
from a non-AUG start codon that cells transfected with a vector encoding wild-type ABC50 (318),

Chapter 1
39
displaying a decreased discrimination of the start-site selection, independently of whether the
adjacent sequence was a correct Kozak consensus or not. Hence, abnormal ABC50 proteins lead to
a relaxation of start-site selection stringency, allowing the use of non-AUG codons.
The high prevalence of mutation-induced defects that alter RNA processing and translation
efficiency has led to the development of corrective strategies in vitro and in vivo (232,322). In the
past twenty years, several studies have shown the potential of antisense oligonucleotide (AO)-
based therapies for the treatment of genetic diseases, such as human β-thalassemias, cystic fibrosis
and Duchenne muscular dystrophy (232,322).
1.3 The potential of antisense oligonucleotide therapies for genetic
diseases
These therapies are based on oligonucleotide ability to modulate gene expression via interaction
with specific genes or gene transcripts (323).
The first tested oligonucleotides were constituted by simple phosphodiester backbones (324,325).
However, these had low permeability and solubility and were very susceptible to intracellular
degradation by both endo and exonucleases, which leads to the accumulation of dNMPs that exert
cytotoxic and antiproliferative effects (324). Therefore, high doses of phosphodiester
oligonucleotides were required to obtain efficient therapeutic results that proved highly costly
(325).
Since then, a set of chemical modifications have been developed to overcome phosphodiester AOs
limitations, allowing cell growth, and decreasing toxicity, improving stability, potency and
bioavailability while maintaining specificity (323,324,326). Hence, chemical modifications generate
a range of AO analogues with different pharmacological properties, diversifying the mechanisms of
action (323,325,327).
The use of AOs is commonly intended to correct mRNA processing errors caused by mutations in
genes leading to complete or partial exon loss or retention of intronic sequences (323).
Furthermore, this approach has been improved by using bifunctional oligonucleotides that contain
the antisense targeting domain and an effector domain that exerts a silencing or enhancing effect
on a targeted exon (232,322).
AOs are short synthetic (13-25 bases) fragments of deoxy- or riboxinucleic acids used as therapeutic
agents or tools to study gene expression and function (324). AOs act by selective and specific

Chapter 1
40
hybridization with the mRNA sequence of the target gene, via Watson-Crick interactions (324,326),
inducing impairment of mRNA processing or strand cleavage. Consequently, gene expression is
blocked by prevention of mRNA translation (324,326). Specificity and selectivity of AOs are based
on the presence of unique sequences in the total pool of mRNA targets in cells, since sequences
with more than 13 (RNA) and 17 (DNA) nucleotides are expected to occur only once in the human
genome (326).
Depending on the oligo backbone, chemical modification nucleotide sequence, one can define the
mechanism of action through which the oligo modulates gene expression (323).
Based on the chemical modification, AOs are broadly classified into three generations. First
generation AOs are obtained by alteration of the phosphate backbone, while the sugar is modified
in second generation AOs, and third generation AOs contain unnatural bases (326).
First generation AOs are obtained by substitution of one of the nonbridging phosphate oxygens
with a sulfur group (phosphorothioates), a methyl group (methylphosphonates) or amines
(phosphoramidates), which confer stability and resistance to nuclease activity and increase plasma
life-times (324,326). First generation AOs are generally negatively charged, increasing cell delivery,
compared to phosphodiester backbone AOs, and induce RNase H activity (324,326)).
The most widely studied and used first generation AOs are the phosphorothioates. However,
inserted sulfur groups introduce quirality, and only the S enantiomer is resistant to nucleases (324).
First generation AOs are helix destabilizing which decreases the melting temperature of the
oligo/RNA hybrid (324) and produce non-specific in vivo side-effects. By interacting with proteins,
these oligonucleotides activate the complement system and stimulate immune responses (326).
Second generation AOs are produced by introducing alkyl groups at the 2’ position of the ribose,
improving binding affinity and hybridization stability, increasing nuclease resistance, tissue uptake
and half-lives, and decreasing toxicity (326). These oligonucleotides form high melting
heteroduplexes with the target mRNA but their antisense effect is RNase H-independent, whose
recruitment is considered as very important for AOs activity (324,326). Combining the properties
of both first- and second-generation AO principles led to the development of oligonucleotides
containing a phosphorothioate backbone, inducer of RNase H activity, and nuclease resistant arms
such as 2’-O-Methyl (2’-OME) and 2’-O-Methoxyethyl (2’-MOE). Resulting oligonucleotides induce
RNase H activity to target specific mRNA degradation, while their own degradation by nucleases is
prevented (326).

Chapter 1
41
Third generation AOs show further improved nuclease stability and target affinity, accomplished by
modifications in the furanose ring, combined with modified riboses or phosphate linkages. The
most common are the locked nucleic acid (LNA), the peptide nucleic acid (PNA) and the morpholino
phosphoroamidates (MF). Increased nuclease and peptidase resistance confer high stability in
biological fluids. PNAs recognize double-stranded DNA, which allow their use as direct gene
expression modulators or mutation inducers by strand invasion (324,326). Third generation AOs are
uncharged. Therefore, they do not bind to serum proteins, which reduces non-specific interactions
but impairs solubility. Cellular uptake and impairment of body clearance also occurs (326).
AOs are used for the modulation of protein expression by interfering with one of the processing
steps of the target mRNA or inducing transcripts degradation (326).
Phosphodiester and phosphorothioate oligonucleotides act by inducing mRNA degradation via
RNase H activity activation. RNase H is a ubiquitous ribonuclease that specifically hydrolyses
phosphodiester bonds of RNA strands in DNA:RNA hybrids (326,328). By targeting RNA transcripts
for degradation AOs prevent translation of encoded proteins (323). AOs remain intact and get
recycled by binding to other mRNA copies, which increases their effect and allow the use of micro
or nano molar amounts (326).
Most of other AOs are not recognized by RNase H and, therefore, act by targeting different mRNA
synthesis or processing steps, through mechanisms denominated “occupancy-only mediated
mechanisms” or “occupancy activated destabilization” (326,329).
Occupancy-only mediated mechanisms are based on the hybridization of AOs with specific
sequences responsible for the interaction of the target RNA with proteins, other nucleic acids or
regulatory factors. These AOs can, thus, be used for inhibiting steps involved in translation or
splicing processes or altering RNA metabolism (329). Among these, splice-switching AOs bind to
splicing-intervening sequences redirecting pre-mRNA processing (323). Correction of aberrant
splicing events or prevention of splicing reactions, by direct hybridization to splicing cis-acting
elements or steric block of splicing trans-acting factors binding, lead to restoration of normal
protein synthesis and function or protein synthesis inhibition (326). AOs may also recognize and
bind to translation initiation codons, blocking protein translation (326).
Occupancy activated destabilization mechanisms are based on the effects that binding of AOs to
RNA have in 5’ capping or 3’ polyadenylation steps of RNA processing (326). Impeding any of these
steps results in mRNA destabilization and degradation (326).

Chapter 1
42
Several studies describe antisense therapies as promising approaches for the treatment of many
genetic diseases (330–333). There are ongoing studies using antisense oligonucleotides that act via
one out of the above mentioned mechanisms (330,333–335).
Two LNA oligonucleotides were designed to target a cryptic splice site in GALT mRNA that induces
a frameshift in the canonical open reading frame (ORF) and introduces a premature start codon
(PTC), altering the length of two alternatively spliced transcripts. The LNA oligonucleotides block
the access of the spliceosome machinery to the cryptic splice site, promoting the usage of the
canonical splice site, and restoring the correct splicing, and synthesis and function of the wild-type
GALT protein by antisense therapy (336).
For both DMD and SMA, the mutations in DMD and SMN genes, respectively, lead to decreased
expression levels of the encoded proteins (237).
Two AOs, a 2’O-methylphosphorothioate (2’OMePS) and a phosphorodiamidate morpholino
oligomer (PMO), have progressed to clinical trials for the treatment of Duchenne muscular
dystrophy (DMD). The AOs target an ESE in exon 51 of DMD mRNA leading to exon 51 skipping and
restoring use of the canonical ORF. The result is the synthesis of partially functional DMD proteins
(237).
For the treatment of Spinal muscular atrophy (SMA), the 2’-O-methoxyethyl (MOE) AO acts by
blocking an ISS in intron 7 of the survival motor neuron 1 (SMN1) gene, promoting splicing of exon
7 and increasing SMN levels in patients with severe SMA (237).
The above-mentioned AOs have proved as efficient inducers of the correct splicing, inhibiting mRNA
degradation and promoting their translation into functional proteins (237).
Myotubular myopathy is a muscular disease that results from overexpression of dynamin 2 (DNM2)
as a consequence of mutations in the phosphoinositides phosphatase myotubularin (MTM1) gene.
AOs targeting DNM2 transcripts promote RNase H-dependent RNA degradation, efficiently
reducing DNM2 protein levels and preventing the development of myotubular myopathy in MTM1
knockout mice (337).
Three 2’-O-methyl phosphodiester (PO-Me) oligonucleotides were designed with the purpose of
directly increasing synthesis of therapeutic proteins in vivo. These oligonucleotides are
complementary to the uAUG start codon of the human RNASEH1 mRNA, which is located within a
functional reading frame upstream of the canonical one. Hybridization of PO-Me oligonucleotides
to RNASEH1 mRNA efficiently and specifically increase protein translation (338).
Although many studies on the potential use of AOs for the treatment of genetic diseases are being
conducted, only four AOs have provided clear clinical benefits and were approved by the Food and

Chapter 1
43
Drug Administration (FDA) (327). The first approved AO is a phosphorothioate
oligodeoxynucleotide, designed for the treatment of cytomegalovirus (CMV) retinitis (327,339).
Patients with homozygous familial hypercholesterolemia (HoFH) can now control their circulating
levels of low-density lipoprotein cholesterol (LDL-C) with a phosphorothioate 2’-methoxyethoxy
(MOE) gapmer. This AO targets the coding region of apoB-100 mRNA, inducing RNase H1-
dependent mRNA clevage (327). apoB-100 is responsible for lipid transport, including cholesterol,
to cells. Therefore, by reducing apoB-100 levels via antisense therapy, circulating LDL levels are
reduced and hypercholesterolemia is prevented (340,341).
Another FDA-approved AO is a phosphomorpholidate oligonucleotide, designed to target the exon
51 splice-donor region of the dystrophin protein, leading to skipping of this exon and allowing the
production of a truncated but partially functional dystrophin protein (327).
The most promising FDA-approved AO is a phosphorothioate 2’-O-methoxyethoxy oligonucleotide,
which targets and sterically blocks an internal splice site in intron 7 of SMN1 and SMN2 transcripts,
inducing intron inclusion on the final transcript and protein translation (237,327).

Chapter 1
44
1.4 Diabetes: classification, pathophysiology and mechanism
Diabetes mellitus is a multifactorial and genetically heterogeneous disease associated with a
number of hereditary and environmental factors (342). Diabetes pathogenesis is characterized by
defects in insulin secretion and/or action on target issues, associated with abnormalities in
carbohydrate, fat and protein metabolisms (343).
Diabetes is etiologically categorized into four classes: I- Type 1 diabetes, II- Type 2 diabetes, III-
Other specific types and IV- Gestational diabetes mellitus.
The vast majority of diabetes-diagnosed individuals are within either type 1 or type 2 categories
(343,344). However, the diagnosis and assignment to a diabetes category is difficult since many
individuals presenting characteristics of a certain type may evolve into fitting to a different category,
depending on the circumstances at the time of diagnosis and progression of the condition (343).
Therefore, understanding hyperglycaemia pathogenesis is more important for an effective
treatment than type classification (343).
After diagnosis, some individuals do not require insulin; a combination of weight reduction, exercise
and/or oral glucose-lowering agents is enough for an adequate glycaemic control. Individuals with
some residual insulin secretion may require exogenous insulin to control glycaemic levels but can
survive without it. The most severe stage/condition involves the autoimmune destruction of the
pancreatic β-cells followed by no residual insulin secretion; these individuals require exogenous
insulin for survival (343,345,346).
Impaired insulin secretion and defects in its action are often concomitant in the same patient,
leading to chronic hyperglycaemia, which is associated with long-term damage, dysfunction and
failure of several organs, mainly eyes, kidneys, nerves, heart and blood vessels (344,346).
1.4.1 Type 1 Diabetes
Five to ten percent of diabetic patients have T1DM, which is characterized by an autoimmune
destruction of pancreatic β-cells, the presence of autoantibodies and diminished insulin production.
The heterogeneous inflammatory reaction against pancreatic islets leading to T1DM requires three
conditions: initiation of the immune response against β-cell antigens, strong development of
inflammatory mechanisms, and ineffective regulatory control of the autoimmune reaction which
becomes chronic and destroys preproinsulin-producing cells (347). Thus, T1DM is clinically
characterized by high levels of blood glucose (hyperglycaemia), a high dependency on exogenous

Chapter 1
45
insulin, susceptibility to ketosis (346,348), and is usually manifested by an abrupt onset of
symptoms such as polyuria (excessive production of urine), polydipsia (excessive thirst), polyphagia
(excessive hunger), severe weight loss, fatigue, restlessness and body pain (347,349).
β-cell destruction leads to release of one or more biomarkers to bloodstream. The classic
biomarkers are autoantibodies against islet cells (ICA), insulin (IAA), glutamic acid decarboxylase
(GAD/GAD65) and tyrosine phosphatases IA-2 and IA-2, enzyme carboxypeptidase-H, GM-
gangliosides, sex determining region-Y b-ox protein (SOX13) and zinc transporter 8 protein (ZnT8A)
(350,351); these biomarkers are present in 85-90% of individuals with fasting hyperglycaemia
(343,350) and the combination of both genetic and environmental factors determines whether IAA,
GAD or both is the first biomarker to appear. Appearance of more biomarkers, their identity and
occurrence timeline influence disease progression (352).
The aetiology of diabetes is still unclear. T1DM susceptibility is conferred by a combination of
environmental and genetic factors. The environmental factors that may trigger/prevent the disease
in genetically predisposed individuals include: the development of infections that lead to β-cell
destruction or upregulate MHC class I system and proinflammatory cytokines such as IFN-α; no
contact with parasites as a result of more sanitized environments leading to a more reactive
immune system; changes in the gut flora or the exposure to certain bacteria conferring a protective
environment (347).
Albeit being a disease influenced by environmental factors (353), T1DM individuals show strong
genetic predisposition, and many specific susceptibility genes have been identified (348), such as
the HNF (hepatocyte nuclear factors) family gene, GCK (glucokinase), LARS (Leucyl-tRNA
synthetase), point mutations in mitochondrial DNA and in genes coding for proteases responsible
for insulin maturation (346). The strongest evidence for genetic predisposition in T1DM is its
association with the Human Leukocyte Antigen (HLA) system of the Major Histocompatibility
Complex (MHC) class II, which can be either predisposing or protective for the development of the
disease, followed by susceptibility caused by a polymorphism in the promoter region of the
preproInsulin gene (104,107). Polymorphisms in PTPN22 and IL2RA loci have also been associated
with T1DM (354,355).
HLA association with T1DM is determined by the balance between alleles conferring susceptibility
or protection/resistance (350). In addition, more than 50% of the 41 genes known to be associated
with T1DM, in 2013, are expressed in human islets and upregulated by proinflammatory stimuli,
which stablishes a link to HLA allelic predisposition (347).

Chapter 1
46
Genome-wide association studies (GWAS) revealed several HLA loci linked to T1DM susceptibility:
HLA-A, HLA-B, HLA-DPβ1, HLA-DRβ1, HLA-DQα1 and HLA-DQβ1. Diabetogenic and protective
molecules encoded in these loci differ in structure, determining antigen peptide selectivity, binding
affinity and stability of presented HLA molecule. A complex pattern of DR-DQ combinations is what
determines HLA allelic association with T1DM (347).
It has been suggested that HLA-DQ and HLA-DR polymorphisms affect T1DM susceptibility through
alterations in the nature of the peptides presented to T-cells. DR3 or DR4 alleles are commonly
found in the general population, as a single copy. T1DM-susceptible individuals have two allelic
combinations such as DR3/DR3, DR4/DR4 or the high risk DR3/DR4 (350).
Increased risk for T1DM is conferred by HLA alleles, namely, class I molecules (encoded by A*02:01,
A*24 and B39) and class II molecules (encoded by DRB1*04 (DR4)-DQA1*03:01-DQB1*03:02 and
DRB1*03:01 (DR3)-DQA1*05:01-DQB102:01 haplotypes) (356). The DRB1*15:01-DQA1*01:02-
DQB1*06:02 haplotype, encoding the HLA-DQ6 heterodimer confers protection for T1DM
development due to suppression of multiple autoantibodies expression in such a way that
individuals carrying HLA-DR3 or -DR4 risk alleles on the other chromosome are less likely to develop
the disease. Even in the presence of autoantibodies, individuals carrying the protective
DRB1*15:01-DQA1*01:02-DQB1*06:02 haplotype are less susceptible than individuals that do not
have this variant; expression of IA-2A, ZnT8A, or multiple autoantibodies, indicating advanced islet
autoimmunity and more rapid disease progression, is rare. Positivity for IAA autoantibody is not
frequent either (356).
The highest T1DM risk genotype is HLA-DR3-DQ2, HLA-DR4-DQ8 combined with homozygosity for
the type 1 insulin variable number tandem repeat (VNTR) (357). CD4+ cells, responsible for the
recognition of MHC class II, (358), recognize epitopes from the proinsulin C-peptide, supporting the
role of CD4+ proinsulin-specific T cells in the pathogenesis of human T1DM (359); CD8+ T cells, that
recognize MHC class I molecules (358), can infiltrate islets and recognize epitopes from insulin, islet-
glucose-6-phosphatase catalytic subunit-related protein (IGRP), insulinoma antigen 2 (IA-2),
glutamic acid decarboxylase-65 (GAD-65) and pre-pro islet amyloid protein (ppIAP) (357).
Despite the scientific progress in the association of several genes with the development of diabetes,
there is much remaining unclear regarding the mechanisms involving disease onset, such as the
nature of the initial event that triggers the autoimmune response leading to T1DM.
Many people carrying susceptible allelic variants in the HLA locus and presenting islet-specific T
cells in the blood do not develop T1DM. These islet-specific T-cells, probably escaping thymic
selection, produce anti-inflammatory rather than proinflammatory cytokines. Therefore, in order

Chapter 1
47
to develop the disease, regulation of inflammatory responses must be compromised (347). T1DM
individuals have fewer and/or less effective Treg cells, which are responsible for the control of
immune response and peripheral immunological tolerance (347).
1.4.2 Preproinsulin gene (INS)
Human insulin is encoded by a single gene. In some species, such as rodents, insulin is encoded by
two functional copies (360,361). In humans, insulin gene (INS) is located on the short arm of
chromosome 11 (362,363) and is flanked by an Alu element downstream the 3’ end and a
polymorphic region upstream the 5’ end (364).
The preproinsulin gene is composed of three exons and two non-coding intervening sequences (IVS)
or introns (360,361). The canonical translation start is located in exon 2, with intron 1 sited within
the 5’ UTR and with intron 2 interrupting the C-peptide coding sequence (360). INS exon-intron
structure is highly conserved in evolution, including the promoter region (TATAAAG), the 5’UTR and
the polyadenylation signal sequence (AATAAA) (360,361).
Introns are, generally, much less conserved than exons; for example, the length of INS intron 1
varies among species, ranging from 119 base-pair (bp), in rat and guinea pig, to 3500 bp, in chicken
(12). Intron 1 is weakly recognized by the splicing machinery in multiple species, leading to IR in a
significant fraction of polyadenylated transcripts (365–367). The GC content of the human insulin
gene is 64.8%, which is much higher than the average GC content of human DNA, 38% (364,368).
It has been suggested that INS intron 2 may be spliced either co-transcriptionally or in a stepwise
manner, with the 5’ region cleavage occurring in the first step in the nucleus, forming a partially
spliced mRNA that is exported to the cytoplasm (369). INS intron 1 contains a highly conserved
cryptic 5’ss leading to the retention of the first 26 bp of intron 1 in human and primates such as
monkeys (370), indicative of alternative processing for INS intron 1. It is not known, however,
whether INS splicing is mainly co- or post-transcriptional, or both. It also remains elusive how these
mechanisms are defined, which process is selected, and what roles RNA-protein interactions and
RNA structure play.
1.4.2.1 INS intron 1 in T1DM
Insulin-Dependent Diabetes Mellitus locus 2 (IDDM2), the second strongest genetic susceptibility
locus associated with T1DM predisposition, is characterized by a set of variants inherited from

Chapter 1
48
mother and father in tight linkage disequilibrium with each other (371). These variants include a
repeat polymorphism upstream of INS (372) and a single nucleotide polymorphism (SNP) (373)
located at position -6 relative to the 3’ss of intron 1 (IVS1-6A/T) (374). The adenine (A) allele at IVS1-
6 (rs689) disrupts the Py-tract and impairs recognition of the 3’ss of intron 1, leading to higher
retention levels as compared to the thymine allele (100).
Transcripts containing intron 1 have their 5’ UTRs extended by 179 nt (372,373), introducing an 3-
aa peptide uORF (Figure 7), which decreases preproinsulin translation (100). Figure 37 in appendix
B shows a list of potential noncanonical uORFs in the 5’UTR of INS.
Figure 7 - Allele-dependent INS expression. Individuals predisposed to T1DM possess an A allele at rs689, a SNP located six nucleotides upstream of the 3’ss of intron 1 (IVS1-6A/T) (green star). The A allele reduces the strength of the Py-tract and impairs canonical splicing (blue lines), by introducing intron 1 in the mRNA (red line), leading to transcripts with a longer 5’UTR and extra uORF (black botted line), curtailing preproinsulin expression (shown by the number of insulin molecules). Tertiary structure of human insulin was visualized in UCSF Chimera (PBD ID: 2HIU); disulphide bonds between A and B chains are in blue; intra-A chain disulphide bond in yellow.

Chapter 1
49
The rs689 SNP link to T1DM pre-disposition was shown by transient transfection of a set minigenes
comprising all three exons and two introns of INS gene and containing 6 common INS SNPs showed
that INS pre-mRNA processing may potentially originate 6 alternatively spliced isoforms. Minigenes
with the IVS1-6A→T mutation produced a significantly lower proportion of isoforms lacking exon 2
and isoforms retaining intron 1. Except for the 4-nt insertion IVS-69+ SNP, which activates a cryptic
5’ss and extends the 3’ end of the noncoding exon 1, the remaining SNPs had minor effects on
reporter pre-mRNAs splicing (100). Determination of relative amounts of isoforms 2, 4, and 6,
resulting from the correct splicing of the 3’ss of intron 2 revealed that the A allele of the rs689
variant leads to intron retention in 12% ± 3 of INS minigene transcripts, 12x higher than IR observed
for the T allele (100). Additionally, T->A mutations 6 nt upstream of the 3’ss in INS minigene
reporters consistently lead to higher retention levels and reduced proinsulin expression, as
compared to levels from the thymine (T) allele. Splicing efficiency is restored upon A->T mutation
(100).
These findings led to the hypothesis that IDDM2-dependent T1DM predisposition is related to
inadequate presentation of proinsulin peptides, leading to survival of proinsulin-responsive T cells
in A allele carriers, as compared to T allele carriers that would have induced T cell apoptosis in the
thymus (100,375).
Several intronic properties may contribute to IR in INS: high G/C content (66 guanines and 57
cytidines of 179 nt, 68.72%), short length (179 nt) (364), and an evolutionary deletion of a G-run
containing a splicing enhancer and a G>A substitution at first position of exon 2 (E2+1 G>A), which
weakens the 3’ss of intron 1 (100). Altogether, these features may account for inefficient removal
of intron 1 from the INS pre-mRNA, particularly in carriers of the adenine allele at rs689 (100).
It has been shown recently that it is possible to modulate intron 1 splicing of the A allele transcripts
via antisense oligonucleotide targeting. A RNA 16-mer oligonucleotide complementary to INS intron
1 positions 59-74, which are flanked by G-rich regions reduces IR (Figure 8), potentially increasing
preproinsulin levels (315). IR was also shown to be influenced by deletion of some intronic
segments. A series of 14 overlapping deletions, where 1-4 and 7-14 included at least one guanine
of the seven G-runs in INS intron 1 and 5/6 comprise the antisense target, revealed that removal of
any of the G-runs either led to a significant increase in IR, or did not change it. In accordance with
the antisense targeting, deletions 5 and 6, that encompass the target region, improved splicing
efficiency (Figure 8) (100).

Chapter 1
50
Figure 8 - Haplotype-dependent intron retention is modulated by G-rich motifs. Schematics of G-rich elements surrounding the antisense target sequence (highlighted in gray) that showed to modulate INS intron 1 splicing (100). Gr2, Gr3 and Gr4 were shown to be involved in G4 formation and CD and NMR studies indicated that Gr3/4 form a parallel G4 in vitro (315). Exons are shown as boxes (numbered), intron as line. Start and stop codons are denoted by arrowheads. The location of rs689 is denoted by a dashed arrowhead. G-runs (boxed) and intron 1 deletions 1-14 (horizontal lines) that were previously tested for their importance in intron 1 splicing are indicated. Mutations in any G-runs decreased splicing efficiency (100). INS intron retention levels for each deletion construct, in comparison to WT, are at the bottom.

Chapter 1
51
Although the association between the A allele at rs689 and T1DM has been established (374), the
underlying pathogenic mechanisms linking the presence of this genotype to disease development
are yet to be discovered. Particularly, the role of G-runs, and their potential folding into G4
structures in INS pre-mRNA processing remains unclear and further studies to uncover the
importance of G4s in T1DM development and their role in IDDM2-mediated susceptibility are
essential.
1.5 Hypothesis
INS pre-mRNA efficient splicing is mediated by the folding of highly conserved G-rich sequences
into G4 structures, leading to increased protein translation. Intron 1 retention may also be
modulated through the binding of hnRNP F and H1 to the G4-forming segments.
1.6 Aims and Objectives
1) To evaluate ThT as an adequate fluorescence light-up probe for G4 detection
a. To determine ThT capacity to probe G4 formation in sequences known as such
b. To establish an adequate time-window for the analysis of G4-ThT complexes
c. To characterize the discriminatory capacity of ThT in the presence of a series of
oligos known to fold into G4
d. To address ThT fluorescence dependence on oligo concentration, molecular
saturation and appropriate oligo:ratio
2) To evaluate G4 formation propensity of INS intron 1-derived oligos to form G4.
a. To screen a set of overlapping DNA oligonucleotides derived from INS intron 1
antisense target region
b. To evaluate the influence of the antisense target sequence on G4 formation by
extending intron 1 derived oligos Int1 and Int7
c. To evaluate the probing capacity of ThT for the analysis of RNA G4 in comparison
to their DNA counterparts.
d. To determine the influence of mono and divalent cations on DNA and RNA G4
propensity

Chapter 1
52
e. To evaluate the influence of pH in G4 formation.
f. To monitor G4 formation during transcription in real-time.
g. To analyse the presence of different secondary structures in RNA oligos and in vitro
transcripts on a native acrylamide gel
3) To identify proteins that specifically bind to the INS intron 1 segment comprising the
antisense target region.
4) To evaluate and compare translation efficiencies in human and primate INS 5’UTRs
a. To clone Human and other 5 primates’ INS 5’ UTRs into a mammalian-expressing
bicistronic vector
b. To transiently transfect HeLa cells with 5’ UTR constructs
c. To use dual-luciferase reporter system for the analysis of translation efficiency of
the different INS 5’ UTR constructs
d. To analyse the splicing pattern of the different INS 5’ UTR constructs

53
Chapter 2: General Material and Methods

54

Chapter 2
55
2.1 Materials and reagents
Table 3 – General Reagent
Reagent Supplier, Cat no:
0.1M DTT Life Technologies, Y00147
1kb DNA Ladder Promega, G5711
1M HEPES solution Sigma, H3537
1M MgCl2 Sigma, M1028
1M MgSO4 Sigma, M3409
2-β-Mercaptoethanol Fisher, BPE176100
7-deaza-GTP TriLink Biotechnologies, N-1044
40% Acrylamide: Bis-Acrylamide 37.5:1 Fisher Scientific, BP14101
50 bp DNA Ladder Peqlab, 25-2000
100bp DNA ladder Promega, G2101
Acetic Acid, Glacial Fisher Scientific, 64-19-7
Agar, granulated Fisher Scientific, BP1423500
Agarose Sigma, A9539
Ammonium Persulphate Sigma, A-3678
Boric Acid Fisher Scientific, BP1681
Brilliant Blue G Sigma, B-0770
Bromophenol blue BDH, 44305
Cacodylic acid Sigma, C0125
Carbenicillin Gibco, 10177-012
Chloroform Ambion, AM9722
Fisher Scientific, BP1145
DMSO Thermo Scientific, F-515
DTT Invitrogen, D1532
EDTA Fisher Scientific, BP118500
Reagent Supplier, Cat no:
GelRedTM Biotium, 41003
Glycerol Fisher Scientific, BP229-1
Glycine Fisher Scientific, BP3811
HeLa nuclear extract Santa Cruz Biotechnology, sc-2120
Nitrocellulose membrane
GE Healthcare Life Sciences, RPN203D
IPTG Thermo Scientific, R0392
Isopropanol Fisher Scientific, 67-63-0
Kanamycin Affymetrix, 17924
LB Broth Fisher Scientific, BP1426500
Lithium Chloride Sigma, L9650
Lithium Hydroxide Sigma, 402974
Lysozyme Sigma, 62971
Methanol Fisher Scientific, 67-56-1
PBS Sigma, P4417-100TAB
Phenol:Chloroform Ambion, AM9722
Ponceau S Sigma, P3504
Protein-Marker V Peqlab, 27-2210
Potassium chloride Fisher, BPE366
Sodium chloride Fisher Scientific, BP3581
Sodium dodecyl sulphate Sigma, L3771
Sodium phosphate dibasic Calbiochem, 567547
TEMED Sigma, T-8133
Thioflavin T Sigma, T3516
Tri Reagent Ambion, AM9738

Chapter 2
56
Reagent Supplier, Cat no:
Tris Base Fisher Scientific, BP1521
Tween 20 Bio-rad, 161-0781
Tween 20 H5152
Reagent Supplier, Cat no:
Urea Fisher Scientific, U16-50
Western Blotting Filter Paper Thermo, 84784
Table 4 – Reagents for RNA
Reagent Supplier Cat no:
0.5M EDTA Promega V4231
1M Tris pH 8.0 Ambion AM9856
3M KCl Fluka 60135
3M Sodium Acetate Ambion AM9740
5M NaCl Ambion AM9759
5M NH4OAc Ambion AM9070G
10x TBE Ambion AM9863
30% Acrylamide: Bis-Acrylamide 37.5:1 Severn Biotech Ltd. 20-2300-10
50 MgCl2 Thermo F5410Mg
Adipic acid dihydrazide–Agarose Sigma A0802
Chloroform Sigma C2432
DNae&RNase free-Water Life Technologies - Gibco 10977-035
Glycreol Sigma 49767
GlycoBlue™ Ambion AM9515
Heparin Sigma H3393
Isopropanol Fisher 10588630
Ni-NTA agarose Qiagen 30210
RNase A Thermo Scientific EN0531
RNasin® Ribonuclease Inhibitors Promega N2515
Sodium (meta) periodate Sigma S1878
UltraPure™ DNase/RNase-Free Distilled Water Thermo Scientific 10977035
UltraPure™ TBE Buffer, 10X Invitrogen 15581-044

Chapter 2
57
Table 5 – Primers for cloning
Probe Forward 5’ -> 3’ Sequence Reverse5’ -> 3’ Sequence Supplier
hnRNP F attggatccGAAattTTGtatTTCcaaGGAgagctcATGATGCTGGGCCCTGAGG attaagcttCTAGTCATAGCCACCCATG
Eurofins Scientific
F RRM 1 atagagctcagtGTGGTCAAGCTCCGTG attaagcttTCAGAACACCTCAATGTACCGG
F RRM 2 atagagctcagtAACAGTGCCGACAGCG attaagcttTCAGTATGACCTAACTTCCTCC
F RRM 3 atagagctcAGTGAGTTCACAGTGCAGA attaagcttTCACACCTGGCTGCTATACGCC
hnRNP H1 atagagctcATGATGTTGGGCACGGAAG atactcgagtcaTGCAATGTTTGATTGAA
H RRM 1 atagagctcagtTTCGTGGTGAAGGTCC atactcgagtcaGTTGTTTGACTTGAATACT
H RRM 2 atagagctcagtGGCTTTGTACGGCTTA atactcgagtcaTCTACTGCTCTTAAAGATT
H RRM 3 atagagctcCAGAGCACAACAGGACACT atactcgagtcaCATTTGGCTACCATAAGCA
Homo sapiens 5’UTR GGGAGACCCAAGCTGGCT AGTCGAGGCTGATCAGCGG
Pongo pygmeus 5’UTR agtaagcttCAGCCCTCCGGGACAGGCT actcCATGGCAGAAGGACAGTGATccgggagacaggc
Macaca Fuscata 5’UTR
Colobus angolensis 5’UTR agtaagcttCAACCCTCCGGGACAGGC actcCATGGCGGAAGGACAGTGACccgggagacaggc
Semnopithecus entellus 5’UTR

Chapter 2
58
Table 6 – Primers for PCR amplification of DNA templates for in vitro transcription
Primers 5’ -> 3’ Sequence Supplier
T7-sc35 attaatacgactcactataGGATTCCAGGGTGGCT Eurofins Scientific
R-sc35 TGCAGCAGGGAGGACG
R2SC AGGGAGGACGTGGCTGGGC
Table 7 – Plasmid systems
Vectors Source
pGEM®-T easy vector system Promega, A1360
pET28a Novagen | Millipore, 69864
pGLpest.SEQ Kindly given by Mark Coldwell
pICtest2
Table 8 – Enzymes and Buffers
Enzyme Supplier Cat no:
GoTaq® G2 Flexi DNA Polymerase Promega M7805
Pfu DNA Polymerase Promega M7741
HindIII Promega R6045
BamHI Promega R6025
XhoI Promega R6165
NcoI-HF New England Biolabs R3193S
SacI New England Biolabs R0156S
KpnI New England Biolabs R0142S
Shrimp Alkaline Phosphatase (rSAP) New England Biolabs M0371S
T4 DNA Ligase Promega M1801
RQ1 RNase-free DNase Promega M6101
M-MLV Reverse transcriptase Promega M1701

Chapter 2
59
Table 9 – Competent cells
Cells Supplier Cat no:
JM109 Competent Cells Promega L2001
BL21(DE3) Competent E. coli New England Biolabs C2527I
RosettaTM 2 (DE3) Millipore 71397-3
Table 10 – Primers for sequencing
Primers 5’ -> 3’ Sequence Supplier
PICf GCCTCGGCCTCTGAGCTATTCCAG Eurofins Scientific Lucr GTATCTCTTCATAGCCTTATGCAG
T7 TAATACGACTCACTATAGGG GATC Biotech AG
Table 11 - Antibodies
Antigen Source Cat no: Secondary antibody
His-tag with HRP Abcam Ab1187 Rabbit polyclonal
hnRNP F Kindly given by Professor Douglas Black Rabbit polyclonal
hnRNP H1 Kindly given by Professor Douglas Black Rabbit polyclonal
Rb pAb to 6x His-tag Abcam Ab1187-100 N/A
Anti-tb IgG (H+L) Thermo 31458 N/A
Table 12 – Commercial Laboratory Kits
Kit name Supplier Cat no:
BSA standard set Bio-Rad 500-0207
GeneJET Gel Extraction Kit Thermo scientific K0503
GeneJET Plasmid Miniprep Kit Thermo scientific K0503
Wizard® Plus SV Minipreps DNA Purification Systems Promega A1460
PierceTM BCA Protein Assay Kit Thermo Scientific 23225
Pierce™ ECL Western Blotting Substrate Thermo scientific 32209
ProteoSilver™ Silver Stain Kit Sigma PROTSIL1-1KT
MEGAshortscript™ T7 Transcription Kit Life Technologies AM1354
RT-AmpliscribeTM T7-Flash Epicentre ASF3257

Chapter 2
60
Table 13 – DNA oligonucleotides tested for G4 detection with ThT
Oligo 5’ -> 3’ Sequence Supplier
WT TGGGCTCAGGGTTCCAGGGTGGCTGGACCCCAGGCCCCAGCTCTGCAGCAGGGAGGACGTGGCTGGGC
Eurofins Scientific
Int1 TGGGCTCAGGGTTCCAGGGTGGCTGG
Int2 AGGGTTCCAGGGTGGCTGGACCCCA
Int3 AGGGTGGCTGGACCCCAGGCCCCAGC
Int4 TGGACCCCAGGCCCCAGCTCTGCA
Int5 AGGCCCCAGCTCTGCAGCAGGGAGGA
Int6 AGCTCTGCAGCAGGGAGGACGTGGC
Int7 AGGGAGGACGTGGCTGGGC
CD3 CCAGGGTGGCTGGACCCCAGGC
CD4 CCAGGGTGGCTGGACTTCAGGC
c-myc TGAGGGTGGGTAGGGTGGGTAA
Plas24 GGGTTCAGGGTTCAGGGTTCAGGG
21DNA CTAGGGCTAGGGCTAGGGCTAGGG
DCAF6 GCAAACTTAAAACTGGTTCA
CLASP1 TACATCCCATACGGCTCATA
GA8 AAGGAAAGGAAAAGGAAAAGGAAA
GT8 TTGGTTTGGTTTTGGTTTTGGTTT
GA12 GAGAGAGAGAGAGAGAGAGAGAGA
GT12 GTGTGTGTGTGTGTGTGTGTGTGT
G-tr1 ATCGGGTCGTACGTCATGGGTAC
G-tr2 ACTGATCGTACGTGGGGTACGTAC
G-tr3 GGGTACTGACATTAACCGGGAAC
Int1+2 TGGGCTCAGGGTTCCAGGGTGGCTGGAC
Int1+4 TGGGCTCAGGGTTCCAGGGTGGCTGGACCC
Int1+6 TGGGCTCAGGGTTCCAGGGTGGCTGGACCCCA
Int1+8 TGGGCTCAGGGTTCCAGGGTGGCTGGACCCCAGG
Int1+10 TGGGCTCAGGGTTCCAGGGTGGCTGGACCCCAGGCC
In1+12 TGGGCTCAGGGTTCCAGGGTGGCTGGACCCCAGGCCCC
Int1+14 TGGGCTCAGGGTTCCAGGGTGGCTGGACCCCAGGCCCCAG
Int1+16 TGGGCTCAGGGTTCCAGGGTGGCTGGACCCCAGGCCCCAGCT

Chapter 2
61
Oligo 5’ -> 3’ Sequence Supplier
Int1+18 TGGGCTCAGGGTTCCAGGGTGGCTGGACCCCAGGCCCCAGCTCT
Eurofins Scientific
Int7+2 GCAGGGAGGACGTGGCTGGGC
Int7+4 CAGCAGGGAGGACGTGGCTGGGC
Int7+6 TGCAGCAGGGAGGACGTGGCTGGGC
Int7+8 TCTGCAGCAGGGAGGACGTGGCTGGGC
Int7+10 GCTCTGCAGCAGGGAGGACGTGGCTGGGC
Int7+12 CAGCTCTGCAGCAGGGAGGACGTGGCTGGGC
Int7+14 CCCAGCTCTGCAGCAGGGAGGACGTGGCTGGGC
Int7+16 GCCCCAGCTCTGCAGCAGGGAGGACGTGGCTGGGC
Int7+18 AGGCCCCAGCTCTGCAGCAGGGAGGACGTGGCTGGGC
Int7+20 CCAGGCCCCAGCTCTGCAGCAGGGAGGACGTGGCTGGGC
Table 14 - Plasticware
Plastic ware Supplier Cat no:
15 & 50 ml CELLSTAR® centrifuge tubes VWR 82050-278/82050-346
0.2 ml Strip tubes Thermo Scientific AB0266P
1.5 ml Microcentrifuge tubes StarLab E1415-1500
10 µl Graduated Pipette tip StarLab S1111-3000
10 ml sterile serological pipettes Greiner Bio-One 607180
10/20 µl Graduated Filter Pipette tips StarLab S1120-3810
1000 µl Graduated Filter Pipette Tips StarLab S1122-1830
1000 µl Pipette tips Fisher Scientific 10787524
200 µl Graduated Filter Pipette Tips StarLab S1120-8810
200 µl Pipette tips Thermo Scientific 50101182
25 ml sterile serological pipettes Greiner Bio-One 760180
5 ml sterile serological pipettes Greiner Bio-One 606180
Black 96-well plates Thermo Scientific 7605
Clear 96-well plates Thermo Scientific 3855
Petri dishes Thermo Scientific 4021
T175 Flasks Therno Scientific 159920

Chapter 2
62
Table 15 - Apparatus
Apparatus Serial number Supplier
6050 Bench Colorimeter 2311 Jenway, © Bibby Scientific Limited
pHenomenal pH 1000L N/A Fisherbrand
Balance PS-60 N/A Fisherbrand
Water bath Jencons PLS GD100 GK0231026 Grant Instruments
Universal Hood II 76S/04472 Bio-Rad
Multi Bio RS-24 rotor N/A Peqlab brand
Bench top centrifuge, PerfectSpin 24 D801924 Peqlab brand
Bench top centrifuge, refrigerated, PerfectSpin 24R N/A Peqlab brand
Chemi Genius 2 Bio Imaging System N/A Syngene
FLx800 Microplate Fluorescence Reader 181041 BioTek®
Varioskan Flash N/A Thermo Electron Corporation
Incubator Shaker Innova 4200 N/A New Brunswick Scientific Co., INC
Mini-PROTEAN® Tetra Handcast System N/A Bio-Rad
Electrophoresis constant power supply ECPS 3000/150
N/A Amersham/Pharmacia
Electrophpresis power supply EPS 3501 N/A Amersham/Pharmacia
CriterionTM blotter N/A Bio-Rad
PowerPacTM HC 043BR40171 Bio-Rad
MPW-65R centrifuge 10065R019909 MPW Med. Instruments
Nanodrop Spectrophotometer ND 1000 N/A Labtech International, Ltd
Shaking incubator, Thriller® N/A Peqlab brand
Soniprep 150 desintegrator A060299 MSE Ltd
Sorval Legend RT easy set centrifuge; rotor: Sorvall Heraeaus autoclavable 121°C Eq 40308317
40320795 #3057
Thermo Scientific
Thermal cycler peqSTAR 96X Universal Gradient N/A Peqlab brand
Chromato-Vue transilluminator TM-20 95-0179-05 Ultra-Violet Products (UVP), Ltd.
Table 16 - Software
Software Supplier Version/Year
ND-1000 Thermo Scientific V3.7.1/2007-2008
Fluorescence FLx800 Kineticalc BioTek® V3.4

Chapter 2
63
SkanIt software Thermo Fisher Scientific V2.4.3.3.7/2004-2007
QuantityOne Bio-Rad V4.6.3
GeneSnap Synaptics Ltd. V6.00.26/1993-2003
GraphPad Prism GraphPad Software, Inc V7.00
Clustal Omega ©EMBL-EBI 2017
UniProtKb UniProt Consortium 2002-2017
QGRS Mapper Ramapo College Bioinformatics 2006
RNAstructure University of Rochester Medical
Center – Mathews Lab V5.8.1/2016
2.2 Methods
2.2.1 Prediction of G4 forming G-rich sequences in INS intron
In order to investigate the role of quadruplex forming G-rich sequences (QGRS) in regulated RNA
processing, a suite of computational tools has previously been created to map putative G4 elements
within mammalian genes (376). The suite contains algorithms that search for occurrences of G4
motifs and analyses their distribution patterns in genes.
To assess the G4 formation capacity of G-rich INS intron 1, a portion of this sequence was submitted
to the QGRS mapper software for its analysis on the composition and distribution of putative QGRS
(376). These predictions were also performed for a series of overlapping oligonucleotides derived
from the target region (listed in Table 17-Table 19 in appendix B). DNA and RNA derived
oligonucleotides were analysed (Table 13).
QGRS mapper predictions rely on intramolecular interactions and only account for G-run
composition and distribution in tested sequence (376). Therefore, it cannot be assumed that a
sequence containing G-runs that QGRS mapper does not predict to form G4, does not establish
intermolecular interactions and is not involved in G4 formation.
Folding of less stable intermediate states that may co-exist in equilibrium with QGRS mapper
predicted structures and with other non-canonical secondary structures are not accounted for in
this program. To address the possibility of a single sequence to adopt different conformations,
RNAstructure webserver(377) was used to predict the formation of canonical secondary structures
in the same sequences analysed by QGRS mapper (Table 17Table 19).

Chapter 2
64
2.2.2 Screening for G4 formation by the thioflavin T (ThT) fluorescence assay
ThT fluorescence assay has been recently described as a sensitive and highly specific fluorescence
probe for detecting, preferentially, parallel G4 structures, both in G-rich DNA and RNA sequences
(188). For this purpose, INS intron 1-derived oligonucleotides and control oligos were prepared in
water or buffer. Water-treated oligonucleotides were prepared at the desired concentrations in a
total volume of 50 µl and heated at 90°C for 5 minutes, followed by cooling to room temperature
for 1h at a rate of 1°C/min on a peqSTAR 96 Universal Gradient thermocycler (PeqLab). Oligos
prepared in buffer (with or without cation supplementation) were heated at 90°C for 5 min, cooled
to room temperature for 3h and then incubated ON at 4°C. DNA and RNA derived oligos were
treated using the same procedures.
ThT was added (concentrations are indicated for each experiment) to all oligos and fluorescence
read on a FLx800 Microplate Fluorescence Reader (Bio-tek Instruments, Inc). Assay conditions were
as follows: excitation at 400 nm; emission at 508 nm; assay sensitivity at 90. Each reading was the
result of the average of 10 measurements for each sample on the FLx800 Microplate Fluorescence
Reader. G4-forming oligos c-myc, plas24 and 21DNA (derived from a promoter sequence, a
fragment of a plasmodium telomere and a human telomere variant, respectively) were used as
positive controls (188). ThT spectra were obtained on a Varioskan Flash spectral scanning
multimode reader (Thermo Electron Corporation). Assay conditions were: excitation at 420 nm;
emission scan from 430 to 750 at 2 by 2 wavelength steps. For data analysis, the mean fluorescence
of ThT alone was subtracted from all tested oligos fluorescence.
2.2.3 Real-time monitoring of G-quadruplex formation during transcription in vitro
2.2.3.1 Polymerase chain reaction (PCR) amplification of transcription templates
INS intron 1 minigene sequences (315) were used as a template for PCR amplification using the
forward and reverse primers (5’ -> 3’) attaatacgactcactataGGGCTCAGGGTTCCAGG |
GCCCAGCCACGTCCTCCCT, respectively (Table 6). The forward primer includes a T7 promoter tag to
allow transcription. PCR conditions, using Pfu DNA Polymerase (M774A) (Promega), were as follows:
95°C/5 min | 23 x (95°C/ 30 sec | 60.9°C/ 45 sec | 72°C/ 45 sec) | 72°C/ 2 min. PCR products were
analysed on an 1.5% agarose gel at 80V, stained with GelRed and visualized using the Chemi Genius
2 Bio Imaging System with the GeneSnap Software (Synaptics, Ltd). PCR product sizes and amount

Chapter 2
65
were compared against 3 µl of PeqGold DNA ladder-mix 100-10,000 bp (Peqlab). To facilitate
amplification of a GC-rich content of the templates, DMSO was added to a final concentration of 5%
(v/v). PCR products were extracted and purified from the gel using the GeneJET Gel Extraction Kit
(K0692) (Thermo).
2.2.3.2 Real-time transcription
RNA transcripts were obtained by in vitro transcription of the T7-tagged PCR products using RT –
AmpliscribeTM T7-FlashTM Kit (Epicentre, UK) following the manufacturer’s instructions. To prove G4
formation in nascent RNA transcripts, GTP was replaced by 7-deaza-GTP, which inhibits guanine
Hoogsteen interactions, in the reaction mixtures. ThT was added immediately before starting the
transcription reaction by the addition of the polymerase. G-quadruplex formation during
transcription was obtained on a Varioskan Flash (Thermo Electron Corporation) and assay
conditions were as follows: excitation: 420 nm; emission: 481 nm; fluorescence measurements
were collected every 30 sec. After 3h of reaction RNase-Free DNase I was added to stop the reaction
and fluorescence collected for another 15 min. RNA transcripts were recovered by
phenol:chloroform extraction followed by alcohol precipitation. After resuspension in RNase-free
water, RNA transcripts were loaded onto a native 6% acrylamide gel for the analysis of structural
conformation diversity in native conditions. Nucleic acids bands were visualized by staining the gel
for 30 min with 1x GelRed.
2.2.4 Identification of proteins that bind the antisense target regions for the INS intron 1
retention
2.2.4.1 Polymerase chain reaction (PCR) amplification of transcription template
INS intron 1 minigene sequences (315) were used as a template for PCR amplification using the
forward and reverse primers (5’ -> 3’) attaatacgactcactataGGGCTCAGGGTTCCAGG |
TGCAGCAGGGAGGACG. The forward primer includes a T7 promoter tag to allow transcription. PCR
conditions, using GoTaq® DNA Polymerase (M300) (Promega), were as follows: 95°C/5 min | 20 x
(95°C/ 30 sec | 55°C or 60°C/ 45 sec | 72°C/ 1 sec) | 72°C/ 2 min. PCR products were analysed on
an 1.5% agarose gel at 80V, stained with GelRed and visualized using the Chemi Genius 2 Bio
Imaging System with the GeneSnap Software (Synaptics, Ltd). PCR product sizes and amount were
compared against 3 µl of PeqGold DNA ladder-mix 100-10,000 bp (Peqlab). To facilitate
amplification of a GC-rich content of the templates, DMSO was added to a final concentration of 5%

Chapter 2
66
(v/v). PCR products were extracted and purified from the gel using the QIAquick Gel Extraction Kit
250 (Qiagen).
2.2.4.2 INS intron 1 minigene transcription
RNA transcripts were obtained by in vitro transcription of the T7-tagged PCR products using
MEGAshortscriptTM T7 Transcription Kit (Lifetechnologies, USA) following the manufacturer’s
intrsuctions. RNA transcripts were recovered by phenol:chloroform extraction followed by alcohol
precipitation. Transcripts were resuspended in RNase-free water and stored at -80 °C until use.
2.2.4.3 Pull-down assay
Five hundred pmol of in vitro transcribed RNA were treated with 5mM sodium m-periodate and
bound to adipic acid dihydrazide agarose beads (Sigma, USA). Beads with bound RNAs were washed
three times in 2 ml of 2 M NaCl and three times in buffer D (20 mM HEPES–KOH, pH 7, 6.5% v/v
glycerol, 100 m M KCl, 0.2 mM EDTA, 0.5 mM dithiothreitol) followed by incubation with HeLa
nuclear extracts in buffer D supplemented with heparin at a final concentration of 0.5 mg/ml.
Unbound proteins were washed five times with buffer D. Bound proteins were separated on 10%
SDS-PAGE, stained by Coomassie blue and/or blotted on to nitrocellulose membranes. Gels stained
with Coomassie blue were also silver stained using the ProteoSilverTM Silver Stain Kit (Sigma, USA)
according to the manufacturer’s recommendations. Antibodies for Western Blot were purchased
from Sigma (hnRNP E1/E2, product number R4155; U2AF65, product number U4758; and SFRS2,
product number S2320), Abcam (DHX36, product number ab70269) and Millipore (SC35, clone 1SC-
4F11). Antiserum against hnRNP F and hnRNP H was a generous gift of Prof. Douglas Black, UCLA.
Protein identification was confirmed by MS/MS analysis of excised gel fragments, at The Centre of
Excellence in Mass Spectrometry at the University of York.
2.2.5 Cloning, expression and purification of recombinant hnRNPs F and H1 and RRMs
2.2.5.1 Cloning
DNA sequences encoding RRM domains of human hnRNP F (UniProtKb entry: P52597) and human
hnRNP H1 (UniProtKb entry: P31943) were cloned as His-tagged fusion proteins with a TEV protease
cleavage site (amino acid sequence for TEV cleavage: ENLYFQG) into BamHI/Hind III or BamHI/XhoI,

Chapter 2
67
respectively, sites of pET28a (primers list in Table 5). Competent JM109 (Promega) cells were
transformed with cloned plasmids by heat-shock transformation. Briefly, 50 µl of competent cells
were thawed on ice, mixed with 5 µl of ligation reaction and placed on ice for 15 minutes. Cells
were heat-shocked by incubation in a 42°C water bath, followed by 2 minutes on ice. One ml of LB
broth medium was added to each transformation and cells grew for 1h 30 min at 37 °C, followed
by plating on LB agar with 100 µg/ml kanamycin. Confirmation of clone identities was performed
by enzymatic restriction of the plasmids. Clones were sequenced by Source BioScience (Nottingham,
United Kingdom) (Table 10).
2.2.5.2 Expression and purification of recombinant proteins
BL21 (DE3) bacterial cells (New England Biolabs, Inc.) were transformed with plasmids containing
hnRNP RRM sequences (Figure 35 in appendix B). Cells were grown at 37°C to OD600≈0.4. Protein
expression was induced with 1mM isopropyl-b-D-thiogalactopyranoside (IPTG). Cells were
harvested 2h after induction by centrifugation at 4000 rpm for 20 min. Cell pellets were
resuspended in a lysis buffer (50 mM Tris-Base pH 7.4, 300 mM NaCl, 1 mM DTT) and lysed by 10x
10s sonication, followed by centrifugation at 4000 rpm for 45 min at room temperature (RT). One
ml of Ni-NTA agarose beads (Qiagen) were incubated with 4 ml of each lysate and stirred for 1h at
room temperature. Unbound proteins were washed four times with 1 ml of washing buffer 1 (50
mM Tris-Base pH 7.4, 300 mM NaCl, 20 mM imidazole), followed by six times 1 ml of washing buffer
2 (50 mM Tris-Base pH 7.4, 300 mM NaCl, 50 mM imidazole), twice with 1 ml of washing buffer 3
(50 mM Tris-Base pH 7.4, 300 mM NaCl, 75 mM imidazole) and twice with 1 ml of washing buffer 4
(50 mM Tris-Base pH 7.4, 300 mM NaCl, 100 mM imidazole). Protein elution was performed four
times times with 1 ml of elution buffer (50 mM Tris-Base pH 7.4, 300 mM NaCl, 250 mM imidazole).
Aliquots of eluted proteins were visualized on 15% SDS-PAGE and stained with Coomassie or blotted
on to nitrocellulose membranes. Antibodies against the penta-His-tag were purchased from
InvitrogenTM (product number P-21315).
Full-length hnRNP F and H constructs (Figure 35 in appendix A) were transformed into RosettaTM 2
competent cells (71397-3) (Millipore) and purified as described for RRMs.
2.2.6 Cloning and transfection of 5’UTR regions of Human and primates INS gene
2.2.6.1 Cloning
5’ UTR DNA sequences from Homo sapiens (Genbank accession number AY138590), Pongo
pygmeus (AY137503), Macaca fuscata (GU901176), Colobus angolensis (GU901183),

Chapter 2
68
Semnopithecus entellus (GU901185), Aotus azarae (GU901198) preproinsulin genes were cloned
into Hind III/NcoI sites of the monocistronic pGLpest.SEQ plasmid (primers in Table 5). The
pGLpest.SEQ plasmid was kindly given by Mark Coldwell (Centre for Biological Science, University
of Southampton, United Kingdom). Competent JM109 cells (Promega) were transformed with
plasmid constructs as described above. Insert sizes were confirmed by enzymatic restriction of the
plasmid DNA. Constructs were then subcloned into KpnI sites of the bicistronic pICtest2 (pIC)
plasmid (pIC) (also given by Mark Coldwell). Cloning efficiency and insert sizes were confirmed after
transformation into DH5α competent cells and enzymatic restriction of the plasmid DNA. All
constructs were sequenced at Source BioScience (Nottingham, United Kingdom) (primers in Table
10 and clone sequences in Figure 36 in appendix A).
2.2.6.2 Culturing of HeLa cells
HeLa cells were kindly given by Mark Coldwell (Centre for Biological Science, University of
Southampton, United Kingdom). For passaging, the medium was aspirated, cells washed with 500
µl of 1x PBS and incubated at 37°C and 5% CO2 with 2.5 ml of TrypLE Express reagent (Gibco) per
well until cells detached (10-15 min). Seven and half ml of DMEM containing 10% FBS were added
to cells and 2.5 ml out of the 10 ml of dissociated cells were transferred into a new T175 flask.
Passaging was performed every two to three days. For transfection with Human and primates’ 5’
UTR constructs, cells were routinely cultured and passaged until they reached at least their fifth
passage.
2.2.6.3 Transfection of HeLa with INS 5’UTR constructs
For luciferase assays, 5 000 HeLa cells were seeded in 200 µl of DMEM medium per well of a 96-
well-plate. Sixty thousand HeLa cells were seeded in 2 ml of DMEM medium per well of 12-well-
plates and transfected for total RNA extraction. Twenty-four hours after seeding, cells were
transfected with 50 ng (96-well-plate) or 600 ng (12-well-plate) of plasmid DNA, previously mixed
with GeneJuice transfection reagent (according to manufacturer’s protocol). Medium was removed
and replaced by fresh DMEM with 10% FBS 4h after transfection.
2.2.6.4 Dual-Luciferase Reporter Assay
The dual-luciferase reporter assay (E1910) (Promega) was used to compared mRNA processing and
translation efficiency of Human and other five primates INS 5’ UTRs. Two individual reporter
enzymes, the firefly and Renilla luciferases, are simultaneous and independently expressed and

Chapter 2
69
their activity measured, where thetranslated firefly reporter is dependent on experimental
conditions and the Renilla reporter provides an internal control serving as the baseline response.
Normalization of both activities minimizes experimental variability caused by differences in cell
viability or transfection efficiency. Forty-eight hours post-transfection, medium was aspirated and
HeLa cells were washed with 100 µl of 1x PBS. Following the addition of 20 µl of 1x Passive Lysis
Buffer (PLB) to each well, cells were incubated at RT for 15 min with gentle shaking. Five µl of each
cell lysate were transferred to a white 96-well-plate and chemiluminescence of each luciferase was
measured separately on a GloMax®-Multi+ Microplate Multimode Reader with Instinct® software.
The reader automatically injects 25 µl of Luciferase Assay Reagent II, previously prepared according
to manufacturer’s protocol, and measures the firefly luciferase signal, which is immediately
followed by addition of 25 µl of Stop & Glo Reagent to quench firefly luciferase activity and measure
the Renilla luciferase signal. The procedure is then repeated for all the wells with HeLa lysates.
Data were transferred into an Excel spread sheet, calculating the ratio of firefly luciferase: Renilla
luciferase (fluc:rluc) activities. Each construct was compared to the activity from the transfection
with the empty pIC vector.
2.2.6.5 Total RNA extraction
RNA was isolated from HeLa cells 24 hours after transfection in 12-well-plates using the TRIzol
isolation method, adapted from Invitrogen.
Medium was removed, cells washed with 1 ml of 1x PBS, 500 µl of TRIzol applied directly to the cells
and incubated for 5 min atRT after homogenization by up-and-down pipetting. One-hundred and
thirty µl of chloroform was added to cell lysate, briefly vortexed and incubated for 15 min at RT.
The sample was centrifuged at 12000 rpm for 15 min at 4°C to allow phase separation. The upper
aqueous-phase was transferred into a new 1.5 ml macrocentrifuge tube and 330 µl of isopropanol
added. After briefly vortexed, samples were incubated at RT for 15 min and centrifuged at 13000
rpm for 15 min at 4°C. Supernatant was discarded and the pellet was washed with 1 ml of chilled
80% ethanol for 10 min and centrifuged at 12000 rpm at 4°C. Ethanol was removed, the pellet dried
at RT for approximately 5 min and dissolved in 30 µl of RNase-free water. RNA concentration was
spectrophotometrically measured using NanoDrop (Thermo Scientific) at 260 nm and 280 nm. A
ratio of ≈2 for each sample was accepted as “pure” RNA, free of contaminants such as phenol. RNA
samples were stored at -80°C until use.

Chapter 2
70
2.2.6.6 Reverse transcription using oligo-dT primer
Isolated RNA was treated with RQ1 DNase enzyme to digest any potential contaminating in the
sample. Approximately 800 ng of total RNA, in a total volume of 17 µl, were mixed with 3 µl of the
master mix (2 µl of RQ1 DNase 10X Reaction Buffer, 0.4 µl of RQ1 RNase-free DNase (M6101,
Promega) and 0.6 µl of RNase-free water) and incubated at 37 °C for 30 min. Reaction was stopped
by the addition of 1 µl of DNase stop solution followed by incubation at 65 °C for 10 min. DNase-
treated RNA was stored at -80 °C until use.
Four-hundred nanograms of DNase-treated RNA and 1 µl of 15-mer oligo-dT primer (Eurofins) were
mixed in a total volume of 5 µl, incubated at 70 °C for 5 min and chilled on ice until 4 µl of Moloney
Murine Leukemia Virus (M-MLV) Reverse Transcriptase (T) 5X Reaction Buffer, 5 µl dNTPs, 0.5 µl of
RNasin and 1 µl of M-MLV RT were added. Transcription reaction was then incubated at 42 °C for
1h, followed by 5 min at 90 °C. cDNA was stored at -20 °C.
2.2.6.7 cDNA PCR amplification for splicing pattern analysis
The reverse transcribed cDNA was used for the analysis of spliced products from INS 5’ UTR
constructs. PCR amplification was then performed using a peqSTAR 96 Universal Gradient PCR
equipment (PeqLab) using the forward and reverse primers (5’ -> 3’)
GCCTCGGCCTCTGAGCTATTCCAG | GTATCTCTTCATAGCCTTATGCAG (Table 10). PCR conditions,
using Pfu polymerase were: 95 °C/3 min | 32x (95 °C/ 30 sec | 52 °C/ 1 min | 72 °C/ 1 min) 72 °C/ 2
min. Amplification products were analysed on an 2% agarose gel at 80V, stained with GelRed and
visualized using the Chemi Genius 2 Bio Imaging System with the GeneSnap Software (Synaptics,
Ltd). PCR product sizes and amount were compared against 3 µl of PeqGold DNA ladder-mix 100-
10,000 bp (Peqlab). To facilitate amplification of a GC-rich content of the templates, DMSO was
added to a final concentration of 5% (v/v).
2.2.7 Statistical analysis
Using GraphPad Prism, version 7.00 for Windows (GraphPad Software, La Jolia, California, USA,
www-graphpad.com), statistical tests were performed to determine significance of data. A Shapiro-
Wilk normality test was performed to all data to test whether data followed a Gaussian distribution.
Depending on the result of normality test and the aim of the assay, different tests were performed.
Regarding data following a Gaussian distribution, statistical significance of ThT fluorescence time-
course in the presence of G4 complexes was examined by comparing the fluorescence intensities

Chapter 2
71
at different incubation times with fluorescence obtained immediately after ThT addition. For that,
multiple comparison unpaired t-tests using the Šídák-Bonferroni method were performed (378).
For the saturation of G4 complexes with ThT, data were analysed using a multiple comparative
analysis using two-way ANOVA with Tukey’s correction. Tukey’s method is used for the comparison
of every mean with every other mean in tested population. The method computes confidence
intervals for every comparison (379).
A Fisher’s Least Significant Difference (LSD) test (380) was chosen for the comparison of
fluorescence intensities from Int1 derived oligos. Statistical significance of the influence of solvents
and pH on G4 propensity was evaluated using the unpaired t-test with Welch’s correction, by
performing two-by-two comparisons. This test is used to test the hypothesis that two populations
have equal means. It is more reliable than Student’s t-test when two samples have unequal
variances. Assumption of normality is maintained. Welch’s t-test tests the null hypothesis that the
two population means are equal or the alternative hypothesis that one of the population means is
greater than or equal to the other. Welch’s t-test is more robust than Student’s t-test. It also
remains robust for skewed distributions and smaller samples (381).
The Welch’s corrected unpaired t-test was performed for the analysis of solvent and pH influence
on G4 propensity in RNA oligos.
For significance of luciferase assay data sets, Dunnett’s or Tukey’s multiple comparison tests or
Welch’s corrected unpaired t-tests were performed. The Dunnett´s test is similar to Tukey’s, but is
used for the comparison of every mean with a control mean.
With respect to data sets that did not pass the Shapiro-Wilk normality test were analysed using the
nonparametric Friedman test. This test compares the mean fluorescence of each oligo with the
mean of every other oligo and via random sampling of every mean evaluates the probability of the
differences between means being null. Small p-values (< 0.05) indicate that at least one mean
differs from the rest (382).
All tests were chosen based on the type of analysis intended, which is influenced by normality of
data (parametric or nonparametric) and size of the sample (t-test for 2 samples, and ANOVA
variations for multiple comparisons – Fisher, Friedman, Dunnett or Tukey). The alpha value was set
to 0.05 for all the data and were considered significant different when *p ≤ 0.05, **p ≤ 0.01 and
***p ≤ 0.001.

72
73
Chapter 3: Thioflavin T (ThT) as a fluorescent light-up
probe for monitoring of G4 formation

74

Chapter 3
75
3.1 Introduction
The structure adopted by RNA transcripts can constrain or promote recognition of cis-acting
elements or binding of trans-acting factors, thus influencing splicing (27). INS intron 1 is rich in G-
tracts, which can potentially fold into non-canonical G4 structures in vivo, but their contribution to
splicing efficiency of this intron is not understood.
To characterize G4 formation in INS intron 1-derived sequences in vitro, the fluorescent dye
Thioflavin T (ThT) was used as a specific probe for both DNA and RNA G-rich sequences surrounding
the antisense target for reduced intron retention (315).
ThT is a fluorescent dye widely used in amyloid fibre formation studies (383–387). In 2013 Mohanty
and collaborators induced and evaluated G4 folding of the 22AG ((TTAGGG)4) (388) human
telomeric DNA using this fluorogenic dye as a fluorescent light-up probe in the visible spectrum
region (389). Since then, ThT has been successfully used as a specific fluorescent G4 ligand capable
of distinguishing this non-canonical structure from canonical single- and double-stranded (ss- and
ds-) DNA structures (155,187,188,389–391). The dye displays a strong fluorescence enhancement
in the presence of both parallel and anti-parallel DNA G4 conformations, depending on the analysed
sequence and folding buffers (191,392). ThT is also an efficient and selective fluorescence sensor
for all-parallel RNA G4s (189).
G4s were first described in telomeres, located at the ends of eukaryotic chromosomes, and many
oncogene promoters (393,394). Therefore, three well-characterized G4-forming oligonucleotides
were used to stablish ThT efficiency for the detection of G4 formation: telomere-derived
oligonucleotide 21DNA; c-myc, a 24 nt oligo derived from the G-rich promoter region of the human
proto-oncogene c-myc; Plas24, a representative oligo from the G-rich sequence of the Plasmodium
telomere with the same length as c-myc (188). All three oligos were previously shown to form G4
and bind ThT, as shown by fluorescence enhancement (188,190). In addition, the oligo Int7, derived
from the parallel G4-forming fragment just to 3’-end of the antisense target for reducing INS intron
1 retention, was used to define experimental conditions.

Chapter 3
76
3.2 Results
3.2.1 Optimization of experimental conditions
3.2.1.1 ThT as a fluorescence light-up probe for G4
To ascertain whether ThT displays a fluorescence enhancement in the presence of G4-forming
sequences, c-myc oligo was denatured and slowly cooled down to room temperature (RT) to
promote secondary structure formation. ThT relative fluorescence (RFU) in the presence of control
oligos was compared with the fluorescence of the dye alone (Figure 9). RFU is referred as
fluorescence or fluorescence intensity throughout the text.
Figure 9 – Fluorescence intensity of ThT variation with increasing dye or oligo concentrations. (A) Fluorescence enhancement of serial dilutions of ThT in the presence of a constant amount of oligo c-myc. (B) Correlation between fluorescence response of 1µM ThT and serial dilutions of c-myc. For both assays, fluorescence emission of Thioflavin T was measured at 508 nm.
Data in Figure 9A showed that for each ThT concentration, fluorescence intensity of ThT in the
presence of the c-myc oligo was, on average, 2.5 times higher than fluorescence of ThT alone.
Fluorescence at two different ThT concentrations for a series of oligo dilutions indicates a linear
and positive correlation between the amount of oligo in the analysed range (Figure 9A).
ThT showed a hyperbolic profile when different concentrations of the dye are used to detect G4
formation at a constant amount of same oligo (Figure 9B), likely reflecting a dye saturation.

Chapter 3
77
3.2.1.2 Time-course of ThT fluorescence
The stability of G4 structures and of G4-ThT complexes is important to establish the assay
conditions and a time-window when fluorescence of the complexes can be analysed.
Oligos were treated as before and ThT fluorescence was measured immediately after complex
formation (0h) and 1h, 2h, 24h and 1 week later (Figure 10). All oligos were prepared in duplicate.
Figure 10 shows, as expected, significant fluorescence enhancements for oligos known to form G4
(c-myc, Plas24and 21 DNA), when compared to ThT alone or either single-stranded and hairpin
structures in dT22, DCAF6 and CLASP1. This confirms previous findings (187,188,190) that ThT is a
sensitive and specific probe for G4 detection.
Figure 10 – Time-course of ThT fluorescence of G4-ThT complexes. Fluorescence of complexes composed of G4-forming c-myc, Plas24 and 21 DNA oligos is compared with the one from oligos that do not fold into this non-canonical secondary structure (dT22, DCAF6 and CLASP1). Fluorescence of 1 µM ThT alone and water is also shown as control.
Statistical testing normality of data using Shapiro-Wilk normality test indicated that the population
is normally distributed, as shown by p-values ≥ 0.05 (the null-hypothesis is that the population is
normally distributed; the hypothesis is rejected when p-value < alpha (0.05)). Therefore, a gaussian
distribution was assumed to perform corrected multiple comparison unpaired t-tests using the
Šídák-Bonferroni method.
Comparative analysis showed that there is no significant decrease in fluorescence intensities of
oligo-ThT complexes, regardless of the tested oligo, for a week storage at 4 °C (Table 20 in Appendix
B). Hence, G4 propensity can be determined by measuring fluorescence of ThT bound to oligos for
up to one week after addition of ThT, without loss of information. Comparison of G4-forming

Chapter 3
78
sequences at each time-point revealed that fluorescence intensity was not statistically different
between oligonucleotides. Therefore, no conclusions can be assumed regarding discriminatory
capacity of ThT, which will be further investigated below.
3.2.1.3 ThT fluorescent signal dependence on oligo concentration
For the optimization of any qualitative and semi-quantitative assay where a probe like ThT is used,
it is essential to establish a linear correlation between the amount of sample to be tested and probe
signal to be measured. This avoids loss of signal due to a poor sample-probe ratio, saturation of the
probe signal or quenching (187).
To confirm that ThT fluorescence intensity is directly proportional to oligo concentration and,
therefore, the amount of G4 formed, several dilutions of 2 oligos predicted by QGRS Mapper to fold
into this structure (Table 17 in appendix B) were analysed. ThT was added to final concentrations
of 10 and 50 µM (Figure 11A-D) or to 1,2 and 5 µM (Figure 11E-H).
Comparison of ThT spectra in the presence of G4-forming oligos Int7 and Plas24 with the spectrum
of ThT alone shows fluorescence enhancement in both oligos for most of the concentrations tested
(Figure 11A-D). As expected, fluorescence increases as oligo concentration increases, independent
of the chosen ThT concentration range.
ThT spectra did not change in the presence of different oligos, displaying two peaks, at 481 and 495
nm. The former corresponds to the maximum fluorescence emission of ThT alone and it is close to
the wavelength to which ThT displays fluorescence when bound to amyloid fibrils (482-485 nm
(383,387,395). The second peak, 495 nm, does not appear in the unbound ThT spectrum, suggesting
that this signal may be specific for the recognition of parallel G4.
Concomitant with fluorescent spectral changes, scatter plots (Figure 11E-G) show linear
fluorescence enhancements at 495 nm upon titration of Int7, c-myc and Plas24 oligos, indicating a
direct and positive correlation between fluorescence and oligo concentration, in tested conditions.
Positive correlations between ThT fluorescence and oligo concentration were supported by highly
significant Pearson correlation coefficients. Strong correlations are shown by R coefficients close to
1 (Figure 11H).
Collectively, these data reveal that ThT is capable of detecting G4 formation in vitro for any G-rich
oligo in tested conditions and that higher fluorescence reflects a stronger propensity to form G4.
Therefore, ThT can be used for the detection of G4 formation in vitro in INS intron 1.

Chapter 3
79
Figure 11 - ThT fluorescence intensity increases linearly with increasing oligo concentrations. Fluorescence spectra at 10 (A and C) and 50 (B and D) µM of ThT alone or in the presence of increasing concentrations of Int7 (A and B) or Plas24 (C and D). Spectra were compared with scattered plots (E-G) showing the correlation between 1 (blue), 2 (orange) and 5 (green) µM of ThT fluorescence intensity and increasing oligo concentrations of Int7 (E), c-myc (F) and Plas24 (G). (H) Pearson R correlation coefficients for ThT concentrations in the presence of increasing concentrations of tested oligos.

Chapter 3
80
3.2.1.4 Molecular saturation
To choose the appropriate ThT concentration in further studies and determine maximum ThT-
bound fraction, saturation profiles of several oligos by ThT were characterized. Nine oligos (Figure
12), predicted by QGRS Mapper to form G4 (Table 17 in appendix B), and one single-stranded oligo
(dT22) as a control, at 2 and 20 µM, were heated and slowly cooled to promote formation of a G4
population as homogeneous as possible. Fluorescence intensities of several concentrations of ThT
(10-500 µM) bound to G4 conformations at either 2 or 20 µM were then compared with the signal
of unbound ThT (Figure 12).
Saturation profiles revealed a hyperbolic curve, with fluorescence intensity increasing with probe
concentrations up to 100-150 µM and gradual loss of the signal until it was slightly above or equal
to the background (ThT alone) (Figure 12). This decrease is most likely due to fluorescence
quenching, already observed for ThT in other studies (187).
A multiple comparative analysis using two-way ANOVA with Tukey’s correction (Table 21 in
appendix B) indicated that fluorescence intensity enhancements are significantly higher at 20 µM
oligo than at 2 µM for ThT concentrations within the range 50-300 µM (Figure 12). ThT
concentrations outside of this range were, therefore, not considered in further studies to avoid
unsaturated oligo readings and/or fluorescence quenching.
Comparing fluorescence signals from the ten oligos in Figure 12, enhancements produced by ThT
concentrations higher than 50 µM and up to 100 µM are, then, more adequate for the
determination of G4 propensity and for oligo discrimination.
Although the saturation profiles were very similar (Figure 12), p-values < 0.05 indicate that different
oligo:ThT ratios display different fluorescence intensities, at tested ThT concentrations.

Chapter 3
81
Figure 12 – Saturation of G4 structures of various oligos by Thioflavin T. Determination of G4 saturation curves by titrating 10 different nucleotides at 2 µM (orange bars) and 20 µM (green bars) with increasing concentrations of ThT (10-500 µM). Fluorescence intensities of G4-ThT complexes, at 495 nm, of WT, Int1, Int7, CD3, CD4, Int1+18, Int7+20, cmyc, Plas24 and dT22 (A to J, respectively) are compared with fluorescence intensities of ThT alone (blue bars). Error bars denote the standard deviation from three independent fluorescence assays. Asterisks denote p-values < 0.05.

Chapter 3
82
ThT fluorescence from 2- and 4-fold the oligo concentration was then measured to evaluate
discrimination power of ThT concentration. Three oligos, Int7, Plas24 and dT22, at 1, 2, 5, 10 and
20 µM, were prepared as above to promote G4 formation.
Figure 13 – Comparison of fluorescence intensities of two oligo:ThT ratios. Fluorescence intensity, at 495 nm, of ThT at twice (A) or four-times (B) the oligo concentration. Comparison of both ratios for each oligo is also shown. (C) Fluorescence intensities of Int7 in the presence of ThT in twice (blue) and four times (light blue) the oligo concentration. (D) Fluorescence intensities of Plas24 in the presence of ThT in twice (orange) and four times (light orange) the oligo concentration. (E) Fluorescence intensities of dT22 in the presence of ThT in twice (green) and four times (light green) the oligo concentration.
Figure 13 showed that differences in fluorescence were greater when ThT concentration is four
times higher than oligo concentration (Figure 13C-E). On the other hand, oligo discrimination at 20
µM is stronger than at 10 µM or lower, where fluorescence intensities are undifferentiated (Figure
13A-B). ThT concentration of 80 µM and 20 µM of oligo, should give more accurate and
reproducible results, thus, these conditions were used in further assays.

Chapter 3
83
3.2.1.5 Conclusions:
As in previous studies (167,188–190,389,392), ThT showed significant fluorescent enhancement in
the presence of oligos known to fold into G4 (c-myc, Plas24, 21 DNA). Complexes formed by G4
oligos and ThT are very stable, if kept at 4 °C, and their fluorescence signal did not change
significantly within a week of their formation.
ThT bound to G4 in a concentration-dependent manner and its fluorescence signal was directly
proportional to the amount of oligonucleotide.
For all tested oligos and oligo concentrations, ThT concentrations between 50-100 µM can be used
without any significant loss of fluorescence intensity. When ThT concentrations were higher than
150 µM ThT may quench itself and fluorescence intensity progressively decreased until background,
ThT alone, levels.
A 1:4 (oligo:ThT) ratio, with oligos at 20 µM, was shown to be adequate for further studies aimed
at discriminating G4 propensity of a series of INS intron 1-derived oligos.

Chapter 3
84
3.2.2 G4 formation in INS intron 1 DNA-derived oligos
The data presented in section 3.2.1 corroborated previous findings (188,189,389) that ThT is an
efficient fluorescence dye for the structural probing of G4 formation and displayed a strong and
positive linear correlation with nucleic acid concentration.
Having selected experimental conditions (including oligo and dye concentrations incubation time,
and temperature) in which DNA oligos fold and/or associate to form G4, ThT was then used to
evaluate the ability of a set of overlapping oligonucleotides derived from the G-rich segment of
intron 1 to fold into G4 (Table 13). This region surrounds the antisense target for reducing intron 1
retention (315) and may have a therapeutic potential in future. The selection of overlapping
sequences was based on oligo length, inclusion or exclusion of segments involved in intron
retention (such as the target sequence for antisense oligonucleotides that promote splicing), and
G4 predictions. This selection included oligo Int7, which has been previously shown by far-UV CD
and NMR to fold into parallel G4 (315), and showed increased fluorescence in preliminary studies
(section 3.2.1 - Figure 12 and Figure 13).
3.2.2.1 INS intron 1 and target sequence-derived oligos screening for G4 formation
Preliminary studies with this set of oligos under suboptimal conditions (Figure 32 in appendix A)
had indicated that G-runs both upstream and downstream of the antisense target were prone to
G4 formation, as shown by 2-4.5-fold enhancements in comparison to DCAF6 fluorescence. In
general, ThT fluorescence enhancement correlated positively with QGRS mapper scores (Table 17
in appendix B). However, there were a few inconsistencies such as the low fluorescence intensity
in oligos predicted by QGRS mapper as potential G4 forming sequences (376) (Int2 and 3, GT8 and
GA8 in Figure 32 in appendix A), and INS intron 1-derived oligos Int5 and 6 showed high fluorescence
intensity, with relation to the negative controls, although they are not expected to form G4.
These inconsistencies could be due to high variability in five independent assays and, also, low oligo
concentrations (1 µM) that could contribute to poor oligo discrimination, as shown in Figure 13A
and B.
Following optimization of discriminatory conditions, in section 3.2.1, oligos were prepared at a
concentration of 20 µM and G4 propensity was evaluated with 80 µM ThT.

Chapter 3
85
Figure 14 - ThT screening for G4 formation in vitro in INS intron 1. (A) Schematics of tested oligonucleotides derived from INS intron 1. Sequences, length and corresponding G-scores of positive and negative controls (coloured in panel (B) are also shown. IAO21 represents the antisense olinucleotide that reduced INS intron 1 retention (315). (B) Mean fluorescence intensity of 80 µM ThT at 508 nm in the presence of the indicated oligonucleotides. Positive controls are in green, negative controls in blue. Controls for ThT binding to G-tract are in orange and ThT binding according to the number of Gs in purple. Tested oligos are in red. Error bars denote standard deviation from three independent fluorescence assays. Asterisks denote p-values ≤ 0.05 (*), ≤ 0.01 (**) or ≤ 0.001 (***). Oligos were prepared in water, at pH 7.2, and mean fluorescence of ThT alone was removed from all samples. Dashed horizontal line indicates the threshold for G4 formation, based on CLASP1 fluorescence intensity.
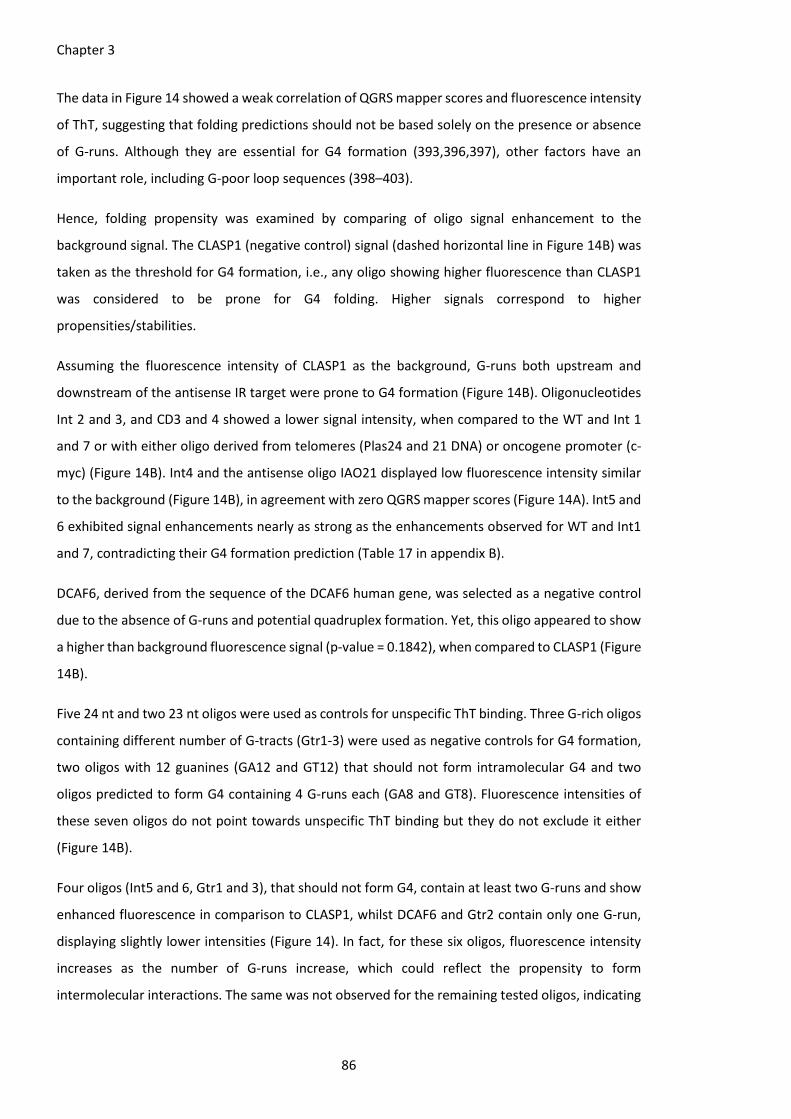
Chapter 3
86
The data in Figure 14 showed a weak correlation of QGRS mapper scores and fluorescence intensity
of ThT, suggesting that folding predictions should not be based solely on the presence or absence
of G-runs. Although they are essential for G4 formation (393,396,397), other factors have an
important role, including G-poor loop sequences (398–403).
Hence, folding propensity was examined by comparing of oligo signal enhancement to the
background signal. The CLASP1 (negative control) signal (dashed horizontal line in Figure 14B) was
taken as the threshold for G4 formation, i.e., any oligo showing higher fluorescence than CLASP1
was considered to be prone for G4 folding. Higher signals correspond to higher
propensities/stabilities.
Assuming the fluorescence intensity of CLASP1 as the background, G-runs both upstream and
downstream of the antisense IR target were prone to G4 formation (Figure 14B). Oligonucleotides
Int 2 and 3, and CD3 and 4 showed a lower signal intensity, when compared to the WT and Int 1
and 7 or with either oligo derived from telomeres (Plas24 and 21 DNA) or oncogene promoter (c-
myc) (Figure 14B). Int4 and the antisense oligo IAO21 displayed low fluorescence intensity similar
to the background (Figure 14B), in agreement with zero QGRS mapper scores (Figure 14A). Int5 and
6 exhibited signal enhancements nearly as strong as the enhancements observed for WT and Int1
and 7, contradicting their G4 formation prediction (Table 17 in appendix B).
DCAF6, derived from the sequence of the DCAF6 human gene, was selected as a negative control
due to the absence of G-runs and potential quadruplex formation. Yet, this oligo appeared to show
a higher than background fluorescence signal (p-value = 0.1842), when compared to CLASP1 (Figure
14B).
Five 24 nt and two 23 nt oligos were used as controls for unspecific ThT binding. Three G-rich oligos
containing different number of G-tracts (Gtr1-3) were used as negative controls for G4 formation,
two oligos with 12 guanines (GA12 and GT12) that should not form intramolecular G4 and two
oligos predicted to form G4 containing 4 G-runs each (GA8 and GT8). Fluorescence intensities of
these seven oligos do not point towards unspecific ThT binding but they do not exclude it either
(Figure 14B).
Four oligos (Int5 and 6, Gtr1 and 3), that should not form G4, contain at least two G-runs and show
enhanced fluorescence in comparison to CLASP1, whilst DCAF6 and Gtr2 contain only one G-run,
displaying slightly lower intensities (Figure 14). In fact, for these six oligos, fluorescence intensity
increases as the number of G-runs increase, which could reflect the propensity to form
intermolecular interactions. The same was not observed for the remaining tested oligos, indicating
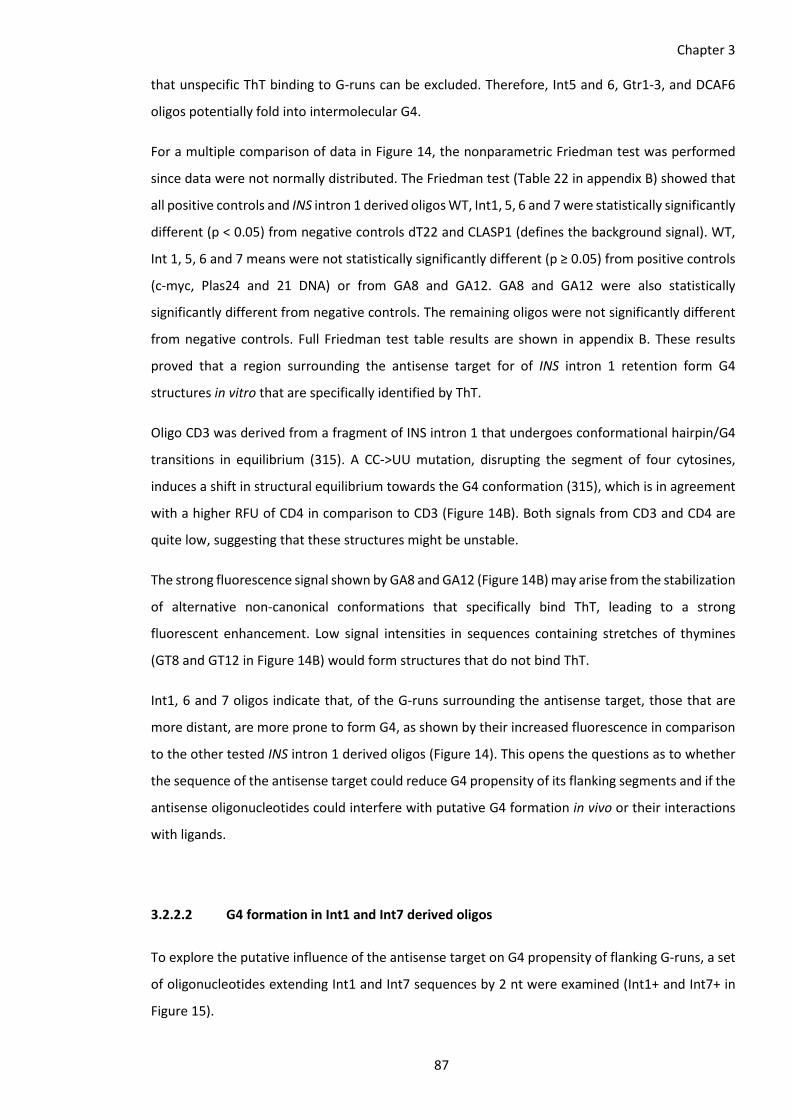
Chapter 3
87
that unspecific ThT binding to G-runs can be excluded. Therefore, Int5 and 6, Gtr1-3, and DCAF6
oligos potentially fold into intermolecular G4.
For a multiple comparison of data in Figure 14, the nonparametric Friedman test was performed
since data were not normally distributed. The Friedman test (Table 22 in appendix B) showed that
all positive controls and INS intron 1 derived oligos WT, Int1, 5, 6 and 7 were statistically significantly
different (p < 0.05) from negative controls dT22 and CLASP1 (defines the background signal). WT,
Int 1, 5, 6 and 7 means were not statistically significantly different (p ≥ 0.05) from positive controls
(c-myc, Plas24 and 21 DNA) or from GA8 and GA12. GA8 and GA12 were also statistically
significantly different from negative controls. The remaining oligos were not significantly different
from negative controls. Full Friedman test table results are shown in appendix B. These results
proved that a region surrounding the antisense target for of INS intron 1 retention form G4
structures in vitro that are specifically identified by ThT.
Oligo CD3 was derived from a fragment of INS intron 1 that undergoes conformational hairpin/G4
transitions in equilibrium (315). A CC->UU mutation, disrupting the segment of four cytosines,
induces a shift in structural equilibrium towards the G4 conformation (315), which is in agreement
with a higher RFU of CD4 in comparison to CD3 (Figure 14B). Both signals from CD3 and CD4 are
quite low, suggesting that these structures might be unstable.
The strong fluorescence signal shown by GA8 and GA12 (Figure 14B) may arise from the stabilization
of alternative non-canonical conformations that specifically bind ThT, leading to a strong
fluorescent enhancement. Low signal intensities in sequences containing stretches of thymines
(GT8 and GT12 in Figure 14B) would form structures that do not bind ThT.
Int1, 6 and 7 oligos indicate that, of the G-runs surrounding the antisense target, those that are
more distant, are more prone to form G4, as shown by their increased fluorescence in comparison
to the other tested INS intron 1 derived oligos (Figure 14). This opens the questions as to whether
the sequence of the antisense target could reduce G4 propensity of its flanking segments and if the
antisense oligonucleotides could interfere with putative G4 formation in vivo or their interactions
with ligands.
3.2.2.2 G4 formation in Int1 and Int7 derived oligos
To explore the putative influence of the antisense target on G4 propensity of flanking G-runs, a set
of oligonucleotides extending Int1 and Int7 sequences by 2 nt were examined (Int1+ and Int7+ in
Figure 15).

Chapter 3
88
Analysis of oligos Int1+ and Int7+ for potentially-G4 forming elements by QGRS mapper indicated
that G4 formation propensity should not significantly change by extension of Int1 and Int7
sequences (Figure 15A) (Table 17 in appendix B).
Figure 15 demonstrated that all extended oligos were still prone to G4 formation; nevertheless, a
global decrease in fluorescence as the length increases was observed (see p-values for comparison
analysis in Table 23 and Table 24 in appendix B. This is in agreement with previous results (Figure
14), where INS intron 1 Int2-4 oligos used for G4 formation screening showed very low fluorescence.
Changes in fluorescence intensities as Int1 and 7 fragment sequences are extended contradicts
what was expected by QGRS mapper scores, as observed in Figure 14.
Data from Int1+ passed both D’Agostino & Pearson and Shapiro-Wilk tests, hence a Gaussian
distribution was assumed for the analysis of the differences between oligo means using ANOVA. No
correction for multiple comparison was performed. Uncorrected Fisher’s LSD results’ summary is
shown in Table 23 in appendix B. Int7+ data did not pass D’Agostino & Pearson and Shapiro-Wilk
tests. Therefore, to determine whether the differences in the means are significant or not, a non-
parametric Friedman test was performed, which is shown in Table 24 in appendix B.
Comparative analysis showed that nucleotides closer or within the antisense target region promote
significant changes in G4 propensity, which is more pronounced for Int7+ oligos (Figure 15B).
Inclusion of the AC dinucleotide in Int1 sequence was strongly disruptive for the formation of
parallel G4, although, extending Int1 by 2, 4 or 6 nt re-establishes G4 formation propensity.
Fluorescence intensity of Int1 is even surpassed if the eight-nucleotide ACCCCAGG (Figure 15A)
sequence is included (Table 23 in appendix B). The signal decreases again when oligo is extended
by including the antisense target fragment (Figure 15B)
Comparative analysis demonstrated that extending Int7 sequence by 2 nt did not produce a
significant change in fluorescence intensity (Figure 15B), reflecting no change on G4 propensity.
However, there seems to be a tendency for a stronger propensity of the 21 nt oligo (Int7+2) in
comparison to the 19 nt (Int7), which may be due to assay’s high variability. ThT fluorescence
decreased once the 6-mer TCTGACGC is included in the extended Int7 sequence (Figure 15A),
disrupting the parallel G4. Propensity for G4 formation is re-established, as in Int1+, by adding the
CAGC segment and disrupted again when the GCCCCAGC fragment is included.

Chapter 3
89
Figure 15 - Variation of ThT fluorescence in the presence of INS intron 1- derived Int1 and Int7 extended oligos (denoted as Int1+ and Int7+ in (B)). (A) Schematics of tested oligos extending Int1 or Int7 sequences (black horizontal bars) into the antisense target sequence (underlined) Their predicted G-scores are to the right. (B) Mean fluorescence intensity, at 508 nm, of 80 µM ThT in the presence of extended oligos in (A). Error bars denote the standard deviation from three independent fluorescence assays. Asterisks denote p-values ≤ 0.05 (*) or ≤ 0.01 (**). The inset shows fluorescence dependence on G-score.
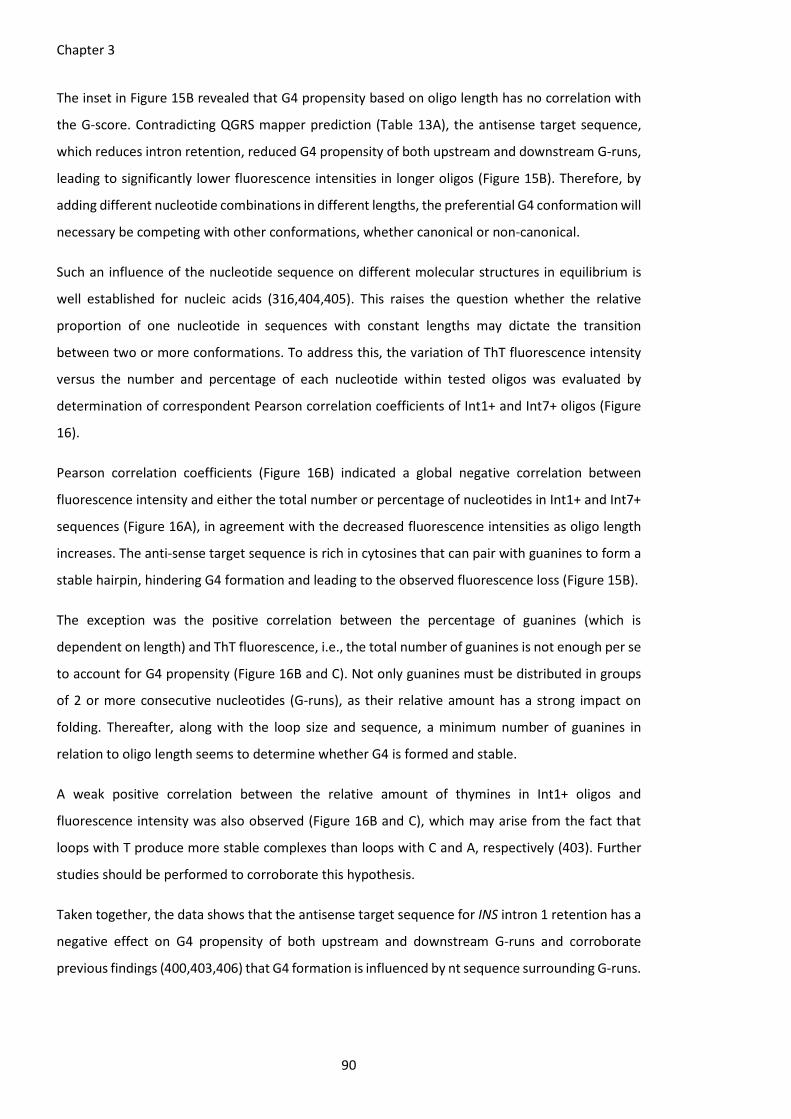
Chapter 3
90
The inset in Figure 15B revealed that G4 propensity based on oligo length has no correlation with
the G-score. Contradicting QGRS mapper prediction (Table 13A), the antisense target sequence,
which reduces intron retention, reduced G4 propensity of both upstream and downstream G-runs,
leading to significantly lower fluorescence intensities in longer oligos (Figure 15B). Therefore, by
adding different nucleotide combinations in different lengths, the preferential G4 conformation will
necessary be competing with other conformations, whether canonical or non-canonical.
Such an influence of the nucleotide sequence on different molecular structures in equilibrium is
well established for nucleic acids (316,404,405). This raises the question whether the relative
proportion of one nucleotide in sequences with constant lengths may dictate the transition
between two or more conformations. To address this, the variation of ThT fluorescence intensity
versus the number and percentage of each nucleotide within tested oligos was evaluated by
determination of correspondent Pearson correlation coefficients of Int1+ and Int7+ oligos (Figure
16).
Pearson correlation coefficients (Figure 16B) indicated a global negative correlation between
fluorescence intensity and either the total number or percentage of nucleotides in Int1+ and Int7+
sequences (Figure 16A), in agreement with the decreased fluorescence intensities as oligo length
increases. The anti-sense target sequence is rich in cytosines that can pair with guanines to form a
stable hairpin, hindering G4 formation and leading to the observed fluorescence loss (Figure 15B).
The exception was the positive correlation between the percentage of guanines (which is
dependent on length) and ThT fluorescence, i.e., the total number of guanines is not enough per se
to account for G4 propensity (Figure 16B and C). Not only guanines must be distributed in groups
of 2 or more consecutive nucleotides (G-runs), as their relative amount has a strong impact on
folding. Thereafter, along with the loop size and sequence, a minimum number of guanines in
relation to oligo length seems to determine whether G4 is formed and stable.
A weak positive correlation between the relative amount of thymines in Int1+ oligos and
fluorescence intensity was also observed (Figure 16B and C), which may arise from the fact that
loops with T produce more stable complexes than loops with C and A, respectively (403). Further
studies should be performed to corroborate this hypothesis.
Taken together, the data shows that the antisense target sequence for INS intron 1 retention has a
negative effect on G4 propensity of both upstream and downstream G-runs and corroborate
previous findings (400,403,406) that G4 formation is influenced by nt sequence surrounding G-runs.

Chapter 3
91
Figure 16 – G4 formation dependence upon nucleotide’s number and percentage in Int1+ and Int7+ sequences. (A) Total number and percentage of each nucleotide in the indicated oligos. Except for GT8, all oligos were not predicted as prone to form quadruplex by QGRS Mapper, as shown by the G-score on the right. (B) Correlation between the number / percentage of each nucleotide and ThT fluorescence intensity in Int1 and Int7 derived oligos. (C) Pearson correlation coefficients between each nucleotide versus fluorescence for Int1+ and Int7+ sequences.

Chapter 3
92
3.2.2.3 G4 formation in the presence of monovalent cations and influence of pH on G4
formation
Following data showing G4 formation in INS intron 1 in vitro, the next objective was to address
whether G4 propensity was maintained when solvent conditions changed, to approximate tested
conditions to cellular environment.
Most of the studies on the role of mono- and divalent cations on G4 formation and stability show
that several DNA sequences adopt the same or similar conformation in the presence of different
cations (407,408); however, some oligonucleotides show slight conformational changes in the
presence of different ions (409). In addition, cation binding to G4 complexes is not only dependent
on the sequence itself (due to interactions between available oligos and the relevant cation) but on
the cationic radius as well (410). At the same time, it has been demonstrated for different G-rich
sequences that different cations induced and/or stabilize distinct G4 conformations (411–413).
Some studies have also shown an influence of pH and solvent on G4 formation, structure and
stability (413,414). This reveals the importance of characterizing G4 propensity in the presence of
different cations, solvents and pH.
For this purpose, Int1 and Int7 were first selected to address whether G4 propensity, evaluated
using ThT binding and fluorescence, changes when these oligos are incubated in buffer (lithium
cacodylate - Licac) in comparison to G4 propensity in water. Two more conditions were tested: Licac
supplemented with potassium chloride (KCl) or lithium chloride (LiCl). The pH of all solvents was
adjusted to either 7.2 or 5.8 and both conditions were tested as well (Figure 17).
Two factors dictated the selection of these two oligos: both oligos represent the G-runs flanking
the antisense target reducing INS intron 1 retention, form G4 structures in vitro (Figure 14B and
Figure 15B); and G4 propensity in both oligos was not influenced by the target sequence. In
contrast, the two oligos have different properties: Int7 should not be able to fold into any type of
secondary structure, other than G4 (as shown by secondary predictions in Table 17 in appendix B);
Int1, on the other hand, is able to fold into G4 or form two independent hairpins (Table 17 in
appendix B). The second hairpin of Int1, closer to the antisense target, contains a portion of the
CD3 oligo, which was previously shown to be in equilibrium with G4 (315). The CD4 oligo is a
derivation of CD3 by two C->U mutations that shifts the equilibrium towards G4formation. Hence,
CD3 and CD4 were also included in G4 formation assays in buffer, with or without supplementation
with monovalent cations. Plas24 and dT22 were the positive and negative controls, respectively.

Chapter 3
93
Figure 17 – ThT fluorescence intensity in the presence of DNA G4s formed in water or lithium cacodylate buffer (Licac), at neutral or acidic pH conditions. Mean fluorescence intensity of DNA oligos in water or 50 mM Licac and in buffers supplemented with 5 mM KCl or 95 mM LiCL in the presence of Int1 (A), Int7 (B), CD3 (C), CD4 (D), a positive control (Plas24 - E) and a negative (dT22 - F) control. pH Samples were prepared in duplicate and pH was adjusted to 7.2 (black bars) or 5.8 (gray bars). Error bars denote standard deviations of three independent fluorescence assays. Asterisks denote p-values ≤ 0.05 (*), ≤ 0.01 (**) or ≤ 0.001 (***).
A comparative analysis using One-way ANOVA with the Greenhouse-Geisser correction/Tukey’s
multiple comparisons test show that there are no significant changes in fluorescence intensity of
ThT in the presence of tested oligos (Table 25 and Table 26), i.e., G4 structures formed in water are
the same that are formed in buffer with or without salt supplementation, at either tested pH
condition, for all tested oligos, as shown in Figure 17.
Data showed that global G4 propensity of INS intron 1 DNA derived oligos is not dependent on
tested conditions, which indicates that guanine-guanine interactions leading to non-canonical

Chapter 3
94
secondary structures in vitro are very stable in vitro and able to resist to changes in solvent
conditions and pH (Figure 17).
This contradicts results from a comparative analysis, which indicated that Int7 is more prone to
form G4 in Licac (alone or supplemented) than it is in water at pH 7.2, as shown by significantly
lower fluorescence intensity in water (Figure 17B). Plas24 (Figure 17E), on its turn, displays high
fluorescence in buffer supplemented with lithium chloride in comparison to buffer supplemented
with potassium chloride, at both pH 7.2 and 5.8.
Thus, data in Figure 17 point towards the in vitro formation of very stable DNA G4 structures that
are not easily disrupted by changes in experimental conditions. However, there is the potential for
sequence-dependent minor structural alterations, since each oligo responds differently to solvent
changes; as mentioned above, significant loos of fluorescence intensity may be observed once
potassium is added to one oligo (Int1) (Figure 17A) while no changes were observed for other (Int7)
(Figure 17B). Both Int1 and 7 did not show changes in fluorescence in the presence of either K or Li,
while Plas24 displayed a significant increase in Li, when compared to K (Figure 17E).
3.2.2.4 Conclusions
Using ThT as a fluorescent probe for G4 formation of short synthetic DNA, it was shown that G-runs
flanking the antisense target for INS intron 1 retention are prone to form G4 complexes. The
propensity to form G4 in vitro was influenced by flanking nucleotides and those that extend into
the sequence for promotion of intron 1 splicing, possibly accounting for an equilibrium of structural
transitions between canonical secondary structures and G4.
G4 complexes of DNA oligos derived from INS intron 1 showed high resistance to changes in
experimental conditions, indicating that these structures are very stable in vitro. G4 stability may
correlate with altered mechanisms such as histone modification (415).

Chapter 3
95
3.2.3 G4 formation in INS intron 1 RNA-derived oligos
In a comparative study of DNA and RNA G4 complexes (159) well-characterized sequences that fold
into intramolecular G4 with different thermodynamic stabilities were analysed. The authors
demonstrated that folding of G-rich sequences such as the human telomeric repeat, the Oxytricha
telomeric repeat and the TBA aptamer is dependent on the solvent conditions and whether cations
are present, along with cation-dependent conformational transitions (159). The same study also
showed that RNA G4 assemblies are generally more stable than their DNA counterparts (398,416).
Stability proved to be highly dependent on the sequence and loop size, as shown for other tested
sequences (402,406). RNA G4s are more stable if their loops are shorter, while longer loops stabilize
DNA G4 (159). Joachimi A, et al. (159) theorised that loop size-stability correlation may be due to a
preference of RNAs to fold intro parallel topologies.
3.2.3.1 ThT fluorescence signal of INS-derived DNA and RNA counterparts
DNA G4s have been extensively studied and their structural conformations and properties are well
defined and characterized (161,162,406,417,418). Structural features such as the type of
interactions established (intra- or intermolecular), strand orientation, coordination of mono- and
divalent cations, loop length and sequence, and association with other molecules, and their effect
on G4 formation and stability have been described (157,400,419,420).
As in DNA, RNAs containing G-tracts can fold into G4 under physiological conditions, with
stabilization factors and folding pathways similar to those observed for DNA G4s [372]. Although
the absence of a complementary strand to hybridize with the RNA should increase chances for G4
assembly, the availability of C-tracts capable of hybridization with the G-tracts may interfere with
the formation of four-stranded RNA structures [95].
To evaluate the capacity of RNA G-rich sequences to assemble into G4 structures, and compare ThT
signal to DNA counterparts, their ThT fluorescence was evaluated at the same concentrations and
in the same conditions. ThT fluorescence was consistently higher in the presence of short synthetic
RNAs than their DNA counterparts (Figure 18), at the same concentration.
This could be explained by cooperative folding processes at high oligo concentrations, leading to
more homogeneous populations (Figure 18C), which would reflect increased ThT binding. The same
way, oligos at low concentrations (Figure 18A) may originate highly heterogenous populations
leading to lower ThT fluorescence intensities due to ThT incapacity of binding to these structures.
This would also apply to RNA G4 conformations, which have been determined to be generally more

Chapter 3
96
homogeneous (all-parallel topology) (165,189). Thus, ThT fluorescence in the presence of RNA
oligonucleotides would only be dependent on oligo concentration.
Data in Figure 18 corroborate previous findings, as shown by significant fluorescence intensities of
ThT in the presence of RNA G4 with respect to DNA G4 (Table 27 in appendix B).
Figure 18 – ThT fluorescence intensity enhancement for DNA and RNA G4s. Oligos were analysed at 2 (A), 10 (B) and 20 (C) µM. DNA oligo dT22 and RNA oligo AV3 are shown as the negative controls for both DNA and RNA sequences. Error bars denote the standard deviation from three independent fluorescence assays. Asterisks denote p-values ≤ 0.05 (*) or ≤ 0.01 (**) (p-values for the Tukey’s multiple comparison of the means of three oligo concentrations for each oligo is shown in Table 27 in appendix B).
Previous findings have shown that ThT preferentially binds parallel G4 (155,191) The topology
variety of DNA G4s cannot be selectively and specifically discriminated by ThT since not all
conformations bind this dye, hence the low fluorescence intensities. The all-parallel conformations
of RNA G4s, in the other hand, allow a better discrimination of RNA G4 forming oligonucleotides,
as shown by the inversion of signal intensities of Int1 and Int7 DNA sequences (Figure 15 and Figure
17) to RNA sequences (Figure 18). This is in agreement with the mixture of hairpin/mixed G4 folding
of Int1, which would produce lower fluorescence, in comparison to its RNA counterpart folding into
all-parallel G4 and displaying higher signal. Differences between DNA and RNA Int7 would then
reflect higher affinity of ThT to RNA structures than to DNA.

Chapter 3
97
3.2.3.2 G4 formation screening in INS intron 1 RNA-derived oligos
Having established the preferential binding of ThT to RNA oligos due to their high propensity to
form homogeneous populations of stable G4s, in comparison to DNA counterparts, the analysis of
G4 formation using RNA oligos derived from INS intron 1 target region will provide further insights
into non-canonical conformations folding relevance for intron retention.
For this purpose, a set of synthetic oligoribonucleotides was tested for propensity to fold into G4s
using ThT. As for DNA oligos in Figure 14, RNA oligonucleotides were derived from the intronic G-
rich segment surrounding the antisense target for enhancing splicing (315) (Figure 19A).
The selection of RNA sequences was based on: (1) previous data obtained by CD/NMR for INS
intronic segments within the target sequence, (2) alteration of predicted structures upon mutation
of nucleotides within and upstream of the antisense target segment and (3) the role of these
mutations on IR (315). This selection included oligos Int1 and 7 as references for G4 formation,
showed by fluorescence enhancement of DNA sequences using ThT (Figure 14). Int7 also
corresponds to CD1 segment previously shown by far-UV CD and NMR to fold into parallel G4 (315).
In Figure 19A, CD2 is a 20-mer derived from a region upstream of the antisense target showed by
NMR the formation of stable hairpin structures (315). CD3 encompasses the 3’end of CD2 and the
5’end of the intron retention target (CD5), predicted to establish an equilibrium between two
hairpins and G4 (315). The non-canonical conformation was stabilized by a CC -> UU mutation (oligo
CD4) that demonstrated to reduce intron retention (315). Mut3, Mut5 and Mut6 were designed to
explore how the G4/hairpin equilibrium affects intron splicing. Intron retention levels of their
transcripts showed that elimination of the G4 increased intron retention (315), showing that INS
intron splicing may be controlled by conformational transitions between canonical and non-
canonical structures.
Figure 19B shows that the three intronic segments analysed here have different propensities to fold
into G4 structures. In agreement with previous findings (315) and differential ThT fluorescence
enhancement in the presence of overlapping DNA oligos derived from INS intron 1, G-rich
sequences upstream and downstream of the antisense target are prone to parallel G4 formation.
Int1/CD2 and Int7, display fluorescence enhancements significantly different from negative
controls Av3 and double-stranded (ds) RNA oligo (Figure 19B). Int1 and 7 intensities do not differ,
which indicates that these regions are equally prone to fold into non-canonical conformations. CD2
intensity, however, is significantly lower than both Int1 and 7. This may be explained by previous
data (315) showing that CD2 segment preferentially acquires hairpin conformations in equilibrium.
Hence, fluorescence enhancement in the presence of CD2 demonstrates that it can form parallel
G4 structures, given adequate conditions (Figure 19B).

Chapter 3
98
Figure 19 - Screening for G4 formation in vitro in INS intron 1. (A) Schematics of tested RNA oligoribonucleotides derived from INS intron 1. Location of oligoribonucleotides is represented by horizontal black bars below and above the primary transcript (WT). Mutations (in red) that altered G4/hairpin equilibrium shown by NMR (CD4) and increased/reduced intron retention (Mut3, Mut5 and Mut6) (315). (B) Mean fluorescence intensity of 80 µM ThT at 508 nm in the presence of the indicated oligoribonucleotides. INS intron 1 derived oligos are in black, mutant oligos in red, positive controls in green and negative controls in blue. Error bars denote standard deviation from three independent fluorescence assays. Asterisks denote p-values ≤ 0.01 (**) or ≤ 0.0001 (****) determined using ANOVA, and indicate samples showing fluorescence intensities significantly higher than intensities of negative controls. Oligos were prepared in water, at pH 7.2, and mean fluorescence of ThT alone was removed from all samples. The inset shows fluorescence intensity of CD3 and its mutated versions at a different scale.

Chapter 3
99
Differences found between Int1 and CD2 propensities may point towards an important role for the
Gr1 (Figure 8) located upstream of the CD2 segment. As expected, CD5 oligo (Figure 19B) displays
a very low fluorescence enhancement that is not significantly different from negative controls. CD3
signal is also very low, as shown for DNA derived oligos in Figure 14, in agreement to hairpin/G4
equilibria shown by NMR (315). This equilibrium seems to be shifted towards G4 by a CC -> UU
mutation (315), as displayed by a slight fluorescence enhancement in the presence of CD4, when
compared to CD3 signal (Figure 19B), although this is not statistically significant.
Fluorescence signals obtained for Mut3, Mut5 and Mu6 are not statistically different between each
other (inset in Figure 19B). However, there seems to be a tendency for differential propensity for
G4 formation. Mutations in Mut3 were designed to eliminate both hairpins present in CD3,
maintaining G4; Mut5 retains folding for hairpin but quadruplex is abolished, while all three are
prevented in Mut6 (315). Signal variations obtained for CD3 mutants (inset in Figure 19B)
correspond structure predictions and correlate with IR data (315), which may indicate that
hairpin/G4 equilibrium in this segment plays an important role in INS splicing. However,
fluorescence enhancement of these RNA oligos is significantly lower in relation to signals of Int1,
CD2 and Int7 (Figure 19B). Therefore, further insight regarding the influence of these mutations in
G4 propensity will be discussed in chapter 3.2.3.5.
3.2.3.3 RNA G4 formation in the presence of monovalent cations and influence of pH
RNA oligos Int1 and 7 and CD3, were selected for G4 studies evaluating the influence of ions and
pH (Figure 20). The two oligos target G-rich regions whose deletions led to an increase in IR. Oligos
were treated as described before (Figure 17).
Fluorescence intensity of RNA oligos derived from INS intron 1 in water was generally higher from
that in Licac supplemented with either KCl or LiCl, at both pH 7.2 and 5.8 (Figure 20). The exception
was CD3, whose signal was more intense in Licac supplemented with potassium chloride than in
water (Figure 20C). Fluorescence in water was not significantly different from fluorescence in Licac,
except, once again, for CD3 (Table 28 and Table 29 in appendix B). This could be explained by a
more homogeneous population of parallel G4 that is more stable in Licac than in water.
Decrease in signal intensity, in the light of previous observations that RNA G-tracts form all-parallel
G4 complexes (159), might be due to conformational transitions/disruption of G4 induced by tested
cations, which vary with the type of cation.
Chapter 3
100
In the tested conditions, which were previously described (188,413) for the formation of both
parallel and anti-parallel in several oligonucleotides, lithium chloride has a stronger disruptive
effect upon parallel G4 than potassium in Int1 (Figure 20A) and CD3 (Figure 20C). The effect was
opposite for Int7 (Figure 20B) and Plas24 (Figure 20D) oligonucleotides, although the treatment
with the later oligo did not reach statistical significance (Table 28 and Table 29 in appendix B).
Potassium seems to induce, and probably stabilize, the parallel conformation in CD3 (315), as
shown by fluorescence enhancement in relation to water (Figure 20C).
In summary, significant changes in RFU upon addition of Li or K, or both ions, were observed.
Changes in fluorescence intensity in different solvents points towards the presence of different
conformations in water and in buffers. Propensity to form G4 tended to decrease in the presence
of potassium or lithium. Reducing pH to acidic conditions did not indicate significant changes in
structural conformations of any of tested oligos (Table 30 in appendix B).

Chapter 3
101
Figure 20 - ThT fluorescence intensity in the presence of RNA G4s formed in water or Licac, at neutral or acidic pH conditions. Mean fluorescence intensity representative of RNA G4 folding propensity in water or 50 mM Licac and in buffers supplemented with 5 mM KCl or 95 mM LiCL in the presence of Int1 (A), Int7 (B), CD3 (C), a positive control Plas24 (D) and a negative control AV3 (E). Samples were prepared in duplicate and pH was adjusted to 7.2 (black bars) or 5.8 (gray bars). Error bars denote standard deviations of three independent fluorescence assays. Asterisks denote p-values ≤ 0.05 (*), ≤ 0.01 (**) or ≤ 0.001 (***).

Chapter 3
102
3.2.3.4 G4 formation in the presence of mono- and divalent cations
Data in Figure 20 raised the question whether significant changes in RFU are concentration
dependent and if they also reflect changes in major divalent ions. The same RNA oligonucleotides
were incubated in Licac supplemented with increasing concentrations of potassium (Figure 21) or
magnesium (Figure 22). A full summary of statistical comparative analysis that corroborate results
in Figures 21-23 is presented in Table 31-Table 33 in Appendix B.
Fluorescence intensity decreased as the concentration of both potassium and magnesium
increased, for each tested oligo. Magnesium showed a stronger effect than potassium: much higher
concentrations of potassium are required to disrupt equimolar amounts of the parallel G4
conformation (for 0 ≤ KCl < 100 mM, p-value > 0.05; for 0 ≤ MgCl2 < 1 mM, p-value < 0.05) (Figures
21 and 22).
A significant decrease in signal intensity was observed for magnesium concentrations of 0.3 mM
(Int1), 1 mM (Int7, CD3 and Plas24) (Figure 22), whilst a 10-100 fold in potassium concentrations
was needed to get the same response: 30 mM (Int1), 1 mM (Int7 and Plas24) and 100 mM (CD3)
(Figure 21). These results indicate that concentrations below 10 mM potassium or 0.3 mM
magnesium are favourable for parallel G4 assembly in vitro. Higher ionic concentrations should then
promote anti-parallel or mixed populations or prevent parallel G4 formation altogether.
If RNA G-rich sequences can only adopt all-parallel G4, as previously stated (159,212), these results
suggest that INS intron 1 RNA derived oligos may not establish G-G interactions at in vitro conditions
that mimic physiological ones (100-150 mM of potassium and 0.3-1 mM of magnesium).
Would, then, there be any possibility of G4 formation in the presence of both ions? Is potassium or
magnesium affinity strong enough to reverse the effect of the other ion?
To address this, two concentrations (one low, allowing parallel G4 formation, and the highest
concentration within physiological range, preventing folding) were selected for each cation and
propensity for structural assembly was analysed in the presence of their combinations (Figure 23).

Chapter 3
103
Figure 21 – Influence of KCl concentration on ThT fluorescence probing for RNA G4s. Mean fluorescence intensity of INS intron 1-ThT complexes in the presence of increasing concentrations of KCl (0, 1, 3, 10, 30, 100, 150, 300 and 500 mM). Plas24 and AV3 are the positive and negative, respectively, G4 controls. The first columns show mean fluorescence intensity for G4 in water. Error bars denote the standard deviation from three independent fluorescence assays. Asterisks denote p-values ≤ 0.05 of Welch’s-corrected unpaired t-tests comparing fluorescence intensities in the presence of consecutive cationic concentrations.

Chapter 3
104
Figure 22 – Influence of MgCl2 concentration on ThT fluorescence probing for RNA G4s. Mean fluorescence intensity of INS intron 1 RNA derived oligos-ThT complexes in the presence of increasing concentrations of MgCl2 (0, 0.01, 0.03, 0.1, 0.3, 1, 3 and 10 mM). Plas24 and AV3 are the positive and negative, respectively, G4 controls. Mean fluorescence intensity for G-quadruplex in water only is shown for comparison. Error bars denote the standard deviation from three independent fluorescence assays. Asterisks denote p-values ≤ 0.05 (*) or ≤ 0.01 (**) of Welch’s-corrected unpaired t-tests comparing fluorescence intensities in the presence of consecutive cationic concentrations.

Chapter 3
105
Figure 23 - Influence of combined KCl and MgCl2 concentrations on ThT fluorescence probing for RNA G4s. Mean fluorescence intensity of INS intron 1 RNA derived oligos-ThT complexes in the presence of combinations of KCl (1 and 150 mM) and MgCl2 (0.03 and 1 mM). Plas24 and AV3 are the positive and negative controls for G4 formation. Mean fluorescence intensities for G4 in water and buffer only are shown for comparison. Error bars denote standard deviation from three independent fluorescence assays. Asterisks denote p-values ≤ 0.05 (*), ≤ 0.01 (**) or ≤ 0.001 (***) of Welch’s-corrected unpaired t-tests comparing fluorescence intensities in the presence of low vs. high cationic concentrations or combinations of low and/or high ionic concentrations.

Chapter 3
106
RNA oligonucleotides derived from INS intron 1 were prone to parallel G4 formation in the presence
of low concentrations of either mono- or divalent cation (1 mM or 0.03 mM, respectively) (Figure
23), as previously shown (Figures 21 and 22). G4 formation at low ionic strength was corroborated
by significantly high fluorescence of derived oligos Int1 and 7, CD3 and positive control Plas24, in
comparison to negative control AV3 (Table 33 in appendix B). A significant signal loss in the presence
of physiologically relevant concentrations for both cations was also observed (150 mM or 1 mM)
(Figure 23).
Intron 1 derived oligos in Figure 23 showed, however, lower propensity for G4 formation in the
presence of lower magnesium concentrations than potassium. Addition of 1 mM of potassium to
0.03 mM of magnesium led to signal enhancement, producing a response similar to the one
obtained for 1 mM potassium alone. Therefore, magnesium at 0.03 mM was not sufficient to induce
G4 in the presence of 1 mM potassium. This might indicate replacement of magnesium ions within
the structure for potassium (421) or simultaneous coordination of both cations, which have also
been observed before (422). When at least one of the cations (K+ or Mg2+) was tested in
physiological conditions there was a significant loss of signal intensity of all three intron 1 derived
oligos, independently of the concentration of the second oligo (Mg2+ or K+, respectively).
In summary, data showed that INS intron 1 RNA-derived oligos were not prone for G4 formation at
both K+ and Mg2+ physiological concentrations. Results also indicated that potassium has a stronger
stabilizing effect on G4 formation than magnesium, for which lower concentrations are sufficient
to promote equimolar conformational changes, in comparison to potassium.

Chapter 3
107
3.2.3.5 Real-time G4 formation during in vitro transcription
Transcripts start adopting secondary structure as soon after transcription is initiated and RNA
sequences are long enough to fold, in a process referred to as co-transcriptional folding (423).
Nascent RNA transcripts adopt different canonical or non-canonical structure, such as stem, bulge,
hairpin, loops, pseudoknot and G4, which can rearrange and interact with each other giving rise to
a more complex tertiary structure (424). Adoption of these structures in pre-mRNA is modulated
by the properties of RNA Pol II, such as the speed of elongation, site-specific pausing and co-
transcriptional interactions with the nascent RNA and proteins (423). Therefore, nucleotides in the
5’ region of the nascent RNA transcripts can establish transient canonical or non-canonical
interactions, producing interchangeable structures that can unfold and refold during transcription
(423).
Recently, Tamaki Endoh and co-workers (425) described a technique allowing monitoring of RNA
G4s’ co-transcriptional folding using fluorescent probes such as ThT. Applying the same technique,
fluorescence signals of ThT were monitored throughout in vitro transcription of INS intron 1
templates (Figure 24).
DNA templates were selected from minigene constructs used in our previous IR study (315), where
elimination of putative G4 forming G-runs, along with removal of cytosine runs, led to increased
intron 1 retention. In the same study, removal of one hairpin segment upstream of the antisense
target for INS intron 1 retention, along with the elimination of at least one C4 run within the same
region improved intron 1 splicing (315).
DNA minigenes del5, Mut3, Mut5 and Mut 6 showed different IR levels, in comparison to WT (315).
del5 was constructed by deleting a 13 nt segment containing two C4-runs from the WT intron 1
sequence, keeping putative G4 G-runs, which significantly decreased IR. To create Mut 3, two
hairpin elements upstream of the C4-runs were eliminated and G4 integrity was kept, leading to a
significant decrease in intron 1 retention. For Mut 5, both C4-runs were eliminated with C -> G
mutations, along with the G-run in the position -7, relative to the first C4-run, which promoted a 4-
fold enhancement in intron retention. In Mut 6 both G-run at -7 position and hairpin elements were
altered, remaining the C4-runs unaltered, resulting in IR enhancement (Figure 24A) (315).

Chapter 3
108
Figure 24 – Real-time monitoring of G4 formation during transcription using ThT. (A) Sequences of RNA transcripts for intron retention modulation via G- and C4-runs elimination 1(315). Mutated nucleotides and deleted segment that alter folding propensity and intron retention levels are in yellow; antisense target sequence for increased intron splicing is in green. Mutations were designed to alter predicted G4s, stem loops and cytosines runs in underlined segments. G-scores of each transcript and altered segment. IRs are on the right. (B-G) Fluorescence intensity of ThT measured during transcription (10 800s) and for 900s after DNase addition to stop transcription of minigene sequences in (A). Their G4 formation was confirmed by comparing fluorescence intensities of native sequences (green lines) to transcripts where guanine was replaced by 7-GTP (orange lines) and to no template control (black lines). Sequence of the control (PC) for the transcription reaction, containing three putative G4 structures (predicted by QGRS mapper) is in Figure 33 in appendix A. (H) Pearson R correlation coefficients between three time-points and IR %.

Chapter 3
109
The fluorescence signal of ThT was then measured during transcription of WT, del5, Mut 3, Mut 5
and Mut 6 constructs (Figure 24B), and a 1,380-bp runoff control transcript with three putative G4
forming segments (Figure 33 in appendix A).
To ensure that signal obtained during in vitro transcription was only due to binding of ThT to G4
structures, native structure of nascent transcripts was compared with co-transcriptional folding of
7-deazaguanine (7-GTP)-substituted RNA transcripts. 7-GTP is a guanosine ribonucleotide in which
the N7 was substituted for a C, abolishing the possibility of Hoogsteen base pairing, while still
permitting canonical base pairing. Therefore, by replacing all guanines by 7-GTP in the transcription
reaction, G4 formation is prevented and ThT should not display significant fluorescence
enhancements, although structures like stem-loops or hairpins are still adopted (222,224).
Although a single experiment was carried out with no measures of variability, a significant
enhancement of ThT fluorescence during the three hours of transcription reaction for transcripts
with GTP, compared to negative controls (without template – black lines in Figure 24B-G - and
without reverse transcriptase – used during the assay but not shown) and the same transcripts in
the presence of 7-GTP (Figure 24B) was observed.
ThT detection of non-canonical folding in tested transcripts correlates positively with G- and C-runs
mutations/deletions for intron splicing modulation and negatively with IR levels (Figure 24H), i.e.,
nucleotide sequence alterations that decrease G4 propensity in the order del5 > mut 3 > WT > mut
6 > mut 5, shown to increase intron retention levels in reverse order (Figure 24A), bind ThT and
produce signals as high as propensity increases. Hence, INS intron 1 segment transcribed in vitro
are prone to G4 formation.
3.2.3.6 Visualization of intron 1 transcripts / oligos on polyacrylamide gels
The variety of canonical and non-canonical base pairings leading to the formation of stable
secondary structures of a single sequence results in different conformations that may exist in
equilibrium, some less stable than others. Most RNA oligonucleotides and transcripts analysed for
G4 formation propensity were predicted by RNAstructure to form only one secondary structure
with lowest free energy (Table 18 and Table 19, respectively). This does not exclude, however,
folding into less stable intermediate states that may co-exist in equilibrium with predicted
structures and with non-canonical secondary structures such as G4.

Chapter 3
110
Native polyacrylamide gels can separate structurally different conformations, i.e., two or more
conformations of the same primary sequence, producing molecules of the same molecular weight,
but with distinct mobility (426).
Synthetic RNA oligonucleotides and T7 transcripts were loaded onto a native polyacrylamide gel to
visualize each putative sub-population (Figure 25).
Figure 25 – Visualization of different native conformations in INS intron 1 RNA transcripts and RNA derived oligos. Purified transcripts used for the real-time analysis of G4 formation during in vitro transcription and INS-derived RNA oligonucleotides (315) were loaded together with controls onto a native 6% polyacrylamide gel, stained with Gelred and visualized on a UV transilluminator. Transcripts and oligos were prepared in RNase-free water, which was loaded as a negative control (NC).
Longer RNA transcripts have a higher number of possible canonical Watson-Crick and non-canonical
intramolecular interactions, with more possibilities for tertiary conformation interactions. This is
consistent with five INS intron 1 transcripts, which showed two major bands that are likely to
correspond to distinct conformations. Further slow migrating bands suggest the existence of
heterogeneous populations, with the two conformations dominating RNA space (Figure 25).
Mut 3 and Mut 6 transcripts showed a higher proportion of the high molecular weight species in
comparison to WT, whereas del5 displayed a lower proportion (Figure 25). These bands may
represent different conformants with distinct free energies and secondary structures, as predicted

Chapter 3
111
(Table 19). An increased fraction of high-mobility fraction of del5 could be related to a sharp decline
of IR compared to the WT sequence, and/or, with a rapid accumulation of ThT fluorescents,
indicative of G4 formation in vitro (Figure 25). In contrast, Mut 5 and Mut 6 variants led to an
increase in IR (315). It is tempting to speculate that the two lower bands could reflect an equilibrium
between two different conformations that regulate the efficiency of intron removal.
A subset of INS intron 1 RNA derived oligos showed two bands (exemplified by Int1 in Figure 25).
This oligo showed the equilibrium between a hairpin structure and G4 in vitro, while Int7 mainly
folded into parallel G4 (Table 18 in appendix B), as determined by CD (315). On the other hand,
oligo CD3 displayed only one band, reflecting the presence of only one conformation (Figure 25),
which most likely corresponds to the hairpin conformation showed by NMR (315), in agreement
with low ThT fluorescence intensities observed in Figure 21Figure 23.
In order to get a better understanding of structural conformants population of tested
ribonucleotides, further analysis should be performed. Visualization of both INS transcripts and
synthetic oligoribonucleotides (Figure 25) on a gel under denaturing conditions would provide
additional insights towards the number of molecular species present, along with a more accurate
estimation of their molecular weight. This would enable discrimination between different
conformations adopted by the same RNA sequence that would show different migrating patterns
under native conditions but run together in denaturing conditions, due to the lack of
secondary/tertiary structures.
A denaturing gel would also allow to eliminate the presence of transcripts longer/shorter than
expected. Staining the gel with G4 specific dyes, such as ThT, would permit determination on-site
of whether G4 structures were formed and maintained on the gel, improving discrimination of
molecular species population. Comparison of RNA migrating pattern under native and denaturing
conditions would abolish any doubts arising from the fact that major bands in Figure 25 largely run
at their size, suggesting that there may not be extensive intramolecular G4s under these conditions.
3.2.3.7 Conclusions
ThT fluorescence intensity was much higher in the presence of INS RNA oligos than in the presence
of correspondent DNA sequences. This increase was concentration independent.
INS intron 1 RNA derived oligonucleotides showed more propensity for G4 formation in vitro in
water than in tested buffers, except for oligo CD3 that showed the opposite. Reducing pH to acidic
condition did not induce significant conformational changes in tested RNAs. However, RNA G4s

Chapter 3
112
were shown to be highly susceptible to variations in cationic concentration. Conformational
changes were induced by increasing concentrations of both potassium and/or magnesium, as
shown by a decrease in fluorescence intensities in these conditions. It was also observed that higher
concentrations of potassium than magnesium are required to produce similar conformational
transitions.
The follow-up of ThT fluorescence during in vitro transcription indicated that G4 structures can be
adopted while RNAs are synthesized, with putative differences between intron 1-derived
transcription templates, potentially contributing to their distinct splicing outcome.
INS intron 1 RNA-derived oligo Int1 showed two bands that correlate with the equilibrium between
hairpin and G4 structures and Int7 displayed a major high-mobility band that could reflect the high
G4 propensity. The single band obtained for CD3 shows a single conformation, most likely hairpin,
in agreement with the low ThT fluorescence displayed by this oligonucleotide.

113
Chapter 4: Identification of INS intron1-binding proteins

114

Chapter 4
115
4.1 Identification and characterization of proteins binding to INS intron
1 antisense target region
Splicing is a complex process that can occur both co- or post-transcriptionally (105) and requires
binding of many proteins to RNA to accurately remove introns from pre-mRNA. These auxiliary
proteins interact with different cis-regulatory RNA elements and modulate splicing by either
enhancing or inhibiting it (427).
4.1.1 Pull-down using INS intron 1 transcripts containing the antisense target and flanking
G-runs
To gain insight into interactions between trans-acting factors and this intronic region (intron 1
nucleotides 36–61 and 78–93) (315) (Figure 26A) pull-down assay was carried out as a screening
method for the identification of unknown molecular interactions (Figure 26B) (428). In this assay,
HeLa nuclear extracts were incubated with RNA transcripts containing the antisense target region
and after washing unbound HeLa proteins, RNA transcripts were loaded onto a gel and specific RNA-
binding proteins were identified.
The majority of the splicing factors known to date have molecular weights comprised between 35
and 70 kDa. Pull-down assays were performed using a wild-type (WT) transcript of a portion of INS
intron1 containing the antisense target for intron retention reduction and a second transcript from
which the two C4-runs were deleted. Pull-down assays showed that either in the presence or
absence of the antisense oligo IAO21 that promotes intron removal, the molecular weight of
proteins that specifically bind to this intronic segment fall within the 35-70 kDa range, as shown by
different band intensities marked with the pink rectangle in Figure 26B. The majority of the splicing
factors known to date have molecular weights comprised between the referred range.
hnRNP F and H splicing factors have previously been shown to have an important role in INS pre-
mRNA splicing. hnRNP F/H-depleted cells showed increased levels of intron retention when
compared to non-depleted or overexpressing cells (100). Due to the highly G-rich nature of INS
intron1 tested transcripts, the presence of these two proteins in the RNA pull-down assays was
analysed by western blotting using hnRNP F/H specific antibodies. Specific antibodies against
hnRNP E and the serine/arginine-rich splicing factor 2 (sc35) were also used to evaluate their
binding to this intronic region. hnRNP E binds preferentially to poly(rC) regions (429) and sc35
interacts with purine-rich sequences (430,431).

Chapter 4
116
Data showed that hnRNP F and hnRNP H1 specifically bound INS intron 1 transcripts, (Figure 26B
and C). MS/MS analysis of excised gel fragments (pink box in Figure 26B) showed four proteins to
specifically bind to either WT or del5 transcripts, as compared to beads and AV3 controls: hnRNP F,
hnRNP H1 and H2, and SRSF6 (Table 34Table 36 in appendix B), corroborating western blot data.
Figure 26 - Identification of proteins that interact with INS intron 1. (A) Sequences of WT transcript containing the antisense target region, del 5 and IAO21.Construct del 5 (315) lacks a large portion of this target region. (B) SDS-PAGE analysis of the pull-down assay. Pink box indicates the gel section analysed by mass spectrometry; (C) Western Blot analysis of the pull-down assay with antibodies against common splicing factors, indicated to the left. Pink boxes highlight hnRNP F and H1 proteins, identified by correspondent antibodies.

Chapter 4
117
hnRNP E and sc35 were not detected by western blotting neither MS/MS analysis. SRSF6 was not
tested by western blot since this splicing factor has been mainly associated with alternative splicing
of exons of MAPT/Tau and TNC pre-mRNAs (432–434). MS/MS data are shown in Tables 34-36 in
appendix B.
hnRNP F and hnRNP H1 belong to the most abundant RNA-binding protein families (44). Although
their binding specificities have been studied (17,49,53,55,56,435), exact structural correlates of
their target regions are still poorly understood. These interactions may be exploited in the future
in inviduals predisposed to T1DM.
To identify domains that specifically bind to INS intron 1, each RNA recognition motif (RRM) domain
(Figure 34 in appendix A) from both hnRNP F and hnRNP H1 was separately cloned into the bacterial
expression vector pET28a, which was followed by expression in BL21 and Rosetta bacterial strains,
respectively, and product purification (Figure 27). Purified proteins will be further used in RNA-
protein binding assays using ThT fluorescence changes in the presence of pre-formed G4s incubated
with proteins to evaluate interactions.
4.1.2 Cloning, expression and purification of full-length hnNRP F/H1 and their individual
RRM domains
Constructs carrying sequences that encode full-length hnRNPs F and H1 and individual RRMs were
cloned as fusion proteins with an N-terminal His-tag and Tobacco Etch Virus endopeptidase (TEV)
cleavage site (Figure 27A). TEV cleavage nucleotide sequence was introduced within the construct
backbone to allow clean and direct ellution of recombinant proteins bound to the beads by
protease cleavage.

Chapter 4
118
Figure 27 - Cloning of hnRNP RRM constructs. (A) Schematic representation of hnRNP F and hnRNP H1 domain organization. Each protein is composed of three RRMs and a putative zinc-finger domain (ZnF). Number of aminoacids in each domain is indicated below; total number of aminoacids in each protein and the expected molecular weights of expressed recombinant proteins are to the right. (B) Diagram illustration of recombinant His-tagged RRM domains cloning into BamH I/Hind III (hnRNP F RRMs) or BamH I/Xho I (hnRNP H1 RRMs) pET28a cloning sites. The TEV protease cleavage site was introduced between His-tag and each domain to facilitate protein purification.
To confirm the accuracy of the inserts, the pET28a cloned vector was sequenced with vector specific
forward and reverse primers (Table 5). Sanger sequencing was carried out by Source BioScience
(Nottingham, United Kingdom) and the accuracy was verified. Mutation-free sequences were
aligned to nucleotide sequences from Ensembl (hnRNP F: ENSG00000169813; hnRNP H1:
ENSG00000169045). Nucleotide sequences are shown in Figure 35 in appendix A.

Chapter 4
119
Recombinant proteins were first expressed in Escherichia coli BL21 (DE3). Full-length proteins
showed a very low yield in this strain in comparison to RRM domains, hence their constructs were
transformed into RosettaTM 2, a host strain derived from BL21 that contains codons rarely used in
E. coli facilitating expression of eukaryotic proteins.
Recombinant protein expression was induced with IPTG for 2 hours at 37°C, as shown by separation
of whole cell lysates on 15% SDS-PAGE (Figure 28). All proteins were found in the soluble fraction,
although RRM 1 to a lesser extent than RRM 2 or RRM 3 of both proteins. Nevertheless, a native
His-tagged protein purification could be performed for all proteins.
Figure 28 – Expression of recombinant hnRNP F, H1 and RRM constructs. Expression of hnRNP F and H1 constructs in Rosetta and correspondent RRMs in BL21 (DE3). Whole cellular lysate before (-) and after (+) a two (and/or three)-hour-IPTG-induced expression; hnRNP F and H1 expression was analysed 2 and 3h after induction with IPTG; expression of RRMs was analysed 2h after induction. Protein marker on the left. Bands corresponding to expressed recombinant proteins are indicated by red boxes.
The first attempt was the elution of the recombinant proteins, bound to nickel beads through the
His-tag, using a TEV protease, which cleaves the aminoacid sequence Glu-Asn-Leu-Tyr-Phe-Gln-Gly
between underlined residues. Therefore, eluted proteins would only have an extra residue that
would not alter their native structures. However, eluants recovered after TEV cleavage did not
contain RRM domains or full-length proteins. Furthermore, analysis of the beads after elution
revealed that recombinant proteins remained bound to these at any tested conditions, most likely
due to conformational constraints for TEV access.
Purification of recombinant proteins (Figure 29A) was then performed by washing the nickel beads
with increasing amounts of free imidazole, which competes with histidine imidazole ring, in order
to remove unspecifically bound proteins to the beads, before recombinant hnRNP elution. Firstly,

Chapter 4
120
three imidazole concentrations were used, 50 (two steps), 100 (three steps) and 250 mM (three
steps). Full-length proteins and RRM domains were eluted from beads with 250 mM of free
imidazole. However, many unspecifically bound proteins were co-eluted with recombinant hnRNP
proteins and domains, showing that more washing steps were required. Therefore, on a second
purification round, beads were washed twice, four times and three times with 50, 100 and 150 mM
of free imidazole, respectively, before eluting recombinant proteins with 250 mM imidazole.
Although purity yields increased, a great amount of recombinant proteins was lost in the third set
of washes, which led to the conclusion that not only more washing steps were needed but that a
fourth imidazole concentration would have to fit within the 50-100 mM range.
After several different combinations of increasing imidazole concentrations for the washing of
bead-bound proteins, the one that produced higher recovery yields of recombinant proteins was
as follows (described in methods section) (Figure 29A):
- Four washes with buffer supplemented with 20 mM of imidazole;
- Six times with buffer supplemented with 50 mM imidazole;
- Twice with buffer supplemented with 75 mM of imidazole;
- Twice with buffer supplemented with 100 mM of imidazole;
- Twice with buffer supplemented with 250 mM of elution buffer.
SDS-PAGE analysis showed that all recombinant proteins were successfully isolated with a high level
of purity (red squares in Figure 29A). hnRNP F showed higher purity yields in fractions
corresponding to wells 12-15, than hNRNP H1 in wells 16-20. Purity levels for each recombinant
protein was cofirmed by Western blotting using anti-His tag and/or protein-specific antibodies
(Figure 29B).

Chapter 4
121
Figure 29 - Purification of recombinant hnRNP F, H1 and RRM constructs. (A) Analysis of purification process progression by separation of purification steps aliquots of each construct. (B) Western Blot analysis of the purified proteins with antibodies against His-tag or protein-specific antibodies.

Chapter 4
122
4.1.2.1 Conclusions
hnRNPs F and H are well-characterized trans-acting factors that bind to G-rich intronic sequences;
both proteins were identified by pull-down as INS intron 1-specific interacting proteins (Figure 26B
and C).
All recombinant proteins were successfully isolated with a high level of purity (Figure 29A and B).
Binding of recombinant proteins could be shown through changes in ThT fluorescence intensity, as
Dan Zhao and co-workers demonstrated for thrombin aptamer (TBA) (191), which would reflect
protein binding to either G4 structures or single-stranded G-tracts.
To further explore interaction between this intronic segment with hnRNPs F and H and elucidate its
role in INS spicing, techniques like CD and NMR in tested conditions should be used as to address
G4 formation in RNA:protein complexes and electrophoretic mobility shift assay (EMSA) to address
binding affinities. Characterization of protein binding in vitro should also be analysed using different
RNA:protein ratios and in the presence of both hnRNPs and combining RRMs (several proteins, such
as spliceosome proteins, require protein:protein interactions to function (436–440); these
techniques would also elucidate whether hnRNPs F and H1 require other interactions or are able to
bind to RNA via recognition of its sequence per se.

123
Chapter 5: Coupled INS 5’UTRs splicing and translation
efficiency in higher primates

124

Chapter 5
125
5.1 Translation efficiency of human and primate INS 5’UTRs
Comparative studies between species are very useful for our understanding of how evolutionary
DNA sequence divergence influences susceptibility to diseases (441).
The 5’UTR of the INS gene (Figure 30B) had previously been sequenced in multiple primate species
(100). This study showed that all intron 1 G-triplets were absolutely conserved in Great Apes and
Old World Monkeys, which points towards their functional importance. The data also demonstrated
a weakening of the 3’ss of intron 1 and associated increase in intron 1 retention in Homininae,
which was accompanied by the acquisition of a uORF (Figure 30A) (100). This new uORF codes for
a 3-amino acid peptide and diminishes translation, providing efficient means of regulating
preproinsulin production in higher primates, possibly in response to their increasing reliance on
carbohydrates in their diet, such as grain and honey (100,315).
5.1.1 Cloning
To study the role of additional uORFs in translation, the WT 5’UTRs of five primate species (Homo
sapiens, Pongo pygmeus, Macaca fuscata, Colobus angolensis and Semnopithecus entellus) were
cloned into the Firefly Luciferase expression vector. In addition, an a->g mutation, which inactivates
the 3’ splice site of intron 1 was introduced in some constructs to address the role of intron 1
splicing in translation efficiency (Figure 36 in appendix A).
Cloning involved PCR amplification of intended inserts, their purification, restriction digests and
subcloning into vector pICtest2 (pIC) (Figure 30B). Sanger sequencing of resulting plasmids
confirmed the presence of desired mutations and absence of PCR-introduced errors and that
constructs were in frame with the Firefly Luciferase coding sequence (Figure 36 in appendix A).
5.1.2 Transfection efficiency
Preliminary transient transfections with these constructs, in a monocistronic vector, into HeLa cells
confirmed that they were capable of expressing RNA products of predicted sizes and that the
mutation prevented correct splicing of intron 1.

Chapter 5
126
Figure 30 - Luciferase expression system used in the study of the role of additional uORFs in translation efficiency of five primate species. (A) Schematic representation of uORFs in primates. With the exception of Pongo pygmeus (PP), retention of intron 1 leads to the acquisition of an in frame uORF; Homo sapiens (Hs) uORF, however is located downstream to the one in Old World Monkeys, Macaca fuscata (PM), Colobus angolensis (PC) and Semnopithecus entellus (PS) (adapted from reference (100)). (B) Luciferase assay procedure and chemical reactions used for the analysis of intron retention influence upon translation. Lysis of mammalian cells transfected with pGLpest.Seq or pICtest2 releases Firefly luciferase, which translation will be regulated by UTR constructs. Expression of Renilla luciferase allows determination of transfection efficiency.
To avoid co-transfection of separate reporter plasmids, a dual-luciferase, pIC, vector was used (442),
where the luciferase Renilla reniformis (Rluc) acts as an internal control and is constitutively

Chapter 5
127
translated from an AUG in the optimal Kozak consensus GCCACCAUGG (start codon is underlined).
INS 5’UTRs were inserted in between Simian virus 40 (SV40) promoter and luciferase from the firefly
(Photinus pyralis; Fluc), which allowed study of the translation efficiency of this protein (Figure 30C).
Figure 31 – Transfection efficiencies of human and primates INS 5’UTRs. (A) Schematic representation of human and primates INS 5’UTR constructs in pICtest2 bicistronic vector. Exons 1 and 2 are shown as black and white boxes, respectively. Lines denote intron 1. uORFs are shown as dashed boxes. (B) Evaluation of WT and mutated 3’ss translation efficiency of INS 5’UTR from human, Pongo pygmeus and Old World Monkeys Macaca fuscata, Colobus angolensis and Semnopithecus entellus. Fourty-eight hours after transfection into HeLa cells, the activities of the two luciferases were measured. FLuc values were normalized to those for Rluc. Error bars denote standard deviation from four independent chemiluminescence assays in HeLa cells. Horizontal bars denote comparison of human vs. primate WT constructs (black), human vs. primate mutated 3’ss constructs (gray), intron-containing vs. exon-only human constructs (dashed) and WT vs. mutated uORF/3’ss in Hominidae (arrowed). Asterisks denote p-values ≤ 0.05 (*), ≤ 0.01 (**), ≤ 0.001 (***) or ≤ 0.0001 (****). (C) Splicing pattern of primates’ INS 5’UTR constructs. Spliced- or retained-intron RNA isoforms, are indicated to the right. Amplification was with primers pICf and Lucr (Table 10 in materials and reagents).
The ratio between Firefly luciferase and Renilla luciferase chemiluminescence reflects variability in
5’UTR-dependent luciferase translation.

Chapter 5
128
Insertion of INS 5’UTRs in pIC bicistronic vector had an inhibitory effect on luciferase expression in
HeLa cells as compared to empty pIC, as shown by a significant decrease in Firefly luciferase
chemiluminescence in constructs including INS intron 1 (Hs6 to PS 3’ss) (Figure 31A). A slight non-
significant decrease of human construct containing only exon 1 and a portion of exon 2 (Hs4) in
relation to pIC was observed, but a significantly higher intensity (ratio), when compared to
remaining human constructs (Table 37 in appendix B), suggests that removal of intron 1 is essential
for high-level translation levels of luciferase in HeLa cells (Figure 31A). Lower signal intensities
therefore indicate low levels of intron splicing. INS intron 1 has a weak 3’ss (100), thus high levels
of unspliced RNA products were expected, as observed in Figure 31B.
The increased intensity of Hs6 ATG 3’ss in comparison to Hs6 (Figure 31B) may be due to the
elimination of the uORF in intron 1 that leads to the production of a 3-aa peptide if intron 1 is
retained. Hence, in this construct, even if levels of RNA spliced products are not higher than in Hs6,
the canonical start codon in exon 2 may still be used and luciferase is normally translated. However,
levels of spliced products in Hs6 ATG 3’ss showed to be slightly higher than in Hs6 (Figure 31C), in
agreement with previous findings (100) that showed high levels of mRNA proinsulin secretion in
reports lacking the short uORF.
Hs6 3’ss construct was designed with the purpose of increasing intron retention levels, in relation
to Hs6 construct, by mutation of the A->G mutation in the 3’ss (Figure 36 in appendix A). Expectedly,
this would lead to enhanced use of the uORF within intron 1, which would render decreased
luciferase expression levels. However, the opposite was observed, and luciferase activity tends to
be lower expression for the WT construct (Hs6) (Figure 31B). Luciferase expression levels were
corroborated by the apparent presence of high levels of spliced products of the Hs6 3’ss construct
than of Hs6 (Figure 31C).
Quantification of reporter mRNA levels in transfected cells would elucidate on the correlation
between differences in luciferase expression and splicing levels. In particular, it would be possible
to ascertain if lower translation is due to mRNA degradation. This would help addressing the
question on whether increased IR, caused by disruption of the 3’ss, could lead to a concentration
of mRNA degradation machinery around intron-retained transcripts, leaving room for more
translational cycles of normally spliced transcripts. The odd phenomenon that splicing appears to
be enhanced when the 3’ss is mutated would, thus, simply reflect levels of transcripts with longer
life-times than the Hs6 ones.
Luciferase translations in remaining WT primates showed as significantly higher than human WT in
a multiple comparative analysis, which most likely correlates with an evolutionary relaxation of
intron 1 3’ss in human INS (100).

Chapter 5
129
Comparative analysis using unpaired t tests did not show significant changes in luciferase
translation with the elimination of intron 1 3’ss with relation to WT 5’UTRs in either Pongo pygmeus
(PP) or any of the Old World Monkeys (PM, PC and PS) (Table 37 in appendix B). However, the data
indicates a slight tendency for increased translation for PM and PS 5’UTRs (Figure 31A), which might
correlate with lower levels of spliced products in mutated 5’UTRs (Figure 31B) and activation of the
in frame uORF (Figure 30A). The absence of an uORF in Pongo pygmeus (PP) would, thus, be
associated with the slight but not significant decrease in luciferase levels in this species.
Nevertheless, this does not explain the increased levels of spliced products in PP 3’ss (Figure 31B).
Alternatively, translation levels higher than expected may arise from the use of in frame non-
canonical initiation codons.
IR in 5’ UTRs often leads to the introduction of upstream start codons (99). The most efficiently
used are the ATG start codons, however, translation may also start at alternative start codons, such
as ACG, CTG, ATC, ATT, ATA, GTG, TTG, AAG OR AGG (317,443). In a recent study (317), translation
initiation from non-canonical ATG codons was demonstrated to occur in 42 human genes, resulting
in N-terminal extensions of the encoded proteins. The use of different codons in 5’UTRs may
indicate an alternative regulation of translation initiation (317). In the INS gene, the increased
retention of intron 1 in individuals carrying the A allele at rs689 as compared to T allele leads to a
higher fraction of transcripts with the canonical initiation codon, which is out-of-frame and curtails
preproinsulin translation (100).
Figure 37 in appendix B shows a distribution of strong and weak non-canonical start codons that
are in or out of frame relative to the main INS open reading frame. INS 5’UTR has 40 potential non-
canonical initiation codons, from which 16 are in frame with the main ATG initiation codon. Twelve
out of the sixteen in frame codons have a good Kozak context and four are in a poor Kozak context.
From the 24 in a different reading frame, 17 are in a good Kozak context and 7 in a poor. Statistical
analysis between the frequency of non-ATG initiation codons grouped according to their predicted
translation efficiency (443), and correspondent reading frame (relative to the main open reading
frame initiated by ATG), indicated that codon distribution was not associated with any particular
reading frame (p value = 0.1965) (Figure 37 in appendix A). These results may indicate that usage
of alternative start codons in 5’UTRs may depend upon their translation efficiency and surrounding
context, playing an important role in regulation of translation. Alterations to the Kozak context
and/or elimination of alternative start codons in transcripts with retained introns may elucidate the
role of upstream open reading frames in disease.

Chapter 5
130
5.1.3 Conclusions
Translation of firefly luciferase is more efficient in constructs that do not contain human INS intron
1 sequence, in comparison to remaining human constructs. This suggests that removal of intron 1
is essential for high-level luciferase translation in HeLa cells. Removal of the uORF in human intron1-
retained transcripts (Hs-6 ATG 3’ss) increased luciferase expression levels in relation to WT
transcripts (Hs-6), showing the importance of the uORF for regulation of intron-retained transcripts
translation. Mutation of intronic 3’ss did not significantly change luciferase expression in any of
tested primates, in comparison to WT constructs.
These results highlight the important role of coupled splicing and translation regulation via
untranslated regions in INS expression and most likely, susceptibility to T1DM.

131
Chapter 6: General discussion

132
Chapter 6
133
The adoption of diverse secondary structural motifs is known to contribute to the regulation of RNA
processing (108,444–446). Studies in this thesis provide information about the propensity of INS
intron 1 segments to adopt noncanonical secondary G4 structures in vitro, pointing to potential role
in in vivo regulation of INS expression.
The broader aim of this study was to understand the molecular determinants leading to increased
INS intron 1 retention levels in individuals susceptible to T1DM. These individuals possess an
adenine variant in intron 1 that disrupts the Py-tract, which is an essential element for accurate
recognition of 3’ss (Figure 1 and Figure 2) (100). This allele further increases retention of an already
weak intron in mature transcripts, extends the 5’UTR and decreases preproinsulin levels, as a result
of introducing translation inhibitory motifs (Figure 7) and reducing the stimulating effect of splicing
on translation (100,315).
Understanding of the processes involved in RNA processing is still in its early stages. RNA structure
is very important for an efficient splicing (108,446); therefore, its characterisation is essential to
understand RNA processing.
Our previous study (315) showed that the antisense target for reducing INS intron 1 retention is
flanked by two G-rich regions predicted to fold into G4. It was shown, using circular dichroism
analysis, that the downstream region, represented by oligo Int7 in this study, is capable of forming
a parallel G4 (Figure 8) (315).
Using ThT, a specific fluorescent dye for G4 (188), the capacity of a set of intron 1-derived DNA and
RNA oligonucleotides to fold into this structure was evaluated (Chapter 3). ThT efficiency for G4
detection was first confirmed via its fluorescent enhancement in the presence of oligos that were
previously shown to fold into this structure (Figure 9). This corroborated previous findings
(187,189,447) that ThT can be used as a sensor for G4-forming sequences. ThT is a sensitive
fluorogenic dye that can reveal formation of stable G4s (Figure 10) in a concentration dependent
manner (Figure 11) (187).
G4s are highly polymorphic, adopting all-parallel, all-anti-parallel or mixed conformations, which
was reflected by different fluorescence intensities in the presence of either conformation, with all-
parallel displaying higher intensities than remaining conformations (187,191,389,392).
Experimental conditions such as buffer composition and pH have been shown to determine G4
conformation propensity, even leading to transitions between conformations (448–451) (392). This
was confirmed for both INS intron 1 DNA- and RNA-derived oligonucleotides (Figure 17 and Figure

Chapter 6
134
20 - Chapter 3). Higher fluorescence signals in the presence of RNA oligos indicated a higher
sensitivity to all-parallel conformations (Figure 18), corroborating previous findings (392).
Folding into G4 was shown to be susceptible to ionic strength, as demonstrated by the loss of ThT
signal with increasing potassium and magnesium concentrations (Figure 21-Figure 23), indicating
that these structures can be modulated in vitro by altering experimental conditions. Furthermore,
the tested set of INS intron 1 DNA- and RNA-derived oligos displayed distinct signals, proving a
differential and discriminatory G4 stabilization and detection capacity (Chapter 3) (188,189).
ThT assays do not guarantee the homogeneity of the population in solution. It is likely that most
sequences have assembled into G4 structures, but, these are, presumably, in equilibrium with other
secondary structures. In agreement with this, fluorescence correlated weakly with the QGRS
mapper predictions (Figure 14). However, ThT was not able to recognize some predicted structures
(Int 2 and 3; GT8 and GA8 ), which may be explained by its specificity to the parallel G4 conformation
or incorrect predictions (191).
Quadruplex forming G-rich Sequences (QGRS) mapper scores are only predictive indicators of the
occurrence of putative G4s (376) and do not give absolute certainty on G4 propensity of analysed
sequences. The software generates information based on composition and distribution of those
putative QGRS in single nucleotide sequences. It does not consider the sequences in between the
G-runs that constitute loops in G4s and have an important role in the stability of the structure
(402,403). On the other hand, the software evaluates the presence of putative G-runs that can
establish intramolecular interactions, regardless the possible formation of intermolecular bonds.
Hence, no conclusion can be inferred for potential intermolecular G4s.
G-scores may thus be used as G4 formation indicators but folding needs to be further demonstrated
by in vitro or in vivo assays.
ThT fluorescence could respond to structural transitions to other G4 conformations or to canonical
secondary structures. Adoption of structures other than parallel G4 would explain signal intensities
of tested oligos with a null G-score, such as Int5/6 and GA12 (Figure 14 and Table 17 in appendix B),
and confirm data in Figure 25, suggesting the existence of different conformations in equilibrium
for the same sequence, in agreement with both RNAstructure and QGRS predictions (Table 17-
Figure 22). Nevertheless, further work would be needed to confirm structural properties of each
species and to determine which is the predominant structure in equilibrium.

Chapter 6
135
It has also been demonstrated that RNA containing G-tracts can assemble into G4 conformations in
vivo, which has been shown for mammalian telomeric transcripts containing 5’-UUAGGG-3’ repeats
(212). These results suggest that G4 formation in INS-derived primary transcripts could have a
physiological function. In addition, the detection of G4s under conditions that intend to mimic
transcription in cells is very promising for exploiting modulation of these structures in cells and
ascertain their role in preproinsulin pre-mRNA processing.
Real-time monitoring of G4s during transcription further corroborate and validate data obtained
with synthetic RNA oligos in water, showing that the ThT assay used in this project can be used to
address G4 formation for other RNAs and explore their role in splicing-mediated diseasea
development.
For example, G4 structures in G-rich segments flanking the antisense target sequence may be
important for efficient splicing. This should be addressed in future studies since these noncanonical
structures could provide efficient means to correct the minor splicing defects object in T1DM
predisposed individuals carrying the A allele at rs689 SNP.
These results validate the ThT assay as a screening method for evaluating G-rich DNA or RNA
sequences (Chapter 3) to fold into the non-canonical G4 structures. However, it only shows the
capacity to inform about parallel G4 conformations. Hence, to ascertain that the decrease in ThT
fluorescence intensities is due to loss of G4 structures, which may or may not be accompanied of
folding into canonical structures, structural properties should be corroborated using, whenever
possible and appropriate, complementary assays. These might include preparation of the same
DNA and RNA oligos or RNA in vitro transcripts to be analysed by circular dichroism and/or NMR.
These may also include similar fluorescence assays using probes specifically recognizing anti-
parallel G4, such as N-Methyl mesoporphyrin IX (NMM).
Pull-down assays (Chapter 4) showed that RNA constructs derived from the region targeted to
promote INS intron 1 splicing (315) specifically bind hnRNP F and H1 (Figure 26). Both hnRNP F and
hnRNP H1 recognize and bind to G-rich regions, which are able to fold into G4 in vitro (154).
However, it is not clear yet if they bind to canonical structures or to the non-canonical G4s. Further
studies are necessary to understand the role of G4 formation in binding of hnRNPs to INS intron 1
and promotion of its removal (100).
In summary of chapters 3 and 4, folding of nascent RNAs is transient, limited to 50nt downstream
of the transcribing polymerase and subject to changes upon interaction of RNA with splicing factors.
However, G4 structures may generally assemble from sequences with 18 nt (Figure 6A), which

Chapter 6
136
indicates that pre-mRNAs may adopt this non-canonical secondary structure during transcription in
vivo, as shown in the real-time monitoring of G4 formation in Figure 24. It is also tempting to
speculate that G4 formation here shown by G-rich segments of INS intron 1 indicate that INS pre-
mRNA folding into G4 may occur in vivo and modulate splicing efficiency. Demonstration of G4
assembly in vivo is yet difficult, due to rapid equilibrium transitions between secondary structures
and binding of trans-acting factors that may mask RNA structures or promote their
folding/unfolding. Nevertheless, G4s have already been shown to modulate splicing through its
interaction with hnNRP F promoting alternative splicing and production of the epithelial-specific
CD44v isoform. Interaction of hnNRPs F and H1 with INS intronic segment comprising the antisense
target flanked by G4-forming regions (Figure 14 and Figure 19), revealed by pulldown assays also
point towards a role of this structure on INS pre-mRNA splicing via its interaction with these
proteins. In agreement with this, our previous study showed that overexpression of either protein
led to increased splicing efficiency, while protein depleted increased intron retention levels.
Further studies on the characterization of G-runs folding into G4s in INS intron 1 and their role in IR
should be performed. Using CD and NMR, the presence of G4 structures detected by ThT could be
confirmed, and characterization of G4 conformations in these assemblies addressed. Using RNA
polymerase pausing assays and transcription assays in the presence of G4 Resolvase1 (452,453), G4
formation could also be explored via evaluation of transcription efficiency, in WT and G4-abolished
constructs.
Additionally, using ThT to detect G4 structures in G-rich intronic sequences comprising the
antisense target, in the presence of our splicing stimulating oligos (315), would help addressing if
these ribonucleotides promote G4 formation. This data would directly correlate G4 formation with
splicing promotion/inhibition. Combination with mutated G-rich sequences and/or mutated target
region, in the presence of the same antisense oligoribonucleotides, would also provide a better
insight into the influence each region has over the folding of the remaining segments.
Studies on the characterization of the interaction of hnRNP F, hnRNP H1 and their RRM domains, in
separate, with INS intron 1 should also be performed. Using WT and G4-abolished oligonucleotides
and RNA transcripts containing the antisense target region for reducing INS IR, hnRNPs interaction
with these intronic sequences could be explored. For this purpose, G4-specific probe ThT could be
used to detect G4 formation/inhibition upon protein binding to oligonucleotides or RNA transcripts.
Binding affinities of each purified recombinant hnRNP and RRM domain to transcripts or oligos
would be determined by performing EMSA combined with western blotting using protein- and G4-
specific antibodies (51,454,455).
Chapter 6
137
G4 pre-folding could be modulated using a range of ionic strength conditions, from low to ionic
concentrations above physiological levels.
G-tracts have shown to be essential for splicing regulation of some introns, particularly short introns
rich in guanine, (53,142) and their highly conserved location within 5’UTRs may point to a critical
role in the evolution of some genes, like preproinsulin gene (100). G4 formation, along with an uORF
in INS mRNA transcripts with retained introns, has a potential to markedly influence coupled
splicing and translation regulation of short G-rich introns.
A secondary purpose of my study was to investigate how these new uORFs, combined with IR,
modulate protein translation, using constructs derived from 5’UTRs of different primate species
(Figure 31 - Chapter 5). Results showed that luciferase translation levels were higher in constructs
lacking intron 1 sequence in comparison to WT and mutated constructs containing INS intron 1,
regardless of tested primate species (Figure 31). This indicates the importance of intron removal
from untranslated regions. The data point towards the importance of human uORF within the 5’UTR
as a splicing regulatory motif in INS gene expression, as shown by increased luciferase translation,
in human constructs lacking both uORF and 3’ss (Figure 31A - Chapter 5).
Further studies are necessary to understand the role of intron retention in INS expression in other
primates. These studies should exploit the evolutionary conservation of the importance of G4
formation and the interaction of G4/G-tracts with hnRNPs on INS intron 1 splicing efficiency. Such
investigation should be facilitated by a set of constructs developed in this study combined with
constructs containing mutated Gr1, 2 and 7 (Figure 8). The role of the non-canonical structure in
splicing and translation can be studied using dual-luciferase-reporter assays. The role of individual
domains of hnRNPs F and H can be investigated using their specific RNA targets. Finally, these
studies will provide further insights into evolution of regulatory motifs in untranslated regions,
which have been subject to distinct selection pressures as compared to coding regions.
In summary, data obtained in this project corroborate previous findings, validating ThT as an
external sensitive and specific water-soluble fluorogenic probe for the detection of G4 structures
in INS intron 1 in vitro (Figure 14, Figure 23 and Figure 24). Demonstration of propensity for G4
formation of INS intronic G-runs improve the understanding of the molecular mechanisms driving
IR in T1DM susceptible individuals. G-runs are the RNA binding sites for proteins such as hnRNPs F
and H1, which specifically bind to INS intron 1 (Figure 26) and increase the efficiency of intron 1
elimination from RNA. Further studies on the in vitro characterization of intron1 G-runs: hnRNPs
interactions and their role in INS RNA processing are essential to expand our knowledge about
IDDM2-mediated susceptibility. A combined approach of in vitro findings with modulation of RNA

Chapter 6
138
processing of INS 5’UTR of higher primates (Figure 31), in mammalian cells, elucidate the
importance of G4 in INS gene evolution, also contributing to future development of potential
treatments applied to disease prevention.
Overall, the assay system presented in this project could also be used to screen for small molecule
enhancers/inhibitors of G4 folding in order to modulate splicing and develop novel treatments for
T1DM.

References
139
VII. References
1. Hoopes L. Introduction to the gene expression and regulation topic room. Nat Educ.
2008;1(1):160.
2. Mariño-Ramírez L, et al. Histone structure and nucleosome stability. Expert Rev Proteomics.
2005;2(5):719–29.
3. Annunziato A. DNA Packaging: Nucleosomes and Chromatin. Nat Educ. 2008;1(1):26.
4. Radman-Livaja M, Rando OJ. Nucleosome positioning: How is it established, and why does
it matter?. Vol. 339, Developmental Biology. NIH Public Access; 2010. p. 258–66.
5. Kouzarides T. Chromatin Modifications and Their Function. Cell. 2007;128(4):693–705.
6. Nocetti N, Whitehouse I. Nucleosome repositioning underlies dynamic gene expression.
Genes Dev. 2016;30(6):660–72.
7. Bai L, Morozov A V. Gene regulation by nucleosome positioning. Vol. 26, Trends in Genetics.
2010. p. 476–83.
8. Struhl K, Segal E. Determinants of nucleosome positioning. Vol. 20, Nature Structural and
Molecular Biology. NIH Public Access; 2013. p. 267–73.
9. Kim M-S, et al. A draft map of the human proteome. Nature. 2014;509(7502):575–81.
10. Hattori M. Finishing the euchromatic sequence of the human genome. Nature.
2004;431:931–45.
11. Baker MS, et al. Accelerating the search for the missing proteins in the human proteome.
Nat Commun. 2017;8(14271):1–13.
12. McManus CJ, et al. RNA structure and the mechanisms of alternative splicing. Curr Opin
Genet Dev. 2011;21(4):373–9.
13. Smith CWJ, Valcárcel J. Alternative pre-mRNA splicing: the logic of combinatorial control.
Trends Biochem Sci. 2000;25(8):381–8.
14. Cascino I, et al. Three functional soluble forms of the human apoptosis-inducing Fas
molecule are produced by alternative splicing. J Immunol. 1995;154(6):2706–13.
15. Wang Z, Burge CB. Splicing regulation: From a parts list of regulatory elements to an

References
140
integrated splicing code. RNA. 2008;14(5):802–13.
16. Von Philipsborn AC, et al. Cellular and behavioral functions of fruitless isoforms in Drosophila
courtship. Curr Biol. 2014;24(3):242–51.
17. Matunis MJ, Xing J, Dreyfuss G. The hnRNP F protein: unique primary structure, nucleic acid-
binding properties, and subcellular localization. Nucleic Acids Res. 1994;22(6):1059–67.
18. Lodish H, Berk A, Zipursky SL, Matsudaira P, Baltimore D, Darnell J. Processing of Eukaryotic
mRNA. In: Molecular Cell Biology 4th edition. 4th ed. New York: W. H. Freeman; 2000
19. Slomovic S, et al. Polyadenylation of ribosomal RNA in human cells. Nucleic Acids Res.
2006;34(10):2966–75.
20. Schellenberg, M., et al. Pre-mRNA splicing: a complex picture in higher definition. Trends
Biochem Sci. 2008;33(6):243–6.
21. Phillips T. Small non-coding RNA and gene expression. Nat Educ. 2008;1(1):115.
22. Wilusz JE. Long noncoding RNAs: Re-writing dogmas of RNA processing and stability. Biochim
Biophys Acta. 2016 Jan;1859(1):128–38.
23. Palazzo AF, Lee ES. Non-coding RNA: what is functional and what is junk? Front Genet.
2015;6(2):1–11.
24. Nissim-Rafinia M, Kerem B. Splicing regulation as a potential genetic modifier. Trends Genet.
2002;18(3):123–7.
25. Braunschweig U, et al. Dynamic integration of splicing within gene regulatory pathways. Cell.
2013;152(6):1252–69.
26. Baralle D, Baralle M. Splicing in action: assessing disease causing sequence changes. J Med
Genet. 2005;42(10):737–48.
27. Warf MB, Berglund JA. Role of RNA structure in regulating pre-mRNA splicing. Trends
Biochem Sci. 2010;35(3):169–78.
28. Wang Y, et al. Mechanism of alternative splicing and its regulation. Biomed Reports.
2015;3(2):152–8.
29. Chen M, Manley JL. Mechanisms of alternative splicing regulation: insights from molecular
and genomics approaches. Nat Rev Mol Cell Biol. 2010;10(11):741–54.
References
141
30. Zhang XH-F, et al. Exon inclusion is dependent on predictable exonic splicing enhancers. Mol
Cell Biol. 2005 Aug;25(16):7323–32.
31. Zhang XH-F, Chasin LA. Computational definition of sequence motifs governing constitutive
exon splicing. Genes Dev. 2004 Jun 1;18(11):1241–50.
32. Wang Z, et al. Systematic Identification and Analysis of Exonic Splicing Silencers. Cell. 2004
Dec 17;119(6):831–45.
33. Fairbrother WG, et al. Predictive Identification of Exonic Splicing Enhancers in Human Genes.
Science (80- ). 2002;297(5583):1007–13.
34. Panchapakesan SSS, Ferguson ML, Hayden EJ, Chen X, Hoskins AA, Unrau PJ.
Ribonucleoprotein purification and characterization using RNA Mango. RNA.
2017;23(10):1592–9.
35. Wahl MC, et al. The Spliceosome: Design Principles of a Dynamic RNP Machine. Cell.
2009;136(4):701–18.
36. Lin C-L, et al. RNA Structure in Splicing: an Evolutionary Perspective. RNA Biol.
2016;13(9):766–71.
37. Pagani F, Baralle FE. Genomic variants in exons and introns: identifying the splicing spoilers.
Nat Rev Genet. 2004;5:389–96.
38. Lee Y, Rio DC, Biology S, Biology C. Mechanisms and Regulation of Alternative Pre-mRNA
Splicing. AnnuRevBiochem. 2015;(258):291–323.
39. Hui J, et al. Intronic CA-repeat and CA-rich elements: a new class of regulators of mammalian
alternative splicing. EMBO J. 2005;24(11):1988–98.
40. Blencowe BJ. Exonic splicing enhancers: Mechanism of action, diversity and role in human
genetic diseases. Trends Biochem Sci. 2000;25(3):106–10.
41. Blencowe BJ. Exonic splicing enhancers: mechanism of action, diversity and role in human
genetic diseases [published erratum appears in Trends Biochem Sci 2000 May;25(5):228].
Trends Biochem Sci. 2000;25(3):106–10.
42. Wang, Z. et al. General and specific functions of exonic splicing silencers in splicing control.
Mol Cell. 2006;23(1):61–70.
43. Bradley T, et al. SR proteins control a complex network of RNA-processing events. RNA. 2015

References
142
Jan;21(1):75–92.
44. Busch A, Hertel KJ. Evolution of SR protein and hnRNP splicing regulatory factors. Wiley
Interdiscip Rev RNA. 2012;3(1):1–12.
45. Chaudhury A, et al. Heterogeneous nuclear ribonucleoproteins (hnRNPs) in cellular
processes: Focus on hnRNP E1’s multifunctional regulatory roles. RNA. 2010;16(8):1449–62.
46. Han SP, et al. Functional diversity of the hnRNPs: past, present and perspectives. Biochem J.
2010;430(3):379–92.
47. Geuens T, Bouhy D, Timmerman V. The hnRNP family: insights into their role in health and
disease. Hum Genet. 2016;135(8):851–67.
48. Martinez-Contreras R, Cloutier P, Shkreta L, Fisette J-F, Revil T, Chabot B. hnRNP proteins
and splicing control. Adv Exp Med Biol. 2007;623:123–47.
49. Dominguez C, Allain FHT. NMR structure of the three quasi RNA recognition motifs (qRRMs)
of human hnRNP F and interaction studies with Bcl-x G-tract RNA: A novel mode of RNA
recognition. Nucleic Acids Res. 2006;34(13):3634–45.
50. Dominguez C, et al. Structural basis of G-tract recognition and encaging by hnRNP F quasi-
RRMs. Nat Struct Mol Biol. 2010;17(7):853–61.
51. Alkan S a, et al. The hnRNPs F and H2 bind to similar sequences to influence gene expression.
Biochem J. 2006;393:361–71.
52. Martinez-Contreras R, et al. Intronic binding sites for hnRNP A/B and hnRNP F/H proteins
stimulate pre-mRNA splicing. PLoS Biol. 2006;4(2):172–85.
53. Decorsière A, et al. Essential role for the interaction between hnRNP H/F and a G quadruplex
in maintaining p53 pre-mRNA 3′-end processing and function during DNA damage. Genes
Dev. 2011;25(3):220–5.
54. Yoshida T, et al. Heterogeneous nuclear RNA-ribonucleoprotein F binds to DNA via an
oligo(dG)-motif and is associated with RNA polymerase II. Genes Cells. 1999;4(12):707–19.
55. Chou MY, et al. hnRNP H is a component of a splicing enhancer complex that activates a c-
src alternative exon in neuronal cells. Mol Cell Biol. 1999;19(1):69–77.
56. Buratti E, et al. hnRNP H binding at the 5’ splice site correlates with the pathological effect
of two intronic mutations in the NF-1 and TSH?? genes. Nucleic Acids Res.

References
143
2004;32(14):4224–36.
57. Zhang YZ, et al. Evidence that Dim1 associates with proteins involved in pre-mRNA splicing,
and delineation of residues essential for Dim1 interactions with hnRNP F and Npw38/PQBP-
1. Gene. 2000;257(1):33–43.
58. Ayoubi T. Alternative Promoter Usage. In: eLS. Chichester, UK: John Wiley & Sons, Ltd; 2005
59. Elkon R, Ugalde AP, Agami R. Alternative cleavage and polyadenylation: extent, regulation
and function. Nat Rev Genet Vol. 2013;14:496–506.
60. Tian B, Manley JL. Alternative polyadenylation of mRNA precursors. Nat Rev Mol Cell Biol.
2017;18:18–30.
61. B. Akman H, E. Erson-Bensan A. Alternative Polyadenylation and Its Impact on Cellular
Processes. MicroRNA. 2014;3(1):2–9.
62. Pal S, et al. Alternative transcription exceeds alternative splicing in generating the
transcriptome diversity of cerebellar development. Genome Res. 2011;21(8):1260–72.
63. Sprung CN, et al. Alternative transcript initiation and splicing as a response to DNA damage.
PLoS One. 2011;6(10):e25758.
64. Wada Y, et al. A wave of nascent transcription on activated human genes. PNAS.
2009;106(43):18357–61.
65. Blencowe BJ. Alternative Splicing: New Insights from Global Analyses. Cell. 2006;126(1):37–
47.
66. Brett D, et al. Alternative splicing and genome complexity. Nat Genet. 2002;30(1):29–30.
67. Zhou X, et al. Transcriptome analysis of alternative splicing events regulated by SRSF10
reveals position-dependent splicing modulation. Nucleic Acids Res. 2014;42(6):4019–30.
68. Shukla S, Oberdoerffer S. Co-transcriptional regulation of alternative pre-mRNA splicing.
Biochim Biophys Acta - Gene Regul Mech. 2012;1819(7):673–83.
69. Goldstrohm AC, et al. Co-transcriptional splicing of pre-messenger RNAs: Considerations for
the mechanism of alternative splicing. Gene. 2001;277(1–2):31–47.
70. Boutz PL, et al. Detained introns are a novel, widespread class of post-transcriptionally
spliced introns. Genes Dev. 2014;29:63–80.

References
144
71. Neugebauer KM, Roth MB. Distribution of pre-mRNA splicing factors at sites of RNA
polymerase II transcription. Genes Dev. 1997;11(9):1148–59.
72. Naftelberg S, Schor IE, Ast G, Kornblihtt AR. Regulation of Alternative Splicing Through
Coupling with Transcription and Chromatin Structure. Annu Rev Biochem. 2015;84:165–98.
73. De Conti L, Baralle M, Buratti E. Exon and intron definition in pre-mRNA splicing. WIREs RNA.
2013;4(1):49–60.
74. Berget SM. Exon recognition in vertebrate splicing. J Biol Chem. 1995;270(6):2411–4.
75. de Almeida SF, Carmo-Fonseca M. The CTD role in cotranscriptional RNA processing and
surveillance. Vol. 582, FEBS Letters. 2008. p. 1971–6.
76. Hsin J-P, Manley JL. The RNA polymerase II CTD coordinates transcription and RNA
processing. Genes Dev. 2012;26(19):2119–37.
77. Millhouse S, Manley JL. The C-Terminal Domain of RNA Polymerase II Functions as a
Phosphorylation-Dependent Splicing Activator in a Heterologous Protein. Mol Cell Biol.
2005;25(2):533–44.
78. Phatnani HP, Greenleaf AL. Phosphorylation and functions of the RNA polymerase II CTD.
Vol. 20, Genes and Development. 2006. p. 2922–36.
79. Merkhofer EC, Hu P, Johnson TL. Introduction to cotranscriptional RNA splicing. Vol. 1126,
Methods in Molecular Biology. 2014. p. 83–96.
80. Gunderson FQ, Johnson TL. Acetylation by the transcriptional coactivator Gcn5 plays a novel
role in co-transcriptional spliceosome assembly. Madhani HD, editor. PLoS Genet.
2009;5(10):e1000682.
81. Hsin J-P, Manley JL. The RNA polymerase II CTD coordinates transcription and RNA
processing. Genes Dev. 2012;26(19):2119–37.
82. Tanny JC. Chromatin modification by the RNA Polymerase II elongation complex.
Transcription. 2014;5(5):e988093.
83. Huang Y, Steitz JA. Splicing factors SRp20 and 9G8 promote the nucleocytoplasmic export of
mRNA. Mol Cell. 2001;7(4):899–905.
84. Pozzoli U, Riva L, Menozzi G, Cagliani R, Comi GP, Bresolin N, et al. Over-representation of
exonic splicing enhancers in human intronless genes suggests multiple functions in mRNA

References
145
processing. Biochem Biophys Res Commun. 2004;322(2):470–6.
85. Damgaard CK, Kahns S, Lykke-Andersen S, Nielsen AL, Jensen TH, Kjems J. A 5′ Splice Site
Enhances the Recruitment of Basal Transcription Initiation Factors In Vivo. Mol Cell.
2008;29(2):271–8.
86. Marquez Y, et al. Unmasking alternative splicing inside protein-coding exons defines exitrons
and their role in proteome plasticity. Genome Res. 2015;25:995–1007.
87. Galante PA, et al. Detection and evaluation of intron retention events in the human
transcriptome. RNA. 2004;10(5):757–65.
88. Staiger D, Simpson GG. Enter exitrons. Genome Biol. 2015;16:136–8.
89. Mayer K, et al. Three novel types of splicing aberrations in the tuberous sclerosis TSC2 gene
caused by mutations apart from splice consensus sequences. Biochim Biophys Acta - Mol
Basis Dis. 2000;1502(3):495–507.
90. Braunschweig U, et al. Widespread intron retention in mammals functionally tunes
transcriptomes. Genome Res. 2014;24:1774–86.
91. Ner-Gaon H, et al. Intron retention is a major phenomenon in alternative splicing in
Arabidopsis. Plant J. 2004;39(6):877–85.
92. Nott A, Meislin SH, Moore MJ. A quantitative analysis of intron effects on mammalian gene
expression. RNA. 2003;9(5):607–17.
93. Buckley PT, et al. Cytoplasmic intron retention, function, splicing, and the sentinel RNA
hypothesis. Wiley Interdiscip Rev RNA. 2014;5(2):223–30.
94. Lareau LF, et al. The evolving roles of alternative splicing. Curr Opin Struct Biol.
2004;14(3):273–82.
95. Wong JJL, et al. Orchestrated intron retention regulates normal granulocyte differentiation.
Cell. 2013;154(3):583–95.
96. Wong JJ-L, et al. Intron retention in mRNA: No longer nonsense. BioEssays. 2016
Jan;38(1):41–9.
97. Popp MW-L, Maquat LE. Organizing Principles of Mammalian Nonsense-Mediated mRNA
Decay. Annu Rev Genet. 2013;47(1):139–65.
98. Nomakuchi TT, Rigo F, Aznarez I, Krainer AR. Antisense oligonucleotide–directed inhibition

References
146
of nonsense-mediated mRNA decay. Nat Biotechnol. 2016;34(2):164–6.
99. Rípodas C, et al. Annotation , phylogeny and expression analysis of the nuclear factor Y gene
families in common bean ( Phaseolus vulgaris). Front Plant Sci. 2015;14(5):761–73.
100. Kralovicova J, Vorechovsky I. Allele-specific recognition of the 3’ splice site of INS intron 1.
Hum Genet. 2010;128(4):383–400.
101. Ge Y, Porse BT. The functional consequences of intron retention: Alternative splicing coupled
to NMD as a regulator of gene expression. BioEssays. 2014;36(3):236–43.
102. Barbosa C, Peixeiro I. Gene Expression Regulation by Upstream Open Reading Frames and
Human Disease. PLOS Genet. 2013;9(8):e1003529.
103. Xue S, Barna M. Specialized ribosomes: a new frontier in gene regulation and organismal
biology. Nat Rev Mol Cell Biol. 2012;13(6):355–69.
104. Neugebauer KM. On the importance of being co-transcriptional. J Cell Sci. 2002;115:3865–
71.
105. Kornblihtt AR, et al. Multiple links between transcription and splicing. RNA. 2004;10:1489–
98.
106. Sakabe NJ, de Souza SJ. Sequence features responsible for intron retention in human. BMC
Genomics. 2007;8:59–72.
107. Russell R. RNA misfolding and the action of chaperones. Front Biosci. 2008;13:1–20.
108. Andronescu M, et al. RNA STRAND: the RNA secondary structure and statistical analysis
database. BMC Bioinformatics. 2008 Aug 13;9:340.
109. Tatei K, et al. U1 RNA-protein complex preferentially binds to both 5’ and 3’ splice junction
sequences in RNA or single-stranded DNA. Proc Natl Acad Sci U S A. 1984;81(20):6281–5.
110. Mitrovich QM, Guthrie C. Evolution of small nuclear RNAs in S. cerevisiae, C. albicans, and
other hemiascomycetous yeasts. RNA. 2007;13(12):2066–80.
111. Buratti E, et al. RNA folding affects the recruitment of SR proteins by mouse and human
polypurinic enhancer elements in the fibronectin EDA exon. Mol Cell Biol. 2004;24(3):1387–
400.
112. Nagaswamy U, et al. NCIR: a database of non-canonical interactions in known RNA structures.
Nucleic Acids Res. 2002;30:395–7.

References
147
113. Words K, Words K. Structural motifs in RNA. Annu Rev Biochem. 1999;68:287–300.
114. Lemieux S, Major F. RNA canonical and non-canonical base pairing types: a recognition
method and complete repertoire. Nucleic Acids Res. 2002;30(19):4250–63.
115. McManus CJ, Graveley BR. RNA structure and the mechanisms of alternative splicing. Curr
Opin Genet Dev. 2011;21(4):373–9.
116. Buratti E, Baralle FE. Influence of RNA Secondary Structure on the Pre-mRNA Splicing Process
MINIREVIEW Influence of RNA Secondary Structure on the Pre-mRNA Splicing Process. Mol
Cell Biol. 2004;24(24):10505–14.
117. Klaff P, Riesner D, Steger G. RNA structure and the regulation of gene expression. Plant Mol
Biol. 1996;32(1–2):89–106.
118. Hiller M, Zhang Z, Backofen R, Stamm S. Pre-mRNA secondary structures influence exon
recognition. PLoS Genet. 2007;3(11):2147–55.
119. Graveley BR, Hertel KJ, Maniatis T. A systematic analysis of the factors that determine the
strength of pre-mRNA splicing enhancers. EMBO J. 1998;17(22):6747–56.
120. Schroeder R, Grossberger R, Pichler A, Waldsich C. RNA folding in vivo. Vol. 12, Current
Opinion in Structural Biology. 2002. p. 296–300.
121. Liu W, Zhou Y, Hu Z, Sun T, Denise A, Fu XD, et al. Regulation of splicing enhancer activities
by RNA secondary structures. FEBS Lett. 2010;584(21):4401–7.
122. Patterson DJ, Yasuhara K, Ruzzo WL. Pre-mRNA secondary structure prediction aids splice
site prediction. Pac Symp Biocomput. 2002;234:223–34.
123. Soemedi R, Cygan KJ, Rhine CL, Glidden DT, Taggart AJ, Lin CL, et al. The effects of structure
on pre-mRNA processing and stability. Vol. 125, Methods. 2017. p. 36–44.
124. Shepard PJ, Hertel KJ. Conserved RNA secondary structures promote alternative splicing
Conserved RNA secondary structures promote alternative splicing. Rna. 2008;14:1463–9.
125. Zhang J, Kuo CCJ, Chen L. GC content around splice sites affects splicing through pre-mRNA
secondary structures. BMC Genomics. 2011;12:90.
126. Woodson SA, Cech TR. Alternative Secondary Structures in the 5′ Exon Affect both Forward
and Reverse Self-Splicing of the Tetrahymena Intervening Sequence RNA. Biochemistry.
1991;30(8):2042–50.

References
148
127. Graveley BR. Mutually exclusive splicing of the insect Dscam Pre-mRNA directed by
competing intronic RNA secondary structures. Cell. 2005;123(1):65–73.
128. May GE, Olson S, McManus CJ, Graveley BR. Competing RNA secondary structures are
required for mutually exclusive splicing of the Dscam exon 6 cluster. RNA. 2011;17:222–9.
129. Anastassiou D, Liu H, Varadan V. Variable window binding for mutually exclusive alternative
splicing. Genome Biol. 2006;7(1):R2.
130. Kreahling JM, Graveley BR. The iStem, a long-range RNA secondary structure element
required for efficient exon inclusion in the Drosophila Dscam pre-mRNA. Mol Cell Biol.
2005;25(23):10251–60.
131. Raker VA, Mironov AA, Gelfand MS, Pervouchine DD. Modulation of alternative splicing by
long-range RNA structures in Drosophila. Nucleic Acids Res. 2009;37(14):4533–44.
132. Warf MB, Diegel J V., von Hippel PH, Berglund JA. The protein factors MBNL1 and U2AF65
bind alternative RNA structures to regulate splicing. Proc Natl Acad Sci. 2009;106(23):9203–
8.
133. Muro a F, Caputi M, Pariyarath R, Pagani F, Buratti E, Baralle FE. Regulation of fibronectin
EDA exon alternative splicing: possible role of RNA secondary structure for enhancer display.
Mol Cell Biol. 1999;19(4):2657–71.
134. Singh NN, Singh RN, Androphy EJ. Modulating role of RNA structure in alternative splicing of
a critical exon in the spinal muscular atrophy genes. Nucleic Acids Res. 2007;35(2):371–89
135. Buckanovich RJ, Darnell RB. The neuronal RNA binding protein Nova-1 recognizes specific
RNA targets in vitro and in vivo. Mol Cell Biol. 1997;17(6):3194–201.
136. Damgaard CK, Tange TØ, Kjems J. HnRNP A1 controls HIV-1 mRNA splicing through
cooperative binding to intron and exon splicing silencers in the context of a conserved
secondary structure. RNA. 2002;8(11):1401–15.
137. Nagel RJ, Lancaster AM, Zahler AM. Specific binding of an exonic splicing enhancer by the
pre-mRNA splicing factor SRp55. RNA. 1998;4(1):11–23.
138. Shi H, Hoffman BE, Lis JT. A specific RNA hairpin loop structure binds the RNA recognition
motifs of the Drosophila SR protein B52. Mol Cell Biol. 1997;17(5):2649–57.
139. Kent OA, Reayi A, Foong L, Chilibeck KA, MacMillan AM. Structuring of the 3′ Splice Site by
U2AF65. J Biol Chem. 2003;278(50):50572–7.

References
149
140. Huang H, Zhang J, Harvey SE, Hu X, Cheng C. RNA G-quadruplex secondary structure
promotes alternative splicing via the RNA-binding protein hnRNPF. Genes Dev.
2017;31(22):2296–309.
141. Blice-Baum AC, Mihailescu M-R. Biophysical characterization of G-quadruplex forming FMR1
mRNA and of its interactions with different fragile X mental retardation protein isoforms.
RNA. 2014;20(1):103–14.
142. Marcel V, et al. G-quadruplex structures in TP53 intron 3: Role in alternative splicing and in
production of p53 mRNA isoforms. Carcinogenesis. 2011;32(3):271–8.
143. Garneau D, Revil T, Fisette JF, Chabot B. Heterogeneous nuclear ribonucleoprotein F/H
proteins modulate the alternative splicing of the apoptotic mediator Bcl-x. J Biol Chem.
2005;280(24):22641–50.
144. Khateb S, Weisman-Shomer P, Hershco-Shani I, Ludwig AL, Fry M. The tetraplex
(CGG)ndestabilizing proteins hnRNP A2 and CBF-A enhance the in vivo translation of fragile
X premutation mRNA. Nucleic Acids Res. 2007;35(17):5775–88.
145. Lattmann S, Giri B, Vaughn JP, Akman SA, Nagamine Y. Role of the amino terminal RHAU-
specific motif in the recognition and resolution of guanine quadruplex-RNA by the DEAH-
box RNA helicase RHAU. Nucleic Acids Res. 2010;38(18):6219–33.
146. Von Hacht A, Seifert O, Menger M, Schütze T, Arora A, Konthur Z, et al. Identification and
characterization of RNA guanine-quadruplex binding proteins. Nucleic Acids Res.
2014;42(10):6630–44.
147. Zhang K, Donnelly CJ, Haeusler AR, Grima JC, Machamer JB, Steinwald P, et al. The C9orf72
repeat expansion disrupts nucleocytoplasmic transport. Nature. 2015;525(7567):56–61
148. Liu X, Ishizuka T, Bao HL, Wada K, Takeda Y, Iida K, et al. Structure-Dependent Binding of
hnRNPA1 to Telomere RNA. J Am Chem Soc. 2017;139(22):7533–9.
149. Conlon EG, Lu L, Sharma A, Yamazaki T, Tang T, Shneider NA, et al. The C9ORF72 GGGGCC
expansion forms RNA G-quadruplex inclusions and sequesters hnRNP H to disrupt splicing in
ALS brains. Elife. 2016;5
150. Xu Y, Gao XD, Lee JH, Huang H, Tan H, Ahn J, et al. Cell type-restricted activity of hnRNPM
promotes breast cancer metastasis via regulating alternative splicing. Genes Dev.
2014;28(11):1191–203.

References
150
151. Bardin C, Leroy JL. The formation pathway of tetramolecular G-quadruplexes. Nucleic Acids
Res. 2008;36(2):477–88.
152. Tran PLT, De Cian A, Gros J, Moriyama R, Mergny J-L. Emergence and evolution of meaning.
Top Curr Chem. 2012;330:243–73.
153. Neidle S, Parkinson GN. The structure of telomeric DNA. Curr Opin Struct Biol.
2003;13(3):275–83.
154. Simonsson T. G-quadruplex DNA structures - Variations on a theme. Biol Chem.
2001;382(4):621–8.
155. Luo D, Mu Y. All-Atomic Simulations on Human Telomeric G-Quadruplex DNA Binding with
Thioflavin T. J Phys Chem B. 2015;119:4955–67.
156. Yang D, Okamoto K. Structural insights into G-quadruplexes: towards new anticancer drugs.
Future Med Chem. 2010;2(4):619–46.
157. Bhattacharyya D, et al. Metal Cations in G-Quadruplex Folding and Stability. Front Chem.
2016;4:38.
158. Lorenz R, et al. 2D meets 4G: G-quadruplexes in RNA secondary structure prediction.
IEEE/ACM Trans Comput Biol Bioinforma. 2013;10(4):832–44.
159. Joachimi A, et al. A comparison of DNA and RNA quadruplex structures and stabilities.
Bioorganic Med Chem. 2009;17(19):6811–5.
160. Varizhuk A, et al. The expanding repertoire of G4 DNA structures. Biochimie. 2017;135:54–
62.
161. Malgowska M, et al. Distinctive structural motifs of RNA G-quadruplexes composed of AGG,
CGG and UGG trinucleotide repeats. Nucleic Acids Res. 2014;42(15):10196–207.
162. Mukundan VT, Phan AT. Bulges in G-Quadruplexes: Broadening the Definition of G-
Quadruplex-Forming Sequences. J Am Chem Soc. 2013 Apr 3;135(13):5017–28.
163. Li X, et al. Guanine-vacancy-bearing G-quadruplexes responsive to guanine derivatives. Proc
Natl Acad Sci U S A. 2015 Nov 24;112(47):14581–6.
164. Seow N, Kirk Y, Yung LYL. Detection of G-Quadruplex Formation via Light Scattering of
Defined Gold Nanoassemblies Modulated by Molecular Hairpins. Bioconjug Chem.
2016;27(5):1236–43.

References
151
165. Weldon C, et al. Do we know whether potential G-quadruplexes actually form in long
functional RNA molecules? Biochem Soc Trans. 2016;44(6):1761–8.
166. Hardin CC, et al. Cation-dependent transition between the quadruplex and Watson-Crick
hairpin forms of d(CGCG3GCG). Biochemistry. 1992;31(3):833–41.
167. Jin B, et al. Fluorescence light-up probe for parallel G-quadruplexes. Anal Chem.
2014;86(1):943–52.
168. Mendoza O, et al. Orienting Tetramolecular G-Quadruplex Formation: The Quest for the
Elusive RNA Antiparallel Quadruplex. Chem - A Eur J. 2015 Apr 27;21(18):6732–9.
169. Kumari S, et al. An RNA G-quadruplex in the 5’ UTR of the NRAS proto-oncogene modulates
translation. Nat Chem Biol. 2007;3(4):218–21.
170. Gomez D, et al. A G-quadruplex structure within the 5′-UTR of TRF2 mRNA represses
translation in human cells. Nucleic Acids Res. 2010;38(20):7187–98.
171. Beaudoin JD, Perreault JP. Exploring mRNA 3’-UTR G-quadruplexes: Evidence of roles in both
alternative polyadenylation and mRNA shortening. Nucleic Acids Res. 2013;41(11):5898–
911.
172. Fisette JF, et al. A G-Rich element forms a G-quadruplex and regulates BACE1 mRNA
alternative splicing. J Neurochem. 2012;121(5):763–73.
173. Kwok CK, Merrick CJ. G-Quadruplexes: Prediction, Characterization, and Biological
Application. Vol. 35, Trends in Biotechnology. Elsevier Current Trends; 2017. p. 997–1013
174. Beaudoin J-D, Jodoin R, Perreault J-P. New scoring system to identify RNA G-quadruplex
folding. Nucleic Acids Res. 2014;42(2):1209–23.
175. Lorenz R, Bernhart SH, Externbrink F, Qin J, Siederdissen CH zu, Amman F, et al. RNA Folding
Algorithms with G-Quadruplexes. In: de Souto MCP, Kann MG, editors. Advances in
Bioinformatics and Computational Biology. Berlin, Heidelberg: Springer Berlin Heidelberg;
2012. p. 49–60. (Lecture Notes in Bioinformatics; vol. 7409).
176. Menendez C, Frees S, Bagga PS. QGRS-H Predictor: a web server for predicting homologous
quadruplex forming G-rich sequence motifs in nucleotide sequences. Nucleic Acids Res.
2012;40(Web Server issue):W96–103.
177. Tradigo G, Mannella L, Veltri P. Assessment of G-quadruplex Prediction Tools. In: 2014 IEEE
27th International Symposium on Computer-Based Medical Systems. 2014. p. 243–6.

References
152
178. Eddy J, Maizels N. Gene function correlates with potential for G4 DNA formation in the
human genome. Nucleic Acids Res. 2006;34(14):3887–96.
179. Cer RZ, Bruce KH, Donohue DE, Temiz AN, Bacolla A, Mudunuri US, et al. Introducing the
non-B DNA Motif Search Tool (nBMST). Genome Biol. 2011;12(Suppl 1):P34.
180. Hon J, Martínek T, Zendulka J, Lexa M. pqsfinder: an exhaustive and imperfection-tolerant
search tool for potential quadruplex-forming sequences in R. Bioinformatics.
2017;33(21):3373–9.
181. Harkness RW, Mittermaier AK. G-quadruplex dynamics. Biochim Biophys Acta - Proteins
Proteomics. 2017;1865(11):1544–54.
182. Hänsel-Hertsch R, Di Antonio M, Balasubramanian S. DNA G-quadruplexes in the human
genome: Detection, functions and therapeutic potential. Nat Rev Mol Cell Biol.
2017;18(5):279–84.
183. Hon J, Lexa M, Martinek T. pqsfinder: User Guide. pqsfinder: an exhaustive and
imperfection-tolerant search tool for potential quadruplex-forming sequences in R. 2017
184. Frees S, Menendez C, Crum M, Bagga PS. QGRS-Conserve: a computational method for
discovering evolutionarily conserved G-quadruplex motifs. Hum Genomics. 2014;8(1):8.
185. Chen J, Lin J, Zhang X, Cai S, Wu D, Li C, et al. Label-free fluorescent biosensor based on the
target recycling and Thioflavin T-induced quadruplex formation for short DNA species of c-
erbB-2 detection. Anal Chim Acta. 2014;817:42–7.
186. Du Y-C, Zhu L-N, Kong D-M. Label-free thioflavin T/G-quadruplex-based real-time strand
displacement amplification for biosensing applications. Biosens Bioelectron. 2016;86:811–
7.
187. Gabelica V, et al. Multiple and cooperative binding of fluorescence light-up probe thioflavin
t with human telomere DNA G-quadruplex. Biochemistry. 2013;52(33):5620–8.
188. De La Faverie AR, Guédin A, Bedrat A, Yatsunyk L a., Mergny JL. Thioflavin T as a fluorescence
light-up probe for G4 formation. Nucleic Acids Res. 2014;42(8):1–8.
189. Xu S, et al. Thioflavin T as an efficient fluorescence sensor for selective recognition of RNA
G-quadruplexes. Sci Rep. 2016;6(1):24793.
190. Bhasikuttan AC, Mohanty J. Targeting G-quadruplex structures with extrinsic fluorogenic
dyes: promising fluorescence sensors. Chem Commun. 2015;51(36):7581–97.

References
153
191. Zhao D, et al. Selective recognition of parallel and anti-parallel thrombin-binding aptamer
G-quadruplexes by different fluorescent dyes. Nucleic Acids Res. 2014;42(18):11612–21.
192. Li M, Zhao A, Ren J, Qu X. N -Methyl Mesoporphyrin IX as an Effective Probe for Monitoring
Alzheimer’s Disease β-Amyloid Aggregation in Living Cells. ACS Chem Neurosci.
2017;8(6):1299–304.
193. Kreig A, Calvert J, Sanoica J, Cullum E, Tipanna R, Myong S. G-quadruplex formation in double
strand DNA probed by NMM and CV fluorescence. Nucleic Acids Res. 2015;43(16):7961–70.
194. Bhasikuttan AC, Mohanty J, Pal H. Interaction of Malachite Green with Guanine-Rich Single-
Stranded DNA: Preferential Binding to a G-Quadruplex. Angew Chemie Int Ed.
2007;46(48):9305–7.
195. Kong D-M, Guo J-H, Yang W, Ma Y-E, Shen H-X. Crystal violet–G-quadruplex complexes as
fluorescent sensors for homogeneous detection of potassium ion. Biosens Bioelectron.
2009;25:88–93.
196. Lubitz I, Zikich D, Kotlyar A. Specific High-Affinity Binding of Thiazole Orange to Triplex and
G-Quadruplex DNA. pubs.acs.org/Biochemistry Biochem. 2010;49:3567–74.
197. Wang M-Q, Zhu W-X, Song Z-Z, Li S, Zhang Y-Z. A triphenylamine-based colorimetric and
fluorescent probe with donor-bridge-acceptor structure for detection of G-quadruplex DNA.
Bioorg Med Chem Lett. 2015;25:5672–6.
198. Yaku H, Fujimoto T, Murashima T, Miyoshi D, Sugimoto N. Phthalocyanines: a new class of
G-quadruplex-ligands with many potential applications. Chem Commun. 2012;48:6203–16.
199. Tran PLT, Mergny J-L, Alberti P. Stability of telomeric G-quadruplexes. Nucleic Acids Res.
2011;39(8):3282–94.
200. Mergny JL, Li J, Lacroix L, Amrane S, Chaires JB. Thermal difference spectra: A specific
signature for nucleic acid structures. Nucleic Acids Res. 2005;33(16):e138.
201. Olsen CM, Lee H-T, Marky LA. Unfolding Thermodynamics of Intramolecular G-Quadruplexes:
Base Sequence Contributions of the Loops. J Phys Chem. 2009;113(9):2587–95.
202. Chaires JB. Human telomeric G-quadruplex: thermodynamic and kinetic studies of telomeric
quadruplex stability. FEBS J. 2010;277(5):1098–106.
203. Lane AN, Chaires JB, Gray RD, Trent JO. Stability and kinetics of G-quadruplex structures. Vol.
36, Nucleic Acids Research. 2008. p. 5482–515.
References
154
204. Gray RD, Chaires JB. Analysis of multidimensional G-quadruplex melting curves. Curr Protoc
nucleic acid Chem. 2011;Chapter 17:Unit17.4.
205. Lee JY, Yoon J, Kihm HW, Kim DS. Structural Diversity and Extreme Stability of Unimolecular
Oxytricha nova Telomeric G-Quadruplex. Biochemistry. 2008;47(11):3389–96.
206. Medeiros-Silva J, Guédin A, Salgado GF, Mergny J-L, Queiroz JA, Cabrita EJ, et al.
Phenanthroline-bis-oxazole ligands for binding and stabilization of G-quadruplexes. Biochim
Biophys Acta - Gen Subj. 2017;1861(5):1281–92.
207. Adrian M, Heddi B, Phan AT. NMR spectroscopy of G-quadruplexes. Methods. 2012;57:11–
24.
208. Gulerez IE, Gehring K. X-ray crystallography and NMR as tools for the study of protein
tyrosine phosphatases. Methods. 2014;65:175–83.
209. Xiao C-D, Ishizuka T, Xu Y. Antiparallel RNA G-quadruplex Formed by Human Telomere RNA
Containing 8-Bromoguanosine. Sci Rep. 2017;7(1):6695.
210. Campbell N, Collie GW, Neidle S. Crystallography of DNA and RNA G-Quadruplex Nucleic
Acids and Their Ligand Complexes. In: Current Protocols in Nucleic Acid Chemistry. Hoboken,
NJ, USA: John Wiley & Sons, Inc.; 2012. p. 17.6.1-17.6.22.
211. Ma D-L, et al. Recent Developments in G-Quadruplex Probes. Chem Biol. 2015 Jul;22(7):812–
28.
212. Dolinnaya NG, et al. Structure, Properties, and Biological Relevance of the DNA and RNA G
Quadruplexes : Overview 50 Years after Their Discovery. Vol. 81, Biochemistry (Moscow).
2016. 1602-1649 p.
213. Sun D, Hurley LH. Biochemical techniques for the characterization of G-quadruplex
structures: EMSA, DMS footprinting, and DNA polymerase stop assay. Methods Mol Biol.
2010;608:65–79.
214. Lormand JD, Buncher N, Murphy CT, Kaur P, Lee MY, Burgers P, et al. DNA polymerase δ
stalls on telomeric lagging strand templates independently from G-quadruplex formation.
Nucleic Acids Res. 2013;41(22):10323–33.
215. Eddy S, Tillman M, Maddukuri L, Ketkar A, Zafar MK, Eoff RL. Human translesion polymerase
kappa exhibits enhanced activity and reduced fidelity two nucleotides from G-quadruplex
DNA. Biochemistry. 2016;55(37):5218–29.

References
155
216. Edwards DN, Machwe A, Wang Z, Orren DK. Intramolecular telomeric G-quadruplexes
dramatically inhibit DNA synthesis by replicative and translesion polymerases, revealing
their potential to lead to genetic change. PLoS One. 2014;9(1)
217. Sun D, Guo K, Shin Y-J. Evidence of the formation of G-quadruplex structures in the promoter
region of the human vascular endothelial growth factor gene. Nucleic Acids Res.
2011;39(4):1256–65.
218. Beaudoin J-D, Jodoin R, Perreault J-P. In-line probing of RNA G-quadruplexes. Methods.
2013;64(1):79–87.
219. Waldsich C. Dissecting RNA folding by nucleotide analog interference mapping (NAIM). Nat
Protoc. 2008;3(5):811–23.
220. Gopinath SCB. Mapping of RNA–protein interactions. Anal Chim Acta. 2009;636(2):117–28.
221. Kwok CK, Sahakyan AB, Balasubramanian S. G-Quadruplexes Structural Analysis using
SHALiPE to Reveal RNAG-Quadruplex Formationi nHuman Precursor MicroRNA.
AngewChem Int Ed. 2016;55:8958–61.
222. Weldon C, et al. Identification of G-quadruplexes in long functional RNAs using 7-
deazaguanine RNA. Nat Chem Biol. 2016;13(1):18–20.
223. Weldon C, Dacanay JG, Gokhale V, Boddupally PVL, Behm-Ansmant I, Burley GA, et al.
Specific G-quadruplex ligands modulate the alternative splicing of Bcl-X. Nucleic Acids Res.
2018 ;46(2):886–96.
224. Murchie AIH, Lilley DMJ. Retinoblastoma susceptibility genes contain 5’ sequences with a
high propensity to form guanine-tetrad structures. Nucleic Acids Res. 1992;20(1):49–53.
225. Lam EYN, Beraldi D, Tannahill D, Balasubramanian S. G-quadruplex structures are stable and
detectable in human genomic DNA. Nat Commun. 2013;4:1796.
226. Hänsel-Hertsch R, Beraldi D, Lensing S V, Marsico G, Zyner K, Parry A, et al. G-quadruplex
structures mark human regulatory chromatin. Nat Genet. 2016;48(10):1267–72.
227. Kazemier HG, Paeschke K, Lansdorp PM. Guanine quadruplex monoclonal antibody 1H6
cross-reacts with restrained thymidine-rich single stranded DNA. Nucleic Acids Res. 2017 Jun
2;45(10):5913–9.
228. Chambers VS, Marsico G, Boutell JM, Di Antonio M, Smith GP, Balasubramanian S. High-
throughput sequencing of DNA G-quadruplex structures in the human genome. Nat
References
156
Biotechnol. 2015;33(8):877–81.
229. Fenouil R, Cauchy P, Koch F, Descostes N, Cabeza JZ, Innocenti C, et al. rG4-seq reveals
widespread formation of G-quadruplex structures in the human transcriptome. Nat
Methods. 2016;13(10):2399–408.
230. Kwok CK, Balasubramanian S. Targeted Detection of G-Quadruplexes in Cellular RNAs.
Angew Chemie Int Ed. 2015;54(23):6751–4.
231. Cáceres JF, Kornblihtt AR. Alternative splicing: multiple control mechanisms and
involvement in human disease. Trends Genet. 2002;18(4):186–93.
232. Garcia-Blanco M a, et al. Alternative splicing in disease and therapy. Nat Biotechnol.
2004;22(5):535–46.
233. Tazi J, et al. Alternative splicing and disease. Biochim Biophys Acta - Mol Basis Dis.
2009;1792:14–26.
234. Pajares MJ, et al. Alternative splicing: an emerging topic in molecular and clinical oncology.
Lancet Oncol. 2007;8(4):349–57.
235. Wang G-S, Cooper T a. Splicing in disease: disruption of the splicing code and the decoding
machinery. Nat Rev Genet. 2007;8(10):749–61.
236. Ward AJ, Cooper TA. The Pathobiology of Splicing. J Pathol. 2010;220:152–63.
237. Scotti MM, Swanson MS. RNA mis-splicing in disease. Nat Rev Genet. 2015;17(1):19–32.
238. Ahmad S, Bhatia K, Kannan A, Gangwani L. Molecular Mechanisms of Neurodegeneration in
Spinal Muscular Atrophy. J Exp Neurosci. 2016;10:39–49.
239. Zhou J, Zheng X, Shen H. Targeting RNA-splicing for SMA treatment. Vol. 33, Molecules and
Cells. 2012. p. 223–8.
240. Lorson CL, Rindt H, Shababi M. Spinal muscular atrophy: Mechanisms and therapeutic
strategies. Hum Mol Genet. 2010;19(R1).
241. Gonzalez JM, Pla D, Perez-Sala D, Andres V. A-type lamins and Hutchinson-Gilford progeria
syndrome: pathogenesis and therapy. Front Biosci (Schol Ed). 2011;3:1133–46.
242. Muchir A, Bonne G, van der Kooi a J, van Meegen M, Baas F, Bolhuis PA, et al. Identification
of mutations in the gene encoding lamins A/C in autosomal dominant limb girdle muscular
dystrophy with atrioventricular conduction disturbances (LGMD1B). Hum Mol Genet.

References
157
2000;9(9):1453–9.
243. Todorova A, Halliger-Keller B, Walter MC, Dabauvalle M-C, Lochmüller H, Müller CR. A
synonymous codon change in the LMNA gene alters mRNA splicing and causes limb girdle
muscular dystrophy type 1B. J Med Genet. 2003;40(10):e115.
244. Vieira NM, Naslavsky MS, Licinio L, Kok F, Schlesinger D, Vainzof M, et al. A defect in the
RNA-processing protein HNRPDL causes limb-girdle muscular dystrophy 1G (LGMD1G). Hum
Mol Genet [. 2014;23(15):4103–10.
245. Sisakian H. Cardiomyopathies: Evolution of pathogenesis concepts and potential for new
therapies. World J Cardiol. 2014;6(6):478.
246. Dellefave L, McNally EM. The genetics of dilated cardiomyopathy. Curr Opin Cardiol.
2010;25(3):198–204.
247. Mestroni L, Brun F, Spezzacatene A, Sinagra G, Taylor MR. GENETIC CAUSES OF DILATED
CARDIOMYOPATHY. Prog Pediatr Cardiol. 2014;37(1–2):13–8.
248. Wyles SP, Li X, Hrstka SC, Reyes S, Oommen S, Beraldi R, et al. Modeling structural and
functional deficiencies of RBM20 familial dilated cardiomyopathy using human induced
pluripotent stem cells. Hum Mol Genet. 2016;25(2):254–65.
249. Streckfuss-Bömeke K, Tiburcy M, Fomin A, Luo X, Li W, Fischer C, et al. Severe DCM
phenotype of patient harboring RBM20 mutation S635A can be modeled by patient-specific
induced pluripotent stem cell-derived cardiomyocytes. J Mol Cell Cardiol. 2017;113:9–21.
250. Tonino P, Kiss B, Strom J, Methawasin M, Smith JE, Kolb J, et al. The giant protein titin
regulates the length of the striated muscle thick filament. Nat Commun. 2017;8(1).
251. Guo W, Schafer S, Greaser ML, Radke MH, Liss M, Govindarajan T, et al. RBM20, a gene for
hereditary cardiomyopathy, regulates titin splicing. Nat Med. 2012;18(5):766–73.
252. Rubin BY, Anderson SL. IKBKAP/ELP1 gene mutations: Mechanisms of familial dysautonomia
and gene-targeting therapies. Vol. 10, Application of Clinical Genetics. Dove Press; 2017. p.
95–103.
253. Lee G, Papapetrou EP, Kim H, Chambers SM, Tomishima MJ, Fasano CA, et al. Modelling
pathogenesis and treatment of familial dysautonomia using patient-specific iPSCs. Nature.
2009;461(7262):402–6.
254. Wein N, Alfano L, Flanigan KM. Genetics and Emerging Treatments for Duchenne and Becker

References
158
Muscular Dystrophy. Pediatr Clin North Am. 2015;62(3):723–42.
255. Le Rumeur E, Rumeur E Le. Dystrophin and the two related genetic diseases, Duchenne and
Becker muscular dystrophies. Bosn J Basic Med Sci. 2015;15(3):14–20.
256. La Cognata V, D’Agata V, Cavalcanti F, Cavallaro S. Splicing: is there an alternative
contribution to Parkinson’s disease?. Vol. 16, Neurogenetics. Springer; 2015. p. 245–63.
257. Wszolek ZK, Tsuboi Y, Ghetti B, Pickering-Brown S, Baba Y, Cheshire WP. Frontotemporal
dementia and parkinsonism linked to chromosome 17 (FTDP-17). Vol. 1, Orphanet Journal
of Rare Diseases. BioMed Central; 2006. p. 30.
258. AVILA J. Role of Tau Protein in Both Physiological and Pathological Conditions. Physiol Rev.
2004;84(2):361–84.
259. Rademakers R, Melquist S, Cruts M, Theuns J, Del-Favero J, Poorkaj P, et al. High-density SNP
haplotyping suggests altered regulation of tau gene expression in progressive supranuclear
palsy. Hum Mol Genet. 2005;14(21):3281–92.
260. Goedert M. Tau gene mutations and their effects. Vol. 20, Movement Disorders. 2005. p.
S45–52.
261. Goedert M, Spillantini MG. Tau mutations in frontotemporal dementia FTDP-17 and their
relevance for Alzheimer’s disease. Vol. 1502, Biochimica et Biophysica Acta - Molecular Basis
of Disease. Elsevier; 2000. p. 110–21.
262. Tanackovic G, Ransijn A, Ayuso C, Harper S, Berson EL, Rivolta C. A missense mutation in
PRPF6 causes impairment of pre-mRNA splicing and autosomal-dominant retinitis
pigmentosa. Am J Hum Genet. 2011;88(5):643–9.
263. Tanackovic G, Ransijn A, Thibault P, Abou Elela S, Klinck R, Berson EL, et al. PRPF mutations
are associated with generalized defects in spliceosome formation and pre-mRNA splicing in
patients with retinitis pigmentosa. Hum Mol Genet. 2011;20(11):2116–30.
264. Zhao C, Bellur DL, Lu S, Zhao F, Grassi MA, Bowne SJ, et al. Autosomal-Dominant Retinitis
Pigmentosa Caused by a Mutation in SNRNP200, a Gene Required for Unwinding of U4/U6
snRNAs. Am J Hum Genet. 2009;85(5):617–27.
265. Sperling AS, Gibson CJ, Ebert BL. The genetics of myelodysplastic syndrome: from clonal
haematopoiesis to secondary leukaemia. Nat Rev Cancer. 2017;17(1):5–19.
266. Jafarifar F, Dietrich RC, Hiznay JM, Padgett RA. Biochemical defects in minor spliceosome

References
159
function in the developmental disorder MOPD I. RNA. 2014;20(7):1078–89.
267. Krøigård AB, Jackson AP, Bicknell LS, Baple E, Brusgaard K, Hansen LK, et al. Two novel
mutations in RNU4ATAC in two siblings with an atypical mild phenotype of microcephalic
osteodysplastic primordial dwarfism type 1. Clin Dysmorphol. 2016;25(2):68–72.
268. Nagy R, Wang H, Albrecht B, Wieczorek D, Gillessen-Kaesbach G, Haan E, et al. Microcephalic
osteodysplastic primordial dwarfism type I with biallelic mutations in the RNU4ATAC gene.
Clin Genet. 2012;82(2):140–6.
269. Scotter EL, Chen HJ, Shaw CE. TDP-43 Proteinopathy and ALS: Insights into Disease
Mechanisms and Therapeutic Targets. Vol. 12, Neurotherapeutics. Springer; 2015. p. 352–
63.
270. Geser F, Lee VM-Y, Trojanowski JQ. Amyotrophic lateral sclerosis and frontotemporal lobar
degeneration: a spectrum of TDP-43 proteinopathies. Neuropathology. 2010 Apr;30(2):103–
12.
271. Rademakers R, Stewart H, Dejesus-Hernandez M, Krieger C, Graff-Radford N, Fabros M, et
al. Fus gene mutations in familial and sporadic amyotrophic lateral sclerosis. Muscle Nerve.
2010;42(2):170–6.
272. Bartoletti-Stella A, Gasparini L, Giacomini C, Corrado P, Terlizzi R, Giorgio E, et al. Messenger
RNA processing is altered in autosomal dominant leukodystrophy. Hum Mol Genet.
2015;24(10):2746–56.
273. Sveen A, Kilpinen S, Ruusulehto A, Lothe RA, Skotheim RI. Aberrant RNA splicing in cancer;
Expression changes and driver mutations of splicing factor genes. Vol. 35, Oncogene. 2016.
p. 2413–27.
274. Ctor Climente-Gonzá Lez H, Porta-Pardo E, Godzik A, Correspondence EE, Eyras E. The
Functional Impact of Alternative Splicing in Cancer. CellReports. 2017;20:2215–26.
275. Lee SCW, Abdel-Wahab O. Therapeutic targeting of splicing in cancer. Vol. 22, Nature
Medicine. 2016. p. 976–86.
276. Singh B, Eyras E. The role of alternative splicing in cancer. Vol. 8, Transcription. 2017. p. 91–
8.
277. de Lima Morais DA, Harrison PM. Large-scale evidence for conservation of NMD candidature
across mammals. PLoS One. 2010;5(7):e11695.

References
160
278. Middleton R, Gao D, Thomas A, Singh B, Au A, Wong JJ-L, et al. IRFinder: Assessing the impact
of intron retention on mammalian gene expression. Genome Biol. 2017;18(1):51.
279. Li Y, Bor YC, Misawa Y, Xue Y, Rekosh D, Hammarskjöld ML. An intron with a constitutive
transport element is retained in a Tap messenger RNA. Nature. 2006;443(7108):234–7.
280. Bergeron D, Pal G, Beaulieu YB, Chabot B, Bachand F. Regulated Intron Retention and
Nuclear Pre-mRNA Decay Contribute to PABPN1 Autoregulation. Mol Cell Biol.
2015;35(14):2503–17.
281. Naro C, Sette C. Timely-regulated intron retention as device to fine-tune protein expression.
Vol. 16, Cell Cycle. 2017. p. 1321–2.
282. Yap K, Lim ZQ, Khandelia P, Friedman B, Makeyev E V. Coordinated regulation of neuronal
mRNA steady-state levels through developmentally controlled intron retention. Genes Dev.
2012 ;26(11):1209–23.
283. Makeyev E V, Zhang J, Carrasco MA, Maniatis T. The MicroRNA miR-124 Promotes Neuronal
Differentiation by Triggering Brain-Specific Alternative Pre-mRNA Splicing. Mol Cell.
2007;27(3):435–48.
284. Wollerton MC, Gooding C, Wagner EJ, Garcia-Blanco MA, Smith CW. Autoregulation of
Polypyrimidine Tract Binding Protein by Alternative Splicing Leading to Nonsense-Mediated
Decay. Mol Cell. 2004;13(1):91–100.
285. Nicholson P, Mühlemann O. Cutting the nonsense: the degradation of PTC-containing
mRNAs. Biochem Soc Trans. 2010;38(6):1615–20.
286. Isken O, Maquat LE. The multiple lives of NMD factors: Balancing roles in gene and genome
regulation. Vol. 9, Nature Reviews Genetics. NIH Public Access; 2008. p. 699–712.
287. Boutz PL, Stoilov P, Li Q, Lin CH, Chawla G, Ostrow K, et al. A post-transcriptional regulatory
switch in polypyrimidine tract-binding proteins reprograms alternative splicing in
developing neurons. Genes Dev. 2007;21(13):1636–52.
288. Spellman R, Llorian M, Smith CWJ. Crossregulation and Functional Redundancy between the
Splicing Regulator PTB and Its Paralogs nPTB and ROD1. Mol Cell. 2007;27(3):420–34.
289. Zheng S, Gray EE, Chawla G, Porse BT, O’Dell TJ, Black DL. PSD-95 is post-transcriptionally
repressed during early neural development by PTBP1 and PTBP2. Nat Neurosci.
2012;15(3):381–8.

References
161
290. Park SK, Zhou X, Pendleton KE, Hunter O V., Kohler JJ, O’Donnell KA, et al. A Conserved
Splicing Silencer Dynamically Regulates O-GlcNAc Transferase Intron Retention and O-
GlcNAc Homeostasis. Cell Rep. 2017;20(5):1088–99.
291. Kanaji T, et al. A common genetic polymorphism (46 C to T substitution) in the 5’-
untranslated region of the coagulation factor XII gene is associated with low translation
efficiency and decrease in plasma factor XII level. Blood. 1998;91(6):2010–4.
292. Matafonov A, et al. Factor XII inhibition reduces thrombus formation in a primate
thrombosis model. Blood. 2014 Mar 13;123(11):1739–46.
293. Calvo SE, et al. Upstream open reading frames cause widespread reduction of protein
expression and are polymorphic among humans. Proc Natl Acad Sci U S A.
2009;106(18):7507–12.
294. Liu L, et al. Mutation of the CDKN2A 5’ UTR creates an aberrant initiation codon and
predisposes to melanoma. Nat Genet. 1999;21(1):128–32.
295. Bisio A, et al. Functional analysis of CDKN2A/p16INK4a 5’-UTR variants predisposing to
melanoma. Hum Mol Genet. 2010;19(8):1479–91.
296. Sözen MM, et al. The molecular basis of familial hypercholesterolaemia in Turkish patients.
Atherosclerosis. 2005;180:63–71.
297. Lukowski SW, et al. Disrupted post-transcriptional regulation of the cystic fibrosis
transmembrane conductance regulator (CFTR) by a 5’UTR mutation is associated with a
CFTR-related disease. Hum Mutat. 2011;32(10):E2266–682.
298. Huopio H, et al. Acute insulin response tests for the differential diagnosis of congenital
hyperinsulinism. J Clin Endocrinol Metab. 2002;87(10):4502–7.
299. Braverman N, et al. Mutation Analysis of PEX7 in 60 Probands With Rhizomelic
Chondrodysplasia Punctata and Functional Correlations of Genotype With Phenotype. Hum
Mutat. 2002;20:284–97.
300. Krude H, et al. Severe early-onset obesity , adrenal insufficiency and red hair pigmentation
caused by POMC mutations in humans. Nat Genet. 1998;19:155–7.
301. Tassin J, et al. Levodopa-responsive dystonia. GTP cyclohydrolase I or parkin mutations?
Brain. 2000;123 ( Pt 6:1112–21.
302. Kit DM. Molecular mechanism of hepcidin deficiency in a patient with juvenile

References
162
hemochromatosis. Haematol Hematol J. 2007;92:127–8.
303. Wen Y, et al. Loss-of-function mutations of an inhibitory upstream ORF in the human hairless
transcript cause Marie Unna hereditary hypotrichosis. Nat Genet. 2009;41(2):228–33.
304. Ghilardi N, Skoda RC. A single-base deletion in the thrombopoietin (TPO) gene causes
familial essential thrombocythemia through a mechanism of more efficient translation of
TPO mRNA. Blood. 1999;94:1480–2.
305. Guilardi N, et al. Hereditary thrombocythaemia in a Japanese family is caused by a novel
point mutation in the thrombopoietin gene. Br J Haematol. 1999;107:310–6.
306. Sivagnanasundaram S, et al. A cluster of single nucleotide polymorphisms in the 5’-leader of
the human dopamine D3 receptor gene (DRD3) and its relationship to schizophrenia.
Neurosci Lett. 2000;279:13–6.
307. Pasaje CF, et al. WDR46 is a Genetic Risk Factor for Aspirin-Exacerbated Respiratory Disease
in a Korean Population. Allergy Asthma Immunol Res. 2012;4(4):199–205.
308. Beffagna G, et al. Regulatory mutations in transforming growth factor-beta3 gene cause
arrhythmogenic right ventricular cardiomyopathy type 1. Cardiovasc Res. 2005;65:366–73.
309. Wethmar K, et al. C / EBPb DuORF mice — a genetic model for uORF-mediated translational
control in mammals. Genes Dev. 2010;24:15–20.
310. Brown CY, et. Role of two upstream open reading frames in the translational control of
oncogene mdm2. Oncogene. 1999;18(41):5631–7.
311. Mihailovich M, et al. Complex translational regulation of BACE1 involves upstream AUGs and
stimulatory elements within the 5’ untranslated region. Nucleic Acids Res. 2007;35(9):2975–
85.
312. Lareau LF, Brooks AN, Soergel DAW, Meng Q, Brenner SE. The coupling of alternative splicing
and nonsense-mediated mRNA decay. Adv Exp Med Biol. 2007;623:190–211.
313. Lejeune F, Maquat LE. Mechanistic links between nonsense-mediated mRNA decay and pre-
mRNA splicing in mammalian cells. Vol. 17, Current Opinion in Cell Biology. 2005. p. 309–15.
314. Malabat C, Feuerbach F, Ma L, Saveanu C, Jacquier A. Quality control of transcription start
site selection by nonsense-mediated-mRNA decay. Elife. 2015;2015(4):1–59.
315. Kralovicova J, et al. Optimal antisense target reducing INS intron 1 retention is adjacent to a

References
163
parallel G quadruplex. Nucleic Acids Res. 2014;42(12):8161–73.
316. Hunter CA. Sequence-dependent DNA Structure. J Mol Biol. 1993 Apr;230(3):1025–54.
317. Ivanov IP, et al. Identification of evolutionarily conserved non-AUG-initiated N-terminal
extensions in human coding sequences. Nucleic Acids Res. 2011;39(10):4220–34.
318. Stewart JD, Al E. ABC50 mutants modify translation start codon selection. Biochem J.
2015;467:217–29.
319. Ivanov IP, Loughran G, Atkins JF. uORFs with unusual translational start codons autoregulate
expression of eukaryotic ornithine decarboxylase homologs. Proc Natl Acad Sci.
2008;105(29):10079–84.
320. Ingolia NT, Ghaemmaghami S, Newman JRS, Weissman JS. Genome-wide analysis in vivo of
translation with nucleotide resolution using ribosome profiling. Science.
2009;324(5924):218–23.
321. Ivanov IP, Loughran G, Sachs MS, Atkins JF. Initiation context modulates autoregulation of
eukaryotic translation initiation factor 1 (eIF1). Proc Natl Acad Sci. 2010;107(42):18056–60.
322. Havens M, et. Targeting RNA splicing for disease therapy. Wiley Interdiscip Rev RNA.
2012;29(6):997–1003.
323. Martinovich KM, Shaw NC, Kicic A, Schultz A, Fletcher S, Wilton SD, et al. The potential of
antisense oligonucleotide therapies for inherited childhood lung diseases. Mol Cell Pediatr.
2018;5(1):3.
324. Dias N, Stein CA. Antisense oligonucleotides: basic concepts and mechanisms. Mol Cancer
Ther. 2002;1(5):347–55.
325. Khvorova A, Watts JK. The chemical evolution of oligonucleotide therapies of clinical utility.
Nat Biotechnol. 2017;35(3):238–48.
326. Mansoor M, Melendez AJ. Advances in antisense oligonucleotide development for target
identification, validation, and as novel therapeutics. Gene Regul Syst Bio. 2008;2:275–95.
327. Stein CA, Castanotto D. FDA-Approved Oligonucleotide Therapies in 2017. Mol Ther.
2017;25(5):1069–75.
328. Donis-Keller H. Site specific enzymatic cleavage of RNA. Nucleic Acids Res. 1979;7(1):179–
92.

References
164
329. Crooke ST. Progress in Antisense Technology. Annu Rev Med. 2004;55(1):61–95.
330. Havens MA, Hastings ML. Splice-switching antisense oligonucleotides as therapeutic drugs.
Nucleic Acids Res. 2016;44(14):6549–63.
331. Geary RS, Crooke R, Bhanot S, Singleton W. Antisense therapies for
cardiovascular/metabolic diseases. Drug Discov Today Ther Strateg. 2013;10(3):e165–70.
332. Rigo F, Seth PP, Bennett CF. Antisense oligonucleotide-based therapies for diseases caused
by pre-mRNA processing defects. Adv Exp Med Biol. 2014;825:303–52.
333. Lukasz J. Kielpinki, Peter H. Hagedorn, Morten Lindow, Jeppe Vinther. RNase H sequence
preferences influence antisense oligonucleotide efficiency. Nucleic Acids Res.
2017;45(22):12932–44.
334. Liang XH, Sun H, Nichols JG, Crooke ST. RNase H1-Dependent Antisense Oligonucleotides
Are Robustly Active in Directing RNA Cleavage in Both the Cytoplasm and the Nucleus. Mol
Ther. 2017;25(9):2075–92.
335. Liang X-H, Nichols JG, Sun H, Crooke ST. Translation can affect the antisense activity of RNase
H1-dependent oligonucleotides targeting mRNAs. Nucleic Acids Res [. 2017;46(10):293–313.
336. Coelho AI, Lourenço S, Trabuco M, Silva MJ, Oliveira A, Gaspar A, et al. Functional correction
by antisense therapy of a splicing mutation in the GALT gene. Eur J Hum Genet.
2015;23(4):500–6.
337. Tasfaout H, Buono S, Guo S, Kretz C, Messaddeq N, Booten S, et al. Antisense
oligonucleotide-mediated Dnm2 knockdown prevents and reverts myotubular myopathy in
mice. Nat Commun. 2017;8:15661.
338. Liang X, Shen W, Sun H, Migawa MT, Vickers TA, Crooke ST. Translation efficiency of mRNAs
is increased by antisense oligonucleotides targeting upstream open reading frames. Nat
Biotechnol. 2016;34(8):875–80.
339. Henry SP, Miner RC, Drew WL, Fitchett J, York-Defalco C, Rapp LM, et al. Antiviral activity
and ocular kinetics of antisense oligonucleotides designed to inhibit CMV replication. Invest
Ophthalmol Vis Sci. 2001;42(11):2646–51.
340. Toth PP. Emerging LDL therapies: Mipomersen - Antisense oligonucleotide therapy in the
management of hypercholesterolemia. J Clin Lipidol. 2013;7(3 SUPPL.).
341. Parhofer KG. Mipomersen: evidence-based review of its potential in the treatment of

References
165
homozygous and severe heterozygous familial hypercholesterolemia. Core Evid. 2012;7:29–
38.
342. Davies JL, et al. A genome-wide search for human type 1 diabetes susceptibility genes. Vol.
371, Nature. 1994. p. 130–6.
343. Of D, Mellitus D. Diagnosis and classification of diabetes mellitus. Diabetes Care.
2014;37(SUPPL.1):81–90.
344. Bastaki S. Diabetes mellitus and its treatment. Int J Diabetes Metab. 2005;13(3):111–34.
345. ASSOCIATION AD. Diagnosis and Classification of Diabetes Mellitus. Diabetes Care.
2004;27(Suppl 1):S5–10.
346. Diabetes DOF. Diagnosis and classification of diabetes mellitus. Diabetes Care.
2010;33(SUPPL. 1):S62–9.
347. Wållberg M, Cooke A. Immune mechanisms in type 1 diabetes. Trends Immunol.
2013;34(12):583–91.
348. Pociot F, McDermott MF. Genetics of type 1 diabetes mellitus. Genes Immun. 2002;3:235–
49.
349. Ramachandran A. Know the signs and symptoms of diabetes. Indian J Med Res. 2014
Nov;140(5):579–81.
350. Precechtelova J, et al. Type I Diabetes Mellitus: Genetic Factors and Presumptive Enteroviral
Etiology or Protection. J Pathog. 2014;2014:1–21.
351. Bonifacio E. Predicting type 1 diabetes using biomarkers. Diabetes Care. 2015;38(6):989–96.
352. Regnell SE, Lernmark Å. Early prediction of autoimmune (type 1) diabetes. Diabetologia.
2017;1–12.
353. Knip M, Simell O. Environmental triggers of type 1 diabetes. Cold Spring Harb Perspect Biol.
2011;3(10):1–15.
354. Cerosaletti K, Buckner JH. Protein tyrosine phosphatases and type 1 diabetes: genetic and
functional implications of PTPN2 and PTPN22. Rev Diabet Stud. 2012;9(4):188–200.
355. Tang W, et al. Association of common polymorphisms in the IL2RA gene with type 1 diabetes:
Evidence of 32,646 individuals from 10 independent studies. J Cell Mol Med.
2015;19(10):2481–8.

References
166
356. Pugliese A, et al. HLA-DRB1∗15:01-DQA1∗01:02-DQB1∗06:02 haplotype protects
autoantibody-positive relatives from type 1 diabetes throughout the stages of disease
progression. Diabetes. 2016;65(4):1109–19.
357. Coppieters KT, et al. Demonstration of islet-autoreactive CD8 T cells in insulitic lesions from
recent onset and long-term type 1 diabetes patients. J Exp Med. 2012;209(1):51–60.
358. Jr JC, et al. The Immune System in Health and Disease. 5th edition. New York: Garland
Science. 2001.
359. Pathiraja V, et al. Proinsulin-specific, HLA-DQ8, and HLA-DQ8-transdimer-restricted CD4+ T
cells infiltrate islets in type 1 diabetes. Diabetes. 2015;64(1):172–82.
360. Steiner DF, et al. Structure and evolution of the insulin gene. Ann Rev Genet. 1985;19:463–
84.
361. Sander M, German MS. The beta cell transcription factors and development of the pancreas.
J Mol Med. 1997;75:327–40.
362. Owerbach D, et al. The insulin gene is located on the short arm of chromosome 11 in humans.
Diabetes. 1981;30:267–70.
363. Owebach D, et al. The insulin gene is located on chromosome 11 in humans. Nature.
1980;286:82–4.
364. Bell GI, et al. Sequence of the human insulin gene. Nature. 1980;284(5751):26–32.
365. Wang J, et al. Regulation of insulin preRNA splicing by glucose. Proc Natl Acad Sci U S A.
1997;94(9):4360–5.
366. Lu S, Cullen BR. Analysis of the stimulatory effect of splicing on mRNA production and
utilization in mammalian cells. RNA. 2003 May;9(5):618–30.
367. Mansilla A, et al. Developmental regulation of a proinsulin messenger RNA generated by
intron retention. EMBO Rep. 2005;6(12):1182–7.
368. Arrighi FE, et al. Buoyant densities of DNA of mammals. Biochem Genet. 1970;4(3):367–76.
369. Evans-Molina C, et al. Glucose regulation of insulin gene transcription and pre-mRNA
processing in human islets. Diabetes. 2007;56:827–35.
370. Shalev A, et al. A Proinsulin Gene Splice Variant with Increased Translation Efficiency Is
Expressed in Human Pancreatic Islets. Endocrinology. 2002 Jul 1;143(7):2541–7.

References
167
371. Bennett ST, et al. Susceptibility to human type 1 diabetes at IDDM2 is determined by tandem
repeat variation at the insulin gene minisatellite locus. Nat Genet. 1995;9(3):284–92.
372. Marchand L, Polychronakos C. Evaluation of polymorphic splicing in the mechanism of the
association of the insulin gene with diabetes. Diabetes. 2007;56(3):709–13.
373. Kralovicova J, et al. Variants in the Human Insulin Gene That Affect Pre-mRNA Splicing Is
−23HphI a Functional Single Nucleotide Polymorphism at IDDM2? Diabetes. 2006;55:260–4.
374. Barratt BJ, et al. Remapping the insulin gene/IDDM2 locus in type 1 diabetes. Diabetes.
2004;53:1884–9.
375. Alizadeh BZ, Koeleman BPC. Genetic polymorphisms in susceptibility to Type 1 Diabetes. Clin
Chim Acta. 2008;387(1–2):9–17.
376. Kikin O, D’Antonio L, Bagga PS. QGRS Mapper: A web-based server for predicting G-
quadruplexes in nucleotide sequences. Nucleic Acids Res. 2006;34(WEB. SERV. ISS.):676–82.
377. Bellaousov S, et al. RNAstructure: Web servers for RNA secondary structure prediction and
analysis. Nucleic Acids Res. 2013;41(Web Server issue):471–4.
378. Abdi HH. The Bonferonni and Šidák Corrections for Multiple Comparisons. Encycl Meas Stat.
2007;1:103–7.
379. Haynes W. Tukey’s Test. In: Encyclopedia of Systems Biology. New York, NY: Springer New
York; 2013. p. 2303–4.
380. McDonald JH. Fisher’s exact test of independence. In: Handbook of Biological Statistics. 2nd
editio. Baltimore, Maryland: Sparky House Publishing; 2009. p. 70–5.
381. Sawilowsky SS. The Probable Difference Between Two Means When σ_1^2≠σ_2^2. J Mod
Appl Stat Methods. 2002;1(2):461–72.
382. MacFarland TW, Yates JM. Friedman Twoway Analysis of Variance (ANOVA) by Ranks. In:
Introduction to Nonparametric Statistics for the Biological Sciences Using R. Cham: Springer
International Publishing; 2016. p. 213–47.
383. Oliveira LM, et al. Insulin glycation by methylglyoxal results in native-like aggregation and
inhibition of fibril formation. BMC Biochem. 2011;12(1):41–53.
384. Matthew Biancalana SK. Molecular Mechanism of Thioflavin-T Binding to Amyloid Fibrils.
Biochim Biophys Acta. 2010;1804(7):1405–12.

References
168
385. Reinke A, Gestwicki J. Insight into Amyloid Structure Using Chemical Probes. Chem Biol Drug
Des. 2011;77(6):399–411.
386. Kuznetsova IM, et al. Analyzing thioflavin t binding to amyloid fibrils by an equilibrium
microdialysis-based technique. PLoS One. 2012;7(2):1–8.
387. Tu LH, et al. Mutational analysis of the ability of resveratrol to inhibit amyloid formation by
islet amyloid polypeptide: Critical evaluation of the importance of aromatic-inhibitor and
histidine-inhibitor interactions. Biochemistry. 2015;54(3):666–76.
388. Saccà B, Lacroix L, Mergny J-L. The effect of chemical modifications on the thermal stability
of different G-quadruplex-forming oligonucleotides. Nucleic Acids Res. 2005;33(4):1182–92.
389. Bhasikuttan AC. Thioflavin T as an Efficient Inducer and Selective Fluorescent Sensor for the
Human Telomeric G-Quadruplex DNA. J. 2013;135(3670376).
390. Tong LL, et al. Stable label-free fluorescent sensing of biothiols based on ThT direct inducing
conformation-specific G-quadruplex. Biosens Bioelectron. 2013;49:420–5.
391. Chen J, et al. Label-free fluorescent biosensor based on the target recycling and Thioflavin
T-induced quadruplex formation for short DNA species of c-erbB-2 detection. Anal Chim Acta.
2014;817:42–7.
392. Li Y, et al. Thioflavin T as a fluorescence light-up probe for both parallel and antiparallel G-
quadruplexes of 29-mer thrombin binding aptamer. Anal Bioanal Chem.
2016;408(28):8025–36.
393. Henderson E, et al. Telomeric DNA oligonucleotides form novel intramolecular structures
containing guanine-guanine base pairs. Cell. 1987;51(6):899–908.
394. Sen D, Gilbert W. Formation of parallel four-stranded complexes by guanine-rich motifs in
DNA and its implications for meiosis. Nature. 1988;334(6180):364–6.
395. Noor H, Cao P, Raleigh DP. Morin hydrate inhibits amyloid formation by islet amyloid
polypeptide and disaggregates amyloid fibers. Protein Sci. 2012;21(3):373–82.
396. Marathias VM, Bolton PH. Determinants of DNA quadruplex structural type: Sequence and
potassium binding. Biochemistry. 1999;38(14):4355–64.
397. Granqvist L, Virta P. Characterization of G-Quadruplex/Hairpin Transitions of RNAs by19F
NMR Spectroscopy. Chem - A Eur J. 2016;22(43):15360–72.

References
169
398. Zhang AYQ, et al. A sequence-independent analysis of the loop length dependence of
intramolecular RNA G-quadruplex stability and topology. Biochemistry. 2011;50(33):7251–
8.
399. Bugaut A, Balasubramanian S. A sequence-independent study of the influence of short loop
lengths on the stability and topology of intramolecular DNA G-quadraplexes. Biochemistry.
2008;47(2):689–97.
400. Hazel P, et al. Loop-length-dependent folding of G-quadruplexes. J Am Chem Soc.
2004;126(50):16405–15.
401. Xu Y, et al. T-loop formation by human telomeric G-quadruplex. Nucleic Acids Symp Ser.
2007;51(51):243–4.
402. Guédin A, et al. How long is too long? Effects of loop size on G-quadruplex stability. Nucleic
Acids Res. 2010;38(21):7858–68.
403. Rachwal PA, et al. Sequence effects of single base loops in intramolecular quadruplex DNA.
FEBS Lett. 2007;581(8):1657–60.
404. Yakovchuk P, et al. Base-stacking and base-pairing contributions into thermal stability of the
DNA double helix. Nucleic Acids Res. 2006;34(2):564–74.
405. Assenberg R, et al. Sequence-dependent folding of DNA three-way junctions. Nucleic Acids
Res. 2002 Dec 1;30(23):5142–50.
406. Guédin A, Alberti P, Mergny JL. Stability of intramolecular quadruplexes: Sequence effects
in the central loop. Nucleic Acids Res. 2009;37(16):5559–67.
407. Zhang X-Y, et al. K + and Na + -Induced Self-Assembly of Telomeric Oligonucleotide
d(TTAGGG) n. J Biomol Struct Dyn. 2003;20(5):693–701.
408. Šket P, Črnugelj M, Plavec J. D(G 3T 4G 4) forms unusual dimeric G-quadruplex structure
with the same general fold in the presence of K +, Na + or NH 4 + ions. Bioorganic Med Chem.
2004;12(22):5735–44.
409. Cheng Q, Benson DR, Rivera M, Kuczera K. Formation and Temperature Stability of G-
Quadruplex Structures Formation and Temperature Stability of G-Quadruplex Structures
Studied Studied by Electronic and Vibrational Circular Dichroism by Electronic and
Vibrational Circular Dichroism Spectroscopy Co. Biopolymers. 2007;83(2):144–52.
410. Williamson JR, Raghuraman MK, Cech TR. Monovalent cation-induced structure of telomeric
References
170
DNA: The G-quartet model. Cell. 1989;59(5):871–80.
411. Miyoshi D, et al. Effect of divalent cations on antiparallel G-quartet structure of d(G4T4G4).
FEBS Lett. 2001;496(2–3):128–33.
412. Zhang Z, Gaffney BL, Jones RA. c-di-GMP displays A monovalent metal ion-dependent
polymorphism. J Am Chem Soc. 2004;126(51):16700–1.
413. Sabharwal NC, et al. N-methylmesoporphyrin IX fluorescence as a reporter of strand
orientation in guanine quadruplexes. FEBS J. 2014;281(7):1726–37.
414. Miyoshi D, Matsumura S, Li W, Sugimoto N. Structural Polymorphism of Telomeric DNA
Regulated by pH and Divalent Cation. Nucleosides Nucleotides Nucleic Acids [Internet].
2003;22(2):203–21. Available from: www.dekker.com
415. Schiavone D, et al. Determinants of G quadruplex-induced epigenetic instability in REV1-
deficient cells. EMBO J. 2014 Nov 3;33(21):2507–20.
416. Zhang AYQ, Balasubramanian S. The kinetics and folding pathways of intramolecular G-
quadruplex nucleic acids. J Am Chem Soc. 2012;134(46):19297–308.
417. Kuo MHJ, Wang ZF, Tseng TY, Li MH, Hsu STD, Lin JJ, et al. Conformational transition of a
hairpin structure to G-quadruplex within the WNT1 gene promoter. J Am Chem Soc.
2015;137(1):210–8.
418. Balasubramanian S, Hurley LH. Targeting G-quadruplexes in gene promoters : a novel
anticancer. Nat Rev Drug Discov. 2011;10(4):261–75.
419. Marušič M, Plavec J. The Effect of DNA Sequence Directionality on G-Quadruplex Folding.
Angew Chemie - Int Ed. 2015;54(40):11716–9.
420. Gomez D, et al. Telomerase downregulation induced by the G-quadruplex ligand 12459 in
A549 cells is mediated by hTERT RNA alternative splicing. Nucleic Acids Res. 2004;32(1):371–
9.
421. Bugaut A, Murat P, Balasubramanian S. An RNA hairpin to g-quadruplex conformational
transition. J Am Chem Soc. 2012;134(49):19953–6.
422. Ageely EA, Kartje ZJ, Rohilla KJ, Barkau CL, Gagnon KT. Quadruplex-Flanking Stem Structures
Modulate the Stability and Metal Ion Preferences of RNA Mimics of GFP. ACS Chem Biol.
2016;11(9):2398–406.

References
171
423. Pan T, Sosnick T. RNA folding during transcription. Annu Rev Biophys Biomol Struct.
2006;35:161–75.
424. Chheda N, Gupta MK. RNA as a Permutation. arXiv.org [Internet]. 2014;(March). Available
from: http://arxiv.org/pdf/1403.5477v1.pdf
425. Endoh T, Rode AB, Takahashi S, Kataoka Y, Kuwahara M, Sugimoto N. Real-Time Monitoring
of G-Quadruplex Formation during Transcription. Anal Chem. 2016;88(4):1984–9.
426. Woodson SA, Koculi E. Analysis of RNA Folding by Native Polyacrylamide Gel Electrophoresis.
1st ed. Vol. 469, Biophysical, Chemical, and Functional Probes of RNA Structure, Interactions
and Folding: Part B. Elsevier Inc.; 2009. 189-208 p.
427. Matera AG, Wang Z. A day in the life of the spliceosome. Nat Rev Mol Cell Biol.
2014;15(2):108–21.
428. Bendak K, et al. A rapid method for assessing the RNA-binding potential of a protein. Nucleic
Acids Res. 2012;40(14):1–11.
429. Walter BL, Parsley TB, Ehrenfeld E, Semler BL. Distinct poly(rC) binding protein KH domain
determinants for poliovirus translation initiation and viral RNA replication. J Virol.
2002;76(23):12008–22.
430. Jang S-W, Liu X, Fu H, Rees H, Yepes M, Levey A, et al. Interaction of Akt-phosphorylated
SRPK2 with 14-3-3 mediates cell cycle and cell death in neurons. J Biol Chem.
2009;284(36):24512–25.
431. Edmond V, Moysan E, Khochbin S, Matthias P, Brambilla C, Brambilla E, et al. Acetylation
and phosphorylation of SRSF2 control cell fate decision in response to cisplatin. EMBO J.
2011;30(3):510–23.
432. Wang J, Gao Q-S, Wang Y, Lafyatis R, Stamm S, Andreadis A. Tau exon 10, whose missplicing
causes frontotemporal dementia, is regulated by an intricate interplay of cis elements and
trans factors. J Neurochem. 2004;88(5):1078–90.
433. Yin X, Jin N, Gu J, Shi J, Zhou J, Gong C-X, et al. Dual-specificity tyrosine phosphorylation-
regulated kinase 1A (Dyrk1A) modulates serine/arginine-rich protein 55 (SRp55)-promoted
Tau exon 10 inclusion. J Biol Chem. 2012;287(36):30497–506.
434. Jensen MA, Wilkinson JE, Krainer AR. Splicing factor SRSF6 promotes hyperplasia of
sensitized skin. Nat Struct Mol Biol. 2014;21(2):189–97.

References
172
435. Samatanga B, Dominguez C, Jelesarov I, Allain FHT. The high kinetic stability of a G-
quadruplex limits hnRNP F qRRM3 binding to G-tract RNA. Nucleic Acids Res.
2013;41(4):2505–16.
436. Klass DM, et al. Quantitative proteomic analysis reveals concurrent RNA-protein interactions
and identifies new RNA-binding proteins in Saccharomyces cerevisiae. Genome Res. 2013
Jun;23(6):1028–38.
437. Yeh F-L, Tung L, Chang T-H. Detection of Protein–Protein Interaction Within an RNA–Protein
Complex Via Unnatural-Amino-Acid-Mediated Photochemical Crosslinking. In: Methods in
molecular biology (Clifton, NJ). 2016. p. 175–89.
438. Pires MM, et al. The network organization of protein interactions in the spliceosome is
reproduced by the simple rules of food-web models. Sci Rep. 2015;5(March):14865.
439. Chan S-P, et al. The Prp19p-Associated Complex in Spliceosome Activation. Science (80- ).
2003 Oct 10;302(5643):279–82.
440. Will CL, Luhrmann R. Spliceosome Structure and Function. Cold Spring Harb Perspect Biol.
2011 Jul 1;3(7):a003707–a003707.
441. Park S, et al. Evolutionary history of human disease genes reveals phenotypic connections
and comorbidity among genetic diseases. Sci Rep. 2012;2:757–63.
442. Stewart JD, et al. ABC50 mutants modify translation start codon selection. Biochem J.
2015;467(2):217–29.
443. Peabody DS. Translation initiation at non-AUG triplets in mammalian cells. J Biol Chem.
1989;264(9):5031–5.
444. Jin Y, Yang Y, Zhang P. New insights into RNA secondary structure in the alternative splicing
of pre-mRNAs. RNA Biol. 2011;8(3):450–7.
445. Mortimer SA, et al. Insights into RNA structure and function from genome-wide studies. Nat
Rev Genet. 2014;15(7):469–79.
446. Ding Y, et al. In vivo genome-wide profiling of RNA secondary structure reveals novel
regulatory features. Nature. 2013;505(7485):696–700.
447. Sugimoto S, et al. Thioflavin T as a fluorescence probe for monitoring RNA metabolism at
molecular and cellular levels. Nucleic Acids Res. 2015;43(14).

References
173
448. Yan Y-Y, et al. G-Quadruplex conformational change driven by pH variation with potential
application as a nanoswitch. Biochim Biophys Acta - Gen Subj. 2013 Oct;1830(10):4935–42.
449. Tuntiwechapikul W, et al. The influence of pH on the G-quadruplex binding selectivity of
perylene derivatives. Bioorg Med Chem Lett. 2006 Aug;16(15):4120–6.
450. Petrovic AG, Polavarapu PL. Quadruplex structure of polyriboinosinic acid: Dependence on
alkali metal ion concentration, pH and temperature. J Phys Chem B. 2008;112(7):2255–60.
451. Galer P, et al. Reversible pH Switch of Two-Quartet G-Quadruplexes Formed by Human
Telomere. Angew Chemie Int Ed. 2016 Feb 5;55(6):1993–7.
452. Tippana R, Xiao W, Myong S. G-quadruplex conformation and dynamics are determined by
loop length and sequence. Nucleic Acids Res. 2014;42(12):8106–14.
453. Creacy SD, et al. G4 resolvase 1 binds both DNA and RNA tetramolecular quadruplex with
high affinity and is the major source of tetramolecular quadruplex G4-DNA and G4-RNA
resolving activity in HeLa cell lysates. J Biol Chem. 2008 Dec 12;283(50):34626–34.
454. Henderson A, et al. Detection of G-quadruplex DNA in mammalian cells. Nucleic Acids Res.
2014 Jan 1;42(2):860–9.
455. Liu H, et al. RNA G-quadruplex formation in defined sequence in living cells detected by
bimolecular fluorescence complementation. Chem Sci. 2016 Jun 21;7(7):4573–81.
456. Larkin MA, Blackshields G, Brown NP, Chenna R, Mcgettigan PA, McWilliam H, et al. Clustal
W and Clustal X version 2.0. Bioinformatics. 2007;23(21):2947–8.
457. Kozak M. Initiation of translation in prokaryotes and eukaryotes. Gene. 1999;234:187–208.
458. Kozak M. Point mutations define a sequence flanking the AUG initiator codon that
modulates translation by eukaryotic ribosomes. Cell. 1986;44(2):283–92.
459. Reuter JS, Mathews DH. RNAstructure: software for RNA secondary structure prediction and
analysis. BMC Bioinformatics. 2010;11(1):129.

174

175
VIII. Appendices

176

Appendix A
177
Appendix A Supplementary figures
Figure 32 – Preliminary screening of G1 formation propensity using ThT fluorescence.
Mean fluorescence intensity of 2 µM ThT at 508 nm in the presence of indicated oligonucleotides at 1 µM. Positive controls are in green, negative controls in blue. Controls for ThT binding to G-tract are in orange and ThT binding according to the number of Gs in purple. Tested oligos are in red. Fluorescence intensity of the dye was removed from all samples. Error bars denote the standard deviation from five independent fluorescence assays. Asterisks denote p-values ≤ 0.05 (*), ≤ 0.01 (**) or ≤ 0.001 (***).

Appendix A
178
Figure 33 – Nucleotide sequence of AmpliScribe™ T7-Flash™ Transcription Kit control template. Segments predicted by QGRS mapper to form G-quadruplex structures, with G-scores of 12, 17 and 16, respectively, are highlighted in yellow and nucleotides involved in Hoogsteen interactions are underlined.

Appendix A
179
FRRM1 ----------VVKLRGLPWSCSVEDVQNFLSDCTIHDGAAGVHFIYTREGRQSGEAFVELGSEDDVKMALKKDR FRRM2 SNSADSANDGFVRLRGLPFGCTKEEIVQFFSGLEIVP--NGITLPVDPEGKITGEAFVQFASQELAEKALGKHK FRRM3 EFTVQSTTGHCVHMRGLPYKATENDIYNFFSPLNPV----RVHIEIGPDGRVTGEADVEFATHEEAVAAMSKDR H1RRM1 ---------FVVKVRGLPWSCSADEVQRFFSDCKIQNGAQGIRFIYTREGRPSGEAFVELESEDEVKLALKKDR H1RRM2 ---------GFVRLRGLPFGCSKEEIVQFFSGLEIVP--NGITLPVDFQGRSTGEAFVQFASQEIAEKALKKHK H1RRM3 ----QSTTGHCVHMRGLPYRATENDIYNFFSPLNPV----RVHIEIGPDGRVTGEADVEFATHEDAVAAMSKDK *::****: .: ::: .*:* : : :*: :*** *:: :.: . *: *. FRRM1 ESMGHRYIEVF------------------------------------ FRRM2 ERIGHRYIEVFKSSQEEVRSY-------------------------- FRRM3 ANMQHRYIELFLNSTTGASNGAYSSQV-------------------- H1RRM1 ETMGHRYVEVFKSNN-------------------------------- H1RRM2 ERIGHRYIEIFKSSR-------------------------------- H1RRM3 ANMQHRYVELFLNSTAGASGGAYEHRYVELFLNSTAGASGGAYGSQM : : ***:*:*
Figure 34 – Multiple alignment of amino acid sequences of hnRNP F and H1 RRM constructs. Multiple alignment of sequences was performed at Clustal Omega web service from © EMBL-EBI. Conserved aminoacids (“*”) are highlighted in grey. The “:” (colons) denote aminoacid conservation between groups with strong similar properties. The “.” (periods) indicate aminoacid conservation between groups of weakly similar properties (456).

Appendix A
180
Figure 35 - Nucleotide sequences of hnRNPs F and H1 and respective RRM constructs. RRM sequences are shown in upper case, restriction enzyme sites are highlighted in light grey and start and stop codons in black. TEV cleavage site and plasmid sequence including His-tag are in lower case. Figure 34 in appendix B shows the alignment of hnRNP F and H1 RRMs.

Appendix A
181
Figure 36 - Nucleotide sequences of primates INS 5’UTR constructs. Sequences of the INS 5’UTR of the tested primate species. Nucleotide sequences of primate 5’UTRs from clone sequencing at Source BioScience. Exonic sequences are in upper case, intronic sequences are in lower case. Restriction sites are highlighted in light grey and a -> g mutations that disrupt splicing in yellow.

Appendix A
182
A Non-ATG codons in a good Kozak context, in frame with the canonical ATG codon
agccctccaggacAGGCTGcatcagaagAGGccatcaagcAGGtctgttccaAGGgcctttgcgtcaggtgggctcAGGgttccagggtggCTGgaccccaggccccagctctgcagcAGGgaggacGTGgctgggctcgtgAAGcatGTGgggGTGagcccaggggccccaaggcagggcacctggccttcagcctgcctcagccctgcctgtcacccagatcactgtccttctgccATGg
Non-ATG codons in a good Kozak context, out of frame with the canonical ATG codon
agccctccaggacaggctgcatcagaagaggccATCAAGcaggtCTGttccAAGggcctttgcgtcAGGtgggctcagggttccAGGgtggctggaccccaggccccagctCTGcagcagggAGGACGtggCTGggctcgtgaagcATGtgggggtgagcccAGGggccccAAGgcAGGgcacCTGgccttcagcCTGcctcagccCTGcctgtcacccagatcactgtccttctgccATGg
Non-ATG codons in a weak Kozak context, in frame with the canonical ATG codon
agccctccaggacaggctgcatcagAAGaggccatcaagcaggtctgttccaagggcctttgcgtcaggtgggctcagggttccagggtggctggaccccAGGccccagctctgcagcagggaggacgtggctgggctcGTGaagcatgtgggggtgagcccaggggccccaAGGcagggcacctggccttcagcctgcctcagccctgcctgtcacccagatcactgtccttctgccATGg
Non-ATG codons in a weak Kozak context, out of frame with the canonical ATG codon
agccctccAGGacaggctgcATCagaagaggccatcaagcaggtctgttccaagggcctTTGcgtcaggtgggctcagggttccagggtggctggaccccaggccccagctctgcagcagggaggacgtggctgggctcgtgaagcatgtgggggtgagcccaggggccccaaggcagggcacctggccttcagcctgcctcagccctgcCTGtcacccagATCaCTGtccttCTGccATGg
B Number of non-canonical codons in 5'UTR
Translation efficiency
Initiation codon
Individually Grouped
In frame Out of frame In frame
Out of frame
High
ATG 0 1
6 15
ACG 0 1 Fisher’s exact test CTG 2 9 P value 0.1965
ATC 0 3 P value summary Ns
TTG 0 1 One- or two tailed Two-tailed GTG 4 0 Statistically
significant? (alpha<0.05)
No Low AGG 8 6 10 9
AAG 2 3
Figure 37 - Potential non-canonical initiation codons in human INS 5’UTR. (A) Codons are divided according to the surrounding nucleotide context, reading frame and translation efficiency. The preferred context (Kozak sequence) in mammals is GCCRCCAUGG, with the nucleotides in positions -3 and +4 (underlined) relative to the first nucleotide of initiation codon being the most relevant (457,458). For the analysis, it was considered that a codon is in a good Kozak context when one or both nucleotides in positions -3 and +4 are present. For a weak Kozak context, neither of them matches the preferred consensus context. Non-canonical codons (in uppercase) have different translation efficiencies (443): from the most efficient to the least efficient codon: ATG>ACG>CTG>ATC>TTG>GTG>AGG≈AAG (317,443). The main open reading frame initiated by ATG is highlighted in bold. Upstream stop codons are highlighted in black. (B) Distribution of non-canonical codons in INS 5’UTR, by their predicted translation efficiency. David Peabody (443) showed that alternative start codons may be used and that they have different relative translation efficiencies. In INS 5’UTR, in frame/out of frame distribution (table on the left) of these codons is very similar, shown by the Fisher’s exact test (table on the right).

Appendix B
183
Appendix B Supplementary tables
Table 17 – Secondary structure prediction of INS intron DNA-derived oligonucleotides The most stable predicted structure, by RNAstructure (377,459) web server, for each tested DNA oligonucleotide, corresponding to the lowest free energy (ΔG), and G-scores of putative G4 forming motifs are shown. For each sequence, motif nucleotides predicted by QGRS mapper (376) are highlighted in blue. Structures are coloured according to probabilities, indicating the likelihood of paired nucleotides being in the correct pair. From the highest probability (p) to the lowest: red (≥ 99%), orange (99% > p ≥ 95%), yellow (95% > p ≥ 90%), dark green (90% > p ≥ 80%), light green (80% > p ≥ 70%), light blue (70% > p ≥ 60%), dark blue (60% > p ≥ 50%) and purple (< 50%). The same is applied to unpaired nucleotides. For some oligonucleotides, no structure (-) was predicted by the web server. 1(377).
Oligo Sequence Predicted structure
(Fold1) ΔG
(kcal/mol) QGRS
G-score
WT TGGGCTCAGGGTTCCAGGGTGGCTGGACCCCAGGCCCCAGCTCTGCAGCAGGGA
GGACGTGGCTGGGC
-13.8
21/19
-12.8
Int1 TGGGCTCAGGGTTCCAGGGTGGCTGG
-3.1 20

Appendix B
184
Oligo Sequence Predicted structure
(Fold1) ΔG
(kcal/mol) QGRS
G-score
Int2 AGGGTTCCAGGGTGGCTGGACCCCA
-6.7 18
Int3 AGGGTGGCTGGACCCCAGGCCCCAGC
-4.5 17
Int4 TGGACCCCAGGCCCCAGCTCTGCA
-2.7 0
Int5 AGGCCCCAGCTCTGCAGCAGGGAGGA
-3.7 0
Int6 AGCTCTGCAGCAGGGAGGACGTGGC
-1.4 0
Int7 AGGGAGGACGTGGCTGGGC - - 19
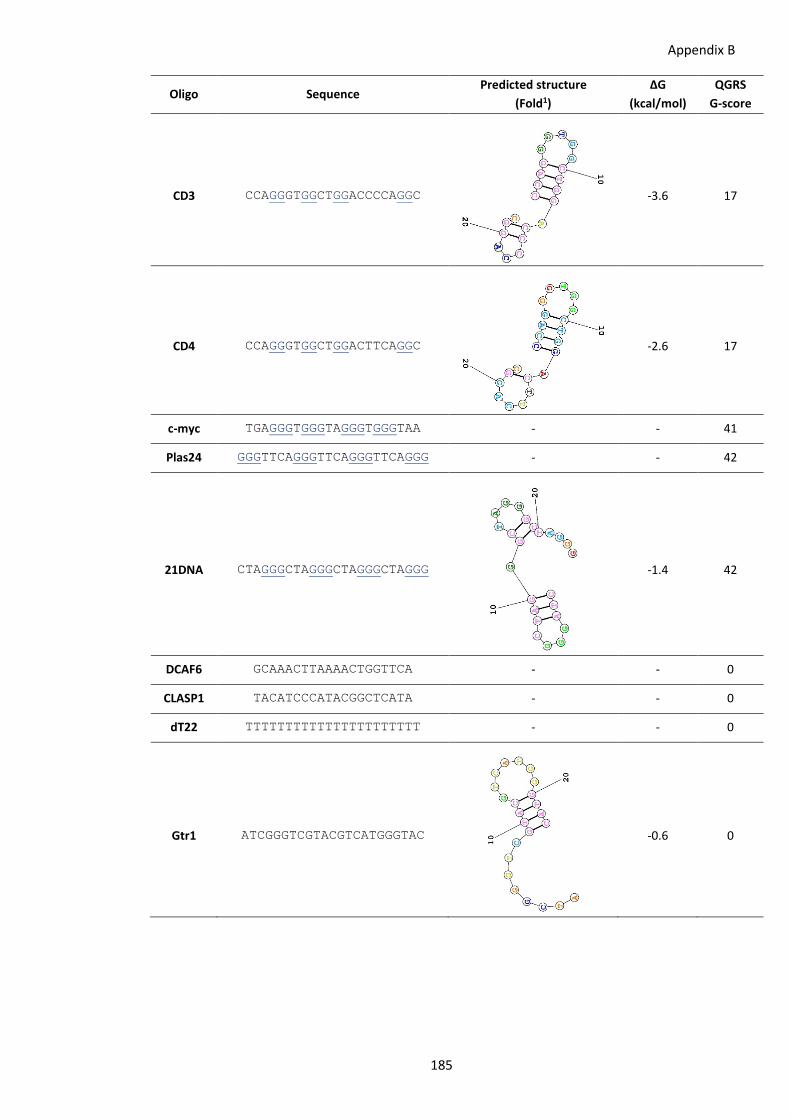
Appendix B
185
Oligo Sequence Predicted structure
(Fold1) ΔG
(kcal/mol) QGRS
G-score
CD3 CCAGGGTGGCTGGACCCCAGGC
-3.6 17
CD4 CCAGGGTGGCTGGACTTCAGGC
-2.6 17
c-myc TGAGGGTGGGTAGGGTGGGTAA - - 41
Plas24 GGGTTCAGGGTTCAGGGTTCAGGG - - 42
21DNA CTAGGGCTAGGGCTAGGGCTAGGG
-1.4 42
DCAF6 GCAAACTTAAAACTGGTTCA - - 0
CLASP1 TACATCCCATACGGCTCATA - - 0
dT22 TTTTTTTTTTTTTTTTTTTTTT - - 0
Gtr1 ATCGGGTCGTACGTCATGGGTAC
-0.6 0

Appendix B
186
Oligo Sequence Predicted structure
(Fold1) ΔG
(kcal/mol) QGRS
G-score
Gtr2 ACTGATCGTACGTGGGGTACGTAC
-4.5 0
Gtr3 GGGTACTGACATTAACCGGGAAC
-2.9 0
GA8 AAGGAAAGGAAAAGGAAAAGGAAA - - 20
GA12 GAGAGAGAGAGAGAGAGAGAGAGA - - 0
GT8 TTGGTTTGGTTTTGGTTTTGGTTT - - 20
GT12 GTGTGTGTGTGTGTGTGTGTGTGT - - 0
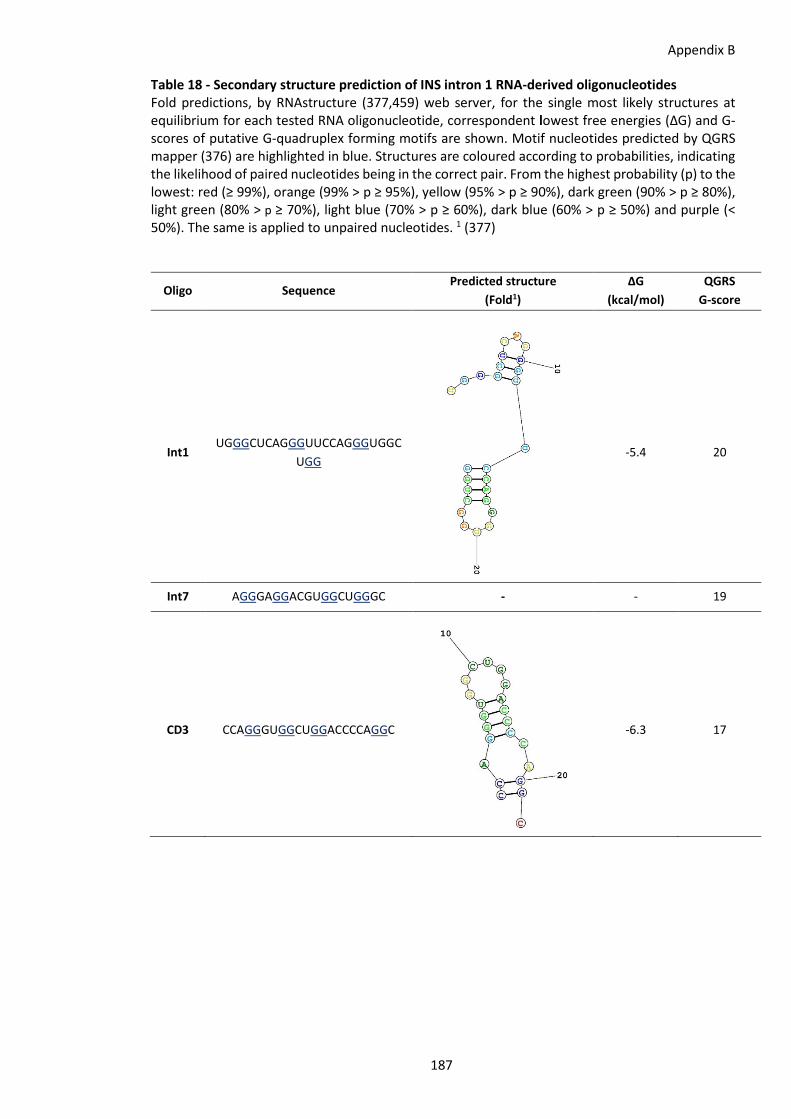
Appendix B
187
Table 18 - Secondary structure prediction of INS intron 1 RNA-derived oligonucleotides Fold predictions, by RNAstructure (377,459) web server, for the single most likely structures at equilibrium for each tested RNA oligonucleotide, correspondent lowest free energies (ΔG) and G-scores of putative G-quadruplex forming motifs are shown. Motif nucleotides predicted by QGRS mapper (376) are highlighted in blue. Structures are coloured according to probabilities, indicating the likelihood of paired nucleotides being in the correct pair. From the highest probability (p) to the lowest: red (≥ 99%), orange (99% > p ≥ 95%), yellow (95% > p ≥ 90%), dark green (90% > p ≥ 80%), light green (80% > p ≥ 70%), light blue (70% > p ≥ 60%), dark blue (60% > p ≥ 50%) and purple (< 50%). The same is applied to unpaired nucleotides. 1 (377)
Oligo Sequence Predicted structure
(Fold1) ΔG
(kcal/mol) QGRS
G-score
Int1 UGGGCUCAGGGUUCCAGGGUGGC
UGG
-5.4 20
Int7 AGGGAGGACGUGGCUGGGC - - 19
CD3 CCAGGGUGGCUGGACCCCAGGC
-6.3 17

Appendix B
188
Oligo Sequence Predicted structure
(Fold1) ΔG
(kcal/mol) QGRS
G-score
Plas24 GGGUUCAGGGUUCAGGGUUCAGG
G
-1.4 42
AV3 CCCUGUCCUUUUUUUUCCACAGCU
G
-0.5 0

Appendix B
189
Table 19 - Secondary structure prediction of INS RNA transcripts Fold predictions, by RNAstructure (377,459) web server, for the single most likely structures at equilibrium for INS intron 1 in vitro transcripts, correspondent lowest free energies (ΔG) and G-scores of putative G4 forming motifs are shown. Motif nucleotides predicted by QGRS mapper (376) are highlighted in blue. Mutations/deletions are highlighted in yellow. Structures are coloured according to probabilities, indicating the likelihood of paired nucleotides being in the correct pair. From the highest probability (p) to the lowest: red (≥ 99%), orange (99% > p ≥ 95%), yellow (95% > p ≥ 90%), dark green (90% > p ≥ 80%), light green (80% > p ≥ 70%), light blue (70% > p ≥ 60%), dark blue (60% > p ≥ 50%) and purple (< 50%). The same is applied to unpaired nucleotides. 1 (377)
Oligo Sequence Predicted structure
(Fold1) ΔG
(kcal/mol) QGRS
G-score
WT GGGCUCAGGGUUCCAGGGUGGCUGGACCCCAGGCCCCAGCUCUGCAGCAGGGAGG
ACGUGGCUGGGC
-29.4 21/19
del5
GGGCUCAGGGUUCCAGGGUGGCUGG-------------
GCUCUGCAGCAGGGAGGACGUGGCUGGGC
-18.2
41/19
-18.1
Mut 3 GGGCUCAGGGUUCCAGGAUGGUAGGACCCCAGGCCCCAGCUCUGCAGCAGGGAGG
ACGUGGCUGGGC
-23.8 21/19
Mut 5 GGGCUCAGGGUUCCAGGGUUGCUGGACCCGAGUCGCCAGCUCUGCAGCAGGGAGG
ACGUGGCUGGGC -29.6 20/19
Mut 6 GGGCUCAGGGUUCCAGGAUUGUAGGACCCCAGUCCCCAGCUCUGCAGCAGGGAGG
ACGUGGCUGGGC
-23.3
20/19
-22.8

Appendix B
190
Table 20 – Significance of ThT fluorescence differences in the time-course of G4-ThT complexes. Summary of the results of Šídák-Bonferroni corrected-multiple unpaired t-tests, performed for the comparison of mean fluorescence intensities of oligo-ThT complexes for one week (relative to Figure 10).
P value 𝒙𝒙�𝟏𝟏 𝒙𝒙�𝟐𝟐 𝒙𝒙�𝟐𝟐 − 𝒙𝒙�𝟏𝟏 SEM t ratio df Adjusted P Value
H2O 0.0171, ns 126 98.5 27.5 3.64 7.555 2 0.1287
ThT 0.2937, ns 141 116 25 17.72 1.411 2 0.9381
c-myc 0.8459, ns 451 439.5 11.5 52.15 0.2205 2 1.0000
Plas24 0.9530, ns 817.5 805.5 12 180.3 0.06654 2 1.0000
21 DNA 0.7659, ns 626.5 648.5 -22 64.59 0.3406 2 1.0000
dT22 0.2458, ns 115 136.5 -21.5 13.24 1.624 2 0.8954
DCAF6 0.8740, ns 153.5 142 11.5 64.02 0.1796 2 1.0000
CLASP1 0.8574, ns 122.5 127.5 -5 24.55 0.2037 2 1.0000

Appendix B
191
Table 21 – Significance of ThT-DNA G4 saturation curves. Summary of comparison of fluorescence intensities of titration curves of 10 different nucleotides at 2 and 20 µM with increasing concentrations of ThT, using the Tukey’s multiple comparison test (relative to Figure 12).
Oligo [ThT] [Oligo] Tukey’s multiple comparison test
p-value 𝒙𝒙�𝟐𝟐 − 𝒙𝒙�𝟏𝟏 95% CI
WT
10
0 vs. 20 0.8419, ns -2.45 -13 to 8.05
0 vs. 20 0.2503, ns -7.04 -17.5 to 3.47
2 vs. 20 0.5505, ns -4.59 -15.1 to 5.92
50
0 vs. 20 0.5675, ns -4.47 -15 to 6.04
0 vs. 20 <0.001, **** -22.4 -32.9 to -11.9
2 vs. 20 0.0004, *** -17.9 -28.4 to -7.4
100
0 vs. 20 0.6293, ns -4.03 -14.5 to 6.47
0 vs. 20 <0.0001, **** -37.2 -47.7 to -26.7
2 vs. 20 <0.0001, **** -33.2 -43.7 to -22.6
150
0 vs. 20 0.7518, ns -3.16 -13.7 to 7.35
0 vs. 20 <0.0001, **** -36.3 -46.8 to -25.8
2 vs. 20 <0.0001, **** -33.2 -43.7 to -22.7
200
0 vs. 20 0.8647, ns -2.25 -12.8 to 8.25
0 vs. 20 <0.0001, **** -33.5 -44 to -23
2 vs. 20 <0.0001, **** -31.3 -41.8 to -20.8
250
0 vs. 20 0.9259, ns -1.64 -12.1 to 8.87
0 vs. 20 <0.0001, **** -28 -40.1 to -19.1
2 vs. 20 <0.0001, **** -28 -38.5 to -17.5
300
0 vs. 20 0.9577, ns -1.23 -11.7 to 9.28
0 vs. 20 <0.0001, **** -23.4 -33.9 to -12.9
2 vs. 20 <0.0001, **** -22.1 -32.6 to 11.6
350
0 vs. 20 0.9779, ns -0.882 -11.4 to 9.62
0 vs. 20 0.0003, *** -18.2 -28.7 to -7.69
2 vs. 20 0.0006, *** -17.3 -27.8 to -6.81
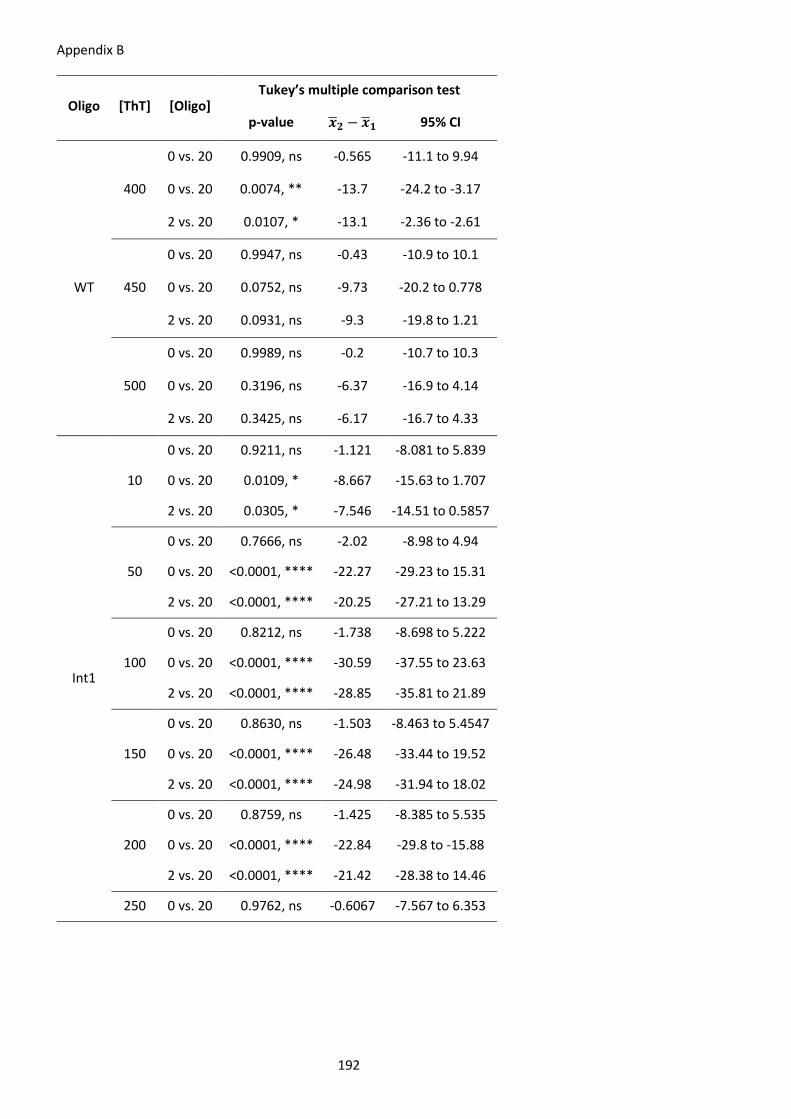
Appendix B
192
Oligo [ThT] [Oligo] Tukey’s multiple comparison test
p-value 𝒙𝒙�𝟐𝟐 − 𝒙𝒙�𝟏𝟏 95% CI
WT
400
0 vs. 20 0.9909, ns -0.565 -11.1 to 9.94
0 vs. 20 0.0074, ** -13.7 -24.2 to -3.17
2 vs. 20 0.0107, * -13.1 -2.36 to -2.61
450
0 vs. 20 0.9947, ns -0.43 -10.9 to 10.1
0 vs. 20 0.0752, ns -9.73 -20.2 to 0.778
2 vs. 20 0.0931, ns -9.3 -19.8 to 1.21
500
0 vs. 20 0.9989, ns -0.2 -10.7 to 10.3
0 vs. 20 0.3196, ns -6.37 -16.9 to 4.14
2 vs. 20 0.3425, ns -6.17 -16.7 to 4.33
Int1
10
0 vs. 20 0.9211, ns -1.121 -8.081 to 5.839
0 vs. 20 0.0109, * -8.667 -15.63 to 1.707
2 vs. 20 0.0305, * -7.546 -14.51 to 0.5857
50
0 vs. 20 0.7666, ns -2.02 -8.98 to 4.94
0 vs. 20 <0.0001, **** -22.27 -29.23 to 15.31
2 vs. 20 <0.0001, **** -20.25 -27.21 to 13.29
100
0 vs. 20 0.8212, ns -1.738 -8.698 to 5.222
0 vs. 20 <0.0001, **** -30.59 -37.55 to 23.63
2 vs. 20 <0.0001, **** -28.85 -35.81 to 21.89
150
0 vs. 20 0.8630, ns -1.503 -8.463 to 5.4547
0 vs. 20 <0.0001, **** -26.48 -33.44 to 19.52
2 vs. 20 <0.0001, **** -24.98 -31.94 to 18.02
200
0 vs. 20 0.8759, ns -1.425 -8.385 to 5.535
0 vs. 20 <0.0001, **** -22.84 -29.8 to -15.88
2 vs. 20 <0.0001, **** -21.42 -28.38 to 14.46
250 0 vs. 20 0.9762, ns -0.6067 -7.567 to 6.353

Appendix B
193
Oligo [ThT] [Oligo] Tukey’s multiple comparison test
p-value 𝒙𝒙�𝟐𝟐 − 𝒙𝒙�𝟏𝟏 95% CI
Int1
250 0 vs. 20 <0.0001, **** -19.53 -26.49 to 12.57
2 vs. 20 <0.0001, **** -18.93 -25.89 to 11.97
300
0 vs. 20 0.9968, ns -0.2213 -7.181 to 6.739
0 vs. 20 <0.0001, **** -14.88 -21.84 to 7.922
2 vs. 20 <0.0001, **** -14.66 -21.62 to 7.701
350
0 vs. 20 0.9967, ns -0.2233 -7.183 to 6.737
0 vs. 20 0.0011, ** -10.86 -17.82 to 3.898
2 vs. 20 0.0014, ** -10.63 -17.59 to 3.675
400
0 vs. 20 0.9969, ns -0.2193 -7.179 to 6.741
0 vs. 20 0.0159, * -8.273 -15.23 to 1.093
2 vs. 20 0.0194, * -8.053 -15.01 to 1.093
450
0 vs. 20 0.9992, ns -0.108 -7.068 to 6.852
0 vs. 20 0.1136, ns -5.993 -12.95 to 0.9669
2 vs. 20 0.1136, ns -5.885 -12.84 to 1.075
500
0 vs. 20 >0.9999, ns -0.001 -6.961 to 6.959
0 vs. 20 0.2461, ns -4.691 -11.65 to 2.269
2 vs. 20 0.2463, ns -4.69 -11.65 to 2.27
Int7
10
0 vs. 20 0.9644, ns -1.04 -10.7 to 8.65
0 vs. 20 0.0253, * -10.8 -20.5 to -1.11
2 vs. 20 0.0477, * -9.77 -19.5 to -0.0787
50
0 vs. 20 0.9157, ns -1.62 -11.3 to 8.07
0 vs. 20 <0.0001, **** -22.6 -32.2 to -12.9
2 vs. 20 <0.0001, **** -20.9 -30.6 to -11.2
100
0 vs. 20 0.8454, ns -2.23 -11.9 to 7.46
0 vs. 20 <0.0001, **** -33.6 -43.3 to -23.9
2 vs. 20 <0.0001, **** -31.4 -41.1 to -21.7
150
0 vs. 20 0.8960, ns -1.81 -11.5 to 7.88
0 vs. 20 <0.0001, **** -31.3 -40.9 to -21.6
2 vs. 20 <0.0001, **** -29.4 -39.1 to -19.8

Appendix B
194
Oligo [ThT] [Oligo] Tukey’s multiple comparison test
p-value 𝒙𝒙�𝟐𝟐 − 𝒙𝒙�𝟏𝟏 95% CI
Int7
200
0 vs. 20 0.9323, ns -1.44 -11.1 to 8.25
0 vs. 20 <0.0001, ns -25.1 -33.4 to -15.4
2 vs. 20 <0.0001, **** -23.7 -33.4 to -14
250
0 vs. 20 0.9629, ns -1.06 -10.7 to 8.63
0 vs. 20 <0.0001, **** -19.1 -28.8 to -9.42
2 vs. 20 <0.0001, **** -18.1 -27.7 to -8.36
300
0 vs. 20 0.9714, ns -0.928 -10.6 to 8.76
0 vs. 20 0.0019, ** -14.4 -24.1 to -4.75
2 vs. 20 0.0039, ** -13.5 -23.2 to -3.82
350
0 vs. 20 0.9869, ns -0.625 -10.3 to 9.07
0 vs. 20 0.037, * -10.2 -19.9 to -0.503
2 vs. 20 0.0537, ns -9.57 -19.3 to 0.122
400
0 vs. 20 0.9923 -0.478 -10.2 to 9.21
0 vs. 20 0.1975, ns -7.04 -16.7 to 2.65
2 vs. 20 0.2430, ns -6.56 16.3 to 3.13
450
0 vs. 20 0.9978, ns -0.255 -9.94 to 9.44
0 vs. 20 0.4735, ns -4.74 -14.4 to 4.95
2 vs. 20 0.5115, ns -4.49 -14.2 to 5.21
500
0 vs. 20 0.9984, ns -0.218 -9.91 to 9.47
0 vs. 20 0.5844, ns -4.01 -13.7 to 5.68
2 vs. 20 0.6183, ns -3.79 -13.5 to 5.9
CD3
10
0 vs. 20 0.9923, ns -0.338 -7.18 to 6.5
0 vs. 20 0.8362, ns -1.63 -8.47 to 5.21
2 vs. 20 0.8936, ns -1.29 -8.13 to 5.55
50
0 vs. 20 0.9559, ns -0.816 -7.66 to 6.03
0 vs. 20 0.0816, ns -6.23 -13.1 to 0.612
2 vs. 20 0.1475, ns -5.41 -12.3 to 1.43
100 0 vs. 20 0.9478, ns -0.891 -7.73 to 5.95
0 vs. 20 0.0048, ** -9.33 -16.2 to -2.49

Appendix B
195
Oligo [ThT] [Oligo] Tukey’s multiple comparison test
p-value 𝒙𝒙�𝟐𝟐 − 𝒙𝒙�𝟏𝟏 95% CI
CD3
100 2 vs. 20 0.0118, * -8.44 -15.3 to -1.6
150
0 vs. 20 0.9631, ns -0.746 -7.59 to 6.1
0 vs. 20 0.0050, ** -9.3 -16.1 to -2.46
2 vs. 20 0.0106, * -8.55 -15.4 to -1.71
200
0 vs. 20 0.9803, ns -0.543 -7.39 to 6.3
0 vs. 20 0.0213, * -7.82 -14.7 to -0.977
2 vs. 20 0.0346, * -7.28 -14.1 to -0.435
250
0 vs. 20 0.9807, ns -0.536 -7.38 to 6.31
0 vs. 20 0.0013, ** -10.5 -17.4 to -3.69
2 vs. 20 0.0024, ** -10 -16.8 to -3.16
300
0 vs. 20 0.9937, ns -0.305 -7.15 to 6.54
0 vs. 20 0.0025, ** -9.94 -16.8 to -3.1
2 vs. 20 0.0035, ** -9.64 -16.5 to -2.8
350
0 vs. 20 0.9920, ns -0.344 -7.19 to 605
0 vs. 20 0.0103, * -8.58 -15.4 to -1.74
2 vs. 20 0.0144, * -8.24 -15.1 to -1.4
400
0 vs. 20 0.9940, ns -0.297 -7.14 to 6.55
0 vs. 20 0.0275, * -7.53 -14.4 to -0.692
2 vs. 20 0.0358, * -7.24 -14.1 to -0.394
450
0 vs. 20 0.9798, ns -0.549 -7.39 to 6.29
0 vs. 20 0.0789, ns -6.27 -13.1 to 0.57
2 vs. 20 0.1188, ns -5.72 -12.6 to 1.12
500
0 vs. 20 0.9638, ns 0.738 -7.58 to 6.1
0 vs. 20 0.1465, ns -5.42 -12.3 to 1.42
2 vs. 20 0.2354, ns -4.69 -11.5 to 2.16
CD4 10
0 vs. 20 0.9997, ns -0.0443 -4.57 to 4.48
0 vs. 20 0.3194, ns -2.74 -7.27 to 1.78
2 vs. 20 0.3310, ns -2.7 -7.22 to 1.82

Appendix B
196
Oligo [ThT] [Oligo] Tukey’s multiple comparison test
p-value 𝒙𝒙�𝟐𝟐 − 𝒙𝒙�𝟏𝟏 95% CI
CD4
50
0 vs. 20 0.9702, ns -0.442 -4.96 to 4.08
0 vs. 20 0.0001, *** -8.25 -12.8 to 3.72
2 vs. 20 0.0003, *** -7.81 -12.3 to -3.28
100
0 vs. 20 0.9902, ns -0.252 -4.77 to 4.27
0 vs. 20 <0.0001, **** -13.2 -17.8 to -8.71
2 vs. 20 <0.0001, **** -13 -17.5 to -8.46
150
0 vs. 20 0.9928, ns -0.217 -4.74 to 4.31
0 vs. 20 <0.0001, **** -13.1 -17.6 to -8.56
2 vs. 20 <0.0001, **** -12.9 -17.4 to -8.33
200
0 vs. 20 0.9861, ns -0.301 -4.82 to 4.22
0 vs. 20 <0.0001, **** -12.9 -17.4 to -8.33
2 vs. 20 <0.0001, **** -12.6 -17.1 to -8.03
250
0 vs. 20 0.9944, ns -0.191 -4.71 to 4.33
0 vs. 20 <0.0001, **** -11.3 -15.8 to -6.78
2 vs. 20 <0.0001, **** -11.1 -15.6 to -6.59
300
0 vs. 20 0.9756, ns -0.399 -4.92 to 4.12
0 vs. 20 <0.0001, **** -8.81 -13.3 to -4.29
2 vs. 20 <0.0001, **** -8.41 -12.9 to -3.89
350
0 vs. 20 0.9905, ns -0.248 -4.77 to 4.27
0 vs. 20 0.0039, ** -6.29 -10.8 to -1.77
2 vs. 20 0.0058, ** -6.04 -10.6 to -1.52
400
0 vs. 20 0.9759, ns -0.397 -4.92 to 4.13
0 vs. 20 0.0243, * -5.07 -9.6 to -0.551
2 vs. 20 0.0411, * -4.68 -9.2 to -0.154
450
0 vs. 20 0.9913, ns -0.238 -4.76 to 4.28
0 vs. 20 0.1670, ns -3.46 -7.98 to1.07
2 vs. 20 0.2104, ns -3.22 -7.74 to1.3
500
0 vs. 20 0.9985, ns -0.097 -4.62 to 4.43
0 vs. 20 0.5119, ns -2.09 -6.61 to 2.43
2 vs. 20 0.5436, ns -2 -6.52 to 2.53

Appendix B
197
Oligo [ThT] [Oligo] Tukey’s multiple comparison test
p-value 𝒙𝒙�𝟐𝟐 − 𝒙𝒙�𝟏𝟏 95% CI
cmyc
10
0 vs. 20 0.9986, ns -0.12 -5.75 to5.51
0 vs. 20 0.0002, *** -9.92 -15.5 to -4.29
2 vs. 20 0.0003, *** -9.8 -15.4 to -4.17
50
0 vs. 20 0.9925, ns -0.275 -5.9 to 5.35
0 vs. 20 <0.0001, **** -20 -25.6 to -14.4
2 vs. 20 <0.0001, **** -19.7 -25.4 to -14.1
100
0 vs. 20 0.9818, ns -0.429 -6.05 to 5.2
0 vs. 20 <0.0001, **** -28 -33.6 to -22.4
2 vs. 20 <0.0001, **** -27.6 -33.2 to -22
150
0 vs. 20 0.9953, ns -0.218 -5.84 to 5.41
0 vs. 20 <0.0001, **** -28.3 -34 to -22.7
2 vs. 20 <0.0001, **** -28.1 -33.7 to -22.5
200
0 vs. 20 0.9967, ns -0.18 -5.81 to 5.45
0 vs. 20 <0.0001, **** -23.9 -29.5 to -18.3
2 vs. 20 <0.0001, **** -23.7 -29.4 to -18.1
250
0 vs. 20 0.9920, ns -0.283 -5.91 to 5.34
0 vs. 20 <0.0001, **** -19.7 -25.4 to -14.1
2 vs. 20 <0.0001, **** -19.4 -25.1 to -13.8
300
0 vs. 20 0.9953 -0.216 -5.84 to 5.41
0 vs. 20 <0.0001 -15.8 -21.4 to -10.1
2 vs. 20 <0.0001, **** -15.5 -21.2 to -9.92
350
0 vs. 20 0.9999, ns -0.0207 -5.65 to 5.6
0 vs. 20 <0.0001, **** -11.7 -17.4 to -6.12
2 vs. 20 <0.0001, **** -11.7 -17.3 to -6.1
400
0 vs. 20 0.9937, ns -0.251 -5.88 to 5.37
0 vs. 20 0.0004, *** -9.54 -15.2 to -3.91
2 vs. 20 0.0005, *** -9.54 -15.2 to -3.91
450 0 vs. 20 0.9984, ns -0.128 -5.75 to 5.5

Appendix B
198
Oligo [ThT] [Oligo] Tukey’s multiple comparison test
p-value 𝒙𝒙�𝟐𝟐 − 𝒙𝒙�𝟏𝟏 95% CI
cmyc
450 0 vs. 20 0.0058, ** -7.52 -13.1 to -1.9
2 vs. 20 0.0068, ** -7.39 -13 to -1.77
500
0 vs. 20 0.9996, ns -0.062 -5.69 to 5.56
0 vs. 20 0.1603, ns -4.35 -9.98 to 1.28
2 vs. 20 0.1685, ns -4.29 -9.91 to 1.34
Plas24
10
0 vs. 20 0.9824, ns -0.496 -7.12 to 6.13
0 vs. 20 0.0899, ns -5.91 -12.5 to 0.716
2 vs. 20 0.1305, ns -5.41 -12 to 1.21
50
0 vs. 20 0.8685, ns -1.4 -8.02 to 5.22
0 vs. 20 <0.0001, **** -22.9 -29.6 to -16.3
2 vs. 20 <0.0001, **** -21.5 -28.2 to -14.9
100
0 vs. 20 0.7554, ns -1.98 -8.6 to 4.65
0 vs. 20 <0.0001, **** -29.3 -35.9 to .22.6
2 vs. 20 <0.0001, **** -27.3 -33.9 to -20.7
150
0 vs. 20 0.9024, ns -1.19 -782 to 5.43
0 vs. 20 <0.0001, **** -24.6 -31.2 to -17.9
2 vs. 20 <0.0001, **** -23.4 -30 to -16.8
200
0 vs. 20 0.9422, ns -0.908 -7.53 to 5.72
0 vs. 20 <0.0001, **** -20.4 -27 to -13.8
2 vs. 20 <0.0001, **** -19.5 -26.1 to -12.8
250
0 vs. 20 0.9681, ns -0.67 -7.29 to 5.95
0 vs. 20 <0.0001, **** -14.1 -20.7 to-7.49
2 vs. 20 <0.0001, **** -13.4 -20.1 to -6.82
300
0 vs. 20 0.9737, ns -0.608 -7.23 to 6.02
0 vs. 20 0.0011, ** -10.4 -17 to -3.74
2 vs. 20 0.0022, ** -9.76 -16.4 to -3.14
350
0 vs. 20 0.9845, ns -0.465 -7.09 to 6.16
0 vs. 20 0.0218, * -7.54 -14.2 to -0.919
2 vs. 20 0.0335, * -7.08 -13.7 to -0.454

Appendix B
199
Oligo [ThT] [Oligo] Tukey’s multiple comparison test
p-value 𝒙𝒙�𝟐𝟐 − 𝒙𝒙�𝟏𝟏 95% CI
Plas24
400
0 vs. 20 0.9854, ns -0.451 -7.07 to 6.17
0 vs. 20 0.1437, ns -5.28 -11.9 to 1.35
2 vs. 20 0.1955, ns -4.83 -11.5 to 1.8
450
0 vs. 20 0.9993, ns -0.099 -6.72 to 6.52
0 vs. 20 0.2755, ns -4.28 -10.9 to 2.35
2 vs. 20 0.2919, ns -4.18 -10.8 to 2.45
500
0 vs. 20 0.9991, ns -0.111 -6.73 to 6.51
0 vs. 20 0.5581, ns -2.86 -9.48 to 3.77
2 vs. 20 0.5832, ns -2.75 -9.37 to 3.88
Int1+18
10
0 vs. 20 0.8736, ns -0.544 -3.17 to 2.09
0 vs. 20 0.0672, ns -2.49 -5.12 to 0.14
2 vs. 20 0.1862, ns -1.95 -4.57 to 0.684
50
0 vs. 20 0.1802, ns -1.96 -4.59 to 0.664
0 vs. 20 <0.0001, **** -10.1 -12.7 to -7.43
2 vs. 20 <0.0001, **** -8.1 -107. To -5.47
100
0 vs. 20 0.1771, ns -1.98 -4.6 to 0.654
0 vs. 20 <0.0001, **** -14.5 -17.1 to -11.9
2 vs. 20 <0.0001, **** -12.5 -15.1 to -9.89
150
0 vs. 20 0.4235, ns -1.38 -4.01 to 1.25
0 vs. 20 <0.0001, **** -15.5 -18.1 to -12.9
2 vs. 20 <0.0001, **** -14.1 -16.7 to -11.5
200
0 vs. 20 0.3897, ns -1.45 -4.08 to 1.18
0 vs. 20 <0.0001, **** -13.5 -16.1 to -10.9
2 vs. 20 <0.0001, **** -12.1 -14.7 to -9.43
250
0 vs. 20 0.6379, ns -0.994 -3.62 to 1.63
0 vs. 20 <0.0001, **** -11.3 -13.9 to -8.63
2 vs. 20 <0.0001, **** -10.3 -12.9 to -7.64
300 0 vs. 20 0.8186, ns -0.662 -3.29 to 1.97
0 vs. 20 <0.0001, **** -8.95 -11.6 to -6.32

Appendix B
200
Oligo [ThT] [Oligo] Tukey’s multiple comparison test
p-value 𝒙𝒙�𝟐𝟐 − 𝒙𝒙�𝟏𝟏 95% CI
Int1+18
300 2 vs. 20 <0.0001, **** -8.29 -10.9 to -5.66
350
0 vs. 20 0.8848, ns -0.517 -3.15 to 2.11
0 vs. 20 <0.0001, **** -6.26 -8.89 to -3.63
2 vs. 20 <0.0001, **** -5.74 -8.37 to -3.11
400
0 vs. 20 0.8852, ns -0.516 -3.15 to 2.11
0 vs. 20 <0.0001, **** -4.96 -7.59 to -2.33
2 vs. 20 0.0004, *** -4.45 -7.07 to -1.82
450
0 vs. 20 0.9869, ns -0.169 -2.8 to 2.46
0 vs. 20 0.0112, * -3.27 -5.89 to -0.636
2 vs. 20 0.017, * -3.1 -5.73 to -0.467
500
0 vs. 20 0.9996, ns 0.0307 -2.6 to 2.66
0 vs. 20 0.3334, ns -1.56 -4.19 to 1.07
2 vs. 20 0.3195, ns -1.59 -4.22 to 1.03
Int7+20
10
0 vs. 20 0.7915, ns -0.889 -4.15 to 2.38
0 vs. 20 0.0091, ** -4.15 -7.42-0.888
2 vs. 20 0.05, ns -3.26 -6.53 to 0.000227
50
0 vs. 20 0.3871, ns -1.8 -5.07 to 1.46
0 vs. 20 <0.0001, **** -14.2 -17.5 to -11
2 vs. 20 <0.0001, **** -12.4 -15.7 to 1.37
100
0 vs. 20 0.3525, ns -1.89 -5.16 to 1.37
0 vs. 20 <0.0001, **** -20 -23.3 to -16.8
2 vs. 20 <0.0001, **** -18.1 -21.4 to -14.9
150
0 vs. 20 0.5988, ns -1.32 -4.58 to 1.95
0 vs. 20 <0.0001, **** -20.9 -24.1 to -17.6
2 vs. 20 <0.0001, **** -19.6 -22.8 to -16.3
200
0 vs. 20 0.6724, ns -1.16 -4.42 to 2.11
0 vs. 20 <0.0001, **** -19 -22.3 to -15.8
2 vs. 20 <0.0001, **** -17.9 -21.1 to -14.6
250 0 vs. 20 0.8146, ns -0.832 -4.1 to 2.43

Appendix B
201
Oligo [ThT] [Oligo] Tukey’s multiple comparison test
p-value 𝒙𝒙�𝟐𝟐 − 𝒙𝒙�𝟏𝟏 95% CI
Int7+20
250 0 vs. 20 <0.0001, **** -16.2 -19.5 to -13
2 vs. 20 <0.0001, **** -15.4 -18.7 to -12.1
300
0 vs. 20 0.9374, ns -0.467 -3.73 to 2.8
0 vs. 20 <0.0001, **** -13.4 -16.7 to -10.2
2 vs. 20 <0.0001, **** -13 -16.7 to -9.72
350
0 vs. 20 0.9411, ns -0.452 -3.72 to 2.81
0 vs. 20 <0.0001, **** -10.3 -13.5 to -7.01
2 vs. 20 <0.0001, **** -9.82 -13.1 to -6.56
400
0 vs. 20 0.8564, ns -0.723 -3.99 to 2.54
0 vs. 20 <0.0001, **** -7.75 -11 to -4.48
2 vs. 20 <0.0001, **** -7.02 -10.3 to -3.76
450
0 vs. 20 0.9597, ns -0.72 -3.64 to 2.89
0 vs. 20 0.0015, ** -4.97 -8.24 to -1.71
2 vs. 20 0.0035, ** -4.6 -7.86 to -1.33
500
0 vs. 20 0.9793, ns -0.265 -3.53 to 3
0 vs. 20 0.1173, ns -2.74 -6 to 0.526
2 vs. 20 0.1720, ns -2.47 -5.74 to 0.791
dT22
10
0 vs. 20 0.5238, ns 0.197 -0.236 to 0.629
0 vs. 20 0.9923, ns -0.0213 -0.454 to 0.411
2 vs. 20 0.4527, ns -0.218 -0.651 to 0.215
50
0 vs. 20 0.3789, ns 0.242 -0.191 to 0.674
0 vs. 20 0.0859, ns -0.39 -0.822 to 0.043
2 vs. 20 0.0024, ** -0.631 -1.06 to -0.199
100
0 vs. 20 0.1092, ns 0.369 -0.0634 to 0.802
0 vs. 20 0.0029, ** -0.619 -1.05 to -0.187
2 vs. 20 <0.0001, **** -0.989 -1.42 to -0.556
150
0 vs. 20 0.1165, ns 0.364 -0.069 to 0.796
0 vs. 20 <0.0001, **** -0.866 -1.3 to -0.434
2 vs. 20 <0.0001, **** -1.23 -1.66 to -0.797
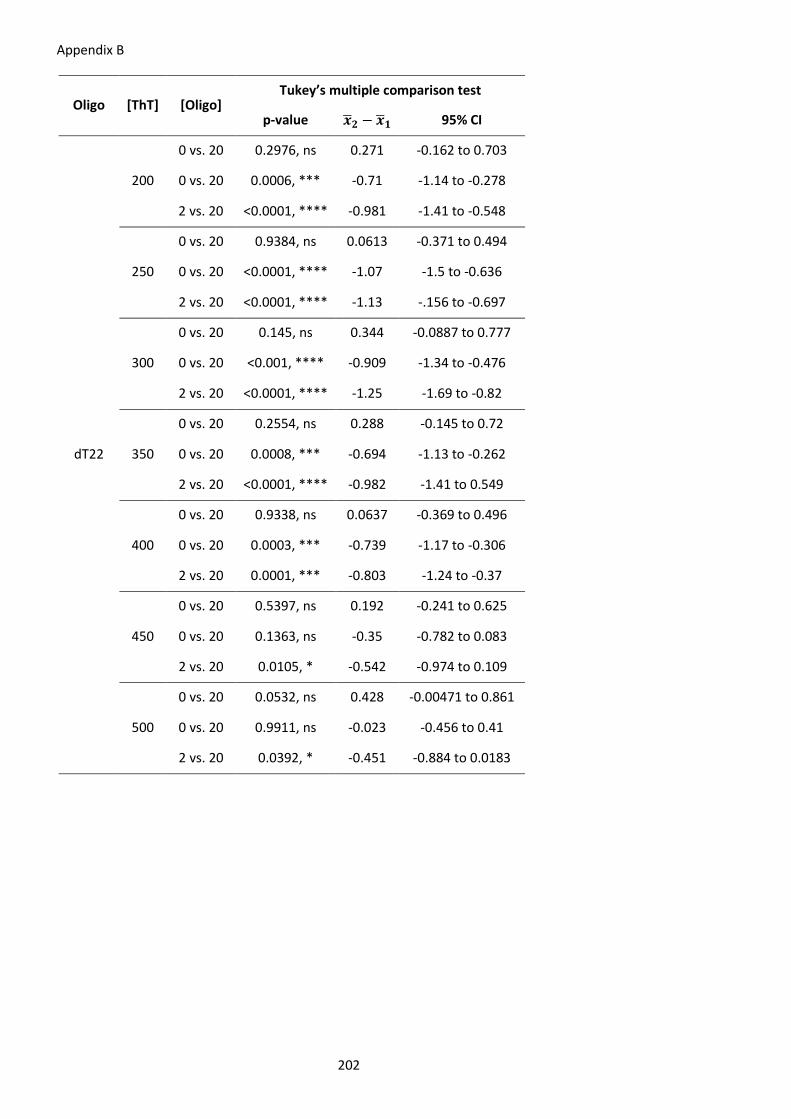
Appendix B
202
Oligo [ThT] [Oligo] Tukey’s multiple comparison test
p-value 𝒙𝒙�𝟐𝟐 − 𝒙𝒙�𝟏𝟏 95% CI
dT22
200
0 vs. 20 0.2976, ns 0.271 -0.162 to 0.703
0 vs. 20 0.0006, *** -0.71 -1.14 to -0.278
2 vs. 20 <0.0001, **** -0.981 -1.41 to -0.548
250
0 vs. 20 0.9384, ns 0.0613 -0.371 to 0.494
0 vs. 20 <0.0001, **** -1.07 -1.5 to -0.636
2 vs. 20 <0.0001, **** -1.13 -.156 to -0.697
300
0 vs. 20 0.145, ns 0.344 -0.0887 to 0.777
0 vs. 20 <0.001, **** -0.909 -1.34 to -0.476
2 vs. 20 <0.0001, **** -1.25 -1.69 to -0.82
350
0 vs. 20 0.2554, ns 0.288 -0.145 to 0.72
0 vs. 20 0.0008, *** -0.694 -1.13 to -0.262
2 vs. 20 <0.0001, **** -0.982 -1.41 to 0.549
400
0 vs. 20 0.9338, ns 0.0637 -0.369 to 0.496
0 vs. 20 0.0003, *** -0.739 -1.17 to -0.306
2 vs. 20 0.0001, *** -0.803 -1.24 to -0.37
450
0 vs. 20 0.5397, ns 0.192 -0.241 to 0.625
0 vs. 20 0.1363, ns -0.35 -0.782 to 0.083
2 vs. 20 0.0105, * -0.542 -0.974 to 0.109
500
0 vs. 20 0.0532, ns 0.428 -0.00471 to 0.861
0 vs. 20 0.9911, ns -0.023 -0.456 to 0.41
2 vs. 20 0.0392, * -0.451 -0.884 to 0.0183

Appendix B
203
Table 22 – Significance of ThT screening for G4 formation in vitro in INS intron 1. Summary of Friedman test performed for the comparison of mean fluorescence intensities of INS intron 1 DNA derived oligos, G4-forming control oligos and sequence-binding properties by ThT, in water (relative to Figure 14).
Friedman test
Dunn’s test Rank sum diff. p-value
WT vs. Int1 3 0.8625, ns
WT vs. Int2 51 0.0032, **
WT vs. Int3 40 0.0209, *
WT vs. Int4 42 0.0153, *
WT vs. Int5 14 0.4189, ns
WT vs. Int6 -3 0.8625, ns
WT vs. Int7 -9 0.6033, ns
WT vs. CD3 39 0.0243, *
WT vs. CD4 31 0.0735, ns
WT vs. IAO21 41 0.0179, *
WT vs. c-myc -2 0.9081, ns
WT vs. Plas24 2 0.9081, ns
WT vs. 21DNA 10 0.5637, ns
WT vs. dT22 54 0.0018, **
WT vs. DCAF6 25 0.1489, ns
WT vs. CLASP1 48 0.0056, **
WT vs. Gtr1 14 0.4189, ns
WT vs. Gtr2 30 0.0833, ns
WT vs. Gtr3 16 0.3556, ns
WT vs. GA8 -15 0.3865, ns
WT vs. GA12 -12 0.4884, ns
WT vs. GT8 23 0.1842, ns
WT vs. GT12 26 0.1333, ns
Friedman test Dunn’s test
Rank sum diff. p-value
Int1 vs. Int2 48 0.0056, **
Int1 vs. Int3 37 0.0327, *
Int1 vs. Int4 39 0.0243, *
Int1 vs. Int5 11 0.5254, ns
Int1 vs. Int6 -6 0.7290, ns
Int1 vs. Int7 -12 0.4884, ns
Int1 vs. CD3 36 0.0377, *
Int1 vs. CD4 28 0.1060, ns
Int1 vs. IAO21 38 0.0282, *
Int1 vs. c-myc -5 0.7728, ns
Int1 vs. Plas24 -1 0.9540, ns
Int1 vs. 21DNA 7 0.6861, ns
Int1 vs. dT22 51 0.0032, **
Int1 vs. DCAF6 22 0.2040, ns
Int1 vs. CLASP1 45 0.0094, **
Int1 vs. Gtr1 11 0.5254, ns
Int1 vs. Gtr2 27 0.1190, ns
Int1 vs. Gtr3 13 0.4529, ns
Int1 vs. GA8 -18 0.2987, ns
Int1 vs. GA12 -15 0.3865, ns
Int1 vs. GT8 20 0.2482, ns
Int1 vs. GT12 23 0.1842, ns
Int2 vs. Int3 -11 0.5254, ns
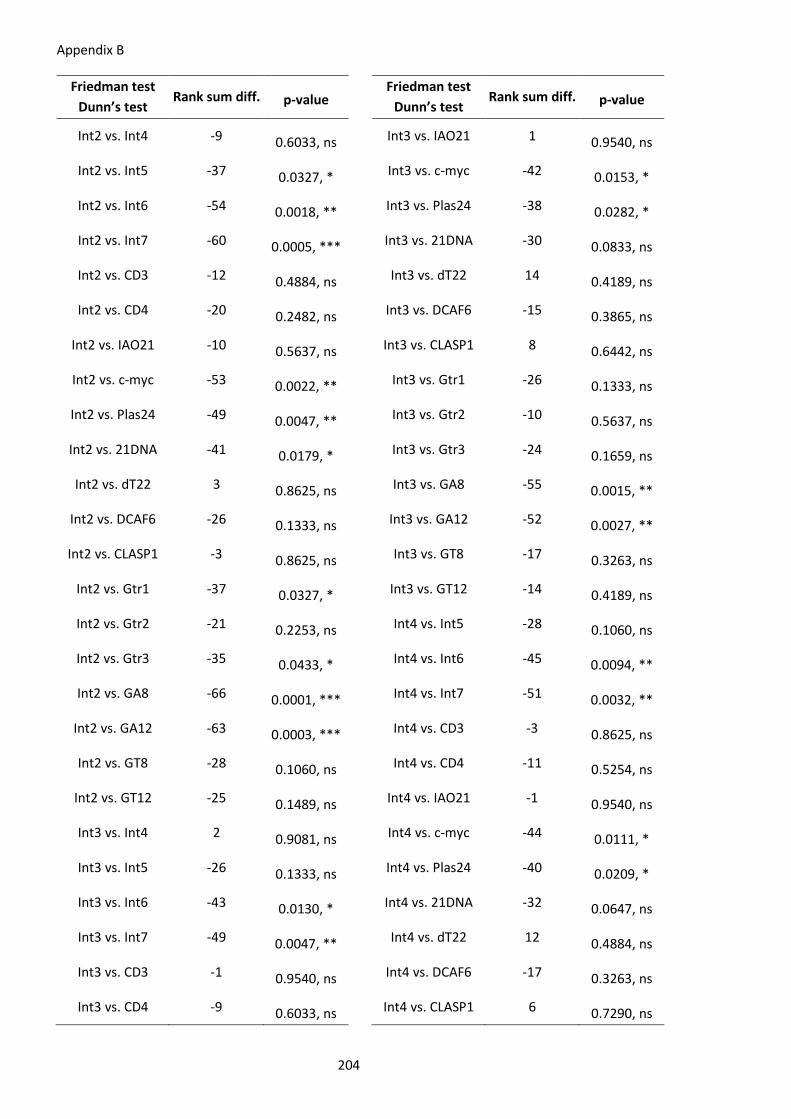
Appendix B
204
Friedman test Dunn’s test
Rank sum diff. p-value
Int2 vs. Int4 -9 0.6033, ns
Int2 vs. Int5 -37 0.0327, *
Int2 vs. Int6 -54 0.0018, **
Int2 vs. Int7 -60 0.0005, ***
Int2 vs. CD3 -12 0.4884, ns
Int2 vs. CD4 -20 0.2482, ns
Int2 vs. IAO21 -10 0.5637, ns
Int2 vs. c-myc -53 0.0022, **
Int2 vs. Plas24 -49 0.0047, **
Int2 vs. 21DNA -41 0.0179, *
Int2 vs. dT22 3 0.8625, ns
Int2 vs. DCAF6 -26 0.1333, ns
Int2 vs. CLASP1 -3 0.8625, ns
Int2 vs. Gtr1 -37 0.0327, *
Int2 vs. Gtr2 -21 0.2253, ns
Int2 vs. Gtr3 -35 0.0433, *
Int2 vs. GA8 -66 0.0001, ***
Int2 vs. GA12 -63 0.0003, ***
Int2 vs. GT8 -28 0.1060, ns
Int2 vs. GT12 -25 0.1489, ns
Int3 vs. Int4 2 0.9081, ns
Int3 vs. Int5 -26 0.1333, ns
Int3 vs. Int6 -43 0.0130, *
Int3 vs. Int7 -49 0.0047, **
Int3 vs. CD3 -1 0.9540, ns
Int3 vs. CD4 -9 0.6033, ns
Friedman test Dunn’s test
Rank sum diff. p-value
Int3 vs. IAO21 1 0.9540, ns
Int3 vs. c-myc -42 0.0153, *
Int3 vs. Plas24 -38 0.0282, *
Int3 vs. 21DNA -30 0.0833, ns
Int3 vs. dT22 14 0.4189, ns
Int3 vs. DCAF6 -15 0.3865, ns
Int3 vs. CLASP1 8 0.6442, ns
Int3 vs. Gtr1 -26 0.1333, ns
Int3 vs. Gtr2 -10 0.5637, ns
Int3 vs. Gtr3 -24 0.1659, ns
Int3 vs. GA8 -55 0.0015, **
Int3 vs. GA12 -52 0.0027, **
Int3 vs. GT8 -17 0.3263, ns
Int3 vs. GT12 -14 0.4189, ns
Int4 vs. Int5 -28 0.1060, ns
Int4 vs. Int6 -45 0.0094, **
Int4 vs. Int7 -51 0.0032, **
Int4 vs. CD3 -3 0.8625, ns
Int4 vs. CD4 -11 0.5254, ns
Int4 vs. IAO21 -1 0.9540, ns
Int4 vs. c-myc -44 0.0111, *
Int4 vs. Plas24 -40 0.0209, *
Int4 vs. 21DNA -32 0.0647, ns
Int4 vs. dT22 12 0.4884, ns
Int4 vs. DCAF6 -17 0.3263, ns
Int4 vs. CLASP1 6 0.7290, ns

Appendix B
205
Friedman test Dunn’s test
Rank sum diff. p-value
Int4 vs. Gtr1 -28 0.1060, ns
Int4 vs. Gtr2 -12 0.4884, ns
Int4 vs. Gtr3 -26 0.1333, ns
Int4 vs. GA8 -57 0.0010, ***
Int4 vs. GA12 -54 0.0018, **
Int4 vs. GT8 -19 0.2727, ns
Int4 vs. GT12 -16 0.3556, ns
Int5 vs. Int6 -17 0.3263, ns
Int5 vs. Int7 -23 0.1842, ns
Int5 vs. CD3 25 0.1489, ns
Int5 vs. CD4 17 0.3263, ns
Int5 vs. IAO21 27 0.1190, ns
Int5 vs. c-myc -16 0.3556, ns
Int5 vs. Plas24 -12 0.4884, ns
Int5 vs. 21DNA -4 0.8174, ns
Int5 vs. dT22 40 0.0209, *
Int5 vs. DCAF6 11 0.5254, ns
Int5 vs. CLASP1 34 0.0496, *
Int5 vs. Gtr1 0 >0.9999, ns
Int5 vs. Gtr2 16 0.3556, ns
Int5 vs. Gtr3 2 0.9081, ns
Int5 vs. GA8 -29 0.0941, ns
Int5 vs. GA12 -26 0.1333, ns
Int5 vs. GT8 9 0.6033, ns
Int5 vs. GT12 12 0.4884, ns
Int6 vs. Int7 -6 0.7290, ns
Friedman test Dunn’s test
Rank sum diff. p-value
Int6 vs. CD3 42 0.0153, *
Int6 vs. CD4 34 0.0496, *
Int6 vs. IAO21 44 0.0111, *
Int6 vs. c-myc 1 0.9540, ns
Int6 vs. Plas24 5 0.7728, ns
Int6 vs. 21DNA 13 0.4529, ns
Int6 vs. dT22 57 0.0010, ***
Int6 vs. DCAF6 28 0.1060, ns
Int6 vs. CLASP1 51 0.0032, **
Int6 vs. Gtr1 17 0.3263, ns
Int6 vs. Gtr2 33 0.0567, ns
Int6 vs. Gtr3 19 0.2727, ns
Int6 vs. GA8 -12 0.4884, ns
Int6 vs. GA12 -9 0.6033, ns
Int6 vs. GT8 26 0.1333, ns
Int6 vs. GT12 29 0.0941, ns
Int7 vs. CD3 48 0.0056, **
Int7 vs. CD4 40 0.0209, *
Int7 vs. IAO21 50 0.0039, n**
Int7 vs. c-myc 7 0.6861, ns
Int7 vs. Plas24 11 0.5254, ns
Int7 vs. 21DNA 19 0.2727, ns
Int7 vs. dT22 63 0.0003, ***
Int7 vs. DCAF6 34 0.0496, *
Int7 vs. CLASP1 57 0.0010, ***
Int7 vs. Gtr1 23 0.1842, ns
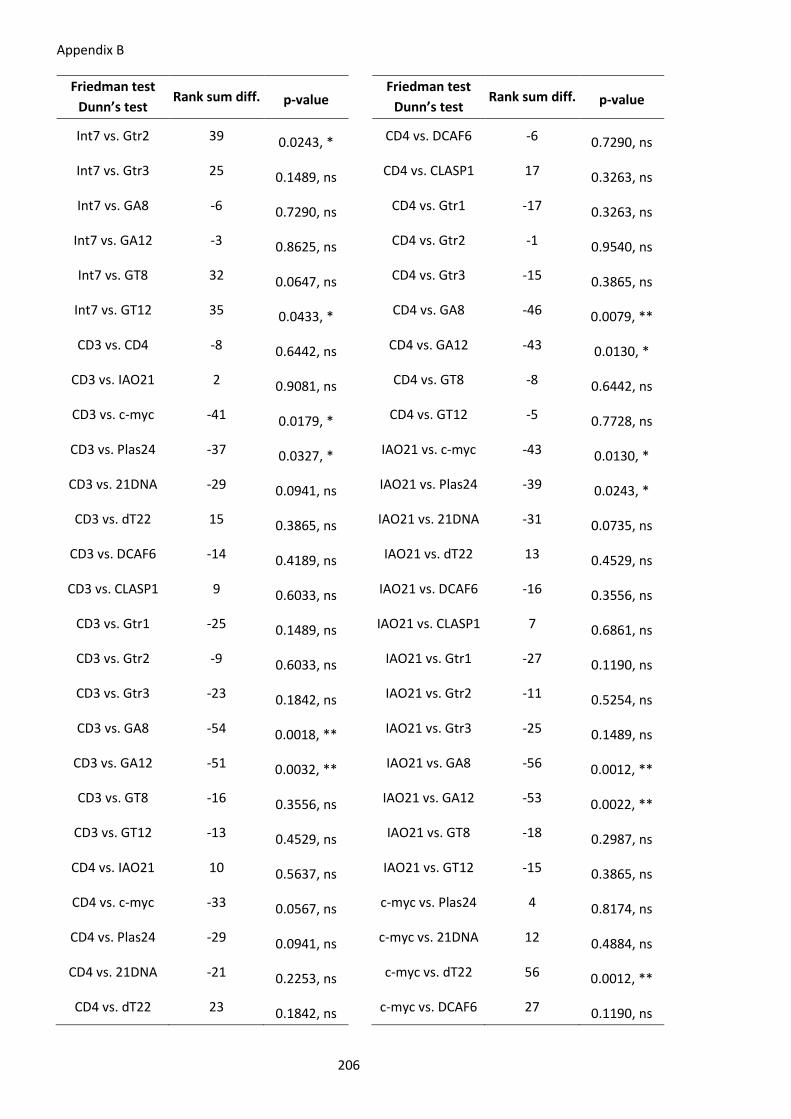
Appendix B
206
Friedman test Dunn’s test
Rank sum diff. p-value
Int7 vs. Gtr2 39 0.0243, *
Int7 vs. Gtr3 25 0.1489, ns
Int7 vs. GA8 -6 0.7290, ns
Int7 vs. GA12 -3 0.8625, ns
Int7 vs. GT8 32 0.0647, ns
Int7 vs. GT12 35 0.0433, *
CD3 vs. CD4 -8 0.6442, ns
CD3 vs. IAO21 2 0.9081, ns
CD3 vs. c-myc -41 0.0179, *
CD3 vs. Plas24 -37 0.0327, *
CD3 vs. 21DNA -29 0.0941, ns
CD3 vs. dT22 15 0.3865, ns
CD3 vs. DCAF6 -14 0.4189, ns
CD3 vs. CLASP1 9 0.6033, ns
CD3 vs. Gtr1 -25 0.1489, ns
CD3 vs. Gtr2 -9 0.6033, ns
CD3 vs. Gtr3 -23 0.1842, ns
CD3 vs. GA8 -54 0.0018, **
CD3 vs. GA12 -51 0.0032, **
CD3 vs. GT8 -16 0.3556, ns
CD3 vs. GT12 -13 0.4529, ns
CD4 vs. IAO21 10 0.5637, ns
CD4 vs. c-myc -33 0.0567, ns
CD4 vs. Plas24 -29 0.0941, ns
CD4 vs. 21DNA -21 0.2253, ns
CD4 vs. dT22 23 0.1842, ns
Friedman test Dunn’s test
Rank sum diff. p-value
CD4 vs. DCAF6 -6 0.7290, ns
CD4 vs. CLASP1 17 0.3263, ns
CD4 vs. Gtr1 -17 0.3263, ns
CD4 vs. Gtr2 -1 0.9540, ns
CD4 vs. Gtr3 -15 0.3865, ns
CD4 vs. GA8 -46 0.0079, **
CD4 vs. GA12 -43 0.0130, *
CD4 vs. GT8 -8 0.6442, ns
CD4 vs. GT12 -5 0.7728, ns
IAO21 vs. c-myc -43 0.0130, *
IAO21 vs. Plas24 -39 0.0243, *
IAO21 vs. 21DNA -31 0.0735, ns
IAO21 vs. dT22 13 0.4529, ns
IAO21 vs. DCAF6 -16 0.3556, ns
IAO21 vs. CLASP1 7 0.6861, ns
IAO21 vs. Gtr1 -27 0.1190, ns
IAO21 vs. Gtr2 -11 0.5254, ns
IAO21 vs. Gtr3 -25 0.1489, ns
IAO21 vs. GA8 -56 0.0012, **
IAO21 vs. GA12 -53 0.0022, **
IAO21 vs. GT8 -18 0.2987, ns
IAO21 vs. GT12 -15 0.3865, ns
c-myc vs. Plas24 4 0.8174, ns
c-myc vs. 21DNA 12 0.4884, ns
c-myc vs. dT22 56 0.0012, **
c-myc vs. DCAF6 27 0.1190, ns

Appendix B
207
Friedman test Dunn’s test
Rank sum diff. p-value
c-myc vs. CLASP1 50 0.0039, **
c-myc vs. Gtr1 16 0.3556, ns
c-myc vs. Gtr2 32 0.0647, ns
c-myc vs. Gtr3 18 0.2987, ns
c-myc vs. GA8 -13 0.4529, ns
c-myc vs. GA12 -10 0.5637, ns
c-myc vs. GT8 25 0.1489, ns
c-myc vs. GT12 28 0.1060, ns
Plas24 vs. 21DNA 8 0.6442, ns
Plas24 vs. dT22 52 0.0027, **
Plas24 vs. DCAF6 23 0.1842, ns
Plas24 vs. CLASP1 46 0.0079, **
Plas24 vs. Gtr1 12 0.4884, ns
Plas24 vs. Gtr2 28 0.1060, ns
Plas24 vs. Gtr3 14 0.4189, ns
Plas24 vs. GA8 -17 0.3263, ns
Plas24 vs. GA12 -14 0.4189, ns
Plas24 vs. GT8 21 0.2253, ns
Plas24 vs. GT12 24 0.1659, ns
21DNA vs. dT22 44 0.0111, *
21DNA vs. DCAF6 15 0.3865, ns
21DNA vs. CLASP1 38 0.0282, *
21DNA vs. Gtr1 4 0.8174, ns
21DNA vs. Gtr2 20 0.2482, ns
21DNA vs. Gtr3 6 0.7290, ns
21DNA vs. GA8 -25 0.1489, ns
Friedman test Dunn’s test
Rank sum diff. p-value
21DNA vs. GA12 -22 0.2040, ns
21DNA vs. GT8 13 0.4529, ns
21DNA vs. GT12 16 0.3556, ns
dT22 vs. DCAF6 -29 0.0941, ns
dT22 vs. CLASP1 -6 0.7290, ns
dT22 vs. Gtr1 -40 0.0209, *
dT22 vs. Gtr2 -24 0.1659, ns
dT22 vs. Gtr3 -38 0.0282, *
dT22 vs. GA8 -69 <0.0001, ****
dT22 vs. GA12 -66 0.0001, ***
dT22 vs. GT8 -31 0.0735, ns
dT22 vs. GT12 -28 0.1060, ns
DCAF6 vs. CLASP1 23 0.1842, ns
DCAF6 vs. Gtr1 -11 0.5254, ns
DCAF6 vs. Gtr2 5 0.7728, ns
DCAF6 vs. Gtr3 -9 0.6033, ns
DCAF6 vs. GA8 -40 0.0209, *
DCAF6 vs. GA12 -37 0.0327, *
DCAF6 vs. GT8 -2 0.9081, ns
DCAF6 vs. GT12 1 0.9540, ns
CLASP1 vs. Gtr1 -34 0.0496, *
CLASP1 vs. Gtr2 -18 0.2987, ns
CLASP1 vs. Gtr3 -32 0.0647, ns
CLASP1 vs. GA8 -63 0.0003, ***
CLASP1 vs. GA12 -60 0.0005, ***
CLASP1 vs. GT8 -25 0.1489, ns

Appendix B
208
Friedman test Dunn’s test
Rank sum diff. p-value
CLASP1 vs. GT12 -22 0.2040, ns
Gtr1 vs. Gtr2 16 0.3556, ns
Gtr1 vs. Gtr3 2 0.9081, ns
Gtr1 vs. GA8 -29 0.0941, ns
Gtr1 vs. GA12 -26 0.1333, ns
Gtr1 vs. GT8 9 0.6033, ns
Gtr1 vs. GT12 12 0.4884, ns
Gtr2 vs. Gtr3 -14 0.4189, ns
Gtr2 vs. GA8 -45 0.0094, **
Gtr2 vs. GA12 -42 0.0153, *
Gtr2 vs. GT8 -7 0.6861, ns
Friedman test Dunn’s test
Rank sum diff. p-value
Gtr2 vs. GT12 -4 0.8174, ns
Gtr3 vs. GA8 -31 0.0735, ns
Gtr3 vs. GA12 -28 0.1060, ns
Gtr3 vs. GT8 7 0.6861, ns
Gtr3 vs. GT12 10 0.5637, ns
GA8 vs. GA12 3 0.8625, ns
GA8 vs. GT8 38 0.0282, *
GA8 vs. GT12 41 0.0179, *
GA12 vs. GT8 35 0.0433, *
GA12 vs. GT12 38 0.0282, *
GT8 vs. GT12 3 0.8625, ns

Appendix B
209
Table 23 - Significance of fluorescence variation of ThT in the presence of INS intron 1-derived Int1+. Summary of Fisher’s LSD multiple comparison test was performed for the comparison of mean fluorescence intensities of Int1+ oligos (relative to Figure 15). For each pair of oligos, difference between means ( �̅�𝑥2 − �̅�𝑥1 ), and 95% confidence interval (CI) and p-value and its summary, respectively, are shown.
Fisher's LSD 𝒙𝒙�𝟐𝟐 − 𝒙𝒙�𝟏𝟏 95% CI p-value
Int1 vs. Int1+2 4108 1198 to 7018 0.0261, *
Int1 vs. Int1+4 929.7 -1735 to 3594 0.2721, ns
Int1 vs. Int1+6 1832 234.6 to 3429 0.0387, *
Int1 vs. Int1+8 -279.7 -2536 to 1977 0.6472, ns
Int1 vs. Int1+10 2420 -522.5 to 5362 0.0714, ns
Int1 vs. Int1+12 2475 151.4 to 4799 0.0445, *
Int1 vs. Int1+14 2058 356.7 to 3759 0.0350, *
Int1 vs. Int1+16 2716 1496 to 3937 0.0107, *
Int1 vs. Int1+18 2448 1420 to 3477 0.0094, **
Int1+2 vs. Int1+4 -3178 -4729 to -1628 0.0126, *
Int1+2 vs. Int1+6 -2276 -4059 to -493.4 0.0316, *
Int1+2 vs. Int1+8 -4388 -5108 to -3668 0.0015, **
Int1+2 vs. Int1+10 -1688 -2211 to -1166 0.0051, **
Int1+2 vs. Int1+12 -1633 -3468 to 202.5 0.0620, ns
Int1+2 vs. Int1+14 -2050 -3265 to -835.8 0.0184, *
Int1+2 vs. Int1+16 -1392 -3114 to 330.3 0.0737, ns
Int1+2 vs. Int1+18 -1660 -3669 to 350.1 0.0709, ns
Int1+4 vs. Int1+6 902 -165.5 to 1969 0.0680, ns
Int1+4 vs. Int1+8 -1209 -2352 to -66.22 0.0450, *
Int1+4 vs. Int1+10 1490 400.7 to 2579 0.0277, *
Int1+4 vs. Int1+12 1546 -1363 to 4455 0.1496, ns
Int1+4 vs. Int1+14 1128 -308.9 to 2565 0.0776, ns
Int1+4 vs. Int1+16 1787 -150.5 to 3724 0.0580, ns

Appendix B
210
Fisher's LSD 𝒙𝒙�𝟐𝟐 − 𝒙𝒙�𝟏𝟏 95% CI p-value
Int1+4 vs. Int1+18 1519 -134.6 to 3172 0.0585, ns
Int1+6 vs. Int1+8 -2111 -3183 to -1039 0.0136, *
Int1+6 vs. Int1+10 588 -996.1 to 2172 0.2513, ns
Int1+6 vs. Int1+12 643.7 -1723 to 3010 0.3625, ns
Int1+6 vs. Int1+14 226 -621.8 to 1074 0.3701, ns
Int1+6 vs. Int1+16 884.7 -195.9 to 1965 0.0720, ns
Int1+6 vs. Int1+18 616.7 14.37 to 1219 0.0479, *
Int1+8 vs. Int1+10 2699 1996 to 3403 0.0036, **
Int1+8 vs. Int1+12 2755 970.9 to 4539 0.0219, *
Int1+8 vs. Int1+14 2337 1766 to 2908 0.0032, **
Int1+8 vs. Int1+16 2996 1852 to 4140 0.0078, **
Int1+8 vs. Int1+18 2728 1422 to 4034 0.0122, *
Int1+10 vs. Int1+12 55.67 -2211 to 2322 0.9255, ns
Int1+10 vs. Int1+14 -362 -1636 to 911.6 0.3459, ns
Int1+10 vs. Int1+16 296.7 -1550 to 2143 0.5609, ns
Int1+10 vs. Int1+18 28.67 -1927 to 1984 0.9554, ns
Int1+12 vs. Int1+14 -417.7 -1972 to 1137 0.3671, ns
Int1+12 vs. Int1+16 241 -1148 to 1630 0.5332, ns
Int1+12 vs. Int1+18 -27 -2091 to 2037 0.9602, ns
Int1+14 vs. Int1+16 658.7 78.3 to 1239 0.0395, *
Int1+14 vs. Int1+18 390.7 -432 to 1213 0.1778, ns
Int1+16 vs. Int1+18 -268 -943.7 to 407.7 0.2300, ns

Appendix B
211
Table 24 - Significance of fluorescence variation of ThT in the presence of INS intron 1-derived Int7+.
Summary of Friedman multiple comparison test was performed for the comparison of mean fluorescence intensities of Int1+ oligos (relative to Figure 15). For each pair of oligos, differences between rank sums and the p-value and its summary, respectively, are shown.
Friedman test Dunn’s test
Rank sum diff. p-value
Int7 vs. Int7+2 -3 0.7119, ns
Int7 vs. Int7+4 14 0.0848, ns
Int7 vs. Int7+6 16 0.0489, *
Int7 vs. Int7+8 21 0.0097, **
Int7 vs. Int710 6 0.4602, ns
Int7 vs. Int7+12 3 0.7119, ns
Int7 vs. Int7+14 20 0.0138, *
Int7 vs. Int7+16 24 0.0031, **
Int7 vs. Int7+18 18 0.0267, *
Int7 vs. Int7+20 13 0.1096, ns
Int7+2 vs. Int7+4 17 0.0364, *
Int7+2 vs. Int7+6 19 0.0193, *
Int7+2 vs. Int7+8 24 0.0031, **
Int7+2 vs. Int7+10 9 0.2679, ns
Int7+2 vs. Int7+12 6 0.4602, ns
Int7+2 vs. Int7+14 23 0.0046, **
Int7+2 vs. Int7+16 27 0.0009, ***
Int7+2 vs. Int7+18 21 0.0097, **
Int7+2 vs. Int7+20 16 0.0489, *
Int7+4 vs. Int7+6 2 0.8055, ns
Int7+4 vs. Int7+8 7 0.3889, ns
Int7+4 vs. Int1+10 -8 0.3248, ns
Friedman test Dunn’s test
Rank sum diff. p-value
Int7+4 vs. Int7+12 -11 0.1757, ns
Int7+4 vs. Int7+14 6 0.4602, ns
Int7+4 vs. Int7+16 10 0.2184, ns
Int7+4 vs. Int7+18 4 0.6225, ns
Int7+4 vs. Int7+20 -1 0.9020, ns
Int7+6 vs. Int7+8 5 0.5383, ns
Int7+6 vs. Int7+10 -10 0.2184, ns
Int7+6 vs. Int7+12 -13 0.1096, ns
Int7+6 vs. Int7+14 4 0.6225, ns
Int7+6 vs. Int7+16 8 0.3248, ns
Int7+6 vs. Int7+18 2 0.8055, ns
Int7+6 vs. Int7+20 -3 0.7119, ns
Int7+8 vs. Int1+10 -15 0.0648, ns
Int7+8 vs. Int7+12 -18 0.0267, *
Int7+8 vs. Int7+14 -1 0.9020, ns
Int7+8 vs. Int7+16 3 0.7119, ns
Int7+8 vs. Int7+18 -3 0.7119, ns
Int7+8 vs. Int7+20 -8 0.3248, ns
Int7+10 vs. Int7+12 -3 0.7119, ns
Int7+10 vs. Int7+14 14 0.0848, ns
Int7+10 vs. Int7+16 18 0.0267, *
Int7+10 vs. Int7+18 12 0.1396, ns

Appendix B
212
Friedman test Dunn’s test
Rank sum diff. p-value
Int7+10 vs. Int7+20 7 0.3889, ns
Int7+12 vs. Int7+14 17 0.0364, *
Int7+12 vs. Int7+16 21 0.0097, **
Int7+12 vs. Int7+18 15 0.0648, ns
Int7+12 vs. Int7+20 10 0.2184, ns
Int7+14 vs. Int7+16 4 0.6225, ns
Int7+14 vs. Int7+18 -2 0.8055, ns
Int7+14 vs. Int7+20 -7 0.3889, ns
Int7+16 vs. Int7+18 -6 0.4602, ns
Int7+16 vs. Int7+20 -11 0.1757, ns
Int7+18 vs. Int7+20 -5 0.5383, ns

Appendix B
213
Table 25 – Significance of fluorescence variation of INS intron 1 DNA-derived oligos in the presence of different solvents at neutral pH conditions. Summary of Welch’s-corrected unpaired t-test, performed to mean fluorescence in the presence of INS DNA-derived oligos in water or buffer at pH 7.2 (relative to Figure 17). For each pair of compared solvents, p-value and its summary, t and degrees of freedom, means difference (�̅�𝑥2 −�̅�𝑥1), and 95% confidence interval (CI), respectively, are shown.
Oligo Solvents Unpaired t-test with Welch’s correction
p-value t, df 𝒙𝒙�𝟐𝟐 − 𝒙𝒙�𝟏𝟏 95% CI
Int1
H2O vs Licac 0.0394, * t=4.72 df=2.07 1820 ± 386 212 to 3429
H2O vs Licac+KCl 0.2526, ns t=1.56 df=2.11 605 ± 387 -984 to 2194
H2O vs Licac+LiCl 0.1627, ns t=1.72 df=3.89 1022 ± 594 -647 to 2691
Licac vs Licac+KCl 0.0002, *** t=15.2 df=3.8 -1215 ± 79.8 -1442 to -989
Licac vs Licac+LiCl 0.2202, ns t=1.74 df=2.05 -798 ± 458 -2724 to 1127
Licac+KCl vs Licac+LiCl 0.4566, ns t=0.9082 df=2.076 417 ± 459.2 -1491 to 2325
Int7
H2O vs Licac 0.0218, * t=5.21 df=2.48 3122 ± 600 964 to 5280
H2O vs Licac+KCl 0.0208, * t=4.33 df=3.13 2806 ± 648 791 to 4821
H2O vs Licac+LiCl 0.0101, * t=5.09 df=3.49 3466 ± 681 1460 to 5471
Licac vs Licac+KCl 0.4522, ns t=0.849 df=3.35 -316 ± 372 -1433 to 801
Licac vs Licac+LiCl 0.4788, ns t=0.806 df=3.01 344 ± 426 -1009 to 1696
Licac+KCl vs Licac+LiCl 0.2534, ns t=1.34 df=3.88 660 ± 492 -725 to 2044
CD3
H2O vs Licac 0.1366, ns t=2.24 df=2.32 300 ± 134 -206 to 805
H2O vs Licac+KCl 0.2958, ns t=1.39 df=2.05 456 ± 328 -922 to 1834
H2O vs Licac+LiCl 0.6332, ns t=0.552 df=2.14 110 ± 199 -696 to 916
Licac vs Licac+KCl 0.6897, ns t=0.446 df=2.61 156 ± 350 -1059 to 1371
Licac vs Licac+LiCl 0.4704, ns t=0.809 df=3.45 -190 ± 234 -883 to 504
Licac+KCl vs Licac+LiCl 0.4245, ns t=0.91 df=3.28 -346 ± 380 -1499 to 807
CD4
H2O vs Licac 0.4126, ns t=1.03 df=2 411 ± 400 -1309 to 2131
H2O vs Licac+KCl 0.8292, ns t=0.242 df=2.25 9 ± 37.2 -135 to 153
H2O vs Licac+LiCl 0.0136, * t=7.56 df=2.17 -341 ± 45.1 -521 to -161
Licac vs Licac+KCl 0.4212, ns t=1 df=2.03 -402 ± 402 -2104 to 1300
Licac vs Licac+LiCl 0.1997, ns t=1.87 df=2.05 -752 ± 402 -2444 to 941
Licac+KCl vs Licac+LiCl 0.0041, ** t=6.13 df=3.85 -350 ± 57.1 -511 to -189

Appendix B
214
Oligo Solvents Unpaired t-test with Welch’s correction
p-value t, df 𝒙𝒙�𝟐𝟐 − 𝒙𝒙�𝟏𝟏 95% CI
Plas24
H2O vs Licac 0.2203, ns t=1.5 df=3.36 1376 ± 915 -1368 to 4120
H2O vs Licac+KCl 0.5098, ns t=0.757 df=2.69 637 ± 842 -2225 to 3500
H2O vs Licac+LiCl 0.1061, ns t=2.37 df=2.76 2011 ± 849 -828 to 4850
Licac vs Licac+KCl 0.2850, ns t=1.26 df=3.5 -738 ± 586 -2460 to 983
Licac vs Licac+LiCl 0.3522, ns t=1.07 df=3.61 636 ± 596 -1092 to 2364
Licac+KCl vs Licac+LiCl 0.0447, * t=2.89 df=3.99 1374 ± 475 52.6 to 2695
dT22
H2O vs Licac 0.9839, ns t=0.0215 df=3.95 1 ± 46.6 -129 to 131
H2O vs Licac+KCl 0.1580, ns t=1.76 df=3.71 -76.7 ± 43.5 -201 to 47.8
H2O vs Licac+LiCl 0.1930, ns t=1.62 df=3.37 -106 ± 65.1 -301 to 89.2
Licac vs Licac+KCl 0.1303, ns t=1.91 df=3.88 -77.7 ± 40.6 -192 to 36.3
Licac vs Licac+LiCl 0.1857, ns t=1.69 df=3.16 -107 ± 63.2 -302 to 89.1
Licac+KCl vs Licac+LiCl 0.6683, ns t=0.476 df=2.86 -29 ± 61 -229 to 171

Appendix B
215
Table 26 – Significance of fluorescence variation of INS intron 1 DNA-derived oligos in the presence of different solvents at acidic pH conditions. Summary of Welch’s-corrected unpaired t-test, performed to mean fluorescence in the presence of INS DNA-derived oligos in water or buffer at pH 5.8 (relative to Figure 17). For each pair of compared solvents, p-value and its summary, t and degrees of freedom, means difference (�̅�𝑥2 −�̅�𝑥1), and 95% confidence interval (CI), respectively, are shown.
Oligo Solvents Unpaired t-test with Welch’s correction
p-value t, df 𝒙𝒙�𝟐𝟐 − 𝒙𝒙�𝟏𝟏 95% CI
Int1
H2O vs Licac 0.2260, ns t=1.68 df=2.16 1991 ± 1187 -2763 to 6745
H2O vs Licac+KCl 0.1543, ns t=1.79 df=3.7 -525 ± 294 -1368 to 318
H2O vs Licac+LiCl 0.6538, ns t=0.494 df=3.12 -241 ± 487 -1757 to 1276
Licac vs Licac+KCl 0.1603, ns t=2.14 df=2.09 -2516 ± 1177 -7373 to 2341
Licac vs Licac+LiCl 0.1864, ns t=1.8 df=2.53 -2231 ± 1239 -6626 to 2164
Licac+KCl vs Licac+LiCl 0.5856, ns t=0.618 df=2.66 285 ± 461 -1294 to 1863
Int7
H2O vs Licac 0.0595, ns t=2.66 df=3.79 2004 ± 753 -132 to 4139
H2O vs Licac+KCl 0.3890, ns t=0.998 df=3.13 955 ± 957 -2019 to 3929
H2O vs Licac+LiCl 0.1032, ns t=2.39 df=2.79 2693 ± 1127 -1050 to 6436
Licac vs Licac+KCl 0.3696, ns t=1.02 df=3.6 -1049 ± 1024 -4020 to 1923
Licac vs Licac+LiCl 0.5990, ns t=0.582 df=3.2 689 ± 1184 -2952 to 4330
Licac+KCl vs Licac+LiCl 0.2620, ns t=1.31 df=3.84 1738 ± 1323 -1996 to 5472
CD3
H2O vs Licac 0.0465, * t=4.17 df=2.15 680 ± 163 24.4 to 1336
H2O vs Licac+KCl 0.2003, ns t=1.87 df=2.03 713 ± 381 -905 to 2331
H2O vs Licac+LiCl 0.6455, ns t=0.535 df=2.02 220 ± 412 -1531 to 1972
Licac vs Licac+KCl 0.9411, ns t=0.08092 df=2.689 33.33 ± 411.9 -1368 to 1435
Licac vs Licac+LiCl 0.3840, ns t=1.04 df=2.59 -460 ± 440 -1994 to 1075
Licac+KCl vs Licac+LiCl 0.4279, ns t=0.882 df=3.98 -493 ± 559 -2049 to 1063
CD4
H2O vs Licac 0.2052, ns t=1.53 df=3.76 228 ± 149 -196 to 652
H2O vs Licac+KCl 0.2488, ns t=1.53 df=2.31 523 ± 341 -773 to 1818
H2O vs Licac+LiCl 0.5602, ns t=0.655 df=2.92 -66.7 ± 102 -396 to 262
Licac vs Licac+KCl 0.4715, ns t=0.844 df=2.51 295 ± 349 -951 to 1540
Licac vs Licac+LiCl 0.1162, ns t=2.34 df=2.57 -295 ± 126 -737 to 148
Licac+KCl vs Licac+LiCl 0.2130, ns t=1.78 df=2.07 -589 ± 332 -1968 to 789

Appendix B
216
Oligo Solvents Unpaired t-test with Welch’s correction
p-value t, df 𝒙𝒙�𝟐𝟐 − 𝒙𝒙�𝟏𝟏 95% CI
Plas24
H2O vs Licac 0.2949, ns t=1.41 df=2 512 ± 365 -1054 to 2078
H2O vs Licac+KCl 0.0467, * t=4.41 df=2.03 -600 ± 136 -1178 to -21.2
H2O vs Licac+LiCl 0.1086, ns t=2.78 df=2 1142 ± 411 -624 to 2908
Licac vs Licac+KCl 0.0785, ns t=2.86 df=2.54 -1112 ± 389 -2485 to 261
Licac vs Licac+LiCl 0.3161, ns t=1.15 df=3.94 630 ± 549 -903 to 2163
Licac+KCl vs Licac+LiCl 0.0404, * t=4.03 df=2.43 1742 ± 433 163 to 3321
dT22
H2O vs Licac 0.3340, ns t=1.1 df=4 62 ± 56.5 -94.9 to 219
H2O vs Licac+KCl 0.8838, ns t=0.156 df=3.99 -8.67 ± 55.6 -163 to 146
H2O vs Licac+LiCl 0.5076, ns t=0.797 df=2.04 305 ± 383 -1310 to 1920
Licac vs Licac+KCl 0.2689, ns t=1.28 df=4 -70.7 ± 55.1 -224 to 82.3
Licac vs Licac+LiCl 0.5892, ns t=0.635 df=2.04 243 ± 383 -1373 to 1859
Licac+KCl vs Licac+LiCl 0.4971, ns t=0.82 df=2.04 314 ± 383 -1303 to 1931

Appendix B
217
Table 27 – Significance of RNA fluorescence intensity compared to DNA. Comparison of mean fluorescence intensity enhancement in RNA oligos at 2, 10 and 20 µM to DNA oligos at the same concentrations (relative to Figure 18). The Welch’s-corrected unpaired t-test was performed for the comparison of RNA oligos to their DNA counterparts at the same concentration. Tukey’s multiple comparison test compared the variation of fluorescence intensity of increasing oligo concentrations.
DNA vs. RNA Unpaired t-test with Welch’s correction
Oligo [Oligo] p-value t, df 𝒙𝒙�𝟐𝟐 − 𝒙𝒙�𝟏𝟏 95% CI
Int1
2 0.0354, * 4.842; 2.128 867 ± 179.1 139.1 to 1595
10 0.0041, ** 15.31; 2.01 9483 ± 619.4 6831 to 12135
20 0.0051, ** 6.298; 3.487 7153 ± 1136 3808 to 10499
Int7
2 0.0830, ns 3.097; 2.139 392 ± 126.6 -119.9 to 904
10 0.0469, * 3.668; 2.511 3576 ± 974.9 101.5 to 7050
20 0.0335, * 5.227; 2.033 3658 ± 699.8 693.1 to 6623
Plas24
2 0.002, ** 11.96; 2.578 1061 ± 88.72 750.2 to 1371
10 0.0016, ** 11.42; 2.935 6119 ± 535.6 4393 to 7845
20 0.0195, * 4.673; 2.928 5219 ± 1117 1614 to 8823
dT22/AV3
2 0.2262, ns 1.431; 3.972 64.67 ± 45.19 -61.15 to 190.5
10 0.0688, ns 3.28; 2.271 368 ± 112.2 -63.55 to 799.5
20 0.0609, ns 3.692; 2.112 630 ± 170.6 -68.15 to 1328
Tukey’s multiple comparison test
Oligo Nucleic acid [Oligo] p-value 𝒙𝒙�𝟐𝟐 − 𝒙𝒙�𝟏𝟏 95% CI
Int1
DNA
2 vs. 10 >0.9999, ns 0 ± 772.2 -2369 to 2369
2 vs. 20 0.0006, *** -5955 ± 772.2 -8325 to -3586
10vs. 20 0.0006, *** -5955 ± 772.2 -8325 to -3586
RNA
2 vs. 10 0.0039, ** -5088 ± 938.5 -7968 to -2209
2 vs. 20 <0.0001, **** -12242 ± 938.5 -15121 to -9362
10vs. 20 0.0007, *** -7153 ± 938.5 -1003 to -4274
Int7
DNA
2 vs. 10 0.0248, * -2304 ± 630.1 -4237 to -370.2
2 vs. 20 0.0002, *** -5879 ± 630.1 -7812 to -3694
10vs. 20 0.0031, ** -3575 ± 630.1 -5509 to -1642
RNA
2 vs. 10 0.0009, *** .5487 ± 757.5 -7811 to -3163
2 vs. 20 <0.0001, **** -9145 ± 757.5 -11469 to -6821
10vs. 20 0.007, ** -3658 ± 757.5 -5982 to -1334

Appendix B
218
Plas24
DNA
2 vs. 10 0.0037, ** -2476 ± 450.5 -3858 to -1093
2 vs. 20 <0.0001, **** -5321 ± 450.5 -6703 to -3938
10vs. 20 0.0018, ** -2845 ± 450.5 -4227 to -1463
RNA
2 vs. 10 0.0004, *** -7534 ± 908.4 -10321 to -4746
2 vs. 20 0.0001, *** -9478 ± 908.4 -12266 to -6691
10vs. 20 0.1614, ns -1945 ± 908.4 -4732 to 842.4
dT22/AV3
DNA
2 vs. 10 0.1350, ns -93.67 ± 41.06 -219.7 to 32.33
2 vs. 20 0.0128, * -174.3 ± 41.06 -300.3 to -48.33
10vs. 20 0.2019, ns -80.66 ± 41.06 -206.7 to 45.34
RNA
2 vs. 10 0.1167, ns -397 ± 165.8 -905.6 to 111.6
2 vs. 20 0.0101, * -739.7 ± 165.8 -1248 to -231.1
10vs. 20 0.1722, ns -342.7 ± 165.8 -851 to 165.9

Appendix B
219
Table 28 – Significance of fluorescence variation of INS intron 1 RNA-derived oligos in the presence of different solvents at neutral pH conditions. Summary of Welch’s-corrected unpaired t-test, performed to mean fluorescence in the presence of INS RNA-derived oligos in water or buffer at pH 7.2 (relative to Figure 20). For each pair of compared solvents, p-value and its summary, t and degrees of freedom, means difference (�̅�𝑥2 −�̅�𝑥1), and 95% confidence interval (CI), respectively, are shown.
Oligo Solvents Unpaired t-test with Welch’s correction
p-value t, df 𝒙𝒙�𝟐𝟐 − 𝒙𝒙�𝟏𝟏 95% CI
Int1
H2O vs Licac 0.7084, ns 0.4018; 4 -943.7 ± 2349 -7465 to 5577
H2O vs Licac+KCl 0.1613, ns 1.746; 3.707 -3603 ± 2064 -9516 to 2309
H2O vs Licac+LiCl 0.0258, * 3.464; 3.997 -7976 ± 2302 -14370 to -1582
Licac vs Licac+KCl 0.2752, ns 1.28; 3.687 -2660 ± 2078 -8628 to 3309
Licac vs Licac+LiCl 0.0386, * 3.037; 3.994 -7032 ± 2315 -13465 to -599.1
Licac+KCl vs Licac+LiCl 0.1015, ns 2.158; 3.758 -4372 ± 2026 -10143 to 1398
Int7
H2O vs Licac 0.4334, ns 0.8704; 3.984 -1238 ± 1423 -5195 to 2718
H2O vs Licac+KCl 0.0065, ** 7.437; 2.781 -8465 ± 1138 -12254 to -4676
H2O vs Licac+LiCl 0.0227. * 5.016; 2.529 -5544 ± 1105 -9463 to -1625
Licac vs Licac+KCl 0.0078, ** 6.691; 2.878 -7227 ± 1080 -10749 to -3705
Licac vs Licac+LiCl 0.0340, * 4.12; 2.597 -4306 ± 1045 -7944 to -668.1
Licac+KCl vs Licac+LiCl 0.0093, ** 4.842; 3.84 2921 ± 603.2 1218 to 4624
CD3
H2O vs Licac 0.0360, * 3.261; 3.615 866 ± 265.6 96.67 to 1635
H2O vs Licac+KCl 0.0208, * 3.762; 3.889 758.7 ± 201.7 192.4 to 1325
H2O vs Licac+LiCl 0.1797, ns 1.871; 2.42 -303.3 ± 162.1 -896.8 to 290.2
Licac vs Licac+KCl 0.6970, ns 0.4254; 3.279 -107.3 ± 252.3 -873.1 to 658.4
Licac vs Licac+LiCl 0.0274, * 5.267; 2.215 -1169 ± 222 -2041 to -297.7
Licac+KCl vs Licac+LiCl 0.0078, ** 7.619; 2.584 -1062 ± 139.4 -1549 to -575.1
Plas24
H2O vs Licac 0.2533, ns 1.368; 3.46 1546 ± 1129 -1793 to 4884
H2O vs Licac+KCl 0.0460, * 3.589; 2.621 -3645 ± 1016 -7158 to -132.3
H2O vs Licac+LiCl 0.1022, ns 2.255; 3.264 -2477 ± 1098 -5818 to 863.8
Licac vs Licac+KCl 0.0041, ** 7.146; 3.294 -5191 ± 726.4 -7390 to -2992
Licac vs Licac+LiCl 0.0089, ** 4.799; 3.962 -4023 ± 838.3 -6359 to -1687
Licac+KCl vs Licac+LiCl 0.1700, ns 1.725; 3.491 1168 ± 677.2 -825.3 to 3161

Appendix B
220
Oligo Solvents Unpaired t-test with Welch’s correction
p-value t, df 𝒙𝒙�𝟐𝟐 − 𝒙𝒙�𝟏𝟏 95% CI
AV3
H2O vs Licac 0.2494, ns 1.553; 2.203 -182 ± 117.2 -644.3 to 280.3
H2O vs Licac+KCl 0.1449, ns 2.142; 2.376 -256.3 ± 119.6 -700.4 to 187.7
H2O vs Licac+LiCl 0.1308, ns 2.422; 2.095 -280.2 ± 115.7 -757 to 196.6
Licac vs Licac+KCl 0.1704, ns 1.702; 3.667 -74.33 ± 43.67 -200 to 51.38
Licac vs Licac+LiCl 0.0413, * 3.141; 3.53 -98.17 ± 31.25 -189.7 to -6.658
Licac+KCl vs Licac+LiCl 0.5886, ns 0.6052; 2.941 -23.83 ± 39.38 -150.6 to 102.9
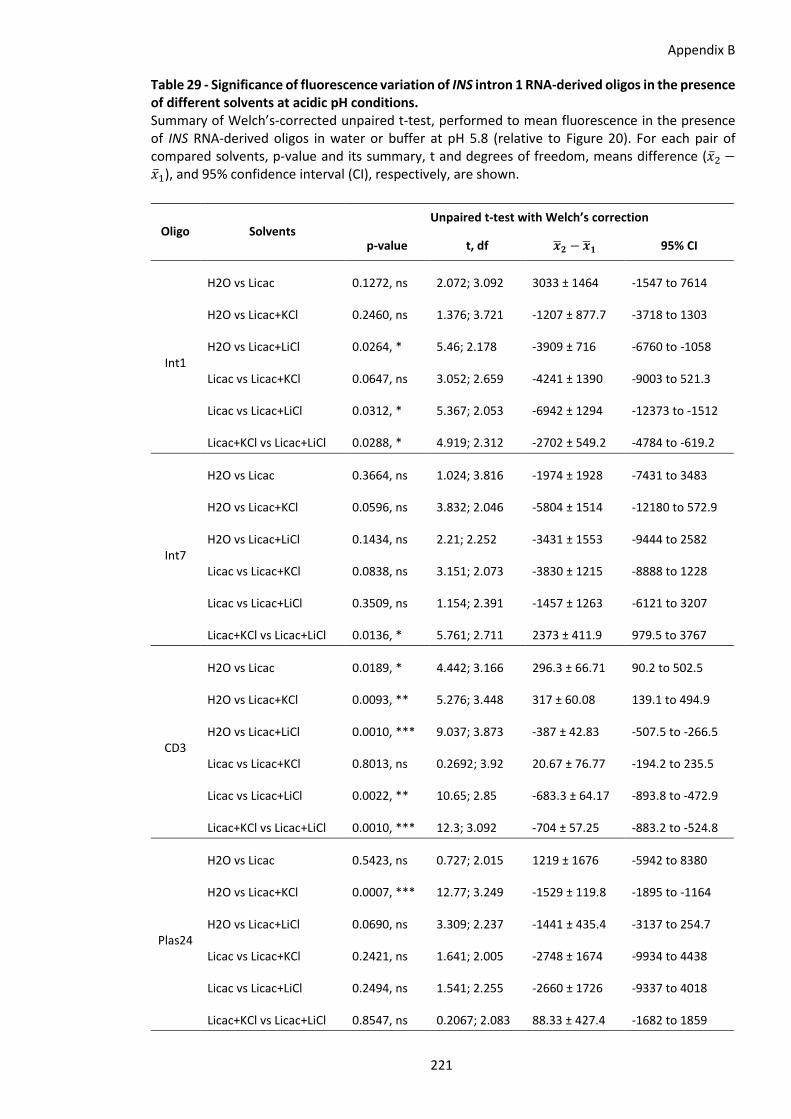
Appendix B
221
Table 29 - Significance of fluorescence variation of INS intron 1 RNA-derived oligos in the presence of different solvents at acidic pH conditions. Summary of Welch’s-corrected unpaired t-test, performed to mean fluorescence in the presence of INS RNA-derived oligos in water or buffer at pH 5.8 (relative to Figure 20). For each pair of compared solvents, p-value and its summary, t and degrees of freedom, means difference (�̅�𝑥2 −�̅�𝑥1), and 95% confidence interval (CI), respectively, are shown.
Oligo Solvents Unpaired t-test with Welch’s correction
p-value t, df 𝒙𝒙�𝟐𝟐 − 𝒙𝒙�𝟏𝟏 95% CI
Int1
H2O vs Licac 0.1272, ns 2.072; 3.092 3033 ± 1464 -1547 to 7614
H2O vs Licac+KCl 0.2460, ns 1.376; 3.721 -1207 ± 877.7 -3718 to 1303
H2O vs Licac+LiCl 0.0264, * 5.46; 2.178 -3909 ± 716 -6760 to -1058
Licac vs Licac+KCl 0.0647, ns 3.052; 2.659 -4241 ± 1390 -9003 to 521.3
Licac vs Licac+LiCl 0.0312, * 5.367; 2.053 -6942 ± 1294 -12373 to -1512
Licac+KCl vs Licac+LiCl 0.0288, * 4.919; 2.312 -2702 ± 549.2 -4784 to -619.2
Int7
H2O vs Licac 0.3664, ns 1.024; 3.816 -1974 ± 1928 -7431 to 3483
H2O vs Licac+KCl 0.0596, ns 3.832; 2.046 -5804 ± 1514 -12180 to 572.9
H2O vs Licac+LiCl 0.1434, ns 2.21; 2.252 -3431 ± 1553 -9444 to 2582
Licac vs Licac+KCl 0.0838, ns 3.151; 2.073 -3830 ± 1215 -8888 to 1228
Licac vs Licac+LiCl 0.3509, ns 1.154; 2.391 -1457 ± 1263 -6121 to 3207
Licac+KCl vs Licac+LiCl 0.0136, * 5.761; 2.711 2373 ± 411.9 979.5 to 3767
CD3
H2O vs Licac 0.0189, * 4.442; 3.166 296.3 ± 66.71 90.2 to 502.5
H2O vs Licac+KCl 0.0093, ** 5.276; 3.448 317 ± 60.08 139.1 to 494.9
H2O vs Licac+LiCl 0.0010, *** 9.037; 3.873 -387 ± 42.83 -507.5 to -266.5
Licac vs Licac+KCl 0.8013, ns 0.2692; 3.92 20.67 ± 76.77 -194.2 to 235.5
Licac vs Licac+LiCl 0.0022, ** 10.65; 2.85 -683.3 ± 64.17 -893.8 to -472.9
Licac+KCl vs Licac+LiCl 0.0010, *** 12.3; 3.092 -704 ± 57.25 -883.2 to -524.8
Plas24
H2O vs Licac 0.5423, ns 0.727; 2.015 1219 ± 1676 -5942 to 8380
H2O vs Licac+KCl 0.0007, *** 12.77; 3.249 -1529 ± 119.8 -1895 to -1164
H2O vs Licac+LiCl 0.0690, ns 3.309; 2.237 -1441 ± 435.4 -3137 to 254.7
Licac vs Licac+KCl 0.2421, ns 1.641; 2.005 -2748 ± 1674 -9934 to 4438
Licac vs Licac+LiCl 0.2494, ns 1.541; 2.255 -2660 ± 1726 -9337 to 4018
Licac+KCl vs Licac+LiCl 0.8547, ns 0.2067; 2.083 88.33 ± 427.4 -1682 to 1859

Appendix B
222
Oligo Solvents Unpaired t-test with Welch’s correction
p-value t, df 𝒙𝒙�𝟐𝟐 − 𝒙𝒙�𝟏𝟏 95% CI
AV3
H2O vs Licac 0.8344, ns 0.2281; 2.966 8.467 ± 37.12 -110.4 to 127.4
H2O vs Licac+KCl 0.4028, ns 0.9411; 3.779 -39.53 ± 42.01 -158.9 to 79.84
H2O vs Licac+LiCl 0.1792, ns 1.827; 2.597 -64.93 ± 35.54 -188.7 to 58.79
Licac vs Licac+KCl 0.2061, ns 1.556; 3.433 -48 ± 30.84 -139.5 to 43.51
Licac vs Licac+LiCl 0.0285, * 3.462; 3.754 -73.4 ± 21.2 -133.8 to -12.98
Licac+KCl vs Licac+LiCl 0.4456, ns 0.8783; 2.941 -25.4 ± 28.92 -118.5 to 67.68

Appendix B
223
Table 30 – Significance of fluorescence variation in the presence of RNA-derived oligos at neutral and acidic pH conditions. The unpaired Welch’s-corrected t-test was performed for the comparison of INS intron 1-derived oligos at neutral and acidic pH conditions, in water or buffer (relative to Figure 20). For each pair of compared pH condition in water or buffer, the p-value and its summary, Welch-corrected t and degrees of freedom, difference between means ( �̅�𝑥2 − �̅�𝑥1 ), and 95% confidence interval (CI), respectively, are indicated.
Oligo Solvent Unpaired t-test with Welch’s correction
p-value t, df 𝒙𝒙�𝟐𝟐 − 𝒙𝒙�𝟏𝟏 95% CI
Int1
H2O 0.0719, ns 2.885; 2.697 -5175 ± 1794 -11264 to 914.7
Licac 0.6020, ns 0.5684; 3.754 -1198 ± 2107 -7202 to 4807
Licac+KCl 0.1406, ns 2.065; 2.707 -2779 ± 1346 -7335 to 1778
Licac+LiCl 0.5616, ns 0.6878; 2.034 -1108 ± 1611 -7929 to 5713
Int7
H2O 0.1444, ns 1.866; 3.55 -3413 ± 1829 -8754 to 1928
Licac 0.0579, ns 2.679; 3.831 -4149 ± 1549 -8524 to 227.2
Licac+KCl 0.2450, ns 1.517; 2.474 -751.3 ± 495.4 -2535 to 1033
Licac+LiCl 0.0727, ns 2.42; 4 -1299 ± 536.8 -2790 to 191.1
CD3
H2O 0.6986, ns 0.4418; 2.182 -69.63 ± 157.6 -696.4 to 557.1
Licac 0.0891, ns 2.855; 2.286 -639.3 ± 223.9 -1496 to 217.2
Licac+KCl 0.0448, * 3.668; 2.585 -511.3 ± 139.4 -998.1 to -24.49
Licac+LiCl 0.0726, ns 2.68; 3.094 -153.3 ± 57.2 -332.2 to 25.65
Plas24
H2O 0.1190, ns 2.596; 2.048 -2463 ± 948.9 -6456 to 1530
Licac 0.2318, ns 1.563; 2.541 -2790 ± 1785 -9097 to 3517
Licac+KCl 0.4545, ns 0.9106; 2.105 -347.3 ± 381.4 -1912 to 1218
Licac+LiCl 0.1181, ns 2.027; 3.713 -1427 ± 704.1 -3443 to 589
AV3
H2O 0.1960, ns 1.796; 2.333 -213.8 ± 119 -661.9 to 234.4
Licac 0.4979, ns 0.7565; 3.437 -23.3 ± 30.8 -114.6 to 68.04
Licac+KCl 0.9483, ns 0.06941; 3.671 3.033 ± 43.70 -122.7 to 128.8
Licac+LiCl 0.9500, ns 0.06712; 3.671 1.467 ± 21.85 -61.41 to 64.34

Appendix B
224
Table 31 - Significance of fluorescence intensity of INS intron 1 RNA-derived oligos in the presence of increasing potassium (K) concentrations. Comparison of mean fluorescence of G4 formation in RNA oligos in the presence of increasing potassium concentrations (mM), using unpaired t-tests with Welch’s correction (relative to Figure 21). For each pair of compared concentrations, p-value and its summary, t and degrees of freedom, means difference (�̅�𝑥2 − �̅�𝑥1), and 95% confidence interval (CI), respectively, are shown.
Oligo Solvents Unpaired t-test with Welch’s correction
p-value t, df 𝒙𝒙�𝟐𝟐 − 𝒙𝒙�𝟏𝟏 95% CI
Int1
Licac vs. Licac+1 K 0.5156, ns 0.712; 4 -1475 ± 2070 -7222 to 4273
Licac vs. Licac+3 K 0.4420, ns 0.853; 3.99 -1722 ± 2019 -7334 to 3890
Licac vs. Licac+10 K 0.1372, ns 2.11; 2.65 -3335 ± 1580 -8761 to 2091
Licac vs. Licac+30 K 0.0453, * 3.9; 2.37 -5959 ± 1529 -11646 to -272
Licac vs. Licac+100 K 0.0212, * 6.23; 2.13 -9263 ± 1487 -15295 to -3232
Licac vs. Licac+150 K 0.0212, * 6.7; 2.01 -9822 ± 1465 -16087 to -3556
Licac vs. Licac+300 K 0.0205, * 6.84; 2.01 -10018 ± 1464 -16297 to -3739
Licac vs. Licac+500 K 0.0200, * 6.94; 2.01 -10165 ± 1464 -16446 to -3885
Int7
Licac vs. Licac+1 K 0.2171, ns 1.67; 2.38 -3578 ± 2146 -11530 to 4374
Licac vs. Licac+3 K 0.0991, ns 2.75; 2.21 -5792 ± 2103 -14069 to 2486
Licac vs. Licac+10 K 0.0570, ns 3.989; 2.011 -8188 ± 2053 -16975 to 598.5
Licac vs. Licac+30 K 0.0433, * 4.639; 2.005 -9515 ± 2051 -18320 to -710.5
Licac vs. Licac+100 K 0.0366, * 4.906; 2.066 -10140 ± 2067 -18766 to -1514
Licac vs. Licac+150 K 0.0389, * 4.901; 2.008 -10058 ± 2052 -18853 to -1262
Licac vs. Licac+300 K 0.0377, * 5; 2.001 -10249 ± 2050 -19068 to -1431
Licac vs. Licac+500 K 0.0361, * 5.106; 2.004 -10472 ± 2051 -19281 to -1663
CD3
Licac vs. Licac+1 K 0.6087, ns 0.5646; 3.274 -239 ± 423.3 -1525 to 1047
Licac vs. Licac+3 K 0.5893, ns 0.6122; 2.623 -239.3 ± 390.9 -1591 to 1112
Licac vs. Licac+10 K 0.2877, ns 1.37;2.332 -517.7 ± 377.9 -1941 to 905.3
Licac vs. Licac+30 K 0.1395, ns 2.256; 2.231 -842.3 ± 373.4
-2300 to 615
Licac vs. Licac+100 K 0.0562, ns 4.012; 2.015 -1459 ± 363.7 -3013 to 95.06
Licac vs. Licac+150 K 0.0466, * 4.428; 2.018 -1611 ± 363.9 -3163 to -59.34
Licac vs. Licac+300 K 0.0391, * 4.775; 2.053 -1745 ± 365.4 -3279 to -210.5
Licac vs. Licac+500 K 0.0380, * 4.888; 2.036 -1782 ± 364.7 -3325 to -239.8
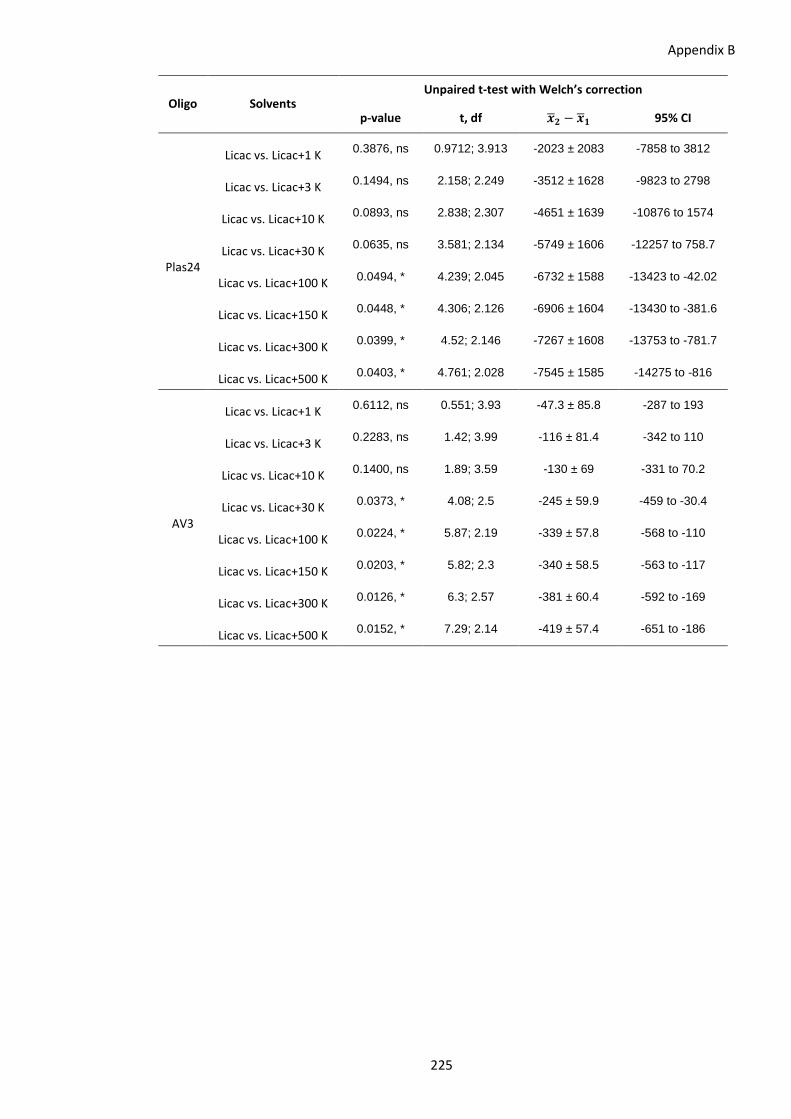
Appendix B
225
Oligo Solvents Unpaired t-test with Welch’s correction
p-value t, df 𝒙𝒙�𝟐𝟐 − 𝒙𝒙�𝟏𝟏 95% CI
Plas24
Licac vs. Licac+1 K 0.3876, ns 0.9712; 3.913 -2023 ± 2083 -7858 to 3812
Licac vs. Licac+3 K 0.1494, ns 2.158; 2.249 -3512 ± 1628 -9823 to 2798
Licac vs. Licac+10 K 0.0893, ns 2.838; 2.307 -4651 ± 1639 -10876 to 1574
Licac vs. Licac+30 K 0.0635, ns 3.581; 2.134 -5749 ± 1606 -12257 to 758.7
Licac vs. Licac+100 K 0.0494, * 4.239; 2.045 -6732 ± 1588 -13423 to -42.02
Licac vs. Licac+150 K 0.0448, * 4.306; 2.126 -6906 ± 1604 -13430 to -381.6
Licac vs. Licac+300 K 0.0399, * 4.52; 2.146 -7267 ± 1608 -13753 to -781.7
Licac vs. Licac+500 K 0.0403, * 4.761; 2.028 -7545 ± 1585 -14275 to -816
AV3
Licac vs. Licac+1 K 0.6112, ns 0.551; 3.93 -47.3 ± 85.8 -287 to 193
Licac vs. Licac+3 K 0.2283, ns 1.42; 3.99 -116 ± 81.4 -342 to 110
Licac vs. Licac+10 K 0.1400, ns 1.89; 3.59 -130 ± 69 -331 to 70.2
Licac vs. Licac+30 K 0.0373, * 4.08; 2.5 -245 ± 59.9 -459 to -30.4
Licac vs. Licac+100 K 0.0224, * 5.87; 2.19 -339 ± 57.8 -568 to -110
Licac vs. Licac+150 K 0.0203, * 5.82; 2.3 -340 ± 58.5 -563 to -117
Licac vs. Licac+300 K 0.0126, * 6.3; 2.57 -381 ± 60.4 -592 to -169
Licac vs. Licac+500 K 0.0152, * 7.29; 2.14 -419 ± 57.4 -651 to -186

Appendix B
226
Table 32 - Significance of fluorescence intensity of INS intron 1 RNA-derived oligos in the presence of increasing magnesium (Mg) concentrations. Comparison of mean fluorescence intensity of G4 formation in RNA oligos in the presence of increasing magnesium concentrations (mM), using unpaired t-tests with Welch’s correction (relative to Figure 22). For each pair of compared concentrations, the p-value and its summary, Welch-corrected t and degrees of freedom, difference between means ( �̅�𝑥2 − �̅�𝑥1 ), and 95% confidence interval (CI), respectively, are shown.
Oligo Solvents Unpaired t-test with Welch’s correction
p-value t, df 𝒙𝒙�𝟐𝟐 − 𝒙𝒙�𝟏𝟏 95% CI
Int1
Licac vs. Licac+0.01 Mg 0.6204, ns 0.5367; 3.931 -1040 ± 1937 -6455 to 4376
Licac vs. Licac+0.03 Mg 0.6383, ns 0.5287; 2.633 -831 ± 1572 -6252 to 4590
Licac vs. Licac+0.1 Mg 0.1539, ns 2.083; 2.339 -3164 ± 1519 -8870 to 2542
Licac vs. Licac+0.3 Mg 0.0599, ns 3.463; 2.321 -5247 ± 1515 -10976 to 481.8
Licac vs. Licac+1 Mg 0.0442, * 4.515; 2.037 -6612 ± 1464 -12805 to -418.2
Licac vs. Licac+3 Mg 0.0389, * 4.9; 2.008 -7150 ± 1459 -13406 to -895.1
Licac vs. Licac+10 Mg 0.0368, * 5.049; 2.006 -7365 ± 1459 -13625 to -1106
Int7
Licac vs. Licac+0.01 Mg 0.4001, ns 1.05; 2.083 936.7 ± 892 -2758 to 4631
Licac vs. Licac+0.03 Mg 0.5441, ns 0.6799; 3.084 -1259 ± 1851 -7061 to 4544
Licac vs. Licac+0.1 Mg 0.3032, ns 1.181; 4 -1475 ± 1249 -4943 to 1993
Licac vs. Licac+0.3 Mg 0.1321, ns 2.464; 2.009 -2178 ± 883.9 -5964 to 1608
Licac vs. Licac+1 Mg 0.0192, * 6.56; 2.127 -5883 ± 896.8 -9529 to -2237
Licac vs. Licac+3 Mg 0.0090, ** 9.029; 2.189 -8158 ± 903.6 -11741 to -4576
Licac vs. Licac+10 Mg 0.0093, ** 10.29; 2.002 -9084 ± 883.1 -12880 to -5288
CD3
Licac vs. Licac+0.01 Mg 0.7441, ns 0.3529; 3.542 -89 ± 252.2 -826.4 to 648.4
Licac vs. Licac+0.03 Mg 0.5122, ns 0.7201; 3.911 197.3 ± 274.1 -570.5 to 965.1
Licac vs. Licac+0.1 Mg 0.3381, ns 1.162; 2.682 -262 ± 225.5 -1030 to 506.1
Licac vs. Licac+0.3 Mg 0.1540, ns 2.191; 2.094 -461 ± 210.4 -1328 to 406.2
Licac vs. Licac+1 Mg 0.0820, ns 3.139; 2.118 -662.3 ± 211 -1523 to 198.5
Licac vs. Licac+3 Mg 0.0644, ns 3.64; 2.072 -763.7 ± 209.8 -1637 to 109.6
Licac vs. Licac+10 Mg 0.0578, ns 3.899; 2.046 -815.3 ± 209.1 -1696 to 65.46
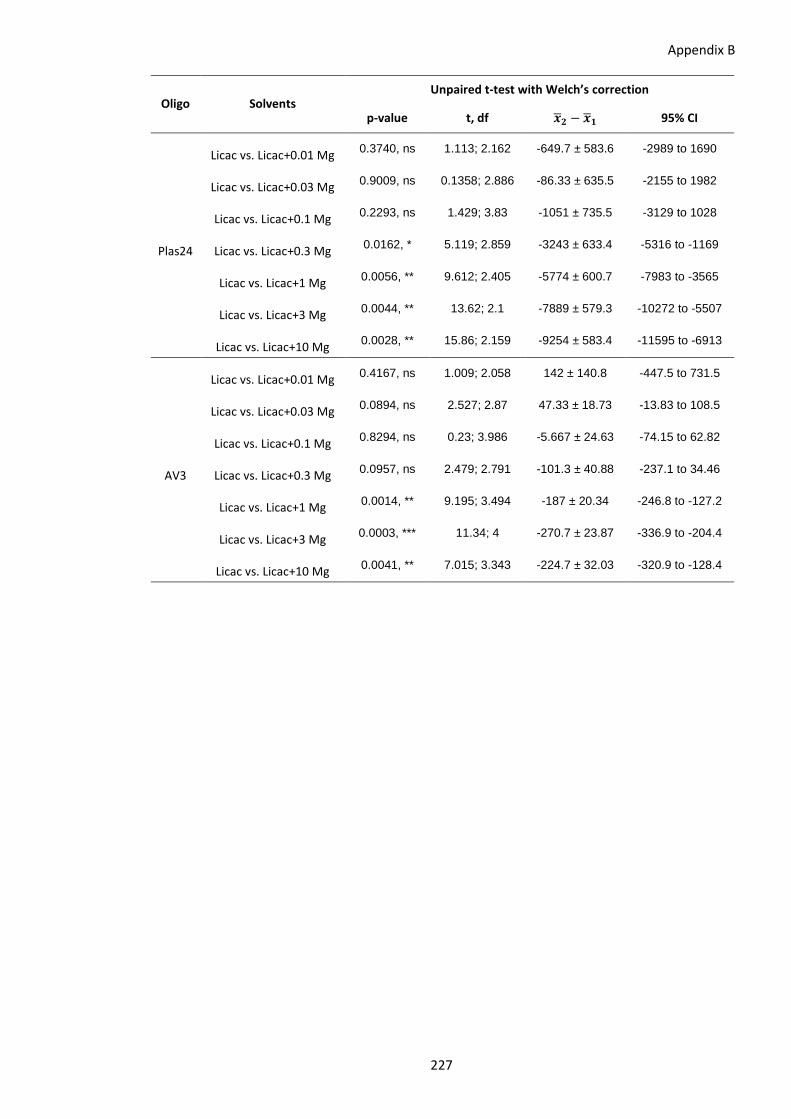
Appendix B
227
Oligo Solvents Unpaired t-test with Welch’s correction
p-value t, df 𝒙𝒙�𝟐𝟐 − 𝒙𝒙�𝟏𝟏 95% CI
Plas24
Licac vs. Licac+0.01 Mg 0.3740, ns 1.113; 2.162 -649.7 ± 583.6 -2989 to 1690
Licac vs. Licac+0.03 Mg 0.9009, ns 0.1358; 2.886 -86.33 ± 635.5 -2155 to 1982
Licac vs. Licac+0.1 Mg 0.2293, ns 1.429; 3.83 -1051 ± 735.5 -3129 to 1028
Licac vs. Licac+0.3 Mg 0.0162, * 5.119; 2.859 -3243 ± 633.4 -5316 to -1169
Licac vs. Licac+1 Mg 0.0056, ** 9.612; 2.405 -5774 ± 600.7 -7983 to -3565
Licac vs. Licac+3 Mg 0.0044, ** 13.62; 2.1 -7889 ± 579.3 -10272 to -5507
Licac vs. Licac+10 Mg 0.0028, ** 15.86; 2.159 -9254 ± 583.4 -11595 to -6913
AV3
Licac vs. Licac+0.01 Mg 0.4167, ns 1.009; 2.058 142 ± 140.8 -447.5 to 731.5
Licac vs. Licac+0.03 Mg 0.0894, ns 2.527; 2.87 47.33 ± 18.73 -13.83 to 108.5
Licac vs. Licac+0.1 Mg 0.8294, ns 0.23; 3.986 -5.667 ± 24.63 -74.15 to 62.82
Licac vs. Licac+0.3 Mg 0.0957, ns 2.479; 2.791 -101.3 ± 40.88 -237.1 to 34.46
Licac vs. Licac+1 Mg 0.0014, ** 9.195; 3.494 -187 ± 20.34 -246.8 to -127.2
Licac vs. Licac+3 Mg 0.0003, *** 11.34; 4 -270.7 ± 23.87 -336.9 to -204.4
Licac vs. Licac+10 Mg 0.0041, ** 7.015; 3.343 -224.7 ± 32.03 -320.9 to -128.4

Appendix B
228
Table 33 - Significance of fluorescence intensity of INS intron 1 RNA-derived oligos in the presence of combined potassium (K) and magnesium (Mg) concentrations. Comparison of mean fluorescence intensity of G4 formation in RNA oligos in the presence of combined concentrations of potassium (K) and magnesium (mM), using unpaired t-tests with Welch’s correction (relative to Figure 23). For each pair of compared concentrations, the p-value and its summary, Welch-corrected t and degrees of freedom, difference between means (�̅�𝑥2 − �̅�𝑥1), and 95% confidence interval (CI), respectively, are shown.
Oligo Solvents Unpaired t-test with Welch’s correction
p-value t, df 𝒙𝒙�𝟐𝟐 − 𝒙𝒙�𝟏𝟏 95% CI
Int1
1 K vs. Licac+150 K 0.0018, ** 23.24; 2.017 -6474 ± 278.5 -7662 to -5285
1 K vs. 0.03 Mg 0.0739, ns 2.875; 2.651 -2111 ± 734.4 -4633 to 410.1
1 K vs. 1 Mg 0.0003, *** 20.49; 2.97 -6389 ± 311.8 -7387 to -5391
1 K vs. 1 K+0.03 Mg 0.0200, * 3.76; 3.974 -1421 ± 378 -2474 to -369
1 K vs.1 K+1 Mg 0.0014, ** 23.51; 2.109 -6623 ± 281.7 -7776 to -5469
1 K vs. 150 K+0.03 Mg 0.0012, ** 22.71; 2.205 -6470 ± 285 -7593 to -5347
1 K vs. 150 K+1 Mg 0.0014, ** 23.84; 2.096 -6705 ± 281.2 -7863 to -5547
0.03 Mg vs. 150 K 0.0234, * 6.415; 2.003 4362 ± 680 1441 to 7284
0.03 Mg vs. 1 Mg 0.0207, * 6.161; 2.173 -4277 ± 694.3 -7048 to -1506
0.03 Mg vs. 1 K+0.03 Mg 0.4231, ns 0.9498; 2.557 690 ± 726.4 -1866 to 3246
0.03 Mg vs. 1 K+1 Mg 0.0215, * 6.622; 2.018 -4511 ± 681.3 -7417 to -1605
0.03 Mg vs. 150 K+0.03 Mg 0.0227, * 6.385; 2.034 -4359 ± 682.6 -7249 to -1469
0.03 Mg vs. 150 K+1 Mg 0.0208, * 6.744; 2.016 -4594 ± 681.1 -7502 to -1685
1K+0.03 Mg vs. 150 K 0.0025, ** 19.67; 2.02 5052 ± 256.9 3957 to 6147
1 K+0.03 Mg vs. 1 Mg 0.0004, *** 16.97; 3.114 4967 ± 292.7 4055 to 5880
1 K+0.03 Mg vs. 1 K+1 Mg 0.0019, ** 19.98; 2.128 -5201 ± 260.4 -6259 to -4143
1 K+0.03 Mg vs. 150 K+0.03 Mg 0.0016, ** 19.13; 2.241 -5049 ± 263.9 -6075 to -4023
1 K+0.03 Mg vs. 150 K+1 Mg 0.0018, ** 20.33; 2.113 -5284 ± 259.9 -6346 to -4221
Int7
1 K vs. Licac+150 K 0.0042, ** 14.4; 2.061 -4479 ± 311 -5780 to -3178
1 K vs. 0.03 Mg 0.0045, ** 5.983; 3.829 -2373 ± 396.6 -3494 to -1252
1 K vs. 1 Mg 0.0055, ** 11.85; 2.14 -3721 ± 314 -4991 to -2451
1 K vs. 1 K+0.03 Mg 0.5247, ns 0.7196; 2.94 -497 ± 690.6 -2720 to 1726
1 K vs.1 K+1 Mg 0.0043, ** 13.23; 2.14 -4156 ± 314 -5426 to -2886

Appendix B
229
Oligo Solvents Unpaired t-test with Welch’s correction
p-value t, df 𝒙𝒙�𝟐𝟐 − 𝒙𝒙�𝟏𝟏 95% CI
Int7
1 K vs. 150 K+0.03 Mg 0.0037, ** 14.25; 2.141 -4476 ± 314.1 -5746 to -3206
1 K vs. 150 K+1 Mg 0.0037, ** 14.82; 2.096 -4630 ± 312.4 -5917 to -3343
0.03 Mg vs. 150 K 0.0122, * 8.361; 2.094 2106 ± 251.9 1068 to 3145
0.03 Mg vs. 1 Mg 0.0274, * 5.272; 2.214 -1348 ± 255.6 -2352 to -343.7
0.03 Mg vs. 1 K+0.03 Mg 0.0778, ns 2.816; 2.633 1876 ± 666.1 -421.1 to 4173
0.03 Mg vs. 1 K+1 Mg 0.0151, * 6.973; 2.215 -1783 ± 255.7 -2786 to -778.9
0.03 Mg vs. 150 K+0.03 Mg 0.0106, * 8.225; 2.216 -2103 ± 255.7 -3107 to -1099
0.03 Mg vs. 150 K+1 Mg 0.0099, ** 8.9; 2.147 -2257 ± 253.6 -3279 to -1235
1K+0.03 Mg vs. 150 K 0.0229, * 6.434; 2.015 3982 ± 619 1338 to 6626
1 K+0.03 Mg vs. 1 Mg 0.0339, * 5.195; 2.035 3224 ± 620.5 597.3 to 5850
1 K+0.03 Mg vs. 1 K+1 Mg 0.0265, * 5.896; 2.035 -3659 ± 620.5 -6285 to -1032
1 K+0.03 Mg vs. 150 K+0.03 Mg 0.0225, * 6.412; 2.035 -3979 ± 620.5 -6605 to -1353
1 K+0.03 Mg vs. 150 K+1 Mg 0.0211, * 6.67; 2.024 -4133 ± 619.7 -6769 to -1497
CD3
1 K vs. Licac+150 K 0.0011, ** 11.03; 3.25 -1145 ± 103.9 -1462 to -828.8
1 K vs. 0.03 Mg 0.0102, * 3.825; 5.508 -483 ± 126.3 -798.8 to -167.2
1 K vs. 1 Mg 0.0004, *** 10.16; 4.278 -1144 ± 112.6 -1448 to -839
1 K vs. 1 K+0.03 Mg 0.0428, * 2.821; 4.4 -320.7 ± 113.6 -625.2 to -16.1
1 K vs.1 K+1 Mg 0.0012, ** 10.2; 3.361 -1069 ± 104.8 -1383 to -754.6
1 K vs. 150 K+0.03 Mg 0.0012, ** 12.01; 3.047 -1227 ± 102.1 -1549 to -904.8
1 K vs. 150 K+1 Mg 0.0010, ** 12.75; 3.014 -1298 ± 101.9 -1622 to -975
0.03 Mg vs. 150 K 0.0019, ** 8.535; 3.461 662.3 ± 77.6 433 to 891.7
0.03 Mg vs. 1 Mg 0.0006, *** 7.43; 5.122 -660.7 ± 88.91 -887.6 to -433.7
0.03 Mg vs. 1 K+0.03 Mg 0.1291, ns 1.798; 5.273 162.4 ± 90.29 -66.18 to 390.9
0.03 Mg vs. 1 K+1 Mg 0.0025, ** 7.429; 3.662 -585.7 ± 78.83 -812.7 to -358.6
0.03 Mg vs. 150 K+0.03 Mg 0.0020, ** 9.88; 3.088 -744 ± 75.31 -979.9 to -508.1
0.03 Mg vs. 150 K+1 Mg 0.0016, ** 10.88; 3.025 -815.3 ± 74.92 -1053 to -578
1K+0.03 Mg vs. 150 K 0.0001, *** 15.07; 3.984 824.7 ± 54.73 672.5 to 976.9

Appendix B
230
Oligo Solvents Unpaired t-test with Welch’s correction
p-value t, df 𝒙𝒙�𝟐𝟐 − 𝒙𝒙�𝟏𝟏 95% CI
CD3
1 K+0.03 Mg vs. 1 Mg <0.0001, **** 11.78; 5.985 823 ± 69.85 652 to 994
1 K+0.03 Mg vs. 1 K+1 Mg 0.0001, *** 13.25; 4.38 -748 ± 56.46 -899.5 to -596.5
1 K+0.03 Mg vs. 150 K+0.03 Mg 0.0003, *** 17.62; 3.191 -906.4 ± 51.43 -1065 to -748.1
1 K+0.03 Mg vs. 150 K+1 Mg 0.0003, *** 19.22; 3.056 -977.7 ± 50.86 -1138 to -817.5
Plas24
1 K vs. Licac+150 K 0.0192, * 6.635; 2.105 -3338 ± 503.1 -5402 to -1274
1 K vs. 0.03 Mg 0.7734, ns 0.3119; 3.369 183 ± 586.6 -1574 to 1940
1 K vs. 1 Mg 0.0641, ns 3.16; 2.53 -1672 ± 529 -3547 to 203.5
1 K vs. 1 K+0.03 Mg 0.8787, ns 0.1652; 3.197 94.67 ± 573.2 -1667 to 1857
1 K vs.1 K+1 Mg 0.0491, * 3.807; 2.327 -1967 ± 516.6 -3915 to -17.94
1 K vs. 150 K+0.03 Mg 0.0228, * 6.484; 2.006 -3222 ± 496.9 -5354 to -1090
1 K vs. 150 K+1 Mg 0.0213, * 6.63; 2.026 -3303 ± 498.2 -5420 to -1185
0.03 Mg vs. 150 K 0.0053, ** 10.91; 2.265 3521 ± 322.6 2277 to 4764
0.03 Mg vs. 1 Mg 0.0120, * 5.128; 3.221 -1855 ± 361.7 -2962 to -747
0.03 Mg vs. 1 K+0.03 Mg 0.8451, ns 0.2085; 3.97 -88.33 ± 423.7 -1268 to 1092
0.03 Mg vs. 1 K+1 Mg 0.0101, * 6.262; 2.797 -2150 ± 343.3 -3288 to -1011
0.03 Mg vs. 150 K+0.03 Mg 0.0081, ** 10.88; 2.015 -3405 ± 313 -4742 to -2068
0.03 Mg vs. 150 K+1 Mg 0.0072, ** 11.07; 2.065 -3486 ± 314.9 -4800 to -2171
1K+0.03 Mg vs. 150 K 0.0043, ** 11.54; 2.316 3432 ± 297.4 2306 to 4559
1 K+0.03 Mg vs. 1 Mg 0.0101, * 5.204; 3.394 1766 ± 339.4 753.7 to 2779
1 K+0.03 Mg vs. 1 K+1 Mg 0.0081, ** 6.447; 2.933 -2061 ± 319.7 -3092 to -1031
1 K+0.03 Mg vs. 150 K+0.03 Mg 0.0072, ** 11.56; 2.018 -3317 ± 286.9 -4541 to -2093
1 K+0.03 Mg vs. 150 K+1 Mg 0.0062, ** 11.75; 2.078 -3397 ± 289 -4597 to -2197
AV3
1 K vs. Licac+150 K 0.0089, ** 5.071; 3.674 -156.3 ± 30.83 -245 to -67.66
1 K vs. 0.03 Mg 0.3786, ns 1.003; 3.587 -43.33 ± 43.2 -168.9 to 82.26
1 K vs. 1 Mg 0.0105, * 4.633; 3.887 -178.7 ± 38.56 -287 to -70.36
1 K vs. 1 K+0.03 Mg 0.1158, ns 2.003; 3.997 -69.33 ± 34.62 -165.5 to 26.81
1 K vs.1 K+1 Mg 0.0060, ** 5.363; 3.955 -199.3 ± 37.17 -303 to -95.67

Appendix B
231
Oligo Solvents Unpaired t-test with Welch’s correction
p-value t, df 𝒙𝒙�𝟐𝟐 − 𝒙𝒙�𝟏𝟏 95% CI
AV3
1 K vs. 150 K+0.03 Mg 0.0068, ** 6.418; 3.113 -182 ± 28.36 -270.4 to -93.57
1 K vs. 150 K+1 Mg 0.0025, ** 6.978; 3.856 -224.3 ± 32.15 -314.9 to -133.7
0.03 Mg vs. 150 K 0.0657, ns 2.84; 2.997 113 ± 39.79 -13.71 to 239.7
0.03 Mg vs. 1 Mg 0.0441, * 2.939; 3.876 -135.3 ± 46.04 -264.8 to -5.862
0.03 Mg vs. 1 K+0.03 Mg 0.5804, ns 0.6076; 3.53 -26 ± 42.79 -151.3 to 99.32
0.03 Mg vs. 1 K+1 Mg 0.0279, * 3.476; 3.781 -156 ± 44.88 -283.5 to -28.48
0.03 Mg vs. 150 K+0.03 Mg 0.0450, * 3.658; 2.587 -138.7 ± 37.91 -271 to -6.345
0.03 Mg vs. 150 K+1 Mg 0.0186, * 4.434; 3.2 -181 ± 40.82 -306.4 to -55.57
1K+0.03 Mg vs. 150 K 0.0492, * 2.876; 3.727 87 ± 30.25 0.5229 to 173.5
1 K+0.03 Mg vs. 1 Mg 0.0476, * 2.869; 3.848 109.3 ± 38.1 1.872 to 216.8
1 K+0.03 Mg vs. 1 K+1 Mg 0.0247, * 3.543; 3.927 -130 ± 36.69 -232.6 to -27.38
1 K+0.03 Mg vs. 150 K+0.03 Mg 0.0242, * 4.063; 3.168 -112.7 ± 27.73 -198.3 to -27.01
1 K+0.03 Mg vs. 150 K+1 Mg 0.0086, ** 4.906; 3.894 -155 ± 31.59 -243.7 to -66.33

Appendix B
232
Table 34 – Proteins bound to INS WT transcript in pull-down assay, identified by mass spectrometry

Appendix B
233

Appendix B
234

Appendix B
235
Table 35 - Proteins bound to INS del5 transcript in pull-down assay, identified by mass spectrometry

Appendix B
236

Appendix B
237

Appendix B
238

Appendix B
239
Table 36 - Proteins bound to beads in pull-down assay, identified by mass spectrometry

Appendix B
240

Appendix B
241

Appendix B
242

Appendix B
243

Appendix B
244
Table 37 – Significance of transfection efficiencies of human and primates’ INS 5’ UTRs. Comparison of INS 5’UTR-dependent fluc expression from human and primates. Dunnett’s test was performed for the comparison of luciferase expression levels of each higher primate construct to the empty pICtest (pIC) vector (relative to Figure 31). Tukey’s multiple comparison test was used for three sets of luciferase expression comparison: WT INS 5’UTR of primates’ vs. human; multiple comparison of constructs mutated at the 3’ss; and multiple comparison of human constructs. Welch’s-corrected unpaired t-test for the comparison WT construct of each primate to the mutated 3’ss construct.
Constructs Dunnett’s multiple comparison test
p-value 𝒙𝒙�𝟐𝟐 − 𝒙𝒙�𝟏𝟏 95% CI
pIC vs. Hs4 0.9916, ns 0.335 -0.989 to 1.66
pIC vs. Hs6 0.0001, **** 3.53 2.21 to 4.85
pIC vs. Hs6 ATG 3’ss 0.0002, *** 2.25 0.928 to 3.58
pIC vs. Hs6 3’ss 0.0001, **** 3.16 1.83 to 4.48
pIC vs. PP 0.0351, * 1.39 0.067 to 2.71
pIC vs. PP 3’ss 0.0107, * 1.6 0.277 to 2.93
pIC vs. PM 0.0001, **** 2.59 1.27 to 3.92
pIC vs. PM 3’ss 0.0002, *** 2.25 0.921 to 3.57
pIC vs. PC 0.0002, *** 2.28 0.952 to 3.6
pIC vs. PC 3’ss 0.0001, *** 2.29 0.971 to 3.62
pIC vs. PS 0.0001, **** 2.98 1.66 to 4.31
pIC vs. PS 3’ss 0.0001, **** 2.64 1.31 to 3.96
Constructs Tukey’s multiple comparison test
p-value 𝒙𝒙�𝟐𝟐 − 𝒙𝒙�𝟏𝟏 95% CI
Hs6 vs. PP 0.0001, **** -2.14 -3.01 to -1.27
Hs6 vs. PM 0.0331, * -0.937 -1.81 to -0.068
Hs6 vs. PC 0.0047, ** -1.25 -2.12 to -0.384
Hs6 vs. PS 0.2957, ns -0.545 -1.41 to 0.325

Appendix B
245
Constructs Tukey’s multiple comparison test
p-value 𝒙𝒙�𝟐𝟐 − 𝒙𝒙�𝟏𝟏 95% CI
Hs6 3'ss vs. PP 3'ss 0.0164, * -1.55 -2.86 to -0.247
Hs6 3'ss vs. PM 3'ss 0.2504, ns -0.91 -2.22 to 0.397
Hs6 3'ss vs. PC 3'ss 0.2974, ns -0.861 -2.17 to 0.446
Hs6 3'ss vs. PS 3'ss 0.7398, ns -0.517 -1.82 to 0.79
PP 3'ss vs. PM 3'ss 0.5652, ns 0.644 -0.663 to 1.95
PP 3'ss vs. PC 3'ss 0.4976, ns 0.693 -0.614 to 2
PP 3'ss vs. PS 3'ss 0.1552, ns 1.04 -0.27 to 2.34
PM 3'ss vs. PC 3'ss >0.9999, ns 0.0493 -1.26 to 1.36
PM 3'ss vs. PS 3'ss 0.8812, ns 0.393 -0.914 to 1.7
PC 3'ss vs. PS 3'ss 0.9227, ns 0.344 -0.963 to 1.65
Constructs Tukey’s multiple comparison test
p-value 𝒙𝒙�𝟐𝟐 − 𝒙𝒙�𝟏𝟏 95% CI
Hs4 vs. Hs6 <0.0001, **** 3.19 2.22 to 4.17
Hs4 vs. Hs6 ATG 3’ss 0.0004, *** 1.92 0.944 to 2.89
Hs4 vs. Hs6 3’ss <0.0001, **** 2.82 1.85 to 3.79
Hs6 vs. Hs6 ATG 3’ss 0.0098, ** -1.28 -2.25 to -0.305
Hs6 vs. Hs6 3’ss 0.6721, ns -0.374 -1.35 to 0.599
Hs6 ATG 3’ss vs. Hs6 3’ss 0.0717, ns 0.904 -0.0691 to 1.88
Constructs Welch’s corrected unpaired t test
p-value t, df 𝒙𝒙�𝟐𝟐 − 𝒙𝒙�𝟏𝟏 95% CI
PP vs. PP 3’ss 0.7432, ns 0.343; 5.98 -0.21 ± 0.613 -1.71 to 1.29
PM vs. PM 3’ss 0.5254, ns 0.697; 3.88 0.347 ± 0.498 -1.05 to 1.75
PC vs. PC 3’ss 0.9298, ns 0.092; 5.75 -0.0182 ± 0.198 -0.507 to 0.47
PS vs. PS 3’ss 0.1111, ns 2.06; 3.86 0.346 ± 0.168 -0.127 to 0.82

246

247
Appendix C Publications

248

Nucleic Acids Research, 2014 1doi: 10.1093/nar/gku507
Optimal antisense target reducing INS intron 1retention is adjacent to a parallel G quadruplexJana Kralovicova1, Ana Lages1, Alpa Patel2, Ashish Dhir3, Emanuele Buratti3, Mark Searle2
and Igor Vorechovsky1,*
1University of Southampton, Faculty of Medicine, Southampton SO16 6YD, UK, 2University of Nottingham, School ofChemistry, Centre for Biomolecular Sciences, Nottingham NG7 2RD, UK and 3ICGEB, Padriciano 99, 34149 Trieste,Italy
Received March 26, 2014; Revised May 14, 2014; Accepted May 20, 2014
ABSTRACT
Splice-switching oligonucleotides (SSOs) have beenwidely used to inhibit exon usage but antisensestrategies that promote removal of entire intronsto increase splicing-mediated gene expression havenot been developed. Here we show reduction of INSintron 1 retention by SSOs that bind transcripts de-rived from a human haplotype expressing low lev-els of proinsulin. This haplotype is tagged by apolypyrimidine tract variant rs689 that decreases theefficiency of intron 1 splicing and increases the rela-tive abundance of mRNAs with extended 5′ untrans-lated region (5′UTR), which curtails translation. Co-expression of haplotype-specific reporter constructswith SSOs bound to splicing regulatory motifs anddecoy splice sites in primary transcripts revealed amotif that significantly reduced intron 1-containingmRNAs. Using an antisense microwalk at a single nu-cleotide resolution, the optimal target was mapped toa splicing silencer containing two pseudoacceptorsites sandwiched between predicted RNA guanine(G) quadruplex structures. Circular dichroism spec-troscopy and nuclear magnetic resonance of syn-thetic G-rich oligoribonucleotide tracts derived fromthis region showed formation of a stable parallel 2-quartet G-quadruplex on the 3′ side of the antisenseretention target and an equilibrium between quadru-plexes and stable hairpin-loop structures bound byoptimal SSOs. This region interacts with heteroge-neous nuclear ribonucleoproteins F and H that mayinterfere with conformational transitions involvingthe antisense target. The SSO-assisted promotion ofweak intron removal from the 5′UTR through compet-ing noncanonical and canonical RNA structures may
facilitate development of novel strategies to enhancegene expression.
INTRODUCTION
Most eukaryotic genes contain intervening sequences or in-trons that must be accurately removed from primary tran-scripts to create functional mRNAs capable of encodingproteins (1). This process modifies mRNP composition ina highly dynamic manner, employing interdependent inter-actions of five small nuclear RNAs and a large number ofproteins with conserved but degenerate sequences in thepre-mRNA (2). Intron splicing generally promotes mRNAaccumulation and protein expression across species (3–5).This process can be altered by intronic mutations or vari-ants that may also impair coupled gene expression path-ways, including transcription, mRNA export and transla-tion. This is best exemplified by introns in the 5′ untrans-lated region (5′UTR) where natural variants or mutationsmodifying intron retention alter the relative abundance oftranscripts with upstream open reading frames (uORFs) orother regulatory motifs and dramatically influence transla-tion (6,7). However, successful sequence-specific strategiesto normalize gene expression in such situations have notbeen developed.
Splice-switching oligonucleotides (SSOs) are antisensereagents that modulate intron splicing by binding splice-siterecognition or regulatory sequences and competing withcis- and trans-acting factors for their targets (8). They havebeen shown to restore aberrant splicing, modify the rela-tive expression of existing mRNAs or produce novel splicevariants that are not normally expressed (8). Improved sta-bility of targeted SSO-RNA duplexes by a number of SSOmodifications, such as 2′-O-methyl and 2′-O-methoxyethylribose, facilitated studies exploring their therapeutic poten-tial for a growing number of human disease genes, includingDMD in muscular dystrophy (9,10), SMN2 in spinal mus-cular atrophy (11), ATM in ataxia-telangiectasia (12) andBTK in X-linked agammaglobulinemia (13). Although suchapproaches are close to achieving their clinical potential for
*To whom correspondence should be addressed. Tel: +44 2381 206425; Fax: +44 2381 204264; Email: [email protected]
C© The Author(s) 2014. Published by Oxford University Press on behalf of Nucleic Acids Research.This is an Open Access article distributed under the terms of the Creative Commons Attribution License (http://creativecommons.org/licenses/by-nc/3.0/), whichpermits non-commercial re-use, distribution, and reproduction in any medium, provided the original work is properly cited. For commercial re-use, please [email protected]
Nucleic Acids Research Advance Access published June 17, 2014 at U
niversity of Southampton on June 17, 2014
http://nar.oxfordjournals.org/D
ownloaded from

2 Nucleic Acids Research, 2014
a restricted number of diseases (8), >300 Mendelian disor-ders resulting from mutation-induced aberrant splicing (14)and a growing number of complex traits may be amenableto SSO-mediated correction of gene expression.
Etiology of type 1 diabetes has a strong genetic compo-nent conferred by human leukocyte antigens (HLA) anda number of modifying non-HLA loci (15). The strongestmodifier was identified in the proinsulin gene (INS) re-gion on chromosome 11 (termed IDDM2) (15). Furthermapping of this area suggested that INS is the most likelyIDDM2 target (16), consistent with a critical role of this au-toantigen in pathogenesis (17). Genetic risk to this diseaseat IDDM2 has been attributed to differential steady-stateRNA levels from predisposing and protective INS haplo-types, potentially involving a minisatellite DNA sequenceupstream of this gene (18,19). However, systematic exami-nation of naturally occurring INS polymorphisms revealedhaplotype-specific proinsulin expression levels in reporterconstructs devoid of the minisatellite sequence, resultingfrom two variants in intron 1 (7), termed IVS1+5ins4 (alsoknown as rs3842740 or INS-69) and IVS1–6A/T (rs689,INS-27 or HphI+/−) (16,20). The former variant activatesa cryptic 5′ splice site of intron 1 whereas adenine (A) atthe latter variant, which resides 6 nucleotides upstream ofthe 3′ splice site (3′ss), promotes intron retention, expandingthe relative abundance of transcripts with extended 5′UTR(21). As compared to thymine (T), the A allele at IVS1–6A/T decreases affinity to pyrimidine-binding proteins invitro and renders the 3′ss more dependent on the auxiliaryfactor of U2 small nuclear ribonucleoprotein (U2AF) (7), aheterodimer required for U2 binding, spliceosome assemblyand 3′ss selection (22). Intron 1-containing transcripts areoverrepresented in IVS1-6A-derived cDNA libraries pre-pared from insulin producing tissues (21), are exported fromthe nucleus (23) and contain a short, Homininae-specificuORF that co-evolved with relaxation of the 3′ss of intron1 in higher primates (7). The lower proinsulin expressionconferred by the A allele may lead to suboptimal presenta-tion of proinsulin peptides in the foetal thymus and inade-quate negative selection of autoreactive T cells, culminatingin autoimmune destruction of insulin-producing � cells inthe pancreas (7). However, no attempts have been made tocorrect the low efficiency of INS intron 1 removal from theIVS1-6A-containing pre-mRNAs and reduce intron reten-tion to the levels observed for the disease-protective T allele.
In this study, we set out to search for SSOs that increasethe efficiency of INS intron 1 splicing and repress splicingsilencers or decoy splice sites in the pre-mRNA to enhanceproinsulin expression. We report identification of SSOs re-ducing the relative abundance of intron 1-retaining tran-scripts, delineation of the optimized antisense target at asingle-nucleotide resolution, evidence for formation of aparallel G-quadruplex adjacent to the antisense target se-quence and identification of proteins that bind to this re-gion.
MATERIALS AND METHODS
Antisense oligonucleotides
SSOs were purchased from the MWG Biotech (Germany).All SSOs and scrambled controls had a full-length phos-
Figure 1. Location of SSOs in the human proinsulin gene. (A) Schematicsof the INS reporter and its mRNA products. SSOs are shown as blackhorizontal bars below exons (numbered boxes) and below intron 1 (line);their sequences are in Supplementary Table S1. Start and stop codons aredenoted by arrowheads. Canonical (solid lines) and cryptic (dotted lines)splicing is shown above the primary transcript; designation of cryptic splicesites is in grey. SSOs targeting intron 1 segments del4-del7 are shown in thelower panel. (B) mRNA isoforms (numbered 1–6) generated by the INSreporter construct. Description of isoforms that do not produce proinsulinis in grey.
phorothioate backbone with 2′-O-methyl ribonucleotides atthe second ribose position. Apart from INS SSOs and theirscrambled versions, we employed SSOs that target other hu-man genes as additional controls, as described (13). Loca-tion of each SSO is shown in Figure 1A and their sequencesin Supplementary Table S1.
Splicing reporter constructs
The wild-type splicing reporter carrying the type 1 diabetes-associated haplotype termed IC was reported previ-ously (7,21). Each construct contains all INS exons andunabridged introns but differ in the length of the last exon.The IC reporters were cloned using primers D-C, D-F andD-B; IC D-B lacks the cryptic 3′ss of intron 2. The relativeabundance of isoforms spliced to this site is lower for IC D-F than for IC D-C (7,21). To test SSOs targeting the cryptic5′ splice site of intron 1, the IC construct was modified by a4-nt insertion at rs3842740 to create a reporter termed IC-IVS1+5ins4. TSC2 and F9 constructs were reported previ-ously (24). Plasmids were propagated in the E. coli strainDH5� and plasmid DNA was extracted using the WizardPlus SV Miniprep kit (Promega, USA). Their inserts werecompletely sequenced to confirm the identity of each of the14 intragenic natural variants and to exclude undesired mu-tations.
at University of Southam
pton on June 17, 2014http://nar.oxfordjournals.org/
Dow
nloaded from

Nucleic Acids Research, 2014 3
Cell cultures and transfections
Human embryonic kidney 293 (HEK293), human hepato-cellular liver carcinoma HepG2 and African green mon-key COS7 cells were cultured in Dulbecco’s modified Eaglemedium, 10% fetal calf serum and penicillin/streptomycin(Life technologies, USA). Transient transfections were car-ried out as described (13), using jetPRIME (Polyplus, USA)according to manufacturer’s recommendations. Downregu-lation of U2AF35 by RNA interference (RNAi) to inducecryptic 3′ss of intron 1 was performed with two hits of smallinterfering RNA (siRNA) U2AF35ab, as reported earlier(7,25); siRNA duplex targeting DHX36 was as described(26). The second hit was applied 24 h before the additionof SSOs and/or reporter. Cell cultures were harvested 24 hafter addition of reporter constructs.
Analysis of spliced products
Total RNA was extracted with TRI Reagent and treatedwith DNase (Life technologies, USA). The first-strandcDNA was reverse transcribed using oligo-(dT)15 primersand Moloney murine virus reverse transcriptase (Promega,USA). Polymerase chain reaction (PCR) was carried outwith a combination of a vector-specific primer PL3 andprimer E targeting the 3′UTR, as reported previously (7).PCR products were separated on polyacrylamide gels andtheir signal intensity was measured as described (27). Theidentity of each mRNA isoform was confirmed by Sangernucleotide sequencing.
Circular dichroism and nuclear magnetic resonance spec-troscopy
Oligoribonucleotides for circular dichroism (CD) and nu-clear magnetic resonance (NMR) were purchased fromThermo Scientific, deprotected according to manufacturer’sinstructions, lyophilized and stored at −20◦C. Stock solu-tions were prepared from the desalted, lyophilized samplesby resuspending in milliQ water or KCl buffer (100 mMKCl, 10 mM K2HPO4/KH2PO4, pH 7.0, milliQ water) to afinal concentration of 2–4 �M.
CD spectra were acquired using a PiStar-180 spectropho-tometer (Applied Photophysics Ltd, Surrey, UK), equippedwith a LTD6G circulating water bath (Grant Instruments,UK) and thermoelectric temperature controller (Melcor,USA). Samples were heated in the cell to 95oC for a totalperiod of 15 min, samples were then annealed by allowingto cool to room temperature for a minimum period of 4 h.CD spectra were recorded over a wavelength range of 215–340 nm using a 1 cm path length strain-free quartz cuvetteand at the temperatures indicated. Data points recordedat 1 nm intervals. A bandwidth of 3 nm was used and5000 counts acquired at each point with adaptive samplingenabled. Each trace is shown as the mean of three scans(±SD). CD temperature ramps were acquired at 265 nmcorresponding to the band maxima of the folded quadru-plex species. Ranges between 5 and 99oC were used, withpoints acquired at 0.5oC intervals with a 120–180 s time-step between 0.5oC increments. Points were acquired with10 000 counts and adaptive sampling enabled. Heating and
cooling studies were compared to check for hysteresis andoverall reversibility.
NMR spectra (1H) were collected at 800 MHz using aBruker Avance III spectrometer with a triple resonance cry-oprobe. Standard Bruker acquisition parameters were used.Data were collected using Topspin (v. 3.0) and processed inCCPN Analysis (v. 2.1).
Pull-down assays and western blotting
In vitro transcription was carried out usingMEGAshortscriptTM T7 (LifeTechnologies, USA) andT7-tagged PCR products amplified with primers 5′-ATTAATACGACTCACTATAGGGCTCAGGGTTCCAGG and 5′-TGCAGCAGGGAGGACG, and DNA ofthe indicated plasmids as a template. Indicated syntheticRNAs were purchased from Eurofins UK. Five hundredpmols of each RNA was treated with 5 mM sodiumm-periodate and bound to adipic acid dihydrazide agarosebeads (Sigma, USA). Beads with bound RNAs werewashed three times in 2 ml of 2 M NaCl and three times inbuffer D (20 mM HEPES–KOH, pH 7, 6.5% v/v glycerol,100 m M KCl, 0.2 mM EDTA, 0.5 mM dithiothreitol),incubated with HeLa nuclear extracts and buffer D withheparin at a final concentration of 0.5 mg/ml. Unboundproteins were washed five times with buffer D. Boundproteins were separated on 10% sodium dodecyl sulphate-polyacrylamide gel electrophoresis, stained by Coomassieblue and/or blotted on to nitrocellulose membranes.
Western blotting was carried out as described (7). Anti-bodies were purchased from Sigma (hnRNP E1/E2, prod-uct number R4155, U2AF65, product number U4758 andSFRS2, product number S2320), Abcam (DHX36, productnumber ab70269) and Millipore (SC35, clone 1SC-4F11).Antiserum against hnRNP F and hnRNP H was a gener-ous gift of Prof. Douglas Black, UCLA.
Mass spectrometry analysis
Following trypsin digestion, samples were freeze dried andresuspended with 25 ul of 5% ACN/0.1% formic acidfor mass spectrometry (MS). Peptides were analysed byLC/MS/MS using a Surveyor LC system and LCQ DecaXP Plus (ThermoScientific). The raw data files were con-verted into mascot generic files using the MassMatrix FileConversion Tool (Version 2.0; http://www.massmatrix.net)for input into the Mascot searching algorithm (Matrix Sci-ence).
Enzymatic structural probing
RNA secondary structure determination with the use oflimited V1 RNAse (Ambion), T1 RNAse (Ambion) and S1nuclease (Fermentas) digestion has been described in detailelsewhere (28). Briefly, 1 �g aliquots of RNAs from the in-sertion (ins) and deletion (del) pre-mRNAs were digestedwith 0.002 U of RNAse V1, 0.05 U of RNAse T1 and 19 Uof S1 nuclease in a 100 �l at 30◦C for 10 min. An enzyme-free aliquot was used as a control (C). The cleaved RNAswere retrotranscribed according to standard protocols us-ing antisense primers labeled with [32P]-ATP at the 5′ end.
at University of Southam
pton on June 17, 2014http://nar.oxfordjournals.org/
Dow
nloaded from
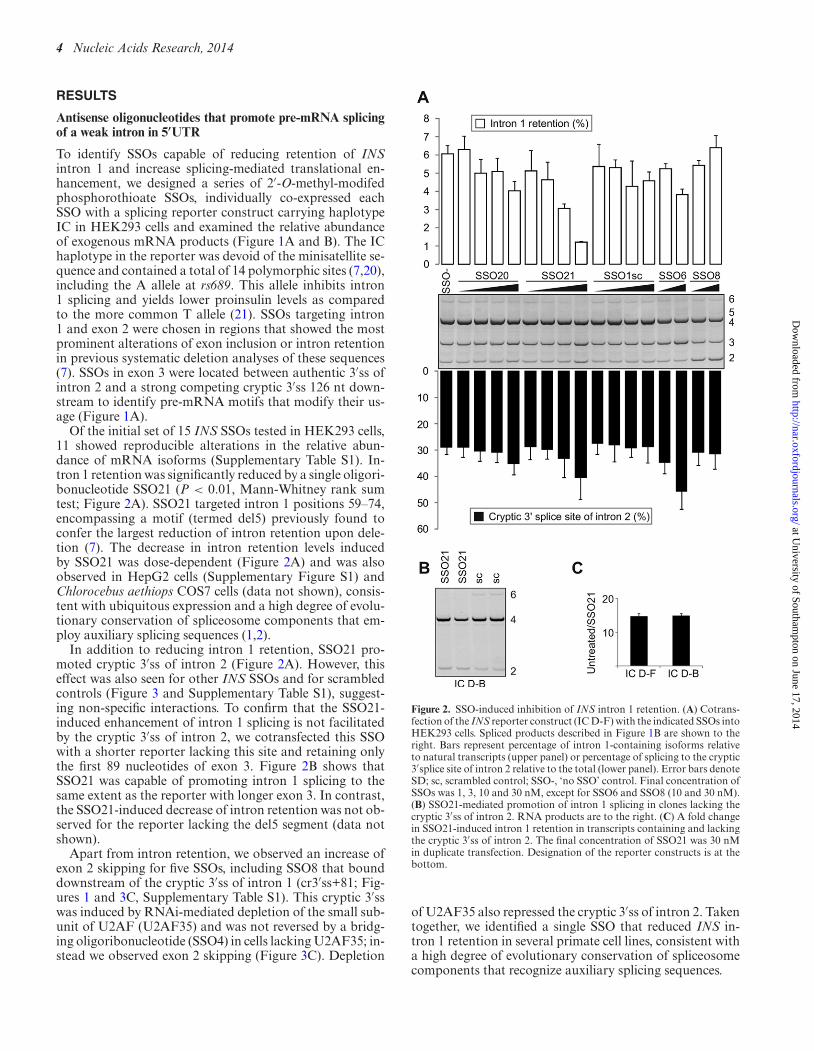
4 Nucleic Acids Research, 2014
RESULTS
Antisense oligonucleotides that promote pre-mRNA splicingof a weak intron in 5′UTR
To identify SSOs capable of reducing retention of INSintron 1 and increase splicing-mediated translational en-hancement, we designed a series of 2′-O-methyl-modifedphosphorothioate SSOs, individually co-expressed eachSSO with a splicing reporter construct carrying haplotypeIC in HEK293 cells and examined the relative abundanceof exogenous mRNA products (Figure 1A and B). The IChaplotype in the reporter was devoid of the minisatellite se-quence and contained a total of 14 polymorphic sites (7,20),including the A allele at rs689. This allele inhibits intron1 splicing and yields lower proinsulin levels as comparedto the more common T allele (21). SSOs targeting intron1 and exon 2 were chosen in regions that showed the mostprominent alterations of exon inclusion or intron retentionin previous systematic deletion analyses of these sequences(7). SSOs in exon 3 were located between authentic 3′ss ofintron 2 and a strong competing cryptic 3′ss 126 nt down-stream to identify pre-mRNA motifs that modify their us-age (Figure 1A).
Of the initial set of 15 INS SSOs tested in HEK293 cells,11 showed reproducible alterations in the relative abun-dance of mRNA isoforms (Supplementary Table S1). In-tron 1 retention was significantly reduced by a single oligori-bonucleotide SSO21 (P < 0.01, Mann-Whitney rank sumtest; Figure 2A). SSO21 targeted intron 1 positions 59–74,encompassing a motif (termed del5) previously found toconfer the largest reduction of intron retention upon dele-tion (7). The decrease in intron retention levels inducedby SSO21 was dose-dependent (Figure 2A) and was alsoobserved in HepG2 cells (Supplementary Figure S1) andChlorocebus aethiops COS7 cells (data not shown), consis-tent with ubiquitous expression and a high degree of evolu-tionary conservation of spliceosome components that em-ploy auxiliary splicing sequences (1,2).
In addition to reducing intron 1 retention, SSO21 pro-moted cryptic 3′ss of intron 2 (Figure 2A). However, thiseffect was also seen for other INS SSOs and for scrambledcontrols (Figure 3 and Supplementary Table S1), suggest-ing non-specific interactions. To confirm that the SSO21-induced enhancement of intron 1 splicing is not facilitatedby the cryptic 3′ss of intron 2, we cotransfected this SSOwith a shorter reporter lacking this site and retaining onlythe first 89 nucleotides of exon 3. Figure 2B shows thatSSO21 was capable of promoting intron 1 splicing to thesame extent as the reporter with longer exon 3. In contrast,the SSO21-induced decrease of intron retention was not ob-served for the reporter lacking the del5 segment (data notshown).
Apart from intron retention, we observed an increase ofexon 2 skipping for five SSOs, including SSO8 that bounddownstream of the cryptic 3′ss of intron 1 (cr3′ss+81; Fig-ures 1 and 3C, Supplementary Table S1). This cryptic 3′sswas induced by RNAi-mediated depletion of the small sub-unit of U2AF (U2AF35) and was not reversed by a bridg-ing oligoribonucleotide (SSO4) in cells lacking U2AF35; in-stead we observed exon 2 skipping (Figure 3C). Depletion
Figure 2. SSO-induced inhibition of INS intron 1 retention. (A) Cotrans-fection of the INS reporter construct (IC D-F) with the indicated SSOs intoHEK293 cells. Spliced products described in Figure 1B are shown to theright. Bars represent percentage of intron 1-containing isoforms relativeto natural transcripts (upper panel) or percentage of splicing to the cryptic3′splice site of intron 2 relative to the total (lower panel). Error bars denoteSD; sc, scrambled control; SSO-, ‘no SSO’ control. Final concentration ofSSOs was 1, 3, 10 and 30 nM, except for SSO6 and SSO8 (10 and 30 nM).(B) SSO21-mediated promotion of intron 1 splicing in clones lacking thecryptic 3′ss of intron 2. RNA products are to the right. (C) A fold changein SSO21-induced intron 1 retention in transcripts containing and lackingthe cryptic 3′ss of intron 2. The final concentration of SSO21 was 30 nMin duplicate transfection. Designation of the reporter constructs is at thebottom.
of U2AF35 also repressed the cryptic 3′ss of intron 2. Takentogether, we identified a single SSO that reduced INS in-tron 1 retention in several primate cell lines, consistent witha high degree of evolutionary conservation of spliceosomecomponents that recognize auxiliary splicing sequences.
at University of Southam
pton on June 17, 2014http://nar.oxfordjournals.org/
Dow
nloaded from

Nucleic Acids Research, 2014 5
Figure 3. INS SSOs targeting cryptic 3′ splice sites. (A) Activation of cryp-tic 3′ss of intron 2 (cr3′ss+126; Figure 1A) by SSO6 and promotion of exon2 skipping by SSO8. Concentration of each SSO was 2, 10, 50 and 250 nM.SSOs are shown at the top, spliced products to the right, reporter at thebottom. (B) A predicted stable hairpin between the authentic and cryptic3′ss of INS intron 2. Bases targeted by SSO6 are denoted by asterisks andpredicted splicing enhancer hexamers (listed to the right) are denoted bya dotted line. (C) SSO4 does not prevent activation of cryptic 3′ss 81 basepairs downstream of its authentic counterpart (cr3′ss+81) in cells depletedof U2AF35 but induces exon skipping. The final concentration of eachSSO in COS7 cells was 5, 20 and 80 nM. The final concentration of thesiRNA duplex U2AF35ab (29) was 70 nM. The reporter was the same asin panel A.
Optimization of the intron retention target at the single-nucleotide level
Interestingly, other SSOs designed to target the del5 seg-ment did not reduce intron 1 retention, except for a smalleffect of SSO20 (Figures 1A and 2A). To test the impor-tance of nucleotides flanking SSO21 and to map the op-timal target at a single-base resolution, we carried out adetailed antisense microwalk in this region. We individu-ally co-transfected the INS reporter with additional eigh-teen 16-mers bound 1–9 nucleotides 5′ and 3′ of SSO21 intoHEK293 cells and examined their RNA products. Intron 1retention was most repressed by SSO21 and by SSOs thatwere shifted by 1–2 nucleotides in each direction (Figure 4).In agreement with the initial screen, SSOs targeting morethan one cytosine in the upstream run of four Cs (C4, seeSSO1 and SSO2, Figure 1A) were not effective (SSO21–3r
through SSO21–10r, Figure 4). In the opposite direction,SSOs targeting consecutive Gs, which are often found inintronic splicing enhancers (30–32), increased intron reten-tion. Thus, the optimal antisense target for reducing reten-tion of INS intron 1 was mapped at a single nucleotide res-olution to a region previously identified as the most repres-sive by a systematic deletion analysis of the entire intron (7).
Antisense target for intron retention is adjacent to a parallelRNA quadruplex
We noticed that the target was sandwiched between twointronic segments predicted to form stable RNA guanine(G) quadruplexes (intron 1 nucleotides 36–61 and 78–93;highlighted in Figure 4A). These structures are producedby stacking G-quartets that consist of four Gs organizedin a cyclic Hoogsteen hydrogen bonding arrangement (33)and have been implicated in important cellular processes,including replication, recombination, transcription, trans-lation (34,35) and RNA processing (36–40). To test if theyare formed in vitro, we employed synthetic ribonucleotidesderived from this region in CD spectroscopy that has beenused widely to characterize DNA and RNA quadruplexstructures (41–44). The CD spectrum of a downstream 19-mer (termed CD1) recorded between 215 and 330 nm at25◦C revealed strong positive ellipticity at 265 nm withnegative intensity at around 240 nm, indicative of a par-allel quadruplex (Figure 5A). To confirm the presence ofa quadruplex, rather than other stable secondary struc-ture motifs, we recorded UV absorbance spectra at 5◦Cand 95◦C. The UV absorbance difference spectrum at thetwo temperatures (below and above the melting transitionpoint) showed the characteristic hyperchromic shift at ∼295nm (data not shown) and a double maximum at 240 nmand 280 nm, providing evidence for formation of a sta-ble parallel-stranded RNA quadruplex in vitro. This wasconfirmed by 1H NMR studies of CD1 (Figure 5B) whichshowed a characteristic envelope of signals between 10 and12 ppm corresponding to Hoogsteen H-bonded Gs withinG-tetrad structures. Thermal stability measurements by CDproduced a highly reversible sigmoidal co-operative unfold-ing transition with a Tm = 56.8 ± 0.2◦C (Figure 5C). Fig-ure 5D (upper panel) shows a possible arrangement of the19-mer into two stacked G-tetrads connected by relativelyshort loop sequences of 1–4 nucleotides.
Conformational transition model for splicing inhibitory se-quences in INS intron 1
CD of a synthetic 20-mer derived from a region upstreamof the antisense target (termed CD2) also showed evidenceof stable structure formation, giving a broader absorp-tion envelope centered around 270 nm and a sigmoidalthermal unfolding transition (Tm = 69.0 ± 0.45◦C; Fig-ure 5A). Unlike the downstream oligo CD1, no hyper-chromic shift in the UV was found in the thermal differ-ence spectrum (data not shown). However, a well-definedset of sharp signals in the 1H NMR spectrum between 12and 14 ppm that differed from those for CD1 showed theformation of Watson–Crick H-bonded base pairs charac-teristic of double-stranded RNA (Figure 5B). Secondary
at University of Southam
pton on June 17, 2014http://nar.oxfordjournals.org/
Dow
nloaded from

6 Nucleic Acids Research, 2014
Figure 4. Optimization of the intron retention target by antisense microwalk at a single-nucleotide resolution. (A) Location of oligoribonucletoides. Mi-crowalk SSOs and oligos used for CD/NMR are represented by horizontal black bars below and above the primary transcript, respectively. Intron 1sequences predicted to form RNA G-quadruplexes are highlighted in grey. Microwalk direction is shown by grey arrows; winner oligos are highlighted inblack. A box denotes a single nucleotide polymorphism reported previously (20). (B) Intron retention levels of each microwalk SSO in two cell lines. Errorbars denote SDs obtained from two independent cotransfections with reporter IC D-F.
structure predictions of overlapping intronic segments us-ing Mfold suggested that the pre-mRNA forms stable lo-cal stem-loops; one of them was further stabilized by aG→C mutation (termed G2; Figure 5D, lower panel) thatincreased intron 1 retention (7). Another G→C substitu-tion (termed G3) located further downstream and destabi-lizing the quadruplex structure (Figure 5D, upper panel)also repressed intron splicing (7). Finally, CD2 oligonu-cleotides containing either A or G at a single-nucleotidepolymorphism (Figure 4A and (20) exhibited very similarCD spectra with well-defined melting transitions and Tmvalues (data not shown), suggesting that the G and A al-leles form the same structure.
To test further the importance of a tentative equilibriumbetween canonical and noncanonical structures in intronsplicing, we used a combination of CD, NMR and mutagen-
esis experiments (Figure 6). We synthesized an oligoribonu-cleotide CD3 encompassing the 5′ end of the intron reten-tion target and predicted stem-loops/quadruplex (Figures4A and 6A). We also synthesised a mutated version CD4,which carried two C→U transitions destabilizing the hair-pin but maintaining stability of the quadruplex. The samemutation was also introduced in our IC reporter constructtransfected into HEK293 cells.
The NMR spectrum of CD3 revealed the co-existence ofsignals for both G-tetrad and canonical base-paired hair-pin structures (termed H1 and H2) in equilibrium (Figure6B and C). We investigated the effects of Mg2+ on the con-formational equilibrium between quadruplex and hairpinby adding 2 mM and then 6 mM MgCl2 to the bufferedsolution containing 100 mM KCl. As reported by Bugautet al. (45), the conformational equilibrium was not sig-
at University of Southam
pton on June 17, 2014http://nar.oxfordjournals.org/
Dow
nloaded from

Nucleic Acids Research, 2014 7
Figure 5. Biophysical characterization of RNA secondary structure formation. (A) Far-UV CD spectrum at 25◦C for CD1 (19-mer) and CD2 (20-mer)RNAs, revealing ellipticity maximum at 265 and 270 nm, respectively. (B) 1H NMR spectra of CD1 and CD2 recorded at 800 MHz and 298 K showingcharacteristic groups of resonances from H-bonded G bases. (C) Sigmoidal CD melting curves for the two RNAs showing a transition mid-point at 56.8± 0.2◦C and 69.0 ± 0.45◦C, respectively. The two curves have been displaced slightly from each other for clarity. (D) The proposed parallel quadruplexstructure with two stacked G-tetrads connected by short loop sequences for CD1 (top panel). Predicted hairpin structures for CD2 are shown at the bottompanel. G→C mutations are in red.
nificantly perturbed by the addition of Mg2+ in the pres-ence of KCl. Thus, we observed formation of the RNAhairpin and quadruplex structures in an environment thatmimics the cellular context where both K+ and Mg2+ ionswere present at high concentrations. The CD melting curveshowed a broad transition (Tm = 79.9◦C), consistent withmultiple conformational states with different stabilities. TheCC→UU mutation in CD4 resulted in the loss of NMR sig-nals for H1 (Figure 6B) and a reduction in the Tm by 13oC,consistent with the selective destabilization of the more sta-ble hairpin H1, leading to an increase in the population ofH2 in equilibrium with the quadruplex. Transient transfec-tions showed that the CC→UU mutation improved intron1 splicing while a mutation termed M1 predicted to desta-bilize both the quadruplex and the hairpin had only a smalleffect (Figure 6D, Supplementary Table S2).
To explore how the equilibrium of these structures af-fects intron splicing more systematically, we prepared a se-ries of mutated constructs to destabilize/maintain predictedquadruplex, H1/H2 structures and two cytosine runs (Sup-plementary Table S2). Their transcripts showed significant
differences in intron retention levels (Figure 7; P = 0.0001,Kruskal–Wallis one-way ANOVA on ranks). First, elimi-nation of the G-quadruplex increased intron 1 retention,which was further enhanced by removing each cytosine run(cf. mutations 4–6 with the wild-type, P = 0.0004). Thesemutations appeared to have additive effects on intron reten-tion (cf. wild-type versus mutations 1 or 9; 3 versus 2 and 4versus 5). Second, the increased intron retention in the ab-sence of the G-quadruplex was not altered by removing H1and H2, but their elimination enhanced exon skipping (cf.isoform 2 for mutations 4 versus 6). Third, when only oneof the two C4 runs was present, removal of H1 somewhatimproved intron 1 splicing (cf. 8 versus 9), consistent witha statistically significant correlation between intron reten-tion and predicted stability of tested RNAs (Figure 7B). Theefficiency of intron splicing was thus controlled by confor-mational transitions between canonical and noncanonicalstructures in equilibrium.
at University of Southam
pton on June 17, 2014http://nar.oxfordjournals.org/
Dow
nloaded from

8 Nucleic Acids Research, 2014
Figure 6. Conformational quadruplex/hairpin transitions involving the antisense target. (A) Schematic equilibrium between hairpin (black) and quadru-plex (dark blue) structures proposed to form within the G-rich motif encompassing oligoribonucleotide CD3. CD4 contains a CC→UU mutation (in red).(B) The NMR spectrum in the 9–15 ppm region reveals imino proton signals corresponding to hydrogen bonded bases. The signals between 10 and 12ppm are characteristic of Hoogsteen hydrogen bonded Gs within a G-tetrad (red box), while signals > 12 ppm are indicative of Watson–Crick A-U andG-C base pairs within hairpin structures (black box). In CD3, hairpin H1 is significantly populated, but mutations in CD4 destabilize H1 making H2 themajor species, with both in equilibrium with the quadruplex structure. (C) Mfold predictions of two possible hairpins, consistent with the NMR data. (D)Reduction of intron retention upon destabilization of the hairpin structure by the CC→UU mutation. Error bars denote SD of a duplicate experimentwith reporter IC D-C. Del5, the IC D-C reporter lacking segment del5 (Figure 1A); M1, a reporter containing two substitutions (Supplementary Table S2)to destabilize both the G-quadruplex and the stem-loop.
Protein–RNA interactions in the region targeted by winnerSSOs
To identify proteins that interact with RNAs encompassingthe antisense target and/or associated canonical and non-canonical structures, we carried out pull-down assays usingwild type and del5 RNAs transcribed from T7-tagged PCRproducts, a synthetic RNA (CD5) representing the target se-quence, and a control oligo containing a 3′ss CAG, termedAV3. Western blotting showed that both wild type and del5transcripts bound hnRNPs F/H but this binding was ab-sent for CD5 (Figure 7C). These proteins were also detectedby MS/MS analysis of differentially stained fragments frompull down gels with wild type and del5 RNAs as comparedto beads-only controls (data not shown). Two antibodiesagainst SRSF2, which showed the highest score for putativebinding activity among several SR proteins (SupplementaryFigure S2), failed to detect any specific interaction (Figure7C). Although the signal from hnRNP E1/E2, which con-stitute a major poly(C) binding activity in mammalian cells(46), was above background for del5 (Figure 7C), we ob-
served no change in intron retention in cells lacking hnRNPE1/E2 (data not shown).
Splicing pattern of G-rich and G-poor reporters upon DHX36depletion
RNA G-quadruplexes bind helicase DHX36, which is capa-ble of converting quadruplex RNA to a stable duplex andis a major source of quadruplex-resolving activity in HeLacells (26,47). DHX36 was crosslinked to an intronic splic-ing enhancer in the ATM pre-mRNA (48) and could un-wind the quadruplex structure within the 5′ region of TERC(26). To test if DHX36 depletion can influence INS splicing,we transiently transfected G-quadruplex-poor and -rich re-porters (Figure 8A, Table 1) into depleted cells. Controlconstructs were chosen to give approximately equal repre-sentation of spliced products, which was achieved by weak-ening the branch site (24), thus providing a sensitive exvivo splicing assay. However, despite efficient DHX36 de-pletion (Figure 8B), we did not see statistically significantalterations of INS intron 1 retention in either short or long
at University of Southam
pton on June 17, 2014http://nar.oxfordjournals.org/
Dow
nloaded from

Nucleic Acids Research, 2014 9
Figure 7. Identification of proteins that interact with pre-mRNAs encom-passing the antisense target for intron retention. (A) Intron retention levelsfor wild type and mutated reporter constructs (IC D-C) following transienttransfections into HEK293T cells. Mutations are shown in SupplementaryTable S2. RNA products are to the right. The presence of predicted RNAquadruplexes, hairpins H1/H2 and the upstream and downstream C4 runare indicated below the gel figure. Error bars denote SDs obtained fromtwo replicate experiments. (B) Intron retention levels of tested RNAs corre-late with their predicted stabilities across the antisense target. (C) Westernblot analysis of a pull-down assay with antibodies indicated to the right.NE, nuclear extracts; B, beads-only control; AV3, control RNA oligo con-taining a cytosine run and a 3′ss AG (7). The sequence of CD5 RNA isshown in Figure 4A.
constructs, nor did we observe major changes in G-poorand G-rich controls (Figure 8C–E and data not shown).These results are in agreement with a previous lack of sig-nificant enrichment of quadruplex sequences among tran-scripts downregulated in DHX36-depleted cells (49) andwith the absence of ATM response to the knockdown (48).
SSO-induced repression of a population-specific cryptic 5′splice site of INS intron 1
In addition to rs689, INS intron 1 splicing is influenced bya polymorphic TTGC insertion at rs3842740 located in thevicinity of the natural 5′ss (21). This insertion is present ina quarter of all African chromosomes but is absent on Cau-casian IC haplotypes (20). The insertion activates a down-stream cryptic 5′ss (Figure 1A), extending the 5′UTR of theresulting mRNAs by further 26 nucleotides and repressing
Figure 8. Splicing pattern of quadruplex-rich and -poor minigenes uponDHX36 depletion. (A) Schematics of reporter constructs. Predictedquadruplexes are denoted by black rectangles; their densities are shownin Table 1. Exons (boxes) are numbered; forward slash denotes shorten-ing of F9 intron 3 (24). The F9 and TSC2 minigenes contain branch pointsubstitutions c.253–25C and c.5069–18C, respectively, that impair splicing(24). Cr5′ss-104; cryptic 5′ss 104 upstream of authentic 5′ss of intron 2.(B) Immunoblot with antibodies against DHX36. sc, scrambled siRNA;c, untreated cells. Error bars are SDs of two transfection experiments. (C–E) Intron retention and exon skipping of the indicated reporters. The finalconcentration of DHX36 siRNA was 50 nM. RNA products are shownschematically to the right. Error bars are SDs of two transfection experi-ments.
proinsulin expression (7,21). To test if the new 5′ss can beefficiently inhibited by SSOs, we introduced the same in-sertion in our IC construct and co-expressed the wild typeand mutated reporters with a bridging oligoribonucleotidetermed SSO10. Although the cryptic splicing was inhibited,canonical splicing of intron 1 was not completely restoredeven at high SSO10 concentrations (Supplementary FigureS3 and data not shown), most likely as a result of subopti-
at University of Southam
pton on June 17, 2014http://nar.oxfordjournals.org/
Dow
nloaded from

10 Nucleic Acids Research, 2014
Table 1. Density of predicted RNA G-quadruplexes in reporter constructs
Reporter TSC2 F9 INS
G-quadruplexes per nucleotidea 0.25 0.05 0.27G score per nucleotidea 0.20 0.04 0.22
aThe length of non-overlapping quadruplex sequences and their G scores were computed as described (50).
mal recognition of the authentic 5′ss weakened by the inser-tion.
To gain initial insights into folding of 5′UTR sequencesin the presence and absence of the insertion, we carried outenzymatic structural probing using partial RNA digestionwith single- and double-strand specific RNAses (Supple-mentary Figure S4). The overall cleavage positions and in-tensities detected for the wild-type RNA were broadly con-sistent with mfold predictions, in which two major stem-loop regions (SL1 and SL2) were interrupted by several in-ternal bulges. Both the structural probing and mfold pre-dictions suggested that the insertion at rs3842740 extendedthe central bulge in SL1 as the number of T1 and S1 cleav-ages in this region increased in contrast to the remainingportions of SL1 and in SL2 (Supplementary Figure S5). Fi-nally, transcripts were not digested by RNase V1 in regionsshowing quadruplex formation in vitro.
DISCUSSION
Antisense intron retention target in a splicing silencer of INSintron 1
Here we demonstrate the first use of antisense technologyto reduce retention of the entire intron in mature transcriptsand to modify the haplotype-dependent INS expression us-ing SSOs. Identification of winner SSOs that compensatethe adverse impact of the A allele at rs689 on efficient RNAprocessing was facilitated by systematic mutagenesis of in-tron 1 (7), and by our macro- (Figure 1) and micro-walk(Figure 4) strategies. A similar approach was used previ-ously for fine-mapping sequences that influence inclusion ofSMN2 exon 7 in the mRNA (51). Interestingly, the target se-quence contains a tandem CAG(G/C) motif, which resem-bles a 3′ss consensus (Figure 4). Such ‘pseudo-acceptors’were previously implicated in splice-site repression experi-mentally (27) and are overrepresented in splicing silencers.For example, the two tetramers are more common amonghigh-confidence 102 intronic splicing silencers (52) and aredepleted in 109 enhancers (53) identified by fluorescence ac-tivated screen of random 10-mers. The YAG motifs werealso more frequent than expected among QUEPASA splic-ing silencers (54), suggesting that they are important func-tional components of the retention target. The interveningcytosine tract may also play an important role as the fre-quency of C4 runs among QUEPASA silencers is ∼2 timeshigher than expected. We also found these motifs in 4% ofintronic splicing regulatory elements identified by a system-atic screening of sequences inserted at positions –62/–51 rel-ative to a tested 3′ss (55). This study identified an elementtermed ISS22 (AAATAGAGGCCCCAG) that shared a 3′nonamer (underlined) with the optimal intron retention tar-get. However, unlike an optimal 3′ss recognition sequence ofAV3, our pull-down assay coupled with western blotting re-
vealed only a very weak binding if any to U2AF65 (Figure7C).
Conformational transition between quadruplex and hairpinsin RNA processing control
The antisense target was identified just upstream of a po-tential G-quadruplex forming RNA whose structure wassubsequently confirmed by CD and NMR analysis (Fig-ures 1A and 5). RNA quadruplexes are more stable thantheir DNA counterparts, have been increasingly implicatedin regulation of RNA metabolism (34–35,42–43) and offerunique avenues for drug development (56). The 2-quartetquadruplexes are thermodynamically less stable than their3- or 4-quartet counterparts and are probably kineticallymore labile, yet they still display pronounced stability andmay serve as more compliant and dynamic switches betweenquadruplex and non-quadruplex structures in response tocellular environment (57–59). The winner SSOs may blockinteractions with trans-acting factors, alter higher-orderstructures, the rate of RNA–protein complex formationor impair conformational transition between the 2-quartetquadruplex and H1/H2 (Figure 5). A similar transition hasbeen recently described for a quadruplex not predicted abinitio (45), raising a possibility that additional sequences inthe G-rich intron 1 may participate in the equilibria nearthe antisense target, possibly involving multiple quadruplexmotifs and competing stem-loops.
Our binding (Figure 7C) and functional experimentsshowing the increased intron 1 retention upon hnRNP F/Hdepletion and the opposite effect upon hnRNP F/H over-expression (7) indicate that these proteins interact with keysplicing auxiliary sequences in this intron. In contrast to aprevious report concluding that hnRNP F binds directly tothe RNA quadruplex (60), hnRNP F has been shown toprevent formation of RNA quadruplexes by binding exclu-sively single-stranded G-tracts (61). Although preliminarypredictions based on primate genomes suggest that the ma-jority of putative quadruplexes are likely to fold into canon-ical structures (62), future studies will be required to explainhow decreased pre-mRNA occupancy by these proteins,presumably promoting quadruplex formation (61), can re-duce splicing efficiency.
RNA quadruplexes in coupled splicing and translational geneexpression control
RNA quadruplexes were predicted in ∼8.0% of 5′UTRand were proposed to act as general inhibitors of transla-tion (62,63). INS intron 1 is weakly spliced and U2AF35-dependent (7) and a significant fraction of intron 1-containing transcripts is exported from the nucleus (23).This suggests that the RNA G-quadruplex formed by CD1
at University of Southam
pton on June 17, 2014http://nar.oxfordjournals.org/
Dow
nloaded from
Nucleic Acids Research, 2014 11
could influence translation of these mRNAs, which containa three-amino acid uORF specific for Homininae (7). ThisuORF markedly inhibits proinsulin expression and is lo-cated just a few base-pairs downstream, prompting a spec-ulation that the G-quadruplexes can promote translationby sequestering uORFs. As functional 2-quartet quadru-plexes are required for activity of internal ribosomal entrysites (57), future studies should also explore the importanceof these structures in cap-independent translation of proin-sulin transcripts (64).
Antisense strategies for dependencies in splice-site selection
Apart from canonical mRNA isoform 4, isoforms 2, 3and 6 (Figure 1B) have been found in expressed sequencetag databases derived from cDNA libraries from insulin-producing tissues (21). This suggests that cryptic splice sitesproduced by our reporter construct are recognized in vivoand that our haplotype-dependent reporter system reca-pitulates these events accurately in cultured cells no mat-ter whether the cells express or not endogenous insulin.Apart from repressing intron 1-retaining transcripts, opti-mal SSOs increased utilization of cryptic 3′ss of exon 3 (Fig-ure 2). This undesired effect could be explained by coor-dination of splicing of adjacent exons and introns, whichwas observed previously for individual genes and globally(65–69). Also, G-richness downstream transcription startsites have been associated with RNA polymerase II paus-ing sites (70). Although the two robustly competing 3′ss ofintron 2 are likely to respond to non-specific signals that in-fluence RNA folding (Figure 3, Supplementary Table S1),it might be possible to alleviate the observed dependenciesand reduce cryptic 3′ss activation using SSO combinationsat linked splice sites and examine their synergisms or antag-onisms, benefiting from the use of full-gene constructs asopposed to minigenes.
Multifunctional antisense oligonucleotides to reduce INS in-tron 1 retention
Since the first use of 2′-O-methyl-phosphorothioate SSOs(71), this type of chemical modification has been success-fully exploited for many in vitro and in vivo applications (9–10,72). To further fine-tune expression of mRNA isoforms,optimized SSOs can be designed to tether suitable trans-acting splicing factors to their target sequences (11,73). Anobvious candidate for our system is U2AF35 because intron1 is weak as a result of relaxation of the 3′ss in higher pri-mates and is further undermined by the A allele at rs689,which renders this intron highly U2AF35-dependent (Fig-ure 3) (7). Apart from U2AF35, future bi- or multifunc-tional antisense strategies can employ binding platforms forsplicing factors previously shown to influence INS intron 1and exon 2 splicing, such as Tra2� or SRSF3 (7). Tra2� islikely to bind the SSO6 target which forms a predicted stablehairpin structure with a potent GAA splicing enhancer in aterminal loop (Figure 3B). SRSF3 is required for repressionof the cryptic 3′ss of intron 2 (7) and binds pyrimidine-richsequence with a consensus (A/U)C(A/U)(A/U)C (74). TheCAUC motif, which interacts with the RNA-recognitionmotif of SRSF3 (75), is present just upstream of the cryptic3′ss.
Normalizing intron retention levels in human genetic disease
Our results provide an opportunity to use non-geneticmeans to compensate less efficient splicing and lower INSexpression from haplotypes predisposing to type 1 diabetes.Common variants such as rs689 contribute to a great ex-tent to the heritability of complex traits, including autoim-mune diseases (76), but their functional and structural con-sequences are largely unknown. If optimized INS SSOs canbe safely and efficiently introduced into the developing thy-mus, this approach may offer a novel preventive approachto promote tolerance to the principal self-antigen in type1 diabetes. The most obvious candidates for such interven-tion are mothers who had an affected child homozygousfor disease-predisposing alleles at both HLA and INS loci.Such genotypes were associated with an extremely high dis-ease risk for siblings (77). Apart from primary preventionof type 1 diabetes, future SSO-based therapeutics might beapplicable to patients with significant residual �-cell activ-ity at diagnosis and to those who are eligible to receive�-cell transplants and may benefit from increased intron-mediated enhancement of proinsulin expression from trans-planted cells. It is also possible to envisage use of this ther-apeutic modality for other patients with diabetes through amore dramatic enhancement of intron splicing and proin-sulin expression by targeting multiple splicing regulatorymotifs with multifunctional SSOs. Future studies shouldtherefore examine utility of our SSOs in thymic epithelialcells and �-cells that may provide a more natural system fortesting their impact on both exo- and endogenous proin-sulin expression. Finally, similar antisense strategies mayhelp reduce pervasive intron retention in cancer cells result-ing from somatic mutations of splicing factor genes, as il-lustrated by specific substitutions in the zinc finger domainof U2AF35 in myeloproliferative diseases (78).
SUPPLEMENTARY MATERIAL
Supplementary Data are available Online.
ACKNOWLEDGEMENTS
We thank Huw Williams (University of Nottingham),Omar Jallow (University of London) and Joe Rogers (Uni-versity of Southampton) for technical help, Alex Cousins(University of Nottingham) for preliminary CD studies,Mike Gait (University of Cambridge) for useful discus-sions and Chris Proud (University of Southampton) andIan Eperon (University of Leicester) for manuscript com-ments. We also thank Prof. Douglas Black, UCLA, for agenerous gift of antibodies.
FUNDING
Juvenile Diabetes Research Foundation International [1-2008-047 to I.V.]; Diabetes UK [09/3962 to I.V.]. Open ac-cess charge shared with co-authors.Conflict of interest. None.
REFERENCES1. Smith,C.W. and Valcarcel,J. (2000) Alternative pre-mRNA splicing:
the logic of combinatorial control. Trends Biochem. Sci., 25, 381–388.
at University of Southam
pton on June 17, 2014http://nar.oxfordjournals.org/
Dow
nloaded from

12 Nucleic Acids Research, 2014
2. Wahl,M.C., Will,C.L. and Luhrmann,R. (2009) The spliceosome:design principles of a dynamic RNP machine. Cell, 136, 701–718.
3. Callis,J., Fromm,M. and Walbot,V. (1987) Introns increase geneexpression in cultured maize cells. Genes Dev., 1, 1183–1200.
4. Buchman,A.R. and Berg,P. (1988) Comparison of intron-dependentand intron-independent gene expression. Mol. Cell. Biol., 8,4395–4405.
5. Le Hir,H., Nott,A. and Moore,M.J. (2003) How introns influenceand enhance eukaryotic gene expression. Trends Biochem. Sci., 28,215–220.
6. Cazzola,M. and Skoda,R.C. (2000) Translational pathophysiology: anovel molecular mechanism of human disease. Blood, 95, 3280–3288.
7. Kralovicova,J. and Vorechovsky,I. (2010) Allele-dependentrecognition of the 3′ splice site of INS intron 1. Hum. Genet., 128,383–400.
8. Kole,R., Krainer,A.R. and Altman,S. (2012) RNA therapeutics:beyond RNA interference and antisense oligonucleotides. Nat. Rev.Drug Discov., 11, 125–140.
9. Aartsma-Rus,A. and van Ommen,G.J. (2007) Antisense-mediatedexon skipping: a versatile tool with therapeutic and researchapplications. RNA, 13, 1609–1624.
10. Goyenvalle,A., Seto,J.T., Davies,K.E. and Chamberlain,J. (2012)Therapeutic approaches to muscular dystrophy. Hum. Mol. Genet.,20, R69–78.
11. Hua,Y., Sahashi,K., Hung,G., Rigo,F., Passini,M.A., Bennett,C.F.and Krainer,A.R. (2010) Antisense correction of SMN2 splicing inthe CNS rescues necrosis in a type III SMA mouse model. GenesDev., 24, 1634–1644.
12. Du,L., Pollard,J.M. and Gatti,R.A. (2007) Correction of prototypicATM splicing mutations and aberrant ATM function with antisensemorpholino oligonucleotides. Proc. Natl Acad. Sci. U.S.A., 104,6007–6012.
13. Kralovicova,J., Hwang,G., Asplund,A.C., Churbanov,A., Smith,C.I.and Vorechovsky,I. (2011) Compensatory signals associated with theactivation of human GC 5′ splice sites. Nucleic Acids Res., 39,7077–7091.
14. Buratti,E., Chivers,M.C., Hwang,G. and Vorechovsky,I. (2011)DBASS3 and DBASS5: databases of aberrant 3′ and 5′ splice sites inhuman disease genes. Nucleic Acids Res., 39, D86–D91.
15. Davies,J.L., Kawaguchi,Y., Bennett,S.T., Copeman,J.B., Cordell,H.J.,Pritchard,L.E., Reed,P.W., Gough,S.C., Jenkins,S.C., Palmer,S.M.et al. (1994) A genome-wide search for human type 1 diabetessusceptibility genes. Nature, 371, 130–136.
16. Barratt,B.J., Payne,F., Lowe,C.E., Hermann,R., Healy,B.C.,Harold,D., Concannon,P., Gharani,N., McCarthy,M.I.,Olavesen,M.G. et al. (2004) Remapping the insulin gene/IDDM2locus in type 1 diabetes. Diabetes, 53, 1884–1889.
17. Zhang,L., Nakayama,M. and Eisenbarth,G.S. (2008) Insulin as anautoantigen in NOD/human diabetes. Curr. Opin. Immunol., 20,111–118.
18. Vafiadis,P., Bennett,S.T., Todd,J.A., Nadeau,J., Grabs,R.,Goodyer,C.G., Wickramasinghe,S., Colle,E. and Polychronakos,C.(1997) Insulin expression in human thymus is modulated by INSVNTR alleles at the IDDM2 locus. Nat. Genet., 15, 289–292.
19. Pugliese,A., Zeller,M., Fernandez,A. Jr, Zalcberg,L.J., Bartlett,R.J.,Ricordi,C., Pietropaolo,M., Eisenbarth,G.S., Bennett,S.T. andPatel,D.D. (1997) The insulin gene is transcribed in the humanthymus and transcription levels correlated with allelic variation at theINS VNTR-IDDM2 susceptibility locus for type 1 diabetes. Nat.Genet., 15, 293–297.
20. Stead,J.D., Hurles,M.E. and Jeffreys,A.J. (2003) Global haplotypediversity in the human insulin gene region. Genome Res., 13,2101–2111.
21. Kralovicova,J., Gaunt,T.R., Rodriguez,S., Wood,P.J., Day,I.N.M.and Vorechovsky,I. (2006) Variants in the human insulin gene thataffect pre-mRNA splicing: is -23HphI a functional single nucleotidepolymorphism at IDDM2? Diabetes, 55, 260–264.
22. Ruskin,B., Zamore,P.D. and Green,M.R. (1988) A factor, U2AF, isrequired for U2 snRNP binding and splicing complex assembly. Cell,52, 207–219.
23. Wang,J., Shen,L., Najafi,H., Kolberg,J., Matschinsky,F.M.,Urdea,M. and German,M. (1997) Regulation of insulin preRNAsplicing by glucose. Proc. Natl Acad. Sci. U.S.A., 94, 4360–4365.
24. Kralovicova,J., Haixin,L. and Vorechovsky,I. (2006) Phenotypicconsequences of branchpoint substitutions. Hum. Mutat., 27,803–813.
25. Pacheco,T.R., Gomes,A.Q., Barbosa-Morais,N.L., Benes,V.,Ansorge,W., Wollerton,M., Smith,C.W., Valcarcel,J. andCarmo-Fonseca,M. (2004) Diversity of vertebrate splicing factorU2AF35: identification of alternatively spliced U2AF1 mRNAS. J.Biol. Chem., 279, 27 039–27 049.
26. Booy,E.P., Meier,M., Okun,N., Novakowski,S.K., Xiong,S.,Stetefeld,J. and McKenna,S.A. (2012) The RNA helicase RHAU(DHX36) unwinds a G4-quadruplex in human telomerase RNA andpromotes the formation of the P1 helix template boundary. NucleicAcids Res., 40, 4110–4124.
27. Lei,H. and Vorechovsky,I. (2005) Identification of splicing silencersand enhancers in sense Alus: a role for pseudo-acceptors in splice siterepression. Mol. Cell. Biol., 25, 6912–6920.
28. Buratti,E., Muro,A.F., Giombi,M., Gherbassi,D., Iaconcig,A. andBaralle,F.E. (2004) RNA folding affects the recruitment of SRproteins by mouse and human polypurinic enhancer elements in thefibronectin EDA exon. Mol. Cell. Biol., 24, 1387–1400.
29. Pacheco,T.R., Moita,L.F., Gomes,A.Q., Hacohen,N. andCarmo-Fonseca,M. (2006) RNA interference knockdown ofhU2AF35 impairs cell cycle progression and modulates alternativesplicing of Cdc25 transcripts. Mol. Biol. Cell, 17, 4187–4199.
30. Nussinov,R. (1988) Conserved quartets near 5′ intron junctions inprimate nuclear pre-mRNA. J. Theor. Biol., 133, 73–84.
31. Sirand-Pugnet,P., Durosay,P., Brody,E. and Marie,J. (1995) Anintronic (A/U)GGG repeat enhances the splicing of an alternativeintron of the chicken beta-tropomyosin pre-mRNA. Nucleic AcidsRes., 23, 3501–3507.
32. Kralovicova,J. and Vorechovsky,I. (2006) Position-dependentrepression and promotion of DQB1 intron 3 splicing by GGGGmotifs. J. Immunol., 176, 2381–2388.
33. Neidle,S. and Balasubramanian,S. (2006) Quadruplex Nucleic Acids.RSC Biomolecular Sciences, Cambridge, UK.
34. Bugaut,A. and Balasubramanian,S. (2012) 5′-UTR RNAG-quadruplexes: translation regulation and targeting. Nucleic AcidsRes., 40, 4727–4741.
35. Millevoi,S., Moine,H. and Vagner,S. (2012) G-quadruplexes in RNAbiology. Wiley Interdiscip. Rev. RNA, 3, 495–507.
36. Gomez,D., Lemarteleur,T., Lacroix,L., Mailliet,P., Mergny,J.L. andRiou,J.F. (2004) Telomerase downregulation induced by theG-quadruplex ligand 12459 in A549 cells is mediated by hTERTRNA alternative splicing. Nucleic Acids Res., 32, 371–379.
37. Didiot,M.C., Tian,Z., Schaeffer,C., Subramanian,M., Mandel,J.L.and Moine,H. (2008) The G-quartet containing FMRP binding sitein FMR1 mRNA is a potent exonic splicing enhancer. Nucleic AcidsRes., 36, 4902–4912.
38. Hai,Y., Cao,W., Liu,G., Hong,S.P., Elela,S.A., Klinck,R., Chu,J. andXie,J. (2008) A G-tract element in apoptotic agents-inducedalternative splicing. Nucleic Acids Res., 36, 3320–3331.
39. Marcel,V., Tran,P.L., Sagne,C., Martel-Planche,G., Vaslin,L.,Teulade-Fichou,M.P., Hall,J., Mergny,J.L., Hainaut,P. and VanDyck,E. (2011) G-quadruplex structures in TP53 intron 3: role inalternative splicing and in production of p53 mRNA isoforms.Carcinogenesis, 32, 271–278.
40. Melko,M., Douguet,D., Bensaid,M., Zongaro,S., Verheggen,C.,Gecz,J. and Bardoni,B. (2011) Functional characterization of theAFF (AF4/FMR2) family of RNA-binding proteins: insights intothe molecular pathology of FRAXE intellectual disability. Hum.Mol. Genet., 20, 1873–1885.
41. Balagurumoorthy,P., Brahmachari,S.K., Mohanty,D., Bansal,M.and Sasisekharan,V. (1992) Hairpin and parallel quartet structuresfor telomeric sequences. Nucleic Acids Res., 20, 4061–4067.
42. Derecka,K., Balkwill,G.D., Garner,T.P., Hodgman,C., Flint,A.P.and Searle,M.S. (2010) Occurrence of a quadruplex motif in a uniqueinsert within exon C of the bovine estrogen receptor alpha gene(ESR1). Biochemistry. 49, 7625–7633.
43. Balkwill,G.D., Derecka,K., Garner,T.P., Hodgman,C., Flint,A.P.and Searle,M.S. (2009) Repression of translation of human estrogenreceptor alpha by G-quadruplex formation. Biochemistry. 48,11487–11495.
44. Garner,T.P., Williams,H.E., Gluszyk,K.I., Roe,S., Oldham,N.J.,Stevens,M.F., Moses,J.E. and Searle,M.S. (2009) Selectivity of small
at University of Southam
pton on June 17, 2014http://nar.oxfordjournals.org/
Dow
nloaded from

Nucleic Acids Research, 2014 13
molecule ligands for parallel and anti-parallel DNA G-quadruplexstructures. Org. Biomol. Chem., 7, 4194–4200.
45. Bugaut,A., Murat,P. and Balasubramanian,S. (2012) An RNAhairpin to g-quadruplex conformational transition. J. Am. Chem.Soc., 134, 19953–19956.
46. Thisted,T., Lyakhov,D.L. and Liebhaber,S.A. (2001) OptimizedRNA targets of two closely related triple KH domain proteins,heterogeneous nuclear ribonucleoprotein K and alphaCP-2KL,suggest Distinct modes of RNA recognition. J. Biol. Chem., 276,17484–17496.
47. Creacy,S.D., Routh,E.D., Iwamoto,F., Nagamine,Y., Akman,S.A.and Vaughn,J.P. (2008) G4 resolvase 1 binds both DNA and RNAtetramolecular quadruplex with high affinity and is the major sourceof tetramolecular quadruplex G4-DNA and G4-RNA resolvingactivity in HeLa cell lysates. J. Biol. Chem., 283, 34626–34634.
48. Pastor,T. and Pagani,F. (2011) Interaction of hnRNPA1/A2 andDAZAP1 with an Alu-derived intronic splicing enhancer regulatesATM aberrant splicing. PLoS One, 6, e23349.
49. Iwamoto,F., Stadler,M., Chalupnikova,K., Oakeley,E. andNagamine,Y. (2008) Transcription-dependent nucleolar caplocalization and possible nuclear function of DExH RNA helicaseRHAU. Exp. Cell Res., 314, 1378–1391.
50. Kikin,O., D′Antonio,L. and Bagga,P.S. (2006) QGRS Mapper: aweb-based server for predicting G-quadruplexes in nucleotidesequences. Nucleic Acids Res., 34, W676–W682.
51. Singh,N.N., Hollinger,K., Bhattacharya,D. and Singh,R.N. (2010)An antisense microwalk reveals critical role of an intronic positionlinked to a unique long-distance interaction in pre-mRNA splicing.RNA, 16, 1167–1181.
52. Wang,Y., Xiao,X., Zhang,J., Choudhury,R., Robertson,A., Li,K.,Ma,M., Burge,C.B. and Wang,Z. (2012) A complex network offactors with overlapping affinities represses splicing through intronicelements. Nat. Struct. Mol. Biol., 20, 36–45.
53. Wang,Y., Ma,M., Xiao,X. and Wang,Z. (2012) Intronic splicingenhancers, cognate splicing factors and context-dependent regulationrules. Nat. Struct. Mol. Biol., 19, 1044–1052.
54. Ke,S., Shang,S., Kalachikov,S.M., Morozova,I., Yu,L., Russo,J.J.,Ju,J. and Chasin,L.A. (2011) Quantitative evaluation of all hexamersas exonic splicing elements. Genome Res., 21, 1360 –1374.
55. Culler,S.J., Hoff,K.G., Voelker,R.B., Berglund,J.A. and Smolke,C.D.(2010) Functional selection and systematic analysis of intronicsplicing elements identify active sequence motifs and associatedsplicing factors. Nucleic Acids Res., 38, 5152–5165.
56. Collie,G.W. and Parkinson,G.N. (2011) The application of DNA andRNA G-quadruplexes to therapeutic medicines. Chem. Soc. Rev., 40,5867–5892.
57. Morris,M.J., Negishi,Y., Pazsint,C., Schonhoft,J.D. and Basu,S.(2010) An RNA G-quadruplex is essential for cap-independenttranslation initiation in human VEGF IRES. J. Am. Chem. Soc., 132,17831–17839.
58. Wieland,M. and Hartig,J.S. (2007) RNA quadruplex-basedmodulation of gene expression. Chem. Biol., 14, 757–763.
59. Zhang,A.Y. and Balasubramanian,S. (2012) The kinetics and foldingpathways of intramolecular g-quadruplex nucleic acids. J. Am. Chem.Soc., 134, 19297–19308.
60. Decorsiere,A., Cayrel,A., Vagner,S. and Millevoi,S. (2011) Essentialrole for the interaction between hnRNP H/F and a G quadruplex inmaintaining p53 pre-mRNA 3′-end processing and function duringDNA damage. Genes Dev., 25, 220–225.
61. Samatanga,B., Dominguez,C., Jelesarov,I. and Allain,F.H. (2013)The high kinetic stability of a G-quadruplex limits hnRNP FqRRM3 binding to G-tract RNA. Nucleic Acids Res., 41, 2505–2516.
62. Lorenz,R., Bernhart,S.H., Qin,J., Honer,Zu, Siederdissen,C.,Tanzer,A., Amman,F., Hofacker,I.L. and Stadler,P.F. (2013) 2Dmeets 4G: G-quadruplexes in RNA secondary structureprediction. IEEE/ACM Trans. Comput. Biol. Bioinform. 10, 832–844.
63. Beaudoin,J.D. and Perreault,J.P. (2010) 5′-UTR G-quadruplexstructures acting as translational repressors. Nucleic Acids Res., 38,7022–7036.
64. Fred,R.G., Sandberg,M., Pelletier,J. and Welsh,N. (2011) The humaninsulin mRNA is partly translated via a cap- and eIF4A-independentmechanism. Biochem. Biophys. Res. Commun., 412, 693–698.
65. Schwarze,U., Starman,B.J. and Byers,P.H. (1999) Redefinition ofexon 7 in the COL1A1 gene of type I collagen by an intron 8splice-donor-site mutation in a form of osteogenesis imperfecta:influence of intron splice order on outcome of splice-site mutation.Am. J. Hum. Genet., 65, 336–344.
66. Xing,Y., Resch,A. and Lee,C. (2004) The multiassembly problem:reconstructing multiple transcript isoforms from EST fragmentmixtures. Genome Res., 14, 426–441.
67. Fededa,J.P., Petrillo,E., Gelfand,M.S., Neverov,A.D., Kadener,S.,Nogues,G., Pelisch,F., Baralle,F.E., Muro,A.F. and Kornblihtt,A.R.(2005) A polar mechanism coordinates different regions ofalternative splicing within a single gene. Mol. Cell, 19, 393–404.
68. Emerick,M.C., Parmigiani,G. and Agnew,W.S. (2007) Multivariateanalysis and visualization of splicing correlations in single-genetranscriptomes. BMC Bioinformatics, 8, 16.
69. Peng,T., Xue,C., Bi,J., Li,T., Wang,X., Zhang,X. and Li,Y. (2008)Functional importance of different patterns of correlation betweenadjacent cassette exons in human and mouse. BMC Genomics, 9, 191.
70. Eddy,J., Vallur,A.C., Varma,S., Liu,H., Reinhold,W.C., Pommier,Y.and Maizels,N. (2011) G4 motifs correlate with promoter-proximaltranscriptional pausing in human genes. Nucleic Acids Res., 39,4975–4983.
71. Mayeda,A., Hayase,Y., Inoue,H., Ohtsuka,E. and Ohshima,Y.(1990) Surveying cis-acting sequences of pre-mRNA by addingantisense 2′-O-methyl oligoribonucleotides to a splicing reaction. J.Biochem., 108, 399–405.
72. Dominski,Z. and Kole,R. (1993) Restoration of correct splicing inthalassemic pre-mRNA by antisense oligonucleotides. Proc. NatlAcad. Sci. U.S.A., 90, 8673–8677.
73. Baughan,T.D., Dickson,A., Osman,E.Y. and Lorson,C.L. (2009)Delivery of bifunctional RNAs that target an intronic repressor andincrease SMN levels in an animal model of spinal muscular atrophy.Hum. Mol. Genet., 18, 1600–1611.
74. Cavaloc,Y., Bourgeois,C.F., Kister,L. and Stevenin,J. (1999) Thesplicing factors 9G8 and SRp20 transactivate splicing throughdifferent and specific enhancers. RNA, 5, 468–483.
75. Hargous,Y., Hautbergue,G.M., Tintaru,A.M., Skrisovska,L.,Golovanov,A.P., Stevenin,J., Lian,L.Y., Wilson,S.A. and Allain,F.H.(2006) Molecular basis of RNA recognition and TAP binding by theSR proteins SRp20 and 9G8. EMBO J., 25, 5126–5137.
76. Hunt,K.A., Mistry,V., Bockett,N.A., Ahmad,T., Ban,M.,Barker,J.N., Barrett,J.C., Blackburn,H., Brand,O., Burren,O.et al. (2013) Negligible impact of rare autoimmune-locuscoding-region variants on missing heritability. Nature, 498, 232–235.
77. Aly,T.A., Ide,A., Jahromi,M.M., Barker,J.M., Fernando,M.S.,Babu,S.R., Yu,L., Miao,D., Erlich,H.A., Fain,P.R. et al. (2006)Extreme genetic risk for type 1A diabetes. Proc. Natl Acad. Sci.U.S.A., 103, 14074–14079.
78. Yoshida,K., Sanada,M., Shiraishi,Y., Nowak,D., Nagata,Y.,Yamamoto,R., Sato,Y., Sato-Otsubo,A., Kon,A., Nagasaki,M.et al. (2011) Frequent pathway mutations of splicing machinery inmyelodysplasia. Nature, 478, 64–69.
at University of Southam
pton on June 17, 2014http://nar.oxfordjournals.org/
Dow
nloaded from

SUPPLEMENTARY DATA
Figures S1-S5
Tables S1 and S2
Optimal antisense target reducing INS intron 1 retention is adjacent to a parallel G quadruplex
Jana Kralovicova1, Ana Lages1, Alpa Patel2, Ashish Dhir3,
Emanuele Buratti3, Mark Searle2, Igor Vorechovsky1
1University of Southampton Faculty of Medicine Southampton SO16 6YD United Kingdom 2University of Nottingham School of Chemistry Centre for Biomolecular Sciences Nottingham NG7 2RD United Kingdom 3ICGEB, Padriciano 99, 34149 Trieste, Italy

FIGURE S1 SSO21-induced decrease of INS intron 1 retention in HepG2 cells
Legend: Final SSO concentrations were the same as in Fig. 2A. SCm, scrambled controls, SSO-, no-SSO control.
FIGURE S2 Prediction of putative enhancer binding sites of SR proteins in the region surrounding the intron 1 antisense target Legend: The prediction was carried out by ESEFinder using default score matrices (1). SRSF1/SRSF1(IgM-BRCA1) sites are shown in red/purple, SRSF2 in blue, SRSF5 in green and SRSF6 in yellow. The SSO21 target sequence is shown by a box.

FIGURE S3 A partial restoration of authentic 5’ splice site of INS intron 1 Legend: RNA products are shown to the right, the reporter at the bottom. SSOs are shown at the top, the final concentration of SSO10 in transfections wells were 10, 30 and 90 nM.

FIGURE S4 Enzymatic probing of INS 5’UTR
Legend: In vitro transcribed RNA enzymatically digested with S1 nuclease, T1 and V1 RNases. No enzyme was added to the RNA in a control reaction mixture (lane C).The cleaved fragments were detected by an RT reaction with an isotopically labelled oligonucleotides. The RT products were separated on a denaturing 6% polyacrylamide gel. A sequencing reaction performed with the same RT primer was run in parallel (lanes g, a, t and c). Squares, circles and triangles indicate S1, T1 and V1 cleavage sites. Black and white symbols indicate high and low cleavage intensity, respectively. The positions of the splice sites are indicated by arrows and their intrinsic strength by Shapiro-Senapathy scores (2). Secondary structure predictions were carried out using mfold (3).

FIGURE S5 Structural probing of ins/del RNAs at rs3842740 For legend, see Figure S4.

TABLE S1 Splice-switching oligonucleotides targeting proinsulin pre-mRNAs
SSO
Location1 Sequence (5’-3’) Effects on the relative abundance
of INS mRNA isoforms
1 Intron 1 (del5, del6) AGCUGGGGCCUGGGGU Activation of the cryptic 3’ss of
intron 2
2 Intron 1 (del5, del6) UGCAGAGCUGGGGCCUGGGGU Activation of the cryptic 3’ss of
intron 2
3 Intron 1 (del8, del9) CAUGCUUCACGAGCCCAGCC Increased exon 2 skipping
4 Exon 2 (cryptic 3’ss +81,
del8, del9)
AAGGCUGCGGCUGGGUC Increased exon 2 skipping
5 Exon 3 UGGUAGAGGGAGCAGAUGCUG Decreased efficiency of intron 2
splicing; Activation of the cryptic
3’ss of intron 2
6 Exon 3 UGGUACAGCAUUGUUCCACA Activation of the cryptic 3’ss of
intron 2 at high concentration
8 Exon 2 (del13-15) CGCACACUAGGUAGAGAGC Increased exon 2 skipping
9 Exon 1 GAUGCAGCCUGUCCUGGAG None
10 Intron 1 (del1, del2, cryptic 5’ splice
site +30)
GAGCCCACCUGACGCAAAGGC Partial restoration of authentic 5’
splice site
16 Exon 1 UGGAGGGCUGAGGGCUGCU None
17 Exon 1 AUGGCCUCUUCUGAUGCA None
18 Intron 1 (del9, del10) UCACCCCCACAUGCUUC Increased exon 2 skipping
19 Intron 1 (del9) ACAUGCUUCACGAG Increased exon 2 skipping
20 Intron 1 (del5) CUGGGGCCUGGGGU Minor reduction of intron 1
retention; activation of the cryptic
3’ss of intron 2
21 Intron 1 (del5, del6) UGCAGAGCUGGGGCCU Reduction of intron 1 retention;
activation of the cryptic 3’ss of
intron 2
1sc Scrambled control AGGUGCUCGCGGGUGG None
2sc Scrambled control GGGUGGAAGCGUCCGGUCGUG Stimulation of the cryptic 3’ss of
intron 2
3sc Scrambled control ACACACUGUGCCUCGCCAGC None
6sc Scrambled control GACUCACUUGCCGUAGUUAA Stimulation of the cryptic 3’ss of
intron 2
8sc Scrambled control CACGCUCAGUAGAGAAGGC None
1, sequence of deleted segments (del) is shown in Fig. 2 and Supplemental Fig. 13 of our previous study (4).

TABLE S2 INS intron 1 mutatons altering predicted RNA G quadruplexes, stem loops and two cytosines runs in plasmid constructs
Mutation Input sequence for computation predictions1 Predicted RNA quadruplex
H2 H1 C runs The most stable RNA structure
Free energy (kcal/mmol)
Wildtype sequence
GGAUUCCAGGGUGGCUGGACCCCAGGCCCC
+ + + +
-9.8
Del5 GGAUUCCAGGGUGGCUGG------------
+ + - - -2.7
M1 GGAUUCCAGGGUGGCUGCACGCCAGGCCCC
+ - - -
-9.3
1 GGAUUCCAGGGUGGCUGGACCCGAGGCGCC
+ + + -
-8.4
2 GGAUUCCAGGAUGGUAGGACCCGAGGCGCC
+ - - -
-2.8
3 GGAUUCCAGGAUGGUAGGACCCCAGGCCCC
+ - - + -4.3
4 GGAUUCCAGGGUUGCUGGACCCCAGUCCCC
- + + + -11.1
5 GGAUUCCAGGGUUGCUGGACCCGAGUCGCC
- + + - -11.3

6 GGAUUCCAGGAUUGUAGGACCCCAGUCCCC
- - - +
-6.4
8
GGAUUCCAGGGUGGCUGGACUUCAGGCCCC
+ + - -
-9.0
9
GGAUUCCAGGGUGGCUGGACCCCAGGCUUC
+ + + -
-9.8
10
GGAUUCCAGGGUGGCUGGACUUCAGGCUUC
+ + - -
-9.0
1sequences that form H1 (strikethrough) and H2 (underlined) stems are highlighted. Guanines contributing to predicted quadruplex formation are in yellow; mutations are in red. RNA secondary structures/free energy were predicted by RNAStructure (v.5.2) (5).
References to supplementary data 1 Cartegni, L., Wang, J., Zhu, Z., Zhang, M.Q. and Krainer, A.R. (2003) ESEfinder: a web resource to identify exonic splicing enhancers. Nucleic Acids Res., 31, 3568-3571. 2 Shapiro, M.B. and Senapathy, P. (1987) RNA splice junctions of different classes of eukaryotes: sequence statistics and functional implications in gene expression. Nucleic Acids Res., 15, 7155-7174. 3 Zuker, M. (2003) Mfold web server for nucleic acid folding and hybridization prediction. Nucleic Acids Res., 31, 3406-3415. 4 Kralovicova, J. and Vorechovsky, I. (2010) Allele-dependent recognition of the 3' splice site of INS intron 1. Hum. Genet., 128, 383-400. 5 Reuter, J.S. and Mathews, D.H. (2010) RNAstructure: software for RNA secondary structure prediction and analysis. BMC Bioinformatics, 11, 129.
Copyright © 2022 FDOKUMEN


![arXiv:1912.05704v1 [astro-ph.HE] 12 Dec 2019 - ePrints Soton](https://static.fdokumen.com/doc/165x107/631962ea1a1adcf65a0ea184/arxiv191205704v1-astro-phhe-12-dec-2019-eprints-soton.jpg)