Fatigue of multilayer coatings for plain bearings - ePrints Soton
205
UNIVERSITY OF SOUTHAMPTON FACULTY OF ENGINEERING AND THE ENVIRONMENT MECHANICAL ENGINEERING ENGINEERING MATERIALS GROUP Fatigue of multilayer coatings for plain bearings by Andreu Laborda Cabo Thesis for the degree of Doctor of Philosophy April 2018
-
Upload
khangminh22 -
Category
Documents
-
view
0 -
download
0
Transcript of Fatigue of multilayer coatings for plain bearings - ePrints Soton

UNIVERSITY OF SOUTHAMPTON
FACULTY OF ENGINEERING AND THE ENVIRONMENT
MECHANICAL ENGINEERING
ENGINEERING MATERIALS GROUP
Fatigue of multilayer coatings for plain bearings
by
Andreu Laborda Cabo
Thesis for the degree of Doctor of Philosophy
April 2018


i
UNIVERSITY OF SOUTHAMPTON
ABSTRACT FACULTY OF ENGINEERING AND THE ENVIRONMENT
Engineering Materials
Thesis for the degree of Doctor of Philosophy
FATIGUE OF MULTILAYER COATINGS FOR PLAIN BEARINGS
by Andreu Laborda Cabo
The work described in this thesis considers the fundamental fatigue behaviour exhibited by multilayer coatings used in plain bearings. Modern plain bearing designs comprise a number of layers with very different mechanical properties in order to accommodate dissimilar requirements such as load capacity and embeddability. Due to the evolution of modern internal combustion engines, power output has dramatically increased, increasing the loads that plain bearings have to support. Therefore, bearings have also evolved becoming more sophisticated but also more complex, comprising micrometre multi-layered structures. The development of these systems has been carried out in a semi-empirical manner over the past years. In industry the bearings are tested in engine-like rigs, these are useful pass-fail tests but they cannot provide mechanistic insight. This thesis presents the results of a three year research program focusing on three bearing designs that comprise three different multilayer coatings electrodeposited on a leaded bronze interlayer bonded to a steel backing. Each multilayer coating consists of different combinations of layers made of Sn-Ni-Cu. A series of standard experimental characterization techniques, as well as more advanced methods such as nanoindentation, tomography and image analysis are applied to investigate the microstructure and mechanical properties of the material system under study. Likewise, the results of simplified fatigue tests, as well as newly developed methodologies adding strain gauges and infrared thermography techniques are presented, ranking the different coatings based on their fatigue performance and characterizing initiation and short fatigue crack growth propagation in these systems. A combination of characterization techniques and fatigue tests were used to study the interaction between microstructure and fatigue cracks in order to establish the key factors controlling initiation and early crack propagation, hence providing data to propose new routes for new coating designs and to optimize current designs. The first part of this research was dedicated to the study of the interlayer, where we found that fatigue cracks tend to initiate and propagate preferentially through lead (soft phase) and early crack propagation through bronze grain boundaries. Moreover, voids (defects) also affect crack propagation increasing crack tortuosity and crack deflection at the interlayer/backing interface due to shielding effect. During the second part of the thesis, we ranked the fatigue performance of three multilayer coatings, finding that the best performance was given by the structure with two hard layers, versus one and three hard layer structures. We also identified the factors affecting their fatigue performance (constraint, roughness, defects, creep and shielding), which were studied in the third part of this project, concluding that the best performance is shown by the coating with the best balance between crack initiation and propagation. This was then used to propose concepts to improve new coating designs.

iii
Contents ABSTRACT ................................................................................................................. i
Contents .................................................................................................................. iii
List of tables ........................................................................................................... vii
List of figures ........................................................................................................... ix
DECLARATION OF AUTHORSHIP ............................................................................ xvii
Acknowledgements ............................................................................................... xix
Abbreviations ........................................................................................................ xxi
1. Introduction .................................................................................................... 1
1.1 Objectives .......................................................................................................................1
1.2 Thesis structure ..............................................................................................................2
2. Literature review ............................................................................................. 5
2.1 Bearings ..........................................................................................................................5
2.1.1 Basic concepts ............................................................................................................5
2.1.2 History and evolution .................................................................................................5
2.1.3 Types of bearings .......................................................................................................6
2.1.4 Reciprocating internal combustion engine ................................................................7
2.1.5 Requirements .............................................................................................................8
2.1.6 Bearing structures ......................................................................................................9
2.1.7 Manufacturing process of trimetal plain bearings .................................................. 11
2.1.8 New trends .............................................................................................................. 11
2.2 Fatigue ......................................................................................................................... 12
2.2.1 Terminology and basic definitions .......................................................................... 12
2.2.2 Cyclic deformation in ductile materials .................................................................. 13
2.2.3 Fatigue crack initiation in ductile materials ............................................................ 15
2.2.4 Fatigue life approaches ........................................................................................... 17
2.2.5 Retardation in fatigue crack growth ....................................................................... 25
2.2.6 Short cracks ............................................................................................................. 27
2.3 Fatigue in bearing structures ...................................................................................... 29
2.3.1 Fatigue in plain engine bearings ............................................................................. 29
2.3.2 Multilayer architectures .......................................................................................... 32
2.4 Summary ..................................................................................................................... 35
3. Materials and Experimental techniques ......................................................... 37
3.1 Materials, manufacture and geometry ....................................................................... 37
3.1.1 Geometry ................................................................................................................ 37
3.1.2 Manufacturing process ........................................................................................... 38

iv
3.1.3 Overlay structures ................................................................................................... 39
3.2 Microstructural characterization ................................................................................. 41
3.2.1 Sample preparation ................................................................................................. 42
3.2.2 Microscopy .............................................................................................................. 43
3.3 Mechanical testing ...................................................................................................... 46
3.3.1 Microhardness tests ................................................................................................ 46
3.3.2 Nanohardness tests ................................................................................................. 46
3.4 Fatigue test .................................................................................................................. 47
3.4.1 Test configuration .................................................................................................... 47
3.4.2 Introduction to thermography ................................................................................ 49
3.4.3 Accelerated test ....................................................................................................... 51
3.4.4 Replica tests ............................................................................................................. 52
3.4.5 Cyclic tests ............................................................................................................... 52
3.5 Image analysis .............................................................................................................. 53
4. Fatigue behaviour of a leaded bronze interlayer for multilayer bearings ........ 55
4.1 Introduction ................................................................................................................. 55
4.2 Materials and Methods ............................................................................................... 55
4.2.1 Specimens ................................................................................................................ 55
4.2.2 Materials characterization ....................................................................................... 56
4.2.3 Mechanical characterization ................................................................................... 56
4.2.4 Modelling ................................................................................................................. 59
4.2.5 Fatigue testing ......................................................................................................... 60
4.2.6 X-ray Computed Tomography ................................................................................. 60
4.2.7 Image analysis .......................................................................................................... 61
4.3 Results ......................................................................................................................... 61
4.3.1 Microstructural characterization ............................................................................. 61
4.3.2 Mechanical properties ............................................................................................. 65
4.3.3 Modelling ................................................................................................................. 66
4.3.4 Test methodology .................................................................................................... 69
4.3.5 Surface crack behaviour .......................................................................................... 72
4.3.6 3D characterization ................................................................................................. 75
4.3.7 Cross-section observations ...................................................................................... 85
4.4 Discussion .................................................................................................................... 88
4.4.1 Microstructural characterization ............................................................................. 88
4.4.2 Methodology to characterize the fatigue performance of the Interlayer .............. 89
4.4.3 Fatigue characterization (Crack initiation and propagation) ................................... 89
4.5 Conclusions .................................................................................................................. 91
5. Fatigue assessment of multilayer coatings using lock-in thermography .......... 93

v
5.1 Introduction ................................................................................................................ 93
5.2 Materials and Methods ............................................................................................... 94
5.2.1 Specimens ............................................................................................................... 94
5.2.2 Sample preparation ................................................................................................ 95
5.2.3 Fatigue testing ......................................................................................................... 95
5.2.4 Characterization ...................................................................................................... 95
5.2.5 Image processing .................................................................................................... 96
5.3 Results and Discussion ................................................................................................ 98
5.3.1 Microstructure characterization ............................................................................. 98
5.3.2 Application of lock-in thermography for crack detection ..................................... 100
5.3.3 Fatigue tests .......................................................................................................... 103
5.3.4 Post-test observations .......................................................................................... 108
5.4 Conclusions ............................................................................................................... 113
6. Competing mechanisms affecting the fatigue performance of Sn-Ni-Cu based multilayer coatings ............................................................................................... 115
6.1 Introduction .............................................................................................................. 115
6.2 Materials and Methods ............................................................................................. 115
6.2.1 Specimens ............................................................................................................. 115
6.2.2 Fatigue testing ....................................................................................................... 117
6.2.3 Materials characterization .................................................................................... 117
6.2.4 Mechanical characterization ................................................................................. 118
6.2.5 Tomographic analysis ............................................................................................ 119
6.2.6 Image analysis ....................................................................................................... 121
6.3 Results ....................................................................................................................... 123
6.3.1 Microstructural characterization .......................................................................... 123
6.3.2 Mechanical properties .......................................................................................... 129
6.3.3 Cavity characterization.......................................................................................... 131
6.3.4 3D crack characterization...................................................................................... 135
6.3.5 Short crack behaviour ........................................................................................... 147
6.4 Discussion .................................................................................................................. 154
6.4.1 Constraint effect of intermetallic compounds ...................................................... 154
6.4.2 Effect of roughness ............................................................................................... 154
6.4.3 Effect of defects .................................................................................................... 155
6.4.4 Effect of creep ....................................................................................................... 156
6.4.5 Shielding effects .................................................................................................... 158
6.4.6 Impact of the combined effects ............................................................................ 159
6.5 Conclusions ............................................................................................................... 160
7. Conclusions ................................................................................................. 163

vi
8. Future work ................................................................................................ 165
References ........................................................................................................... 167

vii
List of tables Table 3-1. Chemical composition for the steel backing of bearings ............................................ 37
Table 3-2. Chemical composition for the steel backing of flat samples ...................................... 38
Table 3-3. Process of grind and polish ......................................................................................... 43
Table 3-4. Steel microhardness results for bearings and flat samples. ....................................... 46
Table 4-1. Composition of the steel backing and leaded bronze interlayer. ............................... 56
Table 4-2. Microindentation and nanoindentation results, where HV is micro-Vickers hardness, Hm converted microindentation hardness, Hn nanoindentation hardness and E Young modulus from nanoindentation. ................................................................................................................. 66
Table 4-3. Mesh sensitivity analysis results. ................................................................................ 68
Table 4-4. Volume fraction of the main components of the interlayer. ...................................... 76
Table 5-1. Layer thickness for each coating structure. ................................................................ 99
Table 5-2. Correlation between the number of passes and the pain thickness. ....................... 101
Table 6-1. Flat semi-coated samples.......................................................................................... 116
Table 6-2. Resolution and dimensions of the FIB tomographs for each sample. ...................... 120
Table 6-3. Detected phases from XRD analysis of several coatings, using 2 and /2 configurations. ........................................................................................................................... 123
Table 6-4. Nanoindentation results for hardness and Young Modulus. .................................... 129
Table 6-5. Hardness and Young’s modulus extracted from nanoindentation creep tests. ....... 130
Table 6-6. Fraction volumes for each phase in each multilayer coating. .................................. 140
Table 6-7. Statistics to quantify the influence of IML on the crack propagation....................... 142
Table 6-8. Quantification of crack fields for 1IML, 2IML and 3IML. .......................................... 148
Table 6-9. Quantifications of single cracks in 1IML, 2IML and 3IML. ........................................ 151


ix
List of figures Figure 2-1. a) Painting in El-Bersheh (1880 B. C.) representing the transportation of an statue with the help of lubrication [3]. b) Bas-relief of circa (700 B. C.) at Kouyunjik, the picture shows the use of rollers to reduce the friction between the ground and the sled in order to move a big statue [4]. ................................................................................................................................. 5
Figure 2-2. a) Plain bearing and b) rolling bearing [2]. .................................................................. 7
Figure 2-3. Four-stroke reciprocating internal combustion engine [5]. ........................................ 7
Figure 2-4. Lubrication regimes for engine bearings after[10]. ..................................................... 8
Figure 2-5. Typical engine bearings structures: a) Single-metal, b) Bimetal and c) Trimetal. ..... 10
Figure 2-6. Typical stress-time graph in fatigue. .......................................................................... 13
Figure 2-7. Response for cyclic hardening and softening under: a) Stress-control and b) Strain-control [24]. ................................................................................................................................. 14
Figure 2-8. a) Parameters to describe hysteresis loops: plastic strain range (Δɛp), elastic strain
range (Δɛe), strain range (Δɛ) and stress range (Δ). b) Cyclic stress-strain (CSS) curve. ............ 14
Figure 2-9. a) Elastic shakedown, b) Plastic shakedown, c) Ratcheting. ...................................... 15
Figure 2-10. Extrusions and intrusions on the surface of a fatigued Cu crystal [33]. .................. 16
Figure 2-11. Fatigue crack initiation in the interface between PSB and matrix in a fatigued Cu crystal [33]. .................................................................................................................................. 16
Figure 2-12. S-N curve where we can see defined the fatigue limit. ........................................... 18
Figure 2-13. Large plate under tensile stress with a crack of length 2a in the middle. ............... 19
Figure 2-14. Main modes of fracture: a) Mode I (tensile opening), b) Mode II (in-plane sliding), c) Mode III (anti-plane shear)....................................................................................................... 20
Figure 2-15. Local elastic stress distributions close to the crack tip for mode I. ......................... 21
Figure 2-16. Zones near the crack tip. ......................................................................................... 21
Figure 2-17. Contour around a crack tip used to define J-Integral. ............................................. 22
Figure 2-18. Fatigue crack growth under constant stress amplitude. ......................................... 23
Figure 2-19. Stage I mechanism for fatigue crack growth. .......................................................... 24
Figure 2-20. Stage II mechanism for fatigue crack growth. ......................................................... 24
Figure 2-21. The three regimes of fatigue crack propagation. .................................................... 25
Figure 2-22. Mechanisms for fatigue crack growth retardation: a) plasticity-induced crack closure, b) oxide-induced crack closure, c) roughness-induced crack closure, d) fluid-induced crack closure, e) transformation-induced crack closure, f) crack deflection and g) crack-bridging (trapping) by particles. ................................................................................................................. 26
Figure 2-23. Difference between long and short cracks in fatigue crack growth. ....................... 28
Figure 2-24. Sapphire fatigue test machine scheme. .................................................................. 31
Figure 2-25. Plain engine bearing tested in Sapphire test machine: a) Front view [69], b) cross-section under SEM [69] and c) cross-section under optical microscope from current work. ..... 32

x
Figure 2-26. Numerically predicted variation of Jtip/Japp as a function of KI/(y𝐿) for a crack
approaching perpendicular to an interface. Where y1 and y2 are the yield strengths of materials 1 and 2, respectively, with the crack always approaching the interface from material
1. y refers to the lower of the two yield strengths and L is the distance from the crack tip to the interface. ............................................................................................................................... 34
Figure 3-1. Half shell bearing (a) and flat sample (b) dimensions. .............................................. 38
Figure 3-2. Basic steps of the sintering process to produce the systems under study. .............. 39
Figure 3-3. 1IML structure (%wt.) a) As plated from top to bottom: Sn-3Cu, Sn-10Cu, Ni, leaded bronze and steel. b) After thermal annealing: Sn-Cu (low), Sn-Cu (high), Ni-Cu-Sn, Ni, leaded bronze and steel. *bearings; **flat samples ............................................................................... 40
Figure 3-4. 2IML structure (%wt.). a) As plated from top to bottom: Sn-3Cu, Ni, Sn-3Cu, Ni, leaded bronze and steel. b) After thermal annealing: Sn-Cu, Ni-Cu-Sn, Sn-Cu, Ni-Sn, Ni, leaded bronze and steel. *bearings; **flat samples ............................................................................... 41
Figure 3-5. 3IML structure (%wt.). a) As plated from top to bottom: Sn-3Cu, Ni, Sn-3Cu, Ni, Sn-3Cu, Ni, leaded bronze and steel. b) After thermal annealing: Sn-Cu, Ni-Sn-Cu, Sn-Cu, Ni-Sn-Cu, Sn-Cu, Ni-Sn, Ni, leaded bronze and steel. *bearings; **flat samples ........................................ 41
Figure 3-6. Sample sectioning method for a) bearings and b) flat samples. ............................... 42
Figure 3-7. Surface sample of 1IML coating: a) before BBIM (as manufactured) and b) after BBIM. ........................................................................................................................................... 43
Figure 3-8. Optical micrographs of 1IML cross-section a) with a x200 magnification and b) with a x1000 magnification. ................................................................................................................ 44
Figure 3-9. Optical micrographs of 2IML cross-section a) with a x200 magnification and b) with a x1000 magnification. ................................................................................................................ 44
Figure 3-10. Optical micrographs of 3IML cross-section a) with a x200 magnification and b) with a x1000 magnification. ................................................................................................................ 44
Figure 3-11. Example of thickness measurements for a bearing with 3IML. .............................. 45
Figure 3-12. Typical loading and unloading curve during nanoindentation................................ 47
Figure 3-13. 3-point bend test configuration for half-shell bearings. ......................................... 48
Figure 3-14. Fatigue test set-up of a 3-point bend configuration with infra-red detector: a) schematic view, b) view of the set-up from the infra-red detector and c) elements used to ensure correct alignment of the bearings. .................................................................................. 48
Figure 3-15. 3-point bend test configuration for flat samples. ................................................... 49
Figure 3-16. Examples of the three types of files yielded by the infra-red detector. a) *.ptm file, b) *.ptw file and c) *.ptp file. ...................................................................................................... 51
Figure 3-17. Definition of maximum and minimum position used to set the failure criterion. .. 51
Figure 3-18. Position of strain gauge on the bearing coating. .................................................... 52
Figure 3-19. Graph illustrating determination of ISO50%. .......................................................... 53
Figure 3-20. a) Scheme of the angles representing the orientations on the different planes. b) Variation of aspect ratio. c) Scheme of the parameters used to calculate sphericity. ............... 53
Figure 3-21. EDM approach to quantify crack-particle interaction. ............................................ 54
Figure 3-22. Types of crack lengths measured. ........................................................................... 54

xi
Figure 4-1. Schematic of a flat sample. ........................................................................................ 56
Figure 4-2. Steel and leaded bronze dog-bone specimens for tensile tests. ............................... 57
Figure 4-3. SEM image of nanoindentations on leaded bronze. ................................................. 58
Figure 4-4. Assembly of the FE model. ........................................................................................ 59
Figure 4-5. Partitions and mesh densities used in the FE model. ................................................ 60
Figure 4-6. 3-point bend test configuration for flat samples. ...................................................... 60
Figure 4-7. Schematic of a 'match stick'-like sample. .................................................................. 60
Figure 4-8. Comparison of thresholding procedures to segment voids. ..................................... 61
Figure 4-9. Images of the cross-section and surface of the interlayer, taken with the optical microscope (OM) and the SEM. ................................................................................................... 62
Figure 4-10. EDS identification of the bronze matrix (mainly Cu) and lead islands. .................... 62
Figure 4-11. a) Two -CT cross-sections of the interlayer, showing lead in white, bronze in light grey and air in dark grey. b) 3D reconstruction of the bronze. ................................................... 63
Figure 4-12. EBSD map of the bronze from a cross-sectional point of view. The inserted inverse pole figure (IPFZ) shows the orientations of different colours in the map. ................................ 63
Figure 4-13. Grain size distribution measured from EBSD maps carried out from the cross-section of the interlayer. These measurements were conducted considering a misorientation
over 15 as grain boundary. ......................................................................................................... 64
Figure 4-14. Inverse pole figures in X, Y and Z directions extracted from EBSD analysis of the leaded bronze material. ............................................................................................................... 64
Figure 4-15. Micrographs of the steel microstructure under different magnifications. ............. 64
Figure 4-16. Tensile test results for the steel. ............................................................................. 65
Figure 4-17. Tensile test results for the leaded bronze. .............................................................. 65
Figure 4-18. Position of strain gauges on a flat sample. .............................................................. 66
Figure 4-19. Comparison between experimental and FE model results for a static test on a steel flat sample.................................................................................................................................... 67
Figure 4-20. Comparison between experimental and FE model results for a static test on a flat sample made of steel and leaded bronze. ................................................................................... 67
Figure 4-21. Comparison between FE results and experimental results on a flat sample of steel and leaded bronze, where three strain gauges were attached at different positions. ............... 68
Figure 4-22. Relationship between strains at the centre and 10 mm away from the centre of a flat sample made of steel and leaded bronze.............................................................................. 69
Figure 4-23. Schematics of strain gauges attached to a flat sample. .......................................... 69
Figure 4-24. Strain vs number of cycles using the minimum position displacement failure criterion. ....................................................................................................................................... 70
Figure 4-25. Strain range vs number of cycles to detect a consistent strain range drop as failure criterion. ....................................................................................................................................... 70
Figure 4-26. Strain vs number of cycles using the strain range drop failure criterion. ............... 71
Figure 4-27. Flow chart of the methodology used to test flat samples. ...................................... 71

xii
Figure 4-28.Projected surface crack length vs number of cycles for the interrupted test, where each colour represents a crack. ................................................................................................... 72
Figure 4-29. Replicas of cracks during the interrupted test, from 0 to 100000 cycles. .............. 73
Figure 4-30. Replicas of cracks during the interrupted test, from 100000 to 180000 cycles (failure). ....................................................................................................................................... 74
Figure 4-31. Surface crack initiation in lead ‘islands’. ................................................................. 74
Figure 4-32. EBSD map on the surface of a flat sample with fatigue cracks. .............................. 75
Figure 4-33. -CT 2D sections of a crack propagating through the interlayer (a) and propagating from the interlayer into the steel backing (b). ............................................................................ 76
Figure 4-34. Segmentation and volume reconstruction of bronze, lead and voids contained in the interlayer. .............................................................................................................................. 77
Figure 4-35. Original OM image of a cross-section of the interlayer and its segmented image. 77
Figure 4-36. Interlayer voids position on the XZ plane. .............................................................. 78
Figure 4-37. Volume distribution of the voids found in the interlayer. ...................................... 78
Figure 4-38. Aspect ratio and sphericity distribution of the interlayer voids. ............................ 79
Figure 4-39. 3D reconstruction of voids surrounded by lead. ..................................................... 79
Figure 4-40. Original -CT 2D section; manual segmentation of the crack and voids; volume reconstructions of the crack with close voids; volume reconstructions of the crack, voids and lead. ............................................................................................................................................. 80
Figure 4-41. Different views of the 3D reconstruction of the cracks and the voids in contact with it (video). ............................................................................................................................. 81
Figure 4-42. Crack quantification in the ZY plane along X axis (front to back). ........................... 82
Figure 4-43. Crack quantification in the XY plane along Z axis (top to bottom).......................... 83
Figure 4-44. Diagonal view of segmented cracks propagating from the interlayer into the steel backing (video). ........................................................................................................................... 84
Figure 4-45. Front and back view (ZY plane) of the segmented cracks and their position in the interlayer and steel backing (video). ........................................................................................... 84
Figure 4-46. Top view (XY plane) of the segmented cracks and their position in the interlayer and steel backing (video). ............................................................................................................ 85
Figure 4-47. Side views (ZX plane) of the segmented cracks and their position in the interlayer and steel backing (video). ............................................................................................................ 85
Figure 4-48. OM and SEM images showing preferential crack propagation though the lead of the interlayer. .............................................................................................................................. 86
Figure 4-49. OM images showing cracks propagating from the interlayer into the steel backing, where the green arrows point at interfacial crack propagation and the red arrows point at cracks propagating into the steel. ............................................................................................... 87
Figure 4-50. SEM image showing a fatigue crack propagating into the steel from the lead (red arrows) and the interface interlayer/backing composed of lead with small defects. ................ 87
Figure 4-51. Schematic of the proposed propagation mechanism, where a fatigue crack connects two lead islands though bronze grain boundaries due to previous subsurface propagation through the interconnected lead islands. ............................................................... 90

xiii
Figure 5-1. Schematics of: a) a bearing and b) cross-sectional structures of the specimens (not to scale). ....................................................................................................................................... 95
Figure 5-2. Example of the process followed to measure the thickness of the layers that compose the overlay for 2IML. a) Image taken with SEM, b) binarized image of one of the layers where the edges are highlighted and c) exported image to Matlab to run the program in order to measure the layer thickness. ......................................................................................... 96
Figure 5-3. Schematic of the steps followed to process the phase images: a) Subtraction of the image of reference from the image of interest (step i); b) Measurement of the mean (m) and standard deviation (std) of the signal (step ii). Use these results as a threshold by displaying only the data above m+2std (step iii); c) Resultant image, where possible anomalies have been eliminated. ................................................................................................................................... 97
Figure 5-4. Backscatter image with compositional line scan for Ni, Sn and Cu in: a) 1IML, b) 2IML and c) 3IML coatings. ........................................................................................................ 100
Figure 5-5. Change of temperature (ΔT) for samples with different pain thickness tested for 1000 cycles at maximum load of 1000 N, R=0.1 and three different frequencies: 5, 10 and 15 Hz. .............................................................................................................................................. 101
Figure 5-6. Comparison between images taken with an optical microscope and phase images taken with an infra-red camera (the red arrows point at cracks in the micrographs and sudden phase change in the phase images). .......................................................................................... 103
Figure 5-7. La-N curve, plotting the load amplitude versus the number of cycles to failure using the compliance failure criterion for 1IML, 2IML and 3IML. ....................................................... 104
Figure 5-8. La-N curve, plotting the load amplitude versus the number of cycles to damage detection using lock-in thermography for 1IML, 2IML and 3IML. ............................................. 105
Figure 5-9. Failure criteria comparison between the compliance criterion and the thermography failure criterion in terms of number of cycle to damage detection versus load amplitude (La). ............................................................................................................................ 106
Figure 5-10. Total strain range for 1IML, 2IML and 3IML. ......................................................... 107
Figure 5-11. Δ-N curve, plotting the total strain range versus the number of cycles to failure using: a) compliance failure criterion and b) failure criterion by using lock-in thermography for 1IML, 2IML and 3IML. ................................................................................................................ 108
Figure 5-12. Post-processed infra-red images showing the evolution of damage in a 1IML tested at 315 N of load amplitude (total strain range = 0.003491) (video). .............................. 109
Figure 5-13. Surface cracks on six samples (two for each type of coating) tested under the same conditions, the three top stopped using the compliance failure criterion and the other three using lock-in thermography. ...................................................................................................... 111
Figure 5-14. Cross-sectional image of cracks growing through the multilayer coatings: a) 1IML La=225 N, Nf,thermography=20500 cycles, Stopped at 25000 cycles; b) 2IML La=225 N, Nf,thermography=25500 cycles, Stopped at 30000 cycles; c) 3IML La=225 N, Nf,thermography=14000 cycles, Stopped at 15000 cycles. ................................................................................................ 112
Figure 6-1. Schematics of: a) semi-cylindrical sample, b) a flat sample and c) cross-sectional structures of the specimens (not to scale) [201]. ...................................................................... 116
Figure 6-2. Schematics of the semi-coated samples. ................................................................. 117
Figure 6-3. a) Depth vs time curve during dwell period. b) Graphic determination of the creep exponent. ................................................................................................................................... 119

xiv
Figure 6-4. Schematic of a 'match stick'-like sample. ................................................................ 119
Figure 6-5. Schematic of a trench ready for FIB tomography. .................................................. 120
Figure 6-6. Schematic of the calculated deflection angle between two materials. .................. 121
Figure 6-7. Process to extract the interfaces used to calculate Rq of layers. ............................ 122
Figure 6-8. Process to segment a) fields of cracks and b) single cracks for their quantification. ........................................................................................................................... 122
Figure 6-9. XRD results for phase identification in samples: a) FIMC and b) FS10S. ................. 123
Figure 6-10. FIB cross-sections of the multilayer coatings: a) and b) for 1IML, c) and d) for 2IML, e) and f) for 3IML. The back-scatter detector was used for the images in the left hand column and the in-lens secondary electron detector was used to produce the right hand column of images. ....................................................................................................................................... 125
Figure 6-11. EBSD maps from top surface of samples with 1IML (a), 2IML (b) and 3IML (c). The inserted inverse pole figure (ipfz) shows the orientations of different colours in the map. Tensile axis refers to the loading conditions during testing. ..................................................... 127
Figure 6-12. Grain size distribution (a) and Aspect ratio distribution (b) measured from EBSD maps carried out from the surface of 1IML, 2IML and 3IML. These measurements were
conducted considering a misorientation over 10 as grain boundary. ..................................... 128
Figure 6-13. Figures are extracted from EBSD analysis of 1IML and they represent: a) Inverse Pole Figures in X, Y and Z directions. b) Pole Figure for 221 in Z direction. .............................. 128
Figure 6-14. Roughness results represented by Rq, where surface roughness was measured with Alicona and roughness of IMLs was measured from the data obtained through FIB tomography. .............................................................................................................................. 129
Figure 6-15. Depth vs Load of microindentation on 1IML, 2IML and 3IML for different holding times. ......................................................................................................................................... 130
Figure 6-16. H and E values extracted from nanoindentation creep tests on 1IML, 2IML and 3IML. .......................................................................................................................................... 131
Figure 6-17. General view of a -CT scan and three cross-sections of each one of the coatings under study, that is, 1IML, 2IML and 3IML. ............................................................................... 132
Figure 6-18. Cavity positions on the XZ plane for 1IML, 2IML and 3IML. .................................. 133
Figure 6-19. FIB cross-sections showing microstructural cavities in Sn layer for a) 1IML, b) 2IML, c) and d) 3IML. ........................................................................................................................... 133
Figure 6-20. Volume distribution and volume fraction of cavities for 1IML, 2IML and 3IML. .. 134
Figure 6-21. Sphericity distribution for the cavities found in 1IML, 2IML and 3IML. ................ 134
Figure 6-22. Aspect ratio distribution for the microstructural cavities in 1IML, 2IML and 3IML. .......................................................................................................................................... 134
Figure 6-23. Orientation in XZ-Plane of cavities found in 1IML, 2IML and 3IML....................... 135
Figure 6-24. 3D visualization of a crack (blue) and IML (red) in 1IML (video). .......................... 136
Figure 6-25. 3D visualization of the main crack (light blue), IMLs (red) and main cavity (dark blue) in 2IML (video). ................................................................................................................. 136
Figure 6-26. 3D visualization of cracks (light blue), IMLs (red) and cavities (dark blue) in 3IML (video). ....................................................................................................................................... 137

xv
Figure 6-27. Euclidean and Projected tortuosity of a 3D short crack in ZY plane along X axis and XY plane along Z axis, in 1IML. ................................................................................................... 138
Figure 6-28. Euclidean and Projected tortuosity of a 3D short crack in ZY plane along X axis and XY plane along Z axis, in 2IML. ................................................................................................... 139
Figure 6-29. Euclidean and Projected tortuosity of a 3D short crack in ZY plane along X axis and XY plane along Z axis, in 3IML. ................................................................................................... 139
Figure 6-30. Volume distribution of IMCs in 1IML. .................................................................... 140
Figure 6-31. Position distribution of IMCs in 1IML in the ZY plane. .......................................... 141
Figure 6-32. Orientation of IMCs in 1IML in ZY plane. ............................................................... 141
Figure 6-33. Aspect ratio and Sphericity distribution of IMCs in 1IML. ..................................... 141
Figure 6-34. Deflection angle distribution for cracks in Sn and IML, in 2IML and 3IML. ........... 143
Figure 6-35. Crack arrest at IMCs in 1IML. ................................................................................. 144
Figure 6-36. Very short crack being arrested by an IMC in 1IML. .............................................. 144
Figure 6-37. Crack propagating along the interface of Sn-IMCs in 1IML. .................................. 144
Figure 6-38. Crack arrested in triple grain boundaries in 1IML. ................................................ 145
Figure 6-39. Cracks initiating at surface valleys meeting grain boundaries. ............................. 145
Figure 6-40. Cracks in 2IML, where the cracks originate at stress raisers and in the middle part
of the IML, the crack form at an angle of 45. ........................................................................... 145
Figure 6-41. Transgranular propagation of cracks through Sn grains, when these are near a cavity. ......................................................................................................................................... 146
Figure 6-42. Crack arrest by Cu6Sn5 ‘filaments’ at Sn grain boundaries in 3IML. ...................... 146
Figure 6-43. SEM images of coating response to microindentations. ....................................... 146
Figure 6-44. Schematic of a single semi-elliptical surface crack and 3 coalesced semi-elliptical surface cracks, where 2c is the length and a the depth of the crack. ....................................... 148
Figure 6-45. Crack growth rate of un-coalesced short cracks: comparison between 1IML, 2IML and 3IML. ................................................................................................................................... 149
Figure 6-46. Evolution of projected crack length with number of cycles for un-coalesced short cracks in1IML, 2IML and 3IML. .................................................................................................. 149
Figure 6-47. Replicas of cracks through short crack test of 1IML. ............................................. 149
Figure 6-48. Replicas of cracks through short crack test of 2IML. ............................................. 150
Figure 6-49. Replicas of cracks through short crack test of 3IML. ............................................. 150
Figure 6-50. Example of surface crack fields for 1IML, 2IML and 3IML. .................................... 151
Figure 6-51. Single surface cracks in a) 1IML, b) 2IML and c) 3IML. .......................................... 152
Figure 6-52. EBSD on single short cracks found in a) 1IML, b) 2IML and c) 3IML. ..................... 152
Figure 6-53. Comparison between misorientation angle of all grain boundaries and those containing a fatigue crack in a) 1IML, b) 2IML and c) 3IML. ...................................................... 153
Figure 6-54. Microvoids formed at triple points in 1IML. .......................................................... 157
Figure 6-55. Schematic of a balance between the factors affecting fatigue crack initiation and propagation. ............................................................................................................................... 160

xvi

xvii
DECLARATION OF AUTHORSHIP I, Andreu Laborda Cabo declare that the thesis entitled:
Fatigue of multilayer coatings for plain bearings
and the work presented in the thesis are both my own, and have been generated by me as the result of my own original research. I confirm that:
this work was done wholly or mainly while in candidature for a research degree at this University;
where any part of this thesis has previously been submitted for a degree or any other qualification at this University or any other institution, this has been clearly stated;
where I have consulted the published work of others, this is always clearly attributed;
where I have quoted from the work of others, the source is always given. With the exception of such quotations, this thesis is entirely my own work;
I have acknowledged all main sources of help;
where the thesis is based on work done by myself jointly with others, I have made clear exactly what was done by others and what I have contributed myself;
part of this work has been published as:
- A. Laborda, A. Robinson, S. Wang, Y. Zhang, P. Reed, Fatigue assessment of multilayer coatings using lock-in thermography, Materials & Design, 141 (2018) 361-373.
Signed: ………………………………………………………………………..
Date: …………………………………………………………………………….


xix
Acknowledgements I would like to thank my supervisor Professor Philippa Reed who gave the opportunity to pursue this PhD, the freedom to develop my research and the guidance to be successful. My gratitude also goes to my other academic supervisors: Dr. Andrew Robinson for his invaluable advice and expertise, and Dr. Shuncai Wang. Also thank my industrial supervisor Dr. Yi Zhang (Adam) for helping me maintaining the industrial focus during this project and his advice on the industrial world.
I am also grateful to my office mates (Mike, Pawee, Angelos, Som, Binyan, Rong, Junquin, Alvaro, Chao, Pedro, Luis, Alex) for valuable discussions. Special thanks to Metal Mike, whose excellent work allowed me to start my PhD.
Likewise, I would like to thank all the people in Daido Metal (Grazina, Nacho, Guy, Rolandas) who always made me feel like one more of the team.
Finalment agrair a la Madina, la meva futura muller, per cuidar-me i aguantar-me; al millor germà del món, el Guillem, que sempre ha estat al meu costat sense importar les circumstancies; i als meus pares, Jaume i Celsa, els qui m’ho han donat tot i a qui dedico la meva Tesis.


xxi
Abbreviations BBIM Broad Beam Ion Milling
BEI Back-scattered electron image
CCD Charge Couple Device
CSS Cyclic Stress-Strain curve
EBSD Electron Back-Scattered Diffraction
EDM Euclidean Distance Map
EDS Energy Dispersive X-ray Spectrometry
EPFM Elastic-Plastic Fracture Mechanics
FE Finite Element
FEG Field Emision Gun
FFT Fast Fourier Transform
FIB Focussed Ion Beam
GBS Grain Boundary Sliding
HCF High Cycle Fatigue
HVOF High Velocity OxyFuel
IMC InterMetallic Compound
IML InterMetallic Layer
IPF Inverse Pole Figure
LCF Low Cycle Fatigue
LEFM Linear Elastic Fracture Mechanics
LPS Liquid Phase Sintering
-CT Micro-X-ray computed tomography
NETD Noise Equivalent Temperature Difference
OM Optical Microscopy
PSB Persistent Slip Bands
SEI Secondary Electron Image
SEM Scanning Electron Microscope
SLS Swiss Light Source
STD Standard Deviation
TSA Thermoelastic Stress Analysis
UTS Ultimate Tensile Strength
XRD X-Ray Diffraction
YS Yield Strength


Introduction
1
1. Introduction
Plain bearings are a crucial part of internal combustion engines; typically comprising two half-shell bearings fitted together into a housing, supporting the crankshaft or the connecting rod. Multilayer coatings are used in such devices in order to reach a property compromise or balance between hard and soft materials, since a bearing needs to have high mechanical strength but also has to be able to embed foreign particles that could damage the crankshaft. The material system considered in this work comprises multilayer coatings made of Sn-Ni-Cu electrodeposited onto a leaded bronze interlayer bonded to a steel-backing. In service, the engine loads are transferred to the bearing coating through a thin oil film, hydrodynamic pressure concentration variations of such oil films lead to dynamic stress fields, applying cyclic loading, which may then lead to cracking and failure of these coatings.
Competition between manufacturers to achieve better performance resulted in smarter engine designs, which are lightweight, compact and have high output power. This has resulted in a dramatic increase in the loads supported by the plain bearings. In order to cope with the new demands, plain bearings became more complex, increasing their resistance to fatigue failure. Now, the multilayer coatings consist of layers of a few microns, making the assessment of any fatigue crack (within the coating) more difficult.
In addition, in industry, test rigs are used to assess the fatigue performance of plain bearings, where the rigs try to emulate the loading conditions and environment of an engine. However, these methods do not offer insight into fatigue micromechanisms, allowing targeted design approaches, instead they work as a pass-fail test to rank bearing structures based on performance. This method was useful in the past when assessing more simplistic bearing architectures, where the optimization of bearings could be treated as a ‘black box’ and achieved empirically through trial and error. Moreover, these tests are very expensive to conduct and require long times of testing, making them a ‘bottle-neck’ for the design/optimization process.
1.1 Objectives
This project aims to study the fundamental fatigue behaviour of multilayer coatings for plain bearings by understanding fatigue crack initiation and early propagation in different architectures and materials. Specific objectives of this thesis were:
- Design a methodology to assess the fatigue performance of different bearing
architectures, simplifying loading and environmental conditions. Ideally, this new
methodology should work as screening test for future bearing designs, so the number
of tests to be carried out on engine-like rigs can be minimized.
- Rank different multilayer coatings based on their fatigue performance.
- Identify the factors affecting their fatigue performance.
- Study these factors in order to elucidate and understand the micromechanisms leading
to fatigue failure.
- Propose routes of improvement/optimization for multilayer coatings based on previous
findings.

Chapter 1
2
1.2 Thesis structure
This thesis is divided in eight chapters:
- Chapter 1 introduces the theme of the thesis and what motivated the project, as well as
the objectives set to achieve a successful project.
- Chapter 2 gives a detailed background about the three general topics involved in this
research: bearings, fatigue and fatigue in bearings.
- Chapter 3 presents the materials, structures, geometries, etc. to define the studied
samples, as well as a brief introduction of the experimental techniques or methods used
in several results chapters.
- Chapter 4 is the first results chapter, where we characterize the fatigue behaviour of the
interlayer, since it is service relevant to the bearing performance and also works as a
model system to study fatigue crack behaviour in systems of layered materials with very
different mechanical properties.
- In Chapter 5 we present the methodology designed to assess the fatigue performance
of different overlays and we identify the factors thought to be affecting the fatigue
behaviour in such multilayer coatings.
- Chapter 1 studies these factors in order to elucidate the fatigue micromechanisms
behind crack initiation and propagation in such systems.
- Finally, in Chapter 7 we summarize the main findings of this project, as well as proposing
routes to improve or optimize bearing designs; and in Chapter 8 we propose future work
to continue carrying out the project by implementing new ideas and methods.
In addition, a route map is presented on the next page, where one can see the process followed to achieve the main goals of this project. The process consists of different methods and techniques used to obtain outputs that helped reach the goals of the project. Thus, the main goal was to understand the micromechanisms behind fatigue failure of the systems under study, this goal was divided into two other goals: the design of a methodology to assess the fatigue performance and the materials characterization. Different approaches were applied directly or indirectly to finally achieve the desired understanding on the fatigue failure of multilayer coatings for plain bearings.

Introduction
3

Chapter 1
4

Literature review
5
2. Literature review
The literature review for this project includes three main topics (1) bearings (2) fatigue and (3) fatigue in bearings. Each topic has several subheadings to explain the classical (theoretical) background and current relevant research.
2.1 Bearings
The first section of the literature review will focus on bearings, their history, types, requirements, failure causes, structures, manufacturing processes and new trends.
2.1.1 Basic concepts
It is apparent from the title that the aim of this thesis is to understand the fatigue behaviour of bearings. However, these devices were invented to improve the tribological behaviour between parts in movement. Therefore, it is also important to understand the demands of tribology. Tribology deals with phenomena of friction, lubrication and wear when surfaces touch and slide. Tribological properties are not attributes of only one material, but of two materials sliding against each other with (almost always) a third material in between [1].
2.1.2 History and evolution
Since ancient times people transported heavy objects using techniques to reduce friction between the objects and the ground, such as inserting rollers between them or applying lubricant, in order to ease the task. The painting in the cave of El-Bersheh (Figure 2-1a), dated around 1880 B. C., represents how the Egyptians transported a statue secured on a sleigh and transported by some people, while an officer situated on the sleigh poured lubricant on the ground immediately before the sleigh. This lubricant must have reduced friction between the sleigh and the ground making the transportation easier. Also a relief of Mesopotamian civilization (Figure 2-1b), dated at around 700 B. C., shows a huge statue being transported in a similar way as the Egyptians, except that they used logs to move the sleigh. These historical facts indicate that tribology technologies have been employed for a long time [2].
Figure 2-1. a) Painting in El-Bersheh (1880 B. C.) representing the transportation of an statue with the help of
lubrication [3]. b) Bas-relief of circa (700 B. C.) at Kouyunjik, the picture shows the use of rollers to reduce the friction between the ground and the sled in order to move a big statue [4].
Nowadays, bearings are used in the moving parts of all machines, especially in engines. Since all moving parts in an engine must be supported by some sort of bearing, the automobile industry

Chapter 2
6
is one of the major users of these components. The purpose of a bearing is to transmit a load through two elements moving relative to each other [5], for this reason the friction properties of the bearing materials have huge importance. Since the beginning of tribology as a field of research, investigators have been developing materials for bearings with friction, wear and conformability as key aspects of the selection criterion [6].
In the 19th century, the first materials being used for bearings were Sn and Pb chosen for their softness and moldability. However, the incapacity of these materials to support higher loads led researchers to improve their strength whilst maintaining the conformable characteristics, driving the manufacturers to add other metals such as Sb and Cu to Sn (Cu and Sb improve strength and corrosion resistance respectively), which resulted in Babbit metal (Sn-11Sb-6Cu) (%wt.), the historical bearing alloy invented by Isaac Babbit in 1839. Later on, Babbit metal was replaced by Cu-Pb and Al based systems [7].
The continuous developments in automobile engines have increased the engine power and reduced the fuel consumption, size and weight of engines, increasing the total stress to be carried by the bearings at crankshaft and connecting rods. Therefore, Cu-Pb bearing systems experience wear, corrosion and seizure problems when subjected to these higher stresses [8]. As a result, higher strength aluminium based alloys with silicon and copper were introduced. These materials were stronger than the previous bearing metals but with poorer embeddability, for this reason it was found necessary to add a third very thin layer or “overlay” with similar properties to Babbitt materials [9].
2.1.3 Types of bearings
Two main bearing families exist: rolling and plain bearings (the latter being the type investigated in this project):
i. Rolling bearings A rolling bearing has balls or rollers between the housing and rolling elements (Figure 2-2a); the bearing works through the rolling motion of these components. The contact area between the balls and the race is small, so the stresses are high [1]. A rolling bearing takes advantage of the fact that there is very little friction between rolling objects.
ii. Plain bearings Generally, a plain bearing surface supports the shaft sliding and generating sliding friction (Figure 2-2b). When a lubricant is introduced between the sliding surfaces the friction is reduced, this phenomena is called hydrodynamic lubrication (Section 2.1.4). However, hydrodynamic lubrication can disappear under static loads or with slow sliding speeds, and mixed or boundary lubrication can appear, threatening the bearing integrity. Bearings can be designed to deal with this, for example if in a trimetal bearing (Section 2.1.6) the overlay vanishes due to boundary lubrication, an interlayer that consists of soft lead supported in a matrix of a stronger bronze will support the contact of asperities, since the lead will smear out acting as a solid lubricant. These sort of bearings are not designed to work in dry conditions, but if it is necessary, the leaded bronze interlayer can bear this environment and avoid a catastrophic failure for a limited time. Plain bearings are ideal for engines, where there are large variations in loads and the oil film pressure can absorb shocks. Also, plain bearings do not require excessive space, making them relatively low cost [2].

Literature review
7
Figure 2-2. a) Plain bearing and b) rolling bearing [2].
2.1.4 Reciprocating internal combustion engine
An internal combustion engine is a machine that obtains mechanical energy directly from the chemical energy produced by a mixture of air-fuel burning inside the combustion chamber, which is found inside the engine. A reciprocating internal combustion engine is an engine in which combustion process occurs in a cylinder with a piston pushed by the pressure of the combustion explosion. The pressure force is transmitted to the crankshaft through a connecting rod that links the piston with the crankshaft, converting the pressure into a rotating motion [5].
The reciprocating internal combustion engine as shown in Figure 2-3 is the most important component in a motor vehicle, as well as in many ground and sea transportation vehicles. This device is very popular because of its performance, reliability and versatility. However, there are also some important drawbacks such as low thermal and mechanical efficiencies, dissipating a lot of fuel energy as heat and friction [10].
Figure 2-3. Four-stroke reciprocating internal combustion engine [5].
The effective use of tribology in the engine is required to reduce friction and wear of all moving components. However, to achieve the desired or ideal performance is especially difficult given the wide range of speed, load, and temperature conditions in an engine, but is vital since the frictional losses derived from the bearings are one of the most important [11].

Chapter 2
8
i. Lubrication regimes in the engine Engine bearings are designed to operate with a liquid lubricant, the purposes of lubrication are to decrease the coefficient of friction, extract the heat generated by friction and remove foreign particles from rubbing surfaces.
The lubricant film thickness, which separates the bearing and crankshaft surfaces, is the key parameter to distinguish the lubrication regimes. Engine bearings generally work in hydrodynamic regimes of friction which implies the presence of a continuous lubricant film between the bearing and journal surfaces, so the lubricant film thickness is greater than the surface asperities and there is no contact between metal surfaces. However, the disappearance of lubricant (or extremely thin lubricant film) is expected to take place at low speeds and high loads and with low-viscosity lubricants (Figure 2-4), in that case the roughness between the counterparts is higher than the oil film thickness, therefore the bearing will be in boundary lubrication, so there will be contact between metal surfaces. Also, a mixed lubrication regime between both previously defined regimes exists.
Figure 2-4. Lubrication regimes for engine bearings after[10].
ii. Bearings in internal combustion engines In a typical internal combustion engine, the bearings are supporting the crankshaft and the connecting rod. The general configuration is two half-shell bearings fitted into a housing. The half-shell plain bearings considered in this work are representative samples manufactured for testing. Afterwards, they will be used to design the connecting rod and main bearings. This pair of half-shell bearings are clamped together within a housing and are either located between the connecting-rod head and its crankpin providing rotating motion of the crankpin within the connecting rod, which transmits cycling loads applied to the piston (known as the “con-rod big-end bearing”); and used to support any part of the crankshaft/engine-block providing its rotation under inertia forces generated by the parts of the shaft and oscillating forces transmitted by the connecting rods (they are known as the “main bearings”).
2.1.5 Requirements
The efficient functioning of bearings during the life of an engine depends on the design as well as the structural and mechanical properties of all the materials of the bearing system. Materials for bearings used in engines have a property compromise between hard and soft materials. The

Literature review
9
bearings have to have high mechanical strength, anti-friction properties but also conformability. To solve this contradiction the bearings have a composite structure:
- Composites where there is hard matrix (copper, aluminium) with a soft phase as a
second phase (tin, bismuth, lead, graphite).
- Composites where there are several layers with (very) different properties. Usually, the
last layer or overlay is softer than lower layers (intermediate layer, back layer).
The combination of multilayer bearing systems with multiphase layers, such as the interlayer that may come in contact with the shaft or journal in the presence of boundary lubrication, gives rise to conflicting demands upon the materials properties.
Some of the main requirements for bearing materials are as follows [12-14]:
- Load capacity: The materials must be stiff enough and must have enough strength to
bear the load that has to be transmitted by the bearing.
- Fatigue resistance: Due to the location of plain bearings in the engine, they experience
cyclic loads. Thus, the bearing surface layer will suffer cyclic stresses (acting through the
hydrodynamic oil layer) varying in intensity along the coating as well as through the
layers of a multilayer bearing. For this reason, the surface materials should be able to
endure these cyclic stresses and resist the initiation and growth of fatigue cracks.
- Toughness: The bulk bearing must resist the accumulation of micro-cracks, as it may
result in catastrophic damage under cyclic loading.
- Seizure resistance (compatibility): The material must resist (at least for a while) physical
joining (friction welding) with the crankshaft when there is metal-metal contact
between the parts.
- Wear resistance: The material has to maintain its dimensional stability, even when
mixed or boundary lubrication may occur.
- Conformability: Since bearings are in contact with the crankshaft and its housing,
irregularities or misalignments may cause concentration of load that originates from
inadequate oil film thickness, causing wear. The bearing material should be able to
accommodate this.
- Embeddability: The lubricant circulating in between the bearing and the crankshaft may
contain particles that could damage the crankshaft. Therefore, the bearing material
must absorb those particles in order to avoid such possible damage.
- Corrosion resistance: The lubricant may be degraded. Such degradation could result in
an oxidizing agent that could corrode the bearing material if its chemical stability is not
good enough to resist the chemical attack.
- Cavitation resistance: In the lubricant, bubbles can appear due to a localized pressure
reduction. The implosion of these bubbles may result in impacts causing concentration
of load at the bearing surface, which an ideal bearing material should resist.
- High thermal conductivity: A material with high conductivity could dissipate faster the
heat produced during operation, reducing the possibility of further problems related
with overheating.
2.1.6 Bearing structures
Due to the wide range of environments under which bearings have to operate, bearing materials have evolved as specialized systems or structures. The structure of a plain bearing can be classified as single-layer (single-metal), double-layer (Bimetal) and multilayer (Trimetal)

Chapter 2
10
according to the materials comprising each device (Figure 2-5). The last is the bearing structure which will be studied in this research, in particular a tin based overlay, with a Ni diffusion barrier, leaded bronze as interlayer and a steel backing.
Figure 2-5. Typical engine bearings structures: a) Single-metal, b) Bimetal and c) Trimetal.
i. Single-metal These types of systems exhibit poor surface properties and present a very limited resistance to boundary lubrication. As a consequence, single-metal bearings present low load capacity and fatigue resistance. The majority of single-metal structures are made of copper alloys or aluminium alloys, but there are also some low-cost bearings made of cast zinc-base alloys [15].
ii. Bimetal A bearing requires a wide range of properties. The most important features are the overall strength and shape stability; for this reason steel as the backing material is the best material to ensure these characteristics. In addition to this, the bearing needs to have wear resistance, fatigue resistance, conformability, etc. Therefore, a bimetal compound consisting of a layer of an alloy with the desired characteristics bonded to a steel base (or steel backing) is used as the material for the bearing [16]. Most of the bimetal structures are aluminium based (Al-Sn, Al-Sn-Si and Al-Sn-Ni-Mn) and copper based (Cu-10Pb-10Sn and Cu-Al) alloy materials.
iii. Trimetal The basic trimetal structure consists of a steel backing, an intermediate layer (based on the bimetal bearing alloys) and a top layer (or multilayer) known as the overlay. The steel backing supports the bearing structure providing its rigidity and shape stability to the system. The intermediate layer (or interlayer) lies between the steel backing and the overlay and is made of a material with moderate tribological properties but high fatigue resistance increasing the bearing’s life. Anti-friction properties are needed to avoid catastrophic failure in case of boundary lubrication, hence the interlayer acts as a fuse in case the overlay vanishes; but more important is that it is used to support the load applied on the overlay. Most interlayers are made of Copper based alloys such as Cu-Pb-Sn (leaded bronzes), Cu-Al (aluminium bronze) and Cu-Bi-Sn [16].
The overlay is a thin layer of soft materials (Pb-Sn-Cu, Sn-Cu, Pb-In, graphite/MoS2 polymer based materials) with very good tribological properties, applied onto the interlayer. Low thickness of overlays is necessary to achieve the required level of fatigue strength, since in thinner layers the dislocations have shorter mean glide distance, therefore plastic deformation becomes more difficult and the strength of the composite is enhanced [17]. The focus of this study is on tin based overlays (a material chosen due to its inherent resistance to corrosion in an engine environment) with copper and nickel.

Literature review
11
2.1.7 Manufacturing process of trimetal plain bearings
Engine bearings are a product with high added value: the main costs reside in the manufacturing process, the raw materials are relatively cheap compared to the bearing final price [18].
The process to produce a trimetal bearing can be separated into three steps [2, 19]:
- Bimetal bonding: Strong bonding is required in order to join steel backing and interlayer so
that the steel and alloy layer do not separate after the bearing is mounted in the machine.
The steel backing and the interlayer alloy are attached by metallic bonding. Processes such
as sintering, roll bonding, and casting are used to perform the first step in the trimetal
bearing manufacturing process:
o Roll bonding: High pressure is applied to the alloy on the back steel to bond them.
o Casting: Melted alloy is cast and bonded to the back steel.
o Sintering: this is the chosen method to produce the materials used in this work
(described in Section 3.1.2).
- Surface treatment: The last set of layers (overlay) are applied to the bimetal structure of
the steel and alloy to improve the characteristics of the bearing surface. The overlay can be
produced by several technologies:
o Vacuum techniques: Sputtering, Physical Vapour Deposition, Chemical Vapour
Deposition and variants of each technique.
o Spraying: High Velocity OxyFuel (thermal spraying), cold spraying and plasma
spraying.
o Electroplating (or electrodeposition) technology: This is the technology used to
produce the overlays studied in this research and is described in the next chapter.
- Thermal treatment: This final process is not always used, as it depends on the overlay
structure and the manufacturing objectives (see Chapter 3).
2.1.8 New trends
Over the last 50 years, the literature on engine bearing materials has been limited, with only some small improvements based on old concepts [20, 21]. The absence of new ideas in this field to some extent limits the improvement of engines [18]. The design of internal combustion engines has been continuously modified, increasing the output and efficiency due to achievements in materials engineering, electronics and computer control, but these improvements change the conditions under which the bearings are working. Greater output means higher combustion pressures and higher loads, and engine downsizing results in higher load application to the bearings. As a result, the propensity to suffer from fatigue has increased [22].
One of the most popular engine bearing systems is the trimetal bearing, where in order to meet the increasing service demands, the overlay thickness has been reduced. Another action to improve the fatigue strength and wear resistance is being developed via materials with stronger overlays, by means of hardening processes. In addition the bi-metal (aluminium-tin) bearings are being improved with new strengthening additives and special thermo-mechanical treatments to enhance the fatigue strength.
Polymer coatings have also become quite popular for engines with start-stop systems due to their elastic recovery (no plastic deformation). These coatings are composed of polymer and additives in the form of small particles of solid lubricants, and are applied onto the overlays of

Chapter 2
12
conventional trimetal bearings. Other paths being followed are the use of reduced grain size materials, i.e. nanocrystalline and ultrafine-grained alloys [23], and the use of vacuum techniques such as sputtering or PVD to deposit overlays with improved properties.
2.2 Fatigue
Fatigue is defined as the failure of materials under dynamic and fluctuating stresses or strains at lower loads than the yield or tensile strengths measured by static tests.
This part of the literature review does not try to explain the basics of fatigue theory in detail, as text books such as those by Suresh [24], Benham [25], Velázquez [26] and Anglada [27] are available. Instead, only concepts more directly related to this project will be explained.
2.2.1 Terminology and basic definitions
Typically, cyclic loading is quantified in terms of:
- Mean stress which is the mean value between the maximum and the minimum stresses
within a cycle.
σm =(σmax + σmin)
2 Equation 2-1
- Stress range is the difference between the maximum and minimum stress within a cycle.
∆σ = (σmax − σmin) Equation 2-2
- Stress amplitude which is the maximum value between the mean stress and the maximum
and/or the minimum stress.
σa =∆σ
2 Equation 2-3
- Load ratio which is the ratio of minimum to maximum load (R=-1 for fully reversed loading,
R=0 for zero-tension fatigue, and R=1 for a static load).
R =σmin
σmax Equation 2-4
Where max and min are the maximum and minimum stresses respectively in one cycle.
Figure 2-6 shows a generalised loading cycle in which the parameters described above are represented. This cycle can represent any combinations of upper and lower limits which can be either positive (in the case of this figure) or negative.

Literature review
13
Figure 2-6. Typical stress-time graph in fatigue.
2.2.2 Cyclic deformation in ductile materials
Microscopic deformation processes were linked to the origin of fatigue damage more than 100 years ago by the studies of Ewing and Rosenhain [28] and Ewing and Humfrey [29]. Research studies have clearly demonstrated the existence of a wide variety of underlying mechanisms related to cyclic loading conditions. A good understanding of these mechanisms is necessary to improve the fatigue resistance of materials through the design of their microstructure.
i. Persistent Slip Bands (PSB) As previously mentioned, this research aims to study metallic materials (polycrystalline), but in order to understand how a ductile polycrystalline material behaves, in this section we will initially refer to single crystals to explain Persistent Slip Bands (PSBs).
When a single crystal is cyclically strained, the rate of hardening (due to accumulation of dislocations) decreases up to a steady-state called ‘saturation’. At this point, fine slip markings can be observed on the surface, as slip bands are created by sets of dislocations shuttling back and forth along the same set of slip planes, weakening the material. These slip lines were called ‘Persistent Slip Bands’ (PSBs) by Thomson, Wadsworth and Louat [30] as those slip bands re-appear in the same location after electropolishing. So, a PSB can cross a whole single ductile crystal whilst in polycrystals slip bands are formed within the interior of grains.
ii. Hardening-Softening When a polycrystalline material is subjected to cyclic loading, it shows two possible behaviours (Figure 2-7):
- Softening, when the strain range increases or the stress range decreases under the same
stress or strain conditions respectively as the number of cycles increases.
- Hardening, when the strain range decreases or the stress range increases under the same
stress or strain conditions respectively as the number of cycles increases.

Chapter 2
14
Figure 2-7. Response for cyclic hardening and softening under: a) Stress-control and b) Strain-control [24].
During hardening and softening, continuous microstructural changes (dislocation movement/creation) take place, however, after a number of cycles those trends tend to stabilize reaching a steady-state or saturation point giving rise to stable hysteresis loops. After the saturation point, the hysteresis loop remains constant in further cycling. In Figure 2-8 the parameters used to describe such hysteresis loops can be seen, as well as a CSS curve formed when one links the peaks of the saturated cycles for different strain or stress conditions. One
can also compare the monotonic - curve with the CSS curve, if the monotonic curve appears above the CSS, the material is cyclically softened, and vice versa.
Figure 2-8. a) Parameters to describe hysteresis loops: plastic strain range (Δɛp), elastic strain range (Δɛe), strain
range (Δɛ) and stress range (Δ). b) Cyclic stress-strain (CSS) curve.
iii. Effect of precipitates Extensive experimental work has shown that precipitation-hardened alloys show cyclic hardening and softening due to mechanisms related to the precipitate geometry and distribution as well as dislocation-particle interactions. Brett and Doherty [31] presented evidence revealing that cyclic hardening occurs due to an increase in dislocation density and dislocation-precipitate interaction. On the other hand, cyclic softening was attributed to extensive precipitate shearing.

Literature review
15
iv. Shakedown-Ratcheting Ductile materials under some cyclic load conditions may lead to a situation where an entirely elastic cycle is initiated after some cycles. Therefore, no plastic strain is accumulated after the saturation point or Shakedown. There are two types of shakedowns, elastic shakedown can be found when in the steady state the total strain is equal to the elastic strain (Figure 2-9a). On the other hand, plastic shakedown occurs when a closed cycle is formed, representing the existence of plastic and elastic deformation but without plastic strain accumulation (Figure 2-9b). However, when the plastic strain continues to accumulate cycle after cycle (Figure 2-9c), the shakedown limit has been exceeded, giving rise to a phenomenon called ratcheting, cyclic creep or incremental collapse.
Figure 2-9. a) Elastic shakedown, b) Plastic shakedown, c) Ratcheting.
2.2.3 Fatigue crack initiation in ductile materials
The cracks due to fatigue are known to usually initiate at defects in the grain boundaries, inclusions, microstructural and chemical inhomogeneities and local stress concentrations.
i. Surface roughness Wood [32] was considering flawless metals when he postulated that “repeated cyclic straining leads to different amount of net slip on different glide planes”, roughening the surface due to the irreversibility of shear displacements along the slip bands. This phenomenon generates ‘intrusions’ and ‘extrusions’ (Figure 2-10) acting as stress raisers and promoting crack initiation on the surface even in the absence of initial defects.

Chapter 2
16
Figure 2-10. Extrusions and intrusions on the surface of a fatigued Cu crystal [33].
In addition, it was proved by Cheng and Laird [34] that cracks preferentially initiate at PSBs. The difference in density and distribution of dislocations between the matrix and PSB create an interface with preferential sites for fatigue crack initiation (Figure 2-11). In the light of those results, it was of interest to investigate if the surface topography made a greater contribution than the internal dislocation structure in the process of crack initiation; experiments by Thompson, Wadsworth and Louat [30] suggested that decreasing the surface roughness, increased the fatigue life.
Figure 2-11. Fatigue crack initiation in the interface between PSB and matrix in a fatigued Cu crystal [33].
ii. Grain boundaries The most common situations where a crack initiates at the grain boundary are when those are embrittled, and therefore are attacked preferentially. In absence of these situations or particles in the grain boundaries, fatigue crack initiation at grain boundaries in ductile materials is less usual.
However, work done by Kim and Laird [35, 36] established that cracks might initiate at grain boundaries if (1) the grains forming the grain boundary are highly misoriented, (2) at least one of the active slip systems is directed at the intersection of the boundary with the surface, (3) the traces of the high angle grain boundaries in the free surface make a large angle with the tensile stress axis (i.e. experience a high resolved shear stress) [24].
There are two main mechanisms that explain crack initiation at grain boundaries during cyclic loading. One for low plastic strain amplitudes, which explains the cracking as caused by impingement of PSBs at grain boundaries, and the other for high plastic strain amplitudes, which explains the cracking as a consequence of surface steps formed at the boundary.
iii. Inhomogeneities The main sites where heterogeneities cause fatigue crack initiation are: voids, inclusions, local variations in chemical composition and so on. The existence of these kinds of defects means that the formation of fatigue cracks is likely in both surface and internal material sites. Crack initiation at defects depends on several factors such as available matrix slip systems, relative matrix and

Literature review
17
defect strength/stiffness, matrix-defect interface strength and its susceptibility to be chemically attacked. Although inclusion types depend on a specific materials system; micromechanical models have been developed to analyse these effects including for example: estimating the voids or debonded inclusions as local notches that reduce the material fatigue strength, or considering the pile-up of dislocations in the interface as responsible for initiating cracking.
2.2.4 Fatigue life approaches
The process of fatigue failure in a component can be defined as several steps from crack initiation until the final failure. These steps are usually classified as: (1) Crack initiation, (2) propagation and coalescence of short cracks to form dominant cracks, (3) stable propagation of dominant cracks and (4) catastrophic propagation of dominant cracks until failure of the component.
The above mentioned steps are dependent on a wide range of factors such as environment or microstructure. The two main approaches to estimating fatigue are the total-life and the damage-tolerant approach.
i. Total fatigue life approaches The total fatigue life (Nf) is defined as the number of cycles necessary to initiate the crack and propagate it until the final (critical) crack size which causes catastrophic failure. These approaches characterize the total fatigue life by means of an overall stress or strain range assuming that the sample is un-cracked, free of defects and with a smooth surface. With samples that meet those assumptions it has been shown that the crack initiation phase is the main contribution to fatigue life (up to 90% of total fatigue life). Therefore, this approach is mainly considering crack initiation as the criterion to assess fatigue.
Two different total-life approaches can be distinguished: the stress-life approach, usually applied when the sample is under high-cycle fatigue (HCF, Nf > 105 cycles) i.e. low stress conditions (the sample experiences mainly elastic strains, and therefore is usually characterized in terms of stress range); and the strain-life approach, applied in situations of low-cycle fatigue (LCF, Nf < 105 cycles) and high enough stress to cause significant plastic deformation, and is therefore characterized in terms of strain range.
Stress-life approach
The stress-life approach was first introduced by Wöhler who evolved the concept of a ‘fatigue limit’, which defines the maximum stress amplitude below which the fatigue lifetime is infinite (or rather no fatigue failure is seen). This concept is mainly used when the stress amplitude is low and the strains are primarily elastic which usually means long fatigue life, defined as high-cycle fatigue or HCF.
In order to characterize the fatigue limit (e) of a material, the nominal stress amplitude (a) for fully reversed loading is plotted against the number of cycles to failure (Nf) generating the stress-life plot or S-N curve (Figure 2-12). When a material with a fatigue limit is represented in an S-N curve, a plateau can be observed at low stress amplitudes and high number of cycles indicating
the fatigue limit (e). However not all materials show such a well-defined parameter, in these cases the endurance limit is instead defined as the stress amplitude at which the material can bear at least 107 fatigue cycles.

Chapter 2
18
Figure 2-12. S-N curve where we can see defined the fatigue limit.
In a similar way, if the true stress amplitude is plotted against the number of reversals to failure (2Nf) on a log-log scale, a linear relationship can be observed. This relation can be represented by the Basquin [37] equation:
σa = σ′f(2Nf)b Equation 2-5
Where ’f is the fatigue strength coefficient (similar to the true fracture strength in a tensile test) and b is the fatigue strength exponent.
Strain-life approach
The majority of engineering components support certain levels of constraint and plastic strain, particularly at stress concentration points. In these situations a strain approach is more accurate than a stress approach, because the former takes into account the plastic deformation within the material.
Coffin [38] and Manson [39] were the first who proposed a model based on the plastic strain amplitude in order to characterize the fatigue life. They realized that plotting the plastic strain amplitude against the number of reversals to failure in a log-log scale, a linear relationship could be seen:
∆εp
2= ε′f(2Nf)
c Equation 2-6
Where ɛ’f is the fatigue ductility coefficient (similar to the true fracture ductility) and c the fatigue ductility exponent (between -0.5 and -0.7 for most metals).
The total strain amplitude (ɛa) can be expressed as the sum of the elastic strain amplitude (ɛae) and the plastic strain amplitude (ɛap):
εa = εae + εap or ∆ε
2=
∆εe
2+
∆εp
2 Equation 2-7
The Coffin-Manson relation (Equation 2-6) represents the plastic contribution to the total strain model, whereas the Basquin relation (Equation 2-5) represents the elastic contribution. Therefore, knowing that in the elastic field the stress is proportional to the elastic strain:
Δ = EΔɛe Equation 2-8

Literature review
19
Where E is the Young’s modulus. Combining the Equation 2-3, Equation 2-5, and Equation 2-8 the elastic contribution appears:
∆εe
2=
σ′f
E(2Nf)
b Equation 2-9
Finally, combining the Equation 2-6, Equation 2-7 and Equation 2-9 the expression that forms the basis for the total strain-life approach is obtained:
∆ε
2=
σ′f
E(2Nf)
b + ε′f(2Nf)c Equation 2-10
ii. Damage tolerant approach - Fracture mechanics The assumption in this approach is that all materials have intrinsic flaws. To characterize the flaws, non-destructive techniques are usually used. Once, an initial crack size is estimated, the fatigue life will be set as the number of cycles to propagate the crack from the initial size to a critical dimension.
The use of a damage (or defect)-tolerant approach exploits fracture mechanics in order to characterise the local crack tip stress state and so to predict the crack growth. The fundamentals of fracture mechanics are briefly outlined below.
Energy approach (Griffith)
Griffith [40] established the basis for current theories of fracture mechanics, with a criterion based on an energy balance between mechanical and surface energies. If we consider a crack of
length 2a in the middle of a large plate of thickness B, which is under a tensile stress (Figure 2-13). Griffith’s theory says that a crack will progress under the applied stress when the decrease in potential energy with respect to the crack extension is equal to the increase in surface energy due to crack extension.
Figure 2-13. Large plate under tensile stress with a crack of length 2a in the middle.

Chapter 2
20
Linear elastic fracture mechanics approach (LEFM)
The critical local conditions for crack growth mentioned above can be described more explicitly by means of linear elastic stress analysis (which can complement the energy-based criterion). Three main modes of fracture exist (Figure 2-14) where the crack surface displacement is different:
- Mode I: In the tensile opening mode the crack surfaces separate in a direction
perpendicular to the plane of the crack.
- Mode II: In the in-plane sliding mode the crack surfaces are sheared in a direction
perpendicular to the crack front.
- Mode III: In the anti-plane shear mode the crack surfaces are sheared parallel to the
crack front.
Figure 2-14. Main modes of fracture: a) Mode I (tensile opening), b) Mode II (in-plane sliding), c) Mode III (anti-plane shear).
Irwin [41] quantified the elastic near-tip fields ahead of a crack in terms of the stress intensity factor (K). This approach quantifies the stresses near the crack tip in terms of nominal applied stresses and the crack length. Therefore, the local elastic stress distributions for mode I at co-
ordinates (r,) close to the crack tip are given by (Figure 2-15):
x =KI
√2πrcos (
θ
2) [1 − sin (
θ
2) sin (
3θ
2)] Equation 2-11
y =KI
√2πrcos (
θ
2) [1 + sin (
θ
2) sin (
3θ
2)]
Equation 2-12
xy =KI
√2πrsin (
θ
2) cos (
θ
2) cos (
3θ
2)
Equation 2-13
z =2𝜈KI
√2πrcos (
θ
2) z = 0
(for plane strain) (for plane stress)
Equation 2-14

Literature review
21
Figure 2-15. Local elastic stress distributions close to the crack tip for mode I.
Where KI is the stress intensify factor in mode I. Irwin [41] also observed that the stresses ahead
the crack tip are proportional to √𝜋𝑎, where a is half of the crack length. Therefore, is possible to define KI in terms of the applied stress and crack length:
KI = Y (a
W) σ√πa Equation 2-15
Where Y is a geometrical factor that depends on crack and specimen size and geometry as well as load configuration.
K-dominance Since K measures the stress intensity ahead of the crack tip, it is reasonable to think that it can be used to characterize fatigue crack initiation and growth. However, K is based on assumptions of elastic behaviour, and fatigue is a locally plastic phenomenon. Therefore, K cannot be used to explicitly characterize the elastic-plastic behaviour occurring at the crack tip. Nevertheless, K is valid in the area surrounding such a zone, but within the annular region of K-dominance (Figure 2-16). This condition is called the ‘small scale yielding condition’, i.e. when the plastic zone is very small. Under this condition K might be expressed as in Equation 2-15.
Figure 2-16. Zones near the crack tip.
The incorporation of plasticity
Previous equations defining stress fields near the crack tip were considering perfectly elastic bodies. In practice, these high elastic stresses do not occur in ductile materials, because the material becomes plastically deformed and redistributes the local stresses. In these cases a significant plastic zone near the crack tip appears, which may invalidate the use of LEFM and making necessary the use of plastic approaches.
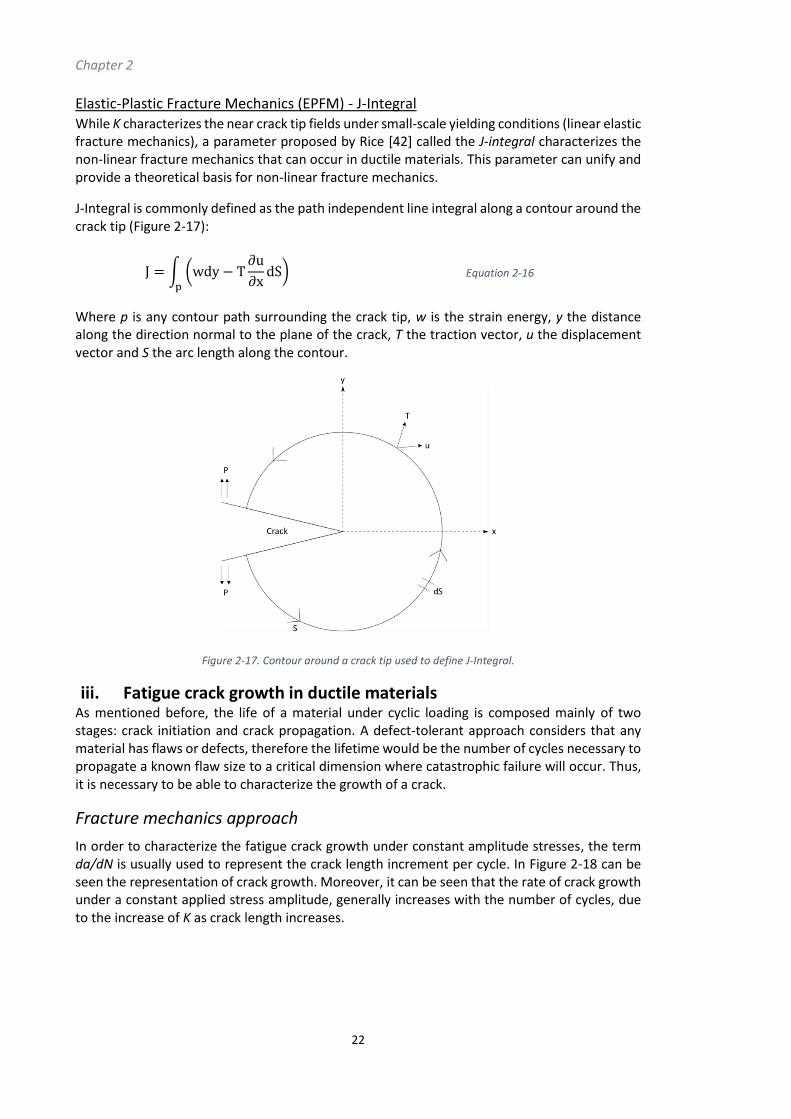
Chapter 2
22
Elastic-Plastic Fracture Mechanics (EPFM) - J-Integral While K characterizes the near crack tip fields under small-scale yielding conditions (linear elastic fracture mechanics), a parameter proposed by Rice [42] called the J-integral characterizes the non-linear fracture mechanics that can occur in ductile materials. This parameter can unify and provide a theoretical basis for non-linear fracture mechanics.
J-Integral is commonly defined as the path independent line integral along a contour around the crack tip (Figure 2-17):
J = ∫ (wdy − T∂u
∂xdS)
p
Equation 2-16
Where p is any contour path surrounding the crack tip, w is the strain energy, y the distance along the direction normal to the plane of the crack, T the traction vector, u the displacement vector and S the arc length along the contour.
Figure 2-17. Contour around a crack tip used to define J-Integral.
iii. Fatigue crack growth in ductile materials As mentioned before, the life of a material under cyclic loading is composed mainly of two stages: crack initiation and crack propagation. A defect-tolerant approach considers that any material has flaws or defects, therefore the lifetime would be the number of cycles necessary to propagate a known flaw size to a critical dimension where catastrophic failure will occur. Thus, it is necessary to be able to characterize the growth of a crack.
Fracture mechanics approach
In order to characterize the fatigue crack growth under constant amplitude stresses, the term da/dN is usually used to represent the crack length increment per cycle. In Figure 2-18 can be seen the representation of crack growth. Moreover, it can be seen that the rate of crack growth under a constant applied stress amplitude, generally increases with the number of cycles, due to the increase of K as crack length increases.

Literature review
23
Figure 2-18. Fatigue crack growth under constant stress amplitude.
LEFM LEFM can be used to characterize the fatigue (long) crack growth for conditions of small-scale yield, where the material is mostly elastic and the local stress state zone ahead of the crack tip is adequately described by linear elastic behaviour. Paris [43, 44] proposed a law under which the fatigue crack growth should be governed by:
da
dN= C∆Km Equation 2-17
Where C and m are empirical constants that depend on the material, environment and test conditions such as load ratio (R). And ΔK is the stress intensity factor range:
∆K = Kmax − Kmin Equation 2-18
Where Kmax and Kmin are the maximum and minimum stress intensity factors during a fatigue stress cycle, respectively. It is also important to note that stable fatigue crack growth will occur when stress intensity factor levels are well below fracture toughness (KIc).
The Paris law provides an important tool to estimate the lifetime of materials under fatigue as well as describing crack propagation behaviour. The number of cycles to failure (Nf) can be calculated by integrating Equation 2-17 from an initial defect size a0 to a critical crack size ac and knowing that:
∆K = Y∆σ√𝜋𝑎 Equation 2-19
Then:
CYm(∆σ)mπm 2⁄ ∫ dNNf
0
= ∫da
am 2⁄
ac
a0
Equation 2-20
EPFM Dowling [45, 46] proposed a law to characterize fatigue crack growth in materials exhibiting elastic-plastic behaviour. This law is based on the cyclic J-integral (Jc or ΔJ), resulting in a proportionality as da/dN ∝ (Jc)m’. This law provides a good approach for the characterization of fatigue cracks where their lengths are similar in dimension to the plastic zone near the crack-tip, and for larger defects under higher loads where the sample/component is close to overall yield.

Chapter 2
24
Microscopic stages of fatigue crack growth
The fatigue crack growth microscopic mode depends on the PSB characteristics, microstructural dimensions, applied stress and the size of plastic zone near the crack tip. In ductile materials, fatigue crack growth is predicted to happen as a process via localized strain in macroscopic slip bands near the crack tip.
Stage I It is said that crack growth occurs in stage I when the plastic zone near the crack and the crack itself are confined within a few grain diameters, and therefore, sensitive to microstructure. At this stage the crack would propagate mainly by single shear in the direction of the dominant slip system, leading to a zig-zag path or faceted profile as the crack grows (Figure 2-19). This stage represents the main part of the fatigue life for ductile materials.
Figure 2-19. Stage I mechanism for fatigue crack growth.
Stage II When the stress intensity range is higher, the plastic zone near the crack tip is also larger, making this stage insensitive to microstructure. In this situation, the crack growth may involve simultaneously or alternately two slip systems, resulting in a more planar (mode I dominated) crack path normal to the tensile axis (Figure 2-20). This mechanism was called stage II by Forsyth [47] who also named the stage I regime.
Figure 2-20. Stage II mechanism for fatigue crack growth.
Regimes of fatigue crack growth If da/dN and ΔK are plotted in a log-log scale we may observe that the Paris law (indicating stable fatigue fracture) is only linear in the middle portion of the graph. In the first and last portions of the crack growth, the crack propagation rate increases asymptotically with the stress intensity range.

Literature review
25
Those three portions or regimes are represented in Figure 2-21, and different features can be observed:
- Regime (A): fatigue crack propagation occurs by non-continuum failure processes. The
stress intensity factor range approaches ΔK0, the threshold parameter that is strongly
affected by the material microstructure, load ratio, environment and crack size. The
transition from regime (A) to (B) is accompanied by a change from microstructure-
sensitive to more microstructure-insensitive fracture behaviour. The transition between
those regimes (slow growth rate regime to Paris regime) generally occurs when the size
of the plastic zone grows beyond a dimension comparable to the microstructure of the
system. However, similar plastic zones in materials with similar grain size but different
slip characteristics may have different thresholds due to its sensitivity to microstructure,
mostly due to the development of tortuous crack path (promoted by stage I) and the
consequent possibility of crack face contact (closure).
- Regime (B) (or Paris regime): shows a linear variation of log(da/dN) with log(ΔK) and
microscopic mechanisms of fatigue crack growth such as stage II. It is clear that also in
this regime the rate of fatigue crack growth depends on several processes related to
microstructure, load variables and environment.
- Regime (C): describes the high ΔK region where the fatigue crack growth rates are
significantly higher than in regime (B). The crack growth is also affected by the
microstructure, load ratio and stress conditions, but not by the environment since the
propagation rates are too fast. At high ΔK static fracture modes such as transgranular
cleavage and intergranular separation occur, increasing the sensitivity of crack growth
to microstructure.
Figure 2-21. The three regimes of fatigue crack propagation.
2.2.5 Retardation in fatigue crack growth
Nominal imposed values of stress intensity factor range can be considered as the driving force for fatigue crack growth. However, there are situations where the effective stress intensity factor range is different to these nominal (or globally applied) values. This difference could be caused by various phenomena such as (Figure 2-22): (i) premature closure of the crack faces, (ii) deflections of the crack due to microstructure or stress state, (iii) shielding of the crack tip by residual stresses or phase transformations and (iv) bridging of the faces of the crack by particles or oxide formation. These processes may lead to an apparent retardation of the fatigue crack growth and therefore improve the lifetime of materials.

Chapter 2
26
Figure 2-22. Mechanisms for fatigue crack growth retardation: a) plasticity-induced crack closure, b) oxide-induced crack closure, c) roughness-induced crack closure, d) fluid-induced crack closure, e) transformation-induced crack
closure, f) crack deflection and g) crack-bridging (trapping) by particles.
i. Fatigue crack closure Elber [48] was the first to rationalize the concept of crack closure, proposing the mechanism of ‘plasticity-induced crack closure’. Since then, additional mechanisms of crack closure, due to a variety of mechanical, microstructural and environmental factors, have been identified.
Due to different phenomena, the crack faces enter into contact prematurely causing a change in the driving force for crack advance. However, the evolution of different crack closure (or retardation) mechanisms are processes that cannot be quantified accurately, since they can be markedly influenced by small variations in load conditions, environment and methodology.
Plasticity-induced
It has been proved that the conditions ahead of the crack tip are not the only ones that affect the crack growth rate, but also the conditions in the wake of the crack tip (behind the crack tip) affect these rates. During the propagation of a fatigue crack a wake of material previously deformed plastically is formed leaving residual compressive stresses, formed during unloading as the surrounding elastic material recovers and pushes the plastic wake inside the crack, giving rise to premature contact between the faces of the crack and a reduction in the apparent 'driving force' for fatigue crack advance.
Oxide-induced
The presence of some environments like a moist atmosphere during fatigue crack growth may lead to the formation of oxides on the newly formed surfaces. At low R and ∆K, there are low amplitudes of cyclic crack tip opening displacement and the possibility of crack face contact is increased as a consequence of continual breaking and reforming of the oxide lining on the crack faces. However, at high R or ∆K, the rate of crack growth is too fast to promote oxidation, therefore this mechanism is unlikely to occur.
Roughness-induced
This mechanism affects the fatigue crack growth rates mostly in the near-threshold regime, where the stage I growth mechanism occurs. Due to the faceted fracture morphology often produced by stage I, there exists the possibility of mismatch between the faces of the crack during unloading, providing a mechanism for enhanced crack closure.

Literature review
27
Viscous-induced
The majority of studies regard this mechanism in an oil medium acting as an inhibitor of the effect of air environments and promoting slower stage II fatigue crack growth rates. The effect of oil in crack closure depends on factors such as suppression of environmental embrittlement, minimization of oxide linings on the crack faces, penetration of oil and hydrodynamic wedging action. For this reason it is not clear what the general net effect is for this mechanism. However, Endo [49] tested plain bearing materials comprising white metal linings and steel backings, and observed lower crack growth rates when tested in oil environment and proposed that the oil penetrates into the crack promoting crack closure.
Phase transformation-induced
Retardation in the crack growth rate due to phase transformation at the crack tip has been demonstrated in some systems [50, 51]. The mechanism is characterized by an increase of the volume of the transformation zone at the crack tip, leading to a reduction of the crack tip opening displacement due to compressive stresses in the wake of the crack.
ii. Fatigue crack deflection Crack deflection is seen as a mechanism to toughen a material by tilting or twisting the crack front causing an improved resistance to crack growth [52]. This mechanism may reduce by orders of magnitude crack growth rates even for small deflections (especially in regime (A) of fatigue crack growth) by means of three main effects:
- The effective driving force (KI) for crack growth of a deflected crack is smaller than that
of a straight crack, since a deflected crack no longer experiences pure opening (mode I),
hence KI at the crack tip decreases in favour of KII (mixed mode).
- A deflected crack grows at an apparently slower rate for the same effective driving force
than a straight crack, as for the same projected length, a deflected crack is longer than
a straight crack.
- A deflected crack has more probabilities of mismatch during the closing of the crack,
causing premature contact between faces (i.e. surface roughness induced closure).
iii. Crack bridging by particles (trapping) It is known that the geometry of the crack front and the crack growth rate might be affected by the interaction of the crack tip with discontinuous particles. This interaction can cause two types of mechanisms: (i) deflection of the crack tip caused by impenetrable particles reducing the effective ΔK and (ii) trapping of the crack front due to dispersed particles in a ductile matrix improving the crack growth resistance by changing the crack front geometry.
2.2.6 Short cracks
The basis of fracture mechanics, in terms of fatigue crack growth characterization, relies on ‘long cracks’ (usually several millimetres long) to ensure the crack tip process zone is sufficiently small with respect to surrounding material and the actual crack itself to allow K to describe the crack tip stress field reliably. However, since this work on thin coatings is also likely to involve smaller cracks, it is important to understand the behaviour of small or ‘short cracks’. Several investigations have shown that differences exist between the behaviour of small and long cracks, for example small cracks may have greater growth rates when LEFM assumptions of similitude are applied.

Chapter 2
28
i. Types of short cracks Short cracks can be classified depending on the relative scales for which a dependence exists between crack size and crack growth rate:
- Microstructurally short cracks: Fatigue cracks where their size is comparable to the
microstructure (such as grain size).
- Mechanically short cracks: Cracks where the near-tip plasticity is comparable to the
crack size, or cracks that are engulfed by the plastic region of a notch.
- Physically short cracks: Cracks that are larger than the microstructure or plastic zone,
but are smaller than one or two millimetres.
- Chemically short cracks: Cracks that, in general, may be analysed with LEFM, but present
anomalies in crack growth rates that depend on the crack size due to influences of the
crack tip environment.
ii. Microstructural aspects of short crack growth The principal differences that have been found between long and short cracks are that (Figure 2-23): short cracks grow faster than long cracks subjected to the same applied ΔK, they may also propagate at stress intensity levels below the threshold and significant transient acceleration and retardation are often observed in crack growth rates for short cracks.
Several mechanisms have been proposed in order to explain these transient effects:
- Interactions between the crack tip and grain boundaries may cause: (i) decrease of crack
growth until a plastic zone is formed in the neighbouring grain, (ii) slip bands from the
crack tip pinned at the grain boundary and (iii) change in the driving force due to the
change of crystallographic orientation as the crack deflects from one grain to another.
- Increase of crack closure when the crack length is increased and when the crack is
deflected.
Figure 2-23. Difference between long and short cracks in fatigue crack growth.
iii. Short cracks at notches An approximation to characterize short crack initiation due to roughness is to consider the valleys where the cracks are likely to initiate as notches (tip radius ρ>0), the solutions to characterize the fields at the tip are provided by LEFM. It is well known that during the
application of a far-field cyclic stress (∆σ∞), the maximum stress (Δmax) occurs at the notch tip:

Literature review
29
∆σmax =2∆KI
√πρ= ∆σ∞2√
a
ρ Equation 2-21
From this expression, the number of cycles to initiate a fatigue crack ahead of a stress
concentration is characterized in terms of ∆𝐾𝐼 √𝜌⁄ , following a stress life approach.
iv. Growth of short fatigue cracks We realize from the basis of K-dominance that LEFM cannot be used to provide accurate results when short cracks are being characterized due to the comparable size between the plastic zone and the short cracks. Although several methods can be found in the literature to compare short and long crack growth behaviour in terms of ΔK. The most common are those from Scott [53] and Newmann [54]. However, elastic-plastic characterization may also improve such comparisons. Dowling [55] proposed the cyclic J-integral (Jc or ΔJ) as a measure of the driving force for elastic-plastic fatigue crack growth:
v. Summary of the dissimilarities between short and long cracks The causes for the differences in the short and long crack growths are:
- Due to the small size of short cracks, local discontinuities with similar size may affect the
crack propagation. However, the same discontinuities do not affect long cracks in the
same way, these are more affected by the bulk averaged properties.
- Differences in the constraint imposed by surrounding elastic material may cause
differences in the growth mechanisms between long and short cracks, even under the
same conditions.
- The differences in the driving force due to crack deflection and crack deformation, may
produce a different behaviour in the crack growth observed for short and long cracks.
- Due to the longer wake for long cracks, the probabilities of crack closure for a wide range
of mechanisms are increased, decreasing the long crack propagation rate.
- Since corrosive fatigue mechanisms are dependent on crack size, short cracks show
greater growth rates.
2.3 Fatigue in bearing structures
In the plain bearing industry, fatigue is one of the main causes of concern in bearing failure. This phenomenon is usually localized on the overlay producing cracks that destroy the top coating.
In this part of the literature review the main features that affect the fatigue behaviour in engine plain bearings and how the layered architecture of the bearings under study could affect fatigue performance are explained.
2.3.1 Fatigue in plain engine bearings
i. Effect of layer thickness The most important geometrical parameter that affects the fatigue behaviour is the thickness of the layers that compose the bearing structure. Love [56] suggested that as the steel backing has a higher elastic modulus than the lining materials, these linings should be made thinner in order to transfer more load to the backing. Therefore, by limiting the strain imposed on the lining, the stresses on the lining decrease and its effective load capacity increases. They

Chapter 2
30
theorised that if the lining and backing thicknesses were in proportion to their elastic moduli, the fatigue resistance would increase. From this hypothesis one would expect an optimum resistance when the ratio of elastic moduli is as great as possible. However, Duckworth and Walter [57] investigated this hypothesis and no such simple relation between elastic modulus and fatigue resistance was found. They suggested that the reduction of lining thickness was causing apparently increased cyclic yield stress, increasing the fatigue resistance.
ii. Effect of housing rigidity Blount [58] investigated the effect of the housing rigidity on the fatigue resistance of bearings, showing that those bearings tested in a more rigid housing had a greater fatigue resistance than those tested in a more compliant housing. The suggested explanation is that in more compliant housings the flexing in the bearing increases, increasing the bending stresses in addition to the compressive stresses. Blount [58] also showed that if the bearing thickness is increased without a change in the rigidity of the housing, the fatigue resistance is reduced due to a decrease in the conformability of the bearing that lead to a premature failure. Therefore, the main conclusion that may be extracted from his work, is that, to achieve an optimum fatigue resistance a thin and compliant bearing mounted in a housing as rigid as possible should be used.
iii. Effect of roughness Another important factor that may affect fatigue life is the surface roughness in the overlay, since the asperities (peaks and valleys) on the surface may act as a stress concentration sites where cracks are preferentially initiated. Hence, the higher the surface roughness of the overlay, the easier the expected crack initiation and the lower the fatigue resistance [59, 60]. As previously mentioned, part of the roughness may come from the formation of intrusions and extrusions on the surface due to the activity of slip bands. For this reason, many researchers have tried to prevent crack initiation by suppressing the PSB in the surface via high hardness coatings [61]. However cracks may then initiate in the subsurface (on the substrate) due to slip localization between the coating and the substrate [62-66].
iv. Typical fatigue failures Engine bearings seem to be pretty simple and cheap components in the engine, however failure of these components usually leads to serious issues for the engine. The bearings also function as a “fuse”, because even if there is no problem in the bearing, failures in related sections such as the housing or shaft, may result in damage to the bearing preventing a more severe failure of other main components. “Failure” refers to any abnormal conditions such that the performance of the bearing drops dramatically in comparison to a regular performance.
Fatigue failure in engine plain bearings is usually as a result of repeated application of high maximum cyclic loads caused by the high pressure gradients due to oil film breaks. These breaks in the lubrication film create maximum hydrodynamic stresses due to the change of the oil film shape during the loading cycle, causing high shear stresses in the top coating that will initiate fatigue failure [67]. Generally, a vertical crack perpendicular to the sliding direction is generated. When the crack propagates through the interphase between layers, different cracks may connect causing delamination and removing the superficial layer. However, fatigue failure might also be caused by bearing bending or differential thermal contraction.
In industry, accelerated test rigs are used to rank the fatigue performance of bearings by testing them to failure in an engine-like environment. The accelerated test used by DAIDO to assess the fatigue life of bearings is the Sapphire test [2] (Figure 2-24). This method, described by Wilson [68], aims to reproduce the conditions within an engine generating dynamic loads via an eccentric shaft and the reactive force of the oil pressure. Due to the high rigidity of the housing of the test this ensures good stability that allows use of severe enough loads to cause failure

Literature review
31
through fatigue within a reasonable time. A typical staircase test would be conducted, with an individual “step” carried out at a certain nominal load for 20 hours, after that time the specimen would be visually examined with x10 loupe, if no cracks are visible, the load would be increased by 10 MPa for a further 20 hours, following this procedure until cracks appear or the bearing fails [69]. This is a useful pass-fail test to rank bearings in an engine-like environment; however, it does not offer insight into the fatigue mechanisms controlling the performance.
Figure 2-24. Sapphire fatigue test machine scheme.
Glyde [67] observed that in tested bearings (using the Sapphire test) fatigue failure usually occurs only in the central part of the bearing surface (Figure 2-25a). He realized that the edges of the bearing did not contain oil, therefore the central part of the lining was supporting the load. As mentioned previously, it is generally agreed that the oil film breaks up generating discontinuous islands that create varying tensile stresses in the surface of the overlay. Since these islands are constantly moving, the points of maximum tensile stress are also moving creating several crack initiation points. Hence, in a typical tested bearing, it is observed that multiple cracks initiate on the surface of the overlay (Figure 2-25a), seen as a network of thin cracks. Then, this network of cracks propagate and cause the overlay delamination (Figure 2-25b and c), therefore boundary lubrication will be more likely to appear causing excessive wear and overloading on some regions, which may result in the failure of the interlayer. Thus, fatigue in the interlayer starts from fatigue of the overlay. The overlay is removed changing the lubrication regime to boundary lubrication. The overload in some points will be the place where small cracks will initiate. Then these cracks will propagate through the interlayer meeting the interphase interlayer-steel backing. In that moment the cracks will deflect and growth through the interface may cause interlayer detachment and immediate engine failure.

Chapter 2
32
Figure 2-25. Plain engine bearing tested in Sapphire test machine: a) Front view [69], b) cross-section under SEM [69] and c) cross-section under optical microscope from current work.
2.3.2 Multilayer architectures
Since crack initiation due to the existence of defects in engineering materials is almost impossible to avoid, the best option to improve the fatigue resistance of engineering components is by not only minimising defects but also by the control of the fatigue crack growth mechanisms in these materials. One of the methods that gives good results regarding the deceleration, and sometimes arrest, of a fatigue cracks is the formation of multilayer structures [69-73]. A multilayer structure usually presents better mechanical properties than the individual component layers; one of the most interesting enhanced properties is the toughness, its mechanism is attributed to crack deflection along interfaces and multiple cracking in the more brittle layers [74]. Usually these enhanced properties exceed those predicted by simple rule-of-mixtures approaches [75-78].
A review written by Stoudt, Ricker and Cammarata [79] conclude that an ideal coating should have five properties in order to resist fatigue failure: hardness, toughness, cyclic work hardenability, residual compressive stress and adherence. Also, the use of laminated structures may enable the adjustment of such properties by changing layer thickness or the composition for each individual layer [80-82].
Wang and Singh [83] studied the mechanical properties (UTS, YS and microhardness) evolution of multilayer Ni/Sn materials. They observed that the multilayer materials were less ductile than the single layers, due to the effect of the interfaces blocking the dislocation glide, generating a pile-up and work hardening in these interfaces. They also realized that when the Sn layer thickness was reduced, the tensile strength increased rapidly; this was mainly attributed to the shielding effect of the stronger Ni component. In addition, the tensile strength showed a strong dependence on the layer spacing due to the barrier effect of the interface blocking dislocations, which depends on the layer spacing and dislocation stress transfer between the two different phases. So, the strength of the multilayer material was enhanced and the ductility reduced because the dislocations have a shorter mean glide distance in thinner layers and plastic deformation becomes more difficult. Also, a larger difference in the elastic modulus for the two components increased the difficulty of dislocation glide/transfer from the softer phase to the harder, strengthening the material. This can be explained by two models:

Literature review
33
- Hall-Petch [84, 85]: Gives a dependence of the yield stress with the grain size (d):
σy = σ0 + Kd−1 2⁄ Equation 2-22
Where y is the yield stress of the material, 0 and K are material-dependent constants, and d, in multilayer materials, is the bilayer thickness of the component phases.
This relation is based on the pile-up lengths of a large number of dislocations. When the layer spacing is extremely small (<30nm) this relation is invalid.
- Koehler [86]: Gives a dependence of shear strength with the elastic modulus of two
components and the layer spacing:
στ =GA − GB
GA + GBGBb
sin θ
4πd Equation 2-23
Where A is a material with higher modulus than B, is the shear stress required to drive the dislocation within the layer thickness d. GA and GB are the moduli of rigidity of A and
B, respectively, b is the Burgers vector for B, and is the angle between the interfaces and dislocation glide planes.
This expression gives a linear dependence of the flow stress on the reciprocal of the layer thickness, and is based on the image force on dislocations which becomes dominant when the layer thickness is very small (>30nm).
Other authors varied the number of layers, order and thickness in order to study the effects in fatigue. Kovářík [87] investigated multilayer coatings changing the order of the coatings (hard/soft/hard substrate or soft/hard/soft/substrate) and the number of layers; and they realized that the fatigue resistance was enhanced when the monolayer was hard or the interlayer in a bi-layer was soft; the addition of a third layer or a hard interlayer in a bi-layer coating had no effect on the fatigue life; and finally the coated substrates with a softer layer presented a reduced fatigue life. Also, Yonekura [88] studied the influence of the thickness and number of bi-layers (hard/soft layers) in the fatigue behaviour by producing coatings with 2, 3, 4 and 5 bi-layers with similar overall thickness and a thickness ratio of about 0.5 (soft/hard layer). They found that the optimum multilayer effect was with 3 bi-layers, since for a lower number of layers the layers were too thick. However, all the coated substrates presented better results regarding fatigue resistance than the uncoated substrate.
i. Crack deflection in multilayer materials The overlay structures of the bearings studied in this research are a complex combination of different layers with various materials and several thicknesses. For this reason it is thought that crack deflection processes could be an important mechanism to assess in order to describe the fatigue crack growth through the overlays. The general literature regarding crack deflection has been discussed in Section 2.2.5 while in the current section we will discuss crack deflection in multilayer architectures.
The key concept to have in mind when one is studying crack deflection in materials with several layers is how the crack interacts with different interfaces. Suresh [89, 90] investigated the behaviour of a crack approaching to an interface between two different materials with similar elastic properties and yield stress but different strain hardening rates, ultimate tensile stress and hardness; and they observed that a fatigue crack approaching normal to the interface from the harder (or plastically stronger) material would pass through the interface without deflection, while a fatigue crack approaching the interface from the soft (or plastically weaker) material

Chapter 2
34
would see a reduced growth rate and deflection would occur. It was proposed [89], in order to explain the phenomenon, that when the crack approaches from the hard side the local compliance ahead the crack is decreased, and increased when it comes from the soft side precluding its propagation in mode I, hence the crack deflects. It was also argued that when the crack approaches from the softer side, cyclic slip into the harder material becomes more difficult and the crack deflects seeking material with a lower resistance to fracture.
Later on, Sugimura [91] and Kim [92] showed through finite-element simulations that the J-integral at the crack-tip (Jtip) becomes smaller than the applied J-integral (Japp) (when the crack comes from the softer material). Therefore, the crack tip is partially shielded from the applied loads as the plastically stronger material supports more stress than the weaker material. They used the ratio Jtip/Japp to represent the degree of shielding and plot this parameter against the distance of tip to the interface (Figure 2-26) to explain the drop in driving force when the crack approaches to the hard material, this being the shielding effect that causes the reduction in growth rate. Therefore, it can be seen that for Jtip/Japp>1 the crack comes from the hardest material, while for Jtip/Japp<1 the crack comes from the soft material and hence the shielding effect appears decreasing the driving force.
Figure 2-26. Numerically predicted variation of Jtip/Japp as a function of KI/(y√𝐿) for a crack approaching
perpendicular to an interface. Where y1 and y2 are the yield strengths of materials 1 and 2, respectively, with the
crack always approaching the interface from material 1. y refers to the lower of the two yield strengths and L is the distance from the crack tip to the interface.
The addition of an interlayer was also studied [90, 92]. This interlayer was made either with homogenous properties or graded properties. It was concluded that for a given thickness, the homogeneous interlayer presented greater shielding (crack approach from the soft side) and amplification (crack approach from the hard side) effects. Although, both interlayers presented a greater effect regarding the crack-tip driving force than those studied only with an interface.
Wiklund [93] confirmed the enhanced fatigue resistance in multilayer coatings above single layer coatings through bending tests, based on other work which had studied coated specimens using similar methods [94, 95]. These trends were also confirmed through bending tests by Joyce [96], who used the J-integral to characterize the crack driving force in order to investigate the crack deflection in Al multilayer plain bearings. In this work the structure was basically a hard lining (0.3mm), a soft interlayer (0.05mm) and a far harder steel backing (1.5mm), where the crack initiated in the lining, propagated towards the interlayer, penetrated in the interlayer without deflection and finally the crack deflected within the soft interlayer due to the shielding effect of the steel backing. He also assessed the role of the interlayer, concluding that increasing the hardness, the crack deflection is promoted; and postulated that the magnitude of the evolved shielding is proportional to the hardness ratio of the two materials. The role of the interlayer

Literature review
35
thickness was also quantified, showing that in the case of a soft interlayer, a reduction in thickness promoted enhanced shielding. However, in the case of a hard interlayer, increasing thickness to a maximum was predicted to be beneficial. Other authors like Wieciński [97] have reported the importance of a ductile interlayer in order to improve fatigue resistance. In addition, Sistaninia [98] propose conditions for a soft interlayer to be achieved in order to reach the maximum decrease in the driving force of a crack. Those conditions are that: (i) the interlayer thickness should be equal to the size of the plastic zone in the interlayer and (ii) the yield stress of the interlayer should be approximately equal or smaller than 0.2 times of the hard layer.
The shielding and amplification (or anti-shielding) effect have been found to be dependent on the direction of the crack growth relative to the interface, the distance between crack-tip and interface, the thickness of the interface and its gradient in properties [91, 92, 99].
2.4 Summary
Most of the work done in an industrial environment to assess fatigue in bearings is carried out in a semi-empirical manner based on a total life approach, using for example the Sapphire test, which tries to simulate the real conditions of an in-service bearing. The complex loading conditions developed in these environments make them difficult to study. However, fundamental fatigue based studies have been carried out through simple test configurations and FE models in order to simplify the assessment and better understand the mechanisms behind fatigue crack initiation and propagation of bearings. These studies were conducted using Al based systems with thicker coatings. Nevertheless, a similar methodology can be developed, adding new techniques and substituting those not applicable to thinner and more complex coatings, in order to investigate the role of each bearing component, crack initiation, crack propagation through the layers and also to compare the performance of different structures. This will also allow the study of short fatigue crack behaviour and their interaction with the microstructure in thinner multilayer coatings, since it has not been yet studied.
This literature review introduces a general background about plain bearings, their requirements, structures, manufacturing process and so on, to introduce the engineering components that will be the focus of this project. Then, a fatigue theory background was given, introducing basic concepts, lifing approaches, crack initiation and propagation, crack retardation and short cracks; since these are the most relevant issues to characterize the fatigue behaviour in these systems. Finally, reviewing literature surrounding the effects of different bearing features on fatigue and multilayer materials shows that: the effect of multiple layers in the overlay fatigue performance, the evolution of strains and stresses in multilayer systems and early crack initiation and small crack propagation have not been fully understood. So, the aim of this study is to investigate the fundamental fatigue performance of different multilayer structures and materials, identifying the factors affecting the fatigue performance and study such factors to understand the fatigue behaviour in such architectures. It is intended that by developing such understanding, the design of bearings in the future will be aided.


Materials and Experimental techniques
37
3. Materials and Experimental techniques
This chapter details the different materials that comprise the multi-layered samples under study, as well as the common methodologies and equipment used in different chapters of this thesis.
3.1 Materials, manufacture and geometry
The samples under investigation are manufactured by a method that comprises three material processes: sintering, electrodeposition and thermal treatment. The samples can be divided into three main sections: backing, interlayer and overlay.
3.1.1 Geometry
In this project two different geometries are studied: bearings and flat samples.
i. Bearings The samples provided by DAIDO are standard semi-cylindrical bearings (Figure 3-1a) designed only for testing and evaluation. These bearings are therefore not service-ready bearings for engines, but are the basis from which the real bearings will be produced. These samples have a simple design, i.e. without grooves or holes for oil lubrication, however, a “lug” in one of the corners is produced to ensure correct assembly.
The steel used as a backing in the bearings is supplied in the fully cold rolled and annealed condition with the chemical composition found in Table 3-1. In addition a leaded bronze is used as the interlayer (Cu-17Pb-3Sn) (%wt.).
Table 3-1. Chemical composition for the steel backing of bearings
Chemical element Composition (%wt.)
Carbon (C) 0.08 - 0.13
Manganese (Mn) 0.30 - 0.60
Silicon (Si) 0.03 max.
Sulphur (S) 0.02 max.
Phosphorous (P) 0.03 max.
Nitrogen (N) 0.008 max
Aluminium (Al) 0.02 – 0.06

Chapter 3
38
Figure 3-1. Half shell bearing (a) and flat sample (b) dimensions.
ii. Flat samples DAIDO also supplied flat samples to allow simpler application of some of the experimental techniques and FE modelling. The sample dimension can be seen in Figure 3-1b. Unlike the bearings, the steel used for the flat samples has a different composition (Table 3-2). However, the interlayer has the same composition.
Table 3-2. Chemical composition for the steel backing of flat samples
Chemical element Composition (%wt.)
Carbon (C) 0.039
Silicon (Si) 0.003
Manganese (Mn) 0.146
Phosphorous (P) 0.015
Sulphur (S) 0.017
Nickel (Ni) 0.022
Chromium (Cr) 0.024
Molybdenum (Mo) 0.001
Copper (Cu) 0.045
Aluminium (Al) 0.047
3.1.2 Manufacturing process
The process to produce the samples investigated in this project can be separated into three steps:
- Bimetal bonding by sintering, which includes the following stages (Figure 3-2):
i. Steel processing up to desired thickness.
ii. Washing the steel with an alkaline solution.
iii. Linishing the strip surface.
iv. Spreading the alloy powder on the steel strip through nozzles.
v. Sintering the powder in a sintering furnace with a reducing atmosphere at
temperatures from 850 to 870C.
vi. Compacting the strip through a rolling mill to reduce the porosity.

Materials and Experimental techniques
39
vii. Re-sintering to sinter the compacted particles (under the same conditions as the 1st
sintering process).
viii. Rolling the strip to strengthen (strain hardening) both the steel backing and the
sintered copper alloy.
Figure 3-2. Basic steps of the sintering process to produce the systems under study.
- Overlay deposition by electroplating: During this process the bimetal samples pass through
several steps such as surface machining to eliminate the oxides and roughness peaks,
degreasing in an alkaline cleaner, etching in a solution of 30 vol% hydrochloric acid and
plating to deposit each layer. The tin based layers are usually electroplated from an
electrolyte containing fluoroboric acid, tin fluoroborate, copper fluoroborate and a
proprietary additive package at 3.5 A dm-2 at room temperature; and the nickel based layers
are produced from a Watt’s bath at 4.0 A dm-2 at 50°C [69]. Full details of the electroplating
processes used are proprietary to the sponsoring company.
- Thermal treatment: The final treatment used is a thermal annealing which can comprise
varying ranges of time and temperature. It offers some advantages such as the stabilization
of the microstructure, due to the high mobility of Cu atoms in Sn at room temperature,
annealing accelerates these diffusion processes thus stabilizing the microstructure [100,
101]. Another advantage of this process is that by accelerating the diffusion between layers
the adhesion between them is enhanced. In addition, during the plating process residual
stresses might be introduced and growth of intermetallic compounds might cause stress in
the matrix [102-105], while annealing processes are likely to decrease such mechanical
stresses. However, the thermal treatment may also accelerate recrystallization of Sn, for
those overlays with enough deformation, changing their grain morphology [106, 107] and
creating new preferential crack paths [108-111].
3.1.3 Overlay structures
In this project three types of tin based overlays were studied. These coatings are designated as 1IML, 2IML and 3IML, referring to the number of intermetallic layers: 1, 2 and 3 intermetallic layers, respectively. The structures to be evaluated are as follows:
- 1IML: See Figure 3-3: A sintered leaded bronze (Cu-17Pb-3Sn) interlayer is first applied to
the steel backing, then the overlay is built up in the following steps by electrodeposition: a
nickel barrier is first electrodeposited on, which is intended to avoid the diffusion of copper
up from the interlayer into the subsequent overlay, thus preventing the formation of Cu3Sn
which is a brittle intermetallic with undesirable properties. The next layer is tin based with
a 2 m thickness, but with 10%wt. Cu, with a final (surface) layer which is an 18 m tin
based layer with 3%wt. Cu, which is believed by the sponsors (based on an industrial study
[112]) to be the proportion required to achieve the best compromise between surface
properties and fatigue resistance during service. The tin based layer with a higher

Chapter 3
40
percentage of Cu is applied in order to avoid the diffusion of top layer copper towards the
Ni in the next layer, and hence to maintain the beneficial properties in the surface for a
longer time in service. Instead, with the correct proportion of Sn-Cu, Cu6Sn5 intermetallics
will be formed. Therefore, the overlay matrix is tin with a proportion of copper designed to
generate these Cu6Sn5 intermetallics as the secondary phase in order to strengthen the
matrix and improve the mechanical properties of the system. This system then creates a
microhardness gradient across the overlay thickness due to varying content of copper
(essentially a soft top layer and hard bottom layer of the overlay) [113]. This structure is not
usually thermally treated, but due to significant Sn-Cu diffusion at room temperature,
changes in the microstructure may occur from sample to sample whilst they are being
studied. For this reason it was decided to conduct a standardising thermal annealing
emulating the diffusion processes that would occur in an engine during one year [114], and
stabilizing the subsequent diffusion the samples would suffer at room temperature,
minimizing the variability of microstructure from sample to sample in order to establish a
more consistent test matrix and methodology.
Figure 3-3. 1IML structure (%wt.) a) As plated from top to bottom: Sn-3Cu, Sn-10Cu, Ni, leaded bronze and steel. b) After thermal annealing: Sn-Cu (low), Sn-Cu (high), Ni-Cu-Sn, Ni, leaded bronze and steel. *bearings; **flat samples
- 2IML: This structure also comprises a metallic copper alloy (Cu-17Pb-3Sn) interlayer which
is bonded to a steel backing, but with a more complex set of electrodeposited layers in the
subsequent overlay, with firstly a Ni barrier layer put down, then a Sn-3wt% Cu layer, a
second Ni layer and then a further Sn-3wt% Cu layer (see Figure 3-4). 2IML was
manufactured by a combination of electrodeposition and thermal annealing. After plating
the multilayer overlay was thermally annealed to convert the nickel layers into nickel-tin
intermetallic layers. Thus, 2IML is expected to have two tin-copper layers which are
separated by a tin-nickel middle layer. Also, after thermal annealing some of the original
nickel barrier layer is converted into a tin-nickel intermetallic compound layer. The nickel
diffusion barrier and the tin-nickel intermetallic layer, combined, work as an upgraded
barrier layer in the multilayer system. The overlay is laid on a nickel plated bronze substrate.
The dimensions of the overlay comprises an upper 8 to 9 microns tin-copper layer with the
composition being predominately tin after thermal annealing, a middle intermetallic layer
of approximately 4 microns comprising mainly tin and nickel, a lower layer of 7-8 microns
of tin-copper and a final nickel barrier layer that contains both nickel and tin-nickel
intermetallic [69].

Materials and Experimental techniques
41
Figure 3-4. 2IML structure (%wt.). a) As plated from top to bottom: Sn-3Cu, Ni, Sn-3Cu, Ni, leaded bronze and steel. b) After thermal annealing: Sn-Cu, Ni-Cu-Sn, Sn-Cu, Ni-Sn, Ni, leaded bronze and steel. *bearings; **flat samples
- 3IML (Figure 3-5): The structure of this sample follows the same idea or principle as 2IML
combining multiple Ni based and Sn based layers. Moreover, the new structure adds two
additional layers on the top compared to 2IML. Although the layer thicknesses are reduced
proportionally to still achieve 20 micron of total overlay thickness. Therefore, the multilayer
consists of three Sn based layers with about 3%wt. Cu and two Ni based layers in between
them. As in 2IML, firstly the layers are electrodeposited and secondly the whole structure
is thermally annealed in order to create the intermetallic compounds due to the diffusion
of Ni towards Sn [114].
Figure 3-5. 3IML structure (%wt.). a) As plated from top to bottom: Sn-3Cu, Ni, Sn-3Cu, Ni, Sn-3Cu, Ni, leaded bronze and steel. b) After thermal annealing: Sn-Cu, Ni-Sn-Cu, Sn-Cu, Ni-Sn-Cu, Sn-Cu, Ni-Sn, Ni, leaded bronze and steel.
*bearings; **flat samples
3.2 Microstructural characterization
In order to investigate the layered structure in more detail and the microstructure of these layers, the samples were prepared and observed using a variety of microscopy techniques.

Chapter 3
42
3.2.1 Sample preparation
3.2.1.1 Cutting
The first step to prepare a sample for microstructure observation is to cut the samples in order to have access to the cross-section. The samples are cut along two directions (Figure 3-6) by means of a Mecatome T210 cutting machine with a blade normally rated for steel at 3000 rpm and with a feed rate of 0.066 mm/s to minimize damage.
Figure 3-6. Sample sectioning method for a) bearings and b) flat samples.
3.2.1.2 Mounting
Afterwards, the sample extracted from the bearing is mounted using KonductoMet (a conductive phenolic mounting compound with good edge retention, which eases SEM observations) and a
hydraulic press Buehler Simplimet 2000, heating for 4 minutes at 150 C and 290 bar, and cooling for 3 minutes.
3.2.1.3 Grinding and polishing
Due to the thin layers of different materials and the difference in hardness of these different materials (e.g. the tin based coating and the steel backing) that are being polished at the same time, this process is complex, but is a critical step to achieve good quality in the observations. There is no defined standard route to polish these kinds of layered structures, for this reason the method used in this project is based on an initial method provided by DAIDO and modified to adapt to the University’s equipment (Struers TegraPol-15), after a significant trial and error process. In Table 3-3 the method used in this investigation can be seen, where MetaDi Supreme are suspensions of polycrystalline diamond and Silco is a colloidal silica suspension.

Materials and Experimental techniques
43
Table 3-3. Process of grind and polish
Steps Cloth Abrasive Lubricant Speed (rpm)
Force (N)
Time
1 SiC-220 - Water 40 10 Until plane
2 SiC-500 - Water 50 15 1 min
3 SiC-800 - Water 50 15 1 min
4 MD-Plan MetaDi Supreme 9 m MetaDi Fluid 150 20 4 mins
5 MD-Mol MetaDi Supreme 3 m - 150 20 4 mins
6 MD-Nap MetaDi Supreme 1 m - 120 20 4 mins
7 MD-Chem Silco 0.06 m - 100 15 40 s
3.2.1.4 Broad beam ion milling
Broad beam ion milling (BBIM) uses an Argon ion gun to bombard with a controlled angle the surface of a sample with high-energy argon ions. By using low angles of ion incidence with respect to the sample surface, the ions gradually reduce the roughness of the surface by removing the rougher peaks. The BBIM system used here was a Hitachi IM4000PLUS at University of Warwick, WMG.
Due to the softness of the Sn layers and the geometry of the bearing samples, mechanical polishing could not be used to polish the surface of the overlays. Therefore, a BBIM method was used to achieve good surface quality (Figure 3-7) in order to apply further characterization techniques, i.e. EBSD.
Figure 3-7. Surface sample of 1IML coating: a) before BBIM (as manufactured) and b) after BBIM.
3.2.2 Microscopy
An optical microscope Olympus BX51 with magnifications from x50 to x1000 was used in order to investigate crack fields on the tested samples surfaces and on replica records by taking some pictures along the width and stitching them together using MosaicJ (Fiji-ImageJ). Also, once the sample is prepared, the first cross-section observations were done with the optical microscope (Figure 3-8, Figure 3-9 and Figure 3-10).

Chapter 3
44
Figure 3-8. Optical micrographs of 1IML cross-section a) with a x200 magnification and b) with a x1000 magnification.
Figure 3-9. Optical micrographs of 2IML cross-section a) with a x200 magnification and b) with a x1000 magnification.
Figure 3-10. Optical micrographs of 3IML cross-section a) with a x200 magnification and b) with a x1000 magnification.
This technique revealed the multi-layered structure and allowed measurement of the actual (as opposed to the expected) thickness of the main layers (steel, leaded bronze and overlay) by means of its software (Stream Essentials), the thickness is measured by taking a random point

Materials and Experimental techniques
45
at one interface of a layer and measuring the vertical distance to the other interface (Figure 3-11), these measures are performed three times in three different micrographs of the cross-section for the same sample; the micrographs are taken from the centre of the cross-section and close to both edges in order to obtain an average as an approximation.
Figure 3-11. Example of thickness measurements for a bearing with 3IML.
For a more detailed microstructural characterization a JEOL 6500F Field Emission Gun (FEG) Scanning Electron Microscope (SEM) was used, revealing each layer of the different structures with more detail using both secondary and back-scattered electron images (SEI and BEI respectively). Moreover, an NVision40 and a FEI Versa3D dual systems Focussed Ion Beam (FIB)-FEG-SEM were used to make high resolution observations, as well as to produce cross-sections of specific locations in order to observe crack propagation through thickness, which is a less invasive method than mechanical polishing.
In addition, energy dispersive X-ray spectrometry (EDS) was used to perform qualitative and quantitative compositional analysis in order to reveal the elemental composition of each layer and the distribution of the elements of interest through the structures. In order to obtain the orientation and grain size of different materials, SEM (FEI Versa3D at University of Warwick, WMG) was operated in an Electron Back-Scattered Diffraction (EBSD) mode. The system was equipped with a NordlysMax3 detector, a CCD camera, the AZtekHKL data acquisition software and the Channel 5.0 post-processing analysis package.
Micro-X-ray computed tomography (-CT) was carried out in order to obtain statistically reliable
data of observed microstructural features, as well as three dimensional crack behaviour. -CT was carried out on the ZEISS Xradia 510 Versa 3D X-ray microscope at the μ-VIS X-ray imaging centre at the University of Southampton and at the Swiss Light Source (SLS) (TOMCAT-X02DA Beamline, Paul Scherrer Institute, Switzerland). Prior to each scan, a fast (60 min) warm-up scan was performed in order to ensure that thermal equilibrium had been reached within the X-ray source and the scanner enclosure. Following the acquisition, the raw data were reconstructed using Zeiss’ reconstruction software, which uses a filtered back projection algorithm.

Chapter 3
46
3.3 Mechanical testing
A combination of microhardness and nanohardness tests (and tensile tests described in Chapter 4) were used to obtain basic mechanical properties of the different materials used in the multi-layered samples.
3.3.1 Microhardness tests
The tests were conducted in a Matsuzawa Seiki micro hardness tester. Before the tests, the surface of the samples were slightly polished in order to avoid the interference of oxides or scratches. It was also important to ensure that the surface was plane and the counterpart was in contact with the microindenter base. Vickers hardness (HV) was calculated with,
𝐻𝑉 =2𝑃𝑚𝑎𝑥 𝑠𝑖𝑛 68°
𝑑2 [kgf/mm2] Equation 3-1
Where Pmax is the load in gf and d is the arithmetic mean of the two diagonals left by the indenter in the material.
This technique also allows rapid assessment of the steel properties from sample to sample, and batch to batch since the steel properties may have a big effect on the apparent fatigue performance of the overlay [12, 115, 116] due to constraint changes. The previously mentioned difference between the steels used for semi-cylindrical bearings and flat samples is also reflected in the microhardness values shown in Table 3-4:
Table 3-4. Steel microhardness results for bearings and flat samples.
Sample geometry Steel microhardness (HV)
Bearing 180 6
Flat sample 107 7
3.3.2 Nanohardness tests
Nanoindentation tests were performed using a MicroMaterials NanoTest Vantage system equipped with a Berkovich indenter, calibrated by using a standard fused silica sample. All tests
were carried out at a stabilized chamber temperature of 21 C. Thermal drift was measured by adding a dwell period of 60 s during unloading and calculated over 40% of the collected depth vs time data.
Calculation of mechanical properties was based on the procedure outlined by Oliver and Pharr [117]; nanohardness (H) can be defined as the maximum indentation load (Pmax) divided by the projected area of contact (Ap), which is estimated from the projected contact depth (h), such that,
𝐻 =𝑃𝑚𝑎𝑥
𝐴𝑝; 𝐴𝑝 = 24.5ℎ2 Equation 3-2
The reduced elastic modulus (Er) is measured from the slope of unloading curve (dP/dh), which is given by,

Materials and Experimental techniques
47
𝐸𝑟 =1
2
√𝜋
√𝐴𝑝
𝑑𝑃
𝑑ℎ Equation 3-3
Also depicted in Figure 3-12. The elastic modulus can be calculated using the equation shown below,
1
𝐸𝑟=
1 − 𝜈𝑚2
𝐸𝑚+
1 − 𝜈𝑖2
𝐸𝑖 Equation 3-4
where Em and m are the modulus and Poisson’s ratio of the indented material, and Ei and i are elastic modulus and Poisson’s ratio of the indenter, which correspond to 1140 GPa and 0.07 for the Berkovich indenter, respectively.
Figure 3-12. Typical loading and unloading curve during nanoindentation.
3.4 Fatigue test
3.4.1 Test configuration
The fatigue tests are intended to assess the fundamental fatigue behaviour of the multi-layered structure materials. Hence, the tests do not aim to simulate the complex stress and strain conditions which a bearing in service will suffer due to the rotation of the journal against it. Instead, tests were conducted under 3-point bend, simplifying the load states and the conditions in order to have more control of the factors that could affect fatigue. Using this configuration the maximum stress developed in the overlay is in a line below the load application, ensuring localization of (and hence easier study of) the cracks. In addition it is noteworthy that this configuration has been successfully used to assess multi-layered materials and bearings by many previous researchers [12, 93-95, 115, 116, 118]. It also provides useful benchmarking data since the cracks generated in industrial tests (the Sapphire test) are developed in mode I [69].
Fatigue tests on bearings were carried out on an InstronPuls E1000 electrodynamic test
instrument with 1000 N dynamic load capacity, with a capacity to operate at frequencies greater than 100 Hz, with sample tuning based on specimen stiffness (1345 N/mm in our case) and digitally controlled by WaveMatrix software. All the bearings were tested in a 3-point bend configuration, with the ends of the bearing constrained in a steel rig (Figure 3-13) clamped to the test machine base and aligned with the bearing and the load cell. The load cylinder was aligned with the load-cell and the rig by using an aligner that fits into the rig and allows the correct linear contact between the bearing and the load cylinder in order to ensure test reproducibility. In addition, a Cedip Silver 480M infra-red detector is used to measure

Chapter 3
48
temperature changes and conduct lock-in thermography during the fatigue test. The camera unit (or detector) uses an inbuilt 27 mm lens that can be used to study objects at a distance of 150 mm or further and can capture data at rates of up to 383 Hz (383 frames per second) for a 320 x 256 field of view. The noise equivalent temperature difference (NETD) of the infra-red system is 15.56 mK, the lock-in technique allows the NETD to be reduced to approximately 4 mK [119]. A series of 1000 images were recorded every 500 cycles so that changes in the surface
temperature due to fatigue could be periodically observed. The camera is aimed at a 45 piece of aluminium with a mirror finish placed below the bearing in order to obtain images from the region of the coating where the maximum stress is developed (Figure 3-14).
Figure 3-13. 3-point bend test configuration for half-shell bearings.
Figure 3-14. Fatigue test set-up of a 3-point bend configuration with infra-red detector: a) schematic view, b) view of
the set-up from the infra-red detector and c) elements used to ensure correct alignment of the bearings.
Conversely, fatigue tests on flat samples were carried out on an Instron 8502 servo-hydraulic test machine with a 5 kN load cell. The flat samples were also tested in a 3-point bend configuration with a total outer span (L) of 60 mm and rollers with a diameter of 8 mm (Figure 3-15).

Materials and Experimental techniques
49
Figure 3-15. 3-point bend test configuration for flat samples.
3.4.2 Introduction to thermography
The detector used in this project is typically used to apply Thermoelastic Stress Analysis (TSA), which is a type of thermography that provides full-field stress data over the surface of a cyclically loaded component. This technique is based on small temperature changes that take place when a material is subject to a change in elastic strain, generally referred to as the ‘thermoelastic effect’.
When a material is subjected to a cyclic load, the strain induced produces a cyclic variation in temperature. The temperature change (∆T) can be related to the change in the ‘first stress
invariant’, Δ(1+2), i.e. the sum of the principal surface stresses [120]. An infra-red detector is used to measure the surface temperature change, which can then be related to the stress using the following equation:
∆T = −KT0∆(σ1 + σ2) Equation 3-5
Where K is the thermoelastic constant for an isotropic, homogeneous material loaded elastically under adiabatic conditions. It is assumed to be a material constant that is independent of the stress field. The basic equation for TSA (Equation 3-5) is valid for any linear elastic, homogenous material at room temperature, assuming there is no heat transfer within the system. The analysis that leads to Equation 3-5 is dependent on three important assumptions [120]:
i. The material behaviour is linear elastic.
ii. The temperature changes in the material occur adiabatically.
iii. The relevant material properties are not temperature dependent.
In basic terms, the two requirements for TSA are firstly, a means of applying a cyclic load to a component in order to generate a temperature change, and secondly, a means of accurately measuring this temperature change. The first requirement is usually considered as a disadvantage, since it limits the application of TSA, however, since we study the appearance of cracks during fatigue tests, this drawback becomes an advantage.

Chapter 3
50
The temperature change is measured by means of infra-red detectors. Most infra-red detectors utilise a charge-coupled device (CCD) to obtain a digital signal that is proportional to the illumination intensity. A semi-conductor material that is sensitive to light within the infra-red wavelength is incorporated, and allows charge to accumulate proportional to the intensity of light received. This charge is then converted into a voltage which is typically sent to an analogue to digital converter for conversion into a digital signal. The Cedip system, used in this work, utilises a CCD array which consists of multiple squares of semi-conductor material that allow simultaneous measurement of multiple points, allowing full-field maps of light intensity to be obtained from across the surface of a component.
TSA provides a stress map over the surface of a component, and while it is applicable to a wide range of materials, there are important differences in the method of stress calculation and surface preparation for different materials. For metals it is usually necessary to apply a thin coating of matt black paint to provide a uniform and high surface emissivity.
If one considers that under adiabatic conditions, an applied stress causing a local volume variation will subsequently cause a local variation in the temperature of that volume, and that these conditions are achieved where a uniform stress distribution occurs. Then one of the main disadvantages of TSA is that if non-adiabatic conditions prevail then the measured temperature change will not be as a result of the stress change alone. However, identifying non-adiabatic conditions and what causes them, can mean that further information about the behaviour of the material is elicited. For example, the plastic deformation associated to the existence of a crack would generate heat, producing non-adiabatic conditions.
Using the infra-red camera during the fatigue tests, a certain number of frames or images are recorded and stored sequentially so they can be viewed as a video. For an image, each pixel represents one of the elements of the detector array, hence, each pixel contains a value that is proportional to the infra-red radiation detected and recorded during the test. The infra-red signal from the camera is correlated to the loading signal from the test machine (known as the lock-in technique), consequently, the level of noise is significantly reduced as only the infra-red response at the specified loading frequency is analysed. The recorded set of frames are processed by using AltairLI software, which gives three files in the form of images for ease of manipulation and presentation using the Altair software. The first file (*.ptm) contains the absolute temperature of the specimen for each pixel (Figure 3-16a). The second file (*.ptw) contains the temperature change, ΔT (Figure 3-16b); this is calculated from a fast Fourier transform (FFT) based averaging procedure operated over all the recorded images. The third file (*.ptp) contains phase data which can enable the effect of cracks on the stress field to be detected (Figure 3-16c); phase is also obtained from the FFT [121]. Analysis of the phase data allows areas of non-adiabatic behaviour to be identified, since one of the assumptions of the technique is that the system behaves adiabatically. Therefore, any phase change would indicate non-adiabatic behaviour, which may be caused by the heating generated by the cyclic plasticity experienced in the region of the neighbourhood of a crack [122]. Phase data also enables the stress change to be identified as either compressive or tensile. The temperature change should be negative if tensile, and positive if compressive, and thus the phase of the temperature change should be either in phase (0º) or out of phase (180º) with the loading signal.

Materials and Experimental techniques
51
Figure 3-16. Examples of the three types of files yielded by the infra-red detector. a) *.ptm file, b) *.ptw file and c) *.ptp file.
Further details on the applicability of the technique to fatigue tests are given in Chapter 5.
3.4.3 Accelerated test
In order to assess the fatigue life, accelerated fatigue tests were performed at 10 Hz and R=0.1
for different load conditions. The objective was to construct -N curves as a first approximation to assess the performance under fatigue of the different layered structures.
The applied loading conditions were in order to evaluate fatigue behaviour at different lifetimes
ranging between 103-105 cycles. To ensure that the tests were terminated when all the samples have reached a similar degree of fatigue damage, a general failure criterion was required to determine the number of cycles to a certain level of failure. The chosen method as general failure criterion is based on the compliance of the sample; this method was also used in previous projects at Southampton[12, 115, 116]. For bearings, while running the test, the displacement of the sample was monitored; failure of the sample was deemed to occur when the minimum position of the load cell had displaced by 0.1 mm from the initial value (Figure 3-17). At this point the sample coating presents a substantial amount of surface cracks but without gross failure of the bearings occurring. Since in the first cycles the minimum position tends to change a great amount due to the need of the sample to settle on the rig, the initial displacement value was defined as the displacement after 1000 cycles. For the flat samples, failure was deemed to occur when the minimum position of the actuator had displaced by 0.5 mm, during the steady state set after the first 500 cycles.
Figure 3-17. Definition of maximum and minimum position used to set the failure criterion.

Chapter 3
52
3.4.4 Replica tests
Interrupted fatigue tests were also conducted in order to observe the short crack behaviour and subsequent propagation. Surface replication was taken with Struers RepliSet-F5, a two-part silicone based mixture with a curing time of 18 min, which can resolve features up to 0.1 μm. The replica intervals were chosen with the intention of obtaining regular increments of crack length. The replica material was applied using a mixing nozzle, which allows a precise delivery to the desired area. Micrographs of the replicas were then taken with the optical microscope and the projected crack lengths measured.
3.4.5 Cyclic tests
In order to measure the maximum strain on the top surface of the samples during the fatigue test, strain gauges were placed (Figure 3-18) during further cyclic tests conducted under the same conditions as the accelerated fatigue tests.
Figure 3-18. Position of strain gauge on the bearing coating.
Due to the complexity of a multilayered plain bearing, a strain-controlled test with constant strain amplitude would be expected to better describe the coating behaviour. However, the tests were conducted in load control and hence the evolving strain was measured to detect the saturation point from which point the strain amplitude might become constant.
Tee-rosette strain gauges CEA-06-062UT-120 were used, as the gauges are small enough to ensure good accuracy in measuring the maximum strain at the point where the maximum stress is developed in this 3-point bend test. Before placing the gauges on the bearing, the surface was cleaned and prepared with M-PREP Conditioner A and M-PREP Neutralizer 5A, then the gauge was bonded to the centre of the bearing overlay, where the maximum stress will be developed, using M-Bond 200 Adhesive [123]. In a similar process, bigger pads were glued near the gauge to ease the soldering step. Finally, the strain gauges were connected to the pads through thin silver wire, and the pads connected to a StrainSmart 6200 Data Acquisition System through thicker (regular) wires (Figure 3-18). To avoid limits on the measurement of maximum strain, the excitation range was set at a high range and 0.5 V through the StrainSmart software. Measurement was carried out with an acquisition rate of 1000 Hz to produce 100 points to define each recorded cycle.

Materials and Experimental techniques
53
3.5 Image analysis
Here we describe general procedures to process individual images, as well as stacks of images yielded by the tomographs.
Alignment of the image stacks was carried out using the software Fiji-ImageJ. Avizo 9.1 was used to conduct a general volume segmentation by using a conventional ISO50% thresholding consisting of a value exactly halfway between the mean air and material grey scale values (Figure 3-19) [124], previous filtering to increase signal-to-noise ratio. The same software was used for visualization and particle quantification.
Figure 3-19. Graph illustrating determination of ISO50%.
Avizo 9.1 was also used to perform precise manual segmentation. The segmented areas were then exported as separate volumes to allow better visualisation and quantification. Fraction volumes and particle-like analysis, were conducted with Avizo, whilst crack-related quantifications were conducted with Fiji and Matlab.
Particle analysis approaches quantified the position of the centre of the analysed particles within the studied volume, as well as their orientation and shape. The orientation was assessed by
means of α, φ and , the angles which define the orientation of the particle in terms of its maximum dimension, i.e. the longest line measurable in the particle with respect to the general axis, in the planes XZ, ZY and XY respectively (as shown in Figure 3-20a). Whilst the shape of the particles was quantified by measuring their aspect ratio and sphericity. Aspect ratio is the ratio between the length and width of the particle, i.e. the longest dimension that is perpendicular to the length, hence, the higher the aspect ratio the more circular the particle (Figure 3-20b). The sphericity is calculated by dividing the diameter of the sphere (DSV) of the same volume as the particle (Vp) by the diameter of the circumscribed sphere (DCIR) (Figure 3-20c), thus, the higher the ratio the more spherical the particle.
Figure 3-20. a) Scheme of the angles representing the orientations on the different planes. b) Variation of aspect
ratio. c) Scheme of the parameters used to calculate sphericity.

Chapter 3
54
Regarding crack-related quantification, Fiji was used to generate Euclidean distance maps (EDM) from binary images of the segmented cracks, consisting of replacing each foreground pixel in the binary with a grey value equal to that pixel’s distance from the nearest background pixel (for background pixels the EDM is 0) [125]. Then, the EDM can be combined with typical thresholding to segment a crack border of a chosen number of pixels and overlap the resulting image with the segmented particles. Finally, we quantify the percentage of crack in contact with the particles in order to evaluate the interaction of such cracks with the particles (Figure 3-21).
Figure 3-21. EDM approach to quantify crack-particle interaction.
Fiji was also used to measure crack fractions in different materials by overlapping the segmented crack with the segmented materials, as well as by measuring different crack lengths (Figure 3-22): Euclidean (Le, measured by calculating the distance between the ends of a crack), projected (Lp, measured by calculating the projected distance between the ends of the crack with respect to the tensile axis) and real crack lengths (Lr, measured by calculating the number of pixels of a skeletonized crack, i.e. 1 pixel wide). Then Matlab was used to process all the data created by Fiji, so we could represent and calculate tortuosity along different planes of crack growth.
Crack tortuosity was calculated by dividing the real length (Lr) by the Euclidean length (Le) or projected length (Lp), hence, Euclidean and Projected tortuosities can be calculated for one crack. This process of calculation can be executed for each image contained in the assessed volume, therefore, obtaining values of tortuosity for each slice of the tomograph, however, this process is based on 2D data (i.e. image/slice), therefore, the results depend on the plane we are assessing. For this reason, tortuosities were measured in the XY plane (cross-section) and XZ plane (surface).
Figure 3-22. Types of crack lengths measured.

Fatigue behaviour of a leaded bronze interlayer for multilayer bearings
55
4. Fatigue behaviour of a leaded bronze interlayer for multilayer bearings
4.1 Introduction
Leaded bronze materials have a wide range of applications in industry. These materials are used in components that require low wear rates and friction coefficients and high fatigue resistance, such as thrust washers, piston pin bushings and plain bearings [126]. Since, this alloys show a good tribological response but high strength in conditions of high speed and high stress. These materials are typically manufactured applying powder metallurgy with sintering processes [127]. Particularly, the processing of Cu-Sn-Pb materials is given the name of liquid phase sintering (LPS), since during the sintering process the Pb melts forming a liquid, while the solid grains undergo solid-state sintering. In this process, the liquid Pb is contained between solid Cu-Sn agglomerates and spreads to form neck bonds in contact with more Pb [128].
Multilayer bearings comprise thin overlay coatings deposited onto a leaded bronze interlayer bonded to a steel-backing. In service, the engine loads are transferred to the bearing coating through a thin oil film [67]. The thin overlay has the desired material properties to perform under hydrodynamic lubrication. However, under certain conditions boundary lubrication can occur, removing the thin overlay from the bearing surface, in these situations the thicker leaded bronze interlayer avoids seizure by smearing out lead, that acts as a solid lubricant, while the bronze matrix bears the load. Therefore, understanding the inherent fatigue performance of the leaded bronze interlayer has service relevance to a bearing.
Moreover, this system contains materials with very different mechanical properties (softer lead and harder bronze), which can also be considered as a model system to assess how fatigue cracks behave in dissimilar systems. In addition, it provides an interesting insight into fatigue crack initiation and propagation micromechanics in a two phase material where the phases have very different mechanical properties, which has relevance and applicability to other systems composed of dissimilar materials and subjected to cyclic loading such as the overlay multilayer coatings.
The present chapter characterizes the microstructure, fatigue behaviour and the interaction between fatigue cracks and microstructure of a leaded bronze material used as an interlayer in multilayer bearings. This allow us to offer an insight on the fatigue crack initiation and propagation mechanisms in this system. In addition, we propose a simple methodology to assess the fatigue performance of relatively thick linings with a slight variation on their geometry. The research presented in this chapter focuses on the fundamental fatigue behaviour of the material system described above. Thus, we do not try to emulate the service loading, instead, tests were carried out under simplified cyclic loading conditions.
4.2 Materials and Methods
4.2.1 Specimens
The specimens tested are flat samples (final dimensions as shown in Figure 4-1), consisting of a steel backing and a leaded bronze interlayer (Table 4-1). While the final forming process does introduce slight work hardening into the bearing materials, the impact on fatigue properties was

Chapter 4
56
found to be negligible [129]. The interlayer has been applied to the steel by a sintering process (Section 3.1.2).
Figure 4-1. Schematic of a flat sample.
Table 4-1. Composition of the steel backing and leaded bronze interlayer.
Composition (wt%)
Steel backing
C 0.04
Al 0.05
Mn 0.15
P 0.02
S 0.02
Ni 0.02
Cr 0.02
Cu 0.05
Fe 99.64
Leaded bronze
interlayer
Pb 17
Sn 3
Cu 80
- - - - - -
4.2.2 Materials characterization
An optical microscope was used to observe the different layers and phase distributions in metallographic samples as well as surface and cross-sectional cracks after fatigue testing, as well as on plastic replicas of tested sample surfaces. Prior to observation, the samples were polished
to 0.06 m with a colloidal silica suspension. A JEOL 6500F FEG- SEM was used to make high resolution observations of the microstructure as well as surface cracks, and cross-sectional cracks at specific locations in order to observe crack propagation through the thickness. The SEM was also equipped with an EDS which allowed compositional analysis.
EBSD analyses were performed using a FIB-FEG-SEM (FEI Versa3D) system. The samples were
tilted at 70, the accelerated voltage was 20 kV, the minimum step size was 0.1 m and the indexing was over 80% for all the mappings. The samples analysed with EBSD were previously
polished using a BBIM in two steps: 1. tilting the sample 85 and using an accelerated voltage of
6 kV for 20 minutes; 2. tilting the sample 87 and using an accelerated voltage of 3 kV for 20 minutes. Mappings were conducted on both tested and un-tested samples.
4.2.3 Mechanical characterization
4.2.3.1 Tensile tests
Tensile tests were carried out in order to investigate the mechanical properties of the two materials of the bilayer system under study. The tested materials were the steel, which forms the backing, and the sintered bronze, which forms the interlayer.
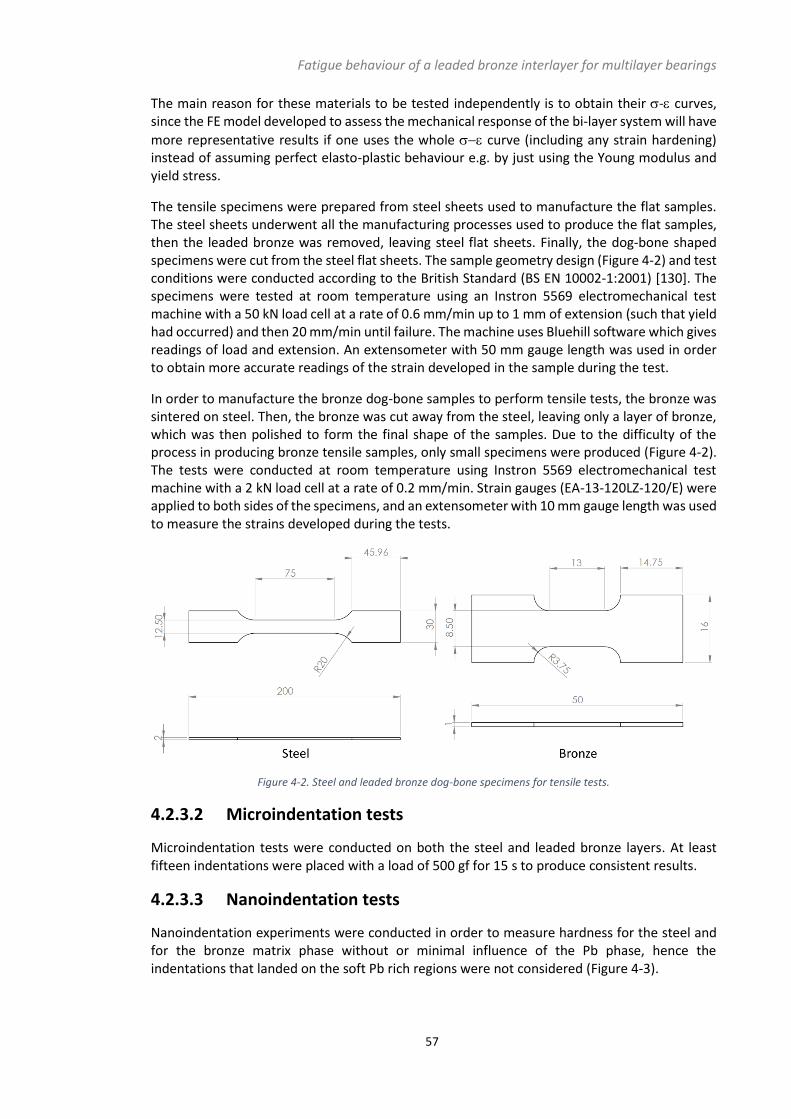
Fatigue behaviour of a leaded bronze interlayer for multilayer bearings
57
The main reason for these materials to be tested independently is to obtain their - curves, since the FE model developed to assess the mechanical response of the bi-layer system will have
more representative results if one uses the whole curve (including any strain hardening) instead of assuming perfect elasto-plastic behaviour e.g. by just using the Young modulus and yield stress.
The tensile specimens were prepared from steel sheets used to manufacture the flat samples. The steel sheets underwent all the manufacturing processes used to produce the flat samples, then the leaded bronze was removed, leaving steel flat sheets. Finally, the dog-bone shaped specimens were cut from the steel flat sheets. The sample geometry design (Figure 4-2) and test conditions were conducted according to the British Standard (BS EN 10002-1:2001) [130]. The specimens were tested at room temperature using an Instron 5569 electromechanical test machine with a 50 kN load cell at a rate of 0.6 mm/min up to 1 mm of extension (such that yield had occurred) and then 20 mm/min until failure. The machine uses Bluehill software which gives readings of load and extension. An extensometer with 50 mm gauge length was used in order to obtain more accurate readings of the strain developed in the sample during the test.
In order to manufacture the bronze dog-bone samples to perform tensile tests, the bronze was sintered on steel. Then, the bronze was cut away from the steel, leaving only a layer of bronze, which was then polished to form the final shape of the samples. Due to the difficulty of the process in producing bronze tensile samples, only small specimens were produced (Figure 4-2). The tests were conducted at room temperature using Instron 5569 electromechanical test machine with a 2 kN load cell at a rate of 0.2 mm/min. Strain gauges (EA-13-120LZ-120/E) were applied to both sides of the specimens, and an extensometer with 10 mm gauge length was used to measure the strains developed during the tests.
Figure 4-2. Steel and leaded bronze dog-bone specimens for tensile tests.
4.2.3.2 Microindentation tests
Microindentation tests were conducted on both the steel and leaded bronze layers. At least fifteen indentations were placed with a load of 500 gf for 15 s to produce consistent results.
4.2.3.3 Nanoindentation tests
Nanoindentation experiments were conducted in order to measure hardness for the steel and for the bronze matrix phase without or minimal influence of the Pb phase, hence the indentations that landed on the soft Pb rich regions were not considered (Figure 4-3).

Chapter 4
58
Figure 4-3. SEM image of nanoindentations on leaded bronze.
Nanohardness tests were conducted under load control with a maximum load of 20 mN. The dwell time was fixed at 60 s, loading and unloading rate were set at 0.8 mN/s. The indentations were performed on untested flat samples. 250 indents were placed on the sample, which had
been polished with 1 m diamond suspension and 0.06 m colloidal silica.
We also compared the results obtained by microindentation and nanoindentation, since the tip geometries for each test provide similar strains in the materials when testing. This is true when comparing Vickers and Berkovich indenters, since both have the same projected contact area with respect to the penetration depth, producing similar strains during indentation. However, when comparing tests it is important to realize that, while both hardness values are calculated as the maximum force divided by the area of contact, the definition of the contact area differs between the test techniques [131]. While the contact area in microindentation is defined as the surface area of the tip-faces that are in contact with the sample, in nanoindentation it is defined as the projected area of contact between the sample and tip. Therefore, to do a comparison of the results between the two indentation techniques, the results must be converted to common definitions. For this reason, HV was converted into H by converting the contact area (Ac) into the projected area (Ap) of a Vickers indenter:
𝐴𝑝 = 𝐴𝑐 sin 68° Equation 4-1
Where the angle of 68° is based on a standard Vickers hardness indenter tip in a pyramidal shape with square base having an angle of 136° between the opposite faces. In addition, the units have to be converted to GPa, obtaining a final equation to convert Vickers hardness and be able to compare it with nanoindentation results:
𝐻 =𝐻𝑉
94.5 Equation 4-2
Where H has units of GPa and HV units of kgf/mm2. From this point, hardness values obtained from microindentation will be designated as Hm, and from nanointentation Hn. Note that despite the conversion, there are fundamental differences between the scale of the tests themselves, such as tested volumes, hence the level of sampling of different phases, defects, grain boundaries etc. [132].

Fatigue behaviour of a leaded bronze interlayer for multilayer bearings
59
4.2.4 Modelling
Finite Element modelling has been used to calculate the strain/stress level of the flat samples under applied test loads. The software used for this purpose was Abaqus 6.14 and initially we designed a model to simulate the stress-strain response in a static bending test for the flat samples.
In order to simplify the modelling work, only a quarter of the sample has been modelled with appropriate boundary conditions for symmetry; displacements along the Y axis and X axis were constrained on face A and face B respectively (Figure 4-4). The roller applying the load and the supporting roller were modelled as analytical rigid bodies, based on Abaqus in-built functions such that they were independent of mesh. The load and constraints were applied on the reference node of the rigid body. The supporting roller was fully constrained and the loading roller was only allowed to move along the loading direction (normal to the contact surface between the roller and the sample). The contact between the rollers and the sample was defined as frictionless.
Figure 4-4. Assembly of the FE model.
An isotropic hardening material model based on the monotonic tensile stress-strain experimental data was used, the data was obtained from the results presented in Section 4.3.2.
Partitions were made to the model to ensure that a fine structured mesh was used in crucial zones (such as contact areas and higher stress/strain zones which may have a significant effect on the final results), while applying a relatively coarse structured mesh elsewhere (Figure 4-5). Three different mesh densities were used, selected after a suitable mesh sensitivity analysis in each case to find the most computationally effective approach to obtain results in agreement with experimental validation data: 1. A very fine mesh in the contact areas (loading and supporting-roller contact areas), 2. A fine mesh in the maximum tensile stress zone, and 3. A coarse mesh in the rest of the model (Figure 4-5). C3D20R (20-node quadratic brick, reduced integration) elements were used, since this type of second-order reduced integration element is expected to generate more accurate results and show better computational efficiency (expected to improve by roughly 3.5 times) than a fully integrated element [133].

Chapter 4
60
Figure 4-5. Partitions and mesh densities used in the FE model.
Before application, the model was validated with experimental data obtained using strain gauges in actual static 3-point bend tests (see in more detail in Section 4.3.3).
4.2.5 Fatigue testing
Fatigue tests on the flat samples were carried out under three-point bend load control (Figure
4-6), after polishing with 0.06 m colloidal silica suspension. Three levels of maximum applied top surface strain in the Y direction were used for the un-interrupted tests in order to build an understanding of the underlying S-N curve: 2500, 3000 and 3500 micro-strain (estimated by strain gauges, FLA-1-11, attached on the top surface), but only 2500 micro-strain was applied for the interrupted test. All tests were conducted at an R = 0.1 and a frequency of 10 Hz.
Figure 4-6. 3-point bend test configuration for flat samples.
For more details on the fatigue test methodology, see Section 4.3.4.
4.2.6 X-ray Computed Tomography
-CT was carried out on the ZEISS Xradia 510 Versa 3D X-ray microscope in order to obtain statistically reliable data on three dimensional crack propagation. Due to the high degree of attenuation of X-rays in the sample materials (steel and leaded bronze), ‘match stick’-like
samples (dimensions 2×2×8 mm3) containing fatigue cracks were extracted from the specimens so that a minimum of 10% transmission of the incoming X-ray beam was preserved at all exposure angles.
Figure 4-7. Schematic of a 'match stick'-like sample.

Fatigue behaviour of a leaded bronze interlayer for multilayer bearings
61
Two types of scan were conducted, one focused on the crack propagation in the leaded bronze and the other focused on the transition of the cracks in the steel backing. The scans focusing on the leaded bronze were conducted at a peak voltage of 140 kV and the beam was pre-filtered through 1 mm of CaF2 to reduce beam-hardening artefacts. To achieve sufficient flux, the power was set at 7 W (50 μA) and the 2048×2048 detector was binned twice resulting in effective detector dimensions of 1024×1024. However, the "shuttling" movement between frames sacrifices a few pixels around the edge, giving slightly smaller projection sizes of 995 x 995 pixels in our case. The source to detector distance was set at 26 mm (SrcZ: −15, DetZ: +11), which in combination with the ×20 lens resulted in a pixel size of 0.767 μm. During the scan, 1601
projections were collected with an angular step of 0.225° over a 360° rotation of the sample and an exposure time of 23 s, thus, 10.2 h per scan. While the scans focused on the cracks propagating from the interlayer to the backing were conducted at slightly different parameters
achieving a pixel size of 2.524 m.
4.2.7 Image analysis
Beside the image analysis explained in Section 3.5, the following approaches have been also applied.
EDMs were also used to evaluate the interaction between voids and other materials. Yet, in this case the thresholding needed to be more precise than ISO50% (Figure 4-8a), for this reason the ‘Trainable Weka Segmentation’ plugin from Fiji was used (Figure 4-8b) [134]. This plugin combines a collection of learning algorithms with a set of selected image features to produce pixel-based segmentations. However, it is much more demanding computationally, making it computationally inefficient to segment large volumes containing different materials. But, worthwhile for small specific volumes like individual voids.
Figure 4-8. Comparison of thresholding procedures to segment voids.
4.3 Results
4.3.1 Microstructural characterization
As explained in Section 4.2.1, the interlayer is composed of copper, tin and lead. The first two elements form the bronze, by substitutional solid solution, which is the main component of the
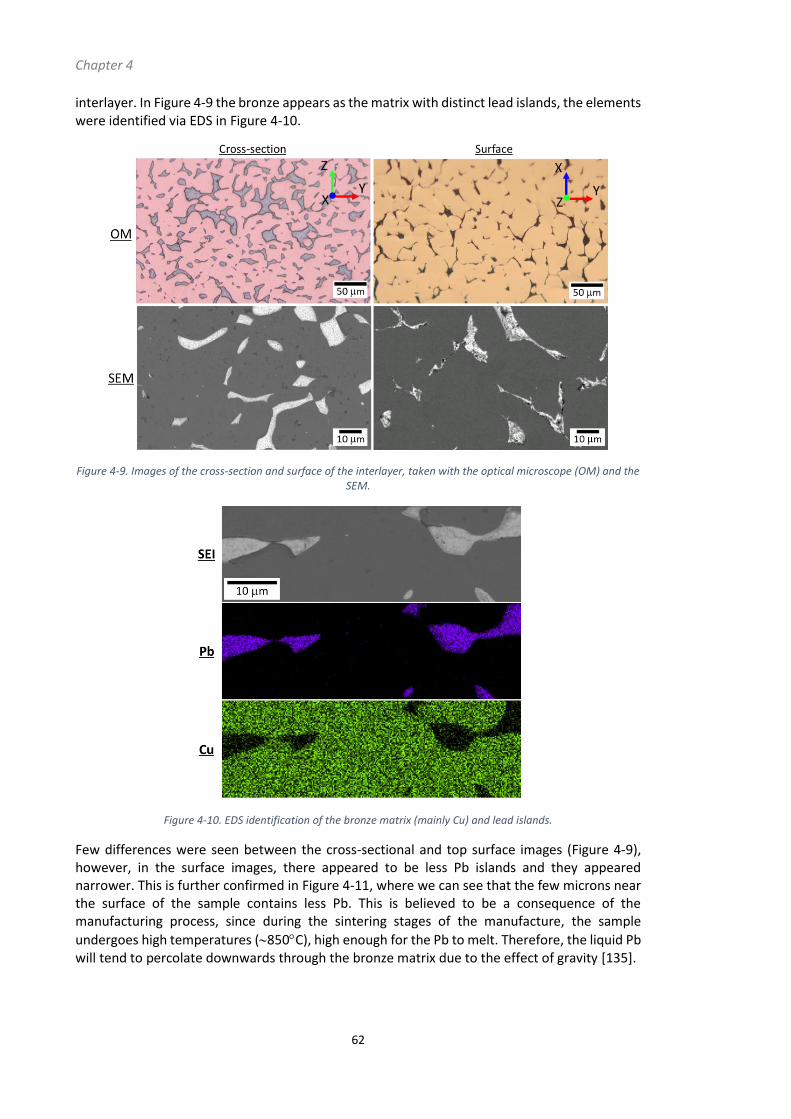
Chapter 4
62
interlayer. In Figure 4-9 the bronze appears as the matrix with distinct lead islands, the elements were identified via EDS in Figure 4-10.
Figure 4-9. Images of the cross-section and surface of the interlayer, taken with the optical microscope (OM) and the SEM.
Figure 4-10. EDS identification of the bronze matrix (mainly Cu) and lead islands.
Few differences were seen between the cross-sectional and top surface images (Figure 4-9), however, in the surface images, there appeared to be less Pb islands and they appeared narrower. This is further confirmed in Figure 4-11, where we can see that the few microns near the surface of the sample contains less Pb. This is believed to be a consequence of the manufacturing process, since during the sintering stages of the manufacture, the sample
undergoes high temperatures (850C), high enough for the Pb to melt. Therefore, the liquid Pb will tend to percolate downwards through the bronze matrix due to the effect of gravity [135].
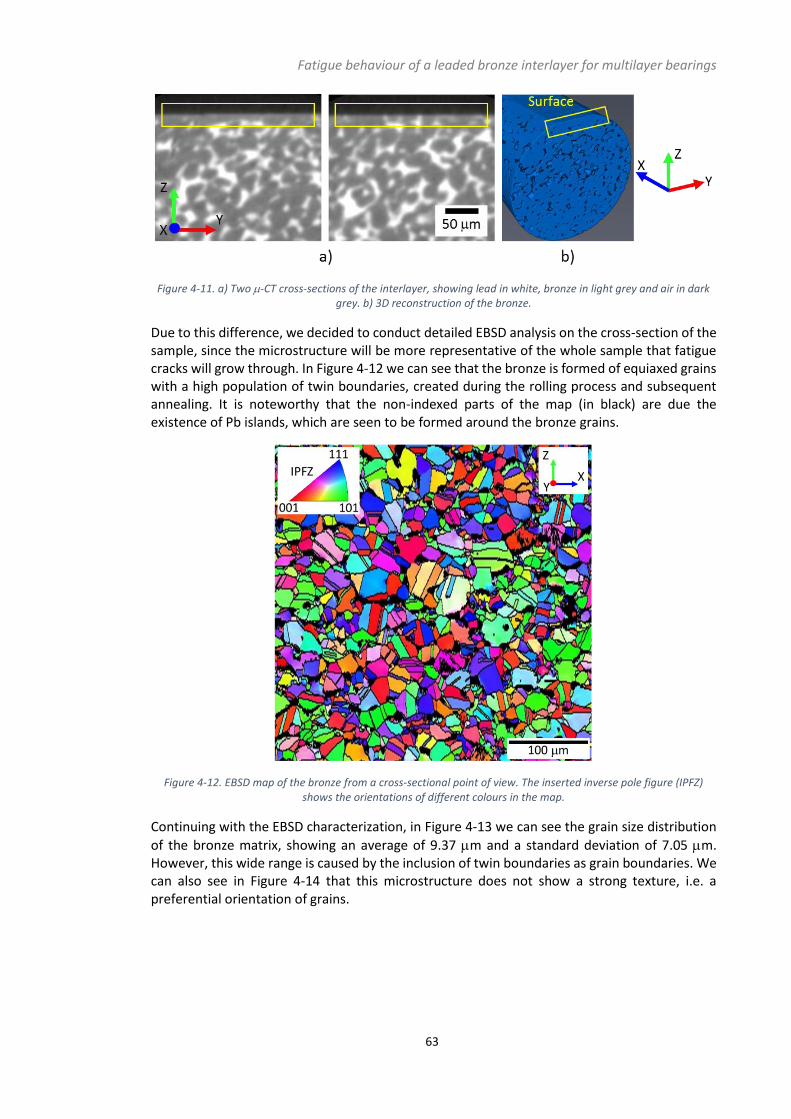
Fatigue behaviour of a leaded bronze interlayer for multilayer bearings
63
Figure 4-11. a) Two -CT cross-sections of the interlayer, showing lead in white, bronze in light grey and air in dark grey. b) 3D reconstruction of the bronze.
Due to this difference, we decided to conduct detailed EBSD analysis on the cross-section of the sample, since the microstructure will be more representative of the whole sample that fatigue cracks will grow through. In Figure 4-12 we can see that the bronze is formed of equiaxed grains with a high population of twin boundaries, created during the rolling process and subsequent annealing. It is noteworthy that the non-indexed parts of the map (in black) are due the existence of Pb islands, which are seen to be formed around the bronze grains.
Figure 4-12. EBSD map of the bronze from a cross-sectional point of view. The inserted inverse pole figure (IPFZ) shows the orientations of different colours in the map.
Continuing with the EBSD characterization, in Figure 4-13 we can see the grain size distribution
of the bronze matrix, showing an average of 9.37 m and a standard deviation of 7.05 m. However, this wide range is caused by the inclusion of twin boundaries as grain boundaries. We can also see in Figure 4-14 that this microstructure does not show a strong texture, i.e. a preferential orientation of grains.

Chapter 4
64
Figure 4-13. Grain size distribution measured from EBSD maps carried out from the cross-section of the interlayer.
These measurements were conducted considering a misorientation over 15 as grain boundary.
Figure 4-14. Inverse pole figures in X, Y and Z directions extracted from EBSD analysis of the leaded bronze material.
The basic microstructure of the steel backing was also revealed by etching polished steel samples with 2% Nital for 20 s. Figure 4-15 shows a microstructure formed of equiaxed ferrite
grains [136] with a grain size of 453 m ( 229 m), measured by linear intercept method. No further microstructural characterization for the steel was conducted, since it is not the focus of this research.
Figure 4-15. Micrographs of the steel microstructure under different magnifications.
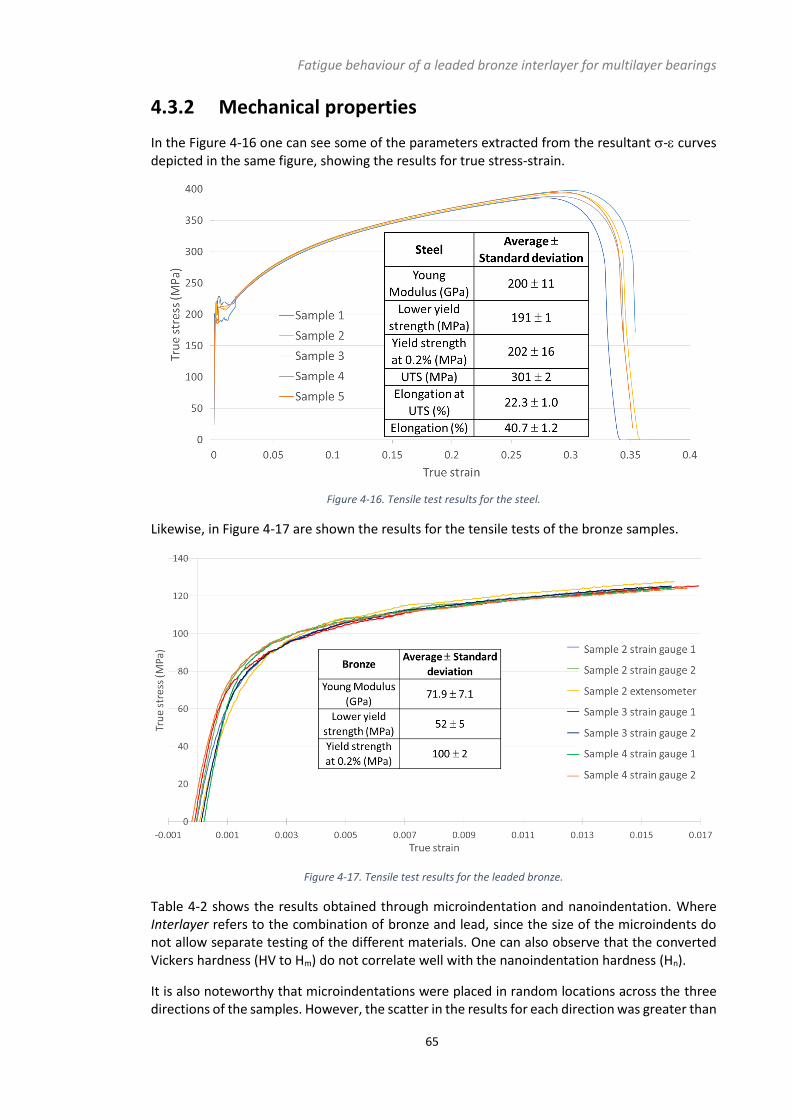
Fatigue behaviour of a leaded bronze interlayer for multilayer bearings
65
4.3.2 Mechanical properties
In the Figure 4-16 one can see some of the parameters extracted from the resultant - curves depicted in the same figure, showing the results for true stress-strain.
Figure 4-16. Tensile test results for the steel.
Likewise, in Figure 4-17 are shown the results for the tensile tests of the bronze samples.
Figure 4-17. Tensile test results for the leaded bronze.
Table 4-2 shows the results obtained through microindentation and nanoindentation. Where Interlayer refers to the combination of bronze and lead, since the size of the microindents do not allow separate testing of the different materials. One can also observe that the converted Vickers hardness (HV to Hm) do not correlate well with the nanoindentation hardness (Hn).
It is also noteworthy that microindentations were placed in random locations across the three directions of the samples. However, the scatter in the results for each direction was greater than

Chapter 4
66
the difference in hardness for each direction. Thus, it was considered that no obvious difference in hardness existed between different directions (implying isotropic properties), this is why all the indent values were averaged to give only one value per material.
Table 4-2. Microindentation and nanoindentation results, where HV is micro-Vickers hardness, Hm converted microindentation hardness, Hn nanoindentation hardness and E Young modulus from nanoindentation.
HV (kgf/mm2) Hm (GPa) Hn (GPa)
Bronze 154* 1.63 3.49 0.22
Lead 5.2* 0.055 0.22 0.01*
Interlayer 79.81 4.83 0.84 0.05 -
Steel 106.67 6.67 1.13 0.07 2.34 0.13
*values from literature: [137-139]
4.3.3 Modelling
Due to the flat samples’ manufacturing process, the thickness of each sample layer can vary by a few tens of microns, somewhat changing the stress/strain state of the sample under the same load. We thus used FE modelling to more accurately calculate stresses and strains in the flat samples depending on the measured thickness of their respective layers. This allowed consistent testing of samples with slightly different thickness by ensuring the applied loads resulted in similar strain conditions to perform accelerated fatigue tests consistently. It should be noted that the strains measured by the strain gauges and calculated by the FE models are referring to the strain acting along the tensile axis (Y axis), unless stated otherwise. Since the maximum tensile strain develops along the tensile axis, it is likely to control the failure mechanisms.
4.3.3.1 Validation
To develop a consistent approach to applying known strains on the top surface of the samples with varying layer thicknesses, the first model was of a flat sample made purely of steel. A material model was produced by using the data obtained from the steel tensile tests (Section 4.3.2) and applying the Ramberg-Osgood relationship [140], to remove the effect of the Lüder bands seen in the tensile test results. A static validation test was also performed with a strain gauge attached to the surface of a steel flat sample and positioned at the centre (Figure 4-18) in order to obtain experimental validation results and compare them with those obtained from the FE model. In Figure 4-19 we can see the comparison between the results obtained by the FE model and the experimental data from the static test.
Figure 4-18. Position of strain gauges on a flat sample.

Fatigue behaviour of a leaded bronze interlayer for multilayer bearings
67
Figure 4-19. Comparison between experimental and FE model results for a static test on a steel flat sample.
Once the model for the steel was validated, the same procedure was followed to produce a model of a flat sample with steel and leaded bronze, where the material model for the leaded bronze was applied to a partition of the previous model. Likewise, a static test with strain gauges was conducted, and the results compared with those produced by the FE model (Figure 4-20).
Figure 4-20. Comparison between experimental and FE model results for a static test on a flat sample made of steel and leaded bronze.
A good correlation was found between the FE model and the static test and a mesh sensitivity analysis was conducted by varying the mesh density systematically in order to find the most efficient combination of densities to obtain good results (Table 4-3).

Chapter 4
68
Table 4-3. Mesh sensitivity analysis results.
Loading area Supporting-roller contact area Global
Spacing in x (mm) 0.1 0.1 0.2
Spacing in y (mm) 0.1 0.2 0.2
Spacing in z (mm) 0.5 0.5 0.5
4.3.3.2 Position correlation
In addition, we used the model to calculate the strain developed at different points along the sample surface: centre, 10 and 20 mm away from the centre. Then, we conducted a static test with strain gauges attached at those same positions (Figure 4-18) in order to compare the results. Figure 4-21 shows the comparison between the results calculated by the FE model and the results obtained by the strain gauges during the static test.
Figure 4-21. Comparison between FE results and experimental results on a flat sample of steel and leaded bronze, where three strain gauges were attached at different positions.
The model also allows us to trace a correlation between strains at different positions of a flat sample with a specific geometry (Figure 4-22). Hence, we can estimate the maximum strain developed at the centre of the sample by measuring the strain 10 mm away from the centre and using this correlation.
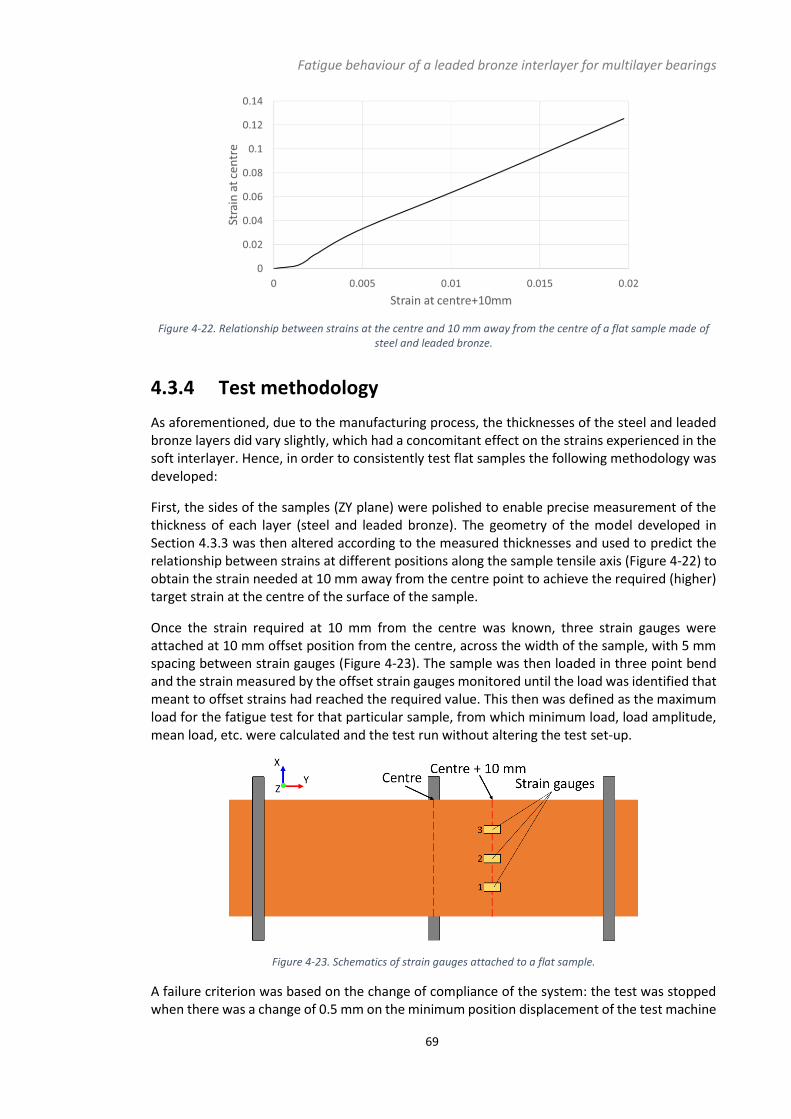
Fatigue behaviour of a leaded bronze interlayer for multilayer bearings
69
Figure 4-22. Relationship between strains at the centre and 10 mm away from the centre of a flat sample made of steel and leaded bronze.
4.3.4 Test methodology
As aforementioned, due to the manufacturing process, the thicknesses of the steel and leaded bronze layers did vary slightly, which had a concomitant effect on the strains experienced in the soft interlayer. Hence, in order to consistently test flat samples the following methodology was developed:
First, the sides of the samples (ZY plane) were polished to enable precise measurement of the thickness of each layer (steel and leaded bronze). The geometry of the model developed in Section 4.3.3 was then altered according to the measured thicknesses and used to predict the relationship between strains at different positions along the sample tensile axis (Figure 4-22) to obtain the strain needed at 10 mm away from the centre point to achieve the required (higher) target strain at the centre of the surface of the sample.
Once the strain required at 10 mm from the centre was known, three strain gauges were attached at 10 mm offset position from the centre, across the width of the sample, with 5 mm spacing between strain gauges (Figure 4-23). The sample was then loaded in three point bend and the strain measured by the offset strain gauges monitored until the load was identified that meant to offset strains had reached the required value. This then was defined as the maximum load for the fatigue test for that particular sample, from which minimum load, load amplitude, mean load, etc. were calculated and the test run without altering the test set-up.
Figure 4-23. Schematics of strain gauges attached to a flat sample.
A failure criterion was based on the change of compliance of the system: the test was stopped when there was a change of 0.5 mm on the minimum position displacement of the test machine

Chapter 4
70
actuator. Figure 4-24 shows the results of using this methodology with the displacement control failure criterion, significant scatter can be seen for the samples tested at high and low strain levels.
Figure 4-24. Strain vs number of cycles using the minimum position displacement failure criterion.
In addition, during the fatigue test, the offset strain gauges continued recording strain at an acquisition rate of 1000 Hz, (i.e. 100 data points per fatigue cycle) as the test was carried out at 10 Hz. This data was used to calculate the strain range for each cycle, which is plotted in Figure 4-25, a consistent drop of the strain range was considered to indicate the formation of a crack
[141]. By using strain range drop as a failure criterion we obtained the -N results depicted in Figure 4-26, where we can observe a more consistent correlation (less scatter in the results) and an earlier detection of fatigue cracks.
Figure 4-25. Strain range vs number of cycles to detect a consistent strain range drop as failure criterion.

Fatigue behaviour of a leaded bronze interlayer for multilayer bearings
71
Figure 4-26. Strain vs number of cycles using the strain range drop failure criterion.
In addition, the use of three strain gauges across the sample width also helped to properly align the sample before the start of the test, since all strain gauges should display similar strain when the sample is well aligned. The strain gauges also helped estimate the whereabouts of crack initiation and propagation, since the first strain gauge suffering a drop in strain range indicated the formation of a crack close to that particular strain gauge, then the crack propagation towards the zones assessed by the other strain gauges was subsequently detected.
Finally, a summary of the methodology followed to test the flat samples is shown in Figure 4-27.
Figure 4-27. Flow chart of the methodology used to test flat samples.

Chapter 4
72
4.3.5 Surface crack behaviour
In order to study the crack initiation and propagation behaviour semi-quantitatively, projected crack lengths perpendicular to the applied tensile axis (Y axis) were measured from micrographs of the replica record of the surface. In Figure 4-28 we can see the projected crack length evolution with the number of cycles, where we can observe irregular crack propagation due to coalescence events, difficult to detect due to the presence of lead. In addition, one might notice
that the minimum crack length detected is around 50 m, although the resolution of the replica
is 0.1 m. This is attributed to the difficulty of differentiating the cracks from lead as one can observe in Figure 4-29.
Figure 4-28.Projected surface crack length vs number of cycles for the interrupted test, where each colour represents a crack.

Fatigue behaviour of a leaded bronze interlayer for multilayer bearings
73
Figure 4-29. Replicas of cracks during the interrupted test, from 0 to 100000 cycles.
However, once the crack has propagated further, the propagation is much clearer and more rapid due to gross opening of the crack (catastrophic failure (Figure 4-30)). Nevertheless, from the replica record, one can observe that the cracks seem to initiate from the softer lead ‘islands’ and propagate preferentially through these ‘islands’. Due to the multiple crack initiation sites (red arrows), coalescence events are inevitable. In fact, it was seen that short cracks coalesced quickly to form a dominant crack (red arrows) that eventually crossed the sample. However, two different modes of crack coalescence were observed: The first one is observed during early crack propagation of short cracks, where the crack tips become colinear when they merge to form a longer crack. The second coalescence mode is observed on longer cracks, where these grow offset to each other but propagating perpendicular to the tensile axis until they overlap and their crack tips deflect towards each other (yellow circles). It was also seen that cracks propagating parallel to the dominant crack were arrested during the test (blue arrows).

Chapter 4
74
Figure 4-30. Replicas of cracks during the interrupted test, from 100000 to 180000 cycles (failure).
Moreover, Figure 4-31 shows SEM images of fatigue crack initiating from surface lead islands, the cracks continue propagating through the lead phase and towards other lead ‘islands’ that eventually connect through the bronze matrix.
Figure 4-31. Surface crack initiation in lead ‘islands’.
In order to study the crack propagation process through the bronze, EBSD maps were produced for the surface of flat samples containing short cracks. In Figure 4-32 we can see one of these EBSD maps, where one can observe intergranular crack propagation through the bronze. It is noteworthy that the non-indexed zones of the EBSD map are due to the presence of lead and the crack itself.

Fatigue behaviour of a leaded bronze interlayer for multilayer bearings
75
Figure 4-32. EBSD map on the surface of a flat sample with fatigue cracks.
4.3.6 3D characterization
As mentioned previously, two types of -CT were conducted, at different resolutions. Figure
4-33 shows examples of 2D sections of the -CT performed focusing on the crack propagation in the interlayer and the crack transitioning from the interlayer into the steel backing. These images show a good contrast between bronze, lead and voids, which eased the segmentation of such features, however, the cracks present more difficulties when segmented, and had to be manually segmented, leaving the final results dependent to some degree of subjective researcher interpretation.

Chapter 4
76
Figure 4-33. -CT 2D sections of a crack propagating through the interlayer (a) and propagating from the interlayer into the steel backing (b).
4.3.6.1 Volume fraction quantification of the interlayer
After segmentation, three different volumes containing bronze, lead and voids were reconstructed. Figure 4-34 shows such reconstructed volumes, which were used to measure the volume fraction of each element, depicted in Table 4-4. We can also observe that most of the lead is in fact interconnected, the Pb does not form isolated particles as appears to be the case from simple 2D assessment.
Table 4-4. Volume fraction of the main components of the interlayer.
Volume fraction (%)
Bronze 81.91
Lead 17.53
Voids 0.56

Fatigue behaviour of a leaded bronze interlayer for multilayer bearings
77
Figure 4-34. Segmentation and volume reconstruction of bronze, lead and voids contained in the interlayer.
In addition, thirty cross-sections of thirty different samples were evaluated under the optical microscope. The images were segmented (Figure 4-35) and the percentage of bronze and lead
quantified, giving rise to an average volume fraction of 18% ( 1%) of lead, confirming the results
obtained via -CT.
Figure 4-35. Original OM image of a cross-section of the interlayer and its segmented image.
4.3.6.2 Interlayer void characterization
Once the voids were segmented, several parameters were used to characterize them in order to better understand their origin. Firstly, the position of the voids was determined, finding a random distribution in the XY plane, but a higher concentration of voids as we move away from the surface in XZ plane (Figure 4-36).

Chapter 4
78
Figure 4-36. Interlayer voids position on the XZ plane.
Also, Figure 4-37 shows that the majority of the voids are small (in terms of the resolution of the scan). In addition, the orientation of such voids was also measured, and appeared random.
Figure 4-37. Volume distribution of the voids found in the interlayer.
Figure 4-38 displays the results of the aspect ratio and sphericity of the voids, showing a wide range of shapes but with most being relatively smooth ellipsoidal voids.

Fatigue behaviour of a leaded bronze interlayer for multilayer bearings
79
Figure 4-38. Aspect ratio and sphericity distribution of the interlayer voids.
Finally, several voids were individually segmented with their surrounding materials (bronze and lead) in order to more precisely evaluate their origin with the aid of EDMs. Euclidean distance
maps indicated that 41.2% ( 2.1%) of the void surface is surrounded by lead, meaning that the voids seen in the interlayer are principally lead voids. A feature unaffected by the microstructure of the interlayer would be expected to be (on average) surrounded by the same relative proportion of the materials that comprise the interlayer as their composition ratio, therefore, an uncorrelated feature should be surrounded by 18% of lead (Table 4-4), whereas the voids are surrounded by 41.2% of lead (41.2>>18%).
Figure 4-39. 3D reconstruction of voids surrounded by lead.
4.3.6.3 Influence of different materials and voids on crack propagation
As mentioned previously, part of a crack in the interlayer was manually segmented, together with the voids that were close enough to the crack to influence its propagation and the lead

Chapter 4
80
(Figure 4-40). Each of these features was segmented separately in order to study the interaction of these volumes by means of EDMs.
Figure 4-40. Original -CT 2D section; manual segmentation of the crack and voids; volume reconstructions of the crack with close voids; volume reconstructions of the crack, voids and lead.
Euclidean distance map results show that the crack is in contact with lead for 42.15% ( 2.23%)
of its volume, while it is 1.15% ( 0.16%) in contact with voids. Hence, the crack clearly propagates preferentially through the lead (42.15>>18%) and also tends to propagate towards neighbouring voids (1.15>0.56%).
4.3.6.4 Interlayer crack tortuosity characterization
Figure 4-41 (with an attached video) shows the reconstructed volume of the crack in the interlayer with the voids in contact with it. We can see that the crack is quite tortuous, meaning that its propagation is likely to have been affected by the microstructure. One can also observe that a higher number of voids exist in contact at the bottom of the crack than close to the surface (as seen previously).

Fatigue behaviour of a leaded bronze interlayer for multilayer bearings
81
Figure 4-41. Different views of the 3D reconstruction of the cracks and the voids in contact with it (video).
The projections of this crack in the ZY and XY planes were used in order to measure the lengths, number of branches, and tortuosities of the crack along the X and Z axis respectively. Figure 4-42 shows the results of these analyses in the ZY plane along the X axis (front to back), where we can see that, in general, tortuosities are affected by the length of the cracks and the number of branches: i.e. the longer or more branches has the crack, the more tortuous. Projected and Euclidean tortuosities are quite similar, meaning that the cracks are mostly aligned perpendicular to the tensile axis (Y axis). One can also observe that tortuosity increases when more voids are present, i.e. close to the front and in the middle of the crack.

Chapter 4
82
Figure 4-42. Crack quantification in the ZY plane along X axis (front to back).
Conversely, Figure 4-43 shows the crack quantification analysis in the XY plane along the Z axis (top to bottom), where we observe again that the higher number of branches and longer cracks increase the tortuosity. However, in this case the projected tortuosity is significantly greater than the Euclidean tortuosity, meaning that in this plane the cracks have an angle with respect to the tensile axis (Y axis). Also, one can observe that the projected tortuosity is higher towards the surface, with a peak in the middle and towards the bottom.

Fatigue behaviour of a leaded bronze interlayer for multilayer bearings
83
Figure 4-43. Crack quantification in the XY plane along Z axis (top to bottom).
Comparing results in both planes we realize that the projected tortuosity in the XY plane is higher than in the ZY plane, but Euclidean tortuosity is lower in the XY than in the ZY plane. Therefore, the crack propagates in a more deflected manner with respect to the tensile axis from top to bottom, but the crack is ‘rougher’ when propagating from the front to the back. Nevertheless, these differences are not significant, considering the scatter of the results. We can also see that projected tortuosity is always higher than the Euclidean, since the projection accounts for the angle of the crack with the tensile axis.
4.3.6.5 Transition interlayer-steel backing
By reducing the resolution and increasing the field of view of the -CT, we can study how fatigue cracks are affected by the steel backing. Figure 4-44 (with an attached video) shows a crack

Chapter 4
84
divided into three volumes (the volumes are interconnected). From this point we will refer to these volumes as: red crack, blue crack and green crack.
Figure 4-45 shows how two of the cracks (red and blue) propagate along the ZX plane while the third crack (green) propagates along YX plane. Moreover, the green crack propagates along the interface interlayer/backing. One can also perceive that while the part of the blue and red cracks that propagates though the interlayer, does so perpendicular to the surface, when the red crack penetrates into the steel it starts to deflect.
Figure 4-44. Diagonal view of segmented cracks propagating from the interlayer into the steel backing (video).
Figure 4-45. Front and back view (ZY plane) of the segmented cracks and their position in the interlayer and steel backing (video).
Figure 4-46 shows the cracks from a top view, where we can see that the red and blue cracks initiated at different sites and coalesced together at the interface (interlayer/backing), when the blue crack started deflecting and propagating along the interface. The side view of the cracks depicted in Figure 4-47 indicate that the cracks initiated at the surface and propagated towards the steel backing, since we can observe that the red crack presents the typical semi-elliptical crack front shape.

Fatigue behaviour of a leaded bronze interlayer for multilayer bearings
85
Figure 4-46. Top view (XY plane) of the segmented cracks and their position in the interlayer and steel backing (video).
Figure 4-47. Side views (ZX plane) of the segmented cracks and their position in the interlayer and steel backing (video).
4.3.7 Cross-section observations
In addition to the tomographs, several samples were physically cut to make observations on the cross-sections in order to confirm the main behaviours seen in the 3D characterizations. First of all, Figure 4-48 shows the preferential crack propagation through lead (identified statistically in the tomographs), we can see how the fatigue cracks propagate through the lead ‘islands’ and then between ‘islands’ through the shortest possible path in the bronze.

Chapter 4
86
Figure 4-48. OM and SEM images showing preferential crack propagation though the lead of the interlayer.
Figure 4-49 shows fatigue cracks propagating from the interlayer into the steel backing, we can see that most of the cracks propagate along the interface of the interlayer/backing before they penetrate into the steel, where they propagate with an angle. Moreover, Figure 4-50 shows that during the transition of the crack between interlayer and backing, the interface is mainly composed of lead containing small defects, thus making easier any deflection and delamination along the interface.

Fatigue behaviour of a leaded bronze interlayer for multilayer bearings
87
Figure 4-49. OM images showing cracks propagating from the interlayer into the steel backing, where the green arrows point at interfacial crack propagation and the red arrows point at cracks propagating into the steel.
Figure 4-50. SEM image showing a fatigue crack propagating into the steel from the lead (red arrows) and the interface interlayer/backing composed of lead with small defects.

Chapter 4
88
4.4 Discussion
4.4.1 Microstructural characterization
As previously mentioned, the manufacturing process for the interlayer contains rolling steps. After rolling, one would expect elongated grains and a preferential grain orientation (texture) [142]; and if the twin boundaries were created during this process, these would also have a preferential orientation [143]. However, in our case we can see that the grains seem to be equiaxed, with no apparent strong texture and random orientation of the twin boundaries, which indicates the effect of the annealing process on the final microstructure [144]. For this reason, a relatively isotropic microstructure is observed.
Moreover, the isotropy of the interlayer was corroborated by the microindentations, since they were carried out in different directions but the obtained hardness values were very similar. In addition, the measured crack tortuosities along the X axis (front to back) and Z axis (top to bottom) are not significantly different, which is another indication of an isotropic crack propagation.
Regarding the hardness results, we also observed that the converted Vickers hardness (HV to Hm) do not correlate well with the nanoindentation hardness (Hn). This can be explained in terms of the size effect difference between micro and nanoindentation. The indentation size effect is based on geometrically necessary dislocations [145] created during a non-uniform plastic deformation (strain gradients), for example an indentation. Hence, this effect becomes more important when strain gradients are large, i.e. when the material is deformed in very small volumes [146]. This then predicts that the shallower the indentation, the harder the material will appear, this indicates why Hn presents higher values than Hm.
During the three-dimensional characterization of the interlayer we could observe the interconnection of the lead. This is caused by the sintering process and is strongly dependent on the temperature of the process and the composition of the alloy [135]. The design purpose behind this microstructure is the use of the lead as a solid lubricant, since at certain temperatures the lead will smear out to the surface. Hence, if the lead is interconnected, the lead reservoir in the interlayer will be greater and better able to travel to the surface.
Also in the 3D characterization section, we have studied the voids detected in the interlayer, such voids were found to be voids principally within the lead, with smooth-ellipsoidal shape, randomly oriented and in higher concentration towards the bottom. Based on these characteristics, it is proposed that the void formation mechanism is based on porosity occurring due to lead shrinkage during solidification [147], this would explain why the voids are more contained within the lead, as well as the shape (spherical voids are usually produced by trapped gas) and orientation. The higher concentration of voids towards the bottom of the interlayer, can be considered in terms of the last parts of lead to solidify will be at the bottom, since heat is more difficult to dissipate there than at the surface. Hence, the lead close to the surface will solidify earlier, compensating their solidification volume shrinkage by capillary attraction of lead from below [147], leaving the lead at the bottom without enough lead to feed through and compensate the shrinkage. It is noteworthy that the voids were found in relatively small quantity and size, reflecting that one of the objectives of rolling is to reduce porosity.

Fatigue behaviour of a leaded bronze interlayer for multilayer bearings
89
4.4.2 Methodology to characterize the fatigue performance of the Interlayer
As seen in Section 4.3.3 and 4.3.4, we have combined simple FE modelling and experimental techniques to be able to test flat samples with slightly different thicknesses. The developed methodology shows more consistent results when the failure criterion based on the measured strain range drop is used, since this criterion is more sensitive to the surface response, where the cracks initiate; whereas the displacement criterion is based on the compliance of the whole system, where the stiff steel has a much higher contribution compared to the interlayer. Moreover, the failure criterion measured by the strain gauges also allows earlier detection of the cracks and an estimation of their relative initiation and propagation.
Several simplifying assumptions have been made, e.g. that a loading ramp to maximum load can define a fatigue cycle; and the model underestimates the strain component at some points of the load-strain curve. The effect of these assumptions on the methodology needs further consideration in light of the need to also test much thinner (overlay) layers with different mechanical properties on the top of the interlayer in a real bearing system.
4.4.3 Fatigue characterization (Crack initiation and propagation)
As observed in the replica test (Section 4.3.5), fatigue cracks predominantly initiate at the lead ‘islands’. These observations were made on the surface of the sample, suggesting surface crack initiation. This was confirmed by the crack front shape in Section 4.3.6, which was expected, since the maximum stress during a 3-point bend test is on the surface.
Likewise, it was also expected that the fatigue cracks would initiate in the lead instead of the bronze, since the former is much softer (as demonstrated in Section 4.3.2) and fatigue cracks are known to initiate due to an accumulation of plastic strain [24], therefore, making the soft lead the best candidate. This agrees with studies conducted by several workers [148-151] on duplex steels, where they found that fatigue cracks initiate at the phase sustaining more plastic deformation, i.e. the softer phase.
Later, during the early stages of crack propagation, we can see how the cracks connect between the lead islands, propagating the fatigue crack. As we learnt in previous sections, the lead islands are in fact interconnected in 3D and the fatigue cracks propagate preferentially though the soft lead, however, when they propagate though bronze, the propagation is intergranular along bronze grain boundaries. Similar behaviour has been reported in Al-Sn-Si alloys, where a fatigue crack propagates in an Al matrix seeking out softer Sn islands [152]. Hence, we propose a propagation mechanism (Figure 4-51) where the fatigue cracks firstly propagate subsurface through the interconnected lead islands, and later propagate towards the surface due to the stress concentration experienced by the bronze grain boundaries surrounded by cracked lead. This would also explain why any arrested cracks were observed in the bronze. For this reason, it is extremely difficult to measure the crack growth with precision, which is reflected in the results for crack growth shown in Section 4.3.5.
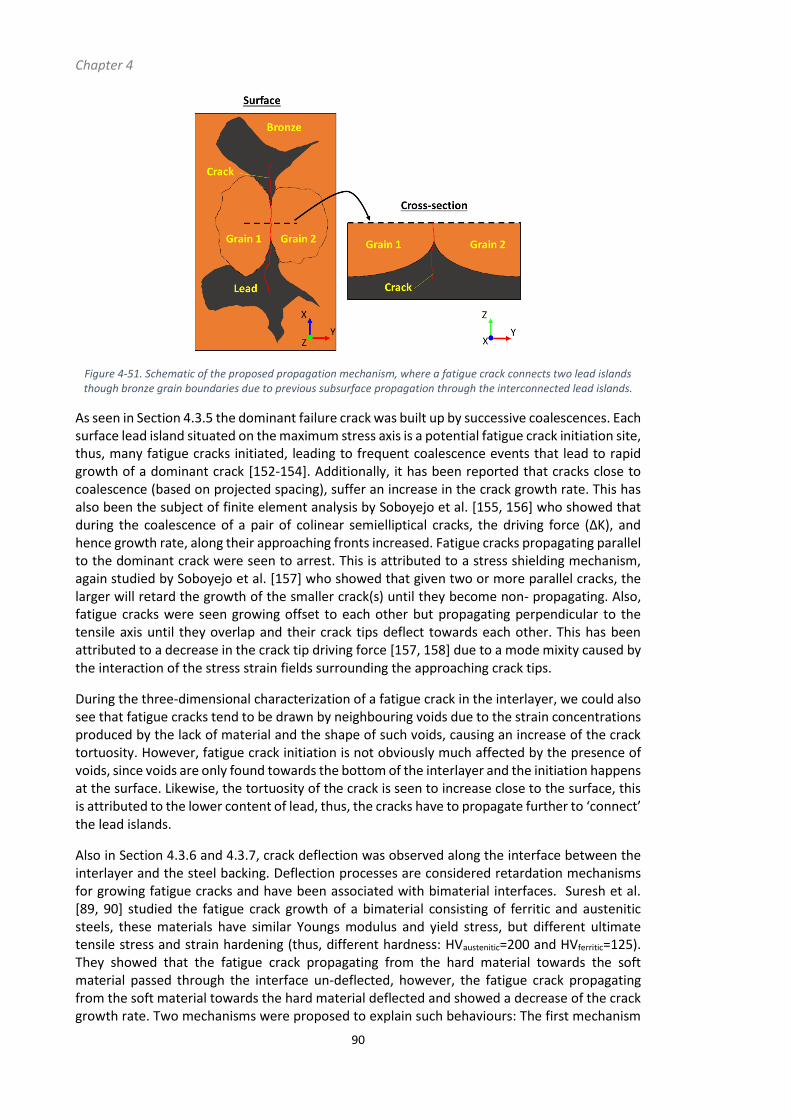
Chapter 4
90
Figure 4-51. Schematic of the proposed propagation mechanism, where a fatigue crack connects two lead islands though bronze grain boundaries due to previous subsurface propagation through the interconnected lead islands.
As seen in Section 4.3.5 the dominant failure crack was built up by successive coalescences. Each surface lead island situated on the maximum stress axis is a potential fatigue crack initiation site, thus, many fatigue cracks initiated, leading to frequent coalescence events that lead to rapid growth of a dominant crack [152-154]. Additionally, it has been reported that cracks close to coalescence (based on projected spacing), suffer an increase in the crack growth rate. This has also been the subject of finite element analysis by Soboyejo et al. [155, 156] who showed that during the coalescence of a pair of colinear semielliptical cracks, the driving force (ΔK), and hence growth rate, along their approaching fronts increased. Fatigue cracks propagating parallel to the dominant crack were seen to arrest. This is attributed to a stress shielding mechanism, again studied by Soboyejo et al. [157] who showed that given two or more parallel cracks, the larger will retard the growth of the smaller crack(s) until they become non- propagating. Also, fatigue cracks were seen growing offset to each other but propagating perpendicular to the tensile axis until they overlap and their crack tips deflect towards each other. This has been attributed to a decrease in the crack tip driving force [157, 158] due to a mode mixity caused by the interaction of the stress strain fields surrounding the approaching crack tips.
During the three-dimensional characterization of a fatigue crack in the interlayer, we could also see that fatigue cracks tend to be drawn by neighbouring voids due to the strain concentrations produced by the lack of material and the shape of such voids, causing an increase of the crack tortuosity. However, fatigue crack initiation is not obviously much affected by the presence of voids, since voids are only found towards the bottom of the interlayer and the initiation happens at the surface. Likewise, the tortuosity of the crack is seen to increase close to the surface, this is attributed to the lower content of lead, thus, the cracks have to propagate further to ‘connect’ the lead islands.
Also in Section 4.3.6 and 4.3.7, crack deflection was observed along the interface between the interlayer and the steel backing. Deflection processes are considered retardation mechanisms for growing fatigue cracks and have been associated with bimaterial interfaces. Suresh et al. [89, 90] studied the fatigue crack growth of a bimaterial consisting of ferritic and austenitic steels, these materials have similar Youngs modulus and yield stress, but different ultimate tensile stress and strain hardening (thus, different hardness: HVaustenitic=200 and HVferritic=125). They showed that the fatigue crack propagating from the hard material towards the soft material passed through the interface un-deflected, however, the fatigue crack propagating from the soft material towards the hard material deflected and showed a decrease of the crack growth rate. Two mechanisms were proposed to explain such behaviours: The first mechanism

Fatigue behaviour of a leaded bronze interlayer for multilayer bearings
91
is based on continuum mechanics and propose that the local compliance ahead of the crack tip decreases when the fatigue crack propagates from the soft material towards the interface with the hard material, and increases when it propagates from the hard material; meaning that the decrease in local compliance prevents the crack from further propagation in the nominal mode I, thus, the crack deflects. The second mechanism uses a micromechanics approach and proposes that when a crack propagates towards an interface from the softer material, cyclic slip into the harder material becomes more difficult and the crack deflects as it seeks material with a lower resistance, hence, the crack deflection causes a decrease in crack tip driving force. The same system was studied by Sugimura et al [91], who conducted a finite element investigation using the J-integral to characterise the driving force variation of an approaching crack under quasi-static conditions. They concluded that a crack approaching the interface from the softer material experienced a significant drop in driving force as it neared the interface, decreasing the crack growth rate (shielding effect). However, when a crack approached the interface propagating from the hard material the driving force increases, increasing the crack growth rate (anti-shielding effect). In the system under study, the cracks propagating from the interlayer, mainly through lead, deflect before penetrating into the steel and propagate along the interface until eventually penetrate. This can be attributed to the shielding effect [89-91] induced by the steel, since it is harder and stiffer than the lead, hence, the crack continue propagating along the interface (mainly composed of lead) parallel to the tensile axis before penetrating into the steel. This behaviour can cause delamination and subsequent detachment of parts of the interlayer.
Moreover, we have observed fairly straight fatigue cracks in the interlayer (similar Euclidean and projected tortuosities in the ZY plane), however, the cracks start to deflect once they penetrate deep into the steel. This can be explained due to a decrease of the tensile stress towards the neutral axis of the sample (Z axis) in a 3-point bend configuration, plus, an increase of the stress at the centre of the sample (Y axis). Thus, the propagating crack is less drawn towards the bottom and the contribution of the stress at the centre of the sample gain weight, making the crack deflect towards the centre roller (Y axis).
4.5 Conclusions
A sintered leaded bronze material used as an interlayer for multilayer bearings has been manufactured as flat samples to allow us to assess its fatigue performance under simplified loading conditions, as well as to study its fatigue behaviour by investigating fatigue crack initiation, propagation and their interaction with the microstructure. A methodology has been developed in order to conduct fatigue tests on such flat samples, allowing for slight variations in layer geometry. In addition we have characterized the microstructure of the leaded bronze material, as well as its fatigue behaviour. The main findings of this chapter can be summarized as follows:
- EBSD maps and hardness results suggest an isotropic microstructure and mechanical
properties.
- The developed methodology can test flat samples consistently at similar surface strain
levels in three point bend. A failure criterion based on drops in the strain range on the
top surface detect cracks earlier than other overall sample displacement criteria and
more accurately compare lifetimes.
- The dominant failure crack was built up through successive coalescence of shorter
cracks.
- Fatigue crack initiation occurs at lead islands on the top surface of the interlayer.

Chapter 4
92
- Early crack propagation is attributed to subsurface crack propagation through the 3D
interconnected lead islands.
- A quantifiable preferential fatigue crack propagation through lead has been observed.
Lead voids also affect the fatigue crack propagation, since the voids draw the cracks
towards them increasing crack tortuosity.
- We have also observed crack deflection and interface propagation between the
interlayer and the steel backing. This was attributed to shielding effect created by the
harder and stiffer steel, compared to the lead decorating the interface, which also
allowed easy delamination.
Fatigue assessment of multilayer coatings using lock-in thermography
93
5. Fatigue assessment of multilayer coatings using lock-in thermography
5.1 Introduction
Engine manufacturers are always trying to increase the power output, while decreasing the weight and size of new engines, thus increasing the loads that the plain bearings have to support. In response, coating architectures for bearings have become more and more complex in order to increase the fatigue lifetime under higher service loads. Such coating systems now comprise
overlay bearings that consist of complex micrometre scale-multilayer structures (1-18 m per layer) [112, 159], that make the fatigue assessment process more complex, in particular detecting early damage in the coatings is challenging [160, 161]. Previous methods have been based on detecting a compliance change in far thicker coatings.
In industry, accelerated test rigs are used to rank the fatigue performance of bearings by testing them to failure in an engine-like environment. One example is the Sapphire test machine [68], which simulates service loading by rotating an eccentric test shaft within the test bearing, where the dynamic load is applied as the result of oil film pressure between the bearing and the shaft due to the motion of the shaft. This is a useful pass-fail test to rank bearings in an engine-like environment; however, it does not offer insight into the fatigue mechanisms controlling the performance. Without a mechanistic understanding of what controls the fatigue performance of these layered systems, optimisation of bearing layer architectures and the microstructures of the various coatings is “black box” and can only be achieved empirically through trial and error.
In previous studies, simple bending tests have been used to test fatigue performance of coated systems [93-95]. This approach has also been adapted to test half-shell bearings, using a 3-point-bend configuration, in order to assess their fundamental fatigue performance. Several
researchers have used such methodologies to assess relatively thick (400-180 m) bilayer aluminium based coatings in plain journal bearings: M.C. Mwanza et al. [162] studied the different fatigue performance of aluminium based bilayer bearings with different lining compositions, Ali et al. [163] compared the fatigue performance of bearings produced by different manufacturing processes (HVOF versus roll bonding), and Joyce et al. [164] investigated the effect of environment by testing Al-Sn-Si bearing linings under oil, vacuum and air conditions. Each of these test methodologies involve simpler loading cases than the Sapphire rig, and hence allow the effect of changing the load levels, frequency, environment, etc., to be investigated. In addition, since the test configuration is simple, access to the lining surface of the sample is relatively easy, which allows monitoring techniques, such as strain gauging or different kinds of imaging (including replica approaches combined with optical microscopy) [165-172] to investigate the test in-situ during testing. A substantial increase in fatigue evolution observations becomes possible (e.g. crack initiation and growth) that helps us to understand what happens during the test. The simpler loading case also allows better control of the test conditions and the ability to link the effect of these more directly to the observed fatigue mechanisms.
The application of infrared thermography as a full-field, non-contact, non-destructive method to detect damage has been increasingly studied in the past years. Infra-red thermography has been successfully used for several applications related to damage detection such as monitoring civil structures [173-175], exploring plastic deformations [176] and evaluation of fatigue damage in materials [177-181]. For instance, Ummenhofer et al. [182] applied thermographic approaches to investigate localized damage occurring due to fatigue on welded structures

Chapter 5
94
during tests, showing the great potential of such techniques in detecting and studying the evolution of localized damage throughout lifetime.
Moreover, lock-in infrared thermography allows investigation of the temperature distribution on the surface of a cyclically loaded component by using the loading signal to filter out all temperature measurement that is not fluctuating and the same frequency as the test. This enables erroneous temperature changes to be disregarded, reduces significantly the measurement noise and allows for the detection of even smaller changes in temperature that are only related to the applied fatigue loading. Researchers have used this variant to successfully evaluate fatigue parameters and also evaluate the occurrence of fatigue damage in metals [177, 183, 184]. In this study we have introduced this observation approach to particularly investigate the fatigue performance of multilayer overlay bearing coatings and the detection of cracks.
The present work proposes a significant improvement to established fatigue evaluation methodologies [162-164] by using lock-in thermography approaches. This will enable the assessment of fatigue performance of thin coatings (where replication approaches are less successful in tracking fatigue initiation and growth processes on the very thin electrodeposited coatings), and the improvement of damage assessment location in post-mortem observations. Such improvements help elucidate the mechanisms leading to the fatigue and fracture of the coatings [185, 186], making possible the optimization and informed design of new fatigue resistant bearings. This is in contrast to the empirical process followed by using industry standard approaches such as the Sapphire test. This methodology also offers opportunities to detect early damage in other coated structures and geometries, showing its wider applicability beyond the bearing domain.
This chapter is largely based on the publication: A. Laborda, A. Robinson, S. Wang, Y. Zhang, P. Reed, Fatigue assessment of multilayer coatings using lock-in thermography, Materials & Design, 141 (2018) 361-373.
5.2 Materials and Methods
5.2.1 Specimens
The specimens tested are standard semi-circular bearings (Figure 5-1a), consisting of a steel backing, a leaded bronze interlayer and the final multilayer coatings. Such coatings have thin nickel based and tin based layers applied to the bronze interlayer by proprietary electroplating approaches (Section 3.1.2). Three types of multilayer coatings were investigated (Figure 5-1b): these coatings are designated as 1IML, 2IML and 3IML, referring to the number of intermetallic layers: 1, 2 and 3 intermetallic layers, respectively.
In order to study the fatigue performance of the coatings, the rest of the bearing structure was maintained the same for all the specimens. The steel backing and leaded bronze interlayer had the same thickness and composition for all the samples, only the top multilayer coating configuration changed among the three types of specimens.

Fatigue assessment of multilayer coatings using lock-in thermography
95
Figure 5-1. Schematics of: a) a bearing and b) cross-sectional structures of the specimens (not to scale).
5.2.2 Sample preparation
To allow the use of thermography, the coated side of the specimens is painted with matt black paint in order to provide a uniform and high surface emissivity and to make the specimens behave as a ‘black body’, i.e. only emitting heat radiation, hence, avoiding reflections of radiation coming from surrounding bodies [187]. The samples were first submerged in acetone
for degreasing and painted applying 20 m of ELECTROLUBE Matt Black Paint (a detailed study of the paint thickness choice is found in Section 5.3.2), widely used for thermography applications. In order to achieve this paint thickness, each sample was painted in separate passes, waiting 20 minutes between passes to allow the paint to dry. Each pass consisted of a single movement of the spray can across the specimen at approximately 1 m/s with the nozzle positioned at approximately 300 mm from the surface (these values are approximate and are somewhat operator dependent).
5.2.3 Fatigue testing
The specimens were tested in a 3-point bend configuration. In addition, a Cedip Silver 480M infra-red detector was used to measure temperature changes and conduct lock-in thermography during the fatigue tests. A series of 1000 images were recorded every 500 cycles so that changes in the surface temperature due to fatigue could be periodically observed. The tests were conducted at 10 Hz and R (load ratio) = 0.1 for different load conditions ranging from 500 N to 900 N maximum load in order to evaluate fatigue behaviour at lifetimes between 103-105
cycles.
Since the tests were conducted under load control, CEA-06-062UT-120 strain gauges were placed on the area of interest of the coatings i.e. the maximum strain zone, in order to evaluate the strain developed on the top surface of each coating for each set of load conditions.
5.2.4 Characterization
An optical microscope was used to observe the presence of cracks on the sample surfaces enabling comparison with the infra-red images obtained. Cross-sections of tested and un-tested bearings were also studied with SEM. Fine strips of un-tested samples were cut and polished with successively finer grades of silicon-carbide paper (220, 500 and 800), then of diamond
suspensions (9, 3 and 1 m) and finally a colloidal silica suspension (0.06 m). The multilayer structure of the coating is revealed with a JEOL 6500F FEG-SEM equipped with an EDS for compositional analysis. Finally, cross-sectional analysis of the fatigue tested samples was

Chapter 5
96
conducted using an NVision40 dual system FIB-FEG-SEM, which allows cross-sections of specific locations to be made without damaging sensitive surface features such as cracks.
5.2.5 Image processing
The layer thicknesses of each thin overlay electroplated coating were measured using SEM images at high magnification and process them to evaluate coating thickness values. Firstly, Fiji-ImageJ is used to select the layer of interest (Figure 5-2a), then to highlight the edges by adjusting the threshold, binarizing the image (Figure 5-2b) and then exporting the binarized image to Matlab (Figure 5-2c). Using Matlab, the distance between the two edges for each column of pixels was measured. A similar process was followed to measure the thickness of the interlayer and the backing using optical microscope images.
Figure 5-2. Example of the process followed to measure the thickness of the layers that compose the overlay for 2IML. a) Image taken with SEM, b) binarized image of one of the layers where the edges are highlighted and c)
exported image to Matlab to run the program in order to measure the layer thickness.
Using the infra-red camera during the fatigue tests, a certain number of frames or images were recorded and stored sequentially every 500 cycles. The infra-red signal from the camera is correlated to the loading signal from the test machine (known as the lock-in technique), consequently, the level of noise is significantly reduced since only the infra-red response at the specified loading frequency is analysed. The recorded images were processed using AltairLI software, which performs a fast Fourier transform (FFT) based averaging procedure over all the recorded images to generate three data sets [188]. The first file contains the absolute temperature, T, of the specimen for each pixel. The second file contains the temperature change, ΔT. The third file contains phase data which identifies whether the temperature change was in phase or out of phase with the applied loading. Typically the T and ΔT signals would be used to provide quantitative full field surface stress data via a technique called Thermoelastic Stress Analysis (TSA) which allows temperature change to be directly related to the sum of the principal stresses. Meanwhile the phase signal would be used to identify areas of tensile or compressive stress.
One of the fundamental assumptions of thermoelastic stress analysis is that adiabatic conditions are maintained (i.e. no heating or heat transfer) during the period of time that data is recorded (i.e. from one image to the next). Under adiabatic conditions, an applied stress causing a local

Fatigue assessment of multilayer coatings using lock-in thermography
97
volume variation will subsequently cause a local variation in the temperature of that volume, these conditions are achieved where a uniform stress distribution occurs. If non-adiabatic conditions prevail, the measured temperature change will not be as a result of the stress change alone.
Violations of this assumption, i.e. non-adiabatic behaviour, can be readily observed from the phase change information. This assumption can be used to our benefit since the formation and growth of small cracks, and the cyclic plasticity in the region, will cause internal heating (non-adiabaticity) which would manifest itself as a change in phase signal in the region of the damage. Therefore analysis of the phase signal may enable the effect of cracks on the stress field to be detected.
In order to highlight areas with variations in the phase and thereby allowing crack location identification, the images were processed with Matlab using the following steps (Figure 5-3):
i. Subtract each image from an image of reference, taken at the beginning of each test, in order to obtain the relative change of phase (Figure 5-3a).
ii. From the resultant image calculate the mean (m) and standard deviation (std) of the phase-signal in the area of interest in order to quantify the noise within the images (Figure 5-3b).
iii. Use the results of the previous step as a threshold, in our case we removed the noise with 95% confidence by eliminating all the values below m+2std (Figure 5-3b).
iv. Remove groups of pixels with less than ten members in order to eliminate possible anomalies. Following this process one can obtain images to identify relative changes of phase due to the appearance of cracks in different samples and use them to establish a consistent and quantitative criterion of crack initiation-early crack growth (Figure 5-3c).
Following this procedure we were able to better identify the fatigue damage detected by the infrared camera.
Figure 5-3. Schematic of the steps followed to process the phase images: a) Subtraction of the image of reference
from the image of interest (step i); b) Measurement of the mean (m) and standard deviation (std) of the signal (step ii). Use these results as a threshold by displaying only the data above m+2std (step iii); c) Resultant image, where
possible anomalies have been eliminated.

Chapter 5
98
5.3 Results and Discussion
5.3.1 Microstructure characterization
The multilayer overlay coating is the only variation between the three bearing architectures, as the same dimensions (and composition) of leaded bronze interlayer and steel backing were used in all the bearings. In order to study the microstructure of the three different overlays, the bearings were therefore cut perpendicular to the coating surface, to assess the cross-sections of the layers.
In Figure 5-4a one can see an overall cross-section for a 1IML coating. Four distinct, different layers can be seen: at the bottom there is the bronze interlayer (containing lead islands), which will smear out acting as a solid lubricant in case the top coating spalls off or is otherwise removed during service. Above the interlayer the nickel barrier can be seen, then a very thin intermetallic layer and finally the tin top layer with 3%wt. of copper that is believed to provide the best compromise between surface properties and fatigue resistance during service [112]. On being first manufactured, the coating is produced with a Sn layer containing 10%wt. of copper above the nickel layer, and then a Sn-3wt%Cu layer on the top surface, this cannot be distinguished in the SEM after the annealing process. It is believed that this is because most of the copper in the original 10wt% region has diffused to the interface between the Ni and Sn layers (to form the intermetallic), and that this original higher Cu composition profile also acts to reduce the diffusion of Cu from the outermost Sn layers towards the Ni, hence, the system maintains the original properties on the top layer for longer [112].
Similarly, Figure 5-4b shows the layered structure for the 2IML coating, which also comprises the leaded bronze interlayer and the nickel diffusion barrier that prevents the diffusion of copper up from the interlayer into the subsequent Sn based coatings, thus preventing the formation of Cu3Sn which is a brittle intermetallic with undesirable properties. Thus the result is that there is a thin intermetallic layer, a Sn based layer, a thicker intermetallic layer of
approximately 4 microns and finally the upper 8 microns is a tin-copper layer with the composition being predominantly tin after thermal annealing. Y. Zhang et al. [159] obtained similar results for this structure (2IML), however, they observed some differences in the microstructure for 1IML i.e. the quantity of Cu6Sn5 intermetallics in the Sn based layers; this variation is due to the lack of thermal annealing in their structure compared to the coating investigated in this work.
The structure of the 3IML coating follows the same principle as 2IML combining multiple Ni based and Sn based layers, while utilising two additional layers on the top (Figure 5-4c). Although the layer thicknesses are reduced proportionally to still achieve 20 micron of total overlay thickness (Table 5-1).
It can also be observed that after thermal annealing some of the original nickel barrier layer was converted into a tin-nickel intermetallic compound layer, due to the diffusion between Ni and Sn. This also explains why the interface between the Sn-IMC is rougher than the interface between Ni-IMC, since the diffusion between Ni-Sn is faster than Ni-Cu [189, 190].
In all the overlay coatings, it has been observed that the Ni layer is displaced towards (or directly linked to) lead particles when they are close to the Ni barrier layer. This phenomenon can be explained by considering the leaded bronze structure in the top surface plane just before the Ni electrodeposition step. During the electrochemical etching step the lead is preferentially removed creating a difference in the surface level of those materials. Thus the nickel deposited

Fatigue assessment of multilayer coatings using lock-in thermography
99
directly above a lead particle would be deposited at a different (lower) level as seen in the cross-sections.
Table 5-1 outlines the systematic image analysis based thickness evaluations of each layer in the coatings, showing a good agreement with the SEM pictures and EDS analysis in Figure 5-4.
Table 5-1. Layer thickness for each coating structure.
Thickness (average std) (m)
Layers 1IML 2IML 3IML
Steel backing 1239 5 1239 10 1233 4
Leaded bronze interlayer 243.3 0.6 245.7 0.6 246 4
Ni diffusion barrier 1.6 0.1 1.2 0.1 1.4 0.2
Bottom IML 0.7 0.1 1.6 0.3 1.2 0.1
Bottom Sn-Cu layer 21.3 0.5 6.8 0.1 5.9 0.2
Middle IML - - 1.9 0.1
Middle Sn-Cu layer - - 4.4 0.2
Top IML - 3.5 0.6 2.0 0.3
Top Sn-Cu layer - 8.3 0.2 5.4 0.1
Total multilayer coating 22.0 0.7 20.2 1.2 20.8 1.0

Chapter 5
100
Figure 5-4. Backscatter image with compositional line scan for Ni, Sn and Cu in: a) 1IML, b) 2IML and c) 3IML
coatings.
5.3.2 Application of lock-in thermography for crack detection
The objective of applying the thermography approach is to find a technique that can reliably detect the onset of cracking at an earlier stage than existing methods or criteria, (e.g. the compliance based failure criteria linked to a certain displacement under load control, discussed in Section 5.3.3). This technique is also a non-contact and non-destructive technique, allowing extra information during the fatigue test to be obtained without introducing any potential damage to the samples, thus helping to gain understanding on how the cracks initiate and grow.
In order to apply lock-in thermography, samples under infra-red observation need to behave like a ‘black body’, i.e. only emitting heat radiation, in order to avoid reflections of radiation coming from surrounding bodies and external sources. In addition, this will maximize the measured response and reduce signal to noise ratio. For this reason, the surface of samples are typically coated with a matt black paint to create a uniformly and high emissivity surface [187].

Fatigue assessment of multilayer coatings using lock-in thermography
101
However, it is important that the correct thickness and type of coating is achieved. If the paint is too thin, the sample will not be opaque and will reflect radiation from other bodies (increasing noise); conversely, if the paint is too thick, the signal will suffer a delay or lag (since the paint acts as a thermal insulator, and its temperature lags that of the substrate beneath it [191, 192]). Therefore a study was required to determine the optimum paint thickness which was conducted in accordance with the procedure outlined in [121]. In order to study the optimum paint thickness, six samples with a top tin coating were painted with different thicknesses. Each one of the six samples were painted applying different ‘number of passes’, from one pass to six passes and then the paint thickness was measured (Table 5-2).
Table 5-2. Correlation between the number of passes and the pain thickness.
Number of passes Measured paint thickness (m)
1 9.22 1.01
2 16.13 2.30
3 20.59 1.65
4 24.48 1.50
5 26.97 0.99
6 28.85 1.50
All specimens were cyclically loaded for 1000 cycles within the elastic regime while recorded with the infrared detector. Since the response at any given paint thickness is also dependent on the loading frequency, the effects of both paint thickness and loading frequency are explored concurrently, therefore, the frequencies used were 5, 10 and 15 Hz. In order to assess the response of the signal, ΔT was measured from a profile crossing the centre of each sample, where maximum change in temperature occurs due to the localization of maximum stress.
Figure 5-5. Change of temperature (ΔT) for samples with different pain thickness tested for 1000 cycles at maximum
load of 1000 N, R=0.1 and three different frequencies: 5, 10 and 15 Hz.
From the results shown in Figure 5-5, one can observe that when the paint thickness is around
10 m, the surface emissivity is that of the combined surface and paint coating, resulting in a reduced response and greater dispersion due to the noise produced for possible reflections. The
paint appears to present the highest response at a thickness of 20.59 m, where the response seems to be more independent of the loading frequency, which further reinforces that this is

Chapter 5
102
the optimum thickness, since the thermic response should be independent of loading frequency given adiabatic conditions, hence, it can be concluded that the experimental variation of the thermal response is purely an attenuation effect of the paint. The response for thicker thicknesses suffer from thermal lag [192], which is caused by the insulating effect of the paint coating, decreasing ΔT as the paint thickness increases. At such thicknesses the signal is also suffering from thermal drag-down [192], which is a phenomenon relating to both the paint thickness and the loading frequency, where the heat does not flow into the paint sufficiently quickly to maintain the temperature change for accurate measurements to be recorded, therefore, as shown in Figure 5-5 at low frequencies the measures are greater than at high frequencies. It can be concluded that the paint coating gives a good representation of the
surface temperature when it is around 20.59 m thick. Therefore, all the samples are painted with 3 passes for subsequent fatigue tests.
A further study was conducted to correlate between cracks detected using the infra-red detector and those seen under the optical microscope in order to confirm that the phase changes observed in the infra-red images are caused by the appearance of cracks, as detailed in Section 5.2.5. Three bearings with 1IML were tested with a load amplitude of 315 N, at 10 Hz and a load ratio of 0.1, whilst being recorded with the infrared detector at 500 cycle intervals. The first bearing was tested for a total of 5000 cycles, and the test was stopped every 1000 cycles to observe the coating surface under the optical microscope. The second bearing was tested for 10000 cycles in total and stopped only once at 5000 cycles, and the third was tested for 20000 cycles in total and stopped only once at 10000 cycles. After the tests, the images obtained using the optical microscope and the infra-red camera were compared qualitatively. Figure 5-6 shows the comparison of images for the first tested bearing, where it can be seen that after 3000 cycles, damage is found at the same position with both techniques. It is noteworthy that we found similar results with the second and third bearings, confirming these results. Therefore, a qualitative correlation between cracks observed using optical microscope and the phase changes obtained in the infra-red images exists. Thus confirming that the change in phase on the surface of the sample is indicating the presence of cracks and identifying their location.

Fatigue assessment of multilayer coatings using lock-in thermography
103
Figure 5-6. Comparison between images taken with an optical microscope and phase images taken with an infra-red camera (the red arrows point at cracks in the micrographs and sudden phase change in the phase images).
5.3.3 Fatigue tests
The fatigue tests were intended to assess the fundamental fatigue behaviour of these multilayer materials architectures. Hence, the tests do not aim to simulate the complex stress and strain conditions which a bearing in service will suffer due to the rotation of the journal against it. Instead, tests were conducted under 3-point bend, simplifying the load states and the conditions in order to have more control of the factors that could affect fatigue. Using this configuration, the maximum stress developed in the overlay is in a line below the top roller load application, ensuring localization of (and hence easier study of) the cracks.
In Figure 5-7 the results of fatigue tests for 30 bearings (3 coatings, 5 load conditions and 2 repetitions, all with the same dimensions) are plotted using a compliance based failure criterion. This criterion was used in order to ensure that the tests were terminated when all the bearings had reached a similar degree of fatigue damage, and to determine the number of cycles to a certain level of failure. While running the test, the displacement of the sample was monitored; failure of the sample was deemed to occur when the minimum position of the load cell had displaced by 0.1 mm from the initial minimum value. At this point the sample coating presents a substantial amount of surface cracks but without gross failure of the bearings occurring. In the first few loading cycles the minimum position tends to change significantly due to the sample settling in the rig, thus the initial displacement value was defined as the displacement after 1000 cycles.

Chapter 5
104
Figure 5-7. La-N curve, plotting the load amplitude versus the number of cycles to failure using the compliance failure
criterion for 1IML, 2IML and 3IML.
From these results one may observe that there is not much difference in the performance of the tested bearings in terms of their lifetimes as a function of applied load, since the scatter in the results within a particular bearing class is sometimes greater than the difference between classes. This can be considered in terms of the crudeness of the chosen failure criterion, which accounts for the compliance of the whole sample, which is mostly the steel backing. This criterion assesses then mainly the response of the steel backing, which is the essentially the same for all the bearings. By sectioning some of the bearings, we found that in all of them the fatigue crack had penetrated into the steel at the point when the tests were stopped on achieving the compliance change criterion. Thus confirming the lack of sensitivity in assessing particularly the fatigue response differences in the thin overlay coatings, which is of far greater interest for the service failure assessment. This motivated our move to use another failure criterion based instead on the surface damage detection made possible by infra-red thermography.
The use of thermography provides a wealth of data around the zone of maximum stress/strain, enabling full-field information about crack evolution to be obtained. Use of such a technique in-situ helps to provide valuable information about the crack initiation and crack growth on the surface of the coating, and to set a more sensitive failure criterion based on these crack-related features. Therefore fatigue tests were conducted while recording data with the infra-red camera, and the obtained phase images were subsequently processed to obtain binary images at the different stages of testing in order to detect crack evolution on the surface of the coating during the fatigue tests. This information can then be used to establish a failure criterion that is far less conservative (and explicitly linked to the very early stages of crack initiation and growth in the multilayer overlay coatings) than the more gross failure criterion based on the compliance of the sample. This then will allow ranking of the coatings in terms of fatigue processes occurring principally in the overlay coatings (which has much higher service relevance). The criterion used was defined as the earliest image that could detect cracks reliably on the infra-red data recorded throughout the test. Based on the study described in Section 5.3.2, the minimum crack length that could be detected was around 0.7 mm, so this was defined as the damage initiation detection limit and the corresponding lifetimes were identified. In Figure 5-8 one can see the results for 34 bearings, where we can discern the different fatigue performance of the three coatings in terms now of the new lifetime observed as a function of the load amplitude (all bearings had the same overall dimensions to within a tolerance of 0.02 mm). Figure 5-8 shows now a clear separation of the best performance of 2IML and the worst performance for 3IML

Fatigue assessment of multilayer coatings using lock-in thermography
105
indicating that this method has a higher sensitivity for detecting initiation of damage and evaluating different coating systems under this simplified fatigue loading. They also show a lower scatter in the results with respect to Figure 5-7, indicating the better consistency of such
a determination of lifetime to a similar level of damage initiation (0.7mm surface crack length).
Some of these tests were then stopped as soon as damage was detected (0.7mm surface cracks), with the objective of studying in detail some of the shorter cracks. Looking at these smaller cracks at high resolution provides insight into the processes occurring during crack initiation and early crack propagation within these multilayer coatings to elucidate the reasons why the 2IML coating architecture is performing better than the 3IML system. It is noteworthy that any tests above a load amplitude of 315 N conducted with the infra-red camera, detected damage at these higher loads in the very first cycles, so the lifetime to early crack formation was effectively zero in these cases and has not been plotted in Figure 5-8.
Figure 5-8. La-N curve, plotting the load amplitude versus the number of cycles to damage detection using lock-in
thermography for 1IML, 2IML and 3IML.
The lifetimes obtained applying the lock-in thermography approach are linked to much earlier stages of damage and so are much shorter than the life-time obtained using the grosser compliance based failure criterion (where the crack had propagated into the steel backing). In
Figure 5-9 we can see that by using the new damage initiation methodology (cracks 0.7mm), the lifetime occurs between 5-25% of the lifetime obtained with the old methodology (i.e. the point of crack growth into the steel backing, the gross compliance criterion). Thus, this new methodology has established a failure criterion which is far less conservative than the previous methodology and has more direct service relevance to the failure processes of the overlay coating.

Chapter 5
106
Figure 5-9. Failure criteria comparison between the compliance criterion and the thermography failure criterion in terms of number of cycle to damage detection versus load amplitude (La).
Strain gauges were placed on the coatings to evaluate the strain level developed on the overlay coating surface at the applied loads during these accelerated fatigue tests. We then emulated the load conditions of an accelerated test whilst measuring the evolving strain in the overlay coating surface. We used two frequencies during the test: first we ran the tests at 10 cycles per second until the strain stabilized, since during the first few cycles we observed significant work-hardening, and then slowed down the test frequency to 1 cycle per second in order to record the stabilised cyclic stress-strain in detail and to allow accurate measurement of the total strain range. We confirmed that there is no strain rate effect on the measured stresses and strains between these 2 frequencies. We carried out these cyclic tests for all three overlays, using the five load conditions used for the accelerated fatigue tests, and focussed on characterising the cyclically stabilised strain range, since we observed strain ratcheting during the test. The results are shown in Figure 5-10, where we can observe that the strain range increases with the load applied. From this plot it can be seen that 1IML is the coating that presents the highest amount of deformation under these load controlled tests. This can be attributed to the strength contribution of the aligned hard intermetallic layers, which can be expressed by a simple rule-of-mixtures approximation along the applied stress direction:
Ec = EIntermetallicXIntermetallic + ESnXSn Equation 5-1
σyc = σyIntermetallicXIntermetallic + σySnXSn Equation 5-2
Where EC and yc are the moduli and the yield strength of the coating, EIntermetallic and ESn are the
moduli of the intermetallic material and Sn layer, respectively, and Intermetallic and Sn are the yield strength for the intermetallic material and Sn layer; and XIntermetallic and XSn are the volume fractions of the intermetallic compounds and Sn phases in the coating. Therefore, the Young’s modulus and the yield strength for 1IML are expected to be lower due to the lesser amount of hard intermetallic in the coating structure. 1IML contains around 3% of hard intermetallic materials, whilst 2IML and 3IML contain around 25% out of the overall coating (calculated by area fraction analysis). Thus, the average Young’s modulus and yield strength would be higher for 2IML and 3IML, which means that the strain range would be reduced compared with 1IML. However, 3IML shows less deformation than 2IML with the same expected volume fraction of

Fatigue assessment of multilayer coatings using lock-in thermography
107
hard material. This could also be considered in terms of the Hall-Petch [84, 85] equation which can also be applied for multilayer materials (Equation 5-3) [83]:
σy = σ0 + Kd−1 2⁄ Equation 5-3
Where y is the yield stress of the material, 0 and K are material-dependent constants, and d, in multilayer materials, is the bilayer thickness of the component phases. In this case, the Hall–Petch relation is based on the pile-ups of a large number of dislocations at the interface of
multilayers. Since d is smaller in 3IML (7 m), its yield stress is predicted to be higher than 2IML
(10 m). In our case we would expect an increase of 20% in the yield strength of 3IML compared with 2IML. Therefore, the thinner the bilayer thickness, the higher predicted yield strength, reducing the strain range. This can be explained by the mobility of dislocations. The plastic deformation in thin layers becomes more difficult because dislocations have shorter mean glide distances due to the barrier effect of the interfaces in the multilayers. This is because the dislocations in soft Sn layers can pile-up at the interfaces, and cannot glide across these interfaces because of the lattice and elastic modulus mismatches. Hence, the plastic strain experienced by the coatings will decrease with decreasing layer thickness [83].
Figure 5-10. Total strain range for 1IML, 2IML and 3IML.
Although, we have used load amplitude versus number of cycles as a first approximation to compare the fatigue performance of different coatings, we can also combine Figure 5-7 and Figure 5-8 with Figure 5-10 in order to better rank such coatings by using the strains measured on the surface of the overlay coating during fatigue tests, which may better describe the behaviour developed in the coating during the fatigue tests. In Figure 5-11 one can see how by using the lock-in thermography technology, we can observe a more significant difference regarding the fatigue performance of the three coatings considered in this study when the lifetime to damage initiation in the overlay coating is considered in terms of the total strain experienced in the overlay coating.

Chapter 5
108
Figure 5-11. Δ-N curve, plotting the total strain range versus the number of cycles to failure using: a) compliance failure criterion and b) failure criterion by using lock-in thermography for 1IML, 2IML and 3IML.
5.3.4 Post-test observations
5.3.4.1 Thermographic observations
In addition to establishing a more service relevant failure criterion, the processed images taken with the infra-red camera can also be used to observe the evolution of damage during the fatigue tests. For example, in Figure 5-12 (and the attached video) we can see the initiation and growth of cracks in 1IML, tested at La=315 N and Nf=32984 cycles (using the compliance failure criterion). In these images the damage, in white, grows along the ‘x’ axis (along the width of the sample), being the tensile axis perpendicular to the ‘x’ axis. In this case, we can see how the cracks initiate on the left side of the bearing, propagating perpendicular to the tensile axis towards both edges. This allows assessment of the location of crack initiation and the evolution of crack propagation, facilitating any subsequent search for cracks at high or very high magnifications. Higher magnification observations will help to understand the failure mechanisms of these samples in particular, and by extension offers similar opportunities to

Fatigue assessment of multilayer coatings using lock-in thermography
109
other fatigue tests in other systems, highlighting the potential of this combination of methodologies.
Figure 5-12. Post-processed infra-red images showing the evolution of damage in a 1IML tested at 315 N of load amplitude (total strain range = 0.003491) (video).
5.3.4.2 Surface observations
After these accelerated fatigue tests, the bearings were also examined by optical microscopy in order to observe the amount of damage and crack morphology development from the top surface. In Figure 5-13 we can see surface crack observations for each of the coatings tested at 225 N of load amplitude (total strain range for 1IML, 2IML and 3IML are 0.002284, 0.002228 and 0.002142, respectively), for both cases stopping the fatigue tests using the compliance failure criterion (Figure 5-13a-c) and using the lock-in thermography as the failure criterion (Figure 5-13d-f). In the same set of images one can observe that different cracks have grown and coalesced together to form longer cracks, it is especially visible in Figure 5-13a-c, but also discernible in Figure 5-13g-i. It is also interesting to note that, although most of the cracks have propagated in the surface perpendicular to the tensile axis, some of the smaller cracks in Figure 5-13g-i appear to propagate at an angle to, or even parallel to, the tensile axis in order to coalesce as longer cracks, indicating the locally complex stress state in which the cracks are propagating. We can also see that the relatively high roughness of the electroplated surface is making any detailed observation (including grain size) difficult, since the surface cannot be mechanically polished without removing the very thin, soft Sn based overlay itself (which is the focus of the research investigation).
One can observe in the magnified images of the last three samples (Figure 5-13g-i) how different the crack fields are in the different coating architectures. In the 1IML architecture (Figure 5-13g) fewer cracks are observed but they appear thicker and longer, on the other hand, 3IML (Figure 5-13i) has more cracks but they are shorter and thinner, and finally, the 2IML architecture (Figure 5-13h) appears intermediate between the two previous cases. This could be linked to the strain range results at the same applied load if we consider that long cracks are also expected to be deeper [193], then it is evident that since 1IML experiences more total strain range for the same load, this may produce longer cracks, as the driving force for fatigue crack propagation will have been higher. It is less clear why the number of initiation sites may have varied between the architectures. Further consideration needs to be given as to why fewer longer cracks have given rise to a similar final failure displacement criterion (linked to significant crack penetration into the steel backing).
Also, from Figure 5-13g-i one can see that the surface paths of the cracks in 1IML seem to be more tortuous than those in 2IML and 3IML, and the cracks in 2IML more tortuous than the cracks in 3IML. This could be explained by considering:

Chapter 5
110
1. Tin has a low melting point (231 C), thus, the annealing temperature is sufficient for the Sn grains to grow in a columnar fashion in the deposition direction after the initial plating process (columnar grains of Sn can be seen in the cross-sections in Figure 5-14). Thus, structures with a thicker Sn layer are expected to allow larger Sn grains to grow (as can be seen in the cross-sectional images in Figure 5-14, where thicker Sn layers contain larger columnar Sn grains). Although we don’t have direct observations of the grain size in the top surface plane, it is reasonable to expect that, the thicker the top-surface Sn layer, the coarser the grain size in the Sn.
2. The fatigue cracks at room temperature usually propagate along tin grain boundaries (examples of intergranular crack propagation can be seen in the overlay cross-sections in Figure
5-14). As the fatigue tests are conducted at room temperature (21 C), which is 58% of the absolute melting point for pure Sn, these then can be considered as effectively high temperature or time-dependent fatigue tests [74]. This creep-fatigue regime would also explain the ratcheting strain performance seen under cyclic loading and the possible effects of creep fatigue need to be considered. Typically intergranular crack growth is seen under creep-fatigue conditions.
Thus, it is possible that, the thicker the final top-surface Sn layer in the overlay, the larger the expected columnar grain size and so the more tortuous the surface cracks would be, if they are indeed growing intergranularly. This increase in tortuosity with Sn layer thickness is indeed seen in Figure 5-13g-i. This would also explain some of the differences in the observed crack field distributions between the coatings. A thinner Sn coating being expected to have a smaller grain size and more grain boundaries, and hence more potential crack propagation routes, perhaps creating the higher density of cracks (although the initiation process at a microstructural level still needs to be confirmed). As a result, it is likely that a coarser grain size in the thicker Sn coatings will have a better fatigue performance, since intergranular fatigue processes will be expected to pre-dominate and will be less prevalent with a coarser grain size. Thus, a Sn microstructure with bigger grains will have a higher creep resistance [194] offering less crack propagation paths and these will also be more deflected (and so offer additional intrinsic and extrinsic shielding effects to crack propagation rates). These additional factors may explain why 1IML has a better performance than 3IML, since the latter is composed of thinner Sn layers, hence, potentially a smaller Sn grain size and worse creep-fatigue resistance.

Fatigue assessment of multilayer coatings using lock-in thermography
111
Figure 5-13. Surface cracks on six samples (two for each type of coating) tested under the same conditions, the three top stopped using the compliance failure criterion and the other three using lock-in thermography.
5.3.4.3 Cross-sectional observations
Examples of intergranular crack propagation in Sn can be seen in Figure 5-14, where we have used FIB to obtain cross-sections of some of the fatigue cracks seen on the bearing overlay surface. Firstly, one can see in Figure 5-14a a fatigue crack in 1IML, which propagates along the columnar tin grain boundaries towards the intermetallic layer, where it seems to be arrested. Due to this phenomenon the crack path was observed to present a higher degree of tortuosity in the Sn layers than in the intermetallic layers. Secondly, in Figure 5-14b we can see cracks in 2IML with some degree of deflection in the interface between the Sn layer and the intermetallic layer, where the crack changes its direction following the interface until it eventually penetrates to the harder material. It is noteworthy that in most of the observations the cracks are deflected and sometimes arrested in the Sn layers in between the intermetallic layers. Thirdly, in Figure 5-14c we can observe the crack path in 3IML, which also presents some degree of deflection, where the cracks propagate along the tin-intermetallic interface. Finally, we have also observed in some cases that the cracks initiate on the top surface, usually from stress-raisers induced by surface roughness that are found between Sn grains. Moreover, in all three architectures the direction of the crack propagation in Sn-Ni intermetallic and pure Ni layers is mostly perpendicular to the tensile axis, however in the Sn based layers the angle of propagation changes frequently as it follows the grain boundaries.
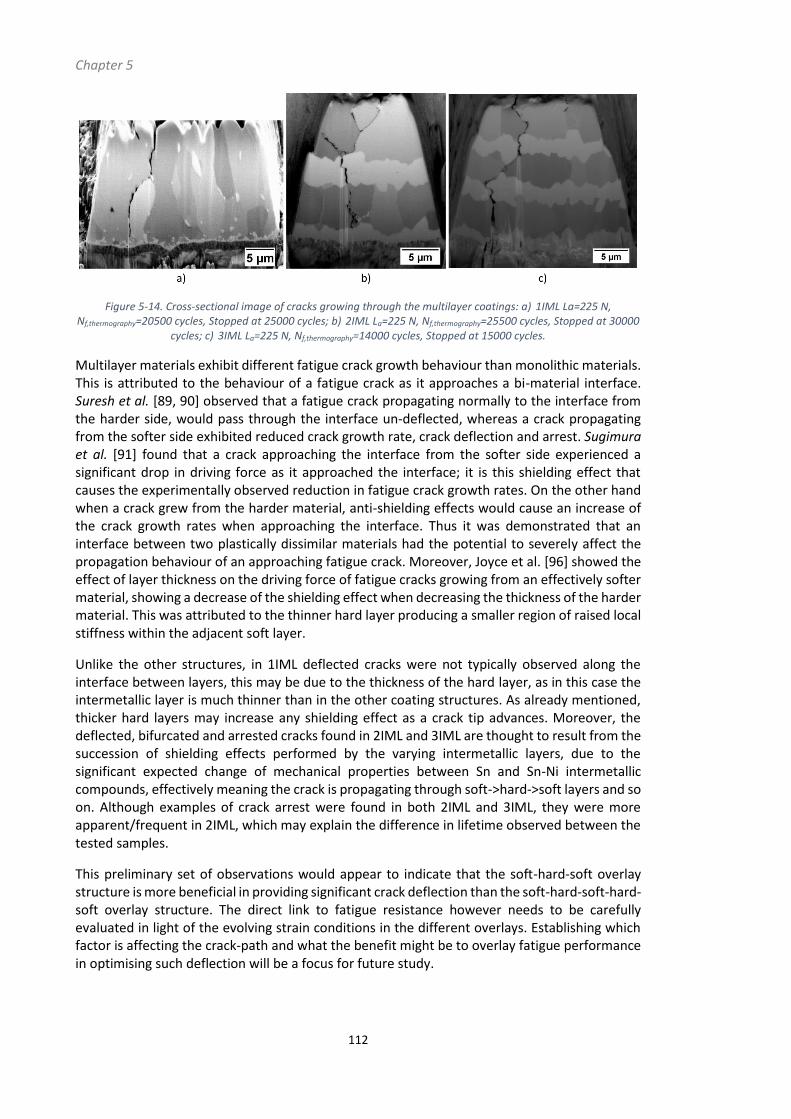
Chapter 5
112
Figure 5-14. Cross-sectional image of cracks growing through the multilayer coatings: a) 1IML La=225 N, Nf,thermography=20500 cycles, Stopped at 25000 cycles; b) 2IML La=225 N, Nf,thermography=25500 cycles, Stopped at 30000
cycles; c) 3IML La=225 N, Nf,thermography=14000 cycles, Stopped at 15000 cycles.
Multilayer materials exhibit different fatigue crack growth behaviour than monolithic materials. This is attributed to the behaviour of a fatigue crack as it approaches a bi-material interface. Suresh et al. [89, 90] observed that a fatigue crack propagating normally to the interface from the harder side, would pass through the interface un-deflected, whereas a crack propagating from the softer side exhibited reduced crack growth rate, crack deflection and arrest. Sugimura et al. [91] found that a crack approaching the interface from the softer side experienced a significant drop in driving force as it approached the interface; it is this shielding effect that causes the experimentally observed reduction in fatigue crack growth rates. On the other hand when a crack grew from the harder material, anti-shielding effects would cause an increase of the crack growth rates when approaching the interface. Thus it was demonstrated that an interface between two plastically dissimilar materials had the potential to severely affect the propagation behaviour of an approaching fatigue crack. Moreover, Joyce et al. [96] showed the effect of layer thickness on the driving force of fatigue cracks growing from an effectively softer material, showing a decrease of the shielding effect when decreasing the thickness of the harder material. This was attributed to the thinner hard layer producing a smaller region of raised local stiffness within the adjacent soft layer.
Unlike the other structures, in 1IML deflected cracks were not typically observed along the interface between layers, this may be due to the thickness of the hard layer, as in this case the intermetallic layer is much thinner than in the other coating structures. As already mentioned, thicker hard layers may increase any shielding effect as a crack tip advances. Moreover, the deflected, bifurcated and arrested cracks found in 2IML and 3IML are thought to result from the succession of shielding effects performed by the varying intermetallic layers, due to the significant expected change of mechanical properties between Sn and Sn-Ni intermetallic compounds, effectively meaning the crack is propagating through soft->hard->soft layers and so on. Although examples of crack arrest were found in both 2IML and 3IML, they were more apparent/frequent in 2IML, which may explain the difference in lifetime observed between the tested samples.
This preliminary set of observations would appear to indicate that the soft-hard-soft overlay structure is more beneficial in providing significant crack deflection than the soft-hard-soft-hard-soft overlay structure. The direct link to fatigue resistance however needs to be carefully evaluated in light of the evolving strain conditions in the different overlays. Establishing which factor is affecting the crack-path and what the benefit might be to overlay fatigue performance in optimising such deflection will be a focus for future study.

Fatigue assessment of multilayer coatings using lock-in thermography
113
5.4 Conclusions
In summary, a new methodology combining a number of techniques has been established to assess the fatigue performance of multilayer coatings. This methodology is able to consistently detect damage in the overlay coatings subjected to fatigue testing, hence, it is possible to rank different thin overlay coating structures in terms of their fatigue response. Moreover, the approach used has allowed us to locate the damage origin and observe the evolution of such damage during the tests, using non contacting full-field techniques, without test interruption. The use of the lock-in thermography establishes a failure criterion that is much less conservative than a failure criterion based on the compliance change of the sample, detecting damage much earlier. This eases study of the micromechanisms that control the fatigue performance of such multilayer coatings.
The fatigue tests revealed a better resistance to early damage in the coating with two hard layers (2IML) and the worst fatigue damage resistance was developed by the coating with three hard layers (3IML). It is proposed that the balance between several mechanisms may explain the different fatigue performance of the presented coatings:
- Less Sn or thinner Sn based layers which are more constrained by the IMC, make the system less compliant (decreasing the strain range experienced) and more brittle. This can also be linked to the stress relaxation that Sn provides, hence, less Sn or more constraint of thinner Sn layers will allow less stress relaxation of the system.
- Higher surface roughness may cause higher stress concentration on the top Sn surface, leading to earlier crack initiation. Also, differences in the roughness of the IMC layers can create preferential sites for subsurface crack initiation or propagation.
- Different population, shape and size of defects between coatings might also affect their fatigue performance by creating sites of preferential initiation or propagation.
- Creep can also control propagation processes, since the fatigue tests were done at a high homologous temperature for Sn. Hence, the grain size will affect the creep resistance: coarser grains will present better creep-fatigue performance.
- Crack shielding and anti-shielding effects will also influence the crack propagation. Differences in the thickness and properties of the coating layers will reduce or increase the crack growth rate, deflecting and even arresting cracks.


Competing mechanisms affecting the fatigue performance of Sn-Ni-Cu based multilayer coatings
115
6. Competing mechanisms affecting the fatigue performance of Sn-Ni-Cu based multilayer coatings
6.1 Introduction
The complexity of the micrometre-scale multilayer structures that comprise overlay coatings offers challenges to the investigation of short fatigue cracks in terms of both the varying materials microstructure and the interaction of fatigue cracks with the microstructure. The replication technique replicates the surface sample via a plastic compound, which is applied at intervals during the fatigue test to the region where the fatigue crack is expected to initiate. This provides a series of snapshots of the crack growth process on the surface. However, the growth of a small surface-breaking fatigue crack is a complex 3D process due to its interaction with local microstructure below the surface and other features such as potential defects, especially in the case of sub-surface initiating short cracks. The replica record is used to measure only the surface fatigue crack growth (da/dN), usually based on assumptions of a single semi-elliptical crack with a driving force simply described by ΔK values. However, the three dimensional fatigue crack shape provides a better reflection of true fatigue crack behaviour [195].
Two main categories can be distinguished when classifying experimental techniques that can reveal the three-dimensional shape of a small crack: destructive and non-destructive techniques. While mechanical serial sectioning [196, 197] and focused ion beam (FIB)
tomography [198] fall in the first category, micro-X-ray computed tomography (-CT) [199] falls into the second. These methods enable the 3D reconstruction of cracks, as well as microstructures, which can then be used to study the 3D interaction between crack growth and microstructure through quantitative evaluation of a 3D microstructure and its interaction with crack morphologies [200].
In the present work we investigate further the effects of identified factors (intermetallic constraint, roughness, defects, creep, shielding [201]) that are expected to control the micromechanisms causing fatigue failure of the Sn-Ni-Cu based multilayer coatings. The study of these factors will help understand the intrinsic fatigue crack behaviour in such systems, which can then be used to aid new strategies for coating designs with enhanced fatigue resistance.
6.2 Materials and Methods
6.2.1 Specimens
A full description of the multilayer coatings in the semi-cylindrical samples have been provided in Chapter 3, the relevant details are therefore reported here only briefly.
Two types of geometries are considered in this chapter: semi-cylindrical and flat samples (Figure 6-1a-b). Both kinds of specimens have the same basic coating architecture. The specimens consist of a steel backing, a leaded bronze interlayer and the final multilayer coatings. Such coatings have thin nickel based and tin based layers applied to the bronze interlayer by proprietary electrodeposition approaches (Section 3.1.2). Once coated, the specimens are
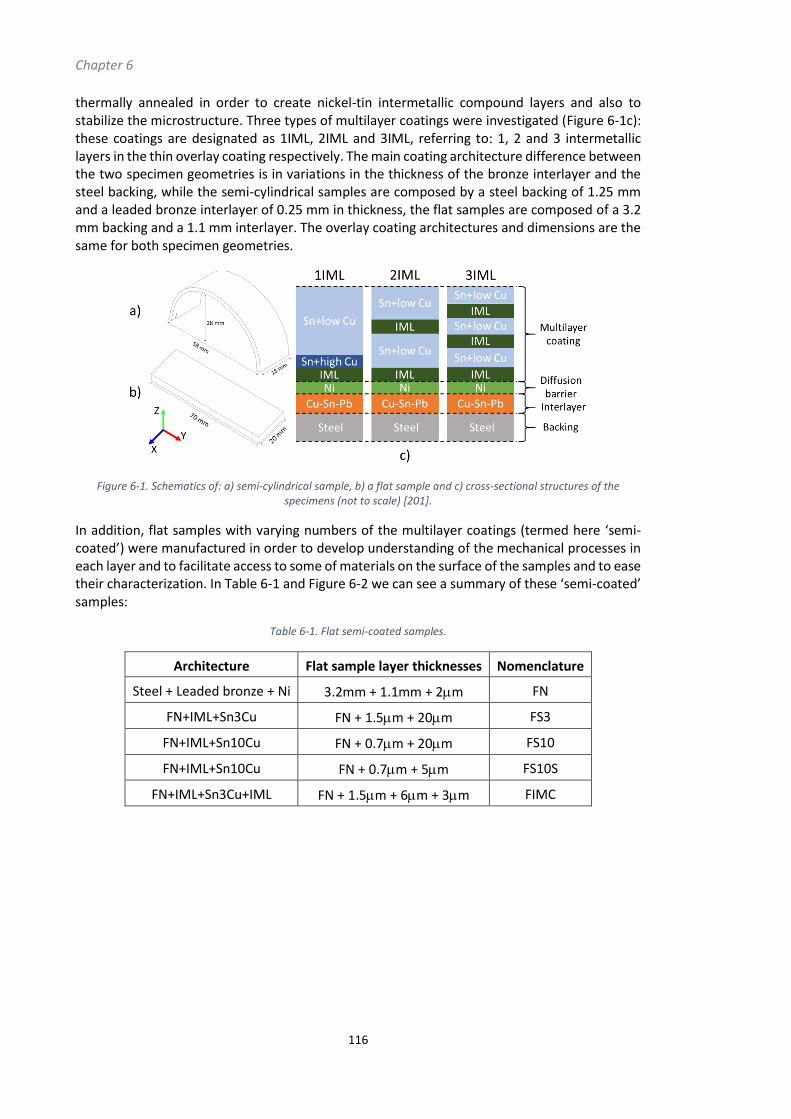
Chapter 6
116
thermally annealed in order to create nickel-tin intermetallic compound layers and also to stabilize the microstructure. Three types of multilayer coatings were investigated (Figure 6-1c): these coatings are designated as 1IML, 2IML and 3IML, referring to: 1, 2 and 3 intermetallic layers in the thin overlay coating respectively. The main coating architecture difference between the two specimen geometries is in variations in the thickness of the bronze interlayer and the steel backing, while the semi-cylindrical samples are composed by a steel backing of 1.25 mm and a leaded bronze interlayer of 0.25 mm in thickness, the flat samples are composed of a 3.2 mm backing and a 1.1 mm interlayer. The overlay coating architectures and dimensions are the same for both specimen geometries.
Figure 6-1. Schematics of: a) semi-cylindrical sample, b) a flat sample and c) cross-sectional structures of the specimens (not to scale) [201].
In addition, flat samples with varying numbers of the multilayer coatings (termed here ‘semi-coated’) were manufactured in order to develop understanding of the mechanical processes in each layer and to facilitate access to some of materials on the surface of the samples and to ease their characterization. In Table 6-1 and Figure 6-2 we can see a summary of these ‘semi-coated’ samples:
Table 6-1. Flat semi-coated samples.
Architecture Flat sample layer thicknesses Nomenclature
Steel + Leaded bronze + Ni 3.2mm + 1.1mm + 2m FN
FN+IML+Sn3Cu FN + 1.5m + 20m FS3
FN+IML+Sn10Cu FN + 0.7m + 20m FS10
FN+IML+Sn10Cu FN + 0.7m + 5m FS10S
FN+IML+Sn3Cu+IML FN + 1.5m + 6m + 3m FIMC

Competing mechanisms affecting the fatigue performance of Sn-Ni-Cu based multilayer coatings
117
Figure 6-2. Schematics of the semi-coated samples.
6.2.2 Fatigue testing
A full description of the fatigue tests on semi-cylindrical samples has been provided in the previous chapter (Chapter 5), the relevant details are therefore recapped here only briefly. Semi-cylindrical specimens were tested in a 3-point bend configuration, with a Cedip Silver 480M infra-red detector used to conduct lock-in thermography during the fatigue tests. The tests were conducted at 10 Hz and R (load ratio) = 0.1 and 500 N of maximum load. The tests were stopped when damage was detected on semi-cylindrical samples with 1IML, 2IML and 3IML; so we could assess short crack behaviour in the multilayer coatings.
Fatigue tests on flat samples were carried out under three-point bend load control. The tests were performed on flat specimens with 1IML, 2IML and 3IML. The maximum applied top surface strain was 2500 micro-strain (estimated by strain gauges attached on the top surface), at an R = 0.1 and a frequency of 10 Hz (the methodology followed is explained in Section 4.3.4, since we consider that the measurable strains will be mainly controlled by the constraint and loading boundary conditions provided by the steel backing and bronze interlayer). During the interrupted tests, replicas were taken in order to assess short crack behaviour and subsequent crack propagation on the top surface.
6.2.3 Materials characterization
An optical microscope was used to observe the surface crack field development in tested samples and on the replica records of tested samples. An NVision40 and a FEI Versa3D dual systems FIB-FEG-SEM were used to make high resolution observations of surface cracks, as well as to produce cross-sections of specific locations in order to observe crack propagation through the thickness.
EBSD analyses were performed using a dual beam FIB-FEG-SEM (FEI Versa3D) system. The
samples were tilted at 70, the accelerated voltage was 20 kV, the minimum step size was 0.1
m and the indexing was over 90% for all the mappings. The samples analysed with EBSD were
previously polished using a BBIM in two steps: 1. tilting the sample 87 and using an accelerated
voltage of 6 kV for 10 minutes; 2. tilting the sample 88 and using an accelerated voltage of 2 kV for 20 minutes. After this polishing process the microstructure is revealed (Figure 3-7) and the EBSD analysis can be conducted. Mappings were conducted on tested semi-cylindrical samples with 1IML, 2IML and 3IML.
X-ray diffraction (XRD) analyses were carried out using a Rigaku SmartLab diffraction system (Rigaku Corporation, Japan) with Cu-Kα X-rays. The diffractometer was operated at a grazing

Chapter 6
118
incidence angle of 1° for phase identification of the top-surface coatings. Also, a typical /2 symmetrical configuration was used to gain some penetration into the coatings. Analysis was conducted on untested flat samples with 1IML, 2IML, 3IML, FN, FS10S and FIMC.
An optical profilometer (Alicona InfiniteFocus) was used to measure the surface roughness (Rq) of the coatings. The measurements were carried out with an objective of x50, 20 nm of vertical
resolution, 2 m of lateral resolution, 800 m of cut-off length and a profile length of 4 mm; all these conditions were chosen following the ISO4287-1996 extended 4288. Measurements were carried out on untested semi-cylindrical samples with 1IML, 2IML and 3IML.
6.2.4 Mechanical characterization
Microindentation tests were conducted on flat samples with 1IML, 2IML and 3IML. At least ten indentations were placed for each sample at different testing conditions, with loads ranging from 10 gf to 1000 gf and with dwell times from 5 s to 20 s. The depth of the indent was measured from the arithmetic mean of the two diagonals left by the indenter in the material: for a Vickers diamond pyramid indenter (a square pyramid with opposite faces at an angle of
136° and edges at 2ψ=148°), the depth of the indent is 1/7 of the indent diagonal d [202].
Nanoindentation experiments were conducted in order to measure hardness and Young modulus for the different materials that compose the multilayer coatings, as well as to measure creep resistance of the top-surface Sn based layers in different coating configurations.
Nanohardness tests were conducted under depth control in order to achieve an indentation depth of around 10% of the coating thickness and to avoid the substrate affecting the measurements. The dwell time was fixed at 90 s, loading and unloading rates were set at 0.05 mN/s for Sn and 0.2 mN/s for the remaining materials. The indentations were performed on untested flat samples with FN, FS3 and FIMC architectures. At least 25 indents were placed on
each material, which were prepared by polishing with 1 m diamond suspension and 0.06 m colloidal silica.
Nanoindentation creep tests were carried out under a loading and unloading rate of 0.1 mN/s,
at different load and depth conditions in order to achieve different indentation depths (500 - 3000 nm). The load was then maintained for 1000 s, while recording the change in depth with time. The indentations were conducted on untested flat samples with FS3, FS10, 1IML, 2IML and 3IML. Unless otherwise noted, 5 to 10 indentations were conducted on mechanically polished samples. In order to study the displacement vs time curves obtained during the dwell period (Figure 6-3a), the empirical data was fitted by using:
ℎ(𝑡) − ℎ(0) = A ln(𝐵 𝑡 + 1) Equation 6-1
where A and B are fitting parameters. Then, the estimated stress (i) produced by the indentation is calculated by,
𝜎𝑖 =𝑃
𝐴𝑝 Equation 6-2
where P is the applied load maintained during the creep test. The strain rate (𝜀̇) is calculated with the following equation:
𝜀̇ =1
ℎ
𝑑ℎ
𝑑𝑡 Equation 6-3

Competing mechanisms affecting the fatigue performance of Sn-Ni-Cu based multilayer coatings
119
Finally, the creep exponent (n) is calculated from the slope of the ln-ln plot for i vs 𝜀̇, since it is assumed that (Figure 6-3b):
𝜀̇ = 𝐶𝜎𝑖𝑛 Equation 6-4
Figure 6-3. a) Depth vs time curve during dwell period. b) Graphic determination of the creep exponent.
In addition, hardness and Young’s modulus were also calculated, from the nanoindentation creep tests, following the aforementioned process outlined by Oliver and Pharr [117].
6.2.5 Tomographic analysis
-CT was carried out in order to obtain statistically reliable data of observed microstructural cavities found in the multilayer coatings. Due to the high degree of attenuation of X-rays in sample materials (steel, leaded bronze, tin and nickel), ‘match stick’-like samples (dimensions
0.5×0.7×7 mm3) containing the top-surface coating (Figure 6-4) were extracted from the specimens so that a minimum of 10% transmission of the incoming X-ray beam was preserved at all exposure angles.
Figure 6-4. Schematic of a 'match stick'-like sample.
Two untested semi-cylindrical samples with 1IML and 2IML were scanned at the SLS. The beam energy was 40 keV and the distance between the specimen and detector was set to provide a degree of phase contrast to facilitate the visualisation of small features. The exposure time was set to 200 ms and 500 projections were collected through the rotation of 180°, thus, 100 s per scan. The scans were conducted at a voxel resolution of 0.65 μm, with a detector size of 2560 × 2160 pixels.
Also, an untested semi-cylindrical sample with 3IML was scanned on the ‘ZEISS Xradia 510 Versa 3D X-ray microscope’. The scans were conducted at a peak voltage of 110 kV and the beam was pre-filtered through 1 mm of CaF2 to reduce beam-hardening artefacts. To achieve sufficient flux, the power was set at 10 W (91 μA) and the 2048×2048 detector was binned twice resulting in effective detector dimensions of 1024×1024. However, the "shuttling" movement between frames sacrifices a few pixels around the edge, giving slightly smaller projection sizes of 995 x 995 pixels in our case. The source to detector distance was set at 30 mm (SrcZ: −16, DetZ: +14), which in combination with the ×20 lens resulted in a pixel size of 0.709 μm. During the scan,

Chapter 6
120
1601 projections were collected with an angular step of 0.225° over a 360° rotation of the sample and an exposure time of 12 s, thus, 5.5 h per scan.
FIB tomography was conducted on small surface cracks found in tested semi-cylindrical samples with 1IML, 2IML and 3IML. The samples were previously polished via BBIM, in order to identify the small cracks. The tomographs were conducted in an NVision40 using a Ga ion beam of 30 kV and 3 nA of current during the serial sectioning of the cracks, producing a distance between slices of a few tens of nm. After each slice an SEM picture from an In-lens secondary electron
detector was automatically taken, this process was repeated for 1000 slices per crack/sample. The slices were made normal to the sample surface, successively along the cracks. The
dimensions of the trenches were around 33 m wide and 30 m deep. Table 6-2 shows the dimensions of the volume assessed and pixel size for each sample.
Table 6-2. Resolution and dimensions of the FIB tomographs for each sample.
Pixel size z and y (nm/pixel)
Pixel size x (nm/slice)
Width of
trench (m)
Height of
trench (m)
Number of slices
Volume
(m3)
1IML 39 64 36 28 845 54432
2IML 38 110 32 25 1214 107200
3IML 42 84 31 35 925 84630
Where z and y correspond to the front view of the cross-sections, the resolution is given by the imaging conditions of the SEM micrographs. The voxel size in the x-direction is determined by the precision of the milling steps, which produce the distance between individual cross-sections imaged by SEM. In Figure 6-5 we can see a schematic of a trench ready for tomography.
Figure 6-5. Schematic of a trench ready for FIB tomography.

Competing mechanisms affecting the fatigue performance of Sn-Ni-Cu based multilayer coatings
121
6.2.6 Image analysis
In addition to the image analysis explained in Section 3.5, the following approaches have been also applied.
Deflection angles were measured by calculating the angle between the last few pixels of a crack before and after the interface of two materials (Figure 6-6).
Figure 6-6. Schematic of the calculated deflection angle between two materials.
Matlab was also used to measure the profile roughness (Rq) of each layer of the multilayer coating:
𝑅𝑞 = √1
𝑛∑ 𝑦𝑖
2
𝑛
𝑖=1
Equation 6-5
Where 𝑛 is the number of measurements taken and 𝑦𝑖 is the height of the profile with respect to the mean line. First, interfaces of each segmented layer are extracted (Figure 6-7), then, the mean line is calculated using the least mean square method:
For a line with general form
𝑦 = 𝑚𝑥 + 𝑏 Equation 6-6
first, calculate mean values of x and y
�̅� =∑ 𝑥𝑖
𝑛𝑖=1
𝑛 and �̅� =
∑ 𝑦𝑖𝑛𝑖=1
𝑛 Equation 6-7
then, calculate the slope of the mean line
𝑚 =∑ (𝑥𝑖 − �̅�)𝑛
𝑖=1 (𝑦𝑖 − �̅�)
∑ (𝑥𝑖 − �̅�)2𝑛𝑖=1
Equation 6-8
and finally, compute the y-intercept to get the equation of the line.
𝑏 = �̅� − 𝑚�̅� Equation 6-9

Chapter 6
122
Figure 6-7. Process to extract the interfaces used to calculate Rq of layers.
A combination of Fiji and Matlab was again used to segment (Fiji, Figure 6-8) and quantify (Matlab): 1. Fields of cracks observed with an optical microscope by counting number of cracks, length distribution and tortuosity. 2. Single cracks were observed in SEM micrographs, so we could measure their lengths, tortuosity and number of branches.
Figure 6-8. Process to segment a) fields of cracks and b) single cracks for their quantification.

Competing mechanisms affecting the fatigue performance of Sn-Ni-Cu based multilayer coatings
123
6.3 Results
6.3.1 Microstructural characterization
6.3.1.1 Phase identification
Figure 6-9 shows the XRD results for FIMC (Figure 6-9a) and FS10S (Figure 6-9b). These two samples were manufactured to have the intermetallic compounds as close to the surface as possible. From these samples we can easily identify the phase structures of such intermetallic compounds. In Figure 6-9a we can see that XRD detected Ni3Sn4 intermetallic and residual Ni. Also, in Figure 6-9b XRD detected Cu6Sn5 intermetallic, Sn from the layer upon which the IMC rest and Ni from the diffusion barrier. Thus, we can see that IML is composed of Ni3Sn4, and the intermetallic compounds (IMC) in the Sn layers are Cu6Sn5 (also identified in Figure 6-10). These results were confirmed by XRD results on the rest of the samples summarized in Table 6-3 (where Cu and Pb are detected from the bronze interlayer below the Ni diffusion barrier):
Table 6-3. Detected phases from XRD analysis of several coatings, using 2 and /2 configurations.
Coating 2 /2
1IML Sn, Cu6Sn5 Sn, Cu6Sn5
2IML Sn, Cu6Sn5 Sn, Cu6Sn5
3IML Sn, Cu6Sn5 Sn, Cu6Sn5, Ni3Sn4
FN Ni, Cu, Pb Ni, Cu, Pb
FS10S Sn, Ni, Cu6Sn5 Sn, Ni, Cu6Sn5, Cu, Pb
FIMC Ni, Ni3Sn4 Sn, Ni, Ni3Sn4
Figure 6-9. XRD results for phase identification in samples: a) FIMC and b) FS10S.

Chapter 6
124
In Figure 6-10 one can see FIB cross-sections of the three complete multilayer coatings (1IML, 2IML and 3IML). The images are taken using the backscattered electron detector and in-lens secondary electron detector to show the clear difference between types of intermetallic compounds and grain boundaries. Also, a Pt coating was deposited on the surface in order to conserve the surface geometry and avoid any curtaining effect from the ion beam.
We can see that the Sn based layers have columnar grains, where Cu6Sn5 intermetallics appear at their grain boundaries [203, 204]. Due to higher Cu content in the 1IML thicker IMCs are found in this coating, whereas much thinner IMCs are found in the other two, which also accumulate along the interface between Sn and Ni3Sn4. According to previous literature the Ni/Sn interface is very sensitive to Cu content, therefore is likely that Cu from Cu6Sn5 compounds diffuses towards the Ni/Sn interface through the Sn phase, forming a Cu6Sn5 diffusion layer between the Ni-Sn intermetallic diffusion layer and the Sn layer [205-208]. We can also observe that the IML for 1IML is made of Cu6Sn5 while the IMLs for the other two coatings are made of Ni3Sn4. This is confirmed by the XRD results, since Ni3Sn4 is not detected in sample FS10S.

Competing mechanisms affecting the fatigue performance of Sn-Ni-Cu based multilayer coatings
125
Figure 6-10. FIB cross-sections of the multilayer coatings: a) and b) for 1IML, c) and d) for 2IML, e) and f) for 3IML. The back-scatter detector was used for the images in the left hand column and the in-lens secondary electron
detector was used to produce the right hand column of images.

Chapter 6
126
6.3.1.2 Grain characterization
Figure 6-11 shows EBSD maps of grains coloured according to their orientations, the maps represent the surface of tested semi-cylindrical samples with 1IML (a), 2IML (b) and 3IML (c), therefore, these are Sn grains from the top-surface Sn based layer. In Figure 6-12 we can see the quantitative results extracted from the mappings, where we considered a misorientation over
10 as grain boundary. From these figures we can observe that the grain size is fairly similar for
1IML (5.85 2.70 m) and 2IML (5.95 2.73 m), but smaller for 3IML (4.29 1.87 m). Also,
the grains seem to be quite equiaxed in all cases (0.7). From the maps (Figure 6-11), one can also observe that a certain texture exists in the Z axis, which is the direction perpendicular to the surface of the sample. Moreover, in Figure 6-13a we can confirm a texture in the plane normal to the coating surface (Z), but a random orientation of grains in the axes parallel to the surface (X and Y). Which shows the electrodeposited coating grain growth direction (bottom-to-top, Z). It can be observed that the IPFZ display a strongly preferred orientation in which the most intensive peak is located in {221} planes. This is shown by the preponderance of purple grains in the maps (Figure 6-11).
As for the texture formed in the surface sample, the term “fibre texture” has been adopted in a previous study on thin layers of tin coating [209], since only one axis is preferentially aligned whereas the other two are uniformly distributed (“random”). In order to derive the surface sample fibre texture, the {221} pole figure is shown in Figure 6-13b, which shows that a particular set of planes, {221}, are aligned with a particular sample direction (Z or perpendicular to the surface), i.e. the growth direction. The three multilayer coatings present similar texture. Thus, this tin coating layer exhibits a strong fibre texture which is usually formed in some thin films, such as Al, Cu and Pt [210]. The texture observed is, in general, the result of growth competition between different crystallographic directions. This texture can be achieved by adjusting electrodeposition conditions (current density, chemistry of electrolyte etc., or substrate temperature, deposition rate) and it indicates bottom-up growth [211], which is confirmed by the columnar grains observed in cross-section images such as Figure 6-10.

Competing mechanisms affecting the fatigue performance of Sn-Ni-Cu based multilayer coatings
127
Figure 6-11. EBSD maps from top surface of samples with 1IML (a), 2IML (b) and 3IML (c). The inserted inverse pole figure (ipfz) shows the orientations of different colours in the map. Tensile axis refers to the loading conditions
during testing.

Chapter 6
128
Figure 6-12. Grain size distribution (a) and Aspect ratio distribution (b) measured from EBSD maps carried out from
the surface of 1IML, 2IML and 3IML. These measurements were conducted considering a misorientation over 10 as grain boundary.
Figure 6-13. Figures are extracted from EBSD analysis of 1IML and they represent: a) Inverse Pole Figures in X, Y and Z directions. b) Pole Figure for {221} in Z direction.
6.3.1.3 Roughness
The results for the roughness measurements on the semi-cylindrical samples can be found in Figure 6-14, where we decided to use Rq to define roughness, since this parameter is more sensitive to peaks and valleys than Ra (the amplitudes are squared), so it is mostly used to control very fine surfaces in scientific measurements and statistical evaluations, this may be more relevant to the case of fatigue where the worst defect is likely to initiate fatigue. One may notice that looking at the surface, the roughest coating corresponded to 1IML and the smoothest to 2IML. Surface measurements were carried out with the Alicona, since it allows a larger sampling area. However, the rest of the measurements were conducted by using the segmented IMLs from each one of the FIB tomographs, hence the volumes assessed are smaller. Nevertheless, we can observe that the IML for 1IML is much rougher than the rest, which can

Competing mechanisms affecting the fatigue performance of Sn-Ni-Cu based multilayer coatings
129
be seen in Figure 6-10 as well. Roughness results for the rest of the IMLs are very similar, however, the thinner IML from 3IML seem to be consistently smoother than those from 2IML.
Figure 6-14. Roughness results represented by Rq, where surface roughness was measured with Alicona and roughness of IMLs was measured from the data obtained through FIB tomography.
6.3.2 Mechanical properties
Nanoindentations were carried out on FN, FS3 and FIMC in order to obtain hardness and Young’s modulus for Ni, Sn and Ni3Sn4, which can be seen in Table 6-4, where we can also see the Poisson ratio used to calculate the Young’s Modulus from the reduced modulus. When comparing the measured values with the literature we see a good correlation for Ni [212, 213] and Sn [213, 214], however, measured Ni3Sn4 shows significantly lower hardness and higher modulus due to surface roughness and substrate effects coming from the Sn layer below [215]. Although, Cu6Sn5 was not tested, results from the literature were also added in Table 6-4.
Table 6-4. Nanoindentation results for hardness and Young Modulus.
Sample H (GPa) E (GPa) Poisson's ratio
FN (Ni) 3.44 ± 0.77 206.6 ± 17.8 0.31
FS3 (Sn-3%Cu) 0.18 ± 0.01 59.9 ± 6.8 0.36
FIMC (Ni3Sn4) 4.13 ± 1.43 159.2 ± 24.0 0.33
Ni3Sn4* 6.1-8.9* 119.4-142.7* -
Cu5Sn6* 5.6-6.5* 112.3-134.0* -
*Values from literature [216-220]
We conducted microindentation examinations in order to test the three sets of coatings (1IML, 2IML and 3IML). Figure 6-15 shows the results of microindentations varying the holding time and loads for each test. One can observe that at low load, i.e. 10gf, the indentation depth is very
similar for all the coatings (5.5 m), where no IML should be hit in any of the coatings. However, once the load is increased the indenter penetrates deeper in 1IML. We can also observe that by increasing the holding time, the depth is also increased in all cases. This could be an indication of creep behaviour of the coatings, hence, nanoindentation creep tests were conducted in order to assess creep behaviour on surface layer, which contain Sn (which is expected to be more prone to creep at room temperature).
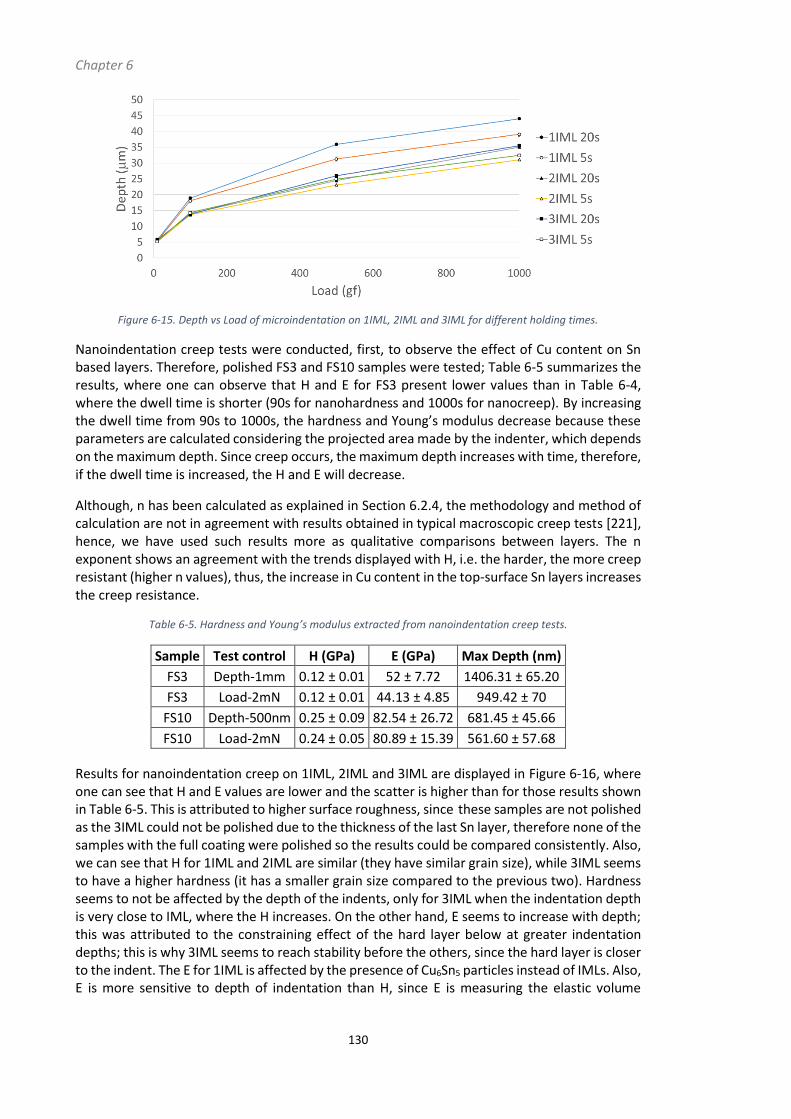
Chapter 6
130
Figure 6-15. Depth vs Load of microindentation on 1IML, 2IML and 3IML for different holding times.
Nanoindentation creep tests were conducted, first, to observe the effect of Cu content on Sn based layers. Therefore, polished FS3 and FS10 samples were tested; Table 6-5 summarizes the results, where one can observe that H and E for FS3 present lower values than in Table 6-4, where the dwell time is shorter (90s for nanohardness and 1000s for nanocreep). By increasing the dwell time from 90s to 1000s, the hardness and Young’s modulus decrease because these parameters are calculated considering the projected area made by the indenter, which depends on the maximum depth. Since creep occurs, the maximum depth increases with time, therefore, if the dwell time is increased, the H and E will decrease.
Although, n has been calculated as explained in Section 6.2.4, the methodology and method of calculation are not in agreement with results obtained in typical macroscopic creep tests [221], hence, we have used such results more as qualitative comparisons between layers. The n exponent shows an agreement with the trends displayed with H, i.e. the harder, the more creep resistant (higher n values), thus, the increase in Cu content in the top-surface Sn layers increases the creep resistance.
Table 6-5. Hardness and Young’s modulus extracted from nanoindentation creep tests.
Sample Test control H (GPa) E (GPa) Max Depth (nm)
FS3 Depth-1mm 0.12 ± 0.01 52 ± 7.72 1406.31 ± 65.20
FS3 Load-2mN 0.12 ± 0.01 44.13 ± 4.85 949.42 ± 70
FS10 Depth-500nm 0.25 ± 0.09 82.54 ± 26.72 681.45 ± 45.66
FS10 Load-2mN 0.24 ± 0.05 80.89 ± 15.39 561.60 ± 57.68
Results for nanoindentation creep on 1IML, 2IML and 3IML are displayed in Figure 6-16, where one can see that H and E values are lower and the scatter is higher than for those results shown in Table 6-5. This is attributed to higher surface roughness, since these samples are not polished as the 3IML could not be polished due to the thickness of the last Sn layer, therefore none of the samples with the full coating were polished so the results could be compared consistently. Also, we can see that H for 1IML and 2IML are similar (they have similar grain size), while 3IML seems to have a higher hardness (it has a smaller grain size compared to the previous two). Hardness seems to not be affected by the depth of the indents, only for 3IML when the indentation depth is very close to IML, where the H increases. On the other hand, E seems to increase with depth; this was attributed to the constraining effect of the hard layer below at greater indentation depths; this is why 3IML seems to reach stability before the others, since the hard layer is closer to the indent. The E for 1IML is affected by the presence of Cu6Sn5 particles instead of IMLs. Also, E is more sensitive to depth of indentation than H, since E is measuring the elastic volume

Competing mechanisms affecting the fatigue performance of Sn-Ni-Cu based multilayer coatings
131
produced by the indentation, which is bigger than the plastic volume measured by the H. Therefore E is influenced by the IML while H is not [222].
As aforementioned, n follows similar trends to H, showing an increase in creep resistance (shown here as an increase of notional n values) with the indentation depth, for all three multilayer coatings; except at shallow depths where IML does not affect creep, we see that 3IML is less resistant (n=8>7.2>6 for 1IML>2IML>3IML).
Finally, we can also observe that following the 10% depth-coating thickness rule, 3IML should be affected by the IML after 550nm, 2IML after 830nm and 1IML after 2130nm, which is what we see.
Figure 6-16. H and E values extracted from nanoindentation creep tests on 1IML, 2IML and 3IML.
6.3.3 Cavity characterization
Results from -CT showed a slight difference in the resolutions achieved in the scans for 1IML-2IML and 3IML between the different X-ray scanning facilities used. For this reason, a sensitivity analysis was conducted in order to find the minimum volume of cavities detected with
confidence in 3IML (the scan with lower resolution), which was found to be 500 m3, therefore
all the cavities found in 2IML smaller than 500 m3 are not considered in the comparative statistics, so we can compare all coating architectures on a similar basis.
In Figure 6-17 we can see a general view of the -CT scans, one can see that the contrast between coating materials is not great due to the density of heavy elements, such as Ni, Sn and Cu. Therefore it is not possible to distinguish the different layers that compose the multilayer coating, however, the contrast between the cavities and the rest of the coating is sufficient to allow segmentation of these features.

Chapter 6
132
Figure 6-17. General view of a -CT scan and three cross-sections of each one of the coatings under study, that is, 1IML, 2IML and 3IML.
Once segmented, the position of the cavities were located in the XY plane, showing a random distribution in all coatings. Observations in the XZ plane showed a random cavity distribution for 1IML, but an alignment of cavities for 2IML and 3IML. Figure 6-18 shows the alignment of these
cavities at around 10 m from the surface of the coating for the 2IML system, and around 12
m and 5 m for the 3IML system, this seems to coincide with the expected position of the Sn layers in the overlay coating. This was confirmed by performing FIB cross-sections (Figure 6-19). Subsequently, the volume distribution and volume fraction of cavities were measured: in Figure 6-20 we can observe 1IML (0.021%) has far less cavities and these are far smaller than those observed in the other two coatings. When comparing 2IML and 3IML, we can see that 2IML has more small cavities and 3IML more big cavities. Although 2IML and 3IML have similar volume fractions of cavities (0.865% and 1.028% respectively), compared to 1IML, 3IML shows the higher percentage. Regarding the shape of the cavities, Figure 6-21 and Figure 6-22 show that 1IML has the highest sphericity (0.74) and aspect ratio (0.68), and 2IML the lowest in both cases (0.45 and 0.43, respectively).
Finally, random orientation of the cavities was found in the XY plane, however preferential orientations were found for 2IML and 3IML in the XZ plane, where the majority of the cavities
were aligned at 0, +180 and -180 (Figure 6-23), meaning that there was a horizontal orientation of cavities, i.e. parallel to the surface.

Competing mechanisms affecting the fatigue performance of Sn-Ni-Cu based multilayer coatings
133
Figure 6-18. Cavity positions on the XZ plane for 1IML, 2IML and 3IML.
Figure 6-19. FIB cross-sections showing microstructural cavities in Sn layer for a) 1IML, b) 2IML, c) and d) 3IML.

Chapter 6
134
Figure 6-20. Volume distribution and volume fraction of cavities for 1IML, 2IML and 3IML.
Figure 6-21. Sphericity distribution for the cavities found in 1IML, 2IML and 3IML.
Figure 6-22. Aspect ratio distribution for the microstructural cavities in 1IML, 2IML and 3IML.

Competing mechanisms affecting the fatigue performance of Sn-Ni-Cu based multilayer coatings
135
Figure 6-23. Orientation in XZ-Plane of cavities found in 1IML, 2IML and 3IML.
6.3.4 3D crack characterization
Damage segmentation allows the influence of microstructure on the crack growth to be understood. Figure 6-24-26 (and attached videos) show the segmented cracks from the FIB tomographs. In Figure 6-24 we can see in blue the crack in 1IML, in green the IMCs and in red the IML; the crack seems to be bifurcated on one side and to have coalesced with a shorter crack on the other side, it also shows a typical semi-elliptical crack shape front initiated from the surface. In Figure 6-25 one can observe cracks in 2IML in light blue, IMLs in red and cavities in dark blue; the crack seems to have propagated preferentially through the IML, due to fast propagation through the brittle phase caused by internal residual stresses [223] (Figure 6-43), and initiated from the cavity, since the cavity is situated in the middle of the crack. However, we can also see a couple of very short cracks that had initiated on the surface and have a semi-elliptical crack front shape. Finally, in Figure 6-26 we see cracks using the same colour code but this time in the 3IML multilayer coating, where we can again see crack initiation from cavities and fast propagation through IMLs.

Chapter 6
136
Figure 6-24. 3D visualization of a crack (blue) and IML (red) in 1IML (video).
Figure 6-25. 3D visualization of the main crack (light blue), IMLs (red) and main cavity (dark blue) in 2IML (video).
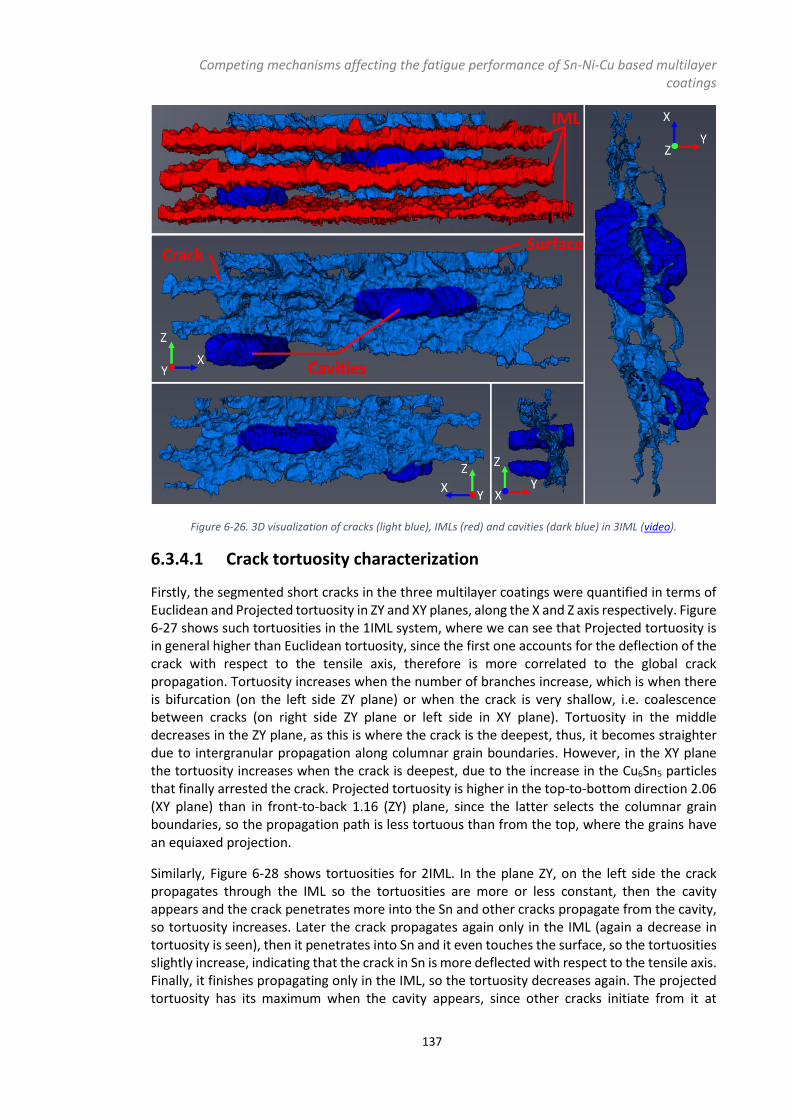
Competing mechanisms affecting the fatigue performance of Sn-Ni-Cu based multilayer coatings
137
Figure 6-26. 3D visualization of cracks (light blue), IMLs (red) and cavities (dark blue) in 3IML (video).
6.3.4.1 Crack tortuosity characterization
Firstly, the segmented short cracks in the three multilayer coatings were quantified in terms of Euclidean and Projected tortuosity in ZY and XY planes, along the X and Z axis respectively. Figure 6-27 shows such tortuosities in the 1IML system, where we can see that Projected tortuosity is in general higher than Euclidean tortuosity, since the first one accounts for the deflection of the crack with respect to the tensile axis, therefore is more correlated to the global crack propagation. Tortuosity increases when the number of branches increase, which is when there is bifurcation (on the left side ZY plane) or when the crack is very shallow, i.e. coalescence between cracks (on right side ZY plane or left side in XY plane). Tortuosity in the middle decreases in the ZY plane, as this is where the crack is the deepest, thus, it becomes straighter due to intergranular propagation along columnar grain boundaries. However, in the XY plane the tortuosity increases when the crack is deepest, due to the increase in the Cu6Sn5 particles that finally arrested the crack. Projected tortuosity is higher in the top-to-bottom direction 2.06 (XY plane) than in front-to-back 1.16 (ZY) plane, since the latter selects the columnar grain boundaries, so the propagation path is less tortuous than from the top, where the grains have an equiaxed projection.
Similarly, Figure 6-28 shows tortuosities for 2IML. In the plane ZY, on the left side the crack propagates through the IML so the tortuosities are more or less constant, then the cavity appears and the crack penetrates more into the Sn and other cracks propagate from the cavity, so tortuosity increases. Later the crack propagates again only in the IML (again a decrease in tortuosity is seen), then it penetrates into Sn and it even touches the surface, so the tortuosities slightly increase, indicating that the crack in Sn is more deflected with respect to the tensile axis. Finally, it finishes propagating only in the IML, so the tortuosity decreases again. The projected tortuosity has its maximum when the cavity appears, since other cracks initiate from it at
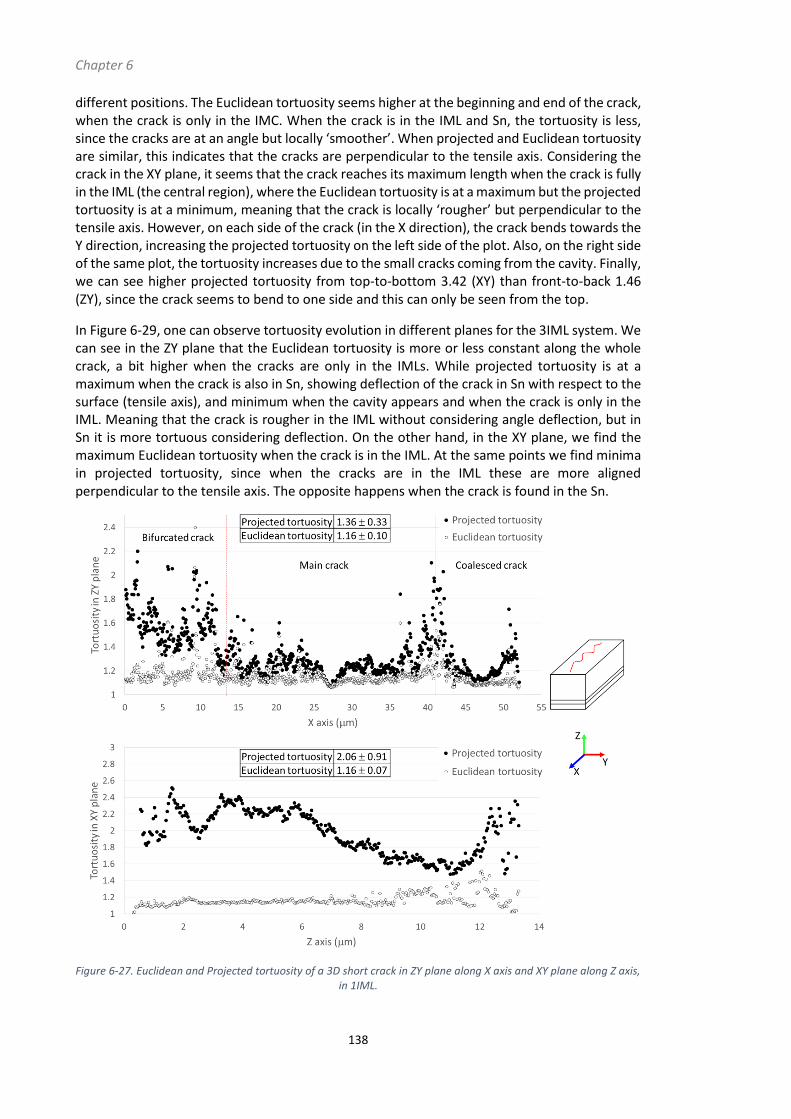
Chapter 6
138
different positions. The Euclidean tortuosity seems higher at the beginning and end of the crack, when the crack is only in the IMC. When the crack is in the IML and Sn, the tortuosity is less, since the cracks are at an angle but locally ‘smoother’. When projected and Euclidean tortuosity are similar, this indicates that the cracks are perpendicular to the tensile axis. Considering the crack in the XY plane, it seems that the crack reaches its maximum length when the crack is fully in the IML (the central region), where the Euclidean tortuosity is at a maximum but the projected tortuosity is at a minimum, meaning that the crack is locally ‘rougher’ but perpendicular to the tensile axis. However, on each side of the crack (in the X direction), the crack bends towards the Y direction, increasing the projected tortuosity on the left side of the plot. Also, on the right side of the same plot, the tortuosity increases due to the small cracks coming from the cavity. Finally, we can see higher projected tortuosity from top-to-bottom 3.42 (XY) than front-to-back 1.46 (ZY), since the crack seems to bend to one side and this can only be seen from the top.
In Figure 6-29, one can observe tortuosity evolution in different planes for the 3IML system. We can see in the ZY plane that the Euclidean tortuosity is more or less constant along the whole crack, a bit higher when the cracks are only in the IMLs. While projected tortuosity is at a maximum when the crack is also in Sn, showing deflection of the crack in Sn with respect to the surface (tensile axis), and minimum when the cavity appears and when the crack is only in the IML. Meaning that the crack is rougher in the IML without considering angle deflection, but in Sn it is more tortuous considering deflection. On the other hand, in the XY plane, we find the maximum Euclidean tortuosity when the crack is in the IML. At the same points we find minima in projected tortuosity, since when the cracks are in the IML these are more aligned perpendicular to the tensile axis. The opposite happens when the crack is found in the Sn.
Figure 6-27. Euclidean and Projected tortuosity of a 3D short crack in ZY plane along X axis and XY plane along Z axis, in 1IML.

Competing mechanisms affecting the fatigue performance of Sn-Ni-Cu based multilayer coatings
139
Figure 6-28. Euclidean and Projected tortuosity of a 3D short crack in ZY plane along X axis and XY plane along Z axis,
in 2IML.
Figure 6-29. Euclidean and Projected tortuosity of a 3D short crack in ZY plane along X axis and XY plane along Z axis,
in 3IML.

Chapter 6
140
6.3.4.2 Influence of different phases
In order to characterize the influence of each of the phases on the crack behaviour, first the volume fraction of each material was quantified (Table 6-6).
Table 6-6. Fraction volumes for each phase in each multilayer coating.
Layer Fraction volume (%)
1IML 2IML 3IML
Sn top 92.57 38.05 22.62
IML top - 21.32 12.62
IMCs 2.08 - -
Sn middle - - 20.85
IML middle - - 14.22
Sn bottom - 32.53 22.55
IML bottom 5.35 8.10 7.15
Then, the IMCs found in Sn grain boundaries of 1IML were quantified in terms of: volume distribution, position, orientation and shape. Firstly, we found in Figure 6-30 a higher number fraction of small IMCs. We also found that these IMCs were randomly distributed in the XY plane, however, in the ZY plane we could see a higher concentration of IMCs located near the bottom of the coating (as expected since the Cu content is higher there) as shown in Figure 6-31. We also found a random orientation of such particles in the XY plane, but a preferential orientation
perpendicular to the surface (when α comprises angles from 50-150 and (-50)-(-150)) in XZ plane, shown in Figure 6-32. Regarding the shape of Cu6Sn5 intermetallics, in Figure 6-33 we can see their aspect ratio and sphericity distribution, showing a smooth ellipsoidal shape.
Figure 6-30. Volume distribution of IMCs in 1IML.

Competing mechanisms affecting the fatigue performance of Sn-Ni-Cu based multilayer coatings
141
Figure 6-31. Position distribution of IMCs in 1IML in the ZY plane.
Figure 6-32. Orientation of IMCs in 1IML in ZY plane.
Figure 6-33. Aspect ratio and Sphericity distribution of IMCs in 1IML.
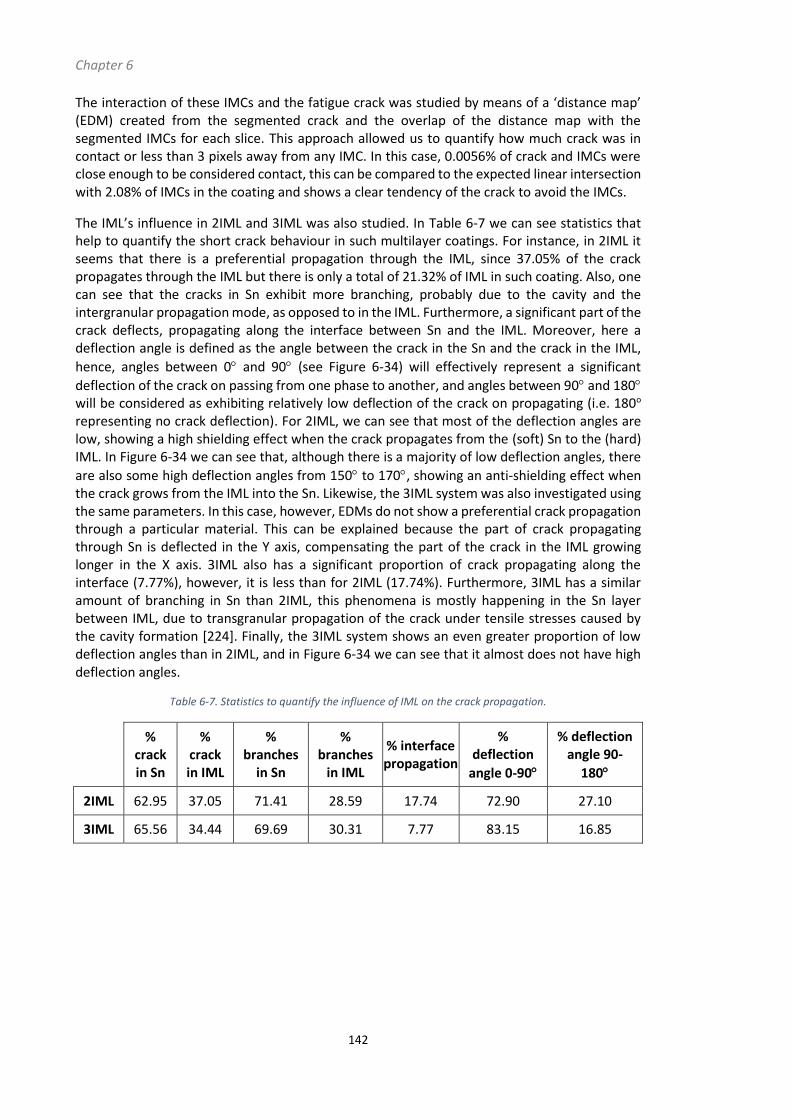
Chapter 6
142
The interaction of these IMCs and the fatigue crack was studied by means of a ‘distance map’ (EDM) created from the segmented crack and the overlap of the distance map with the segmented IMCs for each slice. This approach allowed us to quantify how much crack was in contact or less than 3 pixels away from any IMC. In this case, 0.0056% of crack and IMCs were close enough to be considered contact, this can be compared to the expected linear intersection with 2.08% of IMCs in the coating and shows a clear tendency of the crack to avoid the IMCs.
The IML’s influence in 2IML and 3IML was also studied. In Table 6-7 we can see statistics that help to quantify the short crack behaviour in such multilayer coatings. For instance, in 2IML it seems that there is a preferential propagation through the IML, since 37.05% of the crack propagates through the IML but there is only a total of 21.32% of IML in such coating. Also, one can see that the cracks in Sn exhibit more branching, probably due to the cavity and the intergranular propagation mode, as opposed to in the IML. Furthermore, a significant part of the crack deflects, propagating along the interface between Sn and the IML. Moreover, here a deflection angle is defined as the angle between the crack in the Sn and the crack in the IML,
hence, angles between 0 and 90 (see Figure 6-34) will effectively represent a significant
deflection of the crack on passing from one phase to another, and angles between 90 and 180 will be considered as exhibiting relatively low deflection of the crack on propagating (i.e. 180o representing no crack deflection). For 2IML, we can see that most of the deflection angles are low, showing a high shielding effect when the crack propagates from the (soft) Sn to the (hard) IML. In Figure 6-34 we can see that, although there is a majority of low deflection angles, there
are also some high deflection angles from 150 to 170, showing an anti-shielding effect when the crack grows from the IML into the Sn. Likewise, the 3IML system was also investigated using the same parameters. In this case, however, EDMs do not show a preferential crack propagation through a particular material. This can be explained because the part of crack propagating through Sn is deflected in the Y axis, compensating the part of the crack in the IML growing longer in the X axis. 3IML also has a significant proportion of crack propagating along the interface (7.77%), however, it is less than for 2IML (17.74%). Furthermore, 3IML has a similar amount of branching in Sn than 2IML, this phenomena is mostly happening in the Sn layer between IML, due to transgranular propagation of the crack under tensile stresses caused by the cavity formation [224]. Finally, the 3IML system shows an even greater proportion of low deflection angles than in 2IML, and in Figure 6-34 we can see that it almost does not have high deflection angles.
Table 6-7. Statistics to quantify the influence of IML on the crack propagation.
%
crack in Sn
% crack in IML
% branches
in Sn
% branches
in IML
% interface propagation
% deflection
angle 0-90
% deflection angle 90-
180
2IML 62.95 37.05 71.41 28.59 17.74 72.90 27.10
3IML 65.56 34.44 69.69 30.31 7.77 83.15 16.85

Competing mechanisms affecting the fatigue performance of Sn-Ni-Cu based multilayer coatings
143
Figure 6-34. Deflection angle distribution for cracks in Sn and IML, in 2IML and 3IML.
6.3.4.3 Cross-section observations
Besides volume segmentation and 3D views, FIB tomographs also give a series of high resolution SEM images that help understand the crack growth behaviour through the thickness. For instance, we can observe in Figure 6-35 how IMCs in 1IML seem to arrest parts of the fatigue crack, this has also been found in very short cracks than do not progress more than a few microns (Figure 6-24 and Figure 6-36). In Figure 6-37 we can also see how cracks surround IMCs propagating along the interface between the Sn matrix and the IMC. Also, crack arrest due to triple grain boundary can be seen in Figure 6-38. In the 1IML case, we can easily observe surface crack initiation in the valleys that surface roughness creates, the crack usually initiates when the valley (acting as a stress raiser) meets with a grain boundary (Figure 6-39). In addition, we have seen that usually the cracks in the IML are localized at stress raisers (valleys) at the edges and
join together in the middle with an angle of about 45, shown in Figure 6-40. Figure 6-41 shows transgranular crack propagation through Sn grains in the 2IML system when these are near a cavity; these cracks never cross a grain and they are quite branchy and tortuous. Although 2IML and 3IML have less Cu6Sn5 IMCs, we can still see some ‘filaments’ in grain boundaries (Figure 6-10), which also help in arresting cracks (Figure 6-42). In both cases, 2IML and 3IML, the cracks have been arrested around the last IML; for the 2IML system the cracks are arrested at the cavity, but for the 3IML layer the cracks continue propagating through the last IML where they then stop propagating.

Chapter 6
144
Figure 6-35. Crack arrest at IMCs in 1IML.
Figure 6-36. Very short crack being arrested by an IMC in 1IML.
Figure 6-37. Crack propagating along the interface of Sn-IMCs in 1IML.
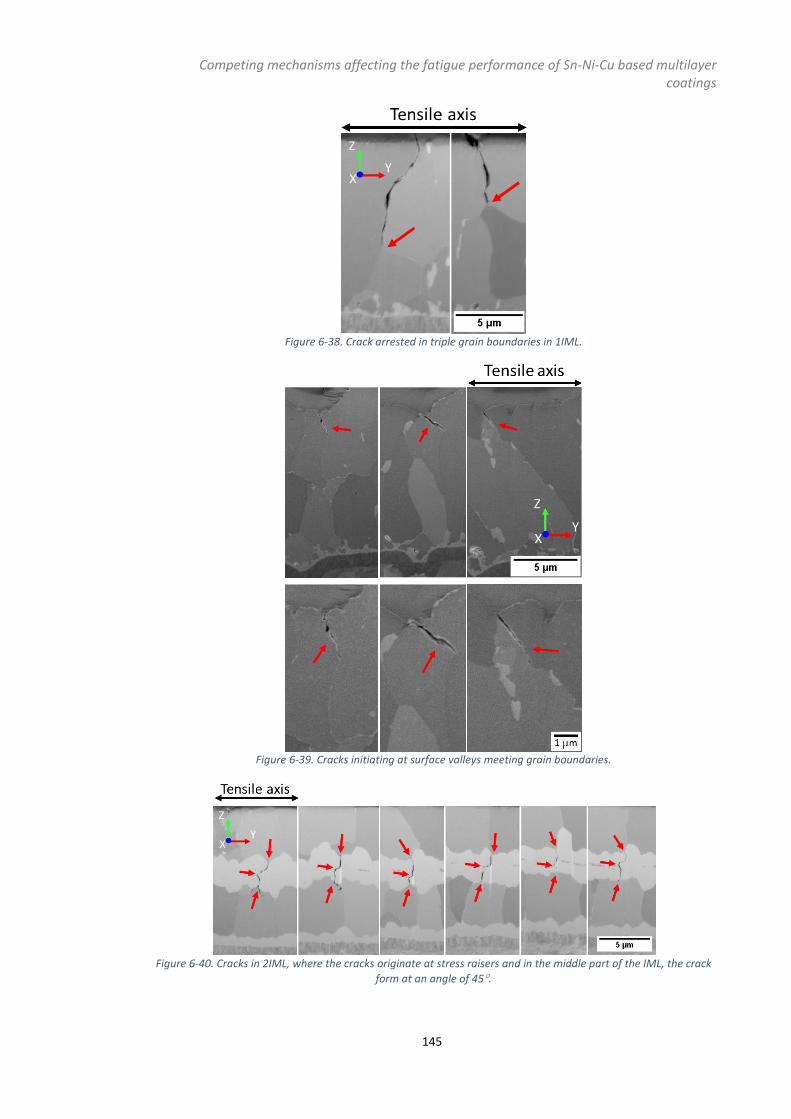
Competing mechanisms affecting the fatigue performance of Sn-Ni-Cu based multilayer coatings
145
Figure 6-38. Crack arrested in triple grain boundaries in 1IML.
Figure 6-39. Cracks initiating at surface valleys meeting grain boundaries.
Figure 6-40. Cracks in 2IML, where the cracks originate at stress raisers and in the middle part of the IML, the crack
form at an angle of 45.

Chapter 6
146
Figure 6-41. Transgranular propagation of cracks through Sn grains, when these are near a cavity.
Figure 6-42. Crack arrest by Cu6Sn5 ‘filaments’ at Sn grain boundaries in 3IML.
In addition, we placed several microindentations on coating cross-sections in order to assess the different response of the materials. In Figure 6-43 we can see that the IML (Ni3Sn4) are the only materials exhibiting brittle cracking under the deformation produced by the indentation.
Figure 6-43. SEM images of coating response to microindentations.

Competing mechanisms affecting the fatigue performance of Sn-Ni-Cu based multilayer coatings
147
6.3.5 Short crack behaviour
6.3.5.1 Surface crack quantification
In order to study the crack propagation behaviour more quantitatively, projected crack lengths perpendicular to the applied tensile axis were measured from micrographs of the replica record. To compare crack propagation rates, the changes in surface crack length were related to ΔK using the equations by Scott and Thorpe [225] for semi-elliptical (surface breaking) cracks (Figure 6-44):
∆𝐾 = [[𝑀𝑓(0) (1 − 0.3𝑎
𝑊) (1 − (
𝑎
𝑊)
12
)]
+ [0.391 ∙ 𝐸(𝑘) ∙ (𝑎
𝑊)
12
∙ √𝑐
𝑎]]
∆𝜎
𝐸(𝑘)√𝜋𝑎
Equation 6-10
Where Mf(0) is a front face correction factor (required for surface breaking cracks) given by:
𝑀𝑓(0) = [1.21 − 0.1 (𝑎
𝑐) + 0.1 (
𝑎
𝑐)
4
] √𝑎
𝑐 Equation 6-11
and E(k) may be approximated by:
𝐸(𝑘) = [1 + 1.47 (𝑎
𝑐)
1.64
]
0.5
Equation 6-12
The ΔK given by Equation 6-10 is relevant to surface breaking cracks due to the front face correction factor and has a finite thickness correction incorporated. However, the equation must be further modified to account for a finite width. Such a correction can be made by multiplying by the factor Bw given by Holbrook and Dover [226]:
𝐵𝑤 =𝐹 (
𝑎𝑐) 𝐺 (
𝑐𝐵) 𝐻 (
𝑎𝑊)
(0.2745)2 Equation 6-13
Where the functions 𝐹 (𝑎
𝑐), 𝐺 (
𝑐
𝐵) and 𝐻 (
𝑎
𝑊) are:
𝐹 (𝑎
𝑐) = 0.38 − 0.141 (
𝑎
𝑐) − 0.366 (
𝑎
𝑐)
2
+ 0.569 (𝑎
𝑐)
3
− 0.248 (𝑎
𝑐)
4
Equation 6-14
𝐺 (𝑐
𝐵) = 0.0239 + 1.434 (
𝑐
𝐵) − 2.984 (
𝑐
𝐵)
2
+ 7.822 (𝑐
𝐵)
3
Equation 6-15
𝐻 (𝑎
𝑊) = 0.0113 + 0.323 (
𝑎
𝑊) + 0.749 (
𝑎
𝑊)
2
− 0.535 (𝑎
𝑊)
3
Equation 6-16

Chapter 6
148
Figure 6-44. Schematic of a single semi-elliptical surface crack and 3 coalesced semi-elliptical surface cracks, where 2c is the length and a the depth of the crack.
The crack aspect ratio (a/c) for each data point was estimated by measuring projected crack length (2c) and depth (a) of the 3D crack obtained by the segmentation of the FIB tomography
in 1IML, which resulted in a/c=0.907. The stress range (Δ) was estimated from the model mentioned in (Section 4.2.4), since we consider that the measurable stresses will be mainly controlled by the combination of steel backing and bronze interlayer): the maximum stress
(max) was calculated at 2500 micro-strain, then, stress ratio equal to 0.1 was applied to obtain
the minimum stress (min).
Several assumptions have been made by following this methodology: comparing crack growth rates of cracks with different lengths, assuming that a/c remains unchanged for all the coating systems and after traversing the theoretical depth of the multilayer coating, estimation of stresses and no consideration of sub-surface cracking. One may argue that these assumptions limit the validity of the results, however, the authors believe that the results shown in this section help to understand the short crack behaviour of such complex architectures in a useful qualitative/semi-quantitative approach.
Figure 6-45 shows the comparison of crack growth rate for un-coalesced cracks at similar ΔK levels, where we can see that, although they have very similar behaviour, 1IML has a slightly slower crack growth rate and 3IML the fastest. Only un-coalesced cracks were represented due to the change in a/c ratio for coalesced cracks [227] (Figure 6-44). Also, in Figure 6-46 we can see that 1IML has much longer cracks than the other two multilayer coatings, however, the cracks in 1IML continue to always grow longer, but cracks in 2IML and 3IML seem to arrest. We can see this difference in crack length in the replicas shown in Figure 6-47, Figure 6-48 and Figure 6-49, where we can observe difference in the crack behaviour that is reflected in their crack field, also pointed out in [201]. While 2IML and 3IML have many initiation sites, 1IML has less; we can also observe more crack coalescence for 2IML and 3IML, which seems to be coalescence with crack tips overlapping [115, 228]). The difference in the crack fields for the different multilayer coatings have been quantified by assessing 13 mm2 of different samples tested under the same conditions (Figure 6-50). These quantifications are summarized in Table 6-8, where we can see that 1IML has less cracks but they are longer, and 3IML more cracks but shorter. In addition, cracks in 1IML seems to have higher tortuosity and cracks in 2IML lower tortuosity.
Table 6-8. Quantification of crack fields for 1IML, 2IML and 3IML.
1IML 2IML 3IML
Crack length (m) 642 379 444 191 368 212
Projected crack length (m) 499 299 395 170 311 183
Projected tortuosity 1.35 0.43 1.13 0.05 1.20 0.13
Number of cracks 45 40 104 55 219 71

Competing mechanisms affecting the fatigue performance of Sn-Ni-Cu based multilayer coatings
149
Figure 6-45. Crack growth rate of un-coalesced short cracks: comparison between 1IML, 2IML and 3IML.
Figure 6-46. Evolution of projected crack length with number of cycles for un-coalesced short cracks in1IML, 2IML and 3IML.
Figure 6-47. Replicas of cracks through short crack test of 1IML.

Chapter 6
150
Figure 6-48. Replicas of cracks through short crack test of 2IML.
Figure 6-49. Replicas of cracks through short crack test of 3IML.

Competing mechanisms affecting the fatigue performance of Sn-Ni-Cu based multilayer coatings
151
Figure 6-50. Example of surface crack fields for 1IML, 2IML and 3IML.
However, with such resolution these cannot be considered as single cracks but ‘streams (groups) of cracks’, since if we take a closer look at polished samples (via BBIM) with the SEM (Figure 6-51) we can see that the cracks are much thinner and following Sn grain boundaries. Then, if we quantify a series of single cracks we can see in Table 6-9 that single cracks follow the same trend regarding crack length, but now tortuosity is very similar for all the samples.
Table 6-9. Quantifications of single cracks in 1IML, 2IML and 3IML.
1IML 2IML 3IML
Crack length (m) 156.4 126.1 73.1 44.6 81.1 35.3
Projected crack length (m) 95.3 74.7 43.8 26.9 49.2 21.2
Euclidean crack length (m) 123.6 100.3 59.0 37.1 65.2 28.2
Projected tortuosity 1.61 0.16 1.70 0.22 1.65 0.11
Euclidean tortuosity 1.26 0.08 1.25 0.11 1.25 0.09

Chapter 6
152
Figure 6-51. Single surface cracks in a) 1IML, b) 2IML and c) 3IML.
6.3.5.2 Misorientation characterization
EBSD was carried out on such single cracks (Figure 6-52) in order to investigate preferential paths of propagation. In Figure 6-53 we can see that fatigue cracks in 1IML and 2IML tend to propagate preferentially along high misorientation angle grain boundaries, however, cracks in 3IML do not show any preference, propagation perpendicular to the tensile axis overrides any effects of individual grain misorientations. From the maps in Figure 6-52 we can also observe that all the cracks seem to arrest at triple grain boundaries (as seen in Section 6.3.4).
Figure 6-52. EBSD on single short cracks found in a) 1IML, b) 2IML and c) 3IML.

Competing mechanisms affecting the fatigue performance of Sn-Ni-Cu based multilayer coatings
153
Figure 6-53. Comparison between misorientation angle of all grain boundaries and those containing a fatigue crack in a) 1IML, b) 2IML and c) 3IML.

Chapter 6
154
6.4 Discussion
In this section we present a critical evaluation of the results above. This evaluation aims to elucidate the effect of the main factors affecting the fatigue performance of the multilayer coating under study [201].
6.4.1 Constraint effect of intermetallic compounds
The constraint considered in this section is that experienced by the top-surface layer of coatings (always Sn-based), since this is expected to experience the maximum stress under the 3-point bend testing configuration.
First of all, the global constraint (or loading boundary condition) of all the multilayer architectures comes from the thick substrate made of steel and leaded bronze, however, this constraint should be equivalent for all the samples. Therefore, the difference in terms of
microscale constraint relies on four materials in the overlay coating identified by XRD: -Sn, Ni3Sn4, Cu6Sn5 and Ni. Nanoindentation tests showed a big difference in stiffness and hardness of such materials (Table 6-4), with Sn the softest and most compliant material. Therefore, it is reasonable to consider the proportion of hard/stiff materials in relation to Sn will have a direct effect on the local evolution of constraint/stiffness in the overlay. This is mentioned in [201], where we measured the overall stiffness of the three multilayer coatings with strain gauges, showing higher stiffness (lower strain) for 3IML and lower stiffness (higher strain) for 1IML (with 2IML in the middle). The role of layer thickness was also discussed to explain the results, reaching the conclusion that thinner layers will increase the constraint (allowing lower strain).
Nanoindentation tests were also used to further study the effect of the different hard intermetallics. For this reason H and E were used to estimate the constraint, i.e. the harder/stiffer the more constraint [229]. For instance, when we increased the amount of Cu in a Sn layer (FS3 and FS10) both H and E increased, confirming that by increasing the amount of intermetallics increases the overall constraint of the Sn layer (Table 6-5). This behaviour has been attributed to intermetallics acting as obstacles for dislocation motion [230]. Also, the layer thickness was explored through nanoindentation: the three coatings (1IML, 2IML and 3IML) were indented from the surface at different depths, showing an increase in the constraint (evidenced by increasing E) with proximity to an IML (Figure 6-16), hence the same ranking shown by the strain gauges in [201] (3IML>2IML>1IML).
The constraint of hard materials on the Sn layers will have an effect on the fatigue crack behaviour. This effect will influence the fatigue performance of the multilayer coatings under study. For example, when we apply the same strain conditions, the Sn layer under more constraint will experience higher stresses [231], making it more likely for cracks to initiate and propagate faster. In fact, we can see in Figure 6-45 that the coating with lower constraint is also the coating with the lower crack growth rate (1IML). Moreover, the coatings with higher constraints due to IMLs (2IML and 3IML) present more initiation sites, from where short cracks propagate and coalesce together to form longer cracks. Hence, high constraint creates more initiation sites to release stress, which leads to the formation of more short cracks and coalescence events.
6.4.2 Effect of roughness
Surface roughness measurements were performed in order to quantify the likelihood for a crack to initiate at a ‘valley’ of roughness acting as stress raiser. This is assuming that the fatigue cracks

Competing mechanisms affecting the fatigue performance of Sn-Ni-Cu based multilayer coatings
155
would initiate at the surface, where the maximum stress is expected under a 3-point bend configuration. This behaviour is shown in Section 6.3.4, where we can see surface crack initiation from roughness ‘valleys’ in Figure 6-39, however, this is only observed consistently for 1IML. Thus, it is misleading to simplistically compare surface roughness of the different multilayer coatings in order to compare crack initiation events.
Nevertheless, it is clear that for all the coatings the roughness results are somewhat similar (Figure 6-14). We can see that 1IML presents the highest values and 2IML the lowest; this can be explained by two factors: 1. Kinetic roughening of electrodeposited Sn layers: the thicker the layer of Sn the rougher [232-234]. 2. Levelling effect of electrodeposited Ni: the thicker the Ni layer the more levelling (smoother surface) [235-238]. These two factors counterbalance each other to varying degrees during the manufacturing process, making the final roughness complex to predict when designing, but consistent for each individual coating design. These are manufacturer observations that can be affected by many parameters (current density, additives, etc.), however, it is not the focus of this investigation, therefore, it is not discussed here beyond assessing the surface roughnesses of the investigated coating systems.
IML/Sn interface roughness was also measured, as it was thought that this might have an effect on the fatigue crack propagation, again, it is expected that ‘valleys’ in these phases may create localised internal stress concentration features. From our observations, these ‘valleys’ appear to have an effect on crack propagation, in Figure 6-40 one can see that the cracks propagate through these stress concentration features in the IML.
Comparing coatings we can see that, in general, 1IML has the highest interface roughness and 3IML the lowest, but the latter is very similar to 2IML. This difference is due to the different nature of the intermetallics constituting the IMLs of the different coatings, as well as the grain growth of the intermetallic compounds, i.e. the thicker these are the rougher they become. As shown in Section 6.3.1: while 1IML is mainly composed of Cu6Sn5, 2IML and 3IML are composed of Ni3Sn4. Thus, if we only consider IML roughness, one would expect that cracks in 1IML will grow faster near the single IML layer and slower near the less rough IML layers in 3IML. However, 3IML has more IML interfaces on traversing the coating than the other coatings, giving rise to more opportunities for a crack to be accelerated due to the stress concentration of a ‘valley’, and this effect will counter-balance the lower roughness of the interfaces compared to 2IML.
Likewise, surface roughness is expected to have an effect on crack propagation upwards to the surface for sub-surface initiated cracks. Hence, a coating with higher surface roughness would also have cracks with higher growth rate (for cracks propagating towards the surface) and hence more surface cracks, which is the case when we compare 2IML with 3IML.
6.4.3 Effect of defects
Although many types of defects could be studied, we have focused here on the cavities found in the multilayer coatings. Such cavities in Sn-Ni-Cu systems have been investigated by several researchers. A combination of different mechanisms are used to explain their formation [239, 240]: 1. The highly asymmetric diffusion of Sn and Ni in the Ni3Sn4 layer cause the formation of Kirkendall voids in the Sn layer, which accelerate the growth of the Ni3Sn4 layer by the concurrent growth of the cavities [241]. 2. Space confinement causes the formation/growth of cavities in Ni/Sn/Ni sandwiches, since the volume shrinkage (-11.3%) from the reaction 3Ni+4Sn -> Ni3Sn4 cannot be completely dissipated through the reduction in vertical thickness of the sandwiches [242].

Chapter 6
156
This can be extrapolated to the smaller cavities found in 1IML, which are created due to the Kirkendall effect due to different diffusivities of Cu and Sn, which explains why the cavities appear at the interface Sn/Cu6Sn5 [243] (Figure 6-19a). However, the volume shrinkage (-5%) during the formation of Cu6Sn5 can be compensated by decreasing the upper layer thickness, avoiding the possible growth of the small cavities. Unlike 2IML and 3IML, where the hard IMLs restrict any possible thickness reduction of the Sn, meaning the cavities will grow larger.
Due to the cavity formation mechanisms, the larger cavities (2IML and 3IML) are always situated in a Sn layer in between two IML and have an ellipsoidal shape with orientation parallel to the surface. Conversely, the smaller cavities (1IML) are rounder with a more random position and orientations, these do not have any discernible effect on the crack initiation or propagation. Contrasting with the larger cavities that have an important role in the crack behaviour in 2IML and 3IML.
The FIB tomographs in Section 6.3.4 show cavities in the middle of the main cracks for 2IML and 3IML, indicating the cavities are acting as crack initiation sites. Hence, 2IML and 3IML present sub-surface crack initiation, making it more difficult to assess crack behaviour from surface observations. Nonetheless, surface crack analysis in Table 6-8 shows a higher number of cracks per unit area in 3IML than in 2IML, which correlates with the amount of cavities found in each coating. As for the effect of the cavities on crack propagation, we can see in Figure 6-41 transgranular crack propagation due to the high local tensile stress derived from the existence of the cavity [224], elsewhere we observe that cracks propagate in an intergranular fashion. This has also been quantified in Figure 6-28, where one can observe an increase of the tortuosity when the cavity appears, i.e. transgranular cracks. This can be related to the lower sphericity of the cavities found in 2IML, as opposed to 3IML, giving rise to higher stress raisers from which cracks can propagate. Although multiple-cracking from cavities was not observed in 3IML, cavities have an impact on the crack propagation in this multilayer coating. We noticed that all the main cracks assessed in 3IML contained cavities in two different Sn layers, which were connected by the crack, indicating that either the cracks initiated at the same time at both cavities and then coalesced together, or that one crack initiated at one of the cavities but then propagated directly towards the other cavity. In either scenario, the effective spacing of the cavities dramatically increases stress concentrations, affecting the fatigue performance of these multilayer coatings.
6.4.4 Effect of creep
XRD results show -Sn as the main component of the multilayer coatings under study. This
material has a relatively high homologous temperature (0.58Tm) at room temperature (21C). As aforementioned, all tests have been conducted at room temperature, hence, it is expected that creep will play an important role in the failure mechanism of the Sn layers.
Firstly, microindentation tests were used to evaluate the existence of creep, as well as to assess the overall creep response of the whole coating structure [244-246]. Figure 6-15 shows an increase of the indentation depth with time at constant load, indicating creep processes are operating. We can also see that the creep effect for 2IML and 3IML is reduced in comparison to 1IML, since the latter contains more Sn.
Researchers have previously discussed the lack of correlation between the creep exponent (n) obtained from nanoindentation creep with that normally described in conventional creep tests [221, 247]. For this reason, in our study the calculated creep exponents from the nanoindentation tests are not used to unambiguously identify the dominant creep mechanism.

Competing mechanisms affecting the fatigue performance of Sn-Ni-Cu based multilayer coatings
157
Instead, we have identified the contribution of grain boundary sliding (GBS) [248] by analysing microstructural features of the failed samples [249].
First of all, cracks in Sn propagate along grain boundaries, i.e. intergranular crack propagation, which is a typical feature of time-dependent fatigue due to GBS [250-253]. This can be seen in Section 6.3.4 and 6.3.5, where we can observe intergranular crack propagation from both a cross-sectional and a surface view, respectively. It is interesting to see in Figure 6-27 that the crack propagating only through Sn tends to be more tortuous from a surface point of view than from a cross-sectional point of view, this is because the crack follows the grain boundaries and the grains are columnar in the cross-sectional view but equiaxed from a surface point of view. Thus, one would expect that a microstructure with larger Sn grains would develop cracks with higher surface tortuosities, making the material more creep resistant. This might be true, but the tortuosity quantifications shown in Table 6-8 and Table 6-9 do not show a clear tendency with the grain size (Figure 6-12a), making evident the complexity of the failure mechanisms of the multilayer coatings under study.
However, in Section 6.3.2 we were also able to measure a higher creep resistance (higher n) for larger grain sizes in the Sn layer, showing 1IML is more creep-resistant due to the larger grains (in both the surface and the cross-section) and that the 3IML Sn layer has less creep-resistance due to smaller grains (surface and cross-section). Moreover, the creep resistance was also increased by adding a higher content of Cu in the Sn layers [254], this is attributed to the increase of Cu6Sn5 particles hindering Sn grain boundaries from sliding [255, 256].
The occurrence of GBS often increases the stress concentration at triple points [248], where voids can be formed and fatigue cracks initiate and propagate [257]. In fact, in Figure 6-54 we can observe micro voids formed at triple points. This phenomenon can also occur at the surface of the coating, which could also explain surface crack initiation, as well as propagation occurring at the grain boundaries. In Figure 6-38 and Figure 6-52 triple points were also seen to arrest fatigue cracks, however, in this case we consider that the triple points act as a ‘bifurcation’ where the crack has to deflect to continue propagating along grain boundaries [258].
Figure 6-54. Microvoids formed at triple points in 1IML.

Chapter 6
158
Since the main failure mechanism in Sn is intergranular fatigue, grain boundary misorientations were studied by means of EBSD. The results are shown in Figure 6-53, where we can see that
cracked grain boundaries are always above 10-15 of misorientation [259], hence, reinforcing
the idea of GBS, since misorientations below 10-15 are considered sub-grains, i.e. do not suffer from GBS. We also realise that the larger the grain size the higher the tendency for cracks to propagate along higher misorientation angles, hence, 3IML (smaller Sn grain size) does not show a particular preferential grain boundary misorientation through which the crack propagates. This could mean that crack propagation in the Sn is less dependent on creep mechanisms; this is the coating with Sn layers that presents a higher amount of transgranular crack propagation through thickness (compared to the other two coatings), where intergranular propagation was observed to be the main propagation mechanism. Also in Figure 6-52, we can observe a mix of large and small grains for 1IML and 2IML, but a more homogeneous microstructure for 3IML (also reflected with higher standard deviations in Figure 6-12a). This was attributed to recrystallization by polygonization as the main mechanism for the formation of small grains in Sn matrix during the fatigue tests [252], which can affect the crack tortuosity by providing straighter routes of propagation, reducing the effectiveness of a microstructure with larger grain sizes, i.e. lowering the creep resistance.
6.4.5 Shielding effects
A shielding effect is attributed to the behaviour of a fatigue crack as it approaches a bi-material interface. Suresh et al. [89, 90] observed that a fatigue crack propagating normally to the interface from the softer side exhibited reduced crack growth rate, crack deflection and arrest (shielding), whereas a crack propagating from the harder side, would pass through the interface un-deflected and at an accelerated rate (anti-shielding). Hence, an interface between two plastically (and elastically) dissimilar materials has the potential to severely affect the propagation behaviour of an approaching fatigue crack.
As shown in Table 6-4, a mismatch of properties exists between the materials composing the multilayer coatings, with Sn the soft/compliant material and Cu6Sn5 and Ni3Sn4 the hard/stiff materials. Due to the different nature of the intermetallic compounds and the amount in each multilayer coating, we consider that Cu6Sn5 has a greater impact in the 1IML system and Ni3Sn4 in 2IML and 3IML.
Figure 6-35-37 show the interaction between fatigue cracks and Cu6Sn5, where cracks are deflected, propagating along such intermetallics or even arrested by them. This interaction was quantified through EDMs (Section 4.3.5), showing that cracks tended to avoid the intermetallic compounds. This behaviour has been reported to block fatigue crack propagation [260] and retard the fracture path because the cracks do not propagate throughout Cu6Sn5 particles but propagate around these obstacles [254]. Moreover, this has even more relevance in the coatings under study, since the fatigue cracks have been observed to propagate intergranularly along Sn grain boundaries, precisely where the Cu6Sn5 intermetallics are formed, thus the position of the Cu6Sn5 intermetallics is particularly enhancing the intergranular fatigue resistance of the Sn-based layers. In fact, Figure 6-24 shows a very tortuous crack path in the XY plane, in part, due to the interaction of crack and Cu6Sn5. This is quantified in Figure 6-27, where we can see that the tortuosity increases along the Z axis when the crack is being arrested. In addition, it was also observed that fatigue cracks were being arrested by ‘filaments’ of Cu6Sn5 in 2IML and 3IML (Figure 6-42).
On the other hand, we can see in Figure 6-41-42 the expected shielding/anti-shielding (in deflection terms) as the cracks approach the interface Sn/Ni3Sn4. This was quantified in terms of percentage of crack propagating along the interface Sn/Ni3Sn4 (Table 6-7) and deflection angle

Competing mechanisms affecting the fatigue performance of Sn-Ni-Cu based multilayer coatings
159
between Sn and Ni3Sn4 (Figure 6-34). Comparing 2IML with 3IML, we can observe a more efficient (higher percentage of interface propagation) and greater (lower deflection angles) crack deflection in 2IML. This can be explained considering the thickness ratio of the soft/hard layers; the thicker the hard layer the higher the shielding effect, since it will produce a larger region of raised stiffness and hardness within the adjacent soft layer [96]. The deflection caused by the shielding effect can also be seen in Figure 6-25-26, where we can observe in plane ZY how the crack ‘bends’ towards the Y direction. This was also quantified in terms of projected tortuosity (Figure 6-28-29), which reaches maximum values when the crack is contained in Sn+IML.
Finally, shielding effects of the IML might also be the reason for the different crack lengths between 1IML and the other two coatings, since the latter are arrested at early stages of crack propagation, while cracks in 1IML continue growing to longer lengths (Figure 6-46).
6.4.6 Impact of the combined effects
In previous sections of the discussion, we have considered separately the effect of several mechanisms that affect the performance, and therefore, failure of the multilayer coatings under investigation. However, the reality is more complex, since it is expected that a combination of all studied factors will be contributing at different times (initiation, propagation, etc.) and with varying magnitudes (i.e. which ones are the controlling or dominant mechanisms) to the fatigue failure of the coatings. Nevertheless, an effort has been made to consider combinations of mechanisms that might expose the failure mechanism and eventually explain the fatigue performance reported in Chapter 5 and the publication extracted from it [201].
It seems that surface crack initiation occurs due to a combination of three factors: 1. Higher stress for a given strain (constraint from stiffer layers in the overlay coating), 2. Strain accumulation at triple points (creep) and 3. Stress concentrations (surface roughness). Therefore, crack initiation for 1IML happens when these three factors combine. If we add the effect of internal defects (cavities) as a fourth factor, then we can explain the prevalence of sub-surface crack initiation, observed in 2IML and 3IML. However, as aforementioned, small surface cracks have also been observed in 2IML (Figure 6-25), revealing a possible co-existence of crack initiation mechanisms. In this case, cracks would initiate at the surface, as well as from cavities, such cracks would then coalesce together. Furthermore, if we compare sub-surface crack initiation between 2IML and 3IML, we expect more initiation in 3IML, since it suffers more constraint, it has more IML interfaces i.e. more stress raisers due to IML roughness and it contains more cavities and these are larger. However, the comparison for surface crack initiation between 1IML and 2IML is not evident, since the 2IML surface is smoother but IML constraint levels and creep resistance is similar for both coatings. One then could argue that the effect of defects on crack initiation is more relevant than the effect of roughness, due to the higher local stresses expected to develop near the cavities.
On the other hand, crack propagation seems to arise from the combination of: 1. Stress distribution (mesoscopic constraint from the overlay layers), 2. Creep crack growth processes (i.e. the resistance to this offered by the microstructure), 3. Shielding and anti-shielding effects growing between mechanically dissimilar layers, 4. Defect distributions and 5. Roughness. Hence, a crack will propagate faster under higher stresses, through less creep resistant layers, with more stress concentrations (due to cavities and roughness ‘valleys’) and less efficient shielding events. Consequently, if we compare the three coatings under investigation we observe: 1. Higher constraints in 3IML and lower in 1IML, 2. Similar creep resistance for 1IML and 2IML but less for 3IML, 3. More efficient shielding for 2IML and less for 1IML, 4. Less effect

Chapter 6
160
of defects for 1IML and more effect for 3IML and 5. Higher IML roughness for 2IML than 3IML but with more stress concentration sites of the latter.
Thus, 2IML seems to present a better performance due to an enhanced balance between crack initiation and propagation (Figure 6-55), since 2IML presents better initiation resistance than 3IML but worse than 1IML and better crack propagation resistance than both 1IML and 3IML. These are essentially qualitative and semi-quantitative comparisons based on detailed mechanism observation and comparison.
Figure 6-55. Schematic of a balance between the factors affecting fatigue crack initiation and propagation.
6.5 Conclusions
In conclusion, different factors affecting the fatigue failure mechanisms and subsequent fatigue performance of Sn-Ni-Cu based multilayer coatings have been assessed through multiple techniques. The effect of these factors have been discussed, as well as the combination of these factors, in order to propose a plausible failure mechanism that can explain the different fatigue performance exposed in Chapter 5 and the publication extracted from it [201] (2IML best performance and 3IML worst). Thus, the main findings of this work are:
- More IMLs and higher content of Cu, increase the constraint of Sn based layers, increasing the crack growth rate as higher stresses are experienced at similar load levels. Hence, 3IML experiences the fastest crack growth rate and 1IML the slowest.
- Surface crack initiation has been observed for 1IML and 2IML. And it is attributed to the combination of higher stresses developed at the surface with creep strain accumulation at Sn grain boundary triple points and the surface roughness ‘valleys’.
- Sub-surface crack initiation has been identified as the main initiation mechanism for 2IML and 3IML. And it is attributed to the existence of sub-surface cavities located between IMLs, more of which exist in higher amount and at larger size in 3IML.
- Intergranular crack propagation was observed, and is attributed to grain boundary sliding of Sn during creep at room temperature contributing to creep-fatigue. Moreover, creep resistance was higher for Sn layers with larger grain size (1IML), and was increased by increasing the content of Cu, which was explained in terms of Cu6Sn5 particles hindering grain boundary sliding.
- It was seen that cracks propagate preferentially along grain boundaries with
misorientation angles >10-15. - Crack retardation/deflection was observed at triple points and interfaces between Sn
and: IML (Ni3Sn4) and IMC particles (Cu6Sn5).

Competing mechanisms affecting the fatigue performance of Sn-Ni-Cu based multilayer coatings
161
- It was finally concluded that 2IML presents a better fatigue resistance due to a balance between fatigue crack initiation and propagation. Since, 2IML present better initiation resistance than 3IML but worse than 1IML but a better crack propagation resistance than both 1IML and 3IML.

Conclusions
163
7. Conclusions
The research developed in this project aimed to gain understanding on the fatigue micromechanisms affecting the performance of multilayer plain bearings, as well as ranking these structures based on their fatigue performance. Such understanding is expected to provide routes for improvement/optimization of bearing structures with a mechanistic insight. The
studied samples consist of thin (20 m) Sn-Ni-Cu based layers electrodeposited onto a thicker leaded bronze interlayer bonded onto a far thicker steel backing.
In this attempt we firstly studied the leaded bronze interlayer, as it is service relevant to the bearing and works as a system model to study fatigue crack behaviour in dissimilar materials. During the interlayer study we developed a methodology to successfully conduct fatigue tests on simplified flat samples with slight variations in layer geometry. In addition we characterized the microstructure of the leaded bronze material, as well as its fatigue behaviour. We found that fatigue cracks tend to initiate at lead on the surface, early crack propagation through bronze grain boundaries was attributed to subsurface crack propagation through the interconnected lead, which agrees with a further preferential crack propagation through the lead. Moreover, leaded voids also affect crack propagation increasing crack tortuosity and crack deflection at the interlayer/backing interface which is attributed to shielding effect raised by their very different mechanical properties.
After a first approach studying the interlayer, we started investigating the thinner overlays. We developed an enhanced methodology to be able to detect damage in these thin multilayer coatings by incorporating lock-in thermography during the fatigue tests. This allowed us to rank different overlay coatings based on their fatigue performance and stop the tests when similar amounts of damage were reached by different coatings, so we could compare them and study short crack propagation, finding that the coating with two intermetallic layers performed the best and the coating with three intermetallic layers the worst. A first assessment of the overlays post-test elucidated a few factors thought to be affecting the fatigue behaviour of these coatings. The identified factors were: 1. Constraint, 2. Roughness, 3, Defects, 4. Creep and 5. Shielding. Finally, we attempted to study the previously mentioned factors in order to propose possible mechanisms of fatigue failure. Hence, the effect of these factors was studied concluding that: 1. More intermetallic layers or Cu content increases the constraint in Sn, increasing crack growth rate due to higher stresses for the same overall strain level. 2. Fatigue crack initiation in the coating with one intermetallic layer is attributed to surface roughness, however, for coatings with more intermetallic layers it is attributed to sub-surface cavities found in Sn layers between intermetallic layers. 3. Intergranular crack propagation in Sn was attributed to grain boundary sliding during creep at room temperature. 4. Crack shielding was considered to be an efficient retardation mechanism often observed at layer interfaces. 5. Finally it was concluded that the coating with two intermetallic layers presents a better fatigue resistance due to the balance between factors affecting fatigue crack initiation and propagation.
Based on these conclusions, it is proposed that in order to improve the fatigue performance of future coating designs: 1. Cavities should be suppressed (as much as possible) in order to decrease stress concentrations and sub-surface initiation, 2. A larger Sn grain size is preferred to increase the creep resistance, 3. Avoid columnar grains, since the grain boundaries promote crack growth directly into the next layers, 4. Thicker intermetallic layers would increase the efficiency of shielding, 5. Two intermetallic layers seem a good balance between shielding and constraint, 6. By increasing the amount of Cu, the crack resistance would also increase and 7.

Chapter 7
164
Smooth surfaces and appropriate positioning of IMLs would decrease stress concentrations, increasing crack initiation and propagation resistance.
It is thought that by following these recommendations, the fatigue resistance of multilayer coatings for plain bearings will increase.

Future work
165
8. Future work
Although, the present work has covered extensive experimental work analysis on the fatigue behaviour of the studied systems, more accurate and consistent data is needed to better define the fatigue crack growth rate, as well as a three-dimensional approach with higher resolution is needed to confirm the early crack propagation mechanisms proposed. Also, more advanced finite element modelling approaches should be applied to help explain the observed crack initiation and propagation mechanisms and to ascertain the magnitude of any benefits of the proposed changes. One main approach to continue this project must be to reliably produce flat samples, so we can continue further research with confidence that sample geometry and processing variables are well controlled.
The main problem we encountered when assessing the fatigue crack growth rate was the surface finish, since the roughness reduced the crack resolution. In order to better assess the fatigue crack growth rates, one solution would be to polish the surface via broad beam ion milling, for this reason the size of the sample should be reduced, since the current dimensions make this task impossible. In addition, interrupted tests could be carried out in the InstronPuls (capable of a more precise but lower maximum load) instead of in the Instron 8502. Another possibility to increase the crack resolution after BBIM polishing, would be to test the sample in-situ in a SEM. Moreover, a solution involving three dimensional characterization of crack growth would be to test even smaller samples in-situ in a nano-x-ray CT. Continuing with the 3D approach it would also be interesting to conduct 3D-EBSD from FIB tomography in order to study the existence of preferential crystal orientations for cavity formation or crack propagation, for example.
Another step to take this research further is to implement modelling strategies in order to evaluate the likely relative contributions of these postulated mechanisms. By using a modelling approach we can run systematic parametric studies of simplified architectures and study the variation of different parameters, such as: layer thickness, thickness-ratio between different layers, material properties, size and/or existence of defects, microstructure, etc. These studies will help to determine the dominant parameters controlling fatigue failure and aid the further design of optimized multilayer coatings.
However, in order to produce reliable FE models, the quality of the material models are also important. For this reason, it is proposed to acquire stress-strain curves of each material present in the multilayer coating by masked micro-tensile tests [261], DIC [262] or nanoindentation tests[263]. Moreover, in recent years nanoimpact tests have been reported as a reliable fatigue test for coatings [264]. This would also be worth exploring, since the test needs a very small amount material, is very reproducible and fast.


References
167
References [1] M. Ashby, H. Shercliff, D. Cebon, Materials Engineering, Science, Processing and Design, 2007.
[2] Daido, Book of Engineering Data Required to Design Plain Bearings for Automobile Engines.
[3] P.E. Newberry, G.W. Fraser, El Bersheh Part I, Hieroglyphic text
[4] http://www.bible-
history.com/ibh/Assyrian+Stone+Reliefs/Kouyunjik+Reliefs/Slaves+Dragging+a
+Winged+Bull.
[5] D. Kopeliovich, Bearing in internal combustion engines, www.substech.com.
[6] D. Dowson, History of Tribology (second edition), Professional Engineering Publishing, (1998).
[7] G.C. Pratt, Bearing materials: plain bearings, Encyclopedia of Materials: Science and Technology, (2001) 488-496.
[8] K. Mihara, Y. Inada, T. Mashiko, Anti-Seizure Properties of Bearing in Heavy-Duty Diesel Engines, SAE International, (1991).
[9] N.A. MacQuarrie, D.S. Green, Bearing material requirements for the future, Tribology of Reciprocating Engines, 1993, pp. 191-200.
[10] S.C. Tung, M.L. McMillan, Automotive tribology overview of current advances and challenges for the future, Tribology International, 37 (2004) 517-536.
[11] M. Nakasa, Engine friction overview, Proceedings of International Tribology Conference.Japan: Yokohama, (1995).
[12] M.S. Ali, Microstructural modelling of fatigue in layered bearing architectures, University of Southampton, 2007.
[13] D. Kopeliovich, Requirements to engine bearing materials, www.substech.com.
[14] A. Zeren, Embeddability behaviour of tin-based bearing material in dry sliding, Materials & Design, 28 (2007) 2344-2350.
[15] A. International, ASM Handbook, ASM International, 1992.
[16] D. Kopeliovich, Engine bearing materials, www.substech.com.
[17] F.E. Black, Babbitt bearings : F. E. Black. Machine Design, v. 32, Feb. 18, 1960, p. 163–165, Wear, 3 (1960) 407.
[18] A.E. Bravo, H.A. Durán, V.H. Jacobo, A. Ortiz, R. Schouwenaars, Towards new formulations for journal bearing alloys, Wear, 302 (2013) 1528-1535.
[19] D. Kopeliovich, Manufacturing bi-metal strips for copper bearings, www.substech.com.
[20] G.C. Pratt, Materials for Plain Bearings, International Metallurgical Reviews, 18 (1973) 62-88.
[21] R.K. George, Oil Film Bearing Materials, Tribology Data Handbook, CRC Press, 1997.
[22] D. Kopeliovich, Modern Trends In Materials For High Performance Engine Bearings, www.substech.com.
[23] Z.C. Lu, M.Q. Zeng, Y. Gao, M. Zhu, Significant improvement of wear properties by creating micro/nano dual-scale structure in Al–Sn alloys, Wear, 296 (2012) 469-478.
[24] S. Suresh, Fatigue of Materials, 2003.

References
168
[25] P.P. Benham, R.J. Crawford, C.G. Armstrong, Mechanics of Engineering Materials, Longman Group, 1996.
[26] J.L.G. Velázquez, Mecánica de fractura, Editorial Limusa S.A. De C.V., 2004.
[27] M.J.A. Gomila, Fractura de Materiales, Edicions UPC, 2002.
[28] J.A. Ewing, W. Rosenhain, Bakerian Lecture: The Crystalline Structure of Metals, 1900.
[29] J.A. Ewing, J.C.W. Humfrey, The Fracture of Metals under Repeated Alternations of Stress, 1903.
[30] N. Thompson, N. Wadsworth, N. Louat, The origin of fatigue fracture in copper, Philosophical Magazine, 1 (1956) 113-126.
[31] S. Brett, R.D. Doherty, Loss of solute at the fracture surface in fatigued aluminium precipitation-hardened alloys, Materials Science and Engineering, 32 (1978) 255-265.
[32] T. Vreeland Jr, D.S. Wood, D.S. Clark, The basal slip in zinc under static and dynamic loading, Journal of the Mechanics and Physics of Solids, 6 (1958) 111-126.
[33] B.T. Ma, C. Laird, Comments on "A cumulative fatigue damage formulation for persistent slip band type materials", Scripta Metallurgica, 23 (1989) 1029-1031.
[34] A.S. Cheng, C. Laird, The high cycle fatigue life of copper single crystals tested under plastic-strain-controlled conditions, Materials Science and Engineering, 51 (1981) 55-60.
[35] W.H. Kim, C. Laird, Crack nucleation and stage I propagation in high strain fatigue-I. Microscopic and interferometric observations, Acta Metallurgica, 26 (1978) 777-787.
[36] W.H. Kim, C. Laird, Crack nucleation and stage I propagation in high strain fatigue-II. mechanism, Acta Metallurgica, 26 (1978) 789-799.
[37] O.H. Basquin, The exponential law of endurance tests, Procedings of ASTM, 10 (1910) 625-630.
[38] L.F. Coffin, A study of the effect of cyclic thermal stresses on a ductile metal, Transactions of ASME, 76 (1954) 15-22.
[39] S.S. Manson, Behaviour of materials under conditions of thermal stress, National advisory commission on aeronautics, Report 1170 (1954).
[40] A.A. Griffith, The phenomenon of rupture and flow in solids, Philosophical Transactions of the Royal Society, A221 (1921) 163-197.
[41] G.R. Irwin, Analysis of Stresses and Strains near the end of a Crack Transversing a Plate, Journal of applied Mechanics, 24 (1957) 361-364.
[42] J.R. Rice, A path Independent Integral and the Approximate Analysis of Strain Concentrations by Notches and Cracks, Journal of applied Mechanics, 35 (1968) 379-386.
[43] P.C. Paris, M. Gomez, W.E. Anderson, A rational analytic theory of fatigue, Trend Engineering, 13 (1961) 9-14.
[44] P.C. Paris, F. Erdogan, A critical analysis of crack propagation laws, Journal of Basic Engineering, 85 (1963) 528-534.
[45] N.E. Dowling, J.A. Begley, Fatigue-crack growth during gross plasticity and the J-integral, American Society for Testing and Materials, 590 (1976) 82-103.
[46] N.E. Dowling, Fatigue-crack growth rate testing at high stress intensities, American Society for Testing and Materials, 631 (1977) 139-158.

References
169
[47] P.J.E. Forsyth, A two stage process of fatigue crack growth, Crack propagation: Procedings of Cranfield symposium, (1962) 76-94.
[48] E. Wolf, Fatigue crack closure under cyclic tension, Engineering Fracture Mechanics, 2 (1970) 37-45.
[49] K. Endo, T. Okada, T. Hariya, Fatigue crack propagation in bearing metals lining of steel plates in lubricating oil, Bulletin of the Japan Society of Mechanical Engineers, 15 (1972) 439-445.
[50] E. Hornbogen, Martensitic transformation at a propagating crack, Acta Metallurgica, 26 (1978) 147-152.
[51] A.G. Pineau, R.M. Pelloux, Influence of strain-induced martensitic transformations on fatigue crack growth rates in stainless steels, MT, 5 (1974) 1103-1112.
[52] K.T. Faber, A.G. Evans, Crack deflection processes, Acta Metallurgica, 31 (1983) 565-576.
[53] P.M. Scott, T.W. Thorpe, A critical review of crack tip stress intensity factors for semi-eliptic cracks, Fatigue of Engineering Materials and Structures, 4 (1981).
[54] J.C. Newmann, I.S. Raju, An empirical stress-intensity factor equation for the surface crack, Engineering Fracture Mechanics, 15 (1981) 185-192.
[55] N.E. Dowling, Crack growth during low-cycle fatigue of smooth axial specimens, In Cyclic Stress-Strain and Plastic Deformation Aspects of Fatigue Crack Growth (ASTM), 637 (1977) 97-121.
[56] P.P. Love, P.G. Forrester, A.E. Burke, Functions of Materials in Bearing Operation, Proceedings of the Institution of Mechanical Engineers: Automobile Division, 7 (1953) 29-44.
[57] W.E. Duckworth, G.H. Walter, Fatigue of plain bearings, International conference on fatigue of metals, (1956) 585-592.
[58] E.A. Blount, Design factors influencing the fatigue resistance of connecting-rod big-end bearings, Proceedings of the Institution of Mechanical Engineers, 175 (1961) 513-527.
[59] A.S. Guilherme, G.E.P. Henriques, R.A. Zavanelli, M.F. Mesquita, Surface roughness and fatigue performance of commercially pure titanium and Ti-6Al-4V alloy after different polishing protocols, The Journal of Prosthetic Dentistry, 93 (2005) 378-385.
[60] Y. Murakami, Effect of Surface Roughness on Fatigue Strength, in: Y. Murakami (Ed.) Metal Fatigue, Elsevier Science Ltd, Oxford, 2002, pp. 305-320.
[61] I.G. Greenfield, A. Purohit, The effect of near-surface diffusion layer on fatigue of copper, Surface effects in crystal plasticity. Hohegeiss (Germany): Noordhoff-Leyden, (1977) 609-624.
[62] C. Laird, D.J. Duquette, Mechanisms of fatigue crack nucleation, Corrosion fatigue (TX): NACE, (1972) 88-117.
[63] D.S. Grummon, D.J. Morrison, J.W. Jones, G.S. Was, Ion implantation and fatigue crack initiation: Interaction of persistent slip bands with modified surface layers, Materials Science and Engineering: A, 115 (1989) 331-336.
[64] J.C. Figueroa, C. Laird, Crack initiation mechanisms in copper polycrystals cycled under constant strain amplitudes and in step tests, Materials Science and Engineering, 60 (1983) 45-58.
[65] B.T. Ma, C. Laird, A.L. Radin, Dependence of fatigue failure mechanism on the cycling history of polycrystalline copper, Materials Science and Engineering: A, 123 (1990) 159-167.

References
170
[66] J. Mendez, P. Violan, G. Gasc, Initiation and growth of surface microcracks in polycrystalline copper cycled in air and in vacuum, The behaviour of short fatigue cracks. Mechanical Engineering Publications, London, (1986) 145-161.
[67] N. Gyde, Fatigue Fractures in Babbitt Lined Journal Bearings, Technical University of Denmark., 1969.
[68] W.H. Wilson, A test machine for assessing the fatigue properties of impulsively loaded plain bearings, Proceedings of the Institution of Mechanical Engineers, 182 (1967) 129-131.
[69] Y. Zhang, I. Tudela, M. Pal, I. Kerr, High strength tin-based overlay for medium and High speed diesel engine bearing tribological applications, Tribology International.
[70] M.C. Shaw, D.B Marshall, B.J. Dalgleish, M. S. Dadkhah, M.Y. He, A.G. Evans, Fatigue Crack Growth and Stress Redistribution in Multilayered Metal/Ceramic Composites, Acta Metallurgica et Materialia, 42 (1994) 4091-4099.
[71] M.C. Shaw, D.B. Marshall, M.S. Dadkhah, A.G. Evans, Cracking and Damage Mechanisms in Ceramic/Metal Multilayers, Acta metallurgica et materialia, 41 (1993) 3311-3322.
[72] P.B. Hoffman, J.C. Gibeling, Near-threshold fatigue crack growth in aluminum composite laminates, Scripta Metallurgica et Materialia, 32 (1995) 901-906.
[73] T. Tanaka, Y. Fukuchi, M. Terayama, Fatigue crack propagation behaviour of multilayered low carbon steel-stainless steel composite plates, Bulletin of the Japan Society of Mechanical Engineers, 29 (1986) 1081-1088.
[74] W. Wang, R.N. Singh, Fatigue crack growth in a Ni–Sn multilayered composite, Materials Science and Engineering: A, 251 (1998) 184-191.
[75] T. Tsakalakos, A.F. Jankowski, Mechanical-properties of composition-modulated metallic foils, Annual Review of Materials Science, 16 (1986) 293-313.
[76] K. Yoshii, H. Takagi, M. Umeno, H. Kawabe, Tensile strength of Ni/Cu/(001)Ni triple layer films, Metallurgical Transactions A, 15 (1984) 1273-1280.
[77] T. Foecke, D.S. Lashmore, Mechanical behavior of compositionallty modulated alloys, Scripta Metallurgica et Materialia, 27 (1992) 651-656.
[78] D.J. Srolovitz, S.M. Yalisove, J.C. Bilello, Design of multiscalar metallic multilayer composites for high strength, high toughness, and low CTE mismatch, Metallurgical and Materials Transactions A, 26 (1995) 1805-1813.
[79] M.R. Stoudt, R.E. Ricker, R.C. Cammarata, The influence of a multilayered metallic coating on fatigue crack nucleation, International Journal of Fatigue, 23, Supplement 1 (2001) 215-223.
[80] G.S. Was, T. Foecke, Deformation and fracture in microlaminates, Thin Solid Films, 286 (1996) 1-31.
[81] R.C. Cammarata, Mechanical properties of nanocomposite thin films, Thin Solid Films, 240 (1994) 82-87.
[82] S.A. Barnett, M. Shinn, Plastic and elastic properties of compositionally modulated thin-films, Annual Review of Materials Science, 24 (1994) 481-511.
[83] W. Wang, R.N. Singh, Influence of the microstructure on the mechanical properties of Ni/Sn multilayered composites, Materials Science and Engineering: A, 271 (1999) 306-314.
[84] N.J. Petch, The cleavage of polycrystals, Journal of the iron and steel Institute, 174 (1953) 8.

References
171
[85] E.O. Hall, The Deformation and Ageing of Mild Steel: III Discussion of Results, Proceedings of the Physical Society. Section B, 64 (1951) 747.
[86] J.S. Koehler, Attempt to Design a Strong Solid, Physical Review B, 2 (1970) 547-551.
[87] O. Kovářík, P. Haušild, J. Siegl, Z. Pala, J. Matějíček, V. Davydov, The influence of plasma sprayed multilayers of Cr2O3 and Ni10wt%Al on fatigue resistance, Surface and Coatings Technology, 251 (2014) 143-150.
[88] D. Yonekura, J. Fujita, K. Miki, Fatigue and wear properties of Ti–6Al–4V alloy with Cr/CrN multilayer coating, Surface and Coatings Technology, 275 (2015) 232-238.
[89] S. Suresh, Y. Sugimura, E.K. Tschegg, The growth of a fatigue crack approaching a perpendicularly-oriented, bimaterial interface, Scripta Metallurgica et Materialia, 27 (1992) 1189-1194.
[90] S. Suresh, Y. Sugimura, T. Ogawa, Fatigue cracking in materials with brittle surface coatings, Scripta Metallurgica et Materialia, 29 (1993) 237-242.
[91] Y. Sugimura, P.G. Lim, C.F. Shih, S. Suresh, Fracture normal to a bimaterial interface: Effects of plasticity on crack-tip shielding and amplification, Acta Metallurgica et Materialia, 43 (1995) 1157-1169.
[92] A.S. Kim, S. Suresh, C.F. Shih, Plasticity effects on fracture normal to interfaces with homogeneous and graded compositions, International Journal of Solids and Structures, 34 (1997) 3415-3432.
[93] U. Wiklund, P. Hedenqvist, S. Hogmark, Multilayer cracking resistance in bending, Surface and Coatings Technology, 97 (1997) 773-778.
[94] P.M. Ramsey, H.W. Chandler, T.F. Page, Bending tests to estimate the through-thickness strength and interfacial shear strength in coated systems, Thin Solid Films, 201 (1991) 81-89.
[95] G. Gille, K. Wetzig, Investigations on mechanical behaviour of brittle wear-resistant coatings I. Experimental results, Thin Solid Films, 110 (1983) 37-54.
[96] M.R. Joyce, P.A.S. Reed, S. Syngellakis, Numerical modelling of crack shielding and deflection in a multi-layered material system, Materials Science and Engineering: A, 342 (2003) 11-22.
[97] P. Wieciński, J. Smolik, H. Garbacz, K.J. Kurzydłowski, Failure and deformation mechanisms during indentation in nanostructured Cr/CrN multilayer coatings, Surface and Coatings Technology, 240 (2014) 23-31.
[98] M. Sistaninia, O. Kolednik, Effect of a single soft interlayer on the crack driving force, Engineering Fracture Mechanics, 130 (2014) 21-41.
[99] A.S. Kim, J. Besson, A. Pineau, Global and local approaches to fracture normal to interfaces, International Journal of Solids and Structures, 36 (1999) 1845-1864.
[100] K.N. Tu, Interdiffusion and reaction in bimetallic Cu-Sn thin films, Acta Metallurgica, 21 (1973) 347-354.
[101] K.N. Tu, R.D. Thompson, Kinetics of interfacial reaction in bimetallic Cu-Sn thin films, Acta Metallurgica, 30 (1982) 947-952.
[102] M. Sobiech, U. Welzel, E.J. Mittemeijer, W. Hügel, A. Seekamp, Driving force for Sn whisker growth in the system Cu–Sn, Applied Physics Letters, 93 (2008) 011906.
[103] B. Horváth, Influence of copper diffusion on the shape of whiskers grown on bright tin layers, Microelectronics Reliability, 53 (2013) 1009-1020.

References
172
[104] B. Horváth, B. Illés, T. Shinohara, G. Harsányi, Effects of humidity on tin whisker growth — Investigated on Ni and Ag underplated layer construction, Thin Solid Films, 520 (2011) 384-390.
[105] M. Sobiech, M. Wohlschlögel, U. Welzel, E.J. Mittemeijer, W. Hügel, A. Seekamp, W. Liu, G.E. Ice, Local, submicron, strain gradients as the cause of Sn whisker growth, Applied Physics Letters, 94 (2009) 221901.
[106] B. Horváth, B. Illés, T. Shinohara, G. Harsányi, Whisker growth on annealed and recrystallized tin platings, Thin Solid Films, 520 (2012) 5733-5740.
[107] M. Moazami Goudarzi, S.A. Jenabali Jahromi, A. Nazarboland, Investigation of characteristics of tin-based white metals as a bearing material, Materials & Design, 30 (2009) 2283-2288.
[108] H. Chen, J. Li, M. Li, Dependence of recrystallization on grain morphology of Sn-based solder interconnects under thermomechanical stress, Journal of Alloys and Compounds, 540 (2012) 32-35.
[109] H. Chen, B. Yan, M. Yang, X. Ma, M. Li, Effect of grain orientation on mechanical properties and thermomechanical response of Sn-based solder interconnects, Materials Characterization, 85 (2013) 64-72.
[110] J.J. Sundelin, S.T. Nurmi, T.K. Lepistö, Recrystallization behaviour of SnAgCu solder joints, Materials Science and Engineering: A, 474 (2008) 201-207.
[111] H.T. Chen, L. Wang, J. Han, M.Y. Li, Q.B. Wu, J.M. Kim, Grain Orientation Evolution and Deformation Behaviors in Pb-Free Solder Interconnects Under Mechanical Stresses, Journal of Elec Materi, 40 (2011) 2445-2457.
[112] H. Tsuji, Y. Tomita, N. Kawakami, I. Kerr, J. Harrison, Development of a new tin based overlay for medium speed diesel engines, CIMAC Congress 2004, Kyoto, (2004).
[113] D. Kopeliovich, Tin based engine bearing overlays, www.substech.com.
[114] Daido Metal, UK. (Private Communication), 2015.
[115] M.R. Joyce, Fatigue of aluminium linings in plain automotive bearings, University of Southampton, 2000.
[116] M.C. Mwanza, Microstructural characterization and modelling of fatigue in aluminium based plain bearing materials, University of Southampton, 2004.
[117] W.C. Oliver, G.M. Pharr, An improved technique for determining hardness and elastic modulus using load and displacement sensing indentation experiments, Journal of Materials Research, 7 (1992) 1564-1583.
[118] A.B. Veliz, Finite element modelling of fatigue crack growth in multi-layered architectures, University of Southampton, 2009.
[119] J. Chicken, Private communication with manufacturer, FLIR, (2010).
[120] J. Dulieu-Barton, P. Stanley, Development and applications of thermoelastic stress analysis, The Journal of Strain Analysis for Engineering Design, 33 (1998) 93-104.
[121] A.F. Robinson, Assessment of Residual Stress using Thermoelastic Stress Analysis, University of Southampton, 2011.
[122] A.F. Robinson, J. Dulieu-Barton, S. Quinn, D. Howarth, Crack Detection in Large Welded Components Under Fatigue Using TSA, Conference on Experimental and Applied Mechanics, 2013, pp. 47-50.

References
173
[123] VishayMeasurementsGroupUK, Basic Surface Preparation and Installation with M-Bond 200 Adhesive.
[124] K. Kiekens, F. Welkenhuyzen, Y. Tan, B. Ph, A. Voet, J.P. Kruth, W. Dewulf, A test object with parallel grooves for calibration and accuracy assessment of industrial computed tomography (CT) metrology, Measurement Science and Technology, 22 (2011) 115502.
[125] F. Leymarie, M.D. Levine, Fast raster scan distance propagation on the discrete rectangular lattice, CVGIP: Image Understanding, 55 (1992) 84-94.
[126] M. Aksoy, V. Kuzucu, H. Turhan, A note on the effect of phosphorus on the microstructure and mechanical properties of leaded-tin bronze, Journal of Materials Processing Technology, 124 (2002) 113-119.
[127] L.F. Kolesnichenko, O.I. Fushchich, L.D. Ignatenko, A.Y. Talochka, S.V. Chernyauskas, Structure formation in the Cu-Sn-Pb system during sintering, Soviet Powder Metallurgy and Metal Ceramics, 25 (1986) 377-382.
[128] R.M. German, Supersolidus liquid-phase sintering of prealloyed powders, Metallurgical and Materials Transactions A, 28 (1997) 1553-1567.
[129] M.R. JOYCE, K.K. LEE, S. SYNGELLAKIS, P.A.S. REED, Quantitative assessment of preferential
fatigue initiation sites in a multi‐phase aluminium alloy, Fatigue & Fracture of Engineering Materials & Structures, 27 (2004) 1025-1036.
[130] B.S.E. 10002-1:2001, Metallic materials Tensile testing, Method of test at ambient temperature.
[131] N.X. Zhang, N.Q. Chinh, M. Kawasaki, Y. Huang, T.G. Langdon, Self-annealing in a two-phase Pb-Sn alloy after processing by high-pressure torsion, Materials Science and Engineering: A, 666 (2016) 350-359.
[132] E. Broitman, Indentation Hardness Measurements at Macro-, Micro-, and Nanoscale: A Critical Overview, Tribology Letters, 65 (2016) 23.
[133] B.L. Boyce, X. Chen, J.O. Peters, J.W. Hutchinson, R.O. Ritchie, Mechanical relaxation of localized residual stresses associated with foreign object damage, Materials Science and Engineering: A, 349 (2003) 48-58.
[134] I. Arganda-Carreras, A. Cardona, V. Kaynig, J. Schindelin, Trainable weka segmentation, http://fiji.sc/Trainable_Weka_Segmentation.
[135] A. Sabahi Namini, M. Azadbeh, A. Mohammadzadeh, S. Shadpour, Liquid Phase Sintering of Leaded Tin Bronze Alloyed Powder, Transactions of the Indian Institute of Metals, 69 (2016) 1377-1388.
[136] A. International, ASM Handbook: Formerly Ninth Edition, Metals Handbook. Metallography and microstructures, ASM International, 1985.
[137] K. Edalati, Z. Horita, High-pressure torsion of pure metals: Influence of atomic bond parameters and stacking fault energy on grain size and correlation with hardness, Acta Materialia, 59 (2011) 6831-6836.
[138] F. Gontad, A. Lorusso, M. Panareo, A.G. Monteduro, G. Maruccio, E. Broitman, A. Perrone, Nanomechanical and electrical properties of Nb thin films deposited on Pb substrates by pulsed laser deposition as a new concept photocathode for superconductor cavities, Nuclear Instruments and Methods in Physics Research Section A: Accelerators, Spectrometers, Detectors and Associated Equipment, 804 (2015) 132-136.

References
174
[139] C. Paul, R. Sellamuthu, The Effect of Sn Content on the Properties of Surface Refined Cu-Sn Bronze Alloys, Procedia Engineering, 97 (2014) 1341-1347.
[140] W. Ramberg, W.R. Osgood, Description of stress-strain curves by three parameters, (1943).
[141] Z. Wu, M. Abe, Structural Health Monitoring and Intelligent Infrastructure, 2003.
[142] S.-H. Kim, S.Z. Han, C.J. Kim, I.-Y. Hwang, F. Yin, Evolution of Rolling Textures of Cold Rolled Copper Foils, MATERIALS TRANSACTIONS, 50 (2009) 537-543.
[143] W.F. Pan Hongchen, Jin Li,Feng Miaolin,Dong Jie, Mechanical Behavior and Microstructure Evolution of a Rolled Magnesium Alloy AZ31B Under Low Stress Triaxiality, J. Mater. Sci. Technol., 32 (2016) 1282-1288.
[144] S. Mahajan, C.S. Pande, M.A. Imam, B.B. Rath, Formation of annealing twins in f.c.c. crystals, Acta Materialia, 45 (1997) 2633-2638.
[145] H. Gao, Y. Huang, Geometrically necessary dislocation and size-dependent plasticity, Scripta Materialia, 48 (2003) 113-118.
[146] W.D. Nix, H. Gao, Indentation size effects in crystalline materials: A law for strain gradient plasticity, Journal of the Mechanics and Physics of Solids, 46 (1998) 411-425.
[147] R.M. German, P. Suri, S.J. Park, Review: liquid phase sintering, Journal of Materials Science, 44 (2009) 1-39.
[148] R. Strubbia, S. Hereñú, I. Alvarez-Armas, U. Krupp, Short fatigue cracks nucleation and growth in lean duplex stainless steel LDX 2101, Materials Science and Engineering: A, 615 (2014) 169-174.
[149] R. Strubbia, S. Hereñú, A. Giertler, I. Alvarez-Armas, U. Krupp, Experimental characterization of short crack nucleation and growth during cycling in lean duplex stainless steels, International Journal of Fatigue, 65 (2014) 58-63.
[150] R. Strubbia, S. Hereñú, M.C. Marinelli, I. Alvarez-Armas, Fatigue damage in coarse-grained lean duplex stainless steels, Materials Science and Engineering: A, 659 (2016) 47-54.
[151] H. Knobbe, P. Starke, S. Hereñú, H.J. Christ, D. Eifler, Cyclic deformation behaviour, microstructural evolution and fatigue life of duplex steel AISI 329 LN, International Journal of Fatigue, 80 (2015) 81-89.
[152] M.R. Joyce, S. Syngellakis, P.A.S. Reed, Fatigue crack initiation and early growth in a multiphase Al alloy included in a multilayer material system, Materials Science and Technology, 20 (2004) 47-56.
[153] Zhao, Gao, Wang, Microstructural effects on the short crack behaviour of a stainless steel
weld metal during low‐cycle fatigue, Fatigue & Fracture of Engineering Materials & Structures, 22 (1999) 469-480.
[154] N. Gao, M.W. Brown, K.J. Miller, CRACK GROWTH MORPHOLOGY AND MICROSTRUCTURAL
CHANGES IN 316 STAINLESS STEEL UNDER CREEP‐FATIGUE CYCLING, Fatigue & Fracture of Engineering Materials & Structures, 18 (1995) 1407-1422.
[155] W.O. Soboyejo, K. Kishimoto, R.A. Smith, J.F. Knott, A study of the interaction and coalescence of two coplanar fatigue cracks in bending, International Journal of Fatigue, 11 (1989) 453.
[156] W.O. Soboyejo, J.F. Knott, M.J. Walsh, K.R. Cropper, Fatigue crack propagation of coplanar semi-elliptical cracks in pure bending, Engineering Fracture Mechanics, 37 (1990) 323-340.

References
175
[157] W.O. Soboyejo, J.F. Knott, THE PROPAGATION OF NON‐COPLANAR SEMI‐ELLIPTICAL FATIGUE CRACKS, Fatigue & Fracture of Engineering Materials & Structures, 14 (1991) 37-49.
[158] P.J.E. Forsyth, Fatigue damage and crack growth in aluminium alloys, Acta Metallurgica, 11 (1963) 703-715.
[159] Y. Zhang, I. Tudela, M. Pal, I. Kerr, High Strength Tin-based Overlay for Medium and High Speed Diesel Engine Bearing Tribological Applications, Tribology International, (2015).
[160] Y. He, S.C. Wang, F. C. Walsh, W. S. Li, L. He, P.A.S. Reed., The monitoring of coating health by in situ luminescent layers, Royal Society of Chemistry, 5 (2015) 42965-42970.
[161] M. Anand, G. Burmistroviene, I. Tudela, R. Verbickas, G. Lowman, Y. Zhang, Tribological evaluation of soft metallic multilayer coatings for wear applications based on a multiple pass scratch test method, Wear, 388-389 (2017) 39-46.
[162] M.C. Mwanza, M.R. Joyce, K.K. Lee, S. Syngellakis, P.A.S. Reed, Microstructural characterisation of fatigue crack initiation in Al-based plain bearing alloys, International Journal of Fatigue, 25 (2003) 1135-1145.
[163] M.S. Ali, P.A.S. Reed, S. Syngellakis, Comparison of fatigue performance of HVOF spray coated and conventional roll bonded aluminium bearing alloys, Materials Science and Technology, 25 (2009) 575-581.
[164] M. R. Joyce, S. Syngellakis, P.A.S. Reed, Fatigue crack initiation and early growth in a multiphase Al alloy included in a multilayer material system, Materials Science and Technology, 20 (2004).
[165] R. Jiang, S. Everitt, N. Gao, K. Soady, J.W. Brooks, P.A.S. Reed, Influence of oxidation on fatigue crack initiation and propagation in turbine disc alloy N18, International Journal of Fatigue, 75 (2015) 89-99.
[166] R. Jiang, N. Karpasitis, N. Gao, P.A.S. Reed, Effects of microstructures on fatigue crack initiation and short crack propagation at room temperature in an advanced disc superalloy, Materials Science and Engineering: A, 641 (2015) 148-159.
[167] B.Y. He, K.A. Soady, B.G. Mellor, G. Harrison, P.A.S. Reed, Fatigue crack growth behaviour in the LCF regime in a shot peened steam turbine blade material, International Journal of Fatigue, 82 (2016) 280-291.
[168] T. O. Mbuya, Y. Gu, R. C. Thomson, P.A.S. Reed., Effect of intermetallic particles and grain boundaries on short fatigue crack growth behaviour in a cast Al–4Cu–3Ni–0.7Si piston alloy, Fatigue & Fracture of Engineering Materials & Structures, 40 (2017) 1428–1442.
[169] A.C. Melado, A.S. Nishikawa, H. Goldenstein, M.A. Giles, P.A.S. Reed, Effect of microstructure on fatigue behaviour of advanced high strength ductile cast iron produced by quenching and partitioning process, International Journal of Fatigue, 104 (2017) 397-407.
[170] R. Jiang, F. Pierron, S. Octaviani, P.A.S. Reed, Characterisation of strain localisation processes during fatigue crack initiation and early crack propagation by SEM-DIC in an advanced disc alloy, Materials Science and Engineering: A, 699 (2017) 128-144.
[171] A. Lanzutti, M. Pujatti, M. Magnan, F. Andreatta, H. Nurmi, A. Silvonen, E. Hlede, L. Fedrizzi, Uniaxial fatigue properties of closed die hot forged 42CrMo4 steel: Effect of flash and mechanical surface treatments, Materials & Design, 132 (2017) 324-336.
[172] L. Yan, J. Fan, In-situ SEM study of fatigue crack initiation and propagation behavior in 2524 aluminum alloy, Materials & Design, 110 (2016) 592-601.

References
176
[173] E. Grinzato, C. Bressan, S. Marinetti, P.G. Bison, C. Bonacina, Monitoring of the Scrovegni Chapel by IR thermography: Giotto at infrared, Infrared Physics & Technology, 43 (2002) 165-169.
[174] M.R. Clark, D.M. McCann, M.C. Forde, Application of infrared thermography to the non-destructive testing of concrete and masonry bridges, NDT & E International, 36 (2003) 265-275.
[175] C. Meola, Infrared thermography of masonry structures, Infrared Physics & Technology, 49 (2007) 228-233.
[176] C. Badulescu, M. Grédiac, H. Haddadi, J.D. Mathias, X. Balandraud, H.S. Tran, Applying the grid method and infrared thermography to investigate plastic deformation in aluminium multicrystal, Mechanics of Materials, 43 (2011) 36-53.
[177] M.P. Luong, Fatigue limit evaluation of metals using an infrared thermographic technique, Mechanics of Materials, 28 (1998) 155-163.
[178] M.L. Pastor, X. Balandraud, M. Grédiac, J.L. Robert, Applying infrared thermography to study the heating of 2024-T3 aluminium specimens under fatigue loading, Infrared Physics & Technology, 51 (2008) 505-515.
[179] H. Wang, L. Jiang, P.K. Liaw, C.R. Brooks, D.L. Klarstrom, Infrared temperature mapping of ULTIMET alloy during high-cycle fatigue tests, Metallurgical and Materials Transactions A, 31 (2000) 1307-1310.
[180] H.X. Zhang, G.H. Wu, Z.F. Yan, S.F. Guo, P.D. Chen, W.X. Wang, An experimental analysis of fatigue behavior of AZ31B magnesium alloy welded joint based on infrared thermography, Materials & Design, 55 (2014) 785-791.
[181] X. Tong, X. Chen, J. Xu, C. Sun, W. Liang, Excitation of thermal dissipation of solid propellants during the fatigue process, Materials & Design, 128 (2017) 47-55.
[182] T. Ummenhofer, J. Medgenberg, On the use of infrared thermography for the analysis of fatigue damage processes in welded joints, International Journal of Fatigue, 31 (2009) 130-137.
[183] G. Fargione, A. Geraci, G. La Rosa, A. Risitano, Rapid determination of the fatigue curve by the thermographic method, International Journal of Fatigue, 24 (2002) 11-19.
[184] F. Curà, G. Curti, R. Sesana, A new iteration method for the thermographic determination of fatigue limit in steels, International Journal of Fatigue, 27 (2005) 453-459.
[185] P. Jiang, X. Fan, Y. Sun, D. Li, B. Li, T. Wang, Competition mechanism of interfacial cracks in thermal barrier coating system, Materials & Design, 132 (2017) 559-566.
[186] K. Gopinath, R.K. Gupta, J.K. Sahu, P.K. Ray, R.N. Ghosh, Designing P92 grade martensitic steel header pipes against creep–fatigue interaction loading condition: Damage micromechanisms, Materials & Design, 86 (2015) 411-420.
[187] M.H. Belgen, Infrared radiometric stress instrumentation application range study, NASA, 142 (1967).
[188] J.M. Dulieu-Barton, P. Stanley, Development and applications of thermoelastic stress analysis, The Journal of Strain Analysis for Engineering Design, 33 (1998) 93-104.
[189] C.E. Ho, S.C. Yang, C.R. Kao, Interfacial reaction issues for lead-free electronic solders, Journal of Materials Science: Materials in Electronics, 18 (2007) 155-174.
[190] J.A.v. Beek, S.A. Stolk, F.J.J.v. Loo, Multiphase diffusion in the systems Fe-Sn and Si-Sn, Zeitschrift fuer Metallkunde, 73 (1982) 439-444.

References
177
[191] A.F. Robinson, J.M. Dulieu-Barton, S. Quinn, R.L. Burguete, Paint coating characterization for thermoelastic stress analysis of metallic materials, Measurement Science and Technology, 21 (2010).
[192] J. McKelvie, Consideration Of The Surface Temperature Response To Cyclic Thermoelastic Heat Generation, 1987, pp. 44-55.
[193] S.-X. Wu, Shape change of surface crack during fatigue growth, Engineering Fracture Mechanics, 22 (1985) 897-913.
[194] H. Abdel-Raouf, T.H. Topper, A. Plumtree, Fatigue At Elevated Temperatures, ASTM Special Technical Publication 1972.
[195] B.Y. He, O.L. Katsamenis, B.G. Mellor, P.A.S. Reed, 3-D analysis of fatigue crack behaviour in a shot peened steam turbine blade material, Materials Science and Engineering: A, 642 (2015) 91-103.
[196] S.I. Lieberman, A.M. Gokhale, S. Tamirisakandala, Reconstruction of three-dimensional microstructures of TiB phase in a powder metallurgy titanium alloy using montage serial sectioning, Scripta Materialia, 55 (2006) 63-68.
[197] J.E. Spowart, Automated serial sectioning for 3-D analysis of microstructures, Scripta Materialia, 55 (2006) 5-10.
[198] L. Holzer, M. Cantoni, Review of FIB-tomography, 2012.
[199] S.R. Stock, X-ray microtomography of materials, International Materials Reviews, 44 (1999) 141-164.
[200] W. Ludwig, J.Y. Buffière, S. Savelli, P. Cloetens, Study of the interaction of a short fatigue crack with grain boundaries in a cast Al alloy using X-ray microtomography, Acta Materialia, 51 (2003) 585-598.
[201] A. Laborda, A. Robinson, S. Wang, Y. Zhang, P. Reed, Fatigue assessment of multilayer coatings using lock-in thermography, Materials & Design, 141 (2018) 361-373.
[202] A.R.F. Jr., G. Pintaúde, A. Sinatora, C.E. Pinedo, A.P. Tschiptschin, The Use of a Vickers Indenter in Depth Sensing Indentation for Measuring Elastic Modulus and Vickers Hardness, Materials Research, 7 (2004) 483-491.
[203] A. Baated, K. Hamasaki, S.S. Kim, K.-S. Kim, K. Suganuma, Whisker Growth Behavior of Sn and Sn Alloy Lead-Free Finishes, Journal of Elec Materi, 40 (2011) 2278.
[204] P.Y. Chia, A.S.M.A. Haseeb, S.H. Mannan, Reactions in Electrodeposited Cu/Sn and Cu/Ni/Sn Nanoscale Multilayers for Interconnects, Materials, 9 (2016) 430.
[205] S.W. Chen, S.H. Wu, S.W. Lee, Interfacial reactions in the Sn-(Cu)/Ni, Sn-(Ni)/Cu, and Sn/(Cu,Ni) systems, Journal of Elec Materi, 32 (2003) 1188-1194.
[206] C.H. Lin, S.W. Chen, C.H. Wang, Phase equilibria and solidification properties of Sn-Cu-Ni alloys, Journal of Elec Materi, 31 (2002) 907-915.
[207] H. Yu, V. Vuorinen, J.K. Kivilahti, Solder/Substrate Interfacial Reactions in the Sn-Cu-Ni Interconnection System, Journal of Elec Materi, 36 (2007) 136-146.
[208] C.Y. LI, G.J. CHIOU, J.G. DUH, Phase Distribution and Phase Analysis in Cu6Sn5, Ni3Sn4, and the Sn-Rich Corner in the Ternary Sn-Cu-Ni Isotherm at 240°C, Journal of Elec Materi, Vol. 35 (2006).
[209] S. Wen, J.A. Szpunar, The Correlation of Texture and Microstructure to the Corrosion Resistance of Tin Coatings, Materials Science Forum, 495-497 (2005) 1413-1418.

References
178
[210] T. Maitland, S. Sitzman, Scanning Microscopy for Nanotechnology: Techniques and Applications, Springer, 2007.
[211] M.A. Meyer, I. Zienert, E. Zschech, Electron Backscatter Diffraction: Application to Cu Interconnects in Top-View and Cross Section, in: E. Zschech, C. Whelan, T. Mikolajick (Eds.) Materials for Information Technology: Devices, Interconnects and Packaging, Springer London, London, 2005, pp. 485-495.
[212] A. Conde, C. Muñoz-García, I. García, G.G. Fuentes, E. Almandoz, J.A. García, R.J. Rodríguez, Y. Qin, Nano-wear, nano-hardness and corrosion-resistance of electroplated nickel surfaces after co-implantation of Cr+ and N2+ ions, Surface and Coatings Technology, 205 (2011) 4447-4452.
[213] E. Dănăilă, L. Benea, N. Caron, O. Raquet, Titanium carbide nanoparticles reinforcing nickel matrix for improving nanohardness and fretting wear properties in wet conditions, Metals and Materials International, 22 (2016) 924-934.
[214] V.M.F. Marques, C. Johnston, P.S. Grant, Nanomechanical characterization of Sn–Ag–Cu/Cu joints—Part 1: Young’s modulus, hardness and deformation mechanisms as a function of temperature, Acta Materialia, 61 (2013) 2460-2470.
[215] C. Gamonpilas, E.P. Busso, On the effect of substrate properties on the indentation behaviour of coated systems, Materials Science and Engineering: A, 380 (2004) 52-61.
[216] P.-F. Yang, Y.-S. Lai, S.-R. Jian, J. Chen, R.-S. Chen, Nanoindentation identifications of mechanical properties of Cu6Sn5, Cu3Sn, and Ni3Sn4 intermetallic compounds derived by diffusion couples, Materials Science and Engineering: A, 485 (2008) 305-310.
[217] Y. Rosenthal, A. Stern, S.R. Cohen, D. Eliezer, Nanoindentation measurements and mechanical testing of as-soldered and aged Sn–0.7Cu lead-free miniature joints, Materials Science and Engineering: A, 527 (2010) 4014-4020.
[218] J. Chen, S.J. Bull, S. Roy, A. Kapoor, H. Mukaibo, H. Nara, T. Momma, T. Osaka, Y. Shacham-Diamand, Nanoindentation and nanowear study of Sn and Ni–Sn coatings, Tribology International, 42 (2009) 779-791.
[219] H. Tsukamoto, Z. Dong, H. Huang, T. Nishimura, K. Nogita, Nanoindentation characterization of intermetallic compounds formed between Sn–Cu (–Ni) ball grid arrays and Cu substrates, Materials Science and Engineering: B, 164 (2009) 44-50.
[220] L. Xu, J.H.L. Pang, Nano-indentation characterization of Ni–Cu–Sn IMC layer subject to isothermal aging, Thin Solid Films, 504 (2006) 362-366.
[221] R. Goodall, T.W. Clyne, A critical appraisal of the extraction of creep parameters from nanoindentation data obtained at room temperature, Acta Materialia, 54 (2006) 5489-5499.
[222] S. Chen, L. Liu, T. Wang, Investigation of the mechanical properties of thin films by nanoindentation, considering the effects of thickness and different coating–substrate combinations, Surface and Coatings Technology, 191 (2005) 25-32.
[223] Z. Chen, M. He, B. Balakrisnan, C.C. Chum, Elasticity modulus, hardness and fracture toughness of Ni3Sn4 intermetallic thin films, Materials Science and Engineering: A, 423 (2006) 107-110.
[224] T. Liu, D. Ding, Y. Hu, Y. Gong, Effect of interfacial reaction on tin whisker formation of Sn/Ni films deposited on copper lead-frame, 2014 15th International Conference on Electronic Packaging Technology, 2014, pp. 1005-1009.

References
179
[225] P.M. Scott, T.W. Thorpe, A CRITICAL REVIEW OF CRACK TIP STRESS INTENSITY FACTORS FOR SEMI-ELLIPTIC CRACKS*, Fatigue & Fracture of Engineering Materials & Structures, 4 (1981) 291-309.
[226] S.J. Holdbrook, W.D. Dover, The stress intensity factor for a deep surface crack in a finite plate, Engineering Fracture Mechanics, 12 (1979) 347-364.
[227] B.Y. He, K.A. Soady, B.G. Mellor, G. Harrison, P.A.S. Reed, Fatigue crack growth behaviour in the LCF regime in a shot peened steam turbine blade material, International Journal of Fatigue, 82 (2016) 280-291.
[228] Y.Z. Wang, J.D. Atkinson, R. Akid, R.N. Parkins, CRACK INTERACTION, COALESCENCE AND MIXED MODE FRACTURE MECHANICS, Fatigue & Fracture of Engineering Materials & Structures, 19 (1996) 51-63.
[229] J.J. Roa, E. Jiménez-Piqué, J.M. Tarragó, D.A. Sandoval, A. Mateo, J. Fair, L. Llanes, Hall-Petch strengthening of the constrained metallic binder in WC–Co cemented carbides: Experimental assessment by means of massive nanoindentation and statistical analysis, Materials Science and Engineering: A, 676 (2016) 487-491.
[230] M. Kerr, N. Chawla, Creep deformation behavior of Sn–3.5Ag solder/Cu couple at small length scales, Acta Materialia, 52 (2004) 4527-4535.
[231] Y. Xiang, J.J. Vlassak, Bauschinger and size effects in thin-film plasticity, Acta Materialia, 54 (2006) 5449-5460.
[232] V. Venkatasamy, S. Riemer, I. Tabakovic, Electrodeposition of eutectic Sn96.5Ag3.5 films from iodide–pyrophosphate solution, Electrochimica Acta, 56 (2011) 4834-4840.
[233] W. Schwarzacher, Kinetic roughening of electrodeposited films, Journal of Physics: Condensed Matter, 16 (2004) R859.
[234] H. Brune, Epitaxial Growth of Thin Films, Surface and Interface Science, Wiley-VCH Verlag GmbH & Co. KGaA, 2013, pp. 421-492.
[235] J.D. Thomas, Proceedings of the American Electroplaters' Society, 43 (1956) 60-66.
[236] S. E. Beacom, B. J. Riley, A Radioisotopic Study of Leveling in Bright Nickel Electroplating Baths, 1959.
[237] L. Oniciu, L. Mureşan, Some fundamental aspects of levelling and brightening in metal electrodeposition, Journal of Applied Electrochemistry, 21 (1991) 565-574.
[238] Z. Liu, W. Gao, The effect of substrate on the electroless nickel plating of Mg and Mg alloys, Surface and Coatings Technology, 200 (2006) 3553-3560.
[239] Y. Liu, Y.-T. Chen, S. Gu, D.-W. Kim, K.N. Tu, Fracture reliability concern of (Au, Ni)Sn4 phase in 3D integrated circuit microbumps using Ni/Au surface finishing, Scripta Materialia, 119 (2016) 9-12.
[240] H.Y. Chuang, T.L. Yang, M.S. Kuo, Y.J. Chen, J.J. Yu, C.C. Li, C.R. Kao, Critical Concerns in Soldering Reactions Arising from Space Confinement in 3-D IC Packages, IEEE Transactions on Device and Materials Reliability, 12 (2012) 233-240.
[241] B.-M. Chung, J. Choi, J.-Y. Huh, Fast Concurrent Growth of Ni3Sn4 and Voids During Solid-State Reaction Between Sn-Rich Solder and Ni Substrates, Journal of Elec Materi, 41 (2012) 44-52.
[242] H.Y. Chuang, J.J. Yu, M.S. Kuo, H.M. Tong, C.R. Kao, Elimination of voids in reactions between Ni and Sn: A novel effect of silver, Scripta Materialia, 66 (2012) 171-174.

References
180
[243] K. Byoung-Joon, L. Gi-Tae, K. Jaedong, L. Kiwook, P. Young-Bae, J. Young-Chang, Intermetallic compound and Kirkendall void growth in Cu pillar bump during annealing and current stressing, 2008 58th Electronic Components and Technology Conference, 2008, pp. 336-340.
[244] I. Dutta, C. Park, S. Choi, Impression creep characterization of rapidly cooled Sn–3.5Ag solders, Materials Science and Engineering: A, 379 (2004) 401-410.
[245] A.F. Abd El-Rehim, H.Y. Zahran, Investigation of microstructure and mechanical properties of Sn-xCu solder alloys, Journal of Alloys and Compounds, 695 (2017) 3666-3673.
[246] M. Kamal, T. El-Ashram, Microcreep of rapidly solidified Sn–0.7wt.% Cu–In solder alloys, Materials Science and Engineering: A, 456 (2007) 1-4.
[247] J. Dean, A. Bradbury, G. Aldrich-Smith, T.W. Clyne, A procedure for extracting primary and secondary creep parameters from nanoindentation data, Mechanics of Materials, 65 (2013) 124-134.
[248] T.G. Langdon, Identifying creep mechanisms in plastic flow, Zeitschrift für Metallkunde, 96 (2005) 522-531.
[249] G.S. Zhang, H.Y. Jing, L.Y. Xu, J. Wei, Y.D. Han, Creep behavior of eutectic 80Au/20Sn solder alloy, Journal of Alloys and Compounds, 476 (2009) 138-141.
[250] K. Fakpan, Y. Otsuka, Y. Mutoh, S. Inoue, K. Nagata, K. Kodani, Creep-fatigue crack growth behavior of Pb-contained and Pb-free solders at room and elevated temperatures, Procedia Engineering, 10 (2011) 1238-1243.
[251] J. Zhao, Effect of aging treatment on fatigue crack growth in eutectic Sn–Pb alloy, Scripta Materialia, 48 (2003) 1277-1281.
[252] J. Zhao, Y. Miyashita, Y. Mutoh, Fatigue crack growth behavior of 96.5Sn–3.5Ag lead-free solder, International Journal of Fatigue, 23 (2001) 723-731.
[253] J. Zhao, Y. Mutoh, Y. Miyashita, S.L. Mannan, Fatigue crack-growth behavior of Sn-Ag-Cu and Sn-Ag-Cu-Bi lead-free solders, Journal of Elec Materi, 31 (2002) 879-886.
[254] F. Tai, F. Guo, M.T. Han, Z.D. Xia, Y.P. Lei, Y.W. Shi, Creep and thermomechanical fatigue properties of in situ Cu6Sn5 reinforced lead-free composite solder, Materials Science and Engineering: A, 527 (2010) 3335-3342.
[255] W.J. Boettinger, C.E. Johnson, L.A. Bendersky, K.W. Moon, M.E. Williams, G.R. Stafford, Whisker and Hillock formation on Sn, Sn–Cu and Sn–Pb electrodeposits, Acta Materialia, 53 (2005) 5033-5050.
[256] Sanka Ganesan, M.G. Pecht, Lead-free electronics, 2006.
[257] M.E. Kassner, Fundamentals of Creep in Metals and Alloys, 2004.
[258] P. Mulvihill, C.J. Beevers, The initiation and growth of intergranularly initiated short fatigue cracks in an aluminium 4.5 per cent copper alloy, The behaviour of short fatigue cracks, EGF Pub. 1(Edited by K.J. Miller and E.R. de los Rios. Mechanical Engineering Publications, London, (1986) 203-213.
[259] M. Erinc, P.J.G. Schreurs, M.G.D. Geers, Intergranular thermal fatigue damage evolution in SnAgCu lead-free solder, Mechanics of Materials, 40 (2008) 780-791.
[260] M. Braunovic, N.K. Myshkin, V.V. Konchits, Electrical Contacts: Fundamentals, Applications and Technology, CRC Press, 2006.

References
181
[261] S. Yanagida, T.-F.M. Chang, C.-Y. Chen, T. Nagoshi, D. Yamane, K. Machida, K. Masu, M. Sone, Tensile tests of micro-specimens composed of electroplated gold, Microelectronic Engineering, 174 (2017) 6-10.
[262] G. Valeri, B. Koohbor, A. Kidane, M.A. Sutton, Determining the tensile response of materials at high temperature using DIC and the Virtual Fields Method, Optics and Lasers in Engineering, 91 (2017) 53-61.
[263] E. Martínez, J. Romero, A. Lousa, J. Esteve, Nanoindentation stress–strain curves as a method for thin-film complete mechanical characterization: application to nanometric CrN/Cr multilayer coatings, Applied Physics A, 77 (2003) 419-427.
[264] B.D. Beake, J.F. Smith, Nano-impact testing—an effective tool for assessing the resistance of advanced wear-resistant coatings to fatigue failure and delamination, Surface and Coatings Technology, 188-189 (2004) 594-598.