
Miniature Wind Energy Harvesters - ePrints Soton
158
UNIVERSITY OF SOUTHAMPTON FACULTY OF PHYSICAL AND APPLIED SCIENCE Electronics and Computer Science Miniature Wind Energy Harvesters by Huihui Sun Thesis for the degree of Doctor of Philosophy May 2017
-
Upload
khangminh22 -
Category
Documents
-
view
2 -
download
0
Transcript of Miniature Wind Energy Harvesters - ePrints Soton

UNIVERSITY OF SOUTHAMPTON
FACULTY OF PHYSICAL AND APPLIED SCIENCE
Electronics and Computer Science
Miniature Wind Energy Harvesters
by
Huihui Sun
Thesis for the degree of Doctor of Philosophy
May 2017

ABSTRACT
UNIVERSITY OF SOUTHAMPTON
ABSTRACT
FACULTY OF PHYSICAL AND APPLIED SCIENCES
Doctor of Philosophy
MINIATURE WIND ENERGY HARVESTERS
by Huihui Sun
Energy harvesting is a very attractive technique for a wide variety of self-powered
microsystems such as wireless sensors. Airflow induced oscillations have been used as
an attractive technique for energy harvesting because of its potential capacity for
generating electrical power. The aero-elastic instability phenomenon such as flutter has
been suggested especially for small scale energy harvesters.
This paper describes the design, simulation, fabrication, measurement and performance
of a miniature wind energy harvester based on a flapping cantilevered beam. The wind
generator is based on oscillations of a cantilever that faces the direction of the airflow.
The oscillation is amplified by interactions between an aerofoil attached on the
cantilever and a bluff body placed in front of the aerofoil. To achieve the optimum
design of the harvester, both computational simulations and experiments have been
carried out to investigate the structure. Simulation is achieved with ANSYS to optimise
the structure and predict the power generation for practical design.
Both piezoelectric materials and electromagnetic transducers are used for the generator
and tested. Three prototypes with the same volume of 37.5 cm3 are fabricated and tested
through two aspects of the performance namely the threshold wind speed for operation
and the output power. Wind tunnel test results are presented to determine the optimum
structure and to characterize the performance of the harvesters. The piezoelectric
generator is fabricated by thick-film screen printing technique. The optimized device
finally achieved a working wind speed range from 2 m/s to 8 m/s. The power output
was ranging from 0.35 to 3.6 µW and the open-circuit output voltage was from 0.6V to
1.9V. The first electromagnetic harvester had a working wind speed range from 1.35
m/s to 6 m/s with a maximum power output of 29.8 µW and a voltage of 293 mV. While
for the second generator, the wind speed for operation is form 1.5 m/s to 6.5 m/s. The
output power is ranging from 8.9 µW to 41 µW and the output voltage is up to 171 mV.
Results verified the harvester can effectively convert wind energy into large amplitude
mechanical vibration without strict frequency matching constraints.

DECLARATION OF AUTHORSHIP
i
Declaration of Authorship
I, Huihui Sun, declare that the thesis entitled Miniature Wind energy Harvesters and
the work presented in the thesisit are both my own, and have been generated by me as
the results of my own original research. I confirm that:
this work was done wholly or mainly while in candidature for a research degree
at the University;
where any part of this thesis has previously been submitted for a degree or any
other qualification at this University or any other institution, this has been
clearly stated;
where I have consulted the published work of others, this is always clearly
attributed;
where I have quoted from the work of others, the source is always given. With
the exception of such quotations, this thesis is entirely my own work;
I have acknowledged all main sources of help;
where the thesis is based on work done by myself jointly with others, I have
made clear exactly what was done by others and what I have contributed myself;
parts of this work have been published as:
H. Sun, D. Zhu, N. M. White, and S. P. Beeby (2016) A miniature electromagnetic
generator for wind energy harvesting, (In preparation).
H. Sun, D. Zhu, N.M. White, S.P. Beeby (2015) A miniature piezoelectric energy
harvester for air flows, IEEE Symp. Des. Test, Integr. Packag. MEMS/MOEMS, 1–3,
doi:10.1109/DTIP.2015.7161035.
H. Sun, D. Zhu, N. M. White, and S. P. Beeby (2013) A miniature airflow energy
harvester from piezoelectric materials, J. Phys. Conf. Ser., 476, 012057, doi:
10.1088/1742-6596/476/1/012057.
H. Sun, D. Zhu, N. M. White, and S. P. Beeby (2015) A miniature piezoelectric
energy harvester for air flows, The 17th Symposium on Design, Test, Integration and
Packaging of MEMS/MOEMS, Montpellier, France

DECLARATION OF AUTHORSHIP
ii
H. Sun, D. Zhu, N. M. White, and S. P. Beeby (2013) A miniature airflow energy
harvester from piezoelectric materials, The 13th International Conference on Micro
and Nanotechnology for Power Generation and Energy Conversion Applications,
London, United Kingdom,
Signed:………………………………………………….…………………
Date:…………………………………………………….…………………

ACKNOWLEDGEMENTS
iii
Acknowledgements
This PhD thesis marks the end of my four-year challenging journey in Southampton,
and it is now time for me to express my gratitude for all who made this journey smooth
and enjoyable.
I am particularly grateful to my supervisor, Prof. Steeve Beeby, for giving me this
opportunity to be his student and for his guidance and enthusiasm throughout my PhD
and beyond. His scientific vision and rigorous academic attitude along with the trust
and freedom he has offered makes an ideal environment for a simple student to develop
into a research scientist. Thanks also go to my co-supervisor, Prof. Neil White for his
helpful comments in my work. A special gratitude to Dr Dibin Zhu, my third supervisor,
for his extensive advice and ceaseless supply of suggestions. The working experience
with him in has made me completely forgotten any “hierarchy” in this academic world.
My sincere gratitude also goes to Dr Yang Wei and Dr Russel Torah for showing me
the thick-film processing techniques. I also would like to take this opportunity to thank
my fellow colleagues without whom this stimulating scientific environment would
never exist and many of whom have become good friends of mine.
Furthermore, I would like to thank my friends in Southampton who I have shared great
time with me. Big thanks to all the members of our “Poker Gang”, and Dr 4U group.
I would thank my big family for their tireless love and support over the years. To my
parents, thank you for always believing in me and raising me to be the person that I am
today. I hope I have made you proud.
A special thanks to my beloved husband, Dr Ruomeng Huang, thank you for your
constant unwavering support through the darkest of times, for your understanding,
kindness and patience with me, and for constantly reminding me that life is wonderful.
Finally, thanks to my son for giving me so much love and courage. Daddy and Mummy
love you.

CONTENTS
iv
CONTENT
Declaration of Authorship ............................................................................................ i
Acknowledgements .................................................................................................... iii
List of Figures .............................................................................................................. vi
List of Tables ................................................................................................................ x
Chapter 1 Introduction ............................................................................................ 1
1.1 Background .................................................................................................. 1
1.2 Energy Harvesting Overview ...................................................................... 1
1.3 Motivation of Work ..................................................................................... 3
1.4 Objectives of Work ...................................................................................... 4
1.5 Thesis Structure ........................................................................................... 5
Chapter 2 Literature Review .................................................................................. 6
2.1 Energy Harvesting History .......................................................................... 6
2.2 Kinetic Energy Harvesting .......................................................................... 6
2.2.1. Types of Kinetic Energy Transduction Mechanisms ....................... 7
2.2.2. Piezoelectric Generators ................................................................... 7
2.2.3. Electromagnetic Transduction ........................................................ 13
2.2.4. Electrostatic Generators .................................................................. 14
2.3 Wind Energy Harvesting ........................................................................... 15
2.3.1. Wind Turbines ................................................................................ 15
2.3.2. Energy harvesters based on flow-induced vibration ....................... 21
2.3.3. Energy harvesting from Helmholtz resonators ............................... 35
2.4 Conclusion ................................................................................................. 36
Chapter 3 Theory ................................................................................................... 38
3.1 Oscillation under Air Flow ........................................................................ 38
3.2 Power of Wind ........................................................................................... 40
3.3 Power of Generator .................................................................................... 41
3.4 Theoretical Model of Piezoelectricity ....................................................... 43
3.5 Theoretical Model of Electromagnetism ................................................... 46
3.6 Aerofoil ...................................................................................................... 48
3.7 Conclusion ................................................................................................. 49
Chapter 4 Oscillation Wind Harvester Design .................................................... 50
4.1 Design Considerations ............................................................................... 50
4.2 Structure Design ........................................................................................ 51
4.2.1. Overall Size .................................................................................... 51
4.2.2. Material Chosen .............................................................................. 51
4.2.3. Design Configuration ..................................................................... 52
4.3 Simulation Analysis ................................................................................... 52
4.4 Testing of the Wind Harvester................................................................... 57

CONTENTS
v
4.4.1. Experimental Setup......................................................................... 57
4.4.2. Experimental Results ...................................................................... 59
4.5 Comparison ................................................................................................ 66
4.5.1. Optimum Mechanical Structure...................................................... 66
4.5.2. Natural Frequency .......................................................................... 68
4.6 Conclusion ................................................................................................. 69
Chapter 5 Piezoelectric Wind Generator ............................................................. 71
5.1 Transducer Design ..................................................................................... 71
5.1.1. Design Configuration ..................................................................... 71
5.1.2. Material Chosen .............................................................................. 72
5.1.3. Modal Analysis ............................................................................... 72
5.2 Screen Printing Design .............................................................................. 76
5.2.1. Substrate Design ............................................................................. 76
5.2.2. Screen Design ................................................................................. 77
5.3 Fabrication of the Piezoelectric Cantilever ............................................... 79
5.3.1. Materials Preparation ...................................................................... 79
5.3.2. Screen Printing Process .................................................................. 80
5.3.3. Poling .............................................................................................. 82
5.3.4. Results and Discussion ................................................................... 83
5.4 Testing of the Wind Generator .................................................................. 86
5.4.1. Experimental Setup......................................................................... 87
5.4.2. Experimental Results ...................................................................... 88
5.4.3. Comparison ..................................................................................... 95
5.5 Conclusion ............................................................................................... 100
Chapter 6 Electromagnetic Wind Generator .................................................... 102
6.1 Transducer Design ................................................................................... 102
6.1.1. Design Considerations .................................................................. 102
6.1.2. Design Configuration ................................................................... 103
6.1.3. Materials Chosen .......................................................................... 105
6.2 Testing of the Wind Generator ................................................................ 105
6.2.1. Prototype Fabrication ................................................................... 105
6.2.2. Experimental Setup....................................................................... 106
6.2.3. Experimental Results .................................................................... 107
6.2.4. Comparison ................................................................................... 115
6.3 Conclusion ............................................................................................... 117
Chapter 7 Conclusion and Future Work ........................................................... 120
7.1 Summary of Achievement ....................................................................... 120
7.2 Summary of Contributions ...................................................................... 120
7.2.1. Modelling and Comparison .......................................................... 120
7.2.2. Fabrication .................................................................................... 121
7.2.3. Characterisation and Optimisation ............................................... 122
7.3 Recommendations for Future work ......................................................... 124
Appendix ................................................................................................................... 128
Reference .................................................................................................................. 137

LIST OF FIGURES
vi
List of Figures
Figure 1.1: World final energy consumption and energy use in buildings. ................... 3
Figure 2.1: Direction of forces affecting a piezoelectric element. ................................. 9
Figure 2.2: Piezoelectric constants in typical energy harvesting modes. Reprinted from
[25]. ................................................................................................................................ 9
Figure 2.3: Schematic of the contact poling technique. ............................................... 10
Figure 2.4: Process of screen printing. Reprinted from [32]. ...................................... 12
Figure 2.5: Schematics of two electromagnetic generators arrangements. .................. 14
Figure 2.6: Principle of operation of the electrostatic generator. ................................ 15
Figure 2.7: Schematic view of wind turbine. Reprinted from [61]. ............................. 19
Figure 2.8: Piezoelectric windmill with isometric view and internal structure. Reprinted
from [68]. ..................................................................................................................... 20
Figure 2.9: Typical velocity–amplitude curves of aerodynamic instability phenomena;
(a) vortex-induced vibration, (b) divergent oscillations (i.e. flutter), (c) wake galloping.
Reprinted from [69]. .................................................................................................... 22
Figure 2.10: An example of Kármán Vortex Street. .................................................... 23
Figure 2.11: Schematic of the ‘Energy Harvesting Eel’ (top view). ........................... 23
Figure 2.12: Different configurations of piezo-leaf. Reprinted from [79]. .................. 24
Figure 2.13: Schematic of the cantilevered piezoelectric beam. Reprinted from [85].25
Figure 2.14: Schematic of wake galloping phenomenon. ............................................ 26
Figure 2.15: A prototype of the wake galloping-based energy harvesting system.
Reprinted from [88]. .................................................................................................... 27
Figure 2.16: Schematic of a piezoaeroelastic section under uniform airflow. Reprinted
from [93]. ..................................................................................................................... 28
Figure 2.17: Photograph of the aeroelastic power harvester design. Reprinted from [99].
...................................................................................................................................... 29
Figure 2.18: Photograph of the aeroelastic power harvester with wind funnel. Reprinted
from [101]. ................................................................................................................... 29
Figure 2.19: Schematic of a windbelt. Reprinted from [102]. ..................................... 30
Figure 2.20: Three-dimensional schematics of the windbelt vibration energy harvester.
Reprinted from [105]. .................................................................................................. 31
Figure 2.21: Energy harvesting using flow-induced self-excited oscillations. Reprinted
from [107]. ................................................................................................................... 32
Figure 2.22: The structure of piezoelectric energy harvester using flow-induced
vibration. Reprinted from [109]. .................................................................................. 32
Figure 2.23: Schematic of a triboelectric nanogenerator for wind energy
harvesting .Reprinted from [111]. ................................................................................ 33
Figure 2.24: Schematic of the cantilever-based electromagnetic wind generator.
Reprinted from [114]. .................................................................................................. 34

LIST OF FIGURES
vii
Figure 2.25: Helmholtz resonator with the piezoelectric cantilever harvester. Reprinted
from [117]. ................................................................................................................... 36
Figure 3.1: Schematic showing the operation of the cantilever oscillation. ................ 39
Figure 3.2: Schematic of a second order mass-spring-damper system. ....................... 42
Figure 3.3: Circuit model of piezoelectric with resistive load. .................................... 44
Figure 3.4: Schematic of an aerofoil module. Reprinted from [122]........................... 48
Figure 4.1: Schematic of the harvester mechanical structure. ..................................... 52
Figure 4.2: Static modal in ANSYS CFX (Inlet wind speed = 2 m/s). ........................ 53
Figure 4.3: Flow speed distributions around the bluff body (Inlet wind speed = 1 m/s).
...................................................................................................................................... 54
Figure 4.4: Flow speed distributions around aerofoil at different positions (Inlet wind
speed = 2 m/s) .............................................................................................................. 54
Figure 4.5: Lift force distributions on the aerofoil and cantilever (Inlet wind speed = 1
m/s). ............................................................................................................................. 55
Figure 4.6: 3D bar chart of the lift force with different heights and distances from bluff
body (Attack angle = 5º). ............................................................................................. 56
Figure 4.7: Lift force at different attack angles with the fixed height and distance. ... 56
Figure 4.8: Prototype of the harvester in this work. .................................................... 57
Figure 4.9: (a) Wind tunnel used in this work; (b) The flow speed profile in the wind
tunnel............................................................................................................................ 58
Figure 4.10: Diagram of a sequence test system.......................................................... 59
Figure 4.11: Threshold wind speed at different attack angle the same height and
distance (d = 5 mm, h = 20 mm). ................................................................................. 60
Figure 4.12: A 3D bar chart for threshold wind speed with variable distances and
heights of bluff body (attack angle = 5º). .................................................................... 61
Figure 4.13: Threshold wind speed with variable distances with the bluff body 3 mm
lower and 1 mm higher than the wing (attack angle = 5º and lines plotted are used to
indicate the trend). ....................................................................................................... 61
Figure 4.14: Relationship between the height and the distance (attack angle = 5º). ... 62
Figure 4.15: (a) Threshold wind speed with different lengths of the wing; (b) Threshold
wind speed with different widths of the wing. ............................................................. 63
Figure 4.16: Threshold wind speed and amplitude with variable weights of masses
(plotted line was used to indicate the trend). ............................................................... 64
Figure 4.17: Experimental results for resonant frequency with different proof mass. 65
Figure 4.18: (a) Lift force and (b) threshold wind speed as functions of different
distances and heights of bluff body from simulation in ANSYS (attack angle = 5°). . 67
Figure 4.19: (a) Lift force and (b) threshold wind speed a function of different distances
and heights of bluff body from simulation in ANSYS (attack angle = 5°, lines plotted
are used to indicate the trend). ..................................................................................... 67
Figure 4.20: (a) Lift force and (b) threshold wind speed a function of different attack
angles from simulation in ANSYS (distance = 3 mm, height = 19 mm, lines plotted are
used to indicate the trend). ........................................................................................... 68
Figure 4.21: Comparison of the experimental results with the theoretical calculation for
resonant frequency with different proof mass. ............................................................ 69

LIST OF FIGURES
viii
Figure 5.1: Schematic of a cantilevered beam with bimorph structure. ...................... 72
Figure 5.2: (a) Diagram of the cantilever with dimensions in Table 5.1; (b) Diagram of
the output voltage generated by the cantilever. ........................................................... 74
Figure 5.3: Natural frequency and output power with different lengths of the PZT layer
(lines plotted are used to indicate the trend). ............................................................... 75
Figure 5.4: Natural frequency with different lengths of the PZT layer after adding the
aerofoil. ........................................................................................................................ 76
Figure 5.5: Design schematic of the cantilever beam used in this work. ..................... 77
Figure 5.6: Layout of the Cantilever beams on a metal foils in this work. .................. 77
Figure 5.7: (a) Layout of the piezoelectric cantilever structure; (b) 4 layers on the
cantilever structure. ...................................................................................................... 78
Figure 5.8: Stainless Steel substrate fabricated in this work. ...................................... 80
Figure 5.9. Flow chart of the screening printing process. ............................................ 81
Figure 5.10: Photograph of a printed piezoelectric cantilever in this work. ................ 82
Figure 5.11: The setup of the polarisation process. ..................................................... 83
Figure 5.12: The setup of the d33 measurement by piezometer. .................................. 83
Figure 5.13: Microscope images of PZT surface fired at (a) 950°C and (b) 850°C. ... 84
Figure 5.14: Measured d33 values with variatiosn of poling temperature and time at a
field strength of 3 MV/m. ............................................................................................ 85
Figure 5.15: Measured d33 values at different electric fields. ...................................... 86
Figure 5.16: The prototype piezoelectric harvester fabricated in this work. ............... 87
Figure 5.17: Setup of the testing process on the shaker. .............................................. 88
Figure 5.18: Threshold wind speed at different attack angle (distance = 5 mm, height =
20mm). ......................................................................................................................... 89
Figure 5.19: RMS power output vs. wind speed for four configurations (distances of 3
mm, 5 mm, 7 mm and 11 mm; height of 20 mm, 20 mm, 19 mm and 16 mm respectively;
attack angle = 6º, lines plotted are used to indicate the trend). .................................... 90
Figure 5.20: Threshold wind speed with variable weights of masses (distance = 11 mm;
height = 16 mm). .......................................................................................................... 91
Figure 5.21: RMS power output at variable wind speed with different weights of masses
(distance = 11 mm; height = 16 mm; load resistance = 800 k). ................................ 91
Figure 5.22: (a) Natural frequencies of the cantilever with different PZT lengths; (b)
RMS power output and threshold wind speed versus different PZT lengths (attack angle
= 6º; distance = 11 mm; height = 16 mm; load resistance = 900 klines plotted are
used to indicate the trend). ........................................................................................... 92
Figure 5.23: Output power with a varying resistive loads on the shaker. .................... 93
Figure 5.24: Output power with varying resistive loads at different wind speeds in the
air duct (lines plotted are used to indicate the trend). .................................................. 94
Figure 5.25: (a) RMS Output power in varying flow speed conditions with optimal
configuration and load. (b) RMS open circuit output voltage in varying flow speed
conditions with optimal configuration. ........................................................................ 95
Figure 5.26: Comparison of natural frequency of the cantilever from simulation and
experimental results with different PZT lengths. ......................................................... 96
Figure 5.27: Calculated damping ration with different length of PZT layer. .............. 97

LIST OF FIGURES
ix
Figure 5.28: Power outputs from simulation and experimental results with different
PZT lengths. ................................................................................................................. 98
Figure 5.29: Points selected on the cantilever for the displacement measurements. ... 99
Figure 5.30: Measured cantilever displacements at different points ........................... 99
Figure 5.31 Output power of PZT and PVDF materials with differnent lenghts ..... 100
Figure 6.1: Cross-sectional view of the electromagnetic transducer with magnet through
coil induction. ............................................................................................................ 103
Figure 6.2: Cross-sectional view of the electromagnetic transducer with magnet across
coil induction. ............................................................................................................ 103
Figure 6.3: Transduce design with magnet through coil induction in this work. ...... 104
Figure 6.4: Transduce design with magnet across coil induction in this work. ......... 105
Figure 6.5: Prototype of the MTC harvester fabricated in this work. ........................ 106
Figure 6.6: Prototype of the MAC harvester fabricated in this work. ....................... 106
Figure 6.7: Threshold wind speeds at different attack angles in MTC generator (distance
= 11 mm and height = 16 mm). ................................................................................. 108
Figure 6.8: Threshold wind speeds at different attack angles in MAC generator
(distance = 11 mm and height = 16 mm). .................................................................. 108
Figure 6.9: (a) Output power with a variety of resistive loads at different wind speeds
for MTC generator (lines plotted are used to indicate the trend); (b) Optimum resistive
loads at different wind speeds for MTC generator in this work. ............................... 109
Figure 6.10: Optimum resistive loads at different wind speeds for MAC generator in
this work..................................................................................................................... 110
Figure 6.11: Threshold wind speeds with variable distances and heights of the bluff
body for the (a) MTC generator and (b) MAC generator at the attack angle of 10º. . 111
Figure 6.12: RMS Power versus wind speed for four configurations with (a) MTC
generator and (b) MAC generator at the attack angle of 10° (lines plotted are used to
indicate the trend). ..................................................................................................... 112
Figure 6.13: RMS output (a) power and (b) voltage in varying flow speed conditions
with optimal configuration and load of the MTC generator fabricated in this work. 113
Figure 6.14: RMS output (a) power and (b) voltage in varying flow speed conditions
with optimal configuration and load of the MAC generator fabricated in this work. 114
Figure 6.15: Comparison of (a) maximum power output, (b) maximum power density
and (c) efficiency between the airflow energy harvesters fabricated in this work and
other reported works. ................................................................................................. 118

LIST OF TABLES
x
List of Tables
Table 2.1: A Summary of miniature wind turbines reviewed. ..................................... 21
Table 2.2: A summary of the flow-driven devices. ..................................................... 34
Table 4.1: Main components of two harvesters. .......................................................... 51
Table 4.2: Material Properties...................................................................................... 51
Table 4.3: Design values for parameters optimization. ............................................... 57
Table 4.4: Comparison of four Wings Parameters. ...................................................... 63
Table 4.5: Optimum structure of the harvester in this work. ....................................... 65
Table 4.6: Comparison of optimal configurations of the harvester in simulation and test
results. .......................................................................................................................... 68
Table 5.1: Parameters for ANSYS piezoelectric simulation in this work. .................. 73
Table 5.2: Parameters of aerofoil for simulation. ........................................................ 75
Table 5.3: Components of the PZT paste used in this work. ....................................... 79
Table 5.4: A summary of f materials deposited in this work. ...................................... 80
Table 5.5: Drying and firing conditions of materials printed. ..................................... 81
Table 5.6: Optimal parameters of the final device. ...................................................... 94
Table 6.1: Comparison of the optimum parameters in the three devices fabricated in
this work..................................................................................................................... 115
Table 6.2: Comparison of the performances in the three harvesters fabricated in this
work. .......................................................................................................................... 116

To My Dear Husband,
Ruomeng Huang
And My Son
Qianmu Huang

Chapter 1 Introduction
1
Chapter 1 Introduction
1.1 Background
Wireless sensor networks are one of the key enabling technologies as a concept
formally put forward in 1991 by Mark Weiser [1]. It is a concept of deploying small,
self-contained sensor nodes into an environment to collect and transmit information,
and provide localised actuation. Potential uses for wireless sensor networks include:
medical applications [2], structural monitoring of buildings [3]; status monitoring of
machinery; environmental monitoring [4]; military tracking [5]; security; human
guidance systems [6]; and wearable computing. Current wireless devices are often
powered by electrochemical batteries. Considering their limited lifespan, it is obvious
that periodic replacement of batteries is necessitated. These battery replacements can
be troublesome due to the high cost and the large number of wireless devices in use at
present [7]. In the case of wireless sensors that are located remotely, the sensor must be
easily accessible to make the device function over extended periods of time [8].
Consequently, one of the major obstacles to extend the life of such devices is the limited
lifespan of power sources, which must be replaced periodically. The continual evolution
of solid-state electronics, from the invention of the bipolar transistor in 1949 [9] to the
current state of the art integrated circuit manufacturing techniques [10], has led to large
reductions in both the power and size of circuits required to perform given functions.
This continual reduction in power consumption opens the possibility of other methods
to power the sensors in a wireless sensor network [11]. Rather than powering the
devices from a finite local store of energy, such as a battery, the device could be
powered by harvesting energy from its local environment. Hence, as long as energy is
present in that environment in a particular form, and the device has a suitable
mechanism for converting that energy into an electrical form, the device can run
indefinitely, subject to device reliability [12]. Towards this mission, researchers have
begun investigating methods of energy scavenging for wireless devices over the past
decades [13].
1.2 Energy Harvesting Overview
Energy harvesting, also known as energy scavenging, describes the process of capturing
the ambient energy surrounding the electronics then converting it into electrical energy.
The general concept behind energy harvesting is to convert unusable form energy into

Chapter 1 Introduction
2
a more useful form. Often the most useful form of energy in modern applications is
electrical energy that can be stored in batteries or used to power electronic systems. The
initial form of energy can originate from any number of energy domains, then being
converted into a usable form of electrical energy by some form of transducer.
Depending on the situation, we can classify energy harvesting sources in two ways. The
first classification scheme places an emphasis on what kind of energy is converted; thus
identifying four types of energy: photovoltaic energy, kinetic energy, thermal energy
and electromagnetic energy.
The other classification scheme may consider the source where the conversion energy
comes from. For example human energy source means the energy is provided by the
activity of human beings or animals. Another example is environment energy source,
in which the energy comes from the environment [14].
There are a number of ambient energy sources available as listed below [15]:
Electromagnetic (RF) energy: Base stations, wireless internet, satellite
communication, radio, TV, digital multimedia broadcasting, etc.
Solar and light. The conversion mechanism can be Photovoltaic cell.
Motion, vibration or mechanical energy: floors, stairs, object’s movement,
transfer energy from the engine to the battery during braking, etc. The
electromechanical transducer can be electromagnetic, electrostatic, or
piezoelectric.
Fluid flow (liquids or air).
Pressure gradients (from air or sea water)
Thermal energy: Geothermal from temperature, combustion, waste heat from
vehicle exhausts, etc.
Biological energy: biofuels, biomass.
Each of these sources can be utilized separately or combined together to power
microelectronic systems. However, it is difficult to generalize which energy source is
the most suitable; as each application should be evaluated individually with regards to
choosing the best energy harvesting method.
Among the common renewable energy sources, wind (airflow) energy harvesting has
been widely researched for high power applications where large wind turbine
generators are used for supplying power to remote loads and grid-connected
applications. With the recent increase in public interest in renewable energy sources,
wind energy is gaining popularity as perhaps the most technologically developed and
practical alternative today. The wind turbine technology has already been well
documented and sophisticated. As generating energy from wind does not depend on a
dominant-frequency, the natural frequency of the vibrating structural therefore does not
need to match a certain frequency, which results in great flexibility in the configuration
of the harvester. Another method for wind energy extraction is called flow-induced

Chapter 1 Introduction
3
vibration based on aerodynamic instability phenomena.
Despite those advantages previously mentioned on energy harvesting from wind, there
are many challenges as well. The intermittency of wind hinders continuous energy
production, and the inconsistent quality of wind reduces the efficiency of harvesters.
Unpredictable directions of wind are another issue for flow-induced harvesters. All
these challenges must be addressed in using wind as a reliable input energy source.
1.3 Motivation of Work
Energy consumption of buildings in developed countries comprises 40% approximately
of total energy use and is above industry and transport as shown in Figure 1.1. The
upward trend in energy demand will continue in the future because of growing
population, increasing demand for building services, as well as the rise in time spent
inside buildings. Among the building servicers, the growth in HVAC systems energy
use, which presents 55% of the total primary energy consumption, is particularly
significant [16].
Figure 1.1: World final energy consumption and energy use in buildings.
HVAC (Heat, Ventilation and Air Condition) system is designed to provide a
comfortable and desired environment for the occupants. To achieve this, temperature,
humidity and gas sensors are deployed in air ducts to monitor air quality. Harvesting
localized air flow power form HVAC systems is an opportune way to power a sensor.
For this application, airflow energy is the most obvious source since it is already
available in air ducts in the buildings. Although many devices have been published for
airflow energy harvesting, few can operate in the entire range of flow speeds in HVAC
ducts in the buildings, typically between 1.5 m/s – 4.5 m/s [17]. For small scale wind
turbines, which are the most common used structures, the starting airflow speed of
operation are normally 3 m/s to 4 m/s. The relatively high starting speed makes small

Chapter 1 Introduction
4
turbines unable to harvest from the entire air ducts flow range. Moreover, these rotating
components suffer from fatigue and wear, hence are not desirable for long-term
applications. Flow-induced vibration is a novel approach to airflow energy harvesting,
and many studies have already been done on these structures. The potential advantages
of this technique appear in compactness, robustness and simple construction. However,
as these harvesters are not currently at “utility scale”, there still exists a gap in
investigating them theoretically and experimentally. In addition this application just
begins to touch on the large potential of energy harvesting for powering many sensors
that could be used in air ducts.
1.4 Objectives of Work
The focus of this work is to provide an airflow energy harvester which can effectively
convert the energy of a uniform and steady flow into periodic motion of the solid
structure. The main objective of this work includes the following specifications:
The harvester has a wider air speed range for operation. This goal implies minimising
the threshold wind speed (the lowest wind speed at which the harvester can operate) of
the harvester. As mentioned above, many published devices, particularly small wind
turbines, are developed for wind speeds above 3 m/s, which make them unable to
harvest from low flow speed in the ducts. However for practical applications, wind
harvesters should operate below 2.5 m/s of wind speed to charge sensor nodes. In
HVAC ducts, in order to operate throughout the entire range of flow speeds, a low
threshold wind speed (1.5 m/s) is necessary for the harvesters. Moreover, the
inconsistent quality of wind reduces the efficiency of the harvester. And this problem
can be improved by designing the harvester with a wider flow speed range for operation
as well.
The focus of the wind energy harvester is the conversion of energy of a uniform and
steady flow into periodic motion of the mechanical structure with the aim of obtaining
high efficiency, high power density and having a capability to self-start and sustain the
periodic motions. To build up a self-excited energy harvester with the optimum
structure, investigations should be carried out with both computational simulations and
experimental work. In addition, the scaling effects of flow-induced harvesters are
unknown. Hence such harvesters may have better performance than rotary harvesters
at some scales. In order to compare the performances of wind harvesters with different
scales, a previously published wind generator should be used as a reference system.
Converting the mechanical energy from wind into electrical energy is performed by a
transducer. Among these transduction systems, piezoelectric and electromagnetic
generators present the advantages of harvesting high power levels with simple
implementations. They have been widely studied in both macroscopic realizations as
well as MEMS structures [18]. Most researches have discussed some optimizations of

Chapter 1 Introduction
5
harvested power of the electromagnetic or piezoelectric energy harvesters while limited
works have been conducted to compare the power harvesting performance. Generally
electromagnetic transducers bear the advantage of high efficiency if there is no size
constraints applied. While piezoelectric generators are favourable for miniature devices
when size is the main concern. However, most researchers used piezoelectric
transducers of flexible materials such as PVDF, piezoelectric ceramics especially thick-
film printed PZT materials should be investigated for wind energy harvester
applications. Moreover the performance of piezoelectric and electromagnetic
generators should also be compared theoretically and experimentally.
1.5 Thesis Structure
This thesis will detail the development of a miniature energy harvester for airflow. In
Chapter 2, an extensive literature review is conducted. The background of wind
energy harvesting together with the current state in this field especially in micro
size is briefly introduced. In Chapter 3, the wind energy generator with
cantilevered beam structure is studied, together with theory relatively to both
piezoelectric and electromagnetic transduction systems. Chapter 4 focuses on the
derivation of design parameters and the simulation model of the mechanical
structure. The harvester consists of four components, including a beam, a wing, a
base part and a bluff body. In order to investigate the influence of the mechanical
structure, both computational simulations and experimental work are carried out.
An analytical model based on pure mechanical structures of the device is
developed. And a prototype of the harvester is fabricated for experimental work.
Both simulation and experimental results will be compared to obtain the optimum
structure of the harvester. After investigating the mechanical structure, the
transduction systems should also be considered. To compare the performance of
piezoelectric and electromagnetic generators, both transducers are used for the
harvester during the tests. In Chapter 5, a prototype of the piezoelectric wind
harvester is fabricated and tested. The typical piezoceramic material, PZT, is
chosen for the transducer using normal thick-film printing technique. Both
simulations and experiments are carried out to estimate the performance of the
harvester. A set of experiments both on shaker and in the air duct are carried out
to investigate the performance of the harvester. The testing results are used to
compare with the simulation results in Chapter 4 as well. In Chapter 6, the
electromagnetic transducer is also investigated to compare with the piezoelectric
one. Two commonly electromagnetic generator structure are designed, which are
magnet-through-coil (MTC) structure and magnet-across-coil (MAC) structure.
Final devices with optimum design and structures are used to compare with the
piezoelectric one and other devices in review part. All these works are
summarized and concluded in the final chapter.

Chapter 2 Literature Review
6
Chapter 2 Literature Review
2.1 Energy Harvesting History
The first harvesting energy in the form of current generation from heat was observed by
Thomas Johann Seebeck in 1821. He found that a closed circuit made of two dissimilar metals
with junctions at different temperatures, would induce an electrical current. This phenomenon
was then given the name thermoelectric effect [19]. Electromagnetic induction was discovered
by Joseph Henry and Michael Faraday in 1831 [20], and in the same year, the first direct-
current generator, consisting of a copper plate rotating between magnetic poles, was invented
by Faraday. In 1839, Edmund Becquerel discovered the photovoltaic effect when he did
experiments with an electrolytic cell composed of two metal electrodes [21]. However, it was
not until 1894 that Charles Fritts built the first large area solar cell using a layer of selenium
with a thin layer of gold coated to form the junctions [22]. The first harvesting energy in the
form of charge generation was recognised in 1880 by Pierre and Jacques Curie. They
successfully proved that certain crystals would exhibit a surface charge when subject to
mechanical stress, known as piezoelectricity.
2.2 Kinetic Energy Harvesting
Although it is difficult to generalize the power levels available from different types of energy
to determine which energy source is the best for harvesting, kinetic energy in the form of
motion or vibration is generally considered as the most versatile ambient energy source
available. Solar energy harvesters can achieve relatively high power densities in good light
conditions, but they are unsuitable for implantable devices, low light or dirty situations.
Thermal devices require a temperature gradient to generate electrical energy, which is difficult
to achieve in miniature generators. Kinetic energy is a readily harvestable energy source, both
for human and for environment energy harvesting devices. The power transferred to a load is
limited by the availability of the raw energy, the efficiency of the transducer, the conversion
circuit and the harvester size constrains.

Chapter 2 Literature Review
7
2.2.1. Types of Kinetic Energy Transduction Mechanisms
The principle behind kinetic energy harvesting is the displacement of a moving part or the
mechanical deformation of some structure inside the energy harvesting device. With respect to
mechanical structures, there are two types of possible generators. One is called inertial
generators, which the kinetic energy is obtained from vibrations or displacements of a proof
mass. These devices are mostly based on mass-spring-damper systems that resonate at a
particular frequency. Being resonant, when the mechanical stimulus vibrates at a frequency
that matches the resonance, these generators work most efficiently. The other mechanical
structure is the non-inertial generator, where energy is obtained from the deformation caused
by applied pressure on piezoelectric materials. In this case, the obtained energy usually depends
on the rate and amount of deformation instead of on the proof mass in inertial generators.
One of the crucial requirements for energy harvester is to convert energy collected into an
electrical form, that is, some form of transduction mechanism. In this report for example, it is
the kinetic energy collected by the mechanical part of device that should be transferred into
electrical energy. Different methods have been utilized to realize this requirement. The
electricity can either be generated from mechanical strain or the relative displacement present
in the system. These methods lead to three major transduction mechanisms which have been
widely used nowadays: piezoelectric generators, electromagnetic transduction and electrostatic
generators. The characteristics such as damping effects ease of use, scalability and
effectiveness are different for each mechanism, and hence the suitability for these mechanisms
are subjected to practical constraints. The following subsection will describe these three
mechanisms in detail separately.
2.2.2. Piezoelectric Generators
2.2.2.1 Piezoelectric Effect
If a piezoelectric material is loaded with a pressure, it is compressed as any other elastic
material, and it is extended transversely to the direction of the load. In addition, electrical
charges are generated on the electrodes on the surface of the piezoelectric material and it is
possible to measure a voltage between the electrodes. The generation of charges is called the
piezoelectric effect. There is also an inverse piezoelectric effect whereby an applied electric
field can produce a mechanical strain. Piezoelectric materials are therefore used to convert
mechanical energy into electrical energy.

Chapter 2 Literature Review
8
2.2.2.2 Piezoelectric Materials
There are two kinds of piezoelectric materials: monocrystalline materials, such as quartz, zinc
oxide, and ferroelectric materials, such as ceramics PZT (lead zirconate titanate), and the
polymer PVDF (poly vinylidene fluoride). The efficiency of electric transduction differs for
each material with different piezoelectric properties. In general the piezoelectric effect of
monocrystalline materials is comparatively small. Therefore, the piezoelectric effect of
ferroelectric materials is employed in most cases [23]. However, ferroelectric materials are not
immediately piezoelectric after they are fabricated and they need a certain procedure to activate
the electromechanical interaction property. Similar to ferromagnetic materials which need to
be magnetized in a magnetic field before they become permanent magnets, ferroelectric
materials need to be polarized by a large electrical field before use.
For piezoelectric ceramics, most of them are manufactured in bulk form commercially.
However, due to the relatively large thickness (greater than 100 µm), their application is limited
in Micro-Electro-Mechanical Systems. Film piezoceramics, on the other hand, are more
favourable to fabricate devices with thickness less than 100 µm for electrical power generation
because of its relatively high piezoelectric activity compared to piezoelectric polymer materials
[24]. Film piezoceramics can be fabricated with thin- and thick-film technologies. Thin-film
technology is basically used to fabricate films with thickness less than 5 µm. The process
involves physical vapour deposition, chemical vapour deposition, and solution deposition. For
thicker films between 10 µm – 100 µm, thick-film technology is more favourable, which
involves screen printing technique.
2.2.2.3 Piezoelectric Constants
Since piezoelectric materials are anisotropic, their physical constants relate to both the direction
of the applied stress or electric force and to the directions perpendicular to the applied force.
Therefore each constant generally has two subscripts to indicate the directions of the two
related quantities. As illustrated in Figure 2.1, the direction X, Y and Z are represented by the
subscript 1, 2 and 3 respectively, and the shear about these axes are represented by 4, 5 and 6
respectively. The various constants can be written with these subscripts.

Chapter 2 Literature Review
9
Figure 2.1: Direction of forces affecting a piezoelectric element.
The most frequently used piezoelectric constants are: the piezoelectric charge constant d, the
piezoelectric voltage constant g, and the permittivity e. The main constant describing the
piezoelectric effect is the piezoelectric charge constant d, which relates to the strain caused by
the electric field in the absence of mechanical stress and to the electrical charge per unit area
by the applied stress under zero electric field. The first subscript to dij indicates the direction
of polarization generated in the material, and the second subscript is the direction of the applied
stress or the induced strain, respectively. For instance, as shown in figure 2.2, d31 means that
the induced polarization is in direction 3 and the stress is applied along axis 1. d33 on the other
hand, means both the induced polarization and the stress are in direction 3.
Figure 2.2: Piezoelectric constants in typical energy harvesting modes. Reprinted from [25].
The most advantageous way to employ piezoelectric materials is cantilevered structures
operating in a bending mode with piezoelectric layers attached to surfaces on one or two sides
(unimorph or bimorph). It is commonly used for enabling relatively high stress levels on the
piezoelectric material while minimizing the dimensions of the devices. The structure can be

Chapter 2 Literature Review
10
designed to operate in either d31 or d33 modes depending on the arrangement of the electrodes.
In many cases, d31 mode has been used where a piezoelectric layer is sandwiched between two
metal electrodes. The piezoelectric layer is poled and driven through its thickness thereby
straining the piezoelectric material and generating a charge. In contrast, the d33 mode is poled
parallel to the passive layer using an interdigitated transducer (IDT) where stress can be applied
to the poling direction. In many ferroelectric materials, the d33 coefficient is two to three times
larger than the d31 [26].
2.2.2.4 Poling
The piezoelectric properties of ferroelectric materials can be enhanced by applying a
sufficiently high electric field at an elevated temperature, therefore generating an internal
remnant polarization in the material, which continues long after the removal of the electric and
thermal fields. This process is known as poling [27].
Several poling techniques that have been developed are: contact poling, corona poling, photo
thermal poling and electron beam poling. Each technique has some advantages and drawbacks.
In this paper, contact poling is used as a simple static field poling technique.
In the contact poling process a large poling field is created through electrodes with the
piezoelectric film in between (Figure 2.3). The film is heated up to an elevated temperature and
the poling voltage, depending on the thickness of the material, is applied through electrodes.
The main drawback of this technique is the limited voltage that can be applied due to the
dielectric breakdown in surrounding air or in the poled film itself [28].
Figure 2.3: Schematic of the contact poling technique.
In all techniques, heating is the essential process to permit dipoles inside the material to become
mobile and orient in the direction of the applied external field. The orientation is then frozen

Chapter 2 Literature Review
11
by cooling the poled film to room temperature whilst under the applied external field.
The effect of poling conditions including temperature, time and electric field has been
investigated by Torah et al. [29]. Results showed the value of d33 increased with poling
temperature and duration, as well as the poling voltages. However, the maximum achievable
poling field is limited by the electrical breakdown of the films. An optimum result was obtained
at a temperature of 200°C with poling times of 30 minutes and electric filed strength up to 4
MV/m. However, little improvement was achieved in the piezoelectric activity when the
applied electric field was above 2.5 MV/m.
2.2.2.5 Thick-film Screen Printing
Screen printing is one of the oldest forms of graphic art reproduction. The basic concept is to
deposit ink or paste onto a base material or substrate by the use of a finely woven screen with
the desired pattern [30]. This technique is traditionally used for the production of graphics onto
items such as T-shirts and mugs. Then it has been applied to manufacture electronic
components as well as microelectronic thick-films with typical thickness ranging from 0.1 µm
to 100 µm [31].
The standard process starts with a typical screen, which is made of a finely woven mesh of
stainless steel, adhesively attached to a cast aluminium frame and coated with a UV-sensitive
emulsion. The mask is generated on the mesh through which the paste can be squeegeed to
produce a pattern on the substrate. The mask is patterned by a standard photolithography
process [32]. The paste is poured onto the upper surface of the screen, and then a rubber blade
called a squeegee sweeps across the screen under pressure, forcing the paste through the
apertures of the screen onto the substrate as shown in Figure 2.4. However, before starting
screen printing, some parameters need to be considered in the printing profile such as the
printing gap, velocity and pressure of the squeegee.

Chapter 2 Literature Review
12
Figure 2.4: Process of screen printing. Reprinted from [32].
After screen-printing, the deposit films are dried to remove the organic carriers in the paste and
form a rigid film for over-printed upper layers. This stage is usually undertaken in an infrared
belt drier at a temperature of approximately 150°C The next step is firing the films to produce
a solid film one on the substrate and bind the active particles together. This process is achieved
in a belt furnace in air atmosphere at temperatures up to 900°C [32]. After firing, the film is
firmly attached to the substrate. Then the printing, drying and firing process can be repeated if
further screen printed layers are needed.
2.2.2.6 Applications
The piezoelectric generator is widely employed because of the large output voltage or force
which can be generated in a small volume. A large percentage of recent studies have focused
on improving the efficiency of piezoelectric energy harvesting systems by means of changing
the configuration of the device to maximize the energy captured from the ambient environment.
The type of piezoelectric material selected can have a major influence on functionality and
performance of the harvester. To date, the most commonly used piezoelectric material is lead
zirconate titanate, a piezoelectric ceramic, known as PZT, which has very high
electromechanical coupling ability. However, PZT is extremely brittle, limiting the strain that
it can safely absorb without being damaged [33]. In order to eliminate the disadvantages of
piezoceramic materials and improve their efficiency, researchers have developed a wide variety
of piezoelectric materials that exhibit more flexibility and can be employed in energy
harvesting applications [34, 35]. Other methods of modifying the configuration of piezoelectric
energy harvesters have been investigated by different researchers including changing the

Chapter 2 Literature Review
13
electrode pattern, altering the poling and stress direction, layering the material to maximize the
active volume, and tuning the resonant frequency of the device [36–39].
2.2.3. Electromagnetic Transduction
2.2.3.1 Electromagnetic induction
Electromagnetic induction was first discovered by Faraday in 1831, which states the generation
of electric current in a conductor when it is located within a varying magnetic field. This applies
whether the field itself changes in strength or the conductor moves through it. For a typical
electromagnetic generator, the conductor takes the form of a coil and permanent magnets are
used to produce the magnetic field. Therefore the electricity is generated either by the relative
motion of the magnet and coil, or the changes of the magnetic field. In this case, the induced
voltage across the coil depends upon the strength of the magnetic field, the velocity of the
relative movement and the number of turns of the coil.
2.2.3.2 Application
Electromagnetic transduction has been widely used in the form of rotating generators for many
years. It generates power from a few watts (brushless DC domestic wind turbine systems), to
several hundred megawatts (synchronous machines used for power generation by the utility
companies). For kinetic energy harvesting, both rotating generators and linear generators can
be exploited to harvest power from rotation and vibration. One of the most effective methods
for linear generators is to use an inertial frame configuration, in which the relative movement
between the magnets and the coils are induced by the vibration of a resonating cantilever beam.
Either the magnets or the coil can be chosen to be mounted on the beam while the other remains
fixed. However, it is generally preferable to attach the magnets onto the beam as the inertial
mass [40]. Figure 2.5 shows two commonly used arrangements of electromagnetic generators.

Chapter 2 Literature Review
14
Figure 2.5: Schematics of two electromagnetic generators arrangements.
Electromagnetic transduction has the advantage of high efficiency compared with other
mechanisms when there are no size constraints applied. This advantage is largely contributed
to the feasibility of designing the coil in such a way (e.g., increasing the number of turns,
decreasing the coil resistance by using larger diameter wire, using a larger area coil) to achieve
high coupling factors. Several examples demonstrating this principle can be found in the
literature [41–46].
2.2.4. Electrostatic Generators
Electrostatic forces have also found use in converting kinetic energy into electrical energy.
These types of generators consist of a variable capacitor whose two plates are electrically
isolated by air, a vacuum, or an insulator. External vibration (on both horizontal and vertical
directions) will lead to a movement of the two plates and hence induce a capacitance change.
There are two modes of operation for electrostatic generators. The first is called constant charge
operation as shown in Figure 2.6(a). For the parallel plate structure, in which the two plates
have a constant overlap with a variable separation, the field strength is proportional to the
charge and thus the energy density of the electric field is independent of plate separation. As
the electrode separation increases, additional electrical potential energy is stored as an increase
in the electric field. If the plates, on the other hand, are moved relative to each other with a
sliding motion at a constant separation, mechanical work is done against the fringing field and
there is an increase in stored electrical energy because the electric field strength increases with
the reduction in plate overlap [47].
The other mode of operation is referred as constant voltage operation, in which a constant
voltage is applied on the two plates as illustrated in Figure 2.6(b). If the plate separation is
increased with a fixed overlap, the electric field strength between the plates falls causing charge
to be pushed off the plates into an external circuit as a current flow i(t). If the plates are moved
with constant separation and changing overlap, the field strength stays constant while the
current is again forced to flow into the source because the volume of the field decreases. In
both cases, the mechanical work done is converted into additional electrical potential energy
as an increased space charge in the voltage source.

Chapter 2 Literature Review
15
Figure 2.6: Principle of operation of the electrostatic generator.
The efficiency of electrostatic transducer is limited by technical challenges including charging
the electrodes, the separation distances, and the amplitudes of displacement [48].
2.3 Wind Energy Harvesting
A number of sources can provide kinetic energy including human movements, mechanical
vibrations from environment, and fluid flow (liquid flow and airflow). Of several possible
alternatives, wind energy has been utilized for thousands of years and became one of the most
important sustainable energy resources. Since the beginning of the twentieth century, this
technology has developed rapidly towards new dimensions in both large and micro scales.
Nowadays, existing methods of wind energy harvesting include using turbines, harvesting
energy from flow-induced vibration and using Helmholtz resonators.
2.3.1. Wind Turbines
2.3.1.1 Description of technique
A wind turbine, also known as windmill, is essentially a rotating machine which converts the
kinetic energy from the incoming wind into the electric energy. The design is based on the drag
or lift effect relying on different air resistance on the front and back of the rotor section to cause
rotation. The first wind turbines for electricity generation emerged at the beginning of the 20th
century and the technology improved incrementally since early 1970s. There are two categories
of wind turbines according to different direction of the rotational axis: horizontal-axis wind
turbines (HAWT) and vertical-axis wind turbines (VAWT). The former one captures kinetic
wind energy with propeller rotors and the rotating axis is parallel to the direction of wind.
While the other one uses straight or curved bladed rotors perpendicular to the wind. The
advantage of all vertical-axis windmills is that they can accept wind coming from all directions,

Chapter 2 Literature Review
16
thus, they do not have to face up or downwind for rotation like the horizontal-axis machines.
However, since the end of the 1980s, the development of vertical-axis wind turbines has almost
stopped due to their lower efficiencies [49]. The horizontal-axis approach currently is used
world widely.
Modern wind turbines generate electricity using slender aerodynamic blades and tall towers.
The general components are:
A rotor to convert wind energy into mechanical power.
A tower to support rotor.
A gearbox to adjust the rotational speed.
A control system to monitor operation of wind turbine automatically.
A foundation to protect the turbines in high speed winds.
A generator to convert mechanical energy into electrical power.
The main operation of wind turbines to generate electricity is: When the wind blows, the blades
lift, rotate and turn the rotor, which creates mechanical energy. The generator uses magnetic
fields to convert the kinetic rotating energy into electrical energy. The power output can be
transformed to the right voltage or stored in batteries for typical systems. The control system
is connected to an anemometer to measure wind speed continuously. It allows the turbine to
rotate, producing power in a certain level when wind speed is high enough. If the wind speed
exceeds its limits of the electrical or mechanical parts of turbines, the system will cut out to
prevent more power increase.
Some elements can influence the performance and the design of wind turbines. The most
important factors are wind speed and wind turbine availability. The maximum mechanical
power that can be extracted by a wind turbine is given by:
𝑃𝑡 =1
2𝜌𝐴𝑣3𝑐𝑝(𝜆, 𝛽) (Equation 2.1)
Here 𝑃𝑡 is the power (W), 𝜌 the density of air, 𝐴 the rotor area, 𝑣 the wind speed and 𝑐𝑝 is the
coefficient of power that is a function of tip speed to wind speed ratio, 𝜆 , and blade pitch
angle, 𝛽 . The power is proportional to the area of turbine blades and the cube of the wind speed,
which means that the maximum available power can reduce significantly with scaling down
the size of wind turbine or decreasing wind speeds. The average wind speed is unstable due to
its variation with time, altitude, gusts, and fast changes in direction or air density [50]. An
average speed of 4.5 m/s to 5 m/s is typically needed to make the electricity economically

Chapter 2 Literature Review
17
feasible; however, some windmill designs begin producing electricity at a wind speed as low
as 3.5 m/s [51]. The power efficiency is described by 𝑐𝑝, a dimensionless term with a
theoretical maximum value of 0.59. This is known as the Betz limit. However, in practice, due
to the stall and viscous drags of the rotor, bearing or gear losses of the transmission and the
low efficiency of the generator, the total efficiency of the wind turbine is much lower.
2.3.1.2 Recent development in wind turbine generators
In order to maximize the energy captured by wind turbines, much research had been done in
this field particularly from the point of view of velocity direction control of the wing and in
turbine blade design. With respect to recent development in wind turbine generators at large
scale, some researchers have put an emphasis on magnetic bearings. A mechanical bearing is
typically used to promote smooth rotation of the rotor in the wind turbine. However, there is
always friction between the bearing and the rotor as a result of mechanical contact, increasing
the driving force of transmission drive system and reducing efficiency of energy conversion.
No matter how frequently the bearing is maintained to be lubricated, it will gradually wear out
and eventually fail. To solve this problem, magnetic bearing has been investigated and applied
to wind turbine as a replacement of the traditional mechanical bearing [52]. The magnetic
bearing supports the rotor using magnetic levitation, thus there is no physical contact between
the rotor and the bearing. Because of the full magnetic levitation, the rotation has a very low
friction and no mechanical wear, the life time of the turbine can be increased and the
maintenance cost will be reduced. Liu et al [53] reported a magnetically suspended VAWT,
which also proved that the starting wind speed of the magnetically suspended turbine is reduced
to 1.5–2.5 m/s, which is much lower than that of the traditional turbine with the same size (3–
4 m/s).
On the other hand, as large-scale wind turbine technology is well documented and matures,
more and more attention has been paid to the development of small scale wind turbine
generators. However, to the author’s best knowledge, very few research works can be found in
the literature that discuss the issue of wind energy harvesting using micro wind turbines which
are miniaturized in size. A miniature wind turbine can be generally defined as rotor-tip diameter
of several centimetres in scale. It is used to capture efficient power from where modest ambient
airflows are present, for example, in heating, ventilating, and air-conditioning ducts, or in
outdoor environments [54]. Several challenges are associated with this type of miniature wind
energy harvesting system in contrast to the large-scale systems. They are: (i) wind speeds of
interest at low height and concealed ground are relatively low compared to large-scale systems;
(ii) relatively high viscous drag on the blades at low Reynolds number; (iii) aerodynamic force
generated by miniaturized vanes with very small surface area is extremely small in comparison

Chapter 2 Literature Review
18
to huge wind turbine; (iv) bearing and thermal losses increase significantly as size decreases.
Consequently, for miniature windmills, which operate at a much higher speed and low
Reynolds number, it is important to understand how the size of the generator will affect its
performance. Shrestha et al. [55] investigated scaling laws for wind turbine generators. It
concluded that the output power of the generator decreases with reduction of the mass and
length of the blades at different ratio.
A number of miniature energy scavengers based on turbines have been demonstrated
successfully with different techniques in recent years. Some of them showed good performance
with a maximum efficiency close to 40%. Hirahara et al. demonstrated a small wind turbine
system with a 50 cm rotor diameter [56]. Research group from Uludag University also reported
a miniature wind turbine rotor using different shapes of aerofoils. The rotor models had a 31
cm diameter were made from Balsa wood [57]. However, those devices are relatively large in
size, which may not be appropriate for wireless sensor applications.
Some miniature wind turbines whose rotor-tip diameters smaller than 10 cm have already been
published. A micro electromagnetic power generator with 4.2 cm diameter turbine was reported
by Rancourt in 2007 [58]. After test, an output power of 2.4 mW was achieved with 5.5 m/s
wind speed and 130 mW at 11.8 m/s. The maximum overall efficiency was 9.5% at 11.83 m/s
but at 5.5 m/s efficiency was as low as 1.85%. Holmes and his colleagues from Imperial
College have reported a micro-power conversion device combined an axial-flux
electromagnetic generator, of which the rotor area was down to approximately 1.5 cm2 [59].
However, in this design, due to its configuration, the power generation capability is limited. To
improve performance further, in 2009 and 2011, they developed similar turbine geometry, a
shrouded wind turbine with an integrated axial flux permanent magnet generator [60, 61].
Figure 2.7 shows a prototype of the device. It is fabricated by rapid prototyping and traditional
machining techniques, as well as flexible printed circuit board. In the rotor area, there is a
central hub, an annular rim, and a number of blades, which are all made by rapid prototyping.
A thin layer of nickel coating is electroplated on the blades for strengthening. The rotor is fixed
on a stainless steel casing, held by a pivot and bearings. The static friction of bearings is a
critical issue because it determines the lowest airflow speed for operation of wind turbines. In
this design, they used jewel bearings, which can offer very low starting friction. In the
experiment, a prototype with 12 blades was tested and showed the threshold wind speed for
operation is 4.5 m/s, and the output power is approximately 4.3 mW at average flow speed of
10 m/s.

Chapter 2 Literature Review
19
Figure 2.7: Schematic view of wind turbine. Reprinted from [61].
Most miniature wind turbines are mainly focused on the design and fabrication techniques,
while some researchers concentrated on harvesting circuit control and the general theory of
system modelling to assist the design and estimate the performance. Carli et al. [62] provided
a detailed model and characterization of the micro wind turbine with an effective power-saving
architecture to control the harvesting circuit. The optimized design of the wind flow harvester
had a turbine diameter of just 6.3 cm. A highly efficient buck-boost converter, aimed towards
the minimization of its power losses, is the core of the optimal power point tracking circuit.
The experimental results showed that the wind generator was able to supply up to 10 mW with
an airflow speed of about 7 m/s, and can work at its maximum efficiency over a wide range of
operating conditions. Xu et al. [63] successfully designed an equivalent circuit model used as
a guild line for predicting and optimizing the performance of the wind turbine system. The
maximum output power reached 13.5 mW and 18 mW at the wind speed of 4 m/s and 4.5 m/s
respectively.
Although a majority of existing turbine generators are based on electromagnetic transducers as
mentioned above, there are some researches on piezoelectric wind turbine generators. Chen
and Lin [64] investigated the feasibility of using resonant piezoelectric structures to generate
energy from wind flow. Simulation results showed that the efficiency of such piezoelectric
wind turbine generator is only 0.003% which is much lower than the Betz limit. A novel small
scale piezoelectric windmill for energy harvesting from the wind flow was demonstrated by
Priya et al. in year 2004 [65]. The device has 11 bimorph piezoelectric cantilevers arranged
along the circumference of the centre shaft which is connected to the rotor of the wind turbine.
The centre rotates with the rotation of the wind turbine. The stoppers bend the piezoelectric
cantilevers to produce electricity. As the piezoelectric material has great impact on the

Chapter 2 Literature Review
20
performance of the transducers, with this structure, the mechanical energy transferred to the
bimorph was high. This study was further extended in year 2005 and a theoretical model to
estimate the generated electric power output was presented [66]. The piezoelectric wind mill
was found to be capable of producing electrical power up to 7.5 mW at the wind speed of 4.5
m/s. Two years later, researchers from the same department of the University of Texas designed
another piezoelectric windmill with an optimized structure [67]. Figure 2.8 shows the inner
structure of the windmill and crank assembly which consisted of a vertical shaft connected to
a lever arm that converted the rotational motion into translation motion. All three fans were
connected into the single vertical shaft through an adjustable gear ratio. The wind mill was
composed by two rows of piezoelectric bimorphs, as front and back rows, where each row had
nine bimorphs. Therefore, this windmill can reduce the force required for deflection and expand
the surface area for energy capturing. In addition, the frequency can be adjusted by varying the
gear ratio. After testing, the windmill can operate at a low flow speed down to 3 m/s; and with
a flow speed of 4.5 m/s, it generated a 5 mW continuous power. In year 2010, Bressers et al.
attempted to develop a contact-less wind turbine which utilizes vertical axis Sarvonius wind
turbine rotor and piezoelectric bimorphs [68]. This device has a series of piezoelectric
bimorphs with magnets at the tip placed horizontally around the wind turbine rotor shaft. The
magnets were used to induce harmonic vibration in the piezoelectric elements. The design of
contactless wind turbine having a size of 80 mm × 80 mm × 175 mm was found to provide
peak power output of 1.2 mW at 4 m/s of wind speed.
Figure 2.8: Piezoelectric windmill with isometric view and internal structure. Reprinted from
[68].
Many miniature wind turbines have been demonstrated successfully for wind energy harvesting,
however due to the increased friction losses of the bearings and the reduced surface area of the
blades, the efficiency of conventional turbines reduces with size. These devices reviewed above
are summarised in Table 2.1. Power efficiencies in this table show the percentages of the wind
kinetic energy that converted into electric output energy. In general, almost all reported

Chapter 2 Literature Review
21
miniature wind energy harvester with rotor diameters smaller than 10 cm have practically low
efficiency for specific range flow speed to date. For some miniature wind turbines, the rated
wind speed is higher than the nominal ambient air speed. Therefore achieving lower threshold
wind speed for operation is the main issue of such devices. Additionally, complicated
mechanical structures and intricate fabrication processes also limit the minimization of rotary
air-powered generators.
Table 2.1: A Summary of miniature wind turbines reviewed.
Authors Type
Threshold
wind
speed
(m/s)
Maximum
Power
Output
(mW)
Efficiency
Rancourt et al. Electromagnetic 5.5 130 9%
Holmes et al. Electromagnetic 3 2.5 1.4%
Carli et al. Electromagnetic unknown 10 5.5%
Xu et al. Electromagnetic 3 18 8%
Priya et al. Piezoelectric 2.5 7.5 1%
2.3.2. Energy harvesters based on flow-induced vibration
When a structure is subjected to wind loads, the structure may experience unwanted, excessive
vibrations due to aerodynamic instability phenomena. This kind of flow-induced vibration has
been generally avoided in civil engineering to reduce possible damage. From a totally different
perspective, such vibration has started to emerge recently as a novel approach based on wind
power to generate electrical energy. Several distinct phenomena are known to excite flow
induced vibrations of structures including vortex induced vibration, wake galloping and
divergent oscillation (flutter). Figure 2.9 shows the typical velocity– amplitude curves of the
aerodynamic instability phenomena [69].

Chapter 2 Literature Review
22
Figure 2.9: Typical velocity–amplitude curves of aerodynamic instability phenomena; (a)
vortex-induced vibration, (b) divergent oscillations (i.e. flutter), (c) wake galloping. Reprinted
from [69].
As shown in the figure, Vortex-induced vibration may occur at relatively low wind speed, but
it occurs only within a very narrow range of wind speed along with relatively small amplitude.
Therefore, an energy harvesting system based on vortex-induced vibration may be inefficient.
The flutter-based energy harvesting system can dramatically improve the amplitude with
increasing wind speed. However such devices only operate at very high wind speed and become
unstable under unexpected flows. The wake galloping structures can operate at a wider range
of flow speed, but suffer from drastic deterioration of efficiency at low speed levels.
2.3.2.1 Vortex induced vibration
Vortex induced vibration is one of the most classical-type aerodynamic instability phenomenon.
It predominately occurs in bluff bodies such as bridge decks, smoke stacks, or heat exchanger
tubing. When a fluid flows toward the leading edge of a bluff body, it will be slowed down
while in contact with the surface of the bluff body as a result of viscosity, forming a boundary
layer. This boundary layer can be separated from the body because of its excessive curvature.
If the flow speed is higher than a critical value, pressure on both sides of the bluff body will
change from stable free steam pressure to unstable stagnation pressure, and hence vortices are
created. This phenomenon is called Vortex Street or Kármán Vortex Street as shown in Figure
2.10. In one limited range of flow speed, the exciting frequency may be close enough to one of
the natural frequencies of the body, causing resonance and oscillations. Therefore certain
transduction mechanisms can be applied to extract energy. Sanchez-Sanz and his colleagues
[70] studied the feasibility of energy harvesting based on the Kármán vortex street and
proposed several design rules of such micro-resonator. This method is suitable both air flow

Chapter 2 Literature Review
23
and liquid flow. A preliminary study on harnessing energy from piezoelectric transducers by
vortex-induced vibration phenomena was discussed by Sivadas et al. [71]. Different bluff-body
shapes and dimensions are investigated, including cylindrical, triangular, and pentagonal. The
simulation results obtained showed the cylindrical bluff body had a wider lock-in bandwidth,
which means it can generate appreciable power over a wider range of flow speeds, and higher
average power compared to the other two bluff body shapes investigated.
Flow
Bluff body
Figure 2.10: An example of Kármán Vortex Street.
Classical studies predict that the dominant exciter of this oscillation phenomenon should be
when the vortex is shedding from the bluff body. Bernitsas et al. [72] proposed an energy
harvesting device using vortex induced vibration and the idea has since then been further
developed. Some researchers focused on this type of excitation [73], and the most famous
energy harvester based on Vortex Street is the ‘Energy Harvesting Eel’ [74]. Figure 2.11 shows
a schematic of the device. The ‘eel’ converts the flow energy to electrical power through a flow
induced oscillating motion on the PVDF film behind bluff body. However, those devices are
mostly used in liquid flow such as rivers or oceans [75–78].
.
Figure 2.11: Schematic of the ‘Energy Harvesting Eel’ (top view).

Chapter 2 Literature Review
24
A wind energy harvesting configuration, called flapping-leaf, has been reported by Li and
Lipson as shown in Figure 1.22 [79]. The device consists of a PVDF cantilever with one end
clamped on a bluff body and the other end connected to a triangular plastic leaf. When the
airflow passes through, the vortex shedding, caused by the bluff body, generates harmonic
force; meanwhile another unsteady force is induced by the trailing edge of leaf. Those two
potential excitations generate unstably periodic motion of the flexible plate and thus the PVDF
cantilever produces electrical energy. The energy harvester generated a maximum output
power of 17 W under the wind of 6.5 m/s. Dimensions of the PVDF cantilever is 73 mm × 16
mm × 40 m. The same group explored another type of flapping-leaf with a dangling cross-
flow stalk arrangement, which can amplify the vibration by an order of magnitude. They
claimed that their architecture makes it appropriate for low-cost organic piezo-materials.
Experimentally, the prototype produced a peak output power of approximately 600 W in the
wind of 8 m/s [80].
.
Figure 2.12: Different configurations of piezo-leaf. Reprinted from [79].
Kwon et al. also implemented a leaf-like design for a piezoelectric harvester with two different
kinds of piezoelectric materials. The soft flexible one is used to make the leaf element, while
the hard one is applied to the trunk portion of the tree requiring rather strong winds to generate
any power. Results showed the power output was insufficient for powering a wireless network
node [81].
Dunnmon et al. [82] reported a piezoelectric aeroelastic energy harvester. It consists of a
flexible plate with piezoelectric laminates which is placed behind a bluff body. It is excited by
a uniform axial flow field in a manner analogous to a flapping flag such that the system delivers
power to an electrical impedance load. In this case, the bluff body is in the shape of an aerofoil
rather than a cylinder. The beam is made of aluminium and an off-the-shelf piezoelectric patch
is mounted close to the clamped end of the beam. Experimental results showed that an output
power of 2.5 mW can be derived under a wind of 27 m/s. The plate has dimensions of 310 mm

Chapter 2 Literature Review
25
× 101 mm × 0.39 mm and the bluff body has a length of 550 mm. Dimensions of the
piezoelectric laminate are 25.4 mm × 20.3 mm × 0.25 mm.
Wen et al. [83] proposed a fluid kinetic energy harvester excited by vortex induced vibration.
In order to optimize the harvester, they used a two-way Fluid Structure Interaction (FSI)
simulation to investigate the performance. The harvester was assembled with a cuboid-shaped
aluminium bluff body and a piezoelectric polymer (PVDF) cantilever in size of 60 mm × 12
mm × 52 µm. The test results showed that the energy harvester delivered 1 µW power output.
Researchers from University of Brescia [84] have also reported a VIV energy harvesting
system based on a piezoelectric converter to power autonomous sensors. The convertor was
embedded as a part of a flexure beam (45 mm long and 20 mm wide) with a blade (70 mm long
and 30 mm wide) and a bluff body placed upstream. The results of experimental
characterization showed a harvested power up to 100 µW was obtained at a flow speed of 4m/s.
Weinstein et al. proposed a cantilevered piezoelectric beam for energy harvester used in HVAC
flow. Excitation is amplified by the interactions between an aerodynamic fin attached at the
end of the piezoelectric cantilever and the vortex shedding downstream from a cylinder shaped
bluff body placed in ahead of the cantilever assembly (Figure 2.13). The positioning of small
weights in the form of magnets were placed along the length of the fin to adjust the resonant
frequency of the bender. The energy harvester was test to operate at flow velocities from 2 to
5/m s with power generation of 200 W to 3 mW respectively with a dimension of 22.5 cm
long and 11 cm wide [85].
Figure 2.13: Schematic of the cantilevered piezoelectric beam. Reprinted from [85].
2.3.2.2 Wake galloping
Wake galloping is known to occur in parallel cylinders because of the wake interference

Chapter 2 Literature Review
26
between two circular cylinders. Under certain conditions the leeward cylinder may be subjected
to galloping oscillations induced by the turbulent wake of the windward cylinder. Figure 2.14
shows the schematic of this phenomenon. The vibration orbit depends upon the arrangement
of parallel cylinders. However, there were some incidences that these devices were damaged
by strong forces due to the wake galloping.
Figure 2.14: Schematic of wake galloping phenomenon.
Numerical investigations for two circular cylinders in different arrangement have been reported
since 1973 [86] and researchers found that if the distance between two cylinders is
approximately six times larger than the diameter, the vibration does not appear. Jung et al. [87]
proposed an energy harvesting devices based on the wake galloping phenomenon for the first
time. Tests results showed that with two cylinders with lengths of 85 cm and diameters of 5
cm, a maximum power of 1.13 W was measured under wind speed with 5.6 m/s. Later, a more
detailed investigation followed their conceptual study was reported by Jung and Lee [88]. In
order to validate the effectiveness of the wake galloping-based energy harvesting system
clearly, a prototype device with electromagnetic induction was designed and manufactured as
shown in figure 2.15. In the experiment, the prototype device produced an average output
power of 370 mW under wind of 4.5 m/s.
Chapter 2 Literature Review
27
Figure 2.15: A prototype of the wake galloping-based energy harvesting system. Reprinted
from [88].
2.3.2.3 Flutter
Flutter is a self-feeding and potentially destructive vibration where aerodynamic forces on an
object couple with a structure's natural mode of vibration to produce rapid periodic motion. It
happens when the natural mode of vibration for this object couples with the aerodynamic forces
applied on it. When the natural damping of the system is smaller than the aerodynamic
excitation, the vibration will keep increasing until the aerodynamic or mechanical damping of
the object matches the energy input. This phenomenon leads to large amplitude of the
oscillation for a stable nonlinear limit cycle to emerge or a rapid structure failure of the system
in divergent behaviour due to an increased wind speed. Consequently, the study of this
phenomenon was initiated in the field of aeronautics to aerodynamically stabilize aerofoils.
The possibility of the idea that utilising aerodynamic instability phenomena for energy
harvesting was first addressed by Duncan in 1948 [89]. Since then, some researches has been
carried out for developing energy harvesting systems based on this phenomena, more
specifically divergent oscillation due to the flutter. In the early 1980s, McKinney and
DeLaurier [90] proposed a prototype power generating device called windmill based on the
flutter phenomenon. They carried out wind tunnel tests and demonstrated that their device had
an efficiency of 10% approximately, which was comparable to a conventional windmill. In
1997, Jones et al. [91] described their numerical and experimental methods for an oscillating
rectangular wing generator. Their study found that an oscillating wing would be suitable for
some power generation application, if the pitch amplitude exceeded the induced angle of attack
owing to the plunging motion. In 2003, Isogai et al. [92] proposed a different type of energy
harvesting device using a flapping wing under the flutter phenomenon. They introduced an
electric motor to mechanically drive the pitching oscillation of the wing. The result showed an
increased efficiency of the system.
Erturk et al. [93] reported the use of a curved aerofoil section with piezoceramics for energy
harvesting as shown in Figure 2.16. A mathematical model was established and a prototype
device was built to validate the model. The generator has a 0.5 m long aerofoil vertically placed.
Two PZT-5A piezoceramics were attached onto the two ends of the aerofoil. Under certain
airflow, the aerofoil flaps and actuates the piezoceramics to produce electricity. An electrical
power output of 10.7 mW was achieved at the linear flutter speed of 9.3 m/s.

Chapter 2 Literature Review
28
Figure 2.16: Schematic of a piezoaeroelastic section under uniform airflow. Reprinted from
[93].
Zhu et al. [94] investigated the performance of a new type of flow energy harvester based on
oscillating foils through numerical modelling by using 2D and 3D models. By examining the
power extraction capacity and efficiency of the system at various geometrics including
mechanical and kinematic parameters, the optimal performance of the system was achieved in
the case when there is no spring, and the pitching axis is located at the centre of the chord. They
also found that the presence of the ground increases the heaving response of the foil due to the
blocking of trailing vortices, and greatly enhances both the power extraction and the efficiency.
Kwon published a T-shaped piezoelectric cantilever for generating electric power from fluid
flow. The working principle of the device is based on aeroelastic flutter and utilizes a bimorph
cantilever with T-shape which hastens occurrence of flutter at a low fluid speed. A prototype
device (100 mm × 60 mm × 30 mm) was tested in a wind tunnel. The device was found to
provide power from a wind speed of 4 m/s and a continuous peak electrical power output of 4
mW [95].
Bryant and Garcia [96] proposed a novel energy harvesting device powered by aeroelastic
flutter vibrations to generate power on a helicopter rotor blade. The model of a simple wing
connected to the tips of a pair or bimorph piezoelectric beams has been derived by fusing the
governing mechanical, electromechanical, and aerodynamic terms of the system. One design
for such a power harvester is detailed and the electromechanical behavior of the system has
been predicted. The same group then designed another aeroelastic energy harvester consisting
of an aerofoil section attached to a cantilevered piezoelectric bender by a flexural joint, as
illustrated in Figure 2.17, both theoretically and experimentally [97-100]. The beam was made
of Stainless steel with a size of 250 mm × 25 mm × 0.38 mm, attached with PZT piezoceramics.
This configuration creates an aeroelastic flutter response above a critical cut-in wind speed,
allowing the system to generate vibrations from the airflow and directly transduce the

Chapter 2 Literature Review
29
vibrations to electrical energy. A model based on simple two degree aeroelastic system of this
device has been developed to examine the effects on the cut-in wind speed of the system when
several design parameters are tuned and the size and mass of the system is held fixed.
Experimental results showed an output power of 2 mW at a wind speed of 7 m/s.
Figure 2.17: Photograph of the aeroelastic power harvester design. Reprinted from [99].
Researchers from Stanford University [101] investigated the efficiency of an aero-elastic-
flutter based energy harvester with wind speed augmenting funnel incorporated (Figure 2.18).
The wind-flow-contracting funnel device was designed to direct the wind flow to the flutter
and magnify the wind speed. Tests showed that the wind speed was magnified up to
approximately 20 % by the funnel within an incident angle of 30°, which leads to an increase
in the voltage output of the device.
Figure 2.18: Photograph of the aeroelastic power harvester with wind funnel. Reprinted from
[101].
All of the studies mentioned previously were focused on flapping-wing type power generators

Chapter 2 Literature Review
30
based on the flutter phenomenon, which could be inspired from oscillating wings in an aircraft.
Humdingers windbelt is a flapping wind generator that has been proposed by Shawn Frayne
and his team in 2004 as shown in Figure 2.19 [102]. It uses a tensioned membrane for the flutter
oscillation to collect energy from the wind. Magnets are attached to the end of the membrane.
They move with the membrane and are coupled with static coils to generate electricity. The
smallest Windbelt, with a 12 cm × 0.7 cm membrane, can provide an output power less than
100 W with minimum wind speed of 3 m/s.
Figure 2.19: Schematic of a windbelt. Reprinted from [102].
Pimentel [103] and his group presented a characterization of the wind flutter generator with a
50 cm long windbelt. After several parameters taken into account, experimental results showed
the peak output power was 5 mW with wind speed of 3.6 m/s. Fei et al. [104] also designed a
wind energy converter using windbelt structure which has a better performance than previous
one. By optimizing of the location of the generator coils and the magnet using FEM tools, they
achieved a peak output power of 7 mW at 2.8 m/s wind speed.
Kim et al. from Georgia Institute of Technology has presented an electromagnetic generator
using windbelt-based vibration [105]. As shown in Figure 2.20, it consists of a polymer
resonator with embedded permanent magnets, polymer housing, and copper windings with a
size of 12 mm × 12 mm × 6 mm. The resonator produces high frequency mechanical oscillation
from air-flow with the motion of vibrating membrane in the middle, then converses it to
electrical power with permanent magnet system. The epoxy housing located inlet and outlet
airflow ports is used to maximize the energy conversion efficiency. In experiment, this
generator produced a peak-to-peak output voltage of 81 mV from an input pressure of 50 kPa.

Chapter 2 Literature Review
31
Figure 2.20: Three-dimensional schematics of the windbelt vibration energy harvester.
Reprinted from [105].
Sun et al. reported a PVDF microbelt to convert the energy from low-speed air flow to
electricity via their resonant oscillation. The micrometre thick PVDF thin films were fabricated
by a top-down reactive ion etching process. With measures to improve surface smoothness, the
thickness could be controlled down to a submicron level. MB structures made from the PVDF
thin films were shown to oscillate under low speed air flow around 1 m/s. A continuous 12
minutes of simulated respiration produced a capacitor voltage output of 200 mV, corresponding
to 20 mJ of electrical energy storage [106].
St. Clair et al. reported a micro generator using flow-induced self-excited oscillations of a
piezoelectric beam embedded within a cavity [107]. The principle is similar to music-playing
harmonicas as shown in Figure 2.21. When the flow rate of air past the beam exceeds a certain
threshold, the energy pumped into the structure via nonlinear pressure forces offsets the
system’s intrinsic damping setting the beam into self-sustained limit-cycle oscillations. Output
power between 0.1 mW and 0.8 mW was obtained at wind speeds of 7.5 m/s and 12.5m/s. They
emphasized that their device can eliminate the bandwidth issues associated with resonant
vibratory energy harvesters. Similar device has also been developed by Ji et al. which has
impressive mill watt scale power outputs but suffers from a cut-in speed around 3 m/s [108].

Chapter 2 Literature Review
32
Figure 2.21: Energy harvesting using flow-induced self-excited oscillations. Reprinted from
[107].
Researchers from Kangwon National University designed a piezoelectric MEMS energy
harvester using flow-induced vibration as shown in Figure 2.12 [109]. They used parasitic flow
as the input energy harvester, where reduction of the natural frequency of the harvesters is a
vital factor. The micro harvester was composed of one silicon cantilever coated with
piezoelectric thin film with a size of 610 μm × 300 μm × 3.5 μm. When the bent micro-
cantilever was exposed to wind, the structure undergoes flow-induced vibration which resulted
in electrical power based on piezoelectricity. In the experiments, this harvester generated
voltage of 0.44 V, 0.62 V and 0.82 V at the flow speed of 6.1 m/s, 12.4 m/s, and 21.6 m/s,
respectively. However, no specific power output was mentioned. The harvester was further
investigated in a recent published paper by changing the geometrical properties of engineering
structures [110]. In this work, four silicon cantilevered with PZT film were used, each of which
has a length of 2,000 μm, a width of 200 μm, and a thickness of 3.5 μm. After testing, an output
power of 1.77 μW and an output voltage of 1.88 V was achieved at flow velocity of 12.4 m/s.
Figure 2.22: The structure of piezoelectric energy harvester using flow-induced vibration.
Reprinted from [109].
Recently, Wang and his group proposed a flow-induced triboelectric nanogenerator (TEGs) for
wind energy harvesting [111]. The mechanism is based on the contact/separation between two
triboelectric materials to drive the electrons flow in the external circuit because of the coupling
between triboelectrification and electrostatic induction. The generator consisted of two Al foils
and a fluorinated ethylene propylene (FEP) film in a cuboid acrylic tube, as illustrated in Figure
2.13. The Al foil plays dual roles as a triboelectric surface and as an electrode. One side of the
FEP film was fixed in the middle of the end surface of the tube, leaving the other side free-
standing. The distance between the two Al foils and the FEP film can be changed periodically

Chapter 2 Literature Review
33
due to the vibration of the FEP film, resulting in an output voltage/current across an external
loading resistor. A prototype with dimensions of 2.5 cm × 2.5 cm × 22 cm was tested and an
output power of 0.16 mW at a wind speed of 10 m/s was obtained. To optimise the output
performance of harvester, the device sizes and the film material were further investigated. In
another paper, an improved TEG was fabricated and tested [112]. The new device had a total
size 22 mm ×10 mm × 67 mm, and a triboelectric polytetrafluoroethylene (PTFE) film was
used between the Al foils. The best performance of the generator was 3.7 mW power output at
wind speed of 7.6 m/s. The same group also reported a hybridized nanogenerator integrating
TENGs and the electromagnetic generators (EMGs) to enhance the output performance of the
device [113]. A prototype that consisted of two TENGs and two EMGs was fabricated with
dimensions of 6.7 cm × 4.5 cm × 2 cm. This device can deliver an output power of 3.5 mW
from one TENG and 1.8 mW from one EMG under an air-flow speed of 18 m/s.
Figure 2.23: Schematic of a triboelectric nanogenerator for wind energy harvesting .Reprinted
from [111].
Another flow-induced energy harvester based on aeroelastic flutter vibrations was reported by
Zhu et al. [114] shown in the following Figure 2.24. The generator consists of a wing attached
to a cantilever spring made of beryllium copper. The airflow over the wing causes the cantilever
to bend upwards, the degree of bending being a function of the lift force from the wing and the
spring constant. As the cantilever deflects downwards, the flow of air is reduced by the bluff
body and the lift force reduced causing the cantilever to spring back upwards. This exposes it
to the full airflow again and the cycle is repeated. When the frequency of this movement
approaches the resonant frequency of the structure, the wing has the maximum displacement.
A permanent magnet is fixed on the wing while a coil is attached to the base of the generator.
The movement of the wing causes the magnetic flux cutting the coil to change which generates
electrical power. The proposed device has dimensions of 12 cm × 8 cm × 6.5 cm. This generator
can operate at wind speeds as low as 2.5 m/s with a corresponding electrical output power of
470 μW. This is sufficient for periodic sensing and wireless transmission. When the wind speed
is 5 m/s, the output power is 1.6 mW.

Chapter 2 Literature Review
34
Figure 2.24: Schematic of the cantilever-based electromagnetic wind generator. Reprinted from
[114].
A summary of all flow-driven devices reviewed in this section is listed in Table 2.2. To
calculate the efficiency, the windward sweeping area was calculated by measuring the width
of the flapping part and the vibration amplitude. In some papers, these values were not clearly
listed, however the value could be estimated by the size and the movement of the device. This
made the efficiency calculated not as accurate as the others, therefore the values were only used
as a guide for comparison. Again the efficiencies at different speeds were calculated and the
maximum one was chosen for comparison
Table 2.2: A summary of the flow-driven devices.
Authors Type
Threshold
wind speed
(m/s)
Maximum
Power Output
(mW)
Efficiency
Jung et al. Electromagnetic 2.5 370 unknown
Pimentel Electromagnetic 3.6 5 unknown
Zhu et al. Electromagnetic 2.5 1.6 1.2%
Fei et al. Electromagnetic 2.8 7.5 unknown
Humdinger Electromagnetic 3 0.1 unknown
Kim et al. Piezoelectric unknown 0.0017 4.2%
Demori et al. Piezoelectric 4 0.1 unknown
Dunnmon et
al. Piezoelectric unknown 2.5
0.002%
Wen et al. Piezoelectric unknown 0.001 0.58%
Clair et al. Piezoelectric unknown 0.8 unknown
Li et al. Piezoelectric 4 0.6 0.04%
Weinstein et
al. Piezoelectric 2 3
0.93%

Chapter 2 Literature Review
35
Erturk et al. Piezoelectric 9.3 10.7 unknown
Kwon et al. Piezoelectric 4 4 unknown
Bryant et al. Piezoelectric 2 2.2 0.18%
Ji et al. Piezoelectric 2.8 4.5 unknown
Wang et al. Electrostatic >6 0.16 0.04%
2.3.3. Energy harvesting from Helmholtz resonators
A Helmholtz resonator, which is a type of acoustic resonator, consists of a cavity full of gas
connected to the environment through a narrow neck. When air flows past the opening, an
oscillation wave occurs. A volume of air in and near the open neck vibrates because of the
'springiness' of the air inside. The pressure in the cavity is relatively uniform, and the air in the
neck oscillates as a single mass. Generally, the cavity has several resonance frequencies, the
lowest of which is the Helmholtz resonance. The Helmholtz resonant frequency is given by:
𝑓 =𝑐
2𝜋√
𝑆
𝑉𝐿 (Equation 2.2)
Here 𝑐 is the speed of sound in a gas; 𝑆 is the cross sectional area of the neck; L is the length
of the neck and 𝑉 is the volume of the cavity.
Helmholtz resonators are mostly applied for acoustic energy harvesting, which capture energy
from ambient acoustic field [115]. According to the current review, the published studies on
wind energy harvesting based on Helmholtz resonator are limited. In most cases, the energy
converters are placed at the bottom of the Helmholtz resonators.
A Helmholtz resonator based generator designed for weaker airflow was reported by Liu et al.
[116]. It comprises a gas-filled chamber with an open neck, where the oscillation occurs. As
the membrane oscillates due to the Helmholtz resonance, a static coil is coupled with the
moving magnet to generate electricity. Two energy harvesters were fabricated and tested. The
first one has a dimension of 19 mm × 5 mm and a resonant frequency of 1.4 kHz. It generated
an open circuit voltage of 4 mVpp under the airflow of 0.2 kPa (5 m/s). The second device has
a dimension of 9 mm × 3 mm and a resonant frequency of 4.1 kHz. It generated an open circuit
voltage of 15 mVpp under the airflow of 1.6 kPa.
Matova et al. [117] reported a device that has a packaged MEMS piezoelectric energy harvester
inside a Helmholtz resonator shown in Figure 2.25. It was found that packaged energy
harvesters had better performance than unpackaged energy harvesters as the package removes

Chapter 2 Literature Review
36
the unwanted viscous influence and provides only vibration excitation to the energy harvester.
Experimental results show that the energy harvester generated a maximum output power of 2
μW at 309 Hz under the airflow of 13 m/s.
Figure 2.25: Helmholtz resonator with the piezoelectric cantilever harvester. Reprinted from
[117].
Compared to other wind energy harvesting techniques, reclaiming wind energy using
Helmholtz resonator has received less attention. A major drawback of this kind of device is the
strong dependence of resonant frequency on the ambient temperature. This means that energy
harvesters with Helmholtz resonators can only be used in the environments with stable
temperature.
2.4 Conclusion
The recent development of wind energy harvesting are introduced and reviewed in this chapter.
The main methods of capturing flow energy include wind turbines, flow-induced vibration and
Helmholtz resonators. Based on the current literature review, low efficiency, high threshold
wind speed for operation as well as complicated fabrication process is the main issues of
miniature wind turbine systems. Alternative approaches for replacing these conventional blade
type wind power systems have been investigated in recent years. Due to the temperature
limitation of Helmholtz resonators, most researchers put their emphasis on flow-induced
vibrations.
Most flow-induced structural harvesters take the form of beams cantilevered to a vibrating base
object and tuned to resonate at the vibration frequency of the base object. These cantilevered
based generators have relatively low threshold wind speed for operation than other structures
in the review. In this project, a flow induced energy harvester with a flapping beam is proposed,
which represents a novel opportunity that may achieve low threshold wind speed of operation

Chapter 2 Literature Review
37
as well as large amplitude. The generator has a cantilever beam attached by an aerofoil for limit
cycle oscillation behind a bluff obstacle in the airflow. As all reviewed devices are developed
to operate at wind speeds above 2 m/s, a low threshold wind speed (1.5 m/s) is the first strategy
in this work. In addition, this structure of harvester provides relatively high performance at low
flow speeds and the efficiency can dramatically improve with increasing wind speed. However
the scaling effect of such structure is unknown. Hence it may have better performance than
rotary harvesters at some scales. In order to investigate that, the work by Zhu et al. will be used
as a reference. Generally the smaller the size of the energy harvester the better it is for miniature
systems application. However, considering that the output power reduces significantly with the
size of the generator scaling down, an optimum design is required to balance both power
generation and size of the device. Hence another goal pursued in the report is to achieve higher
power densities than the previous device with smaller sizes.
Since most wind turbines use conventional electromagnetic transducers in the literature review,
there is little progress made in piezoelectric windmills due to their low adaptability. On the
other hand, most flow-induced wind harvesters, especially with miniature sizes, are
piezoelectric generators. Among them, flexible materials like piezoelectric polymers give low
surface energy density because of low piezoelectric coefficient; and high performance material
like bulk piezoelectric ceramics have limitations in size due to large thicknesses. In this
situation, film piezoceramics are more favourable to fabricate devices with small thicknesses.
Further investigations on designing proper transduction systems will be discussed in the
following chapters.

Chapter 3 Theory
38
Chapter 3 Theory
This chapter explains some relating theory to the wind energy harvester that would be used for
concept design.
3.1 Oscillation under Air Flow
Unlike the flow-induced harvesters reviewed in Chapter 2, the operation of the cantilever
oscillation in this work is still not fully understood. However, some parts of the operation can
be speculative based on the ANSYS model which will be discussed in details in the following
chapter. As shown in Figure 3.1, an aerofoil is attached to one end of the cantilever spring
while the other end is clamped. If there is no wind, the aerofoil will slightly bend downward
due to its mass. When air is flowing towards the aerofoil, it will bend as shown in Figure 3.1(b).
The degree of bending is related to the spring constant, mass and the lift/drag force form the
aerofoil caused by the air flow. In this condition, however, the cantilever will remain stationary
with a fixed deflection without oscillation. In order to oscillate the cantilever, a bluff body is
required to be placed in front of the cantilever as shown in Figure 3.1(c). The bluff body will
induce differences in velocity distributions above and under the surface of the aerofoil which
causes the lift force to be asymmetric with deflection and varies the direction of deflection of
the cantilever. The bluff body serves to reduce the flow of air which reduces the lift force when
the cantilever is deflecting. In this case, the cantilever is operating mainly under inertial effects
and will spring back. However when the cantilever springs back to the original position where
the aerofoil can be fully exposed to the airflow again, the cycle is repeated. The amplitude of
displacement increases until it reaches its steady state motion, which almost resembles
harmonic forced vibration. Such a configuration can self-start and sustain the necessary
oscillations under uniform and steady flow conditions. In addition to this advantage, such a
harvester will potentially operate at a lower flow speed.
By attaching the aerofoil to the opening end, the deflection of the beam can be larger and its
response can be better tuned for various flows. The position of the bluff body, both its distance
to the cantilever and its height is of significance to the oscillation of the cantilever. The system
can then resonate through both tuning the resonant frequency of the cantilever spring as well

Chapter 3 Theory
39
as appropriate design and positioning of the bluff body. Specific theory of the generator with
cantilevered structure, theoretical model of piezoelectricity, static aeroelasticity and
aerodynamic characteristics of the aerofoil will be discussed in the following sections.
Figure 3.1: Schematic showing the operation of the cantilever oscillation.
The natural frequency of the cantilever oscillation fn can then be calculated by:
𝑓𝑛 =1
2𝜋√
𝑘
𝑚 (Equation 3.1)
Where k and m are the stiffness and the total mass of the beam, respectively. The stiffness k
can be obtained by the following equation:
𝑘 = 3𝐸𝐼
𝐿3 (Equation 3.2)

Chapter 3 Theory
40
The total mass is the sum of the effective mass of end mass and the mass of cantilever and can
be given by:
𝑚 = 𝑚𝑐𝑎𝑛𝑡𝑖𝑙𝑒𝑣𝑒𝑟 + 𝑚𝑒𝑓𝑓 = 0.2235𝜌𝐿 + 𝑚𝑒𝑓𝑓 (Equation 3.3)
and the natural frequency of the beam can be written as:
𝑓𝑛 = 1
2𝜋√
𝑘
𝑚=
1
2𝜋√
3𝐸𝐼
(0.2235𝜌𝐿+𝑚𝑒𝑓𝑓)𝐿3 (Equation 3.4)
where
E is the Young’s modulus of the beam k is the stiffness of the beam
I is the area moment of inertia 𝑓𝑛 is the natural frequency of the beam
L is the active length of the beam 𝑚𝑐𝑎𝑛𝑡𝑖𝑙𝑒𝑣𝑒𝑟is the mass of cantilever
𝜌 is the mass per unit length of the beam meff is the end mass
According to this equation, for a set material, the natural frequency of beam is related to the
effective end mass and the active length of the beam. The frequency therefore can be decreased
by either increasing the active length or the effective end mass. In other words, known values
of elastic modular E and the density of material, by varying the thickness, width, active length
of the cantilever, its stiffness and natural frequency can be predicted theoretically. Then it was
possible to design a cantilever suited to fit the desired stiffness and frequency.
3.2 Power of Wind
The power generated by a wind generator is originated from the wind power. The theoretical
wind energy can be calculated from the standard formula for the kinetic energy approximation
of a moving system:
𝐸 = 1
2𝑚𝑣2 (Equation 3.5)
Here m is the total mass of air at the windward area while v is the wind speed. The air mass can
be given by
𝑚 = 𝜌𝐴𝑣∆𝑡 (Equation 3.6)

Chapter 3 Theory
41
where 𝜌 is the air density, A is the windward area for the device and Δt is the period of time
over which the calculation is performed. Hence, the kinetic energy becomes
𝐸 = 1
2𝜌𝐴𝑣3∆𝑡 (Equation 3.7)
From this equation, we can obtain the wind power simply by dividing the kinetic energy by the
time:
𝑃 = 1
2𝜌𝐴𝑣3 (Equation 3.8)
In this case, the power of the wind becomes a function of air density, and area as well as wind
speed. The air density and the windward area for a device are fixed while the wind velocity can
be changed and is proportional to its power.
3.3 Power of Generator
A mechanical model of a second order spring mass system, i.e. an inertial device, was was first
proposed by Williams and Yates which consists of the base excitation of an elastically mounted
seismic [118]. While the elastic mount is typically modelled as a coil spring, in practice a
cantilever beam would provide both the flexibility and necessary constraint of the seismic mass.
The means of energy extraction may consist of a magnetic seismic mass moving past a coil, or
the beam may be fabricated from piezoelectric material. As far as the mechanical vibration is
concerned, the combination of mechanical and electrical damping is treated as equivalent to
linear viscous damping, which is proportional to velocity. The basic system can be considered
as a second order spring-mass-damper model as shown in Figure 3.2.

Chapter 3 Theory
42
Figure 3.2: Schematic of a second order mass-spring-damper system.
In Figure 3.2, the model is subject to a sinusoidal force applied directly to the mass. Then the
differential equation of motion is described as:
𝑚�̈� + 𝑐�̇� + 𝑘𝑥 = 𝐹𝑠𝑖𝑛𝜔𝑡 (Equation 3.9)
Where k is the stiffness of the cantilever; 𝑚 is the proof mass added to the end of the cantilever;
c is used to model the mechanical and electrical damping; and x is the displacement of the mass.
The standard steady state response is
𝑥 =𝜔2
[𝑘
𝑚−𝜔2]
2+(
𝑐𝜔
𝑚)
2 𝑌𝑠𝑖𝑛(𝜔𝑡 − 𝜑) (Equation 3.10)
Where Y is the amplitude of vibration and the phase angle 𝜑 is given by:
𝜑 = tan−1 (𝑐𝜔
𝑘−𝑚𝜔2) (Equation 3.11)
The maximum power is extracted from the environment when the frequency of excitation is
equal to the natural frequency, regardless of the damping ratio. Then the resonant frequency is
given by:
𝜔𝑟 = 𝜔𝑛√1 − 2휁2 (Equation 3.12)
Here 휁 is the damping ratio, while the natural frequency is
𝜔𝑛 = √𝑘
𝑚 (Equation 3.13)
The power captured by the damper is described by the following equation by Williams and
Yates [118]:
𝑃 =𝑚𝜁𝑌2(
𝜔
𝜔𝑛)𝜔3
[1−(𝜔
𝜔𝑛)
2]
2
+[2𝜁(𝜔
𝜔𝑛)]
2 (Equation 3.14)
When 𝜔 = 𝜔𝑛, the maximum power generated. Therefore Equation 3.10 can be reduced to

Chapter 3 Theory
43
𝑃𝑑 =𝑚𝑌2𝜔𝑛
3
4𝜁 (Equation 3.15)
From equation above, it can be seen that a low damping factor is required for a higher power
generation. However, the conclusion that the output power will be increase towards infinity as
the damping ratio reduces towards zero cannot yet be made. Setting the damping ratio to zero
implies that the system is no longer in a steady-state; therefore the equations are no longer valid.
Besides it is clear from the above that the mass and the maximum displacement of the mass
should be as large as possible within the size constraints to maximize the output power.
3.4 Theoretical Model of Piezoelectricity
The piezoelectric generator can be modelled by assuming a basic configuration (a bender
mounted as cantilever with a mass on the end) based on beam theory and the piezoelectric
constitutive equations:
𝛿 = 𝜎𝐸⁄ + 𝑑𝑄 (Equation 3.16)
𝐷 = 휀𝑄 + 𝑑𝜎 (Equation 3.17)
where:
𝛿 is mechanical strain
𝜎 is mechanical stress
E is the modulus of elasticity (Young’s Modulus)
d is the piezoelectric strain coefficient
Q is the electric field
D is the electrical displacement (charge density)
휀 is the dielectric constant of the piezoelectric material
A model suggested by Roundy et al. [119] is presented here to better understand the
electromechanical coupling behaviour of the piezoelectric generator. It is an analogous
transformer model where the mechanical and the electrical domains of the piezoelectric system
are modelled as circuit elements and the piezoelectric coupling is then modelled as a
transformer as shown in Figure 3.3.

Chapter 3 Theory
44
Figure 3.3: Circuit model of piezoelectric with resistive load.
The mechanical domain of the equivalent circuit at the left hand side consists of an inductor, a
resistor and a capacitor which represent the generator mass, m, the mechanical damping, bm,
and mechanical stiffness k, respectively. For the electrical domain on the right, Cp is the
capacitance of the piezoelectric and R is the external resistive load. n is the equivalent turn
ratio of the transformer and is proportional to the piezoelectric charge constant. The vibration
input is shown as a stress generator (σin) which originated from the input acceleration Ain. The
relation between input vibrations (Ain) and an equivalent stress can be written as:
𝜎𝑖𝑛 =𝑚
𝑏∗∗ 𝐴𝑖𝑛 (Equation 3.18)
where b** is the geometric constant relating average bending stress to force at the beam’s end.
The system equation can be developed by using Kirchoff’s Voltage Law (KVL) and Kirchoff’s
Current Law (KCL) as:
�̈� =−𝑘𝑠𝑝
𝑚𝛿 −
𝑏𝑚𝑏∗∗
𝑚�̇� +
𝑘𝑠𝑝𝑑
𝑚𝑡𝑐𝑉 + 𝑏∗𝐴𝑖𝑛 (Equation 3.19)
�̇� =−𝑘𝑑𝑡𝑐
𝜀�̇� −
1
𝑅𝐶𝑝𝑉 (Equation 3.20)
where:
V is the voltage at the output
tc is the thickness of a single layer of the piezoelectric material
ksp is the equivalent spring constant of cantilever beam
m bm k
σi
+
-
n
Cp R V
+
-
Mechanical Electrical

Chapter 3 Theory
45
b* is the geometric constant relating average bending stain to force at the beam’s end
The electrical coupling term in Equation (3.19), 𝑘𝑠𝑝𝑑
𝑚𝑡𝑐𝑉, can then be used to find the equivalent
linear damping ratio, ζe, which represents the electrically induced damping as presented in
Equation (3.21):
휁𝑒 =𝜔𝐾2
2√𝜔2+1(𝑅𝐶)2⁄
(Equation 3.21)
where K is the piezoelectric coupling coefficient and 𝐾 = √𝐸
𝜀𝑑 . It is an indication of the
material’s ability to convert mechanical energy to electrical energy [120]. The load resistance
can then be adjusted to equalise the electrically induced damping ζe to the mechanically
induced damping ζm to achieve an optimal output power. The optimal load resistance can then
be given by:
𝑅𝑜𝑝𝑡 =1
𝜔𝐶
2𝜁𝑚
√4𝜁𝑚2 +𝐾4
(Equation 3.22)
and hence the optimal output power can be calculated as:
𝑃 =𝑅𝐶𝑝
2(𝑘𝑑𝑡𝑐𝑏∗
𝜀)
(4𝜁𝑚2 +𝐾4)(𝑅𝐶𝑝𝜔)
2+4𝜁𝑚K(𝑅𝐶𝑝𝜔)+2𝜁𝑚
2𝐴𝑖𝑛
2 (Equation 3.23)
The power output is proportional to the square of the acceleration magnitude of the driving
vibrations and is inversely related to the frequency as can be seen directly from the equation.
However, it should be noted that although a lower frequency will help increase the output
power, the accompanied increase of the displacement of the proof mass may lead to an
increased strain. As there is a limit on the maximum strain can be supported by the material,
the power output is hence limited by the fracture strain of the piezoelectric material. In addition,
although not immediately obvious from the expression in Equation 3.23, we can still conclude
the output power is proportional to the proof mass as an increase of mass will lead to increases
of other variables under a given frequency. For instance, with the increase of mass, either the
thickness or the width of the beam must go up to maintain the same resonant frequency, this
will consequently induce either an increase in both tc and b* or an increase of Cp, both of which
will result in a higher predicted output power.
Although this model is used to calculate output power from vibration, it can also be adapted in

Chapter 3 Theory
46
this work by relating Ain to the amplitude of the cantilever Y:
𝐴𝑖𝑛 = 𝜔2𝑌 (Equation 3.24)
Equation (3.23) can then be further written as:
𝑃 =𝑅𝐶𝑝
2(𝑘𝑑𝑡𝑐𝑏∗
𝜀)
(4𝜁𝑚2 +𝐾4)(𝑅𝐶𝑝𝜔)
2+4𝜁𝑚𝐾2(𝑅𝐶𝑝𝜔)+2𝜁𝑚
2𝜔2𝑌 (Equation 3.25)
In this work, the oscillation amplitude of the cantilever is determined by the test wind speed.
By establishing the relation between the amplitude and wind speed, this equation can then be
applied to direct calculate the theoretical output power of the piezoelectric generator fabricated
in this work at different wind speeds.
3.5 Theoretical Model of Electromagnetism
Most electromagnetic based energy harvesters use an inertial frame configuration, in which the
relative movement between the magnets and the coils are induced by the vibration of the inertial
frame. The voltage induced in the electromagnetic transducer is expressed by the Faraday’s
law as follows:
𝑉 = −𝑁𝑑∅
𝑑𝑧
𝑑𝑧
𝑑𝑡 (Equation 3.26)
where N is the number of coil turns, z is the relative displacement between a magnet and the
coil; ∅ is the magnetic flux. The induced voltage is proportional to the product of a magnetic
gradient. Furthermore, the magnetic flux is proportional to the position of the inertial mass,
which is determined by the geometries and the configuration of the coil and the magnet as well
as the relative velocity between them. Consequently, the voltage across the idealized voltage
source in the electrical domain can also be expressed as:
𝑉(𝑡) = 𝜃𝑧′(𝑡) (Equation 3.27)
where 𝜃 is the coupling coefficient. It can be written as 𝜃 = 𝑁𝑙𝐵 and has units Vs/m. Here 𝑁𝑙
and 𝐵 are the effective length of the coil and the average flux density. From Equation 3.14, it
can be seen that the maximum power generates when the exciting frequency coincides with the
natural frequency of the system. Using the electromagnetic transduction, the amount of power
generated is equivalent to the energy dissipated by the electromagnetic induction. Therefore

Chapter 3 Theory
47
equation can also be expressed as
𝑃𝑒 =𝑚𝜁𝑒𝑌2𝜔𝑛
3
4(𝜁𝑒+𝜁𝑚)2 (Equation 3.28)
Where 휁𝑚 = 𝑐𝑚/2𝑚𝜔𝑛 and 휁𝑒 = 𝑐𝑒/2𝑚𝜔𝑛 , the electric damping coefficient 𝑐𝑒 can be
expressed as
𝑐𝑒 =(𝑁𝑙𝐵)2
𝑅𝐿+𝑅𝑐+𝑗𝜔𝐿𝑐 (Equation 3.29)
where 𝑅𝐿, 𝑅𝑐 and 𝐿𝑐 are, respectively, the load resistance, the coil resistance and inductance.
Based on above equation, to achieve high coupling factors, the coil should be designed with
large effective length, which can be achieved by increasing the number of turns and using a
larger area coil. Moreover, decreasing the coil resistance by using larger diameter wire is also
an effective way.
The average power delivered to the load then can be expressed as
𝑃𝑙𝑜𝑎𝑑 =𝑚𝜁𝑒𝑌2𝜔𝑛
3
4(𝜁𝑒+𝜁𝑚)2 (𝑅𝐿
𝑅𝐿+𝑅𝑐) (Equation 3.30)
The maximum power can be transferred to the load by matching the load impedance to the
source impedance. And the relationship is [121]
𝑅𝐿 = 𝑅𝑐 +𝜃2𝑐𝑚𝜔𝑛
2
(𝑘−𝑚𝜔𝑛2)2+(𝑐𝑚𝜔𝑛)2 (Equation 3.31)
where:
𝑘 is the spring stiffness
𝑐𝑚is the mechanical damping coefficient
Considering the case at mechanical resonance by substituting in 𝜔𝑛 = √𝑘 𝑚⁄ in to equation
3.31 gives:
𝑅𝐿 = 𝑅𝑐 +𝜃2
𝐶𝑚 (Equation 3.32)
This equation has previously been derived by Stephen [122] as the resistive match at resonance,

Chapter 3 Theory
48
taking coil resistance into account. It can be inferred that the optimum load is function of the
coil resistance and the mechanical damping.
3.6 Aerofoil
In this work, an aerofoil was used as the wing of the power harvester. An aerofoil is a device
designed to obtain useful reaction upon its surface from the air. When an aerofoil starts moving
through the air, it is capable of producing lift. Wings, turbines and propellers are all examples
of aerofoils. Operation of an aerofoil is based on Bernoulli's Principle, which states that the
pressure of a fluid (liquid or gas) decreases at points where the speed of the fluid increases
[123]. In other words, within the same fluid, such as air, high speed flow is associated with low
pressure, and low speed flow with high pressure. This phenomenon is used to create lift. By
making proper shape of the aerofoil, velocity of the wind above its surface is increased,
therefore pressure above the aerofoil decreased. Simultaneously, the impact of the air on the
lower surface of the aerofoil increases the pressure below. Then the higher pressure below is
able to produce a perpendicular lift force on it.
Figure 3.4: Schematic of an aerofoil module. Reprinted from [124].
Figure 3.4 illustrates the various modules that make up an aerofoil. The forward part of an
aerofoil is rounded and is called the leading edge. It is the part of the aerofoil that meets the
wind first. The aft part, which is called the trailing edge, is narrow and tapered. It is the last
part before the wind leaves the aerofoil. A reference line often used in discussing aerofoils is
the chord, an imaginary straight line joining the terminals of the leading and trailing edges,
dividing the aerofoil into the upper chamber and the lower chamber. The angle between the
chord and the oncoming wind towards the aerofoil is labelled as the angle of attack. Lift force
on the aerofoil would vary when the angle of attack changes [124].
Aerofoil geometry can be characterized by the coordinates of the upper and lower surface. It is

Chapter 3 Theory
49
often summarized by a few parameters including maximum thickness, maximum camber,
position of max thickness, position of max camber, and nose radius. By given these parameters,
a reasonable aerofoil section can be demonstrated accurately. The NACA aerofoils are aerofoil
shapes for aircraft wings developed by the National Advisory Committee for Aeronautics
(NACA) [125]. The shape of the NACA aerofoil is described using a series of digits following,
illustrating three parameters, the camber (first digit), the position of the camber (second digit)
and the thickness in percent (two digits). In this work, the most commonly used aerofoil shapes
NACA 0024 and NACA 4424 are selected and will be tested in chapter 4. The former one is
symmetric aerofoils (not cambered) while the latter one is an asymmetric aerofoil profile.
According to the operation description, an asymmetric aerofoil should be preferable to
maximise the lift force acting on it. For simplification, only two aerofoil shape are tested in
this work. However, other aerofoil shapes might give better results.
3.7 Conclusion
In this chapter, the theory governing the mechanical behaviour of the harvester was expounded
with different models. Some conclusions were drawn from those models for potential design
feature. The minimum wind speed for operation of the system is a critical design parameter for
tailoring the energy harvester to its target application and maximizing its useful operating range.
Based on the working principle of the harvester, the mechanical structure can be optimised by
designing the bluff body and aerofoil in a proper way. In any practical device, the amplitude
of the mass is limited to some maximum value, together with the magnitude and frequency of
the excitation. To get maximum power output, the maximum displacement of the mass should
be as large as possible within the design constrains of dimension. Moreover, a lower
fundamental frequency of vibration is also preferable for larger output power. The natural
frequency of the cantilever can be decreased by either increasing the active length or the
effective end mass. Besides the mechanical structure, transduction system is also critical to the
generated power. For electromagnetic transducer, high coupling factors can be achieved by
designing coils in such way of increasing effective length and decreasing the coil resistance.
While in the piezoelectric transduction system, although a lower frequency and a larger
amplitude will help increase the output, as piezeceramics are fragile, the maximum
displacement must be controlled to produce strain within the limit of the material. Furthermore,
static aeroelasticity of such device should be considerable for steady operation. All these design
concerns will be discussed in detail and investigated computationally and experimentally in
following chapters.

Chapter 4 Oscillation Wind Harvester Design
50
Chapter 4 Oscillation Wind Harvester Design
In this chapter, a wind harvester model is designed and discussed. The main objective is to
design the structure based on theory and estimate the performance by simulation. The
simulation of the model will be carried out through a finite element method using ANSYS
software, and it will be used to compare with experimental results. To optimise the basic
geometry of the harvester, both simulations and experiments in this chapter focus on the
mechanical design of the harvester without the transducer part. The transducers will be studied
afterwards.
4.1 Design Considerations
As mentioned in previous chapters, in order to operate throughout the entire range of flow
speeds in air ducts, a low threshold wind speed (<1.5 m/s) is desirable for the harvester. This
parameter is an important design point for any potential application and would be constrained
by size, mass, and material limitations in practical applications. It can be achieved by
improving the mechanical and transducer configurations. The mechanical configuration
involves several parameters such as the position of the bluff body, the attack angle of the
cantilever wing, and the dimensions of the cantilever (seen in Figure 4.1). These need to be
optimized simultaneously according to the operating conditions at different wind speed. The
optimum configuration thus should be designed by investigating these factors for a better
performance.
To achieve the maximum output power from the device, the input excitation from the air flow
should ideally match the natural frequency of the cantilever. For low wind speed operations,
the oscillation frequency of the harvester is normally lower than 20 Hz. In order to operate at
resonance, the natural frequency of the structure should reduce to that value as well. This target
can be achieved through changing dimensions of the beam and employing large proof-mass or
low material stiffness.
After considering the mechanical design factors of the harvester, the transducer features will

Chapter 4 Oscillation Wind Harvester Design
51
then be taken into account to enable electrical energy output. For most flow-induced energy
harvesters, piezoelectric generators and electromagnetic transduction are used as major
transduction mechanisms. These design details will be discussed in the following chapters.
4.2 Structure Design
4.2.1. Overall Size
The micro wind harvester presented in this report is based on a previous larger scale device
reviewed in the literature search. The volume of the previous harvester was 624 cm3 in total.
In order to scale down the size and investigate the performance, a miniaturized form with a
volume of 62 cm3 approximately, which is one tenth of the large device volume, was proposed.
The total volumes and the beam sizes of two harvesters are listed below individually. A T-
shape extension of the beam was used to support the length of the blade. This kind of shape is
preferable rather than a traditional simple rectangular shim sheet as the differing air flows along
the length of the blade might lead to a periodic and random twist during oscillation.
Table 4.1: Main components of two harvesters.
Main Components Reference device Miniature prototype
Total volume 120mm ×80mm×65mm 50mm ×35mm×35mm
Beam 50mm ×18mm×0.2mm 35mm ×5mm×0.1mm
4.2.2. Material Chosen
For most flow-induced energy harvesters with a cantilevered structure, two materials,
beryllium copper and stainless steel, are widely used as great spring materials. Properties of
those two alloy materials are slightly different. In this section, beryllium copper was selected
to fabricate the beam because of its lower stiffness which means a lower nature frequency.
Balsa wood was used to make the wing part to minimize weight since the density of this
material is much lower than plastic or other kind of wood. Other components were fabricated
using 3D rapid prototyping. All material properties are listed in the following table.
Table 4.2: Material Properties.
Components material Density
(g/cm3) Poisson ratio
Young’s
modulus
(G Pa)
Beam Beryllium
copper 8.9 0.32 120

Chapter 4 Oscillation Wind Harvester Design
52
Wing Balsa wood 0.35 0.4 11
4.2.3. Design Configuration
The harvester is constituted with four components, including a beam, a wing, a base part and a
wind shield (bluff body). Figure 4.1 shows the sketch of the harvester mechanical structure.
Some factors that may have a significant influence on the performance of the harvester are the
position of the bluff body, shape and the attack angle of the wing. The position of the bluff
body can be represented as the distances between the bluff body and the wing both in horizontal
and vertical directions. The horizontal position of the bluff body is the distance from the wing,
while the vertical position is the height from the wing. A set of simulations and experiments
will be carried out to investigate the influence of these factors.
Figure 4.1: Schematic of the harvester mechanical structure.
4.3 Simulation Analysis
It is necessary to investigate the influence of the mechanical structure both computationally
and experimentally. Ideally fluid-structure interaction simulations should be conducted to
simulate the behaviour of the device. However fluid–structure interaction problems and multi
physics problems are often too complex to solve analytically and numerically. In this work, for
simplification, a static model was used for analysis instead of computational dynamic model.
All simulations were conducted using ANSYS CFX to estimate the effect of bluff body and
the attack angle of the wing. Results from different arrangements were compared and plotted
using ANSYS commercial package of Design Optimization.
Figure 4.2 shows the symmetry scheme of the static model where a laminar airflow passed
through the wind tunnel along –x direction with the bluff body placed at the bottom. The inlet

Chapter 4 Oscillation Wind Harvester Design
53
speed was set from 1 m/s to 8 m/s, which is the wind speed range in the experiments. The
colours in the figure represent the velocity distribution and the arrows represent the wind speed
vector. During the simulation, when the airflow passes the aerofoil, a lift force is generated due
to the asymmetric wind speeds above and below it. In static model, the aerofoil and cantilever
will not move with the airflow, therefore the threshold wind speed is unpredictable. However,
as explained in Chapter 3, the oscillating vibration of the device starts from the asymmetric
force above and below the aerofoil, which is enhanced by placing a bluff body in front of the
aerofoil. Since the consequence that large lift force acting on aerofoil will provide a relatively
low threshold wind speed, configurations generating larger lift force should correspond with
those having lower threshold wind speed. Accordingly, a set of parameters were used to
estimate the lift force applied on the aerofoil, which was used as a guide to determine the
threshold wind speed of the device. The variable simulation parameters included the height of
the bluff body, the horizontal distance from the aerofoil and the attack angle of the aerofoil.
Figure 4.2: Static modal in ANSYS CFX (Inlet wind speed = 2 m/s).
Firstly, the characteristic of flow over the bluff body without the device was investigated. As
shown in Figure 4.3. It is clear to see the airflow over the bluff body has changed both in
magnitude and direction. In area A, the flow speed has magnitude nearly half as much again as
the inlet speed while flow speed at area B reduces significantly. This situation causes an
asymmetry in pressure distribution, resulting in a different pressure field behind it.

Chapter 4 Oscillation Wind Harvester Design
54
Figure 4.3: Flow speed distributions around the bluff body (Inlet wind speed = 1 m/s).
Secondly, simulations were run by placing the bluff body in front of the flapping part at
different positions with the same attack angle and airflow speed. At different positions, velocity
distributions above and under the surface of the aerofoil are different, leading to different lift
forces acting on the aerofoil and beam, as shown in Figure 4.4. For this reason, the position of
the bluff body, in other words, the height and distance between the bluff body and the aerofoil
are important factors that should be studied further.
Figure 4.4: Flow speed distributions around aerofoil at different positions (Inlet wind speed =
2 m/s)
To investigate these parameters, two schemes were defined to estimate the lift force applied on

Chapter 4 Oscillation Wind Harvester Design
55
the aerofoil. The first one is at a fixed attack angle, firstly changing the height of the bluff body
while maintaining a fixed distance from the aerofoil. The other scheme was to vary the distance
between them with a certain height of the bluff body. These adjustments were done with
ANSYS Design Optimization. Results of the simulation are presented in the form of lift force
applied on the aerofoil as seen in Figure 4.5.
Figure 4.5: Lift force distributions on the aerofoil and cantilever (Inlet wind speed = 1 m/s).
A 3D response surface of the lift force at an attack angle of 5º with different heights and
distances from the bluff body is plotted in Figure 4.6. The colours in the figure represent the
force distribution where red corresponds to higher force level. From the response surface,
distribution of the maximum values of force concentrates at distances from 3 mm to 10 mm
and heights from 18mm to 21mm.

Chapter 4 Oscillation Wind Harvester Design
56
Figure 4.6: 3D bar chart of the lift force with different heights and distances from bluff body
(Attack angle = 5º).
The attack angle of the aerofoil also has an influence on performance. The investigation of
attack angle was carried out by setting it as the input parameter ranging from 0º to 30º with a
step of 1º while the height and distance of the bluff body was fixed at 18 mm and 5 mm
respectively. The Lift force on the aerofoil at different attack angles are plotted in Figure 4.7.
It can be seen that with the same height and distance, the lift forces at attack angles smaller
than 8º are relatively higher than the other values. However, when attack angle is larger than
15º, the lift force decreased significantly with the increase of angle.
Figure 4.7: Lift force at different attack angles with the fixed height and distance.

Chapter 4 Oscillation Wind Harvester Design
57
Finally, the optimum configurations are summarized by combining the best values from above
results, shown below in Table 4.3.
Table 4.3: Design values for parameters optimization.
Designing
Point
Height of bluff
body
Distance between bluff body
and aerofoil
Attack angle of
aerofoil
1 21 mm 3 – 4 mm
1º-8º 2 20 mm 5 – 7 mm
3 19 mm 8 – 9 mm
4 18 mm 11 mm
4.4 Testing of the Wind Harvester
4.4.1. Experimental Setup
Figure 4.8: Prototype of the harvester in this work.
To verify the simulation model, a prototype of the harvester only consisting of mechanical parts
(i.e. no transducer), as illustrated in Figure 4.8, was fabricated and tested in the air duct. All
the tests were done in the centre of a wind tunnel as shown in Figure 4.9(a). The air flow was
generated by a centrifugal fan which was then conducted along a steel air duct of approximately
2 m in length. The harvester was placed in the final 40 cm of the duct which is a transparent
plastic section and enables the oscillation of the harvester to be observed during the test. The
cross section of the duct was 20 cm × 35 cm. Small holes were drilled in the 20 cm long steel

Chapter 4 Oscillation Wind Harvester Design
58
section in front of the harvester to enable the insertion of an anemometer probe to measure the
flow speed. The anemometer has a 2% precision error. The airspeed can be adjusted by
controlling the fan speed, which allows tests from 0 to 8 m/s. A flow speed profile was
measured at different positions in the air duct through these holes and plotted in Figure 4.9(b).
Since the onset speed and prevalent of air turbulence changes slightly at different positions in
the wind tunnel, the harvester was placed near to the end of the duct in the centre where the air
flow is most steady and can easily be observed. All tests were done at room temperature. During
the tests, the threshold wind speed was measured by the aerometer; meanwhile amplitude of
the oscillation was measured using a protractor fixed on one side of the harvester. Testing here
should be precise and accurate and required a long time because of some periodic instability.
Short videos were also taken to find average values of the amplitude.
Figure 4.9: (a) Wind tunnel used in this work; (b) The flow speed profile in the wind tunnel.

Chapter 4 Oscillation Wind Harvester Design
59
The generator was also tested on a shaker table operated in sinusoidal vibration over a range
of different frequencies close to the resonant frequency of the cantilever beam. The acceleration
level was maintained at a constant level by using a feedback system as shown in Figure 4.10.
The accelerometer in the shaker measures the actual value of frequency and acceleration level
and is feedback into the control processor. A processed signal is then generated and amplified
to drive the shaker to produce the desired acceleration level at a given frequency. The
displacement was measured using a KEYENCE laser displacement meter LC-2450 and
subsequently converted to a digital signal and is measured with a National Instrument Sequence
Test Programme.
Figure 4.10: Diagram of a sequence test system.
4.4.2. Experimental Results
Experimental results were used to estimate the performance of the harvester focusing on two
aspects; the threshold wind speed and the tip displacement. The threshold wind speed here is
defined as the lowest airflow speed at which the steady peak-to-peak displacement of the wing
exceeds 1 cm as displacement smaller than this value is not easy to be observed.
4.4.2.1 Attack Angle
The attack angle is of significant importance in this structure. The investigation of the influence
was carried out by determining the threshold wind speeds at variable attack angles with
different combinations of distances and heights of the bluff body. The attack angles were tested
ranged from 0º to 30º with a step of 1º. For different bluff body height and distance
combinations, the threshold wind speed at different attack angles changes roughly towards the
same trend. Figure 4.11 illustrates this trend where the distance and the height between the
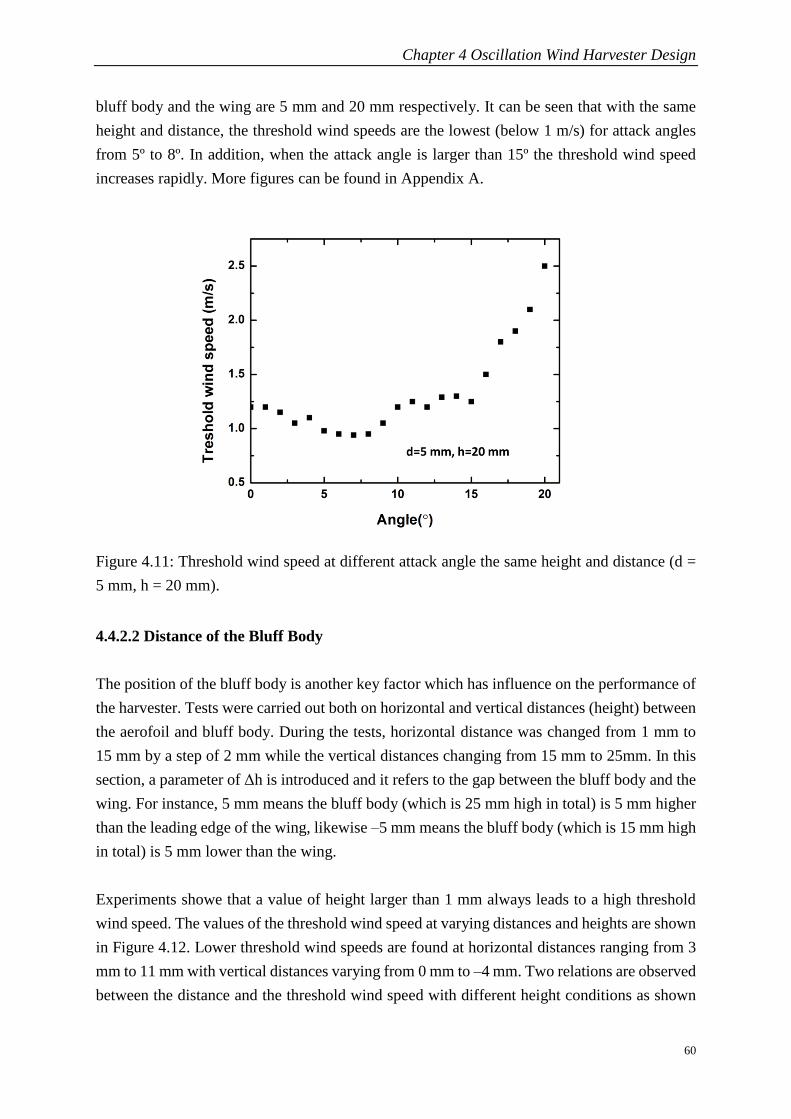
Chapter 4 Oscillation Wind Harvester Design
60
bluff body and the wing are 5 mm and 20 mm respectively. It can be seen that with the same
height and distance, the threshold wind speeds are the lowest (below 1 m/s) for attack angles
from 5º to 8º. In addition, when the attack angle is larger than 15º the threshold wind speed
increases rapidly. More figures can be found in Appendix A.
Figure 4.11: Threshold wind speed at different attack angle the same height and distance (d =
5 mm, h = 20 mm).
4.4.2.2 Distance of the Bluff Body
The position of the bluff body is another key factor which has influence on the performance of
the harvester. Tests were carried out both on horizontal and vertical distances (height) between
the aerofoil and bluff body. During the tests, horizontal distance was changed from 1 mm to
15 mm by a step of 2 mm while the vertical distances changing from 15 mm to 25mm. In this
section, a parameter of Δh is introduced and it refers to the gap between the bluff body and the
wing. For instance, 5 mm means the bluff body (which is 25 mm high in total) is 5 mm higher
than the leading edge of the wing, likewise –5 mm means the bluff body (which is 15 mm high
in total) is 5 mm lower than the wing.
Experiments showe that a value of height larger than 1 mm always leads to a high threshold
wind speed. The values of the threshold wind speed at varying distances and heights are shown
in Figure 4.12. Lower threshold wind speeds are found at horizontal distances ranging from 3
mm to 11 mm with vertical distances varying from 0 mm to –4 mm. Two relations are observed
between the distance and the threshold wind speed with different height conditions as shown

Chapter 4 Oscillation Wind Harvester Design
61
in Figure 4.13. When the bluff body is lower than the leading edge of the wing, the threshold
wind speed reduces with the increasing distance in a certain range before rising again. On the
other hand, when the bluff body is higher than or at the same height of the wing, increasing
distance results in higher threshold wind speed for operation. It has also been found that to
achieve the lowest threshold wind speed, lower heights are favourable for further distances.
More figures can be found in Appendix B.
Figure 4.12: A 3D bar chart for threshold wind speed with variable distances and heights of
bluff body (attack angle = 5º).
Figure 4.13: Threshold wind speed with variable distances with the bluff body 3 mm lower and
1 mm higher than the wing (attack angle = 5º and lines plotted are used to indicate the trend).

Chapter 4 Oscillation Wind Harvester Design
62
Figure 4.14 illustrates this relationship between the height and the distance at a fixed attack
angle. After optimising the distance of the bluff body and the attack angle, the lowest threshold
of the device is lower than 1 m/s.
Figure 4.14: Relationship between the height and the distance (attack angle = 5º).
4.4.2.3 Shape of the Wing
Two main factors may have influence on the performance of the wing are the length and the
width. Experiments were carried out using a model wing with the shape of flat plate, so that
the variations could be easily adjusted. During the experiments, the attack angle was set to 5º
and the distance and height of the bluff body were set to 5 mm and 20 mm respectively. Figure
4.15(a) and (b) illustrate the threshold wind speed of the wings at different length and width
respectively. Results show a plate of around 30 mm long and 11 mm wide are the most
optimising size, which can further decrease the threshold speed to 0.9 m/s. Wings longer than
that length resulte in an increase in twist. More figures can be found in Appendix C.

Chapter 4 Oscillation Wind Harvester Design
63
Figure 4.15: (a) Threshold wind speed with different lengths of the wing; (b) Threshold wind
speed with different widths of the wing.
Three different wing profiles were tested to investigate the effects of the aerodynamic
characteristics of the wing on the harvester performance. These geometries selected were flat
plate; NACA 0024 aerofoil and. NACA 4424 aerofoil. The flat plate represents the simplest
and cheapest possible design while the NACA profiles are selected for different thickness and
cambers of the aerofoils. In order to compare the aerodynamic characteristics of the profiles
only, those wings were build and weighted to closely matching mass and size. And tests were
carried out for different wings at the same construction of the harvester. Table 4.4 shows the
geometry parameters and the threshold wind speed for operation of the wings.
Table 4.4: Comparison of four Wings Parameters.
Wing type Wing
mass
Wing
length
Wing
width
Wing
maximum
thickness
Threshold
wind speed
Flat Plate 0.16 g 30 mm 11 mm 3 mm 0.9m/s
NACA 0024
aerofoil
0.21 g 30 mm 11 mm 3 mm 0.85 m/s
NACA 4424
aerofoil
0.25 g 30 mm 11 mm 5 mm 0.8 m/s
From the results it can be seen that the NACA 4424 aerofoil showed better performance with
a lower threshold wind speed (0.8 m/s) notably than the others. The reason is the asymmetric
aerofoil shape is more preferable to maximise the lift force acting on it. Consequently, it was
used for the harvester for further investigation.
4.4.2.4 Attached Mass

Chapter 4 Oscillation Wind Harvester Design
64
Considering that adding proof mass could alter the amplitude of the oscillation and increase
the power output, investigation was taken in the influence of adding mass. Tests were carried
out by measuring the threshold wind speed and the amplitude of the wing with variable weights
of mass at different attack angles. The weight of the attached mass was ranging from 0.1 g to
2 g with a step of 0.2 g. All the masses were placed under the wing in the centre of the cantilever
tip. During the experiments, the distance and height of the bluff body were set to 5 mm and 20
mm respectively. The origin attack angle was set to 5º and increased with the increase values
of added mass. The threshold wind speed and amplitude at 2 m/s with a variety of proof mass
are plotted in Figure 4.16 respectively. It is found adding weights of the proof mass can magnify
the amplitude; however it increases the threshold speed as well. In order to control the threshold
wind speed below 1.5 m/s, the maximum proof mass should be lower than 2 g.
Figure 4.16: Threshold wind speed and amplitude with variable weights of masses (plotted line
was used to indicate the trend).
The device was tested on the shaker operated as Figure 4.10 to estimate the natural frequency
of the cantilever beam with four different proof masses attached under the wing in the centre
of the cantilever tip. Figure 4.17 shows a typical frequency response for the cantilever. The
cantilever without proof mass has a resonant frequency of around 12.8 Hz, and this value
decrease with increasing proof mass attached on the cantilever. With proof mass of 2 g, the
resonant frequency can be reduced to 7.1 Hz.

Chapter 4 Oscillation Wind Harvester Design
65
Figure 4.17: Experimental results for resonant frequency with different proof mass.
4.4.2.5 Final Results
After testing the influence of all factors mentioned above, a list of optimum configurations of
the harvester is shown in Table 4.5.
Table 4.5: Optimum structure of the harvester in this work.
Angle
of
blade
Distance
from the
blade
(mm)
Height from
the blade
(mm)
Mass
(g)
Threshold
wind speed
(m/s)
Amplitude at
2 m/s (mm)
Natural
frequency
(Hz)
5° 3 0 / 0.8 18 12.8
6° 5 0 / 0.8 22 12.8
7° 7 -1 / 0.8 18 12.8
8° 11 -4 / 0.8 20 12.8
7° 3 0 0.5 1 25 8.9
9° 5 0 1 1.1 26 8.1
10° 7 -1 1.5 1.3 28 7.5
12° 11 -4 2 1.5 32 7.1

Chapter 4 Oscillation Wind Harvester Design
66
To summarize, the configuration of the harvester has great influence on the performance.
Experiments showed that the threshold wind speeds are lowest at attack angles between 6º to
10º. Lower bluff body heights should be combined with increased distances for the lowest
threshold wind speed. It has also been demonstrated that adding mass can increase the
amplitude and reduce the natural frequency significantly. However it also increases the
threshold wind speed. As it has been restricted to 1.5 m/s, the maximum value of the proof
mass added is 2 g.
4.5 Comparison
4.5.1. Optimum Mechanical Structure
Structure simulations by ANSYS CFX were used to investigate the influence on threshold wind
speed of the harvester with different configurations. Results of the simulation are presented by
using the lift force as a guide to determine threshold the wind speed of the device. It is assumed
that the lift force acting on aerofoil will provide an indirect indication of the threshold wind
speed, optimum configurations in simulation should demonstrated maximum lift force. A set
of diagrams comparing the simulation results and the experimental results is shown in Figure
4.18. Both simulation and test results verify that optimum positions of the bluff body are
approximately between 3 mm to 11 mm in horizontal distance and 18 mm to 20 mm in vertical
distance. Relations between the distance and the threshold wind speed at certain height of the
bluff body have the same trend in the simulations and tests. For instance, if the bluff body (with
height of 17 mm) is 3 mm lower than the wing, lift force increases initially and then begins a
gradual decrease when the distance is larger than 8 mm (Figure 4.19(a)). Accordingly, during
the tests, a decrease was observed in the threshold wind speed with the increasing distance in
a certain range before rising again. On the other hand, if the bluff body (with height of 21 mm)
is 1 mm higher than the wing, further distance results in lower lift force level, which in turn
leads to higher threshold wind speed as seen in Figure 4.19(b). However, there is a slight rise
before the significant drop in lift force, which is not observed during the tests. Regard to the
attack angle, largest lift force are generated at attack angle from 1º to 8º, while the lowest
threshold wind speeds are found at attack angle between 5º to 8º. This difference is due to the
static model in ANSYS simulation, which does not involve the small bending of the cantilever
because of the gravity. However, the influences of the attack angle in computational and
experimental work are similar. Figure 4.20(a) showes a smooth increase of the lift force around
6º and a significant decrease when the attack angle was larger than 15º in simulation. And the
same trend is also found in the experiments as shown in Figure 4.20(b). In the test results, the
variation curve is not as clear as that plotted in ANSYS; however, results follow a similar trend.

Chapter 4 Oscillation Wind Harvester Design
67
Table 4.6 shows the comparison of the simulation and the experimental results.
Figure 4.18: (a) Lift force and (b) threshold wind speed as functions of different distances and
heights of bluff body from simulation in ANSYS (attack angle = 5°).
Figure 4.19: (a) Lift force and (b) threshold wind speed a function of different distances and
heights of bluff body from simulation in ANSYS (attack angle = 5°, lines plotted are used to
indicate the trend).

Chapter 4 Oscillation Wind Harvester Design
68
Figure 4.20: (a) Lift force and (b) threshold wind speed a function of different attack angles
from simulation in ANSYS (distance = 3 mm, height = 19 mm, lines plotted are used to indicate
the trend).
Table 4.6: Comparison of optimal configurations of the harvester in simulation and test results.
To sum up, although it is not possible to vary and correspond all of the parameters that were
computationally examined, the experimental results generally show good correlation with the
predicted results, thus validates the simulation model used in this study.
4.5.2. Natural Frequency
As discussed in Chapter 3, known values of elastic modular E and the density of material, the
thickness, width, active length of the cantilever, its natural frequency can be predicted
theoretically using Equation 3.17. Figure 4.21 shows the comparison of the resonant
frequencies of the cantilever in experimental results and theoretical calculation. As can be seen
form the figure that the theoretical values are higher than the experimental results in general.
For example, without proof mass, the theoretical resonant frequency is 13.3 Hz and the
experimental one is 12.8 Hz, which is quite close. However with proof mass of 0.5, the
theoretical value is 11.1 Hz, while the experimental result shows a resonant frequency of 8.9
Hz. This is because in the theoretical calculation, the effective mass of end mass distributes
evenly along the tip while during the experiments the end mass is in the middle of the cantilever.
Simulation Analysis Wind Tunnel Tests
Attack angle of aerofoil 1° - 8° 5°-8°
Height of the bluff body 18 mm - 21mm 16 mm - 20 mm
Distance between bluff body
and aerofoil 3 mm - 11 mm 3 mm - 11mm

Chapter 4 Oscillation Wind Harvester Design
69
Figure 4.21: Comparison of the experimental results with the theoretical calculation for
resonant frequency with different proof mass.
4.6 Conclusion
In this chapter, in order to assess the effect of the bluff body and the attack angle of the aerofoil,
computational simulations were conducted using ANSYS. The lift force applied on the aerofoil
was used as a guide to determine the threshold wind speed. Results from different configuration
arrangements were compared and plotted using ANSYS commercial package of Design
Optimization. As seen in the figures, both simulation and test results verified that optimum
positions of the bluff body were approximately between 3 mm to 11 mm in horizontal distance
and 18mm to 20 mm in vertical distance. The optimum values of attack angle were from 5° –
8°. Moreover, relations between the distance and the threshold wind speed at certain height of
the bluff body had the same trend in the simulations and tests. It could be observed that lower
heights of the bluff body were favourable for further distances to achieve the lowest threshold
wind speed. These similar trends between the simulation and experimental results showed good
correlations, which validated the simulation model used in this study. It should be noted that
simulation in this section was purely on mechanical structure and the transducer was not taken
into account.
Other parameters such as the shape of the wing and the influence of the mass added were also
investigated during the tests. The results showed that adding mass with suitable weight can
increase the amplitude slightly but increases the threshold wins speed at the same time. In order

Chapter 4 Oscillation Wind Harvester Design
70
to restrict the value of threshold wind speed to 1.5 m/s, the maximum value of the proof mass
added is 2 g.
The next chapter will investigate the performance of the harvester with piezoelectric transducer.
The design and fabrication of a prototype of the harvester will be presented. After processing,
performance of the generator will be tested and evaluated.

Chapter 5 Piezoelectric Wind Generator
71
Chapter 5 Piezoelectric Wind Generator
For most flow-induced energy harvesters, piezoelectric generators and electromagnetic
transduction are used as major transduction mechanisms. Generally piezoelectric generators
are favourable for miniature devices when size is the main concern. In this chapter,
piezoelectric generator will be used to convert mechanical energy into electrical power. The
typical piezoceramic material, PZT, is chosen to fabricate the transducer. The design and
fabrication of a prototype of the harvester is presented. After processing, performance of the
generator will be tested and evaluated.
5.1 Transducer Design
For piezoelectric transducers in airflow energy harvesting systems, piezoelectric polymers are
attractive materials because of their flexibility, but suffer from low charge constant thereby
giving low surface energy density. Some researchers developed wind harvesters using
piezoelectric ceramics, which are manufactured in bulk form commercially, for its high level
of piezoelectric behaviour. However, due to the relatively large thickness, it is not compatible
with miniature size devices such as being developed in this work. Therefore a screen printable
version has been developed and this has previously been optimised to maximum performance.
In addition, as the beam is designed to vibrate at low frequency, the excited amplitude will
become large, resulting in a relatively high stress on the beam. As PZT is brittle, the cantilever
has to operate within the limit of stress that the material can withstand. Therefore suitable
design of the geometry of the PZT layer is important for energy transfer capability.
5.1.1. Design Configuration
For this device, the piezoelectric transducer was designed in form of a cantilevered beam with
bimorph structure which consists of PZT attached to both sides of the beam. For each side, a
sandwich layer of electrode-PZT-electrode on the dielectric layer was deposited on the beam
as shown in Figure 5.1. When the cantilevered beam is purely moving along the z axis, the
maximum stress induced at the bottom area, close to clapping edge of the cantilever. Therefore
in order to optimise electrical energy generation, piezoelectric material should be printed

Chapter 5 Piezoelectric Wind Generator
72
concentrating on the end of the clamped area of the beam. This structure is commonly used
piezoelectric generators, and the actual device will be fabricated based on this model. The
limitation of the fabrication technology (in this case, thick-film technology) and the physical
constrains of the real device for a robust piezoceramic structure should be considered.
Figure 5.1: Schematic of a cantilevered beam with bimorph structure.
5.1.2. Material Chosen
In this chapter, stainless steel, instead of beryllium copper, was chosen because it is compatible
with the firing temperature required by the screen printable piezoelectric and conductive pastes.
The type of piezoelectric material selected for a harvester can have a major influence on the
functionality and performance. A common type used in energy harvesting applications is lead
zirconium titanate (PZT) due to its ability to efficiently transform mechanical energy to
electrical energy. The paste should be compatible with the substrate material, (304-type
stainless steel in this case). Gold (Au) paste is commonly used to fabricate the bottom
electrodes due to its good wire bondability and conductivity. Additionally it does not migrate
into the PZT at high temperature. Usually, Pt or Pd are added to form alloys to form a better
soldering pad material for thick-film applications. As the gold bottom electrode cannot be
printed directly onto the stainless steel substrate, an isolating dielectric layer must be printed.
Silver conductor paste is another alternative electrode material with poorer performance but
lower cost of fabrication compared with Au. It is used to fabricate the top electrodes due to the
low curing temperature, which can minimise lead loss form the PZT. More information of the
fabrication materials will be listed in the following section.
5.1.3. Modal Analysis
ANSYS is used to estimate the frequency response and power output produced when the
cantilever is driven with base excitation under harmonic vibration in the direction normal to
the base. The purpose of this simulation is to investigate the effect of the structure geometry to
the resonant frequency and output power with a focus on the PZT layer. The power generated

Chapter 5 Piezoelectric Wind Generator
73
from the simulation is useful for designing a feasible piezoelectric transducer. The simulation
parameters include the length, width, thickness of each layer and the proof mass, and the
constants used in the simulation are the elastic modulus, Poisson ratio and density of the
material. Simulation is carried out by varying one parameter at a time while fixing the other
parameters to estimate the resonant frequency and output power. For simplification, a bimorph
cantilever structure consisting of a sandwiched layer as illustrate in Figure 5.1 is designed with
different dimensions to investigate the performance. The aerofoil is not taken into account in
this structure (shown in Figure 5.2(a)). Firstly, a cantilever with dimensions in Table 5.1 was
used for the analysis. Figure 5.2 (b) showed that a fundamental resonant frequency of 50.7 Hz
were generated form the simulation. By connecting a resistance load of 900 kΩ (the value of
the optimum load is tested in Section 5.4) between the upper and lower electrodes, an output
voltage can be obtained for power calculation.
Table 5.1: Parameters for ANSYS piezoelectric simulation in this work.
Parameter Unit Value
lb Beam length mm 30
wb Beam width mm 5
tb Beam thickness µm 80
lp PZT layer length mm 10
wp PZT layer width mm 5
tp PZT layer thickness µm 80
ld Dielectric layer length mm 10
wd Dielectric layer width mm 5
td Dielectric layer thickness µm 20
le1 Top electrode length mm 10
we1 Top electrode width mm 4
te1 Top electrode thickness µm 10
le2 Bottom electrode length mm 10
we2 Bottom electrode width mm 4
te2 Bottom electrode thickness µm 10
ρb Density of stainless steel kg/m3 7750
ρd Density of dielectric material [126] kg/m3 2230
ρe1 Density of Ag kg/m3 9320
ρp Density of PZT [127] kg/m3 5440
ρe2 Density of Au kg/m3 19280
βb Stainless steel Poisson ratio dimensinless 0.26
βp PZT Poisson ratio [127] dimensinless 0.35
βd Dielectric material Poisson ratio dimensinless 0.2
βe1 Ag Poisson ratio dimensinless 0.38
βe2 Au Poisson ratio dimensinless 0.42
Eb Stainless steel Young’s Modulus GPa 180
Ep PZT Young’s Modulus [127] GPa 60
Ed Dielectric material Young’s Modulus [126] GPa 64
Ee1 Ag Young’s Modulus GPa 110
Ee2 Au Young’s Modulus GPa 80

Chapter 5 Piezoelectric Wind Generator
74
Figure 5.2: (a) Diagram of the cantilever with dimensions in Table 5.1; (b) Diagram of the
output voltage generated by the cantilever.
Analytically, it is confirmed that increasing both the width and length of the PZT layer helped
increase charge output, and that increasing the width is more effective than the length [128].
As a consequence, printing the PZT layer along the total width and length of the beam can
achieve the maximum output charge. However, this will increase the total thickness of the beam,
leading to a high resonant frequency which is not suitable for wind generator. Consequently,
optimising the size of the PZT layer is necessary for trade-off between the electrical energy
output and the resonant frequency. Additionally increasing the PZT thickness also increases
the charge output. In this section, the thickness of the PZT layer is fixed at be 80 µm.
Simulations with different lengths and widths of the PZT layers were carried out to investigate
resonant frequency and output charge. The width of the PZT layer does not have great influence
on resonant frequency; therefore printed width of the PZT material should be the same value
as that of substrate, which is 5 mm in this case. On the other hand, the length of the PZT layer
affects the performance a lot. As shown in the Figure 5.3, length with values from 11 mm to
16 mm can achieve better output power than the others. However, a larger length significantly
increases the resonant frequency at the same time. An important method to reduce resonate
frequency and magnify the output power is by adding mass, which could be the aerofoil in this
case.

Chapter 5 Piezoelectric Wind Generator
75
Figure 5.3: Natural frequency and output power with different lengths of the PZT layer (lines
plotted are used to indicate the trend).
Simulations were also run with aerofoil attached to the tip of the beam, fully covered the T-
shape extension tip of the beam. The simulation parameters are listed in Table 5.2. Results are
plotted in Figure 5.4. It can be seen that by attaching wing as the proof mass at the tip of the
cantilever, resonant frequency can be reduced significantly and the output power increases as
well. For example, with a PZT length of 11 mm, the resonant frequency decreases from 55 Hz
to 16.5 Hz while the power output increases from 3.2 µW to 4.5 µW. As a result, PZT lengths
from 11 mm to 16 mm are chosen for experiments in the following section.
Table 5.2: Parameters of aerofoil for simulation.
Parameter Unit Value
lw Aerofoil length mm 30
ww Aerofoil width mm 11
tw Aerofoil thickness mm 5
ρw Density of balsa wood kg/m3 350
βw Balsa wood Poisson ratio dimensinless 0.4
Ew Balsa wood Young’s Modulus GPa 11

Chapter 5 Piezoelectric Wind Generator
76
Figure 5.4: Natural frequency with different lengths of the PZT layer after adding the aerofoil.
5.2 Screen Printing Design
5.2.1. Substrate Design
An I-shaped beam was designed as shown in Figure 5.5. The tip extension of the beam is used
to support the length of the aerofoil, while the bottom extension is to form the electrode pads
for soldering. This kind of shape is preferable rather than a traditional simple rectangular shim
sheet as the differing air flows along the length of the blade might lead to a periodic and random
twist during oscillation. Layout of the beams on a metal foils (15 cm × 15 cm), was designed
with Autodesk Inventor software and illustrated in Figure 5.6. Grooves with small connections
are made along the edges of beams and used as mask patterns during the machining process,
which will subsequently be etched off to form the beam profiles. The joints can also reduce the
warping effect caused by thin metal foil undergoing high temperature firing process.

Chapter 5 Piezoelectric Wind Generator
77
Figure 5.5: Design schematic of the cantilever beam used in this work.
Figure 5.6: Layout of the Cantilever beams on a metal foils in this work.
5.2.2. Screen Design
The structure of a piezoelectric cantilever beam is illustrated in Figure 5.7(a). The PZT layer
was designed to be 0.5 mm shorter than the dielectric layer, while the bottom and top electrodes
were 0.5 mm narrower peripherally than the piezoelectric material. This is to give a margin for

Chapter 5 Piezoelectric Wind Generator
78
printing tolerance to prevent a short circuit between those electrodes. Each layer of the
composite structure was designed with Autodesk Inventor software and converted separately
into photo-plotter format (DXF) which could be translated into a patterned thick-film printing
screen. As shown in Figure 5.7(b), four screens were needed to fabricate different layers of the
structure.
Figure 5.7: (a) Layout of the piezoelectric cantilever structure; (b) 4 layers on the cantilever
structure.
Geometry of the piezoelectric cantilever was also investigated in simulation. Moreover, screens
were designed for thick-film screen printing process. All the simulation results will finally be

Chapter 5 Piezoelectric Wind Generator
79
compared with experimental results in the next section.
5.3 Fabrication of the Piezoelectric Cantilever
The piezoelectric cantilever is produced by normal thick-film printing steps, including paste
preparation, screen-printing deposition, drying, firing and finally poling process.
5.3.1. Materials Preparation
The ingredients for fabricating the piezoelectric cantilever consist of dielectric pastes, PZT
pastes, conductor pastes and the base substrate.
The PZT used in this paste preparation is based on Morgan Electro Ceramics, Southampton,
UK, PZT-5H by blending the power of different particle size (ball milled and attritor3 milled).
This material exhibits high levels of piezoelectric activity with a low Curie temperature
compared to alternative compositions [30]. The particle sizes available had an average diameter
of 2 µm and 0.8 µm for the ball and attritor3 milled PZT power respectively. Lead borosilicate
glass (CF 7575) is used as the permanent binder. Table 5.3 shows the components of PZT paste
formulation, each of which is expressed as a percentage of the total weight of the paste.
Table 5.3: Components of the PZT paste used in this work.
Components % by Total Weight
PZT-5H(2 µm) 72
PZT-5H (0.8 µm) 18
CF7575 10
The substrate is the essential material on which films or layers of screen printable materials are
deposited and processed to build a whole device. Depending on the process of fabrication, a
range of substrates can be used for thick-film devices such as alumina, silicon, stainless steel,
polymer and glass. Since the device is used for airflow induced cantilever structure, elastic
material is more preferable. Consequently stainless steel is selected for the substrate. There are
various types of stainless steel according to different alloy compositions. In this study, the type
of 302/304 is used because it is compatible with the firing temperature required by the screen
printable pastes. The final substrate with a thickness of 80 µm is shown in Figure 5.8, fabricated
by Tecan Ltd using photo chemical machining process technology.

Chapter 5 Piezoelectric Wind Generator
80
Figure 5.8: Stainless Steel substrate fabricated in this work.
All fabrication materials and their properties are summarized in the following table.
Table 5.4: A summary of f materials deposited in this work.
Layer Material/Paste
Substrate Type 304/302 Stainless Steel
Dielectric ESL 4916
Bottom Electrode(Au) ESL 8884
Top Electrode (Ag) DuPont 5000
PZT PZT-5H University of Southampton
5.3.2. Screen Printing Process
The substrate was printed in University of Southampton Class 100 clean room using a DEK
248 CERD printer. A process flow chart outlining all the steps employed in the report was
listed in Figure 5.9. The screen printing process commenced with one layer of dielectric
material printed to cover the substrate. The film was then dried in a belt furnace at 125°C for
15 minutes. A sequence of printing and drying a dielectric layer on the other side of the
substrate was repeated to create a bimorph structure for the PZT layers. Both dielectric layers
were subsequently fired on the thick-film belt furnace with a peak temperature of 850°C. Once
the dielectric layer was fired, two single bottom electrode layers of gold were added on both
sides of the substrate using the same process. On the bottom electrode, the PZT layer was added
consisting of two prints. The first layer was dried at 125°C for 15 minutes, and then a second
layer was printed directly on top and dried. After the PZT layers were fired, top electrode layers
of silver were printed and dried as well using the same process. This printing and curing

Chapter 5 Piezoelectric Wind Generator
81
sequence avoids firing the device at high temperature again. Drying and firing conditions
depend on the type of printed material and substrate. A summary of drying and firing profile
for each layer of material is shown in Table 5.5. The furnace operator can control the peak
temperature, through speed, and drying time.
Figure 5.9. Flow chart of the screening printing process.
Table 5.5: Drying and firing conditions of materials printed.
Material
Drying
Temperature
(℃)
Time
(mins)
Curing
Temperature
(℃)
Peak Time (mins)
Dielectric ESL
4916 125 15 850 10
PZT 5H 125 15 850 10
Au ESL8884 125 15 850 10
Ag DuPont5000 125 15 / /
Two pieces of substrates were fabricated using above processing and a photograph of the final
device cutting from the metal sheet is shown in Figure 5.10.

Chapter 5 Piezoelectric Wind Generator
82
Figure 5.10: Photograph of a printed piezoelectric cantilever in this work.
5.3.3. Poling
Polarisation is the final fabrication step, which is used to enhance the piezoelectric properties
of the PZT. The general process of poling involves the following steps: the material is heated
up to and held at an elevated temperature (typically around 150°C). A sufficiently high electric
field (usually 2 – 5 MV/m) is applied to the material for certain time to let all ferroelectric
domains get oriented in the direction of the electric field, and the material attains saturation
polarization. Then the material is allowed to cool down to room temperature with electric field
kept on. This is to prevent the sample from depolarising below Curie temperature. Finally the
electric field is removed. The material remains in the maximum polarization state with most of
the domains oriented in the same direction. A set-up of the polarisation is shown in Figure 5.11.
The poling process was undertaken in a chamber with a temperature-controlled hotplate for
heating up. Devices were connected electrically to a high voltage DC power supply. Two clips
were used to connect electrodes on different sides together, thus the PZT layers on both sides
can be poled simultaneously. One alumina block was placed on top to press the beam close to
the hotplate surface avoiding nonuniform temperature caused by the interspace between them.
The d33 values were measured using a commercial Berlincourt piezometer as shown in Figure
5.12. However, clamping effects of the substrate may reduce the effective d33 coefficient in this
measurement [129]. The effect of poling conditions including temperature, time and electric
field on this piezoelectric material will be further discussed in the next section.

Chapter 5 Piezoelectric Wind Generator
83
Figure 5.11: The setup of the polarisation process.
Figure 5.12: The setup of the d33 measurement by piezometer.
5.3.4. Results and Discussion
After printing four pieces of substrates, 36 samples were finally achieved and poled. Other
samples were failed because of a short circuit causing by cracks on the PZT layer during firing
process. It was found that a maximum value of d33 obtained was around 90 pC/N when the
polarisation temperature, time and field strength are 225°C, 30 minutes and 4 MV/m
respectively.

Chapter 5 Piezoelectric Wind Generator
84
5.3.4.1 Firing Condition
The furnace firing profile affects the piezoelectric properties due to the change in stoichiometry
of the film and the degree of particle sintering occurred during the firing process [30]. Typical
firing temperature for screen-printed PZT thick films is 800°C – 1000°C as PZT films at
temperature above 800°C show acceptable adhesion and sintering. In some research, the higher
firing temperature produces an increase d33 value [129], hence two firing profiles with different
temperatures (950°C and 850°C) were used for two substrates respectively.
After firing, however, some devices failed due to electrical shorting between the top and bottom
electrodes. Since they had not been subjected to a high-voltage treatment prior to measurement;
the most likely explanation is a conductive path has been induced between the electrodes
through the PZT layers. An examination of the device surface under microscope (Figure 5.13(a))
shows the presence of some cracks on the PZT layer. If the cracks span the entire thickness of
the layer, it is possible for a conductive path between the upper and lower surface of the layer
to be created. These through-thickness cracks are not present on the other substrate (Figure
5.13(b)); thus it is reasonable to surmise that they arose as a consequence of the high firing
temperature.
Figure 5.13: Microscope images of PZT surface fired at (a) 950°C and (b) 850°C.
5.3.4.2 Poling Conditions
In this report, six samples divided into two batches were prepared for poling parameter
optimization. In all cases five readings were taken on each device with an average recorded.
The necessary poling voltage was calculated by:

Chapter 5 Piezoelectric Wind Generator
85
Vpoling = field strength × PZT thickness (Equation 5.1)
Where the thickness of the PZT layer was measured using electric micrometre.
The first batch was poled at constant field strength of 3 MV/m with temperature varying from
150°C to 225°C for duration of 10 – 120 minutes. At each of four temperatures with five
different time periods, one sample was poled as described above. Results in Figure 5.14 show
that the value of d33 increases with both temperature and time of poling. Devices poled at higher
temperatures achieve a higher value of d33 at a faster rate. For instance, at 150°C the value of
d33 achieved after 30 minutes is 62% of the value after 120 minutes. While at 225°C the 30
minute values were 93% of 120 minutes values. However, beyond 225°C samples are found to
be short circuit. Therefore the optimal value of temperature should be 225°C. If this poling
process was continued for longer time periods, the increase would prove to be exponential as
a maximum polarization is achieved [130].Consequently long poling times are not necessary
to obtain reasonable d33 values. In addition, the increase of d33 over 30 minutes is not significant,
thus a poling time of 30 minutes is enough for sufficient d33 values achieving.
Figure 5.14: Measured d33 values with variatiosn of poling temperature and time at a field
strength of 3 MV/m.
Next, a study of the electric field was conducted. Two samples were poled at temperature of
225°C with electric field strength ranging from 1 MV/m to 5 MV/m and poling duration of 30
minutes. As shown in Figure 5.15 it is found that improved value of coefficient is achieved
when the poling voltages are increased. Nevertheless the piezoelectric layer suffered electrical

Chapter 5 Piezoelectric Wind Generator
86
short circuits when it is polarised with electric field strength greater than 4 MV/m. Therefore,
all the samples were polarised at slightly lower field strengths to prevent the high voltage from
damaging the device.
Figure 5.15: Measured d33 values at different electric fields.
During the polarization, the combined effect of high electrical field and high temperature
applied sometimes led to increased conductivity or even electrical breakdown. To maintain the
high level of poling, this needs to be avoided by reducing the temperature or poling field.
Alternatively, using pulsed fields to apply electric field for short periods of time is an effective
way.
5.4 Testing of the Wind Generator
A prototype was fabricated based on the results from Chapter 4, which has a total volume of
37.5 cm3 as shown in Figure5.16. Then experiments on a shaker and in an actual airflow were
carried out to investigate the performance of the harvester. Based on the testing result in Section
4.4, experiments in this chapter will further optimise the structure to achieve the lowest
threshold wind speed as well as the highest power output of the device. Adjustable parameters
include the position of the bluff body, the attack angle of the aerofoil, the length of the PZT
layer and the adding mass. Testing the energy harvester required a long time because of some
periodic instability.

Chapter 5 Piezoelectric Wind Generator
87
Figure 5.16: The prototype piezoelectric harvester fabricated in this work.
5.4.1. Experimental Setup
The average wind speed in the environment is around 5 m/s, depending on the area, the season
and the time of the day [115]. Close to the ground however, important effects of viscosity
appear and lead to a reduction of the velocity. For internal flow, such as ventilation ducts, the
air velocity can be up to 8 m/s in large ducts and down to 1 – 2 m/s close to the exit in rooms.
The air duct application has significant advantages for wind energy harvester, the constancy of
the wind, the absence of rain; snow and ice provide a well-controlled environment.
Airflow experiments were carried out in the centre of a wind tunnel, as illustrated in Figure 4.9
with the same conditions. During the tests, the voltage across a load resistance was measured
with an oscilloscope in order to determine the power generated by the wind energy harvester,
meanwhile the operation wind speeds of the harvester were measured by the anemometer.
As shown in Figure 5.17, testing of the harvester was also performed on the shaker with an
accelerometer to determine its resonance frequency. The structure was firmly attached to the
vibrating stage and the harvester voltage output was monitored on an oscilloscope. A
programmable resistance box and a PC with LabVIEW software was used to collect the data.
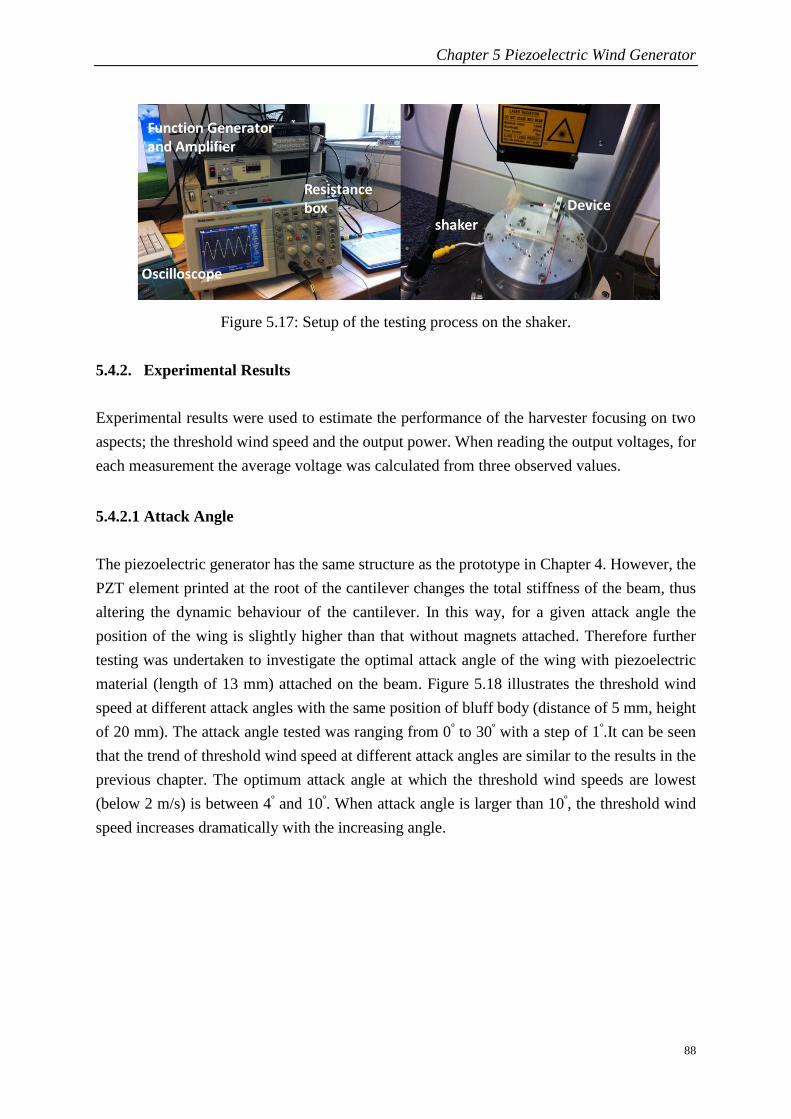
Chapter 5 Piezoelectric Wind Generator
88
Figure 5.17: Setup of the testing process on the shaker.
5.4.2. Experimental Results
Experimental results were used to estimate the performance of the harvester focusing on two
aspects; the threshold wind speed and the output power. When reading the output voltages, for
each measurement the average voltage was calculated from three observed values.
5.4.2.1 Attack Angle
The piezoelectric generator has the same structure as the prototype in Chapter 4. However, the
PZT element printed at the root of the cantilever changes the total stiffness of the beam, thus
altering the dynamic behaviour of the cantilever. In this way, for a given attack angle the
position of the wing is slightly higher than that without magnets attached. Therefore further
testing was undertaken to investigate the optimal attack angle of the wing with piezoelectric
material (length of 13 mm) attached on the beam. Figure 5.18 illustrates the threshold wind
speed at different attack angles with the same position of bluff body (distance of 5 mm, height
of 20 mm). The attack angle tested was ranging from 0º to 30º with a step of 1º.It can be seen
that the trend of threshold wind speed at different attack angles are similar to the results in the
previous chapter. The optimum attack angle at which the threshold wind speeds are lowest
(below 2 m/s) is between 4º and 10º. When attack angle is larger than 10º, the threshold wind
speed increases dramatically with the increasing angle.

Chapter 5 Piezoelectric Wind Generator
89
Figure 5.18: Threshold wind speed at different attack angle (distance = 5 mm, height = 20mm).
5.4.2.2 Position of Bluff Body
The piezoelectric generators in this chapter have the same mechanical structure as that in
Chapter 4; consequently the influence of the bluff body should also be the same. The optimum
position of the bluff body has already been investigated numerically and experimentally in
previous chapters, the results shown in Table 4.5 were using as a reference for the bluff body
position in this section. As listed in Table 4.5, four optimum positions of the bluff body are:
distance of 3 mm, height of 20 mm; distance of 5 mm, height of 20 mm; distance of 7 mm,
height of 19 mm; and distance of 11 mm, height of 16 mm. The performance of the harvester
was tested in these four configurations. As shown in Figure 5.19, testing of the output power
with various bluff body positions is performed at airspeed of 2 m/s to 7 m/s with a resistor of
900 k. The maximum RMS output power occurs in 7 m/s wind from a configuration with
distance of 11 mm and height of 16 mm. It can be observed that at distance below 5 mm, the
performance at high wind speed (higher than 4 m/s) is not stable, thus resulting in even lower
power output. Therefore, for further tests the position of the bluff body is chosen to be 11 mm
in distance and 16 mm in height.

Chapter 5 Piezoelectric Wind Generator
90
Figure 5.19: RMS power output vs. wind speed for four configurations (distances of 3 mm, 5
mm, 7 mm and 11 mm; height of 20 mm, 20 mm, 19 mm and 16 mm respectively; attack angle
= 6º, lines plotted are used to indicate the trend).
5.4.2.3 Adding Mass
Considering that adding proof mass could increase tip amplitude of the cantilever as discussed
in Section 4.4, the addition of extra mass was also investigated. Tests were carried out by
measuring the threshold wind speed and the power output for different values of added mass.
The additional mass was ranged from 0.1 g to 2 g with increments of 0.2 g. All tests were
carried out with the optimum position of the bluff body. The attack angle was set to 6º originally
and varied with different values of mass added as shown in Table 4.5. It is found that increasing
the proof mass causes an increase in the threshold speed as shown in Figure 5.20. For further
investigation, additional mass with four different values were placed under the wing in the
centre of the cantilever tip to measure effect of increasing mass on the output power. Results
verify that adding suitable weight of mass does not show a significant improvement in the
output power, and furthermore it is not desirable to increase the threshold wind speed (shown
in Figure 5.21).

Chapter 5 Piezoelectric Wind Generator
91
Figure 5.20: Threshold wind speed with variable weights of masses (distance = 11 mm; height
= 16 mm).
Figure 5.21: RMS power output at variable wind speed with different weights of masses
(distance = 11 mm; height = 16 mm; load resistance = 800 k).
5.4.2.4 Length of the PZT
The length of the PZT layer is an important consideration for the performance of the harvester
as discussed in Section 5.13. For testes in previous sections, the length of the PZT was 13 mm,

Chapter 5 Piezoelectric Wind Generator
92
which can achieve a maximum output power at 1.35 µW. However, this value is quite low
compare with the simulation result. Therefore six samples were tested to evaluate the influence
of the PZT with lengths varying from 11 mm to 16 mm respectively. Figure 5.22(a) shows the
natural frequencies of the cantilever with different lengths of PZT section. The performance of
these samples is compared in Figure 5.22(b) with the optimum structure obtained above. It can
be seen that although PZT layer with the length of 16 mm has a slightly higher threshold wind
speed (2 m/s) and natural frequency (20 Hz), it achieves the maximum RMS power output. As
a result, this length is chosen for the further testes and the final performance of the device.
Figure 5.22: (a) Natural frequencies of the cantilever with different PZT lengths; (b) RMS
power output and threshold wind speed versus different PZT lengths (attack angle = 6º; distance
= 11 mm; height = 16 mm; load resistance = 900 klines plotted are used to indicate the
trend).

Chapter 5 Piezoelectric Wind Generator
93
5.4.2.5 Optimum Load
For tests in previous sections, the resistive load was set to be 900 kWhen the piezoelectric
harvester is placed on the shaker table at the resonance frequency, namely 20 Hz, a standard
curve for load resistance is noted, as seen in Figure5.23. The maximum power output is found
paired with a resistor of 900 k. In the wind tunnel, the output power of the harvester for a
variety of resistive loads is also plotted in Figure5.24. At different levels of wind speed, the
ideal value is not as clearly defined; however, results follow a similar trend. The power output
at the chosen resistance of 800 k is comparable to maximum power for all test cases, and is
thus determined to be a sufficient load for these initial investigations.
Figure 5.23: Output power with a varying resistive loads on the shaker.

Chapter 5 Piezoelectric Wind Generator
94
Figure 5.24: Output power with varying resistive loads at different wind speeds in the air duct
(lines plotted are used to indicate the trend).
5.4.2.6 Final Performance
For the results presented in the previous four sections, a final design was identified that
optimized the parameters of this device as listed in Table 5.6. The graph in Figure5.25 (a)
shows the ideal performance that could be achieved for the wind harvester in varying flow
speed conditions. As can be seen from the graph, the maximum output power (3.6 µW) is
achieved at wind speed of 6.5 m/s. However, the performance of the device is not stable at this
wind speed. The value of the output voltage has a large variation which can be seen form the
error bar in the figure. In addition, at wind speed larger than 6.5 m/s, the performance is more
unstable and results in even lower power outputs. The open-circuit output voltage curve with
the maximum RMS value of 1.8V is shown in Figure5.25 (b). However due to the high
impedance, this value may not be sufficient for simple power conditioning circuitry as when
the device is connected to the power conditioner, the voltage can drop to unacceptably low
level.
Table 5.6: Optimal parameters of the final device.
Unit Value Distance of the bluff body mm 11
Height of the bluff body mm 16
Attack angle º 6
Length of PZT mm 16

Chapter 5 Piezoelectric Wind Generator
95
Optimum Load k 800
Figure 5.25: (a) RMS Output power in varying flow speed conditions with optimal
configuration and load. (b) RMS open circuit output voltage in varying flow speed conditions
with optimal configuration.
5.4.3. Comparison
5.4.3.1 Output Power

Chapter 5 Piezoelectric Wind Generator
96
In this section, both natural frequency and the output power with different lengths of PZT layer
were compared. The natural frequency from experimental and simulation results were plotted
in Figure 5.26. It can be seen that estimated natural frequencies from the simulation result are
higher than the experimental results. The reason could be the dimensions of the screen printed
parts on the beam as well as the aerofoil are slightly different from the simulation parameters.
Figure 5.26: Comparison of natural frequency of the cantilever from simulation and
experimental results with different PZT lengths.
The damping ratio for the cantilever is an important parameter used to calculate piezoelectric
properties, and it can be estimated by:
휁𝑇 =1
2𝑄𝑇 (Equation 5.2)
Where QT, the total Q-factor can be determined from an experiment by dividing the measured
fundamental natural frequency of the structure f0, by the full width at half maximum electric
output power ∆f, according to
𝑄𝑇 = 2𝜋𝑆𝑡𝑜𝑟𝑒𝑑 𝑣𝑖𝑏𝑟𝑎𝑡𝑖𝑜𝑛 𝑒𝑛𝑒𝑟𝑔𝑦
𝐸𝑛𝑒𝑟𝑔𝑦 𝑙𝑜𝑠𝑡 𝑝𝑒𝑟 𝑐𝑦𝑐𝑙𝑒 𝑜𝑓 𝑣𝑖𝑏𝑟𝑎𝑡𝑖𝑜𝑛=
𝑓0
∆𝑓 (Equation 5.3)
The experiments were carried out on the shaker in Figure 5.17. The cantilever was excited over
a range of frequencies and the value of the full bandwidth at half maximum electrical output
power was taken into equation above to calculate the damping ratio. Figure 5.27 shows that the

Chapter 5 Piezoelectric Wind Generator
97
calculated values of the total damping ratio for different cantilevers with the measured Q-factor
value.
Figure 5.27: Calculated damping ration with different length of PZT layer.
With the damping values tested, the output power could be estimated using Equation 3.25.
Figure 5.28 compares the output power from theoretical calculation, experimental work and
simulation result. It is obvious that the output powers in the tests were much lower than the
expectation values of the calculation and simulation results. Especially with the 11 mm long
PZT layer device, a low output power of 0.86 µW was achieved, which was much lower than
the calculation (4.76 µW) and simulation result (4.5 µW). The most likely explanation for this
could be the reduced displacement of the part of the cantilever that has the PZT element printed
on it. The PZT element adds stiffness to the beam due to the presence of the printed
piezoelectric and electrode layers. As the stiffness of the printed and unprinted sections of the
cantilever are quite different, the majority of the overall cantilever displacement might only be
occurring on the unprinted section and the PZT element experiencing lower than expected
strains. However, with the increasing length of the piezoelectric part of beam, the problem
could be reduced. In order to verify this assumption, displacements at different points on the
beam with 11 mm long PZT layer were measured in both simulations and the experiments.

Chapter 5 Piezoelectric Wind Generator
98
Figure 5.28: Power outputs from simulation and experimental results with different PZT
lengths.
5.4.3.2 Displacement
In the simulation, 8 key points are selected along the beam at different lengths. They are 1mm,
4mm, 7mm, 10mm, 15mm, 20mm, 25mm, and 30mm from the clamping edge respectively. In
the experiments, 8 points at the same positions were also selected for measurement as shown
in Figure 5.29,

Chapter 5 Piezoelectric Wind Generator
99
Figure 5.29: Points selected on the cantilever for the displacement measurements.
Results were plotted in Figure 5.30. From experimental results, a significant displacement was
observed at points E, F, G, and H, while the displacements of the other points were less than
0.2 mm. Therefore the PZT element is experiencing low levels of strain and hence generating
relatively low level of power. However, this trend is not obvious in simulation result.
Consequently it is reasonable to surmise the low output power in the experiments as a result of
the added stiffness of the beam from the presence of the printed piezoelectric layers. This
reason can also explain the fact that increasing the inertial mass did not increase the power
output as expected. The adding mass does increase the cantilever displacemnt as discussed in
Chapter 4, but not the strain on the PZT section.
Figure 5.30: Measured cantilever displacements at different points
5.4.3.3 Different Materials
Due to the added stiffness of the PZT material resulting in low power output, the performance
could be improved by using a flexible piezoelectric material such as PVDF. To estimate the
result of this, simulations were also run with PVDF material using the same dimensions as PZT
devices. As the PVDF device will not be fabricated and tested, the properties of the material
are from the Piezotech leaflet [128]. The physical properties of PVDF material are listed in
table 5.7. In the simulation, the PVDF patches are laminated to the beam with epoxy matric.
The results of simulation are shown in figure 5.31. It can be seen that with PVDF materials,
the power outputs are all below 0.5 µW. This is mainly because of the low piezoelectric charge

Chapter 5 Piezoelectric Wind Generator
100
constant of PVDF material. Therefore using flexible piezoelectric materials cannot solve the
low power output problem.
Table 5.7: Parameters of PVDF device.
Parameter Unit Value
lpv PVDF layer length mm 11
wpv PVDF layer width mm 5
tpv PVDF layer thickness µm 60
ρpv Density of PVDF kg/m3 1780
ρep Density of Epoxy matrix kg/m3 2150
lep Epoxy matrix layer length mm 11
wep Epoxy matrix layer width mm 5
tep Epoxy matrix layer thickness µm 20
Figure 5.31 Output power of PZT and PVDF materials with differnent lenghts
5.5 Conclusion
In this chapter, a prototype of piezoelectric wind harvester with a total volume of 37.5 cm3 (5
cm × 3 cm × 2.5 cm) was fabricated and tested. The dimensions of the beam are 35 mm×5
mm×0.1 mm and the dimensions of the aerofoil are 30 mm ×11mm with a maximum oscillating
amplitude of 20 mm. The piezoelectric transducer was produced by normal thick-film printing
steps, including paste preparation, screen-printing deposition, drying, firing and poling process.
Properties of the piezoelectric cantilever depended on poling conditions including the
temperature, time and electric field applied. With optimal combinations of these parameters, a
maximum value of d33 of 92 pC/N was obtained.

Chapter 5 Piezoelectric Wind Generator
101
A set of experiments both on shaker and in the air duct were carried out to investigate the
performance of the harvester. After testing, the results showed relatively good correlation with
the previous ones in Chapter 4, thus validating the model in this study. Further investigation of
the performance was carried out with four configurations and the power outputs with various
bluff body positions were tested. The maximum output power occurred in 6.5 m/s wind speed
from a configuration with distance of 11 mm and height of 16 mm, which was chosen for final
tests. It can also be observed that at distance smaller than 5 mm, performance at high wind
speed was not stable, which resulted in a lower power output.
The length of the PZT layer was also investigated by testing six samples with different lengths
from 11 mm to 16 mm respectively. Results showed that with the length of 11 mm, the
threshold wind speed was around 1.5 m/s, but the maximum output power was only 0.86 µW
because of the added stiffness of the beam from printed PZT parts. This power generation could
be improved by increasing the volume of the piezoelectric part of the beam. However, such
configurations also suffer from the increasing natural frequency as well as the stiffness of the
beam, resulting in relatively high threshold wind speed. As a result, prototype of a length of 16
mm was chosen for the final tests. The optimized device achieved a working wind speed range
from 2 m/s to 8 m/s. The power output with optimal load (800 k) was ranging from 0.35 µW
to 3.6 µW and the open-circuit output voltage was from 0.6 V to 1.8 V. Results verified the
harvester can effectively convert wind energy into large amplitude mechanical vibration
without strict frequency matching constraints.

Chapter 6 Electromagnetic Wind Generator
102
Chapter 6 Electromagnetic Wind Generator
Compared with piezoelectric generators, electromagnetic transducers have the advantage of
higher efficiency if there is no size constraints applied. This chapter represents the design and
the fabrication of the electromagnetic transducer for the miniature wind generator application
where the transducer is constrained in size. Prototypes with the same size as the piezoelectric
one are made to test the performance of the harvesters and these will be compared with the
piezoelectric version.
6.1 Transducer Design
6.1.1. Design Considerations
The basic operating principle of a magnetic induction system was discussed in Chapter 3. As
mentioned, altering geometric configurations will affect the output power of the harvester.
Considering the arrangements of electromagnetic transducers presented in this section,
changing the geometric configurations include changing the geometries of the magnets and the
coils as well as the gap between them. In addition, increasing the magnetic flux density of the
magnets and the number of coil turns or decreasing the coil resistance should increase the
power output as well. However, increased power output indicates an increased current flow,
resulting in a stronger electromagnetic drag force on the magnet, and the oscillation of the
harvester may be difficult to start. Thus there will be some complexity to the relationships
between these parameters and the power output. It should also be noted that the magnetic flux
density can be increased by using a more highly magnetized material or by increasing the size
of the magnet. However increasing the size of the magnet will increase other parameters, such
as the mass of the magnet and the size of the coil. Another concern should be taken into account
in this design was that a moving magnet design in practice is simpler to fabricate as it avoids
electrical connection to the mass, while the coil required wires, and moving at high speed could
easily break the wires from cyclic stresses. Moreover, the moving magnet attached on the beam
will increase the proof mass of the system, which could also increase the electrical power.

Chapter 6 Electromagnetic Wind Generator
103
6.1.2. Design Configuration
Two commonly used arrangements of electromagnetic transducers were implemented in this
work, which were the magnet-through-coil (MTC) induction and magnet-across-coil (MAC)
induction as shown in Figure 6.1 and Figure 6.2 respectively. The magnet-through-coil
induction consisted of a bar magnet that translates through a cylindrical coil. According to
Faraday’s Law, when the magnet moves towards and away from the coil, the magnetic flux
moves thus inducing an Electromotive Force or emf, in other words a voltage across the coil
ends. The magnets-across-coil induction systems consisted of two magnets separated by an air
gap, in which the coil is located. The magnets are fixed to the cantilever and move relative to
the fixed coil thus generating a voltage across the coil. Both systems used essentially similar
methods of implementing an electromagnetic transducer with magnets attached to the wing for
oscillation while the coil is fixed to the base.
Figure 6.1: Cross-sectional view of the electromagnetic transducer with magnet through coil
induction.
Figure 6.2: Cross-sectional view of the electromagnetic transducer with magnet across coil
induction.

Chapter 6 Electromagnetic Wind Generator
104
6.1.2.1 Magnet-through-coil Induction Design
In this design, the magnet was mounted in the middle of the underside of the cantilever while
the coil was fixed under it. Due to the air flow, the beam oscillated with the magnet moving
towards and away from the coil to produce electricity. The advantage of this kind of magnetic
induction system is easy to build. However the coil never experiences a complete flux reversal,
thus resulting in relatively low voltage and power generation. In order to improve the output,
the magnet was extended further from the wing. The system was implemented as seen in Figure
6.3.
Figure 6.3: Transduce design with magnet through coil induction in this work.
6.1.2.2 Magnets-across-coil Induction Design
In this design, one stator coil was fixed and two translator magnets were attached onto the
cantilever. A schematic diagram of the electromagnetic generator was showed in Figure 6.4.
Although this design is more complicated to build than the former one, it had a higher potential
power output from the transducer because the coil experience complete flux reversals. However
two magnets attached onto the beam increased the proof mass, which could result in relatively
high threshold wind speed for operation. Since the permeability of a magnetic material like
steel is higher than that of air, steel magnet keeper was used to form a magnetic flux path
linking the magnets and maximising the flux density through the coil. A gap was required
between the magnets for the coil to pass through.

Chapter 6 Electromagnetic Wind Generator
105
Figure 6.4: Transduce design with magnet across coil induction in this work.
6.1.3. Materials Chosen
It is important to choose a type of magnet that will produce a strong flux density. As NdFeB
has a large energy density than most of other permanent materials, NdFeB magnets are being
widely used in electromagnetic power generators as high performance magnets. Therefore in
this work, high grade (N52) NdFeB magnet bars were selected for the transducer. The wire
wound coils were fabricated from enamelled copper wire, which has the lowest resistivity of
any metal at room temperature except silver. Beryllium copper was selected to fabricate the
beam because it is a spring material with high fatigue strength.
6.2 Testing of the Wind Generator
Two prototypes were fabricated and tested in the air duct to investigate the performance of the
harvester.
6.2.1. Prototype Fabrication
The actual devices were shown in Figure 6.5 and Figure 6.6. The cantilevers both had
dimensions of 30 mm×5 mm×0.08 mm. As tested in Chapter 4, attached mass should be lighter
than 2 g to achieve a threshold wind speed below 1.5 m/s. The magnets sizes available vary
from Ø3 mm×1 mm, Ø3 mm×3, and Ø4 mm × 3, Ø5 mm × 3 mm to Ø5 mm × 8 mm. The
largest bar magnet size of Ø5 mm × 8 mm, which has a mass of 1.17 g was selected as for the
MTC generator design. It was fixed in the middle of the backside of the wing with extension
part, which makes the total mass up to 1.62 g. The lowest point of the magnet was positioned

Chapter 6 Electromagnetic Wind Generator
106
around 1 mm above the coil due to the cantilever banding. The coil was wound using 60 μm
thick copper wire. Its outer and inner diameters were 15 mm and 6.5 mm, respectively. The
thickness is 3 mm. The coil had a static resistance of 1020 Ω and approximately 3500 turns.
For the MAC design, two bar magnets with diameters of 5 mm and thicknesses of 4 mm, which
together have the same mass as the magnet of MTC generator, were placed below the wing
with an air gap of 5 mm between each other. After adding the steel magnet keeper, the total
mass was up to 1.85 g. The static coil had an outer diameter of 6 mm and in inner diameter of
1 mm with a thickness of 3 mm. The wound wire was also 60 μm thick. The resistance of the
coil was 260 Ω and about 2100 turns. Both generators had the same overall dimensions with
the piezoelectric harvester presented in Chapter 5 of 50 mm× 25 mm×15 mm.
Figure 6.5: Prototype of the MTC harvester fabricated in this work.
Figure 6.6: Prototype of the MAC harvester fabricated in this work.
6.2.2. Experimental Setup

Chapter 6 Electromagnetic Wind Generator
107
The experimental work was set up as described in Chapter 5. Tests were carried out in the
centre of a wind tunnel with the air flow generated by a centrifugal fan (seen in Figure 4.9),
and airspeed can be adjusted from 0 to 8 m/s. During the tests, the harvester was placed near
to the end of the steel duct where the air flow is most steady. The voltage across a load
resistance was measured with an oscilloscope, meanwhile the wind speeds of the harvester
were measured by the anemometer. To get accurate readings of the output voltages, three
values were recorded and an average was taken for each measurement. All tests were done at
room temperature.
6.2.3. Experimental Results
Experimental results were used to determine the performance of the harvester by means of the
threshold wind speed and the output power.
6.2.3.1 Attack angle
In electromagnetic generators, moving magnets were attached on the underside of beam, which
increased the proof mass of the system and then increased the electrical power. In this situation,
the cantilever initially bends downwards due to the mass of the magnets. Then the position of
the wing was lower than that without magnets attached. As a result the optimum attack angle
should be different from the results in Chapter 4. Testing was undertaken to investigate the
optimal attack angle of the wing with magnets attached. The position of the bluff body was set
as 11 mm in distance and 16 mm in length as this is the optimum position for the piezoelectric
device. Figure 6.7 and Figure 6.8 illustrated the threshold wind speed at different attack angles
of MTC generator and MAC generator respectively. The attack angle tested was ranging from
0º to 30º with a step of 1º. It can be seen that with the same position of the bluff body, the trend
of the threshold wind speed at different attack angles were similar. For MTC generators,
threshold wind speeds at attack angles from 6° to 11º were lower than the others indicting the
optimum angle is in this range, and for the MAC generator, the optimum angle range was 7° to
12°. Those values are slightly higher than the piezoelectric one (4° to 10°) due to extra bending
of the beam caused by attached magnets In addition, for attack angles greater than 15°, a
threshold wind speeds of both devices were found to increase with increasing angle.

Chapter 6 Electromagnetic Wind Generator
108
Figure 6.7: Threshold wind speeds at different attack angles in MTC generator (distance = 11
mm and height = 16 mm).
Figure 6.8: Threshold wind speeds at different attack angles in MAC generator (distance = 11
mm and height = 16 mm).
6.2.3.2 Resistive Loads
In order to determine the optimum value of the resistive load for the generators, experiments

Chapter 6 Electromagnetic Wind Generator
109
were carried out in the wind tunnel. The attack angle was set as 10º, which is within the
optimum range for both devices. The position of the bluff body was set as 11 mm in distance
and 16 mm in length. The output power of the MTC generator for a variety of resistive loads
was tested and plotted in Figure 6.9. It was found that, the optimised resistive load decreased
with increasing airflow speeds, from 7.4 kto 2.6 kThe reason is when the airflow is strong;
the force acting on the wing to overcome total damping became larger, resulting in larger
energy extraction. Figure 6.10 shows the optimum load resistance values at different wind
speeds, for the MAC harvester, where the results followed a similar trend clearly. The optimum
load decreased from 1.9 kto 0.6 k
Figure 6.9: (a) Output power with a variety of resistive loads at different wind speeds for MTC
generator (lines plotted are used to indicate the trend); (b) Optimum resistive loads at different
wind speeds for MTC generator in this work.
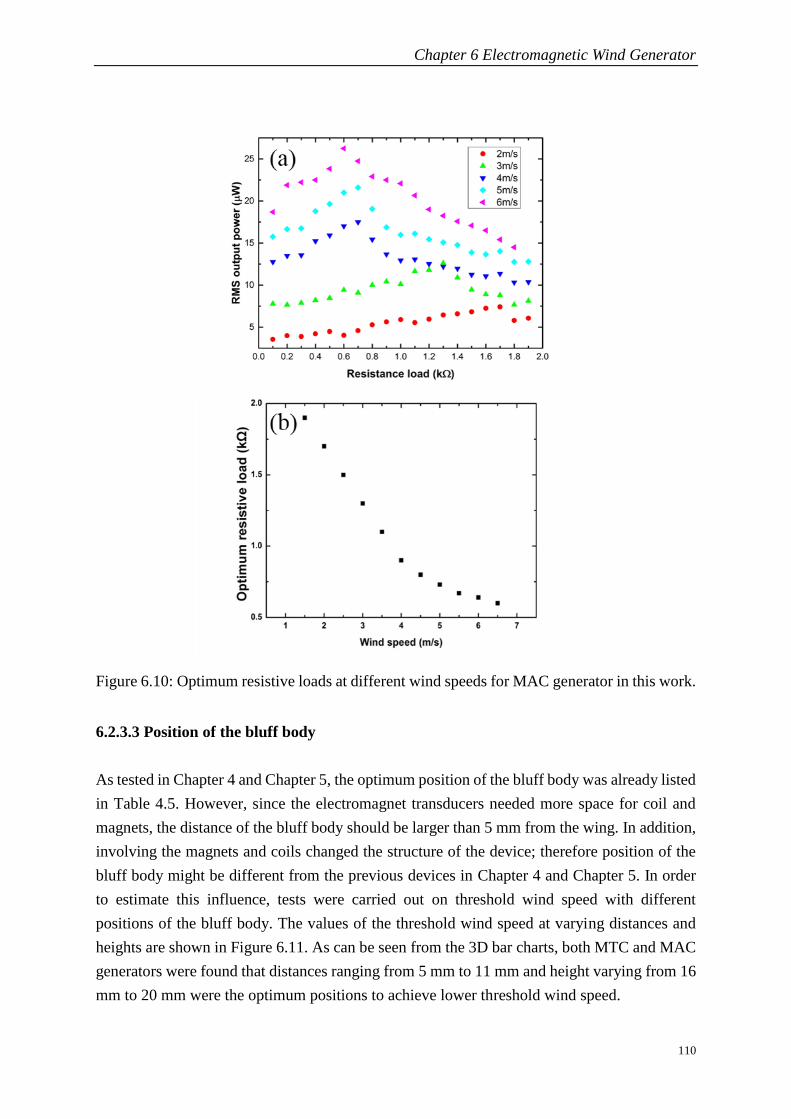
Chapter 6 Electromagnetic Wind Generator
110
Figure 6.10: Optimum resistive loads at different wind speeds for MAC generator in this work.
6.2.3.3 Position of the bluff body
As tested in Chapter 4 and Chapter 5, the optimum position of the bluff body was already listed
in Table 4.5. However, since the electromagnet transducers needed more space for coil and
magnets, the distance of the bluff body should be larger than 5 mm from the wing. In addition,
involving the magnets and coils changed the structure of the device; therefore position of the
bluff body might be different from the previous devices in Chapter 4 and Chapter 5. In order
to estimate this influence, tests were carried out on threshold wind speed with different
positions of the bluff body. The values of the threshold wind speed at varying distances and
heights are shown in Figure 6.11. As can be seen from the 3D bar charts, both MTC and MAC
generators were found that distances ranging from 5 mm to 11 mm and height varying from 16
mm to 20 mm were the optimum positions to achieve lower threshold wind speed.

Chapter 6 Electromagnetic Wind Generator
111
Figure 6.11: Threshold wind speeds with variable distances and heights of the bluff body for
the (a) MTC generator and (b) MAC generator at the attack angle of 10º.
Four configurations were further investigated for performance of the harvester. They are
distance of distance of 5 mm, height of 20 mm; distance of 7 mm, height of 19 mm; distance
of 9 mm, height of 17 mm and distance of 11 mm, height of 16 mm respectively. The output
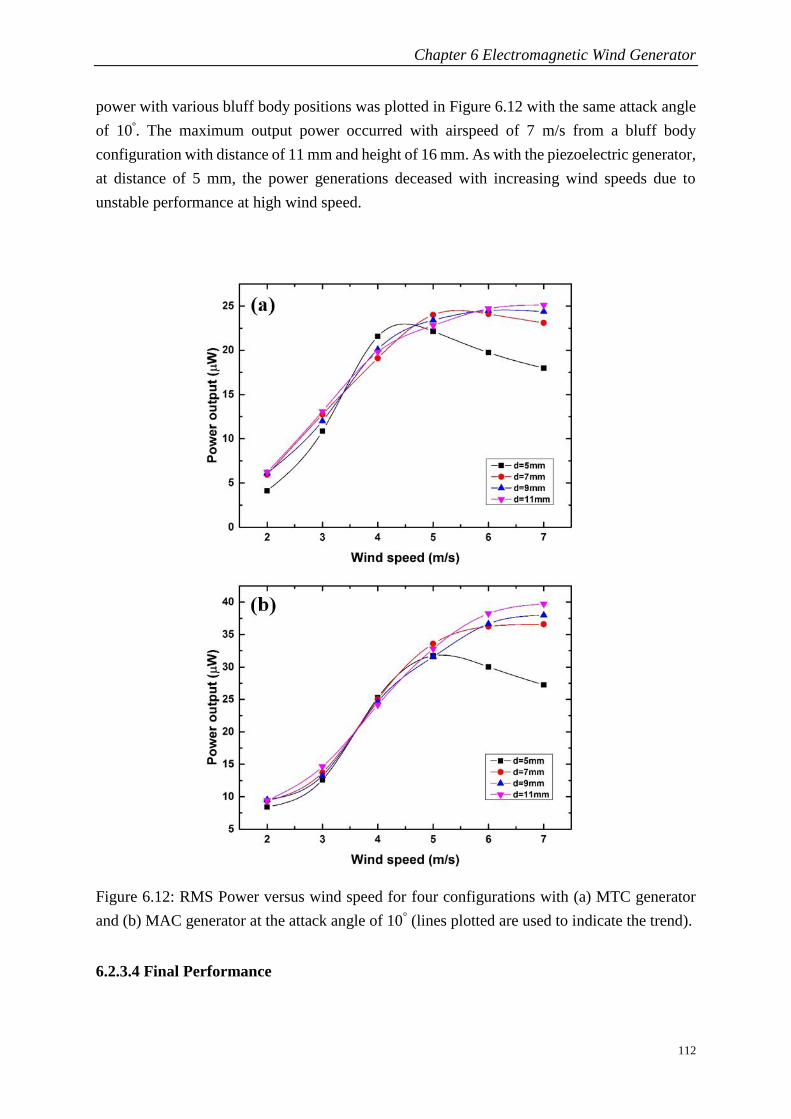
Chapter 6 Electromagnetic Wind Generator
112
power with various bluff body positions was plotted in Figure 6.12 with the same attack angle
of 10º. The maximum output power occurred with airspeed of 7 m/s from a bluff body
configuration with distance of 11 mm and height of 16 mm. As with the piezoelectric generator,
at distance of 5 mm, the power generations deceased with increasing wind speeds due to
unstable performance at high wind speed.
Figure 6.12: RMS Power versus wind speed for four configurations with (a) MTC generator
and (b) MAC generator at the attack angle of 10° (lines plotted are used to indicate the trend).
6.2.3.4 Final Performance

Chapter 6 Electromagnetic Wind Generator
113
The final designs were finished with optimum parameters (attack angle of 10°; distance of 11
mm; height of 16 mm; load values from Figure 6.9 and Figure 6.10) using the testing results
and performances as shown in the following figures.
Figure 6.13(a) showed the optimum performance that could be achieved for the MTC generator
in varying flow speed conditions. As can be seen from the graph, the harvester started operation
from a wind speed of 1 m/s, and the maximum output power was 29.8 μW, which was achieved
at a wind speed of 6 m/s. An output voltage curve with the RMS value of 293 mV (shown in
Figure6.13 (b)) was obtained at the same wind speed.
Figure 6.13: RMS output (a) power and (b) voltage in varying flow speed conditions with
optimal configuration and load of the MTC generator fabricated in this work.

Chapter 6 Electromagnetic Wind Generator
114
While for the MAC generator, the threshold wind speed for operation was 1.5 m/s, which was
slightly higher than the MTC generator due to the extra mass of the attached magnets. However,
the maximum power output was higher up to 41.2 μW as shown in Figure 6.14.
Figure 6.14: RMS output (a) power and (b) voltage in varying flow speed conditions with
optimal configuration and load of the MAC generator fabricated in this work.
In addition, it can be observed that a working wind speed range from 1 m/s to 7 m/s was
achieved by the MTC generator, and the wind speed range of the MAC generator was from 1.5
m/s to 7 m/s.
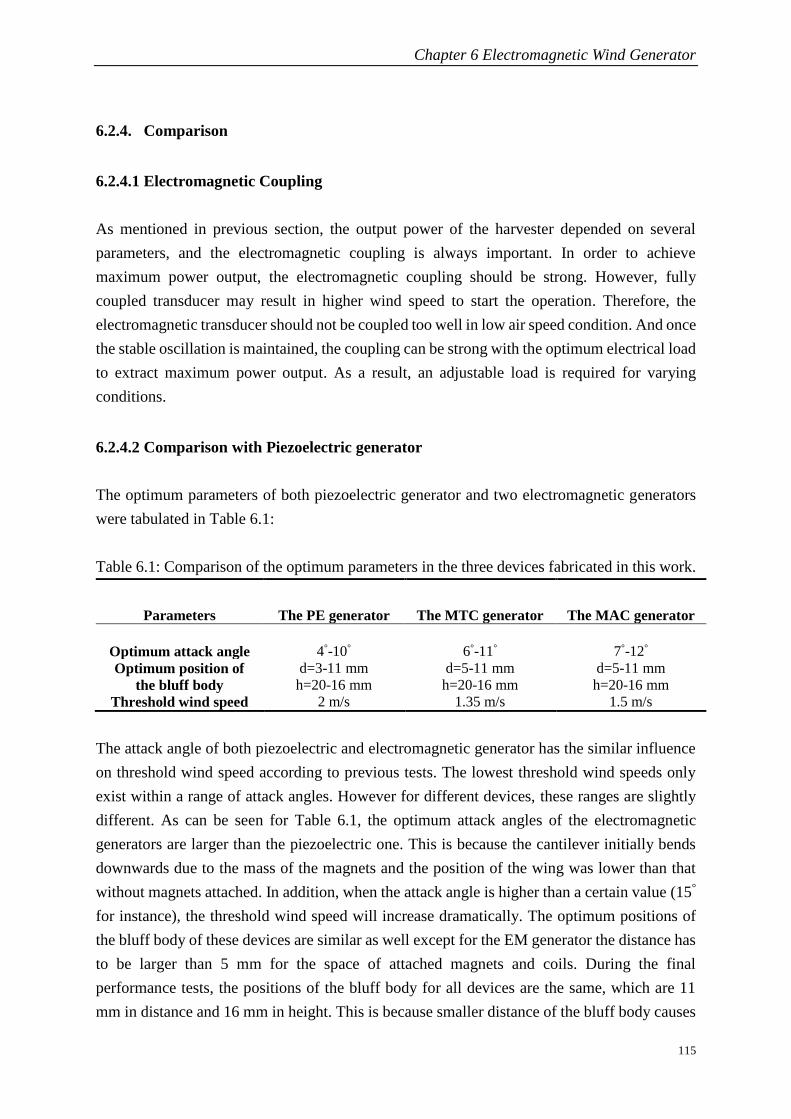
Chapter 6 Electromagnetic Wind Generator
115
6.2.4. Comparison
6.2.4.1 Electromagnetic Coupling
As mentioned in previous section, the output power of the harvester depended on several
parameters, and the electromagnetic coupling is always important. In order to achieve
maximum power output, the electromagnetic coupling should be strong. However, fully
coupled transducer may result in higher wind speed to start the operation. Therefore, the
electromagnetic transducer should not be coupled too well in low air speed condition. And once
the stable oscillation is maintained, the coupling can be strong with the optimum electrical load
to extract maximum power output. As a result, an adjustable load is required for varying
conditions.
6.2.4.2 Comparison with Piezoelectric generator
The optimum parameters of both piezoelectric generator and two electromagnetic generators
were tabulated in Table 6.1:
Table 6.1: Comparison of the optimum parameters in the three devices fabricated in this work.
Parameters The PE generator The MTC generator The MAC generator
Optimum attack angle 4°-10° 6°-11° 7°-12°
Optimum position of
the bluff body
d=3-11 mm
h=20-16 mm
d=5-11 mm
h=20-16 mm
d=5-11 mm
h=20-16 mm
Threshold wind speed 2 m/s 1.35 m/s 1.5 m/s
The attack angle of both piezoelectric and electromagnetic generator has the similar influence
on threshold wind speed according to previous tests. The lowest threshold wind speeds only
exist within a range of attack angles. However for different devices, these ranges are slightly
different. As can be seen for Table 6.1, the optimum attack angles of the electromagnetic
generators are larger than the piezoelectric one. This is because the cantilever initially bends
downwards due to the mass of the magnets and the position of the wing was lower than that
without magnets attached. In addition, when the attack angle is higher than a certain value (15°
for instance), the threshold wind speed will increase dramatically. The optimum positions of
the bluff body of these devices are similar as well except for the EM generator the distance has
to be larger than 5 mm for the space of attached magnets and coils. During the final
performance tests, the positions of the bluff body for all devices are the same, which are 11
mm in distance and 16 mm in height. This is because smaller distance of the bluff body causes

Chapter 6 Electromagnetic Wind Generator
116
unstable oscillations at high wind speed thus results in lower power outputs. The piezoelectric
generator has the highest threshold wind speed compare with the other two, due to added
stiffness of the beam from the printed piezoelectric layers. All three generators can operate
below 2 m/s of wind speed and operate throughout the entire range of flow speeds in HVAC
ducts.
Table 6.2 summarises the electrical output performance between both systems through various
comparison points. The power density is calculated dividing the maximum generated power by
the volume of the device. And the power efficiency is defined as dividing the electric power
output by the power of wind which can be calculated through Equation 3.8, where the
windward area is defined as the sweeping area of the wing.
Table 6.2: Comparison of the performances in the three harvesters fabricated in this work.
Performance The PE generator The MTC generator The MAC generator
Optimum load 800 k 7.4 k -2.6 k 1.9 kk
RMS maximum voltage 1.8 V 293 mV 158 mV
RMS maximum power 3.6 µW 29.8 μW 41.2 μW
Maximum power density 0.09 0.8 1.1
Efficiency 0.01% 0.5% 0.7%
The optimum loads of the piezoelectric generator and the electromagnetic generator that
maximise the power output are not in the same range. For piezoelectric generator the value is
800 kbut for electromagnetic devices, the optimised resistive load are several kand the value
decreases with increasing airflow speed. It should also be noticed that piezoelectric generators
provided typically high peak voltage and low power from the airflow, while electromagnetic
generators provided higher power with less available voltage. With similar threshold wind
speed (1.5 m/s), the MAC generator has higher output power than the MTC one. Both MTC
and MAC generators have higher power density and efficiency. The main issue of the
piezoelectric generator is the small displacement of the active part as well as the limited value
of the charge constant of screen printed PZT materials.
6.2.4.3 Comparison with other Devices
Figure 6.15 compares the performance of various airflow energy harvesters mentioned in the
literature review and the generators presented in this thesis. As shown in Figure 6.15(a), both
electromagnetic generator (MAC) and piezoelectric generators here had lower power outputs
than other devices in the review part. The main reasons for this include most devices are
designed for high wind speed operation and they have larger sizes compared with devices in
this work. Figure 6.15(b) illustrates the power densities of these devices at different wind

Chapter 6 Electromagnetic Wind Generator
117
speeds. As the output power is proportional to the cubic of the wind speed, this rough
comparison focuses on the power density as power divided by the cubic of its corresponding
wind speed and the volume of the main components (transducers and mechanical parts for
vibration).
Although the generators presented in this work had lower power outputs than other devices due
to the size constrain, the power densities comparison of these devices had different results. The
EM generator in this report had the highest power density when it was operated at 1.5 m/s.
However, the performance of the PE generator was not as well as the EM one. The main issue
of the PE generator could be the added stiffness of the PZT part as well as the limited value of
the charge constant of screen printed PZT materials. Moreover, both harvester presented here
had low threshold wind speeds (1.5 m/s and 2 m/s respectively) compare with other devices in
the review.
6.3 Conclusion
In this chapter, two prototypes of electromagnetic wind harvester with MTC and MAC designs
were fabricated and tested. NdFeB magnet bars were selected as the moving parts for the
transducers. The coils were wound by 60 μm thick copper wire with different designed
dimensions.
A set of experiments in the air duct were carried out to investigate the performance of the
harvesters. After testing, the results again showed relatively good correlation with the previous
ones in Chapter 4. The optimized device for the MTC generator achieved a threshold wind
speed of 1.35 m/s. The maximum output power was 29.8 W, which was achieved at wind
speed of 6 m/s. An output voltage with the RMS value of 293 mV was also obtained at the
same wind speed. For the MAC generator, the threshold wind speed for operation was 1.5 m/s,
which was slightly higher than the MTC generator. However, the maximum power output was
higher (41 W) as well. These performances together with the PE generator in Chapter 5 were
compared via mechanical and electrical output performance. It is found that both the
piezoelectric generator and the electromagnetic generator had similar optimum parameters in
mechanical parts. The optimum attack angles and the position of bluff body are within the
similar ranges. Particularly for best electrical output performance, the positions of the bluff
body are all the same (11 mm in distance and 16 mm in height). The piezoelectric generator
has the highest threshold wind speed compare with the other two. The MAC generator has a
higher threshold wind speed than the MTC generator because of the larger mass of the magnets.
All three generators can operate below 2 m/s of wind speed and operate throughout the entire
range of flow speeds in HVAC ducts.

Chapter 6 Electromagnetic Wind Generator
118
Figure 6.15: Comparison of (a) maximum power output, (b) efficiency between the airflow
energy harvesters fabricated in this work and other reported works.
Figure 6.16: Comparison of (a) maximum power output, (b) efficiency between the airflow
energy harvesters fabricated in this work and other reported works.
The electromagnetic generators have higher power output, as well as the efficiency than the
piezoelectric one. However, the piezoelectric one has higher output voltage. In addition, the
optimum loads of the piezoelectric generator and the electromagnetic generator that maximise
the power output are not in the same range. For the electromagnetic generator, an adjustable
load is needed for the EM generator. The EM transducer should not be coupled too well in low
air speed condition to achieve a low threshold wind speed for operation. However, once the
stable oscillation is maintained, the coupling should be strong enough to extract the maximum

Chapter 6 Electromagnetic Wind Generator
119
power output. Therefore with varying conditions, the load should be adjustable for the optimum
performance.
Performance of the generators was also compared with various airflow energy harvesters
mentioned in the literature review. It is shown that the generators presented in this work had
higher power densities and lower threshold wind speeds than the other devices.

Chapter 7 Conclusion and Future Work
120
Chapter 7 Conclusion and Future Work
This thesis has presented the design, simulation, fabrication, measurement and performance of
a miniature wind energy harvester for HVAC systems in the buildings. This final chapter will
give a brief overview of the research presented in this thesis, address how this work contributes
to field of wind energy harvesting and other applications, and then present some possibilities
for future research.
7.1 Summary of Achievement
In Section 1.3, the objective of the research was to design, fabricate and characterise an airflow
energy harvester which can effectively convert the energy of a uniform and steady flow into
periodic motion of the solid structure. These have been achieved, and specifically the following
technical areas have been investigated in detail:
• Modelling the mechanical structure of the harvester in ANSYS CFX.
• Development of piezoelectric generator fabrication processes.
• Characterising the performance of the harvester
• Maximisation on electrical output by optimising the structures
The main results and conclusion will be summarised in more detail.
7.2 Summary of Contributions
The major contributions of the research are mainly divided into three major parts; modelling
and optimization, fabrication, characterisation and comparison.
7.2.1. Modelling and Comparison
The first part of the research was to investigate the performance of wind energy harvesters and
the current state in this field. From the literature review in Chapter 2, as miniature wind turbine
systems suffered from high threshold wind speed for operation and complicated fabrication
process, most researchers put their emphasis on flow-induced harvesters. However, none of

Chapter 7 Conclusion and Future Work
121
these harvesters were designed for low wind speed operation. In this situation, a flow induced
energy harvester with a flapping beam was proposed, which represented a novel opportunity
that may achieve low threshold wind speed of operation as well as large amplitude.
After studying the working principle of the harvester, the mechanical structure can be
optimised by designing the bluff body and aerofoil in a proper way to achieve a low threshold
wind speed for operation. In order to assess the effect of the design parameters, simulation with
finite element analysis software such as ANSYS is necessary. The investigation successfully
employed CFX-ANSYS in constructing a model for examining the aeroelastic phenomena. The
static model was 3-dimensional and encompassed the main components in the mechanical
structure. The lift force applied on the aerofoil was used as a guide to determine the threshold
wind speed. A major contribution of the model is estimating the optimum structures of the
device to achieve a low threshold wind speed. A prototype of the harvester was also fabricated
for experimental work. Both simulation and experimental results are compared and results
show a similar range of optimum positions of the bluff body and the attack angle. Moreover,
relations between the distance and the height of the bluff body have the same trend in the
simulations and tests. These similar trends between the simulation and experimental results
show good correlations, which validates the simulation model used in this study.
In Chapter 5, the modal analysis in ANSYS was also used to estimate performance of the
piezoelectric generator. Simulations with different lengths and widths of the PZT layers were
carried out to investigate the effect of the structure geometry to the resonant frequency and
output power. In order to compare the simulation result with the experimental result, a
prototype was fabricated and tested. It is found that estimated natural frequencies from the
simulation results are higher than the experimental results. The reason could be the dimensions
of the screen printed parts on the beam as well as the aerofoil are slightly different from the
simulation parameters. Regarding to the power output, the testing values are much lower than
the expectation values of simulation results. Especially with the 11 mm long PZT layer device,
an output power of 0.86 µW was achieved, which was much lower than the simulation result
(4.5 µW). The most likely explanation is the reduced displacement of the part of the cantilever
that has the PZT element printed on it due to added stiffness to the beam. This assumption was
then verified by measuring the displacements at different points on the beam with 11 mm long
PZT layer. However, with the increasing length of the piezoelectric part of beam, the problem
could be reduced.
7.2.2. Fabrication
In Chapter 5, a prototype of piezoelectric wind harvester was fabricated by normal thick-film

Chapter 7 Conclusion and Future Work
122
printing steps. The main materials for fabricating the piezoelectric devices are PZT paste,
electrode paste, dielectrode paste and substrate. The PZT paste was based on PZT-5H by
blending the power of different particle size. The components of PZT paste formulation were
72% of 2 µm particles, 18% of 0.8 µm particles and 10% of Lead borosilicate glass, which was
used as the permanent binder. Two kind of electrode paste were used, which are Au (ESL 8884)
for bottom electrode and Ag (DuPont5000) for top electrode. Four layers were designed and
printed onto the substrate (302/304 stainless steel). The dielectric layers were printed to cover
the substrate and dried at 125°C for 15 minutes. It was then fired with a peak temperature of
850°C. This layer was printed because the gold bottom electrode cannot be printed directly onto
the stainless steel substrate. Two single bottom electrode layers of gold were added on both
sides of the substrate using the same process. On the bottom electrode, the PZT layer was added
consisting of two prints. The first layer was dried at 125°C for 15 minutes, and then a second
layer was printed directly on top and dried. Finally, the top electrode layers were printed and
dried at 125°C. This printing and curing sequence avoids firing the device at high temperature
again thus minimise lead loss from the PZT.
7.2.3. Characterisation and Optimisation
7.2.3.1 PZT Material Characterisation
In Chapter 5, the characterisation results for the fabricated thick film piezoelectric samples are
discussed. Two samples at different curing temperature; 850°C and 950°C were inspected under
microscope. The micrographs showed that the piezoelectric sample fired at 950°C had cracks
on the surface resulting in electrical shorting between the top and bottom electrodes. Therefore
the higher firing temperature is not suitable for the PZT paste in this work.
Polarisation was the final fabrication step. The poling conditions including the temperature,
time and electric field applied. The measurement results show that a series of samples polarized
150°C for 30 minutes have an average d33 of 25 pC/N, which is 62% of the value that after 120
minutes. And at 225°C the 30 minute values were 93% of 120 minutes values. These results
verify that the value of d33 increases with both temperature and time of poling. However,
beyond 225°C samples were found to be short circuit. It is also found that improved value of
coefficient is achieved when the poling voltages are increased. Nevertheless the piezoelectric
layer suffered electrical short circuits when it was polarised with electric field strength greater
than 4 MV/m. When the polarisation temperature, time and field strength were 225°C, 30
minutes and 4 MV/m respectively, a maximum value of d33 of 92 pC/N was obtained.

Chapter 7 Conclusion and Future Work
123
7.2.3.2 Mechanical Characterisation
All devices were tested for their mechanical structure properties. The measurements were
carried out both on the shaker and in the air duct to investigate the threshold wind speed and
natural frequency of the harvester.
The threshold wind speed depends on several design parameters, and the attack angle and the
position of bluff body are of significant importance. Experimental work was carried out by
measuring the threshold wind speed at different attack angles and positions of the bluff body.
Results show that for all devices, the lowest threshold wind speed can be achieved within a
certain range of those two parameters. For pure mechanical structure, the optimum range of
attack angle is 5° to 8° and for piezoelectric generator this range is 4° to 10°. Regarding to the
electromagnetic generators, the optimum attack angles increase to 6° – 11° (MTC) and 7° – 12°
(MAC) as the position of the aerofoil is lower than the piezoelectric one due to the bending of the
cantilever caused by attached magnets. In addition, during all tests, it is found that when the attack
angle is higher than a certain value, the threshold wind speed of the harvester increases
dramatically. The optimum positions of the bluff body of these devices are similar. The
experimental results verify that with distance from 3 mm – 11 mm and height from 16 to 20
mm, the threshold wind speeds are the lowest. However, for the electromagnetic generator the
distance has to be larger than 5 mm for the space of attached magnets and coils. Other
parameters were also tested to investigate the influence on the threshold wind speed. Adding
weights of proof mass and increasing the length of PZT layer both increase the threshold wind
speed. Final testes show that all three generators can operate below 2 m/s of wind speed.
Natural frequencies of different cantilevers were tested on the shaker table. It is found that
adding proof mass can effectively reduce the natural frequency. For piezoelectric generator,
the resonant frequency decreases from 55 Hz to 16.5 Hz with added proof mass. For the
electromagnetic generator, magnets are used as the proof mass and the natural frequency of the
cantilever are reduced from 12.8 Hz to 7.3 Hz. The length of PZT layer also has influence on
the natural frequency of the cantilever. Results show that with PZT lengths varying from 11
mm to 16 mm, the natural frequencies increase from 15 Hz to 20 Hz.
7.2.3.3 Electrical Characterisation
The electrical properties were tested through voltage and power output as well as the optimum
resistive load of the harvesters. In Chapter 5, the maximum output power of the generator
occurred at 7 m/s wind speed from a configuration with distance of 11 mm and height of 16
mm. Different lengths of the PZT layer were also investigated and results showed that with a

Chapter 7 Conclusion and Future Work
124
shorter length of PZT materials, the output power was small because of the added stiffness of
the beam from printed PZT parts. As a result, PZT layer with length of 16 mm has much higher
power output than that with length of 11 mm. After testing, the optimized device achieved the
RMS power output ranging from 0.35 µW to 3.6 µW and the open-circuit output voltage from
0.6 V to 1.9 V.
In Chapter 6, the maximum output power of both MTC and MAC generators were achieved
from a configuration with distance of 11 mm and height of 16 mm, which is the same as the
piezoelectric one. For the MTC generator, the maximum output power was 27.2 µW with an
output voltage of 293 mV. For the MAC generator, the maximum power output was 41 µW
and the voltage was 158 mV. During the tests, it can also be observed that at distance smaller
than 5 mm, performance of all devices at high wind speed was not stable, which resulted in a
lower power output.
The optimum loads of the piezoelectric generator and the electromagnetic generator that
maximise the power output are not in the same range. In Chapter 5, at different levels of wind
speed, the ideal value of the optimum load was not as clearly defined; however, results followed
a similar trend. The power output at the chosen resistance of 800 k was comparable to
maximum power for all test cases, and was thus determined to be the optimum resistive load
for the piezoelectric generator. But for electromagnetic devices, the optimised resistive loads
are not as clear as the piezoelectric one. It is found that, the optimised resistive load decreases
with increasing airflow speeds. The reason is when the airflow is strong; the force acting on
the aerofoil to overcome total damping became larger, resulting in larger energy extraction.
Considering this situation, an adjustable load is required for the electromagnetic generator at
varying conditions.
7.3 Recommendations for Future work
The experimental results presented in this thesis show that the harvester can effectively convert
wind energy into large amplitude mechanical vibration without strict frequency matching
constraints and can be used as a useful wind energy harvester in the HVAC systems. However,
there is still room for improvement and other applications for powering many sensors in air
ducts are worth exploring.
The wind harvester in this report was based on a flapping beam with a bluff body to induce the
oscillation. Hence, for more accurate dynamic aeroelasticity analysis, a theoretical aeroelastic
model should be presented and investigated the operation conditions for energy harvesting.

Chapter 7 Conclusion and Future Work
125
The PZT material used for the piezoelectric generator in this thesis has a charge constant (d33)
value of 92 pC/N, which is normal for screen printed PZT layers. However increasing the
charge constant of the PZT material can further improve the electrical output. This can be
achieved by using a high piezoelectric activity material.
This thesis put an emphasis on investigating the structure of wind harvester. However, in
practical application, a power conditioning and storage circuit is needed, which should be the
study of future work. A super capacitor can be used for energy storage and an electronic circuit
with rectifier and microcontroller can be used for power management. The control system
should also be able to detect the output voltage and adjust the electrical load accordingly.
.

APPENDIX
126
Appendix A

APPENDIX
127
Appendix B

APPENDIX
128
Appendix C

APPENDIX
129
Appendix D
The ANSYS model for piezoelectric cantilever analysis.
/prep7
ts = 80e-6 ! substrate thickness (microns)
tpzt = 100e-6 ! pzt thickness (microns)
te = 10e-6 ! electrode thickness (microns)
td = 20e-6 ! dielectric thickness (microns)
tt = 3e-3 ! mass thickness (microns)
ttl= 2e-4
!---
l = 10e-3 ! beamlength (mm)
w1 = 5e-3 ! beam width (mm)
w2= 0.25e-3
w3= 4.75e-3
w4= 0.75e-3
w5= 4.25e-3
g = 20e-3
lc = 5e-3 ! clamping area
!--- mass
l1 = 5e-3 ! l1 length of wing (mm)
w10 = 10e-3 ! w1 wide of wing (mm)
!---
t1 = ts/2
t2 = t1+td
t3 = t2+te
t4 = t3+tpzt
t5 = t4+te
t6 = t2+tt
! MODEL COORDINATES

APPENDIX
130
k ,1,0,0,-t1 ! keypoint 1
k ,2,w1,0,-t1 ! keypoint 2
k ,3,w2,l,-t1 ! keypoint 3
k ,4,w3,l,-t1 ! keypoint 4
k ,5,w4,l+g,-t1 ! keypoint 5
k ,6,w5,l+g,-t1 ! keypoint 6
k ,7,-w10,l+g+l1,-t1 ! keypoint 7
k ,8,w1+w10,l+g+l1,-t1 ! keypoint 8
k ,9,w1+w10,l+g,-t1 ! keypoint 9
k ,10,-w10,l+g,-t1 ! keypoint 10
k ,11,0,-lc,-t1 ! keypoint 1
k ,12,w1,-lc,-t1 ! keypoint 2
kgen, 2,1,12,,,,ts,500 ! substrate
kgen, 2,1,12,,,,-td,100 ! dielectric(b)
kgen, 2,101,104,,,,-te,100 ! electrode1(b)
kgen, 2,201,204,,,,-tpzt,100 ! pzt(b)
kgen, 2,301,304,,,,-te,100 ! electrode1(u)
kgen, 2,501,512,,,,td,100 ! dielectric(u)
kgen, 2,601,604,,,,te,100 ! electrode2(b)
kgen, 2,701,704,,,,tpzt,100 ! pzt(u)
kgen, 2,801,804,,,,te,100 ! electrode2(u)
kgen, 2,107,110,,,,-tt,50 ! mass(b)
kgen, 2,607,610,,,,ttl,50 ! mass(u)
!-----------------------
!-- substrate
v ,11,12,6,5,511,512,506,505 ! volume 1

APPENDIX
131
v ,7,8,9,10,507,508,509,510 ! volume 2
!-- dielectric(b)
v ,11,12,4,3,111,112,104,103 ! volume 3
!v ,7,8,9,10,107,108,109,110 ! volume 4
!-- dielectric(u)
v ,611,612,604,603,511,512,504,503! volume 5
!-- dielectric(u)
!v ,607,608,609,610,507,508,509,510 ! volume 6
!-- mass(b)
!v ,7,8,9,10,157,158,159,160 ! volume 7
!-- mass(u)
!v ,607,608,609,610,657,658,659,660 ! volume 8
!-- electrode1(b)
v ,101,102,104,103,201,202,204,203 ! volume 9
!-- electrode2(b)
v ,301,302,304,303,401,402,404,403! volume 10
!-- electrode1(u)
v ,601,602,604,603,701,702,704,703 ! volume 11
!-- electrode2(u)
v ,801,802,804,803,901,902,904,903 ! volume 12
!-- pzt(b)
v ,201,202,204,203,301,302,304,303 ! volume 13
!-- pzt(u)
v ,701,702,704,703,801,802,804,803 ! volume 14

APPENDIX
132
! substrate
!vadd,1,2 ! volume 15
!-- dielectric(b)
!vadd,3,4 ! volume 1
!-- dielectric(u)
!vadd,5,6 ! volume 2
!beam - material - stainless steel
mat, 1 ! material number 1
ET, 1, 45 ! type of material used "solid45"
MP, DENS, 1, 7750 ! density of stainless steel
MP, NUXY, 1, 0.26 ! poissons ratio for stainless steel
MP, ex, 1, 180e9 ! youngs modulus for stainless steel
!dielectric - material 2 - glass dielectric pyrex
mat, 2 ! material number 2
ET, 2, 45 ! type of material used "solid45"
MP, DENS, 2, 2230 ! density of glass dielectric pyrex
MP, NUXY, 2, 0.2 ! poissons ratio for glass dielectric pyrex
MP, ex, 2, 64e9 ! youngs modulus for glass dielectric pyrex
!electriode - material 3 - gold
mat, 3 ! material number 3
ET, 3, 45 ! type of material used "solid45"
MP, DENS, 3, 19280 ! density of gold
MP, NUXY, 3, 0.42 ! poissons ratio for gold
MP, ex, 3, 80e9 ! youngs modulus for gold

APPENDIX
133
!mass - material - NdFeB
mat, 5 ! material number 5
ET, 5, 45 ! type of material used "solid45"
MP, DENS, 5, 130 ! density of N
MP, NUXY, 5, 0.24 ! poissons ratio for N
MP, ex, 5, 6e9 ! youngs modulus for N
mat, 6 ! material number 5
ET, 6, 45 ! type of material used "solid45"
MP, DENS, 5, 130 ! density of magnetic
MP, NUXY, 5, 0.35 ! poissons ratio for balsa wood
MP, ex, 5, 2.9e9 ! youngs modulus for balsa wood
!pzt - material - pzt
mat, 4 ! material number 4
ET, 4, 5 ! type of material used "solid5"
MP, DENS, 4, 5440 ! density of pzt
MP, NUXY, 4, 0.3 ! poissons ratio for pzt
!MP, DAMP, 4, 4.8e-6
!MP, ex, 4, 15e9 ! youngs modulus for pzt
!--------------------
! - Material properties for Pzt +
!
/com Stiffness
TB, ANEL, 4, 1, , 0
TBDATA, 1, 1.2720E+11, 8.0212E+10, 8.4670E+10
TBDATA, 7, 1.2720E+11, 8.4670E+10
TBDATA, 12, 1.1744E+11
TBDATA, 16, 2.3496E+10
TBDATA, 19, 2.2989E+10
TBDATA, 21, 2.2989E+10
/com Piezo

APPENDIX
134
TB, PIEZ, 4
TBDATA, 3, -.5093
TBDATA, 6, -.5093
TBDATA, 9, 2.1445
TBDATA, 14, 1.523
TBDATA, 16, 1.523
/com Permittivity
EMUNIT, EPZRO, 8.85E-12
MP, PERX, 4, 1000
MP, PERY, 4, 1000
MP, PERZ, 4, 950
tblist,all ! List input and converted material matrices
! selecting materials
vsel ,s,volu,,1,2
vatt ,1,,1
vsel ,s,volu,,3,6
vatt ,2,,2
vsel ,s,volu,,7,8
vatt ,5,,5
vsel ,s,volu,,9,12
vatt ,3,,3
vsel ,s,volu,,13,14
vatt ,4,,4
vsel, all
! meshing
esize,5e-4
vmesh,all
! merge coincidences
!nummrg,all
!waves

APPENDIX
135
! DEFINE MASTER DEGREES OF FREEDOM
!total ,100,1
! MERGE COINCIDENCES AND REDUCE WAVEFRONT
numm,all,1e-8
waves
! CLAMPING
nsel ,s,loc,y,-lc,0 ! selects all nodes on the y=0 axis
nsel ,r,loc,x,w1/2-2e-3,w1/2+2e-3 ! selects all nodes on the x axis
nsel ,a,loc,y,-2e-3,0
d ,all,UX,0 ! clamps selected nodes, sets degrees of freedom
d ,all,UY,0
d ,all,UZ,0
nsel ,all ! reselects all the nodes in the model
! FORCE
!asel,,,,64
!nsla,,1
!f,all,fz,force/16
!asel ,all
!nsel ,all
! VIEW THE MODEL
/view ,1,1,1,1
/pbc ,all,1
eplot
finish
! STATIC ANALYSIS
/solu
antype,static

APPENDIX
136
pstres,on
solve
fini
! MODAL ANALYSIS
/solu
antype ,modal
modopt ,LANB,2
pstres ,on
mxpand ,2
solve
*get,fr,mode,1,freq
/com, Resonant frequency fr = %fr% Hz
fini
! Display deformed shape
/post1
set, first
pldisp ,2

REFERENCE
137
Reference
[1] M. Weiser, “The computer for the twenty-first century,” Scientific American, pp. 94–104,
1991.
[2] P. E. Ross, “Managing care through the air,” IEEE Spectrum, vol. 41, no. 12, pp. 14–19,
2004.
[3] Website, “Strain Energy Harvesting for Wireless Sensor Networks,”.
[4] Website, “I think, therefore I interact, new electronics on campus,”.
[5] L. Doherty, B. A. Warneke, B. E. Boser and K. S. J. Pister, “Energy and performance
considerations for smart dust”, International Journal of Parallel Distributed Systems and
Networks, vol. 4, no. 3, pp. 121–133, 2001.
[6] Website, “ORESTEIA project homepage”.
[7] F. Nack, “An overview on wireless sensor networks” IPCSIT vol.35. 2012
[8] Y. Liao and H. A. Sodano “Model of a single mode energy harvester and properties for
optimal power generation” Smart Material Structure, vol.17,no. 6, pp.1–14,2008.
[9] W. Shockley “The theory of p-n junctions in semiconductors and p-n junction transistors,”
Bell System Technology Journal, vol. 28, pp. 435–489, 1949.
[10] S. E. Thompson, M. Armstrong, C. Auth, M. Alavi, M. Buehler, R. Chau, S. Cea, T.
Ghani, G. Glass, T. Hoffman, C. Jan, C. Kenyon, J. Klaus, K. Kuhn, Z. Ma, B. Mcintyre,
K. Mistry, A. Murthy, B. Obradovic, R. Nagisetty, P. Nguyen, S. Sivakumar, R. Shaheed,
L. Shifren, B. Tufts, S. T yagi, M. Bohr and Y. El-Mansy, “A 90nm logic technology
featuring strained-silicon,” IEEE Transactions on Electron Devices, vol. 51, no. 11, pp.
1790–1797, 2004.
[11] C. Kompis, S. Aliwell, “Energy harvesting technologies to enable remote and wireless
sensing” 2008
[12] ASHTON, K. “That ‘Internet of Things’ Thing. In the real world, things matter more
than ideas”. RFID,2009
[13] James, E.P., Tudor, M.J., Beeby, S.P., Harris, N.R., Glynne-Jones, P., Ross, J.N. and
White, N.M. “An investigation of self-powered systems for condition monitoring
applications” Sensors and Actuators A: Physical, 110, (1-3), 171-176. 2004
[14] L. Mateu and F. Moll, “Review of energy harvesting techniques and applications for
microelectronics,” Proceedings of the SPIE Microtechnologies for the New Millennium,
pp. 359–373, 2005.
[15] A. Harb “Energy harvesting: state-of-the-art,” Renewable Energy, vol. 36, pp. 2641–
2654, 2011.
REFERENCE
138
[16] L. Perez-Lombard, J. Ortiz and C. Pout “A review on buildings energy consumption
information,” Energy Build, vol. 40, no. 3, pp. 394–398, 2008.
[17] Website “Flow velocity air ducts”.
[18] G. Poulin “Comparative study of an electromagnetic and a piezoelectric system,” Sensors
and Actuators A. Physical, vol. 116, pp. 461–471, 2004.
[19] F. Blatt, P. Schroeder, C. Foiles and D. Greig “Thermoelectric power of materials,” New
York: Plenum Press, 1976.
[20] R. Myers, “The basics of physics,” Greenwood Press, 2006.
[21] O. Mah, “Fundamentals of photovoltaic materials,” National Solar Power Research
Institute, Inc., 1998.
[22] R. Elliot “Electromagnetics: history, theory, and applications,” Piscataway: IEEE Press,
1993.
[23] K. Werner “Introduction to Microsystem Design,” Springer, 2011.
[24] L. Kok, N. White and N. Harris “Fabrication and characterisation of free-standing thick-
film piezoelectric cantilevers for energy harvesting.” Measurement Science &
Technology, vol. 20, no. 12, 2009.
[25] Website “Piezoelectric constants,”.
[26] J. Oliver, “Modeling interdigitated piezoelectric thin-film micro-actuators,” ProQuest,
2008.
[27] K. Lee “Polymers for photonics applications II,” Springer-Verlag Berlin Heidelberge,
2003
[28] M. S. Vijaya ”Piezoelectric Materials and Devices,” CRC Press, 2013
[29] R. Torah, S. P. Beeby and N. M. White “An improved thick-film piezoelectric material
by powder blending and enhanced processing parameters,” IEEE transactions on
ultrasonics, ferroelectrics, and frequency control, vol. 52, no. 1, pp. 10–16, 2005.
[30] L. Kok, L. Swee, N. White and N. Harris “Design, fabrication and characterisation of
free-standing thick-film piezoelectric cantilevers for energy harvesting,” Measurement
Science & Technology, vol. 20, no. 12, 2009.
[31] S., Gevorgian “Ferroelectrics in microwave devices, circuits and systems,” Springer–
Verlag London Limited, 2009.
[32] S. P. Beeby “MEMS Mechanical Sensors,” Artech House Publishers, 2004.
[33] A. Nechibvute, A. Chawanda and P. Luhanga “Piezoelectric energy harvesting devices:
An alternative energy source for wireless sensors,” Smart Materials Research, 2012.
[34] H. A. Sodano, D. J. Inman and G. Park “Comparison of piezoelectric energy harvesting
devices for recharging batteries,” Journal of Intelligent Material Systems and Structures,
vol. 16, no. 10, pp, 799–807, 2005

REFERENCE
139
[35] C. S. Lee, J. Joo, S. Han, J. H. Lee and S. K. Koh “Poly (vinylidene fluoride) transducers
with highly conducting poly (3, 4-ethylenedioxythiophene) electrodes,” Synthetic Metals,
vol. 152, pp 49–52, 2005.
[36] J. Rastegar, C. Pereira and H. L. Nguyen “Piezoelectric-based power sources for
harvesting energy from platforms with low frequency vibration,” Proceeding SPIE 6171,
pp. 617101, 2006.
[37] S. R. Platt, S. Farritor and H. Haider “The use of piezoelectric ceramics for electric power
generation within orthopaedic implants,” IEEE/ASME Transactions on Mechatronics,
vol. 104, pp. 55–61, 2006.
[38] W. J. Choi, Y. Jeon, J. H. Jeong, R. Sood and S. G. Kim “Energy harvesting MEMS
device based on thin film piezoelectric cantilevers,” Journal of Electroceramics, vol. 17,
no. 2–4, pp. 543–548, 2006.
[39] D. Zhu, G. Peter, N. White, N. Harris, R. Torah, A. Almusallam, and S. Beeby, “Screen
printed piezoelectric films for energy harvesting.” Advances in Applied Ceramics, 112,
(2), 79-84. 2013
[40] S. P. Beeby and T. J. Kazmierski “Energy Harvesting Systems,” Springer, 2011.
[41] N. N. H. Ching, G. M. H. Chan, W. J. Li, H. Y. Wong and P. H. W. Leong “PCB
integrated micro generator for wireless systems,” International Symposium on Smart
Structures and Microsystems, 2000.
[42] R. Amirtharajah and A. Chandrakasan “Self-powered signal processing using vibration-
based power generation,” IEEE Solid-State Circuits, vol 33, no 5, pp. 687–695, 1998.
[43] C. Williams, C. Shearwood, M. Harradine, P. Mellor, T. Birch and R. Yates
“Development of an electro-magnetic micro-generator,” IEEE Proceeding G-Circuits,
Devices and Systems, vol. 148, pp. 337–342, 2001.
[44] W. Li, T. Ho, G. Chan, P. Leong and H. Y. Wong “Infrared signal transmission by a
laser-micromachined, vibration-induced power generator,” IEEE Midwest Symposium on
Circuits and Systems, vol. 1, pp. 236–239, 2000.
[45] D. Zhu , S. Beeby, J. Tudor and N. Harris “Vibration energy harvesting using the Halbach
array” Smart Mater. Struct. 21 075020 (11pp), 2012.
[46] D. Zhu , S. Beeby, J. Tudor and N. Harris “Increasing output power of electromagnetic
vibration energy harvesters using improved Halbach arrays” Sensors and Actuators A
Physical,203,pp11-19.2013.
[47] R. G. Herb, D. B. Parkinson and D. W. Kerst “The development and performance of an
electrostatic generator operating under high air pressure,” Physical Review, vol. 51, pp.
75–83, 1937
[48] P. D. Mitcheson, P. Miao, B. H. Stark, E. M. Yeatman, A. S. Holmes and T. C. Green
“MEMS electrostatic micro-power generator for low frequency operation,” Sensors
Actuators A, vol. 115, pp. 523–529, 2004.

REFERENCE
140
[49] J. F. Walker, N. Jenkins “Wind energy technology,” John Wiley & Sons, 1997.
[50] T. Ackermann and L. Soder “An overview of wind energy-status.” Renewable and
Sustainable Energy Reviews, vol. 6, pp. 67–128, 2002.
[51] G. M. Herbert, S. Iniyan, E. Sreevalsan and S. Rajapamdian “A review of wind energy
technologies,” Renewable and Sustainable Energy Reviews, vol. 11, pp.1117–1145, 2007.
[52] H. Wu, X. Wang and Y. Hu “Development of small wind generator based on hybrid
magnetic bearing,” Proceedings Asia-Pacific Power and Energy Engineering
Conference, pp. 27–31, 2009.
[53] S. Liu, Z. Bian, D. Li and W. Zhao “A magnetic suspended self-pitch vertical axis wind
generator,” Proceedings Asia-Pacific Power and Energy Engineering Conference, pp.
28–31, 2010.
[54] A. Flammini, D. Marioli and M. Serpelloni “An autonomous sensor with energy
harvesting capability for airflow speed measurements,” IEEE Transactions on
Instrumentation and Measurement, vol. 60, no. 5, pp. 892–897, 2011.
[55] G. Shrestha, H. Polinder and J. A. Ferreira “Scaling laws for direct drive generators in
wind turbines,” IEEE International Electric Machines and Drives Conference
Proceedings, pp 797–803, 2009.
[56] H. Hirahara, M. Z. Hossain, M. Kawahashi and Y. Nonomura “Testing basic
performance of a very small wind turbine designed for multi-purposes,” Renewable
Energy, vol. 30, pp. 1279–1297, 2005.
[57] A. Vardar and I. Alibas “Research on wind turbine rotor models using NACA profiles,”
Renewable Energy, vol.33, pp. 1721–1732, 2008.
[58] D. Rancourt, A. Tabesh and L. G. Fréchette “Evaluation of centimeter-scale micro wind
mills: Aerodynamics and electromagnetic power generation” Proceedings Power MEMS,
pp. 93–96, 2007.
[59] A. S. Holmes, G. Hong, K. R. Pullen and K. R. Buffard “Axial-flow microturbine with
electromagnetic generator: design, CFD simulation and prototype demonstration,”
Proceedings Power MEMS, pp. 568–571, 2004.
[60] A. Bansal, D. A. Howey and A. S. Holmes “cm-Scale air turbine and generator for energy
harvesting from low-speed flows”, IEEE Transducers, pp. 529–532, 2009.
[61] A. Bansal, D. A. Howey and A.S. Holmes “Design and performance of a centimetre-
scale shrouded wind turbine for energy harvesting,” Smart Materials and Structures, vol.
20, pp.1–12, 2011.
[62] D. Carli, D. Brunelli, D. Bertozzi and L. Benini “A high-efficiency wind-flow energy
harvester using micro turbine,” International Symposium on Power Electronics,
Electrical Drives, Automation and Motion, 2010.
[63] F. J. Xu, F. G. Yuan, J. Z. Hu and Y. P. Qiu “Design of a miniature wind turbine for
powering wireless sensors,” Proceedings of SPIE, vol. 7647, pp. 764741–764741, 2010.

REFERENCE
141
[64] P. H. Chen and S. C. Lin “Wind-powered piezo generators,” IEEE Industrial Electronics
Society, pp. 2163–2168, 2007.
[65] S. Priya, C. T. Chen, D. Fye and J Zahnd “Piezoelectric windmill: a novel solution to
remote sensing,” Japanese Journal of Applied Physics, vol. 44, no. 3, pp. 104–107, 2005.
[66] S. Priya “Modeling of electric energy harvesting using piezoelectric windmill,” Applied
Physics Letters, vol.87, pp. 184101–3, 2005.
[67] R. Myers, M. Vickers, H. Kim and S. Priy “Small scale windmill,”, Applied Physics
Letters, vol. 90, pp. 054106, 2007.
[68] S. Bressers, D. Avirovik, M. Lallart, D. Inman, and S. Priya, “Contact-less wind turbine
utilizing piezoelectric bimorphs with magnetic actuation,” Structural Dynamics, vol. 3,
pp. 233–243, 2011.
[69] H. Jung, and S. Lee, “The experimental validation of a new energy harvesting system
based on the wake galloping phenomenon,” Smart Material Structure, vol. 20, pp.
055022, 2011.
[70] M. Sanchez-Sanz, B. Fernandez and A. Velazquez “Energy-harvesting microresonator
based on the forces generated by the Karman street around a rectangular prism,” Journal
of Microelectromechanical Systems, vol. 18, no. 2, pp. 449–457, 2009.
[71] V. Sivadas and A. M. Wickenheiser “A study of several vortex-induced vibration
techniques for piezoelectric wind energy harvesting,” Proceedings SPIE, vol. 7977, pp.
79770F, 2011.
[72] M. M. Bernitsas, K. Raghavan, Y. Ben-Simon and E. M. H. Garcia “VIVACE : A new
concept in generation of clean and renewable energy from fluid flow,” Journal of
Offshore Mechanics and Arctic Engineering, vol. 130, no. 4, pp. 041101, 2008.
[73] A. Barrero-Gil, S. Pindado and S. Avila “Extracting energy from vortex-induced
vibrations: a parametric study,” Applied mathematical modelling, vol. 36, no. 7, pp.
3153-3160, 2012.
[74] J. J. Allen and A. J. Smits “Energy harvesting eel,” Journal of Fluids and Structures, vol.
15, pp. 629-640, 2001
[75] G. W. Taylor, J. R. Burns, S. M. Kammann, W. B. Powers and T. R. Welsh “The energy
harvesting eel: a small subsurface ocean/river power generator,” IEEE Journal of
Oceanic Engineering, vol. 26, no. 4, pp. 539-547, 2001.
[76] S. R. Anton and H. A. Sodano “A review of power harvesting using piezoelectric
materials,” Smart Materials and Structures, vol. 16, no. 3, pp. R1, 2007.
[77] S. Jiang, X. Li, S. Guo, Y. Hu, J. Yang and Q. Jiang “Performance of a piezoelectric
bimorph for scavenging vibration energy,” Smart Materials and Structures, vol. 14, no.
4, pp. 769, 2007.

REFERENCE
142
[78] D. A. Wang and N. Z. Liu “A shear mode piezoelectric energy harvester based on a
pressurized water flow,” Sensors and Actuators A: Physics, vol. 167, no. 2, pp. 449-458,
2011.
[79] S. Li and H. Lipson “Vertical-stalk flapping-leaf generator for wind energy harvesting,”
Proceedings of the ASME 2009 Conference on Smart Materials, Adaptive Structures and
Intelligent Systems, 2009.
[80] S. Li, J. Yuan and H. Lipson “Ambient wind energy harvesting using cross-flow
fluttering,” Journal of Applied Physics, vol.109, pp. 026104, 2011.
[81] S. D. Kwon “A t-shaped piezoelectric cantilever for fluid energy harvesting,” Applied
Physics Letters, vol. 97, no. 16, pp. 164102, 2010.
[82] J. A. Dunnmon, S. C. Stanton, B. P. Mann and E. H. Dowell “Power extraction from
aeroelastic limit cycle oscillations,” Journal of Fluids and Structures, vol. 27, no. 8, pp.
1182-1198, 2011.
[83] Q. Wen, R. Schulze, D. Billep, T. Otto and T. Gessner “Modeling and optimization of a
vortex induced vibration fluid kinetic energy harvester,” Procedia Engineering, vol. 87,
pp. 779-782, 2014.
[84] M. Demori, M. Ferrari, V. Ferrari, S. Farise and P. Poesio “Energy harvesting from von
karman vortices in airflow for autonomous sensors,” Procedia Engineering, vol. 87, pp.
775-778, 2014.
[85] L. A. Weinstein, M. R. Cacan, P. M. So and P. K. Wright “Vortex shedding induced
energy harvesting from piezoelectric materials in heating, ventilation and air
conditioning flows,” Smart Materrial Structures, vol. 21, pp. 045003, 2012
[86] P. W. Bearman and A. J. Wadcock “The interaction between a pair of circular cylinders
normal to a stream,” Journal of Fluid Mechanics, vol. 61, pp. 499-511, 1973.
[87] H. J. Jung, S. W. Lee and D. Jang “Feasibility study on a new energy harvesting
electromagnetic device using aerodynamic instability,” IEEE Transactions on Magnetics,
vol. 45, no. 10, pp. 4376–4379, 2009.
[88] H. Jung and S. Lee “The experimental validation of a new energy harvesting system
based on the wake galloping phenomenon,” Smart Materials and Structures, vol. 20, pp.
055022, 2011.
[89] J. W. Duncan “The fundamentals of flutter,” Aircraft Engineering and Aerospace
Technology, vol. 17, no, 1, pp.16-20, 1945.
[90] W. Mckinney and J. DeLaurier “The wing mill: an oscillating-wing windmill,” Journal
of Energy, vol. 5, no. 2, pp.109–115, 1981.
[91] K. D. Jones and M. F. Platzer “Numerical computation of flapping-wing propulsion and
power extraction,” 35th Aerospace Sciences Meeting and Exhibit, Aerospace Sciences
Meetings, pp. 97-0826, 1997.

REFERENCE
143
[92] K. Isogai, M. Yamazaki, M. Matsubara and T. Asaoka “Design study of elastically
supported flapping wing power generator,” Proceedings of International Forum on
Aeroelasticity and Structural Dynamics, 2003.
[93] A. Erturk, W. G. R. Vieira, C. De Marqui, Jr. and D. J. Inman “On the energy harvesting
potential of piezoaeroelastic systems,” Applied Physics Letters, vol. 96, pp. 184103, 2010.
[94] Q. Zhu, M. Haase and C. H. Wu, “Modelling the capacity of a novel flow-energy
harvester,” Applied Mathematical Modelling, vol. 33, pp. 2207–2217, 2009.
[95] S. D. Kwon, “A t-shaped piezoelectric cantilever for fluid energy harvesting,” Applied
Physics Letters, vol. 97, no. 16, pp. 164102, 2010.
[96] M. Bryant and E. Garcia “Development of an aeroelastic vibration power harvester,”
Proceedings of SPIE, vol. 7288, pp. 728812, 2009.
[97] M. Bryant and E. Garcia “Energy harvesting: A key to wireless sensor nodes,”
Proceedings of SPIE, vol. 7493, pp. 749311, 2009.
[98] M. Bryant, E. Garcia and A. Fang “Self-powered smart blade: Helicopter blade energy
harvesting,” Proceedings of SPIE, vol. 7643, pp. 764317, 2010.
[99] M. Bryant and E. Garcia “Modeling and testing of a novel aeroelastic flutter energy
harvester,” Journal of Vibration and Acoustics, vol. 133, no. 1, pp. 011010, 2011.
[100] M. Bryant, E. Wolff and E. Garcia “Parametric design study of an aeroelastic flutter
energy harvester,” Proceedings of SPIE, vol. 7977, pp. 79770S, 2011.
[101] J. Park, K. Kim, S. Kwon and K. H. Law “An aero-elastic flutter based electromagnetic
energy harvester with wind speed augmenting funnel,” The International Conference on
Advances in Wind and Structures, 2012.
[102] Website, “MicroBelt tech sheet”.
[103] D. Pimentel, P. Musilek and A. Knight “Energy harvesting simulation for automatic
arctic monitoring stations,” IEEE Electrical Power & Energy Conference, 2010.
[104] F. Fei, J. D. Mai, and W. J. Li, “A wind-flutter energy converter for powering wireless
sensors,” Sensors and Actuators A, vol. 173, no. 1, pp.163–171,2 012.
[105] K. H. Kim, D. Choi, and Y. H. Seo “Piezoelectric energy harverster using flow-induced
vibration,” Proceedings of Power MEMS, pp.197-200, 2008.
[106] C. Sun and J. Shi “PVDF microbelts for harvesting energy from respiration,” Energy and
Environmental Science, vol. 4, pp. 4508-4512, 2011.
[107] D. St. Clair, A. Bibo, V. R. Sennakesavababu, M. F. Daqaq and G. Li “A scalable concept
for micropower generation using flow-induced self-excited oscillations,” Journal of
Applied Physics, vol. 96, no. 144103, 2010.
[108] B. H. Kim, D. Choi and Y.H.Seo “Piezoelectric energy harverster using flow-induced
vibration,” Proceedings of Power MEMS, pp.197-200. 2008.

REFERENCE
144
[109] Y. H. Seo, B. Kim and D. Choi “Piezoelectric energy harverster using flow-induced
vibration for infrastructure health monitoring applications” Microsystem Technologies,
vol. 21, pp. 169–172, 2015.
[110] Y. Yang, G. Zhu, H. Zhang, J. Chen, X. Zhong, Z. Lin, Y. Su, P. Bai, X. Wen and Z.
Wang “Triboelectric nanogenrator for harvesting wind energy and as self-powered wind
vector sensor system,” ACS Nano, vol. 7, no.10, pp. 9461-9468, 2013.
[111] S. Wang, X. Mu, Y. Yang, C. Sun, A.Y. Gu and Z. Wang “Flow-driven triboelectric
generator for direct powering a wireless sensor node,” Advanced Materials.,vol. 27, pp.
240-248, 2015.
[112] X. Wang, S. Wang, Y. Yang and Z.Wang “Hybridized electromagnetic–triboelectric
nanogenerator for scavenging air-flow energy to sustainably power temperature sensors,”
ACS Nano, vol. 9, no.4, pp. 4553-4562, 2015.
[113] D. Zhu, S. Beeby, J. Tudor, N. White and N. Harris “A novel miniature wind generator
for wireless sensing applications,” Proceedings of IEEE Sensor, 2010.
[114] S. B. Horowitz, “Development of a MEMS-based acoustic energy harvester,”
Proceedings of Power MEMS, 2005.
[115] F. Liu, A. Phipps, S. Horowitz, K. Ngo, L. Cattafesta, T. Nishida and M. Sheplak,
“Acoustic energy harvesting using an electromechanical Helmholtz resonator,” Journal
of Acoustical Society of America, vol. 123, no. 4, pp. 1983-1990, 2008.
[116] S. P. Matova, R. Elfrink, R. J. M. Vullers and R. van Schaijk “Harvesting energy from
airflow with micromachined piezoelectric harvester inside a Helmholtz resonator,”
Proceedings of Power MEMS, 2010.
[117] C. B. Williams, and R. B. Yates “Analysis of a micro-electric generator for
Microsystems,” Sensors and Actuators A: Physical, vol. 52, no. 1–3, pp 8–11, 1996.
[118] S. Beeby, M. Tudor and N. White “Energy harvesting vibration sources for microsystems
applications” Measurement Science and Technology, vol. 17, no. 12, pp. R175–R195,
2006.
[119] S. J. Roundy “Energy scavenging for wireless sensor nodes with a focus on vibration to
electricity conversion,” Ph.D. Dissertation, University of California, 2003.
[120] S. J. Roundy, P. K. Wright and J. M. Rabaey “Energy scavenging for wireless sensor
nodes with a focus on vibrations” chapter 5, Boston Kluwer Academic Press, 2004.
[121] A Cammarano, S.G. Burrow, D.A.W. Barton, A. Carrella, and L. R. Clare “Tuning a
resonant energy harvester using a generalized electrical load” J Smart Mater Struct, 19
055003, 2010
[122] N. Stephen “On energy harvesting from ambient vibration” J. Sound Vib. 293 409–25,
2006
[123] G. K. Batchelor “An introduction to fluid dynamics,” chapter II, Cambridge University
Press, 2000.

REFERENCE
145
[124] H. Glauert “The elements of aerofoil and airscrew theory,” Cambridge University Press,
1947.
[125] H. Abbott and A. E. Doenhoff “Theory of wing sections including a summary of airfoil
data,” Courier Corporation, 1959.
[126] Website, “http://www.electroscience.com/html”.
[127] Website, “http://www.memsnet.org/material/leadzirconatetitanatepzt”.
[128] H. S. Yoon, G. Washington and A. Danak “Modeling, optimization, and design of
efficient initially curved piezoceramic unimorphs for energy harvesting applications,”
Journal of Intelligent Material Systems and Structures, vol. 16, no. 10, pp. 877–888,
2005.
[129] P. Glynne-Jones, S. P. Beeby, P. Dargie, T. Papakostas and N. M. White “An
investigation into the effect of modified firing profiles on the piezoelectric properties of
thick-film PZT layers on silicon,” Measurement Science and Technology, vol. 11, no. 5,
pp. 526–531, 2000.
[130] P. Dargie, R. Sion, J. Atkinson and N. White “An investigatin of the effect of poling
conditions on the characteristics of screen-printed piezoceramics,” Microelectronics
International, vol. 15, no. 2, pp. 6–10, 1998.