Renal Medullary Nitric Oxide Deficit of Dahl S Rats Enhances Hypertensive Actions of Angiotensin II
Upload
independentCategory
view
1download
0
1
3
4
5
6
7
8 Q1
9
10
1112131415
1617
1 9
2021222324
25262728293031
3 2
49
50
51
52
53
54
55
56
57
58
Molecular and Cellular Endocrinology xxx (2014) xxx–xxx
MCE 8801 No. of Pages 6, Model 5G
13 May 2014
Contents lists available at ScienceDirect
Molecular and Cellular Endocrinology
journal homepage: www.elsevier .com/locate /mce
Epigenetic-related gene expression profile in medullary thyroid cancerrevealed the overexpression of the histone methyltransferases EZH2 andSMYD3 in aggressive tumours
http://dx.doi.org/10.1016/j.mce.2014.04.0160303-7207/� 2014 Published by Elsevier Ireland Ltd.
Abbreviations: MTC, medullary thyroid cancer; TLDA, taqman low density array;RET, REarranged during Transfection.⇑ Corresponding author. Address: Dipartimento di Medicina Interna e Specialità
Mediche, Università di Roma Sapienza, V.le del Policlinico, 155, 00161 Rome, Italy.Tel.: +39 6 49975133; fax: +39 6 4463783.
E-mail address: [email protected] (S. Filetti).1 Equal contribution from both authors.
Please cite this article in press as: Sponziello, M., et al. Epigenetic-related gene expression profile in medullary thyroid cancer revealed the overexpof the histone methyltransferases EZH2 and SMYD3 in aggressive tumours. Molecular and Cellular Endocrinology (2014), http://dx.doi.org/1j.mce.2014.04.016
Marialuisa Sponziello a,1, Cosimo Durante a,1, Amelie Boichard b, Mariavittoria Dima a, Cinzia Puppin c,Antonella Verrienti a, Giulia Tamburrano a, Giorgio Di Rocco d, Adriano Redler d, Ludovic Lacroix b,Jean-Michel Bidart b, Martin Schlumberger b, Giuseppe Damante c, Diego Russo e, Sebastiano Filetti a,⇑a Dipartimento di Medicina Interna e Specialità Mediche, Università di Roma ‘‘Sapienza’’, 00161 Roma, Italyb Institut Gustave Roussy, Université Paris Sud, 94805 Villejuif, Francec Dipartimento di Scienze Mediche e Biologiche, Università di Udine, 33100 Udine, Italyd Dipartimento di Scienze Chirurgiche, Università di Roma ‘‘Sapienza’’, 00161 Roma, Italye Dipartimento di Scienze della Salute, Università di Catanzaro, 88100 Catanzaro, Italy
333435363738394041424344
a r t i c l e i n f o
Article history:Received 6 November 2013Received in revised form 17 April 2014Accepted 29 April 2014Available online xxxx
Keywords:Medullary thyroid cancerEpigeneticsRETRASHistone methylation
4546
a b s t r a c t
Epigenetic control of gene expression plays a major influence in the development and progression ofmany cancer types. Aim of the present study was to investigate the expression of epigenetic regulatorsin a large cohort of medullary thyroid carcinomas (MTC), correlating the data with the clinical outcomeand mutational status of the patients. Taqman Low Density Arrays (TLDAs) were used to analyze expres-sion levels of several genes involved in the epigenetic control of transcription in a series of 54 MTCs. Thepatients cohort included 13 familial MTCs and 41 sporadic forms; 33 hosted a RET mutation and 13 a RASsomatic mutation. The expression profiling revealed in the more aggressive diseases (i.e. occurrence ofmetastases; persistent disease; disease-related death) a significant increase of EZH2 and SMYD3 geneexpression. The increased levels of EZH2 and SMYD3 did not correlate significantly with mutational statusof RET or RAS genes. Thus, the histone methyltransferases EZH2 and SMYD3 mRNA expression may rep-resent useful prognostic biomarkers tailoring the most appropriate follow-up and timing of therapeuticapproaches.
� 2014 Published by Elsevier Ireland Ltd.
47
48
59
60
61
62
63
64
65
66
67
68
1. Introduction
Medullary thyroid cancer (MTC) encompasses about 4% of allthyroid cancer. Approximately 20% of patients develop distantmetastases, which make MTC an incurable disease (Kloos et al.,2009). The course of the MTC is highly heterogeneous. In somepatients it displays very aggressive behaviour, with rapidly pro-gressive disease over a few months, while in other patients theMTC has an indolent course, with lesions remaining stable foryears or even decades. Prediction of the natural course of a tumour
69
70
71
72
73
74
75
would allow to tailor the intensity of the follow-up and the timingof therapeutic approaches. In this regards, the identification ofgermline and somatic mutations of the REarranged during Trans-fection (RET) oncogene in the 1990s, and the recognition of a goodgenotype-phenotype correlation had a tremendous impact on MTCmanagement (Kloos et al., 2009). Nevertheless, a geneticallyguided approach only based on RET analysis may fail to predictthe course of clinical disease (Lombardo et al., 2002). Indeed, it isbecoming increasingly evident that other genetic or epigeneticdeterminants may affect tumour aggressiveness (Santarpia et al.,2009; Castellone et al., 2010).
Epigenetic control of gene expression plays a major influence inthe development and progression of many cancer types. In particu-lar, histone modifications including acetylation and/or methylationand different patterns of DNA methylation have been described invarious malignancies (Dowson and Kouzarides, 2012). Such changesinvolve alterations of both expression and activity of enzymes as
ression0.1016/
76
77
78
79
80
81
82
83
84
85
86
87
88
89
90
91
92
93
94
95
96
97
98
99
100
101
102
103
104
105
106
107
108
109
110
111
112
113
114
115
116
117
118
119
120
121
122
123
124
125
126
127
128
2 M. Sponziello et al. / Molecular and Cellular Endocrinology xxx (2014) xxx–xxx
MCE 8801 No. of Pages 6, Model 5G
13 May 2014
histone deacetylase/acetyltransferase, histone demethylase/meth-yltransferase or DNA methyltransferase.
There are no data about the pattern of expression of epigeneticregulators in MTCs, and their relationship with the genotype andphenotype of the tumours. In this study we investigated the mRNAexpression of several epigenetic regulators in a series of 54 MTCsand correlated the results with the phenotypic (aggressivenessbased on the presence of lymph node and/or distant metastasis,and on the clinical outcome) and genotypic (RET or RAS mutationalstatus) characteristics.
2. Materials and methods
2.1. Tumour samples and patients
Tumour samples came from the archives of the Department ofInternal Medicine of the University of Rome Sapienza (Italy) andInstitut Gustave Roussy, Villejuif (France). Overall, our seriesincluded 54 cases of MTC (Table 1), some of which were previouslyanalyzed in previous reports (Ameur et al., 2009a; Boichard et al.,2012). Cancer tissue and the normal thyroid tissue specimens wereobtained at thyroidectomy. The tumour samples were reviewed bya single pathologist, and after confirmation of the diagnosis andexclusion of the presence of normal tissue were snap-frozen andstored in liquid nitrogen. Tissues included 49 primary tumoursand 5 MTC metastases (3 lymph node, 1 liver, and 1 ovarian metas-tases). Clinical information was collected by reviewing hospitalcharts, and tumours were staged according to the criteria of theAJCC/UICC TNM classification, 7th edition. In particular, accordingto the analysis purpose, patients were classified based on the pres-ence or absence of lymph node (N1 or N0) and distant (M1 or M0)
129
130
131
132
133
134
135
136
137
138
139
140
141
142
143
144
145
146
147
148
149
150
151
152
153
154
155
156
157
Table 1Description of the study population at the time of the primarytreatment and clinical outcome.
Total population (n = 54)
Gender (n; rate)– Male 22 (40.7)– Female 32 (59.3)
Age at the diagnosis (median; range) 50 (8–88)Primary tumour size (median; range) 23 mm (10–45)Primary tumour categories (n; rate)a
– TX 2 (3.9)– T1 21 (41.2)– T2 19 (37.2)– T3 3 (5.9)– T4 6 (11.8)
Lymph node metastases (n; rate)a
– N0 20 (39.2)– N1 31 (60.8)
Distant metastases (n; rate)a
– MX 3 (5.9)– M0 34 (66.7)– M1 14 (27.4)
Genotype (n; rate)– Germ-line RET mutation 13 (24.1)– Somatic RET mutation 20 (37)– Somatic RAS mutation 13 (24.1)– Wild type 8 (14.8)
Clinical status after initial therapy (n; rate)b
– No evidence of disease 26 (57.8)– Biochemical evidence of disease 5 (11.1)– Structural evidence of disease 14 (31.1)
Outcome (n; rate)c
– Alive 33 (75)– Cancer-related death 9 (20.5)– Death from other causes 2 (4.5)
a Data not available for 3 patients.b Data not available for 9 patients.c Data not available for 10 patients.
Please cite this article in press as: Sponziello, M., et al. Epigenetic-related geneof the histone methyltransferases EZH2 and SMYD3 in aggressive tumours.j.mce.2014.04.016
metastases, and the clinical outcome. The study was approved bythe local medical ethics committee. Written, informed consent tothe collection of thyroid tissue for genetic studies was obtainedby each study participant.
2.2. Gene mutation analysis
RET and RAS mutations were identified independently and withsimilar conditions in each centre by Sanger sequencing analysis ofproducts obtained by PCR amplification of RET exons 10, 11, 13,14, 15 and 16 and H-, K-, N-RAS exons 2, 3, 4, as previously described(Castellone et al., 2010). In both centers all PCR reactions andsequencing were repeated at least twice to confirm the presenceof a mutation. (For primers contact the authors). RET germlinemutations have been identified by analyzing normal tissue samples.
2.3. RNA isolation from thyroid tissues and Reverse Transcription
Total RNA was extracted from the tissue samples using Trizolreagent (Life Technologies, Foster City, CA, USA) according to themanufacturer’s instructions. First-strand cDNA synthesis was per-formed using 1.5 lg of each RNA sample primed with randomhexamers according to the protocol provided with the High Capac-ity cDNA Reverse Transcription kit (Life Technologies).
2.4. TaqMan Low Density Array
Gene expression profiles in cancer tissues were assessed by RealTime PCR using custom Taqman Low Density Arrays (TLDA, LifeTechnologies). Each TLDA was configured with specific prede-signed assays (TaqMan Gene Expression Assays from Life Technol-ogies) by one replicate per biological sample. The panel of assaystargeted the key genes belonging to the known epigenetic proteinfamilies (Histone deacetylases, Histone acetyltransferases, Histonemethyltransferases, Histone demethylases, DNA methyltransfer-ases). Finally, three housekeeping genes (Glyceraldehyde-3-Phos-phate Dehydrogenase, GAPDH; Beta-glucuronidase, GUSB andBeta-2 microglobulin, B2M) were included to normalize RNAexpression levels. The TaqMan arrays were set up as previouslydescribed (Sponziello et al., 2013) and all the PCR were performedon a 7900HT Fast Real-Time PCR System (Life Technologies). Ct val-ues were calculated with SDS 2.3 software (Life Technologies) anddata analysis was carried out using RQ Manager 1.2 software. Thedetectability threshold was set to 33. GAPDH was chosen as endog-enous control because of its least variance among samples. Finalresults were determined by the 2�DDCt method and expressed asrelative expression normalized to a calibrator sample.
2.5. Statistical analysis
Results were expressed as means ± SD, and intergroup differ-ences were assessed with the nonparametric Mann–Whitney test.P-values < 0.05 were considered statistically significant. StatViewsoftware (SAS Institute Inc.) was used to perform all statisticalanalysis. Correlations between quantitative variables were ana-lyzed by the Spearman’s rho rank correlation coefficient.
3. Results
3.1. Epigenetic gene expression profiling in MTC tissue specimens
The transcript levels of the epigenetic regulators of gene expres-sion were analyzed according to tumour aggressiveness. In a firstanalysis, the tumours were divided into three subgroups accordingto the presence of lymph node and distant metastases: group I
expression profile in medullary thyroid cancer revealed the overexpressionMolecular and Cellular Endocrinology (2014), http://dx.doi.org/10.1016/
158
159
160
161
162
163
164
165
166
167
168
169
170
171
172
173
174
175
176
177
178
179
180
181
182
183
184
185
186
187
188
189
190
191
192
193
194
195
196
197
198
199
200
201
202
203
204
205
M. Sponziello et al. / Molecular and Cellular Endocrinology xxx (2014) xxx–xxx 3
MCE 8801 No. of Pages 6, Model 5G
13 May 2014
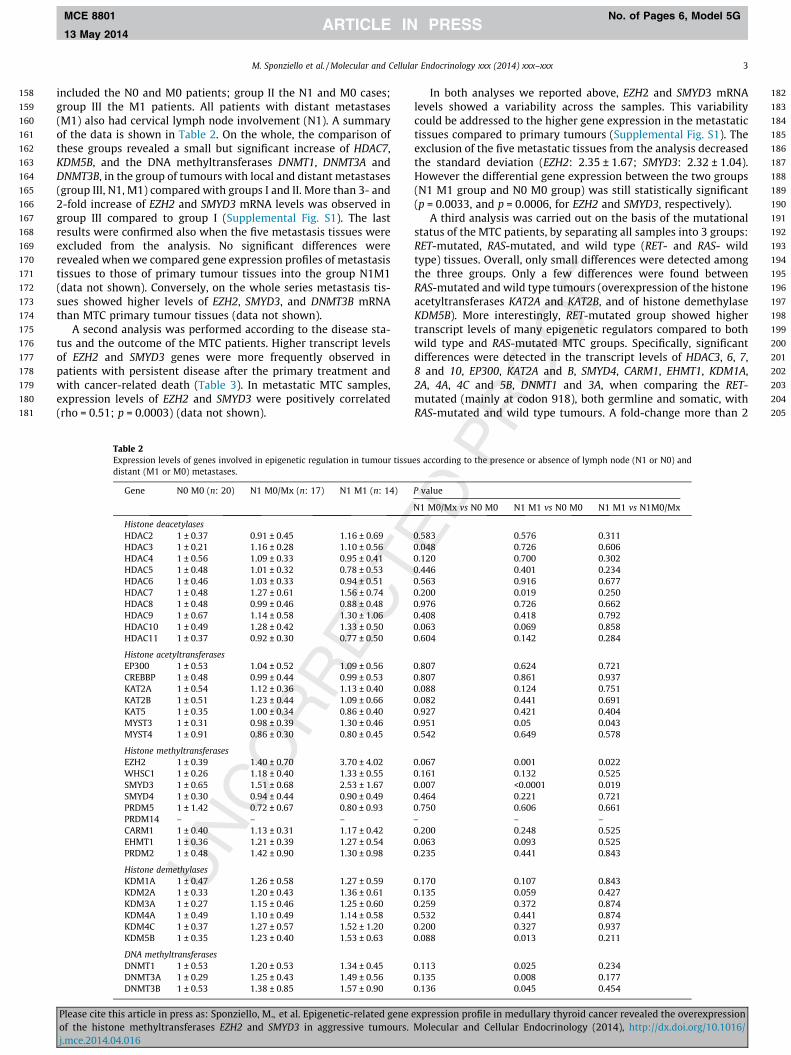
included the N0 and M0 patients; group II the N1 and M0 cases;group III the M1 patients. All patients with distant metastases(M1) also had cervical lymph node involvement (N1). A summaryof the data is shown in Table 2. On the whole, the comparison ofthese groups revealed a small but significant increase of HDAC7,KDM5B, and the DNA methyltransferases DNMT1, DNMT3A andDNMT3B, in the group of tumours with local and distant metastases(group III, N1, M1) compared with groups I and II. More than 3- and2-fold increase of EZH2 and SMYD3 mRNA levels was observed ingroup III compared to group I (Supplemental Fig. S1). The lastresults were confirmed also when the five metastasis tissues wereexcluded from the analysis. No significant differences wererevealed when we compared gene expression profiles of metastasistissues to those of primary tumour tissues into the group N1M1(data not shown). Conversely, on the whole series metastasis tis-sues showed higher levels of EZH2, SMYD3, and DNMT3B mRNAthan MTC primary tumour tissues (data not shown).
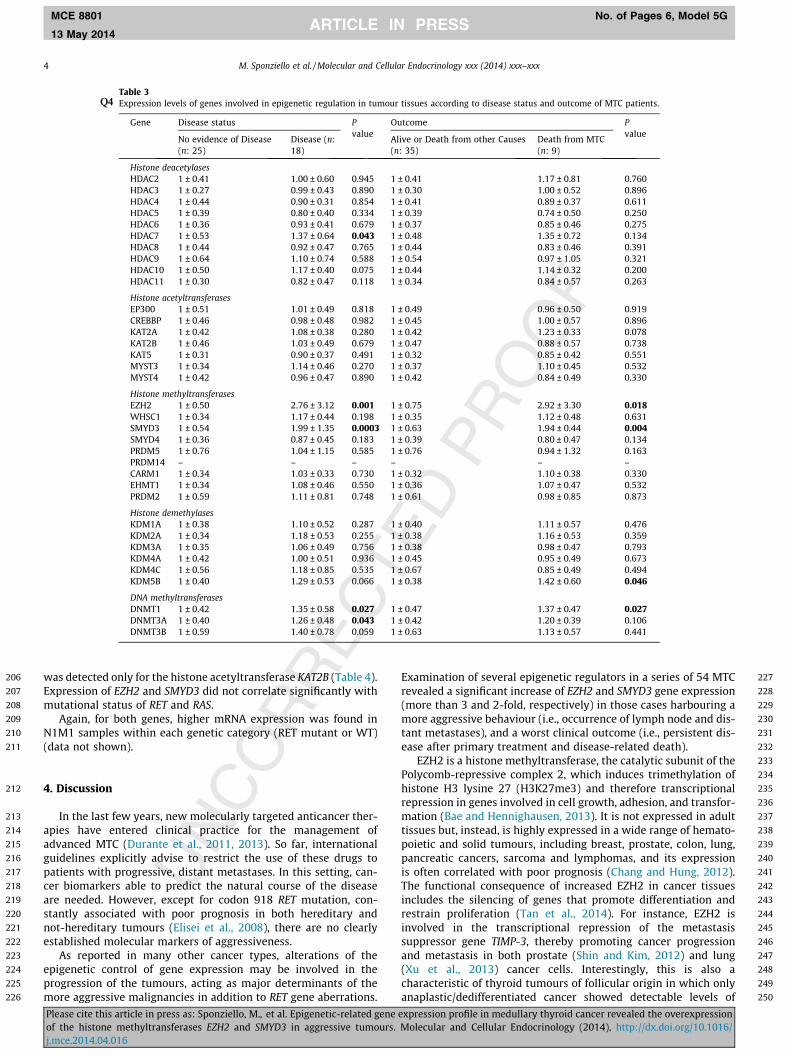
A second analysis was performed according to the disease sta-tus and the outcome of the MTC patients. Higher transcript levelsof EZH2 and SMYD3 genes were more frequently observed inpatients with persistent disease after the primary treatment andwith cancer-related death (Table 3). In metastatic MTC samples,expression levels of EZH2 and SMYD3 were positively correlated(rho = 0.51; p = 0.0003) (data not shown).
Table 2Expression levels of genes involved in epigenetic regulation in tumour tissudistant (M1 or M0) metastases.
Gene N0 M0 (n: 20) N1 M0/Mx (n: 17) N1 M1 (n: 14)
Histone deacetylasesHDAC2 1 ± 0.37 0.91 ± 0.45 1.16 ± 0.69HDAC3 1 ± 0.21 1.16 ± 0.28 1.10 ± 0.56HDAC4 1 ± 0.56 1.09 ± 0.33 0.95 ± 0.41HDAC5 1 ± 0.48 1.01 ± 0.32 0.78 ± 0.53HDAC6 1 ± 0.46 1.03 ± 0.33 0.94 ± 0.51HDAC7 1 ± 0.48 1.27 ± 0.61 1.56 ± 0.74HDAC8 1 ± 0.48 0.99 ± 0.46 0.88 ± 0.48HDAC9 1 ± 0.67 1.14 ± 0.58 1.30 ± 1.06HDAC10 1 ± 0.49 1.28 ± 0.42 1.33 ± 0.50HDAC11 1 ± 0.37 0.92 ± 0.30 0.77 ± 0.50
Histone acetyltransferasesEP300 1 ± 0.53 1.04 ± 0.52 1.09 ± 0.56CREBBP 1 ± 0.48 0.99 ± 0.44 0.99 ± 0.53KAT2A 1 ± 0.54 1.12 ± 0.36 1.13 ± 0.40KAT2B 1 ± 0.51 1.23 ± 0.44 1.09 ± 0.66KAT5 1 ± 0.35 1.00 ± 0.34 0.86 ± 0.40MYST3 1 ± 0.31 0.98 ± 0.39 1.30 ± 0.46MYST4 1 ± 0.91 0.86 ± 0.30 0.80 ± 0.45
Histone methyltransferasesEZH2 1 ± 0.39 1.40 ± 0.70 3.70 ± 4.02WHSC1 1 ± 0.26 1.18 ± 0.40 1.33 ± 0.55SMYD3 1 ± 0.65 1.51 ± 0.68 2.53 ± 1.67SMYD4 1 ± 0.30 0.94 ± 0.44 0.90 ± 0.49PRDM5 1 ± 1.42 0.72 ± 0.67 0.80 ± 0.93PRDM14 – – –CARM1 1 ± 0.40 1.13 ± 0.31 1.17 ± 0.42EHMT1 1 ± 0.36 1.21 ± 0.39 1.27 ± 0.54PRDM2 1 ± 0.48 1.42 ± 0.90 1.30 ± 0.98
Histone demethylasesKDM1A 1 ± 0.47 1.26 ± 0.58 1.27 ± 0.59KDM2A 1 ± 0.33 1.20 ± 0.43 1.36 ± 0.61KDM3A 1 ± 0.27 1.15 ± 0.46 1.25 ± 0.60KDM4A 1 ± 0.49 1.10 ± 0.49 1.14 ± 0.58KDM4C 1 ± 0.37 1.27 ± 0.57 1.52 ± 1.20KDM5B 1 ± 0.35 1.23 ± 0.40 1.53 ± 0.63
DNA methyltransferasesDNMT1 1 ± 0.53 1.20 ± 0.53 1.34 ± 0.45DNMT3A 1 ± 0.29 1.25 ± 0.43 1.49 ± 0.56DNMT3B 1 ± 0.53 1.38 ± 0.85 1.57 ± 0.90
Please cite this article in press as: Sponziello, M., et al. Epigenetic-related geneof the histone methyltransferases EZH2 and SMYD3 in aggressive tumours.j.mce.2014.04.016
In both analyses we reported above, EZH2 and SMYD3 mRNAlevels showed a variability across the samples. This variabilitycould be addressed to the higher gene expression in the metastatictissues compared to primary tumours (Supplemental Fig. S1). Theexclusion of the five metastatic tissues from the analysis decreasedthe standard deviation (EZH2: 2.35 ± 1.67; SMYD3: 2.32 ± 1.04).However the differential gene expression between the two groups(N1 M1 group and N0 M0 group) was still statistically significant(p = 0.0033, and p = 0.0006, for EZH2 and SMYD3, respectively).
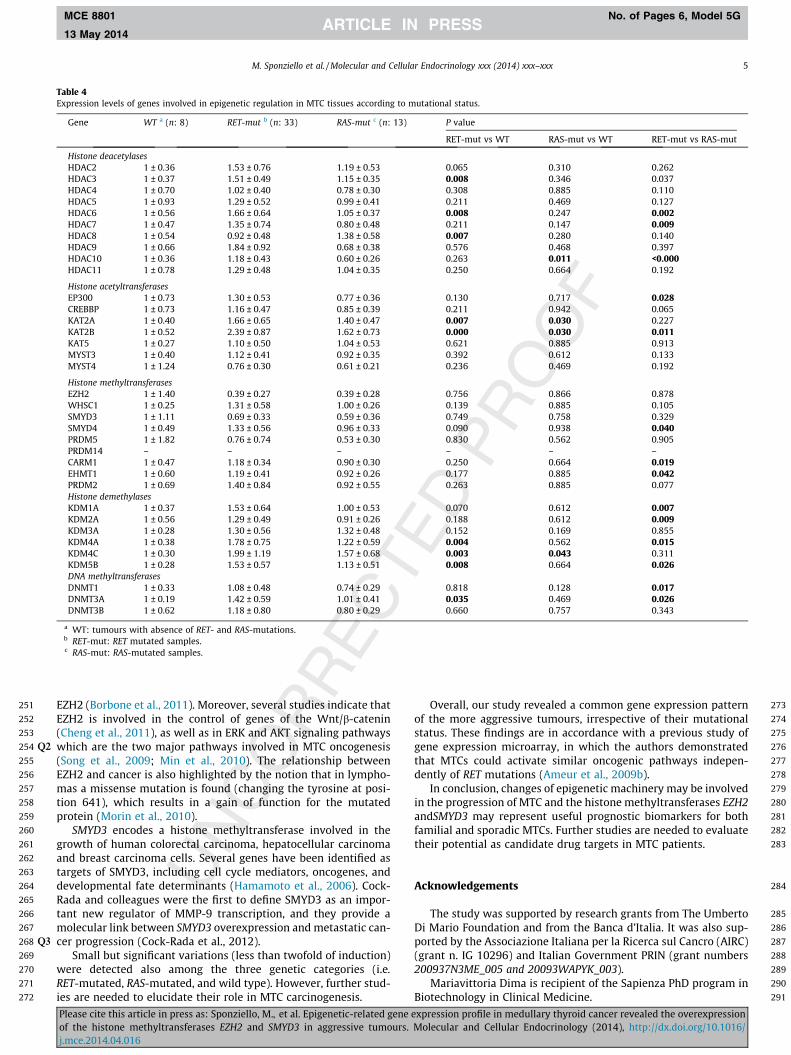
A third analysis was carried out on the basis of the mutationalstatus of the MTC patients, by separating all samples into 3 groups:RET-mutated, RAS-mutated, and wild type (RET- and RAS- wildtype) tissues. Overall, only small differences were detected amongthe three groups. Only a few differences were found betweenRAS-mutated and wild type tumours (overexpression of the histoneacetyltransferases KAT2A and KAT2B, and of histone demethylaseKDM5B). More interestingly, RET-mutated group showed highertranscript levels of many epigenetic regulators compared to bothwild type and RAS-mutated MTC groups. Specifically, significantdifferences were detected in the transcript levels of HDAC3, 6, 7,8 and 10, EP300, KAT2A and B, SMYD4, CARM1, EHMT1, KDM1A,2A, 4A, 4C and 5B, DNMT1 and 3A, when comparing the RET-mutated (mainly at codon 918), both germline and somatic, withRAS-mutated and wild type tumours. A fold-change more than 2
es according to the presence or absence of lymph node (N1 or N0) and
P value
N1 M0/Mx vs N0 M0 N1 M1 vs N0 M0 N1 M1 vs N1M0/Mx
0.583 0.576 0.3110.048 0.726 0.6060.120 0.700 0.3020.446 0.401 0.2340.563 0.916 0.6770.200 0.019 0.2500.976 0.726 0.6620.408 0.418 0.7920.063 0.069 0.8580.604 0.142 0.284
0.807 0.624 0.7210.807 0.861 0.9370.088 0.124 0.7510.082 0.441 0.6910.927 0.421 0.4040.951 0.05 0.0430.542 0.649 0.578
0.067 0.001 0.0220.161 0.132 0.5250.007 <0.0001 0.0190.464 0.221 0.7210.750 0.606 0.661– – –0.200 0.248 0.5250.063 0.093 0.5250.235 0.441 0.843
0.170 0.107 0.8430.135 0.059 0.4270.259 0.372 0.8740.532 0.441 0.8740.200 0.327 0.9370.088 0.013 0.211
0.113 0.025 0.2340.135 0.008 0.1770.136 0.045 0.454
expression profile in medullary thyroid cancer revealed the overexpressionMolecular and Cellular Endocrinology (2014), http://dx.doi.org/10.1016/
206
207
208
209
210
211
212
213
214
215
216
217
218
219
220
221
222
223
224
225
226
227
228
229
230
231
232
Table 3Expression levels of genes involved in epigenetic regulation in tumour tissues according to diseQ4 ase status and outcome of MTC patients.
Gene Disease status Pvalue
Outcome Pvalue
No evidence of Disease(n: 25)
Disease (n:18)
Alive or Death from other Causes(n: 35)
Death from MTC(n: 9)
Histone deacetylasesHDAC2 1 ± 0.41 1.00 ± 0.60 0.945 1 ± 0.41 1.17 ± 0.81 0.760HDAC3 1 ± 0.27 0.99 ± 0.43 0.890 1 ± 0.30 1.00 ± 0.52 0.896HDAC4 1 ± 0.44 0.90 ± 0.31 0.854 1 ± 0.41 0.89 ± 0.37 0.611HDAC5 1 ± 0.39 0.80 ± 0.40 0.334 1 ± 0.39 0.74 ± 0.50 0.250HDAC6 1 ± 0.36 0.93 ± 0.41 0.679 1 ± 0.37 0.85 ± 0.46 0.275HDAC7 1 ± 0.53 1.37 ± 0.64 0.043 1 ± 0.48 1.35 ± 0.72 0.134HDAC8 1 ± 0.44 0.92 ± 0.47 0.765 1 ± 0.44 0.83 ± 0.46 0.391HDAC9 1 ± 0.64 1.10 ± 0.74 0.588 1 ± 0.54 0.97 ± 1.05 0.321HDAC10 1 ± 0.50 1.17 ± 0.40 0.075 1 ± 0.44 1.14 ± 0.32 0.200HDAC11 1 ± 0.30 0.82 ± 0.47 0.118 1 ± 0.34 0.84 ± 0.57 0.263
Histone acetyltransferasesEP300 1 ± 0.51 1.01 ± 0.49 0.818 1 ± 0.49 0.96 ± 0.50 0.919CREBBP 1 ± 0.46 0.98 ± 0.48 0.982 1 ± 0.45 1.00 ± 0.57 0.896KAT2A 1 ± 0.42 1.08 ± 0.38 0.280 1 ± 0.42 1.23 ± 0.33 0.078KAT2B 1 ± 0.46 1.03 ± 0.49 0.679 1 ± 0.47 0.88 ± 0.57 0.738KAT5 1 ± 0.31 0.90 ± 0.37 0.491 1 ± 0.32 0.85 ± 0.42 0.551MYST3 1 ± 0.34 1.14 ± 0.46 0.270 1 ± 0.37 1.10 ± 0.45 0.532MYST4 1 ± 0.42 0.96 ± 0.47 0.890 1 ± 0.42 0.84 ± 0.49 0.330
Histone methyltransferasesEZH2 1 ± 0.50 2.76 ± 3.12 0.001 1 ± 0.75 2.92 ± 3.30 0.018WHSC1 1 ± 0.34 1.17 ± 0.44 0.198 1 ± 0.35 1.12 ± 0.48 0.631SMYD3 1 ± 0.54 1.99 ± 1.35 0.0003 1 ± 0.63 1.94 ± 0.44 0.004SMYD4 1 ± 0.36 0.87 ± 0.45 0.183 1 ± 0.39 0.80 ± 0.47 0.134PRDM5 1 ± 0.76 1.04 ± 1.15 0.585 1 ± 0.76 0.94 ± 1.32 0.163PRDM14 – – – – – –CARM1 1 ± 0.34 1.03 ± 0.33 0.730 1 ± 0.32 1.10 ± 0.38 0.330EHMT1 1 ± 0.34 1.08 ± 0.46 0.550 1 ± 0.36 1.07 ± 0.47 0.532PRDM2 1 ± 0.59 1.11 ± 0.81 0.748 1 ± 0.61 0.98 ± 0.85 0.873
Histone demethylasesKDM1A 1 ± 0.38 1.10 ± 0.52 0.287 1 ± 0.40 1.11 ± 0.57 0.476KDM2A 1 ± 0.34 1.18 ± 0.53 0.255 1 ± 0.38 1.16 ± 0.53 0.359KDM3A 1 ± 0.35 1.06 ± 0.49 0.756 1 ± 0.38 0.98 ± 0.47 0.793KDM4A 1 ± 0.42 1.00 ± 0.51 0.936 1 ± 0.45 0.95 ± 0.49 0.673KDM4C 1 ± 0.56 1.18 ± 0.85 0.535 1 ± 0.67 0.85 ± 0.49 0.494KDM5B 1 ± 0.40 1.29 ± 0.53 0.066 1 ± 0.38 1.42 ± 0.60 0.046
DNA methyltransferasesDNMT1 1 ± 0.42 1.35 ± 0.58 0.027 1 ± 0.47 1.37 ± 0.47 0.027DNMT3A 1 ± 0.40 1.26 ± 0.48 0.043 1 ± 0.42 1.20 ± 0.39 0.106DNMT3B 1 ± 0.59 1.40 ± 0.78 0.059 1 ± 0.63 1.13 ± 0.57 0.441
4 M. Sponziello et al. / Molecular and Cellular Endocrinology xxx (2014) xxx–xxx
MCE 8801 No. of Pages 6, Model 5G
13 May 2014
was detected only for the histone acetyltransferase KAT2B (Table 4).Expression of EZH2 and SMYD3 did not correlate significantly withmutational status of RET and RAS.
Again, for both genes, higher mRNA expression was found inN1M1 samples within each genetic category (RET mutant or WT)(data not shown).
233
234
235
236
237
238
239
240
241
242
243
244
245
246
247
248
249
250
4. Discussion
In the last few years, new molecularly targeted anticancer ther-apies have entered clinical practice for the management ofadvanced MTC (Durante et al., 2011, 2013). So far, internationalguidelines explicitly advise to restrict the use of these drugs topatients with progressive, distant metastases. In this setting, can-cer biomarkers able to predict the natural course of the diseaseare needed. However, except for codon 918 RET mutation, con-stantly associated with poor prognosis in both hereditary andnot-hereditary tumours (Elisei et al., 2008), there are no clearlyestablished molecular markers of aggressiveness.
As reported in many other cancer types, alterations of theepigenetic control of gene expression may be involved in theprogression of the tumours, acting as major determinants of themore aggressive malignancies in addition to RET gene aberrations.
Please cite this article in press as: Sponziello, M., et al. Epigenetic-related geneof the histone methyltransferases EZH2 and SMYD3 in aggressive tumours.j.mce.2014.04.016
Examination of several epigenetic regulators in a series of 54 MTCrevealed a significant increase of EZH2 and SMYD3 gene expression(more than 3 and 2-fold, respectively) in those cases harbouring amore aggressive behaviour (i.e., occurrence of lymph node and dis-tant metastases), and a worst clinical outcome (i.e., persistent dis-ease after primary treatment and disease-related death).
EZH2 is a histone methyltransferase, the catalytic subunit of thePolycomb-repressive complex 2, which induces trimethylation ofhistone H3 lysine 27 (H3K27me3) and therefore transcriptionalrepression in genes involved in cell growth, adhesion, and transfor-mation (Bae and Hennighausen, 2013). It is not expressed in adulttissues but, instead, is highly expressed in a wide range of hemato-poietic and solid tumours, including breast, prostate, colon, lung,pancreatic cancers, sarcoma and lymphomas, and its expressionis often correlated with poor prognosis (Chang and Hung, 2012).The functional consequence of increased EZH2 in cancer tissuesincludes the silencing of genes that promote differentiation andrestrain proliferation (Tan et al., 2014). For instance, EZH2 isinvolved in the transcriptional repression of the metastasissuppressor gene TIMP-3, thereby promoting cancer progressionand metastasis in both prostate (Shin and Kim, 2012) and lung(Xu et al., 2013) cancer cells. Interestingly, this is also acharacteristic of thyroid tumours of follicular origin in which onlyanaplastic/dedifferentiated cancer showed detectable levels of
expression profile in medullary thyroid cancer revealed the overexpressionMolecular and Cellular Endocrinology (2014), http://dx.doi.org/10.1016/
251
252
253
254 Q2
255
256
257
258
259
260
261
262
263
264
265
266
267
268 Q3
269
270
271
272
273
274
275
276
277
278
279
280
281
282
283
284
285
286
287
288
289
290
291
Table 4Expression levels of genes involved in epigenetic regulation in MTC tissues according to mutational status.
Gene WT a (n: 8) RET-mut b (n: 33) RAS-mut c (n: 13) P value
RET-mut vs WT RAS-mut vs WT RET-mut vs RAS-mut
Histone deacetylasesHDAC2 1 ± 0.36 1.53 ± 0.76 1.19 ± 0.53 0.065 0.310 0.262HDAC3 1 ± 0.37 1.51 ± 0.49 1.15 ± 0.35 0.008 0.346 0.037HDAC4 1 ± 0.70 1.02 ± 0.40 0.78 ± 0.30 0.308 0.885 0.110HDAC5 1 ± 0.93 1.29 ± 0.52 0.99 ± 0.41 0.211 0.469 0.127HDAC6 1 ± 0.56 1.66 ± 0.64 1.05 ± 0.37 0.008 0.247 0.002HDAC7 1 ± 0.47 1.35 ± 0.74 0.80 ± 0.48 0.211 0.147 0.009HDAC8 1 ± 0.54 0.92 ± 0.48 1.38 ± 0.58 0.007 0.280 0.140HDAC9 1 ± 0.66 1.84 ± 0.92 0.68 ± 0.38 0.576 0.468 0.397HDAC10 1 ± 0.36 1.18 ± 0.43 0.60 ± 0.26 0.263 0.011 <0.000HDAC11 1 ± 0.78 1.29 ± 0.48 1.04 ± 0.35 0.250 0.664 0.192
Histone acetyltransferasesEP300 1 ± 0.73 1.30 ± 0.53 0.77 ± 0.36 0.130 0.717 0.028CREBBP 1 ± 0.73 1.16 ± 0.47 0.85 ± 0.39 0.211 0.942 0.065KAT2A 1 ± 0.40 1.66 ± 0.65 1.40 ± 0.47 0.007 0.030 0.227KAT2B 1 ± 0.52 2.39 ± 0.87 1.62 ± 0.73 0.000 0.030 0.011KAT5 1 ± 0.27 1.10 ± 0.50 1.04 ± 0.53 0.621 0.885 0.913MYST3 1 ± 0.40 1.12 ± 0.41 0.92 ± 0.35 0.392 0.612 0.133MYST4 1 ± 1.24 0.76 ± 0.30 0.61 ± 0.21 0.236 0.469 0.192
Histone methyltransferasesEZH2 1 ± 1.40 0.39 ± 0.27 0.39 ± 0.28 0.756 0.866 0.878WHSC1 1 ± 0.25 1.31 ± 0.58 1.00 ± 0.26 0.139 0.885 0.105SMYD3 1 ± 1.11 0.69 ± 0.33 0.59 ± 0.36 0.749 0.758 0.329SMYD4 1 ± 0.49 1.33 ± 0.56 0.96 ± 0.33 0.090 0.938 0.040PRDM5 1 ± 1.82 0.76 ± 0.74 0.53 ± 0.30 0.830 0.562 0.905PRDM14 – – – – – –CARM1 1 ± 0.47 1.18 ± 0.34 0.90 ± 0.30 0.250 0.664 0.019EHMT1 1 ± 0.60 1.19 ± 0.41 0.92 ± 0.26 0.177 0.885 0.042PRDM2 1 ± 0.69 1.40 ± 0.84 0.92 ± 0.55 0.263 0.885 0.077Histone demethylasesKDM1A 1 ± 0.37 1.53 ± 0.64 1.00 ± 0.53 0.070 0.612 0.007KDM2A 1 ± 0.56 1.29 ± 0.49 0.91 ± 0.26 0.188 0.612 0.009KDM3A 1 ± 0.28 1.30 ± 0.56 1.32 ± 0.48 0.152 0.169 0.855KDM4A 1 ± 0.38 1.78 ± 0.75 1.22 ± 0.59 0.004 0.562 0.015KDM4C 1 ± 0.30 1.99 ± 1.19 1.57 ± 0.68 0.003 0.043 0.311KDM5B 1 ± 0.28 1.53 ± 0.57 1.13 ± 0.51 0.008 0.664 0.026DNA methyltransferasesDNMT1 1 ± 0.33 1.08 ± 0.48 0.74 ± 0.29 0.818 0.128 0.017DNMT3A 1 ± 0.19 1.42 ± 0.59 1.01 ± 0.41 0.035 0.469 0.026DNMT3B 1 ± 0.62 1.18 ± 0.80 0.80 ± 0.29 0.660 0.757 0.343
a WT: tumours with absence of RET- and RAS-mutations.b RET-mut: RET mutated samples.c RAS-mut: RAS-mutated samples.
M. Sponziello et al. / Molecular and Cellular Endocrinology xxx (2014) xxx–xxx 5
MCE 8801 No. of Pages 6, Model 5G
13 May 2014
EZH2 (Borbone et al., 2011). Moreover, several studies indicate thatEZH2 is involved in the control of genes of the Wnt/b-catenin(Cheng et al., 2011), as well as in ERK and AKT signaling pathwayswhich are the two major pathways involved in MTC oncogenesis(Song et al., 2009; Min et al., 2010). The relationship betweenEZH2 and cancer is also highlighted by the notion that in lympho-mas a missense mutation is found (changing the tyrosine at posi-tion 641), which results in a gain of function for the mutatedprotein (Morin et al., 2010).
SMYD3 encodes a histone methyltransferase involved in thegrowth of human colorectal carcinoma, hepatocellular carcinomaand breast carcinoma cells. Several genes have been identified astargets of SMYD3, including cell cycle mediators, oncogenes, anddevelopmental fate determinants (Hamamoto et al., 2006). Cock-Rada and colleagues were the first to define SMYD3 as an impor-tant new regulator of MMP-9 transcription, and they provide amolecular link between SMYD3 overexpression and metastatic can-cer progression (Cock-Rada et al., 2012).
Small but significant variations (less than twofold of induction)were detected also among the three genetic categories (i.e.RET-mutated, RAS-mutated, and wild type). However, further stud-ies are needed to elucidate their role in MTC carcinogenesis.
Please cite this article in press as: Sponziello, M., et al. Epigenetic-related geneof the histone methyltransferases EZH2 and SMYD3 in aggressive tumours.j.mce.2014.04.016
Overall, our study revealed a common gene expression patternof the more aggressive tumours, irrespective of their mutationalstatus. These findings are in accordance with a previous study ofgene expression microarray, in which the authors demonstratedthat MTCs could activate similar oncogenic pathways indepen-dently of RET mutations (Ameur et al., 2009b).
In conclusion, changes of epigenetic machinery may be involvedin the progression of MTC and the histone methyltransferases EZH2andSMYD3 may represent useful prognostic biomarkers for bothfamilial and sporadic MTCs. Further studies are needed to evaluatetheir potential as candidate drug targets in MTC patients.
Acknowledgements
The study was supported by research grants from The UmbertoDi Mario Foundation and from the Banca d’Italia. It was also sup-ported by the Associazione Italiana per la Ricerca sul Cancro (AIRC)(grant n. IG 10296) and Italian Government PRIN (grant numbers200937N3ME_005 and 20093WAPYK_003).
Mariavittoria Dima is recipient of the Sapienza PhD program inBiotechnology in Clinical Medicine.
expression profile in medullary thyroid cancer revealed the overexpressionMolecular and Cellular Endocrinology (2014), http://dx.doi.org/10.1016/
292
293
294
295
296297298299300301302303304305306307308309310311312313314315316317318319320321322323324325326327328329330331332333334335336
337338339340341342343344345346347348349350351352353354355356357358359360361362363364365366367368369370371372373374375376377378379380381382383384385386
6 M. Sponziello et al. / Molecular and Cellular Endocrinology xxx (2014) xxx–xxx
MCE 8801 No. of Pages 6, Model 5G
13 May 2014
Appendix A. Supplementary material
Supplementary data associated with this article can be found, inthe online version, at http://dx.doi.org/10.1016/j.mce.2014.04.016.
References
Ameur, N., Lacroix, L., Motte, N., Baudin, E., Caillou, B., Ducreux, M., Elias, D.,Chanson, P., Schlumberger, M., Bidart, J.M., 2009a. Mutational status of EGFR,BRAF, PI3KCA and JAK2 genes in endocrine tumors. Int. J. Cancer 124, 751–753.
Ameur, N., Lacroix, L., Roucan, S., Roux, V., Broutin, S., Talbot, M., Dupuy, C., Caillou,B., Schlumberger, M., Bidart, J.M., 2009b. Aggressive inherited and sporadicmedullary thyroid carcinomas display similar oncogenic pathways. Endocr.Relat. Cancer 16, 1261–1272.
Bae, W.K., Hennighausen, L., 2013. Canonical and non-canonical roles of the histonemethyltransferase EZH2 in mammary development and cancer. Mol. Cell.Endocrinol., doi: 10.1016/j.mce.2013.05.002.
Boichard, A., Croux, L., Al Ghuzlan, A., Broutin, S., Dupuy, C., Leboulleux, S.,Schlumberger, M., Bidart, J.M., Lacroix, L., 2012. Somatic RAS mutations occur ina large proportion of sporadic RET-negative medullary thyroid carcinomas andextend to a previously unidentified exon. J. Clin. Endocrinol. Metab. 97, E2031–E2035.
Borbone, E., Troncone, G., Ferraro, A., Jasencakova, Z., Stojic, L., Esposito, F., Hornig,N., Fusco, A., Orlando, V., 2011. Enhancer of Zeste Homolog 2 overexpression hasa role in the development of anaplastic thyroid carcinomas. J. Clin. Endocrinol.Metab. 96, 1029–1038.
Chang, C.J., Hung, M.C., 2012. The role of EZH2 in tumour progression. Br. J. Cancer106, 243–247.
Cheng, A.S., Lau, S.S., Chen, Y., Kondo, Y., Li, M.S., Feng, H., Ching, A.K., Cheung, K.F.,Wong, H.K., Tong, J.H., Jin, H., Choy, K.W., Yu, J., To, K.F., Wong, N., Huang, T.H.,Sung, J.J., 2011. EZH2-mediated concordant repression of Wnt antagonistspromotes b-catenin-dependent hepatocarcinogenesis. Cancer Res. 71, 4028–4039.
Castellone, M.D., Verrienti, A., Rao, D.M., Sponziello, M., Fabbro, D., Muthu, M.,Durante, C., Maranghi, M., Damante, G., Pizzolitto, S., Costante, G., Russo, D.,Santoro, M., Filetti, S., 2010. A novel de novo germ-line V292M mutation in theextracellular region of RET in a patient with pheochromocytoma and medullarythyroid carcinoma: Functional characterization. Clin. Endocrinol. (Oxford) 73,529–534.
Dowson, M.A., Kouzarides, T., 2012. Cancer epigenetics: from mechanism totherapy. Cell 150, 12–27.
Durante, C., Russo, D., Verrienti, A., Filetti, S., 2011. XL184 (cabozantinib) formedullary thyroid carcinoma. Expert Opin. Investig. Drugs 20, 407–413.
Durante, C., Paciaroni, A., Plasmati, K., Trulli, F., Filetti, S., 2013. Vandetanib: openinga new treatment practice in advanced medullary thyroid carcinoma. Endocrine44, 334–342.
Elisei, R., Cosci, B., Romei, C., Bottici, V., Renzini, G., Molinaro, E., Agate, L., Vivaldi, A.,Faviana, P., Basolo, F., Miccoli, P., Berti, P., Pacini, F., Pinchera, A., 2008.
387
Please cite this article in press as: Sponziello, M., et al. Epigenetic-related geneof the histone methyltransferases EZH2 and SMYD3 in aggressive tumours.j.mce.2014.04.016
Prognostic significance of somatic RET oncogene mutations in sporadicmedullary thyroid cancer: a 10-year follow-up study. J. Clin. Endocrinol.Metab. 93, 682–687.
Hamamoto, R., Silva, F.P., Tsuge, M., Nishidate, T., Katagiri, T., Nakamura, Y.,Furukawa, Y., 2006. Enhanced SMYD3 expression is essential for the growth ofbreast cancer cells. Cancer Sci. 97, 113–118.
Kloos, R.T., Eng, C., Evans, D.B., Francis, G.L., Gagel, R.F., Gharib, H., Moley, J.F., Pacini,F., Ringel, M.D., Schlumberger, M., Wells Jr., S.A., 2009. Medullary thyroidcancer: management guidelines of the American Thyroid Association. Thyroid19, 565–612.
Lombardo, F., Baudin, E., Chiefari, E., Arturi, F., Bardet, S., Caillou, B., Conte, C.,Dallapiccola, B., Giuffrida, D., Bidart, J.M., Schlumberger, M., Filetti, S., 2002.Familial medullary thyroid carcinoma: clinical variability and lowaggressiveness associated with RET mutation at codon 804. J. Clin. Endocrinol.Metab. 87, 1674–1680.
Min, J., Zaslavsky, A., Fedele, G., McLaughlin, S.K., Reczek, E.E., De Raedt, T., Guney, I.,Strochlic, D.E., Macconaill, L.E., Beroukhim, R., Bronson, R.T., Ryeom, S., Hahn,W.C., Loda, M., Cichowski, K., 2010. An oncogene-tumor suppressor cascadedrives metastatic prostate cancer by coordinately activating Ras and nuclearfactor-kappa B. Nat. Med. 16, 286–294.
Morin, R.D., Johnson, N.A., Severson, T.M., Mungall, A.J., An, J., Goya, R., Paul, J.E.,Boyle, M., Woolcock, B.W., Kuchenbauer, F., Yap, D., Humphries, R.K., Griffith,O.L., Shah, S., Zhu, H., Kimbara, M., Shashkin, P., Charlot, J.F., Tcherpakov, M.,Corbett, R., Tam, A., Varhol, R., Smailus, D., Moksa, M., Zhao, Y., Delaney, A., Qian,H., Birol, I., Schein, J., Moore, R., Holt, R., Horsman, D.E., Connors, J.M., Jones, S.,Aparicio, S., Hirst, M., Gascoyne, R.D., Marra, M.A., 2010. Somatic mutationsaltering EZH2 (Tyr641) in follicular and diffuse large B-cell lymphomas ofgerminal-center origin. Nat. Genet. 42, 181–185.
Santarpia, L., Ye, L., Gagel, R.F., 2009. Beyond RET: potential therapeutic approachesfor advanced and metastatic medullary thyroid carcinoma. J. Internal Med. 266,99–113.
Shin, Y.J., Kim, J.H., 2012. The role of EZH2 in the regulation of the activityof matrix metalloproteinases in prostate cancer cells. PLoS One 7,e30393.
Song, L.B., Li, J., Liao, W.T., Feng, Y., Yu, C.P., Hu, L.J., Kong, Q.L., Xu, L.H., Zhang, X., Liu,W.L., Li, M.Z., Zhang, L., Kang, T.B., Fu, L.W., Huang, W.L., Xia, Y.F., Tsao, S.W., Li,M., Band, V., Band, H., Shi, Q.H., Zeng, Y.X., Zeng, M.S., 2009. The polycomb groupprotein Bmi-1 represses the tumor suppressor PTEN and induces epithelial-mesenchymal transition in human nasopharyngeal epithelial cells. J. Clin.Invest. 119, 3626–3636.
Sponziello, M., Lavarone, E., Pegolo, E., Di Loreto, C., Puppin, C., Russo, M.A., Bruno,R., Filetti, S., Durante, C., Russo, D., Di Cristofano, A., Damante, G., 2013.Molecular differences between human thyroid follicular adenoma andcarcinoma revealed by analysis of a murine model of thyroid cancer.Endocrinology 154, 3043–3053.
Tan, J.Z., Yan, Y., Wang, X.X., Jiang, Y., Xu, H.E., 2014. EZH2: biology, disease, andstructure-based drug discovery. Acta Pharmacol. Sin. 35, 161–174.
Xu, C., Hou, Z., Zhan, P., Zhao, W., Chang, C., Zou, J., Hu, H., Zhang, Y., Yao, X., Yu, L.,Yan, J., 2013. EZH2 regulates cancer cell migration through repressing TIMP-3 innon-small cell lung cancer. Med. Oncol. 30, 713.
expression profile in medullary thyroid cancer revealed the overexpressionMolecular and Cellular Endocrinology (2014), http://dx.doi.org/10.1016/
Copyright © 2022 FDOKUMEN