Elucidating dynamic responses of North Pacific fish populations to climatic forcing: Influence of...
18
This article appeared in a journal published by Elsevier. The attached copy is furnished to the author for internal non-commercial research and education use, including for instruction at the authors institution and sharing with colleagues. Other uses, including reproduction and distribution, or selling or licensing copies, or posting to personal, institutional or third party websites are prohibited. In most cases authors are permitted to post their version of the article (e.g. in Word or Tex form) to their personal website or institutional repository. Authors requiring further information regarding Elsevier’s archiving and manuscript policies are encouraged to visit: http://www.elsevier.com/copyright
-
Upload
independent -
Category
Documents
-
view
1 -
download
0
Transcript of Elucidating dynamic responses of North Pacific fish populations to climatic forcing: Influence of...

This article appeared in a journal published by Elsevier. The attachedcopy is furnished to the author for internal non-commercial researchand education use, including for instruction at the authors institution
and sharing with colleagues.
Other uses, including reproduction and distribution, or selling orlicensing copies, or posting to personal, institutional or third party
websites are prohibited.
In most cases authors are permitted to post their version of thearticle (e.g. in Word or Tex form) to their personal website orinstitutional repository. Authors requiring further information
regarding Elsevier’s archiving and manuscript policies areencouraged to visit:
http://www.elsevier.com/copyright
Author's personal copy
Elucidating dynamic responses of North Pacific fish populations to climaticforcing: Influence of life-history strategy
A. Yatsu a,*, K.Y. Aydin b, J.R. King c, G.A. McFarlane c, S. Chiba d, K. Tadokoro e, M. Kaeriyama f, Y. Watanabe g
a Hokkaido National Fisheries Research Institute, 116 Katsurakoi, Kushiro 085-0802, Japanb Alaska Fisheries Science Center, National Marine Fisheries Service, 7600 Sand Point Way NE, Seattle, WA 98115-0070, USAc Pacific Biological Station, Fisheries and Oceans Canada, Nanaimo, British Columbia, Canada V9T 6N7d Ecosystem Change Research Program, JAMSTEC, 3173-25 Showa-machi, Kanazawa-ku, Yokohama 236-0001, Japane Tohoku National Fisheries Research Institute, Shinhama-cho, Shiogama 985-0001, Japanf Graduate School of Fisheries Science, Hokkaido University, 3-1-1 Minato-cho, Hakodate 041-8611, Japang Ocean Research Institute, University of Tokyo, 1-15-1 Minamidai, Nakanoku, Tokyo 164-8639, Japan
a r t i c l e i n f o
Available online 1 April 2008
Keywords:Regime shiftZooplanktonFishesLife-history strategyPopulation dynamicsMechanistic modelsKuroshio/OyashioOkhotsk SeaBering SeaGulf of AlaskaCalifornia
a b s t r a c t
In order to explore mechanistic linkages between low-frequency ocean/climate variability, and fishpopulation responses, we undertook comparative studies of time-series of recruitment-related produc-tivity and the biomass levels of fish stocks representing five life-history strategies in the northern NorthPacific between the 1950s and the present. We selected seven species: Japanese sardine (Sardinopusmelanostictus) and California sardine (Sardinopus sagax) (opportunistic strategists), walleye pollock(Theragra chalcogramma, intermediate strategist), pink salmon (Oncorhynchus gorbuscha, salmonic strat-egist), sablefish (Anoplopoma fimbria) and Pacific halibut (Hippoglossus stenolepis) (periodic strategists)and spiny dogfish (Squalus acanthias, equilibrium strategist). The responses in terms of productivity ofsardine, pink salmon, sablefish and halibut to climatic regime shifts were generally immediate, delayed,or no substantial responses depending on the particular regime shift year and fish stock (population). Inwalleye pollock, there were some periods of high productivity and low productivity, but not coinciden-tal to climatic regime shifts, likely due to indirect climate forcing impacts on both bottom-up and top-down processes. Biomass of zooplankton and all fish stocks examined, except for spiny dogfish whosedata were limited, indicated a decadal pattern with the most gradual changes in periodic strategistsand most intensive and rapid changes in opportunistic strategists. Responses of sardine productivityto regime shifts were the most intense, probably due to the absence of density-dependent effectsand the availability of refuges from predators when sardine biomass was extremely low. Spiny dogfishwere least affected by environmental variability. Conversely, spiny dogfish are likely to withstand onlymodest harvest rates due to their very low intrinsic rate of increase. Thus, each life-history strategytype had a unique response to climatic forcing, owing to their inherent biological traits such as mode,frequency and intensity of reproduction, early life style, age of maturity and longevity. On the otherhand, responses of different stocks within a species to climatic regime shifts were unique to each localregion, because large-scale climatic forcings are modulated by local physical, chemical and biologicalprocesses. The observed response time or absence of response in recruitment-related fish productivityto climatic regime shifts may be influenced by (1) local environmental conditions (immediate, with adelay or no effects), (2) phenological shifts in zooplankton life-history (immediate or with a delay), and(3) stochastic episodic events in both top-down and bottom-up processes (immediate, with a delay orno effects).
� 2008 Elsevier Ltd. All rights reserved.
1. Introduction
Environmental-forced decadal-scale fluctuations of many com-mercial fish stocks are now well known, usually examined throughcomparisons of long time-series of commercial catch and large-scale climatic forcing indices such as the Aleutian Low PressureIndex (Beamish, 1995; Hare and Mantua, 2000). The mechanistic
0079-6611/$ - see front matter � 2008 Elsevier Ltd. All rights reserved.doi:10.1016/j.pocean.2008.03.009
* Corresponding author. Present address: Seikai National Fisheries ResearchInstitute, Fisheries Research Agency, Taira-machi, Nagasaki 851-2213, Japan.
E-mail addresses: [email protected] (A. Yatsu), [email protected](K.Y. Aydin), [email protected] (J.R. King), [email protected] (G.A. McFarlane), [email protected] (S. Chiba), [email protected] (K. Tado-koro), [email protected] (M. Kaeriyama), [email protected](Y. Watanabe).
Progress in Oceanography 77 (2008) 252–268
Contents lists available at ScienceDirect
Progress in Oceanography
journal homepage: www.elsevier .com/locate /pocean
Author's personal copy
linkages between climate forcing and fish stocks (populations),however, are poorly known. Climate forcing affects physical pro-cesses, primary production and prey-predator relations in localecosystems (Pyper et al., 2001; Yatsu et al., 2005). The mechanisticlinkages are the response of key biological processes, such asgrowth, survival, recruitment and maturation in relation tochanges in the local environment (Hunt et al., 2002). Importantkey processes may differ from stock to stock, depending on ambi-ent ecosystems and may differ between life-history strategies(Rose et al., 2001; Winemiller, 2005). In addition, the populationresponses of marine fish to the same climate forcing events maydiffer depending on each species’ life-history strategy.
Marine fish evolved a wide range of life-history strategies todeal with varying environmental conditions. These strategies canbe generalized into five major categories: opportunistic strategists,which are species that are short-lived, with early maturation andlow fecundity; periodic strategists, which are species that arelong-lived, with late maturation and high fecundity; equilibriumstrategists, which are also long-lived and late maturing species,but with extreme low fecundity with large egg-size or parentalcare; salmonic strategists comprised of species with a freshwaterand a marine phase; and intermediate strategists, which are specieswith a lifespan, maturation rate and fecundity that are intermedi-ate to the opportunistic and periodic strategists (King and McFar-lane, 2003; McCann and Shuter, 1997; Winemiller and Rose, 1992).
On the basis of combinations of demographic features (juvenilesurvivorship, age of maturity, and fecundity) and environmentalconditions of habitats, Rose et al. (2001) expected greater interan-nual variation of recruitment in periodic and opportunistic strate-gists than in equilibrium strategists and verified their hypothesisusing 249 fish populations belonging to 57 species (standard devi-ation of log-transformed residuals of recruitment values from pre-dicted spawner-recruitment curves were 0.71, 0.60 and 0.55 inopportunistic, periodic and equilibrium strategists, respectively).Similarly, Winemiller (2005) argued that (1) fish populations ofthe opportunistic type are expected to be well below their fluctu-ating carrying capacity most of the time and subject to high-fre-quency density-independent source of mortality, (2) equilibriumstrategists are subject to strong density-dependence, and (3) peri-odic strategists should show low-frequency interannual recruit-ment variability. Recruitment is probably the most importantprocess for fish stock fluctuation, because their eggs and larvaeare small and hence subject to both bottom-up and top-down ef-fects of ecosystems and climate change (Hunt and McKinnell,2006). Since interannual variation in recruitment reflects bothcompensation (the net effect of the density-dependent processesthat cause negative feedback on population size) and environmen-tal fluctuations (Rose et al., 2001), time-series comparisons ofrecruitment-related productivity such as recruitment per spawner(RPS) among different life-history strategies within and betweenecosystems are important for understanding mechanisms of stockfluctuation. The idea of life-history strategy is useful for fisheriesmanagement; however, responses to ocean/climate regime shifts
are also of great interests for management, yet the combinedeffects have never been examined. Our expectations of responsesto a regime shift for five life-history strategists are shown inTable 1.
For the synthesis of PICES/GLOBEC Climate Change and CarryingCapacity program, the CFAME (Climate Forcing and Marine Ecosys-tem) Task Team undertook comparative studies of conceptualmechanistic models of the linkages between climate forcing andfish population responses. Target species were selected for eachof the five life-history strategies: Japanese sardine (Sardinopusmelanostictus) and California sardine (S. sagax) (opportunistic strat-egists), walleye pollock (Theragra chalcogramma, intermediatestrategist), pink salmon (Oncorhynchus gorbuscha, salmonic strate-gist), sablefish (Anoplopoma fimbria) and Pacific halibut (Hippoglos-sus stenolepis) (periodic strategists) and spiny dogfish (Squalusacanthias, equilibrium strategist).
The objectives of this paper are three-fold: (1) to describe time-series data of ocean/climate forcing, zooplankton biomass andrecruitment-related indicators, productivity, biomass and associ-ated factors of the above fish species distributed in the northernNorth Pacific Ocean, (2) to compare responses of these fish speciesto ocean/climate regime shifts, and (3) to discuss possiblemechanisms, commonalities and differences in response by fivelife-history strategists, and their implications for ecosystem stud-ies and monitoring.
2. Material and methods
2.1. Environmental data
Several climatic and oceanographic indices were selected torepresent temporal variability in Pacific-basin climate forcing.The Pacific Decadal Oscillation (PDO) and Victoria pattern (Bondet al., 2003) index in winter (November–March) for the period1950–2003 were provided by Dr. Mick Spillane of the PacificMarine Environmental Laboratory, National Oceanic and Atmo-spheric Administration in Seattle. The PDO is the first empiricalorthogonal function (EOF1), and the Victoria index the secondEOF (EOF2) of the pattern of North Pacific sea surface temperature(SST). The winter Arctic Oscillation (AO) was calculated as amean January–March values from http://www.atmos.colostate.edu/ao/Data/ao_index.html. Scripps pier SST data was taken fromftp://ccsweb1.ucsd.edu/shore/active_data/lajolla_sio/temperatureand mean January–March values were calculated for winter. SSTtime series of the Kuroshio Extension south area were adaptedfrom Noto (2003). Years designated as regime shifts since the1950s followed Yasunaka and Hanawa (2002) who identified re-gime shifts in 1957/58, 1970/71, 1976/1977 and 1988/1989 basedon significant and systematic changes in terms of (1) the number ofgrids with significant changes in SST and (2) significant changes inthe first two modes of an EOF analysis of SST variations over theNorthern Hemisphere (Fig. 1). Generally, the 1976/1977 and1988/1989 regime shifts have been described as major shifts
Table 1Summary of expected responses to climatic regime shifts of five life-history strategists
Strategy Speciesexamined
Expected responses to climatic regime shifts Biological reasons
Opportunistic Sardine Immediate and drastic Short lifespan and young age at maturityIntermediate Walleye pollock Oscillatory Juveniles are opportunistic but good year-classes followed by strong density-
dependenceSalmonic Pink salmon Immediate and drastic but with two phases Freshwater and marine life stages involve two phases for climate forcingPeriodic Sablefish, Halibut Immediate but gradual and delayed population
responseOlder ages of recruitment
Equilibrium Dogfish Slight Low fecundity and stable early survival rate
A. Yatsu et al. / Progress in Oceanography 77 (2008) 252–268 253

Author's personal copy
having Pacific-wide impacts, and the 1957/58 and 1970/1971 re-gime shifts have been described as minor shifts with limited eco-logical impacts. We also designated 1998/1999 as a regime shiftaccording to King (2005). Other physical and chemical environ-mental factors relevant to lower trophic production of regionalecosystems were collected from various published sources (e.g.,King, 2005; Miller et al., 2004; PICES, 2004).
2.2. Biological data
Time series of relative biomass (wet weight (g) per m3) of meso-zooplankton in summer (June–August) were analyzed for five sub-arctic and one transitional region of the North Pacific Oceanfollowing Sugimoto and Tadokoro (1997) and Odate (1994): Gulfof Alaska (eastern Pacific); the basin and shelf areas of the easternBering Sea; central Pacific, Oyashio and Kuroshio-Oyashio Transi-tion Zone. The eastern Bering Sea was divided into shelf (bottomdepth of 0–250 m) and basin regions (>500 m). Data obtained fromthe continental slope area (250–500 m) were omitted because ofthe small sample size. Data were obtained from T/S Oshoro Marucruises during 1956–2000 (Hokkaido University, 1957–2001),Ocean Weather Station Papa during 1957–1980 (Waddell andMcKinnell, 1995), Odate (1994) and its subsequent unpublished re-cords held by the Tohoku National Fisheries Research Institute.
Catch, age-aggregated biomass (hereafter, simply biomass),recruitment and spawning stock biomass (SSB) of the Pacific stockof Japanese sardine was taken from Yatsu et al. (2005). Catch andrecruitment per spawner (RPS) data of the California sardine weretaken from Hill et al. (2005). Russian pink salmon catch data weretaken from Eggers et al. (2004). Pink salmon data were lagged bytwo years in order to obtain the stock-recruitment relationship,since the life span of pink salmon is exactly two years. Data ofcatch, escapement, and juveniles released for Hokkaido pink sal-mon were adopted from Kaeriyama (1999). British Columbia pinksalmon catch and escapement data were available from The PacificSalmon Commission (PSC, 1988, 1990, 1994, 1996, 1998, 1999;2000, 2005). Catch and biomass data of walleye pollock in the Okh-otsk Sea and western Kamchatka were adopted from Bulatov(2003). Catch, biomass, recruitment and SSB data of two stocks ofwalleye pollock from Japanese waters were taken from Yabuki(2005) and Yabuki and Honda (2005). Walleye pollock data fromthe eastern Bering Sea and Gulf of Alaska were taken from Ianelliet al. (2005) and Dorn et al. (2005). Pacific halibut in the easternNorth Pacific were from Clark et al. (2002). Sablefish data fromthe Gulf of Alaska and British Columbia were taken from Hansel-man et al. (2005) and Haist et al. (2005), respectively. Catch andcatch-per-unit-effort (CPUE) data for spiny dogfish in Japaneseand Canadian waters were taken from Muto (2005) and Fisheries
Fig. 1. Time-series of (a) Pacific Decadal Oscillation (PDO), (b) Victoria mode, and (c) Arctic Oscillation (AO) in winter with years of climatic regime shifts indicated by verticallines (Yasunaka and Hanawa, 2002; except for the 1998/99 regime shift), and regime shift index (d).
254 A. Yatsu et al. / Progress in Oceanography 77 (2008) 252–268

Author's personal copy
and Oceans Canada catch databases (Fisheries and Oceans Canada,Pacific Region, Catch Statistics Unit; Fisheries and Oceans Canada,Pacific Region, Groundfish Data Unit), respectively. Other life-his-tory parameters were obtained from various sources. Recruit-ment-related productivity measures were standardized to broodyears for comparison with environmental conditions and shifts.
2.3. Measures of fish productivity
We used three measures of fish productivity: production perunit biomass (P/B, year�1), recruitment per spawner (RPS) and log-arithm of recruitment residuals from the Ricker model (LNRR).Units for recruitment and spawners are either individual numbersor weight. Thus, RPS may not have a dimension.
Production of a year Pt was computed from
Pt ¼ Btþ1 � Bt þ Ct ð1Þ
where Ct and Bt is catch and biomass in year t, respectively.Log-recruitment residuals (LNRR) from the Ricker model were
also used, since RPS is often subject to density-dependence:
LNRR ¼ lnðRobst
RrictÞ ¼ lnðRPSobst
RPSrictÞ ¼ lnðRobst
SobstÞ � ða� bSobstÞ ð2Þ
where Robst and Sobst is observed recruitment and spawners in yeart, respectively, a, b, Rrict are parameters and expected recruitmentof a Ricker curve fitted to a time series of Robst and Sobst, respec-tively, RPSobst and RPSrict is observed and expected recruitmentper spawners in year t, respectively (Pyper et al., 2001; Yatsuet al., 2005).
We considered LNRR as the preferred recruitment-related indi-cator followed by RPS and recruitment. LNRR is the most suitableto explore mechanisms and to detect responses of a populationto regime shifts; in theory, it is independent of the population size(density). Similarly, RPS is preferable to recruitment, as the effectof SSB is removed. Since production is an aggregation of recruit-ment, individual growth, mortality, and compensation (Roseet al., 2001), P/B may be a less sensitive indicator for mechanisticstudies of population fluctuation.
2.4. Method of shift detection
Among several methods for the detection of regime shift yearsin time-series, only that of Rodionov (2004, 2006) can be appliedto potential recent shifts. His method was initially based on asequential t-test that can assess the probability of a shift in real-time, and was further expanded to exclude serial autocorrelation(red noise) by either adopting a prewhitening technique or adjust-ing the degrees of freedom of a t-test (Rodionov, 2006). The mag-nitude of a shift is indicated by the regime shift index (RSI):
RSI ¼Xcþm
i¼c
x�ilrl
ð3Þ
where c is a potential shift year, l is cutoff length, m is 0, 1,. . . l-1(i.e., number of years since the start of a potential new regime), rl
is the average standard deviation for all one-year intervals in thetime-series, and x�l is normalized deviations from the hypotheticalmean level of new regime, for which the difference from the meanlevel for the current regime is statistically significant according to aStudent’s t-test (Rodionov, 2004). We used STARS version 3.2 down-loaded from http://www.beringclimate.noaa.gov/regimes/. Sinceour time-series is relatively short (<60 years) and fish productionmay shift not only on decadal scales but also shorter time-scales(for example, corresponding to El Niño Southern Oscillation (ENSO)events), we had to adjust the degrees of freedom in order to over-come potential autocorrelation effects by setting the cutoff lengthas five years. The level of statistical significance was set to 0.1.
3. Results and discussion
3.1. Climatic regime shifts
The five regime shifts identified by Yasunaka and Hanawa(2002) and King (2005) since the 1950 s (Fig. 1) are closely relatedto changes in atmospheric circulation as indexed by the AleutianLow (PNA pattern) and Arctic Oscillation (AO) (Yasunaka andHanawa, 2002). The regime shift index (RSI) was highest in 1978,for which the PDO is responsible, followed by 1999 (Victoria),1989 (AO and PDO), 1958 (PDO), 1971 (PDO), and 1956 (Victoria)(Fig. 1d). Thus, six regimes since the 1950s were verified and theyhave different combinations of PDO, Victoria and AO anomalies, aswell as ENSO (King, 2005, Table 2). RSI results confirmed previousknowledge that 1977 shift is the most prominent and 1970 shift isthe least significant. These ocean/climatic indices (PDO, Victoriaand AO) show step-like shifts, as well as high-frequency variabilityduring a regime. We used ocean/climatic regime shifts (hereafter,simply climatic regime shifts) to discriminate these regime shiftsfrom ecosystem or fishery regime shifts which may be laggeddue to the biology of the system (Bakun, 2005; Hunt et al., 2002).
3.2. Effects of climatic forcings to lower trophic production of regionalecosystems
The effects of the well documented 1976/77 and 1988/89climatic regime shifts on regional ecosystems of the North Pacificfrom winter to spring are summarized in Fig. 2. After the 1976/77 regime shift, the Aleutian Low intensified and enhanced subarc-tic circulation (PDO mode), thus eastern North Pacific and easternBering Sea became warmer in contrast to cooled western NorthPacific and its marginal seas. Biological production in the Gulf ofAlaska (Brodeur et al., 1996) and Transitional Zone of the centralPacific (Polovina et al., 1994) was enhanced, but decreased in theCalifornia Current (McGowan et al., 1996) and the Oyashio regions(Chiba et al., 2004). After the 1988/89 regime shift, the AleutianLow weakened and the polar vortex was intensified (Victoriamode), resulting in reversed temperature conditions (with aNorth-South contrast). Biological production of regional ecosys-tems, however, was not necessarily reversed. For example, thespring bloom in the Kuroshio/Oyashio region was earlier than theprevious regime (Chiba et al., 2006). The response of lower trophicecosystems to the 1988/89 regime shift is generally weaker in theeastern North Pacific.
Summer-time mesozooplankton relative biomass of the six sub-arctic regions of the North Pacific (Fig. 3) generally (but not always)showed oscillatory low-frequency variability with some coherencyto climatic regime shifts. The RSI was highest in 1993 for bothOyashio and Kuroshio-Oyashio Transition Zone (KOTZ), followedby 1998 (KOTZ), 2002 (Oyashio), 1997 (KOTZ), 1977 (Oyashio),1968 (KOTZ), and 1969 (Oyashio) (Fig. 3d). Since Rodionov(2004) method cannot be applicable to time-series with missingvalues, RSI was not calculated for the remaining five areas. During
Table 2Characteristics of six regimes since 1950 in terms of PDO winter, Victoria winter, AOwinter and El Niño/La Niña
Regime PDO Victoria AO El Niño/La Niña
–1957 � Variable � Variable1958–70 Variable Variable � Variable1971–76 � Variable + La Niña dominant1977–89 + Variable � El Niño dominant1990–98 Variable � + El Niño dominant1999– Variable + Variable La Niña dominant
+: positive anomaly, �: negative anomaly.
A. Yatsu et al. / Progress in Oceanography 77 (2008) 252–268 255

Author's personal copy
1958–1970, the 5-year running mean of zooplankton biomass in-creased in all seven areas; thereafter, biomass trend differed byarea. Thus, there are only weak correlations among areas exceptthat observed between Oyashio and KOTZ, and between the BeringSea shelf and Western Pacific (Table 3). The correlation betweenOyashio and KOTZ was statistically significant (P < 0.05), even afterautocorrelation was removed by the method of Pyper and Peter-man (1998). It was impossible, however, to estimate statistical sig-nificance between Bering Sea shelf and Western Pacific, since theyhave many missing data points. If we compare the observed re-sponse of zooplankton biomass to the 1976/77 regime shift withthe expected biological production based on the physical andchemical conditions (e.g., the conceptual model of Fig. 2a; Fig. 3)in each regions, they were, as expected, identical in the Oyashio,KOTZ and Eastern Subarctic Pacific regions. After the 1988/89 re-gime shift (Fig. 2b), the zooplankton biomass responded as antici-pated in the Eastern Subarctic Pacific, however, zooplankton
biomass recovered more slowly than anticipated in the Oyashioand KOTZ (Fig. 3). This delay or shift in 1993 may be caused froma common factor: the stock collapse and subsequent plausiblereduction of predation by Japanese sardine (Figs. 4 and 5; Tanigu-chi, 1999; Tadokoro et al., 2005), which represents the outstandingbiomass and catch among small pelagic fishes in western North Pa-cific. Thus, the delayed recovery of zooplankton biomass may be alagged ecosystem response of 1988 climatic regime shift.
These examples suggest that top-down effects and large-scaleclimatic forcing will impact biological production of local ecosys-tems differently, probably through changes in oceanic current sys-tems, wind field, timing and intensity of stratification, solarradiation, and nutrient supply, which are unique to each region.There are, however, some commonalities in the zooplankton bio-mass trends in 1960s for all areas, for which we have no mechanis-tic hypothesis yet, and in the statistically significant correlationbetween Oyashio and KOTZ, which are geographically proximate.
Fig. 2. Schematic drawings of winter climate and lower trophic biological production during winter-spring in the North Pacific: (a) after the 1976/77 regime shift; (b) afterthe 1988/89 regime shift.
256 A. Yatsu et al. / Progress in Oceanography 77 (2008) 252–268

Author's personal copy
The transition from observed step-like climatic regime shifts tomore gradual oscillatory trajectories in zooplankton biomass prob-ably arises due to many complex interactions that integrate eco-system processes.
3.3. Sardines (opportunistic strategy)
Japanese and California sardine live seven years or more, andmature at age 1 when the population is small or age 3 when
the population is abundant (Nishida et al., 2006; http://www.fish-base.org/). The age of recruitment is about 10 months and twoyears in the Japanese and California sardine, respectively (Jacob-son and MacCall, 1995; Yatsu et al., 2005). The synchrony in bio-mass trends (based on catch) of world sardine populations andthe alternation of sardine/anchovy cycles are well known and of-ten cited as an example of large-scale climate forcing on fish pop-ulations (Chavez et al., 2003; Kawasaki, 1983; Lluch-Belda et al.,1989). Catches and biomass trends of Japanese and California sar-dine were in phase from the 1910s until the early 1990s (Fig. 4a).However, since the early 1990s only the California sardine catchhas increased. It should be noted that different stocks of sardineoff California and Mexico have contributed to catches during thepeak periods of the 20th century, and that a sardine fishery inthe Gulf of California started in the late 1960s (Fig. 4a). Accordingto Chavez et al. (2003), an intensified Aleutian Low brings favor-able conditions for Japanese, California and Chile-Peruvian sar-dines and unfavorable conditions for anchovies in these threeregions. In contrast, Takasuka et al. (2008) and Takahashi et al.(2004) proposed a simple ‘‘optimum temperature hypothesis”based on the observed differential of optimum temperatures for
Western Subarctic Pacific
0
200
400
600
800
1.000
1950 1960 1970 1980 1990 2000
Biom
ass
(mg
m-3)
Oyashio
0
100
200
300
400
500
1950 1960 1970 1980 1990 2000
Biom
ass
(mg
m-3
)
Kuroshio-Oyashio Transition
0
50
100
150
200
250
1950 1960 1970 1980 1990 2000
Year
Biom
ass
(mg
m-3)
Bering Sea Basin
0
200
400
600
800
1.000
1.200
1950 1960 1970 1980 1990 2000
Biom
ass
(mg
m-3
)
Bering Sea Shelf
0200400600800
1.0001.2001.4001.600
1950 1960 1970 1980 1990 2000
Biom
ass
(mg
m-3
)Eastern Subarctic Pacific
0100200300400500600700
1950 1960 1970 1980 1990 2000
Biom
ass
(mg
m-3
)
0.0
0.5
1.0
1.5
2.0
2.5
3.0
1950 1960 1970 1980 1990 2000
Year
Reg
ime
shift
inde
x Kuroshio-Oyashio Transition
Oyashio
Central Subarctic Pacific
0200400600800
1.0001.2001.400
1950 1960 1970 1980 1990 2000
Year
Biom
ass
(mg
m-3)
Fig. 3. Time-series of mesozooplankton relative biomass (wet weight in mg per cubic meter) in summer (June–August) of major ecosystems of the North Pacific (a–c and e–h)and regime shift index for Oyashio and Kuroshio-Oyashio Transition Zone (d). Dots: annual value, lines: 5-year running mean.
Table 3Correlation coefficients and significance levels of zooplankton time-series of six areas
Oyashio KOTZ Western Central Eastern BS basin BS shelf
Oyashio 0.68 0.02 0.12 0.44 �0.08 0.13KOTZ P < 0.05 �0.06 �0.07 0.13 0.02 �0.07Western 0.55 �0.14 0.12 0.63Central 0.24 0.29 0.27Eastern �0.13 0.17BS basin 0.28
Only that between Oyashio and KOTZ was statistically significant when effect ofautocorrelation was removed. BS: Bering Sea, KOTZ: Kuroshio-Oyashio TransitionZone.
A. Yatsu et al. / Progress in Oceanography 77 (2008) 252–268 257
Author's personal copy
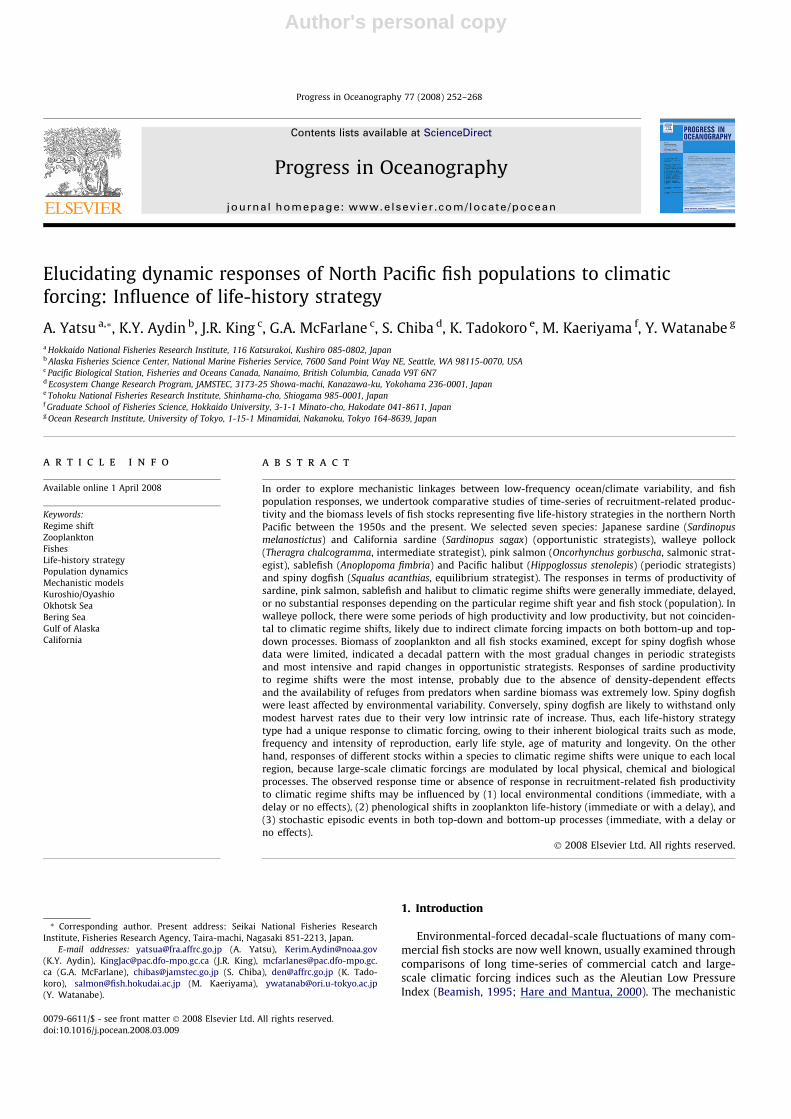
early growth of Japanese and California sardines and anchoviesfrom field data and tank rearing experiments: Japanese sardineand California anchovy flourish in cool regimes, but Japanese an-chovy and California sardine flourish in warm regimes. Therefore,reversed temperature condition between western and easternNorth Pacific (Fig. 2) will result in synchrony in sardine/anchovycycle through the reversed optimum temperature by species(Takasuka et al., 2007). From the 1920s to early 1940s, catchesof both of the Japanese and California sardine were high. TheSST anomaly (SSTa, hereafter) was negative in the Kuroshio Exten-sion south area (key area for Japanese sardine recruitment successor failure) during this period (Noto and Yasuda, 1999; Yatsu et al.,2005; Fig. 4b). In contrast, SSTa was positive in the California Cur-rent during the sardine peaks in the 1930s–1940s (Jacobson andMacCall, 1995; Fig. 4c). Consistent negative SSTa of the KuroshioExtension south were observed from the early 1970s to the late1980s, corresponding to the increase of Japanese sardine catchand subsequent decline in the 1990s which was caused by consec-utive recruitment failures from 1988 to 1991 when SST turnedinto positive anomalies (Noto and Yasuda, 1999; Watanabeet al., 1995). In the California Current, consistent positive SSTavalues started in the late 1970s and lasted to the present, consis-tent with the slowly increasing catch shown in Fig. 4a. In additionto the unfavorable conditions in waters off Japan, intensive fishingis also responsible for the continuous decline of sardine since the
mid 1990s when SST conditions were moderate (Yatsu and Kae-riyama, 2005).
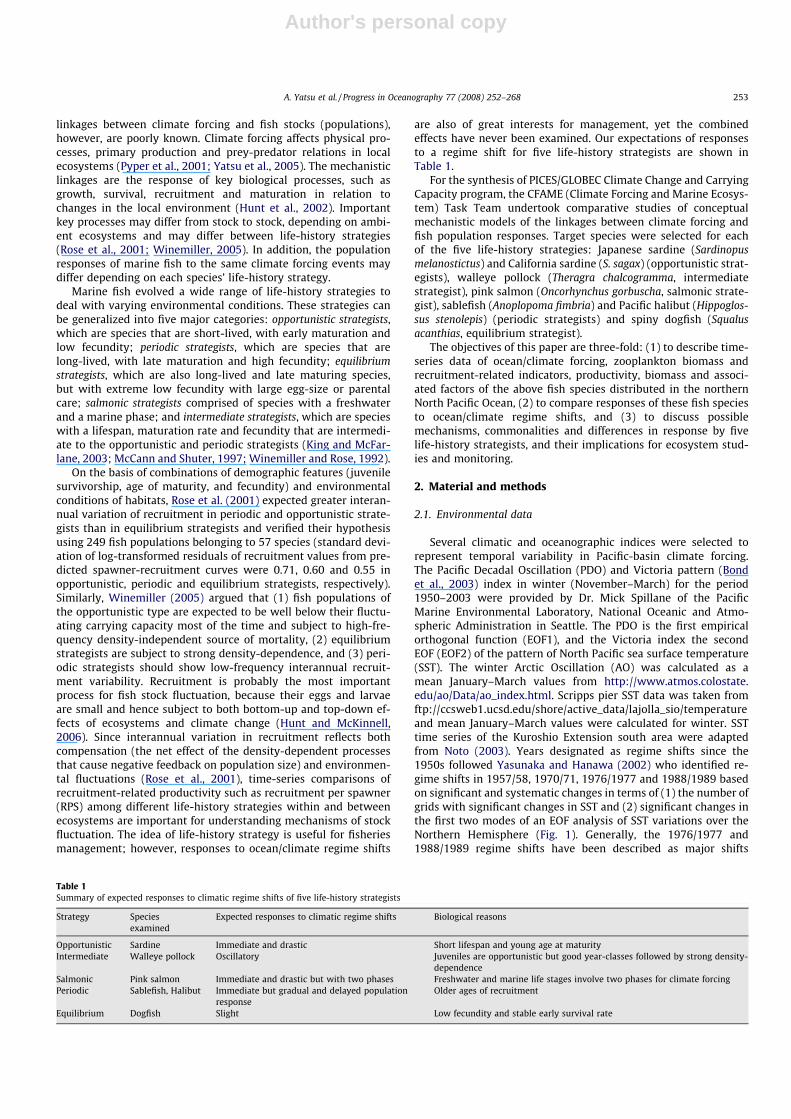
Effects of climatic regime shifts on the Japanese sardine weregenerally evident in all recruitment-related productivity metrics,LNRR, RPS and P/B, among which the most prominent was LNRR(Fig. 5a). The trend in biomass was almost identical to that ofcatch (Fig. 5a). Dramatic increase in LNRR and RPS at around1970 followed by almost continuously positive LNRR until1987 resulted in increasing biomass during the 1970s and1980s. The collapse of biomass was caused by extremely nega-tive LNRR (or near zero RPS) during 1988–1991, followed bymostly negative LNRR through 2000 (Fig. 5a). The highest regimeshift index (RSI) for Japanese sardine was detected in 1969, forwhich LNRR and P/B are responsible, followed by 1974 (LNRRand RPS), 1988 (LNRR) and, 1970 (RPS) (Fig. 5c). Thus the1970/71 and 1988/89 regime shifts may have affected Japanesesardine recruitment and productivity. Pulse-like responses ofLNRR in the Japanese sardine were observed within one or twoyears of the climatic regime shifts (both before and after) withmagnitudes of up to ca. ±3, and then decayed to quasi-stablestate (new equilibrium). This pattern of LNRR is considered a re-sponse to drastic shifts and subsequent relaxation in density-dependent effects owing to a shift in carrying capacity for thisstock (Tanaka, 2003; Yatsu et al., 2005) and perhaps also a‘‘predator pit” (Bakun, 2006; Hunt and McKinnell, 2006). Thus,
Kuroshio Extension south area winter SST
-3
-2
-1
0
1
2
3
1900 1910 1920 1930 1940 1950 1960 1970 1980 1990 2000
Ano
mal
y
0
1.000
2.000
3.000
4.000
5.000
1900 1910 1920 1930 1940 1950 1960 1970 1980 1990 2000
Japa
nese
cat
ch (
1000
t)
0
200
400
600
800
1,000
Cal
iforn
ia c
atch
(10
00t)
JapanCalifornia-west coastGulf of California
Uncorrected
Scripps pier winter SST
-3
-2
-1
0
1
2
3
1900 1910 1920 1930 1940 1950 1960 1970 1980 1990 2000Year
Ano
mal
y
Corrected
Fig. 4. Time-series of (a) catch of Japanese, California and for recent years Gulf of California sardine, (b) sea surface temperature anomalies (SSTa) of the Kuroshio Extensionsouth area in winter (adopted from Noto (2003)) and (c) Scripps pier SSTa in winter. Kuroshio Extension SST data before 1945 had a bias derived from different samplingmethods; it was corrected empirically (Noto, 2003).
258 A. Yatsu et al. / Progress in Oceanography 77 (2008) 252–268
Author's personal copy
it should be pointed out that a density-dependent effect is pre-vailing when carrying capacity is suddenly reduced, as occurredin 1988/89. The observed trend of P/B ratio is similar to butmuch milder than those of LNRR and RPS, probably because pro-duction is a sum of recruitment, growth and mortality of all age-groups and annual growth is negatively affected by biomass(Yatsu and Kaeriyama, 2005). The 1–2 year lead time of a sar-dine response to climatic regime shift years may be caused bythe immediate response of early growth and survival of Japanesesardine to SST shifts in the Kuroshio Extension area (Yatsu et al.,2005), which, in turn, may act as a trigger (and a precursor) ofclimatic regime shifts with a short time-lag (Yasuda et al.,2000). For example, winter SST suddenly increased in 1988(Fig. 4b), recruitment and LNRR of Japanese sardine declinedfrom 1988 (Fig. 5a), but the North Pacific climate shifted in1989. Thus, Japanese sardine and other small pelagic fishes thatspend their early life in the Kuroshio Extension may respond inadvance of a climatic regime shift. It should be stressed that therecovery of Japanese sardine that started around 1970 (whenhigh productivity was observed), was well before the 1976/77climatic regime shift, rather it may be related to the minor1970/71 shift.
RPS of California sardine does not appear related to the tworegime shifts (1988/89 and 1998/99) as RSI were detected in1985 and 1996 (Fig. 5b and c). The abrupt increase in Scrippspier SST after the 1976/77 regime shift (Fig. 4c), and subsequent
increase of catch (Fig. 4a) may indicate that decreasing RPS inthe 1980s of California sardine (Fig. 5b) is a relaxation of den-sity-dependence to a new equilibrium. Recovery of spawningstock biomass since around 1980 can be explained by a combi-nation of positive LNRR and high RPS during 1980–83 followedby fluctuating but neutral LNRR until 1998 (mean of LNRRduring 1984–1997 was 0.003) and adaptive fishery managementusing Scripps pier SST as a proxy of environmental condition(Hill et al., 2005; http://www.pcouncil.org/cps/cpsfmp/cpsa11.html).
A conceptual model of the recovery of the Pacific stock ofJapanese sardine during the 1970s and 1980s is presented inFig. 6. This model is based on the optimum temperature hypothesis(Takahashi et al., 2004; Takasuka et al., 2008), the physical-biolog-ical processes described in Fig. 2 and Yatsu et al. (2005), and therelationship of sardine to tropical predators such as skipjack(Katsuwonus pelamis) and Japanese common squid (Todarodes pac-ificus). Temperature may also affect the abundance of predatorsand the probability of these predators encountering sardine (Huntand McKinnell, 2006). The process of decline of sardine populationswould be the mirror image but the biomass change is more strikingbecause of the density-dependent effect coupled with a diminishedcarrying capacity (Fig. 5a; MacCall, 2002). Sardines expand theirgeographic distribution during high abundance periods, and shrinktheir distribution during periods of decreasing or low abundance(Yatsu and Kaeriyama, 2005).
05,000
10,00015,00020,00025,00030,00035,00040,000
1950 1960 1970 1980 1990 2000
Biom
ass
and
catc
h(1
000t
)
-4-3-2-101234
LNR
R,R
PS(1
00in
dpe
rkg)
and
P/B
BiomassCatchRPSP/BLNRR
Japanese sardine Pacific stock
0500
1,0001,5002,0002,5003,0003,5004,0004,500
1950 1960 1970 1980 1990 2000
Spaw
ning
biom
ass
(100
0t)
and
catc
h(t)
-1.8-1.4-1.0-0.6-0.20.20.61.01.41.8
LNR
Ran
dR
PS
SSB (Calif)Catch (Canada)Catch (California) /100RPS (Calif)LNRR
California sardine BC-California
0.00.51.01.52.02.53.0
1950 1960 1970 1980 1990 2000Year
Reg
ime
shift
inde
x Japanese Sardine P/BJapanese Sardine RPSJapanese Sardine LNRRCalifornia Sardine RPS
Fig. 5. Time-series of (a) catch, biomass, recruitment per spawner (RPS), production per biomass (P/B) and log recruitment residuals (LNRR) of Japanese sardine, (b) catch,spawning stock biomass (SSB), RPS and LNRR of California sardine, and (c) regime shift index.
A. Yatsu et al. / Progress in Oceanography 77 (2008) 252–268 259

Author's personal copy
3.4. Pink salmon (salmonic strategy)
Pink salmon have a life span of two years and spawn at the endof the 2nd year of life, thus odd-year and even-year bloods haveindependent population dynamics (Eggers et al., 2004; Pyperet al., 2005). Year-to-year variation in LNRR and RPS was morestable in the British Columbia pink salmon stocks than those ofRussian and Hokkaido (Northern Japan) stocks (Fig. 7). Low-fre-quency fluctuation in biomass was evident in Russian and Hokka-ido stocks. High regime shift index (RSI) were detected in 1956 and1961 in Russian LNRR and RPS, and lower RSI were observed in1989, 1994 and 1995 in Hokkaido LNRR and RPS (Fig. 7d). In1998, a weak RSI signal was observed in Russian LNRR. Thus, onlythe 1988/89 and 1998/99 climatic regime shifts were linked to theAsian pink salmon stocks, though correlation of time series be-tween Hokkaido and Russian pink salmon was detected neitherin LNRR nor RPS. The British Columbia and Washington State pinksalmon stocks showed much less variability without any apparentrelationship to regime shift years (Pyper et al., 2001). Although var-iability of LNRR in these three regions is less (<±1) than those ofsardine and pollock, this is not the case for pink salmon in all re-gions of the North Pacific. Recruitment residuals of the Alaskanpink salmon populations (Pyper et al., 2001) was usually up to±2 (not shown). The Alaskan pink stocks had a pulse-like responseto climatic regime shift years: 1970/71 for Yakutat, Kodiak Is., Bris-tol Bay, Chignik, Norton Sound, Cook Inlet and Alaska Peninsula;1976/77 for Bristol Bay, Prince William Sound and SoutheasternAlaska, and 1988/89 for Kodiak Is., Norton Sound, Southeast Alaskaand Cook Inlet (according to Fig. 4 of Pyper et al. (2001) superim-posed on regime shift years as indicated by vertical lines of Fig. 1).
Based on an inter-species comparison across the Gulf of Alaskaand eastern Bering Sea, Pyper et al. (2005) concluded that therewas no evidence that basin-scale environmental processes simul-taneously influenced survival rates of pink, chum, and sockeye sal-mon. Pink and chum salmon showed the strongest patterns ofpositive covariation in survival rate among the three species exam-ined, probably related to similar life-history and ecological charac-teristics (Pyper et al., 2005). Pyper et al. (2001, 2005) stressed theimportance of local (< 1000 km) environmental conditions forstudies of mechanisms of population fluctuation and fishery man-agement. Botsford and Lawrence (2002) reported an inverse regio-nal relationship in commercial catch of coho salmon (Oncorhynchuskisutch); an increase in the Gulf of Alaska since the mid-1970s andconcurrent declines in the California Current. They concluded thatthe dominant, warm/cool mode of physical co-variability, whichdrives these populations regionally, is related to basin-scale indi-ces. This conclusion does not conflict with that of Pyper et al.(2005), because their target current systems are differentiated,and contrasting coho catch trends in two areas (Botsford and Law-
rence, 2002) are consistent to regional differences in primary pro-duction after the 1976/77 regime shift (Fig. 2a ; also see Section3.2).
3.5. Walleye pollock (intermediate strategy)
The life span of walleye pollock is more than 10 years with max-imum reported ages near 30 years (McFarlane and Beamish, 1990).Maturation starts near age 3 with 50% maturity occurring betweenthree and four years of age (30–35 cm fork length) in the easternBering Sea, Gulf of Alaska and Japanese waters (Bakkala et al.,1978; Hughes and Hirschhorn, 1979; Mito et al., 1999; Yabuki,2005; Yabuki and Honda, 2005). Recruitment to the fishery in theeastern Bering Sea and Gulf of Alaska usually takes place near thesesizes (e.g. Dorn et al., 2005; Ianelli et al., 2005) or at slightly smallersizes in Japanese waters (Yabuki, 2005; Yabuki and Honda, 2005).Size at 50% maturity in the western Bering Sea is reported near40 cm fork length (Balykin, 1986).
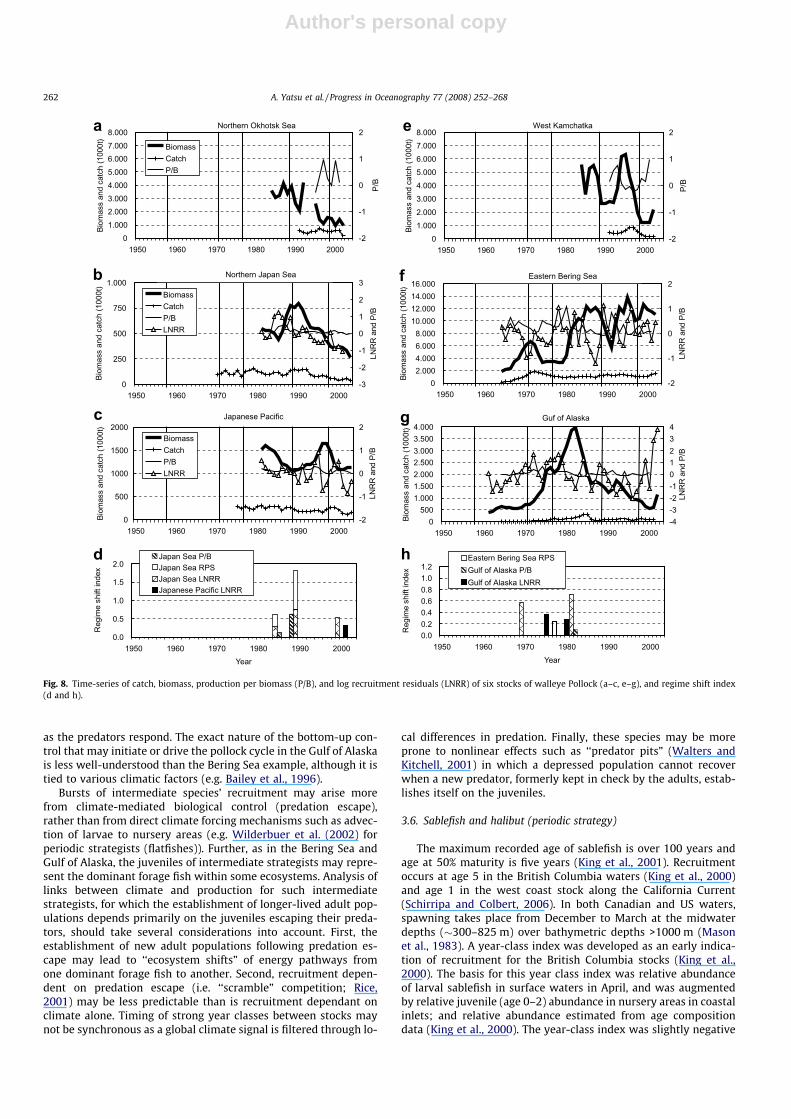
The biomass of walleye pollock shows a decadal pattern with-out apparent relation to years of climatic regime shifts (Fig. 8).Declining trends in biomass were commonly observed during the1990s to early 2000s in all stocks examined except for the easternBering Sea shelf stock, though in some stocks there wereshort-term recoveries in mid or late 1990s (West Kamchatka andJapanese Pacific) and slight increases in recent years (WestKamchatka and Gulf of Alaska). The Bering Sea basin stock in theinternational waters (the Donut Hole) recorded its peak biomassof ca. 2.4 million tons in the mid 1980s, and then declined to a verylow level despite a moratorium on fishing since 1993 (PICES, 2004).The regime shift index (RSI) for the Japan Sea stock was highest in1989, for which both LNRR and RPS are responsible, followed by1984 (LNRR and RPS), 1988 (P/B), 1999 (LNRR), and 1985 (P/B)(Fig. 8d). RSI for the Japanese Pacific stock was detected only in2001. RSI for the eastern Bering Sea stock was detected in LNRR,and highest in 1981, followed by 1969 and 1977 (Fig. 8h). In theGulf of Alaska stock, RSI was most prominent in 1975 (LNRR) fol-lowed by 1980 (LNRR) and 1982 (P/B).
LNRR for pollock is generally more variable than P/B, and LNRRshowed high-frequency variability (generally within several years),which is distinct from those of sardines and pink salmon. Responseof LNRR is much less than in sardines (almost within ±1), except forthat of the Gulf of Alaska stock, whose LNRR ranged within ±2 andmore than 3 in most recent years. These latter values are consid-ered uncertain due to the nature of age-structured methods ofrecruitment estimation in the four stocks that have LNRR time ser-ies, thus excluded from RSI calculation. There were, however, dec-adal periods when positive LNRR values were frequently observed(1970s), while negative LNRR values dominated in other periods(1960s and 1990s).
On the basis of an analysis relating climate to high-trophic levelspecies such as mammals and seabirds in the shelf area of BeringSea, Hunt et al. (2002) proposed the Oscillating Control Hypothesis(OCH), consisting of alternating bottom-up control in cold regimesand top-down control in warm regimes. In the cold regime, late iceretreat and low temperatures limit the production of zooplanktonand the recruitment of fishes including pollock (bottom-up con-trol). A continued cold regime will lead to a decrease of biomassof piscivorous animals including adult pollock, due to their poorrecruitment (relaxing of top-down control). In warmer periodsabundant zooplankton will support strong recruitment of both for-age and predatory fishes that control forage fishes, including juve-nile pollock. As the predators age and grow (during warm regime)the biomass of these predators will accumulate and their feedingpressure on forage fishes will increase (beginning of top-down con-trol). At the onset of a new cold regime, the biomass of predatorsremains high and predation continues to control the biomass of
Fig. 6. Conceptual model of stock fluctuation of the Pacific stock of Japanesesardine. Solid arrows: statistically or mechanistically significant relations; Dashedarrows: unproven but plausible relations.
260 A. Yatsu et al. / Progress in Oceanography 77 (2008) 252–268

Author's personal copy
forage fish, but bottom-up processes begin to limit pollockrecruitment.
The OCH can explain the observed low-frequency pattern of thebiomass trajectory and high-frequency LNRR pattern of pollockstocks, through the occurrence of strong year classes followed bya strong density-dependent effect on reproductive rate whenstrong year classes become piscivorous (including cannibalisticconsumption of young pollock). The OCH also predicts that theoccurrence of strong year classes will be delayed after favorableclimatic conditions return until top-down control is relaxed. This
situation is different from that of sardine and pink salmon whoserecruitment rates respond rapidly and strongly to some climaticregime shifts.
The Gulf of Alaska pollock stock may have experienced a similarshift between bottom-up control in the 1980s (time of high pro-duction) and top-down control in the 1990s, mainly due to preda-tion by arrowtooth flounder, Atheresthes stomias (Bailey, 2000). Inthis case, the population oscillations may resemble a more classicpredator/prey cycle, in which a large outburst of pollock recruit-ment is followed by a dramatic decrease in apparent production,
0
30
60
90
120
150
180
1950 1960 1970 1980 1990 2000
Spa
wne
r(m
illio
nin
ds)
-3
-2
-1
0
1
2
3
LNR
Ran
dR
PS
Russia
0
5
10
15
20
25
30
1950 1960 1970 1980 1990 2000
Spaw
ner(
milli
onin
ds)
-3
-2
-1
0
1
2
3
LNR
Ran
dR
PS
Hokkaido
0
5
10
15
20
25
30
1951 1961 1971 1981 1991 2001
Spaw
ner(
mill
ion
inds
)
-3
-2
-1
0
1
2
3
LNR
Ran
dR
PS
(x10
0)
SpawnerLNRRRPS
Canada
0.0
0.5
1.0
1.5
1950 1960 1970 1980 1990 2000Year
Reg
ime
shift
inde
x
Russia RPSRussia LNRRHokkaido RPSHokkaido LNRR
Fig. 7. Time-series of spawner, recruitment per spawner (RPS), and log recruitment residuals (LNRR) of pink salmon of British Columbia (a), Russia (b), Hokkaido (c), andregime shift index (d).
A. Yatsu et al. / Progress in Oceanography 77 (2008) 252–268 261
Author's personal copy
as the predators respond. The exact nature of the bottom-up con-trol that may initiate or drive the pollock cycle in the Gulf of Alaskais less well-understood than the Bering Sea example, although it istied to various climatic factors (e.g. Bailey et al., 1996).
Bursts of intermediate species’ recruitment may arise morefrom climate-mediated biological control (predation escape),rather than from direct climate forcing mechanisms such as advec-tion of larvae to nursery areas (e.g. Wilderbuer et al. (2002) forperiodic strategists (flatfishes)). Further, as in the Bering Sea andGulf of Alaska, the juveniles of intermediate strategists may repre-sent the dominant forage fish within some ecosystems. Analysis oflinks between climate and production for such intermediatestrategists, for which the establishment of longer-lived adult pop-ulations depends primarily on the juveniles escaping their preda-tors, should take several considerations into account. First, theestablishment of new adult populations following predation es-cape may lead to ‘‘ecosystem shifts” of energy pathways fromone dominant forage fish to another. Second, recruitment depen-dent on predation escape (i.e. ‘‘scramble” competition; Rice,2001) may be less predictable than is recruitment dependant onclimate alone. Timing of strong year classes between stocks maynot be synchronous as a global climate signal is filtered through lo-
cal differences in predation. Finally, these species may be moreprone to nonlinear effects such as ‘‘predator pits” (Walters andKitchell, 2001) in which a depressed population cannot recoverwhen a new predator, formerly kept in check by the adults, estab-lishes itself on the juveniles.
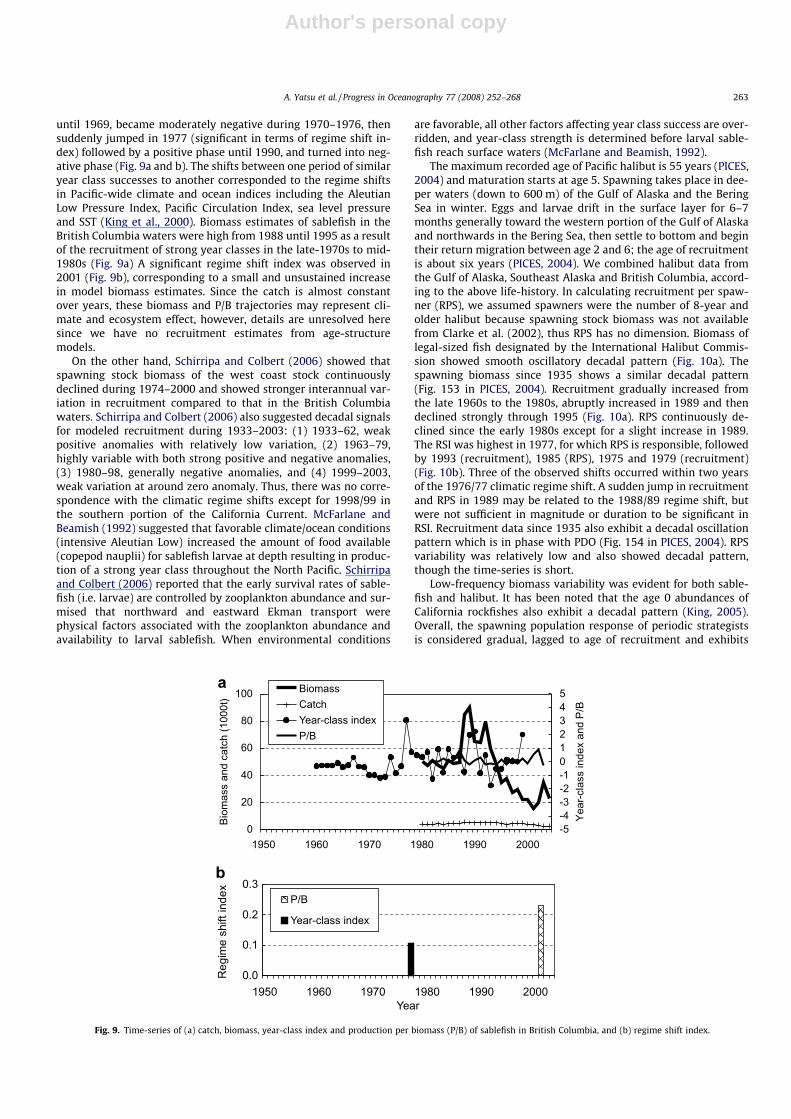
3.6. Sablefish and halibut (periodic strategy)
The maximum recorded age of sablefish is over 100 years andage at 50% maturity is five years (King et al., 2001). Recruitmentoccurs at age 5 in the British Columbia waters (King et al., 2000)and age 1 in the west coast stock along the California Current(Schirripa and Colbert, 2006). In both Canadian and US waters,spawning takes place from December to March at the midwaterdepths (�300–825 m) over bathymetric depths >1000 m (Masonet al., 1983). A year-class index was developed as an early indica-tion of recruitment for the British Columbia stocks (King et al.,2000). The basis for this year class index was relative abundanceof larval sablefish in surface waters in April, and was augmentedby relative juvenile (age 0–2) abundance in nursery areas in coastalinlets; and relative abundance estimated from age compositiondata (King et al., 2000). The year-class index was slightly negative
01.0002.000
3.0004.0005.0006.0007.0008.000
1950 1960 1970 1980 1990 2000
Biom
ass
and
catc
h(1
000t
)
-2
-1
0
1
2
P/B
West Kamchatka
02.0004.0006.0008.000
10.00012.00014.00016.000
1950 1960 1970 1980 1990 2000Bi
omas
san
dca
tch
(100
0t)
-2
-1
0
1
2
LNR
Ran
dP/
B
01.0002.0003.0004.0005.0006.0007.0008.000
1950 1960 1970 1980 1990 2000
Biom
ass
and
catc
h(1
000t
)
-2
-1
0
1
2
P/B
BiomassCatchP/B
0500
1.0001.5002.0002.5003.0003.5004.000
1950 1960 1970 1980 1990 2000
Biom
ass
and
catc
h(1
000t
)
-4-3-2-101234
LNR
Ran
dP/
B
Guf of Alaska
0.00.20.40.60.81.01.2
1950 1960 1970 1980 1990 2000Year
Reg
ime
shift
inde
x
Eastern Bering Sea RPSGulf of Alaska P/BGulf of Alaska LNRR
0.0
0.5
1.0
1.5
2.0
1950 1960 1970 1980 1990 2000Year
Reg
ime
shift
inde
x
Japan Sea P/BJapan Sea RPSJapan Sea LNRRJapanese Pacific LNRR
0
250
500
750
1.000
1950 1960 1970 1980 1990 2000
Biom
ass
and
catc
h (1
000t
)
-3
-2
-1
0
1
2
3
LNR
Ran
dP/
B
BiomassCatchP/BLNRR
0
500
1000
1500
2000
1950 1960 1970 1980 1990 2000
Biom
ass
and
catc
h(1
000t
)
-2
-1
0
1
2
LNR
Ran
dP/
B
BiomassCatchP/BLNRR
Japanese Pacific
Northern Okhotsk Sea
Eastern Bering SeaNorthern Japan Sea
Fig. 8. Time-series of catch, biomass, production per biomass (P/B), and log recruitment residuals (LNRR) of six stocks of walleye Pollock (a–c, e–g), and regime shift index(d and h).
262 A. Yatsu et al. / Progress in Oceanography 77 (2008) 252–268
Author's personal copy
until 1969, became moderately negative during 1970–1976, thensuddenly jumped in 1977 (significant in terms of regime shift in-dex) followed by a positive phase until 1990, and turned into neg-ative phase (Fig. 9a and b). The shifts between one period of similaryear class successes to another corresponded to the regime shiftsin Pacific-wide climate and ocean indices including the AleutianLow Pressure Index, Pacific Circulation Index, sea level pressureand SST (King et al., 2000). Biomass estimates of sablefish in theBritish Columbia waters were high from 1988 until 1995 as a resultof the recruitment of strong year classes in the late-1970s to mid-1980s (Fig. 9a) A significant regime shift index was observed in2001 (Fig. 9b), corresponding to a small and unsustained increasein model biomass estimates. Since the catch is almost constantover years, these biomass and P/B trajectories may represent cli-mate and ecosystem effect, however, details are unresolved heresince we have no recruitment estimates from age-structuremodels.
On the other hand, Schirripa and Colbert (2006) showed thatspawning stock biomass of the west coast stock continuouslydeclined during 1974–2000 and showed stronger interannual var-iation in recruitment compared to that in the British Columbiawaters. Schirripa and Colbert (2006) also suggested decadal signalsfor modeled recruitment during 1933–2003: (1) 1933–62, weakpositive anomalies with relatively low variation, (2) 1963–79,highly variable with both strong positive and negative anomalies,(3) 1980–98, generally negative anomalies, and (4) 1999–2003,weak variation at around zero anomaly. Thus, there was no corre-spondence with the climatic regime shifts except for 1998/99 inthe southern portion of the California Current. McFarlane andBeamish (1992) suggested that favorable climate/ocean conditions(intensive Aleutian Low) increased the amount of food available(copepod nauplii) for sablefish larvae at depth resulting in produc-tion of a strong year class throughout the North Pacific. Schirripaand Colbert (2006) reported that the early survival rates of sable-fish (i.e. larvae) are controlled by zooplankton abundance and sur-mised that northward and eastward Ekman transport werephysical factors associated with the zooplankton abundance andavailability to larval sablefish. When environmental conditions
are favorable, all other factors affecting year class success are over-ridden, and year-class strength is determined before larval sable-fish reach surface waters (McFarlane and Beamish, 1992).
The maximum recorded age of Pacific halibut is 55 years (PICES,2004) and maturation starts at age 5. Spawning takes place in dee-per waters (down to 600 m) of the Gulf of Alaska and the BeringSea in winter. Eggs and larvae drift in the surface layer for 6–7months generally toward the western portion of the Gulf of Alaskaand northwards in the Bering Sea, then settle to bottom and begintheir return migration between age 2 and 6; the age of recruitmentis about six years (PICES, 2004). We combined halibut data fromthe Gulf of Alaska, Southeast Alaska and British Columbia, accord-ing to the above life-history. In calculating recruitment per spaw-ner (RPS), we assumed spawners were the number of 8-year andolder halibut because spawning stock biomass was not availablefrom Clarke et al. (2002), thus RPS has no dimension. Biomass oflegal-sized fish designated by the International Halibut Commis-sion showed smooth oscillatory decadal pattern (Fig. 10a). Thespawning biomass since 1935 shows a similar decadal pattern(Fig. 153 in PICES, 2004). Recruitment gradually increased fromthe late 1960s to the 1980s, abruptly increased in 1989 and thendeclined strongly through 1995 (Fig. 10a). RPS continuously de-clined since the early 1980s except for a slight increase in 1989.The RSI was highest in 1977, for which RPS is responsible, followedby 1993 (recruitment), 1985 (RPS), 1975 and 1979 (recruitment)(Fig. 10b). Three of the observed shifts occurred within two yearsof the 1976/77 climatic regime shift. A sudden jump in recruitmentand RPS in 1989 may be related to the 1988/89 regime shift, butwere not sufficient in magnitude or duration to be significant inRSI. Recruitment data since 1935 also exhibit a decadal oscillationpattern which is in phase with PDO (Fig. 154 in PICES, 2004). RPSvariability was relatively low and also showed decadal pattern,though the time-series is short.
Low-frequency biomass variability was evident for both sable-fish and halibut. It has been noted that the age 0 abundances ofCalifornia rockfishes also exhibit a decadal pattern (King, 2005).Overall, the spawning population response of periodic strategistsis considered gradual, lagged to age of recruitment and exhibits
0
20
40
60
80
100
1950 1960 1970 1980 1990 2000
Biom
ass
and
catc
h(1
000t
)
-5-4-3-2-1012345
Year
-cla
ssin
dex
and
P/B
BiomassCatchYear-class indexP/B
0.0
0.1
0.2
0.3
1950 1960 1970 1980 1990 2000Year
Reg
ime
shift
inde
x
P/B
Year-class index
Fig. 9. Time-series of (a) catch, biomass, year-class index and production per biomass (P/B) of sablefish in British Columbia, and (b) regime shift index.
A. Yatsu et al. / Progress in Oceanography 77 (2008) 252–268 263
Author's personal copy
low variability in RPS and P/B, which may be characteristic of peri-odic strategists, though there were years of a sudden jump linkedto climatic regime shifts followed by immediate return to previousstates or trend in recruitment and RPS, probably due to strong den-sity-dependent effects (most stable biomass in periodic strategist).
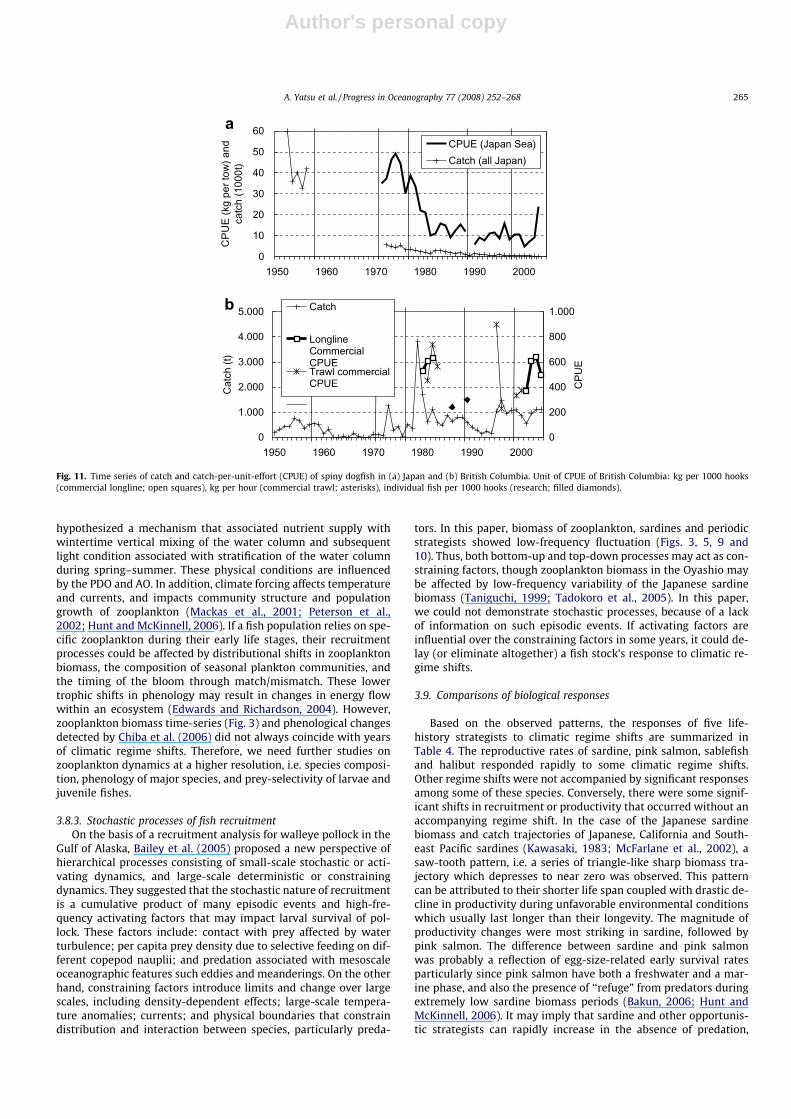
3.7. Spiny dogfish (equilibrium strategy)
The maximum recorded age of spiny dogfish is more than 100years. Maturation starts at age 14 (male) or 23 (female) in Japanesewaters (Muto, 2005). Saunders and McFarlane (1993) reported thatspiny dogfish off the west coast of British Columbia had a medianage of maturity of 22 years (male) and 35 years (female). This spe-cies is ovoviviparous, with litters of 1–20 young, and their gesta-tion period is 18–24 months, which is the longest among thesharks and rays. Equilibrium strategists have a very low intrinsicrate of increase (Smith et al., 1998). As such, equilibrium strategistsshould exhibit relatively stable population dynamics over time.Conversely, these species are unable to withstand even modestharvest rates without experiencing population depletion and po-tential stock collapse. The Japanese spiny dogfish catch and CPUEcontinuously declined since the 1950s with a slight recent recovery(Fig. 11a), although the time series lacks data from the late 1950sand 1960s. In British Columbia, CPUE was rather stable (varying bya factor of 4 only) in contrast to the large interannual variability ofcatch (Fig. 11b). Owing to the low reproductive rate and high juve-nile survival rate arising from ovoviviparity and large size at birth(18–30 cm), responses of equilibrium strategists to climatic regimeshifts are expected to be minimal, although data were not availableto evaluate this. Any excess catch will deplete stocks, which willrequire a long time to recover.
3.8. Time-lag and unique responses of local populations to climaticregime shifts
Statistically significant changes in the regime shift index for thefish stocks examined did not always coincide with years of climaticregime shifts (Figs. 5 and 7–11). In some cases, fish stocks re-sponded 1–2 years after the climatic regime shifts or showed noapparent link. Nor did the time-series of relative biomass of sum-
mer mesozooplankton always match with climatic regime shifts(Fig. 3). We discuss these issues from three aspects: the impor-tance of (1) regional physical environments, (2) phenology of zoo-plankton, and (3) stochastic processes of fish recruitment.
3.8.1. Regional effectsAlthough inter-regional comparisons within the same species
were limited in this paper, some commonalities were observedamong geographically proximate populations. Ecosystem re-sponses to climatic regime shifts are considered unique to regions(<1000 km, Pyper et al., 2001, 2005), because large-scale climaticforcings are modulated by local physical, chemical and biologicalprocesses. Each climatic regime is characterized by unique combi-nations of major physical conditions (Fig. 1, Table 2, King, 2005).Climatic regime shifts affect local physical and lower trophic bio-logical production differently with a lag in some case, i.e. withthe arrival of Rossby waves (Fig. 2). In specific regions, effects ofphysical forcing are reversed, thus the effects for the intermediateregions could be neutral. For example, coho salmon populations inthe Gulf of Alaska increased since the mid-1970s, however popula-tions along the California Current decreased (Botsford and Law-rence, 2002). Another example is the much more prominenteffects of the 1998/99 regime shift for the eastern North Pacificcompared to the waters around Japan (King, 2005; Saitoh et al.,2004).
3.8.2. Phenology of zooplanktonPhenology is the study of annually recurring life cycle events
such as the timing of migration or flowering. These events can pro-vide a sensitive indicator to climatic change and mechanistic linksto higher ecosystem levels (Edwards and Richardson, 2004). In theOyashio, Chiba et al. (2006) analyzed extensive copepod samplessince the 1950s and found (1) a concurrent increase of biomassand a delay by one month of the peak abundance of ‘‘springcommunity” copepods, (2) an earlier peak in the abundance of‘‘spring–summer” type copepods from the early 1970s to the1977/78 regime shift, and (3) that the peak period of these two sea-sonal communities became stable with a slight earliness only inspring community since 1992, i.e. three years after the 1988/89 re-gime shift. For these phenological changes, Chiba et al. (2006)
0200400600800
1.0001.2001.4001.600
1950 1960 1970 1980 1990 2000
Biom
ass
(100
0t).
catc
h(t)
and
recr
uits
(100
00fis
h)
-0.8-0.6-0.4-0.20.00.20.40.60.8
RPS
Biomass
Catch
Recruits
RPS
0.0
0.5
1.0
1.5
2.0
1950 1960 1970 1980 1990 2000Year
Reg
ime
shift
inde
x
RPS
Recruits
Fig. 10. Time-series of (a) biomass, catch, number of recruits and recruitment per spawner (RPS) of halibut in British Columbia, and (b) regime shift index.
264 A. Yatsu et al. / Progress in Oceanography 77 (2008) 252–268
Author's personal copy
hypothesized a mechanism that associated nutrient supply withwintertime vertical mixing of the water column and subsequentlight condition associated with stratification of the water columnduring spring–summer. These physical conditions are influencedby the PDO and AO. In addition, climate forcing affects temperatureand currents, and impacts community structure and populationgrowth of zooplankton (Mackas et al., 2001; Peterson et al.,2002; Hunt and McKinnell, 2006). If a fish population relies on spe-cific zooplankton during their early life stages, their recruitmentprocesses could be affected by distributional shifts in zooplanktonbiomass, the composition of seasonal plankton communities, andthe timing of the bloom through match/mismatch. These lowertrophic shifts in phenology may result in changes in energy flowwithin an ecosystem (Edwards and Richardson, 2004). However,zooplankton biomass time-series (Fig. 3) and phenological changesdetected by Chiba et al. (2006) did not always coincide with yearsof climatic regime shifts. Therefore, we need further studies onzooplankton dynamics at a higher resolution, i.e. species composi-tion, phenology of major species, and prey-selectivity of larvae andjuvenile fishes.
3.8.3. Stochastic processes of fish recruitmentOn the basis of a recruitment analysis for walleye pollock in the
Gulf of Alaska, Bailey et al. (2005) proposed a new perspective ofhierarchical processes consisting of small-scale stochastic or acti-vating dynamics, and large-scale deterministic or constrainingdynamics. They suggested that the stochastic nature of recruitmentis a cumulative product of many episodic events and high-fre-quency activating factors that may impact larval survival of pol-lock. These factors include: contact with prey affected by waterturbulence; per capita prey density due to selective feeding on dif-ferent copepod nauplii; and predation associated with mesoscaleoceanographic features such eddies and meanderings. On the otherhand, constraining factors introduce limits and change over largescales, including density-dependent effects; large-scale tempera-ture anomalies; currents; and physical boundaries that constraindistribution and interaction between species, particularly preda-
tors. In this paper, biomass of zooplankton, sardines and periodicstrategists showed low-frequency fluctuation (Figs. 3, 5, 9 and10). Thus, both bottom-up and top-down processes may act as con-straining factors, though zooplankton biomass in the Oyashio maybe affected by low-frequency variability of the Japanese sardinebiomass (Taniguchi, 1999; Tadokoro et al., 2005). In this paper,we could not demonstrate stochastic processes, because of a lackof information on such episodic events. If activating factors areinfluential over the constraining factors in some years, it could de-lay (or eliminate altogether) a fish stock’s response to climatic re-gime shifts.
3.9. Comparisons of biological responses
Based on the observed patterns, the responses of five life-history strategists to climatic regime shifts are summarized inTable 4. The reproductive rates of sardine, pink salmon, sablefishand halibut responded rapidly to some climatic regime shifts.Other regime shifts were not accompanied by significant responsesamong some of these species. Conversely, there were some signif-icant shifts in recruitment or productivity that occurred without anaccompanying regime shift. In the case of the Japanese sardinebiomass and catch trajectories of Japanese, California and South-east Pacific sardines (Kawasaki, 1983; McFarlane et al., 2002), asaw-tooth pattern, i.e. a series of triangle-like sharp biomass tra-jectory which depresses to near zero was observed. This patterncan be attributed to their shorter life span coupled with drastic de-cline in productivity during unfavorable environmental conditionswhich usually last longer than their longevity. The magnitude ofproductivity changes were most striking in sardine, followed bypink salmon. The difference between sardine and pink salmonwas probably a reflection of egg-size-related early survival ratesparticularly since pink salmon have both a freshwater and a mar-ine phase, and also the presence of ‘‘refuge” from predators duringextremely low sardine biomass periods (Bakun, 2006; Hunt andMcKinnell, 2006). It may imply that sardine and other opportunis-tic strategists can rapidly increase in the absence of predation,
0
10
20
30
40
50
60
1950 1960 1970 1980 1990 2000
CPU
E(k
gpe
rtow
)and
catc
h(1
000t
)
-3
CPUE (Japan Sea)Catch (all Japan)
0
1.000
2.000
3.000
4.000
5.000
1950 1960 1970 1980 1990 2000
Cat
ch (t
)
0
200
400
600
800
1.000
CPU
E
Catch
LonglineCommercialCPUETrawl commercialCPUE
Fig. 11. Time series of catch and catch-per-unit-effort (CPUE) of spiny dogfish in (a) Japan and (b) British Columbia. Unit of CPUE of British Columbia: kg per 1000 hooks(commercial longline; open squares), kg per hour (commercial trawl; asterisks), individual fish per 1000 hooks (research; filled diamonds).
A. Yatsu et al. / Progress in Oceanography 77 (2008) 252–268 265

Author's personal copy
when the environment becomes favorable. Productivity of walleyepollock was not coincident with climatic regime shifts; insteadthere were lengthy (decadal) periods with sustained high produc-tivity or sustained low productivity. Recruitment and biomass ofsablefish and halibut exhibited a low-frequency response to cli-mate forcing with gradual increases or decreases, though therewere some coincidences to climatic regime shifts.
Although few stocks were explored in this analysis, our expec-tations were generally verified (Table 4). For Japanese sardines, itwas noted that the observed extremely low RPS since 1988 isattributed to both SST shifts and strong density-dependence owingto suddenly diminished carrying capacity of traditional singlespecies dynamic model (Tanaka, 2003; Yatsu et al., 2005). Largevariation in recruitment-productivity metrics in the periodic strat-egists were not expected and did not occur. Also, climatic regimeshifts did not always correspond to shifts in recruitment-relatedproductivity, probably because of the mechanisms discussed inSection 3.8.
3.10. Implications to ecosystem dynamics studies and monitoring
The transition from step-like climatic regime shifts to oscilla-tory trajectories in zooplankton biomass probably arises due tomultiple complex processes of ecosystems. The extremely widerange of biomass oscillation from near zero (ca. two thousand) to20 million tons in the Japanese Pacific stock of Japanese sardine,accompanied by an expansion/shrinkage of geographic range (Yat-su and Kaeriyama, 2005), suggests extremely significant impactson ecosystems known as ‘‘wasp-waist” control coupled with ‘‘pred-ator pit” concept (Bakun, 2006), as was considered for the delayedrecovery of zooplankton biomass in Oyashio and Kurosio-OyashioTransition Zone following a climate shift (Taniguchi, 1999; Tadok-oro et al., 2005; Fig. 3b and c). Given the data-rich situation ofimportant commercial fishery stocks, many opportunistic strate-gists such as sardines, anchovies, herrings, are promising candi-dates as indicators of climatic and ecosystem changes. Marinesurvival data for many Pacific salmon populations is extensive aswell as early life stages in freshwater (Botsford and Lawrence,2002; Pyper et al., 2001, 2005; Yatsu and Kaeriyama, 2005), there-fore, they are also useful for near ‘‘real-time” monitoring of localenvironmental conditions.
Both physical factors and copepod abundance are consideredkey factors for recruitment of the periodic strategists, sablefishand halibut, in the Gulf of Alaska. These species responded to someclimatic regime shifts, but recruitment and biomass responseswere gradual. As their recruitment ages are generally older thanin other strategists, they are not suitable for ‘‘real-time monitor-ing” of ecosystem regimes. Rather they are more useful for mech-anistic studies of ecosystem dynamics. In contrast, recruitment of
walleye pollock may be dependent on predation escape, which isconsidered more stochastic and therefore less predictable than isrecruitment dependant on climate alone.
In order to understand the mechanisms linking climaticregime shifts to population dynamics of fisheries stocks throughecosystem responses, it is important to identify the biologicalresponses in productivity, especially early survival and subse-quent biomass change. Further inter-regional and inter-speciescomparisons of mechanistic processes and hypotheses in the Cli-mate Change and Carrying Capacity Program will bring newinsights.
4. Conclusions
We found recruitment-related productivity responses to cli-matic regime shifts for representative species of each life-historystrategy, except for the equilibrium strategist (dogfish). Responsesof sardines (opportunistic strategists), pink salmon (salmonicstrategist), sablefish and halibut (periodic strategists) were eitherimmediate, delayed or absent depending on age of recruitmentand combinations of fish stocks and regime shift years. The mag-nitude of productivity changes were most striking in sardinesfollowed by pink salmon, probably reflecting egg-size-relatedearly survival rates and refuges from predation during extremelylow sardine biomass periods. In walleye pollock (intermediatestrategist), there were near-decadal periods of either high produc-tivity or low productivity, with no clear link to climatic regimeshift years alone. Effects of climate on pollock might be mediatedby alternating bottom-up and top-down processes, where ‘‘pred-ator escape” may be the key. Biomass of zooplankton and fourstrategists examined indicated a decadal pattern with the mostgradual changes occurring in periodic strategists and most inten-sive occurring in sardines. Responses of fish stocks within aspecies to climatic regime shifts are often unique in each localregion, because large-scale climatic forcing is modulated by localphysical, chemical and biological processes. The observed re-sponse time or absence of response in recruitment-relatedfish productivity to climatic regime shifts may be influenced by(1) local environmental conditions (immediate, with a delay orno effects), (2) phenological shifts in zooplankton life-history(immediate or with a delay), and (3) stochastic episodic eventsin both top-down and bottom-up processes (immediate, with adelay or no effects).
Acknowledgments
We thank members of the CFAME Task Team of CCCC, thePICES/GLOBEC program, Skip McKinnell of PICES, Akira Nishimuraof Hokkaido National Research Institute, Shoshiro Minobe of the
Table 4Summary of responses to climatic regime shifts of five life-history strategists with biological mechanisms
Strategy Speciesexamined
Expected responses toclimatic regime shifts
Observed responses to climaticregime shifts
Possible biological reasons Remarks
Opportunistic Sardine Immediate and drastic Immediate and most drastic(recruitment), most intensive low-frequency (biomass)
Short lifespan and high reproductiverate
Extension and shrinkage ofgeographic distribution
Intermediate Walleyepollock
Oscillatory No coincidence (recruitment),oscillatory (biomass)
Juveniles are opportunistic but goodyear-classes followed by strongdensity-dependence
Cannibalism (especially in theeastern Bering Sea stock), may bespecific to pollock
Salmonic Pinksalmon
Immediate and drasticbut with two phases
Immediate and moderate withconsiderable geographic variability
Short lifespan and relatively stableearly survival rate
Artificial propagation
Periodic Sablefish,Halibut
Immediate but gradualand delayed populationresponse
Low-frequency with some peakycoincidence (recruitment), low-frequency (biomass)
Low-frequency variation in spawnerbiomass
Older ages of recruitment
Equilibrium Dogfish Slight None (N.B., poor available data) Low fecundity and stable earlysurvival rate
Most susceptible to fishing ordeteriorations of environments
266 A. Yatsu et al. / Progress in Oceanography 77 (2008) 252–268

Author's personal copy
Hokkaido University for discussion of climatic regime shifts andtheir effects on biological productivity. We also thank Mick Spil-lane and Jim Overland of the Pacific Marine Environmental Labora-tory, National Oceanic and Atmospheric Administration in Seattlefor providing the updated version of PDO and Victoria time series,and Akinori Takasuka of National Research Institute of Fishery Sci-ence for providing his in-press paper. This paper was presented atthe PICES/GLOBEC Symposium on ‘‘Climate variability and ecosys-tem impacts on the North Pacific: A basin-scale synthesis” held April19–21, 2006, in Honolulu, USA.
References
Bailey, K.M., 2000. Shifting control of recruitment of walleye pollock (Theragrachalcogramma) after a major climate and ecosystem change. Marine EcologyProgress Series 198, 215–224.
Bailey, K.M., Brodeur, R.D., Hollowed, A.B., 1996. Cohort survival patterns of walleyepollock (Theragra chalcogramma) in Shelikof Strait, Alaska: a critical factoranalysis. Fisheries Oceanography 5 (Suppl. 1), 179–188.
Bailey, K.M., Cianelli, L., Bond, N.A., Belgrano, A., Stenseth, N.C., 2005. Recruitment ofwalleye Pollock in a physically and biologically complex ecosystem: a newperspective. Progress in Oceanography 67, 24–42.
Bakkala, R.G., Smith, G.B., 1978. Demersal fish resources of the eastern Bering Sea:spring 1976. NMFS NWSFC Processed Report.
Bakun, A., 2005. Regime shifts. In: Robinson, A.R., Brink, K. (Eds.), The Sea, vol. 13.Harvard University Press, Cambridge, Massachusetts, pp. 971–1018 (chapter24).
Bakun, A., 2006. Wasp-waist populations and marine ecosystem dynamics:Navigating the ‘‘predator pit’’ topographies. Progress in Oceanography 68,271–288.
Balykin, P.A., 1986. Fecundity of walleye pollock Theragra chalcogramma in thewestern part of the Bering Sea. Journal of Ichthyology 26 (3), 131–136.
Beamish, R.J. (Ed.), 1995. Climate change and northern fish populations. CanadianSpecial Publication of Fisheries and Aquatic Sciences, p. 121.
Bond, N.A., Overland, J.E., Spillane, M., Stabeno, P., 2003. Recent shifts in the state ofthe North Pacific. Geophysical Research Letters 30 (23), 2183.
Botsford, L.W., Lawrence, C.A., 2002. Patterns of co-variability among CaliforniaCurrent chinook salmon, coho salmon, Dungeness crab, and physicaloceanographic conditions. Progress in Oceanography 53, 283–305.
Brodeur, R.D., Frost B.W., Hare, S.R., Francis R.C., Ingraham Jr., W.J., 1996.Interannual variations in zooplankton biomass in the Gulf of Alaska andcovariation with California Current zooplankton biomass. CalCOFI Report, 37,pp. 80–99.
Bulatov, O.A., 2003. The stock development and mid-term prospects of pollockfishery in the Bering and the Okhotsk Seas. Ps,yoe Xopzqcndo, 5, 30–33 (inRussian).
Chavez, F.P., Ryan, J., Lluch-Cota, S.E., Ñiquen, C.E., 2003. From anchovies tosardines and back: multidecadal change in the Pacific Ocean. Science 299,217–221.
Chiba, S., Ono, T., Tadokoro, K., Midorikawa, T., Saino, T., 2004. Increasedstratification and decreased lower trophic level productivity in the Oyashioregion of the North Pacific: a 30-year retrospective study. Journal ofOceanograpny 60, 149–162.
Chiba, S., Tadokoro, K., Sugisaki, H., Saino, T., 2006. Effect of decadal climate changeon zooplankton over the last 50 years in the western subarctic North Pacific.Global Change Biology 12, 1–14.
Clark, W., Hare, S., 2002. Assessment of the Pacific halibut stock at the end of 2001.International Pacific Halibut Commission Stock Assessment Reports, 1–26,available at <http://www.iphc.washington.edu/halcom/research/sa/sa.html>.
Dorn, M., Aydin, K., Barbeaux, S., Guttormsen, M. Megrey, B., Spalinger, K., Wilkins,M., 2005. Assessment of walleye pollock in the Gulf of Alaska. Section 1 in StockAssessment and Fishery Evaluation Report for the Groundfish Resources of theGulf of Alaska, November 2005. North Pacific Fishery Management Council, 605W 4th Avenue, Suite 306, Anchorage, AK 99501. available at <http://www.afsc.noaa.gov/refm/docs/2005/GOApollock.pdf>.
Edwards, M., Richardson, A.J., 2004. Impact of climate change on marine pelagicphenology and trophic mismatch. Nature 430, 881–884.
Eggers. D.M., Fukuwaka, M., Irvine, J., Karpenko, V., 2004. Pacific salmon. PICESSpecial Publication, 1, pp. 227–261.
Haist, V., Kronlund, A.R., Wyeth, M.R., 2005. Sablefish (Anoplopoma fimbria) inBritish Columbia, Canada: Stock assessment for 2004 and advice to managersfor 2005. Canadian Science Advisory Secretariat Research Document, 2005/031, pp.1–182 available at <http://www.dfo-mpo.gc.ca/csas/Csas/DocREC/2005/RES2005_031_e.pdf>.
Hanselman, D.H., Lunsford, C.R., Sigler, M.F., Fujioka, J.T., 2005. Alaska sablefishassessment for 2006. Section 3 in Stock Assessment and Fishery EvaluationReport for the Groundfish Resources of the Gulf of Alaska, November 2005.North Pacific Fishery Management Council, 605 W 4th Avenue, Suite 306,Anchorage, AK 99501. available at <http://www.afsc.noaa.gov/refm/docs/2005/GOAsable.pdf>.
Hare, S.R., Mantua, N.J., 2000. Empirical evidence for North Pacific regime shifts in1977 and 1989. Progress in Oceanography 47, 103–145.
Hill, K.T., Lo, N.C.H., Macewicz, B.J., Felix-Uraga, R., 2005. Assessment of the Pacificsardine (Sardinops sagax caerulea) population for U.S. management in 2006.Pacific Fishery Management Council, Agenda Item D.1.a, SupplementalAttachment 1. 141 p.
Hokkaido University, 1957–2001. Data record of oceanographic observations andexploratory fishing. Hakodate, Japan. Faculty of Fisheries, Hokkaido UniversityNos. 1–44.
Hughes, S.E., Hirschhorn, G., 1979. The biology of walleye pollock, Theragrachalcogramma, in western Gulf of Alaska. Fishery Bulletin US 77, 263–274.
Hunt, G.L., McKinnell, S., 2006. Interplay between top-down, bottom-up, andwasp-waist control in marine ecosystems. Progress in Oceanography 68,115–124.
Hunt, G.L., Stabeno, P., Walters, G., Sinclair, E., Brodeur, R.D., Napp, J.M., Bond, N.A.,2002. Climate change and control of the southeastern Bering Sea pelagicecosystem. Deep-Sea Research II 49, 5821–5853.
Ianelli, J.N., Barbeaux, S., Honkalehto, T., Lauth, B., Williamson, N., 2005. Assessmentof Alaska pollock stock in the eastern Bering Sea. Section 1 in Stock Assessmentand Fishery Evaluation Report for the Groundfish Resources of the Bering Sea/Aleutian Islands, November 2005. North Pacific Fishery Management Council,605 W 4th Avenue, Suite 306, Anchorage, AK 99501. available at <http://www.afsc.noaa.gov/refm/docs/2005/EBSpollock.pdf>.
Jacobson, L.D., MacCall, A.D., 1995. Stock-recruitment models for Pacific sardine(Sardinops sagax). Canadian Journal of Fisheries and Aquatic Sciences 52, 566–577.
Kaeriyama, M., 1999. Hatchery programmes and stock management of salmonidpopulations in Japan. In: Howell, B.R., Moksness, E., Svasand, T. (Eds.), StockEnhancement and Sea Ranching. Fishing News Books, pp. 153–167.
Kawasaki, T., 1983. Why do some pelagic fishes have wide fluctuations in theirnumbers? FAO Fisheries Report 291, 1065–1080.
King, J.R. (Ed.), 2005. Report of the study group on fisheries and ecosystemresponses to recent regime shifts. PICES Scientific Report, 28, pp. 1–162.
King, J.R., McFarlane, G.A., 2003. Marine fish life history strategies:applications to fishery management. Fisheries Management and Ecology10, 249–264.
King, J.R., McFarlane, G.A., Beamish, R.J., 2000. Decadal scale patterns in the relativeyear class success of sablefish, Anoplopoma fimbria. Fisheries Oceanography 9,62–70.
King, J.R., McFarlane, G.A., Beamish, R.J., 2001. Incorporating the dynamics of marinesystems into the stock assessment and management of sablefish. Progress inOceanography 49, 619–639.
Lluch-Belda, D., Crawford, R.J.M., Kawasaki, T., McCall, A.D., Parrish, R.H., 1989.World-wide fluctuations of sardine and anchovy stocks: the regime problem.South African Journal of Marine Science 8, 195–205.
MacCall, A.D., 2002. Fishery-management and stock-rebuilding prospects underconditions of low-frequency environmental variability and species interactions.Bulletin of Marine Science 70, 613–628.
Mackas, D.L., Thomson, R.E., Galbraith, M., 2001. Changes in zooplanktoncommunity of the British Columbia continental margin, and covariation withoceanographic conditions, 1985–1999. Canadian Journal of Fisheries andAquatic Sciences 58, 685–702.
Mason, J.C., Beamish, R.J., McFarlane, G.A., 1983. Sexual maturity, fecundity,spawning, and early life history of sablefish (Anoplopoma fimbria) off thePacific coast of Canada. Canadian Journal of Fisheries and Aquatic Sciences 40,2126–2134.
McCann, K., Shuter, B.J., 1997. Bioenergetics of life history strategies and thecomparative allometry of reproduction. Canadian Journal of Fisheries andAquatic Sciences 54, 1289–1298.
McFarlane, G., Beamish, R.J., 1990. An examination of age determination structuresof walleye pollock from five stocks in the northeast Pacific Ocean. InternationalNorth Pacific Fisheries Commission Bulletin 50, 37–56.
McFarlane, G.A., Beamish, R.J., 1992. Climatic influence linking copepod productionwith strong year-classes in sablefish, Anoplopoma fimbria. Canadian Journal ofFisheries and Aquatic Sciences 49, 743–753.
McFarlane, G.A., Smith, P.E., Baumgartner, T.R., Hunter, J.R., 2002. Climate variabilityand Pacific sardine populations and fisheries. American Fisheries SocietySymposium 32, pp. 195–214.
McGowan, J.A., Chelton, D.B., Conversi, A., 1996. Plankton patterns, climate andchange in the California Current. CalCOFI Report, 37, pp. 45–68.
Miller, A.J., Chai, F., Chiba, S., Moisan, J.R., Neilson, D.J., 2004. Decadal-scale climateand ecosystem interactions in the North Pacific Ocean. Journal of Oceanography60, 163–188.
Mito, K., Nishimura, A., Yanagimoto, T., 1999. Ecology of groundfishes in the easternBering Sea, with emphasis on food habits. In: Loughlin, T.R., Ohtani, K.,Dynamics of the Bering Sea. University of Alaska Sea Grant, Fairbanks, Alaska,AK-SG-99-03 pp. 537–580.
Muto, F. (Ed.), 2005. The current status of international fishery stocks (summarizededition FY 2004). Fisheries Agency and Fisheries Research Agency Japan. ii+139pp.
Nishida, H., Ishida, M., Noto, M., Katsukawa Y., 2006. Stock assessment andevaluation for the Japanese Pacific stock of Japanese sardine (fiscal year 2006).In: Marine fisheries stock assessment and evaluation for Japanese waters (fiscalyear 2006), Fisheries Agency of Japan and Fisheries Research Agency of Japanpp. 11–49 (in Japanese).
Noto, M., 2003. Water temperature change of the northwestern Pacific Ocean, andrelation between Japanese sardine population and distribution. Kaiyo Monthly,35, 32–38 (in Japanese).
A. Yatsu et al. / Progress in Oceanography 77 (2008) 252–268 267
Author's personal copy
Noto, M., Yasuda, I., 1999. Population decline of the Japanese sardine, Sardinopsmelanostictus, in relation to sea surface temperature in the Kuroshio Extension.Canadian Journal of Fisheries and Aquatic Sciences 56, 973–983.
Odate, K., 1994. Zooplankton biomass and its long-term variation in the westernNorth Pacific Ocean, Tohoku sea area, Japan. Bulletin of Tohoku NationalFisheries Research Institute, 56, pp. 115–173 (in Japanese with Englishsummary).
Peterson, W.T., Keister, J.E., Feinberg, L.R., 2002. The effects of the 1997–99 El Niño/La Niña events on hydrography and zooplankton off the central Oregon coast.Progress in Oceanography 54, 381–398.
PICES, 2004. Marine ecosystems of the North Pacific. PICES Special Publication, 1,280 p.
Polovina, J.J., Mitchum, G.T., Graham, N.E., Craig, M.P., Demartine, E.E., Flint, E.N.,1994. Physical and biological consequences of a climate event in the centralNorth Pacific. Fisheries Oceanography 3, 15–21.
PSC, 1988, 1990, 1994, 1996, 1998, 1999, 2000, 2005. Report of the Fraser RiverPanel to the Pacific Salmon Commission on the 2001 Fraser River Sockeye andPink Salmon Fishing Season. Pacific Salmon Commission, Vancouver, Canada.
Pyper, B.J., Peterman, R.M., 1998. Comparison of methods to account forautocorrelation in correlation analyses of fish data. Canadian Journal ofFisheries and Aquatic Sciences 55, 2127–2140.
Pyper, B.J., Mueter, F.J., Peterman, R.M., Blackbourn, D.J., Wood, C.C., 2001. Spatialcovariation in survival rates of Northeast Pacific pink salmon (Oncorhynchusgorbuscha). Canadian Journal of Fisheries and Aquatic Sciences 58, 1501–1515.
Pyper, B.J., Mueter, F.J., Peterman, R.M., 2005. Across-species comparisons of spatialscales of environmental effects on survival rates of Northeast Pacific salmon.Transactions of the American Fisheries Society 134, 86–104.
Rice, J., 2001. Implications of variability on many time scales for scientific advice onsustainable management of living marine resources. Progress in Oceanography49, 189–209.
Rodionov, S.N., 2004. A sequential algorithm for testing climate regime shifts.Geophysical Research Letters 31, L09204.
Rodionov, S.N., 2006. Ecological indicators: software development. PICES ScientificReport, 33, pp. 39–47.
Rose, K.A., Cowan, J.H., Winemiller, K.O., Myers, R.A., Hilborn, R., 2001.Compensatory density-dependence in fish populations: importance,controversy, understanding, and prognosis. Fish and Fisheries 2, 293–327.
Saitoh, S., Chiba, S., Nakata, K., Yatsu, A., 2004. Did a regime shift occur in 1998around Japan? Highlights from a symposium addressing this question. PICESPress (vol. 12(2) pp. 21–24).
Saunders, M.W., McFarlane, G.A., 1993. Age and length-at-maturity of the femalespiny dogfish, Squalus acanthias, in the Strait of Georgia, British Columbia,Canada. Environmental Biology of Fishes 38, 49–57.
Schirripa, M.J., Colbert, J.J., 2006. Interannual changes in sablefish (Anoplopomafimbria) recruitment in relation to oceanographic conditions within theCalifornia Current System. Fisheries Oceanography 15, 25–36.
Smith, S.E., Au, D.W., Show, C., 1998. Intrinsic rebound potentials of 26 species ofPacific sharks. Marine and Freshwater Research 49, 663–678.
Sugimoto, T., Tadokoro, K., 1997. Interannual–interdecadal variations inzooplankton biomass, chlorophyll concentration and physical environment inthe subarctic Pacific and Bering Sea. Fisheries Oceanography 6, 74–93.
Tadokoro, K., Chiba, S., Ono, T., Midorikawa, T., Saino, T., 2005. Interannual variationin Neocalanus biomass in the Oyashio water of the western North Pacific.Fisheries Oceanography 14, 210–222.
Takahashi, M., Nishida, H., Yatsu, A., 2004. Preliminary study of growth of larval andearly juvenile Japanese sardine in the Kuroshio-Oyashio transition region. PICES13th Annual Meeting Abstract, p. 231.
Takasuka, A., Oozeki, Y., Aoki, I., 2007. Optimal growth temperature hypothesis:Why do anchovy flourish and sardine collapse or vice versa under the sameocean regime? Canadian Journal of Fisheries and Aquatic Sciences 64, 768–776.
Takasuka, A., Oozeki, Y., Kubota, H., Lluch-Cota, S.E., 2008. Contrasting spawningtemperature optima: why are anchovy and sardine regime shifts synchronousacross the North Pacific? Progress in Oceanography 77, 225–232.
Tanaka, E., 2003. A method for estimating dynamics of carrying capacity using timeseries of stock and recruitment. Fishery Science 69, 677–686.
Taniguchi, A., 1999. Difference in the structure of the lower trophic levels of pelagicecosystems in the eastern and western subarctic Pacific. Progress inOceanography 43, 289–315.
Waddell, B.J., Mckinnell. S., 1995. Ocean station ‘‘Papa” detailed zooplankton data:1956–1980. Canadian Technical Report of Fisheries and Aquatic Sciences, p.2056.
Walters, C., Kitchell, J.F., 2001. Cultivation/depensation effects on juvenile survivaland recruitment: implications for the theory of fishing. Canadian Journal ofFisheries and Aquatic Sciences 58, 39–50.
Watanabe, Y., Zenitani, H., Kimura, R., 1995. Population decline of the Japanesesardine Sardinops melanostictus owing to recruitment failures. Canadian Journalof Fisheries and Aquatic Sciences 52, 1609–1616.
Wilderbuer, T.K., Hollowed, A.B., Ingraham Jr., W.J., Spencer, P.D., Conners, M.E.,Bond, N.A., Walters, G.E., 2002. Flatfish recruitment response to decadal climaticvariability and ocean conditions in the eastern Bering Sea. Progress inOceanography 55, 235–247.
Winemiller, K.O., 2005. Life history strategies, population regulation, andimplications for fisheries management. Canadian Journal of Fisheries andAquatic Sciences 62, 872–885.
Winemiller, K.O., Rose, K.A., 1992. Patterns of life-history diversification in NorthAmerican fishes: implications for population regulation. Canadian Journal ofFisheries and Aquatic Sciences 49, 2196–2218.
Yabuki, K., Honda, S., 2005. Stock assessment and evaluation for the Pacific stock ofwalleye pollock (fiscal year 2005). In Marine fisheries stock assessment andevaluation for Japanese waters (fiscal year 2005). Fisheries Agency and FisheriesResearch Agency of Japan pp. 304–339 (in Japanese).
Yabuki, K., 2005. Stock assessment and evaluation for the northern Japan Sea stockof walleye pollock (fiscal year 2005). In Marine fisheries stock assessment andevaluation for Japanese waters (fiscal year 2005). Fisheries Agency and FisheriesResearch Agency of Japan pp. 249–283 (in Japanese).
Yasuda, I., Tozuka, T., Noto, M., Kouketsu, S., 2000. Heat balance and regime shifts ofthe mixed layer in the Kuroshio Extension. Progress in Oceanography 47, 257–278.
Yasunaka, S., Hanawa, K., 2002. Regime shifts found in the Northern HemisphereSST field. Journal of Meteorological Society of Japan 80, 119–135.
Yatsu, A., Kaeriyama, M., 2005. Linkages between coastal and open-ocean habitatsand dynamics of Japanese stocks of chum salmon and Japanese sardine. Deep-Sea Research II 52, 727–737.
Yatsu, A., Watanabe, T., Ishida, M., Sugisaki, H., Jacobson, L.D., 2005. Environmentaleffects on recruitment and productivity of the Japanese sardine, Sardinopsmelanostictus, and chub mackerel, Scomber japonicus, with recommendations formanagement. Fisheries Oceanography 14, 263–278.
268 A. Yatsu et al. / Progress in Oceanography 77 (2008) 252–268